UNITED STATES
SECURITIES AND EXCHANGE COMMISSION
Washington, D.C. 20549
FORM N-CSR
CERTIFIED SHAREHOLDER REPORT OF REGISTERED
MANAGEMENT INVESTMENT COMPANIES
Investment Company Act file number 811-03329
Variable Insurance Products Fund
(Exact name of registrant as specified in charter)
245 Summer St., Boston, Massachusetts 02210
(Address of principal executive offices) (Zip code)
Cynthia Lo Bessette, Secretary
245 Summer St.
Boston, Massachusetts 02210
(Name and address of agent for service)
Registrant's telephone number, including area code:
617-563-7000
| |
Date of fiscal year end: | December 31 |
|
|
Date of reporting period: | December 31, 2020 |
Item 1.
Reports to Stockholders
Fidelity® Variable Insurance Products:
High Income Portfolio
Annual Report
December 31, 2020


Contents
To view a fund's proxy voting guidelines and proxy voting record for the 12-month period ended June 30, visit http://www.fidelity.com/proxyvotingresults or visit the Securities and Exchange Commission's (SEC) web site at http://www.sec.gov.
You may also call 1-877-208-0098 to request a free copy of the proxy voting guidelines.
Fidelity® Variable Insurance Products are separate account options which are purchased through a variable insurance contract.
Standard & Poor's, S&P and S&P 500 are registered service marks of The McGraw-Hill Companies, Inc. and have been licensed for use by Fidelity Distributors Corporation.
Other third-party marks appearing herein are the property of their respective owners.
All other marks appearing herein are registered or unregistered trademarks or service marks of FMR LLC or an affiliated company. © 2021 FMR LLC. All rights reserved.
This report and the financial statements contained herein are submitted for the general information of the shareholders of the Fund. This report is not authorized for distribution to prospective investors in the Fund unless preceded or accompanied by an effective prospectus.
A fund files its complete schedule of portfolio holdings with the SEC for the first and third quarters of each fiscal year on Form N-PORT. Forms N-PORT are available on the SEC’s web site at http://www.sec.gov. A fund's Forms N-PORT may be reviewed and copied at the SEC’s Public Reference Room in Washington, DC. Information regarding the operation of the SEC's Public Reference Room may be obtained by calling 1-800-SEC-0330.
For a complete list of a fund's portfolio holdings, view the most recent holdings listing, semiannual report, or annual report on Fidelity's web site at http://www.fidelity.com, http://www.institutional.fidelity.com, or http://www.401k.com, as applicable.
NOT FDIC INSURED •MAY LOSE VALUE •NO BANK GUARANTEE
Neither the Fund nor Fidelity Distributors Corporation is a bank.
Note to Shareholders:
Early in 2020, the outbreak and spread of a new coronavirus emerged as a public health emergency that had a major influence on financial markets, primarily based on its impact on the global economy and the outlook for corporate earnings. The virus causes a respiratory disease known as COVID-19. On March 11, the World Health Organization declared the COVID-19 outbreak a pandemic, citing sustained risk of further global spread.
In the weeks following, as the crisis worsened, we witnessed an escalating human tragedy with wide-scale social and economic consequences from coronavirus-containment measures. The outbreak of COVID-19 prompted a number of measures to limit the spread, including travel and border restrictions, quarantines, and restrictions on large gatherings. In turn, these resulted in lower consumer activity, diminished demand for a wide range of products and services, disruption in manufacturing and supply chains, and – given the wide variability in outcomes regarding the outbreak – significant market uncertainty and volatility. Amid the turmoil, global governments and central banks took unprecedented action to help support consumers, businesses, and the broader economies, and to limit disruption to financial systems.
The situation continues to unfold, and the extent and duration of its impact on financial markets and the economy remain highly uncertain. Extreme events such as the coronavirus crisis are “exogenous shocks” that can have significant adverse effects on mutual funds and their investments. Although multiple asset classes may be affected by market disruption, the duration and impact may not be the same for all types of assets.
Fidelity is committed to helping you stay informed amid news about COVID-19 and during increased market volatility, and we’re taking extra steps to be responsive to customer needs. We encourage you to visit our websites, where we offer ongoing updates, commentary, and analysis on the markets and our funds.
Performance: The Bottom Line
Average annual total return reflects the change in the value of an investment, assuming reinvestment of distributions from dividend income and capital gains (the profits earned upon the sale of securities that have grown in value, if any) and assuming a constant rate of performance each year. During periods of reimbursement by Fidelity, a fund’s total return will be greater than it would be had the reimbursement not occurred. Performance numbers are net of all underlying fund operating expenses, but do not include any insurance charges imposed by your insurance company’s separate account. If performance information included the effect of these additional charges, the total returns would have been lower. How a fund did yesterday is no guarantee of how it will do tomorrow.
Average Annual Total Returns
| For the periods ended December 31, 2020 | Past 1 year | Past 5 years | Past 10 years |
| Initial Class | 2.75% | 6.99% | 5.58% |
| Service Class | 2.65% | 6.85% | 5.46% |
| Service Class 2 | 2.42% | 6.70% | 5.30% |
| Investor Class | 2.74% | 6.92% | 5.51% |
$10,000 Over 10 Years
Let's say hypothetically that $10,000 was invested in VIP High Income Portfolio - Initial Class on December 31, 2010.
The chart shows how the value of your investment would have changed, and also shows how the ICE® BofA® US High Yield Constrained Index performed over the same period.

| Period Ending Values |
| $17,205 | VIP High Income Portfolio - Initial Class |
| $18,972 | ICE® BofA® US High Yield Constrained Index |
Management's Discussion of Fund Performance
Market Recap: U.S. high-yield bonds gained 6.07% in 2020, according to The ICE BofA
® US High Yield Constrained Index, capping a highly volatile and unpredictable year that will be remembered by most investors for the impact of the coronavirus pandemic. The early-2020 outbreak and spread of COVID-19 resulted in high yield suffering a swift decline through March 23, followed by a historic rebound through year-end. Declared a pandemic on March 11, the crisis and containment efforts caused broad economic contraction, along with extreme uncertainty, volatility and dislocation in financial markets. A historically rapid and expansive U.S. monetary/fiscal-policy response provided a partial offset to the economic disruption and fueled the market surge, as did resilient corporate earnings and potential for a COVID-19 vaccine breakthrough. The rally slowed in early September (-1%), due to Congress’s inability to reach a deal on additional fiscal stimulus, as well as concerns about election uncertainty, indications the U.S. economic recovery was stalling and a new wave of COVID-19 cases. November (+4%) was a much different story, as investors reacted favorably to election results. The momentum continued in December (+2%), driven by two vaccine approvals in the U.S. For the full 12 months, higher-rated bonds (+15%) fared best. The BB and B credit tiers rose 9% and 4%, respectively, while bonds rated CCC-C gained 3%. By industry, publishing/printing (+19%) led, whereas entertainment/film returned -25%.
Comments from Co-Portfolio Managers Michael Weaver and Alexandre Karam: For the year, the fund's share classes gained about 2% to 3%, lagging the 6.07% advance of the benchmark, The ICE BofAMLÒ US High Yield Constrained Index. In 2020, we took a consistent, conservative approach to investing in high-yield bonds, based on our belief that higher-quality businesses in the high-yield market offer the best balance of risk and reward over time. The fund's core high-yield bond investments gained 4.11%, well short of the benchmark and detracting from relative performance. Here, an overweighting in energy and our picks within this lagging category hurt most by a wide margin and in roughly equal measure. Security selection in diversified financials detracted to a lesser degree. The biggest individual relative detractors were oil and gas producers Chesapeake Energy, California Resources and Sanchez Energy, the latter a non-benchmark holding. Performance versus the benchmark also was hampered by our much smaller, non-benchmark allocation to floating-rate bank loans, which returned -36.88%. Our modest cash position was another drag on relative performance. In contrast, our lack of exposure to entertainment/film and positioning in broadcasting bolstered relative performance for the year. Not owning or underweighting some benchmark components facing acute pandemic-related pressure hurt our relative result. This included Hertz, Transocean, Whiting Petroleum, Sinclair Group and AMC Entertainment.
The views expressed above reflect those of the portfolio manager(s) only through the end of the period as stated on the cover of this report and do not necessarily represent the views of Fidelity or any other person in the Fidelity organization. Any such views are subject to change at any time based upon market or other conditions and Fidelity disclaims any responsibility to update such views. These views may not be relied on as investment advice and, because investment decisions for a Fidelity fund are based on numerous factors, may not be relied on as an indication of trading intent on behalf of any Fidelity fund.
Investment Summary (Unaudited)
Top Five Holdings as of December 31, 2020
| (by issuer, excluding cash equivalents) | % of fund's net assets |
| TransDigm, Inc. | 2.6 |
| CCO Holdings LLC/CCO Holdings Capital Corp. | 2.4 |
| Occidental Petroleum Corp. | 2.4 |
| C&W Senior Financing Designated Activity Co. | 2.2 |
| Tenet Healthcare Corp. | 2.0 |
| | 11.6 |
Top Five Market Sectors as of December 31, 2020
| | % of fund's net assets |
| Energy | 14.4 |
| Telecommunications | 11.1 |
| Healthcare | 7.0 |
| Gaming | 7.0 |
| Services | 6.8 |
Quality Diversification (% of fund's net assets)
| As of December 31, 2020 |
| | BBB | 0.7% |
| | BB | 34.6% |
| | B | 45.9% |
| | CCC,CC,C | 14.8% |
| | Not Rated | 0.8% |
| | Equities | 0.4% |
| | Short-Term Investments and Net Other Assets | 2.8% |

We have used ratings from Moody's Investors Service, Inc. Where Moody's® ratings are not available, we have used S&P® ratings. All ratings are as of the date indicated and do not reflect subsequent changes.
Asset Allocation (% of fund's net assets)
| As of December 31, 2020* |
| | Nonconvertible Bonds | 93.6% |
| | Convertible Bonds, Preferred Stocks | 1.0% |
| | Common Stocks | 0.4% |
| | Bank Loan Obligations | 2.2% |
| | Short-Term Investments and Net Other Assets (Liabilities) | 2.8% |

* Foreign investments - 21.6%
Schedule of Investments December 31, 2020
Showing Percentage of Net Assets
| Corporate Bonds - 94.6% | | | |
| | | Principal Amount | Value |
| Convertible Bonds - 1.0% | | | |
| Broadcasting - 0.8% | | | |
| DISH Network Corp.: | | | |
| 2.375% 3/15/24 | | $7,126,000 | $6,640,932 |
| 3.375% 8/15/26 | | 1,580,000 | 1,506,106 |
| | | | 8,147,038 |
| Energy - 0.2% | | | |
| Mesquite Energy, Inc.: | | | |
| 15% 7/15/23 (a)(b) | | 940,000 | 940,000 |
| 15% 7/15/23 (a)(b) | | 538,879 | 538,879 |
| | | | 1,478,879 |
|
| TOTAL CONVERTIBLE BONDS | | | 9,625,917 |
|
| Nonconvertible Bonds - 93.6% | | | |
| Aerospace - 5.7% | | | |
| Allegheny Technologies, Inc.: | | | |
| 5.875% 12/1/27 | | 4,795,000 | 5,046,738 |
| 7.875% 8/15/23 | | 400,000 | 437,736 |
| BBA U.S. Holdings, Inc. 5.375% 5/1/26 (c) | | 5,085,000 | 5,212,125 |
| Bombardier, Inc.: | | | |
| 6% 10/15/22 (c) | | 915,000 | 898,210 |
| 6.125% 1/15/23 (c) | | 5,425,000 | 5,302,938 |
| 7.5% 12/1/24 (c) | | 185,000 | 177,465 |
| 7.5% 3/15/25 (c) | | 935,000 | 867,213 |
| 7.875% 4/15/27 (c) | | 1,220,000 | 1,121,717 |
| BWX Technologies, Inc.: | | | |
| 4.125% 6/30/28 (c) | | 1,785,000 | 1,858,631 |
| 5.375% 7/15/26 (c) | | 2,935,000 | 3,048,731 |
| Howmet Aerospace, Inc. 6.75% 1/15/28 | | 110,000 | 134,512 |
| Kaiser Aluminum Corp.: | | | |
| 4.625% 3/1/28 (c) | | 2,735,000 | 2,837,563 |
| 6.5% 5/1/25 (c) | | 970,000 | 1,037,900 |
| Moog, Inc. 4.25% 12/15/27 (c) | | 2,140,000 | 2,220,250 |
| TransDigm UK Holdings PLC 6.875% 5/15/26 | | 975,000 | 1,030,136 |
| TransDigm, Inc.: | | | |
| 5.5% 11/15/27 | | 9,785,000 | 10,298,713 |
| 6.25% 3/15/26 (c) | | 7,860,000 | 8,370,900 |
| 6.5% 5/15/25 | | 425,000 | 436,688 |
| 7.5% 3/15/27 | | 850,000 | 907,375 |
| 8% 12/15/25 (c) | | 4,020,000 | 4,448,492 |
| | | | 55,694,033 |
| Automotive & Auto Parts - 0.9% | | | |
| Ford Motor Credit Co. LLC: | | | |
| 4% 11/13/30 | | 3,035,000 | 3,192,608 |
| 4.687% 6/9/25 | | 1,600,000 | 1,706,000 |
| 5.113% 5/3/29 | | 2,635,000 | 2,934,600 |
| 5.125% 6/16/25 | | 1,185,000 | 1,288,451 |
| | | | 9,121,659 |
| Banks & Thrifts - 0.5% | | | |
| Ally Financial, Inc.: | | | |
| 5.75% 11/20/25 | | 2,040,000 | 2,374,565 |
| 8% 11/1/31 | | 1,415,000 | 2,075,934 |
| | | | 4,450,499 |
| Broadcasting - 1.9% | | | |
| Diamond Sports Group LLC/Diamond Sports Finance Co. 5.375% 8/15/26 (c) | | 4,470,000 | 3,631,875 |
| Gray Television, Inc. 4.75% 10/15/30 (c) | | 895,000 | 908,425 |
| Netflix, Inc.: | | | |
| 4.875% 4/15/28 | | 1,385,000 | 1,561,865 |
| 5.375% 11/15/29 (c) | | 525,000 | 618,844 |
| 5.875% 11/15/28 | | 1,285,000 | 1,540,394 |
| 6.375% 5/15/29 | | 175,000 | 216,125 |
| Sinclair Television Group, Inc.: | | | |
| 5.125% 2/15/27 (c) | | 2,290,000 | 2,330,075 |
| 5.5% 3/1/30 (c) | | 1,010,000 | 1,052,925 |
| Sirius XM Radio, Inc.: | | | |
| 4.125% 7/1/30 (c) | | 575,000 | 612,016 |
| 5% 8/1/27 (c) | | 3,455,000 | 3,670,972 |
| Tegna, Inc. 5% 9/15/29 | | 425,000 | 448,977 |
| Univision Communications, Inc. 6.625% 6/1/27 (c) | | 1,815,000 | 1,949,129 |
| | | | 18,541,622 |
| Building Materials - 0.4% | | | |
| Advanced Drain Systems, Inc. 5% 9/30/27 (c) | | 3,680,000 | 3,865,398 |
| Cable/Satellite TV - 6.3% | | | |
| CCO Holdings LLC/CCO Holdings Capital Corp.: | | | |
| 4.25% 2/1/31 (c) | | 4,075,000 | 4,294,480 |
| 4.5% 8/15/30 (c) | | 1,750,000 | 1,857,188 |
| 4.5% 5/1/32 (c) | | 2,190,000 | 2,338,307 |
| 5% 2/1/28 (c) | | 8,430,000 | 8,914,725 |
| 5.125% 5/1/27 (c) | | 5,530,000 | 5,868,381 |
| CSC Holdings LLC: | | | |
| 4.125% 12/1/30 (c) | | 1,895,000 | 1,981,412 |
| 4.625% 12/1/30 (c) | | 1,130,000 | 1,179,438 |
| 5.75% 1/15/30 (c) | | 2,510,000 | 2,751,588 |
| DISH DBS Corp.: | | | |
| 5.875% 11/15/24 | | 3,685,000 | 3,863,851 |
| 7.75% 7/1/26 | | 2,070,000 | 2,317,324 |
| Dolya Holdco 18 DAC 5% 7/15/28 (c) | | 2,285,000 | 2,376,400 |
| Radiate Holdco LLC/Radiate Financial Service Ltd.: | | | |
| 4.5% 9/15/26 (c) | | 2,425,000 | 2,500,781 |
| 6.5% 9/15/28 (c) | | 2,935,000 | 3,081,750 |
| Telenet Finance Luxembourg Notes SARL 5.5% 3/1/28 (c) | | 3,000,000 | 3,199,500 |
| Virgin Media Finance PLC 5% 7/15/30 (c) | | 2,395,000 | 2,484,813 |
| Virgin Media Secured Finance PLC: | | | |
| 4.5% 8/15/30 (c) | | 690,000 | 721,050 |
| 5.5% 8/15/26 (c) | | 3,170,000 | 3,292,838 |
| 5.5% 5/15/29 (c) | | 1,555,000 | 1,685,231 |
| Ziggo Bond Co. BV: | | | |
| 5.125% 2/28/30 (c) | | 185,000 | 195,231 |
| 6% 1/15/27 (c) | | 3,095,000 | 3,270,703 |
| Ziggo BV 5.5% 1/15/27 (c) | | 2,607,000 | 2,721,056 |
| | | | 60,896,047 |
| Capital Goods - 0.5% | | | |
| Vertical U.S. Newco, Inc. 5.25% 7/15/27 (c) | | 4,830,000 | 5,119,800 |
| Chemicals - 5.1% | | | |
| Axalta Coating Systems/Dutch Holding BV 4.75% 6/15/27 (c) | | 2,155,000 | 2,292,381 |
| Bausch Health Companies, Inc. 6.25% 2/15/29 (c) | | 2,710,000 | 2,943,738 |
| CF Industries Holdings, Inc.: | | | |
| 4.95% 6/1/43 | | 1,823,000 | 2,237,733 |
| 5.15% 3/15/34 | | 170,000 | 208,897 |
| 5.375% 3/15/44 | | 1,440,000 | 1,822,687 |
| Consolidated Energy Finance SA: | | | |
| 3 month U.S. LIBOR + 3.750% 3.9665% 6/15/22 (c)(d)(e) | | 4,410,000 | 4,329,258 |
| 6.5% 5/15/26 (c) | | 3,425,000 | 3,425,000 |
| 6.875% 6/15/25 (c) | | 415,000 | 420,706 |
| Kronos Acquisition Holdings, Inc. / KIK Custom Products, Inc.: | | | |
| 5% 12/31/26 (c) | | 1,780,000 | 1,855,650 |
| 7% 12/31/27 (c) | | 260,000 | 272,225 |
| Methanex Corp.: | | | |
| 5.125% 10/15/27 | | 2,855,000 | 3,103,042 |
| 5.65% 12/1/44 | | 997,000 | 1,069,283 |
| NOVA Chemicals Corp. 5.25% 6/1/27 (c) | | 2,090,000 | 2,226,937 |
| Olin Corp.: | | | |
| 5% 2/1/30 | | 1,830,000 | 1,948,950 |
| 5.125% 9/15/27 | | 2,270,000 | 2,374,738 |
| 5.625% 8/1/29 | | 1,715,000 | 1,862,919 |
| The Chemours Co. LLC: | | | |
| 5.375% 5/15/27 | | 6,542,000 | 6,967,230 |
| 5.75% 11/15/28 (c) | | 7,390,000 | 7,537,800 |
| 7% 5/15/25 | | 205,000 | 212,497 |
| Valvoline, Inc. 4.25% 2/15/30 (c) | | 660,000 | 699,600 |
| W. R. Grace & Co.-Conn. 4.875% 6/15/27 (c) | | 1,140,000 | 1,208,993 |
| | | | 49,020,264 |
| Consumer Products - 0.3% | | | |
| Mattel, Inc.: | | | |
| 5.45% 11/1/41 | | 250,000 | 275,088 |
| 6.2% 10/1/40 | | 1,480,000 | 1,727,900 |
| Newell Brands, Inc. 5.875% 4/1/36 | | 245,000 | 297,063 |
| Prestige Brands, Inc. 6.375% 3/1/24 (c) | | 945,000 | 966,263 |
| | | | 3,266,314 |
| Containers - 1.7% | | | |
| Ardagh Packaging Finance PLC/Ardagh MP Holdings U.S.A., Inc.: | | | |
| 4.125% 8/15/26 (c) | | 95,000 | 99,275 |
| 6% 2/15/25 (c) | | 1,213,000 | 1,256,971 |
| Flex Acquisition Co., Inc.: | | | |
| 6.875% 1/15/25 (c) | | 2,965,000 | 3,009,475 |
| 7.875% 7/15/26 (c) | | 2,805,000 | 2,947,550 |
| OI European Group BV 4% 3/15/23 (c) | | 850,000 | 867,000 |
| Owens-Brockway Glass Container, Inc. 5.375% 1/15/25 (c) | | 2,115,000 | 2,278,913 |
| Trivium Packaging Finance BV: | | | |
| 5.5% 8/15/26 (c) | | 3,555,000 | 3,759,413 |
| 8.5% 8/15/27 (c) | | 2,470,000 | 2,704,650 |
| | | | 16,923,247 |
| Diversified Financial Services - 1.9% | | | |
| Icahn Enterprises LP/Icahn Enterprises Finance Corp.: | | | |
| 4.75% 9/15/24 | | 3,085,000 | 3,204,544 |
| 5.25% 5/15/27 | | 780,000 | 836,160 |
| 6.25% 5/15/26 | | 4,405,000 | 4,664,455 |
| Ladder Capital Finance Holdings LLLP/Ladder Capital Finance Corp. 4.25% 2/1/27 (c) | | 900,000 | 884,250 |
| Springleaf Finance Corp.: | | | |
| 6.875% 3/15/25 | | 2,180,000 | 2,531,525 |
| 7.125% 3/15/26 | | 1,300,000 | 1,537,250 |
| VMED O2 UK Financing I PLC 4.25% 1/31/31 (c) | | 4,450,000 | 4,546,298 |
| | | | 18,204,482 |
| Diversified Media - 0.8% | | | |
| Nielsen Co. SARL (Luxembourg) 5% 2/1/25 (c) | | 1,420,000 | 1,457,275 |
| Nielsen Finance LLC/Nielsen Finance Co.: | | | |
| 5.625% 10/1/28 (c) | | 1,850,000 | 2,010,118 |
| 5.875% 10/1/30 (c) | | 1,840,000 | 2,081,500 |
| Terrier Media Buyer, Inc. 8.875% 12/15/27 (c) | | 2,105,000 | 2,320,763 |
| | | | 7,869,656 |
| Energy - 13.8% | | | |
| Apache Corp.: | | | |
| 4.25% 1/15/30 | | 435,000 | 456,750 |
| 5.1% 9/1/40 | | 2,085,000 | 2,236,163 |
| 5.35% 7/1/49 | | 305,000 | 312,939 |
| 7.375% 8/15/47 | | 310,000 | 337,900 |
| Cheniere Energy Partners LP 5.625% 10/1/26 | | 3,190,000 | 3,325,575 |
| Cheniere Energy, Inc. 4.625% 10/15/28 (c) | | 3,640,000 | 3,822,000 |
| Citgo Petroleum Corp.: | | | |
| 6.25% 8/15/22 (c) | | 3,820,000 | 3,743,600 |
| 7% 6/15/25 (c) | | 2,125,000 | 2,119,688 |
| CNX Resources Corp. 6% 1/15/29 (c) | | 430,000 | 440,529 |
| Comstock Resources, Inc.: | | | |
| 7.5% 5/15/25 (c) | | 1,265,000 | 1,280,813 |
| 9.75% 8/15/26 | | 1,820,000 | 1,951,950 |
| 9.75% 8/15/26 | | 615,000 | 659,588 |
| Continental Resources, Inc. 5.75% 1/15/31 (c) | | 1,395,000 | 1,548,422 |
| Crestwood Midstream Partners LP/Crestwood Midstream Finance Corp.: | | | |
| 5.625% 5/1/27 (c) | | 5,473,000 | 5,418,270 |
| 5.75% 4/1/25 | | 5,907,000 | 6,010,373 |
| 6.25% 4/1/23 | | 3,370,000 | 3,378,425 |
| CVR Energy, Inc.: | | | |
| 5.25% 2/15/25 (c) | | 4,720,000 | 4,554,800 |
| 5.75% 2/15/28 (c) | | 1,915,000 | 1,814,463 |
| DCP Midstream Operating LP: | | | |
| 5.375% 7/15/25 | | 3,420,000 | 3,757,964 |
| 5.6% 4/1/44 | | 175,000 | 180,464 |
| 6.45% 11/3/36 (c) | | 775,000 | 829,250 |
| 8.125% 8/16/30 | | 55,000 | 70,263 |
| Endeavor Energy Resources LP/EER Finance, Inc.: | | | |
| 5.5% 1/30/26 (c) | | 450,000 | 461,768 |
| 5.75% 1/30/28 (c) | | 1,635,000 | 1,763,675 |
| 6.625% 7/15/25 (c) | | 395,000 | 422,650 |
| EnLink Midstream LLC 5.625% 1/15/28 (c) | | 395,000 | 403,487 |
| EnLink Midstream Partners LP: | | | |
| 5.05% 4/1/45 | | 515,000 | 409,425 |
| 5.45% 6/1/47 | | 1,080,000 | 866,700 |
| 5.6% 4/1/44 | | 185,000 | 148,463 |
| EQM Midstream Partners LP: | | | |
| 5.5% 7/15/28 | | 110,000 | 120,214 |
| 6.5% 7/1/27 (c) | | 1,705,000 | 1,919,890 |
| EQT Corp. 3.9% 10/1/27 | | 1,490,000 | 1,480,241 |
| Global Partners LP/GLP Finance Corp. 6.875% 1/15/29 (c) | | 2,060,000 | 2,229,950 |
| Hess Midstream Partners LP: | | | |
| 5.125% 6/15/28 (c) | | 2,465,000 | 2,576,689 |
| 5.625% 2/15/26 (c) | | 5,785,000 | 6,016,400 |
| Hilcorp Energy I LP/Hilcorp Finance Co.: | | | |
| 5% 12/1/24 (c) | | 1,255,000 | 1,245,588 |
| 6.25% 11/1/28 (c) | | 670,000 | 685,075 |
| Holly Energy Partners LP/Holly Energy Finance Corp. 5% 2/1/28 (c) | | 2,885,000 | 2,906,638 |
| MEG Energy Corp. 7.125% 2/1/27 (c) | | 1,090,000 | 1,125,425 |
| New Fortress Energy LLC 6.75% 9/15/25 (c) | | 4,860,000 | 5,146,983 |
| Occidental Petroleum Corp.: | | | |
| 2.9% 8/15/24 | | 835,000 | 803,688 |
| 3.4% 4/15/26 | | 1,140,000 | 1,086,882 |
| 3.5% 8/15/29 | | 1,715,000 | 1,569,517 |
| 4.2% 3/15/48 | | 1,145,000 | 931,744 |
| 4.3% 8/15/39 | | 590,000 | 496,279 |
| 4.4% 4/15/46 | | 1,730,000 | 1,507,634 |
| 4.4% 8/15/49 | | 1,275,000 | 1,074,570 |
| 5.55% 3/15/26 | | 2,880,000 | 3,006,547 |
| 6.125% 1/1/31 | | 1,365,000 | 1,460,823 |
| 6.2% 3/15/40 | | 575,000 | 570,688 |
| 6.45% 9/15/36 | | 3,050,000 | 3,193,350 |
| 7.5% 5/1/31 | | 3,730,000 | 4,158,950 |
| 7.875% 9/15/31 | | 375,000 | 418,125 |
| 8.875% 7/15/30 | | 1,270,000 | 1,490,663 |
| PBF Holding Co. LLC/PBF Finance Corp. 9.25% 5/15/25 (c) | | 3,305,000 | 3,241,214 |
| Rockies Express Pipeline LLC: | | | |
| 4.95% 7/15/29 (c) | | 245,000 | 254,829 |
| 6.875% 4/15/40 (c) | | 385,000 | 419,015 |
| Sanchez Energy Corp. 7.25% 2/15/23 (b)(c)(f) | | 5,722,000 | 1 |
| Sunoco LP/Sunoco Finance Corp.: | | | |
| 4.5% 5/15/29 (c) | | 2,260,000 | 2,350,400 |
| 5.875% 3/15/28 | | 500,000 | 540,000 |
| 6% 4/15/27 | | 65,000 | 69,096 |
| Tallgrass Energy Partners LP / Tallgrass Energy Finance Corp.: | | | |
| 5.5% 1/15/28 (c) | | 450,000 | 459,563 |
| 6% 3/1/27 (c) | | 2,000,000 | 2,072,500 |
| 6% 12/31/30 (c) | | 1,290,000 | 1,330,712 |
| Targa Resources Partners LP/Targa Resources Partners Finance Corp.: | | | |
| 4.875% 2/1/31 (c) | | 2,567,000 | 2,785,195 |
| 5.125% 2/1/25 | | 5,120,000 | 5,248,000 |
| 5.375% 2/1/27 | | 665,000 | 698,496 |
| 5.5% 3/1/30 | | 498,000 | 540,679 |
| Transocean Guardian Ltd. 5.875% 1/15/24 (c) | | 928,200 | 779,688 |
| Transocean Phoenix 2 Ltd. 7.75% 10/15/24 (c) | | 180,000 | 174,600 |
| Transocean Pontus Ltd. 6.125% 8/1/25 (c) | | 464,100 | 440,890 |
| Transocean Poseidon Ltd. 6.875% 2/1/27 (c) | | 595,000 | 541,450 |
| Transocean Proteus Ltd. 6.25% 12/1/24 (c) | | 198,000 | 185,873 |
| Transocean Sentry Ltd. 5.375% 5/15/23 (c) | | 917,431 | 834,862 |
| Viper Energy Partners LP 5.375% 11/1/27 (c) | | 3,965,000 | 4,143,425 |
| Western Gas Partners LP: | | | |
| 3.95% 6/1/25 | | 430,000 | 438,600 |
| 4.1% 2/1/25 | | 1,750,000 | 1,803,498 |
| 4.65% 7/1/26 | | 660,000 | 692,597 |
| 5.05% 2/1/30 | | 2,965,000 | 3,298,563 |
| | | | 133,292,656 |
| Environmental - 0.5% | | | |
| LBC Tank Terminals Holding Netherlands BV 6.875% 5/15/23 (c) | | 3,630,000 | 3,630,000 |
| Stericycle, Inc. 3.875% 1/15/29 (c) | | 1,625,000 | 1,669,688 |
| | | | 5,299,688 |
| Food & Drug Retail - 0.2% | | | |
| Albertsons Companies LLC/Safeway, Inc./New Albertson's, Inc./Albertson's LLC 3.5% 3/15/29 (c) | | 1,720,000 | 1,737,200 |
| Food/Beverage/Tobacco - 3.4% | | | |
| C&S Group Enterprises LLC 5% 12/15/28 (c) | | 3,000,000 | 2,992,290 |
| JBS U.S.A. LLC/JBS U.S.A. Finance, Inc.: | | | |
| 5.75% 6/15/25 (c) | | 2,925,000 | 3,020,063 |
| 6.75% 2/15/28 (c) | | 940,000 | 1,056,090 |
| JBS U.S.A. Lux SA / JBS Food Co.: | | | |
| 5.5% 1/15/30 (c) | | 2,735,000 | 3,141,859 |
| 6.5% 4/15/29 (c) | | 5,495,000 | 6,401,675 |
| Kraft Heinz Foods Co. 5% 7/15/35 | | 2,075,000 | 2,513,650 |
| Performance Food Group, Inc.: | | | |
| 5.5% 10/15/27 (c) | | 1,830,000 | 1,930,650 |
| 6.875% 5/1/25 (c) | | 2,480,000 | 2,653,600 |
| Post Holdings, Inc.: | | | |
| 4.625% 4/15/30 (c) | | 1,125,000 | 1,183,455 |
| 5% 8/15/26 (c) | | 2,300,000 | 2,374,750 |
| 5.625% 1/15/28 (c) | | 1,050,000 | 1,118,250 |
| 5.75% 3/1/27 (c) | | 1,635,000 | 1,731,056 |
| TreeHouse Foods, Inc. 4% 9/1/28 | | 1,465,000 | 1,515,359 |
| U.S. Foods, Inc. 6.25% 4/15/25 (c) | | 1,645,000 | 1,758,094 |
| | | | 33,390,841 |
| Gaming - 6.4% | | | |
| Affinity Gaming LLC 6.875% 12/15/27 (c) | | 1,235,000 | 1,292,119 |
| Boyd Gaming Corp.: | | | |
| 4.75% 12/1/27 | | 1,090,000 | 1,132,238 |
| 6% 8/15/26 | | 930,000 | 964,875 |
| 6.375% 4/1/26 | | 2,460,000 | 2,555,473 |
| Caesars Entertainment, Inc.: | | | |
| 6.25% 7/1/25 (c) | | 3,365,000 | 3,583,725 |
| 8.125% 7/1/27 (c) | | 4,540,000 | 5,025,882 |
| Caesars Resort Collection LLC 5.25% 10/15/25 (c) | | 6,330,000 | 6,397,035 |
| Golden Entertainment, Inc. 7.625% 4/15/26 (c) | | 3,070,000 | 3,296,413 |
| Golden Nugget, Inc. 6.75% 10/15/24 (c) | | 4,845,000 | 4,810,213 |
| MCE Finance Ltd.: | | | |
| 4.875% 6/6/25 (c) | | 2,075,000 | 2,138,330 |
| 5.375% 12/4/29 (c) | | 940,000 | 975,907 |
| 5.75% 7/21/28 (c) | | 1,420,000 | 1,513,010 |
| MGM Growth Properties Operating Partnership LP: | | | |
| 4.5% 9/1/26 | | 2,695,000 | 2,899,551 |
| 4.5% 1/15/28 | | 2,895,000 | 3,079,933 |
| 4.625% 6/15/25 (c) | | 560,000 | 599,760 |
| 5.75% 2/1/27 | | 870,000 | 976,027 |
| Scientific Games Corp. 5% 10/15/25 (c) | | 2,210,000 | 2,280,477 |
| Stars Group Holdings BV 7% 7/15/26 (c) | | 2,315,000 | 2,436,538 |
| Station Casinos LLC: | | | |
| 4.5% 2/15/28 (c) | | 2,835,000 | 2,856,263 |
| 5% 10/1/25 (c) | | 3,520,000 | 3,560,656 |
| VICI Properties, Inc. 4.625% 12/1/29 (c) | | 2,410,000 | 2,578,700 |
| Wynn Las Vegas LLC/Wynn Las Vegas Capital Corp. 5.25% 5/15/27 (c) | | 1,935,000 | 1,994,501 |
| Wynn Macau Ltd.: | | | |
| 4.875% 10/1/24 (c) | | 1,845,000 | 1,871,522 |
| 5.5% 10/1/27 (c) | | 2,950,000 | 3,051,406 |
| | | | 61,870,554 |
| Healthcare - 7.0% | | | |
| Avantor Funding, Inc. 4.625% 7/15/28 (c) | | 2,795,000 | 2,955,713 |
| Bausch Health Companies, Inc.: | | | |
| 5% 2/15/29 (c) | | 595,000 | 611,779 |
| 5.25% 1/30/30 (c) | | 3,020,000 | 3,163,450 |
| 5.25% 2/15/31 (c) | | 2,085,000 | 2,178,241 |
| Catalent Pharma Solutions 4.875% 1/15/26 (c) | | 400,000 | 408,000 |
| Centene Corp.: | | | |
| 4.25% 12/15/27 | | 980,000 | 1,038,800 |
| 4.625% 12/15/29 | | 5,100,000 | 5,662,071 |
| 5.375% 8/15/26 (c) | | 3,945,000 | 4,166,906 |
| Charles River Laboratories International, Inc.: | | | |
| 4.25% 5/1/28 (c) | | 290,000 | 303,775 |
| 5.5% 4/1/26 (c) | | 1,325,000 | 1,387,805 |
| Community Health Systems, Inc.: | | | |
| 5.625% 3/15/27 (c) | | 1,490,000 | 1,602,123 |
| 6% 1/15/29 (c) | | 1,190,000 | 1,285,509 |
| 8% 3/15/26 (c) | | 2,480,000 | 2,672,200 |
| 8.125% 6/30/24 (c) | | 1,190,000 | 1,231,650 |
| CTR Partnership LP/CareTrust Capital Corp. 5.25% 6/1/25 | | 3,145,000 | 3,253,361 |
| DaVita HealthCare Partners, Inc. 4.625% 6/1/30 (c) | | 3,060,000 | 3,243,600 |
| HCA Holdings, Inc. 5.875% 2/15/26 | | 170,000 | 195,500 |
| Hologic, Inc.: | | | |
| 3.25% 2/15/29 (c) | | 2,030,000 | 2,065,525 |
| 4.625% 2/1/28 (c) | | 395,000 | 419,194 |
| IMS Health, Inc. 5% 5/15/27 (c) | | 2,745,000 | 2,918,004 |
| Molina Healthcare, Inc. 3.875% 11/15/30 (c) | | 855,000 | 916,988 |
| Radiology Partners, Inc. 9.25% 2/1/28 (c) | | 2,216,000 | 2,493,665 |
| RP Escrow Issuer LLC 5.25% 12/15/25 (c) | | 820,000 | 857,654 |
| Teleflex, Inc.: | | | |
| 4.25% 6/1/28 (c) | | 535,000 | 567,100 |
| 4.875% 6/1/26 | | 2,115,000 | 2,202,328 |
| Tenet Healthcare Corp.: | | | |
| 4.625% 6/15/28 (c) | | 680,000 | 712,300 |
| 4.875% 1/1/26 (c) | | 1,550,000 | 1,621,471 |
| 5.125% 5/1/25 | | 1,030,000 | 1,050,075 |
| 6.125% 10/1/28 (c) | | 4,680,000 | 4,884,305 |
| 6.25% 2/1/27 (c) | | 2,720,000 | 2,883,200 |
| 7% 8/1/25 | | 7,260,000 | 7,504,299 |
| U.S. Renal Care, Inc. 10.625% 7/15/27 (c) | | 1,250,000 | 1,381,250 |
| Vizient, Inc. 6.25% 5/15/27 (c) | | 240,000 | 258,000 |
| | | | 68,095,841 |
| Homebuilders/Real Estate - 1.3% | | | |
| Howard Hughes Corp. 5.375% 3/15/25 (c) | | 3,200,000 | 3,300,000 |
| MPT Operating Partnership LP/MPT Finance Corp. 5.25% 8/1/26 | | 1,515,000 | 1,586,205 |
| Service Properties Trust: | | | |
| 3.95% 1/15/28 | | 150,000 | 144,938 |
| 4.375% 2/15/30 | | 2,385,000 | 2,325,375 |
| 4.95% 2/15/27 | | 920,000 | 924,600 |
| 4.95% 10/1/29 | | 905,000 | 907,263 |
| 5.5% 12/15/27 | | 845,000 | 923,527 |
| Starwood Property Trust, Inc. 4.75% 3/15/25 | | 415,000 | 425,375 |
| Uniti Group LP / Uniti Group Finance, Inc. 8.25% 10/15/23 | | 1,685,000 | 1,697,638 |
| | | | 12,234,921 |
| Hotels - 0.3% | | | |
| Hilton Domestic Operating Co., Inc.: | | | |
| 3.75% 5/1/29 (c) | | 295,000 | 307,594 |
| 4% 5/1/31 (c) | | 1,055,000 | 1,113,141 |
| Wyndham Hotels & Resorts, Inc. 4.375% 8/15/28 (c) | | 1,060,000 | 1,101,393 |
| | | | 2,522,128 |
| Insurance - 2.6% | | | |
| Alliant Holdings Intermediate LLC: | | | |
| 4.25% 10/15/27 (c) | | 260,000 | 265,850 |
| 6.75% 10/15/27 (c) | | 8,742,000 | 9,353,940 |
| AmWINS Group, Inc. 7.75% 7/1/26 (c) | | 6,340,000 | 6,808,526 |
| AssuredPartners, Inc. 5.625% 1/15/29 (c) | | 795,000 | 829,781 |
| HUB International Ltd. 7% 5/1/26 (c) | | 2,155,000 | 2,253,677 |
| USI, Inc. 6.875% 5/1/25 (c) | | 5,270,000 | 5,401,750 |
| | | | 24,913,524 |
| Leisure - 0.7% | | | |
| Carnival Corp. 7.625% 3/1/26 (c) | | 1,345,000 | 1,465,364 |
| NCL Corp. Ltd. 5.875% 3/15/26 (c) | | 525,000 | 553,219 |
| Royal Caribbean Cruises Ltd.: | | | |
| 9.125% 6/15/23 (c) | | 470,000 | 509,950 |
| 11.5% 6/1/25 (c) | | 2,005,000 | 2,338,331 |
| Viking Cruises Ltd. 13% 5/15/25 (c) | | 635,000 | 758,825 |
| Voc Escrow Ltd. 5% 2/15/28 (c) | | 715,000 | 709,638 |
| | | | 6,335,327 |
| Metals/Mining - 1.0% | | | |
| First Quantum Minerals Ltd.: | | | |
| 6.875% 10/15/27 (c) | | 1,175,000 | 1,270,469 |
| 7.25% 4/1/23 (c) | | 4,195,000 | 4,301,217 |
| FMG Resources (August 2006) Pty Ltd. 4.5% 9/15/27 (c) | | 40,000 | 44,440 |
| Howmet Aerospace, Inc. 5.95% 2/1/37 | | 95,000 | 114,475 |
| Nufarm Australia Ltd. 5.75% 4/30/26 (c) | | 3,603,000 | 3,702,083 |
| | | | 9,432,684 |
| Publishing/Printing - 0.2% | | | |
| Meredith Corp. 6.875% 2/1/26 | | 2,405,000 | 2,344,875 |
| Restaurants - 1.1% | | | |
| 1011778 BC Unlimited Liability Co./New Red Finance, Inc.: | | | |
| 4% 10/15/30 (c) | | 6,875,000 | 6,926,563 |
| 5.75% 4/15/25 (c) | | 755,000 | 807,850 |
| Yum! Brands, Inc. 7.75% 4/1/25 (c) | | 2,250,000 | 2,491,875 |
| | | | 10,226,288 |
| Services - 6.5% | | | |
| AECOM 5.125% 3/15/27 | | 3,525,000 | 3,922,726 |
| APX Group, Inc. 6.75% 2/15/27 (c) | | 2,032,000 | 2,184,400 |
| Aramark Services, Inc.: | | | |
| 4.75% 6/1/26 | | 1,955,000 | 2,012,575 |
| 5% 2/1/28 (c) | | 8,965,000 | 9,446,869 |
| 6.375% 5/1/25 (c) | | 4,365,000 | 4,665,094 |
| Ascend Learning LLC: | | | |
| 6.875% 8/1/25 (c) | | 2,470,000 | 2,541,013 |
| 6.875% 8/1/25 (c) | | 335,000 | 344,631 |
| ASGN, Inc. 4.625% 5/15/28 (c) | | 1,020,000 | 1,060,800 |
| Booz Allen Hamilton, Inc. 3.875% 9/1/28 (c) | | 2,865,000 | 2,950,950 |
| Brand Energy & Infrastructure Services, Inc. 8.5% 7/15/25 (c) | | 5,105,000 | 5,213,481 |
| CoreCivic, Inc.: | | | |
| 4.625% 5/1/23 | | 495,000 | 476,438 |
| 5% 10/15/22 | | 860,000 | 860,000 |
| Double Eagle III Midco 1 LLC 7.75% 12/15/25 (c) | | 1,500,000 | 1,590,570 |
| Fair Isaac Corp. 5.25% 5/15/26 (c) | | 1,065,000 | 1,211,438 |
| Frontdoor, Inc. 6.75% 8/15/26 (c) | | 1,570,000 | 1,674,013 |
| Gartner, Inc. 3.75% 10/1/30 (c) | | 955,000 | 1,002,750 |
| GEMS MENASA Cayman Ltd. 7.125% 7/31/26 (c) | | 5,480,000 | 5,685,500 |
| Laureate Education, Inc. 8.25% 5/1/25 (c) | | 2,375,000 | 2,517,500 |
| PowerTeam Services LLC 9.033% 12/4/25 (c) | | 1,170,000 | 1,301,754 |
| Service Corp. International 5.125% 6/1/29 | | 1,420,000 | 1,572,650 |
| Sotheby's 7.375% 10/15/27 (c) | | 3,590,000 | 3,845,788 |
| Tempo Acquisition LLC: | | | |
| 5.75% 6/1/25 (c) | | 1,345,000 | 1,429,063 |
| 6.75% 6/1/25 (c) | | 3,210,000 | 3,317,696 |
| The GEO Group, Inc.: | | | |
| 5.875% 10/15/24 | | 330,000 | 273,900 |
| 6% 4/15/26 | | 2,455,000 | 1,951,725 |
| | | | 63,053,324 |
| Super Retail - 1.5% | | | |
| EG Global Finance PLC: | | | |
| 6.75% 2/7/25 (c) | | 2,170,000 | 2,235,100 |
| 8.5% 10/30/25 (c) | | 3,690,000 | 3,929,850 |
| L Brands, Inc.: | | | |
| 5.25% 2/1/28 | | 235,000 | 244,988 |
| 6.625% 10/1/30 (c) | | 360,000 | 397,800 |
| 6.694% 1/15/27 | | 850,000 | 937,125 |
| 6.75% 7/1/36 | | 2,115,000 | 2,356,374 |
| 6.875% 11/1/35 | | 285,000 | 319,913 |
| LBM Acquisition LLC 6.25% 1/15/29 (c) | | 360,000 | 374,519 |
| The William Carter Co. 5.625% 3/15/27 (c) | | 1,575,000 | 1,657,688 |
| Wolverine World Wide, Inc. 6.375% 5/15/25 (c) | | 2,335,000 | 2,486,775 |
| | | | 14,940,132 |
| Technology - 3.8% | | | |
| Arches Buyer, Inc.: | | | |
| 4.25% 6/1/28 (c) | | 1,905,000 | 1,929,194 |
| 6.125% 12/1/28 (c) | | 1,905,000 | 1,967,294 |
| Black Knight InfoServ LLC 3.625% 9/1/28 (c) | | 2,525,000 | 2,584,969 |
| Boxer Parent Co., Inc. 7.125% 10/2/25 (c) | | 800,000 | 868,358 |
| Camelot Finance SA 4.5% 11/1/26 (c) | | 2,410,000 | 2,515,438 |
| CDK Global, Inc.: | | | |
| 4.875% 6/1/27 | | 1,105,000 | 1,165,775 |
| 5.25% 5/15/29 (c) | | 465,000 | 515,183 |
| Entegris, Inc. 4.375% 4/15/28 (c) | | 1,820,000 | 1,938,300 |
| Gartner, Inc. 4.5% 7/1/28 (c) | | 1,470,000 | 1,550,850 |
| Match Group Holdings II LLC 4.125% 8/1/30 (c) | | 685,000 | 710,688 |
| Northwest Fiber LLC/Northwest Fiber Finance Sub, Inc. 10.75% 6/1/28 (c) | | 3,700,000 | 4,218,000 |
| Nuance Communications, Inc. 5.625% 12/15/26 | | 3,135,000 | 3,317,206 |
| ON Semiconductor Corp. 3.875% 9/1/28 (c) | | 1,115,000 | 1,151,238 |
| Qorvo, Inc. 4.375% 10/15/29 | | 1,500,000 | 1,650,330 |
| Rackspace Hosting, Inc. 5.375% 12/1/28 (c) | | 1,982,000 | 2,076,541 |
| SS&C Technologies, Inc. 5.5% 9/30/27 (c) | | 200,000 | 213,604 |
| TTM Technologies, Inc. 5.625% 10/1/25 (c) | | 7,895,000 | 8,082,506 |
| | | | 36,455,474 |
| Telecommunications - 10.8% | | | |
| Altice Financing SA: | | | |
| 5% 1/15/28 (c) | | 940,000 | 963,157 |
| 7.5% 5/15/26 (c) | | 5,260,000 | 5,550,878 |
| Altice France Holding SA 6% 2/15/28 (c) | | 4,250,000 | 4,324,375 |
| C&W Senior Financing Designated Activity Co.: | | | |
| 6.875% 9/15/27 (c) | | 13,430,000 | 14,489,179 |
| 7.5% 10/15/26 (c) | | 6,270,000 | 6,670,465 |
| Cablevision Lightpath LLC: | | | |
| 3.875% 9/15/27 (c) | | 455,000 | 457,844 |
| 5.625% 9/15/28 (c) | | 360,000 | 376,650 |
| CenturyLink, Inc.: | | | |
| 4.5% 1/15/29 (c) | | 2,410,000 | 2,452,175 |
| 5.125% 12/15/26 (c) | | 4,810,000 | 5,079,168 |
| 5.625% 4/1/25 | | 1,725,000 | 1,860,844 |
| 6.875% 1/15/28 | | 162,000 | 187,891 |
| Frontier Communications Corp.: | | | |
| 5% 5/1/28 (c) | | 2,380,000 | 2,481,150 |
| 5.875% 10/15/27 (c) | | 840,000 | 908,250 |
| 6.75% 5/1/29 (c) | | 2,335,000 | 2,498,450 |
| Level 3 Financing, Inc.: | | | |
| 3.625% 1/15/29 (c) | | 340,000 | 339,150 |
| 4.25% 7/1/28 (c) | | 2,320,000 | 2,383,800 |
| 4.625% 9/15/27 (c) | | 1,979,000 | 2,066,937 |
| Millicom International Cellular SA: | | | |
| 4.5% 4/27/31 (c) | | 200,000 | 216,000 |
| 6.625% 10/15/26 (c) | | 2,780,000 | 2,986,763 |
| Sable International Finance Ltd. 5.75% 9/7/27 (c) | | 515,000 | 547,831 |
| SFR Group SA: | | | |
| 5.125% 1/15/29 (c) | | 3,850,000 | 3,984,750 |
| 7.375% 5/1/26 (c) | | 5,850,000 | 6,157,125 |
| 8.125% 2/1/27(c) | | 6,580,000 | 7,254,516 |
| Sprint Capital Corp.: | | | |
| 6.875% 11/15/28 | | 6,978,000 | 9,200,353 |
| 8.75% 3/15/32 | | 1,820,000 | 2,881,743 |
| Telecom Italia Capital SA: | | | |
| 6% 9/30/34 | | 1,185,000 | 1,443,437 |
| 7.721% 6/4/38 | | 235,000 | 326,650 |
| Uniti Group, Inc.: | | | |
| 7.125% 12/15/24 (c) | | 4,065,000 | 4,105,650 |
| 7.875% 2/15/25 (c) | | 8,450,000 | 9,077,075 |
| Zayo Group Holdings, Inc.: | | | |
| 4% 3/1/27 (c) | | 1,600,000 | 1,604,000 |
| 6.125% 3/1/28 (c) | | 1,810,000 | 1,914,075 |
| | | | 104,790,331 |
| Transportation Ex Air/Rail - 0.3% | | | |
| XPO Logistics, Inc. 6.25% 5/1/25 (c) | | 3,000,000 | 3,228,420 |
| Utilities - 6.2% | | | |
| Clearway Energy Operating LLC: | | | |
| 4.75% 3/15/28 (c) | | 585,000 | 627,413 |
| 5% 9/15/26 | | 2,150,000 | 2,225,250 |
| 5.75% 10/15/25 | | 1,720,000 | 1,810,300 |
| DCP Midstream Operating LP: | | | |
| 5.125% 5/15/29 | | 3,300,000 | 3,660,096 |
| 5.625% 7/15/27 | | 2,305,000 | 2,558,550 |
| Global Partners LP/GLP Finance Corp. 7% 8/1/27 | | 2,782,000 | 2,976,740 |
| InterGen NV 7% 6/30/23 (c) | | 6,695,000 | 6,494,150 |
| NextEra Energy Partners LP 4.5% 9/15/27 (c) | | 565,000 | 632,388 |
| NRG Energy, Inc.: | | | |
| 3.375% 2/15/29 (c) | | 415,000 | 424,877 |
| 3.625% 2/15/31 (c) | | 820,000 | 843,616 |
| 5.25% 6/15/29 (c) | | 2,105,000 | 2,315,500 |
| 5.75% 1/15/28 | | 1,190,000 | 1,300,075 |
| 6.625% 1/15/27 | | 900,000 | 950,436 |
| NSG Holdings II LLC/NSG Holdings, Inc. 7.75% 12/15/25 (c) | | 7,590,854 | 8,046,305 |
| Pattern Energy Operations LP 4.5% 8/15/28 (c) | | 770,000 | 812,350 |
| PG&E Corp. 5.25% 7/1/30 | | 2,935,000 | 3,228,500 |
| Pike Corp. 5.5% 9/1/28 (c) | | 3,840,000 | 4,056,000 |
| TerraForm Power Operating LLC: | | | |
| 4.75% 1/15/30 (c) | | 265,000 | 283,550 |
| 5% 1/31/28 (c) | | 2,570,000 | 2,887,781 |
| Vistra Operations Co. LLC: | | | |
| 5% 7/31/27 (c) | | 3,790,000 | 4,017,400 |
| 5.5% 9/1/26 (c) | | 7,084,000 | 7,382,945 |
| 5.625% 2/15/27 (c) | | 2,175,000 | 2,313,417 |
| | | | 59,847,639 |
|
| TOTAL NONCONVERTIBLE BONDS | | | 906,984,868 |
|
| TOTAL CORPORATE BONDS | | | |
| (Cost $876,230,314) | | | 916,610,785 |
| | | Shares | Value |
|
| Common Stocks - 0.4% | | | |
| Automotive & Auto Parts - 0.0% | | | |
| Motors Liquidation Co. GUC Trust (g) | | 3 | 6 |
| Energy - 0.4% | | | |
| California Resources Corp. (g) | | 4,962 | 117,054 |
| California Resources Corp. (a) | | 5,205 | 122,786 |
| California Resources Corp. warrants 10/27/24 (g) | | 1,768 | 7,072 |
| Denbury, Inc. (g) | | 54,291 | 1,394,736 |
| Jonah Energy LLC (b) | | 58,499 | 877,485 |
| Mesquite Energy, Inc.(b) | | 82,533 | 1,320,524 |
|
| TOTAL ENERGY | | | 3,839,657 |
|
| Telecommunications - 0.0% | | | |
| CUI Acquisition Corp. Class E (b)(g) | | 1 | 35,011 |
| TOTAL COMMON STOCKS | | | |
| (Cost $6,594,129) | | | 3,874,674 |
| | | Principal Amount | Value |
|
| Bank Loan Obligations - 2.2% | | | |
| Cable/Satellite TV - 0.1% | | | |
| WideOpenWest Finance LLC Tranche B, term loan 3 month U.S. LIBOR + 3.250% 4.25% 8/19/23 (d)(e)(h) | | 1,296,144 | 1,289,300 |
| Consumer Products - 0.2% | | | |
| Kronos Acquisition Holdings, Inc. Tranche B 1LN, term loan 3 month U.S. LIBOR + 4.500% 12/17/26 (e)(h)(i) | | 1,515,000 | 1,513,106 |
| Energy - 0.0% | | | |
| Gavilan Resources LLC Tranche 2LN, term loan 3 month U.S. LIBOR + 6.000% 0% 3/1/24 (b)(e)(f)(h) | | 4,810,000 | 0 |
| Sanchez Energy Corp.: | | | |
| 1LN, term loan 3 month U.S. LIBOR + 8.000% 0% 5/11/20(b)(e)(f)(h) | | 1,525,908 | 0 |
| term loan 3 month U.S. LIBOR + 0.000% 7.25% 5/11/20(b)(d)(e)(f)(h) | | 658,000 | 0 |
|
| TOTAL ENERGY | | | 0 |
|
| Gaming - 0.6% | | | |
| Golden Entertainment, Inc. Tranche B, term loan 3 month U.S. LIBOR + 3.000% 3.75% 10/20/24 (d)(e)(h) | | 3,072,025 | 2,995,716 |
| Golden Nugget, Inc. Tranche B 1LN, term loan 3 month U.S. LIBOR + 2.500% 3.25% 10/4/23 (d)(e)(h) | | 2,918,532 | 2,811,363 |
|
| TOTAL GAMING | | | 5,807,079 |
|
| Healthcare - 0.0% | | | |
| U.S. Renal Care, Inc. Tranche B 1LN, term loan 3 month U.S. LIBOR + 5.000% 5.1875% 6/13/26 (d)(e)(h) | | 359,091 | 356,847 |
| Services - 0.3% | | | |
| Brand Energy & Infrastructure Services, Inc. Tranche B, term loan 3 month U.S. LIBOR + 4.250% 5.25% 6/21/24 (d)(e)(h) | | 3,247,225 | 3,160,134 |
| Finastra U.S.A., Inc. Tranche B 1LN, term loan 3 month U.S. LIBOR + 3.500% 4.5% 6/13/24 (d)(e)(h) | | 171,535 | 167,837 |
|
| TOTAL SERVICES | | | 3,327,971 |
|
| Super Retail - 0.3% | | | |
| LBM Acquisition LLC Tranche B 1LN, term loan: | | | |
| 3 month U.S. LIBOR + 3.750% 12/18/27 (e)(h)(i) | | 432,727 | 432,277 |
| 3 month U.S. LIBOR + 3.750% 4.5% 12/18/27 (d)(e)(h) | | 1,947,273 | 1,945,248 |
|
| TOTAL SUPER RETAIL | | | 2,377,525 |
|
| Technology - 0.4% | | | |
| Tempo Acquisition LLC Tranche B 1LN, term loan 3 month U.S. LIBOR + 3.250% 3.75% 10/31/26 (d)(e)(h) | | 2,443,859 | 2,424,015 |
| Ultimate Software Group, Inc. 1LN, term loan 3 month U.S. LIBOR + 4.000% 4.75% 5/3/26 (d)(e)(h) | | 1,241,888 | 1,247,389 |
|
| TOTAL TECHNOLOGY | | | 3,671,404 |
|
| Telecommunications - 0.3% | | | |
| Intelsat Jackson Holdings SA: | | | |
| Tranche B-4, term loan 3 month U.S. LIBOR + 5.500% 8.75% 1/2/24 (d)(e)(h) | | 280,000 | 283,937 |
| Tranche DD 1LN, term loan 3 month U.S. LIBOR + 5.500% 6.5% 7/13/22 (d)(e)(h) | | 2,116,460 | 2,155,614 |
|
| TOTAL TELECOMMUNICATIONS | | | 2,439,551 |
|
| TOTAL BANK LOAN OBLIGATIONS | | | |
| (Cost $24,353,171) | | | 20,782,783 |
| | | Shares | Value |
|
| Money Market Funds - 1.6% | | | |
| Fidelity Cash Central Fund 0.11% (j) | | | |
| (Cost $15,870,899) | | 15,868,052 | 15,871,226 |
| TOTAL INVESTMENT IN SECURITIES - 98.8% | | | |
| (Cost $923,048,513) | | | 957,139,468 |
| NET OTHER ASSETS (LIABILITIES) - 1.2% | | | 11,973,519 |
| NET ASSETS - 100% | | | $969,112,987 |
Legend
(a) Restricted securities (including private placements) - Investment in securities not registered under the Securities Act of 1933 (excluding 144A issues). At the end of the period, the value of restricted securities (excluding 144A issues) amounted to $1,601,665 or 0.2% of net assets.
(b) Level 3 security
(c) Security exempt from registration under Rule 144A of the Securities Act of 1933. These securities may be resold in transactions exempt from registration, normally to qualified institutional buyers. At the end of the period, the value of these securities amounted to $663,877,528 or 68.5% of net assets.
(d) Coupon rates for floating and adjustable rate securities reflect the rates in effect at period end.
(e) Coupon is indexed to a floating interest rate which may be multiplied by a specified factor and/or subject to caps or floors.
(f) Non-income producing - Security is in default.
(g) Non-income producing
(h) Remaining maturities of bank loan obligations may be less than the stated maturities shown as a result of contractual or optional prepayments by the borrower. Such prepayments cannot be predicted with certainty.
(i) The coupon rate will be determined upon settlement of the loan after period end.
(j) Affiliated fund that is generally available only to investment companies and other accounts managed by Fidelity Investments. The rate quoted is the annualized seven-day yield of the fund at period end. A complete unaudited listing of the fund's holdings as of its most recent quarter end is available upon request. In addition, each Fidelity Central Fund's financial statements, which are not covered by the Fund's Report of Independent Registered Public Accounting Firm, are available on the SEC's website or upon request.
Additional information on each restricted holding is as follows:
| Security | Acquisition Date | Acquisition Cost |
| California Resources Corp. | 10/27/20 | $33,511 |
| Mesquite Energy, Inc. 15% 7/15/23 | 7/10/20 - 11/5/20 | $1,478,879 |
Affiliated Central Funds
Information regarding fiscal year to date income earned by the Fund from investments in Fidelity Central Funds is as follows:
| Fund | Income earned |
| Fidelity Cash Central Fund | $202,046 |
| Total | $202,046 |
Amounts in the income column in the above table include any capital gain distributions from underlying funds, which are presented in the corresponding line-item in the Statement of Operations, if applicable.
Investment Valuation
The following is a summary of the inputs used, as of December 31, 2020, involving the Fund's assets and liabilities carried at fair value. The inputs or methodology used for valuing securities may not be an indication of the risk associated with investing in those securities. For more information on valuation inputs, and their aggregation into the levels used below, please refer to the Investment Valuation section in the accompanying Notes to Financial Statements.
| | Valuation Inputs at Reporting Date: |
| Description | Total | Level 1 | Level 2 | Level 3 |
| Investments in Securities: | | | | |
| Equities: | | | | |
| Communication Services | $35,011 | $-- | $-- | $35,011 |
| Energy | 3,839,657 | 1,641,648 | -- | 2,198,009 |
| Financials | 6 | 6 | -- | -- |
| Corporate Bonds | 916,610,785 | -- | 915,131,905 | 1,478,880 |
| Bank Loan Obligations | 20,782,783 | -- | 20,782,783 | -- |
| Money Market Funds | 15,871,226 | 15,871,226 | -- | -- |
| Total Investments in Securities: | $957,139,468 | $17,512,880 | $935,914,688 | $3,711,900 |
Other Information
Distribution of investments by country or territory of incorporation, as a percentage of Total Net Assets, is as follows (Unaudited):
| United States of America | 78.4% |
| Canada | 3.9% |
| Luxembourg | 3.7% |
| Netherlands | 2.7% |
| Ireland | 2.5% |
| United Kingdom | 2.1% |
| Cayman Islands | 2.1% |
| France | 1.8% |
| Multi-National | 1.7% |
| Others (Individually Less Than 1%) | 1.1% |
| | 100.0% |
See accompanying notes which are an integral part of the financial statements.
Financial Statements
Statement of Assets and Liabilities
| | | December 31, 2020 |
| Assets | | |
Investment in securities, at value — See accompanying schedule:
Unaffiliated issuers (cost $907,177,614) | $941,268,242 | |
| Fidelity Central Funds (cost $15,870,899) | 15,871,226 | |
| Total Investment in Securities (cost $923,048,513) | | $957,139,468 |
| Cash | | 1,108,008 |
| Receivable for investments sold | | 4,207,384 |
| Receivable for fund shares sold | | 1,069,026 |
| Interest receivable | | 14,082,907 |
| Distributions receivable from Fidelity Central Funds | | 1,548 |
| Prepaid expenses | | 1,215 |
| Total assets | | 977,609,556 |
| Liabilities | | |
| Payable for investments purchased | $7,370,228 | |
| Payable for fund shares redeemed | 472,856 | |
| Accrued management fee | 440,421 | |
| Distribution and service plan fees payable | 39,757 | |
| Other affiliated payables | 95,565 | |
| Other payables and accrued expenses | 77,742 | |
| Total liabilities | | 8,496,569 |
| Net Assets | | $969,112,987 |
| Net Assets consist of: | | |
| Paid in capital | | $1,032,155,074 |
| Total accumulated earnings (loss) | | (63,042,087) |
| Net Assets | | $969,112,987 |
| Net Asset Value and Maximum Offering Price | | |
| Initial Class: | | |
| Net Asset Value, offering price and redemption price per share ($313,972,796 ÷ 59,181,292 shares) | | $5.31 |
| Service Class: | | |
| Net Asset Value, offering price and redemption price per share ($53,326,187 ÷ 10,134,717 shares) | | $5.26 |
| Service Class 2: | | |
| Net Asset Value, offering price and redemption price per share ($170,257,031 ÷ 33,461,297 shares) | | $5.09 |
| Investor Class: | | |
| Net Asset Value, offering price and redemption price per share ($431,556,973 ÷ 81,840,092 shares) | | $5.27 |
See accompanying notes which are an integral part of the financial statements.
Statement of Operations
| | | Year ended December 31, 2020 |
| Investment Income | | |
| Dividends | | $614,381 |
| Interest | | 53,290,192 |
| Income from Fidelity Central Funds | | 202,046 |
| Total income | | 54,106,619 |
| Expenses | | |
| Management fee | $5,123,582 | |
| Transfer agent fees | 774,827 | |
| Distribution and service plan fees | 449,068 | |
| Accounting fees and expenses | 337,222 | |
| Custodian fees and expenses | 14,976 | |
| Independent trustees' fees and expenses | 5,412 | |
| Audit | 82,252 | |
| Legal | 4,272 | |
| Miscellaneous | 56,314 | |
| Total expenses before reductions | 6,847,925 | |
| Expense reductions | (10,848) | |
| Total expenses after reductions | | 6,837,077 |
| Net investment income (loss) | | 47,269,542 |
| Realized and Unrealized Gain (Loss) | | |
| Net realized gain (loss) on: | | |
| Investment securities: | | |
| Unaffiliated issuers | (36,762,406) | |
| Fidelity Central Funds | 3,710 | |
| Total net realized gain (loss) | | (36,758,696) |
| Change in net unrealized appreciation (depreciation) on: | | |
| Investment securities: | | |
| Unaffiliated issuers | 10,013,120 | |
| Fidelity Central Funds | 1 | |
| Total change in net unrealized appreciation (depreciation) | | 10,013,121 |
| Net gain (loss) | | (26,745,575) |
| Net increase (decrease) in net assets resulting from operations | | $20,523,967 |
See accompanying notes which are an integral part of the financial statements.
Statement of Changes in Net Assets
| | Year ended December 31, 2020 | Year ended December 31, 2019 |
| Increase (Decrease) in Net Assets | | |
| Operations | | |
| Net investment income (loss) | $47,269,542 | $52,166,800 |
| Net realized gain (loss) | (36,758,696) | (12,326,337) |
| Change in net unrealized appreciation (depreciation) | 10,013,121 | 94,044,788 |
| Net increase (decrease) in net assets resulting from operations | 20,523,967 | 133,885,251 |
| Distributions to shareholders | (47,004,184) | (51,787,940) |
| Share transactions - net increase (decrease) | (48,310,959) | 73,598,351 |
| Total increase (decrease) in net assets | (74,791,176) | 155,695,662 |
| Net Assets | | |
| Beginning of period | 1,043,904,163 | 888,208,501 |
| End of period | $969,112,987 | $1,043,904,163 |
See accompanying notes which are an integral part of the financial statements.
Financial Highlights
VIP High Income Portfolio Initial Class
| Years ended December 31, | 2020 | 2019 | 2018 | 2017 | 2016 |
| Selected Per–Share Data | | | | | |
| Net asset value, beginning of period | $5.43 | $4.97 | $5.46 | $5.38 | $4.95 |
| Income from Investment Operations | | | | | |
| Net investment income (loss)A | .266 | .286 | .288 | .290 | .320 |
| Net realized and unrealized gain (loss) | (.121) | .457 | (.473) | .091 | .402 |
| Total from investment operations | .145 | .743 | (.185) | .381 | .722 |
| Distributions from net investment income | (.265) | (.283) | (.305) | (.301) | (.292) |
| Total distributions | (.265) | (.283) | (.305) | (.301) | (.292) |
| Net asset value, end of period | $5.31 | $5.43 | $4.97 | $5.46 | $5.38 |
| Total ReturnB,C | 2.75% | 15.11% | (3.46)% | 7.13% | 14.61% |
| Ratios to Average Net AssetsD,E | | | | | |
| Expenses before reductions | .67% | .67% | .67% | .67% | .68% |
| Expenses net of fee waivers, if any | .67% | .67% | .67% | .67% | .68% |
| Expenses net of all reductions | .67% | .67% | .67% | .67% | .68% |
| Net investment income (loss) | 5.14% | 5.31% | 5.33% | 5.22% | 6.05% |
| Supplemental Data | | | | | |
| Net assets, end of period (000 omitted) | $313,973 | $327,442 | $299,239 | $355,469 | $457,620 |
| Portfolio turnover rateF | 72% | 30% | 69% | 70% | 73% |
A Calculated based on average shares outstanding during the period.
B Total returns do not reflect charges attributable to your insurance company's separate account. Inclusion of these charges would reduce the total returns shown.
C Total returns would have been lower if certain expenses had not been reduced during the applicable periods shown.
D Fees and expenses of any underlying mutual funds or exchange-traded funds (ETFs) are not included in the Fund's expense ratio. The Fund indirectly bears its proportionate share of these expenses. For additional expense information related to investments in Fidelity Central Funds, please refer to the "Investments in Fidelity Central Funds" note found in the Notes to Financial Statements section of the most recent Annual or Semi-Annual report.
E Expense ratios reflect operating expenses of the class. Expenses before reductions do not reflect amounts reimbursed, waived, or reduced through arrangements with the investment adviser, brokerage services, or other offset arrangements, if applicable, and do not represent the amount paid by the class during periods when reimbursements, waivers or reductions occur.
F Amount does not include the portfolio activity of any underlying mutual funds or exchange-traded funds (ETFs).
See accompanying notes which are an integral part of the financial statements.
VIP High Income Portfolio Service Class
| Years ended December 31, | 2020 | 2019 | 2018 | 2017 | 2016 |
| Selected Per–Share Data | | | | | |
| Net asset value, beginning of period | $5.38 | $4.93 | $5.42 | $5.34 | $4.92 |
| Income from Investment Operations | | | | | |
| Net investment income (loss)A | .259 | .279 | .280 | .283 | .311 |
| Net realized and unrealized gain (loss) | (.120) | .449 | (.471) | .092 | .395 |
| Total from investment operations | .139 | .728 | (.191) | .375 | .706 |
| Distributions from net investment income | (.259) | (.278) | (.299) | (.295) | (.286) |
| Total distributions | (.259) | (.278) | (.299) | (.295) | (.286) |
| Net asset value, end of period | $5.26 | $5.38 | $4.93 | $5.42 | $5.34 |
| Total ReturnB,C | 2.65% | 14.92% | (3.60)% | 7.07% | 14.37% |
| Ratios to Average Net AssetsD,E | | | | | |
| Expenses before reductions | .77% | .77% | .77% | .77% | .78% |
| Expenses net of fee waivers, if any | .77% | .77% | .77% | .77% | .78% |
| Expenses net of all reductions | .77% | .77% | .77% | .77% | .78% |
| Net investment income (loss) | 5.04% | 5.21% | 5.23% | 5.12% | 5.95% |
| Supplemental Data | | | | | |
| Net assets, end of period (000 omitted) | $53,326 | $66,123 | $58,231 | $68,104 | $84,945 |
| Portfolio turnover rateF | 72% | 30% | 69% | 70% | 73% |
A Calculated based on average shares outstanding during the period.
B Total returns do not reflect charges attributable to your insurance company's separate account. Inclusion of these charges would reduce the total returns shown.
C Total returns would have been lower if certain expenses had not been reduced during the applicable periods shown.
D Fees and expenses of any underlying mutual funds or exchange-traded funds (ETFs) are not included in the Fund's expense ratio. The Fund indirectly bears its proportionate share of these expenses. For additional expense information related to investments in Fidelity Central Funds, please refer to the "Investments in Fidelity Central Funds" note found in the Notes to Financial Statements section of the most recent Annual or Semi-Annual report.
E Expense ratios reflect operating expenses of the class. Expenses before reductions do not reflect amounts reimbursed, waived, or reduced through arrangements with the investment adviser, brokerage services, or other offset arrangements, if applicable, and do not represent the amount paid by the class during periods when reimbursements, waivers or reductions occur.
F Amount does not include the portfolio activity of any underlying mutual funds or exchange-traded funds (ETFs).
See accompanying notes which are an integral part of the financial statements.
VIP High Income Portfolio Service Class 2
| Years ended December 31, | 2020 | 2019 | 2018 | 2017 | 2016 |
| Selected Per–Share Data | | | | | |
| Net asset value, beginning of period | $5.22 | $4.79 | $5.27 | $5.20 | $4.80 |
| Income from Investment Operations | | | | | |
| Net investment income (loss)A | .244 | .262 | .264 | .267 | .296 |
| Net realized and unrealized gain (loss) | (.121) | .438 | (.451) | .090 | .383 |
| Total from investment operations | .123 | .700 | (.187) | .357 | .679 |
| Distributions from net investment income | (.253) | (.270) | (.293) | (.287) | (.279) |
| Total distributions | (.253) | (.270) | (.293) | (.287) | (.279) |
| Net asset value, end of period | $5.09 | $5.22 | $4.79 | $5.27 | $5.20 |
| Total ReturnB,C | 2.42% | 14.77% | (3.63)% | 6.91% | 14.17% |
| Ratios to Average Net AssetsD,E | | | | | |
| Expenses before reductions | .92% | .92% | .92% | .92% | .93% |
| Expenses net of fee waivers, if any | .92% | .92% | .92% | .92% | .93% |
| Expenses net of all reductions | .92% | .92% | .92% | .92% | .93% |
| Net investment income (loss) | 4.89% | 5.06% | 5.08% | 4.97% | 5.80% |
| Supplemental Data | | | | | |
| Net assets, end of period (000 omitted) | $170,257 | $187,747 | $139,564 | $166,993 | $189,179 |
| Portfolio turnover rateF | 72% | 30% | 69% | 70% | 73% |
A Calculated based on average shares outstanding during the period.
B Total returns do not reflect charges attributable to your insurance company's separate account. Inclusion of these charges would reduce the total returns shown.
C Total returns would have been lower if certain expenses had not been reduced during the applicable periods shown.
D Fees and expenses of any underlying mutual funds or exchange-traded funds (ETFs) are not included in the Fund's expense ratio. The Fund indirectly bears its proportionate share of these expenses. For additional expense information related to investments in Fidelity Central Funds, please refer to the "Investments in Fidelity Central Funds" note found in the Notes to Financial Statements section of the most recent Annual or Semi-Annual report.
E Expense ratios reflect operating expenses of the class. Expenses before reductions do not reflect amounts reimbursed, waived, or reduced through arrangements with the investment adviser, brokerage services, or other offset arrangements, if applicable, and do not represent the amount paid by the class during periods when reimbursements, waivers or reductions occur.
F Amount does not include the portfolio activity of any underlying mutual funds or exchange-traded funds (ETFs).
See accompanying notes which are an integral part of the financial statements.
VIP High Income Portfolio Investor Class
| Years ended December 31, | 2020 | 2019 | 2018 | 2017 | 2016 |
| Selected Per–Share Data | | | | | |
| Net asset value, beginning of period | $5.39 | $4.94 | $5.43 | $5.36 | $4.93 |
| Income from Investment Operations | | | | | |
| Net investment income (loss)A | .263 | .283 | .284 | .287 | .317 |
| Net realized and unrealized gain (loss) | (.119) | .448 | (.470) | .083 | .403 |
| Total from investment operations | .144 | .731 | (.186) | .370 | .720 |
| Distributions from net investment income | (.264) | (.281) | (.304) | (.300) | (.290) |
| Total distributions | (.264) | (.281) | (.304) | (.300) | (.290) |
| Net asset value, end of period | $5.27 | $5.39 | $4.94 | $5.43 | $5.36 |
| Total ReturnB,C | 2.74% | 14.94% | (3.50)% | 6.95% | 14.64% |
| Ratios to Average Net AssetsD,E | | | | | |
| Expenses before reductions | .71% | .70% | .71% | .71% | .71% |
| Expenses net of fee waivers, if any | .71% | .70% | .71% | .71% | .71% |
| Expenses net of all reductions | .71% | .70% | .71% | .71% | .71% |
| Net investment income (loss) | 5.11% | 5.28% | 5.30% | 5.18% | 6.02% |
| Supplemental Data | | | | | |
| Net assets, end of period (000 omitted) | $431,557 | $462,593 | $391,173 | $456,983 | $469,732 |
| Portfolio turnover rateF | 72% | 30% | 69% | 70% | 73% |
A Calculated based on average shares outstanding during the period.
B Total returns do not reflect charges attributable to your insurance company's separate account. Inclusion of these charges would reduce the total returns shown.
C Total returns would have been lower if certain expenses had not been reduced during the applicable periods shown.
D Fees and expenses of any underlying mutual funds or exchange-traded funds (ETFs) are not included in the Fund's expense ratio. The Fund indirectly bears its proportionate share of these expenses. For additional expense information related to investments in Fidelity Central Funds, please refer to the "Investments in Fidelity Central Funds" note found in the Notes to Financial Statements section of the most recent Annual or Semi-Annual report.
E Expense ratios reflect operating expenses of the class. Expenses before reductions do not reflect amounts reimbursed, waived, or reduced through arrangements with the investment adviser, brokerage services, or other offset arrangements, if applicable, and do not represent the amount paid by the class during periods when reimbursements, waivers or reductions occur.
F Amount does not include the portfolio activity of any underlying mutual funds or exchange-traded funds (ETFs).
See accompanying notes which are an integral part of the financial statements.
Notes to Financial Statements
For the period ended December 31, 2020
1. Organization.
VIP High Income Portfolio (the Fund) is a fund of Variable Insurance Products Fund (the Trust) and is authorized to issue an unlimited number of shares. The Trust is registered under the Investment Company Act of 1940, as amended (the 1940 Act), as an open-end management investment company organized as a Massachusetts business trust. Shares of the Fund may only be purchased by insurance companies for the purpose of funding variable annuity or variable life insurance contracts. The Fund offers the following classes of shares: Initial Class shares, Service Class shares, Service Class 2 shares and Investor Class shares. All classes have equal rights and voting privileges, except for matters affecting a single class.
Effective January 1, 2020:
Investment advisers Fidelity Investments Money Management, Inc., FMR Co., Inc., and Fidelity SelectCo, LLC, merged with and into Fidelity Management & Research Company. In connection with the merger transactions, the resulting, merged investment adviser was then redomiciled from Massachusetts to Delaware, changed its corporate structure from a corporation to a limited liability company, and changed its name to "Fidelity Management & Research Company LLC".
Broker-dealer Fidelity Distributors Corporation merged with and into Fidelity Investments Institutional Services Company, Inc. ("FIISC"). FIISC was then redomiciled from Massachusetts to Delaware, changed its corporate structure from a corporation to a limited liability company, and changed its name to "Fidelity Distributors Company LLC".
Fidelity Investments Institutional Operations Company, Inc. converted from a Massachusetts corporation to a Massachusetts LLC, and changed its name to "Fidelity Investments Institutional Operations Company LLC".
2. Investments in Fidelity Central Funds.
The Fund invests in Fidelity Central Funds, which are open-end investment companies generally available only to other investment companies and accounts managed by the investment adviser and its affiliates. The Fund's Schedule of Investments lists each of the Fidelity Central Funds held as of period end, if any, as an investment of the Fund, but does not include the underlying holdings of each Fidelity Central Fund. As an Investing Fund, the Fund indirectly bears its proportionate share of the expenses of the underlying Fidelity Central Funds.
The Money Market Central Funds seek preservation of capital and current income and are managed by the investment adviser. Annualized expenses of the Money Market Central Funds as of their most recent shareholder report date ranged from less than .005% to .01%.
A complete unaudited list of holdings for each Fidelity Central Fund is available upon request or at the Securities and Exchange Commission (the SEC) website at www.sec.gov. In addition, the financial statements of the Fidelity Central Funds, which are not covered by the Fund's Report of Independent Registered Public Accounting Firm, are available on the SEC website or upon request.
3. Significant Accounting Policies.
The Fund is an investment company and applies the accounting and reporting guidance of the Financial Accounting Standards Board (FASB) Accounting Standards Codification Topic 946 Financial Services - Investment Companies. The financial statements have been prepared in conformity with accounting principles generally accepted in the United States of America (GAAP), which require management to make certain estimates and assumptions at the date of the financial statements. Actual results could differ from those estimates. Subsequent events, if any, through the date that the financial statements were issued have been evaluated in the preparation of the financial statements. The following summarizes the significant accounting policies of the Fund:
Investment Valuation. Investments are valued as of 4:00 p.m. Eastern time on the last calendar day of the period. The Board of Trustees (the Board) has delegated the day to day responsibility for the valuation of the Fund's investments to the Fair Value Committee (the Committee) established by the Fund's investment adviser. In accordance with valuation policies and procedures approved by the Board, the Fund attempts to obtain prices from one or more third party pricing vendors or brokers to value its investments. When current market prices, quotations or currency exchange rates are not readily available or reliable, investments will be fair valued in good faith by the Committee, in accordance with procedures adopted by the Board. Factors used in determining fair value vary by investment type and may include market or investment specific events, changes in interest rates and credit quality. The frequency with which these procedures are used cannot be predicted and they may be utilized to a significant extent. The Committee oversees the Fund's valuation policies and procedures and reports to the Board on the Committee's activities and fair value determinations. The Board monitors the appropriateness of the procedures used in valuing the Fund's investments and ratifies the fair value determinations of the Committee.
The Fund categorizes the inputs to valuation techniques used to value its investments into a disclosure hierarchy consisting of three levels as shown below:
- Level 1 – quoted prices in active markets for identical investments
- Level 2 – other significant observable inputs (including quoted prices for similar investments, interest rates, prepayment speeds, etc.)
- Level 3 – unobservable inputs (including the Fund's own assumptions based on the best information available)
Valuation techniques used to value the Fund's investments by major category are as follows:
Debt securities, including restricted securities, are valued based on evaluated prices received from third party pricing vendors or from brokers who make markets in such securities. Corporate bonds and bank loan obligations are valued by pricing vendors who utilize matrix pricing which considers yield or price of bonds of comparable quality, coupon, maturity and type or by broker-supplied prices. When independent prices are unavailable or unreliable, debt securities may be valued utilizing pricing methodologies which consider similar factors that would be used by third party pricing vendors. Debt securities are generally categorized as Level 2 in the hierarchy but may be Level 3 depending on the circumstances. The Fund invests a significant portion of its assets in below investment grade securities. The value of these securities can be more volatile due to changes in the credit quality of the issuer and is sensitive to changes in economic, market and regulatory conditions.
Equity securities, including restricted securities, for which market quotations are readily available, are valued at the last reported sale price or official closing price as reported by a third party pricing vendor on the primary market or exchange on which they are traded and are categorized as Level 1 in the hierarchy. In the event there were no sales during the day or closing prices are not available, securities are valued at the last quoted bid price or may be valued using the last available price and are generally categorized as Level 2 in the hierarchy. For foreign equity securities, when market or security specific events arise, comparisons to the valuation of American Depositary Receipts (ADRs), futures contracts, Exchange-Traded Funds (ETFs) and certain indexes as well as quoted prices for similar securities may be used and would be categorized as Level 2 in the hierarchy. For equity securities, including restricted securities, where observable inputs are limited, assumptions about market activity and risk are used and these securities may be categorized as Level 3 in the hierarchy.
Investments in open-end mutual funds, including the Fidelity Central Funds, are valued at their closing net asset value (NAV) each business day and are categorized as Level 1 in the hierarchy.
Changes in valuation techniques may result in transfers in or out of an assigned level within the disclosure hierarchy. The aggregate value of investments by input level as of December 31, 2020 is included at the end of the Fund's Schedule of Investments.
Investment Transactions and Income. For financial reporting purposes, the Fund's investment holdings and NAV include trades executed through the end of the last business day of the period. The NAV per share for processing shareholder transactions is calculated as of the close of business of the New York Stock Exchange (NYSE), normally 4:00 p.m. Eastern time and includes trades executed through the end of the prior business day. Gains and losses on securities sold are determined on the basis of identified cost and include proceeds received from litigation. Dividend income is recorded on the ex-dividend date. Income and capital gain distributions from Fidelity Central Funds, if any, are recorded on the ex-dividend date. Interest income is accrued as earned and includes coupon interest and amortization of premium and accretion of discount on debt securities as applicable. Debt obligations may be placed on non-accrual status and related interest income may be reduced by ceasing current accruals and writing off interest receivables when the collection of all or a portion of interest has become doubtful based on consistently applied procedures. A debt obligation is removed from non-accrual status when the issuer resumes interest payments or when collectability of interest is reasonably assured.
Class Allocations and Expenses. Investment income, realized and unrealized capital gains and losses, common expenses of the Fund, and certain fund-level expense reductions, if any, are allocated daily on a pro-rata basis to each class based on the relative net assets of each class to the total net assets of the Fund. Each class differs with respect to transfer agent and distribution and service plan fees incurred. Certain expense reductions may also differ by class. For the reporting period, the allocated portion of income and expenses to each class as a percent of its average net assets may vary due to the timing of recording these transactions in relation to fluctuating net assets of the classes. Expenses directly attributable to a fund are charged to that fund. Expenses attributable to more than one fund are allocated among the respective funds on the basis of relative net assets or other appropriate methods. Expense estimates are accrued in the period to which they relate and adjustments are made when actual amounts are known.
Income Tax Information and Distributions to Shareholders. Each year, the Fund intends to qualify as a regulated investment company under Subchapter M of the Internal Revenue Code, including distributing substantially all of its taxable income and realized gains. As a result, no provision for U.S. Federal income taxes is required. As of December 31, 2020, the Fund did not have any unrecognized tax benefits in the financial statements; nor is the Fund aware of any tax positions for which it is reasonably possible that the total amounts of unrecognized tax benefits will significantly change in the next twelve months. The Fund files a U.S. federal tax return, in addition to state and local tax returns as required. The Fund's federal income tax returns are subject to examination by the Internal Revenue Service (IRS) for a period of three fiscal years after they are filed. State and local tax returns may be subject to examination for an additional fiscal year depending on the jurisdiction.
Distributions are declared and recorded on the ex-dividend date. Income and capital gain distributions are declared separately for each class. Income and capital gain distributions are determined in accordance with income tax regulations, which may differ from GAAP.
Capital accounts within the financial statements are adjusted for permanent book-tax differences. These adjustments have no impact on net assets or the results of operations. Capital accounts are not adjusted for temporary book-tax differences which will reverse in a subsequent period.
Book-tax differences are primarily due to market discount, capital loss carryforwards, partnerships and losses deferred due to wash sales.
As of period end, the cost and unrealized appreciation (depreciation) in securities, and derivatives if applicable, for federal income tax purposes were as follows:
| Gross unrealized appreciation | $49,715,340 |
| Gross unrealized depreciation | (13,385,681) |
| Net unrealized appreciation (depreciation) | $36,329,659 |
| Tax Cost | $920,809,809 |
The tax-based components of distributable earnings as of period end were as follows:
| Undistributed ordinary income | $7,700,490 |
| Capital loss carryforward | $(107,072,237) |
| Net unrealized appreciation (depreciation) on securities and other investments | $36,329,659 |
Capital loss carryforwards are only available to offset future capital gains of the Fund to the extent provided by regulations and may be limited. The capital loss carryforward information presented below, including any applicable limitation, is estimated as of fiscal period end and is subject to adjustment.
| No expiration | |
| Short-term | $(42,982,296) |
| Long-term | (64,089,941) |
| Total capital loss carryforward | $(107,072,237) |
The tax character of distributions paid was as follows:
| | December 31, 2020 | December 31, 2019 |
| Ordinary Income | $47,004,184 | $ 51,787,940 |
Restricted Securities (including Private Placements). The Fund may invest in securities that are subject to legal or contractual restrictions on resale. These securities generally may be resold in transactions exempt from registration or to the public if the securities are registered. Disposal of these securities may involve time-consuming negotiations and expense, and prompt sale at an acceptable price may be difficult. Information regarding restricted securities is included at the end of the Fund's Schedule of Investments.
Loans and Other Direct Debt Instruments. Direct debt instruments are interests in amounts owed to lenders by corporate or other borrowers. These instruments may be in the form of loans, trade claims or other receivables and may include standby financing commitments such as revolving credit facilities that obligate a fund to supply additional cash to the borrower on demand. Loans may be acquired through assignment, participation, or may be made directly to a borrower. Such instruments are presented in the Bank Loan Obligations section in the Schedule of Investments. Certain funds may also invest in unfunded loan commitments, which are contractual obligations for future funding. Information regarding unfunded commitments is included at the end of the Schedule of Investments, if applicable.
4. Purchases and Sales of Investments.
Purchases and sales of securities, other than short-term securities are noted in the table below.
| | Purchases ($) | Sales ($) |
| VIP High Income Portfolio | 647,807,348 | 643,327,939 |
5. Fees and Other Transactions with Affiliates.
Management Fee. Fidelity Management & Research Company LLC (the investment adviser) and its affiliates provide the Fund with investment management related services for which the Fund pays a monthly management fee. The management fee is the sum of an individual fund fee rate that is based on an annual rate of .45% of the Fund's average net assets and an annualized group fee rate that averaged .10% during the period. The group fee rate is based upon the monthly average net assets of a group of registered investment companies with which the investment adviser has management contracts. The group fee rate decreases as assets under management increase and increases as assets under management decrease. For the reporting period, the total annual management fee rate was .55% of the Fund's average net assets.
Distribution and Service Plan Fees. In accordance with Rule 12b-1 of the 1940 Act, the Fund has adopted separate 12b-1 Plans for each Service Class of shares. Each Service Class pays Fidelity Distributors Company LLC (FDC), an affiliate of the investment adviser, a service fee. For the period, the service fee is based on an annual rate of .10% of Service Class' average net assets and .25% of Service Class 2's average net assets.
For the period, total fees, all of which were re-allowed to insurance companies for the distribution of shares and providing shareholder support services, were as follows:
| Service Class | $54,939 |
| Service Class 2 | 394,129 |
| | $449,068 |
Transfer Agent Fees. Fidelity Investments Institutional Operations Company LLC (FIIOC), an affiliate of the investment adviser, is the Fund's transfer, dividend disbursing, and shareholder servicing agent. FIIOC receives an asset-based fee with respect to each class. Each class pays a fee for transfer agent services, typesetting and printing and mailing of shareholder reports, excluding mailing of proxy statements. For the period, transfer agent fees for each class were as follows:
| | Amount | % of Class-Level Average Net Assets |
| Initial Class | $204,965 | .07 |
| Service Class | 37,359 | .07 |
| Service Class 2 | 107,203 | .07 |
| Investor Class | 425,300 | .10 |
| | $774,827 | |
Accounting Fees. Fidelity Service Company, Inc. (FSC), an affiliate of the investment adviser, maintains the Fund's accounting records. The accounting fee is based on the level of average net assets for each month. For the period, the fees were equivalent to the following annual rates:
| | % of Average Net Assets |
| VIP High Income Portfolio | .04 |
Brokerage Commissions. A portion of portfolio transactions were placed with brokerage firms which are affiliates of the investment adviser. Brokerage commissions are included in net realized gain (loss) and change in net unrealized appreciation (depreciation) in the Statement of Operations. The commissions paid to these affiliated firms were as follows:
| | Amount |
| VIP High Income Portfolio | $198 |
Interfund Trades. Funds may purchase from or sell securities to other Fidelity Funds under procedures adopted by the Board. The procedures have been designed to ensure these interfund trades are executed in accordance with Rule 17a-7 of the 1940 Act. Interfund trades are included within the respective purchases and sales amounts shown in the Purchases and Sales of Investments note.
6. Committed Line of Credit.
Certain Funds participate with other funds managed by the investment adviser or an affiliate in a $4.25 billion credit facility (the "line of credit") to be utilized for temporary or emergency purposes to fund shareholder redemptions or for other short-term liquidity purposes. The participating funds have agreed to pay commitment fees on their pro-rata portion of the line of credit, which are reflected in Miscellaneous expenses on the Statement of Operations, and are as follows:
| | Amount |
| VIP High Income Portfolio | $2,242 |
During the period, there were no borrowings on this line of credit.
7. Expense Reductions.
Commissions paid to certain brokers with whom the investment adviser, or its affiliates, places trades on behalf of the Fund include an amount in addition to trade execution, which may be rebated back to the Fund to offset certain expenses. This amount totaled $494 for the period. In addition, through arrangements with the Fund's custodian, credits realized as a result of certain uninvested cash balances were used to reduce the Fund's expenses. During the period, custodian credits reduced the Fund's expenses by $8,292.
In addition, during the period the investment adviser or an affiliate reimbursed and/or waived a portion of fund-level operating expenses in the amount of $2,062.
8. Distributions to Shareholders.
Distributions to shareholders of each class were as follows:
| | Year ended
December 31, 2020 | Year ended
December 31, 2019 |
| Distributions to shareholders | | |
| Initial Class | $15,186,395 | $16,485,830 |
| Service Class | 2,588,287 | 3,337,223 |
| Service Class 2 | 8,136,361 | 9,087,326 |
| Investor Class | 21,093,141 | 22,877,561 |
| Total | $47,004,184 | $51,787,940 |
9. Share Transactions.
Transactions for each class of shares were as follows:
| | Shares | Shares | Dollars | Dollars |
| | Year ended December 31, 2020 | Year ended December 31, 2019 | Year ended December 31, 2020 | Year ended December 31, 2019 |
| Initial Class | | | | |
| Shares sold | 7,828,791 | 8,124,182 | $40,541,734 | $43,792,349 |
| Reinvestment of distributions | 2,885,195 | 3,096,871 | 15,186,395 | 16,485,830 |
| Shares redeemed | (11,887,391) | (11,077,536) | (61,018,472) | (59,550,108) |
| Net increase (decrease) | (1,173,405) | 143,517 | $(5,290,343) | $728,071 |
| Service Class | | | | |
| Shares sold | 3,385,369 | 3,875,790 | $17,308,661 | $20,747,165 |
| Reinvestment of distributions | 495,370 | 632,722 | 2,588,287 | 3,337,223 |
| Shares redeemed | (6,031,210) | (4,026,231) | (31,043,815) | (21,473,406) |
| Net increase (decrease) | (2,150,471) | 482,281 | $(11,146,867) | $2,610,982 |
| Service Class 2 | | | | |
| Shares sold | 20,817,025 | 22,192,279 | $102,995,226 | $114,467,369 |
| Reinvestment of distributions | 1,610,356 | 1,776,501 | 8,136,361 | 9,087,326 |
| Shares redeemed | (24,966,605) | (17,110,197) | (124,070,315) | (88,421,021) |
| Net increase (decrease) | (2,539,224) | 6,858,583 | $(12,938,728) | $35,133,674 |
| Investor Class | | | | |
| Shares sold | 17,448,094 | 9,695,037 | $87,498,777 | $51,724,578 |
| Reinvestment of distributions | 4,029,639 | 4,320,731 | 21,093,141 | 22,877,561 |
| Shares redeemed | (25,383,687) | (7,394,959) | (127,526,939) | (39,476,515) |
| Net increase (decrease) | (3,905,954) | 6,620,809 | $(18,935,021) | $35,125,624 |
10. Other.
The Fund's organizational documents provide former and current trustees and officers with a limited indemnification against liabilities arising in connection with the performance of their duties to the Fund. In the normal course of business, the Fund may also enter into contracts that provide general indemnifications. The Fund's maximum exposure under these arrangements is unknown as this would be dependent on future claims that may be made against the Fund. The risk of material loss from such claims is considered remote.
At the end of the period, the investment adviser or its affiliates were the owners of record of 50% of the total outstanding shares of the Fund and one otherwise unaffiliated shareholder was the owner of record of 12% of the total outstanding shares of the Fund.
11. Coronavirus (COVID-19) Pandemic.
An outbreak of COVID-19 first detected in China during December 2019 has since spread globally and was declared a pandemic by the World Health Organization during March 2020. Developments that disrupt global economies and financial markets, such as the COVID-19 pandemic, may magnify factors that affect the Fund's performance.
Report of Independent Registered Public Accounting Firm
To the Board of Trustees of Variable Insurance Products Fund and Shareholders of VIP High Income Portfolio
Opinion on the Financial Statements
We have audited the accompanying statement of assets and liabilities, including the schedule of investments, of VIP High Income Portfolio (one of the funds constituting Variable Insurance Products Fund, referred to hereafter as the “Fund”) as of December 31, 2020, the related statement of operations for the year ended December 31, 2020, the statement of changes in net assets for each of the two years in the period ended December 31, 2020, including the related notes, and the financial highlights for each of the five years in the period ended December 31, 2020 (collectively referred to as the “financial statements”). In our opinion, the financial statements present fairly, in all material respects, the financial position of the Fund as of December 31, 2020, the results of its operations for the year then ended, the changes in its net assets for each of the two years in the period ended December 31, 2020 and the financial highlights for each of the five years in the period ended December 31, 2020 in conformity with accounting principles generally accepted in the United States of America.
Basis for Opinion
These financial statements are the responsibility of the Fund’s management. Our responsibility is to express an opinion on the Fund’s financial statements based on our audits. We are a public accounting firm registered with the Public Company Accounting Oversight Board (United States) (PCAOB) and are required to be independent with respect to the Fund in accordance with the U.S. federal securities laws and the applicable rules and regulations of the Securities and Exchange Commission and the PCAOB.
We conducted our audits of these financial statements in accordance with the standards of the PCAOB. Those standards require that we plan and perform the audit to obtain reasonable assurance about whether the financial statements are free of material misstatement, whether due to error or fraud.
Our audits included performing procedures to assess the risks of material misstatement of the financial statements, whether due to error or fraud, and performing procedures that respond to those risks. Such procedures included examining, on a test basis, evidence regarding the amounts and disclosures in the financial statements. Our audits also included evaluating the accounting principles used and significant estimates made by management, as well as evaluating the overall presentation of the financial statements. Our procedures included confirmation of securities owned as of December 31, 2020 by correspondence with the custodian, issuers of privately offered securities, agent banks and brokers; when replies were not received from brokers or agent banks, we performed other auditing procedures. We believe that our audits provide a reasonable basis for our opinion.
/s/ PricewaterhouseCoopers LLP
Boston, Massachusetts
February 11, 2021
We have served as the auditor of one or more investment companies in the Fidelity group of funds since 1932.
Trustees and Officers
The Trustees, Members of the Advisory Board (if any), and officers of the trust and fund, as applicable, are listed below. The Board of Trustees governs the fund and is responsible for protecting the interests of shareholders. The Trustees are experienced executives who meet periodically throughout the year to oversee the fund's activities, review contractual arrangements with companies that provide services to the fund, oversee management of the risks associated with such activities and contractual arrangements, and review the fund's performance. Except for Jonathan Chiel, each of the Trustees oversees 305 funds. Mr. Chiel oversees 176.
The Trustees hold office without limit in time except that (a) any Trustee may resign; (b) any Trustee may be removed by written instrument, signed by at least two-thirds of the number of Trustees prior to such removal; (c) any Trustee who requests to be retired or who has become incapacitated by illness or injury may be retired by written instrument signed by a majority of the other Trustees; and (d) any Trustee may be removed at any special meeting of shareholders by a two-thirds vote of the outstanding voting securities of the trust. Each Trustee who is not an interested person (as defined in the 1940 Act) of the trust and the fund is referred to herein as an Independent Trustee. Each Independent Trustee shall retire not later than the last day of the calendar year in which his or her 75th birthday occurs. The Independent Trustees may waive this mandatory retirement age policy with respect to individual Trustees. Officers and Advisory Board Members hold office without limit in time, except that any officer or Advisory Board Member may resign or may be removed by a vote of a majority of the Trustees at any regular meeting or any special meeting of the Trustees. Except as indicated, each individual has held the office shown or other offices in the same company for the past five years.
The fund’s Statement of Additional Information (SAI) includes more information about the Trustees. To request a free copy, call Fidelity at 1-877-208-0098.
Experience, Skills, Attributes, and Qualifications of the Trustees. The Governance and Nominating Committee has adopted a statement of policy that describes the experience, qualifications, attributes, and skills that are necessary and desirable for potential Independent Trustee candidates (Statement of Policy). The Board believes that each Trustee satisfied at the time he or she was initially elected or appointed a Trustee, and continues to satisfy, the standards contemplated by the Statement of Policy. The Governance and Nominating Committee also engages professional search firms to help identify potential Independent Trustee candidates who have the experience, qualifications, attributes, and skills consistent with the Statement of Policy. From time to time, additional criteria based on the composition and skills of the current Independent Trustees, as well as experience or skills that may be appropriate in light of future changes to board composition, business conditions, and regulatory or other developments, have also been considered by the professional search firms and the Governance and Nominating Committee. In addition, the Board takes into account the Trustees' commitment and participation in Board and committee meetings, as well as their leadership of standing and ad hoc committees throughout their tenure.
In determining that a particular Trustee was and continues to be qualified to serve as a Trustee, the Board has considered a variety of criteria, none of which, in isolation, was controlling. The Board believes that, collectively, the Trustees have balanced and diverse experience, qualifications, attributes, and skills, which allow the Board to operate effectively in governing the fund and protecting the interests of shareholders. Information about the specific experience, skills, attributes, and qualifications of each Trustee, which in each case led to the Board's conclusion that the Trustee should serve (or continue to serve) as a trustee of the fund, is provided below.
Board Structure and Oversight Function. Robert A. Lawrence is an interested person and currently serves as Acting Chairman. The Trustees have determined that an interested Chairman is appropriate and benefits shareholders because an interested Chairman has a personal and professional stake in the quality and continuity of services provided to the fund. Independent Trustees exercise their informed business judgment to appoint an individual of their choosing to serve as Chairman, regardless of whether the Trustee happens to be independent or a member of management. The Independent Trustees have determined that they can act independently and effectively without having an Independent Trustee serve as Chairman and that a key structural component for assuring that they are in a position to do so is for the Independent Trustees to constitute a substantial majority for the Board. The Independent Trustees also regularly meet in executive session. David M. Thomas serves as Lead Independent Trustee and as such (i) acts as a liaison between the Independent Trustees and management with respect to matters important to the Independent Trustees and (ii) with management prepares agendas for Board meetings.
Fidelity® funds are overseen by different Boards of Trustees. The fund's Board oversees Fidelity's high income and certain equity funds, and other Boards oversee Fidelity's investment-grade bond, money market, asset allocation, and other equity funds. The asset allocation funds may invest in Fidelity® funds overseen by the fund's Board. The use of separate Boards, each with its own committee structure, allows the Trustees of each group of Fidelity® funds to focus on the unique issues of the funds they oversee, including common research, investment, and operational issues. On occasion, the separate Boards establish joint committees to address issues of overlapping consequences for the Fidelity® funds overseen by each Board.
The Trustees operate using a system of committees to facilitate the timely and efficient consideration of all matters of importance to the Trustees, the fund, and fund shareholders and to facilitate compliance with legal and regulatory requirements and oversight of the fund's activities and associated risks. The Board, acting through its committees, has charged FMR and its affiliates with (i) identifying events or circumstances the occurrence of which could have demonstrably adverse effects on the fund's business and/or reputation; (ii) implementing processes and controls to lessen the possibility that such events or circumstances occur or to mitigate the effects of such events or circumstances if they do occur; and (iii) creating and maintaining a system designed to evaluate continuously business and market conditions in order to facilitate the identification and implementation processes described in (i) and (ii) above. Because the day-to-day operations and activities of the fund are carried out by or through FMR, its affiliates, and other service providers, the fund's exposure to risks is mitigated but not eliminated by the processes overseen by the Trustees. While each of the Board's committees has responsibility for overseeing different aspects of the fund's activities, oversight is exercised primarily through the Operations, Audit, and Compliance Committees. Appropriate personnel, including but not limited to the fund's Chief Compliance Officer (CCO), FMR's internal auditor, the independent accountants, the fund's Treasurer and portfolio management personnel, make periodic reports to the Board's committees, as appropriate, including an annual review of Fidelity's risk management program for the Fidelity® funds. The responsibilities of each standing committee, including their oversight responsibilities, are described further under "Standing Committees of the Trustees."
Interested Trustees*:
Correspondence intended for a Trustee who is an interested person may be sent to Fidelity Investments, 245 Summer Street, Boston, Massachusetts 02210.
Name, Year of Birth; Principal Occupations and Other Relevant Experience+
Jonathan Chiel (1957)
Year of Election or Appointment: 2016
Trustee
Mr. Chiel also serves as Trustee of other Fidelity® funds. Mr. Chiel is Executive Vice President and General Counsel for FMR LLC (diversified financial services company, 2012-present). Previously, Mr. Chiel served as general counsel (2004-2012) and senior vice president and deputy general counsel (2000-2004) for John Hancock Financial Services; a partner with Choate, Hall & Stewart (1996-2000) (law firm); and an Assistant United States Attorney for the United States Attorney’s Office of the District of Massachusetts (1986-95), including Chief of the Criminal Division (1993-1995). Mr. Chiel is a director on the boards of the Boston Bar Foundation and the Maimonides School.
Bettina Doulton (1964)
Year of Election or Appointment: 2021
Trustee
Ms. Doulton also serves as Trustee of other Fidelity® funds. Prior to her retirement, Ms. Doulton served in a variety of positions at Fidelity Investments, including as a managing director of research (2006-2007), portfolio manager to certain Fidelity® funds (1993-2005), equity analyst and portfolio assistant (1990-1993), and research assistant (1987-1990). Ms. Doulton currently owns and operates Phi Builders + Architects and Cellardoor Winery. Previously, Ms. Doulton served as a member of the Board of Brown Capital Management, LLC (2013-2018).
Robert A. Lawrence (1952)
Year of Election or Appointment: 2020
Trustee
Acting Chairman of the Board of Trustees
Mr. Lawrence also serves as Trustee of other funds. Previously, Mr. Lawrence served as a Member of the Advisory Board of certain funds. Prior to his retirement in 2008, Mr. Lawrence served as Vice President of certain Fidelity® funds (2006-2008), Senior Vice President, Head of High Income Division of Fidelity Management & Research Company (investment adviser firm, 2006-2008), and President of Fidelity Strategic Investments (investment adviser firm, 2002-2005).
* Determined to be an “Interested Trustee” by virtue of, among other things, his or her affiliation with the trust or various entities under common control with FMR.
+ The information includes the Trustee's principal occupation during the last five years and other information relating to the experience, attributes, and skills relevant to the Trustee's qualifications to serve as a Trustee, which led to the conclusion that the Trustee should serve as a Trustee for the fund.
Independent Trustees:
Correspondence intended for an Independent Trustee may be sent to Fidelity Investments, P.O. Box 55235, Boston, Massachusetts 02205-5235.
Name, Year of Birth; Principal Occupations and Other Relevant Experience+
Dennis J. Dirks (1948)
Year of Election or Appointment: 2005
Trustee
Mr. Dirks also serves as Trustee of other Fidelity® funds. Prior to his retirement in May 2003, Mr. Dirks served as Chief Operating Officer and as a member of the Board of The Depository Trust & Clearing Corporation (financial markets infrastructure), President, Chief Operating Officer and a member of the Board of The Depository Trust Company (DTC), President and a member of the Board of the National Securities Clearing Corporation (NSCC), Chief Executive Officer and a member of the Board of the Government Securities Clearing Corporation and Chief Executive Officer and a member of the Board of the Mortgage-Backed Securities Clearing Corporation. Mr. Dirks currently serves as a member of the Finance Committee (2016-present) and Board (2017-present) and is Treasurer (2018-present) of the Asolo Repertory Theatre.
Donald F. Donahue (1950)
Year of Election or Appointment: 2018
Trustee
Mr. Donahue also serves as Trustee of other Fidelity® funds. Mr. Donahue serves as President and Chief Executive Officer of Miranda Partners, LLC (risk consulting for the financial services industry, 2012-present). Previously, Mr. Donahue served as Chief Executive Officer (2006-2012), Chief Operating Officer (2003-2006) and Managing Director, Customer Marketing and Development (1999-2003) of The Depository Trust & Clearing Corporation (financial markets infrastructure). Mr. Donahue currently serves as a member (2007-present) and Co-Chairman (2016-present) of the Board of United Way of New York, a member of the Board of NYC Leadership Academy (2012-present) and a member of the Board of Advisors of Ripple Labs, Inc. (financial services, 2015-present). Mr. Donahue previously served as a member of the Advisory Board of certain Fidelity® funds (2015-2018).
Vicki L. Fuller (1957)
Year of Election or Appointment: 2020
Trustee
Ms. Fuller also serves as Trustee of other Fidelity® funds. Previously, Ms. Fuller served as a member of the Advisory Board of certain Fidelity® funds (2018-2020), Chief Investment Officer of the New York State Common Retirement Fund (2012-2018) and held a variety of positions at AllianceBernstein L.P. (global asset management, 1985-2012), including Managing Director (2006-2012) and Senior Vice President and Senior Portfolio Manager (2001-2006). Ms. Fuller currently serves as a member of the Board, Audit Committee and Nominating and Governance Committee of The Williams Companies, Inc. (natural gas infrastructure, 2018-present), as a member of the Board, Audit Committee and Nominating and Governance Committee of two Blackstone business development companies (2020-present) and as a member of the Board of Treliant, LLC (consulting, 2019-present).
Patricia L. Kampling (1959)
Year of Election or Appointment: 2020
Trustee
Ms. Kampling also serves as Trustee of other Fidelity® funds. Prior to her retirement, Ms. Kampling served as Chairman of the Board and Chief Executive Officer (2012-2019), President and Chief Operating Officer (2011-2012) and Executive Vice President and Chief Financial Officer (2010-2011) of Alliant Energy Corporation. Ms. Kampling currently serves as a member of the Board, Compensation Committee and Executive Committee and as Chair of the Audit Committee of Briggs & Stratton Corporation (manufacturing, 2011-present) and as a member of the Board, Audit, Finance and Risk Committee and Safety, Environmental, Technology and Operations Committee of American Water Works Company, Inc. (utilities company, 2019-present). In addition, Ms. Kampling currently serves as a member of the Board of the Nature Conservancy, Wisconsin Chapter (2019-present). Previously, Ms. Kampling served as a Member of the Advisory Board of certain Fidelity® funds (2020), a member of the Board of Interstate Power and Light Company (2012-2019) and Wisconsin Power and Light Company (2012-2019) (each a subsidiary of Alliant Energy Corporation) and as a member of the Board and Workforce Development Committee of the Business Roundtable (2018-2019).
Thomas A. Kennedy (1955)
Year of Election or Appointment: 2021
Trustee
Mr. Kennedy also serves as Trustee of other Fidelity® funds. Previously, Mr. Kennedy served as a Member of the Advisory Board of certain Fidelity® funds (2020) and held a variety of positions at Raytheon Company (aerospace and defense, 1983-2020), including Chairman and Chief Executive Officer (2014-2020) and Executive Vice President and Chief Operating Officer (2013-2014). Mr. Kennedy currently serves as Executive Chairman of the Board of Directors of Raytheon Technologies Corporation (aerospace and defense, 2020-present). He is also a member of the Rutgers School of Engineering Industry Advisory Board (2011-present) and a member of the UCLA Engineering Dean’s Executive Board (2016-present).
Garnett A. Smith (1947)
Year of Election or Appointment: 2018
Trustee
Mr. Smith also serves as Trustee of other Fidelity® funds. Prior to his retirement, Mr. Smith served as Chairman and Chief Executive Officer (1990-1997) and President (1986-1990) of Inbrand Corp. (manufacturer of personal absorbent products). Prior to his employment with Inbrand Corp., he was employed by a retail fabric chain and North Carolina National Bank (now Bank of America). Mr. Smith previously served as a member of the Advisory Board of certain Fidelity® funds (2012-2013).
David M. Thomas (1949)
Year of Election or Appointment: 2008
Trustee
Lead Independent Trustee
Mr. Thomas also serves as Trustee of other Fidelity® funds. Previously, Mr. Thomas served as Executive Chairman (2005-2006) and Chairman and Chief Executive Officer (2000-2005) of IMS Health, Inc. (pharmaceutical and healthcare information solutions). Mr. Thomas currently serves as Non-Executive Chairman of the Board of Fortune Brands Home and Security (home and security products, 2011-present), and a member of the Board (2004-present) and Presiding Director (2013-present) of Interpublic Group of Companies, Inc. (marketing communication).
Susan Tomasky (1953)
Year of Election or Appointment: 2020
Trustee
Ms. Tomasky also serves as Trustee of other Fidelity® funds. Prior to her retirement, Ms. Tomasky served in various executive officer positions at American Electric Power Company, Inc. (1998-2011), including most recently as President of AEP Transmission (2007-2011). Ms. Tomasky currently serves as a member of the Board and Sustainability Committee and as Chair of the Audit Committee of Marathon Petroleum Corporation (2018-present) and as a member of the Board, Corporate Governance Committee and Organization and Compensation Committee and as Chair of the Audit Committee of Public Service Enterprise Group, Inc. (utilities company, 2012-present). In addition, Ms. Tomasky currently serves as a member of the Board of the Columbus Regional Airport Authority (2007-present), as a member of the Board of the Royal Shakespeare Company – America (2009-present), as a member of the Board of the Columbus Association for the Performing Arts (2011-present) and as a member of the Board of Kenyon College (2016-present). Previously, Ms. Tomasky served as a Member of the Advisory Board of certain Fidelity® funds (2020), a member of the Board (2011-2019) and as Lead Independent Director (2015-2018) of Andeavor Corporation (previously Tesoro Corporation) (independent oil refiner and marketer) and as a member of the Board of Summit Midstream Partners LP (energy, 2012-2018).
Michael E. Wiley (1950)
Year of Election or Appointment: 2020
Trustee
Mr. Wiley also serves as Trustee of other Fidelity® funds. Previously, Mr. Wiley served as a member of the Advisory Board of certain Fidelity® funds (2018-2020), Chairman, President and CEO of Baker Hughes, Inc. (oilfield services, 2000-2004). Mr. Wiley also previously served as a member of the Board of Andeavor Corporation (independent oil refiner and marketer, 2005-2018), a member of the Board of Andeavor Logistics LP (natural resources logistics, 2015-2018) and a member of the Board of High Point Resources (exploration and production, 2005-2020).
+ The information includes the Trustee's principal occupation during the last five years and other information relating to the experience, attributes, and skills relevant to the Trustee's qualifications to serve as a Trustee, which led to the conclusion that the Trustee should serve as a Trustee for the fund.
Advisory Board Members and Officers:
Correspondence intended for a Member of the Advisory Board (if any) may be sent to Fidelity Investments, P.O. Box 55235, Boston, Massachusetts 02205-5235. Correspondence intended for an officer or Peter S. Lynch may be sent to Fidelity Investments, 245 Summer Street, Boston, Massachusetts 02210. Officers appear below in alphabetical order.
Name, Year of Birth; Principal Occupation
Ned C. Lautenbach (1944)
Year of Election or Appointment: 2021
Member of the Advisory Board
Mr. Lautenbach also serves as a Member of the Advisory Board of other Fidelity® funds. Mr. Lautenbach currently serves as Chair of the Board of Governors, State University System of Florida (2013-present) and is a member of the Council on Foreign Relations (1994-present). He is also a member and has in the past served as Chairman of the Board of Directors of Artis-Naples (2012-present). Previously, Mr. Lautenbach served as a Trustee of certain Fidelity® funds (2000-2020) and a member and then Lead Director of the Board of Directors of Eaton Corporation (diversified industrial, 1997-2016). He was also a Partner at Clayton, Dubilier & Rice, LLC (private equity investment, 1998-2010); as well as Director of Sony Corporation (2006-2007). In addition, Mr. Lautenbach had a 30-year career with IBM (technology company), during which time he served as Senior Vice President and as a member of the Corporate Executive Committee (1968-1998).
Peter S. Lynch (1944)
Year of Election or Appointment: 2003
Member of the Advisory Board
Mr. Lynch also serves as a Member of the Advisory Board of other Fidelity® funds. Mr. Lynch is Vice Chairman and a Director of Fidelity Management & Research Company LLC (investment adviser firm). In addition, Mr. Lynch serves as a Trustee of Boston College and as the Chairman of the Inner-City Scholarship Fund. Previously, Mr. Lynch served as Vice Chairman and a Director of FMR Co., Inc. (investment adviser firm) and on the Special Olympics International Board of Directors (1997-2006).
Craig S. Brown (1977)
Year of Election or Appointment: 2019
Assistant Treasurer
Mr. Brown also serves as Assistant Treasurer of other funds. Mr. Brown is an employee of Fidelity Investments (2013-present).
John J. Burke III (1964)
Year of Election or Appointment: 2018
Chief Financial Officer
Mr. Burke also serves as Chief Financial Officer of other funds. Mr. Burke serves as Head of Investment Operations for Fidelity Fund and Investment Operations (2018-present) and is an employee of Fidelity Investments (1998-present). Previously Mr. Burke served as head of Asset Management Investment Operations (2012-2018).
William C. Coffey (1969)
Year of Election or Appointment: 2019
Assistant Secretary
Mr. Coffey also serves as Assistant Secretary of other funds. He is Senior Vice President and Deputy General Counsel of FMR LLC (diversified financial services company, 2010-present), and is an employee of Fidelity Investments. Previously, Mr. Coffey served as Secretary and CLO of certain funds (2018-2019); CLO, Secretary, and Senior Vice President of Fidelity Management & Research Company and FMR Co., Inc. (investment adviser firms, 2018-2019); Secretary of Fidelity SelectCo, LLC and Fidelity Investments Money Management, Inc. (investment adviser firms, 2018-2019); CLO of Fidelity Management & Research (Hong Kong) Limited, FMR Investment Management (UK) Limited, and Fidelity Management & Research (Japan) Limited (investment adviser firms, 2018-2019); and Assistant Secretary of certain funds (2009-2018).
Timothy M. Cohen (1969)
Year of Election or Appointment: 2018
Vice President
Mr. Cohen also serves as Vice President of other funds. Mr. Cohen serves as Co-Head of Equity (2018-present), a Director of Fidelity Management & Research (Japan) Limited (investment adviser firm, 2016-present), and is an employee of Fidelity Investments. Previously, Mr. Cohen served as Executive Vice President of Fidelity SelectCo, LLC (2019), Head of Global Equity Research (2016-2018), Chief Investment Officer - Equity and a Director of Fidelity Management & Research (U.K.) Inc. (investment adviser firm, 2013-2015) and as a Director of Fidelity Management & Research (Hong Kong) Limited (investment adviser firm, 2017).
Jonathan Davis (1968)
Year of Election or Appointment: 2010
Assistant Treasurer
Mr. Davis also serves as Assistant Treasurer of other funds. Mr. Davis serves as Assistant Treasurer of FMR Capital, Inc. (2017-present) and is an employee of Fidelity Investments. Previously, Mr. Davis served as Vice President and Associate General Counsel of FMR LLC (diversified financial services company, 2003-2010).
Laura M. Del Prato (1964)
Year of Election or Appointment: 2018
Assistant Treasurer
Ms. Del Prato also serves as an officer of other funds. Ms. Del Prato is an employee of Fidelity Investments (2017-present). Previously, Ms. Del Prato served as President and Treasurer of The North Carolina Capital Management Trust: Cash Portfolio and Term Portfolio (2018-2020). Prior to joining Fidelity Investments, Ms. Del Prato served as a Managing Director and Treasurer of the JPMorgan Mutual Funds (2014-2017). Prior to JPMorgan, Ms. Del Prato served as a partner at Cohen Fund Audit Services (accounting firm, 2012-2013) and KPMG LLP (accounting firm, 2004-2012).
Colm A. Hogan (1973)
Year of Election or Appointment: 2020
Assistant Treasurer
Mr. Hogan also serves as an officer of other funds. Mr. Hogan serves as Assistant Treasurer of FMR Capital, Inc. (2017-present) and is an employee of Fidelity Investments (2005-present). Previously, Mr. Hogan served as Deputy Treasurer of certain Fidelity® funds (2016-2020) and Assistant Treasurer of certain Fidelity® funds (2016-2018).
Pamela R. Holding (1964)
Year of Election or Appointment: 2018
Vice President
Ms. Holding also serves as Vice President of other funds. Ms. Holding serves as Co-Head of Equity (2018-present) and is an employee of Fidelity Investments (2013-present). Previously, Ms. Holding served as Executive Vice President of Fidelity SelectCo, LLC (2019) and as Chief Investment Officer of Fidelity Institutional Asset Management (2013-2018).
Cynthia Lo Bessette (1969)
Year of Election or Appointment: 2019
Secretary and Chief Legal Officer (CLO)
Ms. Lo Bessette also serves as an officer of other funds. Ms. Lo Bessette serves as CLO, Secretary, and Senior Vice President of Fidelity Management & Research Company LLC (investment adviser firm, 2019-present); and CLO of Fidelity Management & Research (Hong Kong) Limited, FMR Investment Management (UK) Limited, and Fidelity Management & Research (Japan) Limited (investment adviser firms, 2019-present). She is a Senior Vice President and Deputy General Counsel of FMR LLC (diversified financial services company, 2019-present), and is an employee of Fidelity Investments. Previously, Ms. Lo Bessette served as CLO, Secretary, and Senior Vice President of FMR Co., Inc. (investment adviser firm, 2019); Secretary of Fidelity SelectCo, LLC and Fidelity Investments Money Management, Inc. (investment adviser firms, 2019). Prior to joining Fidelity Investments, Ms. Lo Bessette was Executive Vice President, General Counsel (2016-2019) and Senior Vice President, Deputy General Counsel (2015-2016) of OppenheimerFunds (investment management company) and Deputy Chief Legal Officer (2013-2015) of Jennison Associates LLC (investment adviser firm).
Chris Maher (1972)
Year of Election or Appointment: 2020
Deputy Treasurer
Mr. Maher also serves as an officer of other funds. Mr. Maher serves as Assistant Treasurer of FMR Capital, Inc. (2017-present), and is an employee of Fidelity Investments (2008-present). Previously, Mr. Maher served as Assistant Treasurer of certain funds (2013-2020); Vice President of Asset Management Compliance (2013), Vice President of the Program Management Group of FMR (investment adviser firm, 2010-2013), and Vice President of Valuation Oversight (2008-2010).
Jason P. Pogorelec (1975)
Year of Election or Appointment: 2020
Chief Compliance Officer
Mr. Pogorelec also serves as Chief Compliance Officer of other funds. Mr. Pogorelec is a senior Vice President of Asset Management Compliance for Fidelity Investments and is an employee of Fidelity Investments (2006-present). Previously, Mr. Pogorelec served as Vice President, Associate General Counsel for Fidelity Investments (2010-2020) and Assistant Secretary of certain Fidelity funds (2015-2020).
Brett Segaloff (1972)
Year of Election or Appointment: 2021
Anti-Money Laundering (AML) Officer
Mr. Segaloff also serves as an AML Officer of other funds and other related entities. He is Director, Anti-Money Laundering (2007-present) of FMR LLC (diversified financial services company) and is an employee of Fidelity Investments (1996-present).
Stacie M. Smith (1974)
Year of Election or Appointment: 2016
President and Treasurer
Ms. Smith also serves as an officer of other funds. Ms. Smith serves as Assistant Treasurer of FMR Capital, Inc. (2017-present), is an employee of Fidelity Investments (2009-present), and has served in other fund officer roles. Prior to joining Fidelity Investments, Ms. Smith served as Senior Audit Manager of Ernst & Young LLP (accounting firm, 1996-2009). Previously, Ms. Smith served as Assistant Treasurer (2013-2019) and Deputy Treasurer (2013-2016) of certain Fidelity® funds.
Marc L. Spector (1972)
Year of Election or Appointment: 2016
Assistant Treasurer
Mr. Spector also serves as an officer of other funds. Mr. Spector serves as Assistant Treasurer of FMR Capital, Inc. (2017-present) and is an employee of Fidelity Investments (2016-present). Prior to joining Fidelity Investments, Mr. Spector served as Director at the Siegfried Group (accounting firm, 2013-2016), and prior to Siegfried Group as audit senior manager at Deloitte & Touche LLP (accounting firm, 2005-2013).
Jim Wegmann (1979)
Year of Election or Appointment: 2019
Assistant Treasurer
Mr. Wegmann also serves as Assistant Treasurer of other funds. Mr. Wegmann is an employee of Fidelity Investments (2011-present).
Shareholder Expense Example
As a shareholder, you incur two types of costs: (1) transaction costs, which may include sales charges (loads) on purchase payments or redemption proceeds, as applicable and (2) ongoing costs, which generally include management fees, distribution and/or service (12b-1) fees and other Fund expenses. This Example is intended to help you understand your ongoing costs (in dollars) of investing in a fund and to compare these costs with the ongoing costs of investing in other mutual funds.
The Example is based on an investment of $1,000 invested at the beginning of the period and held for the entire period (July 1, 2020 to December 31, 2020).
Actual Expenses
The first line of the accompanying table provides information about actual account values and actual expenses. You may use the information in this line, together with the amount you invested, to estimate the expenses that you paid over the period. Simply divide your account value by $1,000.00 (for example, an $8,600 account value divided by $1,000.00 = 8.6), then multiply the result by the number in the first line for a class/Fund under the heading entitled "Expenses Paid During Period" to estimate the expenses you paid on your account during this period. If any fund is a shareholder of any underlying mutual funds or exchange-traded funds (ETFs) (the Underlying Funds), such fund indirectly bears its proportional share of the expenses of the Underlying Funds in addition to the direct expenses incurred presented in the table. These fees and expenses are not included in the annualized expense ratio used to calculate the expense estimate in the table below. The estimate of expenses does not include any fees or other expenses of any variable annuity or variable life insurance product. If they were, the estimate of expenses you paid during the period would be higher, and your ending account value would be lower.
Hypothetical Example for Comparison Purposes
The second line of the accompanying table provides information about hypothetical account values and hypothetical expenses based on the actual expense ratio and an assumed rate of return of 5% per year before expenses, which is not the actual return. The hypothetical account values and expenses may not be used to estimate the actual ending account balance or expenses you paid for the period. You may use this information to compare the ongoing costs of investing in the Fund and other funds. To do so, compare this 5% hypothetical example with the 5% hypothetical examples that appear in the shareholder reports of the other funds. If any fund is a shareholder of any Underlying Funds, such fund indirectly bears its proportional share of the expenses of the Underlying Funds in addition to the direct expenses as presented in the table. These fees and expenses are not included in the annualized expense ratio used to calculate the expense estimate in the table below. The estimate of expenses does not include any fees or other expenses of any variable annuity or variable life insurance product. If they were, the estimate of expenses you paid during the period would be higher, and your ending account value would be lower.
Please note that the expenses shown in the table are meant to highlight your ongoing costs only and do not reflect any transaction costs. Therefore, the second line of the table is useful in comparing ongoing costs only, and will not help you determine the relative total costs of owning different funds.
| | Annualized Expense Ratio-A | Beginning
Account Value
July 1, 2020 | Ending
Account Value
December 31, 2020 | Expenses Paid
During Period-B
July 1, 2020
to December 31, 2020 |
| VIP High Income Portfolio | | | | |
| Initial Class | .66% | | | |
| Actual | | $1,000.00 | $1,094.30 | $3.47 |
| Hypothetical-C | | $1,000.00 | $1,021.82 | $3.35 |
| Service Class | .76% | | | |
| Actual | | $1,000.00 | $1,094.10 | $4.00 |
| Hypothetical-C | | $1,000.00 | $1,021.32 | $3.86 |
| Service Class 2 | .91% | | | |
| Actual | | $1,000.00 | $1,094.10 | $4.79 |
| Hypothetical-C | | $1,000.00 | $1,020.56 | $4.62 |
| Investor Class | .69% | | | |
| Actual | | $1,000.00 | $1,092.60 | $3.63 |
| Hypothetical-C | | $1,000.00 | $1,021.67 | $3.51 |
A Annualized expense ratio reflects expenses net of applicable fee waivers.
B Expenses are equal to the annualized expense ratio, multiplied by the average account value over the period, multiplied by 184/ 366 (to reflect the one-half year period). The fees and expenses of any Underlying Funds are not included in each annualized expense ratio.
C 5% return per year before expenses
Distributions (Unaudited)
A total of 0.12% of the dividends distributed during the fiscal year was derived from interest on U.S. Government securities which is generally exempt from state income tax.
Proxy Voting Results
A special meeting of shareholders was held on June 9, 2020. The results of votes taken among shareholders on the proposals before them are reported below. Each vote reported represents one dollar of net asset value held on the record date for the meeting.
PROPOSAL 1
To elect a Board of Trustees.
| | # of
Votes | % of
Votes |
| Dennis J. Dirks |
| Affirmative | 11,099,447,424.890 | 95.490 |
| Withheld | 524,241,637.164 | 4.510 |
| TOTAL | 11,623,689,062.054 | 100.000 |
| Donald F. Donahue |
| Affirmative | 11,111,963,232.945 | 95.598 |
| Withheld | 511,725,829.109 | 4.402 |
| TOTAL | 11,623,689,062.054 | 100.000 |
| Bettina Doulton |
| Affirmative | 11,132,379,469.922 | 95.773 |
| Withheld | 491,309,592.132 | 4.227 |
| TOTAL | 11,623,689,062.054 | 100.000 |
| Vicki L. Fuller |
| Affirmative | 11,132,346,192.263 | 95.773 |
| Withheld | 491,342,869.791 | 4.227 |
| TOTAL | 11,623,689,062.054 | 100.000 |
| Patricia L. Kampling |
| Affirmative | 11,141,812,359.694 | 95.854 |
| Withheld | 481,876,702.360 | 4.146 |
| TOTAL | 11,623,689,062.054 | 100.000 |
| Alan J. Lacy |
| Affirmative | 11,081,103,173.144 | 95.332 |
| Withheld | 542,585,888.910 | 4.668 |
| TOTAL | 11,623,689,062.054 | 100.000 |
| Ned C. Lautenbach |
| Affirmative | 11,051,092,644.521 | 95.074 |
| Withheld | 572,596,417.533 | 4.926 |
| TOTAL | 11,623,689,062.054 | 100.000 |
| Robert A. Lawrence |
| Affirmative | 11,100,774,895.497 | 95.501 |
| Withheld | 522,914,166.556 | 4.499 |
| TOTAL | 11,623,689,062.054 | 100.000 |
| Joseph Mauriello |
| Affirmative | 11,070,909,380.371 | 95.244 |
| Withheld | 552,779,681.683 | 4.756 |
| TOTAL | 11,623,689,062.054 | 100.000 |
| Cornelia M. Small |
| Affirmative | 11,101,337,946.609 | 95.506 |
| Withheld | 522,351,115.445 | 4.494 |
| TOTAL | 11,623,689,062.054 | 100.000 |
| Garnett A. Smith |
| Affirmative | 11,082,555,490.179 | 95.345 |
| Withheld | 541,133,571.875 | 4.655 |
| TOTAL | 11,623,689,062.054 | 100.000 |
| David M. Thomas |
| Affirmative | 11,094,352,794.165 | 95.446 |
| Withheld | 529,336,267.889 | 4.554 |
| TOTAL | 11,623,689,062.054 | 100.000 |
| Susan Tomasky |
| Affirmative | 11,124,148,109.894 | 95.702 |
| Withheld | 499,540,952.160 | 4.298 |
| TOTAL | 11,623,689,062.054 | 100.000 |
| Michael E. Wiley |
| Affirmative | 11,096,957,446.084 | 95.468 |
| Withheld | 526,731,615.970 | 4.532 |
| TOTAL | 11,623,689,062.054 | 100.000 |
PROPOSAL 2
To convert a fundamental investment policy to a non-fundamental investment policy.
| | # of
Votes | % of
Votes |
| Affirmative | 706,980,941.578 | 82.483 |
| Against | 77,726,403.651 | 9.068 |
| Abstain | 72,416,126.481 | 8.449 |
| Broker Non-Vote | 0.00 | 0.00 |
| TOTAL | 857,123,471.710 | 100.000 |
|
| Proposal 1 reflects trust wide proposal and voting results. |

VIPHI-ANN-0221
1.540029.123
Fidelity® Variable Insurance Products:
Value Portfolio
Annual Report
December 31, 2020
Contents
To view a fund's proxy voting guidelines and proxy voting record for the 12-month period ended June 30, visit http://www.fidelity.com/proxyvotingresults or visit the Securities and Exchange Commission's (SEC) web site at http://www.sec.gov.
You may also call 1-877-208-0098 to request a free copy of the proxy voting guidelines.
Fidelity® Variable Insurance Products are separate account options which are purchased through a variable insurance contract.
Standard & Poor's, S&P and S&P 500 are registered service marks of The McGraw-Hill Companies, Inc. and have been licensed for use by Fidelity Distributors Corporation.
Other third-party marks appearing herein are the property of their respective owners.
All other marks appearing herein are registered or unregistered trademarks or service marks of FMR LLC or an affiliated company. © 2021 FMR LLC. All rights reserved.
This report and the financial statements contained herein are submitted for the general information of the shareholders of the Fund. This report is not authorized for distribution to prospective investors in the Fund unless preceded or accompanied by an effective prospectus.
A fund files its complete schedule of portfolio holdings with the SEC for the first and third quarters of each fiscal year on Form N-PORT. Forms N-PORT are available on the SEC’s web site at http://www.sec.gov. A fund's Forms N-PORT may be reviewed and copied at the SEC’s Public Reference Room in Washington, DC. Information regarding the operation of the SEC's Public Reference Room may be obtained by calling 1-800-SEC-0330.
For a complete list of a fund's portfolio holdings, view the most recent holdings listing, semiannual report, or annual report on Fidelity's web site at http://www.fidelity.com, http://www.institutional.fidelity.com, or http://www.401k.com, as applicable.
NOT FDIC INSURED •MAY LOSE VALUE •NO BANK GUARANTEE
Neither the Fund nor Fidelity Distributors Corporation is a bank.
Note to Shareholders:
Early in 2020, the outbreak and spread of a new coronavirus emerged as a public health emergency that had a major influence on financial markets, primarily based on its impact on the global economy and the outlook for corporate earnings. The virus causes a respiratory disease known as COVID-19. On March 11, the World Health Organization declared the COVID-19 outbreak a pandemic, citing sustained risk of further global spread.
In the weeks following, as the crisis worsened, we witnessed an escalating human tragedy with wide-scale social and economic consequences from coronavirus-containment measures. The outbreak of COVID-19 prompted a number of measures to limit the spread, including travel and border restrictions, quarantines, and restrictions on large gatherings. In turn, these resulted in lower consumer activity, diminished demand for a wide range of products and services, disruption in manufacturing and supply chains, and – given the wide variability in outcomes regarding the outbreak – significant market uncertainty and volatility. Amid the turmoil, global governments and central banks took unprecedented action to help support consumers, businesses, and the broader economies, and to limit disruption to financial systems.
The situation continues to unfold, and the extent and duration of its impact on financial markets and the economy remain highly uncertain. Extreme events such as the coronavirus crisis are “exogenous shocks” that can have significant adverse effects on mutual funds and their investments. Although multiple asset classes may be affected by market disruption, the duration and impact may not be the same for all types of assets.
Fidelity is committed to helping you stay informed amid news about COVID-19 and during increased market volatility, and we’re taking extra steps to be responsive to customer needs. We encourage you to visit our websites, where we offer ongoing updates, commentary, and analysis on the markets and our funds.
Performance: The Bottom Line
Average annual total return reflects the change in the value of an investment, assuming reinvestment of distributions from dividend income and capital gains (the profits earned upon the sale of securities that have grown in value, if any) and assuming a constant rate of performance each year. During periods of reimbursement by Fidelity, a fund’s total return will be greater than it would be had the reimbursement not occurred. Performance numbers are net of all underlying fund operating expenses, but do not include any insurance charges imposed by your insurance company’s separate account. If performance information included the effect of these additional charges, the total returns would have been lower. How a fund did yesterday is no guarantee of how it will do tomorrow.
Average Annual Total Returns
| For the periods ended December 31, 2020 | Past 1 year | Past 5 years | Past 10 years |
| Initial Class | 6.33% | 9.41% | 10.47% |
| Service Class | 6.23% | 9.30% | 10.37% |
| Service Class 2 | 6.02% | 9.13% | 10.20% |
| Investor Class | 6.20% | 9.31% | 10.38% |
$10,000 Over 10 Years
Let's say hypothetically that $10,000 was invested in VIP Value Portfolio - Initial Class on December 31, 2010.
The chart shows how the value of your investment would have changed, and also shows how the Russell 3000® Value Index performed over the same period.

| Period Ending Values |
| $27,072 | VIP Value Portfolio - Initial Class |
| $26,791 | Russell 3000® Value Index |
Management's Discussion of Fund Performance
Market Recap: The S&P 500
® index gained 18.40% in 2020, a highly volatile and unpredictable year that will be remembered by most investors for the impact of the coronavirus pandemic. The early-2020 outbreak and spread of COVID-19 resulted in stocks suffering one of the quickest declines on record, through March 23, followed by a historic rebound that culminated with the index closing the year at an all-time high. The crisis and containment efforts caused broad contraction in economic activity, along with extreme uncertainty and dislocation in financial markets. A rapid and expansive U.S. monetary/fiscal-policy response partially offset the economic disruption and fueled the market surge, as did resilient corporate earnings and the potential for a COVID-19 vaccine breakthrough. The rally slowed in early September, when the S&P 500 began a two-month retreat amid Congress’s inability to reach a deal on additional fiscal stimulus, as well as concerns about election uncertainty, indications the U.S. economic recovery was stalling and a new wave of COVID-19 cases. November (+11%) was a much different story, however, as investors reacted favorably to election results. The momentum continued in December (+4%), driven by regulatory approvals for two COVID-19 vaccines in the U.S. By sector for the full year, information technology (+44%) and consumer discretionary (+33%) led the way, boosted by a handful of large growth stocks. In contrast, energy shares (-34%) struggled along with global oil demand and pricing here.
Comments from Portfolio Manager Matt Friedman: For the fiscal year ending December 31, 2020, the fund's share classes gained roughly 6%, outperforming the 2.87% result of the benchmark Russell 3000
® Value index. Versus the benchmark, security selection was the primary contributor, especially within the real estate sector. Stock picking and an underweighting in the financials sector, primarily driven by the diversified financials industry, also helped. Also boosting the fund's relative result was stock selection in energy. The fund's biggest individual relative contributor was an overweighting in Darling Ingredients, which gained about 104% the past year. The company was among our biggest holdings. Our second-largest relative contributor this period was avoiding Exxon Mobil, a benchmark component that returned -36%. Another notable relative contributor was an outsized stake in Discover Financial Services (+12%), a stock in which we increased our position. Conversely, the primary detractor from performance versus the benchmark were stock picks in health care. An overweighting in energy also hurt the fund's relative result. Also detracting from the fund's relative result was stock selection in the consumer discretionary sector, primarily within the consumer durables & apparel industry. The fund's largest individual relative detractor was our outsized stake in Truist Financial, which returned -38%. This is a position that was sold the past 12 months. Also hindering performance was our overweighting in Noble Energy, which returned -57%. Noble Energy was not held at period end. Also hurting performance was our outsized stake in Capri Holdings, which returned -66%. Capri Holdings was not held at period end. Notable changes in positioning include increased exposure to the materials sector and a lower allocation to energy.
The views expressed above reflect those of the portfolio manager(s) only through the end of the period as stated on the cover of this report and do not necessarily represent the views of Fidelity or any other person in the Fidelity organization. Any such views are subject to change at any time based upon market or other conditions and Fidelity disclaims any responsibility to update such views. These views may not be relied on as investment advice and, because investment decisions for a Fidelity fund are based on numerous factors, may not be relied on as an indication of trading intent on behalf of any Fidelity fund.
Investment Summary (Unaudited)
Top Ten Stocks as of December 31, 2020
| | % of fund's net assets |
| The Travelers Companies, Inc. | 2.8 |
| Capital One Financial Corp. | 2.4 |
| Discover Financial Services | 2.2 |
| Roche Holding AG (participation certificate) | 2.2 |
| Darling Ingredients, Inc. | 2.1 |
| T-Mobile U.S., Inc. | 1.9 |
| Cigna Corp. | 1.8 |
| Total SA sponsored ADR | 1.7 |
| Caesars Entertainment, Inc. | 1.7 |
| U.S. Foods Holding Corp. | 1.7 |
| | 20.5 |
Top Five Market Sectors as of December 31, 2020
| | % of fund's net assets |
| Financials | 21.9 |
| Industrials | 13.6 |
| Health Care | 11.7 |
| Consumer Staples | 8.7 |
| Consumer Discretionary | 8.3 |
Asset Allocation (% of fund's net assets)
| As of December 31, 2020* |
| | Stocks | 99.1% |
| | Short-Term Investments and Net Other Assets (Liabilities) | 0.9% |

* Foreign investments – 14.6%
Schedule of Investments December 31, 2020
Showing Percentage of Net Assets
| Common Stocks - 99.1% | | | |
| | | Shares | Value |
| COMMUNICATION SERVICES - 5.4% | | | |
| Diversified Telecommunication Services - 1.0% | | | |
| Liberty Global PLC Class C (a) | | 132,900 | $3,143,085 |
| Media - 2.5% | | | |
| Interpublic Group of Companies, Inc. | | 195,100 | 4,588,752 |
| Nexstar Broadcasting Group, Inc. Class A | | 35,200 | 3,843,488 |
| | | | 8,432,240 |
| Wireless Telecommunication Services - 1.9% | | | |
| T-Mobile U.S., Inc. | | 46,690 | 6,296,147 |
|
| TOTAL COMMUNICATION SERVICES | | | 17,871,472 |
|
| CONSUMER DISCRETIONARY - 8.3% | | | |
| Auto Components - 0.7% | | | |
| Lear Corp. | | 15,100 | 2,401,353 |
| Distributors - 0.7% | | | |
| LKQ Corp. (a) | | 67,700 | 2,385,748 |
| Diversified Consumer Services - 0.7% | | | |
| Laureate Education, Inc. Class A (a) | | 159,600 | 2,323,776 |
| Hotels, Restaurants & Leisure - 1.7% | | | |
| Caesars Entertainment, Inc. (a) | | 76,500 | 5,681,655 |
| Household Durables - 1.1% | | | |
| Mohawk Industries, Inc. (a) | | 26,200 | 3,692,890 |
| Internet & Direct Marketing Retail - 2.1% | | | |
| eBay, Inc. | | 64,700 | 3,251,175 |
| Expedia, Inc. | | 27,700 | 3,667,480 |
| | | | 6,918,655 |
| Specialty Retail - 1.3% | | | |
| Lowe's Companies, Inc. | | 17,700 | 2,841,027 |
| Sally Beauty Holdings, Inc. (a) | | 100,400 | 1,309,216 |
| | | | 4,150,243 |
|
| TOTAL CONSUMER DISCRETIONARY | | | 27,554,320 |
|
| CONSUMER STAPLES - 8.7% | | | |
| Food & Staples Retailing - 1.7% | | | |
| U.S. Foods Holding Corp. (a) | | 169,700 | 5,652,707 |
| Food Products - 4.0% | | | |
| Darling Ingredients, Inc. (a) | | 122,000 | 7,036,960 |
| Nomad Foods Ltd. (a) | | 120,700 | 3,068,194 |
| Post Holdings, Inc. (a) | | 32,100 | 3,242,421 |
| | | | 13,347,575 |
| Household Products - 1.9% | | | |
| Energizer Holdings, Inc. (b) | | 52,100 | 2,197,578 |
| Spectrum Brands Holdings, Inc. | | 49,900 | 3,941,102 |
| | | | 6,138,680 |
| Tobacco - 1.1% | | | |
| Altria Group, Inc. | | 90,600 | 3,714,600 |
|
| TOTAL CONSUMER STAPLES | | | 28,853,562 |
|
| ENERGY - 5.4% | | | |
| Oil, Gas & Consumable Fuels - 5.4% | | | |
| Cenovus Energy, Inc. (Canada) | | 268,918 | 1,637,296 |
| Cheniere Energy, Inc. (a) | | 66,000 | 3,961,980 |
| Hess Corp. | | 54,500 | 2,877,055 |
| Total SA sponsored ADR (b) | | 136,600 | 5,724,906 |
| Valero Energy Corp. | | 64,900 | 3,671,393 |
| | | | 17,872,630 |
| FINANCIALS - 21.9% | | | |
| Banks - 2.8% | | | |
| M&T Bank Corp. | | 36,000 | 4,582,800 |
| Wells Fargo & Co. | | 156,600 | 4,726,188 |
| | | | 9,308,988 |
| Capital Markets - 3.5% | | | |
| Ameriprise Financial, Inc. | | 26,600 | 5,169,178 |
| Lazard Ltd. Class A | | 76,300 | 3,227,490 |
| LPL Financial | | 31,800 | 3,314,196 |
| | | | 11,710,864 |
| Consumer Finance - 7.2% | | | |
| Capital One Financial Corp. | | 80,500 | 7,957,425 |
| Discover Financial Services | | 80,300 | 7,269,559 |
| OneMain Holdings, Inc. | | 109,300 | 5,263,888 |
| SLM Corp. | | 275,700 | 3,415,923 |
| | | | 23,906,795 |
| Diversified Financial Services - 1.8% | | | |
| Berkshire Hathaway, Inc. Class B (a) | | 14,100 | 3,269,367 |
| Voya Financial, Inc. | | 44,300 | 2,605,283 |
| | | | 5,874,650 |
| Insurance - 6.6% | | | |
| American International Group, Inc. | | 82,600 | 3,127,236 |
| Assurant, Inc. | | 22,900 | 3,119,438 |
| Fairfax Financial Holdings Ltd. (sub. vtg.) | | 9,400 | 3,203,857 |
| Reinsurance Group of America, Inc. | | 28,800 | 3,337,920 |
| The Travelers Companies, Inc. | | 65,000 | 9,124,049 |
| | | | 21,912,500 |
|
| TOTAL FINANCIALS | | | 72,713,797 |
|
| HEALTH CARE - 11.7% | | | |
| Health Care Providers & Services - 4.0% | | | |
| Centene Corp. (a) | | 81,700 | 4,904,451 |
| Cigna Corp. | | 29,800 | 6,203,764 |
| Laboratory Corp. of America Holdings (a) | | 11,700 | 2,381,535 |
| | | | 13,489,750 |
| Pharmaceuticals - 7.7% | | | |
| AstraZeneca PLC sponsored ADR | | 67,700 | 3,384,323 |
| Bristol-Myers Squibb Co. | | 87,700 | 5,440,031 |
| Jazz Pharmaceuticals PLC (a) | | 22,874 | 3,775,354 |
| Merck & Co., Inc. | | 31,300 | 2,560,340 |
| Roche Holding AG (participation certificate) | | 20,664 | 7,197,242 |
| Sanofi SA sponsored ADR | | 63,500 | 3,085,465 |
| | | | 25,442,755 |
|
| TOTAL HEALTH CARE | | | 38,932,505 |
|
| INDUSTRIALS - 13.6% | | | |
| Aerospace & Defense - 1.0% | | | |
| General Dynamics Corp. | | 21,000 | 3,125,220 |
| Air Freight & Logistics - 1.4% | | | |
| FedEx Corp. | | 17,300 | 4,491,426 |
| Commercial Services & Supplies - 1.0% | | | |
| The Brink's Co. | | 46,900 | 3,376,800 |
| Construction& Engineering - 2.4% | | | |
| AECOM (a) | | 79,185 | 3,941,829 |
| Willscot Mobile Mini Holdings (a) | | 175,700 | 4,070,969 |
| | | | 8,012,798 |
| Electrical Equipment - 1.0% | | | |
| Sensata Technologies, Inc. PLC (a) | | 63,400 | 3,343,716 |
| Machinery - 1.7% | | | |
| Allison Transmission Holdings, Inc. | | 55,200 | 2,380,776 |
| Stanley Black & Decker, Inc. | | 18,600 | 3,321,216 |
| | | | 5,701,992 |
| Professional Services - 1.7% | | | |
| Manpower, Inc. | | 34,400 | 3,102,192 |
| Nielsen Holdings PLC | | 126,300 | 2,635,881 |
| | | | 5,738,073 |
| Road & Rail - 0.8% | | | |
| Ryder System, Inc. | | 44,300 | 2,735,968 |
| Trading Companies & Distributors - 2.6% | | | |
| Beacon Roofing Supply, Inc. (a) | | 82,400 | 3,311,656 |
| BMC Stock Holdings, Inc. (a) | | 33,900 | 1,819,752 |
| Univar, Inc. (a) | | 177,800 | 3,379,978 |
| | | | 8,511,386 |
|
| TOTAL INDUSTRIALS | | | 45,037,379 |
|
| INFORMATION TECHNOLOGY - 5.6% | | | |
| Communications Equipment - 1.0% | | | |
| F5 Networks, Inc. (a) | | 18,200 | 3,202,108 |
| Electronic Equipment & Components - 1.4% | | | |
| Flex Ltd. (a) | | 257,900 | 4,637,042 |
| IT Services - 1.1% | | | |
| DXC Technology Co. | | 88,500 | 2,278,875 |
| Rackspace Technology, Inc. (a) | | 80,700 | 1,538,142 |
| | | | 3,817,017 |
| Semiconductors & Semiconductor Equipment - 0.9% | | | |
| ON Semiconductor Corp. (a) | | 93,000 | 3,043,890 |
| Software - 1.2% | | | |
| SS&C Technologies Holdings, Inc. | | 55,200 | 4,015,800 |
|
| TOTAL INFORMATION TECHNOLOGY | | | 18,715,857 |
|
| MATERIALS - 7.3% | | | |
| Chemicals - 4.7% | | | |
| DuPont de Nemours, Inc. | | 65,660 | 4,669,083 |
| Olin Corp. | | 160,210 | 3,934,758 |
| Tronox Holdings PLC | | 243,400 | 3,558,508 |
| W.R. Grace & Co. | | 61,900 | 3,393,358 |
| | | | 15,555,707 |
| Containers & Packaging - 2.6% | | | |
| Berry Global Group, Inc. (a) | | 57,600 | 3,236,544 |
| Crown Holdings, Inc. (a) | | 37,309 | 3,738,362 |
| WestRock Co. | | 40,200 | 1,749,906 |
| | | | 8,724,812 |
|
| TOTAL MATERIALS | | | 24,280,519 |
|
| REAL ESTATE - 6.5% | | | |
| Equity Real Estate Investment Trusts (REITs) - 5.3% | | | |
| Alexandria Real Estate Equities, Inc. | | 13,800 | 2,459,436 |
| American Tower Corp. | | 7,400 | 1,661,004 |
| CubeSmart | | 145,518 | 4,890,860 |
| Digital Realty Trust, Inc. | | 11,000 | 1,534,610 |
| Douglas Emmett, Inc. | | 69,300 | 2,022,174 |
| Equity Lifestyle Properties, Inc. | | 53,700 | 3,402,432 |
| Kilroy Realty Corp. | | 26,600 | 1,526,840 |
| | | | 17,497,356 |
| Real Estate Management & Development - 1.2% | | | |
| CBRE Group, Inc. (a) | | 62,900 | 3,945,088 |
|
| TOTAL REAL ESTATE | | | 21,442,444 |
|
| UTILITIES - 4.7% | | | |
| Electric Utilities - 2.6% | | | |
| Edison International | | 58,100 | 3,649,842 |
| PG&E Corp. (a) | | 410,200 | 5,111,092 |
| | | | 8,760,934 |
| Independent Power and Renewable Electricity Producers - 1.1% | | | |
| Vistra Corp. | | 181,000 | 3,558,460 |
| Multi-Utilities - 1.0% | | | |
| CenterPoint Energy, Inc. | | 144,800 | 3,133,472 |
|
| TOTAL UTILITIES | | | 15,452,866 |
|
| TOTAL COMMON STOCKS | | | |
| (Cost $256,627,352) | | | 328,727,351 |
|
| Money Market Funds - 2.7% | | | |
| Fidelity Cash Central Fund 0.11% (c) | | 4,756,868 | 4,757,819 |
| Fidelity Securities Lending Cash Central Fund 0.11% (c)(d) | | 4,261,330 | 4,261,756 |
| TOTAL MONEY MARKET FUNDS | | | |
| (Cost $9,019,575) | | | 9,019,575 |
| TOTAL INVESTMENT IN SECURITIES - 101.8% | | | |
| (Cost $265,646,927) | | | 337,746,926 |
| NET OTHER ASSETS (LIABILITIES) - (1.8)% | | | (6,001,234) |
| NET ASSETS - 100% | | | $331,745,692 |
Legend
(a) Non-income producing
(b) Security or a portion of the security is on loan at period end.
(c) Affiliated fund that is generally available only to investment companies and other accounts managed by Fidelity Investments. The rate quoted is the annualized seven-day yield of the fund at period end. A complete unaudited listing of the fund's holdings as of its most recent quarter end is available upon request. In addition, each Fidelity Central Fund's financial statements, which are not covered by the Fund's Report of Independent Registered Public Accounting Firm, are available on the SEC's website or upon request.
(d) Investment made with cash collateral received from securities on loan.
Affiliated Central Funds
Information regarding fiscal year to date income earned by the Fund from investments in Fidelity Central Funds is as follows:
| Fund | Income earned |
| Fidelity Cash Central Fund | $13,153 |
| Fidelity Securities Lending Cash Central Fund | 11,572 |
| Total | $24,725 |
Amounts in the income column in the above table include any capital gain distributions from underlying funds, which are presented in the corresponding line-item in the Statement of Operations, if applicable. Amount for Fidelity Securities Lending Cash Central Fund represents the income earned on investing cash collateral, less rebates paid to borrowers and any lending agent fees associated with the loan, plus any premium payments received for lending certain types of securities.
Investment Valuation
The following is a summary of the inputs used, as of December 31, 2020, involving the Fund's assets and liabilities carried at fair value. The inputs or methodology used for valuing securities may not be an indication of the risk associated with investing in those securities. For more information on valuation inputs, and their aggregation into the levels used below, please refer to the Investment Valuation section in the accompanying Notes to Financial Statements.
| | Valuation Inputs at Reporting Date: |
| Description | Total | Level 1 | Level 2 | Level 3 |
| Investments in Securities: | | | | |
| Equities: | | | | |
| Communication Services | $17,871,472 | $17,871,472 | $-- | $-- |
| Consumer Discretionary | 27,554,320 | 27,554,320 | -- | -- |
| Consumer Staples | 28,853,562 | 28,853,562 | -- | -- |
| Energy | 17,872,630 | 17,872,630 | -- | -- |
| Financials | 72,713,797 | 72,713,797 | -- | -- |
| Health Care | 38,932,505 | 31,735,263 | 7,197,242 | -- |
| Industrials | 45,037,379 | 45,037,379 | -- | -- |
| Information Technology | 18,715,857 | 18,715,857 | -- | -- |
| Materials | 24,280,519 | 24,280,519 | -- | -- |
| Real Estate | 21,442,444 | 21,442,444 | -- | -- |
| Utilities | 15,452,866 | 15,452,866 | -- | -- |
| Money Market Funds | 9,019,575 | 9,019,575 | -- | -- |
| Total Investments in Securities: | $337,746,926 | $330,549,684 | $7,197,242 | $-- |
Other Information
Distribution of investments by country or territory of incorporation, as a percentage of Total Net Assets, is as follows (Unaudited):
| United States of America | 85.4% |
| United Kingdom | 3.9% |
| France | 2.6% |
| Switzerland | 2.2% |
| Canada | 1.5% |
| Singapore | 1.4% |
| Ireland | 1.1% |
| Bermuda | 1.0% |
| Others (Individually Less Than 1%) | 0.9% |
| | 100.0% |
See accompanying notes which are an integral part of the financial statements.
Financial Statements
Statement of Assets and Liabilities
| | | December 31, 2020 |
| Assets | | |
Investment in securities, at value (including securities loaned of $4,083,480) — See accompanying schedule:
Unaffiliated issuers (cost $256,627,352) | $328,727,351 | |
| Fidelity Central Funds (cost $9,019,575) | 9,019,575 | |
| Total Investment in Securities (cost $265,646,927) | | $337,746,926 |
| Foreign currency held at value (cost $14) | | 17 |
| Receivable for fund shares sold | | 232,562 |
| Dividends receivable | | 564,434 |
| Distributions receivable from Fidelity Central Funds | | 455 |
| Prepaid expenses | | 360 |
| Other receivables | | 3,901 |
| Total assets | | 338,548,655 |
| Liabilities | | |
| Payable for fund shares redeemed | $2,339,631 | |
| Accrued management fee | 143,060 | |
| Distribution and service plan fees payable | 2,081 | |
| Other affiliated payables | 39,908 | |
| Other payables and accrued expenses | 16,683 | |
| Collateral on securities loaned | 4,261,600 | |
| Total liabilities | | 6,802,963 |
| Net Assets | | $331,745,692 |
| Net Assets consist of: | | |
| Paid in capital | | $266,335,311 |
| Total accumulated earnings (loss) | | 65,410,381 |
| Net Assets | | $331,745,692 |
| Net Asset Value and Maximum Offering Price | | |
| Initial Class: | | |
| Net Asset Value, offering price and redemption price per share ($131,037,348 ÷ 8,212,912 shares) | | $15.96 |
| Service Class: | | |
| Net Asset Value, offering price and redemption price per share ($275,250 ÷ 17,251 shares) | | $15.96 |
| Service Class 2: | | |
| Net Asset Value, offering price and redemption price per share ($10,203,736 ÷ 650,105 shares) | | $15.70 |
| Investor Class: | | |
| Net Asset Value, offering price and redemption price per share ($190,229,358 ÷ 11,949,100 shares) | | $15.92 |
See accompanying notes which are an integral part of the financial statements.
Statement of Operations
| | | Year ended December 31, 2020 |
| Investment Income | | |
| Dividends | | $5,944,957 |
| Income from Fidelity Central Funds (including $11,572 from security lending) | | 24,725 |
| Total income | | 5,969,682 |
| Expenses | | |
| Management fee | $1,489,395 | |
| Transfer agent fees | 303,050 | |
| Distribution and service plan fees | 19,043 | |
| Accounting fees | 109,160 | |
| Custodian fees and expenses | 19,238 | |
| Independent trustees' fees and expenses | 1,607 | |
| Audit | 56,154 | |
| Legal | 5,745 | |
| Interest | 56 | |
| Miscellaneous | 6,042 | |
| Total expenses before reductions | 2,009,490 | |
| Expense reductions | (30,883) | |
| Total expenses after reductions | | 1,978,607 |
| Net investment income (loss) | | 3,991,075 |
| Realized and Unrealized Gain (Loss) | | |
| Net realized gain (loss) on: | | |
| Investment securities: | | |
| Unaffiliated issuers | (7,235,884) | |
| Fidelity Central Funds | 57 | |
| Foreign currency transactions | 381 | |
| Total net realized gain (loss) | | (7,235,446) |
| Change in net unrealized appreciation (depreciation) on: | | |
| Investment securities: | | |
| Unaffiliated issuers | 23,888,136 | |
| Assets and liabilities in foreign currencies | 10,916 | |
| Total change in net unrealized appreciation (depreciation) | | 23,899,052 |
| Net gain (loss) | | 16,663,606 |
| Net increase (decrease) in net assets resulting from operations | | $20,654,681 |
See accompanying notes which are an integral part of the financial statements.
Statement of Changes in Net Assets
| | Year ended December 31, 2020 | Year ended December 31, 2019 |
| Increase (Decrease) in Net Assets | | |
| Operations | | |
| Net investment income (loss) | $3,991,075 | $5,427,973 |
| Net realized gain (loss) | (7,235,446) | 13,811,765 |
| Change in net unrealized appreciation (depreciation) | 23,899,052 | 66,959,179 |
| Net increase (decrease) in net assets resulting from operations | 20,654,681 | 86,198,917 |
| Distributions to shareholders | (15,636,335) | (27,348,082) |
| Share transactions - net increase (decrease) | 2,891,924 | (23,443,410) |
| Total increase (decrease) in net assets | 7,910,270 | 35,407,425 |
| Net Assets | | |
| Beginning of period | 323,835,422 | 288,427,997 |
| End of period | $331,745,692 | $323,835,422 |
See accompanying notes which are an integral part of the financial statements.
Financial Highlights
VIP Value Portfolio Initial Class
| Years ended December 31, | 2020 | 2019 | 2018 | 2017 | 2016 |
| Selected Per–Share Data | | | | | |
| Net asset value, beginning of period | $15.78 | $13.08 | $16.36 | $14.74 | $13.36 |
| Income from Investment Operations | | | | | |
| Net investment income (loss)A | .19 | .26 | .21 | .21B | .18 |
| Net realized and unrealized gain (loss) | .75 | 3.74 | (2.41) | 2.07 | 1.43 |
| Total from investment operations | .94 | 4.00 | (2.20) | 2.28 | 1.61 |
| Distributions from net investment income | (.20) | (.27) | (.18) | (.21) | (.15) |
| Distributions from net realized gain | (.56) | (1.03) | (.90) | (.45) | (.07) |
| Total distributions | (.76) | (1.30) | (1.08) | (.66) | (.23)C |
| Net asset value, end of period | $15.96 | $15.78 | $13.08 | $16.36 | $14.74 |
| Total ReturnD,E | 6.33% | 32.13% | (13.84)% | 15.58% | 12.08% |
| Ratios to Average Net AssetsF,G | | | | | |
| Expenses before reductions | .67% | .67% | .67% | .68% | .69% |
| Expenses net of fee waivers, if any | .67% | .67% | .67% | .68% | .69% |
| Expenses net of all reductions | .65% | .66% | .66% | .67% | .69% |
| Net investment income (loss) | 1.48% | 1.78% | 1.36% | 1.34%B | 1.33% |
| Supplemental Data | | | | | |
| Net assets, end of period (000 omitted) | $131,037 | $116,401 | $110,203 | $130,365 | $126,526 |
| Portfolio turnover rateH | 81% | 67% | 64% | 55% | 63% |
A Calculated based on average shares outstanding during the period.
B Net investment income per share reflects one or more large, non-recurring dividend(s) which amounted to $.04 per share. Excluding such non-recurring dividend(s), the ratio of net investment income (loss) to average net assets would have been 1.09%.
C Total distributions per share do not sum due to rounding.
D Total returns do not reflect charges attributable to your insurance company's separate account. Inclusion of these charges would reduce the total returns shown.
E Total returns would have been lower if certain expenses had not been reduced during the applicable periods shown.
F Fees and expenses of any underlying mutual funds or exchange-traded funds (ETFs) are not included in the Fund's expense ratio. The Fund indirectly bears its proportionate share of these expenses. For additional expense information related to investments in Fidelity Central Funds, please refer to the "Investments in Fidelity Central Funds" note found in the Notes to Financial Statements section of the most recent Annual or Semi-Annual report.
G Expense ratios reflect operating expenses of the class. Expenses before reductions do not reflect amounts reimbursed, waived, or reduced through arrangements with the investment adviser, brokerage services, or other offset arrangements, if applicable, and do not represent the amount paid by the class during periods when reimbursements, waivers or reductions occur.
H Amount does not include the portfolio activity of any underlying mutual funds or exchange-traded funds (ETFs).
See accompanying notes which are an integral part of the financial statements.
VIP Value Portfolio Service Class
| Years ended December 31, | 2020 | 2019 | 2018 | 2017 | 2016 |
| Selected Per–Share Data | | | | | |
| Net asset value, beginning of period | $15.78 | $13.08 | $16.36 | $14.73 | $13.36 |
| Income from Investment Operations | | | | | |
| Net investment income (loss)A | .18 | .24 | .20 | .19B | .17 |
| Net realized and unrealized gain (loss) | .75 | 3.75 | (2.42) | 2.08 | 1.41 |
| Total from investment operations | .93 | 3.99 | (2.22) | 2.27 | 1.58 |
| Distributions from net investment income | (.19) | (.25) | (.15) | (.20) | (.14) |
| Distributions from net realized gain | (.56) | (1.03) | (.90) | (.45) | (.07) |
| Total distributions | (.75) | (1.29)C | (1.06)C | (.64)C | (.21) |
| Net asset value, end of period | $15.96 | $15.78 | $13.08 | $16.36 | $14.73 |
| Total ReturnD,E | 6.23% | 32.01% | (13.97)% | 15.53% | 11.90% |
| Ratios to Average Net AssetsF,G | | | | | |
| Expenses before reductions | .77% | .77% | .77% | .78% | .79% |
| Expenses net of fee waivers, if any | .77% | .77% | .77% | .78% | .79% |
| Expenses net of all reductions | .75% | .76% | .76% | .77% | .79% |
| Net investment income (loss) | 1.38% | 1.68% | 1.26% | 1.24%B | 1.23% |
| Supplemental Data | | | | | |
| Net assets, end of period (000 omitted) | $275 | $270 | $233 | $368 | $400 |
| Portfolio turnover rateH | 81% | 67% | 64% | 55% | 63% |
A Calculated based on average shares outstanding during the period.
B Net investment income per share reflects one or more large, non-recurring dividend(s) which amounted to $.04 per share. Excluding such non-recurring dividend(s), the ratio of net investment income (loss) to average net assets would have been .99%.
C Total distributions per share do not sum due to rounding.
D Total returns do not reflect charges attributable to your insurance company's separate account. Inclusion of these charges would reduce the total returns shown.
E Total returns would have been lower if certain expenses had not been reduced during the applicable periods shown.
F Fees and expenses of any underlying mutual funds or exchange-traded funds (ETFs) are not included in the Fund's expense ratio. The Fund indirectly bears its proportionate share of these expenses. For additional expense information related to investments in Fidelity Central Funds, please refer to the "Investments in Fidelity Central Funds" note found in the Notes to Financial Statements section of the most recent Annual or Semi-Annual report.
G Expense ratios reflect operating expenses of the class. Expenses before reductions do not reflect amounts reimbursed, waived, or reduced through arrangements with the investment adviser, brokerage services, or other offset arrangements, if applicable, and do not represent the amount paid by the class during periods when reimbursements, waivers or reductions occur.
H Amount does not include the portfolio activity of any underlying mutual funds or exchange-traded funds (ETFs).
See accompanying notes which are an integral part of the financial statements.
VIP Value Portfolio Service Class 2
| Years ended December 31, | 2020 | 2019 | 2018 | 2017 | 2016 |
| Selected Per–Share Data | | | | | |
| Net asset value, beginning of period | $15.55 | $12.91 | $16.15 | $14.55 | $13.21 |
| Income from Investment Operations | | | | | |
| Net investment income (loss)A | .16 | .22 | .17 | .17B | .15 |
| Net realized and unrealized gain (loss) | .72 | 3.68 | (2.37) | 2.05 | 1.39 |
| Total from investment operations | .88 | 3.90 | (2.20) | 2.22 | 1.54 |
| Distributions from net investment income | (.17) | (.23) | (.14) | (.17) | (.13) |
| Distributions from net realized gain | (.56) | (1.03) | (.90) | (.45) | (.07) |
| Total distributions | (.73) | (1.26) | (1.04) | (.62) | (.20) |
| Net asset value, end of period | $15.70 | $15.55 | $12.91 | $16.15 | $14.55 |
| Total ReturnC,D | 6.02% | 31.77% | (14.02)% | 15.36% | 11.71% |
| Ratios to Average Net AssetsE,F | | | | | |
| Expenses before reductions | .92% | .92% | .92% | .93% | .94% |
| Expenses net of fee waivers, if any | .92% | .92% | .92% | .93% | .94% |
| Expenses net of all reductions | .91% | .91% | .91% | .92% | .94% |
| Net investment income (loss) | 1.22% | 1.53% | 1.11% | 1.09%B | 1.08% |
| Supplemental Data | | | | | |
| Net assets, end of period (000 omitted) | $10,204 | $9,262 | $7,764 | $9,474 | $9,050 |
| Portfolio turnover rateG | 81% | 67% | 64% | 55% | 63% |
A Calculated based on average shares outstanding during the period.
B Net investment income per share reflects one or more large, non-recurring dividend(s) which amounted to $.04 per share. Excluding such non-recurring dividend(s), the ratio of net investment income (loss) to average net assets would have been .84%.
C Total returns do not reflect charges attributable to your insurance company's separate account. Inclusion of these charges would reduce the total returns shown.
D Total returns would have been lower if certain expenses had not been reduced during the applicable periods shown.
E Fees and expenses of any underlying mutual funds or exchange-traded funds (ETFs) are not included in the Fund's expense ratio. The Fund indirectly bears its proportionate share of these expenses. For additional expense information related to investments in Fidelity Central Funds, please refer to the "Investments in Fidelity Central Funds" note found in the Notes to Financial Statements section of the most recent Annual or Semi-Annual report.
F Expense ratios reflect operating expenses of the class. Expenses before reductions do not reflect amounts reimbursed, waived, or reduced through arrangements with the investment adviser, brokerage services, or other offset arrangements, if applicable, and do not represent the amount paid by the class during periods when reimbursements, waivers or reductions occur.
G Amount does not include the portfolio activity of any underlying mutual funds or exchange-traded funds (ETFs).
See accompanying notes which are an integral part of the financial statements.
VIP Value Portfolio Investor Class
| Years ended December 31, | 2020 | 2019 | 2018 | 2017 | 2016 |
| Selected Per–Share Data | | | | | |
| Net asset value, beginning of period | $15.75 | $13.06 | $16.33 | $14.71 | $13.35 |
| Income from Investment Operations | | | | | |
| Net investment income (loss)A | .18 | .25 | .20 | .20B | .17 |
| Net realized and unrealized gain (loss) | .74 | 3.73 | (2.40) | 2.07 | 1.41 |
| Total from investment operations | .92 | 3.98 | (2.20) | 2.27 | 1.58 |
| Distributions from net investment income | (.19) | (.26) | (.16) | (.20) | (.14) |
| Distributions from net realized gain | (.56) | (1.03) | (.90) | (.45) | (.07) |
| Total distributions | (.75) | (1.29) | (1.07)C | (.65) | (.22)C |
| Net asset value, end of period | $15.92 | $15.75 | $13.06 | $16.33 | $14.71 |
| Total ReturnD,E | 6.20% | 32.01% | (13.88)% | 15.52% | 11.88% |
| Ratios to Average Net AssetsF,G | | | | | |
| Expenses before reductions | .74% | .75% | .75% | .76% | .77% |
| Expenses net of fee waivers, if any | .74% | .75% | .75% | .76% | .77% |
| Expenses net of all reductions | .73% | .74% | .74% | .75% | .77% |
| Net investment income (loss) | 1.40% | 1.70% | 1.28% | 1.26%B | 1.25% |
| Supplemental Data | | | | | |
| Net assets, end of period (000 omitted) | $190,229 | $197,903 | $170,228 | $204,443 | $194,723 |
| Portfolio turnover rateH | 81% | 67% | 64% | 55% | 63% |
A Calculated based on average shares outstanding during the period.
B Net investment income per share reflects one or more large, non-recurring dividend(s) which amounted to $.04 per share. Excluding such non-recurring dividend(s), the ratio of net investment income (loss) to average net assets would have been 1.01%.
C Total distributions per share do not sum due to rounding.
D Total returns do not reflect charges attributable to your insurance company's separate account. Inclusion of these charges would reduce the total returns shown.
E Total returns would have been lower if certain expenses had not been reduced during the applicable periods shown.
F Fees and expenses of any underlying mutual funds or exchange-traded funds (ETFs) are not included in the Fund's expense ratio. The Fund indirectly bears its proportionate share of these expenses. For additional expense information related to investments in Fidelity Central Funds, please refer to the "Investments in Fidelity Central Funds" note found in the Notes to Financial Statements section of the most recent Annual or Semi-Annual report.
G Expense ratios reflect operating expenses of the class. Expenses before reductions do not reflect amounts reimbursed, waived, or reduced through arrangements with the investment adviser, brokerage services, or other offset arrangements, if applicable, and do not represent the amount paid by the class during periods when reimbursements, waivers or reductions occur.
H Amount does not include the portfolio activity of any underlying mutual funds or exchange-traded funds (ETFs).
See accompanying notes which are an integral part of the financial statements.
Notes to Financial Statements
For the period ended December 31, 2020
1. Organization.
VIP Value Portfolio (the Fund) is a fund of Variable Insurance Products Fund (the Trust) and is authorized to issue an unlimited number of shares. The Trust is registered under the Investment Company Act of 1940, as amended (the 1940 Act), as an open-end management investment company organized as a Massachusetts business trust. Shares of the Fund may only be purchased by insurance companies for the purpose of funding variable annuity or variable life insurance contracts. The Fund offers the following classes of shares: Initial Class shares, Service Class shares, Service Class 2 shares and Investor Class shares. All classes have equal rights and voting privileges, except for matters affecting a single class.
Effective January 1, 2020:
Investment advisers Fidelity Investments Money Management, Inc., FMR Co., Inc., and Fidelity SelectCo, LLC, merged with and into Fidelity Management & Research Company. In connection with the merger transactions, the resulting, merged investment adviser was then redomiciled from Massachusetts to Delaware, changed its corporate structure from a corporation to a limited liability company, and changed its name to "Fidelity Management & Research Company LLC".
Broker-dealer Fidelity Distributors Corporation merged with and into Fidelity Investments Institutional Services Company, Inc. ("FIISC"). FIISC was then redomiciled from Massachusetts to Delaware, changed its corporate structure from a corporation to a limited liability company, and changed its name to "Fidelity Distributors Company LLC".
Fidelity Investments Institutional Operations Company, Inc. converted from a Massachusetts corporation to a Massachusetts LLC, and changed its name to "Fidelity Investments Institutional Operations Company LLC".
2. Investments in Fidelity Central Funds.
The Fund invests in Fidelity Central Funds, which are open-end investment companies generally available only to other investment companies and accounts managed by the investment adviser and its affiliates. The Fund's Schedule of Investments lists each of the Fidelity Central Funds held as of period end, if any, as an investment of the Fund, but does not include the underlying holdings of each Fidelity Central Fund. As an Investing Fund, the Fund indirectly bears its proportionate share of the expenses of the underlying Fidelity Central Funds.
The Money Market Central Funds seek preservation of capital and current income and are managed by the investment adviser. Annualized expenses of the Money Market Central Funds as of their most recent shareholder report date ranged from less than .005% to .01%.
A complete unaudited list of holdings for each Fidelity Central Fund is available upon request or at the Securities and Exchange Commission (the SEC) website at www.sec.gov. In addition, the financial statements of the Fidelity Central Funds, which are not covered by the Fund's Report of Independent Registered Public Accounting Firm, are available on the SEC website or upon request.
3. Significant Accounting Policies.
The Fund is an investment company and applies the accounting and reporting guidance of the Financial Accounting Standards Board (FASB) Accounting Standards Codification Topic 946 Financial Services - Investment Companies. The financial statements have been prepared in conformity with accounting principles generally accepted in the United States of America (GAAP), which require management to make certain estimates and assumptions at the date of the financial statements. Actual results could differ from those estimates. Subsequent events, if any, through the date that the financial statements were issued have been evaluated in the preparation of the financial statements. The following summarizes the significant accounting policies of the Fund:
Investment Valuation. Investments are valued as of 4:00 p.m. Eastern time on the last calendar day of the period. The Board of Trustees (the Board) has delegated the day to day responsibility for the valuation of the Fund's investments to the Fair Value Committee (the Committee) established by the Fund's investment adviser. In accordance with valuation policies and procedures approved by the Board, the Fund attempts to obtain prices from one or more third party pricing vendors or brokers to value its investments. When current market prices, quotations or currency exchange rates are not readily available or reliable, investments will be fair valued in good faith by the Committee, in accordance with procedures adopted by the Board. Factors used in determining fair value vary by investment type and may include market or investment specific events. The frequency with which these procedures are used cannot be predicted and they may be utilized to a significant extent. The Committee oversees the Fund's valuation policies and procedures and reports to the Board on the Committee's activities and fair value determinations. The Board monitors the appropriateness of the procedures used in valuing the Fund's investments and ratifies the fair value determinations of the Committee.
The Fund categorizes the inputs to valuation techniques used to value its investments into a disclosure hierarchy consisting of three levels as shown below:
- Level 1 – quoted prices in active markets for identical investments
- Level 2 – other significant observable inputs (including quoted prices for similar investments, interest rates, prepayment speeds, etc.)
- Level 3 – unobservable inputs (including the Fund's own assumptions based on the best information available)
Valuation techniques used to value the Fund's investments by major category are as follows:
Equity securities, including restricted securities, for which market quotations are readily available, are valued at the last reported sale price or official closing price as reported by a third party pricing vendor on the primary market or exchange on which they are traded and are categorized as Level 1 in the hierarchy. In the event there were no sales during the day or closing prices are not available, securities are valued at the last quoted bid price or may be valued using the last available price and are generally categorized as Level 2 in the hierarchy. For foreign equity securities, when market or security specific events arise, comparisons to the valuation of American Depositary Receipts (ADRs), futures contracts, Exchange-Traded Funds (ETFs) and certain indexes as well as quoted prices for similar securities may be used and would be categorized as Level 2 in the hierarchy. For equity securities, including restricted securities, where observable inputs are limited, assumptions about market activity and risk are used and these securities may be categorized as Level 3 in the hierarchy.
Investments in open-end mutual funds, including the Fidelity Central Funds, are valued at their closing net asset value (NAV) each business day and are categorized as Level 1 in the hierarchy.
Changes in valuation techniques may result in transfers in or out of an assigned level within the disclosure hierarchy. The aggregate value of investments by input level as of December 31, 2020 is included at the end of the Fund's Schedule of Investments.
Foreign Currency. Certain Funds may use foreign currency contracts to facilitate transactions in foreign-denominated securities. Gains and losses from these transactions may arise from changes in the value of the foreign currency or if the counterparties do not perform under the contracts' terms.
Foreign-denominated assets, including investment securities, and liabilities are translated into U.S. dollars at the exchange rates at period end. Purchases and sales of investment securities, income and dividends received, and expenses denominated in foreign currencies are translated into U.S. dollars at the exchange rate in effect on the transaction date.
The effects of exchange rate fluctuations on investments are included with the net realized and unrealized gain (loss) on investment securities. Other foreign currency transactions resulting in realized and unrealized gain (loss) are disclosed separately.
Investment Transactions and Income. For financial reporting purposes, the Fund's investment holdings and NAV include trades executed through the end of the last business day of the period. The NAV per share for processing shareholder transactions is calculated as of the close of business of the New York Stock Exchange (NYSE), normally 4:00 p.m. Eastern time and includes trades executed through the end of the prior business day. Gains and losses on securities sold are determined on the basis of identified cost and include proceeds received from litigation. Dividend income is recorded on the ex-dividend date, except for certain dividends from foreign securities where the ex-dividend date may have passed, which are recorded as soon as the Fund is informed of the ex-dividend date. Non-cash dividends included in dividend income, if any, are recorded at the fair market value of the securities received. Income and capital gain distributions from Fidelity Central Funds, if any, are recorded on the ex-dividend date. Certain distributions received by the Fund represent a return of capital or capital gain. The Fund determines the components of these distributions subsequent to the ex-dividend date, based upon receipt of tax filings or other correspondence relating to the underlying investment. These distributions are recorded as a reduction of cost of investments and/or as a realized gain. Investment income is recorded net of foreign taxes withheld where recovery of such taxes is uncertain.
Class Allocations and Expenses. Investment income, realized and unrealized capital gains and losses, common expenses of the Fund, and certain fund-level expense reductions, if any, are allocated daily on a pro-rata basis to each class based on the relative net assets of each class to the total net assets of the Fund. Each class differs with respect to transfer agent and distribution and service plan fees incurred. Certain expense reductions may also differ by class. For the reporting period, the allocated portion of income and expenses to each class as a percent of its average net assets may vary due to the timing of recording these transactions in relation to fluctuating net assets of the classes. Expenses directly attributable to a fund are charged to that fund. Expenses attributable to more than one fund are allocated among the respective funds on the basis of relative net assets or other appropriate methods. Expense estimates are accrued in the period to which they relate and adjustments are made when actual amounts are known.
Income Tax Information and Distributions to Shareholders. Each year, the Fund intends to qualify as a regulated investment company under Subchapter M of the Internal Revenue Code, including distributing substantially all of its taxable income and realized gains. As a result, no provision for U.S. Federal income taxes is required. As of December 31, 2020, the Fund did not have any unrecognized tax benefits in the financial statements; nor is the Fund aware of any tax positions for which it is reasonably possible that the total amounts of unrecognized tax benefits will significantly change in the next twelve months. The Fund files a U.S. federal tax return, in addition to state and local tax returns as required. The Fund's federal income tax returns are subject to examination by the Internal Revenue Service (IRS) for a period of three fiscal years after they are filed. State and local tax returns may be subject to examination for an additional fiscal year depending on the jurisdiction. Foreign taxes are provided for based on the Fund's understanding of the tax rules and rates that exist in the foreign markets in which it invests.
Distributions are declared and recorded on the ex-dividend date. Income and capital gain distributions are declared separately for each class. Income and capital gain distributions are determined in accordance with income tax regulations, which may differ from GAAP.
Capital accounts within the financial statements are adjusted for permanent book-tax differences. These adjustments have no impact on net assets or the results of operations. Capital accounts are not adjusted for temporary book-tax differences which will reverse in a subsequent period.
Book-tax differences are primarily due to foreign currency transactions, partnerships, capital loss carryforwards and losses deferred due to wash sales.
As of period end, the cost and unrealized appreciation (depreciation) in securities, and derivatives if applicable, for federal income tax purposes were as follows:
| Gross unrealized appreciation | $79,470,903 |
| Gross unrealized depreciation | (9,591,903) |
| Net unrealized appreciation (depreciation) | $69,879,000 |
| Tax Cost | $267,867,926 |
The tax-based components of distributable earnings as of period end were as follows:
| Undistributed ordinary income | $775,327 |
| Undistributed long-term capital gain | $(5,257,157) |
| Net unrealized appreciation (depreciation) on securities and other investments | $69,892,211 |
Capital loss carryforwards are only available to offset future capital gains of the Fund to the extent provided by regulations and may be limited. The capital loss carryforward information presented below, including any applicable limitation, is estimated as of fiscal period end and is subject to adjustment.
| No expiration | |
| Short-term | $(5,257,157) |
| Total capital loss carryforward | $(5,257,157) |
The tax character of distributions paid was as follows:
| | December 31, 2020 | December 31, 2019 |
| Ordinary Income | $4,749,970 | $ 8,873,509 |
| Long-term Capital Gains | 10,886,365 | 18,474,573 |
| Total | $15,636,335 | $ 27,348,082 |
4. Purchases and Sales of Investments.
Purchases and sales of securities, other than short-term securities, are noted in the table below.
| | Purchases ($) | Sales ($) |
| VIP Value Portfolio | 226,748,577 | 235,431,193 |
5. Fees and Other Transactions with Affiliates.
Management Fee. Fidelity Management & Research Company LLC (the investment adviser) and its affiliates provide the Fund with investment management related services for which the Fund pays a monthly management fee. The management fee is the sum of an individual fund fee rate that is based on an annual rate of .30% of the Fund's average net assets and an annualized group fee rate that averaged .23% during the period. The group fee rate is based upon the monthly average net assets of a group of registered investment companies with which the investment adviser has management contracts. The group fee rate decreases as assets under management increase and increases as assets under management decrease. For the reporting period, the total annual management fee rate was .53% of the Fund's average net assets.
Distribution and Service Plan Fees. In accordance with Rule 12b-1 of the 1940 Act, the Fund has adopted separate 12b-1 Plans for each Service Class of shares. Each Service Class pays Fidelity Distributors Company LLC (FDC), an affiliate of the investment adviser, a service fee. For the period, the service fee is based on an annual rate of .10% of Service Class' average net assets and .25% of Service Class 2's average net assets.
For the period, total fees, all of which were re-allowed to insurance companies for the distribution of shares and providing shareholder support services, were as follows:
| Service Class | $230 |
| Service Class 2 | 18,813 |
| | $19,043 |
Transfer Agent Fees. Fidelity Investments Institutional Operations Company LLC (FIIOC), an affiliate of the investment adviser, is the Fund's transfer, dividend disbursing, and shareholder servicing agent. FIIOC receives an asset-based fee with respect to each class. Each class pays a fee for transfer agent services, typesetting and printing and mailing of shareholder reports, excluding mailing of proxy statements. Effective February 1, 2020, the Board approved to change the fee from .145% to .142% for Investor Class, and from .065% to .064% for all other classes. For the period, transfer agent fees for each class were as follows:
| | Amount | % of Class-Level Average Net Assets |
| Initial Class | $70,816 | .06 |
| Service Class | 146 | .06 |
| Service Class 2 | 4,772 | .06 |
| Investor Class | 227,316 | .14 |
| | $303,050 | |
Accounting Fees. Fidelity Service Company, Inc. (FSC), an affiliate of the investment adviser, maintains the Fund's accounting records. The accounting fee is based on the level of average net assets for each month. For the period, the fees were equivalent to the following annual rates:
| | % of Average Net Assets |
| VIP Value Portfolio | .04 |
Brokerage Commissions. A portion of portfolio transactions were placed with brokerage firms which are affiliates of the investment adviser. Brokerage commissions are included in net realized gain (loss) and change in net unrealized appreciation (depreciation) in the Statement of Operations. The commissions paid to these affiliated firms were as follows:
| | Amount |
| VIP Value Portfolio | $7,737 |
Interfund Lending Program. Pursuant to an Exemptive Order issued by the SEC, the Fund, along with other registered investment companies having management contracts with Fidelity Management & Research Company LLC (FMR), or other affiliated entities of FMR, may participate in an interfund lending program. This program provides an alternative credit facility allowing the Fund to borrow from, or lend money to, other participating affiliated funds. At period end, there were no interfund loans outstanding. Activity in this program during the period for which loans were outstanding was as follows:
| | Borrower or Lender | Average Loan Balance | Weighted Average Interest Rate | Interest Expense |
| VIP Value Portfolio | Borrower | $6,847,000 | .30% | $56 |
Interfund Trades. Funds may purchase from or sell securities to other Fidelity Funds under procedures adopted by the Board. The procedures have been designed to ensure these interfund trades are executed in accordance with Rule 17a-7 of the 1940 Act. Interfund trades are included within the respective purchases and sales amounts shown in the Purchases and Sales of Investments note, and amounted to $22,442,342 and $24,499,488, respectively.
6. Committed Line of Credit.
Certain Funds participate with other funds managed by the investment adviser or an affiliate in a $4.25 billion credit facility (the "line of credit") to be utilized for temporary or emergency purposes to fund shareholder redemptions or for other short-term liquidity purposes. The participating funds have agreed to pay commitment fees on their pro-rata portion of the line of credit, which are reflected in Miscellaneous expenses on the Statement of Operations, and are as follows:
| | Amount |
| VIP Value Portfolio | $667 |
During the period, there were no borrowings on this line of credit.
7. Security Lending.
Funds lend portfolio securities from time to time in order to earn additional income. Lending agents are used, including National Financial Services (NFS), an affiliate of the investment adviser. Pursuant to a securities lending agreement, NFS will receive a fee, which is capped at 9.9% of a fund's daily lending revenue, for its services as lending agent. A fund may lend securities to certain qualified borrowers, including NFS. On the settlement date of the loan, a fund receives collateral (in the form of U.S. Treasury obligations, letters of credit and/or cash) against the loaned securities and maintains collateral in an amount not less than 100% of the market value of the loaned securities during the period of the loan. The market value of the loaned securities is determined at the close of business of a fund and any additional required collateral is delivered to a fund on the next business day. A fund or borrower may terminate the loan at any time, and if the borrower defaults on its obligation to return the securities loaned because of insolvency or other reasons, a fund may apply collateral received from the borrower against the obligation. A fund may experience delays and costs in recovering the securities loaned. Any cash collateral received is invested in the Fidelity Securities Lending Cash Central Fund. Any loaned securities are identified as such in the Schedule of Investments, and the value of loaned securities and cash collateral at period end, as applicable, are presented in the Statement of Assets and Liabilities. Security lending income represents the income earned on investing cash collateral, less rebates paid to borrowers and any lending agent fees associated with the loan, plus any premium payments received for lending certain types of securities. Security lending income is presented in the Statement of Operations as a component of income from Fidelity Central Funds. Affiliated security lending activity, if any, was as follows:
| | Total Security Lending Income Fees Paid to NFS | Security Lending Income From Securities Loaned to NFS | Value of Securities Loaned to NFS at Period End |
| VIP Value Portfolio | $683 | $– | $– |
8. Expense Reductions.
Commissions paid to certain brokers with whom the investment adviser, or its affiliates, places trades on behalf of the Fund include an amount in addition to trade execution, which may be rebated back to the Fund to offset certain expenses. This amount totaled $29,605 for the period.
In addition, during the period the investment adviser or an affiliate reimbursed and/or waived a portion of fund-level operating expenses in the amount of $1,278.
9. Distributions to Shareholders.
Distributions to shareholders of each class were as follows:
| | Year ended
December 31, 2020 | Year ended
December 31, 2019 |
| Distributions to shareholders | | |
| Initial Class | $5,859,642 | $10,236,052 |
| Service Class | 12,774 | 22,546 |
| Service Class 2 | 470,255 | 760,135 |
| Investor Class | 9,293,664 | 16,329,349 |
| Total | $15,636,335 | $27,348,082 |
10. Share Transactions.
Transactions for each class of shares were as follows:
| | Shares | Shares | Dollars | Dollars |
| | Year ended December 31, 2020 | Year ended December 31, 2019 | Year ended December 31, 2020 | Year ended December 31, 2019 |
| Initial Class | | | | |
| Shares sold | 4,872,716 | 1,607,672 | $60,054,538 | $23,411,892 |
| Reinvestment of distributions | 392,086 | 738,632 | 5,859,642 | 10,236,052 |
| Shares redeemed | (4,427,348) | (3,394,404) | (58,181,101) | (49,678,548) |
| Net increase (decrease) | 837,454 | (1,048,100) | $7,733,079 | $(16,030,604) |
| Service Class | | | | |
| Shares sold | – | – | $4 | $– |
| Reinvestment of distributions | 626 | 1,137 | 9,347 | 15,785 |
| Shares redeemed | (507) | (1,803) | (7,216) | (25,852) |
| Net increase (decrease) | 119 | (666) | $2,135 | $(10,067) |
| Service Class 2 | | | | |
| Shares sold | 383,884 | 190,276 | $5,144,631 | $2,727,164 |
| Reinvestment of distributions | 31,997 | 55,631 | 470,255 | 760,135 |
| Shares redeemed | (361,517) | (251,707) | (4,497,700) | (3,576,495) |
| Net increase (decrease) | 54,364 | (5,800) | $1,117,186 | $(89,196) |
| Investor Class | | | | |
| Shares sold | 3,064,439 | 1,209,146 | $38,637,975 | $17,645,013 |
| Reinvestment of distributions | 623,605 | 1,179,791 | 9,293,664 | 16,329,349 |
| Shares redeemed | (4,304,233) | (2,858,527) | (53,892,115) | (41,287,905) |
| Net increase (decrease) | (616,189) | (469,590) | $(5,960,476) | $(7,313,543) |
11. Other.
The Fund's organizational documents provide former and current trustees and officers with a limited indemnification against liabilities arising in connection with the performance of their duties to the Fund. In the normal course of business, the Fund may also enter into contracts that provide general indemnifications. The Fund's maximum exposure under these arrangements is unknown as this would be dependent on future claims that may be made against the Fund. The risk of material loss from such claims is considered remote.
At the end of the period, the investment adviser or its affiliates were the owners of record of 50% of the total outstanding shares of the Fund. Mutual funds managed by the investment adviser or its affiliates were the owners of record, in the aggregate, of approximately 45% of the total outstanding shares of the Fund.
12. Coronavirus (COVID-19) Pandemic.
An outbreak of COVID-19 first detected in China during December 2019 has since spread globally and was declared a pandemic by the World Health Organization during March 2020. Developments that disrupt global economies and financial markets, such as the COVID-19 pandemic, may magnify factors that affect the Fund's performance.
Report of Independent Registered Public Accounting Firm
To the Board of Trustees of Variable Insurance Products Fund and Shareholders of VIP Value Portfolio:
Opinion on the Financial Statements and Financial Highlights
We have audited the accompanying statement of assets and liabilities of VIP Value Portfolio (the "Fund"), a fund of Variable Insurance Products Fund, including the schedule of investments, as of December 31, 2020, the related statement of operations for the year then ended, the statement of changes in net assets for each of the two years in the period then ended, the financial highlights for each of the five years in the period then ended, and the related notes. In our opinion, the financial statements and financial highlights present fairly, in all material respects, the financial position of the Fund as of December 31, 2020, and the results of its operations for the year then ended, the changes in its net assets for each of the two years in the period then ended, and the financial highlights for each of the five years in the period then ended in conformity with accounting principles generally accepted in the United States of America.
Basis for Opinion
These financial statements and financial highlights are the responsibility of the Fund's management. Our responsibility is to express an opinion on the Fund's financial statements and financial highlights based on our audits. We are a public accounting firm registered with the Public Company Accounting Oversight Board (United States) (PCAOB) and are required to be independent with respect to the Fund in accordance with the U.S. federal securities laws and the applicable rules and regulations of the Securities and Exchange Commission and the PCAOB.
We conducted our audits in accordance with the standards of the PCAOB. Those standards require that we plan and perform the audit to obtain reasonable assurance about whether the financial statements and financial highlights are free of material misstatement, whether due to error or fraud. The Fund is not required to have, nor were we engaged to perform, an audit of its internal control over financial reporting. As part of our audits we are required to obtain an understanding of internal control over financial reporting but not for the purpose of expressing an opinion on the effectiveness of the Fund’s internal control over financial reporting. Accordingly, we express no such opinion.
Our audits included performing procedures to assess the risks of material misstatement of the financial statements and financial highlights, whether due to error or fraud, and performing procedures that respond to those risks. Such procedures included examining, on a test basis, evidence regarding the amounts and disclosures in the financial statements and financial highlights. Our audits also included evaluating the accounting principles used and significant estimates made by management, as well as evaluating the overall presentation of the financial statements and financial highlights. Our procedures included confirmation of securities owned as of December 31, 2020, by correspondence with the custodian and brokers; when replies were not received from brokers, we performed other auditing procedures. We believe that our audits provide a reasonable basis for our opinion.
/s/ Deloitte & Touche LLP
Boston, Massachusetts
February 10, 2021
We have served as the auditor of one or more of the Fidelity investment companies since 1999.
Trustees and Officers
The Trustees, Members of the Advisory Board (if any), and officers of the trust and fund, as applicable, are listed below. The Board of Trustees governs the fund and is responsible for protecting the interests of shareholders. The Trustees are experienced executives who meet periodically throughout the year to oversee the fund's activities, review contractual arrangements with companies that provide services to the fund, oversee management of the risks associated with such activities and contractual arrangements, and review the fund's performance. Except for Jonathan Chiel, each of the Trustees oversees 305 funds. Mr. Chiel oversees 176 funds.
The Trustees hold office without limit in time except that (a) any Trustee may resign; (b) any Trustee may be removed by written instrument, signed by at least two-thirds of the number of Trustees prior to such removal; (c) any Trustee who requests to be retired or who has become incapacitated by illness or injury may be retired by written instrument signed by a majority of the other Trustees; and (d) any Trustee may be removed at any special meeting of shareholders by a two-thirds vote of the outstanding voting securities of the trust. Each Trustee who is not an interested person (as defined in the 1940 Act) of the trust and the fund is referred to herein as an Independent Trustee. Each Independent Trustee shall retire not later than the last day of the calendar year in which his or her 75th birthday occurs. The Independent Trustees may waive this mandatory retirement age policy with respect to individual Trustees. Officers and Advisory Board Members hold office without limit in time, except that any officer or Advisory Board Member may resign or may be removed by a vote of a majority of the Trustees at any regular meeting or any special meeting of the Trustees. Except as indicated, each individual has held the office shown or other offices in the same company for the past five years.
The fund’s Statement of Additional Information (SAI) includes more information about the Trustees. To request a free copy, call Fidelity at 1-877-208-0098.
Experience, Skills, Attributes, and Qualifications of the Trustees. The Governance and Nominating Committee has adopted a statement of policy that describes the experience, qualifications, attributes, and skills that are necessary and desirable for potential Independent Trustee candidates (Statement of Policy). The Board believes that each Trustee satisfied at the time he or she was initially elected or appointed a Trustee, and continues to satisfy, the standards contemplated by the Statement of Policy. The Governance and Nominating Committee also engages professional search firms to help identify potential Independent Trustee candidates who have the experience, qualifications, attributes, and skills consistent with the Statement of Policy. From time to time, additional criteria based on the composition and skills of the current Independent Trustees, as well as experience or skills that may be appropriate in light of future changes to board composition, business conditions, and regulatory or other developments, have also been considered by the professional search firms and the Governance and Nominating Committee. In addition, the Board takes into account the Trustees' commitment and participation in Board and committee meetings, as well as their leadership of standing and ad hoc committees throughout their tenure.
In determining that a particular Trustee was and continues to be qualified to serve as a Trustee, the Board has considered a variety of criteria, none of which, in isolation, was controlling. The Board believes that, collectively, the Trustees have balanced and diverse experience, qualifications, attributes, and skills, which allow the Board to operate effectively in governing the fund and protecting the interests of shareholders. Information about the specific experience, skills, attributes, and qualifications of each Trustee, which in each case led to the Board's conclusion that the Trustee should serve (or continue to serve) as a trustee of the fund, is provided below.
Board Structure and Oversight Function. Robert A. Lawrence is an interested person and currently serves as Acting Chairman. The Trustees have determined that an interested Chairman is appropriate and benefits shareholders because an interested Chairman has a personal and professional stake in the quality and continuity of services provided to the fund. Independent Trustees exercise their informed business judgment to appoint an individual of their choosing to serve as Chairman, regardless of whether the Trustee happens to be independent or a member of management. The Independent Trustees have determined that they can act independently and effectively without having an Independent Trustee serve as Chairman and that a key structural component for assuring that they are in a position to do so is for the Independent Trustees to constitute a substantial majority for the Board. The Independent Trustees also regularly meet in executive session. David M. Thomas serves as Lead Independent Trustee and as such (i) acts as a liaison between the Independent Trustees and management with respect to matters important to the Independent Trustees and (ii) with management prepares agendas for Board meetings.
Fidelity® funds are overseen by different Boards of Trustees. The fund's Board oversees Fidelity's high income and certain equity funds, and other Boards oversee Fidelity's investment-grade bond, money market, asset allocation, and other equity funds. The asset allocation funds may invest in Fidelity® funds overseen by the fund's Board. The use of separate Boards, each with its own committee structure, allows the Trustees of each group of Fidelity® funds to focus on the unique issues of the funds they oversee, including common research, investment, and operational issues. On occasion, the separate Boards establish joint committees to address issues of overlapping consequences for the Fidelity® funds overseen by each Board.
The Trustees operate using a system of committees to facilitate the timely and efficient consideration of all matters of importance to the Trustees, the fund, and fund shareholders and to facilitate compliance with legal and regulatory requirements and oversight of the fund's activities and associated risks. The Board, acting through its committees, has charged FMR and its affiliates with (i) identifying events or circumstances the occurrence of which could have demonstrably adverse effects on the fund's business and/or reputation; (ii) implementing processes and controls to lessen the possibility that such events or circumstances occur or to mitigate the effects of such events or circumstances if they do occur; and (iii) creating and maintaining a system designed to evaluate continuously business and market conditions in order to facilitate the identification and implementation processes described in (i) and (ii) above. Because the day-to-day operations and activities of the fund are carried out by or through FMR, its affiliates, and other service providers, the fund's exposure to risks is mitigated but not eliminated by the processes overseen by the Trustees. While each of the Board's committees has responsibility for overseeing different aspects of the fund's activities, oversight is exercised primarily through the Operations, Audit, and Compliance Committees. Appropriate personnel, including but not limited to the fund's Chief Compliance Officer (CCO), FMR's internal auditor, the independent accountants, the fund's Treasurer and portfolio management personnel, make periodic reports to the Board's committees, as appropriate, including an annual review of Fidelity's risk management program for the Fidelity® funds. The responsibilities of each standing committee, including their oversight responsibilities, are described further under "Standing Committees of the Trustees."
Interested Trustees*:
Correspondence intended for a Trustee who is an interested person may be sent to Fidelity Investments, 245 Summer Street, Boston, Massachusetts 02210.
Name, Year of Birth; Principal Occupations and Other Relevant Experience+
Jonathan Chiel (1957)
Year of Election or Appointment: 2016
Trustee
Mr. Chiel also serves as Trustee of other Fidelity® funds. Mr. Chiel is Executive Vice President and General Counsel for FMR LLC (diversified financial services company, 2012-present). Previously, Mr. Chiel served as general counsel (2004-2012) and senior vice president and deputy general counsel (2000-2004) for John Hancock Financial Services; a partner with Choate, Hall & Stewart (1996-2000) (law firm); and an Assistant United States Attorney for the United States Attorney’s Office of the District of Massachusetts (1986-95), including Chief of the Criminal Division (1993-1995). Mr. Chiel is a director on the boards of the Boston Bar Foundation and the Maimonides School.
Bettina Doulton (1964)
Year of Election or Appointment: 2021
Trustee
Ms. Doulton also serves as Trustee of other Fidelity® funds. Prior to her retirement, Ms. Doulton served in a variety of positions at Fidelity Investments, including as a managing director of research (2006-2007), portfolio manager to certain Fidelity® funds (1993-2005), equity analyst and portfolio assistant (1990-1993), and research assistant (1987-1990). Ms. Doulton currently owns and operates Phi Builders + Architects and Cellardoor Winery. Previously, Ms. Doulton served as a member of the Board of Brown Capital Management, LLC (2013-2018).
Robert A. Lawrence (1952)
Year of Election or Appointment: 2020
Trustee
Acting Chairman of the Board of Trustees
Mr. Lawrence also serves as Trustee of other funds. Previously, Mr. Lawrence served as a Member of the Advisory Board of certain funds. Prior to his retirement in 2008, Mr. Lawrence served as Vice President of certain Fidelity® funds (2006-2008), Senior Vice President, Head of High Income Division of Fidelity Management & Research Company (investment adviser firm, 2006-2008), and President of Fidelity Strategic Investments (investment adviser firm, 2002-2005).
* Determined to be an “Interested Trustee” by virtue of, among other things, his or her affiliation with the trust or various entities under common control with FMR.
+ The information includes the Trustee's principal occupation during the last five years and other information relating to the experience, attributes, and skills relevant to the Trustee's qualifications to serve as a Trustee, which led to the conclusion that the Trustee should serve as a Trustee for the fund.
Independent Trustees:
Correspondence intended for an Independent Trustee may be sent to Fidelity Investments, P.O. Box 55235, Boston, Massachusetts 02205-5235.
Name, Year of Birth; Principal Occupations and Other Relevant Experience+
Dennis J. Dirks (1948)
Year of Election or Appointment: 2005
Trustee
Mr. Dirks also serves as Trustee of other Fidelity® funds. Prior to his retirement in May 2003, Mr. Dirks served as Chief Operating Officer and as a member of the Board of The Depository Trust & Clearing Corporation (financial markets infrastructure), President, Chief Operating Officer and a member of the Board of The Depository Trust Company (DTC), President and a member of the Board of the National Securities Clearing Corporation (NSCC), Chief Executive Officer and a member of the Board of the Government Securities Clearing Corporation and Chief Executive Officer and a member of the Board of the Mortgage-Backed Securities Clearing Corporation. Mr. Dirks currently serves as a member of the Finance Committee (2016-present) and Board (2017-present) and is Treasurer (2018-present) of the Asolo Repertory Theatre.
Donald F. Donahue (1950)
Year of Election or Appointment: 2018
Trustee
Mr. Donahue also serves as Trustee of other Fidelity® funds. Mr. Donahue serves as President and Chief Executive Officer of Miranda Partners, LLC (risk consulting for the financial services industry, 2012-present). Previously, Mr. Donahue served as Chief Executive Officer (2006-2012), Chief Operating Officer (2003-2006) and Managing Director, Customer Marketing and Development (1999-2003) of The Depository Trust & Clearing Corporation (financial markets infrastructure). Mr. Donahue currently serves as a member (2007-present) and Co-Chairman (2016-present) of the Board of United Way of New York, a member of the Board of NYC Leadership Academy (2012-present) and a member of the Board of Advisors of Ripple Labs, Inc. (financial services, 2015-present). Mr. Donahue previously served as a member of the Advisory Board of certain Fidelity® funds (2015-2018).
Vicki L. Fuller (1957)
Year of Election or Appointment: 2020
Trustee
Ms. Fuller also serves as Trustee of other Fidelity® funds. Previously, Ms. Fuller served as a member of the Advisory Board of certain Fidelity® funds (2018-2020), Chief Investment Officer of the New York State Common Retirement Fund (2012-2018) and held a variety of positions at AllianceBernstein L.P. (global asset management, 1985-2012), including Managing Director (2006-2012) and Senior Vice President and Senior Portfolio Manager (2001-2006). Ms. Fuller currently serves as a member of the Board, Audit Committee and Nominating and Governance Committee of The Williams Companies, Inc. (natural gas infrastructure, 2018-present), as a member of the Board, Audit Committee and Nominating and Governance Committee of two Blackstone business development companies (2020-present) and as a member of the Board of Treliant, LLC (consulting, 2019-present).
Patricia L. Kampling (1959)
Year of Election or Appointment: 2020
Trustee
Ms. Kampling also serves as Trustee of other Fidelity® funds. Prior to her retirement, Ms. Kampling served as Chairman of the Board and Chief Executive Officer (2012-2019), President and Chief Operating Officer (2011-2012) and Executive Vice President and Chief Financial Officer (2010-2011) of Alliant Energy Corporation. Ms. Kampling currently serves as a member of the Board, Compensation Committee and Executive Committee and as Chair of the Audit Committee of Briggs & Stratton Corporation (manufacturing, 2011-present) and as a member of the Board, Audit, Finance and Risk Committee and Safety, Environmental, Technology and Operations Committee of American Water Works Company, Inc. (utilities company, 2019-present). In addition, Ms. Kampling currently serves as a member of the Board of the Nature Conservancy, Wisconsin Chapter (2019-present). Previously, Ms. Kampling served as a Member of the Advisory Board of certain Fidelity® funds (2020), a member of the Board of Interstate Power and Light Company (2012-2019) and Wisconsin Power and Light Company (2012-2019) (each a subsidiary of Alliant Energy Corporation) and as a member of the Board and Workforce Development Committee of the Business Roundtable (2018-2019).
Thomas A. Kennedy (1955)
Year of Election or Appointment: 2021
Trustee
Mr. Kennedy also serves as Trustee of other Fidelity® funds. Previously, Mr. Kennedy served as a Member of the Advisory Board of certain Fidelity® funds (2020) and held a variety of positions at Raytheon Company (aerospace and defense, 1983-2020), including Chairman and Chief Executive Officer (2014-2020) and Executive Vice President and Chief Operating Officer (2013-2014). Mr. Kennedy currently serves as Executive Chairman of the Board of Directors of Raytheon Technologies Corporation (aerospace and defense, 2020-present). He is also a member of the Rutgers School of Engineering Industry Advisory Board (2011-present) and a member of the UCLA Engineering Dean’s Executive Board (2016-present).
Garnett A. Smith (1947)
Year of Election or Appointment: 2018
Trustee
Mr. Smith also serves as Trustee of other Fidelity® funds. Prior to his retirement, Mr. Smith served as Chairman and Chief Executive Officer (1990-1997) and President (1986-1990) of Inbrand Corp. (manufacturer of personal absorbent products). Prior to his employment with Inbrand Corp., he was employed by a retail fabric chain and North Carolina National Bank (now Bank of America). Mr. Smith previously served as a member of the Advisory Board of certain Fidelity® funds (2012-2013).
David M. Thomas (1949)
Year of Election or Appointment: 2008
Trustee
Lead Independent Trustee
Mr. Thomas also serves as Trustee of other Fidelity® funds. Previously, Mr. Thomas served as Executive Chairman (2005-2006) and Chairman and Chief Executive Officer (2000-2005) of IMS Health, Inc. (pharmaceutical and healthcare information solutions). Mr. Thomas currently serves as Non-Executive Chairman of the Board of Fortune Brands Home and Security (home and security products, 2011-present), and a member of the Board (2004-present) and Presiding Director (2013-present) of Interpublic Group of Companies, Inc. (marketing communication).
Susan Tomasky (1953)
Year of Election or Appointment: 2020
Trustee
Ms. Tomasky also serves as Trustee of other Fidelity® funds. Prior to her retirement, Ms. Tomasky served in various executive officer positions at American Electric Power Company, Inc. (1998-2011), including most recently as President of AEP Transmission (2007-2011). Ms. Tomasky currently serves as a member of the Board and Sustainability Committee and as Chair of the Audit Committee of Marathon Petroleum Corporation (2018-present) and as a member of the Board, Corporate Governance Committee and Organization and Compensation Committee and as Chair of the Audit Committee of Public Service Enterprise Group, Inc. (utilities company, 2012-present). In addition, Ms. Tomasky currently serves as a member of the Board of the Columbus Regional Airport Authority (2007-present), as a member of the Board of the Royal Shakespeare Company – America (2009-present), as a member of the Board of the Columbus Association for the Performing Arts (2011-present) and as a member of the Board of Kenyon College (2016-present). Previously, Ms. Tomasky served as a Member of the Advisory Board of certain Fidelity® funds (2020), a member of the Board (2011-2019) and as Lead Independent Director (2015-2018) of Andeavor Corporation (previously Tesoro Corporation) (independent oil refiner and marketer) and as a member of the Board of Summit Midstream Partners LP (energy, 2012-2018).
Michael E. Wiley (1950)
Year of Election or Appointment: 2020
Trustee
Mr. Wiley also serves as Trustee of other Fidelity® funds. Previously, Mr. Wiley served as a member of the Advisory Board of certain Fidelity® funds (2018-2020), Chairman, President and CEO of Baker Hughes, Inc. (oilfield services, 2000-2004). Mr. Wiley also previously served as a member of the Board of Andeavor Corporation (independent oil refiner and marketer, 2005-2018), a member of the Board of Andeavor Logistics LP (natural resources logistics, 2015-2018) and a member of the Board of High Point Resources (exploration and production, 2005-2020).
+ The information includes the Trustee's principal occupation during the last five years and other information relating to the experience, attributes, and skills relevant to the Trustee's qualifications to serve as a Trustee, which led to the conclusion that the Trustee should serve as a Trustee for the fund.
Advisory Board Members and Officers:
Correspondence intended for a Member of the Advisory Board (if any) may be sent to Fidelity Investments, P.O. Box 55235, Boston, Massachusetts 02205-5235. Correspondence intended for an officer or Peter S. Lynch may be sent to Fidelity Investments, 245 Summer Street, Boston, Massachusetts 02210. Officers appear below in alphabetical order.
Name, Year of Birth; Principal Occupation
Ned C. Lautenbach (1944)
Year of Election or Appointment: 2021
Member of the Advisory Board
Mr. Lautenbach also serves as a Member of the Advisory Board of other Fidelity® funds. Mr. Lautenbach currently serves as Chair of the Board of Governors, State University System of Florida (2013-present) and is a member of the Council on Foreign Relations (1994-present). He is also a member and has in the past served as Chairman of the Board of Directors of Artis-Naples (2012-present). Previously, Mr. Lautenbach served as a Trustee of certain Fidelity® funds (2000-2020) and a member and then Lead Director of the Board of Directors of Eaton Corporation (diversified industrial, 1997-2016). He was also a Partner at Clayton, Dubilier & Rice, LLC (private equity investment, 1998-2010); as well as Director of Sony Corporation (2006-2007). In addition, Mr. Lautenbach had a 30-year career with IBM (technology company), during which time he served as Senior Vice President and as a member of the Corporate Executive Committee (1968-1998).
Peter S. Lynch (1944)
Year of Election or Appointment: 2003
Member of the Advisory Board
Mr. Lynch also serves as a Member of the Advisory Board of other Fidelity® funds. Mr. Lynch is Vice Chairman and a Director of Fidelity Management & Research Company LLC (investment adviser firm). In addition, Mr. Lynch serves as a Trustee of Boston College and as the Chairman of the Inner-City Scholarship Fund. Previously, Mr. Lynch served as Vice Chairman and a Director of FMR Co., Inc. (investment adviser firm) and on the Special Olympics International Board of Directors (1997-2006).
Craig S. Brown (1977)
Year of Election or Appointment: 2019
Assistant Treasurer
Mr. Brown also serves as Assistant Treasurer of other funds. Mr. Brown is an employee of Fidelity Investments (2013-present).
John J. Burke III (1964)
Year of Election or Appointment: 2018
Chief Financial Officer
Mr. Burke also serves as Chief Financial Officer of other funds. Mr. Burke serves as Head of Investment Operations for Fidelity Fund and Investment Operations (2018-present) and is an employee of Fidelity Investments (1998-present). Previously Mr. Burke served as head of Asset Management Investment Operations (2012-2018).
William C. Coffey (1969)
Year of Election or Appointment: 2019
Assistant Secretary
Mr. Coffey also serves as Assistant Secretary of other funds. He is Senior Vice President and Deputy General Counsel of FMR LLC (diversified financial services company, 2010-present), and is an employee of Fidelity Investments. Previously, Mr. Coffey served as Secretary and CLO of certain funds (2018-2019); CLO, Secretary, and Senior Vice President of Fidelity Management & Research Company and FMR Co., Inc. (investment adviser firms, 2018-2019); Secretary of Fidelity SelectCo, LLC and Fidelity Investments Money Management, Inc. (investment adviser firms, 2018-2019); CLO of Fidelity Management & Research (Hong Kong) Limited, FMR Investment Management (UK) Limited, and Fidelity Management & Research (Japan) Limited (investment adviser firms, 2018-2019); and Assistant Secretary of certain funds (2009-2018).
Timothy M. Cohen (1969)
Year of Election or Appointment: 2018
Vice President
Mr. Cohen also serves as Vice President of other funds. Mr. Cohen serves as Co-Head of Equity (2018-present), a Director of Fidelity Management & Research (Japan) Limited (investment adviser firm, 2016-present), and is an employee of Fidelity Investments. Previously, Mr. Cohen served as Executive Vice President of Fidelity SelectCo, LLC (2019), Head of Global Equity Research (2016-2018), Chief Investment Officer - Equity and a Director of Fidelity Management & Research (U.K.) Inc. (investment adviser firm, 2013-2015) and as a Director of Fidelity Management & Research (Hong Kong) Limited (investment adviser firm, 2017).
Jonathan Davis (1968)
Year of Election or Appointment: 2010
Assistant Treasurer
Mr. Davis also serves as Assistant Treasurer of other funds. Mr. Davis serves as Assistant Treasurer of FMR Capital, Inc. (2017-present) and is an employee of Fidelity Investments. Previously, Mr. Davis served as Vice President and Associate General Counsel of FMR LLC (diversified financial services company, 2003-2010).
Laura M. Del Prato (1964)
Year of Election or Appointment: 2018
Assistant Treasurer
Ms. Del Prato also serves as an officer of other funds. Ms. Del Prato is an employee of Fidelity Investments (2017-present). Previously, Ms. Del Prato served as President and Treasurer of The North Carolina Capital Management Trust: Cash Portfolio and Term Portfolio (2018-2020). Prior to joining Fidelity Investments, Ms. Del Prato served as a Managing Director and Treasurer of the JPMorgan Mutual Funds (2014-2017). Prior to JPMorgan, Ms. Del Prato served as a partner at Cohen Fund Audit Services (accounting firm, 2012-2013) and KPMG LLP (accounting firm, 2004-2012).
Colm A. Hogan (1973)
Year of Election or Appointment: 2020
Assistant Treasurer
Mr. Hogan also serves as an officer of other funds. Mr. Hogan serves as Assistant Treasurer of FMR Capital, Inc. (2017-present) and is an employee of Fidelity Investments (2005-present). Previously, Mr. Hogan served as Deputy Treasurer of certain Fidelity® funds (2016-2020) and Assistant Treasurer of certain Fidelity® funds (2016-2018).
Pamela R. Holding (1964)
Year of Election or Appointment: 2018
Vice President
Ms. Holding also serves as Vice President of other funds. Ms. Holding serves as Co-Head of Equity (2018-present) and is an employee of Fidelity Investments (2013-present). Previously, Ms. Holding served as Executive Vice President of Fidelity SelectCo, LLC (2019) and as Chief Investment Officer of Fidelity Institutional Asset Management (2013-2018).
Cynthia Lo Bessette (1969)
Year of Election or Appointment: 2019
Secretary and Chief Legal Officer (CLO)
Ms. Lo Bessette also serves as an officer of other funds. Ms. Lo Bessette serves as CLO, Secretary, and Senior Vice President of Fidelity Management & Research Company LLC (investment adviser firm, 2019-present); and CLO of Fidelity Management & Research (Hong Kong) Limited, FMR Investment Management (UK) Limited, and Fidelity Management & Research (Japan) Limited (investment adviser firms, 2019-present). She is a Senior Vice President and Deputy General Counsel of FMR LLC (diversified financial services company, 2019-present), and is an employee of Fidelity Investments. Previously, Ms. Lo Bessette served as CLO, Secretary, and Senior Vice President of FMR Co., Inc. (investment adviser firm, 2019); Secretary of Fidelity SelectCo, LLC and Fidelity Investments Money Management, Inc. (investment adviser firms, 2019). Prior to joining Fidelity Investments, Ms. Lo Bessette was Executive Vice President, General Counsel (2016-2019) and Senior Vice President, Deputy General Counsel (2015-2016) of OppenheimerFunds (investment management company) and Deputy Chief Legal Officer (2013-2015) of Jennison Associates LLC (investment adviser firm).
Chris Maher (1972)
Year of Election or Appointment: 2020
Deputy Treasurer
Mr. Maher also serves as an officer of other funds. Mr. Maher serves as Assistant Treasurer of FMR Capital, Inc. (2017-present), and is an employee of Fidelity Investments (2008-present). Previously, Mr. Maher served as Assistant Treasurer of certain funds (2013-2020); Vice President of Asset Management Compliance (2013), Vice President of the Program Management Group of FMR (investment adviser firm, 2010-2013), and Vice President of Valuation Oversight (2008-2010).
Jason P. Pogorelec (1975)
Year of Election or Appointment: 2020
Chief Compliance Officer
Mr. Pogorelec also serves as Chief Compliance Officer of other funds. Mr. Pogorelec is a senior Vice President of Asset Management Compliance for Fidelity Investments and is an employee of Fidelity Investments (2006-present). Previously, Mr. Pogorelec served as Vice President, Associate General Counsel for Fidelity Investments (2010-2020) and Assistant Secretary of certain Fidelity funds (2015-2020).
Brett Segaloff (1972)
Year of Election or Appointment: 2021
Anti-Money Laundering (AML) Officer
Mr. Segaloff also serves as an AML Officer of other funds and other related entities. He is Director, Anti-Money Laundering (2007-present) of FMR LLC (diversified financial services company) and is an employee of Fidelity Investments (1996-present).
Stacie M. Smith (1974)
Year of Election or Appointment: 2016
President and Treasurer
Ms. Smith also serves as an officer of other funds. Ms. Smith serves as Assistant Treasurer of FMR Capital, Inc. (2017-present), is an employee of Fidelity Investments (2009-present), and has served in other fund officer roles. Prior to joining Fidelity Investments, Ms. Smith served as Senior Audit Manager of Ernst & Young LLP (accounting firm, 1996-2009). Previously, Ms. Smith served as Assistant Treasurer (2013-2019) and Deputy Treasurer (2013-2016) of certain Fidelity® funds.
Marc L. Spector (1972)
Year of Election or Appointment: 2016
Assistant Treasurer
Mr. Spector also serves as an officer of other funds. Mr. Spector serves as Assistant Treasurer of FMR Capital, Inc. (2017-present) and is an employee of Fidelity Investments (2016-present). Prior to joining Fidelity Investments, Mr. Spector served as Director at the Siegfried Group (accounting firm, 2013-2016), and prior to Siegfried Group as audit senior manager at Deloitte & Touche LLP (accounting firm, 2005-2013).
Jim Wegmann (1979)
Year of Election or Appointment: 2019
Assistant Treasurer
Mr. Wegmann also serves as Assistant Treasurer of other funds. Mr. Wegmann is an employee of Fidelity Investments (2011-present).
Shareholder Expense Example
As a shareholder, you incur two types of costs: (1) transaction costs, which may include sales charges (loads) on purchase payments or redemption proceeds, as applicable and (2) ongoing costs, which generally include management fees, distribution and/or service (12b-1) fees and other Fund expenses. This Example is intended to help you understand your ongoing costs (in dollars) of investing in a fund and to compare these costs with the ongoing costs of investing in other mutual funds.
The Example is based on an investment of $1,000 invested at the beginning of the period and held for the entire period (July 1, 2020 to December 31, 2020).
Actual Expenses
The first line of the accompanying table provides information about actual account values and actual expenses. You may use the information in this line, together with the amount you invested, to estimate the expenses that you paid over the period. Simply divide your account value by $1,000.00 (for example, an $8,600 account value divided by $1,000.00 = 8.6), then multiply the result by the number in the first line for a class/Fund under the heading entitled "Expenses Paid During Period" to estimate the expenses you paid on your account during this period. If any fund is a shareholder of any underlying mutual funds or exchange-traded funds (ETFs) (the Underlying Funds), such fund indirectly bears its proportional share of the expenses of the Underlying Funds in addition to the direct expenses incurred presented in the table. These fees and expenses are not included in the annualized expense ratio used to calculate the expense estimate in the table below. The estimate of expenses does not include any fees or other expenses of any variable annuity or variable life insurance product. If they were, the estimate of expenses you paid during the period would be higher, and your ending account value would be lower.
Hypothetical Example for Comparison Purposes
The second line of the accompanying table provides information about hypothetical account values and hypothetical expenses based on the actual expense ratio and an assumed rate of return of 5% per year before expenses, which is not the actual return. The hypothetical account values and expenses may not be used to estimate the actual ending account balance or expenses you paid for the period. You may use this information to compare the ongoing costs of investing in the Fund and other funds. To do so, compare this 5% hypothetical example with the 5% hypothetical examples that appear in the shareholder reports of the other funds. If any fund is a shareholder of any Underlying Funds, such fund indirectly bears its proportional share of the expenses of the Underlying Funds in addition to the direct expenses as presented in the table. These fees and expenses are not included in the annualized expense ratio used to calculate the expense estimate in the table below. The estimate of expenses does not include any fees or other expenses of any variable annuity or variable life insurance product. If they were, the estimate of expenses you paid during the period would be higher, and your ending account value would be lower.
Please note that the expenses shown in the table are meant to highlight your ongoing costs only and do not reflect any transaction costs. Therefore, the second line of the table is useful in comparing ongoing costs only, and will not help you determine the relative total costs of owning different funds.
| | Annualized Expense Ratio-A | Beginning
Account Value
July 1, 2020 | Ending
Account Value
December 31, 2020 | Expenses Paid
During Period-B
July 1, 2020
to December 31, 2020 |
| VIP Value Portfolio | | | | |
| Initial Class | .66% | | | |
| Actual | | $1,000.00 | $1,321.30 | $3.85 |
| Hypothetical-C | | $1,000.00 | $1,021.82 | $3.35 |
| Service Class | .76% | | | |
| Actual | | $1,000.00 | $1,320.30 | $4.43 |
| Hypothetical-C | | $1,000.00 | $1,021.32 | $3.86 |
| Service Class 2 | .91% | | | |
| Actual | | $1,000.00 | $1,319.60 | $5.31 |
| Hypothetical-C | | $1,000.00 | $1,020.56 | $4.62 |
| Investor Class | .74% | | | |
| Actual | | $1,000.00 | $1,320.40 | $4.32 |
| Hypothetical-C | | $1,000.00 | $1,021.42 | $3.76 |
A Annualized expense ratio reflects expenses net of applicable fee waivers.
B Expenses are equal to the annualized expense ratio, multiplied by the average account value over the period, multiplied by 184/ 366 (to reflect the one-half year period). The fees and expenses of any Underlying Funds are not included in each annualized expense ratio.
C 5% return per year before expenses
Distributions (Unaudited)
Initial Class designates 6% and 100%; Service Class designates 6% and 100%; Service Class 2 designates 7% and 100%; and Investor Class designates 6% and 100% of the dividends distributed in February and December 2020, respectively, during the fiscal year as qualifying for the dividends–received deduction for corporate shareholders.
Proxy Voting Results
A special meeting of shareholders was held on June 9, 2020. The results of votes taken among shareholders on the proposals before them are reported below. Each vote reported represents one dollar of net asset value held on the record date for the meeting.
PROPOSAL 1
To elect a Board of Trustees.
| | # of
Votes | % of
Votes |
| Dennis J. Dirks |
| Affirmative | 11,099,447,424.890 | 95.490 |
| Withheld | 524,241,637.164 | 4.510 |
| TOTAL | 11,623,689,062.054 | 100.000 |
| Donald F. Donahue |
| Affirmative | 11,111,963,232.945 | 95.598 |
| Withheld | 511,725,829.109 | 4.402 |
| TOTAL | 11,623,689,062.054 | 100.000 |
| Bettina Doulton |
| Affirmative | 11,132,379,469.922 | 95.773 |
| Withheld | 491,309,592.132 | 4.227 |
| TOTAL | 11,623,689,062.054 | 100.000 |
| Vicki L. Fuller |
| Affirmative | 11,132,346,192.263 | 95.773 |
| Withheld | 491,342,869.791 | 4.227 |
| TOTAL | 11,623,689,062.054 | 100.000 |
| Patricia L. Kampling |
| Affirmative | 11,141,812,359.694 | 95.854 |
| Withheld | 481,876,702.360 | 4.146 |
| TOTAL | 11,623,689,062.054 | 100.000 |
| Alan J. Lacy |
| Affirmative | 11,081,103,173.144 | 95.332 |
| Withheld | 542,585,888.910 | 4.668 |
| TOTAL | 11,623,689,062.054 | 100.000 |
| Ned C. Lautenbach |
| Affirmative | 11,051,092,644.521 | 95.074 |
| Withheld | 572,596,417.533 | 4.926 |
| TOTAL | 11,623,689,062.054 | 100.000 |
| Robert A. Lawrence |
| Affirmative | 11,100,774,895.497 | 95.501 |
| Withheld | 522,914,166.556 | 4.499 |
| TOTAL | 11,623,689,062.054 | 100.000 |
| Joseph Mauriello |
| Affirmative | 11,070,909,380.371 | 95.244 |
| Withheld | 552,779,681.683 | 4.756 |
| TOTAL | 11,623,689,062.054 | 100.000 |
| Cornelia M. Small |
| Affirmative | 11,101,337,946.609 | 95.506 |
| Withheld | 522,351,115.445 | 4.494 |
| TOTAL | 11,623,689,062.054 | 100.000 |
| Garnett A. Smith |
| Affirmative | 11,082,555,490.179 | 95.345 |
| Withheld | 541,133,571.875 | 4.655 |
| TOTAL | 11,623,689,062.054 | 100.000 |
| David M. Thomas |
| Affirmative | 11,094,352,794.165 | 95.446 |
| Withheld | 529,336,267.889 | 4.554 |
| TOTAL | 11,623,689,062.054 | 100.000 |
| Susan Tomasky |
| Affirmative | 11,124,148,109.894 | 95.702 |
| Withheld | 499,540,952.160 | 4.298 |
| TOTAL | 11,623,689,062.054 | 100.000 |
| Michael E. Wiley |
| Affirmative | 11,096,957,446.084 | 95.468 |
| Withheld | 526,731,615.970 | 4.532 |
| TOTAL | 11,623,689,062.054 | 100.000 |
PROPOSAL 2
To convert a fundamental investment policy to a non-fundamental investment policy.
| | # of
Votes | % of
Votes |
| Affirmative | 192,677,000.438 | 82.684 |
| Against | 29,712,875.073 | 12.751 |
| Abstain | 10,637,271.554 | 4.565 |
| Broker Non-Vote | 0.00 | 0.00 |
| TOTAL | 233,027,147.065 | 100.000 |
|
| Proposal 1 reflects trust wide proposal and voting results. |
VIPVAL-ANN-0221
1.768949.119
Fidelity® Variable Insurance Products:
Equity-Income Portfolio
Annual Report
December 31, 2020
Contents
To view a fund's proxy voting guidelines and proxy voting record for the 12-month period ended June 30, visit http://www.fidelity.com/proxyvotingresults or visit the Securities and Exchange Commission's (SEC) web site at http://www.sec.gov.
You may also call 1-877-208-0098 to request a free copy of the proxy voting guidelines.
Fidelity® Variable Insurance Products are separate account options which are purchased through a variable insurance contract.
Standard & Poor's, S&P and S&P 500 are registered service marks of The McGraw-Hill Companies, Inc. and have been licensed for use by Fidelity Distributors Corporation.
Other third-party marks appearing herein are the property of their respective owners.
All other marks appearing herein are registered or unregistered trademarks or service marks of FMR LLC or an affiliated company. © 2021 FMR LLC. All rights reserved.
This report and the financial statements contained herein are submitted for the general information of the shareholders of the Fund. This report is not authorized for distribution to prospective investors in the Fund unless preceded or accompanied by an effective prospectus.
A fund files its complete schedule of portfolio holdings with the SEC for the first and third quarters of each fiscal year on Form N-PORT. Forms N-PORT are available on the SEC’s web site at http://www.sec.gov. A fund's Forms N-PORT may be reviewed and copied at the SEC’s Public Reference Room in Washington, DC. Information regarding the operation of the SEC's Public Reference Room may be obtained by calling 1-800-SEC-0330.
For a complete list of a fund's portfolio holdings, view the most recent holdings listing, semiannual report, or annual report on Fidelity's web site at http://www.fidelity.com, http://www.institutional.fidelity.com, or http://www.401k.com, as applicable.
NOT FDIC INSURED •MAY LOSE VALUE •NO BANK GUARANTEE
Neither the Fund nor Fidelity Distributors Corporation is a bank.
Note to Shareholders:
Early in 2020, the outbreak and spread of a new coronavirus emerged as a public health emergency that had a major influence on financial markets, primarily based on its impact on the global economy and the outlook for corporate earnings. The virus causes a respiratory disease known as COVID-19. On March 11, the World Health Organization declared the COVID-19 outbreak a pandemic, citing sustained risk of further global spread.
In the weeks following, as the crisis worsened, we witnessed an escalating human tragedy with wide-scale social and economic consequences from coronavirus-containment measures. The outbreak of COVID-19 prompted a number of measures to limit the spread, including travel and border restrictions, quarantines, and restrictions on large gatherings. In turn, these resulted in lower consumer activity, diminished demand for a wide range of products and services, disruption in manufacturing and supply chains, and – given the wide variability in outcomes regarding the outbreak – significant market uncertainty and volatility. Amid the turmoil, global governments and central banks took unprecedented action to help support consumers, businesses, and the broader economies, and to limit disruption to financial systems.
The situation continues to unfold, and the extent and duration of its impact on financial markets and the economy remain highly uncertain. Extreme events such as the coronavirus crisis are “exogenous shocks” that can have significant adverse effects on mutual funds and their investments. Although multiple asset classes may be affected by market disruption, the duration and impact may not be the same for all types of assets.
Fidelity is committed to helping you stay informed amid news about COVID-19 and during increased market volatility, and we’re taking extra steps to be responsive to customer needs. We encourage you to visit our websites, where we offer ongoing updates, commentary, and analysis on the markets and our funds.
Performance: The Bottom Line
Average annual total return reflects the change in the value of an investment, assuming reinvestment of distributions from dividend income and capital gains (the profits earned upon the sale of securities that have grown in value, if any) and assuming a constant rate of performance each year. During periods of reimbursement by Fidelity, a fund’s total return will be greater than it would be had the reimbursement not occurred. Performance numbers are net of all underlying fund operating expenses, but do not include any insurance charges imposed by your insurance company’s separate account. If performance information included the effect of these additional charges, the total returns would have been lower. How a fund did yesterday is no guarantee of how it will do tomorrow.
Average Annual Total Returns
| For the periods ended December 31, 2020 | Past 1 year | Past 5 years | Past 10 years |
| Initial Class | 6.69% | 10.69% | 10.17% |
| Service Class | 6.55% | 10.57% | 10.05% |
| Service Class 2 | 6.44% | 10.41% | 9.89% |
| Investor Class | 6.57% | 10.60% | 10.07% |
$10,000 Over 10 Years
Let's say hypothetically that $10,000 was invested in VIP Equity-Income Portfolio℠ - Initial Class on December 31, 2010.
The chart shows how the value of your investment would have changed, and also shows how the Russell 3000® Value Index performed over the same period.
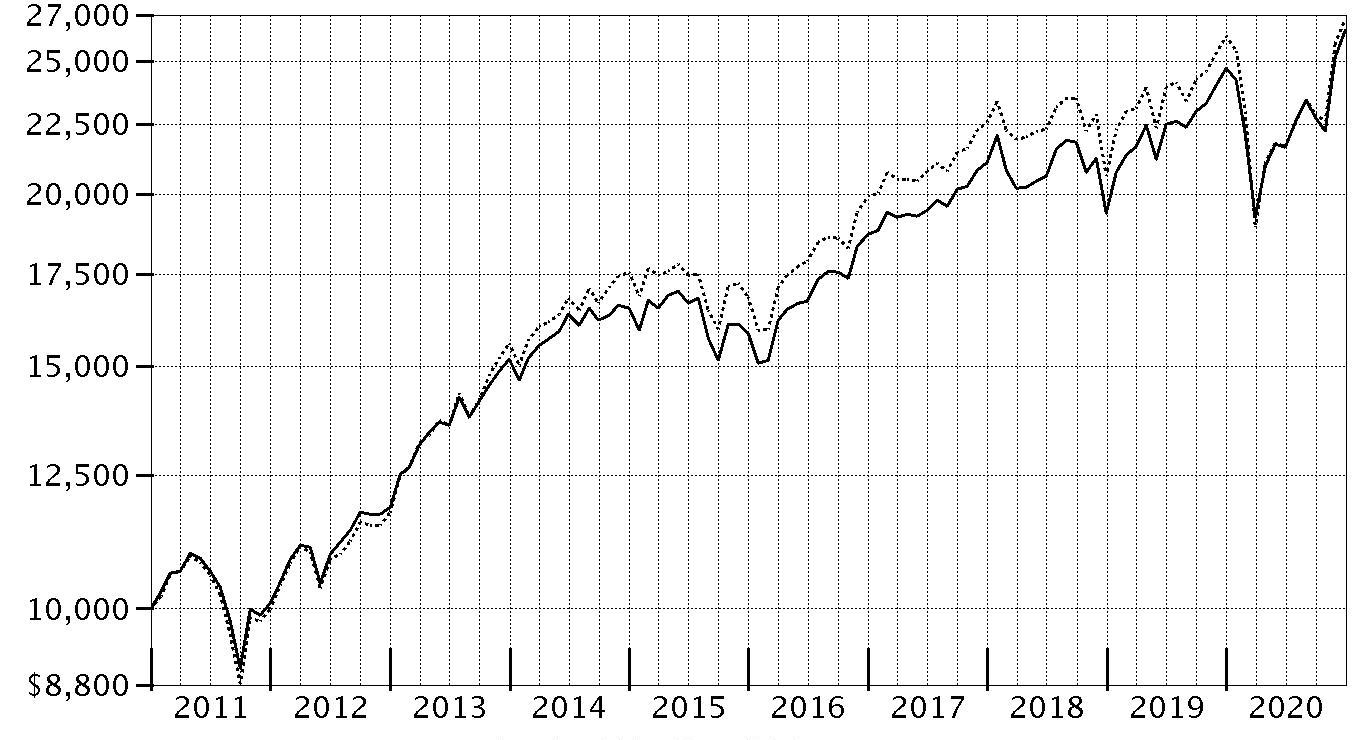
| Period Ending Values |
| $26,330 | VIP Equity-Income Portfolio℠ - Initial Class |
| $26,791 | Russell 3000® Value Index |
Management's Discussion of Fund Performance
Market Recap: The S&P 500
® index gained 18.40% in 2020, a highly volatile and unpredictable year that will be remembered by most investors for the impact of the coronavirus pandemic. The early-2020 outbreak and spread of COVID-19 resulted in stocks suffering one of the quickest declines on record, through March 23, followed by a historic rebound that culminated with the index closing the year at an all-time high. The crisis and containment efforts caused broad contraction in economic activity, along with extreme uncertainty and dislocation in financial markets. A rapid and expansive U.S. monetary/fiscal-policy response partially offset the economic disruption and fueled the market surge, as did resilient corporate earnings and the potential for a COVID-19 vaccine breakthrough. The rally slowed in early September, when the S&P 500 began a two-month retreat amid Congress’s inability to reach a deal on additional fiscal stimulus, as well as concerns about election uncertainty, indications the U.S. economic recovery was stalling and a new wave of COVID-19 cases. November (+11%) was a much different story, however, as investors reacted favorably to election results. The momentum continued in December (+4%), driven by regulatory approvals for two COVID-19 vaccines in the U.S. By sector for the full year, information technology (+44%) and consumer discretionary (+33%) led the way, boosted by a handful of large growth stocks. In contrast, energy shares (-34%) struggled along with global oil demand and pricing.
Comments from Portfolio Manager Ramona Persaud: For the year, the fund's share classes gained about 6% to 7%, outperforming the 2.87% result of the benchmark Russell 3000
® Value index. Versus the benchmark, security selection was the primary contributor, especially within the information technology sector. Strong picks in the consumer staples sector, primarily driven by the food & staples retailing industry, also helped. Also lifting the fund's relative result was security selection in communication services. The fund's position in cash was a notable contributor. Our non-benchmark stake in Apple (+81%) was the top individual contributor. Another notable relative contributor was an out-of-benchmark stake in Microsoft (+41%). This was among the fund's biggest holdings this period. Another notable relative contributor was our overweighting in T-Mobile (+71%). Conversely, the biggest detractor from performance versus the benchmark were stock picks and an underweighting in the industrials sector, primarily within the capital goods industry. Stock selection in health care and an overweighting in energy also hurt the fund's relative performance. The fund's largest individual relative detractor was an overweighting in Wells Fargo, which returned -42% the past 12 months. The company was among our biggest holdings. Also holding back performance was our outsized stake in ConocoPhillips, which returned roughly -34%. Also hampering relative performance was an underweighting in Procter & Gamble, which gained 14%. This was a stake we established the past year. Notable changes in positioning include a higher allocation to the consumer discretionary and industrials sectors.
The views expressed above reflect those of the portfolio manager(s) only through the end of the period as stated on the cover of this report and do not necessarily represent the views of Fidelity or any other person in the Fidelity organization. Any such views are subject to change at any time based upon market or other conditions and Fidelity disclaims any responsibility to update such views. These views may not be relied on as investment advice and, because investment decisions for a Fidelity fund are based on numerous factors, may not be relied on as an indication of trading intent on behalf of any Fidelity fund.
Investment Summary (Unaudited)
Top Ten Stocks as of December 31, 2020
| | % of fund's net assets |
| JPMorgan Chase & Co. | 3.5 |
| The Walt Disney Co. | 3.0 |
| Bank of America Corp. | 2.4 |
| Johnson & Johnson | 2.3 |
| Citigroup, Inc. | 1.8 |
| Comcast Corp. Class A | 1.7 |
| Wells Fargo & Co. | 1.7 |
| Danaher Corp. | 1.7 |
| NextEra Energy, Inc. | 1.6 |
| Capital One Financial Corp. | 1.6 |
| | 21.3 |
Top Five Market Sectors as of December 31, 2020
| | % of fund's net assets |
| Financials | 18.9 |
| Health Care | 13.4 |
| Industrials | 11.5 |
| Consumer Discretionary | 11.1 |
| Information Technology | 10.9 |
Asset Allocation (% of fund's net assets)
| As of December 31, 2020* |
| | Stocks | 98.2% |
| | Short-Term Investments and Net Other Assets (Liabilities) | 1.8% |

* Foreign investments - 13.5%
Schedule of Investments December 31, 2020
Showing Percentage of Net Assets
| Common Stocks - 98.2% | | | |
| | | Shares | Value |
| COMMUNICATION SERVICES - 9.0% | | | |
| Diversified Telecommunication Services - 1.0% | | | |
| AT&T, Inc. | | 536,970 | $15,443,257 |
| Verizon Communications, Inc. | | 637,560 | 37,456,650 |
| | | | 52,899,907 |
| Entertainment - 3.8% | | | |
| Activision Blizzard, Inc. | | 438,975 | 40,758,829 |
| The Walt Disney Co. | | 920,597 | 166,793,764 |
| | | | 207,552,593 |
| Interactive Media & Services - 1.0% | | | |
| Alphabet, Inc. Class A (a) | | 31,288 | 54,836,600 |
| Media - 2.1% | | | |
| Comcast Corp. Class A | | 1,806,733 | 94,672,809 |
| Interpublic Group of Companies, Inc. | | 994,073 | 23,380,597 |
| | | | 118,053,406 |
| Wireless Telecommunication Services - 1.1% | | | |
| T-Mobile U.S., Inc. | | 471,018 | 63,516,777 |
|
| TOTAL COMMUNICATION SERVICES | | | 496,859,283 |
|
| CONSUMER DISCRETIONARY - 11.1% | | | |
| Hotels, Restaurants & Leisure - 2.2% | | | |
| McDonald's Corp. | | 312,180 | 66,987,584 |
| Starbucks Corp. | | 513,741 | 54,960,012 |
| | | | 121,947,596 |
| Household Durables - 0.6% | | | |
| Lennar Corp. Class A | | 335,985 | 25,612,137 |
| Tempur Sealy International, Inc. (a) | | 321,600 | 8,683,200 |
| | | | 34,295,337 |
| Internet & Direct Marketing Retail - 0.3% | | | |
| eBay, Inc. | | 340,598 | 17,115,050 |
| Leisure Products - 0.3% | | | |
| New Academy Holding Co. LLC unit (a)(b)(c) | | 127,200 | 15,905,088 |
| Multiline Retail - 2.8% | | | |
| Dollar General Corp. | | 221,168 | 46,511,630 |
| Dollar Tree, Inc. (a) | | 266,883 | 28,834,039 |
| Nordstrom, Inc. (d) | | 822,100 | 25,657,741 |
| Target Corp. | | 295,108 | 52,095,415 |
| | | | 153,098,825 |
| Specialty Retail - 3.8% | | | |
| Best Buy Co., Inc. | | 164,200 | 16,385,518 |
| Burlington Stores, Inc. (a) | | 108,078 | 28,267,801 |
| Lowe's Companies, Inc. | | 198,072 | 31,792,537 |
| Ross Stores, Inc. | | 147,900 | 18,163,599 |
| The Home Depot, Inc. | | 192,307 | 51,080,585 |
| TJX Companies, Inc. | | 899,574 | 61,431,908 |
| | | | 207,121,948 |
| Textiles, Apparel & Luxury Goods - 1.1% | | | |
| Columbia Sportswear Co. | | 232,230 | 20,292,257 |
| PVH Corp. | | 184,000 | 17,275,760 |
| Tapestry, Inc. | | 781,200 | 24,279,696 |
| | | | 61,847,713 |
|
| TOTAL CONSUMER DISCRETIONARY | | | 611,331,557 |
|
| CONSUMER STAPLES - 7.7% | | | |
| Beverages - 1.5% | | | |
| Diageo PLC | | 290,100 | 11,478,898 |
| Keurig Dr. Pepper, Inc. | | 465,000 | 14,880,000 |
| The Coca-Cola Co. | | 986,246 | 54,085,731 |
| | | | 80,444,629 |
| Food & Staples Retailing - 3.4% | | | |
| Alimentation Couche-Tard, Inc. Class B (sub. vtg.) | | 329,139 | 11,216,945 |
| BJ's Wholesale Club Holdings, Inc. (a) | | 451,950 | 16,848,696 |
| Costco Wholesale Corp. | | 50,400 | 18,989,712 |
| Kroger Co. | | 845,617 | 26,856,796 |
| Sysco Corp. | | 446,200 | 33,134,812 |
| Walmart, Inc. | | 570,945 | 82,301,722 |
| | | | 189,348,683 |
| Food Products - 1.2% | | | |
| Hilton Food Group PLC | | 562,850 | 8,574,429 |
| Mondelez International, Inc. | | 719,971 | 42,096,704 |
| Nestle SA (Reg. S) | | 157,727 | 18,645,116 |
| | | | 69,316,249 |
| Household Products - 1.3% | | | |
| Procter & Gamble Co. | | 503,744 | 70,090,940 |
| Personal Products - 0.3% | | | |
| Estee Lauder Companies, Inc. Class A | | 58,300 | 15,518,877 |
|
| TOTAL CONSUMER STAPLES | | | 424,719,378 |
|
| ENERGY - 6.5% | | | |
| Oil, Gas & Consumable Fuels - 6.5% | | | |
| BP PLC | | 3,609,753 | 12,456,329 |
| Chevron Corp. | | 978,505 | 82,634,747 |
| ConocoPhillips Co. | | 811,604 | 32,456,044 |
| Enterprise Products Partners LP | | 1,322,644 | 25,910,596 |
| Exxon Mobil Corp. | | 1,892,766 | 78,019,815 |
| Imperial Oil Ltd. (d) | | 1,765,135 | 33,502,759 |
| Phillips 66 Co. | | 470,100 | 32,878,794 |
| Suncor Energy, Inc. | | 1,994,700 | 33,456,552 |
| Valero Energy Corp. | | 424,434 | 24,010,231 |
| | | | 355,325,867 |
| FINANCIALS - 18.9% | | | |
| Banks - 11.1% | | | |
| Bank of America Corp. | | 4,285,609 | 129,896,809 |
| Citigroup, Inc. | | 1,612,999 | 99,457,518 |
| Huntington Bancshares, Inc. | | 924,070 | 11,671,004 |
| JPMorgan Chase & Co. | | 1,525,175 | 193,803,988 |
| M&T Bank Corp. | | 389,067 | 49,528,229 |
| PNC Financial Services Group, Inc. | | 236,000 | 35,164,000 |
| Wells Fargo & Co. | | 3,052,368 | 92,120,466 |
| | | | 611,642,014 |
| Capital Markets - 2.6% | | | |
| BlackRock, Inc. Class A | | 78,254 | 56,463,391 |
| KKR & Co. LP | | 785,736 | 31,814,451 |
| Raymond James Financial, Inc. | | 293,000 | 28,031,310 |
| The Blackstone Group LP | | 375,905 | 24,362,403 |
| | | | 140,671,555 |
| Consumer Finance - 1.6% | | | |
| Capital One Financial Corp. | | 907,516 | 89,707,957 |
| Insurance - 3.6% | | | |
| American International Group, Inc. | | 335,500 | 12,702,030 |
| Chubb Ltd. | | 456,782 | 70,307,885 |
| Marsh & McLennan Companies, Inc. | | 335,282 | 39,227,994 |
| The Travelers Companies, Inc. | | 541,640 | 76,030,007 |
| | | | 198,267,916 |
|
| TOTAL FINANCIALS | | | 1,040,289,442 |
|
| HEALTH CARE - 13.4% | | | |
| Biotechnology - 2.0% | | | |
| AbbVie, Inc. | | 423,439 | 45,371,489 |
| Amgen, Inc. | | 282,675 | 64,992,636 |
| | | | 110,364,125 |
| Health Care Equipment & Supplies - 2.5% | | | |
| Becton, Dickinson & Co. | | 171,678 | 42,957,269 |
| Danaher Corp. | | 407,768 | 90,581,584 |
| | | | 133,538,853 |
| Health Care Providers & Services - 1.7% | | | |
| Cigna Corp. | | 193,409 | 40,263,886 |
| UnitedHealth Group, Inc. | | 153,112 | 53,693,316 |
| | | | 93,957,202 |
| Pharmaceuticals - 7.2% | | | |
| AstraZeneca PLC (United Kingdom) | | 305,336 | 30,446,052 |
| Bristol-Myers Squibb Co. | | 1,288,837 | 79,946,559 |
| Eli Lilly & Co. | | 390,858 | 65,992,465 |
| Johnson & Johnson | | 818,696 | 128,846,376 |
| Roche Holding AG (participation certificate) | | 95,621 | 33,304,657 |
| Royalty Pharma PLC | | 79,500 | 3,978,975 |
| Sanofi SA | | 565,455 | 54,805,603 |
| | | | 397,320,687 |
|
| TOTAL HEALTH CARE | | | 735,180,867 |
|
| INDUSTRIALS - 11.5% | | | |
| Aerospace & Defense - 1.4% | | | |
| General Dynamics Corp. | | 216,216 | 32,177,265 |
| Northrop Grumman Corp. | | 146,701 | 44,702,729 |
| | | | 76,879,994 |
| Air Freight & Logistics - 1.1% | | | |
| Deutsche Post AG | | 359,469 | 17,806,574 |
| United Parcel Service, Inc. Class B | | 273,214 | 46,009,238 |
| | | | 63,815,812 |
| Commercial Services & Supplies - 0.3% | | | |
| Waste Connection, Inc. (Canada) | | 142,227 | 14,583,603 |
| Electrical Equipment - 1.0% | | | |
| AMETEK, Inc. | | 442,352 | 53,498,051 |
| Siemens Energy AG (a) | | 38,664 | 1,408,514 |
| | | | 54,906,565 |
| Industrial Conglomerates - 2.6% | | | |
| General Electric Co. | | 5,990,162 | 64,693,750 |
| Roper Technologies, Inc. | | 133,194 | 57,418,601 |
| Siemens AG | | 141,129 | 20,329,135 |
| | | | 142,441,486 |
| Machinery - 1.9% | | | |
| Fortive Corp. | | 297,316 | 21,055,919 |
| ITT, Inc. | | 355,552 | 27,384,615 |
| Otis Worldwide Corp. | | 176,930 | 11,951,622 |
| Snap-On, Inc. | | 60,700 | 10,388,198 |
| Stanley Black & Decker, Inc. | | 190,074 | 33,939,613 |
| | | | 104,719,967 |
| Marine - 0.5% | | | |
| A.P. Moller - Maersk A/S Series B | | 11,445 | 25,468,012 |
| Professional Services - 1.0% | | | |
| Clarivate Analytics PLC (a) | | 482,600 | 14,338,046 |
| Equifax, Inc. | | 98,100 | 18,917,604 |
| IHS Markit Ltd. | | 266,857 | 23,971,764 |
| | | | 57,227,414 |
| Road & Rail - 1.0% | | | |
| Norfolk Southern Corp. | | 223,690 | 53,150,981 |
| Trading Companies & Distributors - 0.7% | | | |
| Watsco, Inc. | | 178,658 | 40,474,970 |
|
| TOTAL INDUSTRIALS | | | 633,668,804 |
|
| INFORMATION TECHNOLOGY - 10.9% | | | |
| Communications Equipment - 1.5% | | | |
| Cisco Systems, Inc. | | 1,867,254 | 83,559,617 |
| Electronic Equipment & Components - 0.3% | | | |
| TE Connectivity Ltd. | | 131,861 | 15,964,411 |
| Vontier Corp. (a) | | 60,455 | 2,019,197 |
| | | | 17,983,608 |
| IT Services - 2.7% | | | |
| Amdocs Ltd. | | 403,233 | 28,601,317 |
| Black Knight, Inc. (a) | | 60,100 | 5,309,835 |
| Fidelity National Information Services, Inc. | | 496,030 | 70,168,404 |
| Genpact Ltd. | | 325,900 | 13,479,224 |
| Visa, Inc. Class A | | 125,542 | 27,459,802 |
| | | | 145,018,582 |
| Semiconductors & Semiconductor Equipment - 2.2% | | | |
| NXP Semiconductors NV | | 296,700 | 47,178,267 |
| Qualcomm, Inc. | | 216,940 | 33,048,640 |
| Taiwan Semiconductor Manufacturing Co. Ltd. sponsored ADR | | 370,142 | 40,360,284 |
| | | | 120,587,191 |
| Software - 1.8% | | | |
| Microsoft Corp. | | 318,150 | 70,762,923 |
| Open Text Corp. | | 344,100 | 15,635,748 |
| SAP SE | | 77,000 | 9,972,947 |
| | | | 96,371,618 |
| Technology Hardware, Storage & Peripherals - 2.4% | | | |
| Apple, Inc. | | 597,429 | 79,272,854 |
| Samsung Electronics Co. Ltd. | | 716,646 | 53,333,388 |
| | | | 132,606,242 |
|
| TOTAL INFORMATION TECHNOLOGY | | | 596,126,858 |
|
| MATERIALS - 3.1% | | | |
| Chemicals - 1.2% | | | |
| Linde PLC | | 248,389 | 65,452,985 |
| Containers & Packaging - 1.6% | | | |
| Crown Holdings, Inc. (a) | | 449,859 | 45,075,872 |
| WestRock Co. | | 1,004,333 | 43,718,615 |
| | | | 88,794,487 |
| Metals & Mining - 0.3% | | | |
| Anglo American PLC (United Kingdom) | | 503,700 | 16,700,192 |
|
| TOTAL MATERIALS | | | 170,947,664 |
|
| REAL ESTATE - 1.1% | | | |
| Equity Real Estate Investment Trusts (REITs) - 1.1% | | | |
| American Tower Corp. | | 150,573 | 33,797,616 |
| Public Storage | | 119,596 | 27,618,304 |
| | | | 61,415,920 |
| UTILITIES - 5.0% | | | |
| Electric Utilities - 3.0% | | | |
| Exelon Corp. | | 885,049 | 37,366,769 |
| NextEra Energy, Inc. | | 1,166,816 | 90,019,854 |
| NRG Energy, Inc. | | 799,929 | 30,037,334 |
| PG&E Corp. (a) | | 662,300 | 8,252,258 |
| | | | 165,676,215 |
| Independent Power and Renewable Electricity Producers - 0.6% | | | |
| Vistra Corp. | | 1,506,001 | 29,607,980 |
| Multi-Utilities - 1.4% | | | |
| Ameren Corp. | | 383,358 | 29,924,925 |
| CenterPoint Energy, Inc. | | 981,568 | 21,241,132 |
| WEC Energy Group, Inc. | | 272,125 | 25,043,664 |
| | | | 76,209,721 |
|
| TOTAL UTILITIES | | | 271,493,916 |
|
| TOTAL COMMON STOCKS | | | |
| (Cost $3,782,484,502) | | | 5,397,359,556 |
|
| Money Market Funds - 2.4% | | | |
| Fidelity Cash Central Fund 0.11% (e) | | 102,577,017 | 102,597,532 |
| Fidelity Securities Lending Cash Central Fund 0.11% (e)(f) | | 32,148,630 | 32,151,844 |
| TOTAL MONEY MARKET FUNDS | | | |
| (Cost $134,746,251) | | | 134,749,376 |
| TOTAL INVESTMENT IN SECURITIES - 100.6% | | | |
| (Cost $3,917,230,753) | | | 5,532,108,932 |
| NET OTHER ASSETS (LIABILITIES) - (0.6)% | | | (34,005,368) |
| NET ASSETS - 100% | | | $5,498,103,564 |
Legend
(a) Non-income producing
(b) Investment is owned by an entity that is treated as a U.S. Corporation for tax purposes in which the Fund holds a percentage ownership.
(c) Restricted securities (including private placements) - Investment in securities not registered under the Securities Act of 1933 (excluding 144A issues). At the end of the period, the value of restricted securities (excluding 144A issues) amounted to $15,905,088 or 0.3% of net assets.
(d) Security or a portion of the security is on loan at period end.
(e) Affiliated fund that is generally available only to investment companies and other accounts managed by Fidelity Investments. The rate quoted is the annualized seven-day yield of the fund at period end. A complete unaudited listing of the fund's holdings as of its most recent quarter end is available upon request. In addition, each Fidelity Central Fund's financial statements, which are not covered by the Fund's Report of Independent Registered Public Accounting Firm, are available on the SEC's website or upon request.
(f) Investment made with cash collateral received from securities on loan.
Additional information on each restricted holding is as follows:
| Security | Acquisition Date | Acquisition Cost |
| New Academy Holding Co. LLC unit | 8/1/11 | $13,406,880 |
Affiliated Central Funds
Information regarding fiscal year to date income earned by the Fund from investments in Fidelity Central Funds is as follows:
| Fund | Income earned |
| Fidelity Cash Central Fund | $828,889 |
| Fidelity Securities Lending Cash Central Fund | 116,687 |
| Total | $945,576 |
Amounts in the income column in the above table include any capital gain distributions from underlying funds, which are presented in the corresponding line-item in the Statement of Operations, if applicable. Amount for Fidelity Securities Lending Cash Central Fund represents the income earned on investing cash collateral, less rebates paid to borrowers and any lending agent fees associated with the loan, plus any premium payments received for lending certain types of securities.
Investment Valuation
The following is a summary of the inputs used, as of December 31, 2020, involving the Fund's assets and liabilities carried at fair value. The inputs or methodology used for valuing securities may not be an indication of the risk associated with investing in those securities. For more information on valuation inputs, and their aggregation into the levels used below, please refer to the Investment Valuation section in the accompanying Notes to Financial Statements.
| | Valuation Inputs at Reporting Date: |
| Description | Total | Level 1 | Level 2 | Level 3 |
| Investments in Securities: | | | | |
| Equities: | | | | |
| Communication Services | $496,859,283 | $496,859,283 | $-- | $-- |
| Consumer Discretionary | 611,331,557 | 595,426,469 | 15,905,088 | -- |
| Consumer Staples | 424,719,378 | 394,595,364 | 30,124,014 | -- |
| Energy | 355,325,867 | 342,869,538 | 12,456,329 | -- |
| Financials | 1,040,289,442 | 1,040,289,442 | -- | -- |
| Health Care | 735,180,867 | 616,624,555 | 118,556,312 | -- |
| Industrials | 633,668,804 | 568,656,569 | 65,012,235 | -- |
| Information Technology | 596,126,858 | 586,153,911 | 9,972,947 | -- |
| Materials | 170,947,664 | 170,947,664 | -- | -- |
| Real Estate | 61,415,920 | 61,415,920 | -- | -- |
| Utilities | 271,493,916 | 271,493,916 | -- | -- |
| Money Market Funds | 134,749,376 | 134,749,376 | -- | -- |
| Total Investments in Securities: | $5,532,108,932 | $5,280,082,007 | $252,026,925 | $-- |
Other Information
Distribution of investments by country or territory of incorporation, as a percentage of Total Net Assets, is as follows (Unaudited):
| United States of America | 86.5% |
| Switzerland | 2.5% |
| Canada | 2.0% |
| United Kingdom | 1.3% |
| Ireland | 1.2% |
| France | 1.0% |
| Korea (South) | 1.0% |
| Others (Individually Less Than 1%) | 4.5% |
| | 100.0% |
See accompanying notes which are an integral part of the financial statements.
Financial Statements
Statement of Assets and Liabilities
| | | December 31, 2020 |
| Assets | | |
Investment in securities, at value (including securities loaned of $30,925,596) — See accompanying schedule:
Unaffiliated issuers (cost $3,782,484,502) | $5,397,359,556 | |
| Fidelity Central Funds (cost $134,746,251) | 134,749,376 | |
| Total Investment in Securities (cost $3,917,230,753) | | $5,532,108,932 |
| Receivable for fund shares sold | | 2,170,703 |
| Dividends receivable | | 4,537,469 |
| Distributions receivable from Fidelity Central Funds | | 36,742 |
| Prepaid expenses | | 6,211 |
| Other receivables | | 54,977 |
| Total assets | | 5,538,915,034 |
| Liabilities | | |
| Payable for fund shares redeemed | $5,850,124 | |
| Accrued management fee | 1,932,108 | |
| Distribution and service plan fees payable | 344,810 | |
| Other affiliated payables | 409,600 | |
| Other payables and accrued expenses | 122,984 | |
| Collateral on securities loaned | 32,151,844 | |
| Total liabilities | | 40,811,470 |
| Net Assets | | $5,498,103,564 |
| Net Assets consist of: | | |
| Paid in capital | | $3,749,834,597 |
| Total accumulated earnings (loss) | | 1,748,268,967 |
| Net Assets | | $5,498,103,564 |
| Net Asset Value and Maximum Offering Price | | |
| Initial Class: | | |
| Net Asset Value, offering price and redemption price per share ($3,185,391,147 ÷ 133,297,368 shares) | | $23.90 |
| Service Class: | | |
| Net Asset Value, offering price and redemption price per share ($284,766,933 ÷ 11,993,281 shares) | | $23.74 |
| Service Class 2: | | |
| Net Asset Value, offering price and redemption price per share ($1,563,662,276 ÷ 67,466,655 shares) | | $23.18 |
| Investor Class: | | |
| Net Asset Value, offering price and redemption price per share ($464,283,208 ÷ 19,554,013 shares) | | $23.74 |
See accompanying notes which are an integral part of the financial statements.
Statement of Operations
| | | Year ended December 31, 2020 |
| Investment Income | | |
| Dividends | | $115,402,976 |
| Income from Fidelity Central Funds (including $116,687 from security lending) | | 945,576 |
| Total income | | 116,348,552 |
| Expenses | | |
| Management fee | $20,946,747 | |
| Transfer agent fees | 3,401,378 | |
| Distribution and service plan fees | 3,629,211 | |
| Accounting fees | 1,075,354 | |
| Custodian fees and expenses | 85,366 | |
| Independent trustees' fees and expenses | 27,953 | |
| Audit | 80,877 | |
| Legal | 10,257 | |
| Miscellaneous | 271,598 | |
| Total expenses before reductions | 29,528,741 | |
| Expense reductions | (266,427) | |
| Total expenses after reductions | | 29,262,314 |
| Net investment income (loss) | | 87,086,238 |
| Realized and Unrealized Gain (Loss) | | |
| Net realized gain (loss) on: | | |
| Investment securities: | | |
| Unaffiliated issuers | 134,275,839 | |
| Fidelity Central Funds | 8,726 | |
| Foreign currency transactions | (428,438) | |
| Total net realized gain (loss) | | 133,856,127 |
| Change in net unrealized appreciation (depreciation) on: | | |
| Investment securities: | | |
| Unaffiliated issuers | 108,975,856 | |
| Fidelity Central Funds | (1) | |
| Assets and liabilities in foreign currencies | 148,746 | |
| Total change in net unrealized appreciation (depreciation) | | 109,124,601 |
| Net gain (loss) | | 242,980,728 |
| Net increase (decrease) in net assets resulting from operations | | $330,066,966 |
See accompanying notes which are an integral part of the financial statements.
Statement of Changes in Net Assets
| | Year ended December 31, 2020 | Year ended December 31, 2019 |
| Increase (Decrease) in Net Assets | | |
| Operations | | |
| Net investment income (loss) | $87,086,238 | $103,608,845 |
| Net realized gain (loss) | 133,856,127 | 232,956,581 |
| Change in net unrealized appreciation (depreciation) | 109,124,601 | 883,636,737 |
| Net increase (decrease) in net assets resulting from operations | 330,066,966 | 1,220,202,163 |
| Distributions to shareholders | (310,505,982) | (427,526,635) |
| Share transactions - net increase (decrease) | 95,361,239 | (60,605,417) |
| Total increase (decrease) in net assets | 114,922,223 | 732,070,111 |
| Net Assets | | |
| Beginning of period | 5,383,181,341 | 4,651,111,230 |
| End of period | $5,498,103,564 | $5,383,181,341 |
See accompanying notes which are an integral part of the financial statements.
Financial Highlights
VIP Equity-Income Portfolio Initial Class
| Years ended December 31, | 2020 | 2019 | 2018 | 2017 | 2016 |
| Selected Per–Share Data | | | | | |
| Net asset value, beginning of period | $23.77 | $20.37 | $23.89 | $21.97 | $20.46 |
| Income from Investment Operations | | | | | |
| Net investment income (loss)A | .39 | .46 | .58 | .50 | .49 |
| Net realized and unrealized gain (loss) | 1.12 | 4.84 | (2.50) | 2.29 | 2.85 |
| Total from investment operations | 1.51 | 5.30 | (1.92) | 2.79 | 3.34 |
| Distributions from net investment income | (.39) | (.45) | (.52) | (.40) | (.48) |
| Distributions from net realized gain | (.99) | (1.45) | (1.07) | (.47) | (1.34) |
| Total distributions | (1.38) | (1.90) | (1.60)B | (.87) | (1.83)B |
| Redemption fees added to paid in capitalA | – | – | – | – | – |
| Net asset value, end of period | $23.90 | $23.77 | $20.37 | $23.89 | $21.97 |
| Total ReturnC,D | 6.69% | 27.44% | (8.29)% | 12.89% | 18.02% |
| Ratios to Average Net AssetsE,F | | | | | |
| Expenses before reductions | .53% | .53% | .53% | .53% | .54% |
| Expenses net of fee waivers, if any | .53% | .53% | .53% | .53% | .54% |
| Expenses net of all reductions | .52% | .52% | .52% | .53% | .54% |
| Net investment income (loss) | 1.87% | 2.11% | 2.53% | 2.19% | 2.39% |
| Supplemental Data | | | | | |
| Net assets, end of period (000 omitted) | $3,185,391 | $3,202,982 | $2,804,988 | $3,440,095 | $3,550,158 |
| Portfolio turnover rateG | 57% | 32% | 39% | 36% | 38% |
A Calculated based on average shares outstanding during the period.
B Total distributions per share do not sum due to rounding.
C Total returns do not reflect charges attributable to your insurance company's separate account. Inclusion of these charges would reduce the total returns shown.
D Total returns would have been lower if certain expenses had not been reduced during the applicable periods shown.
E Fees and expenses of any underlying mutual funds or exchange-traded funds (ETFs) are not included in the Fund's expense ratio. The Fund indirectly bears its proportionate share of these expenses. For additional expense information related to investments in Fidelity Central Funds, please refer to the "Investments in Fidelity Central Funds" note found in the Notes to Financial Statements section of the most recent Annual or Semi-Annual report.
F Expense ratios reflect operating expenses of the class. Expenses before reductions do not reflect amounts reimbursed, waived, or reduced through arrangements with the investment adviser, brokerage services, or other offset arrangements, if applicable, and do not represent the amount paid by the class during periods when reimbursements, waivers or reductions occur.
G Amount does not include the portfolio activity of any underlying mutual funds or exchange-traded funds (ETFs).
See accompanying notes which are an integral part of the financial statements.
VIP Equity-Income Portfolio Service Class
| Years ended December 31, | 2020 | 2019 | 2018 | 2017 | 2016 |
| Selected Per–Share Data | | | | | |
| Net asset value, beginning of period | $23.63 | $20.26 | $23.77 | $21.86 | $20.37 |
| Income from Investment Operations | | | | | |
| Net investment income (loss)A | .37 | .44 | .55 | .47 | .46 |
| Net realized and unrealized gain (loss) | 1.10 | 4.81 | (2.49) | 2.29 | 2.84 |
| Total from investment operations | 1.47 | 5.25 | (1.94) | 2.76 | 3.30 |
| Distributions from net investment income | (.37) | (.43) | (.50) | (.38) | (.47) |
| Distributions from net realized gain | (.99) | (1.45) | (1.07) | (.47) | (1.34) |
| Total distributions | (1.36) | (1.88) | (1.57) | (.85) | (1.81) |
| Redemption fees added to paid in capitalA | – | – | – | – | – |
| Net asset value, end of period | $23.74 | $23.63 | $20.26 | $23.77 | $21.86 |
| Total ReturnB,C | 6.55% | 27.32% | (8.40)% | 12.80% | 17.90% |
| Ratios to Average Net AssetsD,E | | | | | |
| Expenses before reductions | .63% | .63% | .63% | .63% | .64% |
| Expenses net of fee waivers, if any | .63% | .63% | .63% | .63% | .64% |
| Expenses net of all reductions | .62% | .62% | .62% | .63% | .64% |
| Net investment income (loss) | 1.77% | 2.01% | 2.43% | 2.09% | 2.29% |
| Supplemental Data | | | | | |
| Net assets, end of period (000 omitted) | $284,767 | $299,079 | $264,055 | $326,565 | $325,602 |
| Portfolio turnover rateF | 57% | 32% | 39% | 36% | 38% |
A Calculated based on average shares outstanding during the period.
B Total returns do not reflect charges attributable to your insurance company's separate account. Inclusion of these charges would reduce the total returns shown.
C Total returns would have been lower if certain expenses had not been reduced during the applicable periods shown.
D Fees and expenses of any underlying mutual funds or exchange-traded funds (ETFs) are not included in the Fund's expense ratio. The Fund indirectly bears its proportionate share of these expenses. For additional expense information related to investments in Fidelity Central Funds, please refer to the "Investments in Fidelity Central Funds" note found in the Notes to Financial Statements section of the most recent Annual or Semi-Annual report.
E Expense ratios reflect operating expenses of the class. Expenses before reductions do not reflect amounts reimbursed, waived, or reduced through arrangements with the investment adviser, brokerage services, or other offset arrangements, if applicable, and do not represent the amount paid by the class during periods when reimbursements, waivers or reductions occur.
F Amount does not include the portfolio activity of any underlying mutual funds or exchange-traded funds (ETFs).
See accompanying notes which are an integral part of the financial statements.
VIP Equity-Income Portfolio Service Class 2
| Years ended December 31, | 2020 | 2019 | 2018 | 2017 | 2016 |
| Selected Per–Share Data | | | | | |
| Net asset value, beginning of period | $23.10 | $19.85 | $23.32 | $21.46 | $20.04 |
| Income from Investment Operations | | | | | |
| Net investment income (loss)A | .33 | .40 | .51 | .43 | .42 |
| Net realized and unrealized gain (loss) | 1.09 | 4.70 | (2.44) | 2.24 | 2.78 |
| Total from investment operations | 1.42 | 5.10 | (1.93) | 2.67 | 3.20 |
| Distributions from net investment income | (.34) | (.40) | (.47) | (.34) | (.44) |
| Distributions from net realized gain | (.99) | (1.45) | (1.07) | (.47) | (1.34) |
| Total distributions | (1.34)B | (1.85) | (1.54) | (.81) | (1.78) |
| Redemption fees added to paid in capitalA | – | – | – | – | – |
| Net asset value, end of period | $23.18 | $23.10 | $19.85 | $23.32 | $21.46 |
| Total ReturnC,D | 6.44% | 27.11% | (8.54)% | 12.65% | 17.71% |
| Ratios to Average Net AssetsE,F | | | | | |
| Expenses before reductions | .78% | .78% | .78% | .78% | .79% |
| Expenses net of fee waivers, if any | .78% | .78% | .78% | .78% | .79% |
| Expenses net of all reductions | .77% | .77% | .77% | .78% | .79% |
| Net investment income (loss) | 1.62% | 1.86% | 2.28% | 1.94% | 2.14% |
| Supplemental Data | | | | | |
| Net assets, end of period (000 omitted) | $1,563,662 | $1,431,212 | $1,200,026 | $1,452,633 | $1,397,762 |
| Portfolio turnover rateG | 57% | 32% | 39% | 36% | 38% |
A Calculated based on average shares outstanding during the period.
B Total distributions per share do not sum due to rounding.
C Total returns do not reflect charges attributable to your insurance company's separate account. Inclusion of these charges would reduce the total returns shown.
D Total returns would have been lower if certain expenses had not been reduced during the applicable periods shown.
E Fees and expenses of any underlying mutual funds or exchange-traded funds (ETFs) are not included in the Fund's expense ratio. The Fund indirectly bears its proportionate share of these expenses. For additional expense information related to investments in Fidelity Central Funds, please refer to the "Investments in Fidelity Central Funds" note found in the Notes to Financial Statements section of the most recent Annual or Semi-Annual report.
F Expense ratios reflect operating expenses of the class. Expenses before reductions do not reflect amounts reimbursed, waived, or reduced through arrangements with the investment adviser, brokerage services, or other offset arrangements, if applicable, and do not represent the amount paid by the class during periods when reimbursements, waivers or reductions occur.
G Amount does not include the portfolio activity of any underlying mutual funds or exchange-traded funds (ETFs).
See accompanying notes which are an integral part of the financial statements.
VIP Equity-Income Portfolio Investor Class
| Years ended December 31, | 2020 | 2019 | 2018 | 2017 | 2016 |
| Selected Per–Share Data | | | | | |
| Net asset value, beginning of period | $23.63 | $20.26 | $23.77 | $21.86 | $20.37 |
| Income from Investment Operations | | | | | |
| Net investment income (loss)A | .38 | .44 | .55 | .48 | .47 |
| Net realized and unrealized gain (loss) | 1.10 | 4.81 | (2.48) | 2.28 | 2.83 |
| Total from investment operations | 1.48 | 5.25 | (1.93) | 2.76 | 3.30 |
| Distributions from net investment income | (.38) | (.44) | (.51) | (.38) | (.47) |
| Distributions from net realized gain | (.99) | (1.45) | (1.07) | (.47) | (1.34) |
| Total distributions | (1.37) | (1.88)B | (1.58) | (.85) | (1.81) |
| Redemption fees added to paid in capitalA | – | – | – | – | – |
| Net asset value, end of period | $23.74 | $23.63 | $20.26 | $23.77 | $21.86 |
| Total ReturnC,D | 6.57% | 27.35% | (8.37)% | 12.83% | 17.93% |
| Ratios to Average Net AssetsE,F | | | | | |
| Expenses before reductions | .60% | .61% | .61% | .62% | .62% |
| Expenses net of fee waivers, if any | .60% | .61% | .61% | .61% | .62% |
| Expenses net of all reductions | .60% | .60% | .60% | .61% | .62% |
| Net investment income (loss) | 1.80% | 2.03% | 2.45% | 2.11% | 2.31% |
| Supplemental Data | | | | | |
| Net assets, end of period (000 omitted) | $464,283 | $449,909 | $382,041 | $457,011 | $428,682 |
| Portfolio turnover rateG | 57% | 32% | 39% | 36% | 38% |
A Calculated based on average shares outstanding during the period.
B Total distributions per share do not sum due to rounding.
C Total returns do not reflect charges attributable to your insurance company's separate account. Inclusion of these charges would reduce the total returns shown.
D Total returns would have been lower if certain expenses had not been reduced during the applicable periods shown.
E Fees and expenses of any underlying mutual funds or exchange-traded funds (ETFs) are not included in the Fund's expense ratio. The Fund indirectly bears its proportionate share of these expenses. For additional expense information related to investments in Fidelity Central Funds, please refer to the "Investments in Fidelity Central Funds" note found in the Notes to Financial Statements section of the most recent Annual or Semi-Annual report.
F Expense ratios reflect operating expenses of the class. Expenses before reductions do not reflect amounts reimbursed, waived, or reduced through arrangements with the investment adviser, brokerage services, or other offset arrangements, if applicable, and do not represent the amount paid by the class during periods when reimbursements, waivers or reductions occur.
G Amount does not include the portfolio activity of any underlying mutual funds or exchange-traded funds (ETFs).
See accompanying notes which are an integral part of the financial statements.
Notes to Financial Statements
For the period ended December 31, 2020
1. Organization.
VIP Equity-Income Portfolio (the Fund) is a fund of Variable Insurance Products Fund (the Trust) and is authorized to issue an unlimited number of shares. The Trust is registered under the Investment Company Act of 1940, as amended (the 1940 Act), as an open-end management investment company organized as a Massachusetts business trust. Shares of the Fund may only be purchased by insurance companies for the purpose of funding variable annuity or variable life insurance contracts. The Fund offers the following classes of shares: Initial Class shares, Service Class shares, Service Class 2 shares and Investor Class shares. All classes have equal rights and voting privileges, except for matters affecting a single class.
Effective January 1, 2020:
Investment advisers Fidelity Investments Money Management, Inc., FMR Co., Inc., and Fidelity SelectCo, LLC, merged with and into Fidelity Management & Research Company. In connection with the merger transactions, the resulting, merged investment adviser was then redomiciled from Massachusetts to Delaware, changed its corporate structure from a corporation to a limited liability company, and changed its name to "Fidelity Management & Research Company LLC".
Broker-dealer Fidelity Distributors Corporation merged with and into Fidelity Investments Institutional Services Company, Inc. ("FIISC"). FIISC was then redomiciled from Massachusetts to Delaware, changed its corporate structure from a corporation to a limited liability company, and changed its name to "Fidelity Distributors Company LLC".
Fidelity Investments Institutional Operations Company, Inc. converted from a Massachusetts corporation to a Massachusetts LLC, and changed its name to "Fidelity Investments Institutional Operations Company LLC".
2. Investments in Fidelity Central Funds.
The Fund invests in Fidelity Central Funds, which are open-end investment companies generally available only to other investment companies and accounts managed by the investment adviser and its affiliates. The Fund's Schedule of Investments lists each of the Fidelity Central Funds held as of period end, if any, as an investment of the Fund, but does not include the underlying holdings of each Fidelity Central Fund. As an Investing Fund, the Fund indirectly bears its proportionate share of the expenses of the underlying Fidelity Central Funds.
The Money Market Central Funds seek preservation of capital and current income and are managed by the investment adviser. Annualized expenses of the Money Market Central Funds as of their most recent shareholder report date ranged from less than .005% to .01%.
A complete unaudited list of holdings for each Fidelity Central Fund is available upon request or at the Securities and Exchange Commission (the SEC) website at www.sec.gov. In addition, the financial statements of the Fidelity Central Funds, which are not covered by the Fund's Report of Independent Registered Public Accounting Firm, are available on the SEC website or upon request.
3. Significant Accounting Policies.
The Fund is an investment company and applies the accounting and reporting guidance of the Financial Accounting Standards Board (FASB) Accounting Standards Codification Topic 946 Financial Services - Investment Companies. The financial statements have been prepared in conformity with accounting principles generally accepted in the United States of America (GAAP), which require management to make certain estimates and assumptions at the date of the financial statements. Actual results could differ from those estimates. Subsequent events, if any, through the date that the financial statements were issued have been evaluated in the preparation of the financial statements. The following summarizes the significant accounting policies of the Fund:
Investment Valuation. Investments are valued as of 4:00 p.m. Eastern time on the last calendar day of the period. The Board of Trustees (the Board) has delegated the day to day responsibility for the valuation of the Fund's investments to the Fair Value Committee (the Committee) established by the Fund's investment adviser. In accordance with valuation policies and procedures approved by the Board, the Fund attempts to obtain prices from one or more third party pricing vendors or brokers to value its investments. When current market prices, quotations or currency exchange rates are not readily available or reliable, investments will be fair valued in good faith by the Committee, in accordance with procedures adopted by the Board. Factors used in determining fair value vary by investment type and may include market or investment specific events. The frequency with which these procedures are used cannot be predicted and they may be utilized to a significant extent. The Committee oversees the Fund's valuation policies and procedures and reports to the Board on the Committee's activities and fair value determinations. The Board monitors the appropriateness of the procedures used in valuing the Fund's investments and ratifies the fair value determinations of the Committee.
The Fund categorizes the inputs to valuation techniques used to value its investments into a disclosure hierarchy consisting of three levels as shown below:
- Level 1 – quoted prices in active markets for identical investments
- Level 2 – other significant observable inputs (including quoted prices for similar investments, interest rates, prepayment speeds, etc.)
- Level 3 – unobservable inputs (including the Fund's own assumptions based on the best information available)
Valuation techniques used to value the Fund's investments by major category are as follows:
Equity securities, including restricted securities, for which market quotations are readily available, are valued at the last reported sale price or official closing price as reported by a third party pricing vendor on the primary market or exchange on which they are traded and are categorized as Level 1 in the hierarchy. In the event there were no sales during the day or closing prices are not available, securities are valued at the last quoted bid price or may be valued using the last available price and are generally categorized as Level 2 in the hierarchy. For foreign equity securities, when market or security specific events arise, comparisons to the valuation of American Depositary Receipts (ADRs), futures contracts, Exchange-Traded Funds (ETFs) and certain indexes as well as quoted prices for similar securities may be used and would be categorized as Level 2 in the hierarchy. For equity securities, including restricted securities, where observable inputs are limited, assumptions about market activity and risk are used and these securities may be categorized as Level 3 in the hierarchy.
Investments in open-end mutual funds, including the Fidelity Central Funds, are valued at their closing net asset value (NAV) each business day and are categorized as Level 1 in the hierarchy.
Changes in valuation techniques may result in transfers in or out of an assigned level within the disclosure hierarchy. The aggregate value of investments by input level as of December 31, 2020 is included at the end of the Fund's Schedule of Investments.
Foreign Currency. Certain Funds may use foreign currency contracts to facilitate transactions in foreign-denominated securities. Gains and losses from these transactions may arise from changes in the value of the foreign currency or if the counterparties do not perform under the contracts' terms.
Foreign-denominated assets, including investment securities, and liabilities are translated into U.S. dollars at the exchange rates at period end. Purchases and sales of investment securities, income and dividends received, and expenses denominated in foreign currencies are translated into U.S. dollars at the exchange rate in effect on the transaction date.
The effects of exchange rate fluctuations on investments are included with the net realized and unrealized gain (loss) on investment securities. Other foreign currency transactions resulting in realized and unrealized gain (loss) are disclosed separately.
Investment Transactions and Income. For financial reporting purposes, the Fund's investment holdings and NAV include trades executed through the end of the last business day of the period. The NAV per share for processing shareholder transactions is calculated as of the close of business of the New York Stock Exchange (NYSE), normally 4:00 p.m. Eastern time and includes trades executed through the end of the prior business day. Gains and losses on securities sold are determined on the basis of identified cost and include proceeds received from litigation. Dividend income is recorded on the ex-dividend date, except for certain dividends from foreign securities where the ex-dividend date may have passed, which are recorded as soon as the Fund is informed of the ex-dividend date. Non-cash dividends included in dividend income, if any, are recorded at the fair market value of the securities received. Income and capital gain distributions from Fidelity Central Funds, if any, are recorded on the ex-dividend date. Certain distributions received by the Fund represent a return of capital or capital gain. The Fund determines the components of these distributions subsequent to the ex-dividend date, based upon receipt of tax filings or other correspondence relating to the underlying investment. These distributions are recorded as a reduction of cost of investments and/or as a realized gain. Investment income is recorded net of foreign taxes withheld where recovery of such taxes is uncertain.
Class Allocations and Expenses. Investment income, realized and unrealized capital gains and losses, common expenses of the Fund, and certain fund-level expense reductions, if any, are allocated daily on a pro-rata basis to each class based on the relative net assets of each class to the total net assets of the Fund. Each class differs with respect to transfer agent and distribution and service plan fees incurred. Certain expense reductions may also differ by class. For the reporting period, the allocated portion of income and expenses to each class as a percent of its average net assets may vary due to the timing of recording these transactions in relation to fluctuating net assets of the classes. Expenses directly attributable to a fund are charged to that fund. Expenses attributable to more than one fund are allocated among the respective funds on the basis of relative net assets or other appropriate methods. Expense estimates are accrued in the period to which they relate and adjustments are made when actual amounts are known.
Deferred Trustee Compensation. Under a Deferred Compensation Plan (the Plan) for certain Funds, certain independent Trustees have elected to defer receipt of a portion of their annual compensation. Deferred amounts are invested in affiliated mutual funds, are marked-to-market and remain in a fund until distributed in accordance with the Plan. The investment of deferred amounts and the offsetting payable to the Trustees presented below are included in the accompanying Statement of Assets and Liabilities in other receivables and other payables and accrued expenses, as applicable.
| VIP Equity-Income Portfolio | $23,132 |
Income Tax Information and Distributions to Shareholders. Each year, the Fund intends to qualify as a regulated investment company under Subchapter M of the Internal Revenue Code, including distributing substantially all of its taxable income and realized gains. As a result, no provision for U.S. Federal income taxes is required. As of December 31, 2020, the Fund did not have any unrecognized tax benefits in the financial statements; nor is the Fund aware of any tax positions for which it is reasonably possible that the total amounts of unrecognized tax benefits will significantly change in the next twelve months. The Fund files a U.S. federal tax return, in addition to state and local tax returns as required. The Fund's federal income tax returns are subject to examination by the Internal Revenue Service (IRS) for a period of three fiscal years after they are filed. State and local tax returns may be subject to examination for an additional fiscal year depending on the jurisdiction. Foreign taxes are provided for based on the Fund's understanding of the tax rules and rates that exist in the foreign markets in which it invests.
Distributions are declared and recorded on the ex-dividend date. Income and capital gain distributions are declared separately for each class. Income and capital gain distributions are determined in accordance with income tax regulations, which may differ from GAAP.
Capital accounts within the financial statements are adjusted for permanent book-tax differences. These adjustments have no impact on net assets or the results of operations. Capital accounts are not adjusted for temporary book-tax differences which will reverse in a subsequent period.
Book-tax differences are primarily due to foreign currency transactions, passive foreign investment companies (PFIC), deferred Trustees compensation, partnerships and losses deferred due to wash sales.
As of period end, the cost and unrealized appreciation (depreciation) in securities, and derivatives if applicable, for federal income tax purposes were as follows:
| Gross unrealized appreciation | $1,709,958,511 |
| Gross unrealized depreciation | (135,002,945) |
| Net unrealized appreciation (depreciation) | $1,574,955,566 |
| Tax Cost | $3,957,153,366 |
The tax-based components of distributable earnings as of period end were as follows:
| Undistributed ordinary income | $14,572,143 |
| Undistributed long-term capital gain | $166,676,263 |
| Net unrealized appreciation (depreciation) on securities and other investments | $1,567,043,695 |
The tax character of distributions paid was as follows:
| | December 31, 2020 | December 31, 2019 |
| Ordinary Income | $86,284,721 | $ 98,656,425 |
| Long-term Capital Gains | 224,221,261 | 328,870,210 |
| Total | $310,505,982 | $ 427,526,635 |
Restricted Securities (including Private Placements). The Fund may invest in securities that are subject to legal or contractual restrictions on resale. These securities generally may be resold in transactions exempt from registration or to the public if the securities are registered. Disposal of these securities may involve time-consuming negotiations and expense, and prompt sale at an acceptable price may be difficult. Information regarding restricted securities is included at the end of the Fund's Schedule of Investments.
4. Purchases and Sales of Investments.
Purchases and sales of securities, other than short-term securities, are noted in the table below.
| | Purchases ($) | Sales ($) |
| VIP Equity-Income Portfolio | 2,667,175,386 | 2,708,358,256 |
5. Fees and Other Transactions with Affiliates.
Management Fee. Fidelity Management & Research Company LLC (the investment adviser) and its affiliates provide the Fund with investment management related services for which the Fund pays a monthly management fee. The management fee is the sum of an individual fund fee rate that is based on an annual rate of .20% of the Fund's average net assets and an annualized group fee rate that averaged .23% during the period. The group fee rate is based upon the monthly average net assets of a group of registered investment companies with which the investment adviser has management contracts. The group fee rate decreases as assets under management increase and increases as assets under management decrease. For the reporting period, the total annual management fee rate was .43% of the Fund's average net assets.
Distribution and Service Plan Fees. In accordance with Rule 12b-1 of the 1940 Act, the Fund has adopted separate 12b-1 Plans for each Service Class of shares. Each Service Class pays Fidelity Distributors Company LLC (FDC), an affiliate of the investment adviser, a service fee. For the period, the service fee is based on an annual rate of .10% of Service Class' average net assets and .25% of Service Class 2's average net assets.
For the period, total fees, all of which were re-allowed to insurance companies for the distribution of shares and providing shareholder support services, were as follows:
| Service Class | $260,141 |
| Service Class 2 | 3,369,070 |
| | $3,629,211 |
Transfer Agent Fees. Fidelity Investments Institutional Operations Company LLC (FIIOC), an affiliate of the investment adviser, is the Fund's transfer, dividend disbursing, and shareholder servicing agent. FIIOC receives an asset-based fee with respect to each class. Each class pays a fee for transfer agent services, typesetting and printing and mailing of shareholder reports, excluding mailing of proxy statements. Effective February 1, 2020, the Board approved to change the fee from .145% to .142% for Investor Class, and from .065% to .064% for all other classes. For the period, transfer agent fees for each class were as follows:
| | Amount | % of Class-Level Average Net Assets |
| Initial Class | $1,809,390 | .06 |
| Service Class | 165,150 | .06 |
| Service Class 2 | 856,076 | .06 |
| Investor Class | 570,762 | .14 |
| | $3,401,378 | |
Accounting Fees. Fidelity Service Company, Inc. (FSC), an affiliate of the investment adviser, maintains the Fund's accounting records. The accounting fee is based on the level of average net assets for each month. For the period, the fees were equivalent to the following annual rates:
| | % of Average Net Assets |
| VIP Equity-Income Portfolio | .02 |
Brokerage Commissions. A portion of portfolio transactions were placed with brokerage firms which are affiliates of the investment adviser. Brokerage commissions are included in net realized gain (loss) and change in net unrealized appreciation (depreciation) in the Statement of Operations. The commissions paid to these affiliated firms were as follows:
| | Amount |
| VIP Equity-Income Portfolio | $70,611 |
Interfund Trades. Funds may purchase from or sell securities to other Fidelity Funds under procedures adopted by the Board. The procedures have been designed to ensure these interfund trades are executed in accordance with Rule 17a-7 of the 1940 Act. Interfund trades are included within the respective purchases and sales amounts shown in the Purchases and Sales of Investments note, and amounted to $424,225,575 and $232,335,978, respectively.
6. Committed Line of Credit.
Certain Funds participate with other funds managed by the investment adviser or an affiliate in a $4.25 billion credit facility (the "line of credit") to be utilized for temporary or emergency purposes to fund shareholder redemptions or for other short-term liquidity purposes. The participating funds have agreed to pay commitment fees on their pro-rata portion of the line of credit, which are reflected in Miscellaneous expenses on the Statement of Operations, and are as follows:
| | Amount |
| VIP Equity-Income Portfolio | $11,498 |
During the period, there were no borrowings on this line of credit.
7. Security Lending.
Funds lend portfolio securities from time to time in order to earn additional income. Lending agents are used, including National Financial Services (NFS), an affiliate of the investment adviser. Pursuant to a securities lending agreement, NFS will receive a fee, which is capped at 9.9% of a fund's daily lending revenue, for its services as lending agent. A fund may lend securities to certain qualified borrowers, including NFS. On the settlement date of the loan, a fund receives collateral (in the form of U.S. Treasury obligations, letters of credit and/or cash) against the loaned securities and maintains collateral in an amount not less than 100% of the market value of the loaned securities during the period of the loan. The market value of the loaned securities is determined at the close of business of a fund and any additional required collateral is delivered to a fund on the next business day. A fund or borrower may terminate the loan at any time, and if the borrower defaults on its obligation to return the securities loaned because of insolvency or other reasons, a fund may apply collateral received from the borrower against the obligation. A fund may experience delays and costs in recovering the securities loaned. Any cash collateral received is invested in the Fidelity Securities Lending Cash Central Fund. Any loaned securities are identified as such in the Schedule of Investments, and the value of loaned securities and cash collateral at period end, as applicable, are presented in the Statement of Assets and Liabilities. Security lending income represents the income earned on investing cash collateral, less rebates paid to borrowers and any lending agent fees associated with the loan, plus any premium payments received for lending certain types of securities. Security lending income is presented in the Statement of Operations as a component of income from Fidelity Central Funds. Affiliated security lending activity, if any, was as follows:
| | Total Security Lending Income Fees Paid to NFS | Security Lending Income From Securities Loaned to NFS | Value of Securities Loaned to NFS at Period End |
| VIP Equity-Income Portfolio | $7,663 | $– | $– |
8. Expense Reductions.
Commissions paid to certain brokers with whom the investment adviser, or its affiliates, places trades on behalf of the Fund include an amount in addition to trade execution, which may be rebated back to the Fund to offset certain expenses. This amount totaled $244,868 for the period. In addition, through arrangements with the Fund's custodian, credits realized as a result of certain uninvested cash balances were used to reduce the Fund's expenses. During the period, custodian credits reduced the Fund's expenses by $281.
In addition, during the period the investment adviser or an affiliate reimbursed and/or waived a portion of fund-level operating expenses in the amount of $21,278.
9. Distributions to Shareholders.
Distributions to shareholders of each class were as follows:
| | Year ended
December 31, 2020 | Year ended
December 31, 2019 |
| Distributions to shareholders | | |
| Initial Class | $183,966,364 | $256,722,074 |
| Service Class | 16,791,567 | 24,063,816 |
| Service Class 2 | 83,630,899 | 111,518,340 |
| Investor Class | 26,117,152 | 35,222,405 |
| Total | $310,505,982 | $427,526,635 |
10. Share Transactions.
Transactions for each class of shares were as follows:
| | Shares | Shares | Dollars | Dollars |
| | Year ended December 31, 2020 | Year ended December 31, 2019 | Year ended December 31, 2020 | Year ended December 31, 2019 |
| Initial Class | | | | |
| Shares sold | 8,721,428 | 3,636,451 | $182,159,954 | $80,164,788 |
| Reinvestment of distributions | 8,041,682 | 12,293,057 | 183,966,364 | 256,722,074 |
| Shares redeemed | (18,228,223) | (18,894,276) | (383,592,543) | (415,149,779) |
| Net increase (decrease) | (1,465,113) | (2,964,768) | $(17,466,225) | $(78,262,917) |
| Service Class | | | | |
| Shares sold | 392,690 | 433,489 | $8,161,348 | $9,487,821 |
| Reinvestment of distributions | 738,646 | 1,160,382 | 16,791,567 | 24,063,816 |
| Shares redeemed | (1,797,283) | (1,970,881) | (37,396,052) | (43,164,764) |
| Net increase (decrease) | (665,947) | (377,010) | $(12,443,137) | $(9,613,127) |
| Service Class 2 | | | | |
| Shares sold | 11,639,815 | 5,892,036 | $230,966,893 | $125,416,664 |
| Reinvestment of distributions | 3,766,962 | 5,500,426 | 83,630,899 | 111,518,340 |
| Shares redeemed | (9,896,829) | (9,904,795) | (203,737,296) | (211,330,285) |
| Net increase (decrease) | 5,509,948 | 1,487,667 | $110,860,496 | $25,604,719 |
| Investor Class | | | | |
| Shares sold | 2,667,918 | 1,415,515 | $55,485,142 | $31,025,170 |
| Reinvestment of distributions | 1,148,723 | 1,696,863 | 26,117,152 | 35,222,405 |
| Shares redeemed | (3,305,655) | (2,929,696) | (67,192,189) | (64,581,667) |
| Net increase (decrease) | 510,986 | 182,682 | $14,410,105 | $1,665,908 |
11. Other.
The Fund's organizational documents provide former and current trustees and officers with a limited indemnification against liabilities arising in connection with the performance of their duties to the Fund. In the normal course of business, the Fund may also enter into contracts that provide general indemnifications. The Fund's maximum exposure under these arrangements is unknown as this would be dependent on future claims that may be made against the Fund. The risk of material loss from such claims is considered remote.
At the end of the period, the investment adviser or its affiliates were the owners of record of 15% of the total outstanding shares of the Fund and one otherwise unaffiliated shareholder was the owner of record of 18% of the total outstanding shares of the Fund.
12. Coronavirus (COVID-19) Pandemic.
An outbreak of COVID-19 first detected in China during December 2019 has since spread globally and was declared a pandemic by the World Health Organization during March 2020. Developments that disrupt global economies and financial markets, such as the COVID-19 pandemic, may magnify factors that affect the Fund's performance.
Report of Independent Registered Public Accounting Firm
To the Board of Trustees of Variable Insurance Products Fund and Shareholders of VIP Equity-Income Portfolio℠
Opinion on the Financial Statements
We have audited the accompanying statement of assets and liabilities, including the schedule of investments, of VIP Equity-Income Portfolio (one of the funds constituting Variable Insurance Products Fund, referred to hereafter as the “Fund”) as of December 31, 2020, the related statement of operations for the year ended December 31, 2020, the statement of changes in net assets for each of the two years in the period ended December 31, 2020, including the related notes, and the financial highlights for each of the five years in the period ended December 31, 2020 (collectively referred to as the “financial statements”). In our opinion, the financial statements present fairly, in all material respects, the financial position of the Fund as of December 31, 2020, the results of its operations for the year then ended, the changes in its net assets for each of the two years in the period ended December 31, 2020 and the financial highlights for each of the five years in the period ended December 31, 2020 in conformity with accounting principles generally accepted in the United States of America.
Basis for Opinion
These financial statements are the responsibility of the Fund’s management. Our responsibility is to express an opinion on the Fund’s financial statements based on our audits. We are a public accounting firm registered with the Public Company Accounting Oversight Board (United States) (PCAOB) and are required to be independent with respect to the Fund in accordance with the U.S. federal securities laws and the applicable rules and regulations of the Securities and Exchange Commission and the PCAOB.
We conducted our audits of these financial statements in accordance with the standards of the PCAOB. Those standards require that we plan and perform the audit to obtain reasonable assurance about whether the financial statements are free of material misstatement, whether due to error or fraud.
Our audits included performing procedures to assess the risks of material misstatement of the financial statements, whether due to error or fraud, and performing procedures that respond to those risks. Such procedures included examining, on a test basis, evidence regarding the amounts and disclosures in the financial statements. Our audits also included evaluating the accounting principles used and significant estimates made by management, as well as evaluating the overall presentation of the financial statements. Our procedures included confirmation of securities owned as of December 31, 2020 by correspondence with the custodian and issuers of privately offered securities. We believe that our audits provide a reasonable basis for our opinion.
/s/ PricewaterhouseCoopers LLP
Boston, Massachusetts
February 11, 2021
We have served as the auditor of one or more investment companies in the Fidelity group of funds since 1932.
Trustees and Officers
The Trustees, Members of the Advisory Board (if any), and officers of the trust and fund, as applicable, are listed below. The Board of Trustees governs the fund and is responsible for protecting the interests of shareholders. The Trustees are experienced executives who meet periodically throughout the year to oversee the fund's activities, review contractual arrangements with companies that provide services to the fund, oversee management of the risks associated with such activities and contractual arrangements, and review the fund's performance. Except for Jonathan Chiel, each of the Trustees oversees 305 funds. Mr. Chiel oversees 176 funds.
The Trustees hold office without limit in time except that (a) any Trustee may resign; (b) any Trustee may be removed by written instrument, signed by at least two-thirds of the number of Trustees prior to such removal; (c) any Trustee who requests to be retired or who has become incapacitated by illness or injury may be retired by written instrument signed by a majority of the other Trustees; and (d) any Trustee may be removed at any special meeting of shareholders by a two-thirds vote of the outstanding voting securities of the trust. Each Trustee who is not an interested person (as defined in the 1940 Act) of the trust and the fund is referred to herein as an Independent Trustee. Each Independent Trustee shall retire not later than the last day of the calendar year in which his or her 75th birthday occurs. The Independent Trustees may waive this mandatory retirement age policy with respect to individual Trustees. Officers and Advisory Board Members hold office without limit in time, except that any officer or Advisory Board Member may resign or may be removed by a vote of a majority of the Trustees at any regular meeting or any special meeting of the Trustees. Except as indicated, each individual has held the office shown or other offices in the same company for the past five years.
The fund’s Statement of Additional Information (SAI) includes more information about the Trustees. To request a free copy, call Fidelity at 1-877-208-0098.
Experience, Skills, Attributes, and Qualifications of the Trustees. The Governance and Nominating Committee has adopted a statement of policy that describes the experience, qualifications, attributes, and skills that are necessary and desirable for potential Independent Trustee candidates (Statement of Policy). The Board believes that each Trustee satisfied at the time he or she was initially elected or appointed a Trustee, and continues to satisfy, the standards contemplated by the Statement of Policy. The Governance and Nominating Committee also engages professional search firms to help identify potential Independent Trustee candidates who have the experience, qualifications, attributes, and skills consistent with the Statement of Policy. From time to time, additional criteria based on the composition and skills of the current Independent Trustees, as well as experience or skills that may be appropriate in light of future changes to board composition, business conditions, and regulatory or other developments, have also been considered by the professional search firms and the Governance and Nominating Committee. In addition, the Board takes into account the Trustees' commitment and participation in Board and committee meetings, as well as their leadership of standing and ad hoc committees throughout their tenure.
In determining that a particular Trustee was and continues to be qualified to serve as a Trustee, the Board has considered a variety of criteria, none of which, in isolation, was controlling. The Board believes that, collectively, the Trustees have balanced and diverse experience, qualifications, attributes, and skills, which allow the Board to operate effectively in governing the fund and protecting the interests of shareholders. Information about the specific experience, skills, attributes, and qualifications of each Trustee, which in each case led to the Board's conclusion that the Trustee should serve (or continue to serve) as a trustee of the fund, is provided below.
Board Structure and Oversight Function. Robert A. Lawrence is an interested person and currently serves as Acting Chairman. The Trustees have determined that an interested Chairman is appropriate and benefits shareholders because an interested Chairman has a personal and professional stake in the quality and continuity of services provided to the fund. Independent Trustees exercise their informed business judgment to appoint an individual of their choosing to serve as Chairman, regardless of whether the Trustee happens to be independent or a member of management. The Independent Trustees have determined that they can act independently and effectively without having an Independent Trustee serve as Chairman and that a key structural component for assuring that they are in a position to do so is for the Independent Trustees to constitute a substantial majority for the Board. The Independent Trustees also regularly meet in executive session. David M. Thomas serves as Lead Independent Trustee and as such (i) acts as a liaison between the Independent Trustees and management with respect to matters important to the Independent Trustees and (ii) with management prepares agendas for Board meetings.
Fidelity® funds are overseen by different Boards of Trustees. The fund's Board oversees Fidelity's high income and certain equity funds, and other Boards oversee Fidelity's investment-grade bond, money market, asset allocation, and other equity funds. The asset allocation funds may invest in Fidelity® funds overseen by the fund's Board. The use of separate Boards, each with its own committee structure, allows the Trustees of each group of Fidelity® funds to focus on the unique issues of the funds they oversee, including common research, investment, and operational issues. On occasion, the separate Boards establish joint committees to address issues of overlapping consequences for the Fidelity® funds overseen by each Board.
The Trustees operate using a system of committees to facilitate the timely and efficient consideration of all matters of importance to the Trustees, the fund, and fund shareholders and to facilitate compliance with legal and regulatory requirements and oversight of the fund's activities and associated risks. The Board, acting through its committees, has charged FMR and its affiliates with (i) identifying events or circumstances the occurrence of which could have demonstrably adverse effects on the fund's business and/or reputation; (ii) implementing processes and controls to lessen the possibility that such events or circumstances occur or to mitigate the effects of such events or circumstances if they do occur; and (iii) creating and maintaining a system designed to evaluate continuously business and market conditions in order to facilitate the identification and implementation processes described in (i) and (ii) above. Because the day-to-day operations and activities of the fund are carried out by or through FMR, its affiliates, and other service providers, the fund's exposure to risks is mitigated but not eliminated by the processes overseen by the Trustees. While each of the Board's committees has responsibility for overseeing different aspects of the fund's activities, oversight is exercised primarily through the Operations, Audit, and Compliance Committees. Appropriate personnel, including but not limited to the fund's Chief Compliance Officer (CCO), FMR's internal auditor, the independent accountants, the fund's Treasurer and portfolio management personnel, make periodic reports to the Board's committees, as appropriate, including an annual review of Fidelity's risk management program for the Fidelity® funds. The responsibilities of each standing committee, including their oversight responsibilities, are described further under "Standing Committees of the Trustees."
Interested Trustees*:
Correspondence intended for a Trustee who is an interested person may be sent to Fidelity Investments, 245 Summer Street, Boston, Massachusetts 02210.
Name, Year of Birth; Principal Occupations and Other Relevant Experience+
Jonathan Chiel (1957)
Year of Election or Appointment: 2016
Trustee
Mr. Chiel also serves as Trustee of other Fidelity® funds. Mr. Chiel is Executive Vice President and General Counsel for FMR LLC (diversified financial services company, 2012-present). Previously, Mr. Chiel served as general counsel (2004-2012) and senior vice president and deputy general counsel (2000-2004) for John Hancock Financial Services; a partner with Choate, Hall & Stewart (1996-2000) (law firm); and an Assistant United States Attorney for the United States Attorney’s Office of the District of Massachusetts (1986-95), including Chief of the Criminal Division (1993-1995). Mr. Chiel is a director on the boards of the Boston Bar Foundation and the Maimonides School.
Bettina Doulton (1964)
Year of Election or Appointment: 2021
Trustee
Ms. Doulton also serves as Trustee of other Fidelity® funds. Prior to her retirement, Ms. Doulton served in a variety of positions at Fidelity Investments, including as a managing director of research (2006-2007), portfolio manager to certain Fidelity® funds (1993-2005), equity analyst and portfolio assistant (1990-1993), and research assistant (1987-1990). Ms. Doulton currently owns and operates Phi Builders + Architects and Cellardoor Winery. Previously, Ms. Doulton served as a member of the Board of Brown Capital Management, LLC (2013-2018).
Robert A. Lawrence (1952)
Year of Election or Appointment: 2020
Trustee
Acting Chairman of the Board of Trustees
Mr. Lawrence also serves as Trustee of other funds. Previously, Mr. Lawrence served as a Member of the Advisory Board of certain funds. Prior to his retirement in 2008, Mr. Lawrence served as Vice President of certain Fidelity® funds (2006-2008), Senior Vice President, Head of High Income Division of Fidelity Management & Research Company (investment adviser firm, 2006-2008), and President of Fidelity Strategic Investments (investment adviser firm, 2002-2005).
* Determined to be an “Interested Trustee” by virtue of, among other things, his or her affiliation with the trust or various entities under common control with FMR.
+ The information includes the Trustee's principal occupation during the last five years and other information relating to the experience, attributes, and skills relevant to the Trustee's qualifications to serve as a Trustee, which led to the conclusion that the Trustee should serve as a Trustee for the fund.
Independent Trustees:
Correspondence intended for an Independent Trustee may be sent to Fidelity Investments, P.O. Box 55235, Boston, Massachusetts 02205-5235.
Name, Year of Birth; Principal Occupations and Other Relevant Experience+
Dennis J. Dirks (1948)
Year of Election or Appointment: 2005
Trustee
Mr. Dirks also serves as Trustee of other Fidelity® funds. Prior to his retirement in May 2003, Mr. Dirks served as Chief Operating Officer and as a member of the Board of The Depository Trust & Clearing Corporation (financial markets infrastructure), President, Chief Operating Officer and a member of the Board of The Depository Trust Company (DTC), President and a member of the Board of the National Securities Clearing Corporation (NSCC), Chief Executive Officer and a member of the Board of the Government Securities Clearing Corporation and Chief Executive Officer and a member of the Board of the Mortgage-Backed Securities Clearing Corporation. Mr. Dirks currently serves as a member of the Finance Committee (2016-present) and Board (2017-present) and is Treasurer (2018-present) of the Asolo Repertory Theatre.
Donald F. Donahue (1950)
Year of Election or Appointment: 2018
Trustee
Mr. Donahue also serves as Trustee of other Fidelity® funds. Mr. Donahue serves as President and Chief Executive Officer of Miranda Partners, LLC (risk consulting for the financial services industry, 2012-present). Previously, Mr. Donahue served as Chief Executive Officer (2006-2012), Chief Operating Officer (2003-2006) and Managing Director, Customer Marketing and Development (1999-2003) of The Depository Trust & Clearing Corporation (financial markets infrastructure). Mr. Donahue currently serves as a member (2007-present) and Co-Chairman (2016-present) of the Board of United Way of New York, a member of the Board of NYC Leadership Academy (2012-present) and a member of the Board of Advisors of Ripple Labs, Inc. (financial services, 2015-present). Mr. Donahue previously served as a member of the Advisory Board of certain Fidelity® funds (2015-2018).
Vicki L. Fuller (1957)
Year of Election or Appointment: 2020
Trustee
Ms. Fuller also serves as Trustee of other Fidelity® funds. Previously, Ms. Fuller served as a member of the Advisory Board of certain Fidelity® funds (2018-2020), Chief Investment Officer of the New York State Common Retirement Fund (2012-2018) and held a variety of positions at AllianceBernstein L.P. (global asset management, 1985-2012), including Managing Director (2006-2012) and Senior Vice President and Senior Portfolio Manager (2001-2006). Ms. Fuller currently serves as a member of the Board, Audit Committee and Nominating and Governance Committee of The Williams Companies, Inc. (natural gas infrastructure, 2018-present), as a member of the Board, Audit Committee and Nominating and Governance Committee of two Blackstone business development companies (2020-present) and as a member of the Board of Treliant, LLC (consulting, 2019-present).
Patricia L. Kampling (1959)
Year of Election or Appointment: 2020
Trustee
Ms. Kampling also serves as Trustee of other Fidelity® funds. Prior to her retirement, Ms. Kampling served as Chairman of the Board and Chief Executive Officer (2012-2019), President and Chief Operating Officer (2011-2012) and Executive Vice President and Chief Financial Officer (2010-2011) of Alliant Energy Corporation. Ms. Kampling currently serves as a member of the Board, Compensation Committee and Executive Committee and as Chair of the Audit Committee of Briggs & Stratton Corporation (manufacturing, 2011-present) and as a member of the Board, Audit, Finance and Risk Committee and Safety, Environmental, Technology and Operations Committee of American Water Works Company, Inc. (utilities company, 2019-present). In addition, Ms. Kampling currently serves as a member of the Board of the Nature Conservancy, Wisconsin Chapter (2019-present). Previously, Ms. Kampling served as a Member of the Advisory Board of certain Fidelity® funds (2020), a member of the Board of Interstate Power and Light Company (2012-2019) and Wisconsin Power and Light Company (2012-2019) (each a subsidiary of Alliant Energy Corporation) and as a member of the Board and Workforce Development Committee of the Business Roundtable (2018-2019).
Thomas A. Kennedy (1955)
Year of Election or Appointment: 2021
Trustee
Mr. Kennedy also serves as Trustee of other Fidelity® funds. Previously, Mr. Kennedy served as a Member of the Advisory Board of certain Fidelity® funds (2020) and held a variety of positions at Raytheon Company (aerospace and defense, 1983-2020), including Chairman and Chief Executive Officer (2014-2020) and Executive Vice President and Chief Operating Officer (2013-2014). Mr. Kennedy currently serves as Executive Chairman of the Board of Directors of Raytheon Technologies Corporation (aerospace and defense, 2020-present). He is also a member of the Rutgers School of Engineering Industry Advisory Board (2011-present) and a member of the UCLA Engineering Dean’s Executive Board (2016-present).
Garnett A. Smith (1947)
Year of Election or Appointment: 2018
Trustee
Mr. Smith also serves as Trustee of other Fidelity® funds. Prior to his retirement, Mr. Smith served as Chairman and Chief Executive Officer (1990-1997) and President (1986-1990) of Inbrand Corp. (manufacturer of personal absorbent products). Prior to his employment with Inbrand Corp., he was employed by a retail fabric chain and North Carolina National Bank (now Bank of America). Mr. Smith previously served as a member of the Advisory Board of certain Fidelity® funds (2012-2013).
David M. Thomas (1949)
Year of Election or Appointment: 2008
Trustee
Lead Independent Trustee
Mr. Thomas also serves as Trustee of other Fidelity® funds. Previously, Mr. Thomas served as Executive Chairman (2005-2006) and Chairman and Chief Executive Officer (2000-2005) of IMS Health, Inc. (pharmaceutical and healthcare information solutions). Mr. Thomas currently serves as Non-Executive Chairman of the Board of Fortune Brands Home and Security (home and security products, 2011-present), and a member of the Board (2004-present) and Presiding Director (2013-present) of Interpublic Group of Companies, Inc. (marketing communication).
Susan Tomasky (1953)
Year of Election or Appointment: 2020
Trustee
Ms. Tomasky also serves as Trustee of other Fidelity® funds. Prior to her retirement, Ms. Tomasky served in various executive officer positions at American Electric Power Company, Inc. (1998-2011), including most recently as President of AEP Transmission (2007-2011). Ms. Tomasky currently serves as a member of the Board and Sustainability Committee and as Chair of the Audit Committee of Marathon Petroleum Corporation (2018-present) and as a member of the Board, Corporate Governance Committee and Organization and Compensation Committee and as Chair of the Audit Committee of Public Service Enterprise Group, Inc. (utilities company, 2012-present). In addition, Ms. Tomasky currently serves as a member of the Board of the Columbus Regional Airport Authority (2007-present), as a member of the Board of the Royal Shakespeare Company – America (2009-present), as a member of the Board of the Columbus Association for the Performing Arts (2011-present) and as a member of the Board of Kenyon College (2016-present). Previously, Ms. Tomasky served as a Member of the Advisory Board of certain Fidelity® funds (2020), a member of the Board (2011-2019) and as Lead Independent Director (2015-2018) of Andeavor Corporation (previously Tesoro Corporation) (independent oil refiner and marketer) and as a member of the Board of Summit Midstream Partners LP (energy, 2012-2018).
Michael E. Wiley (1950)
Year of Election or Appointment: 2020
Trustee
Mr. Wiley also serves as Trustee of other Fidelity® funds. Previously, Mr. Wiley served as a member of the Advisory Board of certain Fidelity® funds (2018-2020), Chairman, President and CEO of Baker Hughes, Inc. (oilfield services, 2000-2004). Mr. Wiley also previously served as a member of the Board of Andeavor Corporation (independent oil refiner and marketer, 2005-2018), a member of the Board of Andeavor Logistics LP (natural resources logistics, 2015-2018) and a member of the Board of High Point Resources (exploration and production, 2005-2020).
+ The information includes the Trustee's principal occupation during the last five years and other information relating to the experience, attributes, and skills relevant to the Trustee's qualifications to serve as a Trustee, which led to the conclusion that the Trustee should serve as a Trustee for the fund.
Advisory Board Members and Officers:
Correspondence intended for a Member of the Advisory Board (if any) may be sent to Fidelity Investments, P.O. Box 55235, Boston, Massachusetts 02205-5235. Correspondence intended for an officer or Peter S. Lynch may be sent to Fidelity Investments, 245 Summer Street, Boston, Massachusetts 02210. Officers appear below in alphabetical order.
Name, Year of Birth; Principal Occupation
Ned C. Lautenbach (1944)
Year of Election or Appointment: 2021
Member of the Advisory Board
Mr. Lautenbach also serves as a Member of the Advisory Board of other Fidelity® funds. Mr. Lautenbach currently serves as Chair of the Board of Governors, State University System of Florida (2013-present) and is a member of the Council on Foreign Relations (1994-present). He is also a member and has in the past served as Chairman of the Board of Directors of Artis-Naples (2012-present). Previously, Mr. Lautenbach served as a Trustee of certain Fidelity® funds (2000-2020) and a member and then Lead Director of the Board of Directors of Eaton Corporation (diversified industrial, 1997-2016). He was also a Partner at Clayton, Dubilier & Rice, LLC (private equity investment, 1998-2010); as well as Director of Sony Corporation (2006-2007). In addition, Mr. Lautenbach had a 30-year career with IBM (technology company), during which time he served as Senior Vice President and as a member of the Corporate Executive Committee (1968-1998).
Peter S. Lynch (1944)
Year of Election or Appointment: 2003
Member of the Advisory Board
Mr. Lynch also serves as a Member of the Advisory Board of other Fidelity® funds. Mr. Lynch is Vice Chairman and a Director of Fidelity Management & Research Company LLC (investment adviser firm). In addition, Mr. Lynch serves as a Trustee of Boston College and as the Chairman of the Inner-City Scholarship Fund. Previously, Mr. Lynch served as Vice Chairman and a Director of FMR Co., Inc. (investment adviser firm) and on the Special Olympics International Board of Directors (1997-2006).
Craig S. Brown (1977)
Year of Election or Appointment: 2019
Assistant Treasurer
Mr. Brown also serves as Assistant Treasurer of other funds. Mr. Brown is an employee of Fidelity Investments (2013-present).
John J. Burke III (1964)
Year of Election or Appointment: 2018
Chief Financial Officer
Mr. Burke also serves as Chief Financial Officer of other funds. Mr. Burke serves as Head of Investment Operations for Fidelity Fund and Investment Operations (2018-present) and is an employee of Fidelity Investments (1998-present). Previously Mr. Burke served as head of Asset Management Investment Operations (2012-2018).
William C. Coffey (1969)
Year of Election or Appointment: 2019
Assistant Secretary
Mr. Coffey also serves as Assistant Secretary of other funds. He is Senior Vice President and Deputy General Counsel of FMR LLC (diversified financial services company, 2010-present), and is an employee of Fidelity Investments. Previously, Mr. Coffey served as Secretary and CLO of certain funds (2018-2019); CLO, Secretary, and Senior Vice President of Fidelity Management & Research Company and FMR Co., Inc. (investment adviser firms, 2018-2019); Secretary of Fidelity SelectCo, LLC and Fidelity Investments Money Management, Inc. (investment adviser firms, 2018-2019); CLO of Fidelity Management & Research (Hong Kong) Limited, FMR Investment Management (UK) Limited, and Fidelity Management & Research (Japan) Limited (investment adviser firms, 2018-2019); and Assistant Secretary of certain funds (2009-2018).
Timothy M. Cohen (1969)
Year of Election or Appointment: 2018
Vice President
Mr. Cohen also serves as Vice President of other funds. Mr. Cohen serves as Co-Head of Equity (2018-present), a Director of Fidelity Management & Research (Japan) Limited (investment adviser firm, 2016-present), and is an employee of Fidelity Investments. Previously, Mr. Cohen served as Executive Vice President of Fidelity SelectCo, LLC (2019), Head of Global Equity Research (2016-2018), Chief Investment Officer - Equity and a Director of Fidelity Management & Research (U.K.) Inc. (investment adviser firm, 2013-2015) and as a Director of Fidelity Management & Research (Hong Kong) Limited (investment adviser firm, 2017).
Jonathan Davis (1968)
Year of Election or Appointment: 2010
Assistant Treasurer
Mr. Davis also serves as Assistant Treasurer of other funds. Mr. Davis serves as Assistant Treasurer of FMR Capital, Inc. (2017-present) and is an employee of Fidelity Investments. Previously, Mr. Davis served as Vice President and Associate General Counsel of FMR LLC (diversified financial services company, 2003-2010).
Laura M. Del Prato (1964)
Year of Election or Appointment: 2018
Assistant Treasurer
Ms. Del Prato also serves as an officer of other funds. Ms. Del Prato is an employee of Fidelity Investments (2017-present). Previously, Ms. Del Prato served as President and Treasurer of The North Carolina Capital Management Trust: Cash Portfolio and Term Portfolio (2018-2020). Prior to joining Fidelity Investments, Ms. Del Prato served as a Managing Director and Treasurer of the JPMorgan Mutual Funds (2014-2017). Prior to JPMorgan, Ms. Del Prato served as a partner at Cohen Fund Audit Services (accounting firm, 2012-2013) and KPMG LLP (accounting firm, 2004-2012).
Colm A. Hogan (1973)
Year of Election or Appointment: 2020
Assistant Treasurer
Mr. Hogan also serves as an officer of other funds. Mr. Hogan serves as Assistant Treasurer of FMR Capital, Inc. (2017-present) and is an employee of Fidelity Investments (2005-present). Previously, Mr. Hogan served as Deputy Treasurer of certain Fidelity® funds (2016-2020) and Assistant Treasurer of certain Fidelity® funds (2016-2018).
Pamela R. Holding (1964)
Year of Election or Appointment: 2018
Vice President
Ms. Holding also serves as Vice President of other funds. Ms. Holding serves as Co-Head of Equity (2018-present) and is an employee of Fidelity Investments (2013-present). Previously, Ms. Holding served as Executive Vice President of Fidelity SelectCo, LLC (2019) and as Chief Investment Officer of Fidelity Institutional Asset Management (2013-2018).
Cynthia Lo Bessette (1969)
Year of Election or Appointment: 2019
Secretary and Chief Legal Officer (CLO)
Ms. Lo Bessette also serves as an officer of other funds. Ms. Lo Bessette serves as CLO, Secretary, and Senior Vice President of Fidelity Management & Research Company LLC (investment adviser firm, 2019-present); and CLO of Fidelity Management & Research (Hong Kong) Limited, FMR Investment Management (UK) Limited, and Fidelity Management & Research (Japan) Limited (investment adviser firms, 2019-present). She is a Senior Vice President and Deputy General Counsel of FMR LLC (diversified financial services company, 2019-present), and is an employee of Fidelity Investments. Previously, Ms. Lo Bessette served as CLO, Secretary, and Senior Vice President of FMR Co., Inc. (investment adviser firm, 2019); Secretary of Fidelity SelectCo, LLC and Fidelity Investments Money Management, Inc. (investment adviser firms, 2019). Prior to joining Fidelity Investments, Ms. Lo Bessette was Executive Vice President, General Counsel (2016-2019) and Senior Vice President, Deputy General Counsel (2015-2016) of OppenheimerFunds (investment management company) and Deputy Chief Legal Officer (2013-2015) of Jennison Associates LLC (investment adviser firm).
Chris Maher (1972)
Year of Election or Appointment: 2020
Deputy Treasurer
Mr. Maher also serves as an officer of other funds. Mr. Maher serves as Assistant Treasurer of FMR Capital, Inc. (2017-present), and is an employee of Fidelity Investments (2008-present). Previously, Mr. Maher served as Assistant Treasurer of certain funds (2013-2020); Vice President of Asset Management Compliance (2013), Vice President of the Program Management Group of FMR (investment adviser firm, 2010-2013), and Vice President of Valuation Oversight (2008-2010).
Jason P. Pogorelec (1975)
Year of Election or Appointment: 2020
Chief Compliance Officer
Mr. Pogorelec also serves as Chief Compliance Officer of other funds. Mr. Pogorelec is a senior Vice President of Asset Management Compliance for Fidelity Investments and is an employee of Fidelity Investments (2006-present). Previously, Mr. Pogorelec served as Vice President, Associate General Counsel for Fidelity Investments (2010-2020) and Assistant Secretary of certain Fidelity funds (2015-2020).
Brett Segaloff (1972)
Year of Election or Appointment: 2021
Anti-Money Laundering (AML) Officer
Mr. Segaloff also serves as an AML Officer of other funds and other related entities. He is Director, Anti-Money Laundering (2007-present) of FMR LLC (diversified financial services company) and is an employee of Fidelity Investments (1996-present).
Stacie M. Smith (1974)
Year of Election or Appointment: 2016
President and Treasurer
Ms. Smith also serves as an officer of other funds. Ms. Smith serves as Assistant Treasurer of FMR Capital, Inc. (2017-present), is an employee of Fidelity Investments (2009-present), and has served in other fund officer roles. Prior to joining Fidelity Investments, Ms. Smith served as Senior Audit Manager of Ernst & Young LLP (accounting firm, 1996-2009). Previously, Ms. Smith served as Assistant Treasurer (2013-2019) and Deputy Treasurer (2013-2016) of certain Fidelity® funds.
Marc L. Spector (1972)
Year of Election or Appointment: 2016
Assistant Treasurer
Mr. Spector also serves as an officer of other funds. Mr. Spector serves as Assistant Treasurer of FMR Capital, Inc. (2017-present) and is an employee of Fidelity Investments (2016-present). Prior to joining Fidelity Investments, Mr. Spector served as Director at the Siegfried Group (accounting firm, 2013-2016), and prior to Siegfried Group as audit senior manager at Deloitte & Touche LLP (accounting firm, 2005-2013).
Jim Wegmann (1979)
Year of Election or Appointment: 2019
Assistant Treasurer
Mr. Wegmann also serves as Assistant Treasurer of other funds. Mr. Wegmann is an employee of Fidelity Investments (2011-present).
Shareholder Expense Example
As a shareholder, you incur two types of costs: (1) transaction costs, which may include sales charges (loads) on purchase payments or redemption proceeds, as applicable and (2) ongoing costs, which generally include management fees, distribution and/or service (12b-1) fees and other Fund expenses. This Example is intended to help you understand your ongoing costs (in dollars) of investing in a fund and to compare these costs with the ongoing costs of investing in other mutual funds.
The Example is based on an investment of $1,000 invested at the beginning of the period and held for the entire period (July 1, 2020 to December 31, 2020).
Actual Expenses
The first line of the accompanying table provides information about actual account values and actual expenses. You may use the information in this line, together with the amount you invested, to estimate the expenses that you paid over the period. Simply divide your account value by $1,000.00 (for example, an $8,600 account value divided by $1,000.00 = 8.6), then multiply the result by the number in the first line for a class/Fund under the heading entitled "Expenses Paid During Period" to estimate the expenses you paid on your account during this period. If any fund is a shareholder of any underlying mutual funds or exchange-traded funds (ETFs) (the Underlying Funds), such fund indirectly bears its proportional share of the expenses of the Underlying Funds in addition to the direct expenses incurred presented in the table. These fees and expenses are not included in the annualized expense ratio used to calculate the expense estimate in the table below. The estimate of expenses does not include any fees or other expenses of any variable annuity or variable life insurance product. If they were, the estimate of expenses you paid during the period would be higher, and your ending account value would be lower.
Hypothetical Example for Comparison Purposes
The second line of the accompanying table provides information about hypothetical account values and hypothetical expenses based on the actual expense ratio and an assumed rate of return of 5% per year before expenses, which is not the actual return. The hypothetical account values and expenses may not be used to estimate the actual ending account balance or expenses you paid for the period. You may use this information to compare the ongoing costs of investing in the Fund and other funds. To do so, compare this 5% hypothetical example with the 5% hypothetical examples that appear in the shareholder reports of the other funds. If any fund is a shareholder of any Underlying Funds, such fund indirectly bears its proportional share of the expenses of the Underlying Funds in addition to the direct expenses as presented in the table. These fees and expenses are not included in the annualized expense ratio used to calculate the expense estimate in the table below. The estimate of expenses does not include any fees or other expenses of any variable annuity or variable life insurance product. If they were, the estimate of expenses you paid during the period would be higher, and your ending account value would be lower.
Please note that the expenses shown in the table are meant to highlight your ongoing costs only and do not reflect any transaction costs. Therefore, the second line of the table is useful in comparing ongoing costs only, and will not help you determine the relative total costs of owning different funds.
| | Annualized Expense Ratio-A | Beginning
Account Value
July 1, 2020 | Ending
Account Value
December 31, 2020 | Expenses Paid
During Period-B
July 1, 2020
to December 31, 2020 |
| VIP Equity-Income Portfolio | | | | |
| Initial Class | .52% | | | |
| Actual | | $1,000.00 | $1,217.60 | $2.90 |
| Hypothetical-C | | $1,000.00 | $1,022.52 | $2.64 |
| Service Class | .62% | | | |
| Actual | | $1,000.00 | $1,216.50 | $3.45 |
| Hypothetical-C | | $1,000.00 | $1,022.02 | $3.15 |
| Service Class 2 | .77% | | | |
| Actual | | $1,000.00 | $1,216.00 | $4.29 |
| Hypothetical-C | | $1,000.00 | $1,021.27 | $3.91 |
| Investor Class | .60% | | | |
| Actual | | $1,000.00 | $1,216.80 | $3.34 |
| Hypothetical-C | | $1,000.00 | $1,022.12 | $3.05 |
A Annualized expense ratio reflects expenses net of applicable fee waivers.
B Expenses are equal to the annualized expense ratio, multiplied by the average account value over the period, multiplied by 184/ 366 (to reflect the one-half year period). The fees and expenses of any Underlying Funds are not included in each annualized expense ratio.
C 5% return per year before expenses
Distributions (Unaudited)
The Board of Trustees of VIP Equity-Income Portfolio voted to pay to shareholders of record at the opening of business on record date, the following distributions per share derived from capital gains realized from sales of portfolio securities, and dividends derived from net investment income:
| | Pay Date | Record Date | Dividends | Capital Gains |
| VIP Equity-Income Portfolio | | | | |
| Initial Class | 02/05/21 | 02/05/21 | $0.067 | $0.724 |
| Service Class | 02/05/21 | 02/05/21 | $0.063 | $0.724 |
| Service Class 2 | 02/05/21 | 02/05/21 | $0.058 | $0.724 |
| Investor Class | 02/05/21 | 02/05/21 | $0.064 | $0.724 |
|
The fund hereby designates as a capital gain dividend with respect to the taxable year ended December 31, 2020, $166,676,262, or, if subsequently determined to be different, the net capital gain of such year.
Initial Class, Service Class, Service Class 2, and Investor Class designate 100% of the dividends distributed during the fiscal year as qualifying for the dividends–received deduction for corporate shareholders.
Proxy Voting Results
A special meeting of shareholders was held on June 9, 2020. The results of votes taken among shareholders on the proposals before them are reported below. Each vote reported represents one dollar of net asset value held on the record date for the meeting.
PROPOSAL 1
To elect a Board of Trustees.
| | # of
Votes | % of
Votes |
| Dennis J. Dirks |
| Affirmative | 11,099,447,424.890 | 95.490 |
| Withheld | 524,241,637.164 | 4.510 |
| TOTAL | 11,623,689,062.054 | 100.000 |
| Donald F. Donahue |
| Affirmative | 11,111,963,232.945 | 95.598 |
| Withheld | 511,725,829.109 | 4.402 |
| TOTAL | 11,623,689,062.054 | 100.000 |
| Bettina Doulton |
| Affirmative | 11,132,379,469.922 | 95.773 |
| Withheld | 491,309,592.132 | 4.227 |
| TOTAL | 11,623,689,062.054 | 100.000 |
| Vicki L. Fuller |
| Affirmative | 11,132,346,192.263 | 95.773 |
| Withheld | 491,342,869.791 | 4.227 |
| TOTAL | 11,623,689,062.054 | 100.000 |
| Patricia L. Kampling |
| Affirmative | 11,141,812,359.694 | 95.854 |
| Withheld | 481,876,702.360 | 4.146 |
| TOTAL | 11,623,689,062.054 | 100.000 |
| Alan J. Lacy |
| Affirmative | 11,081,103,173.144 | 95.332 |
| Withheld | 542,585,888.910 | 4.668 |
| TOTAL | 11,623,689,062.054 | 100.000 |
| Ned C. Lautenbach |
| Affirmative | 11,051,092,644.521 | 95.074 |
| Withheld | 572,596,417.533 | 4.926 |
| TOTAL | 11,623,689,062.054 | 100.000 |
| Robert A. Lawrence |
| Affirmative | 11,100,774,895.497 | 95.501 |
| Withheld | 522,914,166.556 | 4.499 |
| TOTAL | 11,623,689,062.054 | 100.000 |
| Joseph Mauriello |
| Affirmative | 11,070,909,380.371 | 95.244 |
| Withheld | 552,779,681.683 | 4.756 |
| TOTAL | 11,623,689,062.054 | 100.000 |
| Cornelia M. Small |
| Affirmative | 11,101,337,946.609 | 95.506 |
| Withheld | 522,351,115.445 | 4.494 |
| TOTAL | 11,623,689,062.054 | 100.000 |
| Garnett A. Smith |
| Affirmative | 11,082,555,490.179 | 95.345 |
| Withheld | 541,133,571.875 | 4.655 |
| TOTAL | 11,623,689,062.054 | 100.000 |
| David M. Thomas |
| Affirmative | 11,094,352,794.165 | 95.446 |
| Withheld | 529,336,267.889 | 4.554 |
| TOTAL | 11,623,689,062.054 | 100.000 |
| Susan Tomasky |
| Affirmative | 11,124,148,109.894 | 95.702 |
| Withheld | 499,540,952.160 | 4.298 |
| TOTAL | 11,623,689,062.054 | 100.000 |
| Michael E. Wiley |
| Affirmative | 11,096,957,446.084 | 95.468 |
| Withheld | 526,731,615.970 | 4.532 |
| TOTAL | 11,623,689,062.054 | 100.000 |
PROPOSAL 2
To convert a fundamental investment policy to a non-fundamental investment policy.
| | # of
Votes | % of
Votes |
| Affirmative | 3,363,505,979.729 | 80.831 |
| Against | 415,471,204.530 | 9.984 |
| Abstain | 382,193,640.635 | 9.185 |
| Broker Non-Vote | 0.00 | 0.00 |
| TOTAL | 4,161,170,824.894 | 100.000 |
|
| Proposal 1 reflects trust wide proposal and voting results. |
VIPEI-ANN-0221
1.540027.123
Fidelity® Variable Insurance Products:
Growth Portfolio
Annual Report
December 31, 2020
Contents
To view a fund's proxy voting guidelines and proxy voting record for the 12-month period ended June 30, visit http://www.fidelity.com/proxyvotingresults or visit the Securities and Exchange Commission's (SEC) web site at http://www.sec.gov.
You may also call 1-877-208-0098 to request a free copy of the proxy voting guidelines.
Fidelity® Variable Insurance Products are separate account options which are purchased through a variable insurance contract.
Standard & Poor's, S&P and S&P 500 are registered service marks of The McGraw-Hill Companies, Inc. and have been licensed for use by Fidelity Distributors Corporation.
Other third-party marks appearing herein are the property of their respective owners.
All other marks appearing herein are registered or unregistered trademarks or service marks of FMR LLC or an affiliated company. © 2021 FMR LLC. All rights reserved.
This report and the financial statements contained herein are submitted for the general information of the shareholders of the Fund. This report is not authorized for distribution to prospective investors in the Fund unless preceded or accompanied by an effective prospectus.
A fund files its complete schedule of portfolio holdings with the SEC for the first and third quarters of each fiscal year on Form N-PORT. Forms N-PORT are available on the SEC’s web site at http://www.sec.gov. A fund's Forms N-PORT may be reviewed and copied at the SEC’s Public Reference Room in Washington, DC. Information regarding the operation of the SEC's Public Reference Room may be obtained by calling 1-800-SEC-0330.
For a complete list of a fund's portfolio holdings, view the most recent holdings listing, semiannual report, or annual report on Fidelity's web site at http://www.fidelity.com, http://www.institutional.fidelity.com, or http://www.401k.com, as applicable.
NOT FDIC INSURED •MAY LOSE VALUE •NO BANK GUARANTEE
Neither the Fund nor Fidelity Distributors Corporation is a bank.
Note to Shareholders:
Early in 2020, the outbreak and spread of a new coronavirus emerged as a public health emergency that had a major influence on financial markets, primarily based on its impact on the global economy and the outlook for corporate earnings. The virus causes a respiratory disease known as COVID-19. On March 11, the World Health Organization declared the COVID-19 outbreak a pandemic, citing sustained risk of further global spread.
In the weeks following, as the crisis worsened, we witnessed an escalating human tragedy with wide-scale social and economic consequences from coronavirus-containment measures. The outbreak of COVID-19 prompted a number of measures to limit the spread, including travel and border restrictions, quarantines, and restrictions on large gatherings. In turn, these resulted in lower consumer activity, diminished demand for a wide range of products and services, disruption in manufacturing and supply chains, and – given the wide variability in outcomes regarding the outbreak – significant market uncertainty and volatility. Amid the turmoil, global governments and central banks took unprecedented action to help support consumers, businesses, and the broader economies, and to limit disruption to financial systems.
The situation continues to unfold, and the extent and duration of its impact on financial markets and the economy remain highly uncertain. Extreme events such as the coronavirus crisis are “exogenous shocks” that can have significant adverse effects on mutual funds and their investments. Although multiple asset classes may be affected by market disruption, the duration and impact may not be the same for all types of assets.
Fidelity is committed to helping you stay informed amid news about COVID-19 and during increased market volatility, and we’re taking extra steps to be responsive to customer needs. We encourage you to visit our websites, where we offer ongoing updates, commentary, and analysis on the markets and our funds.
Performance: The Bottom Line
Average annual total return reflects the change in the value of an investment, assuming reinvestment of distributions from dividend income and capital gains (the profits earned upon the sale of securities that have grown in value, if any) and assuming a constant rate of performance each year. During periods of reimbursement by Fidelity, a fund’s total return will be greater than it would be had the reimbursement not occurred. Performance numbers are net of all underlying fund operating expenses, but do not include any insurance charges imposed by your insurance company’s separate account. If performance information included the effect of these additional charges, the total returns would have been lower. How a fund did yesterday is no guarantee of how it will do tomorrow.
Average Annual Total Returns
| For the periods ended December 31, 2020 | Past 1 year | Past 5 years | Past 10 years |
| Initial Class | 43.89% | 21.32% | 17.25% |
| Service Class | 43.77% | 21.20% | 17.14% |
| Service Class 2 | 43.55% | 21.02% | 16.96% |
| Investor Class | 43.80% | 21.22% | 17.16% |
$10,000 Over 10 Years
Let's say hypothetically that $10,000 was invested in VIP Growth Portfolio - Initial Class on December 31, 2010.
The chart shows how the value of your investment would have changed, and also shows how the Russell 3000® Growth Index performed over the same period.
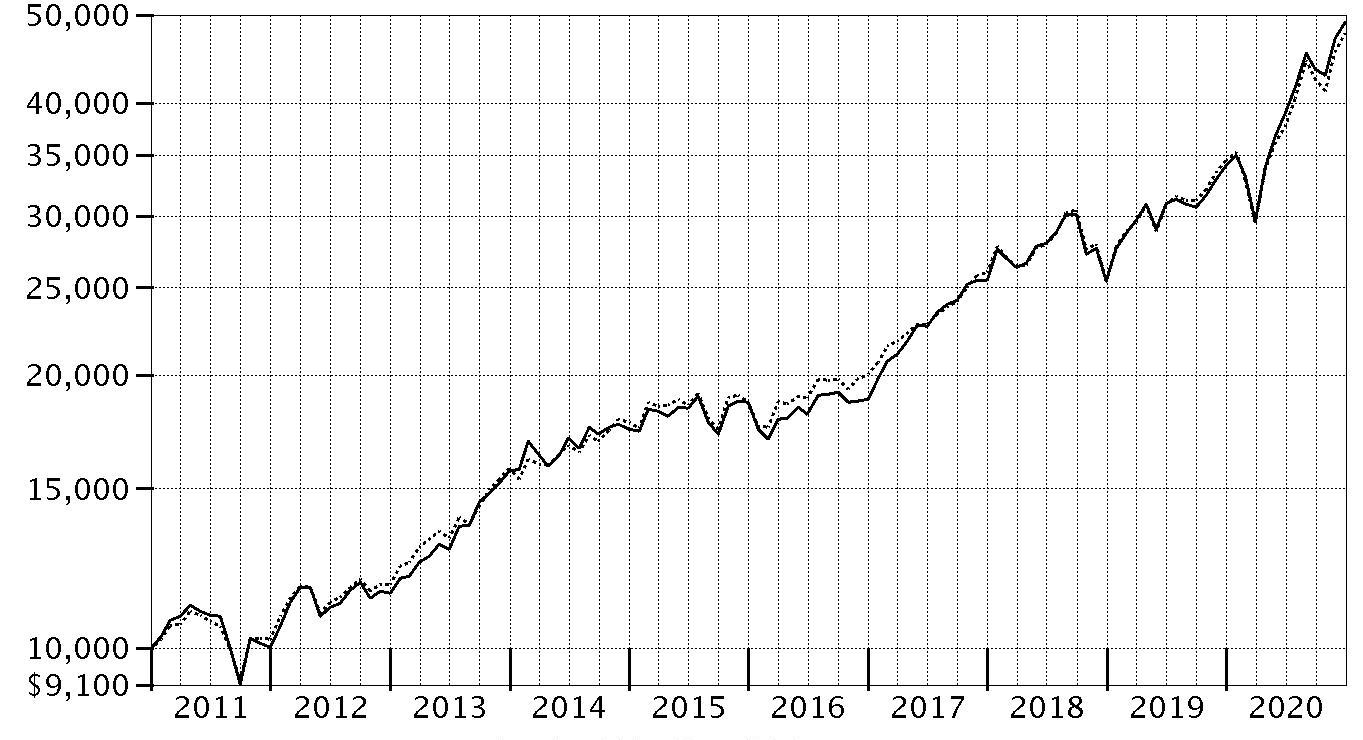
| Period Ending Values |
| $49,118 | VIP Growth Portfolio - Initial Class |
| $47,773 | Russell 3000® Growth Index |
Management's Discussion of Fund Performance
Market Recap: The S&P 500
® index gained 18.40% in 2020, a highly volatile and unpredictable year that will be remembered by most investors for the impact of the coronavirus pandemic. The early-2020 outbreak and spread of COVID-19 resulted in stocks suffering one of the quickest declines on record, through March 23, followed by a historic rebound that culminated with the index closing the year at an all-time high. The crisis and containment efforts caused broad contraction in economic activity, along with extreme uncertainty and dislocation in financial markets. A rapid and expansive U.S. monetary/fiscal-policy response partially offset the economic disruption and fueled the market surge, as did resilient corporate earnings and the potential for a COVID-19 vaccine breakthrough. The rally slowed in early September, when the S&P 500 began a two-month retreat amid Congress’s inability to reach a deal on additional fiscal stimulus, as well as concerns about election uncertainty, indications the U.S. economic recovery was stalling and a new wave of COVID-19 cases. November (+11%) was a much different story, however, as investors reacted favorably to election results. The momentum continued in December (+4%), driven by regulatory approvals for two COVID-19 vaccines in the U.S. By sector for the full year, information technology (+44%) and consumer discretionary (+33%) led the way, boosted by a handful of large growth stocks. In contrast, energy shares (-34%) struggled along with global oil demand and pricing.
Comments from Co-Managers Asher Anolic and Jason Weiner: For the fiscal year ending December 31, 2020, the fund's share classes gained about 44%, outperforming the 38.26% result of the benchmark Russell 3000
® Growth index. Versus the benchmark, security selection was the primary contributor, especially within the information technology sector. Stock picking and an underweighting in the industrials sector, especially within the capital goods industry, also helped. Further lifting performance were investment choices in health care. The biggest individual relative contributor was an overweight position in Nvidia (+121%), also which was among our biggest holdings. Another top relative contributor was an out-of-benchmark stake in Shopify (+178%), although we reduced our position in the company the past 12 months. Adding further value in 2020 was an overweighting in Qualcomm (+77%), which was one of the fund's largest holdings. In contrast, the primary detractor from performance versus the benchmark was our stock selection in the consumer discretionary sector, especially within the automobiles & components industry. An overweighting in energy also hampered the fund's relative result. Further weighing on the fund's relative performance was stock selection in the communication services sector, primarily within the media & entertainment industry. The biggest individual relative detractor was our lighter-than-benchmark stake in Tesla. The company was not held at period end. Another notable relative detractor was our underweighting in Apple (+82%). The company was among the fund's biggest holdings. Avoiding PayPal, a benchmark component that gained roughly 117%, also hurt performance. Notable changes in positioning include increased exposure to the health care sector.
The views expressed above reflect those of the portfolio manager(s) only through the end of the period as stated on the cover of this report and do not necessarily represent the views of Fidelity or any other person in the Fidelity organization. Any such views are subject to change at any time based upon market or other conditions and Fidelity disclaims any responsibility to update such views. These views may not be relied on as investment advice and, because investment decisions for a Fidelity fund are based on numerous factors, may not be relied on as an indication of trading intent on behalf of any Fidelity fund.
Investment Summary (Unaudited)
Top Ten Stocks as of December 31, 2020
| | % of fund's net assets |
| Microsoft Corp. | 8.8 |
| Alphabet, Inc. Class A | 5.9 |
| Apple, Inc. | 5.6 |
| Amazon.com, Inc. | 5.0 |
| Facebook, Inc. Class A | 4.7 |
| Qualcomm, Inc. | 3.8 |
| NVIDIA Corp. | 3.2 |
| UnitedHealth Group, Inc. | 3.1 |
| Adobe, Inc. | 2.9 |
| Tencent Holdings Ltd. | 2.0 |
| | 45.0 |
Top Five Market Sectors as of December 31, 2020
| | % of fund's net assets |
| Information Technology | 37.3 |
| Health Care | 17.2 |
| Communication Services | 14.4 |
| Consumer Discretionary | 12.1 |
| Industrials | 8.0 |
Asset Allocation (% of fund's net assets)
| As of December 31, 2020* |
| | Stocks | 99.8% |
| | Short-Term Investments and Net Other Assets (Liabilities) | 0.2% |

* Foreign investments - 16.9%
Schedule of Investments December 31, 2020
Showing Percentage of Net Assets
| Common Stocks - 99.6% | | | |
| | | Shares | Value |
| COMMUNICATION SERVICES - 14.4% | | | |
| Diversified Telecommunication Services - 0.4% | | | |
| Cellnex Telecom SA (a) | | 545,600 | $32,740,063 |
| Entertainment - 0.8% | | | |
| Activision Blizzard, Inc. | | 560,200 | 52,014,570 |
| DouYu International Holdings Ltd. ADR (b) | | 572,900 | 6,336,274 |
| | | | 58,350,844 |
| Interactive Media & Services - 13.2% | | | |
| Alphabet, Inc. Class A (b) | | 268,398 | 470,405,071 |
| Facebook, Inc. Class A (b) | | 1,372,609 | 374,941,874 |
| Match Group, Inc. (b) | | 112,317 | 16,981,207 |
| Tencent Holdings Ltd. | | 2,191,600 | 157,693,944 |
| Tongdao Liepin Group (b) | | 3,280,200 | 7,903,842 |
| Zoominfo Technologies, Inc. | | 434,300 | 20,946,289 |
| | | | 1,048,872,227 |
| Wireless Telecommunication Services - 0.0% | | | |
| Mobile TeleSystems OJSC sponsored ADR | | 64,300 | 575,485 |
|
| TOTAL COMMUNICATION SERVICES | | | 1,140,538,619 |
|
| CONSUMER DISCRETIONARY - 12.1% | | | |
| Automobiles - 0.7% | | | |
| Ferrari NV | | 232,500 | 53,363,400 |
| XPeng, Inc. ADR (b)(c) | | 75,300 | 3,225,099 |
| | | | 56,588,499 |
| Diversified Consumer Services - 0.6% | | | |
| Laureate Education, Inc. Class A (b) | | 3,166,400 | 46,102,784 |
| Hotels, Restaurants & Leisure - 0.8% | | | |
| Airbnb, Inc. Class A | | 24,600 | 3,611,280 |
| Compass Group PLC | | 241,700 | 4,508,033 |
| Dalata Hotel Group PLC | | 786,300 | 3,635,808 |
| Flutter Entertainment PLC | | 63,400 | 13,100,294 |
| Hilton Worldwide Holdings, Inc. | | 338,600 | 37,672,636 |
| | | | 62,528,051 |
| Household Durables - 1.4% | | | |
| Blu Investments LLC (d)(e) | | 14,533,890 | 4,506 |
| D.R. Horton, Inc. | | 776,900 | 53,543,948 |
| NVR, Inc. (b) | | 8,110 | 33,087,665 |
| Purple Innovation, Inc. (b) | | 138,200 | 4,552,308 |
| Toll Brothers, Inc. | | 529,200 | 23,004,324 |
| | | | 114,192,751 |
| Internet & Direct Marketing Retail - 6.4% | | | |
| Alibaba Group Holding Ltd. sponsored ADR (b) | | 401,200 | 93,371,276 |
| Amazon.com, Inc. (b) | | 122,100 | 397,671,153 |
| Delivery Hero AG (a)(b) | | 75,800 | 11,854,288 |
| Pinduoduo, Inc. ADR (b) | | 26,000 | 4,619,420 |
| | | | 507,516,137 |
| Specialty Retail - 0.6% | | | |
| Aritzia LP (b) | | 157,900 | 3,199,184 |
| Ulta Beauty, Inc. (b) | | 148,400 | 42,614,544 |
| | | | 45,813,728 |
| Textiles, Apparel & Luxury Goods - 1.6% | | | |
| LVMH Moet Hennessy Louis Vuitton SE | | 124,515 | 77,946,567 |
| Prada SpA (b) | | 5,359,100 | 35,393,446 |
| Samsonite International SA (a)(b) | | 6,718,200 | 11,906,954 |
| | | | 125,246,967 |
|
| TOTAL CONSUMER DISCRETIONARY | | | 957,988,917 |
|
| CONSUMER STAPLES - 3.3% | | | |
| Beverages - 1.8% | | | |
| Fever-Tree Drinks PLC | | 1,059 | 36,596 |
| Kweichow Moutai Co. Ltd. (A Shares) | | 228,170 | 69,849,029 |
| Monster Beverage Corp. (b) | | 759,300 | 70,220,064 |
| | | | 140,105,689 |
| Household Products - 1.1% | | | |
| Energizer Holdings, Inc. | | 985,400 | 41,564,172 |
| Reckitt Benckiser Group PLC | | 511,110 | 45,618,719 |
| | | | 87,182,891 |
| Tobacco - 0.4% | | | |
| Swedish Match Co. AB | | 450,500 | 35,058,264 |
|
| TOTAL CONSUMER STAPLES | | | 262,346,844 |
|
| ENERGY - 1.5% | | | |
| Oil, Gas & Consumable Fuels - 1.5% | | | |
| Enterprise Products Partners LP | | 196,500 | 3,849,435 |
| EOG Resources, Inc. | | 77,000 | 3,839,990 |
| Reliance Industries Ltd. | | 235,605 | 3,603,682 |
| Reliance Industries Ltd. | | 3,701,488 | 100,590,233 |
| Valero Energy Corp. | | 168,300 | 9,520,731 |
| | | | 121,404,071 |
| FINANCIALS - 3.4% | | | |
| Banks - 1.2% | | | |
| Comerica, Inc. | | 563,600 | 31,482,696 |
| HDFC Bank Ltd. (b) | | 234,578 | 4,621,188 |
| HDFC Bank Ltd. sponsored ADR (b) | | 431,300 | 31,165,738 |
| M&T Bank Corp. | | 63,900 | 8,134,470 |
| Metro Bank PLC (b) | | 85,000 | 162,733 |
| Wintrust Financial Corp. | | 329,300 | 20,116,937 |
| | | | 95,683,762 |
| Capital Markets - 0.9% | | | |
| CME Group, Inc. | | 357,197 | 65,027,714 |
| JMP Group, Inc. (b) | | 238,900 | 919,765 |
| MSCI, Inc. | | 10,200 | 4,554,606 |
| | | | 70,502,085 |
| Consumer Finance - 0.7% | | | |
| Capital One Financial Corp. | | 579,700 | 57,303,345 |
| Insurance - 0.6% | | | |
| American Financial Group, Inc. | | 124,800 | 10,934,976 |
| Arthur J. Gallagher & Co. | | 147,400 | 18,234,854 |
| BRP Group, Inc. (b) | | 29,100 | 872,127 |
| RenaissanceRe Holdings Ltd. | | 82,300 | 13,646,986 |
| | | | 43,688,943 |
| Thrifts & Mortgage Finance - 0.0% | | | |
| Rocket Cos., Inc. (b)(c) | | 176,600 | 3,570,852 |
|
| TOTAL FINANCIALS | | | 270,748,987 |
|
| HEALTH CARE - 17.1% | | | |
| Biotechnology - 4.1% | | | |
| ACADIA Pharmaceuticals, Inc. (b) | | 294,400 | 15,738,624 |
| Affimed NV (b) | | 594,887 | 3,462,242 |
| Alnylam Pharmaceuticals, Inc. (b) | | 49,700 | 6,459,509 |
| Applied Therapeutics, Inc. (b) | | 400,300 | 8,810,603 |
| Atara Biotherapeutics, Inc. (b) | | 410,500 | 8,058,115 |
| Biogen, Inc. (b) | | 20,100 | 4,921,686 |
| BioNTech SE ADR (b)(c) | | 168,230 | 13,714,110 |
| Certara, Inc. | | 152,100 | 5,128,812 |
| CRISPR Therapeutics AG (b)(c) | | 96,400 | 14,759,804 |
| Gamida Cell Ltd. (b) | | 1,674,200 | 14,046,538 |
| Hookipa Pharma, Inc. (b) | | 306,100 | 3,394,649 |
| Innovent Biologics, Inc. (a)(b) | | 1,085,000 | 11,483,370 |
| Insmed, Inc. (b) | | 1,082,983 | 36,052,504 |
| Neurocrine Biosciences, Inc. (b) | | 486,100 | 46,592,685 |
| Prelude Therapeutics, Inc. | | 30,200 | 2,160,810 |
| Regeneron Pharmaceuticals, Inc. (b) | | 162,800 | 78,650,308 |
| Rubius Therapeutics, Inc. (b) | | 62,800 | 476,652 |
| Sarepta Therapeutics, Inc. (b) | | 22,200 | 3,784,878 |
| Seres Therapeutics, Inc. (b) | | 136,300 | 3,339,350 |
| Vertex Pharmaceuticals, Inc. (b) | | 189,298 | 44,738,689 |
| Viela Bio, Inc. (b) | | 55,800 | 2,007,126 |
| | | | 327,781,064 |
| Health Care Equipment & Supplies - 3.8% | | | |
| Axonics Modulation Technologies, Inc. (b) | | 237,600 | 11,860,992 |
| Danaher Corp. | | 324,826 | 72,156,848 |
| Haemonetics Corp. (b) | | 375,600 | 44,602,500 |
| Hologic, Inc. (b) | | 933,000 | 67,950,390 |
| Intuitive Surgical, Inc. (b) | | 94,500 | 77,310,450 |
| Nevro Corp. (b) | | 87,600 | 15,163,560 |
| Outset Medical, Inc. | | 55,900 | 3,177,356 |
| Penumbra, Inc. (b) | | 61,200 | 10,710,000 |
| | | | 302,932,096 |
| Health Care Providers & Services - 3.8% | | | |
| Centene Corp. (b) | | 457,200 | 27,445,716 |
| Guardant Health, Inc. (b) | | 35,100 | 4,523,688 |
| HealthEquity, Inc. (b) | | 338,100 | 23,568,951 |
| UnitedHealth Group, Inc. | | 691,200 | 242,390,016 |
| | | | 297,928,371 |
| Health Care Technology - 1.3% | | | |
| Inspire Medical Systems, Inc. (b) | | 199,081 | 37,445,145 |
| MultiPlan Corp. (d) | | 1,325,724 | 10,592,535 |
| MultiPlan Corp.: | | | |
| Class A (b)(c) | | 189,400 | 1,513,306 |
| warrants (b)(d) | | 65,630 | 154,257 |
| Schrodinger, Inc. | | 102,400 | 8,108,032 |
| Simulations Plus, Inc. | | 85,000 | 6,113,200 |
| Veeva Systems, Inc. Class A (b) | | 148,600 | 40,456,350 |
| | | | 104,382,825 |
| Life Sciences Tools & Services - 1.8% | | | |
| 10X Genomics, Inc. (b) | | 109,614 | 15,521,342 |
| Berkeley Lights, Inc. (b)(c) | | 275,200 | 24,605,632 |
| Bio-Rad Laboratories, Inc. Class A (b) | | 15,900 | 9,268,746 |
| Bio-Techne Corp. | | 14,100 | 4,477,455 |
| Bruker Corp. | | 564,300 | 30,545,559 |
| Charles River Laboratories International, Inc. (b) | | 82,500 | 20,613,450 |
| Codexis, Inc. (b) | | 601,400 | 13,128,562 |
| Fluidigm Corp. (b)(c) | | 1,014,100 | 6,084,600 |
| Nanostring Technologies, Inc. (b) | | 279,000 | 18,659,520 |
| Sotera Health Co. | | 134,100 | 3,679,704 |
| | | | 146,584,570 |
| Pharmaceuticals - 2.3% | | | |
| AstraZeneca PLC sponsored ADR | | 777,200 | 38,852,228 |
| Eli Lilly & Co. | | 678,600 | 114,574,824 |
| Endo International PLC (b) | | 1,066,442 | 7,657,054 |
| Reata Pharmaceuticals, Inc. (b) | | 37,900 | 4,685,198 |
| Revance Therapeutics, Inc. (b) | | 442,900 | 12,551,786 |
| | | | 178,321,090 |
|
| TOTAL HEALTH CARE | | | 1,357,930,016 |
|
| INDUSTRIALS - 8.0% | | | |
| Aerospace & Defense - 0.8% | | | |
| Airbus Group NV | | 159,500 | 17,504,201 |
| Axon Enterprise, Inc. (b) | | 6,400 | 784,192 |
| TransDigm Group, Inc. | | 74,496 | 46,101,850 |
| | | | 64,390,243 |
| Airlines - 0.7% | | | |
| Ryanair Holdings PLC sponsored ADR (b) | | 505,700 | 55,616,886 |
| Building Products - 0.4% | | | |
| Builders FirstSource, Inc. (b) | | 219,600 | 8,961,876 |
| Fortune Brands Home & Security, Inc. | | 265,300 | 22,741,516 |
| | | | 31,703,392 |
| Electrical Equipment - 0.7% | | | |
| Bloom Energy Corp. Class A (b)(c) | | 174,500 | 5,001,170 |
| Generac Holdings, Inc. (b) | | 240,000 | 54,578,400 |
| | | | 59,579,570 |
| Industrial Conglomerates - 1.4% | | | |
| General Electric Co. | | 10,265,600 | 110,868,480 |
| Machinery - 1.0% | | | |
| Ingersoll Rand, Inc. (b) | | 1,217,400 | 55,464,744 |
| Woodward, Inc. | | 177,200 | 21,535,116 |
| | | | 76,999,860 |
| Professional Services - 1.5% | | | |
| Equifax, Inc. | | 394,900 | 76,152,516 |
| Upwork, Inc. (b) | | 1,168,174 | 40,325,366 |
| | | | 116,477,882 |
| Road & Rail - 1.3% | | | |
| Uber Technologies, Inc. (b) | | 2,105,640 | 107,387,640 |
| Trading Companies & Distributors - 0.2% | | | |
| BMC Stock Holdings, Inc. (b) | | 169,200 | 9,082,656 |
| Fastenal Co. | | 73,300 | 3,579,239 |
| | | | 12,661,895 |
|
| TOTAL INDUSTRIALS | | | 635,685,848 |
|
| INFORMATION TECHNOLOGY - 37.3% | | | |
| Electronic Equipment & Components - 0.4% | | | |
| II-VI, Inc. (b) | | 377,000 | 28,636,920 |
| Jabil, Inc. | | 3,196 | 135,926 |
| Novanta, Inc. (b) | | 12,900 | 1,525,038 |
| | | | 30,297,884 |
| IT Services - 3.9% | | | |
| Adyen BV (a)(b) | | 10,400 | 24,164,834 |
| Black Knight, Inc. (b) | | 381,734 | 33,726,199 |
| CACI International, Inc. Class A (b) | | 66,100 | 16,480,713 |
| Edenred SA | | 2,675 | 151,664 |
| MasterCard, Inc. Class A | | 81,000 | 28,912,140 |
| MongoDB, Inc. Class A (b)(c) | | 197,900 | 71,054,016 |
| Okta, Inc. (b) | | 87,500 | 22,247,750 |
| Shopify, Inc. Class A (b) | | 41,900 | 47,312,207 |
| Square, Inc. (b) | | 305,100 | 66,401,964 |
| | | | 310,451,487 |
| Semiconductors & Semiconductor Equipment - 10.7% | | | |
| Aixtron AG (b) | | 308,800 | 5,369,954 |
| Array Technologies, Inc. | | 238,500 | 10,288,890 |
| ASML Holding NV | | 140,500 | 68,524,660 |
| Enphase Energy, Inc. (b) | | 216,500 | 37,989,255 |
| MediaTek, Inc. | | 148,000 | 3,933,397 |
| NVIDIA Corp. | | 487,700 | 254,676,940 |
| NXP Semiconductors NV | | 529,000 | 84,116,290 |
| Qualcomm, Inc. | | 1,957,500 | 298,205,550 |
| SiTime Corp. (b) | | 93,200 | 10,431,876 |
| SolarEdge Technologies, Inc. (b) | | 71,400 | 22,785,168 |
| Universal Display Corp. | | 218,300 | 50,165,340 |
| | | | 846,487,320 |
| Software - 15.7% | | | |
| Adobe, Inc. (b) | | 460,300 | 230,205,236 |
| Agora, Inc. ADR (b)(c) | | 9,100 | 359,996 |
| Cloudflare, Inc. (b) | | 128,800 | 9,787,512 |
| CyberArk Software Ltd. (b) | | 63,300 | 10,228,647 |
| Datadog, Inc. Class A (b) | | 13,400 | 1,319,096 |
| Duck Creek Technologies, Inc. (b) | | 7,400 | 320,420 |
| Elastic NV (b) | | 5,300 | 774,489 |
| FireEye, Inc. (b) | | 2,880,400 | 66,422,024 |
| JFrog Ltd. (c) | | 9,200 | 578,036 |
| Manhattan Associates, Inc. (b) | | 268,300 | 28,219,794 |
| Microsoft Corp. | | 3,133,700 | 696,997,551 |
| NICE Systems Ltd. sponsored ADR (b) | | 85,800 | 24,327,732 |
| Palo Alto Networks, Inc. (b) | | 99,000 | 35,183,610 |
| Rapid7, Inc. (b) | | 101,300 | 9,133,208 |
| Salesforce.com, Inc. (b) | | 557,062 | 123,963,007 |
| Tenable Holdings, Inc. (b) | | 184,500 | 9,641,970 |
| Volue A/S | | 225,400 | 1,314,353 |
| | | | 1,248,776,681 |
| Technology Hardware, Storage & Peripherals - 6.6% | | | |
| Apple, Inc. | | 3,337,300 | 442,826,337 |
| Samsung Electronics Co. Ltd. | | 1,094,670 | 81,466,246 |
| | | | 524,292,583 |
|
| TOTAL INFORMATION TECHNOLOGY | | | 2,960,305,955 |
|
| MATERIALS - 1.8% | | | |
| Chemicals - 1.5% | | | |
| Albemarle Corp. U.S. (c) | | 147,700 | 21,788,704 |
| DuPont de Nemours, Inc. | | 84,300 | 5,994,573 |
| LG Chemical Ltd. | | 57,470 | 43,508,878 |
| Sherwin-Williams Co. | | 64,600 | 47,475,186 |
| | | | 118,767,341 |
| Construction Materials - 0.3% | | | |
| Eagle Materials, Inc. | | 204,800 | 20,756,480 |
| Metals & Mining - 0.0% | | | |
| MP Materials Corp. (b)(c) | | 74,600 | 2,399,882 |
|
| TOTAL MATERIALS | | | 141,923,703 |
|
| REAL ESTATE - 0.7% | | | |
| Equity Real Estate Investment Trusts (REITs) - 0.5% | | | |
| Simon Property Group, Inc. | | 410,400 | 34,998,912 |
| Real Estate Management & Development - 0.2% | | | |
| CBRE Group, Inc. (b) | | 137,500 | 8,624,000 |
| KE Holdings, Inc. ADR (b) | | 149,500 | 9,200,230 |
| | | | 17,824,230 |
|
| TOTAL REAL ESTATE | | | 52,823,142 |
|
| TOTAL COMMON STOCKS | | | |
| (Cost $4,155,024,685) | | | 7,901,696,102 |
|
| Convertible Preferred Stocks - 0.2% | | | |
| HEALTH CARE - 0.1% | | | |
| Biotechnology - 0.0% | | | |
| Nuvation Bio, Inc. Series A (b)(d) | | 1,667,500 | 3,268,300 |
| Health Care Technology - 0.1% | | | |
| Vor Biopharma, Inc. (d)(e) | | 6,187,935 | 4,331,555 |
|
| TOTAL HEALTH CARE | | | 7,599,855 |
|
| INFORMATION TECHNOLOGY - 0.0% | | | |
| IT Services - 0.0% | | | |
| AppNexus, Inc. Series E (Escrow) (b)(d)(e) | | 181,657 | 5,690 |
| MATERIALS - 0.1% | | | |
| Metals & Mining - 0.1% | | | |
| Illuminated Holdings, Inc.: | | | |
| Series C2 (d)(e) | | 137,249 | 4,940,964 |
| Series C3 (d)(e) | | 171,560 | 6,176,160 |
| | | | 11,117,124 |
| TOTAL CONVERTIBLE PREFERRED STOCKS | | | |
| (Cost $13,082,027) | | | 18,722,669 |
|
| Money Market Funds - 1.0% | | | |
| Fidelity Cash Central Fund 0.11% (f) | | 20,519,863 | 20,523,967 |
| Fidelity Securities Lending Cash Central Fund 0.11% (f)(g) | | 54,816,958 | 54,822,440 |
| TOTAL MONEY MARKET FUNDS | | | |
| (Cost $75,346,407) | | | 75,346,407 |
| TOTAL INVESTMENT IN SECURITIES - 100.8% | | | |
| (Cost $4,243,453,119) | | | 7,995,765,178 |
| NET OTHER ASSETS (LIABILITIES) - (0.8)% | | | (64,042,507) |
| NET ASSETS - 100% | | | $7,931,722,671 |
Legend
(a) Security exempt from registration under Rule 144A of the Securities Act of 1933. These securities may be resold in transactions exempt from registration, normally to qualified institutional buyers. At the end of the period, the value of these securities amounted to $92,149,509 or 1.2% of net assets.
(b) Non-income producing
(c) Security or a portion of the security is on loan at period end.
(d) Restricted securities (including private placements) - Investment in securities not registered under the Securities Act of 1933 (excluding 144A issues). At the end of the period, the value of restricted securities (excluding 144A issues) amounted to $29,473,967 or 0.4% of net assets.
(e) Level 3 security
(f) Affiliated fund that is generally available only to investment companies and other accounts managed by Fidelity Investments. The rate quoted is the annualized seven-day yield of the fund at period end. A complete unaudited listing of the fund's holdings as of its most recent quarter end is available upon request. In addition, each Fidelity Central Fund's financial statements, which are not covered by the Fund's Report of Independent Registered Public Accounting Firm, are available on the SEC's website or upon request.
(g) Investment made with cash collateral received from securities on loan.
Additional information on each restricted holding is as follows:
| Security | Acquisition Date | Acquisition Cost |
| AppNexus, Inc. Series E (Escrow) | 8/1/14 | $327,509 |
| Blu Investments LLC | 5/21/20 | $25,138 |
| Illuminated Holdings, Inc. Series C2 | 7/7/20 | $3,431,225 |
| Illuminated Holdings, Inc. Series C3 | 7/7/20 | $5,146,800 |
| MultiPlan Corp. | 10/8/20 | $13,125,980 |
| MultiPlan Corp. warrants | 10/8/20 | $0 |
| Nuvation Bio, Inc. Series A | 6/17/19 | $1,286,276 |
| Vor Biopharma, Inc. | 6/30/20 | $3,217,726 |
Affiliated Central Funds
Information regarding fiscal year to date income earned by the Fund from investments in Fidelity Central Funds is as follows:
| Fund | Income earned |
| Fidelity Cash Central Fund | $83,021 |
| Fidelity Securities Lending Cash Central Fund | 1,306,816 |
| Total | $1,389,837 |
Amounts in the income column in the above table include any capital gain distributions from underlying funds, which are presented in the corresponding line-item in the Statement of Operations, if applicable. Amount for Fidelity Securities Lending Cash Central Fund represents the income earned on investing cash collateral, less rebates paid to borrowers and any lending agent fees associated with the loan, plus any premium payments received for lending certain types of securities.
Investment Valuation
The following is a summary of the inputs used, as of December 31, 2020, involving the Fund's assets and liabilities carried at fair value. The inputs or methodology used for valuing securities may not be an indication of the risk associated with investing in those securities. For more information on valuation inputs, and their aggregation into the levels used below, please refer to the Investment Valuation section in the accompanying Notes to Financial Statements.
| | Valuation Inputs at Reporting Date: |
| Description | Total | Level 1 | Level 2 | Level 3 |
| Investments in Securities: | | | | |
| Equities: | | | | |
| Communication Services | $1,140,538,619 | $982,844,675 | $157,693,944 | $-- |
| Consumer Discretionary | 957,988,917 | 863,675,523 | 94,308,888 | 4,506 |
| Consumer Staples | 262,346,844 | 181,669,861 | 80,676,983 | -- |
| Energy | 121,404,071 | 121,404,071 | -- | -- |
| Financials | 270,748,987 | 266,127,799 | 4,621,188 | -- |
| Health Care | 1,365,529,871 | 1,357,775,759 | 3,422,557 | 4,331,555 |
| Industrials | 635,685,848 | 618,181,647 | 17,504,201 | -- |
| Information Technology | 2,960,311,645 | 2,929,456,814 | 30,849,141 | 5,690 |
| Materials | 153,040,827 | 141,923,703 | -- | 11,117,124 |
| Real Estate | 52,823,142 | 52,823,142 | -- | -- |
| Money Market Funds | 75,346,407 | 75,346,407 | -- | -- |
| Total Investments in Securities: | $7,995,765,178 | $7,591,229,401 | $389,076,902 | $15,458,875 |
Other Information
Distribution of investments by country or territory of incorporation, as a percentage of Total Net Assets, is as follows (Unaudited):
| United States of America | 83.1% |
| Cayman Islands | 3.6% |
| Netherlands | 3.2% |
| India | 1.8% |
| Korea (South) | 1.5% |
| Ireland | 1.0% |
| France | 1.0% |
| Others (Individually Less Than 1%) | 4.8% |
| | 100.0% |
See accompanying notes which are an integral part of the financial statements.
Financial Statements
Statement of Assets and Liabilities
| | | December 31, 2020 |
| Assets | | |
Investment in securities, at value (including securities loaned of $52,244,991) — See accompanying schedule:
Unaffiliated issuers (cost $4,168,106,712) | $7,920,418,771 | |
| Fidelity Central Funds (cost $75,346,407) | 75,346,407 | |
| Total Investment in Securities (cost $4,243,453,119) | | $7,995,765,178 |
| Foreign currency held at value (cost $2,080,543) | | 2,087,689 |
| Receivable for investments sold | | 4,909,900 |
| Receivable for fund shares sold | | 2,096,644 |
| Dividends receivable | | 2,730,273 |
| Distributions receivable from Fidelity Central Funds | | 99,006 |
| Prepaid expenses | | 8,455 |
| Other receivables | | 135,888 |
| Total assets | | 8,007,833,033 |
| Liabilities | | |
| Payable to custodian bank | $345,689 | |
| Payable for investments purchased | $948,384 | |
| Payable for forward foreign currency contracts | 2,004,287 | |
| Payable for fund shares redeemed | 8,483,640 | |
| Accrued management fee | 3,448,743 | |
| Distribution and service plan fees payable | 408,392 | |
| Other affiliated payables | 568,000 | |
| Other payables and accrued expenses | 5,101,528 | |
| Collateral on securities loaned | 54,801,699 | |
| Total liabilities | | 76,110,362 |
| Net Assets | | $7,931,722,671 |
| Net Assets consist of: | | |
| Paid in capital | | $3,233,093,038 |
| Total accumulated earnings (loss) | | 4,698,629,633 |
| Net Assets | | $7,931,722,671 |
| Net Asset Value and Maximum Offering Price | | |
| Initial Class: | | |
| Net Asset Value, offering price and redemption price per share ($4,533,075,118 ÷ 44,010,804 shares) | | $103.00 |
| Service Class: | | |
| Net Asset Value, offering price and redemption price per share ($1,018,191,673 ÷ 9,941,560 shares) | | $102.42 |
| Service Class 2: | | |
| Net Asset Value, offering price and redemption price per share ($1,587,581,245 ÷ 15,784,964 shares) | | $100.58 |
| Investor Class: | | |
| Net Asset Value, offering price and redemption price per share ($792,874,635 ÷ 7,744,615 shares) | | $102.38 |
See accompanying notes which are an integral part of the financial statements.
Statement of Operations
| | | Year ended December 31, 2020 |
| Investment Income | | |
| Dividends | | $39,878,971 |
| Income from Fidelity Central Funds (including $1,306,816 from security lending) | | 1,389,837 |
| Total income | | 41,268,808 |
| Expenses | | |
| Management fee | $34,698,224 | |
| Transfer agent fees | 4,649,534 | |
| Distribution and service plan fees | 4,061,499 | |
| Accounting fees | 1,144,080 | |
| Custodian fees and expenses | 89,154 | |
| Independent trustees' fees and expenses | 36,144 | |
| Audit | 69,267 | |
| Legal | 16,643 | |
| Interest | 20,068 | |
| Miscellaneous | 226,193 | |
| Total expenses before reductions | 45,010,806 | |
| Expense reductions | (353,160) | |
| Total expenses after reductions | | 44,657,646 |
| Net investment income (loss) | | (3,388,838) |
| Realized and Unrealized Gain (Loss) | | |
| Net realized gain (loss) on: | | |
| Investment securities: | | |
| Unaffiliated issuers | 1,050,673,617 | |
| Fidelity Central Funds | 11,405 | |
| Foreign currency transactions | (344,790) | |
| Total net realized gain (loss) | | 1,050,340,232 |
| Change in net unrealized appreciation (depreciation) on: | | |
| Investment securities: | | |
| Unaffiliated issuers (net of increase in deferred foreign taxes of $3,955,755) | 1,407,921,539 | |
| Assets and liabilities in foreign currencies | 15,775 | |
| Total change in net unrealized appreciation (depreciation) | | 1,407,937,314 |
| Net gain (loss) | | 2,458,277,546 |
| Net increase (decrease) in net assets resulting from operations | | $2,454,888,708 |
See accompanying notes which are an integral part of the financial statements.
Statement of Changes in Net Assets
| | Year ended December 31, 2020 | Year ended December 31, 2019 |
| Increase (Decrease) in Net Assets | | |
| Operations | | |
| Net investment income (loss) | $(3,388,838) | $10,143,028 |
| Net realized gain (loss) | 1,050,340,232 | 522,191,049 |
| Change in net unrealized appreciation (depreciation) | 1,407,937,314 | 1,069,976,572 |
| Net increase (decrease) in net assets resulting from operations | 2,454,888,708 | 1,602,310,649 |
| Distributions to shareholders | (617,512,979) | (353,860,861) |
| Share transactions - net increase (decrease) | 176,892,682 | (229,474,297) |
| Total increase (decrease) in net assets | 2,014,268,411 | 1,018,975,491 |
| Net Assets | | |
| Beginning of period | 5,917,454,260 | 4,898,478,769 |
| End of period | $7,931,722,671 | $5,917,454,260 |
See accompanying notes which are an integral part of the financial statements.
Financial Highlights
VIP Growth Portfolio Initial Class
| Years ended December 31, | 2020 | 2019 | 2018 | 2017 | 2016 |
| Selected Per–Share Data | | | | | |
| Net asset value, beginning of period | $79.09 | $63.12 | $74.05 | $59.31 | $65.75 |
| Income from Investment Operations | | | | | |
| Net investment income (loss)A | .01 | .18 | .21 | .15 | .12 |
| Net realized and unrealized gain (loss) | 32.21 | 20.42 | (.25)B | 19.66 | (.48) |
| Total from investment operations | 32.22 | 20.60 | (.04) | 19.81 | (.36) |
| Distributions from net investment income | (.07) | (.19) | (.18) | (.15) | (.02) |
| Distributions from net realized gain | (8.25) | (4.44) | (10.72) | (4.92) | (6.06) |
| Total distributions | (8.31)C | (4.63) | (10.89)C | (5.07) | (6.08) |
| Redemption fees added to paid in capitalA | – | – | – | – | – |
| Net asset value, end of period | $103.00 | $79.09 | $63.12 | $74.05 | $59.31 |
| Total ReturnD,E | 43.89% | 34.31% | (.17)%B | 35.13% | .80% |
| Ratios to Average Net AssetsF,G | | | | | |
| Expenses before reductions | .62% | .63% | .63% | .64% | .64% |
| Expenses net of fee waivers, if any | .62% | .62% | .63% | .64% | .64% |
| Expenses net of all reductions | .61% | .62% | .62% | .63% | .64% |
| Net investment income (loss) | .02% | .25% | .30% | .22% | .21% |
| Supplemental Data | | | | | |
| Net assets, end of period (000 omitted) | $4,533,075 | $3,441,605 | $2,869,484 | $3,165,086 | $2,736,295 |
| Portfolio turnover rateH | 53% | 47% | 34% | 50% | 61% |
A Calculated based on average shares outstanding during the period.
B Net realized and unrealized gain (loss) per share reflects proceeds received from litigation which amounted to $.02 per share. Excluding these litigation proceeds, the total return would have been (.20)%
C Total distributions per share do not sum due to rounding.
D Total returns do not reflect charges attributable to your insurance company's separate account. Inclusion of these charges would reduce the total returns shown.
E Total returns would have been lower if certain expenses had not been reduced during the applicable periods shown.
F Fees and expenses of any underlying mutual funds or exchange-traded funds (ETFs) are not included in the Fund's expense ratio. The Fund indirectly bears its proportionate share of these expenses. For additional expense information related to investments in Fidelity Central Funds, please refer to the "Investments in Fidelity Central Funds" note found in the Notes to Financial Statements section of the most recent Annual or Semi-Annual report.
G Expense ratios reflect operating expenses of the class. Expenses before reductions do not reflect amounts reimbursed, waived, or reduced through arrangements with the investment adviser, brokerage services, or other offset arrangements, if applicable, and do not represent the amount paid by the class during periods when reimbursements, waivers or reductions occur.
H Amount does not include the portfolio activity of any underlying mutual funds or exchange-traded funds (ETFs).
See accompanying notes which are an integral part of the financial statements.
VIP Growth Portfolio Service Class
| Years ended December 31, | 2020 | 2019 | 2018 | 2017 | 2016 |
| Selected Per–Share Data | | | | | |
| Net asset value, beginning of period | $78.69 | $62.83 | $73.76 | $59.10 | $65.57 |
| Income from Investment Operations | | | | | |
| Net investment income (loss)A | (.07) | .11 | .14 | .08 | .06 |
| Net realized and unrealized gain (loss) | 32.03 | 20.31 | (.25)B | 19.59 | (.47) |
| Total from investment operations | 31.96 | 20.42 | (.11) | 19.67 | (.41) |
| Distributions from net investment income | (.05) | (.12) | (.11) | (.09) | – |
| Distributions from net realized gain | (8.18) | (4.44) | (10.72) | (4.92) | (6.06) |
| Total distributions | (8.23) | (4.56) | (10.82)C | (5.01) | (6.06) |
| Redemption fees added to paid in capitalA | – | – | – | – | – |
| Net asset value, end of period | $102.42 | $78.69 | $62.83 | $73.76 | $59.10 |
| Total ReturnD,E | 43.77% | 34.17% | (.27)%B | 35.00% | .71% |
| Ratios to Average Net AssetsF,G | | | | | |
| Expenses before reductions | .72% | .73% | .73% | .74% | .74% |
| Expenses net of fee waivers, if any | .72% | .72% | .73% | .74% | .74% |
| Expenses net of all reductions | .71% | .72% | .72% | .73% | .74% |
| Net investment income (loss) | (.08)% | .15% | .20% | .12% | .11% |
| Supplemental Data | | | | | |
| Net assets, end of period (000 omitted) | $1,018,192 | $745,767 | $600,590 | $624,381 | $482,603 |
| Portfolio turnover rateH | 53% | 47% | 34% | 50% | 61% |
A Calculated based on average shares outstanding during the period.
B Net realized and unrealized gain (loss) per share reflects proceeds received from litigation which amounted to $.02 per share. Excluding these litigation proceeds, the total return would have been (.30)%
C Total distributions per share do not sum due to rounding.
D Total returns do not reflect charges attributable to your insurance company's separate account. Inclusion of these charges would reduce the total returns shown.
E Total returns would have been lower if certain expenses had not been reduced during the applicable periods shown.
F Fees and expenses of any underlying mutual funds or exchange-traded funds (ETFs) are not included in the Fund's expense ratio. The Fund indirectly bears its proportionate share of these expenses. For additional expense information related to investments in Fidelity Central Funds, please refer to the "Investments in Fidelity Central Funds" note found in the Notes to Financial Statements section of the most recent Annual or Semi-Annual report.
G Expense ratios reflect operating expenses of the class. Expenses before reductions do not reflect amounts reimbursed, waived, or reduced through arrangements with the investment adviser, brokerage services, or other offset arrangements, if applicable, and do not represent the amount paid by the class during periods when reimbursements, waivers or reductions occur.
H Amount does not include the portfolio activity of any underlying mutual funds or exchange-traded funds (ETFs).
See accompanying notes which are an integral part of the financial statements.
VIP Growth Portfolio Service Class 2
| Years ended December 31, | 2020 | 2019 | 2018 | 2017 | 2016 |
| Selected Per–Share Data | | | | | |
| Net asset value, beginning of period | $77.43 | $61.91 | $72.86 | $58.44 | $65.01 |
| Income from Investment Operations | | | | | |
| Net investment income (loss)A | (.19) | –B | .03 | (.02) | (.03) |
| Net realized and unrealized gain (loss) | 31.46 | 20.00 | (.23)C | 19.36 | (.48) |
| Total from investment operations | 31.27 | 20.00 | (.20) | 19.34 | (.51) |
| Distributions from net investment income | (.04) | (.04) | (.03) | (.06) | – |
| Distributions from net realized gain | (8.08) | (4.44) | (10.72) | (4.86) | (6.06) |
| Total distributions | (8.12) | (4.48) | (10.75) | (4.92) | (6.06) |
| Redemption fees added to paid in capitalA | – | – | – | – | – |
| Net asset value, end of period | $100.58 | $77.43 | $61.91 | $72.86 | $58.44 |
| Total ReturnD,E | 43.55% | 33.98% | (.43)%C | 34.81% | .55% |
| Ratios to Average Net AssetsF,G | | | | | |
| Expenses before reductions | .87% | .88% | .88% | .89% | .89% |
| Expenses net of fee waivers, if any | .87% | .87% | .88% | .89% | .89% |
| Expenses net of all reductions | .86% | .87% | .87% | .88% | .89% |
| Net investment income (loss) | (.23)% | - %H | .05% | (.03)% | (.04)% |
| Supplemental Data | | | | | |
| Net assets, end of period (000 omitted) | $1,587,581 | $1,182,162 | $971,010 | $1,069,117 | $783,297 |
| Portfolio turnover rateI | 53% | 47% | 34% | 50% | 61% |
A Calculated based on average shares outstanding during the period.
B Amount represents less than $.005 per share.
C Net realized and unrealized gain (loss) per share reflects proceeds received from litigation which amounted to $.02 per share. Excluding these litigation proceeds, the total return would have been (.46)%
D Total returns do not reflect charges attributable to your insurance company's separate account. Inclusion of these charges would reduce the total returns shown.
E Total returns would have been lower if certain expenses had not been reduced during the applicable periods shown.
F Fees and expenses of any underlying mutual funds or exchange-traded funds (ETFs) are not included in the Fund's expense ratio. The Fund indirectly bears its proportionate share of these expenses. For additional expense information related to investments in Fidelity Central Funds, please refer to the "Investments in Fidelity Central Funds" note found in the Notes to Financial Statements section of the most recent Annual or Semi-Annual report.
G Expense ratios reflect operating expenses of the class. Expenses before reductions do not reflect amounts reimbursed, waived, or reduced through arrangements with the investment adviser, brokerage services, or other offset arrangements, if applicable, and do not represent the amount paid by the class during periods when reimbursements, waivers or reductions occur.
H Amount represents less than .005%.
I Amount does not include the portfolio activity of any underlying mutual funds or exchange-traded funds (ETFs).
See accompanying notes which are an integral part of the financial statements.
VIP Growth Portfolio Investor Class
| Years ended December 31, | 2020 | 2019 | 2018 | 2017 | 2016 |
| Selected Per–Share Data | | | | | |
| Net asset value, beginning of period | $78.66 | $62.81 | $73.73 | $59.08 | $65.55 |
| Income from Investment Operations | | | | | |
| Net investment income (loss)A | (.05) | .12 | .15 | .10 | .07 |
| Net realized and unrealized gain (loss) | 32.02 | 20.30 | (.23)B | 19.58 | (.48) |
| Total from investment operations | 31.97 | 20.42 | (.08) | 19.68 | (.41) |
| Distributions from net investment income | (.06) | (.13) | (.12) | (.10) | – |
| Distributions from net realized gain | (8.20) | (4.44) | (10.72) | (4.92) | (6.06) |
| Total distributions | (8.25)C | (4.57) | (10.84) | (5.03)C | (6.06) |
| Redemption fees added to paid in capitalA | – | – | – | – | – |
| Net asset value, end of period | $102.38 | $78.66 | $62.81 | $73.73 | $59.08 |
| Total ReturnD,E | 43.80% | 34.18% | (.24)%B | 35.03% | .71% |
| Ratios to Average Net AssetsF,G | | | | | |
| Expenses before reductions | .70% | .70% | .71% | .72% | .73% |
| Expenses net of fee waivers, if any | .70% | .70% | .71% | .72% | .72% |
| Expenses net of all reductions | .69% | .70% | .70% | .71% | .72% |
| Net investment income (loss) | (.06)% | .17% | .22% | .14% | .12% |
| Supplemental Data | | | | | |
| Net assets, end of period (000 omitted) | $792,875 | $547,920 | $457,395 | $448,392 | $291,497 |
| Portfolio turnover rateH | 53% | 47% | 34% | 50% | 61% |
A Calculated based on average shares outstanding during the period.
B Net realized and unrealized gain (loss) per share reflects proceeds received from litigation which amounted to $.02 per share. Excluding these litigation proceeds, the total return would have been (.27)%
C Total distributions per share do not sum due to rounding.
D Total returns do not reflect charges attributable to your insurance company's separate account. Inclusion of these charges would reduce the total returns shown.
E Total returns would have been lower if certain expenses had not been reduced during the applicable periods shown.
F Fees and expenses of any underlying mutual funds or exchange-traded funds (ETFs) are not included in the Fund's expense ratio. The Fund indirectly bears its proportionate share of these expenses. For additional expense information related to investments in Fidelity Central Funds, please refer to the "Investments in Fidelity Central Funds" note found in the Notes to Financial Statements section of the most recent Annual or Semi-Annual report.
G Expense ratios reflect operating expenses of the class. Expenses before reductions do not reflect amounts reimbursed, waived, or reduced through arrangements with the investment adviser, brokerage services, or other offset arrangements, if applicable, and do not represent the amount paid by the class during periods when reimbursements, waivers or reductions occur.
H Amount does not include the portfolio activity of any underlying mutual funds or exchange-traded funds (ETFs).
See accompanying notes which are an integral part of the financial statements.
Notes to Financial Statements
For the period ended December 31, 2020
1. Organization.
VIP Growth Portfolio (the Fund) is a fund of Variable Insurance Products Fund (the Trust) and is authorized to issue an unlimited number of shares. The Trust is registered under the Investment Company Act of 1940, as amended (the 1940 Act), as an open-end management investment company organized as a Massachusetts business trust. Shares of the Fund may only be purchased by insurance companies for the purpose of funding variable annuity or variable life insurance contracts. The Fund offers the following classes of shares: Initial Class shares, Service Class shares, Service Class 2 shares and Investor Class shares. All classes have equal rights and voting privileges, except for matters affecting a single class.
Effective January 1, 2020:
Investment advisers Fidelity Investments Money Management, Inc., FMR Co., Inc., and Fidelity SelectCo, LLC, merged with and into Fidelity Management & Research Company. In connection with the merger transactions, the resulting, merged investment adviser was then redomiciled from Massachusetts to Delaware, changed its corporate structure from a corporation to a limited liability company, and changed its name to "Fidelity Management & Research Company LLC".
Broker-dealer Fidelity Distributors Corporation merged with and into Fidelity Investments Institutional Services Company, Inc. ("FIISC"). FIISC was then redomiciled from Massachusetts to Delaware, changed its corporate structure from a corporation to a limited liability company, and changed its name to "Fidelity Distributors Company LLC".
Fidelity Investments Institutional Operations Company, Inc. converted from a Massachusetts corporation to a Massachusetts LLC, and changed its name to "Fidelity Investments Institutional Operations Company LLC".
2. Investments in Fidelity Central Funds.
The Fund invests in Fidelity Central Funds, which are open-end investment companies generally available only to other investment companies and accounts managed by the investment adviser and its affiliates. The Fund's Schedule of Investments lists each of the Fidelity Central Funds held as of period end, if any, as an investment of the Fund, but does not include the underlying holdings of each Fidelity Central Fund. As an Investing Fund, the Fund indirectly bears its proportionate share of the expenses of the underlying Fidelity Central Funds.
The Money Market Central Funds seek preservation of capital and current income and are managed by the investment adviser. Annualized expenses of the Money Market Central Funds as of their most recent shareholder report date ranged from less than .005% to .01%.
A complete unaudited list of holdings for each Fidelity Central Fund is available upon request or at the Securities and Exchange Commission (the SEC) website at www.sec.gov. In addition, the financial statements of the Fidelity Central Funds, which are not covered by the Fund's Report of Independent Registered Public Accounting Firm, are available on the SEC website or upon request.
3. Significant Accounting Policies.
The Fund is an investment company and applies the accounting and reporting guidance of the Financial Accounting Standards Board (FASB) Accounting Standards Codification Topic 946 Financial Services - Investment Companies. The financial statements have been prepared in conformity with accounting principles generally accepted in the United States of America (GAAP), which require management to make certain estimates and assumptions at the date of the financial statements. Actual results could differ from those estimates. Subsequent events, if any, through the date that the financial statements were issued have been evaluated in the preparation of the financial statements. The following summarizes the significant accounting policies of the Fund:
Investment Valuation. Investments are valued as of 4:00 p.m. Eastern time on the last calendar day of the period. The Board of Trustees (the Board) has delegated the day to day responsibility for the valuation of the Fund's investments to the Fair Value Committee (the Committee) established by the Fund's investment adviser. In accordance with valuation policies and procedures approved by the Board, the Fund attempts to obtain prices from one or more third party pricing vendors or brokers to value its investments. When current market prices, quotations or currency exchange rates are not readily available or reliable, investments will be fair valued in good faith by the Committee, in accordance with procedures adopted by the Board. Factors used in determining fair value vary by investment type and may include market or investment specific events. The frequency with which these procedures are used cannot be predicted and they may be utilized to a significant extent. The Committee oversees the Fund's valuation policies and procedures and reports to the Board on the Committee's activities and fair value determinations. The Board monitors the appropriateness of the procedures used in valuing the Fund's investments and ratifies the fair value determinations of the Committee.
The Fund categorizes the inputs to valuation techniques used to value its investments into a disclosure hierarchy consisting of three levels as shown below:
- Level 1 – quoted prices in active markets for identical investments
- Level 2 – other significant observable inputs (including quoted prices for similar investments, interest rates, prepayment speeds, etc.)
- Level 3 – unobservable inputs (including the Fund's own assumptions based on the best information available)
Valuation techniques used to value the Fund's investments by major category are as follows:
Equity securities, including restricted securities, for which market quotations are readily available, are valued at the last reported sale price or official closing price as reported by a third party pricing vendor on the primary market or exchange on which they are traded and are categorized as Level 1 in the hierarchy. In the event there were no sales during the day or closing prices are not available, securities are valued at the last quoted bid price or may be valued using the last available price and are generally categorized as Level 2 in the hierarchy. For foreign equity securities, when market or security specific events arise, comparisons to the valuation of American Depositary Receipts (ADRs), futures contracts, Exchange-Traded Funds (ETFs) and certain indexes as well as quoted prices for similar securities may be used and would be categorized as Level 2 in the hierarchy. For equity securities, including restricted securities, where observable inputs are limited, assumptions about market activity and risk are used and these securities may be categorized as Level 3 in the hierarchy.
Investments in open-end mutual funds, including the Fidelity Central Funds, are valued at their closing net asset value (NAV) each business day and are categorized as Level 1 in the hierarchy.
Changes in valuation techniques may result in transfers in or out of an assigned level within the disclosure hierarchy. The aggregate value of investments by input level as of December 31, 2020 is included at the end of the Fund's Schedule of Investments.
Foreign Currency. Certain Funds may use foreign currency contracts to facilitate transactions in foreign-denominated securities. Gains and losses from these transactions may arise from changes in the value of the foreign currency or if the counterparties do not perform under the contracts' terms.
Foreign-denominated assets, including investment securities, and liabilities are translated into U.S. dollars at the exchange rates at period end. Purchases and sales of investment securities, income and dividends received, and expenses denominated in foreign currencies are translated into U.S. dollars at the exchange rate in effect on the transaction date.
The effects of exchange rate fluctuations on investments are included with the net realized and unrealized gain (loss) on investment securities. Other foreign currency transactions resulting in realized and unrealized gain (loss) are disclosed separately.
Investment Transactions and Income. For financial reporting purposes, the Fund's investment holdings and NAV include trades executed through the end of the last business day of the period. The NAV per share for processing shareholder transactions is calculated as of the close of business of the New York Stock Exchange (NYSE), normally 4:00 p.m. Eastern time and includes trades executed through the end of the prior business day. Gains and losses on securities sold are determined on the basis of identified cost and include proceeds received from litigation. Dividend income is recorded on the ex-dividend date, except for certain dividends from foreign securities where the ex-dividend date may have passed, which are recorded as soon as the Fund is informed of the ex-dividend date. Non-cash dividends included in dividend income, if any, are recorded at the fair market value of the securities received. Income and capital gain distributions from Fidelity Central Funds, if any, are recorded on the ex-dividend date. Certain distributions received by the Fund represent a return of capital or capital gain. The Fund determines the components of these distributions subsequent to the ex-dividend date, based upon receipt of tax filings or other correspondence relating to the underlying investment. These distributions are recorded as a reduction of cost of investments and/or as a realized gain. Investment income is recorded net of foreign taxes withheld where recovery of such taxes is uncertain.
Class Allocations and Expenses. Investment income, realized and unrealized capital gains and losses, common expenses of the Fund, and certain fund-level expense reductions, if any, are allocated daily on a pro-rata basis to each class based on the relative net assets of each class to the total net assets of the Fund. Each class differs with respect to transfer agent and distribution and service plan fees incurred. Certain expense reductions may also differ by class. For the reporting period, the allocated portion of income and expenses to each class as a percent of its average net assets may vary due to the timing of recording these transactions in relation to fluctuating net assets of the classes. Expenses directly attributable to a fund are charged to that fund. Expenses attributable to more than one fund are allocated among the respective funds on the basis of relative net assets or other appropriate methods. Expense estimates are accrued in the period to which they relate and adjustments are made when actual amounts are known.
Deferred Trustee Compensation. Under a Deferred Compensation Plan (the Plan) for certain Funds, certain independent Trustees have elected to defer receipt of a portion of their annual compensation. Deferred amounts are invested in affiliated mutual funds, are marked-to-market and remain in a fund until distributed in accordance with the Plan. The investment of deferred amounts and the offsetting payable to the Trustees presented below are included in the accompanying Statement of Assets and Liabilities in other receivables and other payables and accrued expenses, as applicable.
| VIP Growth Portfolio | $53,174 |
Income Tax Information and Distributions to Shareholders. Each year, the Fund intends to qualify as a regulated investment company under Subchapter M of the Internal Revenue Code, including distributing substantially all of its taxable income and realized gains. As a result, no provision for U.S. Federal income taxes is required. As of December 31, 2020, the Fund did not have any unrecognized tax benefits in the financial statements; nor is the Fund aware of any tax positions for which it is reasonably possible that the total amounts of unrecognized tax benefits will significantly change in the next twelve months. The Fund files a U.S. federal tax return, in addition to state and local tax returns as required. The Fund's federal income tax returns are subject to examination by the Internal Revenue Service (IRS) for a period of three fiscal years after they are filed. State and local tax returns may be subject to examination for an additional fiscal year depending on the jurisdiction. Foreign taxes are provided for based on the Fund's understanding of the tax rules and rates that exist in the foreign markets in which it invests. The Fund is subject to a tax imposed on capital gains by certain countries in which it invests. An estimated deferred tax liability for net unrealized appreciation on the applicable securities is included in Other payables and accrued expenses on the Statement of Assets & Liabilities.
Distributions are declared and recorded on the ex-dividend date. Income and capital gain distributions are declared separately for each class. Income and capital gain distributions are determined in accordance with income tax regulations, which may differ from GAAP. In addition, the Fund claimed a portion of the payment made to redeeming shareholders as a distribution for income tax purposes.
Capital accounts within the financial statements are adjusted for permanent book-tax differences. These adjustments have no impact on net assets or the results of operations. Capital accounts are not adjusted for temporary book-tax differences which will reverse in a subsequent period.
Book-tax differences are primarily due to foreign currency transactions, passive foreign investment companies (PFIC), partnerships (including allocations from Fidelity Central Funds), deferred Trustees compensation, net operating losses and losses deferred due to wash sales.
As of period end, the cost and unrealized appreciation (depreciation) in securities, and derivatives if applicable, for federal income tax purposes were as follows:
| Gross unrealized appreciation | $3,789,246,952 |
| Gross unrealized depreciation | (46,967,771) |
| Net unrealized appreciation (depreciation) | $3,742,279,181 |
| Tax Cost | $4,253,485,997 |
The tax-based components of distributable earnings as of period end were as follows:
| Undistributed ordinary income | $64,800,979 |
| Undistributed long-term capital gain | $896,536,977 |
| Net unrealized appreciation (depreciation) on securities and other investments | $3,742,294,604 |
The tax character of distributions paid was as follows:
| | December 31, 2020 | December 31, 2019 |
| Ordinary Income | $93,635,165 | $11,044,728 |
| Long-term Capital Gains | 523,877,814 | 342,816,133 |
| Total | $617,512,979 | $353,860,861 |
Restricted Securities (including Private Placements). The Fund may invest in securities that are subject to legal or contractual restrictions on resale. These securities generally may be resold in transactions exempt from registration or to the public if the securities are registered. Disposal of these securities may involve time-consuming negotiations and expense, and prompt sale at an acceptable price may be difficult. Information regarding restricted securities is included at the end of the Fund's Schedule of Investments.
4. Purchases and Sales of Investments.
Purchases and sales of securities, other than short-term securities, are noted in the table below.
| | Purchases ($) | Sales ($) |
| VIP Growth Portfolio | 3,469,454,769 | 3,916,193,721 |
5. Fees and Other Transactions with Affiliates.
Management Fee. Fidelity Management & Research Company LLC (the investment adviser) and its affiliates provide the Fund with investment management related services for which the Fund pays a monthly management fee. The management fee is the sum of an individual fund fee rate that is based on an annual rate of .30% of the Fund's average net assets and an annualized group fee rate that averaged .23% during the period. The group fee rate is based upon the monthly average net assets of a group of registered investment companies with which the investment adviser has management contracts. The group fee rate decreases as assets under management increase and increases as assets under management decrease. For the reporting period, the total annual management fee rate was .53% of the Fund's average net assets.
Distribution and Service Plan Fees. In accordance with Rule 12b-1 of the 1940 Act, the Fund has adopted separate 12b-1 Plans for each Service Class of shares. Each Service Class pays Fidelity Distributors Company LLC (FDC), an affiliate of the investment adviser, a service fee. For the period, the service fee is based on an annual rate of .10% of Service Class' average net assets and .25% of Service Class 2's average net assets.
For the period, total fees, all of which were re-allowed to insurance companies for the distribution of shares and providing shareholder support services, were as follows:
| Service Class | $833,866 |
| Service Class 2 | 3,227,633 |
| | $4,061,499 |
Transfer Agent Fees. Fidelity Investments Institutional Operations Company LLC (FIIOC), an affiliate of the investment adviser, is the Fund's transfer, dividend disbursing, and shareholder servicing agent. FIIOC receives an asset-based fee with respect to each class. Each class pays a fee for transfer agent services, typesetting and printing and mailing of shareholder reports, excluding mailing of proxy statements. Effective February 1, 2020, the Board approved to change the fee from .145% to .142% for Investor Class, and from .065% to .064% for all other classes. For the period, transfer agent fees for each class were as follows:
| | Amount | % of Class-Level Average Net Assets |
| Initial Class | $2,403,543 | .06 |
| Service Class | 530,307 | .06 |
| Service Class 2 | 820,926 | .06 |
| Investor Class | 894,758 | .14 |
| | $4,649,534 | |
Accounting Fees. Fidelity Service Company, Inc. (FSC), an affiliate of the investment adviser, maintains the Fund's accounting records. The accounting fee is based on the level of average net assets for each month. For the period, the fees were equivalent to the following annual rates:
| | % of Average Net Assets |
| VIP Growth Portfolio | .02 |
Brokerage Commissions. A portion of portfolio transactions were placed with brokerage firms which are affiliates of the investment adviser. Brokerage commissions are included in net realized gain (loss) and change in net unrealized appreciation (depreciation) in the Statement of Operations. The commissions paid to these affiliated firms were as follows:
| | Amount |
| VIP Growth Portfolio | $79,642 |
Interfund Lending Program. Pursuant to an Exemptive Order issued by the SEC, the Fund, along with other registered investment companies having management contracts with Fidelity Management & Research Company LLC (FMR), or other affiliated entities of FMR, may participate in an interfund lending program. This program provides an alternative credit facility allowing the Fund to borrow from, or lend money to, other participating affiliated funds. At period end, there were no interfund loans outstanding. Activity in this program during the period for which loans were outstanding was as follows:
| | Borrower or Lender | Average Loan Balance | Weighted Average Interest Rate | Interest Expense |
| VIP Growth Portfolio | Borrower | $13,556,089 | .59% | $19,844 |
Interfund Trades. Funds may purchase from or sell securities to other Fidelity Funds under procedures adopted by the Board. The procedures have been designed to ensure these interfund trades are executed in accordance with Rule 17a-7 of the 1940 Act. Interfund trades are included within the respective purchases and sales amounts shown in the Purchases and Sales of Investments note, and amounted to $165,090,790 and $310,212,675, respectively.
Other. During the period, the investment adviser reimbursed the Fund for certain losses in the amount of $29,137.
6. Committed Line of Credit.
Certain Funds participate with other funds managed by the investment adviser or an affiliate in a $4.25 billion credit facility (the "line of credit") to be utilized for temporary or emergency purposes to fund shareholder redemptions or for other short-term liquidity purposes. The participating funds have agreed to pay commitment fees on their pro-rata portion of the line of credit, which are reflected in Miscellaneous expenses on the Statement of Operations, and are as follows:
| | Amount |
| VIP Growth Portfolio | $14,193 |
During the period, there were no borrowings on this line of credit.
7. Security Lending.
Funds lend portfolio securities from time to time in order to earn additional income. Lending agents are used, including National Financial Services (NFS), an affiliate of the investment adviser. Pursuant to a securities lending agreement, NFS will receive a fee, which is capped at 9.9% of a fund's daily lending revenue, for its services as lending agent. A fund may lend securities to certain qualified borrowers, including NFS. On the settlement date of the loan, a fund receives collateral (in the form of U.S. Treasury obligations, letters of credit and/or cash) against the loaned securities and maintains collateral in an amount not less than 100% of the market value of the loaned securities during the period of the loan. The market value of the loaned securities is determined at the close of business of a fund and any additional required collateral is delivered to a fund on the next business day. A fund or borrower may terminate the loan at any time, and if the borrower defaults on its obligation to return the securities loaned because of insolvency or other reasons, a fund may apply collateral received from the borrower against the obligation. A fund may experience delays and costs in recovering the securities loaned. Any cash collateral received is invested in the Fidelity Securities Lending Cash Central Fund. Any loaned securities are identified as such in the Schedule of Investments, and the value of loaned securities and cash collateral at period end, as applicable, are presented in the Statement of Assets and Liabilities. Security lending income represents the income earned on investing cash collateral, less rebates paid to borrowers and any lending agent fees associated with the loan, plus any premium payments received for lending certain types of securities. Security lending income is presented in the Statement of Operations as a component of income from Fidelity Central Funds. Affiliated security lending activity, if any, was as follows:
| | Total Security Lending Income Fees Paid to NFS | Security Lending Income From Securities Loaned to NFS | Value of Securities Loaned to NFS at Period End |
| VIP Growth Portfolio | $132,905 | $40,052 | $– |
8. Bank Borrowings.
The Fund is permitted to have bank borrowings for temporary or emergency purposes to fund shareholder redemptions or for other short-term liquidity requirements. The Fund has established borrowing arrangements with certain banks. The interest rate on the borrowings is the bank's base rate, as revised from time to time. Any open loans, including accrued interest, at period end are presented under the caption "Notes payable" in the Statement of Assets and Liabilities, if applicable. Activity in this program during the period for which loans were outstanding was as follows:
| | Average Loan Balance | Weighted Average Interest Rate | Interest Expense |
| VIP Growth Portfolio | $4,561,000 | .59% | $224 |
9. Expense Reductions.
Commissions paid to certain brokers with whom the investment adviser, or its affiliates, places trades on behalf of the Fund include an amount in addition to trade execution, which may be rebated back to the Fund to offset certain expenses. This amount totaled $329,887 for the period.
In addition, during the period the investment adviser or an affiliate reimbursed and/or waived a portion of fund-level operating expenses in the amount of $23,273.
10. Distributions to Shareholders.
Distributions to shareholders of each class were as follows:
| | Year ended
December 31, 2020 | Year ended
December 31, 2019 |
| Distributions to shareholders | | |
| Initial Class | $358,011,706 | $207,743,506 |
| Service Class | 77,881,583 | 43,128,216 |
| Service Class 2 | 123,304,387 | 69,934,259 |
| Investor Class | 58,315,303 | 33,054,880 |
| Total | $617,512,979 | $353,860,861 |
11. Share Transactions.
Transactions for each class of shares were as follows:
| | Shares | Shares | Dollars | Dollars |
| | Year ended December 31, 2020 | Year ended December 31, 2019 | Year ended December 31, 2020 | Year ended December 31, 2019 |
| Initial Class | | | | |
| Shares sold | 2,421,748 | 1,099,064 | $197,372,757 | $78,545,018 |
| Reinvestment of distributions | 4,467,092 | 3,220,905 | 358,011,706 | 207,743,506 |
| Shares redeemed | (6,395,612) | (6,264,206) | (527,253,371) | (444,812,741) |
| Net increase (decrease) | 493,228 | (1,944,237) | $28,131,092 | $(158,524,217) |
| Service Class | | | | |
| Shares sold | 1,238,658 | 825,622 | $102,304,855 | $58,366,161 |
| Reinvestment of distributions | 977,801 | 673,207 | 77,881,583 | 43,128,216 |
| Shares redeemed | (1,751,676) | (1,581,012) | (144,513,037) | (110,959,261) |
| Net increase (decrease) | 464,783 | (82,183) | $35,673,401 | $(9,464,884) |
| Service Class 2 | | | | |
| Shares sold | 2,657,391 | 1,471,839 | $218,698,194 | $101,254,658 |
| Reinvestment of distributions | 1,580,689 | 1,111,462 | 123,304,387 | 69,934,259 |
| Shares redeemed | (3,720,391) | (2,999,804) | (293,491,865) | (206,473,143) |
| Net increase (decrease) | 517,689 | (416,503) | $48,510,716 | $(35,284,226) |
| Investor Class | | | | |
| Shares sold | 1,145,918 | 490,294 | $92,937,912 | $34,545,073 |
| Reinvestment of distributions | 731,173 | 516,075 | 58,315,303 | 33,054,880 |
| Shares redeemed | (1,097,743) | (1,323,847) | (86,675,742) | (93,800,923) |
| Net increase (decrease) | 779,348 | (317,478) | $64,577,473 | $(26,200,970) |
12. Other.
The Fund's organizational documents provide former and current trustees and officers with a limited indemnification against liabilities arising in connection with the performance of their duties to the Fund. In the normal course of business, the Fund may also enter into contracts that provide general indemnifications. The Fund's maximum exposure under these arrangements is unknown as this would be dependent on future claims that may be made against the Fund. The risk of material loss from such claims is considered remote.
At the end of the period, the investment adviser or its affiliates were the owners of record of 19% of the total outstanding shares of the Fund and two otherwise unaffiliated shareholders were the owners of record of 37% of the total outstanding shares of the Fund.
13. Coronavirus (COVID-19) Pandemic.
An outbreak of COVID-19 first detected in China during December 2019 has since spread globally and was declared a pandemic by the World Health Organization during March 2020. Developments that disrupt global economies and financial markets, such as the COVID-19 pandemic, may magnify factors that affect the Fund's performance.
Report of Independent Registered Public Accounting Firm
To the Board of Trustees of Variable Insurance Products Fund and Shareholders of VIP Growth Portfolio
Opinion on the Financial Statements
We have audited the accompanying statement of assets and liabilities, including the schedule of investments, of VIP Growth Portfolio (one of the funds constituting Variable Insurance Products Fund, referred to hereafter as the “Fund”) as of December 31, 2020, the related statement of operations for the year ended December 31, 2020, the statement of changes in net assets for each of the two years in the period ended December 31, 2020, including the related notes, and the financial highlights for each of the five years in the period ended December 31, 2020 (collectively referred to as the “financial statements”). In our opinion, the financial statements present fairly, in all material respects, the financial position of the Fund as of December 31, 2020, the results of its operations for the year then ended, the changes in its net assets for each of the two years in the period ended December 31, 2020 and the financial highlights for each of the five years in the period ended December 31, 2020 in conformity with accounting principles generally accepted in the United States of America.
Basis for Opinion
These financial statements are the responsibility of the Fund’s management. Our responsibility is to express an opinion on the Fund’s financial statements based on our audits. We are a public accounting firm registered with the Public Company Accounting Oversight Board (United States) (PCAOB) and are required to be independent with respect to the Fund in accordance with the U.S. federal securities laws and the applicable rules and regulations of the Securities and Exchange Commission and the PCAOB.
We conducted our audits of these financial statements in accordance with the standards of the PCAOB. Those standards require that we plan and perform the audit to obtain reasonable assurance about whether the financial statements are free of material misstatement, whether due to error or fraud.
Our audits included performing procedures to assess the risks of material misstatement of the financial statements, whether due to error or fraud, and performing procedures that respond to those risks. Such procedures included examining, on a test basis, evidence regarding the amounts and disclosures in the financial statements. Our audits also included evaluating the accounting principles used and significant estimates made by management, as well as evaluating the overall presentation of the financial statements. Our procedures included confirmation of securities owned as of December 31, 2020 by correspondence with the custodian, issuers of privately offered securities and brokers; when replies were not received from brokers, we performed other auditing procedures. We believe that our audits provide a reasonable basis for our opinion.
/s/ PricewaterhouseCoopers LLP
Boston, Massachusetts
February 9, 2021
We have served as the auditor of one or more investment companies in the Fidelity group of funds since 1932.
Trustees and Officers
The Trustees, Members of the Advisory Board (if any), and officers of the trust and fund, as applicable, are listed below. The Board of Trustees governs the fund and is responsible for protecting the interests of shareholders. The Trustees are experienced executives who meet periodically throughout the year to oversee the fund's activities, review contractual arrangements with companies that provide services to the fund, oversee management of the risks associated with such activities and contractual arrangements, and review the fund's performance. Except for Jonathan Chiel, each of the Trustees oversees 305 funds. Mr. Chiel oversees 176 funds.
The Trustees hold office without limit in time except that (a) any Trustee may resign; (b) any Trustee may be removed by written instrument, signed by at least two-thirds of the number of Trustees prior to such removal; (c) any Trustee who requests to be retired or who has become incapacitated by illness or injury may be retired by written instrument signed by a majority of the other Trustees; and (d) any Trustee may be removed at any special meeting of shareholders by a two-thirds vote of the outstanding voting securities of the trust. Each Trustee who is not an interested person (as defined in the 1940 Act) of the trust and the fund is referred to herein as an Independent Trustee. Each Independent Trustee shall retire not later than the last day of the calendar year in which his or her 75th birthday occurs. The Independent Trustees may waive this mandatory retirement age policy with respect to individual Trustees. Officers and Advisory Board Members hold office without limit in time, except that any officer or Advisory Board Member may resign or may be removed by a vote of a majority of the Trustees at any regular meeting or any special meeting of the Trustees. Except as indicated, each individual has held the office shown or other offices in the same company for the past five years.
The fund’s Statement of Additional Information (SAI) includes more information about the Trustees. To request a free copy, call Fidelity at 1-877-208-0098.
Experience, Skills, Attributes, and Qualifications of the Trustees. The Governance and Nominating Committee has adopted a statement of policy that describes the experience, qualifications, attributes, and skills that are necessary and desirable for potential Independent Trustee candidates (Statement of Policy). The Board believes that each Trustee satisfied at the time he or she was initially elected or appointed a Trustee, and continues to satisfy, the standards contemplated by the Statement of Policy. The Governance and Nominating Committee also engages professional search firms to help identify potential Independent Trustee candidates who have the experience, qualifications, attributes, and skills consistent with the Statement of Policy. From time to time, additional criteria based on the composition and skills of the current Independent Trustees, as well as experience or skills that may be appropriate in light of future changes to board composition, business conditions, and regulatory or other developments, have also been considered by the professional search firms and the Governance and Nominating Committee. In addition, the Board takes into account the Trustees' commitment and participation in Board and committee meetings, as well as their leadership of standing and ad hoc committees throughout their tenure.
In determining that a particular Trustee was and continues to be qualified to serve as a Trustee, the Board has considered a variety of criteria, none of which, in isolation, was controlling. The Board believes that, collectively, the Trustees have balanced and diverse experience, qualifications, attributes, and skills, which allow the Board to operate effectively in governing the fund and protecting the interests of shareholders. Information about the specific experience, skills, attributes, and qualifications of each Trustee, which in each case led to the Board's conclusion that the Trustee should serve (or continue to serve) as a trustee of the fund, is provided below.
Board Structure and Oversight Function. Robert A. Lawrence is an interested person and currently serves as Acting Chairman. The Trustees have determined that an interested Chairman is appropriate and benefits shareholders because an interested Chairman has a personal and professional stake in the quality and continuity of services provided to the fund. Independent Trustees exercise their informed business judgment to appoint an individual of their choosing to serve as Chairman, regardless of whether the Trustee happens to be independent or a member of management. The Independent Trustees have determined that they can act independently and effectively without having an Independent Trustee serve as Chairman and that a key structural component for assuring that they are in a position to do so is for the Independent Trustees to constitute a substantial majority for the Board. The Independent Trustees also regularly meet in executive session. David M. Thomas serves as Lead Independent Trustee and as such (i) acts as a liaison between the Independent Trustees and management with respect to matters important to the Independent Trustees and (ii) with management prepares agendas for Board meetings.
Fidelity® funds are overseen by different Boards of Trustees. The fund's Board oversees Fidelity's high income and certain equity funds, and other Boards oversee Fidelity's investment-grade bond, money market, asset allocation, and other equity funds. The asset allocation funds may invest in Fidelity® funds overseen by the fund's Board. The use of separate Boards, each with its own committee structure, allows the Trustees of each group of Fidelity® funds to focus on the unique issues of the funds they oversee, including common research, investment, and operational issues. On occasion, the separate Boards establish joint committees to address issues of overlapping consequences for the Fidelity® funds overseen by each Board.
The Trustees operate using a system of committees to facilitate the timely and efficient consideration of all matters of importance to the Trustees, the fund, and fund shareholders and to facilitate compliance with legal and regulatory requirements and oversight of the fund's activities and associated risks. The Board, acting through its committees, has charged FMR and its affiliates with (i) identifying events or circumstances the occurrence of which could have demonstrably adverse effects on the fund's business and/or reputation; (ii) implementing processes and controls to lessen the possibility that such events or circumstances occur or to mitigate the effects of such events or circumstances if they do occur; and (iii) creating and maintaining a system designed to evaluate continuously business and market conditions in order to facilitate the identification and implementation processes described in (i) and (ii) above. Because the day-to-day operations and activities of the fund are carried out by or through FMR, its affiliates, and other service providers, the fund's exposure to risks is mitigated but not eliminated by the processes overseen by the Trustees. While each of the Board's committees has responsibility for overseeing different aspects of the fund's activities, oversight is exercised primarily through the Operations, Audit, and Compliance Committees. Appropriate personnel, including but not limited to the fund's Chief Compliance Officer (CCO), FMR's internal auditor, the independent accountants, the fund's Treasurer and portfolio management personnel, make periodic reports to the Board's committees, as appropriate, including an annual review of Fidelity's risk management program for the Fidelity® funds. The responsibilities of each standing committee, including their oversight responsibilities, are described further under "Standing Committees of the Trustees."
Interested Trustees*:
Correspondence intended for a Trustee who is an interested person may be sent to Fidelity Investments, 245 Summer Street, Boston, Massachusetts 02210.
Name, Year of Birth; Principal Occupations and Other Relevant Experience+
Jonathan Chiel (1957)
Year of Election or Appointment: 2016
Trustee
Mr. Chiel also serves as Trustee of other Fidelity® funds. Mr. Chiel is Executive Vice President and General Counsel for FMR LLC (diversified financial services company, 2012-present). Previously, Mr. Chiel served as general counsel (2004-2012) and senior vice president and deputy general counsel (2000-2004) for John Hancock Financial Services; a partner with Choate, Hall & Stewart (1996-2000) (law firm); and an Assistant United States Attorney for the United States Attorney’s Office of the District of Massachusetts (1986-95), including Chief of the Criminal Division (1993-1995). Mr. Chiel is a director on the boards of the Boston Bar Foundation and the Maimonides School.
Bettina Doulton (1964)
Year of Election or Appointment: 2021
Trustee
Ms. Doulton also serves as Trustee of other Fidelity® funds. Prior to her retirement, Ms. Doulton served in a variety of positions at Fidelity Investments, including as a managing director of research (2006-2007), portfolio manager to certain Fidelity® funds (1993-2005), equity analyst and portfolio assistant (1990-1993), and research assistant (1987-1990). Ms. Doulton currently owns and operates Phi Builders + Architects and Cellardoor Winery. Previously, Ms. Doulton served as a member of the Board of Brown Capital Management, LLC (2013-2018).
Robert A. Lawrence (1952)
Year of Election or Appointment: 2020
Trustee
Acting Chairman of the Board of Trustees
Mr. Lawrence also serves as Trustee of other funds. Previously, Mr. Lawrence served as a Member of the Advisory Board of certain funds. Prior to his retirement in 2008, Mr. Lawrence served as Vice President of certain Fidelity® funds (2006-2008), Senior Vice President, Head of High Income Division of Fidelity Management & Research Company (investment adviser firm, 2006-2008), and President of Fidelity Strategic Investments (investment adviser firm, 2002-2005).
* Determined to be an “Interested Trustee” by virtue of, among other things, his or her affiliation with the trust or various entities under common control with FMR.
+ The information includes the Trustee's principal occupation during the last five years and other information relating to the experience, attributes, and skills relevant to the Trustee's qualifications to serve as a Trustee, which led to the conclusion that the Trustee should serve as a Trustee for the fund.
Independent Trustees:
Correspondence intended for an Independent Trustee may be sent to Fidelity Investments, P.O. Box 55235, Boston, Massachusetts 02205-5235.
Name, Year of Birth; Principal Occupations and Other Relevant Experience+
Dennis J. Dirks (1948)
Year of Election or Appointment: 2005
Trustee
Mr. Dirks also serves as Trustee of other Fidelity® funds. Prior to his retirement in May 2003, Mr. Dirks served as Chief Operating Officer and as a member of the Board of The Depository Trust & Clearing Corporation (financial markets infrastructure), President, Chief Operating Officer and a member of the Board of The Depository Trust Company (DTC), President and a member of the Board of the National Securities Clearing Corporation (NSCC), Chief Executive Officer and a member of the Board of the Government Securities Clearing Corporation and Chief Executive Officer and a member of the Board of the Mortgage-Backed Securities Clearing Corporation. Mr. Dirks currently serves as a member of the Finance Committee (2016-present) and Board (2017-present) and is Treasurer (2018-present) of the Asolo Repertory Theatre.
Donald F. Donahue (1950)
Year of Election or Appointment: 2018
Trustee
Mr. Donahue also serves as Trustee of other Fidelity® funds. Mr. Donahue serves as President and Chief Executive Officer of Miranda Partners, LLC (risk consulting for the financial services industry, 2012-present). Previously, Mr. Donahue served as Chief Executive Officer (2006-2012), Chief Operating Officer (2003-2006) and Managing Director, Customer Marketing and Development (1999-2003) of The Depository Trust & Clearing Corporation (financial markets infrastructure). Mr. Donahue currently serves as a member (2007-present) and Co-Chairman (2016-present) of the Board of United Way of New York, a member of the Board of NYC Leadership Academy (2012-present) and a member of the Board of Advisors of Ripple Labs, Inc. (financial services, 2015-present). Mr. Donahue previously served as a member of the Advisory Board of certain Fidelity® funds (2015-2018).
Vicki L. Fuller (1957)
Year of Election or Appointment: 2020
Trustee
Ms. Fuller also serves as Trustee of other Fidelity® funds. Previously, Ms. Fuller served as a member of the Advisory Board of certain Fidelity® funds (2018-2020), Chief Investment Officer of the New York State Common Retirement Fund (2012-2018) and held a variety of positions at AllianceBernstein L.P. (global asset management, 1985-2012), including Managing Director (2006-2012) and Senior Vice President and Senior Portfolio Manager (2001-2006). Ms. Fuller currently serves as a member of the Board, Audit Committee and Nominating and Governance Committee of The Williams Companies, Inc. (natural gas infrastructure, 2018-present), as a member of the Board, Audit Committee and Nominating and Governance Committee of two Blackstone business development companies (2020-present) and as a member of the Board of Treliant, LLC (consulting, 2019-present).
Patricia L. Kampling (1959)
Year of Election or Appointment: 2020
Trustee
Ms. Kampling also serves as Trustee of other Fidelity® funds. Prior to her retirement, Ms. Kampling served as Chairman of the Board and Chief Executive Officer (2012-2019), President and Chief Operating Officer (2011-2012) and Executive Vice President and Chief Financial Officer (2010-2011) of Alliant Energy Corporation. Ms. Kampling currently serves as a member of the Board, Compensation Committee and Executive Committee and as Chair of the Audit Committee of Briggs & Stratton Corporation (manufacturing, 2011-present) and as a member of the Board, Audit, Finance and Risk Committee and Safety, Environmental, Technology and Operations Committee of American Water Works Company, Inc. (utilities company, 2019-present). In addition, Ms. Kampling currently serves as a member of the Board of the Nature Conservancy, Wisconsin Chapter (2019-present). Previously, Ms. Kampling served as a Member of the Advisory Board of certain Fidelity® funds (2020), a member of the Board of Interstate Power and Light Company (2012-2019) and Wisconsin Power and Light Company (2012-2019) (each a subsidiary of Alliant Energy Corporation) and as a member of the Board and Workforce Development Committee of the Business Roundtable (2018-2019).
Thomas A. Kennedy (1955)
Year of Election or Appointment: 2021
Trustee
Mr. Kennedy also serves as Trustee of other Fidelity® funds. Previously, Mr. Kennedy served as a Member of the Advisory Board of certain Fidelity® funds (2020) and held a variety of positions at Raytheon Company (aerospace and defense, 1983-2020), including Chairman and Chief Executive Officer (2014-2020) and Executive Vice President and Chief Operating Officer (2013-2014). Mr. Kennedy currently serves as Executive Chairman of the Board of Directors of Raytheon Technologies Corporation (aerospace and defense, 2020-present). He is also a member of the Rutgers School of Engineering Industry Advisory Board (2011-present) and a member of the UCLA Engineering Dean’s Executive Board (2016-present).
Garnett A. Smith (1947)
Year of Election or Appointment: 2018
Trustee
Mr. Smith also serves as Trustee of other Fidelity® funds. Prior to his retirement, Mr. Smith served as Chairman and Chief Executive Officer (1990-1997) and President (1986-1990) of Inbrand Corp. (manufacturer of personal absorbent products). Prior to his employment with Inbrand Corp., he was employed by a retail fabric chain and North Carolina National Bank (now Bank of America). Mr. Smith previously served as a member of the Advisory Board of certain Fidelity® funds (2012-2013).
David M. Thomas (1949)
Year of Election or Appointment: 2008
Trustee
Lead Independent Trustee
Mr. Thomas also serves as Trustee of other Fidelity® funds. Previously, Mr. Thomas served as Executive Chairman (2005-2006) and Chairman and Chief Executive Officer (2000-2005) of IMS Health, Inc. (pharmaceutical and healthcare information solutions). Mr. Thomas currently serves as Non-Executive Chairman of the Board of Fortune Brands Home and Security (home and security products, 2011-present), and a member of the Board (2004-present) and Presiding Director (2013-present) of Interpublic Group of Companies, Inc. (marketing communication).
Susan Tomasky (1953)
Year of Election or Appointment: 2020
Trustee
Ms. Tomasky also serves as Trustee of other Fidelity® funds. Prior to her retirement, Ms. Tomasky served in various executive officer positions at American Electric Power Company, Inc. (1998-2011), including most recently as President of AEP Transmission (2007-2011). Ms. Tomasky currently serves as a member of the Board and Sustainability Committee and as Chair of the Audit Committee of Marathon Petroleum Corporation (2018-present) and as a member of the Board, Corporate Governance Committee and Organization and Compensation Committee and as Chair of the Audit Committee of Public Service Enterprise Group, Inc. (utilities company, 2012-present). In addition, Ms. Tomasky currently serves as a member of the Board of the Columbus Regional Airport Authority (2007-present), as a member of the Board of the Royal Shakespeare Company – America (2009-present), as a member of the Board of the Columbus Association for the Performing Arts (2011-present) and as a member of the Board of Kenyon College (2016-present). Previously, Ms. Tomasky served as a Member of the Advisory Board of certain Fidelity® funds (2020), a member of the Board (2011-2019) and as Lead Independent Director (2015-2018) of Andeavor Corporation (previously Tesoro Corporation) (independent oil refiner and marketer) and as a member of the Board of Summit Midstream Partners LP (energy, 2012-2018).
Michael E. Wiley (1950)
Year of Election or Appointment: 2020
Trustee
Mr. Wiley also serves as Trustee of other Fidelity® funds. Previously, Mr. Wiley served as a member of the Advisory Board of certain Fidelity® funds (2018-2020), Chairman, President and CEO of Baker Hughes, Inc. (oilfield services, 2000-2004). Mr. Wiley also previously served as a member of the Board of Andeavor Corporation (independent oil refiner and marketer, 2005-2018), a member of the Board of Andeavor Logistics LP (natural resources logistics, 2015-2018) and a member of the Board of High Point Resources (exploration and production, 2005-2020).
+ The information includes the Trustee's principal occupation during the last five years and other information relating to the experience, attributes, and skills relevant to the Trustee's qualifications to serve as a Trustee, which led to the conclusion that the Trustee should serve as a Trustee for the fund.
Advisory Board Members and Officers:
Correspondence intended for a Member of the Advisory Board (if any) may be sent to Fidelity Investments, P.O. Box 55235, Boston, Massachusetts 02205-5235. Correspondence intended for an officer or Peter S. Lynch may be sent to Fidelity Investments, 245 Summer Street, Boston, Massachusetts 02210. Officers appear below in alphabetical order.
Name, Year of Birth; Principal Occupation
Ned C. Lautenbach (1944)
Year of Election or Appointment: 2021
Member of the Advisory Board
Mr. Lautenbach also serves as a Member of the Advisory Board of other Fidelity® funds. Mr. Lautenbach currently serves as Chair of the Board of Governors, State University System of Florida (2013-present) and is a member of the Council on Foreign Relations (1994-present). He is also a member and has in the past served as Chairman of the Board of Directors of Artis-Naples (2012-present). Previously, Mr. Lautenbach served as a Trustee of certain Fidelity® funds (2000-2020) and a member and then Lead Director of the Board of Directors of Eaton Corporation (diversified industrial, 1997-2016). He was also a Partner at Clayton, Dubilier & Rice, LLC (private equity investment, 1998-2010); as well as Director of Sony Corporation (2006-2007). In addition, Mr. Lautenbach had a 30-year career with IBM (technology company), during which time he served as Senior Vice President and as a member of the Corporate Executive Committee (1968-1998).
Peter S. Lynch (1944)
Year of Election or Appointment: 2003
Member of the Advisory Board
Mr. Lynch also serves as a Member of the Advisory Board of other Fidelity® funds. Mr. Lynch is Vice Chairman and a Director of Fidelity Management & Research Company LLC (investment adviser firm). In addition, Mr. Lynch serves as a Trustee of Boston College and as the Chairman of the Inner-City Scholarship Fund. Previously, Mr. Lynch served as Vice Chairman and a Director of FMR Co., Inc. (investment adviser firm) and on the Special Olympics International Board of Directors (1997-2006).
Craig S. Brown (1977)
Year of Election or Appointment: 2019
Assistant Treasurer
Mr. Brown also serves as Assistant Treasurer of other funds. Mr. Brown is an employee of Fidelity Investments (2013-present).
John J. Burke III (1964)
Year of Election or Appointment: 2018
Chief Financial Officer
Mr. Burke also serves as Chief Financial Officer of other funds. Mr. Burke serves as Head of Investment Operations for Fidelity Fund and Investment Operations (2018-present) and is an employee of Fidelity Investments (1998-present). Previously Mr. Burke served as head of Asset Management Investment Operations (2012-2018).
William C. Coffey (1969)
Year of Election or Appointment: 2019
Assistant Secretary
Mr. Coffey also serves as Assistant Secretary of other funds. He is Senior Vice President and Deputy General Counsel of FMR LLC (diversified financial services company, 2010-present), and is an employee of Fidelity Investments. Previously, Mr. Coffey served as Secretary and CLO of certain funds (2018-2019); CLO, Secretary, and Senior Vice President of Fidelity Management & Research Company and FMR Co., Inc. (investment adviser firms, 2018-2019); Secretary of Fidelity SelectCo, LLC and Fidelity Investments Money Management, Inc. (investment adviser firms, 2018-2019); CLO of Fidelity Management & Research (Hong Kong) Limited, FMR Investment Management (UK) Limited, and Fidelity Management & Research (Japan) Limited (investment adviser firms, 2018-2019); and Assistant Secretary of certain funds (2009-2018).
Timothy M. Cohen (1969)
Year of Election or Appointment: 2018
Vice President
Mr. Cohen also serves as Vice President of other funds. Mr. Cohen serves as Co-Head of Equity (2018-present), a Director of Fidelity Management & Research (Japan) Limited (investment adviser firm, 2016-present), and is an employee of Fidelity Investments. Previously, Mr. Cohen served as Executive Vice President of Fidelity SelectCo, LLC (2019), Head of Global Equity Research (2016-2018), Chief Investment Officer - Equity and a Director of Fidelity Management & Research (U.K.) Inc. (investment adviser firm, 2013-2015) and as a Director of Fidelity Management & Research (Hong Kong) Limited (investment adviser firm, 2017).
Jonathan Davis (1968)
Year of Election or Appointment: 2010
Assistant Treasurer
Mr. Davis also serves as Assistant Treasurer of other funds. Mr. Davis serves as Assistant Treasurer of FMR Capital, Inc. (2017-present) and is an employee of Fidelity Investments. Previously, Mr. Davis served as Vice President and Associate General Counsel of FMR LLC (diversified financial services company, 2003-2010).
Laura M. Del Prato (1964)
Year of Election or Appointment: 2018
Assistant Treasurer
Ms. Del Prato also serves as an officer of other funds. Ms. Del Prato is an employee of Fidelity Investments (2017-present). Previously, Ms. Del Prato served as President and Treasurer of The North Carolina Capital Management Trust: Cash Portfolio and Term Portfolio (2018-2020). Prior to joining Fidelity Investments, Ms. Del Prato served as a Managing Director and Treasurer of the JPMorgan Mutual Funds (2014-2017). Prior to JPMorgan, Ms. Del Prato served as a partner at Cohen Fund Audit Services (accounting firm, 2012-2013) and KPMG LLP (accounting firm, 2004-2012).
Colm A. Hogan (1973)
Year of Election or Appointment: 2020
Assistant Treasurer
Mr. Hogan also serves as an officer of other funds. Mr. Hogan serves as Assistant Treasurer of FMR Capital, Inc. (2017-present) and is an employee of Fidelity Investments (2005-present). Previously, Mr. Hogan served as Deputy Treasurer of certain Fidelity® funds (2016-2020) and Assistant Treasurer of certain Fidelity® funds (2016-2018).
Pamela R. Holding (1964)
Year of Election or Appointment: 2018
Vice President
Ms. Holding also serves as Vice President of other funds. Ms. Holding serves as Co-Head of Equity (2018-present) and is an employee of Fidelity Investments (2013-present). Previously, Ms. Holding served as Executive Vice President of Fidelity SelectCo, LLC (2019) and as Chief Investment Officer of Fidelity Institutional Asset Management (2013-2018).
Cynthia Lo Bessette (1969)
Year of Election or Appointment: 2019
Secretary and Chief Legal Officer (CLO)
Ms. Lo Bessette also serves as an officer of other funds. Ms. Lo Bessette serves as CLO, Secretary, and Senior Vice President of Fidelity Management & Research Company LLC (investment adviser firm, 2019-present); and CLO of Fidelity Management & Research (Hong Kong) Limited, FMR Investment Management (UK) Limited, and Fidelity Management & Research (Japan) Limited (investment adviser firms, 2019-present). She is a Senior Vice President and Deputy General Counsel of FMR LLC (diversified financial services company, 2019-present), and is an employee of Fidelity Investments. Previously, Ms. Lo Bessette served as CLO, Secretary, and Senior Vice President of FMR Co., Inc. (investment adviser firm, 2019); Secretary of Fidelity SelectCo, LLC and Fidelity Investments Money Management, Inc. (investment adviser firms, 2019). Prior to joining Fidelity Investments, Ms. Lo Bessette was Executive Vice President, General Counsel (2016-2019) and Senior Vice President, Deputy General Counsel (2015-2016) of OppenheimerFunds (investment management company) and Deputy Chief Legal Officer (2013-2015) of Jennison Associates LLC (investment adviser firm).
Chris Maher (1972)
Year of Election or Appointment: 2020
Deputy Treasurer
Mr. Maher also serves as an officer of other funds. Mr. Maher serves as Assistant Treasurer of FMR Capital, Inc. (2017-present), and is an employee of Fidelity Investments (2008-present). Previously, Mr. Maher served as Assistant Treasurer of certain funds (2013-2020); Vice President of Asset Management Compliance (2013), Vice President of the Program Management Group of FMR (investment adviser firm, 2010-2013), and Vice President of Valuation Oversight (2008-2010).
Jason P. Pogorelec (1975)
Year of Election or Appointment: 2020
Chief Compliance Officer
Mr. Pogorelec also serves as Chief Compliance Officer of other funds. Mr. Pogorelec is a senior Vice President of Asset Management Compliance for Fidelity Investments and is an employee of Fidelity Investments (2006-present). Previously, Mr. Pogorelec served as Vice President, Associate General Counsel for Fidelity Investments (2010-2020) and Assistant Secretary of certain Fidelity funds (2015-2020).
Brett Segaloff (1972)
Year of Election or Appointment: 2021
Anti-Money Laundering (AML) Officer
Mr. Segaloff also serves as an AML Officer of other funds and other related entities. He is Director, Anti-Money Laundering (2007-present) of FMR LLC (diversified financial services company) and is an employee of Fidelity Investments (1996-present).
Stacie M. Smith (1974)
Year of Election or Appointment: 2016
President and Treasurer
Ms. Smith also serves as an officer of other funds. Ms. Smith serves as Assistant Treasurer of FMR Capital, Inc. (2017-present), is an employee of Fidelity Investments (2009-present), and has served in other fund officer roles. Prior to joining Fidelity Investments, Ms. Smith served as Senior Audit Manager of Ernst & Young LLP (accounting firm, 1996-2009). Previously, Ms. Smith served as Assistant Treasurer (2013-2019) and Deputy Treasurer (2013-2016) of certain Fidelity® funds.
Marc L. Spector (1972)
Year of Election or Appointment: 2016
Assistant Treasurer
Mr. Spector also serves as an officer of other funds. Mr. Spector serves as Assistant Treasurer of FMR Capital, Inc. (2017-present) and is an employee of Fidelity Investments (2016-present). Prior to joining Fidelity Investments, Mr. Spector served as Director at the Siegfried Group (accounting firm, 2013-2016), and prior to Siegfried Group as audit senior manager at Deloitte & Touche LLP (accounting firm, 2005-2013).
Jim Wegmann (1979)
Year of Election or Appointment: 2019
Assistant Treasurer
Mr. Wegmann also serves as Assistant Treasurer of other funds. Mr. Wegmann is an employee of Fidelity Investments (2011-present).
Shareholder Expense Example
As a shareholder, you incur two types of costs: (1) transaction costs, which may include sales charges (loads) on purchase payments or redemption proceeds, as applicable and (2) ongoing costs, which generally include management fees, distribution and/or service (12b-1) fees and other Fund expenses. This Example is intended to help you understand your ongoing costs (in dollars) of investing in a fund and to compare these costs with the ongoing costs of investing in other mutual funds.
The Example is based on an investment of $1,000 invested at the beginning of the period and held for the entire period (July 1, 2020 to December 31, 2020).
Actual Expenses
The first line of the accompanying table provides information about actual account values and actual expenses. You may use the information in this line, together with the amount you invested, to estimate the expenses that you paid over the period. Simply divide your account value by $1,000.00 (for example, an $8,600 account value divided by $1,000.00 = 8.6), then multiply the result by the number in the first line for a class/Fund under the heading entitled "Expenses Paid During Period" to estimate the expenses you paid on your account during this period. If any fund is a shareholder of any underlying mutual funds or exchange-traded funds (ETFs) (the Underlying Funds), such fund indirectly bears its proportional share of the expenses of the Underlying Funds in addition to the direct expenses incurred presented in the table. These fees and expenses are not included in the annualized expense ratio used to calculate the expense estimate in the table below. The estimate of expenses does not include any fees or other expenses of any variable annuity or variable life insurance product. If they were, the estimate of expenses you paid during the period would be higher, and your ending account value would be lower.
Hypothetical Example for Comparison Purposes
The second line of the accompanying table provides information about hypothetical account values and hypothetical expenses based on the actual expense ratio and an assumed rate of return of 5% per year before expenses, which is not the actual return. The hypothetical account values and expenses may not be used to estimate the actual ending account balance or expenses you paid for the period. You may use this information to compare the ongoing costs of investing in the Fund and other funds. To do so, compare this 5% hypothetical example with the 5% hypothetical examples that appear in the shareholder reports of the other funds. If any fund is a shareholder of any Underlying Funds, such fund indirectly bears its proportional share of the expenses of the Underlying Funds in addition to the direct expenses as presented in the table. These fees and expenses are not included in the annualized expense ratio used to calculate the expense estimate in the table below. The estimate of expenses does not include any fees or other expenses of any variable annuity or variable life insurance product. If they were, the estimate of expenses you paid during the period would be higher, and your ending account value would be lower.
Please note that the expenses shown in the table are meant to highlight your ongoing costs only and do not reflect any transaction costs. Therefore, the second line of the table is useful in comparing ongoing costs only, and will not help you determine the relative total costs of owning different funds.
| | Annualized Expense Ratio-A | Beginning
Account Value
July 1, 2020 | Ending
Account Value
December 31, 2020 | Expenses Paid
During Period-B
July 1, 2020
to December 31, 2020 |
| VIP Growth Portfolio | | | | |
| Initial Class | .61% | | | |
| Actual | | $1,000.00 | $1,262.50 | $3.47 |
| Hypothetical-C | | $1,000.00 | $1,022.07 | $3.10 |
| Service Class | .71% | | | |
| Actual | | $1,000.00 | $1,262.00 | $4.04 |
| Hypothetical-C | | $1,000.00 | $1,021.57 | $3.61 |
| Service Class 2 | .86% | | | |
| Actual | | $1,000.00 | $1,261.10 | $4.89 |
| Hypothetical-C | | $1,000.00 | $1,020.81 | $4.37 |
| Investor Class | .69% | | | |
| Actual | | $1,000.00 | $1,262.00 | $3.92 |
| Hypothetical-C | | $1,000.00 | $1,021.67 | $3.51 |
A Annualized expense ratio reflects expenses net of applicable fee waivers.
B Expenses are equal to the annualized expense ratio, multiplied by the average account value over the period, multiplied by 184/ 366 (to reflect the one-half year period). The fees and expenses of any Underlying Funds are not included in each annualized expense ratio.
C 5% return per year before expenses
Distributions (Unaudited)
The Board of Trustees of VIP Growth Portfolio voted to pay to shareholders of record at the opening of business on record date, the following distributions per share derived from capital gains realized from sales of portfolio securities:
| | Pay Date | Record Date | Capital Gains |
| VIP Growth Portfolio | | | |
| Initial Class | 02/05/2021 | 02/05/2021 | $12.513 |
| Service Class | 02/05/2021 | 02/05/2021 | $12.497 |
| Service Class 2 | 02/05/2021 | 02/05/2021 | $12.475 |
| Investor Class | 02/05/2021 | 02/05/2021 | $12.501 |
|
The fund hereby designates as a capital gain dividend with respect to the taxable year ended December 31, 2020, $896,536,977, or, if subsequently determined to be different, the net capital gain of such year.
Initial Class designates 94% and 35%; Service Class designates 100% and 37%; Service Class 2 designates 100% and 41%; and Investor Class designates 100% and 37%; of the dividends distributed in February and December, respectively during the fiscal year as qualifying for the dividends–received deduction for corporate shareholders.
Proxy Voting Results
A special meeting of shareholders was held on June 9, 2020. The results of votes taken among shareholders on the proposals before them are reported below. Each vote reported represents one dollar of net asset value held on the record date for the meeting.
PROPOSAL 1
To elect a Board of Trustees.
| | # of
Votes | % of
Votes |
| Dennis J. Dirks |
| Affirmative | 11,099,447,424.890 | 95.490 |
| Withheld | 524,241,637.164 | 4.510 |
| TOTAL | 11,623,689,062.054 | 100.000 |
| Donald F. Donahue |
| Affirmative | 11,111,963,232.945 | 95.598 |
| Withheld | 511,725,829.109 | 4.402 |
| TOTAL | 11,623,689,062.054 | 100.000 |
| Bettina Doulton |
| Affirmative | 11,132,379,469.922 | 95.773 |
| Withheld | 491,309,592.132 | 4.227 |
| TOTAL | 11,623,689,062.054 | 100.000 |
| Vicki L. Fuller |
| Affirmative | 11,132,346,192.263 | 95.773 |
| Withheld | 491,342,869.791 | 4.227 |
| TOTAL | 11,623,689,062.054 | 100.000 |
| Patricia L. Kampling |
| Affirmative | 11,141,812,359.694 | 95.854 |
| Withheld | 481,876,702.360 | 4.146 |
| TOTAL | 11,623,689,062.054 | 100.000 |
| Alan J. Lacy |
| Affirmative | 11,081,103,173.144 | 95.332 |
| Withheld | 542,585,888.910 | 4.668 |
| TOTAL | 11,623,689,062.054 | 100.000 |
| Ned C. Lautenbach |
| Affirmative | 11,051,092,644.521 | 95.074 |
| Withheld | 572,596,417.533 | 4.926 |
| TOTAL | 11,623,689,062.054 | 100.000 |
| Robert A. Lawrence |
| Affirmative | 11,100,774,895.497 | 95.501 |
| Withheld | 522,914,166.556 | 4.499 |
| TOTAL | 11,623,689,062.054 | 100.000 |
| Joseph Mauriello |
| Affirmative | 11,070,909,380.371 | 95.244 |
| Withheld | 552,779,681.683 | 4.756 |
| TOTAL | 11,623,689,062.054 | 100.000 |
| Cornelia M. Small |
| Affirmative | 11,101,337,946.609 | 95.506 |
| Withheld | 522,351,115.445 | 4.494 |
| TOTAL | 11,623,689,062.054 | 100.000 |
| Garnett A. Smith |
| Affirmative | 11,082,555,490.179 | 95.345 |
| Withheld | 541,133,571.875 | 4.655 |
| TOTAL | 11,623,689,062.054 | 100.000 |
| David M. Thomas |
| Affirmative | 11,094,352,794.165 | 95.446 |
| Withheld | 529,336,267.889 | 4.554 |
| TOTAL | 11,623,689,062.054 | 100.000 |
| Susan Tomasky |
| Affirmative | 11,124,148,109.894 | 95.702 |
| Withheld | 499,540,952.160 | 4.298 |
| TOTAL | 11,623,689,062.054 | 100.000 |
| Michael E. Wiley |
| Affirmative | 11,096,957,446.084 | 95.468 |
| Withheld | 526,731,615.970 | 4.532 |
| TOTAL | 11,623,689,062.054 | 100.000 |
PROPOSAL 2
To convert a fundamental investment policy to a non-fundamental investment policy.
| | # of
Votes | % of
Votes |
| Affirmative | 3,822,222,097.497 | 79.261 |
| Against | 563,324,331.002 | 11.682 |
| Abstain | 436,780,758.588 | 9.057 |
| Broker Non-Vote | 0.00 | 0.00 |
| TOTAL | 4,822,327,187.087 | 100.000 |
|
| Proposal 1 reflects trust wide proposal and voting results. |
VIPGRWT-ANN-0221
1.540077.123
Fidelity® Variable Insurance Products:
Overseas Portfolio
Annual Report
December 31, 2020
Contents
To view a fund's proxy voting guidelines and proxy voting record for the 12-month period ended June 30, visit http://www.fidelity.com/proxyvotingresults or visit the Securities and Exchange Commission's (SEC) web site at http://www.sec.gov.
You may also call 1-877-208-0098 to request a free copy of the proxy voting guidelines.
Fidelity® Variable Insurance Products are separate account options which are purchased through a variable insurance contract.
Standard & Poor's, S&P and S&P 500 are registered service marks of The McGraw-Hill Companies, Inc. and have been licensed for use by Fidelity Distributors Corporation.
Other third-party marks appearing herein are the property of their respective owners.
All other marks appearing herein are registered or unregistered trademarks or service marks of FMR LLC or an affiliated company. © 2021 FMR LLC. All rights reserved.
This report and the financial statements contained herein are submitted for the general information of the shareholders of the Fund. This report is not authorized for distribution to prospective investors in the Fund unless preceded or accompanied by an effective prospectus.
A fund files its complete schedule of portfolio holdings with the SEC for the first and third quarters of each fiscal year on Form N-PORT. Forms N-PORT are available on the SEC’s web site at http://www.sec.gov. A fund's Forms N-PORT may be reviewed and copied at the SEC’s Public Reference Room in Washington, DC. Information regarding the operation of the SEC's Public Reference Room may be obtained by calling 1-800-SEC-0330.
For a complete list of a fund's portfolio holdings, view the most recent holdings listing, semiannual report, or annual report on Fidelity's web site at http://www.fidelity.com, http://www.institutional.fidelity.com, or http://www.401k.com, as applicable.
NOT FDIC INSURED •MAY LOSE VALUE •NO BANK GUARANTEE
Neither the Fund nor Fidelity Distributors Corporation is a bank.
Note to Shareholders:
Early in 2020, the outbreak and spread of a new coronavirus emerged as a public health emergency that had a major influence on financial markets, primarily based on its impact on the global economy and the outlook for corporate earnings. The virus causes a respiratory disease known as COVID-19. On March 11, the World Health Organization declared the COVID-19 outbreak a pandemic, citing sustained risk of further global spread.
In the weeks following, as the crisis worsened, we witnessed an escalating human tragedy with wide-scale social and economic consequences from coronavirus-containment measures. The outbreak of COVID-19 prompted a number of measures to limit the spread, including travel and border restrictions, quarantines, and restrictions on large gatherings. In turn, these resulted in lower consumer activity, diminished demand for a wide range of products and services, disruption in manufacturing and supply chains, and – given the wide variability in outcomes regarding the outbreak – significant market uncertainty and volatility. Amid the turmoil, global governments and central banks took unprecedented action to help support consumers, businesses, and the broader economies, and to limit disruption to financial systems.
The situation continues to unfold, and the extent and duration of its impact on financial markets and the economy remain highly uncertain. Extreme events such as the coronavirus crisis are “exogenous shocks” that can have significant adverse effects on mutual funds and their investments. Although multiple asset classes may be affected by market disruption, the duration and impact may not be the same for all types of assets.
Fidelity is committed to helping you stay informed amid news about COVID-19 and during increased market volatility, and we’re taking extra steps to be responsive to customer needs. We encourage you to visit our websites, where we offer ongoing updates, commentary, and analysis on the markets and our funds.
Performance: The Bottom Line
Average annual total return reflects the change in the value of an investment, assuming reinvestment of distributions from dividend income and capital gains (the profits earned upon the sale of securities that have grown in value, if any) and assuming a constant rate of performance each year. During periods of reimbursement by Fidelity, a fund’s total return will be greater than it would be had the reimbursement not occurred. Performance numbers are net of all underlying fund operating expenses, but do not include any insurance charges imposed by your insurance company’s separate account. If performance information included the effect of these additional charges, the total returns would have been lower. How a fund did yesterday is no guarantee of how it will do tomorrow.
Average Annual Total Returns
| For the periods ended December 31, 2020 | Past 1 year | Past 5 years | Past 10 years |
| Initial Class | 15.61% | 9.25% | 6.82% |
| Service Class | 15.49% | 9.15% | 6.72% |
| Service Class 2 | 15.33% | 8.98% | 6.56% |
| Investor Class | 15.49% | 9.17% | 6.73% |
$10,000 Over 10 Years
Let's say hypothetically that $10,000 was invested in VIP Overseas Portfolio - Initial Class on December 31, 2010.
The chart shows how the value of your investment would have changed, and also shows how the MSCI EAFE Index performed over the same period.

| Period Ending Values |
| $19,343 | VIP Overseas Portfolio - Initial Class |
| $17,387 | MSCI EAFE Index |
Management's Discussion of Fund Performance
Market Recap: The MSCI ACWI (All Country World Index) ex USA Index gained 10.81% in 2020, a volatile and unpredictable year that will be remembered by most investors for the impact of the coronavirus pandemic. The early-2020 outbreak and spread of COVID-19 resulted in non-U.S. stocks suffering one of the quickest declines on record in March, followed by a historic rebound through year-end. The crisis and containment efforts caused broad contraction in global economic activity, along with dislocation in financial markets. Rapid and expansive monetary/fiscal-policy responses partially offset the economic disruption and fueled the market surge, as did resilient corporate earnings and the potential for a COVID-19 vaccine breakthrough. The rally slowed in early September (-2.45%), when the index began a two-month retreat. November (+13.46%) was a much different story, however, as investors reacted favorably to election results in the U.S. The momentum continued in December (+5.42%), driven by regulatory approvals for COVID-19 vaccines in certain regions. For the full year, emerging markets (+19%) was the top region, followed by Japan (+15%) and Europe ex U.K. (+12%). Conversely, the U.K. (-10%), Canada (+6%) and Asia Pacific ex Japan (+7%) lagged. By sector, information technology (+46%) led the way, while consumer discretionary (+23%) and materials (+22%) also outpaced the index. In contrast, the energy (-23%), real estate (-9%) and financials (-4%) sectors underperformed.
Comments from Portfolio Manager Vincent Montemaggiore: For the fiscal year ending December 31, 2020, the fund's share classes gained about 15% to 16%, notably outperforming the 8.02% result of the benchmark MSCI EAFE Index. From a regional standpoint, an overweighting and stock picks in Europe ex U.K., along with security selection in Japan, contributed most to the fund's relative result. By sector, the top contributor to performance versus the benchmark was an overweighting and stock selection in information technology. Strong picks in industrials also boosted the fund's relative result. Further bolstering performance was security selection and an overweighting in health care, primarily driven by the pharmaceuticals, biotechnology & life sciences industry. Not owning Royal Dutch Shell, a benchmark component that returned -38%, was the largest individual relative contributor. Also adding value was our out-of-benchmark position in Addlife (+128%). Another key contributor was our non-benchmark position in Indutrade (+79%). In contrast, an underweighting in Japan and largely non-benchmark exposure to the U.S. hindered the fund's relative result. By sector, the largest detractor from performance versus the benchmark was an underweighting in materials. Smaller-than-benchmark exposure to utilities stocks also hindered the fund's relative result. Further detracting was stock selection and an underweighting in consumer discretionary, primarily within the consumer services industry. Not owning SoftBank Group, a benchmark component that gained 80%, was the largest individual relative detractor. Another key detractor was our out-of-benchmark position in IRB Brasil Resseguros (-54%), a position not held at period end. Also holding back performance was our overweighting in Compass Group, which returned about -26%. Notable changes in positioning include increased exposure to Sweden and a lower allocation to U.K. By sector, meaningful changes in positioning include a higher allocation to information technology and consumer discretionary.
The views expressed above reflect those of the portfolio manager(s) only through the end of the period as stated on the cover of this report and do not necessarily represent the views of Fidelity or any other person in the Fidelity organization. Any such views are subject to change at any time based upon market or other conditions and Fidelity disclaims any responsibility to update such views. These views may not be relied on as investment advice and, because investment decisions for a Fidelity fund are based on numerous factors, may not be relied on as an indication of trading intent on behalf of any Fidelity fund.
Note to shareholders: On September 30, 2020, Andrew Sergeant came off of the fund, leaving Vincent Montemaggiore as sole portfolio manager.
Investment Summary (Unaudited)
Geographic Diversification (% of fund's net assets)
| As of December 31, 2020 |
| | Japan | 16.5% |
| | France | 12.5% |
| | Switzerland | 10.9% |
| | United Kingdom | 9.7% |
| | Netherlands | 7.6% |
| | Sweden | 6.7% |
| | Germany | 6.5% |
| | United States of America* | 6.3% |
| | Ireland | 2.8% |
| | Other | 20.5% |

* Includes Short-Term investments and Net Other Assets (Liabilities).
Percentages are based on country or territory of incorporation and are adjusted for the effect of futures contracts, if applicable.
Asset Allocation as of December 31, 2020
| | % of fund's net assets |
| Stocks | 99.5 |
| Short-Term Investments and Net Other Assets (Liabilities) | 0.5 |
Top Ten Stocks as of December 31, 2020
| | % of fund's net assets |
| Nestle SA (Reg. S) (Switzerland, Food Products) | 2.7 |
| LVMH Moet Hennessy Louis Vuitton SE (France, Textiles, Apparel & Luxury Goods) | 2.2 |
| Roche Holding AG (participation certificate) (Switzerland, Pharmaceuticals) | 2.2 |
| ASML Holding NV (Netherlands) (Netherlands, Semiconductors & Semiconductor Equipment) | 2.1 |
| AIA Group Ltd. (Hong Kong, Insurance) | 1.7 |
| Sony Corp. (Japan, Household Durables) | 1.7 |
| Iberdrola SA (Spain, Electric Utilities) | 1.6 |
| Hoya Corp. (Japan, Health Care Equipment & Supplies) | 1.5 |
| Tokyo Electron Ltd. (Japan, Semiconductors & Semiconductor Equipment) | 1.4 |
| Diageo PLC (United Kingdom, Beverages) | 1.3 |
| | 18.4 |
Top Market Sectors as of December 31, 2020
| | % of fund's net assets |
| Information Technology | 19.0 |
| Industrials | 18.6 |
| Financials | 17.2 |
| Health Care | 15.0 |
| Consumer Discretionary | 10.7 |
| Consumer Staples | 9.6 |
| Materials | 3.9 |
| Communication Services | 1.8 |
| Utilities | 1.6 |
| Real Estate | 1.4 |
Schedule of Investments December 31, 2020
Showing Percentage of Net Assets
| Common Stocks - 99.5% | | | |
| | | Shares | Value |
| Austria - 0.4% | | | |
| Erste Group Bank AG | | 213,600 | $6,506,841 |
| Bailiwick of Jersey - 0.4% | | | |
| Sanne Group PLC | | 821,225 | 6,917,835 |
| Belgium - 0.8% | | | |
| KBC Groep NV | | 202,499 | 14,170,093 |
| Bermuda - 2.3% | | | |
| Credicorp Ltd. (United States) | | 54,053 | 8,865,773 |
| Genpact Ltd. | | 230,033 | 9,514,165 |
| Hiscox Ltd. (a) | | 577,945 | 7,855,977 |
| IHS Markit Ltd. | | 169,005 | 15,181,719 |
|
| TOTAL BERMUDA | | | 41,417,634 |
|
| Canada - 1.0% | | | |
| Constellation Software, Inc. | | 13,895 | 18,043,305 |
| Topicus.Com, Inc. (a)(b) | | 26,214 | 99,104 |
|
| TOTAL CANADA | | | 18,142,409 |
|
| Cayman Islands - 0.7% | | | |
| Alibaba Group Holding Ltd. sponsored ADR (a) | | 55,084 | 12,819,699 |
| China - 0.5% | | | |
| Gree Electric Appliances, Inc. of Zhuhai (A Shares) | | 896,600 | 8,508,956 |
| Denmark - 1.2% | | | |
| DSV Panalpina A/S | | 131,072 | 22,028,195 |
| Finland - 0.6% | | | |
| Nordea Bank ABP (Stockholm Stock Exchange) | | 1,381,503 | 11,321,957 |
| France - 12.5% | | | |
| ALTEN (a) | | 99,081 | 11,214,569 |
| Amundi SA (c) | | 111,161 | 9,071,429 |
| BNP Paribas SA (a) | | 325,600 | 17,189,136 |
| Capgemini SA | | 131,465 | 20,364,615 |
| Dassault Systemes SA | | 75,816 | 15,388,915 |
| Edenred SA | | 263,442 | 14,936,312 |
| Kering SA | | 22,640 | 16,440,008 |
| Legrand SA | | 181,600 | 16,195,170 |
| LVMH Moet Hennessy Louis Vuitton SE | | 63,830 | 39,957,671 |
| Pernod Ricard SA | | 85,842 | 16,443,440 |
| Safran SA (a) | | 91,700 | 12,996,996 |
| Sanofi SA | | 146,717 | 14,220,254 |
| SR Teleperformance SA | | 62,624 | 20,755,700 |
|
| TOTAL FRANCE | | | 225,174,215 |
|
| Germany - 6.5% | | | |
| adidas AG | | 50,956 | 18,538,046 |
| Allianz SE | | 90,086 | 22,131,696 |
| Deutsche Borse AG | | 96,872 | 16,494,620 |
| Hannover Reuck SE | | 81,725 | 13,023,390 |
| Merck KGaA | | 78,700 | 13,498,188 |
| SAP SE | | 71,215 | 9,223,680 |
| Siemens Healthineers AG (c) | | 108,500 | 5,583,549 |
| Vonovia SE | | 240,828 | 17,588,653 |
|
| TOTAL GERMANY | | | 116,081,822 |
|
| Hong Kong - 1.8% | | | |
| AIA Group Ltd. | | 2,561,600 | 31,215,971 |
| Techtronic Industries Co. Ltd. | | 77,000 | 1,098,517 |
|
| TOTAL HONG KONG | | | 32,314,488 |
|
| India - 1.4% | | | |
| HDFC Bank Ltd. (a) | | 658,491 | 12,972,276 |
| Reliance Industries Ltd. | | 439,800 | 11,951,838 |
| Reliance Industries Ltd. | | 29,840 | 456,416 |
|
| TOTAL INDIA | | | 25,380,530 |
|
| Ireland - 2.8% | | | |
| Flutter Entertainment PLC | | 50,790 | 10,494,700 |
| Kerry Group PLC Class A | | 102,000 | 14,766,083 |
| Kingspan Group PLC (Ireland) (a) | | 74,900 | 5,252,191 |
| Linde PLC | | 40,868 | 10,769,127 |
| UDG Healthcare PLC (United Kingdom) | | 794,253 | 8,471,900 |
|
| TOTAL IRELAND | | | 49,754,001 |
|
| Italy - 1.8% | | | |
| FinecoBank SpA | | 792,799 | 13,074,857 |
| GVS SpA (c) | | 119,436 | 2,227,004 |
| Recordati SpA | | 298,319 | 16,589,166 |
|
| TOTAL ITALY | | | 31,891,027 |
|
| Japan - 16.5% | | | |
| A/S One Corp. | | 33,026 | 5,645,333 |
| Curves Holdings Co. Ltd. | | 213,300 | 1,592,701 |
| Daikin Industries Ltd. | | 74,881 | 16,658,563 |
| Elecom Co. Ltd. | | 132,758 | 6,852,938 |
| Hoya Corp. | | 201,911 | 27,904,411 |
| Iriso Electronics Co. Ltd. | | 109,829 | 4,743,958 |
| Kao Corp. | | 174,674 | 13,482,657 |
| Keyence Corp. | | 39,361 | 22,109,709 |
| KH Neochem Co. Ltd. | | 207,501 | 5,488,211 |
| Koshidaka Holdings Co. Ltd. | | 213,300 | 917,197 |
| Nexon Co. Ltd. | | 416,695 | 12,833,181 |
| Nitori Holdings Co. Ltd. | | 56,373 | 11,803,634 |
| NOF Corp. | | 204,911 | 10,379,009 |
| Olympus Corp. | | 541,988 | 11,844,423 |
| Oracle Corp. Japan | | 52,056 | 6,780,816 |
| Otsuka Corp. | | 8,698 | 459,097 |
| Persol Holdings Co. Ltd. | | 491,903 | 8,865,735 |
| Recruit Holdings Co. Ltd. | | 416,071 | 17,476,212 |
| Relo Group, Inc. | | 294,074 | 7,114,395 |
| S Foods, Inc. | | 140,737 | 4,586,509 |
| SMC Corp. | | 27,685 | 16,878,318 |
| Sony Corp. | | 297,833 | 30,012,062 |
| Suzuki Motor Corp. | | 206,876 | 9,580,950 |
| TIS, Inc. | | 272,274 | 5,574,425 |
| Tokyo Electron Ltd. | | 65,932 | 24,519,770 |
| Tsuruha Holdings, Inc. | | 92,767 | 13,188,897 |
|
| TOTAL JAPAN | | | 297,293,111 |
|
| Kenya - 0.4% | | | |
| Safaricom Ltd. | | 21,124,300 | 6,625,525 |
| Korea (South) - 1.5% | | | |
| LG Chemical Ltd. | | 16,431 | 12,439,436 |
| Samsung Electronics Co. Ltd. | | 194,825 | 14,499,038 |
|
| TOTAL KOREA (SOUTH) | | | 26,938,474 |
|
| Netherlands - 7.6% | | | |
| ASM International NV (Netherlands) | | 49,800 | 10,947,829 |
| ASML Holding NV (Netherlands) | | 77,239 | 37,397,364 |
| BE Semiconductor Industries NV | | 138,724 | 8,402,430 |
| Euronext NV (c) | | 76,879 | 8,466,819 |
| IMCD NV | | 150,826 | 19,208,749 |
| JDE Peet's BV | | 273,461 | 12,344,021 |
| Koninklijke Philips Electronics NV | | 407,187 | 21,934,164 |
| Wolters Kluwer NV | | 213,417 | 18,005,384 |
|
| TOTAL NETHERLANDS | | | 136,706,760 |
|
| New Zealand - 0.6% | | | |
| EBOS Group Ltd. | | 485,836 | 10,032,343 |
| Norway - 0.7% | | | |
| Schibsted ASA: | | | |
| (A Shares) | | 278,400 | 11,865,358 |
| (B Shares) | | 22 | 817 |
|
| TOTAL NORWAY | | | 11,866,175 |
|
| South Africa - 0.8% | | | |
| Naspers Ltd. Class N | | 71,214 | 14,582,826 |
| Spain - 2.6% | | | |
| Amadeus IT Holding SA Class A | | 255,407 | 18,853,446 |
| Iberdrola SA | | 1,995,468 | 28,521,833 |
| Prosegur Cash SA (c) | | 14,546 | 14,216 |
|
| TOTAL SPAIN | | | 47,389,495 |
|
| Sweden - 6.7% | | | |
| Addlife AB | | 977,424 | 17,129,321 |
| AddTech AB (B Shares) | | 889,009 | 11,814,479 |
| ASSA ABLOY AB (B Shares) | | 605,156 | 14,954,624 |
| Atlas Copco AB (A Shares) | | 295,819 | 15,204,034 |
| Hexagon AB (B Shares) | | 222,342 | 20,384,769 |
| Indutrade AB (a) | | 991,341 | 21,220,968 |
| Nordnet AB | | 372,400 | 5,808,301 |
| Swedish Match Co. AB | | 181,792 | 14,147,196 |
|
| TOTAL SWEDEN | | | 120,663,692 |
|
| Switzerland - 10.9% | | | |
| Alcon, Inc. (a) | | 152,909 | 10,088,936 |
| Julius Baer Group Ltd. | | 280,176 | 16,141,368 |
| Lonza Group AG | | 32,404 | 20,873,581 |
| Nestle SA (Reg. S) | | 411,745 | 48,672,917 |
| Roche Holding AG (participation certificate) | | 112,791 | 39,284,944 |
| Sika AG | | 76,324 | 20,805,407 |
| Sonova Holding AG Class B | | 53,114 | 13,814,612 |
| Temenos Group AG | | 49,450 | 6,889,849 |
| Zurich Insurance Group Ltd. | | 45,720 | 19,267,381 |
|
| TOTAL SWITZERLAND | | | 195,838,995 |
|
| Taiwan - 1.0% | | | |
| Taiwan Semiconductor Manufacturing Co. Ltd. | | 972,600 | 18,393,242 |
| United Kingdom - 9.7% | | | |
| Beazley PLC | | 1,549,192 | 7,724,124 |
| Compass Group PLC | | 964,139 | 17,982,500 |
| Cranswick PLC | | 157,952 | 7,603,177 |
| Dechra Pharmaceuticals PLC | | 184,035 | 8,682,541 |
| Diageo PLC | | 600,322 | 23,753,999 |
| Diploma PLC | | 332,335 | 9,961,941 |
| Hilton Food Group PLC | | 388,177 | 5,913,469 |
| James Fisher and Sons PLC | | 68,830 | 891,364 |
| JTC PLC (c) | | 514,500 | 3,925,969 |
| London Stock Exchange Group PLC | | 185,572 | 22,906,364 |
| Mondi PLC | | 483,182 | 11,361,620 |
| RELX PLC (London Stock Exchange) | | 767,048 | 18,802,216 |
| Rentokil Initial PLC (a) | | 2,315,789 | 16,138,224 |
| Smith & Nephew PLC | | 581,236 | 12,073,707 |
| Volution Group PLC | | 1,586,902 | 6,054,547 |
|
| TOTAL UNITED KINGDOM | | | 173,775,762 |
|
| United States of America - 5.8% | | | |
| Ares Management Corp. | | 201,165 | 9,464,813 |
| Boston Scientific Corp. (a) | | 212,355 | 7,634,162 |
| Equifax, Inc. | | 49,500 | 9,545,580 |
| Fidelity National Information Services, Inc. | | 54,995 | 7,779,593 |
| Global Payments, Inc. | | 64,987 | 13,999,500 |
| Intercontinental Exchange, Inc. | | 109,751 | 12,653,193 |
| Marsh & McLennan Companies, Inc. | | 121,676 | 14,236,092 |
| NICE Systems Ltd. sponsored ADR (a) | | 56,689 | 16,073,599 |
| Roper Technologies, Inc. | | 29,809 | 12,850,362 |
|
| TOTAL UNITED STATES OF AMERICA | | | 104,236,894 |
|
| TOTAL COMMON STOCKS | | | |
| (Cost $1,210,352,549) | | | 1,786,772,996 |
|
| Money Market Funds - 0.8% | | | |
| Fidelity Cash Central Fund 0.11% (d) | | | |
| (Cost $15,666,307) | | 15,663,256 | 15,666,388 |
| TOTAL INVESTMENT IN SECURITIES - 100.3% | | | |
| (Cost $1,226,018,856) | | | 1,802,439,384 |
| NET OTHER ASSETS (LIABILITIES) - (0.3)% | | | (6,187,684) |
| NET ASSETS - 100% | | | $1,796,251,700 |
Categorizations in the Schedule of Investments are based on country or territory of incorporation.
Legend
(a) Non-income producing
(b) Level 3 security
(c) Security exempt from registration under Rule 144A of the Securities Act of 1933. These securities may be resold in transactions exempt from registration, normally to qualified institutional buyers. At the end of the period, the value of these securities amounted to $29,288,986 or 1.6% of net assets.
(d) Affiliated fund that is generally available only to investment companies and other accounts managed by Fidelity Investments. The rate quoted is the annualized seven-day yield of the fund at period end. A complete unaudited listing of the fund's holdings as of its most recent quarter end is available upon request. In addition, each Fidelity Central Fund's financial statements, which are not covered by the Fund's Report of Independent Registered Public Accounting Firm, are available on the SEC's website or upon request.
Affiliated Central Funds
Information regarding fiscal year to date income earned by the Fund from investments in Fidelity Central Funds is as follows:
| Fund | Income earned |
| Fidelity Cash Central Fund | $99,205 |
| Fidelity Securities Lending Cash Central Fund | 67,776 |
| Total | $166,981 |
Amounts in the income column in the above table include any capital gain distributions from underlying funds, which are presented in the corresponding line-item in the Statement of Operations, if applicable. Amount for Fidelity Securities Lending Cash Central Fund represents the income earned on investing cash collateral, less rebates paid to borrowers and any lending agent fees associated with the loan, plus any premium payments received for lending certain types of securities.
Investment Valuation
The following is a summary of the inputs used, as of December 31, 2020, involving the Fund's assets and liabilities carried at fair value. The inputs or methodology used for valuing securities may not be an indication of the risk associated with investing in those securities. For more information on valuation inputs, and their aggregation into the levels used below, please refer to the Investment Valuation section in the accompanying Notes to Financial Statements.
| | Valuation Inputs at Reporting Date: |
| Description | Total | Level 1 | Level 2 | Level 3 |
| Investments in Securities: | | | | |
| Equities: | | | | |
| Communication Services | $31,324,881 | $19,458,706 | $11,866,175 | $-- |
| Consumer Discretionary | 193,230,950 | 72,157,845 | 121,073,105 | -- |
| Consumer Staples | 174,902,365 | 88,328,253 | 86,574,112 | -- |
| Energy | 12,408,254 | 12,408,254 | -- | -- |
| Financials | 307,480,306 | 99,426,148 | 208,054,158 | -- |
| Health Care | 267,532,539 | 90,304,049 | 177,228,490 | -- |
| Industrials | 331,979,973 | 199,625,902 | 132,354,071 | -- |
| Information Technology | 343,446,037 | 232,204,583 | 111,142,350 | 99,104 |
| Materials | 71,242,810 | 50,437,403 | 20,805,407 | -- |
| Real Estate | 24,703,048 | 7,114,395 | 17,588,653 | -- |
| Utilities | 28,521,833 | 28,521,833 | -- | -- |
| Money Market Funds | 15,666,388 | 15,666,388 | -- | -- |
| Total Investments in Securities: | $1,802,439,384 | $915,653,759 | $886,686,521 | $99,104 |
See accompanying notes which are an integral part of the financial statements.
Financial Statements
Statement of Assets and Liabilities
| | | December 31, 2020 |
| Assets | | |
Investment in securities, at value — See accompanying schedule:
Unaffiliated issuers (cost $1,210,352,549) | $1,786,772,996 | |
| Fidelity Central Funds (cost $15,666,307) | 15,666,388 | |
| Total Investment in Securities (cost $1,226,018,856) | | $1,802,439,384 |
| Receivable for investments sold | | 14,055,363 |
| Receivable for fund shares sold | | 2,515,949 |
| Dividends receivable | | 4,437,045 |
| Distributions receivable from Fidelity Central Funds | | 1,184 |
| Prepaid expenses | | 2,105 |
| Other receivables | | 268,960 |
| Total assets | | 1,823,719,990 |
| Liabilities | | |
| Payable to custodian bank | $148,001 | |
| Payable for fund shares redeemed | 25,063,201 | |
| Accrued management fee | 964,121 | |
| Distribution and service plan fees payable | 84,242 | |
| Other affiliated payables | 187,227 | |
| Other payables and accrued expenses | 1,021,498 | |
| Total liabilities | | 27,468,290 |
| Net Assets | | $1,796,251,700 |
| Net Assets consist of: | | |
| Paid in capital | | $1,170,318,989 |
| Total accumulated earnings (loss) | | 625,932,711 |
| Net Assets | | $1,796,251,700 |
| Net Asset Value and Maximum Offering Price | | |
| Initial Class: | | |
| Net Asset Value, offering price and redemption price per share ($872,019,061 ÷ 32,879,373 shares) | | $26.52 |
| Service Class: | | |
| Net Asset Value, offering price and redemption price per share ($151,886,330 ÷ 5,754,147 shares) | | $26.40 |
| Service Class 2: | | |
| Net Asset Value, offering price and redemption price per share ($352,458,568 ÷ 13,429,267 shares) | | $26.25 |
| Investor Class: | | |
| Net Asset Value, offering price and redemption price per share ($419,887,741 ÷ 15,890,699 shares) | | $26.42 |
See accompanying notes which are an integral part of the financial statements.
Statement of Operations
| | | Year ended December 31, 2020 |
| Investment Income | | |
| Dividends | | $24,236,020 |
| Interest | | 15,133 |
| Income from Fidelity Central Funds (including $67,776 from security lending) | | 166,981 |
| Income before foreign taxes withheld | | 24,418,134 |
| Less foreign taxes withheld | | (2,497,079) |
| Total income | | 21,921,055 |
| Expenses | | |
| Management fee | $10,551,808 | |
| Transfer agent fees | 1,321,538 | |
| Distribution and service plan fees | 911,041 | |
| Accounting fees | 720,259 | |
| Custodian fees and expenses | 207,229 | |
| Independent trustees' fees and expenses | 9,215 | |
| Audit | 84,811 | |
| Legal | 6,102 | |
| Interest | 564 | |
| Miscellaneous | 82,281 | |
| Total expenses before reductions | 13,894,848 | |
| Expense reductions | (232,087) | |
| Total expenses after reductions | | 13,662,761 |
| Net investment income (loss) | | 8,258,294 |
| Realized and Unrealized Gain (Loss) | | |
| Net realized gain (loss) on: | | |
| Investment securities: | | |
| Unaffiliated issuers | 56,387,999 | |
| Fidelity Central Funds | 2,033 | |
| Foreign currency transactions | (35,105) | |
| Total net realized gain (loss) | | 56,354,927 |
| Change in net unrealized appreciation (depreciation) on: | | |
| Investment securities: | | |
| Unaffiliated issuers (net of increase in deferred foreign taxes of $744,792) | 171,231,751 | |
| Fidelity Central Funds | (338) | |
| Assets and liabilities in foreign currencies | 358,517 | |
| Total change in net unrealized appreciation (depreciation) | | 171,589,930 |
| Net gain (loss) | | 227,944,857 |
| Net increase (decrease) in net assets resulting from operations | | $236,203,151 |
See accompanying notes which are an integral part of the financial statements.
Statement of Changes in Net Assets
| | Year ended December 31, 2020 | Year ended December 31, 2019 |
| Increase (Decrease) in Net Assets | | |
| Operations | | |
| Net investment income (loss) | $8,258,294 | $27,928,918 |
| Net realized gain (loss) | 56,354,927 | 7,850,060 |
| Change in net unrealized appreciation (depreciation) | 171,589,930 | 344,473,008 |
| Net increase (decrease) in net assets resulting from operations | 236,203,151 | 380,251,986 |
| Distributions to shareholders | (13,279,212) | (82,595,455) |
| Share transactions - net increase (decrease) | (140,128,077) | 7,596,820 |
| Total increase (decrease) in net assets | 82,795,862 | 305,253,351 |
| Net Assets | | |
| Beginning of period | 1,713,455,838 | 1,408,202,487 |
| End of period | $1,796,251,700 | $1,713,455,838 |
See accompanying notes which are an integral part of the financial statements.
Financial Highlights
VIP Overseas Portfolio Initial Class
| Years ended December 31, | 2020 | 2019 | 2018 | 2017 | 2016 |
| Selected Per–Share Data | | | | | |
| Net asset value, beginning of period | $23.13 | $19.13 | $22.87 | $17.81 | $19.08 |
| Income from Investment Operations | | | | | |
| Net investment income (loss)A | .13 | .40 | .36 | .31 | .28 |
| Net realized and unrealized gain (loss) | 3.46 | 4.74 | (3.75) | 5.08 | (1.25) |
| Total from investment operations | 3.59 | 5.14 | (3.39) | 5.39 | (.97) |
| Distributions from net investment income | (.10) | (.38) | (.35) | (.31) | (.27) |
| Distributions from net realized gain | (.10) | (.77) | – | (.02) | (.03) |
| Total distributions | (.20) | (1.14)B | (.35) | (.33) | (.30) |
| Net asset value, end of period | $26.52 | $23.13 | $19.13 | $22.87 | $17.81 |
| Total ReturnC,D | 15.61% | 27.77% | (14.81)% | 30.28% | (5.06)% |
| Ratios to Average Net AssetsE,F | | | | | |
| Expenses before reductions | .79% | .79% | .79% | .80% | .80% |
| Expenses net of fee waivers, if any | .79% | .79% | .79% | .80% | .80% |
| Expenses net of all reductions | .77% | .78% | .78% | .78% | .80% |
| Net investment income (loss) | .59% | 1.87% | 1.59% | 1.46% | 1.56% |
| Supplemental Data | | | | | |
| Net assets, end of period (000 omitted) | $872,019 | $826,554 | $662,011 | $822,994 | $702,946 |
| Portfolio turnover rateG | 47% | 38% | 40% | 35% | 102% |
A Calculated based on average shares outstanding during the period.
B Total distributions per share do not sum due to rounding.
C Total returns do not reflect charges attributable to your insurance company's separate account. Inclusion of these charges would reduce the total returns shown.
D Total returns would have been lower if certain expenses had not been reduced during the applicable periods shown.
E Fees and expenses of any underlying mutual funds or exchange-traded funds (ETFs) are not included in the Fund's expense ratio. The Fund indirectly bears its proportionate share of these expenses. For additional expense information related to investments in Fidelity Central Funds, please refer to the "Investments in Fidelity Central Funds" note found in the Notes to Financial Statements section of the most recent Annual or Semi-Annual report.
F Expense ratios reflect operating expenses of the class. Expenses before reductions do not reflect amounts reimbursed, waived, or reduced through arrangements with the investment adviser, brokerage services, or other offset arrangements, if applicable, and do not represent the amount paid by the class during periods when reimbursements, waivers or reductions occur.
G Amount does not include the portfolio activity of any underlying mutual funds or exchange-traded funds (ETFs).
See accompanying notes which are an integral part of the financial statements.
VIP Overseas Portfolio Service Class
| Years ended December 31, | 2020 | 2019 | 2018 | 2017 | 2016 |
| Selected Per–Share Data | | | | | |
| Net asset value, beginning of period | $23.03 | $19.05 | $22.77 | $17.74 | $19.00 |
| Income from Investment Operations | | | | | |
| Net investment income (loss)A | .11 | .37 | .33 | .28 | .27 |
| Net realized and unrealized gain (loss) | 3.44 | 4.73 | (3.72) | 5.05 | (1.24) |
| Total from investment operations | 3.55 | 5.10 | (3.39) | 5.33 | (.97) |
| Distributions from net investment income | (.08) | (.36) | (.33) | (.28) | (.25) |
| Distributions from net realized gain | (.10) | (.77) | – | (.02) | (.03) |
| Total distributions | (.18) | (1.12)B | (.33) | (.30) | (.29)B |
| Net asset value, end of period | $26.40 | $23.03 | $19.05 | $22.77 | $17.74 |
| Total ReturnC,D | 15.49% | 27.67% | (14.88)% | 30.10% | (5.12)% |
| Ratios to Average Net AssetsE,F | | | | | |
| Expenses before reductions | .89% | .89% | .89% | .90% | .90% |
| Expenses net of fee waivers, if any | .89% | .89% | .89% | .90% | .90% |
| Expenses net of all reductions | .87% | .88% | .88% | .88% | .90% |
| Net investment income (loss) | .49% | 1.77% | 1.49% | 1.36% | 1.46% |
| Supplemental Data | | | | | |
| Net assets, end of period (000 omitted) | $151,886 | $134,648 | $114,094 | $141,047 | $118,444 |
| Portfolio turnover rateG | 47% | 38% | 40% | 35% | 102% |
A Calculated based on average shares outstanding during the period.
B Total distributions per share do not sum due to rounding.
C Total returns do not reflect charges attributable to your insurance company's separate account. Inclusion of these charges would reduce the total returns shown.
D Total returns would have been lower if certain expenses had not been reduced during the applicable periods shown.
E Fees and expenses of any underlying mutual funds or exchange-traded funds (ETFs) are not included in the Fund's expense ratio. The Fund indirectly bears its proportionate share of these expenses. For additional expense information related to investments in Fidelity Central Funds, please refer to the "Investments in Fidelity Central Funds" note found in the Notes to Financial Statements section of the most recent Annual or Semi-Annual report.
F Expense ratios reflect operating expenses of the class. Expenses before reductions do not reflect amounts reimbursed, waived, or reduced through arrangements with the investment adviser, brokerage services, or other offset arrangements, if applicable, and do not represent the amount paid by the class during periods when reimbursements, waivers or reductions occur.
G Amount does not include the portfolio activity of any underlying mutual funds or exchange-traded funds (ETFs).
See accompanying notes which are an integral part of the financial statements.
VIP Overseas Portfolio Service Class 2
| Years ended December 31, | 2020 | 2019 | 2018 | 2017 | 2016 |
| Selected Per–Share Data | | | | | |
| Net asset value, beginning of period | $22.90 | $18.95 | $22.66 | $17.65 | $18.92 |
| Income from Investment Operations | | | | | |
| Net investment income (loss)A | .08 | .34 | .30 | .25 | .24 |
| Net realized and unrealized gain (loss) | 3.42 | 4.71 | (3.71) | 5.04 | (1.25) |
| Total from investment operations | 3.50 | 5.05 | (3.41) | 5.29 | (1.01) |
| Distributions from net investment income | (.05) | (.33) | (.30) | (.26) | (.23) |
| Distributions from net realized gain | (.10) | (.77) | – | (.02) | (.03) |
| Total distributions | (.15) | (1.10) | (.30) | (.28) | (.26) |
| Net asset value, end of period | $26.25 | $22.90 | $18.95 | $22.66 | $17.65 |
| Total ReturnB,C | 15.33% | 27.50% | (15.06)% | 29.99% | (5.32)% |
| Ratios to Average Net AssetsD,E | | | | | |
| Expenses before reductions | 1.04% | 1.04% | 1.04% | 1.05% | 1.05% |
| Expenses net of fee waivers, if any | 1.04% | 1.04% | 1.04% | 1.05% | 1.05% |
| Expenses net of all reductions | 1.02% | 1.03% | 1.03% | 1.03% | 1.05% |
| Net investment income (loss) | .34% | 1.62% | 1.34% | 1.21% | 1.31% |
| Supplemental Data | | | | | |
| Net assets, end of period (000 omitted) | $352,459 | $331,113 | $291,392 | $361,446 | $302,443 |
| Portfolio turnover rateF | 47% | 38% | 40% | 35% | 102% |
A Calculated based on average shares outstanding during the period.
B Total returns do not reflect charges attributable to your insurance company's separate account. Inclusion of these charges would reduce the total returns shown.
C Total returns would have been lower if certain expenses had not been reduced during the applicable periods shown.
D Fees and expenses of any underlying mutual funds or exchange-traded funds (ETFs) are not included in the Fund's expense ratio. The Fund indirectly bears its proportionate share of these expenses. For additional expense information related to investments in Fidelity Central Funds, please refer to the "Investments in Fidelity Central Funds" note found in the Notes to Financial Statements section of the most recent Annual or Semi-Annual report.
E Expense ratios reflect operating expenses of the class. Expenses before reductions do not reflect amounts reimbursed, waived, or reduced through arrangements with the investment adviser, brokerage services, or other offset arrangements, if applicable, and do not represent the amount paid by the class during periods when reimbursements, waivers or reductions occur.
F Amount does not include the portfolio activity of any underlying mutual funds or exchange-traded funds (ETFs).
See accompanying notes which are an integral part of the financial statements.
VIP Overseas Portfolio Investor Class
| Years ended December 31, | 2020 | 2019 | 2018 | 2017 | 2016 |
| Selected Per–Share Data | | | | | |
| Net asset value, beginning of period | $23.05 | $19.06 | $22.79 | $17.75 | $19.02 |
| Income from Investment Operations | | | | | |
| Net investment income (loss)A | .11 | .38 | .34 | .29 | .27 |
| Net realized and unrealized gain (loss) | 3.44 | 4.74 | (3.74) | 5.06 | (1.25) |
| Total from investment operations | 3.55 | 5.12 | (3.40) | 5.35 | (.98) |
| Distributions from net investment income | (.08) | (.36) | (.33) | (.29) | (.26) |
| Distributions from net realized gain | (.10) | (.77) | – | (.02) | (.03) |
| Total distributions | (.18) | (1.13) | (.33) | (.31) | (.29) |
| Net asset value, end of period | $26.42 | $23.05 | $19.06 | $22.79 | $17.75 |
| Total ReturnB,C | 15.49% | 27.74% | (14.90)% | 30.18% | (5.14)% |
| Ratios to Average Net AssetsD,E | | | | | |
| Expenses before reductions | .87% | .87% | .87% | .88% | .88% |
| Expenses net of fee waivers, if any | .86% | .87% | .87% | .88% | .88% |
| Expenses net of all reductions | .85% | .86% | .86% | .86% | .88% |
| Net investment income (loss) | .51% | 1.79% | 1.51% | 1.38% | 1.48% |
| Supplemental Data | | | | | |
| Net assets, end of period (000 omitted) | $419,888 | $421,140 | $340,705 | $445,429 | $303,787 |
| Portfolio turnover rateF | 47% | 38% | 40% | 35% | 102% |
A Calculated based on average shares outstanding during the period.
B Total returns do not reflect charges attributable to your insurance company's separate account. Inclusion of these charges would reduce the total returns shown.
C Total returns would have been lower if certain expenses had not been reduced during the applicable periods shown.
D Fees and expenses of any underlying mutual funds or exchange-traded funds (ETFs) are not included in the Fund's expense ratio. The Fund indirectly bears its proportionate share of these expenses. For additional expense information related to investments in Fidelity Central Funds, please refer to the "Investments in Fidelity Central Funds" note found in the Notes to Financial Statements section of the most recent Annual or Semi-Annual report.
E Expense ratios reflect operating expenses of the class. Expenses before reductions do not reflect amounts reimbursed, waived, or reduced through arrangements with the investment adviser, brokerage services, or other offset arrangements, if applicable, and do not represent the amount paid by the class during periods when reimbursements, waivers or reductions occur.
F Amount does not include the portfolio activity of any underlying mutual funds or exchange-traded funds (ETFs).
See accompanying notes which are an integral part of the financial statements.
Notes to Financial Statements
For the period ended December 31, 2020
1. Organization.
VIP Overseas Portfolio (the Fund) is a fund of Variable Insurance Products Fund (the Trust) and is authorized to issue an unlimited number of shares. The Trust is registered under the Investment Company Act of 1940, as amended (the 1940 Act), as an open-end management investment company organized as a Massachusetts business trust. Shares of the Fund may only be purchased by insurance companies for the purpose of funding variable annuity or variable life insurance contracts. The Fund offers the following classes of shares: Initial Class shares, Service Class shares, Service Class 2 shares and Investor Class shares. All classes have equal rights and voting privileges, except for matters affecting a single class.
Effective January 1, 2020:
Investment advisers Fidelity Investments Money Management, Inc., FMR Co., Inc., and Fidelity SelectCo, LLC, merged with and into Fidelity Management & Research Company. In connection with the merger transactions, the resulting, merged investment adviser was then redomiciled from Massachusetts to Delaware, changed its corporate structure from a corporation to a limited liability company, and changed its name to "Fidelity Management & Research Company LLC".
Broker-dealer Fidelity Distributors Corporation merged with and into Fidelity Investments Institutional Services Company, Inc. ("FIISC"). FIISC was then redomiciled from Massachusetts to Delaware, changed its corporate structure from a corporation to a limited liability company, and changed its name to "Fidelity Distributors Company LLC".
Fidelity Investments Institutional Operations Company, Inc. converted from a Massachusetts corporation to a Massachusetts LLC, and changed its name to "Fidelity Investments Institutional Operations Company LLC".
2. Investments in Fidelity Central Funds.
The Fund invests in Fidelity Central Funds, which are open-end investment companies generally available only to other investment companies and accounts managed by the investment adviser and its affiliates. The Fund's Schedule of Investments lists each of the Fidelity Central Funds held as of period end, if any, as an investment of the Fund, but does not include the underlying holdings of each Fidelity Central Fund. As an Investing Fund, the Fund indirectly bears its proportionate share of the expenses of the underlying Fidelity Central Funds.
The Money Market Central Funds seek preservation of capital and current income and are managed by the investment adviser. Annualized expenses of the Money Market Central Funds as of their most recent shareholder report date ranged from less than .005% to .01%.
A complete unaudited list of holdings for each Fidelity Central Fund is available upon request or at the Securities and Exchange Commission (the SEC) website at www.sec.gov. In addition, the financial statements of the Fidelity Central Funds, which are not covered by the Fund's Report of Independent Registered Public Accounting Firm, are available on the SEC website or upon request.
3. Significant Accounting Policies.
The Fund is an investment company and applies the accounting and reporting guidance of the Financial Accounting Standards Board (FASB) Accounting Standards Codification Topic 946 Financial Services - Investment Companies. The financial statements have been prepared in conformity with accounting principles generally accepted in the United States of America (GAAP), which require management to make certain estimates and assumptions at the date of the financial statements. Actual results could differ from those estimates. Subsequent events, if any, through the date that the financial statements were issued have been evaluated in the preparation of the financial statements. The following summarizes the significant accounting policies of the Fund:
Investment Valuation. Investments are valued as of 4:00 p.m. Eastern time on the last calendar day of the period. The Board of Trustees (the Board) has delegated the day to day responsibility for the valuation of the Fund's investments to the Fair Value Committee (the Committee) established by the Fund's investment adviser. In accordance with valuation policies and procedures approved by the Board, the Fund attempts to obtain prices from one or more third party pricing vendors or brokers to value its investments. When current market prices, quotations or currency exchange rates are not readily available or reliable, investments will be fair valued in good faith by the Committee, in accordance with procedures adopted by the Board. Factors used in determining fair value vary by investment type and may include market or investment specific events. The frequency with which these procedures are used cannot be predicted and they may be utilized to a significant extent. The Committee oversees the Fund's valuation policies and procedures and reports to the Board on the Committee's activities and fair value determinations. The Board monitors the appropriateness of the procedures used in valuing the Fund's investments and ratifies the fair value determinations of the Committee.
The Fund categorizes the inputs to valuation techniques used to value its investments into a disclosure hierarchy consisting of three levels as shown below:
- Level 1 – quoted prices in active markets for identical investments
- Level 2 – other significant observable inputs (including quoted prices for similar investments, interest rates, prepayment speeds, etc.)
- Level 3 – unobservable inputs (including the Fund's own assumptions based on the best information available)
Valuation techniques used to value the Fund's investments by major category are as follows:
Equity securities, including restricted securities, for which market quotations are readily available, are valued at the last reported sale price or official closing price as reported by a third party pricing vendor on the primary market or exchange on which they are traded and are categorized as Level 1 in the hierarchy. In the event there were no sales during the day or closing prices are not available, securities are valued at the last quoted bid price or may be valued using the last available price and are generally categorized as Level 2 in the hierarchy. For foreign equity securities, when market or security specific events arise, comparisons to the valuation of American Depositary Receipts (ADRs), futures contracts, Exchange-Traded Funds (ETFs) and certain indexes as well as quoted prices for similar securities may be used and would be categorized as Level 2 in the hierarchy. For equity securities, including restricted securities, where observable inputs are limited, assumptions about market activity and risk are used and these securities may be categorized as Level 3 in the hierarchy.
Investments in open-end mutual funds, including the Fidelity Central Funds, are valued at their closing net asset value (NAV) each business day and are categorized as Level 1 in the hierarchy.
Changes in valuation techniques may result in transfers in or out of an assigned level within the disclosure hierarchy. The aggregate value of investments by input level as of December 31, 2020 is included at the end of the Fund's Schedule of Investments.
Foreign Currency. Certain Funds may use foreign currency contracts to facilitate transactions in foreign-denominated securities. Gains and losses from these transactions may arise from changes in the value of the foreign currency or if the counterparties do not perform under the contracts' terms.
Foreign-denominated assets, including investment securities, and liabilities are translated into U.S. dollars at the exchange rates at period end. Purchases and sales of investment securities, income and dividends received, and expenses denominated in foreign currencies are translated into U.S. dollars at the exchange rate in effect on the transaction date.
The effects of exchange rate fluctuations on investments are included with the net realized and unrealized gain (loss) on investment securities. Other foreign currency transactions resulting in realized and unrealized gain (loss) are disclosed separately.
Investment Transactions and Income. For financial reporting purposes, the Fund's investment holdings and NAV include trades executed through the end of the last business day of the period. The NAV per share for processing shareholder transactions is calculated as of the close of business of the New York Stock Exchange (NYSE), normally 4:00 p.m. Eastern time and includes trades executed through the end of the prior business day. Gains and losses on securities sold are determined on the basis of identified cost and include proceeds received from litigation. Dividend income is recorded on the ex-dividend date, except for certain dividends from foreign securities where the ex-dividend date may have passed, which are recorded as soon as the Fund is informed of the ex-dividend date. Non-cash dividends included in dividend income, if any, are recorded at the fair market value of the securities received. Income and capital gain distributions from Fidelity Central Funds, if any, are recorded on the ex-dividend date. Interest income is accrued as earned and includes coupon interest and amortization of premium and accretion of discount on debt securities as applicable. Investment income is recorded net of foreign taxes withheld where recovery of such taxes is uncertain.
Class Allocations and Expenses. Investment income, realized and unrealized capital gains and losses, common expenses of the Fund, and certain fund-level expense reductions, if any, are allocated daily on a pro-rata basis to each class based on the relative net assets of each class to the total net assets of the Fund. Each class differs with respect to transfer agent and distribution and service plan fees incurred. Certain expense reductions may also differ by class. For the reporting period, the allocated portion of income and expenses to each class as a percent of its average net assets may vary due to the timing of recording these transactions in relation to fluctuating net assets of the classes. Expenses directly attributable to a fund are charged to that fund. Expenses attributable to more than one fund are allocated among the respective funds on the basis of relative net assets or other appropriate methods. Expense estimates are accrued in the period to which they relate and adjustments are made when actual amounts are known.
Deferred Trustee Compensation. Under a Deferred Compensation Plan (the Plan) for certain Funds, certain independent Trustees have elected to defer receipt of a portion of their annual compensation. Deferred amounts are invested in affiliated mutual funds, are marked-to-market and remain in a fund until distributed in accordance with the Plan. The investment of deferred amounts and the offsetting payable to the Trustees presented below are included in the accompanying Statement of Assets and Liabilities in other receivables and other payables and accrued expenses, as applicable.
| VIP Overseas Portfolio | $19,977 |
Income Tax Information and Distributions to Shareholders. Each year, the Fund intends to qualify as a regulated investment company under Subchapter M of the Internal Revenue Code, including distributing substantially all of its taxable income and realized gains. As a result, no provision for U.S. Federal income taxes is required. As of December 31, 2020, the Fund did not have any unrecognized tax benefits in the financial statements; nor is the Fund aware of any tax positions for which it is reasonably possible that the total amounts of unrecognized tax benefits will significantly change in the next twelve months. The Fund files a U.S. federal tax return, in addition to state and local tax returns as required. The Fund's federal income tax returns are subject to examination by the Internal Revenue Service (IRS) for a period of three fiscal years after they are filed. State and local tax returns may be subject to examination for an additional fiscal year depending on the jurisdiction. Foreign taxes are provided for based on the Fund's understanding of the tax rules and rates that exist in the foreign markets in which it invests. The Fund is subject to a tax imposed on capital gains by certain countries in which it invests. An estimated deferred tax liability for net unrealized appreciation on the applicable securities is included in Other payables and accrued expenses on the Statement of Assets & Liabilities.
Distributions are declared and recorded on the ex-dividend date. Income and capital gain distributions are declared separately for each class. Income and capital gain distributions are determined in accordance with income tax regulations, which may differ from GAAP.
Capital accounts within the financial statements are adjusted for permanent book-tax differences. These adjustments have no impact on net assets or the results of operations. Capital accounts are not adjusted for temporary book-tax differences which will reverse in a subsequent period.
Book-tax differences are primarily due to foreign currency transactions, certain foreign taxes, passive foreign investment companies (PFIC), deferred trustees compensation and losses deferred due to wash sales.
As of period end, the cost and unrealized appreciation (depreciation) in securities, and derivatives if applicable, for federal income tax purposes were as follows:
| Gross unrealized appreciation | $590,232,551 |
| Gross unrealized depreciation | (17,998,471) |
| Net unrealized appreciation (depreciation) | $572,234,080 |
| Tax Cost | $1,230,205,304 |
The tax-based components of distributable earnings as of period end were as follows:
| Undistributed long-term capital gain | $54,299,662 |
| Net unrealized appreciation (depreciation) on securities and other investments | $572,505,278 |
The tax character of distributions paid was as follows:
| | December 31, 2020 | December 31, 2019 |
| Ordinary Income | $6,852,956 | $ 27,062,965 |
| Long-term Capital Gains | 6,696,256 | 55,532,490 |
| Total | $13,279,212 | $ 82,595,455 |
Restricted Securities (including Private Placements). The Fund may invest in securities that are subject to legal or contractual restrictions on resale. These securities generally may be resold in transactions exempt from registration or to the public if the securities are registered. Disposal of these securities may involve time-consuming negotiations and expense, and prompt sale at an acceptable price may be difficult. Information regarding restricted securities is included at the end of the Fund's Schedule of Investments.
4. Purchases and Sales of Investments.
Purchases and sales of securities, other than short-term securities, are noted in the table below.
| | Purchases ($) | Sales ($) |
| VIP Overseas Portfolio | 749,418,090 | 877,104,607 |
5. Fees and Other Transactions with Affiliates.
Management Fee. Fidelity Management & Research Company LLC (the investment adviser) and its affiliates provide the Fund with investment management related services for which the Fund pays a monthly management fee. The management fee is the sum of an individual fund fee rate that is based on an annual rate of .424% of the Fund's average net assets and an annualized group fee rate that averaged .23% during the period. The group fee rate is based upon the monthly average net assets of a group of registered investment companies with which the investment adviser has management contracts. The group fee rate decreases as assets under management increase and increases as assets under management decrease. For the reporting period, the total annual management fee rate was .66% of the Fund's average net assets.
Distribution and Service Plan Fees. In accordance with Rule 12b-1 of the 1940 Act, the Fund has adopted separate 12b-1 Plans for each Service Class of shares. Each Service Class pays Fidelity Distributors Company LLC (FDC), an affiliate of the investment adviser, a service fee. For the period, the service fee is based on an annual rate of .10% of Service Class' average net assets and .25% of Service Class 2's average net assets.
For the period, total fees, all of which were re-allowed to insurance companies for the distribution of shares and providing shareholder support services, were as follows:
| Service Class | $129,382 |
| Service Class 2 | 781,659 |
| | $911,041 |
Transfer Agent Fees. Fidelity Investments Institutional Operations Company LLC (FIIOC), an affiliate of the investment adviser, is the Fund's transfer, dividend disbursing, and shareholder servicing agent. FIIOC receives an asset-based fee with respect to each class. Each class pays a fee for transfer agent services, typesetting and printing and mailing of shareholder reports, excluding mailing of proxy statements. Effective February 1, 2020, the Board approved to change the fee from .145% to .142% for Investor Class, and from .065% to .064% for all other classes. For the period, transfer agent fees for each class were as follows:
| | Amount | % of Class-Level Average Net Assets |
| Initial Class | $498,672 | .06 |
| Service Class | 82,200 | .06 |
| Service Class 2 | 198,621 | .06 |
| Investor Class | 542,045 | .14 |
| | $1,321,538 | |
Accounting Fees. Fidelity Service Company, Inc. (FSC), an affiliate of the investment adviser, maintains the Fund's accounting records. The accounting fee is based on the level of average net assets for each month. For the period, the fees were equivalent to the following annual rates:
| | % of Average Net Assets |
| VIP Overseas Portfolio | .04 |
Brokerage Commissions. A portion of portfolio transactions were placed with brokerage firms which are affiliates of the investment adviser. Brokerage commissions are included in net realized gain (loss) and change in net unrealized appreciation (depreciation) in the Statement of Operations. The commissions paid to these affiliated firms were as follows:
| | Amount |
| VIP Overseas Portfolio | $2,523 |
Interfund Lending Program. Pursuant to an Exemptive Order issued by the SEC, the Fund, along with other registered investment companies having management contracts with Fidelity Management & Research Company LLC (FMR), or other affiliated entities of FMR, may participate in an interfund lending program. This program provides an alternative credit facility allowing the Fund to borrow from, or lend money to, other participating affiliated funds. At period end, there were no interfund loans outstanding. Activity in this program during the period for which loans were outstanding was as follows:
| | Borrower or Lender | Average Loan Balance | Weighted Average Interest Rate | Interest Expense |
| VIP Overseas Portfolio | Borrower | $10,393,500 | .33% | $564 |
Interfund Trades. Funds may purchase from or sell securities to other Fidelity Funds under procedures adopted by the Board. The procedures have been designed to ensure these interfund trades are executed in accordance with Rule 17a-7 of the 1940 Act. Interfund trades are included within the respective purchases and sales amounts shown in the Purchases and Sales of Investments note, and amounted to $23,443,145 and $63,311,887, respectively.
6. Committed Line of Credit.
Certain Funds participate with other funds managed by the investment adviser or an affiliate in a $4.25 billion credit facility (the "line of credit") to be utilized for temporary or emergency purposes to fund shareholder redemptions or for other short-term liquidity purposes. The participating funds have agreed to pay commitment fees on their pro-rata portion of the line of credit, which are reflected in Miscellaneous expenses on the Statement of Operations, and are as follows:
| | Amount |
| VIP Overseas Portfolio | $3,748 |
During the period, there were no borrowings on this line of credit.
7. Security Lending.
Funds lend portfolio securities from time to time in order to earn additional income. Lending agents are used, including National Financial Services (NFS), an affiliate of the investment adviser. Pursuant to a securities lending agreement, NFS will receive a fee, which is capped at 9.9% of a fund's daily lending revenue, for its services as lending agent. A fund may lend securities to certain qualified borrowers, including NFS. On the settlement date of the loan, a fund receives collateral (in the form of U.S. Treasury obligations, letters of credit and/or cash) against the loaned securities and maintains collateral in an amount not less than 100% of the market value of the loaned securities during the period of the loan. The market value of the loaned securities is determined at the close of business of a fund and any additional required collateral is delivered to a fund on the next business day. A fund or borrower may terminate the loan at any time, and if the borrower defaults on its obligation to return the securities loaned because of insolvency or other reasons, a fund may apply collateral received from the borrower against the obligation. A fund may experience delays and costs in recovering the securities loaned. Any cash collateral received is invested in the Fidelity Securities Lending Cash Central Fund. Any loaned securities are identified as such in the Schedule of Investments, and the value of loaned securities and cash collateral at period end, as applicable, are presented in the Statement of Assets and Liabilities. Security lending income represents the income earned on investing cash collateral, less rebates paid to borrowers and any lending agent fees associated with the loan, plus any premium payments received for lending certain types of securities. Security lending income is presented in the Statement of Operations as a component of income from Fidelity Central Funds. Affiliated security lending activity, if any, was as follows:
| | Total Security Lending Income Fees Paid to NFS | Security Lending Income From Securities Loaned to NFS | Value of Securities Loaned to NFS at Period End |
| VIP Overseas Portfolio | $– | $– | $– |
8. Expense Reductions.
Commissions paid to certain brokers with whom the investment adviser, or its affiliates, places trades on behalf of the Fund include an amount in addition to trade execution, which may be rebated back to the Fund to offset certain expenses. This amount totaled $225,370 for the period.
In addition, during the period the investment adviser or an affiliate reimbursed and/or waived a portion of fund-level operating expenses in the amount of $6,717.
9. Distributions to Shareholders.
Distributions to shareholders of each class were as follows:
| | Year ended
December 31, 2020 | Year ended
December 31, 2019 |
| Distributions to shareholders | | |
| Initial Class | $7,003,268 | $39,313,910 |
| Service Class | 1,056,975 | 6,672,484 |
| Service Class 2 | 2,052,603 | 16,547,564 |
| Investor Class | 3,166,366 | 20,061,497 |
| Total | $13,279,212 | $82,595,455 |
10. Share Transactions.
Transactions for each class of shares were as follows:
| | Shares | Shares | Dollars | Dollars |
| | Year ended December 31, 2020 | Year ended December 31, 2019 | Year ended December 31, 2020 | Year ended December 31, 2019 |
| Initial Class | | | | |
| Shares sold | 8,718,934 | 6,754,504 | $193,650,308 | $144,874,699 |
| Reinvestment of distributions | 288,231 | 1,927,663 | 7,003,268 | 39,313,910 |
| Shares redeemed | (11,859,183) | (7,563,955) | (264,785,465) | (161,041,185) |
| Net increase (decrease) | (2,852,018) | 1,118,212 | $(64,131,889) | $23,147,424 |
| Service Class | | | | |
| Shares sold | 1,102,068 | 437,947 | $25,655,019 | $9,216,435 |
| Reinvestment of distributions | 43,826 | 329,796 | 1,056,975 | 6,672,484 |
| Shares redeemed | (1,239,298) | (910,822) | (27,816,457) | (19,274,934) |
| Net increase (decrease) | (93,404) | (143,079) | $(1,104,463) | $(3,386,015) |
| Service Class 2 | | | | |
| Shares sold | 1,038,522 | 690,561 | $22,307,745 | $14,157,013 |
| Reinvestment of distributions | 86,431 | 825,053 | 2,052,603 | 16,547,564 |
| Shares redeemed | (2,155,681) | (2,432,181) | (47,995,578) | (51,165,435) |
| Net increase (decrease) | (1,030,728) | (916,567) | $(23,635,230) | $(20,460,858) |
| Investor Class | | | | |
| Shares sold | 3,078,543 | 2,445,080 | $66,853,744 | $51,998,485 |
| Reinvestment of distributions | 131,397 | 988,426 | 3,166,366 | 20,061,497 |
| Shares redeemed | (5,591,632) | (3,033,412) | (121,276,605) | (63,763,713) |
| Net increase (decrease) | (2,381,692) | 400,094 | $(51,256,495) | $8,296,269 |
11. Other.
The Fund's organizational documents provide former and current trustees and officers with a limited indemnification against liabilities arising in connection with the performance of their duties to the Fund. In the normal course of business, the Fund may also enter into contracts that provide general indemnifications. The Fund's maximum exposure under these arrangements is unknown as this would be dependent on future claims that may be made against the Fund. The risk of material loss from such claims is considered remote.
At the end of the period, the investment adviser or its affiliates were the owners of record of 18% of the total outstanding shares of the Fund and one otherwise unaffiliated shareholder was the owner of record of 15% of the total outstanding shares of the Fund. Mutual funds managed by the investment adviser or its affiliates were the owners of record, in the aggregate, of approximately 33% of the total outstanding shares of the Fund.
12. Coronavirus (COVID-19) Pandemic.
An outbreak of COVID-19 first detected in China during December 2019 has since spread globally and was declared a pandemic by the World Health Organization during March 2020. Developments that disrupt global economies and financial markets, such as the COVID-19 pandemic, may magnify factors that affect the Fund's performance.
Report of Independent Registered Public Accounting Firm
To the Board of Trustees of Variable Insurance Products Fund and Shareholders of VIP Overseas Portfolio
Opinion on the Financial Statements
We have audited the accompanying statement of assets and liabilities, including the schedule of investments, of VIP Overseas Portfolio (one of the funds constituting Variable Insurance Products Fund, referred to hereafter as the “Fund”) as of December 31, 2020, the related statement of operations for the year ended December 31, 2020, the statement of changes in net assets for each of the two years in the period ended December 31, 2020, including the related notes, and the financial highlights for each of the five years in the period ended December 31, 2020 (collectively referred to as the “financial statements”). In our opinion, the financial statements present fairly, in all material respects, the financial position of the Fund as of December 31, 2020, the results of its operations for the year then ended, the changes in its net assets for each of the two years in the period ended December 31, 2020 and the financial highlights for each of the five years in the period ended December 31, 2020 in conformity with accounting principles generally accepted in the United States of America.
Basis for Opinion
These financial statements are the responsibility of the Fund’s management. Our responsibility is to express an opinion on the Fund’s financial statements based on our audits. We are a public accounting firm registered with the Public Company Accounting Oversight Board (United States) (PCAOB) and are required to be independent with respect to the Fund in accordance with the U.S. federal securities laws and the applicable rules and regulations of the Securities and Exchange Commission and the PCAOB.
We conducted our audits of these financial statements in accordance with the standards of the PCAOB. Those standards require that we plan and perform the audit to obtain reasonable assurance about whether the financial statements are free of material misstatement, whether due to error or fraud.
Our audits included performing procedures to assess the risks of material misstatement of the financial statements, whether due to error or fraud, and performing procedures that respond to those risks. Such procedures included examining, on a test basis, evidence regarding the amounts and disclosures in the financial statements. Our audits also included evaluating the accounting principles used and significant estimates made by management, as well as evaluating the overall presentation of the financial statements. Our procedures included confirmation of securities owned as of December 31, 2020 by correspondence with the custodian. We believe that our audits provide a reasonable basis for our opinion.
/s/ PricewaterhouseCoopers LLP
Boston, Massachusetts
February 9, 2021
We have served as the auditor of one or more investment companies in the Fidelity group of funds since 1932.
Trustees and Officers
The Trustees, Members of the Advisory Board (if any), and officers of the trust and fund, as applicable, are listed below. The Board of Trustees governs the fund and is responsible for protecting the interests of shareholders. The Trustees are experienced executives who meet periodically throughout the year to oversee the fund's activities, review contractual arrangements with companies that provide services to the fund, oversee management of the risks associated with such activities and contractual arrangements, and review the fund's performance. Except for Jonathan Chiel, each of the Trustees oversees 305 funds. Mr. Chiel oversees 176 funds.
The Trustees hold office without limit in time except that (a) any Trustee may resign; (b) any Trustee may be removed by written instrument, signed by at least two-thirds of the number of Trustees prior to such removal; (c) any Trustee who requests to be retired or who has become incapacitated by illness or injury may be retired by written instrument signed by a majority of the other Trustees; and (d) any Trustee may be removed at any special meeting of shareholders by a two-thirds vote of the outstanding voting securities of the trust. Each Trustee who is not an interested person (as defined in the 1940 Act) of the trust and the fund is referred to herein as an Independent Trustee. Each Independent Trustee shall retire not later than the last day of the calendar year in which his or her 75th birthday occurs. The Independent Trustees may waive this mandatory retirement age policy with respect to individual Trustees. Officers and Advisory Board Members hold office without limit in time, except that any officer or Advisory Board Member may resign or may be removed by a vote of a majority of the Trustees at any regular meeting or any special meeting of the Trustees. Except as indicated, each individual has held the office shown or other offices in the same company for the past five years.
The fund’s Statement of Additional Information (SAI) includes more information about the Trustees. To request a free copy, call Fidelity at 1-877-208-0098.
Experience, Skills, Attributes, and Qualifications of the Trustees. The Governance and Nominating Committee has adopted a statement of policy that describes the experience, qualifications, attributes, and skills that are necessary and desirable for potential Independent Trustee candidates (Statement of Policy). The Board believes that each Trustee satisfied at the time he or she was initially elected or appointed a Trustee, and continues to satisfy, the standards contemplated by the Statement of Policy. The Governance and Nominating Committee also engages professional search firms to help identify potential Independent Trustee candidates who have the experience, qualifications, attributes, and skills consistent with the Statement of Policy. From time to time, additional criteria based on the composition and skills of the current Independent Trustees, as well as experience or skills that may be appropriate in light of future changes to board composition, business conditions, and regulatory or other developments, have also been considered by the professional search firms and the Governance and Nominating Committee. In addition, the Board takes into account the Trustees' commitment and participation in Board and committee meetings, as well as their leadership of standing and ad hoc committees throughout their tenure.
In determining that a particular Trustee was and continues to be qualified to serve as a Trustee, the Board has considered a variety of criteria, none of which, in isolation, was controlling. The Board believes that, collectively, the Trustees have balanced and diverse experience, qualifications, attributes, and skills, which allow the Board to operate effectively in governing the fund and protecting the interests of shareholders. Information about the specific experience, skills, attributes, and qualifications of each Trustee, which in each case led to the Board's conclusion that the Trustee should serve (or continue to serve) as a trustee of the fund, is provided below.
Board Structure and Oversight Function. Robert A. Lawrence is an interested person and currently serves as Acting Chairman. The Trustees have determined that an interested Chairman is appropriate and benefits shareholders because an interested Chairman has a personal and professional stake in the quality and continuity of services provided to the fund. Independent Trustees exercise their informed business judgment to appoint an individual of their choosing to serve as Chairman, regardless of whether the Trustee happens to be independent or a member of management. The Independent Trustees have determined that they can act independently and effectively without having an Independent Trustee serve as Chairman and that a key structural component for assuring that they are in a position to do so is for the Independent Trustees to constitute a substantial majority for the Board. The Independent Trustees also regularly meet in executive session. David M. Thomas serves as Lead Independent Trustee and as such (i) acts as a liaison between the Independent Trustees and management with respect to matters important to the Independent Trustees and (ii) with management prepares agendas for Board meetings.
Fidelity® funds are overseen by different Boards of Trustees. The fund's Board oversees Fidelity's high income and certain equity funds, and other Boards oversee Fidelity's investment-grade bond, money market, asset allocation, and other equity funds. The asset allocation funds may invest in Fidelity® funds overseen by the fund's Board. The use of separate Boards, each with its own committee structure, allows the Trustees of each group of Fidelity® funds to focus on the unique issues of the funds they oversee, including common research, investment, and operational issues. On occasion, the separate Boards establish joint committees to address issues of overlapping consequences for the Fidelity® funds overseen by each Board.
The Trustees operate using a system of committees to facilitate the timely and efficient consideration of all matters of importance to the Trustees, the fund, and fund shareholders and to facilitate compliance with legal and regulatory requirements and oversight of the fund's activities and associated risks. The Board, acting through its committees, has charged FMR and its affiliates with (i) identifying events or circumstances the occurrence of which could have demonstrably adverse effects on the fund's business and/or reputation; (ii) implementing processes and controls to lessen the possibility that such events or circumstances occur or to mitigate the effects of such events or circumstances if they do occur; and (iii) creating and maintaining a system designed to evaluate continuously business and market conditions in order to facilitate the identification and implementation processes described in (i) and (ii) above. Because the day-to-day operations and activities of the fund are carried out by or through FMR, its affiliates, and other service providers, the fund's exposure to risks is mitigated but not eliminated by the processes overseen by the Trustees. While each of the Board's committees has responsibility for overseeing different aspects of the fund's activities, oversight is exercised primarily through the Operations, Audit, and Compliance Committees. Appropriate personnel, including but not limited to the fund's Chief Compliance Officer (CCO), FMR's internal auditor, the independent accountants, the fund's Treasurer and portfolio management personnel, make periodic reports to the Board's committees, as appropriate, including an annual review of Fidelity's risk management program for the Fidelity® funds. The responsibilities of each standing committee, including their oversight responsibilities, are described further under "Standing Committees of the Trustees."
Interested Trustees*:
Correspondence intended for a Trustee who is an interested person may be sent to Fidelity Investments, 245 Summer Street, Boston, Massachusetts 02210.
Name, Year of Birth; Principal Occupations and Other Relevant Experience+
Jonathan Chiel (1957)
Year of Election or Appointment: 2016
Trustee
Mr. Chiel also serves as Trustee of other Fidelity® funds. Mr. Chiel is Executive Vice President and General Counsel for FMR LLC (diversified financial services company, 2012-present). Previously, Mr. Chiel served as general counsel (2004-2012) and senior vice president and deputy general counsel (2000-2004) for John Hancock Financial Services; a partner with Choate, Hall & Stewart (1996-2000) (law firm); and an Assistant United States Attorney for the United States Attorney’s Office of the District of Massachusetts (1986-95), including Chief of the Criminal Division (1993-1995). Mr. Chiel is a director on the boards of the Boston Bar Foundation and the Maimonides School.
Bettina Doulton (1964)
Year of Election or Appointment: 2021
Trustee
Ms. Doulton also serves as Trustee of other Fidelity® funds. Prior to her retirement, Ms. Doulton served in a variety of positions at Fidelity Investments, including as a managing director of research (2006-2007), portfolio manager to certain Fidelity® funds (1993-2005), equity analyst and portfolio assistant (1990-1993), and research assistant (1987-1990). Ms. Doulton currently owns and operates Phi Builders + Architects and Cellardoor Winery. Previously, Ms. Doulton served as a member of the Board of Brown Capital Management, LLC (2013-2018).
Robert A. Lawrence (1952)
Year of Election or Appointment: 2020
Trustee
Acting Chairman of the Board of Trustees
Mr. Lawrence also serves as Trustee of other funds. Previously, Mr. Lawrence served as a Member of the Advisory Board of certain funds. Prior to his retirement in 2008, Mr. Lawrence served as Vice President of certain Fidelity® funds (2006-2008), Senior Vice President, Head of High Income Division of Fidelity Management & Research Company (investment adviser firm, 2006-2008), and President of Fidelity Strategic Investments (investment adviser firm, 2002-2005).
* Determined to be an “Interested Trustee” by virtue of, among other things, his or her affiliation with the trust or various entities under common control with FMR.
+ The information includes the Trustee's principal occupation during the last five years and other information relating to the experience, attributes, and skills relevant to the Trustee's qualifications to serve as a Trustee, which led to the conclusion that the Trustee should serve as a Trustee for the fund.
Independent Trustees:
Correspondence intended for an Independent Trustee may be sent to Fidelity Investments, P.O. Box 55235, Boston, Massachusetts 02205-5235.
Name, Year of Birth; Principal Occupations and Other Relevant Experience+
Dennis J. Dirks (1948)
Year of Election or Appointment: 2005
Trustee
Mr. Dirks also serves as Trustee of other Fidelity® funds. Prior to his retirement in May 2003, Mr. Dirks served as Chief Operating Officer and as a member of the Board of The Depository Trust & Clearing Corporation (financial markets infrastructure), President, Chief Operating Officer and a member of the Board of The Depository Trust Company (DTC), President and a member of the Board of the National Securities Clearing Corporation (NSCC), Chief Executive Officer and a member of the Board of the Government Securities Clearing Corporation and Chief Executive Officer and a member of the Board of the Mortgage-Backed Securities Clearing Corporation. Mr. Dirks currently serves as a member of the Finance Committee (2016-present) and Board (2017-present) and is Treasurer (2018-present) of the Asolo Repertory Theatre.
Donald F. Donahue (1950)
Year of Election or Appointment: 2018
Trustee
Mr. Donahue also serves as Trustee of other Fidelity® funds. Mr. Donahue serves as President and Chief Executive Officer of Miranda Partners, LLC (risk consulting for the financial services industry, 2012-present). Previously, Mr. Donahue served as Chief Executive Officer (2006-2012), Chief Operating Officer (2003-2006) and Managing Director, Customer Marketing and Development (1999-2003) of The Depository Trust & Clearing Corporation (financial markets infrastructure). Mr. Donahue currently serves as a member (2007-present) and Co-Chairman (2016-present) of the Board of United Way of New York, a member of the Board of NYC Leadership Academy (2012-present) and a member of the Board of Advisors of Ripple Labs, Inc. (financial services, 2015-present). Mr. Donahue previously served as a member of the Advisory Board of certain Fidelity® funds (2015-2018).
Vicki L. Fuller (1957)
Year of Election or Appointment: 2020
Trustee
Ms. Fuller also serves as Trustee of other Fidelity® funds. Previously, Ms. Fuller served as a member of the Advisory Board of certain Fidelity® funds (2018-2020), Chief Investment Officer of the New York State Common Retirement Fund (2012-2018) and held a variety of positions at AllianceBernstein L.P. (global asset management, 1985-2012), including Managing Director (2006-2012) and Senior Vice President and Senior Portfolio Manager (2001-2006). Ms. Fuller currently serves as a member of the Board, Audit Committee and Nominating and Governance Committee of The Williams Companies, Inc. (natural gas infrastructure, 2018-present), as a member of the Board, Audit Committee and Nominating and Governance Committee of two Blackstone business development companies (2020-present) and as a member of the Board of Treliant, LLC (consulting, 2019-present).
Patricia L. Kampling (1959)
Year of Election or Appointment: 2020
Trustee
Ms. Kampling also serves as Trustee of other Fidelity® funds. Prior to her retirement, Ms. Kampling served as Chairman of the Board and Chief Executive Officer (2012-2019), President and Chief Operating Officer (2011-2012) and Executive Vice President and Chief Financial Officer (2010-2011) of Alliant Energy Corporation. Ms. Kampling currently serves as a member of the Board, Compensation Committee and Executive Committee and as Chair of the Audit Committee of Briggs & Stratton Corporation (manufacturing, 2011-present) and as a member of the Board, Audit, Finance and Risk Committee and Safety, Environmental, Technology and Operations Committee of American Water Works Company, Inc. (utilities company, 2019-present). In addition, Ms. Kampling currently serves as a member of the Board of the Nature Conservancy, Wisconsin Chapter (2019-present). Previously, Ms. Kampling served as a Member of the Advisory Board of certain Fidelity® funds (2020), a member of the Board of Interstate Power and Light Company (2012-2019) and Wisconsin Power and Light Company (2012-2019) (each a subsidiary of Alliant Energy Corporation) and as a member of the Board and Workforce Development Committee of the Business Roundtable (2018-2019).
Thomas A. Kennedy (1955)
Year of Election or Appointment: 2021
Trustee
Mr. Kennedy also serves as Trustee of other Fidelity® funds. Previously, Mr. Kennedy served as a Member of the Advisory Board of certain Fidelity® funds (2020) and held a variety of positions at Raytheon Company (aerospace and defense, 1983-2020), including Chairman and Chief Executive Officer (2014-2020) and Executive Vice President and Chief Operating Officer (2013-2014). Mr. Kennedy currently serves as Executive Chairman of the Board of Directors of Raytheon Technologies Corporation (aerospace and defense, 2020-present). He is also a member of the Rutgers School of Engineering Industry Advisory Board (2011-present) and a member of the UCLA Engineering Dean’s Executive Board (2016-present).
Garnett A. Smith (1947)
Year of Election or Appointment: 2018
Trustee
Mr. Smith also serves as Trustee of other Fidelity® funds. Prior to his retirement, Mr. Smith served as Chairman and Chief Executive Officer (1990-1997) and President (1986-1990) of Inbrand Corp. (manufacturer of personal absorbent products). Prior to his employment with Inbrand Corp., he was employed by a retail fabric chain and North Carolina National Bank (now Bank of America). Mr. Smith previously served as a member of the Advisory Board of certain Fidelity® funds (2012-2013).
David M. Thomas (1949)
Year of Election or Appointment: 2008
Trustee
Lead Independent Trustee
Mr. Thomas also serves as Trustee of other Fidelity® funds. Previously, Mr. Thomas served as Executive Chairman (2005-2006) and Chairman and Chief Executive Officer (2000-2005) of IMS Health, Inc. (pharmaceutical and healthcare information solutions). Mr. Thomas currently serves as Non-Executive Chairman of the Board of Fortune Brands Home and Security (home and security products, 2011-present), and a member of the Board (2004-present) and Presiding Director (2013-present) of Interpublic Group of Companies, Inc. (marketing communication).
Susan Tomasky (1953)
Year of Election or Appointment: 2020
Trustee
Ms. Tomasky also serves as Trustee of other Fidelity® funds. Prior to her retirement, Ms. Tomasky served in various executive officer positions at American Electric Power Company, Inc. (1998-2011), including most recently as President of AEP Transmission (2007-2011). Ms. Tomasky currently serves as a member of the Board and Sustainability Committee and as Chair of the Audit Committee of Marathon Petroleum Corporation (2018-present) and as a member of the Board, Corporate Governance Committee and Organization and Compensation Committee and as Chair of the Audit Committee of Public Service Enterprise Group, Inc. (utilities company, 2012-present). In addition, Ms. Tomasky currently serves as a member of the Board of the Columbus Regional Airport Authority (2007-present), as a member of the Board of the Royal Shakespeare Company – America (2009-present), as a member of the Board of the Columbus Association for the Performing Arts (2011-present) and as a member of the Board of Kenyon College (2016-present). Previously, Ms. Tomasky served as a Member of the Advisory Board of certain Fidelity® funds (2020), a member of the Board (2011-2019) and as Lead Independent Director (2015-2018) of Andeavor Corporation (previously Tesoro Corporation) (independent oil refiner and marketer) and as a member of the Board of Summit Midstream Partners LP (energy, 2012-2018).
Michael E. Wiley (1950)
Year of Election or Appointment: 2020
Trustee
Mr. Wiley also serves as Trustee of other Fidelity® funds. Previously, Mr. Wiley served as a member of the Advisory Board of certain Fidelity® funds (2018-2020), Chairman, President and CEO of Baker Hughes, Inc. (oilfield services, 2000-2004). Mr. Wiley also previously served as a member of the Board of Andeavor Corporation (independent oil refiner and marketer, 2005-2018), a member of the Board of Andeavor Logistics LP (natural resources logistics, 2015-2018) and a member of the Board of High Point Resources (exploration and production, 2005-2020).
+ The information includes the Trustee's principal occupation during the last five years and other information relating to the experience, attributes, and skills relevant to the Trustee's qualifications to serve as a Trustee, which led to the conclusion that the Trustee should serve as a Trustee for the fund.
Advisory Board Members and Officers:
Correspondence intended for a Member of the Advisory Board (if any) may be sent to Fidelity Investments, P.O. Box 55235, Boston, Massachusetts 02205-5235. Correspondence intended for an officer or Peter S. Lynch may be sent to Fidelity Investments, 245 Summer Street, Boston, Massachusetts 02210. Officers appear below in alphabetical order.
Name, Year of Birth; Principal Occupation
Ned C. Lautenbach (1944)
Year of Election or Appointment: 2021
Member of the Advisory Board
Mr. Lautenbach also serves as a Member of the Advisory Board of other Fidelity® funds. Mr. Lautenbach currently serves as Chair of the Board of Governors, State University System of Florida (2013-present) and is a member of the Council on Foreign Relations (1994-present). He is also a member and has in the past served as Chairman of the Board of Directors of Artis-Naples (2012-present). Previously, Mr. Lautenbach served as a Trustee of certain Fidelity® funds (2000-2020) and a member and then Lead Director of the Board of Directors of Eaton Corporation (diversified industrial, 1997-2016). He was also a Partner at Clayton, Dubilier & Rice, LLC (private equity investment, 1998-2010); as well as Director of Sony Corporation (2006-2007). In addition, Mr. Lautenbach had a 30-year career with IBM (technology company), during which time he served as Senior Vice President and as a member of the Corporate Executive Committee (1968-1998).
Peter S. Lynch (1944)
Year of Election or Appointment: 2003
Member of the Advisory Board
Mr. Lynch also serves as a Member of the Advisory Board of other Fidelity® funds. Mr. Lynch is Vice Chairman and a Director of Fidelity Management & Research Company LLC (investment adviser firm). In addition, Mr. Lynch serves as a Trustee of Boston College and as the Chairman of the Inner-City Scholarship Fund. Previously, Mr. Lynch served as Vice Chairman and a Director of FMR Co., Inc. (investment adviser firm) and on the Special Olympics International Board of Directors (1997-2006).
Craig S. Brown (1977)
Year of Election or Appointment: 2019
Assistant Treasurer
Mr. Brown also serves as Assistant Treasurer of other funds. Mr. Brown is an employee of Fidelity Investments (2013-present).
John J. Burke III (1964)
Year of Election or Appointment: 2018
Chief Financial Officer
Mr. Burke also serves as Chief Financial Officer of other funds. Mr. Burke serves as Head of Investment Operations for Fidelity Fund and Investment Operations (2018-present) and is an employee of Fidelity Investments (1998-present). Previously Mr. Burke served as head of Asset Management Investment Operations (2012-2018).
William C. Coffey (1969)
Year of Election or Appointment: 2019
Assistant Secretary
Mr. Coffey also serves as Assistant Secretary of other funds. He is Senior Vice President and Deputy General Counsel of FMR LLC (diversified financial services company, 2010-present), and is an employee of Fidelity Investments. Previously, Mr. Coffey served as Secretary and CLO of certain funds (2018-2019); CLO, Secretary, and Senior Vice President of Fidelity Management & Research Company and FMR Co., Inc. (investment adviser firms, 2018-2019); Secretary of Fidelity SelectCo, LLC and Fidelity Investments Money Management, Inc. (investment adviser firms, 2018-2019); CLO of Fidelity Management & Research (Hong Kong) Limited, FMR Investment Management (UK) Limited, and Fidelity Management & Research (Japan) Limited (investment adviser firms, 2018-2019); and Assistant Secretary of certain funds (2009-2018).
Timothy M. Cohen (1969)
Year of Election or Appointment: 2018
Vice President
Mr. Cohen also serves as Vice President of other funds. Mr. Cohen serves as Co-Head of Equity (2018-present), a Director of Fidelity Management & Research (Japan) Limited (investment adviser firm, 2016-present), and is an employee of Fidelity Investments. Previously, Mr. Cohen served as Executive Vice President of Fidelity SelectCo, LLC (2019), Head of Global Equity Research (2016-2018), Chief Investment Officer - Equity and a Director of Fidelity Management & Research (U.K.) Inc. (investment adviser firm, 2013-2015) and as a Director of Fidelity Management & Research (Hong Kong) Limited (investment adviser firm, 2017).
Jonathan Davis (1968)
Year of Election or Appointment: 2010
Assistant Treasurer
Mr. Davis also serves as Assistant Treasurer of other funds. Mr. Davis serves as Assistant Treasurer of FMR Capital, Inc. (2017-present) and is an employee of Fidelity Investments. Previously, Mr. Davis served as Vice President and Associate General Counsel of FMR LLC (diversified financial services company, 2003-2010).
Laura M. Del Prato (1964)
Year of Election or Appointment: 2018
Assistant Treasurer
Ms. Del Prato also serves as an officer of other funds. Ms. Del Prato is an employee of Fidelity Investments (2017-present). Previously, Ms. Del Prato served as President and Treasurer of The North Carolina Capital Management Trust: Cash Portfolio and Term Portfolio (2018-2020). Prior to joining Fidelity Investments, Ms. Del Prato served as a Managing Director and Treasurer of the JPMorgan Mutual Funds (2014-2017). Prior to JPMorgan, Ms. Del Prato served as a partner at Cohen Fund Audit Services (accounting firm, 2012-2013) and KPMG LLP (accounting firm, 2004-2012).
Colm A. Hogan (1973)
Year of Election or Appointment: 2020
Assistant Treasurer
Mr. Hogan also serves as an officer of other funds. Mr. Hogan serves as Assistant Treasurer of FMR Capital, Inc. (2017-present) and is an employee of Fidelity Investments (2005-present). Previously, Mr. Hogan served as Deputy Treasurer of certain Fidelity® funds (2016-2020) and Assistant Treasurer of certain Fidelity® funds (2016-2018).
Pamela R. Holding (1964)
Year of Election or Appointment: 2018
Vice President
Ms. Holding also serves as Vice President of other funds. Ms. Holding serves as Co-Head of Equity (2018-present) and is an employee of Fidelity Investments (2013-present). Previously, Ms. Holding served as Executive Vice President of Fidelity SelectCo, LLC (2019) and as Chief Investment Officer of Fidelity Institutional Asset Management (2013-2018).
Cynthia Lo Bessette (1969)
Year of Election or Appointment: 2019
Secretary and Chief Legal Officer (CLO)
Ms. Lo Bessette also serves as an officer of other funds. Ms. Lo Bessette serves as CLO, Secretary, and Senior Vice President of Fidelity Management & Research Company LLC (investment adviser firm, 2019-present); and CLO of Fidelity Management & Research (Hong Kong) Limited, FMR Investment Management (UK) Limited, and Fidelity Management & Research (Japan) Limited (investment adviser firms, 2019-present). She is a Senior Vice President and Deputy General Counsel of FMR LLC (diversified financial services company, 2019-present), and is an employee of Fidelity Investments. Previously, Ms. Lo Bessette served as CLO, Secretary, and Senior Vice President of FMR Co., Inc. (investment adviser firm, 2019); Secretary of Fidelity SelectCo, LLC and Fidelity Investments Money Management, Inc. (investment adviser firms, 2019). Prior to joining Fidelity Investments, Ms. Lo Bessette was Executive Vice President, General Counsel (2016-2019) and Senior Vice President, Deputy General Counsel (2015-2016) of OppenheimerFunds (investment management company) and Deputy Chief Legal Officer (2013-2015) of Jennison Associates LLC (investment adviser firm).
Chris Maher (1972)
Year of Election or Appointment: 2020
Deputy Treasurer
Mr. Maher also serves as an officer of other funds. Mr. Maher serves as Assistant Treasurer of FMR Capital, Inc. (2017-present), and is an employee of Fidelity Investments (2008-present). Previously, Mr. Maher served as Assistant Treasurer of certain funds (2013-2020); Vice President of Asset Management Compliance (2013), Vice President of the Program Management Group of FMR (investment adviser firm, 2010-2013), and Vice President of Valuation Oversight (2008-2010).
Jason P. Pogorelec (1975)
Year of Election or Appointment: 2020
Chief Compliance Officer
Mr. Pogorelec also serves as Chief Compliance Officer of other funds. Mr. Pogorelec is a senior Vice President of Asset Management Compliance for Fidelity Investments and is an employee of Fidelity Investments (2006-present). Previously, Mr. Pogorelec served as Vice President, Associate General Counsel for Fidelity Investments (2010-2020) and Assistant Secretary of certain Fidelity funds (2015-2020).
Brett Segaloff (1972)
Year of Election or Appointment: 2021
Anti-Money Laundering (AML) Officer
Mr. Segaloff also serves as an AML Officer of other funds and other related entities. He is Director, Anti-Money Laundering (2007-present) of FMR LLC (diversified financial services company) and is an employee of Fidelity Investments (1996-present).
Stacie M. Smith (1974)
Year of Election or Appointment: 2016
President and Treasurer
Ms. Smith also serves as an officer of other funds. Ms. Smith serves as Assistant Treasurer of FMR Capital, Inc. (2017-present), is an employee of Fidelity Investments (2009-present), and has served in other fund officer roles. Prior to joining Fidelity Investments, Ms. Smith served as Senior Audit Manager of Ernst & Young LLP (accounting firm, 1996-2009). Previously, Ms. Smith served as Assistant Treasurer (2013-2019) and Deputy Treasurer (2013-2016) of certain Fidelity® funds.
Marc L. Spector (1972)
Year of Election or Appointment: 2016
Assistant Treasurer
Mr. Spector also serves as an officer of other funds. Mr. Spector serves as Assistant Treasurer of FMR Capital, Inc. (2017-present) and is an employee of Fidelity Investments (2016-present). Prior to joining Fidelity Investments, Mr. Spector served as Director at the Siegfried Group (accounting firm, 2013-2016), and prior to Siegfried Group as audit senior manager at Deloitte & Touche LLP (accounting firm, 2005-2013).
Jim Wegmann (1979)
Year of Election or Appointment: 2019
Assistant Treasurer
Mr. Wegmann also serves as Assistant Treasurer of other funds. Mr. Wegmann is an employee of Fidelity Investments (2011-present).
Shareholder Expense Example
As a shareholder, you incur two types of costs: (1) transaction costs, which may include sales charges (loads) on purchase payments or redemption proceeds, as applicable and (2) ongoing costs, which generally include management fees, distribution and/or service (12b-1) fees and other Fund expenses. This Example is intended to help you understand your ongoing costs (in dollars) of investing in a fund and to compare these costs with the ongoing costs of investing in other mutual funds.
The Example is based on an investment of $1,000 invested at the beginning of the period and held for the entire period (July 1, 2020 to December 31, 2020).
Actual Expenses
The first line of the accompanying table provides information about actual account values and actual expenses. You may use the information in this line, together with the amount you invested, to estimate the expenses that you paid over the period. Simply divide your account value by $1,000.00 (for example, an $8,600 account value divided by $1,000.00 = 8.6), then multiply the result by the number in the first line for a class/Fund under the heading entitled "Expenses Paid During Period" to estimate the expenses you paid on your account during this period. If any fund is a shareholder of any underlying mutual funds or exchange-traded funds (ETFs) (the Underlying Funds), such fund indirectly bears its proportional share of the expenses of the Underlying Funds in addition to the direct expenses incurred presented in the table. These fees and expenses are not included in the annualized expense ratio used to calculate the expense estimate in the table below. The estimate of expenses does not include any fees or other expenses of any variable annuity or variable life insurance product. If they were, the estimate of expenses you paid during the period would be higher, and your ending account value would be lower.
Hypothetical Example for Comparison Purposes
The second line of the accompanying table provides information about hypothetical account values and hypothetical expenses based on the actual expense ratio and an assumed rate of return of 5% per year before expenses, which is not the actual return. The hypothetical account values and expenses may not be used to estimate the actual ending account balance or expenses you paid for the period. You may use this information to compare the ongoing costs of investing in the Fund and other funds. To do so, compare this 5% hypothetical example with the 5% hypothetical examples that appear in the shareholder reports of the other funds. If any fund is a shareholder of any Underlying Funds, such fund indirectly bears its proportional share of the expenses of the Underlying Funds in addition to the direct expenses as presented in the table. These fees and expenses are not included in the annualized expense ratio used to calculate the expense estimate in the table below. The estimate of expenses does not include any fees or other expenses of any variable annuity or variable life insurance product. If they were, the estimate of expenses you paid during the period would be higher, and your ending account value would be lower.
Please note that the expenses shown in the table are meant to highlight your ongoing costs only and do not reflect any transaction costs. Therefore, the second line of the table is useful in comparing ongoing costs only, and will not help you determine the relative total costs of owning different funds.
| | Annualized Expense Ratio-A | Beginning
Account Value
July 1, 2020 | Ending
Account Value
December 31, 2020 | Expenses Paid
During Period-B
July 1, 2020
to December 31, 2020 |
| VIP Overseas Portfolio | | | | |
| Initial Class | .78% | | | |
| Actual | | $1,000.00 | $1,213.40 | $4.34 |
| Hypothetical-C | | $1,000.00 | $1,021.22 | $3.96 |
| Service Class | .88% | | | |
| Actual | | $1,000.00 | $1,212.60 | $4.89 |
| Hypothetical-C | | $1,000.00 | $1,020.71 | $4.47 |
| Service Class 2 | 1.03% | | | |
| Actual | | $1,000.00 | $1,212.10 | $5.73 |
| Hypothetical-C | | $1,000.00 | $1,019.96 | $5.23 |
| Investor Class | .86% | | | |
| Actual | | $1,000.00 | $1,212.50 | $4.78 |
| Hypothetical-C | | $1,000.00 | $1,020.81 | $4.37 |
A Annualized expense ratio reflects expenses net of applicable fee waivers.
B Expenses are equal to the annualized expense ratio, multiplied by the average account value over the period, multiplied by 184/ 366 (to reflect the one-half year period). The fees and expenses of any Underlying Funds are not included in each annualized expense ratio.
C 5% return per year before expenses
Distributions (Unaudited)
The Board of Trustees of VIP Overseas Portfolio voted to pay to shareholders of record at the opening of business on record date, the following distributions per share derived from capital gains realized from sales of portfolio securities:
| | Pay Date | Record Date | Capital Gains |
| VIP Overseas Portfolio | | | |
| Initial Class | 02/05/21 | 02/05/21 | $0.808 |
| Service Class | 02/05/21 | 02/05/21 | $0.808 |
| Service Class 2 | 02/05/21 | 02/05/21 | $0.808 |
| Investor Class | 02/05/21 | 02/05/21 | $0.808 |
|
The fund hereby designates as a capital gain dividend with respect to the taxable year ended December 2020, $54,613,728, or, if subsequently determined to be different, the net capital gain of such year.
Initial Class designates 0% and 7%; Service Class designates 1% and 8%; Service Class 2 designates 1% and 12%; and Investor Class designates 0% and 8%; of the dividends distributed in February and December, 2020, respectively during the fiscal year as qualifying for the dividends–received deduction for corporate shareholders.
The amounts per share which represent income derived from sources within, and taxes paid to, foreign countries or possessions of the United States are as follows:
| | Pay Date | Income | Taxes |
| VIP Overseas Portfolio | | | |
| Initial Class | 02/07/2020 | $0.0140 | $0.0000 |
| | 12/01/2020 | $0.1299 | $0.0309 |
| Service Class | 02/07/2020 | $0.0100 | $0.0000 |
| | 12/01/2020 | $0.1119 | $0.0309 |
| Service Class 2 | 02/07/2020 | $0.0050 | $0.0000 |
| | 12/01/2020 | $0.0819 | $0.0309 |
| Investor Class | 02/07/2020 | $0.0110 | $0.0000 |
| | 12/01/2020 | $0.1139 | $0.0309 |
|
Proxy Voting Results
A special meeting of shareholders was held on June 9, 2020. The results of votes taken among shareholders on the proposals before them are reported below. Each vote reported represents one dollar of net asset value held on the record date for the meeting.
PROPOSAL 1
To elect a Board of Trustees.
| | # of
Votes | % of
Votes |
| Dennis J. Dirks |
| Affirmative | 11,099,447,424.890 | 95.490 |
| Withheld | 524,241,637.164 | 4.510 |
| TOTAL | 11,623,689,062.054 | 100.000 |
| Donald F. Donahue |
| Affirmative | 11,111,963,232.945 | 95.598 |
| Withheld | 511,725,829.109 | 4.402 |
| TOTAL | 11,623,689,062.054 | 100.000 |
| Bettina Doulton |
| Affirmative | 11,132,379,469.922 | 95.773 |
| Withheld | 491,309,592.132 | 4.227 |
| TOTAL | 11,623,689,062.054 | 100.000 |
| Vicki L. Fuller |
| Affirmative | 11,132,346,192.263 | 95.773 |
| Withheld | 491,342,869.791 | 4.227 |
| TOTAL | 11,623,689,062.054 | 100.000 |
| Patricia L. Kampling |
| Affirmative | 11,141,812,359.694 | 95.854 |
| Withheld | 481,876,702.360 | 4.146 |
| TOTAL | 11,623,689,062.054 | 100.000 |
| Alan J. Lacy |
| Affirmative | 11,081,103,173.144 | 95.332 |
| Withheld | 542,585,888.910 | 4.668 |
| TOTAL | 11,623,689,062.054 | 100.000 |
| Ned C. Lautenbach |
| Affirmative | 11,051,092,644.521 | 95.074 |
| Withheld | 572,596,417.533 | 4.926 |
| TOTAL | 11,623,689,062.054 | 100.000 |
| Robert A. Lawrence |
| Affirmative | 11,100,774,895.497 | 95.501 |
| Withheld | 522,914,166.556 | 4.499 |
| TOTAL | 11,623,689,062.054 | 100.000 |
| Joseph Mauriello |
| Affirmative | 11,070,909,380.371 | 95.244 |
| Withheld | 552,779,681.683 | 4.756 |
| TOTAL | 11,623,689,062.054 | 100.000 |
| Cornelia M. Small |
| Affirmative | 11,101,337,946.609 | 95.506 |
| Withheld | 522,351,115.445 | 4.494 |
| TOTAL | 11,623,689,062.054 | 100.000 |
| Garnett A. Smith |
| Affirmative | 11,082,555,490.179 | 95.345 |
| Withheld | 541,133,571.875 | 4.655 |
| TOTAL | 11,623,689,062.054 | 100.000 |
| David M. Thomas |
| Affirmative | 11,094,352,794.165 | 95.446 |
| Withheld | 529,336,267.889 | 4.554 |
| TOTAL | 11,623,689,062.054 | 100.000 |
| Susan Tomasky |
| Affirmative | 11,124,148,109.894 | 95.702 |
| Withheld | 499,540,952.160 | 4.298 |
| TOTAL | 11,623,689,062.054 | 100.000 |
| Michael E. Wiley |
| Affirmative | 11,096,957,446.084 | 95.468 |
| Withheld | 526,731,615.970 | 4.532 |
| TOTAL | 11,623,689,062.054 | 100.000 |
PROPOSAL 2
To convert a fundamental investment policy to a non-fundamental investment policy.
| | # of
Votes | % of
Votes |
| Affirmative | 1,099,059,801.392 | 79.845 |
| Against | 160,601,995.813 | 11.668 |
| Abstain | 116,825,222.406 | 8.487 |
| Broker Non-Vote | 0.00 | 0.00 |
| TOTAL | 1,376,487,019.611 | 100.000 |
|
| Proposal 1 reflects trust wide proposal and voting results. |
VIPOVRS-ANN-0221
1.540205.123
Fidelity® Variable Insurance Products:
Floating Rate High Income Portfolio
Annual Report
December 31, 2020
Contents
To view a fund's proxy voting guidelines and proxy voting record for the 12-month period ended June 30, visit http://www.fidelity.com/proxyvotingresults or visit the Securities and Exchange Commission's (SEC) web site at http://www.sec.gov.
You may also call 1-877-208-0098 to request a free copy of the proxy voting guidelines.
Fidelity® Variable Insurance Products are separate account options which are purchased through a variable insurance contract.
Standard & Poor's, S&P and S&P 500 are registered service marks of The McGraw-Hill Companies, Inc. and have been licensed for use by Fidelity Distributors Corporation.
Other third-party marks appearing herein are the property of their respective owners.
All other marks appearing herein are registered or unregistered trademarks or service marks of FMR LLC or an affiliated company. © 2021 FMR LLC. All rights reserved.
This report and the financial statements contained herein are submitted for the general information of the shareholders of the Fund. This report is not authorized for distribution to prospective investors in the Fund unless preceded or accompanied by an effective prospectus.
A fund files its complete schedule of portfolio holdings with the SEC for the first and third quarters of each fiscal year on Form N-PORT. Forms N-PORT are available on the SEC’s web site at http://www.sec.gov. A fund's Forms N-PORT may be reviewed and copied at the SEC’s Public Reference Room in Washington, DC. Information regarding the operation of the SEC's Public Reference Room may be obtained by calling 1-800-SEC-0330.
For a complete list of a fund's portfolio holdings, view the most recent holdings listing, semiannual report, or annual report on Fidelity's web site at http://www.fidelity.com, http://www.institutional.fidelity.com, or http://www.401k.com, as applicable.
NOT FDIC INSURED •MAY LOSE VALUE •NO BANK GUARANTEE
Neither the Fund nor Fidelity Distributors Corporation is a bank.
Note to Shareholders:
Early in 2020, the outbreak and spread of a new coronavirus emerged as a public health emergency that had a major influence on financial markets, primarily based on its impact on the global economy and the outlook for corporate earnings. The virus causes a respiratory disease known as COVID-19. On March 11, the World Health Organization declared the COVID-19 outbreak a pandemic, citing sustained risk of further global spread.
In the weeks following, as the crisis worsened, we witnessed an escalating human tragedy with wide-scale social and economic consequences from coronavirus-containment measures. The outbreak of COVID-19 prompted a number of measures to limit the spread, including travel and border restrictions, quarantines, and restrictions on large gatherings. In turn, these resulted in lower consumer activity, diminished demand for a wide range of products and services, disruption in manufacturing and supply chains, and – given the wide variability in outcomes regarding the outbreak – significant market uncertainty and volatility. Amid the turmoil, global governments and central banks took unprecedented action to help support consumers, businesses, and the broader economies, and to limit disruption to financial systems.
The situation continues to unfold, and the extent and duration of its impact on financial markets and the economy remain highly uncertain. Extreme events such as the coronavirus crisis are “exogenous shocks” that can have significant adverse effects on mutual funds and their investments. Although multiple asset classes may be affected by market disruption, the duration and impact may not be the same for all types of assets.
Fidelity is committed to helping you stay informed amid news about COVID-19 and during increased market volatility, and we’re taking extra steps to be responsive to customer needs. We encourage you to visit our websites, where we offer ongoing updates, commentary, and analysis on the markets and our funds.
Performance: The Bottom Line
Average annual total return reflects the change in the value of an investment, assuming reinvestment of distributions from dividend income and capital gains (the profits earned upon the sale of securities that have grown in value, if any) and assuming a constant rate of performance each year. During periods of reimbursement by Fidelity, a fund’s total return will be greater than it would be had the reimbursement not occurred. Performance numbers are net of all underlying fund operating expenses, but do not include any insurance charges imposed by your insurance company’s separate account. If performance information included the effect of these additional charges, the total returns would have been lower. How a fund did yesterday is no guarantee of how it will do tomorrow.
Average Annual Total Returns
| For the periods ended December 31, 2020 | Past 1 year | Past 5 years | Life of fundA |
| Initial Class | 2.82% | 4.83% | 3.43% |
| Investor Class | 2.78% | 4.80% | 3.40% |
A From April 9, 2014
$10,000 Over Life of Fund
Let's say hypothetically that $10,000 was invested in VIP Floating Rate High Income Portfolio - Initial Class on April 9, 2014, when the fund started.
The chart shows how the value of your investment would have changed, and also shows how the S&P®/LSTA Leveraged Performing Loan Index performed over the same period.

| Period Ending Values |
| $12,546 | VIP Floating Rate High Income Portfolio - Initial Class |
| $13,124 | S&P®/LSTA Leveraged Performing Loan Index |
Management's Discussion of Fund Performance
Market Recap: Floating-rate bank loans gained 3.50% for the 12 months ending December 31, 2020, as measured by the S&P/LSTA
® Leveraged Performing Loan Index, trailing high-yield bonds and the broad investment-grade fixed-income market. Loans posted modest gains in January and most of February before succumbing to their largest setback since August 2011. Mounting investor anxiety about the outbreak and spread of COVID-19 sparked a decisive global retreat from risk assets, and selling pressure plagued the loan market through most of March. Loans began to recover in late March and continued through April on hopes that historic government stimulus would be enough to offset the near-term economic fallout from the pandemic. The market rally moderated in June on concerns that a possible second wave of infections could slow progress toward the economy reopening. After posting solid gains in July and August, loans faced pressure from an upsurge in virus cases, fading hope for more U.S. fiscal stimulus and uncertainty surrounding upcoming U.S. elections. The asset class rallied strongly in November and December, as encouraging vaccine news bolstered investor optimism about the strength of the economic recovery in 2021. Within the index, most industry groups posted a gain, led by three defensive categories: food products (+8%), telecom (+7%) and drugs (+7%). Conversely, air transport (-13%), leisure goods/activities/movies (-5%), and oil & gas (-4%) suffered due to coronavirus-related lockdowns.
Comments from Co-Portfolio Managers Eric Mollenhauer and Kevin Nielsen: For the year, the fund's share classes gained roughly 3%, trailing the benchmark S&P/LSTA
® Leveraged Performing Loan Index. The fund’s core bank loan portfolio, which represented about 88% of assets, on average, along with a small allocation to high-yield credit, lagged the benchmark and, as a result, hampered relative performance. A roughly 6% average cash stake helped considerably amid extreme market volatility early in the year, and was a major contributor versus the benchmark. At the industry level, security selection and an overweighting in oil & gas was the biggest relative detractor. Conversely, picks among retailers added the most value versus the benchmark. Turning to individual holdings, the sharp drop in oil prices during March and April placed heavy pressure on energy exploration & production (E&P) companies California Resources (-69%) and Gavilan Resources (-73%), and they were the biggest relative detractors. Our overweighted stake in TNT Crane (-70%) – a provider of cranes to the refining and petrochemicals industries – was hurt by a substantial decline in oil E&P activities. All three of these companies filed for bankruptcy in 2020. California Resources emerged from bankruptcy late in the year. On the plus side, an overweighting in Securus Technologies (+64%), which provides telecom and payment services to prisons and various governmental entities, was the top relative contributor. Not owning energy E&P company and benchmark member Fieldwood Energy (-87%) proved advantageous, as did an out-of-index investment in supermarket operator Southeastern Grocers (26%). Looking ahead, although we expect the ongoing global health crisis to spark periods of volatility in the loan market, we have a fairly positive intermediate-term outlook for corporate fundamentals and the market’s supply-and-demand dynamics.
The views expressed above reflect those of the portfolio manager(s) only through the end of the period as stated on the cover of this report and do not necessarily represent the views of Fidelity or any other person in the Fidelity organization. Any such views are subject to change at any time based upon market or other conditions and Fidelity disclaims any responsibility to update such views. These views may not be relied on as investment advice and, because investment decisions for a Fidelity fund are based on numerous factors, may not be relied on as an indication of trading intent on behalf of any Fidelity fund.
Investment Summary (Unaudited)
Top Five Holdings as of December 31, 2020
| (by issuer, excluding cash equivalents) | % of fund's net assets |
| Intelsat Jackson Holdings SA | 2.7 |
| Bass Pro Group LLC | 2.4 |
| Asurion LLC | 1.6 |
| Caesars Resort Collection LLC | 1.4 |
| Finastra Usa, Inc. | 1.3 |
| | 9.4 |
Top Five Market Sectors as of December 31, 2020
| | % of fund's net assets |
| Technology | 14.4 |
| Telecommunications | 8.2 |
| Services | 6.5 |
| Healthcare | 6.3 |
| Gaming | 5.2 |
Quality Diversification (% of fund's net assets)
| As of December 31, 2020 |
| | BBB | 2.6% |
| | BB | 23.0% |
| | B | 57.9% |
| | CCC,CC,C | 5.3% |
| | Not Rated | 4.3% |
| | Equities | 0.8% |
| | Short-Term Investments and Net Other Assets | 6.1% |

We have used ratings from Moody's Investors Service, Inc. Where Moody's® ratings are not available, we have used S&P® ratings. All ratings are as of the date indicated and do not reflect subsequent changes.
Asset Allocation (% of fund's net assets)
| As of December 31, 2020* |
| | Bank Loan Obligations | 87.7% |
| | Nonconvertible Bonds | 5.3% |
| | Common Stocks | 0.8% |
| | Preferred Securities | 0.1% |
| | Short-Term Investments and Net Other Assets (Liabilities) | 6.1% |

* Foreign investments - 12.0%
Schedule of Investments December 31, 2020
Showing Percentage of Net Assets
| Bank Loan Obligations - 87.7% | | | |
| | | Principal Amount | Value |
| Aerospace - 1.6% | | | |
| AI Convoy Luxembourg SARL Tranche B 1LN, term loan 3 month U.S. LIBOR + 3.500% 4.5% 1/20/27 (a)(b)(c) | | $362,263 | $361,629 |
| Gemini HDPE LLC Tranche B 1LN, term loan 3 month U.S. LIBOR + 3.000% 12/11/27 (b)(c)(d) | | 160,000 | 158,800 |
| Jazz Acquisition, Inc. 1LN, term loan 3 month U.S. LIBOR + 4.250% 4.4% 6/19/26 (a)(b)(c) | | 246,875 | 228,113 |
| TransDigm, Inc.: | | | |
| Tranche E 1LN, term loan 3 month U.S. LIBOR + 2.250% 2.3968% 5/30/25 (a)(b)(c) | | 590,731 | 578,178 |
| Tranche F 1LN, term loan 3 month U.S. LIBOR + 2.250% 2.3968% 12/9/25 (a)(b)(c) | | 956,046 | 935,634 |
| WP CPP Holdings LLC: | | | |
| Tranche B 1LN, term loan 3 month U.S. LIBOR + 3.750% 4.75% 4/30/25 (a)(b)(c) | | 409,469 | 381,682 |
| Tranche B 2LN, term loan 3 month U.S. LIBOR + 7.750% 8.75% 4/30/26 (a)(b)(c) | | 120,000 | 99,450 |
|
| TOTAL AEROSPACE | | | 2,743,486 |
|
| Air Transportation - 1.4% | | | |
| Delta Air Lines, Inc. Tranche B, term loan 3 month U.S. LIBOR + 4.750% 5.75% 4/29/23 (a)(b)(c) | | 124,375 | 126,130 |
| Dynasty Acquisition Co., Inc.: | | | |
| Tranche B 1LN, term loan 3 month U.S. LIBOR + 3.500% 3.7539% 4/8/26 (a)(b)(c) | | 327,532 | 311,156 |
| Tranche B2 1LN, term loan 3 month U.S. LIBOR + 3.500% 3.7539% 4/4/26 (a)(b)(c) | | 176,093 | 167,288 |
| JetBlue Airways Corp. Tranche B 1LN, term loan 3 month U.S. LIBOR + 5.250% 6.25% 6/17/24(a)(b)(c) | | 185,250 | 190,142 |
| Mileage Plus Holdings LLC Tranche B 1LN, term loan 3 month U.S. LIBOR + 5.250% 6.25% 7/2/27 (a)(b)(c) | | 570,000 | 592,447 |
| SkyMiles IP Ltd. Tranche B 1LN, term loan 3 month U.S. LIBOR + 3.750% 4.75% 10/20/27 (a)(b)(c) | | 495,000 | 512,493 |
| Transplace Holding, Inc. Tranche B 1LN, term loan 3 month U.S. LIBOR + 3.750% 4.75% 10/5/24 (a)(b)(c) | | 116,624 | 115,750 |
| WestJet Airlines Ltd. 1LN, term loan 3 month U.S. LIBOR + 2.750% 4% 12/11/26 (a)(b)(c) | | 439,682 | 420,723 |
|
| TOTAL AIR TRANSPORTATION | | | 2,436,129 |
|
| Automotive & Auto Parts - 0.8% | | | |
| Les Schwab Tire Centers Tranche B 1LN, term loan 3 month U.S. LIBOR + 3.500% 4.25% 10/26/27 (a)(b)(c) | | 350,000 | 349,563 |
| Midas Intermediate Holdco II LLC Tranche B 1LN, term loan 3 month U.S. LIBOR + 6.750% 12/16/25 (b)(c)(d) | | 120,000 | 121,500 |
| North American Lifting Holdings, Inc.: | | | |
| 1LN, term loan 3 month U.S. LIBOR + 6.500% 7.5% 10/16/24 (a)(b)(c) | | 125,787 | 127,360 |
| Tranche B 1LN, term loan 3 month U.S. LIBOR + 9.000% 12% 3/1/25 (a)(b)(c) | | 31,491 | 29,838 |
| Thor Industries, Inc. Tranche B 1LN, term loan 3 month U.S. LIBOR + 3.750% 3.9375% 2/1/26 (a)(b)(c) | | 359,171 | 358,273 |
| UOS LLC Tranche B 1LN, term loan 3 month U.S. LIBOR + 4.250% 4.398% 4/18/25 (a)(b)(c) | | 353,611 | 353,833 |
|
| TOTAL AUTOMOTIVE & AUTO PARTS | | | 1,340,367 |
|
| Banks & Thrifts - 0.8% | | | |
| Blackstone CQP Holdco LP Tranche B, term loan 3 month U.S. LIBOR + 3.500% 3.7358% 9/30/24 (a)(b)(c) | | 350,816 | 349,501 |
| Citadel Securities LP Tranche B 1LN, term loan 3 month U.S. LIBOR + 2.750% 2.8968% 2/27/26 (a)(b)(c) | | 669,906 | 669,625 |
| Deerfield Dakota Holding LLC Tranche B 1LN, term loan 3 month U.S. LIBOR + 3.750% 4.75% 4/9/27 (a)(b)(c) | | 249,373 | 249,413 |
| Victory Capital Holdings, Inc. Tranche B 1LN, term loan 3 month U.S. LIBOR + 2.500% 2.734% 7/1/26 (a)(b)(c) | | 129,833 | 129,238 |
|
| TOTAL BANKS & THRIFTS | | | 1,397,777 |
|
| Broadcasting - 1.7% | | | |
| AppLovin Corp.: | | | |
| Tranche B 1LN, term loan 3 month U.S. LIBOR + 4.000% 4.1468% 8/15/25 (a)(b)(c) | | 249,372 | 248,594 |
| Tranche B, term loan 3 month U.S. LIBOR + 3.500% 3.6468% 8/15/25 (a)(b)(c) | | 69,721 | 69,459 |
| Diamond Sports Group LLC Tranche B 1LN, term loan 3 month U.S. LIBOR + 3.250% 3.4% 8/24/26 (a)(b)(c) | | 1,231,894 | 1,085,348 |
| E.W. Scripps Co. Tranche B 1LN, term loan 3 month U.S. LIBOR + 3.000% 12/15/27 (b)(c)(d) | | 270,000 | 270,000 |
| iHeartCommunications, Inc. Tranche B 1LN, term loan 3 month U.S. LIBOR + 4.000% 4.75% 5/1/26 (a)(b)(c) | | 139,300 | 139,184 |
| ION Media Networks, Inc. Tranche B 1LN, term loan 3 month U.S. LIBOR + 3.000% 3.1875% 12/18/24 (a)(b)(c) | | 458,642 | 457,877 |
| Nexstar Broadcasting, Inc. Tranche B, term loan 3 month U.S. LIBOR + 2.750% 2.9048% 9/19/26 (a)(b)(c) | | 595,021 | 590,338 |
|
| TOTAL BROADCASTING | | | 2,860,800 |
|
| Building Materials - 1.3% | | | |
| APi Group DE, Inc. Tranche B 1LN, term loan 3 month U.S. LIBOR + 2.500% 2.6468% 10/1/26 (a)(b)(c) | | 459,716 | 457,992 |
| GYP Holdings III Corp. Tranche B 1LN, term loan 3 month U.S. LIBOR + 2.750% 2.8968% 6/1/25 (a)(b)(c) | | 137,969 | 137,221 |
| Hamilton Holdco LLC Tranche B 1LN, term loan 3 month U.S. LIBOR + 2.000% 2.26% 1/4/27 (a)(b)(c) | | 361,283 | 355,413 |
| Ingersoll-Rand Services Co. Tranche B 1LN, term loan 3 month U.S. LIBOR + 1.750% 1.8968% 2/28/27 (a)(b)(c) | | 352,338 | 347,317 |
| LEB Holdings U.S.A., Inc. Tranche B 1LN, term loan 3 month U.S. LIBOR + 4.000% 4.75% 11/2/27 (a)(b)(c) | | 110,000 | 110,275 |
| Traverse Midstream Partners Ll Tranche B, term loan 3 month U.S. LIBOR + 5.500% 6.5% 9/27/24 (a)(b)(c) | | 185,536 | 181,593 |
| Ventia Deco LLC Tranche B, term loan 3 month U.S. LIBOR + 4.000% 5% 5/21/26 (a)(b)(c)(e) | | 443,504 | 440,177 |
| White Capital Buyer LLC Tranche B 1LN, term loan: | | | |
| 3 month U.S. LIBOR + 4.000% 4.5% 10/8/27 (a)(b)(c) | | 186,296 | 186,063 |
| 3 month U.S. LIBOR + 4.000% 4.5% 10/8/27 (a)(b)(c) | | 63,705 | 63,625 |
|
| TOTAL BUILDING MATERIALS | | | 2,279,676 |
|
| Cable/Satellite TV - 3.8% | | | |
| Charter Communication Operating LLC Tranche B2 1LN, term loan 3 month U.S. LIBOR + 1.750% 1.9% 2/1/27 (a)(b)(c) | | 1,439,870 | 1,430,338 |
| Coral-U.S. Co.-Borrower LLC Tranche B, term loan 3 month U.S. LIBOR + 2.250% 2.3968% 1/31/28 (a)(b)(c) | | 985,000 | 971,663 |
| CSC Holdings LLC Tranche B3 1LN, term loan 3 month U.S. LIBOR + 2.250% 2.4086% 1/15/26 (a)(b)(c) | | 982,500 | 966,289 |
| LCPR Loan Financing LLC Tranche B 1LN, term loan 3 month U.S. LIBOR + 5.000% 5.1586% 10/22/26 (a)(b)(c) | | 455,000 | 456,233 |
| Neptune Finco Corp. Tranche B, term loan 3 month U.S. LIBOR + 2.250% 2.4086% 7/17/25 (a)(b)(c) | | 918,587 | 903,494 |
| Virgin Media Bristol LLC Tranche N, term loan 3 month U.S. LIBOR + 2.500% 2.6586% 1/31/28 (a)(b)(c) | | 375,000 | 371,183 |
| WideOpenWest Finance LLC Tranche B, term loan 3 month U.S. LIBOR + 3.250% 4.25% 8/19/23 (a)(b)(c) | | 1,310,770 | 1,303,850 |
|
| TOTAL CABLE/SATELLITE TV | | | 6,403,050 |
|
| Capital Goods - 0.7% | | | |
| Altra Industrial Motion Corp. Tranche B 1LN, term loan 3 month U.S. LIBOR + 2.000% 2.1468% 10/1/25 (a)(b)(c) | | 306,034 | 305,269 |
| CPM Holdings, Inc.: | | | |
| 2LN, term loan 3 month U.S. LIBOR + 8.250% 8.4085% 11/15/26 (a)(b)(c) | | 85,000 | 78,519 |
| Tranche B 1LN, term loan 3 month U.S. LIBOR + 3.750% 3.9085% 11/15/25 (a)(b)(c) | | 284,200 | 276,652 |
| MHI Holdings LLC Tranche B 1LN, term loan 3 month U.S. LIBOR + 5.000% 5.1468% 9/20/26 (a)(b)(c) | | 299,244 | 297,748 |
| Vertical U.S. Newco, Inc. Tranche B 1LN, term loan 3 month U.S. LIBOR + 4.250% 4.5666% 7/31/27 (a)(b)(c) | | 189,525 | 190,167 |
|
| TOTAL CAPITAL GOODS | | | 1,148,355 |
|
| Chemicals - 1.9% | | | |
| Aruba Investment Holdings LLC Tranche B 1LN, term loan 3 month U.S. LIBOR + 4.000% 4.75% 10/28/27 (a)(b)(c) | | 195,000 | 194,756 |
| Consolidated Energy Finance SA Tranche B, term loan 3 month U.S. LIBOR + 2.500% 2.6452% 5/7/25 (a)(b)(c) | | 347,878 | 331,788 |
| Element Solutions, Inc. Tranche B 1LN, term loan 3 month U.S. LIBOR + 2.000% 2.1468% 1/31/26 (a)(b)(c) | | 208,246 | 205,904 |
| Hexion, Inc. Tranche B 1LN, term loan 3 month U.S. LIBOR + 3.500% 3.73% 7/1/26 (a)(b)(c) | | 261,025 | 258,415 |
| Messer Industries U.S.A., Inc. Tranche B 1LN, term loan 3 month U.S. LIBOR + 2.500% 2.7539% 3/1/26 (a)(b)(c) | | 264,555 | 262,274 |
| Oxea Corp. Tranche B2, term loan 3 month U.S. LIBOR + 3.500% 3.75% 10/11/24 (a)(b)(c) | | 325,702 | 321,325 |
| SCIH Salt Holdings, Inc. Tranche B 1LN, term loan 3 month U.S. LIBOR + 4.500% 5.5% 3/16/27 (a)(b)(c) | | 248,750 | 248,439 |
| Starfruit U.S. Holdco LLC Tranche B, term loan 3 month U.S. LIBOR + 3.000% 3.1531% 10/1/25 (a)(b)(c) | | 777,607 | 768,533 |
| The Chemours Co. LLC Tranche B 1LN, term loan 3 month U.S. LIBOR + 1.750% 1.9% 4/3/25 (a)(b)(c) | | 370,628 | 362,830 |
| Thermon Holding Corp. Tranche B, term loan 3 month U.S. LIBOR + 3.750% 4.75% 10/30/24 (a)(b)(c) | | 182,655 | 181,285 |
|
| TOTAL CHEMICALS | | | 3,135,549 |
|
| Consumer Products - 1.3% | | | |
| BCPE Empire Holdings, Inc. 1LN, term loan 3 month U.S. LIBOR + 4.000% 4.1468% 6/11/26 (a)(b)(c) | | 247,028 | 244,790 |
| Bombardier Recreational Products, Inc. Tranche B2 1LN, term loan 3 month U.S. LIBOR + 5.000% 6% 5/24/27 (a)(b)(c) | | 498,750 | 507,728 |
| CNT Holdings I Corp. Tranche B 1LN, term loan 3 month U.S. LIBOR + 3.750% 4.5% 11/8/27 (a)(b)(c) | | 345,000 | 344,407 |
| Energizer Holdings, Inc. Tranche B 1LN, term loan: | | | |
| 3 month U.S. LIBOR + 2.250% 12/16/27 (b)(c)(d) | | 124,583 | 124,350 |
| 3 month U.S. LIBOR + 2.250% 2.75% 12/16/27 (a)(b)(c) | | 105,417 | 105,220 |
| Kronos Acquisition Holdings, Inc. Tranche B 1LN, term loan 3 month U.S. LIBOR + 4.500% 12/17/26 (b)(c)(d) | | 250,000 | 249,688 |
| Mattress Firm, Inc. Tranche B 1LN, term loan 3 month U.S. LIBOR + 5.250% 6.25% 11/25/27 (a)(b)(c) | | 185,000 | 185,925 |
| Rodan & Fields LLC Tranche B, term loan 3 month U.S. LIBOR + 4.000% 4.1586% 6/15/25 (a)(b)(c) | | 190,125 | 155,745 |
| Woof Holdings LLC Tranche B 1LN, term loan 3 month U.S. LIBOR + 3.750% 4.5% 12/16/27 (a)(b)(c) | | 300,000 | 299,376 |
|
| TOTAL CONSUMER PRODUCTS | | | 2,217,229 |
|
| Containers - 3.6% | | | |
| Ball Metalpack Finco LLC Tranche B 1LN, term loan 3 month U.S. LIBOR + 4.500% 4.733% 7/31/25 (a)(b)(c) | | 355,875 | 348,580 |
| Berlin Packaging, LLC Tranche B 1LN, term loan 3 month U.S. LIBOR + 3.000% 3.1606% 11/7/25 (a)(b)(c) | | 395,942 | 388,965 |
| Berry Global, Inc.: | | | |
| 1LN, term loan 3 month U.S. LIBOR + 2.000% 2.1488% 10/1/22 (a)(b)(c) | | 68,680 | 68,565 |
| Tranche X 1LN, term loan 3 month U.S. LIBOR + 2.000% 2.1488% 1/19/24 (a)(b)(c) | | 320,445 | 319,464 |
| Tranche Y 1LN, term loan 3 month U.S. LIBOR + 2.000% 2.1488% 7/1/26 (a)(b)(c) | | 352,333 | 350,265 |
| BWAY Holding Co. Tranche B, term loan 3 month U.S. LIBOR + 3.250% 3.4795% 4/3/24 (a)(b)(c) | | 482,500 | 465,009 |
| Canister International Group, Inc. 1LN, term loan 3 month U.S. LIBOR + 4.750% 4.8968% 12/21/26 (a)(b)(c) | | 124,063 | 123,442 |
| Charter NEX U.S., Inc. 1LN, term loan 3 month U.S. LIBOR + 4.250% 5% 11/24/27 (a)(b)(c) | | 295,000 | 296,180 |
| Flex Acquisition Co., Inc.: | | | |
| Tranche B 1LN, term loan 3 month U.S. LIBOR + 3.000% 3.2251% 6/29/25 (a)(b)(c) | | 855,280 | 843,948 |
| Tranche B 1LN, term loan 3 month U.S. LIBOR + 3.000% 4% 12/29/23 (a)(b)(c) | | 605,576 | 601,603 |
| Graham Packaging Co., Inc. 1LN, term loan 3 month U.S. LIBOR + 3.750% 4.5% 8/4/27 (a)(b)(c) | | 440,847 | 441,897 |
| Pixelle Specialty Solutions LLC Tranche B 1LN, term loan 3 month U.S. LIBOR + 6.500% 7.5% 10/31/24 (a)(b)(c) | | 122,633 | 122,050 |
| Pregis TopCo Corp.: | | | |
| 1LN, term loan 3 month U.S. LIBOR + 3.750% 3.8968% 7/31/26 (a)(b)(c) | | 247,500 | 246,263 |
| Tranche B 1LN, term loan 3 month U.S. LIBOR + 4.250% 5% 8/1/26 (a)(b)(c) | | 100,000 | 99,250 |
| Reynolds Consumer Products LLC Tranche B 1LN, term loan 3 month U.S. LIBOR + 1.750% 1.8968% 1/30/27 (a)(b)(c) | | 633,626 | 628,874 |
| Reynolds Group Holdings, Inc.: | | | |
| Tranche B 1LN, term loan 3 month U.S. LIBOR + 3.250% 3.3968% 2/16/26 (a)(b)(c) | | 210,000 | 208,163 |
| Tranche B, term loan 3 month U.S. LIBOR + 2.750% 2.8968% 2/5/23 (a)(b)(c) | | 507,003 | 504,468 |
|
| TOTAL CONTAINERS | | | 6,056,986 |
|
| Diversified Financial Services - 2.1% | | | |
| ACNR Holdings, Inc. term loan 17% 9/21/27 (a)(c)(e) | | 321,892 | 321,892 |
| Alpine Finance Merger Sub LLC Tranche B, term loan 3 month U.S. LIBOR + 3.000% 4% 7/12/24 (a)(b)(c) | | 44,259 | 43,983 |
| AVSC Holding Corp. Tranche B2 1LN, term loan 3 month U.S. LIBOR + 5.500% 6.5% 10/15/26 (a)(b)(c) | | 371,257 | 330,419 |
| BCP Renaissance Parent LLC Tranche B, term loan 3 month U.S. LIBOR + 3.500% 4.5% 10/31/24 (a)(b)(c) | | 101,047 | 97,426 |
| Financial & Risk U.S. Holdings, Inc. Tranche B, term loan 3 month U.S. LIBOR + 3.250% 3.3968% 10/1/25 (a)(b)(c) | | 521,796 | 520,711 |
| Finco I LLC Tranche B 1LN, term loan 3 month U.S. LIBOR + 2.500% 2.6468% 6/27/25 (a)(b)(c) | | 124,688 | 124,454 |
| GT Polaris, Inc. Tranche B 1LN, term loan 3 month U.S. LIBOR + 4.000% 5% 9/24/27 (a)(b)(c) | | 124,688 | 125,030 |
| HarbourVest Partners LLC Tranche B 1LN, term loan 3 month U.S. LIBOR + 2.250% 2.4031% 3/1/25 (a)(b)(c) | | 645,123 | 637,594 |
| Kingpin Intermediate Holdings LLC Tranche B 1LN, term loan 3 month U.S. LIBOR + 3.500% 4.5% 7/3/24 (a)(b)(c) | | 290,318 | 275,076 |
| KREF Holdings X LLC Tranche B 1LN, term loan 3 month U.S. LIBOR + 4.750% 5.75% 9/1/27 (a)(b)(c) | | 125,000 | 125,938 |
| RPI Intermediate Finance Trust Tranche B 1LN, term loan 3 month U.S. LIBOR + 1.750% 1.8968% 2/11/27 (a)(b)(c) | | 777,893 | 777,115 |
| TransUnion LLC Tranche B5 1LN, term loan 3 month U.S. LIBOR + 1.750% 1.8968% 11/16/26 (a)(b)(c) | | 177,355 | 176,505 |
|
| TOTAL DIVERSIFIED FINANCIAL SERVICES | | | 3,556,143 |
|
| Diversified Media - 1.7% | | | |
| Advantage Sales & Marketing, Inc. Tranche B 1LN, term loan 3 month U.S. LIBOR + 5.250% 6% 10/28/27 (a)(b)(c) | | 520,000 | 517,618 |
| Allen Media LLC Tranche B 1LN, term loan 3 month U.S. LIBOR + 5.500% 5.7539% 2/10/27 (a)(b)(c) | | 992,342 | 986,964 |
| Terrier Media Buyer, Inc. Tranche B 1LN, term loan 3 month U.S. LIBOR + 4.250% 4.3968% 12/12/26 (a)(b)(c) | | 1,361,250 | 1,360,828 |
|
| TOTAL DIVERSIFIED MEDIA | | | 2,865,410 |
|
| Electric Utilities No Longer Use - 0.2% | | | |
| Ascend Learning LLC Tranche B 1LN, term loan 3 month U.S. LIBOR + 3.750% 4.75% 7/12/24 (a)(b)(c) | | 239,400 | 239,800 |
| ExGen Renewables IV, LLC Tranche B 1LN, term loan 3 month U.S. LIBOR + 2.750% 3.75% 12/15/27 (a)(b)(c) | | 185,000 | 184,723 |
|
| TOTAL ELECTRIC UTILITIES NO LONGER USE | | | 424,523 |
|
| Energy - 3.9% | | | |
| Apro LLC Tranche B, term loan 3 month U.S. LIBOR + 4.000% 5% 11/14/26 (a)(b)(c) | | 297,165 | 296,794 |
| Array Technologies, Inc. Tranche B 1LN, term loan 3 month U.S. LIBOR + 4.000% 5% 10/14/27 (a)(b)(c) | | 573,660 | 561,469 |
| BCP Raptor II LLC Tranche B, term loan 3 month U.S. LIBOR + 4.750% 4.8968% 11/3/25 (a)(b)(c) | | 451,859 | 404,866 |
| BCP Raptor LLC Tranche B, term loan 3 month U.S. LIBOR + 4.250% 5.25% 6/24/24 (a)(b)(c) | | 489,207 | 446,709 |
| Brazos Delaware II LLC Tranche B, term loan 3 month U.S. LIBOR + 4.000% 4.1516% 5/21/25 (a)(b)(c) | | 117,693 | 101,637 |
| BW Gas & Convenience Holdings LLC Tranche B 1LN, term loan 3 month U.S. LIBOR + 6.250% 6.4% 11/18/24 (a)(b)(c) | | 260,208 | 260,534 |
| California Resources Corp. 2LN, term loan 3 month U.S. LIBOR + 9.000% 10% 10/27/25 (a)(b)(c) | | 97,223 | 96,494 |
| ChampionX Holding, Inc. Tranche B 1LN, term loan 3 month U.S. LIBOR + 5.000% 6% 6/3/27 (a)(b)(c) | | 195,000 | 197,925 |
| Chesapeake Energy Corp. term loan 3 month U.S. LIBOR + 8.000% 9% 6/9/24 (a)(b)(c)(f) | | 375,000 | 311,250 |
| Citgo Holding, Inc. Tranche B 1LN, term loan 3 month U.S. LIBOR + 7.000% 8% 8/1/23 (a)(b)(c) | | 311,063 | 286,178 |
| Citgo Petroleum Corp. Tranche B 1LN, term loan 3 month U.S. LIBOR + 6.250% 7.25% 3/28/24 (a)(b)(c) | | 419,761 | 415,773 |
| EG America LLC: | | | |
| 2LN, term loan 3 month U.S. LIBOR + 8.000% 9% 3/23/26 (a)(b)(c) | | 94,010 | 90,906 |
| Tranche B 1LN, term loan 3 month U.S. LIBOR + 4.000% 4.2539% 2/6/25(a)(b)(c) | | 226,542 | 223,570 |
| Epic Crude Services LP Tranche B 1LN, term loan 3 month U.S. LIBOR + 5.000% 5.26% 3/1/26 (a)(b)(c) | | 413,963 | 285,117 |
| Gavilan Resources LLC Tranche 2LN, term loan 3 month U.S. LIBOR + 6.000% 0% 3/1/24 (b)(c)(e)(f) | | 1,300,000 | 0 |
| GIP III Stetson I LP Tranche B, term loan 3 month U.S. LIBOR + 4.250% 4.3968% 7/18/25 (a)(b)(c) | | 556,546 | 497,535 |
| Gulf Finance LLC Tranche B 1LN, term loan 3 month U.S. LIBOR + 5.250% 6.25% 8/25/23 (a)(b)(c) | | 191,252 | 143,781 |
| Hamilton Projs. Acquiror LLC Tranche B 1LN, term loan 3 month U.S. LIBOR + 4.750% 5.75% 6/17/27 (a)(b)(c) | | 417,900 | 418,163 |
| Lower Cadence Holdings LLC Tranche B 1LN, term loan 3 month U.S. LIBOR + 4.000% 4.1468% 5/22/26 (a)(b)(c) | | 198,896 | 193,800 |
| Natgasoline LLC Tranche B, term loan 3 month U.S. LIBOR + 3.500% 3.75% 11/14/25 (a)(b)(c) | | 314,694 | 312,334 |
| Oregon Clean Energy LLC Tranche B 1LN, term loan 3 month U.S. LIBOR + 3.750% 4.75% 3/1/26 (a)(b)(c) | | 180,634 | 179,280 |
| Oxbow Carbon LLC Tranche B 1LN, term loan 3 month U.S. LIBOR + 4.250% 5% 10/19/25 (a)(b)(c) | | 113,563 | 113,279 |
| Rockwood Service Corp. Tranche B 1LN, term loan 3 month U.S. LIBOR + 4.250% 4.3968% 1/23/27 (a)(b)(c) | | 248,125 | 247,195 |
| Terra-Gen Finance Co. LLC Tranche B, term loan 3 month U.S. LIBOR + 4.250% 5.25% 12/9/21 (a)(b)(c) | | 265,897 | 263,073 |
| WaterBridge Operating LLC Tranche B 1LN, term loan 3 month U.S. LIBOR + 5.750% 6.75% 6/21/26 (a)(b)(c) | | 235,710 | 201,680 |
|
| TOTAL ENERGY | | | 6,549,342 |
|
| Entertainment/Film - 0.1% | | | |
| SMG U.S. Midco 2, Inc. 1LN, term loan 3 month U.S. LIBOR + 2.500% 2.6945% 1/23/25 (a)(b)(c) | | 152,219 | 142,959 |
| Environmental - 0.3% | | | |
| Tunnel Hill Partners LP Tranche B 1LN, term loan 3 month U.S. LIBOR + 3.500% 3.6468% 2/8/26 (a)(b)(c) | | 298,571 | 273,939 |
| WTG Holdings III Corp. Tranche B 1LN, term loan 3 month U.S. LIBOR + 2.500% 2.6468% 12/20/24 (a)(b)(c) | | 276,695 | 275,774 |
|
| TOTAL ENVIRONMENTAL | | | 549,713 |
|
| Food & Drug Retail - 1.4% | | | |
| BellRing Brands, Inc. Tranche B 1LN, term loan 3 month U.S. LIBOR + 5.000% 6% 10/10/24 (a)(b)(c) | | 340,821 | 341,844 |
| Froneri U.S., Inc. Tranche B 1LN, term loan 3 month U.S. LIBOR + 2.250% 2.3968% 1/30/27 (a)(b)(c) | | 487,550 | 482,187 |
| JBS U.S.A. Lux SA Tranche B 1LN, term loan 3 month U.S. LIBOR + 2.000% 2.1468% 5/1/26 (a)(b)(c) | | 644,738 | 639,096 |
| JP Intermediate B LLC Tranche B, term loan 3 month U.S. LIBOR + 5.500% 6.5% 11/20/25 (a)(b)(c) | | 220,076 | 194,107 |
| Lannett Co., Inc. Tranche B, term loan 3 month U.S. LIBOR + 5.370% 6.375% 11/25/22 (a)(b)(c) | | 693,354 | 678,620 |
|
| TOTAL FOOD & DRUG RETAIL | | | 2,335,854 |
|
| Food/Beverage/Tobacco - 1.1% | | | |
| 8th Avenue Food & Provisions, Inc. Tranche B 1LN, term loan 3 month U.S. LIBOR + 3.500% 3.6516% 10/1/25 (a)(b)(c) | | 147,000 | 146,502 |
| Atkins Nutritional Holdings II, Inc. Tranche B 1LN, term loan 3 month U.S. LIBOR + 3.750% 4.75% 7/7/24 (a)(b)(c) | | 221,777 | 222,123 |
| Chobani LLC Tranche B 1LN, term loan 3 month U.S. LIBOR + 3.500% 4.5% 10/23/27 (a)(b)(c) | | 413,963 | 412,514 |
| EG Finco Ltd. Tranche B, term loan 3 month U.S. LIBOR + 4.000% 4.2539% 2/6/25 (a)(b)(c) | | 243,940 | 240,739 |
| Saffron Borrowco LLC Tranche B 1LN, term loan 3 month U.S. LIBOR + 6.750% 6.8968% 6/20/25 (a)(b)(c) | | 244,375 | 246,208 |
| Shearer's Foods, Inc. Tranche B 1LN, term loan 3 month U.S. LIBOR + 4.000% 4.75% 9/23/27 (a)(b)(c) | | 457,900 | 457,758 |
| U.S. Foods, Inc. 1LN, term loan 3 month U.S. LIBOR + 2.000% 2.1468% 9/13/26 (a)(b)(c) | | 122,200 | 120,024 |
|
| TOTAL FOOD/BEVERAGE/TOBACCO | | | 1,845,868 |
|
| Gaming - 4.9% | | | |
| AP Gaming I LLC Tranche B, term loan 3 month U.S. LIBOR + 3.500% 4.5% 2/15/24 (a)(b)(c) | | 192,995 | 183,965 |
| Aristocrat International Pty Ltd. Tranche B 1LN, term loan 3 month U.S. LIBOR + 3.750% 4.75% 10/19/24 (a)(b)(c) | | 94,525 | 94,703 |
| Bally's Corp. Tranche B 1LN, term loan 3 month U.S. LIBOR + 8.000% 9% 5/10/26 (a)(b)(c) | | 278,600 | 296,709 |
| Boyd Gaming Corp. Tranche B 1LN, term loan 3 month U.S. LIBOR + 2.250% 2.3523% 9/15/23 (a)(b)(c) | | 229,109 | 226,840 |
| Caesars Resort Collection LLC: | | | |
| Tranche B 1LN, term loan 3 month U.S. LIBOR + 2.750% 2.8968% 12/22/24 (a)(b)(c) | | 1,221,950 | 1,197,364 |
| Tranche B 1LN, term loan 3 month U.S. LIBOR + 4.500% 4.6468% 7/20/25 (a)(b)(c) | | 1,216,950 | 1,217,327 |
| CCM Merger, Inc. Tranche B 1LN, term loan 3 month U.S. LIBOR + 3.750% 4.5% 11/4/25 (a)(b)(c) | | 165,000 | 164,518 |
| CityCenter Holdings LLC Tranche B, term loan 3 month U.S. LIBOR + 2.250% 2.3968% 4/18/24(a)(b)(c) | | 556,748 | 548,052 |
| Entain PLC Tranche B3 1LN, term loan 3 month U.S. LIBOR + 2.250% 3.25% 3/16/24 (a)(b)(c) | | 195,393 | 195,454 |
| Golden Entertainment, Inc. Tranche B, term loan 3 month U.S. LIBOR + 3.000% 3.75% 10/20/24 (a)(b)(c) | | 482,500 | 470,515 |
| Golden Nugget, Inc. Tranche B 1LN, term loan 3 month U.S. LIBOR + 2.500% 3.25% 10/4/23 (a)(b)(c) | | 771,928 | 743,583 |
| PCI Gaming Authority 1LN, term loan 3 month U.S. LIBOR + 2.500% 2.6468% 5/29/26 (a)(b)(c) | | 329,351 | 325,346 |
| Penn National Gaming, Inc. Tranche B, term loan 3 month U.S. LIBOR + 2.250% 3% 10/15/25 (a)(b)(c) | | 442,942 | 436,798 |
| Playtika Holding Corp. Tranche B 1LN, term loan 3 month U.S. LIBOR + 6.000% 7% 12/10/24 (a)(b)(c) | | 711,282 | 714,760 |
| Stars Group Holdings BV Tranche B, term loan 3 month U.S. LIBOR + 3.500% 3.7539% 7/10/25 (a)(b)(c) | | 480,516 | 481,986 |
| Station Casinos LLC Tranche B 1LN, term loan 3 month U.S. LIBOR + 2.250% 2.5% 2/7/27 (a)(b)(c) | | 990,203 | 973,736 |
|
| TOTAL GAMING | | | 8,271,656 |
|
| Healthcare - 5.4% | | | |
| Aldevron LLC 1LN, term loan 3 month U.S. LIBOR + 4.250% 5.25% 10/11/26 (a)(b)(c) | | 486,325 | 487,337 |
| American Renal Holdings, Inc. Tranche B, term loan 3 month U.S. LIBOR + 5.000% 5.1468% 6/22/24 (a)(b)(c) | | 503,188 | 501,573 |
| Avantor Funding, Inc. Tranche B 1LN, term loan 3 month U.S. LIBOR + 2.500% 3.5% 11/6/27 (a)(b)(c) | | 285,000 | 285,180 |
| Da Vinci Purchaser Corp. Tranche B 1LN, term loan 3 month U.S. LIBOR + 4.000% 5% 12/13/26 (a)(b)(c) | | 507,450 | 508,297 |
| Elanco Animal Health, Inc. Tranche B 1LN, term loan 3 month U.S. LIBOR + 1.750% 1.9048% 8/1/27 (a)(b)(c) | | 1,217,635 | 1,205,715 |
| Global Medical Response, Inc. Tranche B 1LN, term loan 3 month U.S. LIBOR + 4.750% 5.75% 10/2/25 (a)(b)(c) | | 125,000 | 123,959 |
| Maravai Intermediate Holdings LLC Tranche B 1LN, term loan 3 month U.S. LIBOR + 4.250% 5.25% 10/19/27 (a)(b)(c) | | 369,167 | 372,397 |
| MED ParentCo LP: | | | |
| 1LN, term loan 3 month U.S. LIBOR + 4.250% 4.3968% 8/31/26 (a)(b)(c) | | 225,203 | 221,343 |
| 2LN, term loan 3 month U.S. LIBOR + 8.250% 8.3968% 8/30/27 (a)(b)(c) | | 180,000 | 177,975 |
| Tranche DD 1LN, term loan 3 month U.S. LIBOR + 4.250% 4.3958% 8/31/26 (a)(b)(c) | | 56,474 | 55,506 |
| Milano Acquisition Corp. Tranche B 1LN, term loan 3 month U.S. LIBOR + 4.000% 4.75% 10/1/27 (a)(b)(c) | | 875,000 | 873,539 |
| MPH Acquisition Holdings LLC Tranche B, term loan 3 month U.S. LIBOR + 2.750% 3.75% 6/7/23 (a)(b)(c) | | 557,380 | 554,248 |
| Packaging Coordinators Midco, Inc. Tranche B 1LN, term loan 3 month U.S. LIBOR + 3.750% 4.5% 11/30/27(a)(b)(c) | | 230,000 | 230,000 |
| Pathway Vet Alliance LLC: | | | |
| 1LN, term loan 3 month U.S. LIBOR + 4.000% 4.1463% 3/31/27 (a)(b)(c) | | 22,492 | 22,459 |
| Tranche B 1LN, term loan 3 month U.S. LIBOR + 4.000% 4.1468% 3/31/27 (a)(b)(c) | | 275,370 | 274,957 |
| RegionalCare Hospital Partners Holdings, Inc. Tranche B, term loan 3 month U.S. LIBOR + 3.750% 3.8968% 11/16/25 (a)(b)(c) | | 299,993 | 298,832 |
| U.S. Anesthesia Partners, Inc. Tranche B, term loan 3 month U.S. LIBOR + 3.000% 4% 6/23/24 (a)(b)(c) | | 526,732 | 513,975 |
| U.S. Radiology Specialists, Inc. Tranche B 1LN, term loan 3 month U.S. LIBOR + 5.500% 6.25% 12/15/27 (a)(b)(c) | | 175,000 | 173,523 |
| U.S. Renal Care, Inc. Tranche B 1LN, term loan 3 month U.S. LIBOR + 5.000% 5.1875% 6/13/26 (a)(b)(c) | | 986,321 | 980,156 |
| Valeant Pharmaceuticals International, Inc. Tranche B, term loan 3 month U.S. LIBOR + 3.000% 3.148% 6/1/25 (a)(b)(c) | | 93,204 | 92,797 |
| VVC Holding Corp. Tranche B 1LN, term loan 3 month U.S. LIBOR + 4.500% 4.6479% 2/11/26 (a)(b)(c) | | 1,094,730 | 1,091,720 |
|
| TOTAL HEALTHCARE | | | 9,045,488 |
|
| Homebuilders/Real Estate - 1.2% | | | |
| DTZ U.S. Borrower LLC Tranche B 1LN, term loan 3 month U.S. LIBOR + 2.750% 2.8951% 8/21/25(a)(b)(c) | | 471,757 | 462,558 |
| Landry's Finance Acquisition Co. Tranche B 1LN, term loan 3 month U.S. LIBOR + 12.000% 13% 10/4/23 (a)(b)(c) | | 120,000 | 135,600 |
| Lightstone Holdco LLC: | | | |
| Tranche B 1LN, term loan 3 month U.S. LIBOR + 3.750% 4.75% 1/30/24 (a)(b)(c) | | 438,873 | 406,506 |
| Tranche C 1LN, term loan 3 month U.S. LIBOR + 3.750% 4.75% 1/30/24 (a)(b)(c) | | 24,753 | 22,928 |
| RS Ivy Holdco, Inc. Tranche B 1LN, term loan 3 month U.S. LIBOR + 5.500% 6.5% 12/17/27 (a)(b)(c) | | 145,000 | 143,550 |
| Ryan Specialty Group LLC Tranche B 1LN, term loan 3 month U.S. LIBOR + 3.250% 4% 9/1/27 (a)(b)(c) | | 394,013 | 392,535 |
| VICI Properties, LLC Tranche B 1LN, term loan 3 month U.S. LIBOR + 1.750% 1.8938% 12/22/24 (a)(b)(c) | | 443,182 | 435,315 |
|
| TOTAL HOMEBUILDERS/REAL ESTATE | | | 1,998,992 |
|
| Hotels - 1.6% | | | |
| Aimbridge Acquisition Co., Inc.: | | | |
| Tranche B 1LN, term loan 3 month U.S. LIBOR + 6.000% 6.75% 10/1/27 (a)(b)(c) | | 104,738 | 104,214 |
| Tranche B, term loan 3 month U.S. LIBOR + 3.750% 3.8951% 2/1/26 (a)(b)(c) | | 170,910 | 160,977 |
| Four Seasons Holdings, Inc. Tranche B, term loan 3 month U.S. LIBOR + 2.000% 2.1468% 11/30/23 (a)(b)(c) | | 488,015 | 484,091 |
| Marriott Ownership Resorts, Inc. Tranche B 1LN, term loan 3 month U.S. LIBOR + 1.750% 1.8968% 8/31/25 (a)(b)(c) | | 552,638 | 540,204 |
| Travelport Finance Luxembourg SARL 1LN, term loan: | | | |
| 3 month U.S. LIBOR + 5.000% 5.2539% 5/30/26 (a)(b)(c) | | 527,430 | 355,904 |
| 3 month U.S. LIBOR + 8.000% 9% 2/28/25 (a)(b)(c) | | 334,772 | 329,593 |
| Wyndham Destinations, Inc. Tranche B, term loan 3 month U.S. LIBOR + 2.250% 2.4644% 5/31/25 (a)(b)(c) | | 488,750 | 472,406 |
| Wyndham Hotels & Resorts, Inc. Tranche B, term loan 3 month U.S. LIBOR + 1.750% 1.8968% 5/30/25 (a)(b)(c) | | 201,881 | 200,266 |
|
| TOTAL HOTELS | | | 2,647,655 |
|
| Insurance - 4.3% | | | |
| Alliant Holdings Intermediate LLC: | | | |
| Tranche B, term loan 3 month U.S. LIBOR + 3.250% 3.3968% 5/10/25 (a)(b)(c) | | 204,606 | 201,195 |
| Tranche B-2 1LN, term loan 3 month U.S. LIBOR + 3.250% 3.3968% 5/9/25 (a)(b)(c) | | 492,500 | 483,699 |
| Tranche B3 1LN, term loan 3 month U.S. LIBOR + 3.750% 4.25% 11/5/27 (a)(b)(c) | | 99,673 | 99,611 |
| AmeriLife Holdings LLC Tranche B 1LN, term loan 3 month U.S. LIBOR + 4.000% 4.1548% 3/18/27 (a)(b)(c) | | 417,948 | 411,679 |
| AmWINS Group, Inc. Tranche B 1LN, term loan 3 month U.S. LIBOR + 2.750% 3.75% 1/25/24 (a)(b)(c) | | 682,802 | 681,402 |
| AssuredPartners, Inc. Tranche B 1LN, term loan 3 month U.S. LIBOR + 3.500% 3.6468% 2/13/27 (a)(b)(c) | | 371,250 | 365,332 |
| Asurion LLC: | | | |
| Tranche B 6LN, term loan 3 month U.S. LIBOR + 3.000% 3.1468% 11/3/23 (a)(b)(c) | | 747,325 | 739,538 |
| Tranche B, term loan: | | | |
| 3 month U.S. LIBOR + 3.000% 3.3968% 8/4/22 (a)(b)(c) | | 591,274 | 584,593 |
| 3 month U.S. LIBOR + 6.500% 6.6468% 8/4/25 (a)(b)(c) | | 723,333 | 727,854 |
| Tranche B8 1LN, term loan 3 month U.S. LIBOR + 3.250% 3.3968% 12/23/26 (a)(b)(c) | | 635,329 | 628,150 |
| HUB International Ltd. Tranche B, term loan 3 month U.S. LIBOR + 2.750% 2.9648% 4/25/25 (a)(b)(c) | | 1,656,809 | 1,625,230 |
| USI, Inc.: | | | |
| 1LN, term loan 3 month U.S. LIBOR + 4.000% 4.2539% 12/2/26 (a)(b)(c) | | 123,750 | 123,364 |
| Tranche B, term loan 3 month U.S. LIBOR + 3.000% 3.2539% 5/16/24 (a)(b)(c) | | 590,762 | 581,776 |
|
| TOTAL INSURANCE | | | 7,253,423 |
|
| Leisure - 2.2% | | | |
| Alterra Mountain Co. Tranche B 1LN, term loan 3 month U.S. LIBOR + 4.500% 5.5% 8/3/26 (a)(b)(c) | | 129,025 | 129,509 |
| Callaway Golf Co. Tranche B, term loan 3 month U.S. LIBOR + 3.500% 4.6516% 1/4/26 (a)(b)(c) | | 175,238 | 175,457 |
| Carnival Corp. Tranche B 1LN, term loan 3 month U.S. LIBOR + 7.500% 8.5% 6/30/25 (a)(b)(c) | | 253,725 | 260,702 |
| Crown Finance U.S., Inc. Tranche B 1LN, term loan: | | | |
| 3 month U.S. LIBOR + 2.500% 3.5% 2/28/25 (a)(b)(c) | | 520,546 | 351,286 |
| 15.25% 5/23/24 (c) | | 64,016 | 75,965 |
| Delta 2 SARL Tranche B, term loan 3 month U.S. LIBOR + 2.500% 3.5% 2/1/24 (a)(b)(c) | | 705,522 | 696,957 |
| Equinox Holdings, Inc.: | | | |
| Tranche 2LN, term loan 3 month U.S. LIBOR + 7.000% 8% 9/8/24 (a)(b)(c) | | 115,000 | 76,269 |
| Tranche B-1, term loan 3 month U.S. LIBOR + 3.000% 4% 3/8/24 (a)(b)(c) | | 303,239 | 270,725 |
| Herschend Entertainment Co. LLC Tranche B 1LN, term loan 3 month U.S. LIBOR + 5.750% 6.75% 8/18/25 (a)(b)(c) | | 124,688 | 125,311 |
| LTF Merger Sub, Inc. Tranche B, term loan 3 month U.S. LIBOR + 2.750% 3.75% 6/10/22 (a)(b)(c) | | 314,059 | 304,794 |
| PlayPower, Inc. Tranche B 1LN, term loan 3 month U.S. LIBOR + 5.500% 5.7401% 5/10/26 (a)(b)(c) | | 238,989 | 227,936 |
| Seminole Tribe of Florida Tranche B, term loan 3 month U.S. LIBOR + 1.750% 1.8968% 7/6/24 (a)(b)(c) | | 431,536 | 426,681 |
| SP PF Buyer LLC Tranche B 1LN, term loan 3 month U.S. LIBOR + 4.500% 4.6468% 12/21/25 (a)(b)(c) | | 120,956 | 116,248 |
| United PF Holdings LLC: | | | |
| 1LN, term loan 3 month U.S. LIBOR + 4.000% 4.2539% 12/30/26 (a)(b)(c) | | 366,754 | 342,182 |
| 2LN, term loan 3 month U.S. LIBOR + 8.500% 8.7539% 12/30/27 (a)(b)(c)(e) | | 100,000 | 99,000 |
| Tranche B 1LN, term loan 3 month U.S. LIBOR + 8.500% 9.5% 12/30/26 (a)(b)(c)(e) | | 84,788 | 84,576 |
|
| TOTAL LEISURE | | | 3,763,598 |
|
| Metals/Mining - 0.2% | | | |
| American Rock Salt Co. LLC Tranche B, term loan 3 month U.S. LIBOR + 3.500% 4.5% 3/21/25 (a)(b)(c) | | 282,318 | 281,895 |
| Paper - 0.1% | | | |
| Clearwater Paper Corp. Tranche B 1LN, term loan 3 month U.S. LIBOR + 3.000% 3.25% 7/26/26 (a)(b)(c) | | 53,854 | 53,989 |
| Neenah, Inc. Tranche B 1LN, term loan 3 month U.S. LIBOR + 4.000% 5% 6/30/27 (a)(b)(c) | | 99,500 | 99,376 |
|
| TOTAL PAPER | | | 153,365 |
|
| Publishing/Printing - 0.9% | | | |
| Cengage Learning, Inc. Tranche B, term loan 3 month U.S. LIBOR + 4.250% 5.25% 6/7/23 (a)(b)(c) | | 482,638 | 461,851 |
| Harland Clarke Holdings Corp. Tranche B 7LN, term loan 3 month U.S. LIBOR + 4.750% 5.75% 11/3/23 (a)(b)(c) | | 465,034 | 409,755 |
| Learning Care Group (U.S.) No 2, Inc. Tranche B 1LN, term loan: | | | |
| 3 month U.S. LIBOR + 3.250% 4.25% 3/13/25 (a)(b)(c) | | 123,127 | 116,253 |
| 3 month U.S. LIBOR + 8.500% 9.5% 3/13/25 (a)(b)(c) | | 208,950 | 208,950 |
| Proquest LLC Tranche B 1LN, term loan 3 month U.S. LIBOR + 3.500% 3.6468% 10/17/26 (a)(b)(c) | | 150,978 | 150,600 |
| Scripps (E.W.) Co. Tranche B, term loan 3 month U.S. LIBOR + 2.000% 2.1468% 10/2/24 (a)(b)(c) | | 241,875 | 239,986 |
|
| TOTAL PUBLISHING/PRINTING | | | 1,587,395 |
|
| Railroad - 0.2% | | | |
| Genesee & Wyoming, Inc. 1LN, term loan 3 month U.S. LIBOR + 2.000% 2.2539% 12/30/26 (a)(b)(c) | | 327,525 | 326,552 |
| Restaurants - 1.3% | | | |
| Burger King Worldwide, Inc. Tranche B 1LN, term loan 3 month U.S. LIBOR + 1.750% 1.8968% 11/19/26 (a)(b)(c) | | 495,000 | 487,422 |
| CEC Entertainment, Inc.: | | | |
| 1LN, term loan 3 month U.S. LIBOR + 9.250% 10.25% 12/29/25 (a)(b)(c)(e) | | 71,313 | 71,313 |
| 2LN, term loan 3 month U.S. LIBOR + 6.500% 7.5% 12/30/27 (a)(b)(c)(e) | | 75,699 | 75,699 |
| KFC Holding Co. Tranche B, term loan 3 month U.S. LIBOR + 1.750% 1.9079% 4/3/25 (a)(b)(c) | | 311,337 | 308,669 |
| PFC Acquisition Corp. Tranche B 1LN, term loan 3 month U.S. LIBOR + 6.250% 6.3968% 3/1/26 (a)(b)(c) | | 368,438 | 320,846 |
| Red Lobster Hospitality LLC Tranche B, term loan 3 month U.S. LIBOR + 5.250% 6.25% 7/28/21 (a)(b)(c) | | 399,714 | 391,719 |
| Whatabrands LLC Tranche B 1LN, term loan 3 month U.S. LIBOR + 2.750% 2.9039% 8/3/26 (a)(b)(c) | | 523,834 | 518,511 |
|
| TOTAL RESTAURANTS | | | 2,174,179 |
|
| Services - 6.3% | | | |
| ABG Intermediate Holdings 2 LLC Tranche B 1LN, term loan 3 month U.S. LIBOR + 5.250% 6.25% 9/29/24 (a)(b)(c) | | 79,800 | 79,800 |
| Airbnb, Inc. Tranche B 1LN, term loan 3 month U.S. LIBOR + 7.500% 8.5% 4/17/25 (a)(b)(c) | | 388,050 | 419,579 |
| APX Group, Inc. Tranche B 1LN, term loan 3 month U.S. LIBOR + 5.000% 5.1487% 12/31/25 (a)(b)(c) | | 89,774 | 89,181 |
| Aramark Services, Inc.: | | | |
| Tranche B 3LN, term loan 3 month U.S. LIBOR + 1.750% 1.8951% 3/11/25 (a)(b)(c) | | 699,497 | 689,179 |
| Tranche B-4 1LN, term loan 3 month U.S. LIBOR + 1.750% 1.8951% 1/15/27 (a)(b)(c) | | 124,063 | 122,318 |
| Brand Energy & Infrastructure Services, Inc. Tranche B, term loan 3 month U.S. LIBOR + 4.250% 5.25% 6/21/24 (a)(b)(c) | | 724,962 | 705,519 |
| Cast & Crew Payroll LLC Tranche B 1LN, term loan 3 month U.S. LIBOR + 3.750% 3.8968% 2/7/26 (a)(b)(c) | | 491,250 | 477,893 |
| CoreCivic, Inc. Tranche B 1LN, term loan 3 month U.S. LIBOR + 4.500% 5.5% 12/18/24 (a)(b)(c) | | 308,750 | 304,119 |
| Creative Artists Agency LLC Tranche B 1LN, term loan 3 month U.S. LIBOR + 3.750% 3.8968% 11/26/26 (a)(b)(c) | | 247,500 | 244,201 |
| Ensemble RCM LLC 1LN, term loan 3 month U.S. LIBOR + 3.750% 3.9644% 8/1/26 (a)(b)(c) | | 370,313 | 369,387 |
| Filtration Group Corp. Tranche B, term loan 3 month U.S. LIBOR + 3.000% 3.1468% 3/29/25 (a)(b)(c) | | 330,922 | 327,050 |
| Finastra U.S.A., Inc.: | | | |
| Tranche 2LN, term loan 3 month U.S. LIBOR + 7.250% 8.25% 6/13/25 (a)(b)(c) | | 695,000 | 695,250 |
| Tranche B 1LN, term loan 3 month U.S. LIBOR + 3.500% 4.5% 6/13/24 (a)(b)(c) | | 1,491,690 | 1,459,529 |
| Flexera Software LLC: | | | |
| 1LN, term loan 3 month U.S. LIBOR + 3.250% 4.25% 2/26/25 (a)(b)(c) | | 123,728 | 123,396 |
| Tranche B 1LN, term loan 3 month U.S. LIBOR + 3.750% 1/26/28 (b)(c)(d) | | 50,000 | 49,938 |
| GEMS MENASA Cayman Ltd. Tranche B 1LN, term loan 3 month U.S. LIBOR + 5.000% 6% 7/30/26 (a)(b)(c) | | 269,541 | 267,519 |
| Greeneden U.S. Holdings II LLC Tranche B 1LN, term loan 3 month U.S. LIBOR + 4.000% 4.75% 10/8/27 (a)(b)(c) | | 250,000 | 250,235 |
| IAA Spinco, Inc. Tranche B 1LN, term loan 3 month U.S. LIBOR + 2.250% 2.4375% 6/29/26 (a)(b)(c) | | 212,813 | 210,861 |
| KUEHG Corp. Tranche B, term loan 3 month U.S. LIBOR + 3.750% 4.75% 2/21/25 (a)(b)(c) | | 834,494 | 789,014 |
| Maverick Purchaser Sub LLC Tranche B 1LN, term loan: | | | |
| 3 month U.S. LIBOR + 3.500% 3.6468% 1/23/27 (a)(b)(c) | | 467,650 | 465,896 |
| 3 month U.S. LIBOR + 4.750% 5.5% 2/3/27 (a)(b)(c) | | 75,000 | 75,375 |
| Sabert Corp. Tranche B 1LN, term loan 3 month U.S. LIBOR + 4.500% 5.5% 12/10/26 (a)(b)(c) | | 482,313 | 480,301 |
| Sotheby's 1LN, term loan 3 month U.S. LIBOR + 5.500% 6.5% 1/3/27 (a)(b)(c) | | 222,345 | 222,901 |
| Spin Holdco, Inc. Tranche B, term loan 3 month U.S. LIBOR + 3.250% 4.25% 11/14/22 (a)(b)(c) | | 795,130 | 789,914 |
| Staples, Inc.: | | | |
| Tranche B 1LN, term loan 3 month U.S. LIBOR + 5.000% 5.2144% 4/16/26 (a)(b)(c) | | 142,662 | 137,911 |
| Tranche B 2LN, term loan 3 month U.S. LIBOR + 4.500% 4.7144% 9/12/24 (a)(b)(c) | | 28,677 | 27,989 |
| SuperMoose Borrower LLC Tranche B 1LN, term loan 3 month U.S. LIBOR + 3.750% 4.0039% 8/29/25 (a)(b)(c) | | 286,123 | 266,237 |
| WASH Multifamily Acquisition, Inc.: | | | |
| 2LN, term loan 3 month U.S. LIBOR + 7.000% 8% 5/15/23 (a)(b)(c) | | 5,962 | 5,485 |
| Tranche B 1LN, term loan: | | | |
| 3 month U.S. LIBOR + 3.250% 4.25% 5/14/22 (a)(b)(c) | | 62,233 | 61,649 |
| 3 month U.S. LIBOR + 3.250% 4.25% 5/14/22 (a)(b)(c) | | 431,593 | 427,549 |
| Tranche B 2LN, term loan 3 month U.S. LIBOR + 7.000% 8% 5/14/23 (a)(b)(c) | | 34,038 | 31,315 |
|
| TOTAL SERVICES | | | 10,666,490 |
|
| Steel - 0.2% | | | |
| JMC Steel Group, Inc. 1LN, term loan 3 month U.S. LIBOR + 2.000% 2.1432% 1/24/27 (a)(b)(c) | | 388,310 | 384,912 |
| Super Retail - 4.3% | | | |
| Academy Ltd. Tranche B 1LN, term loan 3 month U.S. LIBOR + 5.000% 5.75% 11/6/27 (a)(b)(c) | | 380,000 | 378,195 |
| Bass Pro Group LLC Tranche B, term loan 3 month U.S. LIBOR + 5.000% 5.75% 9/25/24 (a)(b)(c) | | 4,099,223 | 4,106,542 |
| David's Bridal, Inc.: | | | |
| 2LN, term loan 3 month U.S. LIBOR + 8.000% 9% 1/18/24 (a)(b)(c)(e) | | 40,531 | 0 |
| Tranche B 1LN, term loan 3 month U.S. LIBOR + 6.000% 7% 6/30/23 (a)(b)(c)(e) | | 29,738 | 0 |
| Harbor Freight Tools U.S.A., Inc. Tranche B 1LN, term loan 3 month U.S. LIBOR + 3.250% 4% 10/19/27 (a)(b)(c) | | 625,000 | 623,956 |
| LBM Acquisition LLC Tranche B 1LN, term loan: | | | |
| 3 month U.S. LIBOR + 3.750% 12/18/27 (b)(c)(d) | | 56,364 | 56,305 |
| 3 month U.S. LIBOR + 3.750% 4.5% 12/18/27 (a)(b)(c) | | 253,636 | 253,373 |
| Michaels Stores, Inc. Tranche B 1LN, term loan 3 month U.S. LIBOR + 3.500% 4.25% 10/1/27 (a)(b)(c) | | 314,213 | 311,463 |
| PETCO Animal Supplies, Inc. Tranche B 1LN, term loan 3 month U.S. LIBOR + 3.250% 4.25% 1/26/23 (a)(b)(c) | | 318,893 | 304,587 |
| Red Ventures LLC Tranche B 1LN, term loan 3 month U.S. LIBOR + 2.500% 2.6468% 11/8/24 (a)(b)(c) | | 552,783 | 542,767 |
| Sports Authority, Inc. Tranche B, term loan 3 month U.S. LIBOR + 6.000% 0% 11/16/17 (b)(c)(e)(f) | | 180,849 | 0 |
| The Hillman Group, Inc. Tranche B, term loan 3 month U.S. LIBOR + 4.000% 4.1468% 5/31/25 (a)(b)(c) | | 606,900 | 603,581 |
|
| TOTAL SUPER RETAIL | | | 7,180,769 |
|
| Technology - 14.1% | | | |
| Allegro MicroSystems LLC Tranche B 1LN, term loan 3 month U.S. LIBOR + 4.250% 4.5% 9/30/27 (a)(b)(c) | | 769 | 767 |
| Anastasia Parent LLC Tranche B, term loan 3 month U.S. LIBOR + 3.750% 4.0039% 8/10/25 (a)(b)(c) | | 977,500 | 642,530 |
| Aptean, Inc. 1LN, term loan 3 month U.S. LIBOR + 4.250% 4.3968% 4/23/26 (a)(b)(c) | | 245,625 | 240,867 |
| Arches Buyer, Inc. Tranche B 1LN, term loan 3 month U.S. LIBOR + 4.000% 4.5% 11/24/27 (a)(b)(c) | | 465,000 | 465,233 |
| Big Ass Fans LLC 1LN, term loan 3 month U.S. LIBOR + 3.750% 4.75% 5/21/24 (a)(b)(c) | | 64,831 | 64,345 |
| Boxer Parent Co., Inc. Tranche B, term loan 3 month U.S. LIBOR + 4.250% 4.3968% 10/2/25 (a)(b)(c) | | 820,768 | 816,427 |
| Camelot Finance SA: | | | |
| Tranche B 1LN, term loan 3 month U.S. LIBOR + 3.000% 4% 10/31/26 (a)(b)(c) | | 750,000 | 749,295 |
| Tranche B, term loan 3 month U.S. LIBOR + 3.000% 3.1468% 10/31/26 (a)(b)(c) | | 481,344 | 478,735 |
| Ceridian HCM Holding, Inc. Tranche B, term loan 3 month U.S. LIBOR + 2.500% 2.6023% 4/30/25 (a)(b)(c) | | 423,695 | 417,691 |
| CMC Materials, Inc. Tranche B 1LN, term loan 3 month U.S. LIBOR + 2.000% 2.1875% 11/15/25 (a)(b)(c) | | 186,167 | 184,774 |
| CommerceHub, Inc. Tranche B 1LN, term loan 3 month U.S. LIBOR + 4.000% 4.75% 12/2/27 (a)(b)(c) | | 250,000 | 249,688 |
| CommScope, Inc. Tranche B 1LN, term loan 3 month U.S. LIBOR + 3.250% 3.3968% 4/4/26 (a)(b)(c) | | 204,019 | 202,234 |
| Cvent, Inc. Tranche B, term loan 3 month U.S. LIBOR + 3.750% 3.8968% 11/29/24 (a)(b)(c) | | 364,688 | 350,100 |
| DCert Buyer, Inc. 1LN, term loan 3 month U.S. LIBOR + 4.000% 4.1468% 10/16/26 (a)(b)(c) | | 496,250 | 495,099 |
| DG Investment Intermediate Holdings, Inc.: | | | |
| Tranche B 1LN, term loan 3 month U.S. LIBOR + 3.000% 3.75% 2/1/25 (a)(b)(c) | | 507,545 | 501,201 |
| Tranche B 2LN, term loan 3 month U.S. LIBOR + 6.750% 7.5% 2/1/26 (a)(b)(c) | | 55,000 | 52,800 |
| EIG Investors Corp. Tranche B, term loan 3 month U.S. LIBOR + 3.750% 4.75% 2/9/23 (a)(b)(c) | | 670,028 | 669,190 |
| Electro Rent Corp. Tranche B 1LN, term loan 3 month U.S. LIBOR + 5.000% 6% 1/31/24 (a)(b)(c) | | 131,916 | 132,576 |
| Emerald TopCo, Inc. 1LN, term loan 3 month U.S. LIBOR + 3.500% 3.7144% 7/22/26 (a)(b)(c) | | 172,194 | 169,826 |
| Epicor Software Corp. Tranche B 1LN, term loan 3 month U.S. LIBOR + 4.250% 5.25% 7/30/27 (a)(b)(c) | | 369,075 | 370,843 |
| EPV Merger Sub, Inc.: | | | |
| Tranche 2LN, term loan 3 month U.S. LIBOR + 7.250% 7.3968% 3/8/26 (a)(b)(c) | | 45,000 | 42,413 |
| Tranche B 1LN, term loan 3 month U.S. LIBOR + 3.250% 3.3968% 3/8/25 (a)(b)(c) | | 580,125 | 565,622 |
| EXC Holdings III Corp. Tranche B, term loan 3 month U.S. LIBOR + 3.500% 4.5% 12/2/24 (a)(b)(c) | | 155,200 | 153,583 |
| Go Daddy Operating Co. LLC: | | | |
| Tranche B 1LN, term loan 3 month U.S. LIBOR + 2.500% 2.6468% 8/10/27 (a)(b)(c) | | 124,375 | 124,738 |
| Tranche B, term loan 3 month U.S. LIBOR + 1.750% 1.8968% 2/15/24 (a)(b)(c) | | 478,523 | 477,925 |
| Hyland Software, Inc. Tranche B 1LN, term loan 3 month U.S. LIBOR + 3.500% 4.25% 7/1/24 (a)(b)(c) | | 399,596 | 400,040 |
| Imprivata, Inc. Tranche B 1LN, term loan 3 month U.S. LIBOR + 3.750% 4.25% 11/24/27 (a)(b)(c) | | 290,000 | 290,000 |
| ION Trading Technologies Ltd. Tranche B 1LN, term loan 3 month U.S. LIBOR + 4.000% 5% 11/21/24 (a)(b)(c) | | 728,583 | 725,982 |
| MA FinanceCo. LLC: | | | |
| Tranche B 1LN, term loan 3 month U.S. LIBOR + 4.250% 5.25% 6/5/25 (a)(b)(c) | | 149,063 | 150,057 |
| Tranche B 3LN, term loan: | | | |
| 3 month U.S. LIBOR + 2.500% 2.8968% 6/21/24 (a)(b)(c) | | 1,743,226 | 1,717,077 |
| 3 month U.S. LIBOR + 2.500% 2.8968% 6/21/24 (a)(b)(c) | | 275,243 | 271,114 |
| McAfee LLC Tranche B, term loan 3 month U.S. LIBOR + 3.750% 3.898% 9/29/24 (a)(b)(c) | | 749,534 | 748,972 |
| MH Sub I LLC: | | | |
| 1LN, term loan 3 month U.S. LIBOR + 3.750% 4.75% 9/15/24 (a)(b)(c) | | 129,674 | 129,155 |
| Tranche B, term loan 3 month U.S. LIBOR + 3.500% 3.6468% 9/15/24 (a)(b)(c) | | 208,334 | 205,288 |
| NAVEX TopCo, Inc. Tranche B 1LN, term loan 3 month U.S. LIBOR + 3.250% 3.4% 9/4/25 (a)(b)(c) | | 159,475 | 155,887 |
| Northwest Fiber LLC Tranche B 1LN, term loan 3 month U.S. LIBOR + 5.500% 5.6528% 4/30/27 (a)(b)(c) | | 621,875 | 622,845 |
| Park Place Technologies LLC 1LN, term loan 3 month U.S. LIBOR + 5.000% 6% 11/10/27 (a)(b)(c) | | 175,000 | 167,708 |
| PointClickCare Technologies, Inc. Tranche B 1LN, term loan 3 month U.S. LIBOR + 3.000% 12/16/27 (b)(c)(d) | | 145,000 | 144,638 |
| Project Boost Purchaser LLC Tranche B 1LN, term loan 3 month U.S. LIBOR + 4.250% 5% 5/30/26 (a)(b)(c) | | 124,688 | 124,428 |
| Rackspace Hosting, Inc. Tranche B, term loan 3 month U.S. LIBOR + 3.000% 4% 11/3/23 (a)(b)(c) | | 593,137 | 591,803 |
| Renaissance Holding Corp. Tranche B 1LN, term loan 3 month U.S. LIBOR + 3.250% 3.3968% 5/31/25 (a)(b)(c) | | 255,911 | 251,072 |
| Severin Acquisition LLC Tranche B 1LN, term loan 3 month U.S. LIBOR + 3.250% 3.4039% 8/1/25 (a)(b)(c) | | 233,963 | 230,746 |
| Sophia LP 1LN, term loan 3 month U.S. LIBOR + 3.750% 4.5% 10/7/27 (a)(b)(c) | | 580,000 | 580,412 |
| SS&C Technologies, Inc.: | | | |
| Tranche B 3LN, term loan 3 month U.S. LIBOR + 1.750% 1.8968% 4/16/25 (a)(b)(c) | | 300,148 | 295,946 |
| Tranche B 4LN, term loan 3 month U.S. LIBOR + 1.750% 1.8968% 4/16/25 (a)(b)(c) | | 232,248 | 228,996 |
| Tranche B 5LN, term loan 3 month U.S. LIBOR + 1.750% 1.8968% 4/16/25 (a)(b)(c) | | 872,660 | 861,865 |
| STG-Fairway Holdings LLC Tranche B 1LN, term loan 3 month U.S. LIBOR + 3.250% 3.3968% 1/31/27 (a)(b)(c) | | 59,700 | 58,655 |
| SUSE Tranche B 1LN, term loan 3 month U.S. LIBOR + 4.000% 4.75% 9/22/27 (a)(b)(c) | | 140,000 | 140,000 |
| Tempo Acquisition LLC: | | | |
| Tranche B 1LN, term loan 3 month U.S. LIBOR + 3.250% 3.75% 10/31/26 (a)(b)(c) | | 254,361 | 252,295 |
| Tranche B, term loan 3 month U.S. LIBOR + 2.750% 2.8968% 5/1/24 (a)(b)(c) | | 355,058 | 351,951 |
| TTM Technologies, Inc. Tranche B, term loan 3 month U.S. LIBOR + 2.500% 2.6548% 9/28/24 (a)(b)(c) | | 318,685 | 317,092 |
| Uber Technologies, Inc. Tranche B, term loan 3 month U.S. LIBOR + 4.000% 5% 4/4/25 (a)(b)(c) | | 732,952 | 734,938 |
| Ultimate Software Group, Inc.: | | | |
| 1LN, term loan: | | | |
| 3 month U.S. LIBOR + 3.750% 3.8968% 5/4/26 (a)(b)(c) | | 809,750 | 808,487 |
| 3 month U.S. LIBOR + 4.000% 4.75% 5/3/26 (a)(b)(c) | | 957,600 | 961,842 |
| 2LN, term loan 3 month U.S. LIBOR + 6.750% 7.5% 5/3/27 (a)(b)(c) | | 350,000 | 359,188 |
| VFH Parent LLC Tranche B 1LN, term loan 3 month U.S. LIBOR + 3.000% 3.1531% 3/1/26 (a)(b)(c) | | 205,737 | 205,179 |
| VM Consolidated, Inc. Tranche B L1N, term loan 3 month U.S. LIBOR + 3.250% 3.3968% 2/28/25 (a)(b)(c) | | 495,194 | 489,831 |
| VS Buyer LLC Tranche B 1LN, term loan 3 month U.S. LIBOR + 3.250% 3.3968% 2/28/27 (a)(b)(c) | | 258,050 | 256,437 |
| Web.com Group, Inc.: | | | |
| 2LN, term loan 3 month U.S. LIBOR + 7.750% 7.898% 10/11/26 (a)(b)(c) | | 164,297 | 156,356 |
| Tranche B 1LN, term loan 3 month U.S. LIBOR + 3.750% 3.898% 10/11/25 (a)(b)(c) | | 404,772 | 398,530 |
| Weber-Stephen Products LLC Tranche B 1LN, term loan 3 month U.S. LIBOR + 3.250% 4% 10/30/27 (a)(b)(c) | | 255,000 | 255,128 |
| Xperi Holding Corp. Tranche B 1LN, term loan 3 month U.S. LIBOR + 4.000% 4.1468% 6/1/25 (a)(b)(c) | | 324,536 | 324,873 |
| Zelis Payments Buyer, Inc. Tranche B 1LN, term loan 3 month U.S. LIBOR + 4.750% 4.8968% 9/30/26 (a)(b)(c) | | 123,750 | 123,939 |
|
| TOTAL TECHNOLOGY | | | 23,707,254 |
|
| Telecommunications - 7.7% | | | |
| Altice Financing SA Tranche B, term loan 3 month U.S. LIBOR + 2.750% 2.9086% 7/15/25 (a)(b)(c) | | 482,802 | 471,679 |
| Blucora, Inc. Tranche B, term loan 3 month U.S. LIBOR + 4.000% 5% 5/22/24 (a)(b)(c) | | 300,758 | 300,006 |
| Cablevision Lightpath LLC Tranche B 1LN, term loan 3 month U.S. LIBOR + 3.250% 3.75% 9/29/27 (a)(b)(c) | | 225,000 | 224,368 |
| CenturyLink, Inc. Tranche B 1LN, term loan 3 month U.S. LIBOR + 2.250% 2.3968% 3/15/27 (a)(b)(c) | | 109,173 | 107,917 |
| Connect Finco Sarl Tranche B 1LN, term loan 3 month U.S. LIBOR + 4.500% 5.5% 12/11/26 (a)(b)(c) | | 248,125 | 248,701 |
| Consolidated Communications, Inc. Tranche B 1LN, term loan 3 month U.S. LIBOR + 4.750% 5.75% 10/2/27 (a)(b)(c) | | 224,438 | 225,151 |
| Evo Payments International LLC Tranche B, term loan 3 month U.S. LIBOR + 3.250% 3.4% 12/22/23 (a)(b)(c) | | 287,672 | 287,312 |
| Frontier Communications Corp. 1LN, term loan 3 month U.S. LIBOR + 4.750% 5.75% 10/8/27 (a)(b)(c) | | 625,000 | 626,956 |
| GTT Communications, Inc.: | | | |
| 1LN, term loan 3 month U.S. LIBOR + 5.000% 8.5% 12/31/21 (a)(b)(c)(e) | | 30,724 | 30,724 |
| Tranche B, term loan 3 month U.S. LIBOR + 2.750% 3% 5/31/25 (a)(b)(c) | | 487,500 | 379,480 |
| Tranche DD 1LN, term loan 3 month U.S. LIBOR + 4.000% 12/31/21 (b)(c)(e)(g) | | 53,767 | 53,767 |
| Intelsat Jackson Holdings SA: | | | |
| Tranche B, term loan 3 month U.S. LIBOR + 3.750% 8% 11/27/23 (a)(b)(c) | | 1,685,000 | 1,706,063 |
| Tranche B-4, term loan 3 month U.S. LIBOR + 5.500% 8.75% 1/2/24 (a)(b)(c) | | 200,000 | 202,812 |
| Tranche B-5, term loan 8.625% 1/2/24 (c) | | 1,635,000 | 1,660,114 |
| Tranche DD 1LN, term loan 3 month U.S. LIBOR + 5.500% 6.5% 7/13/22 (a)(b)(c) | | 943,786 | 961,246 |
| Iridium Satellite LLC 1LN, term loan 3 month U.S. LIBOR + 3.750% 4.75% 11/4/26 (a)(b)(c) | | 347,375 | 348,775 |
| Level 3 Financing, Inc. Tranche B 1LN, term loan 3 month U.S. LIBOR + 1.750% 1.8968% 3/1/27 (a)(b)(c) | | 317,652 | 312,026 |
| Radiate Holdco LLC Tranche B 1LN, term loan 3 month U.S. LIBOR + 3.500% 4.25% 9/10/26 (a)(b)(c) | | 805,000 | 805,378 |
| SBA Senior Finance II, LLC Tranche B, term loan 3 month U.S. LIBOR + 1.750% 1.9% 4/11/25 (a)(b)(c) | | 335,682 | 331,577 |
| Securus Technologies Holdings Tranche B, term loan: | | | |
| 3 month U.S. LIBOR + 4.500% 5.5% 11/1/24 (a)(b)(c) | | 489,550 | 457,426 |
| 3 month U.S. LIBOR + 8.250% 9.25% 11/1/25 (a)(b)(c) | | 685,000 | 524,025 |
| SFR Group SA: | | | |
| Tranche B 11LN, term loan 3 month U.S. LIBOR + 2.750% 2.8968% 7/31/25 (a)(b)(c) | | 569,180 | 556,328 |
| Tranche B 12LN, term loan 3 month U.S. LIBOR + 3.680% 3.8461% 1/31/26 (a)(b)(c) | | 487,437 | 481,802 |
| Tranche B 13LN, term loan 3 month U.S. LIBOR + 4.000% 4.2369% 8/14/26 (a)(b)(c) | | 122,500 | 121,786 |
| Windstream Services LLC Tranche B 1LN, term loan 3 month U.S. LIBOR + 6.250% 7.25% 9/21/27 (a)(b)(c) | | 343,335 | 335,181 |
| Xplornet Communications, Inc. 1LN, term loan 3 month U.S. LIBOR + 4.750% 4.8968% 6/10/27 (a)(b)(c) | | 233,825 | 233,883 |
| Zayo Group Holdings, Inc. 1LN, term loan 3 month U.S. LIBOR + 3.000% 3.1468% 3/9/27 (a)(b)(c) | | 948,133 | 941,022 |
|
| TOTAL TELECOMMUNICATIONS | | | 12,935,505 |
|
| Textiles/Apparel - 0.1% | | | |
| Samsonite IP Holdings SARL Tranche B2 1LN, term loan 3 month U.S. LIBOR + 4.500% 5.5% 4/25/25 (a)(b)(c) | | 149,624 | 148,596 |
| Utilities - 3.0% | | | |
| Brookfield WEC Holdings, Inc. Tranche B 1LN, term loan 3 month U.S. LIBOR + 3.000% 3.75% 8/1/25 (a)(b)(c) | | 1,169,586 | 1,165,410 |
| Granite Generation LLC 1LN, term loan 3 month U.S. LIBOR + 3.750% 4.75% 11/1/26 (a)(b)(c) | | 355,768 | 355,917 |
| Green Energy Partners/Stonewall LLC Tranche B 1LN, term loan 3 month U.S. LIBOR + 5.500% 6.5% 11/13/21 (a)(b)(c) | | 256,388 | 234,915 |
| Invenergy Thermal Operating I LLC Tranche B, term loan 3 month U.S. LIBOR + 3.000% 3.1468% 8/28/25 (a)(b)(c) | | 353,102 | 353,325 |
| Limetree Bay Terminals LLC term loan 3 month U.S. LIBOR + 4.000% 5% 2/15/24 (a)(b)(c) | | 189,018 | 177,205 |
| LMBE-MC HoldCo II LLC Tranche B, term loan 3 month U.S. LIBOR + 4.000% 5% 12/3/25 (a)(b)(c) | | 375,861 | 370,693 |
| PG&E Corp. Tranche B 1LN, term loan 3 month U.S. LIBOR + 4.500% 5.5% 6/23/25 (a)(b)(c) | | 621,875 | 628,249 |
| Pike Corp. Tranche B 1LN, term loan 3 month U.S. LIBOR + 3.000% 4.12% 7/24/26 (a)(b)(c) | | 178,215 | 177,515 |
| UGI Energy Services LLC Tranche B 1LN, term loan 3 month U.S. LIBOR + 3.750% 3.8968% 8/13/26 (a)(b)(c) | | 246,250 | 246,250 |
| Vertiv Group Corp. Tranche B 1LN, term loan 3 month U.S. LIBOR + 3.000% 3.1534% 3/2/27 (a)(b)(c) | | 744,375 | 739,142 |
| Vistra Operations Co. LLC Tranche B 3LN, term loan 3 month U.S. LIBOR + 1.750% 1.9% 12/31/25(a)(b)(c) | | 559,798 | 557,290 |
|
| TOTAL UTILITIES | | | 5,005,911 |
|
| TOTAL BANK LOAN OBLIGATIONS | | | |
| (Cost $151,100,629) | | | 147,822,851 |
|
| Nonconvertible Bonds - 5.3% | | | |
| Aerospace - 0.3% | | | |
| TransDigm, Inc.: | | | |
| 6.25% 3/15/26 (h) | | 500,000 | 532,500 |
| 8% 12/15/25 (h) | | 40,000 | 44,264 |
|
| TOTAL AEROSPACE | | | 576,764 |
|
| Air Transportation - 0.0% | | | |
| Delta Air Lines, Inc. / SkyMiles IP Ltd. 4.5% 10/20/25 (h) | | 70,000 | 74,809 |
| Broadcasting - 0.1% | | | |
| Univision Communications, Inc.: | | | |
| 6.625% 6/1/27 (h) | | 105,000 | 112,760 |
| 9.5% 5/1/25 (h) | | 115,000 | 127,938 |
|
| TOTAL BROADCASTING | | | 240,698 |
|
| Cable/Satellite TV - 0.2% | | | |
| Charter Communications Operating LLC/Charter Communications Operating Capital Corp. 3 month U.S. LIBOR + 1.650% 1.8644% 2/1/24 (a)(b) | | 250,000 | 256,349 |
| Chemicals - 0.4% | | | |
| Consolidated Energy Finance SA 3 month U.S. LIBOR + 3.750% 3.9665% 6/15/22 (a)(b)(h) | | 735,000 | 721,543 |
| Kronos Acquisition Holdings, Inc. / KIK Custom Products, Inc. 5% 12/31/26 (h) | | 5,000 | 5,213 |
|
| TOTAL CHEMICALS | | | 726,756 |
|
| Containers - 0.6% | | | |
| Ardagh Packaging Finance PLC/Ardagh MP Holdings U.S.A., Inc. 4.125% 8/15/26 (h) | | 260,000 | 271,700 |
| Berry Global, Inc. 4.875% 7/15/26 (h) | | 500,000 | 537,095 |
| Trivium Packaging Finance BV 5.5% 8/15/26 (h) | | 150,000 | 158,625 |
|
| TOTAL CONTAINERS | | | 967,420 |
|
| Diversified Financial Services - 0.2% | | | |
| Financial & Risk U.S. Holdings, Inc. 6.25% 5/15/26 (h) | | 250,000 | 266,875 |
| Park Aerospace Holdings Ltd. 5.25% 8/15/22 (h) | | 7,000 | 7,347 |
|
| TOTAL DIVERSIFIED FINANCIAL SERVICES | | | 274,222 |
|
| Energy - 0.2% | | | |
| Citgo Petroleum Corp. 7% 6/15/25 (h) | | 200,000 | 199,500 |
| New Fortress Energy LLC 6.75% 9/15/25 (h) | | 45,000 | 47,657 |
|
| TOTAL ENERGY | | | 247,157 |
|
| Food & Drug Retail - 0.0% | | | |
| Albertsons Companies LLC/Safeway, Inc./New Albertson's, Inc./Albertson's LLC 3.5% 2/15/23 (h) | | 30,000 | 30,750 |
| Gaming - 0.3% | | | |
| Affinity Gaming LLC 6.875% 12/15/27 (h) | | 5,000 | 5,231 |
| Golden Entertainment, Inc. 7.625% 4/15/26 (h) | | 145,000 | 155,694 |
| Scientific Games Corp. 5% 10/15/25 (h) | | 200,000 | 206,378 |
| VICI Properties, Inc.: | | | |
| 3.5% 2/15/25 (h) | | 30,000 | 30,683 |
| 4.25% 12/1/26 (h) | | 45,000 | 46,672 |
| 4.625% 12/1/29 (h) | | 25,000 | 26,750 |
|
| TOTAL GAMING | | | 471,408 |
|
| Healthcare - 0.9% | | | |
| Bausch Health Companies, Inc.: | | | |
| 5.5% 11/1/25 (h) | | 125,000 | 129,536 |
| 7% 3/15/24 (h) | | 470,000 | 483,513 |
| 9% 12/15/25 (h) | | 180,000 | 199,094 |
| Tenet Healthcare Corp.: | | | |
| 4.625% 7/15/24 | | 375,000 | 384,383 |
| 5.125% 5/1/25 | | 375,000 | 382,309 |
|
| TOTAL HEALTHCARE | | | 1,578,835 |
|
| Hotels - 0.1% | | | |
| Marriott Ownership Resorts, Inc. 6.125% 9/15/25 (h) | | 170,000 | 181,050 |
| Leisure - 0.1% | | | |
| NCL Corp. Ltd. 12.25% 5/15/24 (h) | | 25,000 | 30,000 |
| Royal Caribbean Cruises Ltd.: | | | |
| 9.125% 6/15/23 (h) | | 25,000 | 27,125 |
| 10.875% 6/1/23 (h) | | 120,000 | 136,546 |
|
| TOTAL LEISURE | | | 193,671 |
|
| Publishing/Printing - 0.1% | | | |
| Clear Channel International BV 6.625% 8/1/25 (h) | | 200,000 | 211,000 |
| Restaurants - 0.1% | | | |
| 1011778 BC Unlimited Liability Co./New Red Finance, Inc. 4.25% 5/15/24 (h) | | 129,000 | 131,580 |
| Services - 0.2% | | | |
| APX Group, Inc. 7.625% 9/1/23 | | 85,000 | 88,188 |
| Aramark Services, Inc. 6.375% 5/1/25 (h) | | 60,000 | 64,125 |
| Expedia, Inc.: | | | |
| 6.25% 5/1/25 (h) | | 70,000 | 81,123 |
| 7% 5/1/25 (h) | | 25,000 | 27,523 |
| GEMS MENASA Cayman Ltd. 7.125% 7/31/26 (h) | | 115,000 | 119,313 |
|
| TOTAL SERVICES | | | 380,272 |
|
| Super Retail - 0.2% | | | |
| EG Global Finance PLC: | | | |
| 6.75% 2/7/25 (h) | | 125,000 | 128,750 |
| 8.5% 10/30/25 (h) | | 250,000 | 266,250 |
|
| TOTAL SUPER RETAIL | | | 395,000 |
|
| Technology - 0.3% | | | |
| CommScope, Inc.: | | | |
| 5.5% 3/1/24 (h) | | 125,000 | 128,875 |
| 6% 3/1/26 (h) | | 125,000 | 131,700 |
| SSL Robotics LLC 9.75% 12/31/23 (h) | | 150,000 | 169,500 |
|
| TOTAL TECHNOLOGY | | | 430,075 |
|
| Telecommunications - 0.5% | | | |
| Altice Financing SA 7.5% 5/15/26 (h) | | 225,000 | 237,443 |
| Frontier Communications Corp. 5% 5/1/28 (h) | | 100,000 | 104,250 |
| SFR Group SA: | | | |
| 5.125% 1/15/29 (h) | | 15,000 | 15,525 |
| 7.375% 5/1/26 (h) | | 485,000 | 510,463 |
|
| TOTAL TELECOMMUNICATIONS | | | 867,681 |
|
| Transportation Ex Air/Rail - 0.5% | | | |
| Avolon Holdings Funding Ltd.: | | | |
| 5.125% 10/1/23 (h) | | 500,000 | 534,855 |
| 5.25% 5/15/24 (h) | | 200,000 | 217,494 |
|
| TOTAL TRANSPORTATION EX AIR/RAIL | | | 752,349 |
|
| TOTAL NONCONVERTIBLE BONDS | | | |
| (Cost $8,544,497) | | | 8,987,846 |
| | | Shares | Value |
|
| Common Stocks - 0.8% | | | |
| Capital Goods - 0.1% | | | |
| TNT Crane & Rigging LLC (e) | | 4,832 | 100,989 |
| TNT Crane & Rigging LLC warrants 10/31/25 (e)(i) | | 1,797 | 5,930 |
|
| TOTAL CAPITAL GOODS | | | 106,919 |
|
| Diversified Financial Services - 0.0% | | | |
| ACNR Holdings, Inc. (e) | | 1,374 | 9,498 |
| Energy - 0.7% | | | |
| California Resources Corp. (i) | | 24,995 | 589,632 |
| California Resources Corp. (j) | | 12,101 | 285,463 |
| California Resources Corp. warrants 10/27/24 (i) | | 885 | 3,540 |
| Denbury, Inc. (i) | | 11,185 | 287,343 |
|
| TOTAL ENERGY | | | 1,165,978 |
|
| Entertainment/Film - 0.0% | | | |
| Cineworld Group PLC warrants 11/23/25 (i) | | 22,063 | 8,381 |
| Restaurants - 0.0% | | | |
| CEC Entertainment, Inc. (e) | | 15,069 | 0 |
| Super Retail - 0.0% | | | |
| David's Bridal, Inc. (e)(i) | | 1,375 | 0 |
| David's Bridal, Inc. rights (e)(i) | | 347 | 0 |
|
| TOTAL SUPER RETAIL | | | 0 |
|
| TOTAL COMMON STOCKS | | | |
| (Cost $3,559,398) | | | 1,290,776 |
|
| Nonconvertible Preferred Stocks - 0.0% | | | |
| Diversified Financial Services - 0.0% | | | |
| ACNR Holdings, Inc.(e) | | | |
| (Cost $98,250) | | 786 | 98,250 |
| | | Principal Amount | Value |
|
| Preferred Securities - 0.1% | | | |
| Banks & Thrifts - 0.1% | | | |
| JPMorgan Chase & Co.: | | | |
| 3 month U.S. LIBOR + 3.320% 3.5451% (a)(b)(k) | | 80,000 | 79,305 |
| 3 month U.S. LIBOR + 3.470% 3.6844% (a)(b)(k) | | 80,000 | 79,787 |
| TOTAL BANKS & THRIFTS | | | |
| (Cost $146,935) | | | 159,092 |
| | | Shares | Value |
|
| Money Market Funds - 6.3% | | | |
| Fidelity Cash Central Fund 0.11% (l) | | | |
| (Cost $10,580,936) | | 10,578,820 | 10,580,936 |
| TOTAL INVESTMENT IN SECURITIES - 100.2% | | | |
| (Cost $174,030,645) | | | 168,939,751 |
| NET OTHER ASSETS (LIABILITIES) - (0.2)%�� | | | (321,596) |
| NET ASSETS - 100% | | | $168,618,155 |
Legend
(a) Coupon rates for floating and adjustable rate securities reflect the rates in effect at period end.
(b) Coupon is indexed to a floating interest rate which may be multiplied by a specified factor and/or subject to caps or floors.
(c) Remaining maturities of bank loan obligations may be less than the stated maturities shown as a result of contractual or optional prepayments by the borrower. Such prepayments cannot be predicted with certainty.
(d) The coupon rate will be determined upon settlement of the loan after period end.
(e) Level 3 security
(f) Non-income producing - Security is in default.
(g) Position represents an unfunded loan commitment. At period end, the total principal amount and market value of unfunded commitments totaled $53,767 and $53,767, respectively.
(h) Security exempt from registration under Rule 144A of the Securities Act of 1933. These securities may be resold in transactions exempt from registration, normally to qualified institutional buyers. At the end of the period, the value of these securities amounted to $7,876,617 or 4.7% of net assets.
(i) Non-income producing
(j) Restricted securities (including private placements) - Investment in securities not registered under the Securities Act of 1933 (excluding 144A issues). At the end of the period, the value of restricted securities (excluding 144A issues) amounted to $285,463 or 0.2% of net assets.
(k) Security is perpetual in nature with no stated maturity date.
(l) Affiliated fund that is generally available only to investment companies and other accounts managed by Fidelity Investments. The rate quoted is the annualized seven-day yield of the fund at period end. A complete unaudited listing of the fund's holdings as of its most recent quarter end is available upon request. In addition, each Fidelity Central Fund's financial statements, which are not covered by the Fund's Report of Independent Registered Public Accounting Firm, are available on the SEC's website or upon request.
Additional information on each restricted holding is as follows:
| Security | Acquisition Date | Acquisition Cost |
| California Resources Corp. | 10/27/20 | $125,326 |
Affiliated Central Funds
Information regarding fiscal year to date income earned by the Fund from investments in Fidelity Central Funds is as follows:
| Fund | Income earned |
| Fidelity Cash Central Fund | $76,688 |
| Total | $76,688 |
Amounts in the income column in the above table include any capital gain distributions from underlying funds, which are presented in the corresponding line-item in the Statement of Operations, if applicable.
The value, beginning of period, for the Fidelity Cash Central Fund was $24,262,225. Net realized gain (loss) and change in net unrealized appreciation (depreciation) on Fidelity Cash Central Fund is presented in the Statement of Operations, if applicable. Purchases and sales of the Fidelity Cash Central Fund were $81,726,465 and $95,409,567, respectively, during the period.
Investment Valuation
The following is a summary of the inputs used, as of December 31, 2020, involving the Fund's assets and liabilities carried at fair value. The inputs or methodology used for valuing securities may not be an indication of the risk associated with investing in those securities. For more information on valuation inputs, and their aggregation into the levels used below, please refer to the Investment Valuation section in the accompanying Notes to Financial Statements.
| | Valuation Inputs at Reporting Date: |
| Description | Total | Level 1 | Level 2 | Level 3 |
| Investments in Securities: | | | | |
| Equities: | | | | |
| Communication Services | $8,381 | $-- | $8,381 | $-- |
| Consumer Discretionary | -- | -- | -- | -- |
| Energy | 1,165,978 | 1,165,978 | -- | -- |
| Financials | 107,748 | -- | -- | 107,748 |
| Industrials | 106,919 | -- | -- | 106,919 |
| Bank Loan Obligations | 147,822,851 | -- | 146,645,703 | 1,177,148 |
| Corporate Bonds | 8,987,846 | -- | 8,987,846 | -- |
| Preferred Securities | 159,092 | -- | 159,092 | -- |
| Money Market Funds | 10,580,936 | 10,580,936 | -- | -- |
| Total Investments in Securities: | $168,939,751 | $11,746,914 | $155,801,022 | $1,391,815 |
Other Information
Distribution of investments by country or territory of incorporation, as a percentage of Total Net Assets, is as follows (Unaudited):
| United States of America | 88.0% |
| Luxembourg | 6.4% |
| Canada | 1.9% |
| Cayman Islands | 1.1% |
| France | 1.0% |
| Others (Individually Less Than 1%) | 1.6% |
| | 100.0% |
See accompanying notes which are an integral part of the financial statements.
Financial Statements
Statement of Assets and Liabilities
| | | December 31, 2020 |
| Assets | | |
Investment in securities, at value — See accompanying schedule:
Unaffiliated issuers (cost $163,449,709) | $158,358,815 | |
| Fidelity Central Funds (cost $10,580,936) | 10,580,936 | |
| Total Investment in Securities (cost $174,030,645) | | $168,939,751 |
| Cash | | 1,186,293 |
| Receivable for investments sold | | 462,172 |
| Interest receivable | | 929,924 |
| Distributions receivable from Fidelity Central Funds | | 988 |
| Prepaid expenses | | 220 |
| Total assets | | 171,519,348 |
| Liabilities | | |
| Payable for investments purchased | $2,611,730 | |
| Payable for fund shares redeemed | 120,902 | |
| Accrued management fee | 77,327 | |
| Other affiliated payables | 21,079 | |
| Other payables and accrued expenses | 70,155 | |
| Total liabilities | | 2,901,193 |
| Net Assets | | $168,618,155 |
| Net Assets consist of: | | |
| Paid in capital | | $187,189,494 |
| Total accumulated earnings (loss) | | (18,571,339) |
| Net Assets | | $168,618,155 |
| Net Asset Value and Maximum Offering Price | | |
| Initial Class: | | |
| Net Asset Value, offering price and redemption price per share ($7,689,200 ÷ 795,813 shares) | | $9.66 |
| Investor Class: | | |
| Net Asset Value, offering price and redemption price per share ($160,928,955 ÷ 16,665,309 shares) | | $9.66 |
See accompanying notes which are an integral part of the financial statements.
Statement of Operations
| | | Year ended December 31, 2020 |
| Investment Income | | |
| Dividends | | $4,380 |
| Interest | | 8,581,748 |
| Income from Fidelity Central Funds | | 76,688 |
| Total income | | 8,662,816 |
| Expenses | | |
| Management fee | $1,021,388 | |
| Transfer agent fees | 186,311 | |
| Accounting fees and expenses | 91,291 | |
| Custodian fees and expenses | 34,751 | |
| Independent trustees' fees and expenses | 1,138 | |
| Audit | 71,888 | |
| Legal | 1,989 | |
| Interest | 1,347 | |
| Miscellaneous | 4,096 | |
| Total expenses before reductions | 1,414,199 | |
| Expense reductions | (6,545) | |
| Total expenses after reductions | | 1,407,654 |
| Net investment income (loss) | | 7,255,162 |
| Realized and Unrealized Gain (Loss) | | |
| Net realized gain (loss) on: | | |
| Investment securities: | | |
| Unaffiliated issuers | (10,104,754) | |
| Fidelity Central Funds | 3,707 | |
| Foreign currency transactions | 41 | |
| Total net realized gain (loss) | | (10,101,006) |
| Change in net unrealized appreciation (depreciation) on: | | |
| Investment securities: | | |
| Unaffiliated issuers | (2,143,295) | |
| Fidelity Central Funds | (1,894) | |
| Assets and liabilities in foreign currencies | (202) | |
| Total change in net unrealized appreciation (depreciation) | | (2,145,391) |
| Net gain (loss) | | (12,246,397) |
| Net increase (decrease) in net assets resulting from operations | | $(4,991,235) |
See accompanying notes which are an integral part of the financial statements.
Statement of Changes in Net Assets
| | Year ended December 31, 2020 | Year ended December 31, 2019 |
| Increase (Decrease) in Net Assets | | |
| Operations | | |
| Net investment income (loss) | $7,255,162 | $13,192,787 |
| Net realized gain (loss) | (10,101,006) | (931,797) |
| Change in net unrealized appreciation (depreciation) | (2,145,391) | 10,021,251 |
| Net increase (decrease) in net assets resulting from operations | (4,991,235) | 22,282,241 |
| Distributions to shareholders | (8,416,335) | (13,475,219) |
| Share transactions - net increase (decrease) | (83,976,072) | (8,952,103) |
| Total increase (decrease) in net assets | (97,383,642) | (145,081) |
| Net Assets | | |
| Beginning of period | 266,001,797 | 266,146,878 |
| End of period | $168,618,155 | $266,001,797 |
See accompanying notes which are an integral part of the financial statements.
Financial Highlights
VIP Floating Rate High Income Portfolio Initial Class
| Years ended December 31, | 2020 | 2019 | 2018 | 2017 | 2016 |
| Selected Per–Share Data | | | | | |
| Net asset value, beginning of period | $9.85 | $9.55 | $9.93 | $9.86 | $9.34 |
| Income from Investment Operations | | | | | |
| Net investment income (loss)A | .376 | .505 | .438 | .402 | .412 |
| Net realized and unrealized gain (loss) | (.104) | .325 | (.452) | (.027) | .445 |
| Total from investment operations | .272 | .830 | (.014) | .375 | .857 |
| Distributions from net investment income | (.462) | (.530) | (.366) | (.305) | (.337) |
| Total distributions | (.462) | (.530) | (.366) | (.305) | (.337) |
| Net asset value, end of period | $9.66 | $9.85 | $9.55 | $9.93 | $9.86 |
| Total ReturnB,C | 2.82% | 8.79% | (.16)% | 3.81% | 9.18% |
| Ratios to Average Net AssetsD,E | | | | | |
| Expenses before reductions | .73% | .71% | .71% | .73% | .76% |
| Expenses net of fee waivers, if any | .73% | .71% | .71% | .73% | .76% |
| Expenses net of all reductions | .73% | .70% | .71% | .72% | .76% |
| Net investment income (loss) | 3.95% | 5.06% | 4.37% | 4.01% | 4.23% |
| Supplemental Data | | | | | |
| Net assets, end of period (000 omitted) | $7,689 | $12,292 | $12,905 | $6,602 | $6,810 |
| Portfolio turnover rateF | 40% | 29% | 45% | 68% | 54% |
A Calculated based on average shares outstanding during the period.
B Total returns do not reflect charges attributable to your insurance company's separate account. Inclusion of these charges would reduce the total returns shown.
C Total returns would have been lower if certain expenses had not been reduced during the applicable periods shown.
D Fees and expenses of any underlying mutual funds or exchange-traded funds (ETFs) are not included in the Fund's expense ratio. The Fund indirectly bears its proportionate share of these expenses. For additional expense information related to investments in Fidelity Central Funds, please refer to the "Investments in Fidelity Central Funds" note found in the Notes to Financial Statements section of the most recent Annual or Semi-Annual report.
E Expense ratios reflect operating expenses of the class. Expenses before reductions do not reflect amounts reimbursed, waived, or reduced through arrangements with the investment adviser, brokerage services, or other offset arrangements, if applicable, and do not represent the amount paid by the class during periods when reimbursements, waivers or reductions occur.
F Amount does not include the portfolio activity of any underlying mutual funds or exchange-traded funds (ETFs).
See accompanying notes which are an integral part of the financial statements.
VIP Floating Rate High Income Portfolio Investor Class
| Years ended December 31, | 2020 | 2019 | 2018 | 2017 | 2016 |
| Selected Per–Share Data | | | | | |
| Net asset value, beginning of period | $9.85 | $9.54 | $9.93 | $9.86 | $9.34 |
| Income from Investment Operations | | | | | |
| Net investment income (loss)A | .373 | .502 | .434 | .398 | .409 |
| Net realized and unrealized gain (loss) | (.105) | .335 | (.461) | (.025) | .446 |
| Total from investment operations | .268 | .837 | (.027) | .373 | .855 |
| Distributions from net investment income | (.458) | (.527) | (.363) | (.303) | (.335) |
| Total distributions | (.458) | (.527) | (.363) | (.303) | (.335) |
| Net asset value, end of period | $9.66 | $9.85 | $9.54 | $9.93 | $9.86 |
| Total ReturnB,C | 2.78% | 8.88% | (.30)% | 3.79% | 9.16% |
| Ratios to Average Net AssetsD,E | | | | | |
| Expenses before reductions | .76% | .74% | .74% | .76% | .79% |
| Expenses net of fee waivers, if any | .76% | .74% | .74% | .76% | .79% |
| Expenses net of all reductions | .76% | .74% | .74% | .76% | .79% |
| Net investment income (loss) | 3.91% | 5.03% | 4.33% | 3.97% | 4.20% |
| Supplemental Data | | | | | |
| Net assets, end of period (000 omitted) | $160,929 | $253,710 | $253,242 | $180,482 | $145,821 |
| Portfolio turnover rateF | 40% | 29% | 45% | 68% | 54% |
A Calculated based on average shares outstanding during the period.
B Total returns do not reflect charges attributable to your insurance company's separate account. Inclusion of these charges would reduce the total returns shown.
C Total returns would have been lower if certain expenses had not been reduced during the applicable periods shown.
D Fees and expenses of any underlying mutual funds or exchange-traded funds (ETFs) are not included in the Fund's expense ratio. The Fund indirectly bears its proportionate share of these expenses. For additional expense information related to investments in Fidelity Central Funds, please refer to the "Investments in Fidelity Central Funds" note found in the Notes to Financial Statements section of the most recent Annual or Semi-Annual report.
E Expense ratios reflect operating expenses of the class. Expenses before reductions do not reflect amounts reimbursed, waived, or reduced through arrangements with the investment adviser, brokerage services, or other offset arrangements, if applicable, and do not represent the amount paid by the class during periods when reimbursements, waivers or reductions occur.
F Amount does not include the portfolio activity of any underlying mutual funds or exchange-traded funds (ETFs).
See accompanying notes which are an integral part of the financial statements.
Notes to Financial Statements
For the period ended December 31, 2020
1. Organization.
VIP Floating Rate High Income Portfolio (the Fund) is a fund of Variable Insurance Products Fund (the Trust) and is authorized to issue an unlimited number of shares. The Trust is registered under the Investment Company Act of 1940, as amended (the 1940 Act), as an open-end management investment company organized as a Massachusetts business trust. Shares of the Fund may only be purchased by insurance companies for the purpose of funding variable annuity or variable life insurance contracts. The Fund offers the following classes of shares: Initial Class shares and Investor Class shares. All classes have equal rights and voting privileges, except for matters affecting a single class.
Effective January 1, 2020:
Investment advisers Fidelity Investments Money Management, Inc., FMR Co., Inc., and Fidelity SelectCo, LLC, merged with and into Fidelity Management & Research Company. In connection with the merger transactions, the resulting, merged investment adviser was then redomiciled from Massachusetts to Delaware, changed its corporate structure from a corporation to a limited liability company, and changed its name to "Fidelity Management & Research Company LLC".
Fidelity Investments Institutional Operations Company, Inc. converted from a Massachusetts corporation to a Massachusetts LLC, and changed its name to "Fidelity Investments Institutional Operations Company LLC".
2. Investments in Fidelity Central Funds.
The Fund invests in Fidelity Central Funds, which are open-end investment companies generally available only to other investment companies and accounts managed by the investment adviser and its affiliates. The Fund's Schedule of Investments lists each of the Fidelity Central Funds held as of period end, if any, as an investment of the Fund, but does not include the underlying holdings of each Fidelity Central Fund. As an Investing Fund, the Fund indirectly bears its proportionate share of the expenses of the underlying Fidelity Central Funds.
The Money Market Central Funds seek preservation of capital and current income and are managed by the investment adviser. Annualized expenses of the Money Market Central Funds as of their most recent shareholder report date ranged from less than .005% to .01%.
A complete unaudited list of holdings for each Fidelity Central Fund is available upon request or at the Securities and Exchange Commission (the SEC) website at www.sec.gov. In addition, the financial statements of the Fidelity Central Funds, which are not covered by the Fund's Report of Independent Registered Public Accounting Firm, are available on the SEC website or upon request.
3. Significant Accounting Policies.
The Fund is an investment company and applies the accounting and reporting guidance of the Financial Accounting Standards Board (FASB) Accounting Standards Codification Topic 946 Financial Services - Investment Companies. The financial statements have been prepared in conformity with accounting principles generally accepted in the United States of America (GAAP), which require management to make certain estimates and assumptions at the date of the financial statements. Actual results could differ from those estimates. Subsequent events, if any, through the date that the financial statements were issued have been evaluated in the preparation of the financial statements. The following summarizes the significant accounting policies of the Fund:
Investment Valuation. Investments are valued as of 4:00 p.m. Eastern time on the last calendar day of the period. The Board of Trustees (the Board) has delegated the day to day responsibility for the valuation of the Fund's investments to the Fair Value Committee (the Committee) established by the Fund's investment adviser. In accordance with valuation policies and procedures approved by the Board, the Fund attempts to obtain prices from one or more third party pricing vendors or brokers to value its investments. When current market prices, quotations or currency exchange rates are not readily available or reliable, investments will be fair valued in good faith by the Committee, in accordance with procedures adopted by the Board. Factors used in determining fair value vary by investment type and may include market or investment specific events, changes in interest rates and credit quality. The frequency with which these procedures are used cannot be predicted and they may be utilized to a significant extent. The Committee oversees the Fund's valuation policies and procedures and reports to the Board on the Committee's activities and fair value determinations. The Board monitors the appropriateness of the procedures used in valuing the Fund's investments and ratifies the fair value determinations of the Committee.
The Fund categorizes the inputs to valuation techniques used to value its investments into a disclosure hierarchy consisting of three levels as shown below:
- Level 1 – quoted prices in active markets for identical investments
- Level 2 – other significant observable inputs (including quoted prices for similar investments, interest rates, prepayment speeds, etc.)
- Level 3 – unobservable inputs (including the Fund's own assumptions based on the best information available)
Valuation techniques used to value the Fund's investments by major category are as follows:
Debt securities, including restricted securities, are valued based on evaluated prices received from third party pricing vendors or from brokers who make markets in such securities. Corporate bonds, bank loan obligations and preferred securities are valued by pricing vendors who utilize matrix pricing which considers yield or price of bonds of comparable quality, coupon, maturity and type or by broker-supplied prices. When independent prices are unavailable or unreliable, debt securities may be valued utilizing pricing methodologies which consider similar factors that would be used by third party pricing vendors. Debt securities are generally categorized as Level 2 in the hierarchy but may be Level 3 depending on the circumstances. The Fund invests a significant portion of its assets in below investment grade securities. The value of these securities can be more volatile due to changes in the credit quality of the issuer and is sensitive to changes in economic, market and regulatory conditions.
Equity securities, including restricted securities, for which market quotations are readily available, are valued at the last reported sale price or official closing price as reported by a third party pricing vendor on the primary market or exchange on which they are traded and are categorized as Level 1 in the hierarchy. In the event there were no sales during the day or closing prices are not available, securities are valued at the last quoted bid price or may be valued using the last available price and are generally categorized as Level 2 in the hierarchy. For equity securities, including restricted securities, where observable inputs are limited, assumptions about market activity and risk are used and these securities may be categorized as Level 3 in the hierarchy.
Investments in open-end mutual funds, including the Fidelity Central Funds, are valued at their closing net asset value (NAV) each business day and are categorized as Level 1 in the hierarchy.
Changes in valuation techniques may result in transfers in or out of an assigned level within the disclosure hierarchy. The aggregate value of investments by input level as of December 31, 2020 is included at the end of the Fund's Schedule of Investments.
Foreign Currency. Certain Funds may use foreign currency contracts to facilitate transactions in foreign-denominated securities. Gains and losses from these transactions may arise from changes in the value of the foreign currency or if the counterparties do not perform under the contracts' terms.
Foreign-denominated assets, including investment securities, and liabilities are translated into U.S. dollars at the exchange rates at period end. Purchases and sales of investment securities, income and dividends received, and expenses denominated in foreign currencies are translated into U.S. dollars at the exchange rate in effect on the transaction date.
The effects of exchange rate fluctuations on investments are included with the net realized and unrealized gain (loss) on investment securities. Other foreign currency transactions resulting in realized and unrealized gain (loss) are disclosed separately.
Investment Transactions and Income. For financial reporting purposes, the Fund's investment holdings and NAV include trades executed through the end of the last business day of the period. The NAV per share for processing shareholder transactions is calculated as of the close of business of the New York Stock Exchange (NYSE), normally 4:00 p.m. Eastern time and includes trades executed through the end of the prior business day. Gains and losses on securities sold are determined on the basis of identified cost. Dividend income is recorded on the ex-dividend date. Income and capital gain distributions from Fidelity Central Funds, if any, are recorded on the ex-dividend date. Certain distributions received by the Fund represent a return of capital or capital gain. The Fund determines the components of these distributions subsequent to the ex-dividend date, based upon receipt of tax filings or other correspondence relating to the underlying investment. These distributions are recorded as a reduction of cost of investments and/or as a realized gain. Interest income is accrued as earned and includes coupon interest and amortization of premium and accretion of discount on debt securities as applicable. Investment income is recorded net of foreign taxes withheld where recovery of such taxes is uncertain. Debt obligations may be placed on non-accrual status and related interest income may be reduced by ceasing current accruals and writing off interest receivables when the collection of all or a portion of interest has become doubtful based on consistently applied procedures. A debt obligation is removed from non-accrual status when the issuer resumes interest payments or when collectability of interest is reasonably assured. The Fund earns certain fees in connection with its floating rate loan purchasing activities. These fees are in addition to interest payments earned and may include amendment fees, consent fees and prepayment fees. These fees are recorded as Interest in the accompanying financial statements.
Class Allocations and Expenses. Investment income, realized and unrealized capital gains and losses, common expenses of the Fund, and certain fund-level expense reductions, if any, are allocated daily on a pro-rata basis to each class based on the relative net assets of each class to the total net assets of the Fund. Each class differs with respect to transfer agent fees incurred. Certain expense reductions may also differ by class. For the reporting period, the allocated portion of income and expenses to each class as a percent of its average net assets may vary due to the timing of recording these transactions in relation to fluctuating net assets of the classes. Expenses directly attributable to a fund are charged to that fund. Expenses attributable to more than one fund are allocated among the respective funds on the basis of relative net assets or other appropriate methods. Expense estimates are accrued in the period to which they relate and adjustments are made when actual amounts are known.
Income Tax Information and Distributions to Shareholders. Each year, the Fund intends to qualify as a regulated investment company under Subchapter M of the Internal Revenue Code, including distributing substantially all of its taxable income and realized gains. As a result, no provision for U.S. Federal income taxes is required. As of December 31, 2020, the Fund did not have any unrecognized tax benefits in the financial statements; nor is the Fund aware of any tax positions for which it is reasonably possible that the total amounts of unrecognized tax benefits will significantly change in the next twelve months. The Fund files a U.S. federal tax return, in addition to state and local tax returns as required. The Fund's federal income tax returns are subject to examination by the Internal Revenue Service (IRS) for a period of three fiscal years after they are filed. State and local tax returns may be subject to examination for an additional fiscal year depending on the jurisdiction. Foreign taxes are provided for based on the Fund's understanding of the tax rules and rates that exist in the foreign markets in which it invests.
Distributions are declared and recorded on the ex-dividend date. Income and capital gain distributions are declared separately for each class. Income and capital gain distributions are determined in accordance with income tax regulations, which may differ from GAAP.
Capital accounts within the financial statements are adjusted for permanent book-tax differences. These adjustments have no impact on net assets or the results of operations. Capital accounts are not adjusted for temporary book-tax differences which will reverse in a subsequent period.
Book-tax differences are primarily due to market discount, capital loss carryforwards and losses deferred due to wash sales.
As of period end, the cost and unrealized appreciation (depreciation) in securities, and derivatives if applicable, for federal income tax purposes were as follows:
| Gross unrealized appreciation | $2,023,681 |
| Gross unrealized depreciation | (6,818,945) |
| Net unrealized appreciation (depreciation) | $(4,795,264) |
| Tax Cost | $173,735,015 |
The tax-based components of distributable earnings as of period end were as follows:
| Undistributed ordinary income | $559,845 |
| Capital loss carryforward | $(14,335,718) |
| Net unrealized appreciation (depreciation) on securities and other investments | $(4,795,466) |
Capital loss carryforwards are only available to offset future capital gains of the Fund to the extent provided by regulations and may be limited. The capital loss carryforward information presented below, including any applicable limitation, is estimated as of fiscal period end and is subject to adjustment.
| No expiration | |
| Short-term | $(3,559,118) |
| Long-term | (10,776,600) |
| Total capital loss carryforward | $(14,335,718) |
The tax character of distributions paid was as follows:
| | December 31, 2020 | December 31, 2019 |
| Ordinary Income | $8,416,335 | $ 13,475,219 |
Restricted Securities (including Private Placements). The Fund may invest in securities that are subject to legal or contractual restrictions on resale. These securities generally may be resold in transactions exempt from registration or to the public if the securities are registered. Disposal of these securities may involve time-consuming negotiations and expense, and prompt sale at an acceptable price may be difficult. Information regarding restricted securities is included at the end of the Fund's Schedule of Investments.
Loans and Other Direct Debt Instruments. Direct debt instruments are interests in amounts owed to lenders by corporate or other borrowers. These instruments may be in the form of loans, trade claims or other receivables and may include standby financing commitments such as revolving credit facilities that obligate a fund to supply additional cash to the borrower on demand. Loans may be acquired through assignment, participation, or may be made directly to a borrower. Such instruments are presented in the Bank Loan Obligations section in the Schedule of Investments. Certain funds may also invest in unfunded loan commitments, which are contractual obligations for future funding. Information regarding unfunded commitments is included at the end of the Schedule of Investments, if applicable.
New Accounting Pronouncement. In March 2020, the Financial Accounting Standards Board (FASB) issued an Accounting Standards Update (ASU), ASU 2020-04, which provides optional, temporary relief with respect to the financial reporting of contracts subject to certain types of modifications due to the planned discontinuation of the London Interbank Offered Rate (LIBOR) and other IBOR-based reference rates as of the end of 2021. The temporary relief provided by ASU 2020-04 is effective for certain reference rate-related contract modifications that occur during the period March 12, 2020 through December 31, 2022. Management is currently evaluating the potential impact of ASU 2020-04 to the financial statements.
4. Purchases and Sales of Investments.
Purchases and sales of securities, other than short-term securities, are noted in the table below.
| | Purchases ($) | Sales ($) |
| VIP Floating Rate High Income Portfolio | 70,146,164 | 141,423,833 |
5. Fees and Other Transactions with Affiliates.
Management Fee. Fidelity Management & Research Company LLC (the investment adviser) and its affiliates provide the Fund with investment management related services for which the Fund pays a monthly management fee. The management fee is the sum of an individual fund fee rate that is based on an annual rate of .45% of the Fund's average net assets and an annualized group fee rate that averaged .10% during the period. The group fee rate is based upon the monthly average net assets of a group of registered investment companies with which the investment adviser has management contracts. The group fee rate decreases as assets under management increase and increases as assets under management decrease. For the reporting period, the total annual management fee rate was .55% of the Fund's average net assets.
Transfer Agent Fees. Fidelity Investments Institutional Operations Company LLC (FIIOC), an affiliate of the investment adviser, is the Fund's transfer, dividend disbursing, and shareholder servicing agent. FIIOC receives an asset-based fee with respect to each class. Each class pays a fee for transfer agent services, typesetting and printing and mailing of shareholder reports, excluding mailing of proxy statements. For the period, transfer agent fees for each class were as follows:
| | Amount | % of Class-Level Average Net Assets |
| Initial Class | $5,901 | .07 |
| Investor Class | 180,410 | .10 |
| | $186,311 | |
Accounting Fees. Fidelity Service Company, Inc. (FSC), an affiliate of the investment adviser, maintains the Fund's accounting records. The accounting fee is based on the level of average net assets for each month. For the period, the fees were equivalent to the following annual rates:
| | % of Average Net Assets |
| VIP Floating Rate High Income Portfolio | .05 |
Interfund Lending Program. Pursuant to an Exemptive Order issued by the SEC, the Fund, along with other registered investment companies having management contracts with Fidelity Management & Research Company LLC (FMR), or other affiliated entities of FMR, may participate in an interfund lending program. This program provides an alternative credit facility allowing the Fund to borrow from, or lend money to, other participating affiliated funds. At period end, there were no interfund loans outstanding. Activity in this program during the period for which loans were outstanding was as follows:
| | Borrower or Lender | Average Loan Balance | Weighted Average Interest Rate | Interest Expense |
| VIP Floating Rate High Income Portfolio | Borrower | $5,979,238 | .39% | $1,347 |
Interfund Trades. Funds may purchase from or sell securities to other Fidelity Funds under procedures adopted by the Board. The procedures have been designed to ensure these interfund trades are executed in accordance with Rule 17a-7 of the 1940 Act. Interfund trades are included within the respective purchases and sales amounts shown in the Purchases and Sales of Investments note.
6. Committed Line of Credit.
Certain Funds participate with other funds managed by the investment adviser or an affiliate in a $4.25 billion credit facility (the "line of credit") to be utilized for temporary or emergency purposes to fund shareholder redemptions or for other short-term liquidity purposes. The participating funds have agreed to pay commitment fees on their pro-rata portion of the line of credit, which are reflected in Miscellaneous expenses on the Statement of Operations, and are as follows:
| | Amount |
| VIP Floating Rate High Income Portfolio | $497 |
During the period, there were no borrowings on this line of credit.
7. Expense Reductions.
Through arrangements with the Fund's custodian, credits realized as a result of certain uninvested cash balances were used to reduce the Fund's expenses. During the period, custodian credits reduced the Fund's expenses by $6,025.
In addition, during the period the investment adviser or an affiliate reimbursed and/or waived a portion of fund-level operating expenses in the amount of $520.
8. Distributions to Shareholders.
Distributions to shareholders of each class were as follows:
| | Year ended December 31, 2020 | Year ended December 31, 2019 |
| Distributions to shareholders | | |
| Initial Class | $390,895 | $644,638 |
| Investor Class | 8,025,440 | 12,830,581 |
| Total | $8,416,335 | $13,475,219 |
9. Share Transactions.
Transactions for each class of shares were as follows:
| | Shares | Shares | Dollars | Dollars |
| | Year ended December 31, 2020 | Year ended December 31, 2019 | Year ended December 31, 2020 | Year ended December 31, 2019 |
| Initial Class | | | | |
| Shares sold | 250,158 | 227,187 | $2,383,482 | $2,266,876 |
| Reinvestment of distributions | 40,656 | 66,117 | 390,895 | 644,638 |
| Shares redeemed | (742,517) | (397,435) | (6,787,110) | (3,969,146) |
| Net increase (decrease) | (451,703) | (104,131) | $(4,012,733) | $(1,057,632) |
| Investor Class | | | | |
| Shares sold | 1,995,709 | 4,073,181 | $19,338,394 | $40,493,664 |
| Reinvestment of distributions | 835,197 | 1,316,883 | 8,021,841 | 12,826,440 |
| Shares redeemed | (11,929,851) | (6,160,197) | (107,323,574) | (61,214,575) |
| Net increase (decrease) | (9,098,945) | (770,133) | $(79,963,339) | $(7,894,471) |
10. Other.
The Fund's organizational documents provide former and current trustees and officers with a limited indemnification against liabilities arising in connection with the performance of their duties to the Fund. In the normal course of business, the Fund may also enter into contracts that provide general indemnifications. The Fund's maximum exposure under these arrangements is unknown as this would be dependent on future claims that may be made against the Fund. The risk of material loss from such claims is considered remote.
At the end of the period, the investment adviser or its affiliates were the owners of record of 100% of the total outstanding shares of the Fund.
11. Coronavirus (COVID-19) Pandemic.
An outbreak of COVID-19 first detected in China during December 2019 has since spread globally and was declared a pandemic by the World Health Organization during March 2020. Developments that disrupt global economies and financial markets, such as the COVID-19 pandemic, may magnify factors that affect the Fund's performance.
Report of Independent Registered Public Accounting Firm
To the Board of Trustees of Variable Insurance Products Fund and Shareholders of VIP Floating Rate High Income Portfolio
Opinion on the Financial Statements
We have audited the accompanying statement of assets and liabilities, including the schedule of investments, of VIP Floating Rate High Income Portfolio (one of the funds constituting Variable Insurance Products Fund, referred to hereafter as the “Fund”) as of December 31, 2020, the related statement of operations for the year ended December 31, 2020, the statement of changes in net assets for each of the two years in the period ended December 31, 2020, including the related notes, and the financial highlights for each of the five years in the period ended December 31, 2020 (collectively referred to as the “financial statements”). In our opinion, the financial statements present fairly, in all material respects, the financial position of the Fund as of December 31, 2020, the results of its operations for the year then ended, the changes in its net assets for each of the two years in the period ended December 31, 2020 and the financial highlights for each of the five years in the period ended December 31, 2020 in conformity with accounting principles generally accepted in the United States of America.
Basis for Opinion
These financial statements are the responsibility of the Fund’s management. Our responsibility is to express an opinion on the Fund’s financial statements based on our audits. We are a public accounting firm registered with the Public Company Accounting Oversight Board (United States) (PCAOB) and are required to be independent with respect to the Fund in accordance with the U.S. federal securities laws and the applicable rules and regulations of the Securities and Exchange Commission and the PCAOB.
We conducted our audits of these financial statements in accordance with the standards of the PCAOB. Those standards require that we plan and perform the audit to obtain reasonable assurance about whether the financial statements are free of material misstatement, whether due to error or fraud.
Our audits included performing procedures to assess the risks of material misstatement of the financial statements, whether due to error or fraud, and performing procedures that respond to those risks. Such procedures included examining, on a test basis, evidence regarding the amounts and disclosures in the financial statements. Our audits also included evaluating the accounting principles used and significant estimates made by management, as well as evaluating the overall presentation of the financial statements. Our procedures included confirmation of securities owned as of December 31, 2020 by correspondence with the custodian, issuers of privately offered securities, agent banks and brokers; when replies were not received from agent banks or brokers, we performed other auditing procedures. We believe that our audits provide a reasonable basis for our opinion.
/s/ PricewaterhouseCoopers LLP
Boston, Massachusetts
February 12, 2021
We have served as the auditor of one or more investment companies in the Fidelity group of funds since 1932.
Trustees and Officers
The Trustees, Members of the Advisory Board (if any), and officers of the trust and fund, as applicable, are listed below. The Board of Trustees governs the fund and is responsible for protecting the interests of shareholders. The Trustees are experienced executives who meet periodically throughout the year to oversee the fund's activities, review contractual arrangements with companies that provide services to the fund, oversee management of the risks associated with such activities and contractual arrangements, and review the fund's performance. Except for Jonathan Chiel, each of the Trustees oversees 305 funds. Mr. Chiel oversees 176 funds.
The Trustees hold office without limit in time except that (a) any Trustee may resign; (b) any Trustee may be removed by written instrument, signed by at least two-thirds of the number of Trustees prior to such removal; (c) any Trustee who requests to be retired or who has become incapacitated by illness or injury may be retired by written instrument signed by a majority of the other Trustees; and (d) any Trustee may be removed at any special meeting of shareholders by a two-thirds vote of the outstanding voting securities of the trust. Each Trustee who is not an interested person (as defined in the 1940 Act) of the trust and the fund is referred to herein as an Independent Trustee. Each Independent Trustee shall retire not later than the last day of the calendar year in which his or her 75th birthday occurs. The Independent Trustees may waive this mandatory retirement age policy with respect to individual Trustees. Officers and Advisory Board Members hold office without limit in time, except that any officer or Advisory Board Member may resign or may be removed by a vote of a majority of the Trustees at any regular meeting or any special meeting of the Trustees. Except as indicated, each individual has held the office shown or other offices in the same company for the past five years.
The fund’s Statement of Additional Information (SAI) includes more information about the Trustees. To request a free copy, call Fidelity at 1-877-208-0098.
Experience, Skills, Attributes, and Qualifications of the Trustees. The Governance and Nominating Committee has adopted a statement of policy that describes the experience, qualifications, attributes, and skills that are necessary and desirable for potential Independent Trustee candidates (Statement of Policy). The Board believes that each Trustee satisfied at the time he or she was initially elected or appointed a Trustee, and continues to satisfy, the standards contemplated by the Statement of Policy. The Governance and Nominating Committee also engages professional search firms to help identify potential Independent Trustee candidates who have the experience, qualifications, attributes, and skills consistent with the Statement of Policy. From time to time, additional criteria based on the composition and skills of the current Independent Trustees, as well as experience or skills that may be appropriate in light of future changes to board composition, business conditions, and regulatory or other developments, have also been considered by the professional search firms and the Governance and Nominating Committee. In addition, the Board takes into account the Trustees' commitment and participation in Board and committee meetings, as well as their leadership of standing and ad hoc committees throughout their tenure.
In determining that a particular Trustee was and continues to be qualified to serve as a Trustee, the Board has considered a variety of criteria, none of which, in isolation, was controlling. The Board believes that, collectively, the Trustees have balanced and diverse experience, qualifications, attributes, and skills, which allow the Board to operate effectively in governing the fund and protecting the interests of shareholders. Information about the specific experience, skills, attributes, and qualifications of each Trustee, which in each case led to the Board's conclusion that the Trustee should serve (or continue to serve) as a trustee of the fund, is provided below.
Board Structure and Oversight Function. Robert A. Lawrence is an interested person and currently serves as Acting Chairman. The Trustees have determined that an interested Chairman is appropriate and benefits shareholders because an interested Chairman has a personal and professional stake in the quality and continuity of services provided to the fund. Independent Trustees exercise their informed business judgment to appoint an individual of their choosing to serve as Chairman, regardless of whether the Trustee happens to be independent or a member of management. The Independent Trustees have determined that they can act independently and effectively without having an Independent Trustee serve as Chairman and that a key structural component for assuring that they are in a position to do so is for the Independent Trustees to constitute a substantial majority for the Board. The Independent Trustees also regularly meet in executive session. David M. Thomas serves as Lead Independent Trustee and as such (i) acts as a liaison between the Independent Trustees and management with respect to matters important to the Independent Trustees and (ii) with management prepares agendas for Board meetings.
Fidelity® funds are overseen by different Boards of Trustees. The fund's Board oversees Fidelity's high income and certain equity funds, and other Boards oversee Fidelity's investment-grade bond, money market, asset allocation, and other equity funds. The asset allocation funds may invest in Fidelity® funds overseen by the fund's Board. The use of separate Boards, each with its own committee structure, allows the Trustees of each group of Fidelity® funds to focus on the unique issues of the funds they oversee, including common research, investment, and operational issues. On occasion, the separate Boards establish joint committees to address issues of overlapping consequences for the Fidelity® funds overseen by each Board.
The Trustees operate using a system of committees to facilitate the timely and efficient consideration of all matters of importance to the Trustees, the fund, and fund shareholders and to facilitate compliance with legal and regulatory requirements and oversight of the fund's activities and associated risks. The Board, acting through its committees, has charged FMR and its affiliates with (i) identifying events or circumstances the occurrence of which could have demonstrably adverse effects on the fund's business and/or reputation; (ii) implementing processes and controls to lessen the possibility that such events or circumstances occur or to mitigate the effects of such events or circumstances if they do occur; and (iii) creating and maintaining a system designed to evaluate continuously business and market conditions in order to facilitate the identification and implementation processes described in (i) and (ii) above. Because the day-to-day operations and activities of the fund are carried out by or through FMR, its affiliates, and other service providers, the fund's exposure to risks is mitigated but not eliminated by the processes overseen by the Trustees. While each of the Board's committees has responsibility for overseeing different aspects of the fund's activities, oversight is exercised primarily through the Operations, Audit, and Compliance Committees. Appropriate personnel, including but not limited to the fund's Chief Compliance Officer (CCO), FMR's internal auditor, the independent accountants, the fund's Treasurer and portfolio management personnel, make periodic reports to the Board's committees, as appropriate, including an annual review of Fidelity's risk management program for the Fidelity® funds. The responsibilities of each standing committee, including their oversight responsibilities, are described further under "Standing Committees of the Trustees."
Interested Trustees*:
Correspondence intended for a Trustee who is an interested person may be sent to Fidelity Investments, 245 Summer Street, Boston, Massachusetts 02210.
Name, Year of Birth; Principal Occupations and Other Relevant Experience+
Jonathan Chiel (1957)
Year of Election or Appointment: 2016
Trustee
Mr. Chiel also serves as Trustee of other Fidelity® funds. Mr. Chiel is Executive Vice President and General Counsel for FMR LLC (diversified financial services company, 2012-present). Previously, Mr. Chiel served as general counsel (2004-2012) and senior vice president and deputy general counsel (2000-2004) for John Hancock Financial Services; a partner with Choate, Hall & Stewart (1996-2000) (law firm); and an Assistant United States Attorney for the United States Attorney’s Office of the District of Massachusetts (1986-95), including Chief of the Criminal Division (1993-1995). Mr. Chiel is a director on the boards of the Boston Bar Foundation and the Maimonides School.
Bettina Doulton (1964)
Year of Election or Appointment: 2021
Trustee
Ms. Doulton also serves as Trustee of other Fidelity® funds. Prior to her retirement, Ms. Doulton served in a variety of positions at Fidelity Investments, including as a managing director of research (2006-2007), portfolio manager to certain Fidelity® funds (1993-2005), equity analyst and portfolio assistant (1990-1993), and research assistant (1987-1990). Ms. Doulton currently owns and operates Phi Builders + Architects and Cellardoor Winery. Previously, Ms. Doulton served as a member of the Board of Brown Capital Management, LLC (2013-2018).
Robert A. Lawrence (1952)
Year of Election or Appointment: 2020
Trustee
Acting Chairman of the Board of Trustees
Mr. Lawrence also serves as Trustee of other funds. Previously, Mr. Lawrence served as a Member of the Advisory Board of certain funds. Prior to his retirement in 2008, Mr. Lawrence served as Vice President of certain Fidelity® funds (2006-2008), Senior Vice President, Head of High Income Division of Fidelity Management & Research Company (investment adviser firm, 2006-2008), and President of Fidelity Strategic Investments (investment adviser firm, 2002-2005).
* Determined to be an “Interested Trustee” by virtue of, among other things, his or her affiliation with the trust or various entities under common control with FMR.
+ The information includes the Trustee's principal occupation during the last five years and other information relating to the experience, attributes, and skills relevant to the Trustee's qualifications to serve as a Trustee, which led to the conclusion that the Trustee should serve as a Trustee for the fund.
Independent Trustees:
Correspondence intended for an Independent Trustee may be sent to Fidelity Investments, P.O. Box 55235, Boston, Massachusetts 02205-5235.
Name, Year of Birth; Principal Occupations and Other Relevant Experience+
Dennis J. Dirks (1948)
Year of Election or Appointment: 2005
Trustee
Mr. Dirks also serves as Trustee of other Fidelity® funds. Prior to his retirement in May 2003, Mr. Dirks served as Chief Operating Officer and as a member of the Board of The Depository Trust & Clearing Corporation (financial markets infrastructure), President, Chief Operating Officer and a member of the Board of The Depository Trust Company (DTC), President and a member of the Board of the National Securities Clearing Corporation (NSCC), Chief Executive Officer and a member of the Board of the Government Securities Clearing Corporation and Chief Executive Officer and a member of the Board of the Mortgage-Backed Securities Clearing Corporation. Mr. Dirks currently serves as a member of the Finance Committee (2016-present) and Board (2017-present) and is Treasurer (2018-present) of the Asolo Repertory Theatre.
Donald F. Donahue (1950)
Year of Election or Appointment: 2018
Trustee
Mr. Donahue also serves as Trustee of other Fidelity® funds. Mr. Donahue serves as President and Chief Executive Officer of Miranda Partners, LLC (risk consulting for the financial services industry, 2012-present). Previously, Mr. Donahue served as Chief Executive Officer (2006-2012), Chief Operating Officer (2003-2006) and Managing Director, Customer Marketing and Development (1999-2003) of The Depository Trust & Clearing Corporation (financial markets infrastructure). Mr. Donahue currently serves as a member (2007-present) and Co-Chairman (2016-present) of the Board of United Way of New York, a member of the Board of NYC Leadership Academy (2012-present) and a member of the Board of Advisors of Ripple Labs, Inc. (financial services, 2015-present). Mr. Donahue previously served as a member of the Advisory Board of certain Fidelity® funds (2015-2018).
Vicki L. Fuller (1957)
Year of Election or Appointment: 2020
Trustee
Ms. Fuller also serves as Trustee of other Fidelity® funds. Previously, Ms. Fuller served as a member of the Advisory Board of certain Fidelity® funds (2018-2020), Chief Investment Officer of the New York State Common Retirement Fund (2012-2018) and held a variety of positions at AllianceBernstein L.P. (global asset management, 1985-2012), including Managing Director (2006-2012) and Senior Vice President and Senior Portfolio Manager (2001-2006). Ms. Fuller currently serves as a member of the Board, Audit Committee and Nominating and Governance Committee of The Williams Companies, Inc. (natural gas infrastructure, 2018-present), as a member of the Board, Audit Committee and Nominating and Governance Committee of two Blackstone business development companies (2020-present) and as a member of the Board of Treliant, LLC (consulting, 2019-present).
Patricia L. Kampling (1959)
Year of Election or Appointment: 2020
Trustee
Ms. Kampling also serves as Trustee of other Fidelity® funds. Prior to her retirement, Ms. Kampling served as Chairman of the Board and Chief Executive Officer (2012-2019), President and Chief Operating Officer (2011-2012) and Executive Vice President and Chief Financial Officer (2010-2011) of Alliant Energy Corporation. Ms. Kampling currently serves as a member of the Board, Compensation Committee and Executive Committee and as Chair of the Audit Committee of Briggs & Stratton Corporation (manufacturing, 2011-present) and as a member of the Board, Audit, Finance and Risk Committee and Safety, Environmental, Technology and Operations Committee of American Water Works Company, Inc. (utilities company, 2019-present). In addition, Ms. Kampling currently serves as a member of the Board of the Nature Conservancy, Wisconsin Chapter (2019-present). Previously, Ms. Kampling served as a Member of the Advisory Board of certain Fidelity® funds (2020), a member of the Board of Interstate Power and Light Company (2012-2019) and Wisconsin Power and Light Company (2012-2019) (each a subsidiary of Alliant Energy Corporation) and as a member of the Board and Workforce Development Committee of the Business Roundtable (2018-2019).
Thomas A. Kennedy (1955)
Year of Election or Appointment: 2021
Trustee
Mr. Kennedy also serves as Trustee of other Fidelity® funds. Previously, Mr. Kennedy served as a Member of the Advisory Board of certain Fidelity® funds (2020) and held a variety of positions at Raytheon Company (aerospace and defense, 1983-2020), including Chairman and Chief Executive Officer (2014-2020) and Executive Vice President and Chief Operating Officer (2013-2014). Mr. Kennedy currently serves as Executive Chairman of the Board of Directors of Raytheon Technologies Corporation (aerospace and defense, 2020-present). He is also a member of the Rutgers School of Engineering Industry Advisory Board (2011-present) and a member of the UCLA Engineering Dean’s Executive Board (2016-present).
Garnett A. Smith (1947)
Year of Election or Appointment: 2018
Trustee
Mr. Smith also serves as Trustee of other Fidelity® funds. Prior to his retirement, Mr. Smith served as Chairman and Chief Executive Officer (1990-1997) and President (1986-1990) of Inbrand Corp. (manufacturer of personal absorbent products). Prior to his employment with Inbrand Corp., he was employed by a retail fabric chain and North Carolina National Bank (now Bank of America). Mr. Smith previously served as a member of the Advisory Board of certain Fidelity® funds (2012-2013).
David M. Thomas (1949)
Year of Election or Appointment: 2008
Trustee
Lead Independent Trustee
Mr. Thomas also serves as Trustee of other Fidelity® funds. Previously, Mr. Thomas served as Executive Chairman (2005-2006) and Chairman and Chief Executive Officer (2000-2005) of IMS Health, Inc. (pharmaceutical and healthcare information solutions). Mr. Thomas currently serves as Non-Executive Chairman of the Board of Fortune Brands Home and Security (home and security products, 2011-present), and a member of the Board (2004-present) and Presiding Director (2013-present) of Interpublic Group of Companies, Inc. (marketing communication).
Susan Tomasky (1953)
Year of Election or Appointment: 2020
Trustee
Ms. Tomasky also serves as Trustee of other Fidelity® funds. Prior to her retirement, Ms. Tomasky served in various executive officer positions at American Electric Power Company, Inc. (1998-2011), including most recently as President of AEP Transmission (2007-2011). Ms. Tomasky currently serves as a member of the Board and Sustainability Committee and as Chair of the Audit Committee of Marathon Petroleum Corporation (2018-present) and as a member of the Board, Corporate Governance Committee and Organization and Compensation Committee and as Chair of the Audit Committee of Public Service Enterprise Group, Inc. (utilities company, 2012-present). In addition, Ms. Tomasky currently serves as a member of the Board of the Columbus Regional Airport Authority (2007-present), as a member of the Board of the Royal Shakespeare Company – America (2009-present), as a member of the Board of the Columbus Association for the Performing Arts (2011-present) and as a member of the Board of Kenyon College (2016-present). Previously, Ms. Tomasky served as a Member of the Advisory Board of certain Fidelity® funds (2020), a member of the Board (2011-2019) and as Lead Independent Director (2015-2018) of Andeavor Corporation (previously Tesoro Corporation) (independent oil refiner and marketer) and as a member of the Board of Summit Midstream Partners LP (energy, 2012-2018).
Michael E. Wiley (1950)
Year of Election or Appointment: 2020
Trustee
Mr. Wiley also serves as Trustee of other Fidelity® funds. Previously, Mr. Wiley served as a member of the Advisory Board of certain Fidelity® funds (2018-2020), Chairman, President and CEO of Baker Hughes, Inc. (oilfield services, 2000-2004). Mr. Wiley also previously served as a member of the Board of Andeavor Corporation (independent oil refiner and marketer, 2005-2018), a member of the Board of Andeavor Logistics LP (natural resources logistics, 2015-2018) and a member of the Board of High Point Resources (exploration and production, 2005-2020).
+ The information includes the Trustee's principal occupation during the last five years and other information relating to the experience, attributes, and skills relevant to the Trustee's qualifications to serve as a Trustee, which led to the conclusion that the Trustee should serve as a Trustee for the fund.
Advisory Board Members and Officers:
Correspondence intended for a Member of the Advisory Board (if any) may be sent to Fidelity Investments, P.O. Box 55235, Boston, Massachusetts 02205-5235. Correspondence intended for an officer or Peter S. Lynch may be sent to Fidelity Investments, 245 Summer Street, Boston, Massachusetts 02210. Officers appear below in alphabetical order.
Name, Year of Birth; Principal Occupation
Ned C. Lautenbach (1944)
Year of Election or Appointment: 2021
Member of the Advisory Board
Mr. Lautenbach also serves as a Member of the Advisory Board of other Fidelity® funds. Mr. Lautenbach currently serves as Chair of the Board of Governors, State University System of Florida (2013-present) and is a member of the Council on Foreign Relations (1994-present). He is also a member and has in the past served as Chairman of the Board of Directors of Artis-Naples (2012-present). Previously, Mr. Lautenbach served as a Trustee of certain Fidelity® funds (2000-2020) and a member and then Lead Director of the Board of Directors of Eaton Corporation (diversified industrial, 1997-2016). He was also a Partner at Clayton, Dubilier & Rice, LLC (private equity investment, 1998-2010); as well as Director of Sony Corporation (2006-2007). In addition, Mr. Lautenbach had a 30-year career with IBM (technology company), during which time he served as Senior Vice President and as a member of the Corporate Executive Committee (1968-1998).
Peter S. Lynch (1944)
Year of Election or Appointment: 2003
Member of the Advisory Board
Mr. Lynch also serves as a Member of the Advisory Board of other Fidelity® funds. Mr. Lynch is Vice Chairman and a Director of Fidelity Management & Research Company LLC (investment adviser firm). In addition, Mr. Lynch serves as a Trustee of Boston College and as the Chairman of the Inner-City Scholarship Fund. Previously, Mr. Lynch served as Vice Chairman and a Director of FMR Co., Inc. (investment adviser firm) and on the Special Olympics International Board of Directors (1997-2006).
Craig S. Brown (1977)
Year of Election or Appointment: 2019
Assistant Treasurer
Mr. Brown also serves as Assistant Treasurer of other funds. Mr. Brown is an employee of Fidelity Investments (2013-present).
John J. Burke III (1964)
Year of Election or Appointment: 2018
Chief Financial Officer
Mr. Burke also serves as Chief Financial Officer of other funds. Mr. Burke serves as Head of Investment Operations for Fidelity Fund and Investment Operations (2018-present) and is an employee of Fidelity Investments (1998-present). Previously Mr. Burke served as head of Asset Management Investment Operations (2012-2018).
William C. Coffey (1969)
Year of Election or Appointment: 2019
Assistant Secretary
Mr. Coffey also serves as Assistant Secretary of other funds. He is Senior Vice President and Deputy General Counsel of FMR LLC (diversified financial services company, 2010-present), and is an employee of Fidelity Investments. Previously, Mr. Coffey served as Secretary and CLO of certain funds (2018-2019); CLO, Secretary, and Senior Vice President of Fidelity Management & Research Company and FMR Co., Inc. (investment adviser firms, 2018-2019); Secretary of Fidelity SelectCo, LLC and Fidelity Investments Money Management, Inc. (investment adviser firms, 2018-2019); CLO of Fidelity Management & Research (Hong Kong) Limited, FMR Investment Management (UK) Limited, and Fidelity Management & Research (Japan) Limited (investment adviser firms, 2018-2019); and Assistant Secretary of certain funds (2009-2018).
Timothy M. Cohen (1969)
Year of Election or Appointment: 2018
Vice President
Mr. Cohen also serves as Vice President of other funds. Mr. Cohen serves as Co-Head of Equity (2018-present), a Director of Fidelity Management & Research (Japan) Limited (investment adviser firm, 2016-present), and is an employee of Fidelity Investments. Previously, Mr. Cohen served as Executive Vice President of Fidelity SelectCo, LLC (2019), Head of Global Equity Research (2016-2018), Chief Investment Officer - Equity and a Director of Fidelity Management & Research (U.K.) Inc. (investment adviser firm, 2013-2015) and as a Director of Fidelity Management & Research (Hong Kong) Limited (investment adviser firm, 2017).
Jonathan Davis (1968)
Year of Election or Appointment: 2010
Assistant Treasurer
Mr. Davis also serves as Assistant Treasurer of other funds. Mr. Davis serves as Assistant Treasurer of FMR Capital, Inc. (2017-present) and is an employee of Fidelity Investments. Previously, Mr. Davis served as Vice President and Associate General Counsel of FMR LLC (diversified financial services company, 2003-2010).
Laura M. Del Prato (1964)
Year of Election or Appointment: 2018
Assistant Treasurer
Ms. Del Prato also serves as an officer of other funds. Ms. Del Prato is an employee of Fidelity Investments (2017-present). Previously, Ms. Del Prato served as President and Treasurer of The North Carolina Capital Management Trust: Cash Portfolio and Term Portfolio (2018-2020). Prior to joining Fidelity Investments, Ms. Del Prato served as a Managing Director and Treasurer of the JPMorgan Mutual Funds (2014-2017). Prior to JPMorgan, Ms. Del Prato served as a partner at Cohen Fund Audit Services (accounting firm, 2012-2013) and KPMG LLP (accounting firm, 2004-2012).
Colm A. Hogan (1973)
Year of Election or Appointment: 2020
Assistant Treasurer
Mr. Hogan also serves as an officer of other funds. Mr. Hogan serves as Assistant Treasurer of FMR Capital, Inc. (2017-present) and is an employee of Fidelity Investments (2005-present). Previously, Mr. Hogan served as Deputy Treasurer of certain Fidelity® funds (2016-2020) and Assistant Treasurer of certain Fidelity® funds (2016-2018).
Pamela R. Holding (1964)
Year of Election or Appointment: 2018
Vice President
Ms. Holding also serves as Vice President of other funds. Ms. Holding serves as Co-Head of Equity (2018-present) and is an employee of Fidelity Investments (2013-present). Previously, Ms. Holding served as Executive Vice President of Fidelity SelectCo, LLC (2019) and as Chief Investment Officer of Fidelity Institutional Asset Management (2013-2018).
Cynthia Lo Bessette (1969)
Year of Election or Appointment: 2019
Secretary and Chief Legal Officer (CLO)
Ms. Lo Bessette also serves as an officer of other funds. Ms. Lo Bessette serves as CLO, Secretary, and Senior Vice President of Fidelity Management & Research Company LLC (investment adviser firm, 2019-present); and CLO of Fidelity Management & Research (Hong Kong) Limited, FMR Investment Management (UK) Limited, and Fidelity Management & Research (Japan) Limited (investment adviser firms, 2019-present). She is a Senior Vice President and Deputy General Counsel of FMR LLC (diversified financial services company, 2019-present), and is an employee of Fidelity Investments. Previously, Ms. Lo Bessette served as CLO, Secretary, and Senior Vice President of FMR Co., Inc. (investment adviser firm, 2019); Secretary of Fidelity SelectCo, LLC and Fidelity Investments Money Management, Inc. (investment adviser firms, 2019). Prior to joining Fidelity Investments, Ms. Lo Bessette was Executive Vice President, General Counsel (2016-2019) and Senior Vice President, Deputy General Counsel (2015-2016) of OppenheimerFunds (investment management company) and Deputy Chief Legal Officer (2013-2015) of Jennison Associates LLC (investment adviser firm).
Chris Maher (1972)
Year of Election or Appointment: 2020
Deputy Treasurer
Mr. Maher also serves as an officer of other funds. Mr. Maher serves as Assistant Treasurer of FMR Capital, Inc. (2017-present), and is an employee of Fidelity Investments (2008-present). Previously, Mr. Maher served as Assistant Treasurer of certain funds (2013-2020); Vice President of Asset Management Compliance (2013), Vice President of the Program Management Group of FMR (investment adviser firm, 2010-2013), and Vice President of Valuation Oversight (2008-2010).
Jason P. Pogorelec (1975)
Year of Election or Appointment: 2020
Chief Compliance Officer
Mr. Pogorelec also serves as Chief Compliance Officer of other funds. Mr. Pogorelec is a senior Vice President of Asset Management Compliance for Fidelity Investments and is an employee of Fidelity Investments (2006-present). Previously, Mr. Pogorelec served as Vice President, Associate General Counsel for Fidelity Investments (2010-2020) and Assistant Secretary of certain Fidelity funds (2015-2020).
Brett Segaloff (1972)
Year of Election or Appointment: 2021
Anti-Money Laundering (AML) Officer
Mr. Segaloff also serves as an AML Officer of other funds and other related entities. He is Director, Anti-Money Laundering (2007-present) of FMR LLC (diversified financial services company) and is an employee of Fidelity Investments (1996-present).
Stacie M. Smith (1974)
Year of Election or Appointment: 2016
President and Treasurer
Ms. Smith also serves as an officer of other funds. Ms. Smith serves as Assistant Treasurer of FMR Capital, Inc. (2017-present), is an employee of Fidelity Investments (2009-present), and has served in other fund officer roles. Prior to joining Fidelity Investments, Ms. Smith served as Senior Audit Manager of Ernst & Young LLP (accounting firm, 1996-2009). Previously, Ms. Smith served as Assistant Treasurer (2013-2019) and Deputy Treasurer (2013-2016) of certain Fidelity® funds.
Marc L. Spector (1972)
Year of Election or Appointment: 2016
Assistant Treasurer
Mr. Spector also serves as an officer of other funds. Mr. Spector serves as Assistant Treasurer of FMR Capital, Inc. (2017-present) and is an employee of Fidelity Investments (2016-present). Prior to joining Fidelity Investments, Mr. Spector served as Director at the Siegfried Group (accounting firm, 2013-2016), and prior to Siegfried Group as audit senior manager at Deloitte & Touche LLP (accounting firm, 2005-2013).
Jim Wegmann (1979)
Year of Election or Appointment: 2019
Assistant Treasurer
Mr. Wegmann also serves as Assistant Treasurer of other funds. Mr. Wegmann is an employee of Fidelity Investments (2011-present).
Shareholder Expense Example
As a shareholder, you incur two types of costs: (1) transaction costs, which may include sales charges (loads) on purchase payments or redemption proceeds, as applicable and (2) ongoing costs, which generally include management fees, distribution and/or service (12b-1) fees and other Fund expenses. This Example is intended to help you understand your ongoing costs (in dollars) of investing in a fund and to compare these costs with the ongoing costs of investing in other mutual funds.
The Example is based on an investment of $1,000 invested at the beginning of the period and held for the entire period (July 1, 2020 to December 31, 2020).
Actual Expenses
The first line of the accompanying table provides information about actual account values and actual expenses. You may use the information in this line, together with the amount you invested, to estimate the expenses that you paid over the period. Simply divide your account value by $1,000.00 (for example, an $8,600 account value divided by $1,000.00 = 8.6), then multiply the result by the number in the first line for a class/Fund under the heading entitled "Expenses Paid During Period" to estimate the expenses you paid on your account during this period. If any fund is a shareholder of any underlying mutual funds or exchange-traded funds (ETFs) (the Underlying Funds), such fund indirectly bears its proportional share of the expenses of the Underlying Funds in addition to the direct expenses incurred presented in the table. These fees and expenses are not included in the annualized expense ratio used to calculate the expense estimate in the table below. The estimate of expenses does not include any fees or other expenses of any variable annuity or variable life insurance product. If they were, the estimate of expenses you paid during the period would be higher, and your ending account value would be lower.
Hypothetical Example for Comparison Purposes
The second line of the accompanying table provides information about hypothetical account values and hypothetical expenses based on the actual expense ratio and an assumed rate of return of 5% per year before expenses, which is not the actual return. The hypothetical account values and expenses may not be used to estimate the actual ending account balance or expenses you paid for the period. You may use this information to compare the ongoing costs of investing in the Fund and other funds. To do so, compare this 5% hypothetical example with the 5% hypothetical examples that appear in the shareholder reports of the other funds. If any fund is a shareholder of any Underlying Funds, such fund indirectly bears its proportional share of the expenses of the Underlying Funds in addition to the direct expenses as presented in the table. These fees and expenses are not included in the annualized expense ratio used to calculate the expense estimate in the table below. The estimate of expenses does not include any fees or other expenses of any variable annuity or variable life insurance product. If they were, the estimate of expenses you paid during the period would be higher, and your ending account value would be lower.
Please note that the expenses shown in the table are meant to highlight your ongoing costs only and do not reflect any transaction costs. Therefore, the second line of the table is useful in comparing ongoing costs only, and will not help you determine the relative total costs of owning different funds.
| | Annualized Expense Ratio-A | Beginning
Account Value
July 1, 2020 | Ending
Account Value
December 31, 2020 | Expenses Paid
During Period-B
July 1, 2020
to December 31, 2020 |
| VIP Floating Rate High Income Portfolio | | | | |
| Initial Class | .72% | | | |
| Actual | | $1,000.00 | $1,075.40 | $3.76 |
| Hypothetical-C | | $1,000.00 | $1,021.52 | $3.66 |
| Investor Class | .75% | | | |
| Actual | | $1,000.00 | $1,076.30 | $3.91 |
| Hypothetical-C | | $1,000.00 | $1,021.37 | $3.81 |
A Annualized expense ratio reflects expenses net of applicable fee waivers.
B Expenses are equal to the annualized expense ratio, multiplied by the average account value over the period, multiplied by 184/ 366 (to reflect the one-half year period). The fees and expenses of any Underlying Funds are not included in each annualized expense ratio.
C 5% return per year before expenses
Proxy Voting Results
A special meeting of shareholders was held on June 9, 2020. The results of votes taken among shareholders on the proposals before them are reported below. Each vote reported represents one dollar of net asset value held on the record date for the meeting.
PROPOSAL 1
To elect a Board of Trustees.
| | # of
Votes | % of
Votes |
| Dennis J. Dirks |
| Affirmative | 11,099,447,424.890 | 95.490 |
| Withheld | 524,241,637.164 | 4.510 |
| TOTAL | 11,623,689,062.054 | 100.000 |
| Donald F. Donahue |
| Affirmative | 11,111,963,232.945 | 95.598 |
| Withheld | 511,725,829.109 | 4.402 |
| TOTAL | 11,623,689,062.054 | 100.000 |
| Bettina Doulton |
| Affirmative | 11,132,379,469.922 | 95.773 |
| Withheld | 491,309,592.132 | 4.227 |
| TOTAL | 11,623,689,062.054 | 100.000 |
| Vicki L. Fuller |
| Affirmative | 11,132,346,192.263 | 95.773 |
| Withheld | 491,342,869.791 | 4.227 |
| TOTAL | 11,623,689,062.054 | 100.000 |
| Patricia L. Kampling |
| Affirmative | 11,141,812,359.694 | 95.854 |
| Withheld | 481,876,702.360 | 4.146 |
| TOTAL | 11,623,689,062.054 | 100.000 |
| Alan J. Lacy |
| Affirmative | 11,081,103,173.144 | 95.332 |
| Withheld | 542,585,888.910 | 4.668 |
| TOTAL | 11,623,689,062.054 | 100.000 |
| Ned C. Lautenbach |
| Affirmative | 11,051,092,644.521 | 95.074 |
| Withheld | 572,596,417.533 | 4.926 |
| TOTAL | 11,623,689,062.054 | 100.000 |
| Robert A. Lawrence |
| Affirmative | 11,100,774,895.497 | 95.501 |
| Withheld | 522,914,166.556 | 4.499 |
| TOTAL | 11,623,689,062.054 | 100.000 |
| Joseph Mauriello |
| Affirmative | 11,070,909,380.371 | 95.244 |
| Withheld | 552,779,681.683 | 4.756 |
| TOTAL | 11,623,689,062.054 | 100.000 |
| Cornelia M. Small |
| Affirmative | 11,101,337,946.609 | 95.506 |
| Withheld | 522,351,115.445 | 4.494 |
| TOTAL | 11,623,689,062.054 | 100.000 |
| Garnett A. Smith |
| Affirmative | 11,082,555,490.179 | 95.345 |
| Withheld | 541,133,571.875 | 4.655 |
| TOTAL | 11,623,689,062.054 | 100.000 |
| David M. Thomas |
| Affirmative | 11,094,352,794.165 | 95.446 |
| Withheld | 529,336,267.889 | 4.554 |
| TOTAL | 11,623,689,062.054 | 100.000 |
| Susan Tomasky |
| Affirmative | 11,124,148,109.894 | 95.702 |
| Withheld | 499,540,952.160 | 4.298 |
| TOTAL | 11,623,689,062.054 | 100.000 |
| Michael E. Wiley |
| Affirmative | 11,096,957,446.084 | 95.468 |
| Withheld | 526,731,615.970 | 4.532 |
| TOTAL | 11,623,689,062.054 | 100.000 |
PROPOSAL 2
To convert a fundamental investment policy to a non-fundamental investment policy.
| | # of
Votes | % of
Votes |
| Affirmative | 136,574,965.535 | 78.693 |
| Against | 20,173,814.529 | 11.624 |
| Abstain | 16,804,631.622 | 9.683 |
| Broker Non-Vote | 0.00 | 0.00 |
| TOTAL | 173,553,411.686 | 100.000 |
|
| Proposal 1 reflects trust wide proposal and voting results. |
VIPFHI-ANN-0221
1.9859331.106
Item 2.
Code of Ethics
As of the end of the period, December 31, 2020, Variable Insurance Products Fund (the trust) has adopted a code of ethics, as defined in Item 2 of Form N-CSR, that applies to its President and Treasurer and its Chief Financial Officer. A copy of the code of ethics is filed as an exhibit to this Form N-CSR.
Item 3.
Audit Committee Financial Expert
The Board of Trustees of the trust has determined that Donald F. Donahue is an audit committee financial expert, as defined in Item 3 of Form N-CSR. Mr. Donahue is independent for purposes of Item 3 of Form N-CSR.
Item 4.
Principal Accountant Fees and Services
Fees and Services
The following table presents fees billed by Deloitte & Touche LLP, the member firms of Deloitte Touche Tohmatsu, and their respective affiliates (collectively, “Deloitte Entities”) in each of the last two fiscal years for services rendered to VIP Value Portfolio (the “Fund”):
Services Billed by Deloitte Entities
December 31, 2020 FeesA
| | | | |
| Audit Fees | Audit-Related Fees | Tax Fees | All Other Fees |
VIP Value Portfolio | $40,900 | $- | $12,200 | $1,100 |
| | | | |
| Audit Fees | Audit-Related Fees | Tax Fees | All Other Fees |
VIP Value Portfolio | $45,000 | $100 | $8,400 | $1,100 |
A Amounts may reflect rounding.
The following table presents fees billed by PricewaterhouseCoopers LLP (“PwC”) in each of the last two fiscal years for services rendered to VIP Equity-Income Portfolio, VIP Floating Rate High Income Portfolio, VIP Growth Portfolio, VIP High Income Portfolio and VIP Overseas Portfolio (the “Funds”):
Services Billed by PwC
December 31, 2020 FeesA
| | | | |
| Audit Fees | Audit-Related Fees | Tax Fees | All Other Fees |
VIP Equity-Income Portfolio | $58,500 | $5,300 | $11,300 | $2,200 |
VIP Floating Rate High Income Portfolio | $59,500 | $5,400 | $9,800 | $2,200 |
VIP Growth Portfolio | $52,200 | $4,600 | $7,700 | $1,900 |
VIP High Income Portfolio | $68,900 | $6,000 | $8,700 | $2,400 |
VIP Overseas Portfolio | $54,300 | $5,000 | $10,900 | $2,100 |
| | | | |
| Audit Fees | Audit-Related Fees | Tax Fees | All Other Fees |
VIP Equity-Income Portfolio | $66,000 | $5,400 | $5,600 | $2,300 |
VIP Floating Rate High Income Portfolio | $59,000 | $4,800 | $3,500 | $2,000 |
VIP Growth Portfolio | $58,000 | $4,700 | $3,100 | $2,000 |
VIP High Income Portfolio | $85,000 | $6,800 | $3,300 | $2,900 |
VIP Overseas Portfolio | $62,000 | $5,100 | $5,500 | $2,200 |
A Amounts may reflect rounding.
The following table(s) present(s) fees billed by Deloitte Entities and PwC that were required to be approved by the Audit Committee for services that relate directly to the operations and financial reporting of the Fund(s) and that are rendered on behalf of Fidelity Management & Research Company LLC ("FMR") and entities controlling, controlled by, or under common control with FMR (not including any sub-adviser whose role is primarily portfolio management and is subcontracted with or overseen by another investment adviser) that provide ongoing services to the Fund(s) (“Fund Service Providers”):
Services Billed by Deloitte Entities
| | |
| December 31, 2020A | December 31, 2019A |
Audit-Related Fees | $- | $290,000 |
Tax Fees | $- | $5,000 |
All Other Fees | $- | $- |
A Amounts may reflect rounding.
Services Billed by PwC
| | |
| December 31, 2020A | December 31, 2019A |
Audit-Related Fees | $9,377,400 | $7,705,000 |
Tax Fees | $30,000 | $10,000 |
All Other Fees | $- | $- |
A Amounts may reflect rounding.
“Audit-Related Fees” represent fees billed for assurance and related services that are reasonably related to the performance of the fund audit or the review of the fund's financial statements and that are not reported under Audit Fees.
“Tax Fees” represent fees billed for tax compliance, tax advice or tax planning that relate directly to the operations and financial reporting of the fund.
“All Other Fees” represent fees billed for services provided to the fund or Fund Service Provider, a significant portion of which are assurance related, that relate directly to the operations and financial reporting of the fund, excluding those services that are reported under Audit Fees, Audit-Related Fees or Tax Fees.
Assurance services must be performed by an independent public accountant.
* * *
The aggregate non-audit fees billed by Deloitte Entities and PwC for services rendered to the Fund(s), FMR (not including any sub-adviser whose role is primarily portfolio management and is subcontracted with or overseen by another investment adviser), and any Fund Service Provider for each of the last two fiscal years of the Fund(s) are as follows:
| | |
Billed By | December 31, 2020A | December 31, 2019A |
Deloitte Entities | $514,900 | $585,000 |
PwC | $14,567,800 | $12,415,000 |
A Amounts may reflect rounding.
The trust's Audit Committee has considered non-audit services that were not pre-approved that were provided by Deloitte Entities and PwC to Fund Service Providers to be compatible with maintaining the independence of Deloitte Entities and PwC in its(their) audit of the Fund(s), taking into account representations from Deloitte Entities and PwC, in accordance with Public Company Accounting Oversight Board rules,
regarding its independence from the Fund(s) and its(their) related entities and FMR’s review of the appropriateness and permissibility under applicable law of such non-audit services prior to their provision to the Fund(s) Service Providers.
Audit Committee Pre-Approval Policies and Procedures
The trust’s Audit Committee must pre-approve all audit and non-audit services provided by a fund’s independent registered public accounting firm relating to the operations or financial reporting of the fund. Prior to the commencement of any audit or non-audit services to a fund, the Audit Committee reviews the services to determine whether they are appropriate and permissible under applicable law.
The Audit Committee has adopted policies and procedures to, among other purposes, provide a framework for the Committee’s consideration of non-audit services by the audit firms that audit the Fidelity funds. The policies and procedures require that any non-audit service provided by a fund audit firm to a Fidelity fund and any non-audit service provided by a fund auditor to a Fund Service Provider that relates directly to the operations and financial reporting of a Fidelity fund (“Covered Service”) are subject to approval by the Audit Committee before such service is provided.
All Covered Services must be approved in advance of provision of the service either: (i) by formal resolution of the Audit Committee, or (ii) by oral or written approval of the service by the Chair of the Audit Committee (or if the Chair is unavailable, such other member of the Audit Committee as may be designated by the Chair to act in the Chair’s absence). The approval contemplated by (ii) above is permitted where the Treasurer determines that action on such an engagement is necessary before the next meeting of the Audit Committee.
Non-audit services provided by a fund audit firm to a Fund Service Provider that do not relate directly to the operations and financial reporting of a Fidelity fund are reported to the Audit Committee periodically.
Non-Audit Services Approved Pursuant to Rule 2-01(c)(7)(i)(C) and (ii) of Regulation S-X (“De Minimis Exception”)
There were no non-audit services approved or required to be approved by the Audit Committee pursuant to the De Minimis Exception during the Fund’s(s’) last two fiscal years relating to services provided to (i) the Fund(s) or (ii) any Fund Service Provider that relate directly to the operations and financial reporting of the Fund(s).
Item 5.
Audit Committee of Listed Registrants
Not applicable.
Item 6.
Investments
(a)
Not applicable.
(b)
Not applicable.
Item 7.
Disclosure of Proxy Voting Policies and Procedures for Closed-End Management Investment Companies
Not applicable.
Item 8.
Portfolio Managers of Closed-End Management Investment Companies
Not applicable.
Item 9.
Purchase of Equity Securities by Closed-End Management Investment Company and Affiliated Purchasers
Not applicable.
Item 10.
Submission of Matters to a Vote of Security Holders
There were no material changes to the procedures by which shareholders may recommend nominees to the trust’s Board of Trustees.
Item 11.
Controls and Procedures
(a)(i) The President and Treasurer and the Chief Financial Officer have concluded that the trust’s disclosure controls and procedures (as defined in Rule 30a-3(c) under the Investment Company Act) provide reasonable assurances that material information relating to the trust is made known to them by the appropriate persons, based on their evaluation of these controls and procedures as of a date within 90 days of the filing date of this report.
(a)(ii) There was no change in the trust’s internal control over financial reporting (as defined in Rule 30a-3(d) under the Investment Company Act) that occurred during the period covered by this report that has materially affected, or is reasonably likely to materially affect, the trust’s internal control over financial reporting.
Item 12.
Disclosure of Securities Lending Activities for Closed-End Management
Investment Companies
Not applicable.
Item 13.
Exhibits
SIGNATURES
Pursuant to the requirements of the Securities Exchange Act of 1934 and the Investment Company Act of 1940, the registrant has duly caused this report to be signed on its behalf by the undersigned, thereunto duly authorized.
Variable Insurance Products Fund
| |
By: | /s/Stacie M. Smith |
| Stacie M. Smith |
| President and Treasurer |
|
|
Date: | February 18, 2021 |
Pursuant to the requirements of the Securities Exchange Act of 1934 and the Investment Company Act of 1940, this report has been signed below by the following persons on behalf of the registrant and in the capacities and on the dates indicated.
| |
By: | /s/Stacie M. Smith |
| Stacie M. Smith |
| President and Treasurer |
|
|
Date: | February 18, 2021 |
| |
By: | /s/John J. Burke III |
| John J. Burke III |
| Chief Financial Officer |
|
|
Date: | February 18, 2021 |