UNITED STATES
SECURITIES AND EXCHANGE COMMISSION
Washington, D.C. 20549
Form N-CSR
CERTIFIED SHAREHOLDER REPORT OF REGISTERED
MANAGEMENT INVESTMENT COMPANIES
Investment Company Act File Number: 811-03334
CALVERT SOCIAL INVESTMENT FUND
(Exact Name of Registrant as Specified in Charter)
1825 Connecticut Avenue NW, Suite 400, Washington, DC 20009
(Address of Principal Executive Offices)
Deidre E. Walsh
Two International Place, Boston, Massachusetts 02110
(Name and Address of Agent for Services)
(202) 238-2200
(Registrant’s Telephone Number)
September 30
Date of Fiscal Year End
September 30, 2022
Date of Reporting Period
| Item 1. | Reports to Stockholders |
Calvert
Social Investment Fund
Annual Report
September 30, 2022
Calvert Balanced Fund • Calvert Bond Fund • Calvert Equity Fund
Commodity Futures Trading Commission Registration. The Commodity Futures Trading Commission (“CFTC”) has adopted regulations that subject registered investment companies and advisers to regulation by the CFTC if a fund invests more than a prescribed level of its assets in certain CFTC-regulated instruments (including futures, certain options and swap agreements) or markets itself as providing investment exposure to such instruments. The adviser has claimed an exclusion from the definition of “commodity pool operator” under the Commodity Exchange Act with respect to its management of each Fund and the other funds it manages. Accordingly, neither the Funds nor the adviser is subject to CFTC regulation.
Fund shares are not insured by the FDIC and are not deposits or other obligations of, or guaranteed by, any depository institution. Shares are subject to investment risks, including possible loss of principal invested.
This report must be preceded or accompanied by a current summary prospectus or prospectus. Before investing, investors should consider carefully the investment objective, risks, and charges and expenses of a mutual fund. This and other important information is contained in the summary prospectus and prospectus, which can be obtained from a financial intermediary. Prospective investors should read the prospectus carefully before investing. For further information, please call 1-800-368-2745.
Choose Planet-friendly E-delivery!
Sign up now for on-line statements, prospectuses, and fund reports. In less than five minutes you can help reduce paper mail and lower fund costs.
Just go to www.calvert.com. If you already have an online account with the Calvert funds, click on Login to access your Account and select the documents you would like to receive via e-mail.
If you’re new to online account access, click on Login, then Register to create your user name and password. Once you’re in, click on the E-delivery sign-up on the Account Portfolio page and follow the quick, easy steps.
Note: If your shares are not held directly with the Calvert funds but through a brokerage firm, you must contact your broker for electronic delivery options available through their firm.
Annual Report September 30, 2022
Calvert
Social Investment Fund
Calvert
Social Investment Fund
September 30, 2022
Management's Discussion of Fund Performance†
Economic and Market Conditions
The 12-month period starting October 1, 2021 was dominated by the ongoing effects of the COVID-19 pandemic and fallout from Russia’s invasion of Ukraine.
In the opening months of the period — despite the appearance of a new COVID-19 variant, the highest U.S. inflation readings in nearly four decades, and the U.S. Federal Reserve (the Fed) announcing it would begin tapering bond purchases — major U.S. equity indexes attained successive new highs.
But in February, Russia’s invasion of Ukraine sent shock waves through U.S. and global markets, exacerbating inflationary pressures on energy and food costs. Stock performance turned negative. Investors began to expect multiple interest rate hikes in the months ahead and worried that lower demand might lead to an economic recession. Between June and the end of September, the Fed hiked the federal funds rate three times — 0.75% each — and stock prices demonstrated sharp volatility
For the period as a whole, the S& P 500® Index returned -15.47%; and the Nasdaq Composite Index returned -26.25%.
For fixed-income assets, high inflation and attempts by global central banks to intentionally slow demand by raising interest rates, resulted in a period-long sell-off, with nearly all major U.S. bond indexes reporting double-digit declines.
In the opening months of the period, interest rates rose and bond prices fell in anticipation the Fed would begin a tapering policy to reduce monetary stimulus within the U.S. economy. As the Fed began to slow the pace of monthly bond purchases, U.S. Treasury rates rose amid mounting concerns over the prospect of multiple Fed rate hikes in 2022. That February, the invasion of Ukraine added to inflationary pressures, and interest rates rose during most of the spring and summer months.
By period-end, the Bloomberg U.S. Treasury Index returned -12.94%; the Bloomberg U.S. Corporate Bond Index returned -18.53%; and the Bloomberg U.S. Corporate High Yield Index returned -14.14%.
Fund Performance - Calvert Balanced Fund
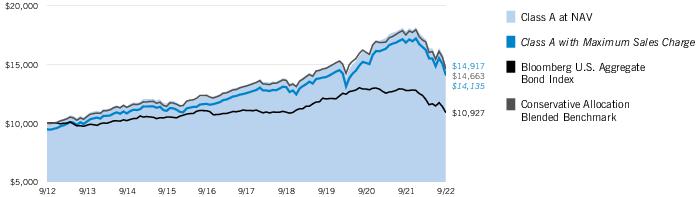
For the 12-month period ended September 30, 2022, Calvert Balanced Fund (the Fund) returned -14.40% for Class A shares at net asset value (NAV). The Fund outperformed its benchmark, the Russell 1000® Index (the Primary Index), which returned -17.22%; and outperformed the Balanced Blended Benchmark (the Blended Index), which returned -15.90%.
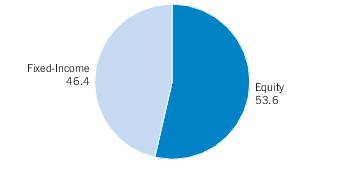
The Blended Index is composed of a mix of 60% Russell 1000® Index and 40% Bloomberg U.S. Aggregate Bond Index (the Secondary Index). The Fund normally invests between 50% and 75% of its net assets in equity securities and between 25% and 50% of its net assets in fixed-income securities. The equity portion is primarily in large-cap U.S. stocks. The fixed-income portion is primarily in investment-grade debt securities.
Within the equity portion of the Fund, security selections — especially in the communication services and information technology sectors -- contributed to performance relative to the Primary Index during the period. An overweight exposure to the health care sector further contributed relative returns.
AbbVie, Inc. (AbbVie), a bio-pharmaceutical company, was a leading contributor to Fund performance. AbbVie’s share price rose after the company reported strong earnings growth during the first two quarters of its fiscal year. AbbVie’s stock price also benefited from management’s positive outlook for several new products.
The Fund’s lack of exposure to Meta Platforms, Inc. (Meta), formerly known as Facebook, also contributed to performance relative to the Primary Index during the period. Meta’s share price declined amid concerns about the social media company’s slowing growth and increasing competition.
Elevance Health, Inc. (Elevance) is a managed health care provider offering clinical and behavioral pharmacy care. Elevance’s share price rose as it reported better-than-expected earnings growth during the period. Elevance’s share price was further strengthened by its multifaceted growth strategy, price increases, and expanding membership.
Overall, sector allocations in the Fund detracted from returns relative to the Primary Index during the period. In particular, an underweight exposure to the energy sector weighed on relative returns.
Alphabet, Inc., a technology conglomerate, was a leading detractor from performance relative to the Primary Index. Its share price fell on shrinking advertising revenue, lower-than-expected earnings, and management’s outlook for slowing growth.
Bill.com Holdings, Inc. (Bill.com), a provider of cloud-based software for automating back-office operations, also detracted from performance relative to the Primary Index. Bill.com’s share price fell during a period of rising interest rates and disappointing third-quarter results. By period-end, the stock was sold from the Fund.
See Endnotes and Additional Disclosures in this report.
Past performance is no guarantee of future results. Returns are historical and are calculated by determining the percentage change in net asset value (NAV) or offering price (as applicable) with all distributions reinvested. Furthermore, returns do not reflect the deduction of taxes that shareholders may have to pay on Fund distributions or upon the redemption of Fund shares. Investment return and principal value will fluctuate so that shares, when redeemed, may be worth more or less than their original cost. Performance for periods less than or equal to one year is cumulative. Performance is for the stated time period only; due to market volatility, current Fund performance may be lower or higher than the quoted return. For performance as of the most recent month-end, please refer to www.calvert.com.
Calvert
Social Investment Fund
September 30, 2022
Management's Discussion of Fund Performance† — continued
The Fund’s lack of exposure to Tesla, Inc. (Tesla) — because of concerns about the electric car maker’s earnings inconsistency and the stock’s high valuation — weighed on returns relative to the Primary Index. Tesla’s share price rose during the period as the company continued to increase revenues and meet production expectations.
Within the fixed-income portion of the Fund, a shorter-than-Secondary Index duration contributed to relative performance. An overweight allocation to asset-backed securities (ABS) further contributed to relative returns.
Overall, sector allocation positioning within the fixed-income portion of the Fund detracted from returns relative to the Secondary Index. In particular, an underweight exposure to U.S. Treasurys weighed on relative returns. In the fixed-income portion of the Fund, security selections also detracted overall. Selections within investment-grade credits and ABS especially detracted from performance relative to the Secondary Index during the period.
Fund Performance - Calvert Bond Fund
For the 12-month period ended September 30, 2022, Calvert Bond Fund (the Fund) returned -14.15% for Class A shares at net asset value (NAV), outperforming its benchmark, the Bloomberg U.S. Aggregate Bond Index (the Index), which returned -14.60%.
The Fund’s shorter-than-Index duration contributed to performance relative to the Index during the period. Overweight exposures to asset-backed securities (ABS) and non-agency mortgage-backed securities further enhanced relative performance. Security selections in government-related securities also contributed to relative returns.
In contrast, sector allocations and security selections in the Fund detracted overall from relative returns. Selections in investment-grade corporate bonds, ABS, and U.S. Treasurys, in particular, weighed on relative returns. In addition, an underweight exposure to U.S. Treasurys, and overweight exposures to high yield corporate and investment-grade corporate securities detracted from returns relative to the Index during the period.
Fund Performance - Calvert Equity Fund
For the 12-month period ended September 30, 2022, Calvert Equity Fund (the Fund) returned -16.35% for Class A shares at net asset value (NAV), outperforming its benchmark, the Russell 1000® Growth Index (the Index), which returned -22.59%.
The Fund’s security selections, especially in the consumer discretionary and communication services sectors, contributed to returns relative to the Index during the period. Selections in the information technology (IT) and financials sectors also enhanced relative performance. An underweight exposure to the communication services sector further contributed.
The Fund’s lack of exposure to Meta Platforms, Inc. (Meta), formerly known as Facebook, contributed to relative performance during the period. Meta’s share price declined during the period over concerns about the social media company’s slowing growth and increasing competition.
The share price of Dollar General Corp., a leading U.S. discount retailer, rose during the period as investors anticipated a growth in future sales by cost-conscious consumers seeking bargains in an inflationary economic environment.
PayPal Holdings, Inc. (PayPal), an online payments company, also contributed to relative returns. The Fund did not own PayPal stock early in the period when its share price suffered from slowing growth as the U.S. economy reopened and consumers shifted away from online purchases. However, the Fund did purchase a position in PayPal later in the period.
In contrast, security selections in the consumer staples sector and lack of exposure to the energy sector, which performed well during the period, detracted from returns relative to the Index.
The Fund’s lack of exposure to Apple, Inc. (Apple) detracted from performance relative to the Index during the period. Its share price rose as investors anticipated the launch of Apple’s iPhone 14 late in the period.
The share price of Tesla, Inc. (Tesla) rose during the period as the electric car manufacturer continued to increase revenues and meet production expectations. The Fund’s lack of exposure to Tesla — due to concerns about earnings inconsistency and the stock’s high valuation — weighed on returns relative to the Index during the period.
Adobe, Inc. (Adobe), a producer of software for creative professionals, detracted from performance relative to the Index. Adobe’s share price fell along with an overall decline in the IT sector during the period. Investors also grew concerned about the price of a recent acquisition and Adobe’s long-term competitive position in its market.
See Endnotes and Additional Disclosures in this report.
Past performance is no guarantee of future results. Returns are historical and are calculated by determining the percentage change in net asset value (NAV) or offering price (as applicable) with all distributions reinvested. Furthermore, returns do not reflect the deduction of taxes that shareholders may have to pay on Fund distributions or upon the redemption of Fund shares. Investment return and principal value will fluctuate so that shares, when redeemed, may be worth more or less than their original cost. Performance for periods less than or equal to one year is cumulative. Performance is for the stated time period only; due to market volatility, current Fund performance may be lower or higher than the quoted return. For performance as of the most recent month-end, please refer to www.calvert.com.
Calvert
Balanced Fund
September 30, 2022
Performance
Portfolio Manager(s) Vishal Khanduja, CFA, Brian S. Ellis, CFA and Charles B. Gaffney, each of Calvert Research and Management
| % Average Annual Total Returns1,2 | Class
Inception Date | Performance
Inception Date | One Year | Five Years | Ten Years |
| Class A at NAV | 10/21/1982 | 10/21/1982 | (14.40)% | 5.97% | 6.78% |
| Class A with 5.25% Maximum Sales Charge | — | — | (18.90) | 4.83 | 6.21 |
| Class C at NAV | 03/01/1994 | 10/21/1982 | (15.05) | 5.17 | 6.12 |
| Class C with 1% Maximum Deferred Sales Charge | — | — | (15.84) | 5.17 | 6.12 |
| Class I at NAV | 12/27/2004 | 10/21/1982 | (14.20) | 6.25 | 7.16 |
| Class R6 at NAV | 02/01/2019 | 10/21/1982 | (14.14) | 6.28 | 7.17 |
|
| Russell 1000® Index | — | — | (17.22)% | 8.99% | 11.60% |
| Bloomberg U.S. Aggregate Bond Index | — | — | (14.60) | (0.27) | 0.89 |
| Balanced Blended Benchmark | — | — | (15.90) | 5.57 | 7.45 |
| % Total Annual Operating Expense Ratios3 | Class A | Class C | Class I | Class R6 |
| | 0.90% | 1.66% | 0.66% | 0.61% |
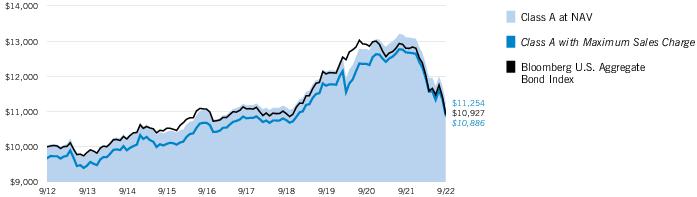
Growth of $10,000
This graph shows the change in value of a hypothetical investment of $10,000 in Class A of the Fund for the period indicated. For comparison, the same investment is shown in the indicated index.
| Growth of Investment2 | Amount Invested | Period Beginning | At NAV | With Maximum Sales Charge |
| Class C | $10,000 | 09/30/2012 | $18,114 | N.A. |
| Class I, at minimum investment | $1,000,000 | 09/30/2012 | $1,996,855 | N.A. |
| Class R6, at minimum investment | $5,000,000 | 09/30/2012 | $10,001,207 | N.A. |
See Endnotes and Additional Disclosures in this report.
Past performance is no guarantee of future results. Returns are historical and are calculated by determining the percentage change in net asset value (NAV) or offering price (as applicable) with all distributions reinvested. Furthermore, returns do not reflect the deduction of taxes that shareholders may have to pay on Fund distributions or upon the redemption of Fund shares. Investment return and principal value will fluctuate so that shares, when redeemed, may be worth more or less than their original cost. Performance for periods less than or equal to one year is cumulative. Performance is for the stated time period only; due to market volatility, current Fund performance may be lower or higher than the quoted return. For performance as of the most recent month-end, please refer to www.calvert.com.
Calvert
Balanced Fund
September 30, 2022
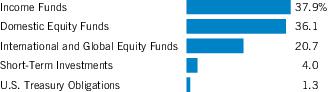
Asset Allocation (% of total investments)
Equity Investments Sector Allocation (% of total investments)
Fixed-Income Allocation (% of total investments)
Calvert
Bond Fund
September 30, 2022
Performance
Portfolio Manager(s) Vishal Khanduja, CFA and Brian S. Ellis, CFA, each of Calvert Research and Management
| % Average Annual Total Returns1,2 | Class
Inception Date | Performance
Inception Date | One Year | Five Years | Ten Years |
| Class A at NAV | 08/24/1987 | 08/24/1987 | (14.15)% | 0.15% | 1.19% |
| Class A with 3.25% Maximum Sales Charge | — | — | (16.95) | (0.51) | 0.85 |
| Class C at NAV | 06/01/1998 | 08/24/1987 | (14.83) | (0.65) | 0.51 |
| Class C with 1% Maximum Deferred Sales Charge | — | — | (15.66) | (0.65) | 0.51 |
| Class I at NAV | 03/31/2000 | 08/24/1987 | (13.95) | 0.37 | 1.55 |
| Class R6 at NAV | 10/03/2017 | 08/24/1987 | (13.96) | 0.42 | 1.57 |
|
| Bloomberg U.S. Aggregate Bond Index | — | — | (14.60)% | (0.27)% | 0.89% |
| % Total Annual Operating Expense Ratios3 | Class A | Class C | Class I | Class R6 |
| Gross | 0.74% | 1.54% | 0.54% | 0.47% |
| Net | 0.73 | 1.53 | 0.53 | 0.46 |
Growth of $10,000
This graph shows the change in value of a hypothetical investment of $10,000 in Class A of the Fund for the period indicated. For comparison, the same investment is shown in the indicated index.
| Growth of Investment2 | Amount Invested | Period Beginning | At NAV | With Maximum Sales Charge |
| Class C | $10,000 | 09/30/2012 | $10,527 | N.A. |
| Class I, at minimum investment | $1,000,000 | 09/30/2012 | $1,166,366 | N.A. |
| Class R6, at minimum investment | $5,000,000 | 09/30/2012 | $5,843,668 | N.A. |
See Endnotes and Additional Disclosures in this report.
Past performance is no guarantee of future results. Returns are historical and are calculated by determining the percentage change in net asset value (NAV) or offering price (as applicable) with all distributions reinvested. Furthermore, returns do not reflect the deduction of taxes that shareholders may have to pay on Fund distributions or upon the redemption of Fund shares. Investment return and principal value will fluctuate so that shares, when redeemed, may be worth more or less than their original cost. Performance for periods less than or equal to one year is cumulative. Performance is for the stated time period only; due to market volatility, current Fund performance may be lower or higher than the quoted return. For performance as of the most recent month-end, please refer to www.calvert.com.
Calvert
Bond Fund
September 30, 2022
Asset Allocation (% of total investments)
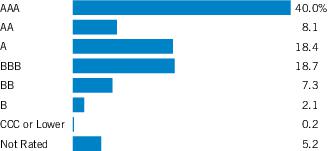
| Credit Quality (% of bond and loan holdings)1 |
Footnotes:
| 1 | For purposes of the Fund’s rating restrictions, ratings are based on Moody’s Investors Service, Inc. (“Moody’s”), S&P Global Ratings (“S&P”) or Fitch Ratings (“Fitch”), or Kroll Bond Rating Agency, LLC (“Kroll”) for securitized debt instruments only (such as asset-backed securities (“ABS”) and mortgage-backed securities (“MBS”)), as applicable. If securities are rated differently by the ratings agencies, the highest rating is applied. Ratings, which are subject to change, apply to the creditworthiness of the issuers of the underlying securities and not to the Fund or its shares. Credit ratings measure the quality of an issuance based on the issuer’s creditworthiness, with ratings ranging from AAA, being the highest, to D, being the lowest based on S&P’s measures. Ratings of BBB or higher by S&P, Fitch or Kroll (Baa or higher by Moody’s) are considered to be investment-grade quality. Credit ratings are based largely on the ratings agency’s analysis at the time of rating. The rating assigned to any particular security is not necessarily a reflection of the issuer’s current financial condition and does not necessarily reflect its assessment of the volatility of a security’s market value or of the liquidity of an investment in the security. Holdings designated as “Not Rated” (if any) are not rated by the national ratings agencies stated above. |
Calvert
Equity Fund
September 30, 2022
Performance
Portfolio Manager(s) Joseph B. Hudepohl, CFA, Lance V. Garrison, CFA, Jeffrey A. Miller, CFA and Robert R. Walton, Jr., CFA, each of Atlanta Capital Management Company, LLC
| % Average Annual Total Returns1,2 | Class
Inception Date | Performance
Inception Date | One Year | Five Years | Ten Years |
| Class A at NAV | 08/24/1987 | 08/24/1987 | (16.35)% | 13.01% | 12.79% |
| Class A with 5.25% Maximum Sales Charge | — | — | (20.74) | 11.80 | 12.18 |
| Class C at NAV | 03/01/1994 | 08/24/1987 | (16.96) | 12.17 | 12.12 |
| Class C with 1% Maximum Deferred Sales Charge | — | — | (17.73) | 12.17 | 12.12 |
| Class I at NAV | 11/01/1999 | 08/24/1987 | (16.14) | 13.32 | 13.20 |
| Class R6 at NAV | 10/03/2017 | 08/24/1987 | (16.09) | 13.37 | 13.23 |
|
| Russell 1000® Growth Index | — | — | (22.59)% | 12.16% | 13.69% |
| % Total Annual Operating Expense Ratios3 | Class A | Class C | Class I | Class R6 |
| | 0.91% | 1.66% | 0.66% | 0.60% |
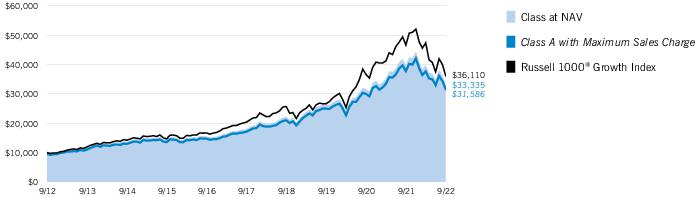
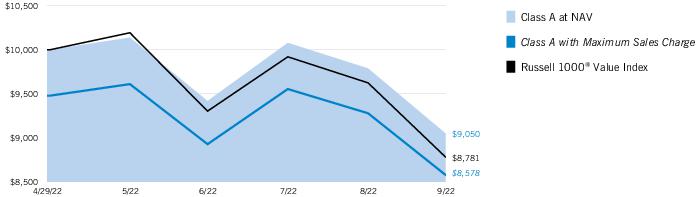
Growth of $10,000
This graph shows the change in value of a hypothetical investment of $10,000 in Class A of the Fund for the period indicated. For comparison, the same investment is shown in the indicated index.
| Growth of Investment2 | Amount Invested | Period Beginning | At NAV | With Maximum Sales Charge |
| Class C | $10,000 | 09/30/2012 | $31,411 | N.A. |
| Class I, at minimum investment | $1,000,000 | 09/30/2012 | $3,458,614 | N.A. |
| Class R6, at minimum investment | $5,000,000 | 09/30/2012 | $17,331,932 | N.A. |
See Endnotes and Additional Disclosures in this report.
Past performance is no guarantee of future results. Returns are historical and are calculated by determining the percentage change in net asset value (NAV) or offering price (as applicable) with all distributions reinvested. Furthermore, returns do not reflect the deduction of taxes that shareholders may have to pay on Fund distributions or upon the redemption of Fund shares. Investment return and principal value will fluctuate so that shares, when redeemed, may be worth more or less than their original cost. Performance for periods less than or equal to one year is cumulative. Performance is for the stated time period only; due to market volatility, current Fund performance may be lower or higher than the quoted return. For performance as of the most recent month-end, please refer to www.calvert.com.
Calvert
Equity Fund
September 30, 2022
| Sector Allocation (% of net assets) |
| Top 10 Holdings (% of net assets)1 | |
| Danaher Corp. | 4.8% |
| Thermo Fisher Scientific, Inc. | 4.5 |
| Alphabet, Inc., Class C | 4.3 |
| Visa, Inc., Class A | 4.3 |
| Microsoft Corp. | 4.3 |
| Mastercard, Inc., Class A | 4.1 |
| Verisk Analytics, Inc. | 3.8 |
| TJX Cos., Inc. (The) | 3.6 |
| Dollar General Corp. | 3.2 |
| American Tower Corp. | 3.2 |
| Total | 40.1% |
Footnotes:
| 1 | Excludes cash and cash equivalents. |
Calvert
Social Investment Fund
September 30, 2022
Endnotes and Additional Disclosures
| † | The views expressed in this report are those of the portfolio manager(s) and are current only through the date stated at the top of this page. These views are subject to change at any time based upon market or other conditions, and Calvert and the Fund(s) disclaim any responsibility to update such views. These views may not be relied upon as investment advice and, because investment decisions are based on many factors, may not be relied upon as an indication of trading intent on behalf of any Calvert fund. This commentary may contain statements that are not historical facts, referred to as “forward-looking statements.” The Fund’s actual future results may differ significantly from those stated in any forward-looking statement, depending on factors such as changes in securities or financial markets or general economic conditions, the volume of sales and purchases of Fund shares, the continuation of investment advisory, administrative and service contracts, and other risks discussed from time to time in the Fund’s filings with the Securities and Exchange Commission. |
| | |
| 1 | Russell 1000® Index is an unmanaged index of 1,000 U.S. large-cap stocks. Russell 1000® Growth Index is an unmanaged index of U.S. large-cap growth stocks. Bloomberg U.S. Aggregate Bond Index is an unmanaged index of domestic investment-grade bonds, including corporate, government and mortgage-backed securities. The Balanced Blended Benchmark is an internally constructed benchmark comprised of a blend of 60% Russell 1000® Index and 40% Bloomberg U.S. Aggregate Bond Index, and is rebalanced monthly. Unless otherwise stated, index returns do not reflect the effect of any applicable sales charges, commissions, expenses, taxes or leverage, as applicable. It is not possible to invest directly in an index. |
| 2 | Total Returns at NAV do not include applicable sales charges. If sales charges were deducted, the returns would be lower. Total Returns shown with maximum sales charge reflect the stated maximum sales charge. Unless otherwise stated, performance does not reflect the deduction of taxes on Fund distributions or redemptions of Fund shares.Performance prior to the inception date of a class may be linked to the performance of an older class of the Fund. This linked performance is adjusted for any applicable sales charge, but is not adjusted for class expense differences. If adjusted for such differences, the performance would be different. The performance of Class R6 is linked to Class I. Performance presented in the Financial Highlights included in the financial statements is not linked.Effective November 5, 2020, Class C shares automatically convert to Class A shares eight years after purchase. The average annual total returns listed for Class C reflect conversion to Class A shares after eight years. Prior to November 5, 2020, Class C shares automatically converted to Class A shares ten years after purchase. |
| | Calvert Research and Management became the investment adviser to each Fund on December 31, 2016. Performance reflected prior to such date is that of each Fund’s former investment adviser. |
| 3 | Source: Fund prospectus. Net expense ratios for Calvert Bond Fund reflect a contractual expense reimbursement that continues through 1/31/23. The expense ratios for the current reporting period can be found in the Financial Highlights section of this report. Performance reflects expenses waived and/or reimbursed, if applicable. Without such waivers and/or reimbursements, performance would have been lower. |
| | Fund profiles subject to change due to active management. |
| | Additional Information |
| | S&P 500® Index is an unmanaged index of large-cap stocks commonly used as a measure of U.S. stock market performance. S&P Dow Jones Indices are a product of S&P Dow Jones Indices LLC (“S&P DJI”) and have been licensed for use. S&P® and S&P 500® are registered trademarks of S&P DJI; Dow Jones® is a registered trademark of Dow Jones Trademark Holdings LLC (“Dow Jones”); S&P DJI, Dow Jones and their respective affiliates do not sponsor, endorse, sell or promote the Fund, will not have any liability with respect thereto and do not have any liability for any errors, omissions, or interruptions of the S&P Dow Jones Indices. Nasdaq Composite Index is a market capitalization-weighted index of all domestic and international securities listed on Nasdaq. Source: Nasdaq, Inc. The information is provided by Nasdaq (with its affiliates, are referred to as the “Corporations”) and Nasdaq’s third party licensors on an “as is” basis and the Corporations make no guarantees and bear no liability of any kind with respect to the information or the Fund. Bloomberg U.S. Treasury Index measures the performance of U.S. Treasuries with a maturity of one year or more. Bloomberg U.S. Corporate Bond Index measures the performance of investment-grade U.S. corporate securities with a maturity of one year or more. Bloomberg U.S. Corporate High Yield Index measures USD-denominated, non-investment grade corporate securities. |
| | Duration is a measure of the expected change in price of a bond — in percentage terms — given a one percent change in interest rates, all else being constant. Securities with lower durations tend to be less sensitive to interest rate changes. |
Calvert
Social Investment Fund
September 30, 2022
Example
As a Fund shareholder, you incur two types of costs: (1) transaction costs, including sales charges (loads) on purchases and redemption fees (if applicable); and (2) ongoing costs, including management fees; distribution and/or service fees; and other Fund expenses. This Example is intended to help you understand your ongoing costs (in dollars) of Fund investing and to compare these costs with the ongoing costs of investing in other mutual funds. The Example is based on an investment of $1,000 invested at the beginning of the period and held for the entire period (April 1, 2022 to September 30, 2022).
Actual Expenses
The first section of the tables below provides information about actual account values and actual expenses. You may use the information in this section, together with the amount you invested, to estimate the expenses that you paid over the period. Simply divide your account value by $1,000 (for example, an $8,600 account value divided by $1,000 = 8.6), then multiply the result by the number in the first section under the heading entitled “Expenses Paid During Period” to estimate the expenses you paid on your account during this period.
Hypothetical Example for Comparison Purposes
The second section of the tables below provides information about hypothetical account values and hypothetical expenses based on the actual Fund expense ratio and an assumed rate of return of 5% per year (before expenses), which is not the actual Fund return. The hypothetical account values and expenses may not be used to estimate the actual ending account balance or expenses you paid for the period. You may use this information to compare the ongoing costs of investing in the Fund and other funds. To do so, compare this 5% hypothetical example with the 5% hypothetical examples that appear in the shareholder reports of the other funds.
Please note that the expenses shown in the tables are meant to highlight your ongoing costs only and do not reflect any transactional costs, such as sales charges (loads) or redemption fees (if applicable). Therefore, the second section of the tables is useful in comparing ongoing costs only, and will not help you determine the relative total costs of owning different funds. In addition, if these transactional costs were included, your costs would be higher.
Calvert Balanced Fund
| | Beginning
Account Value
(4/1/22) | Ending
Account Value
(9/30/22) | Expenses Paid
During Period*
(4/1/22 – 9/30/22) | Annualized
Expense
Ratio |
| Actual | | | | |
| Class A | $1,000.00 | $ 851.90 | $4.22 | 0.91% |
| Class C | $1,000.00 | $ 848.50 | $7.74 | 1.67% |
| Class I | $1,000.00 | $ 852.80 | $3.11 | 0.67% |
| Class R6 | $1,000.00 | $ 853.10 | $2.83 | 0.61% |
| Hypothetical | | | | |
| (5% return per year before expenses) | | | | |
| Class A | $1,000.00 | $1,020.51 | $4.61 | 0.91% |
| Class C | $1,000.00 | $1,016.70 | $8.44 | 1.67% |
| Class I | $1,000.00 | $1,021.71 | $3.40 | 0.67% |
| Class R6 | $1,000.00 | $1,022.01 | $3.09 | 0.61% |
| * | Expenses are equal to the Fund's annualized expense ratio for the indicated Class, multiplied by the average account value over the period, multiplied by 183/365 (to reflect the one-half year period). The Example assumes that the $1,000 was invested at the net asset value per share determined at the close of business on March 31, 2022. |
Calvert
Social Investment Fund
September 30, 2022
Fund Expenses — continued
Calvert Bond Fund
| | Beginning
Account Value
(4/1/22) | Ending
Account Value
(9/30/22) | Expenses Paid
During Period*
(4/1/22 – 9/30/22) | Annualized
Expense
Ratio |
| Actual | | | | |
| Class A | $1,000.00 | $ 911.40 | $3.50 ** | 0.73% |
| Class C | $1,000.00 | $ 907.60 | $7.32 ** | 1.53% |
| Class I | $1,000.00 | $ 912.50 | $2.54 ** | 0.53% |
| Class R6 | $1,000.00 | $ 912.70 | $2.21 ** | 0.46% |
| Hypothetical | | | | |
| (5% return per year before expenses) | | | | |
| Class A | $1,000.00 | $1,021.41 | $3.70 ** | 0.73% |
| Class C | $1,000.00 | $1,017.40 | $7.74 ** | 1.53% |
| Class I | $1,000.00 | $1,022.41 | $2.69 ** | 0.53% |
| Class R6 | $1,000.00 | $1,022.76 | $2.33 ** | 0.46% |
| * | Expenses are equal to the Fund's annualized expense ratio for the indicated Class, multiplied by the average account value over the period, multiplied by 183/365 (to reflect the one-half year period). The Example assumes that the $1,000 was invested at the net asset value per share determined at the close of business on March 31, 2022. |
| ** | Absent a waiver and/or reimbursement of expenses by an affiliate, expenses would be higher. |
Calvert Equity Fund
| | Beginning
Account Value
(4/1/22) | Ending
Account Value
(9/30/22) | Expenses Paid
During Period*
(4/1/22 – 9/30/22) | Annualized
Expense
Ratio |
| Actual | | | | |
| Class A | $1,000.00 | $ 838.70 | $4.19 | 0.91% |
| Class C | $1,000.00 | $ 835.70 | $7.64 | 1.66% |
| Class I | $1,000.00 | $ 839.80 | $3.04 | 0.66% |
| Class R6 | $1,000.00 | $ 840.00 | $2.72 | 0.59% |
| Hypothetical | | | | |
| (5% return per year before expenses) | | | | |
| Class A | $1,000.00 | $1,020.51 | $4.61 | 0.91% |
| Class C | $1,000.00 | $1,016.75 | $8.39 | 1.66% |
| Class I | $1,000.00 | $1,021.76 | $3.35 | 0.66% |
| Class R6 | $1,000.00 | $1,022.11 | $2.99 | 0.59% |
| * | Expenses are equal to the Fund's annualized expense ratio for the indicated Class, multiplied by the average account value over the period, multiplied by 183/365 (to reflect the one-half year period). The Example assumes that the $1,000 was invested at the net asset value per share determined at the close of business on March 31, 2022. |
Calvert
Balanced Fund
September 30, 2022
| Asset-Backed Securities — 6.9% |
| Security | Principal
Amount
(000's omitted) | Value |
| Adams Outdoor Advertising, L.P., Series 2018-1, Class A, 4.81%, 11/15/48(1) | $ | 410 | $ 388,182 |
| Affirm Asset Securitization Trust, Series 2021-A, Class A, 0.88%, 8/15/25(1) | | 216 | 214,578 |
| Avant Loans Funding Trust, Series 2021-REV1, Class D, 4.30%, 7/15/30(1) | | 525 | 467,105 |
| Business Jet Securities, LLC, Series 2020-1A, Class A, 2.981%, 11/15/35(1) | | 61 | 55,969 |
| Coinstar Funding, LLC, Series 2017-1A, Class A2, 5.216%, 4/25/47(1) | | 809 | 756,554 |
| Cologix Data Centers US Issuer, LLC: | | | |
| Series 2021-1A, Class A2, 3.30%, 12/26/51(1) | | 1,640 | 1,465,421 |
| Series 2021-1A, Class B, 3.79%, 12/26/51(1) | | 960 | 843,447 |
| Conn's Receivables Funding, LLC: | | | |
| Series 2021-A, Class A, 1.05%, 5/15/26(1) | | 373 | 371,662 |
| Series 2021-A, Class B, 2.87%, 5/15/26(1) | | 1,370 | 1,336,609 |
| Series 2021-A, Class C, 4.59%, 5/15/26(1) | | 375 | 355,924 |
| Series 2022-A, Class B, 9.52%, 12/15/26(1) | | 2,347 | 2,340,410 |
| DataBank Issuer, Series 2021-2A, Class A2, 2.40%, 10/25/51(1) | | 768 | 662,508 |
| DB Master Finance, LLC, Series 2017-1A, Class A2II, 4.03%, 11/20/47(1) | | 162 | 148,012 |
| Diamond Infrastructure Funding, LLC: | | | |
| Series 2021-1A, Class A, 1.76%, 4/15/49(1) | | 1,139 | 937,329 |
| Series 2021-1A, Class C, 3.475%, 4/15/49(1) | | 255 | 209,943 |
| Diamond Issuer, Series 2021-1A, Class A, 2.305%, 11/20/51(1) | | 2,166 | 1,834,270 |
| Driven Brands Funding, LLC, Series 2018-1A, Class A2, 4.739%, 4/20/48(1) | | 124 | 118,895 |
| ExteNet, LLC: | | | |
| Series 2019-1A, Class A2, 3.204%, 7/26/49(1) | | 805 | 760,634 |
| Series 2019-1A, Class B, 4.14%, 7/26/49(1) | | 124 | 117,256 |
| FMC GMSR Issuer Trust: | | | |
| Series 2021-GT1, Class A, 3.62%, 7/25/26(1)(2) | | 125 | 99,365 |
| Series 2021-GT2, Class A, 3.85%, 10/25/26(1)(2) | | 1,060 | 858,311 |
| Series 2022-GT1, Class A, 6.19%, 4/25/27(1) | | 159 | 139,104 |
| Series 2022-GT2, Class A, 7.90%, 7/25/27(1) | | 900 | 837,387 |
| FOCUS Brands Funding, LLC, Series 2017-1A, Class A2II, 5.093%, 4/30/47(1) | | 341 | 311,892 |
| GoodLeap Sustainable Home Solutions Trust, Series 2021-5CS, Class A, 2.31%, 10/20/48(1) | | 622 | 518,740 |
| Hardee's Funding, LLC, Series 2020-1A, Class A2, 3.981%, 12/20/50(1) | | 427 | 368,142 |
| Jersey Mike's Funding, Series 2019-1A, Class A2, 4.433%, 2/15/50(1) | | 630 | 573,462 |
| JPMorgan Chase Bank, NA: | | | |
| Series 2021-2, Class B, 0.889%, 12/26/28(1) | | 651 | 626,141 |
| Security | Principal
Amount
(000's omitted) | Value |
| JPMorgan Chase Bank, NA: (continued) | | | |
| Series 2021-3, Class B, 0.76%, 2/26/29(1) | $ | 621 | $ 594,578 |
| Lendingpoint Asset Securitization Trust: | | | |
| Series 2022-A, Class A, 1.68%, 6/15/29(1) | | 618 | 608,200 |
| Series 2022-C, Class A, 6.56%, 2/15/30(1) | | 2,060 | 2,059,872 |
| Loanpal Solar Loan, Ltd., Series 2020-1GS, Class C, 2.00%, 6/20/47(1) | | 228 | 175,879 |
| Lunar Aircraft, Ltd., Series 2020-1A, Class B, 4.335%, 2/15/45(1) | | 112 | 82,912 |
| Marlette Funding Trust, Series 2020-2A, Class C, 2.83%, 9/16/30(1) | | 61 | 60,761 |
| Mill City Solar Loan, Ltd., Series 2020-1A, Class C, 2.00%, 6/20/47(1) | | 465 | 379,472 |
| Mosaic Solar Loan Trust: | | | |
| Series 2019-1A, Class A, 4.37%, 12/21/43(1) | | 432 | 406,054 |
| Series 2019-2A, Class B, 3.28%, 9/20/40(1) | | 1,036 | 930,113 |
| Series 2019-2A, Class C, 4.35%, 9/20/40(1) | | 24 | 24,225 |
| Series 2020-1A, Class A, 2.10%, 4/20/46(1) | | 118 | 101,654 |
| Series 2020-1A, Class B, 3.10%, 4/20/46(1) | | 96 | 84,804 |
| Series 2020-2A, Class A, 1.44%, 8/20/46(1) | | 243 | 203,096 |
| Series 2020-2A, Class B, 2.21%, 8/20/46(1) | | 351 | 298,631 |
| Series 2021-1A, Class A, 1.51%, 12/20/46(1) | | 595 | 465,064 |
| Series 2021-1A, Class C, 2.25%, 12/20/46(1) | | 1,415 | 1,257,249 |
| Series 2021-3A, Class C, 1.77%, 6/20/52(1) | | 211 | 181,408 |
| Series 2021-3A, Class D, 3.28%, 6/20/52(1) | | 131 | 113,918 |
| Series 2022-2A, Class B, 5.13%, 1/21/53(1) | | 791 | 748,874 |
| Series 2022-2A, Class D, 8.29%, 1/21/53(1) | | 270 | 258,814 |
| Neighborly Issuer, LLC, Series 2021-1A, Class A2, 3.584%, 4/30/51(1) | | 983 | 816,268 |
| NRZ Excess Spread-Collateralized Notes, Series 2021-GNT1, Class A, 3.474%, 11/25/26(1) | | 1,734 | 1,527,425 |
| OneMain Financial Issuance Trust: | | | |
| Series 2020-1A, Class A, 3.84%, 5/14/32(1) | | 653 | 649,413 |
| Series 2022-S1, Class A, 4.13%, 5/14/35(1) | | 1,400 | 1,331,959 |
| Oportun Funding XIV, LLC, Series 2021-A, Class B, 1.76%, 3/8/28(1) | | 265 | 243,749 |
| Oportun Funding, LLC, Series 2022-1, Class A, 3.25%, 6/15/29(1) | | 1,308 | 1,280,402 |
| Oportun Issuance Trust: | | | |
| Series 2021-B, Class A, 1.47%, 5/8/31(1) | | 979 | 869,905 |
| Series 2021-B, Class C, 3.65%, 5/8/31(1) | | 178 | 161,053 |
| Series 2021-C, Class A, 2.18%, 10/8/31(1) | | 5,100 | 4,506,539 |
| Series 2021-C, Class B, 2.67%, 10/8/31(1) | | 530 | 465,728 |
| Series 2021-C, Class C, 3.61%, 10/8/31(1) | | 105 | 90,200 |
| Series 2022-2, Class C, 9.36%, 10/9/29(1) | | 350 | 343,235 |
| Pagaya AI Debt Selection Trust: | | | |
| Series 2020-3, Class B, 3.22%, 5/17/27(1) | | 212 | 211,343 |
| Series 2021-2, 3.00%, 1/25/29(1) | | 916 | 855,956 |
13
See Notes to Financial Statements.
Calvert
Balanced Fund
September 30, 2022
Schedule of Investments — continued
| Security | Principal
Amount
(000's omitted) | Value |
| Pagaya AI Debt Selection Trust: (continued) | | | |
| Series 2021-3, Class A, 1.15%, 5/15/29(1) | $ | 1,781 | $ 1,726,278 |
| Series 2021-5, Class A, 1.53%, 8/15/29(1) | | 1,442 | 1,392,863 |
| Series 2021-HG1, Class A, 1.22%, 1/16/29(1) | | 427 | 402,278 |
| Planet Fitness Master Issuer, LLC: | | | |
| Series 2018-1A, Class A2II, 4.666%, 9/5/48(1) | | 69 | 65,310 |
| Series 2019-1A, Class A2, 3.858%, 12/5/49(1) | | 613 | 517,446 |
| Prosper Marketplace Issuance Trust, Series 2019-4A, Class C, 4.95%, 2/17/26(1) | | 92 | 91,399 |
| SBA Tower Trust, Series 2014-2A, Class C, 3.869% to 4/15/23, 10/15/49(1)(3) | | 1,000 | 967,702 |
| ServiceMaster Funding, LLC: | | | |
| Series 2020-1, Class A2I, 2.841%, 1/30/51(1) | | 349 | 285,529 |
| Series 2020-1, Class A2II, 3.337%, 1/30/51(1) | | 440 | 339,130 |
| SERVPRO Master Issuer, LLC, Series 2019-1A, Class A2, 3.882%, 10/25/49(1) | | 2,001 | 1,777,408 |
| SolarCity LMC Series I, LLC, Series 2013-1, Class A, 4.80%, 11/20/38(1) | | 336 | 323,804 |
| Sonic Capital, LLC, Series 2020-1A, Class A2I, 3.845%, 1/20/50(1) | | 1,133 | 1,031,857 |
| SpringCastle America Funding, LLC, Series 2020-AA, Class A, 1.97%, 9/25/37(1) | | 647 | 592,071 |
| Stack Infrastructure Issuer, LLC: | | | |
| Series 2019-1A, Class A2, 4.54%, 2/25/44(1) | | 4,783 | 4,725,659 |
| Series 2019-2A, Class A2, 3.08%, 10/25/44(1) | | 405 | 381,665 |
| Series 2020-1A, Class A2, 1.893%, 8/25/45(1) | | 961 | 854,413 |
| Sunnova Helios V Issuer, LLC: | | | |
| Series 2021-A, Class A, 1.80%, 2/20/48(1) | | 1,230 | 991,214 |
| Series 2021-A, Class B, 3.15%, 2/20/48(1) | | 409 | 324,061 |
| Sunnova Sol II Issuer, LLC, Series 2020-2A, Class A, 2.73%, 11/1/55(1) | | 1,412 | 1,115,758 |
| Sunnova Sol Issuer, LLC, Series 2020-1A, Class A, 3.35%, 2/1/55(1) | | 237 | 198,755 |
| Sunrun Atlas Issuer, LLC, Series 2019-2, Class A, 3.61%, 2/1/55(1) | | 462 | 410,085 |
| Sunrun Callisto Issuer, LLC, Series 2015-1A, Class B, 5.38%, 7/20/45(1) | | 425 | 395,171 |
| Sunrun Demeter Issuer, LLC, Series 2021-2A, Class A, 2.27%, 1/30/57(1) | | 694 | 536,759 |
| Sunrun Jupiter Issuer, LLC, Series 2022-1A, Class A, 4.75%, 7/30/57(1) | | 2,067 | 1,880,417 |
| Sunrun Xanadu Issuer, LLC, Series 2019-1A, Class A, 3.98%, 6/30/54(1) | | 303 | 276,442 |
| Theorem Funding Trust: | | | |
| Series 2020-1A, Class B, 3.95%, 10/15/26(1) | | 80 | 79,333 |
| Series 2021-1A, Class A, 1.21%, 12/15/27(1) | | 613 | 598,034 |
| Series 2021-1A, Class B, 1.84%, 12/15/27(1) | | 174 | 158,781 |
| Thunderbolt Aircraft Lease, Ltd., Series 2017-A, Class C, 4.50%, 5/17/32(1) | | 134 | 90,963 |
| Security | Principal
Amount
(000's omitted) | Value |
| United States Small Business Administration, Series 2017-20E, Class 1, 2.88%, 5/1/37 | $ | 930 | $ 859,655 |
| Upstart Pass-Through Trust, Series 2020-ST1, Class A, 3.75%, 2/20/28(1) | | 244 | 238,466 |
| Upstart Securitization Trust, Series 2020-1, Class C, 4.899%, 4/22/30(1) | | 750 | 731,530 |
| Vantage Data Centers Issuer, LLC: | | | |
| Series 2018-2A, Class A2, 4.196%, 11/15/43(1) | | 159 | 156,181 |
| Series 2019-1A, Class A2, 3.188%, 7/15/44(1) | | 1,032 | 985,937 |
| Series 2020-2A, Class A2, 1.992%, 9/15/45(1) | | 1,870 | 1,561,115 |
| Series 2021-1A, Class A2, 2.165%, 10/15/46(1) | | 621 | 539,095 |
| Vivint Solar Financing VII, LLC, Series 2020-1A, Class A, 2.21%, 7/31/51(1) | | 951 | 773,807 |
| Willis Engine Structured Trust V: | | | |
| Series 2020-A, Class B, 4.212%, 3/15/45(1) | | 351 | 258,923 |
| Series 2020-A, Class C, 6.657%, 3/15/45(1) | | 165 | 109,745 |
Total Asset-Backed Securities
(identified cost $75,631,410) | | | $ 68,851,044 |
| Collateralized Mortgage Obligations — 1.4% |
| Security | Principal
Amount
(000's omitted) | Value |
| Bellemeade Re, Ltd.: | | | |
| Series 2017-1, Class B1, 7.834%, (1 mo. USD LIBOR + 4.75%), 10/25/27(1)(4) | $ | 155 | $ 157,857 |
| Series 2021-1A, Class M1A, 4.031%, (30-day average SOFR + 1.75%), 3/25/31(1)(4) | | 207 | 206,853 |
| Series 2021-1A, Class M1B, 4.481%, (30-day average SOFR + 2.20%), 3/25/31(1)(4) | | 248 | 242,471 |
| Series 2021-1A, Class M1C, 5.231%, (30-day average SOFR + 2.95%), 3/25/31(1)(4) | | 150 | 145,440 |
| Series 2021-2A, Class M1A, 3.481%, (30-day average SOFR + 1.20%), 6/25/31(1)(4) | | 1,384 | 1,374,098 |
| Series 2021-3A, Class A2, 3.281%, (30-day average SOFR + 1.00%), 9/25/31(1)(4) | | 590 | 546,856 |
| Series 2021-3A, Class M1B, 3.681%, (30-day average SOFR + 1.40%), 9/25/31(1)(4) | | 415 | 397,788 |
| Cascade MH Asset Trust, Series 2022-MH1, Class A, 4.25% to 7/25/27, 8/25/54(1)(3) | | 1,393 | 1,219,179 |
| CHL GMSR Issuer Trust, Series 2018-GT1, Class A, 5.834%, (1 mo. USD LIBOR + 2.75%), 5/25/23(1)(4) | | 117 | 114,419 |
| Eagle Re, Ltd., Series 2021-2, Class M1C, 5.731%, (30-day average SOFR + 3.45%), 4/25/34(1)(4) | | 415 | 403,614 |
| Federal Home Loan Mortgage Corp. Structured Agency Credit Risk Debt Notes: | | | |
| Series 2018-DNA1, Class M2AT, 4.134%, (1 mo. USD LIBOR + 1.05%), 7/25/30(4) | | 120 | 119,785 |
| Series 2019-DNA3, Class B2, 11.234%, (1 mo. USD LIBOR + 8.15%), 7/25/49(1)(4) | | 240 | 235,404 |
14
See Notes to Financial Statements.
Calvert
Balanced Fund
September 30, 2022
Schedule of Investments — continued
| Security | Principal
Amount
(000's omitted) | Value |
| Federal Home Loan Mortgage Corp. Structured Agency Credit Risk Debt Notes: (continued) | | | |
| Series 2019-DNA3, Class M2, 5.134%, (1 mo. USD LIBOR + 2.05%), 7/25/49(1)(4) | $ | 879 | $ 868,577 |
| Series 2019-DNA4, Class M2, 5.034%, (1 mo. USD LIBOR + 1.95%), 10/25/49(1)(4) | | 70 | 69,722 |
| Series 2019-HQA2, Class B1, 7.184%, (1 mo. USD LIBOR + 4.10%), 4/25/49(1)(4) | | 165 | 162,164 |
| Series 2019-HQA4, Class B1, 6.034%, (1 mo. USD LIBOR + 2.95%), 11/25/49(1)(4) | | 57 | 55,290 |
| Series 2020-DNA6, Class B1, 5.281%, (30-day average SOFR + 3.00%), 12/25/50(1)(4) | | 50 | 47,055 |
| Series 2020-HQA2, Class B1, 7.184%, (1 mo. USD LIBOR + 4.10%), 3/25/50(1)(4) | | 108 | 103,245 |
| Series 2021-DNA3, Class M1, 3.031%, (30-day average SOFR + 0.75%), 10/25/33(1)(4) | | 330 | 325,736 |
| Series 2022-DNA2, Class M1A, 3.581%, (30-day average SOFR + 1.30%), 2/25/42(1)(4) | | 911 | 896,295 |
| Federal National Mortgage Association Connecticut Avenue Securities: | | | |
| Series 2013-C01, Class M2, 8.334%, (1 mo. USD LIBOR + 5.25%), 10/25/23(4) | | 223 | 229,738 |
| Series 2014-C02, Class 2M2, 5.684%, (1 mo. USD LIBOR + 2.60%), 5/25/24(4) | | 92 | 93,033 |
| Series 2014-C03, Class 2M2, 5.984%, (1 mo. USD LIBOR + 2.90%), 7/25/24(4) | | 124 | 125,035 |
| Series 2014-C04, Class 1M2, 7.984%, (1 mo. USD LIBOR + 4.90%), 11/25/24(4) | | 405 | 415,620 |
| Series 2018-R07, Class 1M2, 5.484%, (1 mo. USD LIBOR + 2.40%), 4/25/31(1)(4) | | 73 | 72,948 |
| Series 2019-R01, Class 2B1, 7.434%, (1 mo. USD LIBOR + 4.35%), 7/25/31(1)(4) | | 150 | 150,987 |
| Series 2019-R02, Class 1B1, 7.234%, (1 mo. USD LIBOR + 4.15%), 8/25/31(1)(4) | | 150 | 150,375 |
| Series 2019-R02, Class 1M2, 5.384%, (1 mo. USD LIBOR + 2.30%), 8/25/31(1)(4) | | 6 | 5,898 |
| Series 2019-R03, Class 1B1, 7.184%, (1 mo. USD LIBOR + 4.10%), 9/25/31(1)(4) | | 150 | 149,883 |
| Series 2019-R05, Class 1B1, 7.184%, (1 mo. USD LIBOR + 4.10%), 7/25/39(1)(4) | | 221 | 221,699 |
| Series 2019-R06, Class 2B1, 6.834%, (1 mo. USD LIBOR + 3.75%), 9/25/39(1)(4) | | 911 | 899,284 |
| Series 2019-R07, Class 1B1, 6.484%, (1 mo. USD LIBOR + 3.40%), 10/25/39(1)(4) | | 268 | 260,659 |
| Series 2020-R02, Class 2B1, 6.084%, (1 mo. USD LIBOR + 3.00%), 1/25/40(1)(4) | | 1,120 | 1,018,192 |
| Series 2021-R01, Class 1B2, 8.281%, (30-day average SOFR + 6.00%), 10/25/41(1)(4) | | 395 | 357,484 |
| Series 2021-R02, Class 2B1, 5.581%, (30-day average SOFR + 3.30%), 11/25/41(1)(4) | | 35 | 31,109 |
| Federal National Mortgage Association Grantor Trust, Series 2017-T1, Class A, 2.898%, 6/25/27 | | 547 | 508,914 |
| Home Re, Ltd.: | | | |
| Series 2018-1, Class M2, 6.084%, (1 mo. USD LIBOR + 3.00%), 10/25/28(1)(4) | | 775 | 764,130 |
| Security | Principal
Amount
(000's omitted) | Value |
| Home Re, Ltd.: (continued) | | | |
| Series 2021-1, Class M1B, 4.634%, (1 mo. USD LIBOR + 1.55%), 7/25/33(1)(4) | $ | 654 | $ 649,418 |
| Series 2021-1, Class M2, 5.934%, (1 mo. USD LIBOR + 2.85%), 7/25/33(1)(4) | | 215 | 194,076 |
| Oaktown Re V, Ltd., Series 2020-2A, Class M1B, 6.684%, (1 mo. USD LIBOR + 3.60%), 10/25/30(1)(4) | | 113 | 113,475 |
Total Collateralized Mortgage Obligations
(identified cost $14,570,013) | | | $ 14,103,805 |
| Commercial Mortgage-Backed Securities — 4.4% |
| Security | Principal
Amount
(000's omitted) | Value |
| BAMLL Commercial Mortgage Securities Trust: | | | |
| Series 2019-BPR, Class DNM, 3.719%, 11/5/32(1)(2) | $ | 1,605 | $ 1,248,453 |
| Series 2019-BPR, Class ENM, 3.719%, 11/5/32(1)(2) | | 680 | 519,040 |
| Series 2019-BPR, Class FNM, 3.719%, 11/5/32(1)(2) | | 1,215 | 903,666 |
| BBCMS Mortgage Trust: | | | |
| Series 2017-DELC, Class E, 5.443%, (1 mo. USD LIBOR + 2.625%), 8/15/36(1)(4) | | 360 | 340,917 |
| Series 2017-DELC, Class F, 6.443%, (1 mo. USD LIBOR + 3.625%), 8/15/36(1)(4) | | 285 | 267,200 |
| BX Commercial Mortgage Trust: | | | |
| Series 2019-XL, Class A, 3.738%, (1 mo. USD LIBOR + 0.92%), 10/15/36(1)(4) | | 1,760 | 1,734,989 |
| Series 2019-XL, Class B, 3.898%, (1 mo. USD LIBOR + 1.08%), 10/15/36(1)(4) | | 637 | 622,170 |
| Series 2021-VOLT, Class B, 3.768%, (1 mo. USD LIBOR + 0.95%), 9/15/36(1)(4) | | 1,809 | 1,699,612 |
| Series 2021-VOLT, Class C, 3.918%, (1 mo. USD LIBOR + 1.10%), 9/15/36(1)(4) | | 549 | 509,811 |
| Series 2021-VOLT, Class D, 4.468%, (1 mo. USD LIBOR + 1.65%), 9/15/36(1)(4) | | 1,739 | 1,619,841 |
| CSMC, Series 2022-NWPT, Class A, 5.989%, (1 mo. SOFR + 3.143%), 9/9/24(1)(4) | | 540 | 540,727 |
| Extended Stay America Trust: | | | |
| Series 2021-ESH, Class A, 3.898%, (1 mo. USD LIBOR + 1.08%), 7/15/38(1)(4) | | 636 | 617,142 |
| Series 2021-ESH, Class C, 4.518%, (1 mo. USD LIBOR + 1.70%), 7/15/38(1)(4) | | 1,380 | 1,329,023 |
| Federal Home Loan Mortgage Corp. Multifamily Structured Pass Through Certificates: | | | |
| Series KG02, Class A2, 2.412%, 8/25/29 | | 3,315 | 2,904,460 |
| Series KG03, Class A2, 1.297%, 6/25/30(2) | | 770 | 609,787 |
| Series KSG1, Class A2, 1.503%, 9/25/30 | | 704 | 565,781 |
| Series KW06, Class A2, 3.80%, 6/25/28(2) | | 1,135 | 1,093,097 |
| Series W5FX, Class AFX, 3.336%, 4/25/28(2) | | 412 | 385,605 |
| Federal National Mortgage Association: | | | |
| Series 2017-M13, Class A2, 3.028%, 9/25/27(2) | | 1,090 | 1,019,371 |
15
See Notes to Financial Statements.
Calvert
Balanced Fund
September 30, 2022
Schedule of Investments — continued
| Security | Principal
Amount
(000's omitted) | Value |
| Federal National Mortgage Association: (continued) | | | |
| Series 2018-M4, Class A2, 3.158%, 3/25/28(2) | $ | 2,085 | $ 1,935,903 |
| Series 2018-M13, Class A2, 3.867%, 9/25/30(2) | | 3,022 | 2,879,880 |
| Series 2019-M1, Class A2, 3.666%, 9/25/28(2) | | 911 | 865,095 |
| Series 2019-M22, Class A2, 2.522%, 8/25/29 | | 3,372 | 2,994,182 |
| Series 2020-M1, Class A2, 2.444%, 10/25/29 | | 2,322 | 2,035,064 |
| Series 2020-M20, Class A2, 1.435%, 10/25/29 | | 1,505 | 1,240,349 |
| Federal National Mortgage Association Multifamily Connecticut Avenue Securities Trust: | | | |
| Series 2019-01, Class M10, 6.334%, (1 mo. USD LIBOR + 3.25%), 10/25/49(1)(4) | | 606 | 576,166 |
| Series 2020-01, Class M10, 6.834%, (1 mo. USD LIBOR + 3.75%), 3/25/50(1)(4) | | 1,369 | 1,284,345 |
| Hawaii Hotel Trust, Series 2019-MAUI, Class A, 3.968%, (1 mo. USD LIBOR + 1.15%), 5/15/38(1)(4) | | 2,738 | 2,671,913 |
| JPMorgan Chase Commercial Mortgage Securities Trust: | | | |
| Series 2014-DSTY, Class B, 3.771%, 6/10/27(1) | | 550 | 115,471 |
| Series 2014-DSTY, Class C, 3.931%, 6/10/27(1)(2) | | 225 | 23,621 |
| Morgan Stanley Capital I Trust: | | | |
| Series 2017-CLS, Class A, 3.518%, (1 mo. USD LIBOR + 0.70%), 11/15/34(1)(4)(5) | | 1,909 | 1,897,739 |
| Series 2017-CLS, Class E, 4.768%, (1 mo. USD LIBOR + 1.95%), 11/15/34(1)(4)(5) | | 225 | 222,921 |
| Series 2017-CLS, Class F, 5.418%, (1 mo. USD LIBOR + 2.60%), 11/15/34(1)(4)(5) | | 629 | 617,087 |
| Series 2019-BPR, Class A, 4.468%, (1 mo. USD LIBOR + 1.65%), 5/15/36(1)(4)(5) | | 1,153 | 1,124,891 |
| Series 2019-BPR, Class B, 5.168%, (1 mo. USD LIBOR + 2.10%), 5/15/36(1)(4)(5) | | 386 | 372,310 |
| Series 2019-BPR, Class C, 6.118%, (1 mo. USD LIBOR + 3.05%), 5/15/36(1)(4)(5) | | 205 | 194,852 |
| SLG Office Trust, Series 2021-OVA, Class A, 2.585%, 7/15/41(1) | | 1,674 | 1,345,484 |
| VMC Finance, LLC: | | | |
| Series 2021-HT1, Class A, 4.643%, (1 mo. USD LIBOR + 1.65%), 1/18/37(1)(4) | | 1,061 | 1,031,306 |
| Series 2021-HT1, Class B, 7.493%, (1 mo. USD LIBOR + 4.50%), 1/18/37(1)(4) | | 2,057 | 1,978,872 |
| WFLD Mortgage Trust, Series 2014-MONT, Class C, 3.755%, 8/10/31(1)(2) | | 850 | 705,495 |
Total Commercial Mortgage-Backed Securities
(identified cost $49,593,227) | | | $ 44,643,638 |
| Security | Shares | Value |
| Auto Components — 0.3% | |
| Aptiv PLC(6) | | 38,000 | $ 2,971,980 |
| | | | $ 2,971,980 |
| Security | Shares | Value |
| Banks — 1.6% | |
| PNC Financial Services Group, Inc. (The) | | 46,700 | $ 6,977,914 |
| Wells Fargo & Co. | | 215,700 | 8,675,454 |
| | | | $ 15,653,368 |
| Beverages — 2.6% | |
| Coca-Cola Co. (The) | | 264,300 | $ 14,806,086 |
| PepsiCo, Inc. | | 69,700 | 11,379,222 |
| | | | $ 26,185,308 |
| Biotechnology — 1.4% | |
| AbbVie, Inc. | | 106,400 | $ 14,279,944 |
| | | | $ 14,279,944 |
| Capital Markets — 2.8% | |
| Intercontinental Exchange, Inc. | | 114,600 | $ 10,354,110 |
| S&P Global, Inc. | | 24,200 | 7,389,470 |
| Stifel Financial Corp. | | 105,400 | 5,471,314 |
| Tradeweb Markets, Inc., Class A | | 91,266 | 5,149,228 |
| | | | $ 28,364,122 |
| Chemicals — 1.5% | |
| Ecolab, Inc. | | 51,000 | $ 7,365,420 |
| FMC Corp. | | 71,300 | 7,536,410 |
| | | | $ 14,901,830 |
| Commercial Services & Supplies — 0.8% | |
| Waste Management, Inc. | | 48,525 | $ 7,774,190 |
| | | | $ 7,774,190 |
| Diversified Telecommunication Services — 0.6% | |
| Verizon Communications, Inc. | | 170,100 | $ 6,458,697 |
| | | | $ 6,458,697 |
| Electric Utilities — 2.1% | |
| Constellation Energy Corp. | | 87,400 | $ 7,270,806 |
| NextEra Energy, Inc. | | 174,200 | 13,659,022 |
| | | | $ 20,929,828 |
| Electrical Equipment — 0.7% | |
| AMETEK, Inc. | | 66,500 | $ 7,541,765 |
| | | | $ 7,541,765 |
| Electronic Equipment, Instruments & Components — 0.8% | |
| TE Connectivity, Ltd. | | 68,500 | $ 7,559,660 |
| | | | $ 7,559,660 |
16
See Notes to Financial Statements.
Calvert
Balanced Fund
September 30, 2022
Schedule of Investments — continued
| Security | Shares | Value |
| Energy Equipment & Services — 0.5% | |
| Baker Hughes Co. | | 261,900 | $ 5,489,424 |
| | | | $ 5,489,424 |
| Entertainment — 0.5% | |
| Electronic Arts, Inc. | | 45,400 | $ 5,253,234 |
| | | | $ 5,253,234 |
| Equity Real Estate Investment Trusts (REITs) — 1.0% | |
| EastGroup Properties, Inc. | | 28,900 | $ 4,171,426 |
| Lamar Advertising Co., Class A | | 67,700 | 5,584,573 |
| | | | $ 9,755,999 |
| Food & Staples Retailing — 1.9% | |
| Sysco Corp. | | 102,300 | $ 7,233,633 |
| Walmart, Inc. | | 88,100 | 11,426,570 |
| | | | $ 18,660,203 |
| Health Care Equipment & Supplies — 1.6% | |
| Boston Scientific Corp.(6) | | 258,400 | $ 10,007,832 |
| Intuitive Surgical, Inc.(6) | | 32,300 | 6,054,312 |
| | | | $ 16,062,144 |
| Health Care Providers & Services — 1.2% | |
| Elevance Health, Inc. | | 27,000 | $ 12,264,480 |
| | | | $ 12,264,480 |
| Hotels, Restaurants & Leisure — 0.6% | |
| Marriott International, Inc., Class A | | 41,100 | $ 5,759,754 |
| | | | $ 5,759,754 |
| Insurance — 1.8% | |
| Allstate Corp. (The) | | 100,400 | $ 12,502,812 |
| W.R. Berkley Corp. | | 88,800 | 5,734,704 |
| | | | $ 18,237,516 |
| Interactive Media & Services — 2.9% | |
| Alphabet, Inc., Class C(6) | | 305,640 | $ 29,387,286 |
| | | | $ 29,387,286 |
| Internet & Direct Marketing Retail — 2.4% | |
| Amazon.com, Inc.(6) | | 213,920 | $ 24,172,960 |
| | | | $ 24,172,960 |
| IT Services — 2.3% | |
| Automatic Data Processing, Inc. | | 48,000 | $ 10,857,120 |
| Security | Shares | Value |
| IT Services (continued) | |
| Visa, Inc., Class A | | 69,100 | $ 12,275,615 |
| | | | $ 23,132,735 |
| Life Sciences Tools & Services — 2.4% | |
| Danaher Corp. | | 48,400 | $ 12,501,236 |
| Thermo Fisher Scientific, Inc. | | 22,197 | 11,258,096 |
| | | | $ 23,759,332 |
| Machinery — 0.6% | |
| Westinghouse Air Brake Technologies Corp. | | 70,600 | $ 5,743,310 |
| | | | $ 5,743,310 |
| Multi-Utilities — 1.2% | |
| Sempra Energy | | 78,200 | $ 11,725,308 |
| | | | $ 11,725,308 |
| Pharmaceuticals — 2.0% | |
| Bristol-Myers Squibb Co. | | 133,000 | $ 9,454,970 |
| Eli Lilly & Co. | | 31,700 | 10,250,195 |
| | | | $ 19,705,165 |
| Professional Services — 1.3% | |
| Booz Allen Hamilton Holding Corp. | | 73,900 | $ 6,824,665 |
| TransUnion | | 111,600 | 6,639,084 |
| | | | $ 13,463,749 |
| Real Estate Management & Development — 0.8% | |
| FirstService Corp. | | 63,700 | $ 7,580,937 |
| | | | $ 7,580,937 |
| Road & Rail — 0.8% | |
| Union Pacific Corp. | | 40,700 | $ 7,929,174 |
| | | | $ 7,929,174 |
| Semiconductors & Semiconductor Equipment — 2.4% | |
| Analog Devices, Inc. | | 70,900 | $ 9,879,206 |
| Lam Research Corp. | | 16,200 | 5,929,200 |
| Texas Instruments, Inc. | | 56,696 | 8,775,407 |
| | | | $ 24,583,813 |
| Software — 5.9% | |
| Black Knight, Inc.(6) | | 93,100 | $ 6,026,363 |
| Fair Isaac Corp.(6) | | 15,400 | 6,344,954 |
| Intuit, Inc. | | 17,067 | 6,610,390 |
| Microsoft Corp. | | 151,051 | 35,179,778 |
17
See Notes to Financial Statements.
Calvert
Balanced Fund
September 30, 2022
Schedule of Investments — continued
| Security | Shares | Value |
| Software (continued) | |
| VMware, Inc., Class A | | 48,500 | $ 5,163,310 |
| | | | $ 59,324,795 |
| Specialty Retail — 1.5% | |
| Home Depot, Inc. (The) | | 30,000 | $ 8,278,200 |
| TJX Cos., Inc. (The) | | 117,400 | 7,292,888 |
| | | | $ 15,571,088 |
| Technology Hardware, Storage & Peripherals — 3.6% | |
| Apple, Inc. | | 260,508 | $ 36,002,206 |
| | | | $ 36,002,206 |
| Venture Capital — 0.2% | |
| CFBanc Corp.(6)(7)(8) | | 27,000 | $ 415,729 |
| Consensus Orthopedics, Inc.(6)(7)(8) | | 180,877 | 0 |
| Learn Capital Venture Partners III, L.P.(6)(7)(8) | | 1,072,962 | 1,696,545 |
| Neighborhood Bancorp, Class A(6)(7)(8) | | 10,000 | 12,500 |
| | | | $ 2,124,774 |
| Wireless Telecommunication Services — 1.0% | |
| T-Mobile US, Inc.(6) | | 73,445 | $ 9,854,116 |
| | | | $ 9,854,116 |
Total Common Stocks
(identified cost $454,471,132) | | | $ 558,164,194 |
| Security | Principal
Amount*
(000’s omitted) | Value |
| Basic Materials — 0.2% | |
| Celanese US Holdings, LLC: | | | |
| 6.165%, 7/15/27 | | 807 | $ 764,775 |
| 6.33%, 7/15/29 | | 936 | 873,298 |
| South32 Treasury, Ltd., 4.35%, 4/14/32(1) | | 861 | 742,109 |
| | | | $ 2,380,182 |
| Communications — 1.0% | |
| AT&T, Inc.: | | | |
| 3.50%, 9/15/53 | | 92 | $ 61,453 |
| 3.55%, 9/15/55 | | 1,561 | 1,028,620 |
| 3.65%, 6/1/51 | | 1,190 | 807,179 |
| 3.65%, 9/15/59 | | 111 | 72,149 |
| 3.80%, 12/1/57 | | 1,097 | 743,346 |
| CCO Holdings, LLC/CCO Holdings Capital Corp., 5.00%, 2/1/28(1)(9) | | 304 | 262,645 |
| Security | Principal
Amount*
(000’s omitted) | Value |
| Communications (continued) | |
| Charter Communications Operating, LLC/Charter Communications Operating Capital, 4.80%, 3/1/50 | | 3,015 | $ 2,182,764 |
| Comcast Corp.: | | | |
| 2.887%, 11/1/51 | | 1,125 | 706,378 |
| 2.937%, 11/1/56 | | 1,283 | 768,043 |
| Level 3 Financing, Inc., 3.75%, 7/15/29(1) | | 80 | 58,784 |
| Netflix, Inc., 3.625%, 5/15/27 | EUR | 160 | 148,067 |
| Nokia Oyj: | | | |
| 4.375%, 6/12/27 | | 947 | 854,843 |
| 6.625%, 5/15/39 | | 990 | 919,255 |
| SES Global Americas Holdings GP, 5.30%, 3/25/44(1) | | 463 | 355,934 |
| SES S.A., 5.30%, 4/4/43(1) | | 274 | 209,581 |
| T-Mobile USA, Inc.: | | | |
| 2.25%, 11/15/31 | | 161 | 121,620 |
| 2.55%, 2/15/31 | | 371 | 294,269 |
| | | | $ 9,594,930 |
| Consumer, Cyclical — 1.3% | |
| American Airlines Pass-Through Trust, 4.40%, 9/22/23 | | 199 | $ 191,001 |
| American Airlines, Inc./AAdvantage Loyalty IP, Ltd.: | | | |
| 5.50%, 4/20/26(1) | | 2,115 | 1,989,866 |
| 5.75%, 4/20/29(1) | | 44 | 38,468 |
| Aptiv PLC/Aptiv Corp., 3.25%, 3/1/32(9) | | 410 | 326,935 |
| Bath & Body Works, Inc.: | | | |
| 6.625%, 10/1/30(1) | | 649 | 565,762 |
| 6.875%, 11/1/35 | | 107 | 89,644 |
| 7.60%, 7/15/37 | | 459 | 359,652 |
| Brunswick Corp., 5.10%, 4/1/52 | | 248 | 172,526 |
| Dave & Buster's, Inc., 7.625%, 11/1/25(1) | | 265 | 261,315 |
| Delta Air Lines, Inc./SkyMiles IP, Ltd.: | | | |
| 4.50%, 10/20/25(1) | | 825 | 801,286 |
| 4.75%, 10/20/28(1) | | 1,271 | 1,185,491 |
| Dick's Sporting Goods, Inc., 4.10%, 1/15/52(9) | | 2,802 | 1,737,097 |
| Ford Motor Co., 4.75%, 1/15/43 | | 127 | 84,461 |
| Ford Motor Credit Co., LLC, 3.375%, 11/13/25 | | 206 | 182,299 |
| General Motors Co., 5.60%, 10/15/32 | | 813 | 726,761 |
| General Motors Financial Co., Inc., 4.30%, 4/6/29 | | 1,234 | 1,073,821 |
| Hyatt Hotels Corp.: | | | |
| 1.30%, 10/1/23 | | 409 | 393,629 |
| 1.80%, 10/1/24 | | 168 | 157,654 |
| Lithia Motors, Inc.: | | | |
| 3.875%, 6/1/29(1)(9) | | 1,143 | 919,161 |
| 4.375%, 1/15/31(1)(9) | | 186 | 152,553 |
| Macy's Retail Holdings, LLC, 4.30%, 2/15/43 | | 75 | 42,340 |
| MDC Holdings, Inc., 2.50%, 1/15/31 | | 128 | 85,685 |
18
See Notes to Financial Statements.
Calvert
Balanced Fund
September 30, 2022
Schedule of Investments — continued
| Security | Principal
Amount*
(000’s omitted) | Value |
| Consumer, Cyclical (continued) | |
| WarnerMedia Holdings, Inc.: | | | |
| 5.05%, 3/15/42(1) | | 916 | $ 686,996 |
| 5.141%, 3/15/52(1) | | 1,445 | 1,053,012 |
| | | | $ 13,277,415 |
| Consumer, Non-cyclical — 1.2% | |
| Ashtead Capital, Inc.: | | | |
| 4.00%, 5/1/28(1) | | 200 | $ 175,811 |
| 4.25%, 11/1/29(1) | | 987 | 862,467 |
| Avantor Funding, Inc., 4.625%, 7/15/28(1) | | 901 | 803,827 |
| Avon Products, Inc., 8.45%, 3/15/43 | | 80 | 77,636 |
| Block Financial, LLC, 3.875%, 8/15/30 | | 1,631 | 1,395,104 |
| Centene Corp.: | | | |
| 2.50%, 3/1/31 | | 1,210 | 914,653 |
| 3.375%, 2/15/30 | | 472 | 386,887 |
| 4.25%, 12/15/27 | | 575 | 527,174 |
| 4.625%, 12/15/29 | | 74 | 66,670 |
| Coca-Cola Femsa SAB de CV, 1.85%, 9/1/32 | | 645 | 476,268 |
| Conservation Fund (The), Green Bonds, 3.474%, 12/15/29 | | 655 | 560,701 |
| CVS Pass-Through Trust, 6.036%, 12/10/28 | | 548 | 544,446 |
| Darling Ingredients, Inc., 6.00%, 6/15/30(1) | | 23 | 21,941 |
| Doris Duke Charitable Foundation (The), 2.345%, 7/1/50 | | 1,705 | 964,839 |
| Ford Foundation (The), 2.415%, 6/1/50 | | 1,095 | 679,015 |
| Hikma Finance USA, LLC, 3.25%, 7/9/25(10) | | 200 | 186,522 |
| Natura & Co. Luxembourg Holdings S.a.r.l., 6.00%, 4/19/29(1)(9) | | 1,005 | 829,035 |
| Natura Cosmeticos S.A., 4.125%, 5/3/28(1) | | 787 | 622,966 |
| Perrigo Finance Unlimited Co., 4.40%, 6/15/30 | | 1,058 | 863,518 |
| Royalty Pharma PLC, 3.55%, 9/2/50 | | 890 | 556,835 |
| Smithfield Foods, Inc.: | | | |
| 2.625%, 9/13/31(1) | | 870 | 639,132 |
| 3.00%, 10/15/30(1) | | 192 | 148,497 |
| 5.20%, 4/1/29(1) | | 138 | 129,099 |
| | | | $ 12,433,043 |
| Energy — 0.4% | |
| Neptune Energy Bondco PLC, 6.625%, 5/15/25(1) | | 270 | $ 251,027 |
| NuStar Logistics, L.P.: | | | |
| 6.00%, 6/1/26 | | 1,189 | 1,090,908 |
| 6.375%, 10/1/30 | | 334 | 286,529 |
| TerraForm Power Operating, LLC: | | | |
| 4.75%, 1/15/30(1) | | 1,293 | 1,100,272 |
| 5.00%, 1/31/28(1) | | 1,746 | 1,540,644 |
| | | | $ 4,269,380 |
| Security | Principal
Amount*
(000’s omitted) | Value |
| Financial — 8.3% | |
| AerCap Ireland Capital DAC/AerCap Global Aviation Trust: | | | |
| 1.65%, 10/29/24 | | 443 | $ 405,113 |
| 1.75%, 10/29/24 | | 150 | 136,576 |
| 2.875%, 8/14/24 | | 269 | 253,191 |
| 3.50%, 1/15/25 | | 635 | 597,361 |
| 4.50%, 9/15/23 | | 716 | 706,063 |
| 6.50%, 7/15/25 | | 413 | 412,548 |
| Affiliated Managers Group, Inc., 3.30%, 6/15/30 | | 499 | 412,903 |
| Agree, L.P., 2.00%, 6/15/28 | | 329 | 265,529 |
| Air Lease Corp.: | | | |
| 2.875%, 1/15/26 | | 816 | 731,235 |
| 2.875%, 1/15/32 | | 330 | 249,192 |
| Alliant Holdings Intermediate, LLC/Alliant Holdings Co-Issuer, 6.75%, 10/15/27(1)(9) | | 165 | 142,552 |
| American Assets Trust, L.P., 3.375%, 2/1/31 | | 176 | 140,037 |
| American National Group, Inc., 6.144%, 6/13/32(1) | | 200 | 186,707 |
| Andrew W. Mellon Foundation (The), 0.947%, 8/1/27 | | 845 | 722,621 |
| Australia & New Zealand Banking Group, Ltd., 2.95% to 7/22/25, 7/22/30(1)(11) | | 1,352 | 1,229,763 |
| Banco de Chile, 2.99%, 12/9/31(1) | | 827 | 643,294 |
| Banco Santander S.A.: | | | |
| 1.722% to 9/14/26, 9/14/27(11) | | 800 | 662,776 |
| 5.294%, 8/18/27 | | 1,600 | 1,509,120 |
| Bank of America Corp.: | | | |
| 1.734% to 7/22/26, 7/22/27(11) | | 2,414 | 2,073,372 |
| 1.898% to 7/23/30, 7/23/31(11) | | 680 | 507,494 |
| 1.922% to 10/24/30, 10/24/31(11) | | 753 | 558,087 |
| 2.087% to 6/14/28, 6/14/29(11) | | 1,034 | 841,071 |
| 2.299% to 7/21/31, 7/21/32(11) | | 960 | 718,674 |
| 2.456% to 10/22/24, 10/22/25(11) | | 2,613 | 2,447,638 |
| 2.551% to 2/4/27, 2/4/28(11) | | 1,471 | 1,281,206 |
| 3.846% to 3/8/32, 3/8/37(11) | | 4,100 | 3,313,339 |
| 4.827% to 7/22/25, 7/22/26(11) | | 1,710 | 1,672,963 |
| BankUnited, Inc., 5.125%, 6/11/30 | | 351 | 327,588 |
| BBVA Bancomer S.A./Texas: | | | |
| 1.875%, 9/18/25(1) | | 859 | 770,481 |
| 5.125% to 1/18/28, 1/18/33(1)(11) | | 1,189 | 985,691 |
| BNP Paribas S.A., 7.75% to 8/16/29(1)(11)(12) | | 802 | 742,091 |
| Boston Properties, L.P., 2.45%, 10/1/33 | | 2,042 | 1,440,975 |
| BPCE S.A., 3.648% to 1/14/32, 1/14/37(1)(11) | | 432 | 320,907 |
| Bread Financial Holdings, Inc., 4.75%, 12/15/24(1) | | 972 | 849,883 |
| Broadstone Net Lease, LLC, 2.60%, 9/15/31 | | 58 | 42,782 |
| Capital One Financial Corp.: | | | |
| 3.273% to 3/1/29, 3/1/30(11) | | 721 | 603,758 |
| 3.75%, 7/28/26 | | 658 | 609,168 |
19
See Notes to Financial Statements.
Calvert
Balanced Fund
September 30, 2022
Schedule of Investments — continued
| Security | Principal
Amount*
(000’s omitted) | Value |
| Financial (continued) | |
| Capital One Financial Corp.: (continued) | | | |
| 4.20%, 10/29/25 | | 575 | $ 553,485 |
| 4.927% to 5/10/27, 5/10/28(11) | | 1,006 | 959,437 |
| CI Financial Corp.: | | | |
| 3.20%, 12/17/30 | | 1,239 | 899,728 |
| 4.10%, 6/15/51 | | 711 | 424,457 |
| Citigroup, Inc.: | | | |
| 1.281% to 11/3/24, 11/3/25(11) | | 622 | 568,639 |
| 2.572% to 6/3/30, 6/3/31(11) | | 1,273 | 1,003,076 |
| 3.106% to 4/8/25, 4/8/26(11) | | 784 | 735,379 |
| 3.785% to 3/17/32, 3/17/33(11) | | 1,440 | 1,208,956 |
| 3.887% to 1/10/27, 1/10/28(11) | | 610 | 562,068 |
| 4.00% to 12/10/25(11)(12) | | 770 | 650,650 |
| 5.61% to 9/29/25, 9/29/26(11) | | 1,287 | 1,280,794 |
| Corporate Office Properties, L.P., 2.90%, 12/1/33 | | 626 | 434,642 |
| Discover Bank, 4.682% to 8/9/23, 8/9/28(11) | | 699 | 670,487 |
| Enact Holdings, Inc., 6.50%, 8/15/25(1) | | 1,202 | 1,150,705 |
| EPR Properties: | | | |
| 3.75%, 8/15/29 | | 1,411 | 1,091,632 |
| 4.50%, 6/1/27 | | 1,059 | 915,642 |
| Extra Space Storage, L.P., 2.55%, 6/1/31 | | 803 | 618,626 |
| GA Global Funding Trust, 2.25%, 1/6/27(1) | | 1,872 | 1,623,740 |
| Global Atlantic Fin Co., 3.125%, 6/15/31(1) | | 1,929 | 1,415,096 |
| Goldman Sachs Group, Inc. (The): | | | |
| 1.948% to 10/21/26, 10/21/27(11) | | 1,448 | 1,240,105 |
| 2.64% to 2/24/27, 2/24/28(11) | | 550 | 477,820 |
| 2.65% to 10/21/31, 10/21/32(11) | | 766 | 588,021 |
| 3.102% to 2/24/32, 2/24/33(11) | | 250 | 198,867 |
| HAT Holdings I, LLC/HAT Holdings II, LLC: | | | |
| 3.375%, 6/15/26(1) | | 2,449 | 1,968,347 |
| 3.75%, 9/15/30(1) | | 441 | 321,610 |
| 6.00%, 4/15/25(1)(9) | | 695 | 655,312 |
| HSBC Holdings PLC, 2.251% to 11/22/26, 11/22/27(11) | | 1,402 | 1,179,712 |
| Iron Mountain, Inc.: | | | |
| 4.50%, 2/15/31(1) | | 1,185 | 918,268 |
| 5.00%, 7/15/28(1) | | 374 | 322,403 |
| JPMorgan Chase & Co.: | | | |
| 1.47% to 9/22/26, 9/22/27(11) | | 1,684 | 1,425,951 |
| 2.739% to 10/15/29, 10/15/30(11) | | 485 | 394,965 |
| 4.586% to 4/26/32, 4/26/33(11) | | 372 | 335,278 |
| 4.851% to 7/25/27, 7/25/28(11) | | 1,678 | 1,612,914 |
| KKR Group Finance Co. VII, LLC, 3.625%, 2/25/50(1) | | 758 | 530,000 |
| KKR Group Finance Co. X, LLC, 3.25%, 12/15/51(1) | | 304 | 198,548 |
| Liberty Mutual Group, Inc., 4.125% to 9/15/26, 12/15/51(1)(11) | | 793 | 614,201 |
| Security | Principal
Amount*
(000’s omitted) | Value |
| Financial (continued) | |
| Life Storage, L.P., 2.40%, 10/15/31 | | 1,045 | $ 785,855 |
| Macquarie Bank, Ltd.: | | | |
| 3.052% to 3/3/31, 3/3/36(1)(11) | | 1,525 | 1,119,460 |
| 3.624%, 6/3/30(1) | | 744 | 603,082 |
| National Bank of Canada, 0.55% to 11/15/23, 11/15/24(11) | | 759 | 718,899 |
| Newmark Group, Inc., 6.125%, 11/15/23 | | 388 | 382,790 |
| OneMain Finance Corp.: | | | |
| 3.50%, 1/15/27(9) | | 1,637 | 1,278,395 |
| 7.125%, 3/15/26 | | 188 | 169,756 |
| PennyMac Financial Services, Inc., 4.25%, 2/15/29(1) | | 146 | 104,316 |
| Radian Group, Inc.: | | | |
| 4.875%, 3/15/27 | | 1,328 | 1,179,038 |
| 6.625%, 3/15/25 | | 77 | 75,147 |
| Rocket Mortgage, LLC/Rocket Mortgage Co-Issuer, Inc.: | | | |
| 2.875%, 10/15/26(1) | | 200 | 164,303 |
| 3.875%, 3/1/31(1) | | 1,352 | 982,125 |
| Sabra Health Care, L.P., 3.20%, 12/1/31 | | 1,255 | 923,821 |
| SITE Centers Corp., 3.625%, 2/1/25 | | 517 | 489,210 |
| Societe Generale S.A., 6.221% to 6/15/32, 6/15/33(1)(11) | | 910 | 807,939 |
| Standard Chartered PLC: | | | |
| 1.214% to 3/23/24, 3/23/25(1)(11) | | 326 | 305,784 |
| 1.456% to 1/14/26, 1/14/27(1)(11) | | 1,028 | 871,437 |
| 1.822% to 11/23/24, 11/23/25(1)(11) | | 661 | 599,994 |
| Stifel Financial Corp., 4.00%, 5/15/30 | | 902 | 777,765 |
| Sun Communities Operating, L.P.: | | | |
| 2.30%, 11/1/28 | | 385 | 309,442 |
| 2.70%, 7/15/31 | | 649 | 491,393 |
| 4.20%, 4/15/32 | | 926 | 776,889 |
| Swedbank AB, 5.337%, 9/20/27(1) | | 1,129 | 1,095,350 |
| Synchrony Bank, 5.625%, 8/23/27 | | 1,368 | 1,311,732 |
| Synovus Bank/Columbus, GA, 4.00% to 10/29/25, 10/29/30(11) | | 782 | 728,461 |
| Synovus Financial Corp.: | | | |
| 3.125%, 11/1/22 | | 311 | 310,504 |
| 5.90% to 2/7/24, 2/7/29(11) | | 71 | 69,908 |
| Texas Capital Bancshares, Inc., 4.00% to 5/6/26, 5/6/31(11) | | 596 | 514,069 |
| Toronto-Dominion Bank (The), 3.57%, (SOFR + 0.59%), 9/10/26(4) | | 815 | 788,378 |
| Truist Financial Corp., 5.10% to 3/1/30(11)(12) | | 1,053 | 938,896 |
| UBS AG, 1.25%, 6/1/26(1) | | 928 | 800,805 |
| UBS Group AG: | | | |
| 2.095% to 2/11/31, 2/11/32(1)(11) | | 1,244 | 906,053 |
| 4.375% to 2/10/31(1)(9)(11)(12) | | 649 | 428,015 |
| UniCredit SpA, 5.459% to 6/30/30, 6/30/35(1)(11) | | 795 | 592,058 |
| United Overseas Bank, Ltd., 3.863% to 10/7/27, 10/7/32(1)(11) | | 943 | 860,191 |
20
See Notes to Financial Statements.
Calvert
Balanced Fund
September 30, 2022
Schedule of Investments — continued
| Security | Principal
Amount*
(000’s omitted) | Value |
| Financial (continued) | |
| Westpac Banking Corp., 3.02% to 11/18/31, 11/18/36(11) | | 618 | $ 453,437 |
| | | | $ 82,978,007 |
| Government - Multinational — 1.8% | |
| Asian Development Bank, 3.125%, 9/26/28(9) | | 1,160 | $ 1,090,744 |
| European Bank for Reconstruction & Development, 1.50%, 2/13/25 | | 1,295 | 1,212,526 |
| European Investment Bank: | | | |
| 1.625%, 5/13/31 | | 2,540 | 2,125,471 |
| 2.375%, 5/24/27 | | 2,741 | 2,536,797 |
| 2.875%, 6/13/25(1) | | 5,102 | 4,917,143 |
| Inter-American Development Bank, 0.875%, 4/3/25 | | 1,030 | 945,453 |
| International Bank for Reconstruction & Development: | | | |
| 3.11%, (SOFR + 0.13%), 1/13/23(4) | | 1,637 | 1,637,135 |
| 3.125%, 11/20/25 | | 2,600 | 2,507,921 |
| International Finance Corp., 3.07%, (SOFR + 0.09%), 4/3/24(4) | | 679 | 678,937 |
| | | | $ 17,652,127 |
| Government - Regional — 0.2% | |
| Kommuninvest I Sverige AB, 0.375%, 6/19/24(1) | | 1,940 | $ 1,811,992 |
| | | | $ 1,811,992 |
| Industrial — 0.5% | |
| Imola Merger Corp., 4.75%, 5/15/29(1) | | 727 | $ 615,056 |
| Jabil, Inc.: | | | |
| 3.00%, 1/15/31 | | 1,701 | 1,345,873 |
| 3.60%, 1/15/30 | | 1,434 | 1,199,940 |
| Owens Corning, 3.95%, 8/15/29 | | 1,598 | 1,432,186 |
| Valmont Industries, Inc.: | | | |
| 5.00%, 10/1/44 | | 110 | 93,026 |
| 5.25%, 10/1/54 | | 800 | 693,213 |
| | | | $ 5,379,294 |
| Other Revenue — 0.2% | |
| BlueHub Loan Fund, Inc., 3.099%, 1/1/30 | | 1,625 | $ 1,401,186 |
| | | | $ 1,401,186 |
| Technology — 0.3% | |
| DXC Technology Co., 2.375%, 9/15/28(9) | | 618 | $ 505,516 |
| Kyndryl Holdings, Inc.: | | | |
| 2.05%, 10/15/26 | | 1,045 | 840,639 |
| 2.70%, 10/15/28 | | 382 | 279,811 |
| Seagate HDD Cayman: | | | |
| 3.375%, 7/15/31 | | 990 | 693,431 |
| Security | Principal
Amount*
(000’s omitted) | Value |
| Technology (continued) | |
| Seagate HDD Cayman: (continued) | | | |
| 4.091%, 6/1/29 | | 758 | $ 609,618 |
| 5.75%, 12/1/34 | | 439 | 349,532 |
| | | | $ 3,278,547 |
| Utilities — 0.8% | |
| AES Corp. (The), 2.45%, 1/15/31 | | 1,826 | $ 1,399,647 |
| American Water Capital Corp., 2.30%, 6/1/31 | | 110 | 87,349 |
| Avangrid, Inc., 3.15%, 12/1/24 | | 388 | 371,305 |
| Clearway Energy Operating, LLC, 3.75%, 1/15/32(1) | | 472 | 366,735 |
| Enel Finance International N.V., 1.375%, 7/12/26(1) | | 1,861 | 1,574,413 |
| Engie Energia Chile S.A., 3.40%, 1/28/30(1) | | 200 | 151,013 |
| MidAmerican Energy Co.: | | | |
| 3.15%, 4/15/50 | | 500 | 341,325 |
| 4.25%, 7/15/49 | | 835 | 697,831 |
| NextEra Energy Capital Holdings, Inc., 1.90%, 6/15/28 | | 671 | 556,223 |
| NextEra Energy Operating Partners, L.P., 4.25%, 9/15/24(1) | | 73 | 70,061 |
| Niagara Mohawk Power Corp., 1.96%, 6/27/30(1) | | 586 | 453,028 |
| Pattern Energy Operations, L.P./Pattern Energy Operations, Inc., 4.50%, 8/15/28(1) | | 1,745 | 1,516,580 |
| | | | $ 7,585,510 |
Total Corporate Bonds
(identified cost $192,501,516) | | | $ 162,041,613 |
| High Social Impact Investments — 0.2% |
| Security | Principal
Amount
(000's omitted) | Value |
| Calvert Impact Capital, Inc., Community Investment Notes, 1.50%, 12/15/23(8)(13) | $ | 2,500 | $ 2,321,900 |
Total High Social Impact Investments
(identified cost $2,500,000) | | | $ 2,321,900 |
| Security | Shares | Value |
| Oil, Gas & Consumable Fuels — 0.1% | |
| NuStar Energy, L.P., Series B, 9.126%, (3 mo. USD LIBOR + 5.643%)(4)(9) | | 24,733 | $ 478,089 |
| | | | $ 478,089 |
21
See Notes to Financial Statements.
Calvert
Balanced Fund
September 30, 2022
Schedule of Investments — continued
| Security | Shares | Value |
| Real Estate Management & Development — 0.1% | |
| Brookfield Property Partners, L.P.: | | | |
| Series A, 5.75% | | 31,814 | $ 540,838 |
| Series A2, 6.375% | | 28,000 | 517,440 |
| | | | $ 1,058,278 |
| Venture Capital — 0.0%(14) | |
| Consensus Orthopedics, Inc.: | | | |
| Series A-1(6)(7)(8) | | 420,683 | $ 0 |
| Series B(6)(7)(8) | | 348,940 | 0 |
| Series C(6)(7)(8) | | 601,710 | 0 |
| Lumni, Inc., Series B(6)(7)(8) | | 17,265 | 33,192 |
| Wind Harvest Co., Inc.(6)(7)(8) | | 8,696 | 0 |
| | | | $ 33,192 |
| Wireless Telecommunication Services — 0.1% | |
| United States Cellular Corp.: | | | |
| 5.50% | | 54,000 | $ 999,000 |
| 6.25% | | 4,575 | 94,885 |
| | | | $ 1,093,885 |
Total Preferred Stocks
(identified cost $4,012,675) | | | $ 2,663,444 |
| Senior Floating-Rate Loans(15) — 0.4% |
| Borrower/Description | Principal
Amount
(000's omitted) | Value |
| Diversified Telecommunication Services — 0.2% | |
| CenturyLink, Inc., Term Loan, 5.365%, (1 mo. USD LIBOR + 2.25%), 3/15/27 | $ | �� 827 | $ 753,964 |
| Ziggo Financing Partnership, Term Loan, 5.318%, (1 mo. USD LIBOR + 2.50%), 4/30/28 | | 845 | 806,824 |
| | | | $ 1,560,788 |
| IT Services — 0.0%(14) | |
| Asurion, LLC, Term Loan, 6.365%, (1 mo. USD LIBOR + 3.25%), 12/23/26 | $ | 147 | $ 125,269 |
| | | | $ 125,269 |
| Software — 0.1% | |
| Hyland Software, Inc., Term Loan, 6.615%, (1 mo. USD LIBOR + 3.50%), 7/1/24 | $ | 357 | $ 346,764 |
| Seattle Spinco, Inc., Term Loan, 5.865%, (1 mo. USD LIBOR + 2.75%), 6/21/24 | | 139 | 136,073 |
| Ultimate Software Group, Inc. (The), Term Loan, 6.865%, (1 mo. USD LIBOR + 3.75%), 5/4/26 | | 762 | 728,139 |
| Borrower/Description | Principal
Amount
(000's omitted) | Value |
| Software (continued) | |
| VS Buyer, LLC, Term Loan, 6.115%, (1 mo. USD LIBOR + 3.00%), 2/28/27 | $ | 99 | $ 95,525 |
| | | | $ 1,306,501 |
| Specialty Retail — 0.1% | |
| Petsmart, Inc., Term Loan, 6.87%, (1 mo. USD LIBOR + 3.75%), 2/11/28 | $ | 995 | $ 943,982 |
| | | | $ 943,982 |
Total Senior Floating-Rate Loans
(identified cost $4,164,355) | | | $ 3,936,540 |
| Sovereign Government Bonds — 0.4% |
| Security | Principal
Amount
(000's omitted) | Value |
| Kreditanstalt fuer Wiederaufbau: | | | |
| 0.75%, 9/30/30 | $ | 591 | $ 460,380 |
| 1.00%, 10/1/26 | | 4,213 | 3,705,065 |
Total Sovereign Government Bonds
(identified cost $4,751,744) | | | $ 4,165,445 |
| Taxable Municipal Obligations — 1.3% |
| Security | Principal
Amount
(000's omitted) | Value |
| General Obligations — 0.3% | |
| Los Angeles Unified School District, CA, 5.75%, 7/1/34(16) | $ | 800 | $ 820,360 |
| Massachusetts, Green Bonds, 3.277%, 6/1/46 | | 880 | 673,851 |
| New York City, NY, 5.206%, 10/1/31(16) | | 1,275 | 1,275,459 |
| San Francisco City and County, CA, (Social Bonds - Affordable Housing, 2016), 3.921%, 6/15/39 | | 630 | 556,460 |
| | | | $ 3,326,130 |
| Special Tax Revenue — 0.5% | |
| California Health Facilities Financing Authority, (No Place Like Home Program): | | | |
| 2.361%, 6/1/26 | $ | 935 | $ 860,630 |
| 2.484%, 6/1/27 | | 665 | 599,697 |
| 2.534%, 6/1/28 | | 830 | 731,429 |
| 2.584%, 6/1/29 | | 455 | 392,556 |
| 2.984%, 6/1/33 | | 520 | 423,566 |
| Connecticut, Special Tax Revenue, 5.459%, 11/1/30(16) | | 400 | 410,688 |
22
See Notes to Financial Statements.
Calvert
Balanced Fund
September 30, 2022
Schedule of Investments — continued
| Security | Principal
Amount
(000's omitted) | Value |
| Special Tax Revenue (continued) | |
| New York City Transitional Finance Authority, NY, Future Tax Secured Revenue Bonds, 5.767%, 8/1/36(16) | $ | 955 | $ 990,985 |
| | | | $ 4,409,551 |
| Water and Sewer — 0.5% | |
| District of Columbia Water & Sewer Authority, Green Bonds, 4.814%, 10/1/2114 | $ | 270 | $ 237,627 |
| Narragansett Bay Commission, RI, Wastewater System Revenue: | | | |
| Green Bonds, 2.094%, 9/1/30 | | 430 | 351,185 |
| Green Bonds, 2.184%, 9/1/31 | | 345 | 276,856 |
| Green Bonds, 2.264%, 9/1/32 | | 305 | 240,486 |
| Green Bonds, 2.344%, 9/1/33 | | 335 | 260,489 |
| San Diego County Water Authority, CA: | | | |
| Green Bonds, 1.531%, 5/1/30 | | 360 | 287,179 |
| Green Bonds, 1.701%, 5/1/31 | | 320 | 251,629 |
| Green Bonds, 1.951%, 5/1/34 | | 190 | 141,221 |
| San Francisco City and County Public Utilities Commission, CA, Water Revenue, Green Bonds, 3.303%, 11/1/39 | | 3,420 | 2,796,295 |
| | | | $ 4,842,967 |
Total Taxable Municipal Obligations
(identified cost $14,781,948) | | | $ 12,578,648 |
| U.S. Government Agencies and Instrumentalities — 0.4% |
| Security | Principal
Amount
(000's omitted) | Value |
| U.S. Department of Housing and Urban Development: | | | |
| 2.618%, 8/1/23 | $ | 153 | $ 151,402 |
| 2.668%, 8/1/24 | | 534 | 517,348 |
| 2.738%, 8/1/25 | | 534 | 509,626 |
| 3.435%, 8/1/34 | | 530 | 469,468 |
| 3.485%, 8/1/35 | | 295 | 260,650 |
| 3.585%, 8/1/37 | | 547 | 471,864 |
| U.S. International Development Finance Corp.: | | | |
| 3.22%, 9/15/29 | | 659 | 625,587 |
| 3.52%, 9/20/32 | | 677 | 644,424 |
Total U.S. Government Agencies and Instrumentalities
(identified cost $4,048,870) | | | $ 3,650,369 |
| U.S. Government Agency Mortgage-Backed Securities — 4.5% |
| Security | Principal
Amount
(000's omitted) | Value |
| Federal Home Loan Mortgage Corp., Pool #ZT0383, 3.50%, 3/1/48 | $ | 236 | $ 215,687 |
| Federal National Mortgage Association: | | | |
| 4.00%, 30-Year, TBA(17) | | 28,253 | 26,180,543 |
| 4.50%, 30-Year, TBA(17) | | 8,760 | 8,330,406 |
| 5.00%, 30-Year, TBA(17) | | 5,288 | 5,138,241 |
| Pool #AN1909, 2.68%, 7/1/26 | | 636 | 595,312 |
| Pool #BM3990, 4.00%, 3/1/48 | | 614 | 577,313 |
| Pool #FM1867, 3.00%, 11/1/49 | | 722 | 633,221 |
| Pool #FM6803, 2.00%, 4/1/51 | | 622 | 508,552 |
| Pool #FM7023, 3.00%, 7/1/49 | | 856 | 751,558 |
| Pool #MA3149, 4.00%, 10/1/47 | | 732 | 689,892 |
| Government National Mortgage Association II: | | | |
| Pool #CB2653, 2.50%, 3/20/51 | | 830 | 711,073 |
| Pool #CB8629, 2.50%, 4/20/51 | | 1,266 | 1,084,576 |
Total U.S. Government Agency Mortgage-Backed Securities
(identified cost $47,350,943) | | $ 45,416,374 |
| U.S. Treasury Obligations — 9.3% |
| Security | Principal
Amount
(000's omitted) | Value |
| U.S. Treasury Bonds: | | | |
| 1.375%, 11/15/40 | $ | 961 | $ 621,557 |
| 1.375%, 8/15/50 | | 1,708 | 989,973 |
| 1.875%, 2/15/41 | | 2,040 | 1,446,049 |
| 1.875%, 2/15/51 | | 4,340 | 2,874,911 |
| 1.875%, 11/15/51 | | 996 | 659,111 |
| 2.00%, 2/15/50 | | 1,316 | 904,904 |
| 2.00%, 8/15/51 | | 7,338 | 5,015,638 |
| 2.25%, 5/15/41 | | 7,836 | 5,928,649 |
| 2.25%, 2/15/52 | | 1,804 | 1,311,283 |
| 2.375%, 5/15/51 | | 4,500 | 3,368,672 |
| 2.875%, 5/15/49 | | 815 | 679,904 |
| 3.00%, 8/15/52 | | 720 | 621,563 |
| 3.125%, 5/15/48 | | 371 | 321,096 |
| 3.375%, 8/15/42(9)(18) | | 3,759 | 3,406,006 |
| U.S. Treasury Notes: | | | |
| 0.125%, 9/15/23 | | 932 | 896,036 |
| 0.125%, 10/15/23 | | 934 | 894,715 |
| 0.125%, 12/15/23 | | 275 | 261,723 |
| 0.125%, 1/15/24 | | 324 | 307,155 |
| 0.125%, 2/15/24 | | 324 | 306,091 |
| 0.25%, 3/15/24 | | 1,556 | 1,467,563 |
23
See Notes to Financial Statements.
Calvert
Balanced Fund
September 30, 2022
Schedule of Investments — continued
| Security | Principal
Amount
(000's omitted) | Value |
| U.S. Treasury Notes: (continued) | | | |
| 0.25%, 6/30/25 | $ | 185 | $ 166,077 |
| 0.375%, 10/31/23 | | 545 | 522,551 |
| 0.375%, 4/15/24 | | 323 | 304,163 |
| 0.375%, 9/30/27 | | 371 | 309,597 |
| 0.625%, 7/31/26 | | 1,756 | 1,536,157 |
| 0.75%, 11/15/24 | | 285 | 264,850 |
| 1.00%, 7/31/28 | | 1,203 | 1,013,574 |
| 1.125%, 1/15/25 | | 839 | 781,810 |
| 1.125%, 2/29/28 | | 3,655 | 3,137,732 |
| 1.125%, 8/31/28 | | 448 | 379,383 |
| 1.25%, 12/31/26 | | 1,012 | 899,099 |
| 1.25%, 3/31/28 | | 1,609 | 1,387,700 |
| 1.25%, 4/30/28 | | 2,906 | 2,500,863 |
| 1.25%, 6/30/28 | | 344 | 294,899 |
| 1.25%, 8/15/31 | | 36 | 29,102 |
| 1.375%, 9/30/23 | | 915 | 889,159 |
| 1.375%, 11/15/31 | | 226 | 183,682 |
| 1.50%, 1/31/27 | | 342 | 306,651 |
| 1.875%, 2/28/27 | | 15,885 | 14,470,515 |
| 1.875%, 2/15/32 | | 1,351 | 1,145,078 |
| 2.125%, 3/31/24 | | 6,480 | 6,275,728 |
| 2.625%, 4/15/25 | | 738 | 708,855 |
| 2.75%, 4/30/27 | | 12,701 | 11,989,049 |
| 2.75%, 7/31/27 | | 585 | 550,951 |
| 2.75%, 8/15/32(9) | | 1,420 | 1,298,634 |
| 2.875%, 4/30/29 | | 3,300 | 3,081,375 |
| 3.125%, 8/31/27 | | 2,851 | 2,735,178 |
| 3.125%, 8/31/29 | | 1,228 | 1,165,737 |
| 3.25%, 8/31/24 | | 1,840 | 1,806,937 |
| 3.875%, 9/30/29 | | 1,121 | 1,116,183 |
Total U.S. Treasury Obligations
(identified cost $108,366,562) | | | $ 93,533,868 |
| Venture Capital Limited Partnership Interests — 0.0%(14) |
| Security | | Value |
| First Analysis Private Equity Fund IV, L.P.(6)(7)(8) | | | $ 344,842 |
| GEEMF Partners, L.P.(6)(7)(8)(13) | | | 7,561 |
| Global Environment Emerging Markets Fund, L.P.(6)(7)(8) | | | 32,671 |
| Solstice Capital, L.P.(6)(7)(8) | | | 23,894 |
Total Venture Capital Limited Partnership Interests
(identified cost $0) | | | $ 408,968 |
| Short-Term Investments — 3.1% | | | |
| Affiliated Fund — 2.4% |
| Security | Shares | Value |
| Morgan Stanley Institutional Liquidity Funds - Government Portfolio, Institutional Class, 2.80%(19) | | 24,252,378 | $ 24,252,378 |
Total Affiliated Fund
(identified cost $24,252,378) | | | $ 24,252,378 |
| Securities Lending Collateral — 0.7% |
| Security | Shares | Value |
| State Street Navigator Securities Lending Government Money Market Portfolio, 3.07%(20) | | 6,219,201 | $ 6,219,201 |
Total Securities Lending Collateral
(identified cost $6,219,201) | | | $ 6,219,201 |
Total Short-Term Investments
(identified cost $30,471,579) | | | $ 30,471,579 |
Total Investments — 104.4%
(identified cost $1,007,215,974) | | | $1,046,951,429 |
| Other Assets, Less Liabilities — (4.4)% | | | $ (43,799,070) |
| Net Assets — 100.0% | | | $ 1,003,152,359 |
| The percentage shown for each investment category in the Schedule of Investments is based on net assets. |
| * | In U.S. dollars unless otherwise indicated. |
| (1) | Security exempt from registration under Rule 144A of the Securities Act of 1933, as amended. These securities may be sold in certain transactions in reliance on an exemption from registration (normally to qualified institutional buyers). At September 30, 2022, the aggregate value of these securities is $160,432,346 or 16.0% of the Fund's net assets. |
| (2) | Weighted average fixed-rate coupon that changes/updates monthly. Rate shown is the rate at September 30, 2022. |
| (3) | Step coupon security. Interest rate represents the rate in effect at
September 30, 2022. |
| (4) | Variable rate security. The stated interest rate represents the rate in effect at September 30, 2022. |
| (5) | Represents an investment in an issuer that may be deemed to be an affiliate (see Note 8). |
| (6) | Non-income producing security. |
| (7) | For fair value measurement disclosure purposes, security is categorized as Level 3 (see Note 1A). |
| (8) | Restricted security. Total market value of restricted securities amounts to $4,888,834, which represents 0.4% of the net assets of the Fund as of September 30, 2022. |
| (9) | All or a portion of this security was on loan at September 30, 2022. The aggregate market value of securities on loan at September 30, 2022 was $6,106,270. |
24
See Notes to Financial Statements.
Calvert
Balanced Fund
September 30, 2022
Schedule of Investments — continued
| (10) | Security exempt from registration under Regulation S of the Securities Act of 1933, as amended, which exempts from registration securities offered and sold outside the United States. Security may not be offered or sold in the United States except pursuant to an exemption from, or in a transaction not subject to, the registration requirements of the Securities Act of 1933, as amended. At September 30, 2022, the aggregate value of these securities is $186,522 or less than 0.05% of the Fund's net assets. |
| (11) | Security converts to variable rate after the indicated fixed-rate coupon period. |
| (12) | Perpetual security with no stated maturity date but may be subject to calls by the issuer. |
| (13) | May be deemed to be an affiliated company (see Note 8). |
| (14) | Amount is less than 0.05%. |
| (15) | Senior floating-rate loans (Senior Loans) often require prepayments from excess cash flows or permit the borrowers to repay at their election. The degree to which borrowers repay, whether as a contractual requirement or at their election, cannot be predicted with accuracy. As a result, the actual remaining maturity may be substantially less than the stated maturities shown. However, Senior Loans will typically have an expected average life of approximately two to four years. Senior Loans typically have rates of interest which are redetermined periodically by reference to a base lending rate, plus a spread. These base lending rates are primarily the London Interbank Offered Rate (“LIBOR”) or the Secured Overnight Financing Rate (“SOFR”) and secondarily, the prime rate offered by one or more major United States banks (the “Prime Rate”). Base lending rates may be subject to a floor, or minimum rate. Rates for SOFR are generally 1 or 3-month tenors and may also be subject to a credit spread adjustment. Senior Loans are generally subject to contractual restrictions that must be satisfied before they can be bought or sold. |
| (16) | Build America Bond. Represents taxable municipal obligation issued pursuant to the American Recovery and Reinvestment Act of 2009 or other legislation providing for the issuance of taxable municipal debt on which the issuer receives federal support. |
| (17) | TBA (To Be Announced) securities are purchased on a forward commitment basis with an approximate principal amount and no definite maturity date. The actual principal amount and maturity date are determined upon settlement. |
| (18) | When-issued security. |
| (19) | May be deemed to be an affiliated investment company. The rate shown is the annualized seven-day yield as of September 30, 2022. |
| (20) | Represents investment of cash collateral received in connection with securities lending. |
Forward Foreign Currency Exchange Contracts
| Currency Purchased | Currency Sold | Counterparty | Settlement
Date | Unrealized
Appreciation | Unrealized
(Depreciation) |
| USD | 152,684 | EUR | 152,238 | State Street Bank and Trust Company | 11/30/22 | $ 2,894 | $ — |
| | | | | | | $2,894 | $ — |
Futures Contracts
| Description | Number of
Contracts | Position | Expiration
Date | Notional
Amount | Value/
Unrealized
Appreciation
(Depreciation) |
| Interest Rate Futures | | | | | |
| U.S. 2-Year Treasury Note | 123 | Long | 12/30/22 | $ 25,263,047 | $ (381,628) |
| U.S. 10-Year Treasury Note | 6 | Long | 12/20/22 | 672,375 | (34,551) |
| U.S. Long Treasury Bond | 107 | Long | 12/20/22 | 13,525,469 | (852,681) |
| U.S. Ultra-Long Treasury Bond | 15 | Long | 12/20/22 | 2,055,000 | (192,175) |
| U.S. 5-Year Treasury Note | (140) | Short | 12/30/22 | (15,051,094) | 35,861 |
| U.S. Ultra 10-Year Treasury Note | (142) | Short | 12/20/22 | (16,824,781) | 1,067,702 |
| U.S. Ultra-Long Treasury Bond | (12) | Short | 12/20/22 | (1,644,000) | 153,764 |
| | | | | | $ (203,708) |
25
See Notes to Financial Statements.
Calvert
Balanced Fund
September 30, 2022
Schedule of Investments — continued
Restricted Securities
| Description | Acquisition Dates | Cost |
| Calvert Impact Capital, Inc., Community Investment Notes, 1.50%, 12/15/23 | 12/14/20 | $2,500,000 |
| CFBanc Corp., Common Stock | 3/14/03 | 270,000 |
| Consensus Orthopedics, Inc., Common Stock | 2/10/06 | 504,331 |
| Consensus Orthopedics, Inc., Series A-1, Preferred | 8/19/05 | 4,331 |
| Consensus Orthopedics, Inc., Series B, Preferred | 2/10/06 | 139,576 |
| Consensus Orthopedics, Inc., Series C, Preferred | 2/10/06 | 120,342 |
| First Analysis Private Equity Fund IV, L.P. | 2/25/02-7/6/11 | 0 |
| GEEMF Partners, L.P. | 2/28/97 | 0 |
| Global Environment Emerging Markets Fund, L.P. | 1/14/94-2/1/95 | 0 |
| Learn Capital Venture Partners III, L.P., Common Stock | 8/30/16-5/17/22 | 1,072,962 |
| Lumni, Inc., Series B, Preferred | 8/8/13 | 116,367 |
| Neighborhood Bancorp, Class A, Common Stock | 6/25/97 | 100,000 |
| Solstice Capital, L.P. | 6/26/01-6/17/08 | 0 |
| Wind Harvest Co., Inc., Preferred | 5/16/94 | 100,000 |
| Abbreviations: |
| LIBOR | – London Interbank Offered Rate |
| SOFR | – Secured Overnight Financing Rate |
| TBA | – To Be Announced |
| Currency Abbreviations: |
| EUR | – Euro |
| USD | – United States Dollar |
26
See Notes to Financial Statements.
Calvert
Bond Fund
September 30, 2022
| Asset-Backed Securities — 17.4% |
| Security | Principal
Amount
(000's omitted) | Value |
| Adams Outdoor Advertising, L.P., Series 2018-1, Class A, 4.81%, 11/15/48(1) | $ | 1,674 | $ 1,586,119 |
| Affirm Asset Securitization Trust, Series 2021-A, Class A, 0.88%, 8/15/25(1) | | 1,349 | 1,340,233 |
| Coinstar Funding, LLC, Series 2017-1A, Class A2, 5.216%, 4/25/47(1) | | 4,036 | 3,773,912 |
| Cologix Canadian Issuer, L.P., Series 2022-1CAN, Class C, 7.74%, 1/25/52(1)(2) | | 5,300 | 3,574,426 |
| Cologix Data Centers US Issuer, LLC: | | | |
| Series 2021-1A, Class A2, 3.30%, 12/26/51(1) | | �� 13,910 | 12,429,271 |
| Series 2021-1A, Class B, 3.79%, 12/26/51(1) | | 5,985 | 5,258,368 |
| Conn's Receivables Funding, LLC: | | | |
| Series 2021-A, Class A, 1.05%, 5/15/26(1) | | 2,157 | 2,146,997 |
| Series 2021-A, Class B, 2.87%, 5/15/26(1) | | 6,935 | 6,765,975 |
| Series 2022-A, Class B, 9.52%, 12/15/26(1) | | 12,437 | 12,402,079 |
| DataBank Issuer, Series 2021-2A, Class A2, 2.40%, 10/25/51(1) | | 5,184 | 4,471,927 |
| DB Master Finance, LLC, Series 2017-1A, Class A2II, 4.03%, 11/20/47(1) | | 659 | 600,755 |
| Diamond Infrastructure Funding, LLC: | | | |
| Series 2021-1A, Class A, 1.76%, 4/15/49(1) | | 5,977 | 4,918,712 |
| Series 2021-1A, Class C, 3.475%, 4/15/49(1) | | 1,193 | 982,204 |
| Diamond Issuer, Series 2021-1A, Class A, 2.305%, 11/20/51(1) | | 13,147 | 11,133,494 |
| Driven Brands Funding, LLC, Series 2018-1A, Class A2, 4.739%, 4/20/48(1) | | 6,836 | 6,529,161 |
| ExteNet, LLC, Series 2019-1A, Class A2, 3.204%, 7/26/49(1) | | 6,921 | 6,539,559 |
| FMC GMSR Issuer Trust: | | | |
| Series 2021-GT2, Class A, 3.85%, 10/25/26(1)(3) | | 5,210 | 4,218,680 |
| Series 2022-GT1, Class A, 6.19%, 4/25/27(1) | | 4,391 | 3,841,555 |
| Series 2022-GT2, Class A, 7.90%, 7/25/27(1) | | 6,200 | 5,768,670 |
| FOCUS Brands Funding, LLC, Series 2017-1A, Class A2II, 5.093%, 4/30/47(1) | | 1,180 | 1,078,625 |
| GoodLeap Sustainable Home Solutions Trust: | | | |
| Series 2021-5CS, Class A, 2.31%, 10/20/48(1) | | 3,744 | 3,119,797 |
| Series 2022-2CS, Class A, 4.00%, 4/20/49(1) | | 9,895 | 9,053,659 |
| Hardee's Funding, LLC, Series 2020-1A, Class A2, 3.981%, 12/20/50(1) | | 2,088 | 1,798,395 |
| Jersey Mike's Funding, Series 2019-1A, Class A2, 4.433%, 2/15/50(1) | | 3,602 | 3,277,315 |
| JPMorgan Chase Bank, NA: | | | |
| Series 2021-2, Class B, 0.889%, 12/26/28(1) | | 4,101 | 3,946,431 |
| Series 2021-3, Class B, 0.76%, 2/26/29(1) | | 3,609 | 3,454,610 |
| Lendingpoint Asset Securitization Trust: | | | |
| Series 2022-A, Class A, 1.68%, 6/15/29(1) | | 4,923 | 4,842,207 |
| Series 2022-C, Class A, 6.56%, 2/15/30(1) | | 13,360 | 13,359,173 |
| Security | Principal
Amount
(000's omitted) | Value |
| Loanpal Solar Loan, Ltd., Series 2020-3GS, Class A, 2.47%, 12/20/47(1) | $ | 2,132 | $ 1,701,464 |
| Lunar Aircraft, Ltd.: | | | |
| Series 2020-1A, Class B, 4.335%, 2/15/45(1) | | 829 | 613,548 |
| Series 2020-1A, Class C, 6.413%, 2/15/45(1) | | 367 | 282,175 |
| Mosaic Solar Loan Trust: | | | |
| Series 2019-1A, Class A, 4.37%, 12/21/43(1) | | 2,116 | 1,990,463 |
| Series 2019-2A, Class B, 3.28%, 9/20/40(1) | | 7,246 | 6,505,919 |
| Series 2019-2A, Class C, 4.35%, 9/20/40(1) | | 73 | 72,432 |
| Series 2020-1A, Class A, 2.10%, 4/20/46(1) | | 725 | 626,099 |
| Series 2020-1A, Class B, 3.10%, 4/20/46(1) | | 607 | 534,740 |
| Series 2020-2A, Class A, 1.44%, 8/20/46(1) | | 1,462 | 1,223,590 |
| Series 2020-2A, Class B, 2.21%, 8/20/46(1) | | 1,822 | 1,551,859 |
| Series 2021-1A, Class A, 1.51%, 12/20/46(1) | | 3,386 | 2,647,694 |
| Series 2022-2A, Class B, 5.13%, 1/21/53(1) | | 6,428 | 6,084,606 |
| Mosaic Solar Loans, LLC, Series 2017-1A, Class A, 4.45%, 6/20/42(1) | | 111 | 105,982 |
| Neighborly Issuer, LLC, Series 2021-1A, Class A2, 3.584%, 4/30/51(1) | | 5,357 | 4,450,505 |
| NRZ Excess Spread-Collateralized Notes, Series 2021-GNT1, Class A, 3.474%, 11/25/26(1) | | 8,309 | 7,320,985 |
| OneMain Financial Issuance Trust: | | | |
| Series 2020-1A, Class A, 3.84%, 5/14/32(1) | | 4,142 | 4,117,213 |
| Series 2022-S1, Class A, 4.13%, 5/14/35(1) | | 8,670 | 8,248,629 |
| Oportun Funding XIII, LLC, Series 2019-A, Class A, 3.08%, 8/8/25(1) | | 5,807 | 5,784,529 |
| Oportun Funding XIV, LLC: | | | |
| Series 2021-A, Class B, 1.76%, 3/8/28(1) | | 1,893 | 1,741,195 |
| Series 2021-A, Class C, 3.44%, 3/8/28(1) | | 4,091 | 3,766,954 |
| Oportun Funding, LLC, Series 2022-1, Class A, 3.25%, 6/15/29(1) | | 8,744 | 8,561,098 |
| Oportun Issuance Trust: | | | |
| Series 2021-B, Class A, 1.47%, 5/8/31(1) | | 6,319 | 5,614,842 |
| Series 2021-B, Class B, 1.96%, 5/8/31(1) | | 1,694 | 1,504,954 |
| Series 2021-C, Class A, 2.18%, 10/8/31(1) | | 30,475 | 26,928,780 |
| Pagaya AI Debt Selection Trust: | | | |
| Series 2021-2, 3.00%, 1/25/29(1) | | 4,295 | 4,014,284 |
| Series 2021-3, Class A, 1.15%, 5/15/29(1) | | 10,507 | 10,183,902 |
| Series 2021-5, Class B, 2.63%, 8/15/29(1) | | 3,857 | 3,522,713 |
| Series 2021-5, Class C, 3.93%, 8/15/29(1) | | 2,903 | 2,468,206 |
| Series 2021-HG1, Class A, 1.22%, 1/16/29(1) | | 2,649 | 2,497,599 |
| Series 2022-1, Class A, 2.03%, 10/15/29(1) | | 16,545 | 15,884,877 |
| Planet Fitness Master Issuer, LLC, Series 2019-1A, Class A2, 3.858%, 12/5/49(1) | | 3,127 | 2,640,615 |
| PMT Issuer Trust, Series 2021-FT1, Class A, 6.084%, (1 mo. USD LIBOR + 3.00%), 3/25/26(1)(4) | | 1,360 | 1,273,035 |
| SBA Tower Trust, Series 2014-2A, Class C, 3.869% to 4/15/23, 10/15/49(1)(5) | | 3,300 | 3,193,416 |
27
See Notes to Financial Statements.
Calvert
Bond Fund
September 30, 2022
Schedule of Investments — continued
| Security | Principal
Amount
(000's omitted) | Value |
| ServiceMaster Funding, LLC: | | | |
| Series 2020-1, Class A2I, 2.841%, 1/30/51(1) | $ | 1,987 | $ 1,626,869 |
| Series 2020-1, Class A2II, 3.337%, 1/30/51(1) | | 2,338 | 1,801,106 |
| SERVPRO Master Issuer, LLC, Series 2019-1A, Class A2, 3.882%, 10/25/49(1) | | 10,529 | 9,350,823 |
| SolarCity LMC Series I, LLC, Series 2013-1, Class A, 4.80%, 11/20/38(1) | | 1,342 | 1,295,216 |
| Sonic Capital, LLC, Series 2020-1A, Class A2I, 3.845%, 1/20/50(1) | | 4,514 | 4,111,376 |
| SpringCastle America Funding, LLC, Series 2020-AA, Class A, 1.97%, 9/25/37(1) | | 4,043 | 3,699,894 |
| Stack Infrastructure Issuer, LLC: | | | |
| Series 2019-1A, Class A2, 4.54%, 2/25/44(1) | | 26,664 | 26,343,567 |
| Series 2019-2A, Class A2, 3.08%, 10/25/44(1) | | 2,140 | 2,016,699 |
| Series 2020-1A, Class A2, 1.893%, 8/25/45(1) | | 5,900 | 5,245,614 |
| Sunnova Helios IV Issuer, LLC, Series 2020-AA, Class A, 2.98%, 6/20/47(1) | | 3,346 | 2,913,628 |
| Sunnova Helios V Issuer, LLC, Series 2021-A, Class A, 1.80%, 2/20/48(1) | | 928 | 747,758 |
| Sunnova Sol II Issuer, LLC: | | | |
| Series 2020-2A, Class A, 2.73%, 11/1/55(1) | | 8,850 | 6,993,343 |
| Series 2020-2A, Class B, 5.47%, 11/1/55(1) | | 2,216 | 1,759,419 |
| Sunnova Sol Issuer, LLC: | | | |
| Series 2020-1A, Class A, 3.35%, 2/1/55(1) | | 1,368 | 1,149,661 |
| Series 2020-1A, Class B, 5.54%, 2/1/55(1) | | 4,665 | 4,021,501 |
| Sunrun Atlas Issuer, LLC, Series 2019-2, Class A, 3.61%, 2/1/55(1) | | 2,726 | 2,419,503 |
| Sunrun Demeter Issuer, LLC, Series 2021-2A, Class A, 2.27%, 1/30/57(1) | | 4,080 | 3,153,457 |
| Sunrun Jupiter Issuer, LLC, Series 2022-1A, Class A, 4.75%, 7/30/57(1) | | 25,896 | 23,561,848 |
| Sunrun Vulcan Issuer, LLC, Series 2021-1A, Class A, 2.46%, 1/30/52(1) | | 3,276 | 2,721,300 |
| Sunrun Xanadu Issuer, LLC, Series 2019-1A, Class A, 3.98%, 6/30/54(1) | | 1,324 | 1,206,338 |
| Theorem Funding Trust, Series 2021-1A, Class A, 1.21%, 12/15/27(1) | | 3,860 | 3,763,849 |
| United States Small Business Administration, Series 2017-20E, Class 1, 2.88%, 5/1/37 | | 3,318 | 3,066,005 |
| Vantage Data Centers Issuer, LLC: | | | |
| Series 2018-2A, Class A2, 4.196%, 11/15/43(1) | | 2,116 | 2,082,414 |
| Series 2019-1A, Class A2, 3.188%, 7/15/44(1) | | 2,758 | 2,634,719 |
| Series 2020-2A, Class A2, 1.992%, 9/15/45(1) | | 10,830 | 9,041,110 |
| Series 2021-1A, Class A2, 2.165%, 10/15/46(1) | | 3,726 | 3,234,570 |
| Vivint Solar Financing VII, LLC, Series 2020-1A, Class A, 2.21%, 7/31/51(1) | | 5,908 | 4,807,321 |
| Willis Engine Structured Trust V: | | | |
| Series 2020-A, Class B, 4.212%, 3/15/45(1) | | 2,069 | 1,528,276 |
| Security | Principal
Amount
(000's omitted) | Value |
| Willis Engine Structured Trust V: (continued) | | | |
| Series 2020-A, Class C, 6.657%, 3/15/45(1) | $ | 764 | $ 507,021 |
Total Asset-Backed Securities
(identified cost $469,181,002) | | | $ 426,675,416 |
| Collateralized Mortgage Obligations — 6.8% |
| Security | Principal
Amount
(000's omitted) | Value |
| Bellemeade Re, Ltd.: | | | |
| Series 2021-1A, Class M1A, 4.031%, (30-day average SOFR + 1.75%), 3/25/31(1)(4) | $ | 1,343 | $ 1,343,047 |
| Series 2021-1A, Class M1B, 4.481%, (30-day average SOFR + 2.20%), 3/25/31(1)(4) | | 1,550 | 1,515,445 |
| Series 2021-2A, Class M1A, 3.481%, (30-day average SOFR + 1.20%), 6/25/31(1)(4) | | 10,342 | 10,264,502 |
| Series 2021-3A, Class A2, 3.281%, (30-day average SOFR + 1.00%), 9/25/31(1)(4) | | 3,470 | 3,216,256 |
| Cascade MH Asset Trust, Series 2022-MH1, Class A, 4.25% to 7/25/27, 8/25/54(1)(5) | | 8,165 | 7,143,261 |
| Federal Home Loan Mortgage Corp. Structured Agency Credit Risk Debt Notes: | | | |
| Series 2018-DNA1, Class M2AT, 4.134%, (1 mo. USD LIBOR + 1.05%), 7/25/30(4) | | 736 | 732,718 |
| Series 2019-DNA3, Class B2, 11.234%, (1 mo. USD LIBOR + 8.15%), 7/25/49(1)(4) | | 2,905 | 2,849,365 |
| Series 2019-DNA3, Class M2, 5.134%, (1 mo. USD LIBOR + 2.05%), 7/25/49(1)(4) | | 5,165 | 5,101,565 |
| Series 2019-DNA4, Class M2, 5.034%, (1 mo. USD LIBOR + 1.95%), 10/25/49(1)(4) | | 359 | 356,262 |
| Series 2019-HQA2, Class B1, 7.184%, (1 mo. USD LIBOR + 4.10%), 4/25/49(1)(4) | | 4,852 | 4,766,961 |
| Series 2019-HQA3, Class B1, 6.084%, (1 mo. USD LIBOR + 3.00%), 9/25/49(1)(4) | | 3,974 | 3,662,118 |
| Series 2019-HQA4, Class B1, 6.034%, (1 mo. USD LIBOR + 2.95%), 11/25/49(1)(4) | | 2,768 | 2,684,960 |
| Series 2020-HQA2, Class B1, 7.184%, (1 mo. USD LIBOR + 4.10%), 3/25/50(1)(4) | | 5,321 | 5,086,716 |
| Series 2021-DNA3, Class M1, 3.031%, (30-day average SOFR + 0.75%), 10/25/33(1)(4) | | 2,107 | 2,078,148 |
| Series 2022-DNA2, Class M1A, 3.581%, (30-day average SOFR + 1.30%), 2/25/42(1)(4) | | 6,142 | 6,044,042 |
| Series 2022-HQA1, Class M1A, 4.381%, (30-day average SOFR + 2.10%), 3/25/42(1)(4) | | 1,554 | 1,552,286 |
| Federal National Mortgage Association Connecticut Avenue Securities: | | | |
| Series 2013-C01, Class M2, 8.334%, (1 mo. USD LIBOR + 5.25%), 10/25/23(4) | | 845 | 870,926 |
| Series 2014-C02, Class 2M2, 5.684%, (1 mo. USD LIBOR + 2.60%), 5/25/24(4) | | 424 | 426,260 |
| Series 2014-C03, Class 2M2, 5.984%, (1 mo. USD LIBOR + 2.90%), 7/25/24(4) | | 531 | 537,414 |
28
See Notes to Financial Statements.
Calvert
Bond Fund
September 30, 2022
Schedule of Investments — continued
| Security | Principal
Amount
(000's omitted) | Value |
| Federal National Mortgage Association Connecticut Avenue Securities: (continued) | | | |
| Series 2014-C04, Class 1M2, 7.984%, (1 mo. USD LIBOR + 4.90%), 11/25/24(4) | $ | 6,201 | $ 6,367,011 |
| Series 2018-R07, Class 1M2, 5.484%, (1 mo. USD LIBOR + 2.40%), 4/25/31(1)(4) | | 424 | 424,673 |
| Series 2019-R01, Class 2B1, 7.434%, (1 mo. USD LIBOR + 4.35%), 7/25/31(1)(4) | | 10,565 | 10,634,546 |
| Series 2019-R02, Class 1B1, 7.234%, (1 mo. USD LIBOR + 4.15%), 8/25/31(1)(4) | | 4,805 | 4,817,012 |
| Series 2019-R03, Class 1B1, 7.184%, (1 mo. USD LIBOR + 4.10%), 9/25/31(1)(4) | | 4,825 | 4,821,249 |
| Series 2019-R04, Class 2B1, 8.334%, (1 mo. USD LIBOR + 5.25%), 6/25/39(1)(4) | | 3,251 | 3,336,637 |
| Series 2019-R06, Class 2B1, 6.834%, (1 mo. USD LIBOR + 3.75%), 9/25/39(1)(4) | | 22,273 | 21,986,013 |
| Series 2019-R07, Class 1B1, 6.484%, (1 mo. USD LIBOR + 3.40%), 10/25/39(1)(4) | | 9,454 | 9,199,166 |
| Series 2020-R01, Class 2B1, 6.334%, (1 mo. USD LIBOR + 3.25%), 1/25/40(1)(4) | | 3,000 | 2,839,063 |
| Series 2020-R02, Class 2B1, 6.084%, (1 mo. USD LIBOR + 3.00%), 1/25/40(1)(4) | | 4,570 | 4,155,669 |
| Series 2021-R01, Class 1B2, 8.281%, (30-day average SOFR + 6.00%), 10/25/41(1)(4) | | 10,132 | 9,171,380 |
| Series 2021-R02, Class 2B1, 5.581%, (30-day average SOFR + 3.30%), 11/25/41(1)(4) | | 1,647 | 1,476,780 |
| Federal National Mortgage Association Grantor Trust, Series 2017-T1, Class A, 2.898%, 6/25/27 | | 1,949 | 1,813,585 |
| Home Re, Ltd.: | | | |
| Series 2021-1, Class M1B, 4.634%, (1 mo. USD LIBOR + 1.55%), 7/25/33(1)(4) | | 4,033 | 4,004,745 |
| Series 2021-1, Class M2, 5.934%, (1 mo. USD LIBOR + 2.85%), 7/25/33(1)(4) | | 2,500 | 2,256,699 |
| Oaktown Re VI, Ltd., Series 2021-1A, Class M1A, 3.931%, (30-day average SOFR + 1.65%), 10/25/33(1)(4) | | 2,225 | 2,226,272 |
| PNMAC GMSR Issuer Trust: | | | |
| Series 2018-GT1, Class A, 5.934%, (1 mo. USD LIBOR + 2.85%), 2/25/23(1)(4) | | 7,588 | 7,534,644 |
| Series 2018-GT2, Class A, 5.734%, (1 mo. USD LIBOR + 2.65%), 8/25/25(1)(4) | | 1,555 | 1,532,138 |
| Series 2022-GT1, Class A, 6.531%, (30-day average SOFR + 4.25%), 5/25/27(1)(4) | | 4,680 | 4,471,493 |
| Radnor Re, Ltd., Series 2021-2, Class M1A, 4.131%, (30-day average SOFR + 1.85%), 11/25/31(1)(4) | | 4,026 | 3,993,455 |
Total Collateralized Mortgage Obligations
(identified cost $172,363,893) | | | $ 167,294,482 |
| Commercial Mortgage-Backed Securities — 10.0% |
| Security | Principal
Amount
(000's omitted) | Value |
| BAMLL Commercial Mortgage Securities Trust: | | | |
| Series 2019-BPR, Class DNM, 3.719%, 11/5/32(1)(3) | $ | 9,685 | $ 7,533,498 |
| Series 2019-BPR, Class FNM, 3.719%, 11/5/32(1)(3) | | 4,805 | 3,573,756 |
| BBCMS Mortgage Trust, Series 2017-DELC, Class F, 6.443%, (1 mo. USD LIBOR + 3.625%), 8/15/36(1)(4) | | 3,637 | 3,409,853 |
| BX Commercial Mortgage Trust: | | | |
| Series 2019-XL, Class A, 3.738%, (1 mo. USD LIBOR + 0.92%), 10/15/36(1)(4) | | 14,482 | 14,274,943 |
| Series 2019-XL, Class B, 3.898%, (1 mo. USD LIBOR + 1.08%), 10/15/36(1)(4) | | 2,690 | 2,625,559 |
| Series 2021-VOLT, Class B, 3.768%, (1 mo. USD LIBOR + 0.95%), 9/15/36(1)(4) | | 10,584 | 9,945,083 |
| Series 2021-VOLT, Class C, 3.918%, (1 mo. USD LIBOR + 1.10%), 9/15/36(1)(4) | | 5,226 | 4,851,468 |
| Series 2021-VOLT, Class D, 4.468%, (1 mo. USD LIBOR + 1.65%), 9/15/36(1)(4) | | 7,717 | 7,185,967 |
| CSMC, Series 2022-NWPT, Class A, 5.989%, (1 mo. SOFR + 3.143%), 9/9/24(1)(4) | | 3,480 | 3,484,687 |
| Extended Stay America Trust: | | | |
| Series 2021-ESH, Class A, 3.898%, (1 mo. USD LIBOR + 1.08%), 7/15/38(1)(4) | | 3,909 | 3,792,530 |
| Series 2021-ESH, Class C, 4.518%, (1 mo. USD LIBOR + 1.70%), 7/15/38(1)(4) | | 7,005 | 6,748,525 |
| Federal Home Loan Mortgage Corp. Multifamily Structured Pass Through Certificates: | | | |
| Series KG02, Class A2, 2.412%, 8/25/29 | | 19,890 | 17,426,757 |
| Series KG03, Class A2, 1.297%, 6/25/30(3) | | 4,615 | 3,654,765 |
| Series KSG1, Class A2, 1.503%, 9/25/30 | | 4,386 | 3,524,881 |
| Series KW06, Class A2, 3.80%, 6/25/28(3) | | 5,335 | 5,138,037 |
| Series W5FX, Class AFX, 3.336%, 4/25/28(3) | | 1,896 | 1,772,223 |
| Federal National Mortgage Association: | | | |
| Series 2017-M13, Class A2, 3.028%, 9/25/27(3) | | 5,252 | 4,914,124 |
| Series 2018-M4, Class A2, 3.158%, 3/25/28(3) | | 3,810 | 3,537,340 |
| Series 2018-M13, Class A2, 3.867%, 9/25/30(3) | | 14,523 | 13,839,422 |
| Series 2019-M1, Class A2, 3.666%, 9/25/28(3) | | 8,081 | 7,676,953 |
| Series 2019-M22, Class A2, 2.522%, 8/25/29 | | 11,644 | 10,339,868 |
| Series 2020-M1, Class A2, 2.444%, 10/25/29 | | 13,443 | 11,781,811 |
| Series 2020-M20, Class A2, 1.435%, 10/25/29 | | 5,500 | 4,532,835 |
| Federal National Mortgage Association Multifamily Connecticut Avenue Securities Trust: | | | |
| Series 2019-01, Class M10, 6.334%, (1 mo. USD LIBOR + 3.25%), 10/25/49(1)(4) | | 6,207 | 5,903,609 |
| Series 2020-01, Class M10, 6.834%, (1 mo. USD LIBOR + 3.75%), 3/25/50(1)(4) | | 6,098 | 5,720,919 |
| Hawaii Hotel Trust, Series 2019-MAUI, Class A, 3.968%, (1 mo. USD LIBOR + 1.15%), 5/15/38(1)(4) | | 11,545 | 11,266,338 |
| JPMorgan Chase Commercial Mortgage Securities Trust: | | | |
| Series 2014-DSTY, Class B, 3.771%, 6/10/27(1) | | 2,335 | 490,227 |
| Series 2014-DSTY, Class C, 3.931%, 6/10/27(1)(3) | | 385 | 40,419 |
29
See Notes to Financial Statements.
Calvert
Bond Fund
September 30, 2022
Schedule of Investments — continued
| Security | Principal
Amount
(000's omitted) | Value |
| MHC Commercial Mortgage Trust, Series 2021-MHC, Class C, 4.169%, (1 mo. USD LIBOR + 1.35%), 4/15/38(1)(4) | $ | 2,565 | $ 2,423,234 |
| Morgan Stanley Capital I Trust: | | | |
| Series 2017-CLS, Class A, 3.518%, (1 mo. USD LIBOR + 0.70%), 11/15/34(1)(4)(6) | | 22,473 | 22,340,439 |
| Series 2017-CLS, Class B, 3.668%, (1 mo. USD LIBOR + 0.85%), 11/15/34(1)(4)(6) | | 4,000 | 3,974,132 |
| Series 2019-BPR, Class A, 4.468%, (1 mo. USD LIBOR + 1.65%), 5/15/36(1)(4)(6) | | 8,086 | 7,888,782 |
| SLG Office Trust, Series 2021-OVA, Class A, 2.585%, 7/15/41(1) | | 10,195 | 8,194,271 |
| VMC Finance, LLC: | | | |
| Series 2021-HT1, Class A, 4.643%, (1 mo. USD LIBOR + 1.65%), 1/18/37(1)(4) | | 6,306 | 6,131,267 |
| Series 2021-HT1, Class B, 7.493%, (1 mo. USD LIBOR + 4.50%), 1/18/37(1)(4) | | 13,365 | 12,857,377 |
| WFLD Mortgage Trust: | | | |
| Series 2014-MONT, Class B, 3.755%, 8/10/31(1)(3) | | 1,330 | 1,164,961 |
| Series 2014-MONT, Class C, 3.755%, 8/10/31(1)(3) | | 2,700 | 2,240,983 |
Total Commercial Mortgage-Backed Securities
(identified cost $269,141,886) | | | $ 246,201,843 |
| Security | Principal
Amount
(000’s omitted) | Value |
| Basic Materials — 0.5% | |
| Celanese US Holdings, LLC: | | | |
| 6.165%, 7/15/27 | $ | 4,197 | $ 3,977,399 |
| 6.33%, 7/15/29 | | 5,100 | 4,758,356 |
| South32 Treasury, Ltd., 4.35%, 4/14/32(1) | | 4,488 | 3,868,274 |
| | | | $ 12,604,029 |
| Communications — 2.2% | |
| AT&T, Inc.: | | | |
| 3.55%, 9/15/55 | $ | 14,659 | $ 9,659,539 |
| 3.65%, 6/1/51 | | 4,905 | 3,327,071 |
| 3.65%, 9/15/59 | | 822 | 534,290 |
| 3.80%, 12/1/57 | | 4,973 | 3,369,789 |
| Charter Communications Operating, LLC/Charter Communications Operating Capital, 4.80%, 3/1/50 | | 16,467 | 11,921,584 |
| Comcast Corp.: | | | |
| 2.887%, 11/1/51 | | 6,939 | 4,356,941 |
| 2.937%, 11/1/56 | | 7,567 | 4,529,841 |
| Nokia Oyj: | | | |
| 4.375%, 6/12/27 | | 5,025 | 4,535,992 |
| 6.625%, 5/15/39 | | 5,100 | 4,735,554 |
| Security | Principal
Amount
(000’s omitted) | Value |
| Communications (continued) | |
| SES Global Americas Holdings GP, 5.30%, 3/25/44(1) | $ | 2,440 | $ 1,875,764 |
| SES S.A., 5.30%, 4/4/43(1) | | 1,457 | 1,114,450 |
| T-Mobile USA, Inc.: | | | |
| 2.25%, 11/15/31 | | 4,403 | 3,326,035 |
| 2.55%, 2/15/31 | | 2,306 | 1,829,066 |
| | | | $ 55,115,916 |
| Consumer, Cyclical — 3.0% | |
| American Airlines Pass-Through Trust, 4.40%, 9/22/23 | $ | 1,339 | $ 1,288,304 |
| American Airlines, Inc./AAdvantage Loyalty IP, Ltd., 5.50%, 4/20/26(1) | | 12,493 | 11,753,852 |
| Aptiv PLC/Aptiv Corp., 3.25%, 3/1/32(7) | | 2,704 | 2,156,180 |
| Bath & Body Works, Inc.: | | | |
| 6.625%, 10/1/30(1) | | 5,755 | 5,016,892 |
| 7.60%, 7/15/37 | | 2,744 | 2,150,079 |
| Dave & Buster's, Inc., 7.625%, 11/1/25(1) | | 2,670 | 2,632,874 |
| Delta Air Lines, Inc./SkyMiles IP, Ltd.: | | | |
| 4.50%, 10/20/25(1) | | 5,100 | 4,953,403 |
| 4.75%, 10/20/28(1) | | 4,954 | 4,620,712 |
| Dick's Sporting Goods, Inc., 4.10%, 1/15/52 | | 12,536 | 7,771,680 |
| General Motors Co., 5.60%, 10/15/32 | | 3,705 | 3,311,992 |
| General Motors Financial Co., Inc., 4.30%, 4/6/29 | | 7,598 | 6,611,743 |
| Hyatt Hotels Corp.: | | | |
| 1.30%, 10/1/23 | | 2,600 | 2,502,284 |
| 1.80%, 10/1/24 | | 984 | 923,404 |
| Lithia Motors, Inc.: | | | |
| 3.875%, 6/1/29(1)(7) | | 4,400 | 3,538,326 |
| 4.375%, 1/15/31(1)(7) | | 7,749 | 6,355,536 |
| WarnerMedia Holdings, Inc.: | | | |
| 5.05%, 3/15/42(1) | | 3,835 | 2,876,232 |
| 5.141%, 3/15/52(1) | | 7,777 | 5,667,316 |
| | | | $ 74,130,809 |
| Consumer, Non-cyclical — 2.9% | |
| Ashtead Capital, Inc.: | | | |
| 4.00%, 5/1/28(1) | $ | 1,014 | $ 891,361 |
| 4.25%, 11/1/29(1) | | 5,174 | 4,521,182 |
| Avantor Funding, Inc., 4.625%, 7/15/28(1) | | 6,208 | 5,538,467 |
| Block Financial, LLC, 3.875%, 8/15/30 | | 7,027 | 6,010,666 |
| Centene Corp.: | | | |
| 2.50%, 3/1/31 | | 4,900 | 3,703,967 |
| 3.375%, 2/15/30 | | 2,435 | 1,995,909 |
| 4.25%, 12/15/27 | | 2,693 | 2,469,010 |
| Coca-Cola Europacific Partners PLC, 1.50%, 1/15/27(1) | | 2,149 | 1,842,112 |
| Coca-Cola Femsa SAB de CV, 1.85%, 9/1/32 | | 3,930 | 2,901,912 |
30
See Notes to Financial Statements.
Calvert
Bond Fund
September 30, 2022
Schedule of Investments — continued
| Security | Principal
Amount
(000’s omitted) | Value |
| Consumer, Non-cyclical (continued) | |
| Conservation Fund (The), Green Bonds, 3.474%, 12/15/29 | $ | 3,965 | $ 3,394,170 |
| CVS Pass-Through Trust, 6.036%, 12/10/28 | | 1,265 | 1,256,414 |
| Doris Duke Charitable Foundation (The), 2.345%, 7/1/50 | | 10,210 | 5,777,713 |
| Ford Foundation (The), 2.415%, 6/1/50(7) | | 6,560 | 4,067,892 |
| Kaiser Foundation Hospitals, 3.15%, 5/1/27 | | 4,091 | 3,795,909 |
| Natura & Co. Luxembourg Holdings S.a.r.l., 6.00%, 4/19/29(1)(7) | | 6,835 | 5,638,260 |
| Natura Cosmeticos S.A., 4.125%, 5/3/28(1) | | 4,710 | 3,728,295 |
| Perrigo Finance Unlimited Co., 4.40%, 6/15/30 | | 5,815 | 4,746,087 |
| President and Fellows of Harvard College, 3.619%, 10/1/37 | | 1,000 | 866,034 |
| Royalty Pharma PLC, 3.55%, 9/2/50 | | 4,994 | 3,124,534 |
| Smithfield Foods, Inc.: | | | |
| 2.625%, 9/13/31(1) | | 4,632 | 3,402,824 |
| 3.00%, 10/15/30(1) | | 1,114 | 861,591 |
| | | | $ 70,534,309 |
| Energy — 0.8% | |
| NuStar Logistics, L.P.: | | | |
| 6.00%, 6/1/26 | $ | 4,139 | $ 3,797,532 |
| 6.375%, 10/1/30 | | 1,616 | 1,386,320 |
| TerraForm Power Operating, LLC: | | | |
| 4.75%, 1/15/30(1) | | 5,365 | 4,565,320 |
| 5.00%, 1/31/28(1) | | 10,987 | 9,694,764 |
| | | | $ 19,443,936 |
| Financial — 19.3% | |
| AerCap Ireland Capital DAC/AerCap Global Aviation Trust: | | | |
| 1.65%, 10/29/24 | $ | 813 | $ 743,469 |
| 2.875%, 8/14/24(7) | | 1,878 | 1,767,628 |
| 3.50%, 1/15/25 | | 3,925 | 3,692,348 |
| 4.50%, 9/15/23 | | 4,780 | 4,713,664 |
| 6.50%, 7/15/25 | | 2,742 | 2,739,002 |
| Affiliated Managers Group, Inc., 3.30%, 6/15/30 | | 3,042 | 2,517,138 |
| Agree, L.P., 2.00%, 6/15/28 | | 2,150 | 1,735,217 |
| Air Lease Corp., 2.875%, 1/15/26 | | 2,543 | 2,278,837 |
| American Assets Trust, L.P., 3.375%, 2/1/31 | | 2,454 | 1,952,562 |
| American National Group, Inc., 6.144%, 6/13/32(1) | | 6,355 | 5,932,631 |
| Andrew W. Mellon Foundation (The), 0.947%, 8/1/27(7) | | 5,050 | 4,318,622 |
| Australia & New Zealand Banking Group, Ltd., 2.95% to 7/22/25, 7/22/30(1)(8) | | 6,352 | 5,777,703 |
| Banco de Chile, 2.99%, 12/9/31(1) | | 4,947 | 3,848,095 |
| Banco Santander S.A.: | | | |
| 1.722% to 9/14/26, 9/14/27(8) | | 4,000 | 3,313,878 |
| 5.294%, 8/18/27 | | 9,600 | 9,054,721 |
| Bank of America Corp.: | | | |
| 1.734% to 7/22/26, 7/22/27(8) | | 11,928 | 10,244,897 |
| Security | Principal
Amount
(000’s omitted) | Value |
| Financial (continued) | |
| Bank of America Corp.: (continued) | | | |
| 1.898% to 7/23/30, 7/23/31(8) | $ | 3,540 | $ 2,641,955 |
| 1.922% to 10/24/30, 10/24/31(8) | | 1,865 | 1,382,248 |
| 2.087% to 6/14/28, 6/14/29(8) | | 4,867 | 3,958,890 |
| 2.299% to 7/21/31, 7/21/32(8) | | 5,365 | 4,016,338 |
| 2.456% to 10/22/24, 10/22/25(8) | | 16,534 | 15,487,659 |
| 2.551% to 2/4/27, 2/4/28(8) | | 9,133 | 7,954,626 |
| 3.824% to 1/20/27, 1/20/28(8) | | 7,533 | 6,939,811 |
| 3.846% to 3/8/32, 3/8/37(8) | | 18,871 | 15,250,248 |
| BankUnited, Inc., 5.125%, 6/11/30 | | 1,732 | 1,616,475 |
| BBVA Bancomer S.A./Texas: | | | |
| 1.875%, 9/18/25(1) | | 5,136 | 4,606,742 |
| 5.125% to 1/18/28, 1/18/33(1)(8) | | 1,686 | 1,397,708 |
| BNP Paribas S.A., 7.75% to 8/16/29(1)(8)(9) | | 3,725 | 3,446,742 |
| Boston Properties, L.P., 2.45%, 10/1/33 | | 12,059 | 8,509,655 |
| BPCE S.A., 3.648% to 1/14/32, 1/14/37(1)(7)(8) | | 6,559 | 4,872,287 |
| Bread Financial Holdings, Inc., 4.75%, 12/15/24(1) | | 6,199 | 5,420,189 |
| Broadstone Net Lease, LLC, 2.60%, 9/15/31 | | 3,193 | 2,355,207 |
| Capital One Financial Corp.: | | | |
| 3.273% to 3/1/29, 3/1/30(8) | | 5,920 | 4,957,348 |
| 4.20%, 10/29/25 | | 2,950 | 2,839,621 |
| 4.927% to 5/10/27, 5/10/28(8) | | 6,268 | 5,977,885 |
| CI Financial Corp.: | | | |
| 3.20%, 12/17/30 | | 5,188 | 3,767,383 |
| 4.10%, 6/15/51 | | 2,805 | 1,674,544 |
| Citigroup, Inc.: | | | |
| 1.281% to 11/3/24, 11/3/25(8) | | 1,931 | 1,765,342 |
| 2.572% to 6/3/30, 6/3/31(8) | | 8,550 | 6,737,078 |
| 3.106% to 4/8/25, 4/8/26(8) | | 4,706 | 4,414,153 |
| 3.785% to 3/17/32, 3/17/33(8) | | 8,060 | 6,766,793 |
| 3.887% to 1/10/27, 1/10/28(8) | | 5,045 | 4,648,580 |
| 4.00% to 12/10/25(8)(9) | | 3,895 | 3,291,275 |
| 5.61% to 9/29/25, 9/29/26(8) | | 7,860 | 7,822,096 |
| Corporate Office Properties, L.P., 2.90%, 12/1/33 | | 4,246 | 2,948,069 |
| Discover Bank, 4.682% to 8/9/23, 8/9/28(8) | | 4,337 | 4,160,091 |
| Enact Holdings, Inc., 6.50%, 8/15/25(1) | | 5,470 | 5,236,568 |
| EPR Properties: | | | |
| 3.75%, 8/15/29 | | 6,930 | 5,361,453 |
| 4.50%, 6/1/27 | | 6,725 | 5,814,627 |
| Extra Space Storage, L.P., 2.55%, 6/1/31 | | 4,159 | 3,204,066 |
| GA Global Funding Trust, 2.25%, 1/6/27(1) | | 11,309 | 9,809,231 |
| Global Atlantic Fin Co., 3.125%, 6/15/31(1) | | 10,748 | 7,884,631 |
| Goldman Sachs Group, Inc. (The): | | | |
| 1.948% to 10/21/26, 10/21/27(8) | | 11,226 | 9,614,240 |
| 2.64% to 2/24/27, 2/24/28(8) | | 3,000 | 2,606,293 |
31
See Notes to Financial Statements.
Calvert
Bond Fund
September 30, 2022
Schedule of Investments — continued
| Security | Principal
Amount
(000’s omitted) | Value |
| Financial (continued) | |
| Goldman Sachs Group, Inc. (The): (continued) | | | |
| 2.65% to 10/21/31, 10/21/32(8) | $ | 6,165 | $ 4,732,572 |
| HAT Holdings I, LLC/HAT Holdings II, LLC: | | | |
| 3.375%, 6/15/26(1) | | 13,833 | 11,118,066 |
| 3.75%, 9/15/30(1) | | 6,000 | 4,375,650 |
| 6.00%, 4/15/25(1)(7) | | 6,528 | 6,155,219 |
| HSBC Holdings PLC, 2.251% to 11/22/26, 11/22/27(8) | | 9,071 | 7,632,785 |
| Iron Mountain, Inc.: | | | |
| 4.50%, 2/15/31(1) | | 9,770 | 7,570,871 |
| 5.00%, 7/15/28(1) | | 1,050 | 905,142 |
| JPMorgan Chase & Co.: | | | |
| 1.47% to 9/22/26, 9/22/27(8) | | 8,125 | 6,879,961 |
| 1.578% to 4/22/26, 4/22/27(8) | | 8,750 | 7,563,783 |
| 2.739% to 10/15/29, 10/15/30(8) | | 4,603 | 3,748,506 |
| 4.586% to 4/26/32, 4/26/33(8) | | 2,309 | 2,081,065 |
| 4.851% to 7/25/27, 7/25/28(8) | | 10,349 | 9,947,588 |
| KKR Group Finance Co. VII, LLC, 3.625%, 2/25/50(1) | | 4,662 | 3,259,710 |
| KKR Group Finance Co. X, LLC, 3.25%, 12/15/51(1) | | 2,785 | 1,818,938 |
| Liberty Mutual Group, Inc., 4.125% to 9/15/26, 12/15/51(1)(8) | | 5,399 | 4,181,677 |
| Life Storage, L.P., 2.40%, 10/15/31 | | 6,172 | 4,641,433 |
| Macquarie Bank, Ltd.: | | | |
| 3.052% to 3/3/31, 3/3/36(1)(8) | | 5,408 | 3,969,862 |
| 3.624%, 6/3/30(1) | | 3,355 | 2,719,541 |
| National Bank of Canada, 0.55% to 11/15/23, 11/15/24(8) | | 4,701 | 4,452,627 |
| Newmark Group, Inc., 6.125%, 11/15/23 | | 3,000 | 2,959,716 |
| OneMain Finance Corp., 3.50%, 1/15/27 | | 10,150 | 7,926,516 |
| Radian Group, Inc., 4.875%, 3/15/27 | | 5,757 | 5,111,237 |
| Rocket Mortgage, LLC/Rocket Mortgage Co-Issuer, Inc.: | | | |
| 2.875%, 10/15/26(1) | | 1,059 | 869,984 |
| 3.875%, 3/1/31(1) | | 7,015 | 5,095,864 |
| Sabra Health Care, L.P., 3.20%, 12/1/31 | | 9,535 | 7,018,831 |
| SITE Centers Corp., 3.625%, 2/1/25 | | 4,767 | 4,510,758 |
| Societe Generale S.A., 6.221% to 6/15/32, 6/15/33(1)(8) | | 4,545 | 4,035,254 |
| Standard Chartered PLC: | | | |
| 1.214% to 3/23/24, 3/23/25(1)(8) | | 2,554 | 2,395,623 |
| 1.456% to 1/14/26, 1/14/27(1)(8) | | 4,010 | 3,399,284 |
| 1.822% to 11/23/24, 11/23/25(1)(8) | | 3,977 | 3,609,947 |
| Stifel Financial Corp., 4.00%, 5/15/30 | | 4,782 | 4,123,360 |
| Sun Communities Operating, L.P.: | | | |
| 2.30%, 11/1/28 | | 2,273 | 1,826,912 |
| 2.70%, 7/15/31 | | 3,395 | 2,570,536 |
| 4.20%, 4/15/32 | | 5,697 | 4,779,627 |
| Swedbank AB, 5.337%, 9/20/27(1) | | 7,180 | 6,966,001 |
| Synchrony Bank, 5.625%, 8/23/27 | | 7,309 | 7,008,367 |
| Security | Principal
Amount
(000’s omitted) | Value |
| Financial (continued) | |
| Synovus Bank/Columbus, GA, 4.00% to 10/29/25, 10/29/30(8) | $ | 6,445 | $ 6,003,746 |
| Synovus Financial Corp., 3.125%, 11/1/22 | | 1,267 | 1,264,979 |
| Texas Capital Bancshares, Inc., 4.00% to 5/6/26, 5/6/31(8) | | 3,024 | 2,608,297 |
| Toronto-Dominion Bank (The), 3.57%, (SOFR + 0.59%), 9/10/26(4) | | 4,940 | 4,778,637 |
| Truist Financial Corp., 5.10% to 3/1/30(8)(9) | | 4,856 | 4,329,802 |
| UBS Group AG: | | | |
| 2.095% to 2/11/31, 2/11/32(1)(8) | | 6,300 | 4,588,530 |
| 4.375% to 2/10/31(1)(7)(8)(9) | | 2,686 | 1,771,417 |
| UniCredit SpA, 5.459% to 6/30/30, 6/30/35(1)(8) | | 2,617 | 1,948,949 |
| United Overseas Bank, Ltd., 3.863% to 10/7/27, 10/7/32(1)(8) | | 5,788 | 5,279,732 |
| Westpac Banking Corp., 3.02% to 11/18/31, 11/18/36(8) | | 3,746 | 2,748,505 |
| | | | $ 473,073,966 |
| Government - Multinational — 4.8% | |
| Asian Development Bank, 3.125%, 9/26/28 | $ | 5,500 | $ 5,171,628 |
| European Bank for Reconstruction & Development, 1.50%, 2/13/25 | | 7,640 | 7,153,437 |
| European Investment Bank: | | | |
| 1.625%, 5/13/31 | | 14,990 | 12,543,625 |
| 2.375%, 5/24/27 | | 17,185 | 15,904,729 |
| 2.875%, 6/13/25(1) | | 42,948 | 41,391,895 |
| Inter-American Development Bank, 0.875%, 4/3/25 | | 6,067 | 5,568,996 |
| International Bank for Reconstruction & Development: | | | |
| 0.875%, 7/15/26(7) | | 5,000 | 4,402,956 |
| 3.11%, (SOFR + 0.13%), 1/13/23(4) | | 10,100 | 10,100,830 |
| 3.125%, 11/20/25 | | 12,050 | 11,623,250 |
| International Finance Corp., 3.07%, (SOFR + 0.09%), 4/3/24(4) | | 4,067 | 4,066,625 |
| | | | $ 117,927,971 |
| Government - Regional — 0.5% | |
| Kommuninvest I Sverige AB, 0.375%, 6/19/24(1) | $ | 12,390 | $ 11,572,464 |
| | | | $ 11,572,464 |
| Industrial — 1.4% | |
| Imola Merger Corp., 4.75%, 5/15/29(1) | $ | 7,840 | $ 6,632,797 |
| Jabil, Inc.: | | | |
| 3.00%, 1/15/31 | | 10,766 | 8,518,321 |
| 3.60%, 1/15/30 | | 6,161 | 5,155,392 |
| Owens Corning, 3.95%, 8/15/29 | | 6,455 | 5,785,206 |
| SMBC Aviation Capital Finance DAC, 3.55%, 4/15/24(1) | | 3,200 | 3,078,278 |
| Valmont Industries, Inc., 5.25%, 10/1/54 | | 5,546 | 4,805,698 |
| | | | $ 33,975,692 |
32
See Notes to Financial Statements.
Calvert
Bond Fund
September 30, 2022
Schedule of Investments — continued
| Security | Principal
Amount
(000’s omitted) | Value |
| Other Revenue — 0.3% | |
| BlueHub Loan Fund, Inc., 3.099%, 1/1/30 | $ | 9,400 | $ 8,105,321 |
| | | | $ 8,105,321 |
| Technology — 0.9% | |
| DXC Technology Co., 2.375%, 9/15/28 | $ | 2,648 | $ 2,166,030 |
| Kyndryl Holdings, Inc.: | | | |
| 2.05%, 10/15/26 | | 7,102 | 5,713,131 |
| 2.70%, 10/15/28 | | 4,323 | 3,166,557 |
| Seagate HDD Cayman: | | | |
| 3.375%, 7/15/31 | | 7,315 | 5,123,684 |
| 4.091%, 6/1/29 | | 2,481 | 1,995,332 |
| 5.75%, 12/1/34 | | 6,242 | 4,969,880 |
| | | | $ 23,134,614 |
| Utilities — 1.6% | |
| AES Corp. (The), 2.45%, 1/15/31 | $ | 8,500 | $ 6,515,335 |
| American Water Capital Corp., 2.30%, 6/1/31 | | 639 | 507,419 |
| Clearway Energy Operating, LLC, 3.75%, 1/15/32(1) | | 2,429 | 1,887,284 |
| Enel Finance International N.V., 1.375%, 7/12/26(1) | | 11,675 | 9,877,096 |
| MidAmerican Energy Co.: | | | |
| 3.15%, 4/15/50 | | 3,240 | 2,211,786 |
| 4.25%, 7/15/49 | | 4,815 | 4,024,022 |
| NextEra Energy Operating Partners, L.P.: | | | |
| 4.25%, 7/15/24(1) | | 2,719 | 2,607,469 |
| 4.25%, 9/15/24(1) | | 324 | 310,956 |
| Niagara Mohawk Power Corp., 1.96%, 6/27/30(1) | | 3,518 | 2,719,712 |
| Pattern Energy Operations, L.P./Pattern Energy Operations, Inc., 4.50%, 8/15/28(1) | | 9,921 | 8,622,341 |
| | | | $ 39,283,420 |
Total Corporate Bonds
(identified cost $1,113,929,736) | | | $ 938,902,447 |
| High Social Impact Investments — 0.2% |
| Security | Principal
Amount
(000's omitted) | Value |
| Calvert Impact Capital, Inc., Community Investment Notes, 1.50%, 12/15/23(10)(11) | $ | 5,000 | $ 4,643,800 |
Total High Social Impact Investments
(identified cost $5,000,000) | | | $ 4,643,800 |
| Security | Shares | Value |
| Oil, Gas & Consumable Fuels — 0.1% | |
| NuStar Energy, L.P., Series B, 9.126%, (3 mo. USD LIBOR + 5.643%)(4) | | 76,679 | $ 1,482,205 |
| | | | $ 1,482,205 |
| Real Estate Management & Development — 0.2% | |
| Brookfield Property Partners, L.P.: | | | |
| Series A, 5.75% | | 97,843 | $ 1,663,331 |
| Series A2, 6.375% | | 211,400 | 3,906,672 |
| | | | $ 5,570,003 |
| Wireless Telecommunication Services — 0.3% | |
| United States Cellular Corp.: | | | |
| 5.50% | | 306,800 | $ 5,675,800 |
| 6.25% | | 40,000 | 829,600 |
| | | | $ 6,505,400 |
Total Preferred Stocks
(identified cost $18,291,628) | | | $ 13,557,608 |
| Senior Floating-Rate Loans — 2.1%(12) |
| Borrower/Description | Principal
Amount
(000's omitted) | Value |
| Airlines — 0.1% | |
| SkyMiles IP, Ltd., Term Loan, 6.46%, (3 mo. USD LIBOR + 3.75%), 10/20/27 | $ | 2,900 | $ 2,914,300 |
| | | | $ 2,914,300 |
| Auto Components — 0.2% | |
| Clarios Global, L.P., Term Loan, 6.365%, (1 mo. USD LIBOR + 3.25%), 4/30/26 | $ | 5,156 | $ 4,894,166 |
| | | | $ 4,894,166 |
| Diversified Telecommunication Services — 0.7% | |
| CenturyLink, Inc., Term Loan, 5.365%, (1 mo. USD LIBOR + 2.25%), 3/15/27 | $ | 5,101 | $ 4,652,292 |
| UPC Financing Partnership, Term Loan, 5.743%, (1 mo. USD LIBOR + 2.925%), 1/31/29 | | 5,925 | 5,673,187 |
| Virgin Media Bristol, LLC, Term Loan, 6.068%, (1 mo. USD LIBOR + 3.25%), 1/31/29 | | 1,900 | 1,844,357 |
| Ziggo Financing Partnership, Term Loan, 5.318%, (1 mo. USD LIBOR + 2.50%), 4/30/28 | | 5,185 | 4,950,747 |
| | | | $ 17,120,583 |
33
See Notes to Financial Statements.
Calvert
Bond Fund
September 30, 2022
Schedule of Investments — continued
| Borrower/Description | Principal
Amount
(000's omitted) | Value |
| Health Care Providers & Services — 0.0%(13) | |
| Select Medical Corporation, Term Loan, 5.62%, (1 mo. USD LIBOR + 2.50%), 3/6/25 | $ | 725 | $ 702,948 |
| | | | $ 702,948 |
| IT Services — 0.0% | |
| Asurion, LLC, Term Loan, 6.365%, (1 mo. USD LIBOR + 3.25%), 12/23/26 | $ | 1,297 | $ 1,102,365 |
| | | | $ 1,102,365 |
| Software — 0.8% | |
| Banff Merger Sub, Inc., Term Loan, 6.865%, (1 mo. USD LIBOR + 3.75%), 10/2/25 | $ | 5,700 | $ 5,416,936 |
| Hyland Software, Inc., Term Loan, 6.615%, (1 mo. USD LIBOR + 3.50%), 7/1/24 | | 3,135 | 3,044,332 |
| Seattle Spinco, Inc., Term Loan, 5.865%, (1 mo. USD LIBOR + 2.75%), 6/21/24 | | 613 | 600,991 |
| Ultimate Software Group, Inc. (The), Term Loan, 6.865%, (1 mo. USD LIBOR + 3.75%), 5/4/26 | | 5,048 | 4,821,813 |
| VS Buyer, LLC, Term Loan, 6.115%, (1 mo. USD LIBOR + 3.00%), 2/28/27 | | 5,854 | 5,663,304 |
| | | | $ 19,547,376 |
| Specialty Retail — 0.3% | |
| Petsmart, Inc., Term Loan, 6.87%, (1 mo. USD LIBOR + 3.75%), 2/11/28 | $ | 6,766 | $ 6,419,080 |
| | | | $ 6,419,080 |
Total Senior Floating-Rate Loans
(identified cost $55,388,864) | | | $ 52,700,818 |
| Sovereign Government Bonds — 1.5% |
| Security | Principal
Amount
(000's omitted) | Value |
| Kreditanstalt fuer Wiederaufbau: | | | |
| 0.75%, 9/30/30 | $ | 3,653 | $ 2,845,633 |
| 1.00%, 10/1/26 | | 25,266 | 22,219,835 |
| 1.75%, 9/14/29 | | 14,365 | 12,375,490 |
Total Sovereign Government Bonds
(identified cost $43,065,235) | | | $ 37,440,958 |
| Taxable Municipal Obligations — 2.7% |
| Security | Principal
Amount
(000's omitted) | Value |
| General Obligations — 0.5% | |
| Commonwealth of Massachusetts, 5.456%, 12/1/39(14) | $ | 750 | $ 772,905 |
| Los Angeles Unified School District, CA, 5.75%, 7/1/34(14) | | 3,750 | 3,845,437 |
| Massachusetts, Green Bonds, 3.277%, 6/1/46 | | 4,770 | 3,652,580 |
| New York City, NY, 5.206%, 10/1/31(14) | | 1,030 | 1,030,371 |
| San Francisco City and County, CA, (Social Bonds - Affordable Housing, 2016), 3.921%, 6/15/39 | | 3,085 | 2,724,888 |
| | | | $ 12,026,181 |
| Special Tax Revenue — 1.1% | |
| California Health Facilities Financing Authority, (No Place Like Home Program): | | | |
| 2.361%, 6/1/26 | $ | 5,565 | $ 5,122,360 |
| 2.484%, 6/1/27 | | 3,980 | 3,589,164 |
| 2.534%, 6/1/28 | | 4,980 | 4,388,575 |
| 2.584%, 6/1/29 | | 2,715 | 2,342,393 |
| 2.984%, 6/1/33 | | 3,060 | 2,492,523 |
| 3.034%, 6/1/34 | | 2,195 | 1,756,461 |
| Connecticut, Special Tax Revenue, 5.459%, 11/1/30(14) | | 3,800 | 3,901,536 |
| New York City Transitional Finance Authority, NY, Future Tax Secured Revenue Bonds, 5.767%, 8/1/36(14) | | 3,380 | 3,507,359 |
| | | | $ 27,100,371 |
| Water and Sewer — 1.1% | |
| District of Columbia Water & Sewer Authority, Green Bonds, 4.814%, 10/1/2114 | $ | 1,170 | $ 1,029,717 |
| Narragansett Bay Commission, RI, Wastewater System Revenue: | | | |
| Green Bonds, 2.094%, 9/1/30 | | 2,495 | 2,037,691 |
| Green Bonds, 2.184%, 9/1/31 | | 1,985 | 1,592,923 |
| Green Bonds, 2.264%, 9/1/32 | | 1,780 | 1,403,494 |
| Green Bonds, 2.344%, 9/1/33 | | 1,945 | 1,512,393 |
| San Diego County Water Authority, CA: | | | |
| Green Bonds, 1.531%, 5/1/30 | | 2,130 | 1,699,144 |
| Green Bonds, 1.701%, 5/1/31 | | 1,925 | 1,513,705 |
| Green Bonds, 1.951%, 5/1/34 | | 1,120 | 832,462 |
| San Francisco City and County Public Utilities Commission, CA, Water Revenue, Green Bonds, 3.303%, 11/1/39 | | 19,705 | 16,111,399 |
| | | | $ 27,732,928 |
Total Taxable Municipal Obligations
(identified cost $78,968,183) | | | $ 66,859,480 |
34
See Notes to Financial Statements.
Calvert
Bond Fund
September 30, 2022
Schedule of Investments — continued
| U.S. Government Agencies and Instrumentalities — 1.0% |
| Security | Principal
Amount
(000's omitted) | Value |
| U.S. Department of Housing and Urban Development: | | | |
| 2.618%, 8/1/23 | $ | 778 | $ 769,876 |
| 2.668%, 8/1/24 | | 2,726 | 2,640,991 |
| 2.738%, 8/1/25 | | 2,726 | 2,601,572 |
| 3.435%, 8/1/34 | | 3,105 | 2,750,375 |
| 3.485%, 8/1/35 | | 1,745 | 1,541,811 |
| 3.535%, 8/1/36 | | 929 | 807,040 |
| 3.585%, 8/1/37 | | 3,215 | 2,773,388 |
| 3.635%, 8/1/38 | | 657 | 566,971 |
| U.S. International Development Finance Corp.: | | | |
| 1.79%, 10/15/29 | | 1,654 | 1,493,359 |
| 2.36%, 10/15/29 | | 1,369 | 1,262,117 |
| 3.22%, 9/15/29 | | 2,085 | 1,981,026 |
| 3.52%, 9/20/32 | | 4,652 | 4,426,674 |
Total U.S. Government Agencies and Instrumentalities
(identified cost $26,502,614) | | | $ 23,615,200 |
| U.S. Government Agency Mortgage-Backed Securities — 10.3% |
| Security | Principal
Amount
(000's omitted) | Value |
| Federal Home Loan Mortgage Corp., Pool #ZT0383, 3.50%, 3/1/48 | $ | 1,454 | $ 1,330,510 |
| Federal National Mortgage Association: | | | |
| 4.00%, 30-Year, TBA(15) | | 151,511 | 140,387,213 |
| 4.50%, 30-Year, TBA(15) | | 48,774 | 46,385,245 |
| 5.00%, 30-Year, TBA(15) | | 30,158 | 29,303,909 |
| Pool #AN1909, 2.68%, 7/1/26 | | 2,937 | 2,747,593 |
| Pool #BM3990, 4.00%, 3/1/48 | | 3,526 | 3,317,857 |
| Pool #FM1867, 3.00%, 11/1/49 | | 4,598 | 4,033,939 |
| Pool #FM6803, 2.00%, 4/1/51 | | 3,997 | 3,268,521 |
| Pool #FM7023, 3.00%, 7/1/49 | | 3,411 | 2,994,726 |
| Pool #MA3149, 4.00%, 10/1/47 | | 4,236 | 3,989,687 |
| Government National Mortgage Association II: | | | |
| Pool #CB2653, 2.50%, 3/20/51 | | 5,367 | 4,598,121 |
| Pool #CB8627, 2.50%, 4/20/51 | | 2,351 | 2,018,670 |
| Pool #CB8628, 2.50%, 4/20/51 | | 2,369 | 2,032,744 |
| Pool #CB8629, 2.50%, 4/20/51 | | 8,231 | 7,051,295 |
Total U.S. Government Agency Mortgage-Backed Securities
(identified cost $264,982,234) | | $ 253,460,030 |
| U.S. Treasury Obligations — 15.0% |
| Security | Principal
Amount
(000's omitted) | Value |
| U.S. Treasury Bonds: | | | |
| 1.125%, 8/15/40 | $ | 18,970 | $ 11,762,141 |
| 1.375%, 11/15/40 | | 8,915 | 5,768,458 |
| 1.625%, 11/15/50 | | 7,891 | 4,902,900 |
| 1.75%, 8/15/41 | | 24,781 | 16,959,013 |
| 1.875%, 2/15/41 | | 14,844 | 10,522,135 |
| 1.875%, 2/15/51 | | 15,198 | 10,067,488 |
| 1.875%, 11/15/51 | | 5,814 | 3,847,460 |
| 2.00%, 11/15/41 | | 7,400 | 5,300,973 |
| 2.00%, 8/15/51 | | 18,800 | 12,850,094 |
| 2.25%, 5/15/41 | | 13,545 | 10,247,374 |
| 2.25%, 8/15/49 | | 17,265 | 12,635,822 |
| 2.375%, 5/15/51 | | 13,524 | 10,124,206 |
| 2.875%, 5/15/49 | | 4,593 | 3,831,323 |
| 3.375%, 8/15/42(7) | | 73,492 | 66,590,642 |
| U.S. Treasury Notes: | | | |
| 0.375%, 9/30/27 | | 1,775 | 1,481,224 |
| 0.75%, 11/15/24 | | 1,510 | 1,403,238 |
| 1.125%, 1/15/25 | | 5,054 | 4,709,499 |
| 1.375%, 9/30/23 | | 13,375 | 12,997,266 |
| 1.50%, 1/31/27 | | 14,503 | 13,003,979 |
| 1.875%, 2/28/27 | | 6,372 | 5,804,494 |
| 1.875%, 2/15/32 | | 3,529 | 2,991,103 |
| 2.125%, 3/31/24 | | 6,346 | 6,145,952 |
| 2.375%, 3/31/29 | | 2,500 | 2,264,258 |
| 2.625%, 4/15/25 | | 4,604 | 4,422,178 |
| 2.75%, 4/30/27 | | 58,218 | 54,954,608 |
| 2.875%, 4/30/29 | | 62,162 | 58,043,767 |
| 3.125%, 8/31/29 | | 7,894 | 7,493,749 |
| 3.875%, 9/30/29 | | 7,683 | 7,649,987 |
Total U.S. Treasury Obligations
(identified cost $425,103,932) | | | $ 368,775,331 |
35
See Notes to Financial Statements.
Calvert
Bond Fund
September 30, 2022
Schedule of Investments — continued
| Short-Term Investments — 4.3% | | | |
| Affiliated Fund — 2.1% |
| Security | Shares | Value |
| Morgan Stanley Institutional Liquidity Funds - Government Portfolio, Institutional Class, 2.80%(16) | | 51,806,940 | $ 51,806,940 |
Total Affiliated Fund
(identified cost $51,806,940) | | | $ 51,806,940 |
| Securities Lending Collateral — 2.2% |
| Security | Shares | Value |
| State Street Navigator Securities Lending Government Money Market Portfolio, 3.07%(17) | | 52,438,085 | $ 52,438,085 |
Total Securities Lending Collateral
(identified cost $52,438,085) | | | $ 52,438,085 |
Total Short-Term Investments
(identified cost $104,245,025) | | | $ 104,245,025 |
Total Investments — 110.1%
(identified cost $3,046,164,232) | | | $2,704,372,438 |
| Other Assets, Less Liabilities — (10.1)% | | | $ (247,329,658) |
| Net Assets — 100.0% | | | $ 2,457,042,780 |
| The percentage shown for each investment category in the Schedule of Investments is based on net assets. |
| (1) | Security exempt from registration under Rule 144A of the Securities Act of 1933, as amended. These securities may be sold in certain transactions in reliance on an exemption from registration (normally to qualified institutional buyers). At September 30, 2022, the aggregate value of these securities is $1,066,144,693 or 43.4% of the Fund's net assets. |
| (2) | Principal Amount is denominated in Canadian dollars. |
| (3) | Weighted average fixed-rate coupon that changes/updates monthly. Rate shown is the rate at September 30, 2022. |
| (4) | Variable rate security. The stated interest rate represents the rate in effect at September 30, 2022. |
| (5) | Step coupon security. Interest rate represents the rate in effect at
September 30, 2022. |
| (6) | Represents an investment in an issuer that may be deemed to be an affiliate (see Note 8). |
| (7) | All or a portion of this security was on loan at September 30, 2022. The aggregate market value of securities on loan at September 30, 2022 was $51,072,060. |
| (8) | Security converts to variable rate after the indicated fixed-rate coupon period. |
| (9) | Perpetual security with no stated maturity date but may be subject to calls by the issuer. |
| (10) | May be deemed to be an affiliated company (see Note 8). |
| (11) | Restricted security. Total market value of restricted securities amounts to $4,643,800, which represents 0.2% of the net assets of the Fund as of September 30, 2022. |
| (12) | Senior floating-rate loans (Senior Loans) often require prepayments from excess cash flows or permit the borrowers to repay at their election. The degree to which borrowers repay, whether as a contractual requirement or at their election, cannot be predicted with accuracy. As a result, the actual remaining maturity may be substantially less than the stated maturities shown. However, Senior Loans will typically have an expected average life of approximately two to four years. Senior Loans typically have rates of interest which are redetermined periodically by reference to a base lending rate, plus a spread. These base lending rates are primarily the London Interbank Offered Rate (“LIBOR”) or the Secured Overnight Financing Rate (“SOFR”) and secondarily, the prime rate offered by one or more major United States banks (the “Prime Rate”). Base lending rates may be subject to a floor, or minimum rate. Rates for SOFR are generally 1 or 3-month tenors and may also be subject to a credit spread adjustment. Senior Loans are generally subject to contractual restrictions that must be satisfied before they can be bought or sold. |
| (13) | Amount is less than 0.05%. |
| (14) | Build America Bond. Represents taxable municipal obligation issued pursuant to the American Recovery and Reinvestment Act of 2009 or other legislation providing for the issuance of taxable municipal debt on which the issuer receives federal support. |
| (15) | TBA (To Be Announced) securities are purchased on a forward commitment basis with an approximate principal amount and maturity date. The actual principal amount and maturity date are determined upon settlement. |
| (16) | May be deemed to be an affiliated investment company. The rate shown is the annualized seven-day yield as of September 30, 2022. |
| (17) | Represents investment of cash collateral received in connection with securities lending. |
Forward Foreign Currency Exchange Contracts
| Currency Purchased | Currency Sold | Counterparty | Settlement
Date | Unrealized
Appreciation | Unrealized
(Depreciation) |
| USD | 4,084,416 | CAD | 5,298,108 | State Street Bank and Trust Company | 11/30/22 | $ 248,895 | $ — |
| | | | | | | $248,895 | $ — |
36
See Notes to Financial Statements.
Calvert
Bond Fund
September 30, 2022
Schedule of Investments — continued
Credit Default Swaps - Buy Protection (Centrally Cleared)
| Reference Entity | Notional
Amount
(000's omitted) | Contract
Annual
Fixed Rate* | Termination
Date | Value | Unamortized
Upfront
Receipts
(Payments) | Unrealized
Appreciation
(Depreciation) |
| Markit CDX North America High Yield Index (CDX.NA.HY.39.V1) | $7,500 | 5.00%
(pays quarterly)(1) | 12/20/27 | $ 296,104 | $ (321,994) | $ (25,890) |
| Total | | | | $296,104 | $(321,994) | $(25,890) |
| * The contract annual fixed rate represents the fixed rate of interest received by the Fund (as a seller of protection) or paid by the Fund (as a buyer of protection) on the notional amount of the credit default swap contract. |
| (1) Upfront payment is exchanged with the counterparty as a result of the standardized trading coupon. |
Futures Contracts
| Description | Number of
Contracts | Position | Expiration
Date | Notional
Amount | Value/
Unrealized
Appreciation
(Depreciation) |
| Interest Rate Futures | | | | | |
| U.S. 2-Year Treasury Note | 899 | Long | 12/30/22 | $ 184,646,173 | $ (2,862,343) |
| U.S. 10-Year Treasury Note | 35 | Long | 12/20/22 | 3,922,187 | (201,550) |
| U.S. Long Treasury Bond | 375 | Long | 12/20/22 | 47,402,344 | (3,547,888) |
| U.S. Ultra-Long Treasury Bond | 244 | Long | 12/20/22 | 33,428,000 | (3,126,045) |
| U.S. 5-Year Treasury Note | (935) | Short | 12/30/22 | (100,519,805) | 305,895 |
| U.S. Ultra 10-Year Treasury Note | (79) | Short | 12/20/22 | (9,360,266) | 594,004 |
| | | | | | $(8,837,927) |
Restricted Securities
| Description | Acquisition Date | Cost |
| Calvert Impact Capital, Inc., Community Investment Notes, 1.50%, 12/15/23 | 12/14/20 | $5,000,000 |
| Abbreviations: |
| LIBOR | – London Interbank Offered Rate |
| SOFR | – Secured Overnight Financing Rate |
| TBA | – To Be Announced |
| Currency Abbreviations: |
| CAD | – Canadian Dollar |
| USD | – United States Dollar |
37
See Notes to Financial Statements.
Calvert
Equity Fund
September 30, 2022
| Security | Shares | Value |
| Capital Markets — 7.6% | |
| Charles Schwab Corp. (The) | | 975,946 | $ 70,141,239 |
| Intercontinental Exchange, Inc. | | 1,604,648 | 144,979,947 |
| Moody's Corp. | | 183,533 | 44,618,708 |
| S&P Global, Inc. | | 462,332 | 141,173,076 |
| | | | $ 400,912,970 |
| Chemicals — 6.5% | |
| Air Products & Chemicals, Inc. | | 319,996 | $ 74,472,669 |
| Ecolab, Inc. | | 976,273 | 140,993,347 |
| Linde PLC | | 476,464 | 128,449,930 |
| | | | $ 343,915,946 |
| Containers & Packaging — 0.9% | |
| Ball Corp. | | 919,679 | $ 44,438,889 |
| | | | $ 44,438,889 |
| Electronic Equipment, Instruments & Components — 3.3% | |
| Amphenol Corp., Class A | | 1,936,966 | $ 129,699,244 |
| TE Connectivity, Ltd. | | 418,487 | 46,184,225 |
| | | | $ 175,883,469 |
| Entertainment — 1.1% | |
| Electronic Arts, Inc. | | 509,060 | $ 58,903,333 |
| | | | $ 58,903,333 |
| Equity Real Estate Investment Trusts (REITs) — 4.3% | |
| American Tower Corp. | | 776,679 | $ 166,752,981 |
| Crown Castle, Inc. | | 400,953 | 57,957,756 |
| | | | $ 224,710,737 |
| Food & Staples Retailing — 1.0% | |
| Costco Wholesale Corp. | | 107,543 | $ 50,789,333 |
| | | | $ 50,789,333 |
| Health Care Equipment & Supplies — 1.1% | |
| IDEXX Laboratories, Inc.(1) | | 120,693 | $ 39,321,779 |
| Intuitive Surgical, Inc.(1) | | 107,475 | 20,145,114 |
| | | | $ 59,466,893 |
| Health Care Providers & Services — 0.6% | |
| Laboratory Corp. of America Holdings | | 160,735 | $ 32,920,135 |
| | | | $ 32,920,135 |
| Security | Shares | Value |
| Hotels, Restaurants & Leisure — 1.4% | |
| Starbucks Corp. | | 858,345 | $ 72,324,150 |
| | | | $ 72,324,150 |
| Insurance — 3.5% | |
| Aon PLC, Class A | | 246,840 | $ 66,121,031 |
| Marsh & McLennan Cos., Inc. | | 795,974 | 118,830,958 |
| | | | $ 184,951,989 |
| Interactive Media & Services — 4.3% | |
| Alphabet, Inc., Class C(1) | | 2,376,114 | $ 228,463,361 |
| | | | $ 228,463,361 |
| IT Services — 16.5% | |
| Accenture PLC, Class A | | 157,283 | $ 40,468,916 |
| Fidelity National Information Services, Inc. | | 723,364 | 54,664,617 |
| Fiserv, Inc.(1) | | 1,380,929 | 129,213,527 |
| Gartner, Inc.(1) | | 499,904 | 138,318,438 |
| Mastercard, Inc., Class A | | 762,829 | 216,902,798 |
| PayPal Holdings, Inc.(1) | | 681,444 | 58,651,885 |
| Visa, Inc., Class A | | 1,284,720 | 228,230,508 |
| | | | $ 866,450,689 |
| Life Sciences Tools & Services — 10.9% | |
| Agilent Technologies, Inc. | | 678,110 | $ 82,424,271 |
| Danaher Corp. | | 976,894 | 252,321,951 |
| Thermo Fisher Scientific, Inc. | | 466,439 | 236,573,196 |
| | | | $ 571,319,418 |
| Machinery — 3.8% | |
| IDEX Corp. | | 414,576 | $ 82,853,014 |
| Xylem, Inc. | | 1,352,336 | 118,140,073 |
| | | | $ 200,993,087 |
| Multiline Retail — 3.2% | |
| Dollar General Corp. | | 707,681 | $ 169,744,365 |
| | | | $ 169,744,365 |
| Personal Products — 1.5% | |
| Estee Lauder Cos., Inc. (The), Class A | | 370,109 | $ 79,906,533 |
| | | | $ 79,906,533 |
| Pharmaceuticals — 3.1% | |
| Zoetis, Inc. | | 1,113,900 | $ 165,180,231 |
| | | | $ 165,180,231 |
38
See Notes to Financial Statements.
Calvert
Equity Fund
September 30, 2022
Schedule of Investments — continued
| Security | Shares | Value |
| Professional Services — 3.8% | |
| Verisk Analytics, Inc. | | 1,176,936 | $ 200,702,896 |
| | | | $ 200,702,896 |
| Semiconductors & Semiconductor Equipment — 1.0% | |
| Texas Instruments, Inc. | | 329,976 | $ 51,073,685 |
| | | | $ 51,073,685 |
| Software — 7.3% | |
| Adobe, Inc.(1) | | 260,778 | $ 71,766,106 |
| Intuit, Inc. | | 220,550 | 85,423,426 |
| Microsoft Corp. | | 969,787 | 225,863,392 |
| | | | $ 383,052,924 |
| Specialty Retail — 7.1% | |
| Lowe's Cos., Inc. | | 376,381 | $ 70,688,115 |
| O'Reilly Automotive, Inc.(1) | | 158,802 | 111,693,387 |
| TJX Cos., Inc. (The) | | 3,039,441 | 188,810,075 |
| | | | $ 371,191,577 |
| Textiles, Apparel & Luxury Goods — 0.9% | |
| NIKE, Inc., Class B | | 587,374 | $ 48,822,527 |
| | | | $ 48,822,527 |
| Venture Capital — 0.0%(2) | |
| 20/20 Gene Systems, Inc.(1)(3)(4) | | 73,397 | $ 78,116 |
| Digital Directions International, Inc.(1)(3)(4) | | 354,389 | 92,141 |
| Ivy Capital (Proprietary) Ltd.(1)(3)(4) | | 950,000 | 80,304 |
| | | | $ 250,561 |
Total Common Stocks
(identified cost $3,218,345,154) | | | $4,986,369,698 |
| High Social Impact Investments — 0.2% |
| Security | Principal
Amount
(000's omitted) | Value |
| Calvert Impact Capital, Inc., Community Investment Notes, 1.50%, 12/15/23(4)(5) | $ | 7,970 | $ 7,402,217 |
Total High Social Impact Investments
(identified cost $7,970,000) | | | $ 7,402,217 |
| Preferred Stocks — 0.0%(2) |
| Security | Shares | Value |
| Venture Capital — 0.0%(2) | |
| Entouch: | | | |
| Series C(1)(3)(4) | | 2,628,278 | $ 301,201 |
| Series C-1(1)(3)(4) | | 1,023,444 | 198,343 |
| Sword Diagnostics(1)(3)(4) | | 1,264,108 | 0 |
Total Preferred Stocks
(identified cost $918,761) | | | $ 499,544 |
| Venture Capital Limited Partnership Interests — 0.3% |
| Security | | Value |
| Accion Frontier Inclusion Fund L.P.(1)(3)(4) | | | $ 2,336,568 |
| Adobe Capital Social Mezzanine I L.P.(1)(3)(4) | | | 107,605 |
| Africa Renewable Energy Fund L.P.(1)(3)(4) | | | 1,031,746 |
| Arborview Capital Partners L.P.(1)(3)(4) | | | 515,819 |
| Bridges Ventures US Sustainable Growth Fund L.P.(1)(3)(4) | | | 936,205 |
| China Environment Fund III L.P.(1)(3)(4) | | | 1,134 |
| Coastal Ventures III L.P.(1)(3)(4) | | | 367,339 |
| Core Innovations Capital I L.P.(1)(3)(4) | | | 2,211,465 |
| Cross Culture Ventures I L.P.(1)(3)(4) | | | 1,134,049 |
| DBL Equity Fund - BAEF Il L.P.(1)(3)(4) | | | 2,000,232 |
| DBL Partners III L.P.(1)(3)(4) | | | 1,474,976 |
| First Analysis Private Equity Fund V L.P.(1)(3)(4) | | | 1,044,130 |
| Ignia Fund I L.P.(1)(3)(4) | | | 177,660 |
| Impact Ventures II L.P.(1)(3)(4) | | | 171,696 |
| LeapFrog Financial Inclusion Fund(1)(3)(4) | | | 24,704 |
| New Markets Education Partners L.P.(1)(3)(4) | | | 55,210 |
| New Markets Venture Partners II L.P.(1)(3)(4) | | | 58,584 |
| Owl Ventures L.P.(1)(3)(4) | | | 1,202,794 |
| Renewable Energy Asia Fund L.P.(1)(3)(4) | | | 233,516 |
| SEAF India International Growth Fund L.P.(1)(3)(4) | | | 0 |
| SJF Ventures II L.P., Preferred(1)(3)(4) | | | 216,775 |
| SJF Ventures III L.P.(1)(3)(4) | | | 864,629 |
| Westly Capital Partners Fund II L.P.(1)(3)(4) | | | 358,280 |
Total Venture Capital Limited Partnership Interests
(identified cost $9,375,237) | | | $ 16,525,116 |
39
See Notes to Financial Statements.
Calvert
Equity Fund
September 30, 2022
Schedule of Investments — continued
| Short-Term Investments — 4.4% | | | |
| Security | Shares | Value |
| Morgan Stanley Institutional Liquidity Funds - Government Portfolio, Institutional Class, 2.80%(6) | | 233,925,238 | $ 233,925,238 |
Total Short-Term Investments
(identified cost $233,925,238) | | | $ 233,925,238 |
Total Investments — 99.6%
(identified cost $3,470,534,390) | | | $5,244,721,813 |
| Other Assets, Less Liabilities — 0.4% | | | $ 18,616,739 |
| Net Assets — 100.0% | | | $5,263,338,552 |
| The percentage shown for each investment category in the Schedule of Investments is based on net assets. |
| (1) | Non-income producing security. |
| (2) | Amount is less than 0.05%. |
| (3) | For fair value measurement disclosure purposes, security is categorized as Level 3 (see Note 1A). |
| (4) | Restricted security. Total market value of restricted securities amounts to $24,677,438, which represents 0.5% of the net assets of the Fund as of September 30, 2022. |
| (5) | May be deemed to be an affiliated company (see Note 8). |
| (6) | May be deemed to be an affiliated investment company. The rate shown is the annualized seven-day yield as of September 30, 2022. |
Restricted Securities
| Description | Acquisition Dates | Cost |
| 20/20 Gene Systems, Inc. | 8/1/08-8/27/13 | $ 166,889 |
| Accion Frontier Inclusion Fund L.P. | 11/12/15-9/21/22 | 777,533 |
| Adobe Capital Social Mezzanine I L.P. | 2/8/13-7/26/22 | 301,085 |
| Africa Renewable Energy Fund L.P. | 4/17/14-7/18/22 | 997,030 |
| Arborview Capital Partners L.P. | 11/13/12-12/7/21 | 14,610 |
| Bridges Ventures US Sustainable Growth Fund L.P. | 6/18/16-10/7/21 | 822,498 |
| Calvert Impact Capital, Inc., Community Investment Notes, 1.50%, 12/15/23 | 12/14/20 | 7,970,000 |
| China Environment Fund III L.P. | 1/24/08-4/19/13 | 528,093 |
| Coastal Ventures III L.P. | 7/30/12-1/9/19 | 118,220 |
| Core Innovations Capital I L.P. | 1/6/11-6/30/17 | 0 |
| Cross Culture Ventures I L.P. | 2/24/16-6/29/22 | 362,755 |
| DBL Equity Fund - BAEF Il L.P. | 3/30/11-8/2/16 | 697,586 |
| DBL Partners III L.P. | 1/16/15-4/28/22 | 870,896 |
| Digital Directions International, Inc. | 7/2/08-7/15/09 | 683,778 |
| Entouch, Series C, Preferred | 2/3/16 | 350,000 |
| Entouch, Series C-1, Preferred | 10/11/17-11/5/19 | 136,289 |
| First Analysis Private Equity Fund V L.P. | 6/7/13-6/13/18 | 306,422 |
| Ignia Fund I L.P. | 1/28/10-12/9/16 | 989,801 |
| Impact Ventures II L.P. | 9/8/10-2/5/18 | 638,988 |
| Ivy Capital (Proprietary) Ltd. | 9/12/12-5/14/14 | 557,372 |
| LeapFrog Financial Inclusion Fund | 1/20/10-1/23/19 | 0 |
| New Markets Education Partners L.P. | 9/27/11-6/1/21 | 0 |
| New Markets Venture Partners II L.P. | 7/21/08-5/3/16 | 0 |
| Owl Ventures L.P. | 7/10/14-3/20/20 | 0 |
| Renewable Energy Asia Fund L.P. | 9/29/10-1/5/17 | 1,753,943 |
| SEAF India International Growth Fund L.P. | 3/22/05-5/24/10 | 195,777 |
| SJF Ventures II L.P., Preferred | 2/14/06-11/20/12 | 0 |
| SJF Ventures III L.P. | 2/6/12-7/14/17 | 0 |
| Sword Diagnostics, Preferred | 12/26/06-11/9/10 | 432,472 |
| Westly Capital Partners Fund II L.P. | 12/27/11-4/16/21 | 0 |
40
See Notes to Financial Statements.
Calvert
Social Investment Fund
September 30, 2022
Statements of Assets and Liabilities
| | September 30, 2022 |
| | Balanced Fund | Bond Fund | Equity Fund |
| Assets | | | |
| Investments in securities of unaffiliated issuers, at value (identified cost $975,971,314, $2,954,901,964 and $3,228,639,152, respectively) - including $6,106,270, $51,072,060 and $0, respectively, of securities on loan | $ 1,015,939,790 | $ 2,613,718,345 | $ 5,003,394,358 |
| Investments in securities of affiliated issuers, at value (identified cost $31,244,660, $91,262,268 and $241,895,238, respectively) | 31,011,639 | 90,654,093 | 241,327,455 |
| Receivable for variation margin on open futures contracts | 12,590 | — | — |
| Receivable for open forward foreign currency exchange contracts | 2,894 | 248,895 | — |
| Cash | 132,831 | 703,349 | 2,422 |
| Deposits for forward commitment securities | 890,000 | 5,359,000 | — |
| Deposits for derivatives collateral: | | | |
| Futures contracts | 946,900 | 3,850,100 | — |
| Centrally cleared swap contracts | — | 490,365 | — |
| Receivable for investments sold | 1,830,640 | 15,085,127 | 5,617,631 |
| Receivable for capital shares sold | 570,142 | 8,782,113 | 18,397,902 |
| Receivable for variation margin on open centrally cleared swap contracts | — | 6,089 | — |
| Dividends and interest receivable | 3,130,701 | 16,098,705 | 1,964,893 |
| Dividends and interest receivable - affiliated | 79,282 | 203,248 | 575,715 |
| Securities lending income receivable | 12,789 | 52,339 | — |
| Tax reclaims receivable | 52,404 | — | — |
| Receivable from affiliate | — | 197,851 | — |
| Trustees' deferred compensation plan | 401,196 | 611,380 | 1,351,232 |
| Total assets | $ 1,055,013,798 | $2,756,060,999 | $5,272,631,608 |
| Liabilities | | | |
| Payable for variation margin on open futures contracts | $ — | $ 501,960 | $ — |
| Payable for investments purchased | 2,295,338 | 14,718,246 | — |
| Payable for when-issued/delayed delivery/forward commitment securities | 41,045,954 | 223,749,533 | — |
| Payable for capital shares redeemed | 941,627 | 4,862,376 | 3,815,680 |
| Distributions payable | — | 622,998 | — |
| Deposits for securities loaned | 6,219,201 | 52,438,085 | — |
| Payable to affiliates: | | | |
| Investment advisory fee | 340,458 | 599,482 | 1,942,062 |
| Administrative fee | 104,272 | 247,080 | 553,298 |
| Distribution and service fees | 187,647 | 59,629 | 501,374 |
| Sub-transfer agency fee | 27,287 | 12,222 | 46,190 |
| Trustees' deferred compensation plan | 401,196 | 611,380 | 1,351,232 |
| Accrued expenses | 298,459 | 595,228 | 1,083,220 |
| Total liabilities | $ 51,861,439 | $ 299,018,219 | $ 9,293,056 |
| Commitments and contingent liabilities (Note 10) | | | |
| Net Assets | $ 1,003,152,359 | $2,457,042,780 | $5,263,338,552 |
| Sources of Net Assets | | | |
| Paid-in capital | $ 958,718,564 | $ 2,859,867,949 | $ 3,316,418,836 |
| Distributable earnings (accumulated loss) | 44,433,795 | (402,825,169) | 1,946,919,716 |
| Net Assets | $ 1,003,152,359 | $2,457,042,780 | $5,263,338,552 |
41
See Notes to Financial Statements.
Calvert
Social Investment Fund
September 30, 2022
Statements of Assets and Liabilities — continued
| | September 30, 2022 |
| | Balanced Fund | Bond Fund | Equity Fund |
| Class A Shares | | | |
| Net Assets | $ 688,401,717 | $ 305,654,210 | $ 1,807,405,518 |
| Shares Outstanding | 20,513,599 | 21,804,047 | 29,044,285 |
Net Asset Value and Redemption Price Per Share
(net assets ÷ shares of beneficial interest outstanding) | $ 33.56 | $ 14.02 | $ 62.23 |
Maximum Offering Price Per Share
(100 ÷ 94.75, 96.75 and 94.75, respectively, of net asset value per share) | $ 35.42 | $ 14.49 | $ 65.68 |
| Class C Shares | | | |
| Net Assets | $ 51,249,933 | $ 9,288,715 | $ 114,233,612 |
| Shares Outstanding | 1,588,271 | 667,364 | 3,681,660 |
Net Asset Value and Offering Price Per Share*
(net assets ÷ shares of beneficial interest outstanding) | $ 32.27 | $ 13.92 | $ 31.03 |
| Class I Shares | | | |
| Net Assets | $ 211,957,197 | $ 1,668,530,965 | $ 2,895,475,222 |
| Shares Outstanding | 6,170,972 | 118,789,298 | 39,283,103 |
Net Asset Value, Offering Price and Redemption Price Per Share
(net assets ÷ shares of beneficial interest outstanding) | $ 34.35 | $ 14.05 | $ 73.71 |
| Class R6 Shares | | | |
| Net Assets | $ 51,543,512 | $ 473,568,890 | $ 446,224,200 |
| Shares Outstanding | 1,501,610 | 33,751,922 | 6,068,380 |
Net Asset Value, Offering Price and Redemption Price Per Share
(net assets ÷ shares of beneficial interest outstanding) | $ 34.33 | $ 14.03 | $ 73.53 |
| On sales of $50,000 ($100,000 for Bond Fund) or more, the offering price of Class A shares is reduced. |
| * | Redemption price per share is equal to the net asset value less any applicable contingent deferred sales charge. |
42
See Notes to Financial Statements.
Calvert
Social Investment Fund
September 30, 2022
| | Year Ended September 30, 2022 |
| | Balanced Fund | Bond Fund | Equity Fund |
| Investment Income | | | |
| Dividend income (net of foreign taxes withheld of $16,607, $10,869 and $0, respectively) | $ 9,873,384 | $ 1,107,707 | $ 50,221,613 |
| Dividend income - affiliated issuers | 118,315 | 325,684 | 1,518,070 |
| Interest and other income (net of foreign taxes withheld of $4,682, $26,937 and $0, respectively) | 12,572,677 | 72,975,688 | — |
| Interest income - affiliated issuers | 137,136 | 640,823 | 119,550 |
| Securities lending income, net | 33,635 | 142,415 | 115 |
| Total investment income | $ 22,735,147 | $ 75,192,317 | $ 51,859,348 |
| Expenses | | | |
| Investment advisory fee | $ 4,587,835 | $ 7,447,599 | $ 25,232,159 |
| Administrative fee | 1,410,115 | 3,040,386 | 7,114,291 |
| Distribution and service fees: | | | |
| Class A | 1,916,262 | 696,303 | 5,441,386 |
| Class C | 631,867 | 116,711 | 1,400,705 |
| Trustees' fees and expenses | 51,974 | 116,258 | 262,843 |
| Custodian fees | 32,918 | 57,267 | 91,033 |
| Transfer agency fees and expenses | 1,050,355 | 2,025,764 | 4,231,484 |
| Accounting fees | 332,915 | 468,228 | 840,958 |
| Professional fees | 75,385 | 65,845 | 114,807 |
| Registration fees | 103,470 | 203,047 | 250,138 |
| Reports to shareholders | 42,806 | 110,850 | 218,399 |
| Miscellaneous | 100,619 | 68,776 | 129,543 |
| Total expenses | $ 10,336,521 | $ 14,417,034 | $ 45,327,746 |
| Waiver and/or reimbursement of expenses by affiliate | $ (6,508) | $ (499,647) | $ (135,626) |
| Net expenses | $ 10,330,013 | $ 13,917,387 | $ 45,192,120 |
| Net investment income | $ 12,405,134 | $ 61,274,930 | $ 6,667,228 |
| Realized and Unrealized Gain (Loss) | | | |
| Net realized gain (loss): | | | |
| Investment securities | $ 13,916,298 | $ (41,321,405) | $ 191,913,268 |
| Investment securities - affiliated issuers | 983 | (23,006) | (3,572) |
| Futures contracts | 2,848,022 | (6,079,488) | — |
| Swap contracts | — | 470,583 | — |
| Foreign currency transactions | (79) | 30,933 | — |
| Forward foreign currency exchange contracts | 5,099 | 58,101 | — |
| Net realized gain (loss) | $ 16,770,323 | $ (46,864,282) | $ 191,909,696 |
| Change in unrealized appreciation (depreciation): | | | |
| Investment securities | $ (200,417,208) | $ (390,338,374) | $ (1,198,885,447) |
| Investment securities - affiliated issuers | (164,348) | (499,381) | (442,676) |
| Futures contracts | (913,304) | (12,416,620) | — |
| Swap contracts | — | (25,890) | — |
| Foreign currency | (9,608) | (59) | — |
| Forward foreign currency exchange contracts | 2,894 | 248,895 | — |
| Net change in unrealized appreciation (depreciation) | $(201,501,574) | $(403,031,429) | $(1,199,328,123) |
| Net realized and unrealized loss | $(184,731,251) | $(449,895,711) | $(1,007,418,427) |
| Net decrease in net assets from operations | $(172,326,117) | $(388,620,781) | $(1,000,751,199) |
43
See Notes to Financial Statements.
Calvert
Social Investment Fund
September 30, 2022
Statements of Changes in Net Assets
| | Year Ended September 30, 2022 |
| | Balanced Fund | Bond Fund | Equity Fund |
| Increase (Decrease) in Net Assets | | | |
| From operations: | | | |
| Net investment income | $ 12,405,134 | $ 61,274,930 | $ 6,667,228 |
| Net realized gain (loss) | 16,770,323 | (46,864,282) | 191,909,696 |
| Net change in unrealized appreciation (depreciation) | (201,501,574) | (403,031,429) | (1,199,328,123) |
| Net decrease in net assets from operations | $ (172,326,117) | $ (388,620,781) | $(1,000,751,199) |
| Distributions to shareholders: | | | |
| Class A | $ (64,304,737) | $ (12,338,091) | $ (86,833,850) |
| Class C | (4,956,110) | (325,612) | (10,386,601) |
| Class I | (24,360,884) | (63,325,440) | (108,527,009) |
| Class R6 | (1,383,991) | (15,675,838) | (16,720,268) |
| Total distributions to shareholders | $ (95,005,722) | $ (91,664,981) | $ (222,467,728) |
| Capital share transactions: | | | |
| Class A | $ 45,914,634 | $ (5,566,801) | $ (25,744,896) |
| Class C | (1,522,990) | (2,353,578) | (461,367) |
| Class I | (41,414,804) | 291,288,274 | 397,670,403 |
| Class R6 | 49,394,548 | 233,424,428 | 88,001,775 |
| Net increase in net assets from capital share transactions | $ 52,371,388 | $ 516,792,323 | $ 459,465,915 |
| Net increase (decrease) in net assets | $ (214,960,451) | $ 36,506,561 | $ (763,753,012) |
| Net Assets | | | |
| At beginning of year | $ 1,218,112,810 | $ 2,420,536,219 | $ 6,027,091,564 |
| At end of year | $1,003,152,359 | $2,457,042,780 | $ 5,263,338,552 |
44
See Notes to Financial Statements.
Calvert
Social Investment Fund
September 30, 2022
Statements of Changes in Net Assets — continued
| | Year Ended September 30, 2021 |
| | Balanced Fund | Bond Fund | Equity Fund |
| Increase (Decrease) in Net Assets | | | |
| From operations: | | | |
| Net investment income | $ 8,405,046 | $ 44,427,951 | $ 4,350,668 |
| Net realized gain | 87,470,552 | 31,748,346 | 256,045,998 |
| Net change in unrealized appreciation (depreciation) | 69,358,215 | (17,376,947) | 1,034,820,304 |
| Net increase in net assets from operations | $ 165,233,813 | $ 58,799,350 | $1,295,216,970 |
| Distributions to shareholders: | | | |
| Class A | $ (16,610,145) | $ (10,862,835) | $ (54,180,648) |
| Class C | (1,024,717) | (341,745) | (6,181,589) |
| Class I | (6,391,454) | (51,012,607) | (78,465,706) |
| Class R6 | (245,398) | (9,411,050) | (9,228,369) |
| Total distributions to shareholders | $ (24,271,714) | $ (71,628,237) | $ (148,056,312) |
| Capital share transactions: | | | |
| Class A | $ 40,159,310 | $ 50,639,467 | $ (46,634,430) |
| Class C | (6,957,622) | (2,384,269) | (14,138,082) |
| Class I | 69,485,568 | 339,259,762 | (372,072,443) |
| Class R6 | 5,507,106 | 52,211,377 | 167,442,612 |
| Net increase (decrease) in net assets from capital share transactions | $ 108,194,362 | $ 439,726,337 | $ (265,402,343) |
| Net increase in net assets | $ 249,156,461 | $ 426,897,450 | $ 881,758,315 |
| Net Assets | | | |
| At beginning of year | $ 968,956,349 | $ 1,993,638,769 | $ 5,145,333,249 |
| At end of year | $1,218,112,810 | $2,420,536,219 | $6,027,091,564 |
45
See Notes to Financial Statements.
Calvert
Social Investment Fund
September 30, 2022
| | Balanced Fund — Class A |
| | Year Ended September 30, |
| | 2022 | 2021 | 2020 | 2019 | 2018 |
| Net asset value — Beginning of year | $ 42.36 | $ 37.18 | $ 34.28 | $ 33.14 | $ 32.59 |
| Income (Loss) From Operations | | | | | |
| Net investment income(1) | $ 0.40 | $ 0.30 | $ 0.41 | $ 0.44 | $ 0.43 |
| Net realized and unrealized gain (loss) | (5.91) | 5.77 | 3.67 | 2.24 | 2.68 |
| Total income (loss) from operations | $ (5.51) | $ 6.07 | $ 4.08 | $ 2.68 | $ 3.11 |
| Less Distributions | | | | | |
| From net investment income | $ (0.41) | $ (0.30) | $ (0.42) | $ (0.44) | $ (0.44) |
| From net realized gain | (2.88) | (0.59) | (0.76) | (1.10) | (2.12) |
| Total distributions | $ (3.29) | $ (0.89) | $ (1.18) | $ (1.54) | $ (2.56) |
| Net asset value — End of year | $ 33.56 | $ 42.36 | $ 37.18 | $ 34.28 | $ 33.14 |
| Total Return(2) | (14.40)% | 16.48% | 12.22% | 8.56% | 10.01% |
| Ratios/Supplemental Data | | | | | |
| Net assets, end of year (000’s omitted) | $688,402 | $823,892 | $686,408 | $619,744 | $571,452 |
| Ratios (as a percentage of average daily net assets):(3) | | | | | |
| Total expenses | 0.91% | 0.90% | 0.93% | 0.96% | 0.96% |
| Net expenses | 0.91% (4) | 0.90% | 0.93% | 0.93% | 0.94% |
| Net investment income | 1.03% | 0.73% | 1.17% | 1.37% | 1.33% |
| Portfolio Turnover | 85% (5) | 95% (5) | 98% (5) | 69% (5) | 76% |
| (1) | Computed using average shares outstanding. |
| (2) | Returns are historical and are calculated by determining the percentage change in net asset value with all distributions reinvested and do not reflect the effect of sales charges, if any. |
| (3) | Total expenses do not reflect amounts reimbursed and/or waived by the adviser and certain of its affiliates, if applicable. Net expenses are net of all reductions and represent the net expenses paid by the Fund. |
| (4) | Includes a reduction by the investment adviser of a portion of its adviser fee due to the Fund's investment in the Liquidity Fund (equal to less than 0.005% of average daily net assets for the year ended September 30, 2022). |
| (5) | Includes the effect of To-Be-Announced (TBA) transactions. |
46
See Notes to Financial Statements.
Calvert
Social Investment Fund
September 30, 2022
Financial Highlights — continued
| | Balanced Fund — Class C |
| | Year Ended September 30, |
| | 2022 | 2021 | 2020 | 2019 | 2018 |
| Net asset value — Beginning of year | $ 40.85 | $ 35.90 | $ 33.14 | $ 32.09 | $ 31.63 |
| Income (Loss) From Operations | | | | | |
| Net investment income (loss)(1) | $ 0.10 | $ (0.01) | $ 0.14 | $ 0.20 | $ 0.18 |
| Net realized and unrealized gain (loss) | (5.68) | 5.56 | 3.55 | 2.15 | 2.61 |
| Total income (loss) from operations | $ (5.58) | $ 5.55 | $ 3.69 | $ 2.35 | $ 2.79 |
| Less Distributions | | | | | |
| From net investment income | $ (0.12) | $ (0.01) | $ (0.17) | $ (0.20) | $ (0.21) |
| From net realized gain | (2.88) | (0.59) | (0.76) | (1.10) | (2.12) |
| Total distributions | $ (3.00) | $ (0.60) | $ (0.93) | $ (1.30) | $ (2.33) |
| Net asset value — End of year | $ 32.27 | $ 40.85 | $ 35.90 | $ 33.14 | $ 32.09 |
| Total Return(2) | (15.05)% | 15.59% | 11.39% | 7.77% | 9.14% |
| Ratios/Supplemental Data | | | | | |
| Net assets, end of year (000’s omitted) | $51,250 | $67,292 | $65,760 | $54,062 | $60,674 |
| Ratios (as a percentage of average daily net assets):(3) | | | | | |
| Total expenses | 1.67% | 1.66% | 1.69% | 1.71% | 1.71% |
| Net expenses | 1.67% (4) | 1.66% | 1.68% | 1.68% | 1.69% |
| Net investment income (loss) | 0.26% | (0.03)% | 0.42% | 0.63% | 0.58% |
| Portfolio Turnover | 85% (5) | 95% (5) | 98% (5) | 69% (5) | 76% |
| (1) | Computed using average shares outstanding. |
| (2) | Returns are historical and are calculated by determining the percentage change in net asset value with all distributions reinvested and do not reflect the effect of sales charges, if any. |
| (3) | Total expenses do not reflect amounts reimbursed and/or waived by the adviser and certain of its affiliates, if applicable. Net expenses are net of all reductions and represent the net expenses paid by the Fund. |
| (4) | Includes a reduction by the investment adviser of a portion of its adviser fee due to the Fund's investment in the Liquidity Fund (equal to less than 0.005% of average daily net assets for the year ended September 30, 2022). |
| (5) | Includes the effect of To-Be-Announced (TBA) transactions. |
47
See Notes to Financial Statements.
Calvert
Social Investment Fund
September 30, 2022
Financial Highlights — continued
| | Balanced Fund — Class I |
| | Year Ended September 30, |
| | 2022 | 2021 | 2020 | 2019 | 2018 |
| Net asset value — Beginning of year | $ 43.28 | $ 37.97 | $ 34.97 | $ 33.77 | $ 33.14 |
| Income (Loss) From Operations | | | | | |
| Net investment income(1) | $ 0.50 | $ 0.40 | $ 0.50 | $ 0.54 | $ 0.55 |
| Net realized and unrealized gain (loss) | (6.05) | 5.90 | 3.76 | 2.28 | 2.72 |
| Total income (loss) from operations | $ (5.55) | $ 6.30 | $ 4.26 | $ 2.82 | $ 3.27 |
| Less Distributions | | | | | |
| From net investment income | $ (0.50) | $ (0.40) | $ (0.50) | $ (0.52) | $ (0.52) |
| From net realized gain | (2.88) | (0.59) | (0.76) | (1.10) | (2.12) |
| Total distributions | $ (3.38) | $ (0.99) | $ (1.26) | $ (1.62) | $ (2.64) |
| Net asset value — End of year | $ 34.35 | $ 43.28 | $ 37.97 | $ 34.97 | $ 33.77 |
| Total Return(2) | (14.20)% | 16.75% | 12.55% | 8.87% | 10.33% |
| Ratios/Supplemental Data | | | | | |
| Net assets, end of year (000’s omitted) | $211,957 | $315,744 | $212,490 | $140,961 | $99,878 |
| Ratios (as a percentage of average daily net assets):(3) | | | | | |
| Total expenses | 0.67% | 0.66% | 0.69% | 0.71% | 0.72% |
| Net expenses | 0.67% (4) | 0.66% | 0.68% | 0.66% | 0.62% |
| Net investment income | 1.25% | 0.96% | 1.41% | 1.64% | 1.66% |
| Portfolio Turnover | 85% (5) | 95% (5) | 98% (5) | 69% (5) | 76% |
| (1) | Computed using average shares outstanding. |
| (2) | Returns are historical and are calculated by determining the percentage change in net asset value with all distributions reinvested and do not reflect the effect of sales charges, if any. |
| (3) | Total expenses do not reflect amounts reimbursed and/or waived by the adviser and certain of its affiliates, if applicable. Net expenses are net of all reductions and represent the net expenses paid by the Fund. |
| (4) | Includes a reduction by the investment adviser of a portion of its adviser fee due to the Fund's investment in the Liquidity Fund (equal to less than 0.005% of average daily net assets for the year ended September 30, 2022). |
| (5) | Includes the effect of To-Be-Announced (TBA) transactions. |
48
See Notes to Financial Statements.
Calvert
Social Investment Fund
September 30, 2022
Financial Highlights — continued
| | Balanced Fund — Class R6 |
| | Year Ended September 30, | Period Ended
September 30, |
| | 2022 | 2021 | 2020 | 2019 (1) |
| Net asset value — Beginning of period | $ 43.27 | $ 37.95 | $ 34.98 | $ 31.46 |
| Income (Loss) From Operations | | | | |
| Net investment income(2) | $ 0.57 | $ 0.42 | $ 0.51 | $ 0.36 |
| Net realized and unrealized gain (loss) | (6.10) | 5.91 | 3.75 | 3.55 |
| Total income (loss) from operations | $ (5.53) | $ 6.33 | $ 4.26 | $ 3.91 |
| Less Distributions | | | | |
| From net investment income | $ (0.53) | $ (0.42) | $ (0.53) | $ (0.39) |
| From net realized gain | (2.88) | (0.59) | (0.76) | — |
| Total distributions | $ (3.41) | $ (1.01) | $ (1.29) | $ (0.39) |
| Net asset value — End of period | $ 34.33 | $ 43.27 | $37.95 | $34.98 |
| Total Return(3) | (14.14)% | 16.82% | 12.57% | 12.44% (4) |
| Ratios/Supplemental Data | | | | |
| Net assets, end of period (000’s omitted) | $51,544 | $11,184 | $ 4,298 | $ 230 |
| Ratios (as a percentage of average daily net assets):(5) | | | | |
| Total expenses | 0.61% | 0.61% | 0.65% | 0.66% (6) |
| Net expenses | 0.61% (7) | 0.61% | 0.64% | 0.64% (6) |
| Net investment income | 1.51% | 1.01% | 1.43% | 1.58% (6) |
| Portfolio Turnover | 85% (8) | 95% (8) | 98% (8) | 69% (8)(9) |
| (1) | For the period from the commencement of operations, February 1, 2019, to September 30, 2019. |
| (2) | Computed using average shares outstanding. |
| (3) | Returns are historical and are calculated by determining the percentage change in net asset value with all distributions reinvested and do not reflect the effect of sales charges, if any. |
| (4) | Not annualized. |
| (5) | Total expenses do not reflect amounts reimbursed and/or waived by the adviser and certain of its affiliates, if applicable. Net expenses are net of all reductions and represent the net expenses paid by the Fund. |
| (6) | Annualized. |
| (7) | Includes a reduction by the investment adviser of a portion of its adviser fee due to the Fund's investment in the Liquidity Fund (equal to less than 0.005% of average daily net assets for the year ended September 30, 2022). |
| (8) | Includes the effect of To-Be-Announced (TBA) transactions. |
| (9) | For the year ended September 30, 2019. |
49
See Notes to Financial Statements.
Calvert
Social Investment Fund
September 30, 2022
Financial Highlights — continued
| | Bond Fund — Class A |
| | Year Ended September 30, |
| | 2022 | 2021 | 2020 | 2019 | 2018 |
| Net asset value — Beginning of year | $ 16.91 | $ 17.01 | $ 16.67 | $ 15.69 | $ 16.14 |
| Income (Loss) From Operations | | | | | |
| Net investment income(1) | $ 0.35 | $ 0.31 | $ 0.37 | $ 0.42 | $ 0.37 |
| Net realized and unrealized gain (loss) | (2.69) | 0.12 | 0.50 | 0.99 | (0.45) |
| Total income (loss) from operations | $ (2.34) | $ 0.43 | $ 0.87 | $ 1.41 | $ (0.08) |
| Less Distributions | | | | | |
| From net investment income | $ (0.35) | $ (0.32) | $ (0.38) | $ (0.43) | $ (0.37) |
| From net realized gain | (0.20) | (0.21) | (0.15) | — | — |
| Total distributions | $ (0.55) | $ (0.53) | $ (0.53) | $ (0.43) | $ (0.37) |
| Net asset value — End of year | $ 14.02 | $ 16.91 | $ 17.01 | $ 16.67 | $ 15.69 |
| Total Return(2) | (14.15)% | 2.61% | 5.32% | 9.10% | (0.48)% |
| Ratios/Supplemental Data | | | | | |
| Net assets, end of year (000’s omitted) | $305,654 | $375,792 | $327,252 | $290,893 | $251,714 |
| Ratios (as a percentage of average daily net assets):(3) | | | | | |
| Total expenses | 0.75% | 0.74% | 0.76% | 0.78% | 0.83% |
| Net expenses | 0.73% (4) | 0.73% | 0.73% | 0.75% | 0.83% |
| Net investment income | 2.21% | 1.84% | 2.21% | 2.59% | 2.32% |
| Portfolio Turnover | 122% (5) | 163% (5) | 153% (5) | 75% (5) | 83% |
| (1) | Computed using average shares outstanding. |
| (2) | Returns are historical and are calculated by determining the percentage change in net asset value with all distributions reinvested and do not reflect the effect of sales charges, if any. |
| (3) | Total expenses do not reflect amounts reimbursed and/or waived by the adviser and certain of its affiliates, if applicable. Net expenses are net of all reductions and represent the net expenses paid by the Fund. |
| (4) | Includes a reduction by the investment adviser of a portion of its advisory fee due to the Fund's investment in the Liquidity Fund (equal to less than 0.005% of average daily net assets for the year ended September 30, 2022). |
| (5) | Includes the effect of To-Be-Announced (TBA) transactions. |
50
See Notes to Financial Statements.
Calvert
Social Investment Fund
September 30, 2022
Financial Highlights — continued
| | Bond Fund — Class C |
| | Year Ended September 30, |
| | 2022 | 2021 | 2020 | 2019 | 2018 |
| Net asset value — Beginning of year | $ 16.79 | $ 16.89 | $ 16.55 | $ 15.58 | $ 16.03 |
| Income (Loss) From Operations | | | | | |
| Net investment income(1) | $ 0.22 | $ 0.18 | $ 0.23 | $ 0.28 | $ 0.24 |
| Net realized and unrealized gain (loss) | (2.66) | 0.12 | 0.50 | 0.98 | (0.44) |
| Total income (loss) from operations | $ (2.44) | $ 0.30 | $ 0.73 | $ 1.26 | $ (0.20) |
| Less Distributions | | | | | |
| From net investment income | $ (0.23) | $ (0.19) | $ (0.24) | $ (0.29) | $ (0.25) |
| From net realized gain | (0.20) | (0.21) | (0.15) | — | — |
| Total distributions | $ (0.43) | $ (0.40) | $ (0.39) | $ (0.29) | $ (0.25) |
| Net asset value — End of year | $ 13.92 | $ 16.79 | $ 16.89 | $ 16.55 | $ 15.58 |
| Total Return(2) | (14.83)% | 1.80% | 4.50% | 8.19% | (1.25)% |
| Ratios/Supplemental Data | | | | | |
| Net assets, end of year (000’s omitted) | $ 9,289 | $13,768 | $16,215 | $15,343 | $21,939 |
| Ratios (as a percentage of average daily net assets):(3) | | | | | |
| Total expenses | 1.55% | 1.54% | 1.56% | 1.59% | 1.63% |
| Net expenses | 1.53% (4) | 1.53% | 1.53% | 1.56% | 1.63% |
| Net investment income | 1.39% | 1.05% | 1.41% | 1.79% | 1.52% |
| Portfolio Turnover | 122% (5) | 163% (5) | 153% (5) | 75% (5) | 83% |
| (1) | Computed using average shares outstanding. |
| (2) | Returns are historical and are calculated by determining the percentage change in net asset value with all distributions reinvested and do not reflect the effect of sales charges, if any. |
| (3) | Total expenses do not reflect amounts reimbursed and/or waived by the adviser and certain of its affiliates, if applicable. Net expenses are net of all reductions and represent the net expenses paid by the Fund. |
| (4) | Includes a reduction by the investment adviser of a portion of its advisory fee due to the Fund's investment in the Liquidity Fund (equal to less than 0.005% of average daily net assets for the year ended September 30, 2022). |
| (5) | Includes the effect of To-Be-Announced (TBA) transactions. |
51
See Notes to Financial Statements.
Calvert
Social Investment Fund
September 30, 2022
Financial Highlights — continued
| | Bond Fund — Class I |
| | Year Ended September 30, |
| | 2022 | 2021 | 2020 | 2019 | 2018 |
| Net asset value — Beginning of year | $ 16.94 | $ 17.04 | $ 16.70 | $ 15.72 | $ 16.15 |
| Income (Loss) From Operations | | | | | |
| Net investment income(1) | $ 0.38 | $ 0.35 | $ 0.40 | $ 0.45 | $ 0.42 |
| Net realized and unrealized gain (loss) | (2.68) | 0.12 | 0.50 | 0.99 | (0.45) |
| Total income (loss) from operations | $ (2.30) | $ 0.47 | $ 0.90 | $ 1.44 | $ (0.03) |
| Less Distributions | | | | | |
| From net investment income | $ (0.39) | $ (0.36) | $ (0.41) | $ (0.46) | $ (0.40) |
| From net realized gain | (0.20) | (0.21) | (0.15) | — | — |
| Total distributions | $ (0.59) | $ (0.57) | $ (0.56) | $ (0.46) | $ (0.40) |
| Net asset value — End of year | $ 14.05 | $ 16.94 | $ 17.04 | $ 16.70 | $ 15.72 |
| Total Return(2) | (13.95)% | 2.81% | 5.52% | 9.30% | (0.15)% |
| Ratios/Supplemental Data | | | | | |
| Net assets, end of year (000’s omitted) | $1,668,531 | $1,709,504 | $1,379,529 | $1,144,805 | $629,822 |
| Ratios (as a percentage of average daily net assets):(3) | | | | | |
| Total expenses | 0.55% | 0.54% | 0.56% | 0.58% | 0.63% |
| Net expenses | 0.53% (4) | 0.53% | 0.53% | 0.53% | 0.53% |
| Net investment income | 2.43% | 2.04% | 2.40% | 2.81% | 2.64% |
| Portfolio Turnover | 122% (5) | 163% (5) | 153% (5) | 75% (5) | 83% |
| (1) | Computed using average shares outstanding. |
| (2) | Returns are historical and are calculated by determining the percentage change in net asset value with all distributions reinvested and do not reflect the effect of sales charges, if any. |
| (3) | Total expenses do not reflect amounts reimbursed and/or waived by the adviser and certain of its affiliates, if applicable. Net expenses are net of all reductions and represent the net expenses paid by the Fund. |
| (4) | Includes a reduction by the investment adviser of a portion of its advisory fee due to the Fund's investment in the Liquidity Fund (equal to less than 0.005% of average daily net assets for the year ended September 30, 2022). |
| (5) | Includes the effect of To-Be-Announced (TBA) transactions. |
52
See Notes to Financial Statements.
Calvert
Social Investment Fund
September 30, 2022
Financial Highlights — continued
| | Bond Fund — Class R6 |
| | Year Ended September 30, | Period Ended
September 30, |
| | 2022 | 2021 | 2020 | 2019 | 2018 (1) |
| Net asset value — Beginning of period | $ 16.93 | $ 17.03 | $ 16.69 | $ 15.71 | $ 16.17 |
| Income (Loss) From Operations | | | | | |
| Net investment income(2) | $ 0.40 | $ 0.36 | $ 0.41 | $ 0.46 | $ 0.42 |
| Net realized and unrealized gain (loss) | (2.70) | 0.12 | 0.50 | 0.99 | (0.46) |
| Total income (loss) from operations | $ (2.30) | $ 0.48 | $ 0.91 | $ 1.45 | $ (0.04) |
| Less Distributions | | | | | |
| From net investment income | $ (0.40) | $ (0.37) | $ (0.42) | $ (0.47) | $ (0.42) |
| From net realized gain | (0.20) | (0.21) | (0.15) | — | — |
| Total distributions | $ (0.60) | $ (0.58) | $ (0.57) | $ (0.47) | $ (0.42) |
| Net asset value — End of period | $ 14.03 | $ 16.93 | $ 17.03 | $ 16.69 | $ 15.71 |
| Total Return(3) | (13.96)% | 2.89% | 5.66% | 9.31% | (0.27)% (4) |
| Ratios/Supplemental Data | | | | | |
| Net assets, end of period (000’s omitted) | $473,569 | $321,472 | $270,643 | $252,225 | $133,417 |
| Ratios (as a percentage of average daily net assets):(5) | | | | | |
| Total expenses | 0.48% | 0.47% | 0.49% | 0.51% | 0.56% (6) |
| Net expenses | 0.46% (7) | 0.46% | 0.46% | 0.48% | 0.53% (6) |
| Net investment income | 2.55% | 2.11% | 2.48% | 2.84% | 2.64% (6) |
| Portfolio Turnover | 122% (8) | 163% (8) | 153% (8) | 75% (8) | 83% (9) |
| (1) | For the period from the commencement of operations, October 3, 2017, to September 30, 2018. |
| (2) | Computed using average shares outstanding. |
| (3) | Returns are historical and are calculated by determining the percentage change in net asset value with all distributions reinvested and do not reflect the effect of sales charges, if any. |
| (4) | Not annualized. |
| (5) | Total expenses do not reflect amounts reimbursed and/or waived by the adviser and certain of its affiliates, if applicable. Net expenses are net of all reductions and represent the net expenses paid by the Fund. |
| (6) | Annualized. |
| (7) | Includes a reduction by the investment adviser of a portion of its advisory fee due to the Fund's investment in the Liquidity Fund (equal to less than 0.005% of average daily net assets for the year ended September 30, 2022). |
| (8) | Includes the effect of To-Be-Announced (TBA) transactions. |
| (9) | For the year ended September 30, 2018. |
53
See Notes to Financial Statements.
Calvert
Social Investment Fund
September 30, 2022
Financial Highlights — continued
| | Equity Fund — Class A |
| | Year Ended September 30, |
| | 2022 | 2021 | 2020 | 2019 | 2018 |
| Net asset value — Beginning of year | $ 77.18 | $ 63.00 | $ 53.94 | $ 49.18 | $ 43.31 |
| Income (Loss) From Operations | | | | | |
| Net investment income (loss)(1) | $ (0.02) | $ (0.04) | $ 0.01 | $ 0.05 | $ 0.04 |
| Net realized and unrealized gain (loss) | (11.98) | 16.02 | 10.64 | 8.36 | 9.31 |
| Total income (loss) from operations | $ (12.00) | $ 15.98 | $ 10.65 | $ 8.41 | $ 9.35 |
| Less Distributions | | | | | |
| From net investment income | $ — | $ — | $ (0.02) | $ (0.01) | $ (0.05) |
| From net realized gain | (2.95) | (1.80) | (1.57) | (3.64) | (3.43) |
| Total distributions | $ (2.95) | $ (1.80) | $ (1.59) | $ (3.65) | $ (3.48) |
| Net asset value — End of year | $ 62.23 | $ 77.18 | $ 63.00 | $ 53.94 | $ 49.18 |
| Total Return(2) | (16.35)% | 25.87% | 20.27% | 18.72% | 22.66% |
| Ratios/Supplemental Data | | | | | |
| Net assets, end of year (000’s omitted) | $1,807,406 | $2,278,654 | $1,896,037 | $1,598,391 | $1,291,870 |
| Ratios (as a percentage of average daily net assets):(3) | | | | | |
| Total expenses | 0.91% | 0.91% | 0.94% | 1.00% | 1.01% |
| Net expenses | 0.91% (4) | 0.91% | 0.94% | 0.99% | 1.01% |
| Net investment income (loss) | (0.03)% | (0.06)% | 0.01% | 0.11% | 0.08% |
| Portfolio Turnover | 7% | 13% | 16% | 13% | 18% |
| (1) | Computed using average shares outstanding. |
| (2) | Returns are historical and are calculated by determining the percentage change in net asset value with all distributions reinvested and do not reflect the effect of sales charges, if any. |
| (3) | Total expenses do not reflect amounts reimbursed and/or waived by the adviser and certain of its affiliates, if applicable. Net expenses are net of all reductions and represent the net expenses paid by the Fund. |
| (4) | Includes a reduction by the investment adviser of a portion of its advisory fee due to the Fund's investment in the Liquidity Fund (equal to less than 0.005% of average daily net assets for the year ended September 30, 2022). |
54
See Notes to Financial Statements.
Calvert
Social Investment Fund
September 30, 2022
Financial Highlights — continued
| | Equity Fund — Class C |
| | Year Ended September 30, |
| | 2022 | 2021 | 2020 | 2019 | 2018 |
| Net asset value — Beginning of year | $ 40.04 | $ 33.61 | $ 29.67 | $ 28.80 | $ 26.84 |
| Income (Loss) From Operations | | | | | |
| Net investment loss(1) | $ (0.29) | $ (0.30) | $ (0.22) | $ (0.17) | $ (0.18) |
| Net realized and unrealized gain (loss) | (5.89) | 8.39 | 5.70 | 4.57 | 5.57 |
| Total income (loss) from operations | $ (6.18) | $ 8.09 | $ 5.48 | $ 4.40 | $ 5.39 |
| Less Distributions | | | | | |
| From net realized gain | $ (2.83) | $ (1.66) | $ (1.54) | $ (3.53) | $ (3.43) |
| Total distributions | $ (2.83) | $ (1.66) | $ (1.54) | $ (3.53) | $ (3.43) |
| Net asset value — End of year | $ 31.03 | $ 40.04 | $ 33.61 | $ 29.67 | $ 28.80 |
| Total Return(2) | (16.96)% | 24.92% | 19.38% | 17.82% | 21.75% |
| Ratios/Supplemental Data | | | | | |
| Net assets, end of year (000’s omitted) | $114,234 | $149,033 | $138,072 | $100,276 | $155,419 |
| Ratios (as a percentage of average daily net assets):(3) | | | | | |
| Total expenses | 1.65% | 1.66% | 1.69% | 1.75% | 1.76% |
| Net expenses | 1.65% (4) | 1.66% | 1.69% | 1.75% | 1.76% |
| Net investment loss | (0.78)% | (0.81)% | (0.74)% | (0.64)% | (0.67)% |
| Portfolio Turnover | 7% | 13% | 16% | 13% | 18% |
| (1) | Computed using average shares outstanding. |
| (2) | Returns are historical and are calculated by determining the percentage change in net asset value with all distributions reinvested and do not reflect the effect of sales charges, if any. |
| (3) | Total expenses do not reflect amounts reimbursed and/or waived by the adviser and certain of its affiliates, if applicable. Net expenses are net of all reductions and represent the net expenses paid by the Fund. |
| (4) | Includes a reduction by the investment adviser of a portion of its advisory fee due to the Fund's investment in the Liquidity Fund (equal to less than 0.005% of average daily net assets for the year ended September 30, 2022). |
55
See Notes to Financial Statements.
Calvert
Social Investment Fund
September 30, 2022
Financial Highlights — continued
| | Equity Fund — Class I |
| | Year Ended September 30, |
| | 2022 | 2021 | 2020 | 2019 | 2018 |
| Net asset value — Beginning of year | $ 90.83 | $ 73.80 | $ 62.89 | $ 56.68 | $ 49.44 |
| Income (Loss) From Operations | | | | | |
| Net investment income(1) | $ 0.19 | $ 0.16 | $ 0.17 | $ 0.21 | $ 0.20 |
| Net realized and unrealized gain (loss) | (14.20) | 18.81 | 12.46 | 9.76 | 10.69 |
| Total income (loss) from operations | $ (14.01) | $ 18.97 | $ 12.63 | $ 9.97 | $ 10.89 |
| Less Distributions | | | | | |
| From net investment income | $ (0.08) | $ (0.13) | $ (0.15) | $ (0.12) | $ (0.22) |
| From net realized gain | (3.03) | (1.81) | (1.57) | (3.64) | (3.43) |
| Total distributions | $ (3.11) | $ (1.94) | $ (1.72) | $ (3.76) | $ (3.65) |
| Net asset value — End of year | $ 73.71 | $ 90.83 | $ 73.80 | $ 62.89 | $ 56.68 |
| Total Return(2) | (16.14)% | 26.19% | 20.57% | 19.05% | 23.06% |
| Ratios/Supplemental Data | | | | | |
| Net assets, end of year (000’s omitted) | $2,895,475 | $3,142,730 | $2,863,128 | $1,540,337 | $963,446 |
| Ratios (as a percentage of average daily net assets):(3) | | | | | |
| Total expenses | 0.65% | 0.66% | 0.69% | 0.75% | 0.76% |
| Net expenses | 0.65% (4) | 0.66% | 0.69% | 0.72% | 0.70% |
| Net investment income | 0.22% | 0.19% | 0.26% | 0.37% | 0.38% |
| Portfolio Turnover | 7% | 13% | 16% | 13% | 18% |
| (1) | Computed using average shares outstanding. |
| (2) | Returns are historical and are calculated by determining the percentage change in net asset value with all distributions reinvested and do not reflect the effect of sales charges, if any. |
| (3) | Total expenses do not reflect amounts reimbursed and/or waived by the adviser and certain of its affiliates, if applicable. Net expenses are net of all reductions and represent the net expenses paid by the Fund. |
| (4) | Includes a reduction by the investment adviser of a portion of its advisory fee due to the Fund's investment in the Liquidity Fund (equal to less than 0.005% of average daily net assets for the year ended September 30, 2022). |
56
See Notes to Financial Statements.
Calvert
Social Investment Fund
September 30, 2022
Financial Highlights — continued
| | Equity Fund — Class R6 |
| | Year Ended September 30, | Period Ended
September 30, |
| | 2022 | 2021 | 2020 | 2019 | 2018 (1) |
| Net asset value — Beginning of period | $ 90.64 | $ 73.67 | $ 62.80 | $ 56.65 | $ 49.74 |
| Income (Loss) From Operations | | | | | |
| Net investment income(2) | $ 0.25 | $ 0.23 | $ 0.21 | $ 0.23 | $ 0.17 |
| Net realized and unrealized gain (loss) | (14.16) | 18.74 | 12.44 | 9.74 | 10.42 |
| Total income (loss) from operations | $ (13.91) | $ 18.97 | $ 12.65 | $ 9.97 | $10.59 |
| Less Distributions | | | | | |
| From net investment income | $ (0.17) | $ (0.19) | $ (0.21) | $ (0.18) | $ (0.25) |
| From net realized gain | (3.03) | (1.81) | (1.57) | (3.64) | (3.43) |
| Total distributions | $ (3.20) | $ (2.00) | $ (1.78) | $ (3.82) | $ (3.68) |
| Net asset value — End of period | $ 73.53 | $ 90.64 | $ 73.67 | $ 62.80 | $56.65 |
| Total Return(3) | (16.09)% | 26.28% | 20.65% | 19.12% | 22.30% (4) |
| Ratios/Supplemental Data | | | | | |
| Net assets, end of period (000’s omitted) | $446,224 | $456,674 | $248,096 | $58,035 | $ 843 |
| Ratios (as a percentage of average daily net assets):(5) | | | | | |
| Total expenses | 0.59% | 0.60% | 0.63% | 0.68% | 0.68% (6) |
| Net expenses | 0.59% (7) | 0.60% | 0.63% | 0.67% | 0.68% (6) |
| Net investment income | 0.29% | 0.27% | 0.32% | 0.37% | 0.31% (6) |
| Portfolio Turnover | 7% | 13% | 16% | 13% | 18% (8) |
| (1) | For the period from the commencement of operations, October 3, 2017, to September 30, 2018. |
| (2) | Computed using average shares outstanding. |
| (3) | Returns are historical and are calculated by determining the percentage change in net asset value with all distributions reinvested and do not reflect the effect of sales charges, if any. |
| (4) | Not annualized. |
| (5) | Total expenses do not reflect amounts reimbursed and/or waived by the adviser and certain of its affiliates, if applicable. Net expenses are net of all reductions and represent the net expenses paid by the Fund. |
| (6) | Annualized. |
| (7) | Includes a reduction by the investment adviser of a portion of its advisory fee due to the Fund's investment in the Liquidity Fund (equal to less than 0.005% of average daily net assets for the year ended September 30, 2022). |
| (8) | For the year ended September 30, 2018. |
57
See Notes to Financial Statements.
Calvert
Social Investment Fund
September 30, 2022
Notes to Financial Statements
1 Significant Accounting Policies
Calvert Balanced Fund (Balanced), Calvert Bond Fund (Bond) and Calvert Equity Fund (Equity) (each a Fund and collectively, the Funds) are diversified series of Calvert Social Investment Fund (the Trust). The Trust is a Massachusetts business trust registered under the Investment Company Act of 1940, as amended (the 1940 Act), as an open-end management investment company. The investment objective of Balanced is to seek to achieve a competitive total return through an actively managed portfolio of stocks, bonds, and money market instruments which offer income and capital growth opportunity. The investment objective of Bond is to seek to provide as high a level of current income as is consistent with preservation of capital through investment in bonds and other debt securities. The investment objective of Equity is to seek growth of capital through investment in stocks believed to offer opportunities for potential capital appreciation.
Each Fund offers four classes of shares. Class A shares are generally sold subject to a sales charge imposed at time of purchase. A contingent deferred sales charge of 1.00% for Balanced and Equity and 0.75% for Bond (0.80% for each prior to April 29, 2022) may apply to certain redemptions of Class A shares for accounts for which no sales charge was paid, if redeemed within 12 months of purchase. Class C shares are sold without a front-end sales charge, and with certain exceptions, are charged a contingent deferred sales charge of 1% on shares redeemed within 12 months of purchase. Class C shares are only available for purchase through a financial intermediary. Effective November 5, 2020, Class C shares automatically convert to Class A shares eight years after their purchase as described in the Funds’ prospectus. Class I and Class R6 shares are sold at net asset value, are not subject to a sales charge and are sold only to certain eligible investors. Each class represents a pro rata interest in each Fund, but votes separately on class-specific matters and is subject to different expenses.
Each Fund applies the accounting and reporting guidance in the Financial Accounting Standards Board (FASB) Accounting Standards Codification Topic 946, Financial Services – Investment Companies (ASC 946). Subsequent events, if any, through the date that the financial statements were issued have been evaluated in the preparation of the financial statements.
A Investment Valuation— Net asset value per share is determined every business day as of the close of the regular session of the New York Stock Exchange (generally 4:00 p.m. Eastern time). The Funds use independent pricing services approved by the Board of Trustees (the Board) to value their investments wherever possible. Investments for which market quotations are not available or deemed not reliable are fair valued in good faith under the direction of the Board.
U.S. generally accepted accounting principles (U.S. GAAP) establishes a disclosure hierarchy that categorizes the inputs to valuation techniques used to value assets and liabilities at measurement date. These inputs are summarized in the three broad levels listed below:
Level 1 – quoted prices in active markets for identical securities
Level 2 – other significant observable inputs (including quoted prices for similar securities, interest rates, prepayment speeds, credit risk, etc.)
Level 3 – significant unobservable inputs (including each Fund's own assumptions in determining the fair value of investments)
The inputs or methodologies used for valuing securities are not necessarily an indication of the risk associated with investing in those securities.
Valuation techniques used to value each Fund's investments by major category are as follows:
Equity Securities. Equity securities (including warrants and rights) listed on a U.S. securities exchange generally are valued at the last sale or closing price as reported by an independent pricing service on the primary market or exchange on which they are traded and are categorized as Level 1 in the hierarchy. Equity securities listed on the NASDAQ National Market System are valued at the NASDAQ official closing price and are categorized as Level 1 in the hierarchy. Unlisted or listed securities for which closing sales prices or closing quotations are not available are valued at the mean between the latest available bid and ask prices and are categorized as Level 2 in the hierarchy.
Debt Securities. Debt securities are generally valued based on valuations provided by third party pricing services, as derived from such services’ pricing models. Inputs to the models may include, but are not limited to, reported trades, executable bid and ask prices, broker/dealer quotations, prices or yields of securities with similar characteristics, interest rates, anticipated prepayments, benchmark curves or information pertaining to the issuer, as well as industry and economic events. Accordingly, debt securities are generally categorized as Level 2 in the hierarchy. Short-term debt securities with a remaining maturity at time of purchase of more than sixty days are valued based on valuations provided by a third party pricing service. Such securities are generally categorized as Level 2 in the hierarchy. Short-term debt securities of sufficient credit quality purchased with remaining maturities of sixty days or less for which a valuation from a third party pricing service is not readily available may be valued at amortized cost, which approximates fair value, and are categorized as Level 2 in the hierarchy.
Senior Floating-Rate Loans. Interests in senior floating-rate loans for which reliable market quotations are readily available are valued generally at the average mean of bid and ask quotations obtained from a third party pricing service, and are categorized as Level 2 in the hierarchy.
Venture Capital Securities. Venture capital securities for which market quotations are not readily available are generally categorized as Level 3 in the hierarchy. Venture capital equity securities are generally valued using the most appropriate and applicable method to measure fair value in light of each company’s situation. Methods may include market, income, options-pricing or cost approaches with discounts as appropriate based on assumptions of liquidation or exit risk. Examples of the market approach are subsequent rounds of financing, comparable transactions, and revenue times an industry
Calvert
Social Investment Fund
September 30, 2022
Notes to Financial Statements — continued
multiple. An example of the income approach is the discounted cash flow model. Examples of the cost approach are replacement cost, salvage value, or net asset value. The options-pricing method treats common stock and preferred stock as call options on the enterprise value with strike price based on the preferred stock liquidation preference. Venture capital limited partnership interests are valued at the fair value reported by the general partner of the partnership, adjusted as necessary to reflect subsequent capital calls and distributions and any other available information. In some cases, adjustments may be made to account for daily pricing of material public holdings within the partnership.
Other Securities. Investments in management investment companies (including money market funds) that do not trade on an exchange are valued at the net asset value as of the close of each business day and are categorized as Level 1 in the hierarchy.
Derivatives. Futures contracts are valued at unrealized appreciation (depreciation) based on the settlement price established each day by the board of trade or exchange on which they are traded and are categorized as Level 1 in the hierarchy. Forward foreign currency exchange contracts are generally valued at the mean of the average bid and average ask prices that are reported by currency dealers to a third party pricing service at the valuation time. Such third party pricing service valuations are supplied for specific settlement periods and the Funds' forward foreign currency exchange contracts are valued at an interpolated rate between the closest preceding and subsequent settlement period reported by the third party pricing service and are categorized as Level 2 in the hierarchy. Swaps are normally valued using valuations provided by a third party pricing service. Such pricing service valuations are based on the present value of fixed and projected floating rate cash flows over the term of the swap contract, and in the case of credit default swaps, based on credit spread quotations obtained from broker/dealers and expected default recovery rates determined by the pricing service using proprietary models. Future cash flows on swaps are discounted to their present value using swap rates provided by electronic data services or by broker/dealers. Swaps are categorized as Level 2 in the hierarchy.
Fair Valuation. In connection with Rule 2a-5 of the 1940 Act, which became effective September 8, 2022, the Board has designated a Fund’s investment adviser as its valuation designee. Investments for which valuations or market quotations are not readily available or are deemed unreliable are valued by the investment adviser, as valuation designee, at fair value using methods that most fairly reflect the security’s “fair value”, which is the amount that a Fund might reasonably expect to receive for the security upon its current sale in the ordinary course. Each such determination is based on a consideration of relevant factors, which are likely to vary from one pricing context to another. These factors may include, but are not limited to, the type of security, the existence of any contractual restrictions on the security’s disposition, the price and extent of public trading in similar securities of the issuer or of comparable companies or entities, quotations or relevant information obtained from broker/dealers or other market participants, information obtained from the issuer, analysts, and/or the appropriate stock exchange (for exchange-traded securities), an analysis of the company’s or entity’s financial statements, and an evaluation of the forces that influence the issuer and the market(s) in which the security is purchased and sold.
The values assigned to fair value investments are based on available information and do not necessarily represent amounts that might ultimately be realized. Further, due to the inherent uncertainty of valuations of such investments, the fair values may differ significantly from the values that would have been used had an active market existed, and the differences could be material.
The following tables summarize the market value of each of the Funds' holdings as of September 30, 2022, based on the inputs used to value them:
Balanced
| Asset Description | Level 1 | Level 2 | Level 3(1) | Total |
| Asset-Backed Securities | $ — | $ 68,851,044 | $ — | $ 68,851,044 |
| Collateralized Mortgage Obligations | — | 14,103,805 | — | 14,103,805 |
| Commercial Mortgage-Backed Securities | — | 44,643,638 | — | 44,643,638 |
| Common Stocks | 556,039,420 (2) | — | — | 556,039,420 |
| Common Stocks - Venture Capital | — | — | 2,124,774 | 2,124,774 |
| Corporate Bonds | — | 162,041,613 | — | 162,041,613 |
| High Social Impact Investments | — | 2,321,900 | — | 2,321,900 |
| Preferred Stocks | 2,630,252 | — | — | 2,630,252 |
| Preferred Stocks - Venture Capital | — | — | 33,192 | 33,192 |
| Senior Floating-Rate Loans | — | 3,936,540 | — | 3,936,540 |
| Sovereign Government Bonds | — | 4,165,445 | — | 4,165,445 |
| Taxable Municipal Obligations | — | 12,578,648 | — | 12,578,648 |
| U.S. Government Agencies and Instrumentalities | — | 3,650,369 | — | 3,650,369 |
| U.S. Government Agency Mortgage-Backed Securities | — | 45,416,374 | — | 45,416,374 |
| U.S. Treasury Obligations | — | 93,533,868 | — | 93,533,868 |
| Venture Capital Limited Partnership Interests | — | — | 408,968 | 408,968 |
Calvert
Social Investment Fund
September 30, 2022
Notes to Financial Statements — continued
Balanced — continued
| Asset Description (continued) | Level 1 | Level 2 | Level 3(1) | Total |
| Short-Term Investments: | | | | |
| Affiliated Fund | $ 24,252,378 | $ — | $ — | $ 24,252,378 |
| Securities Lending Collateral | 6,219,201 | — | — | 6,219,201 |
| Total Investments | $589,141,251 | $455,243,244 | $2,566,934 | $1,046,951,429 |
| Forward Foreign Currency Exchange Contracts | $ — | $ 2,894 | $ — | $ 2,894 |
| Futures Contracts | 1,257,327 | — | — | 1,257,327 |
| Total | $590,398,578 | $455,246,138 | $2,566,934 | $1,048,211,650 |
| Liability Description | | | | |
| Futures Contracts | $ (1,461,035) | $ — | $ — | $ (1,461,035) |
| Total | $ (1,461,035) | $ — | $ — | $ (1,461,035) |
| (1) | None of the unobservable inputs for Level 3 assets, individually or collectively, had a material impact on the Fund. |
| (2) | The level classification by major category of investments is the same as the category presentation in the Schedule of Investments. |
Bond
| Asset Description | Level 1 | Level 2 | Level 3 | Total |
| Asset-Backed Securities | $ — | $ 426,675,416 | $ — | $ 426,675,416 |
| Collateralized Mortgage Obligations | — | 167,294,482 | — | 167,294,482 |
| Commercial Mortgage-Backed Securities | — | 246,201,843 | — | 246,201,843 |
| Corporate Bonds | — | 938,902,447 | — | 938,902,447 |
| High Social Impact Investments | — | 4,643,800 | — | 4,643,800 |
| Preferred Stocks | 13,557,608 | — | — | 13,557,608 |
| Senior Floating-Rate Loans | — | 52,700,818 | — | 52,700,818 |
| Sovereign Government Bonds | — | 37,440,958 | — | 37,440,958 |
| Taxable Municipal Obligations | — | 66,859,480 | — | 66,859,480 |
| U.S. Government Agencies and Instrumentalities | — | 23,615,200 | — | 23,615,200 |
| U.S. Government Agency Mortgage-Backed Securities | — | 253,460,030 | — | 253,460,030 |
| U.S. Treasury Obligations | — | 368,775,331 | — | 368,775,331 |
| Short-Term Investments: | | | | |
| Affiliated Fund | 51,806,940 | — | — | 51,806,940 |
| Securities Lending Collateral | 52,438,085 | — | — | 52,438,085 |
| Total Investments | $117,802,633 | $2,586,569,805 | $ — | $2,704,372,438 |
| Forward Foreign Currency Exchange Contracts | $ — | $ 248,895 | $ — | $ 248,895 |
| Futures Contracts | 899,899 | — | — | 899,899 |
| Swap Contracts | — | 296,104 | — | 296,104 |
| Total | $118,702,532 | $2,587,114,804 | $ — | $2,705,817,336 |
| Liability Description | | | | |
| Futures Contracts | $ (9,737,826) | $ — | $ — | $ (9,737,826) |
| Total | $ (9,737,826) | $ — | $ — | $ (9,737,826) |
Calvert
Social Investment Fund
September 30, 2022
Notes to Financial Statements — continued
Equity
| Asset Description | Level 1 | Level 2 | Level 3(1) | Total |
| Common Stocks | $ 4,986,119,137(2) | $ — | $ — | $ 4,986,119,137 |
| Common Stocks - Venture Capital | — | — | 250,561 | 250,561 |
| High Social Impact Investments | — | 7,402,217 | — | 7,402,217 |
| Preferred Stocks - Venture Capital | — | — | 499,544 | 499,544 |
| Venture Capital Limited Partnership Interests | — | — | 16,525,116 | 16,525,116 |
| Short-Term Investments | 233,925,238 | — | — | 233,925,238 |
| Total Investments | $5,220,044,375 | $7,402,217 | $17,275,221 | $5,244,721,813 |
| (1) | None of the unobservable inputs for Level 3 assets, individually or collectively, had a material impact on the Fund. |
| (2) | The level classification by major category of investments is the same as the category presentation in the Schedule of Investments. |
For Balanced and Equity, Level 3 investments at the beginning and/or end of the period in relation to net assets were not significant and accordingly, a reconciliation of Level 3 assets for the year ended September 30, 2022 is not presented.
B Investment Transactions and Income— Investment transactions for financial statement purposes are accounted for on trade date. Realized gains and losses are recorded on an identified cost basis and may include proceeds from litigation. Dividend income is recorded on the ex-dividend date for dividends received in cash and/or securities or, in the case of dividends on certain foreign securities, as soon as the Fund is informed of the ex-dividend date. Non-cash dividends are recorded at the fair value of the securities received. Withholding taxes on foreign dividends and interest, if any, have been provided for in accordance with the Funds' understanding of the applicable country’s tax rules and rates. Distributions received that represent a return of capital are recorded as a reduction of cost of investments. Distributions received that represent a capital gain are recorded as a realized gain. Interest income, which includes amortization of premium and accretion of discount on debt securities, is accrued as earned. The Funds may earn certain fees in connection with their investments in senior floating-rate loans. These fees are in addition to interest payments earned and may include amendment fees, consent fees and prepayment fees, which are recorded to income as earned. Inflation adjustments to the principal amount of inflation-adjusted bonds and notes are reflected as interest income. Deflation adjustments to the principal amount of an inflation-adjusted bond or note are reflected as reductions to interest income to the extent of interest income previously recorded on such bond or note.
C Share Class Accounting— Realized and unrealized gains and losses and net investment income and losses (except for Bond), other than class-specific expenses, are allocated daily to each class of shares based upon the relative net assets of each class to the total net assets of each Fund. For Bond, net investment income and losses, other than class-specific expenses, is allocated daily to each class of shares based upon the ratio of the value of each class’s paid shares to the total value of all paid shares. Expenses arising in connection with a specific class are charged directly to that class. Sub-accounting, recordkeeping and similar administrative fees payable to financial intermediaries, which are a component of transfer agency fees and expenses on the Statements of Operations, are not allocated to Class R6 shares.
D Foreign Currency Transactions— The Funds’ accounting records are maintained in U.S. dollars. For valuation of assets and liabilities on each date of net asset value determination, foreign denominations are converted into U.S. dollars using the current exchange rate. Security transactions, income and expenses are translated at the prevailing rate of exchange on the date of the event. Recognized gains or losses on investment transactions attributable to changes in foreign currency exchange rates are recorded for financial statement purposes as net realized gains and losses on investments. That portion of unrealized gains and losses on investments that results from fluctuations in foreign currency exchange rates is not separately disclosed.
E Senior Floating-Rate Loans— The Funds may invest in direct debt instruments, which are interests in amounts owed to lenders or lending syndicates by corporate, governmental, or other borrowers. The Funds’ investments in loans may be in the form of participations in loans or assignments of all or a portion of loans from third parties. A loan is often administered by a bank or other financial institution (the lender) that acts as agent for all holders. The agent administers the terms of the loan, as specified in the loan agreement. The Funds may invest in multiple series or tranches of a loan, which may have varying terms and carry different associated risks. When the Funds purchase assignments from lenders, they acquire direct rights against the borrower of the loan. When investing in a loan participation, the Funds have the right to receive payments of principal, interest and any fees to which they are entitled only from the lender selling the loan agreement and only upon receipt of such payments by the lender from the borrower. The Funds generally have no right to enforce compliance by the borrower with the terms of the loan agreement. As a result, the Funds may be subject to the credit risk of both the borrower and the lender that is issuing the participation interest.
F Unfunded Loan Commitments— The Funds may enter into certain loan agreements all or a portion of which may be unfunded. Each Fund is obligated to fund these commitments at the borrower's discretion. These commitments, if any, are disclosed in the accompanying Schedules of Investments.
G Futures Contracts— The Funds may enter into futures contracts to buy or sell a financial instrument for a set price at a future date. Initial margin deposits of either cash or securities as required by the broker are made upon entering into the contract. While the contract is open, daily variation margin
Calvert
Social Investment Fund
September 30, 2022
Notes to Financial Statements — continued
payments are made to or received from the broker reflecting the daily change in market value of the contract and are recorded for financial reporting purposes as unrealized gains or losses by the Funds. When a futures contract is closed, a realized gain or loss is recorded equal to the difference between the opening and closing value of the contract. The risks associated with entering into futures contracts may include the possible illiquidity of the secondary market which would limit the Funds' ability to close out a futures contract prior to the settlement date, an imperfect correlation between the value of the contracts and the underlying financial instruments, or that the counterparty will fail to perform its obligations under the contracts’ terms. Futures contracts are designed by boards of trade, which are designated “contracts markets” by the Commodities Futures Trading Commission. Futures contracts trade on the contracts markets in a manner that is similar to the way a stock trades on a stock exchange, and the boards of trade, through their clearing corporations, guarantee the futures contracts against default. As a result, there is minimal counterparty credit risk to the Funds.
H Forward Foreign Currency Exchange Contracts— The Funds may enter into forward foreign currency exchange contracts for the purchase or sale of a specific foreign currency at a fixed price on a future date. The forward foreign currency exchange contracts are adjusted by the daily exchange rate of the underlying currency and any gains or losses are recorded as unrealized until such time as the contracts have been closed. Risks may arise upon entering these contracts from the potential inability of counterparties to meet the terms of their contracts and from movements in the value of a foreign currency relative to the U.S. dollar.
I Credit Default Swaps— Swap contracts are privately negotiated agreements between a Fund and a counterparty. Certain swap contracts may be centrally cleared (“centrally cleared swaps”), whereby all payments made or received by the Fund pursuant to the contract are with a central clearing party (CCP) rather than the original counterparty. The CCP guarantees the performance of the original parties to the contract. Upon entering into centrally cleared swaps, the Fund is required to deposit with the CCP, either in cash or securities, an amount of initial margin determined by the CCP, which is subject to adjustment. When the Fund is the buyer of a credit default swap contract, the Fund is entitled to receive the par (or other agreed-upon) value of a referenced debt obligation (or basket of debt obligations) from the counterparty (or CCP in the case of a centrally cleared swap) to the contract if a credit event by a third party, such as a U.S. or foreign corporate issuer or sovereign issuer, on the debt obligation occurs. In return, the Fund pays the counterparty a periodic stream of payments over the term of the contract provided that no credit event has occurred. If no credit event occurs, the Fund would have spent the stream of payments and received no proceeds from the contract. When the Fund is the seller of a credit default swap contract, it receives the stream of payments, but is obligated to pay to the buyer of the protection an amount up to the notional amount of the swap and in certain instances take delivery of securities of the reference entity upon the occurrence of a credit event, as defined under the terms of that particular swap agreement. Credit events are contract specific but may include bankruptcy, failure to pay, restructuring, obligation acceleration and repudiation/ moratorium. If the Fund is a seller of protection and a credit event occurs, the maximum potential amount of future payments that the Fund could be required to make would be an amount equal to the notional amount of the agreement. This potential amount would be partially offset by any recovery value of the respective referenced obligation, or net amount received from the settlement of a buy protection credit default swap agreement entered into by the Fund for the same referenced obligation. As the seller, the Fund may create economic leverage to its portfolio because, in addition to its total net assets, the Fund is subject to investment exposure on the notional amount of the swap. The interest fee paid or received on the swap contract, which is based on a specified interest rate on a fixed notional amount, is accrued daily as a component of unrealized appreciation (depreciation) and is recorded as realized gain upon receipt or realized loss upon payment. The Fund also records an increase or decrease to unrealized appreciation (depreciation) in an amount equal to the daily valuation. For centrally cleared swaps, the daily change in valuation is recorded as a receivable or payable for variation margin and settled in cash with the CCP daily. All upfront payments and receipts, if any, are amortized over the life of the swap contract as realized gains or losses. Those upfront payments or receipts for non-centrally cleared swaps are recorded as other assets or other liabilities, respectively, net of amortization. For financial reporting purposes, unamortized upfront payments or receipts, if any, are netted with unrealized appreciation or depreciation on swap contracts to determine the market value of swaps as presented in Notes 1A and 5. These transactions involve certain risks, including the risk that the seller may be unable to fulfill the transaction. In the case of centrally cleared swaps, counterparty risk is minimal due to protections provided by the CCP.
J Options Contracts— Upon the purchase of a call or put option, the premium paid by the Funds is included in the Statements of Assets and Liabilities as an investment. The amount of the investment is subsequently marked-to-market to reflect the current market value of the option purchased, in accordance with the Funds' policies on investment valuations discussed above. Premiums paid for purchasing options that expire are treated as realized losses. Premiums paid for purchasing options that are exercised or closed are added to the amounts paid or offset against the proceeds on the underlying investment transaction to determine the realized gain or loss. As the purchaser of an index option, the Funds have the right to receive a cash payment equal to any depreciation in the value of the index below the exercise price of the option (in the case of a put) or equal to any appreciation in the value of the index over the exercise price of the option (in the case of a call) as of the valuation date of the option. The risk associated with purchasing options is limited to the premium originally paid. Purchased options traded over-the-counter involve risk that the issuer or counterparty will fail to perform its contractual obligations.
K Restricted Securities— The Funds may invest in securities that are subject to legal or contractual restrictions on resale. Generally, these securities may only be sold publicly upon registration under the Securities Act of 1933 or in transactions exempt from such registration. Information regarding restricted securities (excluding Rule 144A securities) is included at the end of each Fund's Schedule of Investments.
L Distributions to Shareholders— Distributions to shareholders are recorded by the Funds on ex-dividend date. Distributions from net investment income are declared daily and paid monthly by Bond, quarterly by Balanced and annually by Equity. Distributions from net realized capital gains, if any, are paid at least annually. Distributions are declared separately for each class of shares. Distributions are determined in accordance with income tax regulations, which
Calvert
Social Investment Fund
September 30, 2022
Notes to Financial Statements — continued
may differ from U.S. GAAP; accordingly, periodic reclassifications are made within the Funds’ capital accounts to reflect income and gains available for distribution under income tax regulations.
M Estimates— The preparation of financial statements in conformity with U.S. GAAP requires management to make estimates and assumptions that affect the reported amounts of assets and liabilities and disclosure of contingent assets and liabilities at the date of the financial statements and the reported amounts of increases and decreases in net assets from operations during the reporting period. Actual results could differ from those estimates.
N Indemnifications— Under the Trust’s organizational document, its officers and Trustees may be indemnified against certain liabilities and expenses arising out of the performance of their duties to the Funds. Under Massachusetts law, if certain conditions prevail, shareholders of a Massachusetts business trust (such as the Trust) could be deemed to have personal liability for the obligations of the Trust. However, the Trust’s Declaration of Trust contains an express disclaimer of liability on the part of Fund shareholders and provides that the Trust shall assume, upon request by the shareholder, the defense on behalf of any Fund shareholders or former shareholders. Additionally, in the normal course of business, each Fund enters into agreements with service providers that may contain indemnification clauses. Each Fund’s maximum exposure under these arrangements is unknown as this would involve future claims that may be made against each Fund that have not yet occurred.
O Federal Income Taxes— No provision for federal income or excise tax is required since each Fund intends to continue to qualify as a regulated investment company under the Internal Revenue Code and to distribute substantially all of its taxable earnings.
Management has analyzed the Funds' tax positions taken for all open federal income tax years and has concluded that no provision for federal income tax is required in the Funds' financial statements. Each Fund's federal tax return is subject to examination by the Internal Revenue Service for a period of three years from the date of filing.
P When-Issued Securities and Delayed Delivery Transactions— The Funds may purchase securities on a delayed delivery, when-issued or forward commitment basis, including TBA (To Be Announced) securities. Payment and delivery may take place after the customary settlement period for that security. At the time the transaction is negotiated, the price of the security that will be delivered is fixed. The Funds maintain cash and/or security positions for these commitments such that sufficient liquid assets will be available to make payments upon settlement. Securities purchased on a delayed delivery, when-issued or forward commitment basis are marked-to-market daily and begin earning interest on settlement date. Such security purchases are subject to the risk that when delivered they will be worth less than the agreed upon payment price. Losses may also arise if the counterparty does not perform under the contract. A forward purchase commitment may also be closed by entering into an offsetting commitment. If an offsetting commitment is entered into, the Funds will realize a gain or loss on investments based on the price established when the Funds entered into the commitment.
2 Related Party Transactions
The investment advisory fee is earned by Calvert Research and Management (CRM), an indirect, wholly-owned subsidiary of Morgan Stanley, as compensation for investment advisory services rendered to each Fund. The investment advisory fee is computed at the following annual rates of each respective Fund’s average daily net assets and is payable monthly:
Balanced
| Average Daily Net Assets | Annual Fee Rate |
| Up to and including $500 million | 0.410% |
| Over $500 million up to and including $1 billion | 0.385% |
| Over $1 billion | 0.350% |
Bond
| Average Daily Net Assets | Annual Fee Rate |
| Up to and including $1 billion | 0.300% |
| Over $1 billion | 0.290% |
Calvert
Social Investment Fund
September 30, 2022
Notes to Financial Statements — continued
Equity
| Average Daily Net Assets | Annual Fee Rate |
| Up to and including $2 billion | 0.500% |
| Over $2 billion up to and including $3 billion | 0.425% |
| Over $3 billion | 0.375% |
For the year ended September 30, 2022, the investment advisory fee for Balanced, Bond and Equity amounted to $4,587,835, $7,447,599 and $25,232,159, respectively, or 0.39%, 0.29% and 0.43%, respectively, of each Fund's average daily net assets.
Effective April 26, 2022, each Fund may invest in a money market fund, the Institutional Class of the Morgan Stanley Institutional Liquidity Funds - Government Portfolio (the “Liquidity Fund”), an open-end management investment company managed by Morgan Stanley Investment Management Inc., a wholly-owned subsidiary of Morgan Stanley. The investment advisory fee paid by each Fund is reduced by an amount equal to its pro-rata share of the advisory and administration fees paid by each Fund due to its investment in the Liquidity Fund. For the year ended September 30, 2022, the investment advisory fee paid was reduced by $6,508, $30,687 and $135,626 for Balanced, Bond and Equity, respectively, relating to each Fund's investment in the Liquidity Fund. Prior to April 26, 2022, each Fund may have invested its cash in Calvert Cash Reserves Fund, LLC (Cash Reserves Fund), an affiliated investment company managed by CRM. CRM did not receive a fee for advisory services provided to Cash Reserves Fund.
Pursuant to an investment sub-advisory agreement, CRM has delegated the investment management of Equity to Atlanta Capital Management Company, LLC (Atlanta Capital), an affiliate of CRM and an indirect, wholly-owned subsidiary of Morgan Stanley. CRM pays Atlanta Capital a portion of its investment advisory fee for sub-advisory services provided to the Fund.
CRM has agreed to reimburse the Funds' operating expenses to the extent that total annual operating expenses (relating to ordinary operating expenses only and excluding expenses such as brokerage commissions, acquired fund fees and expenses of unaffiliated funds, borrowing costs, taxes or litigation expenses) exceed, as a percentage of such class’s average daily net assets, the following amounts:
| | Class A | Class C | Class I | Class R6 |
| Balanced | 0.93% | 1.68% | 0.68% | 0.64% |
| Bond | 0.73% | 1.53% | 0.53% | 0.46% |
| Equity | 0.99% | 1.74% | 0.74% | 0.67% |
The expense reimbursement agreements with CRM may be changed or terminated after January 31, 2023. For the year ended September 30, 2022, CRM waived or reimbursed expenses of $468,960 for Bond and no expenses for Balanced and Equity.
The administrative fee is earned by CRM as compensation for administrative services rendered to the Funds. The fee is computed at an annual rate of 0.12% of each Fund’s average daily net assets attributable to Class A, Class C, Class I and Class R6 and is payable monthly. For the year ended September 30, 2022, CRM was paid administrative fees of $1,410,115, $3,040,386 and $7,114,291 for Balanced, Bond and Equity, respectively.
Each Fund has in effect a distribution plan for Class A shares (Class A Plan) pursuant to Rule 12b-1 under the 1940 Act. Pursuant to the Class A Plan, each Fund pays Eaton Vance Distributors, Inc. (EVD), an affiliate of CRM and the Funds' principal underwriter, a distribution and service fee at a rate per annum of its average daily net assets attributable to Class A shares for distribution services and facilities provided to the Funds by EVD, as well as for personal services and/or the maintenance of shareholder accounts. Distribution and service fee rates for Class A shares are as follows:
| | Balanced | Bond | Equity |
| Class A Plan | 0% up to $30 million,
0.25% over $30 million | 0.20% | 0.25% |
Each Fund also has in effect a distribution plan for Class C shares (Class C Plan) pursuant to Rule 12b-1 under the 1940 Act. Pursuant to the Class C Plan, each Fund pays EVD amounts equal to 0.75% per annum of its average daily net assets attributable to Class C shares for providing ongoing distribution services and facilities to the Funds. In addition, pursuant to the Class C Plan, each Fund also makes payments of service fees to EVD, financial intermediaries and other persons in amounts equal to 0.25% per annum of its average daily net assets attributable to that class. Service fees paid or accrued are for personal services and/or the maintenance of shareholder accounts. Distribution and service fees for Balanced, Bond and Equity paid or accrued for the year ended September 30, 2022 amounted to $1,916,262, $696,303 and $5,441,386, respectively, for Class A shares and $631,867, $116,711 and $1,400,705, respectively, for Class C shares.
Calvert
Social Investment Fund
September 30, 2022
Notes to Financial Statements — continued
The Funds were informed that EVD received $153,556, $36,186 and $194,610 for Balanced, Bond and Equity, respectively, as their portion of the sales charge on sales of Class A shares for the year ended September 30, 2022. The Funds were also informed that EVD received $27,854, $4,167 and $14,328 for Balanced, Bond and Equity, respectively, of contingent deferred sales charges paid by each Fund's shareholders for the same period. The Funds were informed that Morgan Stanley affiliated broker-dealers, which may be deemed to be affiliates of CRM and EVD, also received a portion of the sales charge on sales of Class A shares for the year ended September 30, 2022 in the amount of $6,607, $4,828 and $35,540 for Balanced, Bond and Equity, respectively.
Eaton Vance Management (EVM), an affiliate of CRM, provides sub-transfer agency and related services to the Funds pursuant to a Sub-Transfer Agency Support Services Agreement. For the year ended September 30, 2022, sub-transfer agency fees and expenses incurred to EVM amounted to $152,470, $66,313 and $266,225 for Balanced, Bond and Equity, respectively, and are included in transfer agency fees and expenses on the Statements of Operations.
Each Trustee of the Funds who is not an employee of CRM or its affiliates receives an annual fee of $214,000 ($154,000 prior to January 1, 2022), plus an annual Committee fee ranging from $8,500 to $16,500 depending on the Committee. The Board chair receives an additional $30,000 annual fee, Committee chairs receive an additional $6,000 annual fee and the special equities liaison receives an additional $2,500 annual fee. Eligible Trustees may participate in a Deferred Compensation Plan (the Plan). Amounts deferred under the Plan are treated as though equal dollar amounts had been invested in shares of the Funds or other Calvert funds selected by the Trustees. The Funds purchase shares of the funds selected equal to the dollar amounts deferred under the Plan, resulting in an asset equal to the deferred compensation liability. Obligations of the Plan are paid solely from the Funds’ assets. Trustees’ fees are allocated to each of the Calvert funds served. Salaries and fees of officers and Trustees of the Funds who are employees of CRM or its affiliates are paid by CRM.
3 Investment Activity
During the year ended September 30, 2022, the cost of purchases and proceeds from sales of investments, other than short-term securities and including maturities, paydowns, principal repayments on senior floating-rate loans and TBA transactions, were as follows:
| | Balanced | Bond | Equity |
| Purchases | | | |
| U.S. Government and Agency Securities | $ 490,607,196 | $ 2,555,274,171 | $ — |
| Non-U.S. Government and Agency Securities | 510,902,354 | 1,086,601,928 | 552,288,609 |
| Total Purchases | $1,001,509,550 | $3,641,876,099 | $552,288,609 |
| Sales | | | |
| U.S. Government and Agency Securities | $ 453,432,977 | $ 2,306,048,624 | $ — |
| Non-U.S. Government and Agency Securities | 573,905,145 | 898,234,218 | 419,841,282 |
| Total Sales | $1,027,338,122 | $3,204,282,842 | $419,841,282 |
4 Distributions to Shareholders and Income Tax Information
The tax character of distributions declared for the years ended September 30, 2022 and September 30, 2021 was as follows:
| | Balanced | Bond | Equity |
| | Year Ended September 30, | Year Ended September 30, | Year Ended September 30, |
| | 2022 | 2021 | 2022 | 2021 | 2022 | 2021 |
| Ordinary income | $24,878,937 | $11,625,221 | $65,619,833 | $59,743,073 | $ 15,383,698 | $ 20,130,725 |
| Long-term capital gains | $70,126,785 | $12,646,493 | $26,045,148 | $11,885,164 | $207,084,030 | $127,925,587 |
During the year ended September 30, 2022, the following amounts were reclassified due to the Funds' use of equalization accounting. Tax equalization accounting allows a Fund to treat as a distribution that portion of redemption proceeds representing a redeeming shareholder’s portion of undistributed taxable income and net capital gains.
Calvert
Social Investment Fund
September 30, 2022
Notes to Financial Statements — continued
| | Balanced | Bond | Equity |
| Change in: | | | |
| Paid-in capital | $ 3,038,632 | $ 612,770 | $ 19,205,801 |
| Distributable earnings (accumulated loss) | $(3,038,632) | $(612,770) | $(19,205,801) |
These reclassifications had no effect on the net assets or net asset value per share of the Funds.
As of September 30, 2022, the components of distributable earnings (accumulated loss) on a tax basis were as follows:
| | Balanced | Bond | Equity |
| Undistributed ordinary income | $ 85,133 | $ — | $ 5,648,828 |
| Undistributed long-term capital gains | 9,966,083 | — | 168,937,986 |
| Deferred capital losses | — | (59,942,236) | — |
| Net unrealized appreciation (depreciation) | 34,382,579 | (342,259,935) | 1,772,332,902 |
| Distributions payable | — | (622,998) | — |
| Distributable earnings (accumulated loss) | $44,433,795 | $(402,825,169) | $1,946,919,716 |
At September 30, 2022, Bond Fund, for federal income tax purposes, had deferred capital losses of $59,942,236 which would reduce the Fund's taxable income arising from future net realized gains on investment transactions, if any, to the extent permitted by the Internal Revenue Code, and thus would reduce the amount of distributions to shareholders, which would otherwise be necessary to relieve the Fund of any liability for federal income or excise tax. The deferred capital losses are treated as arising on the first day of the Fund's next taxable year, can be carried forward for an unlimited period, and retain the same short-term or long-term character as when originally deferred. Of the deferred capital losses at September 30, 2022, $40,566,251 are short-term and $19,375,985 are long-term.
The cost and unrealized appreciation (depreciation) of investments, including open derivative contracts, of the Funds at September 30, 2022, as determined on a federal income tax basis, were as follows:
| | Balanced | Bond | Equity |
| Aggregate cost | $1,012,556,988 | $3,046,632,315 | $3,472,388,911 |
| Gross unrealized appreciation | $ 126,174,635 | $ 201,616 | $ 1,912,085,030 |
| Gross unrealized depreciation | (91,780,194) | (342,461,493) | (139,752,128) |
| Net unrealized appreciation (depreciation) | $ 34,394,441 | $ (342,259,877) | $1,772,332,902 |
5 Financial Instruments
The Funds may trade in financial instruments with off-balance sheet risk in the normal course of their investing activities. These financial instruments may include forward foreign currency exchange contracts, futures contracts and swap contracts and may involve, to a varying degree, elements of risk in excess of the amounts recognized for financial statement purposes. The notional or contractual amounts of these instruments represent the investment a Fund has in particular classes of financial instruments and do not necessarily represent the amounts potentially subject to risk. The measurement of the risks associated with these instruments is meaningful only when all related and offsetting transactions are considered. A summary of obligations under these financial instruments at September 30, 2022 is included in each Fund’s Schedule of Investments. At September 30, 2022, Balanced and Bond had sufficient cash and/or securities to cover commitments under these contracts. At September 30, 2022, there were no obligations outstanding under these financial instruments for Equity.
In the normal course of pursuing their investment objectives, Balanced and Bond are subject to the following risks:
Credit Risk: During the year ended September 30, 2022, Bond entered into credit default swap contracts to manage certain investment risks and/or to enhance total return or as a substitute for the purchase or sale of securities.
Calvert
Social Investment Fund
September 30, 2022
Notes to Financial Statements — continued
Foreign Exchange Risk: During the year ended September 30, 2022, Balanced and Bond entered into forward foreign currency exchange contracts to seek to hedge against fluctuations in currency exchange rates.
Interest Rate Risk: During the year ended September 30, 2022, Balanced and Bond entered into futures contracts and options thereon to hedge against fluctuations in interest rates and to manage overall duration.
Balanced and Bond enter into forward foreign currency exchange contracts that may contain provisions whereby the counterparty may terminate the contract under certain conditions, including but not limited to a decline in the Fund’s net assets below a certain level over a certain period of time, which would trigger a payment by the Fund for those derivatives in a liability position. At September 30, 2022, Balanced and Bond had no open derivatives with credit-related contingent features in a net liability position.
The over-the-counter (OTC) derivatives in which Balanced and Bond invest are subject to the risk that the counterparty to the contract fails to perform its obligations under the contract. To mitigate this risk, each Fund has entered into an International Swaps and Derivatives Association, Inc. Master Agreement (“ISDA Master Agreement”) with its derivative counterparty. The ISDA Master Agreement is a bilateral agreement between a Fund and the counterparty that governs certain OTC derivatives and typically contains, among other things, set-off provisions in the event of a default and/or termination event as defined under the ISDA Master Agreement. Under the ISDA Master Agreement, the Fund may, under certain circumstances, offset with the counterparty certain derivative financial instruments’ payables and/or receivables with collateral held and/or posted and create one single net payment. The provisions of the ISDA Master Agreement typically permit a single net payment in the event of default including the bankruptcy or insolvency of the counterparty. However, bankruptcy or insolvency laws of a particular jurisdiction may impose restrictions on or prohibitions against the right of offset in bankruptcy or insolvency. The ISDA Master Agreement allows the counterparty to OTC derivatives to terminate derivative contracts prior to maturity in the event the Fund’s net assets decline by a stated percentage or the Fund fails to meet the terms of its ISDA Master Agreement, which would cause the counterparty to accelerate payment by the Fund of any net liability owed to it.
The collateral requirements for derivatives traded under the ISDA Master Agreement are governed by a Credit Support Annex to the ISDA Master Agreement. Collateral requirements are determined at the close of business each day and are typically based on changes in market values for each transaction under the ISDA Master Agreement and netted into one amount for such agreement. Generally, the amount of collateral due from or to a counterparty is subject to a minimum transfer threshold amount before a transfer is required. Collateral pledged for the benefit of a Fund and/or counterparty is held in segregated accounts by the Fund’s custodian and cannot be sold, re-pledged, assigned or otherwise used while pledged. The portion of such collateral representing cash, if any, is reflected as deposits for derivatives collateral and, in the case of cash pledged by a counterparty for the benefit of the Fund, a corresponding liability on the Statements of Assets and Liabilities. Securities pledged by a Fund as collateral, if any, are identified as such in the Schedule of Investments.
At September 30, 2022, the fair value of open derivative instruments (not considered to be hedging instruments for accounting disclosure purposes) by risk exposure was as follows:
Balanced
| Risk | Derivative | Statements of Assets and Liabilities Caption | Assets | Liabilities |
| Foreign exchange | Forward foreign currency exchange contracts | Receivable/Payable for open forward foreign currency
exchange contracts | $ 2,894 | $ — |
| Interest rate | Futures contracts | Distributable earnings | 1,257,327 (1) | (1,461,035) (1) |
| Total | | | $1,260,221 | $(1,461,035) |
| Derivatives not subject to master netting agreements | $1,257,327 | $(1,461,035) |
| Total Derivatives subject to master netting agreements | $ 2,894 | $ — |
| (1) | Only the current day's variation margin is reported within the Statements of Assets and Liabilities as Receivable or Payable for variation margin on open futures contracts, as applicable. |
Calvert
Social Investment Fund
September 30, 2022
Notes to Financial Statements — continued
Bond
| Risk | Derivative | Statements of Assets and Liabilities Caption | Assets | Liabilities |
| Credit | Swap contracts (centrally cleared) | Accumulated loss | $ 296,104(1) | $ — |
| Foreign exchange | Forward foreign currency exchange contracts | Receivable/Payable for open forward foreign currency
exchange contracts | 248,895 | — |
| Interest rate | Futures contracts | Accumulated loss | 899,899 (1) | (9,737,826) (1) |
| Total | | | $1,444,898 | $(9,737,826) |
| Derivatives not subject to master netting agreements | $1,196,003 | $(9,737,826) |
| Total Derivatives subject to master netting agreements | $ 248,895 | $ — |
| (1) | Only the current day's variation margin is reported within the Statements of Assets and Liabilities as Receivable or Payable for variation margin on open futures contracts and centrally cleared swap contracts, as applicable. |
Balanced and Bond's derivative assets and liabilities at fair value by risk, which are reported gross in the Statements of Assets and Liabilities, are presented in the tables above. The following tables present each Fund's derivative assets by counterparty, net of amounts available for offset under a master netting agreement and net of the related collateral received by each Fund for such assets as of September 30, 2022.
Balanced
| Counterparty | Derivative
Assets Subject to
Master Netting
Agreement | Derivatives
Available
for Offset | Non-cash
Collateral
Received(a) | Cash
Collateral
Received(a) | Net Amount
of Derivative
Assets(b) |
| State Street Bank and Trust Company | $2,894 | $ — | $ — | $ — | $2,894 |
| (a) | In some instances, the total collateral received and/or pledged may be more than the amount shown due to overcollateralization. |
| (b) | Net amount represents the net amount due from the counterparty in the event of default. |
Bond
| Counterparty | Derivative
Assets Subject to
Master Netting
Agreement | Derivatives
Available
for Offset | Non-cash
Collateral
Received(a) | Cash
Collateral
Received(a) | Net Amount
of Derivative
Assets(b) |
| State Street Bank and Trust Company | $248,895 | $ — | $ — | $ — | $248,895 |
| (a) | In some instances, the total collateral received and/or pledged may be more than the amount shown due to overcollateralization. |
| (b) | Net amount represents the net amount due from the counterparty in the event of default. |
Calvert
Social Investment Fund
September 30, 2022
Notes to Financial Statements — continued
The effect of derivative instruments (not considered to be hedging instruments for accounting disclosure purposes) on the Statements of Operations by risk exposure for the year ended September 30, 2022 was as follows:
Balanced
| Statements of Operations Caption | Foreign exchange | Interest rate | Total |
| Net realized gain (loss): | | | |
| Investment securities(1) | $ — | $ (4,946) | $ (4,946) |
| Forward foreign currency exchange contracts | 5,099 | — | 5,099 |
| Futures contracts | — | 2,848,022 | 2,848,022 |
| Total | $5,099 | $2,843,076 | $2,848,175 |
| Change in unrealized appreciation (depreciation): | | | |
| Forward foreign currency exchange contracts | $ 2,894 | $ — | $ 2,894 |
| Futures contracts | — | (913,304) | (913,304) |
| Total | $2,894 | $ (913,304) | $ (910,410) |
| (1) | Relates to purchased options. |
Bond
| Statements of Operations Caption | Credit | Foreign exchange | Interest rate | Total |
| Net realized gain (loss): | | | | |
| Investment securities(1) | $ — | $ — | $ 498,205 | $ 498,205 |
| Forward foreign currency exchange contracts | — | 58,101 | — | 58,101 |
| Futures contracts | — | — | (6,079,488) | (6,079,488) |
| Swap contracts | 470,583 | — | — | 470,583 |
| Total | $470,583 | $ 58,101 | $ (5,581,283) | $ (5,052,599) |
| Change in unrealized appreciation (depreciation): | | | | |
| Forward foreign currency exchange contracts | $ — | $ 248,895 | $ — | $ 248,895 |
| Futures contracts | — | — | (12,416,620) | (12,416,620) |
| Swap contracts | (25,890) | — | — | (25,890) |
| Total | $ (25,890) | $248,895 | $(12,416,620) | $(12,193,615) |
| (1) | Relates to purchased options. |
Calvert
Social Investment Fund
September 30, 2022
Notes to Financial Statements — continued
The average notional cost of futures contracts and average notional amounts of other derivative contracts outstanding during the year ended September 30, 2022, which are indicative of the volume of these derivative types, were approximately as follows:
| | Balanced | Bond |
| Futures contracts — long | $61,420,000 | $376,213,000 |
| Futures contracts — short | $45,126,000 | $162,482,000 |
| Forward foreign currency exchange contracts* | $ 36,000 | $ 2,535,000 |
| Swap contracts | $ — | $ 1,148,000 |
| * | The average notional amount for forward foreign currency exchange contracts is based on the absolute value of notional amounts of currency purchased and currency sold. |
The average number of purchased options contracts outstanding during the year ended September 30, 2022, which is indicative of the volume of this derivative type, was approximately 11 contracts and 216 contracts for Balanced and Bond, respectively.
6 Securities Lending
To generate additional income, the Funds may lend their securities pursuant to a securities lending agency agreement with State Street Bank and Trust Company (SSBT), the securities lending agent. Security loans are subject to termination by the Funds at any time and, therefore, are not considered illiquid investments. The Funds require that the loan be continuously collateralized by either cash or securities in an amount at least equal to the market value of the securities on loan. The market value of securities loaned is determined daily and any additional required collateral is delivered to the Funds on the next business day. Cash collateral is generally invested in a money market fund registered under the 1940 Act that is managed by an affiliate of SSBT. Any gain or loss in the market price of the loaned securities that might occur and any interest earned or dividends declared during the term of the loan would accrue to the account of the Funds. Income earned on the investment of collateral, net of broker rebates and other expenses incurred by the securities lending agent, is split between the Funds and the securities lending agent based on agreed upon contractual terms. Non-cash collateral, if any, is held by the lending agent on behalf of a Fund and cannot be sold or re-pledged by the Fund; accordingly, such collateral is not reflected in the Statements of Assets and Liabilities.
The risks associated with lending portfolio securities include, but are not limited to, possible delays in receiving additional collateral or in the recovery of the loaned securities, possible loss of rights to the collateral should the borrower fail financially, as well as risk of loss in the value of the collateral or the value of the investments made with the collateral. The securities lending agent shall indemnify the Funds in the case of default of any securities borrower.
At September 30, 2022, the total value of securities on loan, including accrued interest, and the total value of collateral received were as follows:
| | Balanced | Bond |
| Securities on Loan | $ 6,106,270 | $ 51,072,060 |
| Collateral Received: | | |
| Cash | 6,219,201 | 52,438,085 |
| U.S. government and/or agencies securities | 91,900 | 308,933 |
| Total Collateral Received | $6,311,101 | $52,747,018 |
Equity did not have any securities on loan at September 30, 2022.
Calvert
Social Investment Fund
September 30, 2022
Notes to Financial Statements — continued
The following tables provide a breakdown of securities lending transactions accounted for as secured borrowings, the obligations by class of collateral pledged, and the remaining contractual maturity of those transactions as of September 30, 2022.
| Balanced | Remaining Contractual Maturity of the Transactions |
| | Overnight and
Continuous | <30 days | 30 to 90 days | >90 days | Total |
| Common Stocks | $ 2,980 | $ — | $ — | $ — | $ 2,980 |
| Corporate Bonds | 1,847,162 | — | — | — | 1,847,162 |
| U.S. Treasury Obligations | 4,369,059 | — | — | — | 4,369,059 |
| Total | $6,219,201 | $ — | $ — | $ — | $6,219,201 |
| Bond | Remaining Contractual Maturity of the Transactions |
| | Overnight and
Continuous | <30 days | 30 to 90 days | >90 days | Total |
| Corporate Bonds | $ 17,280,898 | $ — | $ — | $ — | $ 17,280,898 |
| U.S. Treasury Obligations | 35,157,187 | — | — | — | 35,157,187 |
| Total | $52,438,085 | $ — | $ — | $ — | $52,438,085 |
The carrying amounts of the liabilities for deposits for securities loaned at September 30, 2022 approximated their fair value. If measured at fair value, such liabilities would have been considered as Level 2 in the fair value hierarchy (see Note 1A) at September 30, 2022.
7 Line of Credit
The Funds participate with other portfolios and funds managed by EVM and its affiliates, including CRM, in an $800 million unsecured line of credit with a group of banks, which is in effect through October 25, 2022. Borrowings are made by the Funds solely for temporary purposes related to redemptions and other short-term cash needs. Interest is charged to each Fund based on its borrowings at an amount above either the Secured Overnight Financing Rate (SOFR) or Federal Funds rate. In addition, a fee computed at an annual rate of 0.15% on the daily unused portion of the line of credit is allocated among the participating portfolios and funds at the end of each quarter. In connection with the renewal of the agreement in October 2021, an arrangement fee of $150,000 was incurred that was allocated to the participating portfolios and funds. Because the line of credit is not available exclusively to the Funds, a Fund may be unable to borrow some or all of its requested amounts at any particular time.
Balanced and Equity had no borrowings pursuant to their line of credit during the year ended September 30, 2022. Bond had no borrowings outstanding pursuant to its line of credit at September 30, 2022. Bond did not have any significant borrowings or allocated fees during the year ended September 30, 2022. Effective October 25, 2022, the Funds renewed their line of credit agreement, which expires October 24, 2023. In connection with the renewal, the borrowing limit was decreased to $725 million.
8 Affiliated Companies/Issuers and Funds
Each Fund has invested a portion of its assets in notes (the Notes) issued by Calvert Impact Capital, Inc. (CIC), pursuant to exemptive relief granted by the U.S. Securities and Exchange Commission (the SEC). There are certain potential points of affiliation between the Funds and CIC. CRM has licensed use of the Calvert name to CIC and provides other types of support. CRM’s President and Chief Executive Officer (and the only director/trustee on the Fund Board that is an “interested person” of the Funds) serves on the CIC Board. In addition, another director/trustee on the Fund Board serves as a director emeritus on the CIC Board.
In addition to the Notes, Balanced and Bond invested in issuers that may be deemed to be affiliated with Morgan Stanley. Also, a Fund may invest in companies that are considered affiliated companies because the Fund has a direct or indirect ownership of, control of, or voting power of 5 percent or more of the outstanding voting shares of the company, or the company is under common ownership or control with the Fund. At September 30, 2022, the value of each Fund’s investment in the Notes and affiliated companies/issuers and funds was $31,011,639, $90,654,093 and $241,327,455 for Balanced, Bond and Equity, respectively, which represents 3.1%, 3.7% and 4.6% of net assets for Balanced, Bond and Equity, respectively. Transactions in the Notes and affiliated companies/issuers and funds by the Funds for the year ended September 30, 2022 were as follows:
Calvert
Social Investment Fund
September 30, 2022
Notes to Financial Statements — continued
Balanced
| Name | Value,
beginning
of period | Purchases | Sales
proceeds | Net
realized
gain
(loss) | Change in
unrealized
appreciation
(depreciation) | Value,
end of
period | Interest/
Dividend
income | Principal amount/
Units/Shares,
end of period |
| Commercial Mortgage-Backed Securities | | | | | | | | |
| Morgan Stanley Capital I Trust: | | | | | | | | |
| Series 2017-CLS, Class A, 3.518%, (1 mo. USD LIBOR + 0.70%), 11/15/34 | $ 1,909,605 | $ — | $ — | $ — | $ (11,568) | $ 1,897,739 | $ 28,928 | $ 1,909,000 |
| Series 2017-CLS, Class E, 4.768%, (1 mo. USD LIBOR + 1.95%), 11/15/34 | — | 224,824 | — | — | (1,905) | 222,921 | 5,456 | 225,000 |
| Series 2017-CLS, Class F, 5.418%, (1 mo. USD LIBOR + 2.60%), 11/15/34 | 412,531 | 214,902 | — | — | (9,578) | 617,087 | 18,210 | 629,000 |
| Series 2019-BPR, Class A, 4.468%, (1 mo. USD LIBOR + 1.65%), 5/15/36 | 1,304,268 | — | (162,026) | (37) | (16,739) | 1,124,891 | 27,321 | 1,152,974 |
| Series 2019-BPR, Class B, 5.168%, (1 mo. USD LIBOR + 2.10%), 5/15/36 | 366,588 | — | — | — | 5,480 | 372,310 | 11,675 | 386,000 |
| Series 2019-BPR, Class C, 6.118%, (1 mo. USD LIBOR + 3.05%), 5/15/36 | 184,857 | — | — | — | 9,995 | 194,852 | 8,046 | 205,000 |
| High Social Impact Investments | | | | | | | | |
| Calvert Impact Capital, Inc., Community Investment Notes, 1.50%, 12/15/23(1) | 2,457,075 | — | — | — | (135,175) | 2,321,900 | 37,500 | 2,500,000 |
| Venture Capital Limited Partnership Interests | | | | | | | | |
| GEEMF Partners, L.P.(1)(2)(3) | 10,721 | — | — | — | (3,160) | 7,561 | — | — |
| Short-Term Investments | | | | | | |
| Cash Reserves Fund | 17,702,327 | 217,089,693 | (234,791,342) | 1,020 | (1,698) | — | 7,883 | — |
| Liquidity Fund | — | 158,903,468 | (134,651,090) | — | — | 24,252,378 | 110,432 | 24,252,378 |
| Total | | | | $ 983 | $ (164,348) | $ 31,011,639 | $ 255,451 | |
| (1) | Restricted security. |
| (2) | For fair value measurement disclosure purposes, security is categorized as Level 3 (see Note 1A). |
| (3) | Non-income producing security. |
Bond
| Name | Value,
beginning
of period | Purchases | Sales
proceeds | Net
realized
gain
(loss) | Change in
unrealized
appreciation
(depreciation) | Value,
end of
period | Interest/
Dividend
income | Principal amount/
Units/Shares,
end of period |
| Commercial Mortgage-Backed Securities | | | | | | | | |
| Morgan Stanley Capital I Trust: | | | | | | | | |
| Series 2017-CLS, Class A, 3.518%, (1 mo. USD LIBOR + 0.70%), 11/15/34 | $ 17,033,394 | $ 5,429,406 | $ — | $ — | $ (115,095) | $ 22,340,439 | $ 319,713 | $ 22,473,000 |
| Series 2017-CLS, Class B, 3.668%, (1 mo. USD LIBOR + 0.85%), 11/15/34 | — | 3,999,375 | — | — | (25,263) | 3,974,132 | 62,235 | 4,000,000 |
Calvert
Social Investment Fund
September 30, 2022
Notes to Financial Statements — continued
Bond — continued
| Name | Value,
beginning
of period | Purchases | Sales
proceeds | Net
realized
gain
(loss) | Change in
unrealized
appreciation
(depreciation) | Value,
end of
period | Interest/
Dividend
income | Principal amount/
Units/Shares,
end of period |
| Series 2019-BPR, Class A, 4.468%, (1 mo. USD LIBOR+ 1.65%), 5/15/36 | $ 8,136,055 | $ 973,145 | $ (1,136,274) | $ — | $ (88,673) | $ 7,888,782 | $ 183,875 | $ 8,085,726 |
| High Social Impact Investments | | | | | | | | |
| Calvert Impact Capital, Inc., Community Investment Notes, 1.50%, 12/15/23(1) | 4,914,150 | — | — | — | (270,350) | 4,643,800 | 75,000 | 5,000,000 |
| Short-Term Investments | | | | | | |
| Cash Reserves Fund | 13,362,609 | 729,661,883 | (743,001,486) | (23,006) | — | — | 31,640 | — |
| Liquidity Fund | — | 476,960,727 | (425,153,787) | — | — | 51,806,940 | 294,044 | 51,806,940 |
| Total | | | | $(23,006) | $(499,381) | $ 90,654,093 | $ 966,507 | |
Equity
| Name | Value,
beginning
of period | Purchases | Sales
proceeds | Net
realized
gain
(loss) | Change in
unrealized
appreciation
(depreciation) | Value,
end of
period | Interest/
Dividend
income | Principal amount/
Units/Shares,
end of period |
| High Social Impact Investments | | | | | | | | |
| Calvert Impact Capital, Inc., Community Investment Notes, 1.50%, 12/15/23(1) | $ 7,833,155 | $ — | $ — | $ — | $ (430,938) | $ 7,402,217 | $ 119,550 | $ 7,970,000 |
| Short-Term Investments | | | | | | |
| Cash Reserves Fund | 138,546,499 | 335,980,274 | (474,511,463) | (3,572) | (11,738) | — | 61,204 | — |
| Liquidity Fund | — | 700,748,860 | (466,823,622) | — | — | 233,925,238 | 1,456,866 | 233,925,238 |
| Total | | | | $ (3,572) | $(442,676) | $241,327,455 | $1,637,620 | |
9 Capital Shares
Each Fund's Declaration of Trust permits the Trustees to issue an unlimited number of full and fractional shares of beneficial interest (without par value). Such shares may be issued in a number of different series (such as the Funds) and classes.
Transactions in capital shares for the years ended September 30, 2022 and September 30, 2021 were as follows:
Calvert
Social Investment Fund
September 30, 2022
Notes to Financial Statements — continued
Balanced
| | Year Ended
September 30, 2022 | | Year Ended
September 30, 2021 |
| | Shares | Amount | | Shares | Amount |
| Class A | | | | | |
| Shares sold | 1,624,399 | $ 64,806,267 | | 2,279,235 | $ 92,983,161 |
| Reinvestment of distributions | 1,484,224 | 61,111,854 | | 397,057 | 15,794,829 |
| Shares redeemed | (2,150,407) | (84,257,727) | | (1,856,547) | (75,279,097) |
| Converted from Class C | 107,606 | 4,254,240 | | 168,547 | 6,660,417 |
| Net increase | 1,065,822 | $ 45,914,634 | | 988,292 | $ 40,159,310 |
| Class C | | | | | |
| Shares sold | 284,898 | $ 11,004,192 | | 439,525 | $ 17,229,418 |
| Reinvestment of distributions | 117,092 | 4,681,122 | | 23,490 | 889,165 |
| Shares redeemed | (349,095) | (12,954,064) | | (472,702) | (18,415,788) |
| Converted to Class A | (111,920) | (4,254,240) | | (174,827) | (6,660,417) |
| Net decrease | (59,025) | $ (1,522,990) | | (184,514) | $ (6,957,622) |
| Class I | | | | | |
| Shares sold | 1,589,543 | $ 64,656,567 | | 2,917,721 | $120,161,052 |
| Reinvestment of distributions | 557,958 | 23,526,500 | | 148,967 | 6,081,820 |
| Shares redeemed | (3,271,411) | (129,597,871) | | (1,368,210) | (56,757,304) |
| Net increase (decrease) | (1,123,910) | $ (41,414,804) | | 1,698,478 | $ 69,485,568 |
| Class R6 | | | | | |
| Shares sold | 1,374,388 | $ 54,385,726 | | 315,799 | $ 12,873,669 |
| Reinvestment of distributions | 34,453 | 1,383,991 | | 6,002 | 245,398 |
| Shares redeemed | (165,741) | (6,375,169) | | (176,543) | (7,611,961) |
| Net increase | 1,243,100 | $ 49,394,548 | | 145,258 | $ 5,507,106 |
Bond
| | Year Ended
September 30, 2022 | | Year Ended
September 30, 2021 |
| | Shares | Amount | | Shares | Amount |
| Class A | | | | | |
| Shares sold | 4,012,880 | $ 63,085,277 | | 5,847,705 | $ 99,119,549 |
| Reinvestment of distributions | 736,453 | 11,670,199 | | 600,546 | 10,194,310 |
| Shares redeemed | (5,226,819) | (81,191,551) | | (3,644,123) | (61,773,051) |
| Converted from Class C | 55,071 | 869,274 | | 180,930 | 3,098,659 |
| Net increase (decrease) | (422,415) | $ (5,566,801) | | 2,985,058 | $ 50,639,467 |
Calvert
Social Investment Fund
September 30, 2022
Notes to Financial Statements — continued
Bond — continued
| | Year Ended
September 30, 2022 | | Year Ended
September 30, 2021 |
| | Shares | Amount | | Shares | Amount |
| Class C | | | | | |
| Shares sold | 65,325 | $ 1,040,508 | | 189,227 | $ 3,185,889 |
| Reinvestment of distributions | 20,294 | 321,931 | | 19,736 | 332,869 |
| Shares redeemed | (182,840) | (2,846,743) | | (166,729) | (2,804,368) |
| Converted to Class A | (55,462) | (869,274) | | (182,205) | (3,098,659) |
| Net decrease | (152,683) | $ (2,353,578) | | (139,971) | $ (2,384,269) |
| Class I | | | | | |
| Shares sold | 61,787,949 | $ 973,724,565 | | 42,951,446 | $ 728,966,874 |
| Reinvestment of distributions | 3,872,194 | 61,131,535 | | 2,918,783 | 49,632,871 |
| Shares redeemed | (47,786,437) | (743,567,826) | | (25,910,924) | (439,339,983) |
| Net increase | 17,873,706 | $ 291,288,274 | | 19,959,305 | $ 339,259,762 |
| Class R6 | | | | | |
| Shares sold | 20,137,570 | $ 316,166,300 | | 6,054,120 | $ 102,472,452 |
| Reinvestment of distributions | 654,231 | 10,248,941 | | 342,419 | 5,818,329 |
| Shares redeemed | (6,032,216) | (92,990,813) | | (3,298,925) | (56,079,404) |
| Net increase | 14,759,585 | $ 233,424,428 | | 3,097,614 | $ 52,211,377 |
Equity
| | Year Ended
September 30, 2022 | | Year Ended
September 30, 2021 |
| | Shares | Amount | | Shares | Amount |
| Class A | | | | | |
| Shares sold | 2,070,560 | $ 152,912,767 | | 2,596,260 | $ 180,832,787 |
| Reinvestment of distributions | 1,039,306 | 81,876,572 | | 780,979 | 51,036,992 |
| Shares redeemed | (3,685,523) | (267,438,182) | | (4,237,985) | (298,193,577) |
| Converted from Class C | 94,922 | 6,903,947 | | 292,252 | 19,689,368 |
| Net decrease | (480,735) | $ (25,744,896) | | (568,494) | $ (46,634,430) |
| Class C | | | | | |
| Shares sold | 492,246 | $ 18,319,753 | | 800,638 | $ 28,981,689 |
| Reinvestment of distributions | 232,685 | 9,195,700 | | 158,739 | 5,416,186 |
| Shares redeemed | (576,085) | (21,072,873) | | (793,663) | (28,846,589) |
| Converted to Class A | (188,968) | (6,903,947) | | (552,405) | (19,689,368) |
| Net decrease | (40,122) | $ (461,367) | | (386,691) | $ (14,138,082) |
| Class I | | | | | |
| Shares sold | 14,355,562 | $1,212,130,853 | | 12,055,562 | $ 976,388,106 |
| Reinvestment of distributions | 1,052,347 | 97,994,592 | | 873,143 | 67,013,757 |
| Shares redeemed | (10,726,436) | (912,455,042) | | (17,124,119) | (1,415,474,306) |
| Net increase (decrease) | 4,681,473 | $ 397,670,403 | | (4,195,414) | $ (372,072,443) |
Calvert
Social Investment Fund
September 30, 2022
Notes to Financial Statements — continued
Equity — continued
| | Year Ended
September 30, 2022 | | Year Ended
September 30, 2021 |
| | Shares | Amount | | Shares | Amount |
| Class R6 | | | | | |
| Shares sold | 2,569,972 | $ 220,034,805 | | 4,379,332 | $ 380,560,595 |
| Reinvestment of distributions | 138,863 | 12,893,398 | | 63,494 | 4,860,497 |
| Shares redeemed | (1,678,536) | (144,926,428) | | (2,772,361) | (217,978,480) |
| Net increase | 1,030,299 | $ 88,001,775 | | 1,670,465 | $ 167,442,612 |
10 Capital Commitments
In connection with certain venture capital and/or limited partnership investments, Balanced and Equity are committed to future capital calls, which will increase each Fund's investment in these securities. The aggregate amount of the future capital commitments totaled $83,953 and $504,450 for Balanced and Equity, respectively, at September 30, 2022. Balanced and Equity had sufficient cash and/or securities to cover these commitments.
Unfunded capital commitments by investment at September 30, 2022 were as follows:
Balanced
| Name of Investment | Unfunded
Commitment |
| First Analysis Private Equity Fund IV, L.P. | $ 60,000 |
| Learn Capital Venture Partners III, L.P. | 23,953 |
| Total | $83,953 |
Equity
| Name of Investment | Unfunded
Commitment |
| Accion Frontier Inclusion Fund L.P. | $ 9,087 |
| Adobe Capital Social Mezzanine I L.P. | 2,123 |
| Arborview Capital Partners L.P. | 3,929 |
| Bridges Ventures US Sustainable Growth Fund L.P. | 104,268 |
| China Environment Fund III L.P. | 1,205 |
| Core Innovations Capital I L.P. | 51,766 |
| Cross Culture Ventures I L.P. | 34,993 |
| First Analysis Private Equity Fund V L.P. | 18,302 |
| Impact Ventures II L.P. | 9,632 |
| LeapFrog Financial Inclusion Fund | 78,436 |
| New Markets Education Partners L.P. | 51,800 |
| New Markets Venture Partners II L.P. | 25,000 |
| Owl Ventures L.P. | 20,000 |
| Westly Capital Partners Fund II L.P. | 93,909 |
| Total | $504,450 |
Calvert
Social Investment Fund
September 30, 2022
Notes to Financial Statements — continued
11 Risks and Uncertainties
Pandemic Risk
An outbreak of respiratory disease caused by a novel coronavirus was first detected in China in late 2019 and subsequently spread internationally. This coronavirus has resulted in closing borders, enhanced health screenings, changes to healthcare service preparation and delivery, quarantines, cancellations, disruptions to supply chains and customer activity, as well as general concern and uncertainty. Health crises caused by outbreaks of disease, such as the coronavirus outbreak, may exacerbate other pre-existing political, social and economic risks and disrupt normal market conditions and operations. The impact of this outbreak has negatively affected the worldwide economy, as well as the economies of individual countries and industries, and could continue to affect the market in significant and unforeseen ways. Other epidemics and pandemics that may arise in the future may have similar effects. Any such impact could adversely affect the Funds' performance, or the performance of the securities in which the Funds invest.
Calvert
Social Investment Fund
September 30, 2022
Report of Independent Registered Public Accounting Firm
To the Board of Trustees of Calvert Social Investment Fund and Shareholders of Calvert Balanced Fund, Calvert Bond Fund and Calvert Equity Fund:
Opinion on the Financial Statements and Financial Highlights
We have audited the accompanying statements of assets and liabilities of Calvert Balanced Fund, Calvert Bond Fund and Calvert Equity Fund (the "Funds") (three of the funds constituting Calvert Social Investment Fund), including the schedules of investments, as of September 30, 2022, the related statements of operations for the year then ended, the statements of changes in net assets and the financial highlights for each of the two years in the period then ended, and the related notes. In our opinion, the financial statements and financial highlights present fairly, in all material respects, the financial position of each of the Funds as of September 30, 2022, and the results of their operations for the year then ended, and the changes in their net assets and the financial highlights for each of the two years in the period then ended, in conformity with accounting principles generally accepted in the United States of America. The financial highlights for the years ended September 30, 2020, 2019, and 2018 were audited by other auditors whose report, dated November 20, 2020, expressed an unqualified opinion on those financial highlights.
Basis for Opinion
These financial statements and financial highlights are the responsibility of the Funds’ management. Our responsibility is to express an opinion on the Funds’ financial statements and financial highlights based on our audits. We are a public accounting firm registered with the Public Company Accounting Oversight Board (United States) (PCAOB) and are required to be independent with respect to the Funds in accordance with the U.S. federal securities laws and the applicable rules and regulations of the Securities and Exchange Commission and the PCAOB.
We conducted our audits in accordance with the standards of the PCAOB. Those standards require that we plan and perform the audit to obtain reasonable assurance about whether the financial statements and financial highlights are free of material misstatement, whether due to error or fraud. The Funds are not required to have, nor were we engaged to perform, an audit of their internal control over financial reporting. As part of our audits, we are required to obtain an understanding of internal control over financial reporting but not for the purpose of expressing an opinion on the effectiveness of the Funds’ internal control over financial reporting. Accordingly, we express no such opinion.
Our audits included performing procedures to assess the risks of material misstatement of the financial statements and financial highlights, whether due to error or fraud, and performing procedures that respond to those risks. Such procedures included examining, on a test basis, evidence regarding the amounts and disclosures in the financial statements and financial highlights. Our audits also included evaluating the accounting principles used and significant estimates made by management, as well as evaluating the overall presentation of the financial statements and financial highlights. Our procedures included confirmation of securities owned as of September 30, 2022, by correspondence with the custodian, brokers and selling or agent banks; when replies were not received from brokers and selling or agent banks, we performed other auditing procedures. We believe that our audits provide a reasonable basis for our opinion.
/s/ Deloitte & Touche LLP
Boston, Massachusetts
November 22, 2022
We have served as the auditor of one or more Calvert investment companies since 2021.
Calvert
Social Investment Fund
September 30, 2022
Federal Tax Information (Unaudited)
The Form 1099-DIV you receive in February 2023 will show the tax status of all distributions paid to your account in calendar year 2022. Shareholders are advised to consult their own tax adviser with respect to the tax consequences of their investment in the Funds. As required by the Internal Revenue Code and/or regulations, shareholders must be notified regarding the status of qualified business income, qualified dividend income for individuals, the dividends received deduction for corporations, 163(j) interest dividends and capital gains dividends.
Qualified Business Income. For the fiscal year ended September 30, 2022, Balanced Fund designates approximately $110,833, or up to the maximum amount of such dividends allowable pursuant to the Internal Revenue Code, as qualified business income.
Qualified Dividend Income. For the fiscal year ended September 30, 2022, the Funds designate approximately the following amounts, or up to the maximum amount of such dividends allowable pursuant to the Internal Revenue Code, as qualified dividend income eligible for the reduced tax rate of 15%:
| Balanced Fund | $ 8,858,411 |
| Bond Fund | $ 492,411 |
| Equity Fund | $ 44,159,349 |
Dividends Received Deduction. Corporate shareholders are generally entitled to take the dividends received deduction on the portion of a Fund's dividend distribution that qualifies under tax law. For the Funds' fiscal 2022 ordinary income dividends, the following qualifies for the corporate dividends received deduction:
| Balanced Fund | 49.16% |
| Equity Fund | 100.00% |
163(j) Interest Dividends. For the fiscal year ended September 30, 2022, the Funds designate the following as a percentage of distributions from net investment income as a 163(j) interest dividend:
| Balanced Fund | 27.58% |
| Bond Fund | 89.66% |
Capital Gains Dividends. The Funds hereby designate as a capital gain dividend with respect to the taxable year ended September 30, 2022, the following amounts or, if subsequently determined to be different, the net capital gain of such year:
| Balanced Fund | $ 15,257,260 |
| Equity Fund | $192,577,920 |
Calvert
Balanced Fund
September 30, 2022
Board of Trustees' Contract Approval
Overview of the Contract Review Process
The Investment Company Act of 1940, as amended, provides, in substance, that each investment advisory agreement between a fund and its investment adviser will continue in effect from year to year only if its continuation is approved at least annually by the fund’s board of directors, including by a vote of a majority of the directors who are not “interested persons” of the fund (“Independent Trustees”), cast in person at a meeting called for the purpose of considering such approval.
At a video conference meeting of the Boards of Trustees/Directors (each a “Board”) of the registered investment companies advised by Calvert Research and Management (“CRM” or the “Adviser”) (the “Calvert Funds”) held on June 14, 2022, the Board, including a majority of the Independent Trustees, voted to approve continuation of existing investment advisory and investment sub-advisory agreements for the Calvert Funds for an additional one-year period. The meeting was held by video conference due to circumstances related to current or potential effects of COVID-19 pursuant to temporary exemptive relief issued by the Securities and Exchange Commission.
In evaluating the investment advisory and investment sub-advisory agreements for the Calvert Funds, the Board considered a variety of information relating to the Calvert Funds and various service providers, including the Adviser. The Independent Trustees reviewed a report prepared by the Adviser regarding various services provided to the Calvert Funds by the Adviser and its affiliates. Such report included, among other data, information regarding the Adviser’s personnel and the Adviser’s revenue and cost of providing services to the Calvert Funds, and a separate report prepared by an independent data provider, which compared each fund’s investment performance, fees and expenses to those of comparable funds as identified by such independent data provider (“comparable funds”).
The Independent Trustees were separately represented by independent legal counsel with respect to their consideration of the continuation of the investment advisory and investment sub-advisory agreements for the Calvert Funds. Prior to voting, the Independent Trustees reviewed the proposed continuation of the Calvert Funds’ investment advisory and investment sub-advisory agreements with management and also met in private sessions with their counsel at which time no representatives of management were present.
The information that the Board considered included, among other things, the following (for funds that invest through one or more affiliated underlying fund(s), references to “each fund” in this section may include information that was considered at the underlying fund-level):
Information about Fees, Performance and Expenses
| • | A report from an independent data provider comparing the advisory and related fees paid by each fund with fees paid by comparable funds; |
| • | A report from an independent data provider comparing each fund’s total expense ratio and its components to comparable funds; |
| • | A report from an independent data provider comparing the investment performance of each fund to the investment performance of comparable funds over various time periods; |
| • | Data regarding investment performance in comparison to benchmark indices; |
| • | For each fund, comparative information concerning the fees charged and the services provided by the Adviser in managing other accounts (including mutual funds, other collective investment funds and institutional accounts) using investment strategies and techniques similar to those used in managing such fund; |
| • | Profitability analyses for the Adviser with respect to each fund; |
Information about Portfolio Management and Trading
| • | Descriptions of the investment management services provided to each fund, including investment strategies and processes it employs; |
| • | Information about the Adviser’s policies and practices with respect to trading, including the Adviser’s processes for monitoring best execution of portfolio transactions; |
| • | Information about the allocation of brokerage transactions and the benefits received by the Adviser as a result of brokerage allocation, including information concerning the acquisition of research through client commission arrangements and policies with respect to “soft dollars”; |
Information about the Adviser
| • | Reports detailing the financial results and condition of CRM; |
| • | Descriptions of the qualifications, education and experience of the individual investment professionals whose responsibilities include portfolio management and investment research for the funds, and information relating to their compensation and responsibilities with respect to managing other mutual funds and investment accounts; |
| • | Policies and procedures relating to proxy voting and the handling of corporate actions and class actions; |
| • | A description of CRM’s procedures for overseeing sub-advisers, including with respect to regulatory and compliance issues, investment management and other matters; |
Calvert
Balanced Fund
September 30, 2022
Board of Trustees' Contract Approval — continued
Other Relevant Information
| • | Information concerning the nature, cost and character of the administrative and other non-investment advisory services provided by CRM and its affiliates; and |
| • | The terms of each investment advisory agreement. |
Over the course of the year, the Board and its committees held regular quarterly meetings. During these meetings, the Trustees participated in investment and performance reviews with the portfolio managers and other investment professionals of the Adviser relating to each fund, and considered various investment and trading strategies used in pursuing each fund’s investment objective(s), such as the use of derivative instruments, as well as risk management techniques. The Board and its committees also evaluated issues pertaining to industry and regulatory developments, compliance procedures, corporate governance and other issues with respect to the funds, and received and participated in reports and presentations provided by CRM and its affiliates with respect to such matters. In addition to the formal meetings of the Board and its committees, the Independent Trustees held regular video conferences in between meetings to discuss, among other topics, matters relating to the continuation of the Calvert Funds’ investment advisory and investment sub-advisory agreements.
For funds that invest through one or more affiliated underlying funds, the Board considered similar information about the underlying fund(s) when considering the approval of investment advisory agreements. In addition, in cases where the Adviser has engaged a sub-adviser, the Board considered similar information about the sub-adviser when considering the approval of any investment sub-advisory agreement.
The Independent Trustees were assisted throughout the contract review process by their independent legal counsel. The Independent Trustees relied upon the advice of such counsel and their own business judgment in determining the material factors to be considered in evaluating each investment advisory and investment sub-advisory agreement and the weight to be given to each such factor. The Board, including the Independent Trustees, did not identify any single factor as controlling, and each Trustee may have attributed different weight to various factors.
Results of the Contract Review Process
Based on its consideration of the foregoing, and such other information as it deemed relevant, including the factors and conclusions described below, the Board, including the Independent Trustees, concluded that the continuation of the investment advisory agreement of Calvert Balanced Fund (the “Fund”), including the fee payable under the agreement, is in the best interests of the Fund’s shareholders. Accordingly, the Board, including a majority of the Independent Trustees, voted to approve the continuation of the investment advisory agreement of the Fund.
Nature, Extent and Quality of Services
In considering the nature, extent and quality of the services provided by the Adviser under the investment advisory agreement, the Board reviewed information provided by the Adviser relating to its operations and personnel, including, among other information, biographical information on the Adviser’s investment personnel and descriptions of its organizational and management structure. The Board also took into account similar information provided periodically throughout the previous year by the Adviser as well as the Board’s familiarity with management through Board meetings, discussions and other reports. The Board considered the Adviser’s management style and its performance in employing its investment strategies as well as its current level of staffing and overall resources. The Board also noted that it reviewed on a quarterly basis information regarding the Adviser’s compliance with applicable policies and procedures, including those related to personal investing. The Board took into account, among other items, periodic reports received from the Adviser over the past year concerning the Adviser’s ongoing review and enhancement of certain processes, policies and procedures of the Calvert Funds and the Adviser. The Board concluded that it was satisfied with the nature, extent and quality of services provided to the Fund by the Adviser under the investment advisory agreement.
Fund Performance
In considering the Fund’s performance, the Board noted that it reviewed on a quarterly basis detailed information about the Fund’s performance results, portfolio composition and investment strategies. The Board compared the Fund’s investment performance to that of the Fund’s peer universe and its blended benchmark. The Board’s review included comparative performance data for the one-, three- and five-year periods ended December 31, 2021. This performance data indicated that the Fund had outperformed the median of its peer universe for the one-, three- and five-year periods ended December 31, 2021. It also indicated that the Fund had underperformed its blended benchmark for the one-and five-year periods ended December 31, 2021, while it had outperformed its blended benchmark for the three-year period ended December 31, 2021. Based upon its review, the Board concluded that the Fund’s performance was satisfactory relative to the performance of its peer universe and its blended benchmark.
Management Fees and Expenses
In considering the Fund’s fees and expenses, the Board compared the Fund’s fees and total expense ratio with those of comparable funds in its expense group. Among other findings, the data indicated that the Fund’s advisory and administrative fees (referred to collectively as “management fees”) and the Fund’s total expenses were each below the respective median of the Fund’s expense group. The Board took into account the Adviser’s current undertaking to maintain expense limitations for the Fund. Based upon its review, the Board concluded that the management fees were reasonable in view of the nature, extent and quality of services provided by the Adviser.
Calvert
Balanced Fund
September 30, 2022
Board of Trustees' Contract Approval — continued
Profitability and Other “Fall-Out” Benefits
The Board reviewed the Adviser’s profitability in regard to the Fund and the Calvert Funds in the aggregate. In reviewing the overall profitability of the Fund to the Adviser, the Board also considered the fact that the Adviser and its affiliates provided sub-transfer agency support, administrative and distribution services to the Fund for which they received compensation. The information considered by the Board included the profitability of the Fund to the Adviser and its affiliates without regard to any marketing support or other payments by the Adviser and its affiliates to third parties in respect of distribution services. The Board also considered that the Adviser and its affiliates derived benefits to their reputation and other indirect benefits from their relationships with the Fund. Based upon its review, the Board concluded that the Adviser’s and its affiliates’ level of profitability from their relationships with the Fund was reasonable.
Economies of Scale
The Board considered the effect of the Fund’s current size and its potential growth on its performance and fees. The Board also took into account the breakpoints in the advisory fee schedule for the Fund that would reduce the advisory fee rate on assets above specific asset levels. The Board noted that if the Fund’s assets increased over time, the Fund might realize other economies of scale if assets increased proportionally more than certain other expenses.
Calvert
Bond Fund
September 30, 2022
Board of Trustees' Contract Approval
Overview of the Contract Review Process
The Investment Company Act of 1940, as amended, provides, in substance, that each investment advisory agreement between a fund and its investment adviser will continue in effect from year to year only if its continuation is approved at least annually by the fund’s board of directors, including by a vote of a majority of the directors who are not “interested persons” of the fund (“Independent Trustees”), cast in person at a meeting called for the purpose of considering such approval.
At a video conference meeting of the Boards of Trustees/Directors (each a “Board”) of the registered investment companies advised by Calvert Research and Management (“CRM” or the “Adviser”) (the “Calvert Funds”) held on June 14, 2022, the Board, including a majority of the Independent Trustees, voted to approve continuation of existing investment advisory and investment sub-advisory agreements for the Calvert Funds for an additional one-year period. The meeting was held by video conference due to circumstances related to current or potential effects of COVID-19 pursuant to temporary exemptive relief issued by the Securities and Exchange Commission.
In evaluating the investment advisory and investment sub-advisory agreements for the Calvert Funds, the Board considered a variety of information relating to the Calvert Funds and various service providers, including the Adviser. The Independent Trustees reviewed a report prepared by the Adviser regarding various services provided to the Calvert Funds by the Adviser and its affiliates. Such report included, among other data, information regarding the Adviser’s personnel and the Adviser’s revenue and cost of providing services to the Calvert Funds, and a separate report prepared by an independent data provider, which compared each fund’s investment performance, fees and expenses to those of comparable funds as identified by such independent data provider (“comparable funds”).
The Independent Trustees were separately represented by independent legal counsel with respect to their consideration of the continuation of the investment advisory and investment sub-advisory agreements for the Calvert Funds. Prior to voting, the Independent Trustees reviewed the proposed continuation of the Calvert Funds’ investment advisory and investment sub-advisory agreements with management and also met in private sessions with their counsel at which time no representatives of management were present.
The information that the Board considered included, among other things, the following (for funds that invest through one or more affiliated underlying fund(s), references to “each fund” in this section may include information that was considered at the underlying fund-level):
Information about Fees, Performance and Expenses
| • | A report from an independent data provider comparing the advisory and related fees paid by each fund with fees paid by comparable funds; |
| • | A report from an independent data provider comparing each fund’s total expense ratio and its components to comparable funds; |
| • | A report from an independent data provider comparing the investment performance of each fund to the investment performance of comparable funds over various time periods; |
| • | Data regarding investment performance in comparison to benchmark indices; |
| • | For each fund, comparative information concerning the fees charged and the services provided by the Adviser in managing other accounts (including mutual funds, other collective investment funds and institutional accounts) using investment strategies and techniques similar to those used in managing such fund; |
| • | Profitability analyses for the Adviser with respect to each fund; |
Information about Portfolio Management and Trading
| • | Descriptions of the investment management services provided to each fund, including investment strategies and processes it employs; |
| • | Information about the Adviser’s policies and practices with respect to trading, including the Adviser’s processes for monitoring best execution of portfolio transactions; |
| • | Information about the allocation of brokerage transactions and the benefits received by the Adviser as a result of brokerage allocation, including information concerning the acquisition of research through client commission arrangements and policies with respect to “soft dollars”; |
Information about the Adviser
| • | Reports detailing the financial results and condition of CRM; |
| • | Descriptions of the qualifications, education and experience of the individual investment professionals whose responsibilities include portfolio management and investment research for the funds, and information relating to their compensation and responsibilities with respect to managing other mutual funds and investment accounts; |
| • | Policies and procedures relating to proxy voting and the handling of corporate actions and class actions; |
| • | A description of CRM’s procedures for overseeing sub-advisers, including with respect to regulatory and compliance issues, investment management and other matters; |
Calvert
Bond Fund
September 30, 2022
Board of Trustees' Contract Approval — continued
Other Relevant Information
| • | Information concerning the nature, cost and character of the administrative and other non-investment advisory services provided by CRM and its affiliates; and |
| • | The terms of each investment advisory agreement. |
Over the course of the year, the Board and its committees held regular quarterly meetings. During these meetings, the Trustees participated in investment and performance reviews with the portfolio managers and other investment professionals of the Adviser relating to each fund, and considered various investment and trading strategies used in pursuing each fund’s investment objective(s), such as the use of derivative instruments, as well as risk management techniques. The Board and its committees also evaluated issues pertaining to industry and regulatory developments, compliance procedures, corporate governance and other issues with respect to the funds, and received and participated in reports and presentations provided by CRM and its affiliates with respect to such matters. In addition to the formal meetings of the Board and its committees, the Independent Trustees held regular video conferences in between meetings to discuss, among other topics, matters relating to the continuation of the Calvert Funds’ investment advisory and investment sub-advisory agreements.
For funds that invest through one or more affiliated underlying funds, the Board considered similar information about the underlying fund(s) when considering the approval of investment advisory agreements. In addition, in cases where the Adviser has engaged a sub-adviser, the Board considered similar information about the sub-adviser when considering the approval of any investment sub-advisory agreement.
The Independent Trustees were assisted throughout the contract review process by their independent legal counsel. The Independent Trustees relied upon the advice of such counsel and their own business judgment in determining the material factors to be considered in evaluating each investment advisory and investment sub-advisory agreement and the weight to be given to each such factor. The Board, including the Independent Trustees, did not identify any single factor as controlling, and each Trustee may have attributed different weight to various factors.
Results of the Contract Review Process
Based on its consideration of the foregoing, and such other information as it deemed relevant, including the factors and conclusions described below, the Board, including the Independent Trustees, concluded that the continuation of the investment advisory agreement of Calvert Bond Fund (the “Fund”), including the fee payable under the agreement, is in the best interests of the Fund’s shareholders. Accordingly, the Board, including a majority of the Independent Trustees, voted to approve the continuation of the investment advisory agreement of the Fund.
Nature, Extent and Quality of Services
In considering the nature, extent and quality of the services provided by the Adviser under the investment advisory agreement, the Board reviewed information provided by the Adviser relating to its operations and personnel, including, among other information, biographical information on the Adviser’s investment personnel and descriptions of its organizational and management structure. The Board also took into account similar information provided periodically throughout the previous year by the Adviser as well as the Board’s familiarity with management through Board meetings, discussions and other reports. The Board considered the Adviser’s management style and its performance in employing its investment strategies as well as its current level of staffing and overall resources. The Board also noted that it reviewed on a quarterly basis information regarding the Adviser’s compliance with applicable policies and procedures, including those related to personal investing. The Board took into account, among other items, periodic reports received from the Adviser over the past year concerning the Adviser’s ongoing review and enhancement of certain processes, policies and procedures of the Calvert Funds and the Adviser. The Board concluded that it was satisfied with the nature, extent and quality of services provided to the Fund by the Adviser under the investment advisory agreement.
Fund Performance
In considering the Fund’s performance, the Board noted that it reviewed on a quarterly basis detailed information about the Fund’s performance results, portfolio composition and investment strategies. The Board compared the Fund’s investment performance to that of the Fund’s peer universe and its benchmark index. The Board’s review included comparative performance data for the one-, three- and five-year periods ended December 31, 2021. This performance data indicated that the Fund had outperformed the median of its peer universe for the one-year period ended December 31, 2021, while it had underperformed the median of its peer universe for the three-year period ended December 31, 2021, and was at the median of its peer universe for the five-year period ended December 31, 2021. This performance data also indicated that the Fund had outperformed its benchmark index for the one-, three- and five-year periods ended December 31, 2021. The Board took into account management’s discussion of the Fund’s performance. Based upon its review, the Board concluded that the Fund’s performance was satisfactory relative to the performance of its peer universe and its benchmark index.
Management Fees and Expenses
In considering the Fund’s fees and expenses, the Board compared the Fund’s fees and total expense ratio with those of comparable funds in its expense group. Among other findings, the data indicated that the Fund’s advisory and administrative fees (after taking into account waivers and/or reimbursements) (referred to collectively as “management fees”) were at the median of the Fund’s expense group and the Fund’s total expenses (net of waivers and/or reimbursements) were below the median of the Fund’s expense group. The Board took into account the Adviser’s current undertaking to maintain expense limitations for the Fund and that the Adviser was waiving and/or reimbursing a portion of the Fund’s expenses. Based upon its review, the Board concluded that the management fees were reasonable in view of the nature, extent and quality of services provided by the Adviser.
Calvert
Bond Fund
September 30, 2022
Board of Trustees' Contract Approval — continued
Profitability and Other “Fall-Out” Benefits
The Board reviewed the Adviser’s profitability in regard to the Fund and the Calvert Funds in the aggregate. In reviewing the overall profitability of the Fund to the Adviser, the Board also considered the fact that the Adviser and its affiliates provided sub-transfer agency support, administrative and distribution services to the Fund for which they received compensation. The information considered by the Board included the profitability of the Fund to the Adviser and its affiliates without regard to any marketing support or other payments by the Adviser and its affiliates to third parties in respect of distribution services. The Board also considered that the Adviser and its affiliates derived benefits to their reputation and other indirect benefits from their relationships with the Fund. Based upon its review, the Board concluded that the Adviser’s and its affiliates’ level of profitability from their relationships with the Fund was reasonable.
Economies of Scale
The Board considered the effect of the Fund’s current size and its potential growth on its performance and fees. The Board also took into account the breakpoint in the advisory fee schedule for the Fund that would reduce the advisory fee rate on assets above a specific asset level. The Board noted that if the Fund’s assets increased over time, the Fund might realize other economies of scale if assets increased proportionally more than certain other expenses.
Calvert
Equity Fund
September 30, 2022
Board of Trustees' Contract Approval
Overview of the Contract Review Process
The Investment Company Act of 1940, as amended, provides, in substance, that each investment advisory agreement between a fund and its investment adviser will continue in effect from year to year only if its continuation is approved at least annually by the fund’s board of directors, including by a vote of a majority of the directors who are not “interested persons” of the fund (“Independent Trustees”), cast in person at a meeting called for the purpose of considering such approval.
At a video conference meeting of the Boards of Trustees/Directors (each a “Board”) of the registered investment companies advised by Calvert Research and Management (“CRM” or the “Adviser”) (the “Calvert Funds”) held on June 14, 2022, the Board, including a majority of the Independent Trustees, voted to approve continuation of existing investment advisory and investment sub-advisory agreements for the Calvert Funds for an additional one-year period. The meeting was held by video conference due to circumstances related to current or potential effects of COVID-19 pursuant to temporary exemptive relief issued by the Securities and Exchange Commission.
In evaluating the investment advisory and investment sub-advisory agreements for the Calvert Funds, the Board considered a variety of information relating to the Calvert Funds and various service providers, including the Adviser. The Independent Trustees reviewed a report prepared by the Adviser regarding various services provided to the Calvert Funds by the Adviser and its affiliates. Such report included, among other data, information regarding the Adviser’s personnel and the Adviser’s revenue and cost of providing services to the Calvert Funds, and a separate report prepared by an independent data provider, which compared each fund’s investment performance, fees and expenses to those of comparable funds as identified by such independent data provider (“comparable funds”).
The Independent Trustees were separately represented by independent legal counsel with respect to their consideration of the continuation of the investment advisory and investment sub-advisory agreements for the Calvert Funds. Prior to voting, the Independent Trustees reviewed the proposed continuation of the Calvert Funds’ investment advisory and investment sub-advisory agreements with management and also met in private sessions with their counsel at which time no representatives of management were present.
The information that the Board considered included, among other things, the following (for funds that invest through one or more affiliated underlying fund(s), references to “each fund” in this section may include information that was considered at the underlying fund-level):
Information about Fees, Performance and Expenses
| • | A report from an independent data provider comparing the advisory and related fees paid by each fund with fees paid by comparable funds; |
| • | A report from an independent data provider comparing each fund’s total expense ratio and its components to comparable funds; |
| • | A report from an independent data provider comparing the investment performance of each fund to the investment performance of comparable funds over various time periods; |
| • | Data regarding investment performance in comparison to benchmark indices; |
| • | For each fund, comparative information concerning the fees charged and the services provided by the Adviser in managing other accounts (including mutual funds, other collective investment funds and institutional accounts) using investment strategies and techniques similar to those used in managing such fund; |
| • | Profitability analyses for the Adviser with respect to each fund; |
Information about Portfolio Management and Trading
| • | Descriptions of the investment management services provided to each fund, including investment strategies and processes it employs; |
| • | Information about the Adviser’s policies and practices with respect to trading, including the Adviser’s processes for monitoring best execution of portfolio transactions; |
| • | Information about the allocation of brokerage transactions and the benefits received by the Adviser as a result of brokerage allocation, including information concerning the acquisition of research through client commission arrangements and policies with respect to “soft dollars”; |
Information about the Adviser
| • | Reports detailing the financial results and condition of CRM; |
| • | Descriptions of the qualifications, education and experience of the individual investment professionals whose responsibilities include portfolio management and investment research for the funds, and information relating to their compensation and responsibilities with respect to managing other mutual funds and investment accounts; |
| • | Policies and procedures relating to proxy voting and the handling of corporate actions and class actions; |
| • | A description of CRM’s procedures for overseeing sub-advisers, including with respect to regulatory and compliance issues, investment management and other matters; |
Calvert
Equity Fund
September 30, 2022
Board of Trustees' Contract Approval — continued
Other Relevant Information
| • | Information concerning the nature, cost and character of the administrative and other non-investment advisory services provided by CRM and its affiliates; and |
| • | The terms of each investment advisory agreement. |
Over the course of the year, the Board and its committees held regular quarterly meetings. During these meetings, the Trustees participated in investment and performance reviews with the portfolio managers and other investment professionals of the Adviser relating to each fund, and considered various investment and trading strategies used in pursuing each fund’s investment objective(s), such as the use of derivative instruments, as well as risk management techniques. The Board and its committees also evaluated issues pertaining to industry and regulatory developments, compliance procedures, corporate governance and other issues with respect to the funds, and received and participated in reports and presentations provided by CRM and its affiliates with respect to such matters. In addition to the formal meetings of the Board and its committees, the Independent Trustees held regular video conferences in between meetings to discuss, among other topics, matters relating to the continuation of the Calvert Funds’ investment advisory and investment sub-advisory agreements.
For funds that invest through one or more affiliated underlying funds, the Board considered similar information about the underlying fund(s) when considering the approval of investment advisory agreements. In addition, in cases where the Adviser has engaged a sub-adviser, the Board considered similar information about the sub-adviser when considering the approval of any investment sub-advisory agreement.
The Independent Trustees were assisted throughout the contract review process by their independent legal counsel. The Independent Trustees relied upon the advice of such counsel and their own business judgment in determining the material factors to be considered in evaluating each investment advisory and investment sub-advisory agreement and the weight to be given to each such factor. The Board, including the Independent Trustees, did not identify any single factor as controlling, and each Trustee may have attributed different weight to various factors.
Results of the Contract Review Process
Based on its consideration of the foregoing, and such other information as it deemed relevant, including the factors and conclusions described below, the Board, including the Independent Trustees, concluded that the continuation of the investment advisory agreement of Calvert Equity Fund (the “Fund”), and the investment sub-advisory agreement with Atlanta Capital Management Company, LLC (the “Sub-Adviser”), an affiliate of CRM, including the fees payable under each agreement, is in the best interests of the Fund’s shareholders. Accordingly, the Board, including a majority of the Independent Trustees, voted to approve the continuation of the investment advisory agreement and the investment sub-advisory agreement of the Fund.
Nature, Extent and Quality of Services
In considering the nature, extent and quality of the services provided by the Adviser and Sub-Adviser under the investment advisory agreement and investment sub-advisory agreement, respectively, the Board reviewed information relating to the Adviser’s and Sub-Adviser’s operations and personnel, including, among other information, biographical information on the Sub-Adviser’s investment personnel and descriptions of the Adviser’s organizational and management structure. The Board also took into account similar information provided periodically throughout the previous year by the Adviser and Sub-Adviser as well as the Board’s familiarity with the Adviser and Sub-Adviser through Board meetings, discussions and other reports. With respect to the Adviser, the Board considered the Adviser’s responsibilities overseeing the Sub-Adviser and the business-related and other risks to which the Adviser or its affiliates may be subject in managing the Fund. With respect to the Sub-Adviser, the Board took into account the resources available to the Sub-Adviser in fulfilling its duties under the investment sub-advisory agreement and the Sub-Adviser’s experience in managing the Fund. The Board also noted that it reviewed on a quarterly basis information regarding the Adviser’s and Sub-Adviser’s compliance with applicable policies and procedures, including those related to personal investing. The Board took into account, among other items, periodic reports received from the Adviser over the past year concerning the Adviser’s ongoing review and enhancement of certain processes, policies and procedures of the Calvert Funds and the Adviser. The Board concluded that it was satisfied with the nature, extent and quality of services provided to the Fund by the Adviser and the Sub-Adviser under the investment advisory agreement and investment sub-advisory agreement, respectively.
Fund Performance
In considering the Fund’s performance, the Board noted that it reviewed on a quarterly basis detailed information about the Fund’s performance results, portfolio composition and investment strategies. The Board compared the Fund’s investment performance to that of the Fund’s peer universe and its benchmark index. The Board’s review included comparative performance data for the one-, three- and five-year periods ended December 31, 2021. This performance data indicated that the Fund had outperformed the median of the Fund’s peer universe for the one- and five-year periods ended December 31, 2021, while it had underperformed the median of its peer universe for the three-year period ended December 31, 2021. This performance data also indicated that the Fund had outperformed its benchmark index for the one-year period ended December 31, 2021, while it had underperformed its benchmark index for the three- and five-year periods ended December 31, 2021. Based upon its review, the Board concluded that the Fund’s performance was satisfactory relative to the performance of its peer universe and its benchmark index.
Calvert
Equity Fund
September 30, 2022
Board of Trustees' Contract Approval — continued
Management Fees and Expenses
In considering the Fund’s fees and expenses, the Board compared the Fund’s fees and total expense ratio with those of comparable funds in its expense group. Among other findings, the data indicated that the Fund’s advisory and administrative fees (referred to collectively as “management fees”) and the Fund’s total expenses were each below the respective median of the Fund’s expense group. The Board took into account the Adviser’s and Sub-Adviser’s current undertaking to maintain expense limitations for the Fund. Based upon its review, the Board concluded that the management and sub-advisory fees were reasonable in view of the nature, extent and quality of services provided by the Adviser and Sub-Adviser, respectively.
Profitability and Other “Fall-Out” Benefits
The Board reviewed the Adviser’s profitability in regard to the Fund and the Calvert Funds in the aggregate. In reviewing the overall profitability of the Fund to the Adviser, the Board also considered the fact that the Adviser and its affiliates, including the Sub-Adviser, provided sub-advisory, sub-transfer agency support, administrative and distribution services to the Fund for which they received compensation. The information considered by the Board included the profitability of the Fund to the Adviser and its affiliates without regard to any marketing support or other payments by the Adviser and its affiliates to third parties in respect of distribution services. The Board also considered that the Adviser and its affiliates, including the Sub-Adviser, derived benefits to their reputation and other indirect benefits from their relationships with the Fund. Because the Adviser pays the Sub-Adviser’s sub-advisory fee out of its advisory fee, the profitability of the Fund to the Sub-Adviser was not a material factor in the Board’s deliberations concerning the continuation of the investment sub-advisory agreement. Based upon its review, the Board concluded that the level of profitability of the Adviser and its affiliates, including the Sub-Adviser, from their relationships with the Fund was reasonable.
Economies of Scale
The Board considered the effect of the Fund’s current size and its potential growth on its performance and fees. The Board also took into account the breakpoints in the advisory fee schedule for the Fund that would reduce the advisory fee rate on assets above specific asset levels. Because the Adviser pays the Sub-Adviser’s sub-advisory fee out of its advisory fee, the Board did not consider the potential economies of scale from the Sub-Adviser’s management of the Fund to be a material factor in the Board’s deliberations concerning the continuation of the investment sub-advisory agreement, although the Board noted that the sub-advisory fee schedule contained breakpoints. The Board noted that if the Fund’s assets increased over time, the Fund might realize other economies of scale if assets increased proportionally more than certain other expenses.
Calvert
Social Investment Fund
September 30, 2022
Liquidity Risk Management Program
Each Fund has implemented a written liquidity risk management program (Program) and related procedures to manage its liquidity in accordance with Rule 22e-4 under the Investment Company Act of 1940, as amended (Liquidity Rule). The Liquidity Rule defines “liquidity risk” as the risk that a fund could not meet requests to redeem shares issued by the fund without significant dilution of the remaining investors’ interests in the fund. Each Fund’s Board of Trustees/Directors has designated the investment adviser to serve as the administrator of the Program and the related procedures. The administrator has established a Liquidity Risk Management Oversight Committee (Committee) to perform the functions necessary to administer the Program. As part of the Program, the administrator is responsible for identifying illiquid investments and categorizing the relative liquidity of each Fund’s investments in accordance with the Liquidity Rule. Under the Program, the administrator assesses, manages, and periodically reviews each Fund’s liquidity risk, and is responsible for making certain reports to the Fund’s Board of Trustees/Directors and the Securities and Exchange Commission (SEC) regarding the liquidity of the Fund’s investments, and to notify the Board of Trustees/Directors and the SEC of certain liquidity events specified in the Liquidity Rule. The liquidity of each Fund’s portfolio investments is determined based on a number of factors including, but not limited to, relevant market, trading and investment-specific considerations under the Program.
At a meeting of each Fund’s Board of Trustees/Directors on June 14, 2022, the Committee provided a written report to the Fund’s Board of Trustees/ Directors pertaining to the operation, adequacy, and effectiveness of implementation of the Program, as well as the operation of the highly liquid investment minimum (if applicable) for the period January 1, 2021 through December 31, 2021 (Review Period). The Program operated effectively during the Review Period, supporting the administrator’s ability to assess, manage and monitor Fund liquidity risk, including during periods of market volatility and net redemptions. During the Review Period, each Fund met redemption requests on a timely basis.
There can be no assurance that the Program will achieve its objectives in the future. Please refer to each Fund’s prospectus for more information regarding the Fund’s exposure to liquidity risk and other principal risks to which an investment in the Fund may be subject.
Calvert
Social Investment Fund
September 30, 2022
Management and Organization
Fund Management. The Trustees of Calvert Social Investment Fund (the Trust) are responsible for the overall management and supervision of the affairs of the Trust. The Board members and officers of the Trust are listed below. Except as indicated, each individual has held the office shown or other offices in the same company for the last five years. Board members hold indefinite terms of office. Each Board member holds office until his or her successor is elected and qualified, or until his or her earlier death, resignation, retirement, removal or disqualification. Under the terms of the Funds' current Board member retirement policy, an Independent Board member must retire at the end of the calendar year in which he or she turns 75. However, if such retirement would cause the Funds to be out of compliance with Section 16 of the 1940 Act or any other regulations or guidance of the SEC, then such retirement will not become effective until such time as action has been taken for the Funds to be in compliance therewith. The “noninterested Trustees” consist of those Trustees who are not “interested persons” of the Trust, as that term is defined under the 1940 Act. The business address of each Board member and the Chief Compliance Officer is 1825 Connecticut Avenue NW, Suite 400, Washington, DC 20009 and the business address of the Secretary, Vice President and Chief Legal Officer and the Treasurer is Two International Place, Boston, Massachusetts 02110. As used below, “CRM” refers to Calvert Research and Management and “Eaton Vance” refers to Eaton Vance Management. Each Trustee oversees 42 funds in the Calvert fund complex. Effective March 1, 2021, each of Eaton Vance and CRM are indirect wholly-owned subsidiaries of Morgan Stanley. Each officer affiliated with CRM may hold a position with other CRM affiliates that is comparable to his or her position with CRM listed below.
| Name and Year of Birth | Trust
Position(s) | Length of
Service | Principal Occupation(s) and Other Directorships
During Past Five Years and Other Relevant Experience |
| Interested Trustee |
John H. Streur(1)
1960 | Trustee and
President | Since 2015 | President and Chief Executive Officer of CRM (since December 31, 2016). President and Chief Executive Officer of Calvert Investments, Inc.
(January 2015 - December 2016); Chief Executive Officer of Calvert
Investment Distributors, Inc. (August 2015 - December 2016); Chief
Compliance Officer of Calvert Investment Management, Inc. (August 2015 -
April 2016); President and Director, Portfolio 21 Investments, Inc.
(through October 2014); President, Chief Executive Officer and
Director, Managers Investment Group LLC (through January 2012);
President and Director, The Managers Funds and Managers AMG
Funds (through January 2012).
Other Directorships. Portfolio 21 Investments, Inc. (asset management)
(through October 2014); Managers Investment Group LLC (asset management)
(through January 2012); The Managers Funds (asset management)
(through January 2012); Managers AMG Funds (asset management)
(through January 2012); Calvert Impact Capital, Inc. |
| Noninterested Trustees |
Richard L. Baird, Jr.
1948 | Trustee | Since 1982 | Regional Disaster Recovery Lead, American Red Cross of Greater
Pennsylvania (since 2017). Volunteer, American Red Cross (since 2015).
Former President and CEO of Adagio Health Inc. (retired in 2014) in
Pittsburgh, PA.
Other Directorships. None. |
Alice Gresham Bullock
1950 | Chair and
Trustee | Since 2016 | Professor Emerita at Howard University School of Law. Dean Emerita of
Howard University School of Law and Deputy Director of the Association
of American Law Schools (1992-1994).
Other Directorships. None. |
Cari M. Dominguez
1949 | Trustee | Since 2016 | Former Chair of the U.S. Equal Employment Opportunity Commission.
Other Directorships. ManpowerGroup Inc. (workforce solutions company);
Triple S Management Corporation (managed care); National Association of Corporate Directors. |
John G. Guffey, Jr.
1948 | Trustee | Since 1982 | President of Aurora Press Inc., a privately held publisher of trade
paperbacks (since January 1997).
Other Directorships. Calvert Impact Capital, Inc. (through December 31, 2018); Calvert Ventures, LLC. |
Miles D. Harper, III
1962 | Trustee | Since 2005 | Partner, Carr Riggs & Ingram (public accounting firm) since October 2014.
Partner, Gainer Donnelly & Desroches (public accounting firm) (now Carr
Riggs & Ingram) (November 1999 - September 2014).
Other Directorships. Bridgeway Funds (9) (asset management). |
Joy V. Jones
1950 | Trustee | Since 1990 | Attorney.
Other Directorships. Palm Management Corporation. |
Calvert
Social Investment Fund
September 30, 2022
Management and Organization — continued
| Name and Year of Birth | Trust
Position(s) | Length of
Service | Principal Occupation(s) and Other Directorships
During Past Five Years and Other Relevant Experience |
| Noninterested Trustees (continued) |
Anthony A. Williams
1951 | Trustee | Since 2016 | CEO and Executive Director of the Federal City Council (July 2012 to
present); Senior Adviser and Independent Consultant for King and
Spalding LLP (September 2015 to present); Executive Director of Global
Government Practice at the Corporate Executive Board (January 2010 to
January 2012).
Other Directorships. Freddie Mac; Evoq Properties/Meruelo Maddux
Properties, Inc. (real estate management); Weston Solutions, Inc.
(environmental services); Bipartisan Policy Center’s Debt Reduction Task Force;
Chesapeake Bay Foundation; Catholic University of America; Urban Institute (research organization); The Howard Hughes Corporation (real estate development); Old Dominion National Bank. |
| Name and Year of Birth | Trust
Position(s) | Length of
Service | Principal Occupation(s)
During Past Five Years |
| Principal Officers who are not Trustees |
Hope L. Brown
1973 | Chief
Compliance
Officer | Since 2014 | Chief Compliance Officer of 42 registered investment companies advised
by CRM (since 2014). Vice President and Chief Compliance Officer,
Wilmington Funds (2012-2014). |
Deidre E. Walsh
1971 | Secretary,
Vice President
and Chief
Legal Officer | Since 2021 | Vice President of CRM and officer of 42 registered investment companies
advised by CRM (since 2021). Also Vice President of Eaton Vance and
certain of its affiliates and officer of 136 registered investment companies
advised or administered by Eaton Vance. |
James F. Kirchner
1967 | Treasurer | Since 2016 | Vice President of CRM and officer of 42 registered investment companies
advised by CRM (since 2016). Also Vice President of Eaton Vance and
certain of its affiliates and officer of 136 registered investment companies
advised or administered by Eaton Vance. |
| | | | |
| (1) Mr. Streur is an interested person of the Funds because of his positions with the Funds' adviser and certain affiliates. |
The SAI for the Funds includes additional information about the Trustees and officers of the Funds and can be obtained without charge on Calvert’s website at www.calvert.com or by calling 1-800-368-2745.
| FACTS | WHAT DOES EATON VANCE DO WITH YOUR
PERSONAL INFORMATION? |
| Why? | Financial companies choose how they share your personal information. Federal law gives consumers the right to limit some but not all sharing. Federal law also requires us to tell you how we collect, share, and protect your personal information. Please read this notice carefully to understand what we do. |
| |
| What? | The types of personal information we collect and share depend on the product or service you have with us. This information can include:■ Social Security number and income
■
investment experience and risk tolerance
■
checking account number and wire transfer instructions |
| |
| How? | All financial companies need to share customers’ personal information to run their everyday business. In the section below, we list the reasons financial companies can share their customers’ personal information; the reasons Eaton Vance chooses to share; and whether you can limit this sharing. |
Reasons we can share your
personal information | Does Eaton Vance
share? | Can you limit
this sharing? |
| For our everyday business purposes — such as to process your transactions, maintain your account(s), respond to court orders and legal investigations, or report to credit bureaus | Yes | No |
| For our marketing purposes — to offer our products and services to you | Yes | No |
| For joint marketing with other financial companies | No | We don’t share |
| For our investment management affiliates’ everyday business purposes — information about your transactions, experiences, and creditworthiness | Yes | Yes |
| For our affiliates’ everyday business purposes — information about your transactions and experiences | Yes | No |
| For our affiliates’ everyday business purposes — information about your creditworthiness | No | We don’t share |
| For our investment management affiliates to market to you | Yes | Yes |
| For our affiliates to market to you | No | We don’t share |
| For nonaffiliates to market to you | No | We don’t share |
To limit our
sharing | Call toll-free 1-800-368-2745 or email: CRMPrivacy@calvert.comPlease note:If you are a new customer, we can begin sharing your information 30 days from the date we sent this notice. When you are no longer our customer, we continue to share your information as described in this notice. However, you can contact us at any time to limit our sharing. |
| Questions? | Call toll-free 1-800-368-2745 or email: CRMPrivacy@calvert.com |
| Privacy Notice — continued | April 2021 |
| Who we are |
| Who is providing this notice? | Eaton Vance Management, Eaton Vance Distributors, Inc., Eaton Vance Trust Company, Eaton Vance Management (International) Limited, Eaton Vance Advisers International Ltd., Eaton Vance Global Advisors Limited, Eaton Vance Management’s Real Estate Investment Group, Boston Management and Research, Calvert Research and Management, Eaton Vance and Calvert Fund Families and our investment advisory affiliates (“Eaton Vance”) (see Investment Management Affiliates definition below) |
| What we do |
How does Eaton Vance
protect my personal
information? | To protect your personal information from unauthorized access and use, we use security measures that comply with federal law. These measures include computer safeguards and secured files and buildings. We have policies governing the proper handling of customer information by personnel and requiring third parties that provide support to adhere to appropriate security standards with respect to such information. |
How does Eaton Vance
collect my personal
information? | We collect your personal information, for example, when you■ open an account or make deposits or withdrawals from your account
■
buy securities from us or make a wire transfer
■
give us your contact informationWe also collect your personal information from others, such as credit bureaus, affiliates, or other companies. |
| Why can’t I limit all sharing? | Federal law gives you the right to limit only■ sharing for affiliates’ everyday business purposes — information about your creditworthiness
■
affiliates from using your information to market to you
■
sharing for nonaffiliates to market to youState laws and individual companies may give you additional rights to limit sharing. See below for more on your rights under state law. |
| Definitions |
Investment Management
Affiliates | Eaton Vance Investment Management Affiliates include registered investment advisers, registered broker- dealers, and registered and unregistered funds. Investment Management Affiliates does not include entities associated with Morgan Stanley Wealth Management, such as Morgan Stanley Smith Barney LLC and Morgan Stanley & Co. |
| Affiliates | Companies related by common ownership or control. They can be financial and nonfinancial companies.■ Our affiliates include companies with a Morgan Stanley name and financial companies such as Morgan Stanley Smith Barney LLC and Morgan Stanley & Co. |
| Nonaffiliates | Companies not related by common ownership or control. They can be financial and nonfinancial companies.■ Eaton Vance does not share with nonaffiliates so they can market to you. |
| Joint marketing | A formal agreement between nonaffiliated financial companies that together market financial products or services to you.■ Eaton Vance doesn’t jointly market. |
| Other important information |
| Vermont: Except as permitted by law, we will not share personal information we collect about Vermont residents with Nonaffiliates unless you provide us with your written consent to share such information.California: Except as permitted by law, we will not share personal information we collect about California residents with Nonaffiliates and we will limit sharing such personal information with our Affiliates to comply with California privacy laws that apply to us. |
Delivery of Shareholder Documents. The Securities and Exchange Commission (SEC) permits funds to deliver only one copy of shareholder documents, including prospectuses, proxy statements and shareholder reports, to fund investors with multiple accounts at the same residential or post office box address. This practice is often called “householding” and it helps eliminate duplicate mailings to shareholders. Calvert funds, or your financial intermediary, may household the mailing of your documents indefinitely unless you instruct Calvert funds, or your financial intermediary, otherwise. If you would prefer that your Calvert fund documents not be householded, please contact Calvert funds at 1-800-368-2745, or contact your financial intermediary. Your instructions that householding not apply to delivery of your Calvert fund documents will typically be effective within 30 days of receipt by Calvert funds or your financial intermediary.
Portfolio Holdings. Each Calvert fund files a schedule of portfolio holdings on Part F to Form N-PORT with the SEC. Certain information filed on Form N-PORT may be viewed on the Calvert website at www.calvert.com, by calling Calvert at 1-800-368-2745 or in the EDGAR database on the SEC’s website at www.sec.gov.
Proxy Voting. The Proxy Voting Guidelines that each Calvert fund uses to determine how to vote proxies relating to portfolio securities is provided as an Appendix to the fund’s Statement of Additional Information. The Statement of Additional Information can be obtained free of charge by calling the Calvert funds at 1-800-368-2745, by visiting the Calvert funds’ website at www.calvert.com or visiting the SEC’s website at www.sec.gov. Information regarding how a Calvert fund voted proxies relating to portfolio securities during the most recent 12-month period ended June 30 is available by calling Calvert funds, by visiting the Calvert funds’ website at www.calvert.com or by visiting the SEC’s website at www.sec.gov.
This Page Intentionally Left Blank
This Page Intentionally Left Blank
Investment Adviser and Administrator
Calvert Research and Management
1825 Connecticut Avenue NW, Suite 400
Washington, DC 20009
Calvert Equity Fund - Investment Sub-Adviser
Atlanta Capital Management Company, LLC
1075 Peachtree Street, Suite 2100
Atlanta, GA 30309
Principal Underwriter*
Eaton Vance Distributors, Inc.
Two International Place
Boston, MA 02110
(617) 482-8260
Custodian
State Street Bank and Trust Company
State Street Financial Center, One Lincoln Street
Boston, MA 02111
Transfer Agent
DST Asset Manager Solutions, Inc.
2000 Crown Colony Drive
Quincy, MA 02169
Independent Registered Public Accounting Firm
Deloitte & Touche LLP
200 Berkeley Street
Boston, MA 02116-5022
Fund Offices
1825 Connecticut Avenue NW, Suite 400
Washington, DC 20009
* FINRA BrokerCheck. Investors may check the background of their Investment Professional by contacting the Financial Industry Regulatory Authority (FINRA). FINRA BrokerCheck is a free tool to help investors check the professional background of current and former FINRA-registered securities firms and brokers. FINRA BrokerCheck is available by calling 1-800-289-9999 and at www.FINRA.org. The FINRA BrokerCheck brochure describing this program is available to investors at www.FINRA.org.
Printed on recycled paper.
24203 9.30.22
Calvert
Asset Allocation Funds
Annual Report
September 30, 2022
Conservative Allocation • Moderate Allocation • Growth Allocation
Commodity Futures Trading Commission Registration. The Commodity Futures Trading Commission (“CFTC”) has adopted regulations that subject registered investment companies and advisers to regulation by the CFTC if a fund invests more than a prescribed level of its assets in certain CFTC-regulated instruments (including futures, certain options and swap agreements) or markets itself as providing investment exposure to such instruments. The adviser has claimed an exclusion from the definition of “commodity pool operator” under the Commodity Exchange Act with respect to its management of each Fund and the other funds it manages. Accordingly, neither the Funds nor the adviser is subject to CFTC regulation.
Fund shares are not insured by the FDIC and are not deposits or other obligations of, or guaranteed by, any depository institution. Shares are subject to investment risks, including possible loss of principal invested.
This report must be preceded or accompanied by a current summary prospectus or prospectus. Before investing, investors should consider carefully the investment objective, risks, and charges and expenses of a mutual fund. This and other important information is contained in the summary prospectus and prospectus, which can be obtained from a financial intermediary. Prospective investors should read the prospectus carefully before investing. For further information, please call 1-800-368-2745.
Choose Planet-friendly E-delivery!
Sign up now for on-line statements, prospectuses, and fund reports. In less than five minutes you can help reduce paper mail and lower fund costs.
Just go to www.calvert.com. If you already have an online account with the Calvert funds, click on Login to access your Account and select the documents you would like to receive via e-mail.
If you’re new to online account access, click on Login, then Register to create your user name and password. Once you’re in, click on the E-delivery sign-up on the Account Portfolio page and follow the quick, easy steps.
Note: If your shares are not held directly with the Calvert funds but through a brokerage firm, you must contact your broker for electronic delivery options available through their firm.
Annual Report September 30, 2022
Calvert
Asset Allocation Funds
Calvert
Asset Allocation Funds
September 30, 2022
Management's Discussion of Fund Performance†
Economic and Market Conditions
The 12-month period starting October 1, 2021, was dominated by the ongoing effects of the COVID-19 pandemic and fallout from Russia’s invasion of Ukraine.
In the opening months of the period — despite the appearance of a new COVID-19 variant, the highest U.S. inflation readings in nearly four decades, and the U.S. Federal Reserve (the Fed) announcing it would begin tapering bond purchases — major U.S. equity indexes attained successive new highs.
But in February, Russia’s invasion of Ukraine sent shock waves through U.S. and global markets, exacerbating inflationary pressures on energy and food costs. Stock performance turned negative. Investors began to expect multiple interest rate hikes in the months ahead and worried that lower demand might lead to an economic recession. Between June and the end of September, the Fed hiked the federal funds rate three times — 0.75% each — and stock prices demonstrated sharp volatility.
For the period as a whole, the S& P 500® Index returned -15.47%; and the Nasdaq Composite Index returned -26.25%.
For fixed-income assets, high inflation and attempts by global central banks to intentionally slow demand by raising interest rates, resulted in a period-long sell-off, with nearly all major U.S. bond indexes reporting double-digit declines.
In the opening months of the period, interest rates rose and bond prices fell in anticipation the Fed would begin a tapering policy to reduce monetary stimulus within the U.S. economy. As the Fed began to slow the pace of monthly bond purchases, U.S. Treasury rates rose amid mounting concerns over the prospect of multiple Fed rate hikes in 2022. That February, the invasion of Ukraine added to inflationary pressures, and interest rates rose during most of the spring and summer months.
By period-end, the Bloomberg U.S. Treasury Index returned -12.94%; the Bloomberg U.S. Corporate Bond Index returned -18.53%; and the Bloomberg U.S. Corporate High Yield Index returned -14.14%.
Fund Performance - Calvert Conservative Allocation Fund
For the 12-month period ended September 30, 2022, Calvert Conservative Allocation Fund (the Fund) returned -16.18% for Class A shares at net asset value (NAV). The Fund underperformed its primary benchmark, the Bloomberg U.S. Aggregate Bond Index (the Index), which returned -14.60%; and outperformed its secondary benchmark, the Conservative Allocation Blended Benchmark (the Blended Index), which returned -16.30% during the period.
The Blended Index is an internally constructed benchmark comprising a blend of 25% Russell 3000® Index, 10% MSCI ACWI ex USA Investable Market Index, and 65% Bloomberg U.S. Aggregate Bond Index.
The Fund is a “fund of funds” and typically invests 50%-80% of its net assets in underlying Calvert funds that invest primarily in income securities, and 20%-50% of its net assets in underlying Calvert funds that invest primarily in equity securities. The Fund may invest up to 10% of its net assets in cash and short-term money market instruments.
The Fund’s slight underweight exposure to equities contributed to performance relative to the Blended Index during the period. An overweight exposure to cash also helped relative performance.
The Fund’s fixed-income allocations further enhanced relative returns during the period. In particular, a shorter-than-Blended Index duration and the Fund’s overweight exposure to non-investment-grade sectors — specifically floating-rate loans — were beneficial. Yields rose during the period and the more credit-sensitive sectors of the fixed-income market outperformed the more interest-rate sensitive ones.
The Calvert Bond Fund, a sizeable allocation within the fixed-income portion of the Fund, outperformed its bond index due in part to its shorter duration profile as well as overweight exposures to corporate and securitized holdings.
Overall, underlying fund allocations within the equity portion of the Fund did not have a meaningful impact on performance relative to the Blended Index. Within the Fund’s equity allocations, an overweight exposure to value stocks contributed to relative returns. However, overweight exposures to small- and mid-cap stocks, as well as an overweight exposure to non-U.S. stocks, weighed on relative returns during the period.
Many of the underlying Calvert equity funds underperformed their own benchmarks during the period, detracting from relative performance. This was primarily a result of these funds’ underweight allocations to the energy sector — the best-performing sector during the period. Calvert Small-Cap Fund and Calvert Emerging Markets Advancement Fund were notable exceptions as both significantly outperformed their benchmarks. Calvert Emerging Markets Advancement Fund benefited from its lack of exposure to Russia and an underweight exposure to China during most of the period.
An out-of-Blended Index allocation to U.S. Treasury Inflation-Protected Securities (TIPS) aided Fund performance, as TIPS outperformed the fixed-income benchmark component during the period.
See Endnotes and Additional Disclosures in this report.
Past performance is no guarantee of future results. Returns are historical and are calculated by determining the percentage change in net asset value (NAV) or offering price (as applicable) with all distributions reinvested. Furthermore, returns do not reflect the deduction of taxes that shareholders may have to pay on Fund distributions or upon the redemption of Fund shares. Investment return and principal value will fluctuate so that shares, when redeemed, may be worth more or less than their original cost. Performance for periods less than or equal to one year is cumulative. Performance is for the stated time period only; due to market volatility, current Fund performance may be lower or higher than the quoted return. For performance as of the most recent month-end, please refer to www.calvert.com.
Calvert
Asset Allocation Funds
September 30, 2022
Management's Discussion of Fund Performance† — continued
The Fund’s use of derivatives for duration management had a negative impact on returns.
Fund Performance - Calvert Moderate Allocation Fund
For the 12-month period ended September 30, 2022, Calvert Moderate Allocation Fund (the Fund) returned -17.91% for Class A shares at net asset value (NAV). The Fund underperformed its primary benchmark, the Russell 3000® Index (the Index), which returned -17.63%; and outperformed its secondary benchmark, the Moderate Allocation Blended Benchmark (the Blended Index), which returned -18.03% during the period.
The Blended Index is an internally constructed benchmark comprising a blend of 45% Russell 3000® Index, 20% MSCI ACWI ex USA Investable Market Index, and 35% Bloomberg U.S. Aggregate Bond Index.
The Fund is a “fund of funds” and typically invests 20%-50% of its net assets in underlying Calvert funds that invest primarily in income securities, and 50%-80% of its net assets in underlying Calvert funds that invest primarily in equity securities. The Fund may invest up to 10% of its net assets in cash and short-term money market instruments.
The Fund’s slight underweight exposure to equities contributed to performance relative to the Blended Index during the period. An overweight exposure to cash also helped relative performance.
The Fund’s income allocations further enhanced relative returns during the period. In particular, a shorter-than-Blended Index duration and the Fund’s overweight exposure to non-investment-grade sectors — specifically floating-rate loans — were beneficial. Yields rose during the period and the more credit-sensitive sectors of the fixed-income market outperformed the more interest-rate sensitive ones.
The Calvert Bond Fund, a sizeable allocation within the fixed-income portion of the Fund, outperformed its bond index due in part to its shorter duration profile as well as overweight exposures to corporate and securitized holdings.
Overall, underlying fund allocations within the equity portion of the Fund did not have a meaningful impact on performance relative to the Blended Index. Within the Fund’s equity allocations, an overweight exposure to value stocks contributed to relative returns. However, overweight exposures to small-and mid-cap stocks, as well as an overweight exposure to non-U.S. stocks, weighed on relative returns during the period.
Many of the underlying Calvert equity funds underperformed their own benchmarks during the period, detracting from relative performance. This was primarily a result of these funds’ underweight allocations to the energy sector — the best-performing sector during the period. Calvert Small-Cap Fund and Calvert Emerging Markets Advancement Fund were notable exceptions as both significantly outperformed their benchmarks. Calvert Emerging Markets Advancement Fund benefited from its lack of exposure to Russia and an underweight exposure to China during most of the period.
An out-of-Blended Index allocation to U.S. Treasury Inflation-Protected Securities (TIPS) aided Fund performance, as TIPS outperformed the fixed-income benchmark component during the period.
The Fund’s use of derivatives for duration management had a negative impact on returns.
Fund Performance - Calvert Growth Allocation Fund
For the 12-month period ended September 30, 2022, Calvert Growth Allocation Fund (the Fund) returned -20.97% for Class A shares at net asset value (NAV). The Fund underperformed its primary benchmark, the Russell 3000 Index (the Index), which returned -17.63%; and underperformed its secondary benchmark, the Growth Allocation Blended Benchmark (the Blended Index), which returned -19.71% during the period.
The Blended Index is an internally constructed benchmark comprising a blend of 60% Russell 3000® Index, 30% MSCI ACWI ex USA Investable Market Index, and 10% Bloomberg U.S. Aggregate Bond Index.
The Fund is a “fund of funds” and typically invests 0%-20% of its net assets in underlying Calvert funds that invest primarily in income securities, and 80%-100% of its net assets in underlying Calvert funds that invest primarily in equity securities. The Fund may invest up to 10% of its net assets in cash and short-term money market instruments.
Overall, underlying fund allocations within the equity portion of the Fund did not have a meaningful impact on performance relative to the Blended Index. Within the Fund’s equity allocations, an overweight exposure to value stocks contributed to relative returns. However, overweight exposures to small-and mid-cap stocks, as well as an overweight exposure to non-U.S. stocks, weighed on relative returns during the period.
See Endnotes and Additional Disclosures in this report.
Past performance is no guarantee of future results. Returns are historical and are calculated by determining the percentage change in net asset value (NAV) or offering price (as applicable) with all distributions reinvested. Furthermore, returns do not reflect the deduction of taxes that shareholders may have to pay on Fund distributions or upon the redemption of Fund shares. Investment return and principal value will fluctuate so that shares, when redeemed, may be worth more or less than their original cost. Performance for periods less than or equal to one year is cumulative. Performance is for the stated time period only; due to market volatility, current Fund performance may be lower or higher than the quoted return. For performance as of the most recent month-end, please refer to www.calvert.com.
Calvert
Asset Allocation Funds
September 30, 2022
Management's Discussion of Fund Performance† — continued
Many of the underlying Calvert equity funds underperformed their own benchmarks during the period, detracting from relative performance. This was primarily a result of these funds’ underweight allocations to the energy sector — the best-performing sector during the period. Calvert Small-Cap Fund and Calvert Emerging Markets Advancement Fund were notable exceptions as both significantly outperformed their benchmarks. Calvert Emerging Markets Advancement Fund benefited from its lack of exposure to Russia and underweight exposure to China during most of the period.
On the up side, the Fund’s slight underweight exposure to equities generally, contributed to performance relative to the Blended Index during the period. An overweight exposure to cash also helped relative performance.
The Fund’s income allocations further enhanced relative returns during the period. In particular, a shorter-than-Blended Index duration and the Fund’s overweight exposure to non-investment-grade sectors — specifically floating-rate loans — were beneficial. Yields rose during the period and the more credit-sensitive sectors of the fixed-income market outperformed the more interest-rate sensitive ones.
The Calvert Bond Fund, a sizeable allocation within the fixed-income portion of the Fund, outperformed its bond index due in part to its shorter duration profile as well as overweight exposures to corporate and securitized holdings. An out-of-Blended Index allocation to U.S. Treasury Inflation-Protected Securities (TIPS) aided Fund performance, as TIPS outperformed the fixed-income benchmark component during the period.
See Endnotes and Additional Disclosures in this report.
Past performance is no guarantee of future results. Returns are historical and are calculated by determining the percentage change in net asset value (NAV) or offering price (as applicable) with all distributions reinvested. Furthermore, returns do not reflect the deduction of taxes that shareholders may have to pay on Fund distributions or upon the redemption of Fund shares. Investment return and principal value will fluctuate so that shares, when redeemed, may be worth more or less than their original cost. Performance for periods less than or equal to one year is cumulative. Performance is for the stated time period only; due to market volatility, current Fund performance may be lower or higher than the quoted return. For performance as of the most recent month-end, please refer to www.calvert.com.
Calvert
Conservative Allocation Fund
September 30, 2022
Performance
Portfolio Manager(s) Justin H. Bourgette, CFA and Schuyler Hooper, CFA, each of Calvert Research and Management
| % Average Annual Total Returns1,2 | Class
Inception Date | Performance
Inception Date | One Year | Five Years | Ten Years |
| Class A at NAV | 04/29/2005 | 04/29/2005 | (16.18)% | 2.38% | 4.08% |
| Class A with 5.25% Maximum Sales Charge | — | — | (20.59) | 1.28 | 3.52 |
| Class C at NAV | 04/29/2005 | 04/29/2005 | (16.83) | 1.62 | 3.37 |
| Class C with 1% Maximum Deferred Sales Charge | — | — | (17.63) | 1.62 | 3.37 |
| Class I at NAV | 05/20/2016 | 04/29/2005 | (16.00) | 2.66 | 4.27 |
| Class R6 at NAV | 02/01/2022 | 04/29/2005 | (15.96) | 2.67 | 4.28 |
|
| Bloomberg U.S. Aggregate Bond Index | — | — | (14.60)% | (0.27)% | 0.89% |
| Conservative Allocation Blended Benchmark | — | — | (16.30) | 2.17 | 3.90 |
| % Total Annual Operating Expense Ratios3 | Class A | Class C | Class I | Class R6 |
| | 0.86% | 1.61% | 0.61% | 0.57% |
Growth of $10,000
This graph shows the change in value of a hypothetical investment of $10,000 in Class A of the Fund for the period indicated. For comparison, the same investment is shown in the indicated index.
| Growth of Investment2 | Amount Invested | Period Beginning | At NAV | With Maximum Sales Charge |
| Class C | $10,000 | 09/30/2012 | $13,936 | N.A. |
| Class I, at minimum investment | $1,000,000 | 09/30/2012 | $1,520,103 | N.A. |
| Class R6, at minimum investment | $5,000,000 | 09/30/2012 | $7,603,837 | N.A. |
See Endnotes and Additional Disclosures in this report.
Past performance is no guarantee of future results. Returns are historical and are calculated by determining the percentage change in net asset value (NAV) or offering price (as applicable) with all distributions reinvested. Furthermore, returns do not reflect the deduction of taxes that shareholders may have to pay on Fund distributions or upon the redemption of Fund shares. Investment return and principal value will fluctuate so that shares, when redeemed, may be worth more or less than their original cost. Performance for periods less than or equal to one year is cumulative. Performance is for the stated time period only; due to market volatility, current Fund performance may be lower or higher than the quoted return. For performance as of the most recent month-end, please refer to www.calvert.com.
Calvert
Conservative Allocation Fund
September 30, 2022
| Asset Allocation (% of total investments) |
| Top 10 Holdings (% of net assets)1 | |
| Calvert Bond Fund, Class R6 | 40.4% |
| Calvert US Large-Cap Value Responsible Index Fund, Class I | 8.8 |
| Calvert Ultra-Short Duration Income Fund, Class R6 | 6.5 |
| Calvert Flexible Bond Fund, Class R6 | 5.3 |
| Calvert Floating-Rate Advantage Fund, Class R6 | 4.7 |
| Calvert High Yield Bond Fund, Class R6 | 3.6 |
| Calvert Equity Fund, Class R6 | 3.6 |
| Calvert US Large-Cap Growth Responsible Index Fund, Class I | 3.3 |
| Calvert Short Duration Income Fund, Class R6 | 3.3 |
| Calvert International Equity Fund, Class R6 | 3.1 |
| Total | 82.6% |
Footnotes:
| 1 | Excludes cash and cash equivalents. |
Calvert
Moderate Allocation Fund
September 30, 2022
Performance
Portfolio Manager(s) Justin H. Bourgette, CFA and Schuyler Hooper, CFA, each of Calvert Research and Management
| % Average Annual Total Returns1,2 | Class
Inception Date | Performance
Inception Date | One Year | Five Years | Ten Years |
| Class A at NAV | 04/29/2005 | 04/29/2005 | (17.91)% | 3.84% | 6.16% |
| Class A with 5.25% Maximum Sales Charge | — | — | (22.22) | 2.73 | 5.59 |
| Class C at NAV | 04/29/2005 | 04/29/2005 | (18.50) | 3.08 | 5.53 |
| Class C with 1% Maximum Deferred Sales Charge | — | — | (19.27) | 3.08 | 5.53 |
| Class I at NAV | 05/20/2016 | 04/29/2005 | (17.69) | 4.13 | 6.36 |
| Class R6 at NAV | 02/01/2022 | 04/29/2005 | (17.66) | 4.14 | 6.36 |
|
| Russell 3000® Index | — | — | (17.63)% | 8.61% | 11.38% |
| Moderate Allocation Blended Benchmark | — | — | (18.03) | 3.90 | 6.23 |
| % Total Annual Operating Expense Ratios3 | Class A | Class C | Class I | Class R6 |
| | 0.86% | 1.61% | 0.61% | 0.57% |
Growth of $10,000
This graph shows the change in value of a hypothetical investment of $10,000 in Class A of the Fund for the period indicated. For comparison, the same investment is shown in the indicated index.
| Growth of Investment2 | Amount Invested | Period Beginning | At NAV | With Maximum Sales Charge |
| Class C | $10,000 | 09/30/2012 | $17,138 | N.A. |
| Class I, at minimum investment | $1,000,000 | 09/30/2012 | $1,852,980 | N.A. |
| Class R6, at minimum investment | $5,000,000 | 09/30/2012 | $9,268,271 | N.A. |
See Endnotes and Additional Disclosures in this report.
Past performance is no guarantee of future results. Returns are historical and are calculated by determining the percentage change in net asset value (NAV) or offering price (as applicable) with all distributions reinvested. Furthermore, returns do not reflect the deduction of taxes that shareholders may have to pay on Fund distributions or upon the redemption of Fund shares. Investment return and principal value will fluctuate so that shares, when redeemed, may be worth more or less than their original cost. Performance for periods less than or equal to one year is cumulative. Performance is for the stated time period only; due to market volatility, current Fund performance may be lower or higher than the quoted return. For performance as of the most recent month-end, please refer to www.calvert.com.
Calvert
Moderate Allocation Fund
September 30, 2022
| Asset Allocation (% of total investments) |
| Top 10 Holdings (% of net assets)1 | |
| Calvert Bond Fund, Class R6 | 15.8% |
| Calvert US Large-Cap Value Responsible Index Fund, Class I | 12.7 |
| Calvert US Large-Cap Core Responsible Index Fund, Class R6 | 8.2 |
| Calvert Ultra-Short Duration Income Fund, Class R6 | 6.6 |
| Calvert International Equity Fund, Class R6 | 5.3 |
| Calvert Emerging Markets Advancement Fund, Class I | 4.5 |
| Calvert Equity Fund, Class R6 | 4.4 |
| Calvert International Opportunities Fund, Class R6 | 4.4 |
| Calvert Flexible Bond Fund, Class R6 | 4.3 |
| Calvert US Large-Cap Growth Responsible Index Fund, Class I | 4.3 |
| Total | 70.5% |
Footnotes:
| 1 | Excludes cash and cash equivalents. |
Calvert
Growth Allocation Fund
September 30, 2022
Performance
Portfolio Manager(s) Justin H. Bourgette, CFA and Schuyler Hooper, CFA, each of Calvert Research and Management
| % Average Annual Total Returns1,2 | Class
Inception Date | Performance
Inception Date | One Year | Five Years | Ten Years |
| Class A at NAV | 06/30/2005 | 06/30/2005 | (20.97)% | 4.89% | 7.95% |
| Class A with 5.25% Maximum Sales Charge | — | — | (25.12) | 3.77 | 7.37 |
| Class C at NAV | 06/30/2005 | 06/30/2005 | (21.54) | 4.11 | 7.16 |
| Class C with 1% Maximum Deferred Sales Charge | — | — | (22.30) | 4.11 | 7.16 |
| Class I at NAV | 05/20/2016 | 06/30/2005 | (20.81) | 5.16 | 8.14 |
| Class R6 at NAV | 02/01/2022 | 06/30/2005 | (20.77) | 5.17 | 8.14 |
|
| Russell 3000® Index | — | — | (17.63)% | 8.61% | 11.38% |
| Growth Allocation Blended Benchmark | — | — | (19.71) | 5.00 | 7.94 |
| % Total Annual Operating Expense Ratios3 | Class A | Class C | Class I | Class R6 |
| Gross | 0.93% | 1.68% | 0.68% | 0.64% |
| Net | 0.92 | 1.67 | 0.67 | 0.63 |
Growth of $10,000
This graph shows the change in value of a hypothetical investment of $10,000 in Class A of the Fund for the period indicated. For comparison, the same investment is shown in the indicated index.
| Growth of Investment2 | Amount Invested | Period Beginning | At NAV | With Maximum Sales Charge |
| Class C | $10,000 | 09/30/2012 | $19,981 | N.A. |
| Class I, at minimum investment | $1,000,000 | 09/30/2012 | $2,187,907 | N.A. |
| Class R6, at minimum investment | $5,000,000 | 09/30/2012 | $10,944,794 | N.A. |
See Endnotes and Additional Disclosures in this report.
Past performance is no guarantee of future results. Returns are historical and are calculated by determining the percentage change in net asset value (NAV) or offering price (as applicable) with all distributions reinvested. Furthermore, returns do not reflect the deduction of taxes that shareholders may have to pay on Fund distributions or upon the redemption of Fund shares. Investment return and principal value will fluctuate so that shares, when redeemed, may be worth more or less than their original cost. Performance for periods less than or equal to one year is cumulative. Performance is for the stated time period only; due to market volatility, current Fund performance may be lower or higher than the quoted return. For performance as of the most recent month-end, please refer to www.calvert.com.
Calvert
Growth Allocation Fund
September 30, 2022
| Asset Allocation (% of total investments) |
| Top 10 Holdings (% of net assets)1 | |
| Calvert US Large-Cap Value Responsible Index Fund, Class I | 17.1% |
| Calvert US Large-Cap Core Responsible Index Fund, Class R6 | 13.5 |
| Calvert International Equity Fund, Class R6 | 8.5 |
| Calvert International Opportunities Fund, Class R6 | 7.1 |
| Calvert International Responsible Index Fund, Class R6 | 6.5 |
| Calvert Emerging Markets Advancement Fund, Class I | 6.5 |
| Calvert US Large-Cap Growth Responsible Index Fund, Class I | 5.7 |
| Calvert Equity Fund, Class R6 | 5.6 |
| Calvert Emerging Markets Equity Fund, Class R6 | 4.9 |
| Calvert US Mid-Cap Core Responsible Index Fund, Class I | 4.4 |
| Total | 79.8% |
Footnotes:
| 1 | Excludes cash and cash equivalents. |
Calvert
Asset Allocation Funds
September 30, 2022
Endnotes and Additional Disclosures
| † | The views expressed in this report are those of the portfolio manager(s) and are current only through the date stated at the top of this page. These views are subject to change at any time based upon market or other conditions, and Calvert and the Fund(s) disclaim any responsibility to update such views. These views may not be relied upon as investment advice and, because investment decisions are based on many factors, may not be relied upon as an indication of trading intent on behalf of any Calvert fund. This commentary may contain statements that are not historical facts, referred to as “forward-looking statements.” The Fund’s actual future results may differ significantly from those stated in any forward-looking statement, depending on factors such as changes in securities or financial markets or general economic conditions, the volume of sales and purchases of Fund shares, the continuation of investment advisory, administrative and service contracts, and other risks discussed from time to time in the Fund’s filings with the Securities and Exchange Commission. |
| | |
| 1 | Bloomberg U.S. Aggregate Bond Index is an unmanaged index of domestic investment-grade bonds, including corporate, government and mortgage-backed securities. Russell 3000® Index is an unmanaged index of the 3,000 largest U.S. stocks. MSCI ACWI ex USA Investable Market Index is an unmanaged free-float-adjusted market-capitalization-weighted index designed to measure the equity market performance of developed and emerging markets, excluding the United States, with comprehensive coverage of securities in those markets. MSCI indexes are net of foreign withholding taxes. Source: MSCI. MSCI data may not be reproduced or used for any other purpose. MSCI provides no warranties, has not prepared or approved this report, and has no liability hereunder. The Conservative Allocation Blended Benchmark is an internally constructed benchmark which is comprised of a blend of 25% Russell 3000® Index, 10% MSCI ACWI ex USA Investable Market Index and 65% Bloomberg U.S. Aggregate Bond Index, and is rebalanced monthly. The Moderate Allocation Blended Benchmark is an internally constructed benchmark which is comprised of a blend of 45% Russell 3000® Index, 20% MSCI ACWI ex USA Investable Market Index and 35% Bloomberg U.S. Aggregate Bond Index, and is rebalanced monthly. The Growth Allocation Blended Benchmark is an internally constructed benchmark which is comprised of a blend of 60% Russell 3000® Index, 30% MSCI ACWI ex USA Investable Market Index and 10% Bloomberg U.S. Aggregate Bond Index, and is rebalanced monthly. Unless otherwise stated, index returns do not reflect the effect of any applicable sales charges, commissions, expenses, taxes or leverage, as applicable. It is not possible to invest directly in an index. |
| 2 | Total Returns at NAV do not include applicable sales charges. If sales charges were deducted, the returns would be lower. Total Returns shown with maximum sales charge reflect the stated maximum sales charge. Unless otherwise stated, performance does not reflect the deduction of taxes on Fund distributions or redemptions of Fund shares.Performance prior to the inception date of a class may be linked to the performance of an older class of the Fund. This linked performance is adjusted for any applicable sales charge, but is not adjusted for class expense differences. If adjusted for such differences, the performance would be different. The performance of Class I is linked to Class A and the performance of Class R6 is linked to Class I. Performance presented in the Financial Highlights included in the financial statements is not linked.Effective November 5, 2020, Class C shares automatically convert to Class A shares eight years after purchase. The average annual total returns listed for Class C reflect conversion to Class A shares after eight years. Prior to November 5, 2020, Class C shares automatically converted to Class A shares ten years after purchase.Calvert Research and Management became the investment adviser to each Fund on December 31, 2016. Performance reflected prior to such date is that of each Fund’s former investment adviser. |
| 3 | Source: Fund prospectus. Net expense ratios for Calvert Growth Allocation Fund reflect a contractual expense reimbursement that continues through 1/31/23. The expense ratios for the current reporting period can be found in the Financial Highlights section of this report. Performance reflects expenses waived and/or reimbursed, if applicable. Without such waivers and/or reimbursements, performance would have been lower. |
| Fund profiles subject to change due to active management. |
| Additional Information |
| | S&P 500® Index is an unmanaged index of large-cap stocks commonly used as a measure of U.S. stock market performance. S&P Dow Jones Indices are a product of S&P Dow Jones Indices LLC (“S&P DJI”) and have been licensed for use. S&P® and S&P 500® are registered trademarks of S&P DJI; Dow Jones® is a registered trademark of Dow Jones Trademark Holdings LLC (“Dow Jones”); S&P DJI, Dow Jones and their respective affiliates do not sponsor, endorse, sell or promote the Fund, will not have any liability with respect thereto and do not have any liability for any errors, omissions, or interruptions of the S&P Dow Jones Indices. Nasdaq Composite Index is a market capitalization-weighted index of all domestic and international securities listed on Nasdaq. Source: Nasdaq, Inc. The information is provided by Nasdaq (with its affiliates, are referred to as the “Corporations”) and Nasdaq’s third party licensors on an “as |
Calvert
Asset Allocation Funds
September 30, 2022
Endnotes and Additional Disclosures — continued
| | is” basis and the Corporations make no guarantees and bear no liability of any kind with respect to the information or the Fund. Bloomberg U.S. Treasury Index measures the performance of U.S. Treasuries with a maturity of one year or more. Bloomberg U.S. Corporate Bond Index measures the performance of investment-grade U.S. corporate securities with a maturity of one year or more. Bloomberg U.S. Corporate High Yield Index measures USD-denominated, non- investment grade corporate securities. |
| | Duration is a measure of the expected change in price of a bond — in percentage terms — given a one percent change in interest rates, all else being constant. Securities with lower durations tend to be less sensitive to interest rate changes. |
Calvert
Asset Allocation Funds
September 30, 2022
Example
As a Fund shareholder, you incur two types of costs: (1) transaction costs, including sales charges (loads) on purchases and redemption fees (if applicable); and (2) ongoing costs, including management fees; distribution and/or service fees; and other Fund expenses. This Example is intended to help you understand your ongoing costs (in dollars) of Fund investing and to compare these costs with the ongoing costs of investing in other mutual funds. The Example is based on an investment of $1,000 invested at the beginning of the period and held for the entire period (April 1, 2022 to September 30, 2022).
Actual Expenses
The first section of the tables below provides information about actual account values and actual expenses. You may use the information in this section, together with the amount you invested, to estimate the expenses that you paid over the period. Simply divide your account value by $1,000 (for example, an $8,600 account value divided by $1,000 = 8.6), then multiply the result by the number in the first section under the heading entitled “Expenses Paid During Period” to estimate the expenses you paid on your account during this period.
Hypothetical Example for Comparison Purposes
The second section of the tables below provides information about hypothetical account values and hypothetical expenses based on the actual Fund expense ratio and an assumed rate of return of 5% per year (before expenses), which is not the actual Fund return. The hypothetical account values and expenses may not be used to estimate the actual ending account balance or expenses you paid for the period. You may use this information to compare the ongoing costs of investing in the Fund and other funds. To do so, compare this 5% hypothetical example with the 5% hypothetical examples that appear in the shareholder reports of the other funds.
Please note that the expenses shown in the tables are meant to highlight your ongoing costs only and do not reflect any transactional costs, such as sales charges (loads) or redemption fees (if applicable). Therefore, the second section of the tables is useful in comparing ongoing costs only, and will not help you determine the relative total costs of owning different funds. In addition, if these transactional costs were included, your costs would be higher.
Calvert Conservative Allocation Fund
| | Beginning
Account Value
(4/1/22) | Ending
Account Value
(9/30/22) | Expenses Paid
During Period*
(4/1/22 – 9/30/22) | Annualized
Expense
Ratio |
| Actual | | | | |
| Class A | $1,000.00 | $ 870.00 | $1.92 | 0.41% |
| Class C | $1,000.00 | $ 866.50 | $5.43 | 1.16% |
| Class I | $1,000.00 | $ 870.70 | $0.75 | 0.16% |
| Class R6 | $1,000.00 | $ 871.50 | $0.52 | 0.11% |
| Hypothetical | | | | |
| (5% return per year before expenses) | | | | |
| Class A | $1,000.00 | $1,023.01 | $2.08 | 0.41% |
| Class C | $1,000.00 | $1,019.25 | $5.87 | 1.16% |
| Class I | $1,000.00 | $1,024.27 | $0.81 | 0.16% |
| Class R6 | $1,000.00 | $1,024.52 | $0.56 | 0.11% |
| * | Expenses are equal to the Fund's annualized expense ratio for the indicated Class, multiplied by the average account value over the period, multiplied by 183/365 (to reflect the one-half year period). The Example assumes that the $1,000 was invested at the net asset value per share determined at the close of business on March 31, 2022. Expenses do not include fees and expenses incurred indirectly from investment in underlying affiliated funds. |
Calvert
Asset Allocation Funds
September 30, 2022
Fund Expenses — continued
Calvert Moderate Allocation Fund
| | Beginning
Account Value
(4/1/22) | Ending
Account Value
(9/30/22) | Expenses Paid
During Period*
(4/1/22 – 9/30/22) | Annualized
Expense
Ratio |
| Actual | | | | |
| Class A | $1,000.00 | $ 842.90 | $1.89 | 0.41% |
| Class C | $1,000.00 | $ 839.60 | $5.35 | 1.16% |
| Class I | $1,000.00 | $ 843.80 | $0.74 | 0.16% |
| Class R6 | $1,000.00 | $ 844.00 | $0.42 | 0.09% |
| Hypothetical | | | | |
| (5% return per year before expenses) | | | | |
| Class A | $1,000.00 | $1,023.01 | $2.08 | 0.41% |
| Class C | $1,000.00 | $1,019.25 | $5.87 | 1.16% |
| Class I | $1,000.00 | $1,024.27 | $0.81 | 0.16% |
| Class R6 | $1,000.00 | $1,024.62 | $0.46 | 0.09% |
| * | Expenses are equal to the Fund's annualized expense ratio for the indicated Class, multiplied by the average account value over the period, multiplied by 183/365 (to reflect the one-half year period). The Example assumes that the $1,000 was invested at the net asset value per share determined at the close of business on March 31, 2022. Expenses do not include fees and expenses incurred indirectly from investment in underlying affiliated funds. |
Calvert Growth Allocation Fund
| | Beginning
Account Value
(4/1/22) | Ending
Account Value
(9/30/22) | Expenses Paid
During Period*
(4/1/22 – 9/30/22) | Annualized
Expense
Ratio |
| Actual | | | | |
| Class A | $1,000.00 | $ 807.20 | $1.95 ** | 0.43% |
| Class C | $1,000.00 | $ 804.40 | $5.34 ** | 1.18% |
| Class I | $1,000.00 | $ 807.80 | $0.82 ** | 0.18% |
| Class R6 | $1,000.00 | $ 808.20 | $0.63 ** | 0.14% |
| Hypothetical | | | | |
| (5% return per year before expenses) | | | | |
| Class A | $1,000.00 | $1,022.91 | $2.18 ** | 0.43% |
| Class C | $1,000.00 | $1,019.15 | $5.97 ** | 1.18% |
| Class I | $1,000.00 | $1,024.17 | $0.91 ** | 0.18% |
| Class R6 | $1,000.00 | $1,024.37 | $0.71 ** | 0.14% |
| * | Expenses are equal to the Fund's annualized expense ratio for the indicated Class, multiplied by the average account value over the period, multiplied by 183/365 (to reflect the one-half year period). The Example assumes that the $1,000 was invested at the net asset value per share determined at the close of business on March 31, 2022. Expenses do not include fees and expenses incurred indirectly from investment in underlying affiliated funds. |
| ** | Absent a waiver and/or reimbursement of expenses by an affiliate, expenses would be higher. |
Calvert
Conservative Allocation Fund
September 30, 2022
| Security | Shares | Value |
| Equity Funds — 31.3% | |
| Calvert Impact Fund, Inc.: | | | |
| Calvert Small-Cap Fund, Class R6 | | 159,003 | $ 4,412,330 |
| Calvert Responsible Index Series, Inc.: | | | |
| Calvert International Responsible Index Fund, Class R6 | | 198,108 | 4,255,356 |
| Calvert US Large-Cap Core Responsible Index Fund, Class R6 | | 135,944 | 4,264,574 |
| Calvert US Large-Cap Growth Responsible Index Fund, Class I | | 220,137 | 8,486,260 |
| Calvert US Large-Cap Value Responsible Index Fund, Class I | | 911,382 | 22,820,997 |
| Calvert US Mid-Cap Core Responsible Index Fund, Class I | | 122,449 | 3,706,538 |
| Calvert Social Investment Fund: | | | |
| Calvert Equity Fund, Class R6 | | 125,934 | 9,259,927 |
| Calvert World Values Fund, Inc.: | | | |
| Calvert Emerging Markets Advancement Fund, Class I | | 654,234 | 6,444,207 |
| Calvert Emerging Markets Equity Fund, Class R6 | | 171,638 | 2,466,443 |
| Calvert International Equity Fund, Class R6 | | 436,362 | 7,998,519 |
| Calvert International Opportunities Fund, Class R6 | | 368,306 | 4,883,732 |
| Calvert Mid-Cap Fund, Class I | | 53,980 | 1,907,664 |
| | | | $ 80,906,547 |
| Income Funds — 63.9% | |
| Calvert Management Series: | | | |
| Calvert Flexible Bond Fund, Class R6 | | 975,002 | $ 13,728,033 |
| Calvert Floating-Rate Advantage Fund, Class R6 | | 1,424,245 | 12,234,268 |
| Calvert Social Investment Fund: | | | |
| Calvert Bond Fund, Class R6 | | 7,439,886 | 104,381,601 |
| The Calvert Fund: | | | |
| Calvert High Yield Bond Fund, Class R6 | | 414,628 | 9,291,802 |
| Calvert Short Duration Income Fund, Class R6 | | 559,397 | 8,413,323 |
| Calvert Ultra-Short Duration Income Fund, Class R6 | | 1,735,424 | 16,798,908 |
| | | | $164,847,935 |
Total Mutual Funds
(identified cost $261,524,954) | | | $245,754,482 |
| U.S. Treasury Obligations — 1.1% |
| Security | Principal
Amount
(000's omitted) | Value |
| U.S. Treasury Inflation-Protected Bond, 0.75%, 2/15/45(2)(3) | $ | 3,669 | $ 2,834,445 |
Total U.S. Treasury Obligations
(identified cost $3,641,635) | | | $ 2,834,445 |
| Short-Term Investments — 3.9% |
| Security | Shares | Value |
| Morgan Stanley Institutional Liquidity Funds - Government Portfolio, Institutional Class, 2.80%(4) | | 10,018,977 | $ 10,018,977 |
Total Short-Term Investments
(identified cost $10,018,977) | | | $ 10,018,977 |
Total Investments — 100.2%
(identified cost $275,185,566) | | | $258,607,904 |
| Other Assets, Less Liabilities — (0.2)% | | | $ (464,390) |
| Net Assets — 100.0% | | | $ 258,143,514 |
| The percentage shown for each investment category in the Schedule of Investments is based on net assets. |
| (1) | Affiliated fund. |
| (2) | Inflation-linked security whose principal is adjusted for inflation based on changes in the U.S. Consumer Price Index. Interest is calculated based on the inflation-adjusted principal. |
| (3) | Security (or a portion thereof) has been pledged to cover margin requirements on open futures contracts. |
| (4) | May be deemed to be an affiliated investment company. The rate shown is the annualized seven-day yield as of September 30, 2022. |
15
See Notes to Financial Statements.
Calvert
Conservative Allocation Fund
September 30, 2022
Schedule of Investments — continued
Futures Contracts
| Description | Number of
Contracts | Position | Expiration
Date | Notional
Amount | Value/
Unrealized
Appreciation
(Depreciation) |
| Interest Rate Futures | | | | | |
| U.S. 5-Year Treasury Note | 91 | Long | 12/30/22 | $ 9,783,211 | $ (336,981) |
| U.S. 10-Year Treasury Note | 84 | Long | 12/20/22 | 9,413,250 | (475,760) |
| U.S. Long Treasury Bond | 95 | Long | 12/20/22 | 12,008,594 | (898,848) |
| U.S. Ultra 10-Year Treasury Note | 76 | Long | 12/20/22 | 9,004,812 | (573,564) |
| U.S. Ultra-Long Treasury Bond | 35 | Long | 12/20/22 | 4,795,000 | (441,376) |
| | | | | | $(2,726,529) |
16
See Notes to Financial Statements.
Calvert
Moderate Allocation Fund
September 30, 2022
| Security | Shares | Value |
| Equity Funds — 56.8% | |
| Calvert Impact Fund, Inc.: | | | |
| Calvert Small-Cap Fund, Class R6 | | 365,379 | $ 10,139,265 |
| Calvert Responsible Index Series, Inc.: | | | |
| Calvert International Responsible Index Fund, Class R6 | | 624,043 | 13,404,451 |
| Calvert US Large-Cap Core Responsible Index Fund, Class R6 | | 905,719 | 28,412,404 |
| Calvert US Large-Cap Growth Responsible Index Fund, Class I | | 388,355 | 14,971,082 |
| Calvert US Large-Cap Value Responsible Index Fund, Class I | | 1,757,823 | 44,015,878 |
| Calvert US Mid-Cap Core Responsible Index Fund, Class I | | 307,648 | 9,312,497 |
| Calvert Social Investment Fund: | | | |
| Calvert Equity Fund, Class R6 | | 207,683 | 15,270,900 |
| Calvert World Values Fund, Inc.: | | | |
| Calvert Emerging Markets Advancement Fund, Class I | | 1,588,036 | 15,642,155 |
| Calvert Emerging Markets Equity Fund, Class R6 | | 647,530 | 9,305,008 |
| Calvert International Equity Fund, Class R6 | | 1,013,355 | 18,574,803 |
| Calvert International Opportunities Fund, Class R6 | | 1,147,878 | 15,220,862 |
| Calvert Mid-Cap Fund, Class I | | 96,170 | 3,398,641 |
| | | | $197,667,946 |
| Income Funds — 38.0% | |
| Calvert Management Series: | | | |
| Calvert Flexible Bond Fund, Class R6 | | 1,070,617 | $ 15,074,282 |
| Calvert Floating-Rate Advantage Fund, Class R6 | | 1,737,536 | 14,925,433 |
| Calvert Social Investment Fund: | | | |
| Calvert Bond Fund, Class R6 | | 3,922,023 | 55,025,979 |
| The Calvert Fund: | | | |
| Calvert High Yield Bond Fund, Class R6 | | 650,962 | 14,588,072 |
| Calvert Short Duration Income Fund, Class R6 | | 628,287 | 9,449,445 |
| Calvert Ultra-Short Duration Income Fund, Class R6 | | 2,383,582 | 23,073,077 |
| | | | $132,136,288 |
Total Mutual Funds
(identified cost $328,149,639) | | | $329,804,234 |
| U.S. Treasury Obligations — 1.3% |
| Security | Principal
Amount
(000's omitted) | Value |
| U.S. Treasury Inflation-Protected Bond, 0.75%, 2/15/45(2)(3) | $ | 5,781 | $ 4,466,486 |
Total U.S. Treasury Obligations
(identified cost $5,738,446) | | | $ 4,466,486 |
| Short-Term Investments — 4.1% |
| Security | Shares | Value |
| Morgan Stanley Institutional Liquidity Funds - Government Portfolio, Institutional Class, 2.80%(4) | | 14,090,670 | $ 14,090,670 |
Total Short-Term Investments
(identified cost $14,090,670) | | | $ 14,090,670 |
Total Investments — 100.2%
(identified cost $347,978,755) | | | $348,361,390 |
| Other Assets, Less Liabilities — (0.2)% | | | $ (665,073) |
| Net Assets — 100.0% | | | $ 347,696,317 |
| The percentage shown for each investment category in the Schedule of Investments is based on net assets. |
| (1) | Affiliated fund. |
| (2) | Inflation-linked security whose principal is adjusted for inflation based on changes in the U.S. Consumer Price Index. Interest is calculated based on the inflation-adjusted principal. |
| (3) | Security (or a portion thereof) has been pledged to cover margin requirements on open futures contracts. |
| (4) | May be deemed to be an affiliated investment company. The rate shown is the annualized seven-day yield as of September 30, 2022. |
17
See Notes to Financial Statements.
Calvert
Moderate Allocation Fund
September 30, 2022
Schedule of Investments — continued
Futures Contracts
| Description | Number of
Contracts | Position | Expiration
Date | Notional
Amount | Value/
Unrealized
Appreciation
(Depreciation) |
| Interest Rate Futures | | | | | |
| U.S. 2-Year Treasury Note | 21 | Long | 12/30/22 | $ 4,313,203 | $ (73,172) |
| U.S. 5-Year Treasury Note | 82 | Long | 12/30/22 | 8,815,641 | (303,654) |
| U.S. 10-Year Treasury Note | 50 | Long | 12/20/22 | 5,603,125 | (283,190) |
| U.S. Long Treasury Bond | 89 | Long | 12/20/22 | 11,250,156 | (842,078) |
| U.S. Ultra 10-Year Treasury Note | 42 | Long | 12/20/22 | 4,976,344 | (316,970) |
| U.S. Ultra-Long Treasury Bond | 27 | Long | 12/20/22 | 3,699,000 | (340,490) |
| | | | | | $(2,159,554) |
18
See Notes to Financial Statements.
Calvert
Growth Allocation Fund
September 30, 2022
| Security | Shares | Value |
| Equity Funds — 85.9% | |
| Calvert Impact Fund, Inc.: | | | |
| Calvert Small-Cap Fund, Class R6 | | 392,019 | $ 10,878,529 |
| Calvert Responsible Index Series, Inc.: | | | |
| Calvert International Responsible Index Fund, Class R6 | | 793,244 | 17,038,891 |
| Calvert US Large-Cap Core Responsible Index Fund, Class R6 | | 1,123,848 | 35,255,100 |
| Calvert US Large-Cap Growth Responsible Index Fund, Class I | | 389,629 | 15,020,196 |
| Calvert US Large-Cap Value Responsible Index Fund, Class I | | 1,781,610 | 44,611,521 |
| Calvert US Mid-Cap Core Responsible Index Fund, Class I | | 378,673 | 11,462,431 |
| Calvert Social Investment Fund: | | | |
| Calvert Equity Fund, Class R6 | | 199,862 | 14,695,851 |
| Calvert World Values Fund, Inc.: | | | |
| Calvert Emerging Markets Advancement Fund, Class I | | 1,725,076 | 16,991,994 |
| Calvert Emerging Markets Equity Fund, Class R6 | | 890,024 | 12,789,649 |
| Calvert International Equity Fund, Class R6 | | 1,214,959 | 22,270,204 |
| Calvert International Opportunities Fund, Class R6 | | 1,393,000 | 18,471,177 |
| Calvert Mid-Cap Fund, Class I | | 143,548 | 5,072,974 |
| | | | $224,558,517 |
| Income Funds — 5.3% | |
| Calvert Management Series: | | | |
| Calvert Floating-Rate Advantage Fund, Class R6 | | 494,102 | $ 4,244,335 |
| The Calvert Fund: | | | |
| Calvert High Yield Bond Fund, Class R6 | | 428,506 | 9,602,819 |
| | | | $ 13,847,154 |
Total Mutual Funds
(identified cost $240,059,390) | | | $238,405,671 |
| U.S. Treasury Obligations — 0.9% |
| Security | Principal
Amount
(000's omitted) | Value |
| U.S. Treasury Inflation-Protected Bond, 0.25%, 2/15/50(2)(3) | $ | 3,572 | $ 2,347,118 |
Total U.S. Treasury Obligations
(identified cost $3,571,064) | | | $ 2,347,118 |
| Short-Term Investments — 7.9% |
| Security | Shares | Value |
| Morgan Stanley Institutional Liquidity Funds - Government Portfolio, Institutional Class, 2.80%(4) | | 20,645,053 | $ 20,645,053 |
Total Short-Term Investments
(identified cost $20,645,053) | | | $ 20,645,053 |
Total Investments — 100.0%
(identified cost $264,275,507) | | | $261,397,842 |
| Other Assets, Less Liabilities — 0.0%(5) | | | $ 105,272 |
| Net Assets — 100.0% | | | $261,503,114 |
| The percentage shown for each investment category in the Schedule of Investments is based on net assets. |
| (1) | Affiliated fund. |
| (2) | Inflation-linked security whose principal is adjusted for inflation based on changes in the U.S. Consumer Price Index. Interest is calculated based on the inflation-adjusted principal. |
| (3) | Security (or a portion thereof) has been pledged to cover margin requirements on open futures contracts. |
| (4) | May be deemed to be an affiliated investment company. The rate shown is the annualized seven-day yield as of September 30, 2022. |
| (5) | Amount is less than 0.05%. |
19
See Notes to Financial Statements.
Calvert
Growth Allocation Fund
September 30, 2022
Schedule of Investments — continued
Futures Contracts
| Description | Number of
Contracts | Position | Expiration
Date | Notional
Amount | Value/
Unrealized
Appreciation
(Depreciation) |
| Interest Rate Futures | | | | | |
| U.S. 5-Year Treasury Note | 18 | Long | 12/30/22 | $1,935,141 | $ (66,656) |
| U.S. 10-Year Treasury Note | 37 | Long | 12/20/22 | 4,146,312 | (209,561) |
| U.S. Long Treasury Bond | 6 | Long | 12/20/22 | 758,438 | (56,769) |
| U.S. Ultra 10-Year Treasury Note | 24 | Long | 12/20/22 | 2,843,625 | (181,125) |
| U.S. Ultra-Long Treasury Bond | (5) | Short | 12/20/22 | (685,000) | 63,001 |
| | | | | | $(451,110) |
20
See Notes to Financial Statements.
Calvert
Asset Allocation Funds
September 30, 2022
Statements of Assets and Liabilities
| | September 30, 2022 |
| | Conservative Allocation Fund | Moderate Allocation Fund | Growth Allocation Fund |
| Assets | | | |
| Investments in securities of unaffiliated issuers, at value (identified cost $3,641,635, $5,738,446 and $3,571,064, respectively) | $ 2,834,445 | $ 4,466,486 | $ 2,347,118 |
| Investments in securities of affiliated issuers, at value (identified cost $271,543,931, $342,240,309 and $260,704,443, respectively) | 255,773,459 | 343,894,904 | 259,050,724 |
| Receivable for capital shares sold | 113,837 | 77,998 | 270,464 |
| Interest receivable | 3,514 | 5,538 | 1,141 |
| Dividends receivable - affiliated | 511,831 | 443,236 | 99,229 |
| Receivable from affiliate | 1,652 | 2,143 | 15,738 |
| Trustees' deferred compensation plan | 112,153 | 164,786 | 87,639 |
| Total assets | $ 259,350,891 | $349,055,091 | $261,872,053 |
| Liabilities | | | |
| Payable for variation margin on open futures contracts | $ 214,194 | $ 167,702 | $ 27,027 |
| Payable for investments purchased | 505,446 | 427,132 | 65,957 |
| Payable for capital shares redeemed | 222,095 | 408,232 | 29,973 |
| Payable to affiliates: | | | |
| Distribution and service fees | 54,833 | 78,280 | 54,590 |
| Sub-transfer agency fee | 5,317 | 10,503 | 10,564 |
| Trustees' deferred compensation plan | 112,153 | 164,786 | 87,639 |
| Accrued expenses | 93,339 | 102,139 | 93,189 |
| Total liabilities | $ 1,207,377 | $ 1,358,774 | $ 368,939 |
| Net Assets | $ 258,143,514 | $347,696,317 | $261,503,114 |
| Sources of Net Assets | | | |
| Paid-in capital | $ 283,330,681 | $ 348,881,341 | $ 262,329,972 |
| Accumulated loss | (25,187,167) | (1,185,024) | (826,858) |
| Net Assets | $ 258,143,514 | $347,696,317 | $261,503,114 |
| Class A Shares | | | |
| Net Assets | $ 178,331,882 | $ 254,242,978 | $ 190,452,583 |
| Shares Outstanding | 11,352,113 | 13,885,052 | 9,210,722 |
Net Asset Value and Redemption Price Per Share
(net assets ÷ shares of beneficial interest outstanding) | $ 15.71 | $ 18.31 | $ 20.68 |
Maximum Offering Price Per Share
(100 ÷ 94.75 of net asset value per share) | $ 16.58 | $ 19.32 | $ 21.83 |
| Class C Shares | | | |
| Net Assets | $ 19,095,934 | $ 26,148,971 | $ 16,128,653 |
| Shares Outstanding | 1,231,242 | 1,521,457 | 940,718 |
Net Asset Value and Offering Price Per Share*
(net assets ÷ shares of beneficial interest outstanding) | $ 15.51 | $ 17.19 | $ 17.15 |
| Class I Shares | | | |
| Net Assets | $ 60,615,646 | $ 67,287,966 | $ 54,815,175 |
| Shares Outstanding | 3,855,906 | 3,670,889 | 2,634,747 |
Net Asset Value, Offering Price and Redemption Price Per Share
(net assets ÷ shares of beneficial interest outstanding) | $ 15.72 | $ 18.33 | $ 20.80 |
21
See Notes to Financial Statements.
Calvert
Asset Allocation Funds
September 30, 2022
Statements of Assets and Liabilities — continued
| | September 30, 2022 |
| | Conservative Allocation Fund | Moderate Allocation Fund | Growth Allocation Fund |
| Class R6 Shares | | | |
| Net Assets | $ 100,052 | $ 16,402 | $ 106,703 |
| Shares Outstanding | 6,364 | 895 | 5,128 |
Net Asset Value, Offering Price and Redemption Price Per Share
(net assets ÷ shares of beneficial interest outstanding) | $ 15.72 | $ 18.33 | $ 20.81 |
| On sales of $50,000 or more, the offering price of Class A shares is reduced. |
| * | Redemption price per share is equal to the net asset value less any applicable contingent deferred sales charge. |
22
See Notes to Financial Statements.
Calvert
Asset Allocation Funds
September 30, 2022
| | Year Ended September 30, 2022 |
| | Conservative Allocation Fund | Moderate Allocation Fund | Growth Allocation Fund |
| Investment Income | | | |
| Dividend income - affiliated issuers | $ 5,769,469 | $ 6,490,499 | $ 3,437,187 |
| Interest income | 315,873 | 498,217 | 289,408 |
| Total investment income | $ 6,085,342 | $ 6,988,716 | $ 3,726,595 |
| Expenses | | | |
| Distribution and service fees: | | | |
| Class A | $ 513,484 | $ 741,608 | $ 549,424 |
| Class C | 239,260 | 329,118 | 178,548 |
| Trustees' fees and expenses | 13,537 | 18,306 | 13,323 |
| Custodian fees | 1,780 | 760 | 548 |
| Transfer agency fees and expenses | 266,409 | 391,036 | 361,874 |
| Accounting fees | 31,442 | 43,270 | 30,436 |
| Professional fees | 34,627 | 35,904 | 34,706 |
| Registration fees | 92,113 | 90,132 | 88,571 |
| Reports to shareholders | 16,180 | 20,059 | 21,265 |
| Miscellaneous | 17,521 | 21,093 | 17,612 |
| Total expenses | $ 1,226,353 | $ 1,691,286 | $ 1,296,307 |
| Reimbursement of expenses by affiliate | $ (7,896) | $ (11,873) | $ (48,113) |
| Net expenses | $ 1,218,457 | $ 1,679,413 | $ 1,248,194 |
| Net investment income | $ 4,866,885 | $ 5,309,303 | $ 2,478,401 |
| Realized and Unrealized Gain (Loss) | | | |
| Net realized gain (loss): | | | |
| Investment securities | $ 31,829 | $ 49,022 | $ 59,842 |
| Investment securities - affiliated issuers | (1,870,784) | 1,153,853 | (1,728,033) |
| Futures contracts | (6,613,781) | (4,714,858) | (26,685) |
| Written options | 95,709 | 174,104 | 195,197 |
| Capital gains distributions received - affiliated issuers | 4,361,727 | 8,196,394 | 7,817,648 |
| Net realized gain (loss) | $ (3,995,300) | $ 4,858,515 | $ 6,317,969 |
| Change in unrealized appreciation (depreciation): | | | |
| Investment securities | $ (1,582,240) | $ (2,480,952) | $ (1,572,335) |
| Investment securities - affiliated issuers | (49,200,964) | (83,191,448) | (74,979,368) |
| Futures contracts | (2,303,988) | (1,913,807) | (647,228) |
| Written options | 19,211 | 36,675 | 40,167 |
| Net change in unrealized appreciation (depreciation) | $(53,067,981) | $(87,549,532) | $(77,158,764) |
| Net realized and unrealized loss | $(57,063,281) | $(82,691,017) | $(70,840,795) |
| Net decrease in net assets from operations | $(52,196,396) | $(77,381,714) | $(68,362,394) |
23
See Notes to Financial Statements.
Calvert
Asset Allocation Funds
September 30, 2022
Statements of Changes in Net Assets
| | Year Ended September 30, 2022 |
| | Conservative Allocation Fund | Moderate Allocation Fund | Growth Allocation Fund |
| Increase (Decrease) in Net Assets | | | |
| From operations: | | | |
| Net investment income | $ 4,866,885 | $ 5,309,303 | $ 2,478,401 |
| Net realized gain (loss) | (3,995,300) | 4,858,515 | 6,317,969 |
| Net change in unrealized appreciation (depreciation) | (53,067,981) | (87,549,532) | (77,158,764) |
| Net decrease in net assets from operations | $ (52,196,396) | $ (77,381,714) | $ (68,362,394) |
| Distributions to shareholders: | | | |
| Class A | $ (9,758,419) | $ (16,291,226) | $ (8,025,825) |
| Class C | (996,380) | (1,740,794) | (660,986) |
| Class I | (3,412,788) | (4,913,257) | (2,187,032) |
| Class R6(1) | (671) | (103) | — |
| Total distributions to shareholders | $ (14,168,258) | $ (22,945,380) | $ (10,873,843) |
| Capital share transactions: | | | |
| Class A | $ 11,541,722 | $ 13,877,102 | $ 23,855,554 |
| Class C | (2,872,386) | (2,285,071) | 2,262,659 |
| Class I | 14,696,124 | (2,915,481) | 16,840,736 |
| Class R6(1) | 109,789 | 19,129 | 121,397 |
| Net increase in net assets from capital share transactions | $ 23,475,249 | $ 8,695,679 | $ 43,080,346 |
| Net decrease in net assets | $ (42,889,405) | $ (91,631,415) | $ (36,155,891) |
| Net Assets | | | |
| At beginning of year | $ 301,032,919 | $ 439,327,732 | $ 297,659,005 |
| At end of year | $258,143,514 | $347,696,317 | $261,503,114 |
| (1) | For the period from the commencement of operations, February 1, 2022, to September 30, 2022. |
24
See Notes to Financial Statements.
Calvert
Asset Allocation Funds
September 30, 2022
Statements of Changes in Net Assets — continued
| | Year Ended September 30, 2021 |
| | Conservative Allocation Fund | Moderate Allocation Fund | Growth Allocation Fund |
| Increase (Decrease) in Net Assets | | | |
| From operations: | | | |
| Net investment income | $ 3,494,848 | $ 3,930,762 | $ 1,019,944 |
| Net realized gain | 10,041,017 | 16,952,944 | 7,018,472 |
| Net change in unrealized appreciation (depreciation) | 15,109,909 | 44,627,542 | 45,190,340 |
| Net increase in net assets from operations | $ 28,645,774 | $ 65,511,248 | $ 53,228,756 |
| Distributions to shareholders: | | | |
| Class A | $ (7,555,578) | $ (11,455,609) | $ (5,971,036) |
| Class C | (885,825) | (1,303,488) | (555,944) |
| Class I | (2,113,609) | (3,258,054) | (959,883) |
| Total distributions to shareholders | $ (10,555,012) | $ (16,017,151) | $ (7,486,863) |
| Capital share transactions: | | | |
| Class A | $ 21,690,288 | $ 16,528,914 | $ 29,969,401 |
| Class C | (3,896,996) | (2,684,281) | (1,206,936) |
| Class I | 19,302,335 | 23,376,837 | 31,370,919 |
| Net increase in net assets from capital share transactions | $ 37,095,627 | $ 37,221,470 | $ 60,133,384 |
| Net increase in net assets | $ 55,186,389 | $ 86,715,567 | $105,875,277 |
| Net Assets | | | |
| At beginning of year | $ 245,846,530 | $ 352,612,165 | $ 191,783,728 |
| At end of year | $301,032,919 | $439,327,732 | $297,659,005 |
25
See Notes to Financial Statements.
Calvert
Asset Allocation Funds
September 30, 2022
| | Conservative Allocation Fund — Class A |
| | Year Ended September 30, |
| | 2022 | 2021 | 2020 | 2019 | 2018 |
| Net asset value — Beginning of year | $ 19.63 | $ 18.34 | $ 17.57 | $ 17.25 | $ 17.25 |
| Income (Loss) From Operations | | | | | |
| Net investment income(1) | $ 0.29 | $ 0.25 | $ 0.30 | $ 0.37 | $ 0.33 |
| Net realized and unrealized gain (loss) | (3.33) | 1.80 | 1.17 | 0.70 | 0.36 |
| Total income (loss) from operations | $ (3.04) | $ 2.05 | $ 1.47 | $ 1.07 | $ 0.69 |
| Less Distributions | | | | | |
| From net investment income | $ (0.39) | $ (0.29) | $ (0.32) | $ (0.41) | $ (0.42) |
| From net realized gain | (0.49) | (0.47) | (0.38) | (0.34) | (0.27) |
| Total distributions | $ (0.88) | $ (0.76) | $ (0.70) | $ (0.75) | $ (0.69) |
| Net asset value — End of year | $ 15.71 | $ 19.63 | $ 18.34 | $ 17.57 | $ 17.25 |
| Total Return(2) | (16.18)% | 11.37% | 8.66% | 6.57% | 4.08% |
| Ratios/Supplemental Data | | | | | |
| Net assets, end of year (000’s omitted) | $178,332 | $211,702 | $177,060 | $159,188 | $150,237 |
| Ratios (as a percentage of average daily net assets):(3) | | | | | |
| Total expenses(4) | 0.41% | 0.40% | 0.41% | 0.44% | 0.44% |
| Net expenses(4) | 0.41% (5) | 0.40% | 0.41% | 0.44% | 0.44% |
| Net investment income | 1.62% | 1.28% | 1.70% | 2.18% | 1.93% |
| Portfolio Turnover | 20% | 23% | 36% | 85% | 94% |
| (1) | Computed using average shares outstanding. |
| (2) | Returns are historical and are calculated by determining the percentage change in net asset value with all distributions reinvested and do not reflect the effect of sales charges, if any. |
| (3) | Total expenses do not reflect amounts reimbursed and/or waived by the adviser and certain of its affiliates, if applicable. Net expenses are net of all reductions and represent the net expenses paid by the Fund. |
| (4) | Amounts do not include the expenses of the Underlying Funds. |
| (5) | Includes a reimbursement of expenses by the investment adviser due to the Fund’s investment in the Liquidity Fund (equal to less than 0.005% of average daily net assets for the year ended September 30, 2022). |
26
See Notes to Financial Statements.
Calvert
Asset Allocation Funds
September 30, 2022
Financial Highlights — continued
| | Conservative Allocation Fund — Class C |
| | Year Ended September 30, |
| | 2022 | 2021 | 2020 | 2019 | 2018 |
| Net asset value — Beginning of year | $ 19.39 | $ 18.11 | $ 17.36 | $ 17.05 | $ 17.06 |
| Income (Loss) From Operations | | | | | |
| Net investment income(1) | $ 0.16 | $ 0.10 | $ 0.17 | $ 0.25 | $ 0.20 |
| Net realized and unrealized gain (loss) | (3.30) | 1.80 | 1.15 | 0.68 | 0.36 |
| Total income (loss) from operations | $ (3.14) | $ 1.90 | $ 1.32 | $ 0.93 | $ 0.56 |
| Less Distributions | | | | | |
| From net investment income | $ (0.25) | $ (0.15) | $ (0.19) | $ (0.28) | $ (0.30) |
| From net realized gain | (0.49) | (0.47) | (0.38) | (0.34) | (0.27) |
| Total distributions | $ (0.74) | $ (0.62) | $ (0.57) | $ (0.62) | $ (0.57) |
| Net asset value — End of year | $ 15.51 | $ 19.39 | $ 18.11 | $ 17.36 | $ 17.05 |
| Total Return(2) | (16.83)% | 10.62% | 7.81% | 5.77% | 3.30% |
| Ratios/Supplemental Data | | | | | |
| Net assets, end of year (000’s omitted) | $19,096 | $27,062 | $29,017 | $29,828 | $33,843 |
| Ratios (as a percentage of average daily net assets):(3) | | | | | |
| Total expenses(4) | 1.16% | 1.15% | 1.15% | 1.19% | 1.19% |
| Net expenses(4) | 1.16% (5) | 1.15% | 1.15% | 1.19% | 1.19% |
| Net investment income | 0.87% | 0.54% | 0.97% | 1.47% | 1.17% |
| Portfolio Turnover | 20% | 23% | 36% | 85% | 94% |
| (1) | Computed using average shares outstanding. |
| (2) | Returns are historical and are calculated by determining the percentage change in net asset value with all distributions reinvested and do not reflect the effect of sales charges, if any. |
| (3) | Total expenses do not reflect amounts reimbursed and/or waived by the adviser and certain of its affiliates, if applicable. Net expenses are net of all reductions and represent the net expenses paid by the Fund. |
| (4) | Amounts do not include the expenses of the Underlying Funds. |
| (5) | Includes a reimbursement of expenses by the investment adviser due to the Fund’s investment in the Liquidity Fund (equal to less than 0.005% of average daily net assets for the year ended September 30, 2022). |
27
See Notes to Financial Statements.
Calvert
Asset Allocation Funds
September 30, 2022
Financial Highlights — continued
| | Conservative Allocation Fund — Class I |
| | Year Ended September 30, |
| | 2022 | 2021 | 2020 | 2019 | 2018 |
| Net asset value — Beginning of year | $ 19.65 | $ 18.35 | $ 17.58 | $ 17.25 | $ 17.23 |
| Income (Loss) From Operations | | | | | |
| Net investment income(1) | $ 0.34 | $ 0.29 | $ 0.34 | $ 0.42 | $ 0.41 |
| Net realized and unrealized gain (loss) | (3.35) | 1.82 | 1.18 | 0.70 | 0.34 |
| Total income (loss) from operations | $ (3.01) | $ 2.11 | $ 1.52 | $ 1.12 | $ 0.75 |
| Less Distributions | | | | | |
| From net investment income | $ (0.43) | $ (0.34) | $ (0.37) | $ (0.45) | $ (0.46) |
| From net realized gain | (0.49) | (0.47) | (0.38) | (0.34) | (0.27) |
| Total distributions | $ (0.92) | $ (0.81) | $ (0.75) | $ (0.79) | $ (0.73) |
| Net asset value — End of year | $ 15.72 | $ 19.65 | $ 18.35 | $ 17.58 | $ 17.25 |
| Total Return(2) | (16.00)% | 11.70% | 8.93% | 6.89% | 4.40% |
| Ratios/Supplemental Data | | | | | |
| Net assets, end of year (000’s omitted) | $60,616 | $62,269 | $39,770 | $28,288 | $19,605 |
| Ratios (as a percentage of average daily net assets):(3) | | | | | |
| Total expenses(4) | 0.16% | 0.15% | 0.16% | 0.19% | 0.19% |
| Net expenses(4) | 0.16% (5) | 0.15% | 0.16% | 0.16% | 0.09% |
| Net investment income | 1.85% | 1.51% | 1.93% | 2.44% | 2.36% |
| Portfolio Turnover | 20% | 23% | 36% | 85% | 94% |
| (1) | Computed using average shares outstanding. |
| (2) | Returns are historical and are calculated by determining the percentage change in net asset value with all distributions reinvested and do not reflect the effect of sales charges, if any. |
| (3) | Total expenses do not reflect amounts reimbursed and/or waived by the adviser and certain of its affiliates, if applicable. Net expenses are net of all reductions and represent the net expenses paid by the Fund. |
| (4) | Amounts do not include the expenses of the Underlying Funds. |
| (5) | Includes a reimbursement of expenses by the investment adviser due to the Fund’s investment in the Liquidity Fund (equal to less than 0.005% of average daily net assets for the year ended September 30, 2022). |
28
See Notes to Financial Statements.
Calvert
Asset Allocation Funds
September 30, 2022
Financial Highlights — continued
| | Conservative Allocation Fund — Class R6 |
| | Period Ended
September 30, 2022(1) |
| Net asset value — Beginning of period | $ 18.86 |
| Income (Loss) From Operations | |
| Net investment income(2) | $ 0.24 |
| Net realized and unrealized loss | (3.16) |
| Total loss from operations | $ (2.92) |
| Less Distributions | |
| From net investment income | $ (0.22) |
| Total distributions | $ (0.22) |
| Net asset value — End of period | $ 15.72 |
| Total Return(3) | (15.54)% (4) |
| Ratios/Supplemental Data | |
| Net assets, end of period (000’s omitted) | $ 100 |
| Ratios (as a percentage of average daily net assets):(5) | |
| Total expenses(6) | 0.11% (7) |
| Net expenses(6) | 0.11% (7)(8) |
| Net investment income | 2.15% (7) |
| Portfolio Turnover | 20% (4)(9) |
| (1) | For the period from the commencement of operations, February 1, 2022, to September 30, 2022. |
| (2) | Computed using average shares outstanding. |
| (3) | Returns are historical and are calculated by determining the percentage change in net asset value with all distributions reinvested and do not reflect the effect of sales charges, if any. |
| (4) | Not annualized. |
| (5) | Total expenses do not reflect amounts reimbursed and/or waived by the adviser and certain of its affiliates, if applicable. Net expenses are net of all reductions and represent the net expenses paid by the Fund. |
| (6) | Amounts do not include the expenses of the Underlying Funds. |
| (7) | Annualized. |
| (8) | Includes a reimbursement of expenses by the investment adviser due to the Fund’s investment in the Liquidity Fund (equal to less than 0.005% of average daily net assets for the period ended September 30, 2022). |
| (9) | For the year ended September 30, 2022. |
29
See Notes to Financial Statements.
Calvert
Asset Allocation Funds
September 30, 2022
Financial Highlights — continued
| | Moderate Allocation Fund — Class A |
| | Year Ended September 30, |
| | 2022 | 2021 | 2020 | 2019 | 2018 |
| Net asset value — Beginning of year | $ 23.50 | $ 20.66 | $ 19.49 | $ 19.77 | $ 19.32 |
| Income (Loss) From Operations | | | | | |
| Net investment income(1) | $ 0.28 | $ 0.22 | $ 0.26 | $ 0.31 | $ 0.29 |
| Net realized and unrealized gain (loss) | (4.26) | 3.54 | 1.73 | 0.43 | 1.15 |
| Total income (loss) from operations | $ (3.98) | $ 3.76 | $ 1.99 | $ 0.74 | $ 1.44 |
| Less Distributions | | | | | |
| From net investment income | $ (0.44) | $ (0.25) | $ (0.26) | $ (0.40) | $ (0.47) |
| From net realized gain | (0.77) | (0.67) | (0.56) | (0.62) | (0.52) |
| Total distributions | $ (1.21) | $ (0.92) | $ (0.82) | $ (1.02) | $ (0.99) |
| Net asset value — End of year | $ 18.31 | $ 23.50 | $ 20.66 | $ 19.49 | $ 19.77 |
| Total Return(2) | (17.91)% | 18.53% | 10.44% | 4.44% | 7.62% |
| Ratios/Supplemental Data | | | | | |
| Net assets, end of year (000’s omitted) | $254,243 | $312,287 | $259,726 | $247,372 | $231,146 |
| Ratios (as a percentage of average daily net assets):(3) | | | | | |
| Total expenses(4) | 0.40% | 0.39% | 0.41% | 0.42% | 0.43% |
| Net expenses(4) | 0.40% (5) | 0.39% | 0.41% | 0.42% | 0.43% |
| Net investment income | 1.29% | 0.98% | 1.32% | 1.65% | 1.47% |
| Portfolio Turnover | 18% | 26% | 35% | 89% | 73% |
| (1) | Computed using average shares outstanding. |
| (2) | Returns are historical and are calculated by determining the percentage change in net asset value with all distributions reinvested and do not reflect the effect of sales charges, if any. |
| (3) | Total expenses do not reflect amounts reimbursed and/or waived by the adviser and certain of its affiliates, if applicable. Net expenses are net of all reductions and represent the net expenses paid by the Fund. |
| (4) | Amounts do not include the expenses of the Underlying Funds. |
| (5) | Includes a reimbursement of expenses by the investment adviser due to the Fund’s investment in the Liquidity Fund (equal to less than 0.005% of average daily net assets for the year ended September 30, 2022). |
30
See Notes to Financial Statements.
Calvert
Asset Allocation Funds
September 30, 2022
Financial Highlights — continued
| | Moderate Allocation Fund — Class C |
| | Year Ended September 30, |
| | 2022 | 2021 | 2020 | 2019 | 2018 |
| Net asset value — Beginning of year | $ 22.14 | $ 19.56 | $ 18.52 | $ 18.84 | $ 18.37 |
| Income (Loss) From Operations | | | | | |
| Net investment income(1) | $ 0.11 | $ 0.05 | $ 0.11 | $ 0.19 | $ 0.13 |
| Net realized and unrealized gain (loss) | (3.98) | 3.33 | 1.64 | 0.38 | 1.10 |
| Total income (loss) from operations | $ (3.87) | $ 3.38 | $ 1.75 | $ 0.57 | $ 1.23 |
| Less Distributions | | | | | |
| From net investment income | $ (0.31) | $ (0.13) | $ (0.15) | $ (0.27) | $ (0.24) |
| From net realized gain | (0.77) | (0.67) | (0.56) | (0.62) | (0.52) |
| Total distributions | $ (1.08) | $ (0.80) | $ (0.71) | $ (0.89) | $ (0.76) |
| Net asset value — End of year | $ 17.19 | $ 22.14 | $ 19.56 | $ 18.52 | $ 18.84 |
| Total Return(2) | (18.50)% | 17.60% | 9.62% | 3.68% | 6.83% |
| Ratios/Supplemental Data | | | | | |
| Net assets, end of year (000’s omitted) | $26,149 | $36,398 | $34,674 | $36,679 | $45,880 |
| Ratios (as a percentage of average daily net assets):(3) | | | | | |
| Total expenses(4) | 1.15% | 1.14% | 1.16% | 1.17% | 1.18% |
| Net expenses(4) | 1.15% (5) | 1.14% | 1.16% | 1.17% | 1.18% |
| Net investment income | 0.54% | 0.24% | 0.59% | 1.04% | 0.72% |
| Portfolio Turnover | 18% | 26% | 35% | 89% | 73% |
| (1) | Computed using average shares outstanding. |
| (2) | Returns are historical and are calculated by determining the percentage change in net asset value with all distributions reinvested and do not reflect the effect of sales charges, if any. |
| (3) | Total expenses do not reflect amounts reimbursed and/or waived by the adviser and certain of its affiliates, if applicable. Net expenses are net of all reductions and represent the net expenses paid by the Fund. |
| (4) | Amounts do not include the expenses of the Underlying Funds. |
| (5) | Includes a reimbursement of expenses by the investment adviser due to the Fund’s investment in the Liquidity Fund (equal to less than 0.005% of average daily net assets for the year ended September 30, 2022). |
31
See Notes to Financial Statements.
Calvert
Asset Allocation Funds
September 30, 2022
Financial Highlights — continued
| | Moderate Allocation Fund — Class I |
| | Year Ended September 30, |
| | 2022 | 2021 | 2020 | 2019 | 2018 |
| Net asset value — Beginning of year | $ 23.52 | $ 20.68 | $ 19.51 | $ 19.79 | $ 19.36 |
| Income (Loss) From Operations | | | | | |
| Net investment income(1) | $ 0.33 | $ 0.28 | $ 0.30 | $ 0.35 | $ 0.33 |
| Net realized and unrealized gain (loss) | (4.25) | 3.54 | 1.74 | 0.44 | 1.19 |
| Total income (loss) from operations | $ (3.92) | $ 3.82 | $ 2.04 | $ 0.79 | $ 1.52 |
| Less Distributions | | | | | |
| From net investment income | $ (0.50) | $ (0.31) | $ (0.31) | $ (0.45) | $ (0.57) |
| From net realized gain | (0.77) | (0.67) | (0.56) | (0.62) | (0.52) |
| Total distributions | $ (1.27) | $ (0.98) | $ (0.87) | $ (1.07) | $ (1.09) |
| Net asset value — End of year | $ 18.33 | $ 23.52 | $ 20.68 | $ 19.51 | $ 19.79 |
| Total Return(2) | (17.69)% | 18.80% | 10.71% | 4.69% | 8.04% |
| Ratios/Supplemental Data | | | | | |
| Net assets, end of year (000’s omitted) | $67,288 | $90,643 | $58,212 | $42,444 | $29,145 |
| Ratios (as a percentage of average daily net assets):(3) | | | | | |
| Total expenses(4) | 0.15% | 0.14% | 0.16% | 0.17% | 0.17% |
| Net expenses(4) | 0.15% (5) | 0.14% | 0.16% | 0.14% | 0.09% |
| Net investment income | 1.54% | 1.22% | 1.51% | 1.83% | 1.70% |
| Portfolio Turnover | 18% | 26% | 35% | 89% | 73% |
| (1) | Computed using average shares outstanding. |
| (2) | Returns are historical and are calculated by determining the percentage change in net asset value with all distributions reinvested and do not reflect the effect of sales charges, if any. |
| (3) | Total expenses do not reflect amounts reimbursed and/or waived by the adviser and certain of its affiliates, if applicable. Net expenses are net of all reductions and represent the net expenses paid by the Fund. |
| (4) | Amounts do not include the expenses of the Underlying Funds. |
| (5) | Includes a reimbursement of expenses by the investment adviser due to the Fund’s investment in the Liquidity Fund (equal to less than 0.005% of average daily net assets for the year ended September 30, 2022). |
32
See Notes to Financial Statements.
Calvert
Asset Allocation Funds
September 30, 2022
Financial Highlights — continued
| | Moderate Allocation Fund — Class R6 |
| | Period Ended
September 30, 2022(1) |
| Net asset value — Beginning of period | $ 22.51 |
| Income (Loss) From Operations | |
| Net investment income(2) | $ 0.16 |
| Net realized and unrealized loss | (4.18) |
| Total loss from operations | $ (4.02) |
| Less Distributions | |
| From net investment income | $ (0.16) |
| Total distributions | $ (0.16) |
| Net asset value — End of period | $ 18.33 |
| Total Return(3) | (17.90)% (4) |
| Ratios/Supplemental Data | |
| Net assets, end of period (000’s omitted) | $ 16 |
| Ratios (as a percentage of average daily net assets):(5) | |
| Total expenses(6) | 0.09% (7) |
| Net expenses(6) | 0.09% (7)(8) |
| Net investment income | 1.17% (7) |
| Portfolio Turnover | 18% (4)(9) |
| (1) | For the period from the commencement of operations, February 1, 2022, to September 30, 2022. |
| (2) | Computed using average shares outstanding. |
| (3) | Returns are historical and are calculated by determining the percentage change in net asset value with all distributions reinvested and do not reflect the effect of sales charges, if any. |
| (4) | Not annualized. |
| (5) | Total expenses do not reflect amounts reimbursed and/or waived by the adviser and certain of its affiliates, if applicable. Net expenses are net of all reductions and represent the net expenses paid by the Fund. |
| (6) | Amounts do not include the expenses of the Underlying Funds. |
| (7) | Annualized. |
| (8) | Includes a reimbursement of expenses by the investment adviser due to the Fund’s investment in the Liquidity Fund (equal to less than 0.005% of average daily net assets for the period ended September 30, 2022). |
| (9) | For the year ended September 30, 2022. |
33
See Notes to Financial Statements.
Calvert
Asset Allocation Funds
September 30, 2022
Financial Highlights — continued
| | Growth Allocation Fund — Class A |
| | Year Ended September 30, |
| | 2022 | 2021 | 2020 | 2019 | 2018 |
| Net asset value — Beginning of year | $ 27.07 | $ 22.15 | $ 20.38 | $ 21.16 | $ 20.27 |
| Income (Loss) From Operations | | | | | |
| Net investment income(1) | $ 0.21 | $ 0.11 | $ 0.18 | $ 0.20 | $ 0.22 |
| Net realized and unrealized gain (loss) | (5.65) | 5.63 | 2.35 | 0.15 | 1.79 |
| Total income (loss) from operations | $ (5.44) | $ 5.74 | $ 2.53 | $ 0.35 | $ 2.01 |
| Less Distributions | | | | | |
| From net investment income | $ (0.49) | $ (0.12) | $ (0.20) | $ (0.36) | $ (0.44) |
| From net realized gain | (0.46) | (0.70) | (0.56) | (0.77) | (0.68) |
| Total distributions | $ (0.95) | $ (0.82) | $ (0.76) | $ (1.13) | $ (1.12) |
| Net asset value — End of year | $ 20.68 | $ 27.07 | $ 22.15 | $ 20.38 | $ 21.16 |
| Total Return(2) | (20.97)% | 26.32% | 12.52% | 2.56% | 10.19% |
| Ratios/Supplemental Data | | | | | |
| Net assets, end of year (000’s omitted) | $190,453 | $224,233 | $157,659 | $136,474 | $129,981 |
| Ratios (as a percentage of average daily net assets):(3) | | | | | |
| Total expenses(4) | 0.44% | 0.44% | 0.47% | 0.52% | 0.52% |
| Net expenses(4) | 0.43% (5) | 0.43% | 0.43% | 0.43% | 0.43% |
| Net investment income | 0.84% | 0.43% | 0.87% | 1.04% | 1.07% |
| Portfolio Turnover | 9% | 17% | 43% | 92% | 64% |
| (1) | Computed using average shares outstanding. |
| (2) | Returns are historical and are calculated by determining the percentage change in net asset value with all distributions reinvested and do not reflect the effect of sales charges, if any. |
| (3) | Total expenses do not reflect amounts reimbursed and/or waived by the adviser and certain of its affiliates, if applicable. Net expenses are net of all reductions and represent the net expenses paid by the Fund. |
| (4) | Amounts do not include the expenses of the Underlying Funds. |
| (5) | Includes a reimbursement of expenses by the investment adviser due to the Fund’s investment in the Liquidity Fund (equal to less than 0.005% of average daily net assets for the year ended September 30, 2022). |
34
See Notes to Financial Statements.
Calvert
Asset Allocation Funds
September 30, 2022
Financial Highlights — continued
| | Growth Allocation Fund — Class C |
| | Year Ended September 30, |
| | 2022 | 2021 | 2020 | 2019 | 2018 |
| Net asset value — Beginning of year | $ 22.61 | $ 18.63 | $ 17.26 | $ 18.10 | $ 17.50 |
| Income (Loss) From Operations | | | | | |
| Net investment income (loss)(1) | $ 0.02 | $ (0.06) | $ 0.02 | $ 0.08 | $ 0.06 |
| Net realized and unrealized gain (loss) | (4.69) | 4.72 | 1.98 | 0.08 | 1.53 |
| Total income (loss) from operations | $ (4.67) | $ 4.66 | $ 2.00 | $ 0.16 | $ 1.59 |
| Less Distributions | | | | | |
| From net investment income | $ (0.33) | $ — | $ (0.07) | $ (0.23) | $ (0.31) |
| From net realized gain | (0.46) | (0.68) | (0.56) | (0.77) | (0.68) |
| Total distributions | $ (0.79) | $ (0.68) | $ (0.63) | $ (1.00) | $ (0.99) |
| Net asset value — End of year | $ 17.15 | $ 22.61 | $ 18.63 | $ 17.26 | $ 18.10 |
| Total Return(2) | (21.54)% | 25.38% | 11.67% | 1.80% | 9.39% |
| Ratios/Supplemental Data | | | | | |
| Net assets, end of year (000’s omitted) | $16,129 | $18,612 | $16,419 | $15,189 | $19,372 |
| Ratios (as a percentage of average daily net assets):(3) | | | | | |
| Total expenses(4) | 1.19% | 1.19% | 1.22% | 1.27% | 1.27% |
| Net expenses(4) | 1.18% (5) | 1.18% | 1.18% | 1.18% | 1.18% |
| Net investment income (loss) | 0.11% | (0.28)% | 0.13% | 0.48% | 0.33% |
| Portfolio Turnover | 9% | 17% | 43% | 92% | 64% |
| (1) | Computed using average shares outstanding. |
| (2) | Returns are historical and are calculated by determining the percentage change in net asset value with all distributions reinvested and do not reflect the effect of sales charges, if any. |
| (3) | Total expenses do not reflect amounts reimbursed and/or waived by the adviser and certain of its affiliates, if applicable. Net expenses are net of all reductions and represent the net expenses paid by the Fund. |
| (4) | Amounts do not include the expenses of the Underlying Funds. |
| (5) | Includes a reimbursement of expenses by the investment adviser due to the Fund’s investment in the Liquidity Fund (equal to less than 0.005% of average daily net assets for the year ended September 30, 2022). |
35
See Notes to Financial Statements.
Calvert
Asset Allocation Funds
September 30, 2022
Financial Highlights — continued
| | Growth Allocation Fund — Class I |
| | Year Ended September 30, |
| | 2022 | 2021 | 2020 | 2019 | 2018 |
| Net asset value — Beginning of year | $ 27.23 | $ 22.27 | $ 20.48 | $ 21.26 | $ 20.35 |
| Income (Loss) From Operations | | | | | |
| Net investment income(1) | $ 0.25 | $ 0.14 | $ 0.21 | $ 0.24 | $ 0.25 |
| Net realized and unrealized gain (loss) | (5.66) | 5.69 | 2.39 | 0.16 | 1.84 |
| Total income (loss) from operations | $ (5.41) | $ 5.83 | $ 2.60 | $ 0.40 | $ 2.09 |
| Less Distributions | | | | | |
| From net investment income | $ (0.56) | $ (0.17) | $ (0.25) | $ (0.41) | $ (0.50) |
| From net realized gain | (0.46) | (0.70) | (0.56) | (0.77) | (0.68) |
| Total distributions | $ (1.02) | $ (0.87) | $ (0.81) | $ (1.18) | $ (1.18) |
| Net asset value — End of year | $ 20.80 | $ 27.23 | $ 22.27 | $ 20.48 | $ 21.26 |
| Total Return(2) | (20.81)% | 26.63% | 12.81% | 2.84% | 10.57% |
| Ratios/Supplemental Data | | | | | |
| Net assets, end of year (000’s omitted) | $54,815 | $54,814 | $17,706 | $11,864 | $11,938 |
| Ratios (as a percentage of average daily net assets):(3) | | | | | |
| Total expenses(4) | 0.19% | 0.19% | 0.22% | 0.27% | 0.26% |
| Net expenses(4) | 0.18% (5) | 0.18% | 0.18% | 0.15% | 0.08% |
| Net investment income | 1.01% | 0.52% | 1.03% | 1.23% | 1.20% |
| Portfolio Turnover | 9% | 17% | 43% | 92% | 64% |
| (1) | Computed using average shares outstanding. |
| (2) | Returns are historical and are calculated by determining the percentage change in net asset value with all distributions reinvested and do not reflect the effect of sales charges, if any. |
| (3) | Total expenses do not reflect amounts reimbursed and/or waived by the adviser and certain of its affiliates, if applicable. Net expenses are net of all reductions and represent the net expenses paid by the Fund. |
| (4) | Amounts do not include the expenses of the Underlying Funds. |
| (5) | Includes a reimbursement of expenses by the investment adviser due to the Fund’s investment in the Liquidity Fund (equal to less than 0.005% of average daily net assets for the year ended September 30, 2022). |
36
See Notes to Financial Statements.
Calvert
Asset Allocation Funds
September 30, 2022
Financial Highlights — continued
| | Growth Allocation Fund — Class R6 |
| | Period Ended
September 30, 2022(1) |
| Net asset value — Beginning of period | $ 26.49 |
| Income (Loss) From Operations | |
| Net investment income(2) | $ 0.05 |
| Net realized and unrealized loss | (5.73) |
| Total loss from operations | $ (5.68) |
| Net asset value — End of period | $ 20.81 |
| Total Return(3) | (21.44)% (4) |
| Ratios/Supplemental Data | |
| Net assets, end of period (000’s omitted) | $ 107 |
| Ratios (as a percentage of average daily net assets):(5) | |
| Total expenses(6) | 0.15% (7) |
| Net expenses(6) | 0.14% (7)(8) |
| Net investment income | 0.33% (7) |
| Portfolio Turnover | 9% (4)(9) |
| (1) | For the period from the commencement of operations, February 1, 2022, to September 30, 2022. |
| (2) | Computed using average shares outstanding. |
| (3) | Returns are historical and are calculated by determining the percentage change in net asset value with all distributions reinvested and do not reflect the effect of sales charges, if any. |
| (4) | Not annualized. |
| (5) | Total expenses do not reflect amounts reimbursed and/or waived by the adviser and certain of its affiliates, if applicable. Net expenses are net of all reductions and represent the net expenses paid by the Fund. |
| (6) | Amounts do not include the expenses of the Underlying Funds. |
| (7) | Annualized. |
| (8) | Includes a reimbursement of expenses by the investment adviser due to the Fund’s investment in the Liquidity Fund (equal to less than 0.005% of average daily net assets for the period ended September 30, 2022). |
| (9) | For the year ended September 30, 2022. |
37
See Notes to Financial Statements.
Calvert
Asset Allocation Funds
September 30, 2022
Notes to Financial Statements
1 Significant Accounting Policies
Calvert Conservative Allocation Fund (Conservative), Calvert Moderate Allocation Fund (Moderate) and Calvert Growth Allocation Fund (Growth) (each a Fund and collectively, the Funds) are diversified series of Calvert Social Investment Fund (the Trust). The Trust is a Massachusetts business trust registered under the Investment Company Act of 1940, as amended (the 1940 Act), as an open-end management investment company. The investment objective of Conservative is to seek current income and capital appreciation, consistent with the preservation of capital. The investment objective of Moderate is to seek long-term capital appreciation and growth of income, with current income a secondary objective. The investment objective of Growth is to seek long-term capital appreciation. Each Fund is a "fund-of-funds" that invests primarily in a combination of other Calvert equity and income funds (the Underlying Funds). The financial statements of the Underlying Funds are included in their shareholder reports, which are available free of charge at www.calvert.com.
Each Fund offers four classes of shares. Class A shares are generally sold subject to a sales charge imposed at time of purchase. A contingent deferred sales charge of 1.00% (0.80% prior to April 29, 2022) may apply to certain redemptions of Class A shares for accounts for which no sales charge was paid, if redeemed within 12 months of purchase. Class C shares are sold without a front-end sales charge, and with certain exceptions, are charged a contingent deferred sales charge of 1% on shares redeemed within 12 months of purchase. Class C shares are only available for purchase through a financial intermediary. Effective November 5, 2020, Class C shares automatically convert to Class A shares eight years after their purchase as described in the Funds’ prospectus. Class I and Class R6 shares are sold at net asset value, are not subject to a sales charge and are sold only to certain eligible investors. Each class represents a pro rata interest in each Fund, but votes separately on class-specific matters and is subject to different expenses.
Each Fund applies the accounting and reporting guidance in the Financial Accounting Standards Board (FASB) Accounting Standards Codification Topic 946, Financial Services – Investment Companies (ASC 946). Subsequent events, if any, through the date that the financial statements were issued have been evaluated in the preparation of the financial statements.
A Investment Valuation— Net asset value per share is determined every business day as of the close of the regular session of the New York Stock Exchange (generally 4:00 p.m. Eastern time). The Funds use independent pricing services approved by the Board of Trustees (the Board) to value their investments wherever possible. Investments for which market quotations are not available or deemed not reliable are fair valued in good faith under the direction of the Board.
U.S. generally accepted accounting principles (U.S. GAAP) establishes a disclosure hierarchy that categorizes the inputs to valuation techniques used to value assets and liabilities at measurement date. These inputs are summarized in the three broad levels listed below:
Level 1 – quoted prices in active markets for identical securities
Level 2 – other significant observable inputs (including quoted prices for similar securities, interest rates, prepayment speeds, credit risk, etc.)
Level 3 – significant unobservable inputs (including each Fund's own assumptions in determining the fair value of investments)
The inputs or methodologies used for valuing securities are not necessarily an indication of the risk associated with investing in those securities.
Valuation techniques used to value each Fund’s investments by major category are as follows:
Debt Securities. Debt securities are generally valued based on valuations provided by third party pricing services, as derived from such services’ pricing models. Inputs to the models may include, but are not limited to, reported trades, executable bid and ask prices, broker/dealer quotations, prices or yields of securities with similar characteristics, interest rates, anticipated prepayments, benchmark curves or information pertaining to the issuer, as well as industry and economic events. Accordingly, debt securities are generally categorized as Level 2 in the hierarchy. Short-term debt securities with a remaining maturity at time of purchase of more than sixty days are valued based on valuations provided by a third party pricing service. Such securities are generally categorized as Level 2 in the hierarchy. Short-term debt securities of sufficient credit quality purchased with remaining maturities of sixty days or less for which a valuation from a third party pricing service is not readily available may be valued at amortized cost, which approximates fair value, and are categorized as Level 2 in the hierarchy.
Other Securities. Investments in the Underlying Funds and in money market funds are valued at the net asset value as of the close of each business day and are categorized as Level 1 in the hierarchy. Valuation methodologies and policies of the Underlying Funds are included in their financial statements, which are available upon request.
Derivatives. Futures contracts are valued at unrealized appreciation (depreciation) based on the settlement price established each day by the board of trade or exchange on which they are traded and are categorized as Level 1 in the hierarchy.
Fair Valuation. In connection with Rule 2a-5 of the 1940 Act, which became effective September 8, 2022, the Board has designated a Fund’s investment adviser as its valuation designee. Investments for which valuations or market quotations are not readily available or are deemed unreliable are valued by the investment adviser, as valuation designee, at fair value using methods that most fairly reflect the security’s “fair value”, which is the amount that a Fund might reasonably expect to receive for the security upon its current sale in the ordinary course. Each such determination is based on a consideration of relevant factors, which are likely to vary from one pricing context to another. These factors may include, but are not limited to, the type of security, the existence of any contractual restrictions on the security’s disposition, the price and extent of public trading in similar securities of the issuer or of
Calvert
Asset Allocation Funds
September 30, 2022
Notes to Financial Statements — continued
comparable companies or entities, quotations or relevant information obtained from broker/dealers or other market participants, information obtained from the issuer, analysts, and/or the appropriate stock exchange (for exchange-traded securities), an analysis of the company’s or entity’s financial statements, and an evaluation of the forces that influence the issuer and the market(s) in which the security is purchased and sold.
The values assigned to fair value investments are based on available information and do not necessarily represent amounts that might ultimately be realized. Further, due to the inherent uncertainty of valuations of such investments, the fair values may differ significantly from the values that would have been used had an active market existed, and the differences could be material.
The following tables summarize the market value of each of the Funds' holdings as of September 30, 2022, based on the inputs used to value them:
Conservative
| Asset Description | Level 1 | Level 2 | Level 3 | Total |
| Mutual Funds | $ 245,754,482 | $ — | $ — | $ 245,754,482 |
| U.S. Treasury Obligations | — | 2,834,445 | — | 2,834,445 |
| Short-Term Investments | 10,018,977 | — | — | 10,018,977 |
| Total Investments | $255,773,459 | $2,834,445 | $ — | $258,607,904 |
| Liability Description | | | | |
| Futures Contracts | $ (2,726,529) | $ — | $ — | $ (2,726,529) |
| Total | $ (2,726,529) | $ — | $ — | $ (2,726,529) |
Moderate
| Asset Description | Level 1 | Level 2 | Level 3 | Total |
| Mutual Funds | $ 329,804,234 | $ — | $ — | $ 329,804,234 |
| U.S. Treasury Obligations | — | 4,466,486 | — | 4,466,486 |
| Short-Term Investments | 14,090,670 | — | — | 14,090,670 |
| Total Investments | $343,894,904 | $4,466,486 | $ — | $348,361,390 |
| Liability Description | | | | |
| Futures Contracts | $ (2,159,554) | $ — | $ — | $ (2,159,554) |
| Total | $ (2,159,554) | $ — | $ — | $ (2,159,554) |
Growth
| Asset Description | Level 1 | Level 2 | Level 3 | Total |
| Mutual Funds | $ 238,405,671 | $ — | $ — | $ 238,405,671 |
| U.S. Treasury Obligations | — | 2,347,118 | — | 2,347,118 |
| Short-Term Investments | 20,645,053 | — | — | 20,645,053 |
| Total Investments | $259,050,724 | $2,347,118 | $ — | $261,397,842 |
| Futures Contracts | $ 63,001 | $ — | $ — | $ 63,001 |
| Total | $259,113,725 | $2,347,118 | $ — | $261,460,843 |
Calvert
Asset Allocation Funds
September 30, 2022
Notes to Financial Statements — continued
Growth — continued
| Liability Description | Level 1 | Level 2 | Level 3 | Total |
| Futures Contracts | $ (514,111) | $ — | $ — | $ (514,111) |
| Total | $ (514,111) | $ — | $ — | $ (514,111) |
B Investment Transactions and Income— Investment transactions for financial statement purposes are accounted for on trade date. Realized gains and losses are recorded on an identified cost basis and may include proceeds from litigation. Distributions from the Underlying Funds are recorded on the ex-dividend date. Distributions received that represent a return of capital are recorded as a reduction of cost of investments. Distributions received that represent a capital gain are recorded as a realized gain. Interest income, which includes amortization of premium and accretion of discount on debt securities, is accrued as earned. Inflation adjustments to the principal amount of inflation-adjusted bonds and notes are reflected as interest income. Deflation adjustments to the principal amount of an inflation-adjusted bond or note are reflected as reductions to interest income to the extent of interest income previously recorded on such bond or note. Expenses included in the accompanying financial statements reflect the expenses of each Fund and do not include any expenses associated with the Underlying Funds.
C Share Class Accounting— Realized and unrealized gains and losses and net investment income and losses, other than class-specific expenses, are allocated daily to each class of shares based upon the relative net assets of each class to the total net assets of each Fund. Expenses arising in connection with a specific class are charged directly to that class. Sub-accounting, recordkeeping and similar administrative fees payable to financial intermediaries, which are a component of transfer agency fees and expenses on the Statements of Operations, are not allocated to Class R6 shares.
D Futures Contracts— The Funds may enter into futures contracts to buy or sell a financial instrument for a set price at a future date. Initial margin deposits of either cash or securities as required by the broker are made upon entering into the contract. While the contract is open, daily variation margin payments are made to or received from the broker reflecting the daily change in market value of the contract and are recorded for financial reporting purposes as unrealized gains or losses by the Funds. When a futures contract is closed, a realized gain or loss is recorded equal to the difference between the opening and closing value of the contract. The risks associated with entering into futures contracts may include the possible illiquidity of the secondary market which would limit the Funds' ability to close out a futures contract prior to the settlement date, an imperfect correlation between the value of the contracts and the underlying financial instruments, or that the counterparty will fail to perform its obligations under the contracts’ terms. Futures contracts are designed by boards of trade, which are designated “contracts markets” by the Commodities Futures Trading Commission. Futures contracts trade on the contracts markets in a manner that is similar to the way a stock trades on a stock exchange, and the boards of trade, through their clearing corporations, guarantee the futures contracts against default. As a result, there is minimal counterparty credit risk to the Funds.
E Options Contracts— Upon the purchase of a call or put option, the premium paid by the Funds is included in the Statements of Assets and Liabilities as an investment. The amount of the investment is subsequently marked-to-market to reflect the current market value of the option purchased, in accordance with the Funds' policies on investment valuations discussed above. Premiums paid for purchasing options that expire are treated as realized losses. Premiums paid for purchasing options that are exercised or closed are added to the amounts paid or offset against the proceeds on the underlying investment transaction to determine the realized gain or loss. As the purchaser of an index option, the Funds have the right to receive a cash payment equal to any depreciation in the value of the index below the exercise price of the option (in the case of a put) or equal to any appreciation in the value of the index over the exercise price of the option (in the case of a call) as of the valuation date of the option. The risk associated with purchasing options is limited to the premium originally paid. Purchased options traded over-the-counter involve risk that the issuer or counterparty will fail to perform its contractual obligations.
Upon the writing of a call or a put option, the premium received by the Funds is included in the Statements of Assets and Liabilities as a liability. The amount of the liability is subsequently marked-to-market to reflect the current market value of the option written, in accordance with the Funds' policies on investment valuations discussed above. Premiums received from writing options that expire are treated as realized gains. Premiums received from writing options that are exercised or closed are added to or offset against the proceeds or amount paid on the transaction to determine the realized gain or loss. When an index option is exercised, each Fund is required to deliver an amount of cash determined by the excess of the exercise price of the option over the value of the index (in the case of a put) or the excess of the value of the index over the exercise price of the option (in the case of a call) at contract termination. The Funds, as writers of an option, may have no control over whether the underlying instrument may be sold (call) or purchased (put) and, as a result, bear the market risk of an unfavorable change in the price of the instrument underlying the written option. The Funds may also bear the risk of not being able to enter into a closing transaction if a liquid secondary market does not exist.
F Distributions to Shareholders— Distributions to shareholders are recorded by the Funds on ex-dividend date. Distributions from net investment income are declared and paid quarterly for Conservative and Moderate and annually for Growth. Distributions from net realized capital gains, if any, are paid at least annually. Distributions are declared separately for each class of shares. Distributions are determined in accordance with income tax regulations, which may differ from U.S. GAAP; accordingly, periodic reclassifications are made within the Funds’ capital accounts to reflect income and gains available for distribution under income tax regulations.
Calvert
Asset Allocation Funds
September 30, 2022
Notes to Financial Statements — continued
G Estimates— The preparation of financial statements in conformity with U.S. GAAP requires management to make estimates and assumptions that affect the reported amounts of assets and liabilities and disclosure of contingent assets and liabilities at the date of the financial statements and the reported amounts of increases and decreases in net assets from operations during the reporting period. Actual results could differ from those estimates.
H Indemnifications— Under the Trust’s organizational document, its officers and Trustees may be indemnified against certain liabilities and expenses arising out of the performance of their duties to the Funds. Under Massachusetts law, if certain conditions prevail, shareholders of a Massachusetts business trust (such as the Trust) could be deemed to have personal liability for the obligations of the Trust. However, the Trust’s Declaration of Trust contains an express disclaimer of liability on the part of Fund shareholders and provides that the Trust shall assume, upon request by the shareholder, the defense on behalf of any Fund shareholders or former shareholders. Additionally, in the normal course of business, each Fund enters into agreements with service providers that may contain indemnification clauses. Each Fund’s maximum exposure under these arrangements is unknown as this would involve future claims that may be made against each Fund that have not yet occurred.
I Federal Income Taxes— No provision for federal income or excise tax is required since each Fund intends to continue to qualify as a regulated investment company under the Internal Revenue Code and to distribute substantially all of its taxable earnings.
Management has analyzed the Funds' tax positions taken for all open federal income tax years and has concluded that no provision for federal income tax is required in the Funds' financial statements. Each Fund's federal tax return is subject to examination by the Internal Revenue Service for a period of three years from the date of filing.
2 Related Party Transactions
Calvert Research and Management (CRM), an indirect, wholly-owned subsidiary of Morgan Stanley, provides investment advisory services to the Funds. CRM does not receive compensation from the Funds for performing investment advisory services. CRM does, however, receive a fee for investment advisory services provided to the Underlying Funds.
Effective April 26, 2022, the Funds may invest in a money market fund, the Institutional Class of the Morgan Stanley Institutional Liquidity Funds - Government Portfolio (the “Liquidity Fund”), an open-end management investment company managed by Morgan Stanley Investment Management Inc., a wholly-owned subsidiary of Morgan Stanley. Each Fund’s expenses are reduced by an amount equal to its pro-rata share of the advisory and administration fees incurred by each Fund due to its investment in the Liquidity Fund. For the year ended September 30, 2022, expenses reimbursed by CRM for Conservative, Moderate and Growth were $7,896, $11,873 and $10,143, respectively, relating to each Fund’s investment in the Liquidity Fund. Prior to April 26, 2022, each Fund may have invested its cash in Calvert Cash Reserves Fund, LLC (Cash Reserves Fund), an affiliated investment company managed by CRM. CRM did not receive a fee for advisory services provided to Cash Reserves Fund.
CRM has agreed to reimburse the Funds’ operating expenses to the extent that total annual operating expenses (relating to ordinary operating expenses only and excluding expenses such as brokerage commissions, acquired fund fees and expenses, borrowing costs, taxes or litigation expenses) for Conservative, Moderate and Growth exceed 0.44%, 0.44% and 0.43%, respectively, for Class A; 1.19%, 1.19% and 1.18%, respectively, for Class C; 0.19%, 0.19% and 0.18%, respectively, for Class I; and 0.15%, 0.15% and 0.14%, respectively, for Class R6 of such class's average daily net assets. The expense reimbursement agreements with CRM may be changed or terminated after January 31, 2023. For the year ended September 30, 2022, CRM waived or reimbursed expenses of $37,970 for Growth and no expenses were waived or reimbursed for Conservative and Moderate. CRM serves as the administrator of the Funds, but receives no compensation.
Each Fund has in effect a distribution plan for Class A shares (Class A Plan) pursuant to Rule 12b-1 under the 1940 Act. Pursuant to the Class A Plan, each Fund pays Eaton Vance Distributors, Inc. (EVD), an affiliate of CRM and the Funds' principal underwriter, a distribution and service fee of 0.25% per annum of its average daily net assets attributable to Class A shares for distribution services and facilities provided to the Funds by EVD, as well as for personal services and/or the maintenance of shareholder accounts. Each Fund also has in effect a distribution plan for Class C shares (Class C Plan) pursuant to Rule 12b-1 under the 1940 Act. Pursuant to the Class C Plan, each Fund pays EVD amounts equal to 0.75% per annum of its average daily net assets attributable to Class C shares for providing ongoing distribution services and facilities to the Funds. In addition, pursuant to the Class C Plan, each Fund also makes payments of service fees to EVD, financial intermediaries and other persons in amounts equal to 0.25% per annum of its average daily net assets attributable to that class. Service fees paid or accrued are for personal services and/or the maintenance of shareholder accounts. Distribution and service fees for Conservative, Moderate and Growth paid or accrued for the year ended September 30, 2022 amounted to $513,484, $741,608 and $549,424, respectively, for Class A shares and $239,260, $329,118 and $178,548, respectively, for Class C shares.
The Funds were informed that EVD received $35,597, $73,748 and $115,766 for Conservative, Moderate and Growth, respectively, as their portion of the sales charge on sales of Class A shares for the year ended September 30, 2022. The Funds were also informed that EVD received $6,417, $7,975 and $4,071 for Conservative, Moderate and Growth, respectively, of contingent deferred sales charges paid by each Fund's shareholders for the same period.
Calvert
Asset Allocation Funds
September 30, 2022
Notes to Financial Statements — continued
Eaton Vance Management (EVM), an affiliate of CRM, provides sub-transfer agency and related services to the Funds pursuant to a Sub-Transfer Agency Support Services Agreement. For the year ended September 30, 2022, sub-transfer agency fees and expenses incurred to EVM amounted to $28,800, $59,107 and $59,556 for Conservative, Moderate and Growth, respectively, and are included in transfer agency fees and expenses on the Statements of Operations.
Each Trustee of the Funds who is not an employee of CRM or its affiliates receives an annual fee of $214,000 ($154,000 prior to January 1, 2022), plus an annual Committee fee ranging from $8,500 to $16,500 depending on the Committee. The Board chair receives an additional $30,000 annual fee, Committee chairs receive an additional $6,000 annual fee and the special equities liaison receives an additional $2,500 annual fee. Eligible Trustees may participate in a Deferred Compensation Plan (the Plan). Amounts deferred under the Plan are treated as though equal dollar amounts had been invested in shares of the Funds or other Calvert funds selected by the Trustees. The Funds purchase shares of the funds selected equal to the dollar amounts deferred under the Plan, resulting in an asset equal to the deferred compensation liability. Obligations of the Plan are paid solely from the Funds' assets. Trustees’ fees are allocated to each of the Calvert funds served. Salaries and fees of officers and Trustees of the Funds who are employees of CRM or its affiliates are paid by CRM.
3 Investment Activity
During the year ended September 30, 2022, the cost of purchases and proceeds from sales of investments, other than short-term securities, were as follows:
| | Conservative | Moderate | Growth |
| Purchases | | | |
| Non-U.S. Government and Agency Securities | $90,678,991 | $85,740,934 | $67,213,113 |
| Sales | | | |
| Non-U.S. Government and Agency Securities | $54,052,313 | $68,761,747 | $25,034,504 |
4 Distributions to Shareholders and Income Tax Information
The tax character of distributions declared for the years ended September 30, 2022 and September 30, 2021 was as follows:
| | Conservative | Moderate | Growth |
| | Year Ended September 30, | Year Ended September 30, | Year Ended September 30, |
| | 2022 | 2021 | 2022 | 2021 | 2022 | 2021 |
| Ordinary income | $6,838,990 | $5,487,084 | $ 9,236,739 | $ 5,742,341 | $6,878,144 | $1,618,863 |
| Long-term capital gains | $7,329,268 | $5,067,928 | $13,708,641 | $10,274,810 | $3,995,699 | $5,868,000 |
During the year ended September 30, 2022, the following amounts were reclassified due to the Funds' use of equalization accounting. Tax equalization accounting allows a Fund to treat as a distribution that portion of redemption proceeds representing a redeeming shareholder’s portion of undistributed taxable income and net capital gains.
| | Conservative | Moderate | Growth |
| Change in: | | | |
| Paid-in capital | $ 41,949 | $ — | $ 242,907 |
| Accumulated loss | $(41,949) | $ — | $(242,907) |
These reclassifications had no effect on the net assets or net asset value per share of the Funds.
Calvert
Asset Allocation Funds
September 30, 2022
Notes to Financial Statements — continued
As of September 30, 2022, the components of distributable earnings (accumulated loss) on a tax basis were as follows:
| | Conservative | Moderate | Growth |
| Undistributed long-term capital gains | $ — | $ — | $ 4,233,283 |
| Post October capital losses | (7,732,421) | (368,635) | (1,053,094) |
| Late year ordinary losses | — | — | (68,562) |
| Net unrealized depreciation | (17,454,746) | (816,389) | (3,938,485) |
| Accumulated loss | $(25,187,167) | $(1,185,024) | $ (826,858) |
At September 30, 2022, Conservative, Moderate and Growth had a net capital loss of $7,732,421, $368,635 and $1,053,094, respectively, attributable to security transactions incurred after October 31, 2021 that each Fund has elected to defer. This net capital loss is treated as arising on the first day of each Fund’s taxable year ending September 30, 2023.
Additionally, at September 30, 2022, Growth had a late year ordinary loss of $68,562 which it has elected to defer to the following taxable year pursuant to income tax regulations. Late year ordinary losses represent certain specified losses realized in that portion of a taxable year after October 31 that are treated as ordinary for tax purposes plus ordinary losses attributable to that portion of a taxable year after December 31.
The cost and unrealized appreciation (depreciation) of investments, including open derivative contracts, of the Funds at September 30, 2022, as determined on a federal income tax basis, were as follows:
| | Conservative | Moderate | Growth |
| Aggregate cost | $276,062,650 | $349,177,779 | $265,336,327 |
| Gross unrealized appreciation | $ 7,172,944 | $ 22,442,484 | $ 18,561,857 |
| Gross unrealized depreciation | (24,627,690) | (23,258,873) | (22,500,342) |
| Net unrealized depreciation | $ (17,454,746) | $ (816,389) | $ (3,938,485) |
5 Financial Instruments
A summary of futures contracts outstanding at September 30, 2022 is included in each Fund's Schedule of Investments. During the year ended September 30, 2022, each Fund used futures contracts and purchased and written options contracts to facilitate the periodic rebalancing of its portfolio to maintain its target asset allocation and to make tactical asset allocations.
At September 30, 2022, the fair value of open derivative instruments (not considered to be hedging instruments for accounting disclosure purposes) and whose primary underlying risk exposure is interest rate risk was as follows:
Conservative
| Derivative | Statements of Assets and Liabilities Caption | Assets | Liabilities |
| Futures contracts | Accumulated loss | | $ — | $(2,726,529) (1) |
| (1) | Only the current day's variation margin is reported within the Statements of Assets and Liabilities as Receivable or Payable for variation margin on open futures contracts, as applicable. |
Calvert
Asset Allocation Funds
September 30, 2022
Notes to Financial Statements — continued
Moderate
| Derivative | Statements of Assets and Liabilities Caption | Assets | Liabilities |
| Futures contracts | Accumulated loss | | $ — | $(2,159,554) (1) |
| (1) | Only the current day's variation margin is reported within the Statements of Assets and Liabilities as Receivable or Payable for variation margin on open futures contracts, as applicable. |
Growth
| Derivative | Statements of Assets and Liabilities Caption | Assets | Liabilities |
| Futures contracts | Accumulated loss | | $63,001 | $(514,111) (1) |
| (1) | Only the current day's variation margin is reported within the Statements of Assets and Liabilities as Receivable or Payable for variation margin on open futures contracts, as applicable. |
The effect of derivative instruments (not considered to be hedging instruments for accounting disclosure purposes) on the Statements of Operations by risk exposure for the year ended September 30, 2022 was as follows:
Conservative
| Statements of Operations Caption | Equity price | Interest rate | Total |
| Net realized gain (loss): | | | |
| Investment securities(1) | $ 31,829 | $ — | $ 31,829 |
| Futures contracts | — | (6,613,781) | (6,613,781) |
| Written options | 95,709 | — | 95,709 |
| Total | $127,538 | $(6,613,781) | $(6,486,243) |
| Change in unrealized appreciation (depreciation): | | | |
| Investment securities(1) | $ 36,976 | $ — | $ 36,976 |
| Futures contracts | — | (2,303,988) | (2,303,988) |
| Written options | 19,211 | — | 19,211 |
| Total | $ 56,187 | $(2,303,988) | $(2,247,801) |
| (1) | Relates to purchased options. |
Calvert
Asset Allocation Funds
September 30, 2022
Notes to Financial Statements — continued
Moderate
| Statements of Operations Caption | Equity price | Interest rate | Total |
| Net realized gain (loss): | | | |
| Investment securities(1) | $ 49,022 | $ — | $ 49,022 |
| Futures contracts | — | (4,714,858) | (4,714,858) |
| Written options | 174,104 | — | 174,104 |
| Total | $223,126 | $(4,714,858) | $(4,491,732) |
| Change in unrealized appreciation (depreciation): | | | |
| Investment securities(1) | $ 70,590 | $ — | $ 70,590 |
| Futures contracts | — | (1,913,807) | (1,913,807) |
| Written options | 36,675 | — | 36,675 |
| Total | $107,265 | $(1,913,807) | $(1,806,542) |
| (1) | Relates to purchased options. |
Growth
| Statements of Operations Caption | Equity price | Interest rate | Total |
| Net realized gain (loss): | | | |
| Investment securities(1) | $ 59,842 | $ — | $ 59,842 |
| Futures contracts | — | (26,685) | (26,685) |
| Written options | 195,197 | — | 195,197 |
| Total | $255,039 | $ (26,685) | $ 228,354 |
| Change in unrealized appreciation (depreciation): | | | |
| Investment securities(1) | $ 77,313 | $ — | $ 77,313 |
| Futures contracts | — | (647,228) | (647,228) |
| Written options | 40,167 | — | 40,167 |
| Total | $117,480 | $(647,228) | $(529,748) |
| (1) | Relates to purchased options. |
The average notional cost of futures contracts and the average number of purchased and written options contracts outstanding during the year ended September 30, 2022, which are indicative of the volume of these derivative types, were approximately as follows:
| | Conservative | Moderate | Growth |
| Futures contracts — long | $57,416,000 | $47,045,000 | $12,042,000 |
| Futures contracts — short | $ — | $ 130,000 | $ 5,072,000 |
| Purchased options | 3 | 6 | 7 |
| Written options | (4) | (7) | (8) |
Calvert
Asset Allocation Funds
September 30, 2022
Notes to Financial Statements — continued
6 Line of Credit
The Funds participate with other portfolios and funds managed by EVM and its affiliates, including CRM, in an $800 million unsecured line of credit with a group of banks, which is in effect through October 25, 2022. Borrowings are made by the Funds solely for temporary purposes related to redemptions and other short-term cash needs. Interest is charged to each Fund based on its borrowings at an amount above either the Secured Overnight Financing Rate (SOFR) or Federal Funds rate. In addition, a fee computed at an annual rate of 0.15% on the daily unused portion of the line of credit is allocated among the participating portfolios and funds at the end of each quarter. In connection with the renewal of the agreement in October 2021, an arrangement fee of $150,000 was incurred that was allocated to the participating portfolios and funds. Because the line of credit is not available exclusively to the Funds, a Fund may be unable to borrow some or all of its requested amounts at any particular time.
The Funds had no borrowings pursuant to their line of credit during the year ended September 30, 2022. Effective October 25, 2022, the Funds renewed their line of credit agreement, which expires October 24, 2023. In connection with the renewal, the borrowing limit was decreased to $725 million.
7 Affiliated Funds
At September 30, 2022, the value of each Fund’s investment in affiliated funds was $255,773,459, $343,894,904 and $259,050,724 for Conservative, Moderate and Growth, respectively, which represents 99.1%, 98.9% and 99.1% of net assets for Conservative, Moderate and Growth, respectively. Transactions in affiliated funds by the Funds for the year ended September 30, 2022 were as follows:
Conservative
Name of
Calvert Fund | Value,
beginning
of period | Purchases | Sales
proceeds | Net
realized
gain
(loss) | Change in
unrealized
appreciation
(depreciation) | Value,
end of
period | Dividend
income | Capital gains
distributions
received | Shares/Units,
end of period |
| Bond Fund, Class R6 | $77,659,304 | $46,294,597 | $ (1,129,813) | $ (131,427) | $ (18,311,060) | $ 104,381,601 | $ 2,442,779 | $ 985,379 | 7,439,886 |
| Cash Reserves Fund | 36,741,730 | 45,271,114 | (82,009,573) | (1,346) | (1,925) | — | 12,697 | — | — |
| Emerging Markets Advancement Fund, Class I | 5,847,825 | 2,559,311 | (284,400) | (49,495) | (1,629,034) | 6,444,207 | 35,507 | 233,243 | 654,234 |
| Emerging Markets Equity Fund, Class R6 | 5,034,476 | 549,485 | (1,699,546) | (152,871) | (1,265,101) | 2,466,443 | 38,951 | — | 171,638 |
| Equity Fund, Class R6 | 8,789,733 | 3,842,314 | (1,226,405) | (40,603) | (2,105,112) | 9,259,927 | 19,379 | 350,891 | 125,934 |
| Flexible Bond Fund, Class R6 | 16,578,282 | 2,190,024 | (3,461,262) | (97,782) | (1,481,229) | 13,728,033 | 447,896 | 181,222 | 975,002 |
| Floating-Rate Advantage Fund, Class R6 | 20,511,732 | 2,492,443 | (9,085,498) | (681,165) | (1,003,244) | 12,234,268 | 848,649 | — | 1,424,245 |
| High Yield Bond Fund, Class R6 | 3,033,107 | 7,972,701 | (262,506) | (26,728) | (1,424,772) | 9,291,802 | 319,652 | — | 414,628 |
| International Equity Fund, Class R6 | 9,524,109 | 4,152,340 | (1,843,135) | (272,862) | (3,561,933) | 7,998,519 | 115,485 | 507,275 | 436,362 |
| International Opportunities Fund, Class R6 | 8,067,159 | 2,150,747 | (2,362,130) | 188,061 | (3,160,105) | 4,883,732 | 105,292 | 406,994 | 368,306 |
Calvert
Asset Allocation Funds
September 30, 2022
Notes to Financial Statements — continued
Conservative — continued
Name of
Calvert Fund | Value,
beginning
of period | Purchases | Sales
proceeds | Net
realized
gain
(loss) | Change in
unrealized
appreciation
(depreciation) | Value,
end of
period | Dividend
income | Capital gains
distributions
received | Shares/Units,
end of period |
| International Responsible Index Fund, Class R6 | $ 7,255,748 | $ 1,286,772 | $ (2,161,440) | $ (284,622) | $ (1,841,102) | $ 4,255,356 | $ 159,175 | $ — | 198,108 |
| Liquidity Fund | — | 62,164,665 | (52,145,688) | — | — | 10,018,977 | 73,983 | — | 10,018,977 |
| Mid-Cap Fund, Class I | 2,180,760 | 526,800 | (28,440) | (7,570) | (763,886) | 1,907,664 | 3,525 | 233,995 | 53,980 |
| Short Duration Income Fund, Class R6 | 12,021,656 | 1,584,246 | (4,083,309) | (249,376) | (859,894) | 8,413,323 | 250,010 | 78,718 | 559,397 |
| Small-Cap Fund, Class R6 | 3,710,141 | 2,231,842 | (360,917) | (30,139) | (1,138,597) | 4,412,330 | 6,359 | 254,367 | 159,003 |
| Ultra-Short Duration Income Fund, Class R6 | 31,530,433 | 3,157,294 | (17,205,829) | (262,303) | (420,687) | 16,798,908 | 333,341 | — | 1,735,424 |
| US Large-Cap Core Responsible Index Fund, Class R6 | 5,837,809 | 992,054 | (1,399,472) | 129,375 | (1,295,192) | 4,264,574 | 54,127 | 15,572 | 135,944 |
| US Large-Cap Growth Responsible Index Fund, Class I | 8,020,619 | 3,717,385 | (947,302) | (23,712) | (2,280,730) | 8,486,260 | 35,539 | 131,054 | 220,137 |
| US Large-Cap Value Responsible Index Fund, Class I | 30,177,417 | 4,236,609 | (6,191,523) | 163,019 | (5,564,525) | 22,820,997 | 443,837 | 876,451 | 911,382 |
| US Mid-Cap Core Responsible Index Fund, Class I | 4,415,971 | 742,027 | (319,386) | (39,238) | (1,092,836) | 3,706,538 | 23,286 | 106,566 | 122,449 |
| Total | | | | $(1,870,784) | $(49,200,964) | $255,773,459 | $5,769,469 | $4,361,727 | |
Moderate
Name of
Calvert Fund | Value,
beginning
of period | Purchases | Sales
proceeds | Net
realized
gain
(loss) | Change in
unrealized
appreciation
(depreciation) | Value,
end of
period | Dividend
income | Capital gains
distributions
received | Shares/Units,
end of period |
| Bond Fund, Class R6 | $34,196,342 | $29,275,586 | $ (132,471) | $ (6,550) | $ (8,306,928) | $ 55,025,979 | $ 1,058,179 | $ 406,228 | 3,922,023 |
Calvert
Asset Allocation Funds
September 30, 2022
Notes to Financial Statements — continued
Moderate — continued
Name of
Calvert Fund | Value,
beginning
of period | Purchases | Sales
proceeds | Net
realized
gain
(loss) | Change in
unrealized
appreciation
(depreciation) | Value,
end of
period | Dividend
income | Capital gains
distributions
received | Shares/Units,
end of period |
| Cash Reserves Fund | $38,142,702 | $28,043,743 | $(66,183,875) | $ (495) | $ (2,075) | $ — | $ 14,240 | $ — | — |
| Emerging Markets Advancement Fund, Class I | 17,288,189 | 3,835,137 | (1,423,995) | (115,578) | (3,941,598) | 15,642,155 | 96,792 | 635,817 | 1,588,036 |
| Emerging Markets Equity Fund, Class R6 | 14,848,764 | 1,143,182 | (2,199,564) | (191,756) | (4,295,618) | 9,305,008 | 122,487 | — | 647,530 |
| Equity Fund, Class R6 | 15,155,815 | 5,579,826 | (1,912,451) | (12,293) | (3,539,997) | 15,270,900 | 34,126 | 617,918 | 207,683 |
| Flexible Bond Fund, Class R6 | 16,709,396 | 2,025,535 | (2,069,657) | (67,593) | (1,523,399) | 15,074,282 | 449,815 | 179,235 | 1,070,617 |
| Floating-Rate Advantage Fund, Class R6 | 21,346,966 | 1,554,881 | (6,239,522) | (306,888) | (1,430,004) | 14,925,433 | 868,896 | — | 1,737,536 |
| High Yield Bond Fund, Class R6 | 7,814,448 | 10,414,159 | (1,092,180) | (71,325) | (2,477,030) | 14,588,072 | 587,648 | — | 650,962 |
| International Equity Fund, Class R6 | 29,157,548 | 4,836,302 | (6,098,450) | (667,401) | (8,653,196) | 18,574,803 | 347,803 | 1,527,750 | 1,013,355 |
| International Opportunities Fund, Class R6 | 27,074,370 | 3,035,829 | (4,813,457) | 308,992 | (10,384,872) | 15,220,862 | 371,681 | 1,436,687 | 1,147,878 |
| International Responsible Index Fund, Class R6 | 18,280,878 | 3,661,262 | (2,744,510) | (438,783) | (5,354,396) | 13,404,451 | 391,481 | — | 624,043 |
| Liquidity Fund | — | 75,368,640 | (61,277,970) | — | — | 14,090,670 | 113,331 | — | 14,090,670 |
| Mid-Cap Fund, Class I | 4,298,748 | 678,250 | (168,424) | (21,586) | (1,388,347) | 3,398,641 | 6,810 | 452,094 | 96,170 |
| Short Duration Income Fund, Class R6 | 12,214,865 | 862,295 | (2,532,422) | (135,246) | (960,047) | 9,449,445 | 243,535 | 78,412 | 628,288 |
| Small-Cap Fund, Class R6 | 7,649,737 | 5,956,553 | (909,673) | (53,247) | (2,504,105) | 10,139,265 | 12,935 | 517,423 | 365,379 |
| Ultra-Short Duration Income Fund, Class R6 | 38,808,462 | 1,835,860 | (16,727,111) | (259,606) | (584,528) | 23,073,077 | 419,158 | — | 2,383,582 |
Calvert
Asset Allocation Funds
September 30, 2022
Notes to Financial Statements — continued
Moderate — continued
Name of
Calvert Fund | Value,
beginning
of period | Purchases | Sales
proceeds | Net
realized
gain
(loss) | Change in
unrealized
appreciation
(depreciation) | Value,
end of
period | Dividend
income | Capital gains
distributions
received | Shares/Units,
end of period |
| US Large-Cap Core Responsible Index Fund, Class R6 | $41,055,860 | $ 2,723,544 | $ (7,841,368) | $ 2,031,190 | $ (9,556,822) | $ 28,412,404 | $ 373,310 | $ 107,398 | 905,719 |
| US Large-Cap Growth Responsible Index Fund, Class I | 19,385,399 | 2,118,966 | (2,082,078) | 382,750 | (4,833,955) | 14,971,082 | 84,429 | 311,341 | 388,355 |
| US Large-Cap Value Responsible Index Fund, Class I | 57,646,663 | 5,373,789 | (9,158,856) | 823,294 | (10,669,012) | 44,015,878 | 831,956 | 1,642,877 | 1,757,823 |
| US Mid-Cap Core Responsible Index Fund, Class I | 11,927,622 | 829,978 | (615,558) | (44,026) | (2,785,519) | 9,312,497 | 61,887 | 283,214 | 307,648 |
| Total | | | | $ 1,153,853 | $(83,191,448) | $343,894,904 | $6,490,499 | $8,196,394 | |
Growth
Name of
Calvert Fund | Value,
beginning
of period | Purchases | Sales
proceeds | Net
realized
gain
(loss) | Change in
unrealized
appreciation
(depreciation) | Value,
end of
period | Dividend
income | Capital gains
distributions
received | Shares/Units,
end of period |
| Cash Reserves Fund | $21,124,678 | $32,085,918 | $(53,209,914) | $ 1,410 | $ (2,092) | $ — | $ 6,807 | $ — | — |
| Emerging Markets Advancement Fund, Class I | 17,386,469 | 4,234,205 | (299,347) | (16,931) | (4,312,402) | 16,991,994 | 100,722 | 661,635 | 1,725,076 |
| Emerging Markets Equity Fund, Class R6 | 15,675,473 | 3,083,884 | (285,626) | (35,380) | (5,648,702) | 12,789,649 | 134,478 | — | 890,024 |
| Equity Fund, Class R6 | 13,068,966 | 5,660,921 | (560,902) | 4,275 | (3,477,409) | 14,695,851 | 30,016 | 543,496 | 199,862 |
| Floating-Rate Advantage Fund, Class R6 | 6,015,719 | 666,948 | (1,941,672) | (60,323) | (436,337) | 4,244,335 | 248,814 | — | 494,102 |
| High Yield Bond Fund, Class R6 | — | 11,291,842 | (318,762) | (16,788) | (1,353,473) | 9,602,819 | 292,460 | — | 428,506 |
Calvert
Asset Allocation Funds
September 30, 2022
Notes to Financial Statements — continued
Growth — continued
Name of
Calvert Fund | Value,
beginning
of period | Purchases | Sales
proceeds | Net
realized
gain
(loss) | Change in
unrealized
appreciation
(depreciation) | Value,
end of
period | Dividend
income | Capital gains
distributions
received | Shares/Units,
end of period |
| International Equity Fund, Class R6 | $30,423,182 | $ 7,344,428 | $ (4,845,644) | $ (725,343) | $ (9,926,419) | $ 22,270,204 | $ 367,477 | $ 1,614,167 | 1,214,959 |
| International Opportunities Fund, Class R6 | 25,451,309 | 6,145,016 | (1,879,803) | (36,887) | (11,208,458) | 18,471,177 | 366,758 | 1,417,655 | 1,393,000 |
| International Responsible Index Fund, Class R6 | 20,942,871 | 5,015,947 | (1,818,706) | (385,250) | (6,715,971) | 17,038,891 | 438,531 | — | 793,244 |
| Liquidity Fund | — | 33,571,770 | (12,926,717) | — | — | 20,645,053 | 102,996 | — | 20,645,053 |
| Mid-Cap Fund, Class I | 5,774,009 | 1,548,672 | (214,345) | (34,259) | (2,001,103) | 5,072,974 | 9,239 | 613,368 | 143,548 |
| Small-Cap Fund, Class R6 | 10,259,604 | 4,300,231 | (704,275) | (50,944) | (2,926,087) | 10,878,529 | 17,594 | 703,777 | 392,019 |
| US Large-Cap Core Responsible Index Fund, Class R6 | 43,487,601 | 4,518,690 | (3,493,193) | (313,227) | (8,944,771) | 35,255,100 | 400,494 | 115,218 | 1,123,848 |
| US Large-Cap Growth Responsible Index Fund, Class I | 17,346,206 | 3,062,029 | (900,344) | (9,014) | (4,478,681) | 15,020,196 | 76,517 | 282,162 | 389,629 |
| US Large-Cap Value Responsible Index Fund, Class I | 52,542,564 | 8,248,335 | (6,168,731) | 142,862 | (10,153,509) | 44,611,521 | 767,813 | 1,516,211 | 1,781,610 |
| US Mid-Cap Core Responsible Index Fund, Class I | 14,559,808 | 2,091,965 | (1,603,154) | (192,234) | (3,393,954) | 11,462,431 | 76,471 | 349,959 | 378,673 |
| Total | | | | $ (1,728,033) | $(74,979,368) | $259,050,724 | $3,437,187 | $7,817,648 | |
8 Capital Shares
Each Fund's Declaration of Trust permits the Trustees to issue an unlimited number of full and fractional shares of beneficial interest (without par value). Such shares may be issued in a number of different series (such as the Funds) and classes.
Transactions in capital shares for the years ended September 30, 2022 and September 30, 2021 were as follows:
Calvert
Asset Allocation Funds
September 30, 2022
Notes to Financial Statements — continued
Conservative
| | Year Ended
September 30, 2022 | | Year Ended
September 30, 2021 |
| | Shares | Amount | | Shares | Amount |
| Class A | | | | | |
| Shares sold | 1,817,091 | $ 33,606,738 | | 2,489,240 | $ 48,232,172 |
| Reinvestment of distributions | 502,853 | 9,398,557 | | 376,102 | 7,142,236 |
| Shares redeemed | (1,839,716) | (33,064,542) | | (1,935,603) | (37,474,641) |
| Converted from Class C | 88,405 | 1,600,969 | | 197,991 | 3,790,521 |
| Net increase | 568,633 | $ 11,541,722 | | 1,127,730 | $ 21,690,288 |
| Class C | | | | | |
| Shares sold | 174,611 | $ 3,209,237 | | 301,649 | $ 5,725,633 |
| Reinvestment of distributions | 51,728 | 968,803 | | 45,315 | 845,660 |
| Shares redeemed | (301,386) | (5,449,457) | | (352,334) | (6,677,768) |
| Converted to Class A | (89,628) | (1,600,969) | | (200,651) | (3,790,521) |
| Net decrease | (164,675) | $ (2,872,386) | | (206,021) | $ (3,896,996) |
| Class I | | | | | |
| Shares sold | 2,362,038 | $ 44,148,317 | | 1,460,241 | $ 28,209,196 |
| Reinvestment of distributions | 183,400 | 3,411,767 | | 111,024 | 2,113,388 |
| Shares redeemed | (1,858,955) | (32,863,960) | | (569,184) | (11,020,249) |
| Net increase | 686,483 | $ 14,696,124 | | 1,002,081 | $ 19,302,335 |
| Class R6(1) | | | | | |
| Shares sold | 6,322 | $ 109,118 | | — | $ — |
| Reinvestment of distributions | 42 | 671 | | — | — |
| Net increase | 6,364 | $ 109,789 | | — | $ — |
| (1) | For the period from the commencement of operations, February 1, 2022, to September 30, 2022. |
Moderate
| | Year Ended
September 30, 2022 | | Year Ended
September 30, 2021 |
| | Shares | Amount | | Shares | Amount |
| Class A | | | | | |
| Shares sold | 1,602,495 | $ 34,884,259 | | 1,770,464 | $ 40,539,363 |
| Reinvestment of distributions | 685,754 | 15,681,343 | | 500,217 | 10,997,453 |
| Shares redeemed | (1,802,191) | (39,056,476) | | (1,767,741) | (39,928,872) |
| Converted from Class C | 107,880 | 2,367,976 | | 219,257 | 4,920,970 |
| Net increase | 593,938 | $ 13,877,102 | | 722,197 | $ 16,528,914 |
Calvert
Asset Allocation Funds
September 30, 2022
Notes to Financial Statements — continued
Moderate — continued
| | Year Ended
September 30, 2022 | | Year Ended
September 30, 2021 |
| | Shares | Amount | | Shares | Amount |
| Class C | | | | | |
| Shares sold | 196,966 | $ 3,989,402 | | 308,159 | $ 6,692,235 |
| Reinvestment of distributions | 79,489 | 1,732,381 | | 62,727 | 1,295,936 |
| Shares redeemed | (284,180) | (5,638,878) | | (267,358) | (5,751,482) |
| Converted to Class A | (114,881) | (2,367,976) | | (232,182) | (4,920,970) |
| Net decrease | (122,606) | $ (2,285,071) | | (128,654) | $ (2,684,281) |
| Class I | | | | | |
| Shares sold | 839,980 | $ 18,611,883 | | 1,460,779 | $ 33,125,719 |
| Reinvestment of distributions | 211,542 | 4,831,140 | | 145,616 | 3,213,692 |
| Shares redeemed | (1,234,313) | (26,358,504) | | (567,043) | (12,962,574) |
| Net increase (decrease) | (182,791) | $ (2,915,481) | | 1,039,352 | $ 23,376,837 |
| Class R6(1) | | | | | |
| Shares sold | 890 | $ 19,026 | | — | $ — |
| Reinvestment of distributions | 5 | 103 | | — | — |
| Net increase | 895 | $ 19,129 | | — | $ — |
| (1) | For the period from the commencement of operations, February 1, 2022, to September 30, 2022. |
Growth
| | Year Ended
September 30, 2022 | | Year Ended
September 30, 2021 |
| | Shares | Amount | | Shares | Amount |
| Class A | | | | | |
| Shares sold | 1,581,320 | $ 39,847,754 | | 1,718,002 | $ 44,592,171 |
| Reinvestment of distributions | 283,744 | 7,856,858 | | 236,514 | 5,778,037 |
| Shares redeemed | (978,581) | (24,882,729) | | (887,939) | (22,828,968) |
| Converted from Class C | 42,286 | 1,033,671 | | 98,413 | 2,428,161 |
| Net increase | 928,769 | $ 23,855,554 | | 1,164,990 | $ 29,969,401 |
| Class C | | | | | |
| Shares sold | 290,201 | $ 5,741,467 | | 237,157 | $ 5,152,583 |
| Reinvestment of distributions | 28,519 | 658,527 | | 26,856 | 551,078 |
| Shares redeemed | (150,184) | (3,103,664) | | (205,037) | (4,482,436) |
| Converted to Class A | (50,823) | (1,033,671) | | (117,233) | (2,428,161) |
| Net increase (decrease) | 117,713 | $ 2,262,659 | | (58,257) | $ (1,206,936) |
| Class I | | | | | |
| Shares sold | 1,301,369 | $ 33,241,074 | | 1,461,296 | $ 37,842,154 |
| Reinvestment of distributions | 78,583 | 2,185,402 | | 39,090 | 958,486 |
| Shares redeemed | (758,139) | (18,585,740) | | (282,580) | (7,429,721) |
| Net increase | 621,813 | $ 16,840,736 | | 1,217,806 | $ 31,370,919 |
Calvert
Asset Allocation Funds
September 30, 2022
Notes to Financial Statements — continued
Growth — continued
| | Year Ended
September 30, 2022 | | Year Ended
September 30, 2021 |
| | Shares | Amount | | Shares | Amount |
| Class R6(1) | | | | | |
| Shares sold | 5,128 | $ 121,397 | | — | $ — |
| Net increase | 5,128 | $ 121,397 | | — | $ — |
| (1) | For the period from the commencement of operations, February 1, 2022, to September 30, 2022. |
9 Risks and Uncertainties
Pandemic Risk
An outbreak of respiratory disease caused by a novel coronavirus was first detected in China in late 2019 and subsequently spread internationally. This coronavirus has resulted in closing borders, enhanced health screenings, changes to healthcare service preparation and delivery, quarantines, cancellations, disruptions to supply chains and customer activity, as well as general concern and uncertainty. Health crises caused by outbreaks of disease, such as the coronavirus outbreak, may exacerbate other pre-existing political, social and economic risks and disrupt normal market conditions and operations. The impact of this outbreak has negatively affected the worldwide economy, as well as the economies of individual countries and industries, and could continue to affect the market in significant and unforeseen ways. Other epidemics and pandemics that may arise in the future may have similar effects. Any such impact could adversely affect the Funds' performance, or the performance of the securities in which the Funds invest.
Calvert
Asset Allocation Funds
September 30, 2022
Report of Independent Registered Public Accounting Firm
To the Board of Trustees of Calvert Social Investment Fund and Shareholders of Calvert Conservative Allocation Fund, Calvert Moderate Allocation Fund and Calvert Growth Allocation Fund:
Opinion on the Financial Statements and Financial Highlights
We have audited the accompanying statements of assets and liabilities of Calvert Conservative Allocation Fund, Calvert Moderate Allocation Fund and Calvert Growth Allocation Fund (the "Funds") (three of the funds constituting Calvert Social Investment Fund), including the schedules of investments, as of September 30, 2022, the related statements of operations for the year then ended, the statements of changes in net assets and the financial highlights for each of the two years in the period then ended, and the related notes. In our opinion, the financial statements and financial highlights present fairly, in all material respects, the financial position of each of the Funds as of September 30, 2022, and the results of their operations for the year then ended, and the changes in their net assets and the financial highlights for each of the two years in the period then ended, in conformity with accounting principles generally accepted in the United States of America. The financial highlights for the years ended September 30, 2020, 2019, and 2018 were audited by other auditors whose report, dated November 20, 2020, expressed an unqualified opinion on those financial highlights.
Basis for Opinion
These financial statements and financial highlights are the responsibility of the Funds’ management. Our responsibility is to express an opinion on the Funds’ financial statements and financial highlights based on our audits. We are a public accounting firm registered with the Public Company Accounting Oversight Board (United States) (PCAOB) and are required to be independent with respect to the Funds in accordance with the U.S. federal securities laws and the applicable rules and regulations of the Securities and Exchange Commission and the PCAOB.
We conducted our audits in accordance with the standards of the PCAOB. Those standards require that we plan and perform the audit to obtain reasonable assurance about whether the financial statements and financial highlights are free of material misstatement, whether due to error or fraud. The Funds are not required to have, nor were we engaged to perform, an audit of their internal control over financial reporting. As part of our audits, we are required to obtain an understanding of internal control over financial reporting but not for the purpose of expressing an opinion on the effectiveness of the Funds’ internal control over financial reporting. Accordingly, we express no such opinion.
Our audits included performing procedures to assess the risks of material misstatement of the financial statements and financial highlights, whether due to error or fraud, and performing procedures that respond to those risks. Such procedures included examining, on a test basis, evidence regarding the amounts and disclosures in the financial statements and financial highlights. Our audits also included evaluating the accounting principles used and significant estimates made by management, as well as evaluating the overall presentation of the financial statements and financial highlights. Our procedures included confirmation of securities owned as of September 30, 2022, by correspondence with the custodian, brokers and transfer agents; when replies were not received from brokers and transfer agents, we performed other auditing procedures. We believe that our audits provide a reasonable basis for our opinion.
/s/ Deloitte & Touche LLP
Boston, Massachusetts
November 22, 2022
We have served as the auditor of one or more Calvert investment companies since 2021.
Calvert
Asset Allocation Funds
September 30, 2022
Federal Tax Information (Unaudited)
The Form 1099-DIV you receive in February 2023 will show the tax status of all distributions paid to your account in calendar year 2022. Shareholders are advised to consult their own tax adviser with respect to the tax consequences of their investment in the Funds. As required by the Internal Revenue Code and/or regulations, shareholders must be notified regarding the status of qualified dividend income for individuals, the dividends received deduction for corporations and capital gains dividends.
Qualified Dividend Income. For the fiscal year ended September 30, 2022, the Funds designate approximately the following amounts, or up to the maximum amount of such dividends allowable pursuant to the Internal Revenue Code, as qualified dividend income eligible for the reduced tax rate of 15%:
| Conservative Allocation Fund | $3,556,686 |
| Moderate Allocation Fund | $8,602,820 |
| Growth Allocation Fund | $8,895,167 |
Dividends Received Deduction. Corporate shareholders are generally entitled to take the dividends received deduction on the portion of a Fund's dividend distribution that qualifies under tax law. For the Funds' fiscal 2022 ordinary income dividends, the following qualifies for the corporate dividends received deduction:
| Conservative Allocation Fund | 21.77% |
| Moderate Allocation Fund | 35.10% |
| Growth Allocation Fund | 50.49% |
Capital Gains Dividends. The Funds hereby designate as a capital gain dividend with respect to the taxable year ended September 30, 2022, the following amounts or, if subsequently determined to be different, the net capital gain of such year:
| Conservative Allocation Fund | $ 303,871 |
| Moderate Allocation Fund | $ 586,458 |
| Growth Allocation Fund | $4,528,577 |
Calvert
Conservative Allocation Fund
September 30, 2022
Board of Trustees' Contract Approval
Overview of the Contract Review Process
The Investment Company Act of 1940, as amended, provides, in substance, that each investment advisory agreement between a fund and its investment adviser will continue in effect from year to year only if its continuation is approved at least annually by the fund’s board of directors, including by a vote of a majority of the directors who are not “interested persons” of the fund (“Independent Trustees”), cast in person at a meeting called for the purpose of considering such approval.
At a video conference meeting of the Boards of Trustees/Directors (each a “Board”) of the registered investment companies advised by Calvert Research and Management (“CRM” or the “Adviser”) (the “Calvert Funds”) held on June 14, 2022, the Board, including a majority of the Independent Trustees, voted to approve continuation of existing investment advisory and investment sub-advisory agreements for the Calvert Funds for an additional one-year period. The meeting was held by video conference due to circumstances related to current or potential effects of COVID-19 pursuant to temporary exemptive relief issued by the Securities and Exchange Commission.
In evaluating the investment advisory and investment sub-advisory agreements for the Calvert Funds, the Board considered a variety of information relating to the Calvert Funds and various service providers, including the Adviser. The Independent Trustees reviewed a report prepared by the Adviser regarding various services provided to the Calvert Funds by the Adviser and its affiliates. Such report included, among other data, information regarding the Adviser’s personnel and the Adviser’s revenue and cost of providing services to the Calvert Funds, and a separate report prepared by an independent data provider, which compared each fund’s investment performance, fees and expenses to those of comparable funds as identified by such independent data provider (“comparable funds”).
The Independent Trustees were separately represented by independent legal counsel with respect to their consideration of the continuation of the investment advisory and investment sub-advisory agreements for the Calvert Funds. Prior to voting, the Independent Trustees reviewed the proposed continuation of the Calvert Funds’ investment advisory and investment sub-advisory agreements with management and also met in private sessions with their counsel at which time no representatives of management were present.
The information that the Board considered included, among other things, the following (for funds that invest through one or more affiliated underlying fund(s), references to “each fund” in this section may include information that was considered at the underlying fund-level):
Information about Fees, Performance and Expenses
| • | A report from an independent data provider comparing the advisory and related fees paid by each fund with fees paid by comparable funds; |
| • | A report from an independent data provider comparing each fund’s total expense ratio and its components to comparable funds; |
| • | A report from an independent data provider comparing the investment performance of each fund to the investment performance of comparable funds over various time periods; |
| • | Data regarding investment performance in comparison to benchmark indices; |
| • | For each fund, comparative information concerning the fees charged and the services provided by the Adviser in managing other accounts (including mutual funds, other collective investment funds and institutional accounts) using investment strategies and techniques similar to those used in managing such fund; |
| • | Profitability analyses for the Adviser with respect to each fund; |
Information about Portfolio Management and Trading
| • | Descriptions of the investment management services provided to each fund, including investment strategies and processes it employs; |
| • | Information about the Adviser’s policies and practices with respect to trading, including the Adviser’s processes for monitoring best execution of portfolio transactions; |
| • | Information about the allocation of brokerage transactions and the benefits received by the Adviser as a result of brokerage allocation, including information concerning the acquisition of research through client commission arrangements and policies with respect to “soft dollars”; |
Information about the Adviser
| • | Reports detailing the financial results and condition of CRM; |
| • | Descriptions of the qualifications, education and experience of the individual investment professionals whose responsibilities include portfolio management and investment research for the funds, and information relating to their compensation and responsibilities with respect to managing other mutual funds and investment accounts; |
| • | Policies and procedures relating to proxy voting and the handling of corporate actions and class actions; |
| • | A description of CRM’s procedures for overseeing sub-advisers, including with respect to regulatory and compliance issues, investment management and other matters; |
Calvert
Conservative Allocation Fund
September 30, 2022
Board of Trustees' Contract Approval — continued
Other Relevant Information
| • | Information concerning the nature, cost and character of the administrative and other non-investment advisory services provided by CRM and its affiliates; and |
| • | The terms of each investment advisory agreement. |
Over the course of the year, the Board and its committees held regular quarterly meetings. During these meetings, the Trustees participated in investment and performance reviews with the portfolio managers and other investment professionals of the Adviser relating to each fund, and considered various investment and trading strategies used in pursuing each fund’s investment objective(s), such as the use of derivative instruments, as well as risk management techniques. The Board and its committees also evaluated issues pertaining to industry and regulatory developments, compliance procedures, corporate governance and other issues with respect to the funds, and received and participated in reports and presentations provided by CRM and its affiliates with respect to such matters. In addition to the formal meetings of the Board and its committees, the Independent Trustees held regular video conferences in between meetings to discuss, among other topics, matters relating to the continuation of the Calvert Funds’ investment advisory and investment sub-advisory agreements.
For funds that invest through one or more affiliated underlying funds, the Board considered similar information about the underlying fund(s) when considering the approval of investment advisory agreements. In addition, in cases where the Adviser has engaged a sub-adviser, the Board considered similar information about the sub-adviser when considering the approval of any investment sub-advisory agreement.
The Independent Trustees were assisted throughout the contract review process by their independent legal counsel. The Independent Trustees relied upon the advice of such counsel and their own business judgment in determining the material factors to be considered in evaluating each investment advisory and investment sub-advisory agreement and the weight to be given to each such factor. The Board, including the Independent Trustees, did not identify any single factor as controlling, and each Trustee may have attributed different weight to various factors.
Results of the Contract Review Process
Based on its consideration of the foregoing, and such other information as it deemed relevant, including the factors and conclusions described below, the Board, including the Independent Trustees, concluded that the continuation of the investment advisory agreement of Calvert Conservative Allocation Fund (the “Fund”) is in the best interests of the Fund’s shareholders. Accordingly, the Board, including a majority of the Independent Trustees, voted to approve the continuation of the investment advisory agreement of the Fund.
Nature, Extent and Quality of Services
In considering the nature, extent and quality of the services provided by the Adviser under the investment advisory agreement, the Board reviewed information provided by the Adviser relating to its operations and personnel, including, among other information, biographical information on the Adviser’s investment personnel and descriptions of its organizational and management structure. The Board also took into account similar information provided periodically throughout the previous year by the Adviser as well as the Board’s familiarity with management through Board meetings, discussions and other reports. The Board considered the Adviser’s management style and its performance in employing its investment strategies as well as its current level of staffing and overall resources. The Board also noted that it reviewed on a quarterly basis information regarding the Adviser’s compliance with applicable policies and procedures, including those related to personal investing. The Board took into account, among other items, periodic reports received from the Adviser over the past year concerning the Adviser’s ongoing review and enhancement of certain processes, policies and procedures of the Calvert Funds and the Adviser. The Board concluded that it was satisfied with the nature, extent and quality of services provided to the Fund by the Adviser under the investment advisory agreement.
Fund Performance
In considering the Fund’s performance, the Board noted that it reviewed on a quarterly basis detailed information about the Fund’s performance results, portfolio composition and investment strategies. The Board compared the Fund’s investment performance to that of the Fund’s peer universe and its blended benchmark. The Board’s review included comparative performance data for the one-, three- and five-year periods ended December 31, 2021. This performance data indicated that the Fund had underperformed the median of its peer universe for the one-year period ended December 31, 2021, while it had outperformed the median of its peer universe for the three- and five-year periods ended December 31, 2021. It also indicated that the Fund had outperformed its blended benchmark for the one-, three- and five-year periods ended December 31, 2021. Based upon its review, the Board concluded that the Fund’s performance was satisfactory relative to the performance of its peer universe and its blended benchmark.
Management Fees and Expenses
In considering the Fund’s fees and expenses, the Board compared the Fund’s fees and total expense ratio with those of comparable funds in its expense group. Among other findings, the data indicated that the Fund’s total expenses were below the median of the Fund’s expense group. The Board took into consideration that the Fund does not pay an advisory fee to CRM for advisory services but that CRM does receive advisory fees from the underlying funds in which the Fund invests. The Board took into account the Adviser’s current undertaking to maintain expense limitations for the Fund. Based upon its review, the Board concluded that the compensation structure was reasonable in view of the nature, extent and quality of services provided by the Adviser.
Calvert
Conservative Allocation Fund
September 30, 2022
Board of Trustees' Contract Approval — continued
Profitability and Other “Fall-Out” Benefits
The Board reviewed the Adviser’s profitability in regard to the Fund and the Calvert Funds in the aggregate. In reviewing the overall profitability of the Fund to the Adviser, the Board also considered the fact that the Adviser and its affiliates provided sub-transfer agency support, administrative and distribution services to the Fund for which they received compensation. The information considered by the Board included the profitability of the Fund to the Adviser and its affiliates without regard to any marketing support or other payments by the Adviser and its affiliates to third parties in respect of distribution services. The Board also considered that the Adviser and its affiliates derived benefits to their reputation and other indirect benefits from their relationships with the Fund. Based upon its review, the Board concluded that the Adviser’s and its affiliates’ level of profitability from their relationships with the Fund was reasonable.
Economies of Scale
The Board considered the effect of the Fund’s current size and its potential growth on its performance and fees. The Board noted that the Fund did not pay an advisory fee to the Adviser. As a result, the Board did not take into account any economies of scale to be realized with respect to the advisory fee. The Board noted, however, that if the Fund’s assets increased over time, the Fund might realize other economies of scale if assets increased proportionally more than certain other expenses.
Calvert
Moderate Allocation Fund
September 30, 2022
Board of Trustees' Contract Approval
Overview of the Contract Review Process
The Investment Company Act of 1940, as amended, provides, in substance, that each investment advisory agreement between a fund and its investment adviser will continue in effect from year to year only if its continuation is approved at least annually by the fund’s board of directors, including by a vote of a majority of the directors who are not “interested persons” of the fund (“Independent Trustees”), cast in person at a meeting called for the purpose of considering such approval.
At a video conference meeting of the Boards of Trustees/Directors (each a “Board”) of the registered investment companies advised by Calvert Research and Management (“CRM” or the “Adviser”) (the “Calvert Funds”) held on June 14, 2022, the Board, including a majority of the Independent Trustees, voted to approve continuation of existing investment advisory and investment sub-advisory agreements for the Calvert Funds for an additional one-year period. The meeting was held by video conference due to circumstances related to current or potential effects of COVID-19 pursuant to temporary exemptive relief issued by the Securities and Exchange Commission.
In evaluating the investment advisory and investment sub-advisory agreements for the Calvert Funds, the Board considered a variety of information relating to the Calvert Funds and various service providers, including the Adviser. The Independent Trustees reviewed a report prepared by the Adviser regarding various services provided to the Calvert Funds by the Adviser and its affiliates. Such report included, among other data, information regarding the Adviser’s personnel and the Adviser’s revenue and cost of providing services to the Calvert Funds, and a separate report prepared by an independent data provider, which compared each fund’s investment performance, fees and expenses to those of comparable funds as identified by such independent data provider (“comparable funds”).
The Independent Trustees were separately represented by independent legal counsel with respect to their consideration of the continuation of the investment advisory and investment sub-advisory agreements for the Calvert Funds. Prior to voting, the Independent Trustees reviewed the proposed continuation of the Calvert Funds’ investment advisory and investment sub-advisory agreements with management and also met in private sessions with their counsel at which time no representatives of management were present.
The information that the Board considered included, among other things, the following (for funds that invest through one or more affiliated underlying fund(s), references to “each fund” in this section may include information that was considered at the underlying fund-level):
Information about Fees, Performance and Expenses
| • | A report from an independent data provider comparing the advisory and related fees paid by each fund with fees paid by comparable funds; |
| • | A report from an independent data provider comparing each fund’s total expense ratio and its components to comparable funds; |
| • | A report from an independent data provider comparing the investment performance of each fund to the investment performance of comparable funds over various time periods; |
| • | Data regarding investment performance in comparison to benchmark indices; |
| • | For each fund, comparative information concerning the fees charged and the services provided by the Adviser in managing other accounts (including mutual funds, other collective investment funds and institutional accounts) using investment strategies and techniques similar to those used in managing such fund; |
| • | Profitability analyses for the Adviser with respect to each fund; |
Information about Portfolio Management and Trading
| • | Descriptions of the investment management services provided to each fund, including investment strategies and processes it employs; |
| • | Information about the Adviser’s policies and practices with respect to trading, including the Adviser’s processes for monitoring best execution of portfolio transactions; |
| • | Information about the allocation of brokerage transactions and the benefits received by the Adviser as a result of brokerage allocation, including information concerning the acquisition of research through client commission arrangements and policies with respect to “soft dollars”; |
Information about the Adviser
| • | Reports detailing the financial results and condition of CRM; |
| • | Descriptions of the qualifications, education and experience of the individual investment professionals whose responsibilities include portfolio management and investment research for the funds, and information relating to their compensation and responsibilities with respect to managing other mutual funds and investment accounts; |
| • | Policies and procedures relating to proxy voting and the handling of corporate actions and class actions; |
| • | A description of CRM’s procedures for overseeing sub-advisers, including with respect to regulatory and compliance issues, investment management and other matters; |
Calvert
Moderate Allocation Fund
September 30, 2022
Board of Trustees' Contract Approval — continued
Other Relevant Information
| • | Information concerning the nature, cost and character of the administrative and other non-investment advisory services provided by CRM and its affiliates; and |
| • | The terms of each investment advisory agreement. |
Over the course of the year, the Board and its committees held regular quarterly meetings. During these meetings, the Trustees participated in investment and performance reviews with the portfolio managers and other investment professionals of the Adviser relating to each fund, and considered various investment and trading strategies used in pursuing each fund’s investment objective(s), such as the use of derivative instruments, as well as risk management techniques. The Board and its committees also evaluated issues pertaining to industry and regulatory developments, compliance procedures, corporate governance and other issues with respect to the funds, and received and participated in reports and presentations provided by CRM and its affiliates with respect to such matters. In addition to the formal meetings of the Board and its committees, the Independent Trustees held regular video conferences in between meetings to discuss, among other topics, matters relating to the continuation of the Calvert Funds’ investment advisory and investment sub-advisory agreements.
For funds that invest through one or more affiliated underlying funds, the Board considered similar information about the underlying fund(s) when considering the approval of investment advisory agreements. In addition, in cases where the Adviser has engaged a sub-adviser, the Board considered similar information about the sub-adviser when considering the approval of any investment sub-advisory agreement.
The Independent Trustees were assisted throughout the contract review process by their independent legal counsel. The Independent Trustees relied upon the advice of such counsel and their own business judgment in determining the material factors to be considered in evaluating each investment advisory and investment sub-advisory agreement and the weight to be given to each such factor. The Board, including the Independent Trustees, did not identify any single factor as controlling, and each Trustee may have attributed different weight to various factors.
Results of the Contract Review Process
Based on its consideration of the foregoing, and such other information as it deemed relevant, including the factors and conclusions described below, the Board, including the Independent Trustees, concluded that the continuation of the investment advisory agreement of Calvert Moderate Allocation Fund (the “Fund”) is in the best interests of the Fund’s shareholders. Accordingly, the Board, including a majority of the Independent Trustees, voted to approve the continuation of the investment advisory agreement of the Fund.
Nature, Extent and Quality of Services
In considering the nature, extent and quality of the services provided by the Adviser under the investment advisory agreement, the Board reviewed information provided by the Adviser relating to its operations and personnel, including, among other information, biographical information on the Adviser’s investment personnel and descriptions of its organizational and management structure. The Board also took into account similar information provided periodically throughout the previous year by the Adviser as well as the Board’s familiarity with management through Board meetings, discussions and other reports. The Board considered the Adviser’s management style and its performance in employing its investment strategies as well as its current level of staffing and overall resources. The Board also noted that it reviewed on a quarterly basis information regarding the Adviser’s compliance with applicable policies and procedures, including those related to personal investing. The Board took into account, among other items, periodic reports received from the Adviser over the past year concerning the Adviser’s ongoing review and enhancement of certain processes, policies and procedures of the Calvert Funds and the Adviser. The Board concluded that it was satisfied with the nature, extent and quality of services provided to the Fund by the Adviser under the investment advisory agreement.
Fund Performance
In considering the Fund’s performance, the Board noted that it reviewed on a quarterly basis detailed information about the Fund’s performance results, portfolio composition and investment strategies. The Board compared the Fund’s investment performance to that of the Fund’s peer universe and its blended benchmark. The Board’s review included comparative performance data for the one-, three- and five-year periods ended December 31, 2021, as applicable. This performance data indicated that the Fund had underperformed the median of its peer universe for the one-year period ended December 31, 2021, while it had outperformed the median of its peer universe for the three-and five-year periods ended December 31, 2021. It also indicated that the Fund had underperformed its blended benchmark for the one- and three-year periods ended December 31, 2021. Based upon its review, the Board concluded that the Fund’s performance was satisfactory relative to the performance of its peer universe and its blended benchmark.
Management Fees and Expenses
In considering the Fund’s fees and expenses, the Board compared the Fund’s fees and total expense ratio with those of comparable funds in its expense group. Among other findings, the data indicated that the Fund’s total expenses were below the median of the Fund’s expense group. The Board took into consideration that the Fund does not pay an advisory fee to CRM for advisory services but that CRM does receive advisory fees from the underlying funds in which the Fund invests. The Board took into account the Adviser’s current undertaking to maintain expense limitations for the Fund. Based upon its review, the Board concluded that the compensation structure was reasonable in view of the nature, extent and quality of services provided by the Adviser.
Calvert
Moderate Allocation Fund
September 30, 2022
Board of Trustees' Contract Approval — continued
Profitability and Other “Fall-Out” Benefits
The Board reviewed the Adviser’s profitability in regard to the Fund and the Calvert Funds in the aggregate. In reviewing the overall profitability of the Fund to the Adviser, the Board also considered the fact that the Adviser and its affiliates provided sub-transfer agency support, administrative and distribution services to the Fund for which they received compensation. The information considered by the Board included the profitability of the Fund to the Adviser and its affiliates without regard to any marketing support or other payments by the Adviser and its affiliates to third parties in respect of distribution services. The Board also considered that the Adviser and its affiliates derived benefits to their reputation and other indirect benefits from their relationships with the Fund. Based upon its review, the Board concluded that the Adviser’s and its affiliates’ level of profitability from their relationships with the Fund was reasonable.
Economies of Scale
The Board considered the effect of the Fund’s current size and its potential growth on its performance and fees. The Board noted that the Fund did not pay an advisory fee to the Adviser. As a result, the Board did not take into account any economies of scale to be realized with respect to the advisory fee. The Board noted, however, that if the Fund’s assets increased over time, the Fund might realize other economies of scale if assets increased proportionally more than certain other expenses.
Calvert
Growth Allocation Fund
September 30, 2022
Board of Trustees' Contract Approval
Overview of the Contract Review Process
The Investment Company Act of 1940, as amended, provides, in substance, that each investment advisory agreement between a fund and its investment adviser will continue in effect from year to year only if its continuation is approved at least annually by the fund’s board of directors, including by a vote of a majority of the directors who are not “interested persons” of the fund (“Independent Trustees”), cast in person at a meeting called for the purpose of considering such approval.
At a video conference meeting of the Boards of Trustees/Directors (each a “Board”) of the registered investment companies advised by Calvert Research and Management (“CRM” or the “Adviser”) (the “Calvert Funds”) held on June 14, 2022, the Board, including a majority of the Independent Trustees, voted to approve continuation of existing investment advisory and investment sub-advisory agreements for the Calvert Funds for an additional one-year period. The meeting was held by video conference due to circumstances related to current or potential effects of COVID-19 pursuant to temporary exemptive relief issued by the Securities and Exchange Commission.
In evaluating the investment advisory and investment sub-advisory agreements for the Calvert Funds, the Board considered a variety of information relating to the Calvert Funds and various service providers, including the Adviser. The Independent Trustees reviewed a report prepared by the Adviser regarding various services provided to the Calvert Funds by the Adviser and its affiliates. Such report included, among other data, information regarding the Adviser’s personnel and the Adviser’s revenue and cost of providing services to the Calvert Funds, and a separate report prepared by an independent data provider, which compared each fund’s investment performance, fees and expenses to those of comparable funds as identified by such independent data provider (“comparable funds”).
The Independent Trustees were separately represented by independent legal counsel with respect to their consideration of the continuation of the investment advisory and investment sub-advisory agreements for the Calvert Funds. Prior to voting, the Independent Trustees reviewed the proposed continuation of the Calvert Funds’ investment advisory and investment sub-advisory agreements with management and also met in private sessions with their counsel at which time no representatives of management were present.
The information that the Board considered included, among other things, the following (for funds that invest through one or more affiliated underlying fund(s), references to “each fund” in this section may include information that was considered at the underlying fund-level):
Information about Fees, Performance and Expenses
| • | A report from an independent data provider comparing the advisory and related fees paid by each fund with fees paid by comparable funds; |
| • | A report from an independent data provider comparing each fund’s total expense ratio and its components to comparable funds; |
| • | A report from an independent data provider comparing the investment performance of each fund to the investment performance of comparable funds over various time periods; |
| • | Data regarding investment performance in comparison to benchmark indices; |
| • | For each fund, comparative information concerning the fees charged and the services provided by the Adviser in managing other accounts (including mutual funds, other collective investment funds and institutional accounts) using investment strategies and techniques similar to those used in managing such fund; |
| • | Profitability analyses for the Adviser with respect to each fund; |
Information about Portfolio Management and Trading
| • | Descriptions of the investment management services provided to each fund, including investment strategies and processes it employs; |
| • | Information about the Adviser’s policies and practices with respect to trading, including the Adviser’s processes for monitoring best execution of portfolio transactions; |
| • | Information about the allocation of brokerage transactions and the benefits received by the Adviser as a result of brokerage allocation, including information concerning the acquisition of research through client commission arrangements and policies with respect to “soft dollars”; |
Information about the Adviser
| • | Reports detailing the financial results and condition of CRM; |
| • | Descriptions of the qualifications, education and experience of the individual investment professionals whose responsibilities include portfolio management and investment research for the funds, and information relating to their compensation and responsibilities with respect to managing other mutual funds and investment accounts; |
| • | Policies and procedures relating to proxy voting and the handling of corporate actions and class actions; |
| • | A description of CRM’s procedures for overseeing sub-advisers, including with respect to regulatory and compliance issues, investment management and other matters; |
Calvert
Growth Allocation Fund
September 30, 2022
Board of Trustees' Contract Approval — continued
Other Relevant Information
| • | Information concerning the nature, cost and character of the administrative and other non-investment advisory services provided by CRM and its affiliates; and |
| • | The terms of each investment advisory agreement. |
Over the course of the year, the Board and its committees held regular quarterly meetings. During these meetings, the Trustees participated in investment and performance reviews with the portfolio managers and other investment professionals of the Adviser relating to each fund, and considered various investment and trading strategies used in pursuing each fund’s investment objective(s), such as the use of derivative instruments, as well as risk management techniques. The Board and its committees also evaluated issues pertaining to industry and regulatory developments, compliance procedures, corporate governance and other issues with respect to the funds, and received and participated in reports and presentations provided by CRM and its affiliates with respect to such matters. In addition to the formal meetings of the Board and its committees, the Independent Trustees held regular video conferences in between meetings to discuss, among other topics, matters relating to the continuation of the Calvert Funds’ investment advisory and investment sub-advisory agreements.
For funds that invest through one or more affiliated underlying funds, the Board considered similar information about the underlying fund(s) when considering the approval of investment advisory agreements. In addition, in cases where the Adviser has engaged a sub-adviser, the Board considered similar information about the sub-adviser when considering the approval of any investment sub-advisory agreement.
The Independent Trustees were assisted throughout the contract review process by their independent legal counsel. The Independent Trustees relied upon the advice of such counsel and their own business judgment in determining the material factors to be considered in evaluating each investment advisory and investment sub-advisory agreement and the weight to be given to each such factor. The Board, including the Independent Trustees, did not identify any single factor as controlling, and each Trustee may have attributed different weight to various factors.
Results of the Contract Review Process
Based on its consideration of the foregoing, and such other information as it deemed relevant, including the factors and conclusions described below, the Board, including the Independent Trustees, concluded that the continuation of the investment advisory agreement of Calvert Growth Allocation Fund (the “Fund”) is in the best interests of the Fund’s shareholders. Accordingly, the Board, including a majority of the Independent Trustees, voted to approve the continuation of the investment advisory agreement of the Fund.
Nature, Extent and Quality of Services
In considering the nature, extent and quality of the services provided by the Adviser under the investment advisory agreement, the Board reviewed information provided by the Adviser relating to its operations and personnel, including, among other information, biographical information on the Adviser’s investment personnel and descriptions of its organizational and management structure. The Board also took into account similar information provided periodically throughout the previous year by the Adviser as well as the Board’s familiarity with management through Board meetings, discussions and other reports. The Board considered the Adviser’s management style and its performance in employing its investment strategies as well as its current level of staffing and overall resources. The Board also noted that it reviewed on a quarterly basis information regarding the Adviser’s compliance with applicable policies and procedures, including those related to personal investing. The Board took into account, among other items, periodic reports received from the Adviser over the past year concerning the Adviser’s ongoing review and enhancement of certain processes, policies and procedures of the Calvert Funds and the Adviser. The Board concluded that it was satisfied with the nature, extent and quality of services provided to the Fund by the Adviser under the investment advisory agreement.
Fund Performance
In considering the Fund’s performance, the Board noted that it reviewed on a quarterly basis detailed information about the Fund’s performance results, portfolio composition and investment strategies. The Board compared the Fund’s investment performance to that of the Fund’s peer universe and its blended benchmark. The Board’s review included comparative performance data for the one-, three- and five-year periods ended December 31, 2021. This performance data indicated that the Fund had underperformed the median of its peer universe and its blended benchmark for the one-year period ended December 31, 2021, while it had outperformed the median of its peer universe and its blended benchmark for the three- and five-year periods ended December 31, 2021. Based upon its review, the Board concluded that the Fund’s performance was satisfactory relative to the performance of its peer universe and its blended benchmark.
Management Fees and Expenses
In considering the Fund’s fees and expenses, the Board compared the Fund’s fees and total expense ratio with those of comparable funds in its expense universe. Among other findings, the data indicated that the Fund’s total expenses (net of waivers and/or reimbursements) were below the median of the Fund’s expense universe. The Board took into consideration that the Fund does not pay an advisory fee to CRM for advisory services but that CRM does receive advisory fees from the underlying funds in which the Fund invests. The Board took into account the Adviser’s current undertaking to maintain expense limitations for the Fund and that the Adviser was reimbursing a portion of the Fund’s expenses. Based upon its review, the Board concluded that the compensation structure was reasonable in view of the nature, extent and quality of services provided by the Adviser.
Calvert
Growth Allocation Fund
September 30, 2022
Board of Trustees' Contract Approval — continued
Profitability and Other “Fall-Out” Benefits
The Board reviewed the Adviser’s profitability in regard to the Fund and the Calvert Funds in the aggregate. In reviewing the overall profitability of the Fund to the Adviser, the Board also considered the fact that the Adviser and its affiliates provided sub-transfer agency support, administrative and distribution services to the Fund for which they received compensation. The information considered by the Board included the profitability of the Fund to the Adviser and its affiliates without regard to any marketing support or other payments by the Adviser and its affiliates to third parties in respect of distribution services. The Board also considered that the Adviser and its affiliates derived benefits to their reputation and other indirect benefits from their relationships with the Fund. Based upon its review, the Board concluded that the Adviser’s and its affiliates’ level of profitability from their relationships with the Fund was reasonable.
Economies of Scale
The Board considered the effect of the Fund’s current size and its potential growth on its performance and fees. The Board noted that the Fund did not pay an advisory fee to the Adviser. As a result, the Board did not take into account any economies of scale to be realized with respect to the advisory fee. The Board noted, however, that if the Fund’s assets increased over time, the Fund might realize other economies of scale if assets increased proportionally more than certain other expenses.
Calvert
Asset Allocation Funds
September 30, 2022
Liquidity Risk Management Program
Each Fund has implemented a written liquidity risk management program (Program) and related procedures to manage its liquidity in accordance with Rule 22e-4 under the Investment Company Act of 1940, as amended (Liquidity Rule). The Liquidity Rule defines “liquidity risk” as the risk that a fund could not meet requests to redeem shares issued by the fund without significant dilution of the remaining investors’ interests in the fund. Each Fund’s Board of Trustees/Directors has designated the investment adviser to serve as the administrator of the Program and the related procedures. The administrator has established a Liquidity Risk Management Oversight Committee (Committee) to perform the functions necessary to administer the Program. As part of the Program, the administrator is responsible for identifying illiquid investments and categorizing the relative liquidity of each Fund’s investments in accordance with the Liquidity Rule. Under the Program, the administrator assesses, manages, and periodically reviews each Fund’s liquidity risk, and is responsible for making certain reports to the Fund’s Board of Trustees/Directors and the Securities and Exchange Commission (SEC) regarding the liquidity of the Fund’s investments, and to notify the Board of Trustees/Directors and the SEC of certain liquidity events specified in the Liquidity Rule. The liquidity of each Fund’s portfolio investments is determined based on a number of factors including, but not limited to, relevant market, trading and investment-specific considerations under the Program.
At a meeting of each Fund’s Board of Trustees/Directors on June 14, 2022, the Committee provided a written report to the Fund’s Board of Trustees/ Directors pertaining to the operation, adequacy, and effectiveness of implementation of the Program, as well as the operation of the highly liquid investment minimum (if applicable) for the period January 1, 2021 through December 31, 2021 (Review Period). The Program operated effectively during the Review Period, supporting the administrator’s ability to assess, manage and monitor Fund liquidity risk, including during periods of market volatility and net redemptions. During the Review Period, each Fund met redemption requests on a timely basis.
There can be no assurance that the Program will achieve its objectives in the future. Please refer to each Fund’s prospectus for more information regarding the Fund’s exposure to liquidity risk and other principal risks to which an investment in the Fund may be subject.
Calvert
Asset Allocation Funds
September 30, 2022
Management and Organization
Fund Management. The Trustees of Calvert Social Investment Fund (the Trust) are responsible for the overall management and supervision of the affairs of the Trust. The Board members and officers of the Trust are listed below. Except as indicated, each individual has held the office shown or other offices in the same company for the last five years. Board members hold indefinite terms of office. Each Board member holds office until his or her successor is elected and qualified, or until his or her earlier death, resignation, retirement, removal or disqualification. Under the terms of the Funds' current Board member retirement policy, an Independent Board member must retire at the end of the calendar year in which he or she turns 75. However, if such retirement would cause the Fund to be out of compliance with Section 16 of the 1940 Act or any other regulations or guidance of the SEC, then such retirement will not become effective until such time as action has been taken for the Funds to be in compliance therewith. The “noninterested Trustees” consist of those Trustees who are not “interested persons” of the Trust, as that term is defined under the 1940 Act. The business address of each Board member and the Chief Compliance Officer is 1825 Connecticut Avenue NW, Suite 400, Washington, DC 20009 and the business address of the Secretary, Vice President and Chief Legal Officer and the Treasurer is Two International Place, Boston, Massachusetts 02110. As used below, “CRM” refers to Calvert Research and Management and “Eaton Vance” refers to Eaton Vance Management. Each Trustee oversees 42 funds in the Calvert fund complex. Effective March 1, 2021, each of Eaton Vance and CRM are indirect wholly-owned subsidiaries of Morgan Stanley. Each officer affiliated with CRM may hold a position with other CRM affiliates that is comparable to his or her position with CRM listed below.
| Name and Year of Birth | Trust
Position(s) | Length of
Service | Principal Occupation(s) and Other Directorships
During Past Five Years and Other Relevant Experience |
| Interested Trustee |
John H. Streur(1)
1960 | Trustee and
President | Since 2015 | President and Chief Executive Officer of CRM (since December 31, 2016). President and Chief Executive Officer of Calvert Investments, Inc.
(January 2015 - December 2016); Chief Executive Officer of Calvert
Investment Distributors, Inc. (August 2015 - December 2016); Chief
Compliance Officer of Calvert Investment Management, Inc. (August 2015 -
April 2016); President and Director, Portfolio 21 Investments, Inc.
(through October 2014); President, Chief Executive Officer and
Director, Managers Investment Group LLC (through January 2012);
President and Director, The Managers Funds and Managers AMG
Funds (through January 2012).
Other Directorships. Portfolio 21 Investments, Inc. (asset management)
(through October 2014); Managers Investment Group LLC (asset management)
(through January 2012); The Managers Funds (asset management)
(through January 2012); Managers AMG Funds (asset management)
(through January 2012); Calvert Impact Capital, Inc. |
| Noninterested Trustees |
Richard L. Baird, Jr.
1948 | Trustee | Since 1982 | Regional Disaster Recovery Lead, American Red Cross of Greater
Pennsylvania (since 2017). Volunteer, American Red Cross (since 2015).
Former President and CEO of Adagio Health Inc. (retired in 2014) in
Pittsburgh, PA.
Other Directorships. None. |
Alice Gresham Bullock
1950 | Chair and
Trustee | Since 2016 | Professor Emerita at Howard University School of Law. Dean Emerita of
Howard University School of Law and Deputy Director of the Association
of American Law Schools (1992-1994).
Other Directorships. None. |
Cari M. Dominguez
1949 | Trustee | Since 2016 | Former Chair of the U.S. Equal Employment Opportunity Commission.
Other Directorships. ManpowerGroup Inc. (workforce solutions company);
Triple S Management Corporation (managed care); National Association of Corporate Directors. |
John G. Guffey, Jr.
1948 | Trustee | Since 1982 | President of Aurora Press Inc., a privately held publisher of trade
paperbacks (since January 1997).
Other Directorships. Calvert Impact Capital, Inc. (through December 31, 2018); Calvert Ventures, LLC. |
Miles D. Harper, III
1962 | Trustee | Since 2005 | Partner, Carr Riggs & Ingram (public accounting firm) since October 2014.
Partner, Gainer Donnelly & Desroches (public accounting firm) (now Carr
Riggs & Ingram) (November 1999 - September 2014).
Other Directorships. Bridgeway Funds (9) (asset management). |
Joy V. Jones
1950 | Trustee | Since 1990 | Attorney.
Other Directorships. Palm Management Corporation. |
Calvert
Asset Allocation Funds
September 30, 2022
Management and Organization — continued
| Name and Year of Birth | Trust
Position(s) | Length of
Service | Principal Occupation(s) and Other Directorships
During Past Five Years and Other Relevant Experience |
| Noninterested Trustees (continued) |
Anthony A. Williams
1951 | Trustee | Since 2016 | CEO and Executive Director of the Federal City Council (July 2012 to
present); Senior Adviser and Independent Consultant for King and
Spalding LLP (September 2015 to present); Executive Director of Global
Government Practice at the Corporate Executive Board (January 2010 to
January 2012).
Other Directorships. Freddie Mac; Evoq Properties/Meruelo Maddux
Properties, Inc. (real estate management); Weston Solutions, Inc.
(environmental services); Bipartisan Policy Center’s Debt Reduction Task Force;
Chesapeake Bay Foundation; Catholic University of America; Urban Institute (research organization); The Howard Hughes Corporation (real estate development); Old Dominion National Bank. |
| Name and Year of Birth | Trust
Position(s) | Length of
Service | Principal Occupation(s)
During Past Five Years |
| Principal Officers who are not Trustees |
Hope L. Brown
1973 | Chief
Compliance
Officer | Since 2014 | Chief Compliance Officer of 42 registered investment companies advised
by CRM (since 2014). Vice President and Chief Compliance Officer,
Wilmington Funds (2012-2014). |
Deidre E. Walsh
1971 | Secretary,
Vice President
and Chief
Legal Officer | Since 2021 | Vice President of CRM and officer of 42 registered investment companies
advised by CRM (since 2021). Also Vice President of Eaton Vance and
certain of its affiliates and officer of 136 registered investment companies
advised or administered by Eaton Vance. |
James F. Kirchner
1967 | Treasurer | Since 2016 | Vice President of CRM and officer of 42 registered investment companies
advised by CRM (since 2016). Also Vice President of Eaton Vance and
certain of its affiliates and officer of 136 registered investment companies
advised or administered by Eaton Vance. |
| | | | |
| (1) Mr. Streur is an interested person of the Funds because of his positions with the Funds' adviser and certain affiliates. |
The SAI for the Funds includes additional information about the Trustees and officers of the Funds and can be obtained without charge on Calvert’s website at www.calvert.com or by calling 1-800-368-2745.
| FACTS | WHAT DOES EATON VANCE DO WITH YOUR
PERSONAL INFORMATION? |
| Why? | Financial companies choose how they share your personal information. Federal law gives consumers the right to limit some but not all sharing. Federal law also requires us to tell you how we collect, share, and protect your personal information. Please read this notice carefully to understand what we do. |
| |
| What? | The types of personal information we collect and share depend on the product or service you have with us. This information can include:■ Social Security number and income
■
investment experience and risk tolerance
■
checking account number and wire transfer instructions |
| |
| How? | All financial companies need to share customers’ personal information to run their everyday business. In the section below, we list the reasons financial companies can share their customers’ personal information; the reasons Eaton Vance chooses to share; and whether you can limit this sharing. |
Reasons we can share your
personal information | Does Eaton Vance
share? | Can you limit
this sharing? |
| For our everyday business purposes — such as to process your transactions, maintain your account(s), respond to court orders and legal investigations, or report to credit bureaus | Yes | No |
| For our marketing purposes — to offer our products and services to you | Yes | No |
| For joint marketing with other financial companies | No | We don’t share |
| For our investment management affiliates’ everyday business purposes — information about your transactions, experiences, and creditworthiness | Yes | Yes |
| For our affiliates’ everyday business purposes — information about your transactions and experiences | Yes | No |
| For our affiliates’ everyday business purposes — information about your creditworthiness | No | We don’t share |
| For our investment management affiliates to market to you | Yes | Yes |
| For our affiliates to market to you | No | We don’t share |
| For nonaffiliates to market to you | No | We don’t share |
To limit our
sharing | Call toll-free 1-800-368-2745 or email: CRMPrivacy@calvert.comPlease note:If you are a new customer, we can begin sharing your information 30 days from the date we sent this notice. When you are no longer our customer, we continue to share your information as described in this notice. However, you can contact us at any time to limit our sharing. |
| Questions? | Call toll-free 1-800-368-2745 or email: CRMPrivacy@calvert.com |
| Privacy Notice — continued | April 2021 |
| Who we are |
| Who is providing this notice? | Eaton Vance Management, Eaton Vance Distributors, Inc., Eaton Vance Trust Company, Eaton Vance Management (International) Limited, Eaton Vance Advisers International Ltd., Eaton Vance Global Advisors Limited, Eaton Vance Management’s Real Estate Investment Group, Boston Management and Research, Calvert Research and Management, Eaton Vance and Calvert Fund Families and our investment advisory affiliates (“Eaton Vance”) (see Investment Management Affiliates definition below) |
| What we do |
How does Eaton Vance
protect my personal
information? | To protect your personal information from unauthorized access and use, we use security measures that comply with federal law. These measures include computer safeguards and secured files and buildings. We have policies governing the proper handling of customer information by personnel and requiring third parties that provide support to adhere to appropriate security standards with respect to such information. |
How does Eaton Vance
collect my personal
information? | We collect your personal information, for example, when you■ open an account or make deposits or withdrawals from your account
■
buy securities from us or make a wire transfer
■
give us your contact informationWe also collect your personal information from others, such as credit bureaus, affiliates, or other companies. |
| Why can’t I limit all sharing? | Federal law gives you the right to limit only■ sharing for affiliates’ everyday business purposes — information about your creditworthiness
■
affiliates from using your information to market to you
■
sharing for nonaffiliates to market to youState laws and individual companies may give you additional rights to limit sharing. See below for more on your rights under state law. |
| Definitions |
Investment Management
Affiliates | Eaton Vance Investment Management Affiliates include registered investment advisers, registered broker- dealers, and registered and unregistered funds. Investment Management Affiliates does not include entities associated with Morgan Stanley Wealth Management, such as Morgan Stanley Smith Barney LLC and Morgan Stanley & Co. |
| Affiliates | Companies related by common ownership or control. They can be financial and nonfinancial companies.■ Our affiliates include companies with a Morgan Stanley name and financial companies such as Morgan Stanley Smith Barney LLC and Morgan Stanley & Co. |
| Nonaffiliates | Companies not related by common ownership or control. They can be financial and nonfinancial companies.■ Eaton Vance does not share with nonaffiliates so they can market to you. |
| Joint marketing | A formal agreement between nonaffiliated financial companies that together market financial products or services to you.■ Eaton Vance doesn’t jointly market. |
| Other important information |
| Vermont: Except as permitted by law, we will not share personal information we collect about Vermont residents with Nonaffiliates unless you provide us with your written consent to share such information.California: Except as permitted by law, we will not share personal information we collect about California residents with Nonaffiliates and we will limit sharing such personal information with our Affiliates to comply with California privacy laws that apply to us. |
Delivery of Shareholder Documents. The Securities and Exchange Commission (SEC) permits funds to deliver only one copy of shareholder documents, including prospectuses, proxy statements and shareholder reports, to fund investors with multiple accounts at the same residential or post office box address. This practice is often called “householding” and it helps eliminate duplicate mailings to shareholders. Calvert funds, or your financial intermediary, may household the mailing of your documents indefinitely unless you instruct Calvert funds, or your financial intermediary, otherwise. If you would prefer that your Calvert fund documents not be householded, please contact Calvert funds at 1-800-368-2745, or contact your financial intermediary. Your instructions that householding not apply to delivery of your Calvert fund documents will typically be effective within 30 days of receipt by Calvert funds or your financial intermediary.
Portfolio Holdings. Each Calvert fund files a schedule of portfolio holdings on Part F to Form N-PORT with the SEC. Certain information filed on Form N-PORT may be viewed on the Calvert website at www.calvert.com, by calling Calvert at 1-800-368-2745 or in the EDGAR database on the SEC’s website at www.sec.gov.
Proxy Voting. The Proxy Voting Guidelines that each Calvert fund uses to determine how to vote proxies relating to portfolio securities is provided as an Appendix to the fund’s Statement of Additional Information. The Statement of Additional Information can be obtained free of charge by calling the Calvert funds at 1-800-368-2745, by visiting the Calvert funds’ website at www.calvert.com or visiting the SEC’s website at www.sec.gov. Information regarding how a Calvert fund voted proxies relating to portfolio securities during the most recent 12-month period ended June 30 is available by calling Calvert funds, by visiting the Calvert funds’ website at www.calvert.com or by visiting the SEC’s website at www.sec.gov.
This Page Intentionally Left Blank
This Page Intentionally Left Blank
Investment Adviser and Administrator
Calvert Research and Management
1825 Connecticut Avenue NW, Suite 400
Washington, DC 20009
Principal Underwriter*
Eaton Vance Distributors, Inc.
Two International Place
Boston, MA 02110
(617) 482-8260
Custodian
State Street Bank and Trust Company
State Street Financial Center, One Lincoln Street
Boston, MA 02111
Transfer Agent
DST Asset Manager Solutions, Inc.
2000 Crown Colony Drive
Quincy, MA 02169
Independent Registered Public Accounting Firm
Deloitte & Touche LLP
200 Berkeley Street
Boston, MA 02116-5022
Fund Offices
1825 Connecticut Avenue NW, Suite 400
Washington, DC 20009
* FINRA BrokerCheck. Investors may check the background of their Investment Professional by contacting the Financial Industry Regulatory Authority (FINRA). FINRA BrokerCheck is a free tool to help investors check the professional background of current and former FINRA-registered securities firms and brokers. FINRA BrokerCheck is available by calling 1-800-289-9999 and at www.FINRA.org. The FINRA BrokerCheck brochure describing this program is available to investors at www.FINRA.org.
Printed on recycled paper.
24205 9.30.22
Calvert
Focused Value Fund
Annual Report
September 30, 2022
Commodity Futures Trading Commission Registration. The Commodity Futures Trading Commission (“CFTC”) has adopted regulations that subject registered investment companies and advisers to regulation by the CFTC if a fund invests more than a prescribed level of its assets in certain CFTC-regulated instruments (including futures, certain options and swap agreements) or markets itself as providing investment exposure to such instruments. The adviser has claimed an exclusion from the definition of “commodity pool operator” under the Commodity Exchange Act with respect to its management of the Fund and the other funds it manages. Accordingly, neither the Fund nor the adviser is subject to CFTC regulation.
Fund shares are not insured by the FDIC and are not deposits or other obligations of, or guaranteed by, any depository institution. Shares are subject to investment risks, including possible loss of principal invested.
This report must be preceded or accompanied by a current summary prospectus or prospectus. Before investing, investors should consider carefully the investment objective, risks, and charges and expenses of a mutual fund. This and other important information is contained in the summary prospectus and prospectus, which can be obtained from a financial intermediary. Prospective investors should read the prospectus carefully before investing. For further information, please call 1-800-368-2745.
Choose Planet-friendly E-delivery!
Sign up now for on-line statements, prospectuses, and fund reports. In less than five minutes you can help reduce paper mail and lower fund costs.
Just go to www.calvert.com. If you already have an online account with the Calvert funds, click on Login to access your Account and select the documents you would like to receive via e-mail.
If you’re new to online account access, click on Login, then Register to create your user name and password. Once you’re in, click on the E-delivery sign-up on the Account Portfolio page and follow the quick, easy steps.
Note: If your shares are not held directly with the Calvert funds but through a brokerage firm, you must contact your broker for electronic delivery options available through their firm.
Annual Report September 30, 2022
Calvert
Focused Value Fund
Calvert
Focused Value Fund
September 30, 2022
Management's Discussion of Fund Performance†
Economic and Market Conditions
The 12-month period starting October 1, 2021, was dominated by the ongoing effects of one black swan event — the COVID-19 pandemic — and new fallout from another — Russia’s unprovoked invasion of Ukraine.
In the opening months of the period, stock investors as well as consumers appeared to be taking a “glass is half full” approach. Despite the appearance of a new and more contagious COVID-19 variant, the highest inflation readings in nearly four decades, and the U.S. Federal Reserve’s (the Fed’s) announcement that it would begin tapering bond purchases that had supported economic growth, major U.S. equity indexes repeatedly closed at new all-time highs during the final quarter of 2021. As consumers rushed to spend money saved during the early months of the pandemic, Mastercard, Inc. reported its highest retail sales on record during the 2021 holiday season.
But as the new year began, investors appeared to reevaluate the twin threats of inflation and interest rate hikes, and stock performance turned negative. In February, Russia’s invasion of Ukraine sent shock waves through U.S. and global markets, exacerbating inflationary pressures on energy and food costs.
As the Fed’s outlook on inflation worsened from “transitory” to “persistent,” investors began to expect that the Fed would raise interest rates at every 2022 policy meeting and, in turn, worried that aggressive rate hikes could tip the U.S. economy into recession. At its June, July, and September meetings, the Fed hiked the federal funds rate 0.75% each time — its first moves of that magnitude since 1994. Higher interest rates, inflation, and recessionary worries drove stock prices down, with rate-sensitive technology stocks — which had been star performers early in the pandemic — suffering some of the worst declines.
For the period as a whole, the blue-chip Dow Jones Industrial Average® returned -13.40%; the S&P 500® Index, a broad measure of U.S. stocks, lost 15.47%; and the technology-laden Nasdaq Composite Index fell 26.25%.
Fund Performance
For the five-month period since its inception (April 29, 2022) to September 30, 2022, Calvert Focused Value Fund (the Fund) returned -9.50% for Class A shares at net asset value (NAV), outperforming its benchmark, the Russell 1000® Value Index (the Index), which returned -12.19%.
The Fund’s security selections — especially in the utilities, financials, and consumer staples sectors — contributed to returns relative to the Index during the period. Selections in the information technology and industrials sectors also enhanced relative performance.
Constellation Energy Corp., a Baltimore-based utility that generates 90% of its power from nuclear energy or renewable sources, contributed to returns relative to the Index during the period. The company’s share price rose after the U.S. Congress passed the Inflation Reduction Act (IRA), which includes large financial incentives for the country’s conversion to fossil-free energy.
Also in the utilities sector, NextEra Energy, Inc. (NextEra) was a leading contributor to relative performance during the period. NextEra’s share price rose after the company raised its earnings outlook for calendar years 2022 through 2025. The company also benefited from passage of the IRA as NextEra announced its goal to eliminate carbon emissions from its business operations by 2045.
In the consumer discretionary sector, BJ’s Wholesale Club Holdings, Inc. (BJ’s), a membership-only discount retailer, further added to returns. BJ’s share price rose after it reported strong sales and membership gains, driven in part by cost-conscious consumers seeking relief from persistent inflation.
In contrast, a lack of exposure to the energy sector — the strongest performing sector within the Index — detracted from Fund returns relative to the Index. Security selections in the health care and consumer discretionary sectors also weighed on relative returns during the period.
The Fund’s ownership of Sanofi SA, a French pharmaceutical firm, detracted from relative returns during the period. The company’s share price fell following news of a lawsuit alleging Sanofi’s popular heartburn drug, Zantac, was linked to cancer. Share prices were further weakened after Sanofi announced it was stopping work on Amcenetrant, thought to be a promising drug against breast cancer.
Teleflex, Inc. (Teleflex) manufactures single-use medical devices for hospitals and health care providers. Teleflex’s share price fell after the company did not improve its 2022 outlook, raising investor concerns that its once-promising Urolift device for benign prostatic hyperplasia was not meeting growth expectations. By period-end, the stock was sold from the Fund.
Fidelity National Information Services, Inc. (Fidelity) is a financial services company specializing in technology. Fidelity’s share price fell after the firm announced weaker-than-expected earnings due to a slower ramp-up of international travel spending during the period.
See Endnotes and Additional Disclosures in this report.
Past performance is no guarantee of future results. Returns are historical and are calculated by determining the percentage change in net asset value (NAV) or offering price (as applicable) with all distributions reinvested. Furthermore, returns do not reflect the deduction of taxes that shareholders may have to pay on Fund distributions or upon the redemption of Fund shares. Investment return and principal value will fluctuate so that shares, when redeemed, may be worth more or less than their original cost. Performance for periods less than or equal to one year is cumulative. Performance is for the stated time period only; due to market volatility, current Fund performance may be lower or higher than the quoted return. For performance as of the most recent month-end, please refer to www.calvert.com.
Calvert
Focused Value Fund
September 30, 2022
Performance
Portfolio Manager(s) Aaron S. Dunn, CFA and Bradley T. Galko, CFA, each of Calvert Research and Management
| % Cumulative Total Returns1,2 | Class
Inception Date | Performance
Inception Date | One Year | Five Years | Since Inception |
| Class A at NAV | 04/29/2022 | 04/29/2022 | —% | —% | (9.50)% |
| Class A with 5.25% Maximum Sales Charge | — | — | — | — | (14.22) |
| Class C at NAV | 04/29/2022 | 04/29/2022 | — | — | (9.80) |
| Class C with 1% Maximum Deferred Sales Charge | — | — | — | — | (10.70) |
| Class I at NAV | 04/29/2022 | 04/29/2022 | — | — | (9.50) |
| Class R6 at NAV | 04/29/2022 | 04/29/2022 | — | — | (9.50) |
|
| Russell 1000® Value Index | — | — | (11.36)% | 5.28% | (12.19)% |
| % Total Annual Operating Expense Ratios3 | Class A | Class C | Class I | Class R6 |
| Gross | 1.09% | 1.84% | 0.84% | 0.84% |
| Net | 0.99 | 1.74 | 0.74 | 0.74 |
Growth of $10,000
This graph shows the change in value of a hypothetical investment of $10,000 in Class A of the Fund for the period indicated. For comparison, the same investment is shown in the indicated index.
| Growth of Investment | Amount Invested | Period Beginning | At NAV | With Maximum Sales Charge |
| Class C | $10,000 | 04/29/2022 | $9,020 | N.A. |
| Class I, at minimum investment | $1,000,000 | 04/29/2022 | $905,000 | N.A. |
| Class R6, at minimum investment | $5,000,000 | 04/29/2022 | $4,525,000 | N.A. |
See Endnotes and Additional Disclosures in this report.
Past performance is no guarantee of future results. Returns are historical and are calculated by determining the percentage change in net asset value (NAV) or offering price (as applicable) with all distributions reinvested. Furthermore, returns do not reflect the deduction of taxes that shareholders may have to pay on Fund distributions or upon the redemption of Fund shares. Investment return and principal value will fluctuate so that shares, when redeemed, may be worth more or less than their original cost. Performance for periods less than or equal to one year is cumulative. Performance is for the stated time period only; due to market volatility, current Fund performance may be lower or higher than the quoted return. For performance as of the most recent month-end, please refer to www.calvert.com.
Calvert
Focused Value Fund
September 30, 2022
| Sector Allocation (% of net assets)1 |
| Top 10 Holdings (% of net assets)1 | |
| Bristol-Myers Squibb Co. | 5.3% |
| NextEra Energy, Inc. | 5.0 |
| BJ's Wholesale Club Holdings, Inc. | 4.7 |
| Goldman Sachs Group, Inc. (The) | 4.2 |
| Wells Fargo & Co. | 4.2 |
| M&T Bank Corp. | 4.2 |
| Charles Schwab Corp. (The) | 4.1 |
| Alphabet, Inc., Class A | 4.0 |
| Westinghouse Air Brake Technologies Corp. | 3.7 |
| Thermo Fisher Scientific, Inc. | 3.7 |
| Total | 43.1% |
Footnotes:
| 1 | Excludes cash and cash equivalents. |
Calvert
Focused Value Fund
September 30, 2022
Endnotes and Additional Disclosures
| † | The views expressed in this report are those of the portfolio manager(s) and are current only through the date stated at the top of this page. These views are subject to change at any time based upon market or other conditions, and Calvert and the Fund(s) disclaim any responsibility to update such views. These views may not be relied upon as investment advice and, because investment decisions are based on many factors, may not be relied upon as an indication of trading intent on behalf of any Calvert fund. This commentary may contain statements that are not historical facts, referred to as “forward-looking statements.” The Fund’s actual future results may differ significantly from those stated in any forward-looking statement, depending on factors such as changes in securities or financial markets or general economic conditions, the volume of sales and purchases of Fund shares, the continuation of investment advisory, administrative and service contracts, and other risks discussed from time to time in the Fund’s filings with the Securities and Exchange Commission. |
| | |
| 1 | Russell 1000® Value Index is an unmanaged index of U.S. large-cap value stocks. Unless otherwise stated, index returns do not reflect the effect of any applicable sales charges, commissions, expenses, taxes or leverage, as applicable. It is not possible to invest directly in an index. |
| 2 | Cumulative Total Returns at NAV do not include applicable sales charges. If sales charges were deducted, the returns would be lower. Cumulative Total Returns shown with maximum sales charge reflect the stated maximum sales charge. Unless otherwise stated, performance does not reflect the deduction of taxes on Fund distributions or redemptions of Fund shares. Performance since inception for an index, if presented, is the performance since the Fund’s or oldest share class’ inception, as applicable. Performance for periods of more than one year represents the average annual total return for such period. |
| 3 | Source: Fund prospectus. Net expense ratios reflect a contractual expense reimbursement that continues through 1/31/24. The expense ratios for the current reporting period can be found in the Financial Highlights section of this report. Performance reflects expenses waived and/or reimbursed, if applicable. Without such waivers and/or reimbursements, performance would have been lower. |
| | Fund profile subject to change due to active management. |
| | Additional Information |
| | S&P 500® Index is an unmanaged index of large-cap stocks commonly used as a measure of U.S. stock market performance. Dow Jones Industrial Average® is a price-weighted average of 30 blue-chip stocks that are generally the leaders in their industry. S&P Dow Jones Indices are a product of S&P Dow Jones Indices LLC (“S&P DJI”) and have been licensed for use. S&P® and S&P 500® are registered |
trademarks of S&P DJI; Dow Jones® is a registered trademark of Dow Jones Trademark Holdings LLC (“Dow Jones”); S&P DJI, Dow Jones and their respective affiliates do not sponsor, endorse, sell or promote the Fund, will not have any liability with respect thereto and do not have any liability for any errors, omissions, or interruptions of the S&P Dow Jones Indices. Nasdaq Composite Index is a market capitalization-weighted index of all domestic and international securities listed on Nasdaq. Source: Nasdaq, Inc. The information is provided by Nasdaq (with its affiliates, are referred to as the “Corporations”) and Nasdaq’s third party licensors on an “as is” basis and the Corporations make no guarantees and bear no liability of any kind with respect to the information or the Fund.
Calvert
Focused Value Fund
September 30, 2022
Example
As a Fund shareholder, you incur two types of costs: (1) transaction costs, including sales charges (loads) on purchases and redemption fees (if applicable); and (2) ongoing costs, including management fees; distribution and/or service fees; and other Fund expenses. This Example is intended to help you understand your ongoing costs (in dollars) of Fund investing and to compare these costs with the ongoing costs of investing in other mutual funds. The actual expense Example is based on an investment of $1,000 invested at the beginning of the period and held for the entire period (April 29, 2022 to September 30, 2022). The hypothetical expense Example is based on an investment of $1,000 invested for the one-half year period (April 1, 2022 to September 30, 2022).
Actual Expenses
The first section of the table below provides information about actual account values and actual expenses. You may use the information in this section, together with the amount you invested, to estimate the expenses that you paid over the period. Simply divide your account value by $1,000 (for example, an $8,600 account value divided by $1,000 = 8.6), then multiply the result by the number in the first section under the heading entitled “Expenses Paid During Period” to estimate the expenses you paid on your account during this period.
Hypothetical Example for Comparison Purposes
The second section of the table below provides information about hypothetical account values and hypothetical expenses based on the actual Fund expense ratio and an assumed rate of return of 5% per year (before expenses), which is not the actual Fund return. The hypothetical account values and expenses may not be used to estimate the actual ending account balance or expenses you paid for the period. You may use this information to compare the ongoing costs of investing in the Fund and other funds. To do so, compare this 5% hypothetical example with the 5% hypothetical examples that appear in the shareholder reports of the other funds.
Please note that the expenses shown in the table are meant to highlight your ongoing costs only and do not reflect any transactional costs, such as sales charges (loads) or redemption fees (if applicable). Therefore, the second section of the table is useful in comparing ongoing costs only, and will not help you determine the relative total costs of owning different funds. In addition, if these transactional costs were included, your costs would be higher.
| | Beginning
Account Value
(4/29/22) | Ending
Account Value
(9/30/22) | Expenses Paid
During Period
(4/29/22 – 9/30/22) | Annualized
Expense
Ratio |
| Actual * | | | | |
| Class A | $1,000.00 | $905.00 | $4.00 ** | 0.99% |
| Class C | $1,000.00 | $902.00 | $7.03 ** | 1.74% |
| Class I | $1,000.00 | $905.00 | $2.99 ** | 0.74% |
| Class R6 | $1,000.00 | $905.00 | $2.99 ** | 0.74% |
| | | | | |
| | Beginning
Account Value
(4/1/22) | Ending
Account Value
(9/30/22) | Expenses Paid
During Period
(4/1/22 – 9/30/22) | Annualized
Expense
Ratio |
| Hypothetical *** | | | | |
| (5% return per year before expenses) | | | | |
| Class A | $1,000.00 | $1,020.10 | $5.01 ** | 0.99% |
| Class C | $1,000.00 | $1,016.34 | $8.80 ** | 1.74% |
| Class I | $1,000.00 | $1,021.36 | $3.75 ** | 0.74% |
| Class R6 | $1,000.00 | $1,021.36 | $3.75 ** | 0.74% |
| * | The Fund had not commenced operations on April 1, 2022. Actual expenses are equal to the Fund’s annualized expense ratio for the indicated Class, multiplied by the average account value over the period, multiplied by 155/365 (to reflect the period from the commencement of operations on April 29, 2022 to September 30, 2022). The Example assumes that the $1,000 was invested at the net asset value per share determined at the opening of business on
April 29, 2022. |
| ** | Absent a waiver and/or reimbursement of expenses by an affiliate, expenses would be higher. |
| *** | Hypothetical expenses are equal to the Fund’s annualized expense ratio for the indicated Class, multiplied by the average account value over the period, multiplied by 183/365 (to reflect the one-half year period). The Example assumes that the $1,000 was invested at the net asset value per share determined at the opening of business on April 29, 2022. |
Calvert
Focused Value Fund
September 30, 2022
| Security | Shares | Value |
| Aerospace & Defense — 3.1% | |
| Hexcel Corp. | | 2,916 | $ 150,816 |
| | | | $ 150,816 |
| Air Freight & Logistics — 2.6% | |
| C.H. Robinson Worldwide, Inc. | | 1,311 | $ 126,262 |
| | | | $ 126,262 |
| Banks — 8.4% | |
| M&T Bank Corp. | | 1,177 | $ 207,529 |
| Wells Fargo & Co. | | 5,164 | 207,696 |
| | | | $ 415,225 |
| Building Products — 3.3% | |
| Johnson Controls International PLC | | 3,325 | $ 163,657 |
| | | | $ 163,657 |
| Capital Markets — 8.3% | |
| Charles Schwab Corp. (The) | | 2,815 | $ 202,314 |
| Goldman Sachs Group, Inc. (The) | | 709 | 207,773 |
| | | | $ 410,087 |
| Chemicals — 2.7% | |
| FMC Corp. | | 1,273 | $ 134,556 |
| | | | $ 134,556 |
| Diversified Telecommunication Services — 3.5% | |
| Verizon Communications, Inc. | | 4,483 | $ 170,220 |
| | | | $ 170,220 |
| Electric Utilities — 8.5% | |
| Constellation Energy Corp. | | 2,097 | $ 174,450 |
| NextEra Energy, Inc. | | 3,110 | 243,855 |
| | | | $ 418,305 |
| Entertainment — 3.2% | |
| Walt Disney Co. (The)(1) | | 1,674 | $ 157,908 |
| | | | $ 157,908 |
| Equity Real Estate Investment Trusts (REITs) — 4.9% | |
| EastGroup Properties, Inc. | | 817 | $ 117,926 |
| Mid-America Apartment Communities, Inc. | | 808 | 125,296 |
| | | | $ 243,222 |
| Security | Shares | Value |
| Food & Staples Retailing — 7.7% | |
| BJ's Wholesale Club Holdings, Inc.(1) | | 3,212 | $ 233,866 |
| Performance Food Group Co.(1) | | 3,334 | 143,195 |
| | | | $ 377,061 |
| Food Products — 3.6% | |
| Hershey Co. (The) | | 796 | $ 175,494 |
| | | | $ 175,494 |
| Health Care Equipment & Supplies — 3.7% | |
| Zimmer Biomet Holdings, Inc. | | 1,729 | $ 180,767 |
| | | | $ 180,767 |
| Hotels, Restaurants & Leisure — 2.0% | |
| Papa John's International, Inc. | | 1,446 | $ 101,234 |
| | | | $ 101,234 |
| Insurance — 3.5% | |
| American International Group, Inc. | | 3,608 | $ 171,308 |
| | | | $ 171,308 |
| Interactive Media & Services — 4.0% | |
| Alphabet, Inc., Class A(1) | | 2,056 | $ 196,656 |
| | | | $ 196,656 |
| Life Sciences Tools & Services — 3.7% | |
| Thermo Fisher Scientific, Inc. | | 362 | $ 183,603 |
| | | | $ 183,603 |
| Machinery — 3.7% | |
| Westinghouse Air Brake Technologies Corp. | | 2,260 | $ 183,851 |
| | | | $ 183,851 |
| Pharmaceuticals — 8.1% | |
| Bristol-Myers Squibb Co. | | 3,690 | $ 262,322 |
| Sanofi | | 1,817 | 138,358 |
| | | | $ 400,680 |
| Semiconductors & Semiconductor Equipment — 5.6% | |
| Micron Technology, Inc. | | 2,079 | $ 104,158 |
| Texas Instruments, Inc. | | 1,107 | 171,341 |
| | | | $ 275,499 |
| Software — 2.8% | |
| VMware, Inc., Class A | | 1,287 | $ 137,014 |
| | | | $ 137,014 |
Calvert
Focused Value Fund
September 30, 2022
Schedule of Investments — continued
| Security | Shares | Value |
| Specialty Retail — 2.3% | |
| Lithia Motors, Inc., Class A | | 535 | $ 114,784 |
| | | | $ 114,784 |
Total Common Stocks
(identified cost $5,318,538) | | | $4,888,209 |
| Short-Term Investments — 0.5% | | | |
| Security | Shares | Value |
| Morgan Stanley Institutional Liquidity Funds - Government Portfolio, Institutional Class, 2.80%(2) | | 23,139 | $ 23,139 |
Total Short-Term Investments
(identified cost $23,139) | | | $ 23,139 |
Total Investments — 99.7%
(identified cost $5,341,677) | | | $4,911,348 |
| Other Assets, Less Liabilities — 0.3% | | | $ 13,920 |
| Net Assets — 100.0% | | | $4,925,268 |
| The percentage shown for each investment category in the Schedule of Investments is based on net assets. |
| (1) | Non-income producing security. |
| (2) | May be deemed to be an affiliated investment company. The rate shown is the annualized seven-day yield as of September 30, 2022. |
Calvert
Focused Value Fund
September 30, 2022
Statement of Assets and Liabilities
| | September 30, 2022 |
| Assets | |
| Investments in securities of unaffiliated issuers, at value (identified cost $5,318,538) | $ 4,888,209 |
| Investments in securities of affiliated issuers, at value (identified cost $23,139) | 23,139 |
| Receivable for investments sold | 141,523 |
| Receivable for capital shares sold | 9,792 |
| Dividends receivable | 3,950 |
| Dividends receivable - affiliated | 61 |
| Tax reclaims receivable | 546 |
| Deferred offering costs | 53,692 |
| Total assets | $5,120,912 |
| Liabilities | |
| Payable for investments purchased | $ 116,232 |
| Payable to affiliates: | |
| Investment advisory fee | 2,059 |
| Administrative fee | 495 |
| Distribution and service fees | 81 |
| Other | 35,860 |
| Accrued expenses | 40,917 |
| Total liabilities | $ 195,644 |
| Net Assets | $4,925,268 |
| Sources of Net Assets | |
| Paid-in capital | $ 5,405,315 |
| Accumulated loss | (480,047) |
| Net Assets | $4,925,268 |
| Class A Shares | |
| Net Assets | $ 186,690 |
| Shares Outstanding | 20,639 |
Net Asset Value and Redemption Price Per Share
(net assets ÷ shares of beneficial interest outstanding) | $ 9.05 |
Maximum Offering Price Per Share
(100 ÷ 94.75 of net asset value per share) | $ 9.55 |
| Class C Shares | |
| Net Assets | $ 45,080 |
| Shares Outstanding | 5,000 |
Net Asset Value and Offering Price Per Share*
(net assets ÷ shares of beneficial interest outstanding) | $ 9.02 |
| Class I Shares | |
| Net Assets | $ 4,648,230 |
| Shares Outstanding | 513,404 |
Net Asset Value, Offering Price and Redemption Price Per Share
(net assets ÷ shares of beneficial interest outstanding) | $ 9.05 |
9
See Notes to Financial Statements.
Calvert
Focused Value Fund
September 30, 2022
Statement of Assets and Liabilities — continued
| | September 30, 2022 |
| Class R6 Shares | |
| Net Assets | $ 45,268 |
| Shares Outstanding | 5,000 |
Net Asset Value, Offering Price and Redemption Price Per Share
(net assets ÷ shares of beneficial interest outstanding) | $ 9.05 |
| On sales of $50,000 or more, the offering price of Class A shares is reduced. |
| * | Redemption price per share is equal to the net asset value less any applicable contingent deferred sales charge. |
10
See Notes to Financial Statements.
Calvert
Focused Value Fund
September 30, 2022
| | Period Ended |
| | September 30, 2022(1) |
| Investment Income | |
| Dividend income (net of foreign taxes withheld of $1,125) | $ 41,647 |
| Dividend income - affiliated issuers | 271 |
| Total investment income | $ 41,918 |
| Expenses | |
| Investment advisory fee | $ 10,463 |
| Administrative fee | 2,511 |
| Distribution and service fees: | |
| Class A | 145 |
| Class C | 205 |
| Trustees' fees and expenses | 66 |
| Custodian fees | 957 |
| Transfer agency fees and expenses | 218 |
| Accounting fees | 1,519 |
| Professional fees | 37,435 |
| Offering costs | 38,351 |
| Reports to shareholders | 1,794 |
| Miscellaneous | 7,846 |
| Total expenses | $ 101,510 |
| Waiver and/or reimbursement of expenses by affiliate | $ (85,611) |
| Net expenses | $ 15,899 |
| Net investment income | $ 26,019 |
| Realized and Unrealized Gain (Loss) | |
| Net realized gain (loss): | |
| Investment securities | $ (75,351) |
| Foreign currency transactions | (335) |
| Net realized loss | $ (75,686) |
| Change in unrealized appreciation (depreciation): | |
| Investment securities | $ (430,329) |
| Foreign currency | (51) |
| Net change in unrealized appreciation (depreciation) | $(430,380) |
| Net realized and unrealized loss | $(506,066) |
| Net decrease in net assets from operations | $(480,047) |
| (1) | For the period from the commencement of operations, April 29, 2022, to September 30, 2022. |
11
See Notes to Financial Statements.
Calvert
Focused Value Fund
September 30, 2022
Statement of Changes in Net Assets
| | Period Ended
September 30, 2022(1) |
| Increase (Decrease) in Net Assets | |
| From operations: | |
| Net investment income | $ 26,019 |
| Net realized loss | (75,686) |
| Net change in unrealized appreciation (depreciation) | (430,380) |
| Net decrease in net assets from operations | $ (480,047) |
| Capital share transactions: | |
| Class A | $ 195,523 |
| Class C | 50,000 |
| Class I | 5,109,792 |
| Class R6 | 50,000 |
| Net increase in net assets from capital share transactions | $5,405,315 |
| Net increase in net assets | $4,925,268 |
| Net Assets | |
| At beginning of period | $ — |
| At end of period | $4,925,268 |
| (1) | For the period from the commencement of operations, April 29, 2022, to September 30, 2022. |
12
See Notes to Financial Statements.
Calvert
Focused Value Fund
September 30, 2022
| | Class A |
| | Period Ended
September 30, 2022(1) |
| Net asset value — Beginning of period | $10.00 |
| Income (Loss) From Operations | |
| Net investment income(2) | $ 0.03 |
| Net realized and unrealized loss | (0.98) |
| Total loss from operations | $ (0.95) |
| Net asset value — End of period | $ 9.05 |
| Total Return(3) | (9.50)% (4) |
| Ratios/Supplemental Data | |
| Net assets, end of period (000’s omitted) | $ 187 |
| Ratios (as a percentage of average daily net assets):(5) | |
| Total expenses | 5.09% (6) |
| Net expenses | 0.99% (6)(7) |
| Net investment income | 0.77% (6) |
| Portfolio Turnover | 13% (4) |
| (1) | For the period from the commencement of operations, April 29, 2022, to September 30, 2022. |
| (2) | Computed using average shares outstanding. |
| (3) | Returns are historical and are calculated by determining the percentage change in net asset value with all distributions reinvested and do not reflect the effect of sales charges, if any. |
| (4) | Not annualized. |
| (5) | Total expenses do not reflect amounts reimbursed and/or waived by the adviser and certain of its affiliates, if applicable. Net expenses are net of all reductions and represent the net expenses paid by the Fund. |
| (6) | Annualized. |
| (7) | Includes a reduction by the investment adviser of a portion of its advisory fee due to the Fund’s investment in the Liquidity Fund (equal to less than 0.005% of average daily net assets for the period ended September 30, 2022). |
13
See Notes to Financial Statements.
Calvert
Focused Value Fund
September 30, 2022
Financial Highlights — continued
| | Class C |
| | Period Ended
September 30, 2022(1) |
| Net asset value — Beginning of period | $10.00 |
| Income (Loss) From Operations | |
| Net investment income(2) | $ 0.01 |
| Net realized and unrealized loss | (0.99) |
| Total loss from operations | $ (0.98) |
| Net asset value — End of period | $ 9.02 |
| Total Return(3) | (9.80)% (4) |
| Ratios/Supplemental Data | |
| Net assets, end of period (000’s omitted) | $ 45 |
| Ratios (as a percentage of average daily net assets):(5) | |
| Total expenses | 5.84% (6) |
| Net expenses | 1.75% (6)(7) |
| Net investment income | 0.26% (6) |
| Portfolio Turnover | 13% (4) |
| (1) | For the period from the commencement of operations, April 29, 2022, to September 30, 2022. |
| (2) | Computed using average shares outstanding. |
| (3) | Returns are historical and are calculated by determining the percentage change in net asset value with all distributions reinvested and do not reflect the effect of sales charges, if any. |
| (4) | Not annualized. |
| (5) | Total expenses do not reflect amounts reimbursed and/or waived by the adviser and certain of its affiliates, if applicable. Net expenses are net of all reductions and represent the net expenses paid by the Fund. |
| (6) | Annualized. |
| (7) | Includes a reduction by the investment adviser of a portion of its advisory fee due to the Fund’s investment in the Liquidity Fund (equal to less than 0.005% of average daily net assets for the period ended September 30, 2022). |
14
See Notes to Financial Statements.
Calvert
Focused Value Fund
September 30, 2022
Financial Highlights — continued
| | Class I |
| | Period Ended
September 30, 2022(1) |
| Net asset value — Beginning of period | $10.00 |
| Income (Loss) From Operations | |
| Net investment income(2) | $ 0.05 |
| Net realized and unrealized loss | (1.00) |
| Total loss from operations | $ (0.95) |
| Net asset value — End of period | $ 9.05 |
| Total Return(3) | (9.50)% (4) |
| Ratios/Supplemental Data | |
| Net assets, end of period (000’s omitted) | $4,648 |
| Ratios (as a percentage of average daily net assets):(5) | |
| Total expenses | 4.83% (6) |
| Net expenses | 0.74% (6)(7) |
| Net investment income | 1.27% (6) |
| Portfolio Turnover | 13% (4) |
| (1) | For the period from the commencement of operations, April 29, 2022, to September 30, 2022. |
| (2) | Computed using average shares outstanding. |
| (3) | Returns are historical and are calculated by determining the percentage change in net asset value with all distributions reinvested and do not reflect the effect of sales charges, if any. |
| (4) | Not annualized. |
| (5) | Total expenses do not reflect amounts reimbursed and/or waived by the adviser and certain of its affiliates, if applicable. Net expenses are net of all reductions and represent the net expenses paid by the Fund. |
| (6) | Annualized. |
| (7) | Includes a reduction by the investment adviser of a portion of its advisory fee due to the Fund’s investment in the Liquidity Fund (equal to less than 0.005% of average daily net assets for the period ended September 30, 2022). |
15
See Notes to Financial Statements.
Calvert
Focused Value Fund
September 30, 2022
Financial Highlights — continued
| | Class R6 |
| | Period Ended
September 30, 2022(1) |
| Net asset value — Beginning of period | $10.00 |
| Income (Loss) From Operations | |
| Net investment income(2) | $ 0.05 |
| Net realized and unrealized loss | (1.00) |
| Total loss from operations | $ (0.95) |
| Net asset value — End of period | $ 9.05 |
| Total Return(3) | (9.50)% (4) |
| Ratios/Supplemental Data | |
| Net assets, end of period (000’s omitted) | $ 45 |
| Ratios (as a percentage of average daily net assets):(5) | |
| Total expenses | 4.84% (6) |
| Net expenses | 0.75% (6)(7) |
| Net investment income | 1.26% (6) |
| Portfolio Turnover | 13% (4) |
| (1) | For the period from the commencement of operations, April 29, 2022, to September 30, 2022. |
| (2) | Computed using average shares outstanding. |
| (3) | Returns are historical and are calculated by determining the percentage change in net asset value with all distributions reinvested and do not reflect the effect of sales charges, if any. |
| (4) | Not annualized. |
| (5) | Total expenses do not reflect amounts reimbursed and/or waived by the adviser and certain of its affiliates, if applicable. Net expenses are net of all reductions and represent the net expenses paid by the Fund. |
| (6) | Annualized. |
| (7) | Includes a reduction by the investment adviser of a portion of its advisory fee due to the Fund’s investment in the Liquidity Fund (equal to less than 0.005% of average daily net assets for the period ended September 30, 2022). |
16
See Notes to Financial Statements.
Calvert
Focused Value Fund
September 30, 2022
Notes to Financial Statements
1 Significant Accounting Policies
Calvert Focused Value Fund (the Fund) is a diversified series of Calvert Social Investment Fund (the Trust). The Trust is a Massachusetts business trust registered under the Investment Company Act of 1940, as amended (the 1940 Act), as an open-end management investment company. The investment objective of the Fund is total return. The Fund commenced operations on April 29, 2022.
The Fund offers four classes of shares. Class A shares are generally sold subject to a sales charge imposed at time of purchase. A contingent deferred sales charge of 1% may apply to certain redemptions of Class A shares for accounts for which no sales charge was paid, if redeemed within 12 months of purchase. Class C shares are sold without a front-end sales charge, and with certain exceptions, are charged a contingent deferred sales charge of 1% on shares redeemed within 12 months of purchase. Class C shares are only available for purchase through a financial intermediary. Class C shares automatically convert to Class A shares eight years after their purchase as described in the Fund's prospectus. Class I and Class R6 shares are sold at net asset value, are not subject to a sales charge and are sold only to certain eligible investors. Each class represents a pro rata interest in the Fund, but votes separately on class-specific matters and is subject to different expenses.
The Fund applies the accounting and reporting guidance in the Financial Accounting Standards Board (FASB) Accounting Standards Codification Topic 946, Financial Services – Investment Companies (ASC 946). Subsequent events, if any, through the date that the financial statements were issued have been evaluated in the preparation of the financial statements.
A Investment Valuation— Net asset value per share is determined every business day as of the close of the regular session of the New York Stock Exchange (generally 4:00 p.m. Eastern time). The Fund uses independent pricing services approved by the Board of Trustees (the Board) to value its investments wherever possible. Investments for which market quotations are not available or deemed not reliable are fair valued in good faith under the direction of the Board.
U.S. generally accepted accounting principles (U.S. GAAP) establishes a disclosure hierarchy that categorizes the inputs to valuation techniques used to value assets and liabilities at measurement date. These inputs are summarized in the three broad levels listed below:
Level 1 - quoted prices in active markets for identical securities
Level 2 - other significant observable inputs (including quoted prices for similar securities, interest rates, prepayment speeds, credit risk, etc.)
Level 3 - significant unobservable inputs (including the Fund’s own assumptions in determining the fair value of investments)
The inputs or methodologies used for valuing securities are not necessarily an indication of the risk associated with investing in those securities.
Valuation techniques used to value the Fund’s investments by major category are as follows:
Equity Securities. Equity securities (including warrants and rights) listed on a U.S. securities exchange generally are valued at the last sale or closing price as reported by an independent pricing service on the primary market or exchange on which they are traded and are categorized as Level 1 in the hierarchy. Equity securities listed on the NASDAQ National Market System are valued at the NASDAQ official closing price and are categorized as Level 1 in the hierarchy. Unlisted or listed securities for which closing sales prices or closing quotations are not available are valued at the mean between the latest available bid and ask prices and are categorized as Level 2 in the hierarchy. The daily valuation of exchange-traded foreign securities generally is determined as of the close of trading on the principal exchange on which such securities trade. Events occurring after the close of trading on foreign exchanges may result in adjustments to the valuation of foreign securities to more accurately reflect their fair value as of the close of regular trading on the New York Stock Exchange. When valuing foreign equity securities that meet certain criteria, the Fund’s Board has approved the use of a fair value service that values such securities to reflect market trading that occurs after the close of the applicable foreign markets of comparable securities or other instruments that have a strong correlation to the fair-valued securities. Such securities are categorized as Level 2 in the hierarchy.
Other Securities. Investments in management investment companies (including money market funds) that do not trade on an exchange are valued at the net asset value as of the close of each business day and are categorized as Level 1 in the hierarchy.
Fair Valuation. In connection with Rule 2a-5 of the 1940 Act, which became effective September 8, 2022, the Board has designated the Fund’s investment adviser as its valuation designee. Investments for which valuations or market quotations are not readily available or are deemed unreliable are valued by the investment adviser, as valuation designee, at fair value using methods that most fairly reflect the security’s “fair value”, which is the amount that the Fund might reasonably expect to receive for the security upon its current sale in the ordinary course. Each such determination is based on a consideration of relevant factors, which are likely to vary from one pricing context to another. These factors may include, but are not limited to, the type of security, the existence of any contractual restrictions on the security’s disposition, the price and extent of public trading in similar securities of the issuer or of comparable companies or entities, quotations or relevant information obtained from broker/dealers or other market participants, information obtained from the issuer, analysts, and/or the appropriate stock exchange (for exchange-traded securities), an analysis of the company’s or entity’s financial statements, and an evaluation of the forces that influence the issuer and the market(s) in which the security is purchased and sold.
The values assigned to fair value investments are based on available information and do not necessarily represent amounts that might ultimately be realized. Further, due to the inherent uncertainty of valuations of such investments, the fair values may differ significantly from the values that would have been used had an active market existed, and the differences could be material.
Calvert
Focused Value Fund
September 30, 2022
Notes to Financial Statements — continued
The following table summarizes the market value of the Fund's holdings as of September 30, 2022, based on the inputs used to value them:
| Asset Description | Level 1 | Level 2 | Level 3 | Total |
| Common Stocks: | | | | |
| Communication Services | $ 524,784 | $ — | $ — | $ 524,784 |
| Consumer Discretionary | 216,018 | — | — | 216,018 |
| Consumer Staples | 552,555 | — | — | 552,555 |
| Financials | 996,620 | — | — | 996,620 |
| Health Care | 626,692 | 138,358 | — | 765,050 |
| Industrials | 624,586 | — | — | 624,586 |
| Information Technology | 412,513 | — | — | 412,513 |
| Materials | 134,556 | — | — | 134,556 |
| Real Estate | 243,222 | — | — | 243,222 |
| Utilities | 418,305 | — | — | 418,305 |
| Total Common Stocks | $4,749,851 | $138,358 (1) | $ — | $4,888,209 |
| Short-Term Investments | $ 23,139 | $ — | $ — | $ 23,139 |
| Total Investments | $4,772,990 | $138,358 | $ — | $4,911,348 |
| (1) | Includes foreign equity securities whose values were adjusted to reflect market trading of comparable securities or other correlated instruments that occurred after the close of trading in their applicable foreign markets. |
B Investment Transactions and Income— Investment transactions for financial statement purposes are accounted for on trade date. Realized gains and losses are recorded on an identified cost basis and may include proceeds from litigation. Dividend income is recorded on the ex-dividend date for dividends received in cash and/or securities or, in the case of dividends on certain foreign securities, as soon as the Fund is informed of the ex-dividend date. Non-cash dividends are recorded at the fair value of the securities received. Withholding taxes on foreign dividends, if any, have been provided for in accordance with the Fund's understanding of the applicable country’s tax rules and rates. Distributions received that represent a return of capital are recorded as a reduction of cost of investments. Distributions received that represent a capital gain are recorded as a realized gain.
C Share Class Accounting— Realized and unrealized gains and losses and net investment income and losses, other than class-specific expenses, are allocated daily to each class of shares based upon the relative net assets of each class to the total net assets of the Fund. Expenses arising in connection with a specific class are charged directly to that class. Sub-accounting, recordkeeping and similar administrative fees payable to financial intermediaries, which are a component of transfer agency fees and expenses on the Statement of Operations, are not allocated to Class R6 shares.
D Foreign Currency Transactions— The Fund’s accounting records are maintained in U.S. dollars. For valuation of assets and liabilities on each date of net asset value determination, foreign denominations are converted into U.S. dollars using the current exchange rate. Security transactions, income and expenses are translated at the prevailing rate of exchange on the date of the event. Recognized gains or losses on investment transactions attributable to changes in foreign currency exchange rates are recorded for financial statement purposes as net realized gains and losses on investments. That portion of unrealized gains and losses on investments that results from fluctuations in foreign currency exchange rates is not separately disclosed.
E Distributions to Shareholders— Distributions to shareholders are recorded by the Fund on ex-dividend date. Distributions from net investment income and distributions from net realized capital gains, if any, are paid at least annually. Distributions are declared separately for each class of shares. Distributions are determined in accordance with income tax regulations, which may differ from U.S. GAAP; accordingly, periodic reclassifications are made within the Fund's capital accounts to reflect income and gains available for distribution under income tax regulations.
F Estimates— The preparation of financial statements in conformity with U.S. GAAP requires management to make estimates and assumptions that affect the reported amounts of assets and liabilities and disclosure of contingent assets and liabilities at the date of the financial statements and the reported amounts of increases and decreases in net assets from operations during the reporting period. Actual results could differ from those estimates.
G Indemnifications— Under the Trust’s organizational document, its officers and Trustees may be indemnified against certain liabilities and expenses arising out of the performance of their duties to the Fund. Under Massachusetts law, if certain conditions prevail, shareholders of a Massachusetts business trust (such as the Trust) could be deemed to have personal liability for the obligations of the Trust. However, the Trust’s Declaration of Trust contains an express disclaimer of liability on the part of Fund shareholders and provides that the Trust shall assume, upon request by the shareholder, the defense on behalf of any Fund shareholders or former shareholders. Additionally, in the normal course of business, the Fund enters into agreements with service
Calvert
Focused Value Fund
September 30, 2022
Notes to Financial Statements — continued
providers that may contain indemnification clauses. The Fund’s maximum exposure under these arrangements is unknown as this would involve future claims that may be made against the Fund that have not yet occurred.
H Federal Income Taxes— No provision for federal income or excise tax is required since the Fund intends to qualify as a regulated investment company under the Internal Revenue Code and to distribute substantially all of its taxable earnings.
Management has analyzed the Fund's tax positions taken for all open federal income tax years and has concluded that no provision for federal income tax is required in the Fund's financial statements. A Fund's federal tax return is subject to examination by the Internal Revenue Service for a period of three years from the date of filing.
I Offering Costs— Offering costs incurred in connection with the initial offering of the Fund's shares are amortized on a straight-line basis over twelve months from commencement of operations of the Fund. Unamortized offering costs are reflected as deferred offering costs on the Statement of Assets and Liabilities.
2 Related Party Transactions
The investment advisory fee is earned by Calvert Research and Management (CRM), an indirect, wholly-owned subsidiary of Morgan Stanley, as compensation for investment advisory services rendered to the Fund. The investment advisory fee is computed at the annual rate of 0.50% of the Fund’s average daily net assets and is payable monthly. For the period ended September 30, 2022, the investment advisory fee amounted to $10,463.
The Fund may invest in a money market fund, the Institutional Class of the Morgan Stanley Institutional Liquidity Funds - Government Portfolio (the “Liquidity Fund”), an open-end management investment company managed by Morgan Stanley Investment Management Inc., a wholly-owned subsidiary of Morgan Stanley. The investment advisory fee paid by the Fund is reduced by an amount equal to its pro-rata share of the advisory and administration fees paid by the Fund due to its investment in the Liquidity Fund. For the period ended September 30, 2022, the investment advisory fee paid was reduced by $23 relating to the Fund’s investment in the Liquidity Fund.
CRM has agreed to reimburse the Fund’s operating expenses to the extent that total annual operating expenses (relating to ordinary operating expenses only and excluding expenses such as brokerage commissions, acquired fund fees and expenses of unaffiliated funds, borrowing costs, taxes or litigation expenses) exceed 0.99%, 1.74%, 0.74% and 0.74% for Class A, Class C, Class I and Class R6, respectively, of such class’s average daily net assets. The expense reimbursement agreement with CRM may be changed or terminated after January 31, 2024. For the period ended September 30, 2022, CRM waived or reimbursed expenses of $85,588.
The administrative fee is earned by CRM as compensation for administrative services rendered to the Fund. The fee is computed at an annual rate of 0.12% of the Fund’s average daily net assets attributable to Class A, Class C, Class I and Class R6 and is payable monthly. For the period ended September 30, 2022, CRM was paid administrative fees of $2,511.
The Fund has in effect a distribution plan for Class A shares (Class A Plan) pursuant to Rule 12b-1 under the 1940 Act. Pursuant to the Class A Plan, the Fund pays Eaton Vance Distributors, Inc. (EVD), an affiliate of CRM and the Fund’s principal underwriter, a distribution and service fee of 0.25% per annum of its average daily net assets attributable to Class A shares for distribution services and facilities provided to the Fund by EVD, as well as for personal services and/or the maintenance of shareholder accounts.
The Fund also has in effect a distribution plan for Class C shares (Class C Plan) pursuant to Rule 12b-1 under the 1940 Act. Pursuant to the Class C Plan, the Fund pays EVD amounts equal to 0.75% per annum of its average daily net assets attributable to Class C shares for providing ongoing distribution services and facilities to the Fund. In addition, pursuant to the Class C Plan, the Fund also makes payments of service fees to EVD, financial intermediaries and other persons in amounts equal to 0.25% per annum of its average daily net assets attributable to that class. Service fees paid or accrued are for personal services and/or the maintenance of shareholder accounts. Distribution and service fees paid or accrued for the period ended September 30, 2022 amounted to $145 and $205 for Class A shares and Class C shares, respectively.
Eaton Vance Management (EVM), an affiliate of CRM, provides sub-transfer agency and related services to the Fund pursuant to a Sub-Transfer Agency Support Services Agreement. For the period ended September 30, 2022, sub-transfer agency fees and expenses incurred to EVM amounted to $111 and are included in transfer agency fees and expenses on the Statement of Operations.
Each Trustee of the Fund who is not an employee of CRM or its affiliates receives an annual fee of $214,000, plus an annual Committee fee ranging from $8,500 to $16,500 depending on the Committee. The Board chair receives an additional $30,000 annual fee, Committee chairs receive an additional $6,000 annual fee and the special equities liaison receives an additional $2,500 annual fee. Eligible Trustees may participate in a Deferred Compensation Plan (the Plan). Amounts deferred under the Plan are treated as though equal dollar amounts had been invested in shares of the Fund or other Calvert funds selected by the Trustees. The Fund purchases shares of the funds selected equal to the dollar amounts deferred under the Plan, resulting in an asset equal to the deferred compensation liability. Obligations of the Plan are paid solely from the Fund's assets. Trustees’ fees are allocated to each of the Calvert funds served. Salaries and fees of officers and Trustees of the Fund who are employees of CRM or its affiliates are paid by CRM.
Calvert
Focused Value Fund
September 30, 2022
Notes to Financial Statements — continued
3 Investment Activity
During the period ended September 30, 2022, the cost of purchases and proceeds from sales of investments, other than short-term securities, were $6,057,498 and $663,609, respectively.
4 Distributions to Shareholders and Income Tax Information
As of September 30, 2022, the components of distributable earnings (accumulated loss) on a tax basis were as follows:
| Undistributed ordinary income | $ 25,684 |
| Deferred capital losses | (72,850) |
| Net unrealized depreciation | (432,881) |
| Accumulated loss | $(480,047) |
At September 30, 2022, the Fund, for federal income tax purposes, had deferred capital losses of $72,850 which would reduce the Fund’s taxable income arising from future net realized gains on investment transactions, if any, to the extent permitted by the Internal Revenue Code, and thus would reduce the amount of distributions to shareholders, which would otherwise be necessary to relieve the Fund of any liability for federal income or excise tax. The deferred capital losses are treated as arising on the first day of the Fund’s next taxable year, can be carried forward for an unlimited period, and retain the same short-term or long-term character as when originally deferred. Of the deferred capital losses at September 30, 2022, $72,850 are short-term.
The cost and unrealized appreciation (depreciation) of investments of the Fund at September 30, 2022, as determined on a federal income tax basis, were as follows:
| Aggregate cost | $5,344,178 |
| Gross unrealized appreciation | $ 122,066 |
| Gross unrealized depreciation | (554,896) |
| Net unrealized depreciation | $ (432,830) |
5 Affiliated Funds
At September 30, 2022, the value of the Fund’s investment in affiliated funds was $23,139, which represents 0.5% of the Fund’s net assets. Transactions in affiliated funds by the Fund for the period ended September 30, 2022 were as follows:
| Name | Value,
beginning
of period | Purchases | Sales
proceeds | Net
realized
gain
(loss) | Change in
unrealized
appreciation
(depreciation) | Value,
end of
period | Dividend
income | Shares,
end of
period |
| Short-Term Investments | | | | | | |
| Liquidity Fund | $ — | $603,469 | $(580,330) | $ — | $ — | $23,139 | $271 | 23,139 |
6 Capital Shares
The Fund’s Declaration of Trust permits the Trustees to issue an unlimited number of full and fractional shares of beneficial interest (without par value). Such shares may be issued in a number of different series (such as the Fund) and classes.
Calvert
Focused Value Fund
September 30, 2022
Notes to Financial Statements — continued
Transactions in capital shares for the period ended September 30, 2022 were as follows:
| | Period Ended
September 30, 2022(1) |
| | Shares | Amount |
| Class A | | |
| Shares sold | 21,133 | $ 200,046 |
| Shares redeemed | (494) | (4,523) |
| Net increase | 20,639 | $ 195,523 |
| Class C | | |
| Shares sold | 5,000 | $ 50,000 |
| Net increase | 5,000 | $ 50,000 |
| Class I | | |
| Shares sold | 513,404 | $ 5,109,792 |
| Net increase | 513,404 | $5,109,792 |
| Class R6 | | |
| Shares sold | 5,000 | $ 50,000 |
| Net increase | 5,000 | $ 50,000 |
| (1) | For the period from the commencement of operations, April 29, 2022, to September 30, 2022. |
At September 30, 2022, EVM owned 91.9% of the value of the outstanding shares of the Fund.
7 Risks and Uncertainties
Pandemic Risk
An outbreak of respiratory disease caused by a novel coronavirus was first detected in China in late 2019 and subsequently spread internationally. This coronavirus has resulted in closing borders, enhanced health screenings, changes to healthcare service preparation and delivery, quarantines, cancellations, disruptions to supply chains and customer activity, as well as general concern and uncertainty. Health crises caused by outbreaks of disease, such as the coronavirus outbreak, may exacerbate other pre-existing political, social and economic risks and disrupt normal market conditions and operations. The impact of this outbreak has negatively affected the worldwide economy, as well as the economies of individual countries and industries, and could continue to affect the market in significant and unforeseen ways. Other epidemics and pandemics that may arise in the future may have similar effects. Any such impact could adversely affect the Fund's performance, or the performance of the securities in which the Fund invests.
Calvert
Focused Value Fund
September 30, 2022
Report of Independent Registered Public Accounting Firm
To the Board of Trustees of Calvert Social Investment Fund and Shareholders of Calvert Focused Value Fund:
Opinion on the Financial Statements and Financial Highlights
We have audited the accompanying statement of assets and liabilities of Calvert Focused Value Fund (the "Fund") (one of the funds constituting Calvert Social Investment Fund), including the schedule of investments, as of September 30, 2022, the related statements of operations and changes in net assets and the financial highlights for the period from April 29, 2022 (commencement of operations) to September 30, 2022, and the related notes. In our opinion, the financial statements and financial highlights present fairly, in all material respects, the financial position of the Fund as of September 30, 2022, and the results of its operations, the changes in its net assets, and the financial highlights for the period from April 29, 2022 (commencement of operations) to September 30, 2022, in conformity with accounting principles generally accepted in the United States of America.
Basis for Opinion
These financial statements and financial highlights are the responsibility of the Fund's management. Our responsibility is to express an opinion on the Fund's financial statements and financial highlights based on our audit. We are a public accounting firm registered with the Public Company Accounting Oversight Board (United States) (PCAOB) and are required to be independent with respect to the Fund in accordance with the U.S. federal securities laws and the applicable rules and regulations of the Securities and Exchange Commission and the PCAOB.
We conducted our audit in accordance with the standards of the PCAOB. Those standards require that we plan and perform the audit to obtain reasonable assurance about whether the financial statements and financial highlights are free of material misstatement, whether due to error or fraud. The Fund is not required to have, nor were we engaged to perform, an audit of its internal control over financial reporting. As part of our audit, we are required to obtain an understanding of internal control over financial reporting but not for the purpose of expressing an opinion on the effectiveness of the Fund’s internal control over financial reporting. Accordingly, we express no such opinion.
Our audit included performing procedures to assess the risks of material misstatement of the financial statements and financial highlights, whether due to error or fraud, and performing procedures that respond to those risks. Such procedures included examining, on a test basis, evidence regarding the amounts and disclosures in the financial statements and financial highlights. Our audit also included evaluating the accounting principles used and significant estimates made by management, as well as evaluating the overall presentation of the financial statements and financial highlights. Our procedures included confirmation of securities owned as of September 30, 2022, by correspondence with the custodian and brokers; when replies were not received from brokers, we performed other auditing procedures. We believe that our audit provides a reasonable basis for our opinion.
/s/ Deloitte & Touche LLP
Boston, Massachusetts
November 22, 2022
We have served as the auditor of one or more Calvert investment companies since 2021.
Calvert
Focused Value Fund
September 30, 2022
Federal Tax Information (Unaudited)
The Form 1099-DIV you receive in February 2023 will show the tax status of all distributions paid to your account in calendar year 2022. Shareholders are advised to consult their own tax adviser with respect to the tax consequences of their investment in the Fund. As required by the Internal Revenue Code and/or regulations, shareholders must be notified regarding the status of qualified dividend income for individuals.
Qualified Dividend Income. For the fiscal year ended September 30, 2022, the Fund designates approximately $39,540, or up to the maximum amount of such dividends allowable pursuant to the Internal Revenue Code, as qualified dividend income eligible for the reduced tax rate of 15%.
Calvert
Focused Value Fund
September 30, 2022
Board of Trustees' Contract Approval
Overview of the Contract Review Process
At a meeting of the Board of Trustees (the “Board”) of Calvert Social Investment Fund (“CSIF”), held on March 9, 2022, the Board, including a majority of the trustees who are not “interested persons” of the fund (“Independent Trustees”), voted to approve an Investment Advisory Agreement (the “Advisory Agreement”) between CSIF and Calvert Research and Management (“CRM” or the “Adviser”) with respect to the Calvert Focused Value Fund (the “Fund”).
In evaluating the Advisory Agreement for the Fund, the Board considered a variety of information relating to the Fund and its proposed service providers, including the Adviser. At the March meeting, the Independent Trustees reviewed certain materials and information prepared by the Adviser regarding various services to be provided to the Fund by the Adviser and its affiliates. Such report included, among other data, information regarding the Adviser’s personnel, descriptions of the investment strategies and investment process the Adviser proposed to use in managing the Fund, descriptions of the qualifications, education and experience of the investment professionals who would manage the Fund, and the Adviser’s estimated revenue and cost of providing services to the Fund.
The Independent Trustees were separately represented by independent legal counsel with respect to their consideration of the approval of the Advisory Agreement for the Fund. Prior to voting, the Independent Trustees reviewed the Advisory Agreement with management and also met in a private session with their counsel at which time no representatives of management were present.
The Independent Trustees were assisted throughout the contract review process by their independent legal counsel. The Independent Trustees relied upon the advice of such counsel and their own business judgment in determining the material factors to be considered in evaluating the Advisory Agreement and the weight to be given to each such factor. The Board, including the Independent Trustees, did not identify any single factor as controlling, and each Trustee may have attributed different weight to various factors.
Results of the Contract Review Process
Based on its consideration of the foregoing, and such other information as it deemed relevant, including the factors and conclusions described below, the Board, including the Independent Trustees, concluded that the approval of the Advisory Agreement of the Fund, including the proposed fee payable under the Advisory Agreement, is in the best interests of the Fund’s shareholders. Accordingly, the Board, including a majority of the Independent Trustees, voted to approve the Advisory Agreement of the Fund.
Nature, Extent and Quality of Services
In considering the nature, extent and quality of the services to be provided by the Adviser under the Advisory Agreement, the Board reviewed information provided by the Adviser relating to its operations and personnel, including, among other information, biographical information on the Adviser’s investment personnel. The Board also took into account information concerning the Adviser’s organizational and management structure provided periodically throughout the previous year by the Adviser as well as the Board’s familiarity with management through Board meetings, discussions and other reports. The Board considered the Adviser’s management style and its performance in employing its investment strategies as well as its current level of staffing and overall resources. The Board also noted that it reviewed on a quarterly basis information regarding the Adviser’s compliance with applicable policies and procedures, including those related to personal investing. The Board took into account, among other items, periodic reports received from the Adviser over the past year concerning the Adviser’s ongoing review and enhancement of certain processes, policies and procedures of the Calvert Funds and the Adviser. The Board concluded that it was satisfied with the nature, extent and quality of services to be provided to the Fund by the Adviser under the Advisory Agreement.
Fund Performance
In considering investment performance, the Board noted the Fund’s proposed investment objective and investment strategies as well as the investment process to be used by the Adviser in managing the Fund. The Board also took into consideration certain information, including performance information, concerning another fund managed by the proposed portfolio managers for the Fund that used an investment approach similar to the one to be used in managing the Fund. Based upon its review, the Board concluded that the Adviser is qualified to manage the Fund’s assets in accordance with the Fund’s proposed investment objective and strategies and that the Adviser’s proposed investment strategies are appropriate for pursing the Fund’s proposed investment objective.
Management Fees and Expenses
In considering the Fund’s proposed fees and expenses, the Board considered certain comparative fee and expense data provided by the Adviser. The data indicated that the Fund’s proposed advisory and administrative fees (after taking into account waivers and reimbursements) (referred to collectively, as “management fees”) were slightly higher than the average and median annual management fees of its expected Morningstar category, and its estimated total expenses (net of waivers and reimbursements) for Class I shares were below the average and median total expenses of its expected Morningstar category. The Board also took into account that the Adviser had contractually agreed to limit the Fund’s annual operating expenses through January 31, 2024. Based upon its review, the Board concluded that the proposed management fees were reasonable in view of the nature, extent and quality of services to be provided by the Adviser.
Calvert
Focused Value Fund
September 30, 2022
Board of Trustees' Contract Approval — continued
Profitability and Other “Fall-Out” Benefits
The Board reviewed the Adviser’s estimated profitability in regard to the Fund over time at various asset levels. In reviewing the estimated profitability of the Fund to the Adviser, the Board also considered the fact that the Adviser and its affiliates would provide sub-transfer agency support, administrative and distribution services to the Fund for which they would receive compensation. The Board also considered that CRM would likely derive benefits to its reputation and other indirect benefits from its relationship with the Fund. Based, upon their review, the Board concluded that CRM’s estimated profitability from its relationship with the Fund was reasonable.
Economies of Scale
The Board considered the Fund’s potential growth on its performance and expenses. The Board concluded that adding breakpoints to the proposed advisory fee at specified asset levels would not be appropriate at this time. The Board noted that if the Fund’s assets increased over time, the Fund might realize other economies of scale if assets increased proportionally more than certain other expenses.
Calvert
Focused Value Fund
September 30, 2022
Liquidity Risk Management Program
The Fund has implemented a written liquidity risk management program (Program) and related procedures to manage its liquidity in accordance with Rule 22e-4 under the Investment Company Act of 1940, as amended (Liquidity Rule). The Liquidity Rule defines “liquidity risk” as the risk that a fund could not meet requests to redeem shares issued by the fund without significant dilution of the remaining investors’ interests in the fund. The Fund’s Board of Trustees/Directors has designated the investment adviser to serve as the administrator of the Program and the related procedures. The administrator has established a Liquidity Risk Management Oversight Committee (Committee) to perform the functions necessary to administer the Program. As part of the Program, the administrator is responsible for identifying illiquid investments and categorizing the relative liquidity of the Fund’s investments in accordance with the Liquidity Rule. Under the Program, the administrator assesses, manages, and periodically reviews the Fund’s liquidity risk, and is responsible for making certain reports to the Fund’s Board of Trustees/Directors and the Securities and Exchange Commission (SEC) regarding the liquidity of the Fund’s investments, and to notify the Board of Trustees/Directors and the SEC of certain liquidity events specified in the Liquidity Rule. The liquidity of the Fund’s portfolio investments is determined based on a number of factors including, but not limited to, relevant market, trading and investment-specific considerations under the Program.
There can be no assurance that the Program will achieve its objectives in the future. Please refer to the Fund’s prospectus for more information regarding the Fund’s exposure to liquidity risk and other principal risks to which an investment in the Fund may be subject.
Calvert
Focused Value Fund
September 30, 2022
Management and Organization
Fund Management. The Trustees of Calvert Social Investment Fund (the Trust) are responsible for the overall management and supervision of the affairs of the Trust. The Board members and officers of the Trust are listed below. Except as indicated, each individual has held the office shown or other offices in the same company for the last five years. Board members hold indefinite terms of office. Each Board member holds office until his or her successor is elected and qualified, or until his or her earlier death, resignation, retirement, removal or disqualification. Under the terms of the Fund's current Board member retirement policy, an Independent Board member must retire at the end of the calendar year in which he or she turns 75. However, if such retirement would cause the Fund to be out of compliance with Section 16 of the 1940 Act or any other regulations or guidance of the SEC, then such retirement will not become effective until such time as action has been taken for the Fund to be in compliance therewith. The “noninterested Trustees” consist of those Trustees who are not “interested persons” of the Trust, as that term is defined under the 1940 Act. The business address of each Board member and the Chief Compliance Officer is 1825 Connecticut Avenue NW, Suite 400, Washington, DC 20009 and the business address of the Secretary, Vice President and Chief Legal Officer and the Treasurer is Two International Place, Boston, Massachusetts 02110. As used below, “CRM” refers to Calvert Research and Management and “Eaton Vance” refers to Eaton Vance Management. Each Trustee oversees 42 funds in the Calvert fund complex. Effective March 1, 2021, each of Eaton Vance and CRM are indirect wholly-owned subsidiaries of Morgan Stanley. Each officer affiliated with CRM may hold a position with other CRM affiliates that is comparable to his or her position with CRM listed below.
| Name and Year of Birth | Trust
Position(s) | Length of
Service | Principal Occupation(s) and Other Directorships
During Past Five Years and Other Relevant Experience |
| Interested Trustee |
John H. Streur(1)
1960 | Trustee and
President | Since 2015 | President and Chief Executive Officer of CRM (since December 31, 2016). President and Chief Executive Officer of Calvert Investments, Inc.
(January 2015 - December 2016); Chief Executive Officer of Calvert
Investment Distributors, Inc. (August 2015 - December 2016); Chief
Compliance Officer of Calvert Investment Management, Inc. (August 2015 -
April 2016); President and Director, Portfolio 21 Investments, Inc.
(through October 2014); President, Chief Executive Officer and
Director, Managers Investment Group LLC (through January 2012);
President and Director, The Managers Funds and Managers AMG
Funds (through January 2012).
Other Directorships. Portfolio 21 Investments, Inc. (asset management)
(through October 2014); Managers Investment Group LLC (asset management)
(through January 2012); The Managers Funds (asset management)
(through January 2012); Managers AMG Funds (asset management)
(through January 2012); Calvert Impact Capital, Inc. |
| Noninterested Trustees |
Richard L. Baird, Jr.
1948 | Trustee | Since 1982 | Regional Disaster Recovery Lead, American Red Cross of Greater
Pennsylvania (since 2017). Volunteer, American Red Cross (since 2015).
Former President and CEO of Adagio Health Inc. (retired in 2014) in
Pittsburgh, PA.
Other Directorships. None. |
Alice Gresham Bullock
1950 | Chair and
Trustee | Since 2016 | Professor Emerita at Howard University School of Law. Dean Emerita of
Howard University School of Law and Deputy Director of the Association
of American Law Schools (1992-1994).
Other Directorships. None. |
Cari M. Dominguez
1949 | Trustee | Since 2016 | Former Chair of the U.S. Equal Employment Opportunity Commission.
Other Directorships. ManpowerGroup Inc. (workforce solutions company);
Triple S Management Corporation (managed care); National Association of Corporate Directors. |
John G. Guffey, Jr.
1948 | Trustee | Since 1982 | President of Aurora Press Inc., a privately held publisher of trade
paperbacks (since January 1997).
Other Directorships. Calvert Impact Capital, Inc. (through December 31, 2018); Calvert Ventures, LLC. |
Miles D. Harper, III
1962 | Trustee | Since 2005 | Partner, Carr Riggs & Ingram (public accounting firm) since October 2014.
Partner, Gainer Donnelly & Desroches (public accounting firm) (now Carr
Riggs & Ingram) (November 1999 - September 2014).
Other Directorships. Bridgeway Funds (9) (asset management). |
Joy V. Jones
1950 | Trustee | Since 1990 | Attorney.
Other Directorships. Palm Management Corporation. |
Calvert
Focused Value Fund
September 30, 2022
Management and Organization — continued
| Name and Year of Birth | Trust
Position(s) | Length of
Service | Principal Occupation(s) and Other Directorships
During Past Five Years and Other Relevant Experience |
| Noninterested Trustees (continued) |
Anthony A. Williams
1951 | Trustee | Since 2016 | CEO and Executive Director of the Federal City Council (July 2012 to
present); Senior Adviser and Independent Consultant for King and
Spalding LLP (September 2015 to present); Executive Director of Global
Government Practice at the Corporate Executive Board (January 2010 to
January 2012).
Other Directorships. Freddie Mac; Evoq Properties/Meruelo Maddux
Properties, Inc. (real estate management); Weston Solutions, Inc.
(environmental services); Bipartisan Policy Center’s Debt Reduction Task Force;
Chesapeake Bay Foundation; Catholic University of America; Urban Institute (research organization); The Howard Hughes Corporation (real estate development); Old Dominion National Bank. |
| Name and Year of Birth | Trust
Position(s) | Length of
Service | Principal Occupation(s)
During Past Five Years |
| Principal Officers who are not Trustees |
Hope L. Brown
1973 | Chief
Compliance
Officer | Since 2014 | Chief Compliance Officer of 42 registered investment companies advised
by CRM (since 2014). Vice President and Chief Compliance Officer,
Wilmington Funds (2012-2014). |
Deidre E. Walsh
1971 | Secretary,
Vice President
and Chief
Legal Officer | Since 2021 | Vice President of CRM and officer of 42 registered investment companies
advised by CRM (since 2021). Also Vice President of Eaton Vance and
certain of its affiliates and officer of 136 registered investment companies
advised or administered by Eaton Vance. |
James F. Kirchner
1967 | Treasurer | Since 2016 | Vice President of CRM and officer of 42 registered investment companies
advised by CRM (since 2016). Also Vice President of Eaton Vance and
certain of its affiliates and officer of 136 registered investment companies
advised or administered by Eaton Vance. |
| | | | |
| (1) Mr. Streur is an interested person of the Fund because of his positions with the Fund’s adviser and certain affiliates. |
The SAI for the Fund includes additional information about the Trustees and officers of the Fund and can be obtained without charge on Calvert’s website at www.calvert.com or by calling 1-800-368-2745.
| FACTS | WHAT DOES EATON VANCE DO WITH YOUR
PERSONAL INFORMATION? |
| Why? | Financial companies choose how they share your personal information. Federal law gives consumers the right to limit some but not all sharing. Federal law also requires us to tell you how we collect, share, and protect your personal information. Please read this notice carefully to understand what we do. |
| |
| What? | The types of personal information we collect and share depend on the product or service you have with us. This information can include:■ Social Security number and income
■
investment experience and risk tolerance
■
checking account number and wire transfer instructions |
| |
| How? | All financial companies need to share customers’ personal information to run their everyday business. In the section below, we list the reasons financial companies can share their customers’ personal information; the reasons Eaton Vance chooses to share; and whether you can limit this sharing. |
Reasons we can share your
personal information | Does Eaton Vance
share? | Can you limit
this sharing? |
| For our everyday business purposes — such as to process your transactions, maintain your account(s), respond to court orders and legal investigations, or report to credit bureaus | Yes | No |
| For our marketing purposes — to offer our products and services to you | Yes | No |
| For joint marketing with other financial companies | No | We don’t share |
| For our investment management affiliates’ everyday business purposes — information about your transactions, experiences, and creditworthiness | Yes | Yes |
| For our affiliates’ everyday business purposes — information about your transactions and experiences | Yes | No |
| For our affiliates’ everyday business purposes — information about your creditworthiness | No | We don’t share |
| For our investment management affiliates to market to you | Yes | Yes |
| For our affiliates to market to you | No | We don’t share |
| For nonaffiliates to market to you | No | We don’t share |
To limit our
sharing | Call toll-free 1-800-368-2745 or email: CRMPrivacy@calvert.comPlease note:If you are a new customer, we can begin sharing your information 30 days from the date we sent this notice. When you are no longer our customer, we continue to share your information as described in this notice. However, you can contact us at any time to limit our sharing. |
| Questions? | Call toll-free 1-800-368-2745 or email: CRMPrivacy@calvert.com |
| Privacy Notice — continued | April 2021 |
| Who we are |
| Who is providing this notice? | Eaton Vance Management, Eaton Vance Distributors, Inc., Eaton Vance Trust Company, Eaton Vance Management (International) Limited, Eaton Vance Advisers International Ltd., Eaton Vance Global Advisors Limited, Eaton Vance Management’s Real Estate Investment Group, Boston Management and Research, Calvert Research and Management, Eaton Vance and Calvert Fund Families and our investment advisory affiliates (“Eaton Vance”) (see Investment Management Affiliates definition below) |
| What we do |
How does Eaton Vance
protect my personal
information? | To protect your personal information from unauthorized access and use, we use security measures that comply with federal law. These measures include computer safeguards and secured files and buildings. We have policies governing the proper handling of customer information by personnel and requiring third parties that provide support to adhere to appropriate security standards with respect to such information. |
How does Eaton Vance
collect my personal
information? | We collect your personal information, for example, when you■ open an account or make deposits or withdrawals from your account
■
buy securities from us or make a wire transfer
■
give us your contact informationWe also collect your personal information from others, such as credit bureaus, affiliates, or other companies. |
| Why can’t I limit all sharing? | Federal law gives you the right to limit only■ sharing for affiliates’ everyday business purposes — information about your creditworthiness
■
affiliates from using your information to market to you
■
sharing for nonaffiliates to market to youState laws and individual companies may give you additional rights to limit sharing. See below for more on your rights under state law. |
| Definitions |
Investment Management
Affiliates | Eaton Vance Investment Management Affiliates include registered investment advisers, registered broker- dealers, and registered and unregistered funds. Investment Management Affiliates does not include entities associated with Morgan Stanley Wealth Management, such as Morgan Stanley Smith Barney LLC and Morgan Stanley & Co. |
| Affiliates | Companies related by common ownership or control. They can be financial and nonfinancial companies.■ Our affiliates include companies with a Morgan Stanley name and financial companies such as Morgan Stanley Smith Barney LLC and Morgan Stanley & Co. |
| Nonaffiliates | Companies not related by common ownership or control. They can be financial and nonfinancial companies.■ Eaton Vance does not share with nonaffiliates so they can market to you. |
| Joint marketing | A formal agreement between nonaffiliated financial companies that together market financial products or services to you.■ Eaton Vance doesn’t jointly market. |
| Other important information |
| Vermont: Except as permitted by law, we will not share personal information we collect about Vermont residents with Nonaffiliates unless you provide us with your written consent to share such information.California: Except as permitted by law, we will not share personal information we collect about California residents with Nonaffiliates and we will limit sharing such personal information with our Affiliates to comply with California privacy laws that apply to us. |
Delivery of Shareholder Documents. The Securities and Exchange Commission (SEC) permits funds to deliver only one copy of shareholder documents, including prospectuses, proxy statements and shareholder reports, to fund investors with multiple accounts at the same residential or post office box address. This practice is often called “householding” and it helps eliminate duplicate mailings to shareholders. Calvert funds, or your financial intermediary, may household the mailing of your documents indefinitely unless you instruct Calvert funds, or your financial intermediary, otherwise. If you would prefer that your Calvert fund documents not be householded, please contact Calvert funds at 1-800-368-2745, or contact your financial intermediary. Your instructions that householding not apply to delivery of your Calvert fund documents will typically be effective within 30 days of receipt by Calvert funds or your financial intermediary.
Portfolio Holdings. Each Calvert fund files a schedule of portfolio holdings on Part F to Form N-PORT with the SEC. Certain information filed on Form N-PORT may be viewed on the Calvert website at www.calvert.com, by calling Calvert at 1-800-368-2745 or in the EDGAR database on the SEC’s website at www.sec.gov.
Proxy Voting. The Proxy Voting Guidelines that each Calvert fund uses to determine how to vote proxies relating to portfolio securities is provided as an Appendix to the fund’s Statement of Additional Information. The Statement of Additional Information can be obtained free of charge by calling the Calvert funds at 1-800-368-2745, by visiting the Calvert funds’ website at www.calvert.com or visiting the SEC’s website at www.sec.gov. Information regarding how a Calvert fund voted proxies relating to portfolio securities during the most recent 12-month period ended June 30 is available by calling Calvert funds, by visiting the Calvert funds’ website at www.calvert.com or by visiting the SEC’s website at www.sec.gov.
This Page Intentionally Left Blank
Investment Adviser and Administrator
Calvert Research and Management
1825 Connecticut Avenue NW, Suite 400
Washington, DC 20009
Principal Underwriter*
Eaton Vance Distributors, Inc.
Two International Place
Boston, MA 02110
(617) 482-8260
Custodian
State Street Bank and Trust Company
State Street Financial Center, One Lincoln Street
Boston, MA 02111
Transfer Agent
DST Asset Manager Solutions, Inc.
2000 Crown Colony Drive
Quincy, MA 02169
Independent Registered Public Accounting Firm
Deloitte & Touche LLP
200 Berkeley Street
Boston, MA 02116-5022
Fund Offices
1825 Connecticut Avenue NW, Suite 400
Washington, DC 20009
* FINRA BrokerCheck. Investors may check the background of their Investment Professional by contacting the Financial Industry Regulatory Authority (FINRA). FINRA BrokerCheck is a free tool to help investors check the professional background of current and former FINRA-registered securities firms and brokers. FINRA BrokerCheck is available by calling 1-800-289-9999 and at www.FINRA.org. The FINRA BrokerCheck brochure describing this program is available to investors at www.FINRA.org.
Printed on recycled paper.
41356 9.30.22
The registrant has adopted a code of ethics applicable to its Principal Executive Officer, Principal Financial Officer and Principal Accounting Officer. The registrant undertakes to provide a copy of such code of ethics to any person upon request, without charge, by calling 1-800-368-2745. The registrant has not amended the code of ethics as described in Form N-CSR during the period covered by this report. The registrant has not granted any waiver, including an implicit waiver, from a provision of the code of ethics as described in Form N-CSR during the period covered by this report.
| Item 3. | Audit Committee Financial Expert |
The registrant’s Board of Trustees has determined that Miles D. Harper III, an “independent” Trustee serving on the registrant’s audit committee, is an “audit committee financial expert,” as defined in Item 3 of Form N-CSR. Under applicable securities laws, a person who is determined to be an audit committee financial expert will not be deemed an “expert” for any purpose, including without limitation for the purposes of Section 11 of the Securities Act of 1933, as a result of being designated or identified as an audit committee financial expert. The
designation or identification of a person as an audit committee financial expert does not impose on such person any duties, obligations, or liabilities that are greater than the duties, obligations, and liabilities imposed on such person as a member of the audit committee and Board of Trustees in the absence of such designation or identification.
| Item 4. | Principal Accountant Fees and Services |
(a) –(d)
The following table presents the aggregate fees billed to the registrant for the registrant’s fiscal years ended September 30, 2021 and September 30, 2022 by its principal accountant for professional services rendered for the audit of the registrant’s annual financial statements and fees billed for other services rendered by its principal accountant during such periods.
| | | | | | | | | | | | | | | | |
Fiscal Years Ended | | 9/30/21 | | | %* | | | 9/30/22 | | | %* | |
Audit Fees | | $ | 189,500 | | | | 7.7 | % | | $ | 211,500 | | | | 0 | % |
Audit-Related Fees(1) | | $ | 0 | | | | 0 | % | | $ | 0 | | | | 0 | % |
Tax Fees(2) | | $ | 29,510 | | | | 0 | % | | $ | 0 | | | | 0 | % |
All Other Fees(3) | | $ | 0 | | | | 0 | % | | $ | 0 | | | | 0 | % |
| | | | | | | | | | | | | | | | |
Total | | $ | 219,010 | | | | 6.8 | % | | $ | 211,500 | | | | 0 | % |
| | | | | | | | | | | | | | | | |
| * | Percentage of fees approved by the Audit Committee pursuant to (c)(7)(i)(C) of Rule 2-01 of Reg. S-X (statutory de minimis waiver of committee’s requirement to pre-approve). |
| (1) | Audit-related fees consist of the aggregate fees billed for assurance and related services that are reasonably related to the performance of the audit of the registrant’s financial statements and are not reported under the category of audit fees. |
| (2) | Tax fees consist of the aggregate fees billed for professional services rendered by the principal accountant relating to tax compliance, tax advice, and tax planning and specifically include fees for tax return preparation and other related tax compliance/planning matters. |
| (3) | All other fees consist of the aggregate fees billed for products and services provided by the principal accountant other than audit, audit-related, and tax services. |
(e) The Audit Committee is required to pre-approve all audit and non-audit services provided to the registrant by the auditors, and to the registrant’s investment adviser, and any entity controlling, controlled by, or under common control with the adviser that provides ongoing services to the registrant. In determining whether to pre-approve non-audit services, the Audit Committee considers whether the services are consistent with maintaining the independence of the auditors. The Committee may delegate its authority to pre-approve certain matters to one or more of its members. In this regard, the Committee has delegated authority jointly to the Audit Committee Chair together with another Committee member with respect to non-audit services not exceeding $25,000 in each instance. In addition, the Committee has pre-approved the retention of the auditors to provide tax-related services related to the tax treatment and tax accounting of newly acquired securities, upon request by the investment adviser in each instance.
(f) Not applicable.
(g) Aggregate non-audit fees billed by the registrant’s principal accountant for services rendered to the registrant, and rendered to the registrant’s investment adviser, and any entity controlling, controlled by, or under common control with the adviser that provides ongoing services to the registrant for each of the last two fiscal years of the registrant:
| | | | | | | | | | | | | | |
| Fiscal Year ended 9/30/21 | | | Fiscal Year ended 9/30/22 | |
| $ | | | %* | | | $ | | | %* | |
| $ | 29,510 | | | | 0 | % | | $ | 0 | | | | 0 | % |
| * | Percentage of fees approved by the Audit Committee pursuant to (c)(7)(i)(C) of Rule 2-01 of Reg. S-X (statutory de minimis waiver of committee’s requirement to pre-approve). |
(h) The registrant’s audit committee has considered whether the provision by the registrant’s principal accountant of non-audit services to the registrant’s investment adviser and any entity controlling, controlled by, or under common control with the adviser that provides ongoing services to the registrant that were not pre-approved pursuant to Rule 2-01(c)(7)(ii) of Regulation S-X is compatible with maintaining the principal accountant’s independence.
| Item 5. | Audit Committee of Listed Registrants |
Not applicable.
| Item 6. | Schedule of Investments |
Please see schedule of investments contained in the Report to Stockholders included under Item 1 of this Form N-CSR.
| Item 7. | Disclosure of Proxy Voting Policies and Procedures for Closed-End Management Investment Companies |
Not applicable.
| Item 8. | Portfolio Managers of Closed-End Management Investment Companies |
Not applicable.
| Item 9. | Purchases of Equity Securities by Closed-End Management Investment Company and Affiliated Purchasers |
Not applicable.
| Item 10. | Submission of Matters to a Vote of Security Holders |
No material changes.
| Item 11. | Controls and Procedures |
(a) The registrant’s principal executive and principal financial officers have concluded that the registrant’s disclosure controls and procedures (as defined in Rule 30a-3(c) under the Investment Company Act of 1940 Act, as amended (the “1940 Act”) are effective, based on the evaluation of these controls and procedures required by Rule 30a-3(b) under the 1940 Act and Rules 13a-15(b) or 15d-15(b) under the Securities Exchange Act of 1934 (“Exchange Act”), as of a date within 90 days of the filing date of this report.
(b) There was no change in the registrant’s internal control over financial reporting (as defined in Rule 30a-3(d) under the 1940 Act) that occurred during the period covered by this report that has materially affected, or is reasonably likely to materially affect, the registrant’s internal control over financial reporting.
| Item 12. | Disclosure of Securities Lending Activities for Closed-End Management Investment Companies |
Not applicable.
Signatures
Pursuant to the requirements of the Securities Exchange Act of 1934 and the Investment Company Act of 1940, the registrant has duly caused this report to be signed on its behalf by the undersigned, thereunto duly authorized.
| | |
| CALVERT SOCIAL INVESTMENT FUND |
| |
| By: | | /s/ John H. Streur |
| | John H. Streur |
| | President |
| |
| Date: | | November 22, 2022 |
Pursuant to the requirements of the Securities Exchange Act of 1934 and the Investment Company Act of 1940, this report has been signed below by the following persons on behalf of the registrant and in the capacities and on the dates indicated.
| | |
| By: | | /s/ James F. Kirchner |
| | James F. Kirchner |
| | Treasurer |
| |
| Date: | | November 22, 2022 |
| |
| By: | | /s/ John H. Streur |
| | John H. Streur |
| | President |
| |
| Date: | | November 22, 2022 |