0000356682eatonvance:EATONVANCEIndexRussell1000Index19255BroadBasedIndexMember2016-08-310000356682eatonvance:EATONVANCEIndexBloombergUSUniversalIndex19070BroadBasedIndexMember2020-05-310000356682eatonvance:EATONVANCEIndexBloombergUSAggregateBondIndex19382AdditionalIndexMember2019-04-300000356682eatonvance:EATONVANCEIndexCalvertConservativeAllocationBlendedBM19262AdditionalIndexMember2018-02-280000356682eatonvance:EATONVANCEIndexRussell3000nf19048BroadBasedIndexMember2017-08-310000356682eatonvance:EATONVANCEIndexCalvertGrowthAllocationBlendedBM19377AdditionalIndexMember2017-06-30
UNITED STATES
SECURITIES AND EXCHANGE COMMISSION
Washington, D.C. 20549
Form N-CSR
CERTIFIED SHAREHOLDER REPORT OF REGISTERED
MANAGEMENT INVESTMENT COMPANIES
Investment Company Act File Number: 811-03334
Calvert Social Investment Fund
(Exact Name of Registrant as Specified in Charter)
2050 M Street NW, Suite 200, Washington, DC 20036
(Address of Principal Executive Offices)
Deidre E. Walsh
One Post Office Square, Boston, Massachusetts 02109
(Name and Address of Agent for Services)
(202) 238-2200
(Registrant’s Telephone Number)
September 30
Date of Fiscal Year End
September 30, 2024
Date of Reporting Period
Item 1. Reports to Stockholders
(a)
Annual Shareholder Report September 30, 2024
This annual shareholder report contains important information about the Calvert Balanced Fund for the period of October 1, 2023 to September 30, 2024. You can find additional information about the Fund at www.eatonvance.com/calvert-fund-documents.php. You can also request this information by contacting us at 1-800-368-2745.
What were the Fund costs for the last year?
(based on a hypothetical $10,000 investment)
| Class Name | Costs of a $10,000 investment | Costs paid as a percentage of a $10,000 investment |
|---|
| Class A | $103 | 0.90% |
How did the Fund perform last year and what affected its performance?
Key contributors to (↑) and detractors from (↓) performance, relative to the Russell 1000® Index (the Index) and the Bloomberg U.S. Aggregate Bond Index (the Secondary Index):
↓ Not owning Meta Platforms, Inc. detracted from returns relative to the Index as Meta’s stock price rose on strong advertising revenue and user growth
↓ An overweight exposure to health insurer Humana, Inc. hurt returns in the Fund’s equity portfolio as government reimbursements were lower than expected
↓ In the Fund’s fixed-income portfolio, comparatively short interest rate durations weighed on returns relative to the Secondary Index during the period
↑ The equity portion of the Fund’s portfolio outperformed the Index; and the fixed-income portion of the Fund outperformed the Secondary Index
↑ In the equity portion of the Fund’s portfolio, an overweight position in microchip supplier NVIDIA Corp. helped performance relative to the Index
↑ Selections and an overweight position in the information technology sector contributed most to relative returns in the equity portion of the Fund’s portfolio
↑ In the Fund’s fixed-income portion, security selections ― especially in investment-grade corporate bonds ― helped returns relative to the Secondary Index
↑ The use of U.S. Treasury futures contracts to manage interest rate movements contributed to relative returns in the fixed-income portion of the Fund’s portfolio
Comparison of the change in value of a $10,000 investment for the period indicated.
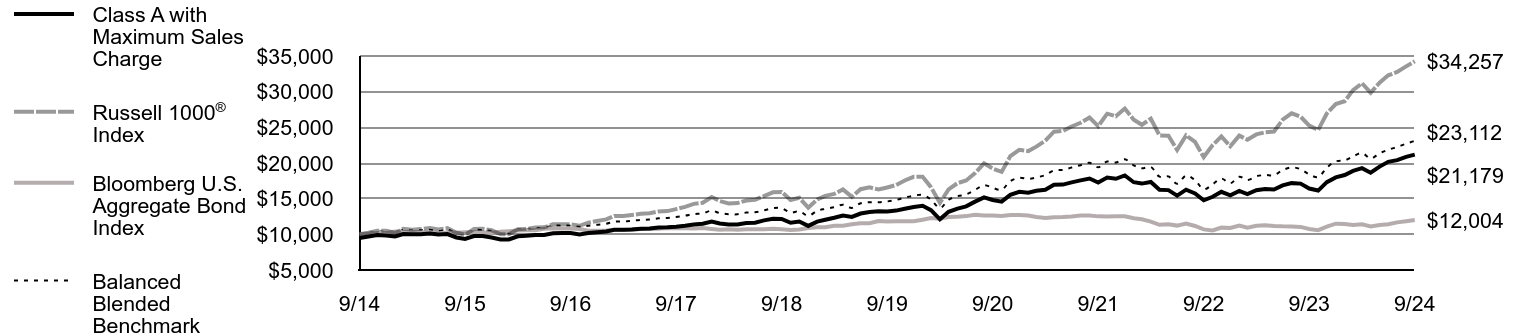
| Class A with Maximum Sales Charge | Russell 1000® Index | Bloomberg U.S. Aggregate Bond Index | Balanced Blended Benchmark |
|---|
| 9/14 | $9,475 | $10,000 | $10,000 | $10,000 |
| 10/14 | $9,704 | $10,244 | $10,098 | $10,186 |
| 11/14 | $9,914 | $10,513 | $10,170 | $10,375 |
| 12/14 | $9,843 | $10,488 | $10,179 | $10,364 |
| 1/15 | $9,706 | $10,200 | $10,393 | $10,280 |
| 2/15 | $10,049 | $10,789 | $10,295 | $10,598 |
| 3/15 | $10,005 | $10,655 | $10,343 | $10,539 |
| 4/15 | $10,022 | $10,731 | $10,306 | $10,568 |
| 5/15 | $10,118 | $10,871 | $10,281 | $10,641 |
| 6/15 | $9,964 | $10,667 | $10,169 | $10,475 |
| 7/15 | $10,040 | $10,873 | $10,240 | $10,625 |
| 8/15 | $9,558 | $10,219 | $10,225 | $10,236 |
| 9/15 | $9,353 | $9,939 | $10,294 | $10,095 |
| 10/15 | $9,754 | $10,743 | $10,296 | $10,586 |
| 11/15 | $9,751 | $10,778 | $10,269 | $10,596 |
| 12/15 | $9,566 | $10,584 | $10,235 | $10,467 |
| 1/16 | $9,269 | $10,015 | $10,376 | $10,187 |
| 2/16 | $9,276 | $10,011 | $10,450 | $10,214 |
| 3/16 | $9,722 | $10,709 | $10,546 | $10,678 |
| 4/16 | $9,791 | $10,767 | $10,586 | $10,729 |
| 5/16 | $9,890 | $10,955 | $10,589 | $10,843 |
| 6/16 | $9,912 | $10,980 | $10,779 | $10,936 |
| 7/16 | $10,146 | $11,398 | $10,847 | $11,214 |
| 8/16 | $10,182 | $11,414 | $10,835 | $11,217 |
| 9/16 | $10,189 | $11,423 | $10,829 | $11,220 |
| 10/16 | $9,987 | $11,200 | $10,746 | $11,055 |
| 11/16 | $10,182 | $11,641 | $10,492 | $11,211 |
| 12/16 | $10,308 | $11,860 | $10,506 | $11,344 |
| 1/17 | $10,412 | $12,099 | $10,527 | $11,490 |
| 2/17 | $10,636 | $12,567 | $10,598 | $11,788 |
| 3/17 | $10,640 | $12,575 | $10,592 | $11,790 |
| 4/17 | $10,670 | $12,708 | $10,674 | $11,901 |
| 5/17 | $10,792 | $12,870 | $10,756 | $12,029 |
| 6/17 | $10,823 | $12,960 | $10,745 | $12,074 |
| 7/17 | $10,962 | $13,217 | $10,792 | $12,238 |
| 8/17 | $10,986 | $13,258 | $10,888 | $12,305 |
| 9/17 | $11,056 | $13,540 | $10,836 | $12,439 |
| 10/17 | $11,202 | $13,851 | $10,843 | $12,613 |
| 11/17 | $11,382 | $14,273 | $10,829 | $12,837 |
| 12/17 | $11,496 | $14,432 | $10,879 | $12,947 |
| 1/18 | $11,783 | $15,225 | $10,753 | $13,314 |
| 2/18 | $11,510 | $14,666 | $10,651 | $12,970 |
| 3/18 | $11,391 | $14,333 | $10,720 | $12,826 |
| 4/18 | $11,388 | $14,381 | $10,640 | $12,814 |
| 5/18 | $11,574 | $14,749 | $10,716 | $13,047 |
| 6/18 | $11,638 | $14,844 | $10,703 | $13,092 |
| 7/18 | $11,956 | $15,356 | $10,705 | $13,364 |
| 8/18 | $12,172 | $15,885 | $10,774 | $13,675 |
| 9/18 | $12,163 | $15,946 | $10,705 | $13,670 |
| 10/18 | $11,620 | $14,817 | $10,620 | $13,047 |
| 11/18 | $11,800 | $15,119 | $10,683 | $13,237 |
| 12/18 | $11,181 | $13,742 | $10,880 | $12,611 |
| 1/19 | $11,776 | $14,893 | $10,995 | $13,299 |
| 2/19 | $12,039 | $15,398 | $10,989 | $13,566 |
| 3/19 | $12,327 | $15,666 | $11,200 | $13,812 |
| 4/19 | $12,644 | $16,298 | $11,203 | $14,148 |
| 5/19 | $12,434 | $15,260 | $11,402 | $13,707 |
| 6/19 | $12,915 | $16,331 | $11,545 | $14,354 |
| 7/19 | $13,138 | $16,585 | $11,570 | $14,500 |
| 8/19 | $13,233 | $16,281 | $11,870 | $14,491 |
| 9/19 | $13,205 | $16,563 | $11,807 | $14,611 |
| 10/19 | $13,328 | $16,914 | $11,842 | $14,814 |
| 11/19 | $13,579 | $17,553 | $11,836 | $15,147 |
| 12/19 | $13,834 | $18,060 | $11,828 | $15,405 |
| 1/20 | $13,996 | $18,080 | $12,056 | $15,534 |
| 2/20 | $13,380 | $16,602 | $12,273 | $14,884 |
| 3/20 | $12,099 | $14,408 | $12,200 | $13,669 |
| 4/20 | $13,153 | $16,312 | $12,417 | $14,850 |
| 5/20 | $13,601 | $17,173 | $12,475 | $15,348 |
| 6/20 | $13,928 | $17,553 | $12,554 | $15,590 |
| 7/20 | $14,588 | $18,581 | $12,741 | $16,231 |
| 8/20 | $15,180 | $19,944 | $12,638 | $16,893 |
| 9/20 | $14,820 | $19,215 | $12,632 | $16,519 |
| 10/20 | $14,584 | $18,752 | $12,575 | $16,251 |
| 11/20 | $15,537 | $20,960 | $12,698 | $17,463 |
| 12/20 | $15,971 | $21,846 | $12,716 | $17,915 |
| 1/21 | $15,821 | $21,666 | $12,625 | $17,775 |
| 2/21 | $16,116 | $22,294 | $12,443 | $17,982 |
| 3/21 | $16,249 | $23,138 | $12,287 | $18,300 |
| 4/21 | $16,948 | $24,384 | $12,384 | $18,949 |
| 5/21 | $16,973 | $24,499 | $12,425 | $19,028 |
| 6/21 | $17,281 | $25,113 | $12,512 | $19,367 |
| 7/21 | $17,561 | $25,635 | $12,652 | $19,695 |
| 8/21 | $17,826 | $26,377 | $12,628 | $20,022 |
| 9/21 | $17,262 | $25,165 | $12,518 | $19,401 |
| 10/21 | $17,959 | $26,911 | $12,515 | $20,207 |
| 11/21 | $17,787 | $26,550 | $12,552 | $20,068 |
| 12/21 | $18,257 | $27,626 | $12,520 | $20,535 |
| 1/22 | $17,305 | $26,068 | $12,250 | $19,664 |
| 2/22 | $17,113 | $25,353 | $12,114 | $19,252 |
| 3/22 | $17,345 | $26,208 | $11,777 | $19,428 |
| 4/22 | $16,261 | $23,872 | $11,330 | $18,094 |
| 5/22 | $16,199 | $23,836 | $11,403 | $18,124 |
| 6/22 | $15,430 | $21,840 | $11,224 | $17,100 |
| 7/22 | $16,259 | $23,874 | $11,498 | $18,222 |
| 8/22 | $15,741 | $22,957 | $11,174 | $17,597 |
| 9/22 | $14,776 | $20,833 | $10,691 | $16,316 |
| 10/22 | $15,260 | $22,504 | $10,552 | $17,016 |
| 11/22 | $15,965 | $23,721 | $10,940 | $17,819 |
| 12/22 | $15,460 | $22,342 | $10,891 | $17,165 |
| 1/23 | $16,085 | $23,840 | $11,226 | $18,067 |
| 2/23 | $15,652 | $23,272 | $10,936 | $17,622 |
| 3/23 | $16,189 | $24,009 | $11,214 | $18,135 |
| 4/23 | $16,350 | $24,306 | $11,282 | $18,314 |
| 5/23 | $16,274 | $24,419 | $11,159 | $18,286 |
| 6/23 | $16,862 | $26,069 | $11,119 | $19,000 |
| 7/23 | $17,177 | $26,965 | $11,111 | $19,387 |
| 8/23 | $17,110 | $26,493 | $11,040 | $19,134 |
| 9/23 | $16,418 | $25,248 | $10,760 | $18,400 |
| 10/23 | $16,135 | $24,638 | $10,590 | $18,017 |
| 11/23 | $17,311 | $26,939 | $11,069 | $19,353 |
| 12/23 | $17,986 | $28,269 | $11,493 | $20,223 |
| 1/24 | $18,311 | $28,663 | $11,462 | $20,370 |
| 2/24 | $18,893 | $30,211 | $11,300 | $20,915 |
| 3/24 | $19,271 | $31,180 | $11,404 | $21,394 |
| 4/24 | $18,641 | $29,853 | $11,116 | $20,632 |
| 5/24 | $19,496 | $31,259 | $11,304 | $21,355 |
| 6/24 | $20,170 | $32,293 | $11,411 | $21,860 |
| 7/24 | $20,396 | $32,763 | $11,678 | $22,255 |
| 8/24 | $20,871 | $33,540 | $11,846 | $22,699 |
| 9/24 | $21,179 | $34,257 | $12,004 | $23,112 |
Average Annual Total Returns (%)
| Fund | 1 Year | 5 Years | 10 Years |
|---|
| Class A | 29.02% | 9.90% | 8.37% |
| Class A with 5.25% Maximum Sales Charge | 22.26% | 8.72% | 7.79% |
Russell 1000® Index | 35.68% | 15.62% | 13.09% |
| Bloomberg U.S. Aggregate Bond Index | 11.57% | 0.33% | 1.84% |
Balanced Blended BenchmarkFootnote Reference1 | 25.61% | 9.59% | 8.73% |
| Footnote | Description |
Footnote1 | Benchmark is an internally constructed benchmark comprised of a blend of 60% Russell 1000® Index and 40% Bloomberg U.S. Aggregate Bond Index, and is rebalanced monthly. |
Performance does not reflect the deduction of taxes that a shareholder would pay on Fund distributions or redemption of Fund shares. Performance assumes that all dividends and distributions, if any, were reinvested. For more recent performance information, visit www.eatonvance.com/performance.php. Performance prior to December 31, 2016 is that of the Fund's former investment adviser.
THE FUND'S PAST PERFORMANCE IS NO GUARANTEE OF FUTURE RESULTS.
| Total Net Assets | $1,347,515,064 |
| # of Portfolio Holdings | 540 |
| Portfolio Turnover Rate | 153% |
| Total Advisory Fees Paid | $4,653,442 |
What did the Fund invest in?
The following tables reflect what the Fund invested in as of the report date.
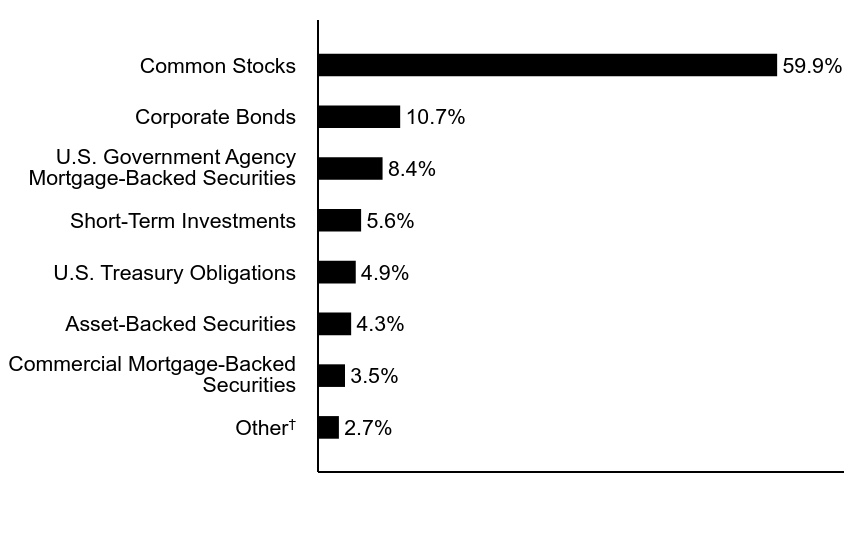
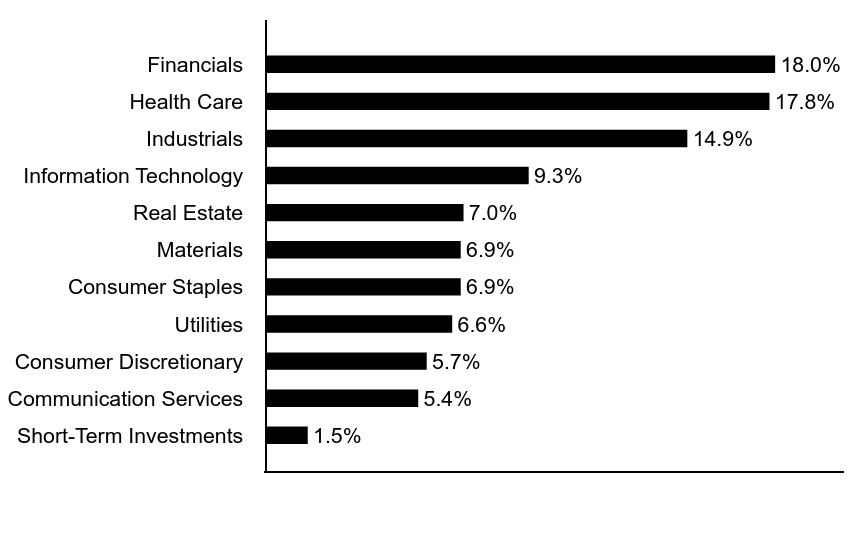
Asset Allocation (% of total investments)
| Value | Value |
|---|
OtherFootnote Reference† | 2.7% |
| Commercial Mortgage-Backed Securities | 3.5% |
| Asset-Backed Securities | 4.3% |
| U.S. Treasury Obligations | 4.9% |
| Short-Term Investments | 5.6% |
| U.S. Government Agency Mortgage-Backed Securities | 8.4% |
| Corporate Bonds | 10.7% |
| Common Stocks | 59.9% |
| Footnote | Description |
Footnote† | Investment types less than 1% each |
Top Ten Holdings (% of total investments)Footnote Referencea
| Microsoft Corp. | 4.9% |
| Apple, Inc. | 4.2% |
| Uniform Mortgage-Backed Security, 5.50%, 30-Year, TBA | 4.0% |
| NVIDIA Corp. | 3.8% |
| Alphabet, Inc., Class C | 2.8% |
| Amazon.com, Inc. | 2.7% |
| Uniform Mortgage-Backed Security, 5.00%, 30-Year, TBA | 2.6% |
| Broadcom, Inc. | 1.7% |
| Eli Lilly & Co. | 1.4% |
| AbbVie, Inc. | 1.4% |
| Total | 29.5% |
| Footnote | Description |
Footnotea | Excluding cash equivalents |
If you wish to view additional information about the Fund, including the prospectus, statement of additional information, financial statements and holdings, please scan the QR code or visit www.eatonvance.com/calvert-fund-documents.php. For proxy information, please visit www.calvert.com/active-engagement.php?DM=how-we-influence.
The Funds may deliver a single copy of certain required shareholder documents (including prospectuses, shareholder reports, and proxy materials) to investors with the same last name and the same address. Your participation will continue indefinitely unless you instruct otherwise by calling 1-800-368-2745 or by contacting your financial intermediary. Your instruction will typically be effective within 30 days of receipt.
Not FDIC Insured | May Lose Value | No Bank Guarantee
Annual Shareholder Report September 30, 2024
Annual Shareholder Report September 30, 2024
This annual shareholder report contains important information about the Calvert Balanced Fund for the period of October 1, 2023 to September 30, 2024. You can find additional information about the Fund at www.eatonvance.com/calvert-fund-documents.php. You can also request this information by contacting us at 1-800-368-2745.
What were the Fund costs for the last year?
(based on a hypothetical $10,000 investment)
| Class Name | Costs of a $10,000 investment | Costs paid as a percentage of a $10,000 investment |
|---|
| Class C | $189 | 1.66% |
How did the Fund perform last year and what affected its performance?
Key contributors to (↑) and detractors from (↓) performance, relative to the Russell 1000® Index (the Index) and the Bloomberg U.S. Aggregate Bond Index (the Secondary Index):
↓ Not owning Meta Platforms, Inc. detracted from returns relative to the Index as Meta’s stock price rose on strong advertising revenue and user growth
↓ An overweight exposure to health insurer Humana, Inc. hurt returns in the Fund’s equity portfolio as government reimbursements were lower than expected
↓ In the Fund’s fixed-income portfolio, comparatively short interest rate durations weighed on returns relative to the Secondary Index during the period
↑ The equity portion of the Fund’s portfolio outperformed the Index; and the fixed-income portion of the Fund outperformed the Secondary Index
↑ In the equity portion of the Fund’s portfolio, an overweight position in microchip supplier NVIDIA Corp. helped performance relative to the Index
↑ Selections and an overweight position in the information technology sector contributed most to relative returns in the equity portion of the Fund’s portfolio
↑ In the Fund’s fixed-income portion, security selections ― especially in investment-grade corporate bonds ― helped returns relative to the Secondary Index
↑ The use of U.S. Treasury futures contracts to manage interest rate movements contributed to relative returns in the fixed-income portion of the Fund’s portfolio
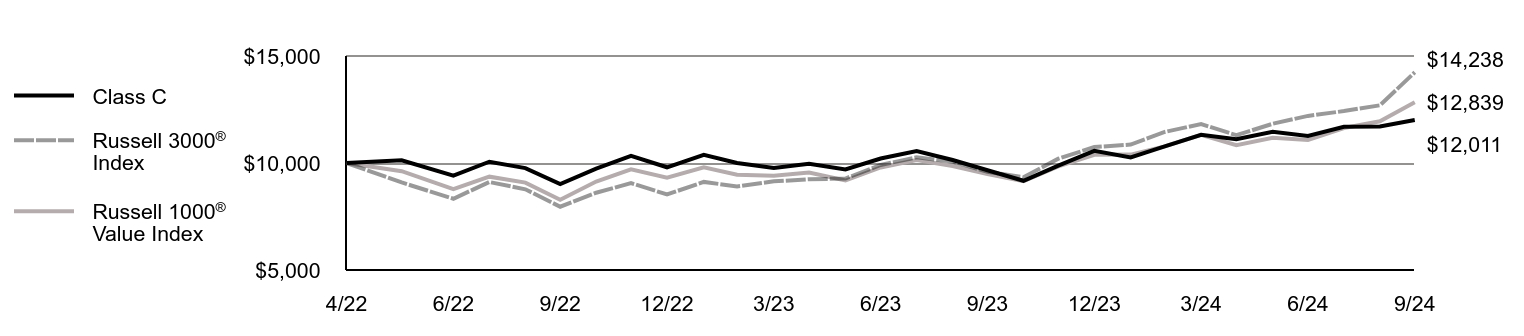
Comparison of the change in value of a $10,000 investment for the period indicated.
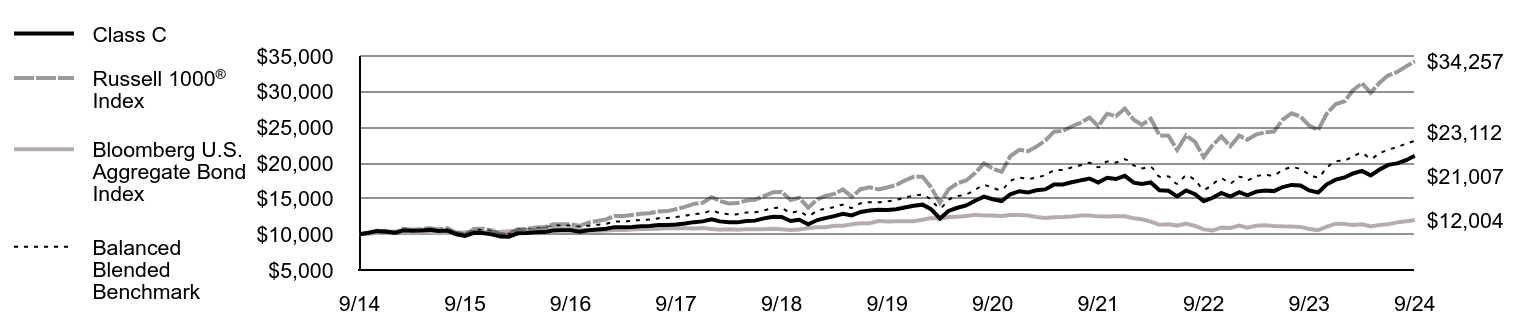
| Class C | Russell 1000® Index | Bloomberg U.S. Aggregate Bond Index | Balanced Blended Benchmark |
|---|
| 9/14 | $10,000 | $10,000 | $10,000 | $10,000 |
| 10/14 | $10,232 | $10,244 | $10,098 | $10,186 |
| 11/14 | $10,449 | $10,513 | $10,170 | $10,375 |
| 12/14 | $10,367 | $10,488 | $10,179 | $10,364 |
| 1/15 | $10,217 | $10,200 | $10,393 | $10,280 |
| 2/15 | $10,571 | $10,789 | $10,295 | $10,598 |
| 3/15 | $10,517 | $10,655 | $10,343 | $10,539 |
| 4/15 | $10,527 | $10,731 | $10,306 | $10,568 |
| 5/15 | $10,624 | $10,871 | $10,281 | $10,641 |
| 6/15 | $10,455 | $10,667 | $10,169 | $10,475 |
| 7/15 | $10,524 | $10,873 | $10,240 | $10,625 |
| 8/15 | $10,012 | $10,219 | $10,225 | $10,236 |
| 9/15 | $9,791 | $9,939 | $10,294 | $10,095 |
| 10/15 | $10,207 | $10,743 | $10,296 | $10,586 |
| 11/15 | $10,194 | $10,778 | $10,269 | $10,596 |
| 12/15 | $9,993 | $10,584 | $10,235 | $10,467 |
| 1/16 | $9,680 | $10,015 | $10,376 | $10,187 |
| 2/16 | $9,677 | $10,011 | $10,450 | $10,214 |
| 3/16 | $10,137 | $10,709 | $10,546 | $10,678 |
| 4/16 | $10,201 | $10,767 | $10,586 | $10,729 |
| 5/16 | $10,299 | $10,955 | $10,589 | $10,843 |
| 6/16 | $10,313 | $10,980 | $10,779 | $10,936 |
| 7/16 | $10,550 | $11,398 | $10,847 | $11,214 |
| 8/16 | $10,581 | $11,414 | $10,835 | $11,217 |
| 9/16 | $10,579 | $11,423 | $10,829 | $11,220 |
| 10/16 | $10,363 | $11,200 | $10,746 | $11,055 |
| 11/16 | $10,558 | $11,641 | $10,492 | $11,211 |
| 12/16 | $10,678 | $11,860 | $10,506 | $11,344 |
| 1/17 | $10,782 | $12,099 | $10,527 | $11,490 |
| 2/17 | $11,008 | $12,567 | $10,598 | $11,788 |
| 3/17 | $11,002 | $12,575 | $10,592 | $11,790 |
| 4/17 | $11,027 | $12,708 | $10,674 | $11,901 |
| 5/17 | $11,145 | $12,870 | $10,756 | $12,029 |
| 6/17 | $11,172 | $12,960 | $10,745 | $12,074 |
| 7/17 | $11,305 | $13,217 | $10,792 | $12,238 |
| 8/17 | $11,323 | $13,258 | $10,888 | $12,305 |
| 9/17 | $11,389 | $13,540 | $10,836 | $12,439 |
| 10/17 | $11,529 | $13,851 | $10,843 | $12,613 |
| 11/17 | $11,709 | $14,273 | $10,829 | $12,837 |
| 12/17 | $11,817 | $14,432 | $10,879 | $12,947 |
| 1/18 | $12,106 | $15,225 | $10,753 | $13,314 |
| 2/18 | $11,817 | $14,666 | $10,651 | $12,970 |
| 3/18 | $11,687 | $14,333 | $10,720 | $12,826 |
| 4/18 | $11,679 | $14,381 | $10,640 | $12,814 |
| 5/18 | $11,857 | $14,749 | $10,716 | $13,047 |
| 6/18 | $11,921 | $14,844 | $10,703 | $13,092 |
| 7/18 | $12,235 | $15,356 | $10,705 | $13,364 |
| 8/18 | $12,451 | $15,885 | $10,774 | $13,675 |
| 9/18 | $12,430 | $15,946 | $10,705 | $13,670 |
| 10/18 | $11,868 | $14,817 | $10,620 | $13,047 |
| 11/18 | $12,047 | $15,119 | $10,683 | $13,237 |
| 12/18 | $11,405 | $13,742 | $10,880 | $12,611 |
| 1/19 | $12,005 | $14,893 | $10,995 | $13,299 |
| 2/19 | $12,266 | $15,398 | $10,989 | $13,566 |
| 3/19 | $12,554 | $15,666 | $11,200 | $13,812 |
| 4/19 | $12,868 | $16,298 | $11,203 | $14,148 |
| 5/19 | $12,647 | $15,260 | $11,402 | $13,707 |
| 6/19 | $13,129 | $16,331 | $11,545 | $14,354 |
| 7/19 | $13,342 | $16,585 | $11,570 | $14,500 |
| 8/19 | $13,431 | $16,281 | $11,870 | $14,491 |
| 9/19 | $13,396 | $16,563 | $11,807 | $14,611 |
| 10/19 | $13,509 | $16,914 | $11,842 | $14,814 |
| 11/19 | $13,756 | $17,553 | $11,836 | $15,147 |
| 12/19 | $14,008 | $18,060 | $11,828 | $15,405 |
| 1/20 | $14,161 | $18,080 | $12,056 | $15,534 |
| 2/20 | $13,532 | $16,602 | $12,273 | $14,884 |
| 3/20 | $12,225 | $14,408 | $12,200 | $13,669 |
| 4/20 | $13,283 | $16,312 | $12,417 | $14,850 |
| 5/20 | $13,727 | $17,173 | $12,475 | $15,348 |
| 6/20 | $14,048 | $17,553 | $12,554 | $15,590 |
| 7/20 | $14,705 | $18,581 | $12,741 | $16,231 |
| 8/20 | $15,291 | $19,944 | $12,638 | $16,893 |
| 9/20 | $14,922 | $19,215 | $12,632 | $16,519 |
| 10/20 | $14,672 | $18,752 | $12,575 | $16,251 |
| 11/20 | $15,620 | $20,960 | $12,698 | $17,463 |
| 12/20 | $16,049 | $21,846 | $12,716 | $17,915 |
| 1/21 | $15,884 | $21,666 | $12,625 | $17,775 |
| 2/21 | $16,172 | $22,294 | $12,443 | $17,982 |
| 3/21 | $16,297 | $23,138 | $12,287 | $18,300 |
| 4/21 | $16,989 | $24,384 | $12,384 | $18,949 |
| 5/21 | $17,002 | $24,499 | $12,425 | $19,028 |
| 6/21 | $17,299 | $25,113 | $12,512 | $19,367 |
| 7/21 | $17,565 | $25,635 | $12,652 | $19,695 |
| 8/21 | $17,823 | $26,377 | $12,628 | $20,022 |
| 9/21 | $17,248 | $25,165 | $12,518 | $19,401 |
| 10/21 | $17,933 | $26,911 | $12,515 | $20,207 |
| 11/21 | $17,751 | $26,550 | $12,552 | $20,068 |
| 12/21 | $18,203 | $27,626 | $12,520 | $20,535 |
| 1/22 | $17,244 | $26,068 | $12,250 | $19,664 |
| 2/22 | $17,045 | $25,353 | $12,114 | $19,252 |
| 3/22 | $17,267 | $26,208 | $11,777 | $19,428 |
| 4/22 | $16,176 | $23,872 | $11,330 | $18,094 |
| 5/22 | $16,104 | $23,836 | $11,403 | $18,124 |
| 6/22 | $15,330 | $21,840 | $11,224 | $17,100 |
| 7/22 | $16,142 | $23,874 | $11,498 | $18,222 |
| 8/22 | $15,620 | $22,957 | $11,174 | $17,597 |
| 9/22 | $14,652 | $20,833 | $10,691 | $16,316 |
| 10/22 | $15,124 | $22,504 | $10,552 | $17,016 |
| 11/22 | $15,810 | $23,721 | $10,940 | $17,819 |
| 12/22 | $15,300 | $22,342 | $10,891 | $17,165 |
| 1/23 | $15,907 | $23,840 | $11,226 | $18,067 |
| 2/23 | $15,471 | $23,272 | $10,936 | $17,622 |
| 3/23 | $15,993 | $24,009 | $11,214 | $18,135 |
| 4/23 | $16,141 | $24,306 | $11,282 | $18,314 |
| 5/23 | $16,058 | $24,419 | $11,159 | $18,286 |
| 6/23 | $16,627 | $26,069 | $11,119 | $19,000 |
| 7/23 | $16,927 | $26,965 | $11,111 | $19,387 |
| 8/23 | $16,849 | $26,493 | $11,040 | $19,134 |
| 9/23 | $16,154 | $25,248 | $10,760 | $18,400 |
| 10/23 | $15,869 | $24,638 | $10,590 | $18,017 |
| 11/23 | $17,014 | $26,939 | $11,069 | $19,353 |
| 12/23 | $17,669 | $28,269 | $11,493 | $20,223 |
| 1/24 | $17,973 | $28,663 | $11,462 | $20,370 |
| 2/24 | $18,531 | $30,211 | $11,300 | $20,915 |
| 3/24 | $18,892 | $31,180 | $11,404 | $21,394 |
| 4/24 | $18,264 | $29,853 | $11,116 | $20,632 |
| 5/24 | $19,090 | $31,259 | $11,304 | $21,355 |
| 6/24 | $19,737 | $32,293 | $11,411 | $21,860 |
| 7/24 | $19,944 | $32,763 | $11,678 | $22,255 |
| 8/24 | $20,395 | $33,540 | $11,846 | $22,699 |
| 9/24 | $21,007 | $34,257 | $12,004 | $23,112 |
Average Annual Total Returns (%)
| Fund | 1 Year | 5 Years | 10 Years |
|---|
| Class C | 28.07% | 9.07% | 7.70% |
| Class C with 1% Maximum Deferred Sales Charge | 27.07% | 9.07% | 7.70% |
Russell 1000® Index | 35.68% | 15.62% | 13.09% |
| Bloomberg U.S. Aggregate Bond Index | 11.57% | 0.33% | 1.84% |
Balanced Blended BenchmarkFootnote Reference1 | 25.61% | 9.59% | 8.73% |
| Footnote | Description |
Footnote1 | Benchmark is an internally constructed benchmark comprised of a blend of 60% Russell 1000® Index and 40% Bloomberg U.S. Aggregate Bond Index, and is rebalanced monthly. |
Performance does not reflect the deduction of taxes that a shareholder would pay on Fund distributions or redemption of Fund shares. Performance assumes that all dividends and distributions, if any, were reinvested. For more recent performance information, visit www.eatonvance.com/performance.php. Performance prior to December 31, 2016 is that of the Fund's former investment adviser.
THE FUND'S PAST PERFORMANCE IS NO GUARANTEE OF FUTURE RESULTS.
| Total Net Assets | $1,347,515,064 |
| # of Portfolio Holdings | 540 |
| Portfolio Turnover Rate | 153% |
| Total Advisory Fees Paid | $4,653,442 |
What did the Fund invest in?
The following tables reflect what the Fund invested in as of the report date.
Asset Allocation (% of total investments)
| Value | Value |
|---|
OtherFootnote Reference† | 2.7% |
| Commercial Mortgage-Backed Securities | 3.5% |
| Asset-Backed Securities | 4.3% |
| U.S. Treasury Obligations | 4.9% |
| Short-Term Investments | 5.6% |
| U.S. Government Agency Mortgage-Backed Securities | 8.4% |
| Corporate Bonds | 10.7% |
| Common Stocks | 59.9% |
| Footnote | Description |
Footnote† | Investment types less than 1% each |
Top Ten Holdings (% of total investments)Footnote Referencea
| Microsoft Corp. | 4.9% |
| Apple, Inc. | 4.2% |
| Uniform Mortgage-Backed Security, 5.50%, 30-Year, TBA | 4.0% |
| NVIDIA Corp. | 3.8% |
| Alphabet, Inc., Class C | 2.8% |
| Amazon.com, Inc. | 2.7% |
| Uniform Mortgage-Backed Security, 5.00%, 30-Year, TBA | 2.6% |
| Broadcom, Inc. | 1.7% |
| Eli Lilly & Co. | 1.4% |
| AbbVie, Inc. | 1.4% |
| Total | 29.5% |
| Footnote | Description |
Footnotea | Excluding cash equivalents |
If you wish to view additional information about the Fund, including the prospectus, statement of additional information, financial statements and holdings, please scan the QR code or visit www.eatonvance.com/calvert-fund-documents.php. For proxy information, please visit www.calvert.com/active-engagement.php?DM=how-we-influence.
The Funds may deliver a single copy of certain required shareholder documents (including prospectuses, shareholder reports, and proxy materials) to investors with the same last name and the same address. Your participation will continue indefinitely unless you instruct otherwise by calling 1-800-368-2745 or by contacting your financial intermediary. Your instruction will typically be effective within 30 days of receipt.
Not FDIC Insured | May Lose Value | No Bank Guarantee
Annual Shareholder Report September 30, 2024
Annual Shareholder Report September 30, 2024
This annual shareholder report contains important information about the Calvert Balanced Fund for the period of October 1, 2023 to September 30, 2024. You can find additional information about the Fund at www.eatonvance.com/calvert-fund-documents.php. You can also request this information by contacting us at 1-800-368-2745.
What were the Fund costs for the last year?
(based on a hypothetical $10,000 investment)
| Class Name | Costs of a $10,000 investment | Costs paid as a percentage of a $10,000 investment |
|---|
| Class I | $76 | 0.66% |
How did the Fund perform last year and what affected its performance?
Key contributors to (↑) and detractors from (↓) performance, relative to the Russell 1000® Index (the Index) and the Bloomberg U.S. Aggregate Bond Index (the Secondary Index):
↓ Not owning Meta Platforms, Inc. detracted from returns relative to the Index as Meta’s stock price rose on strong advertising revenue and user growth
↓ An overweight exposure to health insurer Humana, Inc. hurt returns in the Fund’s equity portfolio as government reimbursements were lower than expected
↓ In the Fund’s fixed-income portfolio, comparatively short interest rate durations weighed on returns relative to the Secondary Index during the period
↑ The equity portion of the Fund’s portfolio outperformed the Index; and the fixed-income portion of the Fund outperformed the Secondary Index
↑ In the equity portion of the Fund’s portfolio, an overweight position in microchip supplier NVIDIA Corp. helped performance relative to the Index
↑ Selections and an overweight position in the information technology sector contributed most to relative returns in the equity portion of the Fund’s portfolio
↑ In the Fund’s fixed-income portion, security selections ― especially in investment-grade corporate bonds ― helped returns relative to the Secondary Index
↑ The use of U.S. Treasury futures contracts to manage interest rate movements contributed to relative returns in the fixed-income portion of the Fund’s portfolio
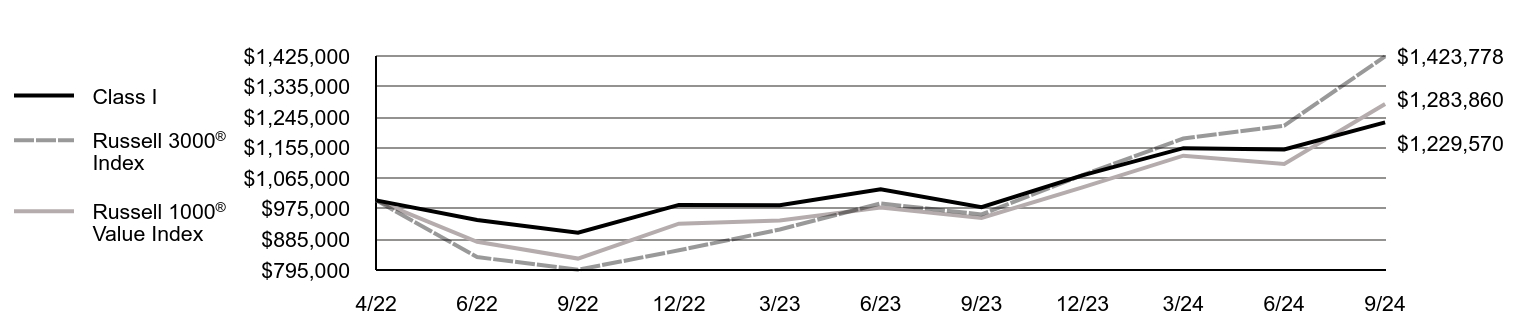
Comparison of the change in value of a $1,000,000 investment for the period indicated.
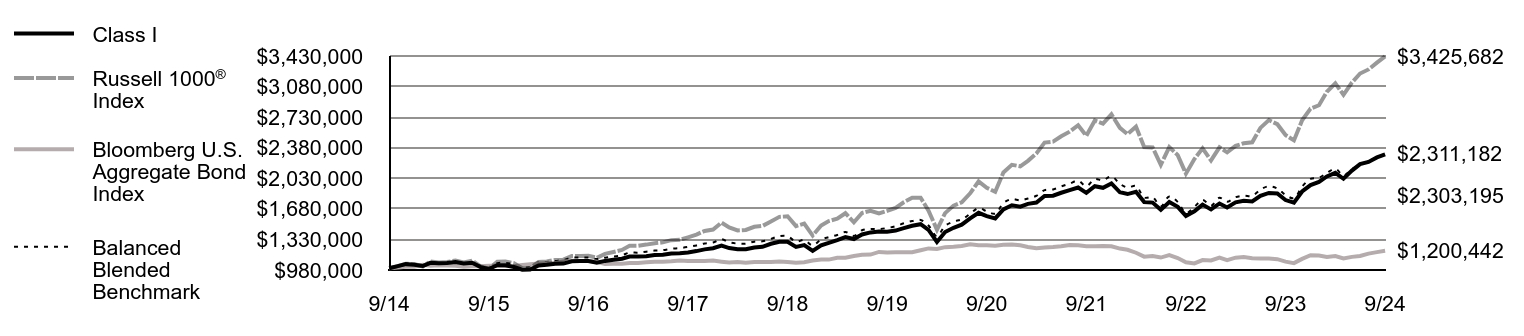
| Class I | Russell 1000® Index | Bloomberg U.S. Aggregate Bond Index | Balanced Blended Benchmark |
|---|
| 9/14 | $1,000,000 | $1,000,000 | $1,000,000 | $1,000,000 |
| 10/14 | $1,024,443 | $1,024,439 | $1,009,828 | $1,018,595 |
| 11/14 | $1,047,117 | $1,051,260 | $1,016,991 | $1,037,486 |
| 12/14 | $1,040,238 | $1,048,811 | $1,017,942 | $1,036,424 |
| 1/15 | $1,026,008 | $1,020,003 | $1,039,288 | $1,028,036 |
| 2/15 | $1,062,647 | $1,078,939 | $1,029,516 | $1,059,810 |
| 3/15 | $1,058,498 | $1,065,504 | $1,034,297 | $1,053,860 |
| 4/15 | $1,060,621 | $1,073,068 | $1,030,585 | $1,056,836 |
| 5/15 | $1,071,279 | $1,087,106 | $1,028,104 | $1,064,114 |
| 6/15 | $1,055,666 | $1,066,712 | $1,016,893 | $1,047,495 |
| 7/15 | $1,063,587 | $1,087,273 | $1,023,962 | $1,062,522 |
| 8/15 | $1,012,924 | $1,021,870 | $1,022,492 | $1,023,563 |
| 9/15 | $991,475 | $993,863 | $1,029,408 | $1,009,501 |
| 10/15 | $1,034,358 | $1,074,275 | $1,029,579 | $1,058,574 |
| 11/15 | $1,034,363 | $1,077,824 | $1,026,859 | $1,059,554 |
| 12/15 | $1,014,963 | $1,058,434 | $1,023,541 | $1,046,747 |
| 1/16 | $983,904 | $1,001,464 | $1,037,626 | $1,018,705 |
| 2/16 | $984,585 | $1,001,121 | $1,044,987 | $1,021,386 |
| 3/16 | $1,032,390 | $1,070,860 | $1,054,574 | $1,067,824 |
| 4/16 | $1,039,944 | $1,076,683 | $1,058,622 | $1,072,948 |
| 5/16 | $1,050,911 | $1,095,538 | $1,058,894 | $1,084,332 |
| 6/16 | $1,053,598 | $1,098,019 | $1,077,920 | $1,093,598 |
| 7/16 | $1,079,071 | $1,139,847 | $1,084,735 | $1,121,360 |
| 8/16 | $1,083,195 | $1,141,362 | $1,083,494 | $1,121,741 |
| 9/16 | $1,083,857 | $1,142,265 | $1,082,859 | $1,122,011 |
| 10/16 | $1,063,077 | $1,119,991 | $1,074,577 | $1,105,450 |
| 11/16 | $1,084,184 | $1,164,145 | $1,049,159 | $1,121,139 |
| 12/16 | $1,097,765 | $1,186,015 | $1,050,639 | $1,134,410 |
| 1/17 | $1,109,026 | $1,209,864 | $1,052,700 | $1,148,987 |
| 2/17 | $1,133,296 | $1,256,696 | $1,059,775 | $1,178,761 |
| 3/17 | $1,133,964 | $1,257,490 | $1,059,220 | $1,178,960 |
| 4/17 | $1,137,863 | $1,270,784 | $1,067,394 | $1,190,078 |
| 5/17 | $1,150,924 | $1,287,003 | $1,075,610 | $1,202,855 |
| 6/17 | $1,154,993 | $1,295,989 | $1,074,527 | $1,207,410 |
| 7/17 | $1,169,897 | $1,321,654 | $1,079,151 | $1,223,835 |
| 8/17 | $1,173,106 | $1,325,788 | $1,088,831 | $1,230,523 |
| 9/17 | $1,180,803 | $1,354,021 | $1,083,645 | $1,243,901 |
| 10/17 | $1,196,480 | $1,385,077 | $1,084,272 | $1,261,307 |
| 11/17 | $1,216,092 | $1,427,316 | $1,082,881 | $1,283,739 |
| 12/17 | $1,228,909 | $1,443,228 | $1,087,851 | $1,294,682 |
| 1/18 | $1,259,794 | $1,522,451 | $1,075,322 | $1,331,359 |
| 2/18 | $1,230,801 | $1,466,557 | $1,065,128 | $1,296,984 |
| 3/18 | $1,218,642 | $1,433,270 | $1,071,959 | $1,282,648 |
| 4/18 | $1,218,636 | $1,438,141 | $1,063,986 | $1,281,448 |
| 5/18 | $1,238,525 | $1,474,851 | $1,071,580 | $1,304,732 |
| 6/18 | $1,246,050 | $1,484,388 | $1,070,262 | $1,309,152 |
| 7/18 | $1,280,261 | $1,535,617 | $1,070,516 | $1,336,385 |
| 8/18 | $1,303,699 | $1,588,530 | $1,077,405 | $1,367,454 |
| 9/18 | $1,302,683 | $1,594,562 | $1,070,467 | $1,367,047 |
| 10/18 | $1,244,816 | $1,481,726 | $1,062,007 | $1,304,684 |
| 11/18 | $1,264,947 | $1,511,880 | $1,068,347 | $1,323,730 |
| 12/18 | $1,198,629 | $1,374,182 | $1,087,974 | $1,261,121 |
| 1/19 | $1,262,791 | $1,489,343 | $1,099,528 | $1,329,889 |
| 2/19 | $1,291,660 | $1,539,770 | $1,098,891 | $1,356,598 |
| 3/19 | $1,322,596 | $1,566,577 | $1,119,992 | $1,381,188 |
| 4/19 | $1,356,801 | $1,629,842 | $1,120,278 | $1,414,797 |
| 5/19 | $1,334,674 | $1,525,981 | $1,140,165 | $1,370,748 |
| 6/19 | $1,386,464 | $1,633,111 | $1,154,483 | $1,435,373 |
| 7/19 | $1,410,305 | $1,658,473 | $1,157,023 | $1,450,011 |
| 8/19 | $1,421,201 | $1,628,098 | $1,187,003 | $1,449,105 |
| 9/19 | $1,418,173 | $1,656,318 | $1,180,681 | $1,461,089 |
| 10/19 | $1,431,558 | $1,691,421 | $1,184,238 | $1,481,429 |
| 11/19 | $1,459,155 | $1,755,343 | $1,183,635 | $1,514,718 |
| 12/19 | $1,486,855 | $1,806,034 | $1,182,810 | $1,540,542 |
| 1/20 | $1,504,751 | $1,807,984 | $1,205,572 | $1,553,398 |
| 2/20 | $1,438,592 | $1,660,241 | $1,227,271 | $1,488,418 |
| 3/20 | $1,300,897 | $1,440,841 | $1,220,049 | $1,366,898 |
| 4/20 | $1,414,920 | $1,631,237 | $1,241,736 | $1,484,993 |
| 5/20 | $1,463,368 | $1,717,304 | $1,247,518 | $1,534,769 |
| 6/20 | $1,498,627 | $1,755,280 | $1,255,376 | $1,559,000 |
| 7/20 | $1,570,278 | $1,858,062 | $1,274,128 | $1,623,088 |
| 8/20 | $1,634,396 | $1,994,438 | $1,263,843 | $1,689,325 |
| 9/20 | $1,596,008 | $1,921,546 | $1,263,150 | $1,651,910 |
| 10/20 | $1,570,813 | $1,875,208 | $1,257,510 | $1,625,058 |
| 11/20 | $1,673,769 | $2,096,028 | $1,269,849 | $1,746,254 |
| 12/20 | $1,720,946 | $2,184,639 | $1,271,599 | $1,791,511 |
| 1/21 | $1,704,718 | $2,166,646 | $1,262,482 | $1,777,520 |
| 2/21 | $1,737,247 | $2,229,436 | $1,244,251 | $1,798,161 |
| 3/21 | $1,751,886 | $2,313,806 | $1,228,714 | $1,830,008 |
| 4/21 | $1,827,770 | $2,438,359 | $1,238,421 | $1,894,897 |
| 5/21 | $1,830,758 | $2,449,934 | $1,242,467 | $1,902,771 |
| 6/21 | $1,864,377 | $2,511,323 | $1,251,197 | $1,936,725 |
| 7/21 | $1,894,901 | $2,563,492 | $1,265,186 | $1,969,527 |
| 8/21 | $1,924,120 | $2,637,686 | $1,262,777 | $2,002,229 |
| 9/21 | $1,863,518 | $2,516,526 | $1,251,844 | $1,940,112 |
| 10/21 | $1,938,868 | $2,691,141 | $1,251,499 | $2,020,670 |
| 11/21 | $1,920,784 | $2,655,041 | $1,255,202 | $2,006,797 |
| 12/21 | $1,971,933 | $2,762,584 | $1,251,990 | $2,053,515 |
| 1/22 | $1,869,674 | $2,606,829 | $1,225,017 | $1,966,352 |
| 2/22 | $1,849,406 | $2,535,294 | $1,211,350 | $1,925,201 |
| 3/22 | $1,874,905 | $2,620,848 | $1,177,697 | $1,942,787 |
| 4/22 | $1,757,608 | $2,387,225 | $1,133,006 | $1,809,388 |
| 5/22 | $1,751,604 | $2,383,596 | $1,140,311 | $1,812,405 |
| 6/22 | $1,668,477 | $2,183,970 | $1,122,422 | $1,709,958 |
| 7/22 | $1,758,852 | $2,387,384 | $1,149,848 | $1,822,230 |
| 8/22 | $1,703,237 | $2,295,717 | $1,117,357 | $1,759,654 |
| 9/22 | $1,598,946 | $2,083,300 | $1,069,080 | $1,631,553 |
| 10/22 | $1,652,012 | $2,250,381 | $1,055,233 | $1,701,610 |
| 11/22 | $1,728,351 | $2,372,122 | $1,094,040 | $1,781,873 |
| 12/22 | $1,673,603 | $2,234,187 | $1,089,105 | $1,716,491 |
| 1/23 | $1,741,586 | $2,383,978 | $1,122,610 | $1,806,662 |
| 2/23 | $1,695,320 | $2,327,249 | $1,093,584 | $1,762,183 |
| 3/23 | $1,754,042 | $2,400,868 | $1,121,364 | $1,813,535 |
| 4/23 | $1,771,587 | $2,430,617 | $1,128,160 | $1,831,414 |
| 5/23 | $1,764,000 | $2,441,938 | $1,115,876 | $1,828,555 |
| 6/23 | $1,828,215 | $2,606,861 | $1,111,896 | $1,900,045 |
| 7/23 | $1,862,503 | $2,696,507 | $1,111,121 | $1,938,718 |
| 8/23 | $1,855,360 | $2,649,337 | $1,104,024 | $1,913,417 |
| 9/23 | $1,780,805 | $2,524,828 | $1,075,969 | $1,840,014 |
| 10/23 | $1,750,385 | $2,463,805 | $1,058,989 | $1,801,716 |
| 11/23 | $1,878,344 | $2,693,913 | $1,106,947 | $1,935,316 |
| 12/23 | $1,952,310 | $2,826,900 | $1,149,319 | $2,022,272 |
| 1/24 | $1,988,204 | $2,866,324 | $1,146,163 | $2,036,972 |
| 2/24 | $2,051,260 | $3,021,109 | $1,129,970 | $2,091,460 |
| 3/24 | $2,092,917 | $3,117,957 | $1,140,404 | $2,139,413 |
| 4/24 | $2,024,744 | $2,985,281 | $1,111,599 | $2,063,175 |
| 5/24 | $2,118,238 | $3,125,857 | $1,130,444 | $2,135,459 |
| 6/24 | $2,191,892 | $3,229,313 | $1,141,147 | $2,185,952 |
| 7/24 | $2,216,828 | $3,276,309 | $1,167,800 | $2,225,462 |
| 8/24 | $2,268,655 | $3,353,969 | $1,184,582 | $2,269,904 |
| 9/24 | $2,303,195 | $3,425,682 | $1,200,442 | $2,311,182 |
Average Annual Total Returns (%)
| Fund | 1 Year | 5 Years | 10 Years |
|---|
| Class I | 29.35% | 10.17% | 8.69% |
Russell 1000® Index | 35.68% | 15.62% | 13.09% |
| Bloomberg U.S. Aggregate Bond Index | 11.57% | 0.33% | 1.84% |
Balanced Blended BenchmarkFootnote Reference1 | 25.61% | 9.59% | 8.73% |
| Footnote | Description |
Footnote1 | Benchmark is an internally constructed benchmark comprised of a blend of 60% Russell 1000® Index and 40% Bloomberg U.S. Aggregate Bond Index, and is rebalanced monthly. |
Performance does not reflect the deduction of taxes that a shareholder would pay on Fund distributions or redemption of Fund shares. Performance assumes that all dividends and distributions, if any, were reinvested. For more recent performance information, visit www.eatonvance.com/performance.php. Performance prior to December 31, 2016 is that of the Fund's former investment adviser.
THE FUND'S PAST PERFORMANCE IS NO GUARANTEE OF FUTURE RESULTS.
| Total Net Assets | $1,347,515,064 |
| # of Portfolio Holdings | 540 |
| Portfolio Turnover Rate | 153% |
| Total Advisory Fees Paid | $4,653,442 |
What did the Fund invest in?
The following tables reflect what the Fund invested in as of the report date.
Asset Allocation (% of total investments)
| Value | Value |
|---|
OtherFootnote Reference† | 2.7% |
| Commercial Mortgage-Backed Securities | 3.5% |
| Asset-Backed Securities | 4.3% |
| U.S. Treasury Obligations | 4.9% |
| Short-Term Investments | 5.6% |
| U.S. Government Agency Mortgage-Backed Securities | 8.4% |
| Corporate Bonds | 10.7% |
| Common Stocks | 59.9% |
| Footnote | Description |
Footnote† | Investment types less than 1% each |
Top Ten Holdings (% of total investments)Footnote Referencea
| Microsoft Corp. | 4.9% |
| Apple, Inc. | 4.2% |
| Uniform Mortgage-Backed Security, 5.50%, 30-Year, TBA | 4.0% |
| NVIDIA Corp. | 3.8% |
| Alphabet, Inc., Class C | 2.8% |
| Amazon.com, Inc. | 2.7% |
| Uniform Mortgage-Backed Security, 5.00%, 30-Year, TBA | 2.6% |
| Broadcom, Inc. | 1.7% |
| Eli Lilly & Co. | 1.4% |
| AbbVie, Inc. | 1.4% |
| Total | 29.5% |
| Footnote | Description |
Footnotea | Excluding cash equivalents |
If you wish to view additional information about the Fund, including the prospectus, statement of additional information, financial statements and holdings, please scan the QR code or visit www.eatonvance.com/calvert-fund-documents.php. For proxy information, please visit www.calvert.com/active-engagement.php?DM=how-we-influence.
The Funds may deliver a single copy of certain required shareholder documents (including prospectuses, shareholder reports, and proxy materials) to investors with the same last name and the same address. Your participation will continue indefinitely unless you instruct otherwise by calling 1-800-368-2745 or by contacting your financial intermediary. Your instruction will typically be effective within 30 days of receipt.
Not FDIC Insured | May Lose Value | No Bank Guarantee
Annual Shareholder Report September 30, 2024
Annual Shareholder Report September 30, 2024
This annual shareholder report contains important information about the Calvert Balanced Fund for the period of October 1, 2023 to September 30, 2024. You can find additional information about the Fund at www.eatonvance.com/calvert-fund-documents.php. You can also request this information by contacting us at 1-800-368-2745.
What were the Fund costs for the last year?
(based on a hypothetical $10,000 investment)
| Class Name | Costs of a $10,000 investment | Costs paid as a percentage of a $10,000 investment |
|---|
| Class R6 | $70 | 0.61% |
How did the Fund perform last year and what affected its performance?
Key contributors to (↑) and detractors from (↓) performance, relative to the Russell 1000® Index (the Index) and the Bloomberg U.S. Aggregate Bond Index (the Secondary Index):
↓ Not owning Meta Platforms, Inc. detracted from returns relative to the Index as Meta’s stock price rose on strong advertising revenue and user growth
↓ An overweight exposure to health insurer Humana, Inc. hurt returns in the Fund’s equity portfolio as government reimbursements were lower than expected
↓ In the Fund’s fixed-income portfolio, comparatively short interest rate durations weighed on returns relative to the Secondary Index during the period
↑ The equity portion of the Fund’s portfolio outperformed the Index; and the fixed-income portion of the Fund outperformed the Secondary Index
↑ In the equity portion of the Fund’s portfolio, an overweight position in microchip supplier NVIDIA Corp. helped performance relative to the Index
↑ Selections and an overweight position in the information technology sector contributed most to relative returns in the equity portion of the Fund’s portfolio
↑ In the Fund’s fixed-income portion, security selections ― especially in investment-grade corporate bonds ― helped returns relative to the Secondary Index
↑ The use of U.S. Treasury futures contracts to manage interest rate movements contributed to relative returns in the fixed-income portion of the Fund’s portfolio
Comparison of the change in value of a $5,000,000 investment for the period indicated.
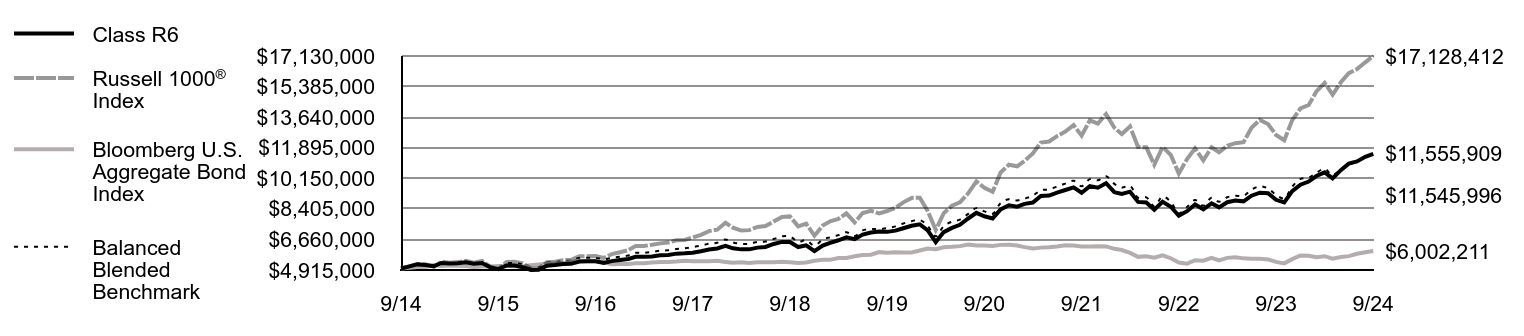
| Class R6 | Russell 1000® Index | Bloomberg U.S. Aggregate Bond Index | Balanced Blended Benchmark |
|---|
| 9/14 | $5,000,000 | $5,000,000 | $5,000,000 | $5,000,000 |
| 10/14 | $5,122,242 | $5,122,197 | $5,049,138 | $5,092,974 |
| 11/14 | $5,235,540 | $5,256,301 | $5,084,956 | $5,187,428 |
| 12/14 | $5,200,998 | $5,244,055 | $5,089,712 | $5,182,118 |
| 1/15 | $5,129,876 | $5,100,015 | $5,196,439 | $5,140,180 |
| 2/15 | $5,312,978 | $5,394,697 | $5,147,580 | $5,299,050 |
| 3/15 | $5,292,271 | $5,327,519 | $5,171,483 | $5,269,301 |
| 4/15 | $5,302,910 | $5,365,338 | $5,152,927 | $5,284,181 |
| 5/15 | $5,356,106 | $5,435,531 | $5,140,518 | $5,320,569 |
| 6/15 | $5,277,979 | $5,333,562 | $5,084,467 | $5,237,477 |
| 7/15 | $5,317,663 | $5,436,367 | $5,119,810 | $5,312,611 |
| 8/15 | $5,064,295 | $5,109,352 | $5,112,458 | $5,117,817 |
| 9/15 | $4,956,970 | $4,969,316 | $5,147,040 | $5,047,504 |
| 10/15 | $5,171,425 | $5,371,377 | $5,147,895 | $5,292,871 |
| 11/15 | $5,171,425 | $5,389,121 | $5,134,295 | $5,297,769 |
| 12/15 | $5,074,382 | $5,292,168 | $5,117,703 | $5,233,735 |
| 1/16 | $4,919,166 | $5,007,322 | $5,188,129 | $5,093,523 |
| 2/16 | $4,922,577 | $5,005,604 | $5,224,933 | $5,106,928 |
| 3/16 | $5,161,557 | $5,354,298 | $5,272,871 | $5,339,122 |
| 4/16 | $5,199,245 | $5,383,416 | $5,293,111 | $5,364,740 |
| 5/16 | $5,254,064 | $5,477,689 | $5,294,468 | $5,421,659 |
| 6/16 | $5,267,480 | $5,490,094 | $5,389,599 | $5,467,991 |
| 7/16 | $5,394,905 | $5,699,236 | $5,423,673 | $5,606,799 |
| 8/16 | $5,415,569 | $5,706,808 | $5,417,471 | $5,608,704 |
| 9/16 | $5,418,743 | $5,711,324 | $5,414,297 | $5,610,053 |
| 10/16 | $5,314,936 | $5,599,953 | $5,372,883 | $5,527,251 |
| 11/16 | $5,420,474 | $5,820,723 | $5,245,795 | $5,605,697 |
| 12/16 | $5,488,399 | $5,930,076 | $5,253,193 | $5,672,048 |
| 1/17 | $5,544,654 | $6,049,322 | $5,263,501 | $5,744,934 |
| 2/17 | $5,665,954 | $6,283,479 | $5,298,877 | $5,893,804 |
| 3/17 | $5,669,219 | $6,287,449 | $5,296,098 | $5,894,802 |
| 4/17 | $5,688,646 | $6,353,922 | $5,336,968 | $5,950,391 |
| 5/17 | $5,753,992 | $6,435,013 | $5,378,048 | $6,014,276 |
| 6/17 | $5,774,334 | $6,479,944 | $5,372,635 | $6,037,050 |
| 7/17 | $5,848,842 | $6,608,269 | $5,395,754 | $6,119,175 |
| 8/17 | $5,864,807 | $6,628,940 | $5,444,153 | $6,152,614 |
| 9/17 | $5,903,357 | $6,770,105 | $5,418,223 | $6,219,505 |
| 10/17 | $5,981,736 | $6,925,383 | $5,421,362 | $6,306,536 |
| 11/17 | $6,079,709 | $7,136,580 | $5,414,403 | $6,418,693 |
| 12/17 | $6,143,766 | $7,216,139 | $5,439,253 | $6,473,410 |
| 1/18 | $6,298,170 | $7,612,256 | $5,376,610 | $6,656,797 |
| 2/18 | $6,153,297 | $7,332,785 | $5,325,642 | $6,484,920 |
| 3/18 | $6,092,521 | $7,166,348 | $5,359,795 | $6,413,239 |
| 4/18 | $6,092,521 | $7,190,705 | $5,319,932 | $6,407,238 |
| 5/18 | $6,191,991 | $7,374,255 | $5,357,900 | $6,523,660 |
| 6/18 | $6,229,659 | $7,421,942 | $5,351,310 | $6,545,762 |
| 7/18 | $6,400,624 | $7,678,084 | $5,352,582 | $6,681,927 |
| 8/18 | $6,517,802 | $7,942,650 | $5,387,024 | $6,837,270 |
| 9/18 | $6,512,815 | $7,972,811 | $5,352,334 | $6,835,236 |
| 10/18 | $6,223,528 | $7,408,628 | $5,310,037 | $6,523,420 |
| 11/18 | $6,324,087 | $7,559,398 | $5,341,736 | $6,618,650 |
| 12/18 | $5,992,441 | $6,870,911 | $5,439,871 | $6,305,604 |
| 1/19 | $6,313,214 | $7,446,716 | $5,497,639 | $6,649,447 |
| 2/19 | $6,457,562 | $7,698,850 | $5,494,454 | $6,782,989 |
| 3/19 | $6,613,103 | $7,832,884 | $5,599,958 | $6,905,941 |
| 4/19 | $6,784,166 | $8,149,208 | $5,601,391 | $7,073,983 |
| 5/19 | $6,673,478 | $7,629,906 | $5,700,825 | $6,853,742 |
| 6/19 | $6,934,394 | $8,165,557 | $5,772,417 | $7,176,866 |
| 7/19 | $7,053,604 | $8,292,367 | $5,785,114 | $7,250,054 |
| 8/19 | $7,106,138 | $8,140,488 | $5,935,016 | $7,245,526 |
| 9/19 | $7,092,007 | $8,281,591 | $5,903,406 | $7,305,444 |
| 10/19 | $7,160,960 | $8,457,106 | $5,921,188 | $7,407,143 |
| 11/19 | $7,296,838 | $8,776,713 | $5,918,173 | $7,573,590 |
| 12/19 | $7,437,479 | $9,030,172 | $5,914,048 | $7,702,708 |
| 1/20 | $7,524,880 | $9,039,919 | $6,027,861 | $7,766,990 |
| 2/20 | $7,196,083 | $8,301,203 | $6,136,354 | $7,442,090 |
| 3/20 | $6,508,594 | $7,204,204 | $6,100,243 | $6,834,491 |
| 4/20 | $7,076,920 | $8,156,187 | $6,208,682 | $7,424,965 |
| 5/20 | $7,319,295 | $8,586,519 | $6,237,589 | $7,673,844 |
| 6/20 | $7,496,532 | $8,776,399 | $6,276,880 | $7,794,998 |
| 7/20 | $7,855,107 | $9,290,310 | $6,370,638 | $8,115,438 |
| 8/20 | $8,175,938 | $9,972,192 | $6,319,215 | $8,446,625 |
| 9/20 | $7,983,121 | $9,607,730 | $6,315,751 | $8,259,550 |
| 10/20 | $7,859,009 | $9,376,042 | $6,287,550 | $8,125,291 |
| 11/20 | $8,374,389 | $10,480,138 | $6,349,245 | $8,731,269 |
| 12/20 | $8,609,542 | $10,923,193 | $6,357,994 | $8,957,553 |
| 1/21 | $8,530,359 | $10,833,229 | $6,312,408 | $8,887,599 |
| 2/21 | $8,690,865 | $11,147,182 | $6,221,254 | $8,990,803 |
| 3/21 | $8,765,626 | $11,569,029 | $6,143,571 | $9,150,042 |
| 4/21 | $9,145,434 | $12,191,796 | $6,192,105 | $9,474,487 |
| 5/21 | $9,162,600 | $12,249,671 | $6,212,335 | $9,513,854 |
| 6/21 | $9,329,485 | $12,556,614 | $6,255,983 | $9,683,626 |
| 7/21 | $9,482,216 | $12,817,462 | $6,325,932 | $9,847,635 |
| 8/21 | $9,628,493 | $13,188,430 | $6,313,887 | $10,011,143 |
| 9/21 | $9,326,020 | $12,582,631 | $6,259,222 | $9,700,562 |
| 10/21 | $9,705,442 | $13,455,705 | $6,257,496 | $10,103,349 |
| 11/21 | $9,614,898 | $13,275,204 | $6,276,009 | $10,033,986 |
| 12/21 | $9,870,339 | $13,812,922 | $6,259,951 | $10,267,575 |
| 1/22 | $9,358,254 | $13,034,145 | $6,125,085 | $9,831,760 |
| 2/22 | $9,259,066 | $12,676,471 | $6,056,752 | $9,626,007 |
| 3/22 | $9,385,977 | $13,104,242 | $5,888,485 | $9,713,935 |
| 4/22 | $8,800,799 | $11,936,123 | $5,665,028 | $9,046,942 |
| 5/22 | $8,770,731 | $11,917,980 | $5,701,554 | $9,062,024 |
| 6/22 | $8,354,432 | $10,919,848 | $5,612,108 | $8,549,791 |
| 7/22 | $8,804,893 | $11,936,918 | $5,749,238 | $9,111,150 |
| 8/22 | $8,528,579 | $11,478,585 | $5,586,784 | $8,798,269 |
| 9/22 | $8,007,289 | $10,416,501 | $5,345,399 | $8,157,763 |
| 10/22 | $8,273,188 | $11,251,906 | $5,276,164 | $8,508,051 |
| 11/22 | $8,655,709 | $11,860,608 | $5,470,198 | $8,909,366 |
| 12/22 | $8,382,601 | $11,170,935 | $5,445,523 | $8,582,453 |
| 1/23 | $8,723,299 | $11,919,888 | $5,613,049 | $9,033,310 |
| 2/23 | $8,491,435 | $11,636,247 | $5,467,922 | $8,810,914 |
| 3/23 | $8,784,522 | $12,004,339 | $5,606,821 | $9,067,673 |
| 4/23 | $8,874,839 | $12,153,085 | $5,640,802 | $9,157,070 |
| 5/23 | $8,834,434 | $12,209,690 | $5,579,381 | $9,142,777 |
| 6/23 | $9,157,638 | $13,034,306 | $5,559,482 | $9,500,224 |
| 7/23 | $9,329,523 | $13,482,533 | $5,555,606 | $9,693,592 |
| 8/23 | $9,296,101 | $13,246,684 | $5,520,121 | $9,567,084 |
| 9/23 | $8,921,409 | $12,624,140 | $5,379,845 | $9,200,068 |
| 10/23 | $8,771,307 | $12,319,025 | $5,294,945 | $9,008,578 |
| 11/23 | $9,412,874 | $13,469,565 | $5,534,733 | $9,676,579 |
| 12/23 | $9,782,773 | $14,134,500 | $5,746,597 | $10,111,358 |
| 1/24 | $9,962,764 | $14,331,619 | $5,730,816 | $10,184,859 |
| 2/24 | $10,278,965 | $15,105,546 | $5,649,850 | $10,457,299 |
| 3/24 | $10,489,324 | $15,589,787 | $5,702,020 | $10,697,063 |
| 4/24 | $10,147,414 | $14,926,406 | $5,557,996 | $10,315,875 |
| 5/24 | $10,616,320 | $15,629,285 | $5,652,222 | $10,677,293 |
| 6/24 | $10,987,211 | $16,146,566 | $5,705,733 | $10,929,758 |
| 7/24 | $11,112,289 | $16,381,545 | $5,839,002 | $11,127,308 |
| 8/24 | $11,372,254 | $16,769,843 | $5,922,908 | $11,349,520 |
| 9/24 | $11,545,996 | $17,128,412 | $6,002,211 | $11,555,909 |
Average Annual Total Returns (%)Footnote Reference1
| Fund | 1 Year | 5 Years | 10 Years |
|---|
| Class R6 | 29.42% | 10.23% | 8.72% |
Russell 1000® Index | 35.68% | 15.62% | 13.09% |
| Bloomberg U.S. Aggregate Bond Index | 11.57% | 0.33% | 1.84% |
Balanced Blended BenchmarkFootnote Reference2 | 25.61% | 9.59% | 8.73% |
| Footnote | Description |
Footnote1 | Class R6 performance prior to 2/1/19 is linked to Class I. This linked performance is adjusted for any applicable sales charge, but is not adjusted for class expense differences. If adjusted for such differences, the performance would be different. Performance presented in the Financial Highlights included in the financial statements is not linked. |
Footnote2 | Benchmark is an internally constructed benchmark comprised of a blend of 60% Russell 1000® Index and 40% Bloomberg U.S. Aggregate Bond Index, and is rebalanced monthly. |
Performance does not reflect the deduction of taxes that a shareholder would pay on Fund distributions or redemption of Fund shares. Performance assumes that all dividends and distributions, if any, were reinvested. For more recent performance information, visit www.eatonvance.com/performance.php. Performance prior to December 31, 2016 is that of the Fund's former investment adviser.
THE FUND'S PAST PERFORMANCE IS NO GUARANTEE OF FUTURE RESULTS.
| Total Net Assets | $1,347,515,064 |
| # of Portfolio Holdings | 540 |
| Portfolio Turnover Rate | 153% |
| Total Advisory Fees Paid | $4,653,442 |
What did the Fund invest in?
The following tables reflect what the Fund invested in as of the report date.
Asset Allocation (% of total investments)
| Value | Value |
|---|
OtherFootnote Reference† | 2.7% |
| Commercial Mortgage-Backed Securities | 3.5% |
| Asset-Backed Securities | 4.3% |
| U.S. Treasury Obligations | 4.9% |
| Short-Term Investments | 5.6% |
| U.S. Government Agency Mortgage-Backed Securities | 8.4% |
| Corporate Bonds | 10.7% |
| Common Stocks | 59.9% |
| Footnote | Description |
Footnote† | Investment types less than 1% each |
Top Ten Holdings (% of total investments)Footnote Referencea
| Microsoft Corp. | 4.9% |
| Apple, Inc. | 4.2% |
| Uniform Mortgage-Backed Security, 5.50%, 30-Year, TBA | 4.0% |
| NVIDIA Corp. | 3.8% |
| Alphabet, Inc., Class C | 2.8% |
| Amazon.com, Inc. | 2.7% |
| Uniform Mortgage-Backed Security, 5.00%, 30-Year, TBA | 2.6% |
| Broadcom, Inc. | 1.7% |
| Eli Lilly & Co. | 1.4% |
| AbbVie, Inc. | 1.4% |
| Total | 29.5% |
| Footnote | Description |
Footnotea | Excluding cash equivalents |
If you wish to view additional information about the Fund, including the prospectus, statement of additional information, financial statements and holdings, please scan the QR code or visit www.eatonvance.com/calvert-fund-documents.php. For proxy information, please visit www.calvert.com/active-engagement.php?DM=how-we-influence.
The Funds may deliver a single copy of certain required shareholder documents (including prospectuses, shareholder reports, and proxy materials) to investors with the same last name and the same address. Your participation will continue indefinitely unless you instruct otherwise by calling 1-800-368-2745 or by contacting your financial intermediary. Your instruction will typically be effective within 30 days of receipt.
Not FDIC Insured | May Lose Value | No Bank Guarantee
Annual Shareholder Report September 30, 2024
Annual Shareholder Report September 30, 2024
This annual shareholder report contains important information about the Calvert Bond Fund for the period of October 1, 2023 to September 30, 2024. You can find additional information about the Fund at www.eatonvance.com/calvert-fund-documents.php. You can also request this information by contacting us at 1-800-368-2745.
What were the Fund costs for the last year?
(based on a hypothetical $10,000 investment)
| Class Name | Costs of a $10,000 investment | Costs paid as a percentage of a $10,000 investment |
|---|
| Class A | $78 | 0.73% |
How did the Fund perform last year and what affected its performance?
Key contributors to (↑) and detractors from (↓) performance, relative to the Bloomberg U.S. Aggregate Bond Index (the Index):
↑ Selections by Fund management, especially in investment-grade bonds and asset-backed securities, contributed most to Index-relative returns during the period
↑ The Fund’s sector positioning, including an underweight allocation to U.S. Treasurys, contributed to performance relative to the Index during the period
↑ Out-of-Index exposures to high yield corporate bonds and non-agency mortgage-backed securities further aided returns relative to the Index
↑ The use of U.S. Treasury futures contracts to manage interest rate movements contributed to Fund performance relative to the Index during the period
↓ The Fund’s underweight duration detracted most from performance relative to the Index during the period
↓ Selections in U.S. Treasurys detracted from performance relative to the Index during the period
↓ An out-of-Index position in bank loans and an overweight position in asset-backed securities detracted from performance relative to the Index during the period
↓ An underweight position in agency mortgage-backed securities also reduced performance relative to the Index during the period
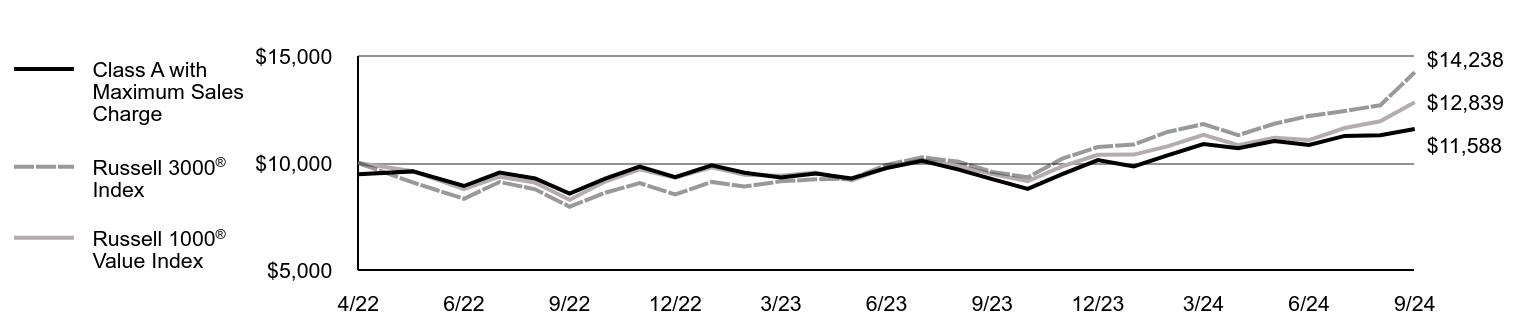
Comparison of the change in value of a $10,000 investment for the period indicated.
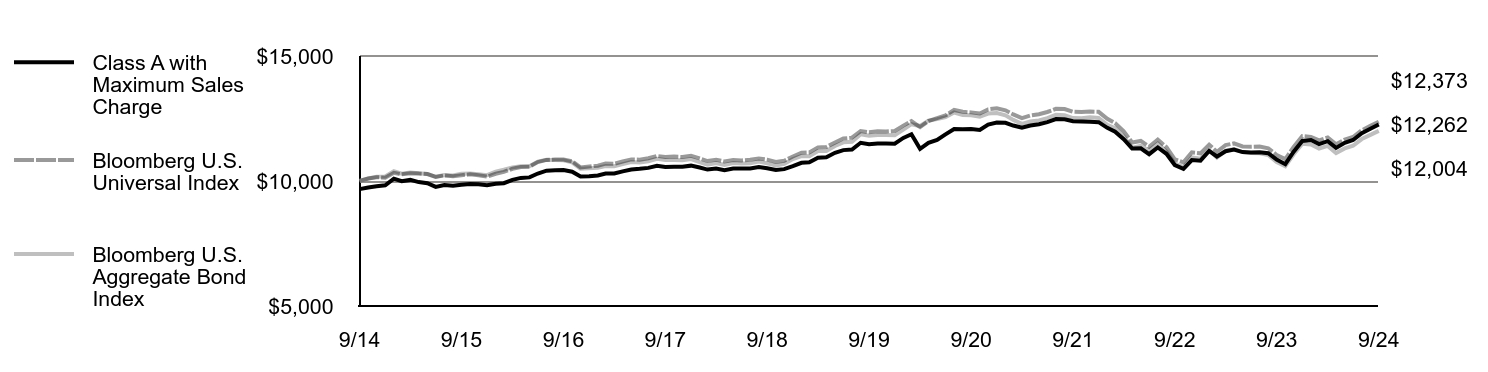
| Class A with Maximum Sales Charge | Bloomberg U.S. Universal Index | Bloomberg U.S. Aggregate Bond Index |
|---|
| 9/14 | $9,675 | $10,000 | $10,000 |
| 10/14 | $9,742 | $10,098 | $10,098 |
| 11/14 | $9,792 | $10,152 | $10,170 |
| 12/14 | $9,828 | $10,134 | $10,179 |
| 1/15 | $10,092 | $10,327 | $10,393 |
| 2/15 | $9,990 | $10,267 | $10,295 |
| 3/15 | $10,044 | $10,309 | $10,343 |
| 4/15 | $9,957 | $10,297 | $10,306 |
| 5/15 | $9,911 | $10,279 | $10,281 |
| 6/15 | $9,765 | $10,164 | $10,169 |
| 7/15 | $9,842 | $10,224 | $10,240 |
| 8/15 | $9,807 | $10,194 | $10,225 |
| 9/15 | $9,849 | $10,233 | $10,294 |
| 10/15 | $9,881 | $10,266 | $10,296 |
| 11/15 | $9,870 | $10,229 | $10,269 |
| 12/15 | $9,830 | $10,178 | $10,235 |
| 1/16 | $9,890 | $10,290 | $10,376 |
| 2/16 | $9,911 | $10,363 | $10,450 |
| 3/16 | $10,046 | $10,490 | $10,546 |
| 4/16 | $10,124 | $10,562 | $10,586 |
| 5/16 | $10,144 | $10,570 | $10,589 |
| 6/16 | $10,299 | $10,756 | $10,779 |
| 7/16 | $10,413 | $10,844 | $10,847 |
| 8/16 | $10,434 | $10,856 | $10,835 |
| 9/16 | $10,435 | $10,859 | $10,829 |
| 10/16 | $10,372 | $10,787 | $10,746 |
| 11/16 | $10,181 | $10,544 | $10,492 |
| 12/16 | $10,187 | $10,576 | $10,506 |
| 1/17 | $10,220 | $10,613 | $10,527 |
| 2/17 | $10,298 | $10,695 | $10,598 |
| 3/17 | $10,299 | $10,691 | $10,592 |
| 4/17 | $10,384 | $10,780 | $10,674 |
| 5/17 | $10,462 | $10,863 | $10,756 |
| 6/17 | $10,487 | $10,854 | $10,745 |
| 7/17 | $10,525 | $10,908 | $10,792 |
| 8/17 | $10,608 | $11,002 | $10,888 |
| 9/17 | $10,561 | $10,963 | $10,836 |
| 10/17 | $10,571 | $10,976 | $10,843 |
| 11/17 | $10,573 | $10,960 | $10,829 |
| 12/17 | $10,614 | $11,008 | $10,879 |
| 1/18 | $10,538 | $10,902 | $10,753 |
| 2/18 | $10,457 | $10,799 | $10,651 |
| 3/18 | $10,499 | $10,853 | $10,720 |
| 4/18 | $10,434 | $10,781 | $10,640 |
| 5/18 | $10,497 | $10,840 | $10,716 |
| 6/18 | $10,497 | $10,824 | $10,703 |
| 7/18 | $10,500 | $10,847 | $10,705 |
| 8/18 | $10,558 | $10,900 | $10,774 |
| 9/18 | $10,510 | $10,853 | $10,705 |
| 10/18 | $10,439 | $10,763 | $10,620 |
| 11/18 | $10,475 | $10,811 | $10,683 |
| 12/18 | $10,597 | $10,980 | $10,880 |
| 1/19 | $10,729 | $11,132 | $10,995 |
| 2/19 | $10,752 | $11,144 | $10,989 |
| 3/19 | $10,933 | $11,345 | $11,200 |
| 4/19 | $10,952 | $11,361 | $11,203 |
| 5/19 | $11,128 | $11,535 | $11,402 |
| 6/19 | $11,235 | $11,698 | $11,545 |
| 7/19 | $11,259 | $11,733 | $11,570 |
| 8/19 | $11,529 | $11,998 | $11,870 |
| 9/19 | $11,467 | $11,946 | $11,807 |
| 10/19 | $11,503 | $11,985 | $11,842 |
| 11/19 | $11,504 | $11,982 | $11,836 |
| 12/19 | $11,492 | $12,000 | $11,828 |
| 1/20 | $11,723 | $12,216 | $12,056 |
| 2/20 | $11,871 | $12,399 | $12,273 |
| 3/20 | $11,286 | $12,156 | $12,200 |
| 4/20 | $11,527 | $12,400 | $12,417 |
| 5/20 | $11,640 | $12,516 | $12,475 |
| 6/20 | $11,863 | $12,620 | $12,554 |
| 7/20 | $12,082 | $12,842 | $12,741 |
| 8/20 | $12,069 | $12,768 | $12,638 |
| 9/20 | $12,076 | $12,745 | $12,632 |
| 10/20 | $12,040 | $12,699 | $12,575 |
| 11/20 | $12,260 | $12,865 | $12,698 |
| 12/20 | $12,340 | $12,909 | $12,716 |
| 1/21 | $12,329 | $12,828 | $12,625 |
| 2/21 | $12,219 | $12,663 | $12,443 |
| 3/21 | $12,129 | $12,515 | $12,287 |
| 4/21 | $12,222 | $12,621 | $12,384 |
| 5/21 | $12,272 | $12,669 | $12,425 |
| 6/21 | $12,356 | $12,761 | $12,512 |
| 7/21 | $12,477 | $12,889 | $12,652 |
| 8/21 | $12,468 | $12,881 | $12,628 |
| 9/21 | $12,392 | $12,771 | $12,518 |
| 10/21 | $12,380 | $12,760 | $12,515 |
| 11/21 | $12,371 | $12,776 | $12,552 |
| 12/21 | $12,352 | $12,767 | $12,520 |
| 1/22 | $12,125 | $12,487 | $12,250 |
| 2/22 | $11,974 | $12,317 | $12,114 |
| 3/22 | $11,673 | $11,986 | $11,777 |
| 4/22 | $11,304 | $11,539 | $11,330 |
| 5/22 | $11,305 | $11,603 | $11,403 |
| 6/22 | $11,073 | $11,371 | $11,224 |
| 7/22 | $11,340 | $11,657 | $11,498 |
| 8/22 | $11,088 | $11,354 | $11,174 |
| 9/22 | $10,638 | $10,865 | $10,691 |
| 10/22 | $10,485 | $10,745 | $10,552 |
| 11/22 | $10,836 | $11,146 | $10,940 |
| 12/22 | $10,814 | $11,108 | $10,891 |
| 1/23 | $11,207 | $11,453 | $11,226 |
| 2/23 | $10,981 | $11,171 | $10,936 |
| 3/23 | $11,193 | $11,434 | $11,214 |
| 4/23 | $11,259 | $11,503 | $11,282 |
| 5/23 | $11,157 | $11,384 | $11,159 |
| 6/23 | $11,139 | $11,366 | $11,119 |
| 7/23 | $11,153 | $11,378 | $11,111 |
| 8/23 | $11,114 | $11,309 | $11,040 |
| 9/23 | $10,855 | $11,040 | $10,760 |
| 10/23 | $10,674 | $10,874 | $10,590 |
| 11/23 | $11,174 | $11,363 | $11,069 |
| 12/23 | $11,604 | $11,794 | $11,493 |
| 1/24 | $11,637 | $11,766 | $11,462 |
| 2/24 | $11,479 | $11,625 | $11,300 |
| 3/24 | $11,595 | $11,739 | $11,404 |
| 4/24 | $11,324 | $11,465 | $11,116 |
| 5/24 | $11,529 | $11,655 | $11,304 |
| 6/24 | $11,639 | $11,761 | $11,411 |
| 7/24 | $11,912 | $12,028 | $11,678 |
| 8/24 | $12,089 | $12,205 | $11,846 |
| 9/24 | $12,262 | $12,373 | $12,004 |
Average Annual Total Returns (%)
| Fund | 1 Year | 5 Years | 10 Years |
|---|
| Class A | 12.93% | 1.34% | 2.39% |
| Class A with 3.25% Maximum Sales Charge | 9.28% | 0.68% | 2.06% |
Bloomberg U.S. Universal IndexFootnote Reference1 | 12.08% | 0.70% | 2.15% |
| Bloomberg U.S. Aggregate Bond Index | 11.57% | 0.33% | 1.84% |
| Footnote | Description |
Footnote1 | In accordance with regulatory changes requiring the Fund’s primary benchmark to represent the overall applicable market, the Fund’s primary prospectus benchmark changed to the indicated benchmark effective May 1, 2024. |
Performance does not reflect the deduction of taxes that a shareholder would pay on Fund distributions or redemption of Fund shares. Performance assumes that all dividends and distributions, if any, were reinvested. For more recent performance information, visit www.eatonvance.com/performance.php. Performance prior to December 31, 2016 is that of the Fund's former investment adviser.
THE FUND'S PAST PERFORMANCE IS NO GUARANTEE OF FUTURE RESULTS.
| Total Net Assets | $3,629,113,563 |
| # of Portfolio Holdings | 466 |
| Portfolio Turnover Rate | 320% |
| Total Advisory Fees Paid | $8,221,534 |
What did the Fund invest in?
The following tables reflect what the Fund invested in as of the report date.
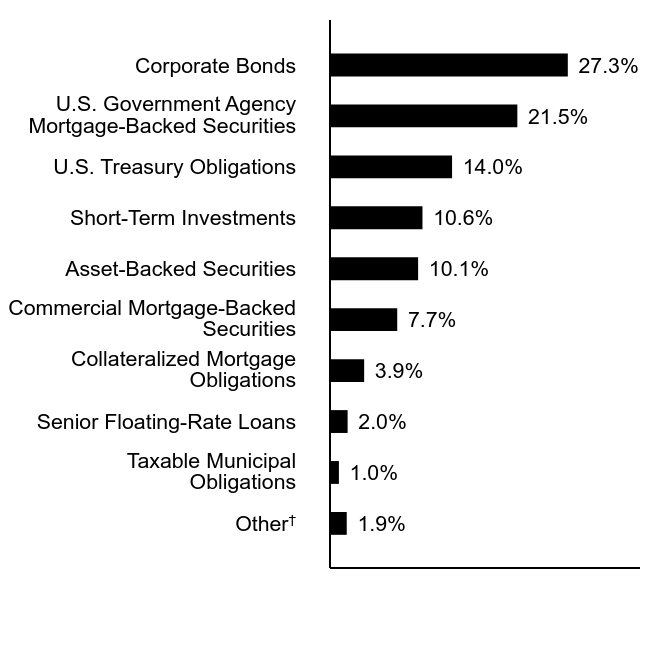
Asset Allocation (% of total investments)
| Value | Value |
|---|
OtherFootnote Reference† | 1.9% |
| Taxable Municipal Obligations | 1.0% |
| Senior Floating-Rate Loans | 2.0% |
| Collateralized Mortgage Obligations | 3.9% |
| Commercial Mortgage-Backed Securities | 7.7% |
| Asset-Backed Securities | 10.1% |
| Short-Term Investments | 10.6% |
| U.S. Treasury Obligations | 14.0% |
| U.S. Government Agency Mortgage-Backed Securities | 21.5% |
| Corporate Bonds | 27.3% |
| Footnote | Description |
Footnote† | Investment types less than 1% each |
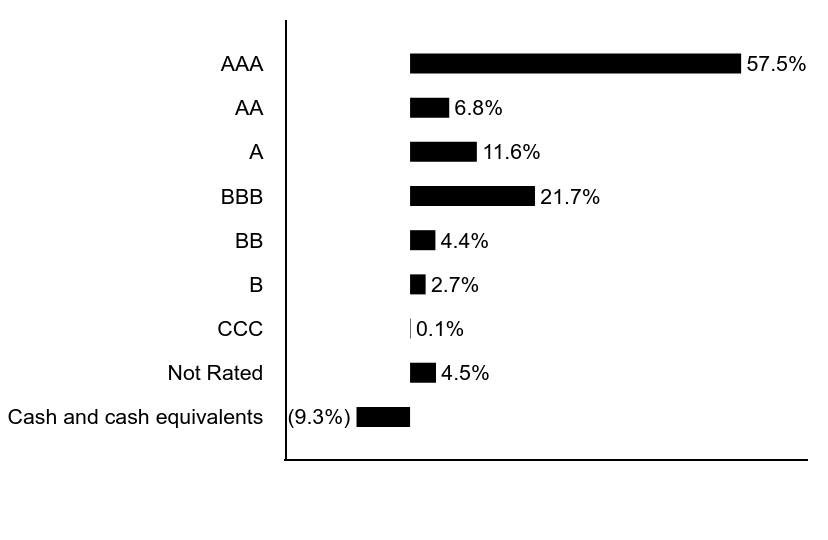
Credit Quality (% of net assets)Footnote Referencea
| Value | Value |
|---|
| Cash and cash equivalents | (9.3%) |
| Not Rated | 4.5% |
| CCC | 0.1% |
| B | 2.7% |
| BB | 4.4% |
| BBB | 21.7% |
| A | 11.6% |
| AA | 6.8% |
| AAA | 57.5% |
| Footnote | Description |
Footnotea | Ratings are based on Moody’s Investors Service, Inc. (“Moody’s”), S&P Global Ratings (“S&P”) or Fitch Ratings (“Fitch”). If securities are rated differently by the ratings agencies, the highest rating is applied. Moody's ratings are converted to the S&P and Fitch scale with ratings ranging from AAA, being the highest, to D, being the lowest. Ratings of BBB or higher are considered to be investment-grade quality. Holdings designated as “Not Rated” (if any) are not rated by the national ratings agencies stated above. |
If you wish to view additional information about the Fund, including the prospectus, statement of additional information, financial statements and holdings, please scan the QR code or visit www.eatonvance.com/calvert-fund-documents.php. For proxy information, please visit www.calvert.com/active-engagement.php?DM=how-we-influence.
The Funds may deliver a single copy of certain required shareholder documents (including prospectuses, shareholder reports, and proxy materials) to investors with the same last name and the same address. Your participation will continue indefinitely unless you instruct otherwise by calling 1-800-368-2745 or by contacting your financial intermediary. Your instruction will typically be effective within 30 days of receipt.
Not FDIC Insured | May Lose Value | No Bank Guarantee
Annual Shareholder Report September 30, 2024
Annual Shareholder Report September 30, 2024
This annual shareholder report contains important information about the Calvert Bond Fund for the period of October 1, 2023 to September 30, 2024. You can find additional information about the Fund at www.eatonvance.com/calvert-fund-documents.php. You can also request this information by contacting us at 1-800-368-2745.
What were the Fund costs for the last year?
(based on a hypothetical $10,000 investment)
| Class Name | Costs of a $10,000 investment | Costs paid as a percentage of a $10,000 investment |
|---|
| Class C | $162 | 1.53% |
How did the Fund perform last year and what affected its performance?
Key contributors to (↑) and detractors from (↓) performance, relative to the Bloomberg U.S. Aggregate Bond Index (the Index):
↑ Selections by Fund management, especially in investment-grade bonds and asset-backed securities, contributed most to Index-relative returns during the period
↑ The Fund’s sector positioning, including an underweight allocation to U.S. Treasurys, contributed to performance relative to the Index during the period
↑ Out-of-Index exposures to high yield corporate bonds and non-agency mortgage-backed securities further aided returns relative to the Index
↑ The use of U.S. Treasury futures contracts to manage interest rate movements contributed to Fund performance relative to the Index during the period
↓ The Fund’s underweight duration detracted most from performance relative to the Index during the period
↓ Selections in U.S. Treasurys detracted from performance relative to the Index during the period
↓ An out-of-Index position in bank loans and an overweight position in asset-backed securities detracted from performance relative to the Index during the period
↓ An underweight position in agency mortgage-backed securities also reduced performance relative to the Index during the period
Comparison of the change in value of a $10,000 investment for the period indicated.
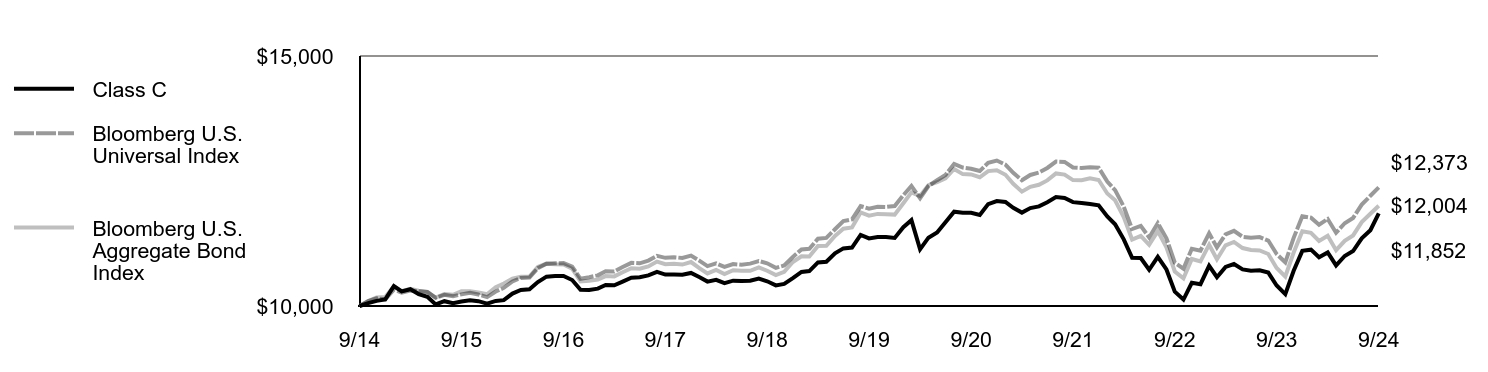
| Class C | Bloomberg U.S. Universal Index | Bloomberg U.S. Aggregate Bond Index |
|---|
| 9/14 | $10,000 | $10,000 | $10,000 |
| 10/14 | $10,057 | $10,098 | $10,098 |
| 11/14 | $10,102 | $10,152 | $10,170 |
| 12/14 | $10,132 | $10,134 | $10,179 |
| 1/15 | $10,399 | $10,327 | $10,393 |
| 2/15 | $10,293 | $10,267 | $10,295 |
| 3/15 | $10,335 | $10,309 | $10,343 |
| 4/15 | $10,239 | $10,297 | $10,306 |
| 5/15 | $10,184 | $10,279 | $10,281 |
| 6/15 | $10,031 | $10,164 | $10,169 |
| 7/15 | $10,096 | $10,224 | $10,240 |
| 8/15 | $10,054 | $10,194 | $10,225 |
| 9/15 | $10,089 | $10,233 | $10,294 |
| 10/15 | $10,115 | $10,266 | $10,296 |
| 11/15 | $10,096 | $10,229 | $10,269 |
| 12/15 | $10,047 | $10,178 | $10,235 |
| 1/16 | $10,102 | $10,290 | $10,376 |
| 2/16 | $10,117 | $10,363 | $10,450 |
| 3/16 | $10,248 | $10,490 | $10,546 |
| 4/16 | $10,321 | $10,562 | $10,586 |
| 5/16 | $10,334 | $10,570 | $10,589 |
| 6/16 | $10,478 | $10,756 | $10,779 |
| 7/16 | $10,587 | $10,844 | $10,847 |
| 8/16 | $10,600 | $10,856 | $10,835 |
| 9/16 | $10,599 | $10,859 | $10,829 |
| 10/16 | $10,519 | $10,787 | $10,746 |
| 11/16 | $10,323 | $10,544 | $10,492 |
| 12/16 | $10,321 | $10,576 | $10,506 |
| 1/17 | $10,347 | $10,613 | $10,527 |
| 2/17 | $10,420 | $10,695 | $10,598 |
| 3/17 | $10,414 | $10,691 | $10,592 |
| 4/17 | $10,487 | $10,780 | $10,674 |
| 5/17 | $10,565 | $10,863 | $10,756 |
| 6/17 | $10,576 | $10,854 | $10,745 |
| 7/17 | $10,613 | $10,908 | $10,792 |
| 8/17 | $10,683 | $11,002 | $10,888 |
| 9/17 | $10,628 | $10,963 | $10,836 |
| 10/17 | $10,632 | $10,976 | $10,843 |
| 11/17 | $10,626 | $10,960 | $10,829 |
| 12/17 | $10,661 | $11,008 | $10,879 |
| 1/18 | $10,577 | $10,902 | $10,753 |
| 2/18 | $10,488 | $10,799 | $10,651 |
| 3/18 | $10,524 | $10,853 | $10,720 |
| 4/18 | $10,458 | $10,781 | $10,640 |
| 5/18 | $10,507 | $10,840 | $10,716 |
| 6/18 | $10,501 | $10,824 | $10,703 |
| 7/18 | $10,504 | $10,847 | $10,705 |
| 8/18 | $10,548 | $10,900 | $10,774 |
| 9/18 | $10,494 | $10,853 | $10,705 |
| 10/18 | $10,413 | $10,763 | $10,620 |
| 11/18 | $10,443 | $10,811 | $10,683 |
| 12/18 | $10,559 | $10,980 | $10,880 |
| 1/19 | $10,682 | $11,132 | $10,995 |
| 2/19 | $10,698 | $11,144 | $10,989 |
| 3/19 | $10,872 | $11,345 | $11,200 |
| 4/19 | $10,884 | $11,361 | $11,203 |
| 5/19 | $11,052 | $11,535 | $11,402 |
| 6/19 | $11,152 | $11,698 | $11,545 |
| 7/19 | $11,168 | $11,733 | $11,570 |
| 8/19 | $11,422 | $11,998 | $11,870 |
| 9/19 | $11,353 | $11,946 | $11,807 |
| 10/19 | $11,381 | $11,985 | $11,842 |
| 11/19 | $11,382 | $11,982 | $11,836 |
| 12/19 | $11,361 | $12,000 | $11,828 |
| 1/20 | $11,577 | $12,216 | $12,056 |
| 2/20 | $11,717 | $12,399 | $12,273 |
| 3/20 | $11,134 | $12,156 | $12,200 |
| 4/20 | $11,366 | $12,400 | $12,417 |
| 5/20 | $11,471 | $12,516 | $12,475 |
| 6/20 | $11,677 | $12,620 | $12,554 |
| 7/20 | $11,886 | $12,842 | $12,741 |
| 8/20 | $11,865 | $12,768 | $12,638 |
| 9/20 | $11,864 | $12,745 | $12,632 |
| 10/20 | $11,820 | $12,699 | $12,575 |
| 11/20 | $12,037 | $12,865 | $12,698 |
| 12/20 | $12,100 | $12,909 | $12,716 |
| 1/21 | $12,081 | $12,828 | $12,625 |
| 2/21 | $11,965 | $12,663 | $12,443 |
| 3/21 | $11,868 | $12,515 | $12,287 |
| 4/21 | $11,958 | $12,621 | $12,384 |
| 5/21 | $11,992 | $12,669 | $12,425 |
| 6/21 | $12,075 | $12,761 | $12,512 |
| 7/21 | $12,178 | $12,889 | $12,652 |
| 8/21 | $12,161 | $12,881 | $12,628 |
| 9/21 | $12,077 | $12,771 | $12,518 |
| 10/21 | $12,058 | $12,760 | $12,515 |
| 11/21 | $12,041 | $12,776 | $12,552 |
| 12/21 | $12,014 | $12,767 | $12,520 |
| 1/22 | $11,791 | $12,487 | $12,250 |
| 2/22 | $11,635 | $12,317 | $12,114 |
| 3/22 | $11,333 | $11,986 | $11,777 |
| 4/22 | $10,965 | $11,539 | $11,330 |
| 5/22 | $10,959 | $11,603 | $11,403 |
| 6/22 | $10,725 | $11,371 | $11,224 |
| 7/22 | $10,984 | $11,657 | $11,498 |
| 8/22 | $10,731 | $11,354 | $11,174 |
| 9/22 | $10,286 | $10,865 | $10,691 |
| 10/22 | $10,129 | $10,745 | $10,552 |
| 11/22 | $10,464 | $11,146 | $10,940 |
| 12/22 | $10,436 | $11,108 | $10,891 |
| 1/23 | $10,803 | $11,453 | $11,226 |
| 2/23 | $10,576 | $11,171 | $10,936 |
| 3/23 | $10,782 | $11,434 | $11,214 |
| 4/23 | $10,839 | $11,503 | $11,282 |
| 5/23 | $10,732 | $11,384 | $11,159 |
| 6/23 | $10,707 | $11,366 | $11,119 |
| 7/23 | $10,713 | $11,378 | $11,111 |
| 8/23 | $10,668 | $11,309 | $11,040 |
| 9/23 | $10,410 | $11,040 | $10,760 |
| 10/23 | $10,236 | $10,874 | $10,590 |
| 11/23 | $10,704 | $11,363 | $11,069 |
| 12/23 | $11,103 | $11,794 | $11,493 |
| 1/24 | $11,127 | $11,766 | $11,462 |
| 2/24 | $10,976 | $11,625 | $11,300 |
| 3/24 | $11,072 | $11,739 | $11,404 |
| 4/24 | $10,811 | $11,465 | $11,116 |
| 5/24 | $11,001 | $11,655 | $11,304 |
| 6/24 | $11,099 | $11,761 | $11,411 |
| 7/24 | $11,354 | $12,028 | $11,678 |
| 8/24 | $11,515 | $12,205 | $11,846 |
| 9/24 | $11,852 | $12,373 | $12,004 |
Average Annual Total Returns (%)
| Fund | 1 Year | 5 Years | 10 Years |
|---|
| Class C | 12.09% | 0.55% | 1.71% |
| Class C with 1% Maximum Deferred Sales Charge | 11.09% | 0.55% | 1.71% |
Bloomberg U.S. Universal IndexFootnote Reference1 | 12.08% | 0.70% | 2.15% |
| Bloomberg U.S. Aggregate Bond Index | 11.57% | 0.33% | 1.84% |
| Footnote | Description |
Footnote1 | In accordance with regulatory changes requiring the Fund’s primary benchmark to represent the overall applicable market, the Fund’s primary prospectus benchmark changed to the indicated benchmark effective May 1, 2024. |
Performance does not reflect the deduction of taxes that a shareholder would pay on Fund distributions or redemption of Fund shares. Performance assumes that all dividends and distributions, if any, were reinvested. For more recent performance information, visit www.eatonvance.com/performance.php. Performance prior to December 31, 2016 is that of the Fund's former investment adviser.
THE FUND'S PAST PERFORMANCE IS NO GUARANTEE OF FUTURE RESULTS.
| Total Net Assets | $3,629,113,563 |
| # of Portfolio Holdings | 466 |
| Portfolio Turnover Rate | 320% |
| Total Advisory Fees Paid | $8,221,534 |
What did the Fund invest in?
The following tables reflect what the Fund invested in as of the report date.
Asset Allocation (% of total investments)
| Value | Value |
|---|
OtherFootnote Reference† | 1.9% |
| Taxable Municipal Obligations | 1.0% |
| Senior Floating-Rate Loans | 2.0% |
| Collateralized Mortgage Obligations | 3.9% |
| Commercial Mortgage-Backed Securities | 7.7% |
| Asset-Backed Securities | 10.1% |
| Short-Term Investments | 10.6% |
| U.S. Treasury Obligations | 14.0% |
| U.S. Government Agency Mortgage-Backed Securities | 21.5% |
| Corporate Bonds | 27.3% |
| Footnote | Description |
Footnote† | Investment types less than 1% each |
Credit Quality (% of net assets)Footnote Referencea
| Value | Value |
|---|
| Cash and cash equivalents | (9.3%) |
| Not Rated | 4.5% |
| CCC | 0.1% |
| B | 2.7% |
| BB | 4.4% |
| BBB | 21.7% |
| A | 11.6% |
| AA | 6.8% |
| AAA | 57.5% |
| Footnote | Description |
Footnotea | Ratings are based on Moody’s Investors Service, Inc. (“Moody’s”), S&P Global Ratings (“S&P”) or Fitch Ratings (“Fitch”). If securities are rated differently by the ratings agencies, the highest rating is applied. Moody's ratings are converted to the S&P and Fitch scale with ratings ranging from AAA, being the highest, to D, being the lowest. Ratings of BBB or higher are considered to be investment-grade quality. Holdings designated as “Not Rated” (if any) are not rated by the national ratings agencies stated above. |
If you wish to view additional information about the Fund, including the prospectus, statement of additional information, financial statements and holdings, please scan the QR code or visit www.eatonvance.com/calvert-fund-documents.php. For proxy information, please visit www.calvert.com/active-engagement.php?DM=how-we-influence.
The Funds may deliver a single copy of certain required shareholder documents (including prospectuses, shareholder reports, and proxy materials) to investors with the same last name and the same address. Your participation will continue indefinitely unless you instruct otherwise by calling 1-800-368-2745 or by contacting your financial intermediary. Your instruction will typically be effective within 30 days of receipt.
Not FDIC Insured | May Lose Value | No Bank Guarantee
Annual Shareholder Report September 30, 2024
Annual Shareholder Report September 30, 2024
This annual shareholder report contains important information about the Calvert Bond Fund for the period of October 1, 2023 to September 30, 2024. You can find additional information about the Fund at www.eatonvance.com/calvert-fund-documents.php. You can also request this information by contacting us at 1-800-368-2745.
What were the Fund costs for the last year?
(based on a hypothetical $10,000 investment)
| Class Name | Costs of a $10,000 investment | Costs paid as a percentage of a $10,000 investment |
|---|
| Class I | $56 | 0.53% |
How did the Fund perform last year and what affected its performance?
Key contributors to (↑) and detractors from (↓) performance, relative to the Bloomberg U.S. Aggregate Bond Index (the Index):
↑ Selections by Fund management, especially in investment-grade bonds and asset-backed securities, contributed most to Index-relative returns during the period
↑ The Fund’s sector positioning, including an underweight allocation to U.S. Treasurys, contributed to performance relative to the Index during the period
↑ Out-of-Index exposures to high yield corporate bonds and non-agency mortgage-backed securities further aided returns relative to the Index
↑ The use of U.S. Treasury futures contracts to manage interest rate movements contributed to Fund performance relative to the Index during the period
↓ The Fund’s underweight duration detracted most from performance relative to the Index during the period
↓ Selections in U.S. Treasurys detracted from performance relative to the Index during the period
↓ An out-of-Index position in bank loans and an overweight position in asset-backed securities detracted from performance relative to the Index during the period
↓ An underweight position in agency mortgage-backed securities also reduced performance relative to the Index during the period
Comparison of the change in value of a $1,000,000 investment for the period indicated.
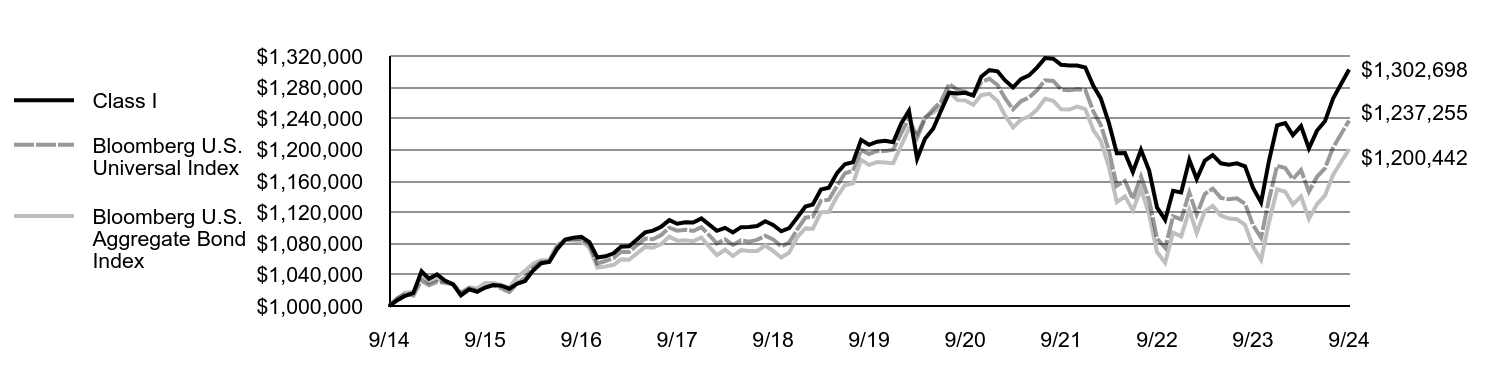
| Class I | Bloomberg U.S. Universal Index | Bloomberg U.S. Aggregate Bond Index |
|---|
| 9/14 | $1,000,000 | $1,000,000 | $1,000,000 |
| 10/14 | $1,007,440 | $1,009,792 | $1,009,828 |
| 11/14 | $1,013,056 | $1,015,242 | $1,016,991 |
| 12/14 | $1,016,692 | $1,013,408 | $1,017,942 |
| 1/15 | $1,044,443 | $1,032,698 | $1,039,288 |
| 2/15 | $1,034,963 | $1,026,679 | $1,029,516 |
| 3/15 | $1,040,429 | $1,030,917 | $1,034,297 |
| 4/15 | $1,032,597 | $1,029,721 | $1,030,585 |
| 5/15 | $1,027,625 | $1,027,919 | $1,028,104 |
| 6/15 | $1,013,571 | $1,016,447 | $1,016,893 |
| 7/15 | $1,021,304 | $1,022,366 | $1,023,962 |
| 8/15 | $1,018,205 | $1,019,354 | $1,022,492 |
| 9/15 | $1,023,556 | $1,023,344 | $1,029,408 |
| 10/15 | $1,026,721 | $1,026,615 | $1,029,579 |
| 11/15 | $1,026,040 | $1,022,871 | $1,026,859 |
| 12/15 | $1,022,169 | $1,017,761 | $1,023,541 |
| 1/16 | $1,028,719 | $1,028,996 | $1,037,626 |
| 2/16 | $1,031,925 | $1,036,306 | $1,044,987 |
| 3/16 | $1,045,565 | $1,049,006 | $1,054,574 |
| 4/16 | $1,054,678 | $1,056,153 | $1,058,622 |
| 5/16 | $1,056,417 | $1,056,978 | $1,058,894 |
| 6/16 | $1,072,842 | $1,075,586 | $1,077,920 |
| 7/16 | $1,085,082 | $1,084,449 | $1,084,735 |
| 8/16 | $1,087,518 | $1,085,619 | $1,083,494 |
| 9/16 | $1,088,592 | $1,085,877 | $1,082,859 |
| 10/16 | $1,081,654 | $1,078,673 | $1,074,577 |
| 11/16 | $1,062,061 | $1,054,427 | $1,049,159 |
| 12/16 | $1,063,647 | $1,057,560 | $1,050,639 |
| 1/17 | $1,067,467 | $1,061,291 | $1,052,700 |
| 2/17 | $1,075,945 | $1,069,479 | $1,059,775 |
| 3/17 | $1,076,469 | $1,069,121 | $1,059,220 |
| 4/17 | $1,085,034 | $1,077,992 | $1,067,394 |
| 5/17 | $1,094,185 | $1,086,309 | $1,075,610 |
| 6/17 | $1,096,523 | $1,085,388 | $1,074,527 |
| 7/17 | $1,101,532 | $1,090,794 | $1,079,151 |
| 8/17 | $1,109,911 | $1,100,205 | $1,088,831 |
| 9/17 | $1,105,347 | $1,096,333 | $1,083,645 |
| 10/17 | $1,107,257 | $1,097,650 | $1,084,272 |
| 11/17 | $1,106,946 | $1,095,989 | $1,082,881 |
| 12/17 | $1,112,162 | $1,100,820 | $1,087,851 |
| 1/18 | $1,103,815 | $1,090,227 | $1,075,322 |
| 2/18 | $1,096,192 | $1,079,889 | $1,065,128 |
| 3/18 | $1,100,024 | $1,085,336 | $1,071,959 |
| 4/18 | $1,094,141 | $1,078,094 | $1,063,986 |
| 5/18 | $1,100,923 | $1,083,973 | $1,071,580 |
| 6/18 | $1,101,155 | $1,082,401 | $1,070,262 |
| 7/18 | $1,102,328 | $1,084,667 | $1,070,516 |
| 8/18 | $1,108,509 | $1,090,010 | $1,077,405 |
| 9/18 | $1,103,652 | $1,085,340 | $1,070,467 |
| 10/18 | $1,095,688 | $1,076,261 | $1,062,007 |
| 11/18 | $1,099,674 | $1,081,101 | $1,068,347 |
| 12/18 | $1,113,276 | $1,098,015 | $1,087,974 |
| 1/19 | $1,127,329 | $1,113,155 | $1,099,528 |
| 2/19 | $1,129,923 | $1,114,368 | $1,098,891 |
| 3/19 | $1,149,103 | $1,134,491 | $1,119,992 |
| 4/19 | $1,151,302 | $1,136,079 | $1,120,278 |
| 5/19 | $1,169,957 | $1,153,482 | $1,140,165 |
| 6/19 | $1,181,399 | $1,169,797 | $1,154,483 |
| 7/19 | $1,184,104 | $1,173,279 | $1,157,023 |
| 8/19 | $1,212,595 | $1,199,827 | $1,187,003 |
| 9/19 | $1,206,325 | $1,194,629 | $1,180,681 |
| 10/19 | $1,210,293 | $1,198,489 | $1,184,238 |
| 11/19 | $1,211,390 | $1,198,249 | $1,183,635 |
| 12/19 | $1,209,546 | $1,200,035 | $1,182,810 |
| 1/20 | $1,234,033 | $1,221,573 | $1,205,572 |
| 2/20 | $1,249,839 | $1,239,864 | $1,227,271 |
| 3/20 | $1,188,509 | $1,215,645 | $1,220,049 |
| 4/20 | $1,214,111 | $1,239,996 | $1,241,736 |
| 5/20 | $1,226,944 | $1,251,577 | $1,247,518 |
| 6/20 | $1,249,859 | $1,262,020 | $1,255,376 |
| 7/20 | $1,273,058 | $1,284,189 | $1,274,128 |
| 8/20 | $1,271,940 | $1,276,784 | $1,263,843 |
| 9/20 | $1,272,918 | $1,274,483 | $1,263,150 |
| 10/20 | $1,269,302 | $1,269,928 | $1,257,510 |
| 11/20 | $1,293,437 | $1,286,499 | $1,269,849 |
| 12/20 | $1,302,074 | $1,290,942 | $1,271,599 |
| 1/21 | $1,300,420 | $1,282,828 | $1,262,482 |
| 2/21 | $1,289,013 | $1,266,275 | $1,244,251 |
| 3/21 | $1,279,800 | $1,251,539 | $1,228,714 |
| 4/21 | $1,290,480 | $1,262,063 | $1,238,421 |
| 5/21 | $1,295,227 | $1,266,877 | $1,242,467 |
| 6/21 | $1,305,124 | $1,276,113 | $1,251,197 |
| 7/21 | $1,317,330 | $1,288,927 | $1,265,186 |
| 8/21 | $1,316,602 | $1,288,066 | $1,262,777 |
| 9/21 | $1,308,730 | $1,277,067 | $1,251,844 |
| 10/21 | $1,307,792 | $1,276,023 | $1,251,499 |
| 11/21 | $1,307,757 | $1,277,564 | $1,255,202 |
| 12/21 | $1,305,228 | $1,276,703 | $1,251,990 |
| 1/22 | $1,281,552 | $1,248,712 | $1,225,017 |
| 2/22 | $1,265,746 | $1,231,687 | $1,211,350 |
| 3/22 | $1,234,236 | $1,198,643 | $1,177,697 |
| 4/22 | $1,195,539 | $1,153,936 | $1,133,006 |
| 5/22 | $1,195,851 | $1,160,286 | $1,140,311 |
| 6/22 | $1,171,551 | $1,137,100 | $1,122,422 |
| 7/22 | $1,199,877 | $1,165,689 | $1,149,848 |
| 8/22 | $1,173,484 | $1,135,386 | $1,117,357 |
| 9/22 | $1,126,205 | $1,086,469 | $1,069,080 |
| 10/22 | $1,110,178 | $1,074,548 | $1,055,233 |
| 11/22 | $1,147,442 | $1,114,614 | $1,094,040 |
| 12/22 | $1,145,387 | $1,110,828 | $1,089,105 |
| 1/23 | $1,187,137 | $1,145,286 | $1,122,610 |
| 2/23 | $1,162,545 | $1,117,145 | $1,093,584 |
| 3/23 | $1,186,006 | $1,143,352 | $1,121,364 |
| 4/23 | $1,193,230 | $1,150,337 | $1,128,160 |
| 5/23 | $1,182,624 | $1,138,410 | $1,115,876 |
| 6/23 | $1,180,872 | $1,136,641 | $1,111,896 |
| 7/23 | $1,182,585 | $1,137,771 | $1,111,121 |
| 8/23 | $1,178,672 | $1,130,920 | $1,104,024 |
| 9/23 | $1,151,431 | $1,103,953 | $1,075,969 |
| 10/23 | $1,132,492 | $1,087,351 | $1,058,989 |
| 11/23 | $1,185,598 | $1,136,287 | $1,106,947 |
| 12/23 | $1,231,370 | $1,179,403 | $1,149,319 |
| 1/24 | $1,234,218 | $1,176,580 | $1,146,163 |
| 2/24 | $1,218,622 | $1,162,474 | $1,129,970 |
| 3/24 | $1,230,191 | $1,173,887 | $1,140,404 |
| 4/24 | $1,201,670 | $1,146,456 | $1,111,599 |
| 5/24 | $1,224,554 | $1,165,459 | $1,130,444 |
| 6/24 | $1,236,363 | $1,176,114 | $1,141,147 |
| 7/24 | $1,265,570 | $1,202,809 | $1,167,800 |
| 8/24 | $1,284,525 | $1,220,515 | $1,184,582 |
| 9/24 | $1,302,698 | $1,237,255 | $1,200,442 |
Average Annual Total Returns (%)
| Fund | 1 Year | 5 Years | 10 Years |
|---|
| Class I | 13.14% | 1.55% | 2.68% |
Bloomberg U.S. Universal IndexFootnote Reference1 | 12.08% | 0.70% | 2.15% |
| Bloomberg U.S. Aggregate Bond Index | 11.57% | 0.33% | 1.84% |
| Footnote | Description |
Footnote1 | In accordance with regulatory changes requiring the Fund’s primary benchmark to represent the overall applicable market, the Fund’s primary prospectus benchmark changed to the indicated benchmark effective May 1, 2024. |
Performance does not reflect the deduction of taxes that a shareholder would pay on Fund distributions or redemption of Fund shares. Performance assumes that all dividends and distributions, if any, were reinvested. For more recent performance information, visit www.eatonvance.com/performance.php. Performance prior to December 31, 2016 is that of the Fund's former investment adviser.
THE FUND'S PAST PERFORMANCE IS NO GUARANTEE OF FUTURE RESULTS.
| Total Net Assets | $3,629,113,563 |
| # of Portfolio Holdings | 466 |
| Portfolio Turnover Rate | 320% |
| Total Advisory Fees Paid | $8,221,534 |
What did the Fund invest in?
The following tables reflect what the Fund invested in as of the report date.
Asset Allocation (% of total investments)
| Value | Value |
|---|
OtherFootnote Reference† | 1.9% |
| Taxable Municipal Obligations | 1.0% |
| Senior Floating-Rate Loans | 2.0% |
| Collateralized Mortgage Obligations | 3.9% |
| Commercial Mortgage-Backed Securities | 7.7% |
| Asset-Backed Securities | 10.1% |
| Short-Term Investments | 10.6% |
| U.S. Treasury Obligations | 14.0% |
| U.S. Government Agency Mortgage-Backed Securities | 21.5% |
| Corporate Bonds | 27.3% |
| Footnote | Description |
Footnote† | Investment types less than 1% each |
Credit Quality (% of net assets)Footnote Referencea
| Value | Value |
|---|
| Cash and cash equivalents | (9.3%) |
| Not Rated | 4.5% |
| CCC | 0.1% |
| B | 2.7% |
| BB | 4.4% |
| BBB | 21.7% |
| A | 11.6% |
| AA | 6.8% |
| AAA | 57.5% |
| Footnote | Description |
Footnotea | Ratings are based on Moody’s Investors Service, Inc. (“Moody’s”), S&P Global Ratings (“S&P”) or Fitch Ratings (“Fitch”). If securities are rated differently by the ratings agencies, the highest rating is applied. Moody's ratings are converted to the S&P and Fitch scale with ratings ranging from AAA, being the highest, to D, being the lowest. Ratings of BBB or higher are considered to be investment-grade quality. Holdings designated as “Not Rated” (if any) are not rated by the national ratings agencies stated above. |
If you wish to view additional information about the Fund, including the prospectus, statement of additional information, financial statements and holdings, please scan the QR code or visit www.eatonvance.com/calvert-fund-documents.php. For proxy information, please visit www.calvert.com/active-engagement.php?DM=how-we-influence.
The Funds may deliver a single copy of certain required shareholder documents (including prospectuses, shareholder reports, and proxy materials) to investors with the same last name and the same address. Your participation will continue indefinitely unless you instruct otherwise by calling 1-800-368-2745 or by contacting your financial intermediary. Your instruction will typically be effective within 30 days of receipt.
Not FDIC Insured | May Lose Value | No Bank Guarantee
Annual Shareholder Report September 30, 2024
Annual Shareholder Report September 30, 2024
This annual shareholder report contains important information about the Calvert Bond Fund for the period of October 1, 2023 to September 30, 2024. You can find additional information about the Fund at www.eatonvance.com/calvert-fund-documents.php. You can also request this information by contacting us at 1-800-368-2745.
What were the Fund costs for the last year?
(based on a hypothetical $10,000 investment)
| Class Name | Costs of a $10,000 investment | Costs paid as a percentage of a $10,000 investment |
|---|
| Class R6 | $49 | 0.46% |
How did the Fund perform last year and what affected its performance?
Key contributors to (↑) and detractors from (↓) performance, relative to the Bloomberg U.S. Aggregate Bond Index (the Index):
↑ Selections by Fund management, especially in investment-grade bonds and asset-backed securities, contributed most to Index-relative returns during the period
↑ The Fund’s sector positioning, including an underweight allocation to U.S. Treasurys, contributed to performance relative to the Index during the period
↑ Out-of-Index exposures to high yield corporate bonds and non-agency mortgage-backed securities further aided returns relative to the Index
↑ The use of U.S. Treasury futures contracts to manage interest rate movements contributed to Fund performance relative to the Index during the period
↓ The Fund’s underweight duration detracted most from performance relative to the Index during the period
↓ Selections in U.S. Treasurys detracted from performance relative to the Index during the period
↓ An out-of-Index position in bank loans and an overweight position in asset-backed securities detracted from performance relative to the Index during the period
↓ An underweight position in agency mortgage-backed securities also reduced performance relative to the Index during the period
Comparison of the change in value of a $5,000,000 investment for the period indicated.
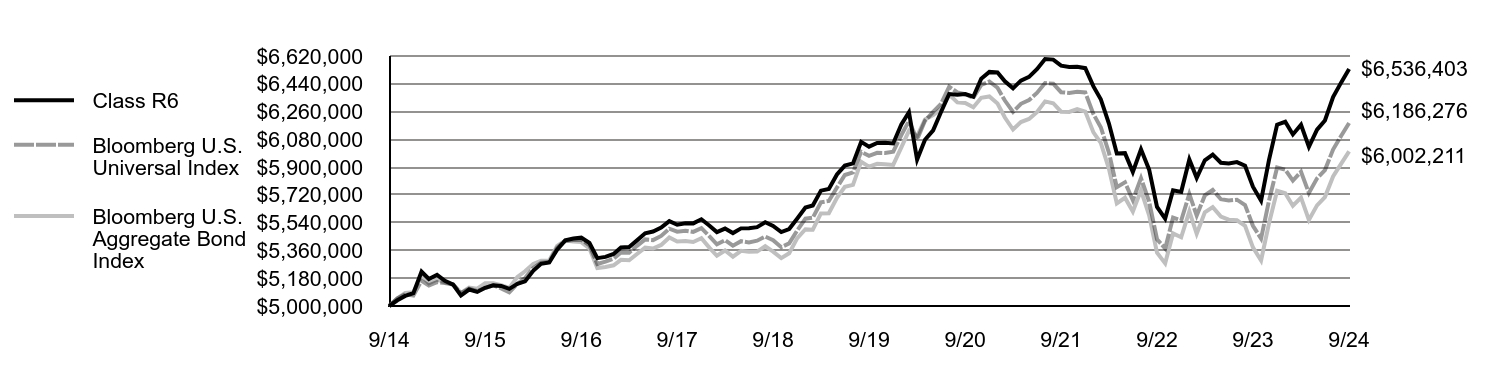
| Class R6 | Bloomberg U.S. Universal Index | Bloomberg U.S. Aggregate Bond Index |
|---|
| 9/14 | $5,000,000 | $5,000,000 | $5,000,000 |
| 10/14 | $5,037,199 | $5,048,962 | $5,049,138 |
| 11/14 | $5,065,280 | $5,076,209 | $5,084,956 |
| 12/14 | $5,083,461 | $5,067,038 | $5,089,712 |
| 1/15 | $5,222,217 | $5,163,490 | $5,196,439 |
| 2/15 | $5,174,817 | $5,133,397 | $5,147,580 |
| 3/15 | $5,202,144 | $5,154,585 | $5,171,483 |
| 4/15 | $5,162,983 | $5,148,604 | $5,152,927 |
| 5/15 | $5,138,124 | $5,139,597 | $5,140,518 |
| 6/15 | $5,067,854 | $5,082,236 | $5,084,467 |
| 7/15 | $5,106,522 | $5,111,830 | $5,119,810 |
| 8/15 | $5,091,023 | $5,096,768 | $5,112,458 |
| 9/15 | $5,117,780 | $5,116,718 | $5,147,040 |
| 10/15 | $5,133,604 | $5,133,074 | $5,147,895 |
| 11/15 | $5,130,199 | $5,114,355 | $5,134,295 |
| 12/15 | $5,110,844 | $5,088,805 | $5,117,703 |
| 1/16 | $5,143,593 | $5,144,980 | $5,188,129 |
| 2/16 | $5,159,626 | $5,181,528 | $5,224,933 |
| 3/16 | $5,227,823 | $5,245,029 | $5,272,871 |
| 4/16 | $5,273,390 | $5,280,765 | $5,293,111 |
| 5/16 | $5,282,084 | $5,284,889 | $5,294,468 |
| 6/16 | $5,364,212 | $5,377,929 | $5,389,599 |
| 7/16 | $5,425,409 | $5,422,245 | $5,423,673 |
| 8/16 | $5,437,592 | $5,428,094 | $5,417,471 |
| 9/16 | $5,442,958 | $5,429,384 | $5,414,297 |
| 10/16 | $5,408,270 | $5,393,365 | $5,372,883 |
| 11/16 | $5,310,305 | $5,272,137 | $5,245,795 |
| 12/16 | $5,318,234 | $5,287,798 | $5,253,193 |
| 1/17 | $5,337,334 | $5,306,454 | $5,263,501 |
| 2/17 | $5,379,727 | $5,347,397 | $5,298,877 |
| 3/17 | $5,382,345 | $5,345,606 | $5,296,098 |
| 4/17 | $5,425,171 | $5,389,960 | $5,336,968 |
| 5/17 | $5,470,926 | $5,431,545 | $5,378,048 |
| 6/17 | $5,482,616 | $5,426,940 | $5,372,635 |
| 7/17 | $5,507,659 | $5,453,971 | $5,395,754 |
| 8/17 | $5,549,557 | $5,501,026 | $5,444,153 |
| 9/17 | $5,526,737 | $5,481,666 | $5,418,223 |
| 10/17 | $5,536,320 | $5,488,248 | $5,421,362 |
| 11/17 | $5,535,413 | $5,479,943 | $5,414,403 |
| 12/17 | $5,561,809 | $5,504,100 | $5,439,253 |
| 1/18 | $5,520,167 | $5,451,135 | $5,376,610 |
| 2/18 | $5,478,759 | $5,399,447 | $5,325,642 |
| 3/18 | $5,501,593 | $5,426,680 | $5,359,795 |
| 4/18 | $5,472,446 | $5,390,471 | $5,319,932 |
| 5/18 | $5,503,100 | $5,419,867 | $5,357,900 |
| 6/18 | $5,504,542 | $5,412,007 | $5,351,310 |
| 7/18 | $5,511,004 | $5,423,333 | $5,352,582 |
| 8/18 | $5,542,344 | $5,450,052 | $5,387,024 |
| 9/18 | $5,518,535 | $5,426,699 | $5,352,334 |
| 10/18 | $5,478,861 | $5,381,303 | $5,310,037 |
| 11/18 | $5,499,018 | $5,405,504 | $5,341,736 |
| 12/18 | $5,567,293 | $5,490,077 | $5,439,871 |
| 1/19 | $5,637,830 | $5,565,773 | $5,497,639 |
| 2/19 | $5,651,106 | $5,571,839 | $5,494,454 |
| 3/19 | $5,747,427 | $5,672,454 | $5,599,958 |
| 4/19 | $5,758,756 | $5,680,394 | $5,601,391 |
| 5/19 | $5,852,440 | $5,767,409 | $5,700,825 |
| 6/19 | $5,910,076 | $5,848,985 | $5,772,417 |
| 7/19 | $5,923,956 | $5,866,395 | $5,785,114 |
| 8/19 | $6,063,323 | $5,999,137 | $5,935,016 |
| 9/19 | $6,032,289 | $5,973,146 | $5,903,406 |
| 10/19 | $6,056,118 | $5,992,444 | $5,921,188 |
| 11/19 | $6,058,327 | $5,991,246 | $5,918,173 |
| 12/19 | $6,053,076 | $6,000,174 | $5,914,048 |
| 1/20 | $6,176,050 | $6,107,865 | $6,027,861 |
| 2/20 | $6,255,537 | $6,199,319 | $6,136,354 |
| 3/20 | $5,948,739 | $6,078,224 | $6,100,243 |
| 4/20 | $6,077,300 | $6,199,980 | $6,208,682 |
| 5/20 | $6,138,223 | $6,257,887 | $6,237,589 |
| 6/20 | $6,257,036 | $6,310,102 | $6,276,880 |
| 7/20 | $6,373,610 | $6,420,945 | $6,370,638 |
| 8/20 | $6,368,383 | $6,383,919 | $6,319,215 |
| 9/20 | $6,373,642 | $6,372,414 | $6,315,751 |
| 10/20 | $6,355,883 | $6,349,638 | $6,287,550 |
| 11/20 | $6,473,419 | $6,432,497 | $6,349,245 |
| 12/20 | $6,517,028 | $6,454,709 | $6,357,994 |
| 1/21 | $6,512,929 | $6,414,139 | $6,312,408 |
| 2/21 | $6,456,113 | $6,331,377 | $6,221,254 |
| 3/21 | $6,410,318 | $6,257,696 | $6,143,571 |
| 4/21 | $6,460,384 | $6,310,316 | $6,192,105 |
| 5/21 | $6,484,554 | $6,334,386 | $6,212,335 |
| 6/21 | $6,534,531 | $6,380,565 | $6,255,983 |
| 7/21 | $6,599,956 | $6,444,633 | $6,325,932 |
| 8/21 | $6,596,692 | $6,440,332 | $6,313,887 |
| 9/21 | $6,557,713 | $6,385,334 | $6,259,222 |
| 10/21 | $6,549,367 | $6,380,115 | $6,257,496 |
| 11/21 | $6,549,556 | $6,387,822 | $6,276,009 |
| 12/21 | $6,541,190 | $6,383,515 | $6,259,951 |
| 1/22 | $6,422,902 | $6,243,562 | $6,125,085 |
| 2/22 | $6,340,032 | $6,158,437 | $6,056,752 |
| 3/22 | $6,182,372 | $5,993,214 | $5,888,485 |
| 4/22 | $5,988,635 | $5,769,682 | $5,665,028 |
| 5/22 | $5,990,544 | $5,801,428 | $5,701,554 |
| 6/22 | $5,868,981 | $5,685,501 | $5,612,108 |
| 7/22 | $6,015,398 | $5,828,446 | $5,749,238 |
| 8/22 | $5,883,343 | $5,676,928 | $5,586,784 |
| 9/22 | $5,642,454 | $5,432,344 | $5,345,399 |
| 10/22 | $5,566,387 | $5,372,739 | $5,276,164 |
| 11/22 | $5,749,639 | $5,573,070 | $5,470,198 |
| 12/22 | $5,739,657 | $5,554,141 | $5,445,523 |
| 1/23 | $5,949,495 | $5,726,432 | $5,613,049 |
| 2/23 | $5,830,455 | $5,585,724 | $5,467,922 |
| 3/23 | $5,944,442 | $5,716,761 | $5,606,821 |
| 4/23 | $5,981,021 | $5,751,684 | $5,640,802 |
| 5/23 | $5,928,117 | $5,692,052 | $5,579,381 |
| 6/23 | $5,923,763 | $5,683,206 | $5,559,482 |
| 7/23 | $5,932,685 | $5,688,856 | $5,555,606 |
| 8/23 | $5,909,206 | $5,654,598 | $5,520,121 |
| 9/23 | $5,772,751 | $5,519,764 | $5,379,845 |
| 10/23 | $5,682,172 | $5,436,756 | $5,294,945 |
| 11/23 | $5,944,933 | $5,681,437 | $5,534,733 |
| 12/23 | $6,175,114 | $5,897,014 | $5,746,597 |
| 1/24 | $6,193,992 | $5,882,902 | $5,730,816 |
| 2/24 | $6,111,724 | $5,812,368 | $5,649,850 |
| 3/24 | $6,174,437 | $5,869,437 | $5,702,020 |
| 4/24 | $6,031,510 | $5,732,278 | $5,557,996 |
| 5/24 | $6,142,484 | $5,827,297 | $5,652,222 |
| 6/24 | $6,202,142 | $5,880,568 | $5,705,733 |
| 7/24 | $6,353,550 | $6,014,044 | $5,839,002 |
| 8/24 | $6,449,127 | $6,102,576 | $5,922,908 |
| 9/24 | $6,536,403 | $6,186,276 | $6,002,211 |
Average Annual Total Returns (%)Footnote Reference1
| Fund | 1 Year | 5 Years | 10 Years |
|---|
| Class R6 | 13.23% | 1.62% | 2.71% |
Bloomberg U.S. Universal IndexFootnote Reference2 | 12.08% | 0.70% | 2.15% |
| Bloomberg U.S. Aggregate Bond Index | 11.57% | 0.33% | 1.84% |
| Footnote | Description |
Footnote1 | Class R6 performance prior to 10/3/17 is linked to Class I. This linked performance is adjusted for any applicable sales charge, but is not adjusted for class expense differences. If adjusted for such differences, the performance would be different. Performance presented in the Financial Highlights included in the financial statements is not linked. |
Footnote2 | In accordance with regulatory changes requiring the Fund’s primary benchmark to represent the overall applicable market, the Fund’s primary prospectus benchmark changed to the indicated benchmark effective May 1, 2024. |
Performance does not reflect the deduction of taxes that a shareholder would pay on Fund distributions or redemption of Fund shares. Performance assumes that all dividends and distributions, if any, were reinvested. For more recent performance information, visit www.eatonvance.com/performance.php. Performance prior to December 31, 2016 is that of the Fund's former investment adviser.
THE FUND'S PAST PERFORMANCE IS NO GUARANTEE OF FUTURE RESULTS.
| Total Net Assets | $3,629,113,563 |
| # of Portfolio Holdings | 466 |
| Portfolio Turnover Rate | 320% |
| Total Advisory Fees Paid | $8,221,534 |
What did the Fund invest in?
The following tables reflect what the Fund invested in as of the report date.
Asset Allocation (% of total investments)
| Value | Value |
|---|
OtherFootnote Reference† | 1.9% |
| Taxable Municipal Obligations | 1.0% |
| Senior Floating-Rate Loans | 2.0% |
| Collateralized Mortgage Obligations | 3.9% |
| Commercial Mortgage-Backed Securities | 7.7% |
| Asset-Backed Securities | 10.1% |
| Short-Term Investments | 10.6% |
| U.S. Treasury Obligations | 14.0% |
| U.S. Government Agency Mortgage-Backed Securities | 21.5% |
| Corporate Bonds | 27.3% |
| Footnote | Description |
Footnote† | Investment types less than 1% each |
Credit Quality (% of net assets)Footnote Referencea
| Value | Value |
|---|
| Cash and cash equivalents | (9.3%) |
| Not Rated | 4.5% |
| CCC | 0.1% |
| B | 2.7% |
| BB | 4.4% |
| BBB | 21.7% |
| A | 11.6% |
| AA | 6.8% |
| AAA | 57.5% |
| Footnote | Description |
Footnotea | Ratings are based on Moody’s Investors Service, Inc. (“Moody’s”), S&P Global Ratings (“S&P”) or Fitch Ratings (“Fitch”). If securities are rated differently by the ratings agencies, the highest rating is applied. Moody's ratings are converted to the S&P and Fitch scale with ratings ranging from AAA, being the highest, to D, being the lowest. Ratings of BBB or higher are considered to be investment-grade quality. Holdings designated as “Not Rated” (if any) are not rated by the national ratings agencies stated above. |
If you wish to view additional information about the Fund, including the prospectus, statement of additional information, financial statements and holdings, please scan the QR code or visit www.eatonvance.com/calvert-fund-documents.php. For proxy information, please visit www.calvert.com/active-engagement.php?DM=how-we-influence.
The Funds may deliver a single copy of certain required shareholder documents (including prospectuses, shareholder reports, and proxy materials) to investors with the same last name and the same address. Your participation will continue indefinitely unless you instruct otherwise by calling 1-800-368-2745 or by contacting your financial intermediary. Your instruction will typically be effective within 30 days of receipt.
Not FDIC Insured | May Lose Value | No Bank Guarantee
Annual Shareholder Report September 30, 2024
Calvert Conservative Allocation Fund
Annual Shareholder Report September 30, 2024
This annual shareholder report contains important information about the Calvert Conservative Allocation Fund for the period of October 1, 2023 to September 30, 2024. You can find additional information about the Fund at www.eatonvance.com/calvert-fund-documents.php. You can also request this information by contacting us at 1-800-368-2745.
What were the Fund costs for the last year?
(based on a hypothetical $10,000 investment)
| Class Name | Costs of a $10,000 investment | Costs paid as a percentage of a $10,000 investment |
|---|
| Class A | $47 | 0.43% |
How did the Fund perform last year and what affected its performance?
Key contributors to (↑) and detractors from (↓) performance, relative to the Conservative Allocation Blended Benchmark (the Blended Index):
↓ Among equity funds, allocations to Calvert Equity Fund and Calvert Emerging Markets Advancement Fund detracted from returns relative to the Blended Index
↓ Among stock sizes, allocations to small-cap and mid-cap companies detracted from performance relative to the Blended Index during the period
↓ Among asset classes, the Fund’s underweight allocation to investment-grade bonds detracted from performance relative to the Blended Index during the period
↓ The Fund’s underweight duration detracted from performance relative to the Blended Index during the period
↑ The Fund’s larger-than-Blended Index allocation to fixed-income assets contributed to returns relative to the Blended Index during the period
↑ Selections among fixed-income funds ― especially the Fund’s allocation to Calvert Bond Fund ― contributed to returns relative to the Blended Index
↑ Among asset classes, the Fund’s overweight allocations to high yield corporate bonds and bank loans aided performance relative to the Blended Index
↑ The Fund’s use of derivatives contributed to performance relative to the Blended Index during the period
Comparison of the change in value of a $10,000 investment for the period indicated.
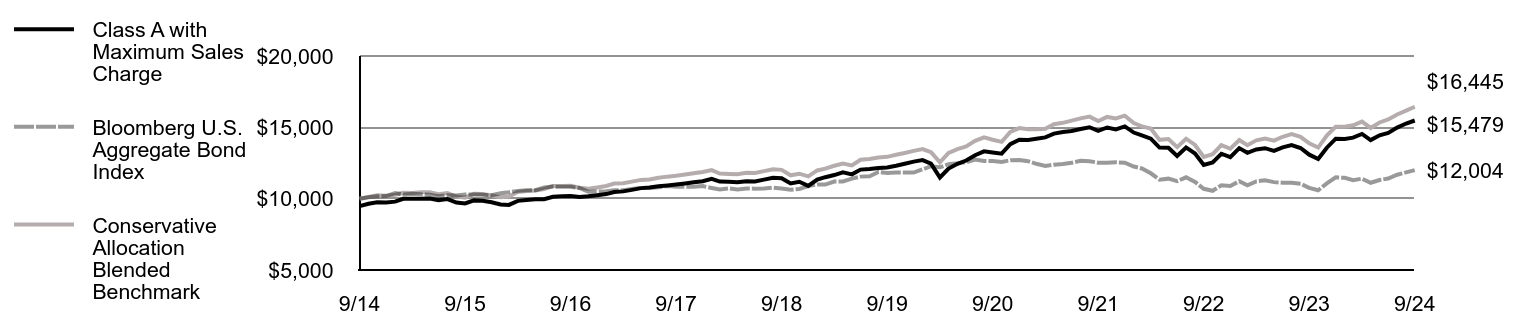
| Class A with Maximum Sales Charge | Bloomberg U.S. Aggregate Bond Index | Conservative Allocation Blended Benchmark |
|---|
| 9/14 | $9,475 | $10,000 | $10,000 |
| 10/14 | $9,646 | $10,098 | $10,121 |
| 11/14 | $9,750 | $10,170 | $10,235 |
| 12/14 | $9,728 | $10,179 | $10,207 |
| 1/15 | $9,791 | $10,393 | $10,274 |
| 2/15 | $9,993 | $10,295 | $10,415 |
| 3/15 | $9,992 | $10,343 | $10,403 |
| 4/15 | $9,998 | $10,306 | $10,445 |
| 5/15 | $10,003 | $10,281 | $10,451 |
| 6/15 | $9,896 | $10,169 | $10,305 |
| 7/15 | $9,971 | $10,240 | $10,389 |
| 8/15 | $9,727 | $10,225 | $10,146 |
| 9/15 | $9,665 | $10,294 | $10,072 |
| 10/15 | $9,880 | $10,296 | $10,345 |
| 11/15 | $9,857 | $10,269 | $10,322 |
| 12/15 | $9,747 | $10,235 | $10,231 |
| 1/16 | $9,588 | $10,376 | $10,107 |
| 2/16 | $9,563 | $10,450 | $10,144 |
| 3/16 | $9,845 | $10,546 | $10,466 |
| 4/16 | $9,907 | $10,586 | $10,536 |
| 5/16 | $9,962 | $10,589 | $10,569 |
| 6/16 | $9,960 | $10,779 | $10,679 |
| 7/16 | $10,132 | $10,847 | $10,883 |
| 8/16 | $10,169 | $10,835 | $10,887 |
| 9/16 | $10,188 | $10,829 | $10,903 |
| 10/16 | $10,120 | $10,746 | $10,772 |
| 11/16 | $10,170 | $10,492 | $10,701 |
| 12/16 | $10,239 | $10,506 | $10,790 |
| 1/17 | $10,321 | $10,527 | $10,893 |
| 2/17 | $10,467 | $10,598 | $11,061 |
| 3/17 | $10,511 | $10,592 | $11,086 |
| 4/17 | $10,618 | $10,674 | $11,196 |
| 5/17 | $10,739 | $10,756 | $11,316 |
| 6/17 | $10,778 | $10,745 | $11,338 |
| 7/17 | $10,874 | $10,792 | $11,465 |
| 8/17 | $10,925 | $10,888 | $11,544 |
| 9/17 | $10,987 | $10,836 | $11,601 |
| 10/17 | $11,063 | $10,843 | $11,690 |
| 11/17 | $11,146 | $10,829 | $11,780 |
| 12/17 | $11,227 | $10,879 | $11,872 |
| 1/18 | $11,397 | $10,753 | $12,005 |
| 2/18 | $11,200 | $10,651 | $11,765 |
| 3/18 | $11,186 | $10,720 | $11,735 |
| 4/18 | $11,147 | $10,640 | $11,708 |
| 5/18 | $11,225 | $10,716 | $11,820 |
| 6/18 | $11,206 | $10,703 | $11,806 |
| 7/18 | $11,332 | $10,705 | $11,931 |
| 8/18 | $11,470 | $10,774 | $12,063 |
| 9/18 | $11,435 | $10,705 | $12,020 |
| 10/18 | $11,070 | $10,620 | $11,636 |
| 11/18 | $11,183 | $10,683 | $11,750 |
| 12/18 | $10,894 | $10,880 | $11,562 |
| 1/19 | $11,340 | $10,995 | $11,978 |
| 2/19 | $11,505 | $10,989 | $12,102 |
| 3/19 | $11,655 | $11,200 | $12,304 |
| 4/19 | $11,841 | $11,203 | $12,460 |
| 5/19 | $11,704 | $11,402 | $12,336 |
| 6/19 | $12,037 | $11,545 | $12,725 |
| 7/19 | $12,085 | $11,570 | $12,776 |
| 8/19 | $12,147 | $11,870 | $12,887 |
| 9/19 | $12,186 | $11,807 | $12,932 |
| 10/19 | $12,304 | $11,842 | $13,073 |
| 11/19 | $12,450 | $11,836 | $13,206 |
| 12/19 | $12,595 | $11,828 | $13,353 |
| 1/20 | $12,702 | $12,056 | $13,480 |
| 2/20 | $12,459 | $12,273 | $13,253 |
| 3/20 | $11,484 | $12,200 | $12,546 |
| 4/20 | $12,108 | $12,417 | $13,209 |
| 5/20 | $12,446 | $12,475 | $13,473 |
| 6/20 | $12,675 | $12,554 | $13,664 |
| 7/20 | $13,042 | $12,741 | $14,053 |
| 8/20 | $13,315 | $12,638 | $14,298 |
| 9/20 | $13,241 | $12,632 | $14,130 |
| 10/20 | $13,155 | $12,575 | $13,981 |
| 11/20 | $13,826 | $12,698 | $14,684 |
| 12/20 | $14,129 | $12,716 | $14,945 |
| 1/21 | $14,106 | $12,625 | $14,861 |
| 2/21 | $14,196 | $12,443 | $14,871 |
| 3/21 | $14,294 | $12,287 | $14,904 |
| 4/21 | $14,563 | $12,384 | $15,219 |
| 5/21 | $14,675 | $12,425 | $15,315 |
| 6/21 | $14,743 | $12,512 | $15,469 |
| 7/21 | $14,886 | $12,652 | $15,627 |
| 8/21 | $15,006 | $12,628 | $15,750 |
| 9/21 | $14,748 | $12,518 | $15,435 |
| 10/21 | $14,988 | $12,515 | $15,728 |
| 11/21 | $14,853 | $12,552 | $15,626 |
| 12/21 | $15,062 | $12,520 | $15,819 |
| 1/22 | $14,633 | $12,250 | $15,301 |
| 2/22 | $14,439 | $12,114 | $15,064 |
| 3/22 | $14,209 | $11,777 | $14,919 |
| 4/22 | $13,578 | $11,330 | $14,122 |
| 5/22 | $13,562 | $11,403 | $14,183 |
| 6/22 | $12,994 | $11,224 | $13,615 |
| 7/22 | $13,589 | $11,498 | $14,202 |
| 8/22 | $13,167 | $11,174 | $13,764 |
| 9/22 | $12,362 | $10,691 | $12,919 |
| 10/22 | $12,543 | $10,552 | $13,114 |
| 11/22 | $13,149 | $10,940 | $13,749 |
| 12/22 | $12,905 | $10,891 | $13,499 |
| 1/23 | $13,542 | $11,226 | $14,109 |
| 2/23 | $13,215 | $10,936 | $13,742 |
| 3/23 | $13,451 | $11,214 | $14,090 |
| 4/23 | $13,539 | $11,282 | $14,207 |
| 5/23 | $13,347 | $11,159 | $14,070 |
| 6/23 | $13,591 | $11,119 | $14,339 |
| 7/23 | $13,760 | $11,111 | $14,521 |
| 8/23 | $13,551 | $11,040 | $14,329 |
| 9/23 | $13,084 | $10,760 | $13,875 |
| 10/23 | $12,776 | $10,590 | $13,581 |
| 11/23 | $13,572 | $11,069 | $14,421 |
| 12/23 | $14,204 | $11,493 | $15,046 |
| 1/24 | $14,188 | $11,462 | $15,044 |
| 2/24 | $14,278 | $11,300 | $15,145 |
| 3/24 | $14,536 | $11,404 | $15,404 |
| 4/24 | $14,106 | $11,116 | $14,955 |
| 5/24 | $14,445 | $11,304 | $15,341 |
| 6/24 | $14,605 | $11,411 | $15,550 |
| 7/24 | $14,981 | $11,678 | $15,898 |
| 8/24 | $15,265 | $11,846 | $16,176 |
| 9/24 | $15,479 | $12,004 | $16,445 |
Average Annual Total Returns (%)
| Fund | 1 Year | 5 Years | 10 Years |
|---|
| Class A | 18.27% | 4.89% | 5.02% |
| Class A with 5.25% Maximum Sales Charge | 12.08% | 3.77% | 4.46% |
| Bloomberg U.S. Aggregate Bond Index | 11.57% | 0.33% | 1.84% |
Conservative Allocation Blended BenchmarkFootnote Reference1 | 18.52% | 4.92% | 5.10% |
| Footnote | Description |
Footnote1 | Benchmark is an internally constructed benchmark which is comprised of a blend of 25% Russell 3000® Index, 10% MSCI ACWI ex USA Investable Market Index and 65% Bloomberg U.S. Aggregate Bond Index, and is rebalanced monthly. |
Performance does not reflect the deduction of taxes that a shareholder would pay on Fund distributions or redemption of Fund shares. Performance assumes that all dividends and distributions, if any, were reinvested. For more recent performance information, visit www.eatonvance.com/performance.php. Performance prior to December 31, 2016 is that of the Fund's former investment adviser.
THE FUND'S PAST PERFORMANCE IS NO GUARANTEE OF FUTURE RESULTS.
| Total Net Assets | $247,005,089 |
| # of Portfolio Holdings | 22 |
| Portfolio Turnover Rate | 13% |
Total Advisory Fees PaidFootnote Reference* | $0 |
| Footnote | Description |
Footnote* | Fund does not pay an advisory fee directly; the underlying funds in which the Fund invests do. |
What did the Fund invest in?
The following tables reflect what the Fund invested in as of the report date.
Asset Allocation (% of total investments)
| Value | Value |
|---|
| Short-Term Investments | 0.0%Footnote Reference* |
| International and Global Equity Funds | 10.8% |
| Domestic Equity Funds | 25.4% |
| Income Funds | 63.8% |
| Footnote | Description |
Footnote* | Amount is less than 0.05% |
Top Ten Holdings (% of total investments)Footnote Referencea
| Calvert Bond Fund, Class R6 | 28.9% |
| Calvert Core Bond Fund, Class I | 11.1% |
| Calvert US Large-Cap Core Responsible Index Fund, Class R6 | 7.5% |
| Calvert Ultra-Short Duration Income Fund, Class R6 | 6.3% |
| Calvert Mortgage Access Fund, Class I | 6.1% |
| Calvert US Large-Cap Value Responsible Index Fund, Class R6 | 4.7% |
| Calvert Floating-Rate Advantage Fund, Class R6 | 3.8% |
| Calvert US Large-Cap Growth Responsible Index Fund, Class R6 | 3.6% |
| Calvert International Equity Fund, Class R6 | 3.4% |
| Calvert Equity Fund, Class R6 | 3.1% |
| Total | 78.5% |
| Footnote | Description |
Footnotea | Excluding cash equivalents |
If you wish to view additional information about the Fund, including the prospectus, statement of additional information, financial statements and holdings, please scan the QR code or visit www.eatonvance.com/calvert-fund-documents.php. For proxy information, please visit www.calvert.com/active-engagement.php?DM=how-we-influence.
The Funds may deliver a single copy of certain required shareholder documents (including prospectuses, shareholder reports, and proxy materials) to investors with the same last name and the same address. Your participation will continue indefinitely unless you instruct otherwise by calling 1-800-368-2745 or by contacting your financial intermediary. Your instruction will typically be effective within 30 days of receipt.
Not FDIC Insured | May Lose Value | No Bank Guarantee
Annual Shareholder Report September 30, 2024
Calvert Conservative Allocation Fund
Annual Shareholder Report September 30, 2024
This annual shareholder report contains important information about the Calvert Conservative Allocation Fund for the period of October 1, 2023 to September 30, 2024. You can find additional information about the Fund at www.eatonvance.com/calvert-fund-documents.php. You can also request this information by contacting us at 1-800-368-2745.
What were the Fund costs for the last year?
(based on a hypothetical $10,000 investment)
| Class Name | Costs of a $10,000 investment | Costs paid as a percentage of a $10,000 investment |
|---|
| Class C | $128 | 1.18% |
How did the Fund perform last year and what affected its performance?
Key contributors to (↑) and detractors from (↓) performance, relative to the Conservative Allocation Blended Benchmark (the Blended Index):
↓ Among equity funds, allocations to Calvert Equity Fund and Calvert Emerging Markets Advancement Fund detracted from returns relative to the Blended Index
↓ Among stock sizes, allocations to small-cap and mid-cap companies detracted from performance relative to the Blended Index during the period
↓ Among asset classes, the Fund’s underweight allocation to investment-grade bonds detracted from performance relative to the Blended Index during the period
↓ The Fund’s underweight duration detracted from performance relative to the Blended Index during the period
↑ The Fund’s larger-than-Blended Index allocation to fixed-income assets contributed to returns relative to the Blended Index during the period
↑ Selections among fixed-income funds ― especially the Fund’s allocation to Calvert Bond Fund ― contributed to returns relative to the Blended Index
↑ Among asset classes, the Fund’s overweight allocations to high yield corporate bonds and bank loans aided performance relative to the Blended Index
↑ The Fund’s use of derivatives contributed to performance relative to the Blended Index during the period
Comparison of the change in value of a $10,000 investment for the period indicated.
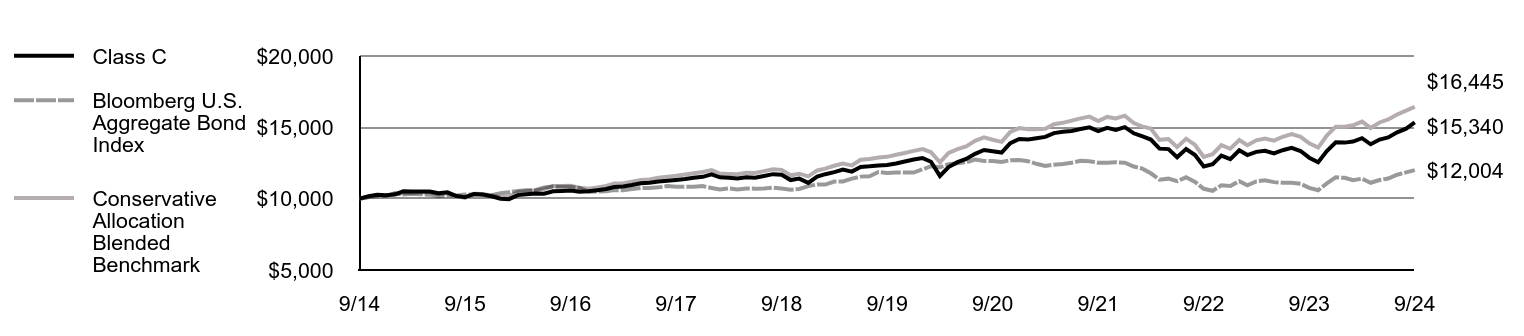
| Class C | Bloomberg U.S. Aggregate Bond Index | Conservative Allocation Blended Benchmark |
|---|
| 9/14 | $10,000 | $10,000 | $10,000 |
| 10/14 | $10,176 | $10,098 | $10,121 |
| 11/14 | $10,281 | $10,170 | $10,235 |
| 12/14 | $10,246 | $10,179 | $10,207 |
| 1/15 | $10,308 | $10,393 | $10,274 |
| 2/15 | $10,511 | $10,295 | $10,415 |
| 3/15 | $10,498 | $10,343 | $10,403 |
| 4/15 | $10,498 | $10,306 | $10,445 |
| 5/15 | $10,498 | $10,281 | $10,451 |
| 6/15 | $10,377 | $10,169 | $10,305 |
| 7/15 | $10,444 | $10,240 | $10,389 |
| 8/15 | $10,180 | $10,225 | $10,146 |
| 9/15 | $10,103 | $10,294 | $10,072 |
| 10/15 | $10,324 | $10,296 | $10,345 |
| 11/15 | $10,288 | $10,269 | $10,322 |
| 12/15 | $10,165 | $10,235 | $10,231 |
| 1/16 | $9,991 | $10,376 | $10,107 |
| 2/16 | $9,965 | $10,450 | $10,144 |
| 3/16 | $10,249 | $10,546 | $10,466 |
| 4/16 | $10,307 | $10,586 | $10,536 |
| 5/16 | $10,359 | $10,589 | $10,569 |
| 6/16 | $10,344 | $10,779 | $10,679 |
| 7/16 | $10,519 | $10,847 | $10,883 |
| 8/16 | $10,545 | $10,835 | $10,887 |
| 9/16 | $10,564 | $10,829 | $10,903 |
| 10/16 | $10,486 | $10,746 | $10,772 |
| 11/16 | $10,525 | $10,492 | $10,701 |
| 12/16 | $10,596 | $10,506 | $10,790 |
| 1/17 | $10,675 | $10,527 | $10,893 |
| 2/17 | $10,814 | $10,598 | $11,061 |
| 3/17 | $10,860 | $10,592 | $11,086 |
| 4/17 | $10,960 | $10,674 | $11,196 |
| 5/17 | $11,079 | $10,756 | $11,316 |
| 6/17 | $11,112 | $10,745 | $11,338 |
| 7/17 | $11,205 | $10,792 | $11,465 |
| 8/17 | $11,251 | $10,888 | $11,544 |
| 9/17 | $11,308 | $10,836 | $11,601 |
| 10/17 | $11,374 | $10,843 | $11,690 |
| 11/17 | $11,460 | $10,829 | $11,780 |
| 12/17 | $11,530 | $10,879 | $11,872 |
| 1/18 | $11,700 | $10,753 | $12,005 |
| 2/18 | $11,496 | $10,651 | $11,765 |
| 3/18 | $11,474 | $10,720 | $11,735 |
| 4/18 | $11,419 | $10,640 | $11,708 |
| 5/18 | $11,494 | $10,716 | $11,820 |
| 6/18 | $11,466 | $10,703 | $11,806 |
| 7/18 | $11,589 | $10,705 | $11,931 |
| 8/18 | $11,719 | $10,774 | $12,063 |
| 9/18 | $11,681 | $10,705 | $12,020 |
| 10/18 | $11,304 | $10,620 | $11,636 |
| 11/18 | $11,407 | $10,683 | $11,750 |
| 12/18 | $11,106 | $10,880 | $11,562 |
| 1/19 | $11,553 | $10,995 | $11,978 |
| 2/19 | $11,716 | $10,989 | $12,102 |
| 3/19 | $11,862 | $11,200 | $12,304 |
| 4/19 | $12,039 | $11,203 | $12,460 |
| 5/19 | $11,897 | $11,402 | $12,336 |
| 6/19 | $12,225 | $11,545 | $12,725 |
| 7/19 | $12,267 | $11,570 | $12,776 |
| 8/19 | $12,324 | $11,870 | $12,887 |
| 9/19 | $12,355 | $11,807 | $12,932 |
| 10/19 | $12,469 | $11,842 | $13,073 |
| 11/19 | $12,604 | $11,836 | $13,206 |
| 12/19 | $12,743 | $11,828 | $13,353 |
| 1/20 | $12,845 | $12,056 | $13,480 |
| 2/20 | $12,589 | $12,273 | $13,253 |
| 3/20 | $11,595 | $12,200 | $12,546 |
| 4/20 | $12,219 | $12,417 | $13,209 |
| 5/20 | $12,556 | $12,475 | $13,473 |
| 6/20 | $12,782 | $12,554 | $13,664 |
| 7/20 | $13,142 | $12,741 | $14,053 |
| 8/20 | $13,413 | $12,638 | $14,298 |
| 9/20 | $13,320 | $12,632 | $14,130 |
| 10/20 | $13,231 | $12,575 | $13,981 |
| 11/20 | $13,893 | $12,698 | $14,684 |
| 12/20 | $14,187 | $12,716 | $14,945 |
| 1/21 | $14,150 | $12,625 | $14,861 |
| 2/21 | $14,233 | $12,443 | $14,871 |
| 3/21 | $14,328 | $12,287 | $14,904 |
| 4/21 | $14,594 | $12,384 | $15,219 |
| 5/21 | $14,692 | $12,425 | $15,315 |
| 6/21 | $14,749 | $12,512 | $15,469 |
| 7/21 | $14,878 | $12,652 | $15,627 |
| 8/21 | $15,000 | $12,628 | $15,750 |
| 9/21 | $14,733 | $12,518 | $15,435 |
| 10/21 | $14,961 | $12,515 | $15,728 |
| 11/21 | $14,817 | $12,552 | $15,626 |
| 12/21 | $15,014 | $12,520 | $15,819 |
| 1/22 | $14,582 | $12,250 | $15,301 |
| 2/22 | $14,377 | $12,114 | $15,064 |
| 3/22 | $14,142 | $11,777 | $14,919 |
| 4/22 | $13,505 | $11,330 | $14,122 |
| 5/22 | $13,474 | $11,403 | $14,183 |
| 6/22 | $12,907 | $11,224 | $13,615 |
| 7/22 | $13,482 | $11,498 | $14,202 |
| 8/22 | $13,057 | $11,174 | $13,764 |
| 9/22 | $12,254 | $10,691 | $12,919 |
| 10/22 | $12,419 | $10,552 | $13,114 |
| 11/22 | $13,020 | $10,940 | $13,749 |
| 12/22 | $12,767 | $10,891 | $13,499 |
| 1/23 | $13,389 | $11,226 | $14,109 |
| 2/23 | $13,054 | $10,936 | $13,742 |
| 3/23 | $13,281 | $11,214 | $14,090 |
| 4/23 | $13,361 | $11,282 | $14,207 |
| 5/23 | $13,169 | $11,159 | $14,070 |
| 6/23 | $13,395 | $11,119 | $14,339 |
| 7/23 | $13,556 | $11,111 | $14,521 |
| 8/23 | $13,339 | $11,040 | $14,329 |
| 9/23 | $12,872 | $10,760 | $13,875 |
| 10/23 | $12,556 | $10,590 | $13,581 |
| 11/23 | $13,333 | $11,069 | $14,421 |
| 12/23 | $13,946 | $11,493 | $15,046 |
| 1/24 | $13,929 | $11,462 | $15,044 |
| 2/24 | $14,003 | $11,300 | $15,145 |
| 3/24 | $14,240 | $11,404 | $15,404 |
| 4/24 | $13,813 | $11,116 | $14,955 |
| 5/24 | $14,142 | $11,304 | $15,341 |
| 6/24 | $14,288 | $11,411 | $15,550 |
| 7/24 | $14,652 | $11,678 | $15,898 |
| 8/24 | $14,908 | $11,846 | $16,176 |
| 9/24 | $15,340 | $12,004 | $16,445 |
Average Annual Total Returns (%)
| Fund | 1 Year | 5 Years | 10 Years |
|---|
| Class C | 17.41% | 4.11% | 4.37% |
| Class C with 1% Maximum Deferred Sales Charge | 16.41% | 4.11% | 4.37% |
| Bloomberg U.S. Aggregate Bond Index | 11.57% | 0.33% | 1.84% |
Conservative Allocation Blended BenchmarkFootnote Reference1 | 18.52% | 4.92% | 5.10% |
| Footnote | Description |
Footnote1 | Benchmark is an internally constructed benchmark which is comprised of a blend of 25% Russell 3000® Index, 10% MSCI ACWI ex USA Investable Market Index and 65% Bloomberg U.S. Aggregate Bond Index, and is rebalanced monthly. |
Performance does not reflect the deduction of taxes that a shareholder would pay on Fund distributions or redemption of Fund shares. Performance assumes that all dividends and distributions, if any, were reinvested. For more recent performance information, visit www.eatonvance.com/performance.php. Performance prior to December 31, 2016 is that of the Fund's former investment adviser.
THE FUND'S PAST PERFORMANCE IS NO GUARANTEE OF FUTURE RESULTS.
| Total Net Assets | $247,005,089 |
| # of Portfolio Holdings | 22 |
| Portfolio Turnover Rate | 13% |
Total Advisory Fees PaidFootnote Reference* | $0 |
| Footnote | Description |
Footnote* | Fund does not pay an advisory fee directly; the underlying funds in which the Fund invests do. |
What did the Fund invest in?
The following tables reflect what the Fund invested in as of the report date.
Asset Allocation (% of total investments)
| Value | Value |
|---|
| Short-Term Investments | 0.0%Footnote Reference* |
| International and Global Equity Funds | 10.8% |
| Domestic Equity Funds | 25.4% |
| Income Funds | 63.8% |
| Footnote | Description |
Footnote* | Amount is less than 0.05% |
Top Ten Holdings (% of total investments)Footnote Referencea
| Calvert Bond Fund, Class R6 | 28.9% |
| Calvert Core Bond Fund, Class I | 11.1% |
| Calvert US Large-Cap Core Responsible Index Fund, Class R6 | 7.5% |
| Calvert Ultra-Short Duration Income Fund, Class R6 | 6.3% |
| Calvert Mortgage Access Fund, Class I | 6.1% |
| Calvert US Large-Cap Value Responsible Index Fund, Class R6 | 4.7% |
| Calvert Floating-Rate Advantage Fund, Class R6 | 3.8% |
| Calvert US Large-Cap Growth Responsible Index Fund, Class R6 | 3.6% |
| Calvert International Equity Fund, Class R6 | 3.4% |
| Calvert Equity Fund, Class R6 | 3.1% |
| Total | 78.5% |
| Footnote | Description |
Footnotea | Excluding cash equivalents |
If you wish to view additional information about the Fund, including the prospectus, statement of additional information, financial statements and holdings, please scan the QR code or visit www.eatonvance.com/calvert-fund-documents.php. For proxy information, please visit www.calvert.com/active-engagement.php?DM=how-we-influence.
The Funds may deliver a single copy of certain required shareholder documents (including prospectuses, shareholder reports, and proxy materials) to investors with the same last name and the same address. Your participation will continue indefinitely unless you instruct otherwise by calling 1-800-368-2745 or by contacting your financial intermediary. Your instruction will typically be effective within 30 days of receipt.
Not FDIC Insured | May Lose Value | No Bank Guarantee
Annual Shareholder Report September 30, 2024
Calvert Conservative Allocation Fund
Annual Shareholder Report September 30, 2024
This annual shareholder report contains important information about the Calvert Conservative Allocation Fund for the period of October 1, 2023 to September 30, 2024. You can find additional information about the Fund at www.eatonvance.com/calvert-fund-documents.php. You can also request this information by contacting us at 1-800-368-2745.
What were the Fund costs for the last year?
(based on a hypothetical $10,000 investment)
| Class Name | Costs of a $10,000 investment | Costs paid as a percentage of a $10,000 investment |
|---|
| Class I | $20 | 0.18% |
How did the Fund perform last year and what affected its performance?
Key contributors to (↑) and detractors from (↓) performance, relative to the Conservative Allocation Blended Benchmark (the Blended Index):
↑ The Fund’s larger-than-Blended Index allocation to fixed-income assets contributed to returns relative to the Blended Index during the period
↑ Selections among fixed-income funds ― especially the Fund’s allocation to Calvert Bond Fund ― contributed to returns relative to the Blended Index
↑ Among asset classes, the Fund’s overweight allocations to high yield corporate bonds and bank loans aided performance relative to the Blended Index
↑ The Fund’s use of derivatives contributed to performance relative to the Blended Index during the period
↓ Among equity funds, allocations to Calvert Equity Fund and Calvert Emerging Markets Advancement Fund detracted from returns relative to the Blended Index
↓ Among stock sizes, allocations to small-cap and mid-cap companies detracted from performance relative to the Blended Index during the period
↓ Among asset classes, the Fund’s underweight allocation to investment-grade bonds detracted from performance relative to the Blended Index during the period
↓ The Fund’s underweight duration detracted from performance relative to the Blended Index during the period
Comparison of the change in value of a $1,000,000 investment for the period indicated.
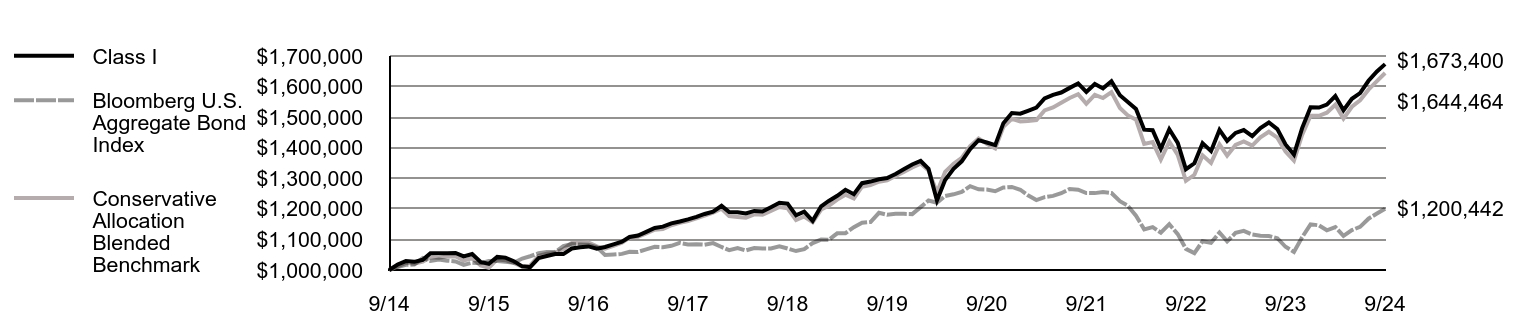
| Class I | Bloomberg U.S. Aggregate Bond Index | Conservative Allocation Blended Benchmark |
|---|
| 9/14 | $1,000,000 | $1,000,000 | $1,000,000 |
| 10/14 | $1,018,002 | $1,009,828 | $1,012,102 |
| 11/14 | $1,029,035 | $1,016,991 | $1,023,486 |
| 12/14 | $1,026,671 | $1,017,942 | $1,020,721 |
| 1/15 | $1,033,370 | $1,039,288 | $1,027,351 |
| 2/15 | $1,054,707 | $1,029,516 | $1,041,451 |
| 3/15 | $1,054,561 | $1,034,297 | $1,040,335 |
| 4/15 | $1,055,172 | $1,030,585 | $1,044,465 |
| 5/15 | $1,055,775 | $1,028,104 | $1,045,098 |
| 6/15 | $1,044,397 | $1,016,893 | $1,030,486 |
| 7/15 | $1,052,357 | $1,023,962 | $1,038,939 |
| 8/15 | $1,026,613 | $1,022,492 | $1,014,632 |
| 9/15 | $1,020,017 | $1,029,408 | $1,007,239 |
| 10/15 | $1,042,762 | $1,029,579 | $1,034,528 |
| 11/15 | $1,040,298 | $1,026,859 | $1,032,236 |
| 12/15 | $1,028,684 | $1,023,541 | $1,023,105 |
| 1/16 | $1,011,917 | $1,037,626 | $1,010,743 |
| 2/16 | $1,009,339 | $1,044,987 | $1,014,370 |
| 3/16 | $1,039,093 | $1,054,574 | $1,046,598 |
| 4/16 | $1,045,575 | $1,058,622 | $1,053,609 |
| 5/16 | $1,052,052 | $1,058,894 | $1,056,867 |
| 6/16 | $1,052,066 | $1,077,920 | $1,067,927 |
| 7/16 | $1,070,291 | $1,084,735 | $1,088,285 |
| 8/16 | $1,074,193 | $1,083,494 | $1,088,725 |
| 9/16 | $1,077,121 | $1,082,859 | $1,090,269 |
| 10/16 | $1,069,938 | $1,074,577 | $1,077,200 |
| 11/16 | $1,075,161 | $1,049,159 | $1,070,099 |
| 12/16 | $1,083,758 | $1,050,639 | $1,078,973 |
| 1/17 | $1,092,473 | $1,052,700 | $1,089,292 |
| 2/17 | $1,107,891 | $1,059,775 | $1,106,073 |
| 3/17 | $1,112,592 | $1,059,220 | $1,108,616 |
| 4/17 | $1,124,658 | $1,067,394 | $1,119,621 |
| 5/17 | $1,137,395 | $1,075,610 | $1,131,636 |
| 6/17 | $1,141,905 | $1,074,527 | $1,133,818 |
| 7/17 | $1,152,683 | $1,079,151 | $1,146,488 |
| 8/17 | $1,158,739 | $1,088,831 | $1,154,416 |
| 9/17 | $1,165,678 | $1,083,645 | $1,160,072 |
| 10/17 | $1,173,799 | $1,084,272 | $1,169,017 |
| 11/17 | $1,183,272 | $1,082,881 | $1,177,979 |
| 12/17 | $1,191,148 | $1,087,851 | $1,187,211 |
| 1/18 | $1,209,929 | $1,075,322 | $1,200,468 |
| 2/18 | $1,189,745 | $1,065,128 | $1,176,483 |
| 3/18 | $1,188,967 | $1,071,959 | $1,173,515 |
| 4/18 | $1,184,768 | $1,063,986 | $1,170,756 |
| 5/18 | $1,193,145 | $1,071,580 | $1,181,965 |
| 6/18 | $1,191,151 | $1,070,262 | $1,180,588 |
| 7/18 | $1,205,199 | $1,070,516 | $1,193,103 |
| 8/18 | $1,219,937 | $1,077,405 | $1,206,259 |
| 9/18 | $1,216,927 | $1,070,467 | $1,201,970 |
| 10/18 | $1,178,832 | $1,062,007 | $1,163,627 |
| 11/18 | $1,190,816 | $1,068,347 | $1,174,959 |
| 12/18 | $1,160,838 | $1,087,974 | $1,156,186 |
| 1/19 | $1,208,348 | $1,099,528 | $1,197,756 |
| 2/19 | $1,225,891 | $1,098,891 | $1,210,200 |
| 3/19 | $1,242,638 | $1,119,992 | $1,230,370 |
| 4/19 | $1,262,431 | $1,120,278 | $1,246,037 |
| 5/19 | $1,247,768 | $1,140,165 | $1,233,603 |
| 6/19 | $1,284,040 | $1,154,483 | $1,272,493 |
| 7/19 | $1,289,193 | $1,157,023 | $1,277,593 |
| 8/19 | $1,296,575 | $1,187,003 | $1,288,690 |
| 9/19 | $1,300,739 | $1,180,681 | $1,293,175 |
| 10/19 | $1,314,060 | $1,184,238 | $1,307,274 |
| 11/19 | $1,329,606 | $1,183,635 | $1,320,556 |
| 12/19 | $1,345,193 | $1,182,810 | $1,335,315 |
| 1/20 | $1,356,652 | $1,205,572 | $1,347,988 |
| 2/20 | $1,330,704 | $1,227,271 | $1,325,280 |
| 3/20 | $1,227,441 | $1,220,049 | $1,254,622 |
| 4/20 | $1,294,143 | $1,241,736 | $1,320,882 |
| 5/20 | $1,330,949 | $1,247,518 | $1,347,339 |
| 6/20 | $1,355,487 | $1,255,376 | $1,366,424 |
| 7/20 | $1,395,497 | $1,274,128 | $1,405,276 |
| 8/20 | $1,424,736 | $1,263,843 | $1,429,786 |
| 9/20 | $1,416,974 | $1,263,150 | $1,412,968 |
| 10/20 | $1,408,482 | $1,257,510 | $1,398,112 |
| 11/20 | $1,480,308 | $1,269,849 | $1,468,428 |
| 12/20 | $1,513,577 | $1,271,599 | $1,494,509 |
| 1/21 | $1,511,193 | $1,262,482 | $1,486,127 |
| 2/21 | $1,520,767 | $1,244,251 | $1,487,063 |
| 3/21 | $1,531,388 | $1,228,714 | $1,490,354 |
| 4/21 | $1,561,010 | $1,238,421 | $1,521,937 |
| 5/21 | $1,573,016 | $1,242,467 | $1,531,495 |
| 6/21 | $1,580,477 | $1,251,197 | $1,546,945 |
| 7/21 | $1,595,735 | $1,265,186 | $1,562,722 |
| 8/21 | $1,610,191 | $1,262,777 | $1,574,993 |
| 9/21 | $1,582,745 | $1,251,844 | $1,543,458 |
| 10/21 | $1,608,520 | $1,251,499 | $1,572,773 |
| 11/21 | $1,594,022 | $1,255,202 | $1,562,628 |
| 12/21 | $1,617,442 | $1,251,990 | $1,581,892 |
| 1/22 | $1,571,516 | $1,225,017 | $1,530,054 |
| 2/22 | $1,550,640 | $1,211,350 | $1,506,443 |
| 3/22 | $1,526,956 | $1,177,697 | $1,491,880 |
| 4/22 | $1,459,148 | $1,133,006 | $1,412,204 |
| 5/22 | $1,457,473 | $1,140,311 | $1,418,332 |
| 6/22 | $1,396,615 | $1,122,422 | $1,361,505 |
| 7/22 | $1,460,518 | $1,149,848 | $1,420,174 |
| 8/22 | $1,415,954 | $1,117,357 | $1,376,393 |
| 9/22 | $1,329,527 | $1,069,080 | $1,291,869 |
| 10/22 | $1,348,979 | $1,055,233 | $1,311,387 |
| 11/22 | $1,414,948 | $1,094,040 | $1,374,909 |
| 12/22 | $1,388,791 | $1,089,105 | $1,349,898 |
| 1/23 | $1,458,102 | $1,122,610 | $1,410,910 |
| 2/23 | $1,422,163 | $1,093,584 | $1,374,195 |
| 3/23 | $1,448,431 | $1,121,364 | $1,409,003 |
| 4/23 | $1,457,909 | $1,128,160 | $1,420,704 |
| 5/23 | $1,438,091 | $1,115,876 | $1,407,033 |
| 6/23 | $1,464,380 | $1,111,896 | $1,433,900 |
| 7/23 | $1,482,598 | $1,111,121 | $1,452,129 |
| 8/23 | $1,460,910 | $1,104,024 | $1,432,880 |
| 9/23 | $1,410,747 | $1,075,969 | $1,387,503 |
| 10/23 | $1,377,471 | $1,058,989 | $1,358,094 |
| 11/23 | $1,464,165 | $1,106,947 | $1,442,081 |
| 12/23 | $1,532,357 | $1,149,319 | $1,504,592 |
| 1/24 | $1,531,470 | $1,146,163 | $1,504,430 |
| 2/24 | $1,541,225 | $1,129,970 | $1,514,465 |
| 3/24 | $1,569,061 | $1,140,404 | $1,540,447 |
| 4/24 | $1,522,623 | $1,111,599 | $1,495,516 |
| 5/24 | $1,560,131 | $1,130,444 | $1,534,072 |
| 6/24 | $1,578,394 | $1,141,147 | $1,555,031 |
| 7/24 | $1,618,935 | $1,167,800 | $1,589,791 |
| 8/24 | $1,649,566 | $1,184,582 | $1,617,594 |
| 9/24 | $1,673,400 | $1,200,442 | $1,644,464 |
Average Annual Total Returns (%)Footnote Reference1
| Fund | 1 Year | 5 Years | 10 Years |
|---|
| Class I | 18.61% | 5.16% | 5.28% |
| Bloomberg U.S. Aggregate Bond Index | 11.57% | 0.33% | 1.84% |
Conservative Allocation Blended BenchmarkFootnote Reference2 | 18.52% | 4.92% | 5.10% |
| Footnote | Description |
Footnote1 | Class I performance prior to 5/20/16 is linked to Class A. This linked performance is adjusted for any applicable sales charge, but is not adjusted for class expense differences. If adjusted for such differences, the performance would be different. Performance presented in the Financial Highlights included in the financial statements is not linked. |
Footnote2 | Benchmark is an internally constructed benchmark which is comprised of a blend of 25% Russell 3000® Index, 10% MSCI ACWI ex USA Investable Market Index and 65% Bloomberg U.S. Aggregate Bond Index, and is rebalanced monthly. |
Performance does not reflect the deduction of taxes that a shareholder would pay on Fund distributions or redemption of Fund shares. Performance assumes that all dividends and distributions, if any, were reinvested. For more recent performance information, visit www.eatonvance.com/performance.php. Performance prior to December 31, 2016 is that of the Fund's former investment adviser.
THE FUND'S PAST PERFORMANCE IS NO GUARANTEE OF FUTURE RESULTS.
| Total Net Assets | $247,005,089 |
| # of Portfolio Holdings | 22 |
| Portfolio Turnover Rate | 13% |
Total Advisory Fees PaidFootnote Reference* | $0 |
| Footnote | Description |
Footnote* | Fund does not pay an advisory fee directly; the underlying funds in which the Fund invests do. |
What did the Fund invest in?
The following tables reflect what the Fund invested in as of the report date.
Asset Allocation (% of total investments)
| Value | Value |
|---|
| Short-Term Investments | 0.0%Footnote Reference* |
| International and Global Equity Funds | 10.8% |
| Domestic Equity Funds | 25.4% |
| Income Funds | 63.8% |
| Footnote | Description |
Footnote* | Amount is less than 0.05% |
Top Ten Holdings (% of total investments)Footnote Referencea
| Calvert Bond Fund, Class R6 | 28.9% |
| Calvert Core Bond Fund, Class I | 11.1% |
| Calvert US Large-Cap Core Responsible Index Fund, Class R6 | 7.5% |
| Calvert Ultra-Short Duration Income Fund, Class R6 | 6.3% |
| Calvert Mortgage Access Fund, Class I | 6.1% |
| Calvert US Large-Cap Value Responsible Index Fund, Class R6 | 4.7% |
| Calvert Floating-Rate Advantage Fund, Class R6 | 3.8% |
| Calvert US Large-Cap Growth Responsible Index Fund, Class R6 | 3.6% |
| Calvert International Equity Fund, Class R6 | 3.4% |
| Calvert Equity Fund, Class R6 | 3.1% |
| Total | 78.5% |
| Footnote | Description |
Footnotea | Excluding cash equivalents |
If you wish to view additional information about the Fund, including the prospectus, statement of additional information, financial statements and holdings, please scan the QR code or visit www.eatonvance.com/calvert-fund-documents.php. For proxy information, please visit www.calvert.com/active-engagement.php?DM=how-we-influence.
The Funds may deliver a single copy of certain required shareholder documents (including prospectuses, shareholder reports, and proxy materials) to investors with the same last name and the same address. Your participation will continue indefinitely unless you instruct otherwise by calling 1-800-368-2745 or by contacting your financial intermediary. Your instruction will typically be effective within 30 days of receipt.
Not FDIC Insured | May Lose Value | No Bank Guarantee
Annual Shareholder Report September 30, 2024
Calvert Conservative Allocation Fund
Annual Shareholder Report September 30, 2024
This annual shareholder report contains important information about the Calvert Conservative Allocation Fund for the period of October 1, 2023 to September 30, 2024. You can find additional information about the Fund at www.eatonvance.com/calvert-fund-documents.php. You can also request this information by contacting us at 1-800-368-2745.
What were the Fund costs for the last year?
(based on a hypothetical $10,000 investment)
| Class Name | Costs of a $10,000 investment | Costs paid as a percentage of a $10,000 investment |
|---|
| Class R6 | $12 | 0.11% |
How did the Fund perform last year and what affected its performance?
Key contributors to (↑) and detractors from (↓) performance, relative to the Conservative Allocation Blended Benchmark (the Blended Index):
↑ The Fund’s larger-than-Blended Index allocation to fixed-income assets contributed to returns relative to the Blended Index during the period
↑ Selections among fixed-income funds ― especially the Fund’s allocation to Calvert Bond Fund ― contributed to returns relative to the Blended Index
↑ Among asset classes, the Fund’s overweight allocations to high yield corporate bonds and bank loans aided performance relative to the Blended Index
↑ The Fund’s use of derivatives contributed to performance relative to the Blended Index during the period
↓ Among equity funds, allocations to Calvert Equity Fund and Calvert Emerging Markets Advancement Fund detracted from returns relative to the Blended Index
↓ Among stock sizes, allocations to small-cap and mid-cap companies detracted from performance relative to the Blended Index during the period
↓ Among asset classes, the Fund’s underweight allocation to investment-grade bonds detracted from performance relative to the Blended Index during the period
↓ The Fund’s underweight duration detracted from performance relative to the Blended Index during the period
Comparison of the change in value of a $5,000,000 investment for the period indicated.
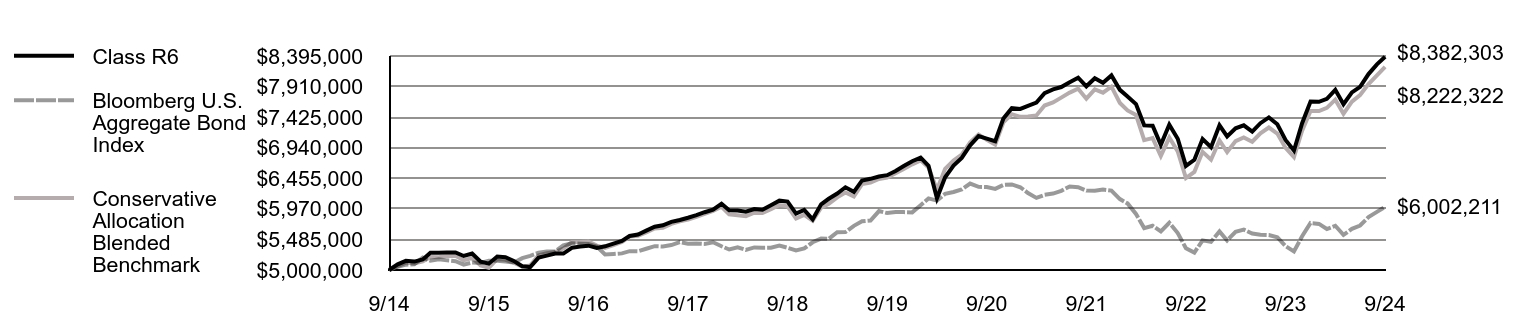
| Class R6 | Bloomberg U.S. Aggregate Bond Index | Conservative Allocation Blended Benchmark |
|---|
| 9/14 | $5,000,000 | $5,000,000 | $5,000,000 |
| 10/14 | $5,090,012 | $5,049,138 | $5,060,509 |
| 11/14 | $5,145,180 | $5,084,956 | $5,117,431 |
| 12/14 | $5,133,474 | $5,089,712 | $5,103,604 |
| 1/15 | $5,167,006 | $5,196,439 | $5,136,757 |
| 2/15 | $5,273,699 | $5,147,580 | $5,207,254 |
| 3/15 | $5,273,047 | $5,171,483 | $5,201,676 |
| 4/15 | $5,276,104 | $5,152,927 | $5,222,323 |
| 5/15 | $5,279,161 | $5,140,518 | $5,225,490 |
| 6/15 | $5,222,231 | $5,084,467 | $5,152,430 |
| 7/15 | $5,262,072 | $5,119,810 | $5,194,696 |
| 8/15 | $5,133,355 | $5,112,458 | $5,073,160 |
| 9/15 | $5,100,391 | $5,147,040 | $5,036,195 |
| 10/15 | $5,214,143 | $5,147,895 | $5,172,641 |
| 11/15 | $5,201,845 | $5,134,295 | $5,161,181 |
| 12/15 | $5,143,735 | $5,117,703 | $5,115,524 |
| 1/16 | $5,059,887 | $5,188,129 | $5,053,713 |
| 2/16 | $5,046,988 | $5,224,933 | $5,071,852 |
| 3/16 | $5,195,721 | $5,272,871 | $5,232,989 |
| 4/16 | $5,228,133 | $5,293,111 | $5,268,043 |
| 5/16 | $5,260,546 | $5,294,468 | $5,284,337 |
| 6/16 | $5,260,659 | $5,389,599 | $5,339,636 |
| 7/16 | $5,351,809 | $5,423,673 | $5,441,426 |
| 8/16 | $5,371,341 | $5,417,471 | $5,443,627 |
| 9/16 | $5,385,973 | $5,414,297 | $5,451,344 |
| 10/16 | $5,350,023 | $5,372,883 | $5,385,999 |
| 11/16 | $5,376,168 | $5,245,795 | $5,350,497 |
| 12/16 | $5,419,208 | $5,253,193 | $5,394,865 |
| 1/17 | $5,462,803 | $5,263,501 | $5,446,458 |
| 2/17 | $5,539,933 | $5,298,877 | $5,530,363 |
| 3/17 | $5,563,407 | $5,296,098 | $5,543,080 |
| 4/17 | $5,623,769 | $5,336,968 | $5,598,103 |
| 5/17 | $5,687,485 | $5,378,048 | $5,658,181 |
| 6/17 | $5,710,017 | $5,372,635 | $5,669,090 |
| 7/17 | $5,763,917 | $5,395,754 | $5,732,442 |
| 8/17 | $5,794,236 | $5,444,153 | $5,772,081 |
| 9/17 | $5,828,863 | $5,418,223 | $5,800,359 |
| 10/17 | $5,869,435 | $5,421,362 | $5,845,087 |
| 11/17 | $5,916,769 | $5,414,403 | $5,889,895 |
| 12/17 | $5,956,158 | $5,439,253 | $5,936,054 |
| 1/18 | $6,050,093 | $5,376,610 | $6,002,342 |
| 2/18 | $5,949,200 | $5,325,642 | $5,882,416 |
| 3/18 | $5,945,242 | $5,359,795 | $5,867,577 |
| 4/18 | $5,924,283 | $5,319,932 | $5,853,781 |
| 5/18 | $5,966,200 | $5,357,900 | $5,909,827 |
| 6/18 | $5,956,243 | $5,351,310 | $5,902,939 |
| 7/18 | $6,026,441 | $5,352,582 | $5,965,516 |
| 8/18 | $6,100,148 | $5,387,024 | $6,031,293 |
| 9/18 | $6,085,179 | $5,352,334 | $6,009,851 |
| 10/18 | $5,894,686 | $5,310,037 | $5,818,133 |
| 11/18 | $5,954,656 | $5,341,736 | $5,874,794 |
| 12/18 | $5,804,651 | $5,439,871 | $5,780,930 |
| 1/19 | $6,042,247 | $5,497,639 | $5,988,780 |
| 2/19 | $6,129,974 | $5,494,454 | $6,050,998 |
| 3/19 | $6,213,708 | $5,599,958 | $6,151,851 |
| 4/19 | $6,312,688 | $5,601,391 | $6,230,183 |
| 5/19 | $6,239,370 | $5,700,825 | $6,168,013 |
| 6/19 | $6,420,795 | $5,772,417 | $6,362,467 |
| 7/19 | $6,446,596 | $5,785,114 | $6,387,967 |
| 8/19 | $6,483,455 | $5,935,016 | $6,443,450 |
| 9/19 | $6,504,280 | $5,903,406 | $6,465,874 |
| 10/19 | $6,570,915 | $5,921,188 | $6,536,371 |
| 11/19 | $6,648,655 | $5,918,173 | $6,602,779 |
| 12/19 | $6,726,567 | $5,914,048 | $6,676,575 |
| 1/20 | $6,783,830 | $6,027,861 | $6,739,941 |
| 2/20 | $6,654,033 | $6,136,354 | $6,626,401 |
| 3/20 | $6,137,729 | $6,100,243 | $6,273,111 |
| 4/20 | $6,471,259 | $6,208,682 | $6,604,410 |
| 5/20 | $6,655,276 | $6,237,589 | $6,736,693 |
| 6/20 | $6,777,893 | $6,276,880 | $6,832,121 |
| 7/20 | $6,977,922 | $6,370,638 | $7,026,379 |
| 8/20 | $7,124,096 | $6,319,215 | $7,148,929 |
| 9/20 | $7,085,197 | $6,315,751 | $7,064,841 |
| 10/20 | $7,042,724 | $6,287,550 | $6,990,562 |
| 11/20 | $7,401,810 | $6,349,245 | $7,342,139 |
| 12/20 | $7,568,150 | $6,357,994 | $7,472,543 |
| 1/21 | $7,556,175 | $6,312,408 | $7,430,635 |
| 2/21 | $7,604,075 | $6,221,254 | $7,435,316 |
| 3/21 | $7,657,254 | $6,143,571 | $7,451,768 |
| 4/21 | $7,805,356 | $6,192,105 | $7,609,683 |
| 5/21 | $7,865,397 | $6,212,335 | $7,657,477 |
| 6/21 | $7,902,690 | $6,255,983 | $7,734,725 |
| 7/21 | $7,978,986 | $6,325,931 | $7,813,611 |
| 8/21 | $8,051,267 | $6,313,887 | $7,874,967 |
| 9/21 | $7,914,035 | $6,259,222 | $7,717,288 |
| 10/21 | $8,042,915 | $6,257,496 | $7,863,865 |
| 11/21 | $7,970,420 | $6,276,009 | $7,813,141 |
| 12/21 | $8,087,526 | $6,259,950 | $7,909,460 |
| 1/22 | $7,857,885 | $6,125,085 | $7,650,270 |
| 2/22 | $7,753,503 | $6,056,752 | $7,532,217 |
| 3/22 | $7,631,517 | $5,888,485 | $7,459,399 |
| 4/22 | $7,296,618 | $5,665,028 | $7,061,020 |
| 5/22 | $7,288,245 | $5,701,554 | $7,091,659 |
| 6/22 | $6,985,093 | $5,612,108 | $6,807,524 |
| 7/22 | $7,304,700 | $5,749,238 | $7,100,871 |
| 8/22 | $7,081,816 | $5,586,784 | $6,881,966 |
| 9/22 | $6,650,797 | $5,345,399 | $6,459,347 |
| 10/22 | $6,748,105 | $5,276,164 | $6,556,933 |
| 11/22 | $7,078,106 | $5,470,198 | $6,874,543 |
| 12/22 | $6,948,490 | $5,445,523 | $6,749,491 |
| 1/23 | $7,295,272 | $5,613,049 | $7,054,552 |
| 2/23 | $7,119,740 | $5,467,922 | $6,870,974 |
| 3/23 | $7,247,968 | $5,606,821 | $7,045,016 |
| 4/23 | $7,295,397 | $5,640,802 | $7,103,520 |
| 5/23 | $7,196,228 | $5,579,381 | $7,035,166 |
| 6/23 | $7,328,989 | $5,559,482 | $7,169,500 |
| 7/23 | $7,420,167 | $5,555,606 | $7,260,646 |
| 8/23 | $7,311,622 | $5,520,121 | $7,164,401 |
| 9/23 | $7,062,044 | $5,379,845 | $6,937,513 |
| 10/23 | $6,895,466 | $5,294,945 | $6,790,470 |
| 11/23 | $7,329,446 | $5,534,733 | $7,210,404 |
| 12/23 | $7,672,210 | $5,746,597 | $7,522,961 |
| 1/24 | $7,667,770 | $5,730,816 | $7,522,150 |
| 2/24 | $7,716,609 | $5,649,850 | $7,572,327 |
| 3/24 | $7,857,499 | $5,702,020 | $7,702,234 |
| 4/24 | $7,629,422 | $5,557,996 | $7,477,582 |
| 5/24 | $7,817,250 | $5,652,222 | $7,670,362 |
| 6/24 | $7,905,355 | $5,705,733 | $7,775,153 |
| 7/24 | $8,108,404 | $5,839,002 | $7,948,953 |
| 8/24 | $8,261,818 | $5,922,908 | $8,087,968 |
| 9/24 | $8,382,303 | $6,002,211 | $8,222,322 |
Average Annual Total Returns (%)Footnote Reference1
| Fund | 1 Year | 5 Years | 10 Years |
|---|
| Class R6 | 18.70% | 5.20% | 5.30% |
| Bloomberg U.S. Aggregate Bond Index | 11.57% | 0.33% | 1.84% |
Conservative Allocation Blended BenchmarkFootnote Reference2 | 18.52% | 4.92% | 5.10% |
| Footnote | Description |
Footnote1 | Class R6 performance prior to 2/1/22 is linked to Class I. This linked performance is adjusted for any applicable sales charge, but is not adjusted for class expense differences. If adjusted for such differences, the performance would be different. Performance presented in the Financial Highlights included in the financial statements is not linked. |
Footnote2 | Benchmark is an internally constructed benchmark which is comprised of a blend of 25% Russell 3000® Index, 10% MSCI ACWI ex USA Investable Market Index and 65% Bloomberg U.S. Aggregate Bond Index, and is rebalanced monthly. |
Performance does not reflect the deduction of taxes that a shareholder would pay on Fund distributions or redemption of Fund shares. Performance assumes that all dividends and distributions, if any, were reinvested. For more recent performance information, visit www.eatonvance.com/performance.php. Performance prior to December 31, 2016 is that of the Fund's former investment adviser.
THE FUND'S PAST PERFORMANCE IS NO GUARANTEE OF FUTURE RESULTS.
| Total Net Assets | $247,005,089 |
| # of Portfolio Holdings | 22 |
| Portfolio Turnover Rate | 13% |
Total Advisory Fees PaidFootnote Reference* | $0 |
| Footnote | Description |
Footnote* | Fund does not pay an advisory fee directly; the underlying funds in which the Fund invests do. |
What did the Fund invest in?
The following tables reflect what the Fund invested in as of the report date.
Asset Allocation (% of total investments)
| Value | Value |
|---|
| Short-Term Investments | 0.0%Footnote Reference* |
| International and Global Equity Funds | 10.8% |
| Domestic Equity Funds | 25.4% |
| Income Funds | 63.8% |
| Footnote | Description |
Footnote* | Amount is less than 0.05% |
Top Ten Holdings (% of total investments)Footnote Referencea
| Calvert Bond Fund, Class R6 | 28.9% |
| Calvert Core Bond Fund, Class I | 11.1% |
| Calvert US Large-Cap Core Responsible Index Fund, Class R6 | 7.5% |
| Calvert Ultra-Short Duration Income Fund, Class R6 | 6.3% |
| Calvert Mortgage Access Fund, Class I | 6.1% |
| Calvert US Large-Cap Value Responsible Index Fund, Class R6 | 4.7% |
| Calvert Floating-Rate Advantage Fund, Class R6 | 3.8% |
| Calvert US Large-Cap Growth Responsible Index Fund, Class R6 | 3.6% |
| Calvert International Equity Fund, Class R6 | 3.4% |
| Calvert Equity Fund, Class R6 | 3.1% |
| Total | 78.5% |
| Footnote | Description |
Footnotea | Excluding cash equivalents |
If you wish to view additional information about the Fund, including the prospectus, statement of additional information, financial statements and holdings, please scan the QR code or visit www.eatonvance.com/calvert-fund-documents.php. For proxy information, please visit www.calvert.com/active-engagement.php?DM=how-we-influence.
The Funds may deliver a single copy of certain required shareholder documents (including prospectuses, shareholder reports, and proxy materials) to investors with the same last name and the same address. Your participation will continue indefinitely unless you instruct otherwise by calling 1-800-368-2745 or by contacting your financial intermediary. Your instruction will typically be effective within 30 days of receipt.
Not FDIC Insured | May Lose Value | No Bank Guarantee
Annual Shareholder Report September 30, 2024
Annual Shareholder Report September 30, 2024
This annual shareholder report contains important information about the Calvert Equity Fund for the period of October 1, 2023 to September 30, 2024. You can find additional information about the Fund at www.eatonvance.com/calvert-fund-documents.php. You can also request this information by contacting us at 1-800-368-2745.
What were the Fund costs for the last year?
(based on a hypothetical $10,000 investment)
| Class Name | Costs of a $10,000 investment | Costs paid as a percentage of a $10,000 investment |
|---|
| Class A | $102 | 0.90% |
How did the Fund perform last year and what affected its performance?
Key contributors to (↑) and detractors from (↓) performance, relative to the Russell 1000® Growth Index (the Index):
↓ Not owning NVIDIA Corp., a major microchip supplier, hurt returns as NVIDIA’s stock price surged on rising business interest in artificial intelligence ― AI
↓ Not owning Meta Platforms, Inc. ― Facebook’s parent ― hampered relative performance as Meta’s stock price rose on strong advertising revenue and user growth
↓ Not owning Broadcom, Inc., a semiconductor maker, hampered relative returns as Broadcom reported strong revenue and earnings growth boosted by the rise of AI
↓ An overweight position in Dollar General Corp., a discount store chain, detracted from relative returns due to financial challenges faced by low-end consumers
↑ Not owning Tesla, Inc. contributed to returns as the electric vehicle maker lowered prices on several models, thereby reducing its margins and cash flows
↑ Not owning Apple, Inc. helped returns as demand for Apple’s iPhone 16 proved sluggish given the technology company’s delayed and unclear AI business strategy
↑ Not owning health insurer UnitedHealth Group, Inc. aided returns as rising medical costs and increased cyber-related expenses hurt UnitedHealth’s business
↑ The Fund’s underweight exposure to Alphabet, Inc. ― Google’s parent company ― contributed to returns relative to the Index during the period
Comparison of the change in value of a $10,000 investment for the period indicated.
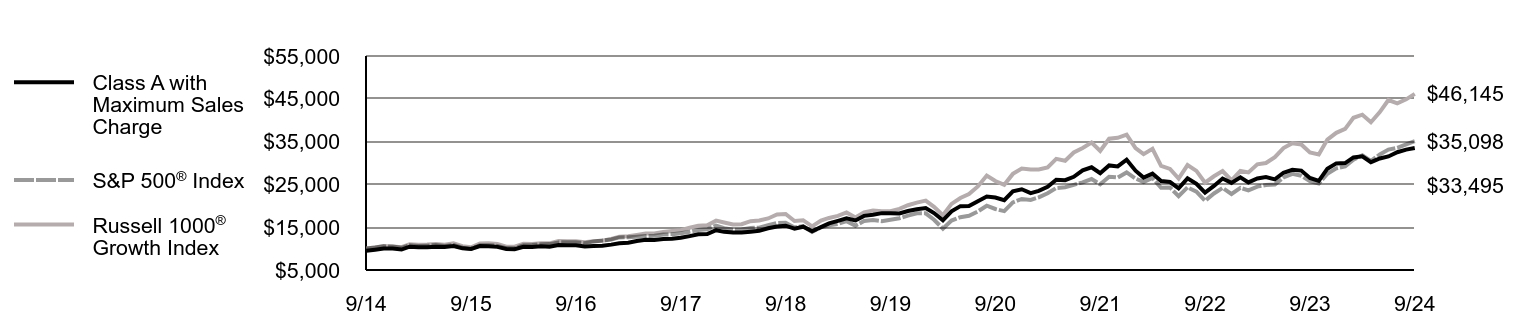
| Class A with Maximum Sales Charge | S&P 500® Index | Russell 1000® Growth Index |
|---|
| 9/14 | $9,475 | $10,000 | $10,000 |
| 10/14 | $9,735 | $10,244 | $10,264 |
| 11/14 | $10,021 | $10,520 | $10,589 |
| 12/14 | $10,036 | $10,493 | $10,478 |
| 1/15 | $9,779 | $10,178 | $10,318 |
| 2/15 | $10,449 | $10,763 | $11,006 |
| 3/15 | $10,300 | $10,593 | $10,881 |
| 4/15 | $10,304 | $10,695 | $10,935 |
| 5/15 | $10,455 | $10,832 | $11,089 |
| 6/15 | $10,382 | $10,622 | $10,894 |
| 7/15 | $10,590 | $10,845 | $11,263 |
| 8/15 | $10,055 | $10,191 | $10,579 |
| 9/15 | $9,908 | $9,939 | $10,317 |
| 10/15 | $10,584 | $10,777 | $11,206 |
| 11/15 | $10,538 | $10,809 | $11,237 |
| 12/15 | $10,406 | $10,638 | $11,072 |
| 1/16 | $9,896 | $10,111 | $10,454 |
| 2/16 | $9,875 | $10,097 | $10,450 |
| 3/16 | $10,442 | $10,782 | $11,154 |
| 4/16 | $10,364 | $10,824 | $11,053 |
| 5/16 | $10,564 | $11,018 | $11,267 |
| 6/16 | $10,416 | $11,047 | $11,223 |
| 7/16 | $10,827 | $11,454 | $11,753 |
| 8/16 | $10,809 | $11,470 | $11,694 |
| 9/16 | $10,757 | $11,472 | $11,737 |
| 10/16 | $10,499 | $11,263 | $11,461 |
| 11/16 | $10,627 | $11,680 | $11,711 |
| 12/16 | $10,647 | $11,911 | $11,856 |
| 1/17 | $10,924 | $12,137 | $12,255 |
| 2/17 | $11,257 | $12,619 | $12,764 |
| 3/17 | $11,381 | $12,633 | $12,912 |
| 4/17 | $11,777 | $12,763 | $13,207 |
| 5/17 | $12,061 | $12,943 | $13,551 |
| 6/17 | $11,994 | $13,023 | $13,515 |
| 7/17 | $12,217 | $13,291 | $13,874 |
| 8/17 | $12,303 | $13,332 | $14,129 |
| 9/17 | $12,520 | $13,607 | $14,312 |
| 10/17 | $12,916 | $13,925 | $14,867 |
| 11/17 | $13,329 | $14,352 | $15,318 |
| 12/17 | $13,393 | $14,511 | $15,438 |
| 1/18 | $14,301 | $15,342 | $16,531 |
| 2/18 | $13,917 | $14,777 | $16,098 |
| 3/18 | $13,758 | $14,401 | $15,656 |
| 4/18 | $13,752 | $14,456 | $15,711 |
| 5/18 | $13,958 | $14,804 | $16,400 |
| 6/18 | $14,158 | $14,896 | $16,557 |
| 7/18 | $14,739 | $15,450 | $17,044 |
| 8/18 | $15,172 | $15,953 | $17,975 |
| 9/18 | $15,356 | $16,044 | $18,076 |
| 10/18 | $14,660 | $14,947 | $16,459 |
| 11/18 | $15,118 | $15,252 | $16,634 |
| 12/18 | $14,066 | $13,875 | $15,204 |
| 1/19 | $15,030 | $14,987 | $16,571 |
| 2/19 | $15,878 | $15,468 | $17,164 |
| 3/19 | $16,476 | $15,769 | $17,652 |
| 4/19 | $17,061 | $16,407 | $18,450 |
| 5/19 | $16,582 | $15,364 | $17,284 |
| 6/19 | $17,649 | $16,447 | $18,471 |
| 7/19 | $17,890 | $16,684 | $18,888 |
| 8/19 | $18,282 | $16,419 | $18,744 |
| 9/19 | $18,231 | $16,727 | $18,746 |
| 10/19 | $18,197 | $17,089 | $19,274 |
| 11/19 | $18,789 | $17,709 | $20,129 |
| 12/19 | $19,204 | $18,244 | $20,737 |
| 1/20 | $19,489 | $18,236 | $21,200 |
| 2/20 | $18,306 | $16,735 | $19,757 |
| 3/20 | $16,590 | $14,668 | $17,813 |
| 4/20 | $18,692 | $16,549 | $20,449 |
| 5/20 | $19,918 | $17,337 | $21,822 |
| 6/20 | $19,931 | $17,682 | $22,772 |
| 7/20 | $21,090 | $18,679 | $24,524 |
| 8/20 | $22,180 | $20,021 | $27,055 |
| 9/20 | $21,929 | $19,260 | $25,782 |
| 10/20 | $21,316 | $18,748 | $24,906 |
| 11/20 | $23,384 | $20,801 | $27,456 |
| 12/20 | $23,865 | $21,600 | $28,719 |
| 1/21 | $22,975 | $21,382 | $28,506 |
| 2/21 | $23,494 | $21,972 | $28,500 |
| 3/21 | $24,420 | $22,934 | $28,990 |
| 4/21 | $26,087 | $24,158 | $30,962 |
| 5/21 | $25,995 | $24,327 | $30,534 |
| 6/21 | $26,774 | $24,895 | $32,449 |
| 7/21 | $28,280 | $25,486 | $33,519 |
| 8/21 | $29,009 | $26,261 | $34,772 |
| 9/21 | $27,604 | $25,040 | $32,824 |
| 10/21 | $29,431 | $26,794 | $35,668 |
| 11/21 | $29,195 | $26,608 | $35,886 |
| 12/21 | $30,771 | $27,801 | $36,644 |
| 1/22 | $28,204 | $26,362 | $33,499 |
| 2/22 | $26,601 | $25,573 | $32,077 |
| 3/22 | $27,532 | $26,522 | $33,331 |
| 4/22 | $25,770 | $24,209 | $29,306 |
| 5/22 | $25,558 | $24,254 | $28,625 |
| 6/22 | $24,085 | $22,252 | $26,357 |
| 7/22 | $26,412 | $24,304 | $29,521 |
| 8/22 | $25,120 | $23,312 | $28,146 |
| 9/22 | $23,091 | $21,165 | $25,409 |
| 10/22 | $24,638 | $22,879 | $26,895 |
| 11/22 | $26,371 | $24,158 | $28,120 |
| 12/22 | $25,361 | $22,766 | $25,967 |
| 1/23 | $26,661 | $24,196 | $28,132 |
| 2/23 | $25,469 | $23,606 | $27,798 |
| 3/23 | $26,377 | $24,473 | $29,698 |
| 4/23 | $26,734 | $24,855 | $29,991 |
| 5/23 | $26,163 | $24,963 | $31,358 |
| 6/23 | $27,715 | $26,612 | $33,502 |
| 7/23 | $28,398 | $27,467 | $34,631 |
| 8/23 | $28,229 | $27,030 | $34,320 |
| 9/23 | $26,515 | $25,741 | $32,453 |
| 10/23 | $25,806 | $25,200 | $31,991 |
| 11/23 | $28,674 | $27,501 | $35,479 |
| 12/23 | $29,910 | $28,750 | $37,050 |
| 1/24 | $29,980 | $29,233 | $37,974 |
| 2/24 | $31,303 | $30,794 | $40,565 |
| 3/24 | $31,577 | $31,785 | $41,279 |
| 4/24 | $30,195 | $30,487 | $39,528 |
| 5/24 | $31,065 | $31,999 | $41,894 |
| 6/24 | $31,534 | $33,147 | $44,719 |
| 7/24 | $32,521 | $33,550 | $43,959 |
| 8/24 | $33,130 | $34,364 | $44,874 |
| 9/24 | $33,495 | $35,098 | $46,145 |
Average Annual Total Returns (%)
| Fund | 1 Year | 5 Years | 10 Years |
|---|
| Class A | 26.34% | 12.92% | 13.45% |
| Class A with 5.25% Maximum Sales Charge | 19.72% | 11.71% | 12.84% |
S&P 500®IndexFootnote Reference1 | 36.35% | 15.96% | 13.37% |
Russell 1000® Growth Index | 42.19% | 19.72% | 16.51% |
| Footnote | Description |
Footnote1 | In accordance with regulatory changes requiring the Fund’s primary benchmark to represent the overall applicable market, the Fund’s primary prospectus benchmark changed to the indicated benchmark effective May 1, 2024. |
Performance does not reflect the deduction of taxes that a shareholder would pay on Fund distributions or redemption of Fund shares. Performance assumes that all dividends and distributions, if any, were reinvested. For more recent performance information, visit www.eatonvance.com/performance.php. Performance prior to December 31, 2016 is that of the Fund's former investment adviser.
THE FUND'S PAST PERFORMANCE IS NO GUARANTEE OF FUTURE RESULTS.
| Total Net Assets | $6,919,418,297 |
| # of Portfolio Holdings | 73 |
| Portfolio Turnover Rate | 9% |
| Total Advisory Fees Paid | $28,515,512 |
What did the Fund invest in?
The following tables reflect what the Fund invested in as of the report date.
Sector Allocation (% of total investments)
| Value | Value |
|---|
| Venture Capital | 0.2% |
| Short-Term Investments | 2.8% |
| Consumer Staples | 3.0% |
| Real Estate | 4.0% |
| Communication Services | 5.0% |
| Consumer Discretionary | 6.9% |
| Materials | 8.3% |
| Industrials | 8.6% |
| Health Care | 17.7% |
| Information Technology | 19.3% |
| Financials | 24.2% |
Top Ten Holdings (% of total investments)Footnote Referencea
| Thermo Fisher Scientific, Inc. | 4.8% |
| Danaher Corp. | 4.8% |
| Mastercard, Inc., Class A | 4.8% |
| Visa, Inc., Class A | 4.6% |
| Microsoft Corp. | 4.3% |
| Alphabet, Inc., Class C | 4.1% |
| S&P Global, Inc. | 4.0% |
| TJX Cos., Inc. | 3.9% |
| Zoetis, Inc. | 3.9% |
| Verisk Analytics, Inc. | 3.3% |
| Total | 42.5% |
| Footnote | Description |
Footnotea | Excluding cash equivalents |
If you wish to view additional information about the Fund, including the prospectus, statement of additional information, financial statements and holdings, please scan the QR code or visit www.eatonvance.com/calvert-fund-documents.php. For proxy information, please visit www.calvert.com/active-engagement.php?DM=how-we-influence.
The Funds may deliver a single copy of certain required shareholder documents (including prospectuses, shareholder reports, and proxy materials) to investors with the same last name and the same address. Your participation will continue indefinitely unless you instruct otherwise by calling 1-800-368-2745 or by contacting your financial intermediary. Your instruction will typically be effective within 30 days of receipt.
Not FDIC Insured | May Lose Value | No Bank Guarantee
Annual Shareholder Report September 30, 2024
Annual Shareholder Report September 30, 2024
This annual shareholder report contains important information about the Calvert Equity Fund for the period of October 1, 2023 to September 30, 2024. You can find additional information about the Fund at www.eatonvance.com/calvert-fund-documents.php. You can also request this information by contacting us at 1-800-368-2745.
What were the Fund costs for the last year?
(based on a hypothetical $10,000 investment)
| Class Name | Costs of a $10,000 investment | Costs paid as a percentage of a $10,000 investment |
|---|
| Class C | $186 | 1.65% |
How did the Fund perform last year and what affected its performance?
Key contributors to (↑) and detractors from (↓) performance, relative to the Russell 1000® Growth Index (the Index):
↓ Not owning NVIDIA Corp., a major microchip supplier, hurt returns as NVIDIA’s stock price surged on rising business interest in artificial intelligence ― AI
↓ Not owning Meta Platforms, Inc. ― Facebook’s parent ― hampered relative performance as Meta’s stock price rose on strong advertising revenue and user growth
↓ Not owning Broadcom, Inc., a semiconductor maker, hampered relative returns as Broadcom reported strong revenue and earnings growth boosted by the rise of AI
↓ An overweight position in Dollar General Corp., a discount store chain, detracted from relative returns due to financial challenges faced by low-end consumers
↑ Not owning Tesla, Inc. contributed to returns as the electric vehicle maker lowered prices on several models, thereby reducing its margins and cash flows
↑ Not owning Apple, Inc. helped returns as demand for Apple’s iPhone 16 proved sluggish given the technology company’s delayed and unclear AI business strategy
↑ Not owning health insurer UnitedHealth Group, Inc. aided returns as rising medical costs and increased cyber-related expenses hurt UnitedHealth’s business
↑ The Fund’s underweight exposure to Alphabet, Inc. ― Google’s parent company ― contributed to returns relative to the Index during the period
Comparison of the change in value of a $10,000 investment for the period indicated.
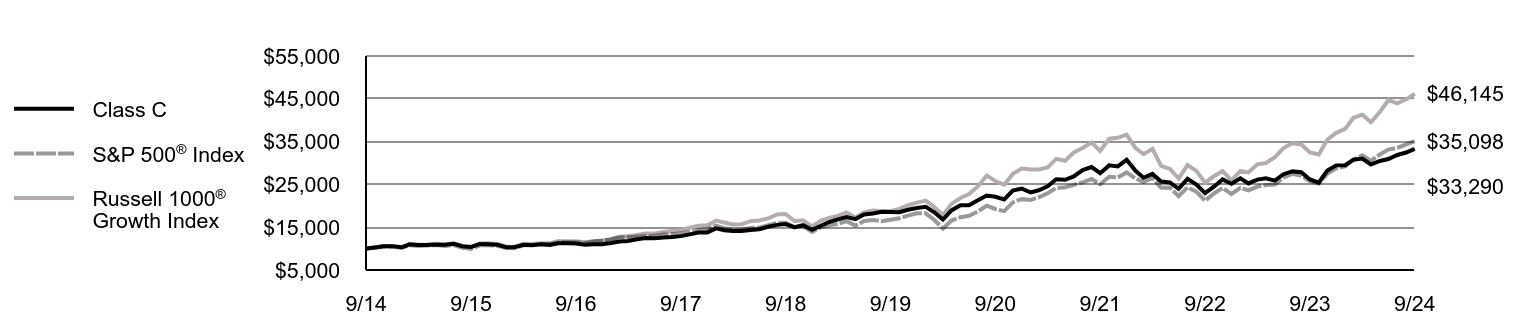
| Class C | S&P 500® Index | Russell 1000® Growth Index |
|---|
| 9/14 | $10,000 | $10,000 | $10,000 |
| 10/14 | $10,269 | $10,244 | $10,264 |
| 11/14 | $10,566 | $10,520 | $10,589 |
| 12/14 | $10,575 | $10,493 | $10,478 |
| 1/15 | $10,299 | $10,178 | $10,318 |
| 2/15 | $10,999 | $10,763 | $11,006 |
| 3/15 | $10,833 | $10,593 | $10,881 |
| 4/15 | $10,833 | $10,695 | $10,935 |
| 5/15 | $10,984 | $10,832 | $11,089 |
| 6/15 | $10,898 | $10,622 | $10,894 |
| 7/15 | $11,109 | $10,845 | $11,263 |
| 8/15 | $10,542 | $10,191 | $10,579 |
| 9/15 | $10,382 | $9,939 | $10,317 |
| 10/15 | $11,082 | $10,777 | $11,206 |
| 11/15 | $11,029 | $10,809 | $11,237 |
| 12/15 | $10,882 | $10,638 | $11,072 |
| 1/16 | $10,342 | $10,111 | $10,454 |
| 2/16 | $10,314 | $10,097 | $10,450 |
| 3/16 | $10,898 | $10,782 | $11,154 |
| 4/16 | $10,808 | $10,824 | $11,053 |
| 5/16 | $11,013 | $11,018 | $11,267 |
| 6/16 | $10,853 | $11,047 | $11,223 |
| 7/16 | $11,270 | $11,454 | $11,753 |
| 8/16 | $11,242 | $11,470 | $11,694 |
| 9/16 | $11,184 | $11,472 | $11,737 |
| 10/16 | $10,910 | $11,263 | $11,461 |
| 11/16 | $11,033 | $11,680 | $11,711 |
| 12/16 | $11,044 | $11,911 | $11,856 |
| 1/17 | $11,328 | $12,137 | $12,255 |
| 2/17 | $11,665 | $12,619 | $12,764 |
| 3/17 | $11,790 | $12,633 | $12,912 |
| 4/17 | $12,189 | $12,763 | $13,207 |
| 5/17 | $12,473 | $12,943 | $13,551 |
| 6/17 | $12,396 | $13,023 | $13,515 |
| 7/17 | $12,618 | $13,291 | $13,874 |
| 8/17 | $12,699 | $13,332 | $14,129 |
| 9/17 | $12,916 | $13,607 | $14,312 |
| 10/17 | $13,320 | $13,925 | $14,867 |
| 11/17 | $13,734 | $14,352 | $15,318 |
| 12/17 | $13,787 | $14,511 | $15,438 |
| 1/18 | $14,716 | $15,342 | $16,531 |
| 2/18 | $14,312 | $14,777 | $16,098 |
| 3/18 | $14,137 | $14,401 | $15,656 |
| 4/18 | $14,126 | $14,456 | $15,711 |
| 5/18 | $14,328 | $14,804 | $16,400 |
| 6/18 | $14,525 | $14,896 | $16,557 |
| 7/18 | $15,109 | $15,450 | $17,044 |
| 8/18 | $15,546 | $15,953 | $17,975 |
| 9/18 | $15,726 | $16,044 | $18,076 |
| 10/18 | $15,000 | $14,947 | $16,459 |
| 11/18 | $15,463 | $15,252 | $16,634 |
| 12/18 | $14,382 | $13,875 | $15,204 |
| 1/19 | $15,350 | $14,987 | $16,571 |
| 2/19 | $16,212 | $15,468 | $17,164 |
| 3/19 | $16,812 | $15,769 | $17,652 |
| 4/19 | $17,392 | $16,407 | $18,450 |
| 5/19 | $16,893 | $15,364 | $17,284 |
| 6/19 | $17,974 | $16,447 | $18,471 |
| 7/19 | $18,204 | $16,684 | $18,888 |
| 8/19 | $18,591 | $16,419 | $18,744 |
| 9/19 | $18,529 | $16,727 | $18,746 |
| 10/19 | $18,485 | $17,089 | $19,274 |
| 11/19 | $19,073 | $17,709 | $20,129 |
| 12/19 | $19,481 | $18,244 | $20,737 |
| 1/20 | $19,757 | $18,236 | $21,200 |
| 2/20 | $18,546 | $16,735 | $19,757 |
| 3/20 | $16,796 | $14,668 | $17,813 |
| 4/20 | $18,915 | $16,549 | $20,449 |
| 5/20 | $20,146 | $17,337 | $21,822 |
| 6/20 | $20,146 | $17,682 | $22,772 |
| 7/20 | $21,297 | $18,679 | $24,524 |
| 8/20 | $22,390 | $20,021 | $27,055 |
| 9/20 | $22,119 | $19,260 | $25,782 |
| 10/20 | $21,488 | $18,748 | $24,906 |
| 11/20 | $23,561 | $20,801 | $27,456 |
| 12/20 | $24,028 | $21,600 | $28,719 |
| 1/21 | $23,117 | $21,382 | $28,506 |
| 2/21 | $23,628 | $21,972 | $28,500 |
| 3/21 | $24,539 | $22,934 | $28,990 |
| 4/21 | $26,202 | $24,158 | $30,962 |
| 5/21 | $26,085 | $24,327 | $30,534 |
| 6/21 | $26,851 | $24,895 | $32,449 |
| 7/21 | $28,348 | $25,486 | $33,519 |
| 8/21 | $29,059 | $26,261 | $34,772 |
| 9/21 | $27,630 | $25,040 | $32,824 |
| 10/21 | $29,445 | $26,794 | $35,668 |
| 11/21 | $29,190 | $26,608 | $35,886 |
| 12/21 | $30,746 | $27,801 | $36,644 |
| 1/22 | $28,165 | $26,362 | $33,499 |
| 2/22 | $26,546 | $25,573 | $32,077 |
| 3/22 | $27,455 | $26,522 | $33,331 |
| 4/22 | $25,681 | $24,209 | $29,306 |
| 5/22 | $25,459 | $24,254 | $28,625 |
| 6/22 | $23,980 | $22,252 | $26,357 |
| 7/22 | $26,280 | $24,304 | $29,521 |
| 8/22 | $24,978 | $23,312 | $28,146 |
| 9/22 | $22,945 | $21,165 | $25,409 |
| 10/22 | $24,461 | $22,879 | $26,895 |
| 11/22 | $26,169 | $24,158 | $28,120 |
| 12/22 | $25,151 | $22,766 | $25,967 |
| 1/23 | $26,422 | $24,196 | $28,132 |
| 2/23 | $25,230 | $23,606 | $27,798 |
| 3/23 | $26,114 | $24,473 | $29,698 |
| 4/23 | $26,446 | $24,855 | $29,991 |
| 5/23 | $25,870 | $24,963 | $31,358 |
| 6/23 | $27,386 | $26,612 | $33,502 |
| 7/23 | $28,041 | $27,467 | $34,631 |
| 8/23 | $27,859 | $27,030 | $34,320 |
| 9/23 | $26,154 | $25,741 | $32,453 |
| 10/23 | $25,435 | $25,200 | $31,991 |
| 11/23 | $28,239 | $27,501 | $35,479 |
| 12/23 | $29,445 | $28,750 | $37,050 |
| 1/24 | $29,494 | $29,233 | $37,974 |
| 2/24 | $30,778 | $30,794 | $40,565 |
| 3/24 | $31,024 | $31,785 | $41,279 |
| 4/24 | $29,650 | $30,487 | $39,528 |
| 5/24 | $30,484 | $31,999 | $41,894 |
| 6/24 | $30,925 | $33,147 | $44,719 |
| 7/24 | $31,874 | $33,550 | $43,959 |
| 8/24 | $32,446 | $34,364 | $44,874 |
| 9/24 | $33,290 | $35,098 | $46,145 |
Average Annual Total Returns (%)
| Fund | 1 Year | 5 Years | 10 Years |
|---|
| Class C | 25.37% | 12.08% | 12.77% |
| Class C with 1% Maximum Deferred Sales Charge | 24.37% | 12.08% | 12.77% |
S&P 500®IndexFootnote Reference1 | 36.35% | 15.96% | 13.37% |
Russell 1000® Growth Index | 42.19% | 19.72% | 16.51% |
| Footnote | Description |
Footnote1 | In accordance with regulatory changes requiring the Fund’s primary benchmark to represent the overall applicable market, the Fund’s primary prospectus benchmark changed to the indicated benchmark effective May 1, 2024. |
Performance does not reflect the deduction of taxes that a shareholder would pay on Fund distributions or redemption of Fund shares. Performance assumes that all dividends and distributions, if any, were reinvested. For more recent performance information, visit www.eatonvance.com/performance.php. Performance prior to December 31, 2016 is that of the Fund's former investment adviser.
THE FUND'S PAST PERFORMANCE IS NO GUARANTEE OF FUTURE RESULTS.
| Total Net Assets | $6,919,418,297 |
| # of Portfolio Holdings | 73 |
| Portfolio Turnover Rate | 9% |
| Total Advisory Fees Paid | $28,515,512 |
What did the Fund invest in?
The following tables reflect what the Fund invested in as of the report date.
Sector Allocation (% of total investments)
| Value | Value |
|---|
| Venture Capital | 0.2% |
| Short-Term Investments | 2.8% |
| Consumer Staples | 3.0% |
| Real Estate | 4.0% |
| Communication Services | 5.0% |
| Consumer Discretionary | 6.9% |
| Materials | 8.3% |
| Industrials | 8.6% |
| Health Care | 17.7% |
| Information Technology | 19.3% |
| Financials | 24.2% |
Top Ten Holdings (% of total investments)Footnote Referencea
| Thermo Fisher Scientific, Inc. | 4.8% |
| Danaher Corp. | 4.8% |
| Mastercard, Inc., Class A | 4.8% |
| Visa, Inc., Class A | 4.6% |
| Microsoft Corp. | 4.3% |
| Alphabet, Inc., Class C | 4.1% |
| S&P Global, Inc. | 4.0% |
| TJX Cos., Inc. | 3.9% |
| Zoetis, Inc. | 3.9% |
| Verisk Analytics, Inc. | 3.3% |
| Total | 42.5% |
| Footnote | Description |
Footnotea | Excluding cash equivalents |
If you wish to view additional information about the Fund, including the prospectus, statement of additional information, financial statements and holdings, please scan the QR code or visit www.eatonvance.com/calvert-fund-documents.php. For proxy information, please visit www.calvert.com/active-engagement.php?DM=how-we-influence.
The Funds may deliver a single copy of certain required shareholder documents (including prospectuses, shareholder reports, and proxy materials) to investors with the same last name and the same address. Your participation will continue indefinitely unless you instruct otherwise by calling 1-800-368-2745 or by contacting your financial intermediary. Your instruction will typically be effective within 30 days of receipt.
Not FDIC Insured | May Lose Value | No Bank Guarantee
Annual Shareholder Report September 30, 2024
Annual Shareholder Report September 30, 2024
This annual shareholder report contains important information about the Calvert Equity Fund for the period of October 1, 2023 to September 30, 2024. You can find additional information about the Fund at www.eatonvance.com/calvert-fund-documents.php. You can also request this information by contacting us at 1-800-368-2745.
What were the Fund costs for the last year?
(based on a hypothetical $10,000 investment)
| Class Name | Costs of a $10,000 investment | Costs paid as a percentage of a $10,000 investment |
|---|
| Class I | $74 | 0.65% |
How did the Fund perform last year and what affected its performance?
Key contributors to (↑) and detractors from (↓) performance, relative to the Russell 1000® Growth Index (the Index):
↓ Not owning NVIDIA Corp., a major microchip supplier, hurt returns as NVIDIA’s stock price surged on rising business interest in artificial intelligence ― AI
↓ Not owning Meta Platforms, Inc. ― Facebook’s parent ― hampered relative performance as Meta’s stock price rose on strong advertising revenue and user growth
↓ Not owning Broadcom, Inc., a semiconductor maker, hampered relative returns as Broadcom reported strong revenue and earnings growth boosted by the rise of AI
↓ An overweight position in Dollar General Corp., a discount store chain, detracted from relative returns due to financial challenges faced by low-end consumers
↑ Not owning Tesla, Inc. contributed to returns as the electric vehicle maker lowered prices on several models, thereby reducing its margins and cash flows
↑ Not owning Apple, Inc. helped returns as demand for Apple’s iPhone 16 proved sluggish given the technology company’s delayed and unclear AI business strategy
↑ Not owning health insurer UnitedHealth Group, Inc. aided returns as rising medical costs and increased cyber-related expenses hurt UnitedHealth’s business
↑ The Fund’s underweight exposure to Alphabet, Inc. ― Google’s parent company ― contributed to returns relative to the Index during the period
Comparison of the change in value of a $1,000,000 investment for the period indicated.
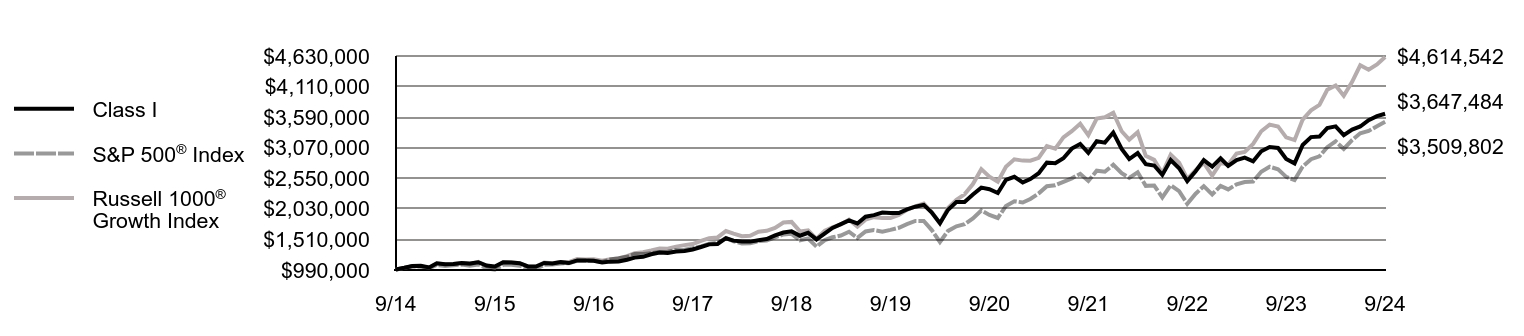
| Class I | S&P 500® Index | Russell 1000® Growth Index |
|---|
| 9/14 | $1,000,000 | $1,000,000 | $1,000,000 |
| 10/14 | $1,027,869 | $1,024,425 | $1,026,352 |
| 11/14 | $1,058,470 | $1,051,977 | $1,058,875 |
| 12/14 | $1,060,403 | $1,049,327 | $1,047,843 |
| 1/15 | $1,034,063 | $1,017,827 | $1,031,798 |
| 2/15 | $1,105,102 | $1,076,323 | $1,100,573 |
| 3/15 | $1,089,737 | $1,059,301 | $1,088,056 |
| 4/15 | $1,090,755 | $1,069,463 | $1,093,505 |
| 5/15 | $1,107,123 | $1,083,216 | $1,108,897 |
| 6/15 | $1,099,969 | $1,062,247 | $1,089,362 |
| 7/15 | $1,122,305 | $1,084,502 | $1,126,303 |
| 8/15 | $1,066,034 | $1,019,070 | $1,057,904 |
| 9/15 | $1,050,891 | $993,855 | $1,031,734 |
| 10/15 | $1,122,948 | $1,077,691 | $1,120,572 |
| 11/15 | $1,118,529 | $1,080,895 | $1,123,718 |
| 12/15 | $1,104,858 | $1,063,848 | $1,107,227 |
| 1/16 | $1,051,104 | $1,011,055 | $1,045,414 |
| 2/16 | $1,049,156 | $1,009,691 | $1,044,968 |
| 3/16 | $1,109,744 | $1,078,187 | $1,115,442 |
| 4/16 | $1,101,636 | $1,082,366 | $1,105,256 |
| 5/16 | $1,123,732 | $1,101,804 | $1,126,719 |
| 6/16 | $1,108,272 | $1,104,659 | $1,122,294 |
| 7/16 | $1,152,212 | $1,145,386 | $1,175,269 |
| 8/16 | $1,150,510 | $1,146,994 | $1,169,430 |
| 9/16 | $1,145,383 | $1,147,211 | $1,173,707 |
| 10/16 | $1,118,615 | $1,126,284 | $1,146,145 |
| 11/16 | $1,132,374 | $1,167,996 | $1,171,083 |
| 12/16 | $1,134,749 | $1,191,083 | $1,185,580 |
| 1/17 | $1,164,798 | $1,213,674 | $1,225,533 |
| 2/17 | $1,200,550 | $1,261,864 | $1,276,436 |
| 3/17 | $1,214,361 | $1,263,336 | $1,291,200 |
| 4/17 | $1,257,155 | $1,276,310 | $1,320,730 |
| 5/17 | $1,287,735 | $1,294,271 | $1,355,072 |
| 6/17 | $1,280,989 | $1,302,349 | $1,351,502 |
| 7/17 | $1,305,370 | $1,329,129 | $1,387,424 |
| 8/17 | $1,314,827 | $1,333,198 | $1,412,857 |
| 9/17 | $1,338,389 | $1,360,699 | $1,431,227 |
| 10/17 | $1,381,193 | $1,392,452 | $1,486,683 |
| 11/17 | $1,425,850 | $1,435,158 | $1,531,848 |
| 12/17 | $1,432,600 | $1,451,115 | $1,543,774 |
| 1/18 | $1,530,530 | $1,534,197 | $1,653,114 |
| 2/18 | $1,489,546 | $1,477,651 | $1,609,767 |
| 3/18 | $1,473,244 | $1,440,099 | $1,565,623 |
| 4/18 | $1,472,963 | $1,445,625 | $1,571,092 |
| 5/18 | $1,495,647 | $1,480,438 | $1,639,955 |
| 6/18 | $1,517,457 | $1,489,550 | $1,655,746 |
| 7/18 | $1,579,954 | $1,544,982 | $1,704,352 |
| 8/18 | $1,626,696 | $1,595,326 | $1,797,540 |
| 9/18 | $1,647,081 | $1,604,406 | $1,807,587 |
| 10/18 | $1,572,697 | $1,494,745 | $1,645,940 |
| 11/18 | $1,622,229 | $1,525,205 | $1,663,422 |
| 12/18 | $1,510,322 | $1,387,493 | $1,520,405 |
| 1/19 | $1,613,830 | $1,498,681 | $1,657,069 |
| 2/19 | $1,705,502 | $1,546,801 | $1,716,358 |
| 3/19 | $1,770,088 | $1,576,858 | $1,765,211 |
| 4/19 | $1,833,078 | $1,640,704 | $1,844,963 |
| 5/19 | $1,781,663 | $1,536,441 | $1,728,411 |
| 6/19 | $1,897,045 | $1,644,723 | $1,847,112 |
| 7/19 | $1,923,289 | $1,668,361 | $1,888,821 |
| 8/19 | $1,966,043 | $1,641,934 | $1,874,355 |
| 9/19 | $1,961,001 | $1,672,655 | $1,874,588 |
| 10/19 | $1,957,598 | $1,708,885 | $1,927,436 |
| 11/19 | $2,021,878 | $1,770,915 | $2,012,943 |
| 12/19 | $2,066,815 | $1,824,365 | $2,073,675 |
| 1/20 | $2,097,829 | $1,823,650 | $2,120,033 |
| 2/20 | $1,970,980 | $1,673,528 | $1,975,655 |
| 3/20 | $1,786,455 | $1,466,826 | $1,781,299 |
| 4/20 | $2,013,606 | $1,654,864 | $2,044,879 |
| 5/20 | $2,145,938 | $1,733,682 | $2,182,161 |
| 6/20 | $2,147,884 | $1,768,160 | $2,277,183 |
| 7/20 | $2,273,085 | $1,867,858 | $2,452,387 |
| 8/20 | $2,391,231 | $2,002,121 | $2,705,454 |
| 9/20 | $2,364,384 | $1,926,047 | $2,578,163 |
| 10/20 | $2,298,683 | $1,874,826 | $2,490,604 |
| 11/20 | $2,522,574 | $2,080,052 | $2,745,621 |
| 12/20 | $2,574,832 | $2,160,026 | $2,871,895 |
| 1/21 | $2,479,301 | $2,138,219 | $2,850,647 |
| 2/21 | $2,535,886 | $2,197,180 | $2,849,987 |
| 3/21 | $2,635,998 | $2,293,407 | $2,898,950 |
| 4/21 | $2,816,973 | $2,415,803 | $3,096,191 |
| 5/21 | $2,807,012 | $2,432,676 | $3,053,367 |
| 6/21 | $2,891,660 | $2,489,466 | $3,244,928 |
| 7/21 | $3,055,100 | $2,548,603 | $3,351,869 |
| 8/21 | $3,134,253 | $2,626,095 | $3,477,191 |
| 9/21 | $2,983,173 | $2,503,956 | $3,282,449 |
| 10/21 | $3,181,219 | $2,679,388 | $3,566,759 |
| 11/21 | $3,156,258 | $2,660,823 | $3,588,567 |
| 12/21 | $3,327,435 | $2,780,070 | $3,664,439 |
| 1/22 | $3,050,488 | $2,636,210 | $3,349,938 |
| 2/22 | $2,877,735 | $2,557,278 | $3,207,655 |
| 3/22 | $2,978,875 | $2,652,229 | $3,333,131 |
| 4/22 | $2,788,814 | $2,420,949 | $2,930,616 |
| 5/22 | $2,766,753 | $2,425,391 | $2,862,486 |
| 6/22 | $2,607,576 | $2,225,190 | $2,635,745 |
| 7/22 | $2,860,426 | $2,430,362 | $2,952,090 |
| 8/22 | $2,721,274 | $2,331,248 | $2,814,570 |
| 9/22 | $2,501,685 | $2,116,543 | $2,540,949 |
| 10/22 | $2,669,686 | $2,287,901 | $2,689,464 |
| 11/22 | $2,858,390 | $2,415,758 | $2,812,015 |
| 12/22 | $2,749,472 | $2,276,576 | $2,596,736 |
| 1/23 | $2,891,071 | $2,419,622 | $2,813,167 |
| 2/23 | $2,762,408 | $2,360,586 | $2,779,757 |
| 3/23 | $2,861,353 | $2,447,253 | $2,969,771 |
| 4/23 | $2,900,511 | $2,485,450 | $2,999,071 |
| 5/23 | $2,839,327 | $2,496,254 | $3,135,763 |
| 6/23 | $3,008,197 | $2,661,194 | $3,350,204 |
| 7/23 | $3,083,017 | $2,746,685 | $3,463,072 |
| 8/23 | $3,065,536 | $2,702,954 | $3,431,977 |
| 9/23 | $2,879,883 | $2,574,083 | $3,245,333 |
| 10/23 | $2,803,665 | $2,519,959 | $3,199,128 |
| 11/23 | $3,115,532 | $2,750,095 | $3,547,868 |
| 12/23 | $3,250,692 | $2,875,033 | $3,704,974 |
| 1/24 | $3,258,869 | $2,923,346 | $3,797,382 |
| 2/24 | $3,403,557 | $3,079,440 | $4,056,467 |
| 3/24 | $3,433,775 | $3,178,520 | $4,127,878 |
| 4/24 | $3,284,109 | $3,048,694 | $3,952,790 |
| 5/24 | $3,379,383 | $3,199,863 | $4,189,425 |
| 6/24 | $3,430,931 | $3,314,681 | $4,471,925 |
| 7/24 | $3,539,714 | $3,355,028 | $4,395,855 |
| 8/24 | $3,606,548 | $3,436,410 | $4,487,412 |
| 9/24 | $3,647,484 | $3,509,802 | $4,614,542 |
Average Annual Total Returns (%)
| Fund | 1 Year | 5 Years | 10 Years |
|---|
| Class I | 26.66% | 13.20% | 13.80% |
S&P 500®IndexFootnote Reference1 | 36.35% | 15.96% | 13.37% |
Russell 1000® Growth Index | 42.19% | 19.72% | 16.51% |
| Footnote | Description |
Footnote1 | In accordance with regulatory changes requiring the Fund’s primary benchmark to represent the overall applicable market, the Fund’s primary prospectus benchmark changed to the indicated benchmark effective May 1, 2024. |
Performance does not reflect the deduction of taxes that a shareholder would pay on Fund distributions or redemption of Fund shares. Performance assumes that all dividends and distributions, if any, were reinvested. For more recent performance information, visit www.eatonvance.com/performance.php. Performance prior to December 31, 2016 is that of the Fund's former investment adviser.
THE FUND'S PAST PERFORMANCE IS NO GUARANTEE OF FUTURE RESULTS.
| Total Net Assets | $6,919,418,297 |
| # of Portfolio Holdings | 73 |
| Portfolio Turnover Rate | 9% |
| Total Advisory Fees Paid | $28,515,512 |
What did the Fund invest in?
The following tables reflect what the Fund invested in as of the report date.
Sector Allocation (% of total investments)
| Value | Value |
|---|
| Venture Capital | 0.2% |
| Short-Term Investments | 2.8% |
| Consumer Staples | 3.0% |
| Real Estate | 4.0% |
| Communication Services | 5.0% |
| Consumer Discretionary | 6.9% |
| Materials | 8.3% |
| Industrials | 8.6% |
| Health Care | 17.7% |
| Information Technology | 19.3% |
| Financials | 24.2% |
Top Ten Holdings (% of total investments)Footnote Referencea
| Thermo Fisher Scientific, Inc. | 4.8% |
| Danaher Corp. | 4.8% |
| Mastercard, Inc., Class A | 4.8% |
| Visa, Inc., Class A | 4.6% |
| Microsoft Corp. | 4.3% |
| Alphabet, Inc., Class C | 4.1% |
| S&P Global, Inc. | 4.0% |
| TJX Cos., Inc. | 3.9% |
| Zoetis, Inc. | 3.9% |
| Verisk Analytics, Inc. | 3.3% |
| Total | 42.5% |
| Footnote | Description |
Footnotea | Excluding cash equivalents |
If you wish to view additional information about the Fund, including the prospectus, statement of additional information, financial statements and holdings, please scan the QR code or visit www.eatonvance.com/calvert-fund-documents.php. For proxy information, please visit www.calvert.com/active-engagement.php?DM=how-we-influence.
The Funds may deliver a single copy of certain required shareholder documents (including prospectuses, shareholder reports, and proxy materials) to investors with the same last name and the same address. Your participation will continue indefinitely unless you instruct otherwise by calling 1-800-368-2745 or by contacting your financial intermediary. Your instruction will typically be effective within 30 days of receipt.
Not FDIC Insured | May Lose Value | No Bank Guarantee
Annual Shareholder Report September 30, 2024
Annual Shareholder Report September 30, 2024
This annual shareholder report contains important information about the Calvert Equity Fund for the period of October 1, 2023 to September 30, 2024. You can find additional information about the Fund at www.eatonvance.com/calvert-fund-documents.php. You can also request this information by contacting us at 1-800-368-2745.
What were the Fund costs for the last year?
(based on a hypothetical $10,000 investment)
| Class Name | Costs of a $10,000 investment | Costs paid as a percentage of a $10,000 investment |
|---|
| Class R6 | $66 | 0.58% |
How did the Fund perform last year and what affected its performance?
Key contributors to (↑) and detractors from (↓) performance, relative to the Russell 1000® Growth Index (the Index):
↓ Not owning NVIDIA Corp., a major microchip supplier, hurt returns as NVIDIA’s stock price surged on rising business interest in artificial intelligence ― AI
↓ Not owning Meta Platforms, Inc. ― Facebook’s parent ― hampered relative performance as Meta’s stock price rose on strong advertising revenue and user growth
↓ Not owning Broadcom, Inc., a semiconductor maker, hampered relative returns as Broadcom reported strong revenue and earnings growth boosted by the rise of AI
↓ An overweight position in Dollar General Corp., a discount store chain, detracted from relative returns due to financial challenges faced by low-end consumers
↑ Not owning Tesla, Inc. contributed to returns as the electric vehicle maker lowered prices on several models, thereby reducing its margins and cash flows
↑ Not owning Apple, Inc. helped returns as demand for Apple’s iPhone 16 proved sluggish given the technology company’s delayed and unclear AI business strategy
↑ Not owning health insurer UnitedHealth Group, Inc. aided returns as rising medical costs and increased cyber-related expenses hurt UnitedHealth’s business
↑ The Fund’s underweight exposure to Alphabet, Inc. ― Google’s parent company ― contributed to returns relative to the Index during the period
Comparison of the change in value of a $5,000,000 investment for the period indicated.
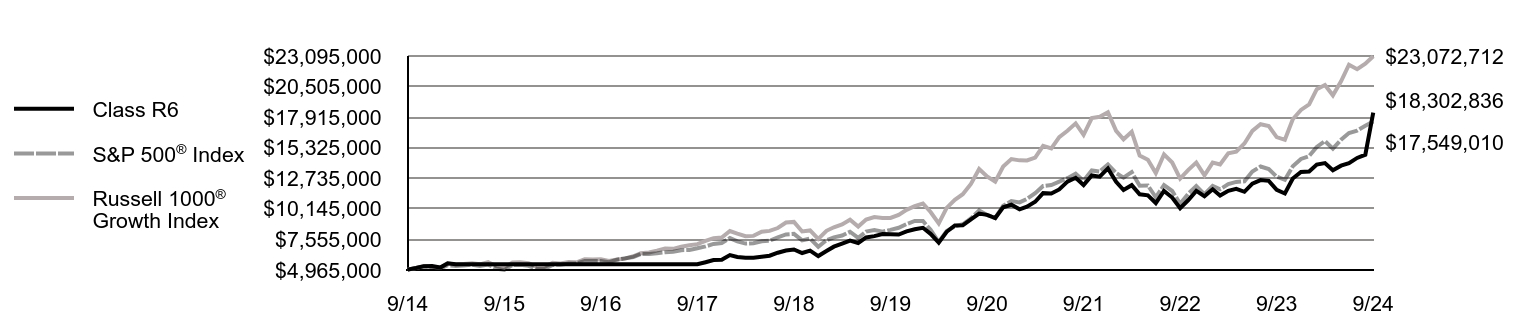
| Class R6 | S&P 500® Index | Russell 1000® Growth Index |
|---|
| 9/14 | $5,000,000 | $5,000,000 | $5,000,000 |
| 10/14 | $5,139,344 | $5,122,126 | $5,131,758 |
| 11/14 | $5,292,350 | $5,259,884 | $5,294,375 |
| 12/14 | $5,302,017 | $5,246,634 | $5,239,217 |
| 1/15 | $5,170,315 | $5,089,134 | $5,158,990 |
| 2/15 | $5,525,512 | $5,381,614 | $5,502,864 |
| 3/15 | $5,448,686 | $5,296,507 | $5,440,280 |
| 4/15 | $5,448,686 | $5,347,317 | $5,467,525 |
| 5/15 | $5,448,686 | $5,416,080 | $5,544,486 |
| 6/15 | $5,448,686 | $5,311,235 | $5,446,811 |
| 7/15 | $5,448,686 | $5,422,512 | $5,631,517 |
| 8/15 | $5,448,686 | $5,095,351 | $5,289,522 |
| 9/15 | $5,448,686 | $4,969,274 | $5,158,671 |
| 10/15 | $5,448,686 | $5,388,453 | $5,602,862 |
| 11/15 | $5,448,686 | $5,404,477 | $5,618,589 |
| 12/15 | $5,448,686 | $5,319,238 | $5,536,137 |
| 1/16 | $5,448,686 | $5,055,275 | $5,227,069 |
| 2/16 | $5,448,686 | $5,048,455 | $5,224,839 |
| 3/16 | $5,448,686 | $5,390,933 | $5,577,209 |
| 4/16 | $5,448,686 | $5,411,832 | $5,526,280 |
| 5/16 | $5,448,686 | $5,509,018 | $5,633,597 |
| 6/16 | $5,448,686 | $5,523,293 | $5,611,471 |
| 7/16 | $5,448,686 | $5,726,930 | $5,876,344 |
| 8/16 | $5,448,686 | $5,734,970 | $5,847,148 |
| 9/16 | $5,448,686 | $5,736,055 | $5,868,537 |
| 10/16 | $5,448,686 | $5,631,422 | $5,730,726 |
| 11/16 | $5,448,686 | $5,839,981 | $5,855,417 |
| 12/16 | $5,448,686 | $5,955,415 | $5,927,901 |
| 1/17 | $5,448,686 | $6,068,368 | $6,127,663 |
| 2/17 | $5,448,686 | $6,309,318 | $6,382,180 |
| 3/17 | $5,448,686 | $6,316,678 | $6,455,998 |
| 4/17 | $5,448,686 | $6,381,550 | $6,603,648 |
| 5/17 | $5,448,686 | $6,471,356 | $6,775,360 |
| 6/17 | $5,448,686 | $6,511,747 | $6,757,510 |
| 7/17 | $5,448,686 | $6,645,646 | $6,937,120 |
| 8/17 | $5,448,686 | $6,665,990 | $7,064,286 |
| 9/17 | $5,448,686 | $6,803,497 | $7,156,136 |
| 10/17 | $5,624,045 | $6,962,259 | $7,433,416 |
| 11/17 | $5,804,697 | $7,175,790 | $7,659,242 |
| 12/17 | $5,833,243 | $7,255,575 | $7,718,870 |
| 1/18 | $6,230,901 | $7,670,986 | $8,265,568 |
| 2/18 | $6,065,198 | $7,388,255 | $8,048,837 |
| 3/18 | $5,997,727 | $7,200,496 | $7,828,113 |
| 4/18 | $5,996,682 | $7,228,124 | $7,855,461 |
| 5/18 | $6,087,692 | $7,402,192 | $8,199,777 |
| 6/18 | $6,176,499 | $7,447,752 | $8,278,728 |
| 7/18 | $6,430,848 | $7,724,910 | $8,521,762 |
| 8/18 | $6,621,404 | $7,976,628 | $8,987,701 |
| 9/18 | $6,704,150 | $8,022,031 | $9,037,933 |
| 10/18 | $6,402,188 | $7,473,724 | $8,229,699 |
| 11/18 | $6,603,432 | $7,626,026 | $8,317,112 |
| 12/18 | $6,147,025 | $6,937,466 | $7,602,027 |
| 1/19 | $6,569,267 | $7,493,405 | $8,285,344 |
| 2/19 | $6,941,735 | $7,734,005 | $8,581,792 |
| 3/19 | $7,206,084 | $7,884,290 | $8,826,056 |
| 4/19 | $7,462,935 | $8,203,522 | $9,224,816 |
| 5/19 | $7,254,533 | $7,682,204 | $8,642,053 |
| 6/19 | $7,723,543 | $8,223,617 | $9,235,560 |
| 7/19 | $7,831,810 | $8,341,807 | $9,444,107 |
| 8/19 | $8,005,822 | $8,209,670 | $9,371,777 |
| 9/19 | $7,985,426 | $8,363,277 | $9,372,940 |
| 10/19 | $7,972,927 | $8,544,423 | $9,637,179 |
| 11/19 | $8,233,624 | $8,854,576 | $10,064,714 |
| 12/19 | $8,417,964 | $9,121,825 | $10,368,377 |
| 1/20 | $8,543,405 | $9,118,249 | $10,600,164 |
| 2/20 | $8,028,210 | $8,367,642 | $9,878,274 |
| 3/20 | $7,277,434 | $7,334,131 | $8,906,493 |
| 4/20 | $8,201,783 | $8,274,320 | $10,224,397 |
| 5/20 | $8,741,923 | $8,668,410 | $10,910,804 |
| 6/20 | $8,749,849 | $8,840,801 | $11,385,915 |
| 7/20 | $9,260,883 | $9,339,290 | $12,261,937 |
| 8/20 | $9,743,201 | $10,010,603 | $13,527,272 |
| 9/20 | $9,633,347 | $9,630,234 | $12,890,815 |
| 10/20 | $9,366,557 | $9,374,129 | $12,453,019 |
| 11/20 | $10,279,555 | $10,400,259 | $13,728,106 |
| 12/20 | $10,492,262 | $10,800,130 | $14,359,477 |
| 1/21 | $10,104,171 | $10,691,094 | $14,253,233 |
| 2/21 | $10,334,805 | $10,985,900 | $14,249,934 |
| 3/21 | $10,744,362 | $11,467,035 | $14,494,752 |
| 4/21 | $11,480,983 | $12,079,016 | $15,480,955 |
| 5/21 | $11,442,358 | $12,163,381 | $15,266,833 |
| 6/21 | $11,789,453 | $12,447,332 | $16,224,640 |
| 7/21 | $12,455,289 | $12,743,017 | $16,759,344 |
| 8/21 | $12,778,681 | $13,130,477 | $17,385,957 |
| 9/21 | $12,164,102 | $12,519,782 | $16,412,243 |
| 10/21 | $12,971,911 | $13,396,940 | $17,833,797 |
| 11/21 | $12,871,270 | $13,304,113 | $17,942,834 |
| 12/21 | $13,569,802 | $13,900,352 | $18,322,196 |
| 1/22 | $12,441,299 | $13,181,050 | $16,749,692 |
| 2/22 | $11,737,546 | $12,786,390 | $16,038,274 |
| 3/22 | $12,151,192 | $13,261,143 | $16,665,654 |
| 4/22 | $11,375,259 | $12,104,747 | $14,653,081 |
| 5/22 | $11,286,422 | $12,126,954 | $14,312,432 |
| 6/22 | $10,638,192 | $11,125,950 | $13,178,725 |
| 7/22 | $11,669,530 | $12,151,812 | $14,760,449 |
| 8/22 | $11,101,808 | $11,656,238 | $14,072,849 |
| 9/22 | $10,206,501 | $10,582,715 | $12,704,746 |
| 10/22 | $10,893,597 | $11,439,506 | $13,447,319 |
| 11/22 | $11,663,978 | $12,078,791 | $14,060,073 |
| 12/22 | $11,220,699 | $11,382,878 | $12,983,680 |
| 1/23 | $11,798,834 | $12,098,109 | $14,065,837 |
| 2/23 | $11,273,647 | $11,802,928 | $13,898,787 |
| 3/23 | $11,677,197 | $12,236,263 | $14,848,854 |
| 4/23 | $11,838,903 | $12,427,252 | $14,995,354 |
| 5/23 | $11,589,904 | $12,481,269 | $15,678,817 |
| 6/23 | $12,279,660 | $13,305,972 | $16,751,022 |
| 7/23 | $12,585,900 | $13,733,426 | $17,315,359 |
| 8/23 | $12,515,780 | $13,514,769 | $17,159,887 |
| 9/23 | $11,758,765 | $12,870,413 | $16,226,666 |
| 10/23 | $11,446,801 | $12,599,793 | $15,995,638 |
| 11/23 | $12,720,417 | $13,750,474 | $17,739,340 |
| 12/23 | $13,274,171 | $14,375,166 | $18,524,872 |
| 1/24 | $13,307,666 | $14,616,731 | $18,986,912 |
| 2/24 | $13,900,380 | $15,397,200 | $20,282,333 |
| 3/24 | $14,024,165 | $15,892,598 | $20,639,388 |
| 4/24 | $13,413,976 | $15,243,472 | $19,763,952 |
| 5/24 | $13,804,264 | $15,999,315 | $20,947,124 |
| 6/24 | $14,015,428 | $16,573,404 | $22,359,623 |
| 7/24 | $14,459,599 | $16,775,142 | $21,979,275 |
| 8/24 | $14,734,840 | $17,182,051 | $22,437,058 |
| 9/24 | $18,302,836 | $17,549,010 | $23,072,712 |
Average Annual Total Returns (%)Footnote Reference1
| Fund | 1 Year | 5 Years | 10 Years |
|---|
| Class R6 | 26.73% | 13.28% | 13.84% |
S&P 500®IndexFootnote Reference2 | 36.35% | 15.96% | 13.37% |
Russell 1000® Growth Index | 42.19% | 19.72% | 16.51% |
| Footnote | Description |
Footnote1 | Class R6 performance prior to 10/3/17 is linked to Class I. This linked performance is adjusted for any applicable sales charge, but is not adjusted for class expense differences. If adjusted for such differences, the performance would be different. Performance presented in the Financial Highlights included in the financial statements is not linked. |
Footnote2 | In accordance with regulatory changes requiring the Fund’s primary benchmark to represent the overall applicable market, the Fund’s primary prospectus benchmark changed to the indicated benchmark effective May 1, 2024. |
Performance does not reflect the deduction of taxes that a shareholder would pay on Fund distributions or redemption of Fund shares. Performance assumes that all dividends and distributions, if any, were reinvested. For more recent performance information, visit www.eatonvance.com/performance.php. Performance prior to December 31, 2016 is that of the Fund's former investment adviser.
THE FUND'S PAST PERFORMANCE IS NO GUARANTEE OF FUTURE RESULTS.
| Total Net Assets | $6,919,418,297 |
| # of Portfolio Holdings | 73 |
| Portfolio Turnover Rate | 9% |
| Total Advisory Fees Paid | $28,515,512 |
What did the Fund invest in?
The following tables reflect what the Fund invested in as of the report date.
Sector Allocation (% of total investments)
| Value | Value |
|---|
| Venture Capital | 0.2% |
| Short-Term Investments | 2.8% |
| Consumer Staples | 3.0% |
| Real Estate | 4.0% |
| Communication Services | 5.0% |
| Consumer Discretionary | 6.9% |
| Materials | 8.3% |
| Industrials | 8.6% |
| Health Care | 17.7% |
| Information Technology | 19.3% |
| Financials | 24.2% |
Top Ten Holdings (% of total investments)Footnote Referencea
| Thermo Fisher Scientific, Inc. | 4.8% |
| Danaher Corp. | 4.8% |
| Mastercard, Inc., Class A | 4.8% |
| Visa, Inc., Class A | 4.6% |
| Microsoft Corp. | 4.3% |
| Alphabet, Inc., Class C | 4.1% |
| S&P Global, Inc. | 4.0% |
| TJX Cos., Inc. | 3.9% |
| Zoetis, Inc. | 3.9% |
| Verisk Analytics, Inc. | 3.3% |
| Total | 42.5% |
| Footnote | Description |
Footnotea | Excluding cash equivalents |
If you wish to view additional information about the Fund, including the prospectus, statement of additional information, financial statements and holdings, please scan the QR code or visit www.eatonvance.com/calvert-fund-documents.php. For proxy information, please visit www.calvert.com/active-engagement.php?DM=how-we-influence.
The Funds may deliver a single copy of certain required shareholder documents (including prospectuses, shareholder reports, and proxy materials) to investors with the same last name and the same address. Your participation will continue indefinitely unless you instruct otherwise by calling 1-800-368-2745 or by contacting your financial intermediary. Your instruction will typically be effective within 30 days of receipt.
Not FDIC Insured | May Lose Value | No Bank Guarantee
Annual Shareholder Report September 30, 2024
Calvert Growth Allocation Fund
Annual Shareholder Report September 30, 2024
This annual shareholder report contains important information about the Calvert Growth Allocation Fund for the period of October 1, 2023 to September 30, 2024. You can find additional information about the Fund at www.eatonvance.com/calvert-fund-documents.php. You can also request this information by contacting us at 1-800-368-2745.
What were the Fund costs for the last year?
(based on a hypothetical $10,000 investment)
| Class Name | Costs of a $10,000 investment | Costs paid as a percentage of a $10,000 investment |
|---|
| Class A | $50 | 0.44% |
How did the Fund perform last year and what affected its performance?
Key contributors to (↑) and detractors from (↓) performance, relative to the Growth Allocation Blended Benchmark (the Blended Index):
↓ The Fund’s higher-than-Blended Index allocation to equities detracted from performance relative to the Blended Index during the period
↓ The Fund’s equity selections ― particularly allocations to Calvert Equity Fund and Calvert Emerging Markets Advancement Fund ― detracted from returns relative to the Blended Index
↓ Among stock sizes, Fund allocations to small-cap and mid-cap companies detracted from returns relative to the Blended Index during the period
↓ Underweight allocations to investment-grade bonds and the Fund’s underweight duration detracted from performance relative to the Blended Index
↑ Allocations among fixed-income assets ― especially the selection of Calvert Bond Fund ― contributed to returns relative to the Blended Index
↑ Among asset classes, overweight allocations to high yield corporate bonds and bank loans aided Fund performance relative to the Blended Index during the period
↑ The Fund’s use of derivatives contributed to returns relative to the Blended Index during the period
Comparison of the change in value of a $10,000 investment for the period indicated.
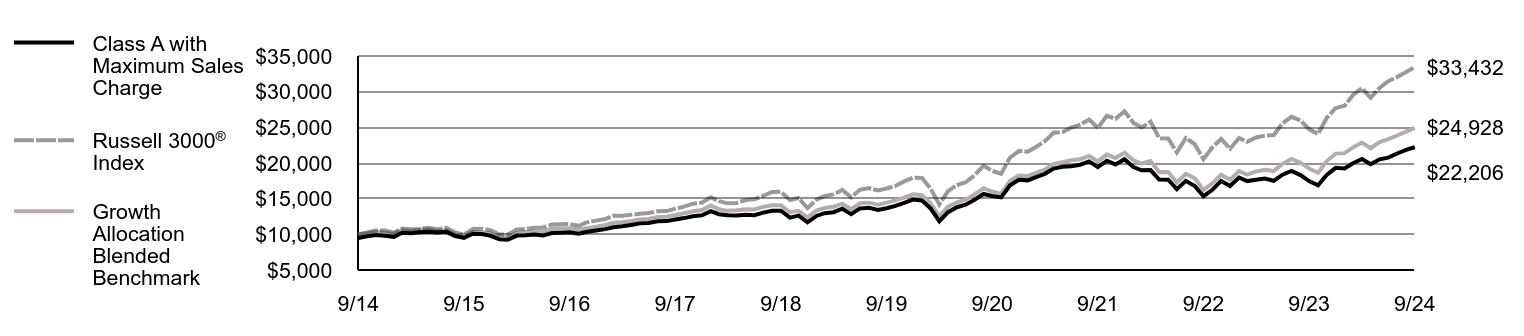
| Class A with Maximum Sales Charge | Russell 3000® Index | Growth Allocation Blended Benchmark |
|---|
| 9/14 | $9,475 | $10,000 | $10,000 |
| 10/14 | $9,736 | $10,275 | $10,140 |
| 11/14 | $9,915 | $10,524 | $10,312 |
| 12/14 | $9,814 | $10,524 | $10,211 |
| 1/15 | $9,652 | $10,231 | $10,056 |
| 2/15 | $10,228 | $10,824 | $10,558 |
| 3/15 | $10,154 | $10,713 | $10,449 |
| 4/15 | $10,282 | $10,762 | $10,636 |
| 5/15 | $10,371 | $10,911 | $10,681 |
| 6/15 | $10,257 | $10,728 | $10,475 |
| 7/15 | $10,351 | $10,908 | $10,572 |
| 8/15 | $9,755 | $10,249 | $9,954 |
| 9/15 | $9,514 | $9,951 | $9,655 |
| 10/15 | $10,085 | $10,736 | $10,322 |
| 11/15 | $10,041 | $10,796 | $10,296 |
| 12/15 | $9,795 | $10,574 | $10,116 |
| 1/16 | $9,291 | $9,978 | $9,577 |
| 2/16 | $9,234 | $9,975 | $9,555 |
| 3/16 | $9,824 | $10,677 | $10,203 |
| 4/16 | $9,863 | $10,743 | $10,326 |
| 5/16 | $9,971 | $10,935 | $10,389 |
| 6/16 | $9,829 | $10,958 | $10,366 |
| 7/16 | $10,187 | $11,393 | $10,776 |
| 8/16 | $10,232 | $11,422 | $10,808 |
| 9/16 | $10,277 | $11,440 | $10,863 |
| 10/16 | $10,096 | $11,192 | $10,662 |
| 11/16 | $10,351 | $11,693 | $10,846 |
| 12/16 | $10,535 | $11,921 | $11,056 |
| 1/17 | $10,726 | $12,145 | $11,301 |
| 2/17 | $11,000 | $12,597 | $11,620 |
| 3/17 | $11,126 | $12,606 | $11,710 |
| 4/17 | $11,322 | $12,739 | $11,873 |
| 5/17 | $11,537 | $12,870 | $12,068 |
| 6/17 | $11,597 | $12,986 | $12,144 |
| 7/17 | $11,823 | $13,231 | $12,420 |
| 8/17 | $11,853 | $13,256 | $12,468 |
| 9/17 | $12,086 | $13,579 | $12,716 |
| 10/17 | $12,277 | $13,876 | $12,955 |
| 11/17 | $12,545 | $14,297 | $13,224 |
| 12/17 | $12,670 | $14,440 | $13,403 |
| 1/18 | $13,261 | $15,201 | $14,032 |
| 2/18 | $12,821 | $14,641 | $13,514 |
| 3/18 | $12,682 | $14,347 | $13,292 |
| 4/18 | $12,645 | $14,402 | $13,374 |
| 5/18 | $12,752 | $14,808 | $13,525 |
| 6/18 | $12,689 | $14,905 | $13,495 |
| 7/18 | $13,041 | $15,400 | $13,851 |
| 8/18 | $13,312 | $15,940 | $14,072 |
| 9/18 | $13,318 | $15,967 | $14,086 |
| 10/18 | $12,343 | $14,791 | $13,099 |
| 11/18 | $12,619 | $15,087 | $13,298 |
| 12/18 | $11,689 | $13,683 | $12,394 |
| 1/19 | $12,574 | $14,858 | $13,328 |
| 2/19 | $12,969 | $15,380 | $13,687 |
| 3/19 | $13,103 | $15,605 | $13,855 |
| 4/19 | $13,586 | $16,228 | $14,295 |
| 5/19 | $12,828 | $15,178 | $13,536 |
| 6/19 | $13,633 | $16,244 | $14,360 |
| 7/19 | $13,720 | $16,485 | $14,442 |
| 8/19 | $13,425 | $16,149 | $14,170 |
| 9/19 | $13,660 | $16,433 | $14,420 |
| 10/19 | $13,981 | $16,786 | $14,765 |
| 11/19 | $14,417 | $17,424 | $15,145 |
| 12/19 | $14,883 | $17,928 | $15,607 |
| 1/20 | $14,731 | $17,908 | $15,498 |
| 2/20 | $13,669 | $16,442 | $14,389 |
| 3/20 | $11,837 | $14,181 | $12,541 |
| 4/20 | $13,107 | $16,059 | $13,866 |
| 5/20 | $13,801 | $16,918 | $14,469 |
| 6/20 | $14,148 | $17,304 | $14,865 |
| 7/20 | $14,856 | $18,287 | $15,596 |
| 8/20 | $15,661 | $19,612 | $16,476 |
| 9/20 | $15,369 | $18,898 | $16,001 |
| 10/20 | $15,175 | $18,490 | $15,680 |
| 11/20 | $16,834 | $20,739 | $17,475 |
| 12/20 | $17,644 | $21,672 | $18,244 |
| 1/21 | $17,565 | $21,576 | $18,191 |
| 2/21 | $18,031 | $22,250 | $18,626 |
| 3/21 | $18,483 | $23,048 | $19,080 |
| 4/21 | $19,222 | $24,236 | $19,866 |
| 5/21 | $19,473 | $24,346 | $20,107 |
| 6/21 | $19,544 | $24,947 | $20,380 |
| 7/21 | $19,759 | $25,369 | $20,530 |
| 8/21 | $20,218 | $26,092 | $20,998 |
| 9/21 | $19,415 | $24,921 | $20,215 |
| 10/21 | $20,312 | $26,607 | $21,172 |
| 11/21 | $19,795 | $26,202 | $20,695 |
| 12/21 | $20,538 | $27,234 | $21,436 |
| 1/22 | $19,440 | $25,631 | $20,372 |
| 2/22 | $18,980 | $24,986 | $19,926 |
| 3/22 | $19,009 | $25,796 | $20,275 |
| 4/22 | $17,681 | $23,481 | $18,723 |
| 5/22 | $17,666 | $23,450 | $18,747 |
| 6/22 | $16,331 | $21,488 | $17,273 |
| 7/22 | $17,496 | $23,504 | $18,483 |
| 8/22 | $16,776 | $22,627 | $17,843 |
| 9/22 | $15,344 | $20,528 | $16,230 |
| 10/22 | $16,249 | $22,212 | $17,155 |
| 11/22 | $17,481 | $23,371 | $18,346 |
| 12/22 | $16,780 | $22,003 | $17,659 |
| 1/23 | $17,962 | $23,518 | $18,866 |
| 2/23 | $17,466 | $22,968 | $18,362 |
| 3/23 | $17,665 | $23,583 | $18,821 |
| 4/23 | $17,810 | $23,834 | $19,049 |
| 5/23 | $17,504 | $23,927 | $18,871 |
| 6/23 | $18,366 | $25,560 | $19,884 |
| 7/23 | $18,877 | $26,477 | $20,561 |
| 8/23 | $18,305 | $25,966 | $20,045 |
| 9/23 | $17,466 | $24,729 | $19,227 |
| 10/23 | $16,871 | $24,073 | $18,641 |
| 11/23 | $18,321 | $26,318 | $20,277 |
| 12/23 | $19,321 | $27,714 | $21,316 |
| 1/24 | $19,233 | $28,021 | $21,382 |
| 2/24 | $19,958 | $29,538 | $22,195 |
| 3/24 | $20,555 | $30,491 | $22,851 |
| 4/24 | $19,830 | $29,149 | $22,070 |
| 5/24 | $20,516 | $30,526 | $22,929 |
| 6/24 | $20,747 | $31,471 | $23,360 |
| 7/24 | $21,336 | $32,056 | $23,852 |
| 8/24 | $21,830 | $32,754 | $24,392 |
| 9/24 | $22,206 | $33,432 | $24,928 |
Average Annual Total Returns (%)
| Fund | 1 Year | 5 Years | 10 Years |
|---|
| Class A | 27.17% | 10.20% | 8.88% |
| Class A with 5.25% Maximum Sales Charge | 20.49% | 9.02% | 8.30% |
Russell 3000® Index | 35.19% | 15.25% | 12.82% |
Growth Allocation Blended BenchmarkFootnote Reference1 | 29.65% | 11.55% | 9.56% |
| Footnote | Description |
Footnote1 | Benchmark is an internally constructed benchmark which is comprised of a blend of 60% Russell 3000® Index, 30% MSCI ACWI ex USA Investable Market Index and 10% Bloomberg U.S. Aggregate Bond Index, and is rebalanced monthly. |
Performance does not reflect the deduction of taxes that a shareholder would pay on Fund distributions or redemption of Fund shares. Performance assumes that all dividends and distributions, if any, were reinvested. For more recent performance information, visit www.eatonvance.com/performance.php. Performance prior to December 31, 2016 is that of the Fund's former investment adviser.
THE FUND'S PAST PERFORMANCE IS NO GUARANTEE OF FUTURE RESULTS.
| Total Net Assets | $359,362,298 |
| # of Portfolio Holdings | 18 |
| Portfolio Turnover Rate | 23% |
Total Advisory Fees PaidFootnote Reference* | $0 |
| Footnote | Description |
Footnote* | Fund does not pay an advisory fee directly; the underlying funds in which the Fund invests do. |
What did the Fund invest in?
The following tables reflect what the Fund invested in as of the report date.
Asset Allocation (% of total investments)
| Value | Value |
|---|
| Short-Term Investments | 0.7% |
| Income Funds | 8.7% |
| International and Global Equity Funds | 30.6% |
| Domestic Equity Funds | 60.0% |
Top Ten Holdings (% of total investments)Footnote Referencea
| Calvert US Large-Cap Core Responsible Index Fund, Class R6 | 19.6% |
| Calvert US Large-Cap Value Responsible Index Fund, Class R6 | 9.7% |
| Calvert US Large-Cap Growth Responsible Index Fund, Class R6 | 9.5% |
| Calvert International Equity Fund, Class R6 | 8.6% |
| Calvert International Responsible Index Fund, Class R6 | 8.3% |
| Calvert Equity Fund, Class R6 | 7.9% |
| Calvert Focused Value Fund, Class R6 | 6.3% |
| Calvert Emerging Markets Advancement Fund, Class I | 6.2% |
| Calvert International Opportunities Fund, Class R6 | 4.8% |
| Calvert Core Bond Fund, Class I | 4.0% |
| Total | 84.9% |
| Footnote | Description |
Footnotea | Excluding cash equivalents |
If you wish to view additional information about the Fund, including the prospectus, statement of additional information, financial statements and holdings, please scan the QR code or visit www.eatonvance.com/calvert-fund-documents.php. For proxy information, please visit www.calvert.com/active-engagement.php?DM=how-we-influence.
The Funds may deliver a single copy of certain required shareholder documents (including prospectuses, shareholder reports, and proxy materials) to investors with the same last name and the same address. Your participation will continue indefinitely unless you instruct otherwise by calling 1-800-368-2745 or by contacting your financial intermediary. Your instruction will typically be effective within 30 days of receipt.
Not FDIC Insured | May Lose Value | No Bank Guarantee
Annual Shareholder Report September 30, 2024
Calvert Growth Allocation Fund
Annual Shareholder Report September 30, 2024
This annual shareholder report contains important information about the Calvert Growth Allocation Fund for the period of October 1, 2023 to September 30, 2024. You can find additional information about the Fund at www.eatonvance.com/calvert-fund-documents.php. You can also request this information by contacting us at 1-800-368-2745.
What were the Fund costs for the last year?
(based on a hypothetical $10,000 investment)
| Class Name | Costs of a $10,000 investment | Costs paid as a percentage of a $10,000 investment |
|---|
| Class C | $135 | 1.19% |
How did the Fund perform last year and what affected its performance?
Key contributors to (↑) and detractors from (↓) performance, relative to the Growth Allocation Blended Benchmark (the Blended Index):
↓ The Fund’s higher-than-Blended Index allocation to equities detracted from performance relative to the Blended Index during the period
↓ The Fund’s equity selections ― particularly allocations to Calvert Equity Fund and Calvert Emerging Markets Advancement Fund ― detracted from returns relative to the Blended Index
↓ Among stock sizes, Fund allocations to small-cap and mid-cap companies detracted from returns relative to the Blended Index during the period
↓ Underweight allocations to investment-grade bonds and the Fund’s underweight duration detracted from performance relative to the Blended Index
↑ Allocations among fixed-income assets ― especially the selection of Calvert Bond Fund ― contributed to returns relative to the Blended Index
↑ Among asset classes, overweight allocations to high yield corporate bonds and bank loans aided Fund performance relative to the Blended Index during the period
↑ The Fund’s use of derivatives contributed to returns relative to the Blended Index during the period
Comparison of the change in value of a $10,000 investment for the period indicated.
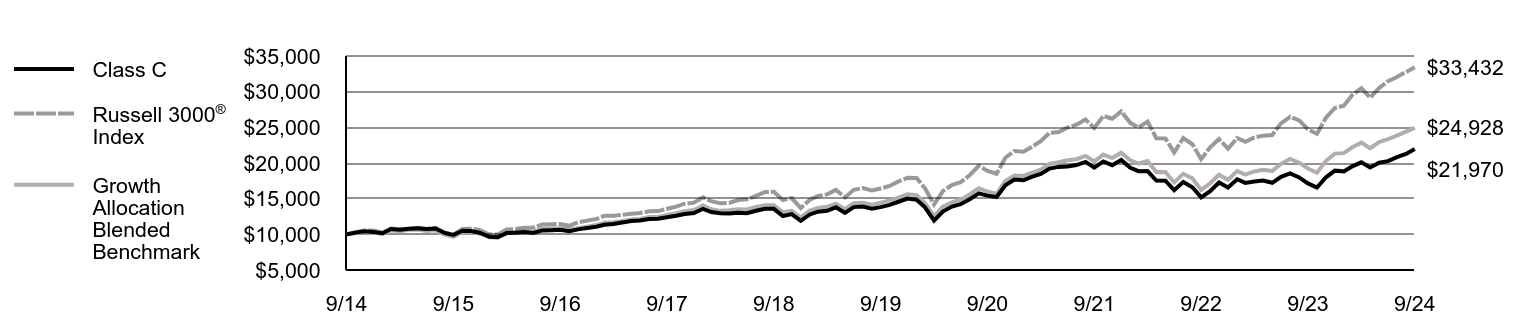
| Class C | Russell 3000® Index | Growth Allocation Blended Benchmark |
|---|
| 9/14 | $10,000 | $10,000 | $10,000 |
| 10/14 | $10,267 | $10,275 | $10,140 |
| 11/14 | $10,443 | $10,524 | $10,312 |
| 12/14 | $10,326 | $10,524 | $10,211 |
| 1/15 | $10,147 | $10,231 | $10,056 |
| 2/15 | $10,747 | $10,824 | $10,558 |
| 3/15 | $10,655 | $10,713 | $10,449 |
| 4/15 | $10,782 | $10,762 | $10,636 |
| 5/15 | $10,868 | $10,911 | $10,681 |
| 6/15 | $10,736 | $10,728 | $10,475 |
| 7/15 | $10,828 | $10,908 | $10,572 |
| 8/15 | $10,194 | $10,249 | $9,954 |
| 9/15 | $9,928 | $9,951 | $9,655 |
| 10/15 | $10,511 | $10,736 | $10,322 |
| 11/15 | $10,459 | $10,796 | $10,296 |
| 12/15 | $10,193 | $10,574 | $10,116 |
| 1/16 | $9,657 | $9,978 | $9,577 |
| 2/16 | $9,590 | $9,975 | $9,555 |
| 3/16 | $10,200 | $10,677 | $10,203 |
| 4/16 | $10,234 | $10,743 | $10,326 |
| 5/16 | $10,341 | $10,935 | $10,389 |
| 6/16 | $10,187 | $10,958 | $10,366 |
| 7/16 | $10,549 | $11,393 | $10,776 |
| 8/16 | $10,589 | $11,422 | $10,808 |
| 9/16 | $10,629 | $11,440 | $10,863 |
| 10/16 | $10,435 | $11,192 | $10,662 |
| 11/16 | $10,696 | $11,693 | $10,846 |
| 12/16 | $10,875 | $11,921 | $11,056 |
| 1/17 | $11,066 | $12,145 | $11,301 |
| 2/17 | $11,343 | $12,597 | $11,620 |
| 3/17 | $11,463 | $12,606 | $11,710 |
| 4/17 | $11,662 | $12,739 | $11,873 |
| 5/17 | $11,875 | $12,870 | $12,068 |
| 6/17 | $11,931 | $12,986 | $12,144 |
| 7/17 | $12,158 | $13,231 | $12,420 |
| 8/17 | $12,179 | $13,256 | $12,468 |
| 9/17 | $12,406 | $13,579 | $12,716 |
| 10/17 | $12,598 | $13,876 | $12,955 |
| 11/17 | $12,860 | $14,297 | $13,224 |
| 12/17 | $12,987 | $14,440 | $13,403 |
| 1/18 | $13,579 | $15,201 | $14,032 |
| 2/18 | $13,122 | $14,641 | $13,514 |
| 3/18 | $12,972 | $14,347 | $13,292 |
| 4/18 | $12,926 | $14,402 | $13,374 |
| 5/18 | $13,032 | $14,808 | $13,525 |
| 6/18 | $12,949 | $14,905 | $13,495 |
| 7/18 | $13,301 | $15,400 | $13,851 |
| 8/18 | $13,571 | $15,940 | $14,072 |
| 9/18 | $13,571 | $15,967 | $14,086 |
| 10/18 | $12,567 | $14,791 | $13,099 |
| 11/18 | $12,844 | $15,087 | $13,298 |
| 12/18 | $11,886 | $13,683 | $12,394 |
| 1/19 | $12,783 | $14,858 | $13,328 |
| 2/19 | $13,175 | $15,380 | $13,687 |
| 3/19 | $13,303 | $15,605 | $13,855 |
| 4/19 | $13,783 | $16,228 | $14,295 |
| 5/19 | $13,007 | $15,178 | $13,536 |
| 6/19 | $13,815 | $16,244 | $14,360 |
| 7/19 | $13,895 | $16,485 | $14,442 |
| 8/19 | $13,591 | $16,149 | $14,170 |
| 9/19 | $13,815 | $16,433 | $14,420 |
| 10/19 | $14,127 | $16,786 | $14,765 |
| 11/19 | $14,567 | $17,424 | $15,145 |
| 12/19 | $15,022 | $17,928 | $15,607 |
| 1/20 | $14,856 | $17,908 | $15,498 |
| 2/20 | $13,788 | $16,442 | $14,389 |
| 3/20 | $11,933 | $14,181 | $12,541 |
| 4/20 | $13,200 | $16,059 | $13,866 |
| 5/20 | $13,887 | $16,918 | $14,469 |
| 6/20 | $14,227 | $17,304 | $14,865 |
| 7/20 | $14,930 | $18,287 | $15,596 |
| 8/20 | $15,734 | $19,612 | $16,476 |
| 9/20 | $15,427 | $18,898 | $16,001 |
| 10/20 | $15,229 | $18,490 | $15,680 |
| 11/20 | $16,876 | $20,739 | $17,475 |
| 12/20 | $17,683 | $21,672 | $18,244 |
| 1/21 | $17,580 | $21,576 | $18,191 |
| 2/21 | $18,042 | $22,250 | $18,626 |
| 3/21 | $18,479 | $23,048 | $19,080 |
| 4/21 | $19,214 | $24,236 | $19,866 |
| 5/21 | $19,454 | $24,346 | $20,107 |
| 6/21 | $19,505 | $24,947 | $20,380 |
| 7/21 | $19,710 | $25,369 | $20,530 |
| 8/21 | $20,155 | $26,092 | $20,998 |
| 9/21 | $19,343 | $24,921 | $20,215 |
| 10/21 | $20,224 | $26,607 | $21,172 |
| 11/21 | $19,693 | $26,202 | $20,695 |
| 12/21 | $20,424 | $27,234 | $21,436 |
| 1/22 | $19,317 | $25,631 | $20,372 |
| 2/22 | $18,848 | $24,986 | $19,926 |
| 3/22 | $18,866 | $25,796 | $20,275 |
| 4/22 | $17,539 | $23,481 | $18,723 |
| 5/22 | $17,512 | $23,450 | $18,747 |
| 6/22 | $16,185 | $21,488 | $17,273 |
| 7/22 | $17,326 | $23,504 | $18,483 |
| 8/22 | $16,601 | $22,627 | $17,843 |
| 9/22 | $15,176 | $20,528 | $16,230 |
| 10/22 | $16,061 | $22,212 | $17,155 |
| 11/22 | $17,264 | $23,371 | $18,346 |
| 12/22 | $16,561 | $22,003 | $17,659 |
| 1/23 | $17,724 | $23,518 | $18,866 |
| 2/23 | $17,215 | $22,968 | $18,362 |
| 3/23 | $17,406 | $23,583 | $18,821 |
| 4/23 | $17,533 | $23,834 | $19,049 |
| 5/23 | $17,224 | $23,927 | $18,871 |
| 6/23 | $18,060 | $25,560 | $19,884 |
| 7/23 | $18,551 | $26,477 | $20,561 |
| 8/23 | $17,978 | $25,966 | $20,045 |
| 9/23 | $17,142 | $24,729 | $19,227 |
| 10/23 | $16,552 | $24,073 | $18,641 |
| 11/23 | $17,960 | $26,318 | $20,277 |
| 12/23 | $18,925 | $27,714 | $21,316 |
| 1/24 | $18,830 | $28,021 | $21,382 |
| 2/24 | $19,534 | $29,538 | $22,195 |
| 3/24 | $20,095 | $30,491 | $22,851 |
| 4/24 | $19,381 | $29,149 | $22,070 |
| 5/24 | $20,038 | $30,526 | $22,929 |
| 6/24 | $20,256 | $31,471 | $23,360 |
| 7/24 | $20,817 | $32,056 | $23,852 |
| 8/24 | $21,274 | $32,754 | $24,392 |
| 9/24 | $21,970 | $33,432 | $24,928 |
Average Annual Total Returns (%)
| Fund | 1 Year | 5 Years | 10 Years |
|---|
| Class C | 26.26% | 9.39% | 8.18% |
| Class C with 1% Maximum Deferred Sales Charge | 25.26% | 9.39% | 8.18% |
Russell 3000® Index | 35.19% | 15.25% | 12.82% |
Growth Allocation Blended BenchmarkFootnote Reference1 | 29.65% | 11.55% | 9.56% |
| Footnote | Description |
Footnote1 | Benchmark is an internally constructed benchmark which is comprised of a blend of 60% Russell 3000® Index, 30% MSCI ACWI ex USA Investable Market Index and 10% Bloomberg U.S. Aggregate Bond Index, and is rebalanced monthly. |
Performance does not reflect the deduction of taxes that a shareholder would pay on Fund distributions or redemption of Fund shares. Performance assumes that all dividends and distributions, if any, were reinvested. For more recent performance information, visit www.eatonvance.com/performance.php. Performance prior to December 31, 2016 is that of the Fund's former investment adviser.
THE FUND'S PAST PERFORMANCE IS NO GUARANTEE OF FUTURE RESULTS.
| Total Net Assets | $359,362,298 |
| # of Portfolio Holdings | 18 |
| Portfolio Turnover Rate | 23% |
Total Advisory Fees PaidFootnote Reference* | $0 |
| Footnote | Description |
Footnote* | Fund does not pay an advisory fee directly; the underlying funds in which the Fund invests do. |
What did the Fund invest in?
The following tables reflect what the Fund invested in as of the report date.
Asset Allocation (% of total investments)
| Value | Value |
|---|
| Short-Term Investments | 0.7% |
| Income Funds | 8.7% |
| International and Global Equity Funds | 30.6% |
| Domestic Equity Funds | 60.0% |
Top Ten Holdings (% of total investments)Footnote Referencea
| Calvert US Large-Cap Core Responsible Index Fund, Class R6 | 19.6% |
| Calvert US Large-Cap Value Responsible Index Fund, Class R6 | 9.7% |
| Calvert US Large-Cap Growth Responsible Index Fund, Class R6 | 9.5% |
| Calvert International Equity Fund, Class R6 | 8.6% |
| Calvert International Responsible Index Fund, Class R6 | 8.3% |
| Calvert Equity Fund, Class R6 | 7.9% |
| Calvert Focused Value Fund, Class R6 | 6.3% |
| Calvert Emerging Markets Advancement Fund, Class I | 6.2% |
| Calvert International Opportunities Fund, Class R6 | 4.8% |
| Calvert Core Bond Fund, Class I | 4.0% |
| Total | 84.9% |
| Footnote | Description |
Footnotea | Excluding cash equivalents |
If you wish to view additional information about the Fund, including the prospectus, statement of additional information, financial statements and holdings, please scan the QR code or visit www.eatonvance.com/calvert-fund-documents.php. For proxy information, please visit www.calvert.com/active-engagement.php?DM=how-we-influence.
The Funds may deliver a single copy of certain required shareholder documents (including prospectuses, shareholder reports, and proxy materials) to investors with the same last name and the same address. Your participation will continue indefinitely unless you instruct otherwise by calling 1-800-368-2745 or by contacting your financial intermediary. Your instruction will typically be effective within 30 days of receipt.
Not FDIC Insured | May Lose Value | No Bank Guarantee
Annual Shareholder Report September 30, 2024
Calvert Growth Allocation Fund
Annual Shareholder Report September 30, 2024
This annual shareholder report contains important information about the Calvert Growth Allocation Fund for the period of October 1, 2023 to September 30, 2024. You can find additional information about the Fund at www.eatonvance.com/calvert-fund-documents.php. You can also request this information by contacting us at 1-800-368-2745.
What were the Fund costs for the last year?
(based on a hypothetical $10,000 investment)
| Class Name | Costs of a $10,000 investment | Costs paid as a percentage of a $10,000 investment |
|---|
| Class I | $22 | 0.19% |
How did the Fund perform last year and what affected its performance?
Key contributors to (↑) and detractors from (↓) performance, relative to the Growth Allocation Blended Benchmark (the Blended Index):
↓ The Fund’s higher-than-Blended Index allocation to equities detracted from performance relative to the Blended Index during the period
↓ The Fund’s equity selections ― particularly allocations to Calvert Equity Fund and Calvert Emerging Markets Advancement Fund ― detracted from returns relative to the Blended Index
↓ Among stock sizes, Fund allocations to small-cap and mid-cap companies detracted from returns relative to the Blended Index during the period
↓ Underweight allocations to investment-grade bonds and the Fund’s underweight duration detracted from performance relative to the Blended Index
↑ Allocations among fixed-income assets ― especially the selection of Calvert Bond Fund ― contributed to returns relative to the Blended Index
↑ Among asset classes, overweight allocations to high yield corporate bonds and bank loans aided Fund performance relative to the Blended Index during the period
↑ The Fund’s use of derivatives contributed to returns relative to the Blended Index during the period
Comparison of the change in value of a $1,000,000 investment for the period indicated.
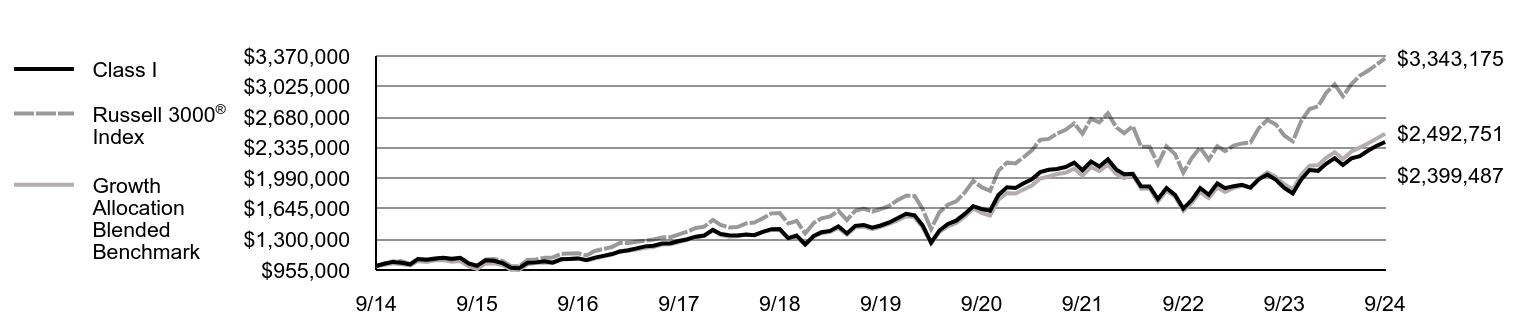
| Class I | Russell 3000® Index | Growth Allocation Blended Benchmark |
|---|
| 9/14 | $1,000,000 | $1,000,000 | $1,000,000 |
| 10/14 | $1,027,565 | $1,027,513 | $1,013,997 |
| 11/14 | $1,046,428 | $1,052,414 | $1,031,221 |
| 12/14 | $1,035,779 | $1,052,402 | $1,021,080 |
| 1/15 | $1,018,636 | $1,023,112 | $1,005,630 |
| 2/15 | $1,079,434 | $1,082,351 | $1,055,792 |
| 3/15 | $1,071,630 | $1,071,348 | $1,044,940 |
| 4/15 | $1,085,151 | $1,076,194 | $1,063,610 |
| 5/15 | $1,094,512 | $1,091,079 | $1,068,077 |
| 6/15 | $1,082,550 | $1,072,825 | $1,047,503 |
| 7/15 | $1,092,432 | $1,090,768 | $1,057,183 |
| 8/15 | $1,029,553 | $1,024,919 | $995,363 |
| 9/15 | $1,004,096 | $995,053 | $965,499 |
| 10/15 | $1,064,386 | $1,073,648 | $1,032,239 |
| 11/15 | $1,059,706 | $1,079,600 | $1,029,565 |
| 12/15 | $1,033,812 | $1,057,440 | $1,011,567 |
| 1/16 | $980,537 | $997,774 | $957,707 |
| 2/16 | $974,550 | $997,453 | $955,497 |
| 3/16 | $1,036,805 | $1,067,679 | $1,020,259 |
| 4/16 | $1,041,001 | $1,074,296 | $1,032,568 |
| 5/16 | $1,052,369 | $1,093,516 | $1,038,889 |
| 6/16 | $1,038,005 | $1,095,764 | $1,036,650 |
| 7/16 | $1,075,716 | $1,139,252 | $1,077,640 |
| 8/16 | $1,080,499 | $1,142,158 | $1,080,814 |
| 9/16 | $1,085,893 | $1,143,953 | $1,086,327 |
| 10/16 | $1,066,741 | $1,119,203 | $1,066,160 |
| 11/16 | $1,094,882 | $1,169,290 | $1,084,574 |
| 12/16 | $1,114,074 | $1,192,107 | $1,105,551 |
| 1/17 | $1,134,854 | $1,214,544 | $1,130,135 |
| 2/17 | $1,163,826 | $1,259,715 | $1,162,009 |
| 3/17 | $1,177,691 | $1,260,572 | $1,171,034 |
| 4/17 | $1,199,105 | $1,273,934 | $1,187,326 |
| 5/17 | $1,221,777 | $1,286,971 | $1,206,823 |
| 6/17 | $1,228,695 | $1,298,586 | $1,214,417 |
| 7/17 | $1,253,262 | $1,323,070 | $1,242,027 |
| 8/17 | $1,256,405 | $1,325,620 | $1,246,823 |
| 9/17 | $1,281,588 | $1,357,949 | $1,271,573 |
| 10/17 | $1,302,369 | $1,387,582 | $1,295,465 |
| 11/17 | $1,330,711 | $1,429,716 | $1,322,433 |
| 12/17 | $1,344,438 | $1,444,006 | $1,340,314 |
| 1/18 | $1,407,772 | $1,520,120 | $1,403,175 |
| 2/18 | $1,361,766 | $1,464,089 | $1,351,435 |
| 3/18 | $1,347,112 | $1,434,699 | $1,329,244 |
| 4/18 | $1,343,767 | $1,440,152 | $1,337,399 |
| 5/18 | $1,355,094 | $1,480,808 | $1,352,492 |
| 6/18 | $1,348,417 | $1,490,492 | $1,349,514 |
| 7/18 | $1,386,423 | $1,539,955 | $1,385,121 |
| 8/18 | $1,415,754 | $1,594,035 | $1,407,154 |
| 9/18 | $1,417,087 | $1,596,674 | $1,408,560 |
| 10/18 | $1,313,114 | $1,479,106 | $1,309,908 |
| 11/18 | $1,343,765 | $1,508,731 | $1,329,777 |
| 12/18 | $1,244,619 | $1,368,314 | $1,239,407 |
| 1/19 | $1,339,275 | $1,485,762 | $1,332,787 |
| 2/19 | $1,381,262 | $1,538,015 | $1,368,724 |
| 3/19 | $1,396,210 | $1,560,473 | $1,385,543 |
| 4/19 | $1,448,148 | $1,622,785 | $1,429,514 |
| 5/19 | $1,367,733 | $1,517,772 | $1,353,649 |
| 6/19 | $1,453,124 | $1,624,375 | $1,435,966 |
| 7/19 | $1,463,098 | $1,648,522 | $1,444,186 |
| 8/19 | $1,432,495 | $1,614,916 | $1,417,003 |
| 9/19 | $1,457,399 | $1,643,259 | $1,442,028 |
| 10/19 | $1,491,553 | $1,678,633 | $1,476,503 |
| 11/19 | $1,539,233 | $1,742,441 | $1,514,478 |
| 12/19 | $1,588,708 | $1,792,752 | $1,560,651 |
| 1/20 | $1,572,453 | $1,790,794 | $1,549,780 |
| 2/20 | $1,460,229 | $1,644,176 | $1,438,887 |
| 3/20 | $1,264,594 | $1,418,072 | $1,254,088 |
| 4/20 | $1,400,426 | $1,605,882 | $1,386,627 |
| 5/20 | $1,474,993 | $1,691,762 | $1,446,881 |
| 6/20 | $1,511,903 | $1,730,439 | $1,486,545 |
| 7/20 | $1,587,937 | $1,828,699 | $1,559,605 |
| 8/20 | $1,675,048 | $1,961,178 | $1,647,553 |
| 9/20 | $1,644,032 | $1,889,770 | $1,600,085 |
| 10/20 | $1,623,345 | $1,848,982 | $1,568,013 |
| 11/20 | $1,801,248 | $2,073,917 | $1,747,517 |
| 12/20 | $1,888,413 | $2,167,218 | $1,824,383 |
| 1/21 | $1,880,011 | $2,157,579 | $1,819,104 |
| 2/21 | $1,930,473 | $2,225,019 | $1,862,610 |
| 3/21 | $1,979,406 | $2,304,770 | $1,907,987 |
| 4/21 | $2,058,921 | $2,423,579 | $1,986,649 |
| 5/21 | $2,086,428 | $2,434,642 | $2,010,713 |
| 6/21 | $2,094,047 | $2,494,678 | $2,037,993 |
| 7/21 | $2,117,002 | $2,536,865 | $2,053,023 |
| 8/21 | $2,166,696 | $2,609,210 | $2,099,837 |
| 9/21 | $2,081,833 | $2,492,141 | $2,021,468 |
| 10/21 | $2,178,164 | $2,660,670 | $2,117,177 |
| 11/21 | $2,123,118 | $2,620,172 | $2,069,454 |
| 12/21 | $2,203,397 | $2,723,350 | $2,143,562 |
| 1/22 | $2,086,094 | $2,563,119 | $2,037,184 |
| 2/22 | $2,036,953 | $2,498,556 | $1,992,619 |
| 3/22 | $2,040,916 | $2,579,600 | $2,027,545 |
| 4/22 | $1,899,043 | $2,348,101 | $1,872,329 |
| 5/22 | $1,897,457 | $2,344,952 | $1,874,746 |
| 6/22 | $1,754,791 | $2,148,777 | $1,727,341 |
| 7/22 | $1,880,021 | $2,350,370 | $1,848,251 |
| 8/22 | $1,803,139 | $2,262,656 | $1,784,281 |
| 9/22 | $1,648,585 | $2,052,842 | $1,623,005 |
| 10/22 | $1,746,866 | $2,221,188 | $1,715,490 |
| 11/22 | $1,880,021 | $2,337,125 | $1,834,634 |
| 12/22 | $1,804,000 | $2,200,278 | $1,765,938 |
| 1/23 | $1,932,215 | $2,351,818 | $1,886,638 |
| 2/23 | $1,879,132 | $2,296,849 | $1,836,207 |
| 3/23 | $1,901,182 | $2,358,265 | $1,882,084 |
| 4/23 | $1,916,699 | $2,383,391 | $1,904,861 |
| 5/23 | $1,884,849 | $2,392,664 | $1,887,133 |
| 6/23 | $1,977,948 | $2,556,048 | $1,988,357 |
| 7/23 | $2,032,664 | $2,647,674 | $2,056,064 |
| 8/23 | $1,972,232 | $2,596,564 | $2,004,549 |
| 9/23 | $1,881,582 | $2,472,879 | $1,922,664 |
| 10/23 | $1,817,883 | $2,407,326 | $1,864,083 |
| 11/23 | $1,974,682 | $2,631,805 | $2,027,671 |
| 12/23 | $2,083,229 | $2,771,401 | $2,131,633 |
| 1/24 | $2,073,826 | $2,802,116 | $2,138,230 |
| 2/24 | $2,153,325 | $2,953,796 | $2,219,545 |
| 3/24 | $2,217,438 | $3,049,077 | $2,285,123 |
| 4/24 | $2,139,648 | $2,914,913 | $2,207,034 |
| 5/24 | $2,214,018 | $3,052,634 | $2,292,871 |
| 6/24 | $2,239,663 | $3,147,135 | $2,336,039 |
| 7/24 | $2,303,776 | $3,205,637 | $2,385,238 |
| 8/24 | $2,356,776 | $3,275,420 | $2,439,182 |
| 9/24 | $2,399,487 | $3,343,175 | $2,492,751 |
Average Annual Total Returns (%)Footnote Reference1
| Fund | 1 Year | 5 Years | 10 Years |
|---|
| Class I | 27.53% | 10.48% | 9.14% |
Russell 3000® Index | 35.19% | 15.25% | 12.82% |
Growth Allocation Blended BenchmarkFootnote Reference2 | 29.65% | 11.55% | 9.56% |
| Footnote | Description |
Footnote1 | Class I performance prior to 5/20/16 is linked to Class A. This linked performance is adjusted for any applicable sales charge, but is not adjusted for class expense differences. If adjusted for such differences, the performance would be different. Performance presented in the Financial Highlights included in the financial statements is not linked. |
Footnote2 | Benchmark is an internally constructed benchmark which is comprised of a blend of 60% Russell 3000® Index, 30% MSCI ACWI ex USA Investable Market Index and 10% Bloomberg U.S. Aggregate Bond Index, and is rebalanced monthly. |
Performance does not reflect the deduction of taxes that a shareholder would pay on Fund distributions or redemption of Fund shares. Performance assumes that all dividends and distributions, if any, were reinvested. For more recent performance information, visit www.eatonvance.com/performance.php. Performance prior to December 31, 2016 is that of the Fund's former investment adviser.
THE FUND'S PAST PERFORMANCE IS NO GUARANTEE OF FUTURE RESULTS.
| Total Net Assets | $359,362,298 |
| # of Portfolio Holdings | 18 |
| Portfolio Turnover Rate | 23% |
Total Advisory Fees PaidFootnote Reference* | $0 |
| Footnote | Description |
Footnote* | Fund does not pay an advisory fee directly; the underlying funds in which the Fund invests do. |
What did the Fund invest in?
The following tables reflect what the Fund invested in as of the report date.
Asset Allocation (% of total investments)
| Value | Value |
|---|
| Short-Term Investments | 0.7% |
| Income Funds | 8.7% |
| International and Global Equity Funds | 30.6% |
| Domestic Equity Funds | 60.0% |
Top Ten Holdings (% of total investments)Footnote Referencea
| Calvert US Large-Cap Core Responsible Index Fund, Class R6 | 19.6% |
| Calvert US Large-Cap Value Responsible Index Fund, Class R6 | 9.7% |
| Calvert US Large-Cap Growth Responsible Index Fund, Class R6 | 9.5% |
| Calvert International Equity Fund, Class R6 | 8.6% |
| Calvert International Responsible Index Fund, Class R6 | 8.3% |
| Calvert Equity Fund, Class R6 | 7.9% |
| Calvert Focused Value Fund, Class R6 | 6.3% |
| Calvert Emerging Markets Advancement Fund, Class I | 6.2% |
| Calvert International Opportunities Fund, Class R6 | 4.8% |
| Calvert Core Bond Fund, Class I | 4.0% |
| Total | 84.9% |
| Footnote | Description |
Footnotea | Excluding cash equivalents |
If you wish to view additional information about the Fund, including the prospectus, statement of additional information, financial statements and holdings, please scan the QR code or visit www.eatonvance.com/calvert-fund-documents.php. For proxy information, please visit www.calvert.com/active-engagement.php?DM=how-we-influence.
The Funds may deliver a single copy of certain required shareholder documents (including prospectuses, shareholder reports, and proxy materials) to investors with the same last name and the same address. Your participation will continue indefinitely unless you instruct otherwise by calling 1-800-368-2745 or by contacting your financial intermediary. Your instruction will typically be effective within 30 days of receipt.
Not FDIC Insured | May Lose Value | No Bank Guarantee
Annual Shareholder Report September 30, 2024
Calvert Growth Allocation Fund
Annual Shareholder Report September 30, 2024
This annual shareholder report contains important information about the Calvert Growth Allocation Fund for the period of October 1, 2023 to September 30, 2024. You can find additional information about the Fund at www.eatonvance.com/calvert-fund-documents.php. You can also request this information by contacting us at 1-800-368-2745.
What were the Fund costs for the last year?
(based on a hypothetical $10,000 investment)
| Class Name | Costs of a $10,000 investment | Costs paid as a percentage of a $10,000 investment |
|---|
| Class R6 | $15 | 0.13% |
How did the Fund perform last year and what affected its performance?
Key contributors to (↑) and detractors from (↓) performance, relative to the Growth Allocation Blended Benchmark (the Blended Index):
↓ The Fund’s higher-than-Blended Index allocation to equities detracted from performance relative to the Blended Index during the period
↓ The Fund’s equity selections ― particularly allocations to Calvert Equity Fund and Calvert Emerging Markets Advancement Fund ― detracted from returns relative to the Blended Index
↓ Among stock sizes, Fund allocations to small-cap and mid-cap companies detracted from returns relative to the Blended Index during the period
↓ Underweight allocations to investment-grade bonds and the Fund’s underweight duration detracted from performance relative to the Blended Index
↑ Allocations among fixed-income assets ― especially the selection of Calvert Bond Fund ― contributed to returns relative to the Blended Index
↑ Among asset classes, overweight allocations to high yield corporate bonds and bank loans aided Fund performance relative to the Blended Index during the period
↑ The Fund’s use of derivatives contributed to returns relative to the Blended Index during the period
Comparison of the change in value of a $5,000,000 investment for the period indicated.
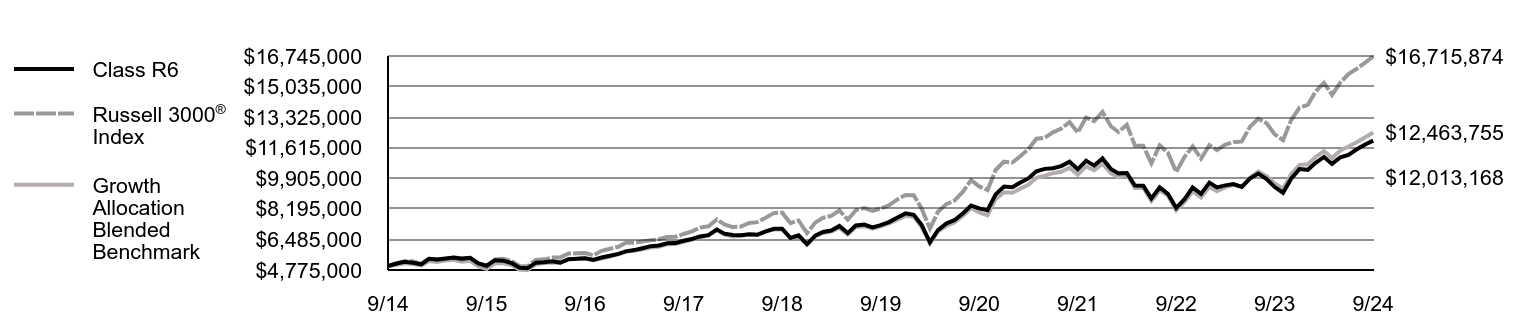
| Class R6 | Russell 3000® Index | Growth Allocation Blended Benchmark |
|---|
| 9/14 | $5,000,000 | $5,000,000 | $5,000,000 |
| 10/14 | $5,137,814 | $5,137,566 | $5,069,987 |
| 11/14 | $5,232,108 | $5,262,069 | $5,156,104 |
| 12/14 | $5,178,794 | $5,262,010 | $5,105,400 |
| 1/15 | $5,093,043 | $5,115,560 | $5,028,151 |
| 2/15 | $5,397,067 | $5,411,756 | $5,278,962 |
| 3/15 | $5,358,089 | $5,356,740 | $5,224,700 |
| 4/15 | $5,425,650 | $5,380,970 | $5,318,052 |
| 5/15 | $5,472,423 | $5,455,396 | $5,340,386 |
| 6/15 | $5,412,658 | $5,364,125 | $5,237,516 |
| 7/15 | $5,462,029 | $5,453,842 | $5,285,914 |
| 8/15 | $5,147,612 | $5,124,596 | $4,976,814 |
| 9/15 | $5,020,286 | $4,975,266 | $4,827,497 |
| 10/15 | $5,321,711 | $5,368,239 | $5,161,196 |
| 11/15 | $5,298,324 | $5,397,998 | $5,147,824 |
| 12/15 | $5,168,781 | $5,287,202 | $5,057,834 |
| 1/16 | $4,902,411 | $4,988,870 | $4,788,536 |
| 2/16 | $4,872,482 | $4,987,263 | $4,777,485 |
| 3/16 | $5,183,746 | $5,338,397 | $5,101,293 |
| 4/16 | $5,204,697 | $5,371,482 | $5,162,841 |
| 5/16 | $5,261,562 | $5,467,580 | $5,194,444 |
| 6/16 | $5,189,732 | $5,478,822 | $5,183,250 |
| 7/16 | $5,378,286 | $5,696,260 | $5,388,198 |
| 8/16 | $5,402,230 | $5,710,790 | $5,404,072 |
| 9/16 | $5,429,166 | $5,719,767 | $5,431,637 |
| 10/16 | $5,333,392 | $5,596,017 | $5,330,798 |
| 11/16 | $5,474,060 | $5,846,451 | $5,422,871 |
| 12/16 | $5,569,972 | $5,960,533 | $5,527,754 |
| 1/17 | $5,673,877 | $6,072,722 | $5,650,675 |
| 2/17 | $5,818,716 | $6,298,576 | $5,810,044 |
| 3/17 | $5,887,986 | $6,302,861 | $5,855,170 |
| 4/17 | $5,995,040 | $6,369,670 | $5,936,630 |
| 5/17 | $6,108,392 | $6,434,857 | $6,034,116 |
| 6/17 | $6,143,027 | $6,492,928 | $6,072,083 |
| 7/17 | $6,265,825 | $6,615,352 | $6,210,135 |
| 8/17 | $6,281,568 | $6,628,098 | $6,234,117 |
| 9/17 | $6,407,514 | $6,789,743 | $6,357,867 |
| 10/17 | $6,511,420 | $6,937,910 | $6,477,324 |
| 11/17 | $6,653,109 | $7,148,580 | $6,612,164 |
| 12/17 | $6,721,791 | $7,220,030 | $6,701,568 |
| 1/18 | $7,038,386 | $7,600,601 | $7,015,877 |
| 2/18 | $6,808,438 | $7,320,446 | $6,757,177 |
| 3/18 | $6,735,122 | $7,173,495 | $6,646,218 |
| 4/18 | $6,718,459 | $7,200,759 | $6,686,996 |
| 5/18 | $6,775,113 | $7,404,039 | $6,762,462 |
| 6/18 | $6,741,787 | $7,452,460 | $6,747,569 |
| 7/18 | $6,931,743 | $7,699,777 | $6,925,605 |
| 8/18 | $7,078,376 | $7,970,176 | $7,035,771 |
| 9/18 | $7,085,042 | $7,983,369 | $7,042,801 |
| 10/18 | $6,565,161 | $7,395,532 | $6,549,541 |
| 11/18 | $6,718,459 | $7,543,654 | $6,648,887 |
| 12/18 | $6,222,803 | $6,841,571 | $6,197,037 |
| 1/19 | $6,696,006 | $7,428,810 | $6,663,936 |
| 2/19 | $6,905,924 | $7,690,075 | $6,843,620 |
| 3/19 | $6,980,640 | $7,802,364 | $6,927,713 |
| 4/19 | $7,240,368 | $8,113,927 | $7,147,570 |
| 5/19 | $6,838,323 | $7,588,860 | $6,768,247 |
| 6/19 | $7,265,274 | $8,121,876 | $7,179,828 |
| 7/19 | $7,315,084 | $8,242,608 | $7,220,928 |
| 8/19 | $7,162,094 | $8,074,580 | $7,085,017 |
| 9/19 | $7,286,621 | $8,216,296 | $7,210,142 |
| 10/19 | $7,457,401 | $8,393,167 | $7,382,517 |
| 11/19 | $7,695,782 | $8,712,206 | $7,572,390 |
| 12/19 | $7,943,148 | $8,963,761 | $7,803,257 |
| 1/20 | $7,861,945 | $8,953,970 | $7,748,901 |
| 2/20 | $7,300,905 | $8,220,879 | $7,194,434 |
| 3/20 | $6,322,775 | $7,090,362 | $6,270,439 |
| 4/20 | $7,001,929 | $8,029,411 | $6,933,136 |
| 5/20 | $7,374,726 | $8,458,811 | $7,234,403 |
| 6/20 | $7,559,278 | $8,652,195 | $7,432,723 |
| 7/20 | $7,939,457 | $9,143,496 | $7,798,027 |
| 8/20 | $8,375,001 | $9,805,891 | $8,237,763 |
| 9/20 | $8,219,977 | $9,448,848 | $8,000,424 |
| 10/20 | $8,116,628 | $9,244,912 | $7,840,065 |
| 11/20 | $9,006,172 | $10,369,585 | $8,737,585 |
| 12/20 | $9,441,907 | $10,836,092 | $9,121,916 |
| 1/21 | $9,399,858 | $10,787,894 | $9,095,522 |
| 2/21 | $9,652,152 | $11,125,094 | $9,313,052 |
| 3/21 | $9,896,800 | $11,523,849 | $9,539,937 |
| 4/21 | $10,294,354 | $12,117,894 | $9,933,245 |
| 5/21 | $10,431,969 | $12,173,212 | $10,053,567 |
| 6/21 | $10,470,195 | $12,473,390 | $10,189,964 |
| 7/21 | $10,584,874 | $12,684,323 | $10,265,117 |
| 8/21 | $10,833,346 | $13,046,052 | $10,499,184 |
| 9/21 | $10,409,033 | $12,460,703 | $10,107,340 |
| 10/21 | $10,890,685 | $13,303,352 | $10,585,887 |
| 11/21 | $10,615,455 | $13,100,858 | $10,347,271 |
| 12/21 | $11,016,845 | $13,616,752 | $10,717,810 |
| 1/22 | $10,430,336 | $12,815,595 | $10,185,920 |
| 2/22 | $10,180,674 | $12,492,779 | $9,963,093 |
| 3/22 | $10,204,451 | $12,897,998 | $10,137,726 |
| 4/22 | $9,495,093 | $11,740,502 | $9,361,647 |
| 5/22 | $9,487,168 | $11,724,761 | $9,373,730 |
| 6/22 | $8,773,847 | $10,743,883 | $8,636,703 |
| 7/22 | $9,399,984 | $11,751,852 | $9,241,257 |
| 8/22 | $9,015,583 | $11,313,282 | $8,921,405 |
| 9/22 | $8,246,782 | $10,264,211 | $8,115,023 |
| 10/22 | $8,738,181 | $11,105,938 | $8,577,448 |
| 11/22 | $9,399,984 | $11,685,626 | $9,173,170 |
| 12/22 | $9,025,447 | $11,001,392 | $8,829,690 |
| 1/23 | $9,662,826 | $11,759,088 | $9,433,188 |
| 2/23 | $9,397,251 | $11,484,246 | $9,181,035 |
| 3/23 | $9,507,567 | $11,791,325 | $9,410,419 |
| 4/23 | $9,585,196 | $11,916,954 | $9,524,306 |
| 5/23 | $9,425,851 | $11,963,320 | $9,435,664 |
| 6/23 | $9,891,628 | $12,780,241 | $9,941,787 |
| 7/23 | $10,169,460 | $13,238,371 | $10,280,320 |
| 8/23 | $9,863,028 | $12,982,821 | $10,022,746 |
| 9/23 | $9,413,594 | $12,364,394 | $9,613,320 |
| 10/23 | $9,094,905 | $12,036,630 | $9,320,416 |
| 11/23 | $9,879,371 | $13,159,025 | $10,138,355 |
| 12/23 | $10,421,113 | $13,857,005 | $10,658,166 |
| 1/24 | $10,378,316 | $14,010,578 | $10,691,152 |
| 2/24 | $10,772,050 | $14,768,978 | $11,097,727 |
| 3/24 | $11,097,308 | $15,245,387 | $11,425,613 |
| 4/24 | $10,707,854 | $14,574,564 | $11,035,168 |
| 5/24 | $11,080,189 | $15,263,169 | $11,464,353 |
| 6/24 | $11,208,581 | $15,735,677 | $11,680,195 |
| 7/24 | $11,529,560 | $16,028,187 | $11,926,191 |
| 8/24 | $11,799,182 | $16,377,100 | $12,195,911 |
| 9/24 | $12,013,168 | $16,715,874 | $12,463,755 |
Average Annual Total Returns (%)Footnote Reference1
| Fund | 1 Year | 5 Years | 10 Years |
|---|
| Class R6 | 27.62% | 10.50% | 9.15% |
Russell 3000® Index | 35.19% | 15.25% | 12.82% |
Growth Allocation Blended BenchmarkFootnote Reference2 | 29.65% | 11.55% | 9.56% |
| Footnote | Description |
Footnote1 | Class R6 performance prior to 2/1/22 is linked to Class I. This linked performance is adjusted for any applicable sales charge, but is not adjusted for class expense differences. If adjusted for such differences, the performance would be different. Performance presented in the Financial Highlights included in the financial statements is not linked. |
Footnote2 | Benchmark is an internally constructed benchmark which is comprised of a blend of 60% Russell 3000® Index, 30% MSCI ACWI ex USA Investable Market Index and 10% Bloomberg U.S. Aggregate Bond Index, and is rebalanced monthly. |
Performance does not reflect the deduction of taxes that a shareholder would pay on Fund distributions or redemption of Fund shares. Performance assumes that all dividends and distributions, if any, were reinvested. For more recent performance information, visit www.eatonvance.com/performance.php. Performance prior to December 31, 2016 is that of the Fund's former investment adviser.
THE FUND'S PAST PERFORMANCE IS NO GUARANTEE OF FUTURE RESULTS.
| Total Net Assets | $359,362,298 |
| # of Portfolio Holdings | 18 |
| Portfolio Turnover Rate | 23% |
Total Advisory Fees PaidFootnote Reference* | $0 |
| Footnote | Description |
Footnote* | Fund does not pay an advisory fee directly; the underlying funds in which the Fund invests do. |
What did the Fund invest in?
The following tables reflect what the Fund invested in as of the report date.
Asset Allocation (% of total investments)
| Value | Value |
|---|
| Short-Term Investments | 0.7% |
| Income Funds | 8.7% |
| International and Global Equity Funds | 30.6% |
| Domestic Equity Funds | 60.0% |
Top Ten Holdings (% of total investments)Footnote Referencea
| Calvert US Large-Cap Core Responsible Index Fund, Class R6 | 19.6% |
| Calvert US Large-Cap Value Responsible Index Fund, Class R6 | 9.7% |
| Calvert US Large-Cap Growth Responsible Index Fund, Class R6 | 9.5% |
| Calvert International Equity Fund, Class R6 | 8.6% |
| Calvert International Responsible Index Fund, Class R6 | 8.3% |
| Calvert Equity Fund, Class R6 | 7.9% |
| Calvert Focused Value Fund, Class R6 | 6.3% |
| Calvert Emerging Markets Advancement Fund, Class I | 6.2% |
| Calvert International Opportunities Fund, Class R6 | 4.8% |
| Calvert Core Bond Fund, Class I | 4.0% |
| Total | 84.9% |
| Footnote | Description |
Footnotea | Excluding cash equivalents |
If you wish to view additional information about the Fund, including the prospectus, statement of additional information, financial statements and holdings, please scan the QR code or visit www.eatonvance.com/calvert-fund-documents.php. For proxy information, please visit www.calvert.com/active-engagement.php?DM=how-we-influence.
The Funds may deliver a single copy of certain required shareholder documents (including prospectuses, shareholder reports, and proxy materials) to investors with the same last name and the same address. Your participation will continue indefinitely unless you instruct otherwise by calling 1-800-368-2745 or by contacting your financial intermediary. Your instruction will typically be effective within 30 days of receipt.
Not FDIC Insured | May Lose Value | No Bank Guarantee
Annual Shareholder Report September 30, 2024
Calvert Moderate Allocation Fund
Annual Shareholder Report September 30, 2024
This annual shareholder report contains important information about the Calvert Moderate Allocation Fund for the period of October 1, 2023 to September 30, 2024. You can find additional information about the Fund at www.eatonvance.com/calvert-fund-documents.php. You can also request this information by contacting us at 1-800-368-2745.
What were the Fund costs for the last year?
(based on a hypothetical $10,000 investment)
| Class Name | Costs of a $10,000 investment | Costs paid as a percentage of a $10,000 investment |
|---|
| Class A | $46 | 0.41% |
How did the Fund perform last year and what affected its performance?
Key contributors to (↑) and detractors from (↓) performance, relative to the Moderate Allocation Blended Benchmark (the Blended Index):
↓ The Fund’s larger-than-Blended Index allocation to equity assets detracted from performance relative to the Blended Index during the period
↓ Equity selections ― especially allocations to Calvert Equity Fund and Calvert Emerging Markets Advancement Fund ― hurt returns relative to the Blended Index
↓ Within the equity market, allocations to small-cap and mid-cap stocks detracted from performance relative to the Blended Index during the period
↓ An underweight position in investment-grade bonds and the Fund’s underweight duration detracted from returns relative to the Blended Index during the period
↑ Fund management’s selections ― especially in fixed-income assets ― were the largest contributor to returns relative to the Blended Index during the period
↑ Fund management’s selection of Calvert Bond Fund was particularly helpful to returns relative to the Blended Index during the period
↑ An overweight position in high yield corporate bonds and bank loans aided returns relative to the Blended Index during the period
↑ The Fund’s use of derivatives contributed to performance relative to the Blended Index during the period
Comparison of the change in value of a $10,000 investment for the period indicated.
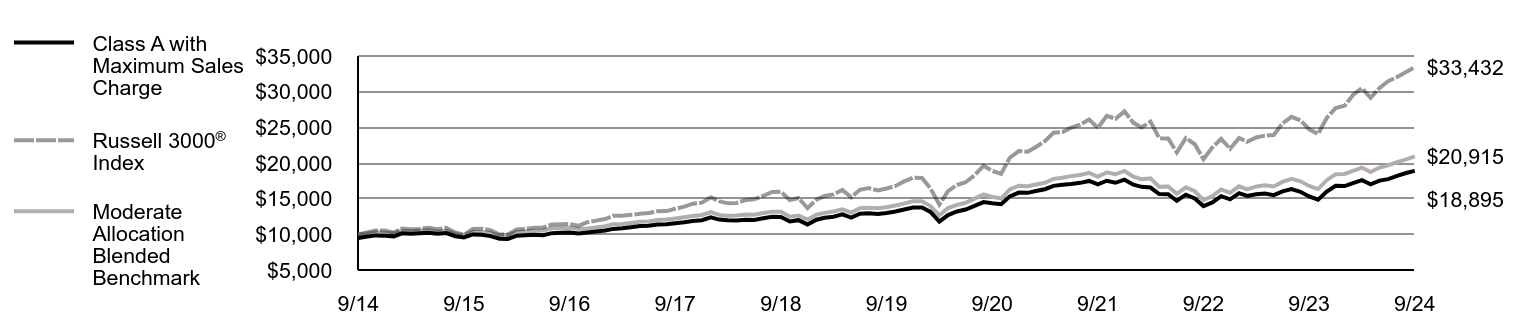
| Class A with Maximum Sales Charge | Russell 3000® Index | Moderate Allocation Blended Benchmark |
|---|
| 9/14 | $9,475 | $10,000 | $10,000 |
| 10/14 | $9,705 | $10,275 | $10,135 |
| 11/14 | $9,853 | $10,524 | $10,282 |
| 12/14 | $9,786 | $10,524 | $10,218 |
| 1/15 | $9,716 | $10,231 | $10,161 |
| 2/15 | $10,136 | $10,824 | $10,501 |
| 3/15 | $10,088 | $10,713 | $10,438 |
| 4/15 | $10,159 | $10,762 | $10,554 |
| 5/15 | $10,215 | $10,911 | $10,584 |
| 6/15 | $10,096 | $10,728 | $10,406 |
| 7/15 | $10,187 | $10,908 | $10,499 |
| 8/15 | $9,731 | $10,249 | $10,054 |
| 9/15 | $9,556 | $9,951 | $9,858 |
| 10/15 | $9,982 | $10,736 | $10,351 |
| 11/15 | $9,942 | $10,796 | $10,329 |
| 12/15 | $9,752 | $10,574 | $10,188 |
| 1/16 | $9,393 | $9,978 | $9,837 |
| 2/16 | $9,348 | $9,975 | $9,842 |
| 3/16 | $9,814 | $10,677 | $10,347 |
| 4/16 | $9,871 | $10,743 | $10,445 |
| 5/16 | $9,957 | $10,935 | $10,497 |
| 6/16 | $9,880 | $10,958 | $10,537 |
| 7/16 | $10,166 | $11,393 | $10,854 |
| 8/16 | $10,206 | $11,422 | $10,873 |
| 9/16 | $10,240 | $11,440 | $10,909 |
| 10/16 | $10,102 | $11,192 | $10,739 |
| 11/16 | $10,269 | $11,693 | $10,815 |
| 12/16 | $10,408 | $11,921 | $10,969 |
| 1/17 | $10,552 | $12,145 | $11,148 |
| 2/17 | $10,761 | $12,597 | $11,400 |
| 3/17 | $10,851 | $12,606 | $11,457 |
| 4/17 | $10,994 | $12,739 | $11,595 |
| 5/17 | $11,156 | $12,870 | $11,753 |
| 6/17 | $11,204 | $12,986 | $11,804 |
| 7/17 | $11,371 | $13,231 | $12,009 |
| 8/17 | $11,401 | $13,256 | $12,071 |
| 9/17 | $11,557 | $13,579 | $12,229 |
| 10/17 | $11,694 | $13,876 | $12,398 |
| 11/17 | $11,880 | $14,297 | $12,584 |
| 12/17 | $11,977 | $14,440 | $12,720 |
| 1/18 | $12,378 | $15,201 | $13,110 |
| 2/18 | $12,065 | $14,641 | $12,728 |
| 3/18 | $11,981 | $14,347 | $12,599 |
| 4/18 | $11,949 | $14,402 | $12,627 |
| 5/18 | $12,037 | $14,808 | $12,765 |
| 6/18 | $11,997 | $14,905 | $12,746 |
| 7/18 | $12,242 | $15,400 | $12,992 |
| 8/18 | $12,449 | $15,940 | $13,177 |
| 9/18 | $12,438 | $15,967 | $13,163 |
| 10/18 | $11,796 | $14,791 | $12,470 |
| 11/18 | $11,985 | $15,087 | $12,630 |
| 12/18 | $11,362 | $13,683 | $12,064 |
| 1/19 | $12,044 | $14,858 | $12,759 |
| 2/19 | $12,329 | $15,380 | $13,008 |
| 3/19 | $12,467 | $15,605 | $13,195 |
| 4/19 | $12,792 | $16,228 | $13,501 |
| 5/19 | $12,354 | $15,178 | $13,048 |
| 6/19 | $12,897 | $16,244 | $13,669 |
| 7/19 | $12,971 | $16,485 | $13,740 |
| 8/19 | $12,858 | $16,149 | $13,655 |
| 9/19 | $12,990 | $16,433 | $13,807 |
| 10/19 | $13,196 | $16,786 | $14,053 |
| 11/19 | $13,483 | $17,424 | $14,319 |
| 12/19 | $13,770 | $17,928 | $14,628 |
| 1/20 | $13,749 | $17,908 | $14,639 |
| 2/20 | $13,134 | $16,442 | $13,955 |
| 3/20 | $11,774 | $14,181 | $12,641 |
| 4/20 | $12,696 | $16,059 | $13,679 |
| 5/20 | $13,201 | $16,918 | $14,130 |
| 6/20 | $13,484 | $17,304 | $14,430 |
| 7/20 | $13,997 | $18,287 | $15,005 |
| 8/20 | $14,517 | $19,612 | $15,589 |
| 9/20 | $14,345 | $18,898 | $15,259 |
| 10/20 | $14,220 | $18,490 | $15,019 |
| 11/20 | $15,324 | $20,739 | $16,298 |
| 12/20 | $15,858 | $21,672 | $16,819 |
| 1/21 | $15,815 | $21,576 | $16,749 |
| 2/21 | $16,067 | $22,250 | $16,974 |
| 3/21 | $16,323 | $23,048 | $17,220 |
| 4/21 | $16,799 | $24,236 | $17,776 |
| 5/21 | $16,965 | $24,346 | $17,940 |
| 6/21 | $17,044 | $24,947 | $18,160 |
| 7/21 | $17,217 | $25,369 | $18,322 |
| 8/21 | $17,485 | $26,092 | $18,617 |
| 9/21 | $17,003 | $24,921 | $18,066 |
| 10/21 | $17,516 | $26,607 | $18,696 |
| 11/21 | $17,227 | $26,202 | $18,417 |
| 12/21 | $17,663 | $27,234 | $18,879 |
| 1/22 | $16,958 | $25,631 | $18,084 |
| 2/22 | $16,655 | $24,986 | $17,740 |
| 3/22 | $16,558 | $25,796 | $17,837 |
| 4/22 | $15,648 | $23,481 | $16,654 |
| 5/22 | $15,618 | $23,450 | $16,698 |
| 6/22 | $14,707 | $21,488 | $15,679 |
| 7/22 | $15,558 | $23,504 | $16,592 |
| 8/22 | $15,033 | $22,627 | $16,046 |
| 9/22 | $13,957 | $20,528 | $14,808 |
| 10/22 | $14,468 | $22,212 | $15,377 |
| 11/22 | $15,344 | $23,371 | $16,289 |
| 12/22 | $14,900 | $22,003 | $15,814 |
| 1/23 | $15,772 | $23,518 | $16,727 |
| 2/23 | $15,386 | $22,968 | $16,287 |
| 3/23 | $15,610 | $23,583 | $16,697 |
| 4/23 | $15,718 | $23,834 | $16,869 |
| 5/23 | $15,486 | $23,927 | $16,716 |
| 6/23 | $16,015 | $25,560 | $17,354 |
| 7/23 | $16,349 | $26,477 | $17,776 |
| 8/23 | $15,968 | $25,966 | $17,429 |
| 9/23 | $15,314 | $24,729 | $16,788 |
| 10/23 | $14,861 | $24,073 | $16,349 |
| 11/23 | $15,994 | $26,318 | $17,592 |
| 12/23 | $16,817 | $27,714 | $18,431 |
| 1/24 | $16,768 | $28,021 | $18,465 |
| 2/24 | $17,172 | $29,538 | $18,909 |
| 3/24 | $17,589 | $30,491 | $19,361 |
| 4/24 | $17,018 | $29,149 | $18,739 |
| 5/24 | $17,531 | $30,526 | $19,359 |
| 6/24 | $17,734 | $31,471 | $19,684 |
| 7/24 | $18,207 | $32,056 | $20,109 |
| 8/24 | $18,597 | $32,754 | $20,516 |
| 9/24 | $18,895 | $33,432 | $20,915 |
Average Annual Total Returns (%)
| Fund | 1 Year | 5 Years | 10 Years |
|---|
| Class A | 23.39% | 7.78% | 7.14% |
| Class A with 5.25% Maximum Sales Charge | 16.89% | 6.62% | 6.56% |
Russell 3000® Index | 35.19% | 15.25% | 12.82% |
Moderate Allocation Blended BenchmarkFootnote Reference1 | 24.59% | 8.65% | 7.65% |
| Footnote | Description |
Footnote1 | Benchmark is an internally constructed benchmark which is comprised of a blend of 45% Russell 3000® Index, 20% MSCI ACWI ex USA Investable Market Index and 35% Bloomberg U.S. Aggregate Bond Index, and is rebalanced monthly. |
Performance does not reflect the deduction of taxes that a shareholder would pay on Fund distributions or redemption of Fund shares. Performance assumes that all dividends and distributions, if any, were reinvested. For more recent performance information, visit www.eatonvance.com/performance.php. Performance prior to December 31, 2016 is that of the Fund's former investment adviser.
THE FUND'S PAST PERFORMANCE IS NO GUARANTEE OF FUTURE RESULTS.
| Total Net Assets | $402,405,880 |
| # of Portfolio Holdings | 22 |
| Portfolio Turnover Rate | 19% |
Total Advisory Fees PaidFootnote Reference* | $0 |
| Footnote | Description |
Footnote* | Fund does not pay an advisory fee directly; the underlying funds in which the Fund invests do. |
What did the Fund invest in?
The following tables reflect what the Fund invested in as of the report date.
Asset Allocation (% of total investments)
| Value | Value |
|---|
| Short-Term Investments | 0.2% |
| International and Global Equity Funds | 20.8% |
| Income Funds | 33.7% |
| Domestic Equity Funds | 45.3% |
Top Ten Holdings (% of total investments)Footnote Referencea
| Calvert US Large-Cap Core Responsible Index Fund, Class R6 | 14.3% |
| Calvert Bond Fund, Class R6 | 9.0% |
| Calvert US Large-Cap Growth Responsible Index Fund, Class R6 | 7.3% |
| Calvert US Large-Cap Value Responsible Index Fund, Class R6 | 7.2% |
| Calvert Ultra-Short Duration Income Fund, Class R6 | 6.5% |
| Calvert International Equity Fund, Class R6 | 6.2% |
| Calvert Focused Value Fund, Class R6 | 5.4% |
| Calvert International Responsible Index Fund, Class R6 | 5.1% |
| Calvert Equity Fund, Class R6 | 5.0% |
| Calvert Core Bond Fund, Class I | 4.1% |
| Total | 70.1% |
| Footnote | Description |
Footnotea | Excluding cash equivalents |
If you wish to view additional information about the Fund, including the prospectus, statement of additional information, financial statements and holdings, please scan the QR code or visit www.eatonvance.com/calvert-fund-documents.php. For proxy information, please visit www.calvert.com/active-engagement.php?DM=how-we-influence.
The Funds may deliver a single copy of certain required shareholder documents (including prospectuses, shareholder reports, and proxy materials) to investors with the same last name and the same address. Your participation will continue indefinitely unless you instruct otherwise by calling 1-800-368-2745 or by contacting your financial intermediary. Your instruction will typically be effective within 30 days of receipt.
Not FDIC Insured | May Lose Value | No Bank Guarantee
Annual Shareholder Report September 30, 2024
Calvert Moderate Allocation Fund
Annual Shareholder Report September 30, 2024
This annual shareholder report contains important information about the Calvert Moderate Allocation Fund for the period of October 1, 2023 to September 30, 2024. You can find additional information about the Fund at www.eatonvance.com/calvert-fund-documents.php. You can also request this information by contacting us at 1-800-368-2745.
What were the Fund costs for the last year?
(based on a hypothetical $10,000 investment)
| Class Name | Costs of a $10,000 investment | Costs paid as a percentage of a $10,000 investment |
|---|
| Class C | $129 | 1.16% |
How did the Fund perform last year and what affected its performance?
Key contributors to (↑) and detractors from (↓) performance, relative to the Moderate Allocation Blended Benchmark (the Blended Index):
↓ The Fund’s larger-than-Blended Index allocation to equity assets detracted from performance relative to the Blended Index during the period
↓ Equity selections ― especially allocations to Calvert Equity Fund and Calvert Emerging Markets Advancement Fund ― hurt returns relative to the Blended Index
↓ Within the equity market, allocations to small-cap and mid-cap stocks detracted from performance relative to the Blended Index during the period
↓ An underweight position in investment-grade bonds and the Fund’s underweight duration detracted from returns relative to the Blended Index during the period
↑ Fund management’s selections ― especially in fixed-income assets ― were the largest contributor to returns relative to the Blended Index during the period
↑ Fund management’s selection of Calvert Bond Fund was particularly helpful to returns relative to the Blended Index during the period
↑ An overweight position in high yield corporate bonds and bank loans aided returns relative to the Blended Index during the period
↑ The Fund’s use of derivatives contributed to performance relative to the Blended Index during the period
Comparison of the change in value of a $10,000 investment for the period indicated.
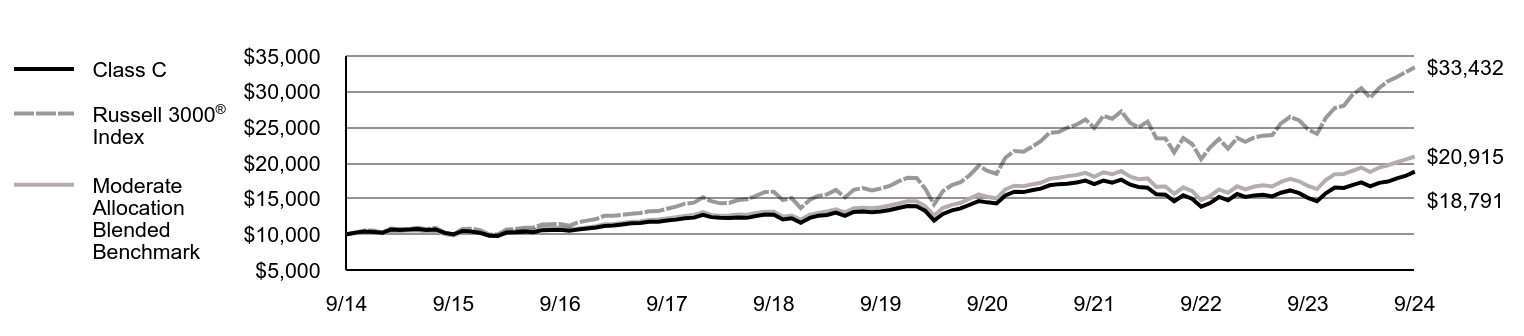
| Class C | Russell 3000® Index | Moderate Allocation Blended Benchmark |
|---|
| 9/14 | $10,000 | $10,000 | $10,000 |
| 10/14 | $10,240 | $10,275 | $10,135 |
| 11/14 | $10,391 | $10,524 | $10,282 |
| 12/14 | $10,312 | $10,524 | $10,218 |
| 1/15 | $10,230 | $10,231 | $10,161 |
| 2/15 | $10,665 | $10,824 | $10,501 |
| 3/15 | $10,610 | $10,713 | $10,438 |
| 4/15 | $10,682 | $10,762 | $10,554 |
| 5/15 | $10,731 | $10,911 | $10,584 |
| 6/15 | $10,599 | $10,728 | $10,406 |
| 7/15 | $10,687 | $10,908 | $10,499 |
| 8/15 | $10,197 | $10,249 | $10,054 |
| 9/15 | $10,009 | $9,951 | $9,858 |
| 10/15 | $10,450 | $10,736 | $10,351 |
| 11/15 | $10,406 | $10,796 | $10,329 |
| 12/15 | $10,199 | $10,574 | $10,188 |
| 1/16 | $9,815 | $9,978 | $9,837 |
| 2/16 | $9,759 | $9,975 | $9,842 |
| 3/16 | $10,242 | $10,677 | $10,347 |
| 4/16 | $10,292 | $10,743 | $10,445 |
| 5/16 | $10,379 | $10,935 | $10,497 |
| 6/16 | $10,292 | $10,958 | $10,537 |
| 7/16 | $10,584 | $11,393 | $10,854 |
| 8/16 | $10,622 | $11,422 | $10,873 |
| 9/16 | $10,646 | $11,440 | $10,909 |
| 10/16 | $10,503 | $11,192 | $10,739 |
| 11/16 | $10,665 | $11,693 | $10,815 |
| 12/16 | $10,803 | $11,921 | $10,969 |
| 1/17 | $10,946 | $12,145 | $11,148 |
| 2/17 | $11,160 | $12,597 | $11,400 |
| 3/17 | $11,238 | $12,606 | $11,457 |
| 4/17 | $11,387 | $12,739 | $11,595 |
| 5/17 | $11,543 | $12,870 | $11,753 |
| 6/17 | $11,589 | $12,986 | $11,804 |
| 7/17 | $11,751 | $13,231 | $12,009 |
| 8/17 | $11,771 | $13,256 | $12,071 |
| 9/17 | $11,926 | $13,579 | $12,229 |
| 10/17 | $12,063 | $13,876 | $12,398 |
| 11/17 | $12,244 | $14,297 | $12,584 |
| 12/17 | $12,343 | $14,440 | $12,720 |
| 1/18 | $12,749 | $15,201 | $13,110 |
| 2/18 | $12,411 | $14,641 | $12,728 |
| 3/18 | $12,316 | $14,347 | $12,599 |
| 4/18 | $12,275 | $14,402 | $12,627 |
| 5/18 | $12,363 | $14,808 | $12,765 |
| 6/18 | $12,310 | $14,905 | $12,746 |
| 7/18 | $12,560 | $15,400 | $12,992 |
| 8/18 | $12,763 | $15,940 | $13,177 |
| 9/18 | $12,741 | $15,967 | $13,163 |
| 10/18 | $12,079 | $14,791 | $12,470 |
| 11/18 | $12,261 | $15,087 | $12,630 |
| 12/18 | $11,616 | $13,683 | $12,064 |
| 1/19 | $12,307 | $14,858 | $12,759 |
| 2/19 | $12,592 | $15,380 | $13,008 |
| 3/19 | $12,720 | $15,605 | $13,195 |
| 4/19 | $13,041 | $16,228 | $13,501 |
| 5/19 | $12,592 | $15,178 | $13,048 |
| 6/19 | $13,137 | $16,244 | $13,669 |
| 7/19 | $13,201 | $16,485 | $13,740 |
| 8/19 | $13,080 | $16,149 | $13,655 |
| 9/19 | $13,211 | $16,433 | $13,807 |
| 10/19 | $13,410 | $16,786 | $14,053 |
| 11/19 | $13,689 | $17,424 | $14,319 |
| 12/19 | $13,971 | $17,928 | $14,628 |
| 1/20 | $13,941 | $17,908 | $14,639 |
| 2/20 | $13,312 | $16,442 | $13,955 |
| 3/20 | $11,927 | $14,181 | $12,641 |
| 4/20 | $12,852 | $16,059 | $13,679 |
| 5/20 | $13,363 | $16,918 | $14,130 |
| 6/20 | $13,630 | $17,304 | $14,430 |
| 7/20 | $14,148 | $18,287 | $15,005 |
| 8/20 | $14,667 | $19,612 | $15,589 |
| 9/20 | $14,482 | $18,898 | $15,259 |
| 10/20 | $14,341 | $18,490 | $15,019 |
| 11/20 | $15,444 | $20,739 | $16,298 |
| 12/20 | $15,976 | $21,672 | $16,819 |
| 1/21 | $15,922 | $21,576 | $16,749 |
| 2/21 | $16,168 | $22,250 | $16,974 |
| 3/21 | $16,407 | $23,048 | $17,220 |
| 4/21 | $16,876 | $24,236 | $17,776 |
| 5/21 | $17,037 | $24,346 | $17,940 |
| 6/21 | $17,099 | $24,947 | $18,160 |
| 7/21 | $17,268 | $25,369 | $18,322 |
| 8/21 | $17,530 | $26,092 | $18,617 |
| 9/21 | $17,030 | $24,921 | $18,066 |
| 10/21 | $17,537 | $26,607 | $18,696 |
| 11/21 | $17,230 | $26,202 | $18,417 |
| 12/21 | $17,660 | $27,234 | $18,879 |
| 1/22 | $16,950 | $25,631 | $18,084 |
| 2/22 | $16,636 | $24,986 | $17,740 |
| 3/22 | $16,531 | $25,796 | $17,837 |
| 4/22 | $15,604 | $23,481 | $16,654 |
| 5/22 | $15,563 | $23,450 | $16,698 |
| 6/22 | $14,646 | $21,488 | $15,679 |
| 7/22 | $15,485 | $23,504 | $16,592 |
| 8/22 | $14,953 | $22,627 | $16,046 |
| 9/22 | $13,880 | $20,528 | $14,808 |
| 10/22 | $14,380 | $22,212 | $15,377 |
| 11/22 | $15,236 | $23,371 | $16,289 |
| 12/22 | $14,786 | $22,003 | $15,814 |
| 1/23 | $15,644 | $23,518 | $16,727 |
| 2/23 | $15,252 | $22,968 | $16,287 |
| 3/23 | $15,459 | $23,583 | $16,697 |
| 4/23 | $15,557 | $23,834 | $16,869 |
| 5/23 | $15,320 | $23,927 | $16,716 |
| 6/23 | $15,832 | $25,560 | $17,354 |
| 7/23 | $16,152 | $26,477 | $17,776 |
| 8/23 | $15,767 | $25,966 | $17,429 |
| 9/23 | $15,113 | $24,729 | $16,788 |
| 10/23 | $14,652 | $24,073 | $16,349 |
| 11/23 | $15,763 | $26,318 | $17,592 |
| 12/23 | $16,567 | $27,714 | $18,431 |
| 1/24 | $16,506 | $28,021 | $18,465 |
| 2/24 | $16,889 | $29,538 | $18,909 |
| 3/24 | $17,289 | $30,491 | $19,361 |
| 4/24 | $16,723 | $29,149 | $18,739 |
| 5/24 | $17,220 | $30,526 | $19,359 |
| 6/24 | $17,400 | $31,471 | $19,684 |
| 7/24 | $17,854 | $32,056 | $20,109 |
| 8/24 | $18,221 | $32,754 | $20,516 |
| 9/24 | $18,791 | $33,432 | $20,915 |
Average Annual Total Returns (%)
| Fund | 1 Year | 5 Years | 10 Years |
|---|
| Class C | 22.47% | 6.97% | 6.51% |
| Class C with 1% Maximum Deferred Sales Charge | 21.47% | 6.97% | 6.51% |
Russell 3000® Index | 35.19% | 15.25% | 12.82% |
Moderate Allocation Blended BenchmarkFootnote Reference1 | 24.59% | 8.65% | 7.65% |
| Footnote | Description |
Footnote1 | Benchmark is an internally constructed benchmark which is comprised of a blend of 45% Russell 3000® Index, 20% MSCI ACWI ex USA Investable Market Index and 35% Bloomberg U.S. Aggregate Bond Index, and is rebalanced monthly. |
Performance does not reflect the deduction of taxes that a shareholder would pay on Fund distributions or redemption of Fund shares. Performance assumes that all dividends and distributions, if any, were reinvested. For more recent performance information, visit www.eatonvance.com/performance.php. Performance prior to December 31, 2016 is that of the Fund's former investment adviser.
THE FUND'S PAST PERFORMANCE IS NO GUARANTEE OF FUTURE RESULTS.
| Total Net Assets | $402,405,880 |
| # of Portfolio Holdings | 22 |
| Portfolio Turnover Rate | 19% |
Total Advisory Fees PaidFootnote Reference* | $0 |
| Footnote | Description |
Footnote* | Fund does not pay an advisory fee directly; the underlying funds in which the Fund invests do. |
What did the Fund invest in?
The following tables reflect what the Fund invested in as of the report date.
Asset Allocation (% of total investments)
| Value | Value |
|---|
| Short-Term Investments | 0.2% |
| International and Global Equity Funds | 20.8% |
| Income Funds | 33.7% |
| Domestic Equity Funds | 45.3% |
Top Ten Holdings (% of total investments)Footnote Referencea
| Calvert US Large-Cap Core Responsible Index Fund, Class R6 | 14.3% |
| Calvert Bond Fund, Class R6 | 9.0% |
| Calvert US Large-Cap Growth Responsible Index Fund, Class R6 | 7.3% |
| Calvert US Large-Cap Value Responsible Index Fund, Class R6 | 7.2% |
| Calvert Ultra-Short Duration Income Fund, Class R6 | 6.5% |
| Calvert International Equity Fund, Class R6 | 6.2% |
| Calvert Focused Value Fund, Class R6 | 5.4% |
| Calvert International Responsible Index Fund, Class R6 | 5.1% |
| Calvert Equity Fund, Class R6 | 5.0% |
| Calvert Core Bond Fund, Class I | 4.1% |
| Total | 70.1% |
| Footnote | Description |
Footnotea | Excluding cash equivalents |
If you wish to view additional information about the Fund, including the prospectus, statement of additional information, financial statements and holdings, please scan the QR code or visit www.eatonvance.com/calvert-fund-documents.php. For proxy information, please visit www.calvert.com/active-engagement.php?DM=how-we-influence.
The Funds may deliver a single copy of certain required shareholder documents (including prospectuses, shareholder reports, and proxy materials) to investors with the same last name and the same address. Your participation will continue indefinitely unless you instruct otherwise by calling 1-800-368-2745 or by contacting your financial intermediary. Your instruction will typically be effective within 30 days of receipt.
Not FDIC Insured | May Lose Value | No Bank Guarantee
Annual Shareholder Report September 30, 2024
Calvert Moderate Allocation Fund
Annual Shareholder Report September 30, 2024
This annual shareholder report contains important information about the Calvert Moderate Allocation Fund for the period of October 1, 2023 to September 30, 2024. You can find additional information about the Fund at www.eatonvance.com/calvert-fund-documents.php. You can also request this information by contacting us at 1-800-368-2745.
What were the Fund costs for the last year?
(based on a hypothetical $10,000 investment)
| Class Name | Costs of a $10,000 investment | Costs paid as a percentage of a $10,000 investment |
|---|
| Class I | $18 | 0.16% |
How did the Fund perform last year and what affected its performance?
Key contributors to (↑) and detractors from (↓) performance, relative to the Moderate Allocation Blended Benchmark (the Blended Index):
↓ The Fund’s larger-than-Blended Index allocation to equity assets detracted from performance relative to the Blended Index during the period
↓ Equity selections ― especially allocations to Calvert Equity Fund and Calvert Emerging Markets Advancement Fund ― hurt returns relative to the Blended Index
↓ Within the equity market, allocations to small-cap and mid-cap stocks detracted from performance relative to the Blended Index during the period
↓ An underweight position in investment-grade bonds and the Fund’s underweight duration detracted from returns relative to the Blended Index during the period
↑ Fund management’s selections ― especially in fixed-income assets ― were the largest contributor to returns relative to the Blended Index during the period
↑ Fund management’s selection of Calvert Bond Fund was particularly helpful to returns relative to the Blended Index during the period
↑ An overweight position in high yield corporate bonds and bank loans aided returns relative to the Blended Index during the period
↑ The Fund’s use of derivatives contributed to performance relative to the Blended Index during the period
Comparison of the change in value of a $1,000,000 investment for the period indicated.
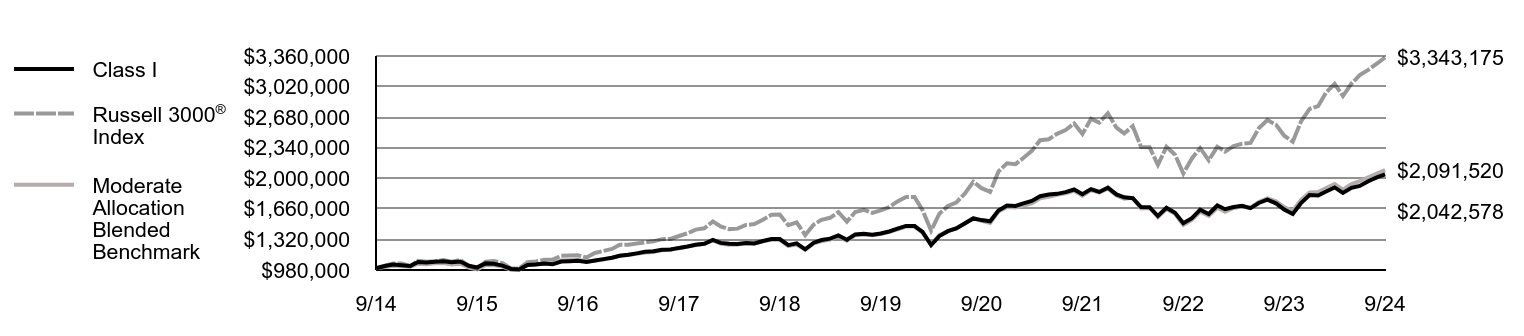
| Class I | Russell 3000® Index | Moderate Allocation Blended Benchmark |
|---|
| 9/14 | $1,000,000 | $1,000,000 | $1,000,000 |
| 10/14 | $1,024,241 | $1,027,513 | $1,013,492 |
| 11/14 | $1,039,905 | $1,052,414 | $1,028,233 |
| 12/14 | $1,032,868 | $1,052,402 | $1,021,764 |
| 1/15 | $1,025,387 | $1,023,112 | $1,016,106 |
| 2/15 | $1,069,727 | $1,082,351 | $1,050,131 |
| 3/15 | $1,064,700 | $1,071,348 | $1,043,783 |
| 4/15 | $1,072,186 | $1,076,194 | $1,055,391 |
| 5/15 | $1,078,062 | $1,091,079 | $1,058,355 |
| 6/15 | $1,065,505 | $1,072,825 | $1,040,609 |
| 7/15 | $1,075,137 | $1,090,768 | $1,049,939 |
| 8/15 | $1,026,973 | $1,024,919 | $1,005,412 |
| 9/15 | $1,008,562 | $995,053 | $985,764 |
| 10/15 | $1,053,538 | $1,073,648 | $1,035,131 |
| 11/15 | $1,049,255 | $1,079,600 | $1,032,855 |
| 12/15 | $1,029,213 | $1,057,440 | $1,018,812 |
| 1/16 | $991,359 | $997,774 | $983,746 |
| 2/16 | $986,551 | $997,453 | $984,194 |
| 3/16 | $1,035,746 | $1,067,679 | $1,034,689 |
| 4/16 | $1,041,781 | $1,074,296 | $1,044,457 |
| 5/16 | $1,050,827 | $1,093,516 | $1,049,729 |
| 6/16 | $1,043,225 | $1,095,764 | $1,053,673 |
| 7/16 | $1,074,093 | $1,139,252 | $1,085,427 |
| 8/16 | $1,078,328 | $1,142,158 | $1,087,345 |
| 9/16 | $1,082,266 | $1,143,953 | $1,090,948 |
| 10/16 | $1,068,313 | $1,119,203 | $1,073,901 |
| 11/16 | $1,085,902 | $1,169,290 | $1,081,472 |
| 12/16 | $1,101,078 | $1,192,107 | $1,096,904 |
| 1/17 | $1,116,902 | $1,214,544 | $1,114,808 |
| 2/17 | $1,139,055 | $1,259,715 | $1,139,965 |
| 3/17 | $1,149,177 | $1,260,572 | $1,145,737 |
| 4/17 | $1,164,997 | $1,273,934 | $1,159,476 |
| 5/17 | $1,182,096 | $1,286,971 | $1,175,291 |
| 6/17 | $1,187,797 | $1,298,586 | $1,180,416 |
| 7/17 | $1,205,528 | $1,323,070 | $1,200,860 |
| 8/17 | $1,208,693 | $1,325,620 | $1,207,119 |
| 9/17 | $1,225,778 | $1,357,949 | $1,222,936 |
| 10/17 | $1,240,976 | $1,387,582 | $1,239,790 |
| 11/17 | $1,260,594 | $1,429,716 | $1,258,427 |
| 12/17 | $1,271,654 | $1,444,006 | $1,272,036 |
| 1/18 | $1,314,850 | $1,520,120 | $1,311,011 |
| 2/18 | $1,281,640 | $1,464,089 | $1,272,846 |
| 3/18 | $1,272,812 | $1,434,699 | $1,259,947 |
| 4/18 | $1,269,478 | $1,440,152 | $1,262,685 |
| 5/18 | $1,280,119 | $1,480,808 | $1,276,520 |
| 6/18 | $1,276,001 | $1,490,492 | $1,274,619 |
| 7/18 | $1,302,689 | $1,539,955 | $1,299,240 |
| 8/18 | $1,324,725 | $1,594,035 | $1,317,668 |
| 9/18 | $1,324,369 | $1,596,674 | $1,316,251 |
| 10/18 | $1,256,120 | $1,479,106 | $1,247,000 |
| 11/18 | $1,276,209 | $1,508,731 | $1,262,968 |
| 12/18 | $1,210,070 | $1,368,314 | $1,206,445 |
| 1/19 | $1,283,407 | $1,485,762 | $1,275,850 |
| 2/19 | $1,313,728 | $1,538,015 | $1,300,819 |
| 3/19 | $1,328,435 | $1,560,473 | $1,319,502 |
| 4/19 | $1,363,754 | $1,622,785 | $1,350,149 |
| 5/19 | $1,317,106 | $1,517,772 | $1,304,803 |
| 6/19 | $1,375,807 | $1,624,375 | $1,366,925 |
| 7/19 | $1,383,608 | $1,648,522 | $1,374,009 |
| 8/19 | $1,372,281 | $1,614,916 | $1,365,455 |
| 9/19 | $1,386,503 | $1,643,259 | $1,380,670 |
| 10/19 | $1,408,540 | $1,678,633 | $1,405,339 |
| 11/19 | $1,439,097 | $1,742,441 | $1,431,904 |
| 12/19 | $1,469,862 | $1,792,752 | $1,462,792 |
| 1/20 | $1,468,392 | $1,790,794 | $1,463,895 |
| 2/20 | $1,402,713 | $1,644,176 | $1,395,536 |
| 3/20 | $1,257,883 | $1,418,072 | $1,264,126 |
| 4/20 | $1,356,977 | $1,605,882 | $1,367,931 |
| 5/20 | $1,411,702 | $1,691,762 | $1,413,020 |
| 6/20 | $1,441,276 | $1,730,439 | $1,442,981 |
| 7/20 | $1,497,551 | $1,828,699 | $1,500,465 |
| 8/20 | $1,553,098 | $1,961,178 | $1,558,876 |
| 9/20 | $1,535,019 | $1,889,770 | $1,525,854 |
| 10/20 | $1,521,661 | $1,848,982 | $1,501,888 |
| 11/20 | $1,640,409 | $2,073,917 | $1,629,822 |
| 12/20 | $1,697,784 | $2,167,218 | $1,681,917 |
| 1/21 | $1,693,160 | $2,157,579 | $1,674,882 |
| 2/21 | $1,720,926 | $2,225,019 | $1,697,351 |
| 3/21 | $1,748,533 | $2,304,770 | $1,721,955 |
| 4/21 | $1,800,296 | $2,423,579 | $1,777,576 |
| 5/21 | $1,818,820 | $2,434,642 | $1,793,981 |
| 6/21 | $1,826,766 | $2,494,678 | $1,815,991 |
| 7/21 | $1,846,123 | $2,536,865 | $1,832,208 |
| 8/21 | $1,875,537 | $2,609,210 | $1,861,684 |
| 9/21 | $1,823,530 | $2,492,141 | $1,806,621 |
| 10/21 | $1,879,352 | $2,660,670 | $1,869,613 |
| 11/21 | $1,848,340 | $2,620,172 | $1,841,662 |
| 12/21 | $1,896,246 | $2,723,350 | $1,887,920 |
| 1/22 | $1,820,689 | $2,563,119 | $1,808,381 |
| 2/22 | $1,788,191 | $2,498,556 | $1,774,014 |
| 3/22 | $1,778,908 | $2,579,600 | $1,783,656 |
| 4/22 | $1,680,442 | $2,348,101 | $1,665,445 |
| 5/22 | $1,678,000 | $2,344,952 | $1,669,809 |
| 6/22 | $1,580,436 | $2,148,777 | $1,567,874 |
| 7/22 | $1,672,635 | $2,350,370 | $1,659,249 |
| 8/22 | $1,616,337 | $2,262,656 | $1,604,583 |
| 9/22 | $1,500,983 | $2,052,842 | $1,480,811 |
| 10/22 | $1,556,665 | $2,221,188 | $1,537,703 |
| 11/22 | $1,650,835 | $2,337,125 | $1,628,937 |
| 12/22 | $1,603,276 | $2,200,278 | $1,581,424 |
| 1/23 | $1,697,830 | $2,351,818 | $1,672,713 |
| 2/23 | $1,656,359 | $2,296,849 | $1,628,684 |
| 3/23 | $1,680,657 | $2,358,265 | $1,669,711 |
| 4/23 | $1,693,156 | $2,383,391 | $1,686,940 |
| 5/23 | $1,668,158 | $2,392,664 | $1,671,596 |
| 6/23 | $1,725,239 | $2,556,048 | $1,735,390 |
| 7/23 | $1,762,071 | $2,647,674 | $1,777,553 |
| 8/23 | $1,721,054 | $2,596,564 | $1,742,929 |
| 9/23 | $1,651,761 | $2,472,879 | $1,678,764 |
| 10/23 | $1,602,116 | $2,407,326 | $1,634,932 |
| 11/23 | $1,724,967 | $2,631,805 | $1,759,185 |
| 12/23 | $1,813,832 | $2,771,401 | $1,843,061 |
| 1/24 | $1,809,393 | $2,802,116 | $1,846,451 |
| 2/24 | $1,852,896 | $2,953,796 | $1,890,870 |
| 3/24 | $1,898,095 | $3,049,077 | $1,936,111 |
| 4/24 | $1,837,499 | $2,914,913 | $1,873,887 |
| 5/24 | $1,893,640 | $3,052,634 | $1,935,902 |
| 6/24 | $1,914,978 | $3,147,135 | $1,968,390 |
| 7/24 | $1,966,903 | $3,205,637 | $2,010,883 |
| 8/24 | $2,008,981 | $3,275,420 | $2,051,578 |
| 9/24 | $2,042,578 | $3,343,175 | $2,091,520 |
Average Annual Total Returns (%)Footnote Reference1
| Fund | 1 Year | 5 Years | 10 Years |
|---|
| Class I | 23.65% | 8.05% | 7.40% |
Russell 3000® Index | 35.19% | 15.25% | 12.82% |
Moderate Allocation Blended BenchmarkFootnote Reference2 | 24.59% | 8.65% | 7.65% |
| Footnote | Description |
Footnote1 | Class I performance prior to 5/20/16 is linked to Class A. This linked performance is adjusted for any applicable sales charge, but is not adjusted for class expense differences. If adjusted for such differences, the performance would be different. Performance presented in the Financial Highlights included in the financial statements is not linked. |
Footnote2 | Benchmark is an internally constructed benchmark which is comprised of a blend of 45% Russell 3000® Index, 20% MSCI ACWI ex USA Investable Market Index and 35% Bloomberg U.S. Aggregate Bond Index, and is rebalanced monthly. |
Performance does not reflect the deduction of taxes that a shareholder would pay on Fund distributions or redemption of Fund shares. Performance assumes that all dividends and distributions, if any, were reinvested. For more recent performance information, visit www.eatonvance.com/performance.php. Performance prior to December 31, 2016 is that of the Fund's former investment adviser.
THE FUND'S PAST PERFORMANCE IS NO GUARANTEE OF FUTURE RESULTS.
| Total Net Assets | $402,405,880 |
| # of Portfolio Holdings | 22 |
| Portfolio Turnover Rate | 19% |
Total Advisory Fees PaidFootnote Reference* | $0 |
| Footnote | Description |
Footnote* | Fund does not pay an advisory fee directly; the underlying funds in which the Fund invests do. |
What did the Fund invest in?
The following tables reflect what the Fund invested in as of the report date.
Asset Allocation (% of total investments)
| Value | Value |
|---|
| Short-Term Investments | 0.2% |
| International and Global Equity Funds | 20.8% |
| Income Funds | 33.7% |
| Domestic Equity Funds | 45.3% |
Top Ten Holdings (% of total investments)Footnote Referencea
| Calvert US Large-Cap Core Responsible Index Fund, Class R6 | 14.3% |
| Calvert Bond Fund, Class R6 | 9.0% |
| Calvert US Large-Cap Growth Responsible Index Fund, Class R6 | 7.3% |
| Calvert US Large-Cap Value Responsible Index Fund, Class R6 | 7.2% |
| Calvert Ultra-Short Duration Income Fund, Class R6 | 6.5% |
| Calvert International Equity Fund, Class R6 | 6.2% |
| Calvert Focused Value Fund, Class R6 | 5.4% |
| Calvert International Responsible Index Fund, Class R6 | 5.1% |
| Calvert Equity Fund, Class R6 | 5.0% |
| Calvert Core Bond Fund, Class I | 4.1% |
| Total | 70.1% |
| Footnote | Description |
Footnotea | Excluding cash equivalents |
If you wish to view additional information about the Fund, including the prospectus, statement of additional information, financial statements and holdings, please scan the QR code or visit www.eatonvance.com/calvert-fund-documents.php. For proxy information, please visit www.calvert.com/active-engagement.php?DM=how-we-influence.
The Funds may deliver a single copy of certain required shareholder documents (including prospectuses, shareholder reports, and proxy materials) to investors with the same last name and the same address. Your participation will continue indefinitely unless you instruct otherwise by calling 1-800-368-2745 or by contacting your financial intermediary. Your instruction will typically be effective within 30 days of receipt.
Not FDIC Insured | May Lose Value | No Bank Guarantee
Annual Shareholder Report September 30, 2024
Calvert Moderate Allocation Fund
Annual Shareholder Report September 30, 2024
This annual shareholder report contains important information about the Calvert Moderate Allocation Fund for the period of October 1, 2023 to September 30, 2024. You can find additional information about the Fund at www.eatonvance.com/calvert-fund-documents.php. You can also request this information by contacting us at 1-800-368-2745.
What were the Fund costs for the last year?
(based on a hypothetical $10,000 investment)
| Class Name | Costs of a $10,000 investment | Costs paid as a percentage of a $10,000 investment |
|---|
| Class R6 | $12 | 0.11% |
How did the Fund perform last year and what affected its performance?
Key contributors to (↑) and detractors from (↓) performance, relative to the Moderate Allocation Blended Benchmark (the Blended Index):
↓ The Fund’s larger-than-Blended Index allocation to equity assets detracted from performance relative to the Blended Index during the period
↓ Equity selections ― especially allocations to Calvert Equity Fund and Calvert Emerging Markets Advancement Fund ― hurt returns relative to the Blended Index
↓ Within the equity market, allocations to small-cap and mid-cap stocks detracted from performance relative to the Blended Index during the period
↓ An underweight position in investment-grade bonds and the Fund’s underweight duration detracted from returns relative to the Blended Index during the period
↑ Fund management’s selections ― especially in fixed-income assets ― were the largest contributor to returns relative to the Blended Index during the period
↑ Fund management’s selection of Calvert Bond Fund was particularly helpful to returns relative to the Blended Index during the period
↑ An overweight position in high yield corporate bonds and bank loans aided returns relative to the Blended Index during the period
↑ The Fund’s use of derivatives contributed to performance relative to the Blended Index during the period
Comparison of the change in value of a $5,000,000 investment for the period indicated.
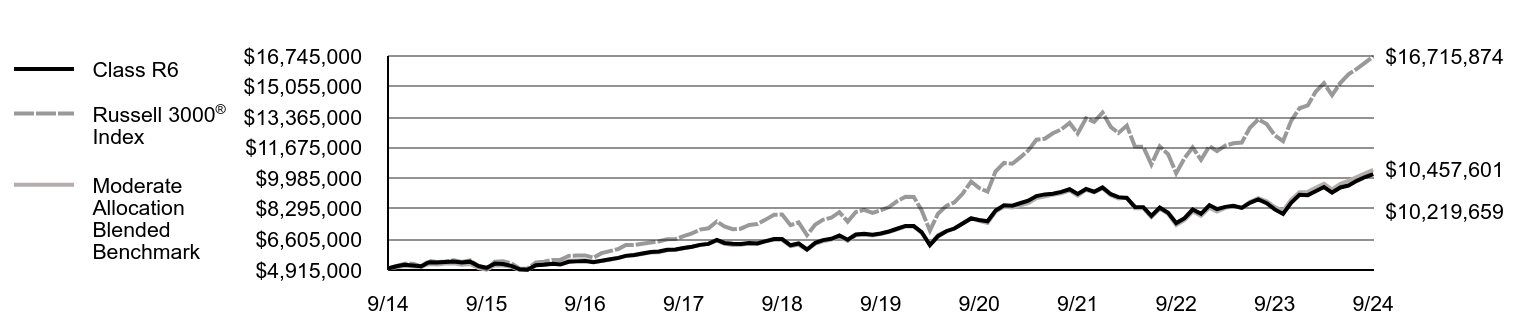
| Class R6 | Russell 3000® Index | Moderate Allocation Blended Benchmark |
|---|
| 9/14 | $5,000,000 | $5,000,000 | $5,000,000 |
| 10/14 | $5,121,212 | $5,137,566 | $5,067,459 |
| 11/14 | $5,199,495 | $5,262,069 | $5,141,167 |
| 12/14 | $5,164,320 | $5,262,010 | $5,108,822 |
| 1/15 | $5,126,917 | $5,115,560 | $5,080,532 |
| 2/15 | $5,348,665 | $5,411,756 | $5,250,655 |
| 3/15 | $5,323,496 | $5,356,740 | $5,218,913 |
| 4/15 | $5,360,929 | $5,380,970 | $5,276,954 |
| 5/15 | $5,390,340 | $5,455,396 | $5,291,776 |
| 6/15 | $5,327,595 | $5,364,125 | $5,203,045 |
| 7/15 | $5,375,760 | $5,453,842 | $5,249,697 |
| 8/15 | $5,134,934 | $5,124,596 | $5,027,060 |
| 9/15 | $5,042,949 | $4,975,266 | $4,928,821 |
| 10/15 | $5,267,794 | $5,368,239 | $5,175,653 |
| 11/15 | $5,246,380 | $5,397,998 | $5,164,274 |
| 12/15 | $5,146,221 | $5,287,202 | $5,094,060 |
| 1/16 | $4,956,955 | $4,988,870 | $4,918,732 |
| 2/16 | $4,932,921 | $4,987,263 | $4,920,972 |
| 3/16 | $5,178,932 | $5,338,397 | $5,173,444 |
| 4/16 | $5,209,112 | $5,371,482 | $5,222,286 |
| 5/16 | $5,254,382 | $5,467,580 | $5,248,647 |
| 6/16 | $5,216,394 | $5,478,822 | $5,268,367 |
| 7/16 | $5,370,708 | $5,696,260 | $5,427,134 |
| 8/16 | $5,391,888 | $5,710,790 | $5,436,727 |
| 9/16 | $5,411,527 | $5,719,767 | $5,454,739 |
| 10/16 | $5,341,798 | $5,596,017 | $5,369,505 |
| 11/16 | $5,429,717 | $5,846,451 | $5,407,362 |
| 12/16 | $5,505,551 | $5,960,533 | $5,484,521 |
| 1/17 | $5,584,700 | $6,072,722 | $5,574,038 |
| 2/17 | $5,695,507 | $6,298,576 | $5,699,823 |
| 3/17 | $5,746,162 | $6,302,861 | $5,728,683 |
| 4/17 | $5,825,310 | $6,369,670 | $5,797,378 |
| 5/17 | $5,910,790 | $6,434,857 | $5,876,454 |
| 6/17 | $5,939,284 | $6,492,928 | $5,902,080 |
| 7/17 | $6,027,930 | $6,615,352 | $6,004,298 |
| 8/17 | $6,043,759 | $6,628,098 | $6,035,594 |
| 9/17 | $6,129,239 | $6,789,743 | $6,114,682 |
| 10/17 | $6,205,222 | $6,937,910 | $6,198,949 |
| 11/17 | $6,303,366 | $7,148,580 | $6,292,136 |
| 12/17 | $6,358,676 | $7,220,030 | $6,360,181 |
| 1/18 | $6,574,619 | $7,600,601 | $6,555,054 |
| 2/18 | $6,408,509 | $7,320,446 | $6,364,229 |
| 3/18 | $6,364,354 | $7,173,495 | $6,299,734 |
| 4/18 | $6,347,711 | $7,200,759 | $6,313,424 |
| 5/18 | $6,400,969 | $7,404,039 | $6,382,602 |
| 6/18 | $6,380,399 | $7,452,460 | $6,373,094 |
| 7/18 | $6,513,880 | $7,699,777 | $6,496,202 |
| 8/18 | $6,624,002 | $7,970,176 | $6,588,342 |
| 9/18 | $6,622,233 | $7,983,369 | $6,581,255 |
| 10/18 | $6,280,916 | $7,395,532 | $6,235,000 |
| 11/18 | $6,381,303 | $7,543,654 | $6,314,840 |
| 12/18 | $6,050,537 | $6,841,571 | $6,032,225 |
| 1/19 | $6,417,236 | $7,428,810 | $6,379,251 |
| 2/19 | $6,568,853 | $7,690,075 | $6,504,093 |
| 3/19 | $6,642,428 | $7,802,364 | $6,597,508 |
| 4/19 | $6,819,088 | $8,113,927 | $6,750,745 |
| 5/19 | $6,585,896 | $7,588,860 | $6,524,014 |
| 6/19 | $6,879,422 | $8,121,876 | $6,834,624 |
| 7/19 | $6,918,409 | $8,242,608 | $6,870,046 |
| 8/19 | $6,861,701 | $8,074,580 | $6,827,276 |
| 9/19 | $6,932,790 | $8,216,296 | $6,903,348 |
| 10/19 | $7,042,947 | $8,393,167 | $7,026,696 |
| 11/19 | $7,195,745 | $8,712,206 | $7,159,519 |
| 12/19 | $7,349,534 | $8,963,761 | $7,313,960 |
| 1/20 | $7,342,155 | $8,953,970 | $7,319,476 |
| 2/20 | $7,013,787 | $8,220,879 | $6,977,679 |
| 3/20 | $6,289,613 | $7,090,362 | $6,320,629 |
| 4/20 | $6,785,091 | $8,029,411 | $6,839,653 |
| 5/20 | $7,058,713 | $8,458,811 | $7,065,101 |
| 6/20 | $7,206,585 | $8,652,195 | $7,214,905 |
| 7/20 | $7,488,035 | $9,143,496 | $7,502,324 |
| 8/20 | $7,765,781 | $9,805,891 | $7,794,381 |
| 9/20 | $7,675,351 | $9,448,848 | $7,629,271 |
| 10/20 | $7,608,544 | $9,244,912 | $7,509,440 |
| 11/20 | $8,202,382 | $10,369,585 | $8,149,108 |
| 12/20 | $8,489,356 | $10,836,092 | $8,409,584 |
| 1/21 | $8,466,214 | $10,787,894 | $8,374,408 |
| 2/21 | $8,605,067 | $11,125,094 | $8,486,755 |
| 3/21 | $8,743,092 | $11,523,849 | $8,609,775 |
| 4/21 | $9,001,946 | $12,117,894 | $8,887,878 |
| 5/21 | $9,094,670 | $12,173,212 | $8,969,907 |
| 6/21 | $9,134,481 | $12,473,390 | $9,079,953 |
| 7/21 | $9,231,245 | $12,684,323 | $9,161,039 |
| 8/21 | $9,378,326 | $13,046,052 | $9,308,421 |
| 9/21 | $9,118,272 | $12,460,703 | $9,033,103 |
| 10/21 | $9,397,403 | $13,303,352 | $9,348,063 |
| 11/21 | $9,242,330 | $13,100,858 | $9,208,309 |
| 12/21 | $9,481,879 | $13,616,752 | $9,439,599 |
| 1/22 | $9,104,066 | $12,815,595 | $9,041,904 |
| 2/22 | $8,941,566 | $12,492,779 | $8,870,068 |
| 3/22 | $8,895,677 | $12,897,998 | $8,918,282 |
| 4/22 | $8,403,281 | $11,740,502 | $8,327,225 |
| 5/22 | $8,391,073 | $11,724,761 | $8,349,044 |
| 6/22 | $7,904,458 | $10,743,883 | $7,839,370 |
| 7/22 | $8,365,585 | $11,751,852 | $8,296,245 |
| 8/22 | $8,079,931 | $11,313,282 | $8,022,915 |
| 9/22 | $7,508,158 | $10,264,211 | $7,404,056 |
| 10/22 | $7,782,597 | $11,105,938 | $7,688,517 |
| 11/22 | $8,257,745 | $11,685,626 | $8,144,685 |
| 12/22 | $8,020,959 | $11,001,392 | $7,907,118 |
| 1/23 | $8,494,000 | $11,759,088 | $8,363,563 |
| 2/23 | $8,282,377 | $11,484,246 | $8,143,419 |
| 3/23 | $8,404,987 | $11,791,325 | $8,348,557 |
| 4/23 | $8,467,524 | $11,916,954 | $8,434,698 |
| 5/23 | $8,346,619 | $11,963,320 | $8,357,982 |
| 6/23 | $8,629,189 | $12,780,241 | $8,676,951 |
| 7/23 | $8,813,502 | $13,238,371 | $8,887,765 |
| 8/23 | $8,608,244 | $12,982,821 | $8,714,646 |
| 9/23 | $8,262,964 | $12,364,394 | $8,393,818 |
| 10/23 | $8,014,486 | $12,036,630 | $8,174,662 |
| 11/23 | $8,629,365 | $13,159,025 | $8,795,927 |
| 12/23 | $9,075,568 | $13,857,005 | $9,215,307 |
| 1/24 | $9,053,346 | $14,010,578 | $9,232,257 |
| 2/24 | $9,271,124 | $14,768,978 | $9,454,351 |
| 3/24 | $9,498,776 | $15,245,387 | $9,680,556 |
| 4/24 | $9,195,387 | $14,574,564 | $9,369,437 |
| 5/24 | $9,476,468 | $15,263,169 | $9,679,510 |
| 6/24 | $9,584,529 | $15,735,677 | $9,841,949 |
| 7/24 | $9,844,539 | $16,028,187 | $10,054,416 |
| 8/24 | $10,055,237 | $16,377,100 | $10,257,888 |
| 9/24 | $10,219,659 | $16,715,874 | $10,457,601 |
Average Annual Total Returns (%)Footnote Reference1
| Fund | 1 Year | 5 Years | 10 Years |
|---|
| Class R6 | 23.68% | 8.06% | 7.40% |
Russell 3000® Index | 35.19% | 15.25% | 12.82% |
Moderate Allocation Blended BenchmarkFootnote Reference2 | 24.59% | 8.65% | 7.65% |
| Footnote | Description |
Footnote1 | Class R6 performance prior to 2/1/22 is linked to Class I. This linked performance is adjusted for any applicable sales charge, but is not adjusted for class expense differences. If adjusted for such differences, the performance would be different. Performance presented in the Financial Highlights included in the financial statements is not linked. |
Footnote2 | Benchmark is an internally constructed benchmark which is comprised of a blend of 45% Russell 3000® Index, 20% MSCI ACWI ex USA Investable Market Index and 35% Bloomberg U.S. Aggregate Bond Index, and is rebalanced monthly. |
Performance does not reflect the deduction of taxes that a shareholder would pay on Fund distributions or redemption of Fund shares. Performance assumes that all dividends and distributions, if any, were reinvested. For more recent performance information, visit www.eatonvance.com/performance.php. Performance prior to December 31, 2016 is that of the Fund's former investment adviser.
THE FUND'S PAST PERFORMANCE IS NO GUARANTEE OF FUTURE RESULTS.
| Total Net Assets | $402,405,880 |
| # of Portfolio Holdings | 22 |
| Portfolio Turnover Rate | 19% |
Total Advisory Fees PaidFootnote Reference* | $0 |
| Footnote | Description |
Footnote* | Fund does not pay an advisory fee directly; the underlying funds in which the Fund invests do. |
What did the Fund invest in?
The following tables reflect what the Fund invested in as of the report date.
Asset Allocation (% of total investments)
| Value | Value |
|---|
| Short-Term Investments | 0.2% |
| International and Global Equity Funds | 20.8% |
| Income Funds | 33.7% |
| Domestic Equity Funds | 45.3% |
Top Ten Holdings (% of total investments)Footnote Referencea
| Calvert US Large-Cap Core Responsible Index Fund, Class R6 | 14.3% |
| Calvert Bond Fund, Class R6 | 9.0% |
| Calvert US Large-Cap Growth Responsible Index Fund, Class R6 | 7.3% |
| Calvert US Large-Cap Value Responsible Index Fund, Class R6 | 7.2% |
| Calvert Ultra-Short Duration Income Fund, Class R6 | 6.5% |
| Calvert International Equity Fund, Class R6 | 6.2% |
| Calvert Focused Value Fund, Class R6 | 5.4% |
| Calvert International Responsible Index Fund, Class R6 | 5.1% |
| Calvert Equity Fund, Class R6 | 5.0% |
| Calvert Core Bond Fund, Class I | 4.1% |
| Total | 70.1% |
| Footnote | Description |
Footnotea | Excluding cash equivalents |
If you wish to view additional information about the Fund, including the prospectus, statement of additional information, financial statements and holdings, please scan the QR code or visit www.eatonvance.com/calvert-fund-documents.php. For proxy information, please visit www.calvert.com/active-engagement.php?DM=how-we-influence.
The Funds may deliver a single copy of certain required shareholder documents (including prospectuses, shareholder reports, and proxy materials) to investors with the same last name and the same address. Your participation will continue indefinitely unless you instruct otherwise by calling 1-800-368-2745 or by contacting your financial intermediary. Your instruction will typically be effective within 30 days of receipt.
Not FDIC Insured | May Lose Value | No Bank Guarantee
Annual Shareholder Report September 30, 2024
Calvert Focused Value Fund
Annual Shareholder Report September 30, 2024
This annual shareholder report contains important information about the Calvert Focused Value Fund for the period of October 1, 2023 to September 30, 2024. You can find additional information about the Fund at www.eatonvance.com/calvert-fund-documents.php. You can also request this information by contacting us at 1-800-368-2745.
What were the Fund costs for the last year?
(based on a hypothetical $10,000 investment)
| Class Name | Costs of a $10,000 investment | Costs paid as a percentage of a $10,000 investment |
|---|
| Class A | $111 | 0.99% |
How did the Fund perform last year and what affected its performance?
Key contributors to (↑) and detractors from (↓) performance, relative to the Russell 1000® Value Index (the Index):
↓ Humana, Inc., a health insurance company, detracted from returns after Medicare and Medicaid set fees lower than expected. The stock was sold by period-end
↓ Dollar Tree, Inc. hurt returns as its earnings and revenue projections fell due to competitive and inflationary pressures. The stock was sold by period-end
↓ A position in human resources consultant Robert Half, Inc. hampered Fund returns as cooling job market growth slowed its revenues and profits during the period
↓ FMC Corp., a chemical manufacturer, detracted from returns as sales ― particularly in Latin America ― declined, in part, as a result of a drought in Brazil
↑ Westinghouse Air Brake Technologies Corp., a maker of locomotives and train cars, contributed to returns on solid demand in the freight and transit sectors
↑ Micron Technology, Inc., a semiconductor maker, helped Index-relative performance as demand for memory chips rose alongside the burgeoning AI market
↑ Zebra Technologies Corp., a computer technology company, aided returns as demand for its scanning and tracking devices rose. The stock was sold by period-end
↑ NextEra Energy, Inc., an energy business focused on wind, solar and other green sources, contributed to returns on growing demand for clean energy solutions
Comparison of the change in value of a $10,000 investment for the period indicated.
| Class A with Maximum Sales Charge | Russell 3000® Index | Russell 1000® Value Index |
|---|
| 4/22 | $9,475 | $10,000 | $10,000 |
| 5/22 | $9,608 | $9,090 | $9,619 |
| 6/22 | $8,925 | $8,330 | $8,779 |
| 7/22 | $9,551 | $9,111 | $9,361 |
| 8/22 | $9,276 | $8,771 | $9,082 |
| 9/22 | $8,575 | $7,958 | $8,286 |
| 10/22 | $9,267 | $8,611 | $9,135 |
| 11/22 | $9,835 | $9,060 | $9,706 |
| 12/22 | $9,334 | $8,530 | $9,315 |
| 1/23 | $9,893 | $9,117 | $9,798 |
| 2/23 | $9,542 | $8,904 | $9,452 |
| 3/23 | $9,324 | $9,142 | $9,409 |
| 4/23 | $9,514 | $9,239 | $9,550 |
| 5/23 | $9,277 | $9,275 | $9,182 |
| 6/23 | $9,761 | $9,909 | $9,792 |
| 7/23 | $10,102 | $10,264 | $10,136 |
| 8/23 | $9,704 | $10,066 | $9,863 |
| 9/23 | $9,248 | $9,586 | $9,482 |
| 10/23 | $8,793 | $9,332 | $9,148 |
| 11/23 | $9,476 | $10,202 | $9,838 |
| 12/23 | $10,139 | $10,744 | $10,383 |
| 1/24 | $9,842 | $10,863 | $10,393 |
| 2/24 | $10,359 | $11,451 | $10,777 |
| 3/24 | $10,885 | $11,820 | $11,316 |
| 4/24 | $10,694 | $11,300 | $10,832 |
| 5/24 | $11,028 | $11,834 | $11,176 |
| 6/24 | $10,847 | $12,200 | $11,071 |
| 7/24 | $11,267 | $12,427 | $11,636 |
| 8/24 | $11,296 | $12,697 | $11,949 |
| 9/24 | $11,588 | $14,238 | $12,839 |
Average Annual Total Returns (%)
| Fund | 1 Year | Since 4/29/22 (Inception) |
|---|
| Class A | 25.24% | 8.64% |
| Class A with 5.25% Maximum Sales Charge | 18.67% | 6.27% |
Russell 3000®IndexFootnote Reference1 | 35.19% | 15.69% |
Russell 1000® Value Index | 27.76% | 10.86% |
| Footnote | Description |
Footnote1 | In accordance with regulatory changes requiring the Fund’s primary benchmark to represent the overall applicable market, the Fund’s primary prospectus benchmark changed to the indicated benchmark effective May 1, 2024. |
Performance does not reflect the deduction of taxes that a shareholder would pay on Fund distributions or redemption of Fund shares. Performance assumes that all dividends and distributions, if any, were reinvested. For more recent performance information, visit www.eatonvance.com/performance.php.
THE FUND'S PAST PERFORMANCE IS NO GUARANTEE OF FUTURE RESULTS.
| Total Net Assets | $62,109,068 |
| # of Portfolio Holdings | 36 |
| Portfolio Turnover Rate | 107% |
| Total Advisory Fees Paid | $208,523 |
What did the Fund invest in?
The following tables reflect what the Fund invested in as of the report date.
Sector Allocation (% of total investments)
| Value | Value |
|---|
| Short-Term Investments | 1.5% |
| Communication Services | 5.4% |
| Consumer Discretionary | 5.7% |
| Utilities | 6.6% |
| Consumer Staples | 6.9% |
| Materials | 6.9% |
| Real Estate | 7.0% |
| Information Technology | 9.3% |
| Industrials | 14.9% |
| Health Care | 17.8% |
| Financials | 18.0% |
Top Ten Holdings (% of total investments)Footnote Referencea
| NextEra Energy, Inc. | 3.9% |
| AbbVie, Inc. | 3.8% |
| Reinsurance Group of America, Inc. | 3.7% |
| Thermo Fisher Scientific, Inc. | 3.6% |
| Charles Schwab Corp. | 3.5% |
| Micron Technology, Inc. | 3.4% |
| Cisco Systems, Inc. | 3.3% |
| Johnson Controls International PLC | 3.2% |
| Robert Half, Inc. | 3.2% |
| Westinghouse Air Brake Technologies Corp. | 3.2% |
| Total | 34.8% |
| Footnote | Description |
Footnotea | Excluding cash equivalents |
If you wish to view additional information about the Fund, including the prospectus, statement of additional information, financial statements and holdings, please scan the QR code or visit www.eatonvance.com/calvert-fund-documents.php. For proxy information, please visit www.calvert.com/active-engagement.php?DM=how-we-influence.
The Funds may deliver a single copy of certain required shareholder documents (including prospectuses, shareholder reports, and proxy materials) to investors with the same last name and the same address. Your participation will continue indefinitely unless you instruct otherwise by calling 1-800-368-2745 or by contacting your financial intermediary. Your instruction will typically be effective within 30 days of receipt.
Not FDIC Insured | May Lose Value | No Bank Guarantee
Annual Shareholder Report September 30, 2024
Calvert Focused Value Fund
Annual Shareholder Report September 30, 2024
This annual shareholder report contains important information about the Calvert Focused Value Fund for the period of October 1, 2023 to September 30, 2024. You can find additional information about the Fund at www.eatonvance.com/calvert-fund-documents.php. You can also request this information by contacting us at 1-800-368-2745.
What were the Fund costs for the last year?
(based on a hypothetical $10,000 investment)
| Class Name | Costs of a $10,000 investment | Costs paid as a percentage of a $10,000 investment |
|---|
| Class C | $195 | 1.74% |
How did the Fund perform last year and what affected its performance?
Key contributors to (↑) and detractors from (↓) performance, relative to the Russell 1000® Value Index (the Index):
↓ Humana, Inc., a health insurance company, detracted from returns after Medicare and Medicaid set fees lower than expected. The stock was sold by period-end
↓ Dollar Tree, Inc. hurt returns as its earnings and revenue projections fell due to competitive and inflationary pressures. The stock was sold by period-end
↓ A position in human resources consultant Robert Half, Inc. hampered Fund returns as cooling job market growth slowed its revenues and profits during the period
↓ FMC Corp., a chemical manufacturer, detracted from returns as sales ― particularly in Latin America ― declined, in part, as a result of a drought in Brazil
↑ Westinghouse Air Brake Technologies Corp., a maker of locomotives and train cars, contributed to returns on solid demand in the freight and transit sectors
↑ Micron Technology, Inc., a semiconductor maker, helped Index-relative performance as demand for memory chips rose alongside the burgeoning AI market
↑ Zebra Technologies Corp., a computer technology company, aided returns as demand for its scanning and tracking devices rose. The stock was sold by period-end
↑ NextEra Energy, Inc., an energy business focused on wind, solar and other green sources, contributed to returns on growing demand for clean energy solutions
Comparison of the change in value of a $10,000 investment for the period indicated.
| Class C | Russell 3000® Index | Russell 1000® Value Index |
|---|
| 4/22 | $10,000 | $10,000 | $10,000 |
| 5/22 | $10,130 | $9,090 | $9,619 |
| 6/22 | $9,410 | $8,330 | $8,779 |
| 7/22 | $10,060 | $9,111 | $9,361 |
| 8/22 | $9,760 | $8,771 | $9,082 |
| 9/22 | $9,020 | $7,958 | $8,286 |
| 10/22 | $9,740 | $8,611 | $9,135 |
| 11/22 | $10,330 | $9,060 | $9,706 |
| 12/22 | $9,800 | $8,530 | $9,315 |
| 1/23 | $10,380 | $9,117 | $9,798 |
| 2/23 | $10,000 | $8,904 | $9,452 |
| 3/23 | $9,770 | $9,142 | $9,409 |
| 4/23 | $9,960 | $9,239 | $9,550 |
| 5/23 | $9,700 | $9,275 | $9,182 |
| 6/23 | $10,210 | $9,909 | $9,792 |
| 7/23 | $10,560 | $10,264 | $10,136 |
| 8/23 | $10,140 | $10,066 | $9,863 |
| 9/23 | $9,660 | $9,586 | $9,482 |
| 10/23 | $9,170 | $9,332 | $9,148 |
| 11/23 | $9,880 | $10,202 | $9,838 |
| 12/23 | $10,567 | $10,744 | $10,383 |
| 1/24 | $10,256 | $10,863 | $10,393 |
| 2/24 | $10,778 | $11,451 | $10,777 |
| 3/24 | $11,319 | $11,820 | $11,316 |
| 4/24 | $11,108 | $11,300 | $10,832 |
| 5/24 | $11,459 | $11,834 | $11,176 |
| 6/24 | $11,259 | $12,200 | $11,071 |
| 7/24 | $11,690 | $12,427 | $11,636 |
| 8/24 | $11,710 | $12,697 | $11,949 |
| 9/24 | $12,011 | $14,238 | $12,839 |
Average Annual Total Returns (%)
| Fund | 1 Year | Since 4/29/22 (Inception) |
|---|
| Class C | 24.34% | 7.85% |
| Class C with 1% Maximum Deferred Sales Charge | 23.34% | 7.85% |
Russell 3000®IndexFootnote Reference1 | 35.19% | 15.69% |
Russell 1000® Value Index | 27.76% | 10.86% |
| Footnote | Description |
Footnote1 | In accordance with regulatory changes requiring the Fund’s primary benchmark to represent the overall applicable market, the Fund’s primary prospectus benchmark changed to the indicated benchmark effective May 1, 2024. |
Performance does not reflect the deduction of taxes that a shareholder would pay on Fund distributions or redemption of Fund shares. Performance assumes that all dividends and distributions, if any, were reinvested. For more recent performance information, visit www.eatonvance.com/performance.php.
THE FUND'S PAST PERFORMANCE IS NO GUARANTEE OF FUTURE RESULTS.
| Total Net Assets | $62,109,068 |
| # of Portfolio Holdings | 36 |
| Portfolio Turnover Rate | 107% |
| Total Advisory Fees Paid | $208,523 |
What did the Fund invest in?
The following tables reflect what the Fund invested in as of the report date.
Sector Allocation (% of total investments)
| Value | Value |
|---|
| Short-Term Investments | 1.5% |
| Communication Services | 5.4% |
| Consumer Discretionary | 5.7% |
| Utilities | 6.6% |
| Consumer Staples | 6.9% |
| Materials | 6.9% |
| Real Estate | 7.0% |
| Information Technology | 9.3% |
| Industrials | 14.9% |
| Health Care | 17.8% |
| Financials | 18.0% |
Top Ten Holdings (% of total investments)Footnote Referencea
| NextEra Energy, Inc. | 3.9% |
| AbbVie, Inc. | 3.8% |
| Reinsurance Group of America, Inc. | 3.7% |
| Thermo Fisher Scientific, Inc. | 3.6% |
| Charles Schwab Corp. | 3.5% |
| Micron Technology, Inc. | 3.4% |
| Cisco Systems, Inc. | 3.3% |
| Johnson Controls International PLC | 3.2% |
| Robert Half, Inc. | 3.2% |
| Westinghouse Air Brake Technologies Corp. | 3.2% |
| Total | 34.8% |
| Footnote | Description |
Footnotea | Excluding cash equivalents |
If you wish to view additional information about the Fund, including the prospectus, statement of additional information, financial statements and holdings, please scan the QR code or visit www.eatonvance.com/calvert-fund-documents.php. For proxy information, please visit www.calvert.com/active-engagement.php?DM=how-we-influence.
The Funds may deliver a single copy of certain required shareholder documents (including prospectuses, shareholder reports, and proxy materials) to investors with the same last name and the same address. Your participation will continue indefinitely unless you instruct otherwise by calling 1-800-368-2745 or by contacting your financial intermediary. Your instruction will typically be effective within 30 days of receipt.
Not FDIC Insured | May Lose Value | No Bank Guarantee
Annual Shareholder Report September 30, 2024
Calvert Focused Value Fund
Annual Shareholder Report September 30, 2024
This annual shareholder report contains important information about the Calvert Focused Value Fund for the period of October 1, 2023 to September 30, 2024. You can find additional information about the Fund at www.eatonvance.com/calvert-fund-documents.php. You can also request this information by contacting us at 1-800-368-2745.
What were the Fund costs for the last year?
(based on a hypothetical $10,000 investment)
| Class Name | Costs of a $10,000 investment | Costs paid as a percentage of a $10,000 investment |
|---|
| Class I | $83 | 0.74% |
How did the Fund perform last year and what affected its performance?
Key contributors to (↑) and detractors from (↓) performance, relative to the Russell 1000® Value Index (the Index):
↓ Humana, Inc., a health insurance company, detracted from returns after Medicare and Medicaid set fees lower than expected. The stock was sold by period-end
↓ Dollar Tree, Inc. hurt returns as its earnings and revenue projections fell due to competitive and inflationary pressures. The stock was sold by period-end
↓ A position in human resources consultant Robert Half, Inc. hampered Fund returns as cooling job market growth slowed its revenues and profits during the period
↓ FMC Corp., a chemical manufacturer, detracted from returns as sales ― particularly in Latin America ― declined, in part, as a result of a drought in Brazil
↑ Westinghouse Air Brake Technologies Corp., a maker of locomotives and train cars, contributed to returns on solid demand in the freight and transit sectors
↑ Micron Technology, Inc., a semiconductor maker, helped Index-relative performance as demand for memory chips rose alongside the burgeoning AI market
↑ Zebra Technologies Corp., a computer technology company, aided returns as demand for its scanning and tracking devices rose. The stock was sold by period-end
↑ NextEra Energy, Inc., an energy business focused on wind, solar and other green sources, contributed to returns on growing demand for clean energy solutions
Comparison of the change in value of a $1,000,000 investment for the period indicated.
| Class I | Russell 3000® Index | Russell 1000® Value Index |
|---|
| 4/22 | $1,000,000 | $1,000,000 | $1,000,000 |
| 6/22 | $942,000 | $832,988 | $877,893 |
| 9/22 | $905,000 | $795,799 | $828,578 |
| 12/22 | $986,653 | $852,953 | $931,493 |
| 3/23 | $985,652 | $914,198 | $940,864 |
| 6/23 | $1,032,731 | $990,870 | $979,200 |
| 9/23 | $979,642 | $958,629 | $948,210 |
| 12/23 | $1,073,723 | $1,074,353 | $1,038,267 |
| 3/24 | $1,153,670 | $1,181,996 | $1,131,561 |
| 6/24 | $1,149,622 | $1,220,009 | $1,107,052 |
| 9/24 | $1,229,570 | $1,423,778 | $1,283,860 |
Average Annual Total Returns (%)
| Fund | 1 Year | Since 4/29/22 (Inception) |
|---|
| Class I | 25.51% | 8.90% |
Russell 3000®IndexFootnote Reference1 | 35.19% | 15.69% |
Russell 1000® Value Index | 27.76% | 10.86% |
| Footnote | Description |
Footnote1 | In accordance with regulatory changes requiring the Fund’s primary benchmark to represent the overall applicable market, the Fund’s primary prospectus benchmark changed to the indicated benchmark effective May 1, 2024. |
Performance does not reflect the deduction of taxes that a shareholder would pay on Fund distributions or redemption of Fund shares. Performance assumes that all dividends and distributions, if any, were reinvested. For more recent performance information, visit www.eatonvance.com/performance.php.
THE FUND'S PAST PERFORMANCE IS NO GUARANTEE OF FUTURE RESULTS.
| Total Net Assets | $62,109,068 |
| # of Portfolio Holdings | 36 |
| Portfolio Turnover Rate | 107% |
| Total Advisory Fees Paid | $208,523 |
What did the Fund invest in?
The following tables reflect what the Fund invested in as of the report date.
Sector Allocation (% of total investments)
| Value | Value |
|---|
| Short-Term Investments | 1.5% |
| Communication Services | 5.4% |
| Consumer Discretionary | 5.7% |
| Utilities | 6.6% |
| Consumer Staples | 6.9% |
| Materials | 6.9% |
| Real Estate | 7.0% |
| Information Technology | 9.3% |
| Industrials | 14.9% |
| Health Care | 17.8% |
| Financials | 18.0% |
Top Ten Holdings (% of total investments)Footnote Referencea
| NextEra Energy, Inc. | 3.9% |
| AbbVie, Inc. | 3.8% |
| Reinsurance Group of America, Inc. | 3.7% |
| Thermo Fisher Scientific, Inc. | 3.6% |
| Charles Schwab Corp. | 3.5% |
| Micron Technology, Inc. | 3.4% |
| Cisco Systems, Inc. | 3.3% |
| Johnson Controls International PLC | 3.2% |
| Robert Half, Inc. | 3.2% |
| Westinghouse Air Brake Technologies Corp. | 3.2% |
| Total | 34.8% |
| Footnote | Description |
Footnotea | Excluding cash equivalents |
If you wish to view additional information about the Fund, including the prospectus, statement of additional information, financial statements and holdings, please scan the QR code or visit www.eatonvance.com/calvert-fund-documents.php. For proxy information, please visit www.calvert.com/active-engagement.php?DM=how-we-influence.
The Funds may deliver a single copy of certain required shareholder documents (including prospectuses, shareholder reports, and proxy materials) to investors with the same last name and the same address. Your participation will continue indefinitely unless you instruct otherwise by calling 1-800-368-2745 or by contacting your financial intermediary. Your instruction will typically be effective within 30 days of receipt.
Not FDIC Insured | May Lose Value | No Bank Guarantee
Annual Shareholder Report September 30, 2024
Calvert Focused Value Fund
Annual Shareholder Report September 30, 2024
This annual shareholder report contains important information about the Calvert Focused Value Fund for the period of October 1, 2023 to September 30, 2024. You can find additional information about the Fund at www.eatonvance.com/calvert-fund-documents.php. You can also request this information by contacting us at 1-800-368-2745.
What were the Fund costs for the last year?
(based on a hypothetical $10,000 investment)
| Class Name | Costs of a $10,000 investment | Costs paid as a percentage of a $10,000 investment |
|---|
| Class R6 | $83 | 0.74% |
How did the Fund perform last year and what affected its performance?
Key contributors to (↑) and detractors from (↓) performance, relative to the Russell 1000® Value Index (the Index):
↓ Humana, Inc., a health insurance company, detracted from returns after Medicare and Medicaid set fees lower than expected. The stock was sold by period-end
↓ Dollar Tree, Inc. hurt returns as its earnings and revenue projections fell due to competitive and inflationary pressures. The stock was sold by period-end
↓ A position in human resources consultant Robert Half, Inc. hampered Fund returns as cooling job market growth slowed its revenues and profits during the period
↓ FMC Corp., a chemical manufacturer, detracted from returns as sales ― particularly in Latin America ― declined, in part, as a result of a drought in Brazil
↑ Westinghouse Air Brake Technologies Corp., a maker of locomotives and train cars, contributed to returns on solid demand in the freight and transit sectors
↑ Micron Technology, Inc., a semiconductor maker, helped Index-relative performance as demand for memory chips rose alongside the burgeoning AI market
↑ Zebra Technologies Corp., a computer technology company, aided returns as demand for its scanning and tracking devices rose. The stock was sold by period-end
↑ NextEra Energy, Inc., an energy business focused on wind, solar and other green sources, contributed to returns on growing demand for clean energy solutions
Comparison of the change in value of a $5,000,000 investment for the period indicated.
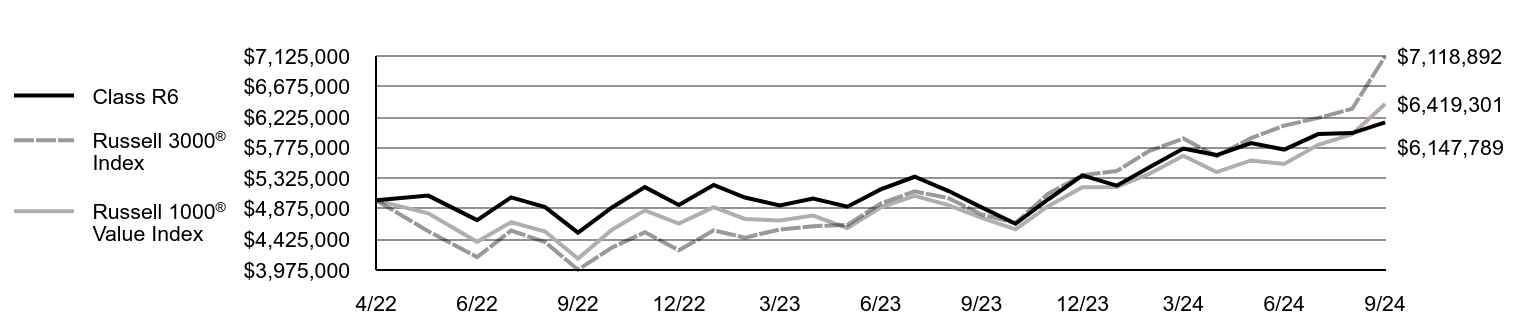
| Class R6 | Russell 3000® Index | Russell 1000® Value Index |
|---|
| 4/22 | $5,000,000 | $5,000,000 | $5,000,000 |
| 5/22 | $5,070,000 | $4,545,187 | $4,809,697 |
| 6/22 | $4,710,000 | $4,164,942 | $4,389,464 |
| 7/22 | $5,045,000 | $4,555,689 | $4,680,541 |
| 8/22 | $4,900,000 | $4,385,673 | $4,541,082 |
| 9/22 | $4,525,000 | $3,978,994 | $4,142,888 |
| 10/22 | $4,895,000 | $4,305,295 | $4,567,659 |
| 11/22 | $5,195,000 | $4,530,015 | $4,853,099 |
| 12/22 | $4,931,292 | $4,264,767 | $4,657,463 |
| 1/23 | $5,226,969 | $4,558,494 | $4,898,814 |
| 2/23 | $5,041,544 | $4,451,949 | $4,726,087 |
| 3/23 | $4,926,280 | $4,570,990 | $4,704,322 |
| 4/23 | $5,026,510 | $4,619,691 | $4,775,202 |
| 5/23 | $4,906,234 | $4,637,666 | $4,591,032 |
| 6/23 | $5,161,820 | $4,954,351 | $4,896,001 |
| 7/23 | $5,347,244 | $5,131,948 | $5,068,169 |
| 8/23 | $5,136,762 | $5,032,882 | $4,931,346 |
| 9/23 | $4,896,211 | $4,793,145 | $4,741,048 |
| 10/23 | $4,655,661 | $4,666,085 | $4,573,774 |
| 11/23 | $5,016,487 | $5,101,189 | $4,918,865 |
| 12/23 | $5,367,921 | $5,371,766 | $5,191,334 |
| 1/24 | $5,215,999 | $5,431,300 | $5,196,709 |
| 2/24 | $5,484,395 | $5,725,299 | $5,388,414 |
| 3/24 | $5,762,919 | $5,909,982 | $5,657,806 |
| 4/24 | $5,666,702 | $5,649,932 | $5,416,130 |
| 5/24 | $5,843,945 | $5,916,875 | $5,587,821 |
| 6/24 | $5,747,727 | $6,100,046 | $5,535,259 |
| 7/24 | $5,975,611 | $6,213,440 | $5,818,231 |
| 8/24 | $5,990,803 | $6,348,698 | $5,974,305 |
| 9/24 | $6,147,789 | $7,118,892 | $6,419,301 |
Average Annual Total Returns (%)
| Fund | 1 Year | Since 4/29/22 (Inception) |
|---|
| Class R6 | 25.56% | 8.90% |
Russell 3000®IndexFootnote Reference1 | 35.19% | 15.69% |
Russell 1000® Value Index | 27.76% | 10.86% |
| Footnote | Description |
Footnote1 | In accordance with regulatory changes requiring the Fund’s primary benchmark to represent the overall applicable market, the Fund’s primary prospectus benchmark changed to the indicated benchmark effective May 1, 2024. |
Performance does not reflect the deduction of taxes that a shareholder would pay on Fund distributions or redemption of Fund shares. Performance assumes that all dividends and distributions, if any, were reinvested. For more recent performance information, visit www.eatonvance.com/performance.php.
THE FUND'S PAST PERFORMANCE IS NO GUARANTEE OF FUTURE RESULTS.
| Total Net Assets | $62,109,068 |
| # of Portfolio Holdings | 36 |
| Portfolio Turnover Rate | 107% |
| Total Advisory Fees Paid | $208,523 |
What did the Fund invest in?
The following tables reflect what the Fund invested in as of the report date.
Sector Allocation (% of total investments)
| Value | Value |
|---|
| Short-Term Investments | 1.5% |
| Communication Services | 5.4% |
| Consumer Discretionary | 5.7% |
| Utilities | 6.6% |
| Consumer Staples | 6.9% |
| Materials | 6.9% |
| Real Estate | 7.0% |
| Information Technology | 9.3% |
| Industrials | 14.9% |
| Health Care | 17.8% |
| Financials | 18.0% |
Top Ten Holdings (% of total investments)Footnote Referencea
| NextEra Energy, Inc. | 3.9% |
| AbbVie, Inc. | 3.8% |
| Reinsurance Group of America, Inc. | 3.7% |
| Thermo Fisher Scientific, Inc. | 3.6% |
| Charles Schwab Corp. | 3.5% |
| Micron Technology, Inc. | 3.4% |
| Cisco Systems, Inc. | 3.3% |
| Johnson Controls International PLC | 3.2% |
| Robert Half, Inc. | 3.2% |
| Westinghouse Air Brake Technologies Corp. | 3.2% |
| Total | 34.8% |
| Footnote | Description |
Footnotea | Excluding cash equivalents |
If you wish to view additional information about the Fund, including the prospectus, statement of additional information, financial statements and holdings, please scan the QR code or visit www.eatonvance.com/calvert-fund-documents.php. For proxy information, please visit www.calvert.com/active-engagement.php?DM=how-we-influence.
The Funds may deliver a single copy of certain required shareholder documents (including prospectuses, shareholder reports, and proxy materials) to investors with the same last name and the same address. Your participation will continue indefinitely unless you instruct otherwise by calling 1-800-368-2745 or by contacting your financial intermediary. Your instruction will typically be effective within 30 days of receipt.
Not FDIC Insured | May Lose Value | No Bank Guarantee
Annual Shareholder Report September 30, 2024
(b) Not applicable.
Item 2. Code of Ethics
The registrant (sometimes referred to as the “Fund”) has adopted a code of ethics applicable to its Principal Executive Officer, Principal Financial Officer and Principal Accounting Officer. The registrant undertakes to provide a copy of such code of ethics to any person upon request, without charge, by calling 1-800-368-2745. The registrant has not amended the code of ethics as described in Form N-CSR during the period covered by this report. The registrant has not granted any waiver, including an implicit waiver, from a provision of the code of ethics as described in Form N-CSR during the period covered by this report.
Item 3. Audit Committee Financial Expert
The registrant’s Board of Trustees has determined that Miles D. Harper III, an “independent” Trustee serving on the registrant’s audit committee, is an “audit committee financial expert,” as defined in Item 3 of Form N-CSR. Under applicable securities laws, a person who is determined to be an audit committee financial expert will not be deemed an “expert” for any purpose, including without limitation for the purposes of Section 11 of the Securities Act of 1933, as a result of being designated or identified as an audit committee financial expert. The designation or identification of a person as an audit committee financial expert does not impose on such person any duties, obligations, or liabilities that are greater than the duties, obligations, and liabilities imposed on such person as a member of the audit committee and Board of Trustees in the absence of such designation or identification.
Item 4. Principal Accountant Fees and Services
(a)-(d)
The following table presents the aggregate fees billed to the registrant for the registrant’s fiscal years ended September 30, 2023 and September 30, 2024 by its principal accountant for professional services rendered for the audit of the registrant’s annual financial statements and fees billed for other services rendered by its principal accountant during such periods.
| | | | | | | | | | | | | | | | |
Fiscal Years Ended | | 9/30/23 | | | %* | | | 9/30/24 | | | %* | |
Audit Fees | | $ | 233,400 | | | | 0 | % | | $ | 245,200 | | | | 0 | % |
Audit-Related Fees(1) | | $ | 0 | | | | 0 | % | | $ | 0 | | | | 0 | % |
Tax Fees(2) | | $ | 0 | | | | 0 | % | | $ | 0 | | | | 0 | % |
All Other Fees(3) | | $ | 0 | | | | 0 | % | | $ | 0 | | | | 0 | % |
| | | | | | | | | | | | | | | | |
Total | | $ | 233,400 | | | | 0 | % | | $ | 245,200 | | | | 0 | % |
| | | | | | | | | | | | | | | | |
| * | Percentage of fees approved by the Audit Committee pursuant to (c)(7)(i)(C) of Rule 2-01 of Reg. S-X (statutory de minimis waiver of Committee’s requirement to pre-approve). |
| (1) | Audit-related fees consist of the aggregate fees billed for assurance and related services that are reasonably related to the performance of the audit of the registrant’s financial statements and are not reported under the category of audit fees. |
| (2) | Tax fees consist of the aggregate fees billed for professional services rendered by the principal accountant relating to tax compliance, tax advice, and tax planning and specifically include fees for tax return preparation and other related tax compliance/planning matters. |
| (3) | All other fees consist of the aggregate fees billed for products and services provided by the principal accountant other than audit, audit-related, and tax services. |
(e) The Audit Committee is required to pre-approve all audit and non-audit services provided to the registrant by the auditors, and to the registrant’s investment adviser, and any entity controlling, controlled by, or under common control with the adviser that provides ongoing services to the registrant. In determining whether to pre-approve non-audit services, the Audit Committee considers whether the services are consistent with maintaining the independence of the auditors. The Committee may delegate its authority to pre-approve certain matters to one or more of its members. In this regard, the Committee has delegated authority jointly to the Audit Committee Chair together with another Committee member with respect to non-audit services not exceeding $25,000 in each instance. In addition, the Committee has pre-approved the retention of the auditors to provide tax-related services related to the tax treatment and tax accounting of newly acquired securities, upon request by the investment adviser in each instance.
(f) Not applicable.
(g) Aggregate non-audit fees billed by the registrant’s principal accountant for services rendered to the registrant, and rendered to the registrant’s investment adviser, and any entity controlling, controlled by, or under common control with the adviser that provides ongoing services to the registrant for each of the last two fiscal years of the registrant:
| | | | | | |
Fiscal Year ended 9/30/23 | | Fiscal Year ended 9/30/24 |
$ | | %* | | $ | | %* |
$0 | | 0% | | $18,490 | | 0% |
| * | Percentage of fees approved by the Audit Committee pursuant to (c)(7)(i)(C) of Rule 2-01 of Reg. S-X (statutory de minimis waiver of Committee’s requirement to pre-approve). |
(h) The registrant’s audit committee has considered whether the provision by the registrant’s principal accountant of non-audit services to the registrant’s investment adviser and any entity controlling, controlled by, or under common control with the adviser that provides ongoing services to the registrant that were not pre-approved pursuant to Rule 2-01(c)(7)(ii) of Regulation S-X is compatible with maintaining the principal accountant’s independence.
(i) Not applicable.
(j) Not applicable.
Item 5. Audit Committee of Listed Registrants
Not applicable.
Item 6. Schedule of Investments
(a) Please see schedule of investments contained in the Financial Statements and Financial Highlights included under Item 7 of this Form N-CSR.
(b) Not applicable.
Item 7. Financial Statements and Financial Highlights for Open-End Management Investment Companies
Calvert
Social Investment Fund
Annual Financial Statements and
Additional Information
September 30, 2024
Calvert Balanced Fund • Calvert Bond Fund • Calvert Equity Fund
This report must be preceded or accompanied by a current summary prospectus or prospectus. Before investing, investors should consider carefully the investment objective, risks, and charges and expenses of a mutual fund. This and other important information is contained in the prospectus and/or statement of additional information, which can be obtained by calling 1-800-368-2745 or from a financial intermediary. Prospective investors should read the prospectus carefully before investing.
Annual Financial Statements and Additional Information September 30, 2024
Calvert
Social Investment Fund
Calvert
Balanced Fund
September 30, 2024
| Asset-Backed Securities — 4.6% |
| Security | Principal
Amount*
(000's omitted) | Value |
| Avant Loans Funding Trust, Series 2021-REV1, Class D, 4.30%, 7/15/30(1) | | 525 | $ 514,311 |
| Avis Budget Rental Car Funding AESOP LLC, Series 2024-3A, Class C, 6.11%, 12/20/30(1) | | 155 | 158,179 |
| Coinstar Funding LLC, Series 2017-1A, Class A2, 5.216%, 4/25/47(1) | | 1,029 | 915,634 |
| Cologix Data Centers U.S. Issuer LLC: | | | |
| Series 2021-1A, Class A2, 3.30%, 12/26/51(1) | | 1,640 | 1,555,584 |
| Series 2021-1A, Class B, 3.79%, 12/26/51(1) | | 960 | 910,001 |
| Conn's Receivables Funding LLC: | | | |
| Series 2022-A, Class C, 0.00%, 12/15/26(1) | | 937 | 882,557 |
| Series 2023-A, Class B, 10.00%, 1/17/28(1) | | 91 | 88,863 |
| DataBank Issuer LLC, Series 2021-2A, Class A2, 2.40%, 10/25/51(1) | | 768 | 725,064 |
| DB Master Finance LLC: | | | |
| Series 2017-1A, Class A2II, 4.03%, 11/20/47(1) | | 159 | 156,185 |
| Series 2021-1A, Class A2I, 2.045%, 11/20/51(1) | | 1,007 | 954,973 |
| Diamond Infrastructure Funding LLC: | | | |
| Series 2021-1A, Class A, 1.76%, 4/15/49(1) | | 1,139 | 1,060,642 |
| Series 2021-1A, Class C, 3.475%, 4/15/49(1) | | 255 | 237,044 |
| Diamond Issuer LLC, Series 2021-1A, Class A, 2.305%, 11/20/51(1) | | 2,166 | 2,022,016 |
| Driven Brands Funding LLC, Series 2019-1A, Class A2, 4.641%, 4/20/49(1) | | 264 | 261,758 |
| Enterprise Fleet Financing LLC, Series 2023-1, Class A2, 5.51%, 1/22/29(1) | | 1,282 | 1,289,412 |
| Federal National Mortgage Association Grantor Trust, Series 2017-T1, Class A, 2.898%, 6/25/27 | | 544 | 524,826 |
| FMC GMSR Issuer Trust, Series 2022-GT2, Class A, 7.90%, 7/25/27(1) | | 900 | 928,888 |
| FOCUS Brands Funding LLC, Series 2017-1A, Class A2II, 5.093%, 4/30/47(1) | | 334 | 333,020 |
| Goddard Funding LLC, Series 2024-1A, Class A2, 6.834%, 10/30/54(1) | | 1,712 | 1,752,431 |
| GoodLeap Sustainable Home Solutions Trust, Series 2021-5CS, Class A, 2.31%, 10/20/48(1) | | 514 | 426,245 |
| Horizon Aircraft Finance I Ltd., Series 2018-1, Class A, 4.458%, 12/15/38(1) | | 242 | 223,831 |
| Horizon Aircraft Finance II Ltd., Series 2019-1, Class A, 3.721%, 7/15/39(1) | | 153 | 144,138 |
| Horizon Aircraft Finance IV Ltd., Series 2024-1, Class A, 5.375%, 9/15/49(1) | | 1,900 | 1,900,602 |
| Jersey Mike's Funding LLC, Series 2019-1A, Class A2, 4.433%, 2/15/50(1) | | 630 | 620,296 |
| JPMorgan Chase Bank NA, Series 2021-3, Class B, 0.76%, 2/26/29(1) | | 98 | 96,104 |
| LAD Auto Receivables Trust: | | | |
| Series 2023-1A, Class A2, 5.68%, 10/15/26(1) | | 102 | 101,499 |
| Series 2023-4A, Class A2, 6.21%, 10/15/26(1) | | 170 | 170,685 |
| LL ABS Trust, Series 2022-1A, Class B, 5.05%, 11/15/29(1) | | 96 | 95,802 |
| Security | Principal
Amount*
(000's omitted) | Value |
| Loanpal Solar Loan Ltd., Series 2020-1GS, Class C, 2.00%, 6/20/47(1) | | 186 | $ 115,575 |
| Lunar Aircraft Ltd.: | | | |
| Series 2020-1A, Class A, 3.376%, 2/15/45(1) | | 76 | 73,188 |
| Series 2020-1A, Class B, 4.335%, 2/15/45(1) | | 76 | 72,296 |
| MetroNet Infrastructure Issuer LLC: | | | |
| Series 2024-1A, Class A2, 6.23%, 4/20/54(1) | | 646 | 666,809 |
| Series 2024-1A, Class B, 7.59%, 4/20/54(1) | | 185 | 192,317 |
| Mill City Solar Loan Ltd., Series 2020-1A, Class C, 2.00%, 6/20/47(1) | | 377 | 276,880 |
| Mosaic Solar Loan Trust: | | | |
| Series 2019-1A, Class A, 4.37%, 12/21/43(1) | | 312 | 297,621 |
| Series 2019-2A, Class B, 3.28%, 9/20/40(1) | | 713 | 649,399 |
| Series 2020-1A, Class A, 2.10%, 4/20/46(1) | | 86 | 76,773 |
| Series 2020-1A, Class B, 3.10%, 4/20/46(1) | | 70 | 62,143 |
| Series 2020-2A, Class A, 1.44%, 8/20/46(1) | | 180 | 154,748 |
| Series 2020-2A, Class B, 2.21%, 8/20/46(1) | | 261 | 216,473 |
| Series 2021-1A, Class C, 2.25%, 12/20/46(1) | | 963 | 838,619 |
| Series 2021-3A, Class C, 1.77%, 6/20/52(1) | | 194 | 139,171 |
| Series 2021-3A, Class D, 3.28%, 6/20/52(1) | | 121 | 82,340 |
| Series 2022-2A, Class B, 5.13%, 1/21/53(1) | | 614 | 555,345 |
| Series 2022-2A, Class D, 8.29%, 1/21/53(1) | | 270 | 82,486 |
| Navigator Aviation Ltd., Series 2024-1, Class A, 5.40%, 8/15/49(1) | | 1,743 | 1,744,868 |
| Neighborly Issuer LLC, Series 2021-1A, Class A2, 3.584%, 4/30/51(1) | | 963 | 893,735 |
| NextGear Floorplan Master Owner Trust, Series 2024-1A, Class A2, 5.12%, 3/15/29(1) | | 755 | 770,756 |
| NRZ Excess Spread-Collateralized Notes: | | | |
| Series 2021-FHT1, Class A, 3.104%, 7/25/26(1) | | 231 | 222,755 |
| Series 2021-GNT1, Class A, 3.474%, 11/25/26(1) | | 578 | 555,244 |
| OneMain Financial Issuance Trust, Series 2022-S1, Class A, 4.13%, 5/14/35(1) | | 1,400 | 1,393,183 |
| Oportun Funding XIV LLC, Series 2021-A, Class B, 1.76%, 3/8/28(1) | | 57 | 55,678 |
| Oportun Issuance Trust: | | | |
| Series 2021-B, Class A, 1.47%, 5/8/31(1) | | 748 | 726,403 |
| Series 2021-C, Class A, 2.18%, 10/8/31(1) | | 5,100 | 4,950,427 |
| Series 2021-C, Class B, 2.67%, 10/8/31(1) | | 530 | 514,108 |
| Series 2022-2, Class C, 9.36%, 10/9/29(1) | | 243 | 244,285 |
| Series 2022-3, Class B, 8.533%, 1/8/30(1) | | 276 | 276,910 |
| Oscar U.S. Funding XVI LLC, Series 2024-1A, Class A2, 5.48%, 2/10/27(1) | | 1,894 | 1,903,848 |
| Pagaya AI Debt Selection Trust: | | | |
| Series 2021-2, 3.00%, 1/25/29(1) | | 127 | 125,509 |
| Series 2021-HG1, Class A, 1.22%, 1/16/29(1) | | 51 | 50,613 |
| Planet Fitness Master Issuer LLC: | | | |
| Series 2019-1A, Class A2, 3.858%, 12/5/49(1) | | 600 | 565,298 |
| Series 2024-1A, Class A2I, 5.765%, 6/5/54(1) | | 1,125 | 1,153,651 |
| Retained Vantage Data Centers Issuer LLC: | | | |
| Series 2023-1A, Class A2A, 5.00%, 9/15/48(1) | | 1,425 | 1,420,809 |
1
See Notes to Financial Statements.
Calvert
Balanced Fund
September 30, 2024
Schedule of Investments — continued
| Security | Principal
Amount*
(000's omitted) | Value |
| Retained Vantage Data Centers Issuer LLC: (continued) | | | |
| Series 2023-1A, Class A2B, 5.25%, 9/15/48(1) | CAD | 247 | $ 181,529 |
| SBA Tower Trust, Series 2014-2A, Class C, 3.869% to 10/15/24, 10/15/49(1)(2) | | 1,000 | 999,317 |
| ServiceMaster Funding LLC: | | | |
| Series 2020-1, Class A2I, 2.841%, 1/30/51(1) | | 334 | 308,811 |
| Series 2020-1, Class A2II, 3.337%, 1/30/51(1) | | 422 | 373,550 |
| SERVPRO Master Issuer LLC: | | | |
| Series 2019-1A, Class A2, 3.882%, 10/25/49(1) | | 1,960 | 1,914,544 |
| Series 2024-1A, Class A2, 6.174%, 1/25/54(1) | | 488 | 502,144 |
| SoFi Consumer Loan Program Trust, Series 2023-1S, Class A, 5.81%, 5/15/31(1) | | 7 | 6,777 |
| SolarCity LMC I LLC, Series 2013-1, Class A, 4.80%, 11/20/38(1) | | 177 | 172,463 |
| Sonic Capital LLC, Series 2020-1A, Class A2I, 3.845%, 1/20/50(1) | | 1,110 | 1,078,516 |
| SpringCastle America Funding LLC, Series 2020-AA, Class A, 1.97%, 9/25/37(1) | | 352 | 327,293 |
| Stack Infrastructure Issuer LLC: | | | |
| Series 2020-1A, Class A2, 1.893%, 8/25/45(1) | | 695 | 674,742 |
| Series 2021-1A, Class A2, 1.877%, 3/26/46(1) | | 85 | 81,251 |
| Stream Innovations Issuer Trust, Series 2024-1A, Class B, 7.89%, 7/15/44(1) | | 180 | 185,956 |
| Subway Funding LLC, Series 2024-3A, Class A2I, 5.246%, 7/30/54(1) | | 644 | 645,540 |
| Sunnova Helios IX Issuer LLC, Series 2022-B, Class A, 5.00%, 8/20/49(1) | | 659 | 635,556 |
| Sunnova Helios V Issuer LLC: | | | |
| Series 2021-A, Class A, 1.80%, 2/20/48(1) | | 1,082 | 830,605 |
| Series 2021-A, Class B, 3.15%, 2/20/48(1) | | 346 | 200,767 |
| Sunnova Helios X Issuer LLC, Series 2022-C, Class B, 5.60%, 11/22/49(1) | | 1,079 | 1,021,789 |
| Sunnova Helios XII Issuer LLC, Series 2023-B, Class A, 5.30%, 8/22/50(1) | | 1,191 | 1,173,345 |
| Sunnova Hestia I Issuer LLC, Series 2023-GRID1, Class 1A, 5.75%, 12/20/50(1) | | 764 | 789,788 |
| Sunnova Sol II Issuer LLC, Series 2020-2A, Class A, 2.73%, 11/1/55(1) | | 1,275 | 1,040,271 |
| Sunnova Sol Issuer LLC, Series 2020-1A, Class A, 3.35%, 2/1/55(1) | | 219 | 189,441 |
| Sunrun Atlas Issuer LLC, Series 2019-2, Class A, 3.61%, 2/1/55(1) | | 428 | 400,730 |
| Sunrun Demeter Issuer LLC, Series 2021-2A, Class A, 2.27%, 1/30/57(1) | | 617 | 535,658 |
| Sunrun Jupiter Issuer LLC, Series 2022-1A, Class A, 4.75%, 7/30/57(1) | | 1,901 | 1,836,222 |
| Sunrun Xanadu Issuer LLC, Series 2019-1A, Class A, 3.98%, 6/30/54(1) | | 238 | 226,454 |
| Theorem Funding Trust: | | | |
| Series 2022-2A, Class B, 9.27%, 12/15/28(1) | | 190 | 196,742 |
| Series 2022-3A, Class A, 7.60%, 4/15/29(1) | | 114 | 115,066 |
| Security | Principal
Amount*
(000's omitted) | Value |
| U.S. Small Business Administration, Series 2017-20E, Class 1, 2.88%, 5/1/37 | | 720 | $ 677,147 |
| Vantage Data Centers LLC: | | | |
| Series 2020-2A, Class A2, 1.992%, 9/15/45(1) | | 1,870 | 1,717,013 |
| Series 2021-1A, Class A2, 2.165%, 10/15/46(1) | | 621 | 589,535 |
| VB-S1 Issuer LLC, Series 2024-1A, Class F, 8.871%, 5/15/54(1) | | 102 | 105,932 |
| Vivint Solar Financing VII LLC, Series 2020-1A, Class A, 2.21%, 7/31/51(1) | | 851 | 758,851 |
| Wendy's Funding LLC, Series 2018-1A, Class A2II, 3.884%, 3/15/48(1) | | 187 | 181,268 |
| Willis Engine Structured Trust V: | | | |
| Series 2020-A, Class B, 4.212%, 3/15/45(1) | | 312 | 288,037 |
| Series 2020-A, Class C, 6.657%, 3/15/45(1) | | 104 | 97,887 |
Total Asset-Backed Securities
(identified cost $64,340,309) | | | $62,231,390 |
| Collateralized Mortgage Obligations — 1.0% |
| Security | Principal
Amount
(000's omitted) | Value |
| Bellemeade Re Ltd.: | | | |
| Series 2021-3A, Class A2, 6.28%, (30-day SOFR Average + 1.00%), 9/25/31(1)(3) | $ | 590 | $ 590,531 |
| Series 2021-3A, Class M1B, 6.68%, (30-day SOFR Average + 1.40%), 9/25/31(1)(3) | | 286 | 286,825 |
| Cascade MH Asset Trust, Series 2022-MH1, Class A, 4.25% to 7/25/27, 8/25/54(1)(2) | | 1,233 | 1,158,036 |
| CHNGE Mortgage Trust: | | | |
| Series 2023-2, Class A3, 7.436% to 5/25/26, 6/25/58(1)(2) | | 567 | 579,253 |
| Series 2023-4, Class A1, 7.573% to 8/25/26, 9/25/58(1)(2) | | 738 | 760,298 |
| Eagle Re Ltd., Series 2021-2, Class M1C, 8.73%, (30-day SOFR Average + 3.45%), 4/25/34(1)(3) | | 415 | 421,061 |
| Federal Home Loan Mortgage Corp.: | | | |
| Series 5324, Class MZ, 6.00%, 7/25/53 | | 113 | 119,572 |
| Series 5402, Class BZ, 6.00%, 4/25/54 | | 52 | 55,326 |
| Series 5413, Class MZ, 6.00%, 5/25/54 | | 97 | 105,235 |
| Federal Home Loan Mortgage Corp. STACR REMICS Trust: | | | |
| Series 2019-DNA3, Class B2, 13.545%, (30-day SOFR Average + 8.264%), 7/25/49(1)(3) | | 240 | 275,731 |
| Series 2020-DNA6, Class B1, 8.28%, (30-day SOFR Average + 3.00%), 12/25/50(1)(3) | | 50 | 54,111 |
| Series 2021-DNA2, Class B1, 8.68%, (30-day SOFR Average + 3.40%), 8/25/33(1)(3) | | 150 | 169,224 |
| Series 2021-DNA2, Class B2, 11.28%, (30-day SOFR Average + 6.00%), 8/25/33(1)(3) | | 140 | 165,537 |
| Series 2022-DNA2, Class M1A, 6.58%, (30-day SOFR Average + 1.30%), 2/25/42(1)(3) | | 449 | 450,858 |
2
See Notes to Financial Statements.
Calvert
Balanced Fund
September 30, 2024
Schedule of Investments — continued
| Security | Principal
Amount
(000's omitted) | Value |
| Federal National Mortgage Association Connecticut Avenue Securities: | | | |
| Series 2019-R01, Class 2B1, 9.745%, (30-day SOFR Average + 4.464%), 7/25/31(1)(3) | $ | 147 | $ 159,615 |
| Series 2019-R03, Class 1B1, 9.495%, (30-day SOFR Average + 4.214%), 9/25/31(1)(3) | | 127 | 135,852 |
| Series 2019-R05, Class 1B1, 9.495%, (30-day SOFR Average + 4.214%), 7/25/39(1)(3) | | 169 | 177,090 |
| Series 2019-R06, Class 2B1, 9.145%, (30-day SOFR Average + 3.864%), 9/25/39(1)(3) | | 752 | 786,060 |
| Series 2019-R07, Class 1B1, 8.795%, (30-day SOFR Average + 3.514%), 10/25/39(1)(3) | | 246 | 255,863 |
| Series 2020-R02, Class 2B1, 8.395%, (30-day SOFR Average + 3.114%), 1/25/40(1)(3) | | 1,120 | 1,151,593 |
| Series 2021-R01, Class 1B2, 11.28%, (30-day SOFR Average + 6.00%), 10/25/41(1)(3) | | 395 | 419,502 |
| Series 2021-R02, Class 2B1, 8.58%, (30-day SOFR Average + 3.30%), 11/25/41(1)(3) | | 35 | 35,906 |
| Government National Mortgage Association: | | | |
| Series 2023-84, Class DL, 6.00%, 6/20/53 | | 460 | 487,460 |
| Series 2023-84, Class MW, 6.00%, 6/20/53 | | 482 | 511,272 |
| Series 2023-98, Class BW, 6.00%, 7/20/53 | | 68 | 72,079 |
| Series 2023-99, Class AL, 6.00%, 7/20/53 | | 68 | 72,071 |
| Series 2023-102, Class SG, 2.626%, (22.55% - 30-day SOFR Average x 3.727), 7/20/53(4) | | 86 | 92,584 |
| Series 2024-44, Class LM, 6.00%, 3/20/54 | | 268 | 285,151 |
| Series 2024-46, Class AL, 6.00%, 3/20/54 | | 67 | 71,490 |
| Series 2024-59, Class LG, 6.00%, 4/20/54 | | 1,870 | 2,008,910 |
| Home Re Ltd., Series 2021-1, Class M2, 8.245%, (30-day SOFR Average + 2.964%), 7/25/33(1)(3) | | 215 | 216,842 |
| LHOME Mortgage Trust, Series 2023-RTL2, Class A1, 8.00% to 1/25/26, 6/25/28(1)(2) | | 100 | 101,776 |
| NYMT Loan Trust, Series 2024-BPL1, Class A1, 7.154% to 7/25/26, 2/25/29(1)(2) | | 145 | 147,159 |
| PNMAC GMSR Issuer Trust, Series 2024-GT1, Class A, 8.055%, (1 mo. SOFR + 3.20%), 3/25/29(1)(3) | | 200 | 202,700 |
| Triangle Re Ltd., Series 2021-3, Class B1, 10.23%, (30-day SOFR Average + 4.95%), 2/25/34(1)(3) | | 175 | 180,147 |
Total Collateralized Mortgage Obligations
(identified cost $12,303,098) | | | $12,762,720 |
| Commercial Mortgage-Backed Securities — 3.8% |
| Security | Principal
Amount
(000's omitted) | Value |
| BAMLL Commercial Mortgage Securities Trust: | | | |
| Series 2019-BPR, Class DNM, 3.843%, 11/5/32(1)(5) | $ | 1,605 | $ 1,047,282 |
| Series 2019-BPR, Class ENM, 3.843%, 11/5/32(1)(5) | | 680 | 275,425 |
| Series 2019-BPR, Class FNM, 3.843%, 11/5/32(1)(5) | | 1,215 | 267,954 |
| BPR Trust, Series 2022-SSP, Class A, 8.097%, (1 mo. SOFR + 3.00%), 5/15/39(1)(3) | | 830 | 833,554 |
| Security | Principal
Amount
(000's omitted) | Value |
| BX Commercial Mortgage Trust: | | | |
| Series 2021-VOLT, Class B, 6.161%, (1 mo. SOFR + 1.064%), 9/15/36(1)(3) | $ | 1,809 | $ 1,793,208 |
| Series 2021-VOLT, Class C, 6.311%, (1 mo. SOFR + 1.214%), 9/15/36(1)(3) | | 549 | 543,767 |
| Series 2021-VOLT, Class D, 6.861%, (1 mo. SOFR + 1.764%), 9/15/36(1)(3) | | 1,739 | 1,722,844 |
| CSMC Trust, Series 2021-BPNY, Class A, 8.926%, (1 mo. SOFR + 3.829%), 8/15/26(1)(3) | | 208 | 190,303 |
| Extended Stay America Trust: | | | |
| Series 2021-ESH, Class A, 6.292%, (1 mo. SOFR + 1.194%), 7/15/38(1)(3) | | 1,081 | 1,080,346 |
| Series 2021-ESH, Class C, 6.912%, (1 mo. SOFR + 1.814%), 7/15/38(1)(3) | | 1,682 | 1,680,643 |
| Series 2021-ESH, Class D, 7.462%, (1 mo. SOFR + 2.364%), 7/15/38(1)(3) | | 441 | 442,554 |
| Federal Home Loan Mortgage Corp. Multifamily Structured Pass-Through Certificates: | | | |
| Series KG02, Class A2, 2.412%, 8/25/29 | | 3,315 | 3,093,715 |
| Series KG08, Class A2, 4.134%, 5/25/33(5) | | 4,277 | 4,265,003 |
| Series KSG1, Class A2, 1.503%, 9/25/30 | | 704 | 613,327 |
| Series KW06, Class A2, 3.80%, 6/25/28(5) | | 1,135 | 1,126,153 |
| Series W5FX, Class AFX, 3.336%, 4/25/28(5) | | 413 | 403,284 |
| Federal National Mortgage Association: | | | |
| Series 2017-M13, Class A2, 3.033%, 9/25/27(5) | | 911 | 884,983 |
| Series 2018-M4, Class A2, 3.159%, 3/25/28(5) | | 1,663 | 1,614,566 |
| Series 2018-M13, Class A2, 3.866%, 9/25/30(5) | | 2,694 | 2,645,320 |
| Series 2019-M1, Class A2, 3.661%, 9/25/28(5) | | 832 | 819,488 |
| Series 2019-M22, Class A2, 2.522%, 8/25/29 | | 3,100 | 2,899,165 |
| Series 2020-M1, Class A2, 2.444%, 10/25/29 | | 2,322 | 2,149,075 |
| Series 2023-M1S, Class A2, 4.651%, 4/25/33(5) | | 2,397 | 2,446,464 |
| Federal National Mortgage Association Multifamily Connecticut Avenue Securities Trust: | | | |
| Series 2019-01, Class M10, 8.645%, (30-day SOFR Average + 3.364%), 10/25/49(1)(3) | | 1,233 | 1,242,030 |
| Series 2020-01, Class M10, 9.145%, (30-day SOFR Average + 3.864%), 3/25/50(1)(3) | | 1,324 | 1,343,291 |
| FS Commercial Mortgage Trust, Series 2023-4SZN, Class A, 7.066%, 11/10/39(1) | | 853 | 895,788 |
| Great Wolf Trust: | | | |
| Series 2024-WLF2, Class A, 6.788%, (1 mo. SOFR + 1.691%), 5/15/41(1)(3) | | 1,328 | 1,330,304 |
| Series 2024-WLF2, Class D, 8.036%, (1 mo. SOFR + 2.939%), 5/15/41(1)(3) | | 213 | 214,196 |
| Hawaii Hotel Trust, Series 2019-MAUI, Class A, 6.544%, (1 mo. SOFR + 1.447%), 5/15/38(1)(3) | | 2,738 | 2,734,517 |
| HLTN Commercial Mortgage Trust: | | | |
| Series 2024-DPLO, Class A, 6.738%, (1 mo. SOFR + 1.642%), 6/15/41(1)(3) | | 830 | 829,901 |
| Series 2024-DPLO, Class C, 7.637%, (1 mo. SOFR + 2.54%), 6/15/41(1)(3) | | 900 | 902,298 |
| Series 2024-DPLO, Class D, 8.436%, (1 mo. SOFR + 3.339%), 6/15/41(1)(3) | | 110 | 110,627 |
| HYT Commercial Mortgage Trust, Series 2024-RGCY, Class B, 7.437%, (1 mo. SOFR + 2.341%), 9/15/41(1)(3) | | 1,028 | 1,029,298 |
3
See Notes to Financial Statements.
Calvert
Balanced Fund
September 30, 2024
Schedule of Investments — continued
| Security | Principal
Amount
(000's omitted) | Value |
| JPMorgan Chase Commercial Mortgage Securities Trust: | | | |
| Series 2014-DSTY, Class B, 3.771%, 6/10/27(1) | $ | 550 | $ 69,256 |
| Series 2014-DSTY, Class C, 3.931%, 6/10/27(1)(5) | | 225 | 11,809 |
| JW Commercial Mortgage Trust, Series 2024-MRCO, Class B, 7.023%, (1 mo. SOFR + 1.941%), 6/15/39(1)(3) | | 886 | 887,663 |
| NYC Trust, Series 2024-3ELV, Class A, 7.088%, (1 mo. SOFR + 1.991%), 8/15/29(1)(3) | | 1,237 | 1,244,941 |
| ORL Trust, Series 2023-GLKS, Class A, 7.447%, (1 mo. SOFR + 2.35%), 10/19/36(1)(3) | | 788 | 792,675 |
| SDR Commercial Mortgage Trust, Series 2024-DSNY, Class A, 6.488%, (1 mo. SOFR + 1.392%), 5/15/39(1)(3) | | 1,267 | 1,263,405 |
| TX Trust: | | | |
| Series 2024-HOU, Class A, 6.688%, (1 mo. SOFR + 1.591%), 6/15/39(1)(3) | | 1,280 | 1,271,588 |
| Series 2024-HOU, Class E, 9.484%, (1 mo. SOFR + 4.387%), 6/15/39(1)(3) | | 215 | 214,179 |
| TYSN Mortgage Trust, Series 2023-CRNR, Class A, 6.799%, 12/10/33(1)(5) | | 1,187 | 1,263,756 |
| WFLD Mortgage Trust, Series 2014-MONT, Class C, 3.88%, 8/10/31(1)(5) | | 850 | 517,730 |
Total Commercial Mortgage-Backed Securities
(identified cost $54,469,574) | | | $51,007,675 |
| Security | Shares | Value |
| Aerospace & Defense — 0.8% | |
| HEICO Corp. | | 41,100 | $ 10,746,828 |
| | | | $ 10,746,828 |
| Biotechnology — 1.5% | |
| AbbVie, Inc. | | 102,700 | $ 20,281,196 |
| | | | $ 20,281,196 |
| Broadline Retail — 2.9% | |
| Amazon.com, Inc.(6) | | 212,220 | $ 39,542,953 |
| | | | $ 39,542,953 |
| Capital Markets — 4.8% | |
| Blue Owl Capital, Inc. | | 592,000 | $11,461,120 |
| Intercontinental Exchange, Inc. | | 78,200 | 12,562,048 |
| S&P Global, Inc. | | 28,600 | 14,775,332 |
| Stifel Financial Corp. | | 118,300 | 11,108,370 |
| Tradeweb Markets, Inc., Class A | | 115,566 | 14,292,047 |
| | | | $64,198,917 |
| Chemicals — 0.7% | |
| Linde PLC | | 18,700 | $8,917,282 |
| | | | $8,917,282 |
| Security | Shares | Value |
| Commercial Services & Supplies — 0.7% | |
| Waste Management, Inc. | | 47,025 | $ 9,762,390 |
| | | | $ 9,762,390 |
| Consumer Staples Distribution & Retail — 2.1% | |
| BJ's Wholesale Club Holdings, Inc.(6) | | 123,500 | $ 10,186,280 |
| Walmart, Inc. | | 228,200 | 18,427,150 |
| | | | $ 28,613,430 |
| Containers & Packaging — 0.7% | |
| AptarGroup, Inc. | | 58,558 | $ 9,380,406 |
| | | | $9,380,406 |
| Electric Utilities — 0.9% | |
| NextEra Energy, Inc. | | 142,800 | $12,070,884 |
| | | | $12,070,884 |
| Electrical Equipment — 1.0% | |
| AMETEK, Inc. | | 80,700 | $13,856,997 |
| | | | $13,856,997 |
| Energy Equipment & Services — 1.4% | |
| Baker Hughes Co. | | 538,100 | $19,452,315 |
| | | | $19,452,315 |
| Entertainment — 1.4% | |
| Netflix, Inc.(6) | | 20,100 | $14,256,327 |
| Spotify Technology SA(6) | | 11,800 | 4,348,654 |
| | | | $18,604,981 |
| Financial Services — 2.2% | |
| Shift4 Payments, Inc., Class A(6)(7) | | 145,000 | $12,847,000 |
| Visa, Inc., Class A | | 62,100 | 17,074,395 |
| | | | $29,921,395 |
| Food Products — 0.8% | |
| Hershey Co. | | 58,000 | $11,123,240 |
| | | | $11,123,240 |
| Ground Transportation — 1.4% | |
| Uber Technologies, Inc.(6) | | 246,400 | $18,519,424 |
| | | | $18,519,424 |
| Health Care Equipment & Supplies — 0.8% | |
| Intuitive Surgical, Inc.(6) | | 21,700 | $10,660,559 |
| | | | $10,660,559 |
| Health Care Providers & Services — 1.4% | |
| Elevance Health, Inc. | | 36,200 | $18,824,000 |
| | | | $18,824,000 |
4
See Notes to Financial Statements.
Calvert
Balanced Fund
September 30, 2024
Schedule of Investments — continued
| Security | Shares | Value |
| Hotels, Restaurants & Leisure — 0.8% | |
| Marriott International, Inc., Class A | | 45,600 | $ 11,336,160 |
| | | | $ 11,336,160 |
| Insurance — 2.3% | |
| Allstate Corp. | | 95,600 | $ 18,130,540 |
| W.R. Berkley Corp. | | 217,450 | 12,335,939 |
| | | | $ 30,466,479 |
| Interactive Media & Services — 4.2% | |
| Alphabet, Inc., Class A | | 97,600 | $ 16,186,960 |
| Alphabet, Inc., Class C | | 242,040 | 40,466,668 |
| | | | $56,653,628 |
| IT Services — 1.0% | |
| Gartner, Inc.(6) | | 27,800 | $14,087,928 |
| | | | $14,087,928 |
| Life Sciences Tools & Services — 1.3% | |
| Thermo Fisher Scientific, Inc. | | 28,397 | $17,565,532 |
| | | | $17,565,532 |
| Machinery — 0.7% | |
| Parker-Hannifin Corp. | | 14,900 | $9,414,118 |
| | | | $9,414,118 |
| Media — 0.6% | |
| Comcast Corp., Class A | | 187,000 | $7,810,990 |
| | | | $7,810,990 |
| Pharmaceuticals — 2.1% | |
| Eli Lilly & Co. | | 23,300 | $20,642,402 |
| Novo Nordisk AS ADR | | 63,000 | 7,501,410 |
| | | | $28,143,812 |
| Professional Services — 3.2% | |
| Automatic Data Processing, Inc. | | 54,200 | $14,998,766 |
| Booz Allen Hamilton Holding Corp. | | 57,400 | 9,342,424 |
| TransUnion | | 174,400 | 18,259,680 |
| | | | $42,600,870 |
| Real Estate Management & Development — 1.6% | |
| CoStar Group, Inc.(6) | | 116,600 | $8,796,304 |
| FirstService Corp. | | 72,100 | 13,155,366 |
| | | | $21,951,670 |
| Semiconductors & Semiconductor Equipment — 8.0% | |
| Analog Devices, Inc. | | 60,300 | $13,879,251 |
| Broadcom, Inc. | | 144,210 | 24,876,225 |
| Lam Research Corp. | | 16,300 | 13,302,104 |
| Security | Shares | Value |
| Semiconductors & Semiconductor Equipment (continued) | |
| NVIDIA Corp. | | 454,500 | $ 55,194,480 |
| | | | $ 107,252,060 |
| Software — 6.7% | |
| Fair Isaac Corp.(6) | | 6,500 | $ 12,632,880 |
| Microsoft Corp. | | 164,851 | 70,935,385 |
| Palo Alto Networks, Inc.(6) | | 20,200 | 6,904,360 |
| | | | $ 90,472,625 |
| Specialty Retail — 1.8% | |
| Burlington Stores, Inc.(6) | | 44,300 | $11,672,164 |
| TJX Cos., Inc. | | 101,500 | 11,930,310 |
| | | | $23,602,474 |
| Technology Hardware, Storage & Peripherals — 4.6% | |
| Apple, Inc. | | 264,208 | $61,560,464 |
| | | | $61,560,464 |
| Venture Capital — 0.1% | |
| Learn Capital Venture Partners III LP(6)(8)(9) | | 1,088,825 | $1,895,451 |
| Neighborhood Bancorp, Class A(6)(8)(9) | | 10,000 | 10,000 |
| | | | $1,905,451 |
Total Common Stocks
(identified cost $491,387,431) | | | $869,301,458 |
| Security | Principal
Amount*
(000’s omitted) | Value |
| Basic Materials — 0.2% | |
| Celanese U.S. Holdings LLC, 6.55%, 11/15/30 | | 801 | $ 863,830 |
| Compass Minerals International, Inc., 6.75%, 12/1/27(1)(7) | | 1,120 | 1,115,701 |
| South32 Treasury Ltd., 4.35%, 4/14/32(1) | | 132 | 125,362 |
| | | | $ 2,104,893 |
| Communications — 0.3% | |
| Charter Communications Operating LLC/Charter Communications Operating Capital, 4.80%, 3/1/50 | | 3,652 | $ 2,797,679 |
| Clear Channel Outdoor Holdings, Inc., 7.875%, 4/1/30(1) | | 122 | 127,678 |
| McGraw-Hill Education, Inc., 8.00%, 8/1/29(1) | | 125 | 125,552 |
| SES GLOBAL Americas Holdings, Inc., 5.30%, 3/25/44(1) | | 463 | 372,572 |
| SES SA, 5.30%, 4/4/43(1) | | 274 | 211,581 |
| | | | $3,635,062 |
| Consumer, Cyclical — 1.2% | |
| American Airlines, Inc./AAdvantage Loyalty IP Ltd., 5.50%, 4/20/26(1) | | 898 | $896,507 |
5
See Notes to Financial Statements.
Calvert
Balanced Fund
September 30, 2024
Schedule of Investments — continued
| Security | Principal
Amount*
(000’s omitted) | Value |
| Consumer, Cyclical (continued) | |
| Aptiv PLC/Aptiv Global Financing DAC: | | | |
| 4.65%, 9/13/29 | | 705 | $ 702,041 |
| 5.15%, 9/13/34 | | 593 | 584,113 |
| Delta Air Lines, Inc./SkyMiles IP Ltd.: | | | |
| 4.50%, 10/20/25(1) | | 344 | 341,714 |
| 4.75%, 10/20/28(1) | | 930 | 929,174 |
| Ford Motor Co., 4.75%, 1/15/43 | | 127 | 105,300 |
| Ford Motor Credit Co. LLC: | | | |
| 5.125%, 6/16/25 | | 750 | 749,882 |
| 5.303%, 9/6/29 | | 548 | 545,708 |
| 7.122%, 11/7/33 | | 479 | 518,019 |
| 7.20%, 6/10/30 | | 509 | 548,658 |
| 7.35%, 11/4/27 | | 1,026 | 1,089,738 |
| 7.35%, 3/6/30 | | 924 | 1,001,003 |
| General Motors Financial Co., Inc.: | | | |
| 5.60%, 6/18/31 | | 1,100 | 1,130,045 |
| 5.80%, 1/7/29 | | 625 | 650,275 |
| 5.95%, 4/4/34 | | 730 | 755,791 |
| Hyundai Capital America: | | | |
| 5.30%, 6/24/29(1) | | 423 | 435,704 |
| 5.70%, 6/26/30(1) | | 123 | 129,300 |
| 6.20%, 9/21/30(1) | | 50 | 53,952 |
| Lithia Motors, Inc.: | | | |
| 3.875%, 6/1/29(1)(7) | | 1,023 | 955,511 |
| 4.375%, 1/15/31(1) | | 159 | 148,073 |
| PetSmart, Inc./PetSmart Finance Corp., 4.75%, 2/15/28(1) | | 570 | 547,000 |
| Sonic Automotive, Inc., 4.625%, 11/15/29(1) | | 150 | 140,953 |
| Tapestry, Inc.: | | | |
| 7.00%, 11/27/26 | | 171 | 176,985 |
| 7.35%, 11/27/28 | | 1,319 | 1,386,654 |
| WarnerMedia Holdings, Inc., 4.279%, 3/15/32(7) | | 1,843 | 1,637,800 |
| | | | $16,159,900 |
| Consumer, Non-cyclical — 0.7% | |
| AbbVie, Inc., 5.50%, 3/15/64 | | 619 | $661,486 |
| Ashtead Capital, Inc., 4.25%, 11/1/29(1) | | 787 | 766,148 |
| Bristol-Myers Squibb Co., 5.65%, 2/22/64 | | 1,184 | 1,255,728 |
| Centene Corp.: | | | |
| 2.50%, 3/1/31 | | 844 | 726,157 |
| 3.375%, 2/15/30 | | 472 | 435,312 |
| 4.25%, 12/15/27 | | 575 | 565,191 |
| Conservation Fund, 3.474%, 12/15/29 | | 655 | 615,418 |
| CVS Pass-Through Trust, 6.036%, 12/10/28 | | 390 | 396,080 |
| Doris Duke Charitable Foundation, 2.345%, 7/1/50 | | 1,705 | 1,086,389 |
| Ford Foundation, 2.415%, 6/1/50 | | 1,095 | 724,284 |
| Kroger Co.: | | | |
| 4.90%, 9/15/31 | | 900 | 906,123 |
| 5.00%, 9/15/34 | | 585 | 590,108 |
| LifePoint Health, Inc., 10.00%, 6/1/32(1) | | 125 | 137,577 |
| Security | Principal
Amount*
(000’s omitted) | Value |
| Consumer, Non-cyclical (continued) | |
| Smithfield Foods, Inc.: | | | |
| 2.625%, 9/13/31(1) | | 870 | $ 737,700 |
| 3.00%, 10/15/30(1) | | 192 | 172,197 |
| 5.20%, 4/1/29(1) | | 138 | 138,529 |
| WASH Multifamily Acquisition, Inc., 5.75%, 4/15/26(1)(7) | | 120 | 119,457 |
| | | | $ 10,033,884 |
| Diversified — 0.0%(10) | |
| Inversiones La Construccion SA, 4.75%, 2/7/32(11) | | 211 | $ 195,280 |
| | | | $195,280 |
| Energy — 0.2% | |
| Enviva Partners LP/Enviva Partners Finance Corp., 6.50%, 1/15/26(1)(12) | | 213 | $9,239 |
| Raizen Fuels Finance SA: | | | |
| 5.70%, 1/17/35(1) | | 200 | 200,350 |
| 6.45%, 3/5/34(1) | | 441 | 467,037 |
| 6.95%, 3/5/54(1) | | 288 | 307,572 |
| TerraForm Power Operating LLC: | | | |
| 4.75%, 1/15/30(1) | | 982 | 940,676 |
| 5.00%, 1/31/28(1) | | 1,047 | 1,036,674 |
| | | | $2,961,548 |
| Financial — 7.0% | |
| ABN AMRO Bank NV, 6.339% to 9/18/26, 9/18/27(1)(13) | | 800 | $828,385 |
| AIB Group PLC, 6.608% to 9/13/28, 9/13/29(1)(13) | | 760 | 813,574 |
| Aircastle Ltd./Aircastle Ireland DAC, 5.75%, 10/1/31(1) | | 1,169 | 1,202,551 |
| Alliant Holdings Intermediate LLC/Alliant Holdings Co.-Issuer, 6.75%, 10/15/27(1) | | 165 | 164,512 |
| Ally Financial, Inc.: | | | |
| 2.20%, 11/2/28 | | 1,263 | 1,136,889 |
| 4.70% to 5/15/26(13)(14) | | 375 | 327,962 |
| 6.184% to 7/26/34, 7/26/35(13) | | 1,045 | 1,069,972 |
| 6.848% to 1/3/29, 1/3/30(13) | | 615 | 649,653 |
| American Assets Trust LP, 3.375%, 2/1/31 | | 176 | 153,139 |
| American National Group, Inc.: | | | |
| 5.75%, 10/1/29(15) | | 900 | 905,816 |
| 6.144%, 6/13/32(1) | | 200 | 199,079 |
| Andrew W. Mellon Foundation, 0.947%, 8/1/27 | | 845 | 781,869 |
| Apollo Debt Solutions BDC: | | | |
| 6.70%, 7/29/31(1) | | 157 | 161,811 |
| 6.90%, 4/13/29(1) | | 212 | 220,463 |
| ASR Nederland NV, 7.00% to 9/7/33, 12/7/43(11)(13) | EUR | 165 | 216,598 |
| Banco Santander SA: | | | |
| 1.722% to 9/14/26, 9/14/27(13) | | 800 | 758,024 |
| 4.175% to 3/24/27, 3/24/28(13) | | 200 | 198,136 |
| 5.294%, 8/18/27 | | 400 | 409,281 |
| 5.439%, 7/15/31 | | 600 | 627,729 |
| 6.35%, 3/14/34 | | 1,400 | 1,499,800 |
6
See Notes to Financial Statements.
Calvert
Balanced Fund
September 30, 2024
Schedule of Investments — continued
| Security | Principal
Amount*
(000’s omitted) | Value |
| Financial (continued) | |
| Bank of America Corp.: | | | |
| 2.456% to 10/22/24, 10/22/25(13) | | 1,307 | $ 1,304,699 |
| 3.419% to 12/20/27, 12/20/28(13) | | 2,865 | 2,787,725 |
| 3.824% to 1/20/27, 1/20/28(13) | | 2,322 | 2,297,127 |
| 5.468% to 1/23/34, 1/23/35(13) | | 1,159 | 1,219,254 |
| 5.819% to 9/15/28, 9/15/29(13) | | 314 | 330,538 |
| 5.933% to 9/15/26, 9/15/27(13) | | 1,030 | 1,060,989 |
| Bank of Nova Scotia, 8.00% to 1/27/29, 1/27/84(13) | | 240 | 257,726 |
| BBVA Bancomer SA: | | | |
| 1.875%, 9/18/25(1) | | 859 | 836,248 |
| 5.125% to 1/18/28, 1/18/33(1)(13) | | 1,189 | 1,131,821 |
| 8.125% to 1/8/34, 1/8/39(1)(13) | | 1,299 | 1,377,834 |
| 8.45% to 6/29/33, 6/29/38(1)(13) | | 200 | 218,226 |
| Blackstone Private Credit Fund, 6.25%, 1/25/31(1) | | 165 | 169,597 |
| Blue Owl Credit Income Corp., 6.65%, 3/15/31 | | 225 | 229,924 |
| BlueHub Loan Fund, Inc., 3.099%, 1/1/30 | | 1,625 | 1,493,420 |
| BNP Paribas SA: | | | |
| 7.75% to 8/16/29(1)(13)(14) | | 1,002 | 1,058,053 |
| 9.25% to 11/17/27(1)(7)(13)(14) | | 445 | 487,303 |
| BPCE SA, 5.716% to 1/18/29, 1/18/30(1)(13) | | 672 | 694,319 |
| Broadstone Net Lease LLC, 2.60%, 9/15/31 | | 58 | 48,903 |
| Brookfield Finance, Inc., 5.675%, 1/15/35 | | 1,935 | 2,031,946 |
| CaixaBank SA: | | | |
| 5.673% to 3/15/29, 3/15/30(1)(13) | | 340 | 353,195 |
| 6.84% to 9/13/33, 9/13/34(1)(13) | | 1,139 | 1,271,497 |
| Capital One Financial Corp., 4.20%, 10/29/25 | | 575 | 571,110 |
| Charles Schwab Corp., 6.136% to 8/24/33, 8/24/34(13) | | 1,808 | 1,977,303 |
| CI Financial Corp., 3.20%, 12/17/30 | | 1,463 | 1,240,232 |
| Citigroup, Inc., 4.00% to 12/10/25(13)(14) | | 770 | 755,797 |
| COPT Defense Properties LP, 2.90%, 12/1/33 | | 1,461 | 1,224,461 |
| Credit Agricole SA: | | | |
| 6.251% to 1/10/34, 1/10/35(1)(13) | | 1,573 | 1,679,442 |
| 6.316% to 10/3/28, 10/3/29(1)(13) | | 400 | 425,485 |
| Enact Holdings, Inc., 6.25%, 5/28/29 | | 1,930 | 2,004,971 |
| EPR Properties: | | | |
| 3.60%, 11/15/31 | | 455 | 406,006 |
| 3.75%, 8/15/29 | | 1,386 | 1,296,821 |
| 4.50%, 6/1/27 | | 245 | 241,491 |
| 4.95%, 4/15/28 | | 1,168 | 1,158,046 |
| Essent Group Ltd., 6.25%, 7/1/29 | | 1,085 | 1,132,454 |
| Global Atlantic Fin Co.: | | | |
| 3.125%, 6/15/31(1) | | 2,578 | 2,266,789 |
| 6.75%, 3/15/54(1) | | 935 | 995,785 |
| 7.95%, 6/15/33(1) | | 597 | 681,840 |
| 7.95% to 7/15/29, 10/15/54(1)(13) | | 1,103 | 1,154,104 |
| HA Sustainable Infrastructure Capital, Inc., 6.375%, 7/1/34(1) | | 3,542 | 3,627,372 |
| HAT Holdings I LLC/HAT Holdings II LLC: | | | |
| 3.375%, 6/15/26(1) | | 440 | 426,397 |
| Security | Principal
Amount*
(000’s omitted) | Value |
| Financial (continued) | |
| HAT Holdings I LLC/HAT Holdings II LLC: (continued) | | | |
| 3.75%, 9/15/30(1)(7) | | 241 | $ 217,803 |
| Intesa Sanpaolo SpA: | | | |
| 7.00%, 11/21/25(1) | | 333 | 341,093 |
| 8.248% to 11/21/32, 11/21/33(1)(13) | | 1,028 | 1,194,223 |
| Jefferies Financial Group, Inc., 6.20%, 4/14/34 | | 1,740 | 1,863,462 |
| JPMorgan Chase & Co.: | | | |
| 5.581% to 4/22/29, 4/22/30(13) | | 2,892 | 3,036,061 |
| 5.766% to 4/22/34, 4/22/35(13) | | 621 | 669,448 |
| KeyBank NA, 5.00%, 1/26/33 | | 1,372 | 1,360,040 |
| Liberty Mutual Group, Inc., 4.125% to 9/15/26, 12/15/51(1)(13) | | 868 | 821,363 |
| LPL Holdings, Inc.: | | | |
| 4.00%, 3/15/29(1) | | 1,035 | 991,191 |
| 6.00%, 5/20/34 | | 254 | 265,628 |
| Newmark Group, Inc., 7.50%, 1/12/29 | | 300 | 324,345 |
| Nuveen LLC, 5.85%, 4/15/34(1) | | 1,184 | 1,254,465 |
| Oaktree Strategic Credit Fund, 8.40%, 11/14/28(1) | | 290 | 313,863 |
| PNC Financial Services Group, Inc., 6.875% to 10/20/33, 10/20/34(13) | | 875 | 1,002,267 |
| Rocket Mortgage LLC/Rocket Mortgage Co.-Issuer, Inc., 3.875%, 3/1/31(1) | | 1,552 | 1,430,355 |
| Societe Generale SA: | | | |
| 5.634% to 1/19/29, 1/19/30(1)(13) | | 3,032 | 3,108,182 |
| 8.50% to 3/25/34(1)(13)(14) | | 218 | 222,446 |
| Stifel Financial Corp., 4.00%, 5/15/30 | | 902 | 866,903 |
| Swedbank AB: | | | |
| 5.407%, 3/14/29(1) | | 378 | 391,760 |
| 6.136%, 9/12/26(1) | | 1,227 | 1,267,512 |
| Synchrony Bank, 5.40%, 8/22/25 | | 500 | 501,187 |
| Synchrony Financial, 4.50%, 7/23/25 | | 900 | 894,997 |
| Synovus Bank/Columbus, GA: | | | |
| 4.00% to 10/29/25, 10/29/30(13) | | 782 | 719,435 |
| 5.625%, 2/15/28 | | 705 | 709,059 |
| Texas Capital Bancshares, Inc., 4.00% to 5/6/26, 5/6/31(13) | | 596 | 566,055 |
| Toronto-Dominion Bank, 8.125% to 10/31/27, 10/31/82(13) | | 1,998 | 2,148,473 |
| TPG Operating Group II LP, 5.875%, 3/5/34 | | 1,435 | 1,531,291 |
| U.S. Bancorp: | | | |
| 5.678% to 1/23/34, 1/23/35(13) | | 3,050 | 3,234,284 |
| 5.85% to 10/21/32, 10/21/33(13) | | 1,088 | 1,160,939 |
| UBS Group AG: | | | |
| 2.095% to 2/11/31, 2/11/32(1)(13) | | 1,244 | 1,060,050 |
| 4.375% to 2/10/31(1)(13)(14) | | 649 | 566,701 |
| 9.25% to 11/13/28(1)(13)(14) | | 270 | 299,187 |
| UniCredit SpA: | | | |
| 2.569% to 9/22/25, 9/22/26(1)(13) | | 1,339 | 1,309,208 |
| 5.459% to 6/30/30, 6/30/35(1)(13) | | 795 | 782,532 |
| 5.861% to 6/19/27, 6/19/32(1)(13) | | 200 | 201,294 |
7
See Notes to Financial Statements.
Calvert
Balanced Fund
September 30, 2024
Schedule of Investments — continued
| Security | Principal
Amount*
(000’s omitted) | Value |
| Financial (continued) | |
| Ventas Realty LP, 5.625%, 7/1/34 | | 1,197 | $ 1,260,301 |
| | | | $ 94,138,896 |
| Government - Multinational — 1.0% | |
| Asian Development Bank, 3.125%, 9/26/28 | | 1,160 | $ 1,142,246 |
| European Investment Bank: | | | |
| 1.625%, 5/13/31 | | 2,540 | 2,236,199 |
| 2.375%, 5/24/27 | | 2,741 | 2,656,744 |
| 2.875%, 6/13/25(1) | | 5,102 | 5,054,708 |
| International Bank for Reconstruction & Development, 3.125%, 11/20/25 | | 2,600 | 2,574,339 |
| | | | $13,664,236 |
| Industrial — 0.2% | |
| Arrow Electronics, Inc., 5.15%, 8/21/29 | | 924 | $938,803 |
| MasTec, Inc., 5.90%, 6/15/29 | | 877 | 916,073 |
| Seaspan Corp., 5.50%, 8/1/29(1) | | 144 | 137,281 |
| Trivium Packaging Finance BV, 5.50%, 8/15/26(1) | | 975 | 972,059 |
| | | | $2,964,216 |
| Technology — 0.5% | |
| Concentrix Corp., 6.60%, 8/2/28(7) | | 3,665 | $3,825,159 |
| Kyndryl Holdings, Inc.: | | | |
| 3.15%, 10/15/31 | | 257 | 225,968 |
| 6.35%, 2/20/34 | | 1,581 | 1,690,883 |
| Seagate HDD Cayman, 9.625%, 12/1/32 | | 893 | 1,038,041 |
| | | | $6,780,051 |
| Utilities — 0.2% | |
| Avangrid, Inc., 3.15%, 12/1/24 | | 388 | $386,562 |
| Clearway Energy Operating LLC, 3.75%, 1/15/32(1) | | 472 | 427,496 |
| NextEra Energy Capital Holdings, Inc., 1.90%, 6/15/28 | | 671 | 618,919 |
| Pattern Energy Operations LP/Pattern Energy Operations, Inc., 4.50%, 8/15/28(1) | | 902 | 873,297 |
| | | | $2,306,274 |
Total Corporate Bonds
(identified cost $154,528,498) | | | $154,944,240 |
| Security | Shares | Value |
| Real Estate Management & Development — 0.1% | |
| Brookfield Property Partners LP: | | | |
| Series A, 5.75% | | 31,814 | $ 470,847 |
| Series A2, 6.375% | | 28,000 | 456,400 |
| | | | $ 927,247 |
| Security | Shares | Value |
| Venture Capital — 0.0%(10) | |
| Lumni, Inc., Series B(6)(8)(9) | | 17,265 | $ 33,192 |
| Wind Harvest International, Inc.(6)(8)(9) | | 8,696 | 0 |
| | | | $ 33,192 |
| Wireless Telecommunication Services — 0.0%(10) | |
| U.S. Cellular Corp.: | | | |
| 5.50% | | 21,926 | $ 488,292 |
| 6.25% | | 1,959 | 46,076 |
| | | | $ 534,368 |
Total Preferred Stocks
(identified cost $2,346,497) | | | $1,494,807 |
| Senior Floating-Rate Loans — 0.8%(16) |
| Borrower/Description | Principal
Amount
(000's omitted) | Value |
| Aerospace and Defense — 0.1% | |
| Dynasty Acquisition Co., Inc.: | | | |
| Term Loan, 8/24/28(17) | $ | 541 | $ 542,325 |
| Term Loan, 8/24/28(17) | | 209 | 209,107 |
| | | | $ 751,432 |
| Commercial Services & Supplies — 0.1% | |
| Covanta Holding Corp.: | | | |
| Term Loan, 11/30/28(17) | $ | 474 | $ 475,093 |
| Term Loan, 11/30/28(17) | | 26 | 25,961 |
| Prime Security Services Borrower LLC, Term Loan, 7.445%, (SOFR + 2.25%), 10/13/30 | | 499 | 498,807 |
| | | | $999,861 |
| Construction & Engineering — 0.0%(10) | |
| APi Group DE, Inc., Term Loan, 6.845%, (SOFR + 2.00%), 1/3/29 | $ | 500 | $500,402 |
| | | | $500,402 |
| Financial Services — 0.0%(10) | |
| CPI Holdco B LLC, Term Loan, 6.845%, (SOFR + 2.00%), 5/19/31 | $ | 500 | $498,125 |
| | | | $498,125 |
| Health Care Equipment & Supplies — 0.1% | |
| Medline Borrower LP, Term Loan, 7.595%, (SOFR + 2.75%), 10/23/28 | $ | 748 | $749,235 |
| | | | $749,235 |
| Insurance — 0.1% | |
| AmWINS Group, Inc., Term Loan, 7.21%, (SOFR + 2.25%), 2/19/28 | $ | 748 | $747,746 |
8
See Notes to Financial Statements.
Calvert
Balanced Fund
September 30, 2024
Schedule of Investments — continued
| Borrower/Description | Principal
Amount
(000's omitted) | Value |
| Insurance (continued) | |
| USI, Inc., Term Loan, 7.354%, (SOFR + 2.75%), 11/22/29 | $ | 499 | $ 497,856 |
| | | | $ 1,245,602 |
| IT Services — 0.1% | |
| Informatica LLC, Term Loan, 10/27/28(17) | $ | 750 | $ 749,844 |
| Sedgwick Claims Management Services, Inc., Term Loan, 8.252%, (SOFR + 3.00%), 7/31/31 | | 750 | 749,531 |
| | | | $ 1,499,375 |
| Machinery — 0.1% | |
| Gates Global LLC, Term Loan, 6/4/31(17) | $ | 750 | $ 752,216 |
| TK Elevator U.S. Newco, Inc., Term Loan, 8.588%, (SOFR + 3.50%), 4/30/30 | | 599 | 600,578 |
| | | | $1,352,794 |
| Metals/Mining — 0.0%(10) | |
| Zekelman Industries, Inc., Term Loan, 7.17%, (SOFR + 2.25%), 1/24/31 | $ | 497 | $498,896 |
| | | | $498,896 |
| Paper and Forest Products — 0.0%(10) | |
| Enviva Partners LP/Fin C: | | | |
| DIP Loan, 13.016%, (SOFR + 8.00%), 12/13/24 | $ | 15 | $17,622 |
| DIP Loan, 13.282%, (SOFR + 8.00%), 12/13/24(18) | | 37 | 38,161 |
| Term Loan, 13.301%, (SOFR + 8.00%), 12/13/24 | | 22 | 26,434 |
| | | | $82,217 |
| Professional Services — 0.0%(10) | |
| Trans Union LLC, Term Loan, 12/1/28(17) | $ | 500 | $500,347 |
| | | | $500,347 |
| Software — 0.1% | |
| CCC Intelligent Solutions, Inc., Term Loan, 7.21%, (SOFR + 2.25%), 9/21/28 | $ | 499 | $499,445 |
| Epicor Software Corp.: | | | |
| Term Loan, 5/30/31(17) | | 447 | 448,289 |
| Term Loan, 5/30/31(17) | | 52 | 52,597 |
| McAfee LLC, Term Loan, 8.451%, (SOFR + 3.25%), 3/1/29 | | 499 | 497,542 |
| | | | $1,497,873 |
| Specialty Retail — 0.1% | |
| Les Schwab Tire Centers, Term Loan, 4/23/31(17) | $ | 500 | $500,781 |
| | | | $500,781 |
| Borrower/Description | Principal
Amount
(000's omitted) | Value |
| Trading Companies & Distributors — 0.0%(10) | |
| Avolon TLB Borrower 1 (U.S.) LLC, Term Loan, 6.961%, (SOFR + 2.00%), 6/24/30 | $ | 499 | $ 500,614 |
| | | | $ 500,614 |
Total Senior Floating-Rate Loans
(identified cost $11,200,884) | | | $ 11,177,554 |
| Sovereign Government Bonds — 0.3% |
| Security | Principal
Amount
(000’s omitted) | Value |
| Kreditanstalt fuer Wiederaufbau: | | | |
| 1.00%, 10/1/26 | $ | 4,213 | $ 3,997,802 |
| 4.375%, 2/28/34 | | 461 | 480,251 |
Total Sovereign Government Bonds
(identified cost $4,635,105) | | | $ 4,478,053 |
| Taxable Municipal Obligations — 0.6% |
| Security | Principal
Amount
(000's omitted) | Value |
| General Obligations — 0.2% | |
| Massachusetts, Green Bonds, 3.277%, 6/1/46 | $ | 880 | $ 738,206 |
| New York City, NY, 5.206%, 10/1/31(19) | | 1,275 | 1,300,640 |
| San Francisco City and County, CA, (Social Bonds - Affordable Housing, 2016), 3.921%, 6/15/39 | | 630 | 579,631 |
| | | | $ 2,618,477 |
| Special Tax Revenue — 0.3% | |
| California Health Facilities Financing Authority, (No Place Like Home Program): | | | |
| Social Bonds, 2.361%, 6/1/26 | $ | 935 | $ 909,316 |
| Social Bonds, 2.484%, 6/1/27 | | 665 | 640,475 |
| Social Bonds, 2.534%, 6/1/28 | | 830 | 790,035 |
| Social Bonds, 2.584%, 6/1/29 | | 455 | 427,755 |
| Social Bonds, 2.984%, 6/1/33 | | 520 | 469,466 |
| Connecticut, Special Tax Revenue, 5.459%, 11/1/30(19) | | 350 | 359,818 |
| | | | $3,596,865 |
| Water and Sewer — 0.1% | |
| District of Columbia Water & Sewer Authority, Green Bonds, 4.814%, 10/1/2114 | $ | 270 | $261,352 |
| Narragansett Bay Commission, RI, Wastewater System Revenue: | | | |
| Green Bonds, 2.094%, 9/1/30 | | 430 | 385,938 |
| Green Bonds, 2.184%, 9/1/31 | | 345 | 304,676 |
| Green Bonds, 2.264%, 9/1/32 | | 305 | 264,960 |
| Green Bonds, 2.344%, 9/1/33 | | 335 | 286,043 |
9
See Notes to Financial Statements.
Calvert
Balanced Fund
September 30, 2024
Schedule of Investments — continued
| Security | Principal
Amount
(000's omitted) | Value |
| Water and Sewer (continued) | |
| San Diego County Water Authority, CA: | | | |
| Green Bonds, 1.531%, 5/1/30 | $ | 360 | $ 317,495 |
| Green Bonds, 1.701%, 5/1/31 | | 320 | 278,025 |
| | | | $ 2,098,489 |
Total Taxable Municipal Obligations
(identified cost $9,044,753) | | | $ 8,313,831 |
| U.S. Government Agencies and Instrumentalities — 0.1% |
| Security | Principal
Amount
(000's omitted) | Value |
| U.S. Department of Housing and Urban Development: | | | |
| 3.435%, 8/1/34 | $ | 530 | $ 488,941 |
| 3.485%, 8/1/35 | | 295 | 271,394 |
| 3.585%, 8/1/37 | | 547 | 498,684 |
| U.S. International Development Finance Corp., 3.52%, 9/20/32 | | 542 | 530,786 |
Total U.S. Government Agencies and Instrumentalities
(identified cost $2,018,274) | | | $ 1,789,805 |
| U.S. Government Agency Mortgage-Backed Securities — 9.1% |
| Security | Principal
Amount
(000's omitted) | Value |
| Federal Home Loan Mortgage Corp.: | | | |
| 3.50%, 3/1/48 | $ | 190 | $ 179,489 |
| 5.00%, 9/1/54 | | 427 | 426,869 |
| 5.50%, 9/1/54 | | 2,044 | 2,068,983 |
| 6.00%, 6/1/53 | | 200 | 205,245 |
| Federal National Mortgage Association: | | | |
| 2.00%, 4/1/51 | | 500 | 422,233 |
| 2.68%, 7/1/26 | | 612 | 598,021 |
| 3.00%, with various maturities to 2049 | | 1,349 | 1,227,792 |
| 4.00%, with various maturities to 2048 | | 1,108 | 1,077,732 |
| 5.50%, with various maturities to 2054 | | 13,475 | 13,643,935 |
| 7.00%, 6/1/53 | | 277 | 293,552 |
| Government National Mortgage Association II: | | | |
| 2.50%, with various maturities to 2051 | | 1,766 | 1,541,197 |
| 6.00%, with various maturities to 2053 | | 833 | 856,913 |
| 6.50%, 6/20/53 | | 917 | 957,153 |
| Uniform Mortgage-Backed Security: | | | |
| 4.50%, 30-Year, TBA(20) | | 3,592 | 3,532,771 |
| 5.00%, 30-Year, TBA(20) | | 37,208 | 37,184,913 |
| 5.50%, 30-Year, TBA(20) | | 57,187 | 57,863,862 |
Total U.S. Government Agency Mortgage-Backed Securities
(identified cost $122,949,885) | | $122,080,660 |
| U.S. Treasury Obligations — 5.3% |
| Security | Principal
Amount
(000's omitted) | Value |
| U.S. Treasury Bonds: | | | |
| 1.375%, 11/15/40 | $ | 961 | $ 652,232 |
| 1.375%, 8/15/50 | | 1,774 | 977,779 |
| 1.875%, 2/15/41 | | 2,040 | 1,496,810 |
| 1.875%, 2/15/51 | | 335 | 209,997 |
| 1.875%, 11/15/51 | | 996 | 620,749 |
| 2.00%, 2/15/50 | | 1,316 | 857,919 |
| 2.00%, 8/15/51 | | 7,338 | 4,728,567 |
| 2.25%, 2/15/52 | | 1,804 | 1,230,561 |
| 2.375%, 2/15/42 | | 19,320 | 15,054,506 |
| 2.75%, 8/15/47 | | 62 | 48,406 |
| 2.875%, 5/15/49 | | 815 | 643,643 |
| 2.875%, 5/15/52 | | 648 | 507,667 |
| 3.00%, 8/15/52 | | 720 | 578,841 |
| 3.125%, 5/15/48 | | 450 | 373,896 |
| 3.375%, 8/15/42 | | 93 | 83,960 |
| 3.625%, 2/15/53 | | 2,957 | 2,689,781 |
| 3.625%, 5/15/53 | | 613 | 558,022 |
| 3.875%, 2/15/43 | | 1,517 | 1,463,905 |
| 3.875%, 5/15/43 | | 135 | 130,017 |
| 4.00%, 11/15/52 | | 3,131 | 3,047,588 |
| 4.25%, 2/15/54 | | 557 | 567,792 |
| 4.50%, 2/15/44 | | 442 | 461,337 |
| 4.625%, 5/15/44 | | 332 | 351,972 |
| 5.375%, 2/15/31 | | 44 | 48,481 |
| 6.25%, 5/15/30 | | 37 | 41,965 |
| U.S. Treasury Notes: | | | |
| 0.25%, 5/31/25 | | 190 | 185,108 |
| 0.25%, 6/30/25 | | 185 | 179,764 |
| 0.375%, 12/31/25 | | 5,400 | 5,174,508 |
| 0.375%, 9/30/27 | | 305 | 277,568 |
| 0.625%, 7/31/26 | | 1,756 | 1,661,958 |
| 1.00%, 7/31/28 | | 1,203 | 1,092,733 |
| 1.125%, 1/15/25 | | 3,432 | 3,398,324 |
| 1.125%, 8/31/28 | | 448 | 408,170 |
| 1.25%, 12/31/26 | | 1,012 | 961,123 |
| 1.25%, 4/30/28 | | 1,683 | 1,552,370 |
| 1.25%, 6/30/28 | | 344 | 316,144 |
| 1.375%, 11/15/31 | | 100 | 85,656 |
| 1.875%, 2/28/27 | | 816 | 783,774 |
| 1.875%, 2/15/32 | | 168 | 148,398 |
| 2.75%, 4/30/27 | | 1,650 | 1,616,291 |
| 2.875%, 4/30/29 | | 2,536 | 2,461,109 |
| 3.125%, 8/31/27 | | 2,851 | 2,816,086 |
| 3.125%, 8/31/29 | | 1,228 | 1,202,649 |
| 3.375%, 5/15/33 | | 128 | 124,477 |
| 3.625%, 5/15/26 | | 64 | 63,906 |
| 3.625%, 5/31/28 | | 490 | 490,861 |
| 3.875%, 9/30/29 | | 1,133 | 1,147,583 |
10
See Notes to Financial Statements.
Calvert
Balanced Fund
September 30, 2024
Schedule of Investments — continued
| Security | Principal
Amount
(000's omitted) | Value |
| U.S. Treasury Notes: (continued) | | | |
| 4.00%, 2/15/34 | $ | 125 | $ 127,178 |
| 4.125%, 3/31/29 | | 256 | 261,860 |
| 4.125%, 11/15/32 | | 173 | 178,001 |
| 4.50%, 11/15/25 | | 2,732 | 2,749,929 |
| 4.50%, 3/31/26 | | 1,745 | 1,763,541 |
| 4.50%, 11/15/33 | | 264 | 278,860 |
| 4.625%, 6/30/25 | | 900 | 903,212 |
| 4.625%, 9/15/26 | | 117 | 119,116 |
| 4.875%, 5/31/26 | | 821 | 836,185 |
Total U.S. Treasury Obligations
(identified cost $77,062,526) | | | $70,792,835 |
| Venture Capital Limited Partnership Interests — 0.0%(10) |
| Security | | Value |
| First Analysis Private Equity Fund IV LP(8)(9) | | | $ 67,173 |
| GEEMF Partners LP(6)(8)(9)(21) | | | 1,566 |
| Global Environment Emerging Markets Fund LP(8)(9) | | | 29,429 |
| Solstice Capital LP(6)(8)(9) | | | 22,345 |
Total Venture Capital Limited Partnership Interests
(identified cost $0) | | | $ 120,513 |
| Short-Term Investments — 6.0% | | | |
| Affiliated Fund — 3.6% |
| Security | Shares | Value |
| Morgan Stanley Institutional Liquidity Funds - Government Portfolio, Institutional Class, 4.83%(22) | | 48,316,470 | $ 48,316,470 |
Total Affiliated Fund
(identified cost $48,316,470) | | | $ 48,316,470 |
| Securities Lending Collateral — 0.4% |
| Security | Shares | Value |
| State Street Navigator Securities Lending Government Money Market Portfolio, 5.02%(23) | | 5,091,583 | $ 5,091,583 |
Total Securities Lending Collateral
(identified cost $5,091,583) | | | $ 5,091,583 |
| U.S. Treasury Obligations — 2.0% |
| Security | Principal
Amount
(000's omitted) | Value |
| U.S. Treasury Bills: | | | |
| 0.00%, 11/7/24 | $ | 13,969 | $ 13,901,805 |
| U.S. Treasury Obligations (continued) |
| Security | Principal
Amount
(000's omitted) | Value |
| U.S. Treasury Bills: (continued) | | | |
| 0.00%, 11/14/24 | $ | 13,995 | $ 13,915,650 |
Total U.S. Treasury Obligations
(identified cost $27,804,634) | | | $ 27,817,455 |
Total Short-Term Investments
(identified cost $81,212,687) | | | $ 81,225,508 |
Total Investments — 107.7%
(identified cost $1,087,499,521) | | | $1,451,721,049 |
| Less Unfunded Loan Commitments — (0.0)%(10) | | | $ (22,338) |
| | | |
Net Investments — 107.7%
(identified cost $1,087,477,183) | | $1,451,698,711 |
| Other Assets, Less Liabilities — (7.7)% | | | $ (104,183,647) |
| Net Assets — 100.0% | | | $1,347,515,064 |
| The percentage shown for each investment category in the Schedule of Investments is based on net assets. |
| * | In U.S. dollars unless otherwise indicated. |
| (1) | Security exempt from registration under Rule 144A of the Securities Act of 1933, as amended. These securities may be sold in certain transactions in reliance on an exemption from registration (normally to qualified institutional buyers). At September 30, 2024, the aggregate value of these securities is $155,331,360 or 11.5% of the Fund's net assets. |
| (2) | Step coupon security. Interest rate represents the rate in effect at
September 30, 2024. |
| (3) | Variable rate security. The stated interest rate represents the rate in effect at September 30, 2024. |
| (4) | Inverse floating-rate security whose coupon varies inversely with changes in the interest rate index. The stated interest rate represents the coupon rate in effect at September 30, 2024. |
| (5) | Weighted average fixed-rate coupon that changes/updates monthly. Rate shown is the rate at September 30, 2024. |
| (6) | Non-income producing security. |
| (7) | All or a portion of this security was on loan at September 30, 2024. The aggregate market value of securities on loan at September 30, 2024 was $18,351,538. |
| (8) | For fair value measurement disclosure purposes, security is categorized as Level 3 (see Note 1A). |
| (9) | Restricted security. Total market value of restricted securities amounts to $2,059,156, which represents 0.1% of the net assets of the Fund as of September 30, 2024. |
| (10) | Amount is less than 0.05% or (0.05)%, as applicable. |
11
See Notes to Financial Statements.
Calvert
Balanced Fund
September 30, 2024
Schedule of Investments — continued
| (11) | Security exempt from registration under Regulation S of the Securities Act of 1933, as amended, which exempts from registration securities offered and sold outside the United States. Security may not be offered or sold in the United States except pursuant to an exemption from, or in a transaction not subject to, the registration requirements of the Securities Act of 1933, as amended. At September 30, 2024, the aggregate value of these securities is $411,878 or less than 0.05% of the Fund's net assets. |
| (12) | Issuer is in default with respect to interest and/or principal payments and is non-income producing. |
| (13) | Security converts to variable rate after the indicated fixed-rate coupon period. |
| (14) | Perpetual security with no stated maturity date but may be subject to calls by the issuer. |
| (15) | When-issued security. |
| (16) | Senior floating-rate loans (Senior Loans) often require prepayments from excess cash flows or permit the borrowers to repay at their election. The degree to which borrowers repay, whether as a contractual requirement or at their election, cannot be predicted with accuracy. As a result, the actual remaining maturity may be substantially less than the stated maturities shown. However, Senior Loans will typically have an expected average life of approximately two to four years. Senior Loans typically have rates of interest which are redetermined periodically by reference to a base lending rate, plus a spread. These base lending rates are primarily the Secured Overnight Financing Rate (“SOFR”) and secondarily, the prime rate offered by one or more major United States banks (the “Prime Rate”). Base lending rates may be subject to a floor, or minimum rate. Rates for SOFR are generally 1 or 3-month tenors and may also be subject to a credit spread adjustment. Senior Loans are generally subject to contractual restrictions that must be satisfied before they can be bought or sold. |
| (17) | This Senior Loan will settle after September 30, 2024, at which time the interest rate will be determined. |
| (18) | Unfunded or partially unfunded loan commitments. The Fund may enter into certain loan agreements all or a portion of which may be unfunded. The Fund is obligated to fund these commitments at the borrower's discretion. The stated interest rate reflects the weighted average of the reference rate and spread for the funded portion, if any, and the commitment fees on the portion of the loan that is unfunded. At September 30, 2024, the total value of unfunded loan commitments is $22,897. See Note 1F for description. |
| (19) | Build America Bond. Represents taxable municipal obligation issued pursuant to the American Recovery and Reinvestment Act of 2009 or other legislation providing for the issuance of taxable municipal debt on which the issuer receives federal support. |
| (20) | TBA (To Be Announced) securities are purchased or sold on a forward commitment basis with an approximate principal amount and maturity date. The actual principal amount, which is not expected to differ significantly from the commitment amount, and maturity date are determined upon settlement. |
| (21) | May be deemed to be an affiliated company (see Note 8). |
| (22) | May be deemed to be an affiliated investment company. The rate shown is the annualized seven-day yield as of September 30, 2024. |
| (23) | Represents investment of cash collateral received in connection with securities lending. |
Forward Foreign Currency Exchange Contracts (OTC)
| Currency Purchased | Currency Sold | Counterparty | Settlement
Date | Unrealized
Appreciation | Unrealized
(Depreciation) |
| USD | 160,291 | CAD | 219,830 | UBS AG | 10/22/24 | $ — | $(2,331) |
| USD | 190,577 | EUR | 174,350 | UBS AG | 10/22/24 | — | (3,661) |
| | | | | | | $ — | $(5,992) |
12
See Notes to Financial Statements.
Calvert
Balanced Fund
September 30, 2024
Schedule of Investments — continued
Futures Contracts
| Description | Number of
Contracts | Position | Expiration
Date | Notional
Amount | Value/
Unrealized
Appreciation
(Depreciation) |
| Interest Rate Futures | | | | | |
| U.S. 2-Year Treasury Note | 392 | Long | 12/31/24 | $81,630,938 | $164,291 |
| U.S. 5-Year Treasury Note | 296 | Long | 12/31/24 | 32,525,312 | (75,216) |
| U.S. 10-Year Treasury Note | 31 | Long | 12/19/24 | 3,542,719 | 6,423 |
| U.S. Long Treasury Bond | 111 | Long | 12/19/24 | 13,784,813 | (29,201) |
| U.S. Ultra-Long Treasury Bond | 22 | Long | 12/19/24 | 2,928,063 | (11,111) |
| U.S. 10-Year Treasury Note | (6) | Short | 12/19/24 | (685,688) | (942) |
| U.S. Ultra 10-Year Treasury Note | (102) | Short | 12/19/24 | (12,066,281) | 3,035 |
| U.S. Ultra-Long Treasury Bond | (11) | Short | 12/19/24 | (1,464,031) | 5,834 |
| | | | | | $63,113 |
Restricted Securities
| Description | Acquisition Dates | Cost |
| First Analysis Private Equity Fund IV LP | 2/25/02-7/6/11 | $0 |
| GEEMF Partners LP | 2/28/97 | 0 |
| Global Environment Emerging Markets Fund LP | 1/14/94-2/1/95 | 0 |
| Learn Capital Venture Partners III LP, Common Stock | 8/30/16-3/1/23 | 873,242 |
| Lumni, Inc., Series B, Preferred | 8/8/13 | 116,367 |
| Neighborhood Bancorp, Class A, Common Stock | 6/25/97 | 100,001 |
| Solstice Capital LP | 6/26/01-6/17/08 | 0 |
| Wind Harvest International, Inc., Preferred | 5/16/94 | 100,000 |
| Abbreviations: |
| ADR | – American Depositary Receipt |
| DIP | – Debtor In Possession |
| OTC | – Over-the-counter |
| SOFR | – Secured Overnight Financing Rate |
| STACR | – Structured Agency Credit Risk |
| TBA | – To Be Announced |
| Currency Abbreviations: |
| CAD | – Canadian Dollar |
| EUR | – Euro |
| USD | – United States Dollar |
13
See Notes to Financial Statements.
Calvert
Bond Fund
September 30, 2024
| Asset-Backed Securities — 12.2% |
| Security | Principal
Amount*
(000's omitted) | Value |
| AASET, Series 2024-1A, Class A1, 6.261%, 5/16/49(1) | | 3,690 | $ 3,841,848 |
| Coinstar Funding LLC, Series 2017-1A, Class A2, 5.216%, 4/25/47(1) | | 5,486 | 4,883,655 |
| Cologix Canadian Issuer LP, Series 2022-1CAN, Class C, 7.74%, 1/25/52(1) | CAD | 5,300 | 3,735,139 |
| Cologix Data Centers U.S. Issuer LLC: | | | |
| Series 2021-1A, Class A2, 3.30%, 12/26/51(1) | | 13,910 | 13,194,012 |
| Series 2021-1A, Class B, 3.79%, 12/26/51(1) | | 5,985 | 5,673,286 |
| Conn's Receivables Funding LLC, Series 2022-A, Class C, 0.00%, 12/15/26(1) | | 5,157 | 4,854,062 |
| DataBank Issuer LLC, Series 2021-2A, Class A2, 2.40%, 10/25/51(1) | | 5,184 | 4,894,181 |
| DB Master Finance LLC: | | | |
| Series 2017-1A, Class A2II, 4.03%, 11/20/47(1) | | 645 | 633,928 |
| Series 2021-1A, Class A2I, 2.045%, 11/20/51(1) | | 8,884 | 8,428,673 |
| Diamond Infrastructure Funding LLC: | | | |
| Series 2021-1A, Class A, 1.76%, 4/15/49(1) | | 5,977 | 5,565,812 |
| Series 2021-1A, Class C, 3.475%, 4/15/49(1) | | 1,193 | 1,108,993 |
| Diamond Issuer LLC, Series 2021-1A, Class A, 2.305%, 11/20/51(1) | | 13,147 | 12,273,061 |
| Driven Brands Funding LLC, Series 2019-1A, Class A2, 4.641%, 4/20/49(1) | | 5,397 | 5,350,675 |
| Enterprise Fleet Financing LLC, Series 2023-1, Class A2, 5.51%, 1/22/29(1) | | 8,563 | 8,611,084 |
| Federal National Mortgage Association Grantor Trust, Series 2017-T1, Class A, 2.898%, 6/25/27 | | 1,939 | 1,870,290 |
| FHF Issuer Trust, Series 2024-2A, Class A2, 5.89%, 6/15/30(1) | | 7,775 | 7,913,557 |
| FMC GMSR Issuer Trust, Series 2022-GT2, Class A, 7.90%, 7/25/27(1) | | 6,200 | 6,399,004 |
| FOCUS Brands Funding LLC, Series 2017-1A, Class A2II, 5.093%, 4/30/47(1) | | 1,155 | 1,151,693 |
| GLS Auto Select Receivables Trust, Series 2024-2A, Class A2, 5.58%, 6/17/30(1) | | 3,595 | 3,643,019 |
| Goddard Funding LLC, Series 2024-1A, Class A2, 6.834%, 10/30/54(1) | | 12,549 | 12,845,360 |
| GoodLeap Sustainable Home Solutions Trust: | | | |
| Series 2021-5CS, Class A, 2.31%, 10/20/48(1) | | 3,092 | 2,563,518 |
| Series 2022-2CS, Class A, 4.00%, 4/20/49(1) | | 8,561 | 7,747,775 |
| Horizon Aircraft Finance I Ltd., Series 2018-1, Class A, 4.458%, 12/15/38(1) | | 2,245 | 2,078,434 |
| Horizon Aircraft Finance II Ltd., Series 2019-1, Class A, 3.721%, 7/15/39(1) | | 1,011 | 951,966 |
| Horizon Aircraft Finance IV Ltd., Series 2024-1, Class A, 5.375%, 9/15/49(1) | | 14,000 | 14,004,439 |
| Jersey Mike's Funding LLC, Series 2019-1A, Class A2, 4.433%, 2/15/50(1) | | 3,602 | 3,544,967 |
| JPMorgan Chase Bank NA, Series 2021-3, Class B, 0.76%, 2/26/29(1) | | 566 | 558,382 |
| Security | Principal
Amount*
(000's omitted) | Value |
| LAD Auto Receivables Trust: | | | |
| Series 2023-1A, Class A2, 5.68%, 10/15/26(1) | | 675 | $ 675,061 |
| Series 2023-4A, Class A2, 6.21%, 10/15/26(1) | | 1,238 | 1,240,876 |
| Series 2024-1A, Class A3, 5.23%, 1/18/28(1) | | 6,135 | 6,179,872 |
| Loanpal Solar Loan Ltd., Series 2020-3GS, Class A, 2.47%, 12/20/47(1) | | 1,787 | 1,541,074 |
| Lunar Aircraft Ltd.: | | | |
| Series 2020-1A, Class B, 4.335%, 2/15/45(1) | | 561 | 534,989 |
| Series 2020-1A, Class C, 6.413%, 2/15/45(1) | | 368 | 346,766 |
| Marlette Funding Trust: | | | |
| Series 2023-1A, Class B, 6.50%, 4/15/33(1) | | 1,519 | 1,527,854 |
| Series 2023-3A, Class B, 6.71%, 9/15/33(1) | | 8,450 | 8,545,433 |
| MetroNet Infrastructure Issuer LLC, Series 2024-1A, Class A2, 6.23%, 4/20/54(1) | | 5,129 | 5,294,216 |
| Mosaic Solar Loan Trust: | | | |
| Series 2019-1A, Class A, 4.37%, 12/21/43(1) | | 1,527 | 1,458,924 |
| Series 2019-2A, Class B, 3.28%, 9/20/40(1) | | 4,990 | 4,542,396 |
| Series 2020-1A, Class A, 2.10%, 4/20/46(1) | | 530 | 472,850 |
| Series 2020-1A, Class B, 3.10%, 4/20/46(1) | | 444 | 391,846 |
| Series 2020-2A, Class A, 1.44%, 8/20/46(1) | | 1,087 | 932,306 |
| Series 2020-2A, Class B, 2.21%, 8/20/46(1) | | 1,354 | 1,124,921 |
| Series 2022-2A, Class B, 5.13%, 1/21/53(1) | | 4,992 | 4,512,178 |
| Mosaic Solar Loans LLC, Series 2017-1A, Class A, 4.45%, 6/20/42(1) | | 76 | 74,437 |
| Navigator Aviation Ltd., Series 2024-1, Class A, 5.40%, 8/15/49(1) | | 13,187 | 13,201,137 |
| Neighborly Issuer LLC, Series 2021-1A, Class A2, 3.584%, 4/30/51(1) | | 5,249 | 4,872,877 |
| NextGear Floorplan Master Owner Trust, Series 2024-1A, Class A2, 5.12%, 3/15/29(1) | | 5,975 | 6,099,694 |
| NRZ Excess Spread-Collateralized Notes, Series 2021-GNT1, Class A, 3.474%, 11/25/26(1) | | 2,768 | 2,661,297 |
| OneMain Financial Issuance Trust, Series 2022-S1, Class A, 4.13%, 5/14/35(1) | | 12,113 | 12,054,022 |
| Oportun Funding XIV LLC, Series 2021-A, Class B, 1.76%, 3/8/28(1) | | 406 | 397,728 |
| Oportun Issuance Trust: | | | |
| Series 2021-B, Class A, 1.47%, 5/8/31(1) | | 4,829 | 4,688,602 |
| Series 2021-B, Class B, 1.96%, 5/8/31(1) | | 1,295 | 1,260,105 |
| Series 2021-C, Class A, 2.18%, 10/8/31(1) | | 30,475 | 29,581,229 |
| Series 2022-3, Class B, 8.533%, 1/8/30(1) | | 1,955 | 1,959,513 |
| Oscar U.S. Funding XVI LLC, Series 2024-1A, Class A2, 5.48%, 2/10/27(1) | | 14,852 | 14,926,365 |
| Pagaya AI Debt Selection Trust: | | | |
| Series 2021-2, 3.00%, 1/25/29(1) | | 626 | 616,730 |
| Series 2021-5, Class B, 2.63%, 8/15/29(1) | | 118 | 117,482 |
| Series 2021-5, Class C, 3.93%, 8/15/29(1) | | 2,903 | 2,817,011 |
| Series 2021-HG1, Class A, 1.22%, 1/16/29(1) | | 318 | 314,238 |
| Planet Fitness Master Issuer LLC: | | | |
| Series 2019-1A, Class A2, 3.858%, 12/5/49(1) | | 3,062 | 2,884,814 |
| Series 2024-1A, Class A2I, 5.765%, 6/5/54(1) | | 11,096 | 11,378,588 |
14
See Notes to Financial Statements.
Calvert
Bond Fund
September 30, 2024
Schedule of Investments — continued
| Security | Principal
Amount*
(000's omitted) | Value |
| Retained Vantage Data Centers Issuer LLC, Series 2023-1A, Class A2A, 5.00%, 9/15/48(1) | | 11,853 | $ 11,818,140 |
| SBA Tower Trust, Series 2014-2A, Class C, 3.869% to 10/15/24, 10/15/49(1)(2) | | 3,300 | 3,297,746 |
| ServiceMaster Funding LLC: | | | |
| Series 2020-1, Class A2I, 2.841%, 1/30/51(1) | | 1,902 | 1,759,525 |
| Series 2020-1, Class A2II, 3.337%, 1/30/51(1) | | 2,239 | 1,983,907 |
| SERVPRO Master Issuer LLC: | | | |
| Series 2019-1A, Class A2, 3.882%, 10/25/49(1) | | 10,313 | 10,072,287 |
| Series 2024-1A, Class A2, 6.174%, 1/25/54(1) | | 3,592 | 3,699,470 |
| SoFi Consumer Loan Program Trust, Series 2023-1S, Class A, 5.81%, 5/15/31(1) | | 45 | 44,904 |
| SolarCity LMC I LLC, Series 2013-1, Class A, 4.80%, 11/20/38(1) | | 707 | 689,851 |
| Sonic Capital LLC, Series 2020-1A, Class A2I, 3.845%, 1/20/50(1) | | 4,422 | 4,297,285 |
| SpringCastle America Funding LLC, Series 2020-AA, Class A, 1.97%, 9/25/37(1) | | 2,203 | 2,045,279 |
| Stack Infrastructure Issuer LLC, Series 2020-1A, Class A2, 1.893%, 8/25/45(1) | | 4,099 | 3,979,522 |
| Subway Funding LLC, Series 2024-3A, Class A2I, 5.246%, 7/30/54(1) | | 4,498 | 4,507,509 |
| Sunnova Helios II Issuer LLC: | | | |
| Series 2019-AA, Class A, 3.75%, 6/20/46(1) | | 1,652 | 1,510,046 |
| Series 2021-B, Class A, 1.62%, 7/20/48(1) | | 8,076 | 7,140,956 |
| Sunnova Helios IV Issuer LLC, Series 2020-AA, Class A, 2.98%, 6/20/47(1) | | 2,908 | 2,607,184 |
| Sunnova Helios V Issuer LLC, Series 2021-A, Class A, 1.80%, 2/20/48(1) | | 816 | 626,597 |
| Sunnova Helios X Issuer LLC, Series 2022-C, Class B, 5.60%, 11/22/49(1) | | 6,295 | 5,960,434 |
| Sunnova Helios XII Issuer LLC: | | | |
| Series 2023-B, Class A, 5.30%, 8/22/50(1) | | 8,403 | 8,281,367 |
| Series 2023-B, Class B, 5.60%, 8/22/50(1) | | 2,666 | 2,564,266 |
| Sunnova Hestia I Issuer LLC, Series 2023-GRID1, Class 1A, 5.75%, 12/20/50(1) | | 2,817 | 2,910,767 |
| Sunnova Sol II Issuer LLC: | | | |
| Series 2020-2A, Class A, 2.73%, 11/1/55(1) | | 5,975 | 4,874,452 |
| Series 2020-2A, Class B, 5.47%, 11/1/55(1) | | 1,996 | 1,600,049 |
| Sunnova Sol Issuer LLC: | | | |
| Series 2020-1A, Class A, 3.35%, 2/1/55(1) | | 1,269 | 1,095,785 |
| Series 2020-1A, Class B, 5.54%, 2/1/55(1) | | 4,055 | 3,347,530 |
| Sunrun Atlas Issuer LLC, Series 2019-2, Class A, 3.61%, 2/1/55(1) | | 2,522 | 2,364,308 |
| Sunrun Demeter Issuer LLC, Series 2021-2A, Class A, 2.27%, 1/30/57(1) | | 3,624 | 3,146,990 |
| Sunrun Jupiter Issuer LLC, Series 2022-1A, Class A, 4.75%, 7/30/57(1) | | 23,815 | 23,008,085 |
| Sunrun Vulcan Issuer LLC, Series 2021-1A, Class A, 2.46%, 1/30/52(1) | | 2,930 | 2,440,492 |
| Sunrun Xanadu Issuer LLC, Series 2019-1A, Class A, 3.98%, 6/30/54(1) | | 1,067 | 1,014,743 |
| Security | Principal
Amount*
(000's omitted) | Value |
| Theorem Funding Trust, Series 2022-3A, Class A, 7.60%, 4/15/29(1) | | 716 | $ 723,145 |
| U.S. Small Business Administration, Series 2017-20E, Class 1, 2.88%, 5/1/37 | | 2,569 | 2,415,079 |
| Vantage Data Centers LLC: | | | |
| Series 2020-2A, Class A2, 1.992%, 9/15/45(1) | | 10,830 | 9,943,985 |
| Series 2021-1A, Class A2, 2.165%, 10/15/46(1) | | 3,726 | 3,537,213 |
| Vivint Solar Financing VII LLC, Series 2020-1A, Class A, 2.21%, 7/31/51(1) | | 5,287 | 4,714,408 |
| Willis Engine Structured Trust V: | | | |
| Series 2020-A, Class B, 4.212%, 3/15/45(1) | | 1,840 | 1,700,122 |
| Series 2020-A, Class C, 6.657%, 3/15/45(1) | | 480 | 452,237 |
Total Asset-Backed Securities
(identified cost $454,086,163) | | | $443,723,909 |
| Collateralized Mortgage Obligations — 4.8% |
| Security | Principal
Amount
(000's omitted) | Value |
| Bellemeade Re Ltd., Series 2021-3A, Class A2, 6.28%, (30-day SOFR Average + 1.00%), 9/25/31(1)(3) | $ | 3,470 | $ 3,473,120 |
| Cascade MH Asset Trust, Series 2022-MH1, Class A, 4.25% to 7/25/27, 8/25/54(1)(2) | | 7,226 | 6,785,019 |
| Champs Trust: | | | |
| Series 2024-1, Class A, 8.39%, 7/25/59(1) | | 9,917 | 10,333,274 |
| Series 2024-2, Class A, 14.782% to 9/25/27, 11/25/59(1) | | 6,564 | 6,871,254 |
| CHNGE Mortgage Trust: | | | |
| Series 2023-2, Class A3, 7.436% to 5/25/26, 6/25/58(1)(2) | | 3,993 | 4,081,192 |
| Series 2023-4, Class A1, 7.573% to 8/25/26, 9/25/58(1)(2) | | 5,209 | 5,366,898 |
| Federal Home Loan Mortgage Corp., Series 5324, Class MZ, 6.00%, 7/25/53 | | 695 | 734,515 |
| Federal Home Loan Mortgage Corp. STACR REMICS Trust: | | | |
| Series 2019-DNA3, Class B2, 13.545%, (30-day SOFR Average + 8.264%), 7/25/49(1)(3) | | 2,905 | 3,337,495 |
| Series 2021-DNA2, Class B1, 8.68%, (30-day SOFR Average + 3.40%), 8/25/33(1)(3) | | 7,095 | 8,004,316 |
| Series 2021-DNA2, Class B2, 11.28%, (30-day SOFR Average + 6.00%), 8/25/33(1)(3) | | 4,000 | 4,729,633 |
| Series 2022-DNA2, Class M1A, 6.58%, (30-day SOFR Average + 1.30%), 2/25/42(1)(3) | | 3,025 | 3,040,299 |
| Series 2022-HQA1, Class M1A, 7.38%, (30-day SOFR Average + 2.10%), 3/25/42(1)(3) | | 740 | 748,618 |
| Federal National Mortgage Association Connecticut Avenue Securities: | | | |
| Series 2019-R01, Class 2B1, 9.745%, (30-day SOFR Average + 4.464%), 7/25/31(1)(3) | | 10,365 | 11,242,232 |
| Series 2019-R03, Class 1B1, 9.495%, (30-day SOFR Average + 4.214%), 9/25/31(1)(3) | | 4,093 | 4,369,892 |
| Series 2019-R06, Class 2B1, 9.145%, (30-day SOFR Average + 3.864%), 9/25/39(1)(3) | | 18,396 | 19,217,871 |
15
See Notes to Financial Statements.
Calvert
Bond Fund
September 30, 2024
Schedule of Investments — continued
| Security | Principal
Amount
(000's omitted) | Value |
| Federal National Mortgage Association Connecticut Avenue Securities: (continued) | | | |
| Series 2019-R07, Class 1B1, 8.795%, (30-day SOFR Average + 3.514%), 10/25/39(1)(3) | $ | 8,678 | $ 9,029,889 |
| Series 2020-R01, Class 1B1, 8.645%, (30-day SOFR Average + 3.364%), 1/25/40(1)(3) | | 3,000 | 3,123,432 |
| Series 2020-R02, Class 2B1, 8.395%, (30-day SOFR Average + 3.114%), 1/25/40(1)(3) | | 4,570 | 4,700,134 |
| Series 2021-R01, Class 1B2, 11.28%, (30-day SOFR Average + 6.00%), 10/25/41(1)(3) | | 10,132 | 10,762,471 |
| Series 2021-R02, Class 2B1, 8.58%, (30-day SOFR Average + 3.30%), 11/25/41(1)(3) | | 1,647 | 1,704,486 |
| Government National Mortgage Association: | | | |
| Series 2023-84, Class DL, 6.00%, 6/20/53 | | 2,863 | 3,033,908 |
| Series 2023-84, Class MW, 6.00%, 6/20/53 | | 2,992 | 3,174,093 |
| Series 2023-116, Class CY, 6.00%, 8/20/53 | | 7,271 | 7,629,874 |
| Series 2023-149, Class S, 5.414%, (21.45% - 30-day SOFR Average x 3.00), 10/20/53(4) | | 1,763 | 1,943,983 |
| Series 2024-44, Class ML, 6.00%, 3/20/54 | | 1,000 | 1,063,995 |
| Series 2024-59, Class LG, 6.00%, 4/20/54 | | 1,500 | 1,611,425 |
| Home Re Ltd., Series 2021-1, Class M2, 8.245%, (30-day SOFR Average + 2.964%), 7/25/33(1)(3) | | 2,500 | 2,521,424 |
| LHOME Mortgage Trust: | | | |
| Series 2023-RTL3, Class A1, 8.00% to 3/25/26, 8/25/28(1)(2) | | 4,911 | 5,026,017 |
| Series 2023-RTL4, Class A1, 7.628% to 8/25/25, 11/25/28(1)(2) | | 4,000 | 4,096,884 |
| Series 2024-RTL1, Class A1, 7.017% to 8/25/26, 1/25/29(1)(2) | | 2,850 | 2,898,441 |
| PNMAC GMSR Issuer Trust: | | | |
| Series 2021-FT1, Class A, 7.97%, (1 mo. SOFR + 3.115%), 3/25/26(1)(3) | | 1,360 | 1,366,924 |
| Series 2022-GT1, Class A, 9.53%, (30-day SOFR Average + 4.25%), 5/25/27(1)(3) | | 8,523 | 8,662,124 |
| Series 2024-GT1, Class A, 8.055%, (1 mo. SOFR + 3.20%), 3/25/29(1)(3) | | 7,480 | 7,580,967 |
Total Collateralized Mortgage Obligations
(identified cost $165,288,328) | | | $172,266,099 |
| Commercial Mortgage-Backed Securities — 9.3% |
| Security | Principal
Amount
(000's omitted) | Value |
| BAMLL Commercial Mortgage Securities Trust: | | | |
| Series 2019-BPR, Class DNM, 3.843%, 11/5/32(1)(5) | $ | 9,685 | $ 6,319,580 |
| Series 2019-BPR, Class FNM, 3.843%, 11/5/32(1)(5) | | 4,805 | 1,059,685 |
| BPR Trust, Series 2022-SSP, Class A, 8.097%, (1 mo. SOFR + 3.00%), 5/15/39(1)(3) | | 9,995 | 10,037,803 |
| BX Commercial Mortgage Trust: | | | |
| Series 2021-VOLT, Class B, 6.161%, (1 mo. SOFR + 1.064%), 9/15/36(1)(3) | | 10,584 | 10,492,747 |
| Series 2021-VOLT, Class C, 6.311%, (1 mo. SOFR + 1.214%), 9/15/36(1)(3) | | 8,166 | 8,085,758 |
| Security | Principal
Amount
(000's omitted) | Value |
| BX Commercial Mortgage Trust: (continued) | | | |
| Series 2021-VOLT, Class D, 6.861%, (1 mo. SOFR + 1.764%), 9/15/36(1)(3) | $ | 7,717 | $ 7,642,912 |
| CSMC Trust, Series 2021-BPNY, Class A, 8.926%, (1 mo. SOFR + 3.829%), 8/15/26(1)(3) | | 3,272 | 2,995,507 |
| Extended Stay America Trust: | | | |
| Series 2021-ESH, Class A, 6.292%, (1 mo. SOFR + 1.194%), 7/15/38(1)(3) | | 11,756 | 11,751,101 |
| Series 2021-ESH, Class B, 6.592%, (1 mo. SOFR + 1.494%), 7/15/38(1)(3) | | 2,479 | 2,475,765 |
| Series 2021-ESH, Class C, 6.912%, (1 mo. SOFR + 1.814%), 7/15/38(1)(3) | | 11,479 | 11,468,071 |
| Federal Home Loan Mortgage Corp., Series 2024-P016, Class A1, 4.759%, 3/25/29(5) | | 6,255 | 6,350,434 |
| Federal Home Loan Mortgage Corp. Multifamily Structured Pass-Through Certificates: | | | |
| Series KG02, Class A2, 2.412%, 8/25/29 | | 19,890 | 18,562,293 |
| Series KG08, Class A2, 4.134%, 5/25/33(5) | | 32,787 | 32,695,031 |
| Series KSG1, Class A2, 1.503%, 9/25/30 | | 4,386 | 3,821,095 |
| Series KW06, Class A2, 3.80%, 6/25/28(5) | | 5,335 | 5,293,416 |
| Series W5FX, Class AFX, 3.336%, 4/25/28(5) | | 1,896 | 1,853,476 |
| Federal National Mortgage Association: | | | |
| Series 2017-M13, Class A2, 3.033%, 9/25/27(5) | | 4,392 | 4,266,271 |
| Series 2018-M4, Class A2, 3.159%, 3/25/28(5) | | 4,906 | 4,764,397 |
| Series 2018-M13, Class A2, 3.866%, 9/25/30(5) | | 12,948 | 12,712,230 |
| Series 2019-M1, Class A2, 3.661%, 9/25/28(5) | | 10,732 | 10,573,286 |
| Series 2019-M22, Class A2, 2.522%, 8/25/29 | | 10,704 | 10,011,744 |
| Series 2020-M1, Class A2, 2.444%, 10/25/29 | | 13,443 | 12,441,866 |
| Series 2023-M1S, Class A2, 4.651%, 4/25/33(5) | | 16,881 | 17,229,355 |
| Federal National Mortgage Association Multifamily Connecticut Avenue Securities Trust: | | | |
| Series 2019-01, Class M10, 8.645%, (30-day SOFR Average + 3.364%), 10/25/49(1)(3) | | 7,627 | 7,682,764 |
| Series 2020-01, Class M10, 9.145%, (30-day SOFR Average + 3.864%), 3/25/50(1)(3) | | 5,898 | 5,983,484 |
| FS Commercial Mortgage Trust, Series 2023-4SZN, Class A, 7.066%, 11/10/39(1) | | 5,322 | 5,588,962 |
| Great Wolf Trust, Series 2024-WLF2, Class A, 6.788%, (1 mo. SOFR + 1.691%), 5/15/41(1)(3) | | 10,857 | 10,875,837 |
| Hawaii Hotel Trust, Series 2019-MAUI, Class A, 6.544%, (1 mo. SOFR + 1.447%), 5/15/38(1)(3) | | 16,052 | 16,032,081 |
| HLTN Commercial Mortgage Trust: | | | |
| Series 2024-DPLO, Class A, 6.738%, (1 mo. SOFR + 1.642%), 6/15/41(1)(3) | | 6,895 | 6,894,179 |
| Series 2024-DPLO, Class C, 7.637%, (1 mo. SOFR + 2.54%), 6/15/41(1)(3) | | 6,660 | 6,677,005 |
| HYT Commercial Mortgage Trust, Series 2024-RGCY, Class B, 7.437%, (1 mo. SOFR + 2.341%), 9/15/41(1)(3) | | 7,649 | 7,658,658 |
| JPMorgan Chase Commercial Mortgage Securities Trust: | | | |
| Series 2014-DSTY, Class B, 3.771%, 6/10/27(1) | | 2,335 | 294,023 |
| Series 2014-DSTY, Class C, 3.931%, 6/10/27(1)(5) | | 385 | 20,207 |
16
See Notes to Financial Statements.
Calvert
Bond Fund
September 30, 2024
Schedule of Investments — continued
| Security | Principal
Amount
(000's omitted) | Value |
| JW Commercial Mortgage Trust, Series 2024-MRCO, Class B, 7.023%, (1 mo. SOFR + 1.941%), 6/15/39(1)(3) | $ | 7,420 | $ 7,433,930 |
| NYC Trust, Series 2024-3ELV, Class A, 7.088%, (1 mo. SOFR + 1.991%), 8/15/29(1)(3) | | 11,031 | 11,101,811 |
| ORL Trust, Series 2023-GLKS, Class A, 7.447%, (1 mo. SOFR + 2.35%), 10/19/36(1)(3) | | 4,994 | 5,023,629 |
| SDR Commercial Mortgage Trust, Series 2024-DSNY, Class A, 6.488%, (1 mo. SOFR + 1.392%), 5/15/39(1)(3) | | 10,331 | 10,301,688 |
| TX Trust: | | | |
| Series 2024-HOU, Class A, 6.688%, (1 mo. SOFR + 1.591%), 6/15/39(1)(3) | | 4,740 | 4,708,849 |
| Series 2024-HOU, Class D, 8.336%, (1 mo. SOFR + 3.239%), 6/15/39(1)(3) | | 4,000 | 3,980,416 |
| Series 2024-HOU, Class E, 9.484%, (1 mo. SOFR + 4.387%), 6/15/39(1)(3) | | 2,859 | 2,848,081 |
| TYSN Mortgage Trust, Series 2023-CRNR, Class A, 6.799%, 12/10/33(1)(5) | | 8,652 | 9,211,475 |
| WFLD Mortgage Trust: | | | |
| Series 2014-MONT, Class B, 3.88%, 8/10/31(1)(5) | | 1,330 | 1,063,623 |
| Series 2014-MONT, Class C, 3.88%, 8/10/31(1)(5) | | 2,700 | 1,644,555 |
Total Commercial Mortgage-Backed Securities
(identified cost $349,775,256) | | | $337,929,080 |
| Security | Principal
Amount
(000's omitted) | Value |
| Communications — 0.0%(6) | |
| Liberty Media Corp.-Liberty Formula One, 2.25%, 8/15/27 | $ | 900 | $ 993,517 |
| | | | $ 993,517 |
| Consumer, Cyclical — 0.0%(6) | |
| Ford Motor Co., 0.00%, 3/15/26 | $ | 875 | $ 859,688 |
| | | | $ 859,688 |
| Consumer, Non-cyclical — 0.1% | |
| BioMarin Pharmaceutical, Inc., 1.25%, 5/15/27(7) | $ | 900 | $ 858,825 |
| Exact Sciences Corp., 1.75%, 4/15/31(1) | | 1,000 | 1,016,346 |
| Jazz Investments I Ltd., 2.00%, 6/15/26 | | 900 | 900,225 |
| | | | $2,775,396 |
| Energy — 0.0%(6) | |
| NextEra Energy Partners LP, 2.50%, 6/15/26(1)(7) | $ | 1,100 | $1,038,078 |
| | | | $1,038,078 |
| Technology — 0.1% | |
| Akamai Technologies, Inc., 1.125%, 2/15/29 | $ | 900 | $916,650 |
| ON Semiconductor Corp., 0.50%, 3/1/29(7) | | 900 | 913,275 |
| Security | Principal
Amount
(000's omitted) | Value |
| Technology (continued) | |
| Super Micro Computer, Inc., 0.00%, 3/1/29(1) | $ | 800 | $ 647,600 |
| | | | $ 2,477,525 |
Total Convertible Bonds
(identified cost $8,199,880) | | | $ 8,144,204 |
| Security | Principal
Amount
(000’s omitted) | Value |
| Basic Materials — 0.3% | |
| Celanese U.S. Holdings LLC, 6.55%, 11/15/30 | $ | 5,100 | $ 5,500,044 |
| Compass Minerals International, Inc., 6.75%, 12/1/27(1)(7) | | 7,090 | 7,062,785 |
| | | | $ 12,562,829 |
| Communications — 0.8% | |
| Arches Buyer, Inc., 4.25%, 6/1/28(1)(7) | $ | 5,775 | $ 5,319,360 |
| Charter Communications Operating LLC/Charter Communications Operating Capital, 4.80%, 3/1/50 | | 24,621 | 18,861,353 |
| SES GLOBAL Americas Holdings, Inc., 5.30%, 3/25/44(1) | | 2,440 | 1,963,448 |
| SES SA, 5.30%, 4/4/43(1) | | 1,457 | 1,125,083 |
| | | | $27,269,244 |
| Consumer, Cyclical — 3.4% | |
| American Airlines, Inc./AAdvantage Loyalty IP Ltd., 5.50%, 4/20/26(1) | $ | 6,418 | $6,404,789 |
| Aptiv PLC/Aptiv Global Financing DAC: | | | |
| 4.65%, 9/13/29 | | 6,220 | 6,193,892 |
| 5.15%, 9/13/34(7) | | 5,322 | 5,242,241 |
| Delta Air Lines, Inc./SkyMiles IP Ltd.: | | | |
| 4.50%, 10/20/25(1) | | 2,125 | 2,112,416 |
| 4.75%, 10/20/28(1) | | 4,954 | 4,949,597 |
| Ferrellgas LP/Ferrellgas Finance Corp., 5.875%, 4/1/29(1) | | 8,000 | 7,492,959 |
| Ford Motor Credit Co. LLC: | | | |
| 5.125%, 6/16/25 | | 5,425 | 5,424,146 |
| 5.303%, 9/6/29 | | 4,864 | 4,843,653 |
| 7.122%, 11/7/33 | | 4,439 | 4,800,597 |
| 7.20%, 6/10/30 | | 2,030 | 2,188,164 |
| 7.35%, 11/4/27 | | 6,678 | 7,092,857 |
| 7.35%, 3/6/30 | | 4,488 | 4,862,017 |
| General Motors Financial Co., Inc.: | | | |
| 5.60%, 6/18/31 | | 7,500 | 7,704,854 |
| 5.80%, 1/7/29 | | 4,030 | 4,192,973 |
| 5.95%, 4/4/34 | | 5,585 | 5,782,316 |
| Hyundai Capital America, 5.30%, 6/24/29(1) | | 3,404 | 3,506,235 |
| Lithia Motors, Inc.: | | | |
| 3.875%, 6/1/29(1)(7) | | 4,400 | 4,109,725 |
| 4.375%, 1/15/31(1) | | 7,749 | 7,216,479 |
17
See Notes to Financial Statements.
Calvert
Bond Fund
September 30, 2024
Schedule of Investments — continued
| Security | Principal
Amount
(000’s omitted) | Value |
| Consumer, Cyclical (continued) | |
| PetSmart, Inc./PetSmart Finance Corp., 4.75%, 2/15/28(1) | $ | 8,191 | $ 7,860,478 |
| Tapestry, Inc.: | | | |
| 7.00%, 11/27/26 | | 1,031 | 1,067,085 |
| 7.35%, 11/27/28 | | 7,907 | 8,312,565 |
| WarnerMedia Holdings, Inc., 4.279%, 3/15/32(7) | | 14,616 | 12,988,651 |
| | | | $ 124,348,689 |
| Consumer, Non-cyclical — 2.2% | |
| AbbVie, Inc., 5.50%, 3/15/64 | $ | 4,761 | $ 5,087,777 |
| Ashtead Capital, Inc.: | | | |
| 4.00%, 5/1/28(1) | | 514 | 501,439 |
| 4.25%, 11/1/29(1) | | 3,524 | 3,430,631 |
| 5.95%, 10/15/33(1) | | 7,500 | 7,904,511 |
| Bristol-Myers Squibb Co., 5.65%, 2/22/64 | | 8,954 | 9,496,446 |
| Centene Corp.: | | | |
| 2.50%, 3/1/31 | | 6,085 | 5,235,386 |
| 3.375%, 2/15/30 | | 2,435 | 2,245,731 |
| 4.25%, 12/15/27 | | 2,693 | 2,647,061 |
| Conservation Fund, 3.474%, 12/15/29 | | 3,965 | 3,725,393 |
| CVS Pass-Through Trust, 6.036%, 12/10/28 | | 898 | 914,030 |
| Doris Duke Charitable Foundation, 2.345%, 7/1/50 | | 10,210 | 6,505,589 |
| Ford Foundation, 2.415%, 6/1/50 | | 6,560 | 4,339,092 |
| Kaiser Foundation Hospitals, 3.15%, 5/1/27 | | 4,091 | 4,010,979 |
| Kroger Co.: | | | |
| 4.90%, 9/15/31 | | 6,651 | 6,696,245 |
| 5.00%, 9/15/34 | | 4,319 | 4,356,710 |
| LifePoint Health, Inc., 9.875%, 8/15/30(1) | | 6,000 | 6,613,525 |
| President and Fellows of Harvard College, 3.619%, 10/1/37 | | 1,000 | 920,626 |
| Smithfield Foods, Inc.: | | | |
| 2.625%, 9/13/31(1) | | 4,632 | 3,927,617 |
| 3.00%, 10/15/30(1) | | 1,114 | 999,099 |
| | | | $79,557,887 |
| Energy — 0.6% | |
| Raizen Fuels Finance SA: | | | |
| 5.70%, 1/17/35(1) | $ | 2,185 | $2,188,824 |
| 6.45%, 3/5/34(1) | | 3,485 | 3,690,758 |
| 6.95%, 3/5/54(1) | | 2,250 | 2,402,908 |
| TerraForm Power Operating LLC: | | | |
| 4.75%, 1/15/30(1) | | 5,174 | 4,956,268 |
| 5.00%, 1/31/28(1) | | 7,060 | 6,990,371 |
| | | | $20,229,129 |
| Financial — 20.0% | |
| ABN AMRO Bank NV, 6.339% to 9/18/26, 9/18/27(1)(8) | $ | 5,700 | $5,902,245 |
| AIB Group PLC, 6.608% to 9/13/28, 9/13/29(1)(8) | | 3,328 | 3,562,595 |
| Aircastle Ltd./Aircastle Ireland DAC, 5.75%, 10/1/31(1) | | 8,397 | 8,638,001 |
| Alliant Holdings Intermediate LLC/Alliant Holdings Co.-Issuer, 7.00%, 1/15/31(1) | | 7,600 | 7,815,635 |
| Security | Principal
Amount
(000’s omitted) | Value |
| Financial (continued) | |
| Ally Financial, Inc.: | | | |
| 2.20%, 11/2/28 | $ | 14,383 | $ 12,946,853 |
| 4.70% to 5/15/26(8)(9) | | 11,472 | 10,033,013 |
| 6.848% to 1/3/29, 1/3/30(8) | | 5,850 | 6,179,628 |
| American Assets Trust LP, 3.375%, 2/1/31 | | 2,454 | 2,135,249 |
| American National Group, Inc.: | | | |
| 5.75%, 10/1/29(10) | | 6,890 | 6,934,528 |
| 6.144%, 6/13/32(1) | | 6,355 | 6,325,726 |
| Andrew W. Mellon Foundation, 0.947%, 8/1/27 | | 5,050 | 4,672,707 |
| Antares Holdings LP, 6.50%, 2/8/29(1) | | 7,800 | 7,927,845 |
| Apollo Debt Solutions BDC, 6.70%, 7/29/31(1)(7) | | 12,058 | 12,427,480 |
| Banco Santander SA: | | | |
| 4.175% to 3/24/27, 3/24/28(8) | | 1,200 | 1,188,815 |
| 5.294%, 8/18/27 | | 2,800 | 2,864,965 |
| 5.439%, 7/15/31 | | 3,800 | 3,975,619 |
| 6.35%, 3/14/34(7) | | 7,200 | 7,713,256 |
| 9.625% to 11/21/28(8)(9) | | 4,000 | 4,455,208 |
| Bank of America Corp.: | | | |
| 2.456% to 10/22/24, 10/22/25(8) | | 8,268 | 8,253,441 |
| 3.419% to 12/20/27, 12/20/28(8) | | 13,510 | 13,145,607 |
| 3.824% to 1/20/27, 1/20/28(8) | | 16,117 | 15,944,357 |
| 5.468% to 1/23/34, 1/23/35(8) | | 10,255 | 10,788,138 |
| 5.819% to 9/15/28, 9/15/29(8) | | 6,153 | 6,477,065 |
| 5.933% to 9/15/26, 9/15/27(8) | | 13,485 | 13,890,720 |
| Bank of Nova Scotia, 8.00% to 1/27/29, 1/27/84(8) | | 7,705 | 8,274,075 |
| BBVA Bancomer SA: | | | |
| 1.875%, 9/18/25(1) | | 5,136 | 4,999,967 |
| 5.125% to 1/18/28, 1/18/33(1)(8) | | 3,686 | 3,508,740 |
| 8.125% to 1/8/34, 1/8/39(1)(8) | | 9,539 | 10,117,903 |
| Blackstone Private Credit Fund, 6.25%, 1/25/31(1) | | 7,515 | 7,724,376 |
| Blue Owl Credit Income Corp.: | | | |
| 6.60%, 9/15/29(1)(7) | | 2,575 | 2,642,659 |
| 7.75%, 1/15/29 | | 5,000 | 5,335,232 |
| BlueHub Loan Fund, Inc., 3.099%, 1/1/30 | | 9,400 | 8,638,858 |
| BNP Paribas SA, 7.75% to 8/16/29(1)(7)(8)(9) | | 13,325 | 14,070,414 |
| BPCE SA, 5.716% to 1/18/29, 1/18/30(1)(8) | | 5,000 | 5,166,067 |
| Broadstone Net Lease LLC, 2.60%, 9/15/31 | | 3,193 | 2,692,185 |
| Brookfield Finance, Inc., 5.675%, 1/15/35 | | 13,916 | 14,613,210 |
| CaixaBank SA: | | | |
| 5.673% to 3/15/29, 3/15/30(1)(8) | | 2,771 | 2,878,542 |
| 6.84% to 9/13/33, 9/13/34(1)(8) | | 7,770 | 8,673,867 |
| Capital One Financial Corp., 4.20%, 10/29/25 | | 2,950 | 2,930,041 |
| Charles Schwab Corp., 6.136% to 8/24/33, 8/24/34(8) | | 12,717 | 13,907,830 |
| CI Financial Corp., 3.20%, 12/17/30 | | 10,506 | 8,906,273 |
| Citigroup, Inc., 4.00% to 12/10/25(8)(9) | | 3,895 | 3,823,154 |
| COPT Defense Properties LP, 2.90%, 12/1/33 | | 8,716 | 7,304,859 |
| Credit Agricole SA: | | | |
| 6.251% to 1/10/34, 1/10/35(1)(8) | | 15,450 | 16,495,468 |
| 6.316% to 10/3/28, 10/3/29(1)(8) | | 3,203 | 3,407,075 |
18
See Notes to Financial Statements.
Calvert
Bond Fund
September 30, 2024
Schedule of Investments — continued
| Security | Principal
Amount
(000’s omitted) | Value |
| Financial (continued) | |
| Enact Holdings, Inc., 6.25%, 5/28/29 | $ | 12,985 | $ 13,489,402 |
| EPR Properties: | | | |
| 3.60%, 11/15/31 | | 2,180 | 1,945,258 |
| 3.75%, 8/15/29 | | 7,415 | 6,937,899 |
| 4.50%, 6/1/27 | | 1,355 | 1,335,594 |
| 4.95%, 4/15/28 | | 6,313 | 6,259,197 |
| Essent Group Ltd., 6.25%, 7/1/29 | | 7,545 | 7,874,994 |
| Global Atlantic Fin Co.: | | | |
| 3.125%, 6/15/31(1) | | 13,342 | 11,731,378 |
| 6.75%, 3/15/54(1) | | 3,564 | 3,795,700 |
| 7.95%, 6/15/33(1) | | 3,581 | 4,089,898 |
| 7.95% to 7/15/29, 10/15/54(1)(8) | | 7,412 | 7,755,413 |
| HA Sustainable Infrastructure Capital, Inc., 6.375%, 7/1/34(1) | | 24,353 | 24,939,976 |
| HAT Holdings I LLC/HAT Holdings II LLC: | | | |
| 3.375%, 6/15/26(1) | | 3,150 | 3,052,617 |
| 3.75%, 9/15/30(1)(7) | | 3,425 | 3,095,338 |
| Intesa Sanpaolo SpA: | | | |
| 7.00%, 11/21/25(1) | | 2,208 | 2,261,663 |
| 8.248% to 11/21/32, 11/21/33(1)(8) | | 12,290 | 14,277,238 |
| Jefferies Financial Group, Inc., 6.20%, 4/14/34 | | 11,634 | 12,459,490 |
| JPMorgan Chase & Co.: | | | |
| 5.581% to 4/22/29, 4/22/30(8) | | 30,492 | 32,010,919 |
| 5.766% to 4/22/34, 4/22/35(8) | | 5,750 | 6,198,593 |
| KeyBank NA, 5.00%, 1/26/33(7) | | 13,591 | 13,472,527 |
| KeyCorp, 6.277%, (SOFR + 1.25%), 5/23/25(3) | | 3,885 | 3,891,370 |
| Liberty Mutual Group, Inc., 4.125% to 9/15/26, 12/15/51(1)(8) | | 11,471 | 10,854,671 |
| LPL Holdings, Inc.: | | | |
| 4.00%, 3/15/29(1) | | 7,750 | 7,421,962 |
| 6.00%, 5/20/34 | | 4,857 | 5,079,354 |
| Nuveen LLC, 5.85%, 4/15/34(1) | | 8,756 | 9,277,111 |
| PNC Financial Services Group, Inc., 6.875% to 10/20/33, 10/20/34(8) | | 2,675 | 3,064,073 |
| Rocket Mortgage LLC/Rocket Mortgage Co.-Issuer, Inc., 3.875%, 3/1/31(1) | | 8,074 | 7,441,161 |
| Societe Generale SA: | | | |
| 5.634% to 1/19/29, 1/19/30(1)(8) | | 17,521 | 17,961,233 |
| 8.50% to 3/25/34(1)(8)(9) | | 7,629 | 7,784,593 |
| Stifel Financial Corp., 4.00%, 5/15/30 | | 4,782 | 4,595,931 |
| Swedbank AB: | | | |
| 5.407%, 3/14/29(1) | | 3,525 | 3,653,315 |
| 6.136%, 9/12/26(1) | | 8,620 | 8,904,605 |
| Synchrony Bank, 5.40%, 8/22/25 | | 3,488 | 3,496,277 |
| Synchrony Financial, 4.50%, 7/23/25 | | 9,400 | 9,347,743 |
| Synovus Bank/Columbus, GA: | | | |
| 4.00% to 10/29/25, 10/29/30(8) | | 6,445 | 5,929,361 |
| 5.625%, 2/15/28 | | 4,830 | 4,857,808 |
| Texas Capital Bancshares, Inc., 4.00% to 5/6/26, 5/6/31(8) | | 3,024 | 2,872,064 |
| Toronto-Dominion Bank, 8.125% to 10/31/27, 10/31/82(8) | | 12,137 | 13,051,062 |
| Security | Principal
Amount
(000’s omitted) | Value |
| Financial (continued) | |
| TPG Operating Group II LP, 5.875%, 3/5/34 | $ | 15,250 | $ 16,273,299 |
| U.S. Bancorp: | | | |
| 5.678% to 1/23/34, 1/23/35(8) | | 16,664 | 17,670,855 |
| 5.85% to 10/21/32, 10/21/33(8) | | 11,195 | 11,945,506 |
| UBS Group AG: | | | |
| 4.375% to 2/10/31(1)(8)(9) | | 2,686 | 2,345,393 |
| 9.016% to 11/15/32, 11/15/33(1)(8) | | 2,382 | 3,011,779 |
| 9.25% to 11/13/33(1)(8)(9) | | 7,000 | 8,272,838 |
| UniCredit SpA: | | | |
| 2.569% to 9/22/25, 9/22/26(1)(8) | | 6,576 | 6,429,685 |
| 5.459% to 6/30/30, 6/30/35(1)(8) | | 4,317 | 4,249,296 |
| Ventas Realty LP, 5.625%, 7/1/34 | | 9,866 | 10,387,747 |
| | | | $727,362,677 |
| Government - Multinational — 3.1% | |
| Asian Infrastructure Investment Bank: | | | |
| 4.125%, 1/18/29 | $ | 7,205 | $7,344,075 |
| 4.25%, 3/13/34 | | 14,385 | 14,794,671 |
| European Investment Bank, 3.25%, 11/15/27 | | 44,000 | 43,576,406 |
| Inter-American Development Bank, 3.50%, 9/14/29 | | 7,300 | 7,257,146 |
| International Bank for Reconstruction & Development: | | | |
| 3.875%, 2/14/30 | | 12,000 | 12,129,254 |
| 4.00%, 1/10/31 | | 28,000 | 28,436,485 |
| | | | $113,538,037 |
| Industrial — 0.6% | |
| Arrow Electronics, Inc., 5.15%, 8/21/29 | $ | 7,894 | $8,020,464 |
| MasTec, Inc., 5.90%, 6/15/29 | | 7,315 | 7,640,905 |
| Trivium Packaging Finance BV, 5.50%, 8/15/26(1) | | 7,073 | 7,051,669 |
| | | | $22,713,038 |
| Technology — 1.7% | |
| Cloud Software Group, Inc., 6.50%, 3/31/29(1) | $ | 7,000 | $6,970,680 |
| Concentrix Corp., 6.60%, 8/2/28(7) | | 22,532 | 23,516,639 |
| Kyndryl Holdings, Inc.: | | | |
| 3.15%, 10/15/31 | | 800 | 703,402 |
| 6.35%, 2/20/34(7) | | 13,675 | 14,625,442 |
| Playtika Holding Corp., 4.25%, 3/15/29(1) | | 7,783 | 7,149,436 |
| Seagate HDD Cayman, 9.625%, 12/1/32 | | 6,112 | 7,101,901 |
| | | | $60,067,500 |
| Utilities — 0.2% | |
| Clearway Energy Operating LLC, 3.75%, 1/15/32(1) | $ | 2,429 | $2,199,976 |
| Pattern Energy Operations LP/Pattern Energy Operations, Inc., 4.50%, 8/15/28(1) | | 5,126 | 4,962,879 |
| | | | $7,162,855 |
Total Corporate Bonds
(identified cost $1,174,935,911) | | | $1,194,811,885 |
19
See Notes to Financial Statements.
Calvert
Bond Fund
September 30, 2024
Schedule of Investments — continued
| Exchange-Traded Funds — 0.1% |
| Security | Shares | Value |
| Fixed-Income Funds — 0.1% | |
| Calvert Ultra-Short Investment Grade ETF(11) | | 47,000 | $ 2,382,900 |
Total Exchange-Traded Funds
(identified cost $2,387,790) | | | $ 2,382,900 |
| High Social Impact Investments — 0.2% |
| Security | Principal
Amount
(000's omitted) | Value |
| Calvert Impact Capital, Inc., Community Investment Notes, 5.00%, 12/15/28(12)(13) | $ | 5,000 | $ 5,068,950 |
| Calvert Impact Capital, Inc., Community Investment Notes, 5.00%, 9/20/29(12)(13) | | 3,500 | 3,552,710 |
Total High Social Impact Investments
(identified cost $8,500,000) | | | $ 8,621,660 |
| Security | Shares | Value |
| Real Estate Management & Development — 0.1% | |
| Brookfield Property Partners LP: | | | |
| Series A, 5.75% | | 97,843 | $ 1,448,076 |
| Series A2, 6.375% | | 211,400 | 3,445,820 |
| | | | $ 4,893,896 |
| Wireless Telecommunication Services — 0.1% | |
| U.S. Cellular Corp., 5.50% | | 102,136 | $ 2,274,569 |
| | | | $ 2,274,569 |
Total Preferred Stocks
(identified cost $10,509,717) | | | $ 7,168,465 |
| Senior Floating-Rate Loans — 2.4%(14) |
| Borrower/Description | Principal
Amount
(000's omitted) | Value |
| Aerospace and Defense — 0.1% | |
| Dynasty Acquisition Co., Inc.: | | | |
| Term Loan, 8.345%, (SOFR + 3.50%), 8/24/28 | $ | 3,959 | $ 3,966,205 |
| Term Loan, 8.345%, (SOFR + 3.50%), 8/24/28 | | 1,526 | 1,529,266 |
| | | | $ 5,495,471 |
| Building Products — 0.1% | |
| Standard Industries, Inc., Term Loan, 6.92%, (SOFR + 2.00%), 9/22/28 | $ | 3,682 | $ 3,694,961 |
| | | | $ 3,694,961 |
| Borrower/Description | Principal
Amount
(000's omitted) | Value |
| Commercial Services & Supplies — 0.1% | |
| Covanta Holding Corp.: | | | |
| Term Loan, 11/30/28(15) | $ | 2,370 | $ 2,375,466 |
| Term Loan, 11/30/28(15) | | 130 | 129,807 |
| Prime Security Services Borrower LLC, Term Loan, 7.445%, (SOFR + 2.25%), 10/13/30 | | 2,494 | 2,494,034 |
| | | | $ 4,999,307 |
| Construction & Engineering — 0.1% | |
| APi Group DE, Inc., Term Loan, 6.845%, (SOFR + 2.00%), 1/3/29 | $ | 2,500 | $ 2,502,010 |
| | | | $ 2,502,010 |
| Financial Services — 0.1% | |
| CPI Holdco B LLC, Term Loan, 6.845%, (SOFR + 2.00%), 5/19/31 | $ | 2,500 | $2,490,625 |
| | | | $2,490,625 |
| Health Care Equipment & Supplies — 0.1% | |
| Medline Borrower LP, Term Loan, 7.595%, (SOFR + 2.75%), 10/23/28 | $ | 5,479 | $5,486,898 |
| | | | $5,486,898 |
| Insurance — 0.4% | |
| AmWINS Group, Inc., Term Loan, 7.21%, (SOFR + 2.25%), 2/19/28 | $ | 5,478 | $5,475,749 |
| HUB International Ltd., Term Loan, 8.225%, (SOFR + 3.00%), 6/20/30 | | 2,985 | 2,984,087 |
| USI, Inc., Term Loan, 7.354%, (SOFR + 2.75%), 11/22/29 | | 5,479 | 5,468,949 |
| | | | $13,928,785 |
| IT Services — 0.3% | |
| Informatica LLC, Term Loan, 10/27/28(15) | $ | 5,500 | $5,498,856 |
| Sedgwick Claims Management Services, Inc., Term Loan, 8.252%, (SOFR + 3.00%), 7/31/31 | | 5,492 | 5,488,991 |
| | | | $10,987,847 |
| Life Sciences Tools & Services — 0.1% | |
| Avantor Funding, Inc., Term Loan, 6.945%, (SOFR + 2.00%), 11/8/27 | $ | 2,946 | $2,966,212 |
| ICON Luxembourg SARL, Term Loan, 6.604%, (SOFR + 2.00%), 7/3/28 | | 770 | 774,852 |
| PRA Health Sciences, Inc., Term Loan, 6.604%, (SOFR + 2.00%), 7/3/28 | | 192 | 193,055 |
| | | | $3,934,119 |
| Machinery — 0.3% | |
| Gates Global LLC: | | | |
| Term Loan, 3/31/27(15) | $ | 3,000 | $3,007,500 |
| Term Loan, 6/4/31(15) | | 2,500 | 2,507,387 |
20
See Notes to Financial Statements.
Calvert
Bond Fund
September 30, 2024
Schedule of Investments — continued
| Borrower/Description | Principal
Amount
(000's omitted) | Value |
| Machinery (continued) | |
| TK Elevator U.S. Newco, Inc., Term Loan, 8.588%, (SOFR + 3.50%), 4/30/30 | $ | 5,379 | $ 5,397,695 |
| | | | $ 10,912,582 |
| Metals/Mining — 0.1% | |
| Zekelman Industries, Inc., Term Loan, 7.17%, (SOFR + 2.25%), 1/24/31 | $ | 2,487 | $ 2,494,479 |
| | | | $ 2,494,479 |
| Professional Services — 0.1% | |
| Trans Union LLC, Term Loan, 6.845%, (SOFR + 2.00%), 12/1/28 | $ | 5,485 | $ 5,488,801 |
| | | | $ 5,488,801 |
| Software — 0.2% | |
| CCC Intelligent Solutions, Inc., Term Loan, 7.21%, (SOFR + 2.25%), 9/21/28 | $ | 2,494 | $2,497,226 |
| Epicor Software Corp.: | | | |
| Term Loan, 5/30/31(15) | | 2,237 | 2,241,442 |
| Term Loan, 5/30/31(15) | | 262 | 262,985 |
| McAfee LLC, Term Loan, 8.451%, (SOFR + 3.25%), 3/1/29 | | 2,494 | 2,487,710 |
| | | | $7,489,363 |
| Specialty Retail — 0.1% | |
| Les Schwab Tire Centers, Term Loan, 4/23/31(15) | $ | 2,500 | $2,503,905 |
| | | | $2,503,905 |
| Trading Companies & Distributors — 0.2% | |
| Avolon TLB Borrower 1 (U.S.) LLC, Term Loan, 6.961%, (SOFR + 2.00%), 6/24/30 | $ | 5,485 | $5,505,531 |
| | | | $5,505,531 |
Total Senior Floating-Rate Loans
(identified cost $88,147,979) | | | $87,914,684 |
| Sovereign Government Bonds — 1.0% |
| Security | Principal
Amount
(000’s omitted) | Value |
| Kreditanstalt fuer Wiederaufbau: | | | |
| 1.00%, 10/1/26 | $ | 12,000 | $ 11,387,046 |
| 4.375%, 2/28/34 | | 22,344 | 23,277,073 |
Total Sovereign Government Bonds
(identified cost $33,791,587) | | | $ 34,664,119 |
| Taxable Municipal Obligations — 1.3% |
| Security | Principal
Amount
(000's omitted) | Value |
| General Obligations — 0.3% | |
| Commonwealth of Massachusetts, 5.456%, 12/1/39(16) | $ | 750 | $ 794,993 |
| Massachusetts, Green Bonds, 3.277%, 6/1/46 | | 4,770 | 4,001,410 |
| New York City, NY, 5.206%, 10/1/31(16) | | 1,030 | 1,050,713 |
| San Francisco City and County, CA, (Social Bonds - Affordable Housing, 2016), 3.921%, 6/15/39 | | 3,085 | 2,838,354 |
| | | | $ 8,685,470 |
| Special Tax Revenue — 0.7% | |
| California Health Facilities Financing Authority, (No Place Like Home Program): | | | |
| Social Bonds, 2.361%, 6/1/26 | $ | 5,565 | $ 5,412,129 |
| Social Bonds, 2.484%, 6/1/27 | | 3,980 | 3,833,218 |
| Social Bonds, 2.534%, 6/1/28 | | 4,980 | 4,740,213 |
| Social Bonds, 2.584%, 6/1/29 | | 2,715 | 2,552,426 |
| Social Bonds, 2.984%, 6/1/33 | | 3,060 | 2,762,629 |
| Social Bonds, 3.034%, 6/1/34 | | 2,195 | 1,953,550 |
| Connecticut, Special Tax Revenue, 5.459%, 11/1/30(16) | | 3,340 | 3,433,687 |
| | | | $24,687,852 |
| Water and Sewer — 0.3% | |
| District of Columbia Water & Sewer Authority, Green Bonds, 4.814%, 10/1/2114 | $ | 1,170 | $1,132,525 |
| Narragansett Bay Commission, RI, Wastewater System Revenue: | | | |
| Green Bonds, 2.094%, 9/1/30 | | 2,495 | 2,239,337 |
| Green Bonds, 2.184%, 9/1/31 | | 1,985 | 1,752,993 |
| Green Bonds, 2.264%, 9/1/32 | | 1,780 | 1,546,321 |
| Green Bonds, 2.344%, 9/1/33 | | 1,945 | 1,660,758 |
| San Diego County Water Authority, CA: | | | |
| Green Bonds, 1.531%, 5/1/30 | | 2,130 | 1,878,511 |
| Green Bonds, 1.701%, 5/1/31 | | 1,925 | 1,672,498 |
| | | | $11,882,943 |
Total Taxable Municipal Obligations
(identified cost $49,327,775) | | | $45,256,265 |
| U.S. Government Agencies and Instrumentalities — 0.5% |
| Security | Principal
Amount
(000's omitted) | Value |
| U.S. Department of Housing and Urban Development: | | | |
| 2.738%, 8/1/25 | $ | 2,726 | $ 2,686,536 |
| 3.435%, 8/1/34 | | 3,105 | 2,864,457 |
| 3.485%, 8/1/35 | | 1,745 | 1,605,364 |
| 3.535%, 8/1/36 | | 929 | 852,420 |
| 3.585%, 8/1/37 | | 3,215 | 2,931,021 |
| 3.635%, 8/1/38 | | 657 | 598,523 |
21
See Notes to Financial Statements.
Calvert
Bond Fund
September 30, 2024
Schedule of Investments — continued
| Security | Principal
Amount
(000's omitted) | Value |
| U.S. International Development Finance Corp.: | | | |
| 1.79%, 10/15/29 | $ | 1,285 | $ 1,213,804 |
| 2.36%, 10/15/29 | | 1,064 | 1,019,227 |
| 3.52%, 9/20/32 | | 3,721 | 3,646,079 |
Total U.S. Government Agencies and Instrumentalities
(identified cost $19,196,464) | | | $ 17,417,431 |
| U.S. Government Agency Mortgage-Backed Securities — 25.9% |
| Security | Principal
Amount
(000's omitted) | Value |
| Federal Home Loan Mortgage Corp.: | | | |
| 3.50%, 3/1/48 | $ | 1,173 | $ 1,107,213 |
| 5.00%, with various maturities to 2054 | | 11,228 | 11,226,803 |
| 5.50%, with various maturities to 2054 | | 30,548 | 30,935,093 |
| 6.00%, with various maturities to 2053 | | 15,878 | 16,248,608 |
| Federal National Mortgage Association: | | | |
| 2.00%, 4/1/51 | | 3,214 | 2,713,735 |
| 2.68%, 7/1/26 | | 2,822 | 2,760,095 |
| 3.00%, with various maturities to 2049 | | 6,886 | 6,265,256 |
| 4.00%, with various maturities to 2048 | | 6,387 | 6,214,667 |
| 5.00%, 1/1/54 | | 2,801 | 2,801,010 |
| 5.50%, with various maturities to 2054 | | 111,522 | 112,919,098 |
| Government National Mortgage Association II: | | | |
| 2.50%, with various maturities to 2051 | | 15,744 | 13,745,987 |
| 6.00%, with various maturities to 2053 | | 10,983 | 11,280,520 |
| 6.50%, with various maturities to 2053 | | 3,672 | 3,821,492 |
| Uniform Mortgage-Backed Security: | | | |
| 4.00%, 30-Year, TBA(17) | | 9,638 | 9,258,881 |
| 4.50%, 30-Year, TBA(17) | | 26,150 | 25,715,784 |
| 5.00%, 30-Year, TBA(17) | | 289,397 | 289,215,627 |
| 5.50%, 30-Year, TBA(17) | | 389,758 | 394,371,156 |
Total U.S. Government Agency Mortgage-Backed Securities
(identified cost $945,873,212) | | $940,601,025 |
| U.S. Treasury Obligations — 16.9% |
| Security | Principal
Amount
(000's omitted) | Value |
| U.S. Treasury Bonds: | | | |
| 3.625%, 5/15/53 | $ | 9,576 | $ 8,717,153 |
| 4.00%, 11/15/42 | | 190,820 | 187,838,438 |
| 4.00%, 11/15/52 | | 19,701 | 19,176,445 |
| 4.25%, 2/15/54 | | 1,440 | 1,467,288 |
| 4.50%, 2/15/44 | | 17,112 | 17,860,650 |
| 4.625%, 5/15/44 | | 7,215 | 7,649,027 |
| 4.75%, 11/15/53 | | 485 | 536,310 |
| Security | Principal
Amount
(000's omitted) | Value |
| U.S. Treasury Notes: | | | |
| 3.625%, 5/31/28 | $ | 1,179 | $ 1,181,072 |
| 3.75%, 12/31/28 | | 8,000 | 8,055,156 |
| 4.00%, 2/15/34 | | 16,133 | 16,414,067 |
| 4.125%, 7/31/28 | | 1,007 | 1,026,747 |
| 4.125%, 3/31/29 | | 13,530 | 13,839,710 |
| 4.25%, 2/28/29 | | 7,869 | 8,089,086 |
| 4.375%, 8/31/28 | | 11,566 | 11,901,685 |
| 4.375%, 5/15/34 | | 36,025 | 37,739,002 |
| 4.50%, 5/31/29 | | 62,422 | 64,929,853 |
| 4.625%, 9/15/26 | | 13,929 | 14,180,919 |
| 4.875%, 11/30/25 | | 157,420 | 159,166,378 |
| 4.875%, 4/30/26 | | 25,700 | 26,142,723 |
| 4.875%, 5/31/26 | | 6,895 | 7,022,531 |
Total U.S. Treasury Obligations
(identified cost $594,236,781) | | | $612,934,240 |
| Short-Term Investments — 12.8% | | | |
| Affiliated Fund — 5.0% |
| Security | Shares | Value |
| Morgan Stanley Institutional Liquidity Funds - Government Portfolio, Institutional Class, 4.83%(18) | | 181,877,046 | $ 181,877,046 |
Total Affiliated Fund
(identified cost $181,877,046) | | | $ 181,877,046 |
| Securities Lending Collateral — 1.2% |
| Security | Shares | Value |
| State Street Navigator Securities Lending Government Money Market Portfolio, 5.02%(19) | | 45,779,848 | $ 45,779,848 |
Total Securities Lending Collateral
(identified cost $45,779,848) | | | $ 45,779,848 |
| U.S. Treasury Obligations — 6.6% |
| Security | Principal
Amount
(000's omitted) | Value |
| U.S. Treasury Bills: | | | |
| 0.00%, 11/7/24 | $ | 119,708 | $ 119,132,173 |
22
See Notes to Financial Statements.
Calvert
Bond Fund
September 30, 2024
Schedule of Investments — continued
| U.S. Treasury Obligations (continued) |
| Security | Principal
Amount
(000's omitted) | Value |
| U.S. Treasury Bills: (continued) | | | |
| 0.00%, 11/14/24 | $ | 119,935 | $ 119,254,982 |
Total U.S. Treasury Obligations
(identified cost $238,277,282) | | | $ 238,387,155 |
Total Short-Term Investments
(identified cost $465,934,176) | | | $ 466,044,049 |
Total Investments — 120.7%
(identified cost $4,370,191,019) | | | $4,379,880,015 |
| Other Assets, Less Liabilities — (20.7)% | | | $ (750,766,452) |
| Net Assets — 100.0% | | | $3,629,113,563 |
| The percentage shown for each investment category in the Schedule of Investments is based on net assets. |
| * | In U.S. dollars unless otherwise indicated. |
| (1) | Security exempt from registration under Rule 144A of the Securities Act of 1933, as amended. These securities may be sold in certain transactions in reliance on an exemption from registration (normally to qualified institutional buyers). At September 30, 2024, the aggregate value of these securities is $1,228,524,469 or 33.9% of the Fund's net assets. |
| (2) | Step coupon security. Interest rate represents the rate in effect at
September 30, 2024. |
| (3) | Variable rate security. The stated interest rate represents the rate in effect at September 30, 2024. |
| (4) | Inverse floating-rate security whose coupon varies inversely with changes in the interest rate index. The stated interest rate represents the coupon rate in effect at September 30, 2024. |
| (5) | Weighted average fixed-rate coupon that changes/updates monthly. Rate shown is the rate at September 30, 2024. |
| (6) | Amount is less than 0.05%. |
| (7) | All or a portion of this security was on loan at September 30, 2024. The aggregate market value of securities on loan at September 30, 2024 was $58,209,936. |
| (8) | Security converts to variable rate after the indicated fixed-rate coupon period. |
| (9) | Perpetual security with no stated maturity date but may be subject to calls by the issuer. |
| (10) | When-issued security. |
| (11) | Affiliated fund (see Note 8). |
| (12) | May be deemed to be an affiliated company (see Note 8). |
| (13) | Restricted security. Total market value of restricted securities amounts to $8,621,660, which represents 0.2% of the net assets of the Fund as of September 30, 2024. |
| (14) | Senior floating-rate loans (Senior Loans) often require prepayments from excess cash flows or permit the borrowers to repay at their election. The degree to which borrowers repay, whether as a contractual requirement or at their election, cannot be predicted with accuracy. As a result, the actual remaining maturity may be substantially less than the stated maturities shown. However, Senior Loans will typically have an expected average life of approximately two to four years. Senior Loans typically have rates of interest which are redetermined periodically by reference to a base lending rate, plus a spread. These base lending rates are primarily the Secured Overnight Financing Rate (“SOFR”) and secondarily, the prime rate offered by one or more major United States banks (the “Prime Rate”). Base lending rates may be subject to a floor, or minimum rate. Rates for SOFR are generally 1 or 3-month tenors and may also be subject to a credit spread adjustment. Senior Loans are generally subject to contractual restrictions that must be satisfied before they can be bought or sold. |
| (15) | This Senior Loan will settle after September 30, 2024, at which time the interest rate will be determined. |
| (16) | Build America Bond. Represents taxable municipal obligation issued pursuant to the American Recovery and Reinvestment Act of 2009 or other legislation providing for the issuance of taxable municipal debt on which the issuer receives federal support. |
| (17) | TBA (To Be Announced) securities are purchased or sold on a forward commitment basis with an approximate principal amount and maturity date. The actual principal amount, which is not expected to differ significantly from the commitment amount, and maturity date are determined upon settlement. |
| (18) | May be deemed to be an affiliated investment company. The rate shown is the annualized seven-day yield as of September 30, 2024. |
| (19) | Represents investment of cash collateral received in connection with securities lending. |
Forward Foreign Currency Exchange Contracts (OTC)
| Currency Purchased | Currency Sold | Counterparty | Settlement
Date | Unrealized
Appreciation | Unrealized
(Depreciation) |
| USD | 3,863,172 | CAD | 5,298,108 | UBS AG | 10/22/24 | $ — | $(56,176) |
| | | | | | | $ — | $(56,176) |
23
See Notes to Financial Statements.
Calvert
Bond Fund
September 30, 2024
Schedule of Investments — continued
Futures Contracts
| Description | Number of
Contracts | Position | Expiration
Date | Notional
Amount | Value/
Unrealized
Appreciation
(Depreciation) |
| Interest Rate Futures | | | | | |
| U.S. 2-Year Treasury Note | 2,390 | Long | 12/31/24 | $497,698,829 | $959,519 |
| U.S. 5-Year Treasury Note | 4,566 | Long | 12/31/24 | 501,724,924 | 8,975 |
| U.S. 10-Year Treasury Note | 486 | Long | 12/19/24 | 55,540,688 | 101,765 |
| U.S. Long Treasury Bond | 631 | Long | 12/19/24 | 78,362,313 | (205,486) |
| U.S. Ultra-Long Treasury Bond | 514 | Long | 12/19/24 | 68,410,187 | (354,144) |
| U.S. Ultra 10-Year Treasury Note | (967) | Short | 12/19/24 | (114,393,078) | 2,359 |
| | | | | | $512,988 |
Restricted Securities
| Description | Acquisition Dates | Cost |
| Calvert Impact Capital, Inc., Community Investment Notes, 5.00%, 12/15/28 | 12/15/23 | $5,000,000 |
| Calvert Impact Capital, Inc., Community Investment Notes, 5.00%, 9/20/29 | 9/20/24 | 3,500,000 |
| Abbreviations: |
| OTC | – Over-the-counter |
| SOFR | – Secured Overnight Financing Rate |
| STACR | – Structured Agency Credit Risk |
| TBA | – To Be Announced |
| Currency Abbreviations: |
| CAD | – Canadian Dollar |
| USD | – United States Dollar |
24
See Notes to Financial Statements.
Calvert
Equity Fund
September 30, 2024
| Security | Shares | Value |
| Capital Markets — 9.2% | |
| Charles Schwab Corp. | | 675,212 | $ 43,760,490 |
| Intercontinental Exchange, Inc. | | 988,528 | 158,797,138 |
| Moody's Corp. | | 165,675 | 78,627,698 |
| MSCI, Inc. | | 132,995 | 77,526,775 |
| S&P Global, Inc. | | 532,842 | 275,276,834 |
| | | | $ 633,988,935 |
| Chemicals — 7.5% | |
| Air Products and Chemicals, Inc. | | 288,861 | $ 86,005,474 |
| Ecolab, Inc. | | 881,282 | 225,017,733 |
| Linde PLC | | 430,105 | 205,099,870 |
| | | | $516,123,077 |
| Commercial Services & Supplies — 1.3% | |
| Veralto Corp. | | 778,709 | $87,106,389 |
| | | | $87,106,389 |
| Consumer Staples Distribution & Retail — 2.2% | |
| Costco Wholesale Corp. | | 79,304 | $70,304,582 |
| Dollar General Corp. | | 950,703 | 80,400,953 |
| | | | $150,705,535 |
| Containers & Packaging — 0.8% | |
| Ball Corp. | | 830,195 | $56,378,542 |
| | | | $56,378,542 |
| Electronic Equipment, Instruments & Components — 3.9% | |
| Amphenol Corp., Class A | | 3,163,410 | $206,127,796 |
| TE Connectivity PLC | | 435,681 | 65,783,474 |
| | | | $271,911,270 |
| Entertainment — 0.9% | |
| Electronic Arts, Inc. | | 459,529 | $65,914,840 |
| | | | $65,914,840 |
| Financial Services — 12.5% | |
| Fiserv, Inc.(1) | | 713,669 | $128,210,636 |
| Mastercard, Inc., Class A | | 666,921 | 329,325,590 |
| PayPal Holdings, Inc.(1) | | 1,141,499 | 89,071,167 |
| Visa, Inc., Class A | | 1,161,997 | 319,491,075 |
| | | | $866,098,468 |
| Health Care Equipment & Supplies — 1.7% | |
| IDEXX Laboratories, Inc.(1) | | 137,204 | $69,318,205 |
| Intuitive Surgical, Inc.(1) | | 97,018 | 47,662,033 |
| | | | $116,980,238 |
| Security | Shares | Value |
| Hotels, Restaurants & Leisure — 1.1% | |
| Starbucks Corp. | | 774,829 | $ 75,538,079 |
| | | | $ 75,538,079 |
| Insurance — 2.5% | |
| Aon PLC, Class A | | 173,608 | $ 60,066,632 |
| Marsh & McLennan Cos., Inc. | | 502,864 | 112,183,930 |
| | | | $ 172,250,562 |
| Interactive Media & Services — 4.1% | |
| Alphabet, Inc., Class C | | 1,683,896 | $ 281,530,572 |
| | | | $281,530,572 |
| IT Services — 6.3% | |
| Accenture PLC, Class A | | 206,744 | $73,079,869 |
| Gartner, Inc.(1) | | 451,263 | 228,682,038 |
| VeriSign, Inc.(1) | | 724,887 | 137,699,535 |
| | | | $439,461,442 |
| Life Sciences Tools & Services — 12.1% | |
| Agilent Technologies, Inc. | | 745,889 | $110,749,599 |
| Danaher Corp. | | 1,185,072 | 329,473,717 |
| Thermo Fisher Scientific, Inc. | | 533,179 | 329,808,534 |
| West Pharmaceutical Services, Inc. | | 229,877 | 68,999,880 |
| | | | $839,031,730 |
| Machinery — 4.0% | |
| IDEX Corp. | | 450,491 | $96,630,319 |
| Xylem, Inc. | | 1,344,051 | 181,487,207 |
| | | | $278,117,526 |
| Personal Care Products — 0.8% | |
| Estee Lauder Cos., Inc., Class A | | 586,361 | $58,454,328 |
| | | | $58,454,328 |
| Pharmaceuticals — 3.9% | |
| Zoetis, Inc. | | 1,370,502 | $267,768,681 |
| | | | $267,768,681 |
| Professional Services — 3.3% | |
| Verisk Analytics, Inc. | | 859,360 | $230,274,106 |
| | | | $230,274,106 |
| Software — 9.1% | |
| Adobe, Inc.(1) | | 191,260 | $99,030,603 |
| Intuit, Inc. | | 367,594 | 228,275,874 |
| Microsoft Corp. | | 697,052 | 299,941,475 |
| | | | $627,247,952 |
25
See Notes to Financial Statements.
Calvert
Equity Fund
September 30, 2024
Schedule of Investments — continued
| Security | Shares | Value |
| Specialized REITs — 4.0% | |
| American Tower Corp. | | 912,299 | $ 212,164,255 |
| Crown Castle, Inc. | | 561,536 | 66,615,016 |
| | | | $ 278,779,271 |
| Specialty Retail — 4.9% | |
| O'Reilly Automotive, Inc.(1) | | 57,776 | $ 66,534,842 |
| TJX Cos., Inc. | | 2,299,656 | 270,301,566 |
| | | | $ 336,836,408 |
| Textiles, Apparel & Luxury Goods — 0.9% | |
| NIKE, Inc., Class B | | 732,750 | $64,775,100 |
| | | | $64,775,100 |
| Venture Capital — 0.0%(2) | |
| 20/20 Gene Systems, Inc.(1)(3)(4) | | 73,397 | $187,162 |
| Digital Directions International, Inc.(1)(3)(4) | | 354,389 | 0 |
| Ivy Capital (Proprietary) Ltd.(1)(3)(4) | | 950,000 | 15,396 |
| | | | $202,558 |
Total Common Stocks
(identified cost $3,139,180,390) | | | $6,715,475,609 |
| Preferred Stocks — 0.0%(2) |
| Security | Shares | Value |
| Venture Capital — 0.0%(2) | |
| Entouch: | | | |
| Series C(1)(3)(4) | | 2,628,278 | $ 265,719 |
| Series C-1(1)(3)(4) | | 1,023,444 | 179,614 |
| Sword Diagnostics(1)(3)(4) | | 1,264,108 | 0 |
Total Preferred Stocks
(identified cost $918,761) | | | $ 445,333 |
| Venture Capital Limited Partnership Interests — 0.2% |
| Security | | Value |
| Accion Frontier Inclusion Fund LP(1)(3)(4) | | | $ 2,301,889 |
| Adobe Capital Social Mezzanine I LP(1)(3)(4) | | | 8,691 |
| Africa Renewable Energy Fund LP(1)(3)(4) | | | 758,270 |
| Arborview Capital Partners LP(1)(3)(4) | | | 512,660 |
| Bridges Ventures U.S. Sustainable Growth Fund LP(1)(3)(4) | | | 119,291 |
| Coastal Ventures III LP(1)(3)(4) | | | 417,164 |
| Core Innovations Capital I LP(1)(3)(4) | | | 1,325,632 |
| Security | | Value |
| Cross Culture Ventures I LP(1)(3)(4) | | | $ 887,447 |
| DBL Equity Fund BAEF II LP(1)(3)(4) | | | 1,316,422 |
| DBL Partners III LP(1)(3)(4) | | | 1,360,082 |
| First Analysis Private Equity Fund V LP(1)(3)(4) | | | 781,727 |
| Impact Ventures II LP(1)(3)(4) | | | 170,347 |
| LeapFrog Financial Inclusion Fund(1)(3)(4) | | | 3,529 |
| New Markets Education Partner LP(1)(3)(4) | | | 25,831 |
| New Markets Venture Partners II LP(1)(3)(4) | | | 42,122 |
| Owl Ventures LP(1)(3)(4) | | | 907,162 |
| Renewable Energy Asia Fund LP(1)(3)(4) | | | 44,426 |
| SEAF India International Growth Fund LP(1)(3)(4) | | | 0 |
| SJF Ventures II LP, Preferred(1)(3)(4) | | | 47,597 |
| SJF Ventures III LP(1)(3)(4) | | | 452,258 |
| Westly Capital Partners Fund II LP(1)(3)(4) | | | 107,614 |
Total Venture Capital Limited Partnership Interests
(identified cost $7,004,810) | | | $11,590,161 |
| Short-Term Investments — 2.8% | | | |
| Security | Shares | Value |
| Morgan Stanley Institutional Liquidity Funds - Government Portfolio, Institutional Class, 4.83%(5) | | 195,144,544 | $ 195,144,544 |
Total Short-Term Investments
(identified cost $195,144,544) | | | $ 195,144,544 |
Total Investments — 100.0%
(identified cost $3,342,248,505) | | | $6,922,655,647 |
| Other Assets, Less Liabilities — (0.0)%(2) | | | $ (3,237,350) |
| Net Assets — 100.0% | | | $6,919,418,297 |
| The percentage shown for each investment category in the Schedule of Investments is based on net assets. |
| (1) | Non-income producing security. |
| (2) | Amount is less than 0.05% or (0.05)%, as applicable. |
| (3) | For fair value measurement disclosure purposes, security is categorized as Level 3 (see Note 1A). |
| (4) | Restricted security. Total market value of restricted securities amounts to $12,238,052, which represents 0.2% of the net assets of the Fund as of September 30, 2024. |
| (5) | May be deemed to be an affiliated investment company. The rate shown is the annualized seven-day yield as of September 30, 2024. |
Restricted Securities
| Description | Acquisition Dates | Cost |
| 20/20 Gene Systems, Inc. | 8/1/08-8/27/13 | $166,889 |
| Accion Frontier Inclusion Fund LP | 11/12/15-12/6/23 | 786,621 |
26
See Notes to Financial Statements.
Calvert
Equity Fund
September 30, 2024
Schedule of Investments — continued
Restricted Securities — continued
| Description | Acquisition Dates | Cost |
| Adobe Capital Social Mezzanine I LP | 2/8/13-1/23/24 | $303,133 |
| Africa Renewable Energy Fund LP | 4/17/14-7/18/22 | 997,030 |
| Arborview Capital Partners LP | 11/13/12-12/7/21 | 14,610 |
| Bridges Ventures U.S. Sustainable Growth Fund LP | 6/18/16-10/27/23 | 409,116 |
| Coastal Ventures III LP | 7/30/12-1/9/19 | 88,585 |
| Core Innovations Capital I LP | 1/6/11-6/30/17 | 0 |
| Cross Culture Ventures I LP | 2/24/16-9/30/24 | 371,152 |
| DBL Equity Fund BAEF II LP | 3/30/11-8/2/16 | 564,959 |
| DBL Partners III LP | 1/16/15-4/28/22 | 870,896 |
| Digital Directions International, Inc. | 7/2/08-7/15/09 | 683,778 |
| Entouch, Series C, Preferred | 2/3/16 | 350,000 |
| Entouch, Series C-1, Preferred | 10/11/17-11/5/19 | 136,289 |
| First Analysis Private Equity Fund V LP | 6/7/13-6/13/18 | 0 |
| Impact Ventures II LP | 9/8/10-2/5/18 | 638,988 |
| Ivy Capital (Proprietary) Ltd. | 9/12/12-5/14/14 | 557,372 |
| LeapFrog Financial Inclusion Fund | 1/20/10-1/23/19 | 0 |
| New Markets Education Partner LP | 9/27/11-6/1/21 | 0 |
| New Markets Venture Partners II LP | 7/21/08-5/3/16 | 0 |
| Owl Ventures LP | 7/10/14-7/5/24 | 10,000 |
| Renewable Energy Asia Fund LP | 9/29/10-1/5/17 | 1,753,943 |
| SEAF India International Growth Fund LP | 3/22/05-5/24/10 | 195,777 |
| SJF Ventures II LP, Preferred | 2/14/06-11/20/12 | 0 |
| SJF Ventures III LP | 2/6/12-7/14/17 | 0 |
| Sword Diagnostics, Preferred | 12/26/06-11/9/10 | 432,472 |
| Westly Capital Partners Fund II LP | 12/27/11-4/16/21 | 0 |
| Abbreviations: |
| REITs | – Real Estate Investment Trusts |
27
See Notes to Financial Statements.
Calvert
Social Investment Fund
September 30, 2024
Statements of Assets and Liabilities
| | September 30, 2024 |
| | Balanced Fund | Bond Fund | Equity Fund |
| Assets | | | |
| Investments in securities of unaffiliated issuers, at value (identified cost $1,039,160,713, $4,177,426,183 and $3,147,103,961, respectively) - including $18,351,538, $58,209,936 and $0, respectively, of securities on loan | $1,403,380,675 | $4,186,998,409 | $6,727,511,103 |
| Investments in securities of affiliated issuers, at value (identified cost $48,316,470, $192,764,836 and $195,144,544, respectively) | 48,318,036 | 192,881,606 | 195,144,544 |
| Cash | 59,149 | — | 9,340 |
| Cash denominated in foreign currency, at value (cost $230, $726,086 and $0, respectively) | 229 | 731,553 | — |
| Deposits at broker for futures contracts | 1,521,900 | 13,263,100 | — |
| Deposits for forward commitment securities | — | 2,030,000 | — |
| Receivable for investments sold | 1,592,218 | 13,201,282 | — |
| Receivable for forward purchase commitment | 38,011,700 | 216,984,873 | — |
| Receivable for capital shares sold | 893,855 | 7,178,516 | 3,841,423 |
| Dividends and interest receivable | 3,332,427 | 29,321,651 | 1,903,713 |
| Dividends and interest receivable - affiliated | 93,532 | 875,580 | 807,534 |
| Securities lending income receivable | 8,785 | 15,339 | — |
| Tax reclaims receivable | 8,638 | — | — |
| Receivable from affiliate | — | 148,171 | — |
| Trustees' deferred compensation plan | 476,365 | 737,908 | 1,636,365 |
| Total assets | $1,497,697,509 | $4,664,367,988 | $6,930,854,022 |
| Liabilities | | | |
| Payable for variation margin on open futures contracts | $298,499 | $3,126,779 | $ — |
| Payable for open forward foreign currency exchange contracts | 5,992 | 56,176 | — |
| Due to custodian | — | 948,607 | — |
| Payable for investments purchased | 4,270,625 | 26,127,500 | — |
| Payable for when-issued/delayed delivery/forward commitment securities | 138,149,016 | 947,114,239 | — |
| Payable for capital shares redeemed | 703,958 | 8,115,937 | 4,654,715 |
| Distributions payable | — | 1,065,611 | — |
| Deposits for securities loaned | 5,091,583 | 45,779,848 | — |
| Payable to affiliates: | | | |
| Investment advisory fee | 417,998 | 843,414 | 2,342,495 |
| Administrative fee | 130,840 | 353,279 | 678,221 |
| Distribution and service fees | 219,725 | 63,909 | 561,705 |
| Sub-transfer agency fee | 40,625 | 18,822 | 72,496 |
| Trustees' deferred compensation plan | 476,365 | 737,908 | 1,636,365 |
| Payable for transfer agency fees and expenses | 171,798 | 502,260 | 956,750 |
| Accrued expenses | 205,421 | 400,136 | 532,978 |
| Total liabilities | $150,182,445 | $1,035,254,425 | $11,435,725 |
| Commitments and contingent liabilities (Note 10) | | | |
| Net Assets | $1,347,515,064 | $3,629,113,563 | $6,919,418,297 |
| Sources of Net Assets | | | |
| Paid-in capital | $939,683,104 | $3,851,198,440 | $2,914,656,973 |
| Distributable earnings (accumulated loss) | 407,831,960 | (222,084,877) | 4,004,761,324 |
| Net Assets | $1,347,515,064 | $3,629,113,563 | $6,919,418,297 |
28
See Notes to Financial Statements.
Calvert
Social Investment Fund
September 30, 2024
Statements of Assets and Liabilities — continued
| | September 30, 2024 |
| | Balanced Fund | Bond Fund | Equity Fund |
| Class A Shares | | | |
| Net Assets | $898,874,647 | $343,119,678 | $2,240,593,491 |
| Shares Outstanding | 19,637,464 | 23,072,521 | 26,104,841 |
Net Asset Value and Redemption Price Per Share
(net assets ÷ shares of beneficial interest outstanding) | $45.77 | $14.87 | $85.83 |
Maximum Offering Price Per Share
(100 ÷ 94.75, 96.75 and 94.75, respectively, of net asset value per share) | $48.31 | $15.37 | $90.59 |
| Class C Shares | | | |
| Net Assets | $53,976,943 | $9,997,193 | $128,240,513 |
| Shares Outstanding | 1,229,179 | 677,047 | 3,197,801 |
Net Asset Value and Offering Price Per Share*
(net assets ÷ shares of beneficial interest outstanding) | $43.91 | $14.77 | $40.10 |
| Class I Shares | | | |
| Net Assets | $288,263,080 | $2,632,247,725 | $3,797,446,425 |
| Shares Outstanding | 6,143,941 | 176,655,714 | 37,009,742 |
Net Asset Value, Offering Price and Redemption Price Per Share
(net assets ÷ shares of beneficial interest outstanding) | $46.92 | $14.90 | $102.61 |
| Class R6 Shares | | | |
| Net Assets | $106,400,394 | $643,748,967 | $753,137,868 |
| Shares Outstanding | 2,269,514 | 43,250,186 | 7,359,583 |
Net Asset Value, Offering Price and Redemption Price Per Share
(net assets ÷ shares of beneficial interest outstanding) | $46.88 | $14.88 | $102.33 |
| On sales of $50,000 ($100,000 for Bond Fund) or more, the offering price of Class A shares is reduced. |
| * | Redemption price per share is equal to the net asset value less any applicable contingent deferred sales charge. |
29
See Notes to Financial Statements.
Calvert
Social Investment Fund
September 30, 2024
| | Year Ended September 30, 2024 |
| | Balanced Fund | Bond Fund | Equity Fund |
| Investment Income | | | |
| Dividend income (net of foreign taxes withheld of $31,383, $52,146 and $0, respectively) | $7,155,802 | $647,267 | $65,744,418 |
| Dividend income - affiliated issuers | 1,476,184 | 6,683,650 | 8,174,313 |
| Interest income | 20,699,615 | 153,063,172 | 10,460 |
| Interest income - affiliated issuers | 85,089 | 577,999 | 24,574 |
| Securities lending income, net | 19,369 | 78,433 | — |
| Other income | 14,016 | 218,019 | — |
| Total investment income | $29,450,075 | $161,268,540 | $73,953,765 |
| Expenses | | | |
| Investment advisory fee | $4,694,802 | $9,021,462 | $28,744,473 |
| Administrative fee | 1,446,789 | 3,691,640 | 8,238,232 |
| Distribution and service fees: | | | |
| Class A | 1,958,289 | 637,903 | 5,416,537 |
| Class C | 528,071 | 95,268 | 1,286,532 |
| Trustees' fees and expenses | 73,489 | 191,333 | 413,288 |
| Custodian fees | 39,248 | 64,870 | 107,473 |
| Transfer agency fees and expenses | 968,359 | 2,364,276 | 4,895,414 |
| Accounting fees | 339,211 | 537,952 | 908,389 |
| Professional fees | 93,863 | 115,349 | 224,421 |
| Registration fees | 93,255 | 265,212 | 217,947 |
| Reports to shareholders | 81,511 | 149,466 | 321,327 |
| Miscellaneous | 80,860 | 274,881 | 264,776 |
| Total expenses | $10,397,747 | $17,409,612 | $51,038,809 |
| Waiver and/or reimbursement of expenses by affiliates | $(41,360) | $(799,928) | $(228,961) |
| Net expenses | $10,356,387 | $16,609,684 | $50,809,848 |
| Net investment income | $19,093,688 | $144,658,856 | $23,143,917 |
| Realized and Unrealized Gain (Loss) | | | |
| Net realized gain (loss): | | | |
| Investment securities | $48,932,895 | $(57,978,622) | $465,074,867 |
| Investment securities - affiliated issuers | 5,934 | — | — |
| Futures contracts | 1,505,294 | 13,770,638 | — |
| Foreign currency transactions | (3,349) | 314 | — |
| Forward foreign currency exchange contracts | 12,110 | 138,098 | — |
| Net realized gain (loss) | $50,452,884 | $(44,069,572) | $465,074,867 |
| Change in unrealized appreciation (depreciation): | | | |
| Investment securities | $235,040,864 | $271,809,697 | $1,116,510,582 |
| Investment securities - affiliated issuers | 89,550 | 414,234 | 109,269 |
| Futures contracts | 522,299 | 7,557,498 | — |
| Foreign currency | 551 | 36,654 | — |
| Forward foreign currency exchange contracts | (15,348) | (132,939) | — |
| Net change in unrealized appreciation (depreciation) | $235,637,916 | $279,685,144 | $1,116,619,851 |
| Net realized and unrealized gain | $286,090,800 | $235,615,572 | $1,581,694,718 |
| Net increase in net assets from operations | $305,184,488 | $380,274,428 | $1,604,838,635 |
30
See Notes to Financial Statements.
Calvert
Social Investment Fund
September 30, 2024
Statements of Changes in Net Assets
| | Year Ended September 30, 2024 |
| | Balanced Fund | Bond Fund | Equity Fund |
| Increase (Decrease) in Net Assets | | | |
| From operations: | | | |
| Net investment income | $19,093,688 | $144,658,856 | $23,143,917 |
| Net realized gain (loss) | 50,452,884 | (44,069,572) | 465,074,867 |
| Net change in unrealized appreciation (depreciation) | 235,637,916 | 279,685,144 | 1,116,619,851 |
| Net increase in net assets from operations | $305,184,488 | $380,274,428 | $1,604,838,635 |
| Distributions to shareholders: | | | |
| Class A | $(12,356,329) | $(14,332,061) | $(38,765,254) |
| Class C | (425,924) | (351,212) | (4,551,157) |
| Class I | (4,325,537) | (102,861,831) | (65,350,307) |
| Class R6 | (1,607,609) | (26,587,366) | (13,284,481) |
| Total distributions to shareholders | $(18,715,399) | $(144,132,470) | $(121,951,199) |
| Capital share transactions: | | | |
| Class A | $(22,857,669) | $14,850,249 | $(217,662,652) |
| Class C | (8,737,772) | (432,452) | (18,168,820) |
| Class I | 12,843,476 | 581,945,526 | (750,712,555) |
| Class R6 | 12,327,763 | 123,992,438 | (84,520,827) |
| Net increase (decrease) in net assets from capital share transactions | $(6,424,202) | $720,355,761 | $(1,071,064,854) |
| Net increase in net assets | $280,044,887 | $956,497,719 | $411,822,582 |
| Net Assets | | | |
| At beginning of year | $1,067,470,177 | $2,672,615,844 | $6,507,595,715 |
| At end of year | $1,347,515,064 | $3,629,113,563 | $6,919,418,297 |
31
See Notes to Financial Statements.
Calvert
Social Investment Fund
September 30, 2024
Statements of Changes in Net Assets — continued
| | Year Ended September 30, 2023 |
| | Balanced Fund | Bond Fund | Equity Fund |
| Increase (Decrease) in Net Assets | | | |
| From operations: | | | |
| Net investment income | $17,205,790 | $105,334,068 | $21,366,487 |
| Net realized gain (loss) | 4,887,277 | (134,990,343) | 107,990,774 |
| Net change in unrealized appreciation (depreciation) | 89,118,195 | 80,872,887 | 689,599,868 |
| Net increase in net assets from operations | $111,211,262 | $51,216,612 | $818,957,129 |
| Distributions to shareholders: | | | |
| Class A | $(25,264,420) | $(11,698,380) | $(63,852,007) |
| Class C | (1,462,486) | (289,225) | (7,963,077) |
| Class I | (7,987,947) | (72,324,272) | (96,218,038) |
| Class R6 | (2,397,546) | (21,446,626) | (15,708,813) |
| Total distributions to shareholders | $(37,112,399) | $(105,758,503) | $(183,741,935) |
| Capital share transactions: | | | |
| Class A | $(10,830,672) | $3,877,980 | $(14,882,958) |
| Class C | (4,774,580) | 587,820 | (355,304) |
| Class I | (11,750,348) | 254,651,246 | 449,223,697 |
| Class R6 | 17,574,555 | 10,997,909 | 175,056,534 |
| Net increase (decrease) in net assets from capital share transactions | $(9,781,045) | $270,114,955 | $609,041,969 |
| Net increase in net assets | $64,317,818 | $215,573,064 | $1,244,257,163 |
| Net Assets | | | |
| At beginning of year | $1,003,152,359 | $2,457,042,780 | $5,263,338,552 |
| At end of year | $1,067,470,177 | $2,672,615,844 | $6,507,595,715 |
32
See Notes to Financial Statements.
Calvert
Social Investment Fund
September 30, 2024
| | Balanced Fund — Class A |
| | Year Ended September 30, |
| | 2024 | 2023 | 2022 | 2021 | 2020 |
| Net asset value — Beginning of year | $36.00 | $33.56 | $42.36 | $37.18 | $34.28 |
| Income (Loss) From Operations | | | | | |
| Net investment income(1) | $0.64 | $0.57 | $0.40 | $0.30 | $0.41 |
| Net realized and unrealized gain (loss) | 9.76 | 3.12 | (5.91) | 5.77 | 3.67 |
| Total income (loss) from operations | $10.40 | $3.69 | $(5.51) | $6.07 | $4.08 |
| Less Distributions | | | | | |
| From net investment income | $(0.63) | $(0.91) | $(0.41) | $(0.30) | $(0.42) |
| From net realized gain | — | (0.34) | (2.88) | (0.59) | (0.76) |
| Total distributions | $(0.63) | $(1.25) | $(3.29) | $(0.89) | $(1.18) |
| Net asset value — End of year | $45.77 | $36.00 | $33.56 | $42.36 | $37.18 |
| Total Return(2) | 29.02% | 11.11% | (14.40)% | 16.48% | 12.22% |
| Ratios/Supplemental Data | | | | | |
| Net assets, end of year (000’s omitted) | $898,875 | $728,372 | $688,402 | $823,892 | $686,408 |
| Ratios (as a percentage of average daily net assets):(3) | | | | | |
| Total expenses | 0.90% | 0.92% | 0.91% | 0.90% | 0.93% |
| Net expenses | 0.90%(4) | 0.92%(4) | 0.91%(4) | 0.90% | 0.93% |
| Net investment income | 1.54% | 1.57% | 1.03% | 0.73% | 1.17% |
| Portfolio Turnover | 153%(5) | 106%(5) | 85%(5) | 95%(5) | 98%(5) |
| (1) | Computed using average shares outstanding. |
| (2) | Returns are historical and are calculated by determining the percentage change in net asset value with all distributions reinvested and do not reflect the effect of sales charges, if any. |
| (3) | Total expenses do not reflect amounts reimbursed and/or waived by the adviser and certain of its affiliates, if applicable. Net expenses are net of all reductions and represent the net expenses paid by the Fund. |
| (4) | Includes a reduction by the investment adviser of a portion of its adviser fee due to the Fund’s investment in the Liquidity Fund (equal to less than 0.005% of average daily net assets for the years ended September 30, 2024, 2023 and 2022). |
| (5) | Includes the effect of To Be Announced (TBA) transactions. |
33
See Notes to Financial Statements.
Calvert
Social Investment Fund
September 30, 2024
Financial Highlights — continued
| | Balanced Fund — Class C |
| | Year Ended September 30, |
| | 2024 | 2023 | 2022 | 2021 | 2020 |
| Net asset value — Beginning of year | $34.56 | $32.27 | $40.85 | $35.90 | $33.14 |
| Income (Loss) From Operations | | | | | |
| Net investment income (loss)(1) | $0.31 | $0.28 | $0.10 | $(0.01) | $0.14 |
| Net realized and unrealized gain (loss) | 9.37 | 3.00 | (5.68) | 5.56 | 3.55 |
| Total income (loss) from operations | $9.68 | $3.28 | $(5.58) | $5.55 | $3.69 |
| Less Distributions | | | | | |
| From net investment income | $(0.33) | $(0.65) | $(0.12) | $(0.01) | $(0.17) |
| From net realized gain | — | (0.34) | (2.88) | (0.59) | (0.76) |
| Total distributions | $(0.33) | $(0.99) | $(3.00) | $(0.60) | $(0.93) |
| Net asset value — End of year | $43.91 | $34.56 | $32.27 | $40.85 | $35.90 |
| Total Return(2) | 28.07% | 10.25% | (15.05)% | 15.59% | 11.39% |
| Ratios/Supplemental Data | | | | | |
| Net assets, end of year (000’s omitted) | $53,977 | $50,105 | $51,250 | $67,292 | $65,760 |
| Ratios (as a percentage of average daily net assets):(3) | | | | | |
| Total expenses | 1.66% | 1.68% | 1.67% | 1.66% | 1.69% |
| Net expenses | 1.66%(4) | 1.68%(4) | 1.67%(4) | 1.66% | 1.68% |
| Net investment income (loss) | 0.78% | 0.81% | 0.26% | (0.03)% | 0.42% |
| Portfolio Turnover | 153%(5) | 106%(5) | 85%(5) | 95%(5) | 98%(5) |
| (1) | Computed using average shares outstanding. |
| (2) | Returns are historical and are calculated by determining the percentage change in net asset value with all distributions reinvested and do not reflect the effect of sales charges, if any. |
| (3) | Total expenses do not reflect amounts reimbursed and/or waived by the adviser and certain of its affiliates, if applicable. Net expenses are net of all reductions and represent the net expenses paid by the Fund. |
| (4) | Includes a reduction by the investment adviser of a portion of its adviser fee due to the Fund’s investment in the Liquidity Fund (equal to less than 0.005% of average daily net assets for the years ended September 30, 2024, 2023 and 2022). |
| (5) | Includes the effect of To Be Announced (TBA) transactions. |
34
See Notes to Financial Statements.
Calvert
Social Investment Fund
September 30, 2024
Financial Highlights — continued
| | Balanced Fund — Class I |
| | Year Ended September 30, |
| | 2024 | 2023 | 2022 | 2021 | 2020 |
| Net asset value — Beginning of year | $36.88 | $34.35 | $43.28 | $37.97 | $34.97 |
| Income (Loss) From Operations | | | | | |
| Net investment income(1) | $0.75 | $0.67 | $0.50 | $0.40 | $0.50 |
| Net realized and unrealized gain (loss) | 10.02 | 3.20 | (6.05) | 5.90 | 3.76 |
| Total income (loss) from operations | $10.77 | $3.87 | $(5.55) | $6.30 | $4.26 |
| Less Distributions | | | | | |
| From net investment income | $(0.73) | $(1.00) | $(0.50) | $(0.40) | $(0.50) |
| From net realized gain | — | (0.34) | (2.88) | (0.59) | (0.76) |
| Total distributions | $(0.73) | $(1.34) | $(3.38) | $(0.99) | $(1.26) |
| Net asset value — End of year | $46.92 | $36.88 | $34.35 | $43.28 | $37.97 |
| Total Return(2) | 29.35% | 11.37% | (14.20)% | 16.75% | 12.55% |
| Ratios/Supplemental Data | | | | | |
| Net assets, end of year (000’s omitted) | $288,263 | $215,983 | $211,957 | $315,744 | $212,490 |
| Ratios (as a percentage of average daily net assets):(3) | | | | | |
| Total expenses | 0.66% | 0.68% | 0.67% | 0.66% | 0.69% |
| Net expenses | 0.66%(4) | 0.68%(4) | 0.67%(4) | 0.66% | 0.68% |
| Net investment income | 1.78% | 1.81% | 1.25% | 0.96% | 1.41% |
| Portfolio Turnover | 153%(5) | 106%(5) | 85%(5) | 95%(5) | 98%(5) |
| (1) | Computed using average shares outstanding. |
| (2) | Returns are historical and are calculated by determining the percentage change in net asset value with all distributions reinvested and do not reflect the effect of sales charges, if any. |
| (3) | Total expenses do not reflect amounts reimbursed and/or waived by the adviser and certain of its affiliates, if applicable. Net expenses are net of all reductions and represent the net expenses paid by the Fund. |
| (4) | Includes a reduction by the investment adviser of a portion of its adviser fee due to the Fund’s investment in the Liquidity Fund (equal to less than 0.005% of average daily net assets for the years ended September 30, 2024, 2023 and 2022). |
| (5) | Includes the effect of To Be Announced (TBA) transactions. |
35
See Notes to Financial Statements.
Calvert
Social Investment Fund
September 30, 2024
Financial Highlights — continued
| | Balanced Fund — Class R6 |
| | Year Ended September 30, |
| | 2024 | 2023 | 2022 | 2021 | 2020 |
| Net asset value — Beginning of year | $36.85 | $34.33 | $43.27 | $37.95 | $34.98 |
| Income (Loss) From Operations | | | | | |
| Net investment income(1) | $0.78 | $0.69 | $0.57 | $0.42 | $0.51 |
| Net realized and unrealized gain (loss) | 10.00 | 3.19 | (6.10) | 5.91 | 3.75 |
| Total income (loss) from operations | $10.78 | $3.88 | $(5.53) | $6.33 | $4.26 |
| Less Distributions | | | | | |
| From net investment income | $(0.75) | $(1.02) | $(0.53) | $(0.42) | $(0.53) |
| From net realized gain | — | (0.34) | (2.88) | (0.59) | (0.76) |
| Total distributions | $(0.75) | $(1.36) | $(3.41) | $(1.01) | $(1.29) |
| Net asset value — End of year | $46.88 | $36.85 | $34.33 | $43.27 | $37.95 |
| Total Return(2) | 29.42% | 11.42% | (14.14)% | 16.82% | 12.57% |
| Ratios/Supplemental Data | | | | | |
| Net assets, end of year (000’s omitted) | $106,400 | $73,010 | $51,544 | $11,184 | $4,298 |
| Ratios (as a percentage of average daily net assets):(3) | | | | | |
| Total expenses | 0.61% | 0.62% | 0.61% | 0.61% | 0.65% |
| Net expenses | 0.61%(4) | 0.62%(4) | 0.61%(4) | 0.61% | 0.64% |
| Net investment income | 1.83% | 1.87% | 1.51% | 1.01% | 1.43% |
| Portfolio Turnover | 153%(5) | 106%(5) | 85%(5) | 95%(5) | 98%(5) |
| (1) | Computed using average shares outstanding. |
| (2) | Returns are historical and are calculated by determining the percentage change in net asset value with all distributions reinvested and do not reflect the effect of sales charges, if any. |
| (3) | Total expenses do not reflect amounts reimbursed and/or waived by the adviser and certain of its affiliates, if applicable. Net expenses are net of all reductions and represent the net expenses paid by the Fund. |
| (4) | Includes a reduction by the investment adviser of a portion of its adviser fee due to the Fund’s investment in the Liquidity Fund (equal to less than 0.005% of average daily net assets for the years ended September 30, 2024, 2023 and 2022). |
| (5) | Includes the effect of To Be Announced (TBA) transactions. |
36
See Notes to Financial Statements.
Calvert
Social Investment Fund
September 30, 2024
Financial Highlights — continued
| | Bond Fund — Class A |
| | Year Ended September 30, |
| | 2024 | 2023 | 2022 | 2021 | 2020 |
| Net asset value — Beginning of year | $13.77 | $14.02 | $16.91 | $17.01 | $16.67 |
| Income (Loss) From Operations | | | | | |
| Net investment income(1) | $0.64 | $0.54 | $0.35 | $0.31 | $0.37 |
| Net realized and unrealized gain (loss) | 1.10 | (0.25) | (2.69) | 0.12 | 0.50 |
| Total income (loss) from operations | $1.74 | $0.29 | $(2.34) | $0.43 | $0.87 |
| Less Distributions | | | | | |
| From net investment income | $(0.64) | $(0.54) | $(0.35) | $(0.32) | $(0.38) |
| From net realized gain | — | — | (0.20) | (0.21) | (0.15) |
| Total distributions | $(0.64) | $(0.54) | $(0.55) | $(0.53) | $(0.53) |
| Net asset value — End of year | $14.87 | $13.77 | $14.02 | $16.91 | $17.01 |
| Total Return(2) | 12.93% | 2.03% | (14.15)% | 2.61% | 5.32% |
| Ratios/Supplemental Data | | | | | |
| Net assets, end of year (000’s omitted) | $343,120 | $303,884 | $305,654 | $375,792 | $327,252 |
| Ratios (as a percentage of average daily net assets):(3) | | | | | |
| Total expenses | 0.75% | 0.76% | 0.75% | 0.74% | 0.76% |
| Net expenses | 0.73%(4) | 0.73%(4) | 0.73%(4) | 0.73% | 0.73% |
| Net investment income | 4.51% | 3.80% | 2.21% | 1.84% | 2.21% |
| Portfolio Turnover | 320%(5) | 209%(5) | 122%(5) | 163%(5) | 153%(5) |
| (1) | Computed using average shares outstanding. |
| (2) | Returns are historical and are calculated by determining the percentage change in net asset value with all distributions reinvested and do not reflect the effect of sales charges, if any. |
| (3) | Total expenses do not reflect amounts reimbursed and/or waived by the adviser and certain of its affiliates, if applicable. Net expenses are net of all reductions and represent the net expenses paid by the Fund. |
| (4) | Includes a reduction by the investment adviser of a portion of its advisory fee due to the Fund’s investment in the Liquidity Fund and in other affiliated funds (equal to less than 0.01% of average daily net assets for the year ended September 30, 2024 and less than 0.005% of average daily net assets for the years ended September 30, 2023 and 2022). |
| (5) | Includes the effect of To Be Announced (TBA) transactions. |
37
See Notes to Financial Statements.
Calvert
Social Investment Fund
September 30, 2024
Financial Highlights — continued
| | Bond Fund — Class C |
| | Year Ended September 30, |
| | 2024 | 2023 | 2022 | 2021 | 2020 |
| Net asset value — Beginning of year | $13.67 | $13.92 | $16.79 | $16.89 | $16.55 |
| Income (Loss) From Operations | | | | | |
| Net investment income(1) | $0.53 | $0.42 | $0.22 | $0.18 | $0.23 |
| Net realized and unrealized gain (loss) | 1.09 | (0.24) | (2.66) | 0.12 | 0.50 |
| Total income (loss) from operations | $1.62 | $0.18 | $(2.44) | $0.30 | $0.73 |
| Less Distributions | | | | | |
| From net investment income | $(0.52) | $(0.43) | $(0.23) | $(0.19) | $(0.24) |
| From net realized gain | — | — | (0.20) | (0.21) | (0.15) |
| Total distributions | $(0.52) | $(0.43) | $(0.43) | $(0.40) | $(0.39) |
| Net asset value — End of year | $14.77 | $13.67 | $13.92 | $16.79 | $16.89 |
| Total Return(2) | 12.09% | 1.21% | (14.83)% | 1.80% | 4.50% |
| Ratios/Supplemental Data | | | | | |
| Net assets, end of year (000’s omitted) | $9,997 | $9,684 | $9,289 | $13,768 | $16,215 |
| Ratios (as a percentage of average daily net assets):(3) | | | | | |
| Total expenses | 1.55% | 1.56% | 1.55% | 1.54% | 1.56% |
| Net expenses | 1.53%(4) | 1.53%(4) | 1.53%(4) | 1.53% | 1.53% |
| Net investment income | 3.70% | 3.00% | 1.39% | 1.05% | 1.41% |
| Portfolio Turnover | 320%(5) | 209%(5) | 122%(5) | 163%(5) | 153%(5) |
| (1) | Computed using average shares outstanding. |
| (2) | Returns are historical and are calculated by determining the percentage change in net asset value with all distributions reinvested and do not reflect the effect of sales charges, if any. |
| (3) | Total expenses do not reflect amounts reimbursed and/or waived by the adviser and certain of its affiliates, if applicable. Net expenses are net of all reductions and represent the net expenses paid by the Fund. |
| (4) | Includes a reduction by the investment adviser of a portion of its advisory fee due to the Fund’s investment in the Liquidity Fund and in other affiliated funds (equal to less than 0.01% of average daily net assets for the year ended September 30, 2024 and less than 0.005% of average daily net assets for the years ended September 30, 2023 and 2022). |
| (5) | Includes the effect of To Be Announced (TBA) transactions. |
38
See Notes to Financial Statements.
Calvert
Social Investment Fund
September 30, 2024
Financial Highlights — continued
| | Bond Fund — Class I |
| | Year Ended September 30, |
| | 2024 | 2023 | 2022 | 2021 | 2020 |
| Net asset value — Beginning of year | $13.80 | $14.05 | $16.94 | $17.04 | $16.70 |
| Income (Loss) From Operations | | | | | |
| Net investment income(1) | $0.68 | $0.57 | $0.38 | $0.35 | $0.40 |
| Net realized and unrealized gain (loss) | 1.09 | (0.25) | (2.68) | 0.12 | 0.50 |
| Total income (loss) from operations | $1.77 | $0.32 | $(2.30) | $0.47 | $0.90 |
| Less Distributions | | | | | |
| From net investment income | $(0.67) | $(0.57) | $(0.39) | $(0.36) | $(0.41) |
| From net realized gain | — | — | (0.20) | (0.21) | (0.15) |
| Total distributions | $(0.67) | $(0.57) | $(0.59) | $(0.57) | $(0.56) |
| Net asset value — End of year | $14.90 | $13.80 | $14.05 | $16.94 | $17.04 |
| Total Return(2) | 13.14% | 2.24% | (13.95)% | 2.81% | 5.52% |
| Ratios/Supplemental Data | | | | | |
| Net assets, end of year (000’s omitted) | $2,632,248 | $1,882,715 | $1,668,531 | $1,709,504 | $1,379,529 |
| Ratios (as a percentage of average daily net assets):(3) | | | | | |
| Total expenses | 0.55% | 0.56% | 0.55% | 0.54% | 0.56% |
| Net expenses | 0.53%(4) | 0.53%(4) | 0.53%(4) | 0.53% | 0.53% |
| Net investment income | 4.71% | 4.01% | 2.43% | 2.04% | 2.40% |
| Portfolio Turnover | 320%(5) | 209%(5) | 122%(5) | 163%(5) | 153%(5) |
| (1) | Computed using average shares outstanding. |
| (2) | Returns are historical and are calculated by determining the percentage change in net asset value with all distributions reinvested and do not reflect the effect of sales charges, if any. |
| (3) | Total expenses do not reflect amounts reimbursed and/or waived by the adviser and certain of its affiliates, if applicable. Net expenses are net of all reductions and represent the net expenses paid by the Fund. |
| (4) | Includes a reduction by the investment adviser of a portion of its advisory fee due to the Fund’s investment in the Liquidity Fund and in other affiliated funds (equal to less than 0.01% of average daily net assets for the year ended September 30, 2024 and less than 0.005% of average daily net assets for the years ended September 30, 2023 and 2022). |
| (5) | Includes the effect of To Be Announced (TBA) transactions. |
39
See Notes to Financial Statements.
Calvert
Social Investment Fund
September 30, 2024
Financial Highlights — continued
| | Bond Fund — Class R6 |
| | Year Ended September 30, |
| | 2024 | 2023 | 2022 | 2021 | 2020 |
| Net asset value — Beginning of year | $13.78 | $14.03 | $16.93 | $17.03 | $16.69 |
| Income (Loss) From Operations | | | | | |
| Net investment income(1) | $0.68 | $0.58 | $0.40 | $0.36 | $0.41 |
| Net realized and unrealized gain (loss) | 1.10 | (0.25) | (2.70) | 0.12 | 0.50 |
| Total income (loss) from operations | $1.78 | $0.33 | $(2.30) | $0.48 | $0.91 |
| Less Distributions | | | | | |
| From net investment income | $(0.68) | $(0.58) | $(0.40) | $(0.37) | $(0.42) |
| From net realized gain | — | — | (0.20) | (0.21) | (0.15) |
| Total distributions | $(0.68) | $(0.58) | $(0.60) | $(0.58) | $(0.57) |
| Net asset value — End of year | $14.88 | $13.78 | $14.03 | $16.93 | $17.03 |
| Total Return(2) | 13.23% | 2.31% | (13.96)% | 2.89% | 5.66% |
| Ratios/Supplemental Data | | | | | |
| Net assets, end of year (000’s omitted) | $643,749 | $476,333 | $473,569 | $321,472 | $270,643 |
| Ratios (as a percentage of average daily net assets):(3) | | | | | |
| Total expenses | 0.48% | 0.48% | 0.48% | 0.47% | 0.49% |
| Net expenses | 0.46%(4) | 0.46%(4) | 0.46%(4) | 0.46% | 0.46% |
| Net investment income | 4.78% | 4.06% | 2.55% | 2.11% | 2.48% |
| Portfolio Turnover | 320%(5) | 209%(5) | 122%(5) | 163%(5) | 153%(5) |
| (1) | Computed using average shares outstanding. |
| (2) | Returns are historical and are calculated by determining the percentage change in net asset value with all distributions reinvested and do not reflect the effect of sales charges, if any. |
| (3) | Total expenses do not reflect amounts reimbursed and/or waived by the adviser and certain of its affiliates, if applicable. Net expenses are net of all reductions and represent the net expenses paid by the Fund. |
| (4) | Includes a reduction by the investment adviser of a portion of its advisory fee due to the Fund’s investment in the Liquidity Fund and in other affiliated funds (equal to less than 0.01% of average daily net assets for the year ended September 30, 2024 and less than 0.005% of average daily net assets for the years ended September 30, 2023 and 2022). |
| (5) | Includes the effect of To Be Announced (TBA) transactions. |
40
See Notes to Financial Statements.
Calvert
Social Investment Fund
September 30, 2024
Financial Highlights — continued
| | Equity Fund — Class A |
| | Year Ended September 30, |
| | 2024 | 2023 | 2022 | 2021 | 2020 |
| Net asset value — Beginning of year | $69.17 | $62.23 | $77.18 | $63.00 | $53.94 |
| Income (Loss) From Operations | | | | | |
| Net investment income (loss)(1) | $0.14 | $0.12 | $(0.02) | $(0.04) | $0.01 |
| Net realized and unrealized gain (loss) | 17.89 | 9.03 | (11.98) | 16.02 | 10.64 |
| Total income (loss) from operations | $18.03 | $9.15 | $(12.00) | $15.98 | $10.65 |
| Less Distributions | | | | | |
| From net investment income | $(0.14) | $ — | $ — | $ — | $(0.02) |
| From net realized gain | (1.23) | (2.21) | (2.95) | (1.80) | (1.57) |
| Total distributions | $(1.37) | $(2.21) | $(2.95) | $(1.80) | $(1.59) |
| Net asset value — End of year | $85.83 | $69.17 | $62.23 | $77.18 | $63.00 |
| Total Return(2) | 26.34% | 14.83% | (16.35)% | 25.87% | 20.27% |
| Ratios/Supplemental Data | | | | | |
| Net assets, end of year (000’s omitted) | $2,240,593 | $1,996,462 | $1,807,406 | $2,278,654 | $1,896,037 |
| Ratios (as a percentage of average daily net assets):(3) | | | | | |
| Total expenses | 0.90% | 0.91% | 0.91% | 0.91% | 0.94% |
| Net expenses | 0.90%(4) | 0.91%(4) | 0.91%(4) | 0.91% | 0.94% |
| Net investment income (loss) | 0.18% | 0.18% | (0.03)% | (0.06)% | 0.01% |
| Portfolio Turnover | 9% | 10% | 7% | 13% | 16% |
| (1) | Computed using average shares outstanding. |
| (2) | Returns are historical and are calculated by determining the percentage change in net asset value with all distributions reinvested and do not reflect the effect of sales charges, if any. |
| (3) | Total expenses do not reflect amounts reimbursed and/or waived by the adviser and certain of its affiliates, if applicable. Net expenses are net of all reductions and represent the net expenses paid by the Fund. |
| (4) | Includes a reduction by the investment adviser of a portion of its advisory fee due to the Fund’s investment in the Liquidity Fund (equal to less than 0.005% of average daily net assets for the years ended September 30, 2024, 2023 and 2022). |
41
See Notes to Financial Statements.
Calvert
Social Investment Fund
September 30, 2024
Financial Highlights — continued
| | Equity Fund — Class C |
| | Year Ended September 30, |
| | 2024 | 2023 | 2022 | 2021 | 2020 |
| Net asset value — Beginning of year | $33.12 | $31.03 | $40.04 | $33.61 | $29.67 |
| Income (Loss) From Operations | | | | | |
| Net investment loss(1) | $(0.21) | $(0.19) | $(0.29) | $(0.30) | $(0.22) |
| Net realized and unrealized gain (loss) | 8.45 | 4.46 | (5.89) | 8.39 | 5.70 |
| Total income (loss) from operations | $8.24 | $4.27 | $(6.18) | $8.09 | $5.48 |
| Less Distributions | | | | | |
| From net investment income | $(0.03) | $ — | $ — | $ — | $ — |
| From net realized gain | (1.23) | (2.18) | (2.83) | (1.66) | (1.54) |
| Total distributions | $(1.26) | $(2.18) | $(2.83) | $(1.66) | $(1.54) |
| Net asset value — End of year | $40.10 | $33.12 | $31.03 | $40.04 | $33.61 |
| Total Return(2) | 25.37% | 13.99% | (16.96)% | 24.92% | 19.38% |
| Ratios/Supplemental Data | | | | | |
| Net assets, end of year (000’s omitted) | $128,241 | $122,005 | $114,234 | $149,033 | $138,072 |
| Ratios (as a percentage of average daily net assets):(3) | | | | | |
| Total expenses | 1.65% | 1.66% | 1.65% | 1.66% | 1.69% |
| Net expenses | 1.65%(4) | 1.66%(4) | 1.65%(4) | 1.66% | 1.69% |
| Net investment loss | (0.57)% | (0.57)% | (0.78)% | (0.81)% | (0.74)% |
| Portfolio Turnover | 9% | 10% | 7% | 13% | 16% |
| (1) | Computed using average shares outstanding. |
| (2) | Returns are historical and are calculated by determining the percentage change in net asset value with all distributions reinvested and do not reflect the effect of sales charges, if any. |
| (3) | Total expenses do not reflect amounts reimbursed and/or waived by the adviser and certain of its affiliates, if applicable. Net expenses are net of all reductions and represent the net expenses paid by the Fund. |
| (4) | Includes a reduction by the investment adviser of a portion of its advisory fee due to the Fund’s investment in the Liquidity Fund (equal to less than 0.005% of average daily net assets for the years ended September 30, 2024, 2023 and 2022). |
42
See Notes to Financial Statements.
Calvert
Social Investment Fund
September 30, 2024
Financial Highlights — continued
| | Equity Fund — Class I |
| | Year Ended September 30, |
| | 2024 | 2023 | 2022 | 2021 | 2020 |
| Net asset value — Beginning of year | $82.38 | $73.71 | $90.83 | $73.80 | $62.89 |
| Income (Loss) From Operations | | | | | |
| Net investment income(1) | $0.40 | $0.35 | $0.19 | $0.16 | $0.17 |
| Net realized and unrealized gain (loss) | 21.35 | 10.71 | (14.20) | 18.81 | 12.46 |
| Total income (loss) from operations | $21.75 | $11.06 | $(14.01) | $18.97 | $12.63 |
| Less Distributions | | | | | |
| From net investment income | $(0.29) | $(0.17) | $(0.08) | $(0.13) | $(0.15) |
| From net realized gain | (1.23) | (2.22) | (3.03) | (1.81) | (1.57) |
| Total distributions | $(1.52) | $(2.39) | $(3.11) | $(1.94) | $(1.72) |
| Net asset value — End of year | $102.61 | $82.38 | $73.71 | $90.83 | $73.80 |
| Total Return(2) | 26.66% | 15.12% | (16.14)% | 26.19% | 20.57% |
| Ratios/Supplemental Data | | | | | |
| Net assets, end of year (000’s omitted) | $3,797,446 | $3,713,256 | $2,895,475 | $3,142,730 | $2,863,128 |
| Ratios (as a percentage of average daily net assets):(3) | | | | | |
| Total expenses | 0.65% | 0.66% | 0.65% | 0.66% | 0.69% |
| Net expenses | 0.65%(4) | 0.66%(4) | 0.65%(4) | 0.66% | 0.69% |
| Net investment income | 0.43% | 0.43% | 0.22% | 0.19% | 0.26% |
| Portfolio Turnover | 9% | 10% | 7% | 13% | 16% |
| (1) | Computed using average shares outstanding. |
| (2) | Returns are historical and are calculated by determining the percentage change in net asset value with all distributions reinvested and do not reflect the effect of sales charges, if any. |
| (3) | Total expenses do not reflect amounts reimbursed and/or waived by the adviser and certain of its affiliates, if applicable. Net expenses are net of all reductions and represent the net expenses paid by the Fund. |
| (4) | Includes a reduction by the investment adviser of a portion of its advisory fee due to the Fund’s investment in the Liquidity Fund (equal to less than 0.005% of average daily net assets for the years ended September 30, 2024, 2023 and 2022). |
43
See Notes to Financial Statements.
Calvert
Social Investment Fund
September 30, 2024
Financial Highlights — continued
| | Equity Fund — Class R6 |
| | Year Ended September 30, |
| | 2024 | 2023 | 2022 | 2021 | 2020 |
| Net asset value — Beginning of year | $82.17 | $73.53 | $90.64 | $73.67 | $62.80 |
| Income (Loss) From Operations | | | | | |
| Net investment income(1) | $0.46 | $0.40 | $0.25 | $0.23 | $0.21 |
| Net realized and unrealized gain (loss) | 21.29 | 10.68 | (14.16) | 18.74 | 12.44 |
| Total income (loss) from operations | $21.75 | $11.08 | $(13.91) | $18.97 | $12.65 |
| Less Distributions | | | | | |
| From net investment income | $(0.36) | $(0.22) | $(0.17) | $(0.19) | $(0.21) |
| From net realized gain | (1.23) | (2.22) | (3.03) | (1.81) | (1.57) |
| Total distributions | $(1.59) | $(2.44) | $(3.20) | $(2.00) | $(1.78) |
| Net asset value — End of year | $102.33 | $82.17 | $73.53 | $90.64 | $73.67 |
| Total Return(2) | 26.73% | 15.21% | (16.09)% | 26.28% | 20.65% |
| Ratios/Supplemental Data | | | | | |
| Net assets, end of year (000’s omitted) | $753,138 | $675,873 | $446,224 | $456,674 | $248,096 |
| Ratios (as a percentage of average daily net assets):(3) | | | | | |
| Total expenses | 0.58% | 0.59% | 0.59% | 0.60% | 0.63% |
| Net expenses | 0.58%(4) | 0.59%(4) | 0.59%(4) | 0.60% | 0.63% |
| Net investment income | 0.50% | 0.49% | 0.29% | 0.27% | 0.32% |
| Portfolio Turnover | 9% | 10% | 7% | 13% | 16% |
| (1) | Computed using average shares outstanding. |
| (2) | Returns are historical and are calculated by determining the percentage change in net asset value with all distributions reinvested and do not reflect the effect of sales charges, if any. |
| (3) | Total expenses do not reflect amounts reimbursed and/or waived by the adviser and certain of its affiliates, if applicable. Net expenses are net of all reductions and represent the net expenses paid by the Fund. |
| (4) | Includes a reduction by the investment adviser of a portion of its advisory fee due to the Fund’s investment in the Liquidity Fund (equal to less than 0.005% of average daily net assets for the years ended September 30, 2024, 2023 and 2022). |
44
See Notes to Financial Statements.
Calvert
Social Investment Fund
September 30, 2024
Notes to Financial Statements
1 Significant Accounting Policies
Calvert Balanced Fund (Balanced), Calvert Bond Fund (Bond) and Calvert Equity Fund (Equity) (each a Fund and collectively, the Funds) are diversified series of Calvert Social Investment Fund (the Trust). The Trust is a Massachusetts business trust registered under the Investment Company Act of 1940, as amended (the 1940 Act), as an open-end management investment company. The investment objective of Balanced is to seek to achieve a competitive total return through an actively managed portfolio of stocks, bonds, and money market instruments which offer income and capital growth opportunity. The investment objective of Bond is to seek to provide as high a level of current income as is consistent with preservation of capital through investment in bonds and other debt securities. The investment objective of Equity is to seek growth of capital through investment in stocks believed to offer opportunities for potential capital appreciation.
Each Fund offers four classes of shares. Class A shares are generally sold subject to a sales charge imposed at time of purchase. A contingent deferred sales charge of 1.00% for Balanced and Equity and 0.75% for Bond may apply to certain redemptions of Class A shares for accounts for which no sales charge was paid, if redeemed within 12 months of purchase. Class C shares are sold without a front-end sales charge, and with certain exceptions, are charged a contingent deferred sales charge of 1.00% on shares redeemed within 12 months of purchase. Class C shares are only available for purchase through a financial intermediary. Effective November 5, 2020, Class C shares automatically convert to Class A shares eight years after their purchase as described in the Funds’ prospectus. Class I and Class R6 shares are sold at net asset value, are not subject to a sales charge and are sold only to certain eligible investors. Each class represents a pro rata interest in each Fund, but votes separately on class-specific matters and is subject to different expenses.
Each Fund applies the accounting and reporting guidance in the Financial Accounting Standards Board (FASB) Accounting Standards Codification Topic 946, Financial Services – Investment Companies (ASC 946). Subsequent events, if any, through the date that the financial statements were issued have been evaluated in the preparation of the financial statements.
A Investment Valuation— Net asset value per share is determined every business day as of the close of the regular session of the New York Stock Exchange (generally 4:00 p.m. Eastern time). The Funds use independent pricing services approved by the Board of Trustees (the Board) to value their investments wherever possible. Investments for which market quotations are not available or deemed not reliable are fair valued in good faith by the Board's valuation designee.
U.S. generally accepted accounting principles (U.S. GAAP) establishes a disclosure hierarchy that categorizes the inputs to valuation techniques used to value assets and liabilities at measurement date. These inputs are summarized in the three broad levels listed below:
Level 1 – quoted prices in active markets for identical securities
Level 2 – other significant observable inputs (including quoted prices for similar securities, interest rates, prepayment speeds, credit risk, etc.)
Level 3 – significant unobservable inputs (including each Fund's own assumptions in determining the fair value of investments)
The inputs or methodologies used for valuing securities are not necessarily an indication of the risk associated with investing in those securities.
Valuation techniques used to value each Fund's investments by major category are as follows:
Equity Securities. Equity securities (including warrants and rights) listed on a U.S. securities exchange generally are valued at the last sale or closing price as reported by an independent pricing service on the primary market or exchange on which they are traded and are categorized as Level 1 in the hierarchy. Equity securities listed on the NASDAQ National Market System are valued at the NASDAQ official closing price and are categorized as Level 1 in the hierarchy. Unlisted or listed securities for which closing sales prices or closing quotations are not available are valued at the mean between the latest available bid and ask prices and are categorized as Level 2 in the hierarchy.
Debt Securities. Debt securities are generally valued based on valuations provided by third party pricing services, as derived from such services’ pricing models. Inputs to the models may include, but are not limited to, reported trades, executable bid and ask prices, broker/dealer quotations, prices or yields of securities with similar characteristics, interest rates, anticipated prepayments, benchmark curves or information pertaining to the issuer, as well as industry and economic events. Accordingly, debt securities are generally categorized as Level 2 in the hierarchy. Short-term debt securities with a remaining maturity at time of purchase of more than sixty days are valued based on valuations provided by a third party pricing service. Such securities are generally categorized as Level 2 in the hierarchy. Short-term debt securities of sufficient credit quality purchased with remaining maturities of sixty days or less for which a valuation from a third party pricing service is not readily available may be valued at amortized cost, which approximates fair value, and are categorized as Level 2 in the hierarchy.
Senior Floating-Rate Loans. Interests in senior floating-rate loans for which reliable market quotations are readily available are valued generally at the average mean of bid and ask quotations obtained from a third party pricing service, and are categorized as Level 2 in the hierarchy.
Venture Capital Securities. Venture capital securities for which market quotations are not readily available are generally categorized as Level 3 in the hierarchy. Venture capital equity securities are generally valued using the most appropriate and applicable method to measure fair value in light of each company’s situation. Methods may include market, income, options-pricing or cost approaches with discounts as appropriate based on assumptions of liquidation or exit risk. Examples of the market approach are subsequent rounds of financing, comparable transactions, and revenue times an industry multiple. An example of the income approach is the discounted cash flow model. Examples of the cost approach are replacement cost, salvage value, or
Calvert
Social Investment Fund
September 30, 2024
Notes to Financial Statements — continued
net asset value. The options-pricing method treats common stock and preferred stock as call options on the enterprise value with strike price based on the preferred stock liquidation preference. Venture capital limited partnership interests are valued at the fair value reported by the general partner of the partnership, adjusted as necessary to reflect subsequent capital calls and distributions and any other available information. In some cases, adjustments may be made to account for daily pricing of material public holdings within the partnership.
Other Securities. Investments in management investment companies (including money market funds) that do not trade on an exchange are valued at the net asset value as of the close of each business day and are categorized as Level 1 in the hierarchy. Exchange-traded funds are valued at the official closing price as reported by an independent pricing service on the primary market or exchange on which they are traded and are categorized as Level 1 in the hierarchy.
Derivatives. Futures contracts are valued at unrealized appreciation (depreciation) based on the settlement price established each day by the board of trade or exchange on which they are traded and are categorized as Level 1 in the hierarchy. Forward foreign currency exchange contracts are generally valued at the mean of the average bid and average ask prices that are reported by currency dealers to a third party pricing service at the valuation time. Such third party pricing service valuations are supplied for specific settlement periods and the Funds' forward foreign currency exchange contracts are valued at an interpolated rate between the closest preceding and subsequent settlement period reported by the third party pricing service and are categorized as Level 2 in the hierarchy.
Fair Valuation. In connection with Rule 2a-5 of the 1940 Act, the Board has designated a Fund’s investment adviser as its valuation designee. Investments for which valuations or market quotations are not readily available or are deemed unreliable are valued by the investment adviser, as valuation designee, at fair value using methods that most fairly reflect the security’s “fair value”, which is the amount that a Fund might reasonably expect to receive for the security upon its current sale in the ordinary course. Each such determination is based on a consideration of relevant factors, which are likely to vary from one pricing context to another. These factors may include, but are not limited to, the type of security, the existence of any contractual restrictions on the security’s disposition, the price and extent of public trading in similar securities of the issuer or of comparable companies or entities, quotations or relevant information obtained from broker/dealers or other market participants, information obtained from the issuer, analysts, and/or the appropriate stock exchange (for exchange-traded securities), an analysis of the company’s or entity’s financial statements, and an evaluation of the forces that influence the issuer and the market(s) in which the security is purchased and sold.
The values assigned to fair value investments are based on available information and do not necessarily represent amounts that might ultimately be realized. Further, due to the inherent uncertainty of valuations of such investments, the fair values may differ significantly from the values that would have been used had an active market existed, and the differences could be material.
The following tables summarize the market value of each of the Funds' holdings as of September 30, 2024, based on the inputs used to value them:
Balanced
| Asset Description | Level 1 | Level 2 | Level 3(1) | Total |
| Asset-Backed Securities | $ — | $62,231,390 | $ — | $62,231,390 |
| Collateralized Mortgage Obligations | — | 12,762,720 | — | 12,762,720 |
| Commercial Mortgage-Backed Securities | — | 51,007,675 | — | 51,007,675 |
| Common Stocks | 867,396,007(2) | — | — | 867,396,007 |
| Common Stocks - Venture Capital | — | — | 1,905,451 | 1,905,451 |
| Corporate Bonds | — | 154,944,240 | — | 154,944,240 |
| Preferred Stocks | 1,461,615 | — | — | 1,461,615 |
| Preferred Stocks - Venture Capital | — | — | 33,192 | 33,192 |
| Senior Floating-Rate Loans (Less Unfunded Loan Commitments) | — | 11,155,216 | — | 11,155,216 |
| Sovereign Government Bonds | — | 4,478,053 | — | 4,478,053 |
| Taxable Municipal Obligations | — | 8,313,831 | — | 8,313,831 |
| U.S. Government Agencies and Instrumentalities | — | 1,789,805 | — | 1,789,805 |
| U.S. Government Agency Mortgage-Backed Securities | — | 122,080,660 | — | 122,080,660 |
| U.S. Treasury Obligations | — | 70,792,835 | — | 70,792,835 |
| Venture Capital Limited Partnership Interests | — | — | 120,513 | 120,513 |
| Short-Term Investments: | | | | |
| Affiliated Fund | 48,316,470 | — | — | 48,316,470 |
| Securities Lending Collateral | 5,091,583 | — | — | 5,091,583 |
Calvert
Social Investment Fund
September 30, 2024
Notes to Financial Statements — continued
Balanced — continued
| Asset Description (continued) | Level 1 | Level 2 | Level 3(1) | Total |
| U.S. Treasury Obligations | $ — | $27,817,455 | $ — | $27,817,455 |
| Total Investments | $922,265,675 | $527,373,880 | $2,059,156 | $1,451,698,711 |
| Futures Contracts | $179,583 | $ — | $ — | $179,583 |
| Total | $922,445,258 | $527,373,880 | $2,059,156 | $1,451,878,294 |
| Liability Description | | | | |
| Forward Foreign Currency Exchange Contracts | $ — | $(5,992) | $ — | $(5,992) |
| Futures Contracts | (116,470) | — | — | (116,470) |
| Total | $(116,470) | $(5,992) | $ — | $(122,462) |
| (1) | None of the unobservable inputs for Level 3 assets, individually or collectively, had a material impact on the Fund. |
| (2) | The level classification by major category of investments is the same as the category presentation in the Schedule of Investments. |
Bond
| Asset Description | Level 1 | Level 2 | Level 3 | Total |
| Asset-Backed Securities | $ — | $443,723,909 | $ — | $443,723,909 |
| Collateralized Mortgage Obligations | — | 172,266,099 | — | 172,266,099 |
| Commercial Mortgage-Backed Securities | — | 337,929,080 | — | 337,929,080 |
| Convertible Bonds | — | 8,144,204 | — | 8,144,204 |
| Corporate Bonds | — | 1,194,811,885 | — | 1,194,811,885 |
| Exchange-Traded Funds | 2,382,900 | — | — | 2,382,900 |
| High Social Impact Investments | ���— | 8,621,660 | — | 8,621,660 |
| Preferred Stocks | 7,168,465 | — | — | 7,168,465 |
| Senior Floating-Rate Loans | — | 87,914,684 | — | 87,914,684 |
| Sovereign Government Bonds | — | 34,664,119 | — | 34,664,119 |
| Taxable Municipal Obligations | — | 45,256,265 | — | 45,256,265 |
| U.S. Government Agencies and Instrumentalities | — | 17,417,431 | — | 17,417,431 |
| U.S. Government Agency Mortgage-Backed Securities | — | 940,601,025 | — | 940,601,025 |
| U.S. Treasury Obligations | — | 612,934,240 | — | 612,934,240 |
| Short-Term Investments: | | | | |
| Affiliated Fund | 181,877,046 | — | — | 181,877,046 |
| Securities Lending Collateral | 45,779,848 | — | — | 45,779,848 |
| U.S. Treasury Obligations | — | 238,387,155 | — | 238,387,155 |
| Total Investments | $237,208,259 | $4,142,671,756 | $ — | $4,379,880,015 |
| Futures Contracts | $1,072,618 | $ — | $ — | $1,072,618 |
| Total | $238,280,877 | $4,142,671,756 | $ — | $4,380,952,633 |
| Liability Description | | | | |
| Forward Foreign Currency Exchange Contracts | $ — | $(56,176) | $ — | $(56,176) |
| Futures Contracts | (559,630) | — | — | (559,630) |
| Total | $(559,630) | $(56,176) | $ — | $(615,806) |
Calvert
Social Investment Fund
September 30, 2024
Notes to Financial Statements — continued
Equity
| Asset Description | Level 1 | Level 2 | Level 3(1) | Total |
| Common Stocks | $6,715,273,051(2) | $ — | $ — | $6,715,273,051 |
| Common Stocks - Venture Capital | — | — | 202,558 | 202,558 |
| Preferred Stocks - Venture Capital | — | — | 445,333 | 445,333 |
| Venture Capital Limited Partnership Interests | — | — | 11,590,161 | 11,590,161 |
| Short-Term Investments | 195,144,544 | — | — | 195,144,544 |
| Total Investments | $6,910,417,595 | $ — | $12,238,052 | $6,922,655,647 |
| (1) | None of the unobservable inputs for Level 3 assets, individually or collectively, had a material impact on the Fund. |
| (2) | The level classification by major category of investments is the same as the category presentation in the Schedule of Investments. |
For Balanced and Equity, Level 3 investments at the beginning and/or end of the period in relation to net assets were not significant and accordingly, a reconciliation of Level 3 assets for the year ended September 30, 2024 is not presented.
B Investment Transactions and Income— Investment transactions for financial statement purposes are accounted for on trade date. Realized gains and losses are recorded on an identified cost basis and may include proceeds from litigation. Dividend income is recorded on the ex-dividend date for dividends received in cash and/or securities or, in the case of dividends on certain foreign securities, as soon as the Fund is informed of the ex-dividend date. Non-cash dividends are recorded at the fair value of the securities received. Withholding taxes on foreign dividends and interest, if any, have been provided for in accordance with the Funds' understanding of the applicable country’s tax rules and rates. Distributions received that represent a return of capital are recorded as a reduction of cost of investments. Distributions received that represent a capital gain are recorded as a realized gain. Interest income, which includes amortization of premium and accretion of discount on debt securities, is accrued as earned. The Funds may earn certain fees in connection with their investments in senior floating-rate loans. These fees are in addition to interest payments earned and may include amendment fees, consent fees and prepayment fees, which are recorded to income as earned. Inflation adjustments to the principal amount of inflation-adjusted bonds and notes are reflected as interest income. Deflation adjustments to the principal amount of an inflation-adjusted bond or note are reflected as reductions to interest income to the extent of interest income previously recorded on such bond or note.
C Share Class Accounting— Realized and unrealized gains and losses and net investment income and losses (except for Bond), other than class-specific expenses, are allocated daily to each class of shares based upon the relative net assets of each class to the total net assets of each Fund. For Bond, net investment income and losses, other than class-specific expenses, is allocated daily to each class of shares based upon the ratio of the value of each class’s paid shares to the total value of all paid shares. Expenses arising in connection with a specific class are charged directly to that class. Sub-accounting, recordkeeping and similar administrative fees payable to financial intermediaries, which are a component of transfer agency fees and expenses on the Statements of Operations, are not allocated to Class R6 shares.
D Foreign Currency Transactions— The Funds’ accounting records are maintained in U.S. dollars. For valuation of assets and liabilities on each date of net asset value determination, foreign denominations are converted into U.S. dollars using the current exchange rate. Security transactions, income and expenses are translated at the prevailing rate of exchange on the date of the event. Recognized gains or losses on investment transactions attributable to changes in foreign currency exchange rates are recorded for financial statement purposes as net realized gains and losses on investments. That portion of unrealized gains and losses on investments that results from fluctuations in foreign currency exchange rates is not separately disclosed.
E Senior Floating-Rate Loans— The Funds may invest in direct debt instruments, which are interests in amounts owed to lenders or lending syndicates by corporate, governmental, or other borrowers. The Funds’ investments in loans may be in the form of participations in loans or assignments of all or a portion of loans from third parties. A loan is often administered by a bank or other financial institution (the lender) that acts as agent for all holders. The agent administers the terms of the loan, as specified in the loan agreement. The Funds may invest in multiple series or tranches of a loan, which may have varying terms and carry different associated risks. When the Funds purchase assignments from lenders, they acquire direct rights against the borrower of the loan. When investing in a loan participation, the Funds have the right to receive payments of principal, interest and any fees to which they are entitled only from the lender selling the loan agreement and only upon receipt of such payments by the lender from the borrower. The Funds generally have no right to enforce compliance by the borrower with the terms of the loan agreement. As a result, the Funds may be subject to the credit risk of both the borrower and the lender that is issuing the participation interest.
F Unfunded Loan Commitments— The Funds may enter into certain loan agreements all or a portion of which may be unfunded. Each Fund is obligated to fund these commitments at the borrower's discretion. These commitments, if any, are disclosed in the accompanying Schedules of Investments.
G Futures Contracts— The Funds may enter into futures contracts to buy or sell a financial instrument for a set price at a future date. Initial margin deposits of either cash or securities as required by the broker are made upon entering into the contract. While the contract is open, daily variation margin payments are made to or received from the broker reflecting the daily change in market value of the contract and are recorded for financial reporting
Calvert
Social Investment Fund
September 30, 2024
Notes to Financial Statements — continued
purposes as unrealized gains or losses by the Funds. When a futures contract is closed, a realized gain or loss is recorded equal to the difference between the opening and closing value of the contract. The risks associated with entering into futures contracts may include the possible illiquidity of the secondary market which would limit the Funds' ability to close out a futures contract prior to the settlement date, an imperfect correlation between the value of the contracts and the underlying financial instruments, or that the counterparty will fail to perform its obligations under the contracts’ terms. Futures contracts are designed by boards of trade, which are designated “contracts markets” by the Commodities Futures Trading Commission. Futures contracts trade on the contracts markets in a manner that is similar to the way a stock trades on a stock exchange, and the boards of trade, through their clearing corporations, guarantee the futures contracts against default. As a result, there is minimal counterparty credit risk to the Funds.
H Forward Foreign Currency Exchange Contracts— The Funds may enter into forward foreign currency exchange contracts for the purchase or sale of a specific foreign currency at a fixed price on a future date. The forward foreign currency exchange contracts are adjusted by the daily exchange rate of the underlying currency and any gains or losses are recorded as unrealized until such time as the contracts have been closed. Risks may arise upon entering these contracts from the potential inability of counterparties to meet the terms of their contracts and from movements in the value of a foreign currency relative to the U.S. dollar.
I Options Contracts— Upon the purchase of a call or put option, the premium paid by the Fund is included in the Statement of Assets and Liabilities as an investment. The amount of the investment is subsequently marked-to-market to reflect the current market value of the option purchased, in accordance with the Fund’s policies on investment valuations discussed above. Premiums paid for purchasing options that expire are treated as realized losses. Premiums paid for purchasing options that are exercised or closed are added to the amounts paid or offset against the proceeds on the underlying investment transaction to determine the realized gain or loss. An option on a futures contract gives the holder the right to enter into a specified futures contract. As the purchaser of an index option, the Fund has the right to receive a cash payment equal to any depreciation in the value of the index below the exercise price of the option (in the case of a put) or equal to any appreciation in the value of the index over the exercise price of the option (in the case of a call) as of the valuation date of the option. The risk associated with purchasing options is limited to the premium originally paid. Purchased options traded over-the-counter involve risk that the issuer or counterparty will fail to perform its contractual obligations.
J Restricted Securities— The Funds may invest in securities that are subject to legal or contractual restrictions on resale. Generally, these securities may only be sold publicly upon registration under the Securities Act of 1933 or in transactions exempt from such registration. Information regarding restricted securities (excluding Rule 144A securities) is included at the end of each Fund's Schedule of Investments.
K Distributions to Shareholders— Distributions to shareholders are recorded by the Funds on ex-dividend date. Distributions from net investment income are declared daily and paid monthly by Bond, quarterly by Balanced and annually by Equity. Distributions from net realized capital gains, if any, are paid at least annually. Distributions are declared separately for each class of shares. Distributions are determined in accordance with income tax regulations, which may differ from U.S. GAAP; accordingly, periodic reclassifications are made within the Funds’ capital accounts to reflect income and gains available for distribution under income tax regulations.
L Estimates— The preparation of financial statements in conformity with U.S. GAAP requires management to make estimates and assumptions that affect the reported amounts of assets and liabilities and disclosure of contingent assets and liabilities at the date of the financial statements and the reported amounts of increases and decreases in net assets from operations during the reporting period. Actual results could differ from those estimates.
M Indemnifications— Under the Trust’s organizational document, its officers and Trustees may be indemnified against certain liabilities and expenses arising out of the performance of their duties to the Funds. Under Massachusetts law, if certain conditions prevail, shareholders of a Massachusetts business trust (such as the Trust) could be deemed to have personal liability for the obligations of the Trust. However, the Trust’s Declaration of Trust contains an express disclaimer of liability on the part of Fund shareholders and provides that the Trust shall assume, upon request by the shareholder, the defense on behalf of any Fund shareholders or former shareholders. Additionally, in the normal course of business, each Fund enters into agreements with service providers that may contain indemnification clauses. Each Fund’s maximum exposure under these arrangements is unknown as this would involve future claims that may be made against each Fund that have not yet occurred.
N Federal Income Taxes— No provision for federal income or excise tax is required since each Fund intends to continue to qualify as a regulated investment company under the Internal Revenue Code and to distribute substantially all of its taxable earnings.
Management has analyzed the Funds' tax positions taken for all open federal income tax years and has concluded that no provision for federal income tax is required in the Funds' financial statements. Each Fund's federal tax return is subject to examination by the Internal Revenue Service for a period of three years from the date of filing.
O When-Issued Securities and Delayed Delivery Transactions— The Funds may purchase securities on a delayed delivery, when-issued or forward commitment basis, including TBA (To Be Announced) securities. Payment and delivery may take place after the customary settlement period for that security. At the time the transaction is negotiated, the price of the security that will be delivered is fixed. Securities purchased on a delayed delivery, when-issued or forward commitment basis are marked-to-market daily and begin earning interest on settlement date. Such security purchases are subject to the risk that when delivered they will be worth less than the agreed upon payment price. Losses may also arise if the counterparty does not perform under the contract. A forward purchase commitment may also be closed by entering into an offsetting commitment. If an offsetting commitment is entered into, the Funds will realize a gain or loss on investments based on the price established when the Funds entered into the commitment.
Calvert
Social Investment Fund
September 30, 2024
Notes to Financial Statements — continued
2 Related Party Transactions
The investment advisory fee is earned by Calvert Research and Management (CRM), an indirect, wholly-owned subsidiary of Morgan Stanley, as compensation for investment advisory services rendered to each Fund. The investment advisory fee is computed at the following annual rates of each respective Fund’s average daily net assets and is payable monthly:
Balanced
| Average Daily Net Assets | Annual Fee Rate |
| Up to and including $500 million | 0.410% |
| Over $500 million up to and including $1 billion | 0.385% |
| Over $1 billion | 0.350% |
Bond
| Average Daily Net Assets | Annual Fee Rate |
| Up to and including $1 billion | 0.300% |
| Over $1 billion | 0.290% |
Equity
| Average Daily Net Assets | Annual Fee Rate |
| Up to and including $2 billion | 0.500% |
| Over $2 billion up to and including $3 billion | 0.425% |
| Over $3 billion | 0.375% |
For the year ended September 30, 2024, the investment advisory fee for Balanced, Bond and Equity amounted to $4,694,802, $9,021,462 and $28,744,473, respectively, or 0.39%, 0.29% and 0.42%, respectively, of each Fund's average daily net assets.
Each Fund may invest in a money market fund, the Institutional Class of the Morgan Stanley Institutional Liquidity Funds - Government Portfolio (the “Liquidity Fund”), an open-end management investment company managed by Morgan Stanley Investment Management Inc., a wholly-owned subsidiary of Morgan Stanley. The investment advisory fee paid by each Fund is reduced by an amount equal to its pro rata share of the advisory and administration fees paid by each Fund due to its investment in the Liquidity Fund. For the year ended September 30, 2024, the investment advisory fee paid was reduced by $41,360, $187,976 and $228,961 for Balanced, Bond and Equity, respectively, relating to each Fund's investment in the Liquidity Fund.
Pursuant to an investment sub-advisory agreement, CRM has delegated the investment management of Equity to Atlanta Capital Management Company, LLC (Atlanta Capital), an affiliate of CRM and an indirect, wholly-owned subsidiary of Morgan Stanley. CRM pays Atlanta Capital a portion of its investment advisory fee for sub-advisory services provided to the Fund.
Calvert
Social Investment Fund
September 30, 2024
Notes to Financial Statements — continued
CRM has agreed to reimburse the Funds’ operating expenses to the extent that total annual operating expenses (relating to ordinary operating expenses only and excluding expenses such as brokerage commissions, acquired fund fees and expenses of unaffiliated funds, borrowing costs, taxes or litigation expenses) exceed, as a percentage of such class’s average daily net assets, the following amounts:
| | Class A | Class C | Class I | Class R6 |
| Balanced | 0.93% | 1.68% | 0.68% | 0.64% |
| Bond | 0.73% | 1.53% | 0.53% | 0.46% |
For Balanced and Bond, the expense reimbursement agreements with CRM may be changed or terminated after February 1, 2025. For the year ended September 30, 2024, CRM waived and/or reimbursed expenses of $611,952 for Bond and no expenses were waived and/or reimbursed for Balanced.
The administrative fee is earned by CRM as compensation for administrative services rendered to the Funds. The fee is computed at an annual rate of 0.12% of each Fund’s average daily net assets attributable to Class A, Class C, Class I and Class R6 and is payable monthly. For the year ended September 30, 2024, CRM was paid administrative fees of $1,446,789, $3,691,640 and $8,238,232 for Balanced, Bond and Equity, respectively.
Each Fund has in effect a distribution plan for Class A shares (Class A Plan) pursuant to Rule 12b-1 under the 1940 Act. Pursuant to the Class A Plan, each Fund pays Eaton Vance Distributors, Inc. (EVD), an affiliate of CRM and the Funds' principal underwriter, a distribution and service fee at a rate per annum of its average daily net assets attributable to Class A shares for distribution services and facilities provided to the Funds by EVD, as well as for personal services and/or the maintenance of shareholder accounts. Distribution and service fee rates for Class A shares are as follows:
| | Balanced | Bond | Equity |
| Class A Plan | 0% up to $30 million,
0.25% over $30 million | 0.20% | 0.25% |
Each Fund also has in effect a distribution plan for Class C shares (Class C Plan) pursuant to Rule 12b-1 under the 1940 Act. Pursuant to the Class C Plan, each Fund pays EVD amounts equal to 0.75% per annum of its average daily net assets attributable to Class C shares for providing ongoing distribution services and facilities to the Funds. In addition, pursuant to the Class C Plan, each Fund also makes payments of service fees to EVD, financial intermediaries and other persons in amounts equal to 0.25% per annum of its average daily net assets attributable to that class. Service fees paid or accrued are for personal services and/or the maintenance of shareholder accounts. Distribution and service fees for Balanced, Bond and Equity paid or accrued for the year ended September 30, 2024 amounted to $1,958,289, $637,903 and $5,416,537, respectively, for Class A shares and $528,071, $95,268 and $1,286,532, respectively, for Class C shares.
The Funds were informed that EVD received $100,119, $31,930 and $135,285 for Balanced, Bond and Equity, respectively, as their portion of the sales charge on sales of Class A shares for the year ended September 30, 2024. The Funds were informed that Morgan Stanley affiliated broker-dealers, which may be deemed to be affiliates of CRM and EVD, also received a portion of the sales charge on sales of Class A shares for the year ended September 30, 2024 in the amount of $11,208, $4,047 and $17,982 for Balanced, Bond and Equity, respectively.
For the year ended September 30, 2024, the Funds were also informed that EVD received the following amounts of contingent deferred sales charges paid by Class A and Class C shareholders:
| | Balanced | Bond | Equity |
| Class A | $2,707 | $1,749 | $2,206 |
| Class C | 4,043 | 4,514 | 10,466 |
Eaton Vance Management (EVM), an affiliate of CRM, provides sub-transfer agency and related services to the Funds pursuant to a Sub-Transfer Agency Support Services Agreement. For the year ended September 30, 2024, sub-transfer agency fees and expenses incurred to EVM amounted to $163,690, $76,249 and $292,976 for Balanced, Bond and Equity, respectively, and are included in transfer agency fees and expenses on the Statements of Operations.
Each Trustee of the Funds who is not an employee of CRM or its affiliates receives an annual fee of $225,000 ($214,000 prior to January 1, 2024), an annual Committee fee ranging from $8,500 to $16,500 depending on the Committee, and may receive a fee of $10,000 for special meetings. The Board chair receives an additional $40,000 annual fee, Committee chairs receive an additional $15,000 annual fee and the special equities liaison receives an additional $2,500 annual fee. Eligible Trustees may participate in a Deferred Compensation Plan (the Plan). Amounts deferred under the Plan are treated as though equal dollar amounts had been invested in shares of the Funds or other Calvert funds selected by the Trustees. The Funds purchase shares of the
Calvert
Social Investment Fund
September 30, 2024
Notes to Financial Statements — continued
funds selected equal to the dollar amounts deferred under the Plan, resulting in an asset equal to the deferred compensation liability. Obligations of the Plan are paid solely from the Funds’ assets. Trustees’ fees are allocated to each of the Calvert funds served. Salaries and fees of officers and Trustees of the Funds who are employees of CRM or its affiliates are paid by CRM.
3 Investment Activity
During the year ended September 30, 2024, the cost of purchases and proceeds from sales of investments, other than short-term securities and including maturities, paydowns, principal repayments on senior floating-rate loans and TBA transactions, were as follows:
| | Balanced | Bond | Equity |
| Purchases | | | |
| U.S. Government and Agency Securities | $1,366,807,857 | $9,468,743,474 | $ — |
| Non-U.S. Government and Agency Securities | 507,795,833 | 1,851,128,091 | 576,961,904 |
| Total Purchases | $1,874,603,690 | $11,319,871,565 | $576,961,904 |
| Sales | | | |
| U.S. Government and Agency Securities | $1,351,918,520 | $8,778,738,798 | $ — |
| Non-U.S. Government and Agency Securities | 538,176,785 | 1,630,683,215 | 1,841,256,727 |
| Total Sales | $1,890,095,305 | $10,409,422,013 | $1,841,256,727 |
4 Distributions to Shareholders and Income Tax Information
The tax character of distributions declared for the years ended September 30, 2024 and September 30, 2023 was as follows:
| | Balanced | Bond | Equity |
| | Year Ended September 30, | Year Ended September 30, | Year Ended September 30, |
| | 2024 | 2023 | 2024 | 2023 | 2024 | 2023 |
| Ordinary income | $18,715,399 | $17,322,425 | $144,132,470 | $105,758,503 | $41,446,052 | $11,059,465 |
| Long-term capital gains | $ — | $19,789,974 | $ — | $ — | $80,505,147 | $172,682,470 |
During the year ended September 30, 2024, the following amounts were reclassified due to the use of equalization accounting. Tax equalization accounting allows a Fund to treat as a distribution that portion of redemption proceeds representing a redeeming shareholder’s portion of undistributed taxable income and net capital gains.
| | Balanced | Bond | Equity |
| Change in: | | | |
| Paid-in capital | $2,470,042 | $336,047 | $45,370,619 |
| Distributable earnings (accumulated loss) | $(2,470,042) | $(336,047) | $(45,370,619) |
These reclassifications had no effect on the net assets or net asset value per share of the Funds.
Calvert
Social Investment Fund
September 30, 2024
Notes to Financial Statements — continued
As of September 30, 2024, the components of distributable earnings (accumulated loss) on a tax basis were as follows:
| | Balanced | Bond | Equity |
| Undistributed ordinary income | $3,862,652 | $ — | $13,215,292 |
| Undistributed long-term capital gains | 46,522,229 | — | 415,558,719 |
| Deferred capital losses | — | (229,228,074) | — |
| Net unrealized appreciation | 357,447,079 | 8,208,808 | 3,575,987,313 |
| Distributions payable | — | (1,065,611) | — |
| Distributable earnings (accumulated loss) | $407,831,960 | $(222,084,877) | $4,004,761,324 |
At September 30, 2024, Bond Fund, for federal income tax purposes, had deferred capital losses of $229,228,074 which would reduce the Fund’s taxable income arising from future net realized gains on investment transactions, if any, to the extent permitted by the Internal Revenue Code, and thus would reduce the amount of distributions to shareholders, which would otherwise be necessary to relieve the Fund of any liability for federal income or excise tax. The deferred capital losses are treated as arising on the first day of the Fund’s next taxable year, can be carried forward for an unlimited period, and retain the same short-term or long-term character as when originally deferred. Of the deferred capital losses at September 30, 2024, $51,248,690 are short-term and $177,979,384 are long-term.
The cost and unrealized appreciation (depreciation) of investments, including open derivative contracts, of the Funds at September 30, 2024, as determined on a federal income tax basis, were as follows:
| | Balanced | Bond | Equity |
| Aggregate cost | $1,094,251,868 | $4,371,676,654 | $3,346,668,334 |
| Gross unrealized appreciation | $379,390,017 | $75,195,533 | $3,617,806,892 |
| Gross unrealized depreciation | (21,943,174) | (66,992,172) | (41,819,579) |
| Net unrealized appreciation | $357,446,843 | $8,203,361 | $3,575,987,313 |
5 Financial Instruments
The Funds may trade in financial instruments with off-balance sheet risk in the normal course of their investing activities. These financial instruments may include forward foreign currency exchange contracts and futures contracts and may involve, to a varying degree, elements of risk in excess of the amounts recognized for financial statement purposes. The notional or contractual amounts of these instruments represent the investment a Fund has in particular classes of financial instruments and do not necessarily represent the amounts potentially subject to risk. The measurement of the risks associated with these instruments is meaningful only when all related and offsetting transactions are considered. A summary of obligations under these financial instruments at September 30, 2024 is included in each Fund’s Schedule of Investments. At September 30, 2024, Balanced and Bond had sufficient cash and/or securities to cover commitments under these contracts. At September 30, 2024, there were no obligations outstanding under these financial instruments for Equity.
In the normal course of pursuing their investment objectives, Balanced and Bond are subject to the following risks:
Foreign Exchange Risk: During the year ended September 30, 2024, Balanced and Bond entered into forward foreign currency exchange contracts to seek to hedge against fluctuations in currency exchange rates.
Interest Rate Risk: During the year ended September 30, 2024, Balanced and Bond entered into futures contracts and options on futures contracts to hedge interest rate risk and to manage duration.
Balanced and Bond enter into forward foreign currency exchange contracts that may contain provisions whereby the counterparty may terminate the contract under certain conditions, including but not limited to a decline in the Fund’s net assets below a certain level over a certain period of time, which would trigger a payment by the Fund for those derivatives in a liability position. At September 30, 2024, for Balanced and Bond, the fair value of derivatives with credit-related contingent features in a net liability position was $5,992 and $56,176, respectively. At September 30, 2024, there were no assets pledged by Balanced and Bond for such liability.
Calvert
Social Investment Fund
September 30, 2024
Notes to Financial Statements — continued
The over-the-counter (OTC) derivatives in which Balanced and Bond invest are subject to the risk that the counterparty to the contract fails to perform its obligations under the contract. To mitigate this risk, each Fund has entered into an International Swaps and Derivatives Association, Inc. Master Agreement (“ISDA Master Agreement”) with its derivative counterparty. The ISDA Master Agreement is a bilateral agreement between a Fund and the counterparty that governs certain OTC derivatives and typically contains, among other things, set-off provisions in the event of a default and/or termination event as defined under the ISDA Master Agreement. Under the ISDA Master Agreement, the Fund may, under certain circumstances, offset with the counterparty certain derivative financial instruments’ payables and/or receivables with collateral held and/or posted and create one single net payment. The provisions of the ISDA Master Agreement typically permit a single net payment in the event of default including the bankruptcy or insolvency of the counterparty. However, bankruptcy or insolvency laws of a particular jurisdiction may impose restrictions on or prohibitions against the right of offset in bankruptcy or insolvency. The ISDA Master Agreement allows the counterparty to OTC derivatives to terminate derivative contracts prior to maturity in the event the Fund’s net assets decline by a stated percentage or the Fund fails to meet the terms of its ISDA Master Agreement, which would cause the counterparty to accelerate payment by the Fund of any net liability owed to it.
The collateral requirements for derivatives traded under the ISDA Master Agreement are governed by a Credit Support Annex to the ISDA Master Agreement. Collateral requirements are determined at the close of business each day and are typically based on changes in market values for each transaction under the ISDA Master Agreement and netted into one amount for such agreement. Generally, the amount of collateral due from or to a counterparty is subject to a minimum transfer threshold amount before a transfer is required. Collateral pledged for the benefit of a Fund and/or counterparty is held in segregated accounts by the Fund’s custodian and cannot be sold, re-pledged, assigned or otherwise used while pledged. The portion of such collateral representing cash, if any, is reflected as deposits for derivatives collateral and, in the case of cash pledged by a counterparty for the benefit of the Fund, a corresponding liability on the Statements of Assets and Liabilities. Securities pledged by a Fund as collateral, if any, are identified as such in the Schedule of Investments.
At September 30, 2024, the fair value of open derivative instruments (not considered to be hedging instruments for accounting disclosure purposes) by risk exposure was as follows:
Balanced
| Risk | Derivative | Statements of Assets and Liabilities Caption | Assets | Liabilities |
| Foreign exchange | Forward foreign currency exchange contracts | Receivable/Payable for open forward foreign currency
exchange contracts | $ — | $(5,992) |
| Interest rate | Futures contracts | Distributable earnings | 179,583(1) | (116,470)(1) |
| Total | | | $179,583 | $(122,462) |
| Derivatives not subject to master netting agreements | $179,583 | $(116,470) |
| Total Derivatives subject to master netting agreements | $ — | $(5,992) |
| (1) | Only the current day's variation margin is reported within the Statements of Assets and Liabilities as Receivable or Payable for variation margin on open futures contracts, as applicable. |
Bond
| Risk | Derivative | Statements of Assets and Liabilities Caption | Assets | Liabilities |
| Foreign exchange | Forward foreign currency exchange contracts | Receivable/Payable for open forward foreign currency
exchange contracts | $ — | $(56,176) |
| Interest rate | Futures contracts | Accumulated loss | 1,072,618(1) | (559,630)(1) |
| Total | | | $1,072,618 | $(615,806) |
| Derivatives not subject to master netting agreements | $1,072,618 | $(559,630) |
| Total Derivatives subject to master netting agreements | $ — | $(56,176) |
| (1) | Only the current day’s variation margin is reported within the Statements of Assets and Liabilities as Receivable or Payable for variation margin on open futures contracts, as applicable. |
Calvert
Social Investment Fund
September 30, 2024
Notes to Financial Statements — continued
Balanced and Bond's derivative assets and liabilities at fair value by risk, which are reported gross in the Statements of Assets and Liabilities, are presented in the tables above. The following tables present each Fund's derivative assets and liabilities by counterparty, net of amounts available for offset under a master netting agreement and net of the related collateral received by each Fund for such assets and pledged by each Fund for such liabilities as of September 30, 2024.
Balanced
| Counterparty | Derivative
Liabilities Subject to
Master Netting
Agreement | Derivatives
Available
for Offset | Non-cash
Collateral
Pledged(a) | Cash
Collateral
Pledged(a) | Net Amount
of Derivative
Liabilities(b) |
| UBS AG | $(5,992) | $ — | $ — | $ — | $(5,992) |
| (a) | In some instances, the total collateral received and/or pledged may be more than the amount shown due to overcollateralization. |
| (b) | Net amount represents the net amount payable to the counterparty in the event of default. |
Bond
| Counterparty | Derivative
Liabilities Subject to
Master Netting
Agreement | Derivatives
Available
for Offset | Non-cash
Collateral
Pledged(a) | Cash
Collateral
Pledged(a) | Net Amount
of Derivative
Liabilities(b) |
| UBS AG | $(56,176) | $ — | $ — | $ — | $(56,176) |
| (a) | In some instances, the total collateral received and/or pledged may be more than the amount shown due to overcollateralization. |
| (b) | Net amount represents the net amount payable to the counterparty in the event of default. |
The effect of derivative instruments (not considered to be hedging instruments for accounting disclosure purposes) on the Statements of Operations by risk exposure for the year ended September 30, 2024 was as follows:
Balanced
| Statements of Operations Caption | Foreign exchange | Interest rate | Total |
| Net realized gain (loss): | | | |
| Investment securities(1) | $ — | $(67,313) | $(67,313) |
| Forward foreign currency exchange contracts | 12,110 | — | 12,110 |
| Futures contracts | — | 1,505,294 | 1,505,294 |
| Total | $12,110 | $1,437,981 | $1,450,091 |
| Change in unrealized appreciation (depreciation): | | | |
| Investment securities(1) | $ — | $(1,255) | $(1,255) |
| Forward foreign currency exchange contracts | (15,348) | — | (15,348) |
| Futures contracts | — | 522,299 | 522,299 |
| Total | $(15,348) | $521,044 | $505,696 |
| (1) | Relates to purchased options. |
Calvert
Social Investment Fund
September 30, 2024
Notes to Financial Statements — continued
Bond
| Statements of Operations Caption | Foreign exchange | Interest rate | Total |
| Net realized gain (loss): | | | |
| Investment securities(1) | $ — | $(417,876) | $(417,876) |
| Forward foreign currency exchange contracts | 138,098 | — | 138,098 |
| Futures contracts | — | 13,770,638 | 13,770,638 |
| Total | $138,098 | $13,352,762 | $13,490,860 |
| Change in unrealized appreciation (depreciation): | | | |
| Investment securities(1) | $ — | $(7,761) | $(7,761) |
| Forward foreign currency exchange contracts | (132,939) | — | (132,939) |
| Futures contracts | — | 7,557,498 | 7,557,498 |
| Total | $(132,939) | $7,549,737 | $7,416,798 |
| (1) | Relates to purchased options. |
The average notional cost of futures contracts and average notional amounts of other derivative contracts outstanding during the year ended September 30, 2024, which are indicative of the volume of these derivative types, were approximately as follows:
| | Balanced | Bond |
| Futures contracts — long | $93,820,000 | $920,815,000 |
| Futures contracts — short | $13,969,000 | $67,098,000 |
| Forward foreign currency exchange contracts* | $350,000 | $3,895,000 |
| * | The average notional amount for forward foreign currency exchange contracts is based on the absolute value of notional amounts of currency purchased and currency sold. |
The average number of purchased options contracts outstanding during the year ended September 30, 2024, which is indicative of the volume of this derivative type, was approximately 27 contracts and 165 contracts for Balanced and Bond, respectively.
6 Securities Lending
To generate additional income, the Funds may lend their securities pursuant to a securities lending agency agreement with State Street Bank and Trust Company (SSBT), the securities lending agent. Security loans are subject to termination by the Funds at any time and, therefore, are not considered illiquid investments. The Funds require that the loan be continuously collateralized by either cash or securities in an amount at least equal to the market value of the securities on loan. The market value of securities loaned is determined daily and any additional required collateral is delivered to the Funds on the next business day. Cash collateral is generally invested in a money market fund registered under the 1940 Act that is managed by an affiliate of SSBT. Any gain or loss in the market price of the loaned securities that might occur and any interest earned or dividends declared during the term of the loan would accrue to the account of the Funds. Income earned on the investment of collateral, net of broker rebates and other expenses incurred by the securities lending agent, is split between the Funds and the securities lending agent based on agreed upon contractual terms. Non-cash collateral, if any, is held by the lending agent on behalf of a Fund and cannot be sold or re-pledged by the Fund; accordingly, such collateral is not reflected in the Statements of Assets and Liabilities.
The risks associated with lending portfolio securities include, but are not limited to, possible delays in receiving additional collateral or in the recovery of the loaned securities, possible loss of rights to the collateral should the borrower fail financially, as well as risk of loss in the value of the collateral or the value of the investments made with the collateral. The securities lending agent shall indemnify the Funds in the case of default of any securities borrower.
Calvert
Social Investment Fund
September 30, 2024
Notes to Financial Statements — continued
At September 30, 2024, the total value of securities on loan, including accrued interest, and the total value of collateral received were as follows:
| | Balanced | Bond |
| Securities on Loan | $18,429,998 | $58,695,057 |
| Collateral Received: | | |
| Cash | 5,091,583 | 45,779,848 |
| U.S. government and/or agencies securities | 13,655,634 | 14,238,002 |
| Total Collateral Received | $18,747,217 | $60,017,850 |
Equity did not have any securities on loan at September 30, 2024.
The following tables provide a breakdown of securities lending transactions accounted for as secured borrowings, the obligations by class of collateral pledged, and the remaining contractual maturity of those transactions as of September 30, 2024.
| Balanced | Remaining Contractual Maturity of the Transactions |
| | Overnight and
Continuous | <30 days | 30 to 90 days | >90 days | Total |
| Corporate Bonds | $5,091,583 | $ — | $ — | $ — | $5,091,583 |
| Bond | Remaining Contractual Maturity of the Transactions |
| | Overnight and
Continuous | <30 days | 30 to 90 days | >90 days | Total |
| Convertible Bonds | $1,238,423 | $ — | $ — | $ — | $1,238,423 |
| Corporate Bonds | 44,541,425 | — | — | — | 44,541,425 |
| Total | $45,779,848 | $ — | $ — | $ — | $45,779,848 |
The carrying amounts of the liabilities for deposits for securities loaned at September 30, 2024 approximated their fair value. If measured at fair value, such liabilities would have been considered as Level 2 in the fair value hierarchy (see Note 1A) at September 30, 2024.
7 Line of Credit
The Funds participate with other portfolios and funds managed by EVM and its affiliates, including CRM, in a $650 million unsecured revolving line of credit agreement with a group of banks, which is in effect through October 22, 2024. In connection with the renewal of the agreement on October 24, 2023, the borrowing limit was decreased from $725 million. Borrowings are made by the Funds solely for temporary purposes related to redemptions and other short-term cash needs. Interest is charged to each Fund based on its borrowings generally at an amount above either the Secured Overnight Financing Rate (SOFR) or Federal Funds rate. In addition, a fee computed at an annual rate of 0.15% on the daily unused portion of the line of credit is allocated among the participating portfolios and funds at the end of each quarter. In connection with the renewal of the agreement in October 2023, an arrangement fee of $150,000 was incurred that was allocated to the participating portfolios and funds. Because the line of credit is not available exclusively to the Funds, a Fund may be unable to borrow some or all of its requested amounts at any particular time.
Balanced and Equity had no borrowings pursuant to their line of credit during the year ended September 30, 2024. Bond had no borrowings outstanding pursuant to its line of credit at September 30, 2024. Bond did not have any significant borrowings or allocated fees during the year ended September 30, 2024. Effective October 22, 2024, the Funds renewed their line of credit agreement, which expires October 21, 2025, at substantially the same terms.
8 Affiliated Investments
During the year ended September 30, 2024, each Fund invested a portion of its assets in notes (the Notes) issued by Calvert Impact Capital, Inc. (CIC), pursuant to exemptive relief granted by the U.S. Securities and Exchange Commission (the SEC). There are certain potential points of affiliation between the Funds and CIC. CRM has licensed use of the Calvert name to CIC and provides other types of support. An officer of CRM's affiliate serves on the CIC Board.
Calvert
Social Investment Fund
September 30, 2024
Notes to Financial Statements — continued
In addition to the Notes, Balanced and Bond invested in issuers that may be deemed to be affiliated. Also, a Fund may invest in companies that are considered affiliated companies because the Fund has a direct or indirect ownership of, control of, or voting power of 5 percent or more of the outstanding voting shares of the company, or the company is under common ownership or control with the Fund. At September 30, 2024, the value of each Fund’s investment in the Notes and affiliated companies and in issuers and funds that may be deemed to be affiliated was $48,318,036, $192,881,606 and $195,144,544 for Balanced, Bond and Equity, respectively, which represents 3.6%, 5.3% and 2.8% of net assets for Balanced, Bond and Equity, respectively. Transactions in such investments by the Funds for the year ended September 30, 2024 were as follows:
Balanced
| Name | Value,
beginning
of period | Purchases | Sales
proceeds | Net
realized
gain
(loss) | Change in
unrealized
appreciation
(depreciation) | Value,
end of
period | Interest/
Dividend
income | Principal amount/
Shares,
end of period |
| Commercial Mortgage-Backed Securities | | | | | | | | |
| Morgan Stanley Capital I Trust: | | | | | | | | |
| Series 2019-BPR, Class A, 7.318%, (1 mo. SOFR + 1.992%), 5/15/36 | $ 996,183 | $ — | $ (1,033,837) | $ — | $ 37,654 | $ — | $ 46,124 | $ — |
| Series 2019-BPR, Class B, 8.018%, (1 mo. SOFR + 2.692%), 5/15/36 | 369,152 | — | (386,000) | 5,934 | 10,782 | — | 19,659 | — |
| Series 2019-BPR, Class C, 8.968%, (1 mo. SOFR + 3.642%), 5/15/36 | 194,054 | — | (205,000) | — | 10,946 | — | 11,598 | — |
| High Social Impact Investments | | | | | | | | |
| Calvert Impact Capital, Inc., Community Investment Notes, 1.50%, 12/15/23 | 2,465,725 | — | (2,500,000) | — | 34,275 | — | 7,708 | — |
| Venture Capital Limited Partnership Interests | | | | | | | | |
| GEEMF Partners LP(1)(2)(3) | 5,673 | — | — | — | (4,107) | 1,566 | — | — |
| Short-Term Investments | | | | | | |
| Liquidity Fund | 18,629,438 | 333,117,490 | (303,430,458) | — | — | 48,316,470 | 1,476,184 | 48,316,470 |
| Total | | | | $5,934 | $89,550 | $48,318,036 | $1,561,273 | |
| (1) | For fair value measurement disclosure purposes, security is categorized as Level 3 (see Note 1A). |
| (2) | Non-income producing security. |
| (3) | Restricted security. |
Bond
| Name | Value,
beginning
of period | Purchases | Sales
proceeds | Net
realized
gain
(loss) | Change in
unrealized
appreciation
(depreciation) | Value,
end of
period | Interest/
Dividend
income | Principal amount/
Shares,
end of period |
| Commercial Mortgage-Backed Securities | | | | | | | | |
| Morgan Stanley Capital I Trust, Series 2019-BPR, Class A, 7.318%, (1 mo. SOFR + 1.992%), 5/15/36 | $ 6,986,162 | $ — | $ (7,250,233) | $ — | $228,914 | $ — | $ 358,624 | $ — |
| Exchange-Traded Funds | | | | | | | | |
| Calvert Ultra-Short Investment Grade ETF | — | 2,387,790 | — | — | (4,890) | 2,382,900 | 9,028 | 47,000 |
Calvert
Social Investment Fund
September 30, 2024
Notes to Financial Statements — continued
Bond — continued
| Name | Value,
beginning
of period | Purchases | Sales
proceeds | Net
realized
gain
(loss) | Change in
unrealized
appreciation
(depreciation) | Value,
end of
period | Interest/
Dividend
income | Principal amount/
Shares,
end of period |
| High Social Impact Investments | | | | | | | | |
| Calvert Impact Capital, Inc., Community Investment Notes, 1.50%, 12/15/23 | $ 4,931,450 | $ — | $ (5,000,000) | $ — | $ 68,550 | $ — | $ 15,417 | $ — |
| Calvert Impact Capital, Inc., Community Investment Notes, 5.00%, 12/15/28(1) | — | 5,000,000 | — | — | 68,950 | 5,068,950 | 198,611 | 5,000,000 |
| Calvert Impact Capital, Inc., Community Investment Notes, 5.00%, 9/20/29(1) | — | 3,500,000 | — | — | 52,710 | 3,552,710 | 5,347 | 3,500,000 |
| Short-Term Investments | | | | | | |
| Liquidity Fund | 69,542,633 | 1,511,264,222 | (1,398,929,809) | — | — | 181,877,046 | 6,674,622 | 181,877,046 |
| Total | | | | $ — | $414,234 | $192,881,606 | $7,261,649 | |
Equity
| Name | Value,
beginning
of period | Purchases | Sales
proceeds | Net
realized
gain
(loss) | Change in
unrealized
appreciation
(depreciation) | Value,
end of
period | Interest/
Dividend
income | Principal amount/
Shares,
end of period |
| High Social Impact Investments | | | | | | | | |
| Calvert Impact Capital, Inc., Community Investment Notes, 1.50%, 12/15/23 | $ 7,860,731 | $ — | $ (7,970,000) | $ — | $109,269 | $ — | $ 24,574 | $ — |
| Short-Term Investments | | | | | | |
| Liquidity Fund | 79,778,996 | 1,334,273,821 | (1,218,908,273) | — | — | 195,144,544 | 8,174,313 | 195,144,544 |
| Total | | | | $ — | $109,269 | $195,144,544 | $8,198,887 | |
9 Capital Shares
Each Fund’s Declaration of Trust permits the Trustees to issue an unlimited number of full and fractional shares of beneficial interest (without par value). Such shares may be issued in a number of different series (such as the Funds) and classes.
Transactions in capital shares, including direct exchanges pursuant to share class conversions, were as follows:
Balanced
| | Year Ended
September 30, 2024 | | Year Ended
September 30, 2023 |
| | Shares | Amount | | Shares | Amount |
| Class A | | | | | |
| Shares sold | 1,374,454 | $57,105,167 | | 1,329,003 | $47,937,117 |
| Reinvestment of distributions | 277,684 | 11,826,965 | | 681,726 | 24,133,724 |
| Shares redeemed | (2,249,809) | (91,789,801) | | (2,289,193) | (82,901,513) |
| Net decrease | (597,671) | $(22,857,669) | | (278,464) | $(10,830,672) |
Calvert
Social Investment Fund
September 30, 2024
Notes to Financial Statements — continued
Balanced — continued
| | Year Ended
September 30, 2024 | | Year Ended
September 30, 2023 |
| | Shares | Amount | | Shares | Amount |
| Class C | | | | | |
| Shares sold | 150,298 | $5,926,458 | | 180,770 | $6,264,349 |
| Reinvestment of distributions | 9,990 | 406,200 | | 41,070 | 1,392,463 |
| Shares redeemed | (380,864) | (15,070,430) | | (360,356) | (12,431,392) |
| Net decrease | (220,576) | $(8,737,772) | | (138,516) | $(4,774,580) |
| Class I | | | | | |
| Shares sold | 1,250,923 | $53,513,519 | | 986,366 | $36,482,700 |
| Reinvestment of distributions | 95,212 | 4,162,617 | | 212,136 | 7,690,917 |
| Shares redeemed | (1,059,199) | (44,832,660) | | (1,512,469) | (55,923,965) |
| Net increase (decrease) | 286,936 | $12,843,476 | | (313,967) | $(11,750,348) |
| Class R6 | | | | | |
| Shares sold | 718,461 | $30,352,771 | | 803,756 | $29,627,300 |
| Reinvestment of distributions | 36,752 | 1,607,606 | | 65,936 | 2,397,546 |
| Shares redeemed | (466,955) | (19,632,614) | | (390,046) | (14,450,291) |
| Net increase | 288,258 | $12,327,763 | | 479,646 | $17,574,555 |
Bond
| | Year Ended
September 30, 2024 | | Year Ended
September 30, 2023 |
| | Shares | Amount | | Shares | Amount |
| Class A | | | | | |
| Shares sold | 4,784,859 | $68,604,114 | | 3,670,540 | $52,346,779 |
| Reinvestment of distributions | 959,716 | 13,756,690 | | 781,930 | 11,125,923 |
| Shares redeemed | (4,744,723) | (67,510,555) | | (4,183,848) | (59,594,722) |
| Net increase | 999,852 | $14,850,249 | | 268,622 | $3,877,980 |
| Class C | | | | | |
| Shares sold | 203,028 | $2,898,573 | | 211,826 | $2,996,407 |
| Reinvestment of distributions | 24,446 | 347,721 | | 20,256 | 286,070 |
| Shares redeemed | (258,824) | (3,678,746) | | (191,049) | (2,694,657) |
| Net increase (decrease) | (31,350) | $(432,452) | | 41,033 | $587,820 |
| Class I | | | | | |
| Shares sold | 83,057,467 | $1,193,091,497 | | 59,654,302 | $851,969,451 |
| Reinvestment of distributions | 6,980,941 | 100,351,468 | | 4,913,008 | 70,050,883 |
| Shares redeemed | (49,859,450) | (711,497,439) | | (46,879,852) | (667,369,088) |
| Net increase | 40,178,958 | $581,945,526 | | 17,687,458 | $254,651,246 |
Calvert
Social Investment Fund
September 30, 2024
Notes to Financial Statements — continued
Bond — continued
| | Year Ended
September 30, 2024 | | Year Ended
September 30, 2023 |
| | Shares | Amount | | Shares | Amount |
| Class R6 | | | | | |
| Shares sold | 14,780,355 | $211,261,269 | | 20,225,876 | $287,740,693 |
| Reinvestment of distributions | 1,276,719 | 18,329,725 | | 925,369 | 13,175,881 |
| Shares redeemed | (7,373,979) | (105,598,556) | | (20,336,076) | (289,918,665) |
| Net increase | 8,683,095 | $123,992,438 | | 815,169 | $10,997,909 |
Equity
| | Year Ended
September 30, 2024 | | Year Ended
September 30, 2023 |
| | Shares | Amount | | Shares | Amount |
| Class A | | | | | |
| Shares sold | 1,383,093 | $107,883,771 | | 2,529,517 | $174,266,162 |
| Reinvestment of distributions | 478,596 | 36,306,282 | | 903,727 | 60,106,902 |
| Shares redeemed | (4,621,585) | (361,852,705) | | (3,612,792) | (249,256,022) |
| Net decrease | (2,759,896) | $(217,662,652) | | (179,548) | $(14,882,958) |
| Class C | | | | | |
| Shares sold | 278,524 | $10,181,016 | | 582,224 | $19,280,831 |
| Reinvestment of distributions | 114,314 | 4,076,421 | | 220,518 | 7,065,406 |
| Shares redeemed | (879,050) | (32,426,257) | | (800,389) | (26,701,541) |
| Net increase (decrease) | (486,212) | $(18,168,820) | | 2,353 | $(355,304) |
| Class I | | | | | |
| Shares sold | 6,261,542 | $579,826,267 | | 20,558,564 | $1,672,279,996 |
| Reinvestment of distributions | 660,004 | 59,737,009 | | 1,103,770 | 87,264,068 |
| Shares redeemed | (14,988,575) | (1,390,275,831) | | (15,868,666) | (1,310,320,367) |
| Net increase (decrease) | (8,067,029) | $(750,712,555) | | 5,793,668 | $449,223,697 |
| Class R6 | | | | | |
| Shares sold | 1,765,481 | $161,545,308 | | 4,247,058 | $348,639,943 |
| Reinvestment of distributions | 117,788 | 10,626,876 | | 153,020 | 12,061,066 |
| Shares redeemed | (2,748,793) | (256,693,011) | | (2,243,351) | (185,644,475) |
| Net increase (decrease) | (865,524) | $(84,520,827) | | 2,156,727 | $175,056,534 |
10 Capital Commitments
In connection with certain venture capital and/or limited partnership investments, Balanced and Equity are committed to future capital calls, which will increase each Fund's investment in these securities. The aggregate amount of the future capital commitments totaled $68,090 and $420,268 for Balanced and Equity, respectively, at September 30, 2024. Balanced and Equity had sufficient cash and/or securities to cover these commitments.
Calvert
Social Investment Fund
September 30, 2024
Notes to Financial Statements — continued
Unfunded capital commitments by investment at September 30, 2024 were as follows:
Balanced
| Name of Investment | Unfunded
Commitment |
| First Analysis Private Equity Fund IV LP | $60,000 |
| Learn Capital Venture Partners III LP | 8,090 |
| Total | $68,090 |
Equity
| Name of Investment | Unfunded
Commitment |
| Adobe Capital Social Mezzanine I LP | $75 |
| Arborview Capital Partners LP | 3,929 |
| Bridges Ventures U.S. Sustainable Growth Fund LP | 62,422 |
| Core Innovations Capital I LP | 51,766 |
| Cross Culture Ventures I LP | 14,997 |
| First Analysis Private Equity Fund V LP | 18,302 |
| Impact Ventures II LP | 9,632 |
| LeapFrog Financial Inclusion Fund | 78,436 |
| New Markets Education Partner LP | 51,800 |
| New Markets Venture Partners II LP | 25,000 |
| Owl Ventures LP | 10,000 |
| Westly Capital Partners Fund II LP | 93,909 |
| Total | $420,268 |
Calvert
Social Investment Fund
September 30, 2024
Report of Independent Registered Public Accounting Firm
To the Board of Trustees of Calvert Social Investment Fund and Shareholders of Calvert Balanced Fund, Calvert Bond Fund and Calvert Equity Fund:
Opinion on the Financial Statements and Financial Highlights
We have audited the accompanying statements of assets and liabilities of Calvert Balanced Fund, Calvert Bond Fund and Calvert Equity Fund (the “Funds”) (three of the funds constituting Calvert Social Investment Fund), including the schedules of investments, as of September 30, 2024, the related statements of operations for the year then ended, the statements of changes in net assets for each of the two years in the period then ended, the financial highlights for each of the four years in the period then ended, and the related notes. In our opinion, the financial statements and financial highlights present fairly, in all material respects, the financial position of each of the Funds as of September 30, 2024, and the results of their operations for the year then ended, the changes in their net assets for each of the two years in the period then ended, and the financial highlights for each of the four years in the period then ended, in conformity with accounting principles generally accepted in the United States of America. The financial highlights for the year ended September 30, 2020 were audited by other auditors whose report, dated November 20, 2020, expressed an unqualified opinion on those financial highlights.
Basis for Opinion
These financial statements and financial highlights are the responsibility of the Funds’ management. Our responsibility is to express an opinion on the Funds’ financial statements and financial highlights based on our audits. We are a public accounting firm registered with the Public Company Accounting Oversight Board (United States) (PCAOB) and are required to be independent with respect to the Funds in accordance with the U.S. federal securities laws and the applicable rules and regulations of the Securities and Exchange Commission and the PCAOB.
We conducted our audits in accordance with the standards of the PCAOB. Those standards require that we plan and perform the audit to obtain reasonable assurance about whether the financial statements and financial highlights are free of material misstatement, whether due to error or fraud. The Funds are not required to have, nor were we engaged to perform, an audit of their internal control over financial reporting. As part of our audits, we are required to obtain an understanding of internal control over financial reporting but not for the purpose of expressing an opinion on the effectiveness of the Funds’ internal control over financial reporting. Accordingly, we express no such opinion.
Our audits included performing procedures to assess the risks of material misstatement of the financial statements and financial highlights, whether due to error or fraud, and performing procedures that respond to those risks. Such procedures included examining, on a test basis, evidence regarding the amounts and disclosures in the financial statements and financial highlights. Our audits also included evaluating the accounting principles used and significant estimates made by management, as well as evaluating the overall presentation of the financial statements and financial highlights. Our procedures included confirmation of securities and senior loans owned as of September 30, 2024, by correspondence with the custodian, brokers and agent banks; when replies were not received from brokers and agent banks, we performed other auditing procedures. We believe that our audits provide a reasonable basis for our opinion.
/s/ Deloitte & Touche LLP
Boston, Massachusetts
November 21, 2024
We have served as the auditor of one or more Calvert investment companies since 2021.
Calvert
Social Investment Fund
September 30, 2024
Federal Tax Information (Unaudited)
The Form 1099-DIV you receive in February 2025 will show the tax status of all distributions paid to your account in calendar year 2024. Shareholders are advised to consult their own tax adviser with respect to the tax consequences of their investment in the Funds. As required by the Internal Revenue Code and/or regulations, shareholders must be notified regarding the status of qualified dividend income for individuals, the dividends received deduction for corporations, 163(j) interest dividends and capital gains dividends.
Qualified Dividend Income. For the fiscal year ended September 30, 2024, the Funds designate approximately the following amounts, or up to the maximum amount of such dividends allowable pursuant to the Internal Revenue Code, as qualified dividend income eligible for the reduced tax rate of 15%:
| Balanced Fund | $ 7,076,109 |
| Bond Fund | $ 270,614 |
| Equity Fund | $ 55,637,386 |
Dividends Received Deduction. Corporate shareholders are generally entitled to take the dividends received deduction on the portion of a Fund's dividend distribution that qualifies under tax law. For the Funds' fiscal 2024 ordinary income dividends, the following qualifies for the corporate dividends received deduction:
| Balanced Fund | 29.97% |
| Equity Fund | 100.00% |
163(j) Interest Dividends. For the fiscal year ended September 30, 2024, the Funds designate the following as a percentage of distributions from net investment income as a 163(j) interest dividend:
| Balanced Fund | 61.08% |
| Bond Fund | 93.77% |
Capital Gains Dividends. The Funds hereby designate as a capital gain dividend with respect to the taxable year ended September 30, 2024, the following amounts or, if subsequently determined to be different, the net capital gain of such year:
| Balanced Fund | $ 48,815,355 |
| Equity Fund | $469,757,986 |
Calvert
Balanced Fund
September 30, 2024
Board of Trustees' Contract Approval
Overview of the Contract Review Process
The Investment Company Act of 1940, as amended, provides, in substance, that each investment advisory agreement between a fund and its investment adviser will continue in effect from year to year only if its continuation is approved at least annually by the fund’s board of directors, including by a vote of a majority of the directors who are not “interested persons” of the fund (“Independent Trustees”), cast in person at a meeting called for the purpose of considering such approval.
At an in-person meeting of the Boards of Trustees/Directors (each a “Board”) of the registered investment companies advised by Calvert Research and Management (“CRM” or the “Adviser”) (the “Calvert Funds”) held on June 10-11, 2024, the Board, including a majority of the Independent Trustees, voted to approve continuation of existing investment advisory and investment sub-advisory agreements for the Calvert Funds for an additional one-year period.
In evaluating the investment advisory and investment sub-advisory agreements for the Calvert Funds, the Board considered a variety of information relating to the Calvert Funds and various service providers, including the Adviser. The Independent Trustees reviewed a report prepared by the Adviser regarding various services provided to the Calvert Funds by the Adviser and its affiliates. Such report included, among other data, information regarding the Adviser’s personnel and the Adviser’s revenue and cost of providing services to the Calvert Funds, and a separate report prepared by an independent data provider, which compared each fund’s investment performance, fees and expenses to those of comparable funds as identified by such independent data provider (“comparable funds”).
The Independent Trustees were separately represented by independent legal counsel with respect to their consideration of the continuation of the investment advisory and investment sub-advisory agreements for the Calvert Funds. Prior to voting, the Independent Trustees reviewed the proposed continuation of the Calvert Funds’ investment advisory and investment sub-advisory agreements with management and also met in private sessions with their counsel at which time no representatives of management were present.
The information that the Board considered included, among other things, the following (for funds that invest through one or more affiliated underlying fund(s), references to “each fund” in this section may include information that was considered at the underlying fund-level):
Information about Fees, Performance and Expenses
| • | A report from an independent data provider comparing the advisory and related fees paid by each fund with fees paid by comparable funds; |
| • | A report from an independent data provider comparing each fund’s total expense ratio and its components to comparable funds; |
| • | A report from an independent data provider comparing the investment performance of each fund to the investment performance of comparable funds over various time periods; |
| • | Data regarding investment performance in comparison to benchmark indices; |
| • | For each fund, comparative information concerning the fees charged and the services provided by the Adviser in managing other accounts (including mutual funds, other collective investment funds and institutional accounts) using investment strategies and techniques similar to those used in managing such fund; |
| • | Profitability analyses for the Adviser with respect to each fund; |
Information about Portfolio Management and Trading
| • | Descriptions of the investment management services provided to each fund, including investment strategies and processes it employs; |
| • | Information about the Adviser’s policies and practices with respect to trading, including the Adviser’s processes for monitoring best execution of portfolio transactions; |
| • | Information about the allocation of brokerage transactions and the benefits received by the Adviser as a result of brokerage allocation, including information concerning the acquisition of research through client commission arrangements and policies with respect to “soft dollars”; |
Information about the Adviser
| • | Reports detailing the financial results and condition of CRM; |
| • | Descriptions of the qualifications, education and experience of the individual investment professionals whose responsibilities include portfolio management and investment research for the funds, and information relating to their compensation and responsibilities with respect to managing other mutual funds and investment accounts; |
| • | Policies and procedures relating to proxy voting and the handling of corporate actions and class actions; |
| • | A description of CRM’s procedures for overseeing sub-advisers, including with respect to regulatory and compliance issues, investment management and other matters; |
Calvert
Balanced Fund
September 30, 2024
Board of Trustees' Contract Approval — continued
Other Relevant Information
| • | Information concerning the nature, cost and character of the administrative and other non-investment advisory services provided by CRM and its affiliates; and |
| • | The terms of each investment advisory agreement. |
Over the course of the year, the Board and its committees held regular quarterly meetings. During these meetings, the Trustees participated in investment and performance reviews with the portfolio managers and other investment professionals of the Adviser relating to each fund and considered various investment and trading strategies used in pursuing each fund’s investment objective(s), such as the use of derivative instruments, as well as risk management techniques. The Board and its committees also evaluated issues pertaining to industry and regulatory developments, compliance procedures, corporate governance and other issues with respect to the funds and received and participated in reports and presentations provided by CRM and its affiliates with respect to such matters. In addition to the formal meetings of the Board and its committees, the Independent Trustees held regular video conferences in between meetings to discuss, among other topics, matters relating to the continuation of the Calvert Funds’ investment advisory and investment sub-advisory agreements.
For funds that invest through one or more affiliated underlying funds, the Board considered similar information about the underlying fund(s) when considering the approval of investment advisory agreements. In addition, in cases where the Adviser has engaged a sub-adviser, the Board considered similar information about the sub-adviser when considering the approval of any investment sub-advisory agreement.
The Independent Trustees were assisted throughout the contract review process by their independent legal counsel. The Independent Trustees relied upon the advice of such counsel and their own business judgment in determining the material factors to be considered in evaluating each investment advisory and investment sub-advisory agreement and the weight to be given to each such factor. The Board, including the Independent Trustees, did not identify any single factor as controlling, and each Trustee may have attributed different weight to various factors.
Results of the Contract Review Process
Based on its consideration of the foregoing, and such other information as it deemed relevant, including the factors and conclusions described below, the Board, including the Independent Trustees, concluded that the continuation of the investment advisory agreement of Calvert Balanced Fund (the “Fund”), including the fee payable under the agreement, is in the best interests of the Fund’s shareholders. Accordingly, the Board, including a majority of the Independent Trustees, voted to approve the continuation of the investment advisory agreement of the Fund.
Nature, Extent and Quality of Services
In considering the nature, extent and quality of the services provided by the Adviser under the investment advisory agreement, the Board reviewed information provided by the Adviser relating to its operations and personnel, including, among other information, biographical information on the Adviser’s investment personnel and descriptions of its organizational and management structure. The Board also took into account similar information provided periodically throughout the previous year by the Adviser as well as the Board’s familiarity with management through Board meetings, discussions and other reports. The Board considered the Adviser’s management style and its performance in employing its investment strategies as well as its current level of staffing and overall resources. The Board also noted that it reviewed on a quarterly basis information regarding the Adviser’s compliance with applicable policies and procedures, including those related to personal investing. The Board took into account, among other items, periodic reports received from the Adviser over the past year concerning the Adviser’s ongoing review and enhancement of certain processes, policies and procedures of the Calvert Funds and the Adviser. The Board concluded that it was satisfied with the nature, extent and quality of services provided to the Fund by the Adviser under the investment advisory agreement.
Fund Performance
In considering the Fund’s performance, the Board noted that it reviewed on a quarterly basis detailed information about the Fund’s performance results, portfolio composition and investment strategies. The Board compared the Fund’s investment performance to that of the Fund’s peer universe and its blended benchmark. The Board’s review included comparative performance data for the one-, three- and five-year periods ended December 31, 2023. This performance data indicated that the Fund had outperformed the median of its peer universe for the one-, three- and five-year periods ended December 31, 2023. This data also indicated that the Fund had underperformed its blended benchmark for the one- and three -year periods ended December 31, 2023, while it had outperformed its blended benchmark for the five-year period ended December 31, 2023. Based upon its review, the Board concluded that the Fund’s performance was satisfactory relative to the performance of its peer universe and its blended benchmark.
Calvert
Balanced Fund
September 30, 2024
Board of Trustees' Contract Approval — continued
Management Fees and Expenses
In considering the Fund’s fees and expenses, the Board compared the Fund’s fees and total expense ratio with those of comparable funds in its expense group. Among other findings, the data indicated that the Fund’s advisory and administrative fees (referred to collectively as “management fees”) and the Fund’s total expenses were each below the respective median of the Fund’s expense group. The Board took into account the Adviser’s current undertaking to maintain expense limitations for the Fund and that the Adviser was waiving and/or reimbursing a portion of the Fund’s expenses. Based upon its review, the Board concluded that the management fees were reasonable in view of the nature, extent and quality of services provided by the Adviser.
Profitability and Other “Fall-Out” Benefits
The Board reviewed the Adviser’s profitability in regard to the Fund and the Calvert Funds in the aggregate. In reviewing the overall profitability of the Fund to the Adviser, the Board also considered the fact that the Adviser and its affiliates provided sub-transfer agency support, administrative and distribution services to the Fund for which they received compensation. The information considered by the Board included the profitability of the Fund to the Adviser and its affiliates without regard to any marketing support or other payments by the Adviser and its affiliates to third parties in respect of distribution services. The Board also considered that the Adviser and its affiliates derived benefits to their reputation and other indirect benefits from their relationships with the Fund. Based upon its review, the Board concluded that the Adviser’s and its affiliates’ level of profitability from their relationships with the Fund was reasonable.
Economies of Scale
The Board considered the effect of the Fund’s current size and its potential growth on its performance and fees. The Board also took into account the breakpoints in the advisory fee schedule for the Fund that would reduce the advisory fee rate on assets above specific asset levels. The Board noted that if the Fund’s assets increased over time, the Fund might realize other economies of scale if assets increased proportionally more than certain other expenses.
Calvert
Bond Fund
September 30, 2024
Board of Trustees' Contract Approval
Overview of the Contract Review Process
The Investment Company Act of 1940, as amended, provides, in substance, that each investment advisory agreement between a fund and its investment adviser will continue in effect from year to year only if its continuation is approved at least annually by the fund’s board of directors, including by a vote of a majority of the directors who are not “interested persons” of the fund (“Independent Trustees”), cast in person at a meeting called for the purpose of considering such approval.
At an in-person meeting of the Boards of Trustees/Directors (each a “Board”) of the registered investment companies advised by Calvert Research and Management (“CRM” or the “Adviser”) (the “Calvert Funds”) held on June 10-11, 2024, the Board, including a majority of the Independent Trustees, voted to approve continuation of existing investment advisory and investment sub-advisory agreements for the Calvert Funds for an additional one-year period.
In evaluating the investment advisory and investment sub-advisory agreements for the Calvert Funds, the Board considered a variety of information relating to the Calvert Funds and various service providers, including the Adviser. The Independent Trustees reviewed a report prepared by the Adviser regarding various services provided to the Calvert Funds by the Adviser and its affiliates. Such report included, among other data, information regarding the Adviser’s personnel and the Adviser’s revenue and cost of providing services to the Calvert Funds, and a separate report prepared by an independent data provider, which compared each fund’s investment performance, fees and expenses to those of comparable funds as identified by such independent data provider (“comparable funds”).
The Independent Trustees were separately represented by independent legal counsel with respect to their consideration of the continuation of the investment advisory and investment sub-advisory agreements for the Calvert Funds. Prior to voting, the Independent Trustees reviewed the proposed continuation of the Calvert Funds’ investment advisory and investment sub-advisory agreements with management and also met in private sessions with their counsel at which time no representatives of management were present.
The information that the Board considered included, among other things, the following (for funds that invest through one or more affiliated underlying fund(s), references to “each fund” in this section may include information that was considered at the underlying fund-level):
Information about Fees, Performance and Expenses
| • | A report from an independent data provider comparing the advisory and related fees paid by each fund with fees paid by comparable funds; |
| • | A report from an independent data provider comparing each fund’s total expense ratio and its components to comparable funds; |
| • | A report from an independent data provider comparing the investment performance of each fund to the investment performance of comparable funds over various time periods; |
| • | Data regarding investment performance in comparison to benchmark indices; |
| • | For each fund, comparative information concerning the fees charged and the services provided by the Adviser in managing other accounts (including mutual funds, other collective investment funds and institutional accounts) using investment strategies and techniques similar to those used in managing such fund; |
| • | Profitability analyses for the Adviser with respect to each fund; |
Information about Portfolio Management and Trading
| • | Descriptions of the investment management services provided to each fund, including investment strategies and processes it employs; |
| • | Information about the Adviser’s policies and practices with respect to trading, including the Adviser’s processes for monitoring best execution of portfolio transactions; |
| • | Information about the allocation of brokerage transactions and the benefits received by the Adviser as a result of brokerage allocation, including information concerning the acquisition of research through client commission arrangements and policies with respect to “soft dollars”; |
Information about the Adviser
| • | Reports detailing the financial results and condition of CRM; |
| • | Descriptions of the qualifications, education and experience of the individual investment professionals whose responsibilities include portfolio management and investment research for the funds, and information relating to their compensation and responsibilities with respect to managing other mutual funds and investment accounts; |
| • | Policies and procedures relating to proxy voting and the handling of corporate actions and class actions; |
| • | A description of CRM’s procedures for overseeing sub-advisers, including with respect to regulatory and compliance issues, investment management and other matters; |
Calvert
Bond Fund
September 30, 2024
Board of Trustees' Contract Approval — continued
Other Relevant Information
| • | Information concerning the nature, cost and character of the administrative and other non-investment advisory services provided by CRM and its affiliates; and |
| • | The terms of each investment advisory agreement. |
Over the course of the year, the Board and its committees held regular quarterly meetings. During these meetings, the Trustees participated in investment and performance reviews with the portfolio managers and other investment professionals of the Adviser relating to each fund and considered various investment and trading strategies used in pursuing each fund’s investment objective(s), such as the use of derivative instruments, as well as risk management techniques. The Board and its committees also evaluated issues pertaining to industry and regulatory developments, compliance procedures, corporate governance and other issues with respect to the funds and received and participated in reports and presentations provided by CRM and its affiliates with respect to such matters. In addition to the formal meetings of the Board and its committees, the Independent Trustees held regular video conferences in between meetings to discuss, among other topics, matters relating to the continuation of the Calvert Funds’ investment advisory and investment sub-advisory agreements.
For funds that invest through one or more affiliated underlying funds, the Board considered similar information about the underlying fund(s) when considering the approval of investment advisory agreements. In addition, in cases where the Adviser has engaged a sub-adviser, the Board considered similar information about the sub-adviser when considering the approval of any investment sub-advisory agreement.
The Independent Trustees were assisted throughout the contract review process by their independent legal counsel. The Independent Trustees relied upon the advice of such counsel and their own business judgment in determining the material factors to be considered in evaluating each investment advisory and investment sub-advisory agreement and the weight to be given to each such factor. The Board, including the Independent Trustees, did not identify any single factor as controlling, and each Trustee may have attributed different weight to various factors.
Results of the Contract Review Process
Based on its consideration of the foregoing, and such other information as it deemed relevant, including the factors and conclusions described below, the Board, including the Independent Trustees, concluded that the continuation of the investment advisory agreement of Calvert Bond Fund (the “Fund”), including the fee payable under the agreement, is in the best interests of the Fund’s shareholders. Accordingly, the Board, including a majority of the Independent Trustees, voted to approve the continuation of the investment advisory agreement of the Fund.
Nature, Extent and Quality of Services
In considering the nature, extent and quality of the services provided by the Adviser under the investment advisory agreement, the Board reviewed information provided by the Adviser relating to its operations and personnel, including, among other information, biographical information on the Adviser’s investment personnel and descriptions of its organizational and management structure. The Board also took into account similar information provided periodically throughout the previous year by the Adviser as well as the Board’s familiarity with management through Board meetings, discussions and other reports. The Board considered the Adviser’s management style and its performance in employing its investment strategies as well as its current level of staffing and overall resources. The Board also noted that it reviewed on a quarterly basis information regarding the Adviser’s compliance with applicable policies and procedures, including those related to personal investing. The Board took into account, among other items, periodic reports received from the Adviser over the past year concerning the Adviser’s ongoing review and enhancement of certain processes, policies and procedures of the Calvert Funds and the Adviser. The Board concluded that it was satisfied with the nature, extent and quality of services provided to the Fund by the Adviser under the investment advisory agreement.
Fund Performance
In considering the Fund’s performance, the Board noted that it reviewed on a quarterly basis detailed information about the Fund’s performance results, portfolio composition and investment strategies. The Board compared the Fund’s investment performance to that of the Fund’s peer universe and its benchmark index. The Board’s review included comparative performance data for the one-, three- and five-year periods ended December 31, 2023. This performance data indicated that the Fund had outperformed the median of its peer universe and its benchmark index for the one-, three- and five-year periods ended December 31, 2023. Based upon its review, the Board concluded that the Fund’s performance was satisfactory relative to the performance of its peer universe and its benchmark index.
Calvert
Bond Fund
September 30, 2024
Board of Trustees' Contract Approval — continued
Management Fees and Expenses
In considering the Fund’s fees and expenses, the Board compared the Fund’s fees and total expense ratio with those of comparable funds in its expense group. Among other findings, the data indicated that the Fund’s advisory and administrative fees (after taking into account waivers and/or reimbursements) (referred to collectively as “management fees”) were above the median of the Fund’s expense group and the Fund’s total expenses (net of waivers and/or reimbursements) were below the median of the Fund’s expense group. The Board took into account the Adviser’s current undertaking to maintain expense limitations for the Fund and that the Adviser was waiving and/or reimbursing a portion of the Fund’s expenses. Based upon its review, the Board concluded that the management fees were reasonable in view of the nature, extent and quality of services provided by the Adviser.
Profitability and Other “Fall-Out” Benefits
The Board reviewed the Adviser’s profitability in regard to the Fund and the Calvert Funds in the aggregate. In reviewing the overall profitability of the Fund to the Adviser, the Board also considered the fact that the Adviser and its affiliates provided sub-transfer agency support, administrative and distribution services to the Fund for which they received compensation. The information considered by the Board included the profitability of the Fund to the Adviser and its affiliates without regard to any marketing support or other payments by the Adviser and its affiliates to third parties in respect of distribution services. The Board also considered that the Adviser and its affiliates derived benefits to their reputation and other indirect benefits from their relationships with the Fund. Based upon its review, the Board concluded that the Adviser’s and its affiliates’ level of profitability from their relationships with the Fund was reasonable.
Economies of Scale
The Board considered the effect of the Fund’s current size and its potential growth on its performance and fees. The Board also took into account the breakpoint in the advisory fee schedule for the Fund that would reduce the advisory fee rate on assets above a specific asset level. The Board noted that if the Fund’s assets increased over time, the Fund might realize other economies of scale if assets increased proportionally more than certain other expenses.
Calvert
Equity Fund
September 30, 2024
Board of Trustees' Contract Approval
Overview of the Contract Review Process
The Investment Company Act of 1940, as amended, provides, in substance, that each investment advisory agreement between a fund and its investment adviser will continue in effect from year to year only if its continuation is approved at least annually by the fund’s board of directors, including by a vote of a majority of the directors who are not “interested persons” of the fund (“Independent Trustees”), cast in person at a meeting called for the purpose of considering such approval.
At an in-person meeting of the Boards of Trustees/Directors (each a “Board”) of the registered investment companies advised by Calvert Research and Management (“CRM” or the “Adviser”) (the “Calvert Funds”) held on June 10-11, 2024, the Board, including a majority of the Independent Trustees, voted to approve continuation of existing investment advisory and investment sub-advisory agreements for the Calvert Funds for an additional one-year period.
In evaluating the investment advisory and investment sub-advisory agreements for the Calvert Funds, the Board considered a variety of information relating to the Calvert Funds and various service providers, including the Adviser. The Independent Trustees reviewed a report prepared by the Adviser regarding various services provided to the Calvert Funds by the Adviser and its affiliates. Such report included, among other data, information regarding the Adviser’s personnel and the Adviser’s revenue and cost of providing services to the Calvert Funds, and a separate report prepared by an independent data provider, which compared each fund’s investment performance, fees and expenses to those of comparable funds as identified by such independent data provider (“comparable funds”).
The Independent Trustees were separately represented by independent legal counsel with respect to their consideration of the continuation of the investment advisory and investment sub-advisory agreements for the Calvert Funds. Prior to voting, the Independent Trustees reviewed the proposed continuation of the Calvert Funds’ investment advisory and investment sub-advisory agreements with management and also met in private sessions with their counsel at which time no representatives of management were present.
The information that the Board considered included, among other things, the following (for funds that invest through one or more affiliated underlying fund(s), references to “each fund” in this section may include information that was considered at the underlying fund-level):
Information about Fees, Performance and Expenses
| • | A report from an independent data provider comparing the advisory and related fees paid by each fund with fees paid by comparable funds; |
| • | A report from an independent data provider comparing each fund’s total expense ratio and its components to comparable funds; |
| • | A report from an independent data provider comparing the investment performance of each fund to the investment performance of comparable funds over various time periods; |
| • | Data regarding investment performance in comparison to benchmark indices; |
| • | For each fund, comparative information concerning the fees charged and the services provided by the Adviser in managing other accounts (including mutual funds, other collective investment funds and institutional accounts) using investment strategies and techniques similar to those used in managing such fund; |
| • | Profitability analyses for the Adviser with respect to each fund; |
Information about Portfolio Management and Trading
| • | Descriptions of the investment management services provided to each fund, including investment strategies and processes it employs; |
| • | Information about the Adviser’s policies and practices with respect to trading, including the Adviser’s processes for monitoring best execution of portfolio transactions; |
| • | Information about the allocation of brokerage transactions and the benefits received by the Adviser as a result of brokerage allocation, including information concerning the acquisition of research through client commission arrangements and policies with respect to “soft dollars”; |
Information about the Adviser
| • | Reports detailing the financial results and condition of CRM; |
| • | Descriptions of the qualifications, education and experience of the individual investment professionals whose responsibilities include portfolio management and investment research for the funds, and information relating to their compensation and responsibilities with respect to managing other mutual funds and investment accounts; |
| • | Policies and procedures relating to proxy voting and the handling of corporate actions and class actions; |
| • | A description of CRM’s procedures for overseeing sub-advisers, including with respect to regulatory and compliance issues, investment management and other matters; |
Calvert
Equity Fund
September 30, 2024
Board of Trustees' Contract Approval — continued
Other Relevant Information
| • | Information concerning the nature, cost and character of the administrative and other non-investment advisory services provided by CRM and its affiliates; and |
| • | The terms of each investment advisory agreement. |
Over the course of the year, the Board and its committees held regular quarterly meetings. During these meetings, the Trustees participated in investment and performance reviews with the portfolio managers and other investment professionals of the Adviser relating to each fund and considered various investment and trading strategies used in pursuing each fund’s investment objective(s), such as the use of derivative instruments, as well as risk management techniques. The Board and its committees also evaluated issues pertaining to industry and regulatory developments, compliance procedures, corporate governance and other issues with respect to the funds and received and participated in reports and presentations provided by CRM and its affiliates with respect to such matters. In addition to the formal meetings of the Board and its committees, the Independent Trustees held regular video conferences in between meetings to discuss, among other topics, matters relating to the continuation of the Calvert Funds’ investment advisory and investment sub-advisory agreements.
For funds that invest through one or more affiliated underlying funds, the Board considered similar information about the underlying fund(s) when considering the approval of investment advisory agreements. In addition, in cases where the Adviser has engaged a sub-adviser, the Board considered similar information about the sub-adviser when considering the approval of any investment sub-advisory agreement.
The Independent Trustees were assisted throughout the contract review process by their independent legal counsel. The Independent Trustees relied upon the advice of such counsel and their own business judgment in determining the material factors to be considered in evaluating each investment advisory and investment sub-advisory agreement and the weight to be given to each such factor. The Board, including the Independent Trustees, did not identify any single factor as controlling, and each Trustee may have attributed different weight to various factors.
Results of the Contract Review Process
Based on its consideration of the foregoing, and such other information as it deemed relevant, including the factors and conclusions described below, the Board, including the Independent Trustees, concluded that the continuation of the investment advisory agreement of Calvert Equity Fund (the “Fund”), and the investment sub-advisory agreement with Atlanta Capital Management Company, LLC (the “Sub-Adviser”), an affiliate of CRM, including the fees payable under each agreement, is in the best interests of the Fund’s shareholders. Accordingly, the Board, including a majority of the Independent Trustees, voted to approve the continuation of the investment advisory agreement and the investment sub-advisory agreement of the Fund.
Nature, Extent and Quality of Services
In considering the nature, extent and quality of the services provided by the Adviser and Sub-Adviser under the investment advisory agreement and investment sub-advisory agreement, respectively, the Board reviewed information relating to the Adviser’s and Sub-Adviser’s operations and personnel, including, among other information, biographical information on the Sub-Adviser’s investment personnel and descriptions of the Adviser’s organizational and management structure. The Board also took into account similar information provided periodically throughout the previous year by the Adviser and Sub-Adviser as well as the Board’s familiarity with the Adviser and Sub-Adviser through Board meetings, discussions and other reports. With respect to the Adviser, the Board considered the Adviser’s responsibilities overseeing the Sub-Adviser and the business-related and other risks to which the Adviser or its affiliates may be subject in managing the Fund. With respect to the Sub-Adviser, the Board took into account the resources available to the Sub-Adviser in fulfilling its duties under the investment sub-advisory agreement and the Sub-Adviser’s experience in managing the Fund. The Board also noted that it reviewed on a quarterly basis information regarding the Adviser’s and Sub-Adviser’s compliance with applicable policies and procedures, including those related to personal investing. The Board took into account, among other items, periodic reports received from the Adviser over the past year concerning the Adviser’s ongoing review and enhancement of certain processes, policies and procedures of the Calvert Funds and the Adviser. The Board concluded that it was satisfied with the nature, extent and quality of services provided to the Fund by the Adviser and the Sub-Adviser under the investment advisory agreement and investment sub-advisory agreement, respectively.
Calvert
Equity Fund
September 30, 2024
Board of Trustees' Contract Approval — continued
Fund Performance
In considering the Fund’s performance, the Board noted that it reviewed on a quarterly basis detailed information about the Fund’s performance results, portfolio composition and investment strategies. The Board compared the Fund’s investment performance to that of the Fund’s peer universe and its benchmark index. The Board’s review included comparative performance data for the one-, three- and five-year periods ended December 31, 2023. This performance data indicated that the Fund had underperformed the median of the Fund’s peer universe for the one-year period ended December 31, 2023, while the Fund had outperformed the median of its peer universe for the three- and five-year periods ended December 31, 2023. This data also indicated that the Fund had underperformed its benchmark index for the one-, three- and five-year periods ended December 31, 2023. The Board took into account management’s discussion of the Fund’s performance. Based upon its review, the Board concluded that the Fund’s performance was satisfactory relative to the performance of its peer universe and its benchmark index.
Management Fees and Expenses
In considering the Fund’s fees and expenses, the Board compared the Fund’s fees and total expense ratio with those of comparable funds in its expense group. Among other findings, the data indicated that the Fund’s advisory and administrative fees (referred to collectively as “management fees”) and the Fund’s total expenses were each below the respective median of the Fund’s expense group. The Board took into account the Adviser’s and Sub-Adviser’s current undertaking to maintain expense limitations for the Fund and that the Adviser was waiving and/or reimbursing a portion of the Fund’s expenses. Based upon its review, the Board concluded that the management and sub-advisory fees were reasonable in view of the nature, extent and quality of services provided by the Adviser and Sub-Adviser, respectively.
Profitability and Other “Fall-Out” Benefits
The Board reviewed the Adviser’s profitability in regard to the Fund and the Calvert Funds in the aggregate. In reviewing the overall profitability of the Fund to the Adviser, the Board also considered the fact that the Adviser and its affiliates, including the Sub-Adviser, provided sub-advisory, sub-transfer agency support, administrative and distribution services to the Fund for which they received compensation. The information considered by the Board included the profitability of the Fund to the Adviser and its affiliates without regard to any marketing support or other payments by the Adviser and its affiliates to third parties in respect of distribution services. The Board also considered that the Adviser and its affiliates, including the Sub-Adviser, derived benefits to their reputation and other indirect benefits from their relationships with the Fund. Because the Adviser pays the Sub-Adviser’s sub-advisory fee out of its advisory fee, the profitability of the Fund to the Sub-Adviser was not a material factor in the Board’s deliberations concerning the continuation of the investment sub-advisory agreement. Based upon its review, the Board concluded that the level of profitability of the Adviser and its affiliates, including the Sub-Adviser, from their relationships with the Fund was reasonable.
Economies of Scale
The Board considered the effect of the Fund’s current size and its potential growth on its performance and fees. The Board also took into account the breakpoints in the advisory fee schedule for the Fund that would reduce the advisory fee rate on assets above specific asset levels. Because the Adviser pays the Sub-Adviser’s sub-advisory fee out of its advisory fee, the Board did not consider the potential economies of scale from the Sub-Adviser’s management of the Fund to be a material factor in the Board’s deliberations concerning the continuation of the investment sub-advisory agreement, although the Board noted that the sub-advisory fee schedule contained breakpoints. The Board noted that if the Fund’s assets increased over time, the Fund might realize other economies of scale if assets increased proportionally more than certain other expenses.
This Page Intentionally Left Blank
This Page Intentionally Left Blank
This Page Intentionally Left Blank
Calvert
Asset Allocation Funds
Annual Financial Statements and
Additional Information
September 30, 2024
Conservative Allocation • Moderate Allocation • Growth Allocation
This report must be preceded or accompanied by a current summary prospectus or prospectus. Before investing, investors should consider carefully the investment objective, risks, and charges and expenses of a mutual fund. This and other important information is contained in the prospectus and/or statement of additional information, which can be obtained by calling 1-800-368-2745 or from a financial intermediary. Prospective investors should read the prospectus carefully before investing.
Annual Financial Statements and Additional Information September 30, 2024
Calvert
Asset Allocation Funds
Calvert
Conservative Allocation Fund
September 30, 2024
| Security | Shares | Value |
| Equity Funds — 36.0% | |
| Calvert Impact Fund, Inc.: | | | |
| Calvert Small-Cap Fund, Class R6 | | 120,088 | $ 4,487,678 |
| Calvert Responsible Index Series, Inc.: | | | |
| Calvert International Responsible Index Fund, Class R6 | | 213,652 | 6,960,776 |
| Calvert US Large-Cap Core Responsible Index Fund, Class R6 | | 365,971 | 18,437,616 |
| Calvert US Large-Cap Growth Responsible Index Fund, Class R6 | | 133,393 | 8,831,929 |
| Calvert US Large-Cap Value Responsible Index Fund, Class R6 | | 337,325 | 11,600,621 |
| Calvert US Mid-Cap Core Responsible Index Fund, Class R6 | | 76,060 | 3,217,344 |
| Calvert Social Investment Fund: | | | |
| Calvert Equity Fund, Class R6 | | 73,300 | 7,500,828 |
| Calvert Focused Value Fund, Class R6 | | 527,016 | 6,397,977 |
| Calvert World Values Fund, Inc.: | | | |
| Calvert Emerging Markets Advancement Fund, Class I | | 464,752 | 5,600,261 |
| Calvert Emerging Markets Equity Fund, Class R6 | | 104,731 | 1,962,670 |
| Calvert International Equity Fund, Class R6 | | 311,152 | 8,298,426 |
| Calvert International Opportunities Fund, Class R6 | | 207,368 | 3,830,080 |
| Calvert Mid-Cap Fund, Class I | | 39,604 | 1,907,317 |
| | | | $89,033,523 |
| Income Funds — 63.5% | |
| Calvert Management Series: | | | |
| Calvert Flexible Bond Fund, Class R6 | | 505,241 | $7,487,664 |
| Calvert Floating-Rate Advantage Fund, Class R6 | | 1,044,965 | 9,352,434 |
| Calvert Social Investment Fund: | | | |
| Calvert Bond Fund, Class R6 | | 4,771,464 | 70,999,391 |
| The Calvert Fund: | | | |
| Calvert Core Bond Fund, Class I | | 1,692,321 | 27,381,753 |
| Calvert High Yield Bond Fund, Class R6 | | 252,340 | 6,235,323 |
| Security | Shares | Value |
| Income Funds (continued) | |
| The Calvert Fund: (continued) | | | |
| Calvert Mortgage Access Fund, Class I | | 1,489,877 | $ 14,913,668 |
| Calvert Short Duration Income Fund, Class R6 | | 313,523 | 4,981,878 |
| Calvert Ultra-Short Duration Income Fund, Class R6 | | 1,561,799 | 15,477,427 |
| | | | $156,829,538 |
Total Mutual Funds
(identified cost $225,555,724) | | | $245,863,061 |
| Short-Term Investments — 0.0%(2) |
| Security | Shares | Value |
| Morgan Stanley Institutional Liquidity Funds - Government Portfolio, Institutional Class, 4.83%(3) | | 28,993 | $ 28,993 |
Total Short-Term Investments
(identified cost $28,993) | | | $ 28,993 |
Total Investments — 99.5%
(identified cost $225,584,717) | | | $245,892,054 |
| Other Assets, Less Liabilities — 0.5% | | | $ 1,113,035 |
| Net Assets — 100.0% | | | $247,005,089 |
| The percentage shown for each investment category in the Schedule of Investments is based on net assets. |
| (1) | Affiliated fund. |
| (2) | Amount is less than 0.05%. |
| (3) | May be deemed to be an affiliated investment company. The rate shown is the annualized seven-day yield as of September 30, 2024. |
Futures Contracts
| Description | Number of
Contracts | Position | Expiration
Date | Notional
Amount | Value/
Unrealized
Appreciation
(Depreciation) |
| Interest Rate Futures | | | | | |
| U.S. 5-Year Treasury Note | 62 | Long | 12/31/24 | $6,812,734 | $6,265 |
| U.S. Long Treasury Bond | 76 | Long | 12/19/24 | 9,438,250 | (41,149) |
| U.S. Ultra-Long Treasury Bond | 33 | Long | 12/19/24 | 4,392,094 | (15,531) |
| | | | | | $(50,415) |
1
See Notes to Financial Statements.
Calvert
Moderate Allocation Fund
September 30, 2024
| Security | Shares | Value |
| Equity Funds — 65.9% | |
| Calvert Impact Fund, Inc.: | | | |
| Calvert Small-Cap Fund, Class R6 | | 297,592 | $ 11,121,015 |
| Calvert Responsible Index Series, Inc.: | | | |
| Calvert International Responsible Index Fund, Class R6 | | 630,055 | 20,527,180 |
| Calvert US Large-Cap Core Responsible Index Fund, Class R6 | | 1,134,707 | 57,166,515 |
| Calvert US Large-Cap Growth Responsible Index Fund, Class R6 | | 444,714 | 29,444,529 |
| Calvert US Large-Cap Value Responsible Index Fund, Class R6 | | 840,285 | 28,897,392 |
| Calvert US Mid-Cap Core Responsible Index Fund, Class R6 | | 217,660 | 9,207,011 |
| Calvert Social Investment Fund: | | | |
| Calvert Equity Fund, Class R6 | | 197,684 | 20,229,043 |
| Calvert Focused Value Fund, Class R6 | | 1,777,522 | 21,579,119 |
| Calvert World Values Fund, Inc.: | | | |
| Calvert Emerging Markets Advancement Fund, Class I | | 1,348,260 | 16,246,537 |
| Calvert Emerging Markets Equity Fund, Class R6 | | 398,860 | 7,474,633 |
| Calvert International Equity Fund, Class R6 | | 925,701 | 24,688,445 |
| Calvert International Opportunities Fund, Class R6 | | 774,616 | 14,307,153 |
| Calvert Mid-Cap Fund, Class I | | 85,430 | 4,114,314 |
| | | | $265,002,886 |
| Income Funds — 33.6% | |
| Calvert Management Series: | | | |
| Calvert Flexible Bond Fund, Class R6 | | 814,857 | $12,076,185 |
| Calvert Floating-Rate Advantage Fund, Class R6 | | 1,472,932 | 13,182,736 |
| Calvert Social Investment Fund: | | | |
| Calvert Bond Fund, Class R6 | | 2,431,148 | 36,175,482 |
| The Calvert Fund: | | | |
| Calvert Core Bond Fund, Class I | | 1,008,173 | 16,312,233 |
| Calvert High Yield Bond Fund, Class R6 | | 536,180 | 13,249,014 |
| Security | Shares | Value |
| Income Funds (continued) | |
| The Calvert Fund: (continued) | | | |
| Calvert Mortgage Access Fund, Class I | | 1,195,196 | $ 11,963,914 |
| Calvert Short Duration Income Fund, Class R6 | | 391,171 | 6,215,707 |
| Calvert Ultra-Short Duration Income Fund, Class R6 | | 2,635,537 | 26,118,174 |
| | | | $135,293,445 |
Total Mutual Funds
(identified cost $322,419,298) | | | $400,296,331 |
| Short-Term Investments — 0.2% |
| Security | Shares | Value |
| Morgan Stanley Institutional Liquidity Funds - Government Portfolio, Institutional Class, 4.83%(2) | | 976,096 | $ 976,096 |
Total Short-Term Investments
(identified cost $976,096) | | | $ 976,096 |
Total Investments — 99.7%
(identified cost $323,395,394) | | | $401,272,427 |
| Other Assets, Less Liabilities — 0.3% | | | $ 1,133,453 |
| Net Assets — 100.0% | | | $402,405,880 |
| The percentage shown for each investment category in the Schedule of Investments is based on net assets. |
| (1) | Affiliated fund. |
| (2) | May be deemed to be an affiliated investment company. The rate shown is the annualized seven-day yield as of September 30, 2024. |
Futures Contracts
| Description | Number of
Contracts | Position | Expiration
Date | Notional
Amount | Value/
Unrealized
Appreciation
(Depreciation) |
| Interest Rate Futures | | | | | |
| U.S. 2-Year Treasury Note | 9 | Long | 12/31/24 | $1,874,180 | $3,441 |
| U.S. 5-Year Treasury Note | 55 | Long | 12/31/24 | 6,043,555 | 5,557 |
| U.S. 10-Year Treasury Note | 16 | Long | 12/19/24 | 1,828,500 | 2,367 |
| U.S. Long Treasury Bond | 48 | Long | 12/19/24 | 5,961,000 | (25,989) |
| U.S. Ultra 10-Year Treasury Note | 38 | Long | 12/19/24 | 4,495,281 | 2,652 |
| U.S. Ultra-Long Treasury Bond | 26 | Long | 12/19/24 | 3,460,438 | (12,236) |
| | | | | | $(24,208) |
2
See Notes to Financial Statements.
Calvert
Growth Allocation Fund
September 30, 2024
| Security | Shares | Value |
| Equity Funds — 90.6% | |
| Calvert Impact Fund, Inc.: | | | |
| Calvert Small-Cap Fund, Class R6 | | 244,173 | $ 9,124,744 |
| Calvert Responsible Index Series, Inc.: | | | |
| Calvert International Responsible Index Fund, Class R6 | | 910,587 | 29,666,919 |
| Calvert US Large-Cap Core Responsible Index Fund, Class R6 | | 1,399,694 | 70,516,562 |
| Calvert US Large-Cap Growth Responsible Index Fund, Class R6 | | 515,857 | 34,154,903 |
| Calvert US Large-Cap Value Responsible Index Fund, Class R6 | | 1,014,601 | 34,892,139 |
| Calvert US Mid-Cap Core Responsible Index Fund, Class R6 | | 258,573 | 10,937,627 |
| Calvert Social Investment Fund: | | | |
| Calvert Equity Fund, Class R6 | | 278,860 | 28,535,788 |
| Calvert Focused Value Fund, Class R6 | | 1,877,510 | 22,792,965 |
| Calvert World Values Fund, Inc.: | | | |
| Calvert Emerging Markets Advancement Fund, Class I | | 1,836,876 | 22,134,356 |
| Calvert Emerging Markets Equity Fund, Class R6 | | 547,904 | 10,267,723 |
| Calvert International Equity Fund, Class R6 | | 1,153,616 | 30,766,924 |
| Calvert International Opportunities Fund, Class R6 | | 929,207 | 17,162,458 |
| Calvert Mid-Cap Fund, Class I | | 93,615 | 4,508,511 |
| | | | $325,461,619 |
| Income Funds — 8.6% | |
| Calvert Management Series: | | | |
| Calvert Floating-Rate Advantage Fund, Class R6 | | 301,960 | $2,702,545 |
| The Calvert Fund: | | | |
| Calvert Core Bond Fund, Class I | | 878,190 | 14,209,112 |
| Calvert High Yield Bond Fund, Class R6 | | 216,490 | 5,349,466 |
| Calvert Ultra-Short Duration Income Fund, Class R6 | | 894,060 | 8,860,134 |
| | | | $31,121,257 |
Total Mutual Funds
(identified cost $264,300,081) | | | $356,582,876 |
| Short-Term Investments — 0.7% |
| Security | Shares | Value |
| Morgan Stanley Institutional Liquidity Funds - Government Portfolio, Institutional Class, 4.83%(2) | | 2,587,614 | $ 2,587,614 |
Total Short-Term Investments
(identified cost $2,587,614) | | | $ 2,587,614 |
Total Investments — 99.9%
(identified cost $266,887,695) | | | $359,170,490 |
| Other Assets, Less Liabilities — 0.1% | | | $ 191,808 |
| Net Assets — 100.0% | | | $359,362,298 |
| The percentage shown for each investment category in the Schedule of Investments is based on net assets. |
| (1) | Affiliated fund. |
| (2) | May be deemed to be an affiliated investment company. The rate shown is the annualized seven-day yield as of September 30, 2024. |
Futures Contracts
| Description | Number of
Contracts | Position | Expiration
Date | Notional
Amount | Value/
Unrealized
Appreciation
(Depreciation) |
| Interest Rate Futures | | | | | |
| U.S. 5-Year Treasury Note | 10 | Long | 12/31/24 | $1,098,828 | $1,010 |
| U.S. 10-Year Treasury Note | 29 | Long | 12/19/24 | 3,314,156 | 4,289 |
| U.S. Long Treasury Bond | 14 | Long | 12/19/24 | 1,738,625 | (7,580) |
| U.S. Ultra 10-Year Treasury Note | 11 | Long | 12/19/24 | 1,301,266 | 768 |
| U.S. Ultra-Long Treasury Bond | 15 | Long | 12/19/24 | 1,996,406 | (7,059) |
| | | | | | $(8,572) |
3
See Notes to Financial Statements.
Calvert
Asset Allocation Funds
September 30, 2024
Statements of Assets and Liabilities
| | September 30, 2024 |
| | Conservative Allocation Fund | Moderate Allocation Fund | Growth Allocation Fund |
| Assets | | | |
| Investments in securities of affiliated issuers, at value (identified cost $225,584,717, $323,395,394 and $266,887,695, respectively) | $245,892,054 | $401,272,427 | $359,170,490 |
| Deposits at broker for futures contracts | 1,443,300 | 1,473,250 | 313,900 |
| Receivable for capital shares sold | 91,614 | 247,546 | 367,868 |
| Dividends receivable - affiliated | 680,238 | 625,027 | 151,271 |
| Receivable from affiliate | 95 | 355 | 379 |
| Trustees' deferred compensation plan | 132,663 | 194,838 | 104,864 |
| Total assets | $248,239,964 | $403,813,443 | $360,108,772 |
| Liabilities | | | |
| Payable for variation margin on open futures contracts | $100,776 | $103,691 | $43,782 |
| Payable for line of credit | 100,000 | — | — |
| Payable for investments purchased | 677,504 | 613,349 | 137,883 |
| Payable for capital shares redeemed | 67,154 | 282,121 | 236,579 |
| Payable to affiliates: | | | |
| Distribution and service fees | 46,595 | 77,636 | 69,451 |
| Sub-transfer agency fee | 7,544 | 15,579 | 17,208 |
| Trustees' deferred compensation plan | 132,663 | 194,838 | 104,864 |
| Payable for professional fees | 37,650 | 41,011 | 39,869 |
| Payable for transfer agency fees and expenses | 43,020 | 59,388 | 71,033 |
| Accrued expenses | 21,969 | 19,950 | 25,805 |
| Total liabilities | $1,234,875 | $1,407,563 | $746,474 |
| Net Assets | $247,005,089 | $402,405,880 | $359,362,298 |
| Sources of Net Assets | | | |
| Paid-in capital | $232,671,034 | $324,485,228 | $266,640,940 |
| Distributable earnings | 14,334,055 | 77,920,652 | 92,721,358 |
| Net Assets | $247,005,089 | $402,405,880 | $359,362,298 |
| Class A Shares | | | |
| Net Assets | $177,269,165 | $295,140,059 | $276,578,435 |
| Shares Outstanding | 9,626,814 | 13,008,636 | 9,919,367 |
Net Asset Value and Redemption Price Per Share
(net assets ÷ shares of beneficial interest outstanding) | $18.41 | $22.69 | $27.88 |
Maximum Offering Price Per Share
(100 ÷ 94.75 of net asset value per share) | $19.43 | $23.95 | $29.42 |
| Class C Shares | | | |
| Net Assets | $12,797,989 | $21,649,181 | $17,198,799 |
| Shares Outstanding | 704,251 | 1,022,829 | 755,793 |
Net Asset Value and Offering Price Per Share*
(net assets ÷ shares of beneficial interest outstanding) | $18.17 | $21.17 | $22.76 |
| Class I Shares | | | |
| Net Assets | $52,565,655 | $84,727,280 | $64,295,768 |
| Shares Outstanding | 2,852,540 | 3,729,866 | 2,290,451 |
Net Asset Value, Offering Price and Redemption Price Per Share
(net assets ÷ shares of beneficial interest outstanding) | $18.43 | $22.72 | $28.07 |
4
See Notes to Financial Statements.
Calvert
Asset Allocation Funds
September 30, 2024
Statements of Assets and Liabilities — continued
| | September 30, 2024 |
| | Conservative Allocation Fund | Moderate Allocation Fund | Growth Allocation Fund |
| Class R6 Shares | | | |
| Net Assets | $4,372,280 | $889,360 | $1,289,296 |
| Shares Outstanding | 237,248 | 39,175 | 45,940 |
Net Asset Value, Offering Price and Redemption Price Per Share
(net assets ÷ shares of beneficial interest outstanding, including fractional shares) | $18.43 | $22.70 | $28.07 |
| On sales of $50,000 or more, the offering price of Class A shares is reduced. |
| * | Redemption price per share is equal to the net asset value less any applicable contingent deferred sales charge. |
5
See Notes to Financial Statements.
Calvert
Asset Allocation Funds
September 30, 2024
| | Year Ended September 30, 2024 |
| | Conservative Allocation Fund | Moderate Allocation Fund | Growth Allocation Fund |
| Investment Income | | | |
| Dividend income - affiliated issuers | $8,930,613 | $10,123,505 | $5,873,698 |
| Interest income | 493,053 | 461,210 | 73,171 |
| Total investment income | $9,423,666 | $10,584,715 | $5,946,869 |
| Expenses | | | |
| Distribution and service fees: | | | |
| Class A | $434,771 | $696,215 | $631,854 |
| Class C | 148,663 | 230,192 | 165,415 |
| Trustees' fees and expenses | 14,628 | 23,135 | 20,334 |
| Custodian fees | 2,941 | 3,269 | 3,033 |
| Transfer agency fees and expenses | 228,618 | 348,618 | 399,549 |
| Accounting fees | 27,273 | 40,652 | 36,532 |
| Professional fees | 44,440 | 49,184 | 47,722 |
| Registration fees | 64,648 | 74,877 | 77,809 |
| Reports to shareholders | 12,670 | 30,767 | 30,834 |
| Interest expense and fees | 22,746 | 18,495 | 34,220 |
| Miscellaneous | 20,903 | 25,577 | 25,159 |
| Total expenses | $1,022,301 | $1,540,981 | $1,472,461 |
| Reimbursement of expenses by affiliates | $(3,190) | $(3,726) | $(41,265) |
| Net expenses | $1,019,111 | $1,537,255 | $1,431,196 |
| Net investment income | $8,404,555 | $9,047,460 | $4,515,673 |
| Realized and Unrealized Gain (Loss) | | | |
| Net realized gain (loss): | | | |
| Investment securities | $(1,181,239) | $(1,585,843) | $(1,488,736) |
| Investment securities - affiliated issuers | 935,955 | 2,285,351 | 2,331,876 |
| Futures contracts | 643,934 | 560,772 | 188,224 |
| Capital gains distributions received - affiliated issuers | 102,002 | 260,571 | 312,866 |
| Net realized gain | $500,652 | $1,520,851 | $1,344,230 |
| Change in unrealized appreciation (depreciation): | | | |
| Investment securities | $1,644,215 | $2,017,807 | $1,675,985 |
| Investment securities - affiliated issuers | 29,800,639 | 67,082,133 | 73,042,144 |
| Futures contracts | 655,854 | 661,785 | 66,528 |
| Net change in unrealized appreciation (depreciation) | $32,100,708 | $69,761,725 | $74,784,657 |
| Net realized and unrealized gain | $32,601,360 | $71,282,576 | $76,128,887 |
| Net increase in net assets from operations | $41,005,915 | $80,330,036 | $80,644,560 |
6
See Notes to Financial Statements.
Calvert
Asset Allocation Funds
September 30, 2024
Statements of Changes in Net Assets
| | Year Ended September 30, 2024 |
| | Conservative Allocation Fund | Moderate Allocation Fund | Growth Allocation Fund |
| Increase (Decrease) in Net Assets | | | |
| From operations: | | | |
| Net investment income | $8,404,555 | $9,047,460 | $4,515,673 |
| Net realized gain | 500,652 | 1,520,851 | 1,344,230 |
| Net change in unrealized appreciation (depreciation) | 32,100,708 | 69,761,725 | 74,784,657 |
| Net increase in net assets from operations | $41,005,915 | $80,330,036 | $80,644,560 |
| Distributions to shareholders: | | | |
| Class A | $(5,929,645) | $(17,663,850) | $(10,690,488) |
| Class C | (389,462) | (1,427,525) | (765,851) |
| Class I | (1,905,458) | (5,100,087) | (3,219,646) |
| Class R6 | (102,429) | (85,944) | (27,841) |
| Total distributions to shareholders | $(8,326,994) | $(24,277,406) | $(14,703,826) |
| Capital share transactions: | | | |
| Class A | $(20,140,995) | $(9,843,156) | $143,633 |
| Class C | (5,888,948) | (5,485,249) | (1,673,173) |
| Class I | (8,025,440) | (2,639,471) | (12,630,882) |
| Class R6 | 3,823,142 | (354,634) | 596,288 |
| Net decrease in net assets from capital share transactions | $(30,232,241) | $(18,322,510) | $(13,564,134) |
| Net increase in net assets | $2,446,680 | $37,730,120 | $52,376,600 |
| Net Assets | | | |
| At beginning of year | $244,558,409 | $364,675,760 | $306,985,698 |
| At end of year | $247,005,089 | $402,405,880 | $359,362,298 |
7
See Notes to Financial Statements.
Calvert
Asset Allocation Funds
September 30, 2024
Statements of Changes in Net Assets — continued
| | Year Ended September 30, 2023 |
| | Conservative Allocation Fund | Moderate Allocation Fund | Growth Allocation Fund |
| Increase (Decrease) in Net Assets | | | |
| From operations: | | | |
| Net investment income | $8,279,746 | $9,074,561 | $4,530,646 |
| Net realized gain (loss) | (432,021) | 14,852,264 | 11,015,033 |
| Net change in unrealized appreciation (depreciation) | 7,460,405 | 9,868,019 | 20,818,341 |
| Net increase in net assets from operations | $15,308,130 | $33,794,844 | $36,364,020 |
| Distributions to shareholders: | | | |
| Class A | $(5,837,731) | $(6,619,505) | $(5,783,317) |
| Class C | (451,419) | (488,603) | (441,259) |
| Class I | (1,990,722) | (2,012,032) | (1,782,510) |
| Class R6 | (6,440) | (7,689) | (3,789) |
| Total distributions to shareholders | $(8,286,312) | $(9,127,829) | $(8,010,875) |
| Capital share transactions: | | | |
| Class A | $(9,001,388) | $(8,186,069) | $15,361,926 |
| Class C | (2,927,576) | (4,143,027) | (2,004,674) |
| Class I | (8,893,978) | 3,548,836 | 3,352,364 |
| Class R6 | 216,019 | 1,092,688 | 419,823 |
| Net increase (decrease) in net assets from capital share transactions | $(20,606,923) | $(7,687,572) | $17,129,439 |
| Net increase (decrease) in net assets | $(13,585,105) | $16,979,443 | $45,482,584 |
| Net Assets | | | |
| At beginning of year | $258,143,514 | $347,696,317 | $261,503,114 |
| At end of year | $244,558,409 | $364,675,760 | $306,985,698 |
8
See Notes to Financial Statements.
Calvert
Asset Allocation Funds
September 30, 2024
| | Conservative Allocation Fund — Class A |
| | Year Ended September 30, |
| | 2024 | 2023 | 2022 | 2021 | 2020 |
| Net asset value — Beginning of year | $16.10 | $15.71 | $19.63 | $18.34 | $17.57 |
| Income (Loss) From Operations | | | | | |
| Net investment income(1) | $0.59 | $0.52 | $0.29 | $0.25 | $0.30 |
| Net realized and unrealized gain (loss) | 2.32 | 0.40 | (3.33) | 1.80 | 1.17 |
| Total income (loss) from operations | $2.91 | $0.92 | $(3.04) | $2.05 | $1.47 |
| Less Distributions | | | | | |
| From net investment income | $(0.60) | $(0.53) | $(0.39) | $(0.29) | $(0.32) |
| From net realized gain | — | — | (0.49) | (0.47) | (0.38) |
| Total distributions | $(0.60) | $(0.53) | $(0.88) | $(0.76) | $(0.70) |
| Net asset value — End of year | $18.41 | $16.10 | $15.71 | $19.63 | $18.34 |
| Total Return(2) | 18.27% | 5.85% | (16.18)% | 11.37% | 8.66% |
| Ratios/Supplemental Data | | | | | |
| Net assets, end of year (000’s omitted) | $177,269 | $174,111 | $178,332 | $211,702 | $177,060 |
| Ratios (as a percentage of average daily net assets):(3) | | | | | |
| Total expenses(4) | 0.43% | 0.43% | 0.41% | 0.40% | 0.41% |
| Net expenses(4) | 0.43%(5) | 0.43%(5) | 0.41%(5) | 0.40% | 0.41% |
| Net investment income | 3.43% | 3.15% | 1.62% | 1.28% | 1.70% |
| Portfolio Turnover | 13% | 43% | 20% | 23% | 36% |
| (1) | Computed using average shares outstanding. |
| (2) | Returns are historical and are calculated by determining the percentage change in net asset value with all distributions reinvested and do not reflect the effect of sales charges, if any. |
| (3) | Total expenses do not reflect amounts reimbursed and/or waived by the adviser and certain of its affiliates, if applicable. Net expenses are net of all reductions and represent the net expenses paid by the Fund. |
| (4) | Amounts do not include the expenses of the Underlying Funds. |
| (5) | Includes a reimbursement of expenses by the investment adviser due to the Fund’s investment in the Liquidity Fund (equal to less than 0.005% of average daily net assets for the years ended September 30, 2024, 2023 and 2022). |
9
See Notes to Financial Statements.
Calvert
Asset Allocation Funds
September 30, 2024
Financial Highlights — continued
| | Conservative Allocation Fund — Class C |
| | Year Ended September 30, |
| | 2024 | 2023 | 2022 | 2021 | 2020 |
| Net asset value — Beginning of year | $15.89 | $15.51 | $19.39 | $18.11 | $17.36 |
| Income (Loss) From Operations | | | | | |
| Net investment income(1) | $0.46 | $0.39 | $0.16 | $0.10 | $0.17 |
| Net realized and unrealized gain (loss) | 2.28 | 0.39 | (3.30) | 1.80 | 1.15 |
| Total income (loss) from operations | $2.74 | $0.78 | $(3.14) | $1.90 | $1.32 |
| Less Distributions | | | | | |
| From net investment income | $(0.46) | $(0.40) | $(0.25) | $(0.15) | $(0.19) |
| From net realized gain | — | — | (0.49) | (0.47) | (0.38) |
| Total distributions | $(0.46) | $(0.40) | $(0.74) | $(0.62) | $(0.57) |
| Net asset value — End of year | $18.17 | $15.89 | $15.51 | $19.39 | $18.11 |
| Total Return(2) | 17.41% | 5.04% | (16.83)% | 10.62% | 7.81% |
| Ratios/Supplemental Data | | | | | |
| Net assets, end of year (000’s omitted) | $12,798 | $16,702 | $19,096 | $27,062 | $29,017 |
| Ratios (as a percentage of average daily net assets):(3) | | | | | |
| Total expenses(4) | 1.18% | 1.18% | 1.16% | 1.15% | 1.15% |
| Net expenses(4) | 1.18%(5) | 1.18%(5) | 1.16%(5) | 1.15% | 1.15% |
| Net investment income | 2.72% | 2.40% | 0.87% | 0.54% | 0.97% |
| Portfolio Turnover | 13% | 43% | 20% | 23% | 36% |
| (1) | Computed using average shares outstanding. |
| (2) | Returns are historical and are calculated by determining the percentage change in net asset value with all distributions reinvested and do not reflect the effect of sales charges, if any. |
| (3) | Total expenses do not reflect amounts reimbursed and/or waived by the adviser and certain of its affiliates, if applicable. Net expenses are net of all reductions and represent the net expenses paid by the Fund. |
| (4) | Amounts do not include the expenses of the Underlying Funds. |
| (5) | Includes a reimbursement of expenses by the investment adviser due to the Fund’s investment in the Liquidity Fund (equal to less than 0.005% of average daily net assets for the years ended September 30, 2024, 2023 and 2022). |
10
See Notes to Financial Statements.
Calvert
Asset Allocation Funds
September 30, 2024
Financial Highlights — continued
| | Conservative Allocation Fund — Class I |
| | Year Ended September 30, |
| | 2024 | 2023 | 2022 | 2021 | 2020 |
| Net asset value — Beginning of year | $16.11 | $15.72 | $19.65 | $18.35 | $17.58 |
| Income (Loss) From Operations | | | | | |
| Net investment income(1) | $0.64 | $0.57 | $0.34 | $0.29 | $0.34 |
| Net realized and unrealized gain (loss) | 2.32 | 0.39 | (3.35) | 1.82 | 1.18 |
| Total income (loss) from operations | $2.96 | $0.96 | $(3.01) | $2.11 | $1.52 |
| Less Distributions | | | | | |
| From net investment income | $(0.64) | $(0.57) | $(0.43) | $(0.34) | $(0.37) |
| From net realized gain | — | — | (0.49) | (0.47) | (0.38) |
| Total distributions | $(0.64) | $(0.57) | $(0.92) | $(0.81) | $(0.75) |
| Net asset value — End of year | $18.43 | $16.11 | $15.72 | $19.65 | $18.35 |
| Total Return(2) | 18.61% | 6.11% | (16.00)% | 11.70% | 8.93% |
| Ratios/Supplemental Data | | | | | |
| Net assets, end of year (000’s omitted) | $52,566 | $53,435 | $60,616 | $62,269 | $39,770 |
| Ratios (as a percentage of average daily net assets):(3) | | | | | |
| Total expenses(4) | 0.18% | 0.18% | 0.16% | 0.15% | 0.16% |
| Net expenses(4) | 0.18%(5) | 0.18%(5) | 0.16%(5) | 0.15% | 0.16% |
| Net investment income | 3.68% | 3.40% | 1.85% | 1.51% | 1.93% |
| Portfolio Turnover | 13% | 43% | 20% | 23% | 36% |
| (1) | Computed using average shares outstanding. |
| (2) | Returns are historical and are calculated by determining the percentage change in net asset value with all distributions reinvested and do not reflect the effect of sales charges, if any. |
| (3) | Total expenses do not reflect amounts reimbursed and/or waived by the adviser and certain of its affiliates, if applicable. Net expenses are net of all reductions and represent the net expenses paid by the Fund. |
| (4) | Amounts do not include the expenses of the Underlying Funds. |
| (5) | Includes a reimbursement of expenses by the investment adviser due to the Fund’s investment in the Liquidity Fund (equal to less than 0.005% of average daily net assets for the years ended September 30, 2024, 2023 and 2022). |
11
See Notes to Financial Statements.
Calvert
Asset Allocation Funds
September 30, 2024
Financial Highlights — continued
| | Conservative Allocation Fund — Class R6 |
| | Year Ended September 30, | Period Ended
September 30,
2022(1) |
| | 2024 | 2023 |
| Net asset value — Beginning of period | $16.11 | $15.72 | $18.86 |
| Income (Loss) From Operations | | | |
| Net investment income(2) | $0.60 | $0.57 | $0.24 |
| Net realized and unrealized gain (loss) | 2.37 | 0.40 | (3.16) |
| Total income (loss) from operations | $2.97 | $0.97 | $(2.92) |
| Less Distributions | | | |
| From net investment income | $(0.65) | $(0.58) | $(0.22) |
| Total distributions | $(0.65) | $(0.58) | $(0.22) |
| Net asset value — End of period | $18.43 | $16.11 | $15.72 |
| Total Return(3) | 18.70% | 6.18% | (15.54)%(4) |
| Ratios/Supplemental Data | | | |
| Net assets, end of period (000’s omitted) | $4,372 | $310 | $100 |
| Ratios (as a percentage of average daily net assets):(5) | | | |
| Total expenses(6) | 0.11% | 0.11% | 0.11%(7) |
| Net expenses(6) | 0.11%(8) | 0.11%(8) | 0.11%(7)(8) |
| Net investment income | 3.39% | 3.44% | 2.15%(7) |
| Portfolio Turnover | 13% | 43% | 20%(4)(9) |
| (1) | For the period from the commencement of operations, February 1, 2022, to September 30, 2022. |
| (2) | Computed using average shares outstanding. |
| (3) | Returns are historical and are calculated by determining the percentage change in net asset value with all distributions reinvested and do not reflect the effect of sales charges, if any. |
| (4) | Not annualized. |
| (5) | Total expenses do not reflect amounts reimbursed and/or waived by the adviser and certain of its affiliates, if applicable. Net expenses are net of all reductions and represent the net expenses paid by the Fund. |
| (6) | Amounts do not include the expenses of the Underlying Funds. |
| (7) | Annualized. |
| (8) | Includes a reimbursement of expenses by the investment adviser due to the Fund’s investment in the Liquidity Fund (equal to less than 0.005% of average daily net assets for the years ended September 30, 2024 and 2023 and the period ended September 30, 2022). |
| (9) | For the year ended September 30, 2022. |
12
See Notes to Financial Statements.
Calvert
Asset Allocation Funds
September 30, 2024
Financial Highlights — continued
| | Moderate Allocation Fund — Class A |
| | Year Ended September 30, |
| | 2024 | 2023 | 2022 | 2021 | 2020 |
| Net asset value — Beginning of year | $19.60 | $18.31 | $23.50 | $20.66 | $19.49 |
| Income (Loss) From Operations | | | | | |
| Net investment income(1) | $0.49 | $0.48 | $0.28 | $0.22 | $0.26 |
| Net realized and unrealized gain (loss) | 3.95 | 1.29 | (4.26) | 3.54 | 1.73 |
| Total income (loss) from operations | $4.44 | $1.77 | $(3.98) | $3.76 | $1.99 |
| Less Distributions | | | | | |
| From net investment income | $(0.50) | $(0.48) | $(0.44) | $(0.25) | $(0.26) |
| From net realized gain | (0.85) | — | (0.77) | (0.67) | (0.56) |
| Total distributions | $(1.35) | $(0.48) | $(1.21) | $(0.92) | $(0.82) |
| Net asset value — End of year | $22.69 | $19.60 | $18.31 | $23.50 | $20.66 |
| Total Return(2) | 23.39% | 9.72% | (17.91)% | 18.53% | 10.44% |
| Ratios/Supplemental Data | | | | | |
| Net assets, end of year (000’s omitted) | $295,140 | $264,282 | $254,243 | $312,287 | $259,726 |
| Ratios (as a percentage of average daily net assets):(3) | | | | | |
| Total expenses(4) | 0.41% | 0.41% | 0.40% | 0.39% | 0.41% |
| Net expenses(4) | 0.41%(5) | 0.41%(5) | 0.40%(5) | 0.39% | 0.41% |
| Net investment income | 2.35% | 2.41% | 1.29% | 0.98% | 1.32% |
| Portfolio Turnover | 19% | 41% | 18% | 26% | 35% |
| (1) | Computed using average shares outstanding. |
| (2) | Returns are historical and are calculated by determining the percentage change in net asset value with all distributions reinvested and do not reflect the effect of sales charges, if any. |
| (3) | Total expenses do not reflect amounts reimbursed and/or waived by the adviser and certain of its affiliates, if applicable. Net expenses are net of all reductions and represent the net expenses paid by the Fund. |
| (4) | Amounts do not include the expenses of the Underlying Funds. |
| (5) | Includes a reimbursement of expenses by the investment adviser due to the Fund’s investment in the Liquidity Fund (equal to less than 0.005% of average daily net assets for the years ended September 30, 2024, 2023 and 2022). |
13
See Notes to Financial Statements.
Calvert
Asset Allocation Funds
September 30, 2024
Financial Highlights — continued
| | Moderate Allocation Fund — Class C |
| | Year Ended September 30, |
| | 2024 | 2023 | 2022 | 2021 | 2020 |
| Net asset value — Beginning of year | $18.37 | $17.19 | $22.14 | $19.56 | $18.52 |
| Income (Loss) From Operations | | | | | |
| Net investment income(1) | $0.32 | $0.32 | $0.11 | $0.05 | $0.11 |
| Net realized and unrealized gain (loss) | 3.68 | 1.20 | (3.98) | 3.33 | 1.64 |
| Total income (loss) from operations | $4.00 | $1.52 | $(3.87) | $3.38 | $1.75 |
| Less Distributions | | | | | |
| From net investment income | $(0.35) | $(0.34) | $(0.31) | $(0.13) | $(0.15) |
| From net realized gain | (0.85) | — | (0.77) | (0.67) | (0.56) |
| Total distributions | $(1.20) | $(0.34) | $(1.08) | $(0.80) | $(0.71) |
| Net asset value — End of year | $21.17 | $18.37 | $17.19 | $22.14 | $19.56 |
| Total Return(2) | 22.47% | 8.89% | (18.50)% | 17.60% | 9.62% |
| Ratios/Supplemental Data | | | | | |
| Net assets, end of year (000’s omitted) | $21,649 | $23,909 | $26,149 | $36,398 | $34,674 |
| Ratios (as a percentage of average daily net assets):(3) | | | | | |
| Total expenses(4) | 1.16% | 1.16% | 1.15% | 1.14% | 1.16% |
| Net expenses(4) | 1.16%(5) | 1.16%(5) | 1.15%(5) | 1.14% | 1.16% |
| Net investment income | 1.65% | 1.70% | 0.54% | 0.24% | 0.59% |
| Portfolio Turnover | 19% | 41% | 18% | 26% | 35% |
| (1) | Computed using average shares outstanding. |
| (2) | Returns are historical and are calculated by determining the percentage change in net asset value with all distributions reinvested and do not reflect the effect of sales charges, if any. |
| (3) | Total expenses do not reflect amounts reimbursed and/or waived by the adviser and certain of its affiliates, if applicable. Net expenses are net of all reductions and represent the net expenses paid by the Fund. |
| (4) | Amounts do not include the expenses of the Underlying Funds. |
| (5) | Includes a reimbursement of expenses by the investment adviser due to the Fund’s investment in the Liquidity Fund (equal to less than 0.005% of average daily net assets for the years ended September 30, 2024, 2023 and 2022). |
14
See Notes to Financial Statements.
Calvert
Asset Allocation Funds
September 30, 2024
Financial Highlights — continued
| | Moderate Allocation Fund — Class I |
| | Year Ended September 30, |
| | 2024 | 2023 | 2022 | 2021 | 2020 |
| Net asset value — Beginning of year | $19.63 | $18.33 | $23.52 | $20.68 | $19.51 |
| Income (Loss) From Operations | | | | | |
| Net investment income(1) | $0.55 | $0.53 | $0.33 | $0.28 | $0.30 |
| Net realized and unrealized gain (loss) | 3.94 | 1.31 | (4.25) | 3.54 | 1.74 |
| Total income (loss) from operations | $4.49 | $1.84 | $(3.92) | $3.82 | $2.04 |
| Less Distributions | | | | | |
| From net investment income | $(0.55) | $(0.54) | $(0.50) | $(0.31) | $(0.31) |
| From net realized gain | (0.85) | — | (0.77) | (0.67) | (0.56) |
| Total distributions | $(1.40) | $(0.54) | $(1.27) | $(0.98) | $(0.87) |
| Net asset value — End of year | $22.72 | $19.63 | $18.33 | $23.52 | $20.68 |
| Total Return(2) | 23.65% | 10.05% | (17.69)% | 18.80% | 10.71% |
| Ratios/Supplemental Data | | | | | |
| Net assets, end of year (000’s omitted) | $84,727 | $75,426 | $67,288 | $90,643 | $58,212 |
| Ratios (as a percentage of average daily net assets):(3) | | | | | |
| Total expenses(4) | 0.16% | 0.16% | 0.15% | 0.14% | 0.16% |
| Net expenses(4) | 0.16%(5) | 0.16%(5) | 0.15%(5) | 0.14% | 0.16% |
| Net investment income | 2.61% | 2.65% | 1.54% | 1.22% | 1.51% |
| Portfolio Turnover | 19% | 41% | 18% | 26% | 35% |
| (1) | Computed using average shares outstanding. |
| (2) | Returns are historical and are calculated by determining the percentage change in net asset value with all distributions reinvested and do not reflect the effect of sales charges, if any. |
| (3) | Total expenses do not reflect amounts reimbursed and/or waived by the adviser and certain of its affiliates, if applicable. Net expenses are net of all reductions and represent the net expenses paid by the Fund. |
| (4) | Amounts do not include the expenses of the Underlying Funds. |
| (5) | Includes a reimbursement of expenses by the investment adviser due to the Fund’s investment in the Liquidity Fund (equal to less than 0.005% of average daily net assets for the years ended September 30, 2024, 2023 and 2022). |
15
See Notes to Financial Statements.
Calvert
Asset Allocation Funds
September 30, 2024
Financial Highlights — continued
| | Moderate Allocation Fund — Class R6 |
| | Year Ended September 30, | Period Ended
September 30,
2022(1) |
| | 2024 | 2023 |
| Net asset value — Beginning of period | $19.62 | $18.33 | $22.51 |
| Income (Loss) From Operations | | | |
| Net investment income(2) | $0.55 | $0.41 | $0.16 |
| Net realized and unrealized gain (loss) | 3.94 | 1.43 | (4.18) |
| Total income (loss) from operations | $4.49 | $1.84 | $(4.02) |
| Less Distributions | | | |
| From net investment income | $(0.56) | $(0.55) | $(0.16) |
| From net realized gain | (0.85) | — | — |
| Total distributions | $(1.41) | $(0.55) | $(0.16) |
| Net asset value — End of period | $22.70 | $19.62 | $18.33 |
| Total Return(3) | 23.68% | 10.05% | (17.90)%(4) |
| Ratios/Supplemental Data | | | |
| Net assets, end of period (000’s omitted) | $889 | $1,058 | $16 |
| Ratios (as a percentage of average daily net assets):(5) | | | |
| Total expenses(6) | 0.11% | 0.10% | 0.09%(7) |
| Net expenses(6) | 0.11%(8) | 0.10%(8) | 0.09%(7)(8) |
| Net investment income | 2.64% | 2.02% | 1.17%(7) |
| Portfolio Turnover | 19% | 41% | 18%(4)(9) |
| (1) | For the period from the commencement of operations, February 1, 2022, to September 30, 2022. |
| (2) | Computed using average shares outstanding. |
| (3) | Returns are historical and are calculated by determining the percentage change in net asset value with all distributions reinvested and do not reflect the effect of sales charges, if any. |
| (4) | Not annualized. |
| (5) | Total expenses do not reflect amounts reimbursed and/or waived by the adviser and certain of its affiliates, if applicable. Net expenses are net of all reductions and represent the net expenses paid by the Fund. |
| (6) | Amounts do not include the expenses of the Underlying Funds. |
| (7) | Annualized. |
| (8) | Includes a reimbursement of expenses by the investment adviser due to the Fund’s investment in the Liquidity Fund (equal to less than 0.005% of average daily net assets for the years ended September 30, 2024 and 2023 and the period ended September 30, 2022). |
| (9) | For the year ended September 30, 2022. |
16
See Notes to Financial Statements.
Calvert
Asset Allocation Funds
September 30, 2024
Financial Highlights — continued
| | Growth Allocation Fund — Class A |
| | Year Ended September 30, |
| | 2024 | 2023 | 2022 | 2021 | 2020 |
| Net asset value — Beginning of year | $22.90 | $20.68 | $27.07 | $22.15 | $20.38 |
| Income (Loss) From Operations | | | | | |
| Net investment income(1) | $0.33 | $0.34 | $0.21 | $0.11 | $0.18 |
| Net realized and unrealized gain (loss) | 5.73 | 2.50 | (5.65) | 5.63 | 2.35 |
| Total income (loss) from operations | $6.06 | $2.84 | $(5.44) | $5.74 | $2.53 |
| Less Distributions | | | | | |
| From net investment income | $(0.37) | $(0.29) | $(0.49) | $(0.12) | $(0.20) |
| From net realized gain | (0.71) | (0.33) | (0.46) | (0.70) | (0.56) |
| Total distributions | $(1.08) | $(0.62) | $(0.95) | $(0.82) | $(0.76) |
| Net asset value — End of year | $27.88 | $22.90 | $20.68 | $27.07 | $22.15 |
| Total Return(2) | 27.17% | 13.83% | (20.97)% | 26.32% | 12.52% |
| Ratios/Supplemental Data | | | | | |
| Net assets, end of year (000’s omitted) | $276,578 | $226,573 | $190,453 | $224,233 | $157,659 |
| Ratios (as a percentage of average daily net assets):(3) | | | | | |
| Total expenses(4) | 0.45%(5) | 0.46% | 0.44% | 0.44% | 0.47% |
| Net expenses(4) | 0.44%(5)(6) | 0.43%(6) | 0.43%(6) | 0.43% | 0.43% |
| Net investment income | 1.30% | 1.47% | 0.84% | 0.43% | 0.87% |
| Portfolio Turnover | 23% | 37% | 9% | 17% | 43% |
| (1) | Computed using average shares outstanding. |
| (2) | Returns are historical and are calculated by determining the percentage change in net asset value with all distributions reinvested and do not reflect the effect of sales charges, if any. |
| (3) | Total expenses do not reflect amounts reimbursed and/or waived by the adviser and certain of its affiliates, if applicable. Net expenses are net of all reductions and represent the net expenses paid by the Fund. |
| (4) | Amounts do not include the expenses of the Underlying Funds. |
| (5) | Includes interest expense of 0.01%. |
| (6) | Includes a reimbursement of expenses by the investment adviser due to the Fund’s investment in the Liquidity Fund (equal to less than 0.005%, less than 0.01% and less than 0.005% of average daily net assets for the years ended September 30, 2024, 2023 and 2022, respectively). |
17
See Notes to Financial Statements.
Calvert
Asset Allocation Funds
September 30, 2024
Financial Highlights — continued
| | Growth Allocation Fund — Class C |
| | Year Ended September 30, |
| | 2024 | 2023 | 2022 | 2021 | 2020 |
| Net asset value — Beginning of year | $18.87 | $17.15 | $22.61 | $18.63 | $17.26 |
| Income (Loss) From Operations | | | | | |
| Net investment income (loss)(1) | $0.13 | $0.15 | $0.02 | $(0.06) | $0.02 |
| Net realized and unrealized gain (loss) | 4.69 | 2.06 | (4.69) | 4.72 | 1.98 |
| Total income (loss) from operations | $4.82 | $2.21 | $(4.67) | $4.66 | $2.00 |
| Less Distributions | | | | | |
| From net investment income | $(0.22) | $(0.16) | $(0.33) | $ — | $(0.07) |
| From net realized gain | (0.71) | (0.33) | (0.46) | (0.68) | (0.56) |
| Total distributions | $(0.93) | $(0.49) | $(0.79) | $(0.68) | $(0.63) |
| Net asset value — End of year | $22.76 | $18.87 | $17.15 | $22.61 | $18.63 |
| Total Return(2) | 26.26% | 12.96% | (21.54)% | 25.38% | 11.67% |
| Ratios/Supplemental Data | | | | | |
| Net assets, end of year (000’s omitted) | $17,199 | $15,796 | $16,129 | $18,612 | $16,419 |
| Ratios (as a percentage of average daily net assets):(3) | | | | | |
| Total expenses(4) | 1.20%(5) | 1.21% | 1.19% | 1.19% | 1.22% |
| Net expenses(4) | 1.19%(5)(6) | 1.18%(6) | 1.18%(6) | 1.18% | 1.18% |
| Net investment income (loss) | 0.61% | 0.76% | 0.11% | (0.28)% | 0.13% |
| Portfolio Turnover | 23% | 37% | 9% | 17% | 43% |
| (1) | Computed using average shares outstanding. |
| (2) | Returns are historical and are calculated by determining the percentage change in net asset value with all distributions reinvested and do not reflect the effect of sales charges, if any. |
| (3) | Total expenses do not reflect amounts reimbursed and/or waived by the adviser and certain of its affiliates, if applicable. Net expenses are net of all reductions and represent the net expenses paid by the Fund. |
| (4) | Amounts do not include the expenses of the Underlying Funds. |
| (5) | Includes interest expense of 0.01%. |
| (6) | Includes a reimbursement of expenses by the investment adviser due to the Fund’s investment in the Liquidity Fund (equal to less than 0.005%, less than 0.01% and less than 0.005% of average daily net assets for the years ended September 30, 2024, 2023 and 2022, respectively). |
18
See Notes to Financial Statements.
Calvert
Asset Allocation Funds
September 30, 2024
Financial Highlights — continued
| | Growth Allocation Fund — Class I |
| | Year Ended September 30, |
| | 2024 | 2023 | 2022 | 2021 | 2020 |
| Net asset value — Beginning of year | $23.04 | $20.80 | $27.23 | $22.27 | $20.48 |
| Income (Loss) From Operations | | | | | |
| Net investment income(1) | $0.42 | $0.40 | $0.25 | $0.14 | $0.21 |
| Net realized and unrealized gain (loss) | 5.75 | 2.52 | (5.66) | 5.69 | 2.39 |
| Total income (loss) from operations | $6.17 | $2.92 | $(5.41) | $5.83 | $2.60 |
| Less Distributions | | | | | |
| From net investment income | $(0.43) | $(0.35) | $(0.56) | $(0.17) | $(0.25) |
| From net realized gain | (0.71) | (0.33) | (0.46) | (0.70) | (0.56) |
| Total distributions | $(1.14) | $(0.68) | $(1.02) | $(0.87) | $(0.81) |
| Net asset value — End of year | $28.07 | $23.04 | $20.80 | $27.23 | $22.27 |
| Total Return(2) | 27.53% | 14.13% | (20.81)% | 26.63% | 12.81% |
| Ratios/Supplemental Data | | | | | |
| Net assets, end of year (000’s omitted) | $64,296 | $64,084 | $54,815 | $54,814 | $17,706 |
| Ratios (as a percentage of average daily net assets):(3) | | | | | |
| Total expenses(4) | 0.20%(5) | 0.21% | 0.19% | 0.19% | 0.22% |
| Net expenses(4) | 0.19%(5)(6) | 0.18%(6) | 0.18%(6) | 0.18% | 0.18% |
| Net investment income | 1.67% | 1.73% | 1.01% | 0.52% | 1.03% |
| Portfolio Turnover | 23% | 37% | 9% | 17% | 43% |
| (1) | Computed using average shares outstanding. |
| (2) | Returns are historical and are calculated by determining the percentage change in net asset value with all distributions reinvested and do not reflect the effect of sales charges, if any. |
| (3) | Total expenses do not reflect amounts reimbursed and/or waived by the adviser and certain of its affiliates, if applicable. Net expenses are net of all reductions and represent the net expenses paid by the Fund. |
| (4) | Amounts do not include the expenses of the Underlying Funds. |
| (5) | Includes interest expense of 0.01%. |
| (6) | Includes a reimbursement of expenses by the investment adviser due to the Fund’s investment in the Liquidity Fund (equal to less than 0.005%, less than 0.01% and less than 0.005% of average daily net assets for the years ended September 30, 2024, 2023 and 2022, respectively). |
19
See Notes to Financial Statements.
Calvert
Asset Allocation Funds
September 30, 2024
Financial Highlights — continued
| | Growth Allocation Fund — Class R6 |
| | Year Ended September 30, | Period Ended
September 30,
2022(1) |
| | 2024 | 2023 |
| Net asset value — Beginning of period | $23.04 | $20.81 | $26.49 |
| Income (Loss) From Operations | | | |
| Net investment income(2) | $0.34 | $0.26 | $0.05 |
| Net realized and unrealized gain (loss) | 5.85 | 2.66 | (5.73) |
| Total income (loss) from operations | $6.19 | $2.92 | $(5.68) |
| Less Distributions | | | |
| From net investment income | $(0.45) | $(0.36) | $ — |
| From net realized gain | (0.71) | (0.33) | — |
| Total distributions | $(1.16) | $(0.69) | $ — |
| Net asset value — End of period | $28.07 | $23.04 | $20.81 |
| Total Return(3) | 27.62% | 14.15% | (21.44)%(4) |
| Ratios/Supplemental Data | | | |
| Net assets, end of period (000’s omitted) | $1,289 | $532 | $107 |
| Ratios (as a percentage of average daily net assets):(5) | | | |
| Total expenses(6) | 0.13%(7) | 0.17% | 0.15%(8) |
| Net expenses(6) | 0.13%(7)(9) | 0.14%(9) | 0.14%(8)(9) |
| Net investment income | 1.34% | 1.12% | 0.33%(8) |
| Portfolio Turnover | 23% | 37% | 9%(4)(10) |
| (1) | For the period from the commencement of operations, February 1, 2022, to September 30, 2022. |
| (2) | Computed using average shares outstanding. |
| (3) | Returns are historical and are calculated by determining the percentage change in net asset value with all distributions reinvested and do not reflect the effect of sales charges, if any. |
| (4) | Not annualized. |
| (5) | Total expenses do not reflect amounts reimbursed and/or waived by the adviser and certain of its affiliates, if applicable. Net expenses are net of all reductions and represent the net expenses paid by the Fund. |
| (6) | Amounts do not include the expenses of the Underlying Funds. |
| (7) | Includes interest expense of 0.01%. |
| (8) | Annualized. |
| (9) | Includes a reimbursement of expenses by the investment adviser due to the Fund’s investment in the Liquidity Fund (equal to less than 0.005%, less than 0.01% and less than 0.005% of average daily net assets for the years ended September 30, 2024 and 2023 and the period ended September 30, 2022, respectively). |
| (10) | For the year ended September 30, 2022. |
20
See Notes to Financial Statements.
Calvert
Asset Allocation Funds
September 30, 2024
Notes to Financial Statements
1 Significant Accounting Policies
Calvert Conservative Allocation Fund (Conservative), Calvert Moderate Allocation Fund (Moderate) and Calvert Growth Allocation Fund (Growth) (each a Fund and collectively, the Funds) are diversified series of Calvert Social Investment Fund (the Trust). The Trust is a Massachusetts business trust registered under the Investment Company Act of 1940, as amended (the 1940 Act), as an open-end management investment company. The investment objective of Conservative is to seek current income and capital appreciation, consistent with the preservation of capital. The investment objective of Moderate is to seek long-term capital appreciation and growth of income, with current income a secondary objective. The investment objective of Growth is to seek long-term capital appreciation. Each Fund is a "fund-of-funds" that invests primarily in a combination of other Calvert equity and income funds (the Underlying Funds). The financial statements of the Underlying Funds are included in their shareholder reports, which are available free of charge at www.calvert.com.
Each Fund offers four classes of shares. Class A shares are generally sold subject to a sales charge imposed at time of purchase. A contingent deferred sales charge of 1.00% may apply to certain redemptions of Class A shares for accounts for which no sales charge was paid, if redeemed within 12 months of purchase. Class C shares are sold without a front-end sales charge, and with certain exceptions, are charged a contingent deferred sales charge of 1.00% on shares redeemed within 12 months of purchase. Class C shares are only available for purchase through a financial intermediary. Effective November 5, 2020, Class C shares automatically convert to Class A shares eight years after their purchase as described in the Funds’ prospectus. Class I and Class R6 shares are sold at net asset value, are not subject to a sales charge and are sold only to certain eligible investors. Each class represents a pro rata interest in each Fund, but votes separately on class-specific matters and is subject to different expenses.
Each Fund applies the accounting and reporting guidance in the Financial Accounting Standards Board (FASB) Accounting Standards Codification Topic 946, Financial Services – Investment Companies (ASC 946). Subsequent events, if any, through the date that the financial statements were issued have been evaluated in the preparation of the financial statements.
A Investment Valuation— Net asset value per share is determined every business day as of the close of the regular session of the New York Stock Exchange (generally 4:00 p.m. Eastern time). The Funds use independent pricing services approved by the Board of Trustees (the Board) to value their investments wherever possible. Investments for which market quotations are not available or deemed not reliable are fair valued in good faith by the Board's valuation designee.
U.S. generally accepted accounting principles (U.S. GAAP) establishes a disclosure hierarchy that categorizes the inputs to valuation techniques used to value assets and liabilities at measurement date. These inputs are summarized in the three broad levels listed below:
Level 1 – quoted prices in active markets for identical securities
Level 2 – other significant observable inputs (including quoted prices for similar securities, interest rates, prepayment speeds, credit risk, etc.)
Level 3 – significant unobservable inputs (including each Fund's own assumptions in determining the fair value of investments)
The inputs or methodologies used for valuing securities are not necessarily an indication of the risk associated with investing in those securities.
Valuation techniques used to value each Fund’s investments by major category are as follows:
Debt Securities. Debt securities are generally valued based on valuations provided by third party pricing services, as derived from such services’ pricing models. Inputs to the models may include, but are not limited to, reported trades, executable bid and ask prices, broker/dealer quotations, prices or yields of securities with similar characteristics, interest rates, anticipated prepayments, benchmark curves or information pertaining to the issuer, as well as industry and economic events. Accordingly, debt securities are generally categorized as Level 2 in the hierarchy. Short-term debt securities with a remaining maturity at time of purchase of more than sixty days are valued based on valuations provided by a third party pricing service. Such securities are generally categorized as Level 2 in the hierarchy. Short-term debt securities of sufficient credit quality purchased with remaining maturities of sixty days or less for which a valuation from a third party pricing service is not readily available may be valued at amortized cost, which approximates fair value, and are categorized as Level 2 in the hierarchy.
Other Securities. Investments in the Underlying Funds and in money market funds are valued at the net asset value as of the close of each business day and are categorized as Level 1 in the hierarchy. Valuation methodologies and policies of the Underlying Funds are included in their financial statements, which are available upon request.
Derivatives. Futures contracts are valued at unrealized appreciation (depreciation) based on the settlement price established each day by the board of trade or exchange on which they are traded and are categorized as Level 1 in the hierarchy.
Fair Valuation. In connection with Rule 2a-5 of the 1940 Act, the Board has designated a Fund’s investment adviser as its valuation designee. Investments for which valuations or market quotations are not readily available or are deemed unreliable are valued by the investment adviser, as valuation designee, at fair value using methods that most fairly reflect the security’s “fair value”, which is the amount that a Fund might reasonably expect to receive for the security upon its current sale in the ordinary course. Each such determination is based on a consideration of relevant factors, which are likely to vary from one pricing context to another. These factors may include, but are not limited to, the type of security, the existence of any contractual restrictions on the security’s disposition, the price and extent of public trading in similar securities of the issuer or of comparable companies or entities, quotations or relevant
Calvert
Asset Allocation Funds
September 30, 2024
Notes to Financial Statements — continued
information obtained from broker/dealers or other market participants, information obtained from the issuer, analysts, and/or the appropriate stock exchange (for exchange-traded securities), an analysis of the company’s or entity’s financial statements, and an evaluation of the forces that influence the issuer and the market(s) in which the security is purchased and sold.
The values assigned to fair value investments are based on available information and do not necessarily represent amounts that might ultimately be realized. Further, due to the inherent uncertainty of valuations of such investments, the fair values may differ significantly from the values that would have been used had an active market existed, and the differences could be material.
The following tables summarize the market value of each of the Funds' holdings as of September 30, 2024, based on the inputs used to value them:
Conservative
| Asset Description | Level 1 | Level 2 | Level 3 | Total |
| Mutual Funds | $245,863,061 | $ — | $ — | $245,863,061 |
| Short-Term Investments | 28,993 | — | — | 28,993 |
| Total Investments | $245,892,054 | $ — | $ — | $245,892,054 |
| Futures Contracts | $6,265 | $ — | $ — | $6,265 |
| Total | $245,898,319 | $ — | $ — | $245,898,319 |
| Liability Description | | | | |
| Futures Contracts | $(56,680) | $ — | $ — | $(56,680) |
| Total | $(56,680) | $ — | $ — | $(56,680) |
Moderate
| Asset Description | Level 1 | Level 2 | Level 3 | Total |
| Mutual Funds | $400,296,331 | $ — | $ — | $400,296,331 |
| Short-Term Investments | 976,096 | — | — | 976,096 |
| Total Investments | $401,272,427 | $ — | $ — | $401,272,427 |
| Futures Contracts | $14,017 | $ — | $ — | $14,017 |
| Total | $401,286,444 | $ — | $ — | $401,286,444 |
| Liability Description | | | | |
| Futures Contracts | $(38,225) | $ — | $ — | $(38,225) |
| Total | $(38,225) | $ — | $ — | $(38,225) |
Growth
| Asset Description | Level 1 | Level 2 | Level 3 | Total |
| Mutual Funds | $356,582,876 | $ — | $ — | $356,582,876 |
| Short-Term Investments | 2,587,614 | — | — | 2,587,614 |
| Total Investments | $359,170,490 | $ — | $ — | $359,170,490 |
| Futures Contracts | $6,067 | $ — | $ — | $6,067 |
| Total | $359,176,557 | $ — | $ — | $359,176,557 |
Calvert
Asset Allocation Funds
September 30, 2024
Notes to Financial Statements — continued
Growth — continued
| Liability Description | Level 1 | Level 2 | Level 3 | Total |
| Futures Contracts | $(14,639) | $ — | $ — | $(14,639) |
| Total | $(14,639) | $ — | $ — | $(14,639) |
B Investment Transactions and Income— Investment transactions for financial statement purposes are accounted for on trade date. Realized gains and losses are recorded on an identified cost basis and may include proceeds from litigation. Distributions from the Underlying Funds are recorded on the ex-dividend date. Distributions received that represent a return of capital are recorded as a reduction of cost of investments. Distributions received that represent a capital gain are recorded as a realized gain. Interest income, which includes amortization of premium and accretion of discount on debt securities, is accrued as earned. Inflation adjustments to the principal amount of inflation-adjusted bonds and notes are reflected as interest income. Deflation adjustments to the principal amount of an inflation-adjusted bond or note are reflected as reductions to interest income to the extent of interest income previously recorded on such bond or note. Expenses included in the accompanying financial statements reflect the expenses of each Fund and do not include any expenses associated with the Underlying Funds.
C Share Class Accounting— Realized and unrealized gains and losses and net investment income and losses, other than class-specific expenses, are allocated daily to each class of shares based upon the relative net assets of each class to the total net assets of each Fund. Expenses arising in connection with a specific class are charged directly to that class. Sub-accounting, recordkeeping and similar administrative fees payable to financial intermediaries, which are a component of transfer agency fees and expenses on the Statements of Operations, are not allocated to Class R6 shares.
D Futures Contracts— The Funds may enter into futures contracts to buy or sell a financial instrument for a set price at a future date. Initial margin deposits of either cash or securities as required by the broker are made upon entering into the contract. While the contract is open, daily variation margin payments are made to or received from the broker reflecting the daily change in market value of the contract and are recorded for financial reporting purposes as unrealized gains or losses by the Funds. When a futures contract is closed, a realized gain or loss is recorded equal to the difference between the opening and closing value of the contract. The risks associated with entering into futures contracts may include the possible illiquidity of the secondary market which would limit the Funds' ability to close out a futures contract prior to the settlement date, an imperfect correlation between the value of the contracts and the underlying financial instruments, or that the counterparty will fail to perform its obligations under the contracts’ terms. Futures contracts are designed by boards of trade, which are designated “contracts markets” by the Commodities Futures Trading Commission. Futures contracts trade on the contracts markets in a manner that is similar to the way a stock trades on a stock exchange, and the boards of trade, through their clearing corporations, guarantee the futures contracts against default. As a result, there is minimal counterparty credit risk to the Funds.
E Distributions to Shareholders— Distributions to shareholders are recorded by the Funds on ex-dividend date. Distributions from net investment income are declared and paid quarterly for Conservative and Moderate and annually for Growth. Distributions from net realized capital gains, if any, are paid at least annually. Distributions are declared separately for each class of shares. Distributions are determined in accordance with income tax regulations, which may differ from U.S. GAAP; accordingly, periodic reclassifications are made within the Funds’ capital accounts to reflect income and gains available for distribution under income tax regulations.
F Estimates— The preparation of financial statements in conformity with U.S. GAAP requires management to make estimates and assumptions that affect the reported amounts of assets and liabilities and disclosure of contingent assets and liabilities at the date of the financial statements and the reported amounts of increases and decreases in net assets from operations during the reporting period. Actual results could differ from those estimates.
G Indemnifications— Under the Trust’s organizational document, its officers and Trustees may be indemnified against certain liabilities and expenses arising out of the performance of their duties to the Funds. Under Massachusetts law, if certain conditions prevail, shareholders of a Massachusetts business trust (such as the Trust) could be deemed to have personal liability for the obligations of the Trust. However, the Trust’s Declaration of Trust contains an express disclaimer of liability on the part of Fund shareholders and provides that the Trust shall assume, upon request by the shareholder, the defense on behalf of any Fund shareholders or former shareholders. Additionally, in the normal course of business, each Fund enters into agreements with service providers that may contain indemnification clauses. Each Fund’s maximum exposure under these arrangements is unknown as this would involve future claims that may be made against each Fund that have not yet occurred.
H Federal Income Taxes— No provision for federal income or excise tax is required since each Fund intends to continue to qualify as a regulated investment company under the Internal Revenue Code and to distribute substantially all of its taxable earnings.
Management has analyzed the Funds' tax positions taken for all open federal income tax years and has concluded that no provision for federal income tax is required in the Funds' financial statements. Each Fund's federal tax return is subject to examination by the Internal Revenue Service for a period of three years from the date of filing.
Calvert
Asset Allocation Funds
September 30, 2024
Notes to Financial Statements — continued
2 Related Party Transactions
Calvert Research and Management (CRM), an indirect, wholly-owned subsidiary of Morgan Stanley, provides investment advisory services to the Funds. CRM does not receive compensation from the Funds for performing investment advisory services. CRM does, however, receive a fee for investment advisory services provided to the Underlying Funds.
The Funds may invest in a money market fund, the Institutional Class of the Morgan Stanley Institutional Liquidity Funds - Government Portfolio (the “Liquidity Fund”), an open-end management investment company managed by Morgan Stanley Investment Management Inc., a wholly-owned subsidiary of Morgan Stanley. Each Fund’s expenses are reduced by an amount equal to its pro rata share of the advisory and administration fees incurred by each Fund due to its investment in the Liquidity Fund. For the year ended September 30, 2024, expenses reimbursed by CRM for Conservative, Moderate and Growth were $3,190, $3,726 and $4,917, respectively, relating to each Fund’s investment in the Liquidity Fund.
For Growth, CRM has agreed to reimburse the Fund’s operating expenses to the extent that total annual operating expenses (relating to ordinary operating expenses only and excluding expenses such as brokerage commissions, acquired fund fees and expenses, borrowing costs, taxes or litigation expenses) exceed 0.43%, 1.18%, 0.18% and 0.14% for Class A, Class C, Class I and Class R6, respectively, of such class’s average daily net assets. For Growth, the expense reimbursement agreement with CRM may be changed or terminated after February 1, 2025. For the year ended September 30, 2024, CRM waived and/or reimbursed expenses of $36,348 for Growth. CRM serves as the administrator of the Funds, but receives no compensation.
Each Fund has in effect a distribution plan for Class A shares (Class A Plan) pursuant to Rule 12b-1 under the 1940 Act. Pursuant to the Class A Plan, each Fund pays Eaton Vance Distributors, Inc. (EVD), an affiliate of CRM and the Funds' principal underwriter, a distribution and service fee of 0.25% per annum of its average daily net assets attributable to Class A shares for distribution services and facilities provided to the Funds by EVD, as well as for personal services and/or the maintenance of shareholder accounts. Each Fund also has in effect a distribution plan for Class C shares (Class C Plan) pursuant to Rule 12b-1 under the 1940 Act. Pursuant to the Class C Plan, each Fund pays EVD amounts equal to 0.75% per annum of its average daily net assets attributable to Class C shares for providing ongoing distribution services and facilities to the Funds. In addition, pursuant to the Class C Plan, each Fund also makes payments of service fees to EVD, financial intermediaries and other persons in amounts equal to 0.25% per annum of its average daily net assets attributable to that class. Service fees paid or accrued are for personal services and/or the maintenance of shareholder accounts. Distribution and service fees for Conservative, Moderate and Growth paid or accrued for the year ended September 30, 2024 amounted to $434,771, $696,215 and $631,854, respectively, for Class A shares and $148,663, $230,192 and $165,415, respectively, for Class C shares.
The Funds were informed that EVD received $10,822, $30,312 and $78,609 for Conservative, Moderate and Growth, respectively, as their portion of the sales charge on sales of Class A shares for the year ended September 30, 2024.
For the year ended September 30, 2024, the Funds were also informed that EVD received the following amounts of contingent deferred sales charges paid by Class A and Class C shareholders:
| | Conservative | Moderate | Growth |
| Class A | $9,925 | $529 | $280 |
| Class C | 1,747 | 3,921 | 3,243 |
Eaton Vance Management (EVM), an affiliate of CRM, provides sub-transfer agency and related services to the Funds pursuant to a Sub-Transfer Agency Support Services Agreement. For the year ended September 30, 2024, sub-transfer agency fees and expenses incurred to EVM amounted to $31,334, $63,052 and $70,146 for Conservative, Moderate and Growth, respectively, and are included in transfer agency fees and expenses on the Statements of Operations.
Each Trustee of the Funds who is not an employee of CRM or its affiliates receives an annual fee of $225,000 ($214,000 prior to January 1, 2024), an annual Committee fee ranging from $8,500 to $16,500 depending on the Committee, and may receive a fee of $10,000 for special meetings. The Board chair receives an additional $40,000 annual fee, Committee chairs receive an additional $15,000 annual fee and the special equities liaison receives an additional $2,500 annual fee. Eligible Trustees may participate in a Deferred Compensation Plan (the Plan). Amounts deferred under the Plan are treated as though equal dollar amounts had been invested in shares of the Funds or other Calvert funds selected by the Trustees. The Funds purchase shares of the funds selected equal to the dollar amounts deferred under the Plan, resulting in an asset equal to the deferred compensation liability. Obligations of the Plan are paid solely from the Funds' assets. Trustees’ fees are allocated to each of the Calvert funds served. Salaries and fees of officers and Trustees of the Funds who are employees of CRM or its affiliates are paid by CRM.
Calvert
Asset Allocation Funds
September 30, 2024
Notes to Financial Statements — continued
3 Investment Activity
During the year ended September 30, 2024, the cost of purchases and proceeds from sales of investments, other than short-term securities, were as follows:
| | Conservative | Moderate | Growth |
| Purchases | | | |
| Non-U.S. Government and Agency Securities | $31,960,854 | $73,128,062 | $75,053,211 |
| Sales | | | |
| U.S. Government and Agency Securities | $14,521,092 | $12,567,064 | $5,224,803 |
| Non-U.S. Government and Agency Securities | 42,563,102 | 91,177,439 | 86,138,709 |
| Total Sales | $57,084,194 | $103,744,503 | $91,363,512 |
4 Distributions to Shareholders and Income Tax Information
The tax character of distributions declared for the years ended September 30, 2024 and September 30, 2023 was as follows:
| | Conservative | Moderate | Growth |
| | Year Ended September 30, | Year Ended September 30, | Year Ended September 30, |
| | 2024 | 2023 | 2024 | 2023 | 2024 | 2023 |
| Ordinary income | $8,326,994 | $8,286,312 | $9,014,658 | $9,127,829 | $5,051,849 | $3,777,345 |
| Long-term capital gains | $ — | $ — | $15,262,748 | $ — | $9,651,977 | $4,233,530 |
During the year ended September 30, 2024, the following amounts were reclassified due to the Funds' use of equalization accounting. Tax equalization accounting allows a Fund to treat as a distribution that portion of redemption proceeds representing a redeeming shareholder’s portion of undistributed taxable income and net capital gains.
| | Conservative | Moderate | Growth |
| Change in: | | | |
| Paid-in capital | $99,475 | $805,891 | $285,237 |
| Distributable earnings | $(99,475) | $(805,891) | $(285,237) |
These reclassifications had no effect on the net assets or net asset value per share of the Funds.
As of September 30, 2024, the components of distributable earnings (accumulated loss) on a tax basis were as follows:
| | Conservative | Moderate | Growth |
| Undistributed ordinary income | $ — | $1,824,801 | $1,367,970 |
| Undistributed long-term capital gains | — | 47,867 | — |
| Deferred capital losses | (4,690,344) | — | — |
| Net unrealized appreciation | 19,024,399 | 76,047,984 | 91,353,388 |
| Distributable earnings | $14,334,055 | $77,920,652 | $92,721,358 |
Calvert
Asset Allocation Funds
September 30, 2024
Notes to Financial Statements — continued
At September 30, 2024, Conservative, for federal income tax purposes, had deferred capital losses of $4,690,344 which would reduce the Fund’s taxable income arising from future net realized gains on investment transactions, if any, to the extent permitted by the Internal Revenue Code, and thus would reduce the amount of distributions to shareholders, which would otherwise be necessary to relieve the Fund of any liability for federal income or excise tax. The deferred capital losses are treated as arising on the first day of the Fund’s next taxable year, can be carried forward for an unlimited period, and retain the same short-term or long-term character as when originally deferred. Of the deferred capital losses at September 30, 2024, $4,690,344 are short-term.
The cost and unrealized appreciation (depreciation) of investments, including open derivative contracts, of the Funds at September 30, 2024, as determined on a federal income tax basis, were as follows:
| | Conservative | Moderate | Growth |
| Aggregate cost | $226,867,655 | $325,224,443 | $267,817,102 |
| Gross unrealized appreciation | $24,821,004 | $78,308,158 | $91,376,031 |
| Gross unrealized depreciation | (5,796,605) | (2,260,174) | (22,643) |
| Net unrealized appreciation | $19,024,399 | $76,047,984 | $91,353,388 |
5 Financial Instruments
A summary of futures contracts outstanding at September 30, 2024 is included in each Fund's Schedule of Investments. During the year ended September 30, 2024, each Fund used futures contracts to facilitate the periodic rebalancing of its portfolio to maintain its target asset allocation and to make tactical asset allocations.
At September 30, 2024, the fair value of open derivative instruments (not considered to be hedging instruments for accounting disclosure purposes) and whose primary underlying risk exposure is interest rate risk was as follows:
Conservative
| Derivative | Statements of Assets and Liabilities Caption | Assets | Liabilities |
| Futures contracts | Distributable earnings | | $6,265(1) | $(56,680)(1) |
| (1) | Only the current day's variation margin is reported within the Statements of Assets and Liabilities as Receivable or Payable for variation margin on open futures contracts, as applicable. |
Moderate
| Derivative | Statements of Assets and Liabilities Caption | Assets | Liabilities |
| Futures contracts | Distributable earnings | | $14,017(1) | $(38,225)(1) |
| (1) | Only the current day's variation margin is reported within the Statements of Assets and Liabilities as Receivable or Payable for variation margin on open futures contracts, as applicable. |
Growth
| Derivative | Statements of Assets and Liabilities Caption | Assets | Liabilities |
| Futures contracts | Distributable earnings | | $6,067(1) | $(14,639)(1) |
| (1) | Only the current day's variation margin is reported within the Statements of Assets and Liabilities as Receivable or Payable for variation margin on open futures contracts, as applicable. |
Calvert
Asset Allocation Funds
September 30, 2024
Notes to Financial Statements — continued
The effect of derivative instruments (not considered to be hedging instruments for accounting disclosure purposes) on the Statements of Operations and whose primary underlying risk exposure is interest rate risk for the year ended September 30, 2024 was as follows:
| Statements of Operations Caption | Conservative | Moderate | Growth |
| Net realized gain (loss): | | | |
| Futures contracts | $643,934 | $560,772 | $188,224 |
| Total | $643,934 | $560,772 | $188,224 |
| Change in unrealized appreciation (depreciation): | | | |
| Futures contracts | $655,854 | $661,785 | $66,528 |
| Total | $655,854 | $661,785 | $66,528 |
The average notional cost of futures contracts outstanding during the year ended September 30, 2024, which are indicative of the volume of these derivative types, were approximately as follows:
| | Conservative | Moderate | Growth |
| Futures contracts — long | $20,846,000 | $24,284,000 | $8,620,000 |
| Futures contracts — short | $ — | $ — | $169,000 |
6 Line of Credit
The Funds participate with other portfolios and funds managed by EVM and its affiliates, including CRM, in a $650 million unsecured revolving line of credit agreement with a group of banks, which is in effect through October 22, 2024. In connection with the renewal of the agreement on October 24, 2023, the borrowing limit was decreased from $725 million. Borrowings are made by the Funds solely for temporary purposes related to redemptions and other short-term cash needs. Interest is charged to each Fund based on its borrowings generally at an amount above either the Secured Overnight Financing Rate (SOFR) or Federal Funds rate. In addition, a fee computed at an annual rate of 0.15% on the daily unused portion of the line of credit is allocated among the participating portfolios and funds at the end of each quarter. In connection with the renewal of the agreement in October 2023, an arrangement fee of $150,000 was incurred that was allocated to the participating portfolios and funds. Because the line of credit is not available exclusively to the Funds, a Fund may be unable to borrow some or all of its requested amounts at any particular time.
At September 30, 2024, Conservative had a balance outstanding pursuant to this line of credit of $100,000 at an annual interest rate of 8.00%. Based on the short-term nature of the borrowings under the line of credit and variable interest rate, the carrying value of the borrowings approximated its fair value at September 30, 2024. If measured at fair value, borrowings under the line of credit would have been considered as Level 2 in the fair value hierarchy (see Note 1A) at September 30, 2024. Average borrowings and the weighted average interest rate (excluding fees) for Conservative, Moderate and Growth for the year ended September 30, 2024 were $338,689 and 6.38%, $284,508 and 6.37% and $520,164 and 6.34%, respectively. Effective October 22, 2024, the Funds renewed their line of credit agreement, which expires October 21, 2025, at substantially the same terms.
7 Affiliated Investments
At September 30, 2024, the value of each Fund’s investment in affiliated funds, including funds that may be deemed to be affiliated, was $245,892,054, $401,272,427 and $359,170,490 for Conservative, Moderate and Growth, respectively, which represents 99.5%, 99.7% and 99.9% of net assets for Conservative, Moderate and Growth, respectively. Transactions in such investments by the Funds for the year ended September 30, 2024 were as follows:
Conservative
Name of
Calvert Fund | Value,
beginning
of period | Purchases | Sales
proceeds | Net
realized
gain
(loss) | Change in
unrealized
appreciation
(depreciation) | Value,
end of
period | Dividend
income | Capital gains
distributions
received | Shares,
end of period |
| Bond Fund, Class R6 | $69,602,117 | $ 4,743,801 | $ (8,757,324) | $(1,278,703) | $ 6,689,500 | $ 70,999,391 | $ 3,306,794 | $ — | 4,771,464 |
Calvert
Asset Allocation Funds
September 30, 2024
Notes to Financial Statements — continued
Conservative — continued
Name of
Calvert Fund | Value,
beginning
of period | Purchases | Sales
proceeds | Net
realized
gain
(loss) | Change in
unrealized
appreciation
(depreciation) | Value,
end of
period | Dividend
income | Capital gains
distributions
received | Shares,
end of period |
| Core Bond Fund, Class I | $24,878,115 | $ 3,029,016 | $ (2,147,705) | $ (52,458) | $ 1,674,785 | $ 27,381,753 | $ 1,182,445 | $ — | 1,692,321 |
| Emerging Markets Advancement Fund, Class I | 6,096,781 | 219,984 | (1,715,711) | (231,232) | 1,230,439 | 5,600,261 | 178,927 | — | 464,752 |
| Emerging Markets Equity Fund, Class R6 | 1,835,864 | 67,449 | (322,965) | 6,591 | 375,731 | 1,962,670 | 19,784 | — | 104,731 |
| Equity Fund, Class R6 | 7,241,115 | 131,897 | (1,537,698) | 381,276 | 1,284,238 | 7,500,828 | 29,895 | 102,002 | 73,300 |
| Flexible Bond Fund, Class R6 | 7,517,814 | 584,855 | (1,056,599) | (37,336) | 478,930 | 7,487,664 | 423,847 | — | 505,241 |
| Floating-Rate Advantage Fund, Class R6 | 9,433,439 | 1,201,704 | (1,314,565) | (95,817) | 127,673 | 9,352,434 | 834,446 | — | 1,044,965 |
| Focused Value Fund, Class R6 | 6,068,754 | 78,790 | (1,117,663) | 84,342 | 1,283,754 | 6,397,977 | 66,519 | — | 527,016 |
| High Yield Bond Fund, Class R6 | 6,255,039 | 494,915 | (948,542) | (77,796) | 511,707 | 6,235,323 | 362,257 | — | 252,340 |
| International Equity Fund, Class R6 | 6,614,264 | 1,359,240 | (1,318,659) | 207,425 | 1,436,156 | 8,298,426 | 72,268 | — | 311,152 |
| International Opportunities Fund, Class R6 | 4,873,269 | 124,284 | (2,038,423) | 68,189 | 802,761 | 3,830,080 | 71,049 | — | 207,368 |
| International Responsible Index Fund, Class R6 | 5,468,557 | 1,332,380 | (1,178,370) | 131,034 | 1,207,175 | 6,960,776 | 116,906 | — | 213,652 |
| Liquidity Fund | 5,377,925 | 34,865,353 | (40,214,285) | — | — | 28,993 | 112,281 | — | 28,993 |
| Mid-Cap Fund, Class I | 1,815,836 | 19,534 | (331,060) | 16,876 | 386,131 | 1,907,317 | 3,012 | — | 39,604 |
| Mortgage Access Fund, Class I | 12,929,949 | 1,738,778 | (566,153) | (14,001) | 825,095 | 14,913,668 | 781,738 | — | 1,489,877 |
| Short Duration Income Fund, Class R6 | 5,044,979 | 430,959 | (702,859) | (33,213) | 242,012 | 4,981,878 | 246,959 | — | 313,523 |
| Small-Cap Fund, Class R6 | 4,235,938 | 89,649 | (801,188) | 24,089 | 939,190 | 4,487,678 | 17,743 | — | 120,088 |
| Ultra-Short Duration Income Fund, Class R6 | 10,097,125 | 6,582,096 | (1,344,492) | (10,362) | 153,060 | 15,477,427 | 549,172 | — | 1,561,799 |
| US Large-Cap Core Responsible Index Fund, Class R6 | 14,514,146 | 8,157,444 | (10,004,175) | 1,046,804 | 4,723,397 | 18,437,616 | 218,176 | — | 365,971 |
Calvert
Asset Allocation Funds
September 30, 2024
Notes to Financial Statements — continued
Conservative — continued
Name of
Calvert Fund | Value,
beginning
of period | Purchases | Sales
proceeds | Net
realized
gain
(loss) | Change in
unrealized
appreciation
(depreciation) | Value,
end of
period | Dividend
income | Capital gains
distributions
received | Shares,
end of period |
| US Large-Cap Growth Responsible Index Fund, Class R6 | $ 7,225,740 | $ 1,102,131 | $ (2,270,039) | $ 491,416 | $ 2,282,681 | $ 8,831,929 | $ 55,326 | $ — | 133,393 |
| US Large-Cap Value Responsible Index Fund, Class R6 | 10,930,482 | 398,506 | (2,444,577) | 216,416 | 2,499,794 | 11,600,621 | 244,882 | — | 337,325 |
| US Mid-Cap Core Responsible Index Fund, Class R6 | 3,049,392 | 73,442 | (644,335) | 92,415 | 646,430 | 3,217,344 | 36,187 | — | 76,060 |
| Total | | | | $ 935,955 | $29,800,639 | $245,892,054 | $ 8,930,613 | $102,002 | |
Moderate
Name of
Calvert Fund | Value,
beginning
of period | Purchases | Sales
proceeds | Net
realized
gain
(loss) | Change in
unrealized
appreciation
(depreciation) | Value,
end of
period | Dividend
income | Capital gains
distributions
received | Shares,
end of period |
| Bond Fund, Class R6 | $37,106,184 | $ 3,610,160 | $ (7,437,872) | $ (971,038) | $ 3,868,048 | $ 36,175,482 | $ 1,802,714 | $ — | 2,431,148 |
| Core Bond Fund, Class I | 18,442,760 | 2,057,767 | (5,340,999) | (112,002) | 1,264,707 | 16,312,233 | 878,347 | — | 1,008,173 |
| Emerging Markets Advancement Fund, Class I | 16,781,735 | 703,285 | (4,196,590) | (543,060) | 3,501,167 | 16,246,537 | 530,717 | — | 1,348,260 |
| Emerging Markets Equity Fund, Class R6 | 8,990,637 | 386,491 | (3,494,993) | (282,340) | 1,874,838 | 7,474,633 | 81,621 | — | 398,860 |
| Equity Fund, Class R6 | 16,838,953 | 1,510,157 | (2,239,751) | 39,156 | 4,080,528 | 20,229,043 | 76,367 | 260,571 | 197,684 |
| Flexible Bond Fund, Class R6 | 11,525,728 | 1,066,138 | (1,205,793) | (40,373) | 730,485 | 12,076,185 | 661,977 | — | 814,857 |
| Floating-Rate Advantage Fund, Class R6 | 13,926,978 | 1,925,067 | (2,709,566) | (256,191) | 296,448 | 13,182,736 | 1,156,680 | — | 1,472,932 |
| Focused Value Fund, Class R6 | 19,262,843 | 353,338 | (2,502,648) | 182,146 | 4,283,440 | 21,579,119 | 214,895 | — | 1,777,522 |
| High Yield Bond Fund, Class R6 | 13,476,130 | 1,366,287 | (2,503,352) | (229,887) | 1,139,836 | 13,249,014 | 748,591 | — | 536,180 |
| International Equity Fund, Class R6 | 18,298,615 | 3,553,869 | (1,917,655) | 189,934 | 4,563,682 | 24,688,445 | 213,917 | — | 925,701 |
| International Opportunities Fund, Class R6 | 16,162,113 | 800,634 | (5,698,349) | 181,097 | 2,861,658 | 14,307,153 | 253,324 | — | 774,616 |
Calvert
Asset Allocation Funds
September 30, 2024
Notes to Financial Statements — continued
Moderate — continued
Name of
Calvert Fund | Value,
beginning
of period | Purchases | Sales
proceeds | Net
realized
gain
(loss) | Change in
unrealized
appreciation
(depreciation) | Value,
end of
period | Dividend
income | Capital gains
distributions
received | Shares,
end of period |
| International Responsible Index Fund, Class R6 | $15,550,458 | $ 3,339,361 | $ (2,222,338) | $ 66,598 | $ 3,793,101 | $ 20,527,180 | $ 339,547 | $ — | 630,055 |
| Liquidity Fund | 4,163,915 | 41,421,123 | (44,608,942) | — | — | 976,096 | 132,358 | — | 976,096 |
| Mid-Cap Fund, Class I | 3,676,112 | 61,470 | (456,681) | (32,716) | 866,129 | 4,114,314 | 6,174 | — | 85,430 |
| Mortgage Access Fund, Class I | 11,233,543 | 1,367,079 | (1,342,185) | 278 | 705,199 | 11,963,914 | 662,381 | — | 1,195,196 |
| Short Duration Income Fund, Class R6 | 5,802,900 | 726,374 | (559,521) | (27,583) | 273,537 | 6,215,707 | 290,024 | — | 391,171 |
| Small-Cap Fund, Class R6 | 10,863,944 | 252,024 | (2,405,636) | 48,822 | 2,361,861 | 11,121,015 | 42,946 | — | 297,592 |
| Ultra-Short Duration Income Fund, Class R6 | 11,658,198 | 19,026,600 | (4,721,775) | 2,991 | 152,160 | 26,118,174 | 540,745 | — | 2,635,537 |
| US Large-Cap Core Responsible Index Fund, Class R6 | 46,861,230 | 19,470,361 | (26,695,640) | 2,733,389 | 14,797,175 | 57,166,515 | 629,560 | — | 1,134,707 |
| US Large-Cap Growth Responsible Index Fund, Class R6 | 17,014,640 | 10,278,619 | (6,089,029) | 610,701 | 7,629,598 | 29,444,529 | 175,065 | — | 444,714 |
| US Large-Cap Value Responsible Index Fund, Class R6 | 26,287,657 | 1,041,160 | (5,050,031) | 407,547 | 6,211,059 | 28,897,392 | 584,885 | — | 840,285 |
| US Mid-Cap Core Responsible Index Fund, Class R6 | 9,216,867 | 231,820 | (2,387,035) | 317,882 | 1,827,477 | 9,207,011 | 100,670 | — | 217,660 |
| Total | | | | $2,285,351 | $67,082,133 | $401,272,427 | $10,123,505 | $260,571 | |
Growth
Name of
Calvert Fund | Value,
beginning
of period | Purchases | Sales
proceeds | Net
realized
gain
(loss) | Change in
unrealized
appreciation
(depreciation) | Value,
end of
period | Dividend
income | Capital gains
distributions
received | Shares,
end of period |
| Core Bond Fund, Class I | $12,255,152 | $12,221,092 | $(10,970,347) | $ (44,274) | $ 747,489 | $ 14,209,112 | $ 609,374 | $ — | 878,190 |
| Emerging Markets Advancement Fund, Class I | 20,139,813 | 1,260,167 | (3,079,670) | (385,724) | 4,199,770 | 22,134,356 | 682,210 | — | 1,836,876 |
Calvert
Asset Allocation Funds
September 30, 2024
Notes to Financial Statements — continued
Growth — continued
Name of
Calvert Fund | Value,
beginning
of period | Purchases | Sales
proceeds | Net
realized
gain
(loss) | Change in
unrealized
appreciation
(depreciation) | Value,
end of
period | Dividend
income | Capital gains
distributions
received | Shares,
end of period |
| Emerging Markets Equity Fund, Class R6 | $11,963,777 | $ 407,744 | $ (4,231,855) | $ (771,487) | $ 2,899,544 | $ 10,267,723 | $ 105,488 | $ — | 547,904 |
| Equity Fund, Class R6 | 17,881,136 | 6,920,826 | (1,156,396) | 27,447 | 4,862,775 | 28,535,788 | 91,694 | 312,866 | 278,860 |
| Floating-Rate Advantage Fund, Class R6 | 4,590,684 | 673,923 | (2,569,355) | (127,867) | 135,160 | 2,702,545 | 369,792 | — | 301,960 |
| Focused Value Fund, Class R6 | 19,049,362 | 1,087,227 | (1,939,573) | 169,353 | 4,426,596 | 22,792,965 | 219,598 | — | 1,877,509 |
| High Yield Bond Fund, Class R6 | 8,798,956 | 2,642,999 | (6,626,110) | (372,613) | 906,234 | 5,349,466 | 469,572 | — | 216,490 |
| International Equity Fund, Class R6 | 21,709,260 | 4,603,001 | (1,365,725) | 53,765 | 5,766,623 | 30,766,924 | 263,055 | — | 1,153,616 |
| International Opportunities Fund, Class R6 | 17,917,886 | 1,027,636 | (5,269,631) | (1,748) | 3,488,315 | 17,162,458 | 295,451 | — | 929,207 |
| International Responsible Index Fund, Class R6 | 22,006,520 | 3,635,323 | (1,557,732) | (19,521) | 5,602,329 | 29,666,919 | 497,837 | — | 910,587 |
| Liquidity Fund | 9,732,678 | 22,574,006 | (29,719,070) | — | — | 2,587,614 | 169,653 | — | 2,587,614 |
| Mid-Cap Fund, Class I | 4,567,771 | 92,221 | (1,117,051) | (84,556) | 1,050,126 | 4,508,511 | 6,677 | — | 93,615 |
| Small-Cap Fund, Class R6 | 12,027,643 | 295,760 | (5,827,123) | 276,530 | 2,351,934 | 9,124,744 | 46,995 | — | 244,173 |
| Ultra-Short Duration Income Fund, Class R6 | 6,413,818 | 7,696,790 | (5,327,399) | 50,274 | 26,651 | 8,860,134 | 293,178 | — | 894,060 |
| US Large-Cap Core Responsible Index Fund, Class R6 | 52,996,400 | 19,068,270 | (21,754,933) | 2,070,950 | 18,135,876 | 70,516,562 | 721,853 | — | 1,399,694 |
| US Large-Cap Growth Responsible Index Fund, Class R6 | 18,806,894 | 11,796,314 | (5,853,205) | 662,897 | 8,742,003 | 34,154,903 | 197,324 | — | 515,857 |
| US Large-Cap Value Responsible Index Fund, Class R6 | 31,153,564 | 1,332,140 | (5,684,871) | 601,749 | 7,489,557 | 34,892,139 | 718,649 | — | 1,014,601 |
| US Mid-Cap Core Responsible Index Fund, Class R6 | 10,015,717 | 291,778 | (1,807,731) | 226,701 | 2,211,162 | 10,937,627 | 115,298 | — | 258,573 |
| Total | | | | $2,331,876 | $73,042,144 | $359,170,490 | $5,873,698 | $312,866 | |
Calvert
Asset Allocation Funds
September 30, 2024
Notes to Financial Statements — continued
8 Capital Shares
Each Fund's Declaration of Trust permits the Trustees to issue an unlimited number of full and fractional shares of beneficial interest (without par value). Such shares may be issued in a number of different series (such as the Funds) and classes.
Transactions in capital shares, including direct exchanges pursuant to share class conversions, were as follows:
Conservative
| | Year Ended
September 30, 2024 | | Year Ended
September 30, 2023 |
| | Shares | Amount | | Shares | Amount |
| Class A | | | | | |
| Shares sold | 694,060 | $12,115,451 | | 1,151,240 | $19,097,240 |
| Reinvestment of distributions | 323,763 | 5,701,553 | | 345,065 | 5,640,826 |
| Shares redeemed | (2,203,691) | (37,957,999) | | (2,035,736) | (33,739,454) |
| Net decrease | (1,185,868) | $(20,140,995) | | (539,431) | $(9,001,388) |
| Class C | | | | | |
| Shares sold | 64,576 | $1,102,120 | | 113,146 | $1,857,003 |
| Reinvestment of distributions | 21,741 | 376,805 | | 27,321 | 440,383 |
| Shares redeemed | (432,910) | (7,367,873) | | (320,865) | (5,224,962) |
| Net decrease | (346,593) | $(5,888,948) | | (180,398) | $(2,927,576) |
| Class I | | | | | |
| Shares sold | 705,587 | $12,197,013 | | 514,651 | $8,598,070 |
| Reinvestment of distributions | 107,915 | 1,901,911 | | 121,422 | 1,987,015 |
| Shares redeemed | (1,277,029) | (22,124,364) | | (1,175,912) | (19,479,063) |
| Net decrease | (463,527) | $(8,025,440) | | (539,839) | $(8,893,978) |
| Class R6 | | | | | |
| Shares sold | 240,050 | $4,219,924 | | 13,727 | $230,508 |
| Reinvestment of distributions | 5,754 | 102,429 | | 395 | 6,440 |
| Shares redeemed | (27,787) | (499,211) | | (1,255) | (20,929) |
| Net increase | 218,017 | $3,823,142 | | 12,867 | $216,019 |
Moderate
| | Year Ended
September 30, 2024 | | Year Ended
September 30, 2023 |
| | Shares | Amount | | Shares | Amount |
| Class A | | | | | |
| Shares sold | 886,831 | $18,579,190 | | 1,164,851 | $23,273,551 |
| Reinvestment of distributions | 832,032 | 17,183,087 | | 326,792 | 6,391,790 |
| Shares redeemed | (2,190,657) | (45,605,433) | | (1,896,265) | (37,851,410) |
| Net decrease | (471,794) | $(9,843,156) | | (404,622) | $(8,186,069) |
Calvert
Asset Allocation Funds
September 30, 2024
Notes to Financial Statements — continued
Moderate — continued
| | Year Ended
September 30, 2024 | | Year Ended
September 30, 2023 |
| | Shares | Amount | | Shares | Amount |
| Class C | | | | | |
| Shares sold | 117,063 | $2,272,990 | | 129,400 | $2,423,194 |
| Reinvestment of distributions | 73,972 | 1,419,631 | | 26,615 | 485,740 |
| Shares redeemed | (469,486) | (9,177,870) | | (376,192) | (7,051,961) |
| Net decrease | (278,451) | $(5,485,249) | | (220,177) | $(4,143,027) |
| Class I | | | | | |
| Shares sold | 880,195 | $18,384,642 | | 1,136,505 | $22,787,881 |
| Reinvestment of distributions | 240,969 | 4,991,621 | | 101,040 | 1,980,547 |
| Shares redeemed | (1,234,561) | (26,015,734) | | (1,065,171) | (21,219,592) |
| Net increase (decrease) | (113,397) | $(2,639,471) | | 172,374 | $3,548,836 |
| Class R6 | | | | | |
| Shares sold | 24,811 | $508,971 | | 60,274 | $1,239,649 |
| Reinvestment of distributions | 4,157 | 85,944 | | 390 | 7,689 |
| Shares redeemed | (43,754) | (949,549) | | (7,598) | (154,650) |
| Net increase (decrease) | (14,786) | $(354,634) | | 53,066 | $1,092,688 |
Growth
| | Year Ended
September 30, 2024 | | Year Ended
September 30, 2023 |
| | Shares | Amount | | Shares | Amount |
| Class A | | | | | |
| Shares sold | 1,067,291 | $26,702,501 | | 1,371,824 | $31,612,276 |
| Reinvestment of distributions | 431,503 | 10,485,514 | | 256,573 | 5,672,819 |
| Shares redeemed | (1,473,947) | (37,044,382) | | (944,599) | (21,923,169) |
| Net increase | 24,847 | $143,633 | | 683,798 | $15,361,926 |
| Class C | | | | | |
| Shares sold | 147,137 | $3,021,426 | | 176,354 | $3,353,256 |
| Reinvestment of distributions | 38,076 | 759,236 | | 23,956 | 438,866 |
| Shares redeemed | (266,522) | (5,453,835) | | (303,926) | (5,796,796) |
| Net decrease | (81,309) | $(1,673,173) | | (103,616) | $(2,004,674) |
| Class I | | | | | |
| Shares sold | 544,677 | $13,700,616 | | 599,846 | $13,931,815 |
| Reinvestment of distributions | 131,801 | 3,218,587 | | 80,229 | 1,781,885 |
| Shares redeemed | (1,166,972) | (29,550,085) | | (533,877) | (12,361,336) |
| Net increase (decrease) | (490,494) | $(12,630,882) | | 146,198 | $3,352,364 |
Calvert
Asset Allocation Funds
September 30, 2024
Notes to Financial Statements — continued
Growth — continued
| | Year Ended
September 30, 2024 | | Year Ended
September 30, 2023 |
| | Shares | Amount | | Shares | Amount |
| Class R6 | | | | | |
| Shares sold | 26,592 | $693,094 | | 19,908 | $466,210 |
| Reinvestment of distributions | 1,141 | 27,841 | | 171 | 3,789 |
| Shares redeemed | (4,872) | (124,647) | | (2,128) | (50,176) |
| Net increase | 22,861 | $596,288 | | 17,951 | $419,823 |
Calvert
Asset Allocation Funds
September 30, 2024
Report of Independent Registered Public Accounting Firm
To the Board of Trustees of Calvert Social Investment Fund and Shareholders of Calvert Conservative Allocation Fund, Calvert Moderate Allocation Fund and Calvert Growth Allocation Fund:
Opinion on the Financial Statements and Financial Highlights
We have audited the accompanying statements of assets and liabilities of Calvert Conservative Allocation Fund, Calvert Moderate Allocation Fund and Calvert Growth Allocation Fund (the “Funds”) (three of the funds constituting Calvert Social Investment Fund), including the schedules of investments, as of September 30, 2024, the related statements of operations for the year then ended, the statements of changes in net assets for each of the two years in the period then ended, the financial highlights for each of the four years in the period then ended, and the related notes. In our opinion, the financial statements and financial highlights present fairly, in all material respects, the financial position of each of the Funds as of September 30, 2024, and the results of their operations for the year then ended, the changes in their net assets for each of the two years in the period then ended, and the financial highlights for each of the four years in the period then ended, in conformity with accounting principles generally accepted in the United States of America. The financial highlights for the year ended September 30, 2020 were audited by other auditors whose report, dated November 20, 2020, expressed an unqualified opinion on those financial highlights.
Basis for Opinion
These financial statements and financial highlights are the responsibility of the Funds’ management. Our responsibility is to express an opinion on the Funds’ financial statements and financial highlights based on our audits. We are a public accounting firm registered with the Public Company Accounting Oversight Board (United States) (PCAOB) and are required to be independent with respect to the Funds in accordance with the U.S. federal securities laws and the applicable rules and regulations of the Securities and Exchange Commission and the PCAOB.
We conducted our audits in accordance with the standards of the PCAOB. Those standards require that we plan and perform the audit to obtain reasonable assurance about whether the financial statements and financial highlights are free of material misstatement, whether due to error or fraud. The Funds are not required to have, nor were we engaged to perform, an audit of their internal control over financial reporting. As part of our audits, we are required to obtain an understanding of internal control over financial reporting but not for the purpose of expressing an opinion on the effectiveness of the Funds’ internal control over financial reporting. Accordingly, we express no such opinion.
Our audits included performing procedures to assess the risks of material misstatement of the financial statements and financial highlights, whether due to error or fraud, and performing procedures that respond to those risks. Such procedures included examining, on a test basis, evidence regarding the amounts and disclosures in the financial statements and financial highlights. Our audits also included evaluating the accounting principles used and significant estimates made by management, as well as evaluating the overall presentation of the financial statements and financial highlights. Our procedures included confirmation of securities owned as of September 30, 2024, by correspondence with the custodian, brokers and transfer agents; when replies were not received from brokers and transfer agents, we performed other auditing procedures. We believe that our audits provide a reasonable basis for our opinion.
/s/ Deloitte & Touche LLP
Boston, Massachusetts
November 21, 2024
We have served as the auditor of one or more Calvert investment companies since 2021.
Calvert
Asset Allocation Funds
September 30, 2024
Federal Tax Information (Unaudited)
The Form 1099-DIV you receive in February 2025 will show the tax status of all distributions paid to your account in calendar year 2024. Shareholders are advised to consult their own tax adviser with respect to the tax consequences of their investment in the Funds. As required by the Internal Revenue Code and/or regulations, shareholders must be notified regarding the status of qualified dividend income for individuals, the dividends received deduction for corporations, 163(j) interest dividends and capital gains dividends.
Qualified Dividend Income. For the fiscal year ended September 30, 2024, the Funds designate approximately the following amounts, or up to the maximum amount of such dividends allowable pursuant to the Internal Revenue Code, as qualified dividend income eligible for the reduced tax rate of 15%:
| Conservative Allocation Fund | $1,101,073 |
| Moderate Allocation Fund | $3,083,082 |
| Growth Allocation Fund | $3,747,404 |
Dividends Received Deduction. Corporate shareholders are generally entitled to take the dividends received deduction on the portion of a Fund's dividend distribution that qualifies under tax law. For the Funds' fiscal 2024 ordinary income dividends, the following qualifies for the corporate dividends received deduction:
| Conservative Allocation Fund | 10.06% |
| Moderate Allocation Fund | 19.62% |
| Growth Allocation Fund | 45.88% |
163(j) Interest Dividends. For the fiscal year ended September 30, 2024, the Funds designate the following distributions from net investment income as a 163(j) interest dividend:
| Conservative Allocation Fund | 1.33% |
| Moderate Allocation Fund | 0.83% |
| Growth Allocation Fund | 0.14% |
Capital Gains Dividends. The Funds hereby designate as a capital gain dividend with respect to the taxable year ended September 30, 2024, the following amounts or, if subsequently determined to be different, the net capital gain of such year:
| Conservative Allocation Fund | $ — |
| Moderate Allocation Fund | $ 69,439 |
| Growth Allocation Fund | $ — |
Calvert
Conservative Allocation Fund
September 30, 2024
Board of Trustees' Contract Approval
Overview of the Contract Review Process
The Investment Company Act of 1940, as amended, provides, in substance, that each investment advisory agreement between a fund and its investment adviser will continue in effect from year to year only if its continuation is approved at least annually by the fund’s board of directors, including by a vote of a majority of the directors who are not “interested persons” of the fund (“Independent Trustees”), cast in person at a meeting called for the purpose of considering such approval.
At an in-person meeting of the Boards of Trustees/Directors (each a “Board”) of the registered investment companies advised by Calvert Research and Management (“CRM” or the “Adviser”) (the “Calvert Funds”) held on June 10-11, 2024, the Board, including a majority of the Independent Trustees, voted to approve continuation of existing investment advisory and investment sub-advisory agreements for the Calvert Funds for an additional one-year period.
In evaluating the investment advisory and investment sub-advisory agreements for the Calvert Funds, the Board considered a variety of information relating to the Calvert Funds and various service providers, including the Adviser. The Independent Trustees reviewed a report prepared by the Adviser regarding various services provided to the Calvert Funds by the Adviser and its affiliates. Such report included, among other data, information regarding the Adviser’s personnel and the Adviser’s revenue and cost of providing services to the Calvert Funds, and a separate report prepared by an independent data provider, which compared each fund’s investment performance, fees and expenses to those of comparable funds as identified by such independent data provider (“comparable funds”).
The Independent Trustees were separately represented by independent legal counsel with respect to their consideration of the continuation of the investment advisory and investment sub-advisory agreements for the Calvert Funds. Prior to voting, the Independent Trustees reviewed the proposed continuation of the Calvert Funds’ investment advisory and investment sub-advisory agreements with management and also met in private sessions with their counsel at which time no representatives of management were present.
The information that the Board considered included, among other things, the following (for funds that invest through one or more affiliated underlying fund(s), references to “each fund” in this section may include information that was considered at the underlying fund-level):
Information about Fees, Performance and Expenses
| • | A report from an independent data provider comparing the advisory and related fees paid by each fund with fees paid by comparable funds; |
| • | A report from an independent data provider comparing each fund’s total expense ratio and its components to comparable funds; |
| • | A report from an independent data provider comparing the investment performance of each fund to the investment performance of comparable funds over various time periods; |
| • | Data regarding investment performance in comparison to benchmark indices; |
| • | For each fund, comparative information concerning the fees charged and the services provided by the Adviser in managing other accounts (including mutual funds, other collective investment funds and institutional accounts) using investment strategies and techniques similar to those used in managing such fund; |
| • | Profitability analyses for the Adviser with respect to each fund; |
Information about Portfolio Management and Trading
| • | Descriptions of the investment management services provided to each fund, including investment strategies and processes it employs; |
| • | Information about the Adviser’s policies and practices with respect to trading, including the Adviser’s processes for monitoring best execution of portfolio transactions; |
| • | Information about the allocation of brokerage transactions and the benefits received by the Adviser as a result of brokerage allocation, including information concerning the acquisition of research through client commission arrangements and policies with respect to “soft dollars”; |
Information about the Adviser
| • | Reports detailing the financial results and condition of CRM; |
| • | Descriptions of the qualifications, education and experience of the individual investment professionals whose responsibilities include portfolio management and investment research for the funds, and information relating to their compensation and responsibilities with respect to managing other mutual funds and investment accounts; |
| • | Policies and procedures relating to proxy voting and the handling of corporate actions and class actions; |
| • | A description of CRM’s procedures for overseeing sub-advisers, including with respect to regulatory and compliance issues, investment management and other matters; |
Calvert
Conservative Allocation Fund
September 30, 2024
Board of Trustees' Contract Approval — continued
Other Relevant Information
| • | Information concerning the nature, cost and character of the administrative and other non-investment advisory services provided by CRM and its affiliates; and |
| • | The terms of each investment advisory agreement. |
Over the course of the year, the Board and its committees held regular quarterly meetings. During these meetings, the Trustees participated in investment and performance reviews with the portfolio managers and other investment professionals of the Adviser relating to each fund, and considered various investment and trading strategies used in pursuing each fund’s investment objective(s), such as the use of derivative instruments, as well as risk management techniques. The Board and its committees also evaluated issues pertaining to industry and regulatory developments, compliance procedures, corporate governance and other issues with respect to the funds, and received and participated in reports and presentations provided by CRM and its affiliates with respect to such matters. In addition to the formal meetings of the Board and its committees, the Independent Trustees held regular video conferences in between meetings to discuss, among other topics, matters relating to the continuation of the Calvert Funds’ investment advisory and investment sub-advisory agreements.
For funds that invest through one or more affiliated underlying funds, the Board considered similar information about the underlying fund(s) when considering the approval of investment advisory agreements. In addition, in cases where the Adviser has engaged a sub-adviser, the Board considered similar information about the sub-adviser when considering the approval of any investment sub-advisory agreement.
The Independent Trustees were assisted throughout the contract review process by their independent legal counsel. The Independent Trustees relied upon the advice of such counsel and their own business judgment in determining the material factors to be considered in evaluating each investment advisory and investment sub-advisory agreement and the weight to be given to each such factor. The Board, including the Independent Trustees, did not identify any single factor as controlling, and each Trustee may have attributed different weight to various factors.
Results of the Contract Review Process
Based on its consideration of the foregoing, and such other information as it deemed relevant, including the factors and conclusions described below, the Board, including the Independent Trustees, concluded that the continuation of the investment advisory agreement of Calvert Conservative Allocation Fund (the “Fund”) is in the best interests of the Fund’s shareholders. Accordingly, the Board, including a majority of the Independent Trustees, voted to approve the continuation of the investment advisory agreement of the Fund.
Nature, Extent and Quality of Services
In considering the nature, extent and quality of the services provided by the Adviser under the investment advisory agreement, the Board reviewed information provided by the Adviser relating to its operations and personnel, including, among other information, biographical information on the Adviser’s investment personnel and descriptions of its organizational and management structure. The Board also took into account similar information provided periodically throughout the previous year by the Adviser as well as the Board’s familiarity with management through Board meetings, discussions and other reports. The Board considered the Adviser’s management style and its performance in employing its investment strategies as well as its current level of staffing and overall resources. The Board also noted that it reviewed on a quarterly basis information regarding the Adviser’s compliance with applicable policies and procedures, including those related to personal investing. The Board took into account, among other items, periodic reports received from the Adviser over the past year concerning the Adviser’s ongoing review and enhancement of certain processes, policies and procedures of the Calvert Funds and the Adviser. The Board concluded that it was satisfied with the nature, extent and quality of services provided to the Fund by the Adviser under the investment advisory agreement.
Fund Performance
In considering the Fund’s performance, the Board noted that it reviewed on a quarterly basis detailed information about the Fund’s performance results, portfolio composition and investment strategies. The Board compared the Fund’s investment performance to that of the Fund’s peer universe and its blended benchmark. The Board’s review included comparative performance data for the one-, three- and five-year periods ended December 31, 2023. This performance data indicated that the Fund had underperformed the median of its peer universe for the one-, three- and five-year periods ended December 31, 2023. The performance data also indicated that the Fund had outperformed its blended benchmark for the one-, three- and five-year periods ended December 31, 2023. The Board took into account management’s discussion of the Fund’s performance. Based upon its review, the Board concluded that the Fund’s performance was satisfactory relative to the performance of its peer universe and its blended benchmark.
Management Fees and Expenses
In considering the Fund’s fees and expenses, the Board compared the Fund’s fees and total expense ratio with those of comparable funds in its expense group. Among other findings, the data indicated that the Fund’s total expenses were below the median of the Fund’s expense group. The Board took into consideration that the Fund does not pay an advisory fee to CRM for advisory services but that CRM does receive advisory fees from the underlying funds in which the Fund invests. The Board took into account the Adviser’s current undertaking to maintain expense limitations for the Fund. Based upon its review, the Board concluded that the compensation structure was reasonable in view of the nature, extent and quality of services provided by the Adviser.
Calvert
Conservative Allocation Fund
September 30, 2024
Board of Trustees' Contract Approval — continued
Profitability and Other “Fall-Out” Benefits
The Board reviewed the Adviser’s profitability in regard to the Fund and the Calvert Funds in the aggregate. In reviewing the overall profitability of the Fund to the Adviser, the Board also considered the fact that the Adviser and its affiliates provided sub-transfer agency support, administrative and distribution services to the Fund for which they received compensation. The information considered by the Board included the profitability of the Fund to the Adviser and its affiliates without regard to any marketing support or other payments by the Adviser and its affiliates to third parties in respect of distribution services. The Board also considered that the Adviser and its affiliates derived benefits to their reputation and other indirect benefits from their relationships with the Fund. Based upon its review, the Board concluded that the Adviser’s and its affiliates’ level of profitability from their relationships with the Fund was reasonable.
Economies of Scale
The Board considered the effect of the Fund’s current size and its potential growth on its performance and fees. The Board noted that the Fund did not pay an advisory fee to the Adviser. As a result, the Board did not take into account any economies of scale to be realized with respect to the advisory fee. The Board noted, however, that if the Fund’s assets increased over time, the Fund might realize other economies of scale if assets increased proportionally more than certain other expenses.
Calvert
Moderate Allocation Fund
September 30, 2024
Board of Trustees' Contract Approval
Overview of the Contract Review Process
The Investment Company Act of 1940, as amended, provides, in substance, that each investment advisory agreement between a fund and its investment adviser will continue in effect from year to year only if its continuation is approved at least annually by the fund’s board of directors, including by a vote of a majority of the directors who are not “interested persons” of the fund (“Independent Trustees”), cast in person at a meeting called for the purpose of considering such approval.
At an in-person meeting of the Boards of Trustees/Directors (each a “Board”) of the registered investment companies advised by Calvert Research and Management (“CRM” or the “Adviser”) (the “Calvert Funds”) held on June 10-11, 2024, the Board, including a majority of the Independent Trustees, voted to approve continuation of existing investment advisory and investment sub-advisory agreements for the Calvert Funds for an additional one-year period.
In evaluating the investment advisory and investment sub-advisory agreements for the Calvert Funds, the Board considered a variety of information relating to the Calvert Funds and various service providers, including the Adviser. The Independent Trustees reviewed a report prepared by the Adviser regarding various services provided to the Calvert Funds by the Adviser and its affiliates. Such report included, among other data, information regarding the Adviser’s personnel and the Adviser’s revenue and cost of providing services to the Calvert Funds, and a separate report prepared by an independent data provider, which compared each fund’s investment performance, fees and expenses to those of comparable funds as identified by such independent data provider (“comparable funds”).
The Independent Trustees were separately represented by independent legal counsel with respect to their consideration of the continuation of the investment advisory and investment sub-advisory agreements for the Calvert Funds. Prior to voting, the Independent Trustees reviewed the proposed continuation of the Calvert Funds’ investment advisory and investment sub-advisory agreements with management and also met in private sessions with their counsel at which time no representatives of management were present.
The information that the Board considered included, among other things, the following (for funds that invest through one or more affiliated underlying fund(s), references to “each fund” in this section may include information that was considered at the underlying fund-level):
Information about Fees, Performance and Expenses
| • | A report from an independent data provider comparing the advisory and related fees paid by each fund with fees paid by comparable funds; |
| • | A report from an independent data provider comparing each fund’s total expense ratio and its components to comparable funds; |
| • | A report from an independent data provider comparing the investment performance of each fund to the investment performance of comparable funds over various time periods; |
| • | Data regarding investment performance in comparison to benchmark indices; |
| • | For each fund, comparative information concerning the fees charged and the services provided by the Adviser in managing other accounts (including mutual funds, other collective investment funds and institutional accounts) using investment strategies and techniques similar to those used in managing such fund; |
| • | Profitability analyses for the Adviser with respect to each fund; |
Information about Portfolio Management and Trading
| • | Descriptions of the investment management services provided to each fund, including investment strategies and processes it employs; |
| • | Information about the Adviser’s policies and practices with respect to trading, including the Adviser’s processes for monitoring best execution of portfolio transactions; |
| • | Information about the allocation of brokerage transactions and the benefits received by the Adviser as a result of brokerage allocation, including information concerning the acquisition of research through client commission arrangements and policies with respect to “soft dollars”; |
Information about the Adviser
| • | Reports detailing the financial results and condition of CRM; |
| • | Descriptions of the qualifications, education and experience of the individual investment professionals whose responsibilities include portfolio management and investment research for the funds, and information relating to their compensation and responsibilities with respect to managing other mutual funds and investment accounts; |
| • | Policies and procedures relating to proxy voting and the handling of corporate actions and class actions; |
| • | A description of CRM’s procedures for overseeing sub-advisers, including with respect to regulatory and compliance issues, investment management and other matters; |
Calvert
Moderate Allocation Fund
September 30, 2024
Board of Trustees' Contract Approval — continued
Other Relevant Information
| • | Information concerning the nature, cost and character of the administrative and other non-investment advisory services provided by CRM and its affiliates; and |
| • | The terms of each investment advisory agreement. |
Over the course of the year, the Board and its committees held regular quarterly meetings. During these meetings, the Trustees participated in investment and performance reviews with the portfolio managers and other investment professionals of the Adviser relating to each fund and considered various investment and trading strategies used in pursuing each fund’s investment objective(s), such as the use of derivative instruments, as well as risk management techniques. The Board and its committees also evaluated issues pertaining to industry and regulatory developments, compliance procedures, corporate governance and other issues with respect to the funds and received and participated in reports and presentations provided by CRM and its affiliates with respect to such matters. In addition to the formal meetings of the Board and its committees, the Independent Trustees held regular video conferences in between meetings to discuss, among other topics, matters relating to the continuation of the Calvert Funds’ investment advisory and investment sub-advisory agreements.
For funds that invest through one or more affiliated underlying funds, the Board considered similar information about the underlying fund(s) when considering the approval of investment advisory agreements. In addition, in cases where the Adviser has engaged a sub-adviser, the Board considered similar information about the sub-adviser when considering the approval of any investment sub-advisory agreement.
The Independent Trustees were assisted throughout the contract review process by their independent legal counsel. The Independent Trustees relied upon the advice of such counsel and their own business judgment in determining the material factors to be considered in evaluating each investment advisory and investment sub-advisory agreement and the weight to be given to each such factor. The Board, including the Independent Trustees, did not identify any single factor as controlling, and each Trustee may have attributed different weight to various factors.
Results of the Contract Review Process
Based on its consideration of the foregoing, and such other information as it deemed relevant, including the factors and conclusions described below, the Board, including the Independent Trustees, concluded that the continuation of the investment advisory agreement of Calvert Moderate Allocation Fund (the “Fund”) is in the best interests of the Fund’s shareholders. Accordingly, the Board, including a majority of the Independent Trustees, voted to approve the continuation of the investment advisory agreement of the Fund.
Nature, Extent and Quality of Services
In considering the nature, extent and quality of the services provided by the Adviser under the investment advisory agreement, the Board reviewed information provided by the Adviser relating to its operations and personnel, including, among other information, biographical information on the Adviser’s investment personnel and descriptions of its organizational and management structure. The Board also took into account similar information provided periodically throughout the previous year by the Adviser as well as the Board’s familiarity with management through Board meetings, discussions and other reports. The Board considered the Adviser’s management style and its performance in employing its investment strategies as well as its current level of staffing and overall resources. The Board also noted that it reviewed on a quarterly basis information regarding the Adviser’s compliance with applicable policies and procedures, including those related to personal investing. The Board took into account, among other items, periodic reports received from the Adviser over the past year concerning the Adviser’s ongoing review and enhancement of certain processes, policies and procedures of the Calvert Funds and the Adviser. The Board concluded that it was satisfied with the nature, extent and quality of services provided to the Fund by the Adviser under the investment advisory agreement.
Fund Performance
In considering the Fund’s performance, the Board noted that it reviewed on a quarterly basis detailed information about the Fund’s performance results, portfolio composition and investment strategies. The Board compared the Fund’s investment performance to that of the Fund’s peer universe and its blended benchmark. The Board’s review included comparative performance data for the one-, three- and five-year periods ended December 31, 2023. This performance data indicated that the Fund had underperformed the median of its peer universe for the one- and three-year periods ended December 31, 2023, while it had outperformed the median of its peer universe for the five-year period ended December 31, 2023. The performance data also indicated that the Fund had underperformed its blended benchmark for the one-, three- and five-year periods ended December 31, 2023. The Board took into account management’s discussion of the Fund’s performance. Based upon its review, the Board concluded that the Fund’s performance was satisfactory relative to the performance of its peer universe and its blended benchmark.
Management Fees and Expenses
In considering the Fund’s fees and expenses, the Board compared the Fund’s fees and total expense ratio with those of comparable funds in its expense group. Among other findings, the data indicated that the Fund’s total expenses (net of waivers and/or reimbursements) were below the median of the Fund’s expense group. The Board took into consideration that the Fund does not pay an advisory fee to CRM for advisory services but that CRM does receive advisory fees from the underlying funds in which the Fund invests. The Board took into account the Adviser’s current undertaking to maintain expense limitations for the Fund and that the Adviser was waiving and/or reimbursing a portion of the Fund’s expenses. Based upon its review, the Board concluded that the compensation structure was reasonable in view of the nature, extent and quality of services provided by the Adviser.
Calvert
Moderate Allocation Fund
September 30, 2024
Board of Trustees' Contract Approval — continued
Profitability and Other “Fall-Out” Benefits
The Board reviewed the Adviser’s profitability in regard to the Fund and the Calvert Funds in the aggregate. In reviewing the overall profitability of the Fund to the Adviser, the Board also considered the fact that the Adviser and its affiliates provided sub-transfer agency support, administrative and distribution services to the Fund for which they received compensation. The information considered by the Board included the profitability of the Fund to the Adviser and its affiliates without regard to any marketing support or other payments by the Adviser and its affiliates to third parties in respect of distribution services. The Board also considered that the Adviser and its affiliates derived benefits to their reputation and other indirect benefits from their relationships with the Fund. Based upon its review, the Board concluded that the Adviser’s and its affiliates’ level of profitability from their relationships with the Fund was reasonable.
Economies of Scale
The Board considered the effect of the Fund’s current size and its potential growth on its performance and fees. The Board noted that the Fund did not pay an advisory fee to the Adviser. As a result, the Board did not take into account any economies of scale to be realized with respect to the advisory fee. The Board noted, however, that if the Fund’s assets increased over time, the Fund might realize other economies of scale if assets increased proportionally more than certain other expenses.
Calvert
Growth Allocation Fund
September 30, 2024
Board of Trustees' Contract Approval
Overview of the Contract Review Process
The Investment Company Act of 1940, as amended, provides, in substance, that each investment advisory agreement between a fund and its investment adviser will continue in effect from year to year only if its continuation is approved at least annually by the fund’s board of directors, including by a vote of a majority of the directors who are not “interested persons” of the fund (“Independent Trustees”), cast in person at a meeting called for the purpose of considering such approval.
At an in-person meeting of the Boards of Trustees/Directors (each a “Board”) of the registered investment companies advised by Calvert Research and Management (“CRM” or the “Adviser”) (the “Calvert Funds”) held on June 10-11, 2024, the Board, including a majority of the Independent Trustees, voted to approve continuation of existing investment advisory and investment sub-advisory agreements for the Calvert Funds for an additional one-year period.
In evaluating the investment advisory and investment sub-advisory agreements for the Calvert Funds, the Board considered a variety of information relating to the Calvert Funds and various service providers, including the Adviser. The Independent Trustees reviewed a report prepared by the Adviser regarding various services provided to the Calvert Funds by the Adviser and its affiliates. Such report included, among other data, information regarding the Adviser’s personnel and the Adviser’s revenue and cost of providing services to the Calvert Funds, and a separate report prepared by an independent data provider, which compared each fund’s investment performance, fees and expenses to those of comparable funds as identified by such independent data provider (“comparable funds”).
The Independent Trustees were separately represented by independent legal counsel with respect to their consideration of the continuation of the investment advisory and investment sub-advisory agreements for the Calvert Funds. Prior to voting, the Independent Trustees reviewed the proposed continuation of the Calvert Funds’ investment advisory and investment sub-advisory agreements with management and also met in private sessions with their counsel at which time no representatives of management were present.
The information that the Board considered included, among other things, the following (for funds that invest through one or more affiliated underlying fund(s), references to “each fund” in this section may include information that was considered at the underlying fund-level):
Information about Fees, Performance and Expenses
| • | A report from an independent data provider comparing the advisory and related fees paid by each fund with fees paid by comparable funds; |
| • | A report from an independent data provider comparing each fund’s total expense ratio and its components to comparable funds; |
| • | A report from an independent data provider comparing the investment performance of each fund to the investment performance of comparable funds over various time periods; |
| • | Data regarding investment performance in comparison to benchmark indices; |
| • | For each fund, comparative information concerning the fees charged and the services provided by the Adviser in managing other accounts (including mutual funds, other collective investment funds and institutional accounts) using investment strategies and techniques similar to those used in managing such fund; |
| • | Profitability analyses for the Adviser with respect to each fund; |
Information about Portfolio Management and Trading
| • | Descriptions of the investment management services provided to each fund, including investment strategies and processes it employs; |
| • | Information about the Adviser’s policies and practices with respect to trading, including the Adviser’s processes for monitoring best execution of portfolio transactions; |
| • | Information about the allocation of brokerage transactions and the benefits received by the Adviser as a result of brokerage allocation, including information concerning the acquisition of research through client commission arrangements and policies with respect to “soft dollars”; |
Information about the Adviser
| • | Reports detailing the financial results and condition of CRM; |
| • | Descriptions of the qualifications, education and experience of the individual investment professionals whose responsibilities include portfolio management and investment research for the funds, and information relating to their compensation and responsibilities with respect to managing other mutual funds and investment accounts; |
| • | Policies and procedures relating to proxy voting and the handling of corporate actions and class actions; |
| • | A description of CRM’s procedures for overseeing sub-advisers, including with respect to regulatory and compliance issues, investment management and other matters; |
Calvert
Growth Allocation Fund
September 30, 2024
Board of Trustees' Contract Approval — continued
Other Relevant Information
| • | Information concerning the nature, cost and character of the administrative and other non-investment advisory services provided by CRM and its affiliates; and |
| • | The terms of each investment advisory agreement. |
Over the course of the year, the Board and its committees held regular quarterly meetings. During these meetings, the Trustees participated in investment and performance reviews with the portfolio managers and other investment professionals of the Adviser relating to each fund and considered various investment and trading strategies used in pursuing each fund’s investment objective(s), such as the use of derivative instruments, as well as risk management techniques. The Board and its committees also evaluated issues pertaining to industry and regulatory developments, compliance procedures, corporate governance and other issues with respect to the funds and received and participated in reports and presentations provided by CRM and its affiliates with respect to such matters. In addition to the formal meetings of the Board and its committees, the Independent Trustees held regular video conferences in between meetings to discuss, among other topics, matters relating to the continuation of the Calvert Funds’ investment advisory and investment sub-advisory agreements.
For funds that invest through one or more affiliated underlying funds, the Board considered similar information about the underlying fund(s) when considering the approval of investment advisory agreements. In addition, in cases where the Adviser has engaged a sub-adviser, the Board considered similar information about the sub-adviser when considering the approval of any investment sub-advisory agreement.
The Independent Trustees were assisted throughout the contract review process by their independent legal counsel. The Independent Trustees relied upon the advice of such counsel and their own business judgment in determining the material factors to be considered in evaluating each investment advisory and investment sub-advisory agreement and the weight to be given to each such factor. The Board, including the Independent Trustees, did not identify any single factor as controlling, and each Trustee may have attributed different weight to various factors.
Results of the Contract Review Process
Based on its consideration of the foregoing, and such other information as it deemed relevant, including the factors and conclusions described below, the Board, including the Independent Trustees, concluded that the continuation of the investment advisory agreement of Calvert Growth Allocation Fund (the “Fund”) is in the best interests of the Fund’s shareholders. Accordingly, the Board, including a majority of the Independent Trustees, voted to approve the continuation of the investment advisory agreement of the Fund.
Nature, Extent and Quality of Services
In considering the nature, extent and quality of the services provided by the Adviser under the investment advisory agreement, the Board reviewed information provided by the Adviser relating to its operations and personnel, including, among other information, biographical information on the Adviser’s investment personnel and descriptions of its organizational and management structure. The Board also took into account similar information provided periodically throughout the previous year by the Adviser as well as the Board’s familiarity with management through Board meetings, discussions and other reports. The Board considered the Adviser’s management style and its performance in employing its investment strategies as well as its current level of staffing and overall resources. The Board also noted that it reviewed on a quarterly basis information regarding the Adviser’s compliance with applicable policies and procedures, including those related to personal investing. The Board took into account, among other items, periodic reports received from the Adviser over the past year concerning the Adviser’s ongoing review and enhancement of certain processes, policies and procedures of the Calvert Funds and the Adviser. The Board concluded that it was satisfied with the nature, extent and quality of services provided to the Fund by the Adviser under the investment advisory agreement.
Fund Performance
In considering the Fund’s performance, the Board noted that it reviewed on a quarterly basis detailed information about the Fund’s performance results, portfolio composition and investment strategies. The Board compared the Fund’s investment performance to that of the Fund’s peer universe and its blended benchmark. The Board’s review included comparative performance data for the one-, three- and five-year periods ended December 31, 2023. This performance data indicated that the Fund had underperformed the median of its peer universe and its blended benchmark for the one-, three- and five-year periods ended December 31, 2023. The Board took into account management’s discussion of the Fund’s performance. Based upon its review, the Board concluded that the Fund’s performance was satisfactory relative to the performance of its peer universe and its blended benchmark.
Management Fees and Expenses
In considering the Fund’s fees and expenses, the Board compared the Fund’s fees and total expense ratio with those of comparable funds in its expense universe. Among other findings, the data indicated that the Fund’s total expenses (net of waivers and/or reimbursements) were below the median of the Fund’s expense universe. The Board took into consideration that the Fund does not pay an advisory fee to CRM for advisory services but that CRM does receive advisory fees from the underlying funds in which the Fund invests. The Board took into account the Adviser’s current undertaking to maintain expense limitations for the Fund and that the Adviser was reimbursing a portion of the Fund’s expenses. Based upon its review, the Board concluded that the compensation structure was reasonable in view of the nature, extent and quality of services provided by the Adviser.
Calvert
Growth Allocation Fund
September 30, 2024
Board of Trustees' Contract Approval — continued
Profitability and Other “Fall-Out” Benefits
The Board reviewed the Adviser’s profitability in regard to the Fund and the Calvert Funds in the aggregate. In reviewing the overall profitability of the Fund to the Adviser, the Board also considered the fact that the Adviser and its affiliates provided sub-transfer agency support, administrative and distribution services to the Fund for which they received compensation. The information considered by the Board included the profitability of the Fund to the Adviser and its affiliates without regard to any marketing support or other payments by the Adviser and its affiliates to third parties in respect of distribution services. The Board also considered that the Adviser and its affiliates derived benefits to their reputation and other indirect benefits from their relationships with the Fund. Based upon its review, the Board concluded that the Adviser’s and its affiliates’ level of profitability from their relationships with the Fund was reasonable.
Economies of Scale
The Board considered the effect of the Fund’s current size and its potential growth on its performance and fees. The Board noted that the Fund did not pay an advisory fee to the Adviser. As a result, the Board did not take into account any economies of scale to be realized with respect to the advisory fee. The Board noted, however, that if the Fund’s assets increased over time, the Fund might realize other economies of scale if assets increased proportionally more than certain other expenses.
This Page Intentionally Left Blank
This Page Intentionally Left Blank
This Page Intentionally Left Blank
Calvert
Focused Value Fund
Annual Financial Statements and
Additional Information
September 30, 2024
This report must be preceded or accompanied by a current summary prospectus or prospectus. Before investing, investors should consider carefully the investment objective, risks, and charges and expenses of a mutual fund. This and other important information is contained in the prospectus and/or statement of additional information, which can be obtained by calling 1-800-368-2745 or from a financial intermediary. Prospective investors should read the prospectus carefully before investing.
Annual Financial Statements and Additional Information September 30, 2024
Calvert
Focused Value Fund
Calvert
Focused Value Fund
September 30, 2024
| Security | Shares | Value |
| Banks — 5.5% | |
| M&T Bank Corp. | | 9,647 | $ 1,718,323 |
| Wells Fargo & Co. | | 30,328 | 1,713,229 |
| | | | $ 3,431,552 |
| Biotechnology — 3.8% | |
| AbbVie, Inc. | | 12,072 | $ 2,383,979 |
| | | | $ 2,383,979 |
| Building Products — 3.3% | |
| Johnson Controls International PLC | | 26,160 | $ 2,030,278 |
| | | | $2,030,278 |
| Capital Markets — 6.0% | |
| Charles Schwab Corp. | | 33,572 | $2,175,801 |
| Interactive Brokers Group, Inc., Class A | | 11,161 | 1,555,397 |
| | | | $3,731,198 |
| Chemicals — 4.1% | |
| FMC Corp. | | 15,303 | $1,009,080 |
| Linde PLC | | 3,256 | 1,552,656 |
| | | | $2,561,736 |
| Communications Equipment — 3.4% | |
| Cisco Systems, Inc. | | 39,244 | $2,088,566 |
| | | | $2,088,566 |
| Consumer Staples Distribution & Retail — 2.7% | |
| BJ's Wholesale Club Holdings, Inc.(1) | | 20,059 | $1,654,466 |
| | | | $1,654,466 |
| Containers & Packaging — 2.8% | |
| Ball Corp. | | 25,870 | $1,756,832 |
| | | | $1,756,832 |
| Electric Utilities — 3.9% | |
| NextEra Energy, Inc. | | 28,464 | $2,406,062 |
| | | | $2,406,062 |
| Electrical Equipment — 2.8% | |
| Emerson Electric Co. | | 16,009 | $1,750,904 |
| | | | $1,750,904 |
| Entertainment — 3.0% | |
| Walt Disney Co. | | 19,564 | $1,881,861 |
| | | | $1,881,861 |
| Security | Shares | Value |
| Food Products — 1.5% | |
| Hershey Co. | | 4,861 | $ 932,243 |
| | | | $ 932,243 |
| Household Products — 2.7% | |
| Clorox Co. | | 10,385 | $ 1,691,820 |
| | | | $ 1,691,820 |
| Industrial REITs — 2.1% | |
| First Industrial Realty Trust, Inc. | | 23,736 | $ 1,328,741 |
| | | | $ 1,328,741 |
| Insurance — 6.5% | |
| American International Group, Inc. | | 23,575 | $1,726,398 |
| Reinsurance Group of America, Inc. | | 10,629 | 2,315,740 |
| | | | $4,042,138 |
| Interactive Media & Services — 2.4% | |
| Alphabet, Inc., Class A | | 8,812 | $1,461,470 |
| | | | $1,461,470 |
| Leisure Products — 2.9% | |
| Hasbro, Inc. | | 24,564 | $1,776,469 |
| | | | $1,776,469 |
| Life Sciences Tools & Services — 6.0% | |
| Mettler-Toledo International, Inc.(1) | | 996 | $1,493,701 |
| Thermo Fisher Scientific, Inc. | | 3,591 | 2,221,285 |
| | | | $3,714,986 |
| Machinery — 5.6% | |
| Toro Co. | | 17,660 | $1,531,652 |
| Westinghouse Air Brake Technologies Corp. | | 10,889 | 1,979,293 |
| | | | $3,510,945 |
| Multi-Utilities — 2.8% | |
| CMS Energy Corp. | | 24,292 | $1,715,744 |
| | | | $1,715,744 |
| Pharmaceuticals — 8.1% | |
| Bristol-Myers Squibb Co. | | 36,512 | $1,889,131 |
| Sanofi SA | | 13,746 | 1,582,703 |
| Zoetis, Inc. | | 7,834 | 1,530,607 |
| | | | $5,002,441 |
| Professional Services — 3.2% | |
| Robert Half, Inc. | | 29,464 | $1,986,168 |
| | | | $1,986,168 |
Calvert
Focused Value Fund
September 30, 2024
Schedule of Investments — continued
| Security | Shares | Value |
| Residential REITs — 4.9% | |
| Invitation Homes, Inc. | | 38,524 | $ 1,358,356 |
| Mid-America Apartment Communities, Inc. | | 10,618 | 1,687,200 |
| | | | $ 3,045,556 |
| Semiconductors & Semiconductor Equipment — 6.0% | |
| Micron Technology, Inc. | | 20,275 | $ 2,102,720 |
| ON Semiconductor Corp.(1) | | 22,506 | 1,634,161 |
| | | | $ 3,736,881 |
| Specialty Retail — 2.9% | |
| Lithia Motors, Inc., Class A | | 5,691 | $1,807,689 |
| | | | $1,807,689 |
Total Common Stocks
(identified cost $51,774,030) | | | $61,430,725 |
| Short-Term Investments — 1.6% | | | |
| Security | Shares | Value |
| Morgan Stanley Institutional Liquidity Funds - Government Portfolio, Institutional Class, 4.83%(2) | | 960,930 | $ 960,930 |
Total Short-Term Investments
(identified cost $960,930) | | | $ 960,930 |
Total Investments — 100.5%
(identified cost $52,734,960) | | | $62,391,655 |
| Other Assets, Less Liabilities — (0.5)% | | | $ (282,587) |
| Net Assets — 100.0% | | | $62,109,068 |
| The percentage shown for each investment category in the Schedule of Investments is based on net assets. |
| (1) | Non-income producing security. |
| (2) | May be deemed to be an affiliated investment company. The rate shown is the annualized seven-day yield as of September 30, 2024. |
| Abbreviations: |
| REITs | – Real Estate Investment Trusts |
Calvert
Focused Value Fund
September 30, 2024
Statement of Assets and Liabilities
| | September 30, 2024 |
| Assets | |
| Investments in securities of unaffiliated issuers, at value (identified cost $51,774,030) | $61,430,725 |
| Investments in securities of affiliated issuers, at value (identified cost $960,930) | 960,930 |
| Dividends receivable | 45,881 |
| Dividends receivable - affiliated | 8,218 |
| Trustees' deferred compensation plan | 403 |
| Total assets | $62,446,157 |
| Liabilities | |
| Payable for investments purchased | $240,427 |
| Payable to affiliates: | |
| Investment advisory fee | 24,449 |
| Administrative fee | 5,926 |
| Distribution and service fees | 314 |
| Trustees' deferred compensation plan | 403 |
| Other | 21,925 |
| Payable for professional fees | 36,057 |
| Accrued expenses | 7,588 |
| Total liabilities | $337,089 |
| Net Assets | $62,109,068 |
| Sources of Net Assets | |
| Paid-in capital | $50,882,286 |
| Distributable earnings | 11,226,782 |
| Net Assets | $62,109,068 |
| Class A Shares | |
| Net Assets | $825,965 |
| Shares Outstanding | 68,219 |
Net Asset Value and Redemption Price Per Share
(net assets ÷ shares of beneficial interest outstanding) | $12.11 |
Maximum Offering Price Per Share
(100 ÷ 94.75 of net asset value per share) | $12.78 |
| Class C Shares | |
| Net Assets | $190,047 |
| Shares Outstanding | 15,879 |
Net Asset Value and Offering Price Per Share*
(net assets ÷ shares of beneficial interest outstanding) | $11.97 |
| Class I Shares | |
| Net Assets | $10,305,590 |
| Shares Outstanding | 848,735 |
Net Asset Value, Offering Price and Redemption Price Per Share
(net assets ÷ shares of beneficial interest outstanding) | $12.14 |
3
See Notes to Financial Statements.
Calvert
Focused Value Fund
September 30, 2024
Statement of Assets and Liabilities — continued
| | September 30, 2024 |
| Class R6 Shares | |
| Net Assets | $50,787,466 |
| Shares Outstanding | 4,187,112 |
Net Asset Value, Offering Price and Redemption Price Per Share
(net assets ÷ shares of beneficial interest outstanding) | $12.13 |
| On sales of $50,000 or more, the offering price of Class A shares is reduced. |
| * | Redemption price per share is equal to the net asset value less any applicable contingent deferred sales charge. |
4
See Notes to Financial Statements.
Calvert
Focused Value Fund
September 30, 2024
| | Year Ended |
| | September 30, 2024 |
| Investment Income | |
| Dividend income (net of foreign taxes withheld of $10,213) | $1,135,586 |
| Dividend income - affiliated issuers | 51,080 |
| Total investment income | $1,186,666 |
| Expenses | |
| Investment advisory fee | $288,599 |
| Administrative fee | 69,264 |
| Distribution and service fees: | |
| Class A | 1,532 |
| Class C | 894 |
| Trustees' fees and expenses | 3,489 |
| Custodian fees | 3,143 |
| Transfer agency fees and expenses | 2,168 |
| Accounting fees | 16,112 |
| Professional fees | 32,631 |
| Registration fees | 73,721 |
| Reports to shareholders | 15 |
| Miscellaneous | 15,896 |
| Total expenses | $507,464 |
| Waiver and/or reimbursement of expenses by affiliates | $(80,076) |
| Net expenses | $427,388 |
| Net investment income | $759,278 |
| Realized and Unrealized Gain (Loss) | |
| Net realized gain (loss): | |
| Investment securities | $1,590,838 |
| Foreign currency transactions | 1,894 |
| Net realized gain | $1,592,732 |
| Change in unrealized appreciation (depreciation): | |
| Investment securities | $10,858,362 |
| Net change in unrealized appreciation (depreciation) | $10,858,362 |
| Net realized and unrealized gain | $12,451,094 |
| Net increase in net assets from operations | $13,210,372 |
5
See Notes to Financial Statements.
Calvert
Focused Value Fund
September 30, 2024
Statements of Changes in Net Assets
| | Year Ended September 30, |
| | 2024 | 2023 |
| Increase (Decrease) in Net Assets | | |
| From operations: | | |
| Net investment income | $759,278 | $468,746 |
| Net realized gain (loss) | 1,592,732 | (458,115) |
| Net change in unrealized appreciation (depreciation) | 10,858,362 | (771,288) |
| Net increase (decrease) in net assets from operations | $13,210,372 | $(760,657) |
| Distributions to shareholders: | | |
| Class A | $(3,525) | $(343) |
| Class C | (170) | — |
| Class I | (95,572) | (8,563) |
| Class R6 | (501,564) | (51,388) |
| Total distributions to shareholders | $(600,831) | $(60,294) |
| Capital share transactions: | | |
| Class A | $323,898 | $182,258 |
| Class C | 112,924 | 9,308 |
| Class I | (509,837) | 3,737,146 |
| Class R6 | (4,039,979) | 45,579,492 |
| Net increase (decrease) in net assets from capital share transactions | $(4,112,994) | $49,508,204 |
| Net increase in net assets | $8,496,547 | $48,687,253 |
| Net Assets | | |
| At beginning of year | $53,612,521 | $4,925,268 |
| At end of year | $62,109,068 | $53,612,521 |
6
See Notes to Financial Statements.
Calvert
Focused Value Fund
September 30, 2024
| | Class A |
| | Year Ended September 30, | Period Ended
September 30,
2022(1) |
| | 2024 | 2023 |
| Net asset value — Beginning of period | $9.75 | $9.05 | $10.00 |
| Income (Loss) From Operations | | | |
| Net investment income(2) | $0.12 | $0.10 | $0.03 |
| Net realized and unrealized gain (loss) | 2.33 | 0.61(3) | (0.98) |
| Total income (loss) from operations | $2.45 | $0.71 | $(0.95) |
| Less Distributions | | | |
| From net investment income | $(0.09) | $(0.01) | $ — |
| Total distributions | $(0.09) | $(0.01) | $ — |
| Net asset value — End of period | $12.11 | $9.75 | $9.05 |
| Total Return(4) | 25.24% | 7.86% | (9.50)%(5) |
| Ratios/Supplemental Data | | | |
| Net assets, end of period (000’s omitted) | $826 | $378 | $187 |
| Ratios (as a percentage of average daily net assets):(6) | | | |
| Total expenses | 1.13% | 1.22% | 5.09%(7) |
| Net expenses | 0.99%(8) | 0.99%(8) | 0.99%(7)(8) |
| Net investment income | 1.08% | 1.00% | 0.77%(7) |
| Portfolio Turnover | 107% | 75% | 13%(5) |
| (1) | For the period from the commencement of operations, April 29, 2022, to September 30, 2022. |
| (2) | Computed using average shares outstanding. |
| (3) | The per share amount is not in accord with the net realized and unrealized gain (loss) for the period because of the timing of Fund share transactions and the amount of the per share realized and unrealized gains and losses at such time. |
| (4) | Returns are historical and are calculated by determining the percentage change in net asset value with all distributions reinvested and do not reflect the effect of sales charges, if any. |
| (5) | Not annualized. |
| (6) | Total expenses do not reflect amounts reimbursed and/or waived by the adviser and certain of its affiliates, if applicable. Net expenses are net of all reductions and represent the net expenses paid by the Fund. |
| (7) | Annualized. |
| (8) | Includes a reduction by the investment adviser of a portion of its advisory fee due to the Fund’s investment in the Liquidity Fund (equal to less than 0.005% of average daily net assets for the years ended September 30, 2024 and 2023 and the period ended September 30, 2022). |
7
See Notes to Financial Statements.
Calvert
Focused Value Fund
September 30, 2024
Financial Highlights — continued
| | Class C |
| | Year Ended September 30, | Period Ended
September 30,
2022(1) |
| | 2024 | 2023 |
| Net asset value — Beginning of period | $9.66 | $9.02 | $10.00 |
| Income (Loss) From Operations | | | |
| Net investment income(2) | $0.03 | $0.02 | $0.01 |
| Net realized and unrealized gain (loss) | 2.31 | 0.62(3) | (0.99) |
| Total income (loss) from operations | $2.34 | $0.64 | $(0.98) |
| Less Distributions | | | |
| From net investment income | $(0.03) | $ — | $ — |
| Total distributions | $(0.03) | $ — | $ — |
| Net asset value — End of period | $11.97 | $9.66 | $9.02 |
| Total Return(4) | 24.34% | 7.10% | (9.80)%(5) |
| Ratios/Supplemental Data | | | |
| Net assets, end of period (000’s omitted) | $190 | $58 | $45 |
| Ratios (as a percentage of average daily net assets):(6) | | | |
| Total expenses | 1.88% | 1.95% | 5.84%(7) |
| Net expenses | 1.74%(8) | 1.74%(8) | 1.75%(7)(8) |
| Net investment income | 0.30% | 0.24% | 0.26%(7) |
| Portfolio Turnover | 107% | 75% | 13%(5) |
| (1) | For the period from the commencement of operations, April 29, 2022, to September 30, 2022. |
| (2) | Computed using average shares outstanding. |
| (3) | The per share amount is not in accord with the net realized and unrealized gain (loss) for the period because of the timing of Fund share transactions and the amount of the per share realized and unrealized gains and losses at such time. |
| (4) | Returns are historical and are calculated by determining the percentage change in net asset value with all distributions reinvested and do not reflect the effect of sales charges, if any. |
| (5) | Not annualized. |
| (6) | Total expenses do not reflect amounts reimbursed and/or waived by the adviser and certain of its affiliates, if applicable. Net expenses are net of all reductions and represent the net expenses paid by the Fund. |
| (7) | Annualized. |
| (8) | Includes a reduction by the investment adviser of a portion of its advisory fee due to the Fund’s investment in the Liquidity Fund (equal to less than 0.005% of average daily net assets for the years ended September 30, 2024 and 2023 and the period ended September 30, 2022). |
8
See Notes to Financial Statements.
Calvert
Focused Value Fund
September 30, 2024
Financial Highlights — continued
| | Class I |
| | Year Ended September 30, | Period Ended
September 30,
2022(1) |
| | 2024 | 2023 |
| Net asset value — Beginning of period | $9.78 | $9.05 | $10.00 |
| Income (Loss) From Operations | | | |
| Net investment income(2) | $0.14 | $0.13 | $0.05 |
| Net realized and unrealized gain (loss) | 2.33 | 0.62(3) | (1.00) |
| Total income (loss) from operations | $2.47 | $0.75 | $(0.95) |
| Less Distributions | | | |
| From net investment income | $(0.11) | $(0.02) | $ — |
| Total distributions | $(0.11) | $(0.02) | $ — |
| Net asset value — End of period | $12.14 | $9.78 | $9.05 |
| Total Return(4) | 25.51% | 8.25% | (9.50)%(5) |
| Ratios/Supplemental Data | | | |
| Net assets, end of period (000’s omitted) | $10,306 | $8,759 | $4,648 |
| Ratios (as a percentage of average daily net assets):(6) | | | |
| Total expenses | 0.88% | 0.96% | 4.83%(7) |
| Net expenses | 0.74%(8) | 0.74%(8) | 0.74%(7)(8) |
| Net investment income | 1.32% | 1.28% | 1.27%(7) |
| Portfolio Turnover | 107% | 75% | 13%(5) |
| (1) | For the period from the commencement of operations, April 29, 2022, to September 30, 2022. |
| (2) | Computed using average shares outstanding. |
| (3) | The per share amount is not in accord with the net realized and unrealized gain (loss) for the period because of the timing of Fund share transactions and the amount of the per share realized and unrealized gains and losses at such time. |
| (4) | Returns are historical and are calculated by determining the percentage change in net asset value with all distributions reinvested and do not reflect the effect of sales charges, if any. |
| (5) | Not annualized. |
| (6) | Total expenses do not reflect amounts reimbursed and/or waived by the adviser and certain of its affiliates, if applicable. Net expenses are net of all reductions and represent the net expenses paid by the Fund. |
| (7) | Annualized. |
| (8) | Includes a reduction by the investment adviser of a portion of its advisory fee due to the Fund’s investment in the Liquidity Fund (equal to less than 0.005% of average daily net assets for the years ended September 30, 2024 and 2023 and the period ended September 30, 2022). |
9
See Notes to Financial Statements.
Calvert
Focused Value Fund
September 30, 2024
Financial Highlights — continued
| | Class R6 |
| | Year Ended September 30, | Period Ended
September 30,
2022(1) |
| | 2024 | 2023 |
| Net asset value — Beginning of period | $9.77 | $9.05 | $10.00 |
| Income (Loss) From Operations | | | |
| Net investment income(2) | $0.14 | $0.13 | $0.05 |
| Net realized and unrealized gain (loss) | 2.33 | 0.61(3) | (1.00) |
| Total income (loss) from operations | $2.47 | $0.74 | $(0.95) |
| Less Distributions | | | |
| From net investment income | $(0.11) | $(0.02) | $ — |
| Total distributions | $(0.11) | $(0.02) | $ — |
| Net asset value — End of period | $12.13 | $9.77 | $9.05 |
| Total Return(4) | 25.56% | 8.20% | (9.50)%(5) |
| Ratios/Supplemental Data | | | |
| Net assets, end of period (000’s omitted) | $50,787 | $44,418 | $45 |
| Ratios (as a percentage of average daily net assets):(6) | | | |
| Total expenses | 0.87% | 0.96% | 4.84%(7) |
| Net expenses | 0.74%(8) | 0.74%(8) | 0.75%(7)(8) |
| Net investment income | 1.32% | 1.29% | 1.26%(7) |
| Portfolio Turnover | 107% | 75% | 13%(5) |
| (1) | For the period from the commencement of operations, April 29, 2022, to September 30, 2022. |
| (2) | Computed using average shares outstanding. |
| (3) | The per share amount is not in accord with the net realized and unrealized gain (loss) for the period because of the timing of Fund share transactions and the amount of the per share realized and unrealized gains and losses at such time. |
| (4) | Returns are historical and are calculated by determining the percentage change in net asset value with all distributions reinvested and do not reflect the effect of sales charges, if any. |
| (5) | Not annualized. |
| (6) | Total expenses do not reflect amounts reimbursed and/or waived by the adviser and certain of its affiliates, if applicable. Net expenses are net of all reductions and represent the net expenses paid by the Fund. |
| (7) | Annualized. |
| (8) | Includes a reduction by the investment adviser of a portion of its advisory fee due to the Fund’s investment in the Liquidity Fund (equal to less than 0.005% of average daily net assets for the years ended September 30, 2024 and 2023 and the period ended September 30, 2022). |
10
See Notes to Financial Statements.
Calvert
Focused Value Fund
September 30, 2024
Notes to Financial Statements
1 Significant Accounting Policies
Calvert Focused Value Fund (the Fund) is a diversified series of Calvert Social Investment Fund (the Trust). The Trust is a Massachusetts business trust registered under the Investment Company Act of 1940, as amended (the 1940 Act), as an open-end management investment company. The investment objective of the Fund is total return.
The Fund offers four classes of shares. Class A shares are generally sold subject to a sales charge imposed at time of purchase. A contingent deferred sales charge of 1.00% may apply to certain redemptions of Class A shares for accounts for which no sales charge was paid, if redeemed within 12 months of purchase. Class C shares are sold without a front-end sales charge, and with certain exceptions, are charged a contingent deferred sales charge of 1.00% on shares redeemed within 12 months of purchase. Class C shares are only available for purchase through a financial intermediary. Class C shares automatically convert to Class A shares eight years after their purchase as described in the Fund's prospectus. Class I and Class R6 shares are sold at net asset value, are not subject to a sales charge and are sold only to certain eligible investors. Each class represents a pro rata interest in the Fund, but votes separately on class-specific matters and is subject to different expenses.
The Fund applies the accounting and reporting guidance in the Financial Accounting Standards Board (FASB) Accounting Standards Codification Topic 946, Financial Services – Investment Companies (ASC 946). Subsequent events, if any, through the date that the financial statements were issued have been evaluated in the preparation of the financial statements.
A Investment Valuation— Net asset value per share is determined every business day as of the close of the regular session of the New York Stock Exchange (generally 4:00 p.m. Eastern time). The Fund uses independent pricing services approved by the Board of Trustees (the Board) to value its investments wherever possible. Investments for which market quotations are not available or deemed not reliable are fair valued in good faith by the
Board’s valuation designee.
U.S. generally accepted accounting principles (U.S. GAAP) establishes a disclosure hierarchy that categorizes the inputs to valuation techniques used to value assets and liabilities at measurement date. These inputs are summarized in the three broad levels listed below:
Level 1 - quoted prices in active markets for identical securities
Level 2 - other significant observable inputs (including quoted prices for similar securities, interest rates, prepayment speeds, credit risk, etc.)
Level 3 - significant unobservable inputs (including the Fund’s own assumptions in determining the fair value of investments)
The inputs or methodologies used for valuing securities are not necessarily an indication of the risk associated with investing in those securities.
Valuation techniques used to value the Fund’s investments by major category are as follows:
Equity Securities. Equity securities (including warrants and rights) listed on a U.S. securities exchange generally are valued at the last sale or closing price as reported by an independent pricing service on the primary market or exchange on which they are traded and are categorized as Level 1 in the hierarchy. Equity securities listed on the NASDAQ National Market System are valued at the NASDAQ official closing price and are categorized as Level 1 in the hierarchy. Unlisted or listed securities for which closing sales prices or closing quotations are not available are valued at the mean between the latest available bid and ask prices and are categorized as Level 2 in the hierarchy. The daily valuation of exchange-traded foreign securities generally is determined as of the close of trading on the principal exchange on which such securities trade. Events occurring after the close of trading on foreign exchanges may result in adjustments to the valuation of foreign securities to more accurately reflect their fair value as of the close of regular trading on the New York Stock Exchange. When valuing foreign equity securities that meet certain criteria, the Fund’s Board has approved the use of a fair value service that values such securities to reflect market trading that occurs after the close of the applicable foreign markets of comparable securities or other instruments that have a strong correlation to the fair-valued securities. Such securities are categorized as Level 2 in the hierarchy.
Other Securities. Investments in management investment companies (including money market funds) that do not trade on an exchange are valued at the net asset value as of the close of each business day and are categorized as Level 1 in the hierarchy.
Fair Valuation. In connection with Rule 2a-5 of the 1940 Act, the Board has designated the Fund’s investment adviser as its valuation designee. Investments for which valuations or market quotations are not readily available or are deemed unreliable are valued by the investment adviser, as valuation designee, at fair value using methods that most fairly reflect the security’s “fair value”, which is the amount that the Fund might reasonably expect to receive for the security upon its current sale in the ordinary course. Each such determination is based on a consideration of relevant factors, which are likely to vary from one pricing context to another. These factors may include, but are not limited to, the type of security, the existence of any contractual restrictions on the security’s disposition, the price and extent of public trading in similar securities of the issuer or of comparable companies or entities, quotations or relevant information obtained from broker/dealers or other market participants, information obtained from the issuer, analysts, and/or the appropriate stock exchange (for exchange-traded securities), an analysis of the company’s or entity’s financial statements, and an evaluation of the forces that influence the issuer and the market(s) in which the security is purchased and sold.
The values assigned to fair value investments are based on available information and do not necessarily represent amounts that might ultimately be realized. Further, due to the inherent uncertainty of valuations of such investments, the fair values may differ significantly from the values that would have been used had an active market existed, and the differences could be material.
Calvert
Focused Value Fund
September 30, 2024
Notes to Financial Statements — continued
The following table summarizes the market value of the Fund's holdings as of September 30, 2024, based on the inputs used to value them:
| Asset Description | Level 1 | Level 2 | Level 3 | Total |
| Common Stocks: | | | | |
| Communication Services | $3,343,331 | $ — | $ — | $3,343,331 |
| Consumer Discretionary | 3,584,158 | — | — | 3,584,158 |
| Consumer Staples | 4,278,529 | — | — | 4,278,529 |
| Financials | 11,204,888 | — | — | 11,204,888 |
| Health Care | 9,518,703 | 1,582,703 | — | 11,101,406 |
| Industrials | 9,278,295 | — | — | 9,278,295 |
| Information Technology | 5,825,447 | — | — | 5,825,447 |
| Materials | 4,318,568 | — | — | 4,318,568 |
| Real Estate | 4,374,297 | — | — | 4,374,297 |
| Utilities | 4,121,806 | — | — | 4,121,806 |
| Total Common Stocks | $59,848,022 | $1,582,703(1) | $ — | $61,430,725 |
| Short-Term Investments | $960,930 | $ — | $ — | $960,930 |
| Total Investments | $60,808,952 | $1,582,703 | $ — | $62,391,655 |
| (1) | Includes foreign equity securities whose values were adjusted to reflect market trading of comparable securities or other correlated instruments that occurred after the close of trading in their applicable foreign markets. |
B Investment Transactions and Income— Investment transactions for financial statement purposes are accounted for on trade date. Realized gains and losses are recorded on an identified cost basis and may include proceeds from litigation. Dividend income is recorded on the ex-dividend date for dividends received in cash and/or securities or, in the case of dividends on certain foreign securities, as soon as the Fund is informed of the ex-dividend date. Non-cash dividends are recorded at the fair value of the securities received. Withholding taxes on foreign dividends, if any, have been provided for in accordance with the Fund’s understanding of the applicable country’s tax rules and rates. Distributions received that represent a return of capital are recorded as a reduction of cost of investments. Distributions received that represent a capital gain are recorded as a realized gain.
C Share Class Accounting— Realized and unrealized gains and losses and net investment income and losses, other than class-specific expenses, are allocated daily to each class of shares based upon the relative net assets of each class to the total net assets of the Fund. Expenses arising in connection with a specific class are charged directly to that class. Sub-accounting, recordkeeping and similar administrative fees payable to financial intermediaries, which are a component of transfer agency fees and expenses on the Statement of Operations, are not allocated to Class R6 shares.
D Foreign Currency Transactions— The Fund’s accounting records are maintained in U.S. dollars. For valuation of assets and liabilities on each date of net asset value determination, foreign denominations are converted into U.S. dollars using the current exchange rate. Security transactions, income and expenses are translated at the prevailing rate of exchange on the date of the event. Recognized gains or losses on investment transactions attributable to changes in foreign currency exchange rates are recorded for financial statement purposes as net realized gains and losses on investments. That portion of unrealized gains and losses on investments that results from fluctuations in foreign currency exchange rates is not separately disclosed.
E Distributions to Shareholders— Distributions to shareholders are recorded by the Fund on ex-dividend date. Distributions from net investment income and distributions from net realized capital gains, if any, are paid at least annually. Distributions are declared separately for each class of shares. Distributions are determined in accordance with income tax regulations, which may differ from U.S. GAAP; accordingly, periodic reclassifications are made within the Fund's capital accounts to reflect income and gains available for distribution under income tax regulations.
F Estimates— The preparation of financial statements in conformity with U.S. GAAP requires management to make estimates and assumptions that affect the reported amounts of assets and liabilities and disclosure of contingent assets and liabilities at the date of the financial statements and the reported amounts of increases and decreases in net assets from operations during the reporting period. Actual results could differ from those estimates.
G Indemnifications— Under the Trust’s organizational document, its officers and Trustees may be indemnified against certain liabilities and expenses arising out of the performance of their duties to the Fund. Under Massachusetts law, if certain conditions prevail, shareholders of a Massachusetts business trust (such as the Trust) could be deemed to have personal liability for the obligations of the Trust. However, the Trust’s Declaration of Trust contains an express disclaimer of liability on the part of Fund shareholders and provides that the Trust shall assume, upon request by the shareholder, the defense on behalf of any Fund shareholders or former shareholders. Additionally, in the normal course of business, the Fund enters into agreements with service
Calvert
Focused Value Fund
September 30, 2024
Notes to Financial Statements — continued
providers that may contain indemnification clauses. The Fund’s maximum exposure under these arrangements is unknown as this would involve future claims that may be made against the Fund that have not yet occurred.
H Federal Income Taxes— No provision for federal income or excise tax is required since the Fund intends to qualify as a regulated investment company under the Internal Revenue Code and to distribute substantially all of its taxable earnings.
Management has analyzed the Fund's tax positions taken for all open federal income tax years and has concluded that no provision for federal income tax is required in the Fund's financial statements. A Fund's federal tax return is subject to examination by the Internal Revenue Service for a period of three years from the date of filing.
2 Related Party Transactions
The investment advisory fee is earned by Calvert Research and Management (CRM), an indirect, wholly-owned subsidiary of Morgan Stanley, as compensation for investment advisory services rendered to the Fund. The investment advisory fee is computed at the annual rate of 0.50% of the Fund’s average daily net assets and is payable monthly. For the year ended September 30, 2024, the investment advisory fee amounted to $288,599.
The Fund may invest in a money market fund, the Institutional Class of the Morgan Stanley Institutional Liquidity Funds - Government Portfolio (the “Liquidity Fund”), an open-end management investment company managed by Morgan Stanley Investment Management Inc., a wholly-owned subsidiary of Morgan Stanley. The investment advisory fee paid by the Fund is reduced by an amount equal to its pro rata share of the advisory and administration fees paid by the Fund due to its investment in the Liquidity Fund. For the year ended September 30, 2024, the investment advisory fee paid was reduced by $1,456 relating to the Fund’s investment in the Liquidity Fund.
CRM has agreed to reimburse the Fund’s operating expenses to the extent that total annual operating expenses (relating to ordinary operating expenses only and excluding expenses such as brokerage commissions, acquired fund fees and expenses of unaffiliated funds, borrowing costs, taxes or litigation expenses) exceed 0.99%, 1.74%, 0.74% and 0.74% for Class A, Class C, Class I and Class R6, respectively, of such class’s average daily net assets. The expense reimbursement agreement with CRM may be changed or terminated after February 1, 2025. For the year ended September 30, 2024, CRM waived and/or reimbursed expenses of $78,620.
The administrative fee is earned by CRM as compensation for administrative services rendered to the Fund. The fee is computed at an annual rate of 0.12% of the Fund’s average daily net assets attributable to Class A, Class C, Class I and Class R6 and is payable monthly. For the year ended September 30, 2024, CRM was paid administrative fees of $69,264.
The Fund has in effect a distribution plan for Class A shares (Class A Plan) pursuant to Rule 12b-1 under the 1940 Act. Pursuant to the Class A Plan, the Fund pays Eaton Vance Distributors, Inc. (EVD), an affiliate of CRM and the Fund’s principal underwriter, a distribution and service fee of 0.25% per annum of its average daily net assets attributable to Class A shares for distribution services and facilities provided to the Fund by EVD, as well as for personal services and/or the maintenance of shareholder accounts.The Fund also has in effect a distribution plan for Class C shares (Class C Plan) pursuant to Rule 12b-1 under the 1940 Act. Pursuant to the Class C Plan, the Fund pays EVD amounts equal to 0.75% per annum of its average daily net assets attributable to Class C shares for providing ongoing distribution services and facilities to the Fund. In addition, pursuant to the Class C Plan, the Fund also makes payments of service fees to EVD, financial intermediaries and other persons in amounts equal to 0.25% per annum of its average daily net assets attributable to that class. Service fees paid or accrued are for personal services and/or the maintenance of shareholder accounts. Distribution and service fees paid or accrued for the year ended September 30, 2024 amounted to $1,532 and $894 for Class A shares and Class C shares, respectively.
The Fund was informed that EVD received $317 as its portion of the sales charge on sales of Class A shares for the year ended September 30, 2024.
Eaton Vance Management (EVM), an affiliate of CRM, provides sub-transfer agency and related services to the Fund pursuant to a Sub-Transfer Agency Support Services Agreement. For the year ended September 30, 2024, sub-transfer agency fees and expenses incurred to EVM amounted to $966 and are included in transfer agency fees and expenses on the Statement of Operations.
Each Trustee of the Fund who is not an employee of CRM or its affiliates receives an annual fee of $225,000 ($214,000 prior to January 1, 2024), an annual Committee fee ranging from $8,500 to $16,500 depending on the Committee, and may receive a fee of $10,000 for special meetings. The Board chair receives an additional $40,000 annual fee, Committee chairs receive an additional $15,000 annual fee and the special equities liaison receives an additional $2,500 annual fee. Eligible Trustees may participate in a Deferred Compensation Plan (the Plan). Amounts deferred under the Plan are treated as though equal dollar amounts had been invested in shares of the Fund or other Calvert funds selected by the Trustees. The Fund purchases shares of the funds selected equal to the dollar amounts deferred under the Plan, resulting in an asset equal to the deferred compensation liability. Obligations of the Plan are paid solely from the Fund's assets. Trustees’ fees are allocated to each of the Calvert funds served. Salaries and fees of officers and Trustees of the Fund who are employees of CRM or its affiliates are paid by CRM.
3 Investment Activity
During the year ended September 30, 2024, the cost of purchases and proceeds from sales of investments, other than short-term securities, were $61,010,823 and $64,363,693, respectively.
Calvert
Focused Value Fund
September 30, 2024
Notes to Financial Statements — continued
4 Distributions to Shareholders and Income Tax Information
The tax character of distributions declared for the years ended September 30, 2024 and September 30, 2023 was as follows:
| | Year Ended September 30, |
| | 2024 | 2023 |
| Ordinary income | $600,831 | $60,294 |
During the year ended September 30, 2024, distributable earnings was decreased by $79,527 and paid-in capital was increased by $79,527 due to the Fund's use of equalization accounting. Tax equalization accounting allows the Fund to treat as a distribution that portion of redemption proceeds representing a redeeming shareholder’s portion of undistributed taxable income and net capital gains. These reclassifications had no effect on the net assets or net asset value per share of the Fund.
As of September 30, 2024, the components of distributable earnings (accumulated loss) on a tax basis were as follows:
| Undistributed ordinary income | $798,255 |
| Undistributed long-term capital gains | 1,106,135 |
| Net unrealized appreciation | 9,322,392 |
| Distributable earnings | $11,226,782 |
The cost and unrealized appreciation (depreciation) of investments of the Fund at September 30, 2024, as determined on a federal income tax basis, were as follows:
| Aggregate cost | $53,069,263 |
| Gross unrealized appreciation | $9,542,881 |
| Gross unrealized depreciation | (220,489) |
| Net unrealized appreciation | $9,322,392 |
5 Line of Credit
The Fund participates with other portfolios and funds managed by EVM and its affiliates, including CRM, in a $650 million unsecured revolving line of credit agreement with a group of banks, which is in effect through October 22, 2024. In connection with the renewal of the agreement on
October 24, 2023, the borrowing limit was decreased from $725 million. Borrowings are made by the Fund solely for temporary purposes related to redemptions and other short-term cash needs. Interest is charged to the Fund based on its borrowings generally at an amount above either the Secured Overnight Financing Rate (SOFR) or Federal Funds rate. In addition, a fee computed at an annual rate of 0.15% on the daily unused portion of the line of credit is allocated among the participating portfolios and funds at the end of each quarter. In connection with the renewal of the agreement in October 2023, an arrangement fee of $150,000 was incurred that was allocated to the participating portfolios and funds. Because the line of credit is not available exclusively to the Fund, it may be unable to borrow some or all of its requested amounts at any particular time.
The Fund had no borrowings outstanding pursuant to its line of credit at September 30, 2024. The Fund did not have any significant borrowings or allocated fees during the year ended September 30, 2024. Effective October 22, 2024, the Fund renewed its line of credit agreement, which expires October 21, 2025, at substantially the same terms.
Calvert
Focused Value Fund
September 30, 2024
Notes to Financial Statements — continued
6 Affiliated Investments
At September 30, 2024, the value of the Fund’s investment in funds that may be deemed to be affiliated was $960,930, which represents 1.6% of the Fund’s net assets. Transactions in such investments by the Fund for the year ended September 30, 2024 were as follows:
| Name | Value,
beginning
of period | Purchases | Sales
proceeds | Net
realized
gain
(loss) | Change in
unrealized
appreciation
(depreciation) | Value,
end of
period | Dividend
income | Shares,
end of
period |
| Short-Term Investments | | | | | | |
| Liquidity Fund | $1,316,739 | $22,723,181 | $(23,078,990) | $ — | $ — | $960,930 | $51,080 | 960,930 |
7 Capital Shares
The Fund’s Declaration of Trust permits the Trustees to issue an unlimited number of full and fractional shares of beneficial interest (without par value). Such shares may be issued in a number of different series (such as the Fund) and classes.
Transactions in capital shares were as follows:
| | Year Ended
September 30, 2024 | | Year Ended
September 30, 2023 |
| | Shares | Amount | | Shares | Amount |
| Class A | | | | | |
| Shares sold | 45,040 | $496,114 | | 21,774 | $221,842 |
| Reinvestment of distributions | 337 | 3,525 | | 35 | 340 |
| Shares redeemed | (15,896) | (175,741) | | (3,710) | (39,924) |
| Net increase | 29,481 | $323,898 | | 18,099 | $182,258 |
| Class C | | | | | |
| Shares sold | 10,083 | $115,222 | | 999 | $9,308 |
| Reinvestment of distributions | 16 | 170 | | — | — |
| Shares redeemed | (219) | (2,468) | | — | — |
| Net increase | 9,880 | $112,924 | | 999 | $9,308 |
| Class I | | | | | |
| Shares sold | 49,402 | $527,418 | | 391,732 | $3,898,679 |
| Reinvestment of distributions | 9,111 | 95,572 | | 876 | 8,563 |
| Shares redeemed | (105,765) | (1,132,827) | | (10,025) | (170,096) |
| Net increase (decrease) | (47,252) | $(509,837) | | 382,583 | $3,737,146 |
| Class R6 | | | | | |
| Shares sold | 92,693 | $1,018,341 | | 4,565,879 | $45,817,101 |
| Reinvestment of distributions | 47,859 | 501,564 | | 5,265 | 51,388 |
| Shares redeemed | (501,027) | (5,559,884) | | (28,557) | (288,997) |
| Net increase (decrease) | (360,475) | $(4,039,979) | | 4,542,587 | $45,579,492 |
At September 30, 2024, Calvert Growth Allocation Fund, Calvert Moderate Allocation Fund and Calvert Conservative Allocation Fund owned in the aggregate 81.7% of the value of the outstanding shares of the Fund and EVM owned 9.8% of the value of the outstanding shares of the Fund.
Calvert
Focused Value Fund
September 30, 2024
Report of Independent Registered Public Accounting Firm
To the Board of Trustees of Calvert Social Investment Fund and Shareholders of Calvert Focused Value Fund:
Opinion on the Financial Statements and Financial Highlights
We have audited the accompanying statement of assets and liabilities of Calvert Focused Value Fund (the “Fund”) (one of the funds constituting Calvert Social Investment Fund), including the schedule of investments, as of September 30, 2024, the related statement of operations for the year then ended, the statements of changes in net assets for each of the two years in the period then ended, the financial highlights for each of the two years in the period then ended and for the period from April 29, 2022 (commencement of operations) to September 30, 2022, and the related notes. In our opinion, the financial statements and financial highlights present fairly, in all material respects, the financial position of the Fund as of September 30, 2024, and the results of its operations for the year then ended, the changes in its net assets for each of the two years in the period then ended, and the financial highlights for each of the two years in the period then ended and for the period from April 29, 2022 (commencement of operations) to September 30, 2022, in conformity with accounting principles generally accepted in the United States of America.
Basis for Opinion
These financial statements and financial highlights are the responsibility of the Fund's management. Our responsibility is to express an opinion on the Fund's financial statements and financial highlights based on our audits. We are a public accounting firm registered with the Public Company Accounting Oversight Board (United States) (PCAOB) and are required to be independent with respect to the Fund in accordance with the U.S. federal securities laws and the applicable rules and regulations of the Securities and Exchange Commission and the PCAOB.
We conducted our audits in accordance with the standards of the PCAOB. Those standards require that we plan and perform the audit to obtain reasonable assurance about whether the financial statements and financial highlights are free of material misstatement, whether due to error or fraud. The Fund is not required to have, nor were we engaged to perform, an audit of its internal control over financial reporting. As part of our audits, we are required to obtain an understanding of internal control over financial reporting but not for the purpose of expressing an opinion on the effectiveness of the Fund’s internal control over financial reporting. Accordingly, we express no such opinion.
Our audits included performing procedures to assess the risks of material misstatement of the financial statements and financial highlights, whether due to error or fraud, and performing procedures that respond to those risks. Such procedures included examining, on a test basis, evidence regarding the amounts and disclosures in the financial statements and financial highlights. Our audits also included evaluating the accounting principles used and significant estimates made by management, as well as evaluating the overall presentation of the financial statements and financial highlights. Our procedures included confirmation of securities owned as of September 30, 2024, by correspondence with the custodian and brokers; when replies were not received from brokers, we performed other auditing procedures. We believe that our audits provide a reasonable basis for our opinion.
/s/ Deloitte & Touche LLP
Boston, Massachusetts
November 21, 2024
We have served as the auditor of one or more Calvert investment companies since 2021.
Calvert
Focused Value Fund
September 30, 2024
Federal Tax Information (Unaudited)
The Form 1099-DIV you receive in February 2025 will show the tax status of all distributions paid to your account in calendar year 2024. Shareholders are advised to consult their own tax adviser with respect to the tax consequences of their investment in the Fund. As required by the Internal Revenue Code and/or regulations, shareholders must be notified regarding the status of qualified business income, qualified dividend income for individuals, the dividends received deduction for corporations and capital gains dividends.
Qualified Business Income. For the fiscal year ended September 30, 2024, the Fund designates approximately $10,620, or up to the maximum amount of such dividends allowable pursuant to the Internal Revenue Code, as qualified business income.
Qualified Dividend Income. For the fiscal year ended September 30, 2024, the Fund designates approximately $935,363, or up to the maximum amount of such dividends allowable pursuant to the Internal Revenue Code, as qualified dividend income eligible for the reduced tax rate of 15%.
Dividends Received Deduction. Corporate shareholders are generally entitled to take the dividends received deduction on the portion of the Fund's dividend distribution that qualifies under tax law. For the Fund's fiscal 2024 ordinary income dividends, 96.03% qualifies for the corporate dividends received deduction.
Capital Gains Dividends. The Fund hereby designates as a capital gain dividend with respect to the taxable year ended September 30, 2024, $1,152,327 or, if subsequently determined to be different, the net capital gain of such year.
Calvert
Focused Value Fund
September 30, 2024
Board of Trustees' Contract Approval
Overview of the Contract Review Process
The Investment Company Act of 1940, as amended, provides, in substance, that each investment advisory agreement between a fund and its investment adviser will continue in effect from year to year only if its continuation is approved at least annually by the fund’s board of directors, including by a vote of a majority of the directors who are not “interested persons” of the fund (“Independent Trustees”), cast in person at a meeting called for the purpose of considering such approval.
At an in-person meeting of the Boards of Trustees/Directors (each a “Board”) of the registered investment companies advised by Calvert Research and Management (“CRM” or the “Adviser”) (the “Calvert Funds”) held on June 10-11, 2024, the Board, including a majority of the Independent Trustees, voted to approve continuation of existing investment advisory and investment sub-advisory agreements for the Calvert Funds for an additional one-year period.
In evaluating the investment advisory and investment sub-advisory agreements for the Calvert Funds, the Board considered a variety of information relating to the Calvert Funds and various service providers, including the Adviser. The Independent Trustees reviewed a report prepared by the Adviser regarding various services provided to the Calvert Funds by the Adviser and its affiliates. Such report included, among other data, information regarding the Adviser’s personnel and the Adviser’s revenue and cost of providing services to the Calvert Funds, and a separate report prepared by an independent data provider, which compared each fund’s investment performance, fees and expenses to those of comparable funds as identified by such independent data provider (“comparable funds”).
The Independent Trustees were separately represented by independent legal counsel with respect to their consideration of the continuation of the investment advisory and investment sub-advisory agreements for the Calvert Funds. Prior to voting, the Independent Trustees reviewed the proposed continuation of the Calvert Funds’ investment advisory and investment sub-advisory agreements with management and also met in private sessions with their counsel at which time no representatives of management were present.
The information that the Board considered included, among other things, the following (for funds that invest through one or more affiliated underlying fund(s), references to “each fund” in this section may include information that was considered at the underlying fund-level):
Information about Fees, Performance and Expenses
| • | A report from an independent data provider comparing the advisory and related fees paid by each fund with fees paid by comparable funds; |
| • | A report from an independent data provider comparing each fund’s total expense ratio and its components to comparable funds; |
| • | A report from an independent data provider comparing the investment performance of each fund to the investment performance of comparable funds over various time periods; |
| • | Data regarding investment performance in comparison to benchmark indices; |
| • | For each fund, comparative information concerning the fees charged and the services provided by the Adviser in managing other accounts (including mutual funds, other collective investment funds and institutional accounts) using investment strategies and techniques similar to those used in managing such fund; |
| • | Profitability analyses for the Adviser with respect to each fund; |
Information about Portfolio Management and Trading
| • | Descriptions of the investment management services provided to each fund, including investment strategies and processes it employs; |
| • | Information about the Adviser’s policies and practices with respect to trading, including the Adviser’s processes for monitoring best execution of portfolio transactions; |
| • | Information about the allocation of brokerage transactions and the benefits received by the Adviser as a result of brokerage allocation, including information concerning the acquisition of research through client commission arrangements and policies with respect to “soft dollars”; |
Information about the Adviser
| • | Reports detailing the financial results and condition of CRM; |
| • | Descriptions of the qualifications, education and experience of the individual investment professionals whose responsibilities include portfolio management and investment research for the funds, and information relating to their compensation and responsibilities with respect to managing other mutual funds and investment accounts; |
| • | Policies and procedures relating to proxy voting and the handling of corporate actions and class actions; |
| • | A description of CRM’s procedures for overseeing sub-advisers, including with respect to regulatory and compliance issues, investment management and other matters; |
Calvert
Focused Value Fund
September 30, 2024
Board of Trustees' Contract Approval — continued
Other Relevant Information
| • | Information concerning the nature, cost and character of the administrative and other non-investment advisory services provided by CRM and its affiliates; and |
| • | The terms of each investment advisory agreement. |
Over the course of the year, the Board and its committees held regular quarterly meetings. During these meetings, the Trustees participated in investment and performance reviews with the portfolio managers and other investment professionals of the Adviser relating to each fund and considered various investment and trading strategies used in pursuing each fund’s investment objective(s), such as the use of derivative instruments, as well as risk management techniques. The Board and its committees also evaluated issues pertaining to industry and regulatory developments, compliance procedures, corporate governance and other issues with respect to the funds and received and participated in reports and presentations provided by CRM and its affiliates with respect to such matters. In addition to the formal meetings of the Board and its committees, the Independent Trustees held regular video conferences in between meetings to discuss, among other topics, matters relating to the continuation of the Calvert Funds’ investment advisory and investment sub-advisory agreements.
For funds that invest through one or more affiliated underlying funds, the Board considered similar information about the underlying fund(s) when considering the approval of investment advisory agreements. In addition, in cases where the Adviser has engaged a sub-adviser, the Board considered similar information about the sub-adviser when considering the approval of any investment sub-advisory agreement.
The Independent Trustees were assisted throughout the contract review process by their independent legal counsel. The Independent Trustees relied upon the advice of such counsel and their own business judgment in determining the material factors to be considered in evaluating each investment advisory and investment sub-advisory agreement and the weight to be given to each such factor. The Board, including the Independent Trustees, did not identify any single factor as controlling, and each Director may have attributed different weight to various factors.
Results of the Contract Review Process
Based on its consideration of the foregoing, and such other information as it deemed relevant, including the factors and conclusions described below, the Board, including the Independent Trustees, concluded that the continuation of the investment advisory agreement of Calvert Focused Value Fund (the “Fund”), including the fee payable under the agreement, is in the best interests of the Fund’s shareholders. Accordingly, the Board, including a majority of the Independent Trustees, voted to approve the continuation of the investment advisory agreement of the Fund.
Nature, Extent and Quality of Services
In considering the nature, extent and quality of the services provided by the Adviser under the investment advisory agreement, the Board reviewed information provided by the Adviser relating to its operations and personnel, including, among other information, biographical information on the Adviser’s investment personnel and descriptions of its organizational and management structure. The Board also took into account similar information provided periodically throughout the previous year by the Adviser as well as the Board’s familiarity with management through Board meetings, discussions and other reports. The Board considered the Adviser’s management style and its performance in employing its investment strategies as well as its current level of staffing and overall resources. The Board also noted that it reviewed on a quarterly basis information regarding the Adviser’s compliance with applicable policies and procedures, including those related to personal investing. The Board took into account, among other items, periodic reports received from the Adviser over the past year concerning the Adviser’s ongoing review and enhancement of certain processes, policies and procedures of the Calvert Funds and the Adviser. The Board concluded that it was satisfied with the nature, extent and quality of services provided to the Fund by the Adviser under the investment advisory agreement.
Fund Performance
In considering the Fund’s performance, the Board noted that it reviewed on a quarterly basis detailed information about the Fund’s performance results, portfolio composition and investment strategies. The Board compared the Fund’s investment performance to that of the Fund’s peer universe and its benchmark index. The Board’s review included comparative performance data for the one-year period ended December 31, 2023. This performance data indicated that the Fund had underperformed the median of its peer universe and its benchmark index for the one-year period ended December 31, 2023. The Board took into account management’s discussion of the Fund’s performance since inception. Based upon its review, the Board concluded that the Adviser is qualified to manage the Fund’s assets in accordance with the Fund’s investment objective and strategies and that the Adviser’s investment strategies are appropriate for pursing the Fund’s investment objective.
Calvert
Focused Value Fund
September 30, 2024
Board of Trustees' Contract Approval — continued
Management Fees and Expenses
In considering the Fund’s fees and expenses, the Board compared the Fund’s fees and total expense ratio with those of comparable funds in its expense group. Among other findings, the data indicated that the Fund’s advisory and administrative fees (after taking into account waivers and/or reimbursements) (referred to collectively as “management fees”) and the Fund’s total expenses (net of waivers and/or reimbursements) were each below the respective median of the Fund’s expense group. The Board took into account the Adviser’s current undertaking to maintain expense limitations for the Fund and that the Adviser was waiving and/or reimbursing a portion of the Fund’s expenses. Based upon its review, the Board concluded that the management fees were reasonable in view of the nature, extent and quality of services provided by the Adviser.
Profitability and Other “Fall-Out” Benefits
The Board reviewed the Adviser’s profitability in regard to the Fund and the Calvert Funds in the aggregate. In reviewing the overall profitability of the Fund to the Adviser, the Board also considered the fact that the Adviser and its affiliates provided sub-transfer agency support, administrative and distribution services to the Fund for which they received compensation. The information considered by the Board included the profitability of the Fund to the Adviser and its affiliates without regard to any marketing support or other payments by the Adviser and its affiliates to third parties in respect of distribution services. The Board also considered that the Adviser and its affiliates derived benefits to their reputation and other indirect benefits from their relationships with the Fund. Based upon its review, the Board concluded that the Adviser’s and its affiliates’ level of profitability from their relationships with the Fund was reasonable.
Economies of Scale
The Board considered the effect of the Fund’s current size and its potential growth on its performance and fees. The Board concluded that adding breakpoints to the advisory fee at specified asset levels was not necessary at this time. The Board noted that if the Fund’s assets increased over time, the Fund might realize other economies of scale if assets increased proportionally more than certain other expenses.
Item 8. Changes in and Disagreements with Accountants for Open-End Management Investment Companies
Not applicable.
Item 9. Proxy Disclosures for Open-End Management Investment Companies
Not applicable.
Item 10. Remuneration Paid to Directors, Officers, and Others of Open-End Management Investment Companies
The information is disclosed as part of the Financial Statements included in Item 7 of this Form N-CSR.
Item 11. Statement Regarding Basis for Approval of Investment Advisory Contract
The information is included in Item 7 of this Form N-CSR.
Item 12. Disclosure of Proxy Voting Policies and Procedures for Closed-End Management Investment Companies
Not applicable.
Item 13. Portfolio Managers of Closed-End Management Investment Companies
Not applicable.
Item 14. Purchases of Equity Securities by Closed-End Management Investment Company and Affiliated Purchasers
Not applicable.
Item 15. Submission of Matters to a Vote of Security Holders
There have been no material changes to the procedures by which shareholders may recommend nominee to the Fund’s Board of Trustees since the Fund last provided disclosure in response to this item.
Item 16. Controls and Procedures
| (a) | It is the conclusion of the registrant’s principal executive officer and principal financial officer that the effectiveness of the registrant’s current disclosure controls and procedures (such disclosure controls and procedures having been evaluated within 90 days of the date of this filing) provide reasonable assurance that the information required to be disclosed by the registrant has been recorded, processed, summarized and reported within the time period specified in the Commission’s rules and forms and that the information required to be disclosed by the registrant has been accumulated and communicated to the registrant’s principal executive officer and principal financial officer in order to allow timely decisions regarding required disclosure. |
| (b) | There have been no changes in the registrant’s internal control over financial reporting during the period covered by this report that has materially affected, or is reasonably likely to materially affect, the registrant’s internal control over financial reporting. |
Item 17. Disclosure of Securities Lending Activities for Closed-End Management Investment Companies
Not applicable.
Item 18. Recovery of Erroneously Awarded Compensation
Not applicable.
Item 19. Exhibits
Signatures
Pursuant to the requirements of the Securities Exchange Act of 1934 and the Investment Company Act of 1940, the registrant has duly caused this report to be signed on its behalf by the undersigned, thereunto duly authorized.
| | |
| Calvert Social Investment Fund |
| |
| By: | | /s/ Von M. Hughes |
| | Von M. Hughes |
| | Principal Executive Officer |
| |
| Date: | | November 25, 2024 |
Pursuant to the requirements of the Securities Exchange Act of 1934 and the Investment Company Act of 1940, this report has been signed below by the following persons on behalf of the registrant and in the capacities and on the dates indicated.
| | |
| By: | | /s/ James F. Kirchner |
| | James F. Kirchner |
| | Principal Financial Officer |
| |
| Date: | | November 25, 2024 |
| |
| By: | | /s/ Von M. Hughes |
| | Von M. Hughes |
| | Principal Executive Officer |
| |
| Date: | | November 25, 2024 |