UNITED STATES SECURITIES AND EXCHANGE COMMISSION
Form N-CSR
CERTIFIED SHAREHOLDER REPORT OF REGISTERED
MANAGEMENT INVESTMENT COMPANIES
Investment Company Act File Number: 811-03334
CALVERT SOCIAL INVESTMENT FUND
(Exact Name of Registrant as Specified in Charter)
1825 Connecticut Avenue NW, Suite 400, Washington, DC 20009
(Address of Principal Executive Offices)
Maureen A. Gemma
Two International Place, Boston, Massachusetts 02110
(Name and Address of Agent for Services)
(202) 238-2200
(Registrant’s Telephone Number)
September 30
Date of Fiscal Year End
September 30, 2018
Date of Reporting Period
____________________________________________________________________________________
Item 1. Reports to Stockholders
Calvert Balanced Fund
Calvert Bond Fund
Calvert Equity Fund
Calvert Conservative Allocation Fund
Calvert Moderate Allocation Fund
Calvert Aggressive Allocation Fund
 |  | |
Calvert Social Investment Fund • Calvert Balanced Fund• Calvert Bond Fund• Calvert Equity Fund |  | |
 |  | |
Annual Report September 30, 2018 E-Delivery Sign-Up — Details Inside |  |
Commodity Futures Trading Commission Registration. Effective December 31, 2012, the Commodity Futures Trading Commission (“CFTC”) adopted certain regulatory changes that subject registered investment companies and advisers to regulation by the CFTC if a fund invests more than a prescribed level of its assets in certain CFTC-regulated instruments (including futures, certain options and swap agreements) or markets itself as providing investment exposure to such instruments. Each Fund and its adviser have claimed an exclusion from the definition of the term “commodity pool operator” under the Commodity Exchange Act. Accordingly, neither the Funds nor the adviser is subject to CFTC regulation. |
Choose Planet-friendly E-delivery! Sign up now for on-line statements, prospectuses, and fund reports. In less than five minutes you can help reduce paper mail and lower fund costs. Just go to www.calvert.com. If you already have an online account with the Calvert funds, click on Login to access your Account and select the documents you would like to receive via e-mail. If you’re new to online account access, click on Login, then Register to create your user name and password. Once you’re in, click on the E-delivery sign-up on the Account Portfolio page and follow the quick, easy steps. Note: If your shares are not held directly with the Calvert funds but through a brokerage firm, you must contact your broker for electronic delivery options available through their firm. |
 | TABLE OF CONTENTS | |||
| Management’s Discussion of Fund Performance | ||||
| Performance and Fund Profile | ||||
| Calvert Balanced Fund | ||||
| Calvert Bond Fund | ||||
| Calvert Equity Fund | ||||
| Endnotes and Additional Disclosures | ||||
| Fund Expenses | ||||
| Financial Statements | ||||
| Report of Independent Registered Public Accounting Firm | ||||
| Federal Tax Information | ||||
| Management and Organization | ||||
| Important Notices | ||||
MANAGEMENT’S DISCUSSION OF FUND PERFORMANCE1
Economic and Market Conditions
U.S. stocks led the way with double-digit gains in the 12-month period ended September 30, 2018, while global stocks delivered mixed results.
U.S. stocks opened the period on the upswing as investors anticipated and then cheered passage of the Republican tax reform package in December 2017. Sharp cuts in corporate taxes, a key element of the bill, raised corporate-profit expectations. Stocks also got a boost from positive U.S. economic data, including the unemployment rate which fell to a 17-year low.
Stocks pulled back in February 2018 amid fears that rising rates would spur inflation and boost the appeal of fixed-income investments at the expense of stocks. After a brief rebound, equity markets weakened in the spring of 2018, as investors confronted the prospect of a global trade war due to President Trump’s imposition of broad new tariffs. The tariffs drew retaliatory action from impacted countries including China, Canada, and certain countries in the European Union. Stocks bounced back in the final three months of the period. Technology stocks led the advance, following an earlier setback from a wave of data-privacy scandals.
For the 12-month period ended September 30, 2018, all major U.S. stock indexes recorded double-digit gains. The blue-chip Dow Jones Industrial Average®2 advanced 20.76%, while the broader U.S. equity market, as represented by the S&P 500® Index, rose 17.91%. The technology-laden NASDAQ Composite Index surged 25.17% in the period. Large-cap U.S. stocks as measured by the S&P 500® Index generally outperformed their small-cap counterparts as measured by the Russell 2000® Index during the period. Growth stocks as a group outpaced value stocks in both the large- and small-cap categories, as measured by the Russell growth and value indexes.
On the fixed income side, U.S. investment-grade, fixed-income securities declined during the period, with the Bloomberg Barclays U.S. Aggregate Bond Index returning -1.22%. In comparison, high-yield credits showed strength with the ICE BofAML U.S. High Yield Index rising 2.94% during the period.
U.S. gross domestic product (GDP) growth accelerated through most of the period, reaching a quarterly annualized rate of 4.2% in the second quarter of 2018, the highest level in four years. Corporate earnings and balance sheets also steadily strengthened and the unemployment rate fell to 3.9% during the period from 4.2% at the start of the period. Wages, which had remained stagnant even as the jobless rate fell, began to rise in the latter stages of the period. Inflation increased modestly with the personal consumption expenditures index rising to nearly 2%, mirroring the U.S. Federal Reserve Board (the Fed) target level.
As the U.S. economy showed signs of building strength, the Fed raised the federal funds rate four times during the period and projected another rate hike before the end of 2018 as well as three more potential increases in 2019.
Later in the period, a strong supply of issuances from merger-and-acquisition transactions ─ in addition to concerns about increased leverage and weakening fundamentals in the latter stages of the credit cycle ─ contributed to widening spreads.
Fund Performance - Calvert Balanced Fund
For the 12-month period ended September 30, 2018, Calvert Balanced Fund (the Fund) returned a total of 10.01% for Class A shares at net asset value (NAV) compared with the Russell 1000® Index (the Index), which returned 17.76%, and the Balanced Composite Benchmark, which returned 9.90%.
The Fund normally invests about 60% of its assets in equity securities and 40% in fixed-income investments. The equity portion is primarily large-cap U.S. stocks. The fixed-income portion is primarily in investment-grade debt securities.
Within the equity portion, sector allocation versus the Index detracted overall, particularly overweight positions in the consumer staples and communication services sectors. Stock selection in the industrials, health care, and consumer discretionary sectors also weighed on returns. Newell Brands, Inc., a consumer and commercial products company, was the largest individual detractor from performance relative to the Index during the period. The stock lagged as the company sold off brands and reduced debt in order to focus on core brands. The transition depressed margins and revenues. In addition, investors were concerned about the potential adverse impact of international tariffs.
Deluxe Corp. (Deluxe), a marketing and business software provider for small- and medium-size companies, detracted from performance relative to the Index during the period after Deluxe lowered its revenue projections and its longtime chief executive officer retired unexpectedly. The stock was sold during the period.
Celgene Corp., a global pharmaceutical firm that develops drugs for cancer and inflammatory diseases, detracted from performance relative to the Index during the period as the company’s growth prospects became clouded. The patent for its leading cancer drug, Revlimid, is set to expire in 2020, and the U.S. Food and Drug Administration rejected the company’s multiple sclerosis drug, Ozanimod.
Stock selection was a leading contributor to performance relative to the Index during the period. Selection within the consumer staples, real estate, and information technology sectors was particularly strong. Underweight positions in the industrials and financials sectors were also beneficial.
Three information technology companies ─ Adobe Systems, Inc. (Adobe), GoDaddy, Inc. (GoDaddy), and Intuit Inc. (Intuit) ─ were among the leading contributors relative to the Index in the equity sleeve.
The stock of Adobe, a digital marketing and media software company, performed well after Adobe reported strong organic revenue growth, especially in its digital media business. The growth led to an increase in operating margins and operating cash flow.
GoDaddy, which builds websites and provides web-hosting services, reported strong revenue growth, primarily supported by its core business of registering and renewing domain names. The company increased both its customer base and average revenue per user during the period.
See Endnotes and Additional Disclosures in this report. Past performance is no guarantee of future results. Returns are historical and are calculated by determining the percentage change in net asset value (NAV) or offering price (as applicable) with all distributions reinvested. Investment return and principal value will fluctuate so that shares, when redeemed, may be worth more or less than their original cost. Performance less than or equal to one year is cumulative. Performance is for the stated time period only; due to market volatility, the Fund’s current performance may be lower or higher than quoted. Returns are before taxes unless otherwise noted. For performance as of the most recent month-end, please refer to www.calvert.com. |
2 www.calvert.com CALVERT SOCIAL INVESTMENT FUND ANNUAL REPORT (Unaudited)
MANAGEMENT’S DISCUSSION OF FUND PERFORMANCE - continued
The stock of Intuit, a financial management and compliance software firm, rose after the company reported impressive revenue growth in all of its business lines. Performance was particularly robust in its small-business and self-employed operations, as well as its consumer groups.
While the Fund’s allocation to fixed-income detracted from overall performance against the Index which only holds equities, within the fixed-income portion, asset allocation, duration,7 and security selection all contributed to performance relative to the Index during the period. Overweight allocations to asset-backed securities (ABS), commercial mortgage-backed securities, high-yield corporate bonds, Treasury Inflation Protected Securities, floating-rate loans, and investment-grade corporate bonds were all beneficial. Underweight allocations to U.S. Treasurys and mortgage-backed securities (MBS) and investment in shorter-duration securities also enhanced performance. Security selection in investment-grade corporate bonds, ABS, and MBS was also beneficial. Security selection in high-yield corporate bonds detracted.
Fund Performance - Calvert Bond Fund
For the 12-month period ended September 30, 2018, Calvert Bond Fund (the Fund) Class A shares at net asset value (NAV) returned -0.48%, outperforming its benchmark, the Bloomberg Barclays U.S. Aggregate Bond Index (the Index), which returned -1.22%.
The Fund’s asset allocation and shorter-than-Index duration7 contributed to outperformance relative to the Index during the period.
Allocations to securitized assets, particularly asset-backed securities, were especially strong contributors to performance relative to the Index. An underweight to U.S. Treasurys and allocations to out-of-Index Treasury Inflation Protected Securities also enhanced performance versus the Index.
Security selection among investment-grade corporate fixed income securities, particularly in banking, further contributed to Index-relative performance, although selection among government-related securities detracted.
At period end, while the Fed had projected a tightening monetary course to offset the prospect of modest inflation, no one knew whether, when, or how much interest rates would increase. Other areas of uncertainty included how trade tensions with China would play out, the impact of U.S. midterm elections, the looming Brexit deadline, the fiscal policy of Italy’s new government, and the imbalances facing several emerging economies.
Against this backdrop, the Fund was conservatively positioned at period end, including a slightly shorter-than-Index duration. Fund management believed that the rapid growth in BBB-rated8 bonds during the period warranted some caution. In this and other sectors, the Fund continued to emphasize bottom-up security selection.
Fund Performance - Calvert Equity Fund
For the 12-month period ended September 30, 2018, Calvert Equity Fund (the Fund) returned a total of 22.66% for Class A shares at net asset value (NAV). By comparison, the Russell 1000® Growth Index (the Index) returned 26.30%.
The Fund normally invests in quality, steady-growth companies. Although its absolute returns were strong during the period, the Fund underperformed the Index. Just two of the high-growth stocks that the Index held that the Fund did not ─ Amazon.com, Inc. and Netflix, Inc. ─ accounted for a large share of the Fund’s underperformance relative to the Index.
The Fund’s underweight position in Apple, Inc. (Apple), further detracted from performance relative to the Index. The Fund began the period with a larger allocation in Apple but began selling it in 2017 before exiting the position entirely in early 2018. The Fund no longer considered Apple a growth company because it believed sales of iPhones were peaking and the company’s ability to continue to raise prices was in doubt.
While the Fund’s underweight to some stocks in the Index detracted from relative performance, the Fund’s overall stock selection was a positive contributor.
Visa, Inc. and Mastercard, Inc. performed better than market expectations and were among leading contributors during the period. Each company benefited from evolving payment trends away from cash in both developed and emerging economies.
The Fund increased its position in Intuit, Inc. (Intuit), a top contributor relative to the Index during the period. Growth in the company’s QuickBooks online business, which enables small- and medium-size firms to keep their own books, had been a major source of strength since moving from a one-time-payment model to a subscription model. Intuit’s tax business, Turbotax, also grew significantly during the period.
Zoetis, Inc. (Zoetis), an animal health care business that provides vaccines for livestock and pets, further contributed to returns during the period. The Fund, which views Zoetis as an attractive opportunity unfettered by the complications of insurance regulations that affect human health care businesses, maintained its position in the company during the period.
See Endnotes and Additional Disclosures in this report. Past performance is no guarantee of future results. Returns are historical and are calculated by determining the percentage change in net asset value (NAV) or offering price (as applicable) with all distributions reinvested. Investment return and principal value will fluctuate so that shares, when redeemed, may be worth more or less than their original cost. Performance less than or equal to one year is cumulative. Performance is for the stated time period only; due to market volatility, the Fund’s current performance may be lower or higher than quoted. Returns are before taxes unless otherwise noted. For performance as of the most recent month-end, please refer to www.calvert.com. |
www.calvert.com CALVERT SOCIAL INVESTMENT FUND ANNUAL REPORT (Unaudited) 3
CALVERT BALANCED FUND
PERFORMANCE
Performance2,3 | ||||||||||||||
Portfolio Managers Vishal Khanduja, CFA, Brian S. Ellis, CFA, and Charles B. Gaffney, each of Calvert Research and Management | ||||||||||||||
| % Average Annual Total Returns | Class Inception Date | Performance Inception Date | One Year | Five Years | Ten Years | |||||||||
| Class A at NAV | 10/21/1982 | 10/21/1982 | 10.01 | % | 7.29 | % | 7.41 | % | ||||||
| Class A with 4.75% Maximum Sales Charge | — | — | 4.77 | 6.25 | 6.89 | |||||||||
| Class C at NAV | 3/1/1994 | 10/21/1982 | 9.14 | 6.44 | 6.53 | |||||||||
| Class C with 1% Maximum Sales Charge | — | — | 8.14 | 6.44 | 6.53 | |||||||||
| Class I at NAV | 12/27/2004 | 10/21/1982 | 10.33 | 7.72 | 7.91 | |||||||||
Russell 1000® Index | — | — | 17.76 | % | 13.66 | % | 12.08 | % | ||||||
| Balanced Composite Benchmark | — | — | 9.90 | 9.06 | 8.99 | |||||||||
% Total Annual Operating Expense Ratios4 | Class A | Class C | Class I | |||||||||||
| Gross | 0.99 | % | 1.80 | % | 0.67 | % | ||||||||
| Net | 0.94 | 1.69 | 0.62 | |||||||||||
| Growth of $10,000 |
| This graph shows the change in value of a hypothetical investment of $10,000 in Class A of the Fund for the period indicated. For comparison, the same investment is shown in the indicated index. |
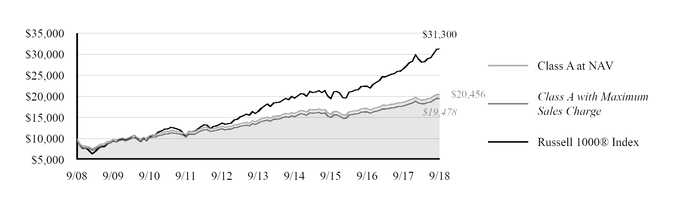
| Growth of Investment | Amount Invested | Period Beginning | At NAV | With Maximum Sales Charge | ||||
| Class C | $10,000 | 09/30/2008 | $18,826 | N.A. | ||||
| Class I | $250,000 | 09/30/2008 | $535,423 | N.A. | ||||
See Endnotes and Additional Disclosures in this report.
Past performance is no guarantee of future results. Returns are historical and are calculated by determining the percentage change in net asset value (NAV) or offering price (as applicable) with all distributions reinvested. Investment return and principal value will fluctuate so that shares, when redeemed, may be worth more or less than their original cost. Performance less than or equal to one year is cumulative. Performance is for the stated time period only; due to market volatility, the Fund’s current performance may be lower or higher than quoted. Returns are before taxes unless otherwise noted. For performance as of the most recent month-end, please refer to www.calvert.com.
4 www.calvert.com CALVERT SOCIAL INVESTMENT FUND ANNUAL REPORT (Unaudited)
CALVERT BALANCED FUND
FUND PROFILE
ASSET ALLOCATION (% of total investments)5 | TEN LARGEST STOCK HOLDINGS (% of net assets)6 | ||||||
| Equity | 63.5 | % | Apple, Inc. | 3.1 | % | ||
| Fixed-Income | 36.4 | % | Alphabet, Inc., Class C | 2.5 | % | ||
| Commercial Paper | 0.1 | % | Microsoft Corp. | 2.2 | % | ||
| Total | 100.0 | % | Amazon.com, Inc. | 1.9 | % | ||
| Walt Disney Co. (The) | 1.6 | % | |||||
| Anthem, Inc. | 1.4 | % | |||||
| Verizon Communications, Inc. | 1.4 | % | |||||
| Ball Corp. | 1.3 | % | |||||
| Mondelez International, Inc., Class A | 1.3 | % | |||||
| Simon Property Group, Inc. | 1.2 | % | |||||
| Total | 17.9 | % | |||||
See Endnotes and Additional Disclosures in this report.
www.calvert.com CALVERT SOCIAL INVESTMENT FUND ANNUAL REPORT (Unaudited) 5
CALVERT BOND FUND
PERFORMANCE
Performance2,3 | ||||||||||||||
Portfolio Managers Vishal Khanduja, CFA and Brian S. Ellis, CFA, each of Calvert Research and Management | ||||||||||||||
| % Average Annual Total Returns | Class Inception Date | Performance Inception Date | One Year | Five Years | Ten Years | |||||||||
| Class A at NAV | 8/24/1987 | 8/24/1987 | -0.48 | % | 2.60 | % | 3.60 | % | ||||||
| Class A with 3.75% Maximum Sales Charge | — | — | -4.22 | 1.82 | 3.21 | |||||||||
| Class C at NAV | 6/1/1998 | 8/24/1987 | -1.25 | 1.75 | 2.75 | |||||||||
| Class C with 1% Maximum Sales Charge | — | — | -2.23 | 1.75 | 2.75 | |||||||||
| Class I at NAV | 3/31/2000 | 8/24/1987 | -0.15 | 3.06 | 4.14 | |||||||||
| Class R6 at NAV | 10/3/2017 | 8/24/1987 | -0.15 | 3.06 | 4.15 | |||||||||
| Bloomberg Barclays U.S. Aggregate Bond Index | — | — | -1.22 | % | 2.16 | % | 3.77 | % | ||||||
% Total Annual Operating Expense Ratios4 | Class A | Class C | Class I | Class R6 | ||||||||||
| Gross | 0.89 | % | 1.78 | % | 0.54 | % | 0.54 | % | ||||||
| Net | 0.88 | 1.63 | 0.53 | 0.53 | ||||||||||
| Growth of $10,000 |
| This graph shows the change in value of a hypothetical investment of $10,000 in Class A of the Fund for the period indicated. For comparison, the same investment is shown in the indicated index. |
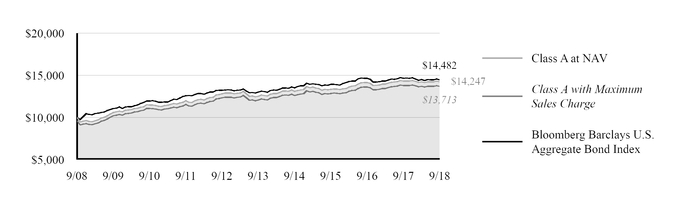
Growth of Investment3 | Amount Invested | Period Beginning | At NAV | With Maximum Sales Charge | ||||
| Class C | $10,000 | 09/30/2008 | $13,123 | N.A. | ||||
| Class I | $250,000 | 09/30/2008 | $375,331 | N.A. | ||||
| Class R6 | $1,000,000 | 09/30/2008 | $1,501,373 | N.A. | ||||
See Endnotes and Additional Disclosures in this report.
Past performance is no guarantee of future results. Returns are historical and are calculated by determining the percentage change in net asset value (NAV) or offering price (as applicable) with all distributions reinvested. Investment return and principal value will fluctuate so that shares, when redeemed, may be worth more or less than their original cost. Performance less than or equal to one year is cumulative. Performance is for the stated time period only; due to market volatility, the Fund’s current performance may be lower or higher than quoted. Returns are before taxes unless otherwise noted. For performance as of the most recent month-end, please refer to www.calvert.com.
6 www.calvert.com CALVERT SOCIAL INVESTMENT FUND ANNUAL REPORT (Unaudited)
CALVERT BOND FUND
FUND PROFILE
PORTFOLIO COMPOSITION (% of total investments)5 | |||||
| Corporate Bonds | 48.7 | % | |||
| Asset-Backed Securities | 23.6 | % | |||
| U.S. Treasury Obligations | 11.4 | % | |||
| Collateralized Mortgage-Backed Obligations | 5.2 | % | |||
| Floating Rate Loans | 2.4 | % | |||
| Commercial Mortgage-Backed Securities | 2.4 | % | |||
| U.S. Government Agency Mortgage-Backed Securities | 2.0 | % | |||
| Taxable Municipal Obligations | 1.9 | % | |||
| Sovereign Government Bonds | 1.2 | % | |||
| High Social Impact Investments | 0.6 | % | |||
| Commercial Paper | 0.3 | % | |||
| U.S. Government Agencies and Instrumentalities | 0.3 | % | |||
| Total | 100.0 | % | |||
See Endnotes and Additional Disclosures in this report.
www.calvert.com CALVERT SOCIAL INVESTMENT FUND ANNUAL REPORT (Unaudited) 7
CALVERT EQUITY FUND
PERFORMANCE
Performance2,3 | ||||||||||||||
Portfolio Managers Joseph B. Hudepohl, CFA, Lance V. Garrison, CFA, Jeffrey A. Miller, CFA and Robert R. Walton, Jr., CFA, each of Atlanta Capital Management Company, LLC | ||||||||||||||
| % Average Annual Total Returns | Class Inception Date | Performance Inception Date | One Year | Five Years | Ten Years | |||||||||
| Class A at NAV | 8/24/1987 | 8/24/1987 | 22.66 | % | 13.77 | % | 11.46 | % | ||||||
| Class A with 4.75% Maximum Sales Charge | — | — | 16.83 | 12.66 | 10.91 | |||||||||
| Class C at NAV | 3/1/1994 | 8/24/1987 | 21.75 | 12.92 | 10.62 | |||||||||
| Class C with 1% Maximum Sales Charge | — | — | 20.75 | 12.92 | 10.62 | |||||||||
| Class I at NAV | 11/1/1999 | 8/24/1987 | 23.06 | 14.25 | 12.00 | |||||||||
| Class R6 at NAV | 10/3/2017 | 8/24/1987 | 23.05 | 14.24 | 12.00 | |||||||||
Russell 1000® Growth Index | — | — | 26.30 | % | 16.57 | % | 14.30 | % | ||||||
% Total Annual Operating Expense Ratios4 | Class A | Class C | Class I | Class R6 | ||||||||||
| Gross | 1.08 | % | 1.85 | % | 0.71 | % | 0.71 | % | ||||||
| Net | 1.08 | 1.84 | 0.71 | 0.71 | ||||||||||
| Growth of $10,000 |
| This graph shows the change in value of a hypothetical investment of $10,000 in Class A of the Fund for the period indicated. For comparison, the same investment is shown in the indicated index. |
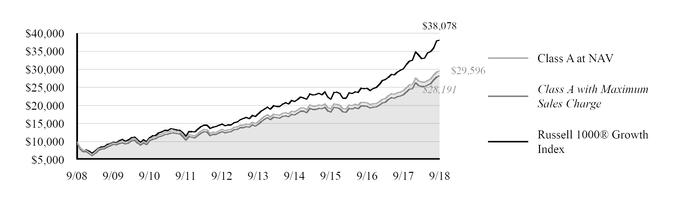
Growth of Investment3 | Amount Invested | Period Beginning | At NAV | With Maximum Sales Charge | ||||
| Class C | $10,000 | 09/30/2008 | $27,453 | N.A. | ||||
| Class I | $250,000 | 09/30/2008 | $776,899 | N.A. | ||||
| Class R6 | $1,000,000 | 09/30/2008 | $3,107,214 | N.A. | ||||
See Endnotes and Additional Disclosures in this report.
Past performance is no guarantee of future results. Returns are historical and are calculated by determining the percentage change in net asset value (NAV) or offering price (as applicable) with all distributions reinvested. Investment return and principal value will fluctuate so that shares, when redeemed, may be worth more or less than their original cost. Performance less than or equal to one year is cumulative. Performance is for the stated time period only; due to market volatility, the Fund’s current performance may be lower or higher than quoted. Returns are before taxes unless otherwise noted. For performance as of the most recent month-end, please refer to www.calvert.com.
8 www.calvert.com CALVERT SOCIAL INVESTMENT FUND ANNUAL REPORT (Unaudited)
CALVERT EQUITY FUND
FUND PROFILE
SECTOR ALLOCATION (% of total investments)5 | TEN LARGEST HOLDINGS (% of net assets)6 | ||||||
| Information Technology | 25.7 | % | Visa, Inc., Class A | 4.9 | % | ||
| Health Care | 19.5 | % | Thermo Fisher Scientific, Inc. | 4.8 | % | ||
| Industrials | 10.7 | % | Microsoft Corp. | 4.8 | % | ||
| Consumer Discretionary | 9.7 | % | Alphabet, Inc., Class C | 4.8 | % | ||
| Communication Services | 8.0 | % | Danaher Corp. | 4.7 | % | ||
| Materials | 7.6 | % | Dollar General Corp. | 3.9 | % | ||
| Financials | 6.9 | % | Ecolab, Inc. | 3.7 | % | ||
| Consumer Staples | 6.7 | % | MasterCard, Inc., Class A | 3.7 | % | ||
| Real Estate | 3.8 | % | Zoetis, Inc. | 3.6 | % | ||
| Venture Capital Limited Partnership Interests | 0.6 | % | Praxair, Inc. | 3.6 | % | ||
| High Social Impact Investments | 0.6 | % | Total | 42.5 | % | ||
| Venture Capital | 0.2 | % | |||||
| Total | 100.0 | % | |||||
See Endnotes and Additional Disclosures in this report.
www.calvert.com CALVERT SOCIAL INVESTMENT FUND ANNUAL REPORT (Unaudited) 9
| Endnotes and Additional Disclosures | ||
1 | The views expressed in this report are those of the portfolio manager(s) and are current only through the date stated on the cover. These views are subject to change at any time based upon market or other conditions, and Calvert and the Fund(s) disclaim any responsibility to update such views. These views may not be relied upon as investment advice and, because investment decisions are based on many factors, may not be relied upon as an indication of trading intent on behalf of any Calvert fund. This commentary may contain statements that are not historical facts, referred to as “forward looking statements.” The Fund’s actual future results may differ significantly from those stated in any forward looking statement, depending on factors such as changes in securities or financial markets or general economic conditions, the volume of sales and purchases of Fund shares, the continuation of investment advisory, administrative and service contracts, and other risks discussed from time to time in the Fund’s filings with the Securities and Exchange Commission. |
2 | Dow Jones Industrial Average® is a price-weighted average of 30 blue-chip stocks that are generally the leaders in their industry. S&P 500® Index is an unmanaged index of large-cap stocks commonly used as a measure of U.S. stock market performance. NASDAQ Composite Index is a market capitalization-weighted index of all domestic and international securities listed on NASDAQ. Source: Nasdaq, Inc. The information is provided by Nasdaq (with its affiliates, are referred to as “Corporations”) and Nasdaq’s third party licensors on an “as is” basis and the Corporations make no guarantees and bear no liability of any kind with respect to the information or the Fund. Russell 2000® Index is an unmanaged index of 2,000 U.S. small-cap stocks. Russell 1000® Index is an unmanaged index of 1,000 U.S. large-cap stocks. Russell 1000® Growth Index is an unmanaged index of U.S. large-cap growth stocks. Bloomberg Barclays U.S. Aggregate Bond Index is an unmanaged index of domestic investment-grade bonds, including corporate, government and mortgage-backed securities. ICE BofAML U.S. High Yield Index is an unmanaged index of below-investment grade U.S. corporate bonds. ICE® BofAML® indices are not for redistribution or other uses; provided “as is”, without warranties, and with no liability. Eaton Vance has prepared this report and ICE Data Indices, LLC does not endorse it, or guarantee, review, or endorse Eaton Vance’s products. BofAML® is a licensed registered trademark of Bank of America Corporation in the United States and other countries. The Balanced Composite Benchmark is an internally constructed benchmark which is comprised of a blend of 60% Russell 1000® Index and 40% Bloomberg Barclays U.S. Aggregate Bond Index, and is rebalanced monthly. Unless otherwise stated, index returns do not reflect the effect of any applicable sales charges, commissions, expenses, taxes or leverage, as applicable. It is not possible to invest directly in an index. |
3 | Total Returns at NAV do not include applicable sales charges. If sales charges were deducted, the returns would be lower. Total Returns shown with maximum sales charge reflect the stated maximum sales charge. Unless otherwise stated, performance does not reflect the deduction of taxes on Fund distributions or redemptions of Fund shares. |
Performance prior to the inception date of a class may be linked to the performance of an older class of the Fund. This linked performance is adjusted for any applicable sales charge, but is not adjusted for class expense differences. If adjusted for such differences, the performance would be different. For the Calvert Bond Fund and the Calvert Equity Fund, the performance of Class R6 is linked to Class I. Performance since inception for an index, if presented, is the performance since the Fund’s or oldest share class’ inception, as applicable. Performance presented in the Financial Highlights included in the financial statements is not linked.
Effective December 31, 2016, Calvert Research and Management became the investment adviser to the Fund and performance reflected prior to such date is that of the Fund’s former investment adviser, Calvert Investment Management, Inc.
4 | Source: Fund prospectus. Net expense ratios reflect a contractual expense reimbursement that continues through 1/31/19. Without the reimbursement, performance would have been lower. The expense ratios for the current reporting period can be found in the Financial Highlights section of this report. |
5 Does not include Short Term Investment of Cash Collateral for Securities Loaned.
6 Excludes cash and cash equivalents.
7 Duration is a measure of the expected change in price of a bond - in percentage terms - given a one percent change in interest rates, all else being constant. Securities with lower durations tend to be less sensitive to interest rate changes.
8 | Ratings are based on Moody’s Investors Service, Inc. (“Moody’s”), S&P Global Ratings (“S&P”) or Fitch Ratings (“Fitch”), as applicable. If securities are rated differently by the ratings agencies, the highest rating is applied. Ratings, which are subject to change, apply to the creditworthiness of the issuers of the underlying securities and not to the Fund or its shares. Credit ratings measure the quality of a bond based on the issuer’s creditworthiness, with ratings ranging from AAA, being the highest, to D, being the lowest based on S&P’s measures. Ratings of BBB or higher by S&P or Fitch (Baa or higher by Moody’s) are considered to be investment-grade quality. Credit ratings are based largely on the ratings agency’s analysis at the time of rating. The rating assigned to any particular security is not necessarily a reflection of the issuer’s current financial condition and does not necessarily reflect its assessment of the volatility of a security’s market value or of the liquidity of an investment in the security. |
Fund profiles subject to change due to active management.
10 www.calvert.com CALVERT SOCIAL INVESTMENT FUND ANNUAL REPORT (Unaudited)
FUND EXPENSES
Example
As a Fund shareholder, you incur two types of costs: (1) transaction costs, including sales charges (loads) on purchases and redemption fees (if applicable); and (2) ongoing costs, including management fees; distribution and/or service fees; and other Fund expenses. This Example is intended to help you understand your ongoing costs (in dollars) of Fund investing and to compare these costs with the ongoing costs of investing in other mutual funds. The Example is based on an investment of $1,000 invested at the beginning of the period and held for the entire period (April 1, 2018 to September 30, 2018).
Actual Expenses
The first section of the tables below provides information about actual account values and actual expenses. You may use the information in this section, together with the amount you invested, to estimate the expenses that you paid over the period. Simply divide your account value by $1,000 (for example, an $8,600 account value divided by $1,000 = 8.6), then multiply the result by the number in the first section under the heading entitled “Expenses Paid During Period” to estimate the expenses you paid on your account during this period.
Hypothetical Example for Comparison Purposes
The second section of the tables below provides information about hypothetical account values and hypothetical expenses based on the actual Fund expense ratio and an assumed rate of return of 5% per year (before expenses), which is not the actual Fund return. The hypothetical account values and expenses may not be used to estimate the actual ending account balance or expenses you paid for the period. You may use this information to compare the ongoing costs of investing in the Fund and other funds. To do so, compare this 5% hypothetical example with the 5% hypothetical examples that appear in the shareholder reports of the other funds.
Please note that the expenses shown in the tables are meant to highlight your ongoing costs only and do not reflect any transactional costs, such as sales charges (loads) or redemption fees (if applicable). Therefore, the second section of the tables is useful in comparing ongoing costs only, and will not help you determine the relative total costs of owning different funds. In addition, if these transactional costs were included, your costs would be higher.
| CALVERT BALANCED FUND | BEGINNING ACCOUNT VALUE (4/1/18) | ENDING ACCOUNT VALUE (9/30/18) | EXPENSES PAID DURING PERIOD* (4/1/18 - 9/30/18) | ANNUALIZED EXPENSE RATIO |
| Actual | ||||
| Class A | $1,000.00 | $1,067.70 | $4.87** | 0.94% |
| Class C | $1,000.00 | $1,063.60 | $8.74** | 1.69% |
| Class I | $1,000.00 | $1,069.00 | $3.22** | 0.62% |
| Hypothetical | ||||
| (5% return per year before expenses) | ||||
| Class A | $1,000.00 | $1,020.36 | $4.76** | 0.94% |
| Class C | $1,000.00 | $1,016.60 | $8.54** | 1.69% |
| Class I | $1,000.00 | $1,021.96 | $3.14** | 0.62% |
| * Expenses are equal to the Fund’s annualized expense ratio for the indicated Class, multiplied by the average account value over the period, multiplied by 183/365 (to reflect the one-half year period). The Example assumes that the $1,000 was invested at the net asset value per share determined at the close of business on March 31, 2018. | ||||
| ** Absent a waiver and/or reimbursement of expenses by an affiliate, expenses would be higher. | ||||
www.calvert.com CALVERT SOCIAL INVESTMENT FUND ANNUAL REPORT (Unaudited) 11
| CALVERT BOND FUND | BEGINNING ACCOUNT VALUE (4/1/18) | ENDING ACCOUNT VALUE (9/30/18) | EXPENSES PAID DURING PERIOD* (4/1/18 - 9/30/18) | ANNUALIZED EXPENSE RATIO |
| Actual | ||||
| Class A | $1,000.00 | $1,001.10 | $4.16 | 0.83% |
| Class C | $1,000.00 | $997.20 | $8.16 | 1.63% |
| Class I | $1,000.00 | $1,003.30 | $2.66** | 0.53% |
| Class R6 | $1,000.00 | $1,003.10 | $2.66** | 0.53% |
| Hypothetical | ||||
| (5% return per year before expenses) | ||||
| Class A | $1,000.00 | $1,020.91 | $4.20 | 0.83% |
| Class C | $1,000.00 | $1,016.90 | $8.24 | 1.63% |
| Class I | $1,000.00 | $1,022.41 | $2.69** | 0.53% |
| Class R6 | $1,000.00 | $1,022.41 | $2.69** | 0.53% |
| * Expenses are equal to the Fund’s annualized expense ratio for the indicated Class, multiplied by the average account value over the period, multiplied by 183/365 (to reflect the one-half year period). The Example assumes that the $1,000 was invested at the net asset value per share determined at the close of business on March 31, 2018. | ||||
| ** Absent a waiver and/or reimbursement of expenses by an affiliate, expenses would be higher. | ||||
| CALVERT EQUITY FUND | BEGINNING ACCOUNT VALUE (4/1/18) | ENDING ACCOUNT VALUE (9/30/18) | EXPENSES PAID DURING PERIOD* (4/1/18 - 9/30/18) | ANNUALIZED EXPENSE RATIO |
| Actual | ||||
| Class A | $1,000.00 | $1,116.20 | $5.36 | 1.01% |
| Class C | $1,000.00 | $1,112.40 | $9.21 | 1.74% |
| Class I | $1,000.00 | $1,118.00 | $3.72** | 0.70% |
| Class R6 | $1,000.00 | $1,117.80 | $3.61 | 0.68% |
| Hypothetical | ||||
| (5% return per year before expenses) | ||||
| Class A | $1,000.00 | $1,020.00 | $5.11 | 1.01% |
| Class C | $1,000.00 | $1,016.34 | $8.80 | 1.74% |
| Class I | $1,000.00 | $1,021.56 | $3.55** | 0.70% |
| Class R6 | $1,000.00 | $1,021.66 | $3.45 | 0.68% |
| * Expenses are equal to the Fund’s annualized expense ratio for the indicated Class, multiplied by the average account value over the period, multiplied by 183/365 (to reflect the one-half year period). The Example assumes that the $1,000 was invested at the net asset value per share determined at the close of business on March 31, 2018. | ||||
| ** Absent a waiver and/or reimbursement of expenses by an affiliate, expenses would be higher. | ||||
12 www.calvert.com CALVERT SOCIAL INVESTMENT FUND ANNUAL REPORT (Unaudited)
CALVERT BALANCED FUND
SCHEDULE OF INVESTMENTS
SEPTEMBER 30, 2018
| SHARES | VALUE ($) | |
| COMMON STOCKS - 62.6% | ||
| Aerospace & Defense - 0.6% | ||
| CAE, Inc. | 223,900 | 4,545,084 |
| Air Freight & Logistics - 0.8% | ||
| C.H. Robinson Worldwide, Inc. | 60,213 | 5,896,057 |
| Auto Components - 0.6% | ||
| Aptiv plc | 55,967 | 4,695,631 |
| Banks - 3.4% | ||
| Bank of America Corp. | 295,000 | 8,690,700 |
| Citigroup, Inc. | 90,325 | 6,479,915 |
| KeyCorp | 218,800 | 4,351,932 |
| PNC Financial Services Group, Inc. (The) | 39,300 | 5,352,267 |
| 24,874,814 | ||
| Beverages - 1.0% | ||
| PepsiCo, Inc. | 63,596 | 7,110,033 |
| Biotechnology - 2.1% | ||
| Biogen, Inc. (1) | 7,752 | 2,738,859 |
| Celgene Corp. (1) | 42,125 | 3,769,766 |
| Gilead Sciences, Inc. | 49,789 | 3,844,209 |
| Incyte Corp. (1) | 35,900 | 2,479,972 |
| Vertex Pharmaceuticals, Inc. (1) | 12,600 | 2,428,524 |
| 15,261,330 | ||
| Commercial Services & Supplies - 1.3% | ||
| Republic Services, Inc. | 79,400 | 5,769,204 |
| Waste Connections, Inc. | 43,200 | 3,446,064 |
| 9,215,268 | ||
| Consumer Finance - 1.5% | ||
| Ally Financial, Inc. | 184,800 | 4,887,960 |
| American Express Co. | 56,200 | 5,984,738 |
| 10,872,698 | ||
| Containers & Packaging - 1.3% | ||
| Ball Corp. (2) | 210,637 | 9,265,922 |
| Diversified Consumer Services - 0.6% | ||
| Grand Canyon Education, Inc. (1) | 38,000 | 4,286,400 |
www.calvert.com CALVERT SOCIAL INVESTMENT FUND ANNUAL REPORT 13
| SHARES | VALUE ($) | |
| COMMON STOCKS - CONT’D | ||
| Diversified Telecommunication Services - 1.4% | ||
| Verizon Communications, Inc. | 190,107 | 10,149,813 |
| Electrical Equipment - 1.0% | ||
| AMETEK, Inc. | 93,200 | 7,373,984 |
| Energy Equipment & Services - 2.9% | ||
| Core Laboratories NV (2) | 43,100 | 4,992,273 |
| National Oilwell Varco, Inc. | 132,402 | 5,703,878 |
| Oceaneering International, Inc. (1) | 200,776 | 5,541,418 |
| TechnipFMC plc | 165,410 | 5,169,062 |
| 21,406,631 | ||
| Entertainment - 1.7% | ||
| Walt Disney Co. (The) | 104,004 | 12,162,228 |
| Equity Real Estate Investment Trusts (REITs) - 2.1% | ||
| AvalonBay Communities, Inc. | 36,700 | 6,648,205 |
| Simon Property Group, Inc. | 50,200 | 8,872,850 |
| 15,521,055 | ||
| Food & Staples Retailing - 0.9% | ||
| Performance Food Group Co. (1) | 200,652 | 6,681,712 |
| Food Products - 2.4% | ||
| Conagra Brands, Inc. | 254,300 | 8,638,571 |
| Mondelez International, Inc., Class A | 215,470 | 9,256,591 |
| 17,895,162 | ||
| Health Care Equipment & Supplies - 1.9% | ||
| Boston Scientific Corp. (1) | 145,100 | 5,586,350 |
| Danaher Corp. | 74,800 | 8,127,768 |
| 13,714,118 | ||
| Health Care Providers & Services - 2.1% | ||
| Anthem, Inc. | 38,100 | 10,441,305 |
| Humana, Inc. | 15,800 | 5,348,616 |
| 15,789,921 | ||
| Household Products - 0.5% | ||
| Colgate-Palmolive Co. | 50,800 | 3,401,060 |
| Independent Power and Renewable Electricity Producers - 0.6% | ||
| NextEra Energy Partners LP | 95,900 | 4,651,150 |
| Industrial Conglomerates - 0.4% | ||
| 3M Co. | 12,811 | 2,699,406 |
14 www.calvert.com CALVERT SOCIAL INVESTMENT FUND ANNUAL REPORT
| SHARES | VALUE ($) | |
| COMMON STOCKS - CONT’D | ||
| Insurance - 2.4% | ||
| American Financial Group, Inc. | 60,896 | 6,757,629 |
| American International Group, Inc. | 123,800 | 6,591,112 |
| First American Financial Corp. | 80,443 | 4,150,054 |
| 17,498,795 | ||
| Interactive Media & Services - 2.5% | ||
| Alphabet, Inc., Class C (1) | 15,112 | 18,035,719 |
| Internet & Direct Marketing Retail - 2.3% | ||
| Amazon.com, Inc. (1) | 6,866 | 13,752,598 |
| Booking Holdings, Inc. (1) | 1,700 | 3,372,800 |
| 17,125,398 | ||
| IT Services - 1.8% | ||
| Amdocs Ltd. | 51,767 | 3,415,587 |
| Cognizant Technology Solutions Corp., Class A | 100,700 | 7,769,005 |
| GoDaddy, Inc., Class A (1) | 27,900 | 2,326,581 |
| 13,511,173 | ||
| Life Sciences Tools & Services - 0.9% | ||
| Thermo Fisher Scientific, Inc. | 27,397 | 6,687,060 |
| Machinery - 1.4% | ||
| Gardner Denver Holdings, Inc. (1) | 206,100 | 5,840,874 |
| Parker-Hannifin Corp. | 23,600 | 4,340,748 |
| 10,181,622 | ||
| Metals & Mining - 0.5% | ||
| Reliance Steel & Aluminum Co. | 43,750 | 3,731,438 |
| Multi-Utilities - 1.3% | ||
| CMS Energy Corp. | 91,273 | 4,472,377 |
| Sempra Energy | 43,315 | 4,927,081 |
| 9,399,458 | ||
| Pharmaceuticals - 2.1% | ||
| GlaxoSmithKline plc ADR | 137,700 | 5,531,409 |
| Jazz Pharmaceuticals plc (1) | 31,400 | 5,279,282 |
| Pfizer, Inc. | 97,884 | 4,313,748 |
| 15,124,439 | ||
| Road & Rail - 0.6% | ||
| Kansas City Southern | 40,200 | 4,553,856 |
www.calvert.com CALVERT SOCIAL INVESTMENT FUND ANNUAL REPORT 15
| SHARES | VALUE ($) | |
| COMMON STOCKS - CONT’D | ||
| Semiconductors & Semiconductor Equipment - 1.6% | ||
| Taiwan Semiconductor Manufacturing Co. Ltd. ADR | 122,800 | 5,422,848 |
| Texas Instruments, Inc. | 61,996 | 6,651,551 |
| 12,074,399 | ||
| Software - 5.9% | ||
| Adobe Systems, Inc. (1) | 21,824 | 5,891,388 |
| Intuit, Inc. | 23,167 | 5,268,176 |
| Microsoft Corp. | 142,051 | 16,246,373 |
| Oracle Corp. | 143,100 | 7,378,236 |
| Salesforce.com, Inc. (1) | 51,400 | 8,174,142 |
| 42,958,315 | ||
| Specialty Retail - 2.4% | ||
| Home Depot, Inc. (The) | 39,100 | 8,099,565 |
| TJX Cos., Inc. (The) | 51,700 | 5,791,434 |
| Tractor Supply Co. | 42,400 | 3,853,312 |
| 17,744,311 | ||
| Technology Hardware, Storage & Peripherals - 4.1% | ||
| Apple, Inc. | 100,252 | 22,630,886 |
| HP, Inc. | 287,800 | 7,416,606 |
| 30,047,492 | ||
| Textiles, Apparel & Luxury Goods - 0.8% | ||
| Gildan Activewear, Inc. | 182,600 | 5,556,518 |
| Thrifts & Mortgage Finance - 0.7% | ||
| MGIC Investment Corp. (1) | 391,400 | 5,209,534 |
| Venture Capital - 0.2% | ||
| CFBanc Corp. (1)(3)(4) | 27,000 | 330,080 |
| Consensus Orthopedics, Inc. (1)(3)(4) | 180,877 | 181 |
| Kickboard (1)(3)(4) | 169,932 | 2,787 |
| Learn Capital Venture Partners III LP (1)(3)(4) | 891,063 | 1,227,216 |
| MACH Energy (1)(3)(4) | 20,536 | 1,891 |
| Neighborhood Bancorp, Class A (1)(3)(4) | 10,000 | 10,000 |
| 1,572,155 | ||
| Total Common Stocks (Cost $386,520,565) | 458,481,159 | |
16 www.calvert.com CALVERT SOCIAL INVESTMENT FUND ANNUAL REPORT
| PRINCIPAL AMOUNT ($) | VALUE ($) | ||
| CORPORATE BONDS - 17.8% | |||
| Basic Materials - 0.1% | |||
| Reliance Steel & Aluminum Co., 4.50%, 4/15/23 | 500,000 | 507,962 | |
| Communications - 1.1% | |||
| AT&T, Inc.: | |||
| 3.514%, (3 mo. USD LIBOR + 1.18%), 6/12/24 (5) | 285,000 | 286,503 | |
| 3.80%, 3/15/22 | 760,000 | 763,384 | |
| 3.80%, 3/1/24 | 525,000 | 520,332 | |
| 4.10%, 2/15/28 (6) | 700,000 | 679,695 | |
| Comcast Corp., 3.20%, 7/15/36 | 990,000 | 826,607 | |
| Crown Castle Towers LLC, 3.663%, 5/15/45 (6) | 450,000 | 442,098 | |
| NBCUniversal Media LLC, 4.45%, 1/15/43 | 405,000 | 386,755 | |
| SBA Communications Corp., 4.00%, 10/1/22 | 102,000 | 100,598 | |
| Verizon Communications, Inc.: | |||
| 3.414%, (3 mo. USD LIBOR + 1.10%), 5/15/25 (5) | 531,000 | 536,069 | |
| 3.50%, 11/1/24 | 1,000,000 | 987,786 | |
| 4.329%, 9/21/28 (6) | 831,000 | 837,425 | |
| 4.862%, 8/21/46 | 1,275,000 | 1,280,068 | |
| Warner Media LLC, 4.90%, 6/15/42 | 500,000 | 468,308 | |
| 8,115,628 | |||
| Consumer, Cyclical - 2.2% | |||
| American Airlines Group, Inc., 5.50%, 10/1/19 (6) | 150,000 | 152,812 | |
| American Airlines Pass-Through Trust: | |||
| 4.40%, 3/22/25 | 664,548 | 664,020 | |
| 5.25%, 7/15/25 | 532,128 | 549,853 | |
| 5.60%, 1/15/22 (6) | 555,767 | 566,883 | |
| Azul Investments LLP, 5.875%, 10/26/24 (6) | 570,000 | 495,307 | |
| Carrols Restaurant Group, Inc., 8.00%, 5/1/22 | 200,000 | 208,810 | |
| CVS Health Corp.: | |||
| 3.047%, (3 mo. USD LIBOR + 0.72%), 3/9/21 (5) | 88,000 | 88,722 | |
| 3.125%, 3/9/20 | 115,000 | 115,047 | |
| 3.70%, 3/9/23 | 647,000 | 644,759 | |
| 4.30%, 3/25/28 | 1,177,000 | 1,167,632 | |
| CVS Pass-Through Trust, 6.036%, 12/10/28 | 811,024 | 865,892 | |
| Ford Motor Credit Co. LLC: | |||
| 2.262%, 3/28/19 | 519,000 | 517,265 | |
| 2.979%, 8/3/22 | 2,350,000 | 2,230,710 | |
| 3.079%, (3 mo. USD LIBOR + 0.88%), 10/12/21 (5) | 910,000 | 901,963 | |
| 3.124%, (3 mo. USD LIBOR + 0.79%), 6/12/20 (5) | 220,000 | 220,013 | |
| 3.147%, (3 mo. USD LIBOR + 0.81%), 4/5/21 (5) | 335,000 | 333,011 | |
| 3.271%, (3 mo. USD LIBOR + 0.93%), 11/4/19 (5) | 600,000 | 601,616 | |
| Latam Airlines Pass-Through Trust, 4.20%, 8/15/29 | 449,190 | 434,592 | |
| Lennar Corp., 4.50%, 11/15/19 | 870,000 | 878,700 | |
| Newell Brands, Inc., 3.85%, 4/1/23 | 500,000 | 489,803 | |
www.calvert.com CALVERT SOCIAL INVESTMENT FUND ANNUAL REPORT 17
| PRINCIPAL AMOUNT ($) | VALUE ($) | ||
| CORPORATE BONDS - CONT’D | |||
| Nordstrom, Inc.: | |||
| 4.00%, 3/15/27 | 250,000 | 242,817 | |
| 5.00%, 1/15/44 (2) | 545,000 | 503,580 | |
| Norwegian Air Shuttle ASA Pass-Through Trust, 4.875%, 11/10/29 (6) | 534,086 | 524,678 | |
| Prime Security Services Borrower LLC / Prime Finance, Inc., 9.25%, 5/15/23 (6) | 130,000 | 139,360 | |
| Starbucks Corp., 2.45%, 6/15/26 | 550,000 | 495,918 | |
| Tapestry, Inc., 4.125%, 7/15/27 | 1,175,000 | 1,118,162 | |
| Virgin Australia Pass-Through Trust: | |||
| 5.00%, 4/23/25 (6) | 168,671 | 171,413 | |
| 6.00%, 4/23/22 (6) | 236,751 | 239,710 | |
| Whirlpool Corp., 3.70%, 5/1/25 | 500,000 | 482,061 | |
| Wyndham Destinations, Inc.: | |||
| 4.15%, 4/1/24 | 132,000 | 128,700 | |
| 4.50%, 4/1/27 | 147,000 | 139,282 | |
| 16,313,091 | |||
| Consumer, Non-cyclical - 1.0% | |||
| Amgen, Inc., 4.663%, 6/15/51 | 895,000 | 884,638 | |
| Becton Dickinson and Co.: | |||
| 2.404%, 6/5/20 | 474,000 | 466,978 | |
| 2.894%, 6/6/22 | 474,000 | 461,173 | |
| 3.261%, (3 mo. USD LIBOR + 0.875%), 12/29/20 (5) | 926,000 | 927,430 | |
| 3.363%, 6/6/24 | 740,000 | 715,667 | |
| Block Financial LLC, 5.25%, 10/1/25 (2) | 150,000 | 151,173 | |
| Ecolab, Inc.: | |||
| 3.25%, 12/1/27 | 214,000 | 205,703 | |
| 3.95%, 12/1/47 | 154,000 | 146,676 | |
| Grupo Bimbo SAB de CV, 4.875%, 6/27/44 (6) | 500,000 | 476,505 | |
| Kaiser Foundation Hospitals, 3.15%, 5/1/27 | 874,000 | 838,673 | |
| Keurig Dr Pepper, Inc.: | |||
| 3.551%, 5/25/21 (6) | 348,000 | 347,586 | |
| 4.057%, 5/25/23 (6) | 222,000 | 222,507 | |
| Kraft Heinz Foods Co.: | |||
| 3.375%, 6/15/21 | 138,000 | 137,350 | |
| 5.20%, 7/15/45 | 575,000 | 563,421 | |
| Life Technologies Corp., 6.00%, 3/1/20 | 500,000 | 518,146 | |
| Massachusetts Institute of Technology, 3.959%, 7/1/38 | 300,000 | 301,662 | |
| MEDNAX, Inc., 5.25%, 12/1/23 (6) | 155,000 | 155,581 | |
| Teva Pharmaceutical Finance Netherlands III BV, 1.70%, 7/19/19 | 112,000 | 110,202 | |
| 7,631,071 | |||
| Energy - 0.1% | |||
| Oceaneering International, Inc., 4.65%, 11/15/24 | 465,000 | 445,736 | |
18 www.calvert.com CALVERT SOCIAL INVESTMENT FUND ANNUAL REPORT
| PRINCIPAL AMOUNT ($) | VALUE ($) | ||
| CORPORATE BONDS - CONT’D | |||
| Financial - 8.5% | |||
| Ally Financial, Inc.: | |||
| 3.25%, 11/5/18 | 1,329,000 | 1,329,000 | |
| 3.50%, 1/27/19 | 980,000 | 981,225 | |
| 4.125%, 3/30/20 | 645,000 | 649,031 | |
| ANZ New Zealand International Ltd., 2.20%, 7/17/20 (6) | 542,000 | 531,240 | |
| Banco Santander S.A.: | |||
| 3.125%, 2/23/23 | 829,000 | 787,403 | |
| 3.40%, (3 mo. USD LIBOR + 1.09%), 2/23/23 (5) | 305,000 | 306,199 | |
| Bank Nederlandse Gemeenten NV, 2.125%, 12/14/20 (6) | 720,000 | 706,795 | |
| Bank of America Corp.: | |||
| 2.727%, (3 mo. USD LIBOR + 0.38%), 1/23/22 (5) | 1,163,000 | 1,159,835 | |
| 3.106%, (3 mo. USD LIBOR + 0.79%), 3/5/24 (5) | 1,450,000 | 1,450,129 | |
| 3.419% to 12/20/27, 12/20/28 (7) | 900,000 | 845,166 | |
| 3.499% to 5/17/21, 5/17/22 (7) | 1,489,000 | 1,488,635 | |
| 3.527%, (3 mo. USD LIBOR + 1.18%), 10/21/22 (5) | 801,000 | 814,191 | |
| 3.593% to 7/21/27, 7/21/28 (7) | 1,400,000 | 1,335,423 | |
| 3.824% to 1/20/27, 1/20/28 (7) | 2,390,000 | 2,328,409 | |
| Bank of Montreal, 3.803% to 12/15/27, 12/15/32 (7) | 886,000 | 828,933 | |
| Capital One Financial Corp.: | |||
| 2.50%, 5/12/20 | 1,001,000 | 988,904 | |
| 2.789%, (3 mo. USD LIBOR + 0.45%), 10/30/20 (5) | 235,000 | 234,597 | |
| 3.059%, (3 mo. USD LIBOR + 0.72%), 1/30/23 (5) | 1,980,000 | 1,972,423 | |
| 3.30%, 10/30/24 | 419,000 | 399,301 | |
| 4.20%, 10/29/25 | 575,000 | 562,435 | |
| Capital One NA, 2.65%, 8/8/22 | 610,000 | 586,710 | |
| CBL & Associates LP: | |||
| 5.25%, 12/1/23 (2) | 68,000 | 58,120 | |
| 5.95%, 12/15/26 (2) | 620,000 | 516,150 | |
| Citigroup, Inc.: | |||
| 2.65%, 10/26/20 | 885,000 | 873,567 | |
| 2.75%, 4/25/22 | 730,000 | 709,632 | |
| 3.142% to 1/24/22, 1/24/23 (7) | 776,000 | 761,678 | |
| 3.292%, (3 mo. USD LIBOR + 0.95%), 7/24/23 (5) | 300,000 | 302,107 | |
| 3.397%, (3 mo. USD LIBOR + 1.07%), 12/8/21 (5) | 300,000 | 305,380 | |
| 3.576%, (3 mo. USD LIBOR + 1.25%), 7/1/26 (5) | 800,000 | 807,489 | |
| 3.887% to 1/10/27, 1/10/28 (7) | 3,320,000 | 3,224,353 | |
| 4.075% to 4/23/28, 4/23/29 (7) | 1,150,000 | 1,129,305 | |
| 4.125%, 7/25/28 (2) | 100,000 | 96,668 | |
| 5.80% to 11/15/19 (7)(8) | 280,000 | 286,230 | |
| 6.125% to 11/15/20 (7)(8) | 140,000 | 146,038 | |
| Citizens Bank NA: | |||
| 2.25%, 3/2/20 | 500,000 | 493,444 | |
| 2.55%, 5/13/21 | 400,000 | 389,914 | |
| Citizens Financial Group, Inc., 2.375%, 7/28/21 | 355,000 | 342,698 | |
| Commonwealth Bank of Australia, 2.50%, 9/18/22 (6) | 550,000 | 527,050 | |
www.calvert.com CALVERT SOCIAL INVESTMENT FUND ANNUAL REPORT 19
| PRINCIPAL AMOUNT ($) | VALUE ($) | ||
| CORPORATE BONDS - CONT’D | |||
| Credit Acceptance Corp.: | |||
| 6.125%, 2/15/21 | 498,000 | 504,848 | |
| 7.375%, 3/15/23 | 480,000 | 504,000 | |
| Crown Castle International Corp.: | |||
| 3.20%, 9/1/24 | 840,000 | 799,946 | |
| 3.65%, 9/1/27 | 422,000 | 397,034 | |
| DDR Corp., 3.625%, 2/1/25 | 517,000 | 490,339 | |
| Digital Realty Trust LP: | |||
| 3.95%, 7/1/22 | 750,000 | 755,180 | |
| 4.75%, 10/1/25 | 525,000 | 538,767 | |
| Discover Bank, 4.682% to 8/9/23, 8/9/28 (7) | 825,000 | 817,550 | |
| Discover Financial Services: | |||
| 3.85%, 11/21/22 | 750,000 | 742,052 | |
| 3.95%, 11/6/24 | 300,000 | 293,608 | |
| EPR Properties: | |||
| 4.50%, 6/1/27 | 845,000 | 808,612 | |
| 4.95%, 4/15/28 | 500,000 | 491,957 | |
| Goldman Sachs Group, Inc. (The): | |||
| 2.876% to 10/31/21, 10/31/22 (7) | 112,000 | 109,321 | |
| 2.905% to 7/24/22, 7/24/23 (7) | 975,000 | 942,466 | |
| 2.908% to 6/5/22, 6/5/23 (7) | 2,020,000 | 1,955,634 | |
| 3.342%, (3 mo. USD LIBOR + 1.00%), 7/24/23 (5) | 545,000 | 551,072 | |
| 3.484%, (3 mo. USD LIBOR + 1.17%), 5/15/26 (5) | 999,000 | 1,000,491 | |
| 3.691% to 6/5/27, 6/5/28 (7) | 70,000 | 66,662 | |
| International Finance Corp., 1.75%, 3/30/20 | 1,780,000 | 1,750,995 | |
| iStar, Inc., 5.00%, 7/1/19 | 236,000 | 236,543 | |
| JPMorgan Chase & Co.: | |||
| 3.237%, (3 mo. USD LIBOR + 0.89%), 7/23/24 (5) | 94,000 | 94,385 | |
| 3.797% to 7/23/23, 7/23/24 (2)(7) | 1,150,000 | 1,149,847 | |
| Series V, 5.00% to 7/1/19 (7)(8) | 1,105,000 | 1,114,669 | |
| Lazard Group LLC, 4.50%, 9/19/28 | 683,000 | 672,369 | |
| Morgan Stanley: | |||
| 2.80%, 6/16/20 | 2,200,000 | 2,183,543 | |
| 2.891%, (3 mo. USD LIBOR + 0.55%), 2/10/21 (5) | 525,000 | 526,784 | |
| 3.277%, (3 mo. USD LIBOR + 0.93%), 7/22/22 (5) | 220,000 | 221,980 | |
| 3.591% to 7/22/27, 7/22/28 (7) | 2,400,000 | 2,278,375 | |
| 3.742%, (3 mo. USD LIBOR + 1.40%), 10/24/23 (5) | 550,000 | 565,483 | |
| 3.772% to 1/24/28, 1/24/29 (7) | 1,000,000 | 960,456 | |
| 4.00%, 7/23/25 | 725,000 | 722,885 | |
| 4.875%, 11/1/22 | 690,000 | 715,401 | |
| 5.45% to 7/15/19 (7)(8) | 200,000 | 202,550 | |
| National Australia Bank Ltd., 3.625%, 6/20/23 | 575,000 | 572,688 | |
| Realogy Group LLC / Realogy Co-Issuer Corp., 4.50%, 4/15/19 (6) | 450,000 | 452,250 | |
20 www.calvert.com CALVERT SOCIAL INVESTMENT FUND ANNUAL REPORT
| PRINCIPAL AMOUNT ($) | VALUE ($) | ||
| CORPORATE BONDS - CONT’D | |||
| Springleaf Finance Corp.: | |||
| 5.25%, 12/15/19 | 300,000 | 305,076 | |
| 6.875%, 3/15/25 | 150,000 | 150,300 | |
| 7.125%, 3/15/26 | 145,000 | 145,000 | |
| Synchrony Financial: | |||
| 3.00%, 8/15/19 | 1,133,000 | 1,130,955 | |
| 3.578%, (3 mo. USD LIBOR + 1.23%), 2/3/20 (5) | 190,000 | 191,272 | |
| 3.95%, 12/1/27 | 1,595,000 | 1,447,832 | |
| Synovus Financial Corp., 3.125%, 11/1/22 | 311,000 | 299,079 | |
| Toronto-Dominion Bank (The), 1.85%, 9/11/20 | 1,000,000 | 977,541 | |
| VFH Parent LLC / Orchestra Co-Issuer, Inc., 6.75%, 6/15/22 (6) | 65,000 | 67,275 | |
| 62,160,879 | |||
| Government - 1.0% | |||
| Asian Development Bank, 3.125%, 9/26/28 | 1,160,000 | 1,151,943 | |
| European Bank for Reconstruction & Development, 0.875%, 7/22/19 | 1,150,000 | 1,133,865 | |
| Inter-American Development Bank, 3.00%, 9/26/22 | 1,160,000 | 1,156,953 | |
| International Bank for Reconstruction & Development, 1.005%, 10/1/18 | 600,000 | 600,000 | |
| International Finance Corp., 2.00%, 10/24/22 | 3,485,000 | 3,346,721 | |
| 7,389,482 | |||
| Industrial - 0.8% | |||
| Carlisle Cos., Inc., 3.50%, 12/1/24 | 327,000 | 313,560 | |
| Jabil, Inc.: | |||
| 4.70%, 9/15/22 | 450,000 | 458,640 | |
| 5.625%, 12/15/20 | 150,000 | 156,450 | |
| Johnson Controls International plc, 4.625%, 7/2/44 | 450,000 | 441,881 | |
| JSL Europe SA, 7.75%, 7/26/24 (6) | 200,000 | 174,250 | |
| Owens Corning: | |||
| 3.40%, 8/15/26 | 800,000 | 734,545 | |
| 4.30%, 7/15/47 | 110,000 | 88,948 | |
| Penske Truck Leasing Co. LP / PTL Finance Corp., 3.375%, 2/1/22 (6) | 765,000 | 754,765 | |
| Reynolds Group Issuer, Inc. / Reynolds Group Issuer LLC, 5.75%, 10/15/20 | 159,903 | 160,503 | |
| SBA Tower Trust: | |||
| 2.877%, 7/10/46 (6) | 600,000 | 590,762 | |
| 3.722%, 4/9/48 (6) | 1,100,000 | 1,090,782 | |
| SMBC Aviation Capital Finance DAC: | |||
| 2.65%, 7/15/21 (6) | 540,000 | 520,735 | |
| 3.00%, 7/15/22 (6) | 467,000 | 448,875 | |
| Wabtec Corp.: | |||
| 3.382%, (3 mo. USD LIBOR + 1.05%), 9/15/21 (5) | 255,000 | 255,556 | |
| 4.70%, 9/15/28 | 150,000 | 147,440 | |
| 6,337,692 | |||
www.calvert.com CALVERT SOCIAL INVESTMENT FUND ANNUAL REPORT 21
| PRINCIPAL AMOUNT ($) | VALUE ($) | ||
| CORPORATE BONDS - CONT’D | |||
| Technology - 2.4% | |||
| Apple, Inc., 3.00%, 6/20/27 | 1,210,000 | 1,152,030 | |
| Broadridge Financial Solutions, Inc., 3.95%, 9/1/20 | 425,000 | 428,882 | |
| CA, Inc., 4.70%, 3/15/27 | 1,000,000 | 1,001,961 | |
| Dell International LLC / EMC Corp.: | |||
| 3.48%, 6/1/19 (6) | 2,640,000 | 2,647,144 | |
| 4.42%, 6/15/21 (6) | 1,815,000 | 1,843,022 | |
| DXC Technology Co.: | |||
| 2.875%, 3/27/20 | 658,000 | 652,747 | |
| 3.271%, (3 mo. USD LIBOR + 0.95%), 3/1/21 (5) | 1,800,000 | 1,800,031 | |
| Hewlett Packard Enterprise Co., 3.105%, (3 mo. USD LIBOR + 0.72%), 10/5/21 (5) | 525,000 | 525,580 | |
| Marvell Technology Group Ltd., 4.20%, 6/22/23 | 158,000 | 157,352 | |
| Microchip Technology, Inc., 4.333%, 6/1/23 (6) | 1,042,000 | 1,036,385 | |
| Microsoft Corp.: | |||
| 2.40%, 8/8/26 | 575,000 | 530,463 | |
| 4.45%, 11/3/45 | 505,000 | 542,069 | |
| NXP BV / NXP Funding LLC: | |||
| 3.875%, 9/1/22 (6) | 200,000 | 198,500 | |
| 4.625%, 6/15/22 (6) | 890,000 | 900,013 | |
| 4.625%, 6/1/23 (6) | 200,000 | 203,540 | |
| Seagate HDD Cayman: | |||
| 3.75%, 11/15/18 | 800,000 | 800,265 | |
| 4.875%, 3/1/24 (2) | 480,000 | 473,544 | |
| 4.875%, 6/1/27 | 640,000 | 599,537 | |
| 5.75%, 12/1/34 | 160,000 | 144,807 | |
| Western Digital Corp., 4.75%, 2/15/26 | 1,938,000 | 1,877,825 | |
| 17,515,697 | |||
| Utilities - 0.6% | |||
| American Water Capital Corp., 2.95%, 9/1/27 | 750,000 | 702,204 | |
| Avangrid, Inc., 3.15%, 12/1/24 | 1,956,000 | 1,866,480 | |
| Consolidated Edison Co. of New York, Inc., 4.45%, 6/15/20 | 300,000 | 305,671 | |
| NextEra Energy Operating Partners LP, 4.25%, 9/15/24 (6) | 750,000 | 737,812 | |
| Public Service Co. of Colorado, 3.70%, 6/15/28 (2) | 548,000 | 548,357 | |
| 4,160,524 | |||
| Total Corporate Bonds (Cost $132,998,721) | 130,577,762 | ||
| ASSET-BACKED SECURITIES - 8.0% | |||
| AASET US Ltd., Series 2018-1A, Class A, 3.844%, 1/16/38 (6) | 210,429 | 208,635 | |
| American Homes 4 Rent, Series 2014-SFR2, Class A, 3.786%, 10/17/36 (6) | 1,213,784 | 1,216,997 | |
| Avant Loans Funding Trust, Series 2017-B, Class A, 2.29%, 6/15/20 (6) | 68,452 | 68,421 | |
| Avis Budget Rental Car Funding AESOP LLC: | |||
| Series 2013-2A, Class A, 2.97%, 2/20/20 (6) | 1,736,667 | 1,737,877 | |
| Series 2014-1A, Class A, 2.46%, 7/20/20 (6) | 1,125,000 | 1,122,199 | |
22 www.calvert.com CALVERT SOCIAL INVESTMENT FUND ANNUAL REPORT
| PRINCIPAL AMOUNT ($) | VALUE ($) | ||
| ASSET-BACKED SECURITIES - CONT’D | |||
| Series 2014-1A, Class C, 3.75%, 7/20/20 (6) | 450,000 | 450,822 | |
| Series 2014-2A, Class A, 2.50%, 2/20/21 (6) | 1,420,000 | 1,408,906 | |
| Citi Held For Asset Issuance: | |||
| Series 2015-PM1, Class C, 5.01%, 12/15/21 (6) | 173,484 | 173,757 | |
| Series 2015-PM3, Class C, 6.99%, 5/16/22 (6) | 155,356 | 155,619 | |
| Coinstar Funding LLC, Series 2017-1A, Class A2, 5.216%, 4/25/47 (6) | 691,250 | 700,138 | |
| Colony Starwood Homes Trust: | |||
| Series 2016-1A, Class C, 4.808%, (1 mo. USD LIBOR + 2.65%), 7/17/33 (5)(6) | 217,369 | 217,817 | |
| Series 2016-1A, Class D, 5.258%, (1 mo. USD LIBOR + 3.10%), 7/17/33 (5)(6) | 198,737 | 199,654 | |
| Conn Funding II LP: | |||
| Series 2017-B, Class A, 2.73%, 7/15/20 (6) | 156,667 | 156,649 | |
| Series 2017-B, Class B, 4.52%, 4/15/21 (6) | 485,000 | 487,692 | |
| Series 2018-A, Class A, 3.25%, 1/15/23 (6) | 441,171 | 441,264 | |
| Series 2018-A, Class B, 4.65%, 1/15/23 (6) | 130,000 | 130,220 | |
| Consumer Loan Underlying Bond Credit Trust: | |||
| Series 2017-NP1, Class B, 3.17%, 4/17/23 (6) | 3,454 | 3,453 | |
| Series 2017-NP1, Class C, 5.13%, 4/17/23 (6) | 441,000 | 444,533 | |
| Series 2017-P1, Class A, 2.42%, 9/15/23 (6) | 307,747 | 306,975 | |
| Series 2017-P2, Class A, 2.61%, 1/15/24 (6) | 60,198 | 59,897 | |
| Credit Acceptance Auto Loan Trust, Series 2017-2A, Class A, 2.55%, 2/17/26 (6) | 625,000 | 619,528 | |
| DB Master Finance LLC: | |||
| Series 2015-1A, Class A2II, 3.98%, 2/20/45 (6) | 590,580 | 591,331 | |
| Series 2017-1A, Class A2II, 4.03%, 11/20/47 (6) | 168,725 | 165,901 | |
| Dell Equipment Finance Trust, Series 2017-1, Class A3, 2.14%, 4/22/22 (6) | 500,000 | 498,346 | |
| DRB Prime Student Loan Trust, Series 2016-B, Class A2, 2.89%, 6/25/40 (6) | 384,574 | 380,256 | |
| Driven Brands Funding LLC: | |||
| Series 2015-1A, Class A2, 5.216%, 7/20/45 (6) | 719,650 | 740,796 | |
| Series 2016-1A, Class A2, 6.125%, 7/20/46 (6) | 294,000 | 305,710 | |
| Series 2018-1A, Class A2, 4.739%, 4/20/48 (6) | 59,850 | 59,591 | |
| Element Rail Leasing I LLC: | |||
| Series 2014-1A, Class A1, 2.299%, 4/19/44 (6) | 106,512 | 105,248 | |
| Series 2014-1A, Class B1, 4.406%, 4/19/44 (6) | 700,000 | 698,237 | |
| FOCUS Brands Funding LLC: | |||
| Series 2017-1A, Class A2I, 3.857%, 4/30/47 (6) | 612,250 | 611,146 | |
| Series 2017-1A, Class A2II, 5.093%, 4/30/47 (6) | 355,500 | 360,898 | |
| Ford Credit Auto Owner Trust/Ford Credit, Series 2014-1, Class B, 2.41%, 11/15/25 (6) | 400,000 | 398,974 | |
| FRS I LLC, Series 2013-1A, Class A2, 3.08%, 4/15/43 (6) | 762,299 | 760,368 | |
| Hardee’s Funding LLC, Series 2018-1A, Class A2I, 4.25%, 6/20/48 (6) | 520,000 | 520,010 | |
| InSite Issuer LLC, Series 2016-1A, Class C, 6.414%, 11/15/46 (6) | 50,000 | 49,521 | |
| Invitation Homes Trust: | |||
| Series 2017-SFR2, Class B, 3.308%, (1 mo. USD LIBOR + 1.15%), 12/17/36 (5)(6) | 187,000 | 187,778 | |
| Series 2017-SFR2, Class C, 3.608%, (1 mo. USD LIBOR + 1.45%), 12/17/36 (5)(6) | 237,000 | 238,318 | |
| Series 2018-SFR1, Class C, 3.408%, (1 mo. USD LIBOR + 1.25%), 3/17/37 (5)(6) | 220,000 | 220,393 | |
| Series 2018-SFR2, Class A, 3.058%, (1 mo. USD LIBOR + 0.90%), 6/17/37 (5)(6) | 2,055,133 | 2,060,307 | |
www.calvert.com CALVERT SOCIAL INVESTMENT FUND ANNUAL REPORT 23
| PRINCIPAL AMOUNT ($) | VALUE ($) | ||
| ASSET-BACKED SECURITIES - CONT’D | |||
| Series 2018-SFR2, Class D, 3.608%, (1 mo. USD LIBOR + 1.45%), 6/17/37 (5)(6) | 325,000 | 324,095 | |
| Series 2018-SFR3, Class A, 3.158%, (1 mo. USD LIBOR + 1.00%), 7/17/37 (5)(6) | 919,146 | 926,466 | |
| Series 2018-SFR3, Class D, 3.808%, (1 mo. USD LIBOR + 1.65%), 7/17/37 (5)(6) | 310,000 | 312,984 | |
| Marlette Funding Trust, Series 2017-1A, Class B, 4.114%, 3/15/24 (6) | 200,000 | 200,764 | |
| NextGear Floorplan Master Owner Trust, Series 2015-2A, Class A, 2.38%, 10/15/20 (6) | 1,625,000 | 1,624,879 | |
| OneMain Financial Issuance Trust: | |||
| Series 2015-1A, Class A, 3.19%, 3/18/26 (6) | 671,744 | 673,432 | |
| Series 2015-2A, Class A, 2.57%, 7/18/25 (6) | 25,319 | 25,347 | |
| Series 2016-2A, Class A, 4.10%, 3/20/28 (6) | 316,236 | 318,300 | |
| Series 2017-1A, Class A1, 2.37%, 9/14/32 (6) | 965,000 | 948,849 | |
| Oportun Funding VI LLC: | |||
| Series 2017-A, Class A, 3.23%, 6/8/23 (6) | 355,000 | 349,431 | |
| Series 2018-B, Class A, 3.91%, 7/8/24 (6) | 2,486,000 | 2,479,168 | |
| Planet Fitness Master Issuer LLC: | |||
| Series 2018-1A, Class A2I, 4.262%, 9/5/48 (6) | 1,040,000 | 1,040,190 | |
| Series 2018-1A, Class A2II, 4.666%, 9/5/48 (6) | 145,000 | 143,796 | |
| Progress Residential Trust, Series 2016-SFR2, Class E, 5.708%, (1 mo. USD LIBOR + 3.55%), 1/17/34 (5)(6) | 290,000 | 292,801 | |
| Prosper Marketplace Issuance Trust: | |||
| Series 2017-1A, Class A, 2.56%, 6/15/23 (6) | 256,616 | 256,575 | |
| Series 2017-1A, Class B, 3.65%, 6/15/23 (6) | 300,000 | 300,497 | |
| Series 2017-1A, Class C, 5.80%, 6/15/23 (6) | 445,000 | 450,316 | |
| Series 2017-2A, Class A, 2.41%, 9/15/23 (6) | 132,710 | 132,584 | |
| Series 2017-2A, Class B, 3.48%, 9/15/23 (6) | 300,000 | 299,920 | |
| Series 2017-3A, Class A, 2.36%, 11/15/23 (6) | 1,820,270 | 1,815,755 | |
| Series 2017-3A, Class B, 3.36%, 11/15/23 (6) | 1,670,000 | 1,659,879 | |
| Series 2018-1A, Class A, 3.11%, 6/17/24 (6) | 775,027 | 775,314 | |
| Series 2018-2A, Class A, 3.35%, 10/15/24 (6) | 1,770,000 | 1,770,122 | |
| Series 2018-2A, Class B, 3.96%, 10/15/24 (6) | 920,000 | 921,972 | |
| RenewFund Receivables Trust, Series 2015-1, Class A, 3.51%, 4/15/25 (6) | 230,669 | 228,325 | |
| SBA Tower Trust, Series 2014-2A, Class C, 3.869%, 10/15/49 (6) | 1,000,000 | 998,929 | |
| Sierra Timeshare Receivables Funding LLC: | |||
| Series 2014-2A, Class B, 2.40%, 6/20/31 (6) | 568,416 | 567,440 | |
| Series 2014-3A, Class B, 2.80%, 10/20/31 (6) | 70,586 | 70,126 | |
| Social Professional Loan Program LLC: | |||
| Series 2014-B, Class A1, 3.466%, (1 mo. USD LIBOR + 1.25%), 8/25/32 (5)(6) | 78,271 | 78,977 | |
| Series 2014-B, Class A2, 2.55%, 8/27/29 (6) | 215,940 | 214,043 | |
| SolarCity LMC: | |||
| Series 2013-1, Class A, 4.80%, 11/20/38 (6) | 645,210 | 649,480 | |
| Series 2014-1, Class A, 4.59%, 4/20/44 (6) | 538,804 | 540,097 | |
| Series 2014-2, Class A, 4.02%, 7/20/44 (6) | 868,459 | 851,807 | |
| Series 2014-2, Class B, 5.44%, 7/20/44 (6) | 1,760,499 | 1,692,024 | |
| SpringCastle America Funding LLC, Series 2016-AA, Class A, 3.05%, 4/25/29 (6) | 1,558,212 | 1,553,299 | |
| Springleaf Funding Trust: | |||
| Series 2015-AA, Class B, 3.62%, 11/15/24 (6) | 600,000 | 598,484 | |
| Series 2016-AA, Class A, 2.90%, 11/15/29 (6) | 1,450,000 | 1,446,382 | |
24 www.calvert.com CALVERT SOCIAL INVESTMENT FUND ANNUAL REPORT
| PRINCIPAL AMOUNT ($) | VALUE ($) | ||
| ASSET-BACKED SECURITIES - CONT’D | |||
| Spruce ABS Trust, Series 2016-E1, Class A, 4.32%, 6/15/28 (6) | 245,402 | 246,289 | |
| Sunrun Callisto Issuer LLC, Series 2015-1A, Class B, 5.38%, 7/20/45 (6) | 532,571 | 516,362 | |
| Taco Bell Funding LLC, Series 2016-1A, Class A2I, 3.832%, 5/25/46 (6) | 1,812,400 | 1,815,562 | |
| TES LLC, Series 2017-1A, Class A, 4.33%, 10/20/47 (6) | 779,562 | 762,346 | |
| Tesla Auto Lease Trust, Series 2018-A, Class A, 2.32%, 12/20/19 (6) | 1,057,510 | 1,054,760 | |
| Thunderbolt Aircraft Lease Ltd., Series 2017-A, Class C, 4.50%, 5/17/32 (6) | 222,619 | 212,048 | |
| Toyota Auto Receivables Owner Trust, Series 2016-B, Class A4, 1.52%, 8/16/21 | 1,865,000 | 1,840,109 | |
| United States Small Business Administration, Series 2017-20E, Class 1, 2.88%, 5/1/37 | 1,663,718 | 1,602,714 | |
| Vantage Data Centers Issuer LLC, Series 2018-1A, Class A2, 4.072%, 2/16/43 (6) | 697,905 | 699,059 | |
| VB-S1 Issuer LLC, Series 2016-1A, Class C, 3.065%, 6/15/46 (6) | 600,000 | 588,832 | |
| Verizon Owner Trust, Series 2016-1A, Class A, 1.42%, 1/20/21 (6) | 278,845 | 277,882 | |
| Wendys Funding LLC, Series 2015-1A, Class A2II, 4.08%, 6/15/45 (6) | 2,279,500 | 2,285,419 | |
| Total Asset-Backed Securities (Cost $59,050,361) | 58,698,413 | ||
| U.S. TREASURY OBLIGATIONS - 4.3% | |||
| U.S. Treasury Bonds: | |||
| 2.75%, 8/15/47 | 16,741,000 | 15,327,170 | |
| 2.75%, 11/15/47 | 545,000 | 498,717 | |
| 3.125%, 5/15/48 | 1,225,000 | 1,208,348 | |
| U.S. Treasury Inflation-Protected Bond, 1.75%, 1/15/28 (9) | 4,744,277 | 5,082,832 | |
| U.S. Treasury Inflation-Protected Note, 0.125%, 4/15/22 (9) | 5,274,411 | 5,126,549 | |
| U.S. Treasury Notes: | |||
| 2.75%, 7/31/23 | 1,622,000 | 1,607,966 | |
| 2.875%, 8/15/28 | 2,775,000 | 2,733,321 | |
| Total U.S. Treasury Obligations (Cost $33,210,018) | 31,584,903 | ||
| COLLATERALIZED MORTGAGE-BACKED OBLIGATIONS - 1.8% | |||
| Bellemeade Re Ltd., Series 2015-1A, Class M2, 6.516%, (1 mo. USD LIBOR + 4.30%), 7/25/25 (5)(6) | 376,735 | 380,795 | |
| Federal Home Loan Mortgage Corp. Multifamily Structured Pass Through Certificates: | |||
| Series KW06, Class A2, 3.80%, 6/25/28 | 1,135,000 | 1,150,496 | |
| Series W5FX, Class AFX, 3.336%, 4/25/28 | 412,500 | 400,084 | |
| Federal Home Loan Mortgage Corp. Structured Agency Credit Risk Debt Notes: | |||
| Series 2015-HQ2, Class M3, 5.466%, (1 mo. USD LIBOR + 3.25%), 5/25/25 (5) | 720,000 | 810,044 | |
| Series 2015-HQA2, Class M2, 5.016%, (1 mo. USD LIBOR + 2.80%), 5/25/28 (5) | 354,529 | 365,608 | |
| Series 2016-DNA2, Class M2, 4.416%, (1 mo. USD LIBOR + 2.20%), 10/25/28 (5) | 325,428 | 329,060 | |
| Series 2017-DNA3, Class M2, 4.716%, (1 mo. USD LIBOR + 2.50%), 3/25/30 (5) | 360,000 | 376,788 | |
| Series 2017-HQA2, Class M2, 4.866%, (1 mo. USD LIBOR + 2.65%), 12/25/29 (5) | 435,000 | 456,663 | |
| Series 2018-DNA1, Class M1, 2.666%, (1 mo. USD LIBOR + 0.45%), 7/25/30 (5) | 578,872 | 578,658 | |
| Series 2018-DNA2, Class B1, 5.916%, (1 mo. USD LIBOR + 3.70%), 12/25/30 (5)(6) | 80,000 | 80,389 | |
| Series 2018-HQA1, Class M2, 4.516%, (1 mo. USD LIBOR + 2.30%), 9/25/30 (5) | 320,000 | 324,476 | |
| Federal National Mortgage Association Connecticut Avenue Securities: | |||
| Series 2013-C01, Class M2, 7.466%, (1 mo. USD LIBOR + 5.25%), 10/25/23 (5) | 1,100,000 | 1,269,670 | |
www.calvert.com CALVERT SOCIAL INVESTMENT FUND ANNUAL REPORT 25
| PRINCIPAL AMOUNT ($) | VALUE ($) | ||
| COLLATERALIZED MORTGAGE-BACKED OBLIGATIONS - CONT’D | |||
| Series 2014-C02, Class 1M2, 4.816%, (1 mo. USD LIBOR + 2.60%), 5/25/24 (5) | 1,320,000 | 1,410,665 | |
| Series 2014-C02, Class 2M2, 4.816%, (1 mo. USD LIBOR + 2.60%), 5/25/24 (5) | 474,395 | 504,471 | |
| Series 2014-C03, Class 1M2, 5.216%, (1 mo. USD LIBOR + 3.00%), 7/25/24 (5) | 922,472 | 994,720 | |
| Series 2014-C03, Class 2M2, 5.116%, (1 mo. USD LIBOR + 2.90%), 7/25/24 (5) | 802,431 | 858,464 | |
| Series 2014-C04, Class 1M2, 7.116%, (1 mo. USD LIBOR + 4.90%), 11/25/24 (5) | 223,698 | 256,991 | |
| Series 2016-C06, Class 1M2, 6.466%, (1 mo. USD LIBOR + 4.25%), 4/25/29 (5) | 400,000 | 456,016 | |
| Series 2017-C05, Class 1M2, 4.416%, (1 mo. USD LIBOR + 2.20%), 1/25/30 (5) | 405,000 | 417,871 | |
| Series 2017-C06, Class 1M2, 4.866%, (1 mo. USD LIBOR + 2.65%), 2/25/30 (5) | 645,000 | 674,734 | |
| Series 2018-C03, Class 1B1, 5.966%, (1 mo. USD LIBOR + 3.75%), 10/25/30 (5) | 166,000 | 166,801 | |
| Series 2018-C03, Class 1M1, 2.896%, (1 mo. USD LIBOR + 0.68%), 10/25/30 (5) | 239,404 | 239,977 | |
| Federal National Mortgage Association Grantor Trust, Series 2017-T1, Class A, 2.898%, 6/25/27 | 549,389 | 521,673 | |
| Toorak Mortgage Corp. Ltd., Series 2018-1, Class A1, 4.336% to 4/25/21, 8/25/21 (6)(10) | 140,000 | 140,335 | |
| Total Collateralized Mortgage-Backed Obligations (Cost $12,781,786) | 13,165,449 | ||
| COMMERCIAL MORTGAGE-BACKED SECURITIES - 1.0% | |||
| CLNS Trust, Series 2017-IKPR, Class B, 3.131%, (1 mo. USD LIBOR + 1.00%), 6/11/32 (5)(6) | 1,230,000 | 1,231,834 | |
| JP Morgan Chase Commercial Mortgage Securities Trust: | |||
| Series 2014-DSTY, Class A, 3.429%, 6/10/27 (6) | 200,000 | 198,306 | |
| Series 2014-DSTY, Class B, 3.771%, 6/10/27 (6) | 550,000 | 544,499 | |
| Series 2014-DSTY, Class C, 3.931%, 6/10/27 (6) | 225,000 | 218,462 | |
| Morgan Stanley Capital I Trust, Series 2017-CLS, Class A, 2.858%, (1 mo. USD LIBOR + 0.70%), 11/15/34 (5)(6) | 1,000,000 | 999,652 | |
| Motel 6 Trust: | |||
| Series 2017-MTL6, Class C, 3.558%, (1 mo. USD LIBOR + 1.40%), 8/15/34 (5)(6) | 740,828 | 742,471 | |
| Series 2017-MTL6, Class D, 4.308%, (1 mo. USD LIBOR + 2.15%), 8/15/34 (5)(6) | 401,887 | 403,655 | |
| Series 2017-MTL6, Class E, 5.408%, (1 mo. USD LIBOR + 3.25%), 8/15/34 (5)(6) | 119,114 | 120,282 | |
RETL Trust: Series 2018-RVP, Class A, 3.258%, (1 mo. USD LIBOR + 1.10%), 3/15/33 (5)(6) | 1,393,690 | 1,400,364 | |
| Series 2018-RVP, Class C, 4.208%, (1 mo. USD LIBOR + 2.05%), 3/15/33 (5)(6) | 145,354 | 146,530 | |
| TRU Trust, Series 2016-TOYS, Class A, 4.408%, (1 mo. USD LIBOR + 2.25%), 11/15/30 (5)(6) | 292,672 | 292,791 | |
| WFLD Mortgage Trust, Series 2014-MONT, Class C, 3.88%, 8/10/31 (6) | 850,000 | 786,059 | |
| Total Commercial Mortgage-Backed Securities (Cost $7,155,166) | 7,084,905 | ||
| TAXABLE MUNICIPAL OBLIGATIONS - 0.7% | |||
| General Obligations - 0.4% | |||
| Los Angeles Unified School District, California, 5.75%, 7/1/34 (11) | 800,000 | 948,176 | |
| Massachusetts, Green Bonds, 3.277%, 6/1/46 | 880,000 | 779,513 | |
| New York City, 5.206%, 10/1/31 (11) | 1,275,000 | 1,416,908 | |
| 3,144,597 | |||
26 www.calvert.com CALVERT SOCIAL INVESTMENT FUND ANNUAL REPORT
| PRINCIPAL AMOUNT ($) | VALUE ($) | ||
| TAXABLE MUNICIPAL OBLIGATIONS - CONT’D | |||
| Special Tax Revenue - 0.2% | |||
| Connecticut, Special Tax Revenue, 5.459%, 11/1/30 (11) | 400,000 | 441,392 | |
| New York City Transitional Finance Authority, Future Tax Secured Revenue Bonds, 5.767%, 8/1/36 (11) | 1,000,000 | 1,170,450 | |
| 1,611,842 | |||
| Water and Sewer - 0.1% | |||
| District of Columbia Water & Sewer Authority, Green Bonds, 4.814%, 10/1/2114 | 270,000 | 295,107 | |
| Total Taxable Municipal Obligations (Cost $5,212,823) | 5,051,546 | ||
| HIGH SOCIAL IMPACT INVESTMENTS - 0.7% | |||
| Calvert Impact Capital, Inc., Community Investment Notes, 1.50%, 12/15/19 (3)(12) | 4,266,666 | 4,106,026 | |
| ImpactAssets Inc., Global Sustainable Agriculture Notes, 2.50%, 11/3/20 (3)(4)(13) | 393,000 | 369,027 | |
| ImpactAssets Inc., Microfinance Plus Notes, 2.40%, 11/3/20 (3)(4)(13) | 506,000 | 462,990 | |
| Total High Social Impact Investments (Cost $5,165,666) | 4,938,043 | ||
| U.S. GOVERNMENT AGENCY MORTGAGE-BACKED SECURITIES - 0.7% | |||
| Federal National Mortgage Association: | |||
| 2.65%, 6/1/26 | 625,756 | 598,072 | |
| 2.68%, 7/1/26 | 650,000 | 619,297 | |
| 2.878%, 2/25/27 (14) | 640,520 | 627,116 | |
| 3.037%, 9/25/27 (14) | 1,350,000 | 1,285,515 | |
| 3.144%, 3/25/28 (14) | 690,000 | 661,217 | |
| 3.436%, 6/25/28 (14) | 989,231 | 967,748 | |
| Total U.S. Government Agency Mortgage-Backed Securities (Cost $4,957,716) | 4,758,965 | ||
| SOVEREIGN GOVERNMENT BONDS - 0.2% | |||
| Export Development Canada, 1.25%, 12/10/18 | 1,140,000 | 1,137,031 | |
| Nacional Financiera SNC, 3.375%, 11/5/20 (6) | 560,000 | 556,506 | |
| Total Sovereign Government Bonds (Cost $1,697,412) | 1,693,537 | ||
| U.S. GOVERNMENT AGENCIES AND INSTRUMENTALITIES - 0.1% | |||
| Overseas Private Investment Corp., 3.22%, 9/15/29 | 871,261 | 866,670 | |
| Total U.S. Government Agencies and Instrumentalities (Cost $871,261) | 866,670 | ||
www.calvert.com CALVERT SOCIAL INVESTMENT FUND ANNUAL REPORT 27
| SHARES | VALUE ($) | ||
| PREFERRED STOCKS - 0.1% | |||
| Venture Capital - 0.1% | |||
| Consensus Orthopedics, Inc.: | |||
| Series A-1 (1)(3)(4) | 420,683 | 5,637 | |
| Series B (1)(3)(4) | 348,940 | 4,431 | |
| Series C (1)(3)(4) | 601,710 | 8,364 | |
| Kickboard: | |||
| Series A (1)(3)(4) | 1,155,503 | 228,905 | |
| Series A2 (1)(3)(4) | 404,973 | 88,001 | |
| LearnZillion, Inc.: | |||
| Series A (1)(3)(4) | 169,492 | 91,187 | |
| Series A-1 (1)(3)(4) | 108,678 | 66,033 | |
| Lumni, Inc. Series B (1)(3)(4) | 17,265 | 124,280 | |
| MACH Energy: | |||
| Series A (1)(3)(4) | 27,977 | 9,669 | |
| Series B (1)(3)(4) | 26,575 | 11,661 | |
| Wind Harvest Co., Inc. (1)(3)(4) | 8,696 | — | |
| 638,168 | |||
| Total Preferred Stocks (Cost $1,132,578) | 638,168 | ||
| VENTURE CAPITAL LIMITED PARTNERSHIP INTERESTS - 0.1% | |||
| Commons Capital LP (1)(3)(4) | 46,560 | ||
| First Analysis Private Equity Fund IV LP (1)(3)(4) | 453,523 | ||
| GEEMF Partners LP (1)(3)(4)(12) | 18,482 | ||
| Global Environment Emerging Markets Fund LP (1)(3)(4) | 44,175 | ||
| Solstice Capital LP (1)(3)(4) | 61,637 | ||
| Total Venture Capital Limited Partnership Interests (Cost $132,194) | 624,377 | ||
| PRINCIPAL AMOUNT ($) | VALUE ($) | ||
| VENTURE CAPITAL DEBT OBLIGATIONS - 0.0% (15) | |||
| Kickboard Bridge Note, 8.00%, 4/6/19 (3)(4) | 41,000 | 32,887 | |
| Total Venture Capital Debt Obligations (Cost $41,000) | 32,887 | ||
| FLOATING RATE LOANS (16) - 0.8% | |||
| Building and Development - 0.1% | |||
| DTZ U.S. Borrower, LLC, Term Loan, 5.492%, (1 mo. USD LIBOR + 3.25%), 8/21/25 | 600,000 | 602,750 | |
| Business Equipment and Services - 0.1% | |||
| Change Healthcare Holdings, LLC, Term Loan, 4.992%, (1 mo. USD LIBOR + 2.75%), 3/1/24 | 521,970 | 524,289 | |
28 www.calvert.com CALVERT SOCIAL INVESTMENT FUND ANNUAL REPORT
| PRINCIPAL AMOUNT ($) | VALUE ($) | ||
| FLOATING RATE LOANS (16) - CONT’D | |||
| Cable and Satellite Television - 0.1% | |||
| UPC Financing Partnership, Term Loan, 4.658%, (1 mo. USD LIBOR + 2.50%), 1/15/26 | 399,797 | 399,964 | |
| Ziggo Secured Finance Partnership, Term Loan, 4.658%, (1 mo. USD LIBOR + 2.50%), 4/15/25 | 480,000 | 471,825 | |
| 871,789 | |||
| Drugs - 0.1% | |||
| Jaguar Holding Company II, Term Loan, 4.742%, (1 mo. USD LIBOR + 2.50%), 8/18/22 | 915,270 | 916,986 | |
| Electronics/Electrical - 0.2% | |||
| Infor (US), Inc., Term Loan, 5.136%, (3 mo. USD LIBOR + 2.75%), 2/1/22 | 903,157 | 906,624 | |
| MA FinanceCo., LLC, Term Loan, 4.742%, (1 mo. USD LIBOR + 2.50%), 6/21/24 | 38,596 | 38,452 | |
| Seattle Spinco, Inc., Term Loan, 4.742%, (1 mo. USD LIBOR + 2.50%), 6/21/24 | 260,652 | 259,479 | |
| 1,204,555 | |||
| Equipment Leasing - 0.1% | |||
| Avolon TLB Borrower 1 (US), LLC, Term Loan, 4.165%, (1 mo. USD LIBOR + 2.00%), 1/15/25 | 867,825 | 871,624 | |
| Financial - 0.0% (15) | |||
| Alliance Mortgage Investments, Term Loan, 0.00%, 6/1/10 (1)(3)(4)(17) | 385,345 | 6,078 | |
| Food/Drug Retailers - 0.1% | |||
| Albertsons, LLC, Term Loan, 4.992%, (1 mo. USD LIBOR + 2.75%), 8/25/21 | 477,582 | 478,687 | |
| Total Floating Rate Loans (Cost $5,844,069) | 5,476,758 | ||
| COMMERCIAL PAPER - 0.1% | |||
| AT&T, Inc., 3.135%, 5/28/19 (6) | 1,050,000 | 1,029,968 | |
| Total Commercial Paper (Cost $1,029,087) | 1,029,968 | ||
| SHARES | VALUE ($) | ||
| SHORT TERM INVESTMENT OF CASH COLLATERAL FOR SECURITIES LOANED - 0.1% | |||
| State Street Navigator Securities Lending Government Money Market Portfolio, 2.16% | 874,433 | 874,433 | |
| Total Short Term Investment of Cash Collateral for Securities Loaned (Cost $874,433) | 874,433 | ||
| TOTAL INVESTMENTS (Cost $658,674,856) - 99.1% | 725,577,943 | ||
| Other assets and liabilities, net - 0.9% | 6,425,828 | ||
NET ASSETS - 100.0% | 732,003,771 | ||
www.calvert.com CALVERT SOCIAL INVESTMENT FUND ANNUAL REPORT 29
| NOTES TO SCHEDULE OF INVESTMENTS | |
| (1) Non-income producing security. | |
| (2) All or a portion of this security was on loan at September 30, 2018. The aggregate market value of securities on loan at September 30, 2018 was $16,105,529. | |
| (3) Restricted security. Total market value of restricted securities amounts to $7,811,708, which represents 1.1% of the net assets of the Fund as of September 30, 2018. | |
| (4) For fair value measurement purposes, security is categorized as Level 3 (see Note 1A). | |
| (5) Variable rate security. The stated interest rate represents the rate in effect at September 30, 2018. | |
| (6) Security is exempt from registration under Rule 144A of the Securities Act of 1933. These securities may be resold in transactions exempt from registration, normally to qualified institutional buyers. Total market value of Rule 144A securities amounts to $83,411,243, which represents 11.4% of the net assets of the Fund as of September 30, 2018. | |
| (7) Security converts to floating rate after the indicated fixed-rate coupon period. | |
| (8) Perpetual security with no stated maturity date but may be subject to calls by the issuer. | |
| (9) Inflation-linked security whose principal is adjusted for inflation based on changes in the U.S. Consumer Price Index. Interest is calculated based on the inflation-adjusted principal. | |
| (10) Step coupon security. The interest rate disclosed is that which is in effect on September 30, 2018. | |
| (11) Build America Bond. Represents taxable municipal obligation issued pursuant to the American Recovery and Reinvestment Act of 2009 or other legislation providing for the issuance of taxable municipal debt on which the issuer receives federal support. | |
| (12) Affiliated company (see Note 8). | |
| (13) Notes carry an interest rate that varies by period and is contingent on the performance of the underlying portfolio of loans to borrowers. The coupon rate shown represents the rate in effect at September 30, 2018. | |
| (14) Weighted average fixed-rate coupon that changes/updates monthly. Rate shown is the rate at September 30, 2018. | |
| (15) Amount is less than 0.05%. | |
| (16) Remaining maturities of floating rate loans may be less than the stated maturities shown as a result of contractual or optional prepayments by the borrower. Such prepayments cannot be predicted with certainty. Floating rate loans generally pay interest at rates which are periodically re-determined at a spread above the London Interbank Offered Rate (“LIBOR”) or other short-term rates. The rate shown is the rate in effect at September 30, 2018. Floating rate loans are generally considered restrictive in that the Fund is ordinarily contractually obligated to receive consent from the Agent Bank and/or borrower prior to disposition of a floating rate loan. | |
| (17) Alliance Bancorp and its affiliates filed for Chapter 7 bankruptcy on July 13, 2007. This security is no longer accruing interest. | |
| FUTURES CONTRACTS | NUMBER OF CONTRACTS | EXPIRATION MONTH/YEAR | NOTIONAL AMOUNT | VALUE/NET UNREALIZED APPRECIATION (DEPRECIATION) | ||||
| Long: | ||||||||
| U.S. 2-Year Treasury Note | 63 | Dec-18 | $13,276,266 | ($36,536 | ) | |||
| U.S. Ultra 10-Year Treasury Note | 19 | Dec-18 | 2,394,000 | (32,488 | ) | |||
| U.S. Ultra-Long Treasury Bond | 28 | Dec-18 | 4,319,875 | (139,616 | ) | |||
| Total Long | ($208,640 | ) | ||||||
| Short: | ||||||||
| U.S. 5-Year Treasury Note | (22) | Dec-18 | ($2,474,484 | ) | $18,757 | |||
| Abbreviations: | |
| ADR: | American Depositary Receipt |
| LIBOR: | London Interbank Offered Rate |
| Currency Abbreviations: | |
| USD: | United States Dollar |
30 www.calvert.com CALVERT SOCIAL INVESTMENT FUND ANNUAL REPORT
| RESTRICTED SECURITIES | ACQUISITION DATES | COST ($) | |
| Alliance Mortgage Investments, Term Loan, 0.00%, 6/1/10 | 5/26/05-6/13/07 | 385,345 | |
| Calvert Impact Capital, Inc., Community Investment Notes, 1.50%, 12/15/19 | 12/15/16 | 4,266,666 | |
| CFBanc Corp., Common Stock | 3/14/03 | 270,000 | |
| Commons Capital LP | 2/15/01-12/27/11 | 132,194 | |
| Consensus Orthopedics, Inc., Common Stock | 2/10/06 | 504,331 | |
| Consensus Orthopedics, Inc., Series A-1, Preferred | 8/19/05 | 4,331 | |
| Consensus Orthopedics, Inc., Series B, Preferred | 2/10/06 | 139,576 | |
| Consensus Orthopedics, Inc., Series C, Preferred | 2/10/06 | 120,342 | |
| First Analysis Private Equity Fund IV LP | 2/25/02-7/6/11 | — | |
| GEEMF Partners LP | 2/28/97 | — | |
| Global Environment Emerging Markets Fund LP | 1/14/94-12/1/95 | — | |
| ImpactAssets Inc., Global Sustainable Agriculture Notes, 2.50%, 11/3/20 | 11/13/15 | 393,000 | |
| ImpactAssets Inc., Microfinance Plus Notes, 2.40%, 11/3/20 | 11/13/15 | 506,000 | |
| Kickboard, Common Stock | 5/23/13 | — | |
| Kickboard, Series A, Preferred | 2/12/13 | 285,328 | |
| Kickboard, Series A2, Preferred | 6/19/14 | 100,000 | |
| Kickboard Bridge Note, 8.00%, 4/6/19 | 9/16/15 | 41,000 | |
| Learn Capital Venture Partners III LP, Common Stock | 8/30/16-9/18/18 | 891,063 | |
| LearnZillion, Inc., Series A, Preferred | 3/27/12 | 100,000 | |
| LearnZillion, Inc., Series A-1, Preferred | 4/23/13 | 134,761 | |
| Lumni, Inc., Series B, Preferred | 8/8/13 | 116,367 | |
| MACH Energy, Common Stock | 10/31/08 | 889 | |
| MACH Energy, Series A, Preferred | 5/31/02 | 11,426 | |
| MACH Energy, Series B, Preferred | 12/20/05 | 20,447 | |
| Neighborhood Bancorp, Class A, Common Stock | 6/25/97 | 100,000 | |
| Solstice Capital LP | 6/26/01-6/17/08 | — | |
| Wind Harvest Co., Inc., Preferred | 5/16/94 | 100,000 | |
| See notes to financial statements. | |||
www.calvert.com CALVERT SOCIAL INVESTMENT FUND ANNUAL REPORT 31
CALVERT BOND FUND
SCHEDULE OF INVESTMENTS
SEPTEMBER 30, 2018
| PRINCIPAL AMOUNT ($) | VALUE ($) | |
| CORPORATE BONDS - 47.0% | ||
| Basic Materials - 0.3% | ||
| Reliance Steel & Aluminum Co., 4.50%, 4/15/23 | 3,000,000 | 3,047,773 |
| Communications - 3.2% | ||
| AT&T, Inc.: | ||
| 3.514%, (3 mo. USD LIBOR + 1.18%), 6/12/24 (1) | 1,350,000 | 1,357,120 |
| 3.80%, 3/15/22 | 2,800,000 | 2,812,467 |
| 3.80%, 3/1/24 | 2,140,000 | 2,120,974 |
| 4.10%, 2/15/28 (2) | 5,300,000 | 5,146,263 |
| Comcast Corp., 3.20%, 7/15/36 | 3,824,000 | 3,192,872 |
| Crown Castle Towers LLC, 3.663%, 5/15/45 (2) | 2,100,000 | 2,063,124 |
| NBCUniversal Media LLC, 4.45%, 1/15/43 | 1,500,000 | 1,432,427 |
| Time Warner, Inc., 5.35%, 12/15/43 | 1,000,000 | 988,219 |
| Verizon Communications, Inc.: | ||
| 3.414%, (3 mo. USD LIBOR + 1.10%), 5/15/25 (1) | 2,386,000 | 2,408,776 |
| 3.50%, 11/1/24 (3) | 3,705,000 | 3,659,748 |
| 4.329%, 9/21/28 (2) | 3,932,000 | 3,962,402 |
| 4.862%, 8/21/46 | 5,450,000 | 5,471,661 |
| 34,616,053 | ||
| Consumer, Cyclical - 5.7% | ||
| American Airlines Pass-Through Trust: | ||
| 4.40%, 3/22/25 | 2,458,828 | 2,456,873 |
| 5.25%, 7/15/25 | 1,906,131 | 1,969,622 |
| 5.60%, 1/15/22 (2) | 378,932 | 386,511 |
| Azul Investments LLP, 5.875%, 10/26/24 (2) | 1,490,000 | 1,294,750 |
| CVS Health Corp.: | ||
| 3.70%, 3/9/23 | 5,846,000 | 5,825,754 |
| 4.30%, 3/25/28 | 5,349,000 | 5,306,425 |
| CVS Pass-Through Trust, 6.036%, 12/10/28 | 1,871,594 | 1,998,212 |
| Ford Motor Credit Co. LLC: | ||
| 2.262%, 3/28/19 | 1,308,000 | 1,303,628 |
| 2.875%, 10/1/18 | 4,985,000 | 4,985,000 |
| 2.979%, 8/3/22 | 10,900,000 | 10,346,698 |
| 3.079%, (3 mo. USD LIBOR + 0.88%), 10/12/21 (1) | 3,522,000 | 3,490,896 |
| 3.147%, (3 mo. USD LIBOR + 0.81%), 4/5/21 (1) | 1,460,000 | 1,451,333 |
| Latam Airlines Pass-Through Trust, 4.20%, 8/15/29 | 1,689,811 | 1,634,893 |
| Lennar Corp., 4.50%, 11/15/19 | 2,425,000 | 2,449,250 |
| Newell Brands, Inc., 3.85%, 4/1/23 | 2,050,000 | 2,008,192 |
| Nordstrom, Inc.: | ||
| 4.00%, 3/15/27 (3) | 950,000 | 922,705 |
| 5.00%, 1/15/44 | 1,350,000 | 1,247,400 |
32 www.calvert.com CALVERT SOCIAL INVESTMENT FUND ANNUAL REPORT
| PRINCIPAL AMOUNT ($) | VALUE ($) | |
| CORPORATE BONDS - CONT’D | ||
| Norwegian Air Shuttle ASA Pass-Through Trust, 4.875%, 11/10/29 (2) | 2,020,239 | 1,984,652 |
| Starbucks Corp., 2.45%, 6/15/26 | 2,150,000 | 1,938,589 |
| Tapestry, Inc., 4.125%, 7/15/27 | 5,425,000 | 5,162,577 |
| Virgin Australia Pass-Through Trust: | ||
| 5.00%, 4/23/25 (2) | 1,529,280 | 1,554,146 |
| 6.00%, 4/23/22 (2) | 1,065,916 | 1,079,239 |
| Whirlpool Corp., 3.70%, 5/1/25 | 1,700,000 | 1,639,006 |
| 62,436,351 | ||
| Consumer, Non-cyclical - 3.0% | ||
| Amgen, Inc.: | ||
| 4.40%, 5/1/45 | 2,500,000 | 2,425,550 |
| 4.663%, 6/15/51 | 1,006,000 | 994,353 |
| Becton Dickinson and Co.: | ||
| 2.404%, 6/5/20 | 1,667,000 | 1,642,306 |
| 2.894%, 6/6/22 | 1,667,000 | 1,621,888 |
| 3.261%, (3 mo. USD LIBOR + 0.875%), 12/29/20 (1) | 5,400,000 | 5,408,337 |
| 3.363%, 6/6/24 | 2,600,000 | 2,514,506 |
| Ecolab, Inc.: | ||
| 3.25%, 12/1/27 | 857,000 | 823,773 |
| 3.95%, 12/1/47 | 631,000 | 600,992 |
| Grupo Bimbo SAB de CV: | ||
| 4.50%, 1/25/22 (2) | 3,000,000 | 3,073,678 |
| 4.875%, 6/27/44 (2) | 1,200,000 | 1,143,613 |
| Kaiser Foundation Hospitals, 3.15%, 5/1/27 | 3,091,000 | 2,966,063 |
| Keurig Dr Pepper, Inc.: | ||
| 3.551%, 5/25/21 (2) | 1,594,000 | 1,592,106 |
| 4.057%, 5/25/23 (2) | 1,013,000 | 1,015,312 |
| Kraft Heinz Foods Co.: | ||
| 3.375%, 6/15/21 | 633,000 | 630,018 |
| 5.20%, 7/15/45 | 2,125,000 | 2,082,207 |
| Life Technologies Corp., 6.00%, 3/1/20 | 1,900,000 | 1,968,953 |
| Massachusetts Institute of Technology, 3.959%, 7/1/38 | 875,000 | 879,847 |
| MEDNAX, Inc., 5.25%, 12/1/23 (2) | 600,000 | 602,250 |
| President and Fellows of Harvard College, 3.619%, 10/1/37 | 1,000,000 | 972,317 |
| Teva Pharmaceutical Finance Netherlands III BV, 1.70%, 7/19/19 | 482,000 | 474,263 |
| 33,432,332 | ||
| Financial - 21.9% | ||
| Ally Financial, Inc.: | ||
| 3.25%, 11/5/18 | 5,148,000 | 5,148,000 |
| 3.50%, 1/27/19 | 5,261,000 | 5,267,576 |
| ANZ New Zealand International Ltd., 2.20%, 7/17/20 (2) | 2,032,000 | 1,991,659 |
| Banco Santander S.A., 3.125%, 2/23/23 | 3,488,000 | 3,312,983 |
| Bank Nederlandse Gemeenten NV, 2.125%, 12/14/20 (2) | 2,930,000 | 2,876,262 |
www.calvert.com CALVERT SOCIAL INVESTMENT FUND ANNUAL REPORT 33
| PRINCIPAL AMOUNT ($) | VALUE ($) | |
| CORPORATE BONDS - CONT’D | ||
| Bank of America Corp.: | ||
| 2.727%, (3 mo. USD LIBOR + 0.38%), 1/23/22 (1) | 7,400,000 | 7,379,864 |
| 3.106%, (3 mo. USD LIBOR + 0.79%), 3/5/24 (1) | 4,900,000 | 4,900,437 |
| 3.419% to 12/20/27, 12/20/28 (4) | 5,369,000 | 5,041,885 |
| 3.499% to 5/17/21, 5/17/22 (4) | 6,741,000 | 6,739,346 |
| 3.527%, (3 mo. USD LIBOR + 1.18%), 10/21/22 (1) | 2,155,000 | 2,190,490 |
| 3.593% to 7/21/27, 7/21/28 (4) | 4,950,000 | 4,721,675 |
| 3.824% to 1/20/27, 1/20/28 (4) | 10,000,000 | 9,742,297 |
| Bank of Montreal, 3.803% to 12/15/27, 12/15/32 (4) | 3,472,000 | 3,248,369 |
| Capital One Financial Corp.: | ||
| 2.50%, 5/12/20 | 3,097,000 | 3,059,576 |
| 2.789%, (3 mo. USD LIBOR + 0.45%), 10/30/20 (1) | 1,005,000 | 1,003,278 |
| 3.059%, (3 mo. USD LIBOR + 0.72%), 1/30/23 (1) | 6,600,000 | 6,574,742 |
| 3.30%, 10/30/24 | 3,279,000 | 3,124,842 |
| 4.20%, 10/29/25 | 2,100,000 | 2,054,112 |
| Capital One NA, 2.65%, 8/8/22 | 2,305,000 | 2,216,996 |
| CBL & Associates LP, 5.95%, 12/15/26 (3) | 2,000,000 | 1,665,000 |
| Citigroup, Inc.: | ||
| 2.65%, 10/26/20 | 3,435,000 | 3,390,625 |
| 2.75%, 4/25/22 | 2,600,000 | 2,527,458 |
| 3.142% to 1/24/22, 1/24/23 (4) | 3,330,000 | 3,268,542 |
| 3.576%, (3 mo. USD LIBOR + 1.25%), 7/1/26 (1) | 3,625,000 | 3,658,933 |
| 3.887% to 1/10/27, 1/10/28 (4) | 12,815,000 | 12,445,809 |
| 4.075% to 4/23/28, 4/23/29 (4) | 5,000,000 | 4,910,023 |
| Citizens Bank NA: | ||
| 2.25%, 3/2/20 | 1,950,000 | 1,924,430 |
| 2.55%, 5/13/21 | 1,400,000 | 1,364,699 |
| Citizens Financial Group, Inc.: | ||
| 2.375%, 7/28/21 | 1,475,000 | 1,423,888 |
| 4.15%, 9/28/22 (2) | 702,000 | 698,986 |
| Commonwealth Bank of Australia, 2.50%, 9/18/22 (2) | 2,120,000 | 2,031,537 |
| Credit Acceptance Corp.: | ||
| 6.125%, 2/15/21 | 1,580,000 | 1,601,725 |
| 7.375%, 3/15/23 | 2,000,000 | 2,100,000 |
| Crown Castle International Corp.: | ||
| 3.20%, 9/1/24 | 3,466,000 | 3,300,728 |
| 3.65%, 9/1/27 | 1,438,000 | 1,352,926 |
| DDR Corp., 3.625%, 2/1/25 | 2,667,000 | 2,529,464 |
| Digital Realty Trust LP: | ||
| 3.95%, 7/1/22 | 3,100,000 | 3,121,410 |
| 4.75%, 10/1/25 | 2,035,000 | 2,088,364 |
| Discover Bank: | ||
| 4.682% to 8/9/23, 8/9/28 (4) | 2,500,000 | 2,477,425 |
| 8.70%, 11/18/19 | 948,000 | 999,575 |
| Discover Financial Services: | ||
| 3.85%, 11/21/22 | 2,435,000 | 2,409,194 |
34 www.calvert.com CALVERT SOCIAL INVESTMENT FUND ANNUAL REPORT
| PRINCIPAL AMOUNT ($) | VALUE ($) | |
| CORPORATE BONDS - CONT’D | ||
| 3.95%, 11/6/24 | 1,500,000 | 1,468,041 |
| EPR Properties: | ||
| 4.50%, 6/1/27 | 3,000,000 | 2,870,812 |
| 4.95%, 4/15/28 | 1,500,000 | 1,475,870 |
| Goldman Sachs Group, Inc. (The): | ||
| 2.905% to 7/24/22, 7/24/23 (4) | 3,656,000 | 3,534,004 |
| 2.908% to 6/5/22, 6/5/23 (4) | 7,700,000 | 7,454,643 |
| 3.484%, (3 mo. USD LIBOR + 1.17%), 5/15/26 (1) | 3,862,000 | 3,867,763 |
| ING Bank NV, 2.00%, 11/26/18 (2) | 3,150,000 | 3,147,464 |
| International Finance Corp., 1.75%, 3/30/20 | 8,300,000 | 8,164,752 |
| JPMorgan Chase & Co.: | ||
| 3.797% to 7/23/23, 7/23/24 (3)(4) | 5,400,000 | 5,399,281 |
| Series V, 5.00% to 7/1/19 (4)(5) | 3,725,000 | 3,757,594 |
| Lazard Group LLC, 4.50%, 9/19/28 | 3,199,000 | 3,149,205 |
| Morgan Stanley: | ||
| 2.20%, 12/7/18 | 7,210,000 | 7,206,289 |
| 2.80%, 6/16/20 | 3,500,000 | 3,473,819 |
| 3.591% to 7/22/27, 7/22/28 (4) | 9,000,000 | 8,543,905 |
| 3.742%, (3 mo. USD LIBOR + 1.40%), 10/24/23 (1) | 2,190,000 | 2,251,649 |
| 3.772% to 1/24/28, 1/24/29 (4) | 4,313,000 | 4,142,446 |
| 4.00%, 7/23/25 | 1,855,000 | 1,849,590 |
| 4.875%, 11/1/22 | 2,075,000 | 2,151,387 |
| National Australia Bank Ltd., 3.625%, 6/20/23 | 2,650,000 | 2,639,344 |
| PNC Bank NA, 2.70%, 11/1/22 | 4,000,000 | 3,854,752 |
| Regions Financial Corp., 2.75%, 8/14/22 | 1,198,000 | 1,156,122 |
| Synchrony Financial: | ||
| 3.00%, 8/15/19 | 3,742,000 | 3,735,247 |
| 3.95%, 12/1/27 | 5,915,000 | 5,369,233 |
| Synovus Financial Corp., 3.125%, 11/1/22 | 1,267,000 | 1,218,436 |
| Toronto-Dominion Bank (The), 1.85%, 9/11/20 | 7,800,000 | 7,624,820 |
| 241,391,598 | ||
| Government - 3.8% | ||
| Asian Development Bank: | ||
| 1.00%, 8/16/19 | 7,000,000 | 6,896,484 |
| 3.125%, 9/26/28 | 5,500,000 | 5,461,798 |
| European Bank for Reconstruction & Development, 0.875%, 7/22/19 | 5,400,000 | 5,324,238 |
| Inter-American Development Bank, 3.00%, 9/26/22 | 5,500,000 | 5,485,551 |
| International Bank for Reconstruction & Development, 1.005%, 10/1/18 | 2,850,000 | 2,850,000 |
| International Finance Corp., 2.00%, 10/24/22 | 16,490,000 | 15,835,705 |
| 41,853,776 | ||
| Industrial - 2.0% | ||
| Carlisle Cos., Inc., 3.50%, 12/1/24 | 1,309,000 | 1,255,198 |
| Jabil, Inc., 4.70%, 9/15/22 | 1,900,000 | 1,936,480 |
| Johnson Controls International plc, 4.625%, 7/2/44 | 1,800,000 | 1,767,522 |
www.calvert.com CALVERT SOCIAL INVESTMENT FUND ANNUAL REPORT 35
| PRINCIPAL AMOUNT ($) | VALUE ($) | |
| CORPORATE BONDS - CONT’D | ||
| Owens Corning, 3.40%, 8/15/26 | 2,900,000 | 2,662,726 |
| Penske Truck Leasing Co. LP/PTL Finance Corp., 4.25%, 1/17/23 (2) | 3,000,000 | 3,023,754 |
| SBA Tower Trust: | ||
| 2.877%, 7/10/46 (2) | 2,500,000 | 2,461,510 |
| 3.722%, 4/9/48 (2) | 4,150,000 | 4,115,221 |
| SMBC Aviation Capital Finance DAC: | ||
| 2.65%, 7/15/21 (2) | 2,040,000 | 1,967,222 |
| 3.00%, 7/15/22 (2)(3) | 1,750,000 | 1,682,081 |
| Wabtec Corp., 3.382%, (3 mo. USD LIBOR + 1.05%), 9/15/21 (1) | 966,000 | 968,107 |
| 21,839,821 | ||
| Technology - 5.4% | ||
| Apple, Inc., 3.00%, 6/20/27 | 4,386,000 | 4,175,870 |
| Broadridge Financial Solutions, Inc., 3.95%, 9/1/20 | 1,645,000 | 1,660,028 |
| CA, Inc., 4.70%, 3/15/27 | 4,235,000 | 4,243,304 |
| Dell International LLC / EMC Corp.: | ||
| 3.48%, 6/1/19 (2) | 8,950,000 | 8,974,220 |
| 4.42%, 6/15/21 (2) | 6,570,000 | 6,671,434 |
| DXC Technology Co.: | ||
| 2.875%, 3/27/20 | 2,566,000 | 2,545,516 |
| 3.271%, (3 mo. USD LIBOR + 0.95%), 3/1/21 (1) | 5,100,000 | 5,100,087 |
| Hewlett Packard Enterprise Co., 3.105%, (3 mo. USD LIBOR + 0.72%), 10/5/21 (1) | 2,449,000 | 2,451,707 |
| Microchip Technology, Inc., 4.333%, 6/1/23 (2) | 3,726,000 | 3,705,923 |
| Microsoft Corp.: | ||
| 2.40%, 8/8/26 | 2,225,000 | 2,052,662 |
| 4.45%, 11/3/45 | 1,800,000 | 1,932,127 |
| NXP BV / NXP Funding LLC: | ||
| 4.625%, 6/15/22 (2) | 2,565,000 | 2,593,856 |
| 4.625%, 6/1/23 (2) | 1,945,000 | 1,979,427 |
| Seagate HDD Cayman: | ||
| 3.75%, 11/15/18 | 3,222,000 | 3,223,065 |
| 4.875%, 3/1/24 | 2,145,000 | 2,116,149 |
| 4.875%, 6/1/27 | 850,000 | 796,260 |
| Western Digital Corp., 4.75%, 2/15/26 | 5,187,000 | 5,025,944 |
| 59,247,579 | ||
| Utilities - 1.7% | ||
| American Water Capital Corp., 2.95%, 9/1/27 | 2,840,000 | 2,659,011 |
| Avangrid, Inc., 3.15%, 12/1/24 | 9,120,000 | 8,702,608 |
| Consolidated Edison Co. of New York, Inc., 4.45%, 6/15/20 | 1,675,000 | 1,706,662 |
| NextEra Energy Operating Partners LP, 4.25%, 9/15/24 (2) | 2,950,000 | 2,902,062 |
| Public Service Co. of Colorado, 3.70%, 6/15/28 | 2,581,000 | 2,582,679 |
| 18,553,022 | ||
| Total Corporate Bonds (Cost $525,959,419) | 516,418,305 | |
36 www.calvert.com CALVERT SOCIAL INVESTMENT FUND ANNUAL REPORT
| PRINCIPAL AMOUNT ($) | VALUE ($) | |
| U.S. TREASURY OBLIGATIONS - 11.0% | ||
| U.S. Treasury Bonds: | ||
| 2.75%, 8/15/47 | 65,623,000 | 60,080,933 |
| 2.75%, 11/15/47 | 1,000,000 | 915,078 |
| U.S. Treasury Inflation-Protected Bond, 1.75%, 1/15/28 (6) | 19,958,683 | 21,382,948 |
| U.S. Treasury Inflation-Protected Note, 0.125%, 4/15/22 (6) | 22,247,858 | 21,624,165 |
| U.S. Treasury Notes: | ||
| 1.875%, 12/15/20 | 6,455,000 | 6,323,378 |
| 2.00%, 11/30/22 | 4,922,000 | 4,743,289 |
| 2.875%, 8/15/28 | 6,515,000 | 6,417,148 |
| Total U.S. Treasury Obligations (Cost $127,778,135) | 121,486,939 | |
| ASSET-BACKED SECURITIES - 22.8% | ||
| AASET US Ltd., Series 2018-1A, Class A, 3.844%, 1/16/38 (2) | 925,889 | 917,993 |
| American Homes 4 Rent, Series 2014-SFR2, Class A, 3.786%, 10/17/36 (2) | 4,108,191 | 4,119,068 |
| Avant Loans Funding Trust, Series 2017-B, Class A, 2.29%, 6/15/20 (2) | 365,370 | 365,202 |
| Avis Budget Rental Car Funding AESOP LLC: | ||
| Series 2013-2A, Class A, 2.97%, 2/20/20 (2) | 8,710,833 | 8,716,904 |
| Series 2014-1A, Class A, 2.46%, 7/20/20 (2) | 14,600,000 | 14,563,653 |
| Series 2014-2A, Class A, 2.50%, 2/20/21 (2) | 6,677,000 | 6,626,613 |
| Coinstar Funding LLC, Series 2017-1A, Class A2, 5.216%, 4/25/47 (2) | 2,123,125 | 2,150,424 |
| Conn Funding II LP: | ||
| Series 2017-B, Class A, 2.73%, 7/15/20 (2) | 1,809,034 | 1,808,829 |
| Series 2018-A, Class A, 3.25%, 1/15/23 (2) | 1,713,015 | 1,713,375 |
| Credit Acceptance Auto Loan Trust, Series 2017-2A, Class A, 2.55%, 2/17/26 (2) | 4,750,000 | 4,708,409 |
| DB Master Finance LLC: | ||
| Series 2015-1A, Class A2II, 3.98%, 2/20/45 (2) | 691,905 | 692,785 |
| Series 2017-1A, Class A2II, 4.03%, 11/20/47 (2) | 684,825 | 673,361 |
| Dell Equipment Finance Trust, Series 2017-1, Class A3, 2.14%, 4/22/22 (2) | 1,755,000 | 1,749,196 |
| DRB Prime Student Loan Trust, Series 2016-B, Class A2, 2.89%, 6/25/40 (2) | 1,208,661 | 1,195,091 |
| Driven Brands Funding LLC: | ||
| Series 2015-1A, Class A2, 5.216%, 7/20/45 (2) | 2,513,913 | 2,587,779 |
| Series 2018-1A, Class A2, 4.739%, 4/20/48 (2) | 1,001,490 | 997,161 |
| Element Rail Leasing I LLC: | ||
| Series 2014-1A, Class A1, 2.299%, 4/19/44 (2) | 390,545 | 385,909 |
| Series 2014-1A, Class B1, 4.406%, 4/19/44 (2) | 2,200,000 | 2,194,459 |
| Enterprise Fleet Financing LLC: | ||
| Series 2017-1, Class A2, 2.13%, 7/20/22 (2) | 3,644,595 | 3,626,702 |
| Series 2017-3, Class A2, 2.13%, 5/22/23 (2) | 2,263,199 | 2,243,707 |
| FOCUS Brands Funding LLC: | ||
| Series 2017-1A, Class A2I, 3.857%, 4/30/47 (2) | 943,063 | 941,362 |
| Series 2017-1A, Class A2II, 5.093%, 4/30/47 (2) | 1,229,438 | 1,248,105 |
| Ford Credit Auto Owner Trust/Ford Credit, Series 2014-1, Class B, 2.41%, 11/15/25 (2) | 1,180,000 | 1,176,972 |
www.calvert.com CALVERT SOCIAL INVESTMENT FUND ANNUAL REPORT 37
| PRINCIPAL AMOUNT ($) | VALUE ($) | |
| ASSET-BACKED SECURITIES - CONT’D | ||
| FRS I LLC: | ||
| Series 2013-1A, Class A2, 3.08%, 4/15/43 (2) | 3,501,813 | 3,492,940 |
| Series 2013-1A, Class B, 3.96%, 4/15/43 (2) | 3,987,186 | 3,969,043 |
| Hardee’s Funding LLC, Series 2018-1A, Class A2I, 4.25%, 6/20/48 (2) | 2,120,000 | 2,120,042 |
| Invitation Homes Trust: | ||
| Series 2017-SFR2, Class B, 3.308%, (1 mo. USD LIBOR + 1.15%), 12/17/36 (1)(2) | 747,000 | 750,109 |
| Series 2017-SFR2, Class C, 3.608%, (1 mo. USD LIBOR + 1.45%), 12/17/36 (1)(2) | 951,000 | 956,289 |
| Series 2018-SFR1, Class B, 3.108%, (1 mo. USD LIBOR + 0.95%), 3/17/37 (1)(2) | 755,000 | 752,860 |
| Series 2018-SFR1, Class C, 3.408%, (1 mo. USD LIBOR + 1.25%), 3/17/37 (1)(2) | 950,000 | 951,698 |
| Series 2018-SFR2, Class A, 3.058%, (1 mo. USD LIBOR + 0.90%), 6/17/37 (1)(2) | 8,563,055 | 8,584,611 |
| Series 2018-SFR3, Class A, 3.158%, (1 mo. USD LIBOR + 1.00%), 7/17/37 (1)(2) | 4,246,054 | 4,279,872 |
| Mosaic Solar Loans LLC, Series 2017-1A, Class A, 4.45%, 6/20/42 (2) | 300,498 | 302,968 |
| NextGear Floorplan Master Owner Trust, Series 2015-2A, Class A, 2.38%, 10/15/20 (2) | 6,900,000 | 6,899,486 |
| OneMain Financial Issuance Trust: | ||
| Series 2015-1A, Class A, 3.19%, 3/18/26 (2) | 2,733,925 | 2,740,798 |
| Series 2015-2A, Class A, 2.57%, 7/18/25 (2) | 60,034 | 60,102 |
| Series 2016-2A, Class A, 4.10%, 3/20/28 (2) | 7,009,152 | 7,054,889 |
| Series 2017-1A, Class A1, 2.37%, 9/14/32 (2) | 4,941,000 | 4,858,305 |
| Oportun Funding VI LLC: | ||
| Series 2017-A, Class A, 3.23%, 6/8/23 (2) | 2,005,000 | 1,973,546 |
| Series 2018-B, Class A, 3.91%, 7/8/24 (2) | 11,527,000 | 11,495,321 |
| Planet Fitness Master Issuer LLC, Series 2018-1A, Class A2I, 4.262%, 9/5/48 (2) | 4,445,000 | 4,445,812 |
| Progress Residential Trust, Series 2016-SFR2, Class E, 5.708%, (1 mo. USD LIBOR + 3.55%), 1/17/34 (1)(2) | 7,313,000 | 7,383,641 |
| Prosper Marketplace Issuance Trust: | ||
| Series 2017-1A, Class A, 2.56%, 6/15/23 (2) | 1,079,665 | 1,079,496 |
| Series 2017-2A, Class A, 2.41%, 9/15/23 (2) | 1,327,101 | 1,325,836 |
| Series 2017-3A, Class A, 2.36%, 11/15/23 (2) | 9,656,720 | 9,632,763 |
| Series 2017-3A, Class B, 3.36%, 11/15/23 (2) | 6,180,000 | 6,142,545 |
| Series 2018-1A, Class A, 3.11%, 6/17/24 (2) | 3,471,610 | 3,472,895 |
| Series 2018-2A, Class A, 3.35%, 10/15/24 (2) | 8,340,000 | 8,340,576 |
| RenewFund Receivables Trust, Series 2015-1, Class A, 3.51%, 4/15/25 (2) | 865,009 | 856,220 |
| SBA Tower Trust, Series 2014-2A, Class C, 3.869%, 10/15/49 (2) | 3,300,000 | 3,296,465 |
| Sierra Timeshare Receivables Funding LLC: | ||
| Series 2014-2A, Class B, 2.40%, 6/20/31 (2) | 572,788 | 571,805 |
| Series 2014-3A, Class B, 2.80%, 10/20/31 (2) | 957,148 | 950,911 |
| Social Professional Loan Program LLC, Series 2014-B, Class A2, 2.55%, 8/27/29 (2) | 607,830 | 602,492 |
| SolarCity LMC: | ||
| Series 2013-1, Class A, 4.80%, 11/20/38 (2) | 2,580,842 | 2,597,918 |
| Series 2014-2, Class A, 4.02%, 7/20/44 (2) | 3,887,388 | 3,812,849 |
| Series 2014-2, Class B, 5.44%, 7/20/44 (2) | 5,721,621 | 5,499,079 |
| SpringCastle America Funding LLC, Series 2016-AA, Class A, 3.05%, 4/25/29 (2) | 5,090,677 | 5,074,624 |
| Springleaf Funding Trust: | ||
| Series 2015-AA, Class B, 3.62%, 11/15/24 (2) | 2,411,000 | 2,404,910 |
| Series 2016-AA, Class A, 2.90%, 11/15/29 (2) | 10,500,000 | 10,473,798 |
| Spruce ABS Trust, Series 2016-E1, Class A, 4.32%, 6/15/28 (2) | 925,639 | 928,985 |
| Taco Bell Funding LLC, Series 2016-1A, Class A2I, 3.832%, 5/25/46 (2) | 6,156,250 | 6,166,989 |
38 www.calvert.com CALVERT SOCIAL INVESTMENT FUND ANNUAL REPORT
| PRINCIPAL AMOUNT ($) | VALUE ($) | |
| ASSET-BACKED SECURITIES - CONT’D | ||
| TES LLC, Series 2017-1A, Class A, 4.33%, 10/20/47 (2) | 3,128,115 | 3,059,033 |
| Tesla Auto Lease Trust, Series 2018-A, Class A, 2.32%, 12/20/19 (2) | 6,358,977 | 6,342,439 |
| Toyota Auto Receivables Owner Trust: | ||
| Series 2016-B, Class A3, 1.30%, 4/15/20 | 977,382 | 973,174 |
| Series 2016-B, Class A4, 1.52%, 8/16/21 | 8,950,000 | 8,830,550 |
| United States Small Business Administration, Series 2017-20E, Class 1, 2.88%, 5/1/37 | 5,933,738 | 5,716,165 |
| Vantage Data Centers Issuer LLC, Series 2018-1A, Class A2, 4.072%, 2/16/43 (2) | 2,468,516 | 2,472,596 |
| VB-S1 Issuer LLC, Series 2016-1A, Class C, 3.065%, 6/15/46 (2) | 2,250,000 | 2,208,120 |
| Verizon Owner Trust, Series 2016-1A, Class A, 1.42%, 1/20/21 (2) | 1,111,454 | 1,107,613 |
| Wendys Funding LLC, Series 2015-1A, Class A2II, 4.08%, 6/15/45 (2) | 8,390,500 | 8,412,288 |
| Total Asset-Backed Securities (Cost $251,996,888) | 250,828,525 | |
| COLLATERALIZED MORTGAGE-BACKED OBLIGATIONS - 5.0% | ||
| Bellemeade Re Ltd., Series 2015-1A, Class M2, 6.516%, (1 mo. USD LIBOR + 4.30%), 7/25/25 (1)(2) | 470,919 | 475,993 |
| Federal Home Loan Mortgage Corp. Multifamily Structured Pass Through Certificates: | ||
| Series KW06, Class A2, 3.80%, 6/25/28 | 5,335,000 | 5,407,837 |
| Series W5FX, Class AFX, 3.336%, 4/25/28 | 1,895,833 | 1,838,771 |
| Federal Home Loan Mortgage Corp. Structured Agency Credit Risk Debt Notes: | ||
| Series 2015-HQA2, Class M2, 5.016%, (1 mo. USD LIBOR + 2.80%), 5/25/28 (1) | 1,890,819 | 1,949,912 |
| Series 2016-DNA2, Class M2, 4.416%, (1 mo. USD LIBOR + 2.20%), 10/25/28 (1) | 867,808 | 877,493 |
| Series 2016-HQA1, Class M2, 4.966%, (1 mo. USD LIBOR + 2.75%), 9/25/28 (1) | 3,004,717 | 3,065,887 |
| Series 2017-DNA3, Class M2, 4.716%, (1 mo. USD LIBOR + 2.50%), 3/25/30 (1) | 1,425,000 | 1,491,452 |
| Series 2017-HQA2, Class M2, 4.866%, (1 mo. USD LIBOR + 2.65%), 12/25/29 (1) | 1,565,000 | 1,642,937 |
| Series 2018-DNA1, Class M1, 2.666%, (1 mo. USD LIBOR + 0.45%), 7/25/30 (1) | 2,467,321 | 2,466,411 |
| Federal National Mortgage Association Connecticut Avenue Securities: | ||
| Series 2013-C01, Class M2, 7.466%, (1 mo. USD LIBOR + 5.25%), 10/25/23 (1) | 4,675,000 | 5,396,096 |
| Series 2014-C02, Class 1M2, 4.816%, (1 mo. USD LIBOR + 2.60%), 5/25/24 (1) | 5,000,000 | 5,343,427 |
| Series 2014-C02, Class 2M2, 4.816%, (1 mo. USD LIBOR + 2.60%), 5/25/24 (1) | 2,173,591 | 2,311,396 |
| Series 2014-C03, Class 1M2, 5.216%, (1 mo. USD LIBOR + 3.00%), 7/25/24 (1) | 2,468,969 | 2,662,339 |
| Series 2014-C03, Class 2M2, 5.116%, (1 mo. USD LIBOR + 2.90%), 7/25/24 (1) | 3,456,626 | 3,698,000 |
| Series 2014-C04, Class 1M2, 7.116%, (1 mo. USD LIBOR + 4.90%), 11/25/24 (1) | 7,236,565 | 8,313,568 |
| Series 2016-C06, Class 1M2, 6.466%, (1 mo. USD LIBOR + 4.25%), 4/25/29 (1) | 1,600,000 | 1,824,064 |
| Series 2017-C05, Class 1M2, 4.416%, (1 mo. USD LIBOR + 2.20%), 1/25/30 (1) | 735,000 | 758,358 |
| Series 2017-C06, Class 1M2, 4.866%, (1 mo. USD LIBOR + 2.65%), 2/25/30 (1) | 2,520,000 | 2,636,169 |
| Series 2018-C03, Class 1M1, 2.896%, (1 mo. USD LIBOR + 0.68%), 10/25/30 (1) | 1,070,562 | 1,073,123 |
| Federal National Mortgage Association Grantor Trust, Series 2017-T1, Class A, 2.898%, 6/25/27 | 1,957,824 | 1,859,055 |
| Total Collateralized Mortgage-Backed Obligations (Cost $53,949,086) | 55,092,288 | |
www.calvert.com CALVERT SOCIAL INVESTMENT FUND ANNUAL REPORT 39
| PRINCIPAL AMOUNT ($) | VALUE ($) | |
| COMMERCIAL MORTGAGE-BACKED SECURITIES - 2.3% | ||
| CLNS Trust, Series 2017-IKPR, Class B, 3.131%, (1 mo. USD LIBOR + 1.00%), 6/11/32 (1)(2) | 4,400,000 | 4,406,562 |
| JP Morgan Chase Commercial Mortgage Securities Trust: | ||
| Series 2014-DSTY, Class B, 3.771%, 6/10/27 (2) | 1,750,000 | 1,732,496 |
| Series 2014-DSTY, Class C, 3.931%, 6/10/27 (2) | 385,000 | 373,812 |
| Morgan Stanley Capital I Trust, Series 2017-CLS, Class A, 2.858%, (1 mo. USD LIBOR + 0.70%), 11/15/34 (1)(2) | 4,100,000 | 4,098,572 |
| Motel 6 Trust: | ||
| Series 2017-MTL6, Class C, 3.558%, (1 mo. USD LIBOR + 1.40%), 8/15/34 (1)(2) | 2,871,316 | 2,877,681 |
| Series 2017-MTL6, Class D, 4.308%, (1 mo. USD LIBOR + 2.15%), 8/15/34 (1)(2) | 1,094,296 | 1,099,109 |
| RETL Trust, Series 2018-RVP, Class A, 3.258%, (1 mo. USD LIBOR + 1.10%), 3/15/33 (1)(2) | 7,250,609 | 7,285,331 |
| TRU Trust, Series 2016-TOYS, Class A, 4.408%, (1 mo. USD LIBOR + 2.25%), 11/15/30 (1)(2) | 1,120,947 | 1,121,402 |
| WFLD Mortgage Trust, Series 2014-MONT, Class C, 3.88%, 8/10/31 (2) | 2,700,000 | 2,496,892 |
| Total Commercial Mortgage-Backed Securities (Cost $25,703,353) | 25,491,857 | |
| TAXABLE MUNICIPAL OBLIGATIONS - 1.9% | ||
| Education - 0.1% | ||
| Georgetown University, Washington, DC, Series 2008B, 7.22%, 4/1/19 | 690,000 | 705,159 |
| General Obligations - 0.9% | ||
| Commonwealth of Massachusetts, 5.456%, 12/1/39 (7) | 750,000 | 891,172 |
| Los Angeles Unified School District, California, 5.75%, 7/1/34 (7) | 3,750,000 | 4,444,575 |
| Massachusetts, Green Bonds, 3.277%, 6/1/46 | 3,975,000 | 3,521,095 |
| New York City, 5.206%, 10/1/31 (7) | 1,030,000 | 1,144,639 |
| 10,001,481 | ||
| Special Tax Revenue - 0.8% | ||
| Connecticut, Special Tax Revenue, 5.459%, 11/1/30 (7) | 3,800,000 | 4,193,224 |
| New York City Transitional Finance Authority, Future Tax Secured Revenue Bonds, 5.767%, 8/1/36 (7) | 3,540,000 | 4,143,393 |
| 8,336,617 | ||
| Water and Sewer - 0.1% | ||
| District of Columbia Water & Sewer Authority, Green Bonds, 4.814%, 10/1/2114 | 1,170,000 | 1,278,799 |
| Total Taxable Municipal Obligations (Cost $20,667,154) | 20,322,056 | |
40 www.calvert.com CALVERT SOCIAL INVESTMENT FUND ANNUAL REPORT
| PRINCIPAL AMOUNT ($) | VALUE ($) | |
| U.S. GOVERNMENT AGENCY MORTGAGE-BACKED SECURITIES - 1.9% | ||
| Federal National Mortgage Association: | ||
| 2.65%, 6/1/26 | 2,888,103 | 2,760,331 |
| 2.68%, 7/1/26 | 3,000,000 | 2,858,296 |
| 2.878%, 2/25/27(8) | 2,846,754 | 2,787,182 |
| 3.037%, 9/25/27(8) | 5,500,000 | 5,237,285 |
| 3.144%, 3/25/28(8) | 3,040,000 | 2,913,188 |
| 3.436%, 6/25/28(8) | 4,628,461 | 4,527,945 |
| Total U.S. Government Agency Mortgage-Backed Securities (Cost $21,956,224) | 21,084,227 | |
| HIGH SOCIAL IMPACT INVESTMENTS - 0.5% | ||
| Calvert Impact Capital, Inc., Community Investment Notes, 1.50%, 12/15/19 (9)(10) | 5,087,392 | 4,895,852 |
| ImpactAssets Inc., Global Sustainable Agriculture Notes, 2.50%, 11/3/20 (10)(11)(12) | 490,000 | 460,110 |
| ImpactAssets Inc., Microfinance Plus Notes, 2.40%, 11/3/20 (10)(11)(12) | 631,000 | 577,365 |
| Total High Social Impact Investments (Cost $6,208,392) | 5,933,327 | |
| SOVEREIGN GOVERNMENT BONDS - 1.2% | ||
| Export Development Canada: | ||
| 1.25%, 12/10/18 | 5,330,000 | 5,316,119 |
| 1.625%, 6/1/20 | 4,500,000 | 4,405,117 |
| Nacional Financiera SNC, 3.375%, 11/5/20 (2) | 3,450,000 | 3,428,472 |
| Total Sovereign Government Bonds (Cost $13,235,197) | 13,149,708 | |
| U.S. GOVERNMENT AGENCIES AND INSTRUMENTALITIES - 0.3% | ||
| Overseas Private Investment Corp., 3.22%, 9/15/29 | 2,758,992 | 2,744,457 |
| Total U.S. Government Agencies and Instrumentalities (Cost $2,758,992) | 2,744,457 | |
| FLOATING RATE LOANS (13) - 2.3% | ||
| Building and Development - 0.2% | ||
| DTZ U.S. Borrower, LLC, Term Loan, 5.492%, (1 mo. USD LIBOR + 3.25%), 8/21/25 | 2,650,000 | 2,662,145 |
| Business Equipment and Services - 0.2% | ||
| Change Healthcare Holdings, LLC, Term Loan, 4.992%, (1 mo. USD LIBOR + 2.75%), 3/1/24 | 2,284,849 | 2,295,002 |
| Cable and Satellite Television - 0.3% | ||
| UPC Financing Partnership, Term Loan, 4.658%, (1 mo. USD LIBOR + 2.50%), 1/15/26 | 1,757,443 | 1,758,176 |
| Ziggo Secured Finance Partnership, Term Loan, 4.658%, (1 mo. USD LIBOR + 2.50%), 4/15/25 | 2,110,000 | 2,074,065 |
| 3,832,241 | ||
www.calvert.com CALVERT SOCIAL INVESTMENT FUND ANNUAL REPORT 41
| PRINCIPAL AMOUNT ($) | VALUE ($) | |
| FLOATING RATE LOANS (13) - CONT’D | ||
| Drugs - 0.4% | ||
| Jaguar Holding Company II, Term Loan, 4.742%, (1 mo. USD LIBOR + 2.50%), 8/18/22 | 3,959,537 | 3,966,961 |
| Electronics/Electrical - 0.5% | ||
| Infor (US), Inc., Term Loan, 5.136%, (3 mo. USD LIBOR + 2.75%), 2/1/22 | 3,923,551 | 3,938,614 |
| MA FinanceCo., LLC, Term Loan, 4.742%, (1 mo. USD LIBOR + 2.50%), 6/21/24 | 170,468 | 169,828 |
| Seattle Spinco, Inc., Term Loan, 4.742%, (1 mo. USD LIBOR + 2.50%), 6/21/24 | 1,151,211 | 1,146,031 |
| 5,254,473 | ||
| Equipment Leasing - 0.3% | ||
| Avolon TLB Borrower 1 (US), LLC, Term Loan, 4.165%, (1 mo. USD LIBOR + 2.00%), 1/15/25 | 3,778,350 | 3,794,888 |
| Financial - 0.0% (14) | ||
| Alliance Mortgage Investments, Term Loan, 0.00%, 6/1/10 (10)(11)(15)(16) | 481,681 | 7,598 |
| Food/Drug Retailers - 0.2% | ||
| Albertsons, LLC, Term Loan, 4.992%, (1 mo. USD LIBOR + 2.75%), 8/25/21 | 2,099,370 | 2,104,226 |
| Telecommunications - 0.2% | ||
| Sprint Communications, Inc., Term Loan, 4.75%, (1 mo. USD LIBOR + 2.50%), 2/2/24 | 1,885,215 | 1,891,107 |
| Total Floating Rate Loans (Cost $26,226,941) | 25,808,641 | |
| COMMERCIAL PAPER - 0.3% | ||
| AT&T, Inc., 3.135%, 5/28/19 (2) | 3,250,000 | 3,187,998 |
| Total Commercial Paper (Cost $3,185,271) | 3,187,998 | |
| SHARES | VALUE ($) | |
| SHORT TERM INVESTMENT OF CASH COLLATERAL FOR SECURITIES LOANED - 0.3% | ||
| State Street Navigator Securities Lending Government Money Market Portfolio, 2.16% | 3,386,150 | 3,386,150 |
| Total Short Term Investment of Cash Collateral for Securities Loaned (Cost $3,386,150) | 3,386,150 | |
| TOTAL INVESTMENTS (Cost $1,083,011,202) - 96.8% | 1,064,934,478 | |
| Other assets and liabilities, net - 3.2% | 34,957,618 | |
NET ASSETS - 100.0% | 1,099,892,096 | |
42 www.calvert.com CALVERT SOCIAL INVESTMENT FUND ANNUAL REPORT
| NOTES TO SCHEDULE OF INVESTMENTS | |
| (1) Variable rate security. The stated interest rate represents the rate in effect at September 30, 2018. | |
| (2) Security is exempt from registration under Rule 144A of the Securities Act of 1933. These securities may be resold in transactions exempt from registration, normally to qualified institutional buyers. Total market value of Rule 144A securities amounts to $343,613,620, which represents 31.2% of the net assets of the Fund as of September 30, 2018. | |
| (3) All or a portion of this security was on loan at September 30, 2018. The aggregate market value of securities on loan at September 30, 2018 was $4,653,168. | |
| (4) Security converts to floating rate after the indicated fixed-rate coupon period. | |
| (5) Perpetual security with no stated maturity date but may be subject to calls by the issuer. | |
| (6) Inflation-linked security whose principal is adjusted for inflation based on changes in the U.S. Consumer Price Index. Interest is calculated based on the inflation-adjusted principal. | |
| (7) Build America Bond. Represents taxable municipal obligation issued pursuant to the American Recovery and Reinvestment Act of 2009 or other legislation providing for the issuance of taxable municipal debt on which the issuer receives federal support. | |
| (8) Weighted average fixed-rate coupon that changes/updates monthly. Rate shown is the rate at September 30, 2018. | |
| (9) Affiliated company (see Note 8). | |
| (10) Restricted security. Total market value of restricted securities amounts to $5,940,925, which represents 0.5% of the net assets of the Fund as of September 30, 2018. | |
| (11) For fair value measurement purposes, security is categorized as Level 3 (see Note 1A). | |
| (12) Notes carry an interest rate that varies by period and is contingent on the performance of the underlying portfolio of loans to borrowers. The coupon rate shown represents the rate in effect at September 30, 2018. | |
| (13) Remaining maturities of floating rate loans may be less than the stated maturities shown as a result of contractual or optional prepayments by the borrower. Such prepayments cannot be predicted with certainty. Floating rate loans generally pay interest at rates which are periodically re-determined at a spread above the London Interbank Offered Rate (“LIBOR”) or other short-term rates. The rate shown is the rate in effect at September 30, 2018. Floating rate loans are generally considered restrictive in that the Fund is ordinarily contractually obligated to receive consent from the Agent Bank and/or borrower prior to disposition of a floating rate loan. | |
| (14) Amount is less than 0.05%. | |
| (15) Alliance Bancorp and its affiliates filed for Chapter 7 bankruptcy on July 13, 2007. This security is no longer accruing interest. | |
| (16) Non-income producing security. | |
| FUTURES CONTRACTS | NUMBER OF CONTRACTS | EXPIRATION MONTH/YEAR | NOTIONAL AMOUNT | VALUE/NET UNREALIZED APPRECIATION (DEPRECIATION) | ||||
| Long: | ||||||||
| U.S. 2-Year Treasury Note | 392 | Dec-18 | $82,607,875 | ($159,058 | ) | |||
| U.S. 5-Year Treasury Note | 303 | Dec-18 | 34,080,399 | (273,005 | ) | |||
| U.S. Long Treasury Bond | 97 | Dec-18 | 13,628,500 | (376,134 | ) | |||
| U.S. Ultra 10-Year Treasury Note | 70 | Dec-18 | 8,820,000 | (25,378 | ) | |||
| U.S. Ultra-Long Treasury Bond | 226 | Dec-18 | 34,867,563 | (1,079,277 | ) | |||
| Total Long | ($1,912,852 | ) | ||||||
| Abbreviations: | |
| LIBOR: | London Interbank Offered Rate |
| Currency Abbreviations: | |
| USD: | United States Dollar |
| RESTRICTED SECURITIES | ACQUISITION DATES | COST ($) |
| Alliance Mortgage Investments, Term Loan, 0.00%, 6/1/10 | 5/26/05-6/13/07 | 481,681 |
| Calvert Impact Capital, Inc., Community Investment Notes, 1.50%, 12/15/19 | 12/15/16 | 5,087,392 |
| ImpactAssets Inc., Global Sustainable Agriculture Notes, 2.50%, 11/3/20 | 11/13/15 | 490,000 |
| ImpactAssets Inc., Microfinance Plus Notes, 2.40%, 11/3/20 | 11/13/15 | 631,000 |
| See notes to financial statements. | ||
www.calvert.com CALVERT SOCIAL INVESTMENT FUND ANNUAL REPORT 43
CALVERT EQUITY FUND
SCHEDULE OF INVESTMENTS
SEPTEMBER 30, 2018
| SHARES | VALUE ($) | |
| COMMON STOCKS - 95.3% | ||
| Beverages - 2.5% | ||
| Coca-Cola Co. (The) | 632,732 | 29,225,891 |
| PepsiCo, Inc. | 284,565 | 31,814,367 |
| 61,040,258 | ||
| Capital Markets - 3.7% | ||
| Charles Schwab Corp. (The) | 437,261 | 21,491,378 |
| Intercontinental Exchange, Inc. | 900,716 | 67,454,621 |
| 88,945,999 | ||
| Chemicals - 7.3% | ||
| Ecolab, Inc. | 573,840 | 89,966,635 |
| Praxair, Inc. | 534,696 | 85,941,688 |
| 175,908,323 | ||
| Electronic Equipment, Instruments & Components - 1.7% | ||
| TE Connectivity Ltd. | 453,860 | 39,907,910 |
| Entertainment - 1.7% | ||
| Walt Disney Co. (The) | 344,169 | 40,247,123 |
| Equity Real Estate Investment Trusts (REITs) - 3.6% | ||
| American Tower Corp. | 441,938 | 64,213,592 |
| Crown Castle International Corp. | 208,546 | 23,217,426 |
| 87,431,018 | ||
| Food Products - 2.1% | ||
| Mondelez International, Inc., Class A | 1,178,554 | 50,630,680 |
| Health Care Equipment & Supplies - 4.7% | ||
| Danaher Corp. | 1,045,789 | 113,635,433 |
| Health Care Providers & Services - 3.0% | ||
| Henry Schein, Inc. (1)(2) | 310,529 | 26,404,281 |
| Laboratory Corp. of America Holdings (2) | 269,862 | 46,869,632 |
| 73,273,913 | ||
| Health Care Technology - 1.1% | ||
| Cerner Corp. (2) | 419,678 | 27,031,460 |
| Hotels, Restaurants & Leisure - 1.1% | ||
| Starbucks Corp. | 482,329 | 27,415,580 |
44 www.calvert.com CALVERT SOCIAL INVESTMENT FUND ANNUAL REPORT
| SHARES | VALUE ($) | ||
| COMMON STOCKS - CONT’D | |||
| Industrial Conglomerates - 2.2% | |||
| 3M Co. | 251,698 | 53,035,286 | |
| Insurance - 3.0% | |||
| Aon plc | 151,655 | 23,321,506 | |
| Marsh & McLennan Cos., Inc. | 599,826 | 49,617,607 | |
| 72,939,113 | |||
| Interactive Media & Services - 4.8% | |||
| Alphabet, Inc., Class C (2) | 96,424 | 115,079,151 | |
| Internet & Direct Marketing Retail - 0.8% | |||
| Booking Holdings, Inc. (2) | 10,236 | 20,308,224 | |
| IT Services - 11.9% | |||
| Accenture plc, Class A | 278,895 | 47,467,929 | |
| Fiserv, Inc. (2) | 387,957 | 31,959,897 | |
| MasterCard, Inc., Class A | 401,613 | 89,403,070 | |
| Visa, Inc., Class A | 783,263 | 117,559,944 | |
| 286,390,840 | |||
| Life Sciences Tools & Services - 6.3% | |||
| QIAGEN NV (2) | 940,207 | 35,615,041 | |
| Thermo Fisher Scientific, Inc. | 479,224 | 116,968,994 | |
| 152,584,035 | |||
| Machinery - 5.3% | |||
| Fortive Corp. (1) | 424,626 | 35,753,509 | |
| IDEX Corp. | 265,804 | 40,046,031 | |
| Xylem, Inc. | 657,684 | 52,529,221 | |
| 128,328,761 | |||
| Media - 1.3% | |||
| Comcast Corp., Class A | 908,506 | 32,170,198 | |
| Multiline Retail - 3.9% | |||
| Dollar General Corp. | 851,598 | 93,079,661 | |
| Personal Products - 1.9% | |||
| Estee Lauder Cos., Inc. (The), Class A | 306,701 | 44,569,789 | |
| Pharmaceuticals - 3.7% | |||
| Zoetis, Inc. | 961,088 | 87,997,217 | |
| Professional Services - 2.8% | |||
| Verisk Analytics, Inc. (2) | 569,011 | 68,594,276 | |
www.calvert.com CALVERT SOCIAL INVESTMENT FUND ANNUAL REPORT 45
| SHARES | VALUE ($) | ||
| COMMON STOCKS - CONT’D | |||
| Semiconductors & Semiconductor Equipment - 0.9% | |||
| Texas Instruments, Inc. | 194,765 | 20,896,337 | |
| Software - 10.4% | |||
| Check Point Software Technologies Ltd. (1)(2) | 529,299 | 62,282,613 | |
| Intuit, Inc. | 322,303 | 73,291,702 | |
| Microsoft Corp. | 1,006,310 | 115,091,675 | |
| 250,665,990 | |||
| Specialty Retail - 2.6% | |||
| Lowe’s Cos., Inc. | 228,027 | 26,182,060 | |
| TJX Cos., Inc. (The) | 320,701 | 35,924,926 | |
| 62,106,986 | |||
| Textiles, Apparel & Luxury Goods - 1.0% | |||
| NIKE, Inc., Class B | 280,214 | 23,739,730 | |
| Venture Capital - 0.0% (3) | |||
| 20/20 Gene Systems, Inc. (2)(4)(5) | 73,397 | 46,974 | |
| Digital Directions International, Inc. (2)(4)(5) | 354,389 | 87,499 | |
| Graduation Alliance, Inc. (2)(4)(5) | 117,833 | 3,076 | |
| Ivy Capital (Proprietary) Ltd. (2)(4)(5) | 19 | 419,287 | |
| Napo Pharmaceuticals, Inc. (2)(4)(5) | 294,196 | — | |
| 556,836 | |||
| Total Common Stocks (Cost $1,399,435,952) | 2,298,510,127 | ||
| PREFERRED STOCKS - 0.1% | |||
| Venture Capital - 0.1% | |||
| Entouch: | |||
| Series C (2)(4)(5) | 2,628,278 | 339,048 | |
| Series C-1 (2)(4)(5) | 510,819 | 118,510 | |
| Graduation Alliance, Inc.: | |||
| Series C (2)(4)(5) | 3,326,181 | 386,170 | |
| Series D, Convertible (2)(4)(5) | 1,325,968 | 351,779 | |
| PresenceLearning, Inc.: | |||
| Series A (2)(4)(5) | 600,000 | 432,000 | |
| Series A-2 (2)(4)(5) | 195,285 | 142,558 | |
| Series B (2)(4)(5) | 399,719 | 323,772 | |
| Sword Diagnostics (2)(4)(5) | 1,264,108 | — | |
| 2,093,837 | |||
| Total Preferred Stocks (Cost $2,299,055) | 2,093,837 | ||
46 www.calvert.com CALVERT SOCIAL INVESTMENT FUND ANNUAL REPORT
| SHARES | VALUE ($) | ||
| VENTURE CAPITAL LIMITED PARTNERSHIP INTERESTS - 0.6% | |||
| Accion Frontier Inclusion Fund LP (2)(4)(5) | 759,588 | ||
| Adobe Capital Social Mezzanine I LP (2)(4)(5) | 348,943 | ||
| Africa Renewable Energy Fund LP (2)(4)(5) | 891,311 | ||
| Arborview Capital Partners LP (2)(4)(5) | 685,146 | ||
| Blackstone Clean Technology Partners LP (2)(4)(5) | 65,505 | ||
| Bridges Ventures US Sustainable Growth Fund, LP (2)(4)(5) | 364,603 | ||
| China Environment Fund 2004 LP (2)(4)(5) | 3,779 | ||
| China Environment Fund III LP (2)(4)(5) | 322,888 | ||
| Coastal Ventures III LP (2)(4)(5) | 267,311 | ||
| Core Innovations Capital I LP (2)(4)(5) | 1,129,215 | ||
| Cross Culture Ventures I LP (2)(4)(5) | 311,176 | ||
| DBL Equity Fund - BAEF Il LP (2)(4)(5) | 1,126,046 | ||
| DBL Partners III LP (2)(4)(5) | 532,724 | ||
| First Analysis Private Equity Fund V LP (2)(4)(5) | 1,180,959 | ||
| Ignia Fund I LP (2)(4)(5) | 460,143 | ||
| Impact Ventures II LP (2)(4)(5) | 326,551 | ||
| LeapFrog Financial Inclusion Fund (2)(4)(5) | 202,151 | ||
| New Markets Education Partners LP (2)(4)(5) | 934,172 | ||
| New Markets Venture Partners II LP (2)(4)(5) | 125,373 | ||
| Owl Ventures LP (2)(4)(5) | 763,481 | ||
| Renewable Energy Asia Fund LP (2)(4)(5) | 1,939,321 | ||
| SEAF India International Growth Fund LP (2)(4)(5) | 26,763 | ||
| SJF Ventures II LP, Preferred (2)(4)(5) | 526,900 | ||
| SJF Ventures III LP (2)(4)(5) | 1,020,549 | ||
| Westly Capital Partners Fund II LP (2)(4)(5) | 686,198 | ||
| Total Venture Capital Limited Partnership Interests (Cost $13,556,652) | 15,000,796 | ||
| PRINCIPAL AMOUNT ($) | VALUE ($) | ||
| VENTURE CAPITAL DEBT OBLIGATIONS - 0.1% | |||
| One Earth Group Ltd., Convertible Note, 5.00%, 10/31/20 (4)(5)(6) | 230,064 | — | |
| SEAF Global SME Facility, 9.00%, 1/1/19 (4)(5) | 2,100,000 | 1,497,741 | |
| Total Venture Capital Debt Obligations (Cost $2,377,601) | 1,497,741 | ||
| HIGH SOCIAL IMPACT INVESTMENTS - 0.5% | |||
| Calvert Impact Capital, Inc., Community Investment Notes, 1.50%, 12/15/19 (4)(7) | 10,833,877 | 10,425,981 | |
| ImpactAssets Inc., Global Sustainable Agriculture Notes, 2.50%, 11/3/20 (4)(5)(8) | 1,445,000 | 1,356,855 | |
| ImpactAssets Inc., Microfinance Plus Notes, 2.40%, 11/3/20 (4)(5)(8) | 1,855,000 | 1,697,325 | |
| Total High Social Impact Investments (Cost $14,133,877) | 13,480,161 | ||
www.calvert.com CALVERT SOCIAL INVESTMENT FUND ANNUAL REPORT 47
| SHARES | VALUE ($) | ||
| SHORT TERM INVESTMENT OF CASH COLLATERAL FOR SECURITIES LOANED - 1.5% | |||
| State Street Navigator Securities Lending Government Money Market Portfolio, 2.16% | 35,542,158 | 35,542,158 | |
| Total Short Term Investment of Cash Collateral for Securities Loaned (Cost $35,542,158) | 35,542,158 | ||
| TOTAL INVESTMENTS (Cost $1,467,345,295) - 98.1% | 2,366,124,820 | ||
| Other assets and liabilities, net - 1.9% | 45,453,113 | ||
NET ASSETS - 100.0% | 2,411,577,933 | ||
| NOTES TO SCHEDULE OF INVESTMENTS |
| (1) All or a portion of this security was on loan at September 30, 2018. The aggregate market value of securities on loan at September 30, 2018 was $57,533,561. |
| (2) Non-income producing security. |
| (3) Amount is less than 0.05%. |
| (4) Restricted security. Total market value of restricted securities amounts to $32,629,371, which represents 1.4% of the net assets of the Fund as of September 30, 2018. |
| (5) For fair value measurement purposes, security is categorized as Level 3 (see Note 1A). |
| (6) Defaulted security. This security is not accruing interest. |
| (7) Affiliated company (see Note 8). |
| (8) Notes carry an interest rate that varies by period and is contingent on the performance of the underlying portfolio of loans to borrowers. The coupon rate shown represents the rate in effect at September 30, 2018. |
| RESTRICTED SECURITIES | ACQUISITION DATES | COST ($) | |
| 20/20 Gene Systems, Inc. | 8/1/08-8/27/13 | 166,890 | |
| Accion Frontier Inclusion Fund LP | 11/12/15-9/24/18 | 612,727 | |
| Adobe Capital Social Mezzanine I LP | 2/8/13-7/31/18 | 375,733 | |
| Africa Renewable Energy Fund LP | 4/17/14-8/24/18 | 879,491 | |
| Arborview Capital Partners LP | 11/13/12-4/13/18 | 542,311 | |
| Blackstone Clean Technology Partners LP | 7/29/10-6/25/15 | 446,830 | |
| Bridges Ventures US Sustainable Growth Fund, LP | 6/8/16-9/18/18 | 484,338 | |
| Calvert Impact Capital, Inc., Community Investment Notes, 1.50%, 12/15/19 | 12/15/16 | 10,833,877 | |
| China Environment Fund 2004 LP | 9/15/05-4/1/09 | — | |
| China Environment Fund III LP | 1/24/08-4/19/13 | 688,450 | |
| Coastal Ventures III LP | 7/30/12-8/17/17 | 240,028 | |
| Core Innovations Capital I LP | 1/6/11-6/30/17 | 314,217 | |
| Cross Culture Ventures I LP | 2/24/16-6/11/18 | 352,430 | |
| DBL Equity Fund - BAEF Il LP | 3/30/11-8/2/16 | 866,008 | |
| DBL Partners III LP | 1/16/15-6/5/18 | 494,627 | |
| Digital Directions International, Inc. | 7/2/08-7/15/09 | 683,778 | |
| Entouch, Series C, Preferred | 2/3/16 | 350,000 | |
| Entouch, Series C-1, Preferred | 10/11/17-5/11/18 | 68,024 | |
| First Analysis Private Equity Fund V LP | 6/7/13-6/13/18 | 813,924 | |
| Graduation Alliance, Inc. | 5/17/16 | 390 | |
| Graduation Alliance, Inc., Series C, Preferred | 3/27/13-8/20/13 | 500,000 | |
| Graduation Alliance, Inc., Series D, Convertible Preferred | 4/29/15-5/17/16 | 228,617 | |
| Ignia Fund I LP | 1/28/10-12/9/16 | 1,001,436 | |
| Impact Ventures II LP | 9/8/10-2/5/18 | 838,672 | |
| ImpactAssets Inc., Global Sustainable Agriculture Notes, 2.50%, 11/3/20 | 11/13/15 | 1,445,000 | |
48 www.calvert.com CALVERT SOCIAL INVESTMENT FUND ANNUAL REPORT
| ImpactAssets Inc., Microfinance Plus Notes, 2.40%, 11/3/20 | 11/13/15 | 1,855,000 | |
| Ivy Capital (Proprietary) Ltd. | 9/12/12-5/14/14 | 557,372 | |
| LeapFrog Financial Inclusion Fund | 1/20/10-5/29/18 | 3,935 | |
| Napo Pharmaceuticals, Inc. | 2/21/07-9/23/09 | 419,720 | |
| New Markets Education Partners LP | 9/27/11-3/1/18 | 817,817 | |
| New Markets Venture Partners II LP | 7/21/08-5/3/16 | — | |
| One Earth Group Ltd., Convertible Note, 5.00%, 10/31/20 | 2/1/17 | 300,000 | |
| Owl Ventures LP | 7/10/14-1/11/18 | 385,000 | |
| PresenceLearning, Inc., Series A, Preferred | 9/29/11 | 300,000 | |
| PresenceLearning, Inc., Series A-2, Preferred | 5/2/12 | 134,942 | |
| PresenceLearning, Inc., Series B, Preferred | 4/4/13 | 285,000 | |
| Renewable Energy Asia Fund LP | 9/29/10-1/5/17 | 1,753,943 | |
| SEAF Global SME Facility, 9.00%, 1/1/19 | 6/28/13-1/25/18 | 2,077,601 | |
| SEAF India International Growth Fund LP | 3/22/05-5/24/10 | 210,391 | |
| SJF Ventures II LP, Preferred | 2/14/06-11/20/12 | — | |
| SJF Ventures III LP | 2/6/12-7/14/17 | 617,464 | |
| Sword Diagnostics, Series B, Preferred | 12/26/06-11/9/10 | 432,472 | |
| Westly Capital Partners Fund II LP | 12/27/11-12/21/17 | 816,881 | |
| See notes to financial statements. | |||
www.calvert.com CALVERT SOCIAL INVESTMENT FUND ANNUAL REPORT 49
CALVERT BALANCED FUND
STATEMENT OF ASSETS AND LIABILITIES
SEPTEMBER 30, 2018
| ASSETS | |||
Investments in securities of unaffiliated issuers, at value (identified cost $654,408,190) - including $16,105,529 of securities on loan | $721,453,435 | ||
| Investments in securities of affiliated issuers, at value (identified cost $4,266,666) | 4,124,508 | ||
| Cash | 3,117,978 | ||
| Cash denominated in foreign currency, at value (cost $14,870) | 14,734 | ||
| Receivable for investments sold | 5,878,968 | ||
| Receivable for capital shares sold | 554,213 | ||
| Dividends and interest receivable | 1,907,871 | ||
| Interest receivable - affiliated | 35,556 | ||
| Securities lending income receivable | 8,213 | ||
| Tax reclaims receivable | 1,693 | ||
| Deposits at broker for futures contracts | 136,858 | ||
| Trustees’ deferred compensation plan | 370,668 | ||
| Other assets | 14,707 | ||
| Total assets | 737,619,402 | ||
| LIABILITIES | |||
| Payable for variation margin on open futures contracts | 3,787 | ||
| Payable for investments purchased | 3,265,832 | ||
| Payable for capital shares redeemed | 248,677 | ||
| Deposits for securities loaned | 874,433 | ||
| Payable to affiliates: | |||
| Investment advisory fee | 241,296 | ||
| Administrative fee | 72,007 | ||
| Distribution and service fees | 161,012 | ||
| Sub-transfer agency fee | 24,657 | ||
| Trustees’ deferred compensation plan | 370,668 | ||
| Other | 54,538 | ||
| Accrued expenses | 298,724 | ||
| Total liabilities | 5,615,631 | ||
| Commitments and contingent liabilities (Note 10) | |||
| NET ASSETS | $732,003,771 | ||
| NET ASSETS CONSIST OF: | |||
| Paid-in capital applicable to shares of beneficial interest | |||
| (unlimited number of no par value shares authorized) | $651,119,898 | ||
| Distributable earnings | 80,883,873 | ||
| Total | $732,003,771 | ||
| See notes to financial statements. | |||
50 www.calvert.com CALVERT SOCIAL INVESTMENT FUND ANNUAL REPORT
CALVERT BALANCED FUND
STATEMENT OF ASSETS AND LIABILITIES
SEPTEMBER 30, 2018 - CONT’D
| NET ASSET VALUE PER SHARE | |||
| Class A (based on net assets of $571,451,561 and 17,241,108 shares outstanding) | $33.14 | ||
| Class C (based on net assets of $60,674,407 and 1,890,767 shares outstanding) | $32.09 | ||
| Class I (based on net assets of $99,877,803 and 2,957,345 shares outstanding) | $33.77 | ||
| OFFERING PRICE PER SHARE* | |||
| Class A (100/95.25 of net asset value per share) | $34.79 | ||
| * On sales of $50,000 or more, the offering price of Class A shares is reduced. | |||
| See notes to financial statements. | |||
www.calvert.com CALVERT SOCIAL INVESTMENT FUND ANNUAL REPORT 51
CALVERT BOND FUND
STATEMENT OF ASSETS AND LIABILITIES
SEPTEMBER 30, 2018
| ASSETS | |||
Investments in securities of unaffiliated issuers, at value (identified cost $1,077,923,810) - including $4,653,168 of securities on loan | $1,060,038,626 | ||
| Investments in securities of affiliated issuers, at value (identified cost $5,087,392) | 4,895,852 | ||
| Cash | 14,938,386 | ||
| Receivable for investments sold | 34,250,358 | ||
| Receivable for capital shares sold | 2,589,974 | ||
| Interest receivable | 5,899,991 | ||
| Interest receivable - affiliated | 61,473 | ||
| Securities lending income receivable | 2,880 | ||
| Receivable from affiliate | 60,346 | ||
| Deposits at broker for futures contracts | 1,449,760 | ||
| Trustees’ deferred compensation plan | 543,549 | ||
| Other assets | 21,135 | ||
| Total assets | 1,124,752,330 | ||
| LIABILITIES | |||
| Payable for variation margin on open futures contracts | 175,515 | ||
| Payable for investments purchased | 19,065,133 | ||
| Payable for capital shares redeemed | 886,451 | ||
| Deposits for securities loaned | 3,386,150 | ||
| Payable to affiliates: | |||
| Investment advisory fee | 312,924 | ||
| Administrative fee | 107,954 | ||
| Distribution and service fees | 59,868 | ||
| Sub-transfer agency fee | 12,451 | ||
| Trustees’ deferred compensation plan | 543,549 | ||
| Accrued expenses | 310,239 | ||
| Total liabilities | 24,860,234 | ||
| NET ASSETS | $1,099,892,096 | ||
| NET ASSETS CONSIST OF: | |||
| Paid-in capital applicable to shares of beneficial interest | |||
| (unlimited number of no par value shares authorized) | $1,122,579,976 | ||
| Accumulated loss | (22,687,880) | ||
| Total | $1,099,892,096 | ||
| NET ASSET VALUE PER SHARE | |||
| Class A (based on net assets of $251,714,269 and 16,040,361 shares outstanding) | $15.69 | ||
| Class C (based on net assets of $21,938,950 and 1,407,961 shares outstanding) | $15.58 | ||
| Class I (based on net assets of $692,821,742 and 44,075,800 shares outstanding) | $15.72 | ||
| Class R6 (based on net assets of $133,417,135 and 8,492,699 shares outstanding) | $15.71 | ||
| OFFERING PRICE PER SHARE* | |||
| Class A (100/96.25 of net asset value per share) | $16.30 | ||
| * On sales of $50,000 or more, the offering price of Class A shares is reduced. | |||
| See notes to financial statements. | |||
52 www.calvert.com CALVERT SOCIAL INVESTMENT FUND ANNUAL REPORT
CALVERT EQUITY FUND
STATEMENT OF ASSETS AND LIABILITIES
SEPTEMBER 30, 2018
| ASSETS | |||
Investments in securities of unaffiliated issuers, at value (identified cost $1,456,511,418) - including $57,533,561 of securities on loan | $2,355,698,839 | ||
| Investments in securities of affiliated issuers, at value (identified cost $10,833,877) | 10,425,981 | ||
| Cash | 80,817,978 | ||
| Receivable for capital shares sold | 2,730,128 | ||
| Dividends and interest receivable | 1,604,256 | ||
| Interest receivable - affiliated | 130,909 | ||
| Securities lending income receivable | 4,500 | ||
| Tax reclaims receivable | 56,640 | ||
| Receivable from affiliate | 63,387 | ||
| Trustees’ deferred compensation plan | 1,218,895 | ||
| Other assets | 47,319 | ||
| Total assets | 2,452,798,832 | ||
| LIABILITIES | |||
| Payable for capital shares redeemed | 2,088,708 | ||
| Deposits for securities loaned | 35,542,158 | ||
| Payable to affiliates: | |||
| Investment advisory fee | 962,177 | ||
| Administrative fee | 236,863 | ||
| Distribution and service fees | 392,823 | ||
| Sub-transfer agency fee | 41,345 | ||
| Trustees’ deferred compensation plan | 1,218,895 | ||
| Accrued expenses | 737,930 | ||
| Total liabilities | 41,220,899 | ||
| Commitments and contingent liabilities (Note 10) | |||
| NET ASSETS | $2,411,577,933 | ||
| NET ASSETS CONSIST OF: | |||
| Paid-in capital applicable to shares of beneficial interest | |||
| (unlimited number of no par value shares authorized) | $1,358,972,932 | ||
| Distributable earnings | 1,052,605,001 | ||
| Total | $2,411,577,933 | ||
| NET ASSET VALUE PER SHARE | |||
| Class A (based on net assets of $1,291,870,394 and 26,267,770 shares outstanding) | $49.18 | ||
| Class C (based on net assets of $155,419,436 and 5,396,447 shares outstanding) | $28.80 | ||
| Class I (based on net assets of $963,445,510 and 16,997,172 shares outstanding) | $56.68 | ||
| Class R6 (based on net assets of $842,593 and 14,875 shares outstanding, including fractional shares) | $56.65 | ||
| OFFERING PRICE PER SHARE* | |||
| Class A (100/95.25 of net asset value per share) | $51.63 | ||
| * On sales of $50,000 or more, the offering price of Class A shares is reduced. | |||
| See notes to financial statements. | |||
www.calvert.com CALVERT SOCIAL INVESTMENT FUND ANNUAL REPORT 53
STATEMENTS OF OPERATIONS
YEAR ENDED SEPTEMBER 30, 2018
| INVESTMENT INCOME | Balanced Fund | Bond Fund | Equity Fund | ||||||||
| Dividend income (net of foreign taxes withheld of $35,005, $0 and $108, respectively) | $7,352,504 | $— | $24,538,462 | ||||||||
| Interest income - unaffiliated issuers (net of foreign taxes withheld of $572, $0 and $0, respectively) | 8,633,933 | 31,815,406 | 391,909 | ||||||||
| Interest income - affiliated issuers | 48,000 | 76,311 | 162,508 | ||||||||
| Securities lending income, net | 52,610 | 131,380 | 23,424 | ||||||||
| Total investment income | 16,087,047 | 32,023,097 | 25,116,303 | ||||||||
| EXPENSES | |||||||||||
| Investment advisory fee | 2,845,727 | 3,540,277 | 11,261,816 | ||||||||
| Administrative fee | 847,914 | 1,215,635 | 2,755,559 | ||||||||
| Distribution and service fees: | |||||||||||
| Class A | 1,323,522 | 536,022 | 3,147,280 | ||||||||
| Class C | 603,956 | 245,876 | 1,544,675 | ||||||||
| Trustees’ fees and expenses | 35,994 | 52,381 | 115,241 | ||||||||
| Custodian fees | 140,039 | 108,248 | 146,203 | ||||||||
| Transfer agency fees and expenses | 783,309 | 788,496 | 2,048,417 | ||||||||
| Accounting fees | 148,264 | 205,800 | 418,253 | ||||||||
| Professional fees | 107,505 | 110,878 | 269,500 | ||||||||
| Registration fees | 68,197 | 128,963 | 126,844 | ||||||||
| Reports to shareholders | 49,415 | 73,270 | 144,800 | ||||||||
| Miscellaneous | 79,411 | 73,747 | 178,596 | ||||||||
| Total expenses | 7,033,253 | 7,079,593 | 22,157,184 | ||||||||
| Waiver and/or reimbursement of expenses by affiliate | (168,978) | (596,250) | (487,722) | ||||||||
| Reimbursement of expenses-other | (14,707) | (21,135) | (47,319) | ||||||||
| Net expenses | 6,849,568 | 6,462,208 | 21,622,143 | ||||||||
| Net investment income | 9,237,479 | 25,560,889 | 3,494,160 | ||||||||
| REALIZED AND UNREALIZED GAIN (LOSS) | |||||||||||
| Net realized gain on: | |||||||||||
| Investment securities - unaffiliated issuers | 21,950,032 | 449,613 | 192,750,082 | ||||||||
| Investment securities - affiliated issuers | — | — | (690,056) | ||||||||
| Futures contracts | 16,029 | 402,275 | — | ||||||||
| Foreign currency transactions | 613 | — | — | ||||||||
| 21,966,674 | 851,888 | 192,060,026 | |||||||||
| Net change in unrealized appreciation (depreciation) on: | |||||||||||
| Investment securities - unaffiliated issuers | 36,065,557 | (26,879,900) | 271,612,423 | ||||||||
| Investment securities - affiliated issuers | 40,781 | 47,160 | 806,655 | ||||||||
| Futures contracts | (189,140) | (1,912,852) | — | ||||||||
| Foreign currency | (178) | — | (707) | ||||||||
| 35,917,020 | (28,745,592) | 272,418,371 | |||||||||
| Net realized and unrealized gain (loss) | 57,883,694 | (27,893,704) | 464,478,397 | ||||||||
| Net increase (decrease) in net assets resulting from operations | $67,121,173 | ($2,332,815 | ) | $467,972,557 | |||||||
| See notes to financial statements. | |||||||||||
54 www.calvert.com CALVERT SOCIAL INVESTMENT FUND ANNUAL REPORT
CALVERT BALANCED FUND
STATEMENTS OF CHANGES IN NET ASSETS
| INCREASE (DECREASE) IN NET ASSETS | Year Ended September 30, 2018 | Year Ended September 30, 2017 | |||||
| Operations: | |||||||
| Net investment income | $9,237,479 | $9,837,401 | |||||
| Net realized gain | 21,966,674 | 53,021,088 | |||||
| Net change in unrealized appreciation (depreciation) | 35,917,020 | (6,922,226) | |||||
| Net increase in net assets resulting from operations | 67,121,173 | 55,936,263 | |||||
Distributions to shareholders:(1) | |||||||
| Class A shares | (42,834,391) | (14,696,192) | |||||
| Class C shares | (4,376,145) | (1,136,732) | |||||
| Class I shares | (6,436,112) | (1,022,798) | |||||
| Class Y shares | — | (551,787) | |||||
| Total distributions to shareholders | (53,646,648) | (17,407,509) | |||||
| Capital share transactions: | |||||||
| Class A shares | 11,604,433 | (74,481,952) | |||||
| Class C shares | (1,470,362) | (1,424,823) | |||||
| Class I shares | 49,849,886 | 30,715,683 | |||||
Class Y shares (2) | (30,424,693) | 15,033,331 | |||||
| Net increase (decrease) in net assets from capital share transactions | 29,559,264 | (30,157,761) | |||||
| TOTAL INCREASE IN NET ASSETS | 43,033,789 | 8,370,993 | |||||
| NET ASSETS | |||||||
| Beginning of year | 688,969,982 | 680,598,989 | |||||
| End of year | $732,003,771 | 688,969,982(3) | |||||
(1) For the year ended September 30, 2017, the source of distributions was as follows: Net investment income - Class A ($8,151,148), Class C ($450,495), Class I ($793,017), and Class Y ($402,507) Net realized gain - Class A ($6,545,044), Class C ($686,237), Class I ($229,781), and Class Y ($149,280) | |||||||
(2) Effective December 8, 2017, Class Y shares of the Fund converted to Class I shares at net asset value. Thereafter, Class Y shares were terminated. | |||||||
(3) Includes accumulated undistributed net investment income of $242,189 at September 30, 2017. The requirement to disclose the corresponding amount as of September 30, 2018 was eliminated. | |||||||
| See notes to financial statements. | |||||||
www.calvert.com CALVERT SOCIAL INVESTMENT FUND ANNUAL REPORT 55
CALVERT BOND FUND
STATEMENTS OF CHANGES IN NET ASSETS
| INCREASE (DECREASE) IN NET ASSETS | Year Ended September 30, 2018 | Year Ended September 30, 2017 | |||||
| Operations: | |||||||
| Net investment income | $25,560,889 | $21,966,994 | |||||
| Net realized gain (loss) | 851,888 | (1,814,864) | |||||
| Net change in unrealized appreciation (depreciation) | (28,745,592) | (7,623,523) | |||||
| Net increase (decrease) in net assets resulting from operations | (2,332,815) | 12,528,607 | |||||
Distributions to shareholders:(1) | |||||||
| Class A shares | (6,243,931) | (8,339,358) | |||||
| Class C shares | (384,376) | (500,911) | |||||
| Class I shares | (14,997,210) | (12,332,413) | |||||
Class R6 shares (2) | (3,109,189) | — | |||||
| Class Y shares | (575,715) | (3,184,189) | |||||
| Total distributions to shareholders | (25,310,421) | (24,356,871) | |||||
| Capital share transactions: | |||||||
| Class A shares | (22,140,591) | (107,818,348) | |||||
| Class C shares | (3,982,816) | (5,236,985) | |||||
| Class I shares | 207,960,971 | 149,145,862 | |||||
Class R6 shares (2) | 137,113,112 | — | |||||
Class Y shares (3) | (141,745,071) | 32,696,224 | |||||
| Net increase in net assets from capital share transactions | 177,205,605 | 68,786,753 | |||||
| TOTAL INCREASE IN NET ASSETS | 149,562,369 | 56,958,489 | |||||
| NET ASSETS | |||||||
| Beginning of year | 950,329,727 | 893,371,238 | |||||
| End of year | $1,099,892,096 | 950,329,727(4) | |||||
(1) For the year ended September 30, 2017, the source of distributions was as follows: Net investment income - Class A ($7,273,146), Class C ($412,882), Class I ($11,297,997), and Class Y ($2,926,328) Net realized gain - Class A ($1,066,212), Class C ($88,029), Class I ($1,034,416), and Class Y ($257,861) | |||||||
(2) For the period from the commencement of operations, October 3, 2017, to September 30, 2018. | |||||||
(3) Effective December 8, 2017, Class Y shares of the Fund converted to Class I shares at net asset value. Thereafter, Class Y shares were terminated. | |||||||
(4) Includes accumulated undistributed net investment income of $83,688 at September 30, 2017. The requirement to disclose the corresponding amount as of September 30, 2018 was eliminated. | |||||||
| See notes to financial statements. | |||||||
56 www.calvert.com CALVERT SOCIAL INVESTMENT FUND ANNUAL REPORT
CALVERT EQUITY FUND
STATEMENTS OF CHANGES IN NET ASSETS
| INCREASE (DECREASE) IN NET ASSETS | Year Ended September 30, 2018 | Year Ended September 30, 2017 | |||||
| Operations: | |||||||
| Net investment income | $3,494,160 | $4,664,225 | |||||
| Net realized gain | 192,060,026 | 211,444,646 | |||||
| Net change in unrealized appreciation (depreciation) | 272,418,371 | 103,095,971 | |||||
| Net increase in net assets resulting from operations | 467,972,557 | 319,204,842 | |||||
Distributions to shareholders:(1) | |||||||
| Class A shares | (94,443,950) | (132,972,596) | |||||
| Class C shares | (18,856,951) | (25,782,355) | |||||
| Class I shares | (56,043,334) | (47,876,535) | |||||
Class R6 shares (2) | (739) | — | |||||
| Class Y shares | — | (15,861,378) | |||||
| Total distributions to shareholders | (169,344,974) | (222,492,864) | |||||
| Capital share transactions: | |||||||
| Class A shares | (91,066,246) | (217,516,856) | |||||
| Class C shares | (8,761,146) | (23,409,675) | |||||
| Class I shares | 301,877,540 | 43,446,160 | |||||
Class R6 shares (2) | 789,962 | — | |||||
Class Y shares (3) | (224,919,540) | 3,370,372 | |||||
| Net decrease in net assets from capital share transactions | (22,079,430) | (194,109,999) | |||||
| TOTAL INCREASE (DECREASE) IN NET ASSETS | 276,548,153 | (97,398,021) | |||||
| NET ASSETS | |||||||
| Beginning of year | 2,135,029,780 | 2,232,427,801 | |||||
| End of year | $2,411,577,933 | 2,135,029,780(4) | |||||
(1) For the year ended September 30, 2017, the source of distributions was as follows: Net investment income - Class A ($1,961,371), Class I ($3,250,521), and Class Y ($856,956) Net realized gain - Class A ($131,011,225), Class C ($25,782,355), Class I ($44,626,014), and Class Y ($15,004,422) | |||||||
(2) For the period from the commencement of operations, October 3, 2017, to September 30, 2018. | |||||||
(3) Effective December 8, 2017, Class Y shares of the Fund converted to Class I shares at net asset value. Thereafter, Class Y shares were terminated. | |||||||
(4) Includes accumulated undistributed net investment income of $2,779,927 at September 30, 2017. The requirement to disclose the corresponding amount as of September 30, 2018 was eliminated. | |||||||
| See notes to financial statements. | |||||||
www.calvert.com CALVERT SOCIAL INVESTMENT FUND ANNUAL REPORT 57
CALVERT BALANCED FUND
FINANCIAL HIGHLIGHTS
| Year Ended September 30, | |||||||||||||||
| CLASS A SHARES | 2018 | 2017 | 2016 | 2015 | 2014 | ||||||||||
| Net asset value, beginning | $32.59 | $30.82 | $31.90 | $33.06 | $34.13 | ||||||||||
| Income from investment operations: | |||||||||||||||
Net investment income (1) | 0.43 | 0.47 | 0.51 | (2) | 0.43 | 0.33 | |||||||||
| Net realized and unrealized gain (loss) | 2.68 | 2.11 | 2.14 | (3) | (0.81) | 3.02 | |||||||||
| Total from investment operations | 3.11 | 2.58 | 2.65 | (0.38) | 3.35 | ||||||||||
| Distributions from: | |||||||||||||||
| Net investment income | (0.44) | (0.46) | (0.50) | (0.41) | (0.32) | ||||||||||
| Net realized gain | (2.12) | (0.35) | (3.23) | (0.37) | (4.10) | ||||||||||
| Total distributions | (2.56) | (0.81) | (3.73) | (0.78) | (4.42) | ||||||||||
| Total increase (decrease) in net asset value | 0.55 | 1.77 | (1.08) | (1.16) | (1.07) | ||||||||||
| Net asset value, ending | $33.14 | $32.59 | $30.82 | $31.90 | $33.06 | ||||||||||
Total return (4) | 10.01 | % | 8.51 | % | 8.93 | % | (3) | (1.27 | %) | 10.77 | % | ||||
Ratios to average net assets: (5) | |||||||||||||||
| Total expenses | 0.96 | % | 0.99 | % | 1.05 | % | 1.13 | % | 1.17 | % | |||||
| Net expenses | 0.94 | % | 0.99 | % | 1.02 | % | 1.13 | % | 1.16 | % | |||||
| Net investment income | 1.33 | % | 1.48 | % | 1.67 | % | (2) | 1.25 | % | 1.02 | % | ||||
| Portfolio turnover | 76 | % | 128 | % | 146 | % | 99 | % | 124 | % | |||||
| Net assets, ending (in thousands) | $571,452 | $549,517 | $592,625 | $569,368 | $561,809 | ||||||||||
(1) Computed using average shares outstanding. | |||||||||||||||
(2) Amount includes a non-recurring refund for overbilling of prior years’ custody out-of-pocket fees. This amounted to $0.007 per share and 0.02% of average net assets. | |||||||||||||||
(3) Total return includes voluntary reimbursement by the adviser for realized investment losses relating to two trading errors which amounted to $0.01 per share. Excluding such payment, the total return would have been 8.90%. | |||||||||||||||
(4) Returns are historical and are calculated by determining the percentage change in net asset value with all distributions reinvested and do not reflect the effect of sales charges, if any. | |||||||||||||||
(5) Total expenses do not reflect amounts reimbursed and/or waived by the adviser and certain of its affiliates, if applicable. Net expenses are net of all reductions and represent the net expenses paid by the Fund. | |||||||||||||||
| See notes to financial statements. | |||||||||||||||
58 www.calvert.com CALVERT SOCIAL INVESTMENT FUND ANNUAL REPORT
CALVERT BALANCED FUND
FINANCIAL HIGHLIGHTS
| Year Ended September 30, | |||||||||||||||
| CLASS C SHARES | 2018 | 2017 | 2016 | 2015 | 2014 | ||||||||||
| Net asset value, beginning | $31.63 | $29.95 | $31.11 | $32.30 | $33.45 | ||||||||||
| Income from investment operations: | |||||||||||||||
Net investment income (1) | 0.18 | 0.20 | 0.25 | (2) | 0.15 | 0.08 | |||||||||
| Net realized and unrealized gain (loss) | 2.61 | 2.06 | 2.08 | (3) | (0.78) | 2.94 | |||||||||
| Total from investment operations | 2.79 | 2.26 | 2.33 | (0.63) | 3.02 | ||||||||||
| Distributions from: | |||||||||||||||
| Net investment income | (0.21) | (0.23) | (0.26) | (0.19) | (0.07) | ||||||||||
| Net realized gain | (2.12) | (0.35) | (3.23) | (0.37) | (4.10) | ||||||||||
| Total distributions | (2.33) | (0.58) | (3.49) | (0.56) | (4.17) | ||||||||||
| Total increase (decrease) in net asset value | 0.46 | 1.68 | (1.16) | (1.19) | (1.15) | ||||||||||
| Net asset value, ending | $32.09 | $31.63 | $29.95 | $31.11 | $32.30 | ||||||||||
Total return (4) | 9.14 | % | 7.66 | % | 8.05 | % | (3) | (2.08 | %) | 9.89 | % | ||||
Ratios to average net assets: (5) | |||||||||||||||
| Total expenses | 1.71 | % | 1.80 | % | 1.86 | % | 1.92 | % | 1.95 | % | |||||
| Net expenses | 1.69 | % | 1.80 | % | 1.84 | % | 1.92 | % | 1.94 | % | |||||
| Net investment income | 0.58 | % | 0.67 | % | 0.85 | % | (2) | 0.47 | % | 0.24 | % | ||||
| Portfolio turnover | 76 | % | 128 | % | 146 | % | 99 | % | 124 | % | |||||
| Net assets, ending (in thousands) | $60,674 | $61,205 | $59,242 | $55,180 | $48,814 | ||||||||||
(1) Computed using average shares outstanding. | |||||||||||||||
(2) Amount includes a non-recurring refund for overbilling of prior years’ custody out-of-pocket fees. This amounted to $0.007 per share and 0.02% of average net assets. | |||||||||||||||
(3) Total return includes voluntary reimbursement by the adviser for realized investment losses relating to two trading errors which amounted to $0.01 per share. Excluding such payment, the total return would have been 8.02%. | |||||||||||||||
(4) Returns are historical and are calculated by determining the percentage change in net asset value with all distributions reinvested and do not reflect the effect of sales charges, if any. | |||||||||||||||
(5) Total expenses do not reflect amounts reimbursed and/or waived by the adviser and certain of its affiliates, if applicable. Net expenses are net of all reductions and represent the net expenses paid by the Fund. | |||||||||||||||
| See notes to financial statements. | |||||||||||||||
www.calvert.com CALVERT SOCIAL INVESTMENT FUND ANNUAL REPORT 59
CALVERT BALANCED FUND
FINANCIAL HIGHLIGHTS
| Year Ended September 30, | |||||||||||||||
| CLASS I SHARES | 2018 | 2017 | 2016 | 2015 | 2014 | ||||||||||
| Net asset value, beginning | $33.14 | $31.32 | $32.36 | $33.53 | $34.55 | ||||||||||
| Income from investment operations: | |||||||||||||||
Net investment income (1) | 0.55 | 0.58 | 0.63 | (2) | 0.59 | 0.51 | |||||||||
| Net realized and unrealized gain (loss) | 2.72 | 2.18 | 2.17 | (3) | (0.82) | 3.06 | |||||||||
| Total from investment operations | 3.27 | 2.76 | 2.80 | (0.23) | 3.57 | ||||||||||
| Distributions from: | |||||||||||||||
| Net investment income | (0.52) | (0.59) | (0.61) | (0.57) | (0.49) | ||||||||||
| Net realized gain | (2.12) | (0.35) | (3.23) | (0.37) | (4.10) | ||||||||||
| Total distributions | (2.64) | (0.94) | (3.84) | (0.94) | (4.59) | ||||||||||
| Total increase (decrease) in net asset value | 0.63 | 1.82 | (1.04) | (1.17) | (1.02) | ||||||||||
| Net asset value, ending | $33.77 | $33.14 | $31.32 | $32.36 | $33.53 | ||||||||||
Total return (4) | 10.33 | % | 8.94 | % | 9.32 | % | (3) | (0.86 | %) | 11.35 | % | ||||
Ratios to average net assets: (5) | |||||||||||||||
| Total expenses | 0.72 | % | 0.67 | % | 0.76 | % | 0.64 | % | 0.66 | % | |||||
| Net expenses | 0.62 | % | 0.62 | % | 0.65 | % | 0.64 | % | 0.66 | % | |||||
| Net investment income | 1.66 | % | 1.80 | % | 2.04 | % | (2) | 1.70 | % | 1.53 | % | ||||
| Portfolio turnover | 76 | % | 128 | % | 146 | % | 99 | % | 124 | % | |||||
| Net assets, ending (in thousands) | $99,878 | $48,780 | $15,554 | $13,894 | $43,579 | ||||||||||
(1) Computed using average shares outstanding. | |||||||||||||||
(2) Amount includes a non-recurring refund for overbilling of prior years’ custody out-of-pocket fees. This amounted to $0.007 per share and 0.02% of average net assets. | |||||||||||||||
(3) Total return includes voluntary reimbursement by the adviser for realized investment losses relating to two trading errors which amounted to $0.01 per share. Excluding such payment, the total return would have been 9.28%. | |||||||||||||||
(4) Returns are historical and are calculated by determining the percentage change in net asset value with all distributions reinvested and do not reflect the effect of sales charges, if any. | |||||||||||||||
(5) Total expenses do not reflect amounts reimbursed and/or waived by the adviser and certain of its affiliates, if applicable. Net expenses are net of all reductions and represent the net expenses paid by the Fund. | |||||||||||||||
| See notes to financial statements. | |||||||||||||||
60 www.calvert.com CALVERT SOCIAL INVESTMENT FUND ANNUAL REPORT
CALVERT BOND FUND
FINANCIAL HIGHLIGHTS
| Year Ended September 30, | |||||||||||||||
| CLASS A SHARES | 2018 | 2017 | 2016 | 2015 | 2014 | ||||||||||
| Net asset value, beginning | $16.14 | $16.36 | $15.83 | $15.92 | $15.61 | ||||||||||
| Income from investment operations: | |||||||||||||||
Net investment income (1) | 0.37 | 0.37 | 0.40 | (2) | 0.38 | 0.38 | |||||||||
| Net realized and unrealized gain (loss) | (0.45) | (0.18) | 0.53 | (0.09) | 0.34 | ||||||||||
| Total from investment operations | (0.08) | 0.19 | 0.93 | 0.29 | 0.72 | ||||||||||
| Distributions from: | |||||||||||||||
| Net investment income | (0.37) | (0.36) | (0.40) | (0.38) | (0.38) | ||||||||||
| Net realized gain | — | (0.05) | — | — | (0.03) | ||||||||||
| Total distributions | (0.37) | (0.41) | (0.40) | (0.38) | (0.41) | ||||||||||
| Total increase (decrease) in net asset value | (0.45) | (0.22) | 0.53 | (0.09) | 0.31 | ||||||||||
| Net asset value, ending | $15.69 | $16.14 | $16.36 | $15.83 | $15.92 | ||||||||||
Total return (3) | (0.48 | %) | 1.21 | % | 5.96 | % | 1.79 | % | 4.66 | % | |||||
Ratios to average net assets: (4) | |||||||||||||||
| Total expenses | 0.83 | % | 0.89 | % | 0.94 | % | 1.07 | % | 1.12 | % | |||||
| Net expenses | 0.83 | % | 0.89 | % | 0.91 | % | 1.07 | % | 1.12 | % | |||||
| Net investment income | 2.32 | % | 2.29 | % | 2.49 | % | (2) | 2.35 | % | 2.40 | % | ||||
| Portfolio turnover | 83 | % | 99 | % | 154 | % | 241 | % | 187 | % | |||||
| Net assets, ending (in thousands) | $251,714 | $281,490 | $395,957 | $395,194 | $378,269 | ||||||||||
(1) Computed using average shares outstanding. | |||||||||||||||
(2) Amount includes a non-recurring refund for overbilling of prior years’ custody out-of-pocket fees. This amounted to less than $0.005 per share and less than 0.005% of average net assets. | |||||||||||||||
(3) Returns are historical and are calculated by determining the percentage change in net asset value with all distributions reinvested and do not reflect the effect of sales charges, if any. | |||||||||||||||
(4) Total expenses do not reflect amounts reimbursed and/or waived by the adviser and certain of its affiliates, if applicable. Net expenses are net of all reductions and represent the net expenses paid by the Fund. | |||||||||||||||
| See notes to financial statements. | |||||||||||||||
www.calvert.com CALVERT SOCIAL INVESTMENT FUND ANNUAL REPORT 61
CALVERT BOND FUND
FINANCIAL HIGHLIGHTS
| Year Ended September 30, | |||||||||||||||
| CLASS C SHARES | 2018 | 2017 | 2016 | 2015 | 2014 | ||||||||||
| Net asset value, beginning | $16.03 | $16.26 | $15.73 | $15.82 | $15.52 | ||||||||||
| Income from investment operations: | |||||||||||||||
Net investment income (1) | 0.24 | 0.22 | 0.25 | (2) | 0.24 | 0.25 | |||||||||
| Net realized and unrealized gain (loss) | (0.44) | (0.18) | 0.54 | (0.09) | 0.33 | ||||||||||
| Total from investment operations | (0.20) | 0.04 | 0.79 | 0.15 | 0.58 | ||||||||||
| Distributions from: | |||||||||||||||
| Net investment income | (0.25) | (0.22) | (0.26) | (0.24) | (0.25) | ||||||||||
| Net realized gain | — | (0.05) | — | — | (0.03) | ||||||||||
| Total distributions | (0.25) | (0.27) | (0.26) | (0.24) | (0.28) | ||||||||||
| Total increase (decrease) in net asset value | (0.45) | (0.23) | 0.53 | (0.09) | 0.30 | ||||||||||
| Net asset value, ending | $15.58 | $16.03 | $16.26 | $15.73 | $15.82 | ||||||||||
Total return (3) | (1.25 | %) | 0.27 | % | 5.05 | % | 0.95 | % | 3.78 | % | |||||
Ratios to average net assets: (4) | |||||||||||||||
| Total expenses | 1.63 | % | 1.78 | % | 1.84 | % | 1.91 | % | 1.92 | % | |||||
| Net expenses | 1.63 | % | 1.78 | % | 1.81 | % | 1.91 | % | 1.92 | % | |||||
| Net investment income | 1.52 | % | 1.40 | % | 1.59 | % | (2) | 1.51 | % | 1.60 | % | ||||
| Portfolio turnover | 83 | % | 99 | % | 154 | % | 241 | % | 187 | % | |||||
| Net assets, ending (in thousands) | $21,939 | $26,631 | $32,349 | $32,626 | $33,963 | ||||||||||
(1) Computed using average shares outstanding. | |||||||||||||||
(2) Amount includes a non-recurring refund for overbilling of prior years’ custody out-of-pocket fees. This amounted to less than $0.005 per share and less than 0.005% of average net assets. | |||||||||||||||
(3) Returns are historical and are calculated by determining the percentage change in net asset value with all distributions reinvested and do not reflect the effect of sales charges, if any. | |||||||||||||||
(4) Total expenses do not reflect amounts reimbursed and/or waived by the adviser and certain of its affiliates, if applicable. Net expenses are net of all reductions and represent the net expenses paid by the Fund. | |||||||||||||||
| See notes to financial statements. | |||||||||||||||
62 www.calvert.com CALVERT SOCIAL INVESTMENT FUND ANNUAL REPORT
CALVERT BOND FUND
FINANCIAL HIGHLIGHTS
| Year Ended September 30, | |||||||||||||||
| CLASS I SHARES | 2018 | 2017 | 2016 | 2015 | 2014 | ||||||||||
| Net asset value, beginning | $16.15 | $16.38 | $15.85 | $15.94 | $15.62 | ||||||||||
| Income from investment operations: | |||||||||||||||
Net investment income (1) | 0.42 | 0.42 | 0.46 | (2) | 0.47 | 0.48 | |||||||||
| Net realized and unrealized gain (loss) | (0.45) | (0.17) | 0.53 | (0.09) | 0.35 | ||||||||||
| Total from investment operations | (0.03) | 0.25 | 0.99 | 0.38 | 0.83 | ||||||||||
| Distributions from: | |||||||||||||||
| Net investment income | (0.40) | (0.43) | (0.46) | (0.47) | (0.48) | ||||||||||
| Net realized gain | — | (0.05) | — | — | (0.03) | ||||||||||
| Total distributions | (0.40) | (0.48) | (0.46) | (0.47) | (0.51) | ||||||||||
| Total increase (decrease) in net asset value | (0.43) | (0.23) | 0.53 | (0.09) | 0.32 | ||||||||||
| Net asset value, ending | $15.72 | $16.15 | $16.38 | $15.85 | $15.94 | ||||||||||
Total return (3) | (0.15 | %) | 1.54 | % | 6.35 | % | 2.36 | % | 5.35 | % | |||||
Ratios to average net assets: (4) | |||||||||||||||
| Total expenses | 0.63 | % | 0.54 | % | 0.54 | % | 0.51 | % | 0.50 | % | |||||
| Net expenses | 0.53 | % | 0.52 | % | 0.53 | % | 0.51 | % | 0.50 | % | |||||
| Net investment income | 2.64 | % | 2.64 | % | 2.86 | % | (2) | 2.91 | % | 3.01 | % | ||||
| Portfolio turnover | 83 | % | 99 | % | 154 | % | 241 | % | 187 | % | |||||
| Net assets, ending (in thousands) | $692,822 | $500,510 | $355,017 | $328,690 | $300,602 | ||||||||||
(1) Computed using average shares outstanding. | |||||||||||||||
(2) Amount includes a non-recurring refund for overbilling of prior years’ custody out-of-pocket fees. This amounted to less than $0.005 per share and less than 0.005% of average net assets. | |||||||||||||||
(3) Returns are historical and are calculated by determining the percentage change in net asset value with all distributions reinvested and do not reflect the effect of sales charges, if any. | |||||||||||||||
(4) Total expenses do not reflect amounts reimbursed and/or waived by the adviser and certain of its affiliates, if applicable. Net expenses are net of all reductions and represent the net expenses paid by the Fund. | |||||||||||||||
| See notes to financial statements. | |||||||||||||||
www.calvert.com CALVERT SOCIAL INVESTMENT FUND ANNUAL REPORT 63
CALVERT BOND FUND
FINANCIAL HIGHLIGHTS
Period Ended September 30, 2018 (1) | ||||
| CLASS R6 SHARES | ||||
| Net asset value, beginning | $16.17 | |||
| Income from investment operations: | ||||
Net investment income (2) | 0.42 | |||
| Net realized and unrealized loss | (0.46) | |||
| Total from investment operations | (0.04) | |||
| Distributions from: | ||||
| Net investment income | (0.42) | |||
| Total distributions | (0.42) | |||
| Total decrease in net asset value | (0.46) | |||
| Net asset value, ending | $15.71 | |||
Total return (3) | (0.27 | %) | (4) | |
Ratios to average net assets: (5) | ||||
| Total expenses | 0.56 | % | (6) | |
| Net expenses | 0.53 | % | (6) | |
| Net investment income | 2.64 | % | (6) | |
| Portfolio turnover | 83 | % | (7) | |
| Net assets, ending (in thousands) | $133,417 | |||
(1) For the period from the commencement of operations, October 3, 2017, to September 30, 2018. | ||||
(2) Computed using average shares outstanding. | ||||
(3) Return is historical and is calculated by determining the percentage change in net asset value with all distributions reinvested and does not reflect the effect of sales charges, if any. | ||||
(4) Not annualized. | ||||
(5) Total expenses do not reflect amounts reimbursed and/or waived by the adviser and certain of its affiliates, if applicable. Net expenses are net of all reductions and represent the net expenses paid by the Fund. | ||||
(6) Annualized. | ||||
(7) For the year ended September 30, 2018. | ||||
| See notes to financial statements. | ||||
64 www.calvert.com CALVERT SOCIAL INVESTMENT FUND ANNUAL REPORT
CALVERT EQUITY FUND
FINANCIAL HIGHLIGHTS
| Year Ended September 30, | |||||||||||||||
| CLASS A SHARES | 2018 | 2017 | 2016 | 2015 | 2014 | ||||||||||
| Net asset value, beginning | $43.31 | $41.38 | $47.79 | $50.33 | $44.68 | ||||||||||
| Income from investment operations: | |||||||||||||||
Net investment income (1) | 0.04 | 0.06 | 0.11 | (2) | 0.10 | 0.02 | |||||||||
| Net realized and unrealized gain | 9.31 | 6.03 | 3.74 | 2.20 | 7.67 | ||||||||||
| Total from investment operations | 9.35 | 6.09 | 3.85 | 2.30 | 7.69 | ||||||||||
| Distributions from: | |||||||||||||||
| Net investment income | (0.05) | (0.06) | (0.13) | (0.02) | (0.05) | ||||||||||
| Net realized gain | (3.43) | (4.10) | (10.13) | (4.82) | (1.99) | ||||||||||
| Total distributions | (3.48) | (4.16) | (10.26) | (4.84) | (2.04) | ||||||||||
| Total increase (decrease) in net asset value | 5.87 | 1.93 | (6.41) | (2.54) | 5.65 | ||||||||||
| Net asset value, ending | $49.18 | $43.31 | $41.38 | $47.79 | $50.33 | ||||||||||
Total return (3) | 22.66 | % | 16.39 | % | 8.57 | % | 4.57 | % | 17.63 | % | |||||
Ratios to average net assets: (4) | |||||||||||||||
| Total expenses | 1.01 | % | 1.06 | % | 1.10 | % | 1.13 | % | 1.15 | % | |||||
| Net expenses | 1.01 | % | 1.06 | % | 1.08 | % | 1.12 | % | 1.14 | % | |||||
| Net investment income | 0.08 | % | 0.16 | % | 0.27 | % | (2) | 0.19 | % | 0.05 | % | ||||
| Portfolio turnover | 18 | % | 29 | % | 44 | % | 37 | % | 24 | % | |||||
| Net assets, ending (in thousands) | $1,291,870 | $1,220,685 | $1,385,988 | $1,328,913 | $1,590,823 | ||||||||||
(1) Computed using average shares outstanding. | |||||||||||||||
(2) Amount includes a non-recurring refund for overbilling of prior years’ custody out-of-pocket fees. This amounted to less than $0.005 per share and less than 0.005% of average net assets. | |||||||||||||||
(3) Returns are historical and are calculated by determining the percentage change in net asset value with all distributions reinvested and do not reflect the effect of sales charges, if any. | |||||||||||||||
(4) Total expenses do not reflect amounts reimbursed and/or waived by the adviser and certain of its affiliates, if applicable. Net expenses are net of all reductions and represent the net expenses paid by the Fund. | |||||||||||||||
| See notes to financial statements. | |||||||||||||||
www.calvert.com CALVERT SOCIAL INVESTMENT FUND ANNUAL REPORT 65
CALVERT EQUITY FUND
FINANCIAL HIGHLIGHTS
| Year Ended September 30, | |||||||||||||||
| CLASS C SHARES | 2018 | 2017 | 2016 | 2015 | 2014 | ||||||||||
| Net asset value, beginning | $26.84 | $27.35 | $34.98 | $38.31 | $34.66 | ||||||||||
| Income from investment operations: | |||||||||||||||
Net investment loss (1) | (0.18) | (0.15) | (0.14) | (2) | (0.20) | (0.25) | |||||||||
| Net realized and unrealized gain | 5.57 | 3.74 | 2.67 | 1.69 | 5.89 | ||||||||||
| Total from investment operations | 5.39 | 3.59 | 2.53 | 1.49 | 5.64 | ||||||||||
| Distributions from: | |||||||||||||||
| Net investment income | — | — | (0.03) | — | — | ||||||||||
| Net realized gain | (3.43) | (4.10) | (10.13) | (4.82) | (1.99) | ||||||||||
| Total distributions | (3.43) | (4.10) | (10.16) | (4.82) | (1.99) | ||||||||||
| Total increase (decrease) in net asset value | 1.96 | (0.51) | (7.63) | (3.33) | 3.65 | ||||||||||
| Net asset value, ending | $28.80 | $26.84 | $27.35 | $34.98 | $38.31 | ||||||||||
Total return (3) | 21.75 | % | 15.48 | % | 7.73 | % | 3.82 | % | 16.76 | % | |||||
Ratios to average net assets: (4) | |||||||||||||||
| Total expenses | 1.76 | % | 1.83 | % | 1.87 | % | 1.87 | % | 1.88 | % | |||||
| Net expenses | 1.76 | % | 1.83 | % | 1.85 | % | 1.86 | % | 1.87 | % | |||||
| Net investment loss | (0.67 | %) | (0.60 | %) | (0.50 | %) | (2) | (0.54 | %) | (0.68 | %) | ||||
| Portfolio turnover | 18 | % | 29 | % | 44 | % | 37 | % | 24 | % | |||||
| Net assets, ending (in thousands) | $155,419 | $152,561 | $178,719 | $169,649 | $171,869 | ||||||||||
(1) Computed using average shares outstanding. | |||||||||||||||
(2) Amount includes a non-recurring refund for overbilling of prior years’ custody out-of-pocket fees. This amounted to less than $0.005 per share and less than 0.005% of average net assets. | |||||||||||||||
(3) Returns are historical and are calculated by determining the percentage change in net asset value with all distributions reinvested and do not reflect the effect of sales charges, if any. | |||||||||||||||
(4) Total expenses do not reflect amounts reimbursed and/or waived by the adviser and certain of its affiliates, if applicable. Net expenses are net of all reductions and represent the net expenses paid by the Fund. | |||||||||||||||
| See notes to financial statements. | |||||||||||||||
66 www.calvert.com CALVERT SOCIAL INVESTMENT FUND ANNUAL REPORT
CALVERT EQUITY FUND
FINANCIAL HIGHLIGHTS
| Year Ended September 30, | |||||||||||||||
| CLASS I SHARES | 2018 | 2017 | 2016 | 2015 | 2014 | ||||||||||
| Net asset value, beginning | $49.44 | $46.68 | $52.65 | $54.90 | $48.48 | ||||||||||
| Income from investment operations: | |||||||||||||||
Net investment income (1) | 0.20 | 0.25 | 0.32 | (2) | 0.38 | 0.29 | |||||||||
| Net realized and unrealized gain | 10.69 | 6.88 | 4.14 | 2.38 | 8.34 | ||||||||||
| Total from investment operations | 10.89 | 7.13 | 4.46 | 2.76 | 8.63 | ||||||||||
| Distributions from: | |||||||||||||||
| Net investment income | (0.22) | (0.27) | (0.30) | (0.19) | (0.22) | ||||||||||
| Net realized gain | (3.43) | (4.10) | (10.13) | (4.82) | (1.99) | ||||||||||
| Total distributions | (3.65) | (4.37) | (10.43) | (5.01) | (2.21) | ||||||||||
| Total increase (decrease) in net asset value | 7.24 | 2.76 | (5.97) | (2.25) | 6.42 | ||||||||||
| Net asset value, ending | $56.68 | $49.44 | $46.68 | $52.65 | $54.90 | ||||||||||
Total return (3) | 23.06 | % | 16.85 | % | 9.01 | % | 5.06 | % | 18.23 | % | |||||
Ratios to average net assets: (4) | |||||||||||||||
| Total expenses | 0.76 | % | 0.69 | % | 0.69 | % | 0.64 | % | 0.64 | % | |||||
| Net expenses | 0.70 | % | 0.67 | % | 0.67 | % | 0.63 | % | 0.62 | % | |||||
| Net investment income | 0.38 | % | 0.54 | % | 0.68 | % | (2) | 0.69 | % | 0.56 | % | ||||
| Portfolio turnover | 18 | % | 29 | % | 44 | % | 37 | % | 24 | % | |||||
| Net assets, ending (in thousands) | $963,446 | $550,055 | $472,583 | $567,954 | $961,680 | ||||||||||
(1) Computed using average shares outstanding. | |||||||||||||||
(2) Amount includes a non-recurring refund for overbilling of prior years’ custody out-of-pocket fees. This amounted to less than $0.005 per share and less than 0.005% of average net assets. | |||||||||||||||
(3) Returns are historical and are calculated by determining the percentage change in net asset value with all distributions reinvested and do not reflect the effect of sales charges, if any. | |||||||||||||||
(4) Total expenses do not reflect amounts reimbursed and/or waived by the adviser and certain of its affiliates, if applicable. Net expenses are net of all reductions and represent the net expenses paid by the Fund. | |||||||||||||||
| See notes to financial statements. | |||||||||||||||
www.calvert.com CALVERT SOCIAL INVESTMENT FUND ANNUAL REPORT 67
CALVERT EQUITY FUND
FINANCIAL HIGHLIGHTS
Period Ended September 30, 2018 (1) | ||||
| CLASS R6 SHARES | ||||
| Net asset value, beginning | $49.74 | |||
| Income from investment operations: | ||||
Net investment income (2) | 0.17 | |||
| Net realized and unrealized gain | 10.42 | |||
| Total from investment operations | 10.59 | |||
| Distributions from: | ||||
| Net investment income | (0.25) | |||
| Net realized gain | (3.43) | |||
| Total distributions | (3.68) | |||
| Total increase in net asset value | 6.91 | |||
| Net asset value, ending | $56.65 | |||
Total return (3) | 22.30 | % | (4) | |
Ratios to average net assets: (5) | ||||
| Total expenses | 0.68 | % | (6) | |
| Net expenses | 0.68 | % | (6) | |
| Net investment income | 0.31 | % | (6) | |
| Portfolio turnover | 18 | % | (7) | |
| Net assets, ending (in thousands) | $843 | |||
(1) For the period from the commencement of operations, October 3, 2017, to September 30, 2018. | ||||
(2) Computed using average shares outstanding. | ||||
(3) Return is historical and is calculated by determining the percentage change in net asset value with all distributions reinvested and does not reflect the effect of sales charges, if any. | ||||
(4) Not annualized. | ||||
(5) Total expenses do not reflect amounts reimbursed and/or waived by the adviser and certain of its affiliates, if applicable. Net expenses are net of all reductions and represent the net expenses paid by the Fund. | ||||
(6) Annualized. | ||||
(7) For the year ended September 30, 2018. | ||||
| See notes to financial statements. | ||||
68 www.calvert.com CALVERT SOCIAL INVESTMENT FUND ANNUAL REPORT
NOTES TO FINANCIAL STATEMENTS
NOTE 1 — SIGNIFICANT ACCOUNTING POLICIES
Calvert Balanced Fund (Balanced), Calvert Bond Fund (Bond) and Calvert Equity Fund (Equity) (each a Fund and collectively, the Funds) are diversified series of Calvert Social Investment Fund (the Trust). The Trust is a Massachusetts business trust registered under the Investment Company Act of 1940, as amended (the 1940 Act), as an open-end management investment company. The investment objective of Balanced is to seek to achieve a competitive total return through an actively managed portfolio of stocks, bonds, and money market instruments which offer income and capital growth opportunity. The investment objective of Bond is to seek to provide as high a level of current income as is consistent with preservation of capital through investment in bonds and other debt securities. The investment objective of Equity is to seek growth of capital through investment in stocks believed to offer opportunities for potential capital appreciation.
Balanced offers three classes of shares and Bond and Equity each offer four classes of shares. Class A shares are generally sold subject to a sales charge imposed at time of purchase. A contingent deferred sales charge of 0.80% may apply to certain redemptions of Class A shares for accounts for which no sales charge was paid, if redeemed within one year of purchase. Class C shares are sold without a front-end sales charge, and with certain exceptions, are charged a contingent deferred sales charge of 1% on shares redeemed within one year of purchase. Class C shares are only available for purchase through a financial intermediary. Class I and Class R6 shares are sold at net asset value, are not subject to a sales charge and are sold only to certain eligible investors. Each Fund previously offered Class Y shares. At the close of business on December 8, 2017, Class Y shares were converted to Class I shares. Each class represents a pro rata interest in each Fund, but votes separately on class-specific matters and is subject to different expenses.
Each Fund applies the accounting and reporting guidance in the Financial Accounting Standards Board (FASB) Accounting Standards Codification Topic 946, Financial Services – Investment Companies (ASC 946). Subsequent events, if any, through the date that the financial statements were issued have been evaluated in the preparation of the financial statements.
A. Investment Valuation: Net asset value per share is determined every business day as of the close of the regular session of the New York Stock Exchange (generally 4:00 p.m. Eastern time). The Funds use independent pricing services approved by the Board of Trustees (the Board) to value their investments wherever possible. Investments for which market quotations are not available or deemed not reliable are fair valued in good faith under the direction of the Board.
U.S. generally accepted accounting principles (U.S. GAAP) establishes a disclosure hierarchy that categorizes the inputs to valuation techniques used to value assets and liabilities at measurement date. These inputs are summarized in the three broad levels listed below:
Level 1 - quoted prices in active markets for identical securities
Level 2 - other significant observable inputs (including quoted prices for similar securities, interest rates, prepayment speeds, credit risk, etc.)
Level 3 - significant unobservable inputs (including each Fund’s own assumptions in determining the fair value of investments)
The inputs or methodologies used for valuing securities are not necessarily an indication of the risk associated with investing in those securities.
Valuation techniques used to value each Fund’s investments by major category are as follows:
Equity Securities. Equity securities (including warrants and rights) listed on a U.S. securities exchange generally are valued at the last sale or closing price as reported by an independent pricing service on the primary market or exchange on which they are traded and are categorized as Level 1 in the hierarchy. Equity securities listed on the NASDAQ Global or Global Select Market are valued at the NASDAQ official closing price and are categorized as Level 1 in the hierarchy. Unlisted or listed securities for which closing sales prices or closing quotations are not available are valued at the mean between the latest available bid and asked prices and are categorized as Level 2 in the hierarchy.
Debt Securities. Debt securities are generally valued on the basis of valuations provided by third party pricing services, as derived from such services’ pricing models. Inputs to the models may include, but are not limited to, reported trades, executable bid and asked prices, broker/dealer quotations, prices or yields of securities with similar characteristics, interest rates, anticipated prepayments, benchmark curves or information pertaining to the issuer, as well as industry and economic events. Accordingly, debt securities are generally categorized as Level 2 in the hierarchy. Short-term debt securities of sufficient credit quality purchased with remaining maturities of sixty days or less for which a valuation from a third party pricing service is not readily available may be valued at amortized cost, which approximates fair value, and are categorized as Level 2 in the hierarchy.
www.calvert.com CALVERT SOCIAL INVESTMENT FUND ANNUAL REPORT 69
Floating Rate Loans. Interests in floating rate loans for which reliable market quotations are readily available are valued generally at the average mean of bid and ask quotations obtained from a third party pricing service, and are categorized as Level 2 in the hierarchy.
Venture Capital Securities. Venture capital securities for which market quotations are not readily available are generally categorized as Level 3 in the hierarchy. Venture capital equity securities are generally valued using the most appropriate and applicable method to measure fair value in light of each company’s situation. Methods may include market, income, options-pricing or cost approaches with discounts as appropriate based on assumptions of liquidation or exit risk. Examples of the market approach are subsequent rounds of financing, comparable transactions, and revenue times an industry multiple. An example of the income approach is the discounted cash flow model. Examples of the cost approach are replacement cost, salvage value, or net asset value. The options-pricing method treats common stock and preferred stock as call options on the enterprise value with strike price based on the preferred stock liquidation preference. Venture capital limited partnership interests are valued at the fair value reported by the general partner of the partnership, adjusted as necessary to reflect subsequent capital calls and distributions and any other available information. In some cases, adjustments may be made to account for daily pricing of material public holdings within the partnership.
Other Securities. Investments in registered investment companies (including money market funds) that do not trade on an exchange are valued at the net asset value per share on the valuation day and are categorized as Level 1 in the hierarchy.
Derivatives. Futures contracts are valued at unrealized appreciation (depreciation) based on the settlement price established each day by the board of trade or exchange on which they are traded and are categorized as Level 1 in the hierarchy. U.S. exchange-traded options are valued at the mean between the bid and asked prices at valuation time as reported by the Options Price Reporting Authority and are categorized as Level 1 in the hierarchy.
Fair Valuation. If a market value cannot be determined for a security using the methodologies described above, or if, in the good faith opinion of the Funds’ adviser, the market value does not constitute a readily available market quotation, or if a significant event has occurred that would materially affect the value of the security, the security will be fair valued as determined in good faith by or at the direction of the Board in a manner that fairly reflects the security’s value, or the amount that the Funds might reasonably expect to receive for the security upon its current sale in the ordinary course. Each such determination is based on a consideration of relevant factors, which are likely to vary from one pricing context to another. These factors may include, but are not limited to, the type of security, the existence of any contractual restrictions on the security’s disposition, the price and extent of public trading in similar securities of the issuer or of comparable companies or entities, quotations or relevant information obtained from broker/dealers or other market participants, information obtained from the issuer, analysts, and/or the appropriate stock exchange (for exchange-traded securities), an analysis of the company’s or entity’s financial condition, and an evaluation of the forces that influence the issuer and the market(s) in which the security is purchased and sold.
The values assigned to fair value investments are based on available information and do not necessarily represent amounts that might ultimately be realized. Further, due to the inherent uncertainty of valuations of such investments, the fair values may differ significantly from the values that would have been used had an active market existed, and the differences could be material.
The following tables summarize the market value of each of the Funds’ holdings as of September 30, 2018, based on the inputs used to value them:
70 www.calvert.com CALVERT SOCIAL INVESTMENT FUND ANNUAL REPORT
BALANCED
| Assets | Level 1 | Level 2 | Level 3(1) | Total | |||||||||
| Common Stocks | $ | 456,909,004 | (2) | $ | — | $ | — | $ | 456,909,004 | ||||
| Common Stocks - Venture Capital | — | — | 1,572,155 | 1,572,155 | |||||||||
| Corporate Bonds | — | 130,577,762 | — | 130,577,762 | |||||||||
| Asset-Backed Securities | — | 58,698,413 | — | 58,698,413 | |||||||||
| U.S. Treasury Obligations | — | 31,584,903 | — | 31,584,903 | |||||||||
| Collateralized Mortgage-Backed Obligations | — | 13,165,449 | — | 13,165,449 | |||||||||
| Commercial Mortgage-Backed Securities | — | 7,084,905 | — | 7,084,905 | |||||||||
| Taxable Municipal Obligations | — | 5,051,546 | — | 5,051,546 | |||||||||
| High Social Impact Investments | — | 4,106,026 | 832,017 | 4,938,043 | |||||||||
| U.S. Government Agency Mortgage-Backed Securities | — | 4,758,965 | — | 4,758,965 | |||||||||
| Sovereign Government Bonds | — | 1,693,537 | — | 1,693,537 | |||||||||
| U.S. Government Agencies and Instrumentalities | — | 866,670 | — | 866,670 | |||||||||
| Preferred Stocks - Venture Capital | — | — | 638,168 | 638,168 | |||||||||
| Venture Capital Limited Partnership Interests | — | — | 624,377 | 624,377 | |||||||||
| Venture Capital Debt Obligations | — | — | 32,887 | 32,887 | |||||||||
| Floating Rate Loans | — | 5,470,680 | 6,078 | 5,476,758 | |||||||||
| Commercial Paper | — | 1,029,968 | — | 1,029,968 | |||||||||
| Short Term Investment of Cash Collateral for Securities Loaned | 874,433 | — | — | 874,433 | |||||||||
| Total Investments | $ | 457,783,437 | $ | 264,088,824 | $ | 3,705,682 | $ | 725,577,943 | |||||
Futures Contracts(3) | $ | 18,757 | $ | — | $ | — | $ | 18,757 | |||||
| Total | $ | 457,802,194 | $ | 264,088,824 | $ | 3,705,682 | $ | 725,596,700 | |||||
| Liabilities | |||||||||||||
Futures Contracts(3) | $ | (208,640 | ) | $ | — | $ | — | $ | (208,640 | ) | |||
(1) None of the unobservable inputs for Level 3 assets, individually or collectively, had a material impact on the Fund. | |||||||||||||
(2) The level classification by major category of investments is the same as the category presentation in the Schedule of Investments. Venture Capital is not included in this category. | |||||||||||||
(3) The value listed reflects unrealized appreciation (depreciation) as shown in the Schedule of Investments. | |||||||||||||
www.calvert.com CALVERT SOCIAL INVESTMENT FUND ANNUAL REPORT 71
BOND
| Assets | Level 1 | Level 2 | Level 3(1) | Total | ||||||||
| Corporate Bonds | $ | — | $ | 516,418,305 | $ | — | $ | 516,418,305 | ||||
| U.S. Treasury Obligations | — | 121,486,939 | — | 121,486,939 | ||||||||
| Asset-Backed Securities | — | 250,828,525 | — | 250,828,525 | ||||||||
| Collateralized Mortgage-Backed Obligations | — | 55,092,288 | — | 55,092,288 | ||||||||
| Commercial Mortgage-Backed Securities | — | 25,491,857 | — | 25,491,857 | ||||||||
| Taxable Municipal Obligations | — | 20,322,056 | — | 20,322,056 | ||||||||
| U.S. Government Agency Mortgage-Backed Securities | — | 21,084,227 | — | 21,084,227 | ||||||||
| High Social Impact Investments | — | 4,895,852 | 1,037,475 | 5,933,327 | ||||||||
| Sovereign Government Bonds | — | 13,149,708 | — | 13,149,708 | ||||||||
| U.S. Government Agencies and Instrumentalities | — | 2,744,457 | — | 2,744,457 | ||||||||
| Floating Rate Loans | — | 25,801,043 | 7,598 | 25,808,641 | ||||||||
| Commercial Paper | — | 3,187,998 | — | 3,187,998 | ||||||||
| Short Term Investment of Cash Collateral for Securities Loaned | 3,386,150 | — | — | 3,386,150 | ||||||||
| Total Investments | $ | 3,386,150 | $ | 1,060,503,255 | $ | 1,045,073 | $ | 1,064,934,478 | ||||
| Liabilities | ||||||||||||
Futures Contracts(2) | $ | (1,912,852 | ) | $ | — | $ | — | $ | (1,912,852 | ) | ||
(1) None of the unobservable inputs for Level 3 assets, individually or collectively, had a material impact on the Fund. | ||||||||||||
(2) The value listed reflects unrealized appreciation (depreciation) as shown in the Schedule of Investments. | ||||||||||||
EQUITY
| Assets | Level 1 | Level 2 | Level 3(1) | Total | |||||||||
| Common Stocks | $ | 2,297,953,291 | (2) | $ | — | $ | — | $ | 2,297,953,291 | ||||
| Common Stocks - Venture Capital | — | — | 556,836 | 556,836 | |||||||||
| Preferred Stocks - Venture Capital | — | — | 2,093,837 | 2,093,837 | |||||||||
| Venture Capital Limited Partnership Interests | — | — | 15,000,796 | 15,000,796 | |||||||||
| Venture Capital Debt Obligations | — | — | 1,497,741 | 1,497,741 | |||||||||
| High Social Impact Investments | — | 10,425,981 | 3,054,180 | 13,480,161 | |||||||||
| Short Term Investment of Cash Collateral for Securities Loaned | 35,542,158 | — | — | 35,542,158 | |||||||||
| Total Investments | $ | 2,333,495,449 | $ | 10,425,981 | $ | 22,203,390 | $ | 2,366,124,820 | |||||
(1) None of the unobservable inputs for Level 3 assets, individually or collectively, had a material impact on the Fund. | |||||||||||||
(2) The level classification by major category of investments is the same as the category presentation in the Schedule of Investments. Venture Capital is not included in this category. | |||||||||||||
For each Fund, Level 3 investments at the beginning and/or end of the period in relation to net assets were not significant and accordingly, a reconciliation of Level 3 assets for the year ended September 30, 2018 is not presented.
B. Investment Transactions and Income: Investment transactions for financial statement purposes are accounted for on trade date. Realized gains and losses are recorded on an identified cost basis and may include proceeds from litigation. Dividend income is recorded on the ex-dividend date for dividends received in cash and/or securities or, in the case of dividends on certain foreign securities, as soon as each Fund is informed of the ex-dividend date. Non-cash dividends are recorded at the fair value of the securities received. Withholding taxes on foreign dividends and interest, if any, have been provided for in accordance with the Funds’ understanding of the applicable country’s tax rules and rates. Distributions received that represent a return of capital are recorded as a reduction of cost of investments. Distributions received that represent a capital gain are recorded as a realized gain. Interest income, which includes amortization of premium and accretion of discount on debt securities, is accrued as earned. The Funds may earn certain fees in connection with their investments in floating rate loans. These fees are in addition to interest
72 www.calvert.com CALVERT SOCIAL INVESTMENT FUND ANNUAL REPORT
payments earned and may include amendment fees, consent fees and prepayment fees, which are recorded to income as earned. Inflation adjustments to the principal amount of inflation-adjusted bonds and notes are reflected as interest income. Deflation adjustments to the principal amount of an inflation-adjusted bond or note are reflected as reductions to interest income to the extent of interest income previously recorded on such bond or note.
C. Share Class Accounting: Realized and unrealized gains and losses and net investment income and losses, other than class-specific expenses, are allocated daily to each class of shares based upon the relative net assets of each class to the total net assets of each Fund. Expenses arising in connection with a specific class are charged directly to that class. Sub-accounting, recordkeeping and similar administrative fees payable to financial intermediaries, which are a component of transfer and dividend disbursing agent fees on the Statements of Operations, are not allocated to Class R6 shares.
D. Foreign Currency Transactions: The Funds’ accounting records are maintained in U.S. dollars. For valuation of assets and liabilities on each date of net asset value determination, foreign denominations are converted into U.S. dollars using the current exchange rate. Security transactions, income and expenses are translated at the prevailing rate of exchange on the date of the event. Recognized gains or losses on investment transactions attributable to changes in foreign currency exchange rates are recorded for financial statement purposes as net realized gains and losses on investments. That portion of unrealized gains and losses on investments that results from fluctuations in foreign currency exchange rates is not separately disclosed.
E. Floating Rate Loans: The Funds may invest in direct debt instruments which are interests in amounts owed to lenders or lending syndicates by corporate, governmental, or other borrowers. The Funds’ investments in loans may be in the form of participations in loans or assignments of all or a portion of loans from third parties. A loan is often administered by a bank or other financial institution (the lender) that acts as agent for all holders. The agent administers the terms of the loan, as specified in the loan agreement. The Funds may invest in multiple series or tranches of a loan, which may have varying terms and carry different associated risks. When the Funds purchase assignments from lenders, they acquire direct rights against the borrower of the loan. When investing in a loan participation, the Funds have the right to receive payments of principal, interest and any fees to which they are entitled only from the lender selling the loan agreement and only upon receipt of such payments by the lender from the borrower. The Funds generally have no right to enforce compliance by the borrower with the terms of the loan agreement. As a result, the Funds may be subject to the credit risk of both the borrower and the lender that is issuing the participation interest.
F. Futures Contracts: The Funds may enter into futures contracts to buy or sell a financial instrument for a set price at a future date. Initial margin deposits of either cash or securities as required by the broker are made upon entering into the contract. While the contract is open, daily variation margin payments are made to or received from the broker reflecting the daily change in market value of the contract and are recorded for financial reporting purposes as unrealized gains or losses by the Funds. When a futures contract is closed, a realized gain or loss is recorded equal to the difference between the opening and closing value of the contract. The risks associated with entering into futures contracts may include the possible illiquidity of the secondary market which would limit the Funds’ ability to close out a futures contract prior to the settlement date, an imperfect correlation between the value of the contracts and the underlying financial instruments, or that the counterparty will fail to perform its obligations under the contracts’ terms. Futures contracts are designed by boards of trade, which are designated “contracts markets” by the Commodities Futures Trading Commission. Futures contracts trade on the contracts markets in a manner that is similar to the way a stock trades on a stock exchange, and the boards of trade, through their clearing corporations, guarantee the futures contracts against default. As a result, there is minimal counterparty credit risk to the Funds.
G. Options Contracts: Upon the purchase of a call or put option, the premium paid by the Funds is included in the Statement of Assets and Liabilities as an investment. The amount of the investment is subsequently marked-to-market to reflect the current market value of the option purchased, in accordance with the Funds’ policies on investment valuations discussed above. Premiums paid for purchasing options that expire are treated as realized losses. Premiums paid for purchasing options that are exercised or closed are added to the amounts paid or offset against the proceeds on the underlying investment transaction to determine the realized gain or loss. As the purchaser of an index option, the Funds have the right to receive a cash payment equal to any depreciation in the value of the index below the exercise price of the option (in the case of a put) or equal to any appreciation in the value of the index over the exercise price of the option (in the case of a call) as of the valuation date of the option. The risk associated with purchasing options is limited to the premium originally paid. Purchased options traded over-the-counter involve risk that the issuer or counterparty will fail to perform its contractual obligations.
H. Restricted Securities: The Funds may invest in securities that are subject to legal or contractual restrictions on resale. Generally, these securities may only be sold publicly upon registration under the Securities Act of 1933 or in transactions exempt from such registration. Information regarding restricted securities (excluding Rule 144A securities) is included at the end of each Fund’s Schedule of Investments.
I. Distributions to Shareholders: Distributions to shareholders are recorded by the Funds on ex-dividend date. Dividends from net investment income are declared and paid monthly by Bond, quarterly by Balanced and annually by Equity. Distributions from
www.calvert.com CALVERT SOCIAL INVESTMENT FUND ANNUAL REPORT 73
net realized capital gains, if any, are paid at least annually. Distributions are determined in accordance with income tax regulations which may differ from U.S. GAAP; accordingly, periodic reclassifications are made within the Funds’ capital accounts to reflect income and gains available for distribution under income tax regulations.
J. Estimates: The preparation of financial statements in conformity with U.S. GAAP requires management to make estimates and assumptions that affect the reported amounts of assets and liabilities and disclosure of contingent assets and liabilities at the date of the financial statements and the reported amounts of increases and decreases in net assets from operations during the reporting period. Actual results could differ from those estimates.
K. Indemnifications: Under the Trust’s organizational document, its officers and Trustees may be indemnified against certain liabilities and expenses arising out of the performance of their duties to the Funds. Under Massachusetts law, if certain conditions prevail, shareholders of a Massachusetts business trust (such as the Trust) could be deemed to have personal liability for the obligations of the Trust. However, the Trust’s Declaration of Trust contains an express disclaimer of liability on the part of Fund shareholders and provides that upon request, the Trust shall assume the defense on behalf of any Fund shareholders or former shareholders. Additionally, in the normal course of business, each Fund enters into agreements with service providers that may contain indemnification clauses. Each Fund’s maximum exposure under these arrangements is unknown as this would involve future claims that may be made against each Fund that have not yet occurred.
L. Federal Income Taxes: No provision for federal income or excise tax is required since each Fund intends to continue to qualify as a regulated investment company under the Internal Revenue Code and to distribute substantially all of its taxable earnings.
Management has analyzed the Funds’ tax positions taken for all open federal income tax years and has concluded that no provision for federal income tax is required in the Funds’ financial statements. Each Fund’s federal tax return is subject to examination by the Internal Revenue Service for a period of three years from the date of filing.
NOTE 2 — RELATED PARTY TRANSACTIONS
The investment advisory fee is earned by Calvert Research and Management (CRM), a subsidiary of Eaton Vance Management (EVM), as compensation for investment advisory services rendered to each Fund. Pursuant to the investment advisory agreement, CRM receives a fee, payable monthly, at the following annual rates of each respective Fund’s average daily net assets:
BALANCED
| Up to and including $500 Million | 0.41 | % |
| Over $500 Million up to and including $1 Billion | 0.385 | % |
| Over $1 Billion | 0.35 | % |
BOND
| Up to and including $1 Billion | 0.35 | % |
| Over $1 Billion | 0.325 | % |
EQUITY
| Up to and including $2 Billion | 0.50 | % |
| Over $2 Billion up to and including $3 Billion | 0.425 | % |
| Over $3 Billion | 0.375 | % |
For the year ended September 30, 2018, the investment advisory fee for Balanced, Bond and Equity amounted to $2,845,727, $3,540,277 and $11,261,816, respectively, or 0.40%, 0.35% and 0.49%, respectively, of each Fund’s average daily net assets.
Atlanta Capital Management Company, LLC, an affiliate of CRM, provides sub-advisory services to Equity pursuant to a sub-advisory agreement with CRM. Sub-advisory fees are paid by CRM from its investment advisory fee.
CRM has agreed to reimburse the Funds’ operating expenses to the extent that total annual operating expenses (relating to ordinary operating expenses only and excluding expenses such as brokerage commissions, acquired fund fees and expenses of unaffiliated funds, interest expense, taxes or litigation expenses) exceed the following amounts:
74 www.calvert.com CALVERT SOCIAL INVESTMENT FUND ANNUAL REPORT
| Class A | Class C | Class I | Class Y* | Class R6 | |
| BALANCED | 0.94% | 1.69% | 0.62% | 0.73% | — |
| BOND | 0.88% | 1.63% | 0.53% | 0.64% | 0.53% |
| EQUITY | 1.07% | 1.82% | 0.70% | 0.96% | 0.70% |
* For the period prior to the close of business on December 8, 2017.
The expense reimbursement agreements with CRM may be changed or terminated after January 31, 2019. For the year ended September 30, 2018, CRM waived or reimbursed expenses of $168,978, $562,968 and $442,245 for Balanced, Bond and Equity, respectively.
The administrative fee is earned by CRM as compensation for administrative services rendered to the Funds. The fee is computed at an annual rate of 0.12% of each Fund’s average daily net assets attributable to Class A, Class C, Class I and Class R6 (and Class Y prior to the close of business on December 8, 2017) and is payable monthly. CRM contractually waived 0.02% of the administrative fee for Class I of Bond and Equity through January 31, 2018. For the year ended September 30, 2018, CRM was paid administrative fees of $847,914, $1,215,635 and $2,755,559 of which $33,282 and $45,477 were waived for Bond and Equity, respectively.
Each Fund has in effect a distribution plan for Class A shares (Class A Plan) pursuant to Rule 12b-1 under the 1940 Act. Pursuant to the Class A Plan, each Fund pays Eaton Vance Distributors, Inc. (EVD), an affiliate of CRM and the Funds’ principal underwriter, a distribution and service fee rate per annum of its average daily net assets attributable to Class A for distribution services and facilities provided to the Fund by EVD, as well as for personal services and/or the maintenance of shareholder accounts. Distribution and service fee rates for Class A shares are as follows:
| Balanced | Bond | Equity | |
| Class A Plan | 0% up to $30 million, 0.25% over $30 million | 0.20% | 0.25% |
Each Fund also has in effect a distribution plan for Class C shares (Class C Plan) pursuant to Rule 12b-1 under the 1940 Act. Pursuant to the Class C Plan, each Fund pays EVD amounts equal to 0.75% per annum of its average daily net assets attributable to Class C shares for providing ongoing distribution services and facilities to the Funds. In addition, pursuant to the Class C Plan, each Fund also makes payments of service fees to EVD, financial intermediaries and other persons in amounts equal to 0.25% per annum of its average daily net assets attributable to that class. Service fees paid or accrued are for personal services and/or the maintenance of shareholder accounts.
Distribution and service fees for Balanced, Bond and Equity paid or accrued for the year ended September 30, 2018 amounted to $1,323,522, $536,022 and $3,147,280, respectively, for Class A shares and $603,956, $245,876 and $1,544,675, respectively, for Class C shares.
The Funds were informed that EVD received $94,702, $34,289 and $111,999 for Balanced, Bond and Equity, respectively, as their portion of the sales charge on sales of Class A shares for the year ended September 30, 2018. The Funds were also informed that EVD received $11,783, $4,452 and $6,637 for Balanced, Bond and Equity, respectively, of contingent deferred sales charges paid by each Fund’s shareholders for the same period.
EVM provides sub-transfer agency and related services to the Funds pursuant to a Sub-Transfer Agency Support Services Agreement. For the year ended September 30, 2018, sub-transfer agency fees and expenses incurred to EVM amounted to $132,598, $68,540 and $228,741 for Balanced, Bond and Equity, respectively, and are included in transfer agency fees and expenses on the Statements of Operations.
Each Trustee of the Funds who is not an employee of CRM or its affiliates receives a fee of $3,000 for each Board meeting attended in person and $2,000 for each Board meeting attended by phone plus an annual fee of $52,000, and $1,500 for each Committee meeting attended in person and $1,000 for each Committee meeting attended by phone plus an annual Committee fee of $2,500. The Board chair receives an additional $10,000 annual retainer and Committee chairs receive an additional $6,000 annual retainer. Eligible Trustees may participate in a Deferred Compensation Plan (the Plan). Amounts deferred under the Plan are treated as though equal dollar amounts had been invested in shares of the Funds or other Calvert funds selected by the Trustees. The Funds purchase shares of the funds selected equal to the dollar amounts deferred under the Plan, resulting in an asset equal to the deferred compensation liability. Obligations of the Plan are paid solely from the Funds’ assets. Trustees’ fees are allocated to each of the Calvert funds served. Salaries and fees of officers and Trustees of the Funds who are employees of CRM or its affiliates are paid by CRM. In addition, an advisory council was established to aid the Board and CRM in advancing the cause of responsible investing through original scholarship and thought leadership. The advisory council consists of CRM’s Chief Executive Officer and four additional members. Each member (other than CRM’s Chief Executive Officer) receives annual
www.calvert.com CALVERT SOCIAL INVESTMENT FUND ANNUAL REPORT 75
compensation of $75,000, which is being reimbursed by Calvert Investment Management, Inc. (CIM), the Calvert funds’ former investment adviser and Ameritas Holding Company, CIM’s parent company, through the end of 2019. For the year ended September 30, 2018, each Fund’s allocated portion of such expense and reimbursement was $14,707, $21,135 and $47,319 for Balanced, Bond and Equity, respectively, which are included in miscellaneous expense and reimbursement of expenses-other, respectively, on the Statements of Operations.
NOTE 3 — INVESTMENT ACTIVITY
During the year ended September 30, 2018, the cost of purchases and proceeds from sales of investments, other than short-term securities and including maturities, paydowns and principal repayments on floating rate loans, were as follows:
| BALANCED | BOND | EQUITY | |||||||
| Purchases | |||||||||
| U.S. Government and Agency Securities | $98,569,780 | $428,831,579 | $— | ||||||
| Non-U.S. Government and Agency Securities | 428,525,652 | 546,121,723 | 406,127,889 | ||||||
| Total Purchases | $527,095,432 | $974,953,302 | $406,127,889 | ||||||
| Sales | |||||||||
| U.S. Government and Agency Securities | $105,677,473 | $454,670,867 | $— | ||||||
| Non-U.S. Government and Agency Securities | 429,264,576 | 352,153,335 | 590,151,267 | ||||||
| Total Sales | $534,942,049 | $806,824,202 | $590,151,267 | ||||||
NOTE 4 — DISTRIBUTIONS TO SHAREHOLDERS AND INCOME TAX INFORMATION
The tax character of distributions declared for the years ended September 30, 2018 and September 30, 2017 was as follows:
| Year Ended September 30, 2018 | |||||||||
| BALANCED | BOND | EQUITY | |||||||
| Distributions declared from: | |||||||||
Ordinary income | $24,303,596 | $25,310,421 | $4,671,559 | ||||||
| Long-term capital gains | 29,343,052 | — | 164,673,415 | ||||||
| Year Ended September 30, 2017 | |||||||||
| BALANCED | BOND | EQUITY | |||||||
| Distributions declared from: | |||||||||
Ordinary income | $9,797,167 | $23,536,080 | $6,068,848 | ||||||
| Long-term capital gains | 7,610,342 | 820,791 | 216,424,016 | ||||||
During the year ended September 30, 2018, the following amounts were reclassified due to the Funds’ use of equalization accounting. Tax equalization accounting allows a Fund to treat as a distribution that portion of redemption proceeds representing a redeeming shareholder’s portion of undistributed taxable income and net capital gains.
| BALANCED | BOND | EQUITY | |||||||
| Change in: | |||||||||
| Paid-in capital | $1,885,623 | $249,179 | $13,908,899 | ||||||
| Distributable earnings/Accumulated loss | (1,885,623) | (249,179) | (13,908,899) | ||||||
These reclassifications had no effect on the net assets or net asset value per share of the Funds.
As of September 30, 2018, the components of distributable earnings (accumulated loss) on a tax basis were as follows:
| BALANCED | BOND | EQUITY | |||||||
| Undistributed ordinary income | $5,441,801 | $311,859 | $7,651,891 | ||||||
| Undistributed long-term capital gains | 13,303,244 | — | 148,888,987 | ||||||
| Deferred capital losses | — | (4,756,263 | ) | (2,235,459 | ) | ||||
| Net unrealized appreciation (depreciation) | 62,138,828 | (18,243,476 | ) | 898,299,582 | |||||
76 www.calvert.com CALVERT SOCIAL INVESTMENT FUND ANNUAL REPORT
At September 30, 2018, the following Funds, for federal income tax purposes, had deferred capital losses which would reduce the respective Fund’s taxable income arising from future net realized gains on investment transactions, if any, to the extent permitted by the Internal Revenue Code, and thus would reduce the amount of distributions to shareholders, which would otherwise be necessary to relieve the Funds of any liability for federal income or excise tax. The deferred capital losses are treated as arising on the first day of a Fund’s next taxable year and retain the same short-term or long-term character as when originally deferred. The amounts of the deferred capital losses are as follows:
| BOND | EQUITY | |||||
| Deferred capital losses: | ||||||
| Short-term | ($4,756,263 | ) | ($1,534,577 | ) | ||
| Long-term | — | (700,882 | ) | |||
The cost and unrealized appreciation (depreciation) of investments, including open derivative contracts, of the Funds at September 30, 2018, as determined on a federal income tax basis, were as follows:
| BALANCED | BOND | EQUITY | |||||||
| Aggregate cost | $663,438,951 | $1,083,177,954 | $1,467,824,843 | ||||||
| Gross unrealized appreciation | $72,790,059 | $2,859,466 | $908,279,831 | ||||||
| Gross unrealized depreciation | (10,651,067) | (21,102,942) | (9,979,854) | ||||||
| Net unrealized appreciation (depreciation) | $62,138,992 | ($18,243,476 | ) | $898,299,977 | |||||
NOTE 5 — FINANCIAL INSTRUMENTS
A summary of futures contracts outstanding at September 30, 2018 is included in each Fund’s Schedule of Investments. During the year ended September 30, 2018, Balanced and Bond used futures contracts and options contracts to hedge against fluctuation in interest rates and to manage overall duration of the Funds.
At September 30, 2018, the fair value of open derivative instruments (not considered to be hedging instruments for accounting disclosure purposes) and whose primary underlying risk exposure is interest rate risk was as follows:
BALANCED
| Derivative | Assets | Liabilities | |||||||
| Futures contracts | $18,757 | (1) | ($208,640 | ) | (1) | ||||
(1) Only the current day’s variation margin is reported within the Statement of Assets and Liabilities as Receivable or Payable for variation margin on open futures contracts, as applicable. | |||||||||
BOND
| Derivative | Assets | Liabilities | |||||||
| Futures contracts | $— | ($1,912,852 | ) | (1) | |||||
(1) Only the current day’s variation margin is reported within the Statement of Assets and Liabilities as Receivable or Payable for variation margin on open futures contracts, as applicable. | |||||||||
At September 30, 2018, Equity did not have any open derivative instruments.
www.calvert.com CALVERT SOCIAL INVESTMENT FUND ANNUAL REPORT 77
The effect of derivative instruments (not considered to be hedging instruments for accounting disclosure purposes) on the Statements of Operations and whose primary underlying risk exposure is interest rate risk for the year ended September 30, 2018 was as follows:
BALANCED
| Statement of Operations Caption | |||
| Net realized gain (loss) on: | |||
| Investment securities – unaffiliated issuers* | $209,713 | ||
| Futures contracts | $16,029 | ||
| Total | $225,742 | ||
| Net change in unrealized appreciation (depreciation) on: | |||
| Futures contracts | ($189,140 | ) | |
BOND
| Statement of Operations Caption | |||
| Net realized gain (loss) on: | |||
| Investment securities – unaffiliated issuers* | $781,899 | ||
| Futures contracts | $402,275 | ||
| Total | $1,184,174 | ||
| Net change in unrealized appreciation (depreciation) on: | |||
| Futures contracts | ($1,912,852 | ) | |
| * Relates to purchased options | |||
The average notional cost of futures contracts and the average number of purchased options contracts outstanding during the year ended September 30, 2018 were approximately as follows:
| BALANCED | BOND | |||||
| Futures contracts – long | $14,315,000 | $88,164,000 | ||||
| Futures contracts – short | $3,597,000 | $19,811,000 | ||||
| Purchased options | 67 | 244 | ||||
NOTE 6 — SECURITIES LENDING
To generate additional income, the Funds may lend their securities pursuant to a securities lending agency agreement with State Street Bank and Trust Company (SSB), the securities lending agent. Security loans are subject to termination by the Funds at any time and, therefore, are not considered illiquid investments. The Funds require that the loan be continuously collateralized by either cash or securities as collateral equal at all times to at least 102% of the market value of the domestic securities loaned and 105% of the market value of the international securities loaned (if applicable). The market value of securities loaned is determined daily and any additional required collateral is delivered to the respective Fund on the next business day. Cash collateral is generally invested in a money market fund registered under the 1940 Act that is managed by an affiliate of SSB. Any gain or loss in the market price of the loaned securities that might occur and any interest earned or dividends declared during the term of the loan would accrue to the account of the Funds. Income earned on the investment of collateral, net of broker rebates and other expenses incurred by the securities lending agent, is split between the respective Fund and the securities lending agent on the basis of agreed upon contractual terms. Non-cash collateral, if any, is held by the lending agent on behalf of the respective Fund and cannot be sold or re-pledged by the respective Fund; accordingly, such collateral is not reflected in each of the Statement of Assets and Liabilities.
The risks associated with lending portfolio securities include, but are not limited to, possible delays in receiving additional collateral or in the recovery of the loaned securities, possible loss of rights to the collateral should the borrower fail financially, as well as risk of loss in the value of the collateral or the value of the investments made with the collateral. The securities lending agent shall indemnify the Funds in the case of default of any securities borrower.
78 www.calvert.com CALVERT SOCIAL INVESTMENT FUND ANNUAL REPORT
At September 30, 2018, the total value of securities on loan, including accrued interest, and the total value of collateral received were as follows:
| Balanced | Bond | Equity | |||||||
| Securities on Loan | $16,121,812 | $4,707,664 | $57,533,561 | ||||||
| Collateral Received: | |||||||||
| Cash | $874,433 | $3,386,150 | $35,542,158 | ||||||
| U.S. Government and/or agencies securities | 15,623,660 | 1,416,923 | 23,487,070 | ||||||
| Total Collateral Received | $16,498,093 | $4,803,073 | $59,029,228 | ||||||
The following tables provide a breakdown of securities lending transactions accounted for as secured borrowings, the obligations by class of collateral pledged, and the remaining contractual maturity of those transactions as of September 30, 2018.
| BALANCED | |||||||||||||||
| Remaining Contractual Maturity of the Transactions | |||||||||||||||
| Overnight and Continuous | <30 days | 30 to 90 days | >90 days | Total | |||||||||||
| Securities Lending Transactions | |||||||||||||||
| Common Stocks | $14,449,590 | $— | $— | $— | $14,449,590 | ||||||||||
| Corporate Bonds | 2,048,503 | — | — | — | 2,048,503 | ||||||||||
| Total | $16,498,093 | $— | $— | $— | $16,498,093 | ||||||||||
| BOND | |||||||||||||||
| Remaining Contractual Maturity of the Transactions | |||||||||||||||
| Overnight and Continuous | <30 days | 30 to 90 days | >90 days | Total | |||||||||||
| Securities Lending Transactions | |||||||||||||||
| Corporate Bonds | $4,803,073 | $— | $— | $— | $4,803,073 | ||||||||||
| EQUITY | |||||||||||||||
| Remaining Contractual Maturity of the Transactions | |||||||||||||||
| Overnight and Continuous | <30 days | 30 to 90 days | >90 days | Total | |||||||||||
| Securities Lending Transactions | |||||||||||||||
| Common Stocks | $59,029,228 | $— | $— | $— | $59,029,228 | ||||||||||
The carrying amount of the liability for deposits for securities loaned at September 30, 2018 approximated its fair value. If measured at fair value, such liability would have been considered as Level 2 in the fair value hierarchy (see Note 1A) at September 30, 2018.
NOTE 7 — LINE OF CREDIT
The Funds participate with other funds managed by CRM in a $62.5 million committed ($25 million committed and $25 million uncommitted prior to August 7, 2018) unsecured line of credit agreement with SSB, which is in effect through August 6, 2019. Borrowings may be made for temporary or emergency purposes only. Borrowings bear interest at the higher of the One-Month London Interbank Offered Rate (LIBOR) in effect that day or the overnight Federal Funds Rate, plus 1.00% (1.25% prior to August 7, 2018) per annum. A commitment fee of 0.20% (0.25% prior to August 7, 2018) per annum is incurred on the unused portion of the committed facility. An administrative fee of $37,500 was incurred in connection with the renewal of the facility in August 2018. These fees are allocated to all participating funds. Because the line of credit is not available exclusively to the Funds, a Fund may be unable to borrow some or all of its requested amounts at any particular time. Equity had no borrowings pursuant to this line of credit during the year ended September 30, 2018. Balanced and Bond had no borrowings pursuant to this line of credit at September 30, 2018 and no significant borrowings or allocated fees during the year ended September 30, 2018.
www.calvert.com CALVERT SOCIAL INVESTMENT FUND ANNUAL REPORT 79
NOTE 8 — AFFILIATED COMPANIES
The Funds have invested a portion of their assets designated for high social impact investments in notes (the “Notes”) issued by Calvert Impact Capital, Inc. (CIC), formerly the Calvert Social Investment Foundation, pursuant to an exemptive order granted by the U.S. Securities and Exchange Commission (the SEC) in 1998 (the Exemptive Order). The Funds obtained the Exemptive Order because at that time there was a significant overlap of Fund Board members and CIC Board members as well as certain other affiliations between CIC and affiliates of the Funds’ investment adviser. CIC may be considered an affiliated person of the Funds based on the overlap between CIC’s Board of Directors and the Calvert funds’ Directors/Trustees and other potential affiliations. CIC has licensed use of the Calvert name from CRM, and currently two Fund Board members (one of whom is CRM’s President and Chief Executive Officer), two members of the Advisory Council to the Calvert Fund Board of Directors/Trustees, and an additional CRM officer serve on CIC’s Board. CIC is not owned or otherwise controlled by CRM or its affiliates. The Funds intend to request a new exemptive order from the SEC to permit investment in the Notes.
In addition to the Notes, a Fund may also invest in companies that are considered affiliated companies because the Fund has direct or indirect ownership of, control of, or voting power of 5 percent or more of the outstanding voting shares of the company, or the company is under common ownership or control with the Fund. At September 30, 2018, the value of each Fund’s investment in the Notes and affiliated companies (if any) was $4,124,508, $4,895,852 and $10,425,981 for Balanced, Bond and Equity, respectively, which represents 0.56%, 0.45% and 0.43% of net assets for Balanced, Bond and Equity, respectively. Transactions in the Notes and affiliated companies by the Funds for the year ended September 30, 2018 were as follows:
| BALANCED | |||||||||||||||||||||||||||
| Name of Issuer | Principal Amount, beginning of period | Gross Additions | Gross Reductions | Principal Amount, end of period | Value, end of period | Interest Income | Net Realized Gain (Loss) | Capital Gains Distributions Received | Change In Unrealized Appreciation (Depreciation) | ||||||||||||||||||
Calvert Impact Capital, Inc., Community Investment Notes, 1.50%, 12/15/19(1) | $4,266,666 | $— | $— | $4,266,666 | $4,106,026 | $48,000 | $— | $— | $39,552 | ||||||||||||||||||
GEEMF Partners LP(1)(2)(3) | — | — | — | — | 18,482 | — | — | — | 1,229 | ||||||||||||||||||
| TOTALS | $4,124,508 | $48,000 | $— | $— | $40,781 | ||||||||||||||||||||||
(1) Restricted security. | |||||||||||||||||||||||||||
(2) Non-income producing security. | |||||||||||||||||||||||||||
(3) For fair value measurement purposes, security is categorized as Level 3. | |||||||||||||||||||||||||||
| BOND | |||||||||||||||||||||||||||
| Name of Issuer | Principal Amount, beginning of period | Gross Additions | Gross Reductions | Principal Amount, end of period | Value, end of period | Interest Income | Net Realized Gain (Loss) | Capital Gains Distributions Received | Change in Unrealized Appreciation (Depreciation) | ||||||||||||||||||
Calvert Impact Capital, Inc., Community Investment Notes, 1.50%, 12/15/19(1) | $5,087,392 | $— | $— | $5,087,392 | $4,895,852 | $76,311 | $— | $— | $47,160 | ||||||||||||||||||
(1) Restricted security. | |||||||||||||||||||||||||||
80 www.calvert.com CALVERT SOCIAL INVESTMENT FUND ANNUAL REPORT
| EQUITY | |||||||||||||||||||||||||||
| Name of Issuer | Principal Amount/Shares, beginning of period | Gross Additions | Gross Reductions | Principal Amount/Shares, end of period | Value, end of period | Interest Income | Net Realized Gain (Loss) | Capital Gains Distributions Received | Change in Unrealized Appreciation (Depreciation) | ||||||||||||||||||
Calvert Impact Capital, Inc., Community Investment Notes, 1.50%, 12/15/19(1) | $10,833,877 | $— | $— | $10,833,877 | $10,425,981 | $162,508 | $— | $— | $100,430 | ||||||||||||||||||
| New Day Farms, Inc., Participation Interest Note | 6,225 | — | (6,225 | ) | — | — | — | (6,225 | ) | — | 6,225 | ||||||||||||||||
| New Day Farms, Inc., Series B, Preferred | 4,547,804 | — | (4,547,804 | ) | — | — | — | (500,000 | ) | — | 500,000 | ||||||||||||||||
| Shangri La Farms, Series A, Preferred | 66,667 | — | (66,667 | ) | — | — | — | (183,831 | ) | — | 200,000 | ||||||||||||||||
| TOTALS | $10,425,981 | $162,508 | ($690,056 | ) | $— | $806,655 | |||||||||||||||||||||
(1) Restricted security. | |||||||||||||||||||||||||||
NOTE 9 — CAPITAL SHARES
Transactions in capital shares for the years ended September 30, 2018 and September 30, 2017 were as follows:
| BALANCED | Year Ended September 30, 2018 | Year Ended September 30, 2017 | |||||||||
| Shares | Amount | Shares | Amount | ||||||||
| Class A | |||||||||||
| Shares sold | 1,232,292 | $39,847,094 | 1,788,008 | $56,550,939 | |||||||
| Reinvestment of distributions | 1,283,609 | 40,711,883 | 442,518 | 13,869,696 | |||||||
| Shares redeemed | (2,135,079 | ) | (68,954,544 | ) | (4,601,387 | ) | (144,902,587 | ) | |||
| Net increase (decrease) | 380,822 | $11,604,433 | (2,370,861 | ) | ($74,481,952 | ) | |||||
| Class C | |||||||||||
| Shares sold | 236,651 | $7,394,031 | 424,327 | $12,910,553 | |||||||
| Reinvestment of distributions | 130,517 | 4,007,059 | 32,486 | 983,605 | |||||||
| Shares redeemed | (411,123 | ) | (12,871,452 | ) | (500,415 | ) | (15,318,981 | ) | |||
| Net decrease | (43,955 | ) | ($1,470,362 | ) | (43,602 | ) | ($1,424,823 | ) | |||
| Class I | |||||||||||
| Shares sold | 906,024 | $29,804,889 | 1,213,710 | $38,480,633 | |||||||
| Reinvestment of distributions | 186,459 | 6,023,778 | 31,138 | 999,298 | |||||||
| Shares redeemed | (538,534 | ) | (17,823,980 | ) | (269,403 | ) | (8,764,248 | ) | |||
| Conversion from Class Y | 931,356 | 31,845,199 | — | — | |||||||
| Net increase | 1,485,305 | $49,849,886 | 975,445 | $30,715,683 | |||||||
Class Y (1) | |||||||||||
| Shares sold | 107,268 | $3,579,531 | 636,692 | $20,241,228 | |||||||
| Reinvestment of distributions | — | — | 14,672 | 467,952 | |||||||
| Shares redeemed | (64,654 | ) | (2,159,025 | ) | (178,625 | ) | (5,675,849 | ) | |||
| Conversion to Class I | (939,567 | ) | (31,845,199 | ) | — | — | |||||
| Net increase (decrease) | (896,953 | ) | ($30,424,693 | ) | 472,739 | $15,033,331 | |||||
(1) Effective December 8, 2017, Class Y shares of the Fund converted to Class I shares at net asset value. Thereafter, Class Y shares were terminated. | |||||||||||
www.calvert.com CALVERT SOCIAL INVESTMENT FUND ANNUAL REPORT 81
| BOND | Year Ended September 30, 2018 | Year Ended September 30, 2017 | |||||||||
| Shares | Amount | Shares | Amount | ||||||||
| Class A | |||||||||||
| Shares sold | 3,010,446 | $47,919,869 | 3,991,688 | $63,932,983 | |||||||
| Reinvestment of distributions | 355,776 | 5,646,223 | 474,446 | 7,582,448 | |||||||
| Shares redeemed | (4,766,798 | ) | (75,706,683 | ) | (11,227,412 | ) | (179,333,779 | ) | |||
| Net decrease | (1,400,576 | ) | ($22,140,591 | ) | (6,761,278 | ) | ($107,818,348 | ) | |||
| Class C | |||||||||||
| Shares sold | 159,666 | $2,527,749 | 217,542 | $3,467,164 | |||||||
| Reinvestment of distributions | 21,681 | 341,665 | 25,898 | 411,161 | |||||||
| Shares redeemed | (434,491 | ) | (6,852,230 | ) | (572,310 | ) | (9,115,310 | ) | |||
| Net decrease | (253,144 | ) | ($3,982,816 | ) | (328,870 | ) | ($5,236,985 | ) | |||
| Class I | |||||||||||
| Shares sold | 21,588,320 | $343,116,106 | 14,000,859 | $224,499,285 | |||||||
| Reinvestment of distributions | 860,189 | 13,652,209 | 748,856 | 11,998,306 | |||||||
| Shares redeemed | (18,809,506 | ) | (301,537,775 | ) | (5,443,245 | ) | (87,351,729 | ) | |||
| Conversion from Class Y | 9,451,082 | 152,730,431 | — | — | |||||||
| Net increase | 13,090,085 | $207,960,971 | 9,306,470 | $149,145,862 | |||||||
Class R6 (1) | |||||||||||
| Shares sold | 9,592,682 | $154,573,829 | — | $— | |||||||
| Reinvestment of distributions | 196,074 | 3,109,189 | — | — | |||||||
| Shares redeemed | (1,296,057 | ) | (20,569,906 | ) | — | — | |||||
| Net increase | 8,492,699 | $137,113,112 | — | $— | |||||||
Class Y (2) | |||||||||||
| Shares sold | 909,077 | $14,783,784 | 5,046,556 | $81,375,140 | |||||||
| Reinvestment of distributions | 33,027 | 535,470 | 174,878 | 2,821,038 | |||||||
| Shares redeemed | (266,596 | ) | (4,333,894 | ) | (3,182,345 | ) | (51,499,954 | ) | |||
| Conversion to Class I | (9,394,113 | ) | (152,730,431 | ) | — | — | |||||
| Net increase (decrease) | (8,718,605 | ) | ($141,745,071 | ) | 2,039,089 | $32,696,224 | |||||
(1) For the period from the commencement of operations, October 3, 2017, to September 30, 2018. | |||||||||||
(2) Effective December 8, 2017, Class Y shares of the Fund converted to Class I shares at net asset value. Thereafter, Class Y shares were terminated. | |||||||||||
82 www.calvert.com CALVERT SOCIAL INVESTMENT FUND ANNUAL REPORT
| EQUITY | Year Ended September 30, 2018 | Year Ended September 30, 2017 | |||||||||
| Shares | Amount | Shares | Amount | ||||||||
| Class A | |||||||||||
| Shares sold | 1,791,118 | $81,264,058 | 2,098,600 | $83,902,160 | |||||||
| Reinvestment of distributions | 2,029,346 | 87,647,447 | 3,333,785 | 124,285,943 | |||||||
| Shares redeemed | (5,734,299 | ) | (259,977,751 | ) | (10,745,032 | ) | (425,704,959 | ) | |||
| Net decrease | (1,913,835 | ) | ($91,066,246 | ) | (5,312,647 | ) | ($217,516,856 | ) | |||
| Class C | |||||||||||
| Shares sold | 380,163 | $10,186,970 | 537,279 | $13,276,376 | |||||||
| Reinvestment of distributions | 666,260 | 16,949,642 | 922,482 | 21,410,804 | |||||||
| Shares redeemed | (1,334,221 | ) | (35,897,758 | ) | (2,310,767 | ) | (58,096,855 | ) | |||
| Net decrease | (287,798 | ) | ($8,761,146 | ) | (851,006 | ) | ($23,409,675 | ) | |||
| Class I | |||||||||||
| Shares sold | 6,856,641 | $356,188,895 | 3,826,988 | $173,015,098 | |||||||
| Reinvestment of distributions | 974,140 | 48,356,291 | 902,169 | 38,441,748 | |||||||
| Shares redeemed | (6,112,228 | ) | (321,026,489 | ) | (3,726,001 | ) | (168,010,686 | ) | |||
| Conversion from Class Y | 4,152,351 | 218,358,843 | — | — | |||||||
| Net increase | 5,870,904 | $301,877,540 | 1,003,156 | $43,446,160 | |||||||
Class R6 (1) | |||||||||||
| Shares sold | 15,220 | $809,551 | — | $— | |||||||
| Reinvestment of distributions | 15 | 739 | — | — | |||||||
| Shares redeemed | (360 | ) | (20,328 | ) | — | — | |||||
| Net increase | 14,875 | $789,962 | — | $— | |||||||
Class Y (2) | |||||||||||
| Shares sold | 199,290 | $9,214,232 | 2,234,886 | $90,283,139 | |||||||
| Reinvestment of distributions | — | — | 329,260 | 12,668,373 | |||||||
| Shares redeemed | (343,197 | ) | (15,774,929 | ) | (2,406,734 | ) | (99,581,140 | ) | |||
| Conversion to Class I | (4,598,451 | ) | (218,358,843 | ) | — | — | |||||
| Net increase (decrease) | (4,742,358 | ) | ($224,919,540 | ) | 157,412 | $3,370,372 | |||||
(1) For the period from the commencement of operations, October 3, 2017, to September 30, 2018. | |||||||||||
(2) Effective December 8, 2017, Class Y shares of the Fund converted to Class I shares at net asset value. Thereafter, Class Y shares were terminated. | |||||||||||
www.calvert.com CALVERT SOCIAL INVESTMENT FUND ANNUAL REPORT 83
NOTE 10 — CAPITAL COMMITMENTS
In connection with certain venture capital and/or limited partnership investments, Balanced and Equity are committed to future capital calls, which will increase each Fund’s investment in these securities. The aggregate amount of the future capital commitments totaled $168,937 and $2,452,548 for Balanced and Equity, respectively, at September 30, 2018. Balanced and Equity had sufficient cash and/or securities to cover these commitments.
Balanced’s unfunded capital commitments by investment at September 30, 2018 were as follows:
| Name of Investment | Unfunded Commitment at 9/30/18 | ||
| First Analysis Private Equity Fund IV LP | $60,000 | ||
| Learn Capital Venture Partners III LP | $108,937 | ||
| Total | $168,937 | ||
| Equity’s unfunded capital commitments by investment at September 30, 2018 were as follows: | |||
| Name of Investment | Unfunded Commitment at 9/30/18 | ||
| Accion Frontier Inclusion Fund LP | $386,047 | ||
| Adobe Capital Social Mezzanine Fund I LP | $50,828 | ||
| Africa Renewable Energy Fund LP | $120,509 | ||
| Arborview Capital Partners LP | $105,514 | ||
| Blackstone Clean Technology Partners LP | $3,170 | ||
| Bridges Ventures US Sustainable Growth Fund LP | $531,850 | ||
| China Environment Fund 2004 LP | $37,764 | ||
| China Environment Fund III LP | $1,205 | ||
| Coastal Ventures III LP | $50,000 | ||
| Core Innovations Capital I LP | $51,766 | ||
| Cross Culture Ventures I LP | $147,571 | ||
| DBL Partners III LP | $505,163 | ||
| First Analysis Private Equity Fund V LP | $18,302 | ||
| Impact Ventures II LP | $9,632 | ||
| LeapFrog Financial Inclusion Fund | $81,818 | ||
| New Markets Education Partners LP | $82,500 | ||
| New Markets Venture Partners II LP | $25,000 | ||
| Owl Ventures LP | $115,000 | ||
| Westly Capital Partners Fund II LP | $128,909 | ||
| Total | $2,452,548 | ||
84 www.calvert.com CALVERT SOCIAL INVESTMENT FUND ANNUAL REPORT
REPORT OF INDEPENDENT REGISTERED PUBLIC ACCOUNTING FIRM
To the Shareholders and Board of Trustees
Calvert Social Investment Fund:
Opinion on the Financial Statements
We have audited the accompanying statements of assets and liabilities of Calvert Balanced Fund, Calvert Bond Fund and Calvert Equity Fund (collectively, the Funds), each a series of Calvert Social Investment Fund, including the schedules of investments, as of September 30, 2018, the related statements of operations for the year then ended, the statements of changes in net assets for each of the years in the two‑year period then ended, and the related notes (collectively, the financial statements) and the financial highlights for each of the years or periods in the five‑year period then ended. In our opinion, the financial statements and financial highlights present fairly, in all material respects, the financial position of the Funds as of September 30, 2018, the results of their operations for the year then ended, the changes in their net assets for each of the years in the two‑year period then ended, and the financial highlights for each of the years or periods in the five‑year period then ended, in conformity with U.S. generally accepted accounting principles.
Basis for Opinion
These financial statements and financial highlights are the responsibility of the Funds’ management. Our responsibility is to express an opinion on these financial statements and financial highlights based on our audits. We are a public accounting firm registered with the Public Company Accounting Oversight Board (United States) (PCAOB) and are required to be independent with respect to the Funds in accordance with the U.S. federal securities laws and the applicable rules and regulations of the Securities and Exchange Commission and the PCAOB.
We conducted our audits in accordance with the standards of the PCAOB. Those standards require that we plan and perform the audit to obtain reasonable assurance about whether the financial statements and financial highlights are free of material misstatement, whether due to error or fraud. Our audits included performing procedures to assess the risks of material misstatement of the financial statements and financial highlights, whether due to error or fraud, and performing procedures that respond to those risks. Such procedures included examining, on a test basis, evidence regarding the amounts and disclosures in the financial statements and financial highlights. Such procedures also included confirmation of securities owned as of September 30, 2018, by correspondence with custodians, brokers and agent banks. Our audits also included evaluating the accounting principles used and significant estimates made by management, as well as evaluating the overall presentation of the financial statements and financial highlights. We believe that our audits provide a reasonable basis for our opinion.
We have served as the auditor of one or more of the Calvert Funds since 2002.
Philadelphia, Pennsylvania
November 21, 2018
www.calvert.com CALVERT SOCIAL INVESTMENT FUND ANNUAL REPORT 85
FEDERAL TAX INFORMATION
The Form 1099-DIV you receive in February 2019 will show the tax status of all distributions paid to your account in calendar year 2018. Shareholders are advised to consult their own tax adviser with respect to the tax consequences of their investment in the Funds. As required by the Internal Revenue Code and/or regulations, shareholders must be notified regarding the status of qualified dividend income for individuals, the dividends received deduction for corporations and capital gains dividends.
Qualified Dividend Income. For the fiscal year ended September 30, 2018, the Funds designate the following amounts, or up to the maximum amount of such dividends allowable pursuant to the Internal Revenue Code, as qualified dividend income eligible for the reduced tax rate of 15%:
| Balanced Fund | $6,554,474 | ||
| Equity Fund | $23,048,648 | ||
Dividends Received Deduction. Corporate shareholders are generally entitled to take the dividends received deduction on the portion of each Fund’s dividend distribution that qualifies under tax law. For each Fund’s fiscal 2018 ordinary income dividends, the following qualifies for the corporate dividends received deduction:
| Balanced Fund | 31.44 | % |
| Equity Fund | 100.00 | % |
Capital Gains Dividends. The Funds hereby designate as a capital gain dividend with respect to the taxable year ended September 30, 2018, the following amounts or, if subsequently determined to be different, the net capital gain of such year:
| Balanced Fund | $14,642,705 | ||
| Equity Fund | $183,391,338 | ||
86 www.calvert.com CALVERT SOCIAL INVESTMENT FUND ANNUAL REPORT (Unaudited)
MANAGEMENT AND ORGANIZATION
Fund Management. The Trustees of Calvert Social Investment Fund (the Trust) are responsible for the overall management and supervision of the Trust’s affairs. The Trustees and officers of the Trust are listed below. Except as indicated, each individual has held the office shown or other offices in the same company for the last five years. Trustees and officers of the Trust hold indefinite terms of office. The “Independent Trustees” consist of those Trustees who are not “interested persons” of the Trust, as that term is defined under the 1940 Act. The business address of each Trustee and officer, with the exception of Ms. Gemma and Mr. Kirchner, is 1825 Connecticut Avenue NW, Suite 400, Washington, DC 20009. As used below, “CRM” refers to Calvert Research and Management. Each Trustee oversees 39 funds in the Calvert fund complex. Each officer serves as an officer of certain other Calvert funds.
| Name and Year of Birth | Position with Trust | Position Start Date | Principal Occupation(s) and Directorships During Past Five Years and Other Relevant Experience |
| Interested Trustee | |||
John H. Streur(1) 1960 | Trustee & President | 2015 | President and Chief Executive Officer of Calvert Research and Management (since December 31, 2016). President and Chief Executive Officer of Calvert Investments, Inc. (January 2015 - December 2016); Chief Executive Officer of Calvert Investment Distributors, Inc. (August 2015 - December 2016); Chief Compliance Officer of Calvert Investment Management, Inc. (August 2015 - April 2016); President and Director, Portfolio 21 Investments, Inc. (through October 2014); President, Chief Executive Officer and Director, Managers Investment Group LLC (through January 2012); President and Director, The Managers Funds and Managers AMG Funds (through January 2012). Directorships in the Last Five Years. Portfolio 21 Investments, Inc. (asset management) (through October 2014); Managers Investment Group LLC (asset management) (through January 2012); The Managers Funds (asset management) (through January 2012); Managers AMG Funds (asset management) (through January 2012); Calvert Impact Capital, Inc. |
| Independent Trustees | |||
| Richard L. Baird, Jr 1948 | Trustee | 1982 | Former President and CEO of Adagio Health Inc. (retired in 2014) in Pittsburgh, PA, a non-profit corporation which provides family planning services, nutrition, maternal/child health care, and various health screening services and community preventive health programs. Directorships in the Last Five Years. None. |
| Alice Gresham Bullock 1950 | Chair & Trustee | 2016 | Professor at Howard University School of Law (retired June 2016). She is former Dean of Howard University School of Law (1996-2002) and Deputy Director of the Association of American Law Schools (1992-1994). Directorships in the Last Five Years. None. |
Cari M. Dominguez 1949 | Trustee | 2016 | Former Chair of the U.S. Equal Employment Opportunity Commission. Directorships in the Last Five Years. Manpower, Inc. (employment agency); Triple S Management Corporation (managed care); National Association of Corporate Directors. |
| John G. Guffey, Jr. 1948 | Trustee | 1982 | President of Aurora Press Inc., a privately held publisher of trade paperbacks (since January 1997). Directorships in the Last Five Years. Calvert Impact Capital, Inc.; Calvert Ventures, LLC. |
| Miles D. Harper, III 1962 | Trustee | 2005 | Partner, Carr Riggs & Ingram (public accounting firm) since October 2014. Partner, Gainer Donnelly & Desroches (public accounting firm) (now Carr Riggs & Ingram), November 1999 - September 2014). Directorships in the Last Five Years. Bridgeway Funds (10) (asset management). |
www.calvert.com CALVERT SOCIAL INVESTMENT FUND ANNUAL REPORT (Unaudited) 87
| Name and Year of Birth | Position with Trust | Position Start Date | Principal Occupation(s) and Directorships During Past Five Years and Other Relevant Experience |
| Joy V. Jones 1950 | Trustee | 1990 | Attorney. Directorships in the Last Five Years. Conduit Street Restaurants SUD 2 Limited; Palm Management Restaurant Corporation. |
| Anthony A. Williams 1951 | Trustee | 2016 | CEO and Executive Director of the Federal City Council (July 2012 to present); Senior Adviser and Independent Consultant for McKenna Long & Aldridge LLP (September 2011 to present); Executive Director of Global Government Practice at the Corporate Executive Board (January 2010 to January 2012). Directorships in the Last Five Years. Freddie Mac; Evoq Properties/ Meruelo Maddux Properties, Inc. (real estate management); Weston Solutions, Inc. (environmental services); Bipartisan Policy Center’s Debt Reduction Task Force; Chesapeake Bay Foundation; Catholic University of America; Urban Institute (research organization). |
| Principal Officers who are not Trustees | |||
| Name and Year of Birth | Position with Trust | Position Start Date | Principal Occupation During Past Five Years |
| Hope L. Brown 1973 | Chief Compliance Officer | 2014 | Chief Compliance Officer of 39 registered investment companies advised by CRM (since 2014). Vice President and Chief Compliance Officer, Wilmington Funds (2012-2014). Vice President and Senior Compliance Officer, Wilmington Trust Investment Advisors, Inc. (2010-2012). |
Maureen A. Gemma(2) 1960 | Secretary, Vice President and Chief Legal Officer | 2016 | Vice President of CRM and officer of 39 registered investment companies advised by CRM (since 2016). Also Vice President of Eaton Vance Management (“EVM”) and certain of its affiliates and officer of 174 registered investment companies advised or administered by EVM. |
James F. Kirchner(2) 1967 | Treasurer | 2016 | Vice President of CRM and officer of 39 registered investment companies advised by CRM (since 2016). Also Vice President of EVM and certain of its affiliates and officer of 174 registered investment companies advised or administered by EVM. |
(1) | Mr. Streur is an interested person of the Funds because of his positions with each Fund’s Adviser and certain affiliates. |
(2) | The business address for Ms. Gemma and Mr. Kirchner is Two International Place, Boston, MA 02110. |
The SAI for the Funds includes additional information about the Trustees and officers of the Funds and can be obtained without charge on Calvert’s website at www.calvert.com or by calling 1-800-368-2745.
88 www.calvert.com CALVERT SOCIAL INVESTMENT FUND ANNUAL REPORT (Unaudited)
IMPORTANT NOTICES
Privacy. The Calvert Funds and Calvert Research and Management are committed to ensuring your financial privacy. Each of the financial institutions identified below has in effect the following policy (“Privacy Policy”) with respect to nonpublic personal information about its customers:
| • | Only such information received from you, through application forms or otherwise, and information about your Calvert fund transactions will be collected. This may include information such as name, address, social security number, tax status, account balances and transactions. |
| • | None of such information about you (or former customers) will be disclosed to anyone, except as permitted by law (which includes disclosure to employees necessary to service your account). In the normal course of servicing a customer’s account, Calvert Research and Management may share information with unaffiliated third parties that perform various required services such as transfer agents, custodians and broker-dealers. |
| • | Policies and procedures (including physical, electronic and procedural safeguards) are in place that are designed to protect the confidentiality of such information. |
| • | The Funds reserve the right to change this Privacy Policy at any time upon proper notification to you. Customers may want to review the Funds’ Privacy Policy periodically for changes by accessing the link on our homepage: www.calvert.com. |
Our pledge of privacy applies to the following entities: the Calvert Family of Funds, Calvert Research and Management and their affiliated service providers, Eaton Vance Management and Eaton Vance Distributors, Inc. In addition, our Privacy Policy applies only to those Calvert customers who are individuals and who have a direct relationship with us. If a customer’s account (i.e., fund shares) is held in the name of a third-party financial advisor/broker-dealer, it is likely that only such advisor’s privacy policies apply to the customer. This notice supersedes all previously issued privacy disclosures. For more information about Calvert’s Privacy Policy, please call 1-800-368-2745.
Delivery of Shareholder Documents. The Securities and Exchange Commission (SEC) permits funds to deliver only one copy of shareholder documents, including prospectuses, proxy statements and shareholder reports, to fund investors with multiple accounts at the same residential or post office box address. This practice is often called “householding” and it helps eliminate duplicate mailings to shareholders. Calvert funds, or your financial advisor, may household the mailing of your documents indefinitely unless you instruct Calvert funds, or your financial advisor, otherwise. If you would prefer that your Calvert fund documents not be householded, please contact Calvert funds at 1-800-368-2745, or contact your financial advisor. Your instructions that householding not apply to delivery of your Calvert fund documents will typically be effective within 30 days of receipt by Calvert funds or your financial advisor. Separate statements will be generated for each separate account and will be householded as described above.
Portfolio Holdings. Each Calvert fund will file a schedule of portfolio holdings on Form N-Q with the SEC for the first and third quarters of each fiscal year. The Form N-Q will be available on the Calvert funds’ website at www.calvert.com, by calling Calvert funds at 1-800-368-2745 or in the EDGAR database on the SEC’s website at www.sec.gov. Form N-Q may also be reviewed and copied at the SEC’s public reference room in Washington, D.C. (call 1-800-732-0330 for information on the operation of the public reference room).
Proxy Voting. The Proxy Voting Guidelines that each Calvert fund uses to determine how to vote proxies relating to portfolio securities is provided as an Appendix to the fund’s Statement of Additional Information. The Statement of Additional Information can be obtained free of charge by calling the Calvert funds at 1-800-368-2745, by visiting the Calvert funds’ website at www.calvert.com or visiting the SEC’s website at www.sec.gov. Information regarding how a Calvert fund voted proxies relating to portfolio securities during the most recent 12-month period ended June 30 is available by calling Calvert funds, by visiting the Calvert funds’ website at www.calvert.com or by visiting the SEC’s website at www.sec.gov.
www.calvert.com CALVERT SOCIAL INVESTMENT FUND ANNUAL REPORT (Unaudited) 89
| This page intentionally left blank. |
| This page intentionally left blank. |
| This page intentionally left blank. |
CALVERT SOCIAL INVESTMENT FUND | |
Investment Adviser and Administrator Calvert Research and Management 1825 Connecticut Avenue NW, Suite 400 Washington, DC 20009 | Transfer Agent DST Asset Manager Solutions, Inc. 2000 Crown Colony Drive Quincy, MA 02169 |
Calvert Equity Fund - Sub-Adviser Atlanta Capital Management Company, LLC 1075 Peachtree Street, Suite 2100 Atlanta, GA 30309 | Independent Registered Public Accounting Firm KPMG LLP 1601 Market Street Philadelphia, PA 19103-2499 |
Principal Underwriter* Eaton Vance Distributors, Inc. Two International Place Boston, MA 02110 (617) 482-8260 | Fund Offices 1825 Connecticut Avenue NW, Suite 400 Washington, DC 20009 |
Custodian State Street Bank and Trust Company State Street Financial Center, One Lincoln Street Boston, MA 02111 | |
* FINRA BrokerCheck. Investors may check the background of their Investment Professional by contacting the Financial Industry Regulatory Authority (FINRA). FINRA BrokerCheck is a free tool to help investors check the professional background of current and former FINRA-registered securities firms and brokers. FINRA BrokerCheck is available by calling 1-800-289-9999 and at www.FINRA.org. The FINRA BrokerCheck brochure describing this program is available to investors at www.FINRA.org.
Fund shares are not insured by the FDIC and are not deposits or other obligations of, or guaranteed by, any depository institution. Shares are subject to investment risks, including possible loss of principal invested. This report is intended to provide fund information to shareholders. It is not authorized for distribution to prospective investors unless preceded or accompanied by a prospectus. Note: The information on our website is not incorporated by reference into this report; our website address is included as an inactive textual reference only. Investors should carefully consider the investment objectives, risks, charges and expenses of the Calvert funds. This and other important information is contained in the fund’s summary prospectus and prospectus, which can be obtained from your financial professional and should be read carefully before investing. You may also call the Calvert funds at 800-368-2745. Printed on recycled paper. | |
| 24203 9.30.18 | |
| | |
Calvert Asset Allocation Funds • Conservative Allocation Fund• Moderate Allocation Fund• Aggressive Allocation Fund | | |
| | |
Annual Report September 30, 2018 E-Delivery Sign-Up — Details Inside | |
Commodity Futures Trading Commission Registration. Effective December 31, 2012, the Commodity Futures Trading Commission (“CFTC”) adopted certain regulatory changes that subject registered investment companies and advisers to regulation by the CFTC if a fund invests more than a prescribed level of its assets in certain CFTC-regulated instruments (including futures, certain options and swap agreements) or markets itself as providing investment exposure to such instruments. Each Fund and its adviser have claimed an exclusion from the definition of the term “commodity pool operator” under the Commodity Exchange Act. Accordingly, neither the Funds nor the adviser is subject to CFTC regulation. |
Choose Planet-friendly E-delivery! Sign up now for on-line statements, prospectuses, and fund reports. In less than five minutes you can help reduce paper mail and lower fund costs. Just go to www.calvert.com. If you already have an online account with the Calvert funds, click on Login to access your Account and select the documents you would like to receive via e-mail. If you’re new to online account access, click on Login, then Register to create your user name and password. Once you’re in, click on the E-delivery sign-up on the Account Portfolio page and follow the quick, easy steps. Note: If your shares are not held directly with the Calvert funds but through a brokerage firm, you must contact your broker for electronic delivery options available through their firm. |
| TABLE OF CONTENTS | |||
| Management’s Discussion of Fund Performance | ||||
| Performance and Fund Profile | ||||
| Conservative Allocation Fund | ||||
| Moderate Allocation Fund | ||||
| Aggressive Allocation Fund | ||||
| Endnotes and Additional Disclosures | ||||
| Fund Expenses | ||||
| Financial Statements | ||||
| Report of Independent Registered Public Accounting Firm | ||||
| Federal Tax Information | ||||
| Management and Organization | ||||
| Important Notices | ||||
MANAGEMENT’S DISCUSSION OF FUND PERFORMANCE1
Economic and Market Conditions
U.S. stocks led the way with double-digit gains in the 12-month period ended September 30, 2018, while global stocks delivered mixed results.
U.S. stocks opened the period on the upswing as investors anticipated and then cheered passage of the Republican tax reform package in December 2017. Sharp cuts in corporate taxes, a key element of the bill, raised corporate-profit expectations. Stocks also got a boost from positive U.S. economic data, including the unemployment rate which fell to a 17-year low.
Stocks pulled back in February 2018 amid fears that rising rates would spur inflation and boost the appeal of fixed-income investments at the expense of stocks. After a brief rebound, equity markets weakened in the spring of 2018, as investors confronted the prospect of a global trade war due to President Trump’s imposition of broad new tariffs. The tariffs drew retaliatory action from impacted countries including China, Canada, and certain countries in the European Union. Stocks bounced back in the final three months of the period. Technology stocks led the advance, following an earlier setback from a wave of data-privacy scandals.
For the 12-month period ended September 30, 2018, all major U.S. stock indexes recorded double-digit gains. The blue-chip Dow Jones Industrial Average®2 advanced 20.76%, while the broader U.S. equity market, as represented by the S&P 500® Index, rose 17.91%. The technology-laden NASDAQ Composite Index surged 25.17% in the period. Large-cap U.S. stocks as measured by the S&P 500® Index generally outperformed their small-cap counterparts as measured by the Russell 2000® Index during the period. Growth stocks as a group outpaced value stocks in both the large- and small-cap categories, as measured by the Russell growth and value indexes.
On the fixed income side, U.S. investment-grade, fixed-income securities declined during the period, with the Bloomberg Barclays U.S. Aggregate Bond Index returning -1.22%. In comparison, high-yield credits showed strength with the ICE BofAML U.S. High Yield Index rising 2.94% during the period.
U.S. gross domestic product (GDP) growth accelerated through most of the period, reaching a quarterly annualized rate of 4.2% in the second quarter of 2018, the highest level in four years. Corporate earnings and balance sheets also steadily strengthened and the unemployment rate fell to 3.9% during the period from 4.2% at the start of the period. Wages, which had remained stagnant even as the jobless rate fell, began to rise in
the latter stages of the period. Inflation increased modestly with the personal consumption expenditures index rising to nearly 2%, mirroring the U.S. Federal Reserve Board (the Fed) target level.
As the U.S. economy showed signs of building strength, the Fed raised the federal funds rate four times during the period and projected another rate hike before the end of 2018 as well as three more potential increases in 2019.
Later in the period, a strong supply of issuances from merger-and-acquisition transactions ─ in addition to concerns about increased leverage and weakening fundamentals in the latter stages of the credit cycle ─ contributed to widening spreads.
Fund Performance - Calvert Conservative Allocation Fund
For the 12-month period ended September 30, 2018, Calvert Conservative Allocation Fund (the Fund) returned a total of 4.08% for Class A shares at net asset value (NAV), outperforming both its primary benchmark, the Bloomberg Barclays U.S. Aggregate Bond Index (the Index), which returned -1.22%, and its blended composite benchmark, which returned 3.61%. The Conservative Allocation Composite Benchmark is an internally constructed benchmark comprising a blend of 25% Russell 3000® Index, 10% MSCI ACWI ex USA Investable Market Index, and 65% Bloomberg Barclays U.S. Aggregate Bond Index.
Calvert Conservative Allocation Fund is a “fund of funds.” It typically invests within the following ranges in the underlying Calvert funds that primarily invest in the following asset classes of 50% to 80% fixed income, 20% to 50% equity, and 0% to 10% cash and money market instruments.
The Fund’s allocation to equities contributed to the Fund’s performance versus the Index, as equities are not included in the Index and equity markets worldwide performed well during the period. The Fund’s allocations to the Calvert Small-Cap Fund and Calvert International Opportunities Fund were notable in this regard during the period. The Fund’s allocation to value stocks on the U.S. side was a negative contributor to performance as high-growth and momentum stocks outperformed.
The Fund’s fixed-income allocations, primarily to the Calvert Floating-Rate Advantage Fund, Calvert Absolute Return Bond Fund and the Calvert Bond Fund contributed to the Fund’s performance relative to the Index. These underlying bond funds’ allocations to shorter duration5 bonds and securitized assets were particularly beneficial as these areas of the fixed-income market outperformed other fixed-income sectors for the period. An overweight to Treasury Inflation Protected Securities also contributed to returns relative to the Index.
See Endnotes and Additional Disclosures in this report. Past performance is no guarantee of future results. Returns are historical and are calculated by determining the percentage change in net asset value (NAV) or offering price (as applicable) with all distributions reinvested. Investment return and principal value will fluctuate so that shares, when redeemed, may be worth more or less than their original cost. Performance less than or equal to one year is cumulative. Performance is for the stated time period only; due to market volatility, the Fund’s current performance may be lower or higher than quoted. Returns are before taxes unless otherwise noted. For performance as of the most recent month-end, please refer to www.calvert.com. |
2 www.calvert.com CALVERT ASSET ALLOCATION FUNDS ANNUAL REPORT (Unaudited)
MANAGEMENT’S DISCUSSION OF FUND PERFORMANCE - continued
Fund Performance - Calvert Moderate Allocation Fund
For the 12-month period ended September 30, 2018, Calvert Moderate Allocation Fund (the Fund) returned a total of 7.62% for Class A shares at net asset value (NAV), underperforming its primary benchmark, the Russell 3000® Index (the Index), which returned 17.58%, and performing in line with its blended composite benchmark, which returned 7.63%. The Moderate Allocation Composite Benchmark is an internally constructed benchmark comprising a blend of 45% Russell 3000® Index, 20% MSCI ACWI ex USA Investable Market Index, and 35% Bloomberg Barclays U.S. Aggregate Bond Index.
Calvert Moderate Allocation Fund is a “fund of funds.” It typically invests within the following ranges in the underlying Calvert funds that primarily invest in the following asset classes of 50% to 80% equity, 20% to 50% fixed income, and 0% to 10% cash and money market instruments.
The Fund’s overweight to small-cap equities relative to the Index contributed to the Fund’s performance versus the Index. The Fund’s allocations to the Calvert Small-Cap Fund and Calvert International Opportunities Fund were notable in this regard during the period.
However, the Fund’s overall underweight allocation to equities relative to the Index, in particular to U.S. stocks, detracted from the Fund’s performance versus the Index as U.S. equities performed strongly during the period. The Fund’s underweight to U.S. equities was partially offset by allocations to S&P 500® Index call options, which positively contributed to performance relative to the Index. The Fund’s underlying allocation to value stocks on the U.S. side weighed on returns relative to the Index as high-growth and momentum stocks outperformed.
The Fund’s fixed-income allocations detracted from performance relative to the Index as fixed-income returns lagged and equity markets worldwide performed well during the period. Within the fixed-income allocation, the Calvert Floating-Rate Advantage Fund and Calvert Absolute Return Bond Fund contributed to the Fund’s performance relative to the Index. These underlying bond funds’ allocations to shorter duration5 bonds and securitized assets were particularly beneficial as these areas of the fixed-income market outperformed other fixed-income sectors for the period. An overweight to Treasury Inflation Protected Securities also contributed to returns relative to the Index.
Fund Performance - Calvert Aggressive Allocation Fund
For the 12-month period ended September 30, 2018, Calvert Aggressive Allocation Fund (the Fund) returned a total of 10.19% for Class A shares at net asset value (NAV), underperforming its primary benchmark, the Russell 3000® Index (the Index), which returned 17.58%; and its blended composite benchmark, which returned 10.77%. The Aggressive Allocation Composite Benchmark is an internally constructed benchmark comprising a blend of 60% Russell 3000® Index, 30% MSCI ACWI ex USA Investable Market Index, and 10% Bloomberg Barclays U.S. Aggregate Bond Index.
Calvert Aggressive Allocation Fund is a “fund of funds.” It typically invests within the following ranges in the underlying Calvert funds that primarily invest in the following asset classes of 80% to 100% equity, 0% to 20% fixed income, and 0% to 10% cash and money market instruments.
The Fund’s overweight to small-cap equities relative to the Index contributed to the Fund’s performance versus the Index. The Fund’s allocations to the Calvert Small-Cap Fund and Calvert International Opportunities Fund were notable in this regard during the period. The Fund’s underweight to U.S. equities was partially offset by allocations to S&P 500® Index call options, which positively contributed to performance relative to the Index. The Fund’s underlying allocation to value stocks on the U.S. side weighed on returns relative to the Index as high-growth and momentum stocks outperformed.
The Fund’s fixed-income allocations detracted from performance relative to the Index as fixed-income returns lagged and equity markets worldwide performed well during the period. Within the fixed-income allocation the Calvert Floating-Rate Advantage Fund, Calvert Absolute Return Bond Fund and Calvert Bond Fund contributed to the Fund’s performance relative to the Index. These underlying bond funds’ allocations to shorter duration5 bonds and securitized assets were particularly beneficial as these areas of the fixed-income market outperformed other fixed-income sectors for the period. An overweight to Treasury Inflation Protected Securities also contributed to returns relative to the Index.
See Endnotes and Additional Disclosures in this report. Past performance is no guarantee of future results. Returns are historical and are calculated by determining the percentage change in net asset value (NAV) or offering price (as applicable) with all distributions reinvested. Investment return and principal value will fluctuate so that shares, when redeemed, may be worth more or less than their original cost. Performance less than or equal to one year is cumulative. Performance is for the stated time period only; due to market volatility, the Fund’s current performance may be lower or higher than quoted. Returns are before taxes unless otherwise noted. For performance as of the most recent month-end, please refer to www.calvert.com. |
www.calvert.com CALVERT ASSET ALLOCATION FUNDS ANNUAL REPORT (Unaudited) 3
CALVERT CONSERVATIVE ALLOCATION FUND
PERFORMANCE
Performance2,3 | ||||||||||||||
Portfolio Managers Dan R. Strelow, CFA, CIPM, Vishal Khanduja, CFA and Justin H. Bourgette, CFA, each of Calvert Research and Management | ||||||||||||||
| % Average Annual Total Returns | Class Inception Date | Performance Inception Date | One Year | Five Years | Ten Years | |||||||||
| Class A at NAV | 04/29/2005 | 04/29/2005 | 4.08 | % | 5.20 | % | 6.06 | % | ||||||
| Class A with 4.75% Maximum Sales Charge | — | — | -0.87 | 4.18 | 5.55 | |||||||||
| Class C at NAV | 04/29/2005 | 04/29/2005 | 3.30 | 4.31 | 4.99 | |||||||||
| Class C with 1% Maximum Sales Charge | — | — | 2.30 | 4.31 | 4.99 | |||||||||
| Class I at NAV | 05/20/2016 | 04/29/2005 | 4.40 | 5.38 | 6.15 | |||||||||
| Bloomberg Barclays U.S. Aggregate Bond Index | — | — | -1.22 | % | 2.16 | % | 3.77 | % | ||||||
| Conservative Allocation Composite Benchmark | — | — | 3.61 | 5.25 | 6.28 | |||||||||
% Total Annual Operating Expense Ratios4 | Class A | Class C | Class I | |||||||||||
| Gross | 1.00 | % | 1.79 | % | 1.92 | % | ||||||||
| Net | 0.96 | 1.71 | 0.61 | |||||||||||
| Growth of $10,000 |
| This graph shows the change in value of a hypothetical investment of $10,000 in Class A of the Fund for the period indicated. For comparison, the same investment is shown in the indicated index. |
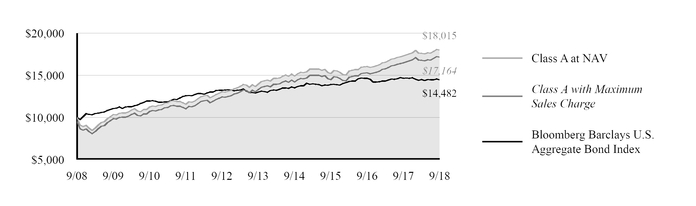
Growth of Investment3 | Amount Invested | Period Beginning | At NAV | With Maximum Sales Charge | ||||
| Class C | $10,000 | 09/30/2008 | $16,281 | N.A. | ||||
| Class I | $250,000 | 09/30/2008 | $454,197 | N.A. | ||||
See Endnotes and Additional Disclosures in this report.
Past performance is no guarantee of future results. Returns are historical and are calculated by determining the percentage change in net asset value (NAV) or offering price (as applicable) with all distributions reinvested. Investment return and principal value will fluctuate so that shares, when redeemed, may be worth more or less than their original cost. Performance less than or equal to one year is cumulative. Performance is for the stated time period only; due to market volatility, the Fund's current performance may be lower or higher than quoted. Returns are before taxes unless otherwise noted. For performance as of the most recent month-end, please refer to www.calvert.com.
4 www.calvert.com CALVERT ASSET ALLOCATION FUNDS ANNUAL REPORT (Unaudited)
CALVERT CONSERVATIVE ALLOCATION FUND
FUND PROFILE
| ASSET ALLOCATION (% of total investments) | ||||||
| Fixed-Income Funds | 64.1 | % | ||||
| Domestic Equity Funds | 22.7 | % | ||||
| International and Global Equity Funds | 10.4 | % | ||||
| U.S. Treasury Obligations | 2.8 | % | ||||
| Purchased Options | 0.0% | * | ||||
| Total | 100.0 | % | ||||
* Amount is less than 0.05%.
See Endnotes and Additional Disclosures in this report.
www.calvert.com CALVERT ASSET ALLOCATION FUNDS ANNUAL REPORT (Unaudited) 5
CALVERT MODERATE ALLOCATION FUND
PERFORMANCE
Performance2,3 | ||||||||||||||
Portfolio Managers Dan R. Strelow, CFA, CIPM, Vishal Khanduja, CFA and Justin H. Bourgette, CFA, each of Calvert Research and Management | ||||||||||||||
| % Average Annual Total Returns | Class Inception Date | Performance Inception Date | One Year | Five Years | Ten Years | |||||||||
| Class A at NAV | 04/29/2005 | 4/29/2005 | 7.62 | % | 7.28 | % | 7.27 | % | ||||||
| Class A with 4.75% Maximum Sales Charge | — | — | 2.53 | 6.24 | 6.75 | |||||||||
| Class C at NAV | 04/29/2005 | 4/29/2005 | 6.83 | 6.48 | 6.45 | |||||||||
| Class C with 1% Maximum Sales Charge | — | — | 5.83 | 6.48 | 6.45 | |||||||||
| Class I at NAV | 05/20/2016 | 4/29/2005 | 8.04 | 7.47 | 7.36 | |||||||||
Russell 3000® Index | — | — | 17.58 | % | 13.45 | % | 12.00 | % | ||||||
| Moderate Allocation Composite Benchmark | — | — | 7.63 | 7.73 | 8.14 | |||||||||
% Total Annual Operating Expense Ratios4 | Class A | Class C | Class I | |||||||||||
| Gross | 0.99 | % | 1.78 | % | 1.06 | % | ||||||||
| Net | 0.96 | 1.71 | 0.61 | |||||||||||
| Growth of $10,000 |
| This graph shows the change in value of a hypothetical investment of $10,000 in Class A of the Fund for the period indicated. For comparison, the same investment is shown in the indicated index. |
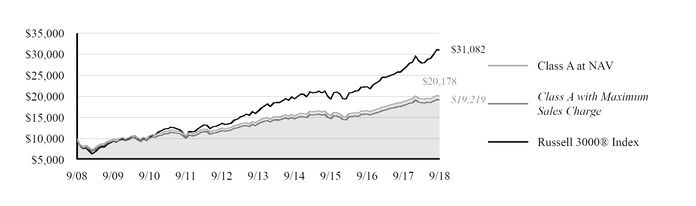
Growth of Investment3 | Amount Invested | Period Beginning | At NAV | With Maximum Sales Charge | ||||
| Class C | $10,000 | 09/30/2008 | $18,699 | N.A. | ||||
| Class I | $250,000 | 09/30/2008 | $508,949 | N.A. | ||||
See Endnotes and Additional Disclosures in this report.
Past performance is no guarantee of future results. Returns are historical and are calculated by determining the percentage change in net asset value (NAV) or offering price (as applicable) with all distributions reinvested. Investment return and principal value will fluctuate so that shares, when redeemed, may be worth more or less than their original cost. Performance less than or equal to one year is cumulative. Performance is for the stated time period only; due to market volatility, the Fund's current performance may be lower or higher than quoted. Returns are before taxes unless otherwise noted. For performance as of the most recent month-end, please refer to www.calvert.com.
6 www.calvert.com CALVERT ASSET ALLOCATION FUNDS ANNUAL REPORT (Unaudited)
CALVERT MODERATE ALLOCATION FUND
FUND PROFILE
| ASSET ALLOCATION (% of total investments) | ||||||
| Domestic Equity Funds | 41.7 | % | ||||
| Fixed-Income Funds | 35.3 | % | ||||
| International and Global Equity Funds | 20.7 | % | ||||
| U.S. Treasury Obligations | 2.3 | % | ||||
| Purchased Options | 0.0 | % | * | |||
| Total | 100.0 | % | ||||
* Amount is less than 0.05%.
See Endnotes and Additional Disclosures in this report.
www.calvert.com CALVERT ASSET ALLOCATION FUNDS ANNUAL REPORT (Unaudited) 7
CALVERT AGGRESSIVE ALLOCATION FUND
PERFORMANCE
Performance2,3 | ||||||||||||||
Portfolio Managers Dan R. Strelow, CFA, CIPM, Vishal Khanduja, CFA and Justin H. Bourgette, CFA, each of Calvert Research and Management | ||||||||||||||
| % Average Annual Total Returns | Class Inception Date | Performance Inception Date | One Year | Five Years | Ten Years | |||||||||
| Class A at NAV | 06/30/2005 | 06/30/2005 | 10.19 | % | 9.07 | % | 8.39 | % | ||||||
| Class A with 4.75% Maximum Sales Charge | — | — | 4.96 | 8.01 | 7.87 | |||||||||
| Class C at NAV | 06/30/2005 | 06/30/2005 | 9.39 | 8.07 | 7.19 | |||||||||
| Class C with 1% Maximum Sales Charge | — | — | 8.39 | 8.07 | 7.19 | |||||||||
| Class I at NAV | 05/20/2016 | 06/30/2005 | 10.57 | 9.25 | 8.48 | |||||||||
Russell 3000® Index | — | — | 17.58 | % | 13.45 | % | 12.00 | % | ||||||
| Aggressive Allocation Composite Benchmark | — | — | 10.77 | 9.62 | 9.41 | |||||||||
% Total Annual Operating Expense Ratios4 | Class A | Class C | Class I | |||||||||||
| Gross | 1.10 | % | 1.92 | % | 2.27 | % | ||||||||
| Net | 0.96 | 1.71 | 0.61 | |||||||||||
| Growth of $10,000 |
| This graph shows the change in value of a hypothetical investment of $10,000 in Class A of the Fund for the period indicated. For comparison, the same investment is shown in the indicated index. |
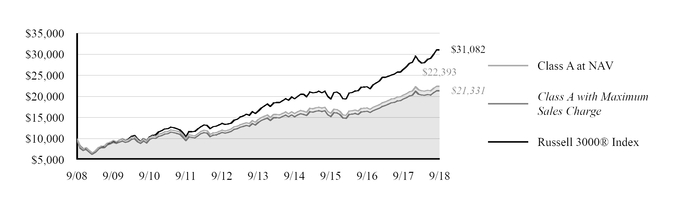
Growth of Investment3 | Amount Invested | Period Beginning | At NAV | With Maximum Sales Charge | ||||
| Class C | $10,000 | 09/30/2008 | $20,035 | N.A. | ||||
| Class I | $250,000 | 09/30/2008 | $564,432 | N.A. | ||||
See Endnotes and Additional Disclosures in this report.
Past performance is no guarantee of future results. Returns are historical and are calculated by determining the percentage change in net asset value (NAV) or offering price (as applicable) with all distributions reinvested. Investment return and principal value will fluctuate so that shares, when redeemed, may be worth more or less than their original cost. Performance less than or equal to one year is cumulative. Performance is for the stated time period only; due to market volatility, the Fund’s current performance may be lower or higher than quoted. Returns are before taxes unless otherwise noted. For performance as of the most recent month-end, please refer to www.calvert.com.
8 www.calvert.com CALVERT ASSET ALLOCATION FUNDS ANNUAL REPORT (Unaudited)
CALVERT AGGRESSIVE ALLOCATION FUND
FUND PROFILE
| ASSET ALLOCATION (% of total investments) | ||||||
| Domestic Equity Funds | 57.4 | % | ||||
| International and Global Equity Funds | 29.2 | % | ||||
| Fixed-Income Funds | 11.6 | % | ||||
| U.S. Treasury Obligations | 1.8 | % | ||||
| Purchased Options | 0.0 | % | * | |||
| Total | 100.0 | % | ||||
* Amount is less than 0.05%.
See Endnotes and Additional Disclosures in this report.
www.calvert.com CALVERT ASSET ALLOCATION FUNDS ANNUAL REPORT (Unaudited) 9
| Endnotes and Additional Disclosures | ||
1 The views expressed in this report are those of the portfolio manager(s) and are current only through the date stated on the cover. These views are subject to change at any time based upon market or other conditions, and Calvert and the Fund(s) disclaim any responsibility to update such views. These views may not be relied upon as investment advice and, because investment decisions are based on many factors, may not be relied upon as an indication of trading intent on behalf of any Calvert fund. This commentary may contain statements that are not historical facts, referred to as “forward looking statements.” The Fund’s actual future results may differ significantly from those stated in any forward looking statement, depending on factors such as changes in securities or financial markets or general economic conditions, the volume of sales and purchases of Fund shares, the continuation of investment advisory, administrative and service contracts, and other risks discussed from time to time in the Fund’s filings with the Securities and Exchange Commission.
2 | Dow Jones Industrial Average® is a price-weighted average of 30 blue-chip stocks that are generally the leaders in their industry. S&P 500® Index is an unmanaged index of large-cap stocks commonly used as a measure of U.S. stock market performance. NASDAQ Composite Index is a market capitalization-weighted index of all domestic and international securities listed on NASDAQ. Source: Nasdaq, Inc. The information is provided by Nasdaq (with its affiliates, are referred to as “Corporations”) and Nasdaq’s third party licensors on an “as is” basis and the Corporations make no guarantees and bear no liability of any kind with respect to the information or the Fund. Russell 2000® Index is an unmanaged index of 2,000 U.S. small-cap stocks. Russell 3000® Index is an unmanaged index of the 3,000 largest U.S. stocks. Bloomberg Barclays U.S. Aggregate Bond Index is an unmanaged index of domestic investment-grade bonds, including corporate, government and mortgage-backed securities. ICE BofAML U.S. High Yield Index is an unmanaged index of below-investment grade U.S. corporate bonds. ICE® BofAML® indices are not for redistribution or other uses; provided “as is”, without warranties, and with no liability. Eaton Vance has prepared this report and ICE Data Indices, LLC does not endorse it, or guarantee, review, or endorse Eaton Vance’s products. BofAML® is a licensed registered trademark of Bank of America Corporation in the United States and other countries. MSCI ACWI ex USA Investable Market Index is an unmanaged free-float-adjusted market-capitalization-weighted index designed to measure the equity market performance of developed and emerging markets, excluding the United States, with comprehensive coverage of securities in those markets. MSCI indexes are net of foreign withholding taxes. Source: MSCI. MSCI data may not be reproduced or used for any other purpose. MSCI provides no warranties, has not prepared or approved this report, and has no liability hereunder. The Conservative Allocation Composite Benchmark is an internally constructed benchmark which is comprised of a blend of 25% Russell 3000® Index, 10% MSCI ACWI ex USA Investable Market Index, and 65% Bloomberg Barclays U.S. Aggregate Bond Index, and is rebalanced monthly. The Moderate Allocation Composite Benchmark is an internally constructed benchmark which is comprised of a blend of 45% Russell 3000® Index, 20% MSCI ACWI ex USA Investable Market Index, and 35% Bloomberg Barclays U.S. Aggregate Bond Index, and is rebalanced monthly. |
The Aggressive Allocation Composite Benchmark is an internally constructed benchmark which is comprised of a blend of 60% Russell 3000® Index, 30% MSCI ACWI ex USA Investable Market Index, and 10% Bloomberg Barclays U.S. Aggregate Bond Index, and is rebalanced monthly. Unless otherwise stated, index returns do not reflect the effect of any applicable sales charges, commissions, expenses, taxes or leverage, as applicable. It is not possible to invest directly in an index.
3 | Total Returns at NAV do not include applicable sales charges. If sales charges were deducted, the returns would be lower. Total Returns shown with maximum sales charge reflect the stated maximum sales charge. Unless otherwise stated, performance does not reflect the deduction of taxes on Fund distributions or redemptions of Fund shares. |
Performance prior to the inception date of a class may be linked to the performance of an older class of the Fund. This linked performance is adjusted for any applicable sales charge, but is not adjusted for class expense differences. If adjusted for such differences, the performance would be different. The performance of Class I is linked to Class A. Performance since inception for an index, if presented, is the performance since the Fund’s or oldest share class’ inception, as applicable. Performance presented in the Financial Highlights included in the financial statements is not linked.
Effective December 31, 2016, Calvert Research and Management became the investment adviser to the Fund and performance reflected prior to such date is that of the Fund’s former investment adviser, Calvert Investment Management, Inc.
4 | Source: Fund prospectus. Net expense ratios reflect a contractual expense reimbursement that continues through 1/31/19. Without the reimbursement, performance would have been lower. The expense ratios for the current reporting period can be found in the Financial Highlights section of this report. |
5 Duration is a measure of the expected change in price of a bond - in percentage terms - given a one percent change in interest rates, all else being constant. Securities with lower durations tend to be less sensitive to interest rate changes.
Fund profiles subject to change due to active management.
10 www.calvert.com CALVERT ASSET ALLOCATION FUNDS ANNUAL REPORT (Unaudited)
FUND EXPENSES
Example
As a Fund shareholder, you incur two types of costs: (1) transaction costs, including sales charges (loads) on purchases and redemption fees (if applicable); and (2) ongoing costs, including management fees; distribution and/or service fees; and other Fund expenses. This Example is intended to help you understand your ongoing costs (in dollars) of Fund investing and to compare these costs with the ongoing costs of investing in other mutual funds. The Example is based on an investment of $1,000 invested at the beginning of the period and held for the entire period (April 1, 2018 to September 30, 2018).
Actual Expenses
The first section of the tables below provides information about actual account values and actual expenses. You may use the information in this section, together with the amount you invested, to estimate the expenses that you paid over the period. Simply divide your account value by $1,000 (for example, an $8,600 account value divided by $1,000 = 8.6), then multiply the result by the number in the first section under the heading entitled “Expenses Paid During Period” to estimate the expenses you paid on your account during this period.
Hypothetical Example for Comparison Purposes
The second section of the tables below provides information about hypothetical account values and hypothetical expenses based on the actual Fund expense ratio and an assumed rate of return of 5% per year (before expenses), which is not the actual Fund return. The hypothetical account values and expenses may not be used to estimate the actual ending account balance or expenses you paid for the period. You may use this information to compare the ongoing costs of investing in the Fund and other funds. To do so, compare this 5% hypothetical example with the 5% hypothetical examples that appear in the shareholder reports of the other funds.
Please note that the expenses shown in the tables are meant to highlight your ongoing costs only and do not reflect any transactional costs, such as sales charges (loads) or redemption fees (if applicable). Therefore, the second section of the tables is useful in comparing ongoing costs only, and will not help you determine the relative total costs of owning different funds. In addition, if these transactional costs were included, your costs would be higher.
| CALVERT CONSERVATIVE ALLOCATION FUND | BEGINNING ACCOUNT VALUE (4/1/18) | ENDING ACCOUNT VALUE (9/30/18) | EXPENSES PAID DURING PERIOD* (4/1/18 - 9/30/18) | ANNUALIZED EXPENSE RATIO |
| Actual | ||||
| Class A | $1,000.00 | $1,022.30 | $2.23 | 0.44% |
| Class C | $1,000.00 | $1,018.10 | $6.02 | 1.19% |
| Class I | $1,000.00 | $1,023.50 | $0.46** | 0.09% |
| Hypothetical | ||||
| (5% return per year before expenses) | ||||
| Class A | $1,000.00 | $1,022.86 | $2.23 | 0.44% |
| Class C | $1,000.00 | $1,019.10 | $6.02 | 1.19% |
| Class I | $1,000.00 | $1,024.62 | $0.46** | 0.09% |
| * Expenses are equal to the Fund’s annualized expense ratio for the indicated Class, multiplied by the average account value over the period, multiplied by 183/365 (to reflect the one-half year period). The Example assumes that the $1,000 was invested at the net asset value per share determined at the close of business on March 31, 2018. Expenses do not include fees and expenses incurred indirectly from investment in underlying affiliated and/or unaffiliated funds. | ||||
| ** Absent a waiver and/or reimbursement of expenses by an affiliate, expenses would be higher. | ||||
www.calvert.com CALVERT ASSET ALLOCATION FUNDS ANNUAL REPORT (Unaudited) 11
| CALVERT MODERATE ALLOCATION FUND | BEGINNING ACCOUNT VALUE (4/1/18) | ENDING ACCOUNT VALUE (9/30/18) | EXPENSES PAID DURING PERIOD* (4/1/18 - 9/30/18) | ANNUALIZED EXPENSE RATIO |
| Actual | ||||
| Class A | $1,000.00 | $1,038.20 | $2.09 | 0.41% |
| Class C | $1,000.00 | $1,034.50 | $5.97 | 1.17% |
| Class I | $1,000.00 | $1,040.50 | $0.46** | 0.09% |
| Hypothetical | ||||
| (5% return per year before expenses) | ||||
| Class A | $1,000.00 | $1,023.01 | $2.08 | 0.41% |
| Class C | $1,000.00 | $1,019.20 | $5.92 | 1.17% |
| Class I | $1,000.00 | $1,024.62 | $0.46** | 0.09% |
| * Expenses are equal to the Fund’s annualized expense ratio for the indicated Class, multiplied by the average account value over the period, multiplied by 183/365 (to reflect the one-half year period). The Example assumes that the $1,000 was invested at the net asset value per share determined at the close of business on March 31, 2018. Expenses do not include fees and expenses incurred indirectly from investment in underlying affiliated and/or unaffiliated funds. | ||||
| ** Absent a waiver and/or reimbursement of expenses by an affiliate, expenses would be higher. | ||||
| CALVERT AGGRESSIVE ALLOCATION FUND | BEGINNING ACCOUNT VALUE (4/1/18) | ENDING ACCOUNT VALUE (9/30/18) | EXPENSES PAID DURING PERIOD* (4/1/18 - 9/30/18) | ANNUALIZED EXPENSE RATIO |
| Actual | ||||
| Class A | $1,000.00 | $1,050.10 | $2.21** | 0.43% |
| Class C | $1,000.00 | $1,046.20 | $6.05** | 1.18% |
| Class I | $1,000.00 | $1,051.90 | $0.41** | 0.08% |
| Hypothetical | ||||
| (5% return per year before expenses) | ||||
| Class A | $1,000.00 | $1,022.91 | $2.18** | 0.43% |
| Class C | $1,000.00 | $1,019.15 | $5.97** | 1.18% |
| Class I | $1,000.00 | $1,024.67 | $0.41** | 0.08% |
| * Expenses are equal to the Fund’s annualized expense ratio for the indicated Class, multiplied by the average account value over the period, multiplied by 183/365 (to reflect the one-half year period). The Example assumes that the $1,000 was invested at the net asset value per share determined at the close of business on March 31, 2018. Expenses do not include fees and expenses incurred indirectly from investment in underlying affiliated and/or unaffiliated funds. | ||||
| ** Absent a waiver and/or reimbursement of expenses by an affiliate, expenses would be higher. | ||||
12 www.calvert.com CALVERT ASSET ALLOCATION FUNDS ANNUAL REPORT (Unaudited)
CALVERT CONSERVATIVE ALLOCATION FUND
SCHEDULE OF INVESTMENTS
SEPTEMBER 30, 2018
| SHARES | VALUE ($) | |
| MUTUAL FUNDS (1) - 97.2% | ||
| Equity Mutual Funds - 33.1% | ||
| Calvert Impact Fund, Inc.: | ||
| Calvert Small-Cap Fund, Class I | 108,092 | 3,105,469 |
| Calvert Responsible Index Series, Inc.: | ||
| Calvert International Responsible Index Fund, Class I | 383,760 | 9,006,844 |
| Calvert US Large-Cap Core Responsible Index Fund, Class R6 | 617,443 | 15,608,955 |
| Calvert US Large-Cap Growth Responsible Index Fund, Class I | 315,849 | 9,481,800 |
| Calvert US Large-Cap Value Responsible Index Fund, Class I | 495,272 | 11,757,764 |
| Calvert US Mid-Cap Core Responsible Index Fund, Class I | 150,941 | 4,143,326 |
| Calvert World Values Fund, Inc.: | ||
| Calvert Emerging Markets Equity Fund, Class I | 384,961 | 6,055,431 |
| Calvert International Opportunities Fund, Class I | 324,772 | 6,014,777 |
| Calvert Mid-Cap Fund, Class I | 53,047 | 2,173,350 |
| 67,347,716 | ||
| Fixed-Income Mutual Funds - 64.1% | ||
| Calvert Management Series: | ||
| Calvert Absolute Return Bond Fund, Class I | 1,769,145 | 26,307,191 |
| Calvert Floating-Rate Advantage Fund, Class R6 | 2,754,465 | 27,434,474 |
| Calvert Social Investment Fund: | ||
| Calvert Bond Fund, Class R6 | 4,714,353 | 74,062,493 |
| The Calvert Fund: | ||
| Calvert Long-Term Income Fund, Class I | 3 | 45 |
| Calvert Ultra-Short Duration Income Fund, Class R6 | 281,969 | 2,816,869 |
| 130,621,072 | ||
| Total Mutual Funds (Cost $189,040,797) | 197,968,788 | |
| U.S. TREASURY OBLIGATIONS - 2.8% | PRINCIPAL AMOUNT($) | VALUE($) |
| U.S. Treasury Inflation-Protected Bonds: | ||
| 0.50%, 1/15/28 (2)(3) | 3,559,429 | 3,418,789 |
| 0.625%, 4/15/23 (3) | 2,308,101 | 2,279,265 |
| Total U.S. Treasury Obligations (Cost $5,759,237) | 5,698,054 | |
| Total Purchased Options (Cost $27,320) - 0.0% (4) | 23,870 | |
| TOTAL INVESTMENTS (Cost $194,827,354) - 100.0% | 203,690,712 | |
| Other assets and liabilities, net - (0.0%) (4) | (5,150) | |
NET ASSETS - 100.0% | 203,685,562 | |
www.calvert.com CALVERT ASSET ALLOCATION FUNDS ANNUAL REPORT 13
| NOTES TO SCHEDULE OF INVESTMENTS | |
| (1) Affiliated company. | |
| (2) Security (or a portion thereof) has been pledged to cover margin requirements on open futures contracts. | |
| (3) Inflation-linked security whose principal is adjusted for inflation based on changes in the U.S. Consumer Price Index. Interest is calculated based on the inflation-adjusted principal. | |
| (4) Amount is less than 0.05% or (0.05)%, as applicable. | |
| PURCHASED CALL OPTIONS - 0.0% (4) | |||||||||||
| EXCHANGE-TRADED OPTIONS - 0.0% (4) | |||||||||||
| DESCRIPTION | NUMBER OF CONTRACTS | NOTIONAL AMOUNT | EXERCISE PRICE | EXPIRATION DATE | VALUE | ||||||
| S&P 500 Index | 14 | $4,079,572 | $3,025 | 12/31/18 | $23,870 | ||||||
| FUTURES CONTRACTS | NUMBER OF CONTRACTS | EXPIRATION MONTH/YEAR | NOTIONAL AMOUNT | VALUE/NET UNREALIZED APPRECIATION (DEPRECIATION) | ||||
| Long: | ||||||||
| E-mini S&P 500 Index | 7 | Dec-18 | $1,021,650 | $8,452 | ||||
| U.S. 2-Year Treasury Note | 23 | Dec-18 | 4,846,891 | (9,775 | ) | |||
| U.S. 5-Year Treasury Note | 103 | Dec-18 | 11,585,086 | (72,646 | ) | |||
| U.S. 10-Year Treasury Note | 49 | Dec-18 | 5,820,281 | (58,731 | ) | |||
| U.S. Ultra-Long Treasury Bond | 45 | Dec-18 | 6,942,656 | (215,251 | ) | |||
| Total Long | ($347,951 | ) | ||||||
| Short: | ||||||||
| MSCI EMU Index | (43) | Dec-18 | ($980,404 | ) | ($13,459 | ) | ||
| MSCI Emerging Markets Index | (29) | Dec-18 | (1,522,065 | ) | 13,143 | |||
| Total Short | ($316 | ) | ||||||
| Abbreviations: | |
| EMU: | European Monetary Union |
| See notes to financial statements. | ||||
14 www.calvert.com CALVERT ASSET ALLOCATION FUNDS ANNUAL REPORT
CALVERT MODERATE ALLOCATION FUND
SCHEDULE OF INVESTMENTS
SEPTEMBER 30, 2018
| SHARES | VALUE ($) | |
| MUTUAL FUNDS (1) - 97.8% | ||
| Equity Mutual Funds - 62.4% | ||
| Calvert Impact Fund, Inc.: | ||
| Calvert Small-Cap Fund, Class I | 285,957 | 8,215,557 |
| Calvert Responsible Index Series, Inc.: | ||
| Calvert International Responsible Index Fund, Class I | 1,065,108 | 24,998,096 |
| Calvert US Large-Cap Core Responsible Index Fund, Class R6 | 2,088,289 | 52,791,952 |
| Calvert US Large-Cap Growth Responsible Index Fund, Class I | 719,103 | 21,587,458 |
| Calvert US Large-Cap Value Responsible Index Fund, Class I | 1,200,123 | 28,490,912 |
| Calvert US Mid-Cap Core Responsible Index Fund, Class I | 439,750 | 12,071,138 |
| Calvert World Values Fund, Inc.: | ||
| Calvert Emerging Markets Equity Fund, Class I | 956,429 | 15,044,626 |
| Calvert International Equity Fund, Class I | 241,340 | 4,517,892 |
| Calvert International Opportunities Fund, Class I | 1,019,753 | 18,885,834 |
| Calvert Mid-Cap Fund, Class I | 110,893 | 4,543,306 |
| 191,146,771 | ||
| Fixed-Income Mutual Funds - 35.4% | ||
| Calvert Management Series: | ||
| Calvert Absolute Return Bond Fund, Class I | 2,359,080 | 35,079,521 |
| Calvert Floating-Rate Advantage Fund, Class R6 | 2,154,334 | 21,457,165 |
| Calvert Social Investment Fund: | ||
| Calvert Bond Fund, Class R6 | 2,885,743 | 45,335,019 |
| The Calvert Fund: | ||
| Calvert Ultra-Short Duration Income Fund, Class R6 | 640,509 | 6,398,689 |
| 108,270,394 | ||
| Total Mutual Funds (Cost $271,530,966) | 299,417,165 | |
| U.S. TREASURY OBLIGATIONS - 2.3% | PRINCIPAL AMOUNT($) | VALUE($) |
| U.S. Treasury Inflation-Protected Bonds: | ||
| 0.50%, 1/15/28 (2)(3) | 4,123,379 | 3,960,458 |
| 0.625%, 4/15/23 (3) | 2,991,908 | 2,954,528 |
| Total U.S. Treasury Obligations (Cost $6,988,576) | 6,914,986 | |
| Total Purchased Options (Cost $58,542) - 0.0% (4) | 51,150 | |
| TOTAL INVESTMENTS (Cost $278,578,084) - 100.1% | 306,383,301 | |
| Other assets and liabilities, net - (0.1%) | (211,962) | |
NET ASSETS - 100.0% | 306,171,339 | |
www.calvert.com CALVERT ASSET ALLOCATION FUNDS ANNUAL REPORT 15
| NOTES TO SCHEDULE OF INVESTMENTS | |
| (1) Affiliated company. | |
| (2) Security (or a portion thereof) has been pledged to cover margin requirements on open futures contracts. | |
| (3) Inflation-linked security whose principal is adjusted for inflation based on changes in the U.S. Consumer Price Index. Interest is calculated based on the inflation-adjusted principal. | |
| (4) Amount is less than 0.05%. | |
| PURCHASED CALL OPTIONS - 0.0% (4) | |||||||||||
| EXCHANGE-TRADED OPTIONS - 0.0% (4) | |||||||||||
| DESCRIPTION | NUMBER OF CONTRACTS | NOTIONAL AMOUNT | EXERCISE PRICE | EXPIRATION DATE | VALUE | ||||||
| S&P 500 Index | 30 | $8,741,940 | $3,025 | 12/31/18 | $51,150 | ||||||
| FUTURES CONTRACTS | NUMBER OF CONTRACTS | EXPIRATION MONTH/YEAR | NOTIONAL AMOUNT | VALUE/NET UNREALIZED APPRECIATION (DEPRECIATION) | ||||
| Long: | ||||||||
| E-mini S&P 500 Index | 16 | Dec-18 | $2,335,200 | $19,317 | ||||
| U.S. 2-Year Treasury Note | 15 | Dec-18 | 3,161,016 | (6,375 | ) | |||
| U.S. 10-Year Treasury Note | 51 | Dec-18 | 6,057,844 | (61,128 | ) | |||
| U.S. Ultra-Long Treasury Bond | 36 | Dec-18 | 5,554,125 | (172,201 | ) | |||
| Total Long | ($220,387 | ) | ||||||
| Short: | ||||||||
| MSCI EMU Index | (92) | Dec-18 | ($2,097,609 | ) | ($28,782 | ) | ||
| MSCI Emerging Markets Index | (31) | Dec-18 | (1,627,035 | ) | 14,050 | |||
| U.S. 5-Year Treasury Note | (8) | Dec-18 | (899,813 | ) | 5,733 | |||
| Total Short | ($8,999 | ) | ||||||
| Abbreviations: | |
| EMU: | European Monetary Union |
| See notes to financial statements. | ||||
16 www.calvert.com CALVERT ASSET ALLOCATION FUNDS ANNUAL REPORT
CALVERT AGGRESSIVE ALLOCATION FUND
SCHEDULE OF INVESTMENTS
SEPTEMBER 30, 2018
| SHARES | VALUE ($) | |
| MUTUAL FUNDS (1) - 98.2% | ||
| Equity Mutual Funds - 86.6% | ||
| Calvert Impact Fund, Inc.: | ||
| Calvert Small-Cap Fund, Class I | 181,657 | 5,218,999 |
| Calvert Responsible Index Series, Inc.: | ||
| Calvert International Responsible Index Fund, Class I | 596,346 | 13,996,237 |
| Calvert US Large-Cap Core Responsible Index Fund, Class R6 | 1,616,931 | 40,876,015 |
| Calvert US Large-Cap Growth Responsible Index Fund, Class I | 489,935 | 14,707,836 |
| Calvert US Large-Cap Value Responsible Index Fund, Class I | 839,438 | 19,928,259 |
| Calvert US Mid-Cap Core Responsible Index Fund, Class I | 295,091 | 8,100,261 |
| Calvert World Values Fund, Inc.: | ||
| Calvert Emerging Markets Equity Fund, Class I | 653,545 | 10,280,264 |
| Calvert International Equity Fund, Class I | 491,570 | 9,202,194 |
| Calvert International Opportunities Fund, Class I | 738,783 | 13,682,259 |
| Calvert Mid-Cap Fund, Class I | 89,042 | 3,648,036 |
| 139,640,360 | ||
| Fixed-Income Mutual Funds - 11.6% | ||
| Calvert Management Series: | ||
| Calvert Absolute Return Bond Fund, Class I | 270,645 | 4,024,488 |
| Calvert Floating-Rate Advantage Fund, Class R6 | 326,141 | 3,248,364 |
| Calvert Social Investment Fund: | ||
| Calvert Bond Fund, Class R6 | 730,757 | 11,480,185 |
| 18,753,037 | ||
| Total Mutual Funds (Cost $139,176,543) | 158,393,397 | |
| U.S. TREASURY OBLIGATIONS - 1.8% | PRINCIPAL AMOUNT($) | VALUE($) |
| U.S. Treasury Inflation-Protected Bond, 0.50%, 1/15/28 (2)(3) | 2,984,240 | 2,866,327 |
| Total U.S. Treasury Obligations (Cost $2,901,111) | 2,866,327 | |
| Total Purchased Options (Cost $40,980) - 0.0% (4) | 35,805 | |
| TOTAL INVESTMENTS (Cost $142,118,634) - 100.0% | 161,295,529 | |
| Other assets and liabilities, net - (0.0%) (4) | (4,898) | |
NET ASSETS - 100.0% | 161,290,631 | |
www.calvert.com CALVERT ASSET ALLOCATION FUNDS ANNUAL REPORT 17
| NOTES TO SCHEDULE OF INVESTMENTS | |
| (1) Affiliated company. | |
| (2) Security (or a portion thereof) has been pledged to cover margin requirements on open futures contracts. | |
| (3) Inflation-linked security whose principal is adjusted for inflation based on changes in the U.S. Consumer Price Index. Interest is calculated based on the inflation-adjusted principal. | |
| (4) Amount is less than 0.05% or (0.05)%, as applicable. | |
| PURCHASED CALL OPTIONS - 0.0% (4) | |||||||||||
| EXCHANGE-TRADED OPTIONS - 0.0% (4) | |||||||||||
| DESCRIPTION | NUMBER OF CONTRACTS | NOTIONAL AMOUNT | EXERCISE PRICE | EXPIRATION DATE | VALUE | ||||||
| S&P 500 Index | 21 | $6,119,358 | $3,025 | 12/31/18 | $35,805 | ||||||
| FUTURES CONTRACTS | NUMBER OF CONTRACTS | EXPIRATION MONTH/YEAR | NOTIONAL AMOUNT | VALUE/NET UNREALIZED APPRECIATION (DEPRECIATION) | ||||
| Long: | ||||||||
| E-mini S&P 500 Index | 11 | Dec-18 | $1,605,450 | $13,280 | ||||
| MSCI Emerging Markets Index | 6 | Dec-18 | 314,910 | 5,670 | ||||
| Total Long | $18,950 | |||||||
| Short: | ||||||||
| MSCI EMU Index | (65) | Dec-18 | ($1,482,006 | ) | ($20,338 | ) | ||
| U.S. Ultra 10-Year Treasury Note | (6) | Dec-18 | (756,000 | ) | 10,393 | |||
| U.S. Ultra-Long Treasury Bond | (6) | Dec-18 | (925,688 | ) | 28,581 | |||
| Total Short | $18,636 | |||||||
| Abbreviations: | |
| EMU: | European Monetary Union |
| See notes to financial statements. | ||||
18 www.calvert.com CALVERT ASSET ALLOCATION FUNDS ANNUAL REPORT
CALVERT CONSERVATIVE ALLOCATION FUND
STATEMENT OF ASSETS AND LIABILITIES
SEPTEMBER 30, 2018
| ASSETS | |||
| Investments in securities of unaffiliated issuers, at value (identified cost $5,786,557) | $5,721,924 | ||
| Investments in securities of affiliated issuers, at value (identified cost $189,040,797) | 197,968,788 | ||
| Receivable for variation margin on open futures contracts | 15,176 | ||
| Receivable for investments sold | 231,288 | ||
| Receivable for capital shares sold | 114,064 | ||
| Interest receivable | 10,433 | ||
| Dividends receivable - affiliated | 86,085 | ||
| Trustees’ deferred compensation plan | 106,667 | ||
| Other assets | 4,143 | ||
| Total assets | 204,258,568 | ||
| LIABILITIES | |||
| Due to custodian | 909 | ||
| Payable for investments purchased | 86,328 | ||
| Payable for capital shares redeemed | 195,218 | ||
| Payable to affiliates: | |||
| Distribution and service fees | 58,730 | ||
| Sub-transfer agency fee | 4,580 | ||
| Trustees’ deferred compensation plan | 106,667 | ||
| Other | 32,342 | ||
| Accrued expenses | 88,232 | ||
| Total liabilities | 573,006 | ||
| NET ASSETS | $203,685,562 | ||
| NET ASSETS CONSIST OF: | |||
| Paid-in capital applicable to shares of beneficial interest | |||
| (unlimited number of no par value shares authorized) | $192,414,612 | ||
| Distributable earnings | 11,270,950 | ||
| Total | $203,685,562 | ||
| NET ASSET VALUE PER SHARE | |||
| Class A (based on net assets of $150,237,408 and 8,711,790 shares outstanding) | $17.25 | ||
| Class C (based on net assets of $33,842,735 and 1,985,432 shares outstanding) | $17.05 | ||
| Class I (based on net assets of $19,605,419 and 1,136,654 shares outstanding) | $17.25 | ||
| OFFERING PRICE PER SHARE* | |||
| Class A (100/95.25 of net asset value per share) | $18.11 | ||
| * On sales of $50,000 or more, the offering price of Class A shares is reduced. | |||
| See notes to financial statements. | |||
www.calvert.com CALVERT ASSET ALLOCATION FUNDS ANNUAL REPORT 19
CALVERT MODERATE ALLOCATION FUND
STATEMENT OF ASSETS AND LIABILITIES
SEPTEMBER 30, 2018
| ASSETS | |||
| Investments in securities of unaffiliated issuers, at value (identified cost $7,047,118) | $6,966,136 | ||
| Investments in securities of affiliated issuers, at value (identified cost $271,530,966) | 299,417,165 | ||
| Receivable for variation margin on open futures contracts | 26,598 | ||
| Cash | 211 | ||
| Receivable for capital shares sold | 248,710 | ||
| Interest receivable | 13,004 | ||
| Dividends receivable - affiliated | 67,329 | ||
| Receivable from affiliate | 319 | ||
| Trustees’ deferred compensation plan | 151,812 | ||
| Other assets | 5,901 | ||
| Total assets | 306,897,185 | ||
| LIABILITIES | |||
| Payable for investments purchased | 93,675 | ||
| Payable for capital shares redeemed | 271,039 | ||
| Payable to affiliates: | |||
| Distribution and service fees | 84,996 | ||
| Sub-transfer agency fee | 9,024 | ||
| Trustees’ deferred compensation plan | 151,812 | ||
| Accrued expenses | 115,300 | ||
| Total liabilities | 725,846 | ||
| NET ASSETS | $306,171,339 | ||
| NET ASSETS CONSIST OF: | |||
| Paid-in capital applicable to shares of beneficial interest | |||
| (unlimited number of no par value shares authorized) | $271,088,693 | ||
| Distributable earnings | 35,082,646 | ||
| Total | $306,171,339 | ||
| NET ASSET VALUE PER SHARE | |||
| Class A (based on net assets of $231,146,138 and 11,689,061 shares outstanding) | $19.77 | ||
| Class C (based on net assets of $45,879,983 and 2,434,720 shares outstanding) | $18.84 | ||
| Class I (based on net assets of $29,145,218 and 1,473,010 shares outstanding) | $19.79 | ||
| OFFERING PRICE PER SHARE* | |||
| Class A (100/95.25 of net asset value per share) | $20.76 | ||
| * On sales of $50,000 or more, the offering price of Class A shares is reduced. | |||
| See notes to financial statements. | |||
20 www.calvert.com CALVERT ASSET ALLOCATION FUNDS ANNUAL REPORT
CALVERT AGGRESSIVE ALLOCATION FUND
STATEMENT OF ASSETS AND LIABILITIES
SEPTEMBER 30, 2018
| ASSETS | |||
| Investments in securities of unaffiliated issuers, at value (identified cost $2,942,091) | $2,902,132 | ||
| Investments in securities of affiliated issuers, at value (identified cost $139,176,543) | 158,393,397 | ||
| Receivable for variation margin on open futures contracts | 18,617 | ||
| Cash | 36 | ||
| Receivable for capital shares sold | 155,395 | ||
| Interest receivable | 3,163 | ||
| Dividends receivable - affiliated | 11,045 | ||
| Trustees’ deferred compensation plan | 80,029 | ||
| Other assets | 3,088 | ||
| Total assets | 161,566,902 | ||
| LIABILITIES | |||
| Payable for investments purchased | 10,819 | ||
| Payable for capital shares redeemed | 38,000 | ||
| Payable to affiliates: | |||
| Distribution and service fees | 42,465 | ||
| Sub-transfer agency fee | 7,760 | ||
| Trustees’ deferred compensation plan | 80,029 | ||
| Other | 11,266 | ||
| Accrued expenses | 85,932 | ||
| Total liabilities | 276,271 | ||
| NET ASSETS | $161,290,631 | ||
| NET ASSETS CONSIST OF: | |||
| Paid-in capital applicable to shares of beneficial interest | |||
| (unlimited number of no par value shares authorized) | $137,415,048 | ||
| Distributable earnings | 23,875,583 | ||
| Total | $161,290,631 | ||
| NET ASSET VALUE PER SHARE | |||
| Class A (based on net assets of $129,981,099 and 6,143,267 shares outstanding) | $21.16 | ||
| Class C (based on net assets of $19,371,927 and 1,070,404 shares outstanding) | $18.10 | ||
| Class I (based on net assets of $11,937,605 and 561,614 shares outstanding) | $21.26 | ||
| OFFERING PRICE PER SHARE* | |||
| Class A (100/95.25 of net asset value per share) | $22.22 | ||
| * On sales of $50,000 or more, the offering price of Class A shares is reduced. | |||
| See notes to financial statements. | |||
www.calvert.com CALVERT ASSET ALLOCATION FUNDS ANNUAL REPORT 21
CALVERT ALLOCATION FUNDS
STATEMENTS OF OPERATIONS
YEAR ENDED SEPTEMBER 30, 2018
| INVESTMENT INCOME | Conservative Allocation Fund | Moderate Allocation Fund | Aggressive Allocation Fund | ||||||||
| Dividend income - unaffiliated issuers | $77,512 | $84,820 | $31,221 | ||||||||
| Dividend income - affiliated issuers | 4,541,864 | 5,210,971 | 2,149,544 | ||||||||
| Interest income | 92,137 | 111,156 | 47,568 | ||||||||
| Securities lending income, net | 3,652 | 3,641 | 1,335 | ||||||||
| Total investment income | 4,715,165 | 5,410,588 | 2,229,668 | ||||||||
| EXPENSES | |||||||||||
| Distribution and service fees: | |||||||||||
| Class A | 371,699 | 556,184 | 307,379 | ||||||||
| Class C | 340,255 | 447,341 | 190,621 | ||||||||
| Trustees’ fees and expenses | 10,204 | 14,654 | 7,676 | ||||||||
| Custodian fees | 22,761 | 22,883 | 22,689 | ||||||||
| Transfer agency fees and expenses | 196,260 | 298,309 | 223,322 | ||||||||
| Accounting fees | 22,115 | 22,117 | 22,117 | ||||||||
| Professional fees | 48,446 | 53,393 | 44,851 | ||||||||
| Registration fees | 60,107 | 62,621 | 58,561 | ||||||||
| Reports to shareholders | 20,213 | 27,260 | 21,072 | ||||||||
| Miscellaneous | 5,014 | 6,887 | 5,833 | ||||||||
| Total expenses | 1,097,074 | 1,511,649 | 904,121 | ||||||||
| Waiver and/or reimbursement of expenses by affiliate | (14,274) | (14,851) | (142,388) | ||||||||
| Reimbursement of expenses-other | (4,143) | (5,901) | (3,088) | ||||||||
| Net expenses | 1,078,657 | 1,490,897 | 758,645 | ||||||||
| Net investment income | 3,636,508 | 3,919,691 | 1,471,023 | ||||||||
22 www.calvert.com CALVERT ASSET ALLOCATION FUNDS ANNUAL REPORT
CALVERT ALLOCATION FUNDS
STATEMENTS OF OPERATIONS
YEAR ENDED SEPTEMBER 30, 2018 - CONT’D
| REALIZED AND UNREALIZED GAIN (LOSS) | Conservative Allocation Fund | Moderate Allocation Fund | Aggressive Allocation Fund | ||||||||
| Net realized gain (loss) on: | |||||||||||
| Investment securities - unaffiliated issuers | 124,875 | 264,488 | 175,056 | ||||||||
| Investment securities - affiliated issuers | 3,564,056 | 8,538,554 | 6,430,158 | ||||||||
| Futures contracts | (337,597) | 57,897 | (354,178) | ||||||||
| Written options | 230,080 | 339,528 | 183,893 | ||||||||
| Capital gains distributions from affiliated issuers | 1,795,401 | 4,169,134 | 2,819,617 | ||||||||
| 5,376,815 | 13,369,601 | 9,254,546 | |||||||||
| Net change in unrealized appreciation (depreciation) on: | |||||||||||
| Investment securities - unaffiliated issuers | (121,464) | (195,785) | (115,187) | ||||||||
| Investment securities - affiliated issuers | (1,012,087) | 3,770,371 | 3,514,726 | ||||||||
| Futures contracts | (232,862) | (182,700) | 105,183 | ||||||||
| Written options | (17,322) | (35,337) | (22,583) | ||||||||
| Foreign currency | (49) | (107) | (103) | ||||||||
| (1,383,784) | 3,356,442 | 3,482,036 | |||||||||
| Net realized and unrealized gain | 3,993,031 | 16,726,043 | 12,736,582 | ||||||||
| Net increase in net assets resulting from operations | $7,629,539 | $20,645,734 | $14,207,605 | ||||||||
| See notes to financial statements. | |||||||||||
www.calvert.com CALVERT ASSET ALLOCATION FUNDS ANNUAL REPORT 23
CALVERT CONSERVATIVE ALLOCATION FUND
STATEMENTS OF CHANGES IN NET ASSETS
| INCREASE (DECREASE) IN NET ASSETS | Year Ended September 30, 2018 | Year Ended September 30, 2017 | |||||
| Operations: | |||||||
| Net investment income | $3,636,508 | $2,807,762 | |||||
| Net realized gain | 5,376,815 | 3,221,955 | |||||
| Net change in unrealized appreciation (depreciation) | (1,383,784) | 6,758,650 | |||||
| Net increase in net assets resulting from operations | 7,629,539 | 12,788,367 | |||||
Distributions to shareholders:(1) | |||||||
| Class A shares | (5,934,409) | (3,833,420) | |||||
| Class C shares | (1,105,663) | (708,562) | |||||
| Class I shares | (641,915) | (98,537) | |||||
| Class Y shares | — | (87,174) | |||||
| Total distributions to shareholders | (7,681,987) | (4,727,693) | |||||
| Capital share transactions: | |||||||
| Class A shares | 11,824,560 | 1,005,058 | |||||
| Class C shares | 191,751 | (2,258,930) | |||||
| Class I shares | 16,669,375 | 1,908,797 | |||||
Class Y shares (2) | (10,313,306) | 9,302,127 | |||||
| Net increase in net assets from capital share transactions | 18,372,380 | 9,957,052 | |||||
| TOTAL INCREASE IN NET ASSETS | 18,319,932 | 18,017,726 | |||||
| NET ASSETS | |||||||
| Beginning of year | 185,365,630 | 167,347,904 | |||||
| End of year | $203,685,562 | $185,365,630 | |||||
(1) For the year ended September 30, 2017, the source of distributions was as follows: Net investment income - Class A ($2,595,975), Class C ($376,473), Class I ($71,237), and Class Y ($82,688) Net realized gain - Class A ($1,237,445), Class C ($332,089), Class I ($27,300), and Class Y ($4,486) | |||||||
(2) Effective December 8, 2017, Class Y shares of the Fund converted to Class I shares at net asset value. Thereafter, Class Y shares were terminated. | |||||||
| See notes to financial statements. | |||||||
24 www.calvert.com CALVERT ASSET ALLOCATION FUNDS ANNUAL REPORT
CALVERT MODERATE ALLOCATION FUND
STATEMENTS OF CHANGES IN NET ASSETS
| INCREASE (DECREASE) IN NET ASSETS | Year Ended September 30, 2018 | Year Ended September 30, 2017 | |||||
| Operations: | |||||||
| Net investment income | $3,919,691 | $3,547,714 | |||||
| Net realized gain | 13,369,601 | 10,495,874 | |||||
| Net change in unrealized appreciation (depreciation) | 3,356,442 | 16,483,112 | |||||
| Net increase in net assets resulting from operations | 20,645,734 | 30,526,700 | |||||
Distributions to shareholders:(1) | |||||||
| Class A shares | (10,925,948) | (8,472,519) | |||||
| Class C shares | (1,785,549) | (1,755,590) | |||||
| Class I shares | (906,196) | (191,489) | |||||
| Class Y shares | — | (24,116) | |||||
| Total distributions to shareholders | (13,617,693) | (10,443,714) | |||||
| Capital share transactions: | |||||||
| Class A shares | 12,439,986 | (6,697,207) | |||||
| Class C shares | 2,180,614 | (3,154,544) | |||||
| Class I shares | 19,636,760 | 7,345,917 | |||||
Class Y shares (2) | (3,786,643) | 3,047,895 | |||||
| Net increase in net assets from capital share transactions | 30,470,717 | 542,061 | |||||
| TOTAL INCREASE IN NET ASSETS | 37,498,758 | 20,625,047 | |||||
| NET ASSETS | |||||||
| Beginning of year | 268,672,581 | 248,047,534 | |||||
| End of year | $306,171,339 | $268,672,581 | |||||
(1) For the year ended September 30, 2017, the source of distributions was as follows: Net investment income - Class A ($3,141,842), Class C ($618,696), Class I ($153,565), and Class Y ($10,236) Net realized gain - Class A ($5,330,677), Class C ($1,136,894), Class I ($37,924), and Class Y ($13,880) | |||||||
(2) Effective December 8, 2017, Class Y shares of the Fund converted to Class I shares at net asset value. Thereafter, Class Y shares were terminated. | |||||||
| See notes to financial statements. | |||||||
www.calvert.com CALVERT ASSET ALLOCATION FUNDS ANNUAL REPORT 25
CALVERT AGGRESSIVE ALLOCATION FUND
STATEMENTS OF CHANGES IN NET ASSETS
| INCREASE (DECREASE) IN NET ASSETS | Year Ended September 30, 2018 | Year Ended September 30, 2017 | |||||
| Operations: | |||||||
| Net investment income | $1,471,023 | $1,462,360 | |||||
| Net realized gain | 9,254,546 | 7,041,756 | |||||
| Net change in unrealized appreciation (depreciation) | 3,482,036 | 12,043,267 | |||||
| Net increase in net assets resulting from operations | 14,207,605 | 20,547,383 | |||||
Distributions to shareholders:(1) | |||||||
| Class A shares | (6,331,795) | (5,121,232) | |||||
| Class C shares | (1,027,180) | (959,075) | |||||
| Class I shares | (362,126) | (107,065) | |||||
| Class Y shares | — | (9,265) | |||||
| Total distributions to shareholders | (7,721,101) | (6,196,637) | |||||
| Capital share transactions: | |||||||
| Class A shares | 7,806,222 | 863,061 | |||||
| Class C shares | 671,240 | (1,286,071) | |||||
| Class I shares | 9,877,048 | 510,957 | |||||
Class Y shares (2) | (1,230,496) | 936,730 | |||||
| Net increase in net assets from capital share transactions | 17,124,014 | 1,024,677 | |||||
| TOTAL INCREASE IN NET ASSETS | 23,610,518 | 15,375,423 | |||||
| NET ASSETS | |||||||
| Beginning of year | 137,680,113 | 122,304,690 | |||||
| End of year | $161,290,631 | 137,680,113(3) | |||||
(1) For the year ended September 30, 2017, the source of distributions was as follows: Net investment income - Class A ($1,378,048), Class C ($237,027), Class I ($49,157), and Class Y ($3,184) Net realized gain - Class A ($3,743,184), Class C ($722,048), Class I ($57,908), and Class Y ($6,081) | |||||||
(2) Effective December 8, 2017, Class Y shares of the Fund converted to Class I shares at net asset value. Thereafter, Class Y shares were terminated. | |||||||
(3) Includes accumulated distributions in excess of net investment income of ($199,027) at September 30, 2017. The requirement to disclose the corresponding amount as of September 30, 2018 was eliminated. | |||||||
| See notes to financial statements. | |||||||
26 www.calvert.com CALVERT ASSET ALLOCATION FUNDS ANNUAL REPORT
CALVERT CONSERVATIVE ALLOCATION FUND
FINANCIAL HIGHLIGHTS
| Year Ended September 30, | |||||||||||||||
| CLASS A SHARES | 2018(1) | 2017(1) | 2016(1) | 2015(1) | 2014 | ||||||||||
| Net asset value, beginning | $17.25 | $16.48 | $16.59 | $17.22 | $16.88 | ||||||||||
| Income from investment operations: | |||||||||||||||
| Net investment income | 0.33 | 0.30 | 0.31 | 0.30 | 0.29 | ||||||||||
| Net realized and unrealized gain | 0.36 | 0.96 | 0.55 | 0.05 | 0.83 | ||||||||||
| Total from investment operations | 0.69 | 1.26 | 0.86 | 0.35 | 1.12 | ||||||||||
| Distributions from: | |||||||||||||||
| Net investment income | (0.42) | (0.33) | (0.30) | (0.29) | (0.29) | ||||||||||
| Net realized gain | (0.27) | (0.16) | (0.67) | (0.69) | (0.49) | ||||||||||
| Total distributions | (0.69) | (0.49) | (0.97) | (0.98) | (0.78) | ||||||||||
| Total increase (decrease) in net asset value | — | 0.77 | (0.11) | (0.63) | 0.34 | ||||||||||
| Net asset value, ending | $17.25 | $17.25 | $16.48 | $16.59 | $17.22 | ||||||||||
Total return (2) | 4.08 | % | 7.84 | % | 5.42 | % | 2.01 | % | 6.78 | % | |||||
Ratios to average net assets: (3) | |||||||||||||||
Total expenses(4) | 0.44 | % | 0.51 | % | 0.67 | % | 0.69 | % | 0.68 | % | |||||
Net expenses(4) | 0.44 | % | 0.44 | % | 0.44 | % | 0.44 | % | 0.44 | % | |||||
| Net investment income | 1.93 | % | 1.77 | % | 1.90 | % | 1.76 | % | 1.71 | % | |||||
| Portfolio turnover | 94 | % | 46 | % | 61 | % | 8 | % | 17 | % | |||||
| Net assets, ending (in thousands) | $150,237 | $138,512 | $131,576 | $112,881 | $92,150 | ||||||||||
(1) Net investment income per share was computed using average shares outstanding. | |||||||||||||||
(2) Returns are historical and are calculated by determining the percentage change in net asset value with all distributions reinvested and do not reflect the effect of sales charges, if any. | |||||||||||||||
(3) Total expenses do not reflect amounts reimbursed and/or waived by the adviser and certain of its affiliates, if applicable. Net expenses are net of all reductions and represent the net expenses paid by the Fund. | |||||||||||||||
(4) Amounts do not include the expenses of the Underlying Funds and/or unaffiliated funds. | |||||||||||||||
| See notes to financial statements. | |||||||||||||||
www.calvert.com CALVERT ASSET ALLOCATION FUNDS ANNUAL REPORT 27
CALVERT CONSERVATIVE ALLOCATION FUND
FINANCIAL HIGHLIGHTS
| Year Ended September 30, | |||||||||||||||
| CLASS C SHARES | 2018(1) | 2017(1) | 2016(1) | 2015(1) | 2014 | ||||||||||
| Net asset value, beginning | $17.06 | $16.28 | $16.40 | $17.06 | $16.74 | ||||||||||
| Income from investment operations: | |||||||||||||||
| Net investment income | 0.20 | 0.17 | 0.17 | 0.13 | 0.13 | ||||||||||
| Net realized and unrealized gain | 0.36 | 0.96 | 0.55 | 0.06 | 0.81 | ||||||||||
| Total from investment operations | 0.56 | 1.13 | 0.72 | 0.19 | 0.94 | ||||||||||
| Distributions from: | |||||||||||||||
| Net investment income | (0.30) | (0.19) | (0.17) | (0.16) | (0.13) | ||||||||||
| Net realized gain | (0.27) | (0.16) | (0.67) | (0.69) | (0.49) | ||||||||||
| Total distributions | (0.57) | (0.35) | (0.84) | (0.85) | (0.62) | ||||||||||
| Total increase (decrease) in net asset value | (0.01) | 0.78 | (0.12) | (0.66) | 0.32 | ||||||||||
| Net asset value, ending | $17.05 | $17.06 | $16.28 | $16.40 | $17.06 | ||||||||||
Total return (2) | 3.30 | % | 7.04 | % | 4.57 | % | 1.03 | % | 5.71 | % | |||||
Ratios to average net assets: (3) | |||||||||||||||
Total expenses(4) | 1.19 | % | 1.30 | % | 1.46 | % | 1.44 | % | 1.40 | % | |||||
Net expenses(4) | 1.19 | % | 1.19 | % | 1.27 | % | 1.44 | % | 1.40 | % | |||||
| Net investment income | 1.17 | % | 1.03 | % | 1.07 | % | 0.76 | % | 0.73 | % | |||||
| Portfolio turnover | 94 | % | 46 | % | 61 | % | 8 | % | 17 | % | |||||
| Net assets, ending (in thousands) | $33,843 | $33,661 | $34,334 | $29,932 | $25,263 | ||||||||||
(1) Net investment income per share was computed using average shares outstanding. | |||||||||||||||
(2) Returns are historical and are calculated by determining the percentage change in net asset value with all distributions reinvested and do not reflect the effect of sales charges, if any. | |||||||||||||||
(3) Total expenses do not reflect amounts reimbursed and/or waived by the adviser and certain of its affiliates, if applicable. Net expenses are net of all reductions and represent the net expenses paid by the Fund. | |||||||||||||||
(4) Amounts do not include the expenses of the Underlying Funds and/or unaffiliated funds. | |||||||||||||||
| See notes to financial statements. | |||||||||||||||
28 www.calvert.com CALVERT ASSET ALLOCATION FUNDS ANNUAL REPORT
CALVERT CONSERVATIVE ALLOCATION FUND
FINANCIAL HIGHLIGHTS
| Year Ended September 30, | Period Ended September 30, | |||||||||
| CLASS I SHARES | 2018 | 2017 | 2016(1) | |||||||
| Net asset value, beginning | $17.23 | $16.48 | $16.07 | |||||||
| Income from investment operations: | ||||||||||
Net investment income (2) | 0.41 | 0.40 | 0.11 | |||||||
| Net realized and unrealized gain | 0.34 | 0.91 | 0.43 | |||||||
| Total from investment operations | 0.75 | 1.31 | 0.54 | |||||||
| Distributions from: | ||||||||||
| Net investment income | (0.46) | (0.40) | (0.13) | |||||||
| Net realized gain | (0.27) | (0.16) | — | |||||||
| Total distributions | (0.73) | (0.56) | (0.13) | |||||||
| Total increase in net asset value | 0.02 | 0.75 | 0.41 | |||||||
| Net asset value, ending | $17.25 | $17.23 | $16.48 | |||||||
Total return (3) | 4.40 | % | 8.22 | % | 3.40 | % | (4) | |||
Ratios to average net assets: (5) | ||||||||||
Total expenses(6) | 0.19 | % | 1.43 | % | 0.97 | % | (7) | |||
Net expenses(6) | 0.09 | % | 0.09 | % | 0.09 | % | (7) | |||
| Net investment income | 2.36 | % | 2.37 | % | 1.93 | % | (7) | |||
| Portfolio turnover | 94 | % | 46 | % | 61 | % | (8) | |||
| Net assets, ending (in thousands) | $19,605 | $3,052 | $1,034 | |||||||
(1) From May 20, 2016 inception. | ||||||||||
(2) Computed using average shares outstanding. | ||||||||||
(3) Returns are historical and are calculated by determining the percentage change in net asset value with all distributions reinvested and do not reflect the effect of sales charges, if any. | ||||||||||
(4) Not annualized. | ||||||||||
(5) Total expenses do not reflect amounts reimbursed and/or waived by the adviser and certain of its affiliates, if applicable. Net expenses are net of all reductions and represent the net expenses paid by the Fund. | ||||||||||
(6) Amounts do not include the expenses of the Underlying Funds and/or unaffiliated funds. | ||||||||||
(7) Annualized. | ||||||||||
(8) For the year ended September 30, 2016. | ||||||||||
| See notes to financial statements. | ||||||||||
www.calvert.com CALVERT ASSET ALLOCATION FUNDS ANNUAL REPORT 29
CALVERT MODERATE ALLOCATION FUND
FINANCIAL HIGHLIGHTS
| Year Ended September 30, | |||||||||||||||
| CLASS A SHARES | 2018(1) | 2017(1) | 2016(1) | 2015(1) | 2014 | ||||||||||
| Net asset value, beginning | $19.32 | $17.86 | $18.84 | $19.80 | $19.04 | ||||||||||
| Income from investment operations: | |||||||||||||||
| Net investment income | 0.29 | 0.28 | 0.25 | 0.23 | 0.20 | ||||||||||
| Net realized and unrealized gain (loss) | 1.15 | 1.93 | 1.00 | (0.04) | 1.34 | ||||||||||
| Total from investment operations | 1.44 | 2.21 | 1.25 | 0.19 | 1.54 | ||||||||||
| Distributions from: | |||||||||||||||
| Net investment income | (0.47) | (0.28) | (0.24) | (0.21) | (0.19) | ||||||||||
| Net realized gain | (0.52) | (0.47) | (1.99) | (0.94) | (0.59) | ||||||||||
| Total distributions | (0.99) | (0.75) | (2.23) | (1.15) | (0.78) | ||||||||||
| Total increase (decrease) in net asset value | 0.45 | 1.46 | (0.98) | (0.96) | 0.76 | ||||||||||
| Net asset value, ending | $19.77 | $19.32 | $17.86 | $18.84 | $19.80 | ||||||||||
Total return (2) | 7.62 | % | 12.86 | % | 7.16 | % | 0.86 | % | 8.27 | % | |||||
Ratios to average net assets: (3) | |||||||||||||||
Total expenses(4) | 0.43 | % | 0.50 | % | 0.73 | % | 0.67 | % | 0.64 | % | |||||
Net expenses(4) | 0.43 | % | 0.44 | % | 0.56 | % | 0.67 | % | 0.64 | % | |||||
| Net investment income | 1.47 | % | 1.52 | % | 1.43 | % | 1.14 | % | 1.01 | % | |||||
| Portfolio turnover | 73 | % | 45 | % | 61 | % | 8 | % | 10 | % | |||||
| Net assets, ending (in thousands) | $231,146 | $213,343 | $203,907 | $189,372 | $172,244 | ||||||||||
(1) Net investment income per share was computed using average shares outstanding. | |||||||||||||||
(2) Returns are historical and are calculated by determining the percentage change in net asset value with all distributions reinvested and do not reflect the effect of sales charges, if any. | |||||||||||||||
(3) Total expenses do not reflect amounts reimbursed and/or waived by the adviser and certain of its affiliates, if applicable. Net expenses are net of all reductions and represent the net expenses paid by the Fund. | |||||||||||||||
(4) Amounts do not include the expenses of the Underlying Funds and/or unaffiliated funds. | |||||||||||||||
| See notes to financial statements. | |||||||||||||||
30 www.calvert.com CALVERT ASSET ALLOCATION FUNDS ANNUAL REPORT
CALVERT MODERATE ALLOCATION FUND
FINANCIAL HIGHLIGHTS
| Year Ended September 30, | |||||||||||||||
| CLASS C SHARES | 2018(1) | 2017(1) | 2016(1) | 2015(1) | 2014 | ||||||||||
| Net asset value, beginning | $18.37 | $17.11 | $18.16 | $19.19 | $18.55 | ||||||||||
| Income from investment operations: | |||||||||||||||
| Net investment income | 0.13 | 0.14 | 0.11 | 0.07 | 0.09 | ||||||||||
| Net realized and unrealized gain (loss) | 1.10 | 1.84 | 0.97 | (0.02) | 1.26 | ||||||||||
| Total from investment operations | 1.23 | 1.98 | 1.08 | 0.05 | 1.35 | ||||||||||
| Distributions from: | |||||||||||||||
| Net investment income | (0.24) | (0.25) | (0.14) | (0.14) | (0.12) | ||||||||||
| Net realized gain | (0.52) | (0.47) | (1.99) | (0.94) | (0.59) | ||||||||||
| Total distributions | (0.76) | (0.72) | (2.13) | (1.08) | (0.71) | ||||||||||
| Total increase (decrease) in net asset value | 0.47 | 1.26 | (1.05) | (1.03) | 0.64 | ||||||||||
| Net asset value, ending | $18.84 | $18.37 | $17.11 | $18.16 | $19.19 | ||||||||||
Total return (2) | 6.83 | % | 12.02 | % | 6.37 | % | 0.09 | % | 7.44 | % | |||||
Ratios to average net assets: (3) | |||||||||||||||
Total expenses(4) | 1.18 | % | 1.29 | % | 1.51 | % | 1.42 | % | 1.38 | % | |||||
Net expenses(4) | 1.18 | % | 1.19 | % | 1.32 | % | 1.42 | % | 1.38 | % | |||||
| Net investment income | 0.72 | % | 0.77 | % | 0.68 | % | 0.37 | % | 0.28 | % | |||||
| Portfolio turnover | 73 | % | 45 | % | 61 | % | 8 | % | 10 | % | |||||
| Net assets, ending (in thousands) | $45,880 | $42,529 | $42,695 | $40,560 | $37,326 | ||||||||||
(1) Net investment income per share was computed using average shares outstanding. | |||||||||||||||
(2) Returns are historical and are calculated by determining the percentage change in net asset value with all distributions reinvested and do not reflect the effect of sales charges, if any. | |||||||||||||||
(3) Total expenses do not reflect amounts reimbursed and/or waived by the adviser and certain of its affiliates, if applicable. Net expenses are net of all reductions and represent the net expenses paid by the Fund. | |||||||||||||||
(4) Amounts do not include the expenses of the Underlying Funds and/or unaffiliated funds. | |||||||||||||||
| See notes to financial statements. | |||||||||||||||
www.calvert.com CALVERT ASSET ALLOCATION FUNDS ANNUAL REPORT 31
CALVERT MODERATE ALLOCATION FUND
FINANCIAL HIGHLIGHTS
| Year Ended September 30, | Period Ended September 30, | |||||||||
| CLASS I SHARES | 2018 | 2017 | 2016(1) | |||||||
| Net asset value, beginning | $19.36 | $17.85 | $17.10 | |||||||
| Income from investment operations: | ||||||||||
Net investment income (2) | 0.33 | 0.26 | 0.07 | |||||||
| Net realized and unrealized gain | 1.19 | 2.02 | 0.76 | |||||||
| Total from investment operations | 1.52 | 2.28 | 0.83 | |||||||
| Distributions from: | ||||||||||
| Net investment income | (0.57) | (0.30) | (0.08) | |||||||
| Net realized gain | (0.52) | (0.47) | — | |||||||
| Total distributions | (1.09) | (0.77) | (0.08) | |||||||
| Total increase in net asset value | 0.43 | 1.51 | 0.75 | |||||||
| Net asset value, ending | $19.79 | $19.36 | $17.85 | |||||||
Total return (3) | 8.04 | % | 13.26 | % | 4.86 | % | (4) | |||
Ratios to average net assets: (5) | ||||||||||
Total expenses(6) | 0.17 | % | 0.55 | % | 0.54 | % | (7) | |||
Net expenses(6) | 0.09 | % | 0.09 | % | 0.09 | % | (7) | |||
| Net investment income | 1.70 | % | 1.43 | % | 1.06 | % | (7) | |||
| Portfolio turnover | 73 | % | 45 | % | 61 | % | (8) | |||
| Net assets, ending (in thousands) | $29,145 | $9,124 | $1,049 | |||||||
(1) From May 20, 2016 inception. | ||||||||||
(2) Computed using average shares outstanding. | ||||||||||
(3) Returns are historical and are calculated by determining the percentage change in net asset value with all distributions reinvested and do not reflect the effect of sales charges, if any. | ||||||||||
(4) Not annualized. | ||||||||||
(5) Total expenses do not reflect amounts reimbursed and/or waived by the adviser and certain of its affiliates, if applicable. Net expenses are net of all reductions and represent the net expenses paid by the Fund. | ||||||||||
(6) Amounts do not include the expenses of the Underlying Funds and/or unaffiliated funds. | ||||||||||
(7) Annualized. | ||||||||||
(8) For the year ended September 30, 2016. | ||||||||||
| See notes to financial statements. | ||||||||||
32 www.calvert.com CALVERT ASSET ALLOCATION FUNDS ANNUAL REPORT
CALVERT AGGRESSIVE ALLOCATION FUND
FINANCIAL HIGHLIGHTS
| Year Ended September 30, | |||||||||||||||
| CLASS A SHARES | 2018 | 2017 | 2016 | 2015 | 2014 | ||||||||||
| Net asset value, beginning | $20.27 | $18.12 | $19.32 | $20.68 | $19.38 | ||||||||||
| Income from investment operations: | |||||||||||||||
Net investment income (1) | 0.22 | 0.23 | 0.19 | 0.21 | 0.18 | ||||||||||
| Net realized and unrealized gain (loss) | 1.79 | 2.82 | 1.25 | (0.08) | 1.70 | ||||||||||
| Total from investment operations | 2.01 | 3.05 | 1.44 | 0.13 | 1.88 | ||||||||||
| Distributions from: | |||||||||||||||
| Net investment income | (0.44) | (0.23) | (0.15) | (0.21) | (0.18) | ||||||||||
| Net realized gain | (0.68) | (0.67) | (2.49) | (1.28) | (0.40) | ||||||||||
| Total distributions | (1.12) | (0.90) | (2.64) | (1.49) | (0.58) | ||||||||||
| Total increase (decrease) in net asset value | 0.89 | 2.15 | (1.20) | (1.36) | 1.30 | ||||||||||
| Net asset value, ending | $21.16 | $20.27 | $18.12 | $19.32 | $20.68 | ||||||||||
Total return (2) | 10.19 | % | 17.59 | % | 8.03 | % | 0.41 | % | 9.85 | % | |||||
Ratios to average net assets: (3) | |||||||||||||||
Total expenses(4) | 0.52 | % | 0.60 | % | 0.78 | % | 0.77 | % | 0.76 | % | |||||
Net expenses(4) | 0.43 | % | 0.43 | % | 0.43 | % | 0.43 | % | 0.43 | % | |||||
| Net investment income | 1.07 | % | 1.24 | % | 1.10 | % | 1.04 | % | 0.88 | % | |||||
| Portfolio turnover | 64 | % | 55 | % | 62 | % | 10 | % | 15 | % | |||||
| Net assets, ending (in thousands) | $129,981 | $116,680 | $103,539 | $93,928 | $83,009 | ||||||||||
(1) Computed using average shares outstanding. | |||||||||||||||
(2) Returns are historical and are calculated by determining the percentage change in net asset value with all distributions reinvested and do not reflect the effect of sales charges, if any. | |||||||||||||||
(3) Total expenses do not reflect amounts reimbursed and/or waived by the adviser and certain of its affiliates, if applicable. Net expenses are net of all reductions and represent the net expenses paid by the Fund. | |||||||||||||||
(4) Amounts do not include the expenses of the Underlying Funds and/or unaffiliated funds. | |||||||||||||||
| See notes to financial statements. | |||||||||||||||
www.calvert.com CALVERT ASSET ALLOCATION FUNDS ANNUAL REPORT 33
CALVERT AGGRESSIVE ALLOCATION FUND
FINANCIAL HIGHLIGHTS
| Year Ended September 30, | |||||||||||||||
| CLASS C SHARES | 2018 | 2017 | 2016 | 2015 | 2014 | ||||||||||
| Net asset value, beginning | $17.50 | $15.85 | $17.21 | $18.71 | $17.71 | ||||||||||
| Income from investment operations: | |||||||||||||||
Net investment income (loss) (1) | 0.06 | 0.08 | 0.03 | (0.01) | (0.06) | ||||||||||
| Net realized and unrealized gain (loss) | 1.53 | 2.45 | 1.10 | (0.07) | 1.58 | ||||||||||
| Total from investment operations | 1.59 | 2.53 | 1.13 | (0.08) | 1.52 | ||||||||||
| Distributions from: | |||||||||||||||
| Net investment income | (0.31) | (0.21) | — | (0.14) | (0.12) | ||||||||||
| Net realized gain | (0.68) | (0.67) | (2.49) | (1.28) | (0.40) | ||||||||||
| Total distributions | (0.99) | (0.88) | (2.49) | (1.42) | (0.52) | ||||||||||
| Total increase (decrease) in net asset value | 0.60 | 1.65 | (1.36) | (1.50) | 1.00 | ||||||||||
| Net asset value, ending | $18.10 | $17.50 | $15.85 | $17.21 | $18.71 | ||||||||||
Total return (2) | 9.39 | % | 16.72 | % | 7.06 | % | (0.72 | %) | 8.66 | % | |||||
Ratios to average net assets: (3) | |||||||||||||||
Total expenses(4) | 1.27 | % | 1.42 | % | 1.60 | % | 1.55 | % | 1.53 | % | |||||
Net expenses(4) | 1.18 | % | 1.18 | % | 1.31 | % | 1.55 | % | 1.53 | % | |||||
| Net investment income (loss) | 0.33 | % | 0.52 | % | 0.20 | % | (0.05 | %) | (0.30 | %) | |||||
| Portfolio turnover | 64 | % | 55 | % | 62 | % | 10 | % | 15 | % | |||||
| Net assets, ending (in thousands) | $19,372 | $18,045 | $17,578 | $16,400 | $14,557 | ||||||||||
(1) Computed using average shares outstanding. | |||||||||||||||
(2) Returns are historical and are calculated by determining the percentage change in net asset value with all distributions reinvested and do not reflect the effect of sales charges, if any. | |||||||||||||||
(3) Total expenses do not reflect amounts reimbursed and/or waived by the adviser and certain of its affiliates, if applicable. Net expenses are net of all reductions and represent the net expenses paid by the Fund. | |||||||||||||||
(4) Amounts do not include the expenses of the Underlying Funds and/or unaffiliated funds. | |||||||||||||||
| See notes to financial statements. | |||||||||||||||
34 www.calvert.com CALVERT ASSET ALLOCATION FUNDS ANNUAL REPORT
CALVERT AGGRESSIVE ALLOCATION FUND
FINANCIAL HIGHLIGHTS
| Year Ended September 30, | Period Ended September 30, | |||||||||
| CLASS I SHARES | 2018 | 2017 | 2016(1) | |||||||
| Net asset value, beginning | $20.35 | $18.14 | $17.17 | |||||||
| Income from investment operations: | ||||||||||
Net investment income (2) | 0.25 | 0.36 | 0.01 | |||||||
| Net realized and unrealized gain | 1.84 | 2.77 | 0.96 | |||||||
| Total from investment operations | 2.09 | 3.13 | 0.97 | |||||||
| Distributions from: | ||||||||||
| Net investment income | (0.50) | (0.25) | — | |||||||
| Net realized gain | (0.68) | (0.67) | — | |||||||
| Total distributions | (1.18) | (0.92) | — | |||||||
| Total increase in net asset value | 0.91 | 2.21 | 0.97 | |||||||
| Net asset value, ending | $21.26 | $20.35 | $18.14 | |||||||
Total return (3) | 10.57 | % | 18.02 | % | 5.65 | % | (4) | |||
Ratios to average net assets: (5) | ||||||||||
Total expenses(6) | 0.26 | % | 1.76 | % | 0.57 | % | (7) | |||
Net expenses(6) | 0.08 | % | 0.08 | % | 0.08 | % | (7) | |||
| Net investment income | 1.20 | % | 1.91 | % | 0.19 | % | (7) | |||
| Portfolio turnover | 64 | % | 55 | % | 62 | % | (8) | |||
| Net assets, ending (in thousands) | $11,938 | $1,790 | $1,056 | |||||||
(1) From May 20, 2016 inception. | ||||||||||
(2) Computed using average shares outstanding. | ||||||||||
(3) Returns are historical and are calculated by determining the percentage change in net asset value with all distributions reinvested and do not reflect the effect of sales charges, if any. | ||||||||||
(4) Not annualized. | ||||||||||
(5) Total expenses do not reflect amounts reimbursed and/or waived by the adviser and certain of its affiliates, if applicable. Net expenses are net of all reductions and represent the net expenses paid by the Fund. | ||||||||||
(6) Amounts do not include the expenses of the Underlying Funds and/or unaffiliated funds. | ||||||||||
(7) Annualized. | ||||||||||
(8) For the year ended September 30, 2016. | ||||||||||
| See notes to financial statements. | ||||||||||
www.calvert.com CALVERT ASSET ALLOCATION FUNDS ANNUAL REPORT 35
NOTES TO FINANCIAL STATEMENTS
NOTE 1 — SIGNIFICANT ACCOUNTING POLICIES
Calvert Conservative Allocation Fund (Conservative), Calvert Moderate Allocation Fund (Moderate) and Calvert Aggressive Allocation Fund (Aggressive), (each a Fund and collectively, the Funds) are diversified series of Calvert Social Investment Fund (the Trust). The Trust is a Massachusetts business trust registered under the Investment Company Act of 1940, as amended (the 1940 Act), as an open-end management investment company. The investment objective of Conservative is to seek current income and capital appreciation, consistent with the preservation of capital. The investment objective of Moderate is to seek long-term capital appreciation and growth of income, with current income a secondary objective. The investment objective of Aggressive is to seek long-term capital appreciation. The Funds invest primarily in a combination of other Calvert equity and fixed-income funds (the Underlying Funds).
Each Fund offers three classes of shares. Class A shares are generally sold subject to a sales charge imposed at time of purchase. A contingent deferred sales charge of 0.80% may apply to certain redemptions of Class A shares for accounts for which no sales charge was paid, if redeemed within one year of purchase. Class C shares are sold without a front-end sales charge, and with certain exceptions, are charged a contingent deferred sales charge of 1% on shares redeemed within one year of purchase. Class C shares are only available for purchase through a financial intermediary. Class I shares are sold at net asset value, are not subject to a sales charge and are sold only to certain eligible investors. Each Fund previously offered Class Y shares. At the close of business on December 8, 2017, Class Y shares were converted to Class I shares. Each class represents a pro rata interest in each Fund, but votes separately on class-specific matters and is subject to different expenses.
Each Fund applies the accounting and reporting guidance in the Financial Accounting Standards Board (FASB) Accounting Standards Codification Topic 946, Financial Services – Investment Companies (ASC 946). Subsequent events, if any, through the date that the financial statements were issued have been evaluated in the preparation of the financial statements.
A. Investment Valuation: Net asset value per share is determined every business day as of the close of the regular session of the New York Stock Exchange (generally 4:00 p.m. Eastern time). The Funds use independent pricing services approved by the Board of Trustees (the Board) to value their investments wherever possible. Investments for which market quotations are not available or deemed not reliable are fair valued in good faith under the direction of the Board.
U.S. generally accepted accounting principles (U.S. GAAP) establishes a disclosure hierarchy that categorizes the inputs to valuation techniques used to value assets and liabilities at measurement date. These inputs are summarized in the three broad levels listed below:
Level 1 - quoted prices in active markets for identical securities
Level 2 - other significant observable inputs (including quoted prices for similar securities, interest rates, prepayment speeds, credit risk, etc.)
Level 3 - significant unobservable inputs (including each Fund’s own assumptions in determining the fair value of investments)
The inputs or methodologies used for valuing securities are not necessarily an indication of the risk associated with investing in those securities.
Valuation techniques used to value each Fund’s investments by major category are as follows:
Debt Securities. Debt securities are generally valued on the basis of valuations provided by third party pricing services, as derived from such services’ pricing models. Inputs to the models may include, but are not limited to, reported trades, executable bid and asked prices, broker/dealer quotations, prices or yields of securities with similar characteristics, interest rates, anticipated prepayments, benchmark curves or information pertaining to the issuer, as well as industry and economic events. Accordingly, debt securities are generally categorized as Level 2 in the hierarchy. Short-term debt securities of sufficient credit quality purchased with remaining maturities of sixty days or less for which a valuation from a third party pricing service is not readily available may be valued at amortized cost, which approximates fair value, and are categorized as Level 2 in the hierarchy.
Other Securities. Investments in the Underlying Funds are valued at their closing net asset value each business day and are categorized as Level 1 in the hierarchy. Valuation methodologies and polices of the Underlying Funds are included in their financial statements, which are available upon request.
Derivatives. Futures contracts are valued at unrealized appreciation (depreciation) based on the settlement price established each day by the board of trade or exchange on which they are traded and are categorized as Level 1 or Level 2 in the hierarchy. U.S. exchange-traded options are valued at the mean between the bid and asked prices at valuation time as reported by the Options Price Reporting Authority and are categorized as Level 1 in the hierarchy.
36 www.calvert.com CALVERT ASSET ALLOCATION FUNDS ANNUAL REPORT
Fair Valuation. If a market value cannot be determined for a security using the methodologies described above, or if, in the good faith opinion of the Funds’ adviser, the market value does not constitute a readily available market quotation, or if a significant event has occurred that would materially affect the value of the security, the security will be fair valued as determined in good faith by or at the direction of the Board in a manner that fairly reflects the security’s value, or the amount that the Funds might reasonably expect to receive for the security upon its current sale in the ordinary course. Each such determination is based on a consideration of relevant factors, which are likely to vary from one pricing context to another. These factors may include, but are not limited to, the type of security, the existence of any contractual restrictions on the security’s disposition, the price and extent of public trading in similar securities of the issuer or of comparable companies or entities, quotations or relevant information obtained from broker/dealers or other market participants, information obtained from the issuer, analysts, and/or the appropriate stock exchange (for exchange-traded securities), an analysis of the company’s or entity’s financial condition, and an evaluation of the forces that influence the issuer and the market(s) in which the security is purchased and sold.
The values assigned to fair value investments are based on available information and do not necessarily represent amounts that might ultimately be realized. Further, due to the inherent uncertainty of valuations of such investments, the fair values may differ significantly from the values that would have been used had an active market existed, and the differences could be material.
The following tables summarize the market value of each of the Funds’ holdings as of September 30, 2018, based on the inputs used to value them:
CONSERVATIVE
| Assets | Level 1 | Level 2 | Level 3 | Total | ||||||||
| Mutual Funds | $ | 197,968,788 | $ | — | $ | — | $ | 197,968,788 | ||||
| U.S. Treasury Obligations | — | 5,698,054 | — | 5,698,054 | ||||||||
| Purchased Options | 23,870 | — | — | 23,870 | ||||||||
| Total Investments | $ | 197,992,658 | $ | 5,698,054 | $ | — | $ | 203,690,712 | ||||
Futures Contracts(1) | $ | 21,595 | $ | — | $ | — | $ | 21,595 | ||||
| Total | $ | 198,014,253 | $ | 5,698,054 | $ | — | $ | 203,712,307 | ||||
| Liabilities | ||||||||||||
Futures Contracts(1) | $ | (356,403 | ) | $ | (13,459 | ) | $ | — | $ | (369,862 | ) | |
(1) The value listed reflects unrealized appreciation (depreciation) as shown in the Schedule of Investments. | ||||||||||||
MODERATE
| Assets | Level 1 | Level 2 | Level 3 | Total | ||||||||
| Mutual Funds | $ | 299,417,165 | $ | — | $ | — | $ | 299,417,165 | ||||
| U.S. Treasury Obligations | — | 6,914,986 | — | 6,914,986 | ||||||||
| Purchased Options | 51,150 | — | — | 51,150 | ||||||||
| Total Investments | $ | 299,468,315 | $ | 6,914,986 | $ | — | $ | 306,383,301 | ||||
Futures Contracts(1) | $ | 39,100 | $ | — | $ | — | $ | 39,100 | ||||
| Total | $ | 299,507,415 | $ | 6,914,986 | $ | — | $ | 306,422,401 | ||||
| Liabilities | ||||||||||||
Futures Contracts(1) | $ | (239,704 | ) | $ | (28,782 | ) | $ | — | $ | (268,486 | ) | |
(1) The value listed reflects unrealized appreciation (depreciation) as shown in the Schedule of Investments. | ||||||||||||
www.calvert.com CALVERT ASSET ALLOCATION FUNDS ANNUAL REPORT 37
AGGRESSIVE
| Assets | Level 1 | Level 2 | Level 3 | Total | ||||||||
| Mutual Funds | $ | 158,393,397 | $ | — | $ | — | $ | 158,393,397 | ||||
| U.S. Treasury Obligations | — | 2,866,327 | — | 2,866,327 | ||||||||
| Purchased Options | 35,805 | — | — | 35,805 | ||||||||
| Total Investments | $ | 158,429,202 | $ | 2,866,327 | $ | — | $ | 161,295,529 | ||||
Futures Contracts(1) | $ | 57,924 | $ | — | $ | — | $ | 57,924 | ||||
| Total | $ | 158,487,126 | $ | 2,866,327 | $ | — | $ | 161,353,453 | ||||
| Liabilities | ||||||||||||
Futures Contracts(1) | $ | — | $ | (20,338 | ) | $ | — | $ | (20,338 | ) | ||
(1) The value listed reflects unrealized appreciation (depreciation) as shown in the Schedule of Investments. | ||||||||||||
B. Investment Transactions and Income: Investment transactions for financial statement purposes are accounted for on trade date. Realized gains and losses are recorded on an identified cost basis and may include proceeds from litigation. Dividend income is recorded on the ex-dividend date for dividends received in cash and/or securities. Distributions received that represent a return of capital are recorded as a reduction of cost of investments. Distributions received that represent a capital gain are recorded as a realized gain. Interest income, which includes amortization of premium and accretion of discount on debt securities, is accrued as earned. Inflation adjustments to the principal amount of inflation-adjusted bonds and notes are reflected as interest income. Deflation adjustments to the principal amount of an inflation-adjusted bond or note are reflected as reductions to interest income to the extent of interest income previously recorded on such bond or note. Expenses included in the accompanying financial statements reflect the expenses of each Fund and do not include any expenses associated with the Underlying Funds.
C. Share Class Accounting: Realized and unrealized gains and losses and net investment income and losses, other than class-specific expenses, are allocated daily to each class of shares based upon the relative net assets of each class to the total net assets of each Fund. Expenses arising in connection with a specific class are charged directly to that class.
D. Foreign Currency Transactions: The Funds’ accounting records are maintained in U.S. dollars. For valuation of assets and liabilities on each date of net asset value determination, foreign denominations are converted into U.S. dollars using the current exchange rate. Security transactions, income, and expenses are translated at the prevailing rate of exchange on the date of the event. Recognized gains or losses on investment transactions attributable to changes in foreign currency exchange rates are recorded for financial statement purposes as net realized gains and losses on investments. That portion of unrealized gains and losses on investments that results from fluctuations in foreign currency exchange rates is not separately disclosed.
E. Futures Contracts: The Funds may enter into futures contracts to buy or sell a financial instrument for a set price at a future date. Initial margin deposits of either cash or securities as required by the broker are made upon entering into the contract. While the contract is open, daily variation margin payments are made to or received from the broker reflecting the daily change in market value of the contract and are recorded for financial reporting purposes as unrealized gains or losses by the Funds. When a futures contract is closed, a realized gain or loss is recorded equal to the difference between the opening and closing value of the contract. The risks associated with entering into futures contracts may include the possible illiquidity of the secondary market which would limit the Funds’ ability to close out a futures contract prior to the settlement date, an imperfect correlation between the value of the contracts and the underlying financial instruments, or that the counterparty will fail to perform its obligations under the contracts’ terms. Futures contracts are designed by boards of trade, which are designated “contracts markets” by the Commodities Futures Trading Commission. Futures contracts trade on the contracts markets in a manner that is similar to the way a stock trades on a stock exchange, and the boards of trade, through their clearing corporations, guarantee the futures contracts against default. As a result, there is minimal counterparty credit risk to the Funds.
F. Options Contracts: Upon the purchase of a call or put option, the premium paid by the Funds is included in the Statement of Assets and Liabilities as an investment. The amount of the investment is subsequently marked-to-market to reflect the current market value of the option purchased, in accordance with the Funds’ policies on investment valuations discussed above. Premiums paid for purchasing options that expire are treated as realized losses. Premiums paid for purchasing options that are exercised or closed are added to the amounts paid or offset against the proceeds on the underlying investment transaction to determine the realized gain or loss. As purchasers of an index option, the Funds have the right to receive a cash payment equal to any depreciation in the value of the index below the exercise price of the option (in the case of a put) or equal to any appreciation in the value of the index over the exercise price of the option (in the case of a call) as of the valuation date of the option. The risk
38 www.calvert.com CALVERT ASSET ALLOCATION FUNDS ANNUAL REPORT
associated with purchasing options is limited to the premium originally paid. Purchased options traded over-the-counter involve risk that the issuer or counterparty will fail to perform its contractual obligations.
Upon the writing of a call or a put option, the premium received by the Funds is included in the Statement of Assets and Liabilities as a liability. The amount of the liability is subsequently marked-to-market to reflect the current market value of the option written, in accordance with the Funds’ policies on investment valuations discussed above. Premiums received from writing options that expire are treated as realized gains. Premiums received from writing options that are exercised or closed are added to or offset against the proceeds or amount paid on the transaction to determine the realized gain or loss. When an index option is exercised, each Fund is required to deliver an amount of cash determined by the excess of the exercise price of the option over the value of the index (in the case of a put) or the excess of the value of the index over the exercise price of the option (in the case of a call) at contract termination. The Funds, as writers of an option, may have no control over whether the underlying instrument may be sold (call) or purchased (put) and, as a result, bear the market risk of an unfavorable change in the price of the instrument underlying the written option. The Funds may also bear the risk of not being able to enter into a closing transaction if a liquid secondary market does not exist.
G. Distributions to Shareholders: Distributions to shareholders are recorded by the Funds on ex-dividend date. Dividends from net investment income are declared and paid quarterly for Conservative and Moderate and annually for Aggressive. Distributions from net realized capital gains, if any, are paid at least annually. Distributions are determined in accordance with income tax regulations which may differ from U.S. GAAP; accordingly, periodic reclassifications are made within the Funds’ capital accounts to reflect income and gains available for distribution under income tax regulations.
H. Estimates: The preparation of financial statements in conformity with U.S. GAAP requires management to make estimates and assumptions that affect the reported amounts of assets and liabilities and disclosure of contingent assets and liabilities at the date of the financial statements and the reported amounts of increases and decreases in net assets from operations during the reporting period. Actual results could differ from those estimates.
I. Indemnifications: Under the Trust’s organizational document, its officers and Trustees may be indemnified against certain liabilities and expenses arising out of the performance of their duties to the Funds. Under Massachusetts law, if certain conditions prevail, shareholders of a Massachusetts business trust (such as the Trust) could be deemed to have personal liability for the obligations of the Trust. However, the Trust’s Declaration of Trust contains an express disclaimer of liability on the part of Fund shareholders and provides that upon request, the Trust shall assume the defense on behalf of any Fund shareholders or former shareholders. Additionally, in the normal course of business, each Fund enters into agreements with service providers that may contain indemnification clauses. Each Fund’s maximum exposure under these arrangements is unknown as this would involve future claims that may be made against each Fund that have not yet occurred.
J. Federal Income Taxes: No provision for federal income or excise tax is required since each Fund intends to continue to qualify as a regulated investment company under the Internal Revenue Code and to distribute substantially all of its taxable earnings.
Management has analyzed the Funds’ tax positions taken for all open federal income tax years and has concluded that no provision for federal income tax is required in the Funds’ financial statements. Each Fund’s federal tax return is subject to examination by the Internal Revenue Service for a period of three years from the date of filing.
NOTE 2 — RELATED PARTY TRANSACTIONS
Calvert Research and Management (CRM), a subsidiary of Eaton Vance Management (EVM), provides investment advisory services to the Funds. The Funds do not pay advisory fees to CRM for performing investment advisory services. CRM, however, receives advisory fees for managing the Underlying Funds.
CRM has agreed to reimburse the Funds’ operating expenses to the extent that total annual operating expenses (relating to ordinary operating expenses only and excluding expenses such as brokerage commissions, acquired fund fees and expenses, interest expense, taxes or litigation expenses) for Conservative, Moderate and Aggressive exceed 0.44%, 0.44% and 0.43%, respectively, for Class A shares; 1.19%, 1.19% and 1.18%, respectively, for Class C shares; 0.09%, 0.09% and 0.08%, respectively, for Class I shares and prior to the close of business on December 8, 2017, 0.19%, 0.19% and 0.18%, respectively, for Class Y shares of such class’ average daily net assets. The expense reimbursement agreements with CRM may be changed or terminated after January 31, 2019. For the year ended September 30, 2018, CRM waived or reimbursed expenses of $14,274, $14,851 and $142,388 of Conservative, Moderate and Aggressive, respectively. CRM serves as the administrator of the Funds, but receives no compensation.
The Funds have in effect distribution plans for Class A shares (Class A Plan) pursuant to Rule 12b-1 under the 1940 Act. Pursuant to the Class A Plan, each Fund pays Eaton Vance Distributors, Inc. (EVD), an affiliate of CRM and the Funds’ principal underwriter, a distribution and service fee of 0.25% per annum of its average daily net assets attributable to Class A for
www.calvert.com CALVERT ASSET ALLOCATION FUNDS ANNUAL REPORT 39
distribution services and facilities provided to the Funds by EVD, as well as for personal services and/or the maintenance of shareholder accounts. The Funds also have in effect distribution plans for Class C shares (Class C Plan) pursuant to Rule 12b-1 under the 1940 Act. Pursuant to the Class C Plan, each Fund pays EVD amounts equal to 0.75% per annum of its average daily net assets attributable to Class C shares for providing ongoing distribution services and facilities to the Funds. In addition, pursuant to the Class C Plan, each Fund also makes payments of service fees to EVD, financial intermediaries and other persons in amounts equal to 0.25% per annum of its average daily net assets attributable to that class. Service fees paid or accrued are for personal services and/or the maintenance of shareholder accounts. Distribution and service fees for Conservative, Moderate and Aggressive paid or accrued for the year ended September 30, 2018 amounted to $371,699, $556,184 and $307,379, respectively, for Class A shares and $340,255, $447,341 and $190,621, respectively, for Class C shares.
The Funds were informed that EVD received $47,627, $96,741 and $68,018 for Conservative, Moderate and Aggressive, respectively, as their portion of the sales charge on sales of Class A shares for the year ended September 30, 2018. The Funds were also informed that EVD received $1,479, $10,769 and $4,920 for Conservative, Moderate and Aggressive, respectively, of contingent deferred sales charges paid by each Fund’s shareholders for the same period.
EVM provides sub-transfer agency and related services to the Funds pursuant to a Sub-Transfer Agency Support Services Agreement. For the year ended September 30, 2018, sub-transfer agency fees and expenses incurred to EVM amounted to $23,762, $46,934 and $39,721 for Conservative, Moderate and Aggressive, respectively, and are included in transfer agency fees and expenses on the Statements of Operations.
Each Trustee of the Funds who is not an employee of CRM or its affiliates receives a fee of $3,000 for each Board meeting attended in person and $2,000 for each Board meeting attended by phone plus an annual fee of $52,000, and $1,500 for each Committee meeting attended in person and $1,000 for each Committee meeting attended by phone plus an annual Committee fee of $2,500. The Board chair receives an additional $10,000 annual retainer and Committee chairs receive an additional $6,000 annual retainer. Eligible Trustees may participate in a Deferred Compensation Plan (the Plan). Amounts deferred under the Plan are treated as though equal dollar amounts had been invested in shares of the Funds or other Calvert funds selected by the Trustees. The Funds purchase shares of the funds selected equal to the dollar amounts deferred under the Plan, resulting in an asset equal to the deferred compensation liability. Obligations of the Plan are paid solely from the Funds’ assets. Trustees’ fees are allocated to each of the Calvert funds served. Salaries and fees of officers and Trustees of the Funds who are employees of CRM or its affiliates are paid by CRM. In addition, an advisory council was established to aid the Board and CRM in advancing the cause of responsible investing through original scholarship and thought leadership. The advisory council consists of CRM’s Chief Executive Officer and four additional members. Each member (other than CRM’s Chief Executive Officer) receives annual compensation of $75,000, which is being reimbursed by Calvert Investment Management, Inc. (CIM), the Calvert funds’ former investment adviser and Ameritas Holding Company, CIM’s parent company, through the end of 2019. For the year ended September 30, 2018, each Fund’s allocated portion of such expense and reimbursement was $4,143, $5,901 and $3,088 for Conservative, Moderate and Aggressive, respectively, which are included in miscellaneous expense and reimbursement of expenses-other, respectively, on the Statements of Operations.
NOTE 3 — INVESTMENT ACTIVITY
During the year ended September 30, 2018, the cost of purchases and proceeds from sales of investments, other than short-term securities, were as follows:
| CONSERVATIVE | MODERATE | AGGRESSIVE | |||||||
| Purchases | |||||||||
| U.S. Government and Agency Securities | $5,680,223 | $6,893,076 | $2,859,006 | ||||||
| Non-U.S. Government and Agency Securities | 196,609,613 | 227,996,280 | 107,143,755 | ||||||
| Total Purchases | $201,989,836 | $234,889,356 | $110,002,761 | ||||||
| Sales | |||||||||
| Non-U.S. Government and Agency Securities | $186,477,126 | $209,284,287 | $96,296,560 | ||||||
40 www.calvert.com CALVERT ASSET ALLOCATION FUNDS ANNUAL REPORT
NOTE 4 — DISTRIBUTIONS TO SHAREHOLDERS AND INCOME TAX INFORMATION
The tax character of distributions declared for the years ended September 30, 2018 and September 30, 2017 was as follows:
| Year Ended September 30, 2018 | |||||||||
| CONSERVATIVE | MODERATE | AGGRESSIVE | |||||||
| Distributions declared from: | |||||||||
| Ordinary income | $ | 4,953,252 | $ | 6,357,229 | $ | 3,000,347 | |||
| Long-term capital gains | 2,728,735 | 7,260,464 | 4,720,754 | ||||||
| Year Ended September 30, 2017 | |||||||||
| CONSERVATIVE | MODERATE | AGGRESSIVE | |||||||
| Distributions declared from: | |||||||||
| Ordinary income | $ | 3,126,373 | $ | 3,924,339 | $ | 1,767,434 | |||
| Long-term capital gains | 1,601,320 | 6,519,375 | 4,429,203 | ||||||
During the year ended September 30, 2018, the following amounts were reclassified due to the Funds’ use of equalization accounting. Tax equalization accounting allows a Fund to treat as a distribution that portion of redemption proceeds representing a redeeming shareholder’s portion of undistributed taxable income and net capital gains.
| CONSERVATIVE | MODERATE | AGGRESSIVE | |||||||
| Change in: | |||||||||
| Paid-in capital | $ | 312,826 | $ | 537,266 | $ | 281,536 | |||
| Distributable earnings | $ | (312,826 | ) | $ | (537,266 | ) | $ | (281,536 | ) |
These reclassifications had no effect on the net assets or net asset value per share of the Funds.
As of September 30, 2018, the components of distributable earnings (accumulated loss) on a tax basis were as follows:
| CONSERVATIVE | MODERATE | AGGRESSIVE | |||||||
| Undistributed ordinary income | $ | 509,443 | $ | 960,475 | $ | 703,411 | |||
| Undistributed long-term capital gains | $ | 3,333,935 | $ | 8,667,134 | $ | 5,203,101 | |||
| Net unrealized appreciation | $ | 7,427,572 | $ | 25,455,037 | $ | 17,969,071 | |||
The cost and unrealized appreciation (depreciation) of investments, including open derivative contracts, of the Funds at September 30, 2018, as determined on a federal income tax basis, were as follows:
| CONSERVATIVE | MODERATE | AGGRESSIVE | |||||||
| Aggregate cost | $196,239,220 | $280,877,007 | $143,290,552 | ||||||
| Gross unrealized appreciation | $9,702,947 | $26,870,726 | $18,096,728 | ||||||
| Gross unrealized depreciation | (2,275,325) | (1,415,582) | (127,556) | ||||||
| Net unrealized appreciation (depreciation) | $7,427,622 | $25,455,144 | $17,969,172 | ||||||
NOTE 5 — FINANCIAL INSTRUMENTS
A summary of futures contracts and options contracts outstanding at September 30, 2018 is included in each Fund’s Schedule of Investments. During the year ended September 30, 2018, the Funds used futures contracts as a substitute for direct investment in particular asset classes to facilitate rebalancing and implement tactical asset allocation decisions.
During the year ended September 30, 2018, the Funds used purchased and written options contracts to make tactical asset allocations (including to gain or limit exposure to certain asset classes and/or sectors).
www.calvert.com CALVERT ASSET ALLOCATION FUNDS ANNUAL REPORT 41
At September 30, 2018, the fair value of open derivative instruments (not considered to be hedging instruments for accounting disclosure purposes) by risk exposure was as follows:
| CONSERVATIVE | ||||||||||
| Risk | Derivative | Statement of Assets and Liabilities Caption | Assets | Liabilities | ||||||
| Equity price | Futures contracts | Distributable earnings | $21,595 | * | ($13,459 | ) | * | |||
| Equity price | Purchased options | Investments in securities of unaffiliated issuers, at value | 23,870 | — | ||||||
| Interest rate | Futures contracts | Distributable earnings | — | (356,403 | ) | * | ||||
| Total | $45,465 | ($369,862 | ) | |||||||
| * Only the current day’s variation margin is reported within the Statement of Assets and Liabilities as Receivable or Payable for variation margin on open futures contracts, as applicable. | ||||||||||
| MODERATE | ||||||||||
| Risk | Derivative | Statement of Assets and Liabilities Caption | Assets | Liabilities | ||||||
| Equity price | Futures contracts | Distributable earnings | $33,367 | * | ($28,782 | ) | * | |||
| Equity price | Purchased options | Investments in securities of unaffiliated issuers, at value | 51,150 | — | ||||||
| Interest rate | Futures contracts | Distributable earnings | 5,733 | * | (239,704 | ) | * | |||
| Total | $90,250 | ($268,486 | ) | |||||||
| * Only the current day’s variation margin is reported within the Statement of Assets and Liabilities as Receivable or Payable for variation margin on open futures contracts, as applicable. | ||||||||||
| AGGRESSIVE | ||||||||||
| Risk | Derivative | Statement of Assets and Liabilities Caption | Assets | Liabilities | ||||||
| Equity price | Futures contracts | Distributable earnings | $18,950 | * | ($20,338 | ) | * | |||
| Equity price | Purchased options | Investments in securities of unaffiliated issuers, at value | 35,805 | — | ||||||
| Interest rate | Futures contracts | Distributable earnings | 38,974 | * | — | |||||
| Total | $93,729 | ($20,338 | ) | |||||||
| * Only the current day’s variation margin is reported within the Statement of Assets and Liabilities as Receivable or Payable for variation margin on open futures contracts, as applicable. | ||||||||||
42 www.calvert.com CALVERT ASSET ALLOCATION FUNDS ANNUAL REPORT
The effect of derivative instruments (not considered to be hedging instruments for accounting disclosure purposes) on the Statements of Operations by risk exposure for the year ended September 30, 2018 was as follows:
| CONSERVATIVE | |||||||||
| Statement of Operations Caption | Foreign Exchange | Equity price | Interest rate | ||||||
| Net realized gain (loss) on: | |||||||||
| Investment securities – unaffiliated issuers | $— | $299,896 | ($23,008 | ) | |||||
| Futures contracts | (4,507 | ) | (78,138 | ) | (254,952 | ) | |||
| Written options | — | 230,080 | — | ||||||
| Total | ($4,507 | ) | $451,838 | ($277,960 | ) | ||||
| Net change in unrealized appreciation (depreciation) on: | |||||||||
| Investment securities – unaffiliated issuers | $— | ($60,281 | ) | $— | |||||
| Futures contracts | — | 58,289 | (291,151 | ) | |||||
| Written options | — | (17,322 | ) | — | |||||
| Total | $— | ($19,314 | ) | ($291,151 | ) | ||||
| MODERATE | |||||||||
| Statement of Operations Caption | Foreign Exchange | Equity price | Interest rate | ||||||
| Net realized gain (loss) on: | |||||||||
| Investment securities – unaffiliated issuers | $— | $468,723 | ($32,868 | ) | |||||
| Futures contracts | (4,723 | ) | (284,728 | ) | 347,348 | ||||
| Written options | — | 339,528 | — | ||||||
| Total | ($4,723 | ) | $523,523 | $314,480 | |||||
| Net change in unrealized appreciation (depreciation) on: | |||||||||
| Investment securities – unaffiliated issuers | $— | ($122,195 | ) | $— | |||||
| Futures contracts | — | 59,770 | (242,470 | ) | |||||
| Written options | — | (35,337 | ) | — | |||||
| Total | $— | ($97,762 | ) | ($242,470 | ) | ||||
| AGGRESSIVE | |||||||||
| Statement of Operations Caption | Foreign Exchange | Equity price | Interest rate | ||||||
| Net realized gain (loss) on: | |||||||||
| Investment securities – unaffiliated issuers | $— | $258,841 | ($17,530 | ) | |||||
| Futures contracts | (7,839 | ) | (422,808 | ) | 76,469 | ||||
| Written options | — | 183,893 | — | ||||||
| Total | ($7,839 | ) | $19,926 | $58,939 | |||||
| Net change in unrealized appreciation (depreciation) on: | |||||||||
| Investment securities - unaffiliated issuers | $— | ($80,403 | ) | $— | |||||
| Futures contracts | — | 66,209 | 38,974 | ||||||
| Written options | — | (22,583 | ) | — | |||||
| Total | $— | ($36,777 | ) | $38,974 | |||||
www.calvert.com CALVERT ASSET ALLOCATION FUNDS ANNUAL REPORT 43
The average notional cost of futures contracts and the average number of purchased and written options contracts outstanding during the year ended September 30, 2018 were approximately as follows:
| CONSERVATIVE | MODERATE | AGGRESSIVE | |||||||
| Futures contracts – long | $ | 20,847,000 | $ | 14,008,000 | $ | 2,849,000 | |||
| Futures contracts – short | $ | 4,989,000 | $ | 13,904,000 | $ | 2,973,000 | |||
| Purchased options | 44 | 65 | 35 | ||||||
| Written options | (22) | (36) | (21) | ||||||
NOTE 6 — OVERDRAFT ADVANCES
Pursuant to the custodian agreement, State Street Bank and Trust Company (SSB) may, in its discretion, advance funds to the Funds to make properly authorized payments. When such payments result in an overdraft, each Fund is obligated to repay SSB at the current rate of interest charged by SSB for secured loans (currently, the Federal Funds rate plus 2%). This obligation is payable on demand to SSB. SSB has a lien on each Fund’s assets to the extent of any overdraft. At September 30, 2018, Conservative had a payment due to SSB pursuant to the foregoing arrangement of $909. Based on the short-term nature of these payments and the variable interest rate, the carrying value of the overdraft advances approximated its fair value at September 30, 2018. If measured at fair value, overdraft advances would have been considered as Level 2 in the fair value hierarchy (see Note 1A) at September 30, 2018. The Funds’ average overdraft advances during the year ended September 30, 2018 were not significant.
NOTE 7 — SECURITIES LENDING
To generate additional income, the Funds may lend their securities pursuant to a securities lending agency agreement with SSB, the securities lending agent. Security loans are subject to termination by the Funds at any time and, therefore, are not considered illiquid investments. The Funds require that the loan be continuously collateralized by either cash or securities as collateral equal at all times to at least 102% of the market value of the domestic securities loaned and 105% of the market value of the international securities loaned (if applicable). The market value of securities loaned is determined daily and any additional required collateral is delivered to the respective Fund on the next business day. Cash collateral is generally invested in a money market fund registered under the 1940 Act that is managed by an affiliate of SSB. Any gain or loss in the market price of the loaned securities that might occur and any interest earned or dividends declared during the term of the loan would accrue to the account of the Funds. Income earned on the investment of collateral, net of broker rebates and other expenses incurred by the securities lending agent, is split between the respective Fund and the securities lending agent on the basis of agreed upon contractual terms. Non-cash collateral, if any, is held by the lending agent on behalf of the respective Fund and cannot be sold or re-pledged by the respective Fund; accordingly, such collateral is not reflected in each of the Statement of Assets and Liabilities.
The risks associated with lending portfolio securities include, but are not limited to, possible delays in receiving additional collateral or in the recovery of the loaned securities, possible loss of rights to the collateral should the borrower fail financially, as well as risk of loss in the value of the collateral or the value of the investments made with the collateral. The securities lending agent shall indemnify the Funds in the case of default of any securities borrower. The Funds did not have any securities on loan at September 30, 2018.
NOTE 8 — LINE OF CREDIT
The Funds participate with other funds managed by CRM in a $62.5 million committed ($25 million committed and $25 million uncommitted prior to August 7, 2018) unsecured line of credit agreement with SSB, which is in effect through August 6, 2019. Borrowings may be made for temporary or emergency purposes only. Borrowings bear interest at the higher of the One-Month London Interbank Offered Rate (LIBOR) in effect that day or the overnight Federal Funds Rate, plus 1.00% (1.25% prior to August 7, 2018) per annum. A commitment fee of 0.20% (0.25% prior to August 7, 2018) per annum is incurred on the unused portion of the committed facility. An administrative fee of $37,500 was incurred in connection with the renewal of the facility in August 2018. These fees are allocated to all participating funds. Because the line of credit is not available exclusively to the Funds, a Fund may be unable to borrow some or all of its requested amounts at any particular time. The Funds had no borrowings pursuant to this line of credit during the year ended September 30, 2018.
NOTE 9 — AFFILIATED COMPANIES
An affiliated company is a company in which a fund has a direct or indirect ownership of, control of, or voting power of 5 percent or more of the outstanding voting shares, or a company that is under common ownership or control with a fund. At September 30, 2018, the value of each Fund’s investment in affiliated companies was $197,968,788, $299,417,165 and $158,393,397 for Conservative, Moderate and Aggressive, respectively, which represents 97.2%, 97.8% and 98.2% of net assets for Conservative,
44 www.calvert.com CALVERT ASSET ALLOCATION FUNDS ANNUAL REPORT
Moderate and Aggressive, respectively. Transactions in affiliated companies by the Funds for the year ended September 30, 2018 were as follows:
CONSERVATIVE
| Name of Calvert Fund | Shares, beginning of period | Gross Additions | Gross Reductions | Shares, end of period | Value, end of period | Dividend Income | Net Realized Gain (Loss) | Capital Gains Distributions Received | Change in Unrealized Appreciation (Depreciation) | ||||||||||||||
| Absolute Return Bond Fund, Class I | 1,580,293 | 188,852 | — | 1,769,145 | $26,307,191 | $773,363 | $— | $202,937 | ($496,530 | ) | |||||||||||||
| Bond Fund, Class I | 4,425,319 | 163,270 | (4,588,589 | ) | — | — | 114,571 | 916,129 | — | (739,800 | ) | ||||||||||||
| Bond Fund, Class R6 | — | 4,730,591 | (16,238 | ) | 4,714,353 | 74,062,493 | 1,761,625 | (6,983 | ) | — | (2,106,821 | ) | |||||||||||
| Emerging Markets Equity Fund, Class I | 281,216 | 166,530 | (62,785 | ) | 384,961 | 6,055,431 | 10,528 | 255,798 | — | (431,613 | ) | ||||||||||||
| Floating-Rate Advantage Fund, Class R6 | — | 2,852,143 | (97,678 | ) | 2,754,465 | 27,434,474 | 1,025,217 | (7,049 | ) | — | (104,085 | ) | |||||||||||
| International Equity Fund, Class I | 309,405 | 885 | (310,290 | ) | — | — | 16,573 | 655,889 | — | (579,220 | ) | ||||||||||||
| International Opportunities Fund, Class I | 310,482 | 31,644 | (17,354 | ) | 324,772 | 6,014,777 | 102,843 | 42,064 | 302,993 | 5,515 | |||||||||||||
| International Responsible Index Fund, Class I | 242,560 | 145,482 | (4,282 | ) | 383,760 | 9,006,844 | 117,763 | 15,619 | — | 2,190 | |||||||||||||
| Long-Term Income Fund, Class I | 321,477 | 9 | (321,483 | ) | 3 | 45 | 160 | 270,667 | — | (264,517 | ) | ||||||||||||
| Mid-Cap Fund, Class I | 48,815 | 6,556 | (2,324 | ) | 53,047 | 2,173,350 | 7,399 | (4,627 | ) | 158,494 | 131,582 | ||||||||||||
| Small-Cap Fund, Class I | 70,175 | 48,196 | (10,279 | ) | 108,092 | 3,105,469 | 5,386 | 32,797 | 237,529 | 143,300 | |||||||||||||
| Ultra-Short Duration Income Fund, Class I | 1,357,595 | 760,399 | (2,117,994 | ) | — | — | 6,906 | 29,240 | — | (9,836 | ) | ||||||||||||
| Ultra-Short Duration Income Fund, Class R6 | — | 2,830,809 | (2,548,840 | ) | 281,969 | 2,816,869 | 86,596 | (1,363,389 | ) | 1,258 | 1,346,531 | ||||||||||||
| US Large-Cap Core Responsible Index Fund, Class I | 687,671 | 4,253 | (691,924 | ) | — | — | — | 2,223,027 | — | (1,875,925 | ) | ||||||||||||
| US Large-Cap Core Responsible Index Fund, Class R6 | — | 678,965 | (61,522 | ) | 617,443 | 15,608,955 | 208,001 | 80,220 | 146,344 | 1,734,153 | |||||||||||||
| US Large-Cap Growth Responsible Index Fund, Class I | 344,496 | 14,119 | (42,766 | ) | 315,849 | 9,481,800 | 76,079 | 239,455 | 115,386 | 1,646,904 | |||||||||||||
| US Large-Cap Value Responsible Index Fund, Class I | 474,198 | 73,296 | (52,222 | ) | 495,272 | 11,757,764 | 189,589 | 163,956 | 557,802 | 169,238 | |||||||||||||
| US Mid-Cap Core Responsible Index Fund, Class I | 135,676 | 27,736 | (12,471 | ) | 150,941 | 4,143,326 | 39,265 | 21,243 | 72,658 | 416,847 | |||||||||||||
| TOTALS | $197,968,788 | $4,541,864 | $3,564,056 | $1,795,401 | ($1,012,087 | ) | |||||||||||||||||
www.calvert.com CALVERT ASSET ALLOCATION FUNDS ANNUAL REPORT 45
MODERATE
| Name of Calvert Fund | Shares, beginning of period | Gross Additions | Gross Reductions | Shares, end of period | Value, end of period | Dividend Income | Net Realized Gain (Loss) | Capital Gains Distributions Received | Change in Unrealized Appreciation (Depreciation) | ||||||||||||||
| Absolute Return Bond Fund, Class I | 2,008,287 | 350,793 | — | 2,359,080 | $35,079,521 | $976,227 | $— | $252,057 | ($621,983 | ) | |||||||||||||
| Bond Fund, Class I | 2,934,178 | 4,093 | (2,938,271 | ) | — | — | 65,864 | 601,805 | — | (495,329 | ) | ||||||||||||
| Bond Fund, Class R6 | — | 2,885,743 | — | 2,885,743 | 45,335,019 | 1,022,171 | — | — | (1,213,460 | ) | |||||||||||||
| Emerging Markets Equity Fund, Class I | 565,098 | 480,613 | (89,282 | ) | 956,429 | 15,044,626 | 22,174 | 418,028 | — | (1,029,055 | ) | ||||||||||||
| Floating-Rate Advantage Fund, Class R6 | — | 2,292,033 | (137,699 | ) | 2,154,334 | 21,457,165 | 789,963 | (9,800 | ) | — | (75,653 | ) | |||||||||||
| International Equity Fund, Class I | 1,185,299 | 23,405 | (967,364 | ) | 241,340 | 4,517,892 | 162,810 | 1,696,115 | — | (1,310,581 | ) | ||||||||||||
| International Opportunities Fund, Class I | 892,071 | 163,521 | (35,839 | ) | 1,019,753 | 18,885,834 | 289,321 | 168,614 | 852,381 | (4,052 | ) | ||||||||||||
| International Responsible Index Fund, Class I | 580,769 | 507,730 | (23,391 | ) | 1,065,108 | 24,998,096 | 293,947 | 88,742 | — | (19,909 | ) | ||||||||||||
| Mid-Cap Fund, Class I | 105,191 | 10,711 | (5,009 | ) | 110,893 | 4,543,306 | 15,582 | (3,797 | ) | 333,795 | 281,196 | ||||||||||||
| Small-Cap Fund, Class I | 151,220 | 150,306 | (15,569 | ) | 285,957 | 8,215,557 | 11,319 | 51,732 | 499,255 | 500,955 | |||||||||||||
| Ultra-Short Duration Income Fund, Class I | 1,438,790 | 413,099 | (1,851,889 | ) | — | — | 13,362 | 28,159 | — | (5,277 | ) | ||||||||||||
| Ultra-Short Duration Income Fund, Class R6 | — | 4,218,618 | (3,578,109 | ) | 640,509 | 6,398,689 | 150,499 | (1,816,294 | ) | 2,215 | 1,790,516 | ||||||||||||
| US Large-Cap Core Responsible Index Fund, Class I | 2,037,548 | — | (2,037,548 | ) | — | — | — | 6,666,432 | — | (5,574,618 | ) | ||||||||||||
| US Large-Cap Core Responsible Index Fund, Class R6 | — | 2,171,115 | (82,826 | ) | 2,088,289 | 52,791,952 | 681,533 | 123,855 | 479,511 | 5,839,975 | |||||||||||||
| US Large-Cap Growth Responsible Index Fund, Class I | 769,928 | 16,285 | (67,110 | ) | 719,103 | 21,587,458 | 166,175 | 381,262 | 252,032 | 3,830,239 | |||||||||||||
| US Large-Cap Value Responsible Index Fund, Class I | 1,125,626 | 99,934 | (25,437 | ) | 1,200,123 | 28,490,912 | 439,761 | 118,535 | 1,293,854 | 639,899 | |||||||||||||
| US Mid-Cap Core Responsible Index Fund, Class I | 388,681 | 66,972 | (15,903 | ) | 439,750 | 12,071,138 | 110,263 | 25,166 | 204,034 | 1,237,508 | |||||||||||||
| TOTALS | $299,417,165 | $5,210,971 | $8,538,554 | $4,169,134 | $3,770,371 | ||||||||||||||||||
46 www.calvert.com CALVERT ASSET ALLOCATION FUNDS ANNUAL REPORT
AGGRESSIVE
| Name of Calvert Fund | Shares, beginning of period | Gross Additions | Gross Reductions | Shares, end of period | Value, end of period | Dividend Income | Net Realized Gain (Loss) | Capital Gains Distributions Received | Change in Unrealized Appreciation (Depreciation) | ||||||||||||||
| Absolute Return Bond Fund, Class I | 267,360 | 97,465 | (94,180 | ) | 270,645 | $4,024,488 | $104,593 | $35,538 | $22,590 | ($90,884 | ) | ||||||||||||
| Bond Fund, Class I | 814,675 | 148,460 | (963,135 | ) | — | — | 17,833 | 61,387 | — | (29,249 | ) | ||||||||||||
| Bond Fund, Class R6 | — | 1,983,537 | (1,252,780 | ) | 730,757 | 11,480,185 | 292,194 | (286,844 | ) | — | (42,450 | ) | |||||||||||
| Emerging Markets Equity Fund, Class I | 536,025 | 243,875 | (126,355 | ) | 653,545 | 10,280,264 | 19,091 | 545,027 | — | (870,757 | ) | ||||||||||||
| Floating-Rate Advantage Fund, Class R6 | — | 421,265 | (95,124 | ) | 326,141 | 3,248,364 | 141,452 | (6,687 | ) | — | (11,795 | ) | |||||||||||
| International Equity Fund, Class I | 926,169 | 45,785 | (480,384 | ) | 491,570 | 9,202,194 | 174,200 | 536,210 | — | (196,883 | ) | ||||||||||||
| International Opportunities Fund, Class I | 644,874 | 102,546 | (8,637 | ) | 738,783 | 13,682,259 | 210,536 | 41,930 | 620,268 | 57,859 | |||||||||||||
| International Responsible Index Fund, Class I | 340,817 | 266,116 | (10,587 | ) | 596,346 | 13,996,237 | 166,085 | 40,520 | — | (22,160 | ) | ||||||||||||
| Mid-Cap Fund, Class I | 107,365 | 7,412 | (25,735 | ) | 89,042 | 3,648,036 | 12,106 | 37,915 | 259,321 | 201,399 | |||||||||||||
| Small-Cap Fund, Class I | 154,350 | 98,696 | (71,389 | ) | 181,657 | 5,218,999 | 8,703 | 221,509 | 383,836 | 115,978 | |||||||||||||
| US Large-Cap Core Responsible Index Fund, Class I | 1,496,712 | 78,342 | (1,575,054 | ) | — | — | — | 4,786,513 | — | (3,967,688 | ) | ||||||||||||
| US Large-Cap Core Responsible Index Fund, Class R6 | — | 1,739,064 | (122,133 | ) | 1,616,931 | 40,876,015 | 533,105 | 111,516 | 375,081 | 4,514,813 | |||||||||||||
| US Large-Cap Growth Responsible Index Fund, Class I | 505,201 | 21,583 | (36,849 | ) | 489,935 | 14,707,836 | 110,366 | 244,298 | 167,388 | 2,625,378 | |||||||||||||
| US Large-Cap Value Responsible Index Fund, Class I | 755,929 | 95,827 | (12,318 | ) | 839,438 | 19,928,259 | 298,885 | 57,403 | 879,374 | 476,030 | |||||||||||||
| US Mid-Cap Core Responsible Index Fund, Class I | 156,311 | 141,279 | (2,499 | ) | 295,091 | 8,100,261 | 60,395 | 3,923 | 111,759 | 755,135 | |||||||||||||
| TOTALS | $158,393,397 | $2,149,544 | $6,430,158 | $2,819,617 | $3,514,726 | ||||||||||||||||||
www.calvert.com CALVERT ASSET ALLOCATION FUNDS ANNUAL REPORT 47
NOTE — CAPITAL SHARES
Transactions in capital shares for the years ended September 30, 2018 and September 30, 2017 were as follows:
| CONSERVATIVE | Year Ended September 30, 2018 | Year Ended September 30, 2017 | |||||||||
| Shares | Amount | Shares | Amount | ||||||||
| Class A | |||||||||||
| Shares sold | 2,180,976 | $37,596,738 | 1,981,979 | $33,126,700 | |||||||
| Reinvestment of distributions | 327,801 | 5,609,954 | 217,729 | 3,582,313 | |||||||
| Shares redeemed | (1,827,394 | ) | (31,382,132 | ) | (2,151,958 | ) | (35,703,955 | ) | |||
| Net increase | 681,383 | $11,824,560 | 47,750 | $1,005,058 | |||||||
| Class C | |||||||||||
| Shares sold | 318,703 | $5,409,924 | 350,847 | $5,765,745 | |||||||
| Reinvestment of distributions | 59,877 | 1,013,444 | 38,422 | 622,901 | |||||||
| Shares redeemed | (366,667 | ) | (6,231,617 | ) | (524,534 | ) | (8,647,576 | ) | |||
| Net increase (decrease) | 11,913 | $191,751 | (135,265 | ) | ($2,258,930 | ) | |||||
| Class I | |||||||||||
| Shares sold | 773,598 | $13,281,667 | 266,172 | $4,450,178 | |||||||
| Reinvestment of distributions | 36,804 | 629,265 | 5,997 | 98,536 | |||||||
| Shares redeemed | (414,494 | ) | (7,122,753 | ) | (157,825 | ) | (2,639,917 | ) | |||
| Conversion from Class Y | 563,657 | 9,881,196 | — | — | |||||||
| Net increase | 959,565 | $16,669,375 | 114,344 | $1,908,797 | |||||||
Class Y (1) | |||||||||||
| Shares sold | 58,801 | $1,022,522 | 655,287 | $10,843,456 | |||||||
| Reinvestment of distributions | — | — | 5,143 | 87,174 | |||||||
| Shares redeemed | (83,453 | ) | (1,454,632 | ) | (96,466 | ) | (1,628,503 | ) | |||
| Conversion to Class I | (563,812 | ) | (9,881,196 | ) | — | — | |||||
| Net increase (decrease) | (588,464 | ) | ($10,313,306 | ) | 563,964 | $9,302,127 | |||||
(1) Effective December 8, 2017, Class Y shares of the Fund converted to Class I shares at net asset value. Thereafter, Class Y shares were terminated. | |||||||||||
48 www.calvert.com CALVERT ASSET ALLOCATION FUNDS ANNUAL REPORT
| MODERATE | Year Ended September 30, 2018 | Year Ended September 30, 2017 | |||||||||
| Shares | Amount | Shares | Amount | ||||||||
| Class A | |||||||||||
| Shares sold | 1,972,821 | $38,427,168 | 1,871,825 | $34,184,103 | |||||||
| Reinvestment of distributions | 548,409 | 10,512,164 | 457,461 | 8,062,036 | |||||||
| Shares redeemed | (1,876,516 | ) | (36,499,346 | ) | (2,701,121 | ) | (48,943,346 | ) | |||
| Net increase (decrease) | 644,714 | $12,439,986 | (371,835 | ) | ($6,697,207 | ) | |||||
| Class C | |||||||||||
| Shares sold | 516,056 | $9,558,830 | 404,329 | $7,013,541 | |||||||
| Reinvestment of distributions | 92,257 | 1,686,140 | 93,798 | 1,580,839 | |||||||
| Shares redeemed | (488,781 | ) | (9,064,356 | ) | (677,620 | ) | (11,748,924 | ) | |||
| Net increase (decrease) | 119,532 | $2,180,614 | (179,493 | ) | ($3,154,544 | ) | |||||
| Class I | |||||||||||
| Shares sold | 963,236 | $18,817,191 | 543,251 | $9,745,165 | |||||||
| Reinvestment of distributions | 45,170 | 866,944 | 10,962 | 191,489 | |||||||
| Shares redeemed | (224,960 | ) | (4,394,879 | ) | (141,632 | ) | (2,590,737 | ) | |||
| Conversion from Class Y | 218,239 | 4,347,504 | — | — | |||||||
| Net increase | 1,001,685 | $19,636,760 | 412,581 | $7,345,917 | |||||||
Class Y (1) | |||||||||||
| Shares sold | 31,981 | $630,011 | 208,511 | $3,800,298 | |||||||
| Reinvestment of distributions | — | — | 1,370 | 24,116 | |||||||
| Shares redeemed | (3,557 | ) | (69,150 | ) | (42,090 | ) | (776,519 | ) | |||
| Conversion to Class I | (218,464 | ) | (4,347,504 | ) | — | — | |||||
| Net increase (decrease) | (190,040 | ) | ($3,786,643 | ) | 167,791 | $3,047,895 | |||||
(1) Effective December 8, 2017, Class Y shares of the Fund converted to Class I shares at net asset value. Thereafter, Class Y shares were terminated. | |||||||||||
www.calvert.com CALVERT ASSET ALLOCATION FUNDS ANNUAL REPORT 49
| AGGRESSIVE | Year Ended September 30, 2018 | Year Ended September 30, 2017 | |||||||||
| Shares | Amount | Shares | Amount | ||||||||
| Class A | |||||||||||
| Shares sold | 1,019,658 | $20,984,060 | 902,755 | $17,031,178 | |||||||
| Reinvestment of distributions | 300,628 | 6,057,659 | 275,795 | 4,947,011 | |||||||
| Shares redeemed | (933,779 | ) | (19,235,497 | ) | (1,135,909 | ) | (21,115,128 | ) | |||
| Net increase | 386,507 | $7,806,222 | 42,641 | $863,061 | |||||||
| Class C | |||||||||||
| Shares sold | 198,663 | $3,510,706 | 122,130 | $1,983,708 | |||||||
| Reinvestment of distributions | 57,534 | 997,061 | 58,413 | 911,004 | |||||||
| Shares redeemed | (216,983 | ) | (3,836,527 | ) | (258,351 | ) | (4,180,783 | ) | |||
| Net increase (decrease) | 39,214 | $671,240 | (77,808 | ) | ($1,286,071 | ) | |||||
| Class I | |||||||||||
| Shares sold | 443,339 | $9,214,545 | 116,645 | $2,120,665 | |||||||
| Reinvestment of distributions | 17,836 | 360,106 | 5,981 | 107,065 | |||||||
| Shares redeemed | (88,806 | ) | (1,836,574 | ) | (92,904 | ) | (1,716,773 | ) | |||
| Conversion from Class Y | 101,282 | 2,138,971 | — | — | |||||||
| Net increase | 473,651 | $9,877,048 | 29,722 | $510,957 | |||||||
Class Y (1) | |||||||||||
| Shares sold | 47,128 | $973,817 | 68,147 | $1,275,567 | |||||||
| Reinvestment of distributions | — | — | 471 | 8,458 | |||||||
| Shares redeemed | (3,134 | ) | (65,342 | ) | (18,526 | ) | (347,295 | ) | |||
| Conversion to Class I | (101,313 | ) | (2,138,971 | ) | — | — | |||||
| Net increase (decrease) | (57,319 | ) | ($1,230,496 | ) | 50,092 | $936,730 | |||||
(1) Effective December 8, 2017, Class Y shares of the Fund converted to Class I shares at net asset value. Thereafter, Class Y shares were terminated. | |||||||||||
50 www.calvert.com CALVERT ASSET ALLOCATION FUNDS ANNUAL REPORT
REPORT OF INDEPENDENT REGISTERED PUBLIC ACCOUNTING FIRM
To the Shareholders and Board of Trustees
Calvert Social Investment Fund:
Opinion on the Financial Statements
We have audited the accompanying statements of assets and liabilities of Calvert Conservative Allocation Fund, Calvert Moderate Allocation Fund and Calvert Aggressive Allocation Fund (collectively, the Funds), each a series of Calvert Social Investment Fund, including the schedules of investments, as of September 30, 2018, the related statements of operations for the year then ended, the statements of changes in net assets for each of the years in the two-year period then ended, and the related notes (collectively, the financial statements) and the financial highlights for each of the years or periods in the five-year period then ended. In our opinion, the financial statements and financial highlights present fairly, in all material respects, the financial position of the Funds as of September 30, 2018, the results of their operations for the year then ended, the changes in their net assets for each of the years in the two-year period then ended, and the financial highlights for each of the years or periods in the five-year period then ended, in conformity with U.S. generally accepted accounting principles.
Basis for Opinion
These financial statements and financial highlights are the responsibility of the Funds’ management. Our responsibility is to express an opinion on these financial statements and financial highlights based on our audits. We are a public accounting firm registered with the Public Company Accounting Oversight Board (United States) (PCAOB) and are required to be independent with respect to the Funds in accordance with the U.S. federal securities laws and the applicable rules and regulations of the Securities and Exchange Commission and the PCAOB.
We conducted our audits in accordance with the standards of the PCAOB. Those standards require that we plan and perform the audit to obtain reasonable assurance about whether the financial statements and financial highlights are free of material misstatement, whether due to error or fraud. Our audits included performing procedures to assess the risks of material misstatement of the financial statements and financial highlights, whether due to error or fraud, and performing procedures that respond to those risks. Such procedures included examining, on a test basis, evidence regarding the amounts and disclosures in the financial statements and financial highlights. Such procedures also included confirmation of securities owned as of September 30, 2018, by correspondence with custodians, brokers and transfer agents. Our audits also included evaluating the accounting principles used and significant estimates made by management, as well as evaluating the overall presentation of the financial statements and financial highlights. We believe that our audits provide a reasonable basis for our opinion.
We have served as the auditor of one or more of the Calvert Funds since 2002.
Philadelphia, Pennsylvania
November 21, 2018
www.calvert.com CALVERT ASSET ALLOCATION FUNDS ANNUAL REPORT 51
FEDERAL TAX INFORMATION
The Form 1099-DIV you receive in February 2019 will show the tax status of all distributions paid to your account in calendar year 2018. Shareholders are advised to consult their own tax adviser with respect to the tax consequences of their investment in the Funds. As required by the Internal Revenue Code and/or regulations, shareholders must be notified regarding the status of qualified dividend income for individuals, the dividends received deduction for corporations and capital gains dividends.
Qualified Dividend Income. For the fiscal year ended September 30, 2018, the Funds designate the following amounts, or up to the maximum amount of such dividends allowable pursuant to the Internal Revenue Code, as qualified dividend income eligible for the reduced tax rate of 15%:
| Conservative Allocation Fund | $1,192,966 | ||
| Moderate Allocation Fund | $3,272,146 | ||
| Aggressive Allocation Fund | $2,180,765 | ||
Dividends Received Deduction. Corporate shareholders are generally entitled to take the dividends received deduction on the portion of each Fund’s dividend distribution that qualifies under tax law. For each Fund’s fiscal 2018 ordinary income dividends, the following qualifies for the corporate dividends received deduction:
| Conservative Allocation Fund | 17.16 | % |
| Moderate Allocation Fund | 34.17 | % |
| Aggressive Allocation Fund | 50.20 | % |
Capital Gains Dividends. The Funds hereby designate as a capital gain dividend with respect to the taxable year ended September 30, 2018, the following amounts or, if subsequently determined to be different, the net capital gain of such year:
| Conservative Allocation Fund | $3,948,422 | ||
| Moderate Allocation Fund | $9,486,235 | ||
| Aggressive Allocation Fund | $5,901,230 | ||
52 www.calvert.com CALVERT ASSET ALLOCATION FUNDS ANNUAL REPORT (Unaudited)
MANAGEMENT AND ORGANIZATION
Fund Management. The Trustees of Calvert Social Investment Fund (the Trust) are responsible for the overall management and supervision of the Trust’s affairs. The Trustees and officers of the Trust are listed below. Except as indicated, each individual has held the office shown or other offices in the same company for the last five years. Trustees and officers of the Trust hold indefinite terms of office. The “Independent Trustees” consist of those Trustees who are not “interested persons” of the Trust, as that term is defined under the 1940 Act. The business address of each Trustee and officer, with the exception of Ms. Gemma and Mr. Kirchner, is 1825 Connecticut Avenue NW, Suite 400, Washington, DC 20009. As used below, “CRM” refers to Calvert Research and Management. Each Trustee oversees 39 funds in the Calvert fund complex. Each officer serves as an officer of certain other Calvert funds.
| Name and Year of Birth | Position with Trust | Position Start Date | Principal Occupation(s) and Directorships During Past Five Years and Other Relevant Experience |
| Interested Trustee | |||
John H. Streur(1) 1960 | Trustee & President | 2015 | President and Chief Executive Officer of Calvert Research and Management (since December 31, 2016). President and Chief Executive Officer of Calvert Investments, Inc. (January 2015 - December 2016); Chief Executive Officer of Calvert Investment Distributors, Inc. (August 2015 - December 2016); Chief Compliance Officer of Calvert Investment Management, Inc. (August 2015 - April 2016); President and Director, Portfolio 21 Investments, Inc. (through October 2014); President, Chief Executive Officer and Director, Managers Investment Group LLC (through January 2012); President and Director, The Managers Funds and Managers AMG Funds (through January 2012). Directorships in the Last Five Years. Portfolio 21 Investments, Inc. (asset management) (through October 2014); Managers Investment Group LLC (asset management) (through January 2012); The Managers Funds (asset management) (through January 2012); Managers AMG Funds (asset management) (through January 2012); Calvert Impact Capital, Inc. |
| Independent Trustees | |||
| Richard L. Baird, Jr 1948 | Trustee | 1982 | Former President and CEO of Adagio Health Inc. (retired in 2014) in Pittsburgh, PA, a non-profit corporation which provides family planning services, nutrition, maternal/child health care, and various health screening services and community preventive health programs. Directorships in the Last Five Years. None. |
| Alice Gresham Bullock 1950 | Chair & Trustee | 2016 | Professor at Howard University School of Law (retired June 2016). She is former Dean of Howard University School of Law (1996-2002) and Deputy Director of the Association of American Law Schools (1992-1994). Directorships in the Last Five Years. None. |
| Cari M. Dominguez 1949 | Trustee | 2016 | Former Chair of the U.S. Equal Employment Opportunity Commission. Directorships in the Last Five Years. Manpower, Inc. (employment agency); Triple S Management Corporation (managed care); National Association of Corporate Directors. |
| John G. Guffey, Jr. 1948 | Trustee | 1982 | President of Aurora Press Inc., a privately held publisher of trade paperbacks (since January 1997). Directorships in the Last Five Years. Calvert Impact Capital, Inc.; Calvert Ventures, LLC. |
www.calvert.com CALVERT ASSET ALLOCATION FUNDS ANNUAL REPORT (Unaudited) 53
| Name and Year of Birth | Position with Trust | Position Start Date | Principal Occupation(s) and Directorships During Past Five Years and Other Relevant Experience |
| Miles D. Harper, III 1962 | Trustee | 2005 | Partner, Carr Riggs & Ingram (public accounting firm) since October 2014. Partner, Gainer Donnelly & Desroches (public accounting firm) (now Carr Riggs & Ingram), November 1999 - September 2014). Directorships in the Last Five Years. Bridgeway Funds (10) (asset management). |
| Joy V. Jones 1950 | Trustee | 1990 | Attorney. Directorships in the Last Five Years. Conduit Street Restaurants SUD 2 Limited; Palm Management Restaurant Corporation. |
| Anthony A. Williams 1951 | Trustee | 2016 | CEO and Executive Director of the Federal City Council (July 2012 to present); Senior Adviser and Independent Consultant for McKenna Long & Aldridge LLP (September 2011 to present); Executive Director of Global Government Practice at the Corporate Executive Board (January 2010 to January 2012). Directorships in the Last Five Years. Freddie Mac; Evoq Properties/ Meruelo Maddux Properties, Inc. (real estate management); Weston Solutions, Inc. (environmental services); Bipartisan Policy Center’s Debt Reduction Task Force; Chesapeake Bay Foundation; Catholic University of America; Urban Institute (research organization). |
| Principal Officers who are not Trustees | |||
| Name and Year of Birth | Position with Trust | Position Start Date | Principal Occupation During Past Five Years |
| Hope L. Brown 1973 | Chief Compliance Officer | 2014 | Chief Compliance Officer of 39 registered investment companies advised by CRM (since 2014). Vice President and Chief Compliance Officer, Wilmington Funds (2012-2014). Vice President and Senior Compliance Officer, Wilmington Trust Investment Advisors, Inc. (2010-2012). |
Maureen A. Gemma(2) 1960 | Secretary, Vice President and Chief Legal Officer | 2016 | Vice President of CRM and officer of 39 registered investment companies advised by CRM (since 2016). Also Vice President of Eaton Vance Management (“EVM”) and certain of its affiliates and officer of 174 registered investment companies advised or administered by EVM. |
James F. Kirchner(2) 1967 | Treasurer | 2016 | Vice President of CRM and officer of 39 registered investment companies advised by CRM (since 2016). Also Vice President of EVM and certain of its affiliates and officer of 174 registered investment companies advised or administered by EVM. |
(1) | Mr. Streur is an interested person of the Funds because of his positions with each Fund’s Adviser and certain affiliates. |
(2) | The business address for Ms. Gemma and Mr. Kirchner is Two International Place, Boston, MA 02110. |
The SAI for the Funds includes additional information about the Trustees and officers of the Funds and can be obtained without charge on Calvert’s website at www.calvert.com or by calling 1-800-368-2745.
54 www.calvert.com CALVERT ASSET ALLOCATION FUNDS ANNUAL REPORT (Unaudited)
IMPORTANT NOTICES
Privacy. The Calvert Funds and Calvert Research and Management are committed to ensuring your financial privacy. Each of the financial institutions identified below has in effect the following policy (“Privacy Policy”) with respect to nonpublic personal information about its customers:
| • | Only such information received from you, through application forms or otherwise, and information about your Calvert fund transactions will be collected. This may include information such as name, address, social security number, tax status, account balances and transactions. |
| • | None of such information about you (or former customers) will be disclosed to anyone, except as permitted by law (which includes disclosure to employees necessary to service your account). In the normal course of servicing a customer’s account, Calvert Research and Management may share information with unaffiliated third parties that perform various required services such as transfer agents, custodians and broker-dealers. |
| • | Policies and procedures (including physical, electronic and procedural safeguards) are in place that are designed to protect the confidentiality of such information. |
| • | The Funds reserve the right to change this Privacy Policy at any time upon proper notification to you. Customers may want to review the Funds’ Privacy Policy periodically for changes by accessing the link on our homepage: www.calvert.com. |
Our pledge of privacy applies to the following entities: the Calvert Family of Funds, Calvert Research and Management and their affiliated service providers, Eaton Vance Management and Eaton Vance Distributors, Inc. In addition, our Privacy Policy applies only to those Calvert customers who are individuals and who have a direct relationship with us. If a customer’s account (i.e., fund shares) is held in the name of a third-party financial advisor/broker-dealer, it is likely that only such advisor’s privacy policies apply to the customer. This notice supersedes all previously issued privacy disclosures. For more information about Calvert’s Privacy Policy, please call 1-800-368-2745.
Delivery of Shareholder Documents. The Securities and Exchange Commission (SEC) permits funds to deliver only one copy of shareholder documents, including prospectuses, proxy statements and shareholder reports, to fund investors with multiple accounts at the same residential or post office box address. This practice is often called “householding” and it helps eliminate duplicate mailings to shareholders. Calvert funds, or your financial advisor, may household the mailing of your documents indefinitely unless you instruct Calvert funds, or your financial advisor, otherwise. If you would prefer that your Calvert fund documents not be householded, please contact Calvert funds at 1-800-368-2745, or contact your financial advisor. Your instructions that householding not apply to delivery of your Calvert fund documents will typically be effective within 30 days of receipt by Calvert funds or your financial advisor. Separate statements will be generated for each separate account and will be householded as described above.
Portfolio Holdings. Each Calvert fund will file a schedule of portfolio holdings on Form N-Q with the SEC for the first and third quarters of each fiscal year. The Form N-Q will be available on the Calvert funds’ website at www.calvert.com, by calling Calvert funds at 1-800-368-2745 or in the EDGAR database on the SEC’s website at www.sec.gov. Form N-Q may also be reviewed and copied at the SEC’s public reference room in Washington, D.C. (call 1-800-732-0330 for information on the operation of the public reference room).
Proxy Voting. The Proxy Voting Guidelines that each Calvert fund uses to determine how to vote proxies relating to portfolio securities is provided as an Appendix to the fund’s Statement of Additional Information. The Statement of Additional Information can be obtained free of charge by calling the Calvert funds at 1-800-368-2745, by visiting the Calvert funds’ website at www.calvert.com or visiting the SEC’s website at www.sec.gov. Information regarding how a Calvert fund voted proxies relating to portfolio securities during the most recent 12-month period ended June 30 is available by calling Calvert funds, by visiting the Calvert funds’ website at www.calvert.com or by visiting the SEC’s website at www.sec.gov.
www.calvert.com CALVERT ASSET ALLOCATION FUNDS ANNUAL REPORT (Unaudited) 55
| This page intentionally left blank. |
| CALVERT ASSET ALLOCATION FUNDS | |
Investment Adviser and Administrator Calvert Research and Management 1825 Connecticut Avenue NW, Suite 400 Washington, DC 20009 | Transfer Agent DST Asset Manager Solutions, Inc. 2000 Crown Colony Drive Quincy, MA 02169 |
Principal Underwriter* Eaton Vance Distributors, Inc. Two International Place Boston, MA 02110 (617) 482-8260 | Independent Registered Public Accounting Firm KPMG LLP 1601 Market Street Philadelphia, PA 19103-2499 |
Custodian State Street Bank and Trust Company State Street Financial Center, One Lincoln Street Boston, MA 02111 | Fund Offices 1825 Connecticut Avenue NW, Suite 400 Washington, DC 20009 |
* FINRA BrokerCheck. Investors may check the background of their Investment Professional by contacting the Financial Industry Regulatory Authority (FINRA). FINRA BrokerCheck is a free tool to help investors check the professional background of current and former FINRA-registered securities firms and brokers. FINRA BrokerCheck is available by calling 1-800-289-9999 and at www.FINRA.org. The FINRA BrokerCheck brochure describing this program is available to investors at www.FINRA.org.
Fund shares are not insured by the FDIC and are not deposits or other obligations of, or guaranteed by, any depository institution. Shares are subject to investment risks, including possible loss of principal invested. This report is intended to provide fund information to shareholders. It is not authorized for distribution to prospective investors unless preceded or accompanied by a prospectus. Note: The information on our website is not incorporated by reference into this report; our website address is included as an inactive textual reference only. Investors should carefully consider the investment objectives, risks, charges and expenses of the Calvert funds. This and other important information is contained in the fund’s summary prospectus and prospectus, which can be obtained from your financial professional and should be read carefully before investing. You may also call the Calvert funds at 800-368-2745. Printed on recycled paper. | |
| 24205 9.30.18 | |
Item 2. Code of Ethics
The registrant has adopted a code of ethics applicable to its Principal Executive Officer, Principal Financial Officer and Principal Accounting Officer. The registrant undertakes to provide a copy of such code of ethics to any person upon request, without charge, by calling 1-800-368-2745. The registrant has amended the code of ethics as described in Form N-CSR during the period covered by this report to make immaterial changes. The registrant has not granted any waiver, including an implicit waiver, from a provision of the code of ethics as described in Form N-CSR during the period covered by this report.
Item 3. Audit Committee Financial Expert
The registrant's Board of Trustees has determined that Miles D. Harper III, an “independent” Trustee serving on the registrant’s audit committee, is an “audit committee financial expert,” as defined in Item 3 of Form N-CSR. Under applicable securities laws, a person who is determined to be an audit committee financial expert will not be deemed an "expert" for any purpose, including without limitation for the purposes of Section 11 of the Securities Act of 1933, as a result of being designated or identified as an audit committee financial expert. The designation or identification of a person as an audit committee financial expert does not impose on such person any duties, obligations, or liabilities that are greater than the duties, obligations, and liabilities imposed on such person as a member of the audit committee and Board of Trustees in the absence of such designation or identification.
Item 4. Principal Accountant Fees and Services
(a) –(d)
The following table presents the aggregate fees billed to the registrant for the registrant’s fiscal years ended September 30, 2017 and September 30, 2018 by KPMG for professional services rendered for the audit of the registrant’s annual financial statements and fees billed for other services rendered by KPMG during such periods.
| Fiscal Years Ended | 9/30/17 | %* | 9/30/18 | %* | ||||||
| Audit Fees | $192,290 | 4.7 | % | $190,478 | 4.3 | % | ||||
| Audit-Related Fees | $0 | 0 | % | $0 | 0 | % | ||||
Tax Fees(1) | $34,200 | 0 | % | $35,850 | 0 | % | ||||
| All Other Fees | $0 | 0 | % | $0 | 0 | % | ||||
| Total | $226,490 | 4.0 | % | $226,328 | 3.6 | % | ||||
*Percentage of fees approved by the Audit Committee pursuant to (c)(7)(i)(C) of Rule 2-01 of Reg. S-X (statutory de minimis waiver of committee’s requirement to pre-approve).
(1) | Tax fees consist of the aggregate fees billed for professional services rendered by the principal accountant relating to tax compliance, tax advice, and tax planning and specifically include fees for tax return preparation and other related tax compliance/planning matters. |
(e) The Audit Committee is required to pre-approve all audit and non-audit services provided to the registrant by the auditors, and to the registrant’s investment adviser, and any entity controlling, controlled by, or under common control with the adviser that provides ongoing services to the registrant. In determining whether to pre-approve non-audit services, the Audit Committee considers whether the services are consistent with maintaining the independence of the auditors. The Committee may delegate its authority to pre-approve certain matters to one or more of its members. In this regard, the Committee has delegated authority jointly to the Audit Committee Chair together with another Committee member with respect to non-audit services not exceeding $25,000 in each instance. In addition, the Committee has pre-approved the retention of the auditors to provide tax-related services related to the tax treatment and tax accounting of newly acquired securities, upon request by the investment adviser in each instance.
(f) Not applicable.
(g) Aggregate non-audit fees billed by the registrant’s accountant for services rendered to the registrant, and rendered to the registrant’s investment adviser, and any entity controlling, controlled by, or under common control with the adviser that provides ongoing services to the registrant for each of the last two fiscal years of the registrant:
Fiscal Year ended 9/30/17 | Fiscal Year ended 9/30/18 | ||
| $ | %* | $ | %* |
| $79,200 | 0% | $35,850 | 0% |
*Percentage of fees approved by the Audit Committee pursuant to (c)(7)(i)(C) of Rule 2-01 of Reg. S-X (statutory de minimis waiver of committee’s requirement to pre-approve)
(h) The registrant’s audit committee has considered whether the provision by the registrant’s principal accountant of non-audit services to the registrant’s investment adviser and any entity controlling, controlled by, or under common control with the adviser that provides ongoing services to the registrant that were not pre-approved pursuant to Rule 2-01(c)(7)(ii) of Regulation S-X is compatible with maintaining the principal accountant’s independence.
Item 5. Audit Committee of Listed Registrants
Not applicable.
Item 6. Schedule of Investments
Please see schedule of investments contained in the Report to Stockholders included under Item 1 of this Form N-CSR.
Item 7. Disclosure of Proxy Voting Policies and Procedures for Closed-End Management Investment Companies
Not applicable.
Item 8. Portfolio Managers of Closed-End Management Investment Companies
Not applicable.
Item 9. Purchases of Equity Securities by Closed-End Management Investment Company and Affiliated Purchasers
Not applicable.
Item 10. Submission of Matters to a Vote of Security Holders
No material changes.
Item 11. Controls and Procedures
(a) The registrant’s principal executive and principal financial officers have concluded that the registrant's disclosure controls and procedures (as defined in Rule 30a-3(c) under the Investment Company Act of 1940 Act, as amended (the “1940 Act”) are effective, based on the evaluation of these controls and procedures required by Rule 30a-3(b) under the 1940 Act and Rules 13a-15(b) or 15d-15(b) under the Securities Exchange Act of 1934 (“Exchange Act”), as of a date within 90 days of the filing date of this report.
(b) There was no change in the registrant's internal control over financial reporting (as defined in Rule 30a-3(d) under the 1940 Act) that occurred during the second fiscal quarter of the period covered by this report that has materially affected, or is reasonably likely to materially affect, the registrant's internal control over financial reporting.
Item 12. Disclosure of Securities Lending Activities for Closed-End Management Investment Companies
Not applicable.
Item 13. Exhibits
(a)(1) Registrant’s Code of Ethics – Not applicable (please see Item 2).
(a)(2)(i) Treasurer’s Section 302 certification.
(a)(2)(ii) President’s Section 302 certification.
(b) Combined Section 906 certification.
Signatures
Pursuant to the requirements of the Securities Exchange Act of 1934 and the Investment Company Act of 1940, the registrant has duly caused this report to be signed on its behalf by the undersigned, thereunto duly authorized.
CALVERT SOCIAL INVESTMENT FUND
By: /s/ John H. Streur
John H. Streur
President
Date: November 26, 2018
Pursuant to the requirements of the Securities Exchange Act of 1934 and the Investment Company Act of 1940, this report has been signed below by the following persons on behalf of the registrant and in the capacities and on the dates indicated.
By: /s/ James F. Kirchner
James F. Kirchner
Treasurer
Date: November 26, 2018
By: /s/ John H. Streur
John H. Streur
President
Date: November 26, 2018