UNITED STATES
SECURITIES AND EXCHANGE COMMISSION
Washington, D.C. 20549
FORM N-CSR
CERTIFIED SHAREHOLDER REPORT OF REGISTERED
MANAGEMENT INVESTMENT COMPANIES
Investment Company Act file number: 811-3334
CALVERT SOCIAL INVESTMENT FUND
(Exact name of registrant as specified in charter)
4550 Montgomery Avenue
Suite 1000N
Bethesda, Maryland 20814
(Address of Principal Executive Offices)
John H. Streur
4550 Montgomery Avenue
Suite 1000N
Bethesda, Maryland 20814
(Name and Address of Agent for Service)
Registrant's telephone number, including area code: (301) 951-4800
Date of fiscal year end: September 30
Date of reporting period: Twelve months ended September 30, 2016
Item 1. Report to Stockholders.
 |  | |
Calvert Social Investment Fund • Calvert Balanced Portfolio• Calvert Bond Portfolio• Calvert Equity Portfolio |  | |
 | | |
Annual Report September 30, 2016 E-Delivery Sign-Up — Details Inside |  |
Choose Planet-friendly E-delivery! Sign up now for on-line statements, prospectuses, and fund reports. In less than five minutes you can help reduce paper mail and lower fund costs. Just go to calvert.com. If you already have an online account at Calvert, click on Login, to access your Account, and select the documents you would like to receive via e-mail. If you’re new to online account access, click on Login, then Register to create your user name and password. Once you’re in, click on the E-delivery sign-up on the Account Portfolio page and follow the quick, easy steps. Note: if your shares are not held directly at Calvert but through a brokerage firm, you must contact your broker for electronic delivery options available through their firm. |
 | TABLE OF CONTENTS | ||
| President's Letter | |||
| Balanced Portfolio Management Discussion | |||
| Bond Portfolio Management Discussion | |||
| Equity Portfolio Management Discussion | |||
| Understanding Your Fund’s Expenses | |||
| Report of Independent Registered Public Accounting Firm | |||
| Schedules of Investments | |||
| Statements of Assets and Liabilities | |||
| Statements of Operations | |||
| Statements of Changes in Net Assets | |||
| Notes to Financial Statements | |||
| Financial Highlights | |||
| Proxy Voting | |||
| Availability of Quarterly Portfolio Holdings | |||
| Trustee and Officer Information Table | |||
 | John Streur President and Chief Executive Officer, Calvert Investments, Inc. |  |
Dear Fellow Shareowners and Friends,
Forty years ago, Calvert Investments was founded on the belief that investment capital, properly stewarded, could improve the world for its less powerful inhabitants and improve environmental sustainability, while producing reasonable investment returns. Calvert was one of the first investment advisers to introduce the responsible investment concept, and through many years of innovation and research (supported by you, our shareholders), we have developed this philosophy to now provide even greater shareholder engagement and impact.
Corporations throughout the world, big and small, have an ever increasing role in determining social and environmental outcomes for every living being, today and into the future. The power of corporations, garnered through global influence, human capital and financial strength, especially relative to our other institutions, has been steadily increasing for decades (http://www.calvert.com/perspective/research/calvert-serafeim-series-report).
Investors recognize the impact of corporations on society, and more and more are making investment decisions based on their assessments of a company’s effect on environmental and social outcomes. Companies able to operate their business in a perceived sustainable manner, promoting, environmental and social justice stand to benefit; while those corporate laggards, that fail to embrace these new responsibilities, will falter.
Reliable information is critical in ensuring that shareholders are able to make informed assessments regarding a corporation’s sustainability profile. Key performance metrics and data (a “sustainability information system”) that indicates how a company is performing regarding environmental and social impacts, is integral to making informed responsible investment decisions. Through partnerships with world class educational institutions and forward thinking business partners, Calvert is developing valuable research methodologies and metrics to assess the quality of data inputs and results, such that we are able to assess companies’ impacts. Are we completely there yet? No, but as data becomes more transparent and consistent, driven, in part by investor demands and regulatory authorities, we will get there, such that we and other market participants can make better informed investment and purchase decisions. For example, key data that measures “true” intrinsic and extrinsic product costs, including indirect environmental and social impacts could be relevant to investors when making corporate comparisons regarding risk and profitability, and also of great interest to consumers making product purchase decisions.
Calvert is participating in the Sustainability Accounting Standards Board Investment Advisory Group, which is working to move the disclosure of ESG metrics forward through corporate SEC filings (http://www.sasb.org/). Calvert is also working to map the United Nations Sustainable Development Goals to the SASB standards (http://www.calvert.com/perspective/social-impact/unsdg-faq), in order to better evaluate the progress of any public corporation on its path towards global sustainability.
Also, involved in this effort are millions of individuals and small organizations throughout the world who are adding to this mosaic of information through their local and specialized efforts and services. They often have access to pockets of information that are not publically available or disseminated, and thereby not available to the financial data service companies. Our myriad and long running engagements with NGOs and corporations provide critical insight to our analysts, driving the enhancement of our information infrastructure forward, as they research potential investments for your portfolios and design shareholder activist agendas.
ESG data about corporate behavior provides a useful baseline, but takes on additional meaning as the Calvert Principles for Responsible Investment guide our interpretation of the data, acting as our “responsibility compass” (http://www.calvert.com/approach/how-we-invest/the-calvert-principles). In addition to providing a context consistent with Calvert’s mission, our Principles lead us to areas where additional, fundamental research is needed to develop a real understanding of corporate impact on society and the environment. In our complex, globalized and rapidly evolving world, the Principles allow us to contextualize information, whereas a rules based system, or an exclusive reliance on data from companies may miss valuable situational and circumstantial inference, as evidenced in the issues surrounding Standing Rock and the role of the corporation, Energy Transfer Partners. The Standing Rock Sioux Nation is striving to halt construction of the Dakota Access Pipeline crossing their sacred land and threatening water contamination (see our resolution in support of the Standing Rock Sioux Nation, (http://www.calvert.com/perspective/climate-and-environment/calvert-releases-statement-in-support-of-standing-rock-sioux-nation).
4 calvert.com CALVERT SOCIAL INVESTMENT FUND ANNUAL REPORT (UNAUDITED)
The concerns surrounding social license and indigenous peoples’ rights are complex and do not lend themselves easily to objective quantification methods employed by the traditional financial data sources. That is why the fundamental overlay performed by the Calvert research analysts is so essential to our effective responsible investing process.
While effecting change through thoughtful ESG capital allocations is important, direct impact can be made through shareholder activism, or more specifically advocacy. Calvert’s shareholder advocacy process (28 resolutions last year) has been effective in influencing corporate behavior and provides another avenue for influencing valuable societal and environmental outcomes (http://www.calvert.com/perspective/social-impact/2016-proxy-season-brings-opportunity-to-accelerate-corporate-sustainability-progress).
Calvert’s voice reflects and respects diversity of thought and is often used to protect the interests of those most in need, and to look out for future generations. We thank you, our shareholders, friends and partners in this mission, for a good start. We promise that our work will never be done and the next forty years will reflect the increasing imperative to work vigorously to produce competitive returns for you and to use our power to forge a better today and future for our society. Often this requires Calvert to go where other investment firms have not, and to speak out and act when others do not.
Thank you, as always, for the incredible privilege to serve your needs through the Calvert Funds.
Respectfully,

John Streur
September 2016
calvert.com CALVERT SOCIAL INVESTMENT FUND ANNUAL REPORT (UNAUDITED) 5
 | PORTFOLIO MANAGEMENT DISCUSSION |
 | Vishal Khanduja, CFA Senior Vice President, Lead Portfolio Manager, Head of Fixed Income |  | Brian S. Ellis, CFA Portfolio Manager |
 | Joshua Linder, CFA Portfolio Manager |  | Christopher Madden, CFA Portfolio Manager |
 | Kurt Moeller, CFA Portfolio Manager |  | Jade Huang Portfolio Manager |
Market Review
For the 12-month period ended September 30, 2016, the S&P 500 Index rose 15.43% and the Russell 1000 Index rose 14.93% while the MSCI EAFE Index and MSCI Emerging Markets Index rose 6.52% and 16.78%, respectively.
The United States Federal Reserve Board (the “Fed”) raised interest rates only one time during the period. This was less than many observers had expected. Long-term government bond yields ended the period lower than where they began in nearly every major economy. The Japanese yen generally strengthened and the British pound weakened over the period, with the U.S. dollar remaining relatively stable vs. the Euro and the Chinese Yuan. Commodity prices fluctuated but most ended near their starting point, except for the price of gold increasing to over $1,300/oz., as of September 30, 2016.
The strong stock returns masked volatility which occurred during the twelve months. Stocks rallied to end 2015, then struggled in the first quarter of 2016, as investors became concerned about near-term economic growth. From April - September 2016 global stocks rallied as central banks kept interest rates low and economic data was generally positive.
The U.S. monthly jobs reports showed more new jobs created in June and July than in any previous month during 2016. The housing and consumer recovery continued to pick up steam. OPEC announced its first production cut in eight years in September. However, market reaction was muted as any negative effects are likely to be mitigated by U.S. producers’ ability to step in and fill outstanding demand. Inflation remained low, contributing to the decision by the Fed in September to maintain its steady-state interest rate policy, while indicating an increased probability of a December rate hike.
Investment Strategy and Technique
The Portfolio typically invests about 60% of its assets in equity securities and 40% in fixed income investments. The equity portion is primarily large-cap U.S. stocks. The fixed-income portion is primarily a variety of investment-grade debt securities. In conjunction with Calvert’s financial analysis, Calvert’s comprehensive responsible investment principles guide our investment research processes and decision-making to inform our view of risk and opportunity factors.
Fund Performance Relative to the Benchmark
For the 12 months ending September 30, 2016, Calvert Balanced Portfolio Class A (at NAV) posted a return of 8.93%, underperforming the benchmark, the Russell 1000 Index, which returned 14.93%.
The Portfolio also underperformed a blended return from the Balanced Composite benchmark, a mix of market indexes that more closely reflects the Portfolio’s asset allocation strategy. The composite benchmark returned 11.43% for the period.
6 calvert.com CALVERT SOCIAL INVESTMENT FUND ANNUAL REPORT (UNAUDITED)
| CALVERT BALANCED PORTFOLIO | ||||
| SEPTEMBER 30, 2016 | ||||
| TEN LARGEST STOCK HOLDINGS | % OF NET ASSETS | |||
| Apple, Inc. | 2.9 | % | ||
| Verizon Communications, Inc. | 1.5 | % | ||
| Microsoft Corp. | 1.4 | % | ||
| Omnicom Group, Inc. | 1.4 | % | ||
| CVS Health Corp. | 1.4 | % | ||
| Wells Fargo & Co. | 1.4 | % | ||
| Amgen, Inc. | 1.4 | % | ||
| Merck & Co., Inc. | 1.3 | % | ||
| Pfizer, Inc. | 1.3 | % | ||
| Cisco Systems, Inc. | 1.2 | % | ||
| Total | 15.2 | % | ||
Relative underperformance by the equity portion of the Portfolio compared with the Russell 1000 Index was the largest detractor during the period.
A year ago, we were expecting interest rates to rise after remaining low for many years. Instead, interest rates on long-term government bonds continued to move down globally. As we reassessed our interest rate view, we sold some insurance stocks, which invest over long time periods and are hurt by low rates.
We increased the Fund’s weighting in Information Technology, which continues to benefit from strong demand, especially for semiconductors and related equipment. With prices apparently stabilizing for energy and metals, we increased the Fund’s holdings in the Energy and Materials sectors.
Sector allocation was the biggest detractor from performance. In a falling rate environment, the Fund’s overweight to Financials and underweight in Utilities each hurt results.
Stock selection also hurt, with Information Technology being the biggest source of weakness. We continue to own Apple, whose stock struggled for much of 2016, but began rising in July after solid results. Reviews of Apple’s iPhone 7, launched in September, were mixed. But Apple’s stock moved up after reports of fires caused by the newest top-of-the-line phone from Samsung, Apple’s chief smartphone rival.
A positive contributor was global advertising agency Omnicom. Omnicom has skillfully navigated the shift toward digital advertising, and it continues to achieve strong organic revenue growth. Unlike main competitors WPP and Publicis, Omnicom is making only small acquisitions and returning lots of cash to shareholders through dividends and stock buybacks.
The Fixed Income allocation of the Portfolio outperformed during the period. Both the core fixed income and the
unconstrained bond sleeves outperformed their benchmarks.
| CALVERT BALANCED PORTFOLIO | ||||||
| SEPTEMBER 30, 2016 | ||||||
| INVESTMENT PERFORMANCE | ||||||
| (TOTAL RETURN AT NAV) | ||||||
6 MONTHS ENDED 9/30/16 | 12 MONTHS ENDED 9/30/16 | |||||
| Class A | 4.79 | % | 8.93 | % | ||
| Class C | 4.36 | % | 8.05 | % | ||
| Class I | 4.98 | % | 9.32 | % | ||
| Class Y | 4.91 | % | 9.15 | % | ||
| Russell 1000 Index | 6.67 | % | 14.93 | % | ||
| Balanced Composite Benchmark | 5.13 | % | 11.43 | % | ||
| Lipper Mixed-Asset Target Alloc. Growth Funds Average | 5.31 | % | 9.23 | % | ||
Investment performance/return at NAV does not reflect the deduction of the Fund’s maximum 4.75% front-end sales charge or any deferred sales charges. Balanced Composite benchmark is comprised of 60% Russell 1000 Index and 40% Barclays U.S. Credit Index. | ||||||
| CALVERT BALANCED PORTFOLIO | ||||
| SEPTEMBER 30, 2016 | ||||
| ASSET ALLOCATION | % OF TOTAL INVESTMENTS* | |||
| Equity | 61.2 | % | ||
| Fixed Income | 36.0 | % | ||
| Short-Term Investments | 2.8 | % | ||
| Total | 100 | % | ||
| * Does not reflect the value of securities held as cash collateral on securities loaned. | ||||
Outperformance for the period was primarily due to asset allocation decisions. The fixed income portion was broadly positioned to benefit from a recovery in U.S. dollar fixed income risk assets.
Specifically, an overweight to investment grade corporates, out of benchmark high-yield, non-agency CMBS, ABS and RMBS all helped outperform passive fixed income indexes.
The fixed income allocation maintained a relatively short interest rate duration throughout the period as we believed that the volatility associated with the low absolute return potential for a longer duration assets was not attractive. This was a slight detractor as interest rates declined during the period.
calvert.com CALVERT SOCIAL INVESTMENT FUND ANNUAL REPORT (UNAUDITED) 7
Positioning and Market Outlook
We remain constructive on the U.S. economy over the medium-to-long run and believe U.S. stocks can continue to post solid performance, although probably not as robust as what we’ve experienced in recent years. While valuations of U.S. equities appear stretched based on historical standards, the positive economic environment in the U.S. relative to the rest of the world should support elevated valuation levels. Many international economies continue to be hindered by underlying structural and economic fiscal challenges, including Europe and Japan.
In the near-term, equity markets face several potential headwinds. The U.S. economy is in solid shape and benefiting from improved visibility into growth, but uncertainty around the outcome of the presidential election, the Fed’s anticipated December interest-rate hike, and political decisions in other parts of Europe post-Brexit could lead to increased volatility. However, accommodative monetary policy by central banks around the world should limit the downside.
Europe may experience a bit of a relief rally, benefiting from continued easing by the ECB and modest improvements in economic data, but structural problems remain. As we anticipated, the impact of Brexit on the global economy and the reaction by markets thus far has been relatively muted, but we are starting to see some implications in the UK with the pound declining and inflation picking-up. The potential for geopolitical turmoil in a number of different European countries is also still a risk that we continue to monitor.
While we remain cautious on China’s long-term growth prospects, their injection of stimulus is starting to flow through to the real economy, easing concerns about a hard economic landing and providing support for the global economy, especially emerging markets.
Although volatility in the equity markets may pick up, this should also provide greater opportunities for stock picking. We believe our stock-selection strategy, which incorporates consideration of environmental, social, and governance (ESG) factors along with quantitative analysis, is well positioned for
the current environment.
 |  |
| Vishal Khanduja, CFA | Brian S. Ellis, CFA |
 |  |
| Joshua Linder, CFA | Christopher Madden, CFA |
 |  |
| Kurt Moeller, CFA | Jade Huang |
Calvert Investment Management, Inc.
September 2016
8 calvert.com CALVERT SOCIAL INVESTMENT FUND ANNUAL REPORT (UNAUDITED)
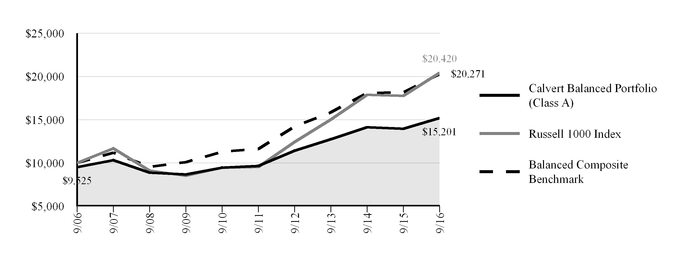
Growth of $10,000
The graph below shows the value of a hypothetical $10,000 investment in the Fund over the past 10 fiscal year periods. The results shown are for Class A shares, reflect the deduction of the maximum front-end Class A sales charge of 4.75%, and assume the reinvestment of dividends. The result is compared with a broad based market index. Market indexes are unmanaged and their results do not reflect the effect of expenses or sales charges. The value of an investment in a different share class would be different.
| CALVERT BALANCED PORTFOLIO | |||||||
| SEPTEMBER 30, 2016 | |||||||
| AVERAGE ANNUAL TOTAL RETURNS | Ticker Symbol | 1 Year | 5 Year # | 10 Year | |||
| Class A (with max. load) | CSIFX | 3.76 | % | 9.15 | % | 4.28 | % |
| Class C (with max. load) | CSGCX | 7.05 | % | 8.65 | % | 3.91 | % |
| Class I | CBAIX | 9.32 | % | 10.03 | % | 5.30 | % |
| Class Y | CBAYX | 9.15 | % | 9.66 | % | 4.85 | % |
| Russell 1000 Index | 14.93 | % | 16.41 | % | 7.40 | % | |
| Balanced Composite Benchmark | 11.43 | % | 11.74 | % | 7.32 | % | |
| Lipper Mixed-Asset Target Alloc. Growth Funds Average | 9.23 | % | 9.97 | % | 5.06 | % | |
Calvert Balanced Portfolio first offered Class Y shares on April 30, 2013. Performance prior to that date reflects the performance of Class A shares at net asset value (NAV). Actual Class Y share performance would have been different. # The investment performance/return has been calculated in accordance with Generally Accepted Accounting Principles (GAAP) and includes certain adjustments. As a result of these adjustments, the investment return may be different than the shareholder received during the reporting period. See Note I - Other in Notes to Financial Statements. | |||||||
All performance data shown, including the graph above and the adjacent table, represents past performance, does not guarantee future results, assumes reinvestment of dividends and distributions, and does not reflect the deduction of taxes that a shareholder would pay on the Fund’s distributions or the redemption of the Fund shares. All performance data reflects fee waivers and/or expense limitations, if any are in effect; in their absence performance would be lower. See Note B in Notes to Financial Statements. The investment return and principal value of an investment will fluctuate so that an investor’s shares, when redeemed, may be worth more or less than their original cost. Current performance may be lower or higher than the performance data quoted; for current performance data, including most recent month-end, visit www.calvert.com. The gross expense ratio from the current prospectus for Class A shares is 0.97%. This number may differ from the expense ratio shown elsewhere in this report because it is based on a different time period and, if applicable, does not include fee or expense waivers. Performance data quoted already reflects the deduction of the Fund’s operating expenses.
calvert.com CALVERT SOCIAL INVESTMENT FUND ANNUAL REPORT (UNAUDITED) 9
| PORTFOLIO MANAGEMENT DISCUSSION |
 | Vishal Khanduja, CFA Senior Vice President, Lead Portfolio Manager, Head of Fixed Income | | Brian S. Ellis, CFA Portfolio Manager |
Market Review
U.S. Fixed Income markets provided positive returns for the twelve month period ending September 30, 2016. Lower interest rates and tighter risk asset spreads helped produce solid total and excess returns for the U.S. fixed income markets. Bloomberg Barclays U.S. Aggregate ended the period with a 5.19% total return. U.S. 10 year treasury yield ended the period 45 basis points lower at 1.6%.
During the fourth quarter of 2015, as widely expected, the FOMC raised the target range for the federal funds rate by 25bps to 25-50bps—nearly seven years to the date after moving to the zero lower bound.
After ending a challenging 2015 both Investment Grade and High Yield had a tumultuous first half of Q1 2016. Risk assets experienced continued volatility through their high correlation with commodity and currency markets, which remained highly volatile. Credit spreads reached post-crisis highs in many sectors, as oil prices reached new lows and uncertainty around the Chinese economy continued to dampen investors’ appetite for risk. After peaking in mid-February, however, spreads sharply recovered and continued to rally as financial conditions eased and U.S. fixed income markets experienced significant inflows.
Global financial markets experienced another significant jolt of volatility, although very short lived, on June 23, 2016 with an unexpected Brexit vote outcome. Risk markets quickly recovered and that started another wave of inflows into U.S. dollar fixed income markets. The significant recovery in the high-yield market continued, and the sector finished the quarter with the highest year-to-date return since 2009.
Investment Strategy and Technique
The Fund seeks to maximize current income, consistent with preservation of capital, through investment in bonds and other debt securities.
The Fund uses a relative value strategy, and typically invests at least 80% of its assets in bonds of any maturity. At least 80% of the Fund's assets will be invested in investment grade debt securities.
In conjunction with financial analysis, Calvert's comprehensive responsible investment principles guide the investment research process and decision-making.
Fund Performance Relative to the Benchmark
For the year ended September 30, 2016, Calvert Bond Portfolio Class A (at NAV) returned 5.96%, outperforming the Bloomberg Barclays U.S. Aggregate Bond Index at 5.19%.
Outperformance for the period was primarily due to asset allocation decisions. The Fund was broadly positioned to benefit from a valuation recovery in U.S. dollar fixed income risk assets. The Fund’s overweight to investment grade corporates, underweight to U.S. Treasuries and Agency MBS, along with allocation to out of benchmark high yield corporates and non-agency CMBS and RMBS all helped outperform the passive benchmark index for the period.
Within investment grade corporates an overweight to the communications subsector and positive security selection within financials and consumer related sectors boosted performance for the period.
The Fund maintained low interest rate duration throughout the period as we believed that the volatility associated with the low absolute return potential for higher duration assets was not attractive.
An allocation to cash and ABS positions related to the transportation sectors were notable detractors of performance for the period.
10 calvert.com CALVERT SOCIAL INVESTMENT FUND ANNUAL REPORT (UNAUDITED)
| CALVERT BOND PORTFOLIO | ||||
| SEPTEMBER 30, 2016 | ||||
| ECONOMIC SECTORS | % OF TOTAL INVESTMENTS* | |||
| Common Stocks | — | % | ||
| Corporate | 49.8 | % | ||
| Financial Institutions | 20.0 | % | ||
| Industrial | 29.6 | % | ||
| Utility | 0.2 | % | ||
| Government Related | 3.3 | % | ||
| Agencies | 0.7 | % | ||
| Local Authorities | 2.3 | % | ||
| Supranational | 0.3 | % | ||
| High Social Impact Investments | 0.7 | % | ||
| Municipal | 1.1 | % | ||
| Education | 0.3 | % | ||
| Government Public Services | 0.1 | % | ||
| Health Care | 0.2 | % | ||
| Transportation | 0.5 | % | ||
| Securitized | 29.8 | % | ||
| Asset-Backed Securities | 14.7 | % | ||
| Collateralized Mortgage Obligations | 0.2 | % | ||
| Collateralized Mortgage-Backed Securities | 11.4 | % | ||
| Mortgage-Backed Passthrough | 3.5 | % | ||
| Short-term Investments | 5.2 | % | ||
| Treasury | 10.1 | % | ||
| Total | 100 | % | ||
| * Does not reflect the value of securities held as cash collateral on securities loaned. | ||||
Positioning and Market Outlook
Divergent global monetary policies, volatility, and liquidity challenges will continue to strongly influence fixed income markets in the near future. The impact of divergence - opposing U.S. and global central bank policy directions - is likely to be reinforced as accumulating signs of strength in the U.S. economy increase the likelihood of another rate hike by the Federal Reserve (Fed) occurring before the end of 2016.
The United States has seen continued strength in consumer spending and employment growth. Mounting signs of inflation, albeit modest, are further building the case for more tightening.
We expect record corporate credit issuance to continue because of low interest rates and investors’ ongoing search for yield in the persistent low-rate environment. We continue to see value in some areas in corporate credit, specifically in credits with deleveraging stories or with minimal incentives or capacity to re-lever, and BBB-rated issuers look relatively attractive. However, we maintain a cautious approach,
| CALVERT BOND PORTFOLIO | ||||||
| SEPTEMBER 30, 2016 | ||||||
| INVESTMENT PERFORMANCE | ||||||
| (TOTAL RETURN AT NAV) | ||||||
6 MONTHS ENDED 9/30/16 | 12 MONTHS ENDED 9/30/16 | |||||
| Class A | 3.88 | % | 5.96 | % | ||
| Class C | 3.43 | % | 5.05 | % | ||
| Class I | 4.12 | % | 6.35 | % | ||
| Class Y | 4.05 | % | 6.26 | % | ||
| Bloomberg Barclays U.S. Aggregate Bond Index | 2.68 | % | 5.19 | % | ||
| Bloomberg Barclays U.S. Credit Index | 4.76 | % | 8.30 | % | ||
| Lipper A Rated Corporate Debt Funds Average | 4.60 | % | 7.38 | % | ||
| Investment performance/return at NAV does not reflect the deduction of the Fund’s maximum 3.75% front-end sales charge or any deferred sales charge. | ||||||
| 30 DAYS ENDED | ||||||
| SEC YIELD | 9/30/15 | 9/30/16 | ||||
| Class A | 2.61 | % | 2.05 | % | ||
| Class C | 1.86 | % | 1.16 | % | ||
| Class I | 3.22 | % | 2.45 | % | ||
| Class Y | 2.97 | % | 2.32 | % | ||
especially as credit fundamentals have deteriorated further and risk premiums have compressed. Strong inflows and the global search for yield could continue to support valuations, though risk premiums are vulnerable to sudden changes to these technical factors, in our view.
We still favor non-benchmark securitized assets, including commercial mortgage-backed securities, asset-backed securities, and non-agency mortgage-backed securities because of their more attractive spreads and tendency to be less vulnerable than corporates to market volatility. These assets are tied to the U.S. economy, specifically to U.S. consumer and housing markets, a further positive in periods of high global economic uncertainty, volatility, and slow growth.
| |
| Vishal Khanduja, CFA | Brian S. Ellis, CFA |
Calvert Investment Management, Inc.
September 2016
calvert.com CALVERT SOCIAL INVESTMENT FUND ANNUAL REPORT (UNAUDITED) 11
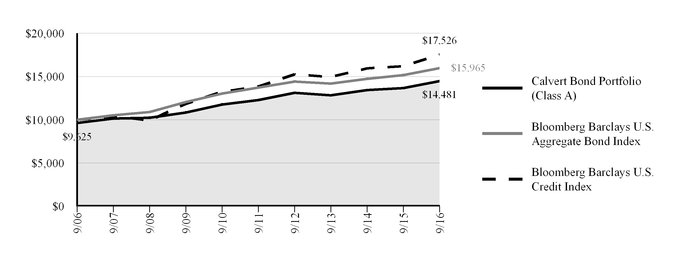
Growth of $10,000
The graph below shows the value of a hypothetical $10,000 investment in the Fund over the past 10 fiscal year periods. The results shown are for Class A shares, reflect the deduction of the maximum front-end Class A sales charge of 3.75%, and assume the reinvestment of dividends. The result is compared with a broad based market index. Market indexes are unmanaged and their results do not reflect the effect of expenses or sales charges. The value of an investment in a different share class would be different.
| CALVERT BOND PORTFOLIO | |||||||
| SEPTEMBER 30, 2016 | |||||||
| AVERAGE ANNUAL TOTAL RETURNS | Ticker Symbol | 1 Year | 5 Year # | 10 Year | |||
| Class A (with max. load) | CSIBX | 1.96 | % | 3.66 | % | 3.77 | % |
| Class C (with max. load) | CSBCX | 4.05 | % | 2.81 | % | 3.33 | % |
| Class I | CBDIX | 6.35 | % | 4.25 | % | 4.77 | % |
| Class Y | CSIYX | 6.26 | % | 3.96 | % | 4.40 | % |
| Bloomberg Barclays U.S. Aggregate Bond Index | 5.19 | % | 3.08 | % | 4.79 | % | |
| Bloomberg Barclays U.S. Credit Index | 8.30 | % | 4.83 | % | 5.77 | % | |
| Lipper A Rated Corporate Debt Funds Average | 7.38 | % | 4.19 | % | 5.05 | % | |
Calvert Bond Portfolio first offered Class Y shares on October 31, 2008. Performance prior to that date reflects the performance of Class A shares at net asset value (NAV). Actual Class Y share performance would have been different. # The investment performance/return has been calculated in accordance with Generally Accepted Accounting Principles (GAAP) and includes certain adjustments. As a result of these adjustments, the investment return may be different than the shareholder received during the reporting period. See Note I - Other in Notes to Financial Statements. | |||||||
All performance data shown, including the graph above and the adjacent table, represents past performance, does not guarantee future results, assumes reinvestment of dividends and distributions, and does not reflect the deduction of taxes that a shareholder would pay on the Fund’s distributions or the redemption of the Fund shares. All performance data reflects fee waivers and/or expense limitations, if any are in effect; in their absence performance would be lower. See Note B in Notes to Financial Statements. The investment return and principal value of an investment will fluctuate so that an investor’s shares, when redeemed, may be worth more or less than their original cost. Current performance may be lower or higher than the performance data quoted; for current performance data, including most recent month-end, visit www.calvert.com. The gross expense ratio from the current prospectus for Class A shares is 0.89%. This number may differ from the expense ratio shown elsewhere in this report because it is based on a different time period and, if applicable, does not include fee or expense waivers. Performance data quoted already reflects the deduction of the Fund’s operating expenses.
12 calvert.com CALVERT SOCIAL INVESTMENT FUND ANNUAL REPORT (UNAUDITED)
| PORTFOLIO MANAGEMENT DISCUSSION |
 | Atlanta Capital Management Company |
Market Review
Most major domestic indices were up 12-15% over the trailing twelve months. Strong returns for an environment where S&P 500 Index earnings actually declined year over year and GDP growth generally disappointed expectations. Volatility dominated the year as several market concerns were raised including slowing China and world GDP growth, weakness in commodities, the potential path of interest rates from the Federal Reserve and the surprising Brexit vote in late June. All of these concerns were short lived corrections and with the Fed remaining on hold and Brexit not immediately having an impact on European GDP, markets staged a low quality, “risk on” rally into August. The US labor market has had some small setbacks, but in general data continues to slowly improve and with unemployment under 5%, the market is now expecting a rate increase from the Federal Reserve before year end.
Investment Strategy and Technique
The Fund primarily invests in the common stocks of U.S. large-cap companies. The sub-advisor looks for companies with a demonstrated history of consistent growth and stability in earnings and whose equities are selling at attractive valuations. In conjunction with this independent financial analysis, companies must meet Calvert’s comprehensive responsible investment principles.
| • | Domestic large-cap growth portfolio |
| • | Incorporates independent financial analysis and Calvert’s comprehensive responsible investment principles |
Fund Performance Relative to the Benchmark
For the twelve-month period ending September 30, 2016, Calvert Equity Portfolio Class A shares (at NAV) returned 8.57%, underperforming both the Russell 1000 Growth Index, which returned 13.76% and the S&P 500 Index, which returned 15.43%. The Fund changed its benchmark from the S&P 500 Index to the Russell 1000 Growth Index during the period. Healthcare was the leading detractor to performance as general concerns around pricing and potential changes from the election weighed on the group. Perrigo’s disappointing outlook relative to expectations provided one of the largest single stock headwinds to performance. Financials also hurt performance as American Express lowered its outlook largely related to the loss of the Costco relationship and slowing trends in card usage. Industrials were the best performing sector in the period and positive stock selection from IDEX Corp, 3M and Danaher helped performance. Positive stock selection from Technology, including Amphenol Corp and Visa provided a tailwind to performance.
| • | The Fund underperformed the Russell 1000 Growth Index during the period due to negative stock selection and sector allocation |
| • | The Fund maintains no exposure to the Telecom sector, and this was one of the largest detractors to performance as the market rewarded yield during this period of volatility |
| • | Positive stock selection in Energy, Industrials and Tech contributed to performance. |
Positioning and Market Outlook
While there have been several headlines swirling in the market over the past year, the Presidential election and the potential increase in the Federal Funds rate appear to be the near term uncertainties. Global growth has remained lackluster yet stable. In the U.S., labor markets have slowly improved and an increase in the Federal Funds rate is anticipated before year end. Volatility will likely continue in the near term. We will maintain our discipline of searching for high quality growth stocks at a discount to intrinsic value. We believe our style of high quality investing is a good strategy for the later stages of the current bull market.
Atlanta Capital Management
September 2016
calvert.com CALVERT SOCIAL INVESTMENT FUND ANNUAL REPORT (UNAUDITED) 13
| CALVERT EQUITY PORTFOLIO | ||||
| SEPTEMBER 30, 2016 | ||||
| ECONOMIC SECTORS | % OF TOTAL INVESTMENTS* | |||
| Information Technology | 27.5 | % | ||
| Consumer Discretionary | 19.5 | % | ||
| Health Care | 19.3 | % | ||
| Consumer Staples | 12.8 | % | ||
| Industrials | 7.1 | % | ||
| Materials | 5.1 | % | ||
| Financials | 4.7 | % | ||
| Short-Term Investments | 2.5 | % | ||
| High Social Impact Investments | 0.6 | % | ||
| Limited Partnership Interest | 0.6 | % | ||
| Venture Capital | 0.3 | % | ||
| Total | 100 | % | ||
| * Does not reflect the value of securities held as cash collateral on securities loaned. | ||||
| CALVERT EQUITY PORTFOLIO | ||||||
| SEPTEMBER 30, 2016 | ||||||
| INVESTMENT PERFORMANCE | ||||||
| (TOTAL RETURN AT NAV) | ||||||
6 MONTHS ENDED 9/30/16 | 12 MONTHS ENDED 9/30/16 | |||||
| Class A | 3.01 | % | 8.57 | % | ||
| Class C | 2.63 | % | 7.73 | % | ||
| Class I | 3.21 | % | 9.01 | % | ||
| Class Y | 3.18 | % | 8.89 | % | ||
| Russell 1000 Growth Index | 5.22 | % | 13.76 | % | ||
| S&P 500 Index | 6.40 | % | 15.43 | % | ||
| Lipper Large-Cap Growth Funds Average | 6.14 | % | 10.80 | % | ||
| Investment performance/return at NAV does not reflect the deduction of the Fund’s maximum 4.75% front-end sales charge or any deferred sales charge. | ||||||
| TEN LARGEST STOCK HOLDINGS | % OF NET ASSETS | |||||
| Alphabet, Inc. | 4.8 | % | ||||
| Visa, Inc. | 4.7 | % | ||||
| CVS Health Corp. | 3.8 | % | ||||
| Microsoft Corp. | 3.5 | % | ||||
| Lowe's Cos., Inc. | 3.3 | % | ||||
| Thermo Fisher Scientific, Inc. | 3.3 | % | ||||
| Dollar Tree, Inc. | 3.1 | % | ||||
| Ecolab, Inc. | 3.0 | % | ||||
| Amphenol Corp. | 2.9 | % | ||||
| Apple, Inc. | 2.9 | % | ||||
| Total | 35.3 | % | ||||
14 calvert.com CALVERT SOCIAL INVESTMENT FUND ANNUAL REPORT (UNAUDITED)
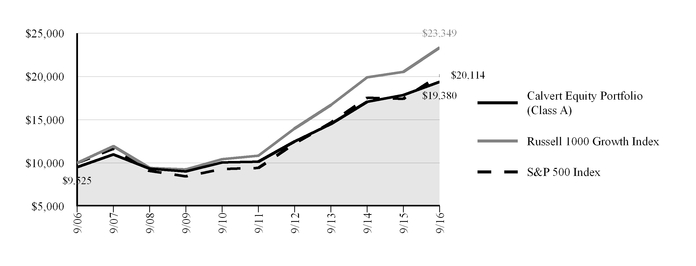
Growth of $10,000
The graph below shows the value of a hypothetical $10,000 investment in the Fund over the past 10 fiscal year periods. The results shown are for Class A shares, reflect the deduction of the maximum front-end Class A sales charge of 4.75%, and assume the reinvestment of dividends. The result is compared with benchmarks that include a broad based market index. Market indexes are unmanaged and their results do not reflect the effect of expenses or sales charges. The value of an investment in a different share class would be different.
| CALVERT EQUITY PORTFOLIO | |||||||
| SEPTEMBER 30, 2016 | |||||||
| AVERAGE ANNUAL TOTAL RETURNS | Ticker Symbol | 1 Year | 5 Year | 10 Year | |||
| Class A (with max. load) | CSIEX | 3.42 | % | 12.67 | % | 6.84 | % |
| Class C (with max. load) | CSECX | 6.73 | % | 12.94 | % | 6.55 | % |
| Class I | CEYIX | 9.01 | % | 14.34 | % | 7.93 | % |
| Class Y | CIEYX | 8.89 | % | 14.16 | % | 7.65 | % |
| Russell 1000 Growth Index | 13.76 | % | 16.60 | % | 8.85 | % | |
| S&P 500 Index | 15.43 | % | 16.37 | % | 7.24 | % | |
| Lipper Large-Cap Growth Funds Average | 10.80 | % | 15.27 | % | 7.74 | % | |
| Calvert Equity Portfolio first offered Class Y shares on October 31, 2008. Performance prior to that date reflects the performance of Class A shares at net asset value (NAV). Actual Class Y share performance would have been different. | |||||||
All performance data shown, including the graph above and the adjacent table, represents past performance, does not guarantee future results, assumes reinvestment of dividends and distributions, and does not reflect the deduction of taxes that a shareholder would pay on the Fund’s distributions or the redemption of the Fund shares. All performance data reflects fee waivers and/or expense limitations, if any are in effect; in their absence performance would be lower. See Note B in Notes to Financial Statements. The investment return and principal value of an investment will fluctuate so that an investor’s shares, when redeemed, may be worth more or less than their original cost. Current performance may be lower or higher than the performance data quoted; for current performance data, including most recent month-end, visit www.calvert.com. The gross expense ratio from the current prospectus for Class A shares is 1.07%. This number may differ from the expense ratio shown elsewhere in this report because it is based on a different time period and, if applicable, does not include fee or expense waivers. Performance data quoted already reflects the deduction of the Fund’s operating expenses.
calvert.com CALVERT SOCIAL INVESTMENT FUND ANNUAL REPORT (UNAUDITED) 15
UNDERSTANDING YOUR FUND'S EXPENSES
As an investor, you incur two types of costs. There are transaction costs, which generally include sales charges on purchases and may include redemption fees. There are also ongoing costs, which generally include management fees, distribution and/or service fees, and other fund expenses. The following information is intended to help you understand your ongoing costs (in dollars) of investing in this mutual fund and to help you compare these costs with the ongoing costs of investing in other mutual funds.
To illustrate these ongoing costs, we have provided examples and calculated the expenses paid by the fund's investors during the period. The actual and hypothetical information presented in the examples is based on an investment of $1,000 invested at the beginning of the period and held for the entire period (April 1, 2016 to September 30, 2016).
Actual Expenses
The first line of the table below provides information about actual account values and actual expenses. You may use the information in this line, together with the amount you invested, to estimate the expenses that you paid over the period. Simply divide your account value by $1,000 (for example, an $8,600 account value divided by $1,000 = 8.6), then multiply the result by the number in the first line under the heading entitled "Expenses Paid During Period" to estimate the expenses you paid on your account during this period.
Balanced and Equity each charge an annual low balance account fee of $15 to those shareholders whose regular account balance is less than $5,000 ($1,000 for IRA accounts). If the low balance fee applies to your account, you should subtract the fee from the ending account value in the chart below.
Hypothetical Example for Comparison Purposes
The second line of the table below provides information about hypothetical account values and hypothetical expenses based on the Fund’s actual expense ratio and an assumed rate of return of 5% per year before expenses, which is not the Fund’s actual return. The hypothetical account values and expenses may not be used to estimate the actual ending account balance or expenses you paid for the period. You may use this information to compare the ongoing costs of investing in the Fund and other funds. To do so, compare the 5% hypothetical example with the 5% hypothetical examples that appear in the shareholder reports of the other funds.
Please note that the expenses shown in the table are meant to highlight your ongoing costs only and do not reflect any transactional costs, such as sales charges (loads), or redemption fees. Therefore, the second line of the table is useful in comparing ongoing costs only, and will not help you determine the relative total costs of owning different funds. In addition, if these transactional costs were included, your costs would have been higher.
| BALANCED | ANNUALIZED EXPENSE RATIO | BEGINNING ACCOUNT VALUE 4/1/16 | ENDING ACCOUNT VALUE 9/30/16 | EXPENSES PAID DURING PERIOD* 4/1/16 - 9/30/16 |
| Class A | ||||
| Actual | 1.01% | $1,000.00 | $1,047.90 | $5.17 |
| Hypothetical (5% return per year before expenses) | 1.01% | $1,000.00 | $1,019.95 | $5.10 |
| Class C | ||||
| Actual | 1.83% | $1,000.00 | $1,043.60 | $9.35 |
| Hypothetical (5% return per year before expenses) | 1.83% | $1,000.00 | $1,015.85 | $9.22 |
| Class I | ||||
| Actual | 0.62% | $1,000.00 | $1,049.80 | $3.18 |
| Hypothetical (5% return per year before expenses) | 0.62% | $1,000.00 | $1,021.90 | $3.13 |
| Class Y | ||||
| Actual | 0.73% | $1,000.00 | $1,049.10 | $3.74 |
| Hypothetical (5% return per year before expenses) | 0.73% | $1,000.00 | $1,021.35 | $3.69 |
| * Expenses paid during the period are equal to the annualized expense ratio for each class as indicated above, multiplied by the average account value over the period, multiplied by 183/366 (to reflect the one-half year period). Expense ratios shown in the Financial Highlights represent the actual expenses incurred for the fiscal year. | ||||
16 calvert.com CALVERT SOCIAL INVESTMENT FUND ANNUAL REPORT (UNAUDITED)
| BOND | ANNUALIZED EXPENSE RATIO | BEGINNING ACCOUNT VALUE 4/1/16 | ENDING ACCOUNT VALUE 9/30/16 | EXPENSES PAID DURING PERIOD* 4/1/16 - 9/30/16 |
| Class A | ||||
| Actual | 0.88% | $1,000.00 | $1,038.80 | $4.49 |
| Hypothetical (5% return per year before expenses) | 0.88% | $1,000.00 | $1,020.60 | $4.45 |
| Class C | ||||
| Actual | 1.80% | $1,000.00 | $1,034.30 | $9.15 |
| Hypothetical (5% return per year before expenses) | 1.80% | $1,000.00 | $1,016.00 | $9.07 |
| Class I | ||||
| Actual | 0.54% | $1,000.00 | $1,041.20 | $2.76 |
| Hypothetical (5% return per year before expenses) | 0.54% | $1,000.00 | $1,022.30 | $2.73 |
| Class Y | ||||
| Actual | 0.62% | $1,000.00 | $1,040.50 | $3.16 |
| Hypothetical (5% return per year before expenses) | 0.62% | $1,000.00 | $1,021.90 | $3.13 |
| * Expenses paid during the period are equal to the annualized expense ratio for each class as indicated above, multiplied by the average account value over the period, multiplied by 183/366 (to reflect the one-half year period). Expense ratios shown in the Financial Highlights represent the actual expenses incurred for the fiscal year. | ||||
| EQUITY | ANNUALIZED EXPENSE RATIO | BEGINNING ACCOUNT VALUE 4/1/16 | ENDING ACCOUNT VALUE 9/30/16 | EXPENSES PAID DURING PERIOD* 4/1/16 - 9/30/16 |
| Class A | ||||
| Actual | 1.05% | $1,000.00 | $1,030.10 | $5.33 |
| Hypothetical (5% return per year before expenses) | 1.05% | $1,000.00 | $1,019.75 | $5.30 |
| Class C | ||||
| Actual | 1.84% | $1,000.00 | $1,026.30 | $9.32 |
| Hypothetical (5% return per year before expenses) | 1.84% | $1,000.00 | $1,015.80 | $9.27 |
| Class I | ||||
| Actual | 0.68% | $1,000.00 | $1,032.10 | $3.45 |
| Hypothetical (5% return per year before expenses) | 0.68% | $1,000.00 | $1,021.60 | $3.44 |
| Class Y | ||||
| Actual | 0.74% | $1,000.00 | $1,031.80 | $3.76 |
| Hypothetical (5% return per year before expenses) | 0.74% | $1,000.00 | $1,021.30 | $3.74 |
| * Expenses paid during the period are equal to the annualized expense ratio for each class as indicated above, multiplied by the average account value over the period, multiplied by 183/366 (to reflect the one-half year period). Expense ratios shown in the Financial Highlights represent the actual expenses incurred for the fiscal year. | ||||
calvert.com CALVERT SOCIAL INVESTMENT FUND ANNUAL REPORT (UNAUDITED) 17
REPORT OF INDEPENDENT REGISTERED PUBLIC ACCOUNTING FIRM
The Board of Trustees and Shareholders of Calvert Social Investment Fund:
We have audited the accompanying statements of assets and liabilities of the Calvert Balanced Portfolio, Calvert Bond Portfolio, and Calvert Equity Portfolio (collectively, the “Funds”), each a series of Calvert Social Investment Fund, including the schedules of investments, as of September 30, 2016, and the related statements of operations for the year then ended, the statements of changes in net assets for each of the years in the two-year period then ended, and the financial highlights for each of the years or periods in the five-year period then ended. These financial statements and financial highlights are the responsibility of the Funds’ management. Our responsibility is to express an opinion on these financial statements and financial highlights based on our audits.
We conducted our audits in accordance with the standards of the Public Company Accounting Oversight Board (United States). Those standards require that we plan and perform the audit to obtain reasonable assurance about whether the financial statements and financial highlights are free of material misstatement. An audit includes examining, on a test basis, evidence supporting the amounts and disclosures in the financial statements. Our procedures included confirmation of securities owned as of September 30, 2016 by correspondence with the custodian and brokers or by other appropriate auditing procedures. An audit also includes assessing the accounting principles used and significant estimates made by management, as well as evaluating the overall financial statement presentation. We believe that our audits provide a reasonable basis for our opinion.
In our opinion, the financial statements and financial highlights referred to above present fairly, in all material respects, the financial position of the Calvert Balanced Portfolio, Calvert Bond Portfolio, and Calvert Equity Portfolio as of September 30, 2016, the results of their operations for the year then ended, the changes in their net assets for each of the years in the two-year period then ended, and the financial highlights for each of the years or periods in the five-year period then ended, in conformity with U.S. generally accepted accounting principles.

Philadelphia, Pennsylvania
November 23, 2016
18 calvert.com CALVERT SOCIAL INVESTMENT FUND ANNUAL REPORT
CALVERT BALANCED PORTFOLIO
SCHEDULE OF INVESTMENTS
SEPTEMBER 30, 2016
| SHARES | VALUE ($) | |
| COMMON STOCKS - 61.0% | ||
| Air Freight & Logistics - 1.0% | ||
| United Parcel Service, Inc., Class B | 63,918 | 6,990,073 |
| Auto Components - 0.8% | ||
| Delphi Automotive plc | 74,267 | 5,296,722 |
| Banks - 2.9% | ||
| Citigroup, Inc. | 90,052 | 4,253,156 |
| Community Bank of the Bay, Class A * | 4,000 | 19,520 |
| US Bancorp | 134,472 | 5,767,504 |
| Wells Fargo & Co. | 211,838 | 9,380,187 |
| 19,420,367 | ||
| Beverages - 0.9% | ||
| PepsiCo, Inc. | 57,277 | 6,230,019 |
| Biotechnology - 2.1% | ||
| Amgen, Inc. | 55,421 | 9,244,777 |
| Gilead Sciences, Inc. | 66,886 | 5,292,020 |
| 14,536,797 | ||
| Capital Markets - 1.8% | ||
| Ameriprise Financial, Inc. | 42,876 | 4,277,738 |
| Moody's Corp. | 71,467 | 7,738,447 |
| 12,016,185 | ||
| Chemicals - 0.5% | ||
| PPG Industries, Inc. | 35,909 | 3,711,554 |
| Communications Equipment - 1.2% | ||
| Cisco Systems, Inc. | 265,972 | 8,436,632 |
| Consumer Finance - 1.8% | ||
| American Express Co. | 83,251 | 5,331,394 |
| Capital One Financial Corp. (a) | 101,136 | 7,264,599 |
| 12,595,993 | ||
| Diversified Telecommunication Services - 2.6% | ||
| AT&T, Inc. | 186,157 | 7,559,836 |
| Verizon Communications, Inc. | 198,241 | 10,304,567 |
| 17,864,403 | ||
calvert.com CALVERT SOCIAL INVESTMENT FUND ANNUAL REPORT 19
| SHARES | VALUE ($) | |||
| COMMON STOCKS - CONT’D | ||||
| Electric Utilities - 0.3% | ||||
| Portland General Electric Co. | 41,868 | 1,783,158 | ||
| Energy Equipment & Services - 1.5% | ||||
| FMC Technologies, Inc. * | 160,574 | 4,764,231 | ||
| Frank's International NV (b) | 189,477 | 2,463,201 | ||
| National Oilwell Varco, Inc. | 76,161 | 2,798,155 | ||
| 10,025,587 | ||||
| Equity Real Estate Investment Trusts (REITs) - 2.1% | ||||
| American Campus Communities, Inc. | 90,067 | 4,581,708 | ||
| American Tower Corp. | 40,414 | 4,580,119 | ||
| Duke Realty Corp. | 177,938 | 4,863,045 | ||
| 14,024,872 | ||||
| Food & Staples Retailing - 1.8% | ||||
| CVS Health Corp. | 108,251 | 9,633,257 | ||
| Kroger Co. (The) | 95,405 | 2,831,620 | ||
| 12,464,877 | ||||
| Food Products - 1.2% | ||||
| General Mills, Inc. | 49,212 | 3,143,662 | ||
| Mondelez International, Inc., Class A | 107,593 | 4,723,333 | ||
| 7,866,995 | ||||
| Gas Utilities - 0.5% | ||||
| ONE Gas, Inc. | 21,341 | 1,319,727 | ||
| UGI Corp. | 48,165 | 2,178,985 | ||
| 3,498,712 | ||||
| Health Care Equipment & Supplies - 2.0% | ||||
| Danaher Corp. | 88,861 | 6,965,814 | ||
| St. Jude Medical, Inc. | 85,234 | 6,798,264 | ||
| 13,764,078 | ||||
| Health Care Providers & Services - 1.5% | ||||
| HCA Holdings, Inc. * | 61,196 | 4,628,254 | ||
| McKesson Corp. | 33,316 | 5,555,443 | ||
| 10,183,697 | ||||
| Hotels, Restaurants & Leisure - 0.7% | ||||
| Darden Restaurants, Inc. | 73,156 | 4,485,926 | ||
| Insurance - 3.1% | ||||
| American Financial Group, Inc. | 97,381 | 7,303,575 | ||
| Prudential Financial, Inc. | 95,721 | 7,815,619 | ||
| Travelers Cos., Inc. (The) | 51,185 | 5,863,242 | ||
| 20,982,436 | ||||
20 calvert.com CALVERT SOCIAL INVESTMENT FUND ANNUAL REPORT
| SHARES | VALUE ($) | |||
| COMMON STOCKS - CONT’D | ||||
| Internet Software & Services - 1.2% | ||||
| Alphabet, Inc., Class A * | 10,372 | 8,339,710 | ||
| IT Services - 3.7% | ||||
| Accenture plc, Class A | 43,661 | 5,334,064 | ||
| Automatic Data Processing, Inc. | 33,803 | 2,981,425 | ||
| Cognizant Technology Solutions Corp., Class A * | 92,296 | 4,403,442 | ||
| DST Systems, Inc. | 50,758 | 5,985,383 | ||
| MasterCard, Inc., Class A | 63,433 | 6,455,577 | ||
| 25,159,891 | ||||
| Life Sciences - Tools & Services - 0.9% | ||||
| Agilent Technologies, Inc. | 130,578 | 6,148,918 | ||
| Machinery - 3.5% | ||||
| Cummins, Inc. | 40,754 | 5,222,625 | ||
| Dover Corp. | 112,385 | 8,276,031 | ||
| Fortive Corp. | 44,430 | 2,261,487 | ||
| Ingersoll-Rand plc | 115,175 | 7,824,990 | ||
| 23,585,133 | ||||
| Media - 2.0% | ||||
| Comcast Corp., Class A | 60,144 | 3,989,953 | ||
| Omnicom Group, Inc. | 114,067 | 9,695,695 | ||
| 13,685,648 | ||||
| Metals & Mining - 0.7% | ||||
| Reliance Steel & Aluminum Co. | 67,891 | 4,890,189 | ||
| Multi-Utilities - 0.2% | ||||
| Avista Corp. | 37,208 | 1,554,922 | ||
| Multiline Retail - 1.2% | ||||
| Target Corp. | 116,997 | 8,035,354 | ||
| Oil, Gas & Consumable Fuels - 1.5% | ||||
| ONEOK, Inc. | 82,319 | 4,230,374 | ||
| Spectra Energy Corp. | 145,599 | 6,224,357 | ||
| 10,454,731 | ||||
| Personal Products - 1.1% | ||||
| Unilever NV, NY Shares | 159,478 | 7,351,936 | ||
calvert.com CALVERT SOCIAL INVESTMENT FUND ANNUAL REPORT 21
| SHARES | VALUE ($) | |||
| COMMON STOCKS - CONT’D | ||||
| Pharmaceuticals - 3.8% | ||||
| Johnson & Johnson | 70,097 | 8,280,559 | ||
| Merck & Co., Inc. | 141,301 | 8,818,595 | ||
| Pfizer, Inc. | 254,978 | 8,636,105 | ||
| 25,735,259 | ||||
| Professional Services - 0.6% | ||||
| Robert Half International, Inc. | 102,350 | 3,874,971 | ||
| Semiconductors & Semiconductor Equipment - 0.9% | ||||
| Intel Corp. | 161,627 | 6,101,419 | ||
| Software - 3.0% | ||||
| Microsoft Corp. | 169,353 | 9,754,733 | ||
| Oracle Corp. | 159,220 | 6,254,162 | ||
| Synopsys, Inc. * | 75,269 | 4,467,215 | ||
| 20,476,110 | ||||
| Specialty Retail - 1.6% | ||||
| Lowe's Cos., Inc. | 75,529 | 5,453,949 | ||
| TJX Cos., Inc. (The) | 73,074 | 5,464,474 | ||
| 10,918,423 | ||||
| Technology Hardware, Storage & Peripherals - 2.9% | ||||
| Apple, Inc. | 173,968 | 19,667,082 | ||
| Trading Companies & Distributors - 0.7% | ||||
| HD Supply Holdings, Inc. * | 141,509 | 4,525,458 | ||
| Venture Capital - 1.2% | ||||
| Agraquest, Inc., Contingent Deferred Distribution *(c)(d) | 1 | 67,429 | ||
| CFBanc Corp. *(c)(d) | 27,000 | 293,347 | ||
| Consensus Orthopedics, Inc. *(c)(d) | 180,877 | 153 | ||
| Kickboard *(c)(d) | 169,932 | 4,850 | ||
| MACH Energy *(c)(d) | 20,536 | 1,785 | ||
| Neighborhood Bancorp, Class A *(c)(d) | 10,000 | — | ||
| Seventh Generation, Inc. *(c)(d) | 150,222 | 7,902,983 | ||
| Wild Planet Entertainment, Contingent Deferred Distribution *(c)(d) | 1 | 11,942 | ||
| Wind Harvest Co., Inc. *(c)(d) | 8,696 | — | ||
| 8,282,489 | ||||
| Wireless Telecommunication Services - 0.0% | ||||
| NII Holdings, Inc. * | 15,747 | 52,438 | ||
| Total Common Stocks (Cost $380,796,796) | 415,019,164 | |||
22 calvert.com CALVERT SOCIAL INVESTMENT FUND ANNUAL REPORT
| SHARES | VALUE ($) | |||
| PREFERRED STOCKS - 0.1% | ||||
| Venture Capital - 0.1% | ||||
| Consensus Orthopedics, Inc.: | ||||
| Series A-1 *(c)(d) | 420,683 | 6,333 | ||
| Series B *(c)(d) | 348,940 | 5,679 | ||
| Series C *(c)(d) | 601,710 | 16,435 | ||
| Kickboard: | ||||
| Series A *(c)(d) | 1,155,503 | 254,654 | ||
| Series A2 *(c)(d) | 404,973 | 88,287 | ||
| LearnZillion, Inc.: | ||||
| Series A *(c)(d) | 169,492 | 129,916 | ||
| Series A-1 *(c)(d) | 108,678 | 95,745 | ||
| Lumni, Inc., Series B *(c)(d) | 17,265 | 123,006 | ||
| MACH Energy: | ||||
| Series A *(c)(d) | 27,977 | 9,495 | ||
| Series B *(c)(d) | 26,575 | 11,481 | ||
| 741,031 | ||||
| Total Preferred Stocks (Cost $1,032,578) | 741,031 | |||
| ADJUSTED BASIS ($) | VALUE ($) | |||
| VENTURE CAPITAL LIMITED PARTNERSHIP INTEREST - 0.2% | ||||
| Coastal Venture Partners *(c)(d) | 20,641 | 23,889 | ||
| Commons Capital LP *(c)(d) | 162,045 | 76,778 | ||
| First Analysis Private Equity Fund IV LP*(c)(d) | 66,786 | 551,855 | ||
| GEEMF Partners LP *(c)(d)(e) | — | 63,070 | ||
| Global Environment Emerging Markets Fund LP*(c)(d) | — | 220,418 | ||
| Infrastructure and Environmental Private Equity Fund III LP*(c)(d) | — | 17,860 | ||
| Labrador Ventures III LP*(c)(d) | 305,585 | 13,283 | ||
| Learn Capital Venture Partners III LP*(c)(d) | 657,000 | 625,750 | ||
| New Markets Growth Fund LLC *(c)(d) | 225,646 | — | ||
| Solstice Capital LP *(c)(d) | — | 53,491 | ||
| Total Venture Capital Limited Partnership Interest (Cost $1,437,703) | 1,646,394 | |||
| PRINCIPAL AMOUNT ($) | VALUE ($) | |||
| VENTURE CAPITAL DEBT OBLIGATIONS - 0.0% | ||||
| Kickboard Bridge Note, 8.00%, 11/1/17 (c)(d) | 41,000 | 36,592 | ||
| Total Venture Capital Debt Obligations (Cost $41,000) | 36,592 | |||
| ASSET-BACKED SECURITIES - 7.8% | ||||
| Asset-Backed - Automobile - 0.5% | ||||
| American Credit Acceptance Receivables Trust, Series 2014-1, Class B, 2.39%, 11/12/19 (f) | 33,208 | 33,222 | ||
| Capital Automotive REIT, Series 2014-1A, Class A, 3.66%, 10/15/44 (f) | 1,000,000 | 1,000,730 | ||
calvert.com CALVERT SOCIAL INVESTMENT FUND ANNUAL REPORT 23
| PRINCIPAL AMOUNT ($) | VALUE ($) | |||
| ASSET-BACKED SECURITIES - CONT’D | ||||
| Carfinance Capital Auto Trust, Series 2013-2A, Class B, 3.15%, 8/15/19 (f) | 316,358 | 318,339 | ||
| Ford Credit Auto Owner Trust/Ford Credit, Series 2014-1, Class B, 2.41%, 11/15/25 (f) | 400,000 | 404,592 | ||
| Skopos Auto Receivables Trust: | ||||
| Series 2015-2A, Class A, 3.55%, 2/15/20 (f) | 700,293 | 700,674 | ||
| Series 2015-1A, Class A, 3.10%, 12/15/23 (f) | 31,597 | 31,562 | ||
| Series 2015-1A, Class B, 5.43%, 12/15/23 (f) | 600,000 | 603,879 | ||
| 3,092,998 | ||||
| Asset-Backed - Other - 7.1% | ||||
| American Homes 4 Rent: | ||||
| Series 2014-SFR1, Class B, 1.881%, 6/17/31 (f)(g) | 270,000 | 268,594 | ||
| Series 2014-SFR1, Class C, 2.281%, 6/17/31 (f)(g) | 315,000 | 314,203 | ||
| Series 2014-SFR1, Class E, 3.031%, 6/17/31 (f)(g) | 1,000,000 | 981,754 | ||
| Series 2014-SFR2, Class A, 3.786%, 10/17/36 (f) | 1,257,756 | 1,359,211 | ||
| Apidos CLO XXI, Series 2015-21A, Class C, 4.229%, 7/18/27 (f)(g) | 300,000 | 290,796 | ||
| AVANT Loans Funding Trust, Class A: | ||||
| Series 2016-A, 4.11%, 5/15/19 (f) | 231,970 | 233,015 | ||
| Series 2016-B, 3.92%, 8/15/19 (f) | 161,809 | 162,638 | ||
| Series 2016-C, 2.96%, 9/16/19 (f) | 303,541 | 304,000 | ||
| Blue Elephant Loan Trust, Series 2015-1, Class A, 3.12%, 12/15/22 (f) | 57,304 | 57,293 | ||
| CAM Mortgage LLC, Series 2015-1: | ||||
| Class A, 3.50%, 7/15/64 (f)(g) | 57,649 | 57,648 | ||
| Class M, 4.75%, 7/15/64 (f)(g) | 1,700,000 | 1,672,074 | ||
| Citi Held For Asset Issuance: | ||||
| Series 2015-PM1, Class A, 1.85%, 12/15/21 (f) | 133,768 | 133,651 | ||
| Series 2015-PM2, Class B, 4.00%, 3/15/22 (f) | 2,150,000 | 2,147,003 | ||
| Series 2015-PM3, Class B, 4.31%, 5/16/22 (f) | 750,000 | 751,356 | ||
| Series 2016-MF1, Class A, 4.48%, 8/15/22 (f) | 327,694 | 332,691 | ||
| CKE Restaurant Holdings, Inc., Series 2013-1A, Class A2, 4.474%, 3/20/43 (f) | 2,010,595 | 2,016,007 | ||
| Colony American Homes, Series 2014-1A, Class B, 1.881%, 5/17/31 (f)(g) | 350,000 | 348,686 | ||
| Colony Starwood Homes Trust, Series 2016-1A: | ||||
| Class C, 3.181%, 7/17/33 (f)(g) | 350,000 | 354,159 | ||
| Class D, 3.631%, 7/17/33 (f)(g) | 320,000 | 323,188 | ||
| Conn Funding II LP, Series 2016-B: | ||||
| Class A, 3.73%, 10/15/18 (f) | 1,700,000 | 1,699,923 | ||
| Class B, 7.34%, 3/15/19 (f) | 200,000 | 199,890 | ||
| Conn's Receivables Funding LLC: | ||||
| Series 2016-A, Class A, 4.68%, 4/16/18 (f) | 500,603 | 501,837 | ||
| Series 2016-A, Class B, 8.96%, 8/15/18 (f) | 150,000 | 151,484 | ||
| Series 2015-A, Class A, 4.565%, 9/15/20 (f) | 291,636 | 292,023 | ||
| DB Master Finance LLC, Series 2015-1A, Class A2I, 3.262%, 2/20/45 (f) | 1,576,000 | 1,584,195 | ||
| Dell Equipment Finance Trust, Series 2014-1, Class C, 1.80%, 6/22/20 (f) | 603,424 | 603,705 | ||
| Driven Brands Funding LLC, Class A2: | ||||
| Series 2015-1A, 5.216%, 7/20/45 (f) | 992,500 | 974,162 | ||
| Series 2016-1A, 6.125%, 7/20/46 (f) | 300,000 | 305,366 | ||
| Dryden 40 Senior Loan Fund, Series 2015-40A, Class D, 4.517%, 8/15/28 (f)(g) | 500,000 | 489,675 | ||
24 calvert.com CALVERT SOCIAL INVESTMENT FUND ANNUAL REPORT
| PRINCIPAL AMOUNT ($) | VALUE ($) | |||
| ASSET-BACKED SECURITIES - CONT’D | ||||
| Element Rail Leasing I LLC, Series 2014-1A: | ||||
| Class A1, 2.299%, 4/19/44 (f) | 191,439 | 187,661 | ||
| Class A2, 3.668%, 4/19/44 (f) | 600,000 | 598,481 | ||
| Class B1, 4.406%, 4/19/44 (f) | 700,000 | 665,096 | ||
| Element Rail Leasing II LLC, Series 2015-1A, Class A2, 3.585%, 2/19/45 (f) | 1,100,000 | 1,083,996 | ||
| FRS I LLC, Series 2013-1A, Class A2, 3.08%, 4/15/43 (f) | 773,717 | 762,905 | ||
| GCAT LLC, Series 2015-1, Class A1, 3.625%, 5/26/20 (f)(g) | 418,758 | 419,402 | ||
| GLC II Trust, Series 2014-A, Class A, 4.00%, 12/18/20 (f) | 66,346 | 65,683 | ||
| GLC Trust, Series 2014-A, Class A, 3.00%, 7/15/21 (f) | 229,838 | 228,528 | ||
| GMAT Trust, Series 2015-1A, Class A1, 4.25%, 9/25/20 (f)(g) | 458,796 | 457,518 | ||
| Invitation Homes Trust: | ||||
| Series 2013-SFR1, Class B, 1.896%, 12/17/30 (f)(g) | 100,000 | 99,794 | ||
| Series 2013-SFR1, Class C, 2.396%, 12/17/30 (f)(g) | 800,000 | 800,101 | ||
| Series 2015-SFR2, Class C, 2.527%, 6/17/32 (f)(g) | 200,000 | 200,361 | ||
| Series 2015-SFR2, Class E, 3.677%, 6/17/32 (f)(g) | 1,800,000 | 1,790,571 | ||
| Series 2015-SFR3, Class D, 3.281%, 8/17/32 (f)(g) | 400,000 | 404,441 | ||
| Magnetite VI Ltd., Series 2012-6A, Class DR, 4.45%, 9/15/23 (f)(g) | 400,000 | 397,310 | ||
| OneMain Financial Issuance Trust: | ||||
| Series 2014-1A, Class A, 2.43%, 6/18/24 (f) | 1,580,765 | 1,582,110 | ||
| Series 2014-1A, Class B, 3.24%, 6/18/24 (f) | 300,000 | 302,120 | ||
| Series 2014-2A, Class A, 2.47%, 9/18/24 (f) | 326,756 | 327,482 | ||
| Series 2015-2A, Class A, 2.57%, 7/18/25 (f) | 700,000 | 702,481 | ||
| PennyMac LLC, Series 2015-NPL1, Class A1, 4.00%, 3/25/55 (f)(g) | 252,632 | 254,424 | ||
| Progress Residential Trust, Series 2016-SFR1: | ||||
| Class B, 2.531%, 9/17/33 (f)(g) | 524,000 | 530,209 | ||
| Class C, 3.031%, 9/17/33 (f)(g) | 325,000 | 329,552 | ||
| RenewFund Receivables Trust, Series 2015-1, Class A, 3.51%, 4/15/25 (f) | 532,420 | 529,926 | ||
| RMAT LLC, Class A1: | ||||
| Series 2015-1, 4.09%, 7/27/20 (f)(g) | 703,391 | 699,861 | ||
| Series 2015-NPL1, 3.75%, 5/25/55 (f)(g) | 467,126 | 462,362 | ||
| SBA Tower Trust, Series 2014-2A, Class C, 3.869%, 10/15/49 (f)(g) | 1,000,000 | 1,031,390 | ||
| Selene Non-Performing Loans LLC, Series 2014-1A, Class A, 2.981%, 5/25/54 (f)(g) | 296,116 | 294,722 | ||
| Sierra Timeshare Receivables Funding LLC, Class B: | ||||
| Series 2013-3A, 2.70%, 10/20/30 (f) | 126,155 | 126,599 | ||
| Series 2014-2A, 2.40%, 6/20/31 (f) | 1,568,171 | 1,568,274 | ||
| Series 2014-3A, 2.80%, 10/20/31 (f) | 181,205 | 182,086 | ||
| SolarCity LMC: | ||||
| Series I LLC, 4.80%, 11/20/38 (f) | 790,862 | 769,118 | ||
| Series II LLC, 4.59%, 4/20/44 (f) | 528,211 | 513,787 | ||
| Series III LLC, 4.02%, 7/20/44 (f) | 828,440 | 779,827 | ||
| Series III LLC, 5.44%, 7/20/44 (f) | 1,907,457 | 2,002,677 | ||
| Springleaf Funding Trust: | ||||
| Series 2014-AA, Class A, 2.41%, 12/15/22 (f) | 94,793 | 94,914 | ||
| Series 2015-AA, Class B, 3.62%, 11/15/24 (f) | 600,000 | 605,345 | ||
| Spruce ABS Trust, Series 2016-E1, Class A, 4.32%, 6/15/28 (f) | 500,259 | 500,602 | ||
| STORE Master Funding LLC, Series 2014-1A, Class A1, 4.21%, 4/20/44 (f) | 1,087,167 | 1,088,442 | ||
| Sunrun Callisto Issuer LLC, Series 2015-1A, Class B, 5.38%, 7/20/45 (f) | 578,573 | 596,351 | ||
| TAL Advantage V LLC, Series 2014-2A, Class B, 3.97%, 5/20/39 (f) | 153,333 | 145,177 | ||
| VB-S1 Issuer LLC, Series 2016-1A, Class C, 3.065%, 6/15/46 (f) | 600,000 | 612,594 | ||
| Vericrest Opportunity Loan Trust, Series 2015-NPL3, Class A1, 3.375%, 10/25/58 (f)(g) | 137,866 | 137,592 | ||
calvert.com CALVERT SOCIAL INVESTMENT FUND ANNUAL REPORT 25
| PRINCIPAL AMOUNT ($) | VALUE ($) | |||
| ASSET-BACKED SECURITIES - CONT’D | ||||
| VML LLC, Series 2014-NPL1, Class A1, 3.875%, 4/27/54 (f)(g) | 448,022 | 446,824 | ||
| VOLT XXV LLC, Series 2015 NPL8, Class A1, 3.50%, 6/26/45 (f)(g) | 433,496 | 433,601 | ||
| VOLT XXX LLC, Series 2015-NPL1, Class A1, 3.625%, 10/25/57 (f)(g) | 683,826 | 684,676 | ||
| VOLT XXXVIII LLC, Series 2015-NP12, Class A1, 3.875%, 9/25/45 (f)(g) | 368,704 | 370,123 | ||
| Wendys Funding LLC, Series 2015-1A: | ||||
| Class A2I, 3.371%, 6/15/45 (f) | 2,009,700 | 2,018,571 | ||
| Class A2II, 4.08%, 6/15/45 (f) | 594,000 | 603,217 | ||
| 48,399,111 | ||||
| Asset-Backed - Student Loan - 0.2% | ||||
| DRB Prime Student Loan Trust, Series 2016-B, Class A2, 2.89%, 6/25/40 (f) | 668,406 | 671,587 | ||
| SoFi Professional Loan Program LLC, Series 2014-B: | ||||
| Class A2, 2.55%, 8/27/29 (f) | 635,647 | 645,032 | ||
| Class A1, 1.775%, 8/25/32 (f)(g) | 228,717 | 230,916 | ||
| 1,547,535 | ||||
| Total Asset-Backed Securities (Cost $52,829,602) | 53,039,644 | |||
COLLATERALIZED MORTGAGE-BACKED OBLIGATIONS (PRIVATELY ORIGINATED) - 1.1% | ||||
| Bellemeade Re Ltd., Series 2015-1A, Class M2, 4.825%, 7/25/25 (f)(g) | 750,000 | 752,574 | ||
| Fannie Mae Connecticut Avenue Securities: | ||||
| Series 2014-C02, Class 1M2, 3.125%, 5/25/24 (g) | 600,000 | 592,207 | ||
| Series 2014-C03, Class 2M2, 3.425%, 7/25/24 (g) | 700,000 | 703,154 | ||
| Series 2016-C05, Class 2M1, 1.875%, 1/25/29 (g) | 346,159 | 347,600 | ||
| Series 2016-C04, Class 1M1, 1.975%, 1/25/29 (g) | 1,411,670 | 1,420,253 | ||
| Series 2016-C04, Class 1M2, 4.775%, 1/25/29 (g) | 540,000 | 555,202 | ||
| Series 2016-C05, Class 2M2, 4.975%, 1/25/29 (g) | 180,000 | 185,954 | ||
| Freddie Mac Structured Agency Credit Risk Debt Notes: | ||||
| Series 2015-HQ2, Class M3, 3.775%, 5/25/25 (g) | 720,000 | 742,718 | ||
| Series 2015-HQA2, Class M2, 3.325%, 5/25/28 (g) | 750,000 | 774,778 | ||
| Series 2016-DNA2, Class M2, 2.725%, 10/25/28 (g) | 600,000 | 609,767 | ||
| Series 2016-DNA2, Class B, 11.025%, 10/25/28 (g) | 250,000 | 279,964 | ||
| LSTAR Securities Investment Ltd., Series 2015-6, Class A, 2.527%, 5/1/20 (f)(g) | 397,690 | 390,968 | ||
| Wedgewood Real Estate Trust, Series 2016-1, Class A2, 5.00%, 7/15/46 (f)(g) | 400,000 | 398,435 | ||
| Total Collateralized Mortgage-Backed Obligations (Privately Originated) (Cost $7,581,454) | 7,753,574 | |||
| COMMERCIAL MORTGAGE-BACKED SECURITIES - 2.7% | ||||
| Bear Stearns Commercial Mortgage Securities Trust, Series 2015-RRI, Class D, 3.424%, 5/15/32 (f)(g) | 200,000 | 196,255 | ||
| BLCP Hotel Trust, Series 2014-CLRN, Class D, 3.024%, 8/15/29 (f)(g) | 1,000,000 | 983,684 | ||
| CDGJ Commercial Mortgage Trust, Series 2014-BXCH, Class B, 2.374%, 12/15/27 (f)(g) | 800,000 | 797,370 | ||
| Citigroup Commercial Mortgage Trust, Series 2015-SSHP, Class E, 3.924%, 9/15/27 (f)(g) | 600,000 | 573,541 | ||
| Colony Multifamily Mortgage Trust, Series 2014-1, Class A, 2.543%, 4/20/50 (f) | 250,729 | 250,040 | ||
| COMM Mortgage Trust: | ||||
| Series 2013-THL, Class C, 2.517%, 6/8/30 (f)(g) | 950,000 | 938,272 | ||
| Series 2014-SAVA, Class D, 3.625%, 6/15/34 (f)(g) | 500,000 | 495,425 | ||
26 calvert.com CALVERT SOCIAL INVESTMENT FUND ANNUAL REPORT
| PRINCIPAL AMOUNT ($) | VALUE ($) | |||
| COMMERCIAL MORTGAGE-BACKED SECURITIES - CONT’D | ||||
| EQTY INNS Mortgage Trust, Series 2014-INNS: | ||||
| Class E, 3.967%, 5/8/31 (f)(g) | 1,100,000 | 1,074,824 | ||
| Class F, 4.417%, 5/8/31 (f)(g) | 150,000 | 140,015 | ||
| GS Mortgage Securities Trust, Series 2014-NEW, Class D, 3.79%, 1/10/31 (f) | 400,000 | 401,989 | ||
| Hilton USA Trust: | ||||
| Series 2013-HLT, Class AFX, 2.662%, 11/5/30 (f) | 250,000 | 249,956 | ||
| Series 2013-HLF, Class DFL, 3.273%, 11/5/30 (f)(g) | 312,816 | 312,816 | ||
| Series 2013-HLT, Class CFX, 3.714%, 11/5/30 (f) | 400,000 | 400,089 | ||
| Series 2013-HLT, Class DFX, 4.407%, 11/5/30 (f) | 3,700,000 | 3,700,814 | ||
| Series 2013-HLT, Class EFX, 5.609%, 11/5/30 (f)(g) | 1,250,000 | 1,251,929 | ||
| JP Morgan Chase Commercial Mortgage Securities Trust: | ||||
| Series 2014-DSTY, Class D, 3.771%, 6/10/27 (f) | 550,000 | 563,752 | ||
| Series 2014-DSTY, Class C, 3.931%, 6/10/27 (f)(g) | 400,000 | 402,448 | ||
| Series 2014-INN, Class E, 4.124%, 6/15/29 (f)(g) | 1,550,000 | 1,519,147 | ||
| Morgan Stanley Capital I Trust, Series 2014-CPT: | ||||
| Class F, 3.56%, 7/13/29 (f)(g) | 410,000 | 403,785 | ||
| Class G, 3.56%, 7/13/29 (f)(g) | 280,000 | 271,305 | ||
| Motel 6 Trust, Series 2015-MTL6, Class E, 5.279%, 2/5/30 (f) | 1,935,000 | 1,939,550 | ||
| ORES NPL LLC, Series 2014-LV3, Class B, 6.00%, 3/27/24 (f) | 600,000 | 600,000 | ||
| WFLD Mortgage Trust, Series 2014-MONT, Class C, 3.88%, 8/10/31 (f)(g) | 850,000 | 897,721 | ||
| WFRBS Commercial Mortgage Trust, Series 2014-C21, Class D, 3.497%, 8/15/47 (f) | 330,000 | 243,617 | ||
| Total Commercial Mortgage-Backed Securities (Cost $18,594,950) | 18,608,344 | |||
| CORPORATE BONDS - 17.0% | ||||
| Basic Materials - 0.3% | ||||
| Methanex Corp.: | ||||
| 3.25%, 12/15/19 | 600,000 | 593,226 | ||
| 5.65%, 12/1/44 | 1,190,000 | 1,030,558 | ||
| Reliance Steel & Aluminum Co., 4.50%, 4/15/23 | 500,000 | 522,590 | ||
| 2,146,374 | ||||
| Communications - 2.1% | ||||
| AT&T, Inc.: | ||||
| 4.125%, 2/17/26 | 1,300,000 | 1,404,781 | ||
| 5.65%, 2/15/47 | 475,000 | 559,832 | ||
| CBS Corp., 2.90%, 1/15/27 | 1,230,000 | 1,199,236 | ||
| Comcast Corp., 3.20%, 7/15/36 | 1,610,000 | 1,574,738 | ||
| Crown Castle Towers LLC: | ||||
| 3.222%, 5/15/22 (f) | 250,000 | 257,750 | ||
| 3.663%, 5/15/25 (f) | 450,000 | 474,305 | ||
| NBCUniversal Media LLC, 4.45%, 1/15/43 | 500,000 | 562,257 | ||
| Sprint Communications, Inc., 8.375%, 8/15/17 | 2,390,000 | 2,485,600 | ||
| Telefonica Emisiones SAU, 3.192%, 4/27/18 | 600,000 | 614,160 | ||
| Thomson Reuters Corp.: | ||||
| 3.85%, 9/29/24 | 300,000 | 318,406 | ||
| 3.35%, 5/15/26 | 250,000 | 256,605 | ||
calvert.com CALVERT SOCIAL INVESTMENT FUND ANNUAL REPORT 27
| PRINCIPAL AMOUNT ($) | VALUE ($) | |
| CORPORATE BONDS - CONT’D | ||
| Time Warner Cable LLC: | ||
| 5.85%, 5/1/17 | 100,000 | 102,497 |
| 4.00%, 9/1/21 | 400,000 | 424,527 |
| Time Warner, Inc., 4.90%, 6/15/42 | 500,000 | 559,231 |
| Verizon Communications, Inc.: | ||
| 1.75%, 8/15/21 | 540,000 | 534,095 |
| 2.45%, 11/1/22 | 585,000 | 594,126 |
| 3.50%, 11/1/24 | 1,000,000 | 1,066,673 |
| 4.125%, 8/15/46 | 485,000 | 485,134 |
| 4.862%, 8/21/46 | 920,000 | 1,030,458 |
| 14,504,411 | ||
| Consumer, Cyclical - 2.9% | ||
| American Airlines Pass-Through Trust: | ||
| 7.00%, 1/31/18 (f) | 795,876 | 831,690 |
| 5.60%, 1/15/20 (f) | 693,957 | 726,053 |
| 4.40%, 9/22/23 | 846,462 | 855,164 |
| 5.25%, 1/15/24 | 667,855 | 700,413 |
| Carrols Restaurant Group, Inc., 8.00%, 5/1/22 | 200,000 | 216,250 |
| CVS Health Corp., 5.125%, 7/20/45 | 550,000 | 673,005 |
| CVS Pass-Through Trust, 6.036%, 12/10/28 | 920,579 | 1,067,920 |
| Delta Air Lines Pass-Through Trust, 6.20%, 7/2/18 | 240,237 | 255,252 |
| Ferrellgas Partners LP / Ferrellgas Partners Finance Corp., 8.625%, 6/15/20 | 50,000 | 49,125 |
| Ford Motor Credit Co. LLC: | ||
| 1.461%, 3/27/17 | 238,000 | 238,283 |
| 3.00%, 6/12/17 | 210,000 | 212,219 |
| 6.625%, 8/15/17 | 1,300,000 | 1,356,716 |
| 2.145%, 1/9/18 | 250,000 | 251,303 |
| 1.698%, 11/4/19 (g) | 600,000 | 602,483 |
| 3.336%, 3/18/21 | 885,000 | 912,420 |
| 3.219%, 1/9/22 | 700,000 | 718,285 |
| 4.134%, 8/4/25 | 350,000 | 369,260 |
| Home Depot, Inc. (The): | ||
| 2.70%, 4/1/23 | 600,000 | 624,756 |
| 4.20%, 4/1/43 | 600,000 | 676,112 |
| Johnson Controls, Inc., 4.625%, 7/2/44 | 450,000 | 499,149 |
| Kohl's Corp., 4.25%, 7/17/25 | 350,000 | 362,648 |
| Latam Airlines Pass-Through Trust A, 4.20%, 11/15/27 | 507,821 | 496,395 |
| Latam Airlines Pass-Through Trust B, 4.50%, 11/15/23 | 456,485 | 439,367 |
| Lowe's Cos., Inc.: | ||
| 2.50%, 4/15/26 | 250,000 | 250,911 |
| 3.70%, 4/15/46 | 225,000 | 232,465 |
| New Albertsons, Inc., 7.75%, 6/15/26 | 50,000 | 50,000 |
| Newell Brands, Inc.: | ||
| 3.85%, 4/1/23 | 500,000 | 532,233 |
| 4.20%, 4/1/26 | 500,000 | 544,554 |
| Norwegian Air Shuttle ASA Pass-Through Trust, 4.875%, 5/10/28 (f) | 575,000 | 571,882 |
| Starbucks Corp., 2.45%, 6/15/26 | 550,000 | 558,596 |
| TJX Cos., Inc. (The), 2.75%, 6/15/21 | 600,000 | 630,422 |
28 calvert.com CALVERT SOCIAL INVESTMENT FUND ANNUAL REPORT
| PRINCIPAL AMOUNT ($) | VALUE ($) | |
| CORPORATE BONDS - CONT’D | ||
| Virgin Australia Trust: | ||
| 7.125%, 10/23/18 (f) | 16,428 | 16,634 |
| 6.00%, 10/23/20 (f) | 614,381 | 623,597 |
| 5.00%, 10/23/23 (f) | 306,039 | 317,516 |
| Walgreens Boots Alliance, Inc., 3.45%, 6/1/26 | 870,000 | 903,163 |
| Whirlpool Corp.: | ||
| 3.70%, 3/1/23 | 500,000 | 532,649 |
| 3.70%, 5/1/25 | 500,000 | 527,943 |
| 19,426,833 | ||
| Consumer, Non-cyclical - 1.5% | ||
| Amgen, Inc., 4.663%, 6/15/51 (f) | 895,000 | 956,573 |
| AstraZeneca plc: | ||
| 3.375%, 11/16/25 | 600,000 | 640,782 |
| 4.375%, 11/16/45 | 350,000 | 387,642 |
| Becton Dickinson and Co., 3.125%, 11/8/21 | 250,000 | 262,757 |
| Express Scripts Holding Co.: | ||
| 3.00%, 7/15/23 | 250,000 | 253,923 |
| 3.40%, 3/1/27 | 200,000 | 201,136 |
| Grupo Bimbo SAB de CV: | ||
| 3.875%, 6/27/24 (f) | 500,000 | 518,173 |
| 4.875%, 6/27/44 (f) | 500,000 | 495,416 |
| Kraft Heinz Foods Co.: | ||
| 5.20%, 7/15/45 | 575,000 | 680,010 |
| 4.375%, 6/1/46 | 350,000 | 370,309 |
| Kroger Co. (The), 2.65%, 10/15/26 | 800,000 | 794,026 |
| Land O'Lakes Capital Trust I, 7.45%, 3/15/28 (f) | 465,000 | 513,825 |
| Land O'Lakes, Inc., 6.00%, 11/15/22 (f) | 800,000 | 887,200 |
| Life Technologies Corp., 6.00%, 3/1/20 | 500,000 | 559,109 |
| Massachusetts Institute of Technology, 3.959%, 7/1/38 | 300,000 | 343,051 |
| MEDNAX, Inc., 5.25%, 12/1/23 (f) | 155,000 | 162,944 |
| Merck & Co., Inc., 3.70%, 2/10/45 | 250,000 | 264,623 |
| Perrigo Co. plc, 5.30%, 11/15/43 | 300,000 | 320,703 |
| Perrigo Finance Unlimited Co., 3.50%, 12/15/21 | 600,000 | 620,189 |
| Shire Acquisitions Investments Ireland DAC: | ||
| 2.40%, 9/23/21 | 225,000 | 225,283 |
| 2.875%, 9/23/23 | 385,000 | 386,865 |
| 3.20%, 9/23/26 | 455,000 | 457,447 |
| SUPERVALU, Inc., 6.75%, 6/1/21 | 238,000 | 222,530 |
| 10,524,516 | ||
| Energy - 0.4% | ||
| Enterprise Products Operating LLC: | ||
| 6.30%, 9/15/17 | 1,095,000 | 1,144,199 |
| 7.034%, 1/15/18 floating rate thereafter to 1/15/68 (g) | 695,000 | 734,469 |
| 4.85%, 3/15/44 | 300,000 | 311,775 |
| Sabine Pass LNG LP, 7.50%, 11/30/16 | 200,000 | 201,500 |
| 2,391,943 | ||
calvert.com CALVERT SOCIAL INVESTMENT FUND ANNUAL REPORT 29
| PRINCIPAL AMOUNT ($) | VALUE ($) | |
| CORPORATE BONDS - CONT’D | ||
| Financial - 7.3% | ||
| Air Lease Corp., 3.00%, 9/15/23 | 350,000 | 346,020 |
| Ally Financial, Inc.: | ||
| 2.75%, 1/30/17 | 100,000 | 100,188 |
| 6.25%, 12/1/17 | 1,075,000 | 1,118,000 |
| American Tower Corp.: | ||
| 3.45%, 9/15/21 | 600,000 | 631,474 |
| 3.375%, 10/15/26 | 600,000 | 608,170 |
| Bank of America Corp.: | ||
| 2.625%, 4/19/21 | 2,810,000 | 2,854,710 |
| 6.10%, 3/17/25 floating rate thereafter to 12/29/49 (g) | 500,000 | 521,250 |
| 3.875%, 8/1/25 | 1,700,000 | 1,816,139 |
| 4.25%, 10/22/26 | 1,170,000 | 1,241,297 |
| Bank of America NA: | ||
| 5.30%, 3/15/17 | 1,200,000 | 1,220,977 |
| 1.15%, 6/15/17 (g) | 1,500,000 | 1,499,310 |
| Capital One Bank, 2.25%, 2/13/19 | 400,000 | 405,186 |
| Capital One Financial Corp.: | ||
| 6.75%, 9/15/17 | 1,075,000 | 1,126,056 |
| 4.20%, 10/29/25 | 575,000 | 599,893 |
| 3.75%, 7/28/26 | 790,000 | 792,800 |
| Capital One NA, 2.35%, 8/17/18 | 650,000 | 657,910 |
| CIT Group, Inc.: | ||
| 4.25%, 8/15/17 | 900,000 | 916,875 |
| 5.25%, 3/15/18 | 1,975,000 | 2,058,937 |
| Citigroup, Inc.: | ||
| 1.70%, 4/27/18 | 1,700,000 | 1,701,843 |
| 2.65%, 10/26/20 | 885,000 | 904,017 |
| 5.90%, 2/15/23 floating rate thereafter to 12/29/49 (g) | 480,000 | 496,800 |
| 4.60%, 3/9/26 | 640,000 | 683,500 |
| 6.25%, 8/15/26 floating rate thereafter to 12/29/49 (g) | 550,000 | 591,937 |
| 4.45%, 9/29/27 | 2,555,000 | 2,673,739 |
| Citizens Bank NA, 2.55%, 5/13/21 | 400,000 | 407,120 |
| Citizens Financial Group, Inc., 2.375%, 7/28/21 | 355,000 | 356,243 |
| Credit Acceptance Corp.: | ||
| 6.125%, 2/15/21 | 400,000 | 402,000 |
| 7.375%, 3/15/23 | 600,000 | 621,000 |
| DDR Corp.: | ||
| 4.75%, 4/15/18 | 500,000 | 519,090 |
| 3.625%, 2/1/25 | 600,000 | 606,625 |
| Digital Realty Trust LP, 4.75%, 10/1/25 | 525,000 | 569,659 |
| Discover Financial Services: | ||
| 3.85%, 11/21/22 | 750,000 | 778,035 |
| 3.95%, 11/6/24 | 300,000 | 307,100 |
| Doric Nimrod Air Alpha Ltd. Pass-Through Trust, 6.125%, 11/30/19 (f) | 248,635 | 259,513 |
| Doric Nimrod Air Finance Alpha Ltd. Pass-Through Trust, 5.125%, 11/30/22 (f) | 308,457 | 322,767 |
| ERP Operating LP, 4.625%, 12/15/21 | 180,000 | 202,082 |
| ING Bank NV, 2.00%, 11/26/18 (f) | 900,000 | 906,006 |
| Ladder Capital Finance Holdings LLLP / Ladder Capital Finance Corp., 7.375%, 10/1/17 | 60,000 | 60,450 |
| MetLife, Inc., 1.756%, 12/15/17 | 1,500,000 | 1,505,805 |
30 calvert.com CALVERT SOCIAL INVESTMENT FUND ANNUAL REPORT
| PRINCIPAL AMOUNT ($) | VALUE ($) | |
| CORPORATE BONDS - CONT’D | ||
| Mitsubishi UFJ Financial Group, Inc., 2.527%, 9/13/23 | 805,000 | 808,195 |
| Morgan Stanley: | ||
| 2.375%, 7/23/19 | 1,500,000 | 1,526,080 |
| 2.80%, 6/16/20 | 2,200,000 | 2,256,910 |
| 4.00%, 7/23/25 | 725,000 | 779,635 |
| 5.00%, 11/24/25 | 1,300,000 | 1,450,410 |
| OneMain Financial Holdings LLC, 6.75%, 12/15/19 (f) | 150,000 | 157,687 |
| PNC Bank NA, 2.70%, 11/1/22 | 1,000,000 | 1,016,463 |
| Prudential Financial, Inc., 4.60%, 5/15/44 | 150,000 | 160,195 |
| Synchrony Financial, 2.192%, 11/9/17 (g) | 2,415,000 | 2,432,311 |
| Toronto-Dominion Bank (The): | ||
| 1.45%, 9/6/18 | 885,000 | 886,551 |
| 3.625%, 9/15/26 floating rate thereafter to 9/15/31 (g) | 1,145,000 | 1,148,158 |
| US Bancorp, 2.95%, 7/15/22 | 500,000 | 520,895 |
| Vornado Realty LP, 2.50%, 6/30/19 | 700,000 | 709,859 |
| Wells Fargo & Co.: | ||
| 2.50%, 3/4/21 | 1,000,000 | 1,014,581 |
| 2.10%, 7/26/21 | 700,000 | 697,602 |
| 3.00%, 4/22/26 | 670,000 | 676,300 |
| 49,632,355 | ||
| Government - 0.1% | ||
| International Bank for Reconstruction & Development, 1.005%, 10/1/18 | 600,000 | 601,391 |
| Industrial - 1.2% | ||
| Beverage Packaging Holdings Luxembourg II SA / Beverage Packaging Holdings II Is, 5.625%, 12/15/16 (f) | 260,000 | 259,376 |
| Canadian National Railway Co., 1.45%, 12/15/16 | 150,000 | 150,089 |
| Eaton Corp.: | ||
| 1.50%, 11/2/17 | 500,000 | 501,242 |
| 2.75%, 11/2/22 | 600,000 | 620,244 |
| Illinois Tool Works, Inc., 3.90%, 9/1/42 | 300,000 | 331,257 |
| Masco Corp.: | ||
| 4.45%, 4/1/25 | 200,000 | 212,500 |
| 6.50%, 8/15/32 | 350,000 | 385,000 |
| Owens Corning, 3.40%, 8/15/26 | 510,000 | 512,366 |
| Penske Truck Leasing Co. LP / PTL Finance Corp., 3.375%, 2/1/22 (f) | 1,000,000 | 1,039,922 |
| Pentair Finance SA: | ||
| 1.875%, 9/15/17 | 1,200,000 | 1,202,774 |
| 3.625%, 9/15/20 | 600,000 | 621,421 |
| SBA Tower Trust: | ||
| 2.877%, 7/15/21 (f) | 600,000 | 610,170 |
| 3.722%, 4/17/23 (f) | 1,100,000 | 1,135,087 |
| SMBC Aviation Capital Finance DAC, 2.65%, 7/15/21 (f) | 540,000 | 540,741 |
| Thermo Fisher Scientific, Inc., 5.30%, 2/1/44 | 300,000 | 357,436 |
| 8,479,625 | ||
calvert.com CALVERT SOCIAL INVESTMENT FUND ANNUAL REPORT 31
| PRINCIPAL AMOUNT ($) | VALUE ($) | |
| CORPORATE BONDS - CONT’D | ||
| Technology - 1.1% | ||
| Apple, Inc.: | ||
| 3.25%, 2/23/26 | 375,000 | 398,591 |
| 3.45%, 2/9/45 | 430,000 | 410,852 |
| Diamond 1 Finance Corp. / Diamond 2 Finance Corp., 6.02%, 6/15/26 (f) | 750,000 | 822,227 |
| Dun & Bradstreet Corp. (The), 3.25%, 12/1/17 | 600,000 | 609,762 |
| Fidelity National Information Services, Inc., 3.00%, 8/15/26 | 190,000 | 188,134 |
| Hewlett Packard Enterprise Co.: | ||
| 2.45%, 10/5/17 (f) | 2,615,000 | 2,635,946 |
| 2.85%, 10/5/18 (f) | 370,000 | 376,987 |
| Intel Corp., 3.10%, 7/29/22 | 400,000 | 427,236 |
| Microsoft Corp.: | ||
| 2.40%, 8/8/26 | 575,000 | 575,486 |
| 4.45%, 11/3/45 | 505,000 | 574,137 |
| Oracle Corp.: | ||
| 2.40%, 9/15/23 | 200,000 | 201,604 |
| 2.65%, 7/15/26 | 440,000 | 440,080 |
| 7,661,042 | ||
| Utilities - 0.1% | ||
| Consolidated Edison Co. of New York, Inc., 4.45%, 6/15/20 | 300,000 | 330,803 |
| Total Corporate Bonds (Cost $112,420,533) | 115,699,293 | |
| FLOATING RATE LOANS (h) - 0.6% | ||
| Consumer, Cyclical - 0.6% | ||
| Albertson's LLC: | ||
| 4.50%, 8/25/21 (g) | 798,000 | 802,389 |
| 4.75%, 6/22/23 (g) | 327,619 | 330,568 |
| BJ's Wholesale Club, Inc., 4.50%, 9/26/19 (g) | 641,779 | 642,143 |
| Kraton Polymers LLC, 6.00%, 1/6/22 (g) | 1,500,000 | 1,509,609 |
| Varsity Brands, Inc., 5.00%, 12/11/21 (g) | 494,962 | 495,952 |
| 3,780,661 | ||
| Financial - 0.0% | ||
| Alliance Mortgage Investments Term Loan, 12.61%, 6/1/10 *(c)(d)(g)(i) | 385,345 | 4,355 |
| Total Floating Rate Loans (Cost $4,002,040) | 3,785,016 | |
| HIGH SOCIAL IMPACT INVESTMENTS - 0.7% | ||
| Calvert Social Investment Foundation Notes, 0.25%, 7/1/17 (c)(d) | 4,266,666 | 4,146,559 |
| ImpactAssets Global Sustainable Agriculture Notes, 0.00%, 11/3/20 (c)(d)(g) | 393,000 | 349,770 |
| ImpactAssets Microfinance Plus Notes, 0.00%, 11/3/20 (c)(d)(g) | 506,000 | 475,640 |
| Total High Social Impact Investments (Cost $5,165,666) | 4,971,969 | |
32 calvert.com CALVERT SOCIAL INVESTMENT FUND ANNUAL REPORT
| PRINCIPAL AMOUNT ($) | VALUE ($) | |||
| MUNICIPAL OBLIGATIONS - 0.9% | ||||
| California - 0.2% | ||||
| Los Angeles California Unified School District GO Bonds, 5.75%, 7/1/34 | 800,000 | 1,065,784 | ||
| Connecticut - 0.1% | ||||
| Connecticut Special Tax Obligation Revenue Bonds, 5.459%, 11/1/30 | 400,000 | 489,804 | ||
| Massachusetts - 0.1% | ||||
| Commonwealth of Massachusetts GO Bonds, 3.277%, 6/1/46 | 650,000 | 672,535 | ||
| New York - 0.5% | ||||
| New York City GO Bonds, 5.206%, 10/1/31 | 1,275,000 | 1,559,172 | ||
| New York City Transitional Finance Authority Future Tax Secured Revenue Bonds, 5.767%, 8/1/36 | 1,000,000 | 1,317,920 | ||
| New York State Dormitory Authority Revenue Bonds, 5.289%, 3/15/33 | 500,000 | 633,295 | ||
| New York Transportation Development Corp. Revenue Bonds: | ||||
| 3.423%, 7/1/27 | 100,000 | 102,607 | ||
| 3.473%, 7/1/28 | 100,000 | 101,358 | ||
| 3,714,352 | ||||
| Total Municipal Obligations (Cost $5,520,617) | 5,942,475 | |||
| SOVEREIGN GOVERNMENT BOND - 0.1% | ||||
| Nacional Financiera SNC, 3.375%, 11/5/20 (f) | 935,000 | 970,250 | ||
| Total Sovereign Government Bonds (Cost $933,617) | 970,250 | |||
| U.S. GOVERNMENT AGENCIES AND INSTRUMENTALITIES - 0.1% | ||||
| Overseas Private Investment Corp., 3.22%, 9/15/29 | 900,000 | 949,335 | ||
| Total U.S. Government Agencies and Instrumentalities (Cost $900,000) | 949,335 | |||
| U.S. GOVERNMENT AGENCY MORTGAGE-BACKED SECURITIES - 0.2% | ||||
| Fannie Mae: | ||||
| 2.65%, 6/1/26 | 647,473 | 674,681 | ||
| 2.68%, 7/1/26 | 650,000 | 679,208 | ||
| Total U.S. Government Agency Mortgage-Backed Securities (Cost $1,318,812) | 1,353,889 | |||
| U.S. TREASURY OBLIGATIONS - 4.8% | ||||
| United States Treasury Bonds, 2.50%, 5/15/46 | 11,578,000 | 11,983,230 | ||
| United States Treasury Notes: | ||||
| 0.75%, 9/30/18 | 1,990,000 | 1,989,379 | ||
| 0.875%, 9/15/19 | 4,897,000 | 4,896,809 | ||
calvert.com CALVERT SOCIAL INVESTMENT FUND ANNUAL REPORT 33
| PRINCIPAL AMOUNT ($) | VALUE ($) | |||
| U.S. TREASURY OBLIGATIONS - 4.8% | ||||
| 1.125%, 9/30/21 | 6,561,000 | 6,552,287 | ||
| 1.375%, 9/30/23 | 500,000 | 498,105 | ||
| 1.50%, 8/15/26 | 6,428,000 | 6,365,475 | ||
| Total U.S. Treasury Obligations (Cost $32,416,288) | 32,285,285 | |||
| COMMERCIAL PAPER - 0.2% | ||||
| Vodafone Group plc, 1.60%, 9/12/17 (f) | 1,155,000 | 1,137,310 | ||
| Total Commercial Paper (Cost $1,137,239) | 1,137,310 | |||
| TIME DEPOSIT - 2.7% | ||||
| State Street Bank Time Deposit, 0.293%, 10/3/16 | 18,140,183 | 18,140,183 | ||
| Total Time Deposit (Cost $18,140,183) | 18,140,183 | |||
| SHARES | VALUE ($) | |||
SHORT TERM INVESTMENT OF CASH COLLATERAL FOR SECURITIES LOANED - 0.4% | ||||
| State Street Institutional U.S. Government Money Market Fund - Premier Class, 0.26% | 2,532,357 | 2,532,357 | ||
| Total Short Term Investment of Cash Collateral For Securities Loaned (Cost $2,532,357) | 2,532,357 | |||
| TOTAL INVESTMENTS (Cost $646,801,435) - 100.6% | 684,612,105 | |||
| Other assets and liabilities, net - (0.6%) | (4,013,116) | |||
NET ASSETS - 100.0% | $680,598,989 | |||
| FUTURES | NUMBER OF CONTRACTS | EXPIRATION DATE | UNDERLYING FACE AMOUNT AT VALUE | UNREALIZED APPRECIATION (DEPRECIATION) | |||||
| Short: | |||||||||
| 2 Year U.S. Treasury Notes | (6) | 12/16 | ($1,310,812 | ) | ($103 | ) | |||
| 5 Year U.S. Treasury Notes | (5) | 12/16 | (607,578) | (126) | |||||
| 10 Year U.S. Treasury Notes | (106) | 12/16 | (13,899,250) | 12,230 | |||||
| E-Mini S&P 500 Index | (47) | 12/16 | (5,076,940) | (104,425) | |||||
| Total Short | ($92,424 | ) | |||||||
| See notes to financial statements. | |||||||||
34 calvert.com CALVERT SOCIAL INVESTMENT FUND ANNUAL REPORT
| NOTES TO SCHEDULE OF INVESTMENTS | ||
| * Non-income producing security. | ||
| (a) 12,500 shares of Capital One Financial Corp. held by the Balanced Portfolio have been soft segregated in order to cover outstanding commitments to certain limit partnership investments within the Portfolio. There are no restrictions on the trading of this security. | ||
| (b) Security, or portion of security, is on loan. Total value of securities on loan is $2,438,566 as of September 30, 2016. | ||
| (c) Total market value of restricted securities amounts to $15,682,830, which represents 2.3% of the net assets of the Fund as of September 30, 2016. | ||
| (d) This security was valued under the direction of the Board of Trustees. Total market value of fair valued securities amounts to $15,682,830, which represents 2.3% of the net assets of the Fund as of September 30, 2016. | ||
| (e) Affiliated company. | ||
| (f) Security is exempt from registration under Rule 144A of the Securities Act of 1933. These securities may be resold in transactions exempt from registration, normally to qualified institutional buyers. Total market value of Rule 144A securities amounts to $91,717,512, which represents 13.5% of the net assets of the Fund as of September 30, 2016. | ||
| (g) The coupon rate shown on floating or adjustable rate securities represents the rate in effect on September 30, 2016. | ||
| (h) Remaining maturities of floating rate loans may be less than the stated maturities shown as a result of contractual or optional prepayments by the borrower. Such prepayments cannot be predicted with certainty. Floating rate loans generally pay interest at rates which are periodically re-determined at a margin above the London InterBank Offered Rate (“LIBOR”) or other short-term rates. The rate shown is the rate in effect at September 30, 2016. Floating rate loans are generally considered restrictive in that the Fund is ordinarily contractually obligated to receive consent from the Agent Bank and/or Borrower prior to disposition of a floating rate loan. | ||
| (i) Alliance Bancorp and its affiliates filed for Chapter 7 bankruptcy on July 13, 2007. This security is no longer accruing interest. | ||
| Abbreviations: | ||
| CLO: | Collateralized Loan Obligations | |
| GO: | General Obligation | |
| LLC: | Limited Liability Corporation | |
| LP: | Limited Partnership | |
| Ltd.: | Limited | |
| plc: | Public Limited Company | |
| REIT: | Real Estate Investment Trust | |
| See notes to financial statements. | ||
calvert.com CALVERT SOCIAL INVESTMENT FUND ANNUAL REPORT 35
| RESTRICTED SECURITIES | ACQUISITION DATES | COST ($) | |
| Agraquest, Inc., Contingent Deferred Distribution | 8/14/12 | — | |
| Alliance Mortgage Investments Term Loan, 12.61%, 6/1/10 | 5/26/05-6/13/07 | 385,345 | |
| Calvert Social Investment Foundation Notes, 0.25%, 7/1/17 | 7/1/14 | 4,266,666 | |
| CFBanc Corp. | 3/14/03 | 270,000 | |
| Coastal Venture Partners | 6/7/96-6/22/00 | 20,641 | |
| Commons Capital LP | 2/15/01-12/27/11 | 162,045 | |
| Consensus Orthopedics, Inc., Common Stock | 2/10/06 | 504,331 | |
| Consensus Orthopedics, Inc., Series A-1, Preferred | 8/19/05 | 4,331 | |
| Consensus Orthopedics, Inc., Series B, Preferred | 2/10/06 | 139,576 | |
| Consensus Orthopedics, Inc., Series C, Preferred | 2/10/06 | 120,342 | |
| First Analysis Private Equity Fund IV LP | 2/25/02-7/6/11 | 66,786 | |
| GEEMF Partners LP | 2/28/97 | — | |
| Global Environment Emerging Markets Fund LP | 1/14/94-12/1/95 | — | |
| ImpactAssets Global Sustainable Agriculture Notes, 0.00%, 11/3/20 | 11/13/15 | 393,000 | |
| ImpactAssets Microfinance Plus Notes, 0.00%, 11/3/20 | 11/13/15 | 506,000 | |
| Infrastructure and Environmental Private Equity Fund III LP | 4/16/97-2/12/01 | — | |
| Kickboard, Common Stock | 5/23/13 | — | |
| Kickboard, Series A, Preferred | 2/12/13 | 285,328 | |
| Kickboard, Series A2, Preferred | 6/19/14 | 100,000 | |
| Kickboard Bridge Note, 8.00%, 11/1/17 | 9/16/15 | 41,000 | |
| Labrador Ventures III LP | 8/11/98-4/2/01 | 305,585 | |
| Learn Capital Venture Partners III LP | 8/30/16 | 657,000 | |
| LearnZillion, Inc., Series A, Preferred | 3/27/12 | 100,000 | |
| LearnZillion, Inc., Series A-1, Preferred | 4/23/13 | 134,761 | |
| Lumni, Inc., Series B, Preferred | 8/8/13 | 116,367 | |
| MACH Energy, Common Stock | 10/31/08 | 889 | |
| MACH Energy, Series A, Preferred | 5/31/02 | 11,426 | |
| MACH Energy, Series B, Preferred | 12/20/05 | 20,447 | |
| Neighborhood Bancorp, Class A | 6/25/97 | 100,000 | |
| New Markets Growth Fund LLC | 1/8/03-7/18/07 | 225,646 | |
| Seventh Generation, Inc. | 4/12/00-5/6/03 | 201,754 | |
| Solstice Capital LP | 6/26/01-6/17/08 | — | |
| Wild Planet Entertainment, Contingent Deferred Distribution | 5/14/14 | 304,337 | |
| Wind Harvest Co., Inc. | 5/6/94 | 100,000 | |
36 calvert.com CALVERT SOCIAL INVESTMENT FUND ANNUAL REPORT
CALVERT BOND PORTFOLIO
SCHEDULE OF INVESTMENTS
SEPTEMBER 30, 2016
| PRINCIPAL AMOUNT ($) | VALUE ($) | ||||
| ASSET-BACKED SECURITIES - 19.8% | |||||
| Asset-Backed - Automobile - 0.9% | |||||
| American Credit Acceptance Receivables Trust, Series 2014-1, Class B, 2.39%, 11/12/19 (a) | 120,379 | 120,428 | |||
| Capital Automotive REIT, Series 2014-1A, Class A, 3.66%, 10/15/44 (a) | 3,350,000 | 3,352,446 | |||
| Skopos Auto Receivables Trust: | |||||
| Series 2015-2A, Class A, 3.55%, 2/15/20 (a) | 1,075,719 | 1,076,305 | |||
| Series 2015-1A, Class A, 3.10%, 12/15/23 (a) | 284,376 | 284,053 | |||
| Series 2015-1A, Class B, 5.43%, 12/15/23 (a) | 2,000,000 | 2,012,930 | |||
| Toyota Auto Receivables Owner Trust, Series 2016-B, Class A3, 1.30%, 4/15/20 | 1,300,000 | 1,301,989 | |||
| 8,148,151 | |||||
| Asset-Backed - Other - 18.2% | |||||
| American Homes 4 Rent: | |||||
| Series 2014-SFR1, Class E, 3.031%, 6/17/31 (a)(b) | 3,500,000 | 3,436,138 | |||
| Series 2014-SFR2, Class A, 3.786%, 10/17/36 (a) | 4,257,021 | 4,600,405 | |||
| Apidos CLO XXI, Series 2015-21A, Class C, 4.229%, 7/18/27 (a)(b) | 1,300,000 | 1,260,116 | |||
| CAM Mortgage LLC, Series 2015-1, Class M, 4.75%, 7/15/64 (a)(b) | 6,200,000 | 6,098,152 | |||
| Citi Held For Asset Issuance: | |||||
| Series 2015-PM2, Class B, 4.00%, 3/15/22 (a) | 5,700,000 | 5,692,055 | |||
| Series 2015-PM3, Class B, 4.31%, 5/16/22 (a) | 2,500,000 | 2,504,520 | |||
| Series 2016-MF1, Class A, 4.48%, 8/15/22 (a) | 1,638,471 | 1,663,456 | |||
| CKE Restaurant Holdings, Inc., Series 2013-1A, Class A2, 4.474%, 3/20/43 (a) | 6,158,750 | 6,175,327 | |||
| Conn Funding II LP, Series 2016-B, Class A, 3.73%, 10/15/18 (a) | 5,750,000 | 5,749,741 | |||
| Conn's Receivables Funding LLC, Series 2016-A, Class A, 4.68%, 4/16/18 (a) | 2,294,432 | 2,300,087 | |||
| DB Master Finance LLC, Series 2015-1A, Class A2I, 3.262%, 2/20/45 (a) | 5,860,750 | 5,891,226 | |||
| Dell Equipment Finance Trust, Series 2014-1, Class C, 1.80%, 6/22/20 (a) | 2,129,731 | 2,130,722 | |||
| Driven Brands Funding LLC, Series 2015-1A, Class A2, 5.216%, 7/20/45 (a) | 3,672,250 | 3,604,398 | |||
| Dryden 40 Senior Loan Fund, Series 2015-40A, Class D, 4.517%, 8/15/28 (a)(b) | 1,750,000 | 1,713,862 | |||
| Element Rail Leasing I LLC, Series 2014-1A: | |||||
| Class A1, 2.299%, 4/19/44 (a) | 701,944 | 688,090 | |||
| Class A2, 3.668%, 4/19/44 (a) | 1,900,000 | 1,895,190 | |||
| Class B1, 4.406%, 4/19/44 (a) | 2,200,000 | 2,090,301 | |||
| Element Rail Leasing II LLC, Series 2015-1A, Class A2, 3.585%, 2/19/45 (a) | 3,983,000 | 3,925,051 | |||
| FRS I LLC, Series 2013-1A: | |||||
| Class A2, 3.08%, 4/15/43 (a) | 3,554,264 | 3,504,594 | |||
| Class B, 3.96%, 4/15/43 (a) | 3,987,186 | 3,964,374 | |||
| GCAT LLC, Series 2015-1, Class A1, 3.625%, 5/26/20 (a)(b) | 2,093,792 | 2,097,011 | |||
| GLC II Trust, Series 2014-A, Class A, 4.00%, 12/18/20 (a) | 682,436 | 675,612 | |||
| GLC Trust, Series 2014-A, Class A, 3.00%, 7/15/21 (a) | 477,356 | 474,635 | |||
| GMAT Trust, Series 2015-1A, Class A1, 4.25%, 9/25/20 (a)(b) | 1,310,845 | 1,307,193 | |||
| Invitation Homes Trust: | |||||
| Series 2013-SFR1, Class B, 1.896%, 12/17/30 (a)(b) | 300,000 | 299,381 | |||
| Series 2013-SFR1, Class C, 2.396%, 12/17/30 (a)(b) | 3,000,000 | 3,000,377 | |||
| Series 2013-SFR1, Class E, 3.196%, 12/17/30 (a)(b) | 2,400,000 | 2,374,208 | |||
| Series 2015-SFR2, Class E, 3.677%, 6/17/32 (a)(b) | 5,450,000 | 5,421,452 | |||
calvert.com CALVERT SOCIAL INVESTMENT FUND ANNUAL REPORT 37
| PRINCIPAL AMOUNT ($) | VALUE ($) | ||||
| ASSET-BACKED SECURITIES - CONT’D | |||||
| Series 2015-SFR2, Class F, 4.227%, 6/17/32 (a)(b) | 3,650,000 | 3,599,781 | |||
| Series 2015-SFR3, Class D, 3.281%, 8/17/32 (a)(b) | 1,400,000 | 1,415,545 | |||
| Magnetite VI Ltd., Series 2012-6A, Class DR, 4.45%, 9/15/23 (a)(b) | 2,400,000 | 2,383,860 | |||
| OneMain Financial Issuance Trust, Class A: | |||||
| Series 2014-1A, 2.43%, 6/18/24 (a) | 5,487,770 | 5,492,438 | |||
| Series 2015-2A, 2.57%, 7/18/25 (a) | 3,100,000 | 3,110,989 | |||
| Progress Residential Trust, Series 2016-SFR1: | |||||
| Class B, 2.531%, 9/17/33 (a)(b) | 2,046,000 | 2,070,245 | |||
| Class C, 3.031%, 9/17/33 (a)(b) | 1,000,000 | 1,014,005 | |||
| RenewFund Receivables Trust, Series 2015-1, Class A, 3.51%, 4/15/25 (a) | 1,996,575 | 1,987,223 | |||
| RMAT LLC, Class A1: | |||||
| Series 2015-1, 4.09%, 7/27/20 (a)(b) | 1,241,279 | 1,235,049 | |||
| Series 2015-NPL1, 3.75%, 5/25/55 (a)(b) | 1,285,079 | 1,271,972 | |||
| SBA Tower Trust, Series 2014-2A, Class C, 3.869%, 10/15/49 (a)(b) | 3,300,000 | 3,403,587 | |||
| Selene Non-Performing Loans LLC, Series 2014-1A, Class A, 2.981%, 5/25/54 (a)(b) | 1,184,464 | 1,178,887 | |||
| Sierra Timeshare Receivables Funding LLC, Class B: | |||||
| Series 2012-3A, 2.66%, 8/20/29 (a) | 621,160 | 620,438 | |||
| Series 2013-3A, 2.70%, 10/20/30 (a) | 435,809 | 437,341 | |||
| Series 2014-2A, 2.40%, 6/20/31 (a) | 1,417,386 | 1,417,479 | |||
| Series 2014-3A, 2.80%, 10/20/31 (a) | 2,457,145 | 2,469,091 | |||
| SolarCity LMC: | |||||
| Series I LLC, 4.80%, 11/20/38 (a) | 3,163,446 | 3,076,474 | |||
| Series III LLC, 4.02%, 7/20/44 (a) | 2,945,563 | 2,772,720 | |||
| Series III LLC, 5.44%, 7/20/44 (a) | 6,199,235 | 6,508,700 | |||
| Spirit Master Funding LLC, Series 2014-4A, Class A2, 4.629%, 1/20/45 (a) | 5,000,000 | 4,872,291 | |||
| Springleaf Funding Trust, Series 2015-AA, Class B, 3.62%, 11/15/24 (a) | 2,100,000 | 2,118,707 | |||
| Spruce ABS Trust, Series 2016-E1, Class A, 4.32%, 6/15/28 (a) | 1,886,943 | 1,888,234 | |||
| STORE Master Funding LLC, Series 2014-1A, Class A1, 4.21%, 4/20/44 (a) | 3,854,500 | 3,859,022 | |||
| SWAY Residential Trust, Series 2014-1, Class A, 1.831%, 1/17/32 (a)(b) | 4,953,666 | 4,960,139 | |||
| TAL Advantage V LLC, Class B: | |||||
| Series 2014-2A, 3.97%, 5/20/39 (a) | 536,667 | 508,120 | |||
| Series 2014-3A, 4.15%, 11/21/39 (a) | 816,667 | 779,864 | |||
| VB-S1 Issuer LLC, Series 2016-1A, Class C, 3.065%, 6/15/46 (a) | 2,250,000 | 2,297,228 | |||
| VML LLC, Series 2014-NPL1, Class A1, 3.875%, 4/27/54 (a)(b) | 906,541 | 904,117 | |||
| VOLT XXX LLC, Series 2015-NPL1, Class A1, 3.625%, 10/25/57 (a)(b) | 1,842,144 | 1,844,433 | |||
| Wendys Funding LLC, Series 2015-1A: | |||||
| Class A2I, 3.371%, 6/15/45 (a) | 6,039,000 | 6,065,656 | |||
| Class A2II, 4.08%, 6/15/45 (a) | 2,425,500 | 2,463,136 | |||
| 162,564,445 | |||||
| Asset-Backed - Student Loan - 0.7% | |||||
| DRB Prime Student Loan Trust, Series 2016-B, Class A2, 2.89%, 6/25/40 (a) | 2,100,705 | 2,110,700 | |||
| SLM Private Education Loan Trust, Series 2013-B, Class B, 3.00%, 5/16/44 (a) | 2,000,000 | 1,976,273 | |||
| SoFi Professional Loan Program LLC, Series 2014-B, Class A2, 2.55%, 8/27/29 (a) | 1,789,229 | 1,815,647 | |||
| 5,902,620 | |||||
| Total Asset-Backed Securities (Cost $176,349,336) | 176,615,216 | ||||
38 calvert.com CALVERT SOCIAL INVESTMENT FUND ANNUAL REPORT
| PRINCIPAL AMOUNT ($) | VALUE ($) | ||||
COLLATERALIZED MORTGAGE-BACKED OBLIGATIONS (PRIVATELY ORIGINATED) - 3.0% | |||||
| Bellemeade Re Ltd., Series 2015-1A, Class M2, 4.825%, 7/25/25 (a)(b) | 1,500,000 | 1,505,148 | |||
| Fannie Mae Connecticut Avenue Securities: | |||||
| Series 2014-C02, Class 1M2, 3.125%, 5/25/24 (b) | 2,200,000 | 2,171,424 | |||
| Series 2014-C03, Class 2M2, 3.425%, 7/25/24 (b) | 2,600,000 | 2,611,713 | |||
| Series 2016-C05, Class 2M1, 1.875%, 1/25/29 (b) | 989,025 | 993,142 | |||
| Series 2016-C04, Class 1M1, 1.975%, 1/25/29 (b) | 3,219,598 | 3,239,175 | |||
| Series 2016-C04, Class 1M2, 4.775%, 1/25/29 (b) | 1,530,000 | 1,573,073 | |||
| Freddie Mac Structured Agency Credit Risk Debt Notes: | |||||
| Series 2015-DNA2, Class M3, 4.425%, 12/25/27 (b) | 3,000,000 | 3,162,038 | |||
| Series 2015-HQA2, Class M2, 3.325%, 5/25/28 (b) | 4,000,000 | 4,132,147 | |||
| Series 2016-HQA1, Class M2, 3.275%, 9/25/28 (b) | 4,000,000 | 4,125,891 | |||
| Series 2016-DNA2, Class M2, 2.725%, 10/25/28 (b) | 1,600,000 | 1,626,046 | |||
| LSTAR Securities Investment Ltd., Series 2015-6, Class A, 2.527%, 5/1/20 (a)(b) | 1,590,760 | 1,563,872 | |||
| Total Collateralized Mortgage-Backed Obligations (Privately Originated) (Cost $26,091,941) | 26,703,669 | ||||
| COMMERCIAL MORTGAGE-BACKED SECURITIES - 6.9% | |||||
| Bear Stearns Commercial Mortgage Securities Trust, Series 2015-RRI, Class D, 3.424%, 5/15/32 (a)(b) | 1,100,000 | 1,079,405 | |||
| BLCP Hotel Trust, Series 2014-CLRN, Class D, 3.024%, 8/15/29 (a)(b) | 5,000,000 | 4,918,421 | |||
| BWAY Mortgage Trust, Series 2013-1515, Class A1, 2.809%, 3/10/33 (a) | 1,908,301 | 1,957,935 | |||
| CDGJ Commercial Mortgage Trust, Series 2014-BXCH, Class B, 2.374%, 12/15/27 (a)(b) | 2,800,000 | 2,790,796 | |||
| Citigroup Commercial Mortgage Trust, Series 2015-SSHP, Class E, 3.924%, 9/15/27 (a)(b) | 2,900,000 | 2,772,115 | |||
| COMM Mortgage Trust, Series 2013-THL, Class C, 2.517%, 6/8/30 (a)(b) | 3,500,000 | 3,456,790 | |||
| EQTY INNS Mortgage Trust, Series 2014-INNS, Class E, 3.967%, 5/8/31 (a)(b) | 3,600,000 | 3,517,606 | |||
| GRACE Mortgage Trust, Series 2014-GRCE, Class F, 3.71%, 6/10/28 (a)(b) | 400,000 | 395,476 | |||
| GS Mortgage Securities Trust, Series 2014-NEW, Class D, 3.79%, 1/10/31 (a) | 1,400,000 | 1,406,960 | |||
| Hilton USA Trust, Series 2013-HLT: | |||||
| Class AFX, 2.662%, 11/5/30 (a) | 925,000 | 924,837 | |||
| Class CFX, 3.714%, 11/5/30 (a) | 1,200,000 | 1,200,266 | |||
| Class DFX, 4.407%, 11/5/30 (a) | 13,050,000 | 13,052,871 | |||
| Class EFX, 5.609%, 11/5/30 (a)(b) | 4,700,000 | 4,707,255 | |||
| JP Morgan Chase Commercial Mortgage Securities Trust: | |||||
| Series 2014-DSTY, Class D, 3.771%, 6/10/27 (a) | 1,750,000 | 1,793,758 | |||
| Series 2014-DSTY, Class C, 3.931%, 6/10/27 (a)(b) | 1,200,000 | 1,207,343 | |||
| Series 2014-INN, Class E, 4.124%, 6/15/29 (a)(b) | 3,000,000 | 2,940,284 | |||
| Morgan Stanley Capital I Trust, Series 2014-CPT, Class G, 3.56%, 7/13/29 (a)(b) | 960,000 | 930,189 | |||
| Motel 6 Trust, Series 2015-MTL6: | |||||
| Class C, 3.644%, 2/5/30 (a) | 3,000,000 | 2,997,626 | |||
| Class E, 5.279%, 2/5/30 (a) | 4,300,000 | 4,310,111 | |||
| ORES NPL LLC, Series 2014-LV3, Class B, 6.00%, 3/27/24 (a) | 2,000,000 | 2,000,000 | |||
| WFLD Mortgage Trust, Series 2014-MONT, Class C, 3.88%, 8/10/31 (a)(b) | 2,700,000 | 2,851,583 | |||
| WFRBS Commercial Mortgage Trust, Series 2014-C21, Class D, 3.497%, 8/15/47 (a) | 980,000 | 723,470 | |||
| Total Commercial Mortgage-Backed Securities (Cost $62,023,042) | 61,935,097 | ||||
calvert.com CALVERT SOCIAL INVESTMENT FUND ANNUAL REPORT 39
| PRINCIPAL AMOUNT ($) | VALUE ($) | ||||
| CORPORATE BONDS - 48.2% | |||||
| Basic Materials - 0.9% | |||||
| Methanex Corp.: | |||||
| 3.25%, 12/15/19 | 1,000,000 | 988,710 | |||
| 5.65%, 12/1/44 | 4,900,000 | 4,243,474 | |||
| Reliance Steel & Aluminum Co., 4.50%, 4/15/23 | 3,000,000 | 3,135,543 | |||
| 8,367,727 | |||||
| Communications - 6.1% | |||||
| AT&T, Inc.: | |||||
| 4.125%, 2/17/26 | 5,350,000 | 5,781,215 | |||
| 5.65%, 2/15/47 | 2,555,000 | 3,011,308 | |||
| BellSouth LLC, 4.40%, 4/26/21 (a) | 4,000,000 | 4,073,200 | |||
| CBS Corp., 2.90%, 1/15/27 | 4,680,000 | 4,562,949 | |||
| CC Holdings GS V LLC / Crown Castle GS III Corp., 3.849%, 4/15/23 | 1,000,000 | 1,069,589 | |||
| Comcast Corp., 3.20%, 7/15/36 | 6,314,000 | 6,175,711 | |||
| Crown Castle Towers LLC: | |||||
| 3.222%, 5/15/42 (a) | 900,000 | 927,900 | |||
| 3.663%, 5/15/45 (a) | 2,100,000 | 2,213,421 | |||
| NBCUniversal Media LLC, 4.45%, 1/15/43 | 1,700,000 | 1,911,672 | |||
| Sprint Communications, Inc., 8.375%, 8/15/17 | 2,450,000 | 2,548,000 | |||
| Telefonica Emisiones SAU, 3.192%, 4/27/18 | 2,000,000 | 2,047,200 | |||
| Thomson Reuters Corp.: | |||||
| 3.85%, 9/29/24 | 500,000 | 530,677 | |||
| 3.35%, 5/15/26 | 900,000 | 923,776 | |||
| Time Warner Cable LLC, 4.00%, 9/1/21 | 1,725,000 | 1,830,774 | |||
| Time Warner, Inc., 5.35%, 12/15/43 | 1,000,000 | 1,189,842 | |||
| Verizon Communications, Inc.: | |||||
| 1.75%, 8/15/21 | 2,030,000 | 2,007,802 | |||
| 2.45%, 11/1/22 | 2,060,000 | 2,092,136 | |||
| 3.50%, 11/1/24 | 3,705,000 | 3,952,024 | |||
| 4.125%, 8/15/46 | 1,835,000 | 1,835,506 | |||
| 4.862%, 8/21/46 | 3,700,000 | 4,144,233 | |||
| Vodafone Group plc, 4.375%, 2/19/43 | 1,200,000 | 1,202,078 | |||
| 54,031,013 | |||||
| Consumer, Cyclical - 7.2% | |||||
| American Airlines Pass-Through Trust: | |||||
| 7.00%, 7/31/19 (a) | 2,908,239 | 3,039,110 | |||
| 5.60%, 1/15/22 (a) | 473,153 | 495,036 | |||
| 4.40%, 3/22/25 | 3,131,909 | 3,164,105 | |||
| 5.25%, 7/15/25 | 2,392,316 | 2,508,941 | |||
| CVS Health Corp., 5.125%, 7/20/45 | 1,810,000 | 2,214,797 | |||
| CVS Pass-Through Trust, 6.036%, 12/10/28 | 2,124,412 | 2,464,430 | |||
| Ford Motor Credit Co. LLC: | |||||
| 3.00%, 6/12/17 | 790,000 | 798,349 | |||
| 6.625%, 8/15/17 | 4,100,000 | 4,278,875 | |||
| 2.145%, 1/9/18 | 650,000 | 653,387 | |||
| 3.157%, 8/4/20 | — | — | |||
| 3.336%, 3/18/21 | 3,295,000 | 3,397,089 | |||
40 calvert.com CALVERT SOCIAL INVESTMENT FUND ANNUAL REPORT
| PRINCIPAL AMOUNT ($) | VALUE ($) | ||||
| CORPORATE BONDS - CONT’D | |||||
| 3.219%, 1/9/22 | 2,500,000 | 2,565,305 | |||
| 4.134%, 8/4/25 | 1,280,000 | 1,350,438 | |||
| Home Depot, Inc. (The): | |||||
| 2.70%, 4/1/23 | 2,000,000 | 2,082,520 | |||
| 4.20%, 4/1/43 | 2,000,000 | 2,253,706 | |||
| Johnson Controls, Inc., 4.625%, 7/2/44 | 2,000,000 | 2,218,442 | |||
| Kohl's Corp., 4.25%, 7/17/25 | 1,165,000 | 1,207,100 | |||
| Latam Airlines Pass-Through Trust A, 4.20%, 8/15/29 | 1,910,375 | 1,867,392 | |||
| Latam Airlines Pass-Through Trust B, 4.50%, 8/15/25 (c) | 1,616,717 | 1,556,090 | |||
| Lowe's Cos., Inc.: | |||||
| 2.50%, 4/15/26 | 925,000 | 928,369 | |||
| 3.70%, 4/15/46 | 850,000 | 878,202 | |||
| Newell Brands, Inc.: | |||||
| 3.85%, 4/1/23 | 2,250,000 | 2,395,048 | |||
| 4.20%, 4/1/26 | 2,225,000 | 2,423,265 | |||
| Norwegian Air Shuttle ASA Pass-Through Trust, 4.875%, 11/10/29 (a) | 2,175,000 | 2,163,205 | |||
| Starbucks Corp., 2.45%, 6/15/26 | 2,350,000 | 2,386,728 | |||
| TJX Cos., Inc. (The), 2.75%, 6/15/21 | 2,000,000 | 2,101,408 | |||
| Virgin Australia Trust: | |||||
| 6.00%, 4/23/22 (a) | 2,766,106 | 2,807,598 | |||
| 5.00%, 4/23/25 (a) | 1,096,640 | 1,137,764 | |||
| Walgreens Boots Alliance, Inc., 3.45%, 6/1/26 | 3,210,000 | 3,332,359 | |||
| Whirlpool Corp.: | |||||
| 3.70%, 3/1/23 | 2,100,000 | 2,237,126 | |||
| 3.70%, 5/1/25 | 1,700,000 | 1,795,008 | |||
| 5.15%, 3/1/43 | 1,000,000 | 1,170,919 | |||
| 63,872,111 | |||||
| Consumer, Non-cyclical - 5.7% | |||||
| American National Red Cross (The), 5.567%, 11/15/17 | 1,500,000 | 1,562,415 | |||
| Amgen, Inc.: | |||||
| 4.40%, 5/1/45 | 2,500,000 | 2,626,060 | |||
| 4.663%, 6/15/51 (a) | 1,006,000 | 1,075,210 | |||
| AstraZeneca plc: | |||||
| 3.375%, 11/16/25 | 2,175,000 | 2,322,835 | |||
| 4.375%, 11/16/45 | 1,325,000 | 1,467,503 | |||
| Becton Dickinson and Co., 3.125%, 11/8/21 | 1,475,000 | 1,550,263 | |||
| Dr Pepper Snapple Group, Inc., 2.00%, 1/15/20 | 1,000,000 | 1,002,979 | |||
| ERAC USA Finance LLC, 6.375%, 10/15/17 (a) | 8,000,000 | 8,383,192 | |||
| Express Scripts Holding Co.: | |||||
| 3.00%, 7/15/23 | 925,000 | 939,515 | |||
| 3.40%, 3/1/27 | 700,000 | 703,975 | |||
| Grupo Bimbo SAB de CV: | |||||
| 4.50%, 1/25/22 (a) | 3,000,000 | 3,216,606 | |||
| 3.875%, 6/27/24 (a) | 1,200,000 | 1,243,616 | |||
| 4.875%, 6/27/44 (a) | 1,200,000 | 1,188,998 | |||
| Harland Clarke Holdings Corp., 9.75%, 8/1/18 (a) | 2,000,000 | 2,055,000 | |||
| Kraft Heinz Foods Co.: | |||||
| 5.20%, 7/15/45 | 2,125,000 | 2,513,080 | |||
| 4.375%, 6/1/46 | 700,000 | 740,618 | |||
calvert.com CALVERT SOCIAL INVESTMENT FUND ANNUAL REPORT 41
| PRINCIPAL AMOUNT ($) | VALUE ($) | ||||
| CORPORATE BONDS - CONT’D | |||||
| Kroger Co. (The), 2.65%, 10/15/26 | 3,195,000 | 3,171,140 | |||
| Land O'Lakes Capital Trust I, 7.45%, 3/15/28 (a) | 1,200,000 | 1,326,000 | |||
| Land O'Lakes, Inc., 6.00%, 11/15/22 (a) | 2,000,000 | 2,218,000 | |||
| Life Technologies Corp., 6.00%, 3/1/20 | 1,900,000 | 2,124,616 | |||
| Massachusetts Institute of Technology, 3.959%, 7/1/38 | 875,000 | 1,000,566 | |||
| MEDNAX, Inc., 5.25%, 12/1/23 (a) | 600,000 | 630,750 | |||
| Merck & Co., Inc., 3.70%, 2/10/45 | 1,200,000 | 1,270,189 | |||
| Perrigo Finance Unlimited Co., 3.90%, 12/15/24 | 1,000,000 | 1,014,689 | |||
| President and Fellows of Harvard College, 3.619%, 10/1/37 | 1,000,000 | 1,103,364 | |||
| Shire Acquisitions Investments Ireland DAC: | |||||
| 2.40%, 9/23/21 | 885,000 | 886,114 | |||
| 2.875%, 9/23/23 | 1,480,000 | 1,487,168 | |||
| 3.20%, 9/23/26 | 1,765,000 | 1,774,494 | |||
| SUPERVALU, Inc., 6.75%, 6/1/21 | 786,000 | 734,910 | |||
| 51,333,865 | |||||
| Energy - 1.3% | |||||
| Enterprise Products Operating LLC: | |||||
| 6.30%, 9/15/17 | 2,617,000 | 2,734,582 | |||
| 7.034%, 1/15/18 floating rate thereafter to 1/15/68 (b) | 8,505,000 | 8,987,999 | |||
| 11,722,581 | |||||
| Financial - 20.3% | |||||
| Air Lease Corp., 3.00%, 9/15/23 | 1,275,000 | 1,260,503 | |||
| Ally Financial, Inc., 6.25%, 12/1/17 | 3,984,000 | 4,143,360 | |||
| American Tower Corp.: | |||||
| 3.45%, 9/15/21 | 2,650,000 | 2,789,011 | |||
| 3.375%, 10/15/26 | 1,950,000 | 1,976,553 | |||
| Bank of America Corp.: | |||||
| 5.70%, 5/2/17 | 2,400,000 | 2,456,244 | |||
| 2.625%, 4/19/21 | 9,800,000 | 9,955,928 | |||
| 6.10%, 3/17/25 floating rate thereafter to 12/29/49 (b) | 1,100,000 | 1,146,750 | |||
| 3.875%, 8/1/25 | 5,100,000 | 5,448,417 | |||
| 4.25%, 10/22/26 | 7,505,000 | 7,962,340 | |||
| Bank of America NA, 5.30%, 3/15/17 | 3,900,000 | 3,968,176 | |||
| Capital One Bank: | |||||
| 2.25%, 2/13/19 | 1,000,000 | 1,012,964 | |||
| 3.375%, 2/15/23 | — | — | |||
| Capital One Financial Corp.: | |||||
| 6.75%, 9/15/17 | 4,270,000 | 4,472,799 | |||
| 4.20%, 10/29/25 | 2,100,000 | 2,190,913 | |||
| 3.75%, 7/28/26 | 3,100,000 | 3,110,986 | |||
| Capital One NA, 2.35%, 8/17/18 | 2,360,000 | 2,388,721 | |||
| CIT Group, Inc.: | |||||
| 5.00%, 5/15/17 | 4,309,000 | 4,389,794 | |||
| 4.25%, 8/15/17 | 5,000,000 | 5,093,750 | |||
| 5.25%, 3/15/18 | 875,000 | 912,187 | |||
| Citigroup, Inc.: | |||||
| 1.70%, 4/27/18 | 6,585,000 | 6,592,138 | |||
| 2.65%, 10/26/20 | 3,435,000 | 3,508,811 | |||
42 calvert.com CALVERT SOCIAL INVESTMENT FUND ANNUAL REPORT
| PRINCIPAL AMOUNT ($) | VALUE ($) | ||||
| CORPORATE BONDS - CONT’D | |||||
| 5.90%, 2/15/23 floating rate thereafter to 12/29/49 (b)(c) | 1,720,000 | 1,780,200 | |||
| 4.60%, 3/9/26 | 2,535,000 | 2,707,299 | |||
| 6.25%, 8/15/26 floating rate thereafter to 12/29/49 (b) | 1,500,000 | 1,614,375 | |||
| 4.45%, 9/29/27 | 9,940,000 | 10,401,942 | |||
| Citizens Bank NA, 2.55%, 5/13/21 | 1,400,000 | 1,424,920 | |||
| Citizens Financial Group, Inc., 2.375%, 7/28/21 | 1,475,000 | 1,480,165 | |||
| Credit Acceptance Corp.: | |||||
| 6.125%, 2/15/21 | 1,580,000 | 1,587,900 | |||
| 7.375%, 3/15/23 | 2,500,000 | 2,587,500 | |||
| DDR Corp.: | |||||
| 4.75%, 4/15/18 | 3,000,000 | 3,114,543 | |||
| 3.625%, 2/1/25 | 3,100,000 | 3,134,227 | |||
| Digital Realty Trust LP, 4.75%, 10/1/25 | 2,035,000 | 2,208,105 | |||
| Discover Bank, 8.70%, 11/18/19 | 948,000 | 1,093,609 | |||
| Discover Financial Services: | |||||
| 3.85%, 11/21/22 | 2,435,000 | 2,526,020 | |||
| 3.95%, 11/6/24 | 1,500,000 | 1,535,500 | |||
| Doric Nimrod Air Finance Alpha Ltd. Pass Through Trust, 6.50%, 5/30/21 (a) | 334,032 | 348,446 | |||
| ERP Operating LP, 4.625%, 12/15/21 | 777,000 | 872,322 | |||
| ING Bank NV, 2.00%, 11/26/18 (a) | 3,150,000 | 3,171,020 | |||
| MetLife, Inc., 1.756%, 12/15/17 | 5,765,000 | 5,787,311 | |||
| Mitsubishi UFJ Financial Group, Inc., 2.527%, 9/13/23 | 3,080,000 | 3,092,225 | |||
| Morgan Stanley: | |||||
| 6.25%, 8/28/17 | 3,500,000 | 3,645,456 | |||
| 2.375%, 7/23/19 | 4,400,000 | 4,476,503 | |||
| 2.80%, 6/16/20 | 3,500,000 | 3,590,538 | |||
| 4.00%, 7/23/25 | 1,855,000 | 1,994,791 | |||
| 5.00%, 11/24/25 | 6,700,000 | 7,475,190 | |||
| PNC Bank NA, 2.70%, 11/1/22 | 4,000,000 | 4,065,852 | |||
| Prudential Financial, Inc., 4.60%, 5/15/44 | 700,000 | 747,578 | |||
| Synchrony Financial, 2.192%, 11/9/17 (b) | 8,855,000 | 8,918,473 | |||
| Toronto-Dominion Bank (The): | |||||
| 1.45%, 9/6/18 | 3,835,000 | 3,841,719 | |||
| 3.625%, 9/15/26 floating rate thereafter to 9/15/31 (b) | 4,795,000 | 4,808,225 | |||
| US Bancorp, 2.95%, 7/15/22 | 1,200,000 | 1,250,148 | |||
| Vornado Realty LP, 2.50%, 6/30/19 | 2,400,000 | 2,433,802 | |||
| Wells Fargo & Co.: | |||||
| 2.50%, 3/4/21 | 3,000,000 | 3,043,743 | |||
| 2.10%, 7/26/21 | 2,950,000 | 2,939,893 | |||
| 3.00%, 4/22/26 | 2,605,000 | 2,629,495 | |||
| 181,109,380 | |||||
| Government - 0.3% | |||||
| International Bank for Reconstruction & Development, 1.005%, 10/1/18 | 2,850,000 | 2,856,606 | |||
| Industrial - 3.3% | |||||
| Eaton Corp., 2.75%, 11/2/22 | 1,400,000 | 1,447,236 | |||
| Illinois Tool Works, Inc., 3.90%, 9/1/42 | 1,000,000 | 1,104,189 | |||
| Owens Corning, 3.40%, 8/15/26 | 1,960,000 | 1,969,093 | |||
calvert.com CALVERT SOCIAL INVESTMENT FUND ANNUAL REPORT 43
| PRINCIPAL AMOUNT ($) | VALUE ($) | ||||
| CORPORATE BONDS - CONT’D | |||||
| Penske Truck Leasing Co. LP / PTL Finance Corp.: | |||||
| 3.75%, 5/11/17 (a) | 3,075,000 | 3,116,955 | |||
| 3.375%, 2/1/22 (a) | 2,000,000 | 2,079,844 | |||
| 4.25%, 1/17/23 (a) | 3,000,000 | 3,164,433 | |||
| Pentair Finance SA: | |||||
| 1.875%, 9/15/17 | 4,100,000 | 4,109,479 | |||
| 3.625%, 9/15/20 | 2,160,000 | 2,237,116 | |||
| SBA Tower Trust: | |||||
| 2.877%, 7/15/46 (a) | 2,500,000 | 2,542,377 | |||
| 3.722%, 4/15/48 (a) | 4,150,000 | 4,282,373 | |||
| SMBC Aviation Capital Finance DAC, 2.65%, 7/15/21 (a) | 2,040,000 | 2,042,799 | |||
| Thermo Fisher Scientific, Inc.: | |||||
| 4.15%, 2/1/24 | 800,000 | 869,252 | |||
| 5.30%, 2/1/44 | 500,000 | 595,726 | |||
| 29,560,872 | |||||
| Technology - 2.9% | |||||
| Apple, Inc.: | |||||
| 3.25%, 2/23/26 | 1,325,000 | 1,408,353 | |||
| 3.45%, 2/9/45 | 1,050,000 | 1,003,243 | |||
| Diamond 1 Finance Corp. / Diamond 2 Finance Corp., 6.02%, 6/15/26 (a) | 2,025,000 | 2,220,014 | |||
| Dun & Bradstreet Corp. (The), 3.25%, 12/1/17 | 800,000 | 813,016 | |||
| Fidelity National Information Services, Inc., 3.00%, 8/15/26 | 720,000 | 712,928 | |||
| Hewlett Packard Enterprise Co.: | |||||
| 2.45%, 10/5/17 (a) | 10,065,000 | 10,145,621 | |||
| 2.85%, 10/5/18 (a) | 1,350,000 | 1,375,492 | |||
| Intel Corp., 3.10%, 7/29/22 | 1,250,000 | 1,335,112 | |||
| Microsoft Corp.: | |||||
| 2.40%, 8/8/26 | 2,225,000 | 2,226,882 | |||
| 4.45%, 11/3/45 | 1,950,000 | 2,216,965 | |||
| Oracle Corp.: | |||||
| 2.40%, 9/15/23 | 1,080,000 | 1,088,662 | |||
| 2.65%, 7/15/26 | 1,600,000 | 1,600,291 | |||
| 26,146,579 | |||||
| Utilities - 0.2% | |||||
| Consolidated Edison Co. of New York, Inc., 4.45%, 6/15/20 | 1,675,000 | 1,846,984 | |||
| Total Corporate Bonds (Cost $417,147,419) | 430,847,718 | ||||
| FLOATING RATE LOANS (d) - 1.3% | |||||
| Consumer, Cyclical - 1.3% | |||||
| Albertson's LLC: | |||||
| 4.50%, 8/25/21 (b) | 3,092,250 | 3,109,257 | |||
| 4.75%, 6/22/23 (b) | 1,219,048 | 1,230,019 | |||
| BJ's Wholesale Club, Inc., 4.50%, 9/26/19 (b) | 1,789,416 | 1,790,432 | |||
| Kraton Polymers LLC, 6.00%, 1/6/22 (b) | 3,750,000 | 3,774,023 | |||
| Varsity Brands, Inc., 5.00%, 12/11/21 (b) | 1,732,368 | 1,735,833 | |||
| 11,639,564 | |||||
44 calvert.com CALVERT SOCIAL INVESTMENT FUND ANNUAL REPORT
| PRINCIPAL AMOUNT ($) | VALUE ($) | ||||
| FLOATING RATE LOANS (d) - CONT’D | |||||
| Financial - 0.0% | |||||
| Alliance Mortgage Investments Term Loan, 12.61%, 6/1/10 *(b)(e)(f)(g) | 481,681 | 5,443 | |||
| Total Floating Rate Loans (Cost $11,717,959) | 11,645,007 | ||||
| HIGH SOCIAL IMPACT INVESTMENTS - 0.7% | |||||
| Calvert Social Investment Foundation Notes: | |||||
| 0.50%, 1/1/17 (f)(g) | 3,087,392 | 3,053,245 | |||
| 0.50%, 3/18/17 (f)(g) | 2,000,000 | 1,966,400 | |||
| ImpactAssets Global Sustainable Agriculture Notes, 0.00%, 11/3/20 (b)(f)(g) | 490,000 | 436,100 | |||
| ImpactAssets Microfinance Plus Notes, 0.00%, 11/3/20 (b)(f)(g) | 631,000 | 593,140 | |||
| Total High Social Impact Investments (Cost $6,208,392) | 6,048,885 | ||||
| MUNICIPAL OBLIGATIONS - 3.2% | |||||
| California - 0.9% | |||||
| Los Angeles California Unified School District GO Bonds, 5.75%, 7/1/34 | 3,750,000 | 4,995,862 | |||
| Oakland California PO Revenue Bonds, Zero Coupon, 0.00%, 12/15/20 | 1,490,000 | 1,356,913 | |||
| Santa Clara Valley California Transportation Authority Revenue Bonds, 5.876%, 4/1/32 | 880,000 | 1,142,566 | |||
| 7,495,341 | |||||
| Connecticut - 0.5% | |||||
| Connecticut Special Tax Obligation Revenue Bonds, 5.459%, 11/1/30 | 3,800,000 | 4,653,138 | |||
| District of Columbia - 0.3% | |||||
| Georgetown University Washington DC Revenue Bonds, Series B, 7.22%, 4/1/19 | 2,285,000 | 2,467,595 | |||
| Maryland - 0.4% | |||||
| Maryland State Transportation Authority Revenue Bonds, 5.604%, 7/1/30 | 3,000,000 | 3,744,810 | |||
| Massachusetts - 0.4% | |||||
| Commonwealth of Massachusetts GO Bonds: | |||||
| 5.456%, 12/1/39 | 750,000 | 1,022,100 | |||
| 3.277%, 6/1/46 | 2,500,000 | 2,586,675 | |||
| 3,608,775 | |||||
| New York - 0.7% | |||||
| New York City GO Bonds, 5.206%, 10/1/31 | 1,030,000 | 1,259,566 | |||
| New York City Transitional Finance Authority Future Tax Secured Revenue Bonds, 5.767%, 8/1/36 | 3,540,000 | 4,665,437 | |||
| New York Transportation Development Corp. Revenue Bonds: | |||||
| 3.423%, 7/1/27 | 200,000 | 205,214 | |||
| 3.473%, 7/1/28 | 200,000 | 202,716 | |||
| 3.573%, 7/1/29 | 200,000 | 202,482 | |||
| 6,535,415 | |||||
| Total Municipal Obligations (Cost $25,573,535) | 28,505,074 | ||||
calvert.com CALVERT SOCIAL INVESTMENT FUND ANNUAL REPORT 45
| PRINCIPAL AMOUNT ($) | VALUE ($) | ||||
| SOVEREIGN GOVERNMENT BOND - 0.4% | |||||
| Nacional Financiera SNC, 3.375%, 11/5/20 (a) | 3,450,000 | 3,580,065 | |||
| Total Sovereign Government Bonds (Cost $3,444,896) | 3,580,065 | ||||
| U.S. GOVERNMENT AGENCIES AND INSTRUMENTALITIES - 0.3% | |||||
| Overseas Private Investment Corp., 3.22%, 9/15/29 | 2,850,000 | 3,006,228 | |||
| Total U.S. Government Agencies and Instrumentalities (Cost $2,850,000) | 3,006,228 | ||||
| U.S. GOVERNMENT AGENCY MORTGAGE-BACKED SECURITIES - 0.7% | |||||
| Fannie Mae: | |||||
| 2.65%, 6/1/26 | 2,988,336 | 3,113,909 | |||
| 2.68%, 7/1/26 | 3,000,000 | 3,134,808 | |||
| Total U.S. Government Agency Mortgage-Backed Securities (Cost $6,086,824) | 6,248,717 | ||||
| U.S. TREASURY OBLIGATIONS - 10.1% | |||||
| United States Treasury Bonds, 2.50%, 5/15/46 | 44,265,000 | 45,814,275 | |||
| United States Treasury Notes: | |||||
| 0.75%, 9/30/18 | 9,860,000 | 9,856,924 | |||
| 0.75%, 9/15/19 | 3,170,000 | 3,169,876 | |||
| 1.125%, 9/30/21 | 14,157,000 | 14,138,200 | |||
| 1.375%, 9/30/23 | 760,000 | 757,120 | |||
| 1.50%, 8/15/26 | 16,382,000 | 16,222,652 | |||
| Total U.S. Treasury Obligations (Cost $90,169,827) | 89,959,047 | ||||
| COMMERCIAL PAPER - 0.5% | |||||
| Vodafone Group plc, 1.60%, 9/12/17 (a) | 4,475,000 | 4,406,460 | |||
| Total Commercial Paper (Cost $4,406,184) | 4,406,460 | ||||
| SHARES | VALUE ($) | ||||
| COMMON STOCKS - 0.0% | |||||
| Wireless Telecommunication Services - 0.0% | |||||
| NII Holdings, Inc. * | 88,599 | 295,035 | |||
| Total Common Stocks (Cost $1,373,284) | 295,035 | ||||
46 calvert.com CALVERT SOCIAL INVESTMENT FUND ANNUAL REPORT
| PRINCIPAL AMOUNT ($) | VALUE ($) | ||||
| TIME DEPOSIT - 4.8% | |||||
| State Street Bank Time Deposit, 0.293%, 10/3/16 | 42,422,173 | 42,422,173 | |||
| Total Time Deposit (Cost $42,422,173) | 42,422,173 | ||||
| SHARES | VALUE ($) | ||||
SHORT TERM INVESTMENT OF CASH COLLATERAL FOR SECURITIES LOANED - 0.4% | |||||
| State Street Institutional U.S. Government Money Market Fund - Premier Class, 0.26% | 3,567,203 | 3,567,203 | |||
| Total Short Term Investment of Cash Collateral For Securities Loaned (Cost $3,567,203) | 3,567,203 | ||||
| TOTAL INVESTMENTS (Cost $879,432,015) - 100.3% | 895,785,594 | ||||
| Other assets and liabilities, net - (0.3%) | (2,414,356) | ||||
NET ASSETS - 100.0% | $893,371,238 | ||||
| FUTURES | NUMBER OF CONTRACTS | EXPIRATION DATE | UNDERLYING FACE AMOUNT AT VALUE | UNREALIZED APPRECIATION (DEPRECIATION) | |||||
| Short: | |||||||||
| 10 Year U.S. Treasury Notes | (225) | 12/16 | ($29,503,125 | ) | $25,960 | ||||
| NOTES TO SCHEDULE OF INVESTMENTS | ||
| * Non-income producing security. | ||
| (a) Security is exempt from registration under Rule 144A of the Securities Act of 1933. These securities may be resold in transactions exempt from registration, normally to qualified institutional buyers. Total market value of Rule 144A securities amounts to $320,987,849, which represents 35.9% of the net assets of the Fund as of September 30, 2016. | ||
| (b) The coupon rate shown on floating or adjustable rate securities represents the rate in effect on September 30, 2016. | ||
| (c) Security, or portion of security, is on loan. Total value of securities on loan is $3,494,297 as of September 30, 2016. | ||
| (d) Remaining maturities of floating rate loans may be less than the stated maturities shown as a result of contractual or optional prepayments by the borrower. Such prepayments cannot be predicted with certainty. Floating rate loans generally pay interest at rates which are periodically re-determined at a margin above the London InterBank Offered Rate (“LIBOR”) or other short-term rates. The rate shown is the rate in effect at September 30, 2016. Floating rate loans are generally considered restrictive in that the Fund is ordinarily contractually obligated to receive consent from the Agent Bank and/or Borrower prior to disposition of a floating rate loan. | ||
| (e) Alliance Bancorp and its affiliates filed for Chapter 7 bankruptcy on July 13, 2007. This security is no longer accruing interest. | ||
| (f) Total market value of restricted securities amounts to $6,054,328, which represents 0.7% of the net assets of the Fund as of September 30, 2016. | ||
| (g) This security was valued under the direction of the Board of Trustees. Total market value of fair valued securities amounts to $6,054,328, which represents 0.7% of the net assets of the Fund as of September 30, 2016. | ||
| Abbreviations: | ||
| CLO: | Collateralized Loan Obligations | |
| GO: | General Obligation | |
| LLC: | Limited Liability Corporation | |
| LP: | Limited Partnership | |
| Ltd.: | Limited | |
| plc: | Public Limited Company | |
| PO: | Pension Obligation | |
| REIT: | Real Estate Investment Trust | |
| See notes to financial statements. | ||
calvert.com CALVERT SOCIAL INVESTMENT FUND ANNUAL REPORT 47
| RESTRICTED SECURITIES | ACQUISITION DATES | COST ($) |
| Alliance Mortgage Investments Term Loan, 12.61%, 6/1/10 | 5/26/05-6/13/07 | 481,681 |
| Calvert Social Investment Foundation Notes, 0.50%, 1/1/17 | 1/1/14 | 3,087,392 |
| Calvert Social Investment Foundation Notes, 0.50%, 3/18/17 | 3/18/16 | 2,000,000 |
| ImpactAssets Global Sustainable Agriculture Notes, 0.00%, 11/3/20 | 11/13/15 | 490,000 |
| ImpactAssets Microfinance Plus Notes, 0.00%, 11/3/20 | 11/13/15 | 631,000 |
48 calvert.com CALVERT SOCIAL INVESTMENT FUND ANNUAL REPORT
CALVERT EQUITY PORTFOLIO
SCHEDULE OF INVESTMENTS
SEPTEMBER 30, 2016
| SHARES | VALUE ($) | ||||
| COMMON STOCKS - 94.1% | |||||
| Banks - 0.9% | |||||
| Wells Fargo & Co. | 425,526 | 18,842,291 | |||
| Beverages - 3.5% | |||||
| Coca-Cola Co. (The) | 847,896 | 35,882,959 | |||
| PepsiCo, Inc. | 380,172 | 41,351,308 | |||
| 77,234,267 | |||||
| Biotechnology - 2.3% | |||||
| Biogen, Inc. * | 49,871 | 15,611,119 | |||
| Gilead Sciences, Inc. | 462,299 | 36,577,097 | |||
| 52,188,216 | |||||
| Capital Markets - 1.1% | |||||
| Charles Schwab Corp. (The) | 806,473 | 25,460,353 | |||
| Chemicals - 5.0% | |||||
| Ecolab, Inc. | 547,165 | 66,600,924 | |||
| Marrone Bio Innovations, Inc. *(a) | 255,843 | 440,050 | |||
| Praxair, Inc. | 367,000 | 44,344,610 | |||
| 111,385,584 | |||||
| Consumer Finance - 1.0% | |||||
| American Express Co. | 343,786 | 22,016,055 | |||
| Electronic Equipment & Instruments - 2.9% | |||||
| Amphenol Corp., Class A | 1,008,359 | 65,462,666 | |||
| Food & Staples Retailing - 5.2% | |||||
| CVS Health Corp. | 958,266 | 85,276,091 | |||
| Whole Foods Market, Inc. | 1,109,589 | 31,456,848 | |||
| 116,732,939 | |||||
| Food Products - 2.5% | |||||
| Mondelez International, Inc., Class A | 1,286,065 | 56,458,253 | |||
| Health Care Equipment & Supplies - 2.5% | |||||
| Danaher Corp. | 710,059 | 55,661,525 | |||
| Health Care Providers & Services - 3.0% | |||||
| Henry Schein, Inc. * | 206,720 | 33,691,226 | |||
| Laboratory Corporation of America Holdings * | 244,544 | 33,619,909 | |||
| 67,311,135 | |||||
calvert.com CALVERT SOCIAL INVESTMENT FUND ANNUAL REPORT 49
| SHARES | VALUE ($) | ||||
| COMMON STOCKS - CONT’D | |||||
| Health Care Technology - 1.2% | |||||
| Cerner Corp. * | 443,713 | 27,399,278 | |||
| Hotels, Restaurants & Leisure - 1.4% | |||||
| Starbucks Corp. | 556,523 | 30,130,155 | |||
| Industrial Conglomerates - 2.4% | |||||
| 3M Co. | 303,939 | 53,563,170 | |||
| Insurance - 1.7% | |||||
| Marsh & McLennan Cos., Inc. | 551,982 | 37,120,790 | |||
| Internet & Direct Marketing Retail - 2.8% | |||||
| Priceline Group, Inc. (The) * | 42,544 | 62,603,071 | |||
| Internet Software & Services - 7.0% | |||||
| Alphabet, Inc., Class C * | 138,166 | 107,395,050 | |||
| Facebook, Inc., Class A * | 373,977 | 47,970,030 | |||
| 155,365,080 | |||||
| IT Services - 9.1% | |||||
| Accenture plc, Class A | 281,957 | 34,446,687 | |||
| MasterCard, Inc., Class A | 615,224 | 62,611,347 | |||
| Visa, Inc., Class A | 1,271,062 | 105,116,827 | |||
| 202,174,861 | |||||
| Life Sciences - Tools & Services - 3.3% | |||||
| Thermo Fisher Scientific, Inc. | 462,358 | 73,542,663 | |||
| Machinery - 3.8% | |||||
| Fortive Corp. | 697,511 | 35,503,310 | |||
| IDEX Corp. | 524,480 | 49,075,593 | |||
| 84,578,903 | |||||
| Media - 4.7% | |||||
| AMC Networks, Inc., Class A * | 226,288 | 11,735,296 | |||
| Comcast Corp., Class A | 693,643 | 46,016,276 | |||
| Walt Disney Co. (The) | 508,378 | 47,207,981 | |||
| 104,959,553 | |||||
| Multiline Retail - 3.1% | |||||
| Dollar Tree, Inc. * | 872,702 | 68,882,369 | |||
| Personal Products - 1.3% | |||||
| Estee Lauder Cos., Inc. (The), Class A | 321,580 | 28,479,125 | |||
50 calvert.com CALVERT SOCIAL INVESTMENT FUND ANNUAL REPORT
| SHARES | VALUE ($) | ||||
| COMMON STOCKS - CONT’D | |||||
| Pharmaceuticals - 6.5% | |||||
| Bristol-Myers Squibb Co. | 942,937 | 50,843,163 | |||
| Novartis AG (ADR) | 199,831 | 15,778,656 | |||
| Perrigo Co. plc | 375,967 | 34,713,033 | |||
| Zoetis, Inc. | 854,479 | 44,441,453 | |||
| 145,776,305 | |||||
| Professional Services - 0.7% | |||||
| Verisk Analytics, Inc. * | 202,840 | 16,486,835 | |||
| Semiconductors & Semiconductor Equipment - 1.7% | |||||
| Texas Instruments, Inc. | 526,313 | 36,936,646 | |||
| Software - 3.5% | |||||
| EXCENT Corp. *(b)(c) | 1,393,607 | 83,616 | |||
| Microsoft Corp. | 1,337,831 | 77,059,066 | |||
| 77,142,682 | |||||
| Specialty Retail - 5.7% | |||||
| Lowe's Cos., Inc. | 1,032,375 | 74,547,799 | |||
| Ross Stores, Inc. | 834,583 | 53,663,687 | |||
| 128,211,486 | |||||
| Technology Hardware, Storage & Peripherals - 2.9% | |||||
| Apple, Inc. (d) | 575,719 | 65,085,033 | |||
| Textiles, Apparel & Luxury Goods - 1.4% | |||||
| NIKE, Inc., Class B | 609,084 | 32,068,273 | |||
| Venture Capital - 0.0% | |||||
| 20/20 Gene Systems, Inc. *(b)(c) | 73,397 | 35,964 | |||
| Digital Directions International, Inc. *(b)(c) | 354,389 | 87,499 | |||
| Graduation Alliance, Inc. *(b)(c) | 117,833 | 742 | |||
| Ivy Capital (Proprietary) Ltd. *(b)(c) | 19 | 691,671 | |||
| Napo Pharmaceuticals, Inc. *(b)(c) | 294,196 | — | |||
| Village Laundry Services, Inc. *(b)(c) | 9,444 | — | |||
| 815,876 | |||||
| Total Common Stocks (Cost $1,571,590,762) | 2,100,075,438 | ||||
| PREFERRED STOCKS - 0.2% | |||||
| Venture Capital - 0.2% | |||||
| Entouch, Series C *(b)(c) | 2,628,278 | 350,000 | |||
| Global Resource Options, Inc.: | |||||
| Series A, Contingent Deferred Distribution *(b)(c) | 750,000 | 345,000 | |||
| Series B, Contingent Deferred Distribution *(b)(c) | 244,371 | 325,013 | |||
| Series C, Contingent Deferred Distribution *(b)(c) | 297,823 | 413,974 | |||
| Series D, Contingent Deferred Distribution *(b)(c) | 38,279 | 400,781 | |||
calvert.com CALVERT SOCIAL INVESTMENT FUND ANNUAL REPORT 51
| SHARES | VALUE ($) | ||||
| PREFERRED STOCKS - 0.2% | |||||
| Graduation Alliance, Inc.: | |||||
| Series C *(b)(c) | 3,225,598 | 161,603 | |||
| Series D *(b)(c) | 1,325,968 | 268,641 | |||
| Immunology Partners, Inc., Series C-1 *(b)(c) | 2,542,915 | 18,395 | |||
| New Day Farms, Inc., Series B *(b)(c)(e) | 4,547,804 | — | |||
| Orteq Bioengineering Ltd., Series A *(b)(c) | 74,910 | — | |||
| PresenceLearning, Inc.: | |||||
| Series A *(b)(c) | 600,000 | 390,000 | |||
| Series A-2 *(b)(c) | 195,285 | 130,841 | |||
| Series B *(b)(c) | 399,719 | 307,784 | |||
| Shangri La Farms, Series A *(b)(c)(e) | 66,667 | 100,000 | |||
| Sword Diagnostics, Series B *(b)(c) | 1,264,108 | — | |||
| 3,212,032 | |||||
| Total Preferred Stocks (Cost $6,852,557) | 3,212,032 | ||||
| WARRANTS - 0.0% | |||||
| Health Care Providers & Services - 0.0% | |||||
| HealthSouth Corp. (strike price $41.40/share, expires 1/17/17), Preferred Warrants * | 1,071 | 2,571 | |||
| Venture Capital - 0.0% | |||||
| Graduation Alliance, Inc., Preferred Warrants (strike price $0.16/share, expires 8/20/18) *(b)(c) | 625,721 | 3,942 | |||
| Total Warrants (Cost $0) | 6,513 | ||||
| ADJUSTED BASIS ($) | VALUE ($) | ||||
| VENTURE CAPITAL LIMITED PARTNERSHIP INTEREST - 0.6% | |||||
| Accion Frontier Inclusion Fund LP *(b)(c) | 309,936 | 281,299 | |||
| Adobe Capital Social Mezzanine Fund I LP *(b)(c) | 272,147 | 189,630 | |||
| Africa Renewable Energy Fund LP *(b)(c) | 344,664 | 285,356 | |||
| Arborview Capital Partners LP *(b)(c) | 662,373 | 470,692 | |||
| Blackstone Clean Technology Partners LP *(b)(c) | 446,829 | 97,093 | |||
| Bridges Ventures US Sustainable Growth Fund LP *(b)(c) | 231,788 | 141,241 | |||
| China Environment Fund 2004 LP *(b)(c) | — | 63,766 | |||
| China Environment Fund III LP *(b)(c) | 693,089 | 487,584 | |||
| Coastal Ventures III LP *(b)(c) | 290,110 | 278,968 | |||
| Core Innovation Capital I LP *(b)(c) | 891,461 | 1,175,569 | |||
| Cross Culture Ventures I LP *(b)(c) | 154,969 | 145,041 | |||
| DBL Equity Fund - BAEF Il LP *(b)(c) | 898,465 | 919,428 | |||
| DBL Partners III LP *(b)(c) | 270,660 | 262,818 | |||
| First Analysis Private Equity Fund V LP *(b)(c) | 712,314 | 936,282 | |||
| Ignia Fund I LP *(b)(c) | 996,339 | 549,763 | |||
| Impact Ventures II LP *(b)(c) | 777,984 | 292,443 | |||
| LeapFrog Financial Inclusion Fund *(b)(c) | 463,913 | 733,981 | |||
| New Markets Education Partners LP *(b)(c) | 739,748 | 824,259 | |||
| New Markets Venture Partners II LP *(b)(c) | 94,269 | 403,349 | |||
| Owl Ventures LP *(b)(c) | 275,000 | 291,841 | |||
52 calvert.com CALVERT SOCIAL INVESTMENT FUND ANNUAL REPORT
| ADJUSTED BASIS ($) | VALUE ($) | ||||
| VENTURE CAPITAL LIMITED PARTNERSHIP INTEREST - CONT’D | |||||
| Renewable Energy Asia Fund LP *(b)(c) | 1,747,526 | 2,024,383 | |||
| SEAF India International Growth Fund *(b)(c) | 219,003 | 35,225 | |||
| SJF Ventures II LP *(b)(c) | — | 562,553 | |||
| SJF Ventures III LP *(b)(c) | 542,348 | 777,430 | |||
| Westly Capital Partners Fund II LP *(b)(c) | 773,433 | 674,522 | |||
| Total Venture Capital Limited Partnership Interest (Cost $12,808,368) | 12,904,516 | ||||
| PRINCIPAL AMOUNT ($) | VALUE ($) | ||||
| VENTURE CAPITAL DEBT OBLIGATIONS - 0.1% | |||||
| New Day Farms, Inc., Participation Interest Note, 9.00%, 9/1/12 (b)(c)(e)(f) | 6,225 | — | |||
| One Earth Group Ltd., Convertible Note, 5.00%, 12/31/14 (b)(c)(g) | 100,000 | 33,333 | |||
| One Earth Group Ltd., Convertible Note II, 5.00%, 5/31/15 (b)(c)(g) | 200,000 | 66,667 | |||
| Orteq Bioengineering Ltd., Note, 0.00%, 7/31/17 (b)(c)(h) | 131,225 | — | |||
| Quantum Intech, 14.00%, 12/15/16 (b)(c) | 18,987 | 14,240 | |||
| SEAF Global SME Facility: | |||||
| 9.00%, 6/30/17 (b)(c) | 1,500,000 | 1,570,991 | |||
| 9.00%, 12/31/17 (b)(c) | 450,000 | 459,965 | |||
| 9.00%, 3/31/18 (b)(c)(h) | 1,000,000 | — | |||
| 9.00%, 3/31/18 (b)(c)(h) | 400,000 | — | |||
| 9.00%, 3/31/18 (b)(c) | 650,000 | 700,203 | |||
| Total Venture Capital Debt Obligations (Cost $4,137,358) | 2,845,399 | ||||
| HIGH SOCIAL IMPACT INVESTMENTS - 0.6% | |||||
| Calvert Social Investment Foundation Notes, 0.50%, 1/1/17 (b)(c) | 10,833,877 | 10,714,054 | |||
| ImpactAssets Global Sustainable Agriculture Notes, 0.00%, 11/3/20 (b)(c)(i) | 1,445,000 | 1,286,050 | |||
| ImpactAssets Microfinance Plus Notes, 0.00%, 11/3/20 (b)(c)(i) | 1,855,000 | 1,743,700 | |||
| Total High Social Impact Investments (Cost $14,133,877) | 13,743,804 | ||||
| PRINCIPAL AMOUNT ($) | VALUE ($) | ||||
| TIME DEPOSIT - 2.4% | |||||
| State Street Bank Time Deposit, 0.293%, 10/3/16 | 53,845,041 | 53,845,041 | |||
| Total Time Deposit (Cost $53,845,041) | 53,845,041 | ||||
calvert.com CALVERT SOCIAL INVESTMENT FUND ANNUAL REPORT 53
| SHARES | VALUE ($) | ||||
SHORT TERM INVESTMENT OF CASH COLLATERAL FOR SECURITIES LOANED - 0.0% | |||||
| State Street Institutional U.S. Government Money Market Fund - Premier Class, 0.26% | 386,575 | 386,575 | |||
| Total Short Term Investment of Cash Collateral For Securities Loaned (Cost $386,575) | 386,575 | ||||
| TOTAL INVESTMENTS (Cost $1,663,754,538) - 98.0% | 2,187,019,318 | ||||
| Other assets and liabilities, net - 2.0% | 45,408,483 | ||||
NET ASSETS - 100.0% | $2,232,427,801 | ||||
| NOTES TO SCHEDULE OF INVESTMENTS | ||
| * Non-income producing security. | ||
| (a) Security, or portion of security, is on loan. Total value of securities on loan is $377,739 as of September 30, 2016. | ||
| (b) This security was valued under the direction of the Board of Trustees. Total market value of fair valued securities amounts to $33,609,185, which represents 1.5% of the net assets of the Fund as of September 30, 2016. | ||
| (c) Total market value of restricted securities amounts to $33,609,185, which represents 1.5% of the net assets of the Fund as of September 30, 2016. | ||
| (d) 160,000 shares of Apple, Inc. held by the Equity Portfolio have been soft segregated in order to cover outstanding commitments to certain limited partnership investments within the Portfolio. There are no restrictions on the trading of this security. | ||
| (e) Affiliated company. | ||
| (f) Security is in default for both principal and interest. | ||
| (g) Security defaulted. Calvert entered into a letter agreement with One Earth Group Ltd. to forebear collection action on the promissory note until 12/31/16. | ||
| (h) This security is not accruing interest. | ||
| (i) The coupon rate shown on floating or adjustable rate securities represents the rate in effect on September 30, 2016. | ||
| Abbreviations: | ||
| ADR: | American Depositary Receipts | |
| LP: | Limited Partnership | |
| Ltd.: | Limited | |
| plc: | Public Limited Company | |
| See notes to financial statements. | ||
54 calvert.com CALVERT SOCIAL INVESTMENT FUND ANNUAL REPORT
| RESTRICTED SECURITIES | ACQUISITION DATES | COST ($) | |
| 20/20 Gene Systems, Inc. | 8/1/08-8/27/13 | 166,890 | |
| Accion Frontier Inclusion Fund LP | 11/12/15-9/29/16 | 309,936 | |
| Adobe Capital Social Mezzanine LP | 2/8/13-9/13/16 | 272,147 | |
| Africa Renewable Energy Fund LP | 4/17/14-7/2/15 | 344,664 | |
| Arborview Capital Partners LP | 11/13/12-9/22/16 | 662,373 | |
| Blackstone Clean Technology Partners LP | 7/29/10-6/25/15 | 446,829 | |
| Bridges Ventures US | 6/8/16 | 231,788 | |
| Calvert Social Investment Foundation Notes, 0.50%, 1/1/17 | 1/1/14 | 10,833,877 | |
| China Environment Fund 2004 LP | 9/15/05-4/1/09 | — | |
| China Environment Fund III LP | 1/24/08-4/19/13 | 693,089 | |
| Coastal Ventures III LP | 7/30/12-5/11/16 | 290,110 | |
| Core Innovations Capital I LP | 1/6/11-6/28/16 | 891,461 | |
| Cross Culture Ventures I, LP Ltd. | 2/24/16-6/13/16 | 154,969 | |
| DBL Equity Fund - BAEF Il LP | 3/30/11-8/2/16 | 898,465 | |
| DBL Partners III LP | 1/16/15-5/3/16 | 270,660 | |
| Digital Directions International, Inc. | 7/2/08-7/15/09 | 683,778 | |
| Entouch, Series C, Preferred | 2/3/16 | 350,000 | |
| EXCENT Corp. | 9/1/16 | — | |
| First Analysis Private Equity Fund V LP | 6/7/13-5/11/16 | 712,314 | |
| Global Resource Options, Inc., Series A, Contingent Deferred Distribution, Preferred | 9/18/06 | 750,000 | |
| Global Resource Options, Inc., Series B, Contingent Deferred Distribution, Preferred | 12/5/07 | 750,000 | |
| Global Resource Options, Inc., Series C, Contingent Deferred Distribution, Preferred | 2/13/09 | 1,000,000 | |
| Global Resource Options, Inc., Series D, Contingent Deferred Distribution, Preferred | 5/24/11 | 117,482 | |
| Graduation Alliance, Inc. | 5/17/16 | 390 | |
| Graduation Alliance, Inc., Series C, Preferred | 3/27/13-8/20/13 | 500,000 | |
| Graduation Alliance, Inc., Series D, Convertible Preferred | 4/29/15-5/17/16 | 228,617 | |
| Graduation Alliance, Inc., Preferred Warrants (strike price $0.16/share, expires 8/20/18) | 9/13/13 | — | |
| Ignia Fund I LP | 1/28/10-6/10/16 | 996,339 | |
| Immunology Partners, Inc., Series C-1, Preferred | 11/30/06 | 305,942 | |
| Impact Ventures II LP | 9/8/10-3/18/16 | 777,984 | |
| ImpactAssets Global Sustainable Agriculture Notes, 0.00%, 11/3/20 | 11/13/15 | 1,445,000 | |
| ImpactAssets Microfinance Plus Notes, 0.00%, 11/3/20 | 11/13/15 | 1,855,000 | |
| Ivy Capital (Proprietary) Ltd. | 9/12/12-5/14/14 | 557,010 | |
| LeapFrog Financial Inclusion Fund LP | 1/20/10-1/14/16 | 463,913 | |
| Napo Pharmaceuticals, Inc. | 2/21/07-9/23/09 | 419,720 | |
| New Day Farms, Inc., Series B, Preferred | 3/12/09 | 500,000 | |
| New Day Farms, Inc., Participation Interest Note, 9.00%, 9/1/12 | 12/31/15 | 6,225 | |
| New Markets Education Partners LP | 9/27/11-5/11/16 | 739,748 | |
| New Markets Venture Partners II LP | 7/21/08-5/3/16 | 94,269 | |
| One Earth Group Ltd., Convertible Note, 5.00%, 12/31/14 | 12/21/12 | 100,000 | |
| One Earth Group Ltd., Convertible Note II, 5.00%, 5/31/15 | 5/15/13 | 200,000 | |
| Orteq Bioengineering Ltd., Series A, Preferred | 7/19/07 | 998,102 | |
| Orteq Bioengineering Ltd., Note, 0.00%, 7/31/17 | 7/22/13 | 201,621 | |
| Owl Ventures LP | 7/10/14-4/18/16 | 275,000 | |
| PresenceLearning, Inc., Series A, Preferred | 9/29/11 | 300,000 | |
| PresenceLearning, Inc., Series A-2, Preferred | 5/2/12 | 134,942 | |
| PresenceLearning, Inc., Series B, Preferred | 4/4/13 | 285,000 | |
calvert.com CALVERT SOCIAL INVESTMENT FUND ANNUAL REPORT 55
| RESTRICTED SECURITIES - CONT’D | ACQUISITION DATES | COST ($) | |
| Quantum Intech, 14.00%, 12/15/16 | 10/5/10-9/30/11 | 18,986 | |
| Renewable Energy Asia Fund LP | 9/29/10-5/22/15 | 1,747,526 | |
| SEAF Global SME Facility, 9.00%, 6/30/17 | 12/16/09 | 1,500,000 | |
| SEAF Global SME Facility, 9.00%, 12/31/17 | 3/29/11 | 450,000 | |
| SEAF Global SME Facility, 9.00%, 3/31/18 | 11/6/15 | 1,000,000 | |
| SEAF Global SME Facility, 9.00%, 3/31/18 | 9/29/16 | 10,526 | |
| SEAF Global SME Facility, 9.00%, 3/31/18 | 7/11/11 | 650,000 | |
| SEAF India International Growth Fund LP | 3/22/05-5/24/10 | 219,003 | |
| Shangri La Farms, Series A, Preferred | 2/1/13 | 200,000 | |
| SJF Ventures II LP, Preferred | 2/14/06-11/20/12 | — | |
| SJF Ventures III LP | 2/6/12-8/16/16 | 542,348 | |
| Sword Diagnostics, Series B, Preferred | 12/26/06-11/9/10 | 432,472 | |
| Village Laundry Services, Inc. | 7/22/09 | 500,000 | |
| Westly Capital Partners Fund II, LP | 12/27/11-6/6/16 | 773,433 | |
56 calvert.com CALVERT SOCIAL INVESTMENT FUND ANNUAL REPORT
CALVERT BALANCED PORTFOLIO
STATEMENT OF ASSETS AND LIABILITIES
SEPTEMBER 30, 2016
| ASSETS | ||||
| Investments in unaffiliated securities, at value (Cost $646,801,435) - see accompanying schedule | $ | 684,549,035 | ||
| Investments in affiliated securities, at value (Cost $0) - see accompanying schedule | 63,070 | |||
| Cash collateral at broker | 347,800 | |||
| Receivable for securities sold | 21,256,650 | |||
| Receivable for shares sold | 540,248 | |||
| Dividends and interest receivable | 1,684,536 | |||
| Securities lending income receivable | 5,658 | |||
| Receivable for futures contracts variation margin | 18,971 | |||
| Trustees' deferred compensation plan | 393,200 | |||
| Total assets | 708,859,168 | |||
| LIABILITIES | ||||
| Payable for securities purchased | 22,995,324 | |||
| Payable upon return of securities loaned | 2,532,357 | |||
| Payable for shares redeemed | 1,604,983 | |||
| Payable to Calvert Investment Management, Inc. | 221,078 | |||
| Payable to Calvert Investment Distributors, Inc. | 164,821 | |||
| Payable to Calvert Investment Administrative Services, Inc. | 66,897 | |||
| Payable to Calvert Investment Services, Inc. | 11,949 | |||
| Payable for Trustees' fees and expenses | 15,255 | |||
| Trustees' deferred compensation plan | 393,200 | |||
| Accrued expenses and other liabilities | 254,315 | |||
| Total liabilities | 28,260,179 | |||
| NET ASSETS | $ | 680,598,989 | ||
| NET ASSETS CONSIST OF: | ||||
| Paid-in capital applicable to the following shares of beneficial interest, | ||||
| unlimited number of no par value shares authorized: | ||||
| Class A: 19,231,147 shares outstanding | $ | 560,268,536 | ||
| Class C: 1,978,324 shares outstanding | 60,465,084 | |||
| Class I: 496,595 shares outstanding | 12,270,236 | |||
| Class Y: 424,214 shares outstanding | 13,294,472 | |||
| Undistributed net investment income | 467,923 | |||
| Accumulated net realized gain (loss) | (3,885,508) | |||
| Net unrealized appreciation (depreciation) | 37,718,246 | |||
| NET ASSETS | $ | 680,598,989 | ||
| NET ASSET VALUE PER SHARE | ||||
| Class A (based on net assets of $592,625,325) | $ | 30.82 | ||
| Class C (based on net assets of $59,241,947) | $ | 29.95 | ||
| Class I (based on net assets of $15,553,744) | $ | 31.32 | ||
| Class Y (based on net assets of $13,177,973) | $ | 31.06 | ||
| See notes to financial statements. | ||||
calvert.com CALVERT SOCIAL INVESTMENT FUND ANNUAL REPORT 57
CALVERT BOND PORTFOLIO
STATEMENT OF ASSETS AND LIABILITIES
SEPTEMBER 30, 2016
| ASSETS | ||||
| Investments in securities, at value (Cost $879,432,015) - see accompanying schedule | $ | 895,785,594 | ||
| Cash collateral at broker | 303,750 | |||
| Receivable for securities sold | 65,369,530 | |||
| Receivable for shares sold | 5,939,842 | |||
| Interest receivable | 5,512,909 | |||
| Securities lending income receivable | 9,369 | |||
| Receivable for futures contracts variation margin | 94,922 | |||
| Trustees' deferred compensation plan | 482,798 | |||
| Total assets | 973,498,714 | |||
| LIABILITIES | ||||
| Payable for securities purchased | 70,986,100 | |||
| Payable upon return of securities loaned | 3,567,203 | |||
| Payable for shares redeemed | 4,432,658 | |||
| Payable to Calvert Investment Management, Inc. | 253,952 | |||
| Payable to Calvert Investment Distributors, Inc. | 92,716 | |||
| Payable to Calvert Investment Administrative Services, Inc. | 81,419 | |||
| Payable to Calvert Investment Services, Inc. | 7,135 | |||
| Payable for Trustees' fees and expenses | 19,086 | |||
| Trustees' deferred compensation plan | 482,798 | |||
| Accrued expenses and other liabilities | 204,409 | |||
| Total liabilities | 80,127,476 | |||
| NET ASSETS | $ | 893,371,238 | ||
| NET ASSETS CONSIST OF: | ||||
| Paid-in capital applicable to the following shares of beneficial interest, | ||||
| unlimited number of no par value shares authorized: | ||||
| Class A: 24,202,215 shares outstanding | $ | 390,504,515 | ||
| Class C: 1,989,975 shares outstanding | 31,181,047 | |||
| Class I: 21,679,245 shares outstanding | 347,202,912 | |||
| Class Y: 6,679,516 shares outstanding | 107,449,965 | |||
| Undistributed net investment income | 36,615 | |||
| Accumulated net realized gain (loss) | 616,645 | |||
| Net unrealized appreciation (depreciation) | 16,379,539 | |||
| NET ASSETS | $ | 893,371,238 | ||
| NET ASSET VALUE PER SHARE | ||||
| Class A (based on net assets of $395,956,673) | $ | 16.36 | ||
| Class C (based on net assets of $32,348,581) | $ | 16.26 | ||
| Class I (based on net assets of $355,017,331) | $ | 16.38 | ||
| Class Y (based on net assets of $110,048,653) | $ | 16.48 | ||
| See notes to financial statements. | ||||
58 calvert.com CALVERT SOCIAL INVESTMENT FUND ANNUAL REPORT
CALVERT EQUITY PORTFOLIO
STATEMENT OF ASSETS AND LIABILITIES
SEPTEMBER 30, 2016
| ASSETS | ||||
| Investments in unaffiliated securities, at value (Cost $1,663,048,313) - see accompanying schedule | $ | 2,186,919,318 | ||
| Investments in affiliated securities, at value (Cost $706,225) - see accompanying schedule | 100,000 | |||
| Receivable for securities sold | 60,844,600 | |||
| Receivable for shares sold | 2,332,871 | |||
| Dividends and interest receivable | 2,514,124 | |||
| Securities lending income receivable | 1,113 | |||
| Trustees' deferred compensation plan | 1,300,771 | |||
| Total assets | 2,254,012,797 | |||
| LIABILITIES | ||||
| Payable for securities purchased | 11,090,842 | |||
| Payable upon return of securities loaned | 386,575 | |||
| Payable for shares redeemed | 6,511,218 | |||
| Payable to Calvert Investment Management, Inc. | 909,966 | |||
| Payable to Calvert Investment Distributors, Inc. | 436,163 | |||
| Payable to Calvert Investment Administrative Services, Inc. | 214,268 | |||
| Payable to Calvert Investment Services, Inc. | 22,577 | |||
| Payable for Trustees' fees and expenses | 50,983 | |||
| Trustees' deferred compensation plan | 1,300,771 | |||
| Accrued expenses and other liabilities | 661,633 | |||
| Total liabilities | 21,584,996 | |||
| NET ASSETS | $ | 2,232,427,801 | ||
| NET ASSETS CONSIST OF: | ||||
| Paid-in capital applicable to the following shares of beneficial interest, | ||||
| unlimited number of no par value shares authorized: | ||||
| Class A: 33,494,252 shares outstanding | $ | 876,363,316 | ||
| Class C: 6,535,251 shares outstanding | 176,984,864 | |||
| Class I: 10,123,112 shares outstanding | 302,189,084 | |||
| Class Y: 4,584,946 shares outstanding | 180,117,802 | |||
| Undistributed net investment income | 5,779,264 | |||
| Accumulated net realized gain (loss) on investments and foreign currency transactions | 167,728,683 | |||
| Net unrealized appreciation (depreciation) on investments and assets and liabilities denominated in foreign currencies | 523,264,788 | |||
| NET ASSETS | $ | 2,232,427,801 | ||
| NET ASSET VALUE PER SHARE | ||||
| Class A (based on net assets of $1,385,987,896) | $ | 41.38 | ||
| Class C (based on net assets of $178,718,904) | $ | 27.35 | ||
| Class I (based on net assets of $472,582,843) | $ | 46.68 | ||
| Class Y (based on net assets of $195,138,158) | $ | 42.56 | ||
| See notes to financial statements. | ||||
calvert.com CALVERT SOCIAL INVESTMENT FUND ANNUAL REPORT 59
STATEMENTS OF OPERATIONS
YEAR ENDED SEPTEMBER 30, 2016
| NET INVESTMENT INCOME | Calvert Balanced Portfolio | Calvert Bond Portfolio | Calvert Equity Portfolio | ||||||||
| Investment Income: | |||||||||||
| Dividend income (net of foreign taxes withheld of $77,068, $0 and $124,898, respectively) | $9,463,601 | $24,808 | $28,827,388 | ||||||||
| Interest income (net of foreign taxes withheld of $170, $410 and $0, respectively) | 8,149,315 | 28,509,192 | 374,653 | ||||||||
| Other income (a) | 143,158 | 13,133 | 27,627 | ||||||||
| Securities lending income | 11,370 | 18,994 | 1,924 | ||||||||
| Total investment income | 17,767,444 | 28,566,127 | 29,231,592 | ||||||||
| Expenses: | |||||||||||
| Investment advisory fee | 2,664,773 | 2,946,419 | 10,768,712 | ||||||||
| Administrative fees | 1,124,969 | 1,293,968 | 3,013,263 | ||||||||
| Transfer agency fees and expenses: | |||||||||||
| Class A | 763,698 | 530,238 | 1,648,369 | ||||||||
| Class C | 95,086 | 64,347 | 241,803 | ||||||||
| Class I | 4,219 | 8,379 | 10,151 | ||||||||
| Class Y | 7,830 | 52,087 | 105,008 | ||||||||
| Distribution Plan expenses: | |||||||||||
| Class A | 1,369,650 | 790,845 | 3,336,585 | ||||||||
| Class C | 580,533 | 329,323 | 1,718,857 | ||||||||
| Trustees' fees and expenses | 75,652 | 92,916 | 240,696 | ||||||||
| Accounting fees | 161,034 | 196,235 | 441,545 | ||||||||
| Custodian fees | 128,263 | 100,518 | 135,916 | ||||||||
| Professional fees | 100,394 | 66,918 | 228,666 | ||||||||
| Registration fees | 69,779 | 82,237 | 111,491 | ||||||||
| Reports to shareholders | 105,435 | 84,383 | 280,006 | ||||||||
| Miscellaneous | 91,614 | 31,281 | 248,850 | ||||||||
| Total expenses | 7,342,929 | 6,670,094 | 22,529,918 | ||||||||
| Reimbursement from Advisor: | |||||||||||
| Class I | (14,639) | — | — | ||||||||
| Class Y | (7,454) | — | — | ||||||||
| Advisory Fees waived | — | — | (83,160) | ||||||||
| Administrative fees waived | (164,663) | (196,875) | (283,981) | ||||||||
| Net expenses | 7,156,173 | 6,473,219 | 22,162,777 | ||||||||
| NET INVESTMENT INCOME | 10,611,271 | 22,092,908 | 7,068,815 | ||||||||
| REALIZED AND UNREALIZED GAIN (LOSS) | |||||||||||
| Net realized gain (loss) on: | |||||||||||
| Investments | 4,164,631 | 8,837,207 | 335,940,769 | ||||||||
| Net increase from payments by affiliates | 274,733 | — | — | ||||||||
| Foreign currency transactions | — | — | 1,348 | ||||||||
| Futures | 635,499 | 272,598 | — | ||||||||
| 5,074,863 | 9,109,805 | 335,942,117 | |||||||||
| See notes to financial statements. | |||||||||||
60 calvert.com CALVERT SOCIAL INVESTMENT FUND ANNUAL REPORT
STATEMENTS OF OPERATIONS YEAR ENDED SEPTEMBER 30, 2016 - CONT’D | |||||||||||
| REALIZED AND UNREALIZED GAIN (LOSS) - Cont’d | Calvert Balanced Portfolio | Calvert Bond Portfolio | Calvert Equity Portfolio | ||||||||
| Change in unrealized appreciation (depreciation) on: | |||||||||||
| Investments in unaffiliated securities | 40,637,195 | 18,816,241 | (149,670,653) | ||||||||
| Investments in affiliated securities | (1,713) | — | (295,334) | ||||||||
| Assets and liabilities denominated in foreign currencies | — | — | 15 | ||||||||
| Futures | (9,290) | (123,587) | — | ||||||||
| 40,626,192 | 18,692,654 | (149,965,972) | |||||||||
| NET REALIZED AND UNREALIZED GAIN | 45,701,055 | 27,802,459 | 185,976,145 | ||||||||
| INCREASE IN NET ASSETS RESULTING FROM OPERATIONS | $56,312,326 | $49,895,367 | $193,044,960 | ||||||||
| (a) Other income represents a non-recurring refund for overbilling of prior years' custody out-of-pocket fees. | |||||||||||
| See notes to financial statements. | |||||||||||
calvert.com CALVERT SOCIAL INVESTMENT FUND ANNUAL REPORT 61
CALVERT BALANCED PORTFOLIO
STATEMENTS OF CHANGES IN NET ASSETS
| INCREASE (DECREASE) IN NET ASSETS | YEAR ENDED SEPTEMBER 30, 2016 | YEAR ENDED SEPTEMBER 30, 2015 | ||
| Operations: | ||||
| Net investment income | $10,611,271 | $8,431,925 | ||
| Net realized gain | 5,074,863 | 61,203,122 | ||
| Net change in unrealized appreciation (depreciation) | 40,626,192 | (77,387,555) | ||
| INCREASE (DECREASE) IN NET ASSETS RESULTING FROM OPERATIONS | 56,312,326 | (7,752,508) | ||
| Distributions to shareholders from: | ||||
| Net investment income: | ||||
| Class A shares | (9,600,026) | (7,215,679) | ||
| Class B shares (a) | — | (1,733) | ||
| Class C shares | (522,729) | (318,771) | ||
| Class I shares | (287,663) | (628,679) | ||
| Class Y shares | (193,304) | (72,855) | ||
| Net realized gain: | ||||
| Class A shares | (57,459,858) | (6,263,382) | ||
| Class B shares (a) | — | (41,853) | ||
| Class C shares | (5,775,639) | (569,186) | ||
| Class I shares | (1,379,237) | (490,451) | ||
| Class Y shares | (638,834) | (46,766) | ||
| Total distributions | (75,857,290) | (15,649,355) | ||
| Capital share transactions: | ||||
| Shares sold: | ||||
| Class A shares (b) | 56,016,018 | 77,314,329 | ||
| Class B shares (a) | — | 23,457 | ||
| Class C shares | 12,131,038 | 13,860,342 | ||
| Class I shares | 4,143,794 | 9,068,557 | ||
| Class Y shares | 9,632,077 | 5,356,913 | ||
| Reinvestment of distributions: | ||||
| Class A shares | 63,192,696 | 12,645,754 | ||
| Class B shares (a) | — | 42,067 | ||
| Class C shares | 5,394,735 | 755,630 | ||
| Class I shares | 1,666,776 | 1,119,130 | ||
| Class Y shares | 734,346 | 104,048 | ||
| Redemption fees: | ||||
| Class A shares | — | 1,062 | ||
| Class C shares | — | 68 | ||
| Shares redeemed: | ||||
| Class A shares | (78,397,141) | (60,888,132) | ||
| Class B shares (a)(b) | — | (4,227,672) | ||
| Class C shares | (11,706,256) | (5,925,701) | ||
| Class I shares | (3,734,394) | (40,417,040) | ||
| Class Y shares | (3,475,485) | (2,324,766) | ||
| Total capital share transactions | 55,598,204 | 6,508,046 | ||
| TOTAL INCREASE (DECREASE) IN NET ASSETS | 36,053,240 | (16,893,817) | ||
| See notes to financial statements. | ||||
62 calvert.com CALVERT SOCIAL INVESTMENT FUND ANNUAL REPORT
CALVERT BALANCED PORTFOLIO STATEMENTS OF CHANGES IN NET ASSETS - CONT’D | ||||
| NET ASSETS | YEAR ENDED SEPTEMBER 30, 2016 | YEAR ENDED SEPTEMBER 30, 2015 | ||
| Beginning of year | 644,545,749 | 661,439,566 | ||
| End of year (including undistributed net investment income of $467,923 and $446,940, respectively) | $680,598,989 | $644,545,749 | ||
| CAPITAL SHARE ACTIVITY | ||||
| Shares sold: | ||||
| Class A shares (c) | 1,860,969 | 2,274,208 | ||
| Class B shares (a) | — | 712 | ||
| Class C shares | 413,389 | 417,930 | ||
| Class I shares | 135,747 | 264,169 | ||
| Class Y shares | 322,628 | 156,527 | ||
| Reinvestment of distributions: | ||||
| Class A shares | 2,130,337 | 374,777 | ||
| Class B shares (a) | — | 1,267 | ||
| Class C shares | 187,399 | 23,045 | ||
| Class I shares | 55,243 | 32,468 | ||
| Class Y shares | 24,528 | 3,067 | ||
| Shares redeemed: | ||||
| Class A shares | (2,608,505) | (1,792,460) | ||
| Class B shares (a)(c) | — | (124,831) | ||
| Class C shares | (396,213) | (178,447) | ||
| Class I shares | (123,753) | (1,167,051) | ||
| Class Y shares | (112,885) | (67,263) | ||
| Total capital share activity | 1,888,884 | 218,118 | ||
| (a) Class B Shares were converted into Class A Shares at the close of business on April 20, 2015. | ||||
| (b) Amounts include $3,427,822 of share transactions that were redeemed from Class B shares and converted into Class A shares at the close of business on April 20, 2015. | ||||
| (c) Amount includes 100,848 shares redeemed from Class B shares and 98,898 shares purchased into Class A shares at the close of business on April 20, 2015. | ||||
| See notes to financial statements. | ||||
calvert.com CALVERT SOCIAL INVESTMENT FUND ANNUAL REPORT 63
CALVERT BOND PORTFOLIO
STATEMENTS OF CHANGES IN NET ASSETS
| INCREASE (DECREASE) IN NET ASSETS | YEAR ENDED SEPTEMBER 30, 2016 | YEAR ENDED SEPTEMBER 30, 2015 | |||||
| Operations: | |||||||
| Net investment income | $22,092,908 | $21,565,873 | |||||
| Net realized gain | 9,109,805 | 2,004,568 | |||||
| Net change in unrealized appreciation (depreciation) | 18,692,654 | (8,455,787) | |||||
| INCREASE IN NET ASSETS RESULTING FROM OPERATIONS | 49,895,367 | 15,114,654 | |||||
| Distributions to shareholders from: | |||||||
| Net investment income: | |||||||
| Class A shares | (9,855,178) | (9,301,172) | |||||
| Class B shares (a) | — | (4,399) | |||||
| Class C shares | (530,716) | (510,454) | |||||
| Class I shares | (9,284,052) | (10,049,863) | |||||
| Class Y shares | (2,501,692) | (1,686,307) | |||||
| Total distributions | (22,171,638) | (21,552,195) | |||||
| Capital share transactions: | |||||||
| Shares sold: | |||||||
| Class A shares (b) | 74,493,183 | 92,254,104 | |||||
| Class B shares (a) | — | 42,764 | |||||
| Class C shares | 4,822,223 | 5,047,017 | |||||
| Class I shares | 131,641,273 | 125,214,709 | |||||
| Class Y shares | 46,036,220 | 35,576,230 | |||||
| Reinvestment of distributions: | |||||||
| Class A shares | 8,969,317 | 8,429,712 | |||||
| Class B shares (a) | — | 4,337 | |||||
| Class C shares | 424,310 | 402,675 | |||||
| Class I shares | 9,028,002 | 9,859,991 | |||||
| Class Y shares | 2,157,817 | 1,410,042 | |||||
| Redemption fees: | |||||||
| Class A shares | — | 5,759 | |||||
| Class C shares | — | 107 | |||||
| Class Y shares | — | 15 | |||||
| Shares redeemed: | |||||||
| Class A shares | (95,763,050) | (81,166,274) | |||||
| Class B shares (a)(b) | — | (880,527) | |||||
| Class C shares | (6,605,374) | (6,607,978) | |||||
| Class I shares | (124,826,149) | (103,897,006) | |||||
| Class Y shares | (18,370,940) | (12,878,054) | |||||
| Total capital share transactions | 32,006,832 | 72,817,623 | |||||
| TOTAL INCREASE IN NET ASSETS | 59,730,561 | 66,380,082 | |||||
| See notes to financial statements. | |||||||
64 calvert.com CALVERT SOCIAL INVESTMENT FUND ANNUAL REPORT
CALVERT BOND PORTFOLIO STATEMENTS OF CHANGES IN NET ASSETS - CONT’D | |||||||
| NET ASSETS | YEAR ENDED SEPTEMBER 30, 2016 | YEAR ENDED SEPTEMBER 30, 2015 | |||||
| Beginning of year | 833,640,677 | 767,260,595 | |||||
| End of year (including undistributed net investment income of $36,615 and $39,488, respectively) | $893,371,238 | $833,640,677 | |||||
| CAPITAL SHARE ACTIVITY | |||||||
| Shares sold: | |||||||
| Class A shares (c) | 4,661,342 | 5,739,886 | |||||
| Class B shares (a) | — | 2,688 | |||||
| Class C shares | 304,478 | 316,229 | |||||
| Class I shares | 8,230,386 | 7,776,102 | |||||
| Class Y shares | 2,848,277 | 2,203,083 | |||||
| Reinvestment of distributions: | |||||||
| Class A shares | 560,750 | 525,647 | |||||
| Class B shares (a) | — | 271 | |||||
| Class C shares | 26,716 | 25,260 | |||||
| Class I shares | 563,814 | 613,865 | |||||
| Class Y shares | 133,803 | 87,394 | |||||
| Shares redeemed: | |||||||
| Class A shares | (5,979,446) | (5,062,758) | |||||
| Class B shares (a)(c) | — | (54,539) | |||||
| Class C shares | (414,724) | (414,132) | |||||
| Class I shares | (7,855,066) | (6,512,113) | |||||
| Class Y shares | (1,140,817) | (796,966) | |||||
| Total capital share activity | 1,939,513 | 4,449,917 | |||||
| (a) Class B Shares were converted into Class A Shares at the close of business on April 20, 2015. | |||||||
| (b) Amounts include $614,021 of share transactions that were redeemed from Class B shares and converted into Class A shares at the close of business on April 20, 2015. | |||||||
| (c) Amount includes 37,879 shares redeemed from Class B shares and 37,509 shares purchased into Class A shares at the close of business on April 20, 2015. | |||||||
| See notes to financial statements. | |||||||
calvert.com CALVERT SOCIAL INVESTMENT FUND ANNUAL REPORT 65
CALVERT EQUITY PORTFOLIO
STATEMENTS OF CHANGES IN NET ASSETS
| INCREASE (DECREASE) IN NET ASSETS | YEAR ENDED SEPTEMBER 30, 2016 | YEAR ENDED SEPTEMBER 30, 2015 | |||||
| Operations: | |||||||
| Net investment income | $7,068,815 | $9,481,917 | |||||
| Net realized gain | 335,942,117 | 388,155,543 | |||||
| Net change in unrealized depreciation | (149,965,972) | (253,288,192) | |||||
| INCREASE IN NET ASSETS RESULTING FROM OPERATIONS | 193,044,960 | 144,349,268 | |||||
| Distributions to shareholders from: | |||||||
| Net investment income: | |||||||
| Class A shares | (4,421,447) | (583,496) | |||||
| Class C shares | (164,566) | — | |||||
| Class I shares | (3,205,143) | (3,716,273) | |||||
| Class Y shares | (1,100,000) | (367,049) | |||||
| Net realized gain: | |||||||
| Class A shares | (278,855,516) | (143,281,964) | |||||
| Class B shares (a) | — | (1,563,454) | |||||
| Class C shares | (48,599,419) | (21,308,533) | |||||
| Class I shares | (93,516,345) | (85,041,426) | |||||
| Class Y shares | (32,976,417) | (12,579,166) | |||||
| Total distributions | (462,838,853) | (268,441,361) | |||||
| Capital share transactions: | |||||||
| Shares sold: | |||||||
| Class A shares (b) | 135,481,957 | 159,258,981 | |||||
| Class B shares (a) | — | 73,926 | |||||
| Class C shares | 20,851,480 | 16,502,253 | |||||
| Class I shares | 133,280,509 | 226,079,599 | |||||
| Class Y shares | 50,268,312 | 62,046,619 | |||||
| Shares issued from merger (See Note J): | |||||||
| Class A shares | 149,136,732 | — | |||||
| Class C shares | 21,258,449 | — | |||||
| Class I shares | 17,638,088 | — | |||||
| Class Y shares | 34,874,208 | — | |||||
| Reinvestment of distributions: | |||||||
| Class A shares | 265,210,280 | 127,526,426 | |||||
| Class B shares (a) | — | 1,472,454 | |||||
| Class C shares | 39,680,003 | 17,142,692 | |||||
| Class I shares | 76,215,766 | 83,957,252 | |||||
| Class Y shares | 25,057,028 | 9,676,039 | |||||
| Redemption fees: | |||||||
| Class A shares | — | 2,035 | |||||
| Class B shares (a) | — | 23 | |||||
| Class C shares | — | 27 | |||||
| Class I shares | — | 2,115 | |||||
| Class Y shares | — | 6 | |||||
| See notes to financial statements. | |||||||
66 calvert.com CALVERT SOCIAL INVESTMENT FUND ANNUAL REPORT
CALVERT EQUITY PORTFOLIO STATEMENTS OF CHANGES IN NET ASSETS - CONT’D | |||||||
| Shares redeemed: | YEAR ENDED SEPTEMBER 30, 2016 | YEAR ENDED SEPTEMBER 30, 2015 | |||||
| Class A shares | (325,800,975) | (484,293,697) | |||||
| Class B shares (a)(b) | — | (15,849,052) | |||||
| Class C shares | (37,778,741) | (21,304,527) | |||||
| Class I shares | (273,001,824) | (665,367,204) | |||||
| Class Y shares | (53,779,893) | (47,547,877) | |||||
| Total capital share transactions | 278,591,379 | (530,621,910) | |||||
| TOTAL INCREASE (DECREASE) IN NET ASSETS | 8,797,486 | (654,714,003) | |||||
| NET ASSETS | |||||||
| Beginning of year | 2,223,630,315 | 2,878,344,318 | |||||
| End of year (including undistributed net investment income of $5,779,264 and $8,883,455, respectively) | $2,232,427,801 | $2,223,630,315 | |||||
| CAPITAL SHARE ACTIVITY | |||||||
| Shares sold: | |||||||
| Class A shares (c) | 3,239,624 | 3,200,185 | |||||
| Class B shares (a) | — | 1,899 | |||||
| Class C shares | 764,181 | 454,384 | |||||
| Class I shares | 2,867,498 | 4,107,001 | |||||
| Class Y shares | 1,183,716 | 1,233,864 | |||||
| Shares issued from merger (See Note J): | |||||||
| Class A shares | 3,808,394 | — | |||||
| Class C shares | 819,840 | — | |||||
| Class I shares | 399,595 | — | |||||
| Class Y shares | 866,655 | — | |||||
| Reinvestment of distributions: | |||||||
| Class A shares | 6,543,005 | 2,668,757 | |||||
| Class B shares (a) | — | 38,127 | |||||
| Class C shares | 1,475,604 | 487,424 | |||||
| Class I shares | 1,666,510 | 1,594,308 | |||||
| Class Y shares | 600,420 | 197,782 | |||||
| Shares redeemed: | |||||||
| Class A shares | (7,904,960) | (9,669,175) | |||||
| Class B shares (a)(c) | — | (391,943) | |||||
| Class C shares | (1,374,863) | (577,212) | |||||
| Class I shares | (5,597,065) | (12,432,783) | |||||
| Class Y shares | (1,279,099) | (931,516) | |||||
| Total capital share activity | 8,079,055 | (10,018,898) | |||||
| (a) Class B Shares were converted into Class A Shares at the close of business on April 20, 2015. | |||||||
| (b) Amounts include $11,964,158 of share transactions that were redeemed from Class B shares and converted into Class A shares at the close of business on April 20, 2015. | |||||||
| (c) Amount includes 296,069 shares redeemed from Class B shares and 238,567 shares purchased into Class A shares at the close of business on April 20, 2015. | |||||||
| See notes to financial statements. | |||||||
calvert.com CALVERT SOCIAL INVESTMENT FUND ANNUAL REPORT 67
NOTES TO FINANCIAL STATEMENTS
NOTE A — SIGNIFICANT ACCOUNTING POLICIES
General: Calvert Social Investment Fund (the “Trust”) was organized as a business trust under the laws of the state of Massachusetts by a Declaration of Trust filed on December 14, 1981, and is registered under the Investment Company Act of 1940, as amended (the “1940 Act”) as an open-end management investment company. The Trust has authorized an unlimited number of shares of beneficial interest (“shares”) without par value. The Trust operates six (6) separate series, or mutual funds, each with its own investment objective(s) and strategies. This report contains the financial statements and financial highlights of the three (3) funds listed below (each, a “Fund” and collectively, the “Funds”):
| • | Calvert Balanced Portfolio (“Balanced”), |
| • | Calvert Bond Portfolio (“Bond”), and |
| • | Calvert Equity Portfolio (“Equity”). |
Balanced is diversified and invests in a combination of stocks, bonds and money market instruments. Bond is non-diversified and invests in investment grade debt securities of any maturity. Equity is diversified and invests primarily in common stocks of U.S. large-cap companies. The operations of each series of the Trust, including the Funds, are accounted for separately. The Funds apply the accounting and reporting guidance in the Financial Accounting Standards Board (FASB) Accounting Standards Codification Topic 946, Financial Services – Investment Companies (ASC 946).
The Funds generally offer Class A, Class C, Class I, and Class Y shares. Class A shares are sold with a maximum front-end sales charge of 4.75% (3.75% for Bond). However, the front-end sales charge is waived for shareholders investing in Class A shares directly with the Funds in an account maintained by Calvert Investment Distributors, Inc. (“Distributor”) or without a specified broker-dealer or financial adviser (“Direct Account”). Class C shares are not available for purchase in Direct Accounts. For non-Direct Accounts, Class C shares are sold without a front-end sales charge, and with certain exceptions, will be charged a contingent deferred sales charge on shares sold within one year of purchase. Class C shares have higher levels of expenses than Class A shares. Class I shares require a minimum account balance of $1 million. The $1 million minimum initial investment is waived for retirement plans that trade through omnibus accounts and may be waived in certain other instances where it is believed to be in the best interest of the Fund and its shareholders. Class I shares have no front-end or contingent deferred sales charge and have lower levels of expenses than Class A shares. Class Y shares are generally only available to wrap or similar fee-based programs offered by financial intermediaries, and retirement plans, foundations, endowments and other consultant-driven business, that have entered into an agreement with the Fund’s Distributor to offer Class Y shares to their clients. Class Y shares have no front-end or contingent deferred sales charge and have lower levels of expenses than Class A shares. Among other things, each class has different: (a) dividend rates, due to differences in Distribution Plan expenses and other class-specific expenses; (b) exchange privileges; and (c) class-specific voting rights.
Security Valuation: Net asset value per share is determined every business day as of the close of the regular session of the New York Stock Exchange (generally 4:00 p.m. Eastern time). The Funds use independent pricing services approved by the Board of Trustees (“the Board”) to value their investments wherever possible. Investments for which market quotations are not available or deemed not reliable are fair valued in good faith under the direction of the Board.
The Board has adopted Valuation Procedures (the “Procedures”) to determine the fair value of securities and other financial instruments for which market prices are not readily available or which may not be reliably priced. The Board has delegated the day-to-day responsibility for determining the fair value of assets of the Funds to Calvert Investment Management, Inc. (the “Advisor” or “Calvert”) and has provided these Procedures to govern Calvert in its valuation duties.
Calvert has chartered an internal Valuation Committee to oversee the implementation of these Procedures and to assist it in carrying out the valuation responsibilities that the Board has delegated.
The Valuation Committee meets on a regular basis to review illiquid securities and other investments which may not have readily available market prices. The Valuation Committee’s fair valuation determinations are subject to review, approval and ratification by the Board at its next regularly scheduled meeting covering the calendar quarter in which the fair valuation was determined.
The Valuation Committee utilizes various methods to measure the fair value of the Funds’ investments. U.S. generally accepted accounting principles (GAAP) establishes a disclosure hierarchy that categorizes the inputs to valuation techniques used to value assets and liabilities at measurement date. These inputs are summarized in the three broad levels listed below:
Level 1 - quoted prices in active markets for identical securities
Level 2 - other significant observable inputs (including quoted prices for similar securities, interest rates, prepayment speeds, credit risk, etc.)
Level 3 - significant unobservable inputs (including the Funds’ own assumptions in determining the fair value of investments)
68 calvert.com CALVERT SOCIAL INVESTMENT FUND ANNUAL REPORT
The inputs or methodologies used for valuing securities are not necessarily an indication of the risk associated with investing in those securities.
Changes in valuation techniques may result in transfers in or out of an investment’s assigned level within the hierarchy during the year. Transfers in and/or out of levels are determined based on the fair value of such securities at the end of the year. Valuation techniques used to value the Funds’ investments by major category are as follows:
Common and preferred stocks, including restricted securities and venture capital securities, for which market quotations are readily available, are valued at the last reported sale price or official closing price as reported by an independent pricing service on the primary market or exchange on which they are traded and are categorized as Level 1 in the hierarchy. In the event there were no sales during the day or closing prices are not available, securities are valued at the last quoted bid price or may be valued using the last available price and are categorized as Level 2 in the hierarchy. Foreign securities are valued based on quotations from the principal market in which such securities are normally traded. The Fund has retained a third party fair value pricing service to quantitatively analyze the price movement of its holdings on foreign exchanges and to automatically fair value these securities each business day. The third party fair value pricing service takes into account many factors, including, but not limited to, movements in U.S. securities markets and changes in futures contracts and foreign exchange rates that have occurred after the close of the principal foreign market, to determine a fair value as of the close of the New York Stock Exchange. Such securities are categorized as Level 2 in the hierarchy.
Venture capital securities for which market quotations are not readily available are generally categorized as Level 3 in the hierarchy. Venture capital direct equity securities are generally valued using the most appropriate and applicable method to measure fair value in light of each company’s situation. Methods may include market, income or cost approaches with discounts as appropriate based on assumptions of liquidation or exit risk. Examples of the market approach are subsequent rounds of financing, comparable transactions, and revenue times an industry multiple. An example of the income approach is the discounted cash flow. Examples of the cost approach are replacement cost, salvage value, or net asset percentage. Venture capital limited partnership (“LP”) securities are valued at the fair value reported by the general partner of the partnership adjusted as necessary to reflect subsequent capital calls and distributions and any other available information, as a practical expedient. In the absence of a reported LP unit value, fair value may be estimated based on the Fund’s percentage equity in the partnership and/or other balance sheet information and portfolio value for the most recently available period reported by the general partner. In some cases adjustments may be made to account for daily pricing of material public holdings within the partnership. Venture capital debt securities are valued based on assumptions of credit and market risk. For venture capital securities denominated in foreign currency, the fair value is marked to the daily exchange rate.
Debt securities, other than Venture capital debt securities, are valued based on evaluated prices received from independent pricing services or from dealers who make markets in such securities. For corporate bonds, floating rate loans, sovereign government bonds, municipal securities, and U.S. government and government agency obligations, pricing services utilize matrix pricing which considers yield or price of bonds of comparable quality, coupon, maturity and type as well as dealer supplied prices and such securities are generally categorized as Level 2 in the hierarchy. For asset-backed securities, collateralized mortgage-backed obligations, commercial mortgage-backed securities, and U.S. government agency mortgage-backed securities, pricing services utilize matrix pricing which considers prepayment speed assumptions, attributes of the collateral, yield or price of bonds of comparable quality, coupon, maturity and type as well as dealer supplied prices and, accordingly, such securities are generally categorized as Level 2 in the hierarchy.
For restricted securities and private placements where observable inputs are limited, assumptions about market activity and risk are used and such securities are categorized as Level 3 in the hierarchy.
Warrants are valued at their official closing price as reported by an independent pricing source on the exchange on which they are traded and categorized as Level 1 in the hierarchy.
Short-term securities of sufficient credit quality with remaining maturities of sixty days or less for which quotations are not readily available are valued at amortized cost, which approximates fair value, and are categorized as Level 2 in the hierarchy.
Mutual funds are valued at their closing net asset value each business day and are categorized as Level 1 in the hierarchy.
Futures contracts are valued at unrealized appreciation (depreciation) based on the settlement price established each day by the board of trade or exchange on which they are traded and are categorized as Level 1 in the hierarchy.
If a market value cannot be determined for a security using the methodologies described above, or if, in the good faith opinion of the Advisor, the market value does not constitute a readily available market quotation, or if a significant event has occurred that would materially affect the value of the security, the security will be fair valued as determined in good faith by the Valuation Committee. Securities which were fair valued at September 30, 2016, if any, are identified on the Schedule of Investments.
calvert.com CALVERT SOCIAL INVESTMENT FUND ANNUAL REPORT 69
The Valuation Committee considers a number of factors, including significant unobservable valuation inputs when arriving at fair value. It considers all significant facts that are reasonably available and relevant to the determination of fair value.
The Valuation Committee primarily employs a market-based approach which may use related or comparable assets or liabilities, recent transactions, market multiples, book values, and other relevant information for the investment to determine the fair value of the investment. When more appropriate, the Funds may employ an income-based or cost approach. An income-based valuation approach discounts anticipated future cash flows of the investment to calculate a present amount (discounted). The measurement is based on the value indicated by current market expectations about those future amounts. Discounts may also be applied due to the nature or duration of any restrictions on the disposition of the investments. A cost based approach is based on the amount that currently would be required to replace the service capacity of an asset (current replacement cost). From the seller’s perspective, the price that would be received for the asset is determined based on the cost to a buyer to acquire or construct a substitute asset of comparable utility, adjusted for obsolescence.
The values assigned to fair value investments are based on available information and do not necessarily represent amounts that might ultimately be realized. Further, due to the inherent uncertainty of valuations of such investments, the fair values may differ significantly from the values that would have been used had an active market existed, and the differences could be material. The Valuation Committee employs various methods for calibrating these valuation approaches including a regular review of key inputs and assumptions, transactional back-testing or disposition analysis and reviews of any related market activity.
The following tables summarize the market value of each of the Funds’ holdings as of September 30, 2016, based on the inputs used to value them:
| BALANCED | VALUATION INPUTS | ||||||||||
| INVESTMENTS IN SECURITIES* | LEVEL 1 | LEVEL 2 | LEVEL 3 | TOTAL | |||||||
| Common Stocks** | $406,736,675 | $— | $— | $406,736,675 | |||||||
| Common Stocks - Venture Capital | — | — | 8,282,489 | 8,282,489 | |||||||
| Preferred Stocks - Venture Capital | — | — | 741,031 | 741,031 | |||||||
| Venture Capital Limited Partnership Interest | — | — | 1,646,394 | 1,646,394 | |||||||
| Venture Capital Debt Obligations | — | — | 36,592 | 36,592 | |||||||
| Asset-Backed Securities | — | 53,039,644 | — | 53,039,644 | |||||||
| Collateralized Mortgage-Backed Obligations (Privately Originated) | — | 7,753,574 | — | 7,753,574 | |||||||
| Commercial Mortgage-Backed Securities | — | 18,608,344 | — | 18,608,344 | |||||||
| Corporate Bonds | — | 115,699,293 | — | 115,699,293 | |||||||
| Floating Rate Loans | — | 3,780,661 | 4,355 | 3,785,016 | |||||||
| High Social Impact Investments | — | 4,146,559 | 825,410 | 4,971,969 | |||||||
| Municipal Obligations | — | 5,942,475 | — | 5,942,475 | |||||||
| Sovereign Government Bonds | — | 970,250 | — | 970,250 | |||||||
| U.S. Government Agencies and Instrumentalities | — | 949,335 | — | 949,335 | |||||||
| U.S. Government Agency Mortgage-Backed Securities | — | 1,353,889 | — | 1,353,889 | |||||||
| U.S. Treasury Obligations | — | 32,285,285 | — | 32,285,285 | |||||||
| Commercial Paper | — | 1,137,310 | — | 1,137,310 | |||||||
| Time Deposit | — | 18,140,183 | — | 18,140,183 | |||||||
| Short Term Investment of Cash Collateral For Securities Loaned | 2,532,357 | — | — | 2,532,357 | |||||||
| TOTAL | $409,269,032 | $263,806,802 | $11,536,271^ | $684,612,105 | |||||||
| Futures Contracts*** | ($92,424 | ) | $— | $— | ($92,424 | ) | |||||
| * For a complete listing of investments, please refer to the Schedule of Investments. | |||||||||||
| ** For further breakdown of equity securities by industry, please refer to the Schedule of Investments. Venture Capital is not included in this category. | |||||||||||
| *** The value listed for these securities reflects unrealized appreciation (depreciation) as shown on the Schedule of Investments. | |||||||||||
| ^ Level 3 securities represent 1.7% of net assets. | |||||||||||
70 calvert.com CALVERT SOCIAL INVESTMENT FUND ANNUAL REPORT
The following is a reconciliation of Level 3 assets for which significant unobservable input were used to determine fair value:
| VENTURE CAPITAL | FLOATING RATE LOANS | HIGH SOCIAL IMPACT INVESTMENTS | TOTAL | |||||||||
| Balance as of 9/30/15 | $8,443,430 | $— | $— | $8,443,430 | ||||||||
| Accrued discounts/premiums | — | — | — | — | ||||||||
| Realized gain (loss) | — | — | — | — | ||||||||
| Change in unrealized appreciation (depreciation) | 2,905,686 | 4,355 | (73,590) | 2,836,451 | ||||||||
| Purchases | 657,000 | — | 899,000 | 1,556,000 | ||||||||
| Sales | (1,299,610) | — | — | (1,299,610) | ||||||||
Transfers in and/or out of Level 31 | — | — | — | — | ||||||||
| Balance as of 9/30/16 | $10,706,506 | $4,355 | $825,410 | $11,536,271 | ||||||||
1 The Fund’s policy is to recognize transfers into and transfers out of Level 3 as of the end of the reporting period. | ||||||||||||
There were no transfers between levels during the year.
| BOND | VALUATION INPUTS | |||||||||||
| INVESTMENTS IN SECURITIES* | LEVEL 1 | LEVEL 2 | LEVEL 3 | TOTAL | ||||||||
| Asset-Backed Securities | $— | $176,615,216 | $— | $176,615,216 | ||||||||
| Collateralized Mortgage-Backed Obligations (Privately Originated) | — | 26,703,669 | — | 26,703,669 | ||||||||
| Commercial Mortgage-Backed Securities | — | 61,935,097 | — | 61,935,097 | ||||||||
| Corporate Bonds | — | 430,847,718 | — | 430,847,718 | ||||||||
| Floating Rate Loans | — | 11,639,564 | 5,443 | 11,645,007 | ||||||||
| High Social Impact Investments | — | 5,019,645 | 1,029,240 | 6,048,885 | ||||||||
| Municipal Obligations | — | 28,505,074 | — | 28,505,074 | ||||||||
| Sovereign Government Bonds | — | 3,580,065 | — | 3,580,065 | ||||||||
| U.S. Government Agencies and Instrumentalities | — | 3,006,228 | — | 3,006,228 | ||||||||
| U.S. Government Agency Mortgage-Backed Securities | — | 6,248,717 | — | 6,248,717 | ||||||||
| U.S. Treasury Obligations | — | 89,959,047 | — | 89,959,047 | ||||||||
| Commercial Paper | — | 4,406,460 | — | 4,406,460 | ||||||||
| Common Stocks** | 295,035 | — | — | 295,035 | ||||||||
| Time Deposit | — | 42,422,173 | — | 42,422,173 | ||||||||
| Short Term Investment of Cash Collateral For Securities Loaned | 3,567,203 | — | — | 3,567,203 | ||||||||
| TOTAL | $3,862,238 | $890,888,673 | $1,034,683 | ^ | $895,785,594 | |||||||
| Futures Contracts*** | $25,960 | $— | $— | $25,960 | ||||||||
| * For a complete listing of investments, please refer to the Schedule of Investments. | ||||||||||||
| ** For further breakdown of equity securities by industry, please refer to the Schedule of Investments. | ||||||||||||
| *** The value listed for these securities reflects unrealized appreciation (depreciation) as shown on the Schedule of Investments. | ||||||||||||
| ^ Level 3 securities represent 0.1% of net assets. | ||||||||||||
There were no transfers between levels during the year.
calvert.com CALVERT SOCIAL INVESTMENT FUND ANNUAL REPORT 71
| EQUITY | VALUATION INPUTS | |||||||||||
| INVESTMENTS IN SECURITIES* | LEVEL 1 | LEVEL 2 | LEVEL 3 | TOTAL | ||||||||
| Common Stocks** | $2,099,175,946 | $— | $83,616 | $2,099,259,562 | ||||||||
| Common Stocks - Venture Capital | — | — | 815,876 | 815,876 | ||||||||
| Preferred Stocks - Venture Capital | — | — | 3,212,032 | 3,212,032 | ||||||||
| Warrants | 2,571 | — | — | 2,571 | ||||||||
| Warrants - Venture Capital | — | — | 3,942 | 3,942 | ||||||||
| Venture Capital Limited Partnership Interest | — | — | 12,904,516 | 12,904,516 | ||||||||
| Venture Capital Debt Obligations | — | — | 2,845,399 | 2,845,399 | ||||||||
| High Social Impact Investments | — | 10,714,054 | 3,029,750 | 13,743,804 | ||||||||
| Time Deposit | — | 53,845,041 | — | 53,845,041 | ||||||||
| Short Term Investment of Cash Collateral For Securities Loaned | 386,575 | — | — | 386,575 | ||||||||
| TOTAL | $2,099,565,092 | $64,559,095 | $22,895,131^ | $2,187,019,318 | ||||||||
| * For a complete listing of investments, please refer to the Schedule of Investments. | ||||||||||||
| ** For further breakdown of equity securities by industry, please refer to the Schedule of Investments. Venture Capital is not included in this category. | ||||||||||||
| ^ Level 3 securities represent 1.0% of net assets. | ||||||||||||
The following is a reconciliation of Level 3 assets for which significant unobservable input were used to determine fair value:
| VENTURE CAPITAL | HIGH SOCIAL IMPACT INVESTMENTS | TOTAL | |||||||
| Balance as of 9/30/15 | $21,573,655 | $— | $21,573,655 | ||||||
| Accrued discounts/premiums | 10,526 | — | 10,526 | ||||||
| Realized gain (loss) | 1,277,668 | — | 1,277,668 | ||||||
| Change in unrealized appreciation (depreciation) | (1,823,576) | (270,250) | (2,093,826) | ||||||
| Purchases | 8,921,615 | 3,300,000 | 12,221,615 | ||||||
| Sales | (10,094,507) | — | (10,094,507) | ||||||
Transfers in and/or out of Level 31 | — | — | — | ||||||
| Balance as of 9/30/16 | $19,865,381 | $3,029,750 | $22,895,131 | ||||||
1 The Fund’s policy is to recognize transfers into and transfers out of Level 3 as of the end of the reporting period.
There were no transfers between levels during the year.
Loan Participations and Assignments: The Funds may invest in direct debt instruments which are interests in amounts owed to lenders or lending syndicates by corporate, governmental, or other borrowers. A Fund’s investment in loans may be in the form of participations in loans or assignments of all or a portion of loans from third parties. A loan is often administered by a bank or other financial institution (the “lender”) that acts as agent for all holders. The agent administers the terms of the loan, as specified in the loan agreement. The Funds may invest in multiple series or tranches of a loan, which may have varying terms and carry different associated risks. The Funds generally have no right to enforce compliance with the terms of the loan agreement with the borrower. As a result, the Funds may be subject to the credit risk of both the borrower and the lender that is selling the loan agreement. When a Fund purchases assignments from lenders it acquires direct rights against the borrower of the loan. When investing in a loan participation, the Funds have the right to receive payments of principal, interest and any fees to which they are entitled only from the lender selling the loan agreement and only upon receipt of payments by the lender from the borrower.
Futures Contracts: The Funds may purchase and sell futures contracts, but only when, in the judgment of the Advisor, such a position acts as a hedge, as a substitute for direct investment in a particular asset class to facilitate rebalancing of a Fund, or to provide market exposure to a Fund’s uncommitted cash balances. The Funds may not enter into futures contracts for the purpose of speculation or leverage. These futures contracts may include, but are not limited to, futures contracts based on U.S. Government obligations and market index futures contracts. The Funds are subject to interest rate risk and market risk in the normal course of pursuing its investment objectives and may use futures contracts to hedge against changes in the value of interest rates and the value of securities. The Funds may enter into futures contracts agreeing to buy or sell a financial instrument for a set price at a future date. Initial margin deposits of either cash or securities as required by the broker are made upon entering
72 calvert.com CALVERT SOCIAL INVESTMENT FUND ANNUAL REPORT
into the contract. While the contract is open, daily variation margin payments are made to or received from the broker reflecting the daily change in market value of the contract and are recorded for financial reporting purposes as unrealized gains or losses by the Funds. When a futures contract is closed, a realized gain or loss is recorded equal to the difference between the opening and closing value of the contract. The risks associated with entering into futures contracts may include the possible illiquidity of the secondary market which would limit the Funds' ability to close out a futures contract prior to the settlement date, an imperfect correlation between the value of the contracts and the underlying financial instruments, or that the counterparty will fail to perform its obligations under the contracts’ terms. Futures contracts are designed by boards of trade which are designated “contracts markets” by the Commodities Futures Trading Commission. Futures contracts trade on the contracts markets in a manner that is similar to the way a stock trades on a stock exchange, and the boards of trade, through their clearing corporations, guarantee the futures contracts against default. As a result, there is minimal counterparty credit risk to the Funds.
During the year, Balanced and Bond used U.S. Treasury Notes futures contracts to hedge against interest rate changes and to manage overall duration of the Funds. Balanced also used futures contracts as a substitute for direct investment in a particular asset class to facilitate rebalancing of the Funds and implement tactical asset allocation decisions. The Funds’ futures contracts at year end are presented in the Schedule of Investments.
At September 30, 2016, the Funds had the following derivatives, categorized by risk exposure:
| BALANCED | |||||
| Risk | Statement of Assets and Liabilities | Assets | Statement of Assets and Liabilities | Liabilities | |
| Equity | Unrealized appreciation on futures contracts | $—* | Unrealized depreciation on futures contracts | ($104,425)* | |
| Interest Rate | Unrealized appreciation on futures contracts | $12,230* | Unrealized depreciation on futures contracts | ($229)* | |
| Total | $12,230* | ($104,654)* | |||
| * Only the current day’s variation margin is reported within the Statement of Assets and Liabilities. | |||||
| BOND | |||||
| Risk | Statement of Assets and Liabilities | Assets | Statement of Assets and Liabilities | Liabilities | |
| Interest Rate | Unrealized appreciation on futures contracts | $25,960* | Unrealized depreciation on futures contracts | $—* | |
| * Only the current day’s variation margin is reported within the Statement of Assets and Liabilities. | |||||
The effect of derivative instruments on the Statement of Operations for the year ended September 30, 2016 was as follows:
| BALANCED | Statement of Operations Location | ||||||
| Risk | Derivatives | Net Realized Gain (Loss) | Net Change in Unrealized appreciation (depreciation) | ||||
| Equity | Futures | $723,587 | ($104,425 | ) | |||
| Interest Rate | Futures | ($88,088 | ) | $95,135 | |||
| Total | $635,499 | ($9,290 | ) | ||||
The volume of outstanding contracts has varied throughout the year with an average number of contracts as in the following table:
| Average Number of Contracts* | |
| Futures contracts long | 51 |
| Futures contracts short | (158) |
* Averages are based on activity levels during the year ended September 30, 2016.
| BOND | Statement of Operations Location | ||||||
| Risk | Derivatives | Net Realized Gain (Loss) | Net Change in Unrealized appreciation (depreciation) | ||||
| Interest Rate | Futures | $272,598 | ($123,587 | ) | |||
The volume of outstanding contracts has varied throughout the year with an average number of contracts as in the following table:
calvert.com CALVERT SOCIAL INVESTMENT FUND ANNUAL REPORT 73
| Derivative Description | Average Number of Contracts* |
| Futures contracts long | 29 |
| Futures contracts short | (240) |
* Averages are based on activity levels during the year ended September 30, 2016.
Restricted Securities: The Funds may invest in securities that are subject to legal or contractual restrictions on resale. Generally, these securities may only be sold publicly upon registration under the Securities Act of 1933 or in transactions exempt from such registration. Information regarding restricted securities is included at the end of the Schedules of Investments.
The Funds invest in Community Investment Notes issued by the Calvert Social Investment Foundation (the “CSI Foundation”). The CSI Foundation is a 501(c)(3) non-profit organization that receives in-kind support from Calvert and its subsidiaries. The Funds have received an exemptive order from the Securities and Exchange Commission permitting the Funds to make investments in these notes under certain conditions.
Security Transactions and Investment Income: Security transactions are accounted for on trade date. Realized gains and losses are recorded on an identified cost basis and may include proceeds from litigation. Dividend income is recorded on the ex-dividend date or, in the case of dividends on certain foreign securities, as soon as each Fund is informed of the ex-dividend date. Withholding taxes on foreign dividends have been provided for in accordance with the Funds’ understanding of the applicable country’s tax rules and rates. Distributions received on securities that represent a return of capital are recorded as a reduction of cost of investments. Distributions received on securities that represent a capital gain are recorded as a realized gain. Interest income, which includes amortization of premium and accretion of discount on debt securities, is accrued as earned. Debt obligations may be placed on non-accrual status and related interest income may be reduced by ceasing current accruals and writing off interest receivables when the collection of all or a portion of interest has become doubtful based on consistently applied procedures (See the Notes to Schedule of Investments). A debt obligation may be removed from non-accrual status when the issuer resumes interest payments or when collectability of interest is reasonably assured. The Funds earns certain fees in connection with its floating rate loan purchasing activities. These fees are in addition to interest payments earned and may include amendment fees, consent fees, and prepayment fees.
Share Class Accounting: Investment income and realized and unrealized gains and losses are allocated to separate classes of shares based upon the relative net assets of each class. Expenses common to the classes are also allocated to each class in proportion to their relative net assets. Expenses arising in connection with a specific class are charged directly to that class.
Foreign Currency Transactions: The Funds’ accounting records are maintained in U.S. dollars. For valuation of assets and liabilities on each date of net asset value determination, foreign denominations are converted into U.S. dollars using the current exchange rate. Security transactions, income and expenses are translated at the prevailing rate of exchange on the date of the event. The effect of changes in foreign exchange rates on securities and foreign currencies is included in the net realized and unrealized gain or loss on investments and assets and liabilities denominated in foreign currencies.
Distributions to Shareholders: Distributions to shareholders are recorded by the Funds on ex-dividend date. Dividends from net investment income are paid monthly by Bond, quarterly by Balanced, and annually by Equity. Distributions from net realized capital gains, if any, are paid at least annually. Distributions are determined in accordance with income tax regulations which may differ from U.S. generally accepted accounting principles; accordingly, periodic reclassifications are made within the Funds’ capital accounts to reflect income and gains available for distribution under income tax regulations.
Estimates: The preparation of financial statements in conformity with U.S. generally accepted accounting principles requires management to make estimates and assumptions that affect the reported amounts of assets and liabilities and disclosure of contingent assets and liabilities at the date of the financial statements and the reported amounts of increases and decreases in net assets from operations during the reporting period. Actual results could differ from those estimates.
Redemption Fees: Balanced, Bond, and Equity each charged a 2% redemption fee on redemptions, including exchanges, made within 30 days of purchase in the same Fund (within seven days for all Class I shares). The redemption fee was accounted for as an addition to paid-in capital. This fee was eliminated effective February 2, 2015.
Federal Income Taxes: No provision for federal income or excise tax is required since each Fund intends to continue to qualify as a regulated investment companies under the Internal Revenue Code and to distribute substantially all of their taxable earnings.
Management has analyzed the Funds' tax positions taken for all open federal income tax years and has concluded that no provision for federal income tax is required in the Funds' financial statements. A Fund’s federal tax return is subject to examination by the Internal Revenue Service for a period of three years.
NOTE B — RELATED PARTY TRANSACTIONS
74 calvert.com CALVERT SOCIAL INVESTMENT FUND ANNUAL REPORT
Calvert Investment Management, Inc. (the “Advisor”) is wholly-owned by Calvert Investments, Inc., which is indirectly wholly-owned by Ameritas Mutual Holding Company. The Advisor provides investment advisory services and pays the salaries and fees of officers and Trustees of the Funds who are employees of the Advisor or its affiliates.
For its services, the Advisor receives monthly fees based on the following annual rates of average daily net assets:
| BALANCED | ||
| First $500 Million | 0.41 | % |
| Next $500 Million | 0.385 | % |
| Over $1 Billion | 0.35 | % |
BOND | ||
| First $1 Billion | 0.35 | % |
| Over $1 Billion | 0.325 | % |
| EQUITY | ||
| First $2 Billion | 0.50 | % |
| Next $1 Billion | 0.475 | % |
| Over $3 Billion | 0.45 | % |
For the year ended September 30, 2016, the Advisor voluntarily waived $83,160 of its fee for Equity.
Calvert Investment Management, Inc. voluntarily reimbursed Balanced $274,733 for two trading errors which occurred during the reporting period. The effect of the losses incurred and the reimbursement by Calvert Investment Management, Inc. of such amounts amounted to $0.01 per share. Excluding such payment, the total return would have been 8.90%, 8.02%, 9.28%, and 9.12% for Class A, Class C, Class I, and Class Y, respectively.
The Advisor has contractually agreed to limit net annual fund operating expenses through January 31, 2017 for Balanced Class I, Balanced Class Y, Bond Class Y, and Equity Class Y. For the purpose of this expense limit, operating expenses do not include interest expense, brokerage commissions, taxes, and extraordinary expenses. This expense limitation does not limit any acquired fund fees and expenses, if any. The contractual expense caps are as follows:
| Balanced | Bond | Equity | |
| Class I | 0.62% | N/A | N/A |
| Class Y | 0.73% | 0.64% | 0.96% |
Prior to February 1, 2016, the expense caps were as follows:
| Balanced | Bond | Equity | |
| Class I | 0.72% | N/A | N/A |
| Class Y | 0.955% | 0.92% | 0.96% |
Calvert Investment Administrative Services, Inc. ("CIAS"), an affiliate of the Advisor, provides administrative services to the Funds for an annual fee, payable monthly, based on the Fund’s average daily net assets.
For the period from October 1, 2015 to January 31, 2016, the administrative fee annual rate were as follows:
| Balanced | Bond | Equity | |
| Class A, C, & Y | 0.275% | 0.30% | 0.20% |
| Class I | 0.125% | 0.10% | 0.10% |
CIAS and the Funds entered into an Amended and Restated Administrative Services Agreement that established a 0.12% administrative fee for all classes of the Funds commencing on February 1, 2016.
For the period from December 1, 2015 through January 31, 2016, CIAS voluntarily waived the following percentages of the average daily net assets (the amount of the administrative fee above 0.12%) for each Fund:
calvert.com CALVERT SOCIAL INVESTMENT FUND ANNUAL REPORT 75
| Balanced | Bond | Equity | |
| Class A, C, & Y | 0.155% | 0.18% | 0.08% |
| Class I | 0.005% | N/A | N/A |
CIAS has also contractually agreed to waive 0.02% for Class I shares of Bond and Equity (the difference between the previous administrative fee and the new 0.12% fee) from February 1, 2016 through January 31, 2018.
During the year ended September 30, 2016, CIAS voluntarily waived $164,663, $153,875, and $220,647 in Balanced, Bond and Equity, respectively.
Calvert Investment Distributors, Inc. (“CID”), an affiliate of the Advisor, is the distributor and principal underwriter for the Fund. Pursuant to Rule 12b-1 under the Investment Company Act of 1940, each Fund has adopted a Distribution Plan that permits each Fund to pay certain expenses associated with the distribution and servicing of its shares. The expenses paid for Class A may not exceed 0.35% of the annual average daily net assets of Balanced and Bond and 0.25% of those of Equity. The amount actually paid by Class A of Balanced, Bond, and Equity is an annualized fee, payable monthly, of 0.25% (for Balanced only on assets over $30 million), 0.20%, and 0.25%, respectively, of each Classes’ average daily net assets. The expenses paid for Class C may not exceed 1.00% of the annual average daily net assets of Balanced, Bond, and Equity. The amount actually paid, is an annualized fee, payable monthly of 1.00%, of each Classes’ average daily net assets. Class I and Class Y do not have Distribution Plan expenses.
CID received the following amounts as its portion of the commissions charged on sales of the Funds' Class A shares for the year ended September 30, 2016: $177,816 for Balanced, $59,616 for Bond, and $185,127 for Equity.
Calvert Investment Services, Inc. (“CIS”), an affiliate of the Advisor, is the shareholder servicing agent for the Fund. For its services, CIS received fees of $144,567, $86,711, and $257,042 for the year ended September 30, 2016 for Balanced, Bond,and Equity, respectively. Boston Financial Data Services, Inc. is the transfer and dividend disbursing agent.
Each Trustee of the Funds who is not an employee of the Advisor or its affiliates receives an annual retainer of $52,000 plus a meeting fee of up to $3,000 for each regular Board meeting attended. Additional fees of up to $6,000 annually may be paid to the Committee chairs ($10,000 for the Board chair and Special Equities Committee chair) and $2,500 annually may be paid to Committee members, plus a Committee meeting fee of $500 for each regular Committee meeting attended. Eligible Trustees may participate in a Deferred Compensation Plan (the "Plan"). Obligations of the Plan will be paid solely out of the Funds’ assets. Trustees’ fees are allocated to each of the funds served.
NOTE C — INVESTMENT ACTIVITY AND TAX INFORMATION
During the year, the cost of purchases and proceeds from sales of investments, other than short-term securities, were:
| BALANCED | BOND | EQUITY | |||||||
| Purchases | |||||||||
| Long-Term U.S. Government Securities | $442,154,933 | $768,079,491 | $— | ||||||
| Other Long-Term Securities | 478,657,272 | 461,074,983 | 926,563,724 | ||||||
| Total Purchases | $920,812,205 | $1,229,154,474 | $926,563,724 | ||||||
| Sales | |||||||||
| Long-Term U.S. Government Securities | $428,846,867 | $716,716,513 | $— | ||||||
| Other Long-Term Securities | 496,502,234 | 470,751,869 | 1,748,891,364 | ||||||
| Total Sales | $925,349,101 | $1,187,468,382 | $1,748,891,364 | ||||||
The Funds may purchase securities, typically short-term variable rate demand notes, from or sell to other Funds managed by the Advisor. These interportfolio transactions are primarily used for cash management purposes and are made pursuant to Rule 17a-7 of the Investment Company Act of 1940. For the year ended September 30, 2016, such purchase and sales transactions were:
| BALANCED | BOND | EQUITY | ||||
| Purchases | $11,901,347 | $— | $— | |||
| Sales | — | 1,380,476 | — | |||
Under the Regulated Investment Company Modernization Act of 2010, capital losses incurred in taxable years beginning after December 22, 2010 can be carried forward to offset future capital gains for an unlimited period. These losses are required to be utilized prior to the losses incurred in pre-enactment taxable years and will retain their characters as either long-term or short-
76 calvert.com CALVERT SOCIAL INVESTMENT FUND ANNUAL REPORT
term. Losses incurred in pre-enactment taxable years can be utilized until expiration. Equity’s use of net capital losses acquired from reorganizations may be limited under certain tax provisions.
| Capital Loss Carryforwards | |||
| Equity Portfolio | |||
| EXPIRATION DATE | |||
| 2017 | ($20,959,591 | ) | |
| NO EXPIRATION DATE | |||
| Short-term | (5,204,821) | ||
| Long-term | (2,579,634) | ||
The tax character of dividends and distributions paid during the years ended September 30, 2016 and September 30, 2015 was as follows:
| BALANCED | |||||||
| DISTRIBUTIONS PAID FROM: | 2016 | 2015 | |||||
| Ordinary income | $12,570,088 | $12,897,283 | |||||
| Long-term capital gains | 63,287,202 | 2,752,072 | |||||
| Total | $75,857,290 | $15,649,355 | |||||
| BOND | |||||||
| DISTRIBUTIONS PAID FROM: | 2016 | 2015 | |||||
| Ordinary income | $22,171,638 | $21,552,195 | |||||
| Total | $22,171,638 | $21,552,195 | |||||
| EQUITY | |||||||
| DISTRIBUTIONS PAID FROM: | 2016 | 2015 | |||||
| Ordinary income | $8,891,156 | $13,087,660 | |||||
| Long-term capital gains | 453,947,697 | 255,353,701 | |||||
| Total | $462,838,853 | $268,441,361 | |||||
As of September 30, 2016, the tax basis components of distributable earnings/(accumulated losses) and the federal tax cost were as follows:
| BALANCED | BOND | EQUITY | |||||||||
| Unrealized appreciation | $48,650,298 | $20,458,746 | $570,074,209 | ||||||||
| Unrealized (depreciation) | (14,730,592) | (4,544,148) | (50,241,965) | ||||||||
| Net unrealized appreciation (depreciation) | $33,919,706 | $15,914,598 | $519,832,244 | ||||||||
| Undistributed ordinary income | $483,178 | $1,189,968 | $5,830,247 | ||||||||
| Undistributed long-term capital gain | $— | $— | $199,205,265 | ||||||||
| Capital loss carryforward | $— | $— | ($28,744,046 | ) | |||||||
| Late year ordinary and post October capital loss deferrals | ($50,865 | ) | $— | $— | |||||||
| Other temporary differences | ($51,538 | ) | ($71,767 | ) | ($50,983 | ) | |||||
| Federal income tax cost of investments | $650,692,399 | $879,870,996 | $1,667,187,074 | ||||||||
The differences between the components of distributable earnings on a tax basis and the amounts reflected in the Statements of Assets and Liabilities are primarily due to temporary book-tax differences that will reverse in a subsequent period. For Balanced, the differences are due to Section 1256 futures contracts, loss deferrals on straddle transactions, partnerships, deferred Trustees’ fees, passive activity losses, and wash sales. For Bond, the differences are due to Section 1256 futures contracts, straddles, deferred Trustees’ fees, and wash sales. For Equity, the differences are due to wash sales, partnerships, and capital loss limitations under Internal Revenue Code Section 382.
calvert.com CALVERT SOCIAL INVESTMENT FUND ANNUAL REPORT 77
Reclassifications, as shown in the table below, have been made to the Funds' components of net assets to reflect income and gains available for distribution (or available capital loss carryforwards, as applicable) under income tax law and regulations.These reclassifications are due to permanent book-tax differences and have no impact on net assets. For Balanced, the reclassifications are due to partnerships, distribution re-designations, and asset-backed securities. For Bond, the reclassifications are due to asset-backed securities. For Equity, the reclassifications are due to foreign currency transactions, real estate investment trusts, distributions recharacterizations, and partnerships.
| BALANCED | BOND | EQUITY | |||||||
| Undistributed net investment income | $13,434 | $75,857 | ($1,281,850 | ) | |||||
| Accumulated net realized gain (loss) | (13,389) | (75,857) | (8,299,582) | ||||||
| Paid-in capital | (45) | — | 9,581,432 | ||||||
NOTE D — SECURITIES LENDING
To generate additional income, the Funds may lend their securities pursuant to a securities lending agency agreement (“Lending Agreement”) with State Street Bank, the securities lending agent. Security loans are subject to termination by the Funds at any time and, therefore, are not considered to be illiquid investments. The Funds require that the loan be continuously collateralized by either cash or securities as collateral equal at all times to at least 102% of the market value of the domestic securities loaned and 105% of the market value on the international securities loaned (if applicable). Cash collateral is generally invested in State Street Institutional U.S. Government Money Market Fund (the “U.S. Government Fund”) that is managed by an affiliate of the custodian. The U.S. Government Fund is a registered money market fund that invests in a variety of high-quality, U.S. dollar-denominated instruments. Any gain or loss in the market price of the loaned securities that might occur and any interest earned or dividends declared during the term of the loan would accrue to the account of the Funds. Income earned on the investment of collateral, net of broker rebates and other expenses incurred by the securities lending agent, is split between the Funds and the securities lending agent on the basis of agreed upon contractual terms.
The risks associated with lending portfolio securities include, but are not limited to, possible delays in receiving additional collateral or in the recovery of the loaned securities, possible loss of rights to the collateral should the borrower fail financially, as well as risk of loss in the value of the collateral or the value of the investments made with the collateral. The securities lending agent shall indemnify the Funds in the case of default of any securities borrower.
The total value of securities on loan as of September 30, 2016 was as follows:
| Balanced | $2,438,566 | ||
| Bond | $3,494,297 | ||
| Equity | $377,739 | ||
The following tables display a breakdown of transactions accounted for a secured borrowings, the obligations by class of collateral pledged, and the remaining contractual maturity of those transactions as of September 30, 2016:
| BALANCED | |||||||||
| Remaining Contractual Maturity of the Agreements as of September 30, 2016 | |||||||||
| Overnight and Continuous | <30 days | Between 30 & 90 days | >90 days | Total | |||||
| Securities Lending Transactions | |||||||||
| Common Stocks | $2,532,357 | $— | $— | $— | $2,532,357 | ||||
| Amount of recognized liabilities for securities lending transactions | $2,532,357 | ||||||||
| BOND | |||||||||
| Remaining Contractual Maturity of the Agreements as of September 30, 2016 | |||||||||
| Overnight and Continuous | <30 days | Between 30 & 90 days | >90 days | Total | |||||
| Securities Lending Transactions | |||||||||
| Corporate Bonds | $3,567,203 | $— | $— | $— | $3,567,203 | ||||
| Amount of recognized liabilities for securities lending transactions | $3,567,203 | ||||||||
78 calvert.com CALVERT SOCIAL INVESTMENT FUND ANNUAL REPORT
| EQUITY | |||||||||
| Remaining Contractual Maturity of the Agreements as of September 30, 2016 | |||||||||
| Overnight and Continuous | <30 days | Between 30 & 90 days | >90 days | Total | |||||
| Securities Lending Transactions | |||||||||
| Common Stocks | $386,575 | $— | $— | $— | $386,575 | ||||
| Amount of recognized liabilities for securities lending transactions | $386,575 | ||||||||
NOTE E — LINE OF CREDIT
A financing agreement is in place with the Calvert Funds and State Street Corporation (“SSC”). Under the agreement, SSC provides an unsecured line of credit facility, in the aggregate amount of $50 million ($25 million committed and $25 million uncommitted), accessible by the Calvert Funds for temporary or emergency purposes only. Borrowings bear interest at the higher of the One-Month London Interbank Offered Rate (LIBOR) in effect that day or the overnight Federal Funds Rate plus 1.25% per annum. A commitment fee of 0.25% per annum is incurred on the unused portion of the committed facility. An administrative fee of $30,000 was paid in connection with the uncommitted facility. These fees were allocated to all participating funds. The Funds had no loans outstanding pursuant to this line of credit at September 30, 2016. Bond had no borrowings under the agreement during the year ended September 30, 2016.
For the year ended September 30, 2016, borrowings by Balanced, Bond and Equity under the arrangement were as follows:
| Fund | Average Daily Balance | Weighted Average Interest Rate | Maximum Amount Borrowed | Month of Maximum Amount Borrowed |
| Balanced | $20,817 | 1.62% | $6,289,135 | January 2016 |
| Equity | $664,182 | 1.39% | $50,000,000 | October 2015 |
NOTE F — AFFILIATED COMPANIES
An affiliated company is a company in which the Funds have a direct or indirect ownership of, control of, or voting power of 5 percent or more of the outstanding voting shares. Affiliated companies of the Funds as of September 30, 2016 are as follows:
| BALANCED | |||||||
| Name of Affiliated Company | Market Value 9/30/15 | Purchases at Cost | Proceeds from Sales | Net Realized Gain (Loss) | Change in Unrealized Gain (Loss) | Market Value 9/30/16 | Dividend Income |
| GEEMF Partners LP | $64,783 | $— | $— | $— | ($1,713) | $63,070 | $— |
| TOTALS | $64,783 | $— | $— | $— | ($1,713) | $63,070 | $— |
| EQUITY | |||||||
| Name of Affiliated Company | Market Value 9/30/15 | Purchases at Cost | Proceeds from Sales | Net Realized Gain (Loss) | Change in Unrealized Gain (Loss) | Market Value 9/30/16 | Dividend Income |
| New Day Farms, Inc., Participation Interest Note | $— | $6,225 | ($6,225) | $— | $— | $— | $— |
| New Day Farms, Inc., Series B, Preferred | — | — | — | — | — | — | — |
| Shangri La Farms, Series A, Preferred | 100,000 | — | — | — | — | 100,000 | — |
| TOTALS | $100,000 | $6,225 | ($6,225) | $— | $— | $100,000 | $— |
NOTE G — CAPITAL COMMITMENTS
In connection with certain venture capital investments, the Balanced and Equity Portfolios are committed to future capital calls, which will increase the Portfolios’ investment in these securities. As of September 30, 2016, the aggregate amount of the future capital commitments totals were $403,000 and $5,286,495 for Balanced and Equity, respectively.
calvert.com CALVERT SOCIAL INVESTMENT FUND ANNUAL REPORT 79
NOTE H — LIMITED PARTNERSHIP INVESTMENT
Balanced executed agreements to invest in the following limited partnerships:
| Name of Partnership | Total Capital Commitment | Unfunded Commitment at 9/30/16 | ||||
| Coastal Ventures Partners | $200,000 | $— | ||||
| Commons Capital LP | $500,000 | $— | ||||
| First Analysis Private Equity Fund IV LP | $1,000,000 | $60,000 | ||||
| GEEMF Partners LP | $255,500 | $— | ||||
| Global Environment Emerging Markets Fund LP | $744,500 | $— | ||||
| Infrastructure and Environmental Private Equity Fund III LP | $1,000,000 | $— | ||||
| Labrador Ventures III LP | $500,000 | $— | ||||
| Learn Capital Venture Partners III LP | $1,000,000 | $343,000 | ||||
| New Markets Growth Fund LLC | $250,000 | $— | ||||
| Solstice Capital LP | $500,000 | $— | ||||
| Total | $5,950,000 | $403,000 | ||||
Equity executed agreements to invest in the following limited partnerships:
| Name of Partnership | Total Capital Commitment | Unfunded Commitment at 9/30/16 | ||||
| Accion Frontier Inclusion Fund LP | $1,000,000 | $690,064 | ||||
| Adobe Capital Social Mezzanine Fund I LP | $500,000 | $224,129 | ||||
| Africa Renewable Energy Fund LP | $1,000,000 | $655,336 | ||||
| Arborview Capital Partners LP | $1,000,000 | $337,211 | ||||
| Blackstone Cleantech Technology Partners LP | $449,715 | $2,885 | ||||
| Bridges Ventures US Sustainable Growth Fund LP | $1,000,000 | $784,400 | ||||
| China Environment Fund 2004 LP | $500,000 | $37,763 | ||||
| China Environment Fund III LP | $1,000,000 | $1,205 | ||||
| Coastal Ventures III LP | $500,000 | $100,000 | ||||
| Core Innovation Capital I LP | $1,000,000 | $108,539 | ||||
| Cross Culture Ventures I LP | $499,900 | $344,931 | ||||
| DBL Equity Fund - BAEF II LP | $1,000,000 | $— | ||||
| DBL Partners III LP | $1,000,000 | $729,130 | ||||
| First Analysis Private Equity Fund V LP | $1,000,000 | $197,302 | ||||
| Ignia Fund I LP | $1,000,000 | $5,097 | ||||
| Impact Ventures II LP | $1,000,000 | $70,320 | ||||
| LeapFrog Financial Inclusion Fund | $1,000,000 | $144,912 | ||||
| New Markets Education Partners LP | $1,000,000 | $212,500 | ||||
| New Markets Venture Partners II LP | $500,000 | $25,000 | ||||
| Owl Ventures LP | $500,000 | $225,000 | ||||
| Renewable Energy Asia Fund LP | $1,336,154 | $6,784 | ||||
| SEAF India International Growth Fund | $482,500 | $— | ||||
| SJF Ventures II LP | $750,000 | $— | ||||
| SJF Ventures III LP | $1,000,000 | $235,000 | ||||
| Westly Capital Partners Fund II LP | $1,000,000 | $228,409 | ||||
| Total | $21,018,369 | $5,365,917 | ||||
NOTE I — REGULATORY MATTERS
In October 19, 2011, the Advisor determined that it was necessary to change the price at which one of Balanced and Bond's Portfolio securities was then being fair valued. The Advisor and the Board of Trustees subsequently determined it was appropriate to change the fair value prices at which that security and certain related securities had been carried from March 18, 2008 through October 18, 2011 (the "Relevant Period"). These fair value revisions had the effect of changing the net asset value
80 calvert.com CALVERT SOCIAL INVESTMENT FUND ANNUAL REPORT
per share at which shareholder subscriptions and redemptions were executed during the Relevant period. Accordingly, in December 2011, pursuant to an agreement (“the Agreement”) with the Board of Trustees, the Advisor contributed $206,623 and $3,320,907 to Balanced and Bond, respectively, to compensate shareholders and Balanced and Bond for harm caused by the prior improper valuation of securities.
The Securities and Exchange Commission (“SEC”) subsequently found that, in distributing the $206,623 and $3,320,907 to Balanced and Bond shareholders, respectively, the Advisor did not precisely calculate Fund and shareholder losses in accordance with the Calvert Funds’ NAV error correction procedures. On October 18, 2016, in acceptance of the Advisor's settlement proposal, the SEC issued an administrative order requiring the Advisor to make further distributions to affected shareholders by October 13, 2017. The administrative order also censured the Advisor and required the Advisor to pay a $3.9 million penalty to the SEC.
NOTE J — REORGANIZATION
The Board of Trustees approved the reorganization of Calvert Global Equity Income Fund ("Global Equity Income") and Calvert Global Value Fund ("Global Value") (both are series of Calvert SAGE Fund) and Calvert Large Cap Core Portfolio ("Large Cap Core") into Calvert Equity Portfolio ("Equity"). Shareholders approved the reorganization at a meeting on June 17, 2016 and the reorganization took place at the close of business on June 24, 2016.
The acquisition was accomplished by a tax-free exchange of the following shares:
| MERGED PORTFOLIO | SHARES | ACQUIRING PORTFOLIO | SHARES | VALUE |
| Global Equity Income, Class A | 1,601,964 | Equity, Class A | 750,153 | $29,375,999 |
| Global Equity Income, Class C | 250,183 | Equity, Class C | 177,021 | 4,590,149 |
| Global Equity Income, Class I | 59,796 | Equity, Class I | 24,824 | 1,095,721 |
| Global Equity Income, Class Y | 123,630 | Equity, Class Y | 56,875 | 2,288,665 |
| Global Value, Class A | 951,286 | Equity, Class A | 1,323,672 | 51,834,992 |
| Global Value, Class C | 90,082 | Equity, Class C | 188,276 | 4,881,991 |
| Global Value, Class I | 20,332 | Equity, Class I | 25,034 | 1,104,990 |
| Global Value, Class Y | 521,720 | Equity, Class Y | 699,267 | 28,138,511 |
| Large Cap Core, Class A | 3,784,626 | Equity, Class A | 1,734,569 | 67,925,741 |
| Large Cap Core, Class C | 754,880 | Equity, Class C | 454,543 | 11,786,309 |
| Large Cap Core, Class I | 831,888 | Equity, Class I | 349,737 | 15,437,377 |
| Large Cap Core, Class Y | 243,025 | Equity, Class Y | 110,513 | 4,447,032 |
For financial reporting purposes, assets received and shares issued by Equity were recorded at fair value; however, the cost basis of the investments received from Global Equity Income, Global Value and Large Cap Core were carried forward to align ongoing reporting of Equity's realized and unrealized gains and losses with amounts distributable to shareholders for tax purposes.
The net assets and net unrealized appreciation (depreciation) immediately before the acquisitions were as follows:
MERGED PORTFOLIO | NET ASSETS | UNREALIZED APPRECIATION (DEPRECIATION) | ACQUIRING PORTFOLIO | NET ASSETS |
| Global Equity Income | $37,350,535 | $742,994 | Equity | $1,987,179,549 |
| Global Value | 85,960,483 | (1,680,627) | Equity | $1,987,179,549 |
| Large Cap Core | 99,596,459 | 3,673,458 | Equity | $1,987,179,549 |
calvert.com CALVERT SOCIAL INVESTMENT FUND ANNUAL REPORT 81
Assuming the acquisition had been completed on October 1, 2015, Equity's results of operations for the year ended September 30, 2016 would have been as follows:
| Net investment income | $10,035,098(a) |
| Net realized and change in unrealized gain (loss) on investments | $184,906,535(b) |
| Net increase (decrease) in assets from operations | $194,941,633 |
(a) $7,068,815 as reported, plus $485,394, $1,502,633 and $978,256 from pre-merger Global Equity Income, Global Value and Large Cap Core, respectively.
(b) $185,976,145 as reported, plus ($1,133,932), ($6,667,339) and $6,731,661 from pre-merger Global Equity Income, Global Value and Large Cap Core, respectively.
Because Equity, Global Equity Income, Global Value and Large Cap Core sold and redeemed shares throughout the period, it is not practicable to provide pro-forma information on a per-share basis.
Because the combined investment portfolios have been managed as a single integrated portfolio since the acquisition was completed, it is also not practicable to separate the amounts of revenue and earnings of Global Equity Income, Global Value and Large Cap Core that have been included in Equity's Statement of Operations since June 24, 2016.
NOTE K — OTHER MATTERS
On October 18, 2016, Calvert announced that it had determined that certain fees paid to third-party financial intermediaries were incorrectly allocated for payment by, and paid by, the Calvert Funds. Specifically, for periods prior to January 1, 2015, the Calvert Funds paid fees under certain intermediary agreements that were primarily for distribution-related services and therefore should have been paid by Calvert out of Calvert’s own assets or by the Funds under a Rule 12b-1 plan. The matter was self-reported to the SEC in 2016. Calvert is in the process of determining the economic impact of misallocated fees on the affected Funds and their shareholders, and intends to develop a plan to reimburse shareholders following that determination.
NOTE L — SUBSEQUENT EVENTS
On October 20, 2016, Calvert and Calvert’s indirect parent company, Ameritas Holding Company, entered into an Asset Purchase Agreement (the “Agreement”) with Eaton Vance Management (“Eaton Vance”), a newly-formed subsidiary of Eaton Vance, to operate as Calvert Research and Management (“New Calvert”), and other parties, pursuant to which New Calvert has agreed to acquire, subject to the terms and conditions set forth in the Agreement, the business assets of Calvert (the “Transaction”). Completion of the Transaction is subject to the approval by the shareholders of Calvert Funds of new investment advisory agreements with New Calvert, among other conditions, and is currently expected to occur by the end of 2016 or early 2017.
A proxy statement containing detailed information regarding several proposals was mailed to shareholders of record in November 2016. The shareholder meeting is expected to be held on or about December 16, 2016.
In preparing the financial statements as of September 30, 2016, no other subsequent events or transactions occurred that would have required recognition or disclosure in these financial statements.
NOTICE TO SHAREHOLDERS (UNAUDITED)
For the fiscal year ended September 30, 2016, the Fund considers certain distributions paid during the year as:
| Fund Name | (a) Long-term Capital Gain | (b) Qualified Dividend Income % | (c) Dividends Received Deduction % (for corporate shareholders) |
| Balanced | $63,287,202 | 85.8% | 77.9% |
| Bond | - | - | - |
| Equity | 453,947,696 | 100.0 | 100.0 |
(a) The Fund considers the amount shown above as capital gain dividends in accordance with Section 852(b)(3)(C) of the Internal Revenue Code.
(b) The Fund considers the percentage shown above of ordinary income dividends paid during the year as qualified dividend income in accordance with Section 854 of the Internal Revenue Code.
(c) The Fund considers the percentage shown above of ordinary income dividends paid during the year as eligible for the corporate dividends received deduction in accordance with Section 854 of the Internal Revenue Code.
82 calvert.com CALVERT SOCIAL INVESTMENT FUND ANNUAL REPORT
CALVERT BALANCED PORTFOLIO
FINANCIAL HIGHLIGHTS
| YEARS ENDED | |||||||||||||||||||
| CLASS A SHARES | September 30, 2016 (a) | September 30, 2015 (a) | September 30, 2014 (a) | September 30, 2013 (a) | September 30, 2012 (a) | ||||||||||||||
| Net asset value, beginning | $31.90 | $33.06 | $34.13 | $30.81 | $26.19 | ||||||||||||||
| Income from investment operations: | |||||||||||||||||||
| Net investment income | 0.51(b) | 0.43 | 0.33 | 0.24 | 0.23 | ||||||||||||||
| Net realized and unrealized gain (loss) | 2.14(c) | (0.81) | 3.02 | 3.32 | 4.62 | ||||||||||||||
| Total from investment operations | 2.65 | (0.38) | 3.35 | 3.56 | 4.85 | ||||||||||||||
| Distributions from: | |||||||||||||||||||
| Net investment income | (0.50) | (0.41) | (0.32) | (0.24) | (0.23) | ||||||||||||||
| Net realized gain | (3.23) | (0.37) | (4.10) | — | — | ||||||||||||||
| Total distributions | (3.73) | (0.78) | (4.42) | (0.24) | (0.23) | ||||||||||||||
| Total increase (decrease) in net asset value | (1.08) | (1.16) | (1.07) | 3.32 | 4.62 | ||||||||||||||
| Net asset value, ending | $30.82 | $31.90 | $33.06 | $34.13 | $30.81 | ||||||||||||||
| Total return (d) | 8.93%(c) | (1.27 | %) | 10.77 | % | 11.60 | % | 18.58 | % | ||||||||||
| Ratios to average net assets: (e) | |||||||||||||||||||
| Net investment income | 1.67%(b) | 1.25 | % | 1.02 | % | 0.76 | % | 0.78 | % | ||||||||||
| Total expenses | 1.05 | % | 1.13 | % | 1.17 | % | 1.18 | % | 1.22 | % | |||||||||
| Net expenses | 1.02 | % | 1.13 | % | 1.16 | % | 1.18 | % | 1.22 | % | |||||||||
| Portfolio turnover | 146 | % | 99 | % | 124 | % | 114 | % | 145 | % | |||||||||
| Net assets, ending (in thousands) | $592,625 | $569,368 | $561,809 | $497,160 | $447,678 | ||||||||||||||
| (a) Per share figures are calculated using the Average Shares Method. | |||||||||||||||||||
| (b) Amount includes a non-recurring refund for overbilling of prior years' custody out-of-pocket fees. This amounted to $0.007 per share and 0.02% of average net assets. | |||||||||||||||||||
| (c) Total return includes voluntary reimbursement by the Advisor for realized investment losses relating to two trading errors which amounted to $0.01 per share. Excluding such payment, the total return would have been 8.90%. | |||||||||||||||||||
| (d) Total return is not annualized for periods of less than one year and does not reflect deduction of any front-end or deferred sales charge. | |||||||||||||||||||
| (e) Total expenses do not reflect amounts reimbursed and/or waived by the Advisor and certain of its affiliates, if applicable. Net expenses are net of all reductions and represent the net expenses paid by the Fund. | |||||||||||||||||||
| See notes to financial statements. | |||||||||||||||||||
calvert.com CALVERT SOCIAL INVESTMENT FUND ANNUAL REPORT 83
CALVERT BALANCED PORTFOLIO
FINANCIAL HIGHLIGHTS
| YEARS ENDED | |||||||||||||||||||
| CLASS C SHARES | September 30, 2016 (a) | September 30, 2015 (a) | September 30, 2014 (a) | September 30, 2013 (a) | September 30, 2012 (a) | ||||||||||||||
| Net asset value, beginning | $31.11 | $32.30 | $33.45 | $30.23 | $25.72 | ||||||||||||||
| Income from investment operations: | |||||||||||||||||||
| Net investment income (loss) | 0.25(b) | 0.15 | 0.08 | (0.02) | (0.02) | ||||||||||||||
| Net realized and unrealized gain (loss) | 2.08(c) | (0.78) | 2.94 | 3.25 | 4.54 | ||||||||||||||
| Total from investment operations | 2.33 | (0.63) | 3.02 | 3.23 | 4.52 | ||||||||||||||
| Distributions from: | |||||||||||||||||||
| Net investment income | (0.26) | (0.19) | (0.07) | (0.01) | (0.01) | ||||||||||||||
| Net realized gain | (3.23) | (0.37) | (4.10) | — | — | ||||||||||||||
| Total distributions | (3.49) | (0.56) | (4.17) | (0.01) | (0.01) | ||||||||||||||
| Total increase (decrease) in net asset value | (1.16) | (1.19) | (1.15) | 3.22 | 4.51 | ||||||||||||||
| Net asset value, ending | $29.95 | $31.11 | $32.30 | $33.45 | $30.23 | ||||||||||||||
| Total return (d) | 8.05%(c) | (2.08 | %) | 9.89 | % | 10.71 | % | 17.60 | % | ||||||||||
| Ratios to average net assets: (e) | |||||||||||||||||||
| Net investment income (loss) | 0.85%(b) | 0.47 | % | 0.24 | % | (0.06 | )% | (0.05 | )% | ||||||||||
| Total expenses | 1.86 | % | 1.92 | % | 1.95 | % | 1.99 | % | 2.05 | % | |||||||||
| Net expenses | 1.84 | % | 1.92 | % | 1.94 | % | 1.99 | % | 2.05 | % | |||||||||
| Portfolio turnover | 146 | % | 99 | % | 124 | % | 114 | % | 145 | % | |||||||||
| Net assets, ending (in thousands) | $59,242 | $55,180 | $48,814 | $37,812 | $29,605 | ||||||||||||||
| (a) Per share figures are calculated using the Average Shares Method. | |||||||||||||||||||
| (b) Amount includes a non-recurring refund for overbilling of prior years' custody out-of-pocket fees. This amounted to $0.007 per share and 0.02% of average net assets. | |||||||||||||||||||
| (c) Total return includes voluntary reimbursement by the Advisor for realized investment losses relating to two trading errors which amounted to $0.01 per share. Excluding such payment, the total return would have been 8.02%. | |||||||||||||||||||
| (d) Total return is not annualized for periods of less than one year and does not reflect deduction of any front-end or deferred sales charge. | |||||||||||||||||||
| (e) Total expenses do not reflect amounts reimbursed and/or waived by the Advisor and certain of its affiliates, if applicable. Net expenses are net of all reductions and represent the net expenses paid by the Fund. | |||||||||||||||||||
| See notes to financial statements. | |||||||||||||||||||
84 calvert.com CALVERT SOCIAL INVESTMENT FUND ANNUAL REPORT
CALVERT BALANCED PORTFOLIO
FINANCIAL HIGHLIGHTS
| YEARS ENDED | |||||||||||||||||||
| CLASS I SHARES | September 30, 2016 (a) | September 30, 2015 (a) | September 30, 2014 (a) | September 30, 2013 (a) | September 30, 2012 (a) | ||||||||||||||
| Net asset value, beginning | $32.36 | $33.53 | $34.55 | $31.19 | $26.49 | ||||||||||||||
| Income from investment operations: | |||||||||||||||||||
| Net investment income | 0.63(b) | 0.59 | 0.51 | 0.41 | 0.45 | ||||||||||||||
| Net realized and unrealized gain (loss) | 2.17(c) | (0.82) | 3.06 | 3.35 | 4.61 | ||||||||||||||
| Total from investment operations | 2.80 | (0.23) | 3.57 | 3.76 | 5.06 | ||||||||||||||
| Distributions from: | |||||||||||||||||||
| Net investment income | (0.61) | (0.57) | (0.49) | (0.40) | (0.36) | ||||||||||||||
| Net realized gain | (3.23) | (0.37) | (4.10) | — | — | ||||||||||||||
| Total distributions | (3.84) | (0.94) | (4.59) | (0.40) | (0.36) | ||||||||||||||
| Total increase (decrease) in net asset value | (1.04) | (1.17) | (1.02) | 3.36 | 4.70 | ||||||||||||||
| Net asset value, ending | $31.32 | $32.36 | $33.53 | $34.55 | $31.19 | ||||||||||||||
| Total return (d) | 9.32%(c) | (0.86 | %) | 11.35 | % | 12.13 | % | 19.16 | % | ||||||||||
| Ratios to average net assets: (e) | |||||||||||||||||||
| Net investment income | 2.04%(b) | 1.70 | % | 1.53 | % | 1.26 | % | 1.43 | % | ||||||||||
| Total expenses | 0.76 | % | 0.64 | % | 0.66 | % | 0.68 | % | 0.83 | % | |||||||||
| Net expenses | 0.65 | % | 0.64 | % | 0.66 | % | 0.68 | % | 0.70 | % | |||||||||
| Portfolio turnover | 146 | % | 99 | % | 124 | % | 114 | % | 145 | % | |||||||||
| Net assets, ending (in thousands) | $15,554 | $13,894 | $43,579 | $35,578 | $29,601 | ||||||||||||||
| (a) Per share figures are calculated using the Average Shares Method. | |||||||||||||||||||
| (b) Amount includes a non-recurring refund for overbilling of prior years' custody out-of-pocket fees. This amounted to $0.007 per share and 0.02% of average net assets. | |||||||||||||||||||
| (c) Total return includes voluntary reimbursement by the Advisor for realized investment losses relating to two trading errors which amounted to $0.01 per share. Excluding such payment, the total return would have been 9.28%. | |||||||||||||||||||
| (d) Total return is not annualized for periods of less than one year and does not reflect deduction of any front-end or deferred sales charge. | |||||||||||||||||||
| (e) Total expenses do not reflect amounts reimbursed and/or waived by the Advisor and certain of its affiliates, if applicable. Net expenses are net of all reductions and represent the net expenses paid by the Fund. | |||||||||||||||||||
| See notes to financial statements. | |||||||||||||||||||
calvert.com CALVERT SOCIAL INVESTMENT FUND ANNUAL REPORT 85
CALVERT BALANCED PORTFOLIO
FINANCIAL HIGHLIGHTS
| PERIODS ENDED | ||||||||||||||||
| CLASS Y SHARES | September 30, 2016 (a) | September 30, 2015 (a) | September 30, 2014 (a) | September 30, 2013 (a)(b) | ||||||||||||
| Net asset value, beginning | $32.13 | $33.29 | $34.25 | $32.60 | ||||||||||||
| Income from investment operations: | ||||||||||||||||
| Net investment income | 0.58(c) | 0.50 | 0.38 | 0.18 | ||||||||||||
| Net realized and unrealized gain (loss) | 2.15(d) | (0.83) | 3.04 | 1.48 | ||||||||||||
| Total from investment operations | 2.73 | (0.33) | 3.42 | 1.66 | ||||||||||||
| Distributions from: | ||||||||||||||||
| Net investment income | (0.57) | (0.46) | (0.28) | (0.01) | ||||||||||||
| Net realized gain | (3.23) | (0.37) | (4.10) | — | ||||||||||||
| Total distributions | (3.80) | (0.83) | (4.38) | (0.01) | ||||||||||||
| Total increase (decrease) in net asset value | (1.07) | (1.16) | (0.96) | 1.65 | ||||||||||||
| Net asset value, ending | $31.06 | $32.13 | $33.29 | $34.25 | ||||||||||||
| Total return (e) | 9.15%(d) | (1.13 | %) | 10.97 | % | 5.11 | % | |||||||||
| Ratios to average net assets: (f) | ||||||||||||||||
| Net investment income | 1.89%(c) | 1.46 | % | 1.27 | % | 0.71%(g) | ||||||||||
| Total expenses | 0.88 | % | 1.09 | % | 3.32 | % | 61.96%(g) | |||||||||
| Net expenses | 0.78 | % | 0.96 | % | 0.96 | % | 0.97%(g) | |||||||||
| Portfolio turnover | 146 | % | 99 | % | 124 | % | 114 | % | ||||||||
| Net assets, ending (in thousands) | $13,178 | $6,103 | $3,250 | $66 | ||||||||||||
| (a) Per share figures are calculated using the Average Shares Method. | ||||||||||||||||
| (b) From April 30, 2013 inception. | ||||||||||||||||
| (c) Amount includes a non-recurring refund for overbilling of prior years' custody out-of-pocket fees. This amounted to $0.008 per share and 0.03% of average net assets. | ||||||||||||||||
| (d) Total return includes voluntary reimbursement by the Advisor for realized investment losses relating to two trading errors which amounted to $0.01 per share. Excluding such payment, the total return would have been 9.12%. | ||||||||||||||||
| (e) Total return is not annualized for periods of less than one year and does not reflect deduction of any front-end or deferred sales charge. | ||||||||||||||||
| (f) Total expenses do not reflect amounts reimbursed and/or waived by the Advisor and certain of its affiliates, if applicable. Net expenses are net of all reductions and represent the net expenses paid by the Fund. | ||||||||||||||||
| (g) Annualized. | ||||||||||||||||
| See notes to financial statements. | ||||||||||||||||
86 calvert.com CALVERT SOCIAL INVESTMENT FUND ANNUAL REPORT
CALVERT BOND PORTFOLIO
FINANCIAL HIGHLIGHTS
| YEARS ENDED | |||||||||||||||||||
| CLASS A SHARES | September 30, 2016 (a) | September 30, 2015 (a) | September 30, 2014 (a) | September 30, 2013 (a) | September 30, 2012 | ||||||||||||||
| Net asset value, beginning | $15.83 | $15.92 | $15.61 | $16.58 | $15.85 | ||||||||||||||
| Income from investment operations: | |||||||||||||||||||
| Net investment income | 0.40(b) | 0.38 | 0.38 | 0.33 | 0.40 | ||||||||||||||
| Net realized and unrealized gain (loss) | 0.53 | (0.09) | 0.34 | (0.69) | 0.91 | ||||||||||||||
| Total from investment operations | 0.93 | 0.29 | 0.72 | (0.36) | 1.31 | ||||||||||||||
| Distributions from: | |||||||||||||||||||
| Net investment income | (0.40) | (0.38) | (0.38) | (0.35) | (0.41) | ||||||||||||||
| Net realized gain | — | — | (0.03) | (0.26) | (0.17) | ||||||||||||||
| Total distributions | (0.40) | (0.38) | (0.41) | (0.61) | (0.58) | ||||||||||||||
| Total increase (decrease) in net asset value | 0.53 | (0.09) | 0.31 | (0.97) | 0.73 | ||||||||||||||
| Net asset value, ending | $16.36 | $15.83 | $15.92 | $15.61 | $16.58 | ||||||||||||||
| Total return (c) | 5.96 | % | 1.79 | % | 4.66 | % | (2.27 | %) | 8.47 | % | |||||||||
| Ratios to average net assets: (d) | |||||||||||||||||||
| Net investment income | 2.49%(b) | 2.35 | % | 2.40 | % | 2.05 | % | 2.52 | % | ||||||||||
| Total expenses | 0.94 | % | 1.07 | % | 1.12 | % | 1.11 | % | 1.16 | % | |||||||||
| Net expenses | 0.91 | % | 1.07 | % | 1.12 | % | 1.11 | % | 1.16 | % | |||||||||
| Portfolio turnover | 154 | % | 241 | % | 187 | % | 214 | % | 228 | % | |||||||||
| Net assets, ending (in thousands) | $395,957 | $395,194 | $378,269 | $408,823 | $473,995 | ||||||||||||||
| (a) Per share figures are calculated using the Average Shares Method. | |||||||||||||||||||
| (b) Amount includes a non-recurring refund for overbilling of prior years' custody out-of-pocket fees. This amounted to $0 per share and 0% of average net assets. | |||||||||||||||||||
| (c) Total return is not annualized for periods of less than one year and does not reflect deduction of any front-end or deferred sales charge. | |||||||||||||||||||
| (d) Total expenses do not reflect amounts reimbursed and/or waived by the Advisor and certain of its affiliates, if applicable. Net expenses are net of all reductions and represent the net expenses paid by the Fund. | |||||||||||||||||||
| See notes to financial statements. | |||||||||||||||||||
calvert.com CALVERT SOCIAL INVESTMENT FUND ANNUAL REPORT 87
CALVERT BOND PORTFOLIO
FINANCIAL HIGHLIGHTS
| YEARS ENDED | |||||||||||||||||||
| CLASS C SHARES | September 30, 2016 (a) | September 30, 2015 (a) | September 30, 2014 (a) | September 30, 2013 (a) | September 30, 2012 | ||||||||||||||
| Net asset value, beginning | $15.73 | $15.82 | $15.52 | $16.48 | $15.76 | ||||||||||||||
| Income from investment operations: | |||||||||||||||||||
| Net investment income | 0.25(b) | 0.24 | 0.25 | 0.20 | 0.27 | ||||||||||||||
| Net realized and unrealized gain (loss) | 0.54 | (0.09) | 0.33 | (0.68) | 0.90 | ||||||||||||||
| Total from investment operations | 0.79 | 0.15 | 0.58 | (0.48) | 1.17 | ||||||||||||||
| Distributions from: | |||||||||||||||||||
| Net investment income | (0.26) | (0.24) | (0.25) | (0.22) | (0.28) | ||||||||||||||
| Net realized gain | — | — | (0.03) | (0.26) | (0.17) | ||||||||||||||
| Total distributions | (0.26) | (0.24) | (0.28) | (0.48) | (0.45) | ||||||||||||||
| Total increase (decrease) in net asset value | 0.53 | (0.09) | 0.30 | (0.96) | 0.72 | ||||||||||||||
| Net asset value, ending | $16.26 | $15.73 | $15.82 | $15.52 | $16.48 | ||||||||||||||
| Total return (c) | 5.05 | % | 0.95 | % | 3.78 | % | (3.01 | %) | 7.58 | % | |||||||||
| Ratios to average net assets: (d) | |||||||||||||||||||
| Net investment income | 1.59%(b) | 1.51 | % | 1.60 | % | 1.26 | % | 1.73 | % | ||||||||||
| Total expenses | 1.84 | % | 1.91 | % | 1.92 | % | 1.90 | % | 1.96 | % | |||||||||
| Net expenses | 1.81 | % | 1.91 | % | 1.92 | % | 1.90 | % | 1.96 | % | |||||||||
| Portfolio turnover | 154 | % | 241 | % | 187 | % | 214 | % | 228 | % | |||||||||
| Net assets, ending (in thousands) | $32,349 | $32,626 | $33,963 | $37,620 | $45,974 | ||||||||||||||
| (a) Per share figures are calculated using the Average Shares Method. | |||||||||||||||||||
| (b) Amount includes a non-recurring refund for overbilling of prior years' custody out-of-pocket fees. This amounted to $0 per share and 0% of average net assets. | |||||||||||||||||||
| (c) Total return is not annualized for periods of less than one year and does not reflect deduction of any front-end or deferred sales charge. | |||||||||||||||||||
| (d) Total expenses do not reflect amounts reimbursed and/or waived by the Advisor and certain of its affiliates, if applicable. Net expenses are net of all reductions and represent the net expenses paid by the Fund. | |||||||||||||||||||
| See notes to financial statements. | |||||||||||||||||||
88 calvert.com CALVERT SOCIAL INVESTMENT FUND ANNUAL REPORT
CALVERT BOND PORTFOLIO
FINANCIAL HIGHLIGHTS
| YEARS ENDED | |||||||||||||||||||
| CLASS I SHARES | September 30, 2016 (a) | September 30, 2015 (a) | September 30, 2014 (a) | September 30, 2013 (a) | September 30, 2012 | ||||||||||||||
| Net asset value, beginning | $15.85 | $15.94 | $15.62 | $16.59 | $15.85 | ||||||||||||||
| Income from investment operations: | |||||||||||||||||||
| Net investment income | 0.46(b) | 0.47 | 0.48 | 0.43 | 0.50 | ||||||||||||||
| Net realized and unrealized gain (loss) | 0.53 | (0.09) | 0.35 | (0.70) | 0.92 | ||||||||||||||
| Total from investment operations | 0.99 | 0.38 | 0.83 | (0.27) | 1.42 | ||||||||||||||
| Distributions from: | |||||||||||||||||||
| Net investment income | (0.46) | (0.47) | (0.48) | (0.44) | (0.51) | ||||||||||||||
| Net realized gain | — | — | (0.03) | (0.26) | (0.17) | ||||||||||||||
| Total distributions | (0.46) | (0.47) | (0.51) | (0.70) | (0.68) | ||||||||||||||
| Total increase (decrease) in net asset value | 0.53 | (0.09) | 0.32 | (0.97) | 0.74 | ||||||||||||||
| Net asset value, ending | $16.38 | $15.85 | $15.94 | $15.62 | $16.59 | ||||||||||||||
| Total return (c) | 6.35 | % | 2.36 | % | 5.35 | % | (1.69 | %) | 9.21 | % | |||||||||
| Ratios to average net assets: (d) | |||||||||||||||||||
| Net investment income | 2.86%(b) | 2.91 | % | 3.01 | % | 2.66 | % | 3.12 | % | ||||||||||
| Total expenses | 0.54 | % | 0.51 | % | 0.50 | % | 0.51 | % | 0.56 | % | |||||||||
| Net expenses | 0.53 | % | 0.51 | % | 0.50 | % | 0.51 | % | 0.56 | % | |||||||||
| Portfolio turnover | 154 | % | 241 | % | 187 | % | 214 | % | 228 | % | |||||||||
| Net assets, ending (in thousands) | $355,017 | $328,690 | $300,602 | $220,621 | $202,799 | ||||||||||||||
| (a) Per share figures are calculated using the Average Shares Method. | |||||||||||||||||||
| (b) Amount includes a non-recurring refund for overbilling of prior years' custody out-of-pocket fees. This amounted to $0 per share and 0% of average net assets. | |||||||||||||||||||
| (c) Total return is not annualized for periods of less than one year and does not reflect deduction of any front-end or deferred sales charge. | |||||||||||||||||||
| (d) Total expenses do not reflect amounts reimbursed and/or waived by the Advisor and certain of its affiliates, if applicable. Net expenses are net of all reductions and represent the net expenses paid by the Fund. | |||||||||||||||||||
| See notes to financial statements. | |||||||||||||||||||
calvert.com CALVERT SOCIAL INVESTMENT FUND ANNUAL REPORT 89
CALVERT BOND PORTFOLIO
FINANCIAL HIGHLIGHTS
| YEARS ENDED | |||||||||||||||||||
| CLASS Y SHARES | September 30, 2016 (a) | September 30, 2015 (a) | September 30, 2014 (a) | September 30, 2013 (a) | September 30, 2012 | ||||||||||||||
| Net asset value, beginning | $15.94 | $16.03 | $15.70 | $16.67 | $15.93 | ||||||||||||||
| Income from investment operations: | |||||||||||||||||||
| Net investment income | 0.44(b) | 0.42 | 0.42 | 0.38 | 0.45 | ||||||||||||||
| Net realized and unrealized gain (loss) | 0.54 | (0.09) | 0.35 | (0.70) | 0.92 | ||||||||||||||
| Total from investment operations | 0.98 | 0.33 | 0.77 | (0.32) | 1.37 | ||||||||||||||
| Distributions from: | |||||||||||||||||||
| Net investment income | (0.44) | (0.42) | (0.41) | (0.39) | (0.46) | ||||||||||||||
| Net realized gain | — | — | (0.03) | (0.26) | (0.17) | ||||||||||||||
| Total distributions | (0.44) | (0.42) | (0.44) | (0.65) | (0.63) | ||||||||||||||
| Total increase (decrease) in net asset value | 0.54 | (0.09) | 0.33 | (0.97) | 0.74 | ||||||||||||||
| Net asset value, ending | $16.48 | $15.94 | $16.03 | $15.70 | $16.67 | ||||||||||||||
| Total return (c) | 6.26 | % | 2.06 | % | 4.98 | % | (1.97 | %) | 8.79 | % | |||||||||
| Ratios to average net assets: (d) | |||||||||||||||||||
| Net investment income | 2.75%(b) | 2.63 | % | 2.66 | % | 2.36 | % | 2.81 | % | ||||||||||
| Total expenses | 0.67 | % | 0.80 | % | 0.85 | % | 0.81 | % | 0.87 | % | |||||||||
| Net expenses | 0.64 | % | 0.80 | % | 0.85 | % | 0.81 | % | 0.87 | % | |||||||||
| Portfolio turnover | 154 | % | 241 | % | 187 | % | 214 | % | 228 | % | |||||||||
| Net assets, ending (in thousands) | $110,049 | $77,131 | $53,613 | $39,300 | $35,396 | ||||||||||||||
| (a) Per share figures are calculated using the Average Shares Method. | |||||||||||||||||||
| (b) Amount includes a non-recurring refund for overbilling of prior years' custody out-of-pocket fees. This amounted to $0 per share and 0% of average net assets. | |||||||||||||||||||
| (c) Total return is not annualized for periods of less than one year and does not reflect deduction of any front-end or deferred sales charge. | |||||||||||||||||||
| (d) Total expenses do not reflect amounts reimbursed and/or waived by the Advisor and certain of its affiliates, if applicable. Net expenses are net of all reductions and represent the net expenses paid by the Fund. | |||||||||||||||||||
| See notes to financial statements. | |||||||||||||||||||
90 calvert.com CALVERT SOCIAL INVESTMENT FUND ANNUAL REPORT
CALVERT EQUITY PORTFOLIO
FINANCIAL HIGHLIGHTS
| YEARS ENDED | |||||||||||||||||||
| CLASS A SHARES | September 30, 2016 (a) | September 30, 2015 (a) | September 30, 2014 (a) | September 30, 2013 (a) | September 30, 2012 (a) | ||||||||||||||
| Net asset value, beginning | $47.79 | $50.33 | $44.68 | $38.48 | $32.91 | ||||||||||||||
| Income from investment operations: | |||||||||||||||||||
| Net investment income (loss) | 0.11(b) | 0.10 | 0.02 | 0.07 | (0.05) | ||||||||||||||
| Net realized and unrealized gain (loss) | 3.74 | 2.20 | 7.67 | 6.19 | 7.32 | ||||||||||||||
| Total from investment operations | 3.85 | 2.30 | 7.69 | 6.26 | 7.27 | ||||||||||||||
| Distributions from: | |||||||||||||||||||
| Net investment income | (0.13) | (0.02) | (0.05) | (0.01) | — | ||||||||||||||
| Net realized gain | (10.13) | (4.82) | (1.99) | (0.05) | (1.70) | ||||||||||||||
| Total distributions | (10.26) | (4.84) | (2.04) | (0.06) | (1.70) | ||||||||||||||
| Total increase (decrease) in net asset value | (6.41) | (2.54) | 5.65 | 6.20 | 5.57 | ||||||||||||||
| Net asset value, ending | $41.38 | $47.79 | $50.33 | $44.68 | $38.48 | ||||||||||||||
| Total return (c) | 8.57 | % | 4.57 | % | 17.63 | % | 16.30 | % | 22.75 | % | |||||||||
| Ratios to average net assets: (d) | |||||||||||||||||||
| Net investment income (loss) | 0.27%(b) | 0.19 | % | 0.05 | % | 0.18 | % | (0.15 | %) | ||||||||||
| Total expenses | 1.10 | % | 1.13 | % | 1.15 | % | 1.21 | % | 1.21 | % | |||||||||
| Net expenses | 1.08 | % | 1.12 | % | 1.14 | % | 1.20 | % | 1.21 | % | |||||||||
| Portfolio turnover | 44 | % | 37 | % | 24 | % | 32 | % | 36 | % | |||||||||
| Net assets, ending (in thousands) | $1,385,988 | $1,328,913 | $1,590,823 | $1,602,401 | $1,500,089 | ||||||||||||||
| (a) Per share figures are calculated using the Average Shares Method. | |||||||||||||||||||
| (b) Amount includes a non-recurring refund for overbilling of prior years' custody out-of-pocket fees. This amounted to $0.001 per share and 0% of average net assets. | |||||||||||||||||||
| (c) Total return is not annualized for periods of less than one year and does not reflect deduction of any front-end or deferred sales charge. | |||||||||||||||||||
| (d) Total expenses do not reflect amounts reimbursed and/or waived by the Advisor and certain of its affiliates, if applicable. Net expenses are net of all reductions and represent the net expenses paid by the Fund. | |||||||||||||||||||
| See notes to financial statements. | |||||||||||||||||||
calvert.com CALVERT SOCIAL INVESTMENT FUND ANNUAL REPORT 91
CALVERT EQUITY PORTFOLIO
FINANCIAL HIGHLIGHTS
| YEARS ENDED | |||||||||||||||||||
| CLASS C SHARES | September 30, 2016 (a) | September 30, 2015 (a) | September 30, 2014 (a) | September 30, 2013 (a) | September 30, 2012 (a) | ||||||||||||||
| Net asset value, beginning | $34.98 | $38.31 | $34.66 | $30.06 | $26.24 | ||||||||||||||
| Income from investment operations: | |||||||||||||||||||
| Net investment loss | (0.14)(b) | (0.20) | (0.25) | (0.17) | (0.25) | ||||||||||||||
| Net realized and unrealized gain (loss) | 2.67 | 1.69 | 5.89 | 4.82 | 5.77 | ||||||||||||||
| Total from investment operations | 2.53 | 1.49 | 5.64 | 4.65 | 5.52 | ||||||||||||||
| Distributions from: | |||||||||||||||||||
| Net investment income | (0.03) | — | — | — | — | ||||||||||||||
| Net realized gain | (10.13) | (4.82) | (1.99) | (0.05) | (1.70) | ||||||||||||||
| Total distributions | (10.16) | (4.82) | (1.99) | (0.05) | (1.70) | ||||||||||||||
| Total increase (decrease) in net asset value | (7.63) | (3.33) | 3.65 | 4.60 | 3.82 | ||||||||||||||
| Net asset value, ending | $27.35 | $34.98 | $38.31 | $34.66 | $30.06 | ||||||||||||||
| Total return (c) | 7.73 | % | 3.82 | % | 16.76 | % | 15.51 | % | 21.82 | % | |||||||||
| Ratios to average net assets: (d) | |||||||||||||||||||
| Net investment loss | (0.50%)(b) | (0.54 | %) | (0.68 | %) | (0.52 | %) | (0.87 | %) | ||||||||||
| Total expenses | 1.87 | % | 1.87 | % | 1.88 | % | 1.91 | % | 1.94 | % | |||||||||
| Net expenses | 1.85 | % | 1.86 | % | 1.87 | % | 1.90 | % | 1.93 | % | |||||||||
| Portfolio turnover | 44 | % | 37 | % | 24 | % | 32 | % | 36 | % | |||||||||
| Net assets, ending (in thousands) | $178,719 | $169,649 | $171,869 | $158,591 | $150,000 | ||||||||||||||
| (a) Per share figures are calculated using the Average Shares Method. | |||||||||||||||||||
| (b) Amount includes a non-recurring refund for overbilling of prior years' custody out-of-pocket fees. This amounted to $0 per share and 0% of average net assets. | |||||||||||||||||||
| (c) Total return is not annualized for periods of less than one year and does not reflect deduction of any front-end or deferred sales charge. | |||||||||||||||||||
| (d) Total expenses do not reflect amounts reimbursed and/or waived by the Advisor and certain of its affiliates, if applicable. Net expenses are net of all reductions and represent the net expenses paid by the Fund. | |||||||||||||||||||
| See notes to financial statements. | |||||||||||||||||||
92 calvert.com CALVERT SOCIAL INVESTMENT FUND ANNUAL REPORT
CALVERT EQUITY PORTFOLIO
FINANCIAL HIGHLIGHTS
| YEARS ENDED | |||||||||||||||||||
| CLASS I SHARES | September 30, 2016 (a) | September 30, 2015 (a) | September 30, 2014 (a) | September 30, 2013 (a) | September 30, 2012 (a) | ||||||||||||||
| Net asset value, beginning | $52.65 | $54.90 | $48.48 | $41.55 | $35.22 | ||||||||||||||
| Income from investment operations: | |||||||||||||||||||
| Net investment income | 0.32(b) | 0.38 | 0.29 | 0.32 | 0.16 | ||||||||||||||
| Net realized and unrealized gain (loss) | 4.14 | 2.38 | 8.34 | 6.70 | 7.87 | ||||||||||||||
| Total from investment operations | 4.46 | 2.76 | 8.63 | 7.02 | 8.03 | ||||||||||||||
| Distributions from: | |||||||||||||||||||
| Net investment income | (0.30) | (0.19) | (0.22) | (0.04) | — | ||||||||||||||
| Net realized gain | (10.13) | (4.82) | (1.99) | (0.05) | (1.70) | ||||||||||||||
| Total distributions | (10.43) | (5.01) | (2.21) | (0.09) | (1.70) | ||||||||||||||
| Total increase (decrease) in net asset value | (5.97) | (2.25) | 6.42 | 6.93 | 6.33 | ||||||||||||||
| Net asset value, ending | $46.68 | $52.65 | $54.90 | $48.48 | $41.55 | ||||||||||||||
| Total return (c) | 9.01 | % | 5.06 | % | 18.23 | % | 16.95 | % | 23.44 | % | |||||||||
| Ratios to average net assets: (d) | |||||||||||||||||||
| Net investment income | 0.68%(b) | 0.69 | % | 0.56 | % | 0.72 | % | 0.40 | % | ||||||||||
| Total expenses | 0.69 | % | 0.64 | % | 0.64 | % | 0.66 | % | 0.67 | % | |||||||||
| Net expenses | 0.67 | % | 0.63 | % | 0.62 | % | 0.65 | % | 0.66 | % | |||||||||
| Portfolio turnover | 44 | % | 37 | % | 24 | % | 32 | % | 36 | % | |||||||||
| Net assets, ending (in thousands) | $472,583 | $567,954 | $961,680 | $798,677 | $667,246 | ||||||||||||||
| (a) Per share figures are calculated using the Average Shares Method. | |||||||||||||||||||
| (b) Amount includes a non-recurring refund for overbilling of prior years' custody out-of-pocket fees. This amounted to $0.001 per share and 0% of average net assets. | |||||||||||||||||||
| (c) Total return is not annualized for periods of less than one year and does not reflect deduction of any front-end or deferred sales charge. | |||||||||||||||||||
| (d) Total expenses do not reflect amounts reimbursed and/or waived by the Advisor and certain of its affiliates, if applicable. Net expenses are net of all reductions and represent the net expenses paid by the Fund. | |||||||||||||||||||
| See notes to financial statements. | |||||||||||||||||||
calvert.com CALVERT SOCIAL INVESTMENT FUND ANNUAL REPORT 93
CALVERT EQUITY PORTFOLIO
FINANCIAL HIGHLIGHTS
| YEARS ENDED | |||||||||||||||||||
| CLASS Y SHARES | September 30, 2016 (a) | September 30, 2015 (a) | September 30, 2014 (a) | September 30, 2013 (a) | September 30, 2012 (a) | ||||||||||||||
| Net asset value, beginning | $48.90 | $51.35 | $45.51 | $39.06 | $33.25 | ||||||||||||||
| Income from investment operations: | |||||||||||||||||||
| Net investment income | 0.25(b) | 0.25 | 0.18 | 0.23 | 0.09 | ||||||||||||||
| Net realized and unrealized gain (loss) | 3.83 | 2.25 | 7.81 | 6.30 | 7.42 | ||||||||||||||
| Total from investment operations | 4.08 | 2.50 | 7.99 | 6.53 | 7.51 | ||||||||||||||
| Distributions from: | |||||||||||||||||||
| Net investment income | (0.29) | (0.13) | (0.16) | (0.03) | — | ||||||||||||||
| Net realized gain | (10.13) | (4.82) | (1.99) | (0.05) | (1.70) | ||||||||||||||
| Total distributions | (10.42) | (4.95) | (2.15) | (0.08) | (1.70) | ||||||||||||||
| Total increase (decrease) in net asset value | (6.34) | (2.45) | 5.84 | 6.45 | 5.81 | ||||||||||||||
| Net asset value, ending | $42.56 | $48.90 | $51.35 | $45.51 | $39.06 | ||||||||||||||
| Total return (c) | 8.89 | % | 4.89 | % | 17.99 | % | 16.76 | % | 23.26 | % | |||||||||
| Ratios to average net assets: (d) | |||||||||||||||||||
| Net investment income | 0.58%(b) | 0.49 | % | 0.36 | % | 0.56 | % | 0.25 | % | ||||||||||
| Total expenses | 0.79 | % | 0.84 | % | 0.83 | % | 0.82 | % | 0.82 | % | |||||||||
| Net expenses | 0.77 | % | 0.82 | % | 0.82 | % | 0.81 | % | 0.81 | % | |||||||||
| Portfolio turnover | 44 | % | 37 | % | 24 | % | 32 | % | 36 | % | |||||||||
| Net assets, ending (in thousands) | $195,138 | $157,114 | $139,319 | $137,137 | $106,723 | ||||||||||||||
| (a) Per share figures are calculated using the Average Shares Method. | |||||||||||||||||||
| (b) Amount includes a non-recurring refund for overbilling of prior years' custody out-of-pocket fees. This amounted to $0.001 per share and 0% of average net assets. | |||||||||||||||||||
| (c) Total return is not annualized for periods of less than one year and does not reflect deduction of any front-end or deferred sales charge. | |||||||||||||||||||
| (d) Total expenses do not reflect amounts reimbursed and/or waived by the Advisor and certain of its affiliates, if applicable. Net expenses are net of all reductions and represent the net expenses paid by the Fund. | |||||||||||||||||||
| See notes to financial statements. | |||||||||||||||||||
94 calvert.com CALVERT SOCIAL INVESTMENT FUND ANNUAL REPORT
PROXY VOTING
The Proxy Voting Guidelines of the Calvert Funds that the Fund uses to determine how to vote proxies relating to portfolio securities are provided as an Appendix to the Fund’s Statement of Additional Information. The Statement of Additional Information can be obtained free of charge by calling the Fund at 1-800-368-2745, by visiting the Calvert website at www.calvert.com; or by visiting the SEC’s website at www.sec.gov.
Information regarding how the Fund voted proxies relating to portfolio securities during the most recent 12-month period ended June 30 is available on the Fund’s website at www.calvert.com and on the SEC’s website at www.sec.gov.
AVAILABILITY OF QUARTERLY PORTFOLIO HOLDINGS
The Fund files its complete schedule of portfolio holdings with the SEC for the first and third quarters of each fiscal year on Form N-Q. The Fund’s Form N-Q is available on the SEC’s website at www.sec.gov. The Fund’s Form N-Q may be reviewed and copied at the SEC’s Public Reference Room in Washington, DC; information on the operation of the Public Reference Room may be obtained by calling 1-800-SEC-0330.
calvert.com CALVERT SOCIAL INVESTMENT FUND ANNUAL REPORT (UNAUDITED) 95
DIRECTOR AND OFFICER INFORMATION TABLE
| Name & Age | Position With Fund | Position Start Date | Principal Occupation During Last 5 Years | # of Calvert Portfolios Overseen | Other Directorships During the Past Five Years |
| INDEPENDENT TRUSTEES/DIRECTORS | |||||
REBECCA L. ADAMSON AGE: 67 | Trustee Director Director Director | 1989 CSIF 2000 IMPACT 2000 CRIS 2005 CWVF | President and Founder of the national non-profit, First People’s Worldwide. Founded in 1980, First People’s Worldwide is the only American Indian alternative development institute in the U.S. | 19 | • Bay & Paul Foundation |
RICHARD L. BAIRD, JR. AGE: 68 | Trustee & Chair Director & Chair Director & Chair Director & Chair | 1982 CSIF 2000 CRIS 2005 CWVF 2005 IMPACT | Former President and CEO of Adagio Health Inc. (retired in 2014) in Pittsburgh, PA, a non-profit corporation which provides family planning services, nutrition, maternal/child health care, and various health screening services and community preventive health programs. | 24 | None |
JOHN G. GUFFEY, JR. AGE: 68 | Director Trustee Director Director | 1992 CWVF 1982 CSIF 2000 CRIS 2005 IMPACT | Consultant and President of Aurora Press Inc., a privately held publisher of trade paperbacks. | 24 | • Ariel Funds (3) (asset management) (through 12/31/11) • Calvert Social Investment Foundation • Calvert Ventures, LLC |
MILES D. HARPER, III AGE: 53 | Director Trustee Director Director | 2000 IMPACT 2005 CSIF 2005 CRIS 2005 CWVF | Partner, Carr Riggs & Ingram (public accounting firm) since October 2014. Partner, Gainer Donnelly & Desroches (public accounting firm) (now Carr Riggs & Ingram), 1999-2014. | 19 | • Bridgeway Funds (14) (asset management) |
JOY V. JONES AGE: 66 | Director Trustee Director Director | 2000 IMPACT 1990 CSIF 2000 CRIS 2005 CWVF | Attorney. | 19 | • Director, Conduit Street Restaurants SUD 2 Limited • Director, Palm Management Corporation |
TERRENCE J. MOLLNER, Ed.D. AGE: 71 | Director Trustee Director Director | 1992 CWVF 1982 CSIF 2000 CRIS 2005 IMPACT | Founder, Chairperson and President of Trusteeship Institute, Inc., an educational organization focused on the personal skills and organizations described in Dr. Mollner’s book, The Love Skill: We Are Mastering the 7 Layers of Human Maturity, particularly businesses that freely chose to give priority to the common good. Chairperson, Stakeholders Capital, Inc., an asset management firm and financial services provider. | 19 | • Calvert Social Investment Foundation • Ben & Jerry’s Homemade, Inc. (food products) |
SYDNEY A. MORRIS AGE: 67 | Trustee Director Director Director | 1982 CSIF 2000 CRIS 2005 CWVF 2005 IMPACT | The Rev. Dr. Morris is a Unitarian Universalist minister. | 19 | None |
96 calvert.com CALVERT SOCIAL INVESTMENT FUND ANNUAL REPORT (UNAUDITED)
| Name & Age | Position With Fund | Position Start Date | Principal Occupation During Last 5 Years | # of Calvert Portfolios Overseen | Other Directorships During the Past Five Years |
| INTERESTED TRUSTEES/DIRECTORS | |||||
D. WAYNE SILBY, Esq.* AGE: 68 | Director Trustee Director Director | 1992 CWVF 1982 CSIF 2000 CRIS 2000 IMPACT | Mr. Silby is the founding Chair of the Calvert Funds. He is the Chair-Elect and a principal of Syntao.com, a Beijing-based company promoting corporate social responsibility. | 24 | • Ameritas Mutual Holding Company (insurance) • Calvert Social Investment Foundation • ImpactAssets, Inc. (asset management) • Committee for the Future (charitable supporting organization) • Syntao.com China (HK) (sustainability consulting) • The ICE Organization (environmental services) |
JOHN H. STREUR* AGE: 56 | Director & President Trustee & President Director & President Director & President | 2015 CWVF 2015 CSIF 2015 CRIS 2015 IMPACT | Director, Chairman, President and Chief Executive Officer of Calvert Investments, Inc., Calvert Investment Administrative Services, Inc., Calvert Investment Management, Inc., Calvert Investment Distributors, Inc. and Calvert Investment Services, Inc. (since January 2015); Chief Compliance Officer, Calvert Investment Distributors, Inc. (since August 2015); Chief Compliance Officer, Calvert Investment Management, Inc. (August 2015 - April 2016); President and Director, Portfolio 21 Investments, Inc. (through October 2014); President, Chief Executive Officer and Director, Managers Investment Group LLC (through January 2012); President and Director, The Managers Funds and Managers AMG Funds (through January 2012). | 37 | • Portfolio 21 Investments, Inc. (asset management)(through October 2014) • Managers Investment Group LLC (asset management)(through January 2012) • The Managers Funds (asset management) (through January 2012) • Managers AMG Funds (asset management) (through January 2012) • Calvert Social Investment Foundation |
* Mr. Silby is an interested person of the Funds since he is a Director of the parent company of each Fund’s Advisor. Mr. Streur is an interested person of the Funds since he is an Officer and Director of each Fund’s Advisor and certain affiliates. The address of the Trustees and Officers is 4550 Montgomery Avenue, Suite 1000N, Bethesda, Maryland 20814, with the exception of Mr. Silby, whose address is 1715 18th Street, N.W., Washington, DC 20009. Additional information about the Fund’s Trustees/Directors can be found in the Statement of Additional Information (SAI). You can get a free copy of the SAI at www.calvert.com, or by contacting your broker, or the Fund at 1-800-368-2745. | |||||
calvert.com CALVERT SOCIAL INVESTMENT FUND ANNUAL REPORT (UNAUDITED) 97
| Name & Age | Position with Funds | Position Start Date | Principal Occupation During Last 5 Years |
| OFFICERS | |||
VICKI L. BENJAMIN AGE: 54 | Treasurer | 2015 | Treasurer of the Funds (since March 2015); Director, Executive Vice President, Chief Financial Officer, Chief Operating Officer and Treasurer of Calvert Investments, Inc., Calvert Investment Administrative Services, Inc., and Calvert Investment Services, Inc. (since October 2015); Director, Executive Vice President, Chief Financial Officer - Elect, Chief Operating Officer and Treasurer of Calvert Investment Management, Inc. and Calvert Investment Distributors, Inc. (since October 2015); Director, Senior Vice President and Chief Financial Officer of Calvert Investments, Inc., Calvert Investment Administrative Services, Inc., Calvert Investment Services, Inc., Calvert Investment Management, Inc. and Calvert Investment Distributors, Inc. (March 2015 - September 2015); and Senior Partner, KPMG LLP (2005 - 2015). |
ROBERT D. BENSON, Esq. AGE: 37 | Associate General Counsel, Assistant Vice President & Assistant Secretary | 2014 | Associate General Counsel (since September 2016), Assistant General Counsel (2014 - September 2016), Assistant Vice President and Assistant Secretary of the Funds, Calvert Investments, Inc., Calvert Investment Administrative Services, Inc., Calvert Investment Services, Inc., Calvert Investment Management, Inc. and Calvert Investment Distributors, Inc. (since 2014); and Staff Attorney, Calvert Investments, Inc., Calvert Investment Administrative Services, Inc., Calvert Investment Services, Inc., Calvert Investment Management, Inc. and Calvert Investment Distributors, Inc. (2008 - 2014). |
HOPE BROWN AGE: 42 | Chief Compliance Officer | 2014 | Chief Compliance Officer of the Funds (since November 2014); Vice President and Chief Compliance Officer, Wilmington Funds (December 2012 - November 2014); and Vice President and Senior Compliance Officer, Wilmington Trust Investment Advisors, Inc. (September 2010 - December 2012). |
THOMAS DAILEY AGE:51 | Vice President | 2012 | Vice President of the Funds (since 2012); and Vice President (since January 2005) and Portfolio Manager - Tax Exempt, Calvert Investment Management, Inc. (since 1995). |
STU DALHEIM AGE: 46 | Vice President | 2015 | Vice President of the Funds (since 2015); and Vice President - Governance and Advocacy of Calvert Investment Management, Inc. (since October 2011). |
BRIAN ELLIS, CFA AGE: 32 | Vice President | 2016 | Vice President of the Funds (since February 2016); Portfolio Manager, Taxable Fixed Income, Calvert Investment Management, Inc. (since May 2012); and Business Analyst (2009 - May 2012), Calvert Investment Management, Inc. |
ROBERT J. ENDERSON, CFA AGE: 57 | Assistant Treasurer | 2014 | Assistant Treasurer of the Funds (since 2014); Vice President, Corporate Finance, and Assistant Treasurer, Calvert Investments, Inc., Calvert Investment Administrative Services, Inc., Calvert Investment Management, Inc., Calvert Investment Services, Inc. and Calvert Investment Distributors, Inc. (since 2007); Acting Chief Financial Officer of Calvert Investments, Inc., Calvert Investment Administrative Services, Inc., Calvert Investment Management, Inc., Calvert Investment Services, Inc. and Calvert Investment Distributors, Inc. (September 2014 - March 2015). |
PATRICK FAUL, CFA AGE: 51 | Vice President | 2010 | Vice President (since 2007) and Head of Credit Research, Calvert Investment Management, Inc. (since January 2010). |
TRACI L. GOLDT AGE: 42 | Assistant Secretary | 2004 | Assistant Secretary of the Funds (since 2004); Director, Strategic Projects and Fund Operations, Calvert Investment Administrative Services, Inc. (since June 2016); and SEC Filing and Operations Manager, Calvert Investment Administrative Services, Inc. (2011 – 2016). |
JADE HUANG AGE: 41 | Vice President | 2015 | Vice President of the Funds (since 2015); Portfolio Manager - Equity, Calvert Investment Management, Inc. (since November 2015); and Senior Equity Analyst, Calvert Investment Management, Inc. (2006 - November 2015). |
VISHAL KHANDUJA, CFA AGE: 38 | Vice President | 2014 | Vice President of the Funds (since 2014); Vice President and Head of Taxable Bond, Calvert Investment Management, Inc. (since May 2016); Vice President and Portfolio Manager, Taxable Fixed Income, Calvert Investment Management, Inc. (2012 - May 2016); Portfolio Manager - Global Rates and Currency Team, Columbia Management (2009 - 2012). |
ERICA LASDON AGE: 45 | Assistant Vice President, Research and Advocacy | 2015 | Assistant Vice President, Research and Advocacy of the Funds (since 2016) and Calvert Investment Management, Inc. (since August 2015); and Senior Sustainability Analyst and Manager, Calvert Investment Management, Inc. (2005 - August 2015). |
JOSHUA LINDER, CFA AGE: 30 | Vice President | 2016 | Vice President of the Funds (since 2016); Portfolio Manager, Equity, Calvert Investment Management, Inc. (since January 2016); Assistant Portfolio Manager, Calvert Investment Management, Inc. (January 2014 - October 2015); and Equity Analyst, Calvert Investment Management, Inc. (2011 - 2013). |
CHRISTOPHER MADDEN AGE: 40 | Vice President | 2015 | Vice President of the Funds (since 2015); Portfolio Manager - Equity, Calvert Investment Management, Inc. (since November 2015); and Senior Equity Analyst, Calvert Investment Management, Inc. (2010 - November 2015). |
98 calvert.com CALVERT SOCIAL INVESTMENT FUND ANNUAL REPORT (UNAUDITED)
| Name & Age | Position with Funds | Position Start Date | Principal Occupation During Last 5 Years |
| OFFICERS | |||
ANDREW K. NIEBLER, Esq. AGE: 48 | Deputy General Counsel, Vice President & Secretary | 2006 (TCF, CMS, CRIS, CSIF, CVS) 2008 (CVP) 2016 (CIF) | Deputy General Counsel, Vice President and Secretary of the Funds, Calvert Investments, Inc., Calvert Investment Administrative Services, Inc., Calvert Investment Management, Inc., Calvert Investment Distributors, Inc. and Calvert Investment Services, Inc. (since May 2016); Assistant Vice President, Associate General Counsel and Assistant Secretary, Calvert Investments, Inc., Calvert Investment Administrative Services, Inc., Calvert Investment Management, Inc., Calvert Investment Distributors, Inc. and Calvert Investment Services, Inc. (September 2009 - May 2016); and Assistant Vice President, Assistant General Counsel and Assistant Secretary, Calvert Investments, Inc., Calvert Investment Administrative Services, Inc., Calvert Investment Management, Inc., Calvert Investment Distributors, Inc. and Calvert Investment Services, Inc. (prior to September 2009). |
MONIQUE S. PATTILLO, Esq. AGE: 34 | Assistant General Counsel, Assistant Vice President & Assistant Secretary | 2016 | Assistant Vice President, Assistant General Counsel and Assistant Secretary of the Funds, Calvert Investments, Inc., Calvert Investment Administrative Services, Inc., Calvert Investment Management, Inc., Calvert Investment Distributors, Inc. and Calvert Investment Services, Inc. (since September 2016); Adjunct Faculty, Howard Community College (since June 2015); Adjunct Assistant Professor, University of Maryland University College (since June 2016); Legal Counsel, T. Rowe Price Associates, Inc. (March 2014 - June 2015); and Assistant U.S. Counsel, Aberdeen Asset Management, Inc. (January 2011 - March 2014). |
MARYBETH PILAT, CPA AGE: 48 | Fund Controller and Assistant Treasurer | 2015 | Fund Controller and Assistant Treasurer of the Funds (since August 2015); Director, Anti-Money Laundering Officer and Assistant Treasurer, Calvert Investments, Inc., Calvert Investment Administrative Services, Inc., Calvert Investment Management, Inc., Calvert Investment Distributors, Inc. and Calvert Investment Services, Inc. (since August 2015); Director of Fund Administration, Calvert Investment Administrative Services, Inc. (since August 2015); VP Expense & Budgeting, Global Fiduciary Platform, Legg Mason (May 2015 - July 2015); and Vice President and Assistant Treasurer, Columbia Funds, Ameriprise, Columbia Management (2010 - April 2015). |
JOHN H. STREUR AGE: 56 | President and Director (except CVS) | 2015 | Director, Chairman, President and Chief Executive Officer of Calvert Investments, Inc., Calvert Investment Administrative Services, Inc., Calvert Investment Management, Inc., Calvert Investment Distributors, Inc. and Calvert Investment Services, Inc. (since January 2015); Chief Compliance Officer, Calvert Investment Distributors, Inc. (since August 2015); Chief Compliance Officer, Calvert Investment Management, Inc. (August 2015 - April 2016); President and Director, Portfolio 21 Investments, Inc. (through October 2014); President, Chief Executive Officer and Director, Managers Investment Group LLC (through January 2012); President and Director, The Managers Funds and Managers AMG Funds (through January 2012). |
calvert.com CALVERT SOCIAL INVESTMENT FUND ANNUAL REPORT (UNAUDITED) 99
| CALVERT SOCIAL INVESTMENT FUND | CALVERT’S FAMILY OF FUNDS | |||
To Open an Account 800-368-2748 Service for Existing Account Shareholders: 800-368-2745 Brokers: 800-368-2746 Registered Mail Calvert Investments c/o BFDS, P.O. Box 219544 Kansas City, MO 64121-9544 Overnight Mail Calvert Investments c/o BFDS, 330 West 9th Street Kansas City, MO 64105 Web Site calvert.com Principal Underwriter Calvert Investment Distributors, Inc. 4550 Montgomery Avenue Suite 1000 North Bethesda, Maryland 20814 | Municipal Funds Tax-Free Responsible Impact Bond Fund Taxable Bond Funds Bond Portfolio Income Fund Short Duration Income Fund Long-Term Income Fund Ultra-Short Income Fund High Yield Bond Fund Green Bond Fund Unconstrained Bond Fund Balanced and Asset Allocation Funds Balanced Portfolio Conservative Allocation Fund Moderate Allocation Fund Aggressive Allocation Fund | Equity Funds Equity Portfolio U.S. Large Cap Core Responsible Index Fund U.S. Large Cap Value Responsible Index Fund U.S. Large Cap Growth Responsible Index Fund U.S. Mid Cap Core Responsible Index Fund Developed Markets Ex-U.S. Responsible Index Fund Capital Accumulation Fund International Equity Fund Small Cap Fund Global Energy Solutions Fund Global Water Fund International Opportunities Fund Emerging Markets Equity Fund | ||
This report is intended to provide fund information to shareholders. It is not authorized for distribution to prospective investors unless preceded or accompanied by a prospectus. Note: The information on our website is not incorporated by reference into this report; our website address is included as an inactive textual reference only. Investors should carefully consider the investment objectives, risks, charges and expenses of the Calvert Funds. This and other important information is contained in the fund’s summary prospectus and prospectus, which can be obtained from your financial professional and should be read carefully before investing. You may also call Calvert at 800/368-2748 or visit calvert.com. | |
| Printed on recycled paper using soy inks. |  |
| | |
Calvert Asset Allocation Funds • Conservative Allocation Fund• Moderate Allocation Fund• Aggressive Allocation Fund | | |
| | |
Annual Report September 30, 2016 E-Delivery Sign-Up — Details Inside |  |
Choose Planet-friendly E-delivery! Sign up now for on-line statements, prospectuses, and fund reports. In less than five minutes you can help reduce paper mail and lower fund costs. Just go to calvert.com. If you already have an online account at Calvert, click on Login, to access your Account, and select the documents you would like to receive via e-mail. If you’re new to online account access, click on Login, then Register to create your user name and password. Once you’re in, click on the E-delivery sign-up on the Account Portfolio page and follow the quick, easy steps. Note: if your shares are not held directly at Calvert but through a brokerage firm, you must contact your broker for electronic delivery options available through their firm. |
| TABLE OF CONTENTS | ||
| President’s Letter | |||
| Portfolio Management Discussion | |||
| Understanding Your Fund’s Expenses | |||
| Report of Independent Registered Public Accounting Firm | |||
| Schedule of Investments | |||
| Statement of Assets and Liabilities | |||
| Statements of Operations | |||
| Statements of Changes in Net Assets | |||
| Notes to Financial Statements | |||
| Financial Highlights | |||
| Proxy Voting | |||
| Availability of Quarterly Portfolio Holdings | |||
| Trustee and Officer Information Table | |||
| John Streur President and Chief Executive Officer, Calvert Investments, Inc. | |
Dear Fellow Shareowners and Friends,
Forty years ago, Calvert Investments was founded on the belief that investment capital, properly stewarded, could improve the world for its less powerful inhabitants and improve environmental sustainability, while producing reasonable investment returns. Calvert was one of the first investment advisers to introduce the responsible investment concept, and through many years of innovation and research (supported by you, our shareholders), we have developed this philosophy to now provide even greater shareholder engagement and impact.
Corporations throughout the world, big and small, have an ever increasing role in determining social and environmental outcomes for every living being, today and into the future. The power of corporations, garnered through global influence, human capital and financial strength, especially relative to our other institutions, has been steadily increasing for decades (http://www.calvert.com/perspective/research/calvert-serafeim-series-report).
Investors recognize the impact of corporations on society, and more and more are making investment decisions based on their assessments of a company’s effect on environmental and social outcomes. Companies able to operate their business in a perceived sustainable manner, promoting, environmental and social justice stand to benefit; while those corporate laggards, that fail to embrace these new responsibilities, will falter.
Reliable information is critical in ensuring that shareholders are able to make informed assessments regarding a corporation’s sustainability profile. Key performance metrics and data (a “sustainability information system”) that indicates how a company is performing regarding environmental and social impacts, is integral to making informed responsible investment decisions. Through partnerships with world class educational institutions and forward thinking business partners, Calvert is developing valuable research methodologies and metrics to assess the quality of data inputs and results, such that we are able to assess companies’ impacts. Are we completely there yet? No, but as data becomes more transparent and consistent, driven, in part by investor demands and regulatory authorities, we will get there, such that we and other market participants can make better informed investment and purchase decisions. For example, key data that measures “true” intrinsic and extrinsic product costs, including indirect environmental and social impacts could be relevant to investors when making corporate comparisons regarding risk and profitability, and also of great interest to consumers making product purchase decisions.
Calvert is participating in the Sustainability Accounting Standards Board Investment Advisory Group, which is working to move the disclosure of ESG metrics forward through corporate SEC filings (http://www.sasb.org/). Calvert is also working to map the United Nations Sustainable Development Goals to the SASB standards (http://www.calvert.com/perspective/social-impact/unsdg-faq), in order to better evaluate the progress of any public corporation on its path towards global sustainability.
Also, involved in this effort are millions of individuals and small organizations throughout the world who are adding to this mosaic of information through their local and specialized efforts and services. They often have access to pockets of information that are not publically available or disseminated, and thereby not available to the financial data service companies. Our myriad and long running engagements with NGOs and corporations provide critical insight to our analysts, driving the enhancement of our information infrastructure forward, as they research potential investments for your portfolios and design shareholder activist agendas.
ESG data about corporate behavior provides a useful baseline, but takes on additional meaning as the Calvert Principles for Responsible Investment guide our interpretation of the data, acting as our “responsibility compass” (http://www.calvert.com/approach/how-we-invest/the-calvert-principles). In addition to providing a context consistent with Calvert’s mission, our Principles lead us to areas where additional, fundamental research is needed to develop a real understanding of corporate impact on society and the environment. In our complex, globalized and rapidly evolving world, the Principles allow us to contextualize information, whereas a rules based system, or an exclusive reliance on data from companies may miss valuable situational and circumstantial inference, as evidenced in the issues surrounding Standing Rock and the role of the corporation, Energy Transfer Partners. The Standing Rock Sioux Nation is striving to halt construction of the Dakota Access Pipeline crossing their sacred land and threatening water contamination (see our resolution in support of the Standing Rock Sioux Nation, (http://www.calvert.com/perspective/climate-and-environment/calvert-releases-statement-in-support-of-standing-rock-sioux-nation).
4 calvert.com CALVERT ASSET ALLOCATION FUNDS ANNUAL REPORT (UNAUDITED)
The concerns surrounding social license and indigenous peoples’ rights are complex and do not lend themselves easily to objective quantification methods employed by the traditional financial data sources. That is why the fundamental overlay performed by the Calvert research analysts is so essential to our effective responsible investing process.
While effecting change through thoughtful ESG capital allocations is important, direct impact can be made through shareholder activism, or more specifically advocacy. Calvert’s shareholder advocacy process (28 resolutions last year) has been effective in influencing corporate behavior and provides another avenue for influencing valuable societal and environmental outcomes (http://www.calvert.com/perspective/social-impact/2016-proxy-season-brings-opportunity-to-accelerate-corporate-sustainability-progress).
Calvert’s voice reflects and respects diversity of thought and is often used to protect the interests of those most in need, and to look out for future generations. We thank you, our shareholders, friends and partners in this mission, for a good start. We promise that our work will never be done and the next forty years will reflect the increasing imperative to work vigorously to produce competitive returns for you and to use our power to forge a better today and future for our society. Often this requires Calvert to go where other investment firms have not, and to speak out and act when others do not.
Thank you, as always, for the incredible privilege to serve your needs through the Calvert Funds.
Respectfully,
John Streur
September 2016
calvert.com CALVERT ASSET ALLOCATION FUNDS ANNUAL REPORT (UNAUDITED) 5
 | PORTFOLIO MANAGEMENT DISCUSSION |
| Joshua Linder, CFA Portfolio Manager |  | John Nichols, CFA Vice President, Equities |
| Vishal Khanduja, CFA Vice President, Portfolio Manager and Head of Taxable Fixed Income | | Brian S. Ellis, CFA Portfolio Manager |
Market Review
For the 12-month period ended September 30, 2016, the S&P 500 rose 15.43% and the Russell 1000 rose 14.93% while the MSCI EAFE Index and the MSCI Emerging Markets Index rose 6.52% and 16.78%, respectively. The Russell 2000 returned 15.47%, with the Russell 2000 Value rising 18.81% and the Russell 2000 Growth rising 12.12%.
The United States Federal Reserve Board (the “Fed”) raised interest rates only one time during the period. This was less than many observers had expected. Long-term government bond yields ended the period lower than where they began in nearly every major economy. The Japanese yen generally strengthened and the British pound weakened over the period, with the U.S. dollar remaining relatively stable vs. the Euro and the Chinese Yuan. Commodity prices fluctuated but most ended near their starting point, except for the price of gold increasing to over $1,300/oz., as of September 30, 2016.
The strong stock returns masked volatility which occurred during the twelve months. Stocks rallied to end 2015, then struggled in the first quarter of 2016, as investors became concerned about near-term economic growth. From April - September 2016, global stocks rallied as central banks kept interest rates low and economic data was generally positive.
The U.S. monthly jobs reports showed more new jobs created in June and July than in any previous month during 2016. The housing and consumer recovery continued to pick up steam. OPEC announced its first production cut in eight years in September. However, market reaction was muted as any negative effects are likely to be mitigated by U.S. producers’ ability to step in and fill outstanding demand. Inflation remained low, contributing to the decision by the Fed in September to maintain its steady-state policy, while indicating an increased probability of a December rate hike.
Investment Strategy and Technique
The asset allocation funds are "funds of funds." They typically invest within the following ranges in the underlying Calvert funds that primarily invest in the following asset classes:
| Fixed Income | Equity | Cash & Money Market Instruments | |
| Conservative Allocation Fund | 45% to 75% | 15% to 45% | 0% to 20% |
| Moderate Allocation Fund | 20% to 50% | 50% to 80% | 0% to 20% |
| Aggressive Allocation Fund | 0% to 30% | 70% to 100% | 0% to 10% |
In addition, the funds may invest, to a limited extent, in derivatives instruments and exchange-traded funds to facilitate periodic rebalancing to their target asset allocations and to implement tactical asset allocation decisions.
6 calvert.com CALVERT ASSET ALLOCATION FUNDS ANNUAL REPORT (UNAUDITED)
| CALVERT CONSERVATIVE ALLOCATION FUND | ||||||
| SEPTEMBER 30, 2016 | ||||||
| ASSET ALLOCATION | % OF TOTAL INVESTMENTS | |||||
| Fixed Income Funds | 61.5 | % | ||||
| Domestic Equity Funds | 29.7 | % | ||||
| International and Global Equity Funds | 8.8 | % | ||||
| Total | 100 | % | ||||
| INVESTMENT PERFORMANCE | ||||||
| (TOTAL RETURN AT NAV) | ||||||
6 MONTHS ENDED 9/30/16 | 12 MONTHS ENDED 9/30/16 | |||||
| Class A | 3.48 | % | 5.42 | % | ||
| Class C | 3.07 | % | 4.57 | % | ||
| Class I * | 3.66 | % | 5.60 | % | ||
| Class Y * | 3.58 | % | 5.51 | % | ||
| Bloomberg Barclays U.S. Aggregate Bond Index | 2.68 | % | 5.19 | % | ||
| Conservative Allocation Composite Benchmark | 3.71 | % | 7.30 | % | ||
| Lipper Mixed-Asset Target Alloc. Conservative Funds Average | 4.60 | % | 7.30 | % | ||
Investment performance/return at NAV does not reflect the deduction of the Fund’s maximum 4.75% front-end sales charge or any deferred sales charge. The Conservative Allocation Composite Benchmark is an internally constructed benchmark comprised of a blend of 22% Russell 3000 Index, 7% MSCI EAFE Investable Market Index, 1% MSCI Emerging Markets Index, 60% Bloomberg Barclays U.S. Aggregate Index, and 10% Bloomberg Barclays U.S. 3 Month Treasury Bellwether. Prior to 3/3/15 the blend was comprised of: 22% Russell 3000 Index, 8% MSCI EAFE Investable Market Index, 60% Bloomberg Barclays U.S. Credit Index, and 10% Bloomberg Barclays U.S. 3 Month Treasury Bellwether. Prior to 11/1/2015 the fixed income component was the Bloomberg Barclays U.S. Credit Index. * See note regarding Class I and Class Y shares on page 10. | ||||||
Fund Performance Relative to the Benchmark
Calvert Conservative Allocation Fund’s Class A shares (at NAV) returned 5.42% for the 12-month period ended September 30, 2016, outperforming its benchmark, the Bloomberg Barclays U.S. Aggregate Bond Index, which returned 5.19% and underperforming its blended composite benchmark, which returned 7.30%.
The Calvert Moderate Allocation Fund’s Class A shares (at NAV) returned 7.16% for the 12-month period ended September 30, 2016, underperforming both its benchmark, the Russell 3000 Index, and its blended composite benchmark, which returned 14.96% and 10.52%, respectively.
The Calvert Aggressive Allocation Fund’s Class A shares (at NAV) returned 8.03% for the 12-month period ended
September 30, 2016, underperforming both its benchmark, the Russell 3000 Index, and its blended composite benchmark, which returned 14.96% and 12.77%, respectively.
The blended composite benchmarks referenced above were developed by Calvert to be used as secondary composite benchmarks based on a mix of market indexes, which more closely reflect the asset allocation strategy of each Fund than the single asset class benchmarks.
The Funds remained overweight in U.S. equities during the period based on our more positive outlook for the U.S. economy, especially compared to the structural challenges facing many international economies. However, when equities rallied to start the fourth quarter of 2015, we used the bounce as an opportunity to reduce equity exposure and allocate to cash. We believe bringing the Funds’ equity allocation closer to their policy targets is a more appropriate level of risk given the backdrop of rising volatility and lingering concerns about global economic growth.
Overall, the Funds benefited from asset allocation positioning during the period. Our overweight to high yield within the fixed income allocation, and within our equity allocation, a higher allocation to the Value Index compared to Growth Index and overweight in U.S. small caps relative to U.S. large caps, all contributed positively to performance.
Relative underperformance by several of the underlying equity funds was the primary detractor from performance.
Outlook
We remain constructive on the U.S. economy over the medium-to-long run and believe U.S. stocks can continue to post decent performance, although probably not as robust as what we’ve experienced in recent years. While valuations of U.S. equities appear stretched based on historical standards, the positive economic environment in the U.S. relative to the rest of the world should support elevated valuation levels. Many international economies continue to be hindered by underlying structural and economic fiscal challenges, including Europe and Japan.
While some earlier sources of volatility have receded, such as commodity prices, other uncertainties remain. In the near term, the U.S. elections in November have the potential to significantly increase economic policy uncertainty. At a minimum, this is likely to continue to weigh on already weak business investment. Given the widely disparate views of the presidential contenders, volatility in currency and risk markets seems likely. A number of national elections in Europe, particularly where populist parties have shown strength, also could contribute to heightened volatility.
While we remain cautious on China’s long-term growth prospects, their injection of stimulus is starting to flow through to the real economy, easing concerns about a hard economic landing and providing support for the global economy, especially emerging markets.
calvert.com CALVERT ASSET ALLOCATION FUNDS ANNUAL REPORT (UNAUDITED) 7
| CALVERT MODERATE ALLOCATION FUND | ||||||
| SEPTEMBER 30, 2016 | ||||||
| ASSET ALLOCATION | % OF TOTAL INVESTMENTS | |||||
| Domestic Equity Funds | 54.0 | % | ||||
| Fixed Income Funds | 28.8 | % | ||||
| International and Global Equity Funds | 17.2 | % | ||||
| Total | 100 | % | ||||
| INVESTMENT PERFORMANCE | ||||||
| (TOTAL RETURN AT NAV) | ||||||
6 MONTHS ENDED 9/30/16 | 12 MONTHS ENDED 9/30/16 | |||||
| Class A | 4.35 | % | 7.16 | % | ||
| Class C | 3.95 | % | 6.37 | % | ||
| Class I * | 4.49 | % | 7.31 | % | ||
| Class Y * | 4.46 | % | 7.28 | % | ||
| Russell 3000 Index | 7.14 | % | 14.96 | % | ||
| Moderate Allocation Composite Benchmark | 5.35 | % | 10.52 | % | ||
| Lipper Mixed-Asset Target Alloc. Growth Funds Average | 5.31 | % | 9.23 | % | ||
Investment performance/return at NAV does not reflect the deduction of the Fund’s maximum 4.75% front-end sales charge or any deferred sales charge. The Moderate Allocation Composite Benchmark is an internally constructed benchmark comprised of a blend of 47% Russell 3000 Index, 15% MSCI EAFE Investable Market Index, 3% MSCI Emerging Markets Index, 30% Bloomberg Barclays U.S. Aggregate Index, and 5% Bloomberg Barclays U.S. 3 Month Treasury Bellwether. Prior to 3/3/15 the blend was comprised of: 47% Russell 3000 Index, 18% MSCI EAFE Investable Market Index, 30% Bloomberg Barclays U.S. Credit Index, and 5% Bloomberg Barclays U.S. 3 Month Treasury Bellwether. Prior to 11/1/2015 the fixed income component was the Bloomberg Barclays U.S. Credit Index. * See note regarding Class I and Class Y shares on page 11. | ||||||
Accommodative monetary policy by central banks around the world should limit the downside for equities. However, divergent global monetary policies, volatility, and liquidity challenges are likely to continue to strongly influence fixed income markets in the fourth quarter. The impact of divergence—opposing U.S. and global central bank policy directions—is likely to be reinforced as accumulating signs of strength in the U.S. economy increase the likelihood of another rate hike by the Fed occurring before the end of 2016.
The United States has seen continued strength in consumer spending and employment growth. Mounting signs of inflation, albeit modest, are further building the case for more tightening.
| CALVERT AGGRESSIVE ALLOCATION FUND | ||||||
| SEPTEMBER 30, 2016 | ||||||
| ASSET ALLOCATION | % OF TOTAL INVESTMENTS | |||||
| Domestic Equity Funds | 69.2 | % | ||||
| International and Global Equity Funds | 24.8 | % | ||||
| Fixed Income Funds | 6.0 | % | ||||
| Total | 100 | % | ||||
| INVESTMENT PERFORMANCE | ||||||
| (TOTAL RETURN AT NAV) | ||||||
6 MONTHS ENDED 9/30/16 | 12 MONTHS ENDED 9/30/16 | |||||
| Class A | 4.62 | % | 8.03 | % | ||
| Class C | 4.21 | % | 7.06 | % | ||
| Class I * | 4.73 | % | 8.14 | % | ||
| Class Y * | 4.79 | % | 8.20 | % | ||
| Russell 3000 Index | 7.14 | % | 14.96 | % | ||
| Aggressive Allocation Composite Benchmark | 6.51 | % | 12.77 | % | ||
| Lipper Mixed-Asset Target Alloc. Agg. Growth Funds Average | 6.34 | % | 10.33 | % | ||
Investment performance/return at NAV does not reflect the deduction of the Fund’s maximum 4.75% front-end sales charge or any deferred sales charge. The Aggressive Allocation Composite Benchmark is an internally constructed benchmark comprised of a blend of 64% Russell 3000 Index, 21% MSCI EAFE Investable Market Index, 5% MSCI Emerging Markets Index and 10% Bloomberg Barclays U.S. Aggregate Index. Prior to 3/3/15 the blend was comprised of: 64% Russell 3000 Index, 26% MSCI EAFE Investable Market Index, and 10% Bloomberg Barclays U.S. Credit Index. Prior to 11/1/2015 the fixed income component was the Bloomberg Barclays U.S. Credit Index. * See note regarding Class I and Class Y shares on page 12. | ||||||
Despite these risks, we think the fixed income market is still mispriced because it is underestimating the pace of rate hikes in the U.S. As a result, in the management of the underlying Calvert fixed income funds we continue to favor a shorter duration at the front end of the yield curve. However, the relative attractiveness of U.S. rates means that global influences will exert more control over intermediate- and longer-term rates than will Fed policy. While we believe these parts of the curve are also fundamentally overvalued, we remain neutral in duration to them for the time being.
We still favor non-benchmark securitized assets, including commercial mortgage-backed securities, asset-backed securities and non-agency mortgage-backed securities because of their more attractive spreads and tendency to be less vulnerable than corporates to market volatility. These assets
8 calvert.com CALVERT ASSET ALLOCATION FUNDS ANNUAL REPORT (UNAUDITED)
are tied to the U.S. economy, specifically to U.S. consumer and housing markets, a further positive in periods of high global economic uncertainty, volatility, and slow growth. In our view, an active, multi-sector approach to fixed income investing remains a sound strategy, and strategic allocations to cash and Treasuries will play a key role in successfully navigating the volatile, liquidity-challenged environment we expect for the foreseeable future.
Although volatility in the equity markets may pick up, we believe this should also provide greater opportunities for stock picking in the actively-managed underlying equity funds. We believe our stock-selection strategy, which incorporates consideration of environmental, social, and governance (ESG) factors along with quantitative analysis, is well positioned for the current environment.
|  |
| Joshua Linder, CFA | John Nichols, CFA |
| |
| Vishal Khanduja, CFA | Brian S. Ellis, CFA |
Calvert Investment Management, Inc.
September 2016
calvert.com CALVERT ASSET ALLOCATION FUNDS ANNUAL REPORT (UNAUDITED) 9
Growth of $10,000
The graph below shows the value of a hypothetical $10,000 investment in the Fund over the past 10 fiscal year periods. The results shown are for Class A shares, reflect the deduction of the maximum front-end Class A sales charge of 4.75%, and assume the reinvestment of dividends. The result is compared with a broad based market index. Market indexes are unmanaged and their results do not reflect the effect of expenses or sales charges. The value of an investment in a different share class would be different.
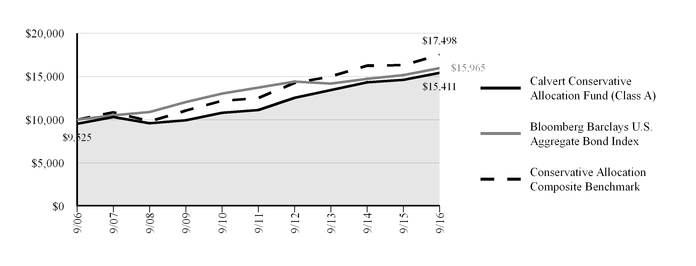
| CALVERT CONSERVATIVE ALLOCATION FUND | |||||||
| SEPTEMBER 30, 2016 | |||||||
| AVERAGE ANNUAL TOTAL RETURNS | Ticker Symbol | 1 Year | 5 Year | 10 Year | |||
| Class A (with max. load) | CCLAX | 0.39 | % | 5.70 | % | 4.42 | % |
| Class C (with max. load) | CALCX | 3.57 | % | 5.72 | % | 3.72 | % |
| Class I * | CFAIX | 5.60 | % | 6.77 | % | 4.95 | % |
| Class Y * | CALYX | 5.51 | % | 6.76 | % | 4.94 | % |
| Bloomberg Barclays U.S. Aggregate Bond Index | 5.19 | % | 3.08 | % | 4.79 | % | |
| Conservative Allocation Composite Benchmark | 7.30 | % | 6.93 | % | 5.75 | % | |
| Lipper Mixed-Asset Target Alloc. Conservative Funds Average | 7.30 | % | 5.83 | % | 4.17 | % | |
| * Calvert Conservative Allocation Fund first offered Class I and Y shares on May 20th, 2016. Performance prior to that date reflects Class A shares at net asset value without adjustments for any differences in the expenses of the same classes. If adjusted for the differences returns would be different. | |||||||
All performance data shown, including the graph above and the adjacent table, represents past performance, does not guarantee future results, assumes reinvestment of dividends and distributions, and does not reflect the deduction of taxes that a shareholder would pay on the Fund’s distributions or the redemption of the Fund shares. All performance data reflects fee waivers and/or expense limitations, if any are in effect; in their absence performance would be lower. See Note B in Notes to Financial Statements. The investment return and principal value of an investment will fluctuate so that an investor’s shares, when redeemed, may be worth more or less than their original cost. Current performance may be lower or higher than the performance data quoted; for current performance data, including most recent month-end, visit www.calvert.com. The gross expense ratio from the current prospectus for Class A shares is 1.27% (includes Underlying Fund Fees). This number may differ from the expense ratio shown elsewhere in this report because it is based on a different time period and, if applicable, does not include fee or expense waivers. Performance data quoted already reflects the deduction of the Fund’s operating expenses.
10 calvert.com CALVERT ASSET ALLOCATION FUNDS ANNUAL REPORT (UNAUDITED)
Growth of $10,000
The graph below shows the value of a hypothetical $10,000 investment in the Fund over the past 10 fiscal year periods. The results shown are for Class A shares, reflect the deduction of the maximum front-end Class A sales charge of 4.75%, and assume the reinvestment of dividends. The result is compared with a broad based market index. Market indexes are unmanaged and their results do not reflect the effect of expenses or sales charges. The value of an investment in a different share class would be different.
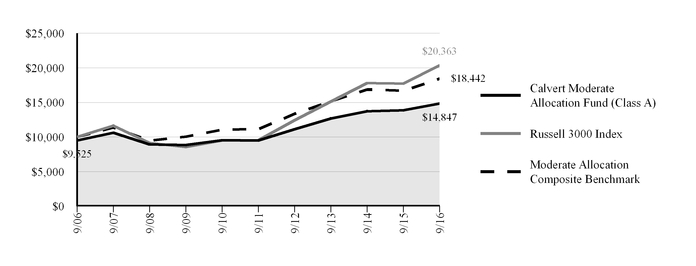
| CALVERT MODERATE ALLOCATION FUND | |||||||
| SEPTEMBER 30, 2016 | |||||||
| AVERAGE ANNUAL TOTAL RETURNS | Ticker Symbol | 1 Year | 5 Year | 10 Year | |||
| Class A (with max. load) | CMAAX | 2.07 | % | 8.30 | % | 4.03 | % |
| Class C (with max. load) | CMACX | 5.37 | % | 8.54 | % | 3.75 | % |
| Class I * | CLAIX | 7.31 | % | 9.39 | % | 4.55 | % |
| Class Y * | CMLYX | 7.28 | % | 9.38 | % | 4.55 | % |
| Russell 3000 Index | 14.96 | % | 16.36 | % | 7.37 | % | |
| Moderate Allocation Composite Benchmark | 10.52 | % | 10.61 | % | 6.31 | % | |
| Lipper Mixed-Asset Target Alloc. Growth Funds Average | 9.23 | % | 9.97 | % | 5.06 | % | |
| * Calvert Moderate Allocation Fund first offered Class I and Y shares on May 20th, 2016. Performance prior to that date reflects Class A shares at net asset value without adjustments for any differences in the expenses of the same classes. If adjusted for the differences returns would be different. | |||||||
All performance data shown, including the graph above and the adjacent table, represents past performance, does not guarantee future results, assumes reinvestment of dividends and distributions, and does not reflect the deduction of taxes that a shareholder would pay on the Fund’s distributions or the redemption of the Fund shares. All performance data reflects fee waivers and/or expense limitations, if any are in effect; in their absence performance would be lower. See Note B in Notes to Financial Statements. The investment return and principal value of an investment will fluctuate so that an investor’s shares, when redeemed, may be worth more or less than their original cost. Current performance may be lower or higher than the performance data quoted; for current performance data, including most recent month-end, visit www.calvert.com. The gross expense ratio from the current prospectus for Class A shares is 1.38% (includes Underlying Fund Fees). This number may differ from the expense ratio shown elsewhere in this report because it is based on a different time period and, if applicable, does not include fee or expense waivers. Performance data quoted already reflects the deduction of the Fund’s operating expenses.
calvert.com CALVERT ASSET ALLOCATION FUNDS ANNUAL REPORT (UNAUDITED) 11
Growth of $10,000
The graph below shows the value of a hypothetical $10,000 investment in the Fund over the past 10 fiscal year periods. The results shown are for Class A shares, reflect the deduction of the maximum front-end Class A sales charge of 4.75%, and assume the reinvestment of dividends. The result is compared with a broad based market index. Market indexes are unmanaged and their results do not reflect the effect of expenses or sales charges. The value of an investment in a different share class would be different.
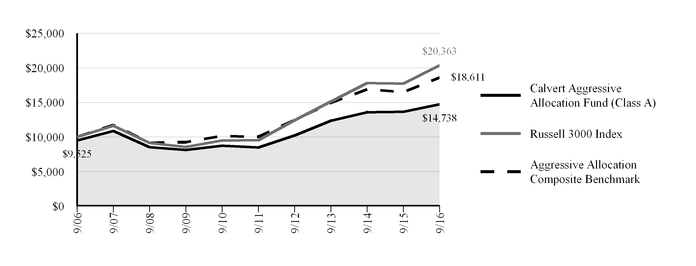
| CALVERT AGGRESSIVE ALLOCATION FUND | |||||||
| SEPTEMBER 30, 2016 | |||||||
| AVERAGE ANNUAL TOTAL RETURNS | Ticker Symbol | 1 Year | 5 Year | 10 Year | |||
| Class A (with max. load) | CAAAX | 2.91 | % | 10.61 | % | 3.96 | % |
| Class C (with max. load) | CAACX | 6.06 | % | 10.46 | % | 3.17 | % |
| Class I * | CAGIX | 8.14 | % | 11.71 | % | 4.47 | % |
| Class Y * | CAIYX | 8.20 | % | 11.72 | % | 4.48 | % |
| Russell 3000 Index | 14.96 | % | 16.36 | % | 7.37 | % | |
| Aggressive Allocation Composite Benchmark | 12.77 | % | 13.13 | % | 6.41 | % | |
| Lipper Mixed-Asset Target Alloc. Agg. Growth Funds Average | 10.33 | % | 11.37 | % | 4.43 | % | |
| * Calvert Aggressive Allocation Fund first offered Class I and Y shares on May 20th, 2016. Performance prior to that date reflects Class A shares at net asset value without adjustments for any differences in the expenses of the same classes. If adjusted for the differences returns would be different. | |||||||
All performance data shown, including the graph above and the adjacent table, represents past performance, does not guarantee future results, assumes reinvestment of dividends and distributions, and does not reflect the deduction of taxes that a shareholder would pay on the Fund’s distributions or the redemption of the Fund shares. All performance data reflects fee waivers and/or expense limitations, if any are in effect; in their absence performance would be lower. See Note B in Notes to Financial Statements. The investment return and principal value of an investment will fluctuate so that an investor’s shares, when redeemed, may be worth more or less than their original cost. Current performance may be lower or higher than the performance data quoted; for current performance data, including most recent month-end, visit www.calvert.com. The gross expense ratio from the current prospectus for Class A shares is 1.57% (includes Underlying Fund Fees). This number may differ from the expense ratio shown elsewhere in this report because it is based on a different time period and, if applicable, does not include fee or expense waivers. Performance data quoted already reflects the deduction of the Fund’s operating expenses.
12 calvert.com CALVERT ASSET ALLOCATION FUNDS ANNUAL REPORT (UNAUDITED)
UNDERSTANDING YOUR FUND’S EXPENSES
As an investor, you incur two types of costs. There are transactions costs, which generally include sales charges on purchases and may include redemption fees. There are also ongoing costs, which generally include management fees, distribution and/or service fees, and other fund expenses. The following information is intended to help you understand your ongoing costs (in dollars) of investing in this mutual fund and to help you compare these costs with the ongoing costs of investing in other mutual funds.
To illustrate these ongoing costs, we have provided examples and calculated the expenses paid by the fund's investors during the period. The actual and hypothetical information presented in the examples is based on an investment of $1,000 invested at the beginning of the period and held for the entire period for Class A and C (April 1, 2016 to September 30, 2016) and since inception for Class I and Y (May 20, 2016 to September 30, 2016).
Actual Expenses
The first line of the table below provides information about actual account values and actual expenses. You may use the information in this line, together with the amount you invested, to estimate the expenses that you paid over the period. Simply divide your account value by $1,000 (for example, an $8,600 account value divided by $1,000 = 8.6), then multiply the result by the number in the first line under the heading entitled "Expenses Paid During Period" to estimate the expenses you paid on your account during this period. In addition, each Fund, as a shareholder in underlying funds, will indirectly bear its pro rata share of the fees and expenses incurred by the underlying Funds. These fees and expenses are not included in each Fund's annualized expense ratio used to calculate the expense estimates in the table below. If they were, the estimate of expense you paid during the period would be higher, and your ending account value lower.
The fund may charge an annual low balance account fee of $15 to those shareholders whose regular account balance is less than $2,000 ($1,000 for IRA accounts). If the low balance fee applies to your account, you should subtract the fee from the ending account value in the chart below.
Hypothetical Example for Comparison Purposes
The second line of the table below provides information about hypothetical account values and hypothetical expenses based on the Fund’s actual expense ratio and an assumed rate of return of 5% per year before expenses, which is not the Fund’s actual return. The hypothetical account values and expenses may not be used to estimate the actual ending account balance or expenses you paid for the period. You may use this information to compare the ongoing costs of investing in the Fund and other funds. To do so, compare the 5% hypothetical example with the 5% hypothetical examples that appear in the shareholder reports of the other funds. In addition, each Fund, as a shareholder in underlying funds, will indirectly bear its pro rata share of the fees and expenses incurred by the underlying funds. These fees and expenses are not included in each Fund's annualized expense ratio used to calculate the expense estimates in the table below. If they were, the estimate of expense you paid during the period would be higher, and your ending account value lower.
Please note that the expenses shown in the table are meant to highlight your ongoing costs only and do not reflect any transactional costs, such as sales charges (loads), or redemption fees. Therefore, the second line of the table is useful in comparing ongoing costs only, and will not help you determine the relative total costs of owning different funds. In addition, if these transactional costs were included, your costs would have been higher.
calvert.com CALVERT ASSET ALLOCATION FUNDS ANNUAL REPORT (UNAUDITED) 13
| CALVERT CONSERVATIVE ALLOCATION FUND | ANNUALIZED EXPENSE RATIO | BEGINNING ACCOUNT VALUE 4/1/16 | ENDING ACCOUNT VALUE 9/30/16 | EXPENSES PAID DURING PERIOD* 4/1/16 - 9/30/16 |
| Class A | ||||
| Actual | 0.44% | $1,000.00 | $1,034.80 | $2.24 |
| Hypothetical (5% return per year before expenses) | 0.44% | $1,000.00 | $1,022.80 | $2.23 |
| Class C | ||||
| Actual | 1.19% | $1,000.00 | $1,030.70 | $6.04 |
| Hypothetical (5% return per year before expenses) | 1.19% | $1,000.00 | $1,019.05 | $6.01 |
| Class I | ||||
| Actual | 0.09% | $1,000.00 | $1,034.00 | $0.33 |
| Hypothetical (5% return per year before expenses) | 0.09% | $1,000.00 | $1,017.57 | $0.32 |
| Class Y | ||||
| Actual | 0.19% | $1,000.00 | $1,033.20 | $0.69 |
| Hypothetical (5% return per year before expenses) | 0.19% | $1,000.00 | $1,017.22 | $0.69 |
| * Expenses paid during the period are equal to the annualized expense ratio for each class as indicated above, multiplied by the average account value over the period, multiplied by 183/366 for class A and C (to reflect the one-half year period) and 131/366 for class I and Y (to reflect since inception date). Expenses do not include fees and expenses incurred indirectly from investment in underlying funds, including affiliated and unaffiliated companies. Expense ratios shown in the Financial Highlights represent the actual expenses incurred for the fiscal year. | ||||
| CALVERT MODERATE ALLOCATION FUND | ANNUALIZED EXPENSE RATIO | BEGINNING ACCOUNT VALUE 4/1/16 | ENDING ACCOUNT VALUE 9/30/16 | EXPENSES PAID DURING PERIOD* 4/1/16 - 9/30/16 |
| Class A | ||||
| Actual | 0.44% | $1,000.00 | $1,043.50 | $2.25 |
| Hypothetical (5% return per year before expenses) | 0.44% | $1,000.00 | $1,022.80 | $2.23 |
| Class C | ||||
| Actual | 1.19% | $1,000.00 | $1,039.50 | $6.07 |
| Hypothetical (5% return per year before expenses) | 1.19% | $1,000.00 | $1,019.05 | $6.01 |
| Class I | ||||
| Actual | 0.09% | $1,000.00 | $1,048.60 | $0.33 |
| Hypothetical (5% return per year before expenses) | 0.09% | $1,000.00 | $1,017.57 | $0.32 |
| Class Y | ||||
| Actual | 0.19% | $1,000.00 | $1,048.30 | $0.70 |
| Hypothetical (5% return per year before expenses) | 0.19% | $1,000.00 | $1,017.22 | $0.69 |
| * Expenses paid during the period are equal to the annualized expense ratio for each class as indicated above, multiplied by the average account value over the period, multiplied by 183/366 for class A and C (to reflect the one-half year period) and 131/366 for class I and Y (to reflect since inception date). Expenses do not include fees and expenses incurred indirectly from investment in underlying funds, including affiliated and unaffiliated companies. Expense ratios shown in the Financial Highlights represent the actual expenses incurred for the fiscal year. | ||||
14 calvert.com CALVERT ASSET ALLOCATION FUNDS ANNUAL REPORT (UNAUDITED)
| CALVERT AGGRESSIVE ALLOCATION FUND | ANNUALIZED EXPENSE RATIO | BEGINNING ACCOUNT VALUE 4/1/16 | ENDING ACCOUNT VALUE 9/30/16 | EXPENSES PAID DURING PERIOD* 4/1/16 - 9/30/16 |
| Class A | ||||
| Actual | 0.43% | $1,000.00 | $1,046.20 | $2.20 |
| Hypothetical (5% return per year before expenses) | 0.43% | $1,000.00 | $1,022.85 | $2.17 |
| Class C | ||||
| Actual | 1.18% | $1,000.00 | $1,042.10 | $6.02 |
| Hypothetical (5% return per year before expenses) | 1.18% | $1,000.00 | $1,019.10 | $5.96 |
| Class I | ||||
| Actual | 0.08% | $1,000.00 | $1,056.50 | $0.29 |
| Hypothetical (5% return per year before expenses) | 0.08% | $1,000.00 | $1,017.61 | $0.29 |
| Class Y | ||||
| Actual | 0.18% | $1,000.00 | $1,057.10 | $0.66 |
| Hypothetical (5% return per year before expenses) | 0.18% | $1,000.00 | $1,017.25 | $0.65 |
| * Expenses paid during the period are equal to the annualized expense ratio for each class as indicated above, multiplied by the average account value over the period, multiplied by 183/366 for class A and C (to reflect the one-half year period) and 131/366 for class I and Y (to reflect since inception date). Expenses do not include fees and expenses incurred indirectly from investment in underlying funds, including affiliated and unaffiliated companies. Expense ratios shown in the Financial Highlights represent the actual expenses incurred for the fiscal year. | ||||
calvert.com CALVERT ASSET ALLOCATION FUNDS ANNUAL REPORT (UNAUDITED) 15
REPORT OF INDEPENDENT REGISTERED PUBLIC ACCOUNTING FIRM
The Board of Trustees of Calvert Social Investment Fund and Shareholders of the Calvert Asset Allocation Funds:
We have audited the accompanying statements of assets and liabilities of the Calvert Conservative Allocation Fund, Calvert Moderate Allocation Fund, and Calvert Aggressive Allocation Fund (collectively the “Funds”), each a series of Calvert Social Investment Fund, including the schedules of investments as of September 30, 2016, and the related statements of operations for the year then ended, the statements of changes in net assets for each of the years in the two-year period then ended, and the financial highlights for each of the years or periods in the five-year period then ended. These financial statements and financial highlights are the responsibility of the Funds’ management. Our responsibility is to express an opinion on these financial statements and financial highlights based on our audits.
We conducted our audits in accordance with the standards of the Public Company Accounting Oversight Board (United States). Those standards require that we plan and perform the audit to obtain reasonable assurance about whether the financial statements and financial highlights are free of material misstatement. An audit includes examining, on a test basis, evidence supporting the amounts and disclosures in the financial statements. Our procedures included confirmation of securities owned as of September 30, 2016 by correspondence with the custodian, transfer agent, and brokers or by other appropriate auditing procedures. An audit also includes assessing the accounting principles used and significant estimates made by management, as well as evaluating the overall financial statement presentation. We believe that our audits provide a reasonable basis for our opinion.
In our opinion, the financial statements and financial highlights referred to above present fairly, in all material respects, the financial position of the Calvert Conservative Allocation Fund, Calvert Moderate Allocation Fund, and Calvert Aggressive Allocation Fund as of September 30, 2016, the results of their operations for the year then ended, the changes in their net assets for each of the years in the two-year period then ended, and the financial highlights for each of the years or periods in the five-year period then ended, in conformity with U.S. generally accepted accounting principles.
Philadelphia, Pennsylvania
November 23, 2016
16 calvert.com CALVERT ASSET ALLOCATION FUNDS ANNUAL REPORT
CALVERT CONSERVATIVE ALLOCATION FUND
SCHEDULE OF INVESTMENTS
SEPTEMBER 30, 2016
| SHARES | VALUE ($) | ||||
| MUTUAL FUNDS (a) - 99.9% | |||||
| Calvert Fund: | |||||
| Calvert High Yield Bond Fund, Class I | 256,200 | 6,899,470 | |||
| Calvert Ultra-Short Income Fund, Class I | 1,780,202 | 27,771,154 | |||
| Calvert Impact Fund, Inc.: | |||||
| Calvert Green Bond Fund, Class I | 63,290 | 989,228 | |||
| Calvert Small Cap Fund, Class I | 357,903 | 8,296,189 | |||
| Calvert Management Series: | |||||
| Calvert Unconstrained Bond Fund, Class I | 1,430,852 | 21,663,105 | |||
| Calvert Responsible Index Series, Inc.: | |||||
| Calvert U.S. Large Cap Core Responsible Index Fund, Class I | 1,001,238 | 19,283,834 | |||
| Calvert U.S. Large Cap Growth Responsible Index Fund, Class I | 282,542 | 5,859,922 | |||
| Calvert U.S. Large Cap Value Responsible Index Fund, Class I | 516,708 | 10,427,158 | |||
| Calvert Social Investment Fund: | |||||
| Calvert Bond Portfolio, Class I | 2,777,467 | 45,494,909 | |||
| Calvert World Values Fund, Inc.: | |||||
| Calvert Capital Accumulation Fund, Class I | 169,843 | 5,839,218 | |||
| Calvert Emerging Markets Equity Fund, Class I | 222,001 | 2,899,337 | |||
| Calvert International Equity Fund, Class I | 471,815 | 7,803,819 | |||
| Calvert International Opportunities Fund, Class I | 270,093 | 3,932,561 | |||
| Total Mutual Funds (Cost $163,718,496) | 167,159,904 | ||||
| TOTAL INVESTMENTS (Cost $163,718,496) - 99.9% | 167,159,904 | ||||
| Other assets and liabilities, net - 0.1% | 188,000 | ||||
NET ASSETS - 100.0% | $167,347,904 | ||||
| FUTURES | NUMBER OF CONTRACTS | EXPIRATION DATE | UNDERLYING FACE AMOUNT AT VALUE | UNREALIZED APPRECIATION (DEPRECIATION) | |||||
| Short: | |||||||||
| E-Mini S&P 500 Index | (60) | 12/16 | ($6,481,200 | ) | ($133,309 | ) | |||
| MSCI EAFE Mini Index | (6) | 12/16 | (512,010) | (5,443) | |||||
| MSCI Emerging Markets Mini Index | (25) | 12/16 | (1,140,625) | (25,055) | |||||
| Russell 2000 Mini Index | (36) | 12/16 | (4,493,880) | (137,425) | |||||
| Total Short | ($301,232 | ) | |||||||
| NOTES TO SCHEDULE OF INVESTMENTS |
| (a) Affiliated company. |
| See notes to financial statements. |
calvert.com CALVERT ASSET ALLOCATION FUNDS ANNUAL REPORT 17
CALVERT MODERATE ALLOCATION FUND
SCHEDULE OF INVESTMENTS
SEPTEMBER 30, 2016
| SHARES | VALUE ($) | ||||
| MUTUAL FUNDS (a) - 100.0% | |||||
| Calvert Fund: | |||||
| Calvert High Yield Bond Fund, Class I | 279,005 | 7,513,595 | |||
| Calvert Ultra-Short Income Fund, Class I | 12,751 | 198,918 | |||
| Calvert Impact Fund, Inc.: | |||||
| Calvert Green Bond Fund, Class I | 60,568 | 946,670 | |||
| Calvert Small Cap Fund, Class I | 943,512 | 21,870,608 | |||
| Calvert Management Series: | |||||
| Calvert Unconstrained Bond Fund, Class I | 1,455,944 | 22,042,988 | |||
| Calvert Responsible Index Series, Inc.: | |||||
| Calvert U.S. Large Cap Core Responsible Index Fund, Class I | 2,569,639 | 49,491,256 | |||
| Calvert U.S. Large Cap Growth Responsible Index Fund, Class I | 879,752 | 18,246,053 | |||
| Calvert U.S. Large Cap Value Responsible Index Fund, Class I | 1,608,835 | 32,466,296 | |||
| Calvert Social Investment Fund: | |||||
| Calvert Bond Portfolio, Class I | 2,481,520 | 40,647,295 | |||
| Calvert World Values Fund, Inc.: | |||||
| Calvert Capital Accumulation Fund,Class I | 343,906 | 11,823,494 | |||
| Calvert Emerging Markets Equity Fund, Class I | 687,712 | 8,981,518 | |||
| Calvert International Equity Fund, Class I | 1,257,575 | 20,800,286 | |||
| Calvert International Opportunities Fund, Class I | 885,843 | 12,897,867 | |||
| Total Mutual Funds (Cost $239,790,619) | 247,926,844 | ||||
| TOTAL INVESTMENTS (Cost $239,790,619) - 100.0% | 247,926,844 | ||||
| Other assets and liabilities, net - 0.0% | 120,690 | ||||
NET ASSETS - 100.0% | $248,047,534 | ||||
| FUTURES | NUMBER OF CONTRACTS | EXPIRATION DATE | UNDERLYING FACE AMOUNT AT VALUE | UNREALIZED APPRECIATION (DEPRECIATION) | ||||||
| Long: | ||||||||||
| MSCI EAFE Mini Index | 27 | 12/16 | $2,304,045 | $24,240 | ||||||
| Short: | ||||||||||
| E-Mini S&P 500 Index | (37) | 12/16 | ($3,996,740 | ) | ($82,207 | ) | ||||
| MSCI Emerging Markets Mini Index | (29) | 12/16 | (1,323,125) | (29,064) | ||||||
| Russell 2000 Mini Index | (82) | 12/16 | (10,236,060) | (313,024) | ||||||
| Total Short | ($424,295 | ) | ||||||||
| NOTES TO SCHEDULE OF INVESTMENTS |
| (a) Affiliated company. |
| See notes to financial statements. |
18 calvert.com CALVERT ASSET ALLOCATION FUNDS ANNUAL REPORT
CALVERT AGGRESSIVE ALLOCATION FUND
SCHEDULE OF INVESTMENTS
SEPTEMBER 30, 2016
| SHARES | VALUE ($) | ||||
| MUTUAL FUNDS (a) - 100.1% | |||||
| Calvert Impact Fund, Inc.: | |||||
| Calvert Small Cap Fund, Class I | 525,290 | 12,176,221 | |||
| Calvert Management Series: | |||||
| Calvert Unconstrained Bond Fund, Class I | 186,452 | 2,822,880 | |||
| Calvert Responsible Index Series, Inc.: | |||||
| Calvert U.S. Large Cap Core Responsible Index Fund, Class I | 1,654,004 | 31,856,109 | |||
| Calvert U.S. Large Cap Growth Responsible Index Fund, Class I | 581,436 | 12,058,980 | |||
| Calvert U.S. Large Cap Value Responsible Index Fund, Class I | 1,075,651 | 21,706,634 | |||
| Calvert Social Investment Fund: | |||||
| Calvert Bond Portfolio, Class I | 273,098 | 4,473,343 | |||
| Calvert World Values Fund, Inc.: | |||||
| Calvert Capital Accumulation Fund, Class I | 202,450 | 6,960,240 | |||
| Calvert Emerging Markets Equity Fund, Class I | 445,555 | 5,818,953 | |||
| Calvert International Equity Fund, Class I | 843,032 | 13,943,755 | |||
| Calvert International Opportunities Fund, Class I | 730,076 | 10,629,912 | |||
| Total Mutual Funds (Cost $118,630,855) | 122,447,027 | ||||
| TOTAL INVESTMENTS (Cost $118,630,855) - 100.1% | 122,447,027 | ||||
| Other assets and liabilities, net - (0.1%) | (142,337) | ||||
NET ASSETS - 100.0% | $122,304,690 | ||||
| FUTURES | NUMBER OF CONTRACTS | EXPIRATION DATE | UNDERLYING FACE AMOUNT AT VALUE | UNREALIZED APPRECIATION (DEPRECIATION) | ||||||
| Long: | ||||||||||
| MSCI EAFE Mini Index | 3 | 12/16 | $256,005 | $2,693 | ||||||
| Short: | ||||||||||
| Russell 2000 Mini Index | (34) | 12/16 | ($4,244,220 | ) | ($129,790 | ) | ||||
| NOTES TO SCHEDULE OF INVESTMENTS |
| (a) Affiliated company. |
| See notes to financial statements. |
calvert.com CALVERT ASSET ALLOCATION FUNDS ANNUAL REPORT 19
CALVERT CONSERVATIVE ALLOCATION FUND
STATEMENT OF ASSETS AND LIABILITIES
SEPTEMBER 30, 2016
| ASSETS | ||||
| Investments in affiliated securities, at value (Cost $163,718,496) - see accompanying schedule | $ | 167,159,904 | ||
| Cash | 1,196 | |||
| Cash collateral at broker | 557,600 | |||
| Receivable for securities sold | 403,056 | |||
| Receivable for shares sold | 86,219 | |||
| Trustees' deferred compensation plan | 90,765 | |||
| Receivable from Calvert Investment Management, Inc. | 24,449 | |||
| Total assets | 168,323,189 | |||
| LIABILITIES | ||||
| Payable for securities purchased | 245,193 | |||
| Payable for shares redeemed | 360,287 | |||
| Payable for futures contracts variation margin | 108,790 | |||
| Payable to Calvert Investment Distributors, Inc. | 55,439 | |||
| Payable to Calvert Investment Administrative Services, Inc. | 16,448 | |||
| Payable to Calvert Investment Services, Inc. | 1,887 | |||
| Payable for Trustees' fees and expenses | 3,725 | |||
| Trustees' deferred compensation plan | 90,765 | |||
| Accrued expenses and other liabilities | 92,751 | |||
| Total liabilities | 975,285 | |||
| NET ASSETS | $ | 167,347,904 | ||
| NET ASSETS CONSIST OF: | ||||
| Paid-in capital applicable to the following shares of beneficial interest, | ||||
| unlimited number of no par value shares authorized: | ||||
| Class A: 7,982,657 shares outstanding | $ | 128,616,501 | ||
| Class C: 2,108,784 shares outstanding | 33,564,769 | |||
| Class I: 62,745 shares outstanding | 1,008,373 | |||
| Class Y: 24,500 shares outstanding | 401,007 | |||
| Undistributed net investment income | 19,815 | |||
| Accumulated net realized gain (loss) | 597,263 | |||
| Net unrealized appreciation (depreciation) | 3,140,176 | |||
| NET ASSETS | $ | 167,347,904 | ||
| NET ASSET VALUE PER SHARE | ||||
| Class A (based on net assets of $131,575,990) | $ | 16.48 | ||
| Class C (based on net assets of $34,334,285) | $ | 16.28 | ||
| Class I (based on net assets of $1,033,995) | $ | 16.48 | ||
| Class Y (based on net assets of $403,634) | $ | 16.47 | ||
| See notes to financial statements. | ||||
20 calvert.com CALVERT ASSET ALLOCATION FUNDS ANNUAL REPORT
CALVERT MODERATE ALLOCATION FUND
STATEMENT OF ASSETS AND LIABILITIES
SEPTEMBER 30, 2016
| ASSETS | ||||
| Investments in affiliated securities, at value (Cost $239,790,619) - see accompanying schedule | $ | 247,926,844 | ||
| Cash | 3,492 | |||
| Cash collateral at broker | 644,517 | |||
| Receivable for securities sold | 1,177,024 | |||
| Receivable for shares sold | 205,640 | |||
| Trustees' deferred compensation plan | 143,565 | |||
| Receivable from Calvert Investment Management, Inc. | 31,945 | |||
| Total assets | 250,133,027 | |||
| LIABILITIES | ||||
| Payable for securities purchased | 1,046,409 | |||
| Payable for shares redeemed | 535,485 | |||
| Payable for futures contracts variation margin | 120,070 | |||
| Payable to Calvert Investment Distributors, Inc. | 77,087 | |||
| Payable to Calvert Investment Administrative Services, Inc. | 24,447 | |||
| Payable to Calvert Investment Services, Inc. | 4,304 | |||
| Payable for Trustees' fees and expenses | 5,564 | |||
| Trustees' deferred compensation plan | 143,565 | |||
| Accrued expenses and other liabilities | 128,562 | |||
| Total liabilities | 2,085,493 | |||
| NET ASSETS | $ | 248,047,534 | ||
| NET ASSETS CONSIST OF: | ||||
| Paid-in capital applicable to the following shares of beneficial interest, | ||||
| unlimited number of no par value shares authorized: | ||||
| Class A: 11,416,182 shares outstanding | $ | 195,739,939 | ||
| Class C: 2,494,681 shares outstanding | 41,842,509 | |||
| Class I: 58,744 shares outstanding | 1,004,593 | |||
| Class Y: 22,249 shares outstanding | 391,781 | |||
| Undistributed net investment income | 17,879 | |||
| Accumulated net realized gain (loss) | 1,314,663 | |||
| Net unrealized appreciation (depreciation) | 7,736,170 | |||
| NET ASSETS | $ | 248,047,534 | ||
| NET ASSET VALUE PER SHARE | ||||
| Class A (based on net assets of $203,906,883) | $ | 17.86 | ||
| Class C (based on net assets of $42,694,800) | $ | 17.11 | ||
| Class I (based on net assets of $1,048,639) | $ | 17.85 | ||
| Class Y (based on net assets of $397,212) | $ | 17.85 | ||
| See notes to financial statements. | ||||
calvert.com CALVERT ASSET ALLOCATION FUNDS ANNUAL REPORT 21
CALVERT AGGRESSIVE ALLOCATION FUND
STATEMENT OF ASSETS AND LIABILITIES
SEPTEMBER 30, 2016
| ASSETS | ||||
| Investments in affiliated securities, at value (Cost $118,630,855) - see accompanying schedule | $ | 122,447,027 | ||
| Cash | 2,730 | |||
| Cash collateral at broker | 193,505 | |||
| Receivable for securities sold | 920,347 | |||
| Receivable for shares sold | 31,648 | |||
| Securities lending income receivable | 16 | |||
| Trustees' deferred compensation plan | 69,695 | |||
| Receivable from Calvert Investment Management, Inc. | 24,125 | |||
| Total assets | 123,689,093 | |||
| LIABILITIES | ||||
| Payable for securities purchased | 702,496 | |||
| Payable for shares redeemed | 429,348 | |||
| Payable for futures contracts variation margin | 38,875 | |||
| Payable to Calvert Investment Distributors, Inc. | 35,921 | |||
| Payable to Calvert Investment Administrative Services, Inc. | 12,058 | |||
| Payable to Calvert Investment Services, Inc. | 3,090 | |||
| Payable for Trustees' fees and expenses | 2,754 | |||
| Trustees' deferred compensation plan | 69,695 | |||
| Accrued expenses and other liabilities | 90,166 | |||
| Total liabilities | 1,384,403 | |||
| NET ASSETS | $ | 122,304,690 | ||
| NET ASSETS CONSIST OF: | ||||
| Paid-in capital applicable to the following shares of beneficial interest, | ||||
| unlimited number of no par value shares authorized: | ||||
| Class A: 5,714,119 shares outstanding | $ | 99,478,812 | ||
| Class C: 1,108,998 shares outstanding | 18,049,588 | |||
| Class I: 58,241 shares outstanding | 1,000,000 | |||
| Class Y: 7,227 shares outstanding | 125,251 | |||
| Distributions in excess of net investment income | (88,905) | |||
| Accumulated net realized gain (loss) | 50,869 | |||
| Net unrealized appreciation (depreciation) | 3,689,075 | |||
| NET ASSETS | $ | 122,304,690 | ||
| NET ASSET VALUE PER SHARE | ||||
| Class A (based on net assets of $103,538,728) | $ | 18.12 | ||
| Class C (based on net assets of $17,578,345) | $ | 15.85 | ||
| Class I (based on net assets of $1,056,414) | $ | 18.14 | ||
| Class Y (based on net assets of $131,203) | $ | 18.15 | ||
| See notes to financial statements. | ||||
22 calvert.com CALVERT ASSET ALLOCATION FUNDS ANNUAL REPORT
CALVERT ALLOCATION FUNDS
STATEMENTS OF OPERATIONS
YEAR ENDED SEPTEMBER 30, 2016
| NET INVESTMENT INCOME | Calvert Conservative Allocation Fund | Calvert Moderate Allocation Fund | Calvert Aggressive Allocation Fund | ||||||||
| Investment Income: | |||||||||||
| Dividend income from affiliated securities | $3,619,619 | $4,675,701 | $1,733,581 | ||||||||
| Dividend income from unaffiliated securities | 43,019 | 83,961 | 52,333 | ||||||||
| Securities lending income | — | 121 | 61 | ||||||||
| Interest income | 8 | 15 | 8 | ||||||||
| Total investment income | 3,662,646 | 4,759,798 | 1,785,983 | ||||||||
| Expenses: | |||||||||||
| Administrative fees | 202,893 | 311,058 | 152,492 | ||||||||
| Transfer agency fees and expenses: | |||||||||||
| Class A | 146,436 | 273,545 | 195,658 | ||||||||
| Class C | 39,692 | 60,333 | 34,240 | ||||||||
| Class I (a) | 2,147 | 612 | 612 | ||||||||
| Class Y (a) | 2,165 | 2,162 | 2,154 | ||||||||
| Distribution Plan expenses: | |||||||||||
| Class A | 309,475 | 492,165 | 249,481 | ||||||||
| Class C | 323,788 | 420,382 | 171,849 | ||||||||
| Trustees' fees and expenses | 17,403 | 26,572 | 13,033 | ||||||||
| Accounting fees | 25,317 | 25,354 | 25,338 | ||||||||
| Custodian fees | 43,681 | 43,926 | 40,899 | ||||||||
| Professional fees | 34,935 | 38,533 | 33,470 | ||||||||
| Registration fees | 34,542 | 37,782 | 32,509 | ||||||||
| Reports to shareholders | 16,013 | 33,571 | 24,320 | ||||||||
| Contract services | 96,084 | 292,695 | 77,502 | ||||||||
| Miscellaneous | 16,697 | 15,796 | 8,811 | ||||||||
| Total expenses | 1,311,268 | 2,074,486 | 1,062,368 | ||||||||
| Reimbursement from Advisor: | |||||||||||
| Class A | (282,554) | (324,586) | (348,951) | ||||||||
| Class C | (60,076) | (77,245) | (48,903) | ||||||||
| Class I (a) | (3,208) | (1,647) | (1,799) | ||||||||
| Class Y (a) | (2,556) | (2,636) | (2,535) | ||||||||
| Administrative fees waived | (7,586) | (11,837) | (5,750) | ||||||||
| Net expenses | 955,288 | 1,656,535 | 654,430 | ||||||||
| NET INVESTMENT INCOME | 2,707,358 | 3,103,263 | 1,131,553 | ||||||||
| See notes to financial statements. | |||||||||||
calvert.com CALVERT ASSET ALLOCATION FUNDS ANNUAL REPORT 23
CALVERT ALLOCATION FUNDS STATEMENTS OF OPERATIONS - CONT’D YEAR ENDED SEPTEMBER 30, 2016 | |||||||||||
| REALIZED AND UNREALIZED GAIN (LOSS) | Calvert Conservative Allocation Fund | Calvert Moderate Allocation Fund | Calvert Aggressive Allocation Fund | ||||||||
| Net realized gain (loss) on: | |||||||||||
| Investments in unaffiliated securities | ($179,524 | ) | ($271,222 | ) | ($131,192 | ) | |||||
| Investments in affiliated securities | 1,489,228 | 17,271,960 | 9,731,986 | ||||||||
| Futures | (773,116) | (910,275) | (274,761) | ||||||||
| Capital gain distributions from affiliated investments | 1,830,258 | 4,846,964 | 3,033,352 | ||||||||
| Capital gain distributions from unaffiliated investments | 17,109 | 49,962 | 39,067 | ||||||||
| 2,383,955 | 20,987,389 | 12,398,452 | |||||||||
| Change in unrealized appreciation (depreciation) on: | |||||||||||
| Investments in unaffiliated securities | 150,576 | 235,616 | 118,991 | ||||||||
| Investments in affiliated securities | 3,500,498 | (7,500,317) | (4,535,004) | ||||||||
| Futures | (558,605) | (581,211) | (163,063) | ||||||||
| 3,092,469 | (7,845,912) | (4,579,076) | |||||||||
| NET REALIZED AND UNREALIZED GAIN | 5,476,424 | 13,141,477 | 7,819,376 | ||||||||
| INCREASE (DECREASE) IN NET ASSETS RESULTING FROM OPERATIONS | $8,183,782 | $16,244,740 | $8,950,929 | ||||||||
| (a) From May 20, 2016 inception. | |||||||||||
| See notes to financial statements. | |||||||||||
24 calvert.com CALVERT ASSET ALLOCATION FUNDS ANNUAL REPORT
CALVERT CONSERVATIVE ALLOCATION FUND
STATEMENTS OF CHANGES IN NET ASSETS
| INCREASE (DECREASE) IN NET ASSETS | YEAR ENDED SEPTEMBER 30, 2016 | YEAR ENDED SEPTEMBER 30, 2015 | |||||
| Operations: | |||||||
| Net investment income | $2,707,358 | $2,052,857 | |||||
| Net realized gain (loss) | 2,383,955 | 4,826,500 | |||||
| Net change in unrealized appreciation (depreciation) | 3,092,469 | (5,232,870) | |||||
| INCREASE (DECREASE) IN NET ASSETS RESULTING FROM OPERATIONS | 8,183,782 | 1,646,487 | |||||
| Distributions to shareholders from: | |||||||
| Net investment income: | |||||||
| Class A shares | (2,343,775) | (1,795,869) | |||||
| Class C shares | (349,630) | (257,442) | |||||
| Class I shares (a) | (8,405) | — | |||||
| Class Y shares (a) | (1,983) | — | |||||
| Net realized gain: | |||||||
| Class A shares | (4,753,391) | (3,780,010) | |||||
| Class C shares | (1,254,611) | (1,053,301) | |||||
| Total distributions | (8,711,795) | (6,886,622) | |||||
| Capital share transactions: | |||||||
| Shares sold: | |||||||
| Class A shares | 35,860,887 | 36,241,561 | |||||
| Class C shares | 7,594,658 | 9,130,945 | |||||
| Class I shares (a) | 1,000,000 | — | |||||
| Class Y shares (a) | 403,003 | — | |||||
| Reinvestment of distributions: | |||||||
| Class A shares | 6,566,581 | 5,254,117 | |||||
| Class C shares | 1,393,915 | 1,131,379 | |||||
| Class I shares (a) | 8,405 | — | |||||
| Class Y shares (a) | 1,983 | — | |||||
| Redemption fees: | |||||||
| Class A shares | — | 96 | |||||
| Shares redeemed: | |||||||
| Class A shares | (23,287,750) | (16,696,197) | |||||
| Class C shares | (4,474,018) | (4,422,091) | |||||
| Class Y shares (a) | (3,974) | — | |||||
| Total capital share transactions | 25,063,690 | 30,639,810 | |||||
| TOTAL INCREASE IN NET ASSETS | 24,535,677 | 25,399,675 | |||||
| NET ASSETS | |||||||
| Beginning of year | 142,812,227 | 117,412,552 | |||||
| End of year (including undistributed net investment income of $19,815 and $11,213, respectively) | $167,347,904 | $142,812,227 | |||||
| See notes to financial statements. | |||||||
calvert.com CALVERT ASSET ALLOCATION FUNDS ANNUAL REPORT 25
CALVERT CONSERVATIVE ALLOCATION FUND STATEMENTS OF CHANGES IN NET ASSETS - CONT’D | |||||||
| CAPITAL SHARE ACTIVITY | YEAR ENDED SEPTEMBER 30, 2016 | YEAR ENDED SEPTEMBER 30, 2015 | |||||
| Shares sold: | |||||||
| Class A shares | 2,210,495 | 2,118,350 | |||||
| Class C shares | 473,596 | 538,322 | |||||
| Class I shares (a) | 62,228 | — | |||||
| Class Y shares (a) | 24,620 | — | |||||
| Reinvestment of distributions: | |||||||
| Class A shares | 407,437 | 310,457 | |||||
| Class C shares | 87,676 | 67,652 | |||||
| Class I shares (a) | 517 | — | |||||
| Class Y shares (a) | 121 | — | |||||
| Shares redeemed: | |||||||
| Class A shares | (1,441,367) | (975,144) | |||||
| Class C shares | (277,824) | (261,111) | |||||
| Class Y shares (a) | (241) | — | |||||
| Total capital share activity | 1,547,258 | 1,798,526 | |||||
| (a) From May 20, 2016 inception. | |||||||
| See notes to financial statements. | |||||||
26 calvert.com CALVERT ASSET ALLOCATION FUNDS ANNUAL REPORT
CALVERT MODERATE ALLOCATION FUND
STATEMENTS OF CHANGES IN NET ASSETS
| INCREASE (DECREASE) IN NET ASSETS | YEAR ENDED SEPTEMBER 30, 2016 | YEAR ENDED SEPTEMBER 30, 2015 | |||||
| Operations: | |||||||
| Net investment income | $3,103,263 | $2,294,821 | |||||
| Net realized gain (loss) | 20,987,389 | 13,284,027 | |||||
| Net change in unrealized appreciation (depreciation) | (7,845,912) | (14,773,181) | |||||
| INCREASE (DECREASE) IN NET ASSETS RESULTING FROM OPERATIONS | 16,244,740 | 805,667 | |||||
| Distributions to shareholders from: | |||||||
| Net investment income: | |||||||
| Class A shares | (2,749,340) | (2,015,631) | |||||
| Class C shares | (346,300) | (280,360) | |||||
| Class I shares (a) | (4,593) | — | |||||
| Class Y shares (a) | (963) | — | |||||
| Net realized gain: | |||||||
| Class A shares | (20,286,828) | (8,361,092) | |||||
| Class C shares | (4,514,786) | (1,848,044) | |||||
| Total distributions | (27,902,810) | (12,505,127) | |||||
| Capital share transactions: | |||||||
| Shares sold: | |||||||
| Class A shares | 33,855,020 | 37,567,503 | |||||
| Class C shares | 7,044,216 | 7,748,416 | |||||
| Class I shares (a) | 1,000,000 | — | |||||
| Class Y shares (a) | 391,072 | — | |||||
| Reinvestment of distributions: | |||||||
| Class A shares | 21,894,759 | 9,820,361 | |||||
| Class C shares | 4,377,995 | 1,905,018 | |||||
| Class I shares (a) | 4,593 | — | |||||
| Class Y shares (a) | 963 | — | |||||
| Redemption fees: | |||||||
| Class A shares | — | 206 | |||||
| Class C shares | — | 280 | |||||
| Shares redeemed: | |||||||
| Class A shares | (31,766,694) | (20,802,945) | |||||
| Class C shares | (7,028,522) | (4,176,414) | |||||
| Class Y shares (a) | (254) | — | |||||
| Total capital share transactions | 29,773,148 | 32,062,425 | |||||
| TOTAL INCREASE IN NET ASSETS | 18,115,078 | 20,362,965 | |||||
| NET ASSETS | |||||||
| Beginning of year | 229,932,456 | 209,569,491 | |||||
| End of year (including undistributed net investment income of $17,879 and $15,829, respectively) | $248,047,534 | $229,932,456 | |||||
| See notes to financial statements. | |||||||
calvert.com CALVERT ASSET ALLOCATION FUNDS ANNUAL REPORT 27
CALVERT MODERATE ALLOCATION FUND STATEMENTS OF CHANGES IN NET ASSETS - CONT’D | |||||||
| CAPITAL SHARE ACTIVITY | YEAR ENDED SEPTEMBER 30, 2016 | YEAR ENDED SEPTEMBER 30, 2015 | |||||
| Shares sold: | |||||||
| Class A shares | 1,925,291 | 1,900,604 | |||||
| Class C shares | 417,535 | 405,055 | |||||
| Class I shares (a) | 58,480 | — | |||||
| Class Y shares (a) | 22,208 | — | |||||
| Reinvestment of distributions: | |||||||
| Class A shares | 1,263,831 | 505,231 | |||||
| Class C shares | 263,626 | 101,462 | |||||
| Class I shares (a) | 264 | — | |||||
| Class Y shares (a) | 55 | — | |||||
| Shares redeemed: | |||||||
| Class A shares | (1,825,443) | (1,052,777) | |||||
| Class C shares | (419,450) | (218,171) | |||||
| Class Y shares (a) | (14) | — | |||||
| Total capital share activity | 1,706,383 | 1,641,404 | |||||
| (a) From May 20, 2016 inception. | |||||||
| See notes to financial statements. | |||||||
28 calvert.com CALVERT ASSET ALLOCATION FUNDS ANNUAL REPORT
CALVERT AGGRESSIVE ALLOCATION FUND
STATEMENTS OF CHANGES IN NET ASSETS
| INCREASE (DECREASE) IN NET ASSETS | YEAR ENDED SEPTEMBER 30, 2016 | YEAR ENDED SEPTEMBER 30, 2015 | |||||
| Operations: | |||||||
| Net investment income | $1,131,553 | $959,428 | |||||
| Net realized gain (loss) | 12,398,452 | 8,454,805 | |||||
| Net change in unrealized appreciation (depreciation) | (4,579,076) | (10,095,776) | |||||
| INCREASE (DECREASE) IN NET ASSETS RESULTING FROM OPERATIONS | 8,950,929 | (681,543) | |||||
| Distributions to shareholders from: | |||||||
| Net investment income: | |||||||
| Class A shares | (874,747) | (898,536) | |||||
| Class C shares | — | (118,856) | |||||
| Net realized gain: | |||||||
| Class A shares | (12,520,504) | (5,217,327) | |||||
| Class C shares | (2,394,715) | (1,034,039) | |||||
| Total distributions | (15,789,966) | (7,268,758) | |||||
| Capital share transactions: | |||||||
| Shares sold: | |||||||
| Class A shares | 20,492,763 | 24,457,754 | |||||
| Class C shares | 2,861,760 | 4,151,635 | |||||
| Class I shares (a) | 1,000,000 | — | |||||
| Class Y shares (a) | 125,251 | — | |||||
| Reinvestment of distributions: | |||||||
| Class A shares | 12,959,041 | 5,871,770 | |||||
| Class C shares | 2,204,296 | 1,072,226 | |||||
| Redemption fees: | |||||||
| Class A shares | — | 120 | |||||
| Class C shares | — | 19 | |||||
| Shares redeemed: | |||||||
| Class A shares | (18,153,215) | (12,824,083) | |||||
| Class C shares | (2,674,124) | (2,017,036) | |||||
| Total capital share transactions | 18,815,772 | 20,712,405 | |||||
| TOTAL INCREASE IN NET ASSETS | 11,976,735 | 12,762,104 | |||||
| NET ASSETS | |||||||
| Beginning of year | 110,327,955 | 97,565,851 | |||||
End of year (including distributions in excess of net investment income of ($88,905) and ($345,673), respectively) | $122,304,690 | $110,327,955 | |||||
| See notes to financial statements. | |||||||
calvert.com CALVERT ASSET ALLOCATION FUNDS ANNUAL REPORT 29
CALVERT AGGRESSIVE ALLOCATION FUND STATEMENTS OF CHANGES IN NET ASSETS - CONT’D | |||||||
| CAPITAL SHARE ACTIVITY | YEAR ENDED SEPTEMBER 30, 2016 | YEAR ENDED SEPTEMBER 30, 2015 | |||||
| Shares sold: | |||||||
| Class A shares | 1,137,360 | 1,182,438 | |||||
| Class C shares | 181,771 | 224,283 | |||||
| Class I shares (a) | 58,241 | — | |||||
| Class Y shares (a) | 7,227 | — | |||||
| Reinvestment of distributions: | |||||||
| Class A shares | 739,616 | 292,725 | |||||
| Class C shares | 144,071 | 59,647 | |||||
| Shares redeemed: | |||||||
| Class A shares | (1,023,579) | (628,431) | |||||
| Class C shares | (169,665) | (109,216) | |||||
| Total capital share activity | 1,075,042 | 1,021,446 | |||||
| (a) From May 20, 2016 inception. | |||||||
| See notes to financial statements. | |||||||
30 calvert.com CALVERT ASSET ALLOCATION FUNDS ANNUAL REPORT
NOTES TO FINANCIAL STATEMENTS
NOTE A — SIGNIFICANT ACCOUNTING POLICIES
General: Calvert Social Investment Fund (the “Trust”) was organized as a business trust under the laws of the state of Massachusetts by a Declaration of Trust filed on December 14, 1981, and is registered under the Investment Company Act of 1940, as amended (the “1940 Act”), as an open-end management investment company. The Trust has authorized an unlimited number of shares of beneficial interest (“shares”) without par value. The Trust operates six (6) separate series, or mutual funds, each with its own investment objective(s) and strategies. This report contains the financial statements and financial highlights of the three (3) funds listed below (each, a “Fund” and collectively, the “Funds”):
| • | Calvert Conservative Allocation Fund (“Conservative”), |
| • | Calvert Moderate Allocation Fund (“Moderate”), and |
| • | Calvert Aggressive Allocation Fund (“Aggressive”). |
The Funds are diversified and invest primarily in a combination of other Calvert equity and fixed income funds (the “Underlying Funds”). The operations of each series of the Trust, including the Funds, are accounted for separately. The Funds apply the accounting and reporting guidance in the Financial Accounting Standards Board (FASB) Accounting Standards Codification Topic 946, Financial Services - Investment Companies (ASC 946).
Each Fund generally offers Class A, Class C, Class I, and Class Y shares. Class A shares are sold with a maximum front-end sales charge of 4.75%. However, the front-end sales charge is waived for shareholders investing in Class A shares directly with the Funds in an account maintained by Calvert Investment Distributors, Inc. (“Distributor”) or without a specified broker-dealer or financial adviser (“Direct Account”). Class C shares are not available for purchase in Direct Accounts. For non-Direct Accounts, Class C shares are sold without a front-end sales charge, and with certain exceptions, will be charged a contingent deferred sales charge on shares sold within one year of purchase. Class C shares have higher levels of expenses than Class A shares. Class I shares require a minimum account balance of $1 million. The $1 million minimum initial investment is waived for retirement plans that trade through omnibus accounts and may be waived in certain other instances where it is believed to be in the best interest of the Fund and its shareholders. Class I shares have no front-end or contingent deferred sales charge and have lower levels of expenses than Class A shares. Class Y shares are generally only available to wrap or similar fee-based programs offered by financial intermediaries, and retirement plans, foundations, endowments and other consultant-driven business, that have entered into an agreement with the Fund’s Distributor to offer Class Y shares to their clients. Class Y shares have no front-end or contingent deferred sales charge and have lower levels of expenses than Class A shares. Among other things, each class has different: (a) dividend rates, due to differences in Distribution Plan expenses and other class-specific expenses; (b) exchange privileges; and (c) class-specific voting rights.
Security Valuation: Net asset value per share is determined every business day as of the close of the regular session of the New York Stock Exchange (generally 4:00 p.m. Eastern time). The Funds use independent pricing services approved by the Board of Trustees (“the Board”) to value their investments wherever possible. Investments for which market quotations are not available or deemed not reliable are fair valued in good faith under the direction of the Board.
The Board has adopted Valuation Procedures (the “Procedures”) to determine the fair value of securities and other financial instruments for which market prices are not readily available or which may not be reliably priced. The Board has delegated the day-to-day responsibility for determining the fair value of assets of the Funds to Calvert Investment Management, Inc. (the “Advisor” or “Calvert”) and has provided these Procedures to govern Calvert in its valuation duties.
Calvert has chartered an internal Valuation Committee to oversee the implementation of these Procedures and to assist it in carrying out the valuation responsibilities that the Board has delegated.
The Valuation Committee meets on a regular basis to review illiquid securities and other investments which may not have readily available market prices. The Valuation Committee’s fair valuation determinations are subject to review, approval and ratification by the Board at its next regularly scheduled meeting covering the calendar quarter in which the fair valuation was determined.
The Valuation Committee utilizes various methods to measure the fair value of the Funds’ investments. U.S. generally accepted accounting principles (GAAP) establishes a disclosure hierarchy that categorizes the inputs to valuation techniques used to value assets and liabilities at measurement date. These inputs are summarized in the three broad levels listed below:
Level 1 - quoted prices in active markets for identical securities
Level 2 - other significant observable inputs (including quoted prices for similar securities, interest rates, prepayment speeds, credit risk, etc.)
Level 3 - significant unobservable inputs (including the Funds’ own assumptions in determining the fair value of investments)
calvert.com CALVERT ASSET ALLOCATION FUNDS ANNUAL REPORT 31
The inputs or methodologies used for valuing securities are not necessarily an indication of the risk associated with investing in those securities.
Changes in valuation techniques may result in transfers in or out of an investment’s assigned level within the hierarchy during the year. Transfers in and/or out of levels are determined based on the fair value of such securities at the end of the year. Valuation techniques used to value the Funds investments by major category are as follows:
Investments in the Underlying Funds are valued at their closing net asset value each business day and are categorized as Level 1 in the hierarchy. Valuation methodologies and policies of the Underlying Funds are included in their financial statements, which are available upon request.
Exchange-traded products are valued at the official closing price as reported by an independent pricing service on the primary market or exchange on which they are traded and are categorized as Level 1 in the hierarchy.
Futures contracts are valued at unrealized appreciation (depreciation) based on the settlement price established each day by the board of trade or exchange on which they are traded and are categorized as Level 1 in the hierarchy.
The following tables summarize the market value of each of the Fund's holdings as of September 30, 2016, based on the inputs used to value them:
| CONSERVATIVE | VALUATION INPUTS | ||||||||
| INVESTMENTS IN SECURITIES* | LEVEL 1 | LEVEL 2 | LEVEL 3 | TOTAL | |||||
| Mutual Funds | $167,159,904 | $— | $— | $167,159,904 | |||||
| TOTAL | $167,159,904 | $— | $— | $167,159,904 | |||||
| Futures Contracts** | ($301,232 | ) | $— | $— | ($301,232 | ) | |||
| * For a complete listing of investments, please refer to the Schedule of Investments. | |||||||||
| ** The value listed for these securities reflects unrealized appreciation (depreciation) as shown on the Schedule of Investments. | |||||||||
There were no transfers between levels during the year.
| MODERATE | VALUATION INPUTS | ||||||||
| INVESTMENTS IN SECURITIES* | LEVEL 1 | LEVEL 2 | LEVEL 3 | TOTAL | |||||
| Mutual Funds | $247,926,844 | $— | $— | $247,926,844 | |||||
| TOTAL | $247,926,844 | $— | $— | $247,926,844 | |||||
| Futures Contracts** | ($400,055 | ) | $— | $— | ($400,055 | ) | |||
| * For a complete listing of investments, please refer to the Schedule of Investments. | |||||||||
| ** The value listed for these securities reflects unrealized appreciation (depreciation) as shown on the Schedule of Investments. | |||||||||
There were no transfers between levels during the year.
| AGGRESSIVE | VALUATION INPUTS | ||||||||
| INVESTMENTS IN SECURITIES* | LEVEL 1 | LEVEL 2 | LEVEL 3 | TOTAL | |||||
| Mutual Funds | $122,447,027 | $— | $— | $122,447,027 | |||||
| TOTAL | $122,447,027 | $— | $— | $122,447,027 | |||||
| Futures Contracts** | ($127,097 | ) | $— | $— | ($127,097 | ) | |||
| * For a complete listing of investments, please refer to the Schedule of Investments. | |||||||||
| ** The value listed for these securities reflects unrealized appreciation (depreciation) as shown on the Schedule of Investments. | |||||||||
There were no transfers between levels during the year.
Futures Contracts: The Funds may purchase and sell futures contracts to facilitate the periodic rebalancing of the portfolios in order to maintain their target asset allocation, to make tactical asset allocations, and to assist in managing cash. These futures contracts may include, but are not limited to, futures contracts based on U.S. government obligations and market index futures contracts. The Funds may enter into futures contracts agreeing to buy or sell a financial instrument for a set price at a future date.
32 calvert.com CALVERT ASSET ALLOCATION FUNDS ANNUAL REPORT
Initial margin deposits of either cash or securities as required by the broker are made upon entering into the contract. While the contract is open, daily variation margin payments are made to or received from the broker reflecting the daily change in market value of the contract and are recorded for financial reporting purposes as unrealized gains or losses by the Funds. When a futures contract is closed, a realized gain or loss is recorded equal to the difference between the opening and closing value of the contract. The risks associated with entering into futures contracts may include the possible illiquidity of the secondary market which would limit the Funds' ability to close out a futures contract prior to the settlement date, an imperfect correlation between the value of the contracts and the underlying financial instruments, or that the counterparty will fail to perform its obligations under the contracts’ terms. Futures contracts are designed by boards of trade which are designated “contracts markets” by the Commodities Futures Trading Commission. Futures contracts trade on the contracts markets in a manner that is similar to the way a stock trades on a stock exchange, and the boards of trade, through their clearing corporations, guarantee the futures contracts against default. As a result, there is minimal counterparty credit risk to the Funds.
During the year, the Funds used market index futures contracts as a substitute for direct investment in a particular asset class to facilitate rebalancing and implement tactical asset allocations. The Funds' futures contracts at year end are presented in the respective Fund’s Schedule of Investments.
At September 30, 2016, the Funds had the following derivatives, categorized by risk exposure:
| CONSERVATIVE | ||||
| Risk | Statement of Assets and Liabilities | Assets | Statement of Assets and Liabilities | Liabilities |
| Equity | Unrealized appreciation on futures contracts | $—* | Unrealized depreciation on futures contracts | ($301,232)* |
| * Only the current day’s variation margin is reported within the Statement of Assets and Liabilities. | ||||
| MODERATE | ||||
| Risk | Statement of Assets and Liabilities | Assets | Statement of Assets and Liabilities | Liabilities |
| Equity | Unrealized appreciation on futures contracts | $24,240* | Unrealized depreciation on futures contracts | ($424,295)* |
| * Only the current day’s variation margin is reported within the Statement of Assets and Liabilities. | ||||
| AGGRESSIVE | ||||
| Risk | Statement of Assets and Liabilities | Assets | Statement of Assets and Liabilities | Liabilities |
| Equity | Unrealized appreciation on futures contracts | $2,693* | Unrealized depreciation on futures contracts | ($129,790)* |
| * Only the current day’s variation margin is reported within the Statement of Assets and Liabilities. | ||||
The effect of derivative instruments on the Statement of Operations for the year ended September 30, 2016 was as follows:
| CONSERVATIVE | Statement of Operations Location | ||
| Risk | Derivatives | Net Realized Gain (Loss) | Net Change in Unrealized appreciation (depreciation) |
| Equity | Futures | ($773,116) | ($558,605) |
The volume of outstanding contracts has varied throughout the year with an average number of contracts as in the following table:
| Derivative Description | Average Number of Contracts* | |
| Futures contracts long | 6 | |
| Futures contracts short | (113) | |
| * Averages are based on activity levels during the year ended September 30, 2016. | ||
| MODERATE | Statement of Operations Location | ||
| Risk | Derivatives | Net Realized Gain (Loss) | Net Change in Unrealized appreciation (depreciation) |
| Equity | Futures | ($910,275) | ($581,211) |
calvert.com CALVERT ASSET ALLOCATION FUNDS ANNUAL REPORT 33
The volume of outstanding contracts has varied throughout the year with an average number of contracts as in the following table:
| Derivative Description | Average Number of Contracts* |
| Futures contracts long | 43 |
| Futures contracts short | (145) |
| * Averages are based on activity levels during the year ended September 30, 2016. | |
| AGGRESSIVE | Statement of Operations Location | ||
| Risk | Derivatives | Net Realized Gain (Loss) | Net Change in Unrealized appreciation (depreciation) |
| Equity | Futures | ($274,761) | ($163,063) |
The volume of outstanding contracts has varied throughout the year with an average number of contracts as in the following table:
| Derivative Description | Average Number of Contracts* |
| Futures contracts long | 8 |
| Futures contracts short | (37) |
| * Averages are based on activity levels during the year ended September 30, 2016. | |
Security Transactions and Investment Income: Security transactions, including purchases and sales of shares of the Underlying Funds, are accounted for on trade date. Realized gains and losses are recorded on an identified cost basis and may include proceeds from litigation. Dividend income is recorded on the ex-dividend date. Distributions received on securities that represent a return of capital are recorded as a reduction of cost of investments. Distributions received on securities that represent a capital gain are recorded as a realized gain. Interest income is accrued as earned.
Share Class Accounting: Investment income and realized and unrealized gains and losses are allocated to separate classes of shares based upon the relative net assets of each class. Expenses common to the classes are also allocated to each class in proportion to their relative net assets. Expenses arising in connection with a specific class are charged directly to that class. Expenses included in the accompanying financial statements reflect the expenses of the Fund and do not include any expenses associated with the Underlying Funds.
Distributions to Shareholders: Distributions to shareholders are recorded by the Funds on ex-dividend date.Dividends from net investment income are paid quarterly. Distributions from net realized capital gains, if any, are paid at least annually. Distributions are determined in accordance with income tax regulations which may differ from U.S. generally accepted accounting principles; accordingly, periodic reclassifications are made within the Funds' capital accounts to reflect income and gains available for distribution under income tax regulations
Estimates: The preparation of financial statements in conformity with U.S. generally accepted accounting principles requires management to make estimates and assumptions that affect the reported amounts of assets and liabilities and disclosure of contingent assets and liabilities at the date of the financial statements and the reported amounts of increases and decreases in net assets from operations during the reporting period. Actual results could differ from those estimates.
Redemption Fees: The Funds charged a 2% redemption fee on redemptions, including exchanges, made within 30 days of purchase in the same Fund. The redemption fee was accounted for as an addition to paid-in capital. This fee was eliminated effective February 2, 2015.
Federal Income Taxes: No provision for federal income or excise tax is required since the Funds intends to continue to qualify as a regulated investment companies under the Internal Revenue Code and to distribute substantially all of their taxable earnings.
Management has analyzed the Funds' tax positions taken for all open federal income tax years and has concluded that no provision for federal income tax is required in the Funds' financial statements. A Fund's federal tax return is subject to examination by the Internal Revenue Service for a period of three years.
NOTE B — RELATED PARTY TRANSACTIONS
Calvert Investment Management, Inc. (the “Advisor”) is wholly-owned by Calvert Investments, Inc., which is indirectly wholly-owned by Ameritas Mutual Holding Company. The Advisor provides investment advisory services for the Funds and the Underlying Funds in which the Funds invest. The Advisor also pays the salaries and fees of officers and Trustees of the Funds
34 calvert.com CALVERT ASSET ALLOCATION FUNDS ANNUAL REPORT
who are employees of the Advisor or its affiliates. The Funds do not pay advisory fees to the Advisor for performing investment advisory services. The Advisor, however, does receive advisory fees for managing the Underlying Funds.
The Advisor has contractually agreed to limit net annual fund operating expenses through January 31, 2017 for Class A and Class C shares and through January 31, 2018 for Class I and Class Y shares. The contractual expense caps are 0.44%, 0.44%, and 0.43% for Class A shares of Conservative, Moderate, and Aggressive, respectively. The contractual expense caps are 1.19%, 1.19%, and 1.18% for Class C shares of Conservative, Moderate, and Aggressive, respectively. Prior to February 1, 2016, the expense caps were 0.44%, 0.80%, and 0.43% for Class A shares of Conservative, Moderate, and Aggressive, respectively, and 2.00% for Class C shares of each of the Funds. Effective May 20, 2016, the contractual expense caps are 0.09%, 0.09%, and 0.08% for Class I shares of Conservative, Moderate, and Aggressive, respectively, and 0.19%, 0.19%, and 0.18% for Class Y shares of Conservative, Moderate, and Aggressive, respectively. This expense limitation does not limit the Underlying Fund expenses indirectly incurred by the Funds. For the purpose of this expense limit, operating expenses do not include interest expense, brokerage commissions, taxes, and extraordinary expenses.
Calvert Investment Administrative Services, Inc. ("CIAS"), an affiliate of the Advisor, provides administrative services to the Fund for an annual fee, payable monthly, based on the Portfolio’s average daily net assets.
For the period October 1, 2015 to January 31, 2016, the administrative fee was 0.15% for Class A and C. CIAS and the Funds entered into an Amended and Restated Administrative Services Agreement that established a 0.12% administrative fee for all classes of the Funds commencing on February 1, 2016. CIAS voluntarily waived 0.03% (the amount of the administrative fee above 0.12%) for Class A and C shares of the Funds for the period from December 1, 2015 through January 31, 2016. During the year ended September 30, 2016, CIAS voluntarily waived $7,586, $11,837, and $5,750 for Conservative, Moderate and Aggressive, respectively.
Calvert Investment Distributors, Inc. ("CID"), an affiliate of the Advisor, is the distributor and principal underwriter for the Funds. Pursuant to Rule 12b-1 under the Investment Company Act of 1940, the Funds have adopted Distribution Plans that permit the Funds to pay certain expenses associated with the distribution and servicing of their shares. The expenses paid may not exceed 0.35% and 1.00% annually of average daily net assets of Class A and C, respectively, for each of the Funds. The amount actually paid by the Funds is an annualized fee, payable monthly, of 0.25% and 1.00% of the Funds’ average daily net assets of Class A and C, respectively. Class I and Y shares do not have Distribution Plan expenses.
CID received $63,749, $97,267, and $64,519 as its portion of the commissions charged on the sales of Conservative, Moderate, and Aggressive Class A shares, respectively, for the year ended September 30, 2016.
Calvert Investment Services, Inc. ("CIS"), an affiliate of the Advisor, acts as shareholder servicing agent for the Funds. For its services, CIS received fees of $22,745, $51,392, and $37,131 for the year ended September 30, 2016 for Conservative, Moderate, and Aggressive, respectively. Boston Financial Data Services, Inc. is the transfer and dividend disbursing agent.
Each Trustee of the Funds who is not an employee of the Advisor or its affiliates receives an annual retainer of $52,000 plus a meeting fee of up to $3,000 for each Board meeting attended. Additional fees of $6,000 annually may be paid to the Committee chairs ($10,000 for the Board chair and the Special Equities Committee chair) and $2,500 annually may be paid to Committee members, plus a Committee meeting fee of $500 for each Committee meeting attended. Eligible Trustees may participate in a Deferred Compensation Plan (the "Plan"). Obligations of the Plan will be paid solely out of the Fund’s assets. Trustees' fees are allocated to each of the funds served.
NOTE C — INVESTMENT ACTIVITY AND TAX INFORMATION
During the year, the cost of purchases and proceeds from sales of investments, other than short-term securities, were:
| CONSERVATIVE | MODERATE | AGGRESSIVE | |||||||
| Purchases | $118,382,120 | $159,047,337 | $82,922,329 | ||||||
| Sales | 95,668,801 | 144,838,830 | 73,088,682 | ||||||
The tax character of dividends and distributions paid during the years ended September 30, 2016 and September 30, 2015 was as follows:
calvert.com CALVERT ASSET ALLOCATION FUNDS ANNUAL REPORT 35
| CONSERVATIVE | |||||||
| DISTRIBUTIONS PAID FROM: | 2016 | 2015 | |||||
| Ordinary income | $2,929,025 | $2,169,920 | |||||
| Long-term capital gains | 5,782,770 | 4,716,702 | |||||
| Total | $8,711,795 | $6,886,622 | |||||
| MODERATE | |||||||
| DISTRIBUTIONS PAID FROM: | 2016 | 2015 | |||||
| Ordinary income | $3,300,944 | $2,299,480 | |||||
| Long-term capital gains | 24,601,866 | 10,205,647 | |||||
| Total | $27,902,810 | $12,505,127 | |||||
| AGGRESSIVE | |||||||
| DISTRIBUTIONS PAID FROM: | 2016 | 2015 | |||||
| Ordinary income | $978,980 | $1,017,392 | |||||
| Long-term capital gains | 14,810,986 | 6,251,366 | |||||
| Total | $15,789,966 | $7,268,758 | |||||
As of September 30, 2016, the tax basis components of distributable earnings/(accumulated losses) and the federal tax cost were as follows:
| CONSERVATIVE | MODERATE | AGGRESSIVE | |||||||||
| Unrealized appreciation | $3,443,001 | $4,490,938 | $669,021 | ||||||||
| Unrealized (depreciation) | (552,692) | (474,988) | (350,675) | ||||||||
| Net unrealized appreciation (depreciation) | $2,890,309 | $4,015,950 | $318,346 | ||||||||
| Undistributed ordinary income | $23,540 | $23,443 | $— | ||||||||
| Undistributed long-term capital gain | $847,130 | $5,034,883 | $3,421,598 | ||||||||
| Late year ordinary and post October capital loss deferrals | $— | $— | ($86,151 | ) | |||||||
| Other temporary differences | ($3,725 | ) | ($5,584 | ) | ($2,754 | ) | |||||
| Federal income tax cost of investments | $164,269,595 | $243,910,894 | $122,128,681 | ||||||||
The differences between the components of distributable earnings on a tax basis and the amounts reflected in the Statement of Assets and Liabilities are primarily due to temporary book-tax differences that will reverse in a subsequent period. These differences are mainly due to wash sales, deferred Trustees’ fees and section 1256 contracts.
Reclassifications, as shown in the table below, have been made to the Funds’ components of net assets to reflect income and gains available for distribution (or available capital loss carryovers, as applicable) under income tax law and regulations. These reclassifications are due to permanent book-tax differences and have no impact on net assets. These permanent differences are primarily due to distributions redesignation and, for Conservative, 2015 excise tax paid.
| CONSERVATIVE | |||
| Undistributed net investment income | $5,037 | ||
| Accumulated net realized gain (loss) | 25 | ||
| Paid-in capital | (5,062 | ) | |
| MODERATE | |||
| Undistributed net investment income | ($17 | ) | |
| Accumulated net realized gain (loss) | 16 | ||
| Paid-in capital | 1 | ||
36 calvert.com CALVERT ASSET ALLOCATION FUNDS ANNUAL REPORT
| AGGRESSIVE | |||
| Undistributed net investment income | ($38 | ) | |
| Accumulated net realized gain (loss) | 38 | ||
NOTE D — SECURITIES LENDING
To generate additional income, the Funds may lend their securities pursuant to a securities lending agency agreement (“Lending Agreement”) with State Street Bank, the securities lending agent. Security loans are subject to termination by the Funds at any time and, therefore, are not considered to be illiquid investments. The Funds require that the loan be continuously collateralized by either cash or securities as collateral equal at all times to at least 102% of the market value of the domestic securities loaned and 105% of the market value on the international securities loaned (if applicable). Cash collateral is generally invested in State Street Institutional U.S. Government Money Market Fund (the “U.S. Government Fund”) that is managed by an affiliate of the custodian. The U.S. Government Fund is a registered money market fund that invests in a variety of high-quality, U.S. dollar-denominated instruments. Any gain or loss in the market price of the loaned securities that might occur and any interest earned or dividends declared during the term of the loan would accrue to the account of the Funds. Income earned on the investment of collateral, net of broker rebates and other expenses incurred by the securities lending agent, is plit between the Funds and the securities lending agent on the basis of agreed upon contractual terms.
The risks associated with the lending portfolio securities include, but are not limited to, possible delays in receiving additional collateral or in the recovery of the loaned securities, possible loss of rights to the collateral should the borrower fail financially, as well as risk of loss in the value of the collateral or the value of the investments made with the collateral. The securities lending agent shall indemnify the Funds in the case of default of any securities borrower.
The Funds did not have any securities on loan at September 30, 2016.
NOTE E — LINE OF CREDIT
A financing agreement is in place with the Calvert Funds and State Street Corporation (“SSC”). Under the agreement, SSC provides an unsecured line of credit facility, in the aggregate amount of $50 million ($25 million committed and $25 million uncommitted), accessible by the Calvert Funds for temporary or emergency purposes only. Borrowings bear interest at the higher of the One-Month London Interbank Offered Rate (LIBOR) in effect that day or the overnight Federal Funds Rate plus 1.25% per annum. A commitment fee of 0.25% per annum is incurred on the unused portion of the committed facility. An administrative fee of $30,000 was paid in connection with the uncommitted facility. These fees are allocated to all participating funds. The Funds had no borrowings under the agreement during the year ended September 30, 2016.
NOTE F — AFFILIATED COMPANIES
The Funds invest primarily in a combination of other Calvert fixed-income and equity funds. These Underlying Funds are considered affiliated companies because Calvert Investment Management, Inc. provides investment advisory services for the Funds and the Underlying Funds. Information regarding the Funds' investments in these affiliated companies for the year ended September 30, 2016 is as follows:
calvert.com CALVERT ASSET ALLOCATION FUNDS ANNUAL REPORT 37
| CONSERVATIVE | ||||||||||||||||||||||||
| Name of Affiliated Company | Market Value 9/30/15 | Purchases at Cost | Proceeds from Sales | Net Realized Gain (Loss) | Change in Unrealized Gain (Loss) | Market Value 9/30/16 | Dividend Income | Capital Gain Distributions | ||||||||||||||||
| Calvert Bond Portfolio, Class I | $77,842,681 | $13,433,133 | ($46,995,612 | ) | ($442,065 | ) | $1,656,772 | $45,494,909 | $1,370,278 | $— | ||||||||||||||
| Calvert Capital Accumulation Fund, Class I | 5,451,304 | 1,340,609 | (408,366) | 16,839 | (561,168) | 5,839,218 | 85,809 | 372,522 | ||||||||||||||||
| Calvert Emerging Markets Equity Fund, Class I | 2,257,664 | 326,058 | (135,984) | (8,565) | 460,164 | 2,899,337 | 30,467 | — | ||||||||||||||||
| Calvert Equity Portfolio, Class I | 9,831,005 | — | (10,161,427) | 1,021,421 | (690,999) | — | — | — | ||||||||||||||||
| Calvert Green Bond Fund, Class I | 6,826,020 | 780,569 | (6,731,481) | 95,876 | 18,244 | 989,228 | 93,418 | — | ||||||||||||||||
| Calvert High Yield Bond Fund, Class I | — | 11,765,333 | (5,406,578) | 116,559 | 424,156 | 6,899,470 | 410,207 | — | ||||||||||||||||
| Calvert International Equity Fund, Class I | 5,904,529 | 2,581,182 | (679,918) | 132,872 | (134,846) | 7,803,819 | 103,231 | — | ||||||||||||||||
| Calvert International Opportunities Fund, Class I | 3,242,932 | 1,041,671 | (407,950) | 4,947 | 50,961 | 3,932,561 | 47,756 | 107,145 | ||||||||||||||||
| Calvert Large Cap Core Portfolio, Class I | 14,059,448 | 32,966 | (14,555,368) | 391,535 | 71,419 | — | — | — | ||||||||||||||||
| Calvert Small Cap Fund, Class I | 7,352,229 | 1,512,404 | (566,951) | (88,635) | 87,142 | 8,296,189 | 212,211 | 413,421 | ||||||||||||||||
| Calvert U.S. Large Cap Core Responsible Index Fund, Class I | 5,018,026 | 15,008,436 | (1,222,606) | 224,214 | 255,764 | 19,283,834 | 296,255 | 937,170 | ||||||||||||||||
| Calvert U.S. Large Cap Growth Responsible Index Fund, Class I | — | 6,134,366 | (701,273) | 14,211 | 412,618 | 5,859,922 | 16,134 | — | ||||||||||||||||
| Calvert U.S. Large Cap Value Responsible Index Fund, Class I | — | 10,466,957 | (813,410) | 2,849 | 770,762 | 10,427,158 | 54,144 | — | ||||||||||||||||
| Calvert Ultra Short Income Fund, Class I | — | 31,423,089 | (3,826,711) | 3,711 | 171,065 | 27,771,154 | 328,749 | — | ||||||||||||||||
| Calvert Unconstrained Bond Fund, Class I | — | 22,535,347 | (1,384,145) | 3,459 | 508,444 | 21,663,105 | 570,960 | — | ||||||||||||||||
| TOTALS | $137,785,838 | $118,382,120 | ($93,997,780 | ) | $1,489,228 | $3,500,498 | $167,159,904 | $3,619,619 | $1,830,258 | |||||||||||||||
38 calvert.com CALVERT ASSET ALLOCATION FUNDS ANNUAL REPORT
| MODERATE | ||||||||||||||||||||||||
| Name of Affiliated Company | Market Value 9/30/15 | Purchases at Cost | Proceeds from Sales | Net Realized Gain (Loss) | Change in Unrealized Gain (Loss) | Market Value 9/30/16 | Dividend Income | Capital Gain Distributions | ||||||||||||||||
| Calvert Bond Portfolio, Class I | $56,863,328 | $7,406,390 | ($24,772,408 | ) | $7,792 | $1,142,193 | $40,647,295 | $1,173,788 | $— | |||||||||||||||
| Calvert Capital Accumulation Fund, Class I | 11,996,605 | 2,133,412 | (1,118,365) | 347,919 | (1,536,077) | 11,823,494 | 184,570 | 801,276 | ||||||||||||||||
| Calvert Emerging Markets Equity Fund, Class I | 7,425,314 | 808,198 | (671,017) | (78,941) | 1,497,964 | 8,981,518 | 98,684 | — | ||||||||||||||||
| Calvert Equity Portfolio, Class I | 37,749,769 | — | (39,018,608) | 8,350,931 | (7,082,092) | — | — | — | ||||||||||||||||
| Calvert Green Bond Fund, Class I | 5,504,606 | 337,233 | (5,002,960) | 90,815 | 16,976 | 946,670 | 82,884 | — | ||||||||||||||||
| Calvert High Yield Bond Fund, Class I | — | 10,539,642 | (3,540,289) | 53,198 | 461,044 | 7,513,595 | 393,101 | — | ||||||||||||||||
| Calvert International Equity Fund, Class I | 18,738,715 | 4,459,662 | (2,236,729) | 437,213 | (598,575) | 20,800,286 | 315,613 | — | ||||||||||||||||
| Calvert International Opportunities Fund, Class I | 11,756,633 | 2,336,417 | (1,342,038) | 160,824 | (13,969) | 12,897,867 | 165,876 | 372,512 | ||||||||||||||||
| Calvert Large Cap Core Portfolio, Class I | 44,448,405 | 251,719 | (46,164,747) | 6,582,068 | (5,117,445) | — | — | — | ||||||||||||||||
| Calvert Small Cap Fund, Class I | 20,383,808 | 3,126,157 | (1,579,037) | 401,171 | (461,491) | 21,870,608 | 578,991 | 1,128,136 | ||||||||||||||||
| Calvert U.S. Large Cap Core Responsible Index Fund, Class I | 6,828,015 | 45,645,979 | (3,802,439) | 838,631 | (18,930) | 49,491,256 | 803,783 | 2,545,040 | ||||||||||||||||
| Calvert U.S. Large Cap Growth Responsible Index Fund, Class I | — | 18,926,260 | (2,026,381) | 49,050 | 1,297,124 | 18,246,053 | 53,487 | — | ||||||||||||||||
| Calvert U.S. Large Cap Value Responsible Index Fund, Class I | — | 33,208,021 | (3,131,419) | 22,924 | 2,366,770 | 32,466,296 | 180,669 | — | ||||||||||||||||
| Calvert Ultra-Short Income Fund, Class I | — | 6,750,227 | (6,554,318) | 2,828 | 181 | 198,918 | 21,316 | — | ||||||||||||||||
| Calvert Unconstrained Bond Fund, Class I | — | 23,118,020 | (1,626,579) | 5,537 | 546,010 | 22,042,988 | 622,939 | — | ||||||||||||||||
| TOTALS | $221,695,198 | $159,047,337 | ($142,587,334 | ) | $17,271,960 | ($7,500,317 | ) | $247,926,844 | $4,675,701 | $4,846,964 | ||||||||||||||
calvert.com CALVERT ASSET ALLOCATION FUNDS ANNUAL REPORT 39
| AGGRESSIVE | ||||||||||||||||||||||||
| Name of Affiliated Company | Market Value 9/30/15 | Purchases at Cost | Proceeds from Sales | Net Realized Gain (Loss) | Change in Unrealized Gain (Loss) | Market Value 9/30/16 | Dividend Income | Capital Gain Distributions | ||||||||||||||||
| Calvert Bond Portfolio, Class I | $3,519,569 | $2,380,690 | ($1,594,539 | ) | $5,265 | $162,358 | $4,473,343 | $134,926 | $— | |||||||||||||||
| Calvert Capital Accumulation Fund, Class I | 6,938,589 | 1,437,158 | (728,729) | 316,420 | (1,003,198) | 6,960,240 | 107,688 | 467,505 | ||||||||||||||||
| Calvert Emerging Markets Equity Fund, Class I | 4,526,404 | 1,005,391 | (607,275) | (68,163) | 962,596 | 5,818,953 | 61,549 | — | ||||||||||||||||
| Calvert Equity Portfolio, Class I | 23,609,539 | — | (24,399,795) | 5,176,045 | (4,385,789) | — | — | — | ||||||||||||||||
| Calvert Green Bond Fund, Class I | 1,444,436 | 58,835 | (1,495,783) | (3,895) | (3,593) | — | 6,458 | — | ||||||||||||||||
| Calvert International Equity Fund, Class I | 12,806,938 | 2,969,714 | (1,700,368) | 164,172 | (296,701) | 13,943,755 | 219,809 | — | ||||||||||||||||
| Calvert International Opportunities Fund, Class I | 9,786,067 | 1,691,017 | (976,035) | 104,856 | 24,007 | 10,629,912 | 139,601 | 312,994 | ||||||||||||||||
| Calvert Large Cap Core Portfolio, Class I | 28,677,134 | 465,490 | (30,095,899) | 3,345,854 | (2,392,579) | — | — | — | ||||||||||||||||
| Calvert Small Cap Fund, Class I | 11,167,634 | 2,176,850 | (1,146,639) | 221,544 | (243,168) | 12,176,221 | 321,650 | 626,681 | ||||||||||||||||
| Calvert U.S. Large Cap Core Responsible Index Fund, Class I | 4,019,741 | 30,148,706 | (2,862,167) | 405,998 | 143,831 | 31,856,109 | 513,873 | 1,626,172 | ||||||||||||||||
| Calvert U.S. Large Cap Growth Responsible Index Fund, Class I | — | 12,334,268 | (1,170,589) | 35,448 | 859,853 | 12,058,980 | 34,569 | — | ||||||||||||||||
| Calvert U.S. Large Cap Value Responsible Index Fund, Class I | — | 22,321,758 | (2,224,120) | 27,060 | 1,581,936 | 21,706,634 | 119,795 | — | ||||||||||||||||
| Calvert Ultra Short Income Fund, Class I | — | 2,956,166 | (2,956,891) | 725 | — | — | 6,928 | — | ||||||||||||||||
| Calvert Unconstrained Bond Fund, Class I | — | 2,976,286 | (209,506) | 657 | 55,443 | 2,822,880 | 66,735 | — | ||||||||||||||||
| TOTALS | $106,496,051 | $82,922,329 | ($72,168,335 | ) | $9,731,986 | ($4,535,004 | ) | $122,447,027 | $1,733,581 | $3,033,352 | ||||||||||||||
NOTE G — OTHER MATTERS
On October 18, 2016, Calvert announced that it had determined that certain fees paid to third-party financial intermediaries were incorrectly allocated for payment by, and paid by, the Calvert Funds. Specifically, for periods prior to January 1, 2015, the Calvert Funds paid fees under certain intermediary agreements that were primarily for distribution-related services and therefore should have been paid by Calvert out of Calvert’s own assets or by the Funds under a Rule 12b-1 plan. The matter was self-reported to the SEC in 2016. Calvert is in the process of determining the economic impact of misallocated fees on the affected Funds and their shareholders, and intends to develop a plan to reimburse shareholders following that determination.
NOTE H — SUBSEQUENT EVENTS
On October 20, 2016, Calvert and Calvert’s indirect parent company, Ameritas Holding Company, entered into an Asset Purchase Agreement (the “Agreement”) with Eaton Vance Management (“Eaton Vance”), a newly-formed subsidiary of Eaton Vance to operate as Calvert Research and Management (“New Calvert”), and other parties, pursuant to which New Calvert has agreed to acquire, subject to the terms and conditions set forth in the Agreement, the business assets of Calvert (the “Transaction”). Completion of the Transaction is subject to the approval by the shareholders of Calvert Funds of new investment advisory agreements with New Calvert, among other conditions, and is currently expected to occur by the end of 2016 or early 2017.
A proxy statement containing detailed information regarding several proposals was mailed to shareholders of record in November 2016. The shareholder meeting is expected to be held on or about December 16, 2016.
In preparing the financial statements as of September 30, 2016, no other subsequent events or transactions occurred that would have required recognition or disclosure in these financial statements.
40 calvert.com CALVERT ASSET ALLOCATION FUNDS ANNUAL REPORT
NOTICE TO SHAREHOLDERS (UNAUDITED)
For the fiscal year ended September 30, 2016, the Fund considers certain distributions paid during the year as:
| Fund Name | (a) Long-term Capital Gain | (b) Qualified Dividend Income % | (c) (for corporate shareholders) Dividends Received Deduction % | ||
| Conservative | $5,782,770 | 26.4 | 19.4 | ||
| Moderate | 24,601,866 | 66.9 | 47.1 | ||
| Aggressive | 14,810,986 | 100.0 | 97.4 | ||
(a) The Fund considers the amount shown above as capital gain dividends in accordance with Section 852(b)(3)(C) of the Internal Revenue Code.
(b) The Fund considers the percentage shown above of ordinary income dividends paid during the year as qualified dividend income in accordance with Section 854 of the Internal Revenue Code.
(c) The Fund considers the percentage shown above of ordinary income dividends paid during the year as eligible for the corporate dividends received deduction in accordance with Section 854 of the Internal Revenue Code.
calvert.com CALVERT ASSET ALLOCATION FUNDS ANNUAL REPORT 41
CALVERT CONSERVATIVE ALLOCATION FUND
FINANCIAL HIGHLIGHTS
| YEARS ENDED | |||||||||||||||||||
| CLASS A SHARES | September 30, 2016 (a) | September 30, 2015 (a) | September 30, 2014 | September 30, 2013 (a) | September 30, 2012 | ||||||||||||||
| Net asset value, beginning | $16.59 | $17.22 | $16.88 | $16.45 | $15.01 | ||||||||||||||
| Income from investment operations: | |||||||||||||||||||
| Net investment income | 0.31 | 0.30 | 0.29 | 0.38 | 0.40 | ||||||||||||||
| Net realized and unrealized gain (loss) | 0.55 | 0.05 | 0.83 | 0.74 | 1.65 | ||||||||||||||
| Total from investment operations | 0.86 | 0.35 | 1.12 | 1.12 | 2.05 | ||||||||||||||
| Distributions from: | |||||||||||||||||||
| Net investment income | (0.30) | (0.29) | (0.29) | (0.39) | (0.40) | ||||||||||||||
| Net realized gain | (0.67) | (0.69) | (0.49) | (0.30) | (0.21) | ||||||||||||||
| Total distributions | (0.97) | (0.98) | (0.78) | (0.69) | (0.61) | ||||||||||||||
| Total increase (decrease) in net asset value | (0.11) | (0.63) | 0.34 | 0.43 | 1.44 | ||||||||||||||
| Net asset value, ending | $16.48 | $16.59 | $17.22 | $16.88 | $16.45 | ||||||||||||||
| Total return (b) | 5.42 | % | 2.01 | % | 6.78 | % | 7.07 | % | 13.96 | % | |||||||||
| Ratios to average net assets: (c)(d) | |||||||||||||||||||
| Net investment income | 1.90 | % | 1.76 | % | 1.71 | % | 2.31 | % | 2.53 | % | |||||||||
| Total expenses | 0.67 | % | 0.69 | % | 0.68 | % | 0.68 | % | 0.77 | % | |||||||||
| Net expenses | 0.44 | % | 0.44 | % | 0.44 | % | 0.44 | % | 0.44 | % | |||||||||
| Portfolio turnover | 61 | % | 8 | % | 17 | % | 31 | % | 26 | % | |||||||||
| Net assets, ending (in thousands) | $131,576 | $112,881 | $92,150 | $73,305 | $53,431 | ||||||||||||||
| (a) Per share figures are calculated using the Average Shares Method. | |||||||||||||||||||
| (b) Total return is not annualized for periods of less than one year and does not reflect deduction of any front-end or deferred sales charge. | |||||||||||||||||||
| (c) Total expenses do not reflect amounts reimbursed and/or waived by the Advisor and certain of its affiliates, if applicable. Net expenses are net of all reductions and represent the net expenses paid by the Fund. | |||||||||||||||||||
| (d) Amounts do not include the income or expenses of the Underlying Funds. | |||||||||||||||||||
| See notes to financial statements. | |||||||||||||||||||
42 calvert.com CALVERT ASSET ALLOCATION FUNDS ANNUAL REPORT
CALVERT CONSERVATIVE ALLOCATION FUND
FINANCIAL HIGHLIGHTS
| YEARS ENDED | |||||||||||||||||||
| CLASS C SHARES | September 30, 2016 (a) | September 30, 2015 (a) | September 30, 2014 | September 30, 2013 (a) | September 30, 2012 | ||||||||||||||
| Net asset value, beginning | $16.40 | $17.06 | $16.74 | $16.32 | $14.90 | ||||||||||||||
| Income from investment operations: | |||||||||||||||||||
| Net investment income | 0.17 | 0.13 | 0.13 | 0.21 | 0.24 | ||||||||||||||
| Net realized and unrealized gain (loss) | 0.55 | 0.06 | 0.81 | 0.74 | 1.62 | ||||||||||||||
| Total from investment operations | 0.72 | 0.19 | 0.94 | 0.95 | 1.86 | ||||||||||||||
| Distributions from: | |||||||||||||||||||
| Net investment income | (0.17) | (0.16) | (0.13) | (0.23) | (0.23) | ||||||||||||||
| Net realized gain | (0.67) | (0.69) | (0.49) | (0.30) | (0.21) | ||||||||||||||
| Total distributions | (0.84) | (0.85) | (0.62) | (0.53) | (0.44) | ||||||||||||||
| Total increase (decrease) in net asset value | (0.12) | (0.66) | 0.32 | 0.42 | 1.42 | ||||||||||||||
| Net asset value, ending | $16.28 | $16.40 | $17.06 | $16.74 | $16.32 | ||||||||||||||
| Total return (b) | 4.57 | % | 1.03 | % | 5.71 | % | 6.02 | % | 12.73 | % | |||||||||
| Ratios to average net assets: (c)(d) | |||||||||||||||||||
| Net investment income | 1.07 | % | 0.76 | % | 0.73 | % | 1.30 | % | 1.45 | % | |||||||||
| Total expenses | 1.46 | % | 1.44 | % | 1.40 | % | 1.44 | % | 1.51 | % | |||||||||
| Net expenses | 1.27 | % | 1.44 | % | 1.40 | % | 1.44 | % | 1.51 | % | |||||||||
| Portfolio turnover | 61 | % | 8 | % | 17 | % | 31 | % | 26 | % | |||||||||
| Net assets, ending (in thousands) | $34,334 | $29,932 | $25,263 | $20,675 | $15,209 | ||||||||||||||
| (a) Per share figures are calculated using the Average Shares Method. | |||||||||||||||||||
| (b) Total return is not annualized for periods of less than one year and does not reflect deduction of any front-end or deferred sales charge. | |||||||||||||||||||
| (c) Total expenses do not reflect amounts reimbursed and/or waived by the Advisor and certain of its affiliates, if applicable. Net expenses are net of all reductions and represent the net expenses paid by the Fund. | |||||||||||||||||||
| (d) Amounts do not include the income or expenses of the Underlying Funds. | |||||||||||||||||||
| See notes to financial statements. | |||||||||||||||||||
calvert.com CALVERT ASSET ALLOCATION FUNDS ANNUAL REPORT 43
CALVERT CONSERVATIVE ALLOCATION FUND
FINANCIAL HIGHLIGHTS
| PERIOD ENDED | ||||
| CLASS I SHARES | September 30, 2016 (a)(b) | |||
| Net asset value, beginning | $16.07 | |||
| Income from investment operations: | ||||
| Net investment income | 0.11 | |||
| Net realized and unrealized gain (loss) | 0.43 | |||
| Total from investment operations | 0.54 | |||
| Distributions from: | ||||
| Net investment income | (0.13) | |||
| Total distributions | (0.13) | |||
| Total increase (decrease) in net asset value | 0.41 | |||
| Net asset value, ending | $16.48 | |||
| Total return (c) | 3.40 | % | ||
| Ratios to average net assets: (d)(e) | ||||
| Net investment income | 1.93%(f) | |||
| Total expenses | 0.97%(f) | |||
| Net expenses | 0.09%(f) | |||
| Portfolio turnover | 61 | % | ||
| Net assets, ending (in thousands) | $1,034 | |||
| (a) Per share figures are calculated using the Average Shares Method. | ||||
| (b) From May 20, 2016 inception. | ||||
| (c) Total return is not annualized for periods of less than one year and does not reflect deduction of any front-end or deferred sales charge. | ||||
| (d) Total expenses do not reflect amounts reimbursed and/or waived by the Advisor and certain of its affiliates, if applicable. Net expenses are net of all reductions and represent the net expenses paid by the Fund. | ||||
| (e) Amounts do not include the income or expenses of the Underlying Funds. | ||||
| (f) Annualized. | ||||
| See notes to financial statements. | ||||
44 calvert.com CALVERT ASSET ALLOCATION FUNDS ANNUAL REPORT
CALVERT CONSERVATIVE ALLOCATION FUND
FINANCIAL HIGHLIGHTS
| PERIOD ENDED | ||||
| CLASS Y SHARES | September 30, 2016 (a)(b) | |||
| Net asset value, beginning | $16.07 | |||
| Income from investment operations: | ||||
| Net investment income | 0.12 | |||
| Net realized and unrealized gain (loss) | 0.41 | |||
| Total from investment operations | 0.53 | |||
| Distributions from: | ||||
| Net investment income | (0.13) | |||
| Total distributions | (0.13) | |||
| Total increase (decrease) in net asset value | 0.40 | |||
| Net asset value, ending | $16.47 | |||
| Total return (c) | 3.32 | % | ||
| Ratios to average net assets: (d)(e) | ||||
| Net investment income | 2.16%(f) | |||
| Total expenses | 4.98%(f) | |||
| Net expenses | 0.19%(f) | |||
| Portfolio turnover | 61 | % | ||
| Net assets, ending (in thousands) | $404 | |||
| (a) Per share figures are calculated using the Average Shares Method. | ||||
| (b) From May 20, 2016 inception. | ||||
| (c) Total return is not annualized for periods of less than one year and does not reflect deduction of any front-end or deferred sales charge. | ||||
| (d) Total expenses do not reflect amounts reimbursed and/or waived by the Advisor and certain of its affiliates, if applicable. Net expenses are net of all reductions and represent the net expenses paid by the Fund. | ||||
| (e) Amounts do not include the income or expenses of the Underlying Funds. | ||||
| (f) Annualized. | ||||
| See notes to financial statements. | ||||
calvert.com CALVERT ASSET ALLOCATION FUNDS ANNUAL REPORT 45
CALVERT MODERATE ALLOCATION FUND
FINANCIAL HIGHLIGHTS
| YEARS ENDED | |||||||||||||||||||
| CLASS A SHARES | September 30, 2016 (a) | September 30, 2015 (a) | September 30, 2014 | September 30, 2013 | September 30, 2012 | ||||||||||||||
| Net asset value, beginning | $18.84 | $19.80 | $19.04 | $16.89 | $14.51 | ||||||||||||||
| Income from investment operations: | |||||||||||||||||||
| Net investment income | 0.25 | 0.23 | 0.20 | 0.20 | 0.21 | ||||||||||||||
| Net realized and unrealized gain (loss) | 1.00 | (0.04) | 1.34 | 2.14 | 2.36 | ||||||||||||||
| Total from investment operations | 1.25 | 0.19 | 1.54 | 2.34 | 2.57 | ||||||||||||||
| Distributions from: | |||||||||||||||||||
| Net investment income | (0.24) | (0.21) | (0.19) | (0.19) | (0.19) | ||||||||||||||
| Net realized gain | (1.99) | (0.94) | (0.59) | — | — | ||||||||||||||
| Total distributions | (2.23) | (1.15) | (0.78) | (0.19) | (0.19) | ||||||||||||||
| Total increase (decrease) in net asset value | (0.98) | (0.96) | 0.76 | 2.15 | 2.38 | ||||||||||||||
| Net asset value, ending | $17.86 | $18.84 | $19.80 | $19.04 | $16.89 | ||||||||||||||
| Total return (b) | 7.16 | % | 0.86 | % | 8.27 | % | 14.02 | % | 17.89 | % | |||||||||
| Ratios to average net assets: (c)(d) | |||||||||||||||||||
| Net investment income | 1.43 | % | 1.14 | % | 1.01 | % | 1.12 | % | 1.28 | % | |||||||||
| Total expenses | 0.73 | % | 0.67 | % | 0.64 | % | 0.69 | % | 0.72 | % | |||||||||
| Net expenses | 0.56 | % | 0.67 | % | 0.64 | % | 0.69 | % | 0.72 | % | |||||||||
| Portfolio turnover | 61 | % | 8 | % | 10 | % | 27 | % | 25 | % | |||||||||
| Net assets, ending (in thousands) | $203,907 | $189,372 | $172,244 | $143,215 | $117,550 | ||||||||||||||
| (a) Per share figures are calculated using the Average Shares Method. | |||||||||||||||||||
| (b) Total return is not annualized for periods of less than one year and does not reflect deduction of any front-end or deferred sales charge. | |||||||||||||||||||
| (c) Total expenses do not reflect amounts reimbursed and/or waived by the Advisor and certain of its affiliates, if applicable. Net expenses are net of all reductions and represent the net expenses paid by the Fund. | |||||||||||||||||||
| (d) Amounts do not include the income or expenses of the Underlying Funds. | |||||||||||||||||||
| See notes to financial statements. | |||||||||||||||||||
46 calvert.com CALVERT ASSET ALLOCATION FUNDS ANNUAL REPORT
CALVERT MODERATE ALLOCATION FUND
FINANCIAL HIGHLIGHTS
| YEARS ENDED | |||||||||||||||||||
| CLASS C SHARES | September 30, 2016 (a) | September 30, 2015 (a) | September 30, 2014 | September 30, 2013 | September 30, 2012 | ||||||||||||||
| Net asset value, beginning | $18.16 | $19.19 | $18.55 | $16.52 | $14.26 | ||||||||||||||
| Income from investment operations: | |||||||||||||||||||
| Net investment income | 0.11 | 0.07 | 0.09 | 0.09 | 0.09 | ||||||||||||||
| Net realized and unrealized gain (loss) | 0.97 | (0.02) | 1.26 | 2.08 | 2.31 | ||||||||||||||
| Total from investment operations | 1.08 | 0.05 | 1.35 | 2.17 | 2.40 | ||||||||||||||
| Distributions from: | |||||||||||||||||||
| Net investment income | (0.14) | (0.14) | (0.12) | (0.14) | (0.14) | ||||||||||||||
| Net realized gain | (1.99) | (0.94) | (0.59) | — | — | ||||||||||||||
| Total distributions | (2.13) | (1.08) | (0.71) | (0.14) | (0.14) | ||||||||||||||
| Total increase (decrease) in net asset value | (1.05) | (1.03) | 0.64 | 2.03 | 2.26 | ||||||||||||||
| Net asset value, ending | $17.11 | $18.16 | $19.19 | $18.55 | $16.52 | ||||||||||||||
| Total return (b) | 6.37 | % | 0.09 | % | 7.44 | % | 13.21 | % | 16.96 | % | |||||||||
| Ratios to average net assets: (c)(d) | |||||||||||||||||||
| Net investment income | 0.68 | % | 0.37 | % | 0.28 | % | 0.38 | % | 0.55 | % | |||||||||
| Total expenses | 1.51 | % | 1.42 | % | 1.38 | % | 1.42 | % | 1.45 | % | |||||||||
| Net expenses | 1.32 | % | 1.42 | % | 1.38 | % | 1.42 | % | 1.45 | % | |||||||||
| Portfolio turnover | 61 | % | 8 | % | 10 | % | 27 | % | 25 | % | |||||||||
| Net assets, ending (in thousands) | $42,695 | $40,560 | $37,326 | $31,242 | $24,869 | ||||||||||||||
| (a) Per share figures are calculated using the Average Shares Method. | |||||||||||||||||||
| (b) Total return is not annualized for periods of less than one year and does not reflect deduction of any front-end or deferred sales charge. | |||||||||||||||||||
| (c) Total expenses do not reflect amounts reimbursed and/or waived by the Advisor and certain of its affiliates, if applicable. Net expenses are net of all reductions and represent the net expenses paid by the Fund. | |||||||||||||||||||
| (d) Amounts do not include the income or expenses of the Underlying Funds. | |||||||||||||||||||
| See notes to financial statements. | |||||||||||||||||||
calvert.com CALVERT ASSET ALLOCATION FUNDS ANNUAL REPORT 47
CALVERT MODERATE ALLOCATION FUND
FINANCIAL HIGHLIGHTS
| PERIOD ENDED | ||||
| CLASS I SHARES | September 30, 2016 (a)(b) | |||
| Net asset value, beginning | $17.10 | |||
| Income from investment operations: | ||||
| Net investment income | 0.07 | |||
| Net realized and unrealized gain (loss) | 0.76 | |||
| Total from investment operations | 0.83 | |||
| Distributions from: | ||||
| Net investment income | (0.08) | |||
| Total distributions | (0.08) | |||
| Total increase (decrease) in net asset value | 0.75 | |||
| Net asset value, ending | $17.85 | |||
| Total return (c) | 4.86 | % | ||
| Ratios to average net assets: (d)(e) | ||||
| Net investment income | 1.06%(f) | |||
| Total expenses | 0.54%(f) | |||
| Net expenses | 0.09%(f) | |||
| Portfolio turnover | 61 | % | ||
| Net assets, ending (in thousands) | $1,049 | |||
| (a) Per share figures are calculated using the Average Shares Method. | ||||
| (b) From May 20, 2016 inception. | ||||
| (c) Total return is not annualized for periods of less than one year and does not reflect deduction of any front-end or deferred sales charge. | ||||
| (d) Total expenses do not reflect amounts reimbursed and/or waived by the Advisor and certain of its affiliates, if applicable. Net expenses are net of all reductions and represent the net expenses paid by the Fund. | ||||
| (e) Amounts do not include the income or expenses of the Underlying Funds. | ||||
| (f) Annualized. | ||||
| See notes to financial statements. | ||||
48 calvert.com CALVERT ASSET ALLOCATION FUNDS ANNUAL REPORT
CALVERT MODERATE ALLOCATION FUND
FINANCIAL HIGHLIGHTS
| PERIOD ENDED | ||||
| CLASS Y SHARES | September 30, 2016 (a)(b) | |||
| Net asset value, beginning | $17.10 | |||
| Income from investment operations: | ||||
| Net investment income | 0.06 | |||
| Net realized and unrealized gain (loss) | 0.76 | |||
| Total from investment operations | 0.82 | |||
| Distributions from: | ||||
| Net investment income | (0.07) | |||
| Total distributions | (0.07) | |||
| Total increase (decrease) in net asset value | 0.75 | |||
| Net asset value, ending | $17.85 | |||
| Total return (c) | 4.83 | % | ||
| Ratios to average net assets: (d)(e) | ||||
| Net investment income | 0.99%(f) | |||
| Total expenses | 4.44%(f) | |||
| Net expenses | 0.19%(f) | |||
| Portfolio turnover | 61 | % | ||
| Net assets, ending (in thousands) | $397 | |||
| (a) Per share figures are calculated using the Average Shares Method. | ||||
| (b) From May 20, 2016 inception. | ||||
| (c) Total return is not annualized for periods of less than one year and does not reflect deduction of any front-end or deferred sales charge. | ||||
| (d) Total expenses do not reflect amounts reimbursed and/or waived by the Advisor and certain of its affiliates, if applicable. Net expenses are net of all reductions and represent the net expenses paid by the Fund. | ||||
| (e) Amounts do not include the income or expenses of the Underlying Funds. | ||||
| (f) Annualized. | ||||
| See notes to financial statements. | ||||
calvert.com CALVERT ASSET ALLOCATION FUNDS ANNUAL REPORT 49
CALVERT AGGRESSIVE ALLOCATION FUND
FINANCIAL HIGHLIGHTS
| YEARS ENDED | |||||||||||||||||||
| CLASS A SHARES | September 30, 2016 (a) | September 30, 2015 (a) | September 30, 2014 (a) | September 30, 2013 | September 30, 2012 | ||||||||||||||
| Net asset value, beginning | $19.32 | $20.68 | $19.38 | $16.15 | $13.47 | ||||||||||||||
| Income from investment operations: | |||||||||||||||||||
| Net investment income | 0.19 | 0.21 | 0.18 | 0.11 | 0.12 | ||||||||||||||
| Net realized and unrealized gain (loss) | 1.25 | (0.08) | 1.70 | 3.23 | 2.68 | ||||||||||||||
| Total from investment operations | 1.44 | 0.13 | 1.88 | 3.34 | 2.80 | ||||||||||||||
| Distributions from: | |||||||||||||||||||
| Net investment income | (0.15) | (0.21) | (0.18) | (0.11) | (0.12) | ||||||||||||||
| Net realized gain | (2.49) | (1.28) | (0.40) | — | — | ||||||||||||||
| Total distributions | (2.64) | (1.49) | (0.58) | (0.11) | (0.12) | ||||||||||||||
| Total increase (decrease) in net asset value | (1.20) | (1.36) | 1.30 | 3.23 | 2.68 | ||||||||||||||
| Net asset value, ending | $18.12 | $19.32 | $20.68 | $19.38 | $16.15 | ||||||||||||||
| Total return (b) | 8.03 | % | 0.41 | % | 9.85 | % | 20.82 | % | 20.88 | % | |||||||||
| Ratios to average net assets: (c)(d) | |||||||||||||||||||
| Net investment income | 1.10 | % | 1.04 | % | 0.88 | % | 0.62 | % | 0.80 | % | |||||||||
| Total expenses | 0.78 | % | 0.77 | % | 0.76 | % | 0.81 | % | 0.86 | % | |||||||||
| Net expenses | 0.43 | % | 0.43 | % | 0.43 | % | 0.43 | % | 0.43 | % | |||||||||
| Portfolio turnover | 62 | % | 10 | % | 15 | % | 31 | % | 24 | % | |||||||||
| Net assets, ending (in thousands) | $103,539 | $93,928 | $83,009 | $72,318 | $60,495 | ||||||||||||||
| (a) Per share figures are calculated using the Average Shares Method. | |||||||||||||||||||
| (b) Total return is not annualized for periods of less than one year and does not reflect deduction of any front-end or deferred sales charge. | |||||||||||||||||||
| (c) Total expenses do not reflect amounts reimbursed and/or waived by the Advisor and certain of its affiliates, if applicable. Net expenses are net of all reductions and represent the net expenses paid by the Fund. | |||||||||||||||||||
| (d) Amounts do not include the income or expenses of the Underlying Funds. | |||||||||||||||||||
| See notes to financial statements. | |||||||||||||||||||
50 calvert.com CALVERT ASSET ALLOCATION FUNDS ANNUAL REPORT
CALVERT AGGRESSIVE ALLOCATION FUND
FINANCIAL HIGHLIGHTS
| YEARS ENDED | |||||||||||||||||||
| CLASS C SHARES | September 30, 2016 (a) | September 30, 2015 (a) | September 30, 2014 (a) | September 30, 2013 | September 30, 2012 | ||||||||||||||
| Net asset value, beginning | $17.21 | $18.71 | $17.71 | $14.89 | $12.57 | ||||||||||||||
| Income from investment operations: | |||||||||||||||||||
| Net investment income (loss) | 0.03 | (0.01) | (0.06) | (0.05) | (0.07) | ||||||||||||||
| Net realized and unrealized gain (loss) | 1.10 | (0.07) | 1.58 | 2.93 | 2.50 | ||||||||||||||
| Total from investment operations | 1.13 | (0.08) | 1.52 | 2.88 | 2.43 | ||||||||||||||
| Distributions from: | |||||||||||||||||||
| Net investment income | — | (0.14) | (0.12) | (0.06) | (0.11) | ||||||||||||||
| Net realized gain | (2.49) | (1.28) | (0.40) | — | — | ||||||||||||||
| Total distributions | (2.49) | (1.42) | (0.52) | (0.06) | (0.11) | ||||||||||||||
| Total increase (decrease) in net asset value | (1.36) | (1.50) | 1.00 | 2.82 | 2.32 | ||||||||||||||
| Net asset value, ending | $15.85 | $17.21 | $18.71 | $17.71 | $14.89 | ||||||||||||||
| Total return (b) | 7.06 | % | (0.72 | %) | 8.66 | % | 19.39 | % | 19.43 | % | |||||||||
| Ratios to average net assets: (c)(d) | |||||||||||||||||||
| Net investment income (loss) | 0.20 | % | (0.05 | %) | (0.30 | %) | (0.61 | %) | (0.46 | %) | |||||||||
| Total expenses | 1.60 | % | 1.55 | % | 1.53 | % | 1.63 | % | 1.69 | % | |||||||||
| Net expenses | 1.31 | % | 1.55 | % | 1.53 | % | 1.63 | % | 1.69 | % | |||||||||
| Portfolio turnover | 62 | % | 10 | % | 15 | % | 31 | % | 24 | % | |||||||||
| Net assets, ending (in thousands) | $17,578 | $16,400 | $14,557 | $11,234 | $8,381 | ||||||||||||||
| (a) Per share figures are calculated using the Average Shares Method. | |||||||||||||||||||
| (b) Total return is not annualized for periods of less than one year and does not reflect deduction of any front-end or deferred sales charge. | |||||||||||||||||||
| (c) Total expenses do not reflect amounts reimbursed and/or waived by the Advisor and certain of its affiliates, if applicable. Net expenses are net of all reductions and represent the net expenses paid by the Fund. | |||||||||||||||||||
| (d) Amounts do not include the income or expenses of the Underlying Funds. | |||||||||||||||||||
| See notes to financial statements. | |||||||||||||||||||
calvert.com CALVERT ASSET ALLOCATION FUNDS ANNUAL REPORT 51
CALVERT AGGRESSIVE ALLOCATION FUND
FINANCIAL HIGHLIGHTS
| PERIOD ENDED | ||||
| CLASS I SHARES | September 30, 2016 (a)(b) | |||
| Net asset value, beginning | $17.17 | |||
| Income from investment operations: | ||||
| Net investment income | 0.01 | |||
| Net realized and unrealized gain (loss) | 0.96 | |||
| Total from investment operations | 0.97 | |||
| Total increase (decrease) in net asset value | 0.97 | |||
| Net asset value, ending | $18.14 | |||
| Total return (c) | 5.65 | % | ||
| Ratios to average net assets: (d)(e) | ||||
| Net investment income | 0.19%(f) | |||
| Total expenses | 0.57%(f) | |||
| Net expenses | 0.08%(f) | |||
| Portfolio turnover | 62 | % | ||
| Net assets, ending (in thousands) | $1,056 | |||
| (a) Per share figures are calculated using the Average Shares Method. | ||||
| (b) From May 20, 2016 inception. | ||||
| (c) Total return is not annualized for periods of less than one year and does not reflect deduction of any front-end or deferred sales charge. | ||||
| (d) Total expenses do not reflect amounts reimbursed and/or waived by the Advisor and certain of its affiliates, if applicable. Net expenses are net of all reductions and represent the net expenses paid by the Fund. | ||||
| (e) Amounts do not include the income or expenses of the Underlying Funds. | ||||
| (f) Annualized. | ||||
| See notes to financial statements. | ||||
52 calvert.com CALVERT ASSET ALLOCATION FUNDS ANNUAL REPORT
CALVERT AGGRESSIVE ALLOCATION FUND
FINANCIAL HIGHLIGHTS
| PERIOD ENDED | ||||
| CLASS Y SHARES | September 30, 2016 (a)(b) | |||
| Net asset value, beginning | $17.17 | |||
| Income from investment operations: | ||||
| Net investment income | 0.01 | |||
| Net realized and unrealized gain (loss) | 0.97 | |||
| Total from investment operations | 0.98 | |||
| Total increase (decrease) in net asset value | 0.98 | |||
| Net asset value, ending | $18.15 | |||
| Total return (c) | 5.71 | % | ||
| Ratios to average net assets: (d)(e) | ||||
| Net investment income | 0.09%(f) | |||
| Total expenses | 6.83%(f) | |||
| Net expenses | 0.18%(f) | |||
| Portfolio turnover | 62 | % | ||
| Net assets, ending (in thousands) | $131 | |||
| (a) Per share figures are calculated using the Average Shares Method. | ||||
| (b) From May 20, 2016 inception. | ||||
| (c) Total return is not annualized for periods of less than one year and does not reflect deduction of any front-end or deferred sales charge. | ||||
| (d) Total expenses do not reflect amounts reimbursed and/or waived by the Advisor and certain of its affiliates, if applicable. Net expenses are net of all reductions and represent the net expenses paid by the Fund. | ||||
| (e) Amounts do not include the income or expenses of the Underlying Funds. | ||||
| (f) Annualized. | ||||
| See notes to financial statements. | ||||
PROXY VOTING
The Proxy Voting Guidelines of the Calvert Funds that the Fund uses to determine how to vote proxies relating to portfolio securities are provided as an Appendix to the Fund’s Statement of Additional Information. The Statement of Additional Information can be obtained free of charge by calling the Fund at 1-800-368-2745, by visiting the Calvert website at www.calvert.com; or by visiting the SEC’s website at www.sec.gov.
Information regarding how the Fund voted proxies relating to portfolio securities during the most recent 12-month period ended June 30 is available on the Fund’s website at www.calvert.com and on the SEC’s website at www.sec.gov.
AVAILABILITY OF QUARTERLY PORTFOLIO HOLDINGS
The Fund files its complete schedule of portfolio holdings with the SEC for the first and third quarters of each fiscal year on Form N-Q. The Fund’s Form N-Q is available on the SEC’s website at www.sec.gov. The Fund’s Form N-Q may be reviewed and copied at the SEC’s Public Reference Room in Washington, DC; information on the operation of the Public Reference Room may be obtained by calling 1-800-SEC-0330.
calvert.com CALVERT ASSET ALLOCATION FUNDS ANNUAL REPORT 53
DIRECTOR AND OFFICER INFORMATION TABLE
| Name & Age | Position With Fund | Position Start Date | Principal Occupation During Last 5 Years | # of Calvert Portfolios Overseen | Other Directorships During the Past Five Years |
| INDEPENDENT TRUSTEES/DIRECTORS | |||||
REBECCA L. ADAMSON AGE: 67 | Trustee Director Director Director | 1989 CSIF 2000 IMPACT 2000 CRIS 2005 CWVF | President and Founder of the national non-profit, First People’s Worldwide. Founded in 1980, First People’s Worldwide is the only American Indian alternative development institute in the U.S. | 19 | • Bay & Paul Foundation |
RICHARD L. BAIRD, JR. AGE: 68 | Trustee & Chair Director & Chair Director & Chair Director & Chair | 1982 CSIF 2000 CRIS 2005 CWVF 2005 IMPACT | Former President and CEO of Adagio Health Inc. (retired in 2014) in Pittsburgh, PA, a non-profit corporation which provides family planning services, nutrition, maternal/child health care, and various health screening services and community preventive health programs. | 24 | None |
JOHN G. GUFFEY, JR. AGE: 68 | Director Trustee Director Director | 1992 CWVF 1982 CSIF 2000 CRIS 2005 IMPACT | Consultant and President of Aurora Press Inc., a privately held publisher of trade paperbacks. | 24 | • Ariel Funds (3) (asset management) (through 12/31/11) • Calvert Social Investment Foundation • Calvert Ventures, LLC |
MILES D. HARPER, III AGE: 53 | Director Trustee Director Director | 2000 IMPACT 2005 CSIF 2005 CRIS 2005 CWVF | Partner, Carr Riggs & Ingram (public accounting firm) since October 2014. Partner, Gainer Donnelly & Desroches (public accounting firm) (now Carr Riggs & Ingram), 1999-2014. | 19 | • Bridgeway Funds (14) (asset management) |
JOY V. JONES AGE: 66 | Director Trustee Director Director | 2000 IMPACT 1990 CSIF 2000 CRIS 2005 CWVF | Attorney. | 19 | • Director, Conduit Street Restaurants SUD 2 Limited • Director, Palm Management Corporation |
TERRENCE J. MOLLNER, Ed.D. AGE: 71 | Director Trustee Director Director | 1992 CWVF 1982 CSIF 2000 CRIS 2005 IMPACT | Founder, Chairperson and President of Trusteeship Institute, Inc., an educational organization focused on the personal skills and organizations described in Dr. Mollner’s book, The Love Skill: We Are Mastering the 7 Layers of Human Maturity, particularly businesses that freely chose to give priority to the common good. Chairperson, Stakeholders Capital, Inc., an asset management firm and financial services provider. | 19 | • Calvert Social Investment Foundation • Ben & Jerry’s Homemade, Inc. (food products) |
SYDNEY A. MORRIS AGE: 67 | Trustee Director Director Director | 1982 CSIF 2000 CRIS 2005 CWVF 2005 IMPACT | The Rev. Dr. Morris is a Unitarian Universalist minister. | 19 | None |
54 calvert.com CALVERT ASSET ALLOCATION FUNDS ANNUAL REPORT (UNAUDITED)
| Name & Age | Position With Fund | Position Start Date | Principal Occupation During Last 5 Years | # of Calvert Portfolios Overseen | Other Directorships During the Past Five Years |
| INTERESTED TRUSTEES/DIRECTORS | |||||
D. WAYNE SILBY, Esq.* AGE: 68 | Director Trustee Director Director | 1992 CWVF 1982 CSIF 2000 CRIS 2000 IMPACT | Mr. Silby is the founding Chair of the Calvert Funds. He is the Chair-Elect and a principal of Syntao.com, a Beijing-based company promoting corporate social responsibility. | 24 | • Ameritas Mutual Holding Company (insurance) • Calvert Social Investment Foundation • ImpactAssets, Inc. (asset management) • Committee for the Future (charitable supporting organization) • Syntao.com China (HK) (sustainability consulting) • The ICE Organization (environmental services) |
JOHN H. STREUR* AGE: 56 | Director & President Trustee & President Director & President Director & President | 2015 CWVF 2015 CSIF 2015 CRIS 2015 IMPACT | Director, Chairman, President and Chief Executive Officer of Calvert Investments, Inc., Calvert Investment Administrative Services, Inc., Calvert Investment Management, Inc., Calvert Investment Distributors, Inc. and Calvert Investment Services, Inc. (since January 2015); Chief Compliance Officer, Calvert Investment Distributors, Inc. (since August 2015); Chief Compliance Officer, Calvert Investment Management, Inc. (August 2015 - April 2016); President and Director, Portfolio 21 Investments, Inc. (through October 2014); President, Chief Executive Officer and Director, Managers Investment Group LLC (through January 2012); President and Director, The Managers Funds and Managers AMG Funds (through January 2012). | 37 | • Portfolio 21 Investments, Inc. (asset management)(through October 2014) • Managers Investment Group LLC (asset management)(through January 2012) • The Managers Funds (asset management) (through January 2012) • Managers AMG Funds (asset management) (through January 2012) • Calvert Social Investment Foundation |
* Mr. Silby is an interested person of the Funds since he is a Director of the parent company of each Fund’s Advisor. Mr. Streur is an interested person of the Funds since he is an Officer and Director of each Fund’s Advisor and certain affiliates. The address of the Trustees and Officers is 4550 Montgomery Avenue, Suite 1000N, Bethesda, Maryland 20814, with the exception of Mr. Silby, whose address is 1715 18th Street, N.W., Washington, DC 20009. Additional information about the Fund’s Trustees/Directors can be found in the Statement of Additional Information (SAI). You can get a free copy of the SAI at www.calvert.com, or by contacting your broker, or the Fund at 1-800-368-2745. | |||||
calvert.com CALVERT ASSET ALLOCATION FUNDS ANNUAL REPORT (UNAUDITED) 55
| Name & Age | Position with Funds | Position Start Date | Principal Occupation During Last 5 Years |
| OFFICERS | |||
VICKI L. BENJAMIN AGE: 54 | Treasurer | 2015 | Treasurer of the Funds (since March 2015); Director, Executive Vice President, Chief Financial Officer, Chief Operating Officer and Treasurer of Calvert Investments, Inc., Calvert Investment Administrative Services, Inc., and Calvert Investment Services, Inc. (since October 2015); Director, Executive Vice President, Chief Financial Officer - Elect, Chief Operating Officer and Treasurer of Calvert Investment Management, Inc. and Calvert Investment Distributors, Inc. (since October 2015); Director, Senior Vice President and Chief Financial Officer of Calvert Investments, Inc., Calvert Investment Administrative Services, Inc., Calvert Investment Services, Inc., Calvert Investment Management, Inc. and Calvert Investment Distributors, Inc. (March 2015 - September 2015); and Senior Partner, KPMG LLP (2005 - 2015). |
ROBERT D. BENSON, Esq. AGE: 37 | Associate General Counsel, Assistant Vice President & Assistant Secretary | 2014 | Associate General Counsel (since September 2016), Assistant General Counsel (2014 - September 2016), Assistant Vice President and Assistant Secretary of the Funds, Calvert Investments, Inc., Calvert Investment Administrative Services, Inc., Calvert Investment Services, Inc., Calvert Investment Management, Inc. and Calvert Investment Distributors, Inc. (since 2014); and Staff Attorney, Calvert Investments, Inc., Calvert Investment Administrative Services, Inc., Calvert Investment Services, Inc., Calvert Investment Management, Inc. and Calvert Investment Distributors, Inc. (2008 - 2014). |
HOPE BROWN AGE: 42 | Chief Compliance Officer | 2014 | Chief Compliance Officer of the Funds (since November 2014); Vice President and Chief Compliance Officer, Wilmington Funds (December 2012 - November 2014); and Vice President and Senior Compliance Officer, Wilmington Trust Investment Advisors, Inc. (September 2010 - December 2012). |
THOMAS DAILEY AGE:51 | Vice President | 2012 | Vice President of the Funds (since 2012); and Vice President (since January 2005) and Portfolio Manager - Tax Exempt, Calvert Investment Management, Inc. (since 1995). |
STU DALHEIM AGE: 46 | Vice President | 2015 | Vice President of the Funds (since 2015); and Vice President - Governance and Advocacy of Calvert Investment Management, Inc. (since October 2011). |
BRIAN ELLIS, CFA AGE: 32 | Vice President | 2016 | Vice President of the Funds (since February 2016); Portfolio Manager, Taxable Fixed Income, Calvert Investment Management, Inc. (since May 2012); and Business Analyst (2009 - May 2012), Calvert Investment Management, Inc. |
ROBERT J. ENDERSON, CFA AGE: 57 | Assistant Treasurer | 2014 | Assistant Treasurer of the Funds (since 2014); Vice President, Corporate Finance, and Assistant Treasurer, Calvert Investments, Inc., Calvert Investment Administrative Services, Inc., Calvert Investment Management, Inc., Calvert Investment Services, Inc. and Calvert Investment Distributors, Inc. (since 2007); Acting Chief Financial Officer of Calvert Investments, Inc., Calvert Investment Administrative Services, Inc., Calvert Investment Management, Inc., Calvert Investment Services, Inc. and Calvert Investment Distributors, Inc. (September 2014 - March 2015). |
PATRICK FAUL, CFA AGE: 51 | Vice President | 2010 | Vice President (since 2007) and Head of Credit Research, Calvert Investment Management, Inc. (since January 2010). |
TRACI L. GOLDT AGE: 42 | Assistant Secretary | 2004 | Assistant Secretary of the Funds (since 2004); Director, Strategic Projects and Fund Operations, Calvert Investment Administrative Services, Inc. (since June 2016); and SEC Filing and Operations Manager, Calvert Investment Administrative Services, Inc. (2011 – 2016). |
JADE HUANG AGE: 41 | Vice President | 2015 | Vice President of the Funds (since 2015); Portfolio Manager - Equity, Calvert Investment Management, Inc. (since November 2015); and Senior Equity Analyst, Calvert Investment Management, Inc. (2006 - November 2015). |
VISHAL KHANDUJA, CFA AGE: 38 | Vice President | 2014 | Vice President of the Funds (since 2014); Vice President and Head of Taxable Bond, Calvert Investment Management, Inc. (since May 2016); Vice President and Portfolio Manager, Taxable Fixed Income, Calvert Investment Management, Inc. (2012 - May 2016); Portfolio Manager - Global Rates and Currency Team, Columbia Management (2009 - 2012). |
ERICA LASDON AGE: 45 | Assistant Vice President, Research and Advocacy | 2015 | Assistant Vice President, Research and Advocacy of the Funds (since 2016) and Calvert Investment Management, Inc. (since August 2015); and Senior Sustainability Analyst and Manager, Calvert Investment Management, Inc. (2005 - August 2015). |
JOSHUA LINDER, CFA AGE: 30 | Vice President | 2016 | Vice President of the Funds (since 2016); Portfolio Manager, Equity, Calvert Investment Management, Inc. (since January 2016); Assistant Portfolio Manager, Calvert Investment Management, Inc. (January 2014 - October 2015); and Equity Analyst, Calvert Investment Management, Inc. (2011 - 2013). |
CHRISTOPHER MADDEN AGE: 40 | Vice President | 2015 | Vice President of the Funds (since 2015); Portfolio Manager - Equity, Calvert Investment Management, Inc. (since November 2015); and Senior Equity Analyst, Calvert Investment Management, Inc. (2010 - November 2015). |
56 calvert.com CALVERT ASSET ALLOCATION FUNDS ANNUAL REPORT (UNAUDITED)
| Name & Age | Position with Funds | Position Start Date | Principal Occupation During Last 5 Years |
| OFFICERS | |||
ANDREW K. NIEBLER, Esq. AGE: 48 | Deputy General Counsel, Vice President & Secretary | 2006 (TCF, CMS, CRIS, CSIF, CVS) 2008 (CVP) 2016 (CIF) | Deputy General Counsel, Vice President and Secretary of the Funds, Calvert Investments, Inc., Calvert Investment Administrative Services, Inc., Calvert Investment Management, Inc., Calvert Investment Distributors, Inc. and Calvert Investment Services, Inc. (since May 2016); Assistant Vice President, Associate General Counsel and Assistant Secretary, Calvert Investments, Inc., Calvert Investment Administrative Services, Inc., Calvert Investment Management, Inc., Calvert Investment Distributors, Inc. and Calvert Investment Services, Inc. (September 2009 - May 2016); and Assistant Vice President, Assistant General Counsel and Assistant Secretary, Calvert Investments, Inc., Calvert Investment Administrative Services, Inc., Calvert Investment Management, Inc., Calvert Investment Distributors, Inc. and Calvert Investment Services, Inc. (prior to September 2009). |
MONIQUE S. PATTILLO, Esq. AGE: 34 | Assistant General Counsel, Assistant Vice President & Assistant Secretary | 2016 | Assistant Vice President, Assistant General Counsel and Assistant Secretary of the Funds, Calvert Investments, Inc., Calvert Investment Administrative Services, Inc., Calvert Investment Management, Inc., Calvert Investment Distributors, Inc. and Calvert Investment Services, Inc. (since September 2016); Adjunct Faculty, Howard Community College (since June 2015); Adjunct Assistant Professor, University of Maryland University College (since June 2016); Legal Counsel, T. Rowe Price Associates, Inc. (March 2014 - June 2015); and Assistant U.S. Counsel, Aberdeen Asset Management, Inc. (January 2011 - March 2014). |
MARYBETH PILAT, CPA AGE: 48 | Fund Controller and Assistant Treasurer | 2015 | Fund Controller and Assistant Treasurer of the Funds (since August 2015); Director, Anti-Money Laundering Officer and Assistant Treasurer, Calvert Investments, Inc., Calvert Investment Administrative Services, Inc., Calvert Investment Management, Inc., Calvert Investment Distributors, Inc. and Calvert Investment Services, Inc. (since August 2015); Director of Fund Administration, Calvert Investment Administrative Services, Inc. (since August 2015); VP Expense & Budgeting, Global Fiduciary Platform, Legg Mason (May 2015 - July 2015); and Vice President and Assistant Treasurer, Columbia Funds, Ameriprise, Columbia Management (2010 - April 2015). |
JOHN H. STREUR AGE: 56 | President and Director (except CVS) | 2015 | Director, Chairman, President and Chief Executive Officer of Calvert Investments, Inc., Calvert Investment Administrative Services, Inc., Calvert Investment Management, Inc., Calvert Investment Distributors, Inc. and Calvert Investment Services, Inc. (since January 2015); Chief Compliance Officer, Calvert Investment Distributors, Inc. (since August 2015); Chief Compliance Officer, Calvert Investment Management, Inc. (August 2015 - April 2016); President and Director, Portfolio 21 Investments, Inc. (through October 2014); President, Chief Executive Officer and Director, Managers Investment Group LLC (through January 2012); President and Director, The Managers Funds and Managers AMG Funds (through January 2012). |
calvert.com CALVERT ASSET ALLOCATION FUNDS ANNUAL REPORT (UNAUDITED) 57
| This page intentionally left blank. |
| CALVERT ASSET ALLOCATION FUND | CALVERT’S FAMILY OF FUNDS | |||
To Open an Account 800-368-2748 Service for Existing Account Shareholders: 800-368-2745 Brokers: 800-368-2746 Registered Mail Calvert Investments c/o BFDS, P.O. Box 219544 Kansas City, MO 64121-9544 Overnight Mail Calvert Investments c/o BFDS, 330 West 9th Street Kansas City, MO 64105 Web Site calvert.com Principal Underwriter Calvert Investment Distributors, Inc. 4550 Montgomery Avenue Suite 1000 North Bethesda, Maryland 20814 | Municipal Funds Tax-Free Responsible Impact Bond Fund Taxable Bond Funds Bond Portfolio Income Fund Short Duration Income Fund Long-Term Income Fund Ultra-Short Income Fund High Yield Bond Fund Green Bond Fund Unconstrained Bond Fund Balanced and Asset Allocation Funds Balanced Portfolio Conservative Allocation Fund Moderate Allocation Fund Aggressive Allocation Fund | Equity Funds Equity Portfolio U.S. Large Cap Core Responsible Index Fund U.S. Large Cap Value Responsible Index Fund U.S. Large Cap Growth Responsible Index Fund U.S. Mid Cap Core Responsible Index Fund Developed Markets Ex-U.S. Responsible Index Fund Capital Accumulation Fund International Equity Fund Small Cap Fund Global Energy Solutions Fund Global Water Fund International Opportunities Fund Emerging Markets Equity Fund | ||
This report is intended to provide fund information to shareholders. It is not authorized for distribution to prospective investors unless preceded or accompanied by a prospectus. Note: The information on our website is not incorporated by reference into this report; our website address is included as an inactive textual reference only. Investors should carefully consider the investment objectives, risks, charges and expenses of the Calvert Funds. This and other important information is contained in the fund’s summary prospectus and prospectus, which can be obtained from your financial professional and should be read carefully before investing. You may also call Calvert at 800/368-2748 or visit calvert.com. | |
| Printed on recycled paper using soy inks. | |
Item 2. Code of Ethics.
| (a) | As of September 30, 2016, the Registrant had adopted a code of ethics that applies to the Registrant’s principal executive officer, principal financial officer, principal accounting officer or controller, or persons performing similar functions, regardless of whether these individuals are employed by the Registrant or a third party (the “Code of Ethics”). |
| (b) | Not applicable. |
| (c) | During the period covered by the report, the Registrant adopted a revised Code of Ethics, which reflected immaterial changes to the provisions of the Code of Ethics. |
| (d) | During the period covered by the report, the Registrant did not grant any waivers to the provisions of the Code of Ethics. |
| (e) | Not applicable. |
| (f) | The Code of Ethics is attached as an Exhibit to this Form N-CSR. |
Item 3. Audit Committee Financial Expert.
The registrant's Board of Trustees has determined that Miles D. Harper, III, an "independent" Trustee serving on the registrant's audit committee, is an "audit committee financial expert," as defined in Item 3 of Form N-CSR. Under applicable securities laws, a person who is determined to be an audit committee financial expert will not be deemed an "expert" for any purpose, including without limitation for the purposes of Section 11 of the Securities Act of 1933, as a result of being designated or identified as an audit committee financial expert. The designation or identification of a person as an audit committee financial expert does not impose on such person any duties, obligations, or liabilities that are greater than the duties, obligations, and liabilities imposed on such person as a member of the audit committee and Board of Trustees in the absence of such designation or identification.
Item 4. Principal Accountant Fees and Services.
Services fees paid to auditing firm:
| Fiscal Year ended 9/30/16 | Fiscal Year ended 9/30/15 | |||
| $ | % * | $ | %* | |
| (a) Audit Fees | $199,798** | 0% | $177,210 | 0% |
| (b) Audit-Related Fees | $0 | 0% | $0 | 0% |
| (c) Tax Fees (tax return preparation and filing for the registrant) | $31,100 | 0% | $21,700 | 0% |
| (d) All Other Fees | $0 | 0% | $0 | 0% |
| Total | $230,898 | 0% | $198,910 | 0% |
* Percentage of fees approved by the Audit Committee pursuant to (c)(7)(i)(C) of Rule 2-01 of Reg. S-X (statutory de minimis waiver of Committee’s requirement to pre-approve)
** Includes fees related to annual audits and review of standard regulatory filings
(e) Audit Committee pre-approval policies and procedures:
The Audit Committee is required to pre-approve all audit and non-audit services provided to the registrant by the auditors, and to the registrant’s investment advisor, and any entity controlling, controlled by, or under common control with the advisor that provides ongoing services to the registrant. In determining whether to pre-approve non-audit services, the Audit Committee considers whether the services are consistent with maintaining the independence of the auditors. The Committee may delegate its authority to pre-approve certain matters to one or more of its members. In this regard, the Committee has delegated authority jointly to the Audit Committee Chair together with another Committee member with respect to non-audit services not exceeding $25,000 in each instance. In addition, the Committee has pre-approved the retention of the auditors to provide tax-related services related to the tax treatment and tax accounting of newly acquired securities, upon request by the investment advisor in each instance.
(f) Not applicable.
(g) Aggregate non-audit fees billed by the registrant’s accountant for services rendered to the registrant, and rendered to the registrant’s investment advisor, and any entity controlling, controlled by, or under common control with the advisor that provides ongoing services to the registrant for each of the last two fiscal years of the registrant:
| Fiscal Year ended 9/30/16 | Fiscal Year ended 9/30/15 | |||
| $ | %* | $ | %* | |
| $— | 0%* | $340,000 | 0%* | |
* Percentage of fees approved by the Audit Committee pursuant to (c)(7)(i)(C) of Rule 2-01 of Reg. S-X (statutory de minimis waiver of Committee’s requirement to pre-approve)
(h) The registrant’s Audit Committee of the Board of Trustees has considered whether the provision of non-audit services that were rendered to the registrant’s investment advisor, and any entity controlling, controlled by, or under common control with the investment advisor that provides ongoing services to the registrant that were not pre-approved pursuant to paragraph (c) (7)(ii) of Rule 2-01 of Reg. S-X is compatible with maintaining the principal accountant’s independence and found that the provision of such services is compatible with maintaining the principal accountant’s independence.
Item 5. Audit Committee of Listed Registrants.
Not applicable.
Item 6. Schedule of Investments.
| (a) | This Schedule is included as part of the report to shareholders filed under Item 1 of this Form. |
| (b) | Not applicable. |
Item 7. Disclosure of Proxy Voting Policies and Procedures for Closed-End Management Investment Companies.
Not applicable.
Item 8. Portfolio Managers of Closed-End Management Investment Companies
Not applicable.
Item 9. Purchases of Equity Securities by Closed-End Management Investment Company and Affiliated Purchasers.
Not applicable.
Item 10. Submission of Matters to a Vote of Security Holders.
No material changes were made to the procedures by which shareholders may recommend nominees to the registrant’s Board of Trustees since registrant last provided disclosure in response to this Item.
Item 11. Controls and Procedures.
(a) The registrant’s principal executive and principal financial officers have concluded that the registrant's disclosure controls and procedures (as defined in Rule 30a-3(c) under the Investment Company Act of 1940 Act, as amended (the “1940 Act”) are effective, based on the evaluation of these controls and procedures required by Rule 30a-3(b) under the 1940 Act and Rules 13a-15(b) or 15d-15(b) under the Securities Exchange Act of 1934 (“Exchange Act”), as of a date within 90 days of the filing date of this report.
(b) There was no change in the registrant's internal control over financial reporting (as defined in Rule 30a-3(d) under the 1940 Act) that occurred during the second fiscal quarter of the period covered by this report that has materially affected, or is reasonably likely to materially affect, the registrant's internal control over financial reporting.
Item 12. Exhibits.
(a)(1) A copy of the Registrant’s Code of Ethics.
Attached hereto.
(a)(2) A separate certification for each principal executive officer and principal financial officer of the registrant as required by Rule 30a-2 under the Act (17 CFR 270.30a-2).
Attached hereto.
(a)(3) Not applicable.
(b) A certification for the registrant's principal executive officer and principal financial officer, as required by Rule 30a-2(b) under the 1940 Act, is attached hereto. The certification furnished pursuant to this paragraph is not deemed to be "filed" for purposes of Section 18 of the Exchange Act, or otherwise subject to the liability of that section. Such certification is not deemed to be incorporated by reference into any filing under the Securities Act of 1933 or the Exchange Act, except to the extent that the registrant specifically incorporates it by reference.
Pursuant to the requirements of the Securities Exchange Act of 1934 and the Investment Act of 1940, the registrant has duly caused this report to be signed on its behalf by the undersigned, thereunto duly authorized.
CALVERT SOCIAL INVESTMENT FUND
By: /s/ John H. Streur
John H. Streur
President -- Principal Executive Officer
Date: November 23, 2016
Pursuant to the requirements of the Securities Exchange Act of 1934 and the Investment Act of 1940, this report has been signed below by the following persons on behalf of the registrant and in the capacities and on the dates indicated.
/s/ John H. Streur
John H. Streur
President -- Principal Executive Officer
Date: November 23, 2016
/s/ Vicki L. Benjamin
Vicki L. Benjamin
Treasurer -- Principal Financial Officer
Date: November 23, 2016