UNITED STATES
SECURITIES AND EXCHANGE COMMISSION
Washington, D.C. 20549
FORM N-CSR
CERTIFIED SHAREHOLDER REPORT OF REGISTERED
MANAGEMENT INVESTMENT COMPANIES
Investment Company Act file number: 811-3334
CALVERT SOCIAL INVESTMENT FUND
(Exact name of registrant as specified in charter)
4550 Montgomery Avenue
Suite 1000N
Bethesda, Maryland 20814
(Address of Principal Executive Offices)
William M. Tartikoff, Esq.
4550 Montgomery Avenue
Suite 1000N
Bethesda, Maryland 20814
(Name and Address of Agent for Service)
Registrant's telephone number, including area code: (301) 951-4800
Date of fiscal year end: September 30
Date of reporting period: Twelve months ended September 30, 2013
Item 1. Report to Stockholders.
[Calvert Social Investment Fund Balanced, Bond, Equity and Large Cap Core Portfolios Annual Report]
[Calvert Asset Allocation Funds Annual Report]
Choose Planet-friendly E-delivery!
Sign up now for on-line statements, prospectuses, and fund reports. In less than five minutes you can help reduce paper mail and lower fund costs.
Just go to www.calvert.com. If you already have an online account at Calvert, click on My Account, and select the documents you would like to receive via e-mail.
If you’re new to online account access, click on Login/Register to open an online account. Once you’re in, click on the E-delivery sign-up at the bottom of the Account Portfolio page and follow the quick, easy steps. Note: if your shares are not held directly at Calvert but through a brokerage firm, you must contact your broker for electronic delivery options available through their firm.

Dear Calvert Shareholder,
In the past 12 months, financial equity markets have staged quite a rally. The S&P 500 Index is up more than 19%. A year ago, many troubling circumstances created some fears in the market (although this letter suggested investors should hang in there).
In My Opinion
Today, with the Federal Reserve flooding the country with quantitative easing money, there seems to be an acquiescence and belief that this pillow of easy money will keep the markets buoyant. Stock prices have increased due more to expansions of price-to-earnings multiples than higher earnings growth. While Wall Street consensus is for the equity markets to be up 7% in the second half of 2014, I am not so sure and admit to some uneasiness about this prediction. The Fed made the right moves, but easy money is not a cure-all for our long-term economic future.
The word at the Federal Reserve is that Janet Yellen, nominated to become the new Chairman, may keep short-term rates low into 2015. While we applaud the selection of a woman, I was also happy to learn she is married to a co-author of one of my favorite economic books, Animal Spirits, which is based on an old concept from economist John Maynard Keynes. Keynes suggested that, for all his theories, the psychology of the markets also played a mysterious but important role. And that is where I believe the mood of the country may be cause for concern.
As of this writing, the U.S. government has reopened and avoided default—but not without considerable consternation. I respect the intentions of the right wing, trying with unfortunate desperation, to bring the spending issue to the table. The Obama administration has not presented a long-term, credible plan to moderate the deficit spending.
Most Americans agree we need a mix of budget cuts and tax increases. I am in the camp that believes we should have a means test for Social Security. But with all the special interests, our political system can’t seem to do what to me is simply common sense on this vital issue. In my opinion, the divisiveness in Washington is contributing to a dour mood in the country. We are very fortunate to have a respite on energy security issues but also unfortunate that important discussions on climate change and carbon reduction seem to have waned.
Compounding this mood is not just the growing divide between rich and poor, but the fact we have a growing underclass for which we don’t have a plan. One-quarter of high school students don’t graduate.1 Twenty percent of families are on food stamps.2 More than four million people have exhausted regular federal unemployment benefits, increasing a sense of discouragement.3 Some suggest the American Dream is fading for too many. I believe some fixes, like the Affordable Care Act, go in the right direction.
4 www.calvert.com CALVERT SOCIAL INVESTMENT FUND ANNUAL REPORT
But it’s uncertain whether this will reduce actual care costs, which are almost twice as high in the United States as in other developed nations.
While I have been an Obama supporter, I still don’t know what his vision is—although employees of his administration may well counter that their plans only allow what’s politically doable. To me, it seems obvious that we need to 1) focus on getting education to the underserved and 2) create a sensible immigration policy that brings needed and motivated talent into our country, however that’s defined and 3) adopt a tax on carbon to accelerate our transition to cleaner energy.
The rest of the world provides no anti-depressant to the global outlook. The Germans seem to have accepted their asymmetric role in Europe but that has only stabilized a despondent dynamic with other states. The Japanese are at least making efforts to moderate stagnation. China is having its quadrennial Congress in November, which will foretell if the new leadership is serious about much-needed reforms. Events in China could easily be the linchpin for the markets, as the various financial bubbles in that country could become a problem—decreasing their global consumption demands, causing stagnation in many emerging market countries, and affecting U.S. corporate earnings.
Even longer-term, the concern is that the U.S. is entering into decades of what some economists predict will be called The Great Stagnation. With declines in productivity indicators, research and development, and the working-age population,4 it’s hard to understand where the tax revenues will come from to support promised entitlements. U.S. politics and policymaking must act responsibly or social dislocation may be in our future.
Then again, perhaps these will be the times that remind us that true wealth is really in our relationships, our communities, and our spiritual practices. Maybe a more local focus, from the foods we eat to the ecological health of our immediate environment, will bring us sustenance and richness, similar to the romanticized agrarian times, and away from today’s getting and spending. Some reflection about how we can transform the “new normal” into the “real normal” may be a silver lining for the slower economic growth ahead.
Shareholder Engagement
Yet, animal spirits at Calvert remain high. Companies are becoming more responsive to our interactions in pushing for best-in-class standards, but not without the occasional arm-twisting. Over the past year, Calvert engaged with 139 companies and filed 22 shareholder proposals, which led to agreements with 14 companies on the issues of board diversity, sustainability reporting, and board oversight of sustainability, among others.
While these numbers tell our story, I was particularly moved by an informal interaction my assistant had with a retired big pharma executive at a recent Wharton awards dinner. He told her that Calvert’s inquiries were taken quite seriously at this global multinational corporation and provoked much internal discussion. He said having a shareholder ask these questions gives internal advocates more of a voice in policy-setting and implored her to keep up the good work!
This exchange was not only a strong validation for Calvert’s work—it shows the shareholder advocacy process is not necessarily as adversarial as some may believe. People inside the company are often already lobbying for the changes we propose. They simply don’t have
www.calvert.com CALVERT SOCIAL INVESTMENT FUND ANNUAL REPORT 5
enough clout or know how to make them happen. But management has a much harder time ignoring a group of investors who own millions of dollars of the company’s stock.
350.Org Divestment Campaign On Fossil Fuels
Calvert closely watched the 350.org campaign urging college and university endowments, as well as other institutional investors, to divest from companies producing fossil fuels. We support the campaign’s broad objectives while making the case for a complementary strategy of active ownership and engagement, as we do on your behalf here at Calvert. After all, shareholders have a lot more leverage for getting management’s ear than outsiders. To illustrate that point, we highlighted specific fossil fuel companies that Calvert has successfully engaged on climate change, alternative energy, and revenue transparency in a web site statement on the matter last December.
In July, we also highlighted Calvert’s low and no-carbon portfolios, breaking down the percentage (between zero and three percent) of carbon exposure in your funds, as calculated by Carbon Tracker Top 200 and portfolio holding weight. Interestingly, some now argue that cleansing portfolios makes even more sense financially, as the carbon situation may become so severe that the oil industry may not be permitted to monetize “stranded assets” of petroleum.
Community Investments
Many of our Funds participate in Calvert’s High Social Impact Investing program, which is administered through the Calvert Foundation. This community investment program may allocate a small percentage of Fund assets at below-market interest rates to investments that provide economic opportunity for struggling populations.
As part of its WIN-WIN portfolio (Women Investing in Women), we recently invested $500,000 through the Foundation in Access to Capital for Entrepreneurs (ACE) to expand their lending to small businesses. ACE is a nonprofit community lender and a certified community development financial institution that provides loans to small businesses owned by low-income individuals, people of color and women who lack access to traditional forms of credit in Georgia.
Special Equities
A modest but important portion of certain funds is allocated to small private companies developing products or services that address important sustainability or environmental issues facing our society.
One recent investment was in Shangri-La Farms. This company in the Yunnan province of China trains minorities to be beekeepers, among other crafts. The honey is then nicely packaged for sale to upscale hotels and stores in Beijing. While this activity may never become large scale, we thought it was important to promote the concept of social enterprise investment in China, as an example to the Chinese, of this social impact investing.
Another investment, Revolution Foods, was held through the Westly Capital Partners Fund II, L.P. This company provides nutritious school meals for kids, educating them about real foods. Two of our companies providing bio-based products for pest management and agricultural plant health, Marrone Bio Innovations and Agraquest, also provided good returns to the fund this year as one was acquired and one conducted an IPO.
6 www.calvert.com CALVERT SOCIAL INVESTMENT FUND ANNUAL REPORT
Your fund’s pioneering work in this area of social venture capital, now called “impact investing,” has been quite a contribution to this growing movement of the intersection between meaning and money, especially with the younger generation. Most of the business schools now have Impact Investing courses, and students no longer need to feel embarrassed asking about the social value of investments in class.
Your support of the Funds has made this difference happen. We thank you and continue to be rewarded with the challenges of our collective mission.

1. Alliance for Excellent Education, America’s Promise Alliance, Civic Enterprises, and Everyone Graduates Center at Johns Hopkins University, Building a Grad Nation: Progress and Challenge in Ending the High School Dropout Epidemic, February 2013 www.americaspromise.org/our-work/grad-nation/building-a-grad-nation.aspx
2. U.S. Department of Agriculture Monthly Supplemental Nutrition Assistance Program Report www.fns.usda.gov/pd/34SNAPmonthly.htm
3. Bureau of Labor Statistics Employment Situation Summary, September 2013, www.bls.gov/news.release/empsit.nr0.htm
4. Jonathan Laing, “Slowing to a Crawl,” Barron’s, October 28, 2013, http://online.barrons.com/article/SB50001424053111904897104579149772682783890.html
As of September 30, 2013, Calvert Social Investment Foundation (“Calvert Foundation” or “Foundation”) Community Investment Notes represented the following percentages of Fund net assets: Calvert Balanced Portfolio .72%, Calvert Equity Portfolio .39%, and Calvert Bond Portfolio .43%. The Calvert Foundation is a 501(c)(3) nonprofit organization. The Calvert Foundation is a 501(c)(3) nonprofit organization. The Foundation’s Community Investment Note Program is not a mutual fund and should not be confused with any Calvert Investments-sponsored investment product.
As of September 30, 2013, the following companies represented the following percentages of Portfolio net assets: Shangri-La Farms .007% of Calvert Equity Portfolio; Westly Capital Partners Fund II .01% of Calvert Equity Portfolio, Marrone Bio Innovations .14% of Calvert Equity Portfolio, and Agraquest .04% of Calvert Balanced Portfolio. Holdings are subject to change.
www.calvert.com CALVERT SOCIAL INVESTMENT FUND ANNUAL REPORT 7

Dear Calvert Shareholder,
For the 12 months ended September 30, 2013, the global equity markets generally had a strong year, while bonds saw more mixed results. Large-cap stocks, as represented by the Russell 1000 Index, posted a healthy 20.9% return, while the smaller-cap Russell 2000 Index led with a 30.1% gain. This occurred despite political turmoil and market concerns worldwide about a forced shutdown of the U.S. government and the upcoming debt ceiling deadline.
Despite these advances, it was a challenging year for the financial markets overall. At various times, issues at home and abroad led to marked volatility in the performance of both stocks and bonds. Emerging-market performance was notably low, as fears of slowing growth in China and the Eurozone, along with continuing struggles in the Eurozone periphery, stalled regional investment. As a result, the formerly high-flying MSCI Emerging Markets Index gained only 1.3% for the period. The Barclays U.S. Credit Index, a barometer for the overall U.S. bond market, returned -1.9%.
Early in the Fall, Fed Chairman Ben Bernanke’s retirement was big news. The nomination of Vice Chair Janet Yellen as his replacement means the Fed will likely stay the course with current monetary policy. Yet, this is a historic moment for the United States, as Yellen, following Senate approval, will be the first woman to lead this critical agency.
Calvert Co-Founder Honored
I’m proud to congratulate Calvert co-founder Wayne Silby, who received the prestigious Joseph Wharton Award for Social Impact from The Alumni Club of New York, honoring his lifetime of achievement in impact investing and social entrepreneurship. Besides founding Calvert with John Guffey, Wayne is a co-founder of the Social Venture Network, Co-Chairman of the board of the Calvert Foundation, Chairman of Syntao Ltd., a CSR consultancy in Beijing, and active in other ventures in social impact and entrepreneurship.
Calvert Releases New Report on Diversity
In March, we published the latest edition of Examining the Cracks in the Glass Ceiling, which measures diversity practices of the companies that constitute the S&P 100 Index. As you know, Calvert believes companies with a diverse workforce are poised for greater success in today’s increasingly global marketplace and will enjoy greater long-term value—a view supported by a growing body of research from McKinsey, Credit Suisse, and others.
Companies in the report were rated on 10 indicators: EEO policy, internal diversity initiatives, external diversity initiatives, scope of diversity initiatives, family-friendly benefits, demographic disclosure of employees (EEO-1), highest-paid executives, board diversity,
8 www.calvert.com CALVERT SOCIAL INVESTMENT FUND ANNUAL REPORT
director selection criteria, and overall corporate commitment. The highest-rated companies were Citigroup, Merck, The Coca-Cola Company, and J.P. Morgan Chase, all scoring at least 95 points or more out of 100. We hold these companies in a number of our Calvert portfolios.
While some progress has been achieved in corporate diversity practices since our last assessment in 2010, the S&P 100 companies are largely failing to translate progressive practices into increased promotion rates for women and minority employees. For example, women are now hired as often as men. However, more than half of the S&P 100 companies lack diversity among their highest-paid senior executive positions. And women still only represent 19% of board members among these large-cap companies. Much remains to be done, which is why we continue to work with a number of international, multi-stakeholder groups on these issues, as well as conduct advocacy work with individual companies.
Stay Informed in the Months Ahead
Maintaining a well-diversified mix of U.S. and international stocks, bonds, and cash—appropriate for your goals and risk tolerance—is one of the best ways to mitigate the effects of an uneven recovery in the economy and markets. Of course, we recommend consulting your financial advisor if you have questions or concerns about your investments.
We also invite you to visit our website, www.calvert.com, for fund information, portfolio updates, and commentary from Calvert professionals. As always, we thank you for investing with Calvert.
Sincerely,

The following companies represented the following percentages of Fund net assets: Citigroup 2.27% of Calvert Large Cap Value, 1.32% of Calvert Social Index; Merck 2.26% of Calvert Equity Income, 2.01% of Calvert Large Cap Value, and 1.25% of Calvert Social Index; Coca-Cola 1.29% of Calvert Social Index, 3.20% of Calvert Large Cap Core and 3.29% Calvert Equity Portfolio; J.P. Morgan Chase 2.54% of Calvert Equity Income, 1.74% of Calvert Social Index and 0.34% of Calvert Balanced Portfolio. Holdings are subject to change.
www.calvert.com CALVERT SOCIAL INVESTMENT FUND ANNUAL REPORT 9

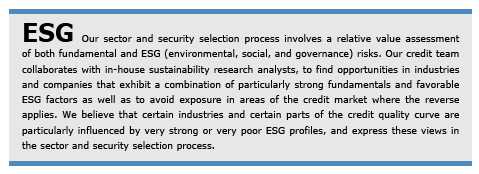
As always, Calvert continues to work hard to ensure you have a say in the responsible management of environmental, social, and governance (ESG) factors for the companies in which we invest. Below are highlights of our accomplishments during the reporting period.
Shareholder Advocacy
Over the past year, Calvert engaged with 139 companies via emails, letters, phone calls, and in-person meetings. We also filed 22 shareholder proposals during the 2013 proxy season, which led to agreements with 14 companies on the issues of board diversity and sustainability reporting, among others. We also presented at four annual meetings where the proposals came to a vote and received shareholder support that exceeded 40% at two companies.
One proposal was for diversified energy services company Cleco, which has significant assets in thermoelectricity, to report on its sustainability risks and opportunities, including an analysis of material water-related risks. The other at Pioneer Natural Resources focused on reporting the environmental and social challenges and opportunities associated with hydraulic fracturing.
Company Engagement
Research and an intensive dialogue across a range of corporate responsibility and sustainability issues led to McDonald’s and Walt Disney meeting our Signature® criteria1 for the first time. McDonald’s is improving its supply chain labor policies and practices, diversifying its menu options, and disclosing their nutritional content—although it continues to face challenges in both areas. Walt Disney now meets the criteria for workplace safety, while continuing to meet our criteria on supply chain labor and human rights practices.
We undertook more engagement with Coca-Cola and PepsiCo on labor and human rights, water, and sustainability issues. In fact, PepsiCo management credited our recommendations with influencing their decision to strengthen their human rights policy framework.
Climate Change And Energy
Calvert, the World Wildlife Fund (WWF) and Ceres published, “Power Forward: Why the World’s Largest Companies are Investing in Renewable Energy.” The report found that more than half of the largest U.S. corporations and more than two-thirds of the largest companies across the globe have set greenhouse gas (GHG) emissions reduction commitments and/or renewable energy commitments.
Calvert joined with other Investor Network on Climate Risk (INCR) members to speak at congressional staff briefings about recommendations for corporations in the report and
10 www.calvert.com CALVERT SOCIAL INVESTMENT FUND ANNUAL REPORT
draft an investor letter to Congress supporting the production tax credit (PTC) for wind energy, which was due to expire at the end of 2012. The report, briefings and investor letter helped spur extension of the PTC to support the growth of renewable energy.
Burma
After the lifting of U.S. sanctions prohibiting new investment in Burma by American companies, the Calvert Social Funds Board approved revisions to Calvert’s long-standing policy language in September. Instead of urging U.S. companies to “cease operations” in Burma, the new language instead calls for Calvert to advocate for “responsible investment.”
Garment Industry Safety
Following the Rana Plaza tragedy earlier this year, where more than 1,100 Bangladesh garment factory workers were killed, Calvert assessed the state of significant country-level sourcing disclosure by retail companies, which is essential to assessing sourcing risks more effectively. After learning that only a handful of companies disclose this necessary data, we contacted 26 retail company CEOs requesting disclosure of sourcing information for those countries representing 5% or more of global order volume.
Human Rights Report
In March, Calvert, Interfaith Center on Corporate Responsibility and the Institute for Human Rights and Business launched “Investing the Rights Way: A Guide for Business and Human Rights” in both New York and London. The guide outlines how investors can apply the UN Guiding Principles on Business and Human Rights as a due diligence and risk assessment framework to assess companies in their portfolios.
Conflict Minerals
Calvert continued to be a leader among investors on “conflict minerals” through a multi-stakeholder group supporting disclosure requirements enacted as Section 1502 of the Dodd-Frank Wall Street Reform and Consumer Protection Act of 2010. The disclosure would certify that certain minerals used in cell phones and other consumer electronic components (tin, titanium, tantalum and gold) are not illegally mined to fuel the continuing bloody conflict in the Democratic Republic of Congo (DRC).
After the SEC approved and released the final rule to implement the reporting requirements of Section 1502 in August 2012, the U.S. Chamber of Commerce filed a lawsuit against the Securities and Exchange Commission (SEC) to stop implementation. Calvert led the multi-stakeholder group’s effort to forge a common statement urging implementation of the law as outlined by the rule, regardless of the lawsuit. On July 23, the court upheld the “conflict minerals rule” in favor of the SEC and the statute requiring adoption of the rule—a major victory for Calvert and its allies.
Extractives Revenue Transparency
Widely credited for its leadership role among investors in supporting extractive revenue transparency as an imperative for investors interested in full disclosure of material information related to oil, gas and mining in certain countries, Calvert has remained actively engaged in the SEC rule-making process. The U.S. Chamber of Commerce and the American Petroleum Institute filed a lawsuit challenging the pro-disclosure rules, Calvert submitted a sworn statement about the problems investors would face if the rules were
www.calvert.com CALVERT SOCIAL INVESTMENT FUND ANNUAL REPORT 11
delayed or revoked. We also sent letters to the SEC emphasizing the materiality of disclosures required by the rules and contributed research to Oxfam America’s January 2013 brief.
On July 2, the court “vacated” the SEC’s rule, declaring it inoperative until the SEC addresses certain key issues (the necessity for exemptions for certain countries and public reporting of the disclosures). Calvert subsequently drafted a letter to SEC Chairman Mary Jo White that acknowledged the value of the Commission’s rules to implement Section 1504 and urged her respond to the API vs. SEC decision by reinstating rules consistent with those issued in August 2012, which were endorsed by investors representing more than $5.6 trillion in assets under management.
1. Calvert’s Signature® criteria examine corporate performance across seven broad areas of concern: Governance and Ethics, Environment, Workplace, Product Safety and Impact, International Operations and Human Rights, Indigenous Peoples’ Rights, and Community Relations. For a company to be eligible for inclusion in a Calvert Signature portfolio, it must meet the criteria in all seven categories.
The following companies represented the following percentages of net assets: Cleco 0.02% of Calvert Social Index; Pioneer Natural Resources 0.23% of Calvert Social Index and 1.39% of Calvert Balanced Portfolio; McDonald’s 0.86% of Calvert Social Index and 2.35% of Calvert Equity Portfolio, Walt Disney 0.96% of Calvert Social Index and 2.25% of Calvert Equity Portfolio; Coca-Cola 1.29% of Calvert Social Index, 3.20% of Calvert Large Cap Core and 3.29% Calvert Equity Portfolio; PepsiCo 1.10% of Calvert Social Index, 1.20% of Calvert Equity Portfolio and 0.54% of Calvert Balanced Portfolio; Denbury Resources 0.06% of Calvert Social Index and 2.86% of Calvert Large Cap Core; and Suncor Energy 0.71%% of Calvert International Equity Portfolio. Holdings are subject to change.
12 www.calvert.com CALVERT SOCIAL INVESTMENT FUND ANNUAL REPORT

Performance
For the 12-month period ended September 30, 2013, Calvert Balanced Portfolio Class A shares (at NAV) returned 11.60% versus 20.91% for its benchmark, the Russell 1000 Index.
The Portfolio’s relative underperformance versus the Russell 1000 Index was due to the Portfolio’s asset allocation strategy which is a mix of stocks and bonds. Stocks outperformed bonds substantially for the period. The Portfolio outperformed a blended return from the Balanced Composite Benchmark, a mix of market indices1 that more closely reflects the Portfolio’s asset allocation strategy, which returned 11.43% for the period.
The Portfolio benefited from Calvert’s tactical asset allocation decisions, the strong performance of the equity portion of the portfolio relative to its asset class benchmark, the Russell 1000 Index, as well as the outperformance of the fixed-income portfolio managed by CIM relative to its asset class benchmark, the Barclays U.S. Credit Index.
At the end of the third quarter, Calvert made a significant change to the management structure of Calvert Balanced Portfolio. On September 10, 2013, the Portfolio’s Board of Trustees voted to approve a new multi-manager structure for the equity portion of the Portfolio, consisting of Calvert Investment Management, Inc., (CIM) and Profit Investment Management, Inc. Calvert will continue to manage the allocation of assets among the two equity managers and the Portfolio’s fixed-income investments.
Investment Climate
Equity markets faced a brief pullback in late 2012, but recovered and posted strong gains over the last three quarters of the period. The third round of Quantitative Easing (QE), unleashed in mid-2012, provided an impetus for equity investors to look past numerous macro headwinds from fiscal cliff debates, sequester, slow growth in China and the Eurozone, and weak corporate earnings. The macro-economic picture in the U.S. continued to show improvement in the key economic sectors—housing and employment. For the year, the S&P 500, Russell 1000, Russell 2000, MSCI EAFE, and MSCI Emerging Markets Indices returned 19.34%, 20.91%, 30.06%, 24.92%, and 1.33%, respectively.
Value stocks outperformed growth stocks by 3.03%, as measured by the Russell 1000 Value and Growth Indices for the 12-month period. Within the Russell 1000 Index, Consumer Discretionary, Industrials, and Health Care were the top-performing sectors in the 12-month period, while Telecoms, Utilities, and Materials lagged.
www.calvert.com CALVERT SOCIAL INVESTMENT FUND ANNUAL REPORT 13
| CALVERT BALANCED | ||
| PORTFOLIO | ||
| SEPTEMBER 30, 2013 | ||
| TEN LARGEST | % OF NET | |
| STOCK HOLDINGS | ASSETS | |
| Microsoft Corp. | 1.7 | % |
| Apple, Inc. | 1.6 | % |
| Wells Fargo & Co. | 1.4 | % |
| Google, Inc. | 1.4 | % |
| Express Scripts Holding Co. | 1.4 | % |
| Rockwell Automation, Inc. | 1.3 | % |
| EMC Corp. | 1.3 | % |
| Franklin Resources, Inc. | 1.3 | % |
| Capital One Financial Corp. | 1.3 | % |
| CIGNA Corp. | 1.2 | % |
| Total | 13.9 | % |
The U.S. fixed-income market was buffeted by the decisions of monetary and fiscal policymakers throughout the reporting period as the U.S. economy continued its slow recovery. Years of Fed quantitative-easing purchases reduced the pool of government bonds and drove investors to high-yield corporate bond yields, which reached a record low of 5.24% in May.2 Suggestions that the Fed would begin tapering QE3 in late spring drove intermediate and long-term interest rates higher, with the 10-year Treasury yield reaching 3% in early September. But the Fed’s subsequent decision to delay the taper caused yields to decline. In the end, the 10-year Treasury yield increased nearly a percentage point to 2.64% over the 12-month period.
| CALVERT BALANCED | ||||
| PORTFOLIO | ||||
| SEPTEMBER 30, 2013 | ||||
| INVESTMENT PERFORMANCE | ||||
| (TOTAL RETURN AT NAV*) | ||||
| 6 MONTHS | 12 MONTHS | |||
| ENDED | ENDED | |||
| 9/30/13 | 9/30/13 | |||
| Class A | 5.99 | % | 11.60 | % |
| Class B | 5.39 | % | 10.37 | % |
| Class C | 5.59 | % | 10.71 | % |
| Class I | 6.26 | % | 12.13 | % |
| Class Y** | 6.02 | % | 11.63 | % |
| Russell 1000 | ||||
| Index | 8.83 | % | 20.91 | % |
| Balanced | ||||
| Composite | ||||
| Benchmark*** | 4.15 | % | 11.43 | % |
| Lipper Mixed- | ||||
| Asset Target | ||||
| Alloc. Growth | ||||
| Funds Average | 5.37 | % | 13.64 | % |
* Investment performance/return at NAV does not reflect the deduction of the Fund’s maximum 4.75% front-end sales charge or any deferred sales charges.
** Calvert Balanced Portfolio first offered Class Y shares on April 30, 2013. Performance prior to that date reflects the performance of Class A shares at net asset value (NAV). Actual Class Y share performance would have been different.
*** Balanced Composite Benchmark 60% Russell 1000 Index and 40% Barclays U.S. Credit Index.
Corporate Earnings Are Weaker
Corporate earnings reports in late 2012 and throughout the first half of 2013 were largely weak on both the top- and bottom-line figures, with the sequester negatively impacting corporate results in the first half of 2013.
Sounding a cautious note, several bellwether companies that reported late in the summer of 2013, including names like Walmart and Cisco, issued reduced earnings forecasts cit-
14 www.calvert.com CALVERT SOCIAL INVESTMENT FUND ANNUAL REPORT
ing everything from consumer weakness to fears of rising interest rates. We continue to believe that, going forward, the U.S. economic recovery can be sustained and able to support earnings growth for U.S. companies.
Improving Macroeconomic Picture in the U.S., Despite Continued Softness Abroad
Throughout the year, U.S. macro indicators continued to improve, albeit slowly. The unemployment rate ticked down to just above 7% and initial jobless claims hit post financial crisis lows in the third quarter of 2013. New job growth remains sluggish. However, consumers continue to remain upbeat and willing to spend on bigger ticket items, as reflected in improving vehicle and home sales. Sales of previously owned homes hit a three-year high in May of 2013 and housing prices continued to trend upward, despite the looming threat of rising interest rates.
During the first six months of the period, tax hikes and deep spending cuts (the “sequester”) created a drag on the U.S. economy, contributing to a poor growth rate of 0.6% annualized.3 The economy logged an estimated 2.3% growth pace4 for second half. For the entire 12 months, the U.S. economy likely grew in the neighborhood of 1.5%, less than half the 50-year average U.S. economic growth rate. The Federal Reserve’s (the Fed) inflation barometer ran at 1.2% annualized, well below the long-term comfort range of 2.0% to 2.25%.5
Federal Reserve: QE Taper and Transition Talk
During the summer, investor consensus largely settled around the view that the Federal Reserve (Fed) would begin tapering its QE program in September of 2013 by reducing both its Treasury and mortgage-backed security purchases. This view took hold despite weakness in both employment and inflation, the two areas highlighted by Fed Chairman Ben Bernanke as needing improvement before tapering would begin. Nevertheless, the “surprise” decision not to taper in September caught market participants off guard, sending equities up and sparking a retreat in bond yields.
As markets digested the lack of a QE taper – and largely gave back the equity gains won on the news – focus also returned to the transition of the Fed Chairman role. With Larry Summers removing himself from consideration, consensus coalesced around eventual nominee Vice Chair Janet Yellen, a selection largely signaling favor for continuing current monetary policy with little change.
With Political Stalemate in Washington It’s Déjà Vu All Over Again…
The debt ceiling drama of 2011 reared its head again in late September 2013. The government shutdown and debt ceiling impasse in Washington fueled uncertainty and created a negative feedback loop in the U.S. economy. Although labor conditions in the U.S. improved materially since the asset purchase program began, recent reductions in public sector employment were felt in the July and August employment reports.
The U.S. Congress failed to approve a budget to fund the government past September 30, which culminated in the shutdown of the federal government. Equity markets appeared largely unconcerned with the event in September despite the looming U.S. debt ceiling debate. Congress was not able to raise the debt ceiling until hours before the October 17th deadline identified by the Treasury Department. Although the markets welcomed the resolution, the turmoil took its toll. Estimates of fiscal drag from the
www.calvert.com CALVERT SOCIAL INVESTMENT FUND ANNUAL REPORT 15
| CALVERT BALANCED | ||
| PORTFOLIO | ||
| SEPTEMBER 30, 2013 | ||
| % OF TOTAL | ||
| ASSET ALLOCATION | INVESTMENTS | |
| Equity Investments | 58 | % |
| Bonds | 42 | % |
| Total | 100 | % |
shutdown were in the billions while credit-rating firm Fitch put the nation’s credit rating on negative outlook as a result of the political stalemate and inability to take timely action on raising the debt ceiling.
Portfolio Strategy
Asset Allocation
The Portfolio benefited from a series of tactical asset allocation decisions executed during the period, particularly the decision to increase equity exposure at the end of 2012, which positioned the Portfolio to capture greater gains from the “relief rally” in the equity markets that took place in January following the last-minute fiscal cliff deal.
Equity
U.S. large-cap stocks posted impressive returns for the period and our portfolio managers’ stock selection further enhanced the Portfolio’s performance relative to the Russell 1000 Index—especially within the Energy, Consumer Staples, Industrials, and Materials sectors.
Highlights included Pioneer Natural Resources, which gained 80% after announcing an increase in production.6 The Portfolio also benefited from not holding ExxonMobil, which does not meet the Portfolio’s sustainability criteria and was down 3% for the period.
| CALVERT BALANCED | ||
| PORTFOLIO | ||
| SEPTEMBER 30, 2013 | ||
| AVERAGE ANNUAL TOTAL RETURNS | ||
| CLASS A SHARES | (WITH MAX. LOAD) | |
| One year | 6.28 | % |
| Five year | 6.50 | % |
| Ten year | 4.90 | % |
| CLASS B SHARES | (WITH MAX. LOAD) | |
| One year | 5.37 | % |
| Five year | 6.27 | % |
| Ten year | 4.34 | % |
| CLASS C SHARES | (WITH MAX. LOAD) | |
| One year | 9.74 | % |
| Five year | 6.62 | % |
| Ten year | 4.47 | % |
| CLASS I SHARES* | ||
| One year | 12.13 | % |
| Five year | 8.10 | % |
| Ten year | 5.87 | % |
| CLASS Y SHARES** | ||
| One year | 11.63 | % |
| Five year | 7.54 | % |
| Ten year | 5.41 | % |
* Note Regarding Class I Shares Total Returns: There were times during the reporting period when there were no shareholders in Class I. For purposes of reporting Average Annual Total Return, Class A performance at NAV (i.e. does not reflect deduction of the Class A front-end sales charge) is used during these periods in which there were no shareholders in Class I. For purposes of this Average Annual Total Return, the Class A performance at NAV was used during the period June 30, 2003 through December 27, 2004.
** Calvert Balanced Portfolio first offered Class Y shares on April 30, 2013. Performance prior to that date reflects the performance of Class A shares at net asset value (NAV). Actual Class Y share performance would have been different.
16 www.calvert.com CALVERT SOCIAL INVESTMENT FUND ANNUAL REPORT
GROWTH OF $10,000
The graph below shows the value of a hypothetical $10,000 investment in the Fund over the past 10 fiscal year periods. The results shown are for Class A shares and reflect the deduction of the maximum front-end Class A sales charge of 4.75% and assume the reinvestment of dividends. The result is compared with benchmarks that include a broad based market index and a Lipper peer group average. Market indexes are unmanaged and their results do not reflect the effect of expenses or sales charges. The Lipper average reflects the deduction of the category’s average front-end sales charge. The value of an investment in a different share class would be different.

All performance data shown, including the graph above and the adjacent table, represents past performance, does not guarantee future results, assumes reinvestment of dividends and distributions and does not reflect the deduction of taxes that a shareholder would pay on the Fund’s distributions or the redemption of the Fund shares. All performance data reflects fee waivers and/or expense limitations, if any are in effect; in their absence performance would be lower. See Note B in Notes to Financial Statements. The investment return and principal value of an investment will fluctuate so that an investor’s shares, when redeemed, may be worth more or less than their original cost. Current performance may be lower or higher than the performance data quoted; for current performance data visit www.calvert.com. The gross expense ratio from the current prospectus for Class A shares is 1.24%. This number may differ from the expense ratio shown elsewhere in this report because it is based on a different time period and, if applicable, does not include fee or expense waivers. Performance data quoted already reflects the deduction of the Fund’s operating expenses.
www.calvert.com CALVERT SOCIAL INVESTMENT FUND ANNUAL REPORT 17
In Consumer Staples, Walgreens gained 51%, after announcing an alliance with AmerisourceBergen and Alliance Booth to provide comprehensive distribution of branded and generic drugs.
Industrials company Rockwell Automation rose 57% for the period after increasing its dividend 11% in April and announcing a large contract with Daewoo shipbuilding in September. Ecolab, a holding in the Materials sector that helps food processors and health care companies maintain safe, clean facilities and processes, raised its 2013 earnings-per-share guidance leading to a 54% gain for the stock.
These positive contributions were partially offset by an overweight to the underperform-ing Information Technology sector and stock selection within the Financials sector. US Bancorp underperformed, returning just 2%, after settling a case with the U.S. government on foreclosures reviews and being named in a suit by the Commodity Futures Trading Commission over a customer’s misconduct.
Fixed Income
Amid a challenging fixed-income climate, bond holdings as a group were a drag on Portfolio returns. Broadly, a significant exposure to higher-quality corporate bonds restricted gains, although its shorter-than-benchmark duration7 was beneficial. The market environment was particularly volatile in the second half of the reporting period. The second quarter of 2013 saw a bond sell-off and lower-quality bonds struggling relative to Treasuries, causing credit spreads8 to widen.
This trend reversed in the third quarter and credit spreads compressed. Not only did corporate bonds outperform Treasuries, but lower-rated securities outperformed higher-rated bonds with high-yield bonds performing best. This trend hurt the Portfolio, which has a higher-quality tilt.
However, lagging performance from higher-quality positions was largely offset by the short relative duration. At the end of the reporting period, the Portfolio’s duration was 5.8 years compared with 6.6 years for the benchmark. With longer-term bond yields rising and prices falling during the period, a comparatively short duration helped protect against losses. The fixed income portion of the Portfolio uses Treasury futures to hedge its interest-rate and yield curve positions. This futures strategy did not materially impact the Portfolio’s performance.
The Portfolio’s positioning was been beneficial for the year as a whole. Its small, opportunistic allocation to out-of-benchmark, higher quality high-yield (non-investment grade) securities (currently 6.5% of assets9) has been a positive contributor.
And while an overweight to the intermediate part of the yield curve detracted from performance in 2013, a relatively short duration and decreased long-end interest-rate sensitivity contributed to positive performance. We intend to maintain these strategic positions for the foreseeable future, but will continue to rigorously review holdings and sector allocations as the markets change.
Outlook
As we have stated in the past, despite negative short-term investor sentiment, the long-term drivers of economic recovery continue to gain strength. Investors continue to look
18 www.calvert.com CALVERT SOCIAL INVESTMENT FUND ANNUAL REPORT
beyond the headlines and focus on the improving macro-economic climate in the U.S. and, to some degree, overseas.
The path to recovery will not necessarily be smooth, however. The Fed is largely expected to taper QE as early as December and interest rates are expected to continue climbing. In such a scenario, higher-dividend stocks remain especially vulnerable. While growth stocks made an impressive recovery in the third quarter, value names may recover when the reality of Fed tapering and interest rate uptick returns to focus. But we expect the Fed will guide the markets not to expect a hike in the policy target rates until at least late in 2015.
However, longer-term factors such as historically low housing inventories and continued household formation will provide support for improving economic growth. Likewise, manufacturing is pulling out of its seasonal slump and the broader trend of consumer balance sheet repair is well underway.
As confidence sets in at both the consumer and corporate level, we continue to expect consumers to increase spending and companies to eventually expand capital expenditures and increase inventories. The sharp rise in interest rates that many feared would continue to 3% and beyond has tempered, and while consumers and companies alike must prepare for a rising-rate environment over the medium and longer term, a gradual shift up in borrowing costs may be a sign of an improving economy and not necessarily a near-term threat to growth.
Regarding fixed income, we expect the economy to continue its modest growth, with low inflation and an improving but soft labor recovery trend. Fiscal and monetary policy uncertainties, including the continued threat of another government shutdown and recurring debt ceiling debate, continue to be major headwinds for fixed-income securities in the near future.
We continue to think that interest rates, especially on the short-to-intermediate part of the yield curve, should remain well-anchored. We remain bullish on those sectors offering attractive yields relative to Treasury bonds, including investment-grade bonds, high-yield corporate bonds, and enhanced collateralized mortgage-backed securities (CMBS). We are maintaining a shorter relative duration for the fixed income portion of the Portfolio. Security selection and active management of duration and the yield curve should be key drivers of fixed income performance going forward.
Calvert Investment Management, Inc.
October 2013
www.calvert.com CALVERT SOCIAL INVESTMENT FUND ANNUAL REPORT 19
1. Calvert Balanced Portfolio Composite Benchmark: 60% Russell 1000 Index and 40% Barclays U.S. Credit Index.
2. The effective yield of the Bank of America Merrill Lynch High Yield Master II.
3. GDP data source: Commerce Department.
4. Per actual Q2 2013 GDP data and the Q3 consensus from the September WSJ Survey of Professional Forecasters.
5. Source: Commerce Department. The September PCE data were not available at this writing.
6. Individual security returns reflect total returns for period held in portfolio.
7. Duration is a measure of a portfolio’s sensitivity to changes in interest rates. The longer the duration, the greater the change in price relative to interest rate movement.
8. Credit, or yield, spreads measure the difference in yield between a corporate bond and a Treasury security with a comparable maturity.
9. Includes non-rated securities deemed equivalent by the investment adviser.
As of September 30, 2013, the following holdings represented the following percentages of Portfolio net assets: Walmart 0%, Cisco 0%, Pioneer Natural Resources 1.39%, ExxonMobil 0%, Walgreens 1.26%, AmerisourceBergen 0%, Alliance Booth 0%, Rockwell Automation 1.32%, Daewoo 0%, Ecolab 1.33%, and US Bancorp .08%. Holdings are subject to change.
20 www.calvert.com CALVERT SOCIAL INVESTMENT FUND ANNUAL REPORT
Performance
For the 12-month period ended September 30, 2013, Calvert Bond Portfolio (Class A shares at NAV) returned -2.27%. Its benchmark index, the Barclays U.S. Credit Index, returned -1.90% for the same period. The Portfolio’s underperformance was the result of several positions in higher-quality corporate bonds, as well as its overweight exposure to the intermediate part of the yield curve.
Market Review
The U.S. fixed-income market was buffeted by the decisions of monetary and fiscal policymakers throughout the reporting period, and the U.S. economy continued on its slow recovery trend. During the first six months, tax hikes and deep spending cuts (the “sequester”) created a drag on the U.S. economy, contributing to a poor growth rate of 0.6% annualized.1 In the second half, the economy logged an estimated 2.3% growth pace.2 For the entire 12 months, the U.S. economy likely grew in the neighborhood of 1.5%, less than half the 50-year average U.S. economic growth rate. The Federal Reserve’s (the Fed) inflation barometer ran at 1.2% annualized, well below the long-term comfort range of 2.0% to 2.25%.3 The unemployment rate posted a 0.5% decline, finishing the period at a relatively high 7.3%.4
www.calvert.com CALVERT SOCIAL INVESTMENT FUND ANNUAL REPORT 21
| CALVERT BOND | ||
| PORTFOLIO | ||
| SEPTEMBER 30, 2013 | ||
| % OF TOTAL | ||
| ECONOMIC SECTORS | INVESTMENTS | |
| Corporate | 74.8 | % |
| Financial Institutions | 26.1 | % |
| Industrial | 46.0 | % |
| Utility | 2.7 | % |
| Government Related | 4.8 | % |
| Agency | 1.5 | % |
| Local Authority | 3.2 | % |
| Supranational | 0.1 | % |
| High Social Impact | ||
| Investments | 0.4 | % |
| Municipal | 2.0 | % |
| Education | 0.5 | % |
| Government Public Service | 0.1 | % |
| Health Care | 0.2 | % |
| Transportation | 0.5 | % |
| Utility | 0.7 | % |
| Securitized | 8.9 | % |
| Asset-Backed Securities | 2.7 | % |
| Commercial Mortgage- | ||
| Backed Securities | 5.2 | % |
| Covered | 1.0 | % |
| Short-Term Investments | 2.2 | % |
| Treasury | 6.9 | % |
| Total | 100 | % |
| CALVERT BOND | ||||
| PORTFOLIO | ||||
| SEPTEMBER 30, 2013 | ||||
| INVESTMENT PERFORMANCE | ||||
| (TOTAL RETURN AT NAV*) | ||||
| 6 MONTHS | 12 MONTHS | |||
| ENDED | ENDED | |||
| 9/30/13 | 9/30/13 | |||
| Class A | -2.88 | % | -2.27 | % |
| Class B | -3.37 | % | -3.28 | % |
| Class C | -3.30 | % | -3.01 | % |
| Class I | -2.60 | % | -1.69 | % |
| Class Y | -2.72 | % | -1.97 | % |
| Barclays U.S. | ||||
| Credit Index | -2.74 | % | -1.90 | % |
| Lipper A Rated | ||||
| Corporate Debt | ||||
| Funds Average | -2.66 | % | -1.79 | % |
| 30 DAYS ENDED | ||||
| SEC YIELD | 9/30/12 | 9/30/13 | ||
| Class A | 1.61 | % | 2.19 | % |
| Class B | 0.68 | % | 1.17 | % |
| Class C | 0.90 | % | 1.49 | % |
| Class I | 2.27 | % | 2.88 | % |
| Class Y | 1.97 | % | 2.59 | % |
* Investment performance/return at NAV does not reflect the deduction of the Fund’s maximum 3.75% front-end sales charge or any deferred sales charge.
There were several monetary policy decisions that moved the bond market. In September 2012, the Fed responded to slower growth, announcing bond purchases of $40 billion per month of mortgage-backed securities (called “QE3”). In December 2012, the Fed expanded QE3 by purchasing an additional $45 billion per month of Treasury securities. In late May, however, the Fed discussed a possible reduction in the $85 billion pace of bond purchasing.
As years of Fed quantitative-easing purchases reduced the pool of government bonds, private-sector investors were forced to search for higher-yielding bonds. This drove high-yield corporate bond yields to a record low of 5.24% in May.5 The Fed’s May and June suggestions that the pace of QE3 would be tapered, however, led to market expectation for less future demand for U.S. government bonds, which led to higher
22 www.calvert.com CALVERT SOCIAL INVESTMENT FUND ANNUAL REPORTintermediate and long term interest rates. The ten-year Treasury yield reached 3% in early September.
Soon thereafter, however, faced with greater uncertainty about fiscal policy and tighter financial conditions, the Fed chose to continue the $85 billion QE3 pace. This surprised global markets and yields came off their highs. At the end of the reporting period, markets braced for the first government shutdown in 17 years and a battle over raising the U.S. debt limit. Market and economic uncertainty was on the rise.
Over the reporting period, the benchmark 10-year Treasury yield increased 99 basis points6 to 2.64%. The broad bond-market Barclays U.S. Aggregate Index declined 1.7% for the 12-month period.
Portfolio Strategy
Throughout the reporting period, the Portfolio navigated a challenging fixed-income climate. Broadly, a significant exposure to higher-quality corporate bonds restricted the Portfolio’s gains for the period, although its shorter-than-benchmark duration7 was beneficial.
The market environment was particularly volatile in the second half of the reporting period. In the second quarter of 2013, there was a sell-off of bonds and lower-quality bonds struggled relative to Treasuries, causing credit spreads8 to widen. This trend reversed in the third quarter and credit spreads compressed. Not only did corporate bonds outperform Treasuries, but lower-rated securities outperformed higher-rated bonds, and high-yield bonds performed best. As a result, the Portfolio, which has a higher-quality tilt, was hurt by this trend.
However, the lagging performance from higher-quality positions was largely offset by the Portfolio’s short duration compared with the benchmark. At the end of the reporting period, the Portfolio’s duration was 5.8 years, as opposed to 6.6 years for the benchmark. With longer-term bond yields rising and prices falling during the period, a comparatively short duration was a helpful strategy for protecting against losses. The Portfolio also uses Treasury futures to hedge its interest-rate and yield curve positions. This futures strategy did not materially impact the Portfolio’s performance.
The Portfolio’s positioning has been beneficial for the year as a whole. Its small, opportunistic allocation to out-of-benchmark, higher-quality high-yield securities (currently 6.5% of assets9) has been a positive contributor. And while an overweight to the intermediate part of the yield curve has detracted from performance in 2013, a relatively short duration and reduced long-end interest-rate sensitivity has contributed to positive performance. We intend to maintain these strategic positions for the foreseeable future, but will continue to rigorously review holdings and sector allocations as the markets change.
Outlook
Looking ahead, we expect the economy to continue its modest growth, with low inflation and an improving but soft labor recovery trend. Fiscal and monetary policy uncertainties, including the continued threat of another government shutdown, the recurring debt ceiling debate, and the appointment of a new Fed chair, continue to be major headwinds in the near future.
www.calvert.com CALVERT SOCIAL INVESTMENT FUND ANNUAL REPORT 23
Given our outlook for the economy and restrictive and uncertain fiscal policy, we expect the Fed will put a strong emphasis on improving economic data before deciding to taper and ultimately raise the Fed Funds rate. We expect the Fed will guide the markets not to expect a hike in the policy target rates until at least late in 2015.
In view of our not-so-bullish macroeconomic and policy outlook, we continue to think that interest rates, especially on the short-to-intermediate part of the yield curve, should remain well anchored. We remain bullish on those sectors offering attractive yields relative to Treasury bonds, including investment-grade and high-yield corporate bonds, as well as enhanced collateralized mortgage-backed securities (CMBS). We believe these “spread sectors” should outperform similar-maturity Treasury bonds over the next six to 12 months. We continue to maintain a shorter overall duration versus the Index. Security selection within these spread sectors, and active management of duration and the yield curve, should be key drivers of performance going forward.
Calvert Investment Management, Inc.
October 2013
| CALVERT BOND | ||
| PORTFOLIO | ||
| SEPTEMBER 30, 2013 | ||
| AVERAGE ANNUAL TOTAL RETURNS | ||
| CLASS A SHARES | (WITH MAX. LOAD) | |
| One year | -5.90 | % |
| Five year | 3.82 | % |
| Ten year | 4.02 | % |
| CLASS B SHARES | (WITH MAX. LOAD) | |
| One year | -7.15 | % |
| Five year | 3.54 | % |
| Ten year | 3.38 | % |
| CLASS C SHARES | (WITH MAX. LOAD) | |
| One year | -4.04 | % |
| Five year | 3.77 | % |
| Ten year | 3.56 | % |
| CLASS I SHARES | ||
| One year | -1.69 | % |
| Five year | 5.24 | % |
| Ten year | 5.03 | % |
| CLASS Y SHARES* | ||
| One year | -1.97 | % |
| Five year | 4.89 | % |
| Ten year | 4.55 | % |
* Calvert Bond Portfolio first offered Class Y shares on October 31, 2008. Performance prior to that date reflects the performance of Class A shares at net asset value (NAV). Actual Class Y share performance would have been different.
1. GDP data source: Commerce Department.
2. Per actual Q2 2013 GDP data and the Q3 consensus from the September WSJ Survey of Professional Forecasters.
3. Data source: Commerce Department. The September PCE data were not available at this writing.
4. Data source: BLS. Employment data for September were not available at this writing.
5. The effective yield of the Bank of America Merrill Lynch High Yield Master II.
6. A basis point is 0.01 percentage points.
7. Duration is a measure of a portfolio’s sensitivity to changes in interest rates. The longer the duration, the greater the change in price relative to interest rate movement.
8. Credit, or yield, spreads measure the difference in yield between a corporate bond and a Treasury security with a comparable maturity.
9. Includes non-rated securities deemed equivalent by the investment adviser.
24 www.calvert.com CALVERT SOCIAL INVESTMENT FUND ANNUAL REPORT
GROWTH OF $10,000
The graph below shows the value of a hypothetical $10,000 investment in the Fund over the past 10 fiscal year periods. The results shown are for Class A shares and reflect the deduction of the maximum front-end Class A sales charge of 3.75% and assume the reinvestment of dividends. The result is compared with benchmarks that include a broad based market index and a Lipper peer group average. Market indexes are unmanaged and their results do not reflect the effect of expenses or sales charges. The Lipper average reflects the deduction of the category’s average front-end sales charge. The value of an investment in a different share class would be different.
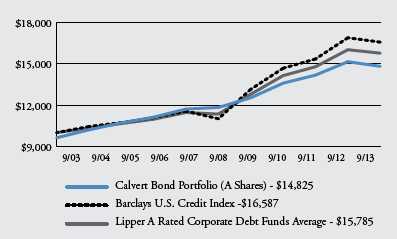
All performance data shown, including the graph above and the adjacent table, represents past performance, does not guarantee future results, assumes reinvestment of dividends and distributions and does not reflect the deduction of taxes that a shareholder would pay on the Fund’s distributions or the redemption of the Fund shares. All performance data reflects fee waivers and/or expense limitations, if any are in effect; in their absence performance would be lower. See Note B in Notes to Financial Statements. The investment return and principal value of an investment will fluctuate so that an investor’s shares, when redeemed, may be worth more or less than their original cost. Current performance may be lower or higher than the performance data quoted; for current performance data visit www.calvert.com. The gross expense ratio from the current prospectus for Class A shares is 1.16%. This number may differ from the expense ratio shown elsewhere in this report because it is based on a different time period and, if applicable, does not include fee or expense waivers. Performance data quoted already reflects the deduction of the Fund’s operating expenses.
www.calvert.com CALVERT SOCIAL INVESTMENT FUND ANNUAL REPORT 25
Investment Performance
For the 12 months ended September 30, 2013, Calvert Equity Portfolio Class A shares (at NAV) returned 16.30%. This compares to a return of 19.34% for the S&P 500 Index. Our relative underperformance was entirely driven by our choice of holdings rather than decisions to overweight or underweight individual sectors.
Investment Climate
It’s been a reluctant market. We end this 12-month period just a few percentage points off of a mid-September all-time high and only 17% away from triple the low reached in March 2009 for the S&P 500 Index. That sounds like reason enough to be popping champagne corks and for wild-eyed bullishness to be rampant. However, you’d be hard-pressed to find an equity bull on Wall Street.
While sentiment is not outright bearish, cautiousness reigns, even among the more optimistic market prognosticators. But it’s not hard to explain the seemingly contradictory strong market returns and the major lack of enthusiasm.
The Federal Reserve’s efforts to keep interest rates very low and the resumption of money flows into equities have supported equity market appreciation these last few years and particularly over the past year. However, we believe the continuation of slow if steady improvement in the economy, and the fading of fears of some major economic event that pushes the global economy back into recession, deserve the majority of the credit.
It’s easy to dismiss economic progress as a driver of sentiment and stocks. After all, this has been a subpar recovery and even after four years of growth, many Americans believe the recession continues. While growth has been undeniably slow and uneven, jobs are being steadily created, consumers and business have de-levered, housing has turned the corner, and manufacturing is re-establishing itself here on U.S. soil. Europe has clearly stopped getting worse and many indicators show things beginning to get better. Europe’s progress will buoy our economy in the months ahead.
26 www.calvert.com CALVERT SOCIAL INVESTMENT FUND ANNUAL REPORT
| CALVERT EQUITY | ||
| PORTFOLIO | ||
| SEPTEMBER 30, 2013 | ||
| % OF TOTAL | ||
| ECONOMIC SECTORS | INVESTMENTS | |
| Consumer Discretionary | 19.6 | % |
| Consumer Staples | 11.4 | % |
| Energy | 4.8 | % |
| Financials | 12.3 | % |
| Health Care | 14.2 | % |
| Industrials | 9.2 | % |
| Information Technology | 24.2 | % |
| Limited Partnership Interest | 0.3 | % |
| Materials | 2.7 | % |
| Short-Term Investments | 0.8 | % |
| Venture Capital | 0.5 | % |
| Total | 100 | % |
| CALVERT EQUITY | ||||
| PORTFOLIO | ||||
| SEPTEMBER 30, 2013 | ||||
| INVESTMENT PERFORMANCE | ||||
| (TOTAL RETURN AT NAV*) | ||||
| 6 MONTHS | 12 MONTHS | |||
| ENDED | ENDED | |||
| 9/30/13 | 9/30/13 | |||
| Class A | 6.84 | % | 16.30 | % |
| Class B | 6.37 | % | 15.29 | % |
| Class C | 6.48 | % | 15.51 | % |
| Class I | 7.16 | % | 16.95 | % |
| Class Y | 7.08 | % | 16.76 | % |
| S&P 500 Index | 8.31 | % | 19.34 | % |
| Lipper Large-Cap | ||||
| Growth Funds | ||||
| Average | 11.45 | % | 19.60 | % |
| TEN LARGEST | % OF NET | |
| STOCK HOLDINGS | ASSETS | |
| CVS Caremark Corp. | 4.1 | % |
| Google, Inc. | 3.9 | % |
| Apple, Inc. | 3.7 | % |
| QUALCOMM, Inc. | 3.7 | % |
| Microsoft Corp. | 3.3 | % |
| The Coca-Cola Co. | 3.3 | % |
| Cameron International Corp. | 2.9 | % |
| Costco Wholesale Corp. | 2.8 | % |
| Gilead Sciences, Inc. | 2.8 | % |
| Ecolab, Inc. | 2.6 | % |
| Total | 33.1 | % |
* Investment performance/return at NAV does not reflect the deduction of the Fund’s maximum 4.75% front-end sales charge or any deferred sales charges.
We believe another major stock-market driver has been a significant drop in the chances for a major event that plunges the global economy back into recession—so-called “tail risk.” While there’s always some very small chance of a shock, like a war, to hit markets, the last few years have felt like those events were lurking around every corner. The European debt crisis was the most obvious one, but U.S. debt defaults and a China bubble bursting took turns terrifying investors. Those fears kept the equity risk premium—the compensation required by investors to hold “risky” assets like stocks compared to “riskless” assets like bonds—historically high until last summer. The practical effect was the valuation of the U.S. market remained fairly low. As the probability of tail risk has faded, multiples have risen.
www.calvert.com CALVERT SOCIAL INVESTMENT FUND ANNUAL REPORT 27
single digits. Secondly, although the economy and markets have powered through various Washington-induced crises, it’s hard for investors to get excited about buying stocks when the government won’t get out of the way.
The mostly onwards and upwards behavior of the market over the last 12 months belies the significant volatility. The market rotated leadership on multiple occasions, sometimes in violent fashion. Although the Index moved consistently higher, waves of optimism and pessimism about economic growth and earnings meant offensive and defensive sectors took turns leading. Looking at sector performance for the period doesn’t really tell you much. We can say this was a very difficult environment for active managers.
Portfolio Strategy
From the most recent low in the summer of 2012, the market moved higher as the European Central Bank stood by the euro and fears of a debt crisis receded. Our positioning benefited from being somewhat more levered to growth than safety. As the S&P 500 Index surged to new highs early in 2013, peculiarly led by defensive stocks, we grew a bit concerned the market was ahead of itself. After all, earnings growth was sharply slowing. Our efforts to get a bit more defensive came up short as growth, particularly cyclical growth like Information Technology, fell out of favor. Therefore, we lagged for much of the first and second quarter. At the margin, we added some growth exposure this past summer as our research indicated business was picking up. That helped us conclude the period on a stronger note.
| CALVERT EQUITY | ||
| PORTFOLIO | ||
| SEPTEMBER 30, 2013 | ||
| AVERAGE ANNUAL TOTAL RETURNS | ||
| CLASS A SHARES | (WITH MAX. LOAD) | |
| One year | 10.77 | % |
| Five year | 8.14 | % |
| Ten year | 6.41 | % |
| CLASS B SHARES | (WITH MAX. LOAD) | |
| One year | 10.29 | % |
| Five year | 8.08 | % |
| Ten year | 6.01 | % |
| CLASS C SHARES | (WITH MAX. LOAD) | |
| One year | 14.51 | % |
| Five year | 8.38 | % |
| Ten year | 6.12 | % |
| CLASS I SHARES | ||
| One year | 16.95 | % |
| Five year | 9.80 | % |
| Ten year | 7.52 | % |
| CLASS Y SHARES* | ||
| One year | 16.76 | % |
| Five year | 9.58 | % |
| Ten year | 7.12 | % |
* Calvert Equity Portfolio first offered Class Y shares on October 31, 2008. Performance prior to that date reflects the performance of Class A shares at net asset value (NAV). Actual Class Y share performance would have been different.
Whether we beat the index in any given period tends to depend more on which stocks we hold than picking the right sectors to overweight and that was true this past year. We held eight stocks that rose more than 50%, including notable winners such as Starbucks, Priceline, Lowe’s, Texas Instruments and Ecolab.1 When you look at both absolute return and weighting, these were all major contributors to relative performance, but none topped Gilead Sciences.
28 www.calvert.com CALVERT SOCIAL INVESTMENT FUND ANNUAL REPORT
GROWTH OF $10,000
The graph below shows the value of a hypothetical $10,000 investment in the Fund over the past 10 fiscal year periods. The results shown are for Class A shares and reflect the deduction of the maximum front-end Class A sales charge of 4.75% and assume the reinvestment of dividends. The result is compared with benchmarks that include a broad based market index and a Lipper peer group average. Market indexes are unmanaged and their results do not reflect the effect of expenses or sales charges. The Lipper average reflects the deduction of the category’s average front-end sales charge. The value of an investment in a different share class would be different.
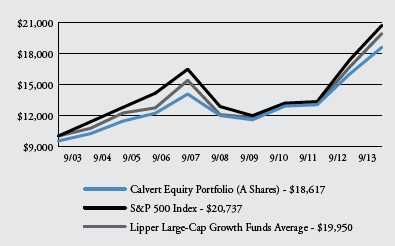
All performance data shown, including the graph above and the adjacent table, represents past performance, does not guarantee future results, assumes reinvestment of dividends and distributions and does not reflect the deduction of taxes that a shareholder would pay on the Fund’s distributions or the redemption of the Fund shares. All performance data reflects fee waivers and/or expense limitations, if any are in effect; in their absence performance would be lower. See Note B in Notes to Financial Statements. The investment return and principal value of an investment will fluctuate so that an investor’s shares, when redeemed, may be worth more or less than their original cost. Current performance may be lower or higher than the performance data quoted; for current performance data visit www.calvert.com. The gross expense ratio from the current prospectus for Class A shares is 1.22%. This number may differ from the expense ratio shown elsewhere in this report because it is based on a different time period and, if applicable, does not include fee or expense waivers. Performance data quoted already reflects the deduction of the Fund’s operating expenses.
www.calvert.com CALVERT SOCIAL INVESTMENT FUND ANNUAL REPORT 29
Gilead has soared as they prepare to bring to market what appears to be a revolutionary treatment for Hepatitis C. This is an unsatisfied market as current treatments are only modestly effective with unpleasant side effects. Gilead will likely make great headway on both fronts and it looks like they will have no competition for one to two years. It remains a large position in the portfolio.
Since we lagged the benchmark for the year, clearly not everything went as we planned. By far, Edwards Lifesciences was the leading detractor. Edwards developed an artificial heart valve that can be delivered by catheter rather than open heart surgery—obviously a big advance for patients. However, the product launch has been fairly erratic with training and reimbursement confusion hampering sales. The stock fell sharply earlier this year after a sales disappointment proved to be too much for investors. We joined the selling, primarily because it looked like the lowered launch trajectory would now allow competitors to catch up.
Our large position in Apple also hurt performance, mostly in late 2012 and early 2013. We’ll admit to being surprised by how much earnings slipped as they transitioned to the recently released iPhone 5s and 5c. But it’s an inexpensive stock that we do not believe is broken and we’re happy they’ve begun to return some of their giant cash hoard to shareholders. The stock outperformed in the most recent quarter and we expect that to continue. Other stocks that hurt performance include Kohl’s, Suncor and QEP within Energy and C.H. Robinson within Industrials. We no longer hold any of them.
Outlook
The U.S. stock market seems to be in a holding pattern. Our expectations as well as the market’s hold that the economy and corporate earnings will accelerate in the final months of 2013 and push further ahead in 2014. The problem is that was the expectation three months ago, too, and evidence of either is not compelling so far. As a result, the market has gone more sideways than up in recent months.
The good news is that while the last three months have not provided current period evidence of acceleration, we can point to many developments that suggest that a pickup is around the corner. Housing momentum continues despite the recent back-up in mortgage rates. Factory order data is outright strong although production data does not yet reflect it.
Consumer and corporate balance sheets are in good shape and ready to spend and invest as confidence in the pick-up grows. Europe has turned the corner and will now add to global growth rather than subtract from it. Inventories are low and will have to be rebuilt as the acceleration gathers steam.
We wish we could say we see robust growth ahead. Unfortunately, we cannot. But we do believe the economy will continue to expand at a solid, if unspectacular pace. Corporate earnings growth should follow. We believe that will allow the stock market to push to new highs in the year ahead. There’s no reason to anticipate a downturn in the economy or the stock market for the foreseeable future, so only modest growth notwithstanding, we remain optimistic at a macro level.
Despite the handful of great performers in the portfolio this past year, it’s been a very tough market for the sort of high-quality, large-cap growth stocks that populate our
30 www.calvert.com CALVERT SOCIAL INVESTMENT FUND ANNUAL REPORT
investment universe. We believe extremely low interest rates have had something to do with that. But that has left some very good values among stocks in our portfolio and within the universe. We will continue to work hard to find the best combinations of growth and attractive valuation and look forward to headwinds shifting to tailwinds in the years ahead as interest rates almost certainly will rise.
October 2013
1. Individual security returns reflect total returns for period held in portfolio.
As of September 30, 2013, the following companies represented the following percentages of Portfolio net assets: Starbucks 2.56%, Priceline 1.87%, Lowe’s 2.38%, Texas Instruments 1.37%, Ecolab 2.68%, Gilead Science 2.84%, Edwards Lifesciences 0%, Apple 3.78%, Kohl’s 0%, Suncor 0%, and C.H. Robinson 0%. Holdings are subject to change.
www.calvert.com CALVERT SOCIAL INVESTMENT FUND ANNUAL REPORT 31

Investment Performance
Calvert Large Cap Core Portfolio Class A Shares (at NAV) returned 21.91% for the 12-month period through September 30, 2013, outperforming its benchmark, the Russell 1000 Index return of 20.91%. The Portfolio’s outperformance is attributable to a combination of sound stock selection and favorable industry and sector selection.
Investment Climate
Equity markets faced a brief pullback in late 2012, but recovered and posted strong gains in the last three quarters of the period. The third round of quantitative easing (QE), unleashed in mid-2012, provided an impetus for equity investors to look past numerous macro headwinds from fiscal cliff debates, sequester, slow growth in China and the Eurozone, and weak corporate earnings. The macro-economic picture in the U.S. continued to show improvement in the key economic drivers—housing and employment. For the year, the S&P 500, Russell 1000, Russell 2000, MSCI EAFE, and MSCI Emerging Markets Indices returned 19.34%, 20.91%, 30.06%, 24.92%, and 1.33%, respectively.
Value stocks outperformed growth stocks by 3.03%, as measured by the Russell 1000 Value and Russell 1000 Growth Indices for the 12-month period. Within the Russell 1000 Index, Consumer Discretionary, Industrials, and Health Care were the top-performing sectors, while Telecoms, Utilities, and Materials lagged.
Corporate Earnings Are Weaker
Corporate earnings reports in late 2012 and throughout the first half of 2013 were largely weak on both the top- and bottom-line figures, with the sequester negatively impacting corporate results in the first half of 2013.
Sounding a cautious note, several bellwether companies that reported late in the summer of 2013, including names like Walmart and Cisco, issued reduced earnings forecasts citing everything from consumer weakness to fears of rising interest rates. We continue to believe that, going forward, the U.S. economic recovery can be sustained and able to support earnings growth for U.S. companies.
Improving Macro-Economic Picture in the U.S., But Continued Softness Abroad
Throughout the year, U.S. macro indicators continued to improve, albeit slowly. The unemployment rate ticked down to just above 7% and initial jobless claims hit post-financial crisis lows in the third quarter of 2013. New job growth remains sluggish.
32 www.calvert.com CALVERT SOCIAL INVESTMENT FUND ANNUAL REPORT
| CALVERT LARGE CAP | ||
| CORE PORTFOLIO | ||
| SEPTEMBER 30, 2013 | ||
| % OF TOTAL | ||
| ECONOMIC SECTORS | INVESTMENTS | |
| Consumer Discretionary | 17.6 | % |
| Consumer Staples | 10.8 | % |
| Energy | 4.9 | % |
| Financials | 17.3 | % |
| Health Care | 12.3 | % |
| Industrials | 7.2 | % |
| Information Technology | 14.6 | % |
| Short-Term Investments | 10.0 | % |
| Telecommunication Services | 5.3 | % |
| Total | 100 | % |
| CALVERT LARGE CAP | ||||
| CORE PORTFOLIO | ||||
| SEPTEMBER 30, 2013 | ||||
| INVESTMENT PERFORMANCE | ||||
| (TOTAL RETURN AT NAV*) | ||||
| 6 MONTHS | 12 MONTHS | |||
| ENDED | ENDED | |||
| 9/30/13 | 9/30/13 | |||
| Class A | 7.40 | % | 21.91 | % |
| Class B | 6.59 | % | 20.11 | % |
| Class C | 6.95 | % | 20.84 | % |
| Class I | 7.65 | % | 22.47 | % |
| Class Y** | 7.45 | % | 21.97 | % |
| Russell 1000 | ||||
| Index | 8.83 | % | 20.91 | % |
| Lipper Large- | ||||
| Cap Core Funds | ||||
| Average | 8.43 | % | 19.68 | % |
| TEN LARGEST | % OF NET | |
| STOCK HOLDINGS | ASSETS | |
| Toyota Motor Corp. (ADR) | 4.2 | % |
| JPMorgan Chase & Co. | 4.1 | % |
| Wells Fargo & Co. | 3.9 | % |
| Time Warner, Inc. | 3.9 | % |
| Cisco Systems, Inc. | 3.8 | % |
| Amgen, Inc. | 3.8 | % |
| Goldman Sachs Group, Inc. | 3.7 | % |
| Symantec Corp. | 3.6 | % |
| CVS Caremark Corp. | 3.4 | % |
| Medtronic, Inc. | 3.3 | % |
| Total | 37.7 | % |
* Investment performance/return at NAV does not reflect the deduction of the Fund’s maximum 4.75% front-end sales charge or any deferred sales charges.
** Calvert Large Cap Core portfolio first offered Class Y shares on April 30, 2013. Performance prior to that date reflects the performance of Class A shares at net asset value (NAV). Actual Class Y share performance would have been different.
However, consumers continue to remain upbeat and willing to spend on bigger-ticket items, as reflected in improving vehicle and home sales. Sales of previously owned homes hit a three-year high in May of 2013 and housing prices continued to trend upward, despite the looming threat of rising interest rates.
Abroad, developed markets kept pace with the U.S., but emerging markets were rattled by developments in China and the Eurozone periphery. A transition of power in China went smoothly, but new leadership promised to curb excesses in the economy, triggering fears of an economic slowdown. The pullback reached its climax with a 14% sell-off in the Shanghai composite in June that rattled markets around the globe. Elsewhere in Asia, Japan launched an unprecedented QE program in late 2012, triggering a massive rally in Japanese equities and a large sell-off in the yen. With similar (but smaller) policy measures in Europe, investors began to focus on the theme of coordinated global QE as a stabilizing force for the global economy in the near term,
www.calvert.com CALVERT SOCIAL INVESTMENT FUND ANNUAL REPORT 33
despite potentially negative effects in the longer term.
In Europe, economic turmoil in the so called “PIIGS” (Portugal, Italy, Ireland, Greece and Spain) continued to simmer in the background. While Italy nearly saw its government collapse, unemployment in Spain reached almost 50% among youth—reminding investors that the region, while improving, remains fragile.
Federal Reserve: QE Taper and Transition Talk
During the summer, investor consensus largely settled around the view that the Federal Reserve (Fed) would begin tapering its QE program in September of 2013 by reducing both its Treasury and mortgage-backed security purchases. This view took hold despite weakness in both employment and inflation, the two areas highlighted by Fed Chairman Ben Bernanke as needing improvement before tapering would begin. Nevertheless, the “surprise” decision not to taper in September caught market participants off guard, sending equities up and sparking a retreat in bond yields.
As markets digested the lack of a QE taper – and largely gave back the equity gains won on the news – focus also returned to the transition of the Fed Chairman role. With Larry Summers removing himself from consideration, consensus coalesced around eventual nominee Vice Chair Janet Yellen, a selection largely signaling favor for continuing current monetary policy with little change.
With Political Stalemate in Washington, It’s Déjà Vu All Over Again…
The debt ceiling drama of 2011 reared its head again in late September 2013.
| CALVERT LARGE CAP | ||
| CORE PORTFOLIO | ||
| SEPTEMBER 30, 2013 | ||
| AVERAGE ANNUAL TOTAL RETURNS | ||
| CLASS A SHARES | (WITH MAX. LOAD) | |
| One year | 16.14 | % |
| Five year | 8.34 | % |
| Ten year | 5.41 | % |
| CLASS B SHARES | (WITH MAX. LOAD) | |
| One year | 15.11 | % |
| Five year | 7.76 | % |
| Ten year | 4.71 | % |
| CLASS C SHARES | (WITH MAX. LOAD) | |
| One year | 19.84 | % |
| Five year | 8.41 | % |
| Ten year | 4.99 | % |
| CLASS I SHARES* | ||
| One year | 22.47 | % |
| Five year | 10.01 | % |
| Ten year | 6.37 | % |
| CLASS Y SHARES** | ||
| One year | 21.97 | % |
| Five year | 9.40 | % |
| Ten year | 5.93 | % |
Note: Calvert Enhanced Equity Portfolio changed its name to Calvert Large Cap Core Portfolio on January 31, 2013.
* Note Regarding Class I Shares Total Returns: There were times during the reporting period when there were no shareholders in Class I. For purposes of reporting Average Annual Total Return, Class A performance at NAV (i.e. does not reflect deduction of the Class A front-end sales charge) is used during these periods in which there were no shareholders in Class I. For purposes of this Average Annual Total Return, the Class A performance at NAV was used during the period January 18, 2002 through April 29, 2005.
** Calvert Large Cap Core portfolio first offered Class Y shares on April 30, 2013. Performance prior to that date reflects the performance of Class A shares at net asset value (NAV). Actual Class Y share performance would have been different.
34 www.calvert.com CALVERT SOCIAL INVESTMENT FUND ANNUAL REPORT
GROWTH OF $10,000
The graph below shows the value of a hypothetical $10,000 investment in the Fund over the past 10 fiscal year periods. The results shown are for Classes A and C shares and reflect the deduction of the maximum front-end Class A sales charge of 4.75%, or deferred sales charge, as applicable and assume the reinvestment of dividends. The result is compared with benchmarks that include a broad based market index and a Lipper peer group average. Market indexes are unmanaged and their results do not reflect the effect of expenses or sales charges. The Lipper average reflects the deduction of the category’s average front-end sales charge. The value of an investment in a different share class would be different.

All performance data shown, including the graph above and the adjacent table, represents past performance, does not guarantee future results, assumes reinvestment of dividends and distributions and does not reflect the deduction of taxes that a shareholder would pay on the Fund’s distributions or the redemption of the Fund shares. All performance data reflects fee waivers and/or expense limitations, if any are in effect; in their absence performance would be lower. See Note B in Notes to Financial Statements. The investment return and principal value of an investment will fluctuate so that an investor’s shares, when redeemed, may be worth more or less than their original cost. Current performance may be lower or higher than the performance data quoted; for current performance data visit www.calvert.com. The gross expense ratio from the current prospectus for Class A shares is 1.40%. This number may differ from the expense ratio shown elsewhere in this report because it is based on a different time period and, if applicable, does not include fee or expense waivers. Performance data quoted already reflects the deduction of the Fund’s operating expenses.
www.calvert.com CALVERT SOCIAL INVESTMENT FUND ANNUAL REPORT 35
The government shutdown and debt ceiling impasse in Washington fueled uncertainty and created a negative feedback loop in the U.S. economy.
Although U.S. labor conditions improved materially since the asset purchase program began, recent reductions in public-sector employment were felt in the July and August employment reports.
The U.S. Congress failed to approve a budget to fund the government past September 30, which culminated in the shutdown of the federal government. Equity markets appeared largely unconcerned with the event in September despite the looming U.S. debt ceiling debate. Congress was not able to raise the debt ceiling until hours before the October 17 deadline identified by the Treasury Department.
Although the markets welcomed the resolution, the turmoil took its toll. Estimates of fiscal drag from the shutdown were in the billions, while credit-rating firm Fitch put the nation’s credit rating on negative outlook as a result of the political stalemate and inability to take timely action on raising the debt ceiling.
Portfolio Strategy
U.S. large capitalization stocks posted impressive returns for the period with the Russell 1000 Index returning 20.91%. Calvert Large Cap Core Portfolio outperformed the benchmark by 1.44% with positive stock selection and sector allocation contributing to its strong performance.
Stock selection was effective across several sectors, most notably in Industrials and Information Technology. Dover Corp., a manufacturer of industrial components, revised its 2013 revenue growth guidance upward and increased its quarterly dividend by 19% before ultimately returning over 61% for the period.1 Strong stock selection in Information Technology was aided by our decision to underweight Apple, which was down 26% for the period. Insights from our fundamental ESG (environmental, social and governance) analysis revealed important sustainability risks in Apple’s supply chain that would impact Apple’s gross margin and sales. We believed these factors would affect the company’s brand, ability to produce new products with optimal cost efficiency, and could temporarily slow the rate of innovation, and we lowered our estimate of the company’s value accordingly. As a result of these insights, we eliminated our position early in the period and then rebuilt a position later as the stock became more attractively valued.
The Portfolio also benefited from selecting Symantec and Cisco, which were up 42.0% and 26.4%, respectively. The only notable negative in Information Technology was Western Union, which only rose 5.4% for the period.
We also delivered good results in the Consumer Discretionary sector where Toyota Motors and media holdings Time Warner and Viacom all produced strong returns. Toyota benefited from increased consumer spending on big ticket items. We chose Time Warner and Viacom based on our belief that media companies that produce programming—”content owners”—are the most attractive names in the industry, which proved to be the case this past year.
In Financials, holding British banking firm Barclays plc, which gained 33.5%, contributed
36 www.calvert.com CALVERT SOCIAL INVESTMENT FUND ANNUAL REPORT
to the Portfolio’s strong relative performance, as did our decision to avoid the interest-rate sensitive real estate investment trusts (REITS).
We did have some of our picks underperform during the period. In the Energy sector, QEP resources underperformed due to weak prices for natural gas. In the Telecommunications sector, AT&T was down 5.8%. While the stock appeared attractive from a financial perspective, we elected to decrease our exposure to the stock over the course of the period due to pension funding risks discussed below and eventually closed out the position in October 2013. In the same sector the Portfolio benefited from the strong performance from UK telephone company BT Group plc, which returned 60.8% for the period. Also, our cash position, which we increased as stock valuations became less attractive during the markets’ strong climb, hurt relative performance during the period.
Company highlight
One company we became much more cautious about in 2013 was AT&T. By late last year, we became concerned about the management’s lack of meaningful contributions to its pension or post-retirement plans, which were underfunded by $35 billion as of December 31, 2012. These actions boosted reported earnings but increased the risk of conflicts between shareholders, debt holders and pensioners with management in the middle, which is known in ESG circles as stewardship and principle-agent conflicts.
Our concerns heightened when management filed to fund the pension with special company securities that would neither dilute the share count nor be accounted for as debt on the balance sheet. This type of action is rarely done by U.S. companies, and primarily only by those in poor financial situations. The Department of Labor recently gave AT&T a tentative nod to proceed after the company holds a public hearing.
While the lack of cash pension contributions, lower cash taxes and a reduced pension liability would improve AT&T’s reported numbers, we remain concerned about potential stakeholder conflicts, the general use of company securities to fund significant portions of the pension plan and disclosure transparency regarding the issue. As a result, we retain a cautious stance on AT&T due to a variety of financial and other material factors, including this pension issue.
Outlook
As we have stated in the past, despite negative short-term investor sentiment, the long-term drivers of economic recovery continue to gain strength. Investors continue to look beyond the headlines and focus on the improving macro-economic climate in the U.S. and, to some degree, overseas.
The path to recovery will not necessarily be smooth, however. The Fed is largely expected to taper QE as early as December and interest rates are expected to continue climbing. In such a scenario, higher dividend stocks remain especially vulnerable. While growth stocks made an impressive recovery in the third quarter, value names may recover when the reality of Fed tapering and interest rate uptick returns to focus.
However, longer-term factors, such as historically low housing inventories and continued household formation, will provide support for improving economic growth. Likewise, manufacturing is pulling out of its seasonal slump and the broader trend of consumer balance sheet repair is well underway.
www.calvert.com CALVERT SOCIAL INVESTMENT FUND ANNUAL REPORT 37
As confidence sets in at both the consumer and corporate level, we continue to expect consumers to increase spending and companies to eventually expand capital expenditures and increase inventories. The sharp rise in interest rates that many feared would continue to 3% and beyond has tempered. While consumers and companies alike must prepare for a rising-rate environment, over the medium- and longer-terms, a gradual shift up in borrowing costs may be a sign of an improving economy and not necessarily a near-term threat to growth.
Calvert Investment Management, Inc.
October 2013
1. Returns reflect the period the holding was in the portfolio
As of September 30, 2013, the following companies represented the following percentages of Fund net assets: Walmart 0%, Cisco Systems 3.76%, Dover 3.27%, Apple 2.68%, Symantec 3.63%, Western Union 2.03%, Toyota Motors ADR 4.28%, Time Warner Inc. 3.90%, Viacom 1.05%, Barclays plc ADR 2.15%, QEP Resources 1.21%, AT&T 3.29%, and BT Group plc 1.63%. Holdings are subject to change.
38 www.calvert.com CALVERT SOCIAL INVESTMENT FUND ANNUAL REPORT
SHAREHOLDER EXPENSE EXAMPLE
As a shareholder of the Portfolio, you incur two types of costs: (1) transaction costs, including sales charges and redemption fees; and (2) ongoing costs, including management fees; distribution (12b-1) fees; and other Portfolio expenses. This Example is intended to help you understand your ongoing costs (in dollars) of investing in the Portfolio and to compare these costs with the ongoing costs of investing in other mutual funds.
This Example is based on an investment of $1,000 invested at the beginning of the period and held for the entire period (April 1, 2013 to September 30, 2013).
Actual Expenses
The first line of the table below provides information about actual account values and actual expenses. You may use the information in this line, together with the amount you invested, to estimate the expenses that you paid over the period. Simply divide your account value by $1,000 (for example, an $8,600 account value divided by $1,000 = 8.6), then multiply the result by the number in the first line under the heading entitled “Expenses Paid During Period” to estimate the expenses you paid on your account during this period.
The Large Cap Core Portfolio charges an annual low balance account fee of $15 to those shareholders whose regular account balance is less than $5,000 ($1,000 for IRA accounts). If the low balance fee applies to your account, you should subtract the fee from the ending account value in the chart below.
Hypothetical Example for Comparison Purposes
The second line of the table below provides information about hypothetical account values and hypothetical expenses based on the Portfolio’s actual expense ratios and an assumed rate of return of 5% per year before expenses, which is not the Portfolio’s actual return. The hypothetical account values and expenses may not be used to estimate the actual ending account balance or expenses you paid for the period. You may use this information to compare the ongoing costs of investing in the Portfolio and other funds. To do so, compare the 5% hypothetical example with the 5% hypothetical examples that appear in the shareholder reports of the other funds.
Please note that the expenses shown in the table are meant to highlight your ongoing costs only and do not reflect any transactional costs, such as sales charges (loads) or redemption fees. Therefore, the second line of the table is useful in comparing ongoing costs only, and will not help you determine the relative total costs of owning different funds. In addition, if these transactional costs were included, your costs would have been higher.
www.calvert.com CALVERT SOCIAL INVESTMENT FUND ANNUAL REPORT 39
| BEGINNING | ENDING ACCOUNT | EXPENSES PAID | |
| ACCOUNT VALUE | VALUE | DURING PERIOD* | |
| BALANCED | 4/1/13 | 9/30/13 | 4/1/13 - 9/30/13 |
| CLASS A | |||
| Actual | $1,000.00 | $1,059.88 | $6.01 |
| Hypothetical | $1,000.00 | $1,019.23 | $5.90 |
| (5% return per year before expenses) | |||
| CLASS B | |||
| Actual | $1,000.00 | $1,053.90 | $11.76 |
| Hypothetical | $1,000.00 | $1,013.62 | $11.53 |
| (5% return per year before expenses) | |||
| CLASS C | |||
| Actual | $1,000.00 | $1,055.87 | $10.13 |
| Hypothetical | $1,000.00 | $1,015.21 | $9.93 |
| (5% return per year before expenses) | |||
| CLASS I | |||
| Actual | $1,000.00 | $1,062.62 | $3.47 |
| Hypothetical | $1,000.00 | $1,021.70 | $3.40 |
| (5% return per year before expenses) | |||
| CLASS Y | |||
| Actual | $1,000.00 | $1,060.18 | $2.10 |
| Hypothetical | $1,000.00 | $1,023.03 | $2.06 |
| (5% return per year before expenses) | |||
* Expenses for Balanced are equal to the annualized expense ratios of 1.16%, 2.28%, 1.97%, 0.67% and 0.41% for Class A, Class B, Class C, Class I, and Class Y, respectively, multiplied by the average account value over the period, multiplied by 183/365 (to reflect the one-half year period).
40 www.calvert.com CALVERT SOCIAL INVESTMENT FUND ANNUAL REPORT
| BEGINNING | ENDING ACCOUNT | EXPENSES PAID | |
| ACCOUNT VALUE | VALUE | DURING PERIOD* | |
| BOND | 4/1/13 | 9/30/13 | 4/1/13 - 9/30/13 |
| CLASS A | |||
| Actual | $1,000.00 | $971.15 | $5.51 |
| Hypothetical | $1,000.00 | $1,019.47 | $5.65 |
| (5% return per year before expenses) | |||
| CLASS B | |||
| Actual | $1,000.00 | $966.31 | $10.79 |
| Hypothetical | $1,000.00 | $1,014.09 | $11.06 |
| (5% return per year before expenses) | |||
| CLASS C | |||
| Actual | $1,000.00 | $966.98 | $9.42 |
| Hypothetical | $1,000.00 | $1,015.49 | $9.66 |
| (5% return per year before expenses) | |||
| CLASS I | |||
| Actual | $1,000.00 | $973.97 | $2.55 |
| Hypothetical | $1,000.00 | $1,022.48 | $2.61 |
| (5% return per year before expenses) | |||
| CLASS Y | |||
| Actual | $1,000.00 | $972.84 | $4.02 |
| Hypothetical | $1,000.00 | $1,021.00 | $4.12 |
| (5% return per year before expenses) | |||
* Expenses for Bond are equal to the annualized expense ratios of 1.12%, 2.19%, 1.91%, 0.52%, and 0.81% for Class A, Class B, Class C, Class I, and Class Y, respectively, multiplied by the average account value over the period, multiplied by 183/365 (to reflect the one-half year period).
www.calvert.com CALVERT SOCIAL INVESTMENT FUND ANNUAL REPORT 41
| BEGINNING | ENDING ACCOUNT | EXPENSES PAID | |
| ACCOUNT VALUE | VALUE | DURING PERIOD* | |
| EQUITY | 4/1/13 | 9/30/13 | 4/1/13 - 9/30/13 |
| CLASS A | |||
| Actual | $1,000.00 | $1,068.39 | $6.27 |
| Hypothetical | $1,000.00 | $1,019.01 | $6.12 |
| (5% return per year before expenses) | |||
| CLASS B | |||
| Actual | $1,000.00 | $1,063.69 | $10.72 |
| Hypothetical | $1,000.00 | $1,014.68 | $10.47 |
| (5% return per year before expenses) | |||
| CLASS C | |||
| Actual | $1,000.00 | $1,064.82 | $9.78 |
| Hypothetical | $1,000.00 | $1,015.60 | $9.55 |
| (5% return per year before expenses) | |||
| CLASS I | |||
| Actual | $1,000.00 | $1,071.62 | $3.33 |
| Hypothetical | $1,000.00 | $1,021.85 | $3.25 |
| (5% return per year before expenses) | |||
| CLASS Y | |||
| Actual | $1,000.00 | $1,070.82 | $4.17 |
| Hypothetical | $1,000.00 | $1,021.04 | $4.07 |
| (5% return per year before expenses) | |||
* Expenses for Equity are equal to the annualized expense ratios of 1.21%, 2.07%, 1.89%, 0.64%, and 0.80% for Class A, Class B, Class C, Class I, and Class Y, respectively, multiplied by the average account value over the period, multiplied by 183/365 (to reflect the one-half year period).
42 www.calvert.com CALVERT SOCIAL INVESTMENT FUND ANNUAL REPORT
| BEGINNING | ENDING ACCOUNT | EXPENSES PAID | |
| ACCOUNT VALUE | VALUE | DURING PERIOD* | |
| LARGE CAP CORE | 4/1/13 | 9/30/13 | 4/1/13 - 9/30/13 |
| CLASS A | |||
| Actual | $1,000.00 | $1,074.00 | $6.13 |
| Hypothetical | $1,000.00 | $1,019.16 | $5.96 |
| (5% return per year before expenses) | |||
| CLASS B | |||
| Actual | $1,000.00 | $1,065.87 | $13.83 |
| Hypothetical | $1,000.00 | $1,011.68 | $13.46 |
| (5% return per year before expenses) | |||
| CLASS C | |||
| Actual | $1,000.00 | $1,069.47 | $10.46 |
| Hypothetical | $1,000.00 | $1,014.96 | $10.18 |
| (5% return per year before expenses) | |||
| CLASS I | |||
| Actual | $1,000.00 | $1,076.49 | $3.67 |
| Hypothetical | $1,000.00 | $1,021.54 | $3.57 |
| (5% return per year before expenses) | |||
| CLASS Y | |||
| Actual | $1,000.00 | $1,074.48 | $2.51 |
| Hypothetical | $1,000.00 | $1,022.65 | $2.44 |
| (5% return per year before expenses) | |||
* Expenses for Large Cap Core are equal to the annualized expense ratios of 1.18%, 2.67%, 2.02%, 0.70%, and 0.48% for Class A, Class B, Class C, Class I, and Class Y, respectively, multiplied by the average account value over the period, multiplied by 183/365 (to reflect the one-half year period).
www.calvert.com CALVERT SOCIAL INVESTMENT FUND ANNUAL REPORT 43
REPORT OF INDEPENDENT REGISTERED PUBLIC ACCOUNTING FIRM
The Board of Trustees and Shareholders of Calvert Social Investment Fund: We have audited the accompanying statements of assets and liabilities, including the schedules of investments, of the Calvert Balanced, Bond, Equity, and Large Cap Core (formerly, Calvert Enhanced Equity) Portfolios (collectively the “Portfolios”), each a series of Calvert Social Investment Fund, as of September 30, 2013, and the related statements of operations for the year then ended, the statements of changes in net assets for each of the years in the two-year period then ended, and the financial highlights for each of the years or periods in the five-year period then ended. These financial statements and financial highlights are the responsibility of the Portfolios’ management. Our responsibility is to express an opinion on these financial statements and financial highlights based on our audits.
We conducted our audits in accordance with the standards of the Public Company Accounting Oversight Board (United States). Those standards require that we plan and perform the audit to obtain reasonable assurance about whether the financial statements and financial highlights are free of material misstatement. An audit includes examining, on a test basis, evidence supporting the amounts and disclosures in the financial statements. Our procedures included confirmation of securities owned as of September 30, 2013, by correspondence with the custodian and brokers or by performing other appropriate auditing procedures. An audit also includes assessing the accounting principles used and significant estimates made by management, as well as evaluating the overall financial statement presentation. We believe that our audits provide a reasonable basis for our opinion.
In our opinion, the financial statements and financial highlights referred to above present fairly, in all material respects, the financial position of the Calvert Balanced, Bond, Equity, and Large Cap Core Portfolios as of September 30, 2013, the results of their operations for the year then ended, the changes in their net assets for each of the years in the two-year period then ended, and the financial highlights for each of the years or periods in the five-year period then ended, in conformity with U.S. generally accepted accounting principles.
44 www.calvert.com CALVERT SOCIAL INVESTMENT FUND ANNUAL REPORT
| BALANCED PORTFOLIO | |||
| SCHEDULE OF INVESTMENTS | |||
| SEPTEMBER 30, 2013 | |||
| EQUITY SECURITIES - 58.5% | SHARES | VALUE | |
| Aerospace & Defense - 0.3% | |||
| B/E Aerospace, Inc.* | 24,920 | $ | 1,839,594 |
| Air Freight & Logistics - 0.8% | |||
| FedEx Corp | 21,152 | 2,413,655 | |
| United Parcel Service, Inc., Class B | 24,725 | 2,259,123 | |
| 4,672,778 | |||
| Auto Components - 0.5% | |||
| TRW Automotive Holdings Corp.* | 36,600 | 2,609,946 | |
| Beverages - 0.4% | |||
| PepsiCo, Inc. | 30,486 | 2,423,637 | |
| Biotechnology - 1.2% | |||
| Amgen, Inc. | 13,049 | 1,460,705 | |
| Gilead Sciences, Inc.* | 87,175 | 5,478,077 | |
| 6,938,782 | |||
| Capital Markets - 2.4% | |||
| Franklin Resources, Inc. | 147,760 | 7,469,268 | |
| State Street Corp. | 93,325 | 6,136,118 | |
| 13,605,386 | |||
| Chemicals - 1.2% | |||
| Ecolab, Inc. | 69,389 | 6,852,858 | |
| Commercial Banks - 1.4% | |||
| Wells Fargo & Co | 194,530 | 8,037,980 | |
| Communications Equipment - 1.7% | |||
| F5 Networks, Inc.* | 42,784 | 3,669,156 | |
| Juniper Networks, Inc.* | 213,600 | 4,242,096 | |
| QUALCOMM, Inc | 30,455 | 2,051,449 | |
| 9,962,701 | |||
| Computers & Peripherals - 3.5% | |||
| Apple, Inc. | 19,555 | 9,322,847 | |
| EMC Corp | 295,192 | 7,545,107 | |
| Western Digital Corp. | 47,843 | 3,033,246 | |
| 19,901,200 | |||
| Consumer Finance - 1.5% | |||
| American Express Co. | 22,196 | 1,676,242 | |
| Capital One Financial Corp. | 104,900 | 7,210,826 | |
| 8,887,068 | |||
www.calvert.com CALVERT SOCIAL INVESTMENT FUND ANNUAL REPORT 45
| EQUITY SECURITIES - CONT’D | SHARES | VALUE | |
| Diversified Financial Services - 1.4% | |||
| IntercontinentalExchange, Inc.* | 30,863 | $ | 5,599,165 |
| JPMorgan Chase & Co. | 23,449 | 1,212,079 | |
| Woodbourne Capital: | |||
| Trust I, Preferred (b)(e) | 500,000 | 258,300 | |
| Trust II, Preferred (b)(e) | 500,000 | 258,300 | |
| Trust III, Preferred (b)(e) | 500,000 | 258,300 | |
| Trust IV, Preferred (b)(e) | 500,000 | 258,300 | |
| 7,844,444 | |||
| Diversified Telecommunication Services - 1.0% | |||
| AT&T, Inc. | 50,245 | 1,699,286 | |
| CenturyLink, Inc. | 121,226 | 3,804,072 | |
| 5,503,358 | |||
| Electrical Equipment - 1.8% | |||
| AMETEK, Inc. | 57,938 | 2,666,307 | |
| Rockwell Automation, Inc | 71,125 | 7,606,107 | |
| 10,272,414 | |||
| Electronic Equipment & Instruments - 0.9% | |||
| Avnet, Inc | 85,860 | 3,581,221 | |
| Jabil Circuit, Inc | 78,402 | 1,699,755 | |
| 5,280,976 | |||
| Energy Equipment & Services - 1.0% | |||
| FMC Technologies, Inc.* | 104,018 | 5,764,678 | |
| Food & Staples Retailing - 1.4% | |||
| Costco Wholesale Corp. | 14,496 | 1,668,780 | |
| Walgreen Co. | 124,094 | 6,676,257 | |
| 8,345,037 | |||
| Food Products - 1.0% | |||
| Green Mountain Coffee Roasters, Inc.* | 33,700 | 2,538,621 | |
| McCormick & Co., Inc | 20,072 | 1,298,658 | |
| The Hershey Co | 19,165 | 1,772,763 | |
| 5,610,042 | |||
| Gas Utilities - 1.2% | |||
| AGL Resources, Inc. (s) | 145,175 | 6,682,405 | |
| Health Care Equipment & Supplies - 1.8% | |||
| CareFusion Corp.* | 144,900 | 5,346,810 | |
| DENTSPLY International, Inc | 35,612 | 1,545,917 | |
| Medtronic, Inc. | 44,720 | 2,381,340 | |
| The Cooper Co.’s, Inc. | 10,462 | 1,356,817 | |
| 10,630,884 | |||
| Health Care Providers & Services - 5.0% | |||
| CIGNA Corp | 93,175 | 7,161,429 | |
| Express Scripts Holding Co.* | 129,124 | 7,977,281 | |
| HCA Holdings, Inc | 56,455 | 2,413,451 | |
46 www.calvert.com CALVERT SOCIAL INVESTMENT FUND ANNUAL REPORT
| EQUITY SECURITIES - CONT’D | SHARES | VALUE | |
| Health Care Providers & Services - Cont’d | |||
| Laboratory Corp. of America Holdings* | 16,095 | $ | 1,595,658 |
| McKesson Corp. | 55,625 | 7,136,688 | |
| Mednax, Inc.* | 13,039 | 1,309,116 | |
| Quest Diagnostics, Inc. | 17,145 | 1,059,390 | |
| 28,653,013 | |||
| Hotels, Restaurants & Leisure - 1.2% | |||
| Starbucks Corp | 91,400 | 7,035,058 | |
| Household Products - 1.2% | |||
| Procter & Gamble Co. | 88,382 | 6,680,795 | |
| Insurance - 1.9% | |||
| Aflac, Inc | 29,652 | 1,838,127 | |
| Lincoln National Corp. | 73,800 | 3,098,862 | |
| The Travelers Co.’s, Inc. | 71,775 | 6,084,367 | |
| 11,021,356 | |||
| Internet & Catalog Retail - 1.3% | |||
| Netflix, Inc.* | 8,561 | 2,647,147 | |
| priceline.com, Inc.* | 4,717 | 4,768,651 | |
| 7,415,798 | |||
| Internet Software & Services - 1.8% | |||
| Akamai Technologies, Inc.* | 47,135 | 2,436,880 | |
| Google, Inc.* | 9,124 | 7,991,803 | |
| 10,428,683 | |||
| IT Services - 2.1% | |||
| Alliance Data Systems Corp.* | 22,559 | 4,770,552 | |
| International Business Machines Corp. | 5,375 | 995,342 | |
| MasterCard, Inc. | 4,545 | 3,057,785 | |
| Teradata Corp.* | 31,690 | 1,756,894 | |
| Visa, Inc. | 9,054 | 1,730,219 | |
| 12,310,792 | |||
| Leisure Equipment & Products - 1.2% | |||
| Polaris Industries, Inc. | 52,823 | 6,823,675 | |
| Machinery - 2.4% | |||
| AGCO Corp. | 116,175 | 7,019,294 | |
| Cummins, Inc. | 52,930 | 7,032,809 | |
| 14,052,103 | |||
| Media - 0.8% | |||
| Scripps Networks Interactive, Inc. | 58,901 | 4,600,757 | |
| Multiline Retail - 0.7% | |||
| Dollar Tree, Inc.* | 35,740 | 2,042,898 | |
| Target Corp | 32,316 | 2,067,578 | |
| 4,110,476 | |||
www.calvert.com CALVERT SOCIAL INVESTMENT FUND ANNUAL REPORT 47
| EQUITY SECURITIES - CONT’D | SHARES | VALUE | |
| Oil, Gas & Consumable Fuels - 3.4% | |||
| Cimarex Energy Co | 71,200 | $ | 6,863,680 |
| Pioneer Natural Resources Co. | 32,704 | 6,174,515 | |
| Whiting Petroleum Corp.* | 110,996 | 6,643,111 | |
| 19,681,306 | |||
| Professional Services - 0.5% | |||
| Manpowergroup, Inc | 40,103 | 2,917,092 | |
| Semiconductors & Semiconductor Equipment - 0.2% | |||
| Intel Corp. | 63,410 | 1,453,357 | |
| Software - 2.2% | |||
| Citrix Systems, Inc.* | 23,584 | 1,665,266 | |
| Microsoft Corp. | 294,168 | 9,798,737 | |
| Symantec Corp | 54,475 | 1,348,256 | |
| 12,812,259 | |||
| Specialty Retail - 3.6% | |||
| O’Reilly Automotive, Inc.* | 42,000 | 5,358,780 | |
| The Home Depot, Inc | 43,802 | 3,322,382 | |
| TJX Co.’s, Inc. | 107,593 | 6,067,169 | |
| Ulta Salon, Cosmetics & Fragrance, Inc.* | 49,955 | 5,967,624 | |
| 20,715,955 | |||
| Textiles, Apparel & Luxury Goods - 0.6% | |||
| Nike, Inc., Class B | 45,664 | 3,317,033 | |
| Trading Companies & Distributors - 1.0% | |||
| W.W. Grainger, Inc. | 20,975 | 5,489,367 | |
| Venture Capital - 1.0% | |||
| Agraquest, Inc., Contingent Deferred Distribution (b)(i)* | 1 | 220,132 | |
| BiddingForGood, Inc. (b)(i)* | 14,049 | — | |
| CFBanc Corp. (b)(i)* | 27,000 | 240,941 | |
| Community Bank of the Bay* | 4,000 | 16,400 | |
| Consensus Orthopedics, Inc.: | |||
| Common Stock (b)(i)* | 180,877 | — | |
| Series A-1, Preferred (b)(i)* | 420,683 | — | |
| Series B, Preferred (b)(i)* | 348,940 | 198,905 | |
| Series C, Preferred (b)(i)* | 601,710 | 209,320 | |
| Environmental Private Equity Fund II, Liquidating Trust LP (b)(i)* | 200,000 | 3,155 | |
| Kickboard: | |||
| Common (a)(b)(i)* | 169,932 | — | |
| Series A, Preferred (a)(b)(i)* | 1,155,503 | 285,328 | |
| LearnZillion, Inc.: | |||
| Series A, Preferred (b)(i)* | 169,492 | 210,170 | |
| Series A-1, Preferred (b)(i)* | 108,678 | 134,761 | |
| Lumni, Inc., Series B, Preferred (b)(i)* | 17,265 | 116,366 | |
| MACH Energy: | |||
| Common (b)(i)* | 20,536 | 344 | |
| Series A, Preferred (b)(i)* | 27,977 | 5,630 | |
| Series B, Preferred (b)(i)* | 26,575 | 7,308 | |
48 www.calvert.com CALVERT SOCIAL INVESTMENT FUND ANNUAL REPORT
| EQUITY SECURITIES - CONT’D | SHARES | VALUE | ||
| Venture Capital - Cont’d | ||||
| Mobius Technologies, Inc.: | ||||
| Common (b)(i)* | 12,560 | $ | — | |
| Series A-1, Preferred (b)(i)* | 6,943 | — | ||
| Series A-4, Preferred (b)(i)* | 2,716 | — | ||
| Neighborhood Bancorp (b)(i)* | 10,000 | — | ||
| Seventh Generation, Inc. (b)(i)* | 200,295 | 4,018,686 | ||
| Wild Planet Entertainment, Inc.: | ||||
| Series B, Preferred (b)(i)* | 476,190 | 39,937 | ||
| Series E, Preferred (b)(i)* | 129,089 | 10,826 | ||
| Wind Harvest Co., Inc. (b)(i)* | 8,696 | — | ||
| 5,718,209 | ||||
| Total Equity Securities (Cost $254,385,087) | 336,903,252 | |||
| VENTURE CAPITAL LIMITED | ADJUSTED | |||
| PARTNERSHIP INTEREST - 0.3% | BASIS | |||
| Coastal Venture Partners (b)(i)* | $ | 57,944 | 58,413 | |
| Commons Capital (b)(i)* | 335,000 | 151,624 | ||
| First Analysis Private Equity Fund IV (b)(i)* | 225,317 | 719,954 | ||
| GEEMF Partners (a)(b)(i)* | - | 105,487 | ||
| Global Environment Emerging Markets Fund (b)(i)* | - | 391,626 | ||
| Infrastructure and Environmental Private Equity Fund III (b)(i)* | 72,089 | 96,332 | ||
| Labrador Ventures III (b)(i)* | 360,875 | 42,492 | ||
| Labrador Ventures IV (b)(i)* | 900,510 | 29,147 | ||
| New Markets Growth Fund LLC (b)(i)* | 225,646 | — | ||
| Solstice Capital (b)(i)* | 173,114 | 132,685 | ||
| Total Venture Capital Limited Partnership Interest (Cost $2,350,494) | 1,727,760 | |||
| PRINCIPAL | ||||
| VENTURE CAPITAL DEBT OBLIGATIONS - 0.2% | AMOUNT | |||
| Rose Smart Growth Investment Fund I LP, 6.545%, 4/1/21 (b)(i) | 1,000,000 | 1,034,695 | ||
| Total Venture Capital Debt Obligations (Cost $1,000,000) | 1,034,695 | |||
| ASSET-BACKED SECURITIES - 1.2% | ||||
| American Credit Acceptance Receivables Trust: | ||||
| 1.64%, 11/15/16 (e) | 293,658 | 293,421 | ||
| 2.84%, 5/15/19 (e) | 545,000 | 546,046 | ||
| Avis Budget Rental Car Funding AESOP LLC, 1.92%, 9/20/19 (e) | 1,260,000 | 1,234,539 | ||
| California Republic Auto Receivables Trust, 1.18%, 8/15/17 (e) | 481,673 | 480,920 | ||
| Exeter Automobile Receivables Trust, 1.49%, 11/15/17 (e) | 1,000,000 | 1,000,342 | ||
| Flagship Rail Services LLC: | ||||
| 3.08%, 4/15/43 (e) | 199,948 | 197,194 | ||
| 3.96%, 4/15/43 (e) | 1,250,000 | 1,229,823 | ||
| MVW Owner Trust, 2.15%, 4/22/30 (e) | 457,110 | 457,335 | ||
| Santander Consumer Acquired Receivables Trust, 1.66%, 8/15/16 (e) | 527,932 | 529,459 | ||
| Santander Drive Auto Receivables Trust, 1.94%, 3/15/18 | 375,000 | 372,287 | ||
www.calvert.com CALVERT SOCIAL INVESTMENT FUND ANNUAL REPORT 49
| PRINCIPAL | |||||
| ASSET-BACKED SECURITIES - CONT’D | AMOUNT | VALUE | |||
| SVO VOI Mortgage Corp., 2.00%, 9/20/29 (e) | $ | 730,411 | $ | 726,805 | |
| Total Asset-Backed Securities (Cost $7,096,188) | 7,068,171 | ||||
| COLLATERALIZED MORTGAGE-BACKED | |||||
| OBLIGATIONS (PRIVATELY ORIGINATED) - 0.1% | |||||
| Springleaf Mortgage Loan Trust, 1.57%, 12/25/59 (e)(r) | 389,537 | 385,764 | |||
| Total Collateralized Mortgage-Backed Obligations | |||||
| (Privately Originated) (Cost $389,486) | 385,764 | ||||
| COMMERCIAL MORTGAGE-BACKED SECURITIES - 1.8% | |||||
| BBCMS Trust, 3.756%, 9/5/32 (e) | 450,000 | 469,140 | |||
| BWAY Mortgage Trust, 2.809%, 3/10/33 (e) | 985,000 | 950,234 | |||
| Commercial Mortgage Pass Through Certificates, 3.424%, 3/10/31 (e) | 780,000 | 750,317 | |||
| Extended Stay America Trust: | |||||
| 2.958%, 12/5/31 (e) | 485,000 | 473,963 | |||
| 3.604%, 12/5/31 (e) | 820,000 | 801,913 | |||
| GS Mortgage Securities Corp. II, 3.007%, 12/10/30 (e) | 750,000 | 686,683 | |||
| GS Mortgage Securities Trust, 4.507%, 8/10/46 | 185,000 | 191,168 | |||
| JP Morgan Chase Commercial Mortgage Securities Trust: | |||||
| 0.962%, 4/15/30 (e)(r) | 1,330,000 | 1,316,470 | |||
| 1.332%, 4/15/30 (e)(r) | 550,000 | 547,417 | |||
| Motel 6 Trust, 1.948%, 10/5/25 (e) | 2,000,000 | 1,961,096 | |||
| ORES NPL LLC, 3.081%, 9/25/25 (e) | 372,454 | 372,488 | |||
| Queens Center Mortgage Trust, 3.59%, 1/11/37 (e)(r) | 720,000 | 631,069 | |||
| UBS | -Barclays Commercial Mortgage Trust, 3.317%, 12/10/45 (e) | 745,000 | 700,767 | ||
| WFRBS Commercial Mortgage Trust, 4.358%, 8/15/46 (r) | 600,000 | 613,717 | |||
| Total Commercial Mortgage-Backed Securities (Cost $10,785,908) | 10,466,442 | ||||
| CORPORATE BONDS - 24.9% | |||||
| Agilent Technologies, Inc., 3.20%, 10/1/22 | 600,000 | 556,837 | |||
| Alliance Mortgage Investments, Inc., 12.61%, 6/1/10 (b)(r)(x)* | 385,345 | — | |||
| Altera Corp., 1.75%, 5/15/17 | 500,000 | 495,836 | |||
| Amazon.com, Inc.: | |||||
| 1.20%, 11/29/17 | 600,000 | 586,126 | |||
| 2.50%, 11/29/22 | 1,200,000 | 1,093,628 | |||
| America Movil SAB de CV: | |||||
| 2.375%, 9/8/16 | 350,000 | 355,880 | |||
| 1.256%, 9/12/16 (r) | 1,000,000 | 1,000,003 | |||
| American Express Centurion Bank, 0.715%, 11/13/15 (r) | 2,400,000 | 2,407,718 | |||
| American Honda Finance Corp., 1.60%, 2/16/18 (e) | 500,000 | 491,882 | |||
| American Tower Corp., 3.40%, 2/15/19 | 500,000 | 494,194 | |||
| Amgen, Inc.: | |||||
| 2.50%, 11/15/16 | 150,000 | 155,695 | |||
| 5.15%, 11/15/41 | 800,000 | 776,605 | |||
50 www.calvert.com CALVERT SOCIAL INVESTMENT FUND ANNUAL REPORT
| PRINCIPAL | ||||
| CORPORATE BONDS - CONT’D | AMOUNT | VALUE | ||
| Apple, Inc.: | ||||
| 2.40%, 5/3/23 | $ | 600,000 | $ | 543,109 |
| 3.85%, 5/4/43 | 600,000 | 502,772 | ||
| AT&T, Inc.: | ||||
| 2.95%, 5/15/16 | 500,000 | 522,815 | ||
| 1.60%, 2/15/17 | 500,000 | 501,148 | ||
| 3.00%, 2/15/22 | 1,000,000 | 937,801 | ||
| Autodesk, Inc., 1.95%, 12/15/17 | 600,000 | 588,097 | ||
| Bank of America Corp.: | ||||
| 0.594%, 8/15/16 (r) | 600,000 | 581,090 | ||
| 2.00%, 1/11/18 | 1,200,000 | 1,180,141 | ||
| 3.30%, 1/11/23 | 2,300,000 | 2,154,548 | ||
| 4.10%, 7/24/23 | 200,000 | 198,757 | ||
| Bank of America NA: | ||||
| 5.30%, 3/15/17 | 1,200,000 | 1,322,521 | ||
| 0.554%, 6/15/17 (r) | 1,000,000 | 969,096 | ||
| Bank of New York Mellon Corp.: | ||||
| 1.70%, 11/24/14 | 300,000 | 304,114 | ||
| 2.40%, 1/17/17 | 400,000 | 412,000 | ||
| Bank of Nova Scotia, 1.85%, 1/12/15 | 450,000 | 457,857 | ||
| BB&T Corp., 1.60%, 8/15/17 | 600,000 | 595,764 | ||
| Becton Dickinson and Co., 3.125%, 11/8/21 | 250,000 | 247,834 | ||
| Boston Properties LP: | ||||
| 3.70%, 11/15/18 | 250,000 | 262,735 | ||
| 3.85%, 2/1/23 | 1,000,000 | 974,135 | ||
| Canadian National Railway Co., 1.45%, 12/15/16 | 150,000 | 151,391 | ||
| Capital One Bank, 3.375%, 2/15/23 | 1,200,000 | 1,122,418 | ||
| Capital One Financial Corp., 2.15%, 3/23/15 | 300,000 | 304,832 | ||
| CBS Corp., 3.375%, 3/1/22 | 1,000,000 | 955,208 | ||
| CC Holdings GS V LLC / Crown Castle GS III Corp., | ||||
| 2.381%, 12/15/17 | 600,000 | 591,506 | ||
| CenturyLink, Inc.: | ||||
| 5.80%, 3/15/22 | 1,150,000 | 1,081,000 | ||
| 7.65%, 3/15/42 | 1,000,000 | 890,000 | ||
| CIT Group, Inc.: | ||||
| 5.25%, 3/15/18 | 375,000 | 392,812 | ||
| 5.00%, 8/1/23 | 700,000 | 677,719 | ||
| Citigroup, Inc.: | ||||
| 4.45%, 1/10/17 | 1,000,000 | 1,082,768 | ||
| 2.50%, 9/26/18 | 500,000 | 497,223 | ||
| 3.50%, 5/15/23 | 900,000 | 812,157 | ||
| 5.50%, 9/13/25 | 400,000 | 411,381 | ||
| Colgate-Palmolive Co., 1.30%, 1/15/17 | 250,000 | 251,772 | ||
| Consolidated Edison Company of New York, Inc., 4.45%, 6/15/20 | 300,000 | 329,899 | ||
| Corning, Inc., 1.45%, 11/15/17 | 500,000 | 494,268 | ||
| Costco Wholesale Corp., 1.70%, 12/15/19 | 600,000 | 579,992 | ||
| COX Communications, Inc., 4.70%, 12/15/42 (e) | 600,000 | 485,931 | ||
| Crown Castle Towers LLC, 4.883%, 8/15/40 (e) | 1,500,000 | 1,591,755 | ||
| Cummins, Inc.: | ||||
| 3.65%, 10/1/23 | 500,000 | 503,388 | ||
| 4.875%, 10/1/43 | 500,000 | 508,100 | ||
| CVS Pass-Through Trust, 6.036%, 12/10/28 | 1,225,446 | 1,350,502 |
www.calvert.com CALVERT SOCIAL INVESTMENT FUND ANNUAL REPORT 51
| PRINCIPAL | ||||
| CORPORATE BONDS - CONT’D | AMOUNT | VALUE | ||
| DDR Corp., 4.75%, 4/15/18 | $ | 500,000 | $ | 539,695 |
| Deere & Co., 2.60%, 6/8/22 | 1,000,000 | 943,363 | ||
| Discover Financial Services, 3.85%, 11/21/22 | 750,000 | 715,562 | ||
| Discovery Communications LLC: | ||||
| 3.30%, 5/15/22 | 1,000,000 | 957,322 | ||
| 4.875%, 4/1/43 | 900,000 | 830,434 | ||
| Dr Pepper Snapple Group, Inc., 3.20%, 11/15/21 | 200,000 | 195,687 | ||
| Dun & Bradstreet Corp., 3.25%, 12/1/17 | 600,000 | 605,117 | ||
| Eaton Corp.: | ||||
| 1.50%, 11/2/17 (e) | 500,000 | 492,964 | ||
| 2.75%, 11/2/22 (e) | 600,000 | 559,135 | ||
| eBay, Inc., 2.60%, 7/15/22 | 500,000 | 464,870 | ||
| Ecolab, Inc., 4.35%, 12/8/21 | 750,000 | 790,214 | ||
| Enterprise Products Operating LLC: | ||||
| 4.85%, 8/15/42 | 200,000 | 187,545 | ||
| 4.85%, 3/15/44 | 300,000 | 279,617 | ||
| 7.034% to 1/15/18, floating rate thereafter to 1/15/68 (r) | 1,250,000 | 1,390,625 | ||
| EOG Resources, Inc., 2.625%, 3/15/23 | 600,000 | 552,700 | ||
| ERP Operating LP, 4.625%, 12/15/21 | 300,000 | 316,690 | ||
| Excalibur One 77B LLC, 1.492%, 1/1/25 | 215,528 | 205,061 | ||
| Experian Finance plc, 2.375%, 6/15/17 (e) | 600,000 | 595,474 | ||
| Express Scripts Holding Co., 2.75%, 11/21/14 | 200,000 | 204,334 | ||
| FedEx Corp.: | ||||
| 2.625%, 8/1/22 | 600,000 | 551,048 | ||
| 3.875%, 8/1/42 | 300,000 | 249,863 | ||
| Fidelity National Information Services, Inc., 2.00%, 4/15/18 | 600,000 | 584,455 | ||
| Ford Motor Credit Co. LLC: | ||||
| 2.75%, 5/15/15 | 600,000 | 613,727 | ||
| 4.207%, 4/15/16 | 750,000 | 794,816 | ||
| 3.984%, 6/15/16 | 1,100,000 | 1,162,302 | ||
| 4.25%, 2/3/17 | 200,000 | 213,704 | ||
| 5.875%, 8/2/21 | 700,000 | 778,140 | ||
| General Mills, Inc., 3.15%, 12/15/21 | 1,500,000 | 1,478,890 | ||
| Gilead Sciences, Inc., 4.40%, 12/1/21 | 550,000 | 589,160 | ||
| GlaxoSmithKline Capital plc, 2.85%, 5/8/22 | 1,500,000 | 1,439,217 | ||
| GlaxoSmithKline Capital, Inc., 2.80%, 3/18/23 | 600,000 | 566,551 | ||
| Goldman Sachs Group, Inc.: | ||||
| 3.625%, 2/7/16 | 700,000 | 736,723 | ||
| 6.15%, 4/1/18 | 875,000 | 1,000,781 | ||
| 5.75%, 1/24/22 | 1,500,000 | 1,662,965 | ||
| 3.625%, 1/22/23 | 1,100,000 | 1,051,884 | ||
| Great River Energy, 5.829%, 7/1/17 (e) | 178,552 | 190,933 | ||
| Harley-Davidson Financial Services, Inc., 2.70%, 3/15/17 (e) | 500,000 | 507,775 | ||
| HCP, Inc., 3.15%, 8/1/22 | 600,000 | 552,349 | ||
| Health Care REIT, Inc., 3.75%, 3/15/23 | 600,000 | 567,553 | ||
| Hershey Co., 1.50%, 11/1/16 | 150,000 | 151,474 | ||
| Hewlett-Packard Co., 0.661%, 5/30/14 (r) | 500,000 | 500,004 | ||
| Home Depot, Inc.: | ||||
| 2.70%, 4/1/23 | 600,000 | 563,028 | ||
| 4.20%, 4/1/43 | 600,000 | 544,221 | ||
| Host Hotels & Resorts LP, 3.75%, 10/15/23 | 500,000 | 462,823 | ||
| Howard Hughes Medical Institute, 3.50%, 9/1/23 | 750,000 | 748,247 |
52 www.calvert.com CALVERT SOCIAL INVESTMENT FUND ANNUAL REPORT
| PRINCIPAL | ||||
| CORPORATE BONDS - CONT’D | AMOUNT | VALUE | ||
| HSBC Holdings plc, 4.00%, 3/30/22 | $ | 500,000 | $ | 508,754 |
| Ingredion, Inc.: | ||||
| 1.80%, 9/25/17 | 600,000 | 591,591 | ||
| 4.625%, 11/1/20 | 600,000 | 635,522 | ||
| Intel Corp., 4.80%, 10/1/41 | 800,000 | 766,508 | ||
| International Business Machines Corp.: | ||||
| 0.875%, 10/31/14 | 750,000 | 754,830 | ||
| 2.90%, 11/1/21 | 500,000 | 490,535 | ||
| International Finance Corp., 0.50%, 5/16/16 | 200,000 | 198,954 | ||
| John Deere Capital Corp.: | ||||
| 1.25%, 12/2/14 | 300,000 | 303,060 | ||
| 2.00%, 1/13/17 | 250,000 | 255,842 | ||
| JPMorgan Chase & Co.: | ||||
| 1.166%, 1/25/18 (r) | 1,000,000 | 1,006,353 | ||
| 3.20%, 1/25/23 | 3,500,000 | 3,274,313 | ||
| 3.375%, 5/1/23 | 600,000 | 544,118 | ||
| Kansas City Southern de Mexico SA de CV, 8.00%, 2/1/18 | 650,000 | 694,688 | ||
| Kellogg Co., 3.125%, 5/17/22 | 2,000,000 | 1,944,946 | ||
| Kimberly-Clark Corp.: | ||||
| 2.40%, 6/1/23 | 500,000 | 463,916 | ||
| 3.70%, 6/1/43 | 500,000 | 436,912 | ||
| Kinder Morgan Energy Partners LP, 3.50%, 9/1/23 | 500,000 | 466,169 | ||
| Laboratory Corporation of America Holdings, 2.20%, 8/23/17 | 600,000 | 600,225 | ||
| Liberty Mutual Group, Inc.: | ||||
| 4.95%, 5/1/22 (e) | 1,600,000 | 1,654,485 | ||
| 6.50%, 5/1/42 (e) | 750,000 | 809,354 | ||
| LL & P Wind Energy, Inc. Washington Revenue Bonds, | ||||
| 6.192%, 12/1/27 (e) | 1,600,000 | 1,519,184 | ||
| Lowe’s Co.’s, Inc., 3.875%, 9/15/23 | 500,000 | 506,379 | ||
| LULWA Ltd., 1.888%, 2/15/25 | 1,039,824 | 1,004,610 | ||
| Masco Corp., 5.85%, 3/15/17 | 600,000 | 649,500 | ||
| Mattel, Inc.: | ||||
| 1.70%, 3/15/18 | 400,000 | 392,739 | ||
| 3.15%, 3/15/23 | 500,000 | 475,646 | ||
| McDonald’s Corp., 3.625%, 5/1/43 | 600,000 | 516,190 | ||
| McKesson Corp., 2.70%, 12/15/22 | 800,000 | 747,769 | ||
| Memorial Sloan-Kettering Cancer Center, 4.125%, 7/1/52 | 600,000 | 500,837 | ||
| Methanex Corp.: | ||||
| 3.25%, 12/15/19 | 600,000 | 589,726 | ||
| 5.25%, 3/1/22 | 1,000,000 | 1,037,297 | ||
| Microsoft Corp.: | ||||
| 2.125%, 11/15/22 | 500,000 | 454,906 | ||
| 3.50%, 11/15/42 | 500,000 | 404,518 | ||
| Morgan Stanley, 5.50%, 1/26/20 | 900,000 | 995,908 | ||
| Nationwide Health Properties, Inc., 6.90%, 10/1/37 | 1,000,000 | 1,144,117 | ||
| Ness Family Partners LP VRDN, 0.44%, 9/1/34 (r)† | 5,375,000 | 5,375,000 | ||
| NetApp, Inc., 3.25%, 12/15/22 | 550,000 | 505,009 | ||
| New York Life Global Funding, 1.65%, 5/15/17 (e) | 200,000 | 199,582 | ||
| NII Capital Corp.: | ||||
| 10.00%, 8/15/16 | 600,000 | 576,000 | ||
| 7.625%, 4/1/21 | 700,000 | 497,000 | ||
| NII International Telecom SCA, 11.375%, 8/15/19 (e) | 400,000 | 414,000 |
www.calvert.com CALVERT SOCIAL INVESTMENT FUND ANNUAL REPORT 53
| PRINCIPAL | ||||
| CORPORATE BONDS - CONT’D | AMOUNT | VALUE | ||
| NIKE, Inc.: | ||||
| 2.25%, 5/1/23 | $ | 600,000 | $ | 547,817 |
| 3.625%, 5/1/43 | 600,000 | 518,839 | ||
| Nissan Motor Acceptance Corp.: | ||||
| 1.95%, 9/12/17 (e) | 150,000 | 149,154 | ||
| 2.65%, 9/26/18 (e) | 500,000 | 501,401 | ||
| Nordstrom, Inc., 4.00%, 10/15/21 | 300,000 | 313,537 | ||
| Novartis Capital Corp., 2.40%, 9/21/22 | 600,000 | 558,944 | ||
| NYU Hospitals Center, 4.428%, 7/1/42 | 500,000 | 412,276 | ||
| Penske Truck Leasing Co. LP / PTL Finance Corp., | ||||
| 2.875%, 7/17/18 (e) | 300,000 | 299,798 | ||
| Pentair Finance SA: | ||||
| 1.35%, 12/1/15 | 600,000 | 602,236 | ||
| 1.875%, 9/15/17 | 600,000 | 589,760 | ||
| PepsiCo, Inc.: | ||||
| 2.75%, 3/5/22 | 300,000 | 285,665 | ||
| 2.75%, 3/1/23 | 400,000 | 374,666 | ||
| Pioneer Natural Resources Co., 5.875%, 7/15/16 | 1,645,000 | 1,832,129 | ||
| PNC Bank NA, 2.70%, 11/1/22 | 1,000,000 | 911,338 | ||
| ProLogis LP, 6.875%, 3/15/20 | 253,000 | 298,284 | ||
| Reliance Steel & Aluminum Co., 4.50%, 4/15/23 | 500,000 | 487,980 | ||
| Rogers Communications, Inc., 3.00%, 3/15/23 | 600,000 | 553,732 | ||
| Safeway, Inc., 1.756%, 12/12/13 (r) | 2,250,000 | 2,255,634 | ||
| Sanofi SA, 1.25%, 4/10/18 | 600,000 | 585,747 | ||
| SBA Tower Trust, 3.722%, 4/15/48 (e) | 1,100,000 | 1,039,276 | ||
| Simon Property Group LP, 6.125%, 5/30/18 | 500,000 | 586,432 | ||
| Spencer Spirit Holdings, Inc.: | ||||
| 11.00%, 5/1/17 (e) | 900,000 | 958,500 | ||
| 9.00%, 5/1/18 (e) | 1,000,000 | 975,000 | ||
| St. Jude Medical, Inc.: | ||||
| 2.50%, 1/15/16 | 1,000,000 | 1,027,498 | ||
| 4.75%, 4/15/43 | 500,000 | 474,750 | ||
| Standard Chartered plc, 3.95%, 1/11/23 (e) | 600,000 | 564,389 | ||
| Stanley Black & Decker, Inc., 2.90%, 11/1/22 | 600,000 | 563,387 | ||
| State Street Corp., 3.10%, 5/15/23 | 300,000 | 279,816 | ||
| SunTrust Bank: | ||||
| 0.552%, 8/24/15 (r) | 500,000 | 494,783 | ||
| 7.25%, 3/15/18 | 500,000 | 596,874 | ||
| Tagua Leasing LLC, 1.581%, 11/16/24 | 943,286 | 899,192 | ||
| Telefonica Emisiones SAU: | ||||
| 3.992%, 2/16/16 | 600,000 | 621,526 | ||
| 3.192%, 4/27/18 | 600,000 | 592,014 | ||
| Texas Instruments, Inc., 1.65%, 8/3/19 | 600,000 | 579,469 | ||
| The Coca-Cola Co., 0.204%, 3/14/14 (r) | 1,750,000 | 1,750,233 | ||
| Thermo Fisher Scientific, Inc., 3.15%, 1/15/23 | 400,000 | 370,384 | ||
| Time Warner Cable, Inc.: | ||||
| 4.00%, 9/1/21 | 500,000 | 466,484 | ||
| 5.50%, 9/1/41 | 400,000 | 327,994 | ||
| Time Warner, Inc.: | ||||
| 4.00%, 1/15/22 | 350,000 | 353,746 | ||
| 3.40%, 6/15/22 | 1,100,000 | 1,067,840 | ||
| 5.375%, 10/15/41 | 500,000 | 498,773 | ||
| 4.90%, 6/15/42 | 500,000 | 467,708 |
54 www.calvert.com CALVERT SOCIAL INVESTMENT FUND ANNUAL REPORT
| PRINCIPAL | ||||
| CORPORATE BONDS - CONT’D | AMOUNT | VALUE | ||
| TJX Co.’s, Inc., 2.50%, 5/15/23 | $ | 600,000 | $ | 557,074 |
| Toronto-Dominion Bank, 2.375%, 10/19/16 | 400,000 | 413,718 | ||
| Total System Services, Inc., 3.75%, 6/1/23 | 600,000 | 555,352 | ||
| Toyota Motor Credit Corp.: | ||||
| 2.05%, 1/12/17 | 400,000 | 409,189 | ||
| 3.30%, 1/12/22 | 400,000 | 397,772 | ||
| United Parcel Service, Inc., 2.45%, 10/1/22 | 500,000 | 467,260 | ||
| US Bancorp, 2.95%, 7/15/22 | 500,000 | 470,384 | ||
| US Bank, 3.778% to 4/29/15, floating rate thereafter to 4/29/20 (r) | 1,500,000 | 1,563,526 | ||
| Ventas Realty LP / Ventas Capital Corp.: | ||||
| 4.00%, 4/30/19 | 1,000,000 | 1,048,909 | ||
| 3.25%, 8/15/22 | 600,000 | 560,498 | ||
| Viacom, Inc., 3.125%, 6/15/22 | 1,600,000 | 1,490,400 | ||
| Volkswagen International Finance NV, 0.884%, 4/1/14 (e)(r) | 1,500,000 | 1,502,842 | ||
| Wachovia Bank NA, 0.584%, 3/15/16 (r) | 500,000 | 496,826 | ||
| Wachovia Capital Trust III, 5.57%, 12/31/49 (r) | 750,000 | 678,750 | ||
| Walgreen Co., 1.80%, 9/15/17 | 600,000 | 602,061 | ||
| Western Union Co., 2.875%, 12/10/17 | 600,000 | 612,968 | ||
| Whirlpool Corp., 3.70%, 3/1/23 | 400,000 | 387,076 | ||
| Willis Group Holdings plc, 4.125%, 3/15/16 | 1,000,000 | 1,050,213 | ||
| Wisconsin Public Service Corp., 3.671%, 12/1/42 | 600,000 | 524,760 | ||
| Yara International ASA, 7.875%, 6/11/19 (e) | 500,000 | 603,614 | ||
| Zoetis, Inc., 3.25%, 2/1/23 (e) | 600,000 | 571,209 | ||
| Total Corporate Bonds (Cost $146,392,646) | 143,332,200 | |||
| FLOATING RATE LOANS(d) - 0.5% | ||||
| BJ’s Wholesale Club, Inc., 1.00%, 9/26/19 (r) | 497,500 | 496,816 | ||
| Dell, Inc., Bridge Term Loans: | ||||
| 2/28/20* | 923,100 | 918,484 | ||
| 2/26/21* | 576,900 | 574,016 | ||
| Dunkin’ Brands, Inc., 1.00%, 2/11/20 (r) | 595,132 | 593,049 | ||
| SUPERVALU, Inc., 1.00%, 3/21/19 (r) | 298,137 | 296,833 | ||
| Total Floating Rate Loans (Cost $2,889,373) | 2,879,198 | |||
| U.S. GOVERNMENT AGENCIES AND INSTRUMENTALITIES - 1.2% | ||||
| Freddie Mac, 1.375%, 5/1/20 | 7,200,000 | 6,852,485 | ||
| Total U.S. Government Agencies and Instrumentalities | ||||
| (Cost $7,161,673) | 6,852,485 | |||
| MUNICIPAL OBLIGATIONS - 1.1% | ||||
| Alexandria Virginia IDA Revenue VRDN, 0.42%, 7/1/30 (r)† | 500,000 | 500,000 | ||
| Connecticut Special Tax Obligation Revenue Bonds, 5.459%, 11/1/30 | 400,000 | 428,736 | ||
| Grafton Wisconsin IDA Revenue VRDN, 0.70%, 12/1/17 (r)† | 980,000 | 980,000 | ||
| New York City GO Bonds, 5.206%, 10/1/31 | 1,275,000 | 1,335,358 | ||
| New York City Transitional Finance Authority Future Tax | ||||
| Secured Revenue Bonds, 5.767%, 8/1/36 | 1,000,000 | 1,133,080 | ||
www.calvert.com CALVERT SOCIAL INVESTMENT FUND ANNUAL REPORT 55
| PRINCIPAL | |||||
| MUNICIPAL OBLIGATIONS - CONT’D | AMOUNT | VALUE | |||
| New York State Dormitory Authority Revenue Bonds, 5.289%, | |||||
| 3/15/33 | $ | 500,000 | $ | 534,685 | |
| New York State HFA Revenue VRDN, 0.25%, 5/15/37 (r)† | 800,000 | 800,000 | |||
| Utah GO Bonds, 3.539%, 7/1/25 | 600,000 | 600,888 | |||
| Total Municipal Obligations (Cost $6,674,613) | 6,312,747 | ||||
| HIGH SOCIAL IMPACT INVESTMENTS - 0.7% | |||||
| Calvert Social Investment Foundation Notes, 0.50%, 7/1/14 (b)(i)(r) | 4,266,666 | 4,167,253 | |||
| Total High Social Impact Investments (Cost $4,266,666) | 4,167,253 | ||||
| U.S. TREASURY OBLIGATIONS - 0.9% | |||||
| United States Treasury Bonds, 2.875%, 5/15/43 | 2,295,000 | 1,947,881 | |||
| United States Treasury Notes: | |||||
| 1.375%, 9/30/18 | 2,400,000 | 2,411,251 | |||
| 2.00%, 9/30/20 | 195,000 | 194,848 | |||
| 2.50%, 8/15/23 | 975,000 | 965,098 | |||
| Total U.S. Treasury Obligations (Cost $5,594,237) | 5,519,078 | ||||
| SOVEREIGN GOVERNMENT BONDS - 0.4% | |||||
| Province of Ontario Canada: | |||||
| 1.65%, 9/27/19 | 715,000 | 688,188 | |||
| 2.45%, 6/29/22 | 1,440,000 | 1,349,074 | |||
| Province of Quebec Canada, 2.625%, 2/13/23 | 380,000 | 353,514 | |||
| Total Sovereign Government Bonds (Cost $2,526,880) | 2,390,776 | ||||
| TIME DEPOSIT - 8.9% | |||||
| State Street Bank Time Deposit, 0.083%, 10/1/13 | 51,555,691 | 51,555,691 | |||
| Total Time Deposit (Cost $51,555,691) | 51,555,691 | ||||
| TOTAL INVESTMENTS (Cost $503,068,942) - 100.7% | 580,595,512 | ||||
| Other assets and liabilities, net - (0.7%) | (4,249,409 | ) | |||
| NET ASSETS - 100% | $ | 576,346,103 | |||
| UNDERLYING | UNREALIZED | ||||
| NUMBER OF | EXPIRATION | FACEAMOUNT | APPRECIATION | ||
| FUTURES | CONTRACTS | DATE | AT VALUE | (DEPRECIATION) | |
| Purchased: | |||||
| 5 Year U.S. Treasury Notes | 49 | 12/13 | $5,931,297 | $32,087 | |
| Sold: | |||||
| 2 Year U.S. Treasury Notes | 22 | 12/13 | $4,845,844 | ($13,090 | ) |
See notes to schedule of investments and notes to financial statements.
56 www.calvert.com CALVERT SOCIAL INVESTMENT FUND ANNUAL REPORT
| BOND PORTFOLIO | ||||
| SCHEDULE OF INVESTMENTS | ||||
| SEPTEMBER 30, 2013 | ||||
| PRINCIPAL | ||||
| ASSET-BACKED SECURITIES - 2.5% | AMOUNT | VALUE | ||
| American Credit Acceptance Receivables Trust: | ||||
| 1.64%, 11/15/16 (e) | $ | 1,057,168 | $ | 1,056,317 |
| 2.84%, 5/15/19 (e) | 1,965,000 | 1,968,773 | ||
| Flagship Rail Services LLC, 3.08%, 4/15/43 (e) | 5,128,677 | 5,058,025 | ||
| MVW Owner Trust, 2.15%, 4/22/30 (e) | 1,614,472 | 1,615,269 | ||
| Santander Consumer Acquired Receivables Trust, 2.01%, 8/15/16 (e) | 3,617,772 | 3,627,417 | ||
| Santander Drive Auto Receivables Trust, 1.94%, 3/15/18 | 1,450,000 | 1,439,508 | ||
| SVO VOI Mortgage Corp., 2.00%, 9/20/29 (e) | 2,921,642 | 2,907,221 | ||
| Total Asset-Backed Securities (Cost $17,760,784) | 17,672,530 | |||
| COLLATERALIZED MORTGAGE-BACKED | ||||
| OBLIGATIONS (PRIVATELY ORIGINATED) - 0.2% | ||||
| Springleaf Mortgage Loan Trust, 1.57%, 12/25/59 (e)(r) | 1,480,239 | 1,465,904 | ||
| Total Collateralized Mortgage-Backed Obligations | ||||
| (Privately Originated) (Cost $1,480,048) | 1,465,904 | |||
| COMMERCIAL MORTGAGE-BACKED SECURITIES - 5.1% | ||||
| BBCMS Trust, 3.756%, 9/5/32 (e) | 1,660,000 | 1,730,605 | ||
| BWAY Mortgage Trust, 2.809%, 3/10/33 (e) | 3,635,000 | 3,506,703 | ||
| COMM Mortgage Trust, 4.539%, 8/10/30 (e)(r) | 2,000,000 | 2,037,602 | ||
| Commercial Mortgage Pass Through Certificates: | ||||
| 3.424%, 3/10/31 (e) | 2,970,000 | 2,856,977 | ||
| 4.557%, 8/10/46 (e) | 2,000,000 | 2,084,380 | ||
| Extended Stay America Trust: | ||||
| 2.958%, 12/5/31 (e) | 1,835,000 | 1,793,241 | ||
| 3.604%, 12/5/31 (e) | 3,270,000 | 3,197,870 | ||
| GS Mortgage Securities Corp. II, 3.007%, 12/10/30 (e) | 2,985,000 | 2,732,997 | ||
| GS Mortgage Securities Trust, 4.507%, 8/10/46 | 665,000 | 687,172 | ||
| JP Morgan Chase Commercial Mortgage Securities Trust: | ||||
| 0.962%, 4/15/30 (e)(r) | 5,000,000 | 4,949,135 | ||
| 1.332%, 4/15/30 (e)(r) | 2,000,000 | 1,990,606 | ||
| ORES NPL LLC, 3.081%, 9/25/25 (e) | 1,489,815 | 1,489,952 | ||
| Queens Center Mortgage Trust, 3.59%, 1/11/37 (e)(r) | 3,700,000 | 3,242,994 | ||
UBS-Barclays Commercial Mortgage Trust, 3.317%, 12/10/45 (e) | 2,690,000 | 2,530,287 | ||
| VFC LLC, 3.13%, 3/20/26 (e) | 1,700,000 | 1,700,143 | ||
| Total Commercial Mortgage-Backed Securities (Cost $37,897,028) | 36,530,664 | |||
| CORPORATE BONDS - 75.0% | ||||
| Agilent Technologies, Inc., 3.20%, 10/1/22 | 2,000,000 | 1,856,122 | ||
| Allergan, Inc.: | ||||
| 1.35%, 3/15/18 | 500,000 | 487,488 | ||
| 2.80%, 3/15/23 | 1,000,000 | 943,519 | ||
www.calvert.com CALVERT SOCIAL INVESTMENT FUND ANNUAL REPORT 57
| PRINCIPAL | ||||
| CORPORATE BONDS - CONT’D | AMOUNT | VALUE | ||
| Alliance Mortgage Investments, Inc.: | ||||
| 12.61%, 6/1/10 (b)(r)(x)* | $ | 481,681 | $ | — |
| 15.36%, 12/1/10 (b)(r)(x)* | 207,840 | — | ||
| Altera Corp., 1.75%, 5/15/17 | 2,000,000 | 1,983,342 | ||
| Amazon.com, Inc.: | ||||
| 1.20%, 11/29/17 | 2,000,000 | 1,953,752 | ||
| 2.50%, 11/29/22 | 4,000,000 | 3,645,428 | ||
| America Movil SAB de CV: | ||||
| 2.375%, 9/8/16 | 2,000,000 | 2,033,600 | ||
| 1.256%, 9/12/16 (r) | 1,500,000 | 1,500,004 | ||
| 4.375%, 7/16/42 | 1,000,000 | 819,412 | ||
| American Honda Finance Corp.: | ||||
| 2.125%, 2/28/17 (e) | 3,000,000 | 3,038,067 | ||
| 1.60%, 2/16/18 (e) | 1,200,000 | 1,180,518 | ||
| American National Red Cross, 5.567%, 11/15/17 | 1,500,000 | 1,564,830 | ||
| American Tower Corp.: | ||||
| 3.40%, 2/15/19 | 1,200,000 | 1,186,067 | ||
| 5.90%, 11/1/21 | 3,700,000 | 3,902,005 | ||
| 4.70%, 3/15/22 | 1,500,000 | 1,457,458 | ||
| Amgen, Inc.: | ||||
| 2.50%, 11/15/16 | 1,000,000 | 1,037,966 | ||
| 5.15%, 11/15/41 | 900,000 | 873,680 | ||
| Apple, Inc.: | ||||
| 2.40%, 5/3/23 | 1,900,000 | 1,719,844 | ||
| 3.85%, 5/4/43 | 2,000,000 | 1,675,906 | ||
| AT&T, Inc.: | ||||
| 1.60%, 2/15/17 | 1,500,000 | 1,503,442 | ||
| 3.00%, 2/15/22 | 4,000,000 | 3,751,204 | ||
| 5.55%, 8/15/41 | 3,000,000 | 2,977,935 | ||
| Bank of America Corp.: | ||||
| 5.25%, 12/1/15 | 1,500,000 | 1,613,328 | ||
| 0.594%, 8/15/16 (r) | 3,000,000 | 2,905,449 | ||
| 2.00%, 1/11/18 | 1,800,000 | 1,770,212 | ||
| 3.30%, 1/11/23 | 4,200,000 | 3,934,392 | ||
| 4.10%, 7/24/23 | 3,600,000 | 3,577,626 | ||
| Bank of America NA, 5.30%, 3/15/17 | �� | 11,400,000 | 12,563,951 | |
| Bank of Montreal, 2.625%, 1/25/16 (e) | 4,930,000 | 5,144,455 | ||
| Bank of New York Mellon Corp.: | ||||
| 1.70%, 11/24/14 | 2,000,000 | 2,027,424 | ||
| 2.40%, 1/17/17 | 2,000,000 | 2,060,002 | ||
| Bank of Nova Scotia, 1.85%, 1/12/15 | 1,800,000 | 1,831,428 | ||
| BB&T Corp., 1.60%, 8/15/17 | 2,000,000 | 1,985,880 | ||
| Becton Dickinson and Co., 3.125%, 11/8/21 | 1,475,000 | 1,462,224 | ||
| Boston Properties LP, 3.80%, 2/1/24 | 2,000,000 | 1,922,414 | ||
| Caisse Centrale Desjardins, 2.55%, 3/24/16 (e) | 2,000,000 | 2,083,400 | ||
| Canadian National Railway Co.: | ||||
| 1.45%, 12/15/16 | 1,725,000 | 1,740,996 | ||
| 2.85%, 12/15/21 | 750,000 | 732,386 | ||
| Capital One Bank, 3.375%, 2/15/23 | 4,000,000 | 3,741,392 | ||
| Capital One Financial Corp.: | ||||
| 2.15%, 3/23/15 | 2,000,000 | 2,032,212 | ||
| 1.00%, 11/6/15 | 1,500,000 | 1,492,444 |
58 www.calvert.com CALVERT SOCIAL INVESTMENT FUND ANNUAL REPORT
| PRINCIPAL | ||||
| CORPORATE BONDS - CONT’D | AMOUNT | VALUE | ||
| CBS Corp., 3.375%, 3/1/22 | $ | 2,000,000 | $ | 1,910,416 |
| CC Holdings GS V LLC / Crown Castle GS III Corp., | ||||
| 3.849%, 4/15/23 | 1,000,000 | 901,731 | ||
| CenturyLink, Inc.: | ||||
| 5.80%, 3/15/22 | 4,250,000 | 3,995,000 | ||
| 7.65%, 3/15/42 | 3,000,000 | 2,670,000 | ||
| CIT Group, Inc.: | ||||
| 4.75%, 2/15/15 (e) | 1,000,000 | 1,035,000 | ||
| 5.25%, 3/15/18 | 1,750,000 | 1,833,125 | ||
| 5.00%, 8/1/23 | 3,850,000 | 3,727,454 | ||
| Citigroup, Inc.: | ||||
| 4.45%, 1/10/17 | 3,400,000 | 3,681,411 | ||
| 2.50%, 9/26/18 | 2,200,000 | 2,187,781 | ||
| 3.50%, 5/15/23 | 3,600,000 | 3,248,629 | ||
| 5.50%, 9/13/25 | 1,400,000 | 1,439,834 | ||
| Colgate-Palmolive Co., 1.30%, 1/15/17 | 1,000,000 | 1,007,086 | ||
| Consolidated Edison Company of New York, Inc., 4.45%, 6/15/20 | 1,675,000 | 1,841,936 | ||
| Corning, Inc., 1.45%, 11/15/17 | 1,200,000 | 1,186,244 | ||
| Costco Wholesale Corp., 1.70%, 12/15/19 | 4,000,000 | 3,866,612 | ||
| COX Communications, Inc., 3.25%, 12/15/22 (e) | 2,000,000 | 1,776,026 | ||
| Crown Castle Towers LLC: | ||||
| 5.495%, 1/15/37 (e) | 3,000,000 | 3,264,195 | ||
| 4.883%, 8/15/40 (e) | 3,000,000 | 3,183,507 | ||
| Cummins, Inc.: | ||||
| 3.65%, 10/1/23 | 1,000,000 | 1,006,777 | ||
| 4.875%, 10/1/43 | 2,200,000 | 2,235,642 | ||
| CVS Pass-Through Trust: | ||||
| 5.789%, 1/10/26 (e) | 700,028 | 759,531 | ||
| 6.036%, 12/10/28 | 2,450,893 | 2,701,004 | ||
| 6.943%, 1/10/30 | 1,299,401 | 1,511,459 | ||
| DDR Corp., 4.75%, 4/15/18 | 3,000,000 | 3,238,170 | ||
| Deere & Co., 2.60%, 6/8/22 | 1,800,000 | 1,698,053 | ||
| Delta Air Lines Pass Through Trust, 6.75%, 5/23/17 | 1,500,000 | 1,575,000 | ||
| Deutsche Telekom International Finance BV, 4.875%, 3/6/42 (e) | 1,300,000 | 1,224,371 | ||
| Discover Bank, 8.70%, 11/18/19 | 948,000 | 1,199,074 | ||
| Discover Financial Services, 3.85%, 11/21/22 | 2,435,000 | 2,323,190 | ||
| Discovery Communications LLC: | ||||
| 3.30%, 5/15/22 | 3,300,000 | 3,159,163 | ||
| 3.25%, 4/1/23 | 500,000 | 470,343 | ||
| 4.875%, 4/1/43 | 2,800,000 | 2,583,571 | ||
| Dr Pepper Snapple Group, Inc.: | ||||
| 2.00%, 1/15/20 | 1,000,000 | 944,908 | ||
| 3.20%, 11/15/21 | 1,000,000 | 978,436 | ||
| 2.70%, 11/15/22 | 1,000,000 | 927,071 | ||
| Dun & Bradstreet Corp., 3.25%, 12/1/17 | 1,750,000 | 1,764,926 | ||
| Eaton Corp.: | ||||
| 2.75%, 11/2/22 (e) | 1,400,000 | 1,304,649 | ||
| 4.00%, 11/2/32 (e) | 500,000 | 459,648 | ||
| 4.15%, 11/2/42 (e) | 500,000 | 444,167 | ||
| eBay, Inc., 2.60%, 7/15/22 | 1,200,000 | 1,115,688 | ||
| Ecolab, Inc.: | ||||
| 4.35%, 12/8/21 | 2,000,000 | 2,107,238 | ||
| 5.50%, 12/8/41 | 1,000,000 | 1,073,170 |
www.calvert.com CALVERT SOCIAL INVESTMENT FUND ANNUAL REPORT 59
| PRINCIPAL | ||||
| CORPORATE BONDS - CONT’D | AMOUNT | VALUE | ||
| Enterprise Products Operating LLC: | ||||
| 4.85%, 8/15/42 | $ | 1,300,000 | $ | 1,219,045 |
| 7.034% to 1/15/18, floating rate thereafter to 1/15/68 (r) | 10,005,000 | 11,130,563 | ||
| EOG Resources, Inc., 2.625%, 3/15/23 | 1,000,000 | 921,166 | ||
| ERP Operating LP, 4.625%, 12/15/21 | 1,300,000 | 1,372,322 | ||
| Excalibur One 77B LLC, 1.492%, 1/1/25 | 852,534 | 811,130 | ||
| Experian Finance plc, 2.375%, 6/15/17 (e) | 1,000,000 | 992,456 | ||
| Express Scripts Holding Co.: | ||||
| 2.75%, 11/21/14 | 800,000 | 817,335 | ||
| 2.65%, 2/15/17 | 1,500,000 | 1,546,440 | ||
| 3.90%, 2/15/22 | 1,500,000 | 1,519,506 | ||
| FedEx Corp.: | ||||
| 2.70%, 4/15/23 | 1,000,000 | 917,446 | ||
| 4.10%, 4/15/43 | 1,000,000 | 865,734 | ||
| Fidelity National Information Services, Inc.: | ||||
| 2.00%, 4/15/18 | 2,000,000 | 1,948,182 | ||
| 3.50%, 4/15/23 | 2,000,000 | 1,799,054 | ||
| Fifth Third Bancorp, 0.672%, 12/20/16 (r) | 4,000,000 | 3,928,788 | ||
| First Niagara Financial Group, Inc., 6.75%, 3/19/20 | 1,000,000 | 1,159,068 | ||
| FMC Technologies, Inc.: | ||||
| 2.00%, 10/1/17 | 1,000,000 | 989,004 | ||
| 3.45%, 10/1/22 | 1,000,000 | 958,994 | ||
| Ford Motor Credit Co. LLC: | ||||
| 2.75%, 5/15/15 | 1,000,000 | 1,022,878 | ||
| 4.207%, 4/15/16 | 4,750,000 | 5,033,832 | ||
| 3.984%, 6/15/16 | 3,150,000 | 3,328,410 | ||
| 4.25%, 2/3/17 | 2,000,000 | 2,137,044 | ||
| 5.875%, 8/2/21 | 2,400,000 | 2,667,907 | ||
| Gilead Sciences, Inc.: | ||||
| 4.40%, 12/1/21 | 3,000,000 | 3,213,600 | ||
| 5.65%, 12/1/41 | 1,000,000 | 1,106,075 | ||
| GlaxoSmithKline Capital plc, 2.85%, 5/8/22 | 1,000,000 | 959,478 | ||
| GlaxoSmithKline Capital, Inc.: | ||||
| 2.80%, 3/18/23 | 1,000,000 | 944,252 | ||
| 4.20%, 3/18/43 | 1,000,000 | 929,415 | ||
| Goldman Sachs Group, Inc.: | ||||
| 6.15%, 4/1/18 | 10,225,000 | 11,694,844 | ||
| 5.75%, 1/24/22 | 2,500,000 | 2,771,608 | ||
| 3.625%, 1/22/23 | 2,200,000 | 2,103,768 | ||
| Great River Energy, 5.829%, 7/1/17 (e) | 1,428,419 | 1,527,465 | ||
| Grupo Bimbo SAB de CV, 4.50%, 1/25/22 (e) | 1,000,000 | 1,002,196 | ||
| Harley-Davidson Financial Services, Inc.: | ||||
| 1.15%, 9/15/15 (e) | 2,000,000 | 2,002,898 | ||
| 2.70%, 3/15/17 (e) | 4,200,000 | 4,265,310 | ||
| Hartford Financial Services Group, Inc., 5.125%, 4/15/22 | 1,000,000 | 1,094,468 | ||
| HCP, Inc., 3.75%, 2/1/19 | 2,000,000 | 2,071,152 | ||
| Health Care REIT, Inc., 3.75%, 3/15/23 | 2,000,000 | 1,891,844 | ||
| Hershey Co., 1.50%, 11/1/16 | 2,640,000 | 2,665,946 | ||
| Hewlett-Packard Co., 0.661%, 5/30/14 (r) | 2,000,000 | 2,000,018 | ||
| Home Depot, Inc.: | ||||
| 2.70%, 4/1/23 | 3,000,000 | 2,815,140 | ||
| 4.20%, 4/1/43 | 2,000,000 | 1,814,070 |
60 www.calvert.com CALVERT SOCIAL INVESTMENT FUND ANNUAL REPORT
| PRINCIPAL | ||||
| CORPORATE BONDS - CONT’D | AMOUNT | VALUE | ||
| Host Hotels & Resorts LP, 3.75%, 10/15/23 | $ | 1,200,000 | $ | 1,110,775 |
| Howard Hughes Medical Institute, 3.50%, 9/1/23 | 3,700,000 | 3,691,353 | ||
| HSBC Holdings plc, 4.00%, 3/30/22 | 2,000,000 | 2,035,016 | ||
| Ingredion, Inc.: | ||||
| 1.80%, 9/25/17 | 2,000,000 | 1,971,970 | ||
| 4.625%, 11/1/20 | 1,525,000 | 1,615,286 | ||
| Intel Corp., 4.80%, 10/1/41 | 3,625,000 | 3,473,239 | ||
| International Business Machines Corp.: | ||||
| 0.875%, 10/31/14 | 5,000,000 | 5,032,200 | ||
| 2.90%, 11/1/21 | 2,000,000 | 1,962,140 | ||
| International Finance Corp., 0.50%, 5/16/16 | 1,000,000 | 994,768 | ||
| John Deere Capital Corp.: | ||||
| 2.00%, 1/13/17 | 1,500,000 | 1,535,054 | ||
| 2.75%, 3/15/22 | 2,000,000 | 1,912,696 | ||
| Johnson Controls, Inc., 5.00%, 3/30/20 | 750,000 | 822,246 | ||
| JPMorgan Chase & Co.: | ||||
| 1.166%, 1/25/18 (r) | 3,000,000 | 3,019,059 | ||
| 1.80%, 1/25/18 | 2,000,000 | 1,972,148 | ||
| 3.20%, 1/25/23 | 13,200,000 | 12,348,838 | ||
| 3.375%, 5/1/23 | 2,000,000 | 1,813,728 | ||
| Kansas City Southern de Mexico SA de CV, 8.00%, 2/1/18 | 2,000,000 | 2,137,500 | ||
| Kimberly-Clark Corp.: | ||||
| 2.40%, 6/1/23 | 1,200,000 | 1,113,400 | ||
| 3.70%, 6/1/43 | 1,200,000 | 1,048,590 | ||
| Kinder Morgan Energy Partners LP, 3.50%, 9/1/23 | 1,500,000 | 1,398,507 | ||
| Laboratory Corporation of America Holdings, 3.75%, 8/23/22 | 1,000,000 | 974,315 | ||
| Liberty Mutual Group, Inc., 4.25%, 6/15/23 (e) | 2,000,000 | 1,950,618 | ||
| LL & P Wind Energy, Inc. Washington Revenue Bonds, | ||||
| 6.192%, 12/1/27 (e) | 5,000,000 | 4,747,450 | ||
| Lowe’s Co.’s, Inc.: | ||||
| 3.12%, 4/15/22 | 1,000,000 | 974,532 | ||
| 3.875%, 9/15/23 | 1,500,000 | 1,519,137 | ||
| Markel Corp.: | ||||
| 3.625%, 3/30/23 | 1,000,000 | 950,301 | ||
| 5.00%, 3/30/43 | 1,000,000 | 931,301 | ||
| Masco Corp.: | ||||
| 4.80%, 6/15/15 | 2,000,000 | 2,090,000 | ||
| 5.85%, 3/15/17 | 2,000,000 | 2,165,000 | ||
| Mattel, Inc.: | ||||
| 1.70%, 3/15/18 | 1,300,000 | 1,276,402 | ||
| 3.15%, 3/15/23 | 2,200,000 | 2,092,842 | ||
| McDonald’s Corp., 3.625%, 5/1/43 | 1,500,000 | 1,290,474 | ||
| McKesson Corp.: | ||||
| 2.70%, 12/15/22 | 1,300,000 | 1,215,124 | ||
| 2.85%, 3/15/23 | 1,000,000 | 942,879 | ||
| Memorial Sloan-Kettering Cancer Center, 4.125%, 7/1/52 | 3,000,000 | 2,504,187 | ||
| Methanex Corp.: | ||||
| 3.25%, 12/15/19 | 1,000,000 | 982,876 | ||
| 5.25%, 3/1/22 | 3,450,000 | 3,578,675 | ||
| Microsoft Corp.: | ||||
| 2.125%, 11/15/22 | 1,200,000 | 1,091,773 | ||
| 3.50%, 11/15/42 | 1,200,000 | 970,843 |
www.calvert.com CALVERT SOCIAL INVESTMENT FUND ANNUAL REPORT 61
| PRINCIPAL | ||||
| CORPORATE BONDS - CONT’D | AMOUNT | VALUE | ||
| Morgan Stanley, 5.50%, 1/26/20 | $ | 3,500,000 | $ | 3,872,974 |
| Nationwide Health Properties, Inc., 6.90%, 10/1/37 | 2,300,000 | 2,631,469 | ||
| NetApp, Inc., 3.25%, 12/15/22 | 2,000,000 | 1,836,398 | ||
| New York Life Global Funding, 1.65%, 5/15/17 (e) | 1,500,000 | 1,496,868 | ||
| NII Capital Corp.: | ||||
| 10.00%, 8/15/16 | 2,000,000 | 1,920,000 | ||
| 7.625%, 4/1/21 | 5,214,000 | 3,701,940 | ||
| NIKE, Inc.: | ||||
| 2.25%, 5/1/23 | 2,000,000 | 1,826,056 | ||
| 3.625%, 5/1/43 | 2,000,000 | 1,729,462 | ||
| Nissan Motor Acceptance Corp.: | ||||
| 1.95%, 9/12/17 (e) | 2,400,000 | 2,386,471 | ||
| 2.65%, 9/26/18 (e) | 2,000,000 | 2,005,604 | ||
| Noble Holding International Ltd., 5.25%, 3/15/42 | 3,000,000 | 2,731,857 | ||
| Nordstrom, Inc., 4.00%, 10/15/21 | 1,000,000 | 1,045,123 | ||
| Novartis Capital Corp.: | ||||
| 2.40%, 9/21/22 | 2,000,000 | 1,863,148 | ||
| 3.70%, 9/21/42 | 1,000,000 | 870,912 | ||
| NYU Hospitals Center, 4.428%, 7/1/42 | 1,800,000 | 1,484,192 | ||
| Penske Truck Leasing Co. LP / PTL Finance Corp., | ||||
| 4.25%, 1/17/23 (e) | 3,000,000 | 2,917,365 | ||
| PepsiCo, Inc.: | ||||
| 2.75%, 3/5/22 | 3,000,000 | 2,856,648 | ||
| 2.75%, 3/1/23 | 1,000,000 | 936,665 | ||
| Pioneer Natural Resources Co., 5.875%, 7/15/16 | 7,600,000 | 8,464,546 | ||
| PNC Bank NA: | ||||
| 2.70%, 11/1/22 | 4,000,000 | 3,645,352 | ||
| 3.80%, 7/25/23 | 1,000,000 | 978,513 | ||
| President and Fellows of Harvard College, 3.619%, 10/1/37 | 1,000,000 | 872,599 | ||
| ProLogis LP, 6.875%, 3/15/20 | 794,000 | 936,117 | ||
| Prudential Financial, Inc., 5.80%, 11/16/41 | 5,400,000 | 5,890,903 | ||
| Reliance Steel & Aluminum Co., 4.50%, 4/15/23 | 3,000,000 | 2,927,880 | ||
| Rogers Communications, Inc., 3.00%, 3/15/23 | 2,000,000 | 1,845,772 | ||
| Ryder System, Inc., 3.15%, 3/2/15 | 3,000,000 | 3,089,688 | ||
| Safeway, Inc., 1.756%, 12/12/13 (r) | 3,245,000 | 3,253,125 | ||
| Sanofi SA, 1.25%, 4/10/18 | 2,000,000 | 1,952,490 | ||
| SBA Tower Trust, 3.722%, 4/15/48 (e) | 4,150,000 | 3,920,903 | ||
| Simon Property Group LP: | ||||
| 6.125%, 5/30/18 | 1,200,000 | 1,407,437 | ||
| 4.125%, 12/1/21 | 1,000,000 | 1,040,247 | ||
| Spencer Spirit Holdings, Inc.: | ||||
| 11.00%, 5/1/17 (e) | 4,000,000 | 4,260,000 | ||
| 9.00%, 5/1/18 (e) | 4,000,000 | 3,900,000 | ||
| St. Jude Medical, Inc.: | ||||
| 2.50%, 1/15/16 | 3,040,000 | 3,123,594 | ||
| 4.75%, 4/15/43 | 1,200,000 | 1,139,401 | ||
| Standard Chartered plc, 3.95%, 1/11/23 (e) | 2,000,000 | 1,881,298 | ||
| State Street Corp., 3.10%, 5/15/23 | 1,500,000 | 1,399,082 | ||
| SunTrust Bank, 0.552%, 8/24/15 (r) | 1,000,000 | 989,566 | ||
| SunTrust Banks, Inc., 3.50%, 1/20/17 | 2,000,000 | 2,114,950 | ||
| TD Ameritrade Holding Corp., 5.60%, 12/1/19 | 2,000,000 | 2,328,378 |
62 www.calvert.com CALVERT SOCIAL INVESTMENT FUND ANNUAL REPORT
| PRINCIPAL | ||||
| CORPORATE BONDS - CONT’D | AMOUNT | VALUE | ||
| Telefonica Emisiones SAU: | ||||
| 3.992%, 2/16/16 | $ | 2,400,000 | $ | 2,486,102 |
| 3.192%, 4/27/18 | 2,000,000 | 1,973,380 | ||
| Texas Instruments, Inc., 1.65%, 8/3/19 | 2,000,000 | 1,931,564 | ||
| Thermo Fisher Scientific, Inc., 3.15%, 1/15/23 | 1,600,000 | 1,481,536 | ||
| Time Warner Cable, Inc.: | ||||
| 4.00%, 9/1/21 | 1,600,000 | 1,492,750 | ||
| 5.50%, 9/1/41 | 2,000,000 | 1,639,972 | ||
| Time Warner, Inc.: | ||||
| 4.00%, 1/15/22 | 1,770,000 | 1,788,943 | ||
| 5.375%, 10/15/41 | 2,650,000 | 2,643,497 | ||
| TJX Co.’s, Inc., 2.50%, 5/15/23 | 2,000,000 | 1,856,912 | ||
| Toronto-Dominion Bank, 2.375%, 10/19/16 | 1,900,000 | 1,965,162 | ||
| Total System Services, Inc., 3.75%, 6/1/23 | 2,000,000 | 1,851,172 | ||
| Toyota Motor Credit Corp.: | ||||
| 2.05%, 1/12/17 | 2,000,000 | 2,045,944 | ||
| 3.30%, 1/12/22 | 2,000,000 | 1,988,862 | ||
| Tyco Electronics Group SA: | ||||
| 1.60%, 2/3/15 | 1,000,000 | 1,007,463 | ||
| 3.50%, 2/3/22 | 1,000,000 | 960,208 | ||
| United Parcel Service, Inc.: | ||||
| 1.125%, 10/1/17 | 1,000,000 | 985,528 | ||
| 2.45%, 10/1/22 | 1,200,000 | 1,121,423 | ||
| US Bancorp, 2.95%, 7/15/22 | 1,200,000 | 1,128,920 | ||
| US Bank, 3.778% to 4/29/15, floating rate thereafter to 4/29/20 (r) | 9,000,000 | 9,381,159 | ||
| Ventas Realty LP / Ventas Capital Corp.: | ||||
| 4.00%, 4/30/19 | 2,000,000 | 2,097,818 | ||
| 4.25%, 3/1/22 | 3,000,000 | 3,029,469 | ||
| 3.25%, 8/15/22 | 1,000,000 | 934,164 | ||
| Viacom, Inc.: | ||||
| 3.50%, 4/1/17 | 2,000,000 | 2,104,254 | ||
| 3.875%, 12/15/21 | 1,000,000 | 990,100 | ||
| 4.50%, 2/27/42 | 1,500,000 | 1,251,458 | ||
| Volkswagen International Finance NV, 0.884%, 4/1/14 (e)(r) | 5,000,000 | 5,009,475 | ||
| Wachovia Bank NA, 0.584%, 3/15/16 (r) | 2,000,000 | 1,987,304 | ||
| Wachovia Capital Trust III, 5.57%, 12/31/49 (r) | 7,750,000 | 7,013,750 | ||
| Walgreen Co., 3.10%, 9/15/22 | 2,000,000 | 1,881,916 | ||
| Weingarten Realty Investors: | ||||
| 3.375%, 10/15/22 | 1,000,000 | 928,005 | ||
| 3.50%, 4/15/23 | 1,000,000 | 929,985 | ||
| Wells Fargo & Co., 3.45%, 2/13/23 | 1,000,000 | 935,963 | ||
| Western Union Co., 2.875%, 12/10/17 | 1,500,000 | 1,532,421 | ||
| Whirlpool Corp.: | ||||
| 3.70%, 3/1/23 | 2,000,000 | 1,935,382 | ||
| 5.15%, 3/1/43 | 1,000,000 | 958,779 | ||
| Willis Group Holdings plc, 4.125%, 3/15/16 | 1,500,000 | 1,575,320 | ||
| Wisconsin Public Service Corp., 3.671%, 12/1/42 | 2,000,000 | 1,749,200 | ||
| Yara International ASA, 7.875%, 6/11/19 (e) | 1,500,000 | 1,810,841 | ||
| Zoetis, Inc., 3.25%, 2/1/23 (e) | 1,000,000 | 952,015 | ||
| Total Corporate Bonds (Cost $534,587,670) | 531,304,642 | |||
www.calvert.com CALVERT SOCIAL INVESTMENT FUND ANNUAL REPORT 63
| PRINCIPAL | ||||
| MUNICIPAL OBLIGATIONS - 4.4% | AMOUNT | VALUE | ||
| Connecticut Special Tax Obligation Revenue Bonds, 5.459%, | ||||
| 11/1/30 | $ | 3,800,000 | $ | 4,072,992 |
| Georgetown University Washington DC Revenue Bonds, | ||||
| 7.22%, 4/1/19 | 2,990,000 | 3,514,087 | ||
| Maryland Transportation Authority Revenue Bonds, 5.604%, 7/1/30 | 3,000,000 | 3,242,790 | ||
| New Britain Connecticut GO Revenue VRDN, 0.25%, 2/1/26 (r)† | 3,400,000 | 3,400,000 | ||
| New York City Transitional Finance Authority Future | ||||
| Tax Secured Revenue Bonds, 5.767%, 8/1/36 | 3,540,000 | 4,011,103 | ||
| New York State MMC Corp. Revenue VRDN, 0.60%, 11/1/35 (r)† | 2,205,000 | 2,205,000 | ||
| Oakland California PO Revenue Bonds, Zero Coupon, 12/15/20 | 1,490,000 | 994,664 | ||
| Rural Electric Cooperative Grantor Trust KEPCO VRDN, | ||||
| 0.35%, 12/18/17 (r)† | 4,695,000 | 4,695,000 | ||
| Utah GO Bonds, 3.539%, 7/1/25 | 4,750,000 | 4,757,030 | ||
| Total Municipal Obligations (Cost $30,756,250) | 30,892,666 | |||
| FLOATING RATE LOANS(d) - 1.5% | ||||
| BJ’s Wholesale Club, Inc., 4.25%, 9/26/19 (r) | 1,990,000 | 1,987,264 | ||
| Dell, Inc., Bridge Term Loans: | ||||
| 2/28/20* | 3,692,300 | 3,673,838 | ||
| 2/26/21* | 2,307,700 | 2,296,162 | ||
| Dunkin’ Brands, Inc., 3.75%, 2/11/20 (r) | 1,983,774 | 1,976,831 | ||
| SUPERVALU, Inc., 5.00%, 3/21/19 (r) | 492,725 | 490,569 | ||
| Total Floating Rate Loans (Cost $10,461,844) | 10,424,664 | |||
| SOVEREIGN GOVERNMENT BONDS - 1.3% | ||||
| Province of Ontario Canada: | ||||
| 1.65%, 9/27/19 | 7,090,000 | 6,824,125 | ||
| 2.45%, 6/29/22 | 1,240,000 | 1,161,703 | ||
| Province of Quebec Canada, 2.625%, 2/13/23 | 1,525,000 | 1,418,707 | ||
| Total Sovereign Government Bonds (Cost $9,862,972) | 9,404,535 | |||
| U.S. GOVERNMENT AGENCIES AND INSTRUMENTALITIES - 1.4% | ||||
| Freddie Mac, 1.375%, 5/1/20 | 6,000,000 | 5,710,404 | ||
| Private Export Funding Corp., 2.125%, 7/15/16 | 4,000,000 | 4,158,132 | ||
| Total U.S. Government Agencies and Instrumentalities | ||||
| (Cost $9,965,243) | 9,868,536 | |||
| U.S. TREASURY OBLIGATIONS - 6.9% | ||||
| United States Treasury Bonds, 2.875%, 5/15/43 | 14,210,000 | 12,060,737 | ||
| United States Treasury Notes: | ||||
| 0.25%, 9/30/15 | 9,545,000 | 9,531,580 | ||
| 1.375%, 9/30/18 | 19,570,000 | 19,661,744 | ||
| 2.00%, 9/30/20 | 7,560,000 | 7,554,096 | ||
| Total U.S. Treasury Obligations (Cost $49,021,469) | 48,808,157 | |||
64 www.calvert.com CALVERT SOCIAL INVESTMENT FUND ANNUAL REPORT
| PRINCIPAL | ||||
| HIGH SOCIAL IMPACT INVESTMENTS - 0.4% | AMOUNT | VALUE | ||
| Calvert Social Investment Foundation Notes, 0.50%, 1/1/14 (b)(i)(r) | $ | 3,087,392 | $ | 3,054,388 |
| Total High Social Impact Investments (Cost $3,087,392) | 3,054,388 | |||
| TIME DEPOSIT - 0.7% | ||||
| State Street Bank Time Deposit, 0.083%, 10/1/13 | 5,334,909 | 5,334,909 | ||
| Total Time Deposit (Cost $5,334,909) | 5,334,909 | |||
| EQUITY SECURITIES - 0.2% | SHARES | |||
| Woodbourne Capital: | ||||
| Trust I, Preferred (b)(e) | 625,000 | 322,875 | ||
| Trust II, Preferred (b)(e) | 625,000 | 322,875 | ||
| Trust III, Preferred (b)(e) | 625,000 | 322,875 | ||
| Trust IV, Preferred (b)(e) | 625,000 | 322,875 | ||
| Total Equity Securities (Cost $2,500,000) | 1,291,500 | |||
| TOTAL INVESTMENTS (Cost $712,715,609) - 99.6% | 706,053,095 | |||
| Other assets and liabilities, net - 0.4% | 2,584,034 | |||
| NET ASSETS - 100% | $ | 708,637,129 | ||
| UNDERLYING | UNREALIZED | ||||
| NUMBER OF | EXPIRATION | FACEAMOUNT | APPRECIATION | ||
| FUTURES | CONTRACTS | DATE | AT VALUE | (DEPRECIATION) | |
| Purchased: | |||||
| 5 Year U.S. Treasury Notes | 140 | 12/13 | $16,946,563 | $53,489 | |
| Sold: | |||||
| 2 Year U.S. Treasury Notes | 84 | 12/13 | $18,502,313 | ($51,293 | ) |
| 10 Year U.S. Treasury Notes | 186 | 12/13 | 23,508,656 | (313,451 | ) |
| Total Sold | ($364,744 | ) |
See notes to schedule of investments and notes to financial statements.
www.calvert.com CALVERT SOCIAL INVESTMENT FUND ANNUAL REPORT 65
| EQUITY PORTFOLIO | |||
| SCHEDULE OF INVESTMENTS | |||
| SEPTEMBER 30, 2013 | |||
| EQUITY SECURITIES - 98.2% | SHARES | VALUE | |
| Aerospace & Defense - 1.7% | |||
| B/E Aerospace, Inc.* | 639,873 | $ | 47,235,425 |
| Beverages - 4.4% | |||
| PepsiCo, Inc. | 405,420 | 32,230,890 | |
| The Coca-Cola Co. | 2,333,110 | 88,378,207 | |
| 120,609,097 | |||
| Biotechnology - 2.8% | |||
| Gilead Sciences, Inc.* | 1,212,966 | 76,222,783 | |
| Capital Markets - 1.6% | |||
| T. Rowe Price Group, Inc. | 610,003 | 43,877,516 | |
| Chemicals - 2.6% | |||
| Ecolab, Inc. | 729,185 | 72,014,311 | |
| Commercial Banks - 3.4% | |||
| SunTrust Banks, Inc. | 1,158,668 | 37,564,017 | |
| Wells Fargo & Co | 1,345,383 | 55,591,225 | |
| 93,155,242 | |||
| Communications Equipment - 5.0% | |||
| Juniper Networks, Inc.* | 1,713,776 | 34,035,592 | |
| QUALCOMM, Inc | 1,505,373 | 101,401,925 | |
| 135,437,517 | |||
| Computers & Peripherals - 3.7% | |||
| Apple, Inc. (t) | 212,963 | 101,530,110 | |
| Consumer Finance - 2.5% | |||
| American Express Co. | 914,731 | 69,080,485 | |
| Diversified Financial Services - 2.5% | |||
| IntercontinentalExchange, Inc.* | 375,409 | 68,106,701 | |
| Electrical Equipment - 1.6% | |||
| Eaton Corp. plc | 429,792 | 29,586,881 | |
| Rockwell Automation, Inc | 137,559 | 14,710,560 | |
| 44,297,441 | |||
| Energy Equipment & Services - 4.8% | |||
| Cameron International Corp.* | 1,353,948 | 79,029,945 | |
| Noble Corp. | 1,371,693 | 51,808,844 | |
| 130,838,789 | |||
66 www.calvert.com CALVERT SOCIAL INVESTMENT FUND ANNUAL REPORT
| EQUITY SECURITIES - CONT’D | SHARES | VALUE | |
| Food & Staples Retailing - 7.0% | |||
| Costco Wholesale Corp. | 666,087 | $ | 76,679,936 |
| CVS Caremark Corp | 1,987,199 | 112,773,543 | |
| 189,453,479 | |||
| Health Care Equipment & Supplies - 1.0% | |||
| Varian Medical Systems, Inc.* | 376,970 | 28,170,968 | |
| Health Care Providers & Services - 4.9% | |||
| CIGNA Corp | 655,451 | 50,377,964 | |
| DaVita HealthCare Partners, Inc.* | 539,624 | 30,704,605 | |
| Express Scripts Holding Co.* | 830,488 | 51,307,549 | |
| 132,390,118 | |||
| Hotels, Restaurants & Leisure - 5.6% | |||
| McDonald’s Corp | 655,354 | 63,051,608 | |
| Panera Bread Co.* | 121,130 | 19,202,739 | |
| Starbucks Corp | 893,120 | 68,743,447 | |
| 150,997,794 | |||
| Industrial Conglomerates - 4.1% | |||
| 3M Co. | 348,899 | 41,662,029 | |
| Danaher Corp. | 1,011,187 | 70,095,483 | |
| 111,757,512 | |||
| Insurance - 1.9% | |||
| Aon plc | 680,429 | 50,651,135 | |
| Internet & Catalog Retail - 3.8% | |||
| Amazon.com, Inc.* | 171,012 | 53,465,192 | |
| priceline.com, Inc.* | 49,576 | 50,118,857 | |
| 103,584,049 | |||
| Internet Software & Services - 5.9% | |||
| eBay, Inc.* | 998,716 | 55,718,366 | |
| Google, Inc.* | 120,911 | 105,907,154 | |
| 161,625,520 | |||
| IT Services - 2.7% | |||
| Alliance Data Systems Corp.* | 87,640 | 18,533,231 | |
| International Business Machines Corp. | 127,732 | 23,653,411 | |
| Visa, Inc. | 157,798 | 30,155,198 | |
| 72,341,840 | |||
| Media - 2.2% | |||
| The Walt Disney Co | 936,533 | 60,397,013 | |
| Multiline Retail - 1.0% | |||
| Nordstrom, Inc. | 474,104 | 26,644,645 | |
www.calvert.com CALVERT SOCIAL INVESTMENT FUND ANNUAL REPORT 67
| EQUITY SECURITIES - CONT’D | SHARES | VALUE | |
| Pharmaceuticals - 5.5% | |||
| Allergan, Inc | 769,010 | $ | 69,556,955 |
| Novartis AG (ADR) | 379,357 | 29,100,475 | |
| Perrigo Co. | 405,597 | 50,042,558 | |
| 148,699,988 | |||
| Semiconductors & Semiconductor Equipment - 1.4% | |||
| Texas Instruments, Inc. | 912,715 | 36,755,033 | |
| Software - 5.5% | |||
| Informatica Corp.* | 773,048 | 30,125,681 | |
| Microsoft Corp. | 2,674,595 | 89,090,759 | |
| VMware, Inc.* | 369,030 | 29,854,527 | |
| 149,070,967 | |||
| Specialty Retail - 5.1% | |||
| Bed Bath & Beyond, Inc.* | 527,184 | 40,782,954 | |
| Lowe’s Co.’s, Inc. | 1,340,650 | 63,828,346 | |
| Ross Stores, Inc. | 460,900 | 33,553,520 | |
| 138,164,820 | |||
| Textiles, Apparel & Luxury Goods - 2.0% | |||
| Michael Kors Holdings Ltd.* | 187,312 | 13,958,490 | |
| Nike, Inc., Class B | 553,873 | 40,233,335 | |
| 54,191,825 | |||
| Trading Companies & Distributors - 1.7% | |||
| Fastenal Co | 903,109 | 45,381,227 | |
| Venture Capital - 0.3% | |||
| 20/20 Gene Systems, Inc. (b)(i)* | 73,397 | 138,720 | |
| Better Energy Systems, Inc., Series B, Preferred (b)(i)* | 992,555 | — | |
| Chesapeake PERL, Inc., Series A-2, Preferred (b)(i)* | 240,000 | 1,695 | |
| Digital Directions International, Inc. (a)(b)(i)* | 354,389 | 91,942 | |
| Envisionier Medical Technologies, Inc., Warrants | |||
| (strike price $.50/share, expires 8/6/20) (b)(i)* | 50,000 | — | |
| Excent Corp. (b)(i)* | 600,745 | 250,000 | |
| Global Resource Options, Inc.: | |||
| Series A, Preferred (a)(b)(i)* | 750,000 | — | |
| Series B, Preferred (a)(b)(i)* | 244,371 | — | |
| Series C, Preferred (a)(b)(i)* | 297,823 | — | |
| Series D, Preferred (a)(b)(i)* | 228,138 | 967,350 | |
| Graduation Alliance, Inc.: | |||
| Series C, Preferred (b)(i)* | 3,225,598 | 500,000 | |
| Series C, Preferred Warrants | |||
| (strike price $0.16/share, expires 8/20/18) (b)(i)* | 625,721 | — | |
| Immunology Partners, Inc., Series C-1, Preferred (b)(i)* | 2,542,915 | 87,423 | |
| Ivy Capital (Proprietary) Ltd. (b)(i)* | 17 | 412,432 | |
| Marrone Bio Innovations, Inc.: | |||
| Series A, Preferred (b)(i)* | 240,761 | 1,119,399 | |
| Series B, Preferred (b)(i)* | 181,244 | 842,680 | |
| Series C, Preferred (b)(i)* | 295,157 | 1,372,309 | |
68 www.calvert.com CALVERT SOCIAL INVESTMENT FUND ANNUAL REPORT
| EQUITY SECURITIES - CONT’D | SHARES | VALUE | ||
| Venture Capital - Cont’d | ||||
| Napo Pharmaceuticals, Inc.: | ||||
| Common Stock (b)(i)* | 294,196 | $ | 117,531 | |
| Common Warrants | ||||
| (strike price $0.55/share, expires 9/15/14) (b)(i)* | 54,061 | — | ||
| New Day Farms, Inc., Series B, Preferred (a)(b)(i)* | 4,547,804 | — | ||
| Orteq Bioengineering Ltd., Preferred (b)(i)* | 74,910 | 935,583 | ||
| PresenceLearning, Inc.: | ||||
| Series A, Preferred (b)(i)* | 600,000 | 427,800 | ||
| Series A-2, Preferred (b)(i)* | 195,285 | 139,238 | ||
| Series B, Preferred (b)(i)* | 399,719 | 285,000 | ||
| Shangri La Farms, Series A, Preferred (a)(b)(i)* | 66,667 | 200,001 | ||
| Sword Diagnostics, Series B, Preferred (b)(i)* | 640,697 | — | ||
| Village Laundry Services, Inc. (b)(i)* | 9,444 | — | ||
| 7,889,103 | ||||
| Total Equity Securities (Cost $1,922,249,380) | 2,670,572,453 | |||
| VENTURE CAPITAL LIMITED | ADJUSTED | |||
| PARTNERSHIP INTEREST - 0.3% | BASIS | |||
| Adobe Capital Social Mezzanine (b)(i)* | $ | 81,815 | 60,542 | |
| Arborview Capital Partners (b)(i)* | 289,638 | 240,906 | ||
| Blackstone Cleantech Venture Partners (b)(i)* | 404,155 | 225,385 | ||
| China Environment Fund 2004 (b)(i)* | - | 263,732 | ||
| China Environment Fund III (b)(i)* | 983,226 | 1,024,915 | ||
| Coastal Ventures III (a)(b)(i)* | 200,000 | 173,513 | ||
| Core Innovations Capital I (b)(i)* | 499,272 | 388,118 | ||
| DBL Equity Fund - BAEF II (b)(i)* | 640,221 | 630,434 | ||
| First Analysis Private Equity Fund V (b)(i)* | 178,585 | 177,276 | ||
| Ignia Fund I (b)(i)* | 883,649 | 648,584 | ||
| Impact Ventures II (b)(i)* | 783,681 | 897,525 | ||
| LeapFrog Financial Inclusion Fund (b)(i)* | 677,730 | 569,310 | ||
| New Markets Education Partners (b)(i)* | 385,000 | 348,403 | ||
| New Markets Venture Partners II (b)(i)* | 281,119 | 331,680 | ||
| Renewable Energy Asia Fund (b)(i)* | 1,300,627 | 1,139,233 | ||
| SEAF India International Growth Fund (b)(i)* | 289,849 | 151,927 | ||
| SJF Ventures II (b)(i)* | 493,946 | 1,079,223 | ||
| SJF Ventures III (b)(i)* | 151,429 | 123,525 | ||
| Westly Capital Partners Fund II (b)(i)* | 398,331 | 326,906 | ||
| Total Venture Capital Limited Partnership Interest | ||||
| (Cost $8,922,274) | 8,801,137 | |||
| PRINCIPAL | ||||
| VENTURE CAPITAL DEBT OBLIGATIONS - 0.2% | AMOUNT | |||
| Envisionier Medical Technologies, Inc.: | ||||
| Note I, 7.00%, 1/15/13 (b)(i)(xx)* | 200,000 | — | ||
| Note II, 7.00%, 1/15/13 (b)(i)(xx)* | 100,000 | — | ||
| Excent Corp., Note, 7.00%, 9/30/19 (b)(i) | 250,000 | 250,000 | ||
| Marrone Bio Innovations, Inc., Note, 10.00%, 3/31/14 (b)(i) | 200,000 | 356,627 | ||
www.calvert.com CALVERT SOCIAL INVESTMENT FUND ANNUAL REPORT 69
| PRINCIPAL | ||||
| VENTURE CAPITAL DEBT OBLIGATIONS - CONT’D | AMOUNT | VALUE | ||
| New Day Farms, Inc., Participation Interest Note, 9.00%, | ||||
| 9/1/12 (a)(b)(i)(v) | $ | 6,225 | $ | — |
| One Earth Group Ltd.: | ||||
| Convertible Note, 5.00%, 12/31/14 (b)(i) | 100,000 | 100,000 | ||
| Convertible Note II, 5.00%, 5/31/15 (b)(i) | 200,000 | 200,000 | ||
| Orteq Bioengineering Ltd., Note, 12.00%, 7/31/17 (b)(i) | 131,225 | 212,296 | ||
| Quantum Intech, Inc., 11.50%, 9/10/15 (b)(i) | 107,147 | 107,146 | ||
| SEAF Global SME Facility: | ||||
| 9.00%, 12/16/14 (b)(i) | 1,500,000 | 1,500,000 | ||
| 9.00%, 4/20/15 (b)(i) | 1,000,000 | 1,000,000 | ||
| 9.00%, 11/5/15 (b)(i) | 1,000,000 | — | ||
| 9.00%, 3/29/16 (b)(i) | 450,000 | 450,000 | ||
| 9.00%, 6/14/16 (b)(i) | 400,000 | 300,000 | ||
| 9.00%, 7/13/16 (b)(i) | 650,000 | 650,000 | ||
| Sword Diagnostics: | ||||
| Convertible Bridge Note, Series C, 10.00%, 6/30/13 (b)(i)(zz)* | 25,000 | — | ||
| Convertible Bridge Note II, Series C, 10.00%, 6/30/13 (b)(i)(zz)* | 100,000 | — | ||
| Total Venture Capital Debt Obligations (Cost $6,489,992) | 5,126,069 | |||
| HIGH SOCIAL IMPACT INVESTMENTS - 0.4% | ||||
| Calvert Social Investment Foundation Notes, 0.50%, 1/1/14 (b)(i)(r) | 10,833,877 | 10,718,063 | ||
| Total High Social Impact Investments (Cost $10,833,877) | 10,718,063 | |||
| TIME DEPOSIT - 0.9% | ||||
| State Street Bank Time Deposit, 0.083%, 10/1/13 | 23,020,733 | 23,020,733 | ||
| Total Time Deposit (Cost $23,020,733) | 23,020,733 | |||
| TOTAL INVESTMENTS (Cost $1,971,516,256) - 100.0% | 2,718,238,455 | |||
| Other assets and liabilities, net - 0.0% | 120,891 | |||
| NET ASSETS - 100% | $ | 2,718,359,346 | ||
See notes to schedule of investments and notes to financial statements.
70 www.calvert.com CALVERT SOCIAL INVESTMENT FUND ANNUAL REPORT
| LARGE CAP CORE PORTFOLIO | |||
| SCHEDULE OF INVESTMENTS | |||
| SEPTEMBER 30, 2013 | |||
| EQUITY SECURITIES - 90.9% | SHARES | VALUE | |
| Air Freight & Logistics - 2.8% | |||
| FedEx Corp | 31,852 | $ | 3,634,632 |
| Automobiles - 4.2% | |||
| Toyota Motor Corp. (ADR) | 42,202 | 5,403,122 | |
| Beverages - 3.2% | |||
| The Coca-Cola Co. | 108,551 | 4,111,912 | |
| Biotechnology - 3.7% | |||
| Amgen, Inc. | 43,103 | 4,824,950 | |
| Capital Markets - 3.7% | |||
| Goldman Sachs Group, Inc. | 30,445 | 4,816,703 | |
| Commercial Banks - 6.1% | |||
| Barclays plc, Rights (b)* | 37,896 | 178,110 | |
| Barclays plc (ADR) | 151,583 | 2,582,974 | |
| Wells Fargo & Co | 122,171 | 5,048,106 | |
| 7,809,190 | |||
| Communications Equipment - 3.8% | |||
| Cisco Systems, Inc | 206,690 | 4,840,680 | |
| Computers & Peripherals - 2.7% | |||
| Apple, Inc. | 7,223 | 3,443,565 | |
| Consumer Finance - 0.6% | |||
| Capital One Financial Corp. | 11,140 | 765,764 | |
| Diversified Financial Services - 4.1% | |||
| JPMorgan Chase & Co. | 102,301 | 5,287,939 | |
| Diversified Telecommunication Services - 4.9% | |||
| AT&T, Inc. | 125,126 | 4,231,761 | |
| BT Group plc (ADR) | 37,913 | 2,096,589 | |
| 6,328,350 | |||
| Energy Equipment & Services - 0.8% | |||
| Dresser-Rand Group, Inc.* | 17,334 | 1,081,642 | |
| Food & Staples Retailing - 3.3% | |||
| CVS Caremark Corp | 75,907 | 4,307,722 | |
| Food Products - 4.4% | |||
| Campbell Soup Co | 53,108 | 2,162,027 | |
| General Mills, Inc. | 72,384 | 3,468,641 | |
| 5,630,668 | |||
www.calvert.com CALVERT SOCIAL INVESTMENT FUND ANNUAL REPORT 71
| EQUITY SECURITIES - CONT’D | SHARES | VALUE | |
| Health Care Equipment & Supplies - 3.5% | |||
| Medtronic, Inc. | 80,369 | $ | 4,279,649 |
| St. Jude Medical, Inc. | 4,736 | 254,039 | |
| 4,533,688 | |||
| Health Care Providers & Services - 2.3% | |||
| DaVita HealthCare Partners, Inc.* | 43,130 | 2,454,097 | |
| McKesson Corp. | 3,568 | 457,774 | |
| 2,911,871 | |||
| Industrial Conglomerates - 0.2% | |||
| Danaher Corp. | 4,360 | 302,235 | |
| Insurance - 3.0% | |||
| ACE Ltd | 37,153 | 3,476,035 | |
| Aflac, Inc | 5,613 | 347,950 | |
| 3,823,985 | |||
| Internet & Catalog Retail - 0.5% | |||
| Liberty Interactive Corp.* | 25,339 | 594,706 | |
| IT Services - 2.0% | |||
| Western Union Co. | 139,758 | 2,607,884 | |
| Machinery - 4.3% | |||
| Cummins, Inc. | 9,610 | 1,276,881 | |
| Dover Corp. | 46,813 | 4,205,212 | |
| 5,482,093 | |||
| Media - 10.4% | |||
| DIRECTV* | 6,711 | 400,982 | |
| Omnicom Group, Inc. | 51,681 | 3,278,643 | |
| Time Warner Cable, Inc. | 29,575 | 3,300,570 | |
| Time Warner, Inc. | 76,211 | 5,015,446 | |
| Viacom, Inc., Class B | 16,135 | 1,348,563 | |
| 13,344,204 | |||
| Multiline Retail - 2.7% | |||
| Target Corp | 55,089 | 3,524,594 | |
| Oil, Gas & Consumable Fuels - 4.1% | |||
| Denbury Resources, Inc.* | 199,233 | 3,667,880 | |
| QEP Resources, Inc | 56,215 | 1,556,593 | |
| 5,224,473 | |||
| Pharmaceuticals - 2.9% | |||
| Roche Holding AG (ADR) | 54,923 | 3,708,950 | |
| Software - 6.3% | |||
| CA, Inc. | 113,756 | 3,375,140 | |
| Symantec Corp | 188,509 | 4,665,598 | |
| 8,040,738 | |||
72 www.calvert.com CALVERT SOCIAL INVESTMENT FUND ANNUAL REPORT
| EQUITY SECURITIES - CONT’D | SHARES | VALUE | |||
| Wireless Telecommunication Services - 0.4% | |||||
| Rogers Communications, Inc., Class B | 12,936 | $ | 556,377 | ||
| Total Equity Securities (Cost $92,656,771) | 116,942,637 | ||||
| PRINCIPAL | |||||
| TIME DEPOSIT - 10.1% | AMOUNT | ||||
| State Street Bank Time Deposit, 0.083%, 10/1/13 | $ | 12,933,011 | 12,933,011 | ||
| Total Time Deposit (Cost $12,933,011) | 12,933,011 | ||||
| TOTAL INVESTMENTS (Cost $105,589,782) - 101.0% | 129,875,648 | ||||
| Other assets and liabilities, net - (1.0%) | (1,304,150 | ) | |||
| NET ASSETS - 100% | $ | 128,571,498 | |||
See notes to schedule of investments and notes to financial statements.
www.calvert.com CALVERT SOCIAL INVESTMENT FUND ANNUAL REPORT 73
NOTES TO SCHEDULES OF INVESTMENTS
(a) Affiliated company.
(b) This security was valued under the direction of the Board of Trustees. See Note A.
(d) Remaining maturities of floating rate loans may be less than the stated maturities shown as a result of contractual or optional prepayments by the borrower. Such prepayments cannot be predicted with certainty.
Floating rate loans generally pay interest at rates which are periodically re-determined at a margin above the London InterBank Offered Rate (LIBOR) or other short-term rates. The rate shown is the rate in effect at period end. Floating rate loans are generally considered restrictive in that the Fund is ordinarily contractually obligated to receive consent from the Agent Bank and/or Borrower prior to disposition of a floating rate loan.
(e) Security is exempt from registration under Rule 144A of the Securities Act of 1933. These securities may be resold in transactions exempt from registration, normally to qualified institutional buyers.
(i) Restricted securities represent 2.2% of the net assets for Balanced Portfolio, 0.4% for Bond Portfolio, and 1.2% for Equity Portfolio.
(r) The coupon rate shown on floating or adjustable rate securities represents the rate at period end.
(s) 4,000 shares of AGL Resources, Inc. held by the Balanced Portfolio have been soft segregated in order to cover outstanding commitments to certain limited partnership investments within the Portfolio. There are no restrictions on the trading of this security.
(t) 40,000 shares of Apple Inc. held by the Equity Portfolio have been soft segregated in order to cover outstanding commitments to certain limited partnership investments within the Portfolio. There are no restrictions on the trading of this security.
(v) Security is in default for principal and interest.
(x) Alliance Bancorp and its affiliates filed for Chapter 7 bankruptcy on July 13, 2007. This security is no longer accruing interest.
(xx) Restructured from an original maturity date of September 15, 2010. Security is currently in default and no longer accruing interest.
(zz) Restructured from an original maturity date of September 30, 2010. This security is no longer accruing interest.
† The date shown for securities represents the date when principal payments must be paid. Most securities have maturity shortening features that function as put options.
* Non-income producing security.
Abbreviations:
ADR: American Depositary Receipts
GO: General Obligation
LLC: Limited Liability Corporation
LO: Limited Obligation
LP: Limited Partnership
plc: Public Limited Company
PO: Pension Obligation
REIT: Real Estate Investment Trust
VRDN: Variable Rate Demand Notes
74 www.calvert.com CALVERT SOCIAL INVESTMENT FUND ANNUAL REPORT
| BALANCED PORTFOLIO | |||
| RESTRICTED SECURITIES | ACQUISITION DATES | COST | |
| Agraquest, Inc., Contingent Deferred Distribution | 8/14/12 | $ | — |
| BiddingForGood, Inc., Common | 6/30/03 | 9,141 | |
| Calvert Social Investment Foundation Notes, 0.50%, | |||
| 7/1/14 | 7/1/10 | 4,266,666 | |
| CFBanc Corp. | 3/14/03 | 270,000 | |
| Coastal Venture Partners LP | 6/7/96 - 6/22/00 | 57,944 | |
| Commons Capital LP | 2/15/01 - 12/27/11 | 335,000 | |
| Consensus Orthopedics, Inc.: | |||
| Common Stock | 2/10/06 | 504,331 | |
| Series A-1, Preferred | 8/19/05 | 4,331 | |
| Series B, Preferred | 2/10/06 | 139,576 | |
| Series C, Preferred | 2/10/06 | 120,342 | |
| Environmental Private Equity Fund II, | |||
| Liquidating Trust LP | 4/26/07 | — | |
| First Analysis Private Equity Fund IV LP | 2/25/02 - 7/6/11 | 225,317 | |
| GEEMF Partners LP | 2/28/97 | — | |
| Global Environment Emerging Markets Fund LP | 1/14/94 - 12/1/95 | — | |
| Infrastructure and Environmental Private | |||
| Equity Fund III LP | 4/16/97 - 2/12/01 | 72,089 | |
| Kickboard: | |||
| Common | 5/23/13 | — | |
| Series A, Preferred | 2/12/13 | 285,329 | |
| Labrador Ventures III LP | 8/11/98 - 4/2/01 | 360,875 | |
| Labrador Ventures IV LP | 12/14/99 - 8/27/07 | 900,510 | |
| LearnZillion, Inc.: | |||
| Series A, Preferred | 3/27/12 | 100,000 | |
| Series A-1, Preferred | 4/23/13 | 134,761 | |
| Lumni, Inc., Series B, Preferred | 8/8/13 | 116,367 | |
| MACH Energy: | |||
| Common | 10/31/08 | 889 | |
| Series A, Preferred | 5/31/02 | 11,426 | |
| Series B, Preferred | 12/20/05 | 20,447 | |
| Mobius Technologies, Inc.: | |||
| Common | 12/11/12 | 99 | |
| Series A-1, Preferred | 10/18/02 | 9,158 | |
| Series A-4, Preferred | 5/26/06 | 795 | |
| Neighborhood Bancorp | 6/25/97 | 100,000 | |
| New Markets Growth Fund LLC, LP | 1/8/03 - 7/18/07 | 225,646 | |
| Rose Smart Growth Investment Fund I LP, | |||
| 6.545%, 4/1/21 | 4/10/06 | 1,000,000 | |
| Seventh Generation, Inc. | 4/12/00 - 5/6/03 | 230,500 | |
| Solstice Capital LP | 6/26/01 - 6/17/08 | 173,114 | |
| Wild Planet Entertainment, Inc.: | |||
| Series B, Preferred | 7/12/94 | 188,609 | |
| Series E, Preferred | 4/9/98 | 170,432 | |
| Wind Harvest Co., Inc | 5/16/94 | 100,000 | |
| BOND PORTFOLIO | |||
| RESTRICTED SECURITIES | ACQUISITION DATES | COST | |
| Calvert Social Investment Foundation Notes, | |||
| 0.50%, 1/1/14 | 7/1/09 | $ | 3,087,392 |
www.calvert.com CALVERT SOCIAL INVESTMENT FUND ANNUAL REPORT 75
| EQUITY PORTFOLIO | |||
| RESTRICTED SECURITIES | ACQUISITIONDATES | COST | |
| 20/20 Gene Systems, Inc., Common Stock | 8/1/08 - 8/27/13 | $ | 166,890 |
| Adobe Capital Social Mezzanine LP | 2/8/13 - 7/25/13 | 81,815 | |
| Arborview Capital Partners LP | 11/13/12 - 9/26/13 | 289,638 | |
| Better Energy Systems, Inc., Series B, Preferred | 8/3/10 | 400,000 | |
| Blackstone Cleantech Venture Partners LP | 7/29/10 - 7/25/13 | 404,155 | |
| Calvert Social Investment Foundation Notes, 0.50%, 1/1/14 | 1/2/13 | 10,833,877 | |
| Chesapeake PERL, Inc., Series A-2, Preferred | 7/30/04 - 9/8/06 | 300,000 | |
| China Environment Fund 2004 LP | 9/15/05 - 4/1/09 | — | |
| China Environment Fund III LP | 1/24/08 - 4/19/13 | 983,226 | |
| Coastal Ventures III LP | 7/30/12 - 4/26/13 | 200,000 | |
| Core Innovations Capital I LP | 1/6/11 - 7/17/13 | 499,272 | |
| DBL Equity Fund - BAEF II LP | 3/30/11 - 9/26/13 | 640,221 | |
| Digital Directions International, Inc. | 7/2/08 - 7/15/09 | 683,778 | |
| Envisionier Medical Technologies, Inc.: | |||
| Warrants (strike price $.50/share, expires 8/6/20) | 8/6/10 | — | |
| Note I, 7.00%, 3/31/14 | 12/14/09 | 200,000 | |
| Note II, 7.00%, 3/31/14 | 8/5/10 | 100,000 | |
| Excent Corp.: | |||
| Common | 9/28/12 | 250,000 | |
| Note, 7.00%, 9/30/19 | 9/28/12 | 250,000 | |
| First Analysis Private Equity Fund V LP | 6/7/13 - 7/10/13 | 178,585 | |
| Global Resource Options, Inc.: | |||
| Series A, Preferred | 9/18/06 | 750,000 | |
| Series B, Preferred | 12/5/07 | 750,000 | |
| Series C, Preferred | 2/13/09 | 1,000,000 | |
| Series D, Preferred | 12/30/10 - 5/24/11 | 700,178 | |
| Graduation Alliance, Inc.: | |||
| Series C, Preferred | 3/27/13 - 8/20/13 | 500,000 | |
| Series C, Preferred Warrants | |||
| (strike price $0.16/share, expires 8/20/18) | 9/13/13 | — | |
| Ignia Fund I LP | 1/28/10 - 8/15/13 | 883,649 | |
| Immunology Partners, Inc., Series C-1, Preferred | 11/30/06 | 471,342 | |
| Impact Ventures II LP | 9/8/10 - 7/24/13 | 783,681 | |
| Ivy Capital (Proprietary) Ltd. | 9/12/12 | 496,026 | |
| LeapFrog Financial Inclusion Fund LP | 1/20/10 - 8/19/13 | 677,730 | |
| Marrone Bio Innovations, Inc.: | |||
| Series A, Preferred | 4/25/07 | 200,000 | |
| Series B, Preferred | 8/28/08 | 280,000 | |
| Series C, Preferred | 11/19/10 | 500,000 | |
| Note, 10.00%, 3/31/14 | 3/15/12 | 200,000 | |
| Napo Pharmaceuticals, Inc.: | |||
| Common Stock | 2/21/07 - 9/23/09 | 419,720 | |
| Common Warrants | |||
| (strike price $0.55/share, expires 9/15/14) | 9/23/09 | 16,908 | |
| New Day Farms, Inc.: | |||
| Series B, Preferred | 3/12/09 | 500,000 | |
| Participation Interest Note, 9.00%, 12/31/13 | 11/25/09 | 6,225 | |
| New Markets Education Partners LP | 9/27/11 - 3/25/13 | 385,000 | |
| New Markets Venture Partners II LP | 7/21/08 - 12/19/12 | 281,119 | |
| One Earth Group Ltd.: | |||
| Convertible Note, 5.00%, 12/31/14 | 12/21/12 | 100,000 | |
| Convertible Note II, 5.00%, 5/31/15 | 5/15/13 | 200,000 |
76 www.calvert.com CALVERT SOCIAL INVESTMENT FUND ANNUAL REPORT
| EQUITY PORTFOLIO | |||
| RESTRICTED SECURITIES - CONT’D | ACQUISITION DATES | COST | |
| Orteq Bioengineering Ltd.: | |||
| Series A, Preferred | 7/19/07 | $ | 998,102 |
| Note, 12.00%, 7/31/17 | 7/22/13 | 201,621 | |
| PresenceLearning, Inc.: | |||
| Series A, Preferred | 9/29/11 | 300,000 | |
| Series A-2, Preferred | 5/2/12 | 134,942 | |
| Series B, Preferred | 4/4/13 | 285,000 | |
| Quantum Intech, Inc., 11.50%, 9/10/15 | 10/5/10 - 7/31/13 | 107,147 | |
| Renewable Energy Asia Fund LP | 9/29/10 - 9/4/13 | 1,300,627 | |
| SEAF Global SME Facility: | |||
| 9.00%, 12/16/14 | 12/16/09 | 1,500,000 | |
| 9.00%, 4/20/15 | 4/20/10 | 1,000,000 | |
| 9.00%, 11/5/15 | 11/4/10 | 1,000,000 | |
| 9.00%, 3/29/16 | 3/29/11 | 450,000 | |
| 9.00%, 6/14/16 | 6/13/11 | 400,000 | |
| 9.00%, 7/13/16 | 7/11/11 | 650,000 | |
| SEAF India International Growth Fund LP | 3/22/05 - 5/24/10 | 289,849 | |
| Shangri La Farms, Series A, Preferred | 2/1/13 | 200,000 | |
| SJF Ventures II LP | 2/14/06 - 11/20/12 | 493,946 | |
| SJF Ventures III LP | 2/6/12 | 151,429 | |
| Sword Diagnostics: | |||
| Series B, Preferred | 12/26/06 | 250,000 | |
| Convertible Bridge Note, Series C, 10.00%, 6/30/13 | 10/29/09 | 25,000 | |
| Convertible Bridge Note II, Series C, 10.00%, 6/30/13 | 11/9/10 | 100,000 | |
| Village Laundry Services, Inc | 7/22/09 | 500,000 | |
| Westly Capital Partners Fund II LP | 12/27/11 - 8/13/13 | 398,331 |
www.calvert.com CALVERT SOCIAL INVESTMENT FUND ANNUAL REPORT 77
| STATEMENTS OF ASSETS AND LIABILITIES | |||||
| YEAR ENDED SEPTEMBER 30, 2013 | |||||
| BALANCED | BOND | ||||
| ASSETS | PORTFOLIO | PORTFOLIO | |||
| Investments in securities, at value (Cost $503,068,942 and | |||||
| $712,715,609, respectively) - see accompanying schedules | $ | 580,595,512 | $ | 706,053,095 | |
| Cash | 2,548,874 | 203,385 | |||
| Receivable for securities sold | 4,692,417 | 46,519,856 | |||
| Receivable for futures variation margin | 2,064 | — | |||
| Receivable for shares sold | 906,543 | 861,493 | |||
| Interest and dividends receivable | 1,593,549 | 5,846,321 | |||
| Collateral at broker (cash) | 40,050 | 273,040 | |||
| Other assets | 42,087 | 51,571 | |||
| Total assets | 590,421,096 | 759,808,761 | |||
| LIABILITIES | |||||
| Payable for securities purchased | 12,930,572 | 49,758,469 | |||
| Payable for shares redeemed | 407,602 | 592,184 | |||
| Payable for futures margin | — | 2,575 | |||
| Payable to Calvert Investment Management, Inc. | 223,489 | 267,142 | |||
| Payable to Calvert Investment Administrative Services, Inc. | 124,722 | 143,184 | |||
| Payable to Calvert Investment Services, Inc. | 12,423 | 8,100 | |||
| Payable to Calvert Distributors, Inc. | 130,446 | 103,919 | |||
| Accrued expenses and other liabilities | 245,739 | 296,059 | |||
| Total liabilities | 14,074,993 | 51,171,632 | |||
| NET ASSETS | $ | 576,346,103 | $ | 708,637,129 | |
| NET ASSETS CONSIST OF: | |||||
| Paid-in capital applicable to the following shares of beneficial interest, | |||||
| unlimited number of no par value shares authorized: | |||||
| Balanced Portfolio: | |||||
| Class A: 14,565,309 shares outstanding | $ | 412,858,572 | |||
| Class B: 170,394 shares outstanding | 6,888,976 | ||||
| Class C: 1,130,530 shares outstanding | 33,992,490 | ||||
| Class I: 1,029,610 shares outstanding | 31,862,375 | ||||
| Class Y: 1,921 shares outstanding | 64,164 | ||||
| Bond Portfolio: | |||||
| Class A: 26,185,460 shares outstanding | $ | 421,178,797 | |||
| Class B: 146,826 shares outstanding | 3,039,909 | ||||
| Class C: 2,424,345 shares outstanding | 38,049,022 | ||||
| Class I: 14,121,388 shares outstanding | 224,811,193 | ||||
| Class Y: 2,502,814 shares outstanding | 39,902,897 | ||||
| Undistributed net investment income | 155,833 | 35,496 | |||
| Accumulated net realized gain (loss) | 12,978,126 | (11,406,416 | ) | ||
| Net unrealized appreciation (depreciation) | 77,545,567 | (6,973,769 | ) | ||
| NET ASSETS | $ | 576,346,103 | $ | 708,637,129 | |
See notes to financial statements.
78 www.calvert.com CALVERT SOCIAL INVESTMENT FUND ANNUAL REPORT
| STATEMENTS OF ASSETS AND LIABILITIES | ||
| YEAR ENDED SEPTEMBER 30, 2013 | ||
| BALANCED | BOND | |
| NET ASSETS VALUE PER SHARE | PORTFOLIO | PORTFOLIO |
| Balanced Portfolio: | ||
| Class A (based on net assets of $497,159,790) | $34.13 | |
| Class B (based on net assets of $5,730,883) | $33.63 | |
| Class C (based on net assets of $37,812,093) | $33.45 | |
| Class I (based on net assets of $35,577,544) | $34.55 | |
| Class Y (based on net assets of $65,793) | $34.25 | |
| Bond Portfolio: | ||
| Class A (based on net assets of $408,823,073) | $15.61 | |
| Class B (based on net assets of $2,274,038) | $15.49 | |
| Class C (based on net assets of $37,619,669) | $15.52 | |
| Class I (based on net assets of $220,620,574) | $15.62 | |
| Class Y (based on net assets of $39,299,775) | $15.70 | |
See notes to financial statements.
www.calvert.com CALVERT SOCIAL INVESTMENT FUND ANNUAL REPORT 79
| STATEMENTS OF ASSETS AND LIABILITIES | ||||
| YEAR ENDED SEPTEMBER 30, 2013 | ||||
| EQUITY | LARGE CAP CORE | |||
| ASSETS | PORTFOLIO | PORTFOLIO | ||
| Investments in securities, at value | ||||
(Cost $1,971,516,256 and $105,589,782, respectively) - | ||||
| see accompanying schedules | $ | 2,718,238,455 | $ | 129,875,648 |
| Cash | — | 823 | ||
| Receivable for shares sold | 5,668,418 | 392,628 | ||
| Interest and dividends receivable | 2,152,063 | 86,464 | ||
| Other assets | 76,017 | 29,867 | ||
| Total assets | 2,726,134,953 | 130,385,430 | ||
| LIABILITIES | ||||
| Payable for securities purchased | — | 1,543,214 | ||
| Payable for shares redeemed | 4,397,478 | 128,073 | ||
| Payable to Calvert Investment Management, Inc. | 1,218,760 | 62,240 | ||
| Payable to Calvert Investment Administrative Services, Inc. | 394,214 | 13,411 | ||
| Payable to Calvert Investment Services, Inc. | 25,091 | 1,637 | ||
| Payable to Calvert Distributors, Inc. | 494,673 | 20,509 | ||
| Accrued expenses and other liabilities | 1,245,391 | 44,848 | ||
| Total liabilities | 7,775,607 | 1,813,932 | ||
| NET ASSETS | $ | 2,718,359,346 | $ | 128,571,498 |
| NET ASSETS CONSIST OF: | ||||
| Paid-in capital applicable to the following shares of beneficial interest, | ||||
| unlimited number of no par value shares authorized: | ||||
| Equity Portfolio: | ||||
| Class A: 35,861,126 shares outstanding | $ | 1,074,519,859 | ||
| Class B: 573,474 shares outstanding | 1,469,538 | |||
| Class C: 4,575,631 shares outstanding | 123,020,853 | |||
| Class I: 16,475,102 shares outstanding | 649,405,501 | |||
| Class Y: 3,013,533 shares outstanding | 115,103,733 | |||
| Large Cap Core Portfolio: | ||||
| Class A: 2,617,839 shares outstanding | $ | 47,216,568 | ||
| Class B: 55,367 shares outstanding | 860,271 | |||
| Class C: 462,755 shares outstanding | 8,043,075 | |||
| Class I: 2,612,226 shares outstanding | 47,147,996 | |||
| Class Y: 195 shares outstanding | 4,300 | |||
| Undistributed net investment income | 6,186,144 | 785,314 | ||
| Accumulated net realized gain (loss) | 1,931,331 | 228,085 | ||
| Net unrealized appreciation (depreciation) on investments and | ||||
| assets and liabilities denominated in foreign currencies | 746,722,387 | 24,285,889 | ||
| NET ASSETS | $ | 2,718,359,346 | $ | 128,571,498 |
See notes to financial statements.
80 www.calvert.com CALVERT SOCIAL INVESTMENT FUND ANNUAL REPORT
| STATEMENT OF ASSETS AND LIABILITIES | ||
| YEAR ENDED SEPTEMBER 30, 2013 | ||
| EQUITY | LARGE CAP CORE | |
| NET ASSETS VALUE PER SHARE | PORTFOLIO | PORTFOLIO |
| Equity Portfolio: | ||
| Class A (based on net assets of $1,602,401,002) | $44.68 | |
| Class B (based on net assets of $21,553,791) | $37.58 | |
| Class C (based on net assets of $158,590,599) | $34.66 | |
| Class I (based on net assets of $798,677,355) | $48.48 | |
| Class Y (based on net assets of $137,136,599) | $45.51 | |
| Large Cap Core Portfolio: | ||
| Class A (based on net assets of $58,507,153) | $22.35 | |
| Class B (based on net assets of $1,093,206) | $19.74 | |
| Class C (based on net assets of $9,403,261) | $20.32 | |
| Class I (based on net assets of $59,563,511) | $22.80 | |
| Class Y (based on net assets of $4,367) | $22.36 | |
See notes to financial statements.
www.calvert.com CALVERT SOCIAL INVESTMENT FUND ANNUAL REPORT 81
| STATEMENTS OF OPERATIONS | ||||||
| YEAR ENDED SEPTEMBER 30, 2013 | ||||||
| BALANCED | BOND | |||||
| NET INVESTMENT INCOME | PORTFOLIO | PORTFOLIO | ||||
| Investment Income: | ||||||
| Interest income | $ | 6,013,347 | $ | 24,092,732 | ||
| Dividend income | 4,328,170 | 16,383 | ||||
| Total investment income | 10,341,517 | 24,109,115 | ||||
| Expenses: | ||||||
| Investment advisory fee | 2,260,671 | 2,663,273 | ||||
| Transfer agency fees and expenses | 788,059 | 1,077,437 | ||||
| Administrative fees | 1,420,003 | 1,850,826 | ||||
| Distribution Plan expenses: | ||||||
| Class A | 1,079,271 | 919,163 | ||||
| Class B | 65,896 | 34,084 | ||||
| Class C | 334,328 | 429,472 | ||||
| Trustees’ fees and expenses | 59,970 | 78,000 | ||||
| Custodian fees | 105,689 | 91,345 | ||||
| Registration fees | 55,701 | 61,144 | ||||
| Reports to shareholders | 147,807 | 156,247 | ||||
| Professional fees | 53,025 | 65,064 | ||||
| Miscellaneous | 117,267 | 1,074 | ||||
| Total expenses | 6,487,687 | 7,427,129 | ||||
| Reimbursement from Advisor: | ||||||
| Class B | (1,005 | ) | (5,851 | ) | ||
| Class Y | (3,814 | ) | — | |||
| Fees waived | (1,215 | ) | — | |||
| Fees paid indirectly | (447 | ) | (678 | ) | ||
| Net expenses | 6,481,206 | 7,420,600 | ||||
| NET INVESTMENT INCOME | 3,860,311 | 16,688,515 | ||||
| REALIZED AND UNREALIZED GAIN (LOSS) | ||||||
| Net realized gain (loss) on: | ||||||
| Investments | 35,783,492 | (9,013,232 | ) | |||
| Futures | (246,712 | ) | 1,277,974 | |||
| 35,536,780 | (7,735,258 | ) | ||||
| Change in unrealized appreciation (depreciation) on: | ||||||
| Investments | 19,430,711 | (25,618,507 | ) | |||
| Futures | 22,758 | (141,362 | ) | |||
| 19,453,469 | (25,759,869 | ) | ||||
| NET REALIZED AND UNREALIZED | ||||||
| GAIN (LOSS) | 54,990,249 | (33,495,127 | ) | |||
| INCREASE (DECREASE) IN NET ASSETS | ||||||
| RESULTING FROM OPERATIONS | $ | 58,850,560 | ($ 16,806,612 | ) | ||
See notes to financial statements.
82 www.calvert.com CALVERT SOCIAL INVESTMENT FUND ANNUAL REPORT
| STATEMENTS OF OPERATIONS | ||||||
| YEAR ENDED SEPTEMBER 30, 2013 | ||||||
| EQUITY | LARGE CAP CORE | |||||
| NET INVESTMENT INCOME | PORTFOLIO | PORTFOLIO | ||||
| Investment Income: | ||||||
| Interest income | $ | 498,184 | $ | 9,026 | ||
| Dividend income (net of foreign taxes withheld of | ||||||
| $218,729 and $25,647, respectively) | 34,697,648 | 2,196,695 | ||||
| Total investment income | 35,195,832 | 2,205,721 | ||||
| Expenses: | ||||||
| Investment advisory fee | 12,693,995 | 674,832 | ||||
| Transfer agency fees and expenses | 3,533,664 | 121,196 | ||||
| Administrative fees | 4,405,722 | 141,903 | ||||
| Distribution Plan expenses: | ||||||
| Class A | 3,846,560 | 123,411 | ||||
| Class B | 245,677 | 12,293 | ||||
| Class C | 1,534,112 | 82,450 | ||||
| Trustees’ fees and expenses | 308,720 | 11,625 | ||||
| Custodian fees | 136,325 | 25,444 | ||||
| Registration fees | 78,127 | 50,026 | ||||
| Reports to shareholders | 558,748 | 20,323 | ||||
| Professional fees | 157,058 | 29,335 | ||||
| Miscellaneous | 317,910 | 19,215 | ||||
| Total expenses | 27,816,618 | 1,312,053 | ||||
| Reimbursement from Advisor: | ||||||
| Class B | — | (4,768 | ) | |||
| Class Y | — | (3,797 | ) | |||
| Fees waived | (284,141 | ) | (112,418 | ) | ||
| Fees paid indirectly | (1,927 | ) | (125 | ) | ||
| Net expenses | 27,530,550 | 1,190,945 | ||||
| NET INVESTMENT INCOME | 7,665,282 | 1,014,776 | ||||
| REALIZED AND UNREALIZED GAIN (LOSS) | ||||||
| Net realized gain (loss) on: | ||||||
| Investments | 108,151,066 | 5,549,903 | ||||
| Foreign currency transactions | (138 | ) | (29 | ) | ||
| 108,150,928 | 5,549,874 | |||||
| Change in unrealized appreciation (depreciation) on: | ||||||
| Investments | 275,816,898 | 15,308,851 | ||||
| Assets and liabilities denominated in foreign currencies | 188 | 23 | ||||
| 275,817,086 | 15,308,874 | |||||
| NET REALIZED AND UNREALIZED | ||||||
| GAIN (LOSS) | 383,968,014 | 20,858,748 | ||||
| INCREASE (DECREASE) IN NET ASSETS | ||||||
| RESULTING FROM OPERATIONS | $ | 391,633,296 | $ | 21,873,524 | ||
See notes to financial statements.
www.calvert.com CALVERT SOCIAL INVESTMENT FUND ANNUAL REPORT 83
| BALANCED PORTFOLIO | ||||||
| STATEMENTS OF CHANGES IN NET ASSETS | ||||||
| YEAR ENDED | YEAR ENDED | |||||
| SEPTEMBER 30, | SEPTEMBER 30, | |||||
| INCREASE (DECREASE) IN NET ASSETS | 2013 | 2012 | ||||
| Operations: | ||||||
| Net investment income | $ | 3,860,311 | $ | 3,525,343 | ||
| Net realized gain (loss) | 35,536,780 | 10,531,153 | ||||
| Change in unrealized appreciation (depreciation) | 19,453,469 | 66,614,808 | ||||
| INCREASE (DECREASE) IN NET ASSETS | ||||||
| RESULTING FROM OPERATIONS | 58,850,560 | 80,671,304 | ||||
| Distributions to shareholders from: | ||||||
| Net investment income: | ||||||
| Class A shares | (3,403,468 | ) | (3,514,382 | ) | ||
| Class B shares | — | (1,243 | ) | |||
| Class C shares | (15,207 | ) | (13,808 | ) | ||
| Class I shares | (397,208 | ) | (83,682 | ) | ||
| Class Y shares | (28 | ) | — | |||
| Total distributions | (3,815,911 | ) | (3,613,115 | ) | ||
| Capital share transactions: | ||||||
| Shares sold: | ||||||
| Class A shares | 63,408,193 | 43,821,226 | ||||
| Class B shares | 214,034 | 307,119 | ||||
| Class C shares | 8,036,921 | 5,299,107 | ||||
| Class I shares | 5,187,762 | 27,118,674 | ||||
| Class Y shares | 64,136 | — | ||||
| Reinvestment of distributions: | ||||||
| Class A shares | 3,168,097 | 3,280,524 | ||||
| Class B shares | — | 1,154 | ||||
| Class C shares | 12,161 | 10,642 | ||||
| Class I shares | 397,208 | 83,682 | ||||
| Class Y shares | 28 | — | ||||
| Redemption fees: | ||||||
| Class A shares | 1,140 | 3,359 | ||||
| Class B shares | 432 | — | ||||
| Class C shares | 13 | 665 | ||||
| Shares redeemed: | ||||||
| Class A shares | (64,696,039 | ) | (75,270,593 | ) | ||
| Class B shares | (2,944,572 | ) | (3,244,601 | ) | ||
| Class C shares | (3,307,773 | ) | (4,330,702 | ) | ||
| Class I shares | (2,949,285 | ) | (596,275 | ) | ||
| Total capital share transactions | 6,592,456 | (3,516,019 | ) | |||
| TOTAL INCREASE (DECREASE) IN NET ASSETS | 61,627,105 | 73,542,170 | ||||
See notes to financial statements.
84 www.calvert.com CALVERT SOCIAL INVESTMENT FUND ANNUAL REPORT
| BALANCED PORTFOLIO | ||||||
| STATEMENTS OF CHANGES IN NET ASSETS | ||||||
| YEAR ENDED | YEAR ENDED | |||||
| SEPTEMBER 30, | SEPTEMBER 30, | |||||
| NET ASSETS | 2013 | 2012 | ||||
| Beginning of year | $ | 514,718,998 | $ | 441,176,828 | ||
| End of year (including undistributed net investment | ||||||
| income of $155,833 and $104,161, respectively) | $ | 576,346,103 | $ | 514,718,998 | ||
| CAPITAL SHARE ACTIVITY | ||||||
| Shares sold: | ||||||
| Class A shares | 1,962,409 | 1,482,360 | ||||
| Class B shares | 6,784 | 10,393 | ||||
| Class C shares | 255,491 | 183,753 | ||||
| Class I shares | 157,666 | 897,699 | ||||
| Class Y shares | 1,920 | — | ||||
| Reinvestment of distributions: | ||||||
| Class A shares | 98,514 | 111,822 | ||||
| Class B shares | — | 42 | ||||
| Class C shares | 406 | 390 | ||||
| Class I shares | 12,159 | 2,719 | ||||
| Class Y shares | 1 | — | ||||
| Shares redeemed: | ||||||
| Class A shares | (2,025,279 | ) | (2,554,674 | ) | ||
| Class B shares | (93,499 | ) | (111,741 | ) | ||
| Class C shares | (104,685 | ) | (150,904 | ) | ||
| Class I shares | (89,365 | ) | (19,970 | ) | ||
| Total capital share activity | 182,522 | (148,111 | ) | |||
See notes to financial statements.
www.calvert.com CALVERT SOCIAL INVESTMENT FUND ANNUAL REPORT 85
| BOND PORTFOLIO | ||||||
| STATEMENTS OF CHANGES IN NET ASSETS | ||||||
| YEAR ENDED | YEAR ENDED | |||||
| SEPTEMBER 30, | SEPTEMBER 30, | |||||
| INCREASE (DECREASE) IN NET ASSETS | 2013 | 2012 | ||||
| Operations: | ||||||
| Net investment income | $ | 16,688,515 | $ | 20,753,149 | ||
| Net realized gain (loss) | (7,735,258 | ) | 12,922,759 | |||
| Change in unrealized appreciation (depreciation) | (25,759,869 | ) | 30,583,575 | |||
| INCREASE (DECREASE) IN NET ASSETS | ||||||
| RESULTING FROM OPERATIONS | (16,806,612 | ) | 64,259,483 | |||
| Distributions to shareholders from: | ||||||
| Net investment income: | ||||||
| Class A shares | (9,776,724 | ) | (12,398,071 | ) | ||
| Class B shares | (35,223 | ) | (76,228 | ) | ||
| Class C shares | (573,342 | ) | (819,563 | ) | ||
| Class I shares | (5,909,076 | ) | (6,956,306 | ) | ||
| Class Y shares | (951,304 | ) | (841,612 | ) | ||
| Net realized gain: | ||||||
| Class A shares | (7,502,401 | ) | (5,304,000 | ) | ||
| Class B shares | (65,325 | ) | (56,321 | ) | ||
| Class C shares | (722,645 | ) | (491,117 | ) | ||
| Class I shares | (3,211,527 | ) | (2,426,790 | ) | ||
| Class Y shares | (595,805 | ) | (285,072 | ) | ||
| Total distributions | (29,343,372 | ) | (29,655,080 | ) | ||
| Capital share transactions: | ||||||
| Shares sold: | ||||||
| Class A shares | 81,872,988 | 91,917,200 | ||||
| Class B shares | 134,685 | 321,055 | ||||
| Class C shares | 5,241,256 | 7,187,289 | ||||
| Class I shares | 70,700,789 | 69,712,757 | ||||
| Class Y shares | 17,877,419 | 14,635,974 | ||||
| Reinvestment of distributions: | ||||||
| Class A shares | 15,206,465 | 15,477,340 | ||||
| Class B shares | 86,476 | 111,996 | ||||
| Class C shares | 963,908 | 920,095 | ||||
| Class I shares | 9,002,425 | 8,664,434 | ||||
| Class Y shares | 618,600 | 421,089 | ||||
| Redemption fees: | ||||||
| Class A shares | 10,718 | 9,317 | ||||
| Class C shares | 35 | 99 | ||||
| Class I shares | 2,742 | 987 | ||||
| Class Y shares | 1,145 | 1,387 | ||||
See notes to financial statements.
86 www.calvert.com CALVERT SOCIAL INVESTMENT FUND ANNUAL REPORT
| BOND PORTFOLIO | ||||||
| STATEMENTS OF CHANGES IN NET ASSETS | ||||||
| YEAR ENDED | YEAR ENDED | |||||
| SEPTEMBER 30, | SEPTEMBER 30, | |||||
| INCREASE (DECREASE) IN NET ASSETS - (CONT’D) | 2013 | 2012 | ||||
| Capital share transactions (cont’d): | ||||||
| Shares redeemed: | ||||||
| Class A shares | ($ | 134,477,388 | ) | ($ | 171,499,957 | ) |
| Class B shares | (2,008,230 | ) | (2,003,400 | ) | ||
| Class C shares | (11,971,381 | ) | (11,325,834 | ) | ||
| Class I shares | (48,694,776 | ) | (110,075,324 | ) | ||
| Class Y shares | (12,209,676 | ) | (8,073,724 | ) | ||
| Total capital share transactions | (7,641,800 | ) | (93,597,220 | ) | ||
| TOTAL INCREASE (DECREASE) IN NET ASSETS | (53,791,784 | ) | (58,992,817 | ) | ||
| NET ASSETS | ||||||
| Beginning of year | 762,428,913 | 821,421,730 | ||||
| End of year (including undistributed net investment | ||||||
| income of $35,496 and $188,500, respectively) | $ | 708,637,129 | $ | 762,428,913 | ||
| CAPITAL SHARE ACTIVITY | ||||||
| Shares sold: | ||||||
| Class A shares | 5,046,798 | 5,746,422 | ||||
| Class B shares | 8,255 | 20,302 | ||||
| Class C shares | 323,505 | 452,206 | ||||
| Class I shares | 4,388,801 | 4,351,438 | ||||
| Class Y shares | 1,099,163 | 905,575 | ||||
| Reinvestment of distributions: | ||||||
| Class A shares | 937,102 | 973,112 | ||||
| Class B shares | 5,346 | 7,118 | ||||
| Class C shares | 59,643 | 58,264 | ||||
| Class I shares | 555,725 | 543,375 | ||||
| Class Y shares | 38,032 | 26,258 | ||||
| Shares redeemed: | ||||||
| Class A shares | (8,392,729 | ) | (10,737,459 | ) | ||
| Class B shares | (126,022 | ) | (126,296 | ) | ||
| Class C shares | (748,716 | ) | (711,423 | ) | ||
| Class I shares | (3,048,259 | ) | (6,850,289 | ) | ||
| Class Y shares | (757,715 | ) | (502,190 | ) | ||
| Total capital share activity | (611,071 | ) | (5,843,587 | ) | ||
See notes to financial statements.
www.calvert.com CALVERT SOCIAL INVESTMENT FUND ANNUAL REPORT 87
| EQUITY PORTFOLIO | ||||||
| STATEMENTS OF CHANGES IN NET ASSETS | ||||||
| YEAR ENDED | YEAR ENDED | |||||
| SEPTEMBER 30, | SEPTEMBER 30, | |||||
| INCREASE (DECREASE) IN NET ASSETS | 2013 | 2012 | ||||
| Operations: | ||||||
| Net investment income (loss) | $ | 7,665,282 | ($ | 1,096,840 | ) | |
| Net realized gain (loss) | 108,150,928 | 52,162,561 | ||||
| Change in unrealized appreciation (depreciation) | 275,817,086 | 415,531,931 | ||||
| INCREASE (DECREASE) IN NET ASSETS | ||||||
| RESULTING FROM OPERATIONS | 391,633,296 | 466,597,652 | ||||
| Distributions to shareholders from: | ||||||
| Net investment income: | ||||||
| Class A shares | (279,800 | ) | — | |||
| Class I shares | (640,601 | ) | — | |||
| Class Y shares | (79,397 | ) | — | |||
| Net realized gain: | ||||||
| Class A shares | (2,093,651 | ) | (66,707,433 | ) | ||
| Class B shares | (44,442 | ) | (2,017,670 | ) | ||
| Class C shares | (266,839 | ) | (8,512,283 | ) | ||
| Class I shares | (863,847 | ) | (26,124,236 | ) | ||
| Class Y shares | (152,811 | ) | (3,483,367 | ) | ||
| Total distributions | (4,421,388 | ) | (106,844,989 | ) | ||
| Capital share transactions: | ||||||
| Shares sold: | ||||||
| Class A shares | 201,724,553 | 244,472,641 | ||||
| Class B shares | 84,191 | 299,827 | ||||
| Class C shares | 11,735,347 | 15,390,147 | ||||
| Class I shares | 153,081,771 | 142,575,757 | ||||
| Class Y shares | 46,400,428 | 51,047,979 | ||||
| Reinvestment of distributions: | ||||||
| Class A shares | 2,171,135 | 62,310,298 | ||||
| Class B shares | 40,654 | 1,794,414 | ||||
| Class C shares | 211,995 | 6,591,046 | ||||
| Class I shares | 1,380,789 | 23,817,881 | ||||
| Class Y shares | 132,181 | 2,139,558 | ||||
| Redemption fees: | ||||||
| Class A shares | 13,412 | 22,795 | ||||
| Class C shares | 298 | 294 | ||||
| Class I shares | 1,371 | 5,788 | ||||
| Class Y shares | 3,124 | 2,938 | ||||
See notes to financial statements.
88 www.calvert.com CALVERT SOCIAL INVESTMENT FUND ANNUAL REPORT
| EQUITY PORTFOLIO | ||||||
| STATEMENTS OF CHANGES IN NET ASSETS | ||||||
YEAR ENDED |
|
| YEAR ENDED | |||
SEPTEMBER |
|
| SEPTEMBER 30, | |||
| INCREASE (DECREASE) IN NET ASSETS - (CONT’D) | 2013 |
|
| 2012 | ||
| Capital share transactions (cont’d): | ||||||
| Shares redeemed: | ||||||
| Class A shares | ($ | 331,866,220 | ) | ($ | 326,998,558 | ) |
| Class B shares | (10,362,030 | ) | (14,326,054 | ) | ||
| Class C shares | (25,261,442 | ) | (24,410,771 | ) | ||
| Class I shares | (135,739,579 | ) | (133,613,985 | ) | ||
| Class Y shares | (35,053,099 | ) | (26,458,000 | ) | ||
| Total capital share transactions | (121,301,121 | ) | 24,663,995 | |||
| TOTALINCREASE (DECREASE) IN NET ASSETS | 265,910,787 | 384,416,658 | ||||
| NET ASSETS | ||||||
| Beginning of year | 2,452,448,559 | 2,068,031,901 | ||||
| End of year (including undistributed net investment income and | ||||||
| undistributed net investment loss of $6,186,144 and | ||||||
| $222,866, respectively) | $ | 2,718,359,346 | $ | 2,452,448,559 | ||
| CAPITAL SHARE ACTIVITY | ||||||
| Shares sold: | ||||||
| Class A shares | 4,896,698 | 6,777,796 | ||||
| Class B shares | 2,430 | 9,913 | ||||
| Class C shares | 366,750 | 547,667 | ||||
| Class I shares | 3,433,069 | 3,667,764 | ||||
| Class Y shares | 1,113,522 | 1,395,316 | ||||
| Reinvestment of distributions: | ||||||
| Class A shares | 56,821 | 1,828,354 | ||||
| Class B shares | 1,256 | 61,600 | ||||
| Class C shares | 7,114 | 246,027 | ||||
| Class I shares | 33,440 | 650,051 | ||||
| Class Y shares | 3,406 | 62,052 | ||||
| Shares redeemed: | ||||||
| Class A shares | (8,075,327 | ) | (9,042,710 | ) | ||
| Class B shares | (299,646 | ) | (464,584 | ) | ||
| Class C shares | (787,551 | ) | (860,799 | ) | ||
| Class I shares | (3,051,497 | ) | (3,470,609 | ) | ||
| Class Y shares | (836,014 | ) | (720,937 | ) | ||
| Total capital share activity | (3,135,529 | ) | 686,901 | |||
See notes to financial statements.
www.calvert.com CALVERT SOCIAL INVESTMENT FUND ANNUAL REPORT 89
| LARGE CAP CORE PORTFOLIO | ||||||
| STATEMENTS OF CHANGES IN NET ASSETS | ||||||
| YEAR ENDED | YEAR ENDED | |||||
| SEPTEMBER 30, | SEPTEMBER 30, | |||||
| INCREASE (DECREASE) IN NET ASSETS | 2013 | 2012 | ||||
| Operations: | ||||||
| Net investment income | $ | 1,014,776 | $ | 829,689 | ||
| Net realized gain (loss) | 5,549,874 | 6,470,959 | ||||
| Change in unrealized appreciation (depreciation) | 15,308,874 | 9,431,883 | ||||
| INCREASE (DECREASE) IN NET ASSETS | ||||||
| RESULTING FROM OPERATIONS | 21,873,524 | 16,732,531 | ||||
| Distributions to shareholders from: | ||||||
| Net investment income: | ||||||
| Class A shares | (306,548 | ) | (269,317 | ) | ||
| Class I shares | (486,395 | ) | (443,599 | ) | ||
| Net realized gain: | ||||||
| Class A shares | (55,863 | ) | — | |||
| Class B shares | (1,924 | ) | — | |||
| Class C shares | (10,413 | ) | — | |||
| Class I shares | (58,612 | ) | — | |||
| Total distributions | (919,755 | ) | (712,916 | ) | ||
| Capital share transactions: | ||||||
| Shares sold: | ||||||
| Class A shares | 14,972,293 | 9,947,198 | ||||
| Class B shares | 17,994 | 6,060 | ||||
| Class C shares | 1,919,432 | 1,050,293 | ||||
| Class I shares | 16,021,042 | 11,131,286 | ||||
| Class Y shares | 4,300 | — | ||||
| Reinvestment of distributions: | ||||||
| Class A shares | 321,792 | 243,305 | ||||
| Class B shares | 1,698 | — | ||||
| Class C shares | 8,143 | — | ||||
| Class I shares | 545,007 | 443,599 | ||||
| Redemption fees: | ||||||
| Class A shares | 467 | 475 | ||||
| Class C shares | 72 | — | ||||
| Shares redeemed: | ||||||
| Class A shares | (7,262,044 | ) | (8,252,016 | ) | ||
| Class B shares | (534,834 | ) | (659,854 | ) | ||
| Class C shares | (1,250,377 | ) | (1,111,663 | ) | ||
| Class I shares | (11,003,585 | ) | (5,846,810 | ) | ||
| Total capital share transactions | 13,761,400 | 6,951,873 | ||||
| TOTAL INCREASE (DECREASE) IN NET ASSETS | 34,715,169 | 22,971,488 | ||||
| NET ASSETS | ||||||
| Beginning of year | 93,856,329 | 70,884,841 | ||||
| End of year (including undistributed net investment income | ||||||
| of $785,314 and $563,510, respectively) | $ | 128,571,498 | $ | 93,856,329 | ||
See notes to financial statements.
90 www.calvert.com CALVERT SOCIAL INVESTMENT FUND ANNUAL REPORT
| LARGE CAP CORE PORTFOLIO | ||||
| STATEMENTS OF CHANGES IN NET ASSETS | ||||
| YEAR ENDED | YEAR ENDED | |||
| SEPTEMBER 30, | SEPTEMBER 30, | |||
| CAPITAL SHARE ACTIVITY | 2013 | 2012 | ||
| Shares sold: | ||||
| Class A shares | 720,225 | 570,927 | ||
| Class B shares | 970 | 416 | ||
| Class C shares | 99,971 | 64,809 | ||
| Class I shares | 761,243 | 629,308 | ||
| Class Y shares | 195 | — | ||
| Reinvestment of distributions: | ||||
| Class A shares | 17,383 | 14,863 | ||
| Class B shares | 104 | — | ||
| Class C shares | 486 | — | ||
| Class I shares | 28,952 | 26,707 | ||
| Shares redeemed: | ||||
| Class A shares | (354,687 | ) | (473,846 | ) |
| Class B shares | (29,684 | ) | (42,001 | ) |
| Class C shares | (65,257 | ) | (68,794 | ) |
| Class I shares | (510,210 | ) | (332,842 | ) |
| Total capital share activity | 669,691 | 389,547 | ||
See notes to financial statements.
www.calvert.com CALVERT SOCIAL INVESTMENT FUND ANNUAL REPORT 91
NOTES TO FINANCIAL STATEMENTS
NOTE A — SIGNIFICANT ACCOUNTING POLICIES
General: Calvert Social Investment Fund (the “Fund”) is registered under the Investment Company Act of 1940 as an open-end management investment company. The Fund operates as a series fund with seven separate portfolios, four of which are reported herein: Balanced, Bond, Equity, and Large Cap Core (formerly known as Enhanced Equity). Balanced, Equity, and Large Cap Core are registered as diversified portfolios. Bond is registered as a non-diversified portfolio. The operations of each series are accounted for separately. Balanced, Bond, Equity, and Large Cap Core each offer Class A, Class B, Class C, Class I, and Class Y shares. Class A shares are sold with a maximum front-end sales charge of 4.75% (3.75% for Bond). Class B shares are sold without a front-end sales charge and, with certain exceptions, will be charged a deferred sales charge at the time of redemption, depending on how long investors have owned the shares. Class B shares are no longer offered for purchase, except through reinvestment of dividends and/or distributions and through certain exchanges. Class C shares are sold without a front-end sales charge and, with certain exceptions, will be charged a deferred sales charge on shares sold within one year of purchase. Class B and Class C shares have higher levels of expenses than Class A shares. Class I shares require a minimum account balance of $1,000,000. The $1 million minimum initial investment is waived for retirement plans that trade through omnibus accounts and may be waived for certain other institutional accounts where it is believed to be in the best interest of the Fund and its shareholders. Class I shares have no front-end or deferred sales charge and have lower levels of expenses than Class A shares. Class Y shares are generally only available to wrap or similar fee-based programs offered by financial intermediaries that have entered into an agreement with the Fund’s Distributor to offer Class Y shares. Class Y shares have no front-end or deferred sales charge and have lower levels of expenses than Class A shares. Each class has different: (a) dividend rates, due to differences in Distribution Plan expenses and other class-specific expenses, (b) exchange privileges and (c) class-specific voting rights.
Security Valuation: Net asset value per share is determined every business day as of the close of the regular session of the New York Stock Exchange (generally 4:00 p.m. Eastern time). The Fund uses independent pricing services approved by the Board of Trustees (“the Board”) to value its investments wherever possible. Investments for which market quotations are not available or deemed not reliable are fair valued in good faith under the direction of the Board.
The Board has adopted Valuation Procedures (the “Procedures”) to determine the fair value of securities and other financial instruments for which market prices are not readily available or which may not be reliably priced. The Board has delegated the day-to-day responsibility for determining the fair value of assets of the Fund, except Special Equities investments, to Calvert Investment Management, Inc. (the “Advisor” or “Calvert”) and has provided these Procedures to govern Calvert in its valuation duties. Special Equities investments, as described in the Fund’s prospectus and statement of additional information, are fair valued by the Board’s Special Equities Committee.
92 www.calvert.com CALVERT SOCIAL INVESTMENT FUND ANNUAL REPORT
Calvert has chartered an internal Valuation Committee to oversee the implementation of these Procedures and to assist it in carrying out the valuation responsibilities that the Board has delegated.
The Valuation Committee meets on a regular basis to review illiquid securities and other investments which may not have readily available market prices. The Valuation Committee’s fair valuation determinations are subject to review, approval and ratification by the Board at its next regularly scheduled meeting covering the calendar quarter in which the fair valuation was determined.
The Valuation Committee utilizes various methods to measure the fair value of the Fund’s investments. Generally Accepted Accounting Principles (GAAP) establishes a disclosure hierarchy that categorizes the inputs to valuation techniques used to value assets and liabilities at measurement date. These inputs are summarized in the three broad levels listed below:
Level 1 – quoted prices in active markets for identical securities
Level 2 – other significant observable inputs (including quoted prices for similar securities, interest rates, prepayment speeds, credit risk, etc.)
Level 3 – significant unobservable inputs (including the Fund’s own assumptions in determining the fair value of investments)
The inputs or methodologies used for valuing securities are not necessarily an indication of the risk associated with investing in those securities. For example, money market securities are valued using amortized cost, in accordance with Rule 2a-7 under the Investment Company Act of 1940. Generally, if the credit quality is sufficient, amortized cost approximates the current fair value of a security, but since the value is not obtained from a quoted price in an active market, such securities are reflected as Level 2.
Changes in valuation techniques may result in transfers in or out of an investment’s assigned level within the hierarchy during the period. Valuation techniques used to value the Funds’ investments by major category are as follows: Debt securities, including restricted securities, are valued based on evaluated prices received from independent pricing services or from dealers who make markets in such securities. For corporate bonds, sovereign government bonds, floating rate loans, municipal securities, and U.S. government and government agency obligations, pricing services utilize matrix pricing which considers yield or price of bonds of comparable quality, coupon, maturity and type as well as dealer supplied prices and such securities are generally categorized as Level 2 in the hierarchy. For asset-backed securities, collateralized mortgage-backed obligations, commercial mortgage-backed securities, and U.S. government agency mortgage-backed securities, pricing services utilize matrix pricing which considers prepayment speed assumptions, attributes of the collateral, yield or price of bonds of comparable quality, coupon, maturity and type as well as dealer supplied prices and, accordingly, such securities are generally categorized as Level 2 in the hierarchy. Short-term securities of sufficient credit quality with remaining maturities of sixty days or less for which quotations are not readily available are valued at amortized cost, which approximates fair value, and are categorized as Level 2 in the hierarchy.
www.calvert.com CALVERT SOCIAL INVESTMENT FUND ANNUAL REPORT 93
When independent prices are unavailable or unreliable, debt securities may be valued utilizing pricing matrices which consider similar factors that would be used by independent pricing services. These are generally categorized as Level 2 in the hierarchy but may be Level 3 depending on the circumstances.
Equity securities, including restricted securities and venture capital securities, for which market quotations are readily available, are valued at the last reported sale price or official closing price as reported by an independent pricing service on the primary market or exchange on which they are traded and are categorized as Level 1 in the hierarchy. In the event there were no sales during the day or closing prices are not available, securities are valued at the last quoted bid price or may be valued using the last available price and are categorized as Level 2 in the hierarchy. Foreign securities are valued based on quotations from the principal market in which such securities are normally traded. If events occur after the close of the principal market in which foreign securities are traded, and before the close of business of the Fund, that are expected to materially affect the value of those securities, then they are valued at their fair value taking these events into account. For restricted securities and private placements where observable inputs are limited, assumptions about market activity and risk are used and such securities are categorized as Level 3 in the hierarchy.
Venture capital securities for which market quotations are not readily available are fair valued by the Board and are categorized as Level 3 in the hierarchy. Venture capital direct equity securities are generally valued using the most appropriate and applicable method to measure fair value in light of each company’s situation. Methods may include market, income or cost approaches with discounts as appropriate based on assumptions of liquidation or exit risk. Examples of the market approach are subsequent rounds of financing, comparable transactions, and revenue times an industry multiple. An example of the income approach is the discounted cash flow. Examples of the cost approach are replacement cost, salvage value, or net asset percentage. Venture capital limited partnership (LP) securities are valued at the fair value reported by the general partner of the partnership adjusted as necessary to reflect subsequent capital calls and distributions and any other available information. In the absence of a reported LP unit value it may be estimated based on the Fund’s percentage equity in the partnership and/or other balance sheet information and portfolio value for the most recently available period reported by the general partner. In some cases adjustments may be made to account for daily pricing of material public holdings within the partnership. Venture capital debt securities are valued based on assumptions of credit and market risk. For venture capital securities denominated in foreign currency, the fair value is marked to the daily exchange rate.
If a market value cannot be determined for a security using the methodologies described above, or if, in the good faith opinion of the Advisor, the market value does not constitute a readily available market quotation, or if a significant event has occurred that would materially affect the value of the security, the security will be fair valued as determined in good faith by the Valuation Committee or, with respect to Special Equities investments, by the Special Equities Committee using the venture capital methodologies described above.
The Valuation Committee considers a number of factors, including significant unobservable valuation inputs when arriving at fair value. It considers all significant facts that are reasonably available and relevant to the determination of fair value.
94 www.calvert.com CALVERT SOCIAL INVESTMENT FUND ANNUAL REPORT
The Valuation Committee primarily employs a market-based approach which may use related or comparable assets or liabilities, recent transactions, market multiples, book values, and other relevant information for the investment to determine the fair value of the investment. When more appropriate, the fund may employ an income-based or cost approach. An income-based valuation approach discounts anticipated future cash flows of the investment to calculate a present amount (discounted). The measurement is based on the value indicated by current market expectations about those future amounts. Discounts may also be applied due to the nature or duration of any restrictions on the disposition of the investments. A cost based approach is based on the amount that currently would be required to replace the service capacity of an asset (current replacement cost). From the seller’s perspective, the price that would be received for the asset is determined based on the cost to a buyer to acquire or construct a substitute asset of comparable utility, adjusted for obsolescence.
The values assigned to fair value investments are based on available information and do not necessarily represent amounts that might ultimately be realized. Further, due to the inherent uncertainty of valuations of such investments, the fair values may differ significantly from the values that would have been used had an active market existed, and the differences could be material. The Valuation Committee employs various methods for calibrating these valuation approaches including a regular review of key inputs and assumptions, transactional back-testing or disposition analysis and reviews of any related market activity.
At September 30, 2013, the following securities were fair valued in good faith under the direction of the Board:
| TOTAL FAIR VALUE INVESTMENTS | % OF NET ASSETS | ||
| Balanced | $13,664,717 | 2.4 | % |
| Bond | $4,345,888 | 0.6 | % |
| Equity | $32,534,372 | 1.2 | % |
| Large Cap Core | $178,110 | 0.1 | % |
The following is a summary of the inputs used to value the Fund’s net assets as of September 30, 2013:
www.calvert.com CALVERT SOCIAL INVESTMENT FUND ANNUAL REPORT 95
| BALANCED | VALUATION INPUTS | ||||
| INVESTMENTS IN SECURITIES | LEVEL 1 | LEVEL 2 | LEVEL 3 | TOTAL | |
| Asset-backed securities | — | $7,068,171 | — | $7,068,171 | |
| Collateralized mortgage-backed obligations | — | 385,764 | — | 385,764 | |
| Commercial mortgage-backed securities | — | 10,466,442 | — | 10,466,442 | |
| Corporate debt | — | 143,332,200 | __ | 143,332,200 | |
| Equity securities* | $330,151,843 | — | $1,033,200 | 331,185,043 | ** |
| Municipal obligations | — | 6,312,747 | — | 6,312,747 | |
| Other debt obligations | — | 60,992,918 | — | 60,992,918 | |
| U.S. government obligations | — | 12,371,563 | — | 12,371,563 | |
| Venture capital | 16,400 | — | 8,464,264 | 8,480,664 | |
| TOTAL | $330,168,243 | $240,929,805 | $9,497,464 | $580,595,512 | |
| Other financial instruments*** | $18,997 | — | — | $18,997 | |
* For further breakdown of equity securities by industry, please refer to the Schedule of Investments. ** Exclusive of $5,718,209 venture capital equity shown in the venture capital heading.
*** Other financial instruments are derivative instruments not reflected in the Schedule of Investments, such as futures, which are valued at the unrealized appreciation/depreciation on the instrument.
The following is a reconciliation of Level 3 assets for which significant unobservable inputs were used to determine fair value:
| CORPORATE | VENTURE | ||||||||||
| BONDS | CAPITAL | EQUITIES | TOTAL | ||||||||
| Balance as of 9/30/12 | $ | 953,783 | $ | 8,411,635 | — | $ | 9,365,418 | ||||
| Accrued discounts/premiums | (18,473 | ) | — | — | (18,473 | ) | |||||
| Realized gain (loss) | (2,951,420 | ) | (144,430 | ) | — | (3,095,850 | ) | ||||
| Change in unrealized appreciation | 3,218,834 | 179,421 | — | 3,398,255 | |||||||
| (depreciation) | |||||||||||
| Purchases | 85,390 | 631,268 | — | 716,658 | |||||||
| Sales | (1,288,114 | ) | (613,630 | ) | — | (1,901,744 | ) | ||||
| Transfers in and/or out of Level 31 | — | — | $ | 1,033,2002 | 1,033,200 | ||||||
| Balance as of 9/30/13 | — | $ | 8,464,264 | $ | 1,033,200 | $ | 9,497,464 |
1 The Fund’s policy is to recognize transfers into and transfers out of Level 3 as of the end of the reporting period.
2 Transferred from Level 2 to Level 3 because fair values were determined using valuation techniques utilizing unobservable inputs due to observable inputs being unavailable.
For the year ended September 30, 2013, total change in unrealized gain (loss) on Level 3 securities included in the change in net assets was $3,856,705. Total unrealized gain (loss) for all securities (including Level 1 and Level 2) can be found on the accompanying Statement of Operations.
96 www.calvert.com CALVERT SOCIAL INVESTMENT FUND ANNUAL REPORT
| BOND | VALUATION INPUTS | |||||
| INVESTMENTS IN SECURITIES* | LEVEL 1 | LEVEL 2 | LEVEL 3 | TOTAL | ||
| Asset-backed securities | — | $17,672,530 | — | $17,672,530 | ||
| Collateralized mortgage-backed | — | 1,465,904 | — | 1,465,904 | ||
| obligations | ||||||
| Commercial mortgage-backed | — | 36,530,664 | — | 36,530,664 | ||
| securities | ||||||
| Corporate debt | — | 531,304,642 | — | 531,304,642 | ||
| Municipal obligations | — | 30,892,666 | — | 30,892,666 | ||
| U.S. government obligations | — | 58,676,693 | — | 58,676,693 | ||
| Other debt obligations | — | 28,218,496 | — | 28,218,496 | ||
| Equity securities | — | — | $1,291,500 | ** | 1,291,500 | |
| TOTAL | — | $704,761,595 | $1,291,500 | *** | $706,053,095 | |
| Other financial instruments**** | ($311,255) | — | — | ($311,255) | ) | |
* For a complete listing of investments, please refer to the Schedule of Investments.
** Securities valued at $1,291,500 were transferred from Level 2 to Level 3 during the period. *** Level 3 securities represent 0.2% of net assets.
**** Other financial instruments are derivative instruments not reflected in the Schedule of Investments, such as futures, which are valued at the unrealized appreciation/depreciation on the instrument.
| EQUITY | VALUATION INPUTS | ||||
| INVESTMENTS IN SECURITIES | LEVEL 1 | LEVEL 2 | LEVEL 3 | TOTAL | |
| Equity securities* | $2,662,683,350 | — | — | $2,662,683,350 | ** |
| Other debt obligations | — | $33,738,796 | — | 33,738,796 | |
| Venture capital | — | — | $21,816,309 | 21,816,309 | |
| TOTAL | $2,662,683,350 | $33,738,796 | $21,816,309*** | $2,718,238,455 | |
* For further breakdown of equity securities by industry, please refer to the Schedule of Investments. ** Exclusive of $7,889,103 venture capital equity shown in the venture capital equities heading. *** Level 3 securities represent 0.8% of net assets.
There were no transfers between levels during the period.
| LARGE CAP CORE | VALUATION INPUTS | |||
| INVESTMENTS IN SECURITIES | LEVEL 1 | LEVEL 2 | LEVEL 3 | TOTAL |
| Equity securities * | $116,942,637 | — | — | $116,942,637 |
| Other debt obligations | — | $12,933,011 | — | 12,933,011 |
| TOTAL | $116,942,637 | $12,933,011 | — | $129,875,648 |
* For further breakdown of equity securities by industry, please refer to the Schedule of Investments.
There were no transfers between levels during the period.
www.calvert.com CALVERT SOCIAL INVESTMENT FUND ANNUAL REPORT 97
Loan Participations and Assignments: The Fund may invest in direct debt instruments which are interests in amounts owed to lenders or lending syndicates by corporate, governmental, or other borrowers. A Fund’s investments in loans may be in the form of participations in loans or assignments of all or a portion of loans from third parties. A loan is often administered by a bank or other financial institution (the “lender”) that acts as agent for all holders. The agent administers the terms of the loan, as specified in the loan agreement. A Fund may invest in multiple series or tranches of a loan, which may have varying terms and carry different associated risks. A Fund generally has no right to enforce compliance with the terms of the loan agreement with the borrower. As a result, a Fund may be subject to the credit risk of both the borrower and the lender that is selling the loan agreement. When a Fund purchases assignments from lenders it acquires direct rights against the borrower of the loan. When investing in a loan participation, a Fund has the right to receive payments of principal, interest and any fees to which it is entitled only from the lender selling the loan agreement and only upon receipt of payments by the lender from the borrower.
Futures Contracts: The Fund may purchase and sell futures contracts, but only when, in the judgment of the Advisor, such a position acts as a hedge. The Fund may not enter into futures contracts for the purpose of speculation or leverage. These futures contracts may include, but are not limited to, futures contracts based on U.S. Government obligations. The Fund is subject to interest rate risk in the normal course of pursuing its investment objectives and may use futures contracts to hedge against changes in the value of interest rates. The Fund may enter into futures contracts agreeing to buy or sell a financial instrument for a set price at a future date. Initial margin deposits of either cash or securities as required by the broker are made upon entering into the contract. While the contract is open, daily variation margin payments are made to or received from the broker reflecting the daily change in market value of the contract and are recorded for financial reporting purposes as unrealized gains or losses by the Fund. When a futures contract is closed, a realized gain or loss is recorded equal to the difference between the opening and closing value of the contract. The risks associated with entering into futures contracts may include the possible illiquidity of the secondary market which would limit the Fund’s ability to close out a futures contract prior to the settlement date, an imperfect correlation between the value of the contracts and the underlying financial instruments, or that the counterparty will fail to perform its obligations under the contracts’ terms. Futures contracts are designed by boards of trade which are designated “contracts markets” by the Commodities Futures Trading Commission. Futures contracts trade on the contracts markets in a manner that is similar to the way a stock trades on a stock exchange and the boards of trade, through their clearing corporations, guarantee the futures contracts against default. As a result, there is minimal counterparty credit risk to the Fund. During the year, Balanced and Bond used U.S. Treasury Notes futures contracts to hedge against interest rate changes and to manage overall duration of the portfolios. The Fund’s futures contracts at year end are presented in the Schedule of Investments.
During the year, Balanced invested in E-Mini S & P 500 Index Futures as well as 2 year, 5 year, and 10 year U.S. Treasury Notes futures. The volume of outstanding contracts has varied throughout the year with a weighted average of 62 contracts and $2,449,978 weighted average notional value.
98 www.calvert.com CALVERT SOCIAL INVESTMENT FUND ANNUAL REPORT
During the year, Bond invested in 2 year, 5 year, 10 year, and 30 year U.S. Treasury Notes futures. The volume of outstanding contracts has varied throughout the year with a weighted average of 48 contracts and $5,315,508 weighted average notional value.
Restricted Securities: The Fund may invest in securities that are subject to legal or contractual restrictions on resale. Generally, these securities may only be sold publicly upon registration under the Securities Act of 1933 or in transactions exempt from such registration. Information regarding restricted securities is included after the Notes to Schedules of Investments.
Security Transactions and Net Investment Income: Security transactions are accounted for on trade date. Realized gains and losses are recorded on an identified cost basis and may include proceeds from litigation. Dividend income is recorded on the ex-dividend date or, in the case of dividends on certain foreign securities, as soon as the Fund is informed of the ex-dividend date. Withholding taxes on foreign dividends have been provided for in accordance with the Fund’s understanding of the applicable country’s tax rules and rates. Distributions received on securities that represent a return of capital or capital gain are recorded as a reduction of cost of investments and/or as a realized gain. Interest income, which includes amortization of premium and accretion of discount on debt securities, is accrued as earned. Debt obligations may be placed on non-accrual status and related interest income may be reduced by ceasing current accruals and writing off interest receivables when the collection of all or a portion of interest has become doubtful based on consistently applied procedures. (See Notes to Schedule of Investments on page 74). A debt obligation may be removed from non-accrual status when the issuer resumes interest payments or when collectability of interest is reasonably assured. The Fund earns certain fees in connection with its floating rate loan purchasing activities. These fees are in addition to interest payments earned and may include amendment fees, consent fees, and prepayment fees. Investment income and realized and unrealized gains and losses are allocated to separate classes of shares based upon the relative net assets of each class. Expenses arising in connection with a specific class are charged directly to that class. Expenses common to the classes are allocated to each class in proportion to their relative net assets.
Foreign Currency Transactions: The Fund’s accounting records are maintained in U.S. dollars. For valuation of assets and liabilities on each date of net asset value determination, foreign denominations are translated into U.S. dollars using the current exchange rate. Security transactions, income and expenses are translated at the prevailing rate of exchange on the date of the event. The effect of changes in foreign exchange rates on securities is included in the net realized and unrealized gain or loss on investments.
Distributions to Shareholders: Distributions to shareholders are recorded by the Fund on ex-dividend date. Dividends from net investment income are paid monthly by Bond, quarterly by Balanced, and annually by Equity and Large Cap Core. Distributions from net realized capital gains, if any, are paid at least annually. Distributions are determined in accordance with income tax regulations which may differ from generally accepted accounting principles; accordingly, periodic reclassifications are made within the Fund’s capital accounts to reflect income and gains available for distribution under income tax regulations.
www.calvert.com CALVERT SOCIAL INVESTMENT FUND ANNUAL REPORT 99
Estimates: The preparation of the financial statements in conformity with accounting principles generally accepted in the United States requires management to make estimates and assumptions that affect the reported amounts of assets and liabilities and disclosure of contingent assets and liabilities at the date of the financial statements and the reported amounts of income and expenses during the reported period. Actual results could differ from those estimates.
Redemption Fees: Balanced, Bond, Equity, and Large Cap Core each charge a 2% redemption fee on redemptions, including exchanges, made within 30 days of purchase in the same Portfolio (within seven days for all Class I shares). The redemption fee is accounted for as an addition to paid-in capital and is intended to discourage market-timers by ensuring that short-term trading costs are borne by the investors making the transactions and not the shareholders already in the Portfolio.
Expense Offset Arrangements: The Fund had an arrangement with the custodian bank whereby the custodian’s fees may have been paid indirectly by credits earned on the Fund’s cash on deposit with the bank. These credits were used to reduce the Fund’s expenses. This arrangement was suspended on January 1, 2013, until further notice, due to low interest rates. Such a deposit arrangement was an alternative to overnight investments.
Federal Income Taxes: No provision for federal income or excise tax is required since the Fund intends to continue to qualify as a regulated investment company under the Internal Revenue Code and to distribute substantially all of its taxable earnings.
Management has analyzed the Fund’s tax positions taken for all open federal income tax years and has concluded that no provision for federal income tax is required in the Fund’s financial statements. A Fund’s federal tax return is subject to examination by the Internal Revenue Service for a period of three years.
NOTE B — RELATED PARTY TRANSACTIONS
Calvert Investment Management, Inc. (the “Advisor”) is wholly-owned by Calvert Investments, Inc., which is indirectly wholly-owned by Ameritas Mutual Holding Company. The Advisor provides investment advisory services and pays the salaries and fees of officers and Trustees of the Fund who are employees of the Advisor or its affiliates.
For its services, the Advisor receives monthly fees based on the following annual rates of average daily net assets:
| BALANCED: | ||
| First $500 Million | .425 | % |
| Next $500 Million | .40 | % |
| Over $1 Billion | .375 | % |
| BOND: | ||
| First $1 Billion | .35 | % |
| Over $1 Billion | .325 | % |
100 www.calvert.com CALVERT SOCIAL INVESTMENT FUND ANNUAL REPORT
| EQUITY: | ||
| First $2 Billion | .50 | % |
| Next $1 Billion | .475 | % |
| Over $3 Billion | .45 | % |
| LARGE CAP CORE: | ||
| First $250 Million | .60 | % |
| Over $250 Million | .55 | % |
For the year ended September 30, 2013, the Advisor voluntarily waived $1,215, $284,141 and $112,418 of its fee for Balanced, Equity and Large Cap Core, respectively.
The Advisor has contractually agreed to limit net annual fund operating expenses through January 31, 2014 for Balanced Class I, Bond Class Y, Equity Class Y, and Large Cap Core Class I, and through January 31, 2015 for Balanced Class Y. For the purpose of this expense limit, operating expenses do not include interest expense, brokerage commissions, taxes, and extraordinary expenses. This expense limitation does not limit any acquired fund fees and expenses, if any. To the extent any expense offset credits are earned, the Advisor’s obligation under the contractual limitation may be reduced and the Advisor may benefit from the expense offset arrangement.
The contractual expense caps are as follows: .72% for Balanced Class I, .97% for Balanced Class Y, .92% for Bond Class Y, .96% for Equity Class Y, and .81% for Large Cap Core Class I.
During the year ended September 30, 2013, the Advisor voluntarily reimbursed expenses of $1,005, $2,074 and $4,768 for Class B shares of Balanced, Bond and Large Cap Core. As well as, $3,797 for Large Cap Core Class Y.
Calvert Investment Administrative Services, Inc., an affiliate of the Advisor, provides administrative services for the Fund for an annual fee, payable monthly, based on the following annual rates of average daily net assets:
| Balanced (Class A, B, C, & Y) | .275 | % |
| Balanced (Class I) | .125 | % |
| Bond (Class A, B, C & Y) | .30 | % |
| Bond (Class I) | .10 | % |
| Equity (Class A, B, C & Y) | .20 | % |
| Equity (Class I) | .10 | % |
| Large Cap Core (Class A, B, C, & Y) | .15 | % |
| Large Cap Core (Class I) | .10 | % |
Calvert Investment Distributors, Inc. (“CID”), an affiliate of the Advisor, is the distributor and principal underwriter for the Fund. Pursuant to Rule 12b-1 under the Investment Company Act of 1940, each Fund has adopted a Distribution Plan that permits each Fund to pay certain expenses associated with the distribution and servicing of its shares. The expenses paid for Class A may not exceed .35% of the annual average daily net assets of Balanced and Bond and .25% of those of Equity and Large Cap Core. The amount
www.calvert.com CALVERT SOCIAL INVESTMENT FUND ANNUAL REPORT 101
actually paid by Class A of Balanced, Bond, Equity, and Large Cap Core is an annualized fee, payable monthly, of .25% (for Balanced only on assets over $30 million), .20%, .25%, and .25%, respectively, of each Classes’ average daily net assets. The expenses paid for Class B and Class C may not exceed 1.00% of the annual average daily net assets of Balanced, Bond, Equity, and Large Cap Core. The amount actually paid, is an annualized fee, payable monthly of 1.00%, of each Classes’ average daily net assets. Class I for Balanced, Bond, Equity, and Large Cap Core, and Class Y for Bond and Equity do not have Distribution Plan expenses.
CID received the following amounts as its portion of the commissions charged on sales of the Fund’s Class A shares for the year ended September 30, 2013: $174,046 for Balanced, $72,394 for Bond, $191,099 for Equity, and $26,461 for Large Cap Core.
Calvert Investment Services, Inc. (“CIS”), an affiliate of the Advisor, is the shareholder servicing agent for the Fund. For its services, CIS received fees of $164,012, $122,118, $367,769, and $21,479 for the year ended September 30, 2013 for Balanced, Bond, Equity, and Large Cap Core, respectively.
The Fund invests in Community Investment Notes issued by the Calvert Social Investment Foundation (the “CSI Foundation”). The CSI Foundation is a 501(c)(3) non-profit organization that receives in-kind support from Calvert and its subsidiaries. The Fund has received an exemptive order from the Securities and Exchange Commission permitting the Fund to make investments in these notes under certain conditions.
Each Trustee of the Funds who is not an employee of the Advisor or its affiliates receives an annual retainer of $48,000 plus a meeting fee of up to $3,000 for each regular Board meeting attended. Additional fees of up to $5,000 annually may be paid to the Board chair and Committee chairs ($10,000 for Special Equities Committee chair) and $2,500 annually may be paid to Committee members, plus a Committee meeting fee of $500 for each regular Committee meeting attended. Trustees’ fees are allocated to each of the funds served.
NOTE C — INVESTMENT ACTIVITY AND TAX INFORMATION
During the year, the cost of purchases and proceeds from sales of investments, other than U.S. Government and short-term securities, were:
| BALANCED | BOND | EQUITY | LARGE CAP CORE | |
| Purchases | $355,273,958 | $609,283,157 | $794,030,396 | $66,134,906 |
| Sales | 360,439,212 | 590,576,106 | 817,499,889 | 60,816,943 |
U.S. Government security purchases and sales were:
| BALANCED | BOND | |
| Purchases | $228,725,674 | $943,989,675 |
| Sales | 242,860,059 | 957,931,778 |
102 www.calvert.com CALVERT SOCIAL INVESTMENT FUND ANNUAL REPORT
The Portfolios may purchase securities, typically short-term variable rate demand notes, from or sell to other Portfolios managed by the Advisor. These interportfolio transactions are primarily used for cash management purposes and are made pursuant to Rule 17a-7 of the Investment Company Act of 1940. For the year ended September 30, 2013, such purchase and sales transactions and the related realized gains and losses were:
| BALANCED | BOND | |
| Purchases | $33,397,132 | $48,195,173 |
| Sales | 30,709,938 | 47,858,938 |
| Realized gain (loss) | 19,302 | 16,016 |
| CAPITAL LOSS CARRYFORWARDS | ||
| EXPIRATION DATE | EQUITY | |
| 30-Sep-17 | ($83,838,364 | ) |
Under the Regulated Investment Company Modernization Act of 2010, capital losses incurred in taxable years beginning after December 22, 2010 can be carried forward for an unlimited period. These losses are required to be utilized prior to the losses incurred in pre-enactment taxable years and will retain their characters as either long-term or short-term. Losses incurred in pre-enactment taxable years can be utilized until expiration. Equity’s use of net capital losses acquired from Calvert Large Cap Growth Fund may be limited under certain tax provisions.
Bond intends to elect to defer net capital losses of $11,924,654 incurred from November 1, 2012 through September 30, 2013 and treat them as arising in the fiscal year ending September 30, 2014.
The tax character of dividends and distributions paid during the years ended September 30, 2013 and September 30, 2012 was as follows:
| BALANCED | ||
| DISTRIBUTIONS PAID FROM: | 2013 | 2012 |
| Ordinary income | $3,815,911 | $3,613,115 |
| Total | $3,815,911 | $3,613,115 |
| BOND | ||
| DISTRIBUTIONS PAID FROM: | 2013 | 2012 |
| Ordinary income | $28,770,766 | $29,655,080 |
| Long-term capital gain | 572,606 | — |
| Total | $29,343,372 | $29,655,080 |
www.calvert.com CALVERT SOCIAL INVESTMENT FUND ANNUAL REPORT 103
| EQUITY | ||
| DISTRIBUTIONS PAID FROM: | 2013 | 2012 |
| Ordinary income | $999,798 | — |
| Long-term capital gain | 3,421,590 | $106,844,989 |
| Total | 4,421,388 | $106,844,989 |
| LARGE CAP CORE | ||
| DISTRIBUTIONS PAID FROM: | 2013 | |
| Ordinary income | $792,943 | |
| Long-term capital gain | 126,812 | |
| Total | $919,755 | |
As of September 30, 2013, the tax basis components of distributable earnings/(accumulated losses) and the federal tax cost were as follows:
| BALANCED | BOND | |||
| Unrealized appreciation | $89,135,608 | $14,694,741 | ||
| Unrealized (depreciation) | (15,148,541 | ) | (22,522,608 | ) |
| Net unrealized appreciation/(depreciation) | $73,987,067 | ($7,827,867 | ) | |
| Undistributed ordinary income | $155,833 | $1,410,817 | ||
| Undistributed long-term capital gain | $16,536,626 | — | ||
| Federal income tax cost of investments | $506,608,445 | $713,880,962 | ||
| EQUITY | LARGE CAP CORE | |||
| Unrealized appreciation | $764,705,598 | $24,645,033 | ||
| Unrealized (depreciation) | (18,668,664 | ) | (363,935 | ) |
| Net unrealized appreciation/(depreciation) | $746,036,934 | $24,281,098 | ||
| Undistributed ordinary income | $6,186,144 | $785,314 | ||
| Undistributed long-term capital gain | $86,454,960 | $232,853 | ||
| Capital loss carryforward | ($83,838,364 | ) | — | |
| Federal income tax cost of investments | $1,972,201,521 | $105,594,550 | ||
The differences between the components of distributable earnings on a tax basis and the amounts reflected in the statements of assets and liabilities are primarily due to temporary book-tax differences that will reverse in a subsequent period. For Balanced, the differences are due to Section 1256 contracts, partnerships, and wash sales. For Bond, the differences are due to Section 1256 contracts, wash sales, and deferral of post-October capital losses. For Equity, the differences are due to wash sales, partnerships, and capital loss limitations under Internal Revenue Code Section 382. For Large Cap Core, the differences are due to wash sales.
104 www.calvert.com CALVERT SOCIAL INVESTMENT FUND ANNUAL REPORT
Reclassifications, as shown in the table below, have been made to the Funds’ components of net assets to reflect income and gains available for distribution (or available capital loss carryforwards, as applicable) under income tax law and regulations. These reclassifications are due to permanent book-tax differences and have no impact on net assets. For Balanced, the reclassifications are due to partnerships, tax-exempt income, return of capital distributions, and asset-backed securities. For Bond, the reclassifications are due to asset-backed securities and tax-exempt income. For Equity, the reclassifications are due to foreign currency transactions and partnerships. For Large Cap Core, the reclassifications are due to foreign currency transactions.
| BALANCED | BOND | |||
| Undistributed net investment income | $7,272 | $404,150 | ||
| Accumulated net realized gain (loss) | (7,355 | ) | (404,716 | ) |
| Paid-in capital | 83 | 566 | ||
| EQUITY | LARGE CAP CORE | |||
| Undistributed net investment income | ($256,474 | ) | ($29 | ) |
| Accumulated net realized gain (loss) | 256,880 | 29 | ||
| Paid-in capital | (406 | ) | — | |
NOTE D — LINE OF CREDIT
A financing agreement is in place with the Calvert Funds and State Street Corporation (“SSC”). Under the agreement, SSC provides an unsecured line of credit facility, in the aggregate amount of $50 million ($25 million committed and $25 million uncommitted), accessible by the Funds for temporary or emergency purposes only. Borrowings under the committed facility bear interest at the higher of the London Interbank Offered Rate (LIBOR) or the overnight Federal Funds Rate plus 1.25% per annum. A commitment fee of .11% per annum is incurred on the unused portion of the committed facility, which is allocated to all participating funds. Balanced, Equity, and Large Cap Core had no borrowings under the agreement during the year ended September 30, 2013. Bond had no loans outstanding pursuant to this line of credit at September 30, 2013. For the year ended September 30, 2013, borrowings by Bond under the agreement were as follows:
| WEIGHTED | MAXIMUM | MONTH OF | ||
| AVERAGE DAILY | AVERAGE INTEREST | AMOUNT | MAXIMUM AMOUNT | |
| PORTFOLIO | BALANCE | RATE | BORROWED | BORROWED |
| Bond | $4,339 | 1.39% | $1,188,343 | August 2013 |
NOTE E — AFFILIATED COMPANIES
An affiliated company is a company in which the Portfolios have a direct or indirect ownership of, control of, or voting power over 5 percent or more of the outstanding voting shares.
www.calvert.com CALVERT SOCIAL INVESTMENT FUND ANNUAL REPORT 105
Affiliated companies of the Balanced Portfolio as of September 30, 2013 are as follows:
| AFFILIATES | COST | VALUE |
| GEEMF Partners LP | — | $105,487 |
| Kickboard, Inc. | $285,329 | 285,328 |
| TOTALS | $285,329 | $390,815 |
Affiliated companies of the Equity Portfolio as of September 30,2013 are as follows:
| AFFILIATES | COST | VALUE |
| Coastal Ventures III, LP | $200,000 | $173,513 |
| Digital Directions International, Inc. | 683,778 | 91,942 |
| Global Resource Options, Inc. | 3,200,178 | 967,350 |
| New Day Farms, Inc. | 506,225 | — |
| Shangri La Farms, Ltd. | 200,000 | 200,001 |
| TOTALS | $4,790,181 | $1,432,806 |
NOTE F — CAPITAL COMMITMENTS
In connection with certain venture capital investments, the Balanced and Equity Portfolios are committed to future capital calls, which will increase the Portfolios’ investment in these securities. The aggregate amount of the future capital commitments totals $60,000 and $6,550,767, respectively, at September 30, 2013.
NOTE G — REGULATORY MATTERS
In October 2011, the Advisor determined that it was necessary to change the price at which one of the Balanced and Bond portfolio securities was then being fair valued. The Advisor and the Board of Trustees subsequently determined it was appropriate to change the fair value prices at which that security and certain related securities had been carried from March 2008 through September 30, 2011. These fair value revisions had the effect of changing the net asset value per share at which shareholder subscriptions and redemptions were executed during the affected period. Accordingly, in December 2011, pursuant to an agreement (“the Agreement”) with the Board of Trustees, the Advisor contributed $206,623 and $3,320,907 to the Balanced and Bond Portfolios, respectively, to adjust shareholder trades occurring during the respective period for the benefit of affected shareholders.
Subsequent to the Agreement, the Securities and Exchange Commission (“SEC”) conducted a compliance examination of the Advisor and the Calvert Funds (“the Funds”). In a letter dated November 1, 2013, the SEC communicated their examination findings that included various deficiencies and weaknesses and concerns regarding whether the contribution and shareholder disbursement, discussed above, was properly calculated and distributed to certain shareholders.
Management of the Advisor and the Funds are preparing a response to the SEC examination and believe a number of corrective actions have been taken since October 2011 to address the matters raised in the examination. Also, in management’s opinion, the con-
106 www.calvert.com CALVERT SOCIAL INVESTMENT FUND ANNUAL REPORT
tribution noted above was properly calculated and distributed by the Balanced and Bond Portfolios to benefit the affected shareholders and was in accordance with the Agreement. It is also management’s opinion that the resolution of the examination matters will not have a material adverse effect on the financial position or results of operations of the Balanced and Bond Portfolios.
NOTE H — SUBSEQUENT EVENTS
In preparing the financial statements as of September 30, 2013, no other subsequent events or transactions occurred that would have required recognition or disclosure in these financial statements.
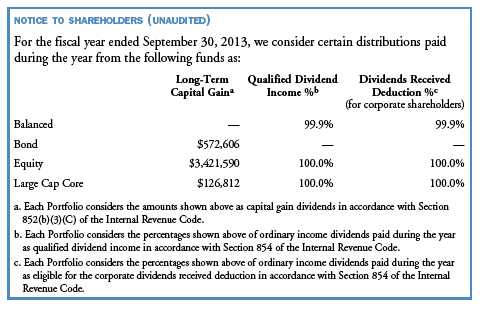
www.calvert.com CALVERT SOCIAL INVESTMENT FUND ANNUAL REPORT 107
| BALANCED PORTFOLIO | ||||||
| FINANCIAL HIGHLIGHTS | ||||||
| YEARS ENDED | ||||||
| SEPTEMBER 30, | SEPTEMBER 30, | SEPTEMBER 30, | ||||
| CLASS A SHARES | 2013 | (z) | 2012 | (z) | 2011 | (z) |
| Net asset value, beginning | $30.81 | $26.19 | $25.94 | |||
| Income from investment operations: | ||||||
| Net investment income | .24 | .23 | .29 | |||
| Net realized and unrealized gain (loss) | 3.32 | 4.62 | .22 | |||
| Total from investment operations | 3.56 | 4.85 | .51 | |||
| Distributions from: | ||||||
| Net investment income | (.24 | ) | (.23 | ) | (.26 | ) |
| Net realized gain | — | — | — | |||
| Total distributions | (.24 | ) | (.23 | ) | (.26 | ) |
| Total increase (decrease) in net asset value | 3.32 | 4.62 | .25 | |||
| Net asset value, ending | $34.13 | $30.81 | $26.19 | |||
| Total return* | 11.60 | % | 18.58 | % | 1.94 | % |
| Ratios to average net assets: A | ||||||
| Net investment income | .76 | % | .78 | % | 1.04 | % |
| Total expenses | 1.18 | % | 1.22 | % | 1.22 | % |
| Expenses before offsets | 1.18 | % | 1.22 | % | 1.22 | % |
| Net expenses | 1.18 | % | 1.22 | % | 1.22 | % |
| Portfolio turnover | 114 | % | 145 | % | 100 | % |
| Net assets, ending (in thousands) | $497,160 | $447,678 | $405,716 | |||
| YEARS ENDED | ||||||
| SEPTEMBER 30, | SEPTEMBER 30, | |||||
| CLASS A SHARES | 2010 | (z) | 2009 | |||
| Net asset value, beginning | $24.02 | $25.03 | ||||
| Income from investment operations: | ||||||
| Net investment income | .27 | .40 | ||||
| Net realized and unrealized gain (loss) | 1.91 | (1.03 | ) | |||
| Total from investment operations | 2.18 | (.63 | ) | |||
| Distributions from: | ||||||
| Net investment income | (.26 | ) | (.38 | ) | ||
| Net realized gain | — | *** | ||||
| Total distributions | (.26 | ) | (.38 | ) | ||
| Total increase (decrease) in net asset value | 1.92 | (1.01 | ) | |||
| Net asset value, ending | $25.94 | $24.02 | ||||
| Total return* | 9.12 | % | (2.29 | %) | ||
| Ratios to average net assets: A | ||||||
| Net investment income | 1.08 | % | 1.87 | % | ||
| Total expenses | 1.23 | % | 1.28 | % | ||
| Expenses before offsets | 1.23 | % | 1.28 | % | ||
| Net expenses | 1.23 | % | 1.28 | % | ||
| Portfolio turnover | 75 | % | 57 | % | ||
| Net assets, ending (in thousands) | $419,363 | $404,542 | ||||
See notes to financial highlights.
108 www.calvert.com CALVERT SOCIAL INVESTMENT FUND ANNUAL REPORT
| BALANCED PORTFOLIO | ||||||
| FINANCIAL HIGHLIGHTS | ||||||
| YEARS ENDED | ||||||
| SEPTEMBER 30, | SEPTEMBER 30, | SEPTEMBER 30, | ||||
| CLASS B SHARES | 2013 | (z) | 2012 | (z) | 2011 | (z) |
| Net asset value, beginning | $30.47 | $25.96 | $25.73 | |||
| Income from investment operations: | ||||||
| Net investment income (loss) | (.11 | ) | (.07 | ) | ** | |
| Net realized and unrealized gain (loss) | 3.27 | 4.58 | .23 | |||
| Total from investment operations | 3.16 | 4.51 | .23 | |||
| Distributions from: | ||||||
| Net investment income | — | *** | — | |||
| Net realized gain | — | — | — | |||
| Total distributions | — | — | — | |||
| Total increase (decrease) in net asset value | 3.16 | 4.51 | .23 | |||
| Net asset value, ending | $33.63 | $30.47 | $25.96 | |||
| Total return* | 10.37 | % | 17.39 | % | .89 | % |
| Ratios to average net assets:A | ||||||
| Net investment income (loss) | (.34 | %) | (.23 | %) | .01 | % |
| Total expenses | 2.30 | % | 2.23 | % | 2.24 | % |
| Expenses before offsets | 2.29 | % | 2.23 | % | 2.24 | % |
| Net expenses | 2.29 | % | 2.23 | % | 2.24 | % |
| Portfolio turnover | 114 | % | 145 | % | 100 | % |
| Net assets, ending (in thousands) | $5,731 | $7,835 | $9,306 | |||
| YEARS ENDED | ||||||
| SEPTEMBER 30, | SEPTEMBER 30, | |||||
| CLASS B SHARES | 2010 | (z) | 2009 | |||
| Net asset value, beginning | $23.83 | $24.84 | ||||
| Income from investment operations: | ||||||
| Net investment income | .01 | .13 | ||||
| Net realized and unrealized gain (loss) | 1.90 | (.99 | ) | |||
| Total from investment operations | 1.91 | (.86 | ) | |||
| Distributions from: | ||||||
| Net investment income | (.01 | ) | (.15 | ) | ||
| Net realized gain | — | *** | ||||
| Total distributions | (.01 | ) | (.15 | ) | ||
| Total increase (decrease) in net asset value | 1.90 | (1.01 | ) | |||
| Net asset value, ending | $25.73 | $23.83 | ||||
| Total return* | 8.02 | % | (3.35 | %) | ||
| Ratios to average net assets:A | ||||||
| Net investment income | .04 | % | .82 | % | ||
| Total expenses | 2.27 | % | 2.36 | % | ||
| Expenses before offsets | 2.27 | % | 2.36 | % | ||
| Net expenses | 2.27 | % | 2.35 | % | ||
| Portfolio turnover | 75 | % | 57 | % | ||
| Net assets, ending (in thousands) | $12,127 | $14,294 | ||||
See notes to financial highlights.
www.calvert.com CALVERT SOCIAL INVESTMENT FUND ANNUAL REPORT 109
| BALANCED PORTFOLIO | |||||||||
| FINANCIAL HIGHLIGHTS | |||||||||
| YEARS ENDED | |||||||||
| SEPTEMBER 30, | SEPTEMBER 30, | SEPTEMBER 30, | |||||||
| CLASS C SHARES | 2013 | (z) | 2012 | (z) | 2011 | (z) | |||
| Net asset value, beginning | $ | 30.23 | $ | 25.72 | $ | 25.47 | |||
| Income from investment operations: | |||||||||
| Net investment income (loss) | (.02 | ) | (.02 | ) | .05 | ||||
| Net realized and unrealized gain (loss) | 3.25 | 4.54 | .23 | ||||||
| Total from investment operations | 3.23 | 4.52 | .28 | ||||||
| Distributions from: | |||||||||
| Net investment income | (.01 | ) | (.01 | ) | (.03 | ) | |||
| Net realized gain | — | �� | — | ||||||
| Total distributions | (.01 | ) | (.01 | ) | (.03 | ) | |||
| Total increase (decrease) in net asset value | 3.22 | 4.51 | .25 | ||||||
| Net asset value, ending | $ | 33.45 | $ | 30.23 | $ | 25.72 | |||
| Total return* | 10.71 | % | 17.60 | % | 1.08 | % | |||
| Ratios to average net assets:A | |||||||||
| Net investment income (loss) | (.06 | %) | (.05 | %) | .18 | % | |||
| Total expenses | 1.99 | % | 2.05 | % | 2.07 | % | |||
| Expenses before offsets | 1.99 | % | 2.05 | % | 2.07 | % | |||
| Net expenses | 1.99 | % | 2.05 | % | 2.07 | % | |||
| Portfolio turnover | 114 | % | 145 | % | 100 | % | |||
| Net assets, ending (in thousands) | $ | 37,812 | $ | 29,605 | $ | 24,335 | |||
| YEARS ENDED | |||||||||
| SEPTEMBER 30, | SEPTEMBER 30, | ||||||||
| CLASS C SHARES | 2010 | (z) | 2009 | ||||||
| Net asset value, beginning | $ | 23.58 | $ | 24.58 | |||||
| Income from investment operations: | |||||||||
| Net investment income | .05 | .19 | |||||||
| Net realized and unrealized gain (loss) | 1.88 | (1.01 | ) | ||||||
| Total from investment operations | 1.93 | (.82 | ) | ||||||
| Distributions from: | |||||||||
| Net investment income | (.04 | ) | (.18 | ) | |||||
| Net realized gain | — | *** | |||||||
| Total distributions | (.04 | ) | (.18 | ) | |||||
| Total increase (decrease) in net asset value | 1.89 | (1.00 | ) | ||||||
| Net asset value, ending | $ | 25.47 | $ | 23.58 | |||||
| Total return* | 8.17 | % | (3.22 | %) | |||||
| Ratios to average net assets:A | |||||||||
| Net investment income | .19 | % | .95 | % | |||||
| Total expenses | 2.12 | % | 2.21 | % | |||||
| Expenses before offsets | 2.12 | % | 2.21 | % | |||||
| Net expenses | 2.12 | % | 2.21 | % | |||||
| Portfolio turnover | 75 | % | 57 | % | |||||
| Net assets, ending (in thousands) | $ | 24,269 | $ | 21,810 | |||||
See notes to financial highlights.
110 www.calvert.com CALVERT SOCIAL INVESTMENT FUND ANNUAL REPORT
| BALANCED PORTFOLIO | |||||||||
| FINANCIAL HIGHLIGHTS | |||||||||
| YEARS ENDED | |||||||||
| SEPTEMBER 30, | SEPTEMBER 30, | SEPTEMBER 30, | |||||||
| CLASS I SHARES | 2013 | (z) | 2012 | (z) | 2011 | (z) | |||
| Net asset value, beginning | $ | 31.19 | $ | 26.49 | $ | 26.22 | |||
| Income from investment operations: | |||||||||
| Net investment income | .41 | .45 | .43 | ||||||
| Net realized and unrealized gain (loss) | 3.35 | 4.61 | .23 | ||||||
| Total from investment operations | 3.76 | 5.06 | .66 | ||||||
| Distributions from: | |||||||||
| Net investment income | (.40 | ) | (.36 | ) | (.39 | ) | |||
| Net realized gain | — | — | — | ||||||
| Total distributions | (.40 | ) | (.36 | ) | (.39 | ) | |||
| Total increase (decrease) in net asset value | 3.36 | 4.70 | .27 | ||||||
| Net asset value, ending | $ | 34.55 | $ | 31.19 | $ | 26.49 | |||
| Total return* | 12.13 | % | 19.16 | % | 2.45 | % | |||
| Ratios to average net assets:A | |||||||||
| Net investment income | 1.26 | % | 1.43 | % | 1.54 | % | |||
| Total expenses | .68 | % | .83 | % | 1.33 | % | |||
| Expenses before offsets | .68 | % | .70 | % | .72 | % | |||
| Net expenses | .68 | % | .70 | % | .72 | % | |||
| Portfolio turnover | 114 | % | 145 | % | 100 | % | |||
| Net assets, ending (in thousands) | $ | 35,578 | $ | 29,601 | $ | 1,820 | |||
| YEARS ENDED | |||||||||
| SEPTEMBER 30, | SEPTEMBER 30, | ||||||||
| CLASS I SHARES | 2010 | (z) | 2009 | ||||||
| Net asset value, beginning | $ | 24.25 | $ | 25.27 | |||||
| Income from investment operations: | |||||||||
| Net investment income | .42 | .52 | |||||||
| Net realized and unrealized gain (loss) | 1.93 | (1.04 | ) | ||||||
| Total from investment operations | 2.35 | (.52 | ) | ||||||
| Distributions from: | |||||||||
| Net investment income | (.38 | ) | (.50 | ) | |||||
| Net realized gain | — | *** | |||||||
| Total distributions | (.38 | ) | (.50 | ) | |||||
| Total increase (decrease) in net asset value | 1.97 | (1.02 | ) | ||||||
| Net asset value, ending | $ | 26.22 | $ | 24.25 | |||||
| Total return* | 9.72 | % | (1.76 | %) | |||||
| Ratios to average net assets:A | |||||||||
| Net investment income | 1.62 | % | 2.42 | % | |||||
| Total expenses | 1.09 | % | .89 | % | |||||
| Expenses before offsets | .72 | % | .73 | % | |||||
| Net expenses | .72 | % | .72 | % | |||||
| Portfolio turnover | 75 | % | 57 | % | |||||
| Net assets, ending (in thousands) | $ | 1,518 | $ | 5,875 | |||||
See notes to financial highlights.
www.calvert.com CALVERT SOCIAL INVESTMENT FUND ANNUAL REPORT 111
| BALANCED PORTFOLIO | |||
| FINANCIAL HIGHLIGHTS | |||
| PERIOD ENDED | |||
| SEPTEMBER 30, | |||
| CLASS Y SHARES | 2013 | ##(z) | |
| Net asset value, beginning | $ | 32.60 | |
| Income from investment operations: | |||
| Net investment income | .18 | ||
| Net realized and unrealized gain (loss) | 1.48 | ||
| Total from investment operations | 1.66 | ||
| Distributions from: | |||
| Net investment income | (.01 | ) | |
| Net realized gain | — | ||
| Total distributions | (.01 | ) | |
| Total increase (decrease) in net asset value | 1.65 | ||
| Net asset value, ending | $ | 34.25 | |
| Total return* | 5.11 | % | |
| Ratios to average net assets:A | |||
| Net investment income | .71 | % (a) | |
| Total expenses | 61.96 | % (a) | |
| Expenses before offsets | .97 | % (a) | |
| Net expenses | .97 | % (a) | |
| Portfolio turnover | 114 | % | |
| Net assets, ending (in thousands) | $ | 66 | |
See notes to financial highlights.
112 www.calvert.com CALVERT SOCIAL INVESTMENT FUND ANNUAL REPORT
| BOND PORTFOLIO | ||||||
| FINANCIAL HIGHLIGHTS | ||||||
| YEARS ENDED | ||||||
| SEPTEMBER 30, | SEPTEMBER 30, | SEPTEMBER 30, | ||||
| CLASS A SHARES | 2013 | (z) | 2012 | 2011 | ||
| Net asset value, beginning | $16.58 | $15.85 | $16.00 | ^ | ||
| Income from investment operations: | ||||||
| Net investment income | .33 | .40 | .42 | |||
| Net realized and unrealized gain (loss) | (.69 | ) | .91 | .02 | ^ | |
| Total from investment operations | (.36 | ) | 1.31 | .44 | ||
| Distributions from: | ||||||
| Net investment income | (.35 | ) | (.41 | ) | (.43 | ) |
| Net realized gain | (.26 | ) | (.17 | ) | (.16 | ) |
| Total distributions | (.61 | ) | (.58 | ) | (.59 | ) |
| Total increase (decrease) in net asset value | (.97 | ) | .73 | (.15 | ) | |
| Net asset value, ending | $15.61 | $16.58 | $15.85 | |||
| Total return* | (2.27 | %) | 8.47 | % | 2.83 | %^ |
| Ratios to average net assets:A | ||||||
| Net investment income | 2.05 | % | 2.52 | % | 2.63 | % |
| Total expenses | 1.11 | % | 1.16 | % | 1.13 | % |
| Expenses before offsets | 1.11 | % | 1.16 | % | 1.13 | % |
| Net expenses | 1.11 | % | 1.16 | % | 1.13 | % |
| Portfolio turnover | 214 | % | 228 | % | 203 | % |
| Net assets, ending (in thousands) | $408,823 | $473,995 | $516,884 | |||
| YEARS ENDED | ||||||
| SEPTEMBER 30, | SEPTEMBER 30, | |||||
| CLASS A SHARES | 2010 | ^ | 2009 | ^ | ||
| Net asset value, beginning | $15.12 | ^ | $15.06 | ^ | ||
| Income from investment operations: | ||||||
| Net investment income | .41 | .53 | ||||
| Net realized and unrealized gain (loss) | .95 | ^ | .30 | ^ | ||
| Total from investment operations | 1.36 | .83 | ||||
| Distributions from: | ||||||
| Net investment income | (.38 | ) | (.51 | ) | ||
| Net realized gain | (.10 | ) | (.26 | ) | ||
| Total distributions | (.48 | ) | (.77 | ) | ||
| Total increase (decrease) in net asset value | .88 | .06 | ||||
| Net asset value, ending | $16.00 | ^ | $15.12 | ^ | ||
| Total return* | 9.19 | %^ | 5.97 | %^ | ||
| Ratios to average net assets:A | ||||||
| Net investment income | 2.63 | % | 3.71 | % | ||
| Total expenses | 1.14 | % | 1.15 | % | ||
| Expenses before offsets | 1.14 | % | 1.15 | % | ||
| Net expenses | 1.14 | % | 1.14 | % | ||
| Portfolio turnover | 78 | % | 77 | % | ||
| Net assets, ending (in thousands) | $592,736 | ^ | $597,246 | ^ | ||
See notes to financial highlights.
www.calvert.com CALVERT SOCIAL INVESTMENT FUND ANNUAL REPORT 113
| BOND PORTFOLIO | ||||||
| FINANCIAL HIGHLIGHTS | ||||||
| YEARS ENDED | ||||||
| SEPTEMBER 30, | SEPTEMBER 30, | SEPTEMBER 30, | ||||
| CLASS B SHARES | 2013 | (z) | 2012 | 2011 | ||
| Net asset value, beginning | $16.45 | $15.74 | $15.89 | ^ | ||
| Income from investment operations: | ||||||
| Net investment income | .16 | .24 | .26 | |||
| Net realized and unrealized gain (loss) | (.69 | ) | .89 | .02 | ^ | |
| Total from investment operations | (.53 | ) | 1.13 | .28 | ||
| Distributions from: | ||||||
| Net investment income | (.17 | ) | (.25 | ) | (.27 | ) |
| Net realized gain | (.26 | ) | (.17 | ) | (.16 | ) |
| Total distributions | (.43 | ) | (.42 | ) | (.43 | ) |
| Total increase (decrease) in net asset value | (.96 | ) | .71 | (.15 | ) | |
| Net asset value, ending | $15.49 | $16.45 | $15.74 | |||
| Total return* | (3.28 | %) | 7.32 | % | 1.78 | %^ |
| Ratios to average net assets:A | ||||||
| Net investment income | .96 | % | 1.50 | % | 1.57 | % |
| Total expenses | 2.36 | % | 2.31 | % | 2.21 | % |
| Expenses before offsets | 2.19 | % | 2.19 | % | 2.19 | % |
| Net expenses | 2.19 | % | 2.19 | % | 2.19 | % |
| Portfolio turnover | 214 | % | 228 | % | 203 | % |
| Net assets, ending (in thousands) | $2,274 | $4,265 | $5,635 | |||
| YEARS ENDED | ||||||
| SEPTEMBER 30, | SEPTEMBER 30, | |||||
| CLASS B SHARES | 2010 | ^ | 2009 | ^ | ||
| Net asset value, beginning | $15.03 | ^ | $14.97 | ^ | ||
| Income from investment operations: | ||||||
| Net investment income | .25 | .40 | ||||
| Net realized and unrealized gain (loss) | .93 | ^ | .29 | ^ | ||
| Total from investment operations | 1.18 | .69 | ||||
| Distributions from: | ||||||
| Net investment income | (.22 | ) | (.37 | ) | ||
| Net realized gain | (.10 | ) | (.26 | ) | ||
| Total distributions | (.32 | ) | (.63 | ) | ||
| Total increase (decrease) in net asset value | .86 | .06 | ||||
| Net asset value, ending | $15.89 | ^ | $15.03 | ^ | ||
| Total return* | 7.98 | %^ | 5.00 | %^ | ||
| Ratios to average net assets:A | ||||||
| Net investment income | 1.60 | % | 2.81 | % | ||
| Total expenses | 2.18 | % | 2.13 | % | ||
| Expenses before offsets | 2.18 | % | 2.13 | % | ||
| Net expenses | 2.18 | % | 2.11 | % | ||
| Portfolio turnover | 78 | % | 77 | % | ||
| Net assets, ending (in thousands) | $8,845 | ^ | $11,803 | ^ | ||
See notes to financial highlights.
114 www.calvert.com CALVERT SOCIAL INVESTMENT FUND ANNUAL REPORT
| BOND PORTFOLIO | ||||||
| FINANCIAL HIGHLIGHTS | ||||||
| YEARS ENDED | ||||||
| SEPTEMBER 30, | SEPTEMBER 30, | SEPTEMBER 30, | ||||
| CLASS C SHARES | 2013 | (z) | 2012 | 2011 | ||
| Net asset value, beginning | $16.48 | $15.76 | $15.90 | ^ | ||
| Income from investment operations: | ||||||
| Net investment income | .20 | .27 | .29 | |||
| Net realized and unrealized gain (loss) | (.68 | ) | .90 | .03 | ^ | |
| Total from investment operations | (.48 | ) | 1.17 | .32 | ||
| Distributions from: | ||||||
| Net investment income | (.22 | ) | (.28 | ) | (.30 | ) |
| Net realized gain | (.26 | ) | (.17 | ) | (.16 | ) |
| Total distributions | (.48 | ) | (.45 | ) | (.46 | ) |
| Total increase (decrease) in net asset value | (.96 | ) | .72 | (.14 | ) | |
| Net asset value, ending | $15.52 | $16.48 | $15.76 | |||
| Total return* | (3.01 | %) | 7.58 | % | 2.08 | %^ |
| Ratios to average net assets:A | ||||||
| Net investment income | 1.26 | % | 1.73 | % | 1.83 | % |
| Total expenses | 1.90 | % | 1.96 | % | 1.93 | % |
| Expenses before offsets | 1.90 | % | 1.96 | % | 1.93 | % |
| Net expenses | 1.90 | % | 1.96 | % | 1.93 | % |
| Portfolio turnover | 214 | % | 228 | % | 203 | % |
| Net assets, ending (in thousands) | $37,620 | $45,974 | $47,123 | |||
| YEARS ENDED | ||||||
| SEPTEMBER 30, | SEPTEMBER 30, | |||||
| CLASS C SHARES | 2010 | ^ | 2009 | ^ | ||
| Net asset value, beginning | $15.04 | ^ | $14.97 | ^ | ||
| Income from investment operations: | ||||||
| Net investment income | .29 | .42 | ||||
| Net realized and unrealized gain (loss) | .93 | ^ | .31 | ^ | ||
| Total from investment operations | 1.22 | .73 | ||||
| Distributions from: | ||||||
| Net investment income | (.26 | ) | (.40 | ) | ||
| Net realized gain | (.10 | ) | (.26 | ) | ||
| Total distributions | (.36 | ) | (.66 | ) | ||
| Total increase (decrease) in net asset value | .86 | .07 | ||||
| Net asset value, ending | $15.90 | ^ | $15.04 | ^ | ||
| Total return* | 8.24 | %^ | 5.23 | %^ | ||
| Ratios to average net assets:A | ||||||
| Net investment income | 1.85 | % | 2.93 | % | ||
| Total expenses | 1.91 | % | 1.94 | % | ||
| Expenses before offsets | 1.91 | % | 1.94 | % | ||
| Net expenses | 1.91 | % | 1.92 | % | ||
| Portfolio turnover | 78 | % | 77 | % | ||
| Net assets, ending (in thousands) | $54,230 | ^ | $56,223 | ^ | ||
See notes to financial highlights.
www.calvert.com CALVERT SOCIAL INVESTMENT FUND ANNUAL REPORT 115
| BOND PORTFOLIO | ||||||
| FINANCIAL HIGHLIGHTS | ||||||
| YEARS ENDED | ||||||
| SEPTEMBER 30, | SEPTEMBER 30, | SEPTEMBER 30, | ||||
| CLASS I SHARES | 2013 | (z) | 2012 | 2011 | ||
| Net asset value, beginning | $16.59 | $15.85 | $16.01 | ^ | ||
| Income from investment operations: | ||||||
| Net investment income | .43 | .50 | .51 | |||
| Net realized and unrealized gain (loss) | (.70 | ) | .92 | .01 | ^ | |
| Total from investment operations | (.27 | ) | 1.42 | .52 | ||
| Distributions from: | ||||||
| Net investment income | (.44 | ) | (.51 | ) | (.52 | ) |
| Net realized gain | (.26 | ) | (.17 | ) | (.16 | ) |
| Total distributions | (.70 | ) | (.68 | ) | (.68 | ) |
| Total increase (decrease) in net asset value | (.97 | ) | .74 | (.16 | ) | |
| Net asset value, ending | $15.62 | $16.59 | $15.85 | |||
| Total return* | (1.69 | %) | 9.21 | % | 3.39 | %^ |
| Ratios to average net assets:A | ||||||
| Net investment income | 2.66 | % | 3.12 | % | 3.25 | % |
| Total expenses | .51 | % | .56 | % | .52 | % |
| Expenses before offsets | .51 | % | .56 | % | .52 | % |
| Net expenses | .51 | % | .56 | % | .52 | % |
| Portfolio turnover | 214 | % | 228 | % | 203 | % |
| Net assets, ending (in thousands) | $220,621 | $202,799 | $224,792 | |||
| YEARS ENDED | ||||||
| SEPTEMBER 30, | SEPTEMBER 30, | |||||
| CLASS I SHARES | 2010 | ^ | 2009 | ^ | ||
| Net asset value, beginning | $15.13 | ^ | $15.07 | ^ | ||
| Income from investment operations: | ||||||
| Net investment income | .50 | .63 | ||||
| Net realized and unrealized gain (loss) | .96 | ^ | .30 | ^ | ||
| Total from investment operations | 1.46 | .93 | ||||
| Distributions from: | ||||||
| Net investment income | (.48 | ) | (.61 | ) | ||
| Net realized gain | (.10 | ) | (.26 | ) | ||
| Total distributions | (.58 | ) | (.87 | ) | ||
| Total increase (decrease) in net asset value | .88 | .06 | ||||
| Net asset value, ending | $16.01 | ^ | $15.13 | ^ | ||
| Total return* | 9.84 | %^ | 6.67 | %^ | ||
| Ratios to average net assets:A | ||||||
| Net investment income | 3.24 | % | 4.35 | % | ||
| Total expenses | .52 | % | .54 | % | ||
| Expenses before offsets | .52 | % | .54 | % | ||
| Net expenses | .52 | % | .52 | % | ||
| Portfolio turnover | 78 | % | 77 | % | ||
| Net assets, ending (in thousands) | $213,395 | ^ | $186,327 | ^ | ||
See notes to financial highlights.
116 www.calvert.com CALVERT SOCIAL INVESTMENT FUND ANNUAL REPORT
| BOND PORTFOLIO | ||||||
| FINANCIAL HIGHLIGHTS | ||||||
| YEARS ENDED | ||||||
| SEPTEMBER 30, | SEPTEMBER 30, | SEPTEMBER 30, | ||||
| CLASS Y SHARES | 2013 | (z) | 2012 | 2011 | ||
| Net asset value, beginning | $16.67 | $15.93 | $16.06 | ^ | ||
| Income from investment operations: | ||||||
| Net investment income | .38 | .45 | .46 | |||
| Net realized and unrealized gain (loss) | (.70 | ) | .92 | .03 | ^ | |
| Total from investment operations | (.32 | ) | 1.37 | .49 | ||
| Distributions from: | ||||||
| Net investment income | (.39 | ) | (.46 | ) | (.46 | ) |
| Net realized gain | (.26 | ) | (.17 | ) | (.16 | ) |
| Total distributions | (.65 | ) | (.63 | ) | (.62 | ) |
| Total increase (decrease) in net asset value | (.97 | ) | .74 | (.13 | ) | |
| Net asset value, ending | $15.70 | $16.67 | $15.93 | |||
| Total return* | (1.97 | %) | 8.79 | % | 3.17 | %^ |
| Ratios to average net assets:A | ||||||
| Net investment income | 2.36 | % | 2.81 | % | 2.91 | % |
| Total expenses | .81 | % | .87 | % | .83 | % |
| Expenses before offsets | .81 | % | .87 | % | .83 | % |
| Net expenses | .81 | % | .87 | % | .83 | % |
| Portfolio turnover | 214 | % | 228 | % | 203 | % |
| Net assets, ending (in thousands) | $39,300 | $35,396 | $26,987 | |||
| PERIODS ENDED | ||||||
| SEPTEMBER 30, | SEPTEMBER 30, | |||||
| CLASS Y SHARES | 2010 | ^ | 2009 | #^ | ||
| Net asset value, beginning | $15.16 | ^ | $14.33 | ^ | ||
| Income from investment operations: | ||||||
| Net investment income | .41 | .48 | ||||
| Net realized and unrealized gain (loss) | .98 | ^ | 1.08 | ^ | ||
| Total from investment operations | 1.39 | 1.56 | ||||
| Distributions from: | ||||||
| Net investment income | (.39 | ) | (.47 | ) | ||
| Net realized gain | (.10 | ) | (.26 | ) | ||
| Total distributions | (.49 | ) | (.73 | ) | ||
| Total increase (decrease) in net asset value | .90 | .83 | ||||
| Net asset value, ending | $16.06 | ^ | $15.16 | ^ | ||
| Total return* | 9.34 | %^ | 11.31 | %^ | ||
| Ratios to average net assets:A | ||||||
| Net investment income | 2.71 | % | 3.36 | % (a) | ||
| Total expenses | 1.00 | % | 5.39 | % (a) | ||
| Expenses before offsets | .92 | % | .93 | % (a) | ||
| Net expenses | .92 | % | .92 | % (a) | ||
| Portfolio turnover | 78 | % | 69 | % | ||
| Net assets, ending (in thousands) | $14,321 | ^ | $624 | ^ | ||
See notes to financial highlights.
www.calvert.com CALVERT SOCIAL INVESTMENT FUND ANNUAL REPORT 117
| EQUITY PORTFOLIO | |||||||||
| FINANCIAL HIGHLIGHTS | |||||||||
| YEARS ENDED | |||||||||
| SEPTEMBER 30, | SEPTEMBER 30, | SEPTEMBER 30, | |||||||
| CLASS A SHARES | 2013 | (z) | 2012 | (z) | 2011 | (z) | |||
| Net asset value, beginning | $ | 38.48 | $ | 32.91 | $ | 32.56 | |||
| Income from investment operations: | |||||||||
| Net investment income (loss) | .07 | (.05 | ) | (.09 | ) | ||||
| Net realized and unrealized gain (loss) | 6.19 | 7.32 | .44 | ||||||
| Total from investment operations | 6.26 | 7.27 | .35 | ||||||
| Distributions from: | |||||||||
| Net investment income | (.01 | ) | — | — | |||||
| Net realized gain | (.05 | ) | (1.70 | ) | — | ||||
| Total distributions | (.06 | ) | (1.70 | ) | — | ||||
| Total increase (decrease) in net asset value | 6.20 | 5.57 | .35 | ||||||
| Net asset value, ending | $ | 44.68 | $ | 38.48 | $ | 32.91 | |||
| Total return* | 16.30 | % | 22.75 | % | 1.07 | % | |||
| Ratios to average net assets:A | |||||||||
| Net investment income (loss) | .18 | % | (.15 | %) | (.25 | %) | |||
| Total expenses | 1.21 | % | 1.21 | % | 1.20 | % | |||
| Expenses before offsets | 1.20 | % | 1.21 | % | 1.20 | % | |||
| Net expenses | 1.20 | % | 1.21 | % | 1.20 | % | |||
| Portfolio turnover | 32 | % | 36 | % | 41 | % | |||
| Net assets, ending (in thousands) | $ | 1,602,401 | $ | 1,500,089 | $ | 1,297,315 | |||
| YEARS ENDED | |||||||||
| SEPTEMBER 30, | �� | SEPTEMBER 30, | |||||||
| CLASS A SHARES | 2010 | (z) | 2009 | (z) | |||||
| Net asset value, beginning | $ | 29.25 | $ | 32.92 | |||||
| Income from investment operations: | |||||||||
| Net investment income (loss) | (.04 | ) | .06 | ||||||
| Net realized and unrealized gain (loss) | 3.39 | (1.81 | ) | ||||||
| Total from investment operations | 3.35 | (1.75 | ) | ||||||
| Distributions from: | |||||||||
| Net investment income | (.04 | ) | — | ||||||
| Net realized gain | — | (1.92 | ) | ||||||
| Total distributions | (.04 | ) | (1.92 | ) | |||||
| Total increase (decrease) in net asset value | 3.31 | (3.67 | ) | ||||||
| Net asset value, ending | $ | 32.56 | $ | 29.25 | |||||
| Total return* | 11.44 | % | (3.46 | %) | |||||
| Ratios to average net assets:A | |||||||||
| Net investment income (loss) | (.13 | %) | .23 | % | |||||
| Total expenses | 1.22 | % | 1.28 | % | |||||
| Expenses before offsets | 1.22 | % | 1.28 | % | |||||
| Net expenses | 1.22 | % | 1.28 | % | |||||
| Portfolio turnover | 39 | % | 38 | % | |||||
| Net assets, ending (in thousands) | $ | 980,605 | $ | 837,205 | |||||
See notes to financial highlights.
118 www.calvert.com CALVERT SOCIAL INVESTMENT FUND ANNUAL REPORT
| EQUITY PORTFOLIO | |||||||||
| FINANCIAL HIGHLIGHTS | |||||||||
| YEARS ENDED | |||||||||
| SEPTEMBER 30, | SEPTEMBER 30, | SEPTEMBER 30, | |||||||
| CLASS B SHARES | 2013 | (z) | 2012 | (z) | 2011 | (z) | |||
| Net asset value, beginning | $ | 32.65 | $ | 28.40 | $ | 28.34 | |||
| Income from investment operations: | |||||||||
| Net investment income (loss) | (.23 | ) | (.31 | ) | (.36 | ) | |||
| Net realized and unrealized gain (loss) | 5.21 | 6.26 | .42 | ||||||
| Total from investment operations | 4.98 | 5.95 | .06 | ||||||
| Distributions from: | |||||||||
| Net realized gain | (.05 | ) | (1.70 | ) | — | ||||
| Total distributions | (.05 | ) | (1.70 | ) | — | ||||
| Total increase (decrease) in net asset value | 4.93 | 4.25 | .06 | ||||||
| Net asset value, ending | $ | 37.58 | $ | 32.65 | $ | 28.40 | |||
| Total return* | 15.29 | % | 21.66 | % | .21 | % | |||
| Ratios to average net assets:A | |||||||||
| Net investment income (loss) | (.67 | %) | (1.02 | %) | (1.14 | %) | |||
| Total expenses | 2.08 | % | 2.09 | % | 2.08 | % | |||
| Expenses before offsets | 2.07 | % | 2.08 | % | 2.08 | % | |||
| Net expenses | 2.07 | % | 2.08 | % | 2.08 | % | |||
| Portfolio turnover | 32 | % | 36 | % | 41 | % | |||
| Net assets, ending (in thousands) | $ | 21,554 | $ | 28,391 | $ | 35,852 | |||
| YEARS ENDED | |||||||||
| SEPTEMBER 30, | SEPTEMBER 30, | ||||||||
| CLASS B SHARES | 2010 | (z) | 2009 | (z) | |||||
| Net asset value, beginning | $ | 25.67 | $ | 29.46 | |||||
| Income from investment operations: | |||||||||
| Net investment income (loss) | (.28 | ) | (.15 | ) | |||||
| Net realized and unrealized gain (loss) | 2.95 | (1.72 | ) | ||||||
| Total from investment operations | 2.67 | (1.87 | ) | ||||||
| Distributions from: | |||||||||
| Net realized gain | — | (1.92 | ) | ||||||
| Total distributions | — | (1.92 | ) | ||||||
| Total increase (decrease) in net asset value | 2.67 | (3.79 | ) | ||||||
| Net asset value, ending | $ | 28.34 | $ | 25.67 | |||||
| Total return* | 10.40 | % | (4.34 | %) | |||||
| Ratios to average net assets:A | |||||||||
| Net investment income (loss) | (1.03 | %) | (.69 | %) | |||||
| Total expenses | 2.13 | % | 2.22 | % | |||||
| Expenses before offsets | 2.13 | % | 2.22 | % | |||||
| Net expenses | 2.13 | % | 2.22 | % | |||||
| Portfolio turnover | 39 | % | 38 | % | |||||
| Net assets, ending (in thousands) | $ | 35,761 | $ | 45,648 | |||||
See notes to financial highlights.
www.calvert.com CALVERT SOCIAL INVESTMENT FUND ANNUAL REPORT 119
| EQUITY PORTFOLIO | |||||||||
| FINANCIAL HIGHLIGHTS | |||||||||
| YEARS ENDED | |||||||||
| SEPTEMBER 30, | SEPTEMBER 30, | SEPTEMBER 30, | |||||||
| CLASS C SHARES | 2013 | (z) | 2012 | (z) | 2011 | (z) | |||
| Net asset value, beginning | $ | 30.06 | $ | 26.24 | $ | 26.15 | |||
| Income from investment operations: | |||||||||
| Net investment income (loss) | (.17 | ) | (.25 | ) | (.29 | ) | |||
| Net realized and unrealized gain (loss) | 4.82 | 5.77 | .38 | ||||||
| Total from investment operations | 4.65 | 5.52 | .09 | ||||||
| Distributions from: | |||||||||
| Net realized gain | (.05 | ) | (1.70 | ) | — | ||||
| Total distributions | (.05 | ) | (1.70 | ) | — | ||||
| Total increase (decrease) in net asset value | 4.60 | 3.82 | .09 | ||||||
| Net asset value, ending | $ | 34.66 | $ | 30.06 | $ | 26.24 | |||
| Total return* | 15.51 | % | 21.82 | % | .34 | % | |||
| Ratios to average net assets:A | |||||||||
| Net investment income (loss) | (.52 | %) | (.87 | %) | (1.01 | %) | |||
| Total expenses | 1.91 | % | 1.94 | % | 1.95 | % | |||
| Expenses before offsets | 1.90 | % | 1.93 | % | 1.95 | % | |||
| Net expenses | 1.90 | % | 1.93 | % | 1.95 | % | |||
| Portfolio turnover | 32 | % | 36 | % | 41 | % | |||
| Net assets, ending (in thousands) | $ | 158,591 | $ | 150,000 | $ | 132,658 | |||
| YEARS ENDED | |||||||||
| SEPTEMBER 30, | SEPTEMBER 30, | ||||||||
| CLASS C SHARES | 2010 | (z) | 2009 | (z) | |||||
| Net asset value, beginning | $ | 23.65 | $ | 27.32 | |||||
| Income from investment operations: | |||||||||
| Net investment income (loss) | (.23 | ) | (.11 | ) | |||||
| Net realized and unrealized gain (loss) | 2.73 | (1.64 | ) | ||||||
| Total from investment operations | 2.50 | (1.75 | ) | ||||||
| Distributions from: | |||||||||
| Net realized gain | — | (1.92 | ) | ||||||
| Total distributions | — | (1.92 | ) | ||||||
| Total increase (decrease) in net asset value | 2.50 | (3.67 | ) | ||||||
| Net asset value, ending | $ | 26.15 | $ | 23.65 | |||||
| Total return* | 10.57 | % | (4.23 | %) | |||||
| Ratios to average net assets:A | |||||||||
| Net investment income (loss) | (.92 | %) | (.57 | %) | |||||
| Total expenses | 2.01 | % | 2.09 | % | |||||
| Expenses before offsets | 2.01 | % | 2.09 | % | |||||
| Net expenses | 2.01 | % | 2.08 | % | |||||
| Portfolio turnover | 39 | % | 38 | % | |||||
| Net assets, ending (in thousands) | $ | 97,961 | $ | 87,512 | |||||
See notes to financial highlights.
120 www.calvert.com CALVERT SOCIAL INVESTMENT FUND ANNUAL REPORT
| EQUITY PORTFOLIO | |||||||||
| FINANCIAL HIGHLIGHTS | |||||||||
| YEARS ENDED | |||||||||
| SEPTEMBER 30, | SEPTEMBER 30, | SEPTEMBER 30, | |||||||
| CLASS I SHARES | 2013 | (z) | 2012 | (z) | 2011 | (z) | |||
| Net asset value, beginning | $ | 41.55 | $ | 35.22 | $ | 34.66 | |||
| Income from investment operations: | |||||||||
| Net investment income | .32 | .16 | .10 | ||||||
| Net realized and unrealized gain (loss) | 6.70 | 7.87 | .46 | ||||||
| Total from investment operations | 7.02 | 8.03 | .56 | ||||||
| Distributions from: | |||||||||
| Net investment income | (.04 | ) | — | — | |||||
| Net realized gain | (.05 | ) | (1.70 | ) | — | ||||
| Total distributions | (.09 | ) | (1.70 | ) | — | ||||
| Total increase (decrease) in net asset value | 6.93 | 6.33 | .56 | ||||||
| Net asset value, ending | $ | 48.48 | $ | 41.55 | $ | 35.22 | |||
| Total return* | 16.95 | % | 23.44 | % | 1.62 | % | |||
| Ratios to average net assets:A | |||||||||
| Net investment income | .72 | % | .40 | % | .28 | % | |||
| Total expenses | .66 | % | .67 | % | .67 | % | |||
| Expenses before offsets | .65 | % | .66 | % | .67 | % | |||
| Net expenses | .65 | % | .66 | % | .67 | % | |||
| Portfolio turnover | 32 | % | 36 | % | 41 | % | |||
| Net assets, ending (in thousands) | $ | 798,677 | $ | 667,246 | $ | 535,829 | |||
| YEARS ENDED | |||||||||
| SEPTEMBER 30, | SEPTEMBER 30, | ||||||||
| CLASS I SHARES | 2010 | (z) | 2009 | (z) | |||||
| Net asset value, beginning | $ | 31.04 | $ | 34.58 | |||||
| Income from investment operations: | |||||||||
| Net investment income | .14 | .21 | |||||||
| Net realized and unrealized gain (loss) | 3.59 | (1.83 | ) | ||||||
| Total from investment operations | 3.73 | (1.62 | ) | ||||||
| Distributions from: | |||||||||
| Net investment income | (.11 | ) | — | ||||||
| Net realized gain | — | (1.92 | ) | ||||||
| Total distributions | (.11 | ) | (1.92 | ) | |||||
| Total increase (decrease) in net asset value | 3.62 | (3.54 | ) | ||||||
| Net asset value, ending | $ | 34.66 | $ | 31.04 | |||||
| Total return* | 12.04 | % | (2.88 | %) | |||||
| Ratios to average net assets:A | |||||||||
| Net investment income | .42 | % | .79 | % | |||||
| Total expenses | .68 | % | .70 | % | |||||
| Expenses before offsets | .68 | % | .70 | % | |||||
| Net expenses | .68 | % | .70 | % | |||||
| Portfolio turnover | 39 | % | 38 | % | |||||
| Net assets, ending (in thousands) | $ | 198,553 | $ | 156,430 | |||||
See notes to financial highlights.
www.calvert.com CALVERT SOCIAL INVESTMENT FUND ANNUAL REPORT 121
| EQUITY PORTFOLIO | ||||||
| FINANCIAL HIGHLIGHTS | ||||||
| YEARS ENDED | ||||||
| SEPTEMBER 30, | SEPTEMBER 30, | SEPTEMBER 30, | ||||
| CLASS Y SHARES | 2013 | (z) | 2012 | (z) | 2011 | (z) |
| Net asset value, beginning | $39.06 | $33.25 | $32.78 | |||
| Income from investment operations: | ||||||
| Net investment income | .23 | .09 | .04 | |||
| Net realized and unrealized gain | 6.30 | 7.42 | .43 | |||
| Total from investment operations | 6.53 | 7.51 | .47 | |||
| Distributions from: | ||||||
| Net investment income | (.03 | ) | — | — | ||
| Net realized gain | (.05 | ) | (1.70 | ) | — | |
| Total distributions | (.08 | ) | (1.70 | ) | — | |
| Total increase (decrease) in net asset value | 6.45 | 5.81 | .47 | |||
| Net asset value, ending | $45.51 | $39.06 | $33.25 | |||
| Total return* | 16.76 | % | 23.26 | % | 1.43 | % |
| Ratios to average net assets:A | ||||||
| Net investment income | .56 | % | .25 | % | .10 | % |
| Total expenses | .82 | % | .82 | % | .84 | % |
| Expenses before offsets | .81 | % | .81 | % | .84 | % |
| Net expenses | .81 | % | .81 | % | .84 | % |
| Portfolio turnover | 32 | % | 36 | % | 41 | % |
| Net assets, ending (in thousands) | $137,137 | $106,723 | $66,377 | |||
| PERIODS ENDED | ||||||
| SEPTEMBER 30, | SEPTEMBER 30, | |||||
| CLASS Y SHARES | 2010 | (z) | 2009 | # (z) | ||
| Net asset value, beginning | $29.35 | $27.35 | ||||
| Income from investment operations: | ||||||
| Net investment income | .02 | .08 | ||||
| Net realized and unrealized gain | 3.42 | 3.84 | ||||
| Total from investment operations | 3.44 | 3.92 | ||||
| Distributions from: | ||||||
| Net investment income | (.01 | ) | — | |||
| Net realized gain | — | (1.92 | ) | |||
| Total distributions | (.01 | ) | (1.92 | ) | ||
| Total increase (decrease) in net asset value | 3.43 | 2.00 | ||||
| Net asset value, ending | $32.78 | $29.35 | ||||
| Total return* | 11.73 | % | 16.59 | % | ||
| Ratios to average net assets:A | ||||||
| Net investment income | .08 | % | .34 | % (a) | ||
| Total expenses | 1.14 | % | 11.72 | % (a) | ||
| Expenses before offsets | .96 | % | .96 | % (a) | ||
| Net expenses | .96 | % | .96 | % (a) | ||
| Portfolio turnover | 39 | % | 35 | % | ||
| Net assets, ending (in thousands) | $11,811 | $483 | ||||
See notes to financial highlights.
122 www.calvert.com CALVERT SOCIAL INVESTMENT FUND ANNUAL REPORT
| LARGE CAP CORE PORTFOLIO | |||||||||
| FINANCIAL HIGHLIGHTS | |||||||||
| YEARS ENDED | |||||||||
| SEPTEMBER 30, | SEPTEMBER 30, | SEPTEMBER 30, | |||||||
| CLASS A SHARES | 2013 | (z) | 2012 | (z) | 2011 | (z) | |||
| Net asset value, beginning | $ | 18.49 | $ | 15.16 | $ | 15.02 | |||
| Income from investment operations: | |||||||||
| Net investment income | .15 | .15 | .11 | ||||||
| Net realized and unrealized gain (loss) | 3.87 | 3.31 | .11 | ||||||
| Total from investment operations | 4.02 | 3.46 | .22 | ||||||
| Distributions from: | |||||||||
| Net investment income | (.14 | ) | (.13 | ) | (.08 | ) | |||
| Net realized gain | (.02 | ) | — | — | |||||
| Total distributions | (.16 | ) | (.13 | ) | (.08 | ) | |||
| Total increase (decrease) in net asset value | 3.86 | 3.33 | .14 | ||||||
| Net asset value, ending | $ | 22.35 | $ | 18.49 | $ | 15.16 | |||
| Total return* | 21.91 | % | 22.91 | % | 1.43 | % | |||
| Ratios to average net assets:A | |||||||||
| Net investment income | .74 | % | .83 | % | .68 | % | |||
| Total expenses | 1.32 | % | 1.40 | % | 1.44 | % | |||
| Expenses before offsets | 1.22 | % | 1.30 | % | 1.34 | % | |||
| Net expenses | 1.22 | % | 1.30 | % | 1.34 | % | |||
| Portfolio turnover | 59 | % | 48 | % | 111 | % | |||
| Net assets, ending (in thousands) | $ | 58,507 | $ | 41,334 | $ | 32,184 | |||
| YEARS ENDED | |||||||||
| SEPTEMBER 30, | SEPTEMBER 30, | ||||||||
| CLASS A SHARES | 2010 | (z) | 2009 | (z) | |||||
| Net asset value, beginning | $ | 13.62 | $ | 14.93 | |||||
| Income from investment operations: | |||||||||
| Net investment income | .07 | .12 | |||||||
| Net realized and unrealized gain (loss) | 1.44 | (1.25 | ) | ||||||
| Total from investment operations | 1.51 | (1.13 | ) | ||||||
| Distributions from: | |||||||||
| Net investment income | (.11 | ) | (.18 | ) | |||||
| Net realized gain | — | — | |||||||
| Total distributions | (.11 | ) | (.18 | ) | |||||
| Total increase (decrease) in net asset value | 1.40 | (1.31 | ) | ||||||
| Net asset value, ending | $ | 15.02 | $ | 13.62 | |||||
| Total return* | 11.10 | % | (7.22 | %) | |||||
| Ratios to average net assets:A | |||||||||
| Net investment income | .47 | % | 1.10 | % | |||||
| Total expenses | 1.48 | % | 1.54 | % | |||||
| Expenses before offsets | 1.38 | % | 1.44 | % | |||||
| Net expenses | 1.38 | % | 1.43 | % | |||||
| Portfolio turnover | 109 | % | 111 | % | |||||
| Net assets, ending (in thousands) | $ | 34,563 | $ | 33,040 | |||||
See notes to financial highlights.
www.calvert.com CALVERT SOCIAL INVESTMENT FUND ANNUAL REPORT 123
| LARGE CAP CORE PORTFOLIO | |||||||||
| FINANCIAL HIGHLIGHTS | |||||||||
| YEARS ENDED | |||||||||
| SEPTEMBER 30, | SEPTEMBER 30, | SEPTEMBER 30, | |||||||
| CLASS B SHARES | 2013 | (z) | 2012 | (z) | 2011 | (z) | |||
| Net asset value, beginning | $ | 16.46 | $ | 13.57 | $ | 13.57 | |||
| Income from investment operations: | |||||||||
| Net investment income (loss) | (.13 | ) | (.08 | ) | (.10 | ) | |||
| Net realized and unrealized gain (loss) | 3.43 | 2.97 | .10 | ||||||
| Total from investment operations | 3.30 | 2.89 | — | ||||||
| Distributions from: | |||||||||
| Net investment income | — | — | — | ||||||
| Net realized gain | (.02 | ) | — | — | |||||
| Total distributions | (.02 | ) | — | — | |||||
| Total increase (decrease) in net asset value | 3.28 | 2.89 | — | ||||||
| Net asset value, ending | $ | 19.74 | $ | 16.46 | $ | 13.57 | |||
| Total return* | 20.11 | % | 21.30 | % | .00 | % | |||
| Ratios to average net assets:A | |||||||||
| Net investment income (loss) | (.69 | %) | (.49 | %) | (.65 | %) | |||
| Total expenses | 3.16 | % | 2.95 | % | 2.80 | % | |||
| Expenses before offsets | 2.67 | % | 2.67 | % | 2.67 | % | |||
| Net expenses | 2.67 | % | 2.67 | % | 2.67 | % | |||
| Portfolio turnover | 59 | % | 48 | % | 111 | % | |||
| Net assets, ending (in thousands) | $ | 1,093 | $ | 1,383 | $ | 1,704 | |||
| YEARS ENDED | |||||||||
| SEPTEMBER 30, | SEPTEMBER 30, | ||||||||
| CLASS B SHARES | 2010 | (z) | 2009 | (z) | |||||
| Net asset value, beginning | $ | 12.36 | $ | 13.51 | |||||
| Income from investment operations: | |||||||||
| Net investment income (loss) | (.11 | ) | (.03 | ) | |||||
| Net realized and unrealized gain (loss) | 1.32 | (1.12 | ) | ||||||
| Total from investment operations | 1.21 | (1.15 | ) | ||||||
| Distributions from: | |||||||||
| Net realized gain | — | — | |||||||
| Total distributions | — | — | |||||||
| Total increase (decrease) in net asset value | 1.21 | (1.15 | ) | ||||||
| Net asset value, ending | $ | 13.57 | $ | 12.36 | |||||
| Total return* | 9.79 | % | (8.51 | %) | |||||
| Ratios to average net assets:A | |||||||||
| Net investment income (loss) | (.82 | %) | (.26 | %) | |||||
| Total expenses | 2.78 | % | 2.97 | % | |||||
| Expenses before offsets | 2.67 | % | 2.83 | % | |||||
| Net expenses | 2.67 | % | 2.83 | % | |||||
| Portfolio turnover | 109 | % | 111 | % | |||||
| Net assets, ending (in thousands) | $ | 2,329 | $ | 2,768 | |||||
See notes to financial highlights.
124 www.calvert.com CALVERT SOCIAL INVESTMENT FUND ANNUAL REPORT
| LARGE CAP CORE PORTFOLIO | |||||||||
| FINANCIAL HIGHLIGHTS | |||||||||
| YEARS ENDED | |||||||||
| SEPTEMBER 30, | SEPTEMBER 30, | SEPTEMBER 30, | |||||||
| CLASS C SHARES | 2013 | (z) | 2012 | (z) | 2011 | (z) | |||
| Net asset value, beginning | $ | 16.84 | $ | 13.82 | $ | 13.75 | |||
| Income from investment operations: | |||||||||
| Net investment income (loss) | (.02 | ) | — | (.03 | ) | ||||
| Net realized and unrealized gain (loss) | 3.52 | 3.02 | .10 | ||||||
| Total from investment operations | 3.50 | 3.02 | .07 | ||||||
| Distributions from: | |||||||||
| Net investment income | — | — | — | ||||||
| Net realized gain | (.02 | ) | — | — | |||||
| Total distributions | (.02 | ) | — | — | |||||
| Total increase (decrease) in net asset value | 3.48 | 3.02 | .07 | ||||||
| Net asset value, ending | $ | 20.32 | $ | 16.84 | $ | 13.82 | |||
| Total return* | 20.84 | % | 21.85 | % | .51 | % | |||
| Ratios to average net assets:A | |||||||||
| Net investment income (loss) | (.09 | %) | (.03 | %) | (.22 | %) | |||
| Total expenses | 2.16 | % | 2.26 | % | 2.33 | % | |||
| Expenses before offsets | 2.06 | % | 2.16 | % | 2.23 | % | |||
| Net expenses | 2.06 | % | 2.16 | % | 2.23 | % | |||
| Portfolio turnover | 59 | % | 48 | % | 111 | % | |||
| Net assets, ending (in thousands) | $ | 9,403 | $ | 7,199 | $ | 5,962 | |||
| YEARS ENDED | |||||||||
| SEPTEMBER 30, | SEPTEMBER 30, | ||||||||
| CLASS C SHARES | 2010 | (z) | 2009 | (z) | |||||
| Net asset value, beginning | $ | 12.48 | $ | 13.61 | |||||
| Income from investment operations: | |||||||||
| Net investment income (loss) | (.06 | ) | .01 | ||||||
| Net realized and unrealized gain (loss) | 1.33 | (1.12 | ) | ||||||
| Total from investment operations | 1.27 | (1.11 | ) | ||||||
| Distributions from: | |||||||||
| Net investment income | — | (.02 | ) | ||||||
| Net realized gain | — | — | |||||||
| Total distributions | — | (.02 | ) | ||||||
| Total increase (decrease) in net asset value | 1.27 | (1.13 | ) | ||||||
| Net asset value, ending | $ | 13.75 | $ | 12.48 | |||||
| Total return* | 10.18 | % | (8.09 | %) | |||||
| Ratios to average net assets:A | |||||||||
| Net investment income (loss) | (.46 | %) | .12 | % | |||||
| Total expenses | 2.42 | % | 2.52 | % | |||||
| Expenses before offsets | 2.32 | % | 2.41 | % | |||||
| Net expenses | 2.32 | % | 2.41 | % | |||||
| Portfolio turnover | 109 | % | 111 | % | |||||
| Net assets, ending (in thousands) | $ | 6,297 | $ | 5,767 | |||||
See notes to financial highlights.
www.calvert.com CALVERT SOCIAL INVESTMENT FUND ANNUAL REPORT 125
| LARGE CAP CORE PORTFOLIO | |||||||||
| FINANCIAL HIGHLIGHTS | |||||||||
| YEARS ENDED | |||||||||
| SEPTEMBER 30, | SEPTEMBER 30, | SEPTEMBER 30, | |||||||
| CLASS I SHARES | 2013 | (z) | 2012 | (z) | 2011 | (z) | |||
| Net asset value, beginning | $ | 18.84 | $ | 15.45 | $ | 15.29 | |||
| Income from investment operations: | |||||||||
| Net investment income | .26 | .24 | .21 | ||||||
| Net realized and unrealized gain (loss) | 3.92 | 3.37 | .11 | ||||||
| Total from investment operations | 4.18 | 3.61 | .32 | ||||||
| Distributions from: | |||||||||
| Net investment income | (.20 | ) | (.22 | ) | (.16 | ) | |||
| Net realized gain | (.02 | ) | — | — | |||||
| Total distributions | (.22 | ) | (.22 | ) | (.16 | ) | |||
| Total increase (decrease) in net asset value | 3.96 | 3.39 | .16 | ||||||
| Net asset value, ending | $ | 22.80 | $ | 18.84 | $ | 15.45 | |||
| Total return* | 22.47 | % | 23.57 | % | 2.02 | % | |||
| Ratios to average net assets:A | |||||||||
| Net investment income | 1.24 | % | 1.37 | % | 1.22 | % | |||
| Total expenses | .82 | % | .87 | % | .89 | % | |||
| Expenses before offsets | .72 | % | .77 | % | .79 | % | |||
| Net expenses | .72 | % | .77 | % | .79 | % | |||
| Portfolio turnover | 59 | % | 48 | % | 111 | % | |||
| Net assets, ending (in thousands) | $ | 59,564 | $ | 43,940 | $ | 31,035 | |||
| YEARS ENDED | |||||||||
| SEPTEMBER 30, | SEPTEMBER 30, | ||||||||
| CLASS I SHARES | 2010 | (z) | 2009 | (z) | |||||
| Net asset value, beginning | $ | 13.83 | $ | 15.13 | |||||
| Income from investment operations: | |||||||||
| Net investment income | .15 | .20 | |||||||
| Net realized and unrealized gain (loss) | 1.47 | (1.27 | ) | ||||||
| Total from investment operations | 1.62 | (1.07 | ) | ||||||
| Distributions from: | |||||||||
| Net investment income | (.16 | ) | (.23 | ) | |||||
| Total distributions | (.16 | ) | (.23 | ) | |||||
| Total increase (decrease) in net asset value | 1.46 | (1.30 | ) | ||||||
| Net asset value, ending | $ | 15.29 | $ | 13.83 | |||||
| Total return* | 11.77 | % | (6.64 | %) | |||||
| Ratios to average net assets:A | |||||||||
| Net investment income | 1.04 | % | 1.70 | % | |||||
| Total expenses | .91 | % | .95 | % | |||||
| Expenses before offsets | .81 | % | .81 | % | |||||
| Net expenses | .81 | % | .81 | % | |||||
| Portfolio turnover | 109 | % | 111 | % | |||||
| Net assets, ending (in thousands) | $ | 30,524 | $ | 25,174 | |||||
See notes to financial highlights.
126 www.calvert.com CALVERT SOCIAL INVESTMENT FUND ANNUAL REPORT
| LARGE CAP CORE PORTFOLIO | ||
| FINANCIAL HIGHLIGHTS | ||
| PERIOD ENDED | ||
| SEPTEMBER 30, | ||
| CLASS Y SHARES | 2013 | ## (z) |
| Net asset value, beginning | $21.09 | |
| Income from investment operations: | ||
| Net investment income | .08 | |
| Net realized and unrealized gain (loss) | 1.19 | |
| Total from investment operations | 1.27 | |
| Distributions from: | ||
| Net investment income | — | |
| Net realized gain | — | |
| Total distributions | — | |
| Total increase (decrease) in net asset value | 1.27 | |
| Net asset value, ending | $22.36 | |
| Total return* | 6.02 | % |
| Ratios to average net assets:A | ||
| Net investment income | .58 | % (a) |
| Total expenses | 612.15 | % (a) |
| Expenses before offsets | 1.15 | % (a) |
| Net expenses | 1.15 | % (a) |
| Portfolio turnover | 59 | % |
| Net assets, ending (in thousands) | $4 | |
A Total expenses do not reflect amounts reimbursed and/or waived by the Advisor or reductions from expense offset arrangements. Expenses before offsets reflect expenses after reimbursement and/or waiver by the Advisor but prior to reductions from expense offset arrangements. Net expenses are net of all reductions and represent the net expenses paid by the Portfolio.
* Total return is not annualized for periods less than one year and does not reflect deduction of any front-end or deferred sales charge.
** Amount was less than .01 per share.
*** Distribution was less than .01 per share.
# From October 31, 2008 inception.
## From April 30, 2013 inception.
(a) Annualized.
(z) Per share figures are calculated using the Average Shares Method.
^ The Financial Highlights for years ended 2009 and 2010 have been restated to reflect an immaterial pricing adjustment made in 2011.
See notes to financial statements.
www.calvert.com CALVERT SOCIAL INVESTMENT FUND ANNUAL REPORT 127
EXPLANATION OF FINANCIAL TABLES
SCHEDULE OF INVESTMENTS
The Schedule of Investments is a snapshot of all securities held in the fund at their market value, on the last day of the reporting period. Securities are listed by asset type (e.g., common stock, corporate bonds, U.S. government obligations) and may be further broken down into sub-groups and by industry classification.
STATEMENT OF ASSETS AND LIABILITIES
The Statement of Assets and Liabilities is often referred to as the fund’s balance sheet. It lists the value of what the fund owns, is due and owes on the last day of the reporting period. The fund’s assets include the market value of securities owned, cash, receivables for securities sold and shareholder subscriptions, and receivables for dividends and interest payments that have been earned, but not yet received. The fund’s liabilities include payables for securities purchased and shareholder redemptions, and expenses owed but not yet paid. The statement also reports the fund’s net asset value (NAV) per share on the last day of the reporting period. The NAV is calculated by dividing the fund’s net assets (assets minus liabilities) by the number of shares outstanding. This statement is accompanied by a Schedule of Investments. Alternatively, if certain conditions are met, a Statement of Net Assets may be presented in lieu of this statement and the Schedule of Investments.
STATEMENT OF NET ASSETS
The Statement of Net Assets provides a detailed list of the fund’s holdings, including each security’s market value on the last day of the reporting period. The Statement of Net Assets includes a Schedule of Investments. Other assets are added and other liabilities subtracted from the investments total to calculate the fund’s net assets. Finally, net assets are divided by the outstanding shares of the fund to arrive at its share price, or Net Asset Value (NAV) per share.
At the end of the Statement of Net Assets is a table displaying the composition of the fund’s net assets. Paid in Capital is the money invested by shareholders and represents the bulk of net assets. Undistributed Net Investment Income and Accumulated Net Realized Gains usually approximate the amounts the fund had available to distribute to shareholders as of the statement date. Accumulated Realized Losses will appear as negative balances. Unrealized Appreciation (Depreciation) is the difference between the market value of the fund’s investments and their cost, and reflects the gains (losses) that would be realized if the fund were to sell all of its investments at their statement-date values.
STATEMENT OF OPERATIONS
The Statement of Operations summarizes the fund’s investment income earned and expenses incurred in operating the fund. Investment income includes dividends earned from stocks and interest earned from interest-bearing securities in the fund. Expenses incurred in operating the fund include the advisory fee paid to the investment advisor, administrative services fees, distribution plan expenses (if applicable), transfer agent fees, shareholder servicing expenses, custodial, legal, and audit fees, and the printing and post-
128 www.calvert.com CALVERT SOCIAL INVESTMENT FUND ANNUAL REPORT (UNAUDITED)
age expenses related to shareholder reports. Expense offsets (fees paid indirectly) are also shown. Credits earned from offset arrangements are used to reduce the fund’s expenses. This statement also shows net gains (losses) realized on the sale of investments and the increase or decrease in the unrealized appreciation (depreciation) on investments held during the period.
STATEMENT OF CHANGES IN NET ASSETS
The Statement of Changes in Net Assets shows how the fund’s total net assets changed during the two most recent reporting periods. Changes in the fund’s net assets are attributable to investment operations, distributions and capital share transactions.
The Operations section of the report summarizes information detailed in the Statement of Operations. The Distribution section shows the dividend and capital gain distributions made to shareholders. The amounts shown as distributions in this section may not match the net investment income and realized gains amounts shown in the Operations section because distributions are determined on a tax basis and certain investments or transactions may be treated differently for financial statement and tax purposes. The Capital Share Transactions section shows the amount shareholders invested in the fund, either by purchasing shares or by reinvesting distributions, and the amounts redeemed. The corresponding numbers of shares issued, reinvested and redeemed are shown at the end of the report.
FINANCIAL HIGHLIGHTS
The Financial Highlights table provides a per-share breakdown per class of the components that affect the fund’s net asset value for current and past reporting periods. The table provides total return, total distributions, expense ratios, portfolio turnover and net assets for the applicable period. Total return is a measure of a fund’s performance that encompasses all elements of return: dividends, capital gain distributions and changes in net asset value. Total return is the change in value of an investment over a given period, assuming reinvestment of any dividends and capital gain distributions, expressed as a percentage of the initial investment. Total distributions include distributions from net investment income and net realized gains. Long-term gains are earned on securities held in the fund more than one year. Short-term gains, on the sale of securities held less than one year, are treated as ordinary dividend income for tax purposes. The expense ratio is a fund’s cost of doing business, expressed as a percentage of net assets. These expenses directly reduce returns to shareholders. Portfolio turnover measures the trading activity in a fund’s investment portfolio – how often securities are bought and sold by a fund. Portfolio turnover is affected by market conditions, changes in the size of the fund, the nature of the fund’s investments and the investment style of the portfolio.
www.calvert.com CALVERT SOCIAL INVESTMENT FUND ANNUAL REPORT (UNAUDITED) 129
PROXY VOTING
The Proxy Voting Guidelines of the Calvert Funds that the Fund uses to determine how to vote proxies relating to portfolio securities are provided as an Appendix to the Fund’s Statement of Additional Information. The Statement of Additional Information can be obtained free of charge by calling the Fund at 1-800-368-2745, by visiting the Calvert website at www.calvert.com; or by visiting the SEC’s website at www.sec.gov.
Information regarding how the Fund voted proxies relating to portfolio securities during the most recent 12-month period ended June 30 is available on the Fund’s website at www.calvert.com and on the SEC’s website at www.sec.gov.
AVAILABILITY OF QUARTERLY PORTFOLIO HOLDINGS
The Fund files its complete schedule of portfolio holdings with the SEC for the first and third quarters of each fiscal year on Form N-Q. The Fund’s Form N-Q is available on the SEC’s website at www.sec.gov. The Fund’s Form N-Q may be reviewed and copied at the SEC’s Public Reference Room in Washington, DC; information on the operation of the Public Reference Room may be obtained by calling 1-800-SEC-0330.
130 www.calvert.com CALVERT SOCIAL INVESTMENT FUND ANNUAL REPORT (UNAUDITED)
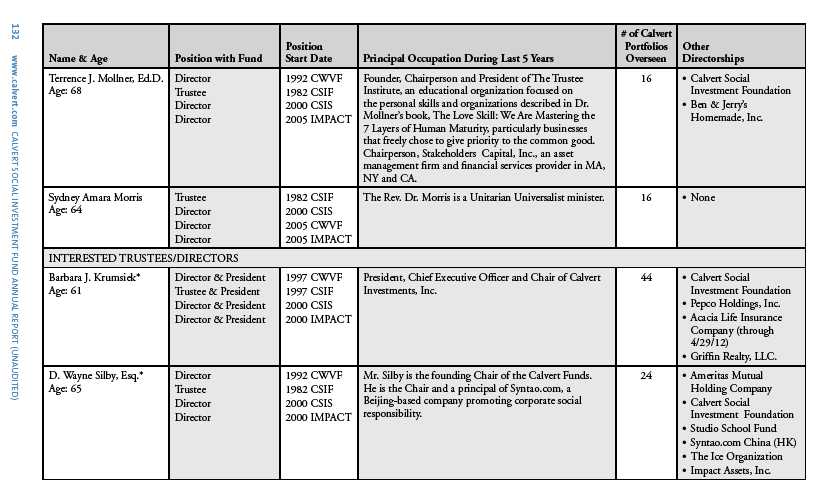
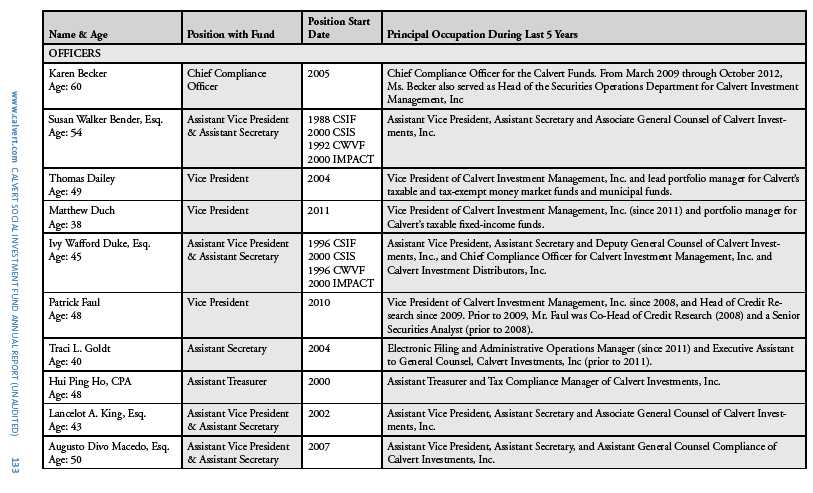
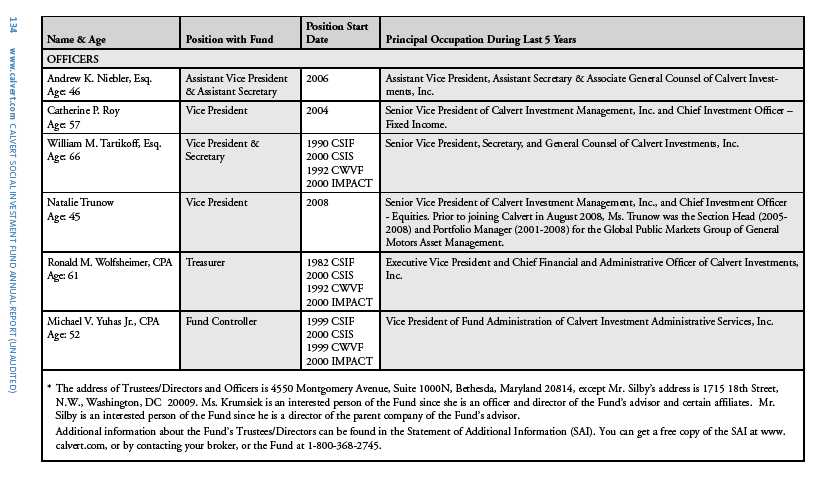
SHAREHOLDER VOTING RESULTS
A special meeting was held on September 20, 2013 by the Calvert Money Market Portfolio of Calvert Social Investment Fund for the purpose of approving the proposed Agreement and Plan of Reorganization into the Calvert Ultra-Short Income Fund, a portfolio of The Calvert Fund. The voting results were as follows:
| Portfolio | For | Against | Abstain |
| Calvert Money Market Portfolio | 43,776,306 | 6,617,968 | 3,856,741 |
www.calvert.com CALVERT SOCIAL INVESTMENT FUND ANNUAL REPORT (UNAUDITED) 135
This page intentionally left blank.
This page intentionally left blank.
This page intentionally left blank.
This page intentionally left blank.
This page intentionally left blank.
This page intentionally left blank.
This page intentionally left blank.
To Open an Account
800-368-2748
Service for Existing Account
Shareholders: 800-368-2745
Brokers: 800-368-2746
TDD for Hearing Impaired
800-541-1524
Registered Mail
Calvert Investments
c/o BFDS,
P.O. Box 219544
Kansas City, MO 64121-9544
Overnight Mail
Calvert Investments
c/o BFDS,
330 West 9th Street
Kansas City, MO 64105
Web Site
www.calvert.com
Principal Underwriter
Calvert Investment Distributors, Inc.
4550 Montgomery Avenue
Suite 1000 North
Bethesda, Maryland 20814
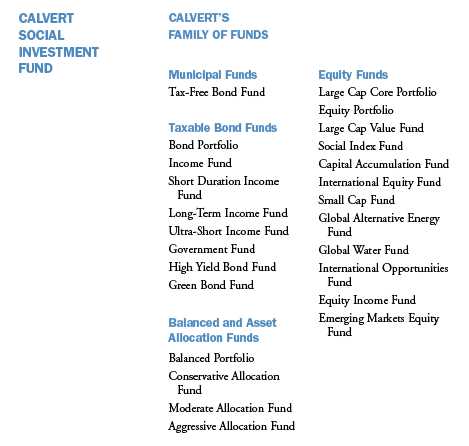
This report is intended to provide fund information to shareholders. It is not authorized for distribution to prospective investors unless preceded or accompanied by a prospectus.
Note: The information on our website is not incorporated by reference into this report; our website address is included as an inactive textual reference only.
Investors should carefully consider the investment objectives, risks, charges and expenses of the Calvert Funds. This and other important information is contained in the fund’s summary prospectus and prospectus, which can be obtained from your financial professional and should be read carefully before investing. You may also call Calvert at 800/368-2748 or visit www. calvert.com.
Choose Planet-friendly E-delivery!
Sign up now for on-line statements, prospectuses, and fund reports. In less than five minutes you can help reduce paper mail and lower fund costs.
Just go to www.calvert.com. If you already have an online account at Calvert, click on My Account, and select the documents you would like to receive via e-mail.
If you’re new to online account access, click on Login/Register to open an online account. Once you’re in, click on the E-delivery sign-up at the bottom of the Account Portfolio page and follow the quick, easy steps. Note: if your shares are not held directly at Calvert but through a brokerage firm, you must contact your broker for electronic delivery options available through their firm.
Dear Calvert Shareholder,
For the 12 months ended September 30, 2013, the global equity markets generally had a strong year, while bonds saw more mixed results. Large-cap stocks, as represented by the Russell 1000 Index, posted a healthy 20.9% return, while the smaller-cap Russell 2000 Index led with a 30.1% gain. This occurred despite political turmoil and market concerns worldwide about a forced shutdown of the U.S. government and the upcoming debt ceiling deadline.
Despite these advances, it was a challenging year for the financial markets overall. At various times, issues at home and abroad led to marked volatility in the performance of both stocks and bonds. Emerging-market performance was notably low, as fears of slowing growth in China and the Eurozone, along with continuing struggles in the Eurozone periphery, stalled regional investment. As a result, the formerly high-flying MSCI Emerging Markets Index gained only 1.3% for the period. The Barclays U.S. Credit Index, a barometer for the overall U.S. bond market, returned -1.9%.
Early in the Fall, Fed Chairman Ben Bernanke’s retirement was big news. The nomination of Vice Chair Janet Yellen as his replacement means the Fed will likely stay the course with current monetary policy. Yet, this is a historic moment for the United States, as Yellen, following Senate approval, will be the first woman to lead this critical agency.
Calvert Co-Founder Honored
I’m proud to congratulate Calvert co-founder Wayne Silby, who received the prestigious Joseph Wharton Award for Social Impact from The Alumni Club of New York, honoring his lifetime of achievement in impact investing and social entrepreneurship. Besides founding Calvert with John Guffey, Wayne is a co-founder of the Social Venture Network, Co-Chairman of the board of the Calvert Foundation, Chairman of Syntao Ltd., a CSR consultancy in Beijing, and active in other ventures in social impact and entrepreneurship.
Calvert Releases New Report on Diversity
In March, we published the latest edition of Examining the Cracks in the Glass Ceiling, which measures diversity practices of the companies that constitute the S&P 100 Index. As you know, Calvert believes companies with a diverse workforce are poised for greater success in today’s increasingly global marketplace and will enjoy greater long-term value—a view supported by a growing body of research from McKinsey, Credit Suisse, and others.
Companies in the report were rated on 10 indicators: EEO policy, internal diversity initiatives, external diversity initiatives, scope of diversity initiatives, family-friendly benefits, demographic disclosure of employees (EEO-1), highest-paid executives, board diversity,
4 www.calvert.com CALVERT ASSET ALLOCATION FUND ANNUAL REPORT
director selection criteria, and overall corporate commitment. The highest-rated companies were Citigroup, Merck, The Coca-Cola Company, and J.P. Morgan Chase, all scoring at least 95 points or more out of 100. We hold these companies in a number of our Calvert portfolios.
While some progress has been achieved in corporate diversity practices since our last assessment in 2010, the S&P 100 companies are largely failing to translate progressive practices into increased promotion rates for women and minority employees. For example, women are now hired as often as men. However, more than half of the S&P 100 companies lack diversity among their highest-paid senior executive positions. And women still only represent 19% of board members among these large-cap companies. Much remains to be done, which is why we continue to work with a number of international, multi-stakeholder groups on these issues, as well as conduct advocacy work with individual companies.
Stay Informed in the Months Ahead
Maintaining a well-diversified mix of U.S. and international stocks, bonds, and cash—appropriate for your goals and risk tolerance—is one of the best ways to mitigate the effects of an uneven recovery in the economy and markets. Of course, we recommend consulting your financial advisor if you have questions or concerns about your investments.
We also invite you to visit our website, www.calvert.com, for fund information, portfolio updates, and commentary from Calvert professionals. As always, we thank you for investing with Calvert.

The following companies represented the following percentages of Fund net assets: Citigroup 2.27% of Calvert Large Cap Value, 1.32% of Calvert Social Index; Merck 2.26% of Calvert Equity Income, 2.01% of Calvert Large Cap Value, and 1.25% of Calvert Social Index; Coca-Cola 1.29% of Calvert Social Index, 3.20% of Calvert Large Cap Core and 3.29% Calvert Equity Portfolio; J.P. Morgan Chase 2.54% of Calvert Equity Income, 1.74% of Calvert Social Index and 0.34% of Calvert Balanced Portfolio. Holdings are subject to change.
www.calvert.com CALVERT ASSET ALLOCATION FUND ANNUAL REPORT 5

As always, Calvert continues to work hard to ensure you have a say in the responsible management of environmental, social, and governance (ESG) factors for the companies in which we invest. Below are highlights of our accomplishments during the reporting period.
Shareholder Advocacy
Over the past year, Calvert engaged with 139 companies via emails, letters, phone calls, and in-person meetings. We also filed 22 shareholder proposals during the 2013 proxy season, which led to agreements with 14 companies on the issues of board diversity and sustainability reporting, among others. We also presented at four annual meetings where the proposals came to a vote and received shareholder support that exceeded 40% at two companies.
One proposal was for diversified energy services company Cleco, which has significant assets in thermoelectricity, to report on its sustainability risks and opportunities, including an analysis of material water-related risks. The other at Pioneer Natural Resources focused on reporting the environmental and social challenges and opportunities associated with hydraulic fracturing.
Company Engagement
Research and an intensive dialogue across a range of corporate responsibility and sustainability issues led to McDonald’s and Walt Disney meeting our Signature® criteria1 for the first time. McDonald’s is improving its supply chain labor policies and practices, diversifying its menu options, and disclosing their nutritional content—although it continues to face challenges in both areas. Walt Disney now meets the criteria for workplace safety, while continuing to meet our criteria on supply chain labor and human rights practices.
We undertook more engagement with Coca-Cola and PepsiCo on labor and human rights, water, and sustainability issues. In fact, PepsiCo management credited our recommendations with influencing their decision to strengthen their human rights policy framework.
Climate Change And Energy
Calvert, the World Wildlife Fund (WWF) and Ceres published, “Power Forward: Why the World’s Largest Companies are Investing in Renewable Energy.” The report found that more than half of the largest U.S. corporations and more than two-thirds of the largest companies across the globe have set greenhouse gas (GHG) emissions reduction commitments and/or renewable energy commitments.
Calvert joined with other Investor Network on Climate Risk (INCR) members to speak at congressional staff briefings about recommendations for corporations in the report and draft an investor letter to Congress supporting the production tax credit (PTC) for wind
6 www.calvert.com CALVERT ASSET ALLOCATION FUND ANNUAL REPORT
energy, which was due to expire at the end of 2012. The report, briefings and investor letter helped spur extension of the PTC to support the growth of renewable energy.
350.Org Divestment Campaign On Fossil Fuels
Calvert watched closely the 350.org campaign urging college and university endowments, as well as other institutional investors, to divest from companies producing fossil fuels. In December, Calvert posted a statement on our website expressing support for the campaign’s broad objectives while making the case for a complementary strategy of active ownership and engagement. The statement pointed to specific fossil fuel companies such as Denbury Resources and Suncor Energy that Calvert has successfully engaged on climate change, alternative energy, and revenue transparency.
Burma
After the lifting of U.S. sanctions prohibiting new investment in Burma by American companies, the Calvert Social Funds Board approved revisions to Calvert’s long-standing policy language in September. Instead of urging U.S. companies to “cease operations” in Burma, the new language instead calls for Calvert to advocate for “responsible investment.”
Garment Industry Safety
Following the Rana Plaza tragedy earlier this year, where more than 1,100 Bangladesh garment factory workers were killed, Calvert assessed the state of significant country-level sourcing disclosure by retail companies, which is essential to assessing sourcing risks more effectively. After learning that only a handful of companies disclose this necessary data, we contacted 26 retail company CEOs requesting disclosure of sourcing information for those countries representing 5% or more of global order volume.
Human Rights Report
In March, Calvert, Interfaith Center on Corporate Responsibility and the Institute for Human Rights and Business launched “Investing the Rights Way: A Guide for Business and Human Rights” in both New York and London. The guide outlines how investors can apply the UN Guiding Principles on Business and Human Rights as a due diligence and risk assessment framework to assess companies in their portfolios.
Conflict Minerals
Calvert continued to be a leader among investors on “conflict minerals” through a multi-stakeholder group supporting disclosure requirements enacted as Section 1502 of the Dodd-Frank Wall Street Reform and Consumer Protection Act of 2010. The disclosure would certify that certain minerals used in cell phones and other consumer electronic components (tin, titanium, tantalum and gold) are not illegally mined to fuel the continuing bloody conflict in the Democratic Republic of Congo (DRC).
After the SEC approved and released the final rule to implement the reporting requirements of Section 1502 in August 2012, the U.S. Chamber of Commerce filed a lawsuit against the Securities and Exchange Commission (SEC) to stop implementation. Calvert led the multi-stakeholder group’s effort to forge a common statement urging implementation of the law as outlined by the rule, regardless of the lawsuit. On July 23, the court upheld the “conflict minerals rule” in favor of the SEC and the statute requiring adoption of the rule—a major victory for Calvert and its allies.
www.calvert.com CALVERT ASSET ALLOCATION FUND ANNUAL REPORT 7
Extractives Revenue Transparency
Widely credited for its leadership role among investors in supporting extractive revenue transparency as an imperative for investors interested in full disclosure of material information related to oil, gas and mining in certain countries, Calvert has remained actively engaged in the SEC rule-making process. The U.S. Chamber of Commerce and the American Petroleum Institute filed a lawsuit challenging the pro-disclosure rules, Calvert submitted a sworn statement about the problems investors would face if the rules were delayed or revoked. We also sent letters to the SEC emphasizing the materiality of disclosures required by the rules and contributed research to Oxfam America’s January 2013 brief.
On July 2, the court “vacated” the SEC’s rule, declaring it inoperative until the SEC addresses certain key issues (the necessity for exemptions for certain countries and public reporting of the disclosures). Calvert subsequently drafted a letter to SEC Chairman Mary Jo White that acknowledged the value of the Commission’s rules to implement Section 1504 and urged her respond to the API vs. SEC decision by reinstating rules consistent with those issued in August 2012, which were endorsed by investors representing more than $5.6 trillion in assets under management.
1. Calvert’s Signature® criteria examine corporate performance across seven broad areas of concern: Governance and Ethics, Environment, Workplace, Product Safety and Impact, International Operations and Human Rights, Indigenous Peoples’ Rights, and Community Relations. For a company to be eligible for inclusion in a Calvert Signature portfolio, it must meet the criteria in all seven categories.
The following companies represented the following percentages of net assets: Cleco 0.02% of Calvert Social Index; Pioneer Natural Resources 0.23% of Calvert Social Index and 1.39% of Calvert Balanced Portfolio; McDonald’s 0.86% of Calvert Social Index and 2.35% of Calvert Equity Portfolio, Walt Disney 0.96% of Calvert Social Index and 2.25% of Calvert Equity Portfolio; Coca-Cola 1.29% of Calvert Social Index, 3.20% of Calvert Large Cap Core and 3.29% Calvert Equity Portfolio; PepsiCo 1.10% of Calvert Social Index, 1.20% of Calvert Equity Portfolio and 0.54% of Calvert Balanced Portfolio; Denbury Resources 0.06% of Calvert Social Index and 2.86% of Calvert Large Cap Core; and Suncor Energy 0.71%% of Calvert International Equity Portfolio. Holdings are subject to change.
8 www.calvert.com CALVERT ASSET ALLOCATION FUND ANNUAL REPORT

Investment Performance
For the 12-month period ended September 30, 2013, Calvert Conservative Allocation Fund’s Class A shares (at NAV) returned 7.07%, outperforming its benchmark, the Barclays Capital U.S. Credit Index, which returned -1.90%. Calvert Moderate Allocation Fund’s Class A shares (at NAV) returned 14.02%, while Calvert Aggressive Allocation Fund’s Class A shares (at NAV) returned 20.82%, both underperforming their common benchmark, the Russell 3000 Index, which returned 21.60%.
Calvert has developed a set of secondary composite benchmarks based on mix of market indices which more closely reflect the asset allocation strategy of each Fund than do the single asset class benchmarks listed above. All three Asset Allocation Funds outperformed their respective composite benchmark for the period. We discuss the performance of each Fund relative to these composite benchmarks in the Portfolio Strategy section below.
Investment Climate
Equities faced a brief pullback in late 2012, but recovered and posted strong gains throughout most of 2013. The third round of Quantitative Easing (QE), unleashed in mid-2012, provided an impetus for equity investors to look past numerous macro head-winds from fiscal cliff debates, sequester, slow growth in China and the Eurozone, and weak corporate earnings. The macro-economic picture in the U.S. continued to show improvement in the key economic sectors—housing and employment. For the year, the S&P 500, Russell 1000, Russell 2000, MSCI EAFE, and MSCI Emerging Markets Indices returned 19.34%, 20.91%, 30.06%, 24.92%, and 1.33%, respectively.
Value stocks outperformed growth stocks by 3.03%, as measured by the Russell 1000 Value and Growth Indices for the 12-month period. Within the Russell 1000 Index, Consumer Discretionary, Industrials, and Health Care were the top-performing sectors in the 12-month period, while Telecoms, Utilities, and Materials lagged.
The U.S. fixed-income market was buffeted by the decisions of monetary and fiscal poli-cymakers throughout the reporting period as the U.S. economy continued its slow recovery. Years of Fed quantitative-easing purchases reduced the pool of government bonds and drove investors to high-yield corporate bond yields, which reached a record low of 5.24% in May.1 Suggestions that the Fed would begin tapering QE3 in late spring drove intermediate and long-term interest rates higher, with the 10-year Treasury yield reaching 3% in early
www.calvert.com CALVERT ASSET ALLOCATION FUND ANNUAL REPORT 9
September. But the Fed's subsequent decision to delay the taper caused yields to decline. In the end, the 10-year Treasury yield increased nearly a percentage point to 2.64% over the 12-month period.
Corporate Earnings Are Weaker
Corporate earnings reports in late 2012 and throughout the first half of 2013 were largely weak on both the top- and bottom-line figures, with the sequester negatively impacting corporate results in the first half of 2013.
Sounding a cautious note, several bellwether companies that reported late in the summer of 2013, including names like Walmart and Cisco, issued reduced earnings forecasts citing everything from consumer weakness to fears of rising interest rates. We continue to believe that, going forward, the U.S. economic recovery can be sustained and able to support earnings growth for U.S. companies.
Improving Macroeconomic Picture in the U.S., Despite Continued Softness Abroad
Throughout the year, U.S. macro indicators continued to improve, albeit slowly. The unemployment rate ticked down to just above 7% and initial jobless claims hit post financial crisis lows in the third quarter of 2013. New job growth remains sluggish. However, consumers continue to remain upbeat and willing to spend on bigger ticket items, as reflected in improving vehicle and home sales. Sales of previously owned homes hit a three-year high in May of 2013 and housing prices continued to trend upward, despite the looming threat of rising interest rates.
During the first six months of the period, tax hikes and deep spending cuts (the “sequester”) created a drag on the U.S. economy, contributing to a poor growth rate of 0.6% annualized.2 The economy logged an estimated 2.3% growth pace3
| CALVERT | ||
| CONSERVATIVE | ||
| ALLOCATION FUND | ||
| SEPTEMBER 30, 2013 | ||
| % OF TOTAL | ||
| ASSET ALLOCATION | INVESTMENTS | |
| Domestic Equity Mutual Funds | 29 | % |
| International and Global Equity | ||
| Mutual Funds | 10 | % |
| Fixed Income Mutual Funds | 49 | % |
| Short-Term Investments | 12 | % |
| Total | 100 | % |
| INVESTMENT PERFORMANCE | ||||
| (TOTAL RETURN AT NAV*) | ||||
| 6 MONTHS | 12 MONTHS | |||
| ENDED | ENDED | |||
| 9/30/13 | 9/30/13 | |||
| Class A | 2.00 | % | 7.07 | % |
| Class C | 1.53 | % | 6.02 | % |
| Barclays U.S. | ||||
| Credit Index | -2.74 | % | -1.90 | % |
| Conservative | ||||
| Allocation | ||||
| Composite | ||||
| Benchmark** | 1.22 | % | 5.27 | % |
| Lipper | ||||
| Mixed-Asset | ||||
| Target Alloc. | ||||
| Conservative | ||||
| Funds Average | 0.85 | % | 4.91 | % |
* Investment performance/return at NAV does not reflect the deduction of the Fund’s maximum 4.75% front-end sales charge or any deferred sales charge.
** Calvert Conservative Allocation Composite Benchmark: 60% Barclays U.S. Credit Index, 22% Russell 3000 Index, 8% MSCI EAFE IMI Index, 10% 3-month Barclays T-Bill Bellwether Index.
10 www.calvert.com CALVERT ASSET ALLOCATION FUND ANNUAL REPORT
| CALVERT | ||
| MODERATE | ||
| ALLOCATION FUND | ||
| SEPTEMBER 30, 2013 | ||
| % OF TOTAL | ||
| ASSET ALLOCATION | INVESTMENTS | |
| Domestic Equity Mutual Funds | 49 | % |
| International and Global Equity | ||
| Mutual Funds | 20 | % |
| Fixed Income Mutual Funds | 24 | % |
| Short-Term Investments | 7 | % |
| Total | 100 | % |
| INVESTMENT PERFORMANCE | ||||
| (TOTAL RETURN AT NAV*) | ||||
| 6 MONTHS | 12 MONTHS | |||
| ENDED | ENDED | |||
| 9/30/13 | 9/30/13 | |||
| Class A | 5.60 | % | 14.02 | % |
| Class C | 5.22 | % | 13.21 | % |
| Russell 3000 | ||||
| Index | 9.20 | % | 21.60 | % |
| Moderate | ||||
| Allocation | ||||
| Composite | ||||
| Benchmark** | 5.47 | % | 13.75 | % |
| Lipper | ||||
| Mixed-Asset Target | ||||
| Alloc. Growth | ||||
| Funds Average | 5.37 | % | 13.64 | % |
* Investment performance/return at NAV does not reflect the deduction of the Fund’s maximum 4.75% front-end sales charge or any deferred sales charge.
** Calvert Moderate Allocation Composite Benchmark: 30% Barclays U.S. Credit Index, 47% Russell 3000 Index, 18% MSCI EAFE IMI Index, 5% 3-month Barclays T-Bill Bellwether Index.
| CALVERT | ||
| AGGRESSIVE | ||
| ALLOCATION FUND | ||
| SEPTEMBER 30, 2013 | ||
| % OF TOTAL | ||
| ASSET ALLOCATION | INVESTMENTS | |
| Domestic Equity Mutual Funds | 64 | % |
| International and Global Equity | ||
| Mutual Funds | 30 | % |
| Fixed Income Mutual Funds | 4 | % |
| Short-Term Investments | 2 | % |
| Total | 100 | % |
| INVESTMENT PERFORMANCE | ||||
| (TOTAL RETURN AT NAV*) | ||||
| 6 MONTHS | 12 MONTHS | |||
| ENDED | ENDED | |||
| 9/30/13 | 9/30/13 | |||
| Class A | 9.06 | % | 20.82 | % |
| Class C | 8.38 | % | 19.39 | % |
| Russell 3000 | ||||
| Index | 9.20 | % | 21.60 | % |
| Aggressive | ||||
| Allocation | ||||
| Composite | ||||
| Benchmark*** | 8.54 | % | 20.10 | % |
| Lipper | ||||
| Multi-Cap | ||||
| Core Funds | ||||
| Average | 9.64 | % | 23.24 | % |
* Investment performance/return at NAV does not reflect the deduction of the Fund’s maximum 4.75% front-end sales charge or any deferred sales charge.
*** Calvert Aggressive Allocation Composite Benchmark: 10% Barclays U.S. Credit Index, 64% Russell 3000 Index, 26% MSCI EAFE IMI Index.
www.calvert.com CALVERT ASSET ALLOCATION FUND ANNUAL REPORT 11
for second half. For the entire 12 months, the U.S. economy likely grew in the neighborhood of 1.5%, less than half the 50-year average U.S. economic growth rate. The Federal Reserve’s (the Fed) inflation barometer ran at 1.2% annualized, well below the long-term comfort range of 2.0% to 2.25%.4
With Political Stalemate in Washington It’s Déjà Vu All Over Again…
The debt ceiling drama of 2011 reared its head again in late September 2013. The government shutdown and debt ceiling impasse in Washington fueled uncertainty and created a negative feedback loop in the U.S. economy. Although labor conditions in the U.S. improved materially since the asset purchase program began, recent reductions in public sector employment were felt in the July and August employment reports.
| CALVERT | ||
| CONSERVATIVE | ||
| ALLOCATION FUND | ||
| SEPTEMBER 30, 2013 | ||
| AVERAGE ANNUAL TOTAL RETURNS | ||
| CLASS A SHARES | (WITH MAX. LOAD) | |
| One year | 1.99 | % |
| Five year | 5.90 | % |
| Since inception (4/29/2005) | 4.61 | % |
| CLASS C SHARES | (WITH MAX. LOAD) | |
| One year | 5.02 | % |
| Five year | 5.69 | % |
| Since inception (4/29/2005) | 3.93 | % |
The U.S. Congress failed to approve a budget to fund the government past September 30, which culminated in the shutdown of the federal government. Equity markets appeared largely unconcerned with the event in September despite the looming U.S. debt ceiling debate. Congress was not able to raise the debt ceiling until hours before the October 17th deadline identified by the Treasury Department. Although the markets welcomed the resolution, the turmoil took its toll. Estimates of fiscal drag from the shutdown were in the billions while credit-rating firm Fitch put the nation’s credit rating on negative outlook as a result of the political stalemate and inability to take timely action on raising the debt ceiling.
Portfolio Strategy
Calvert Conservative Allocation Fund
Calvert Conservative Allocation Fund returned 7.07% for the period, outperforming the blended composite benchmark return of 5.27% from a mix of market indices5 that reflects the Fund’s asset allocation strategy.
Our decision in February 2012 to increase its target equity allocation from 30% to 40% was a major driver of the Fund’s strong investment performance relative to the composite benchmark, as stocks significantly outperformed bonds during the period. The Fund also benefited from executing a series of tactical asset allocation decisions, particularly the decision to increase equity exposure above the long-term target allocation at the end of 2012, which positioned the Fund to capture greater gains from the “relief rally” in equity markets that occurred in January following the last-minute fiscal cliff deal.
Calvert Bond Portfolio, which represents about 60% of assets, was another important contributor to relative performance as the Portfolio outperformed its asset class benchmark, the Barclays Capital U.S. Credit Index.
12 www.calvert.com CALVERT ASSET ALLOCATION FUND ANNUAL REPORT
GROWTH OF $10,000
The graph below shows the value of a hypothetical $10,000 investment in the Fund over the past 10 fiscal year periods or since inception (for funds without 10-year records). The results shown are for Classes A and C shares and reflect the deduction of the maximum front-end Class A sales charge of 4.75%, or deferred sales charge, as applicable and assume the reinvestment of dividends. The result is compared with benchmarks that include a broad based market index and a Lipper peer group average. Market indexes are unmanaged and their results do not reflect the effect of expenses or sales charges. The Lipper average reflects the deduction of the category’s average front-end sales charge. The value of an investment in a different share class would be different.
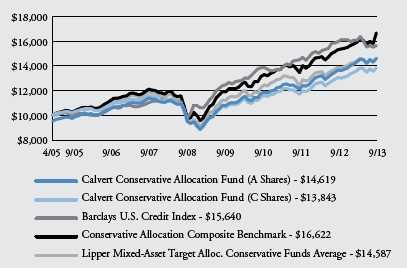
All performance data shown, including the graph above and the adjacent table, represents past performance, does not guarantee future results, assumes reinvestment of dividends and distributions and does not reflect the deduction of taxes that a shareholder would pay on the Fund’s distributions or the redemption of the Fund shares. All performance data reflects fee waivers and/or expense limitations, if any are in effect; in their absence performance would be lower. See Note B in Notes to Financial Statements. The investment return and principal value of an investment will fluctuate so that an investor’s shares, when redeemed, may be worth more or less than their original cost. Current performance may be lower or higher than the performance data quoted; for current performance data visit www.calvert.com. The gross expense ratio from the current prospectus for Class A shares is 1.42% (includes Acquired Fund Fees). This number may differ from the expense ratio shown elsewhere in this report because it is based on a different time period and, if applicable, does not include fee or expense waivers. Performance data quoted already reflects the deduction of the Fund’s operating expenses.
www.calvert.com CALVERT ASSET ALLOCATION FUND ANNUAL REPORT 13
Calvert Large Cap Core Portfolio, Calvert Small Cap Fund, and Calvert Capital Accumulation Fund also made positive contributions as each outperformed the U.S. equity asset class benchmark, the Russell 3000 Index. Calvert Large Cap Core and Calvert Small Cap Fund benefitted from strong stock selection and the strong performance of mid- and small-cap stocks also helped.
However, the weaker performance of Calvert Equity Portfolio relative to the Russell 3000 Index and Calvert International Equity Fund relative to the Allocation Funds' international equity benchmark, the MSCI EAFE IMI Index, detracted from the Fund’s overall performance. Both were largely due to stock selection.
| CALVERT | ||
| MODERATE | ||
| ALLOCATION FUND | ||
| SEPTEMBER 30, 2013 | ||
| AVERAGE ANNUAL TOTAL RETURNS | ||
| CLASS A SHARES | (WITH MAX. LOAD) | |
| One year | 8.62 | % |
| Five year | 6.22 | % |
| Since inception (4/29/2005) | 4.41 | % |
| CLASS C SHARES | (WITH MAX. LOAD) | |
| One year | 12.21 | % |
| Five year | 6.43 | % |
| Since inception (4/29/2005) | 4.17 | % |
We made an allocation to Calvert Emerging
Markets Fund during the first quarter of 2013 to capture more diversification benefits. This Fund delivered good performance relative to the MSCI Emerging Markets Index, but this allocation also hurt relative performance as emerging markets underperformed international developed markets, as measured by the MSIC EAFE IMI Index, for the period.
Calvert Moderate Allocation Fund
Calvert Moderate Allocation Fund returned 14.02% outperforming the composite benchmark return of 13.75% from a mix of market indices6 that reflects the Fund’s asset allocation strategy.
Our decision in February 2012 to increase its target equity allocation from 65% to 70% was a major driver of the Fund’s strong investment performance relative to the composite benchmark as stocks significantly outperformed bonds during the period. The Fund also benefited from executing a series of tactical asset allocation decisions, particularly the decision to increase equity exposure at the end of 2012, which positioned the Fund to capture greater gains from the “relief rally” in equity markets that occurred in January following the last-minute fiscal cliff deal.
The strong relative performance of Calvert Small Cap Fund was another important contributor to performance. It outperformed the Allocation Funds' U.S. equity asset class benchmark, the Russell 3000 Index, by more than 12% due to strong stock selection and small-cap stocks outperformance of large-cap stocks. Calvert Large Cap Core Portfolio also made a positive contribution, largely due to strong stock selection. Meanwhile, Calvert International Opportunities Fund and Calvert Capital Accumulation Fund made positive contributions as these small to mid cap oriented funds benefited from the strong performance of small- and mid-caps stocks relative to large caps in both U.S. and International markets.
14 www.calvert.com CALVERT ASSET ALLOCATION FUND ANNUAL REPORT
GROWTH OF $10,000
The graph below shows the value of a hypothetical $10,000 investment in the Fund over the past 10 fiscal year periods or since inception (for funds without 10-year records). The results shown are for Classes A and C shares and reflect the deduction of the maximum front-end Class A sales charge of 4.75%, or deferred sales charge, as applicable and assume the reinvestment of dividends. The result is compared with benchmarks that include a broad based market index and a Lipper peer group average. Market indexes are unmanaged and their results do not reflect the effect of expenses or sales charges. The Lipper average reflects the deduction of the category’s average front-end sales charge. The value of an investment in a different share class would be different.
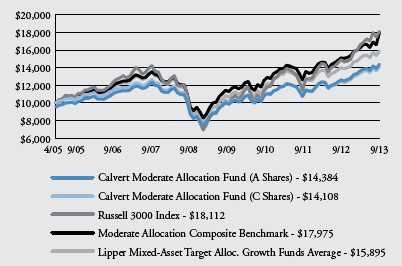
All performance data shown, including the graph above and the adjacent table, represents past performance, does not guarantee future results, assumes reinvestment of dividends and distributions and does not reflect the deduction of taxes that a shareholder would pay on the Fund’s distributions or the redemption of the Fund shares. All performance data reflects fee waivers and/or expense limitations, if any are in effect; in their absence performance would be lower. See Note B in Notes to Financial Statements. The investment return and principal value of an investment will fluctuate so that an investor’s shares, when redeemed, may be worth more or less than their original cost. Current performance may be lower or higher than the performance data quoted; for current performance data visit www.calvert.com. The gross expense ratio from the current prospectus for Class A shares is 1.45% (includes Acquired Fund Fees). This number may differ from the expense ratio shown elsewhere in this report because it is based on a different time period and, if applicable, does not include fee or expense waivers. Performance data quoted already reflects the deduction of the Fund’s operating expenses.
www.calvert.com CALVERT ASSET ALLOCATION FUND ANNUAL REPORT 15
However, the weaker performance of Calvert Equity Portfolio relative to the Russell 3000 Index and Calvert International Equity Fund relative to the Allocation Funds' international equity benchmark, the MSCI EAFE IMI Index, detracted from the Fund’s overall performance. Both were largely due to stock selection.
We made an allocation to Calvert Emerging Markets Fund during the first quarter of 2013 to capture more diversification benefits. The Fund delivered good performance relative to the MSCI Emerging Markets Index, but this allocation also hurt relative performance as emerging markets underperformed international developed markets, as measured by the MSIC EAFE IMI Index, for the period.
| CALVERT | ||
| AGGRESSIVE | ||
| ALLOCATION FUND | ||
| SEPTEMBER 30, 2013 | ||
| AVERAGE ANNUAL TOTAL RETURNS | ||
| CLASS A SHARES | (WITH MAX. LOAD) | |
| One year | 15.05 | % |
| Five year | 6.68 | % |
| Since inception (6/30/2005) | 4.15 | % |
| CLASS C SHARES | (WITH MAX. LOAD) | |
| One year | 18.39 | % |
| Five year | 6.32 | % |
| Since inception (6/30/2005) | 3.43 | % |
Calvert Aggressive Allocation Fund
Calvert Aggressive Allocation Fund returned 20.82%, outperforming the composite benchmark return of 20.10% from a mix of market indices7 that reflects the Fund’s asset allocation strategy.
Our decision in February 2012 to increase its target equity allocation from 90% to 95% was a major driver of the Fund’s strong investment performance relative to the composite benchmark as stocks significantly outperformed bonds during the period. The Fund also benefited from executing a series of tactical asset allocation decisions, particularly the decision to increase equity exposure at the end of 2012, which positioned the Fund to capture greater gains from the “relief rally” in equity markets that occurred in January following the last-minute fiscal cliff deal.
The strong relative performance of Calvert Small Cap Fund was another important contributor to performance. It outperformed the Allocation Funds' U.S. equity asset class benchmark, the Russell 3000 Index, by more than 12% due to strong stock selection and small-cap stocks outperformance of large-cap stocks. Calvert Large Cap Core Portfolio also made a positive contribution, largely due to strong stock selection. Meanwhile, Calvert International Opportunities Fund and Calvert Capital Accumulation Fund made positive contributions as these small to mid cap oriented funds benefited from the strong performance of small- and mid-caps stocks relative to large caps in both U.S. and International markets.
We made an allocation to Calvert Emerging Markets Fund during the first quarter of 2013 to capture more diversification benefits. The Fund delivered good performance relative to the MSCI Emerging Markets Index, but this allocation also hurt relative performance as emerging markets underperformed international developed markets, as measured by the MSIC EAFE IMI Index, for the period.
16 www.calvert.com CALVERT ASSET ALLOCATION FUND ANNUAL REPORT
GROWTH OF $10,000
The graph below shows the value of a hypothetical $10,000 investment in the Fund over the past 10 fiscal year periods or since inception (for funds without 10-year records). The results shown are for Classes A and C shares and reflect the deduction of the maximum front-end Class A sales charge of 4.75%, or deferred sales charge, as applicable and assume the reinvestment of dividends. The result is compared with benchmarks that include a broad based market index and a Lipper peer group average. Market indexes are unmanaged and their results do not reflect the effect of expenses or sales charges. The Lipper average reflects the deduction of the category’s average front-end sales charge. The value of an investment in a different share class would be different.
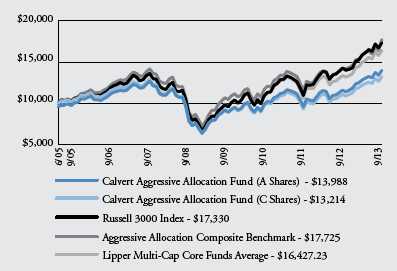
All performance data shown, including the graph above and the adjacent table, represents past performance, does not guarantee future results, assumes reinvestment of dividends and distributions and does not reflect the deduction of taxes that a shareholder would pay on the Fund’s distributions or the redemption of the Fund shares. All performance data reflects fee waivers and/or expense limitations, if any are in effect; in their absence performance would be lower. See Note B in Notes to Financial Statements. The investment return and principal value of an investment will fluctuate so that an investor’s shares, when redeemed, may be worth more or less than their original cost. Current performance may be lower or higher than the performance data quoted; for current performance data visit www.calvert.com. The gross expense ratio from the current prospectus for Class A shares is 1.68% (includes Acquired Fund Fees). This number may differ from the expense ratio shown elsewhere in this report because it is based on a different time period and, if applicable, does not include fee or expense waivers. Performance data quoted already reflects the deduction of the Fund’s operating expenses.
www.calvert.com CALVERT ASSET ALLOCATION FUND ANNUAL REPORT 17
Outlook
As we have stated in the past, despite negative short-term investor sentiment, the long-term drivers of economic recovery continue to gain strength. Investors continue to look beyond the headlines and focus on the improving macro-economic climate in the U.S. and, to some degree, overseas.
The path to recovery will not necessarily be smooth, however. The Fed is largely expected to taper QE as early as December and interest rates are expected to continue climbing. In such a scenario, higher-dividend stocks remain especially vulnerable. While growth stocks made an impressive recovery in the third quarter, value names may recover when the reality of Fed tapering and interest rate uptick returns to focus. But we expect the Fed will guide the markets not to expect a hike in the policy target rates until at least late in 2015.
However, longer-term factors such as historically low housing inventories and continued household formation will provide support for improving economic growth. Likewise, manufacturing is pulling out of its seasonal slump and the broader trend of consumer balance sheet repair is well underway.
As confidence sets in at both the consumer and corporate level, we continue to expect consumers to increase spending and companies to eventually expand capital expenditures and increase inventories. The sharp rise in interest rates that many feared would continue to 3% and beyond has tempered, and while consumers and companies alike must prepare for a rising-rate environment over the medium and longer term, a gradual shift up in borrowing costs may be a sign of an improving economy and not necessarily a near-term threat to growth.
Looking ahead, we expect the economy to continue its modest growth, with low inflation and an improving but soft labor recovery trend. Fiscal and monetary policy uncertainties, including the continued threat of another government shutdown and recurring debt ceiling debate, continue to be major headwinds for fixed-income securities in the near future.
Calvert's tactical asset allocation decisions have become an increasingly important part of the Funds’ investment process. To date, the modest yet well-timed shifts in stock and bond allocations have generally benefited the Funds’ investment performance. We believe the use of exchange-traded index futures and Treasury futures to facilitate a more efficient and cost-effective rebalancing process, introduced during the second quarter of 2013, will further enhance the performance of Calvert's tactical asset allocation process, though its impact was immaterial during the reporting period for each of the Funds.
Calvert Investment Management, Inc.
October 2013
18 www.calvert.com CALVERT ASSET ALLOCATION FUND ANNUAL REPORT
1. The effective yield of the Bank of America Merrill Lynch High Yield Master II
2. GDP data source: Commerce Department.
3. Per actual Q2 2013 GDP data and the Q3 consensus from the September WSJ Survey of Professional Forecasters.
4. Data source: Commerce Department. The September PCE data were not available at this writing.
5. Calvert Conservative Allocation Composite Benchmark: 60% Barclays U.S. Credit Index, 22% Russell 3000 Index, 8% MSCI EAFE IMI Index, 10% 3-month T-Bill Bellwether Index
6. Calvert Moderate Allocation Composite Benchmark: 30% Barclays U.S. Credit Index, 47% Russell 3000 Index, 18% MSCI EAFE IMI Index, 5% 3-month T-Bill Bellwether Index
7. Calvert Aggressive Allocation Composite Benchmark: 10% Barclays U.S. Credit Index, 64% Russell 3000 Index, 26% MSCI EAFE IMI Index.
www.calvert.com CALVERT ASSET ALLOCATION FUND ANNUAL REPORT 19
SHAREHOLDER EXPENSE EXAMPLE
As a shareholder of the Fund, you incur two types of costs: (1) transaction costs, including sales charges and redemption fees; and (2) ongoing costs, including management fees; distribution (12b-1) fees; and other Fund expenses. This Example is intended to help you understand your ongoing costs (in dollars) of investing in the Fund and to compare these costs with the ongoing costs of investing in other mutual funds.
This Example is based on an investment of $1,000 invested at the beginning of the period and held for the entire period (April 1, 2013 to September 30, 2013).
Actual Expenses
The first line of the table below provides information about actual account values and actual expenses. You may use the information in this line, together with the amount you invested, to estimate the expenses that you paid over the period. Simply divide your account value by $1,000 (for example, an $8,600 account value divided by $1,000 = 8.6), then multiply the result by the number in the first line under the heading entitled “Expenses Paid During Period” to estimate the expenses you paid on your account during this period. In addition, each Fund, as a shareholder in underlying Calvert funds, will indirectly bear its pro rata share of the fees and expenses incurred by the underlying Calvert funds. These fees and expenses are not included in each Fund’s annualized expense ratio used to calculate the expense estimates in the table below. If they were, the estimate of expense you paid during the period would be higher, and your ending account value lower.
Hypothetical Example for Comparison Purposes
The second line of the table below provides information about hypothetical account values and hypothetical expenses based on the Fund’s actual expense ratio and an assumed rate of return of 5% per year before expenses, which is not the Fund’s actual return. The hypothetical account values and expenses may not be used to estimate the actual ending account balance or expenses you paid for the period. You may use this information to compare the ongoing costs of investing in the Fund and other funds. To do so, compare the 5% hypothetical example with the 5% hypothetical examples that appear in the shareholder reports of the other funds. In addition, each Fund, as a shareholder in underlying Calvert funds, will indirectly bear its pro rata share of the fees and expenses incurred by the underlying Calvert funds. These fees and expenses are not included in each Fund’s annualized expense ratio used to calculate the expense estimates in the table below. If they were, the estimate of expense you paid during the period would be higher, and your ending account value lower.
Please note that the expenses shown in the table are meant to highlight your ongoing costs only and do not reflect any transactional costs, such as sales charges (loads), or redemption fees. Therefore, the second line of the table is useful in comparing ongoing costs only, and will not help you determine the relative total costs of owning different funds. In addition, if these transactional costs were included, your costs would have been higher.
20 www.calvert.com CALVERT ASSET ALLOCATION FUND ANNUAL REPORT
| BEGINNING | ENDING ACCOUNT | EXPENSES PAID DURING | |
| ACCOUNT VALUE | VALUE | PERIOD* | |
| CONSERVATIVE | 4/1/13 | 9/30/13 | 4/1/13 - 9/30/13 |
| CLASS A | |||
| Actual | $1,000.00 | $1,019.98 | $2.23 |
| Hypothetical | $1,000.00 | $1,022.86 | $2.23 |
| (5% return per year before expenses) | |||
| CLASS C | |||
| Actual | $1,000.00 | $1,015.30 | $7.17 |
| Hypothetical | $1,000.00 | $1,017.95 | $7.18 |
| (5% return per year before expenses) | |||
* Expenses for Conservative are equal to the annualized expense ratios of 0.44% and 1.42% for Class A and Class C, respectively, multiplied by the average account value over the period, multiplied by 183/365 (to reflect the one-half year period). The fees and expenses of the underlying Calvert funds in which the Fund invests are not included in the annualized expense ratios.
| BEGINNING | ENDING ACCOUNT | EXPENSES PAID DURING | |
| ACCOUNT VALUE | VALUE | PERIOD* | |
| MODERATE | 4/1/13 | 9/30/13 | 4/1/13 - 9/30/13 |
| CLASS A | |||
| Actual | $1,000.00 | $1,056.02 | $3.44 |
| Hypothetical | $1,000.00 | $1,021.72 | $3.39 |
| (5% return per year before expenses) | |||
| CLASS C | |||
| Actual | $1,000.00 | $1,052.18 | $7.23 |
| Hypothetical | $1,000.00 | $1,018.02 | $7.11 |
| (5% return per year before expenses) | |||
* Expenses for Moderate are equal to the annualized expense ratios of 0.67% and 1.41% for Class A and Class C, respectively, multiplied by the average account value over the period, multiplied by 183/365 (to reflect the one-half year period). The fees and expenses of the underlying Calvert funds in which the Fund invests are not included in the annualized expense ratios.
www.calvert.com CALVERT ASSET ALLOCATION FUND ANNUAL REPORT 21
| BEGINNING | ENDING | EXPENSES PAID | |
| ACCOUNT VALUE | ACCOUNT VALUE | DURING PERIOD* | |
| AGGRESSIVE | 4/1/13 | 9/30/13 | 4/1/13 - 9/30/13 |
| CLASS A | |||
| Actual | $1,000.00 | $1,090.60 | $2.25 |
| Hypothetical | $1,000.00 | $1,022.91 | $2.18 |
| (5% return per year before expenses) | |||
| CLASS C | |||
| Actual | $1,000.00 | $1,083.84 | $8.35 |
| Hypothetical | $1,000.00 | $1,017.05 | $8.08 |
| (5% return per year before expenses) | |||
* Expenses for Aggressive are equal to the annualized expense ratios of 0.43% and 1.60% for Class A and Class C, respectively, multiplied by the average account value over the period, multiplied by 183/365 (to reflect the one-half year period). The fees and expenses of the underlying Calvert funds in which the Fund invests are not included in the annualized expense ratios.
22 www.calvert.com CALVERT ASSET ALLOCATION FUND ANNUAL REPORT
REPORT OF INDEPENDENT REGISTERED PUBLIC ACCOUNTING FIRM
The Board of Trustees of Calvert Social Investment Fund and Shareholders of the Calvert Allocation Funds: We have audited the accompanying statements of assets and liabilities of the Calvert Conservative Allocation Fund, Calvert Moderate Allocation Fund, and Calvert Aggressive Allocation Fund (collectively the “Funds”), each a series of Calvert Social Investment Fund, including the schedules of investments, as of September 30, 2013, and the related statements of operations for the year then ended, the statements of changes in net assets for each of the years in the two-year period then ended, and the financial highlights for each of the years in the five-year period then ended. These financial statements and financial highlights are the responsibility of the Funds’ management. Our responsibility is to express an opinion on these financial statements and financial highlights based on our audits.
We conducted our audits in accordance with the standards of the Public Company Accounting Oversight Board (United States). Those standards require that we plan and perform the audit to obtain reasonable assurance about whether the financial statements and financial highlights are free of material misstatement. An audit includes examining, on a test basis, evidence supporting the amounts and disclosures in the financial statements. Our procedures included confirmation of securities owned as of September 30, 2013, by correspondence with the custodian and brokers or by performing other appropriate auditing procedures. An audit also includes assessing the accounting principles used and significant estimates made by management, as well as evaluating the overall financial statement presentation. We believe that our audits provide a reasonable basis for our opinion.
In our opinion, the financial statements and financial highlights referred to above present fairly, in all material respects, the financial position of the Calvert Conservative Allocation Fund, Calvert Moderate Allocation Fund, and Calvert Aggressive Allocation Fund as of September 30, 2013, the results of their operations for the year then ended, the changes in their net assets for each of the years in the two-year period then ended, and the financial highlights for each of the years in the five-year period then ended, in conformity with U.S. generally accepted accounting principles.

www.calvert.com CALVERT ASSET ALLOCATION FUND ANNUAL REPORT 23
| CONSERVATIVE ALLOCATION FUND | ||||
| SCHEDULE OF INVESTMENTS | ||||
| SEPTEMBER 30, 2013 | ||||
| MUTUAL FUNDS - 88.2% | SHARES | VALUE | ||
| Calvert Impact Fund, Inc.: | ||||
| Calvert Small Cap Fund, Class I | 118,698 | $ | 3,033,933 | |
| Calvert Social Index Series, Inc.: | ||||
| Calvert Social Index Fund, Class I | 319,459 | 5,178,430 | ||
| Calvert Social Investment Fund: | ||||
| Calvert Bond Portfolio, Class I (a) | 2,973,932 | 46,452,818 | ||
| Calvert Equity Portfolio, Class I | 160,203 | 7,766,620 | ||
| Calvert Large Cap Core Portfolio, Class I | 339,674 | 7,744,568 | ||
| Calvert World Values Fund, Inc.: | ||||
| Calvert Capital Accumulation Fund, Class I | 86,185 | 3,490,484 | ||
| Calvert Emerging Markets Equity Fund, Class I | 174,009 | 2,347,383 | ||
| Calvert International Equity Fund, Class I | 242,266 | 4,285,692 | ||
| Calvert International Opportunities Fund, Class I | 165,331 | 2,569,239 | ||
| Total Mutual Funds (Cost $77,814,210) | 82,869,167 | |||
| PRINCIPAL | ||||
| TIME DEPOSIT - 11.7% | AMOUNT | |||
| State Street Bank Time Deposit, 0.083%, 10/1/13 | $ | 10,993,579 | 10,993,579 | |
| Total Time Deposit (Cost $10,993,579) | 10,993,579 | |||
| TOTAL INVESTMENTS (Cost $88,807,789) - 99.9% | 93,862,746 | |||
| Other assets and liabilities, net - 0.1% | 117,656 | |||
| NET ASSETS - 100% | $ | 93,980,402 | ||
(a) The Fund’s investment in the Calvert Social Investment Fund Bond Portfolio, Class I represents 49% of the Fund’s total investments. The Calvert Conservative Allocation Fund seeks current income and capital appreciation, consistent with the preservation of capital. For further financial information, available upon request at no charge, on the Calvert Social Investment Fund Bond Portfolio please go to the U.S. Securities and Exchange Commission’s website at http://www.sec.gov or call 1-800-368-2745.
See notes to financial statements.
24 www.calvert.com CALVERT ASSET ALLOCATION FUND ANNUAL REPORT
| MODERATE ALLOCATION FUND | |||||
| SCHEDULE OF INVESTMENTS | |||||
| SEPTEMBER 30, 2013 | |||||
| MUTUAL FUNDS - 93.3% | SHARES | VALUE | |||
| Calvert Impact Fund, Inc.: | |||||
| Calvert Small Cap Fund, Class I | 502,683 | $ | 12,848,570 | ||
| Calvert Social Index Series, Inc.: | |||||
| Calvert Social Index Fund, Class I | 508,678 | 8,245,673 | |||
| Calvert Social Investment Fund: | |||||
| Calvert Bond Portfolio, Class I | 2,738,718 | 42,778,776 | |||
| Calvert Equity Portfolio, Class I | 578,149 | 28,028,649 | |||
| Calvert Large Cap Core Portfolio, Class I | 1,225,902 | 27,950,558 | |||
| Calvert World Values Fund, Inc.: | |||||
| Calvert Capital Accumulation Fund, Class I | 205,819 | 8,335,678 | |||
| Calvert Emerging Markets Equity Fund, Class I | 607,149 | 8,190,446 | |||
| Calvert International Equity Fund, Class I | 935,317 | 16,545,751 | |||
| Calvert International Opportunities Fund, Class I | 638,268 | 9,918,688 | |||
| Total Mutual Funds (Cost $134,522,916) | 162,842,789 | ||||
| PRINCIPAL | |||||
| TIME DEPOSIT - 6.7% | AMOUNT | ||||
| State Street Bank Time Deposit, 0.083%, 10/1/13 | $ | 11,640,402 | 11,640,402 | ||
| Total Time Deposit (Cost $11,640,402) | 11,640,402 | ||||
| TOTAL INVESTMENTS (Cost $146,163,318) - 100.0% | 174,483,191 | ||||
| Other assets and liabilities, net - 0.0% | (26,220 | ) | |||
| NET ASSETS - 100% | $ | 174,456,971 | |||
See notes to financial statements.
www.calvert.com CALVERT ASSET ALLOCATION FUND ANNUAL REPORT 25
| AGGRESSIVE ALLOCATION FUND | |||||
| SCHEDULE OF INVESTMENTS | |||||
| SEPTEMBER 30, 2013 | |||||
| MUTUAL FUNDS - 97.9% | SHARES | VALUE | |||
| Calvert Impact Fund, Inc.: | |||||
| Calvert Small Cap Fund, Class I | 330,628 | $ | 8,450,855 | ||
| Calvert Social Index Series, Inc.: | |||||
| Calvert Social Index Fund, Class I | 300,371 | 4,869,017 | |||
| Calvert Social Investment Fund: | |||||
| Calvert Bond Portfolio, Class I | 208,355 | 3,254,501 | |||
| Calvert Equity Portfolio, Class I | 368,156 | 17,848,183 | |||
| Calvert Large Cap Core Portfolio, Class I | 780,602 | 17,797,733 | |||
| Calvert World Values Fund, Inc.: | |||||
| Calvert Capital Accumulation Fund, Class I | 121,529 | 4,921,915 | |||
| Calvert Emerging Markets Equity Fund, Class I | 332,163 | 4,480,881 | |||
| Calvert International Equity Fund, Class I | 697,265 | 12,334,612 | |||
| Calvert International Opportunities Fund, Class I | 502,201 | 7,804,200 | |||
| Total Mutual Funds (Cost $63,949,950) | 81,761,897 | ||||
| PRINCIPAL | |||||
| TIME DEPOSIT - 2.2% | AMOUNT | ||||
| State Street Bank Time Deposit, 0.083%, 10/1/13 | $ | 1,874,463 | 1,874,463 | ||
| Total Time Deposit (Cost $1,874,463) | 1,874,463 | ||||
| TOTAL INVESTMENTS (Cost $65,824,413) - 100.1% | 83,636,360 | ||||
| Other assets and liabilities, net - (0.1%) | (85,070 | ) | |||
| NET ASSETS - 100% | $ | 83,551,290 | |||
See notes to financial statements.
26 www.calvert.com CALVERT ASSET ALLOCATION FUND ANNUAL REPORT
| CONSERVATIVE ALLOCATION FUND | ||
| STATEMENT OF ASSETS AND LIABILITIES | ||
| SEPTEMBER 30, 2013 | ||
| ASSETS | ||
| Investments in securities, at value (Cost $88,807,789) - | ||
| see accompanying schedule | $ | 93,862,746 |
| Receivable for shares sold | 391,961 | |
| Interest receivable | 25 | |
| Other assets | 14,905 | |
| Total assets | 94,269,637 | |
| LIABILITIES | ||
| Payable for securities purchased | 31,484 | |
| Payable for shares redeemed | 161,135 | |
| Payable to Calvert Investment Management, Inc. | 10,889 | |
| Payable to Calvert Investment Administrative Services, Inc. | 12,103 | |
| Payable to Calvert Investment Services, Inc. | 1,421 | |
| Payable to Calvert Investment Distributors, Inc. | 33,481 | |
| Accrued expenses and other liabilities | 38,722 | |
| Total liabilities | 289,235 | |
| NET ASSETS | $ | 93,980,402 |
| NET ASSETS CONSIST OF: | ||
| Paid-in capital applicable to the following shares of beneficial interest, | ||
| unlimited number of no par value shares authorized: | ||
| Class A: 4,343,613 shares outstanding | $ | 67,516,458 |
| Class C: 1,235,363 shares outstanding | 19,077,290 | |
| Undistributed net investment income | 11,469 | |
| Accumulated net realized gain (loss) | 2,320,228 | |
| Net unrealized appreciation (depreciation) | 5,054,957 | |
| NET ASSETS | $ | 93,980,402 |
| NET ASSET VALUE PER SHARE | ||
| Class A (based on net assets of $73,304,989) | $ | 16.88 |
| Class C (based on net assets of $20,675,413) | $ | 16.74 |
See notes to financial statements.
www.calvert.com CALVERT ASSET ALLOCATION FUND ANNUAL REPORT 27
| MODERATE ALLOCATION FUND | |||
| STATEMENT OF ASSETS AND LIABILITIES | |||
| SEPTEMBER 30, 2013 | |||
| ASSETS | |||
| Investments in securities, at value (Cost $146,163,318) - | |||
| see accompanying schedule | $ | 174,483,191 | |
| Receivable for shares sold | 415,032 | ||
| Interest receivable | 27 | ||
| Other assets | 20,938 | ||
| Total assets | 174,919,188 | ||
| LIABILITIES | |||
| Payable for securities purchased | 124,265 | ||
| Payable for shares redeemed | 139,448 | ||
| Payable to Calvert Investment Management, Inc. | 11,719 | ||
| Payable to Calvert Investment Administrative Services, Inc. | 22,632 | ||
| Payable to Calvert Investment Services, Inc. | 3,663 | ||
| Payable to Calvert Investment Distributors, Inc. | 57,925 | ||
| Accrued expenses and other liabilities | 102,565 | ||
| Total liabilities | 462,217 | ||
| NET ASSETS | $ | 174,456,971 | |
| NET ASSETS CONSIST OF: | |||
| Paid-in capital applicable to the following shares of beneficial interest, | |||
| unlimited number of no par value shares authorized: | |||
| Class A: 7,522,947 shares outstanding | $ | 122,374,645 | |
| Class C: 1,684,504 shares outstanding | 27,095,394 | ||
| Undistributed net investment income (loss) | (8,188 | ) | |
| Accumulated net realized gain (loss) | (3,324,753 | ) | |
| Net unrealized appreciation (depreciation) | 28,319,873 | ||
| NET ASSETS | $ | 174,456,971 | |
| NET ASSET VALUE PER SHARE | |||
| Class A (based on net assets of $143,215,117) | $ | 19.04 | |
| Class C (based on net assets of $31,241,854) | $ | 18.55 | |
See notes to financial statements.
28 www.calvert.com CALVERT ASSET ALLOCATION FUND ANNUAL REPORT
| AGGRESSIVE ALLOCATION FUND | |||
| STATEMENT OF ASSETS AND LIABILITIES | |||
| SEPTEMBER 30, 2013 | |||
| ASSETS | |||
| Investments in securities, at value (Cost $65,824,413) - | |||
| see accompanying schedule | $ | 83,636,360 | |
| Cash | 2,698 | ||
| Receivable for shares sold | 108,955 | ||
| Interest receivable | 4 | ||
| Other assets | 20,204 | ||
| Total assets | 83,768,221 | ||
| LIABILITIES | |||
| Payable for securities purchased | 68,520 | ||
| Payable for shares redeemed | 45,323 | ||
| Payable to Calvert Investment Management, Inc. | 9,614 | ||
| Payable to Calvert Investment Administrative Services, Inc. | 10,918 | ||
| Payable to Calvert Investment Services, Inc. | 2,555 | ||
| Payable to Calvert Investment Distributors, Inc. | 25,513 | ||
| Accrued expenses and other liabilities | 54,488 | ||
| Total liabilities | 216,931 | ||
| NET ASSETS | $ | 83,551,290 | |
| NET ASSETS CONSIST OF: | |||
| Paid-in capital applicable to the following shares of beneficial interest, | |||
| unlimited number of no par value shares authorized: | |||
| Class A: 3,731,919 shares outstanding | $ | 60,946,839 | |
| Class C: 634,350 shares outstanding | 9,792,987 | ||
| Undistributed net investment income (loss) | (171,462 | ) | |
| Accumulated net realized gain (loss) | (4,829,021 | ) | |
| Net unrealized appreciation (depreciation) | 17,811,947 | ||
| NET ASSETS | $ | 83,551,290 | |
| NET ASSET VALUE PER SHARE | |||
| Class A (based on net assets of $72,317,687) | $ | 19.38 | |
| Class C (based on net assets of $11,233,603) | $ | 17.71 | |
See notes to financial statements.
www.calvert.com CALVERT ASSET ALLOCATION FUND ANNUAL REPORT 29
| STATEMENTS OF OPERATIONS | |||||||||
| YEAR ENDED SEPTEMBER 30, 2013 | |||||||||
| CONSERVATIVE | MODERATE | AGGRESSIVE | |||||||
| ALLOCATION | ALLOCATION | ALLOCATION | |||||||
| NET INVESTMENT INCOME | FUND | FUND | FUND | ||||||
| Investment Income: | |||||||||
| Dividend income | $ | 2,223,455 | $ | 2,826,701 | $ | 787,699 | |||
| Interest income | 676 | 616 | 76 | ||||||
| Total investment income | 2,224,131 | 2,827,317 | 787,775 | ||||||
| Expenses: | |||||||||
| Transfer agency fees and expenses | 121,450 | 264,857 | 171,291 | ||||||
| Administrative fees | 121,563 | 235,709 | 112,773 | ||||||
| Distribution Plan expenses: | |||||||||
| Class A | 158,396 | 324,003 | 163,820 | ||||||
| Class C | 176,839 | 275,381 | 96,543 | ||||||
| Trustees' fees and expenses | 6,892 | 16,955 | 8,076 | ||||||
| Registration fees | 25,806 | 28,365 | 27,372 | ||||||
| Reports to shareholders | 19,065 | 53,008 | 35,450 | ||||||
| Professional fees | 23,285 | 27,595 | 23,937 | ||||||
| Accounting fees | 28,351 | 34,719 | 34,748 | ||||||
| Miscellaneous | 5,273 | 17,527 | 10,614 | ||||||
| Total expenses | 686,920 | 1,278,119 | 684,624 | ||||||
| Reimbursement from Advisor: | |||||||||
| Class A | (154,427 | ) | — | (245,813 | ) | ||||
| Net expenses | 532,493 | 1,278,119 | 438,811 | ||||||
| NET INVESTMENT INCOME | 1,691,638 | 1,549,198 | 348,964 | ||||||
| REALIZED AND UNREALIZED GAIN (LOSS) | |||||||||
| Net realized gain (loss) on: | |||||||||
| Investments | 3,703,997 | 6,901,298 | 1,794,247 | ||||||
| Futures | (78,105 | ) | (106,586 | ) | (38,199 | ) | |||
| 3,625,892 | 6,794,712 | 1,756,048 | |||||||
| Change in unrealized appreciation (depreciation) on: | |||||||||
| Investments | (68,029 | ) | 12,015,001 | 11,957,160 | |||||
| NET REALIZED AND UNREALIZED | |||||||||
| GAIN (LOSS) | 3,557,863 | 18,809,713 | 13,713,208 | ||||||
| INCREASE (DECREASE) IN NET ASSETS | |||||||||
| RESULTING FROM OPERATIONS | $ | 5,249,501 | $ | 20,358,911 | $ | 14,062,172 | |||
See notes to financial statements.
30 www.calvert.com CALVERT ASSET ALLOCATION FUND ANNUAL REPORT
| CONSERVATIVE ALLOCATION FUND | ||||||
| STATEMENTS OF CHANGES IN NET ASSETS | ||||||
| YEAR ENDED | YEAR ENDED | |||||
| SEPTEMBER 30, | SEPTEMBER 30, | |||||
| INCREASE (DECREASE) IN NET ASSETS | 2013 | 2012 | ||||
| Operations: | ||||||
| Net investment income | $ | 1,691,638 | $ | 1,372,248 | ||
| Net realized gain (loss) | 3,625,892 | 2,542,591 | ||||
| Change in unrealized appreciation (depreciation) | (68,029 | ) | 3,412,189 | |||
| INCREASE (DECREASE) IN NET ASSETS | ||||||
| RESULTING FROM OPERATIONS | 5,249,501 | 7,327,028 | ||||
| Distributions to shareholders from: | ||||||
| Net investment income: | ||||||
| Class A shares | (1,457,423 | ) | (1,178,687 | ) | ||
| Class C shares | (228,983 | ) | (187,324 | ) | ||
| Net realized gain: | ||||||
| Class A shares | (1,042,040 | ) | (564,244 | ) | ||
| Class C shares | (291,597 | ) | (158,834 | ) | ||
| Total distributions | (3,020,043 | ) | (2,089,089 | ) | ||
| Capital share transactions: | ||||||
| Shares sold: | ||||||
| Class A shares | 26,098,588 | 16,545,037 | ||||
| Class C shares | 6,794,665 | 4,682,575 | ||||
| Reinvestment of distributions: | ||||||
| Class A shares | 2,328,632 | 1,642,277 | ||||
| Class C shares | 445,085 | 283,911 | ||||
| Redemption fees: | ||||||
| Class A shares | 587 | 146 | ||||
| Class C shares | 299 | 1 | ||||
| Shares redeemed: | ||||||
| Class A shares | (10,295,435 | ) | (7,188,447 | ) | ||
| Class C shares | (2,261,540 | ) | (1,384,617 | ) | ||
| Total capital share transactions | 23,110,881 | 14,580,883 | ||||
| TOTAL INCREASE (DECREASE) IN NET ASSETS | 25,340,339 | 19,818,822 | ||||
| NET ASSETS | ||||||
| Beginning of year | 68,640,063 | 48,821,241 | ||||
| End of year (including undistributed net investment | ||||||
| income of $11,469 and $6,237, respectively) | $ | 93,980,402 | $ | 68,640,063 | ||
| CAPITAL SHARE ACTIVITY | ||||||
| Shares sold: | ||||||
| Class A shares | 1,571,862 | 1,045,068 | ||||
| Class C shares | 412,794 | 297,266 | ||||
| Reinvestment of distributions: | ||||||
| Class A shares | 143,034 | 106,175 | ||||
| Class C shares | 27,730 | 18,672 | ||||
| Shares redeemed: | ||||||
| Class A shares | (620,088 | ) | (455,723 | ) | ||
| Class C shares | (137,267 | ) | (88,094 | ) | ||
| Total capital share activity | 1,398,065 | 923,364 | ||||
See notes to financial statements.
www.calvert.com CALVERT ASSET ALLOCATION FUND ANNUAL REPORT 31
| MODERATE ALLOCATION FUND | ||||||
| STATEMENTS OF CHANGES IN NET ASSETS | ||||||
| YEAR ENDED | YEAR ENDED | |||||
| SEPTEMBER 30, | SEPTEMBER 30, | |||||
| INCREASE (DECREASE) IN NET ASSETS | 2013 | 2012 | ||||
| Operations: | ||||||
| Net investment income | $ | 1,549,198 | $ | 1,523,346 | ||
| Net realized gain (loss) | 6,794,712 | (2,755,087 | ) | |||
| Change in unrealized appreciation (depreciation) | 12,015,001 | 22,078,105 | ||||
| INCREASE (DECREASE) IN NET ASSETS | ||||||
| RESULTING FROM OPERATIONS | 20,358,911 | 20,846,364 | ||||
| Distributions to shareholders from: | ||||||
| Net investment income: | ||||||
| Class A shares | (1,368,061 | ) | (1,286,135 | ) | ||
| Class C shares | (205,645 | ) | (207,903 | ) | ||
| Class I shares | — | (12,988 | ) | |||
| Total distributions | (1,573,706 | ) | (1,507,026 | ) | ||
| Capital share transactions: | ||||||
| Shares sold: | ||||||
| Class A shares | 30,584,686 | 19,811,340 | ||||
| Class C shares | 5,953,253 | 3,954,340 | ||||
| Class I shares | — | 1,259 | ||||
| Reinvestment of distributions: | ||||||
| Class A shares | 1,306,434 | 1,219,653 | ||||
| Class C shares | 172,242 | 172,964 | ||||
| Class I shares | — | 12,988 | ||||
| Redemption fees: | ||||||
| Class A shares | 350 | 883 | ||||
| Class C shares | 75 | 104 | ||||
| Shares redeemed: | ||||||
| Class A shares | (21,825,657 | ) | (15,300,239 | ) | ||
| Class C shares | (2,938,384 | ) | (3,418,568 | ) | ||
| Class I shares | — | (1,141,484 | ) | |||
| Total capital share transactions | 13,252,999 | 5,313,240 | ||||
| TOTAL INCREASE (DECREASE) IN NET ASSETS | 32,038,204 | 24,652,578 | ||||
| NET ASSETS | ||||||
| Beginning of year | 142,418,767 | 117,766,189 | ||||
| End of year (including distributions in excess of net | ||||||
| investment income and undistributed net investment | ||||||
| income of $8,188 and $16,320, respectively) | $ | 174,456,971 | $ | 142,418,767 | ||
See notes to financial statements.
32 www.calvert.com CALVERT ASSET ALLOCATION FUND ANNUAL REPORT
| MODERATE ALLOCATION FUND | ||||
| STATEMENTS OF CHANGES IN NET ASSETS | ||||
| YEAR ENDED | YEAR ENDED | |||
| SEPTEMBER 30, | SEPTEMBER 30, | |||
| CAPITAL SHARE ACTIVITY | 2013 | 2012 | ||
| Shares sold: | ||||
| Class A shares | 1,702,274 | 1,229,027 | ||
| Class C shares | 337,859 | 250,511 | ||
| Reinvestment of distributions: | ||||
| Class A shares | 76,627 | 80,163 | ||
| Class C shares | 10,407 | 11,640 | ||
| Class I shares | — | 855 | ||
| Shares redeemed: | ||||
| Class A shares | (1,215,001 | ) | (959,281 | ) |
| Class C shares | (168,791 | ) | (218,597 | ) |
| Class I shares | — | (69,064 | ) | |
| Total capital share activity | 743,375 | 325,254 | ||
See notes to financial statements.
www.calvert.com CALVERT ASSET ALLOCATION FUND ANNUAL REPORT 33
| AGGRESSIVE ALLOCATION FUND | ||||||
| STATEMENTS OF CHANGES IN NET ASSETS | ||||||
| YEAR ENDED | YEAR ENDED | |||||
| SEPTEMBER 30, | SEPTEMBER 30, | |||||
| INCREASE (DECREASE) IN NET ASSETS | 2013 | 2012 | ||||
| Operations: | ||||||
| Net investment income | $ | 348,964 | $ | 421,891 | ||
| Net realized gain (loss) | 1,756,048 | (1,860,262 | ) | |||
| Change in unrealized appreciation (depreciation) | 11,957,160 | 13,366,822 | ||||
| INCREASE (DECREASE) IN NET ASSETS | ||||||
| RESULTING FROM OPERATIONS | 14,062,172 | 11,928,451 | ||||
| Distributions to shareholders from: | ||||||
| Net investment income: | ||||||
| Class A shares | (407,877 | ) | (440,420 | ) | ||
| Class C shares | (32,207 | ) | (61,813 | ) | ||
| Total distributions | (440,084 | ) | (502,233 | ) | ||
| Capital share transactions: | ||||||
| Shares sold: | ||||||
| Class A shares | 15,322,772 | 8,607,576 | ||||
| Class C shares | 2,294,480 | 1,176,858 | ||||
| Reinvestment of distributions: | ||||||
| Class A shares | 386,716 | 417,366 | ||||
| Class C shares | 29,876 | 56,791 | ||||
| Redemption fees: | ||||||
| Class A shares | 2,959 | 340 | ||||
| Class C shares | 65 | 60 | ||||
| Shares redeemed: | ||||||
| Class A shares | (15,832,431 | ) | (9,745,801 | ) | ||
| Class C shares | (1,151,748 | ) | (1,394,982 | ) | ||
| Total capital share transactions | 1,052,689 | (881,792 | ) | |||
| TOTAL INCREASE (DECREASE) IN NET ASSETS | 14,674,777 | 10,544,426 | ||||
| NET ASSETS | ||||||
| Beginning of year | 68,876,513 | 58,332,087 | ||||
| End of year (including distributions in excess of net investment | ||||||
| income of $171,462 and $80,342, respectively) | $ | 83,551,290 | $ | 68,876,513 | ||
See notes to financial statements.
34 www.calvert.com CALVERT ASSET ALLOCATION FUND ANNUAL REPORT
| AGGRESSIVE ALLOCATION FUND | ||||
| STATEMENTS OF CHANGES IN NET ASSETS | ||||
| YEAR ENDED | YEAR ENDED | |||
| SEPTEMBER 30, | SEPTEMBER 30, | |||
| CAPITAL SHARE ACTIVITY | 2013 | 2012 | ||
| Shares sold: | ||||
| Class A shares | 855,735 | 566,199 | ||
| Class C shares | 140,592 | 83,319 | ||
| Reinvestment of distributions: | ||||
| Class A shares | 23,783 | 29,268 | ||
| Class C shares | 1,992 | 4,276 | ||
| Shares redeemed: | ||||
| Class A shares | (894,053 | ) | (643,748 | ) |
| Class C shares | (71,125 | ) | (99,609 | ) |
| Total capital share activity | 56,924 | (60,295 | ) | |
See notes to financial statements.
www.calvert.com CALVERT ASSET ALLOCATION FUND ANNUAL REPORT 35
NOTES TO FINANCIAL STATEMENTS
NOTE A — SIGNIFICANT ACCOUNTING POLICIES
General: The Calvert Social Investment Fund is registered under the Investment Company Act of 1940 as an open-end management investment company. The Fund operates as a series fund with seven separate portfolios, three of which are reported herein: Calvert Conservative Allocation Fund ("Conservative"), Calvert Moderate Allocation Fund ("Moderate"), and Calvert Aggressive Allocation Fund ("Aggressive") (the “Funds”). The Funds are registered under the Investment Company Act of 1940 as non-diversified, open-end management investment companies. The operations of each series are accounted for separately. The Funds invest primarily in a combination of other Calvert equity and fixed income funds (the “Underlying Funds”). Each Fund offers Class A and Class C shares. Moderate and Aggressive also offered Class I shares, however these classes were closed and de-registered with the U.S. Securities and Exchange Commission effective April 30, 2012. Class A shares are sold with a maximum front-end sales charge of 4.75%. Class C shares are sold without a front-end sales charge and, with certain exceptions, will be charged a deferred sales charge on shares sold within one year of purchase. Class C shares have higher levels of expenses than Class A shares. Each class has different: (a) dividend rates, due to differences in Distribution Plan expenses and other class-specific expenses, (b) exchange privileges and (c) class-specific voting rights.
Security Valuation: Net asset value per share is determined every business day as of the close of the regular session of the New York Stock Exchange (generally 4:00 p.m. Eastern time). The Funds use independent pricing services approved by the Board of Trustees ("the Board") to value their investments wherever possible. Investments for which market quotations are not available or deemed not reliable are fair valued in good faith under the direction of the Board.
The Board has adopted Valuation Procedures (the “Procedures”) to determine the fair value of securities and other financial instruments for which market prices are not readily available or which may not be reliably priced. The Board has delegated the day-to-day responsibility for determining the fair value of assets of the Funds to Calvert Investment Management, Inc. (the “Advisor” or “Calvert”) and has provided these Procedures to govern Calvert in its valuation duties.
Calvert has chartered an internal Valuation Committee to oversee the implementation of these Procedures and to assist it in carrying out the valuation responsibilities that the Board has delegated.
The Valuation Committee meets on a regular basis to review illiquid securities and other investments which may not have readily available market prices. The Valuation Committee's fair valuation determinations are subject to review, approval and ratification by the Board at its next regularly scheduled meeting covering the calendar quarter in which the fair valuation was determined.
The Valuation Committee utilizes various methods to measure the fair value of the Funds' investments. Generally Accepted Accounting Principles (GAAP) establishes a disclosure hierarchy that categorizes the inputs to valuation techniques used to value assets and liabilities at measurement date. These inputs are summarized in the three broad levels listed below:
36 www.calvert.com CALVERT ASSET ALLOCATION FUND ANNUAL REPORT
Level 1 – quoted prices in active markets for identical securities
Level 2 – other significant observable inputs (including quoted prices for similar securities, interest rates, prepayment speeds, credit risk, etc.)
Level 3 – significant unobservable inputs (including the Funds' own assumptions in determining the fair value of investments) The inputs or methodologies used for valuing securities are not necessarily an indication of the risk associated with investing in those securities.
Changes in valuation techniques may result in transfers in or out of an investment’s assigned level within the hierarchy during the period. There were no such transfers during the period. Valuation techniques used to value the Funds' investments by major category are as follows: Investments in the Underlying Funds are valued at their closing net asset value each business day and are categorized as Level 1 in the hierarchy. Valuation methodologies and policies of the Underlying Funds are included in their financial statements, which are available upon request.
Short-term securities of sufficient credit quality with remaining maturities of sixty days or less for which quotations are not readily available are valued at amortized cost, which approximates fair value, and are categorized as Level 2 in the hierarchy.
At September 30, 2013, no securities were fair valued in good faith under the direction of the Board.
The following is a summary of the inputs used to value the Funds’ net assets as of September 30, 2013:
| CONSERVATIVE | VALUATION INPUTS | |||
| INVESTMENTS IN SECURITIES* | LEVEL 1 | LEVEL 2 | LEVEL 3 | TOTAL |
| Mutual funds | $82,869,167 | — | — | $82,869,167 |
| Other debt obligations | — | $10,993,579 | — | 10,993,579 |
| TOTAL | $82,869,167 | $10,993,579 | — | $93,862,746 |
| MODERATE | VALUATION INPUTS | |||
| INVESTMENTS IN SECURITIES* | LEVEL 1 | LEVEL 2 | LEVEL 3 | TOTAL |
| Mutual funds | $162,842,789 | — | — | $162,842,789 |
| Other debt obligations | — | $11,640,402 | — | 11,640,402 |
| TOTAL | $162,842,789 | $11,640,402 | — | $174,483,191 |
| AGGRESSIVE | VALUATION INPUTS | |||
| INVESTMENTS IN SECURITIES* | LEVEL 1 | LEVEL 2 | LEVEL 3 | TOTAL |
| Mutual funds | $81,761,897 | — | — | $81,761,897 |
| Other debt obligations | — | $1,874,463 | — | 1,874,463 |
| TOTAL | $81,761,897 | $1,874,463 | — | $83,636,360 |
* For a complete listing of investments, please refer to the Schedule of Investments.
www.calvert.com CALVERT ASSET ALLOCATION FUND ANNUAL REPORT 37
Futures Contracts: The Funds may purchase and sell futures contracts to facilitate the periodic rebalancing of the portfolios in order to maintain their target asset allocation, to make tactical asset allocations, and to assist in managing cash. These futures contracts may include, but are not limited to, futures contracts based on U.S. Government obligations and market index futures contracts. The Funds may enter into futures contracts agreeing to buy or sell a financial instrument for a set price at a future date. Initial margin deposits of either cash or securities as required by the broker are made upon entering into the contract. While the contract is open, daily variation margin payments are made to or received from the broker reflecting the daily change in market value of the contract and are recorded for financial reporting purposes as unrealized gains or losses by the Funds. When a futures contract is closed, a realized gain or loss is recorded equal to the difference between the opening and closing value of the contract. The risks associated with entering into futures contracts may include the possible illiquidity of the secondary market which would limit the Funds' ability to close out a futures contract prior to the settlement date, an imperfect correlation between the value of the contracts and the underlying financial instruments, or that the counterparty will fail to perform its obligations under the contracts' terms. Futures contracts are designed by boards of trade which are designated “contracts markets” by the Commodities Futures Trading Commission. Futures contracts trade on the contracts markets in a manner that is similar to the way a stock trades on a stock exchange and the boards of trade, through their clearing corporations, guarantee the futures contracts against default. As a result, there is minimal counterparty credit risk to the Funds. During the year, the Funds used futures contracts as a substitute for direct investment in a particular asset class to facilitate rebalanc-ing and implement tactical asset allocations.
During the year, Conservative invested in E-Mini S&P 500 Index futures and 5 year and 10 year U.S. Treasury Notes futures. The volume of outstanding contracts has varied throughout the year with a weighted average of 42 contracts and $2,874,586 weighted average notional value.
During the year, Moderate invested in E-Mini S&P 500 Index futures and 5 year and 10 year U.S. Treasury Notes futures. The volume of outstanding contracts has varied throughout the year with a weighted average of 28 contracts and $1,909,247 weighted average notional value.
During the year, Aggressive invested in E-Mini S&P 500 Index futures and 5 year and 10 year U.S. Treasury Notes futures. The volume of outstanding contracts has varied throughout the year with a weighted average of 9 contracts and $597,507 weighted average notional value.
Security Transactions and Net Investment Income: Security transactions, normally purchases and sales of shares of the Underlying Funds, are accounted for on trade date. Realized gains and losses are recorded on an identified cost basis. Income and capital gain distributions from the Underlying Funds, if any, are recorded on the ex-dividend date. Interest income is accrued as earned. Investment income and realized and unrealized gains and losses are allocated to separate classes of shares based upon the relative net assets of each class. Expenses arising in connection with a specific class are charged directly to that class. Expenses common to the classes are allocated to each class in proportion to their relative net assets. Expenses included in the accompanying financial statements reflect the expenses of each of the Funds and do not include any expenses associated with the Underlying Funds.
38 www.calvert.com CALVERT ASSET ALLOCATION FUND ANNUAL REPORT
Distributions to Shareholders: Distributions to shareholders are recorded by the Funds on ex-dividend date. Dividends from net investment income are paid quarterly. Distributions from net realized capital gains, if any, are paid at least annually. Distributions are determined in accordance with income tax regulations which may differ from generally accepted accounting principles; accordingly, periodic reclassifications are made within the Funds’ capital accounts to reflect income and gains available for distribution under income tax regulations.
Estimates: The preparation of the financial statements in conformity with accounting principles generally accepted in the United States requires management to make estimates and assumptions that affect the reported amounts of assets and liabilities and disclosure of contingent assets and liabilities at the date of the financial statements and the reported amounts of income and expenses during the reported period. Actual results could differ from those estimates.
Redemption Fees: The Funds charge a 2% redemption fee on redemptions, including exchanges, made within 30 days of purchase in the same Fund. The redemption fee is accounted for as an addition to paid-in capital and is intended to discourage market-timers by ensuring that short-term trading costs are borne by the investors making the transactions and not the shareholders already in the Fund.
Expense Offset Arrangement: The Funds had an arrangement with the custodian bank whereby the custodian’s fees may have been paid indirectly by credits earned on each Fund’s cash on deposit with the bank. These credits were used to reduce the Funds' expenses. This arrangement was suspended on January 1, 2013, until further notice, due to low interest rates. Such a deposit arrangement was an alternative to overnight investments.
Federal Income Taxes: No provision for federal income or excise tax is required since the Funds intend to continue to qualify as regulated investment companies under the Internal Revenue Code and to distribute substantially all taxable earnings.
Management has analyzed the Funds' tax positions taken for all open federal income tax years and has concluded that no provision for federal income tax is required in the Funds' financial statements. A Fund’s federal tax return is subject to examination by the Internal Revenue Service for a period of three years.
NOTE B — RELATED PARTY TRANSACTIONS
Calvert Investment Management, Inc. (the “Advisor”) is wholly-owned by Calvert Investments, Inc., which is indirectly wholly-owned by Ameritas Mutual Holding Company. The Advisor provides investment advisory services for the Funds and the Underlying Funds in which the Funds invest. The Advisor also pays the salaries and fees of officers and Trustees of the Funds who are employees of the Advisor or its affiliates. The Funds do not pay advisory fees to the Advisor for performing investment advisory services. The Advisor, however, will receive advisory fees for managing the Underlying Funds.
The Advisor has contractually agreed to limit direct ordinary operating expenses through January 31, 2014. The contractual expense cap is .44%, .80%, and .43% for Class A shares of Conservative, Moderate, and Aggressive, respectively. The contractual expense cap is 2.00% for Class C shares of each of the Funds. This expense limitation does not
www.calvert.com CALVERT ASSET ALLOCATION FUND ANNUAL REPORT 39
include the Underlying Fund expenses indirectly incurred by the Funds. For the purpose of this expense limit, operating expenses do not include interest expense, brokerage commissions, taxes, and extraordinary expenses. To the extent any expense offset credits were earned, the Advisor’s obligation under the contractual limitation may have been reduced and the Advisor may have benefited from the expense offset arrangement.
Calvert Investment Administrative Services, Inc., an affiliate of the Advisor, provides administrative services to the Funds for an annual fee. Classes A and C of each of the Funds pay an annualized rate, payable monthly, of .15% of the average daily net assets.
Calvert Investment Distributors, Inc. ("CID"), an affiliate of the Advisor, is the distributor and principal underwriter for the Funds. Pursuant to Rule 12b-1 under the Investment Company Act of 1940, the Funds have adopted Distribution Plans that permit the Funds to pay certain expenses associated with the distribution and servicing of their shares. The expenses paid may not exceed .35% and 1.00% annually of average daily net assets of Class A and C, respectively, for each of the Funds. The amount actually paid by the Funds is an annualized fee, payable monthly, of .25% and 1.00% of the Funds’ average daily net assets of Class A and C, respectively.
CID received $63,640, $102,969, and $45,189 as its portion of the commissions charged on the sales of Conservative, Moderate, and Aggressive Class A shares, respectively, for the year ended September 30, 2013.
Calvert Investment Services, Inc. ("CIS"), an affiliate of the Advisor, acts as shareholder servicing agent for the Funds. For its services, CIS received fees of $18,264, $48,502, and $32,736 for the year ended September 30, 2013 for Conservative, Moderate, and Aggressive, respectively. Boston Financial Data Services, Inc. is the transfer and dividend disbursing agent.
Each Trustee of the Funds who is not an employee of the Advisor or its affiliates receives an annual retainer of $48,000 plus a meeting fee of up to $3,000 for each regular Board meeting attended. Additional fees of up to $5,000 annually may be paid to the Board chair and Committee chairs ($10,000 for Special Equities Committee chair) and $2,500 annually may be paid to Committee members, plus a Committee meeting fee of $500 for each regular Committee meeting attended ($1,000 for special Audit Committee meetings). Trustees' fees are allocated to each of the funds served.
NOTE C — INVESTMENT ACTIVITY AND TAX INFORMATION
During the year, the cost of purchases and proceeds from sales of the Underlying Funds were:
| CONSERVATIVE | MODERATE | AGGRESSIVE | |
| Purchases | $35,553,977 | $44,397,027 | $23,488,962 |
| Sales | 24,739,870 | 42,115,032 | 23,943,181 |
Moderate and Aggressive intend to elect to defer net ordinary losses of $8,188 and $171,462, respectively, incurred from January 1, 2013 through September 30, 2013 and treat them as arising in the fiscal year ending September 30, 2014.
40 www.calvert.com CALVERT ASSET ALLOCATION FUND ANNUAL REPORT
The tax character of dividends and distributions paid during the years ended September 30, 2013 and September 30, 2012 was as follows:
| CONSERVATIVE | ||
| Distributions paid from: | 2013 | 2012 |
| Ordinary income | $1,686,406 | $1,366,011 |
| Long-term capital gain | 1,333,637 | 723,078 |
| Total | $3,020,043 | $2,089,089 |
| MODERATE | ||
| Distributions paid from: | 2013 | 2012 |
| Ordinary income | $1,573,706 | $1,507,026 |
| Total | $1,573,706 | $1,507,026 |
| AGGRESSIVE | ||
| Distributions paid from: | 2013 | 2012 |
| Ordinary income | $440,084 | $502,233 |
| Total | $440,084 | $502,233 |
As of September 30, 2013, the tax basis components of distributable earnings/(accumulated losses) and the federal tax cost were as follows:
| CONSERVATIVE | MODERATE | AGGRESSIVE | ||||
| Unrealized appreciation | $5,642,693 | $21,335,145 | $12,890,820 | |||
| Unrealized (depreciation) | (1,130,664 | ) | (1,682,676 | ) | (1,525,825 | ) |
| Net unrealized appreciation/(depreciation) | $4,512,029 | $19,652,469 | $11,364,995 | |||
| Undistributed ordinary income | $47,741 | — | — | |||
| Undistributed long-term capital gain | $2,826,884 | $5,342,651 | $1,617,931 | |||
| Federal income tax cost of investments | $89,350,717 | $154,830,722 | $72,271,365 |
The differences between the components of distributable earnings on a tax basis and the amounts reflected in the statements of net assets are primarily due to temporary book-tax differences that will reverse in a subsequent period. These differences are mainly due to wash sales for all of the Funds and deferral of post-December ordinary losses for Moderate and Aggressive.
NOTE D — LINE OF CREDIT
A financing agreement is in place with the Calvert Funds and State Street Corporation (“SSC”). Under the agreement, SSC provides an unsecured line of credit facility, in the aggregate amount of $50 million ($25 million committed and $25 million uncommitted), accessible by the Funds for temporary or emergency purposes only. Borrowings
www.calvert.com CALVERT ASSET ALLOCATION FUND ANNUAL REPORT 41
under the committed facility bear interest at the higher of the London Interbank Offered Rate (LIBOR) or the overnight Federal Funds Rate plus 1.25% per annum. A commitment fee of .11% per annum is incurred on the unused portion of the committed facility, which is allocated to all participating funds. The Funds had no borrowings under the agreement during the year ended September 30, 2013.
NOTE E — SUBSEQUENT EVENTS
In preparing the financial statements as of September 30, 2013, no subsequent events or transactions occurred that would have required recognition or disclosure in these financial statements.
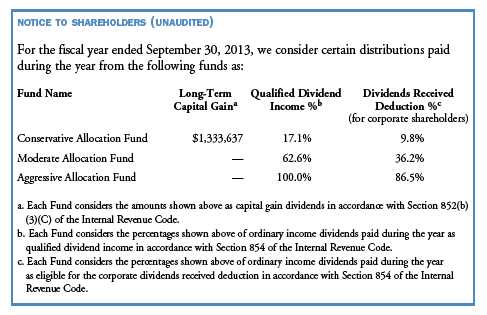
42 www.calvert.com CALVERT ASSET ALLOCATION FUND ANNUAL REPORT
| CONSERVATIVE ALLOCATION FUND | |||||||||
| FINANCIAL HIGHLIGHTS | |||||||||
| YEARS ENDED | |||||||||
| SEPTEMBER 30, | SEPTEMBER 30, | SEPTEMBER 30, | |||||||
| CLASS A SHARES | 2013 | (z) | 2012 | 2011 | |||||
| Net asset value, beginning | $ | 16.45 | $ | 15.01 | $ | 15.17 | |||
| Income from investment operations: | |||||||||
| Net investment income | .38 | .40 | .42 | ||||||
| Net realized and unrealized gain (loss) | .74 | 1.65 | (.13 | ) | |||||
| Total from investment operations | 1.12 | 2.05 | .29 | ||||||
| Distributions from: | |||||||||
| Net investment income | (.39 | ) | (.40 | ) | (.45 | ) | |||
| Net realized gain | (.30 | ) | (.21 | ) | — | ||||
| Total distributions | (.69 | ) | (.61 | ) | (.45 | ) | |||
| Total increase (decrease) in net asset value | .43 | 1.44 | (.16 | ) | |||||
| Net asset value, ending | $ | 16.88 | $ | 16.45 | $ | 15.01 | |||
| Total return* | 7.07 | % | 13.96 | % | 1.86 | % | |||
| Ratios to average net assets:A,B | |||||||||
| Net investment income | 2.31 | % | 2.53 | % | 2.65 | % | |||
| Total expenses | .68 | % | .77 | % | .84 | % | |||
| Expenses before offsets | .44 | % | .44 | % | .44 | % | |||
| Net expenses | .44 | % | .44 | % | .44 | % | |||
| Portfolio turnover | 31 | % | 26 | % | 22 | % | |||
| Net assets, ending (in thousands) | $ | 73,305 | $ | 53,431 | $ | 38,329 | |||
| YEARS ENDED | |||||||||
| SEPTEMBER 30, | SEPTEMBER 30, | ||||||||
| CLASS A SHARES | 2010 | 2009 | |||||||
| Net asset value, beginning | $ | 14.29 | $ | 14.52 | |||||
| Income from investment operations: | |||||||||
| Net investment income | .35 | .45 | |||||||
| Net realized and unrealized gain (loss) | .88 | (.04 | ) | ||||||
| Total from investment operations | 1.23 | .41 | |||||||
| Distributions from: | |||||||||
| Net investment income | (.35 | ) | (.45 | ) | |||||
| Net realized gain | — | (.19 | ) | ||||||
| Total distributions | (.35 | ) | (.64 | ) | |||||
| Total increase (decrease) in net asset value | .88 | (.23 | ) | ||||||
| Net asset value, ending | $ | 15.17 | $ | 14.29 | |||||
| Total return* | 8.69 | % | 3.48 | % | |||||
| Ratios to average net assets:A,B | |||||||||
| Net investment income | 2.37 | % | 3.41 | % | |||||
| Total expenses | .90 | % | 1.04 | % | |||||
| Expenses before offsets | .44 | % | .44 | % | |||||
| Net expenses | .44 | % | .44 | % | |||||
| Portfolio turnover | 9 | % | 24 | % | |||||
| Net assets, ending (in thousands) | $ | 32,565 | $ | 23,300 | |||||
See notes to financial highlights.
www.calvert.com CALVERT ASSET ALLOCATION FUND ANNUAL REPORT 43
| CONSERVATIVE ALLOCATION FUND | |||||||||
| FINANCIAL HIGHLIGHTS | |||||||||
| YEARS ENDED | |||||||||
| SEPTEMBER 30, | SEPTEMBER 30, | SEPTEMBER 30, | |||||||
| CLASS C SHARES | 2013 | (z) | 2012 | 2011 | |||||
| Net asset value, beginning | $ | 16.32 | $ | 14.90 | $ | 15.10 | |||
| Income from investment operations: | |||||||||
| Net investment income | .21 | .24 | .25 | ||||||
| Net realized and unrealized gain (loss) | .74 | 1.62 | (.14 | ) | |||||
| Total from investment operations | .95 | 1.86 | .11 | ||||||
| Distributions from: | |||||||||
| Net investment income | (.23 | ) | (.23 | ) | (.31 | ) | |||
| Net realized gain | (.30 | ) | (.21 | ) | — | ||||
| Total distributions | (.53 | ) | (.44 | ) | (.31 | ) | |||
| Total increase (decrease) in net asset value | .42 | 1.42 | (.20 | ) | |||||
| Net asset value, ending | $ | 16.74 | $ | 16.32 | $ | 14.90 | |||
| Total return* | 6.02 | % | 12.73 | % | .67 | % | |||
| Ratios to average net assets: A,B | |||||||||
| Net investment income | 1.30 | % | 1.45 | % | 1.47 | % | |||
| Total expenses | 1.44 | % | 1.51 | % | 1.59 | % | |||
| Expenses before offsets | 1.44 | % | 1.51 | % | 1.59 | % | |||
| Net expenses | 1.44 | % | 1.51 | % | 1.59 | % | |||
| Portfolio turnover | 31 | % | 26 | % | 22 | % | |||
| Net assets, ending (in thousands) | $ | 20,675 | $ | 15,209 | $ | 10,492 | |||
| YEARS ENDED | |||||||||
| SEPTEMBER 30, | SEPTEMBER 30, | ||||||||
| CLASS C SHARES | 2010 | 2009 | |||||||
| Net asset value, beginning | $ | 14.23 | $ | 14.45 | |||||
| Income from investment operations: | |||||||||
| Net investment income | .17 | .26 | |||||||
| Net realized and unrealized gain (loss) | .87 | (.03 | ) | ||||||
| Total from investment operations | 1.04 | .23 | |||||||
| Distributions from: | |||||||||
| Net investment income | (.17 | ) | (.26 | ) | |||||
| Net realized gain | — | (.19 | ) | ||||||
| Total distributions | (.17 | ) | (.45 | ) | |||||
| Total increase (decrease) in net asset value | .87 | (.22 | ) | ||||||
| Net asset value, ending | $ | 15.10 | $ | 14.23 | |||||
| Total return* | 7.39 | % | 2.05 | % | |||||
| Ratios to average net assets:A,B | |||||||||
| Net investment income | 1.12 | % | 1.99 | % | |||||
| Total expenses | 1.68 | % | 1.88 | % | |||||
| Expenses before offsets | 1.68 | % | 1.88 | % | |||||
| Net expenses | 1.68 | % | 1.88 | % | |||||
| Portfolio turnover | 9 | % | 24 | % | |||||
| Net assets, ending (in thousands) | $ | 8,393 | $ | 5,747 | |||||
See notes to financial highlights.
44 www.calvert.com CALVERT ASSET ALLOCATION FUND ANNUAL REPORT
| MODERATE ALLOCATION FUND | |||||||||
| FINANCIAL HIGHLIGHTS | |||||||||
| YEARS ENDED | |||||||||
| SEPTEMBER 30, | SEPTEMBER 30, | SEPTEMBER 30, | |||||||
| CLASS A SHARES | 2013 | 2012 | 2011 | ||||||
| Net asset value, beginning | $ | 16.89 | $ | 14.51 | $ | 14.87 | |||
| Income from investment operations: | |||||||||
| Net investment income | .20 | .21 | .15 | ||||||
| Net realized and unrealized gain (loss) | 2.14 | 2.36 | (.29 | ) | |||||
| Total from investment operations | 2.34 | 2.57 | (.14 | ) | |||||
| Distributions from: | |||||||||
| Net investment income | (.19 | ) | (.19 | ) | (.20 | ) | |||
| In excess of net investment income | — | — | (.02 | ) | |||||
| Total distributions | (.19 | ) | (.19 | ) | (.22 | ) | |||
| Total increase (decrease) in net asset value | 2.15 | 2.38 | (.36 | ) | |||||
| Net asset value, ending | $ | 19.04 | $ | 16.89 | $ | 14.51 | |||
| Total return* | 14.02 | % | 17.89 | % | (1.03 | %) | |||
| Ratios to average net assets: A,B | |||||||||
| Net investment income | 1.12 | % | 1.28 | % | .97 | % | |||
| Total expenses | .69 | % | .72 | % | .73 | % | |||
| Expenses before offsets | .69 | % | .72 | % | .73 | % | |||
| Net expenses | .69 | % | .72 | % | .73 | % | |||
| Portfolio turnover | 27 | % | 25 | % | 18 | % | |||
| Net assets, ending (in thousands) | $ | 143,215 | $ | 117,550 | $ | 95,930 | |||
| YEARS ENDED | |||||||||
| SEPTEMBER 30, | SEPTEMBER 30, | ||||||||
| CLASS A SHARES | 2010 | 2009 | |||||||
| Net asset value, beginning | $ | 13.94 | $ | 14.83 | |||||
| Income from investment operations: | |||||||||
| Net investment income | .16 | .23 | |||||||
| Net realized and unrealized gain (loss) | .92 | (.51 | ) | ||||||
| Total from investment operations | 1.08 | (.28 | ) | ||||||
| Distributions from: | |||||||||
| Net investment income | (.15 | ) | (.22 | ) | |||||
| Net realized gain | — | (.39 | ) | ||||||
| Total distributions | (.15 | ) | (.61 | ) | |||||
| Total increase (decrease) in net asset value | .93 | (.89 | ) | ||||||
| Net asset value, ending | $ | 14.87 | $ | 13.94 | |||||
| Total return* | 7.76 | % | (.95 | %) | |||||
| Ratios to average net assets: A,B | |||||||||
| Net investment income | 1.06 | % | 1.85 | % | |||||
| Total expenses | .76 | % | .83 | % | |||||
| Expenses before offsets | .76 | % | .80 | % | |||||
| Net expenses | .76 | % | .80 | % | |||||
| Portfolio turnover | 7 | % | 25 | % | |||||
| Net assets, ending (in thousands) | $ | 92,913 | $ | 77,805 | |||||
See notes to financial highlights.
www.calvert.com CALVERT ASSET ALLOCATION FUND ANNUAL REPORT 45
| MODERATE ALLOCATION FUND | |||||||||
| FINANCIAL HIGHLIGHTS | |||||||||
| YEARS ENDED | |||||||||
| SEPTEMBER 30, | SEPTEMBER 30, | SEPTEMBER 30, | |||||||
| CLASS C SHARES | 2013 | 2012 | 2011 | ||||||
| Net asset value, beginning | $ | 16.52 | $ | 14.26 | $ | 14.65 | |||
| Income from investment operations: | |||||||||
| Net investment income | .09 | .09 | .04 | ||||||
| Net realized and unrealized gain (loss) | 2.08 | 2.31 | (.29 | ) | |||||
| Total from investment operations | 2.17 | 2.40 | (.25 | ) | |||||
| Distributions from: | |||||||||
| Net investment income | (.14 | ) | (.14 | ) | (.13 | ) | |||
| In excess of net investment income | — | — | (.01 | ) | |||||
| Total distributions | (.14 | ) | (.14 | ) | (.14 | ) | |||
| Total increase (decrease) in net asset value | 2.03 | 2.26 | (.39 | ) | |||||
| Net asset value, ending | $ | 18.55 | $ | 16.52 | $ | 14.26 | |||
| Total return* | 13.21 | % | 16.96 | % | (1.79 | %) | |||
| Ratios to average net assets: A,B | |||||||||
| Net investment income | .38 | % | .55 | % | .24 | % | |||
| Total expenses | 1.42 | % | 1.45 | % | 1.48 | % | |||
| Expenses before offsets | 1.42 | % | 1.45 | % | 1.48 | % | |||
| Net expenses | 1.42 | % | 1.45 | % | 1.48 | % | |||
| Portfolio turnover | 27 | % | 25 | % | 18 | % | |||
| Net assets, ending (in thousands) | $ | 31,242 | $ | 24,869 | $ | 20,842 | |||
| YEARS ENDED | |||||||||
| SEPTEMBER 30, | SEPTEMBER 30, | ||||||||
| CLASS C SHARES | 2010 | 2009 | |||||||
| Net asset value, beginning | $ | 13.79 | $ | 14.72 | |||||
| Income from investment operations: | |||||||||
| Net investment income | .05 | .13 | |||||||
| Net realized and unrealized gain (loss) | .90 | (.52 | ) | ||||||
| Total from investment operations | .95 | (.39 | ) | ||||||
| Distributions from: | |||||||||
| Net investment income | (.09 | ) | (.15 | ) | |||||
| Net realized gain | — | (.39 | ) | ||||||
| Total distributions | (.09 | ) | (.54 | ) | |||||
| Total increase (decrease) in net asset value | .86 | (.93 | ) | ||||||
| Net asset value, ending | $ | 14.65 | $ | 13.79 | |||||
| Total return* | 6.95 | % | (1.79 | %) | |||||
| Ratios to average net assets: A,B | |||||||||
| Net investment income | .30 | % | 1.03 | % | |||||
| Total expenses | 1.52 | % | 1.60 | % | |||||
| Expenses before offsets | 1.52 | % | 1.60 | % | |||||
| Net expenses | 1.52 | % | 1.60 | % | |||||
| Portfolio turnover | 7 | % | 25 | % | |||||
| Net assets, ending (in thousands) | $ | 20,883 | $ | 17,582 | |||||
See notes to financial highlights.
46 www.calvert.com CALVERT ASSET ALLOCATION FUND ANNUAL REPORT
| AGGRESSIVE ALLOCATION FUND | |||||||||
| FINANCIAL HIGHLIGHTS | |||||||||
| YEARS ENDED | |||||||||
| SEPTEMBER 30, | SEPTEMBER 30, | SEPTEMBER 30, | |||||||
| CLASS A SHARES | 2013 | 2012 | 2011 | (z) | |||||
| Net asset value, beginning | $ | 16.15 | $ | 13.47 | $ | 13.94 | |||
| Income from investment operations: | |||||||||
| Net investment income | .11 | .12 | .05 | ||||||
| Net realized and unrealized gain (loss) | 3.23 | 2.68 | (.49 | ) | |||||
| Total from investment operations | 3.34 | 2.80 | (.44 | ) | |||||
| Distributions from: | |||||||||
| Net investment income | (.11 | ) | (.12 | ) | (.03 | ) | |||
| Total distributions | (.11 | ) | (.12 | ) | (.03 | ) | |||
| Total increase (decrease) in net asset value | 3.23 | 2.68 | (.47 | ) | |||||
| Net asset value, ending | $ | 19.38 | $ | 16.15 | $ | 13.47 | |||
| Total return* | 20.82 | % | 20.88 | % | (3.19 | %) | |||
| Ratios to average net assets: A,B | |||||||||
| Net investment income | .62 | % | .80 | % | .33 | % | |||
| Total expenses | .81 | % | .86 | % | .86 | % | |||
| Expenses before offsets | .43 | % | .43 | % | .43 | % | |||
| Net expenses | .43 | % | .43 | % | .43 | % | |||
| Portfolio turnover | 31 | % | 24 | % | 16 | % | |||
| Net assets, ending (in thousands) | $ | 72,318 | $ | 60,495 | $ | 51,103 | |||
| YEARS ENDED | |||||||||
| SEPTEMBER 30, | SEPTEMBER 30, | ||||||||
| CLASS A SHARES | 2010 | 2009 | |||||||
| Net asset value, beginning | $ | 13.03 | $ | 14.45 | |||||
| Income from investment operations: | |||||||||
| Net investment income | .09 | .15 | |||||||
| Net realized and unrealized gain (loss) | .90 | (1.00 | ) | ||||||
| Total from investment operations | .99 | (.85 | ) | ||||||
| Distributions from: | |||||||||
| Net investment income | (.08 | ) | (.12 | ) | |||||
| Net realized gain | — | (.45 | ) | ||||||
| Total distributions | (.08 | ) | (.57 | ) | |||||
| Total increase (decrease) in net asset value | .91 | (1.42 | ) | ||||||
| Net asset value, ending | $ | 13.94 | $ | 13.03 | |||||
| Total return* | 7.61 | % | (4.67 | %) | |||||
| Ratios to average net assets: A,B | |||||||||
| Net investment income | .66 | % | 1.35 | % | |||||
| Total expenses | .92 | % | 1.06 | % | |||||
| Expenses before offsets | .43 | % | .43 | % | |||||
| Net expenses | .43 | % | .43 | % | |||||
| Portfolio turnover | 8 | % | 15 | % | |||||
| Net assets, ending (in thousands) | $ | 52,132 | $ | 45,307 | |||||
See notes to financial highlights.
www.calvert.com CALVERT ASSET ALLOCATION FUND ANNUAL REPORT 47
| AGGRESSIVE ALLOCATION FUND | |||||||||
| FINANCIAL HIGHLIGHTS | |||||||||
| YEARS ENDED | |||||||||
| SEPTEMBER 30, | SEPTEMBER 30, | SEPTEMBER 30, | |||||||
| CLASS C SHARES | 2013 | 2012 | 2011 | (z) | |||||
| Net asset value, beginning | $ | 14.89 | $ | 12.57 | $ | 13.18 | |||
| Income from investment operations: | |||||||||
| Net investment income (loss) | (.05 | ) | (.07 | ) | (.14 | ) | |||
| Net realized and unrealized gain (loss) | 2.93 | 2.50 | (.44 | ) | |||||
| Total from investment operations | 2.88 | 2.43 | (.58 | ) | |||||
| Distributions from: | |||||||||
| Net investment income | (.06 | ) | (.11 | ) | (.03 | ) | |||
| Total distributions | (.06 | ) | (.11 | ) | (.03 | ) | |||
| Total increase (decrease) in net asset value | 2.82 | 2.32 | (.61 | ) | |||||
| Net asset value, ending | $ | 17.71 | $ | 14.89 | $ | 12.57 | |||
| Total return* | 19.39 | % | 19.43 | % | (4.45 | %) | |||
| Ratios to average net assets: A,B | |||||||||
| Net investment income (loss) | (.61 | %) | (.46 | %) | (.93 | %) | |||
| Total expenses | 1.63 | % | 1.69 | % | 1.70 | % | |||
| Expenses before offsets | 1.63 | % | 1.69 | % | 1.70 | % | |||
| Net expenses | 1.63 | % | 1.69 | % | 1.70 | % | |||
| Portfolio turnover | 31 | % | 24 | % | 16 | % | |||
| Net assets, ending (in thousands) | $ | 11,234 | $ | 8,381 | $ | 7,229 | |||
| YEARS ENDED | |||||||||
| SEPTEMBER 30, | SEPTEMBER 30, | ||||||||
| CLASS C SHARES | 2010 | 2009 | |||||||
| Net asset value, beginning | $ | 12.49 | $ | 14.02 | |||||
| Income from investment operations: | |||||||||
| Net investment income (loss) | (.08 | ) | (.01 | ) | |||||
| Net realized and unrealized gain (loss) | .85 | (.99 | ) | ||||||
| Total from investment operations | .77 | (1.00 | ) | ||||||
| Distributions from: | |||||||||
| Net investment income | (.08 | ) | (.08 | ) | |||||
| Net realized gain | — | (.45 | ) | ||||||
| Total distributions | (.08 | ) | (.53 | ) | |||||
| Total increase (decrease) in net asset value | .69 | (1.53 | ) | ||||||
| Net asset value, ending | $ | 13.18 | $ | 12.49 | |||||
| Total return* | 6.14 | % | (6.06 | %) | |||||
| Ratios to average net assets: A,B | |||||||||
| Net investment income (loss) | (.66 | %) | (.19 | %) | |||||
| Total expenses | 1.77 | % | 1.94 | % | |||||
| Expenses before offsets | 1.77 | % | 1.92 | % | |||||
| Net expenses | 1.77 | % | 1.92 | % | |||||
| Portfolio turnover | 8 | % | 15 | % | |||||
| Net assets, ending (in thousands) | $ | 8,174 | $ | 7,445 | |||||
See notes to financial highlights.
48 www.calvert.com CALVERT ASSET ALLOCATION FUND ANNUAL REPORT
A Total expenses do not reflect amounts reimbursed and/or waived by the Advisor or reductions from expense offset arrangements. Expenses before offsets reflect expenses after reimbursement and/or waiver by the Advisor but prior to reductions from expense offset arrangements. Net expenses are net of all reductions and represent the net expenses paid by the Fund.
B Amounts do not include the activity of the underlying funds. (z) Per share figures are calculated using the Average Shares Method.
* Total return is not annualized for periods of less than one year and does not reflect deduction of any front-end sales charge.
See notes to financial statements.
www.calvert.com CALVERT ASSET ALLOCATION FUND ANNUAL REPORT 49
EXPLANATION OF FINANCIAL TABLES
SCHEDULE OF INVESTMENTS
The Schedule of Investments is a snapshot of all securities held in the fund at their market value, on the last day of the reporting period. Securities are listed by asset type (e.g., common stock, corporate bonds, U.S. government obligations) and may be further broken down into sub-groups and by industry classification.
STATEMENT OF ASSETS AND LIABILITIES
The Statement of Assets and Liabilities is often referred to as the fund’s balance sheet. It lists the value of what the fund owns, is due and owes on the last day of the reporting period. The fund’s assets include the market value of securities owned, cash, receivables for securities sold and shareholder subscriptions, and receivables for dividends and interest payments that have been earned, but not yet received. The fund’s liabilities include payables for securities purchased and shareholder redemptions, and expenses owed but not yet paid. The statement also reports the fund’s net asset value (NAV) per share on the last day of the reporting period. The NAV is calculated by dividing the fund’s net assets (assets minus liabilities) by the number of shares outstanding. This statement is accompanied by a Schedule of Investments. Alternatively, if certain conditions are met, a Statement of Net Assets may be presented in lieu of this statement and the Schedule of Investments.
STATEMENT OF NET ASSETS
The Statement of Net Assets provides a detailed list of the fund’s holdings, including each security’s market value on the last day of the reporting period. The Statement of Net Assets includes a Schedule of Investments. Other assets are added and other liabilities subtracted from the investments total to calculate the fund’s net assets. Finally, net assets are divided by the outstanding shares of the fund to arrive at its share price, or Net Asset Value (NAV) per share.
At the end of the Statement of Net Assets is a table displaying the composition of the fund’s net assets. Paid in Capital is the money invested by shareholders and represents the bulk of net assets. Undistributed Net Investment Income and Accumulated Net Realized Gains usually approximate the amounts the fund had available to distribute to shareholders as of the statement date. Accumulated Realized Losses will appear as negative balances. Unrealized Appreciation (Depreciation) is the difference between the market value of the fund’s investments and their cost, and reflects the gains (losses) that would be realized if the fund were to sell all of its investments at their statement-date values.
STATEMENT OF OPERATIONS
The Statement of Operations summarizes the fund’s investment income earned and expenses incurred in operating the fund. Investment income includes dividends earned from stocks and interest earned from interest-bearing securities in the fund. Expenses incurred in operating the fund include the advisory fee paid to the investment advisor (not applicable to the Asset Allocation Funds), administrative services fees, distribution plan expenses (if applicable), transfer agent fees, shareholder servicing expenses, custodial, legal, and audit fees, and the printing and postage expenses related to shareholder reports.
50 www.calvert.com CALVERT ASSET ALLOCATION FUND ANNUAL REPORT (UNAUDITED)
Expense offsets (fees paid indirectly) are also shown. Credits earned from offset arrangements are used to reduce the fund’s expenses. This statement also shows net gains (losses) realized on the sale of investments and the increase or decrease in the unrealized appreciation (depreciation) on investments held during the period.
STATEMENT OF CHANGES IN NET ASSETS
The Statement of Changes in Net Assets shows how the fund’s total net assets changed during the two most recent reporting periods. Changes in the fund’s net assets are attributable to investment operations, distributions and capital share transactions.
The Operations section of the report summarizes information detailed in the Statement of Operations. The Distribution section shows the dividend and capital gain distributions made to shareholders. The amounts shown as distributions in this section may not match the net investment income and realized gains amounts shown in the Operations section because distributions are determined on a tax basis and certain investments or transactions may be treated differently for financial statement and tax purposes. The Capital Share Transactions section shows the amount shareholders invested in the fund, either by purchasing shares or by reinvesting distributions, and the amounts redeemed. The corresponding numbers of shares issued, reinvested and redeemed are shown at the end of the report.
FINANCIAL HIGHLIGHTS
The Financial Highlights table provides a per-share breakdown per class of the components that affect the fund’s net asset value for current and past reporting periods. The table provides total return, total distributions, expense ratios, portfolio turnover and net assets for the applicable period. Total return is a measure of a fund’s performance that encompasses all elements of return: dividends, capital gain distributions and changes in net asset value. Total return is the change in value of an investment over a given period, assuming reinvestment of any dividends and capital gain distributions, expressed as a percentage of the initial investment. Total distributions include distributions from net investment income and net realized gains. Long-term gains are earned on securities held in the fund more than one year. Short-term gains, on the sale of securities held less than one year, are treated as ordinary dividend income for tax purposes. The expense ratio is a fund’s cost of doing business, expressed as a percentage of net assets. These expenses directly reduce returns to shareholders. Portfolio turnover measures the trading activity in a fund’s investment portfolio – how often securities are bought and sold by a fund. Portfolio turnover is affected by market conditions, changes in the size of the fund, the nature of the fund’s investments and the investment style of the portfolio manager.
www.calvert.com CALVERT ASSET ALLOCATION FUND ANNUAL REPORT (UNAUDITED) 51
PROXY VOTING
The Proxy Voting Guidelines of the Calvert Funds that the Fund uses to determine how to vote proxies relating to portfolio securities are provided as an Appendix to the Fund’s Statement of Additional Information. The Statement of Additional Information can be obtained free of charge by calling the Fund at 1-800-368-2745, by visiting the Calvert website at www.calvert.com; or by visiting the SEC’s website at www.sec.gov.
Information regarding how the Fund voted proxies relating to portfolio securities during the most recent 12-month period ended June 30 is available on the Fund’s website at www.calvert.com and on the SEC’s website at www.sec.gov.
AVAILABILITY OF QUARTERLY PORTFOLIO HOLDINGS
The Fund files its complete schedule of portfolio holdings with the SEC for the first and third quarters of each fiscal year on Form N-Q. The Fund’s Form N-Q is available on the SEC’s website at www.sec.gov. The Fund’s Form N-Q may be reviewed and copied at the SEC’s Public Reference Room in Washington, DC; information on the operation of the Public Reference Room may be obtained by calling 1-800-SEC-0330.
52 www.calvert.com CALVERT ASSET ALLOCATION FUND ANNUAL REPORT (UNAUDITED)
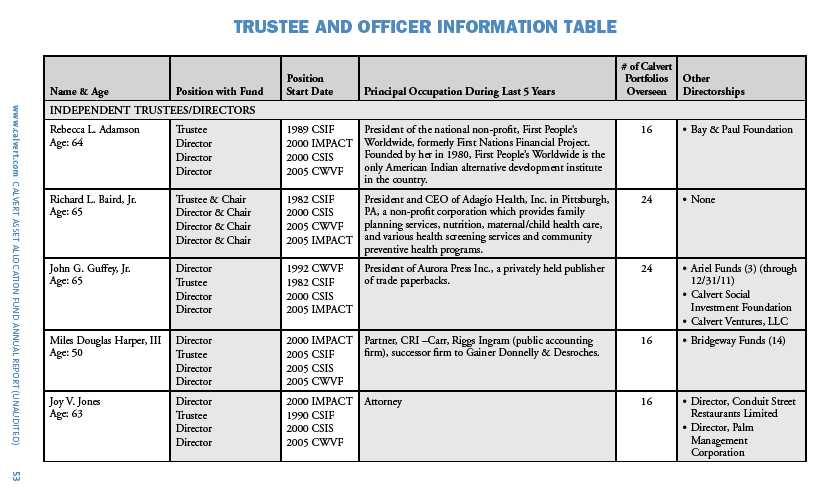

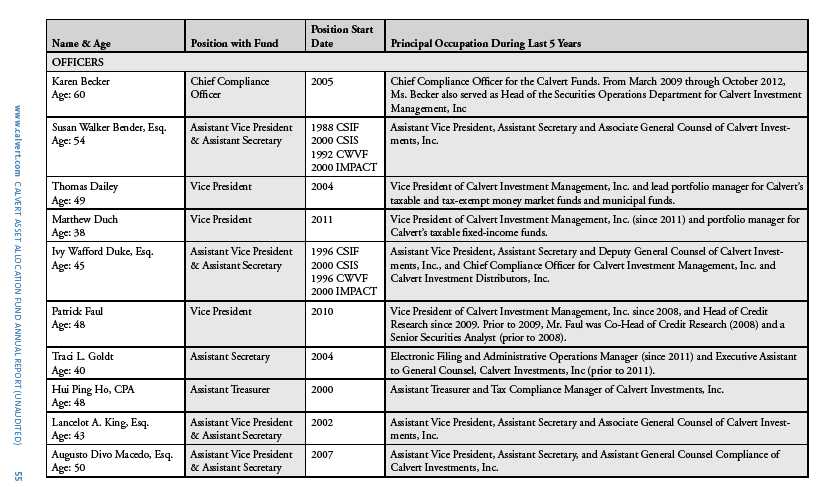
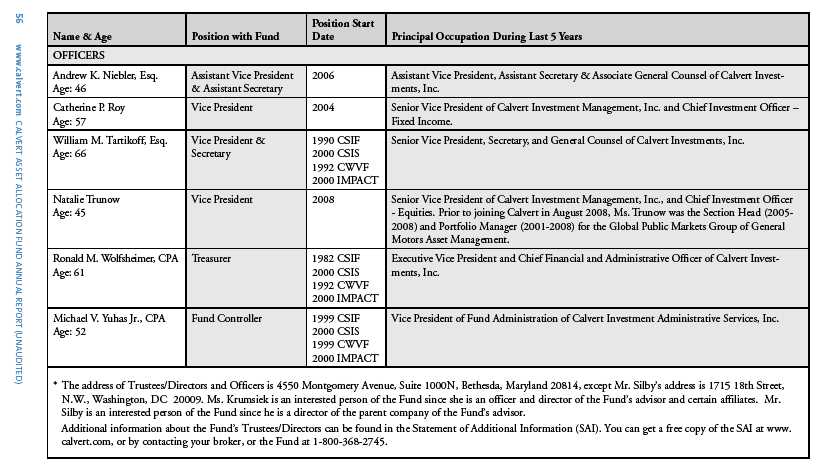
This page intentionally left blank.
This page intentionally left blank.
This page intentionally left blank.
To Open an Account
800-368-2748
Service for Existing Account
Shareholders: 800-368-2745
Brokers: 800-368-2746
TDD for Hearing Impaired
800-541-1524
Registered Mail
Calvert Investments
c/o BFDS,
P.O. Box 219544
Kansas City, MO 64121-9544
Overnight Mail
Calvert Investments
c/o BFDS,
330 West 9th Street
Kansas City, MO 64105
Web Site
www.calvert.com
Principal Underwriter
Calvert Investment Distributors, Inc.
4550 Montgomery Avenue
Suite 1000 North
Bethesda, Maryland 20814
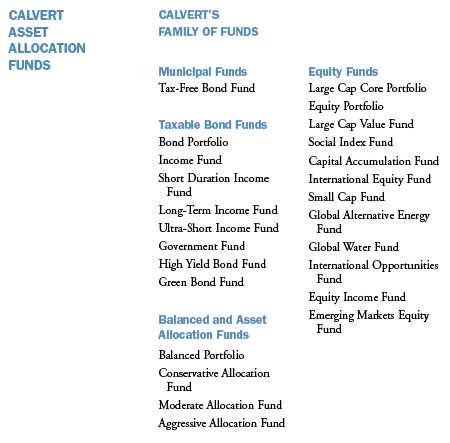
This report is intended to provide fund information to shareholders. It is not authorized for distribution to prospective investors unless preceded or accompanied by a prospectus.
Note: The information on our website is not incorporated by reference into this report; our website address is included as an inactive textual reference only.
Investors should carefully consider the investment objectives, risks, charges and expenses of the Calvert Funds. This and other important information is contained in the fund’s summary prospectus and prospectus, which can be obtained from your financial professional and should be read carefully before investing. You may also call Calvert at 800/368-2748 or visit www. calvert.com.
Item 2. Code of Ethics.
(a) The registrant has adopted a code of ethics (the "Code of Ethics") that applies to its principal executive officer and principal financial officer (also referred to as “principal accounting officer”).
(b) No information need be disclosed under this paragraph.
(c) The registrant has not amended its Code of Ethics during the period covered by the shareholder report presented in Item 1 hereto.
(d) The registrant has not granted a waiver or implicit waiver from a provision of its Code of Ethics during the period covered by the shareholder report presented in Item 1 hereto.
(e) Not applicable.
(f) The registrant's Code of Ethics is attached as an Exhibit hereto.
Item 3. Audit Committee Financial Expert.
The registrant's Board of Trustees has determined that Miles D. Harper, III, an "independent" Trustee serving on the registrant's audit committee, is an "audit committee financial expert," as defined in Item 3 of Form N-CSR. Under applicable securities laws, a person who is determined to be an audit committee financial expert will not be deemed an "expert" for any purpose, including without limitation for the purposes of Section 11 of the Securities Act of 1933, as a result of being designated or identified as an audit committee financial expert. The designation or identification of a person as an audit committee financial expert does not impose on such person any duties, obligations, or liabilities that are greater than the duties, obligations, and liabilities imposed on such person as a member of the audit committee and Board of Trustees in the absence of such designation or identification.
Item 4. Principal Accountant Fees and Services.
Services fees paid to auditing firm:
| Fiscal Year ended 9/30/12 | Fiscal Year ended 9/30/13 | ||
| $ | %* | $ | % * |
|
|
|
|
|
(a) Audit Fees | $219,465 |
| $125,730 |
|
(b) Audit-Related Fees | $0 | 0% | $0 | 0% |
(c) Tax Fees (tax return preparation and filing for the registrant) | $22,560 | 0% | $20,440 | 0% |
(d) All Other Fees | $0 | 0% | $0 | 0% |
|
|
|
|
|
Total | $242,025 | 0% | $146,170 | 0% |
* Percentage of fees approved by the Audit Committee pursuant to (c)(7)(i)(C) of Rule 2-01 of Reg. S-X (statutory de minimis waiver of Committee’s requirement to pre-approve)
(e) Audit Committee pre-approval policies and procedures:
The Audit Committee is required to pre-approve all audit and non-audit services provided to the registrant by the auditors, and to the registrant’s investment advisor, and any entity controlling, controlled by, or under common control with the advisor that provides ongoing services to the registrant. In determining whether to pre-approve non-audit services, the Audit Committee considers whether the services are consistent with maintaining the independence of the auditors. The Committee may delegate its authority to pre-approve certain matters to one or more of its members. In this regard, the Committee has delegated authority jointly to the Audit Committee Chair together with another Committee member with respect to non-audit services not exceeding $25,000 in each instance. In addition, the Committee has pre-approved the retention of the auditors to provide tax-related services related to the tax treatment and tax accounting of newly acquired securities, upon request by the investment advisor in each instance.
(f) Not applicable.
(g) Aggregate non-audit fees billed by the registrant’s accountant for services rendered to the registrant, and rendered to the registrant’s investment advisor, and any entity
controlling, controlled by, or under common control with the advisor that provides ongoing services to the registrant for each of the last two fiscal years of the registrant:
| Fiscal Year ended 9/30/12 | Fiscal Year ended 9/30/13 | ||
| $ | %* | $ | % * |
| $10,000 | 0%* | $292,500 | 0%* |
* Percentage of fees approved by the Audit Committee pursuant to (c)(7)(i)(C) of Rule 2-01 of Reg. S-X (statutory de minimis waiver of Committee’s requirement to pre-approve)
(h) The registrant’s Audit Committee of the Board of Trustees has considered whether the provision of non-audit services that were rendered to the registrant’s investment advisor, and any entity controlling, controlled by, or under common control with the investment advisor that provides ongoing services to the registrant that were not pre-approved pursuant to paragraph (c) (7)(ii) of Rule 2-01 of Reg. S-X is compatible with maintaining the principal accountant’s independence and found that the provision of such services is compatible with maintaining the principal accountant’s independence.
Item 5. Audit Committee of Listed Registrants.
Not applicable.
Item 6. Schedule of Investments.
(a) This Schedule is included as part of the report to shareholders filed under Item 1 of this Form.
(b) Not applicable.
Item 7. Disclosure of Proxy Voting Policies and Procedures for Closed-End Management Investment Companies.
Not applicable.
Item 8. Portfolio Managers of Closed-End Management Investment Companies
Not applicable.
Item 9. Purchases of Equity Securities by Closed-End Management Investment Company and Affiliated Purchasers.
Not applicable.
Item 10. Submission of Matters to a Vote of Security Holders.
No material changes were made to the procedures by which shareholders may recommend nominees to the registrant’s Board of Trustees since registrant last provided disclosure in response to this Item.
Item 11. Controls and Procedures.
(a) The principal executive and financial officers concluded that the registrant's disclosure controls and procedures (as defined in Rule 30a-3(c) under the 1940 Act) are effective, based on the evaluation of these controls and procedures required by Rule 30a-3(b) under the 1940 Act and Rules 13a-15(b) or 15d-15(b) under the Exchange Act, as of a date within 90 days of the filing date of this report.
(b) There was no change in the registrant's internal control over financial reporting (as defined in Rule 30a-3(d) under the 1940 Act) that occurred during the registrant's second fiscal quarter of the period covered by this report that has materially affected, or is reasonably likely to materially affect, the registrant's internal control over financial reporting.
Item 12. Exhibits.
(a)(1) A copy of the Registrant’s Code of Ethics.
Attached hereto.
(a)(2) A separate certification for each principal executive officer and principal financial officer of the registrant as required by Rule 30a-2 under the Act (17 CFR 270.30a-2).
Attached hereto.
(a)(3) Not applicable.
(b) A certification for the registrant's Principal Executive Officer and Principal Financial Officer, as required by Rule 30a-2(b) under the Investment Company Act of 1940, is attached hereto. The certification furnished pursuant to this paragraph is not deemed to be "filed" for purposes of Section 18 of the Securities Exchange Act of 1934, or otherwise subject to the liability of that section. Such certification is not deemed to be incorporated by reference into any filing under the Securities Act of 1933 or the Securities Exchange Act of 1934, except to the extent that the registrant specifically incorporates it by reference.
Pursuant to the requirements of the Securities Exchange Act of 1934 and the Investment Act of 1940, the registrant has duly caused this report to be signed on its behalf by the undersigned, thereunto duly authorized.
CALVERT SOCIAL INVESTMENT FUND
By: /s/ Barbara J. Krumsiek
Barbara J. Krumsiek
President -- Principal Executive Officer
Date: December 3, 2013
Pursuant to the requirements of the Securities Exchange Act of 1934 and the Investment Act of 1940, this report has been signed below by the following persons on behalf of the registrant and in the capacities and on the dates indicated.
/s/ Barbara J. Krumsiek
Barbara J. Krumsiek
President -- Principal Executive Officer
Date: December 3, 2013
/s/ Ronald M. Wolfsheimer
Ronald M. Wolfsheimer
Treasurer -- Principal Financial Officer
Date: December 3, 2013