UNITED STATES
SECURITIES AND EXCHANGE COMMISSION
Washington, D.C. 20549
FORM N-CSR
CERTIFIED SHAREHOLDER REPORT OF REGISTERED
MANAGEMENT INVESTMENT COMPANIES
Investment Company Act file number: 811-3334
CALVERT SOCIAL INVESTMENT FUND
(Exact name of registrant as specified in charter)
4550 Montgomery Avenue
Suite 1000N
Bethesda, Maryland 20814
(Address of Principal Executive Offices)
William M. Tartikoff, Esq.
4550 Montgomery Avenue
Suite 1000N
Bethesda, Maryland 20814
(Name and Address of Agent for Service)
Registrant's telephone number, including area code: (301) 951-4800
Date of fiscal year end: September 30
Date of reporting period: Twelve months ended September 30, 2011
<PAGE>
Item 1. Report to Stockholders.
[Calvert Social Investment Fund Balanced and Bond Portfolios Annual Report]
INFORMATION REGARDING CALVERT OPERATING COMPANY
NAME CHANGES
Effective on April 30, 2011, the following Calvert operating companies changed their names as indicated:
| Old Name | New Name | Company Description |
| Calvert Group, Ltd. | Calvert Investments, Inc. | Corporate parent of each |
| operating company listed | ||
| below | ||
| Calvert Asset Management | Calvert Investment | Investment advisor to the |
| Company, Inc. | Management, Inc. | Calvert Funds |
| Calvert Distributors, Inc. | Calvert Investment Distributors, | Principal underwriter |
| Inc. | and distributor for the | |
| Calvert Funds | ||
| Calvert Administrative | Calvert Investment | Administrative services |
| Services Company | Administrative Services, Inc. | provider for the Calvert |
| Funds | ||
| Calvert Shareholder | Calvert Investment Services, | Shareholder servicing |
| Services, Inc. | Inc. | provider for the Calvert |
| Funds | ||
Choose Planet-friendly E-delivery!
Sign up now for on-line statements, prospectuses, and fund reports. In less than five minutes you can help reduce paper mail and lower fund costs.
Just go to www.calvert.com. If you already have an online account at Calvert, click on My Account, and select the documents you would like to receive via e-mail.
If you’re new to online account access, click on Login/Register to open an online account. Once you’re in, click on the E-delivery sign-up at the bottom of the Account Portfolio page and follow the quick, easy steps. Note: if your shares are not held directly at Calvert but through a brokerage firm, you must contact your broker for electronic delivery options available through their firm.

TABLE
OF CONTENTS
4 Founding Chairman’s Letter
7 President’s Letter
10 SRI Update
12 Calvert Balanced Portfolio Management Discussion
17 Calvert Bond Portfolio Management Discussion
22 Shareholder Expense Example
25 Report of Independent Registered Public Accounting Firm
26 Statements of Net Assets
47 Notes to Statements of Net Assets
50 Statements of Operations
51 Statements of Changes in Net Assets
55 Notes to Financial Statements
69 Financial Highlights
78 Explanation of Financial Tables
80 Proxy Voting and Availability of Quarterly Portfolio Holdings
82 Trustee and Officer Information Table

Dear Investor,
Financial markets have been very volatile over the past year. While your Calvert Portfolios have provided modest positive returns, investors overall are understandably nervous.
All investments entail a higher degree of uncertainty right now as markets are highly correlated and continue to suffer from the “risk on, risk off” syndrome—where investors seek risk everywhere when they’re feeling better about the economy and shun it completely when fears renew. The good news is so much money sits on the sidelines at the moment that any improvement in sentiment can quickly rally the markets.
While markets are typically driven by the financial economy, today they’re much more concerned with the political economy. America’s loss of its Standard & Poor’s AAA credit rating had more to do with political gridlock in Washington than inherent financial problems. European politicians seem to be delaying the necessary bazooka-like changes to resolve ongoing sovereign debt issues, although the financial markets no longer believe they have much road left for “kicking the can.” China is undergoing its scheduled leadership change, which often impedes needed progressive reforms and encourages the hardliners.
In My Opinion
In these times, we need our leaders to articulate a strong vision. Instead, our leaders seem to have a vision of political compromises, which leaves everyone confused as to the underlying plan. The Tea Party and Occupy Wall Street are sparking important conversations about values in this increasingly globalized world. The question is: are the participants just estranged from the system or did the system become estranged from them?
One in four Americans does not graduate high school in four years. One percent of the population has more than 40% of the financial wealth. Wall Street is no longer about the responsible allocation of capital, but about personal bonuses—the largest of which are derived from playing zero-sum games. A few bad apples cause a proliferation of regulations that are burdensome to business and increase consumer costs. Given all this, it’s easy to see how the system may have contributed to the public’s growing alienation.
Meanwhile, the list of issues our government needs to address keeps growing, such as climate change, military spending, the housing crisis, entitlement reform, energy policy, and immigration reform. I can’t remember a time when our financial economy has been so dependent on political resolve. On one level, it’s good the public has awakened around our more intractable issues. But globalization is a reality and the unskilled jobs are not coming back.
www.calvert.com CALVERT SOCIAL INVESTMENT FUND ANNUAL REPORT 4
Sustainable and Responsible Investing in Turbulent Times
As stewards of your money in these turbulent times, Calvert continues to engage with companies about taking the high road with environmental, social, and governance factors.
Shareholder Advocacy
Calvert filed 38 resolutions in the 2011 proxy season with 28 successfully withdrawn after companies agreed to the terms of the resolution. Topics included climate change risks and principles, sustainability reporting, board diversity, disclosure of political contributions, and majority voting procedures.
As the impact of climate change becomes increasingly evident, the consequences on vulnerable, impoverished communities around the world cannot be ignored. We believe businesses can contribute to—and benefit from—their own preparation efforts. To that end, Calvert has joined with leading companies to launch the Partnership for Resilience and Environmental Preparedness (PREP), which promotes business practices that help companies and communities gear up for climate change. PREP also advocates for climate adaptation and resilience-building public policies to mitigate the risk of climate variability.
In October, Calvert will co-host UNEP FI, a United Nations initiative to bring investors and companies together on more detailed initiatives and best practices, such as energy efficiency in buildings. Barbara Krumsiek, Calvert’s CEO, is providing leadership among the more than 300 attendees and serves as co-chair.
Special Equities
A small part of your fund’s investment goes into small new companies that are not yet public but aim to be financially rewarding and have strong social impact that addresses real human needs.1 One recent investment was PresenceLearning, a firm that provides live, online speech therapy to students via web-based video conference technology. A national shortage of speech therapists prevents many students with severe communication disorders from receiving therapy. Now, the company’s distributed network technology enables specialists to serve more students in a more cost-efficient manner.
Another recent investment was DBL Equity Fund. DBL is a women-led firm that stands for “double bottom line” and invests in companies seeking to deliver venture capital returns while working with their companies to create social, environmental, and economic improvement in their region.
Community Investments
Many of our Funds participate in Calvert’s High Social Impact Investing program, which is administered through the Calvert Foundation.2 This community investment program may allocate a small percentage of Fund assets at below-market interest rates to investments that provide economic opportunity for struggling populations.
www.calvert.com CALVERT SOCIAL INVESTMENT FUND ANNUAL REPORT 5
Local banks were unwilling to help South African company Bio2Watt, which converts manure into energy, but Foundation partner E + Co supported the company with funding as well as technology assistance. Today, Bio2Watt can generate enough power round-the-clock for 1,000 homes. It is also decentralizing the power supply, alleviating landfill burdens and water pollution, and generating jobs for locals.
St. John’s Bread & Life in Brooklyn, New York was able to expand to serving 450,000 meals a year thanks to funding from Foundation borrower Low Income Investment Fund. St. John’s also provides nutrition counseling, health and hygiene products, workforce development, literacy training, psychiatric services, and substance abuse counseling to its clients. Client Naishaune Spencer said, “I ran with the wrong crowd and ended up homeless, jobless, and in a whole lot of trouble. With the help of St. Johns, I was able to go back to school, get a great job, have a steady income and, most significantly, get my first apartment.” You can read more about the Foundation’s activities at its website.
We thank you again for your investment, which has enabled Calvert to be a leader in the area of corporate responsibility and the growing impact investing movement through the innovative programs named above. The values expressed by our work and your investments create positive models for governments in these times of global political crisis.

D. Wayne Silby
Founding Chair
1 As of September 30, 2011, PresenceLearning and DBL Equity Fund represented 0.01% and 0.02% of Calvert Equity Portfolio. All holdings are subject to change without notice.
2 As of September 30, 2011, Calvert Social Investment Foundation (“Calvert Foundation” or “Foundation”) Community Investment Notes represented the following percentages of Fund net assets: Calvert Balanced Portfolio 0.93%, Calvert Bond Portfolio 0.35%. The Calvert Foundation is a 501(c)(3) nonprofit organization. The Foundation’s Community Investment Note Program is not a mutual fund and should not be confused with any Calvert Investments-sponsored investment product.
www.calvert.com CALVERT SOCIAL INVESTMENT FUND ANNUAL REPORT 6
Dear Shareholders:
After a strong finish to 2010 and start of the new year, the U.S. economy lost its footing in the summer of 2011. Hope for a second-half rebound gave way to concerns we were heading into another recession as consumer insecurity, a weak job market, the looming sovereign debt crisis in Europe, and uncertainty about the direction of U.S. and European policy weighed on economic growth and turned markets into a roller coaster.
The final months of the reporting period were particularly difficult for equities amid significant market volatility in the financial markets. After U.S. government debt lost its Standard & Poor’s triple A rating for the first time in history, already anxious investors flocked to the relative safety of cash and Treasuries, despite very low short-term yields. In the end, third-quarter market turmoil more than erased stock market gains made through the first six months of 2011. In fact, the -13.87% third-quarter return for the Standard & Poor’s 500 Index was the biggest quarterly drop for that index since the financial meltdown in the fourth quarter of 2008.
The 2008-2009 Financial Crisis -- Where Are We Now?
There have been many media comparisons to the third quarter of 2008 recently, so I think it’s worth noting some key differences. Despite third-quarter events, equity markets are still generally ahead of where they were in the depths of the financial crisis, as the S&P 500 Index and Russell Mid-Cap Index returned an annualized 1.23% and 3.96% for the three-year period ended September 30, 2011. Also, unlike 2008, the stock market seems to be rebounding quickly, having regained much of the lost ground in the first two weeks of October.
While still high, the unemployment rate has decreased a full percentage point from its recession peak. And in a direct month-to-month comparison, the United States added 103,000 jobs in September 2011 (58,000 if you exclude the return of striking Verizon workers) versus losing 434,000 jobs in September 2008.1 In housing, builder confidence in the current market for new single-family homes as measured by the National Association of Home Builders/Wells Fargo Housing Market Index (HMI) rose four points to 18 for October 2011--a sign that pockets of recovery in housing may be starting to emerge across the country. The HMI index is also four points higher than it was in October 2008.
Energy prices have fallen, too--after soaring to $150 a barrel, crude oil hovered around $80 a barrel at the end of September 2011. While prices at the pump did not decrease proportionately, they are lower, which is good for consumers’ wallets and oil-dependent industries. In fact, reports show retail sales have notched up in recent weeks--a sign that consumers are starting to spend a bit more freely now. And although household debt still exceeds consumers’ after-tax income, it fell 12% between its record high in September 2007 and June of this year.2
www.calvert.com CALVERT SOCIAL INVESTMENT FUND ANNUAL REPORT 7
The bottom line is that economic recovery may continue to be more two-steps-forward-one-step-back rather than the straight line progress we’d all prefer, but the recovery is happening. In the meantime, your Calvert fund managers will help guide your investments through the ups and downs that may lie ahead.
Board Diversity and Company Competitiveness
As always, we filed several shareholder resolutions this year asking companies to consider diverse candidates during their board selection. Most were successfully withdrawn after the companies agreed to add specific considerations of race, gender and ethnicity to their selection process. However, Urban Outfitters was one of two companies that opposed the resolution that we filed.
Unlike its five biggest apparel-industry competitors, Urban Outfitters doesn’t have any women or minorities on its board. This is particularly disconcerting since 53% of its North American net retail store sales in fiscal 2011 came from its Anthropologie and Free People stores for women. Of course, the Urban Outfitters flagship store heavily caters to women too. Smart companies understand the importance of having management that reflects their target audiences and Urban Outfitters is certainly missing the mark.
We pressed on and 22% of shareholders voted in favor of the resolution. The battle received a good deal of attention in the press, although it remains to be seen if the company will heed the call of its shareholders.
Your Financial Advisor Is Always Available
It’s easy to be a long-term investor when markets are strong. The challenge is to remain one when markets are going through a protracted period of uncertainty. While it may take longer than we’d like, markets have always recovered in the past and I am confident they will do so again. These cycles are simply the nature of the market.
In times like these, it’s best to stay the course, maintaining a well-diversified mix of U.S. and international stocks, bonds, and cash appropriate for your goals and risk tolerance. However, if you think your financial needs or risk tolerance have changed, your financial advisor is always available to discuss your concerns.
www.calvert.com CALVERT SOCIAL INVESTMENT FUND ANNUAL REPORT 8
We also invite you to visit our website, www.calvert.com, for fund information, portfolio updates, and commentary from Calvert professionals. As always, we thank you for entrusting your investments to Calvert.

Barbara J. Krumsiek
President and CEO
Calvert Investments, Inc.
October 2011
1 Bureau of Labor Statistics
2 Center for American Progress, Economic Snapshot for September 2011
www.calvert.com CALVERT SOCIAL INVESTMENT FUND ANNUAL REPORT 9
SRI Update
from the Calvert Sustainability Research Department
As always, Calvert continues to work hard to ensure you have a say in the responsible management of environmental, social, and governance (ESG) factors for the companies in which we invest. While some highlights from the reporting period were noted in the Founding Chairman’s letter, more are detailed below.
Majority Vote in Director Elections
Shareholders’ role in electing a board of directors is a fundamental part of ensuring accountability. Unfortunately, many companies weaken this role by conducting elections under a plurality rather than a majority standard—which essentially means a director nominee can be elected with only his or her own affirmative vote.
Calvert filed four shareholder proposals calling for companies to adopt majority voting this year. Those at Plains Exploration and Production, Global Payments, and Agco were withdrawn after the companies agreed to the requested changes. Hansen Natural responded with minor improvements to their election process. But we felt they were insufficient, so we kept the resolution on the ballot and 48% of shareholders voted in favor of it.
Update on Board Diversity
Persuading companies to make their boards more representative of their customers, employees and other target audiences continues to be an important initiative. In August, Calvert Senior Sustainability Analyst Aditi Mohapatra published an article in Forbes magazine “Are There Really Boards With No Women?” The article highlighted the fact that women still hold only 18% of corporate board posts at S&P 100 companies, despite a growing body of evidence proving the business case for diverse boards.
Also, five resolutions seeking a proactive commitment to include women and minorities as part of every board director search were filed this year. Three were successfully withdrawn before the annual meeting. The remaining two—at Urban Outfitters and American Financial Group—received strong support with 22% and 27% of shareholder votes.
First U.S. Automaker Added to Calvert Social Index
Another notable event was Ford Motor becoming the first U.S. automaker to qualify for Calvert Signature Funds and be added to the Calvert Social Index. Ford has emerged in recent years as the fuel efficiency leader among the big three U.S. auto manufacturers. A review of Ford’s key industry impacts, as well as our engagement with the company over the past four years, ensured that it met our environment, social, and governance (ESG) criteria for investment.
www.calvert.com CALVERT SOCIAL INVESTMENT FUND ANNUAL REPORT 10
While we remain concerned about the overall impact of automobile companies on issues such as greenhouse emissions, we believe Ford and the foreign automakers Calvert invests in are taking meaningful steps to reduce the negative environmental impacts of their products. Of course, we will continue to seek improvement on key issues by working with senior management of all these companies.
As of September 30, 2011, the following companies represented the following percentages of net assets: Plains Exploration 0.20% of Calvert Balanced Portfolio, Global Payments 0%, Agco 0%, Hansen Natural 0%, Urban Outfitters 0%, American Financial Group 2.18% of Calvert Enhanced Equity Portfolio, and Ford 0%. All holdings are subject to change without notice.
www.calvert.com CALVERT SOCIAL INVESTMENT FUND ANNUAL REPORT 11
CALVERT BALANCED PORTFOLIO
September 30, 2011
Investment Performance†
(total return at NAV*)
| 6 months | 12 months | |||
| ended | ended | |||
| 9/30/11 | 9/30/11 | |||
| Class A | -6.64 | % | 1.94 | % |
| Class B | -7.12 | % | 0.89 | % |
| Class C | -7.06 | % | 1.08 | % |
| Class I | -6.42 | % | 2.45 | % |
| Russell 1000 Index | -14.58 | % | 0.91 | % |
| Balanced Composite | ||||
| Index | -6.51 | % | 2.37 | % |
| Lipper Mixed-Asset Target | ||||
| Alloc. Growth Funds Average | -11.86 | % | -1.43 | % |
| TEN LARGEST | ||||
| STOCK HOLDINGS | NET % ASSETS OF | |||
| Apple, Inc. | 1.8 | % | ||
| Microsoft Corp. | 1.7 | % | ||
| EMC Corp. | 1.6 | % | ||
| W.W. Grainger, Inc. | 1.4 | % | ||
| Google, Inc. | 1.4 | % | ||
| FMC Technologies, Inc. | 1.4 | % | ||
| EQT Corp. | 1.4 | % | ||
| Cerner Corp. | 1.3 | % | ||
| Cameron International Corp. | 1.3 | % | ||
| Oneok, Inc. | 1.3 | % | ||
| Total | 14.6 | % | ||
PORTFOLIO MANAGEMENT DISCUSSION

Natalie A. Trunow, Senior Vice President, Chief Investment Officer - Equities of
Calvert Investment Management, Inc.
Investment Performance
Calvert Balanced Portfolio Class A shares (at NAV) returned 1.94%† for the 12-month period ended September 30, 2011, outperforming the Russell 1000 Index return of 0.91%. The Portfolio’s relative outperformance versus the Russell 1000 was due to the Portfolio’s bond allocation, since bonds in general outperformed stocks during the period. The Russell 1000 has no bond allocation.
The blended benchmark, the Balanced Composite Index (60% Russell 1000, 40% Barclays Capital U.S. Credit Index) returned 2.37%. The Portfolio’s performance relative to the blended benchmark was hurt by the bond portfolio’s short duration while good stock selection in the stock portfolio and modest shifts in the Fund’s allocations to stocks and bonds added value.
*Investment performance/return at NAV does not reflect the deduction of the Fund’s maximum 4.75% front-end sales charge or any deferred sales charge.
† Performance shown in this annual report to shareholders is calculated based on the net asset value of the Portfolio at year-end which was adjusted subsequent to year-end due to adjustments made to the prices of certain portfolio holdings of the Portfolio held as of September 30, 2011 and during the fiscal period then ended. See Note F to Notes to Financial Statements.
www.calvert.com CALVERT SOCIAL INVESTMENT FUND ANNUAL REPORT 12
Investment Climate
The 12-month period that ended September 30, 2011 was marked by unexpected turns and financial market volatility. U.S. economic growth slowed to an estimated 1.5% annual rate during the reporting period,1 sparking fears of a double-dip recession, while inflation rose to a 2.0% annual rate by August 2011.2 The eurozone crisis continued to unfold, weighed down by struggling peripheral economies as the fear of contagion intensified. While we don’t see a high probability of a Greek default driving the U.S. into recession, the possibility still seemed to drive market sentiment. Policy tightening by central banks in emerging countries, where stronger growth has pushed inflation higher, also contributed to global growth concerns. U.S. legislators’ mid-year brinkmanship surrounding the raising of the U.S. government debt ceiling, followed by the Standard & Poor’s downgrade of U.S. government debt on August 5, dealt more blows to investor confidence and tipped the scales toward a global sell-off of riskier assets.
The Federal Reserve (Fed) was expected to move to the sidelines after completing QE2. However, in August it promised to keep interest rates low for the next two years. Also, in September the Fed introduced “operation twist,” a program to sell $400 billion of shorter-maturity Treasuries and buy longer-maturity Treasuries with the proceeds. The move could boost investment and refinancing in the U.S. by reducing long-term interest rates.
Overall, a strong performance by equity markets in the fourth quarter of 2010 and modest gains in the first half of 2011 were largely erased by stocks’ dismal performance in the third quarter of 2011. Despite healthy earnings from U.S. companies, macroeconomic troubles became the focus of attention and weighed on investor sentiment. U.S. investors moved toward more defensive sectors with Utilities and Consumer Staples sectors led in the Russell 1000 Index, while the more cyclical Financials and Materials sectors lagged.
In the meantime, major U.S. bond market sectors delivered positive returns for the period3 as government bonds outperformed both investment grade and high-yield corporate bonds--the latter were hit particularly hard as investors sought more safety in recent months. Interest rates generally moved lower throughout the year, with the 10-year Treasury note yield declining to 1.92% by the end of September 2011.4
Portfolio Strategy
The Portfolio generally maintains a weighting of 60% stocks and 40% bonds. With the high level of market volatility over the past year, the actual weighting has fluctuated with stock and bond returns. Calvert tracked the Portfolio’s stock and bond exposure throughout the period to make sure this weighting did not vary excessively. Overall, the stock/bond allocations had a modestly positive effect on performance.
www.calvert.com CALVERT SOCIAL INVESTMENT FUND ANNUAL REPORT 13
Growth of $10,000
The graph below shows the value of a hypothetical $10,000 investment in the fund over the past 10 fiscal year periods. The results shown are for Class A shares and reflect the deduction of the maximum front-end Class A sales charge of 4.75% and assume the reinvestment of dividends. The result is compared with benchmarks that include a broad based market index and a Lipper peer group average. Market indexes are unmanaged and their results do not reflect the effect of expenses or sales charges. The Lipper average reflects the deduction of the category’s average front-end sales charge. The value of an investment in a different share class would be different.
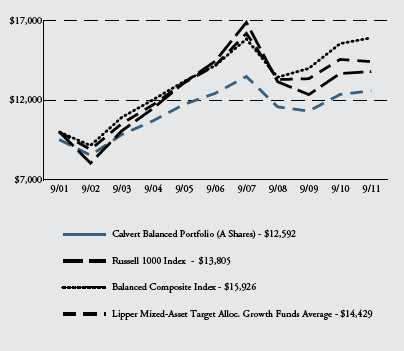
All performance data shown, including the graph above and the adjacent table, represents past performance, does not guarantee future results, assumes reinvestment of dividends and distributions and does not reflect the deduction of taxes that a shareholder would pay on the Fund’s distributions or the redemption of the Fund shares. The investment return and principal value of an investment will fluctuate so that an investor’s shares, when redeemed, may be worth more or less than their original cost. Current performance may be lower or higher than the performance data quoted; for current performance data visit www.calvert.com. The gross expense ratio from the current prospectus for Class A shares is 1.26%. This number may differ from the expense ratio shown elsewhere in this report because it is based on a different time period and, if applicable, does not include fee or expense waivers. Performance data quoted already reflects the deduction of the Fund’s operating expenses.
www.calvert.com CALVERT SOCIAL INVESTMENT FUND ANNUAL REPORT 14
Equities
The Portfolio’s stock allocation under-performed primarily due to poor stock selection in the Consumer Staples and Telecommunication Services sectors. In the Consumer Staples sector, Avon and Colgate-Palmolive were the biggest contributors to the underperformance. In Telecommunication Services, NII Holdings was the top detractor.
However, stock selection in the Financials and Utilities sectors helped returns. In Financials, not holding Citigroup (which is included in the Index but does not meet Calvert’s ESG criteria), an underweight to Bank of America, and strong performance from Intercontinental Exchange boosted relative performance. In Utilities, ONEOK’s strong performance (up 51%) led to the sector’s outperformance.5
Fixed Income
The relatively short duration of the fixed income allocation was a major reason for its underperformance, although a yield curve strategy that positioned the portfolio for higher interest rates also detracted.
Duration is a measure of a portfolio’s sensitivity to changes in interest rates. The longer the duration, the greater the change in price relative to interest rate movements. On September 30, 2010, the duration of the Portfolio’s fixed-income allocation duration was 3.19 years versus 6.56 years for the benchmark. However, we extended the duration after the Fed announced it would keep short-term rates low at least through mid-2013. At the end of the reporting period, the duration of the fixed-income allocation was 5.00 years.
On the other hand, the Portfolio had less exposure to corporate bonds (59% of the fixed income sleeve of the Portfolio was invested in corporate bonds on September
CALVERT BALANCED PORTFOLIO
September 30, 2011
Average Annual Total Returns†
| Class A Shares | (with max. load) | |
| One year | -2.96 | % |
| Five year | -0.72 | % |
| Ten year | 2.33 | % |
| Class B Shares | (with max. load) | |
| One year | -4.18 | % |
| Five year | -0.95 | % |
| Ten year | 1.79 | % |
| Class C Shares | (with max. load) | |
| One year | -0.04 | % |
| Five year | -0.63 | % |
| Ten year | 1.86 | % |
| Class I Shares* | ||
| One year | 2.45 | % |
| Five year | 0.77 | % |
| Ten year | 3.28 | % |
| Asset Allocation | % of totaL InveStmentS | |
| Equity Investments | 57 | % |
| Bonds | 43 | % |
| 100 | % | |
* Note Regarding Class I Shares Total Returns: There were times during the reporting period when there were no shareholders in Class I. For purposes of reporting Average Annual Total Return, Class A performance at NAV (i.e. does not reflect deduction of the Class A front-end sales charge) is used during these periods in which there were no shareholders in Class I. For purposes of this Average Annual Total Return, the Class A performance at NAV was used during the period June 30, 2003 through December 27, 2004.
(see † footnote on page 12)
www. calvert.com CALVERT SOCIAL INVESTMENT FUND ANNUAL REPORT 15
30, 2010, versus 80% of the Barclays Capital U.S. Credit Index), which helped performance as Treasuries outperformed both investment-grade and high-yield corporate bonds of comparable maturities during the year.
The Portfolio uses Treasury futures to hedge its interest rate position.
Outlook
While we may see further volatility in the equity markets, those who step in to buy the dips in a time of uncertainty could have the potential for greater returns. Combined with generally positive U.S. economic data and attractive equity valuations--the 12-month forward price/earnings ratio for the S&P 500 Index was 10.61 after market close on September 30--as well as signs that China’s growth momentum has not stalled, we continue to believe the market can see a healthy recovery in the next few months. We remain cautiously optimistic on U.S. economic growth, albeit less so on European and global growth.
We also believe the U.S. earnings season that started in October is likely to provide positive earnings surprises and serve as a positive catalyst for the U.S. and possibly global equity markets, especially given current valuation levels, which may present some of the best buying opportunities in the equity markets.
October 2011
1 Calculated based on data from the Commerce Department and the Wall Street Journal Survey of Economic Forecasters
2 Core consumer price index (CPI), Bureau of Labor Statistics
3 Barclays Capital
4 Source for all interest rates: Federal Reserve H.15 report
5 All individual security returns shown reflect total returns for period held in portfolio.
The following companies represented the following percentages of Portfolio net assets as of September 30, 2011: Avon 0%, Colgate-Palmolive 0% , NII Holdings 0.85%, Citigroup 0%, Bank of America 0.14%, IntercontinentalExchange 1.24%, ONEOK 1.27%. Holdings are subject to change without notice.
www.calvert.com CALVERT SOCIAL INVESTMENT FUND ANNUAL REPORT 16
 | |||||
| CALVERT BOND | |||||
| PORTFOLIO | |||||
| September 30, 2011 | |||||
| Investment Performance† | |||||
| (total return at NAV*) | |||||
| 6 months | 12 months | ||||
| ended | ended | ||||
| 9/30/11 | 9/30/11 | ||||
| Class A | 3.80 | % | 2.83 | % | |
| Class B | 3.21 | % | 1.78 | % | |
| Class C | 3.40 | % | 2.08 | % | |
| Class I | 4.11 | % | 3.39 | % | |
| Class Y | 3.98 | % | 3.17 | % | |
| Barclays Capital U.S. | |||||
| Credit Index | 5.60 | % | 4.56 | % | |
| Lipper A Rated | |||||
| Corporate | |||||
| Debt Funds Average | 4.40 | % | 4.11 | % | |
| Performance | |||||
| For the 12-month period ended September 30, 2011, Calvert Bond Portfolio’s Class A Shares (at NAV) returned 2.83%*† compared to 4.56% for its benchmark, the Barclays Capital U.S. Credit Index. The Portfolio’s relatively short duration was a major reason for its underperformance during the period, although its yield curve strategy, which was | |||||
| 30 days ended | |||||
| SEC Yields | 9/30/11 | 9/30/10 | |||
| Class A | 2.50 | % | 2.02 | % | |
| Class B | 1.54 | % | 1.06 | % | |
| Class C | 1.80 | % | 1.32 | % | |
| Class I | 3.23 | % | 2.71 | % | |
| Class Y | 2.92 | % | 2.32 | % | |
positioned to benefit from higher short-term interest rates, also detracted from performance. The Portfolio had less exposure to corporate bonds than its benchmark, which helped performance as Treasuries outperformed both investment-grade and high-yield corporate bonds of comparable maturities during the reporting period.
www.calvert.com CALVERT SOCIAL INVESTMENT FUND ANNUAL REPORT 17
| Investment Climate | |||
| The 12-month period that ended September 30, 2011 was marked by unexpected turns and financial market volatility. U.S. eco- nomic growth slowed to an estimated 1.5% annual rate during the reporting period,1 while the inflation rate rose. The core con- sumer price index (CPI) annual rate was at 2.0% by August 2011.2 | CALVERT BOND | ||
| PORTFOLIO | |||
| September 30, 2011 | |||
| % of Total | |||
| Economic Sectors | Investments | ||
| Asset Backed Securities | 2.7 | % | |
| Basic Materials | 0.3 | % | |
| After completing its second around of quantitative easing (known as QE2), the Federal Reserve (Fed) was expected to move to the sidelines. However, it proceeded to introduce two additional easing measures. In August, shortly after QE2 ended, the Fed announced that it would extend the promise of near-zero short-term interest rates per- haps until mid-2013. Then, in September, the Fed introduced “operation twist,” a program to sell $400 billion of shorter- maturity Treasuries and buy longer-maturity Treasuries with the proceeds. | Communications | 3.8 | % |
| Consumer, Cyclical | 4.2 | % | |
| Consumer, Non-cyclical | 1.9 | % | |
| Energy | 4.7 | % | |
| Financials | 28.3 | % | |
| Government | 30.9 | % | |
| Industrials | 2.2 | % | |
| Mortgage Securities | 7.7 | % | |
| Technology | 1.5 | % | |
| Time Deposit | 11.5 | % | |
| Utilities | 0.3 | % | |
| After a period of calm, the euro-area debt crisis surged to the forefront of inves- tors’ concerns once again in mid-2011. | Total | 100 | % |
Widespread unease about the effects of sovereign debt on European banks flowed over into non-European markets. This made for a rough trading summer, as stocks and bonds with credit risk fell. The U.S. Congress’s mid-year flirt with voluntary default on U.S. government debt heightened investors’ anxiety. Policy tightening by central banks in emerging countries, where stronger growth has pushed inflation higher, also contributed to concerns about global growth.
In this uncertain environment, major U.S. bond market sector indices delivered positive returns for the reporting period.3 Interest rates generally moved lower over the 12-month period. The three-month Treasury bill yield fell to 0.02% from 0.16%. The benchmark 10-year Treasury note yield declined 0.61 percentage points to finish the reporting period at 1.92%. The average yield for Moody’s Baa-rated corporate bonds was 5.22% at the end of September 2011, down 0.36 percentage points. Finally, the average rate on a 30-year conventional mortgage bond fell 0.31 percentage points to 4.01%.4
www.calvert.com CALVERT SOCIAL INVESTMENT FUND ANNUAL REPORT 18
Portfolio Strategy
The Portfolio’s relatively short duration was a major reason for its underperformance during the reporting period. Duration is a measure of a portfolio’s sensitivity to changes in interest rates. The longer the duration, the greater the change in price relative to interest rate movements. On September 30, 2010, the Portfolio’s duration was 3.19 years while its passive benchmark’s was 6.56 years. Following the Federal Reserve’s announcement it would keep short-term rates low at least through mid-2013, we extended the Portfolio’s duration. At the end of the reporting period, the Portfolio’s duration was 5.00 years.
Corporate bonds performed well during the first nine months of the period, and then sold off dramatically during the last three months as concerns about the European financial crisis deepened and investors shied away from riskier assets. The Portfolio had less exposure to corporate bonds than its benchmark index. On September 30, 2010, 59% of the Portfolio was invested in corporate bonds, compared to 80% of the passive benchmark. This helped performance as both investment-grade and high-yield corporate bond returns lagged those of Treasuries with comparable maturities over the full reporting period. The Portfolio uses Treasury futures to hedge its interest rate position.
Outlook
We expect the rest of 2011 to unfold with financial markets fitfully trying to understand and adjust to the ongoing debt struggles of the major western nations and Japan. Policymakers’ decisions will continue to have great potential to move global financial markets. Government footprints in credit markets will remain large. The U.S. gross domestic product growth rate is likely to remain modest and choppy, as the country continues to recover from the severe financial crisis of 2007 through 2009. History suggests that recovery from a severe financial crisis that was rooted in excessive debt will take several more years at least. It also indicates that rates of economic growth and consumer price inflation will tend to run below pre-crisis averages. This does not, however, preclude stretches of stronger growth, something markets have heavily discounted.
Within this bigger picture, we expect the issues that have driven markets in 2011 to remain intact. First, the potential for very slow U.S. economic growth remains high, and there is a higher risk of recession amid tightening U.S. fiscal policy and little additional capacity for strong monetary stimulus. Second, it is likely that we will experience ongoing financial market volatility stemming from the euro-area debt crisis. Finally, tighter monetary policies in emerging countries may constrain global growth. As investors’ perceptions of these factors change, markets will react, at times sharply. We expect to experience generally heightened levels of financial market volatility. There is potential for acute bouts of great volatility, but keep in mind that attractive investment opportunities can emerge from great market tumult.
October 2011
www.calvert.com CALVERT SOCIAL INVESTMENT FUND ANNUAL REPORT 19
Growth of $10,000
The graph below shows the value of a hypothetical $10,000 investment in the fund over the past 10 fiscal year periods. The results shown are for Class A shares and reflect the deduction of the maximum front-end sales Class A charge of 3.75% and assume the reinvestment of dividends. The result is compared with benchmarks that include a broad based market index and a Lipper peer group average. Market indexes are unmanaged and their results do not reflect the effect of expenses or sales charges. The Lipper average reflects the deduction of the category’s average front-end sales charge. The value of an investment in a different share class would be different.
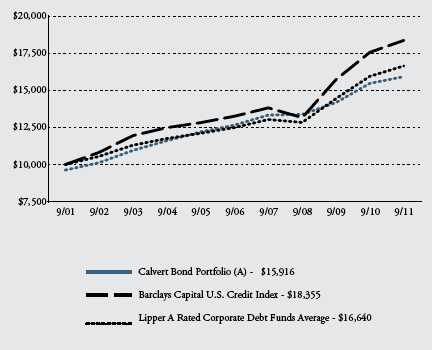
All performance data shown, including the graph above and the adjacent table, represents past performance, does not guarantee future results, assumes reinvestment of dividends and distributions and does not reflect the deduction of taxes that a shareholder would pay on the Portfolio’s distributions or the redemption of the Portfolio shares. The investment return and principal value of an investment will fluctuate so that an investor’s shares, when redeemed, may be worth more or less than their original cost. Current performance may be lower or higher than the performance data quoted; for current performance data visit www.calvert.com. The gross expense ratio from the current prospectus for Class A shares is 1.14%. This number may differ from the expense ratio shown elsewhere in this report because it is based on a different time period and, if applicable, does not include fee or expense waivers. Performance data quoted already reflects the deduction of the Portfolio’s operating expenses.
1 Calculated based on data from the Commerce Department and the Wall Street Journal Survey of Economic Forecasters.
2 Bureau of Labor Statistics
3 Barclays Capital
4 Source for all interest rates: Federal Reserve H.15 report
www.calvert.com CALVERT SOCIAL INVESTMENT FUND ANNUAL REPORT 20
September 30, 2011
Average Annual Total Returns†
| Class A Shares | (with max. load) | |
| One year | -0.94 | % |
| Five year | 3.88 | % |
| Ten year | 4.76 | % |
| Class B Shares | (with max. load) | |
| One year | -2.16 | % |
| Five year | 3.63 | % |
| Ten year | 4.15 | % |
| Class C Shares | (with max. load) | |
| One year | 1.14 | % |
| Five year | 3.87 | % |
| Ten year | 4.28 | % |
| Class I Shares | ||
| One year | 3.58 | % |
| Five year | 5.28 | % |
| Ten year | 5.76 | % |
| Class Y Shares* | ||
| One year | 3.23 | % |
| Five year | 4.84 | % |
| Ten year | 5.23 | % |
* Calvert Bond Portfolio first offered Class Y shares on October 31, 2008. Performance prior to that date reflects the performance of Class A shares at net asset value (NAV). Actual Class Y share performance would have been different.
(see † footnote on page 17)
www.calvert.com CALVERT SOCIAL INVESTMENT FUND ANNUAL REPORT 21
SHAREHOLDER EXPENSE EXAMPLE
As a shareholder of the Portfolio, you incur two types of costs: (1) transaction costs, including sales charges and redemption fees; and (2) ongoing costs, including management fees; distribution (12b-1) fees; and other Portfolio expenses. This Example is intended to help you understand your ongoing costs (in dollars) of investing in the Portfolio and to compare these costs with the ongoing costs of investing in other mutual funds.
This Example is based on an investment of $1,000 invested at the beginning of the period and held for the entire period (April 1, 2011 to September 30, 2011).
Actual Expenses
The first line of the table below provides information about actual account values and actual expenses. You may use the information in this line, together with the amount you invested, to estimate the expenses that you paid over the period. Simply divide your account value by $1,000 (for example, an $8,600 account value divided by $1,000 = 8.6), then multiply the result by the number in the first line under the heading entitled “Expenses Paid During Period” to estimate the expenses you paid on your account during this period.
Hypothetical Example for Comparison Purposes
The second line of the table below provides information about hypothetical account values and hypothetical expenses based on the Portfolio’s actual expense ratios and an assumed rate of return of 5% per year before expenses, which is not the Portfolio’s actual return. The hypothetical account values and expenses may not be used to estimate the actual ending account balance or expenses you paid for the period. You may use this information to compare the ongoing costs of investing in the Portfolio and other funds. To do so, compare the 5% hypothetical example with the 5% hypothetical examples that appear in the shareholder reports of the other funds.
Please note that the expenses shown in the table are meant to highlight your ongoing costs only and do not reflect any transactional costs, such as sales charges (loads) or redemption fees. Therefore, the second line of the table is useful in comparing ongoing costs only, and will not help you determine the relative total costs of owning different funds. In addition, if these transactional costs were included, your costs would have been higher.
www.calvert.com CALVERT SOCIAL INVESTMENT FUND ANNUAL REPORT 22
| BEGINNING | ENDING | EXPENSES PAID | |
| ACCOUNT VALUE | ACCOUNT VALUE | DURING PERIOD* | |
| BALANCED | 4/1/11 | 9/30/11 | 4/1/11 - 9/30/11 |
| Class A | |||
| Actual | $1,000.00 | $933.60 | $5.90 |
| Hypothetical | $1,000.00 | $1,018.96 | $6.16 |
| (5% return per | |||
| year before expenses) | |||
| Class B | |||
| Actual | $1,000.00 | $928.80 | $10.79 |
| Hypothetical | $1,000.00 | $1,013.88 | $11.27 |
| (5% return per | |||
| year before expenses) | |||
| Class C | |||
| Actual | $1,000.00 | $929.40 | $9.94 |
| Hypothetical | $1,000.00 | $1,014.76 | $10.38 |
| (5% return per | |||
| year before expenses) | |||
| Class I | |||
| Actual | $1,000.00 | $935.80 | $3.49 |
| Hypothetical | $1,000.00 | $1,021.46 | $3.65 |
| (5% return per | |||
| year before expenses) | |||
*Expenses for Balanced are equal to the annualized expense ratios of 1.22%, 2.23%, 2.06% and .72% for Class A, Class B, Class C and Class I, respectively, multiplied by the average account value over the period, multiplied by 183/365 (to reflect the one-half year period).
www.calvert.com CALVERT SOCIAL INVESTMENT FUND ANNUAL REPORT 23
| BEGINNING | ENDING ACCOUNT | EXPENSES PAID | |
| ACCOUNT VALUE | VALUE | DURING PERIOD* | |
| BOND | 4/1/11 | 9/30/11 | 4/1/11 -9/30/11 |
| Class A | |||
| Actual | $1,000.00 | $1,031.30 | $5.73 |
| Hypothetical | $1,000.00 | $1,019.43 | $5.70 |
| (5% return per | |||
| year before expenses) | |||
| Class B | |||
| Actual | $1,000.00 | $1,025.40 | $11.12 |
| Hypothetical | $1,000.00 | $1,014.09 | $11.06 |
| (5% return per | |||
| year before expenses) | |||
| Class C | |||
| Actual | $1,000.00 | $1,027.30 | $9.72 |
| Hypothetical | $1,000.00 | $1,015.48 | $9.67 |
| (5% return per | |||
| year before expenses) | |||
| Class I | |||
| Actual | $1,000.00 | $1,033.10 | $2.60 |
| Hypothetical | $1,000.00 | $1,022.51 | $2.59 |
| (5% return per | |||
| year before expenses) | |||
| Class Y | |||
| Actual | $1,000.00 | $1,032.60 | $4.13 |
| Hypothetical | $1,000.00 | $1,021.01 | $4.10 |
| (5% return per | |||
| year before expenses) |
*Expenses for Bond are equal to the annualized expense ratios of 1.12%, 2.19%, 1.91%, .51% and .81% for Class A, Class B, Class C, Class I and Class Y, respectively, multiplied by the average account value over the period, multiplied by 183/365 (to reflect the one-half year period).
www.calvert.com CALVERT SOCIAL INVESTMENT FUND ANNUAL REPORT 24
REPORT OF INDEPENDENT REGISTERED PUBLIC ACCOUNTING FIRM
The Board of Trustees and Shareholders of Calvert Social Investment Fund: We have audited the accompanying statements of net assets of the Calvert Balanced and Bond Portfolios (collectively the Portfolios), each a series of the Calvert Social Investment Fund, as of September 30, 2011, and the related statements of operations for the year then ended, the statements of changes in net assets for each of the years in the two-year period then ended, and the financial highlights for each of the years or periods in the five-year period then ended. These financial statements and financial highlights are the responsibility of the Portfolios’ management. Our responsibility is to express an opinion on these financial statements and financial highlights based on our audits.
We conducted our audits in accordance with the standards of the Public Company Accounting Oversight Board (United States). Those standards require that we plan and perform the audit to obtain reasonable assurance about whether the financial statements and financial highlights are free of material misstatement. An audit includes examining, on a test basis, evidence supporting the amounts and disclosures in the financial statements. Our procedures included confirmation of securities owned as of September 30, 2011, by correspondence with the custodian and brokers or other appropriate auditing procedures. An audit also includes assessing the accounting principles used and significant estimates made by management, as well as evaluating the overall financial statement presentation. We believe that our audits provide a reasonable basis for our opinion.
In our opinion, the financial statements and financial highlights referred to above present fairly, in all material respects, the financial position of the Calvert Balanced and Bond Portfolios as of September 30, 2011, the results of their operations for the year then ended, the changes in their net assets for each of the years in the two-year period then ended, and the financial highlights for each of the years or periods in the five-year period then ended, in conformity with U.S. generally accepted accounting principles.

Philadelphia, Pennsylvania
December 27, 2011
www.calvert.com CALVERT SOCIAL INVESTMENT FUND ANNUAL REPORT 25
| BALANCED PORTFOLIO | |||
| STATEMENT OF NET ASSETS | |||
| SEPTEMBER 30, 2011 | |||
| EQUITY SECURITIES - 57.0% | SHARES | VALUE | |
| Aerospace & Defense - 0.6% | |||
| BE Aerospace, Inc.* | 52,025 | $ | 1,722,548 |
| Rockwell Collins, Inc. | 18,532 | 977,748 | |
| 2,700,296 | |||
| Air Freight & Logistics - 0.6% | |||
| FedEx Corp | 16,542 | 1,119,563 | |
| United Parcel Service, Inc., Class B | 23,880 | 1,508,022 | |
| 2,627,585 | |||
| Beverages - 1.4% | |||
| Coca-Cola Co. | 71,500 | 4,830,540 | |
| PepsiCo, Inc | 23,251 | 1,439,237 | |
| 6,269,777 | |||
| Biotechnology - 0.6% | |||
| Amgen, Inc. | 21,980 | 1,207,801 | |
| Gilead Sciences, Inc.* | 38,285 | 1,485,458 | |
| 2,693,259 | |||
| Capital Markets - 1.5% | |||
| Franklin Resources, Inc | 44,900 | 4,294,236 | |
| Goldman Sachs Group, Inc | 6,667 | 630,365 | |
| T. Rowe Price Group, Inc | 32,536 | 1,554,245 | |
| 6,478,846 | |||
| Chemicals - 2.3% | |||
| Ecolab, Inc. | 102,500 | 5,011,225 | |
| Praxair, Inc | 56,800 | 5,309,664 | |
| 10,320,889 | |||
| Commercial Banks - 0.6% | |||
| US Bancorp | 115,500 | 2,718,870 | |
| Communications Equipment - 0.6% | |||
| Cisco Systems, Inc.* | 64,811 | 1,003,923 | |
| QUALCOMM, Inc. | 32,845 | 1,597,252 | |
| 2,601,175 | |||
| Computers & Peripherals - 3.7% | |||
| Apple, Inc.* | 21,184 | 8,074,917 | |
| EMC Corp.* | 345,657 | 7,255,341 | |
| Western Digital Corp.* | 41,518 | 1,067,843 | |
| 16,398,101 | |||
www.calvert.com CALVERT SOCIAL INVESTMENT FUND ANNUAL REPORT 26
| EQUITY SECURITIES - CONT’D | SHARES | VALUE | |
| Consumer Finance - 1.5% | |||
| American Express Co. | 42,222 | $ | 1,895,768 |
| Capital One Financial Corp | 124,200 | 4,922,046 | |
| 6,817,814 | |||
| Containers & Packaging - 0.8% | |||
| Ball Corp. | 111,600 | 3,461,832 | |
| Diversified Financial Services - 2.8% | |||
| Bank of America Corp. | 99,819 | 610,892 | |
| First Republic Preferred Capital Corp., Preferred (b)(e) | 500 | 510,500 | |
| IntercontinentalExchange, Inc.* | 46,400 | 5,487,264 | |
| JPMorgan Chase & Co. | 154,373 | 4,649,715 | |
| Woodbourne Capital: | |||
| Trust I, Preferred (b)(e) | 500,000 | 330,000 | |
| Trust II, Preferred (b)(e) | 500,000 | 330,000 | |
| Trust III, Preferred (b)(e) | 500,000 | 330,000 | |
| Trust IV, Preferred (b)(e) | 500,000 | 330,000 | |
| 12,578,371 | |||
| Diversified Telecommunication Services - 0.3% | |||
| AT&T, Inc. | 54,195 | 1,545,641 | |
| Electronic Equipment & Instruments - 0.6% | |||
| Amphenol Corp. | 28,417 | 1,158,561 | |
| Jabil Circuit, Inc. | 84,557 | 1,504,269 | |
| 2,662,830 | |||
| Energy Equipment & Services - 2.7% | |||
| Cameron International Corp.* | 137,200 | 5,699,288 | |
| FMC Technologies, Inc.* | 160,700 | 6,042,320 | |
| 11,741,608 | |||
| Food & Staples Retailing - 2.4% | |||
| Costco Wholesale Corp | 15,626 | 1,283,207 | |
| Sysco Corp | 180,200 | 4,667,180 | |
| Walgreen Co. | 136,900 | 4,502,641 | |
| 10,453,028 | |||
| Food Products - 0.8% | |||
| General Mills, Inc. | 36,299 | 1,396,422 | |
| Kellogg Co. | 17,531 | 932,474 | |
| McCormick & Co., Inc. | 21,637 | 998,764 | |
| 3,327,660 | |||
| Gas Utilities - 1.3% | |||
| Oneok, Inc. (s) | 85,300 | 5,633,212 | |
| Health Care Equipment & Supplies - 1.7% | |||
| DENTSPLY International, Inc. | 38,402 | 1,178,557 | |
| Hologic, Inc.* | 84,622 | 1,287,101 | |
| Intuitive Surgical, Inc.* | 10,600 | 3,861,368 | |
| Medtronic, Inc. | 38,545 | 1,281,236 | |
| 7,608,262 | |||
www.calvert.com CALVERT SOCIAL INVESTMENT FUND ANNUAL REPORT 27
| EQUITY SECURITIES - CONT’D | SHARES | VALUE | |
| Health Care Providers & Services - 3.8% | |||
| Cardinal Health, Inc. | 48,000 | $ | 2,010,240 |
| CIGNA Corp | 100,300 | 4,206,582 | |
| Express Scripts, Inc.* | 124,604 | 4,619,070 | |
| Laboratory Corp. of America Holdings* | 50,100 | 3,960,405 | |
| Lincare Holdings, Inc. | 56,228 | 1,265,130 | |
| Quest Diagnostics, Inc. | 12,230 | 603,673 | |
| 16,665,100 | |||
| Health Care Technology - 1.3% | |||
| Cerner Corp.* | 84,100 | 5,762,532 | |
| Household Products - 0.3% | |||
| Procter & Gamble Co | 20,200 | 1,276,236 | |
| Industrial Conglomerates - 0.9% | |||
| Danaher Corp. | 95,700 | 4,013,658 | |
| Insurance - 1.0% | |||
| Aflac, Inc. | 132,572 | 4,633,391 | |
| Internet & Catalog Retail - 1.3% | |||
| Amazon.com, Inc.* | 25,900 | 5,600,357 | |
| Internet Software & Services - 1.5% | |||
| Akamai Technologies, Inc.* | 28,767 | 571,888 | |
| Google, Inc.* | 11,966 | 6,155,071 | |
| 6,726,959 | |||
| IT Services - 1.5% | |||
| International Business Machines Corp. | 10,870 | 1,902,576 | |
| Teradata Corp.* | 90,700 | 4,855,171 | |
| 6,757,747 | |||
| Life Sciences - Tools & Services - 0.6% | |||
| Waters Corp.* | 35,285 | 2,663,665 | |
| Machinery - 2.4% | |||
| Cummins, Inc | 59,600 | 4,866,936 | |
| Deere & Co. | 77,600 | 5,010,632 | |
| Graco, Inc. | 15,245 | 520,464 | |
| 10,398,032 | |||
| Multiline Retail - 1.5% | |||
| Nordstrom, Inc. | 119,000 | 5,435,920 | |
| Target Corp. | 25,231 | 1,237,328 | |
| 6,673,248 | |||
| Oil, Gas & Consumable Fuels - 1.6% | |||
| EQT Corp. | 112,500 | 6,003,000 | |
| Plains Exploration & Production Co.* | 38,402 | 872,109 | |
| 6,875,109 | |||
www.calvert.com CALVERT SOCIAL INVESTMENT FUND ANNUAL REPORT 28
| EQUITY SECURITIES - CONT’D | SHARES | VALUE | |
| Professional Services - 0.2% | |||
| Manpower, Inc | 24,263 | $ | 815,722 |
| Semiconductors & Semiconductor Equipment - 2.3% | |||
| Altera Corp. | 113,900 | 3,591,267 | |
| Intel Corp. | 68,390 | 1,458,759 | |
| Lam Research Corp.* | 107,500 | 4,082,850 | |
| NVIDIA Corp.* | 64,822 | 810,275 | |
| 9,943,151 | |||
| Software - 3.1% | |||
| Adobe Systems, Inc.* | 49,244 | 1,190,228 | |
| Autodesk, Inc.* | 132,500 | 3,680,850 | |
| Citrix Systems, Inc.* | 25,419 | 1,386,098 | |
| Microsoft Corp. | 302,553 | 7,530,544 | |
| 13,787,720 | |||
| Specialty Retail - 2.9% | |||
| Bed Bath & Beyond, Inc.* | 86,200 | 4,940,122 | |
| Best Buy Co., Inc | 32,110 | 748,163 | |
| Home Depot, Inc. | 47,232 | 1,552,516 | |
| Staples, Inc | 56,686 | 753,924 | |
| TJX Co.’s, Inc | 90,300 | 5,008,941 | |
| 13,003,666 | |||
| Textiles, Apparel & Luxury Goods - 0.5% | |||
| Nike, Inc., Class B | 24,617 | 2,105,000 | |
| Trading Companies & Distributors - 1.4% | |||
| W.W. Grainger, Inc | 42,200 | 6,310,588 | |
| Venture Capital - 1.1% | |||
| Agraquest, Inc.: | |||
| Series B, Preferred (b)(i)* | 190,477 | 34,186 | |
| Series C, Preferred (b)(i)* | 117,647 | 24,686 | |
| Series H, Preferred (b)(i)* | 4,647,053 | 291,370 | |
| CFBanc Corp. (b)(i)* | 27,000 | 251,743 | |
| Community Bank of the Bay* | 4,000 | 6,600 | |
| Consensus Orthopedics, Inc.: | |||
| Common Stock (b)(i)* | 180,877 | - | |
| Series A-1, Preferred (b)(i)* | 420,683 | - | |
| Series B, Preferred (b)(i)* | 348,940 | - | |
| Series C, Preferred (b)(i)* | 601,710 | 151,089 | |
| Distributed Energy Systems Corp.* | 14,937 | - | |
| Environmental Private Equity Fund II, Liquidating Trust LP (b)(i)* | 200,000 | 21,055 | |
| Neighborhood Bancorp (b)(i)* | 10,000 | 50,000 | |
| Seventh Generation, Inc. (b)(i)* | 200,295 | 3,186,935 | |
| SmarThinking, Inc. Contingent Deferred Distribution (b)(i)* | 1 | - | |
| Wild Planet Entertainment, Inc.: | |||
| Series B, Preferred (b)(i)* | 476,190 | 781,602 | |
| Series E, Preferred (b)(i)* | 129,089 | 211,882 | |
| Wind Harvest Co., Inc. (b)(i)* | 8,696 | 1 | |
| 5,011,149 | |||
www.calvert.com CALVERT SOCIAL INVESTMENT FUND ANNUAL REPORT 29
| EQUITY SECURITIES - CONT’D | SHARES | VALUE | ||
| Wireless Telecommunication Services - 0.9% | ||||
| NII Holdings, Inc.* | 140,100 | $ | 3,775,695 | |
| Total Equity Securities (Cost $241,121,175) | 251,437,781 | |||
| VENTURE CAPITAL LIMITED | ADJUSTED | |||
| PARTNERSHIP INTEREST - 0.5% | BASIS | |||
| Angels With Attitude I LLC (a)(b)(i)* | $ | 200,000 | 76,451 | |
| Coastal Venture Partners (b)(i)* | 100,976 | 79,757 | ||
| Commons Capital (b)(i)* | 440,520 | 215,597 | ||
| First Analysis Private Equity Fund IV (b)(i)* | 439,044 | 821,287 | ||
| GEEMF Partners (a)(b)(i)* | - | 132,554 | ||
| Global Environment Emerging Markets Fund (b)(i)* | - | 383,274 | ||
| Infrastructure and Environmental Private Equity Fund III (b)(i)* | 156,083 | 153,697 | ||
| Labrador Ventures III (b)(i)* | 360,875 | 43,598 | ||
| Labrador Ventures IV (b)(i)* | 900,510 | 45,034 | ||
| New Markets Growth Fund LLC (b)(i)* | 225,646 | 111,164 | ||
| Solstice Capital (b)(i)* | 288,705 | 239,950 | ||
| Venture Strategy Partners (b)(i)* | 187,205 | - | ||
| Total Venture Capital Limited Partnership Interest (Cost $3,299,564) | 2,302,363 | |||
| VENTURE CAPITAL DEBT | PRINCIPAL | |||
| OBLIGATIONS - 0.4% | AMOUNT | |||
| Access Bank plc, 8.477%, 8/29/12 (b)(i) | 250,000 | 257,109 | ||
| Drop The Chalk, 8.00%, 12/31/12 (b)(i) | 42,857 | 42,857 | ||
| KDM Development Corp., 6.00%, 6/30/19 (b)(i)(j) | 600,000 | 552,501 | ||
| Lumni, Inc., 6.00%, 10/5/15 (b)(i) | 100,000 | 100,000 | ||
| Rose Smart Growth Investment Fund I LP, 6.545%, 4/1/21 (b)(i) | 1,000,000 | 984,287 | ||
| Total Venture Capital Debt Obligations (Cost $1,992,857) | 1,936,754 | |||
| ASSET-BACKED SECURITIES - 1.1% | ||||
| ACLC Business Loan Receivables Trust, 0.879%, 10/15/21 (e)(r) | 11,950 | 11,886 | ||
| CPS Auto Trust, 6.48%, 7/15/13 (e) | 518,794 | 530,372 | ||
| Enterprise Mortgage Acceptance Co. LLC, 8.21%, 1/15/27 (e)(r) | 881,240 | 511,119 | ||
| Franklin Auto Trust, 7.16%, 5/20/16 (e) | 1,000,000 | 1,041,158 | ||
| Santander Drive Auto Receivables Trust: | ||||
| 1.01%, 7/15/13 (e) | 361,247 | 361,441 | ||
| 1.37%, 8/15/13 (e) | 2,524,950 | 2,529,499 | ||
| Total Asset-Backed Securities (Cost $4,977,368) | 4,985,475 | |||
www.calvert.com CALVERT SOCIAL INVESTMENT FUND ANNUAL REPORT 30
| COLLATERALIZED MORTGAGE-BACKED | PRINCIPAL | |||
| OBLIGATIONS (PRIVATELY ORIGINATED) - 0.6% | AMOUNT | VALUE | ||
| GMAC Mortgage Corp. Loan Trust, 5.50%, 10/25/33 | $ | 312,425 | $ | 318,557 |
| Impac CMB Trust, 0.775%, 5/25/35 (r) | 1,090,144 | 768,528 | ||
| JP Morgan Mortgage Trust, 4.991%, 7/25/35 (r) | 78,952 | 77,463 | ||
| Merrill Lynch Mortgage Investors, Inc., 2.762%, 12/25/35 (r) | 116,895 | 114,214 | ||
| WaMu Mortgage Pass Through Certificates, 2.501%, 10/25/35 (r) | 1,500,000 | 1,224,339 | ||
| Total Collateralized Mortgage-Backed Obligations | ||||
| (Privately Originated) (Cost $2,705,881) | 2,503,101 | |||
| COMMERCIAL MORTGAGE-BACKED SECURITIES - 2.8% | ||||
| Asset Securitization Corp., 6.921%, 2/14/43 (r) | 1,000,000 | 1,044,062 | ||
| Banc of America Merrill Lynch Commercial Mortgage, Inc.: | ||||
| 4.576%, 7/10/42 | 464,356 | 469,313 | ||
| 4.783%, 7/10/43 (r) | 1,894,395 | 1,913,318 | ||
| GS Mortgage Securities Corp. II, 4.295%, 1/10/40 | 907,315 | 912,331 | ||
| JP Morgan Chase Commercial Mortgage Securities Corp., 6.162%, | ||||
| 5/12/34 | 4,423,282 | 4,446,960 | ||
| Morgan Stanley Dean Witter Capital I, 6.55%, 7/15/33 | 1,000,000 | 996,352 | ||
| Salomon Brothers Mortgage Securities VII, Inc., 4.467%, 3/18/36 | 843,438 | 847,671 | ||
| Wachovia Bank Commercial Mortgage Trust, 4.566%, 4/15/35 | 1,575,523 | 1,624,064 | ||
| Total Commercial Mortgage-Backed Securities (Cost $12,534,715) | 12,254,071 | |||
| CORPORATE BONDS - 18.7% | ||||
| Achmea Hypotheekbank NV, 0.607%, 11/3/14 (e)(r) | 1,125,000 | 1,121,772 | ||
| Alliance Mortgage Investments, Inc., 12.61%, 6/1/10 (b)(r)(x)* | 385,345 | - | ||
| Ally Financial, Inc., 4.50%, 2/11/14 | 500,000 | 455,000 | ||
| America Movil SAB de CV, 2.375%, 9/8/16 | 350,000 | 339,484 | ||
| American Express Bank FSB, 0.369%, 5/29/12 (r) | 2,000,000 | 1,989,903 | ||
| American National Red Cross, 5.362%, 11/15/11 | 3,215,000 | 3,218,890 | ||
| ANZ National International Ltd., 1.351%, 12/20/13 (e)(r) | 1,500,000 | 1,503,235 | ||
| APL Ltd., 8.00%, 1/15/24 (b) | 550,000 | 352,000 | ||
| Asciano Finance Ltd., 4.625%, 9/23/20 (e) | 750,000 | 752,488 | ||
| AT&T, Inc., 2.95%, 5/15/16 | 500,000 | 515,589 | ||
| Atlantic Marine Corp. Communities LLC, 6.158%, 12/1/51 (e) | 1,000,000 | 1,157,933 | ||
| Atlantic Mutual Insurance Co., 8.15%, 2/15/28 (b)(e)(p)* | 4,060,000 | - | ||
| Aurora Military Housing LLC, 5.35%, 12/15/25 (e) | 2,380,000 | 2,407,870 | ||
| Australia & New Zealand Banking Group Ltd., 0.552%, 10/21/11 (e)(r) 500,000 | 499,928 | |||
| Bank of America Corp.: | ||||
| 3.75%, 7/12/16 | 500,000 | 454,203 | ||
| 5.00%, 5/13/21 | 750,000 | 666,102 | ||
| Bayview Research Center Finance Trust, 6.33%, 1/15/37 (e) | 704,534 | 764,101 | ||
| Capital One Financial Corp.: | ||||
| 4.80%, 2/21/12 | 500,000 | 505,675 | ||
| 4.75%, 7/15/21 | 750,000 | 745,363 | ||
| Crown Castle Towers LLC, 4.883%, 8/15/40 (e) | 1,500,000 | 1,560,000 | ||
| CVS Pass-Through Trust: | ||||
| 6.036%, 12/10/28 | 1,318,995 | 1,432,995 | ||
| 7.507%, 1/10/32 (e) | 726,880 | 856,591 | ||
| Discover Bank, 8.70%, 11/18/19 | 750,000 | 861,452 | ||
| DISH DBS Corp., 6.375%, 10/1/11 | 500,000 | 500,000 | ||
www.calvert.com CALVERT SOCIAL INVESTMENT FUND ANNUAL REPORT 31
| PRINCIPAL | ||||
| CORPORATE BONDS - CONT’D | AMOUNT | VALUE | ||
| Dun & Bradstreet Corp., 2.875%, 11/15/15 | $ | 1,000,000 | $ | 1,029,393 |
| Enterprise Products Operating LLC, 7.034% to 1/15/18, floating | ||||
| rate thereafter to 1/15/68 (r) | 1,250,000 | 1,262,500 | ||
| Fleet Capital Trust V, 1.35%, 12/18/28 (r) | 1,000,000 | 603,201 | ||
| Ford Motor Credit Co. LLC, 5.875%, 8/2/21 | 700,000 | 696,500 | ||
| Fort Knox Military Housing Privatization Project, 5.815%, | ||||
| 2/15/52 (b)(e) | 1,000,000 | 1,088,750 | ||
| FUEL Trust: | ||||
| 4.207%, 4/15/16 (e) | 1,300,000 | 1,276,491 | ||
| 3.984%, 12/15/22 (e) | 1,100,000 | 1,069,135 | ||
| GameStop Corp., 8.00%, 10/1/12 | 295,000 | 295,000 | ||
| Glitnir Banki HF: | ||||
| 2.95%, 10/15/08 (b)(y)* | 2,000,000 | 505,000 | ||
| 6.693% to 6/15/11, floating rate thereafter to 6/15/16 (b)(e)(r)(y)* | 1,500,000 | 150 | ||
| GMAC Commercial Mortgage Asset Corp., 6.107%, 8/10/52 (e) | 1,000,000 | 983,920 | ||
| Goldman Sachs Group, Inc.: | ||||
| 5.125%, 1/15/15 | 650,000 | 671,323 | ||
| 6.15%, 4/1/18 | 500,000 | 516,727 | ||
| 5.375%, 3/15/20 | 300,000 | 296,502 | ||
| Great River Energy, 5.829%, 7/1/17 (e) | 273,846 | 305,087 | ||
| HCA, Inc., 8.00%, 10/1/18 | 300,000 | 293,250 | ||
| Hewlett-Packard Co., 0.719%, 5/30/14 (r) | 500,000 | 488,926 | ||
| HSBC Bank Brasil SA, 4.00%, 5/11/16 (e) | 1,000,000 | 972,191 | ||
| Jefferies Group, Inc., 5.125%, 4/13/18 | 500,000 | 471,236 | ||
| JPMorgan Chase & Co., 4.35%, 8/15/21 | 400,000 | 400,957 | ||
| JPMorgan Chase Capital XXV, 6.80%, 10/1/37 | 1,550,000 | 1,549,798 | ||
| LL & P Wind Energy, Inc. Washington Revenue Bonds, | ||||
| 6.192%, 12/1/27 (e) | 2,000,000 | 1,705,660 | ||
| Lumbermens Mutual Casualty Co.: | ||||
| 9.15%, 7/1/26 (e)(m)* | 1,696,000 | 4,410 | ||
| 8.30%, 12/1/37 (e)(m)* | 6,130,000 | 15,938 | ||
| 8.45%, 12/1/49 (e)(m)* | 2,560,000 | 6,656 | ||
| Masco Corp., 5.85%, 3/15/17 | 600,000 | 567,768 | ||
| McGuire Air Force Base Military Housing Project, 5.611%, 9/15/51 (e) | 1,000,000 | 996,290 | ||
| MMA Financial Holdings, Inc., 0.75%, 5/3/34 (b) | 2,540,000 | 508,000 | ||
| Nationwide Health Properties, Inc., 6.90%, 10/1/37 | 1,000,000 | 1,247,318 | ||
| Nordea Bank AB, 4.875%, 5/13/21 (e) | 1,000,000 | 855,678 | ||
| Ohana Military Communities LLC, 5.675%, 10/1/26 (e) | 2,250,000 | 2,439,293 | ||
| OPTI Canada, Inc., 9.75%, 8/15/13 (e) | 1,580,000 | 1,607,650 | ||
| O’Reilly Automotive, Inc., 4.625%, 9/15/21 | 600,000 | 599,789 | ||
| Orkney Re II plc, Series B, 6.096%, 12/21/35 (b)(e)(r)(w)* | 1,100,000 | - | ||
| Pacific Beacon LLC, 5.628%, 7/15/51 (e) | 1,246,308 | 1,082,244 | ||
| Pacific Pilot Funding Ltd., 1.001%, 10/20/16 (e)(r) | 826,497 | 766,303 | ||
| Pioneer Natural Resources Co., 5.875%, 7/15/16 | 945,000 | 994,613 | ||
| PNC Funding Corp., 2.70%, 9/19/16 | 1,000,000 | 997,496 | ||
| Prudential Holdings LLC, 7.245%, 12/18/23 (e) | 500,000 | 590,283 | ||
| Redstone Arsenal Military Housing, 5.45%, 9/1/26 (e) | 1,125,000 | 1,114,853 | ||
| Ryder System, Inc., 3.50%, 6/1/17 | 500,000 | 518,062 | ||
| Salvation Army, 5.46%, 9/1/16 | 160,000 | 181,256 | ||
| SBA Tower Trust, 4.254%, 4/15/40 (e) | 1,000,000 | 1,055,178 | ||
| Seagate Technology HDD Holdings, 6.375%, 10/1/11 | 1,000,000 | 1,000,000 | ||
| Simon Property Group LP, 6.125%, 5/30/18 | 1,000,000 | 1,127,390 |
www.calvert.com CALVERT SOCIAL INVESTMENT FUND ANNUAL REPORT 32
| PRINCIPAL | ||||
| CORPORATE BONDS - CONT’D | AMOUNT | VALUE | ||
| SPARCS Trust 99-1, STEP, 0.00% to 4/15/19, 7.697% thereafter | ||||
| to 10/15/97 (b)(e)(r) | $ | 1,000,000 | $ | 426,690 |
| Spencer Spirit Holdings, Inc., 11.00%, 5/1/17 (e) | 900,000 | 861,750 | ||
| SSIF Nevada LP, 0.949%, 4/14/14 (e)(r) | 2,390,000 | 2,389,921 | ||
| St. Jude Medical, Inc., 2.50%, 1/15/16 | 1,000,000 | 1,025,179 | ||
| SunTrust Bank: | ||||
| 0.598%, 8/24/15 (r) | 500,000 | 457,143 | ||
| 7.25%, 3/15/18 | 2,000,000 | 2,324,158 | ||
| Svenska Handelsbanken AB, 1.343%, 9/14/12 (e)(r) | 1,500,000 | 1,499,906 | ||
| Telefonica Emisiones SAU, 5.134%, 4/27/20 | 2,000,000 | 1,856,253 | ||
| The Gap, Inc., 5.95%, 4/12/21 | 1,000,000 | 935,000 | ||
| Time Warner Cable, Inc., 4.00%, 9/1/21 | 500,000 | 490,796 | ||
| Time Warner, Inc., 6.25%, 3/29/41 | 500,000 | 563,868 | ||
| Toll Road Investors Partnership II LP, Zero Coupon: | ||||
| 2/15/43 (b)(e) | 5,000,000 | 543,000 | ||
| 2/15/45 (b)(e) | 25,727,303 | 3,990,305 | ||
| Tupperware Brands Corp., 4.75%, 6/1/21 (e) | 1,000,000 | 1,020,979 | ||
| US Bank, 3.778% to 4/29/15, floating rate thereafter to 4/29/20 (r) | 1,500,000 | 1,522,687 | ||
| Volkswagen International Finance NV, 0.856%, 4/1/14 (e)(r) | 1,500,000 | 1,496,655 | ||
| Wachovia Capital Trust III, 5.57%, 3/29/49 (r) | 2,250,000 | 1,845,000 | ||
| Western Express, Inc., 12.50%, 4/15/15 (e) | 500,000 | 325,000 | ||
| Willis Group Holdings plc, 4.125%, 3/15/16 | 1,000,000 | 1,017,489 | ||
| Yara International ASA, 7.875%, 6/11/19 (e) | 500,000 | 635,417 | ||
| Total Corporate Bonds (Cost $99,410,075) | 82,645,935 | |||
| U.S. GOVERNMENT AGENCIES AND INSTRUMENTALITIES - 2.4% | ||
| AgFirst FCB: | ||
| 6.585% to 6/15/12, floating rate thereafter to 6/29/49 (e)(r) | 1,250,000 | 896,875 |
| 7.30%, 10/14/49 (e) | 1,500,000 | 1,500,000 |
| Fannie Mae, 1.25%, 6/22/12 | 6,000,000 | 6,044,204 |
| Premier Aircraft Leasing EXIM 1 Ltd., 3.576%, 2/6/22 | 1,790,954 | 1,901,385 |
| US AgBank FCB, 6.11% to 7/10/12, floating rate thereafter | ||
| to 12/31/49 (e)(r) | 300,000 | 192,000 |
| Total U.S. Government Agencies and Instrumentalities | ||
| (Cost $10,346,396) | 10,534,464 | |
| U.S. GOVERNMENT AGENCY | ||
| MORTGAGE-BACKED SECURITIES - 0.5% | ||
| Fannie Mae, 3.50%, 12/1/41 | 2,000,000 | 2,048,437 |
| Ginnie Mae, 5.50%, 1/16/32 | 669,236 | 27,023 |
| Total U.S. Government Agency Mortgage-Backed | ||
| Securities (Cost $2,149,326) | 2,075,460 | |
www.calvert.com CALVERT SOCIAL INVESTMENT FUND ANNUAL REPORT 33
| PRINCIPAL | ||||
| MUNICIPAL OBLIGATIONS - 5.1% | AMOUNT | VALUE | ||
| California Statewide Communities Development Authority Revenue | ||||
| Bonds, 5.01%, 8/1/15 | $ | 635,000 | $ | 664,928 |
| Illinois State MFH Development Authority Revenue Bonds, | ||||
| 6.537%, 1/1/33 | 1,000,000 | 1,048,430 | ||
| Inglewood California Pension Funding Revenue Bonds, 5.07%, 9/1/20 | 660,000 | 668,481 | ||
| Maryland State Economic Development Corp. Revenue Bonds: | ||||
| Series B, 6.00%, 7/1/48 (f)* | 1,855,000 | 495,285 | ||
| Series C, Zero Coupon, 7/1/48 (f) | 2,534,053 | 25 | ||
| Moreno Valley California Public Financing Authority Revenue | ||||
| Bonds, 5.549%, 5/1/27 | 750,000 | 758,310 | ||
| Oakland California Redevelopment Agency Tax Allocation Bonds: | ||||
| 5.252%, 9/1/16 | 1,105,000 | 1,117,984 | ||
| 5.263%, 9/1/16 | 545,000 | 551,191 | ||
| 5.383%, 9/1/16 | 3,000,000 | 3,212,010 | ||
| Oceanside California PO Revenue Bonds, 5.04%, 8/15/17 | 750,000 | 757,440 | ||
| Palm Springs California Community Redevelopment Agency Tax | ||||
| Allocation Bonds, 6.411%, 9/1/34 | 1,250,000 | 1,215,013 | ||
| San Bernardino California Joint Powers Financing Authority Tax | ||||
| Allocation Bonds, 5.625%, 5/1/16 | 500,000 | 511,535 | ||
| San Diego California Redevelopment Agency Tax Allocation | ||||
| Bonds, 5.66%, 9/1/16 | 890,000 | 909,936 | ||
| San Diego County California PO Revenue Bonds, Zero | ||||
| Coupon, 8/15/12 | 1,790,000 | 1,759,140 | ||
| San Jose California Redevelopment Agency Tax Allocation | ||||
| Bonds, 5.46%, 8/1/35 | 1,000,000 | 846,710 | ||
| San Ramon California Public Financing Authority Tax | ||||
| Allocation Bonds, 5.65%, 2/1/21 | 1,775,000 | 1,780,928 | ||
| Santa Fe Springs California Community Development Commission | ||||
| Tax Allocation Bonds, 5.35%, 9/1/18 | 1,500,000 | 1,533,660 | ||
| Utah State Housing Corp. Military Housing Revenue Bonds, | ||||
| 5.392%, 7/1/50 | 1,500,000 | 1,514,910 | ||
| Vacaville California Redevelopment Agency Housing Tax Allocation | ||||
| Bonds, 6.125%, 9/1/20 | 665,000 | 667,055 | ||
| Wells Fargo Bank NA Custodial Receipts Revenue Bonds, | ||||
| 6.734%, 9/1/27 (e) | 1,500,000 | 1,826,850 | ||
| West Contra Costa California Unified School District COPs, | ||||
| 4.90%, 1/1/15 | 555,000 | 555,389 | ||
| Total Municipal Obligations (Cost $25,313,019) | 22,395,210 | |||
| HIGH SOCIAL IMPACT INVESTMENTS - 0.9% | ||||
| Calvert Social Investment Foundation Notes, 0.94%, 7/1/13 (b)(i)(r) | 4,266,666 | 4,111,359 | ||
| Total High Social Impact Investments (Cost $4,266,666) | 4,111,359 | |||
www.calvert.com CALVERT SOCIAL INVESTMENT FUND ANNUAL REPORT 34
| PRINCIPAL | ||||||
| U.S. TREASURY - 5.6% | AMOUNT | VALUE | ||||
| United States Treasury Bonds: | ||||||
| 4.375%, 5/15/41 | $ | 3,800,000 | $ | 4,907,938 | ||
| 3.75%, 8/15/41 | 14,410,000 | 16,776,392 | ||||
| United States Treasury Notes, 2.125%, 8/15/21 | 2,830,000 | 2,879,525 | ||||
| Total U.S. Treasury (Cost $22,377,145) | 24,563,855 | |||||
| TIME DEPOSIT - 4.3% | ||||||
| State Street Time Deposit, 0.113%, 10/3/11 | 19,145,500 | 19,145,500 | ||||
| Total Time Deposit (Cost $19,145,500) | 19,145,500 | |||||
| TOTAL INVESTMENTS (Cost $449,639,687) - 99.9% | 440,891,328 | |||||
| Receivable from Calvert Investment Management, Inc. | 206,623 | |||||
| Payable to shareholders | (206,623 | ) | ||||
| Other assets and liabilities, net - 0.1% | 285,500 | |||||
| NET ASSETS - 100% | $ | 441,176,828 | ||||
| NET ASSETS CONSIST OF: | ||||||
| Paid-in capital applicable to the following shares of beneficial interest, | ||||||
| unlimited number of no par value shares authorized: | ||||||
| Class A: 15,490,157 shares outstanding | $ | 439,142,224 | ||||
| Class B: 358,415 shares outstanding | 12,555,401 | |||||
| Class C: 946,079 shares outstanding | 28,271,429 | |||||
| Class I: 68,702 shares outstanding | 2,620,602 | |||||
| Undistributed net investment income | 70,817 | |||||
| Accumulated net realized gain (loss) on investments | (32,960,935 | ) | ||||
| Net unrealized appreciation (depreciation) on investments | (8,522,710 | ) | ||||
| NET ASSETS | $ | 441,176,828 | ||||
| NET ASSET VALUE PER SHARE | ||||||
| Class A | (based on net assets of $405,715,813) | $ | 26.19 | |||
| Class B | (based on net assets of $9,305,705) | $ | 25.96 | |||
| Class C | (based on net assets of $24,335,256) | $ | 25.72 | |||
| Class I | (based on net assets of $1,820,054) | $ | 26.49 | |||
www.calvert.com CALVERT SOCIAL INVESTMENT FUND ANNUAL REPORT 35
| UNDERLYING | UNREALIZED | |||
| # OF | EXPIRATION | FACE AMOUNT | APPRECIATION | |
| FUTURES | CONTRACTS | DATE | AT VALUE | (DEPRECIATION) |
| Purchased:. | ||||
| 30 Year U.S. Treasury Bonds | 31 | 12/11 | $4,421,375 | $141,536 |
| Sold: | ||||
| 2 Year U.S. Treasury Notes | 248 | 12/11 | $54,610,375 | $73,350 |
| 5 Year U.S. Treasury Notes | 247 | 12/11 | 30,253,641 | 10,764 |
| Total Sold | $84,114 | |||
See notes to statement of net assets and notes to financial statements.
www.calvert.com CALVERT SOCIAL INVESTMENT FUND ANNUAL REPORT 36
| BOND PORTFOLIO | ||||
| STATEMENT OF NET ASSETS | ||||
| SEPTEMBER 30, 2011 | ||||
| ASSET-BACKED SECURITIES - 2.7% | PRINCIPAL AMOUNT | VALUE | ||
| ACLC Business Loan Receivables Trust, 0.879%, 10/15/21 (e)(r) | $ | 11,950 | $ | 11,886 |
| AmeriCredit Automobile Receivables Trust, 0.272%, 12/6/13 (r) | 2,275,533 | 2,270,482 | ||
| Bear Stearns Asset Backed Securities Trust, 0.455%, 12/25/35 (r) | 1,087,962 | 1,052,045 | ||
| Capital Auto Receivables Asset Trust, 8.30%, 2/18/14 (e) | 3,493,000 | 3,599,579 | ||
| Community Reinvestment Revenue Notes, 5.90%, 6/1/31 (e) | 706,321 | 712,185 | ||
| Countrywide Asset-Backed Certificates, 0.655%, 2/25/36 (r) | 350,000 | 330,416 | ||
| CPS Auto Trust: | ||||
| 6.48%, 7/15/13 (e) | 2,593,971 | 2,651,857 | ||
| 5.60%, 1/15/14 (e) | 997,722 | 1,008,656 | ||
| DT Auto Owner Trust, 0.99%, 5/15/13 (e) | 1,690,377 | 1,690,173 | ||
| Enterprise Mortgage Acceptance Co. LLC, 8.21%, 1/15/27 (e)(r) | 2,349,972 | 1,362,984 | ||
| Fifth Third Auto Trust, 4.81%, 1/15/13 | 359,780 | 361,612 | ||
| Marlin Leasing Receivables LLC, 2.44%, 1/15/16 (e) | 2,113,236 | 2,127,470 | ||
| Santander Drive Auto Receivables Trust, 1.37%, 8/15/13 (e) | 5,049,900 | 5,058,998 | ||
| Total Asset-Backed Securities (Cost $22,282,042) | 22,238,343 | |||
| COLLATERALIZED MORTGAGE-BACKED | ||||
| OBLIGATIONS (PRIVATELY ORIGINATED) - 1.8% | ||||
| Citicorp Mortgage Securities, Inc., 0.068%, 10/25/33 (r) | 51,729,336 | 51,171 | ||
| Countrywide Alternative Loan Trust, 4.968%, 7/25/35 (r) | 1,499,484 | 1,522,483 | ||
| CS First Boston Mortgage Securities Corp.: | ||||
| 2.725%, 12/25/33 (r) | 632,416 | 164,295 | ||
| 5.25%, 12/25/35 | 836,199 | 822,120 | ||
| GMAC Mortgage Corp. Loan Trust, 5.50%, 10/25/33 | 3,124,255 | 3,185,574 | ||
| Impac CMB Trust: | ||||
| 0.775%, 5/25/35 (r) | 2,180,288 | 1,537,055 | ||
| 0.555%, 8/25/35 (r) | 656,891 | 451,899 | ||
| JP Morgan Mortgage Trust: | ||||
| 2.806%, 7/25/35 (r) | 407,892 | 364,020 | ||
| 4.991%, 7/25/35 (r) | 394,760 | 387,316 | ||
| Merrill Lynch Mortgage Investors, Inc., 2.762%, 12/25/35 (r) | 428,617 | 418,783 | ||
| WaMu Mortgage Pass Through Certificates, 2.501%, 10/25/35 (r) | 6,000,000 | 4,897,356 | ||
| Wells Fargo Mortgage Backed Securities Trust: | ||||
| Class 1A10, 0.193%, 10/25/36 | 36,817,919 | 132,986 | ||
| Class 1A9, 0.193%, 10/25/36 | 100,000,000 | 454,600 | ||
| Total Collateralized Mortgage-Backed Obligations | ||||
| (Privately Originated) (Cost $15,089,763) | 14,389,658 | |||
www.calvert.com CALVERT SOCIAL INVESTMENT FUND ANNUAL REPORT 37
| PRINCIPAL | |||||
| COMMERICAL MORTGAGE-BACKED SECURITIES - 4.1% | AMOUNT | VALUE | |||
| Banc of America Merrill Lynch Commercial Mortgage, Inc.: | |||||
| 6.186%, 6/11/35 | $ | 1,181,126 | $ | 1,184,128 | |
| 4.576%, 7/10/42 | 1,160,889 | 1,173,282 | |||
| Bear Stearns Commercial Mortgage Securities: | |||||
| 6.46%, 10/15/36 | 2,325,863 | 2,345,970 | |||
| 4.83%, 8/15/38 | 2,000,000 | 2,038,802 | |||
| Commercial Mortgage Acceptance Corp., 6.21%, 7/15/31 (e) | 4,323,000 | 4,431,408 | |||
| Credit Suisse First Boston Mortgage Securities Corp., | |||||
| 5.253%, 8/15/36 (r) | 2,000,000 | 2,082,008 | |||
| First Union National Bank Commercial Mortgage, 6.141%, 2/12/34 | 1,791,128 | 1,799,634 | |||
| GS Mortgage Securities Corp. II, 4.295%, 1/10/40 | 2,268,287 | 2,280,828 | |||
| JP Morgan Chase Commercial Mortgage Securities Corp., | |||||
| 6.162%, 5/12/34 | 8,846,564 | 8,893,919 | |||
| Morgan Stanley Dean Witter Capital I, 6.55%, 7/15/33 | 2,000,000 | 1,992,704 | |||
| Salomon Brothers Mortgage Securities VII, Inc., 4.467%, 3/18/36 | 2,108,596 | 2,119,177 | |||
| Wachovia Bank Commercial Mortgage Trust: | |||||
| 6.287%, 4/15/34 | 785,464 | 793,554 | |||
| 4.566%, 4/15/35 | 2,625,872 | 2,706,773 | |||
| Total Commercial Mortgage-Backed Securities (Cost $34,640,574) | 33,842,187 | ||||
| CORPORATE BONDS - 48.0% | |||||
| Achmea Hypotheekbank NV, 0.607%, 11/3/14 (e)(r) | 3,000,000 | 2,991,391 | |||
| Airgas, Inc., 2.95%, 6/15/16 | 1,000,000 | 1,012,945 | |||
| Alliance Mortgage Investments, Inc.: | |||||
| 12.61%, 6/1/10 (b)(r)(x)* | 481,681 | - | |||
| 15.36%, 12/1/10 (b)(r)(x)* | 207,840 | - | |||
| Ally Financial, Inc., 4.50%, 2/11/14 | 2,500,000 | 2,275,000 | |||
| America Movil SAB de CV, 2.375%, 9/8/16 | 1,000,000 | 969,955 | |||
| American Express Bank FSB, 0.369%, 5/29/12 (r) | 6,500,000 | 6,467,186 | |||
| American National Red Cross: | |||||
| 5.392%, 11/15/12 | 2,000,000 | 2,021,840 | |||
| 5.567%, 11/15/17 | 1,500,000 | 1,544,310 | |||
| American Tower Corp., 4.50%, 1/15/18 | 1,500,000 | 1,487,415 | |||
| ANZ National International Ltd., 1.351%, 12/20/13 (e)(r) | 2,000,000 | 2,004,313 | |||
| APL Ltd., 8.00%, 1/15/24 (b) | 3,610,000 | 2,310,400 | |||
| Asciano Finance Ltd.: | |||||
| 5.00%, 4/7/18 (e) | 1,500,000 | 1,550,050 | |||
| 4.625%, 9/23/20 (e) | 3,000,000 | 3,009,950 | |||
| AT&T, Inc.: | |||||
| 3.875%, 8/15/21 | 1,000,000 | 1,024,036 | |||
| 5.55%, 8/15/41 | 1,000,000 | 1,074,842 | |||
| Atlantic Marine Corp. Communities LLC, 6.158%, 12/1/51 (e) | 2,500,000 | 2,894,833 | |||
| Atlantic Mutual Insurance Co., 8.15%, 2/15/28 (b)(e)(p)* | 3,500,000 | - | |||
| Aurora Military Housing LLC, 5.32%, 12/15/20 (e) | 2,625,000 | 2,774,756 | |||
| Australia & New Zealand Banking Group Ltd., 0.552%, 10/21/11 (e)(r) | 4,000,000 | 3,999,427 | |||
| Bank of America Corp.: | |||||
| 4.50%, 4/1/15 | 1,500,000 | 1,423,585 | |||
| 5.00%, 5/13/21 | 1,220,000 | 1,083,525 | |||
| Bank of America NA, 0.627%, 6/15/16 (r) | 5,000,000 | 3,877,026 | |||
| Bank of Montreal, 2.625%, 1/25/16 (e) | 4,930,000 | 5,138,489 | |||
| Bayview Research Center Finance Trust, 6.33%, 1/15/37 (e) | 2,966,459 | 3,217,269 | |||
www.calvert.com CALVERT SOCIAL INVESTMENT FUND ANNUAL REPORT 38
| PRINCIPAL | ||||
| CORPORATE BONDS - CONT’D | AMOUNT | VALUE | ||
| BE Aerospace, Inc., 6.875%, 10/1/20 | $ | 1,000,000 | $ | 1,047,500 |
| Canadian Imperial Bank of Commerce, 2.75%, 1/27/16 (e) | 2,000,000 | 2,099,324 | ||
| Capital One Bank, 8.80%, 7/15/19 | 1,500,000 | 1,718,697 | ||
| Capital One Capital VI, 8.875%, 5/15/40 | 443,000 | 441,893 | ||
| Capital One Financial Corp.: | ||||
| 4.80%, 2/21/12 | 2,000,000 | 2,022,701 | ||
| 4.75%, 7/15/21 | 1,690,000 | 1,679,552 | ||
| Crown Castle Towers LLC: | ||||
| 5.495%, 1/15/37 (e) | 3,000,000 | 3,315,000 | ||
| 4.883%, 8/15/40 (e) | 3,000,000 | 3,120,000 | ||
| CVS Caremark Corp., 6.125%, 8/15/16 | 1,642,000 | 1,892,143 | ||
| CVS Pass-Through Trust: | ||||
| 5.789%, 1/10/26 (e) | 776,560 | 826,648 | ||
| 6.036%, 12/10/28 | 2,637,989 | 2,865,990 | ||
| 6.943%, 1/10/30 | 3,219,004 | 3,692,841 | ||
| 7.507%, 1/10/32 (e) | 3,028,666 | 3,569,131 | ||
| Delta Air Lines Pass Through Trust, 6.75%, 5/23/17 | 1,500,000 | 1,395,000 | ||
| Deutsche Bank Capital Funding Trust VII, 5.628% to 1/19/16, | ||||
| floating rate thereafter to 1/29/49 (e)(r) | 1,000,000 | 701,250 | ||
| Discover Bank, 8.70%, 11/18/19 | 4,000,000 | 4,594,410 | ||
| DISH DBS Corp., 6.375%, 10/1/11 | 1,500,000 | 1,500,000 | ||
| DnB NOR Boligkreditt AS, 2.10%, 10/14/16 (e) | 3,000,000 | 3,022,895 | ||
| Dun & Bradstreet Corp., 2.875%, 11/15/15 | 2,890,000 | 2,974,945 | ||
| Earthlink, Inc., 8.875%, 5/15/19 | 250,000 | 219,375 | ||
| Enterprise Products Operating LLC, 7.034% to 1/15/18, floating | ||||
| rate thereafter to 1/15/68 (r) | 11,805,000 | 11,923,050 | ||
| EOG Company of Canada, 7.00%, 12/1/11 (e) | 5,830,000 | 5,882,143 | ||
| Fifth Third Bank, 0.402%, 5/17/13 (r) | 4,000,000 | 3,917,073 | ||
| First Niagara Financial Group, Inc., 6.75%, 3/19/20 | 1,000,000 | 1,091,405 | ||
| Fleet Capital Trust V, 1.35%, 12/18/28 (r) | 3,000,000 | 1,809,602 | ||
| Ford Motor Credit Co. LLC, 5.875%, 8/2/21 | 2,400,000 | 2,388,000 | ||
| Fort Knox Military Housing Privatization Project, | ||||
| 5.815%, 2/15/52 (b)(e) | 3,500,000 | 3,810,625 | ||
| FUEL Trust: | ||||
| 4.207%, 4/15/16 (e) | 6,250,000 | 6,136,978 | ||
| 3.984%, 12/15/22 (e) | 3,150,000 | 3,061,615 | ||
| GameStop Corp., 8.00%, 10/1/12 | 884,000 | 884,000 | ||
| Glitnir Banki HF: | ||||
| 2.95%, 10/15/08 (b)(y)* | 8,000,000 | 2,020,000 | ||
| 3.046%, 4/20/10 (e)(r)(y)* | 4,000,000 | 1,040,000 | ||
| 3.226%, 1/21/11 (e)(r)(y)* | 500,000 | 120,000 | ||
| 6.375%, 9/25/12 (e)(y)* | 2,000,000 | 520,000 | ||
| 6.693% to 6/15/11, floating rate thereafter to 6/15/16 (b)(e)(r)(y)* | 750,000 | 75 | ||
| GMAC Commercial Mortgage Asset Corp., 6.107%, 8/10/52 (e) | 3,000,000 | 2,951,760 | ||
| Goldman Sachs Group, Inc.: | ||||
| 0.522%, 11/9/11 (r) | 6,000,000 | 6,000,274 | ||
| 6.15%, 4/1/18 | 3,500,000 | 3,617,087 | ||
| 5.375%, 3/15/20 | 1,800,000 | 1,779,014 | ||
| 6.00%, 6/15/20 | 1,000,000 | 1,020,982 | ||
| 5.25%, 7/27/21 | 500,000 | 489,493 | ||
| Great River Energy, 5.829%, 7/1/17 (e) | 2,190,765 | 2,440,697 | ||
| HCA, Inc., 8.00%, 10/1/18 | 1,450,000 | 1,417,375 |
www.calvert.com CALVERT SOCIAL INVESTMENT FUND ANNUAL REPORT 39
| PRINCIPAL | ||||
| CORPORATE BONDS - CONT’D | AMOUNT | VALUE | ||
| Hewlett-Packard Co.: | ||||
| 0.719%, 5/30/14 (r) | $ | 2,000,000 | $ | 1,955,706 |
| 4.30%, 6/1/21 | 2,000,000 | 2,015,761 | ||
| Home Depot, Inc., 5.875%, 12/16/36 | 5,000,000 | 5,836,475 | ||
| HSBC Bank Brasil SA, 4.00%, 5/11/16 (e) | 3,000,000 | 2,916,574 | ||
| International Business Machines Corp., 0.304%, 11/4/11 (r) | 1,000,000 | 1,000,025 | ||
| Irwin Land LLC, 4.51%, 12/15/15 (e) | 1,770,000 | 1,773,292 | ||
| Jefferies Group, Inc., 5.125%, 4/13/18 | 2,000,000 | 1,884,945 | ||
| Johnson Controls, Inc., 5.00%, 3/30/20 | 750,000 | 839,029 | ||
| Jones Group, Inc., 6.875%, 3/15/19 | 2,000,000 | 1,810,000 | ||
| JPMorgan Chase & Co.: | ||||
| 0.577%, 6/15/12 (r) | 4,300,000 | 4,308,250 | ||
| 4.40%, 7/22/20 | 1,300,000 | 1,305,650 | ||
| 4.35%, 8/15/21 | 1,500,000 | 1,503,587 | ||
| JPMorgan Chase Capital XXV, 6.80%, 10/1/37 | 6,000,000 | 5,999,219 | ||
| Kaupthing Bank HF, 3.491%, 1/15/10 (e)(r)(y)* | 1,000,000 | 245,000 | ||
| Kinder Morgan Energy Partners LP, 4.15%, 3/1/22 | 3,000,000 | 2,922,291 | ||
| LL & P Wind Energy, Inc. Washington Revenue Bonds, | ||||
| 6.192%, 12/1/27 (e) | 5,000,000 | 4,264,150 | ||
| Lumbermens Mutual Casualty Co.: | ||||
| 9.15%, 7/1/26 (e)(m)* | 2,942,000 | 7,649 | ||
| 8.30%, 12/1/37 (e)(m)* | 3,500,000 | 9,100 | ||
| Masco Corp.: | ||||
| 4.80%, 6/15/15 | 2,000,000 | 1,935,192 | ||
| 5.85%, 3/15/17 | 2,000,000 | 1,892,560 | ||
| 7.125%, 3/15/20 | 1,500,000 | 1,455,000 | ||
| McGuire Air Force Base Military Housing Project, 5.611%, 9/15/51 (e) . 2,420,000 | 2,411,022 | |||
| Merrill Lynch & Co., Inc., 1.107%, 9/15/26 (r) | 2,000,000 | 1,258,823 | ||
| MMA Financial Holdings, Inc., 0.75%, 5/3/34 (b) | 2,540,000 | 508,000 | ||
| Nationwide Building Society, 0.472%, 5/17/12 (e)(r) | 4,000,000 | 3,999,233 | ||
| Nationwide Health Properties, Inc., 6.90%, 10/1/37 | 2,300,000 | 2,868,831 | ||
| Nordea Bank AB, 4.875%, 5/13/21 (e) | 4,000,000 | 3,422,713 | ||
| Ohana Military Communities LLC, 5.675%, 10/1/26 (e) | 5,580,000 | 6,049,445 | ||
| OPTI Canada, Inc.: | ||||
| 9.00%, 12/15/12 (e) | 2,000,000 | 2,035,000 | ||
| 9.75%, 8/15/13 (e) | 4,430,000 | 4,507,525 | ||
| O’Reilly Automotive, Inc., 4.625%, 9/15/21 | 3,000,000 | 2,998,944 | ||
| Orkney Re II plc, Series B, 6.096%, 12/21/35 (b)(e)(r)(w)* | 1,700,000 | - | ||
| Pacific Beacon LLC, 5.628%, 7/15/51 (e) | 2,741,877 | 2,380,936 | ||
| Pacific Pilot Funding Ltd., 1.001%, 10/20/16 (e)(r) | 826,497 | 766,303 | ||
| Pioneer Natural Resources Co., 5.875%, 7/15/16 | 7,600,000 | 7,999,000 | ||
| PNC Funding Corp.: | ||||
| 0.393%, 1/31/12 (r) | 1,000,000 | 998,245 | ||
| 2.70%, 9/19/16 | 1,000,000 | 997,496 | ||
| President and Fellows of Harvard College, 4.875%, 10/15/40 | 2,000,000 | 2,435,914 | ||
| Private Export Funding Corp., 2.125%, 7/15/16 | 4,000,000 | 4,113,988 | ||
| Prudential Holdings LLC: | ||||
| 1.225%, 12/18/17 (e)(r) | 1,000,000 | 950,766 | ||
| 7.245%, 12/18/23 (e) | 1,700,000 | 2,006,964 | ||
| Rabobank Nederland NV, 3.20%, 3/11/15 (e) | 3,000,000 | 3,123,493 | ||
| Royal Bank of Canada, 3.125%, 4/14/15 (e) | 2,800,000 | 2,970,099 | ||
www.calvert.com CALVERT SOCIAL INVESTMENT FUND ANNUAL REPORT 40
| PRINCIPAL | ||||
| CORPORATE BONDS - CONT’D | AMOUNT | VALUE | ||
| Ryder System, Inc.: | ||||
| 3.15%, 3/2/15 | $ | 3,000,000 | $ | 3,056,949 |
| 3.60%, 3/1/16 | 1,000,000 | 1,042,023 | ||
| Salvation Army, 5.46%, 9/1/16 | 310,000 | 351,184 | ||
| Sanofi SA, 0.413%, 3/28/12 (r) | 2,000,000 | 2,001,111 | ||
| SBA Tower Trust, 4.254%, 4/15/40 (e) | 2,000,000 | 2,110,357 | ||
| Seagate Technology HDD Holdings, 6.375%, 10/1/11 | 2,000,000 | 2,000,000 | ||
| Simon Property Group LP, 6.125%, 5/30/18 | 2,500,000 | 2,818,475 | ||
| SPARCS Trust 99-1, STEP, 0.00% to 4/15/19, 7.697% thereafter | ||||
| to 10/15/97 (b)(e)(r) | 1,000,000 | 426,690 | ||
| Spencer Spirit Holdings, Inc., 11.00%, 5/1/17 (e) | 4,000,000 | 3,830,000 | ||
| St. Jude Medical, Inc., 2.50%, 1/15/16 | 3,040,000 | 3,116,543 | ||
| Stadshypotek AB, 0.919%, 9/30/13 (e)(r) | 3,000,000 | 2,999,957 | ||
| SunTrust Bank: | ||||
| 0.408%, 5/21/12 (r) | 5,000,000 | 4,945,307 | ||
| 0.598%, 8/24/15 (r) | 1,000,000 | 914,287 | ||
| 7.25%, 3/15/18 | 2,000,000 | 2,324,158 | ||
| SunTrust Banks, Inc., 3.60%, 4/15/16 | 2,000,000 | 2,011,932 | ||
| Svenska Handelsbanken AB, 1.343%, 9/14/12 (e)(r) | 5,000,000 | 4,999,688 | ||
| Swedbank Hypotek AB, 2.125%, 8/31/16 (e) | 5,000,000 | 5,014,812 | ||
| Symantec Corp., 2.75%, 9/15/15 | 5,000,000 | 5,064,646 | ||
| TD Ameritrade Holding Corp., 5.60%, 12/1/19 | 2,000,000 | 2,182,996 | ||
| Telefonica Emisiones SAU: | ||||
| 6.421%, 6/20/16 | 5,000,000 | 5,126,673 | ||
| 5.134%, 4/27/20 | 4,300,000 | 3,990,944 | ||
| The Gap, Inc., 5.95%, 4/12/21 | 4,000,000 | 3,740,000 | ||
| The Toronto-Dominion Bank, 2.50%, 7/14/16 | 1,500,000 | 1,537,126 | ||
| TIERS Trust, 8.45%, 12/1/17 (b)(e)(n)* | 439,239 | 439 | ||
| Time Warner Cable, Inc., 4.00%, 9/1/21 | 2,800,000 | 2,748,457 | ||
| Time Warner Entertainment Co. LP, 8.875%, 10/1/12 | 1,300,000 | 1,400,965 | ||
| Time Warner, Inc., 6.25%, 3/29/41 | 2,500,000 | 2,819,342 | ||
| Toll Road Investors Partnership II LP, Zero Coupon: | ||||
| 2/15/18 (b)(e) | 3,000,000 | 1,860,300 | ||
| 2/15/28 (b)(e) | 3,300,000 | 804,870 | ||
| 2/15/43 (b)(e) | 54,500,000 | 5,918,700 | ||
| 2/15/45 (b)(e) | 51,386,087 | 7,969,982 | ||
| Tupperware Brands Corp., 4.75%, 6/1/21 (e) | 3,000,000 | 3,062,938 | ||
| US Bank, 3.778% to 4/29/15, floating rate thereafter to 4/29/20 (r) | 9,000,000 | 9,136,122 | ||
| Viacom, Inc., 3.50%, 4/1/17 | 2,000,000 | 2,024,518 | ||
| Volkswagen International Finance NV, 0.856%, 4/1/14 (e)(r) | 5,000,000 | 4,988,849 | ||
| Wachovia Capital Trust III, 5.57%, 3/29/49 (r) | 13,150,000 | 10,783,000 | ||
| Wells Fargo & Co., 0.567%, 6/15/12 (r) | 1,830,000 | 1,830,159 | ||
| Western Express, Inc., 12.50%, 4/15/15 (e) | 1,500,000 | 975,000 | ||
| Willis Group Holdings plc, 4.125%, 3/15/16 | 1,500,000 | 1,526,233 | ||
| Willis North America, Inc., 6.20%, 3/28/17 | 1,225,000 | 1,337,294 | ||
| Xerox Corp., 4.50%, 5/15/21 | 1,940,000 | 1,928,071 | ||
| Yara International ASA, 7.875%, 6/11/19 (e) | 1,500,000 | 1,906,252 | ||
| Total Corporate Bonds (Cost $417,584,668) | 394,482,630 | |||
www.calvert.com CALVERT SOCIAL INVESTMENT FUND ANNUAL REPORT 41
| PRINCIPAL | ||||
| MUNICIPAL OBLIGATIONS - 12.9% | AMOUNT | VALUE | ||
| Adams-Friendship Area Wisconsin School District GO Bonds: | ||||
| 5.28%, 3/1/14 | $ | 155,000 | $ | 169,116 |
| 5.32%, 3/1/15 | 165,000 | 182,439 | ||
| 5.47%, 3/1/18 | 190,000 | 222,302 | ||
| Alameda California Corridor Transportation Authority Revenue Bonds, | ||||
| Zero Coupon, 10/1/11 | 11,655,000 | 11,653,252 | ||
| California Statewide Communities Development Authority | ||||
| Revenue Bonds: | ||||
| Zero Coupon, 6/1/12 | 1,530,000 | 1,489,363 | ||
| Zero Coupon, 6/1/13 | 1,585,000 | 1,479,518 | ||
| 5.58%, 8/1/13 | 1,085,000 | 1,146,096 | ||
| 5.01%, 8/1/15 | 700,000 | 732,991 | ||
| Zero Coupon, 6/1/19 | 2,910,000 | 1,862,749 | ||
| 2004 Series A-2, Zero Coupon, 6/1/14 | 1,645,000 | 1,472,505 | ||
| 2006 Series A-2, Zero Coupon, 6/1/14 | 3,305,000 | 2,958,438 | ||
| Canyon Texas Regional Water Authority Revenue Bonds, | ||||
| 6.10%, 8/1/21 | 750,000 | 787,290 | ||
| Connecticut State Special Tax Obligation Revenue Bonds, | ||||
| 5.459%, 11/1/30 | 2,500,000 | 2,928,400 | ||
| Cook County Illinois School District GO Bonds, Zero Coupon: | ||||
| 12/1/14 | 1,975,000 | 1,805,347 | ||
| 12/1/19 | 280,000 | 179,203 | ||
| 12/1/20 | 700,000 | 415,170 | ||
| 12/1/21 | 700,000 | 385,000 | ||
| 12/1/24 | 620,000 | 264,343 | ||
| Dallas-Fort Worth Texas International Airport Facilities Improvement | ||||
| Corp. Revenue Bonds, 6.60%, 11/1/12 | 995,000 | 1,024,134 | ||
| Fairfield California PO Revenue Bonds, 5.22%, 6/1/20 | 845,000 | 822,548 | ||
| Florida State First Governmental Financing Commission Revenue | ||||
| Bonds, 5.30%, 7/1/19 | 1,340,000 | 1,423,576 | ||
| Georgetown University Washington DC Revenue Bonds, | ||||
| 7.22%, 4/1/19 | 2,990,000 | 3,626,332 | ||
| Gregg County Texas Health Facilities Development Corp. Revenue | ||||
| VRDN, 0.20%, 10/1/29 (r) | 5,740,000 | 5,740,000 | ||
| Illinois State MFH Development Authority Revenue Bonds, | ||||
| 6.537%, 1/1/33 | 3,330,000 | 3,491,272 | ||
| Inglewood California Pension Funding Revenue Bonds, | ||||
| 5.07%, 9/1/20 | 1,000,000 | 1,012,850 | ||
| Jackson & Williamson Counties Illinois GO Bonds, Zero Coupon: | ||||
| 12/1/18 | 180,000 | 128,002 | ||
| 12/1/19 | 180,000 | 119,621 | ||
| 12/1/20 | 180,000 | 110,731 | ||
| 12/1/22 | 180,000 | 96,158 | ||
| 12/1/23 | 180,000 | 89,113 | ||
| 12/1/24 | 180,000 | 81,520 | ||
| Lancaster Pennsylvania Parking Authority Revenue Bonds, | ||||
| 5.76%, 12/1/17 | 565,000 | 616,042 | ||
| Lawrence Township Indiana School District GO Bonds, 5.80%, 7/5/18 | 1,095,000 | 1,260,882 | ||
| Long Beach California Bond Finance Authority Revenue Bonds: | ||||
| 4.66%, 8/1/15 | 1,535,000 | 1,535,982 | ||
| 4.90%, 8/1/17 | 1,715,000 | 1,679,397 | ||
www.calvert.com CALVERT SOCIAL INVESTMENT FUND ANNUAL REPORT 42
| PRINCIPAL | ||||
| MUNICIPAL OBLIGATIONS - CONT’D | AMOUNT | VALUE | ||
| Los Angeles California Community Redevelopment Agency Tax | ||||
| Allocation Bonds, 5.27%, 7/1/13 | $ | 970,000 | $ | 997,053 |
| Malibu California Integrated Water Quality Improvement | ||||
| COPs, 5.64%, 7/1/21 | 1,160,000 | 1,248,798 | ||
| Maryland State Transportation Authority Revenue Bonds, | ||||
| 5.604%, 7/1/30 | 3,000,000 | 3,581,790 | ||
| Monrovia California Redevelopment Agency Tax Allocation | ||||
| Bonds, 5.30%, 5/1/17 | 1,160,000 | 1,157,007 | ||
| Moreno Valley California Public Financing Authority Revenue | ||||
| Bonds, 5.549%, 5/1/27 | 1,500,000 | 1,516,620 | ||
| Nekoosa Wisconsin School District GO Bonds, 5.74%, 4/1/16 | 300,000 | 331,056 | ||
| Nevada State Department of Business & Industry Lease Revenue | ||||
| Bonds, 5.32%, 6/1/17 | 825,000 | 812,938 | ||
| New Jersey State Economic Development Authority State | ||||
| Pension Funding Revenue Bonds, Zero Coupon, 2/15/12 | 2,822,000 | 2,800,355 | ||
| New York City IDA Revenue Bonds, 6.027%, 1/1/46 | 1,885,000 | 1,542,137 | ||
| Oakland California PO Revenue Bonds, Zero Coupon, 12/15/20 | 1,490,000 | 915,158 | ||
| Oakland California Redevelopment Agency Tax Allocation Bonds: | ||||
| 5.263%, 9/1/16 | 1,095,000 | 1,107,439 | ||
| 5.383%, 9/1/16 | 5,565,000 | 5,958,279 | ||
| 5.411%, 9/1/21 | 2,270,000 | 2,212,841 | ||
| Oceanside California PO Revenue Bonds, 5.04%, 8/15/17 | 1,000,000 | 1,009,920 | ||
| Palm Springs California Community Redevelopment Agency | ||||
| Tax Allocation Bonds, 6.411%, 9/1/34 | 3,355,000 | 3,261,094 | ||
| Placer County California Redevelopment Agency Tax Allocation | ||||
| Bonds, 5.95%, 8/1/22 | 1,040,000 | 1,065,272 | ||
| Pomona California Public Finance Authority Tax Allocation | ||||
| Bonds, 5.23%, 2/1/16 | 1,400,000 | 1,457,806 | ||
| Redlands California PO Revenue Bonds, Zero Coupon: | ||||
| 8/1/18 | 120,000 | 83,891 | ||
| 8/1/19 | 135,000 | 89,550 | ||
| 8/1/20 | 145,000 | 89,648 | ||
| 8/1/21 | 160,000 | 91,267 | ||
| San Bernardino California Joint Powers Financing Authority Tax | ||||
| Allocation Bonds, 5.625%, 5/1/16 | 1,000,000 | 1,023,070 | ||
| San Diego California Redevelopment Agency Tax Allocation | ||||
| Bonds, 5.66%, 9/1/16 | 1,790,000 | 1,830,096 | ||
| San Diego County California PO Revenue Bonds, Zero | ||||
| Coupon, 8/15/12 | 4,000,000 | 3,931,040 | ||
| Santa Clara Valley California Transportation Authority | ||||
| Revenue Bonds, 5.876%, 4/1/32 | 2,000,000 | 2,414,320 | ||
| Santa Fe Springs California Community Development | ||||
| Commission Tax Allocation Bonds, 5.35%, 9/1/18 | 2,500,000 | 2,556,100 | ||
| Schenectady New York Metroplex Development Authority | ||||
| Revenue Bonds, 5.33%, 8/1/16 | 445,000 | 491,462 | ||
| Sonoma County California PO Revenue Bonds, 6.625%, 6/1/13 | 1,130,000 | 1,179,211 | ||
| Thorp Wisconsin School District GO Bonds, 6.15%, 4/1/26 | 560,000 | 608,681 | ||
| Utah State Housing Corp. Military Housing Revenue | ||||
| Bonds, 5.392%, 7/1/50 | 2,000,000 | 2,019,880 | ||
| Vacaville California Redevelopment Agency Housing Tax | ||||
| Allocation Bonds, 6.00%, 9/1/18 | 1,185,000 | 1,191,577 | ||
| Wells Fargo Bank NA Custodial Receipts Revenue Bonds, | ||||
| 6.734%, 9/1/27 (e) | 3,000,000 | 3,653,700 |
www.calvert.com CALVERT SOCIAL INVESTMENT FUND ANNUAL REPORT 43
| PRINCIPAL | ||||
| MUNICIPAL OBLIGATIONS - CONT’D | AMOUNT | VALUE | ||
| West Contra Costa California Unified School District COPs: | ||||
| 4.76%, 1/1/12 | $ | 475,000 | $ | 475,788 |
| 4.82%, 1/1/13 | 500,000 | 500,710 | ||
| Total Municipal Obligations (Cost $101,869,878) | 106,197,236 | |||
| U.S. GOVERNMENT AGENCIES | ||||
| AND INSTRUMENTALITIES - 5.9% | ||||
| AgFirst FCB: | ||||
| 8.393% to 12/15/11, floating rate thereafter to 12/15/16 (r) | 6,000,000 | 5,835,000 | ||
| 6.585% to 6/15/12, floating rate thereafter to 6/29/49 (e)(r) | 6,000,000 | 4,305,000 | ||
| 7.30%, 10/14/49 (e) | 2,000,000 | 2,000,000 | ||
| Fannie Mae, 1.25%, 6/22/12 | 7,900,000 | 7,958,202 | ||
| Federal Home Loan Bank: | ||||
| 1.75%, 8/22/12 | 15,000,000 | 15,199,426 | ||
| 5.00%, 11/17/17 | 3,480,000 | 4,170,683 | ||
| Premier Aircraft Leasing EXIM 1 Ltd., 3.576%, 2/6/22 | 7,163,818 | 7,605,539 | ||
| US AgBank FCB, 6.11% to 7/10/12, floating rate thereafter | ||||
| to 12/31/49 (e)(r) | 2,700,000 | 1,728,000 | ||
| Total U.S. Government Agencies and Instrumentalities | ||||
| (Cost $47,105,730) | 48,801,850 | |||
| U.S. GOVERNMENT AGENCY MORTGAGE-BACKED SECURITIES - 1.6% | ||||
| Fannie Mae: | ||||
| 3.50%, 12/1/41 | 1,000,000 | 1,024,219 | ||
| 4.00%, 12/1/41 | 11,630,000 | 12,153,350 | ||
| Ginnie Mae, 5.50%, 1/16/32 | 1,347,396 | 54,406 | ||
| Total U.S. Government Agency Mortgage-Backed | ||||
| Securities (Cost $13,273,507) | 13,231,975 | |||
| U.S. TREASURY - 12.2% | ||||
| United States Treasury Bonds: | ||||
| 4.375%, 5/15/41 | 18,430,000 | 23,803,497 | ||
| 3.75%, 8/15/41 | 43,775,000 | 50,963,676 | ||
| United States Treasury Notes: | ||||
| 1.00%, 8/31/16 | 910,000 | 911,991 | ||
| 2.125%, 8/15/21 | 24,345,000 | 24,771,037 | ||
| Total U.S. Treasury (Cost $94,381,617) | 100,450,201 | |||
www.calvert.com CALVERT SOCIAL INVESTMENT FUND ANNUAL REPORT 44
| PRINCIPAL | |||||
| FLOATING RATE LOANS(d)- 0.1% | AMOUNT | VALUE | |||
| Syniverse Holdings, Inc., Term Loan, 5.25%, 12/21/17 (r) | $ | 496,250 | $ | 487,773 | |
| Total Floating Rate Loans (Cost $491,763) | 487,773 | ||||
| HIGH SOCIAL IMPACT INVESTMENTS - 0.4% | |||||
| Calvert Social Investment Foundation Notes, 0.94%, 7/1/12 (b)(i)(r) | 3,087,392 | 2,975,011 | |||
| Total High Social Impact Investments (Cost $3,087,392) | 2,975,011 | ||||
| TIME DEPOSIT - 11.7% | |||||
| State Street Time Deposit, 0.113%, 10/3/11 | 96,233,521 | 96,233,521 | |||
| Total Time Deposit (Cost $96,233,521) | 96,233,521 | ||||
| EQUITY SECURITIES - 0.3% | SHARES | ||||
| First Republic Preferred Capital Corp., Preferred (b)(e) | 500 | 510,500 | |||
| Woodbourne Capital: | |||||
| Trust I, Preferred (b)(e) | 625,000 | 412,500 | |||
| Trust II, Preferred (b)(e) | 625,000 | 412,500 | |||
| Trust III, Preferred (b)(e) | 625,000 | 412,500 | |||
| Trust IV, Preferred (b)(e) | 625,000 | 412,500 | |||
| Total Equity Securities (Cost $2,875,000) | 2,160,500 | ||||
| TOTAL INVESTMENTS (Cost $848,915,455) - 101.7% | 835,490,885 | ||||
| Receivable from Calvert Investment Management, Inc. | 3,320,907 | ||||
| Payable to shareholders | (3,320,907 | ) | |||
| Other assets and liabilities, net - (1.7%) | (14,069,155 | ) | |||
| NET ASSETS - 100% | $ | 821,421,730 | |||
www.calvert.com CALVERT SOCIAL INVESTMENT FUND ANNUAL REPORT 45
| NET ASSETS CONSIST OF: | |||||||
| Paid-in capital applicable to the following shares of beneficial interest, unlimited number of no par value shares authorized: | |||||||
| Class A: 32,612,214 shares outstanding | $ | 522,661,415 | |||||
| Class B: 358,123 shares outstanding | 6,397,322 | ||||||
| Class C: 2,990,866 shares outstanding | 47,033,489 | ||||||
| Class I: 14,180,597 shares outstanding | 225,496,824 | ||||||
| Class Y: 1,693,691 shares outstanding | 26,630,624 | ||||||
| Accumulated net realized gain (loss) on investments | 4,999,531 | ||||||
| Net unrealized appreciation (depreciation) on investments | (11,797,475 | ) | |||||
| NET ASSETS | $ | 821,421,730 | |||||
| NET ASSET VALUE PER SHARE | |||||||
| Class A (based on net assets of $516,883,918) | $ | 15.85 | |||||
| Class B (based on net assets of $5,635,205) | $ | 15.74 | |||||
| Class C (based on net assets of $47,122,799) | $ | 15.76 | |||||
| Class I (based on net assets of $224,792,457) | $ | 15.85 | |||||
| Class Y (based on net assets of $26,987,351) | $ | 15.93 | |||||
| UNDERLYING | UNREALIZED | ||||||
| # OF | EXPIRATION | FACEAMOUNT | APPRECIATION | ||||
| FUTURES | CONTRACTS | DATE | AT VALUE | (DEPRECIATION) | |||
| Purchased: | |||||||
| 30 Year U.S. Treasury Bonds | 283 | 12/11 | $40,362,875 | $1,319,275 | |||
| Sold: | |||||||
| 2 Year U.S. Treasury Notes | 1,100 | 12/11 | $242,223,439 | $325,471 | |||
| 5 Year U.S. Treasury Notes | 800 | 12/11 | 97,987,500 | (17,651 | ) | ||
| Total Sold | $307,820 | ||||||
See notes to statements of net assets and notes to financial statements.
www.calvert.com CALVERT SOCIAL INVESTMENT FUND ANNUAL REPORT 46
NOTES TO STATEMENTS OF NET ASSETS
| (a) | Affiliated company. |
| (b) | This security was valued by the Board of Trustees. See Note A. |
| (d) | Remaining maturities of floating rate loans may be less than the stated maturities shown as a result of contractual or optional prepayments by the borrower. Such prepayments cannot be predicted with certainty. Floating rate loans generally pay interest at rates which are periodically re-determined at a margin above the London InterBank Offered Rate (LIBOR) or other short-term rates. The rate shown is the rate in effect at period end. Floating rate loans are generally considered restrictive in that the Fund is ordinarily contractually obligated to receive consent from the Agent Bank and/or Borrower prior to disposition of a floating rate loan. |
| (e) | Security is exempt from registration under Rule 144A of the Securities Act of 1933. These securities may be resold in transactions exempt from registration, normally to qualified institutional buyers. |
| (f) | Maryland State Economic Development Corp. Revenue Bonds Series B and C were issued in exchange for 3,750,000 par Maryland State Economic Development Corp. Revenue Bonds due 10/1/19 that were previously held by the Fund. Series B is not accruing interest. |
| (i) | Restricted securities represent 3.0% of the net assets for Balanced Portfolio and 0.4% for Bond Portfolio. |
| (j) | KDM Development Corp. Note has been restructured from an original maturity date of December 31, 2007. |
| (m) | The Illinois Insurance Department prohibited Lumbermens from making interest payments. This secu- rity is no longer accruing interest. |
| (n) | The Illinois Insurance Department prohibited Lumbermens from making interest payments. This TIERS security is based on interest payments from Lumbermens. This security is no longer accruing interest. |
| (p) | The State of New York Insurance Department has prohibited Atlantic Mutual Insurance Co. from making interest payments. This security is no longer accruing interest. |
| (r) | The coupon rate shown on floating or adjustable rate securities represents the rate at period end. |
www.calvert.com CALVERT SOCIAL INVESTMENT FUND ANNUAL REPORT 47
| (s) | 5,500 shares of Oneok, Inc. held by the Balanced Portfolio have been soft segregated in order to cover outstanding commitments to certain limited partnership investments within the Portfolio. There are no restrictions on the trading of this security. |
| (w) | Security is in default and is no longer accruing interest. |
| (x) | Alliance Bancorp and its affiliates filed for Chapter 7 bankruptcy on July 13, 2007. This security is no longer accruing interest. |
| (y) | The government of Iceland took control of Glitnir Banki HF and Kaupthing Bank HF (the “Banks”) on October 8, 2008 and October 9, 2008, respectively. The government has prohibited the Banks from paying any claims owed to foreign entities. These securities are no longer accruing interest. |
| * | Non-income producing security. |
Abbreviations:
COPs: Certificates of Participation
FCB: Farm Credit Bank
FSB: Federal Savings Bank
GO: General Obligation
IDA: Industrial Development Agency/Authority
LLC: Limited Liability Corporation
LP: Limited Partnership
MFH: Multi-Family Housing
PO: Pension Obligation
STEP: Stepped coupon bond for which the coupon rate of interest will adjust on specified future date(s)
VRDN: Variable Rate Demand Notes
www.calvert.com CALVERT SOCIAL INVESTMENT FUND ANNUAL REPORT 48
| BALANCED PORTFOLIO | |||
| RESTRICTED SECURITIES | ACQUISITION DATES | COST | |
| Access Bank plc, 8.477%, 8/29/12 | 8/29/07 | $ | 250,000 |
| Agraquest, Inc.: | |||
| Series B, Preferred | 2/26/97 | 200,001 | |
| Series C, Preferred | 3/11/98 | 200,000 | |
| Series H, Preferred | 5/25/05 - 1/11/07 | 316,894 | |
| Angels With Attitude I LLC, LP | 8/28/00 - 4/30/03 | 200,000 | |
| Calvert Social Investment Foundation Notes, | |||
| 0.94%, 7/1/13 | 7/1/10 | 4,266,666 | |
| CFBanc Corp. | 3/14/03 | 270,000 | |
| Coastal Venture Partners LP | 6/7/96 - 6/22/00 | 100,976 | |
| Commons Capital LP | 2/15/01 - 4/29/08 | 440,520 | |
| Consensus Orthopedics, Inc.: | |||
| Common Stock | 2/10/06 | 504,331 | |
| Series A-1, Preferred | 8/19/05 | 4,331 | |
| Series B, Preferred | 2/10/06 | 139,576 | |
| Series C, Preferred | 2/10/06 | 120,342 | |
| Drop The Chalk, 8.00%, 12/31/12 | 4/5/11 | 42,857 | |
| Environmental Private Equity Fund II, Liquidating | |||
| Trust LP | 4/26/07 | 6,666 | |
| First Analysis Private Equity Fund IV LP | 2/25/02 - 7/6/11 | 439,044 | |
| GEEMF Partners LP | 2/28/97 | - | |
| Global Environment Emerging Markets Fund LP | 1/14/94 - 12/1/95 | - | |
| Infrastructure and Environmental Private Equity | |||
| Fund III LP | 4/16/97 - 2/12/01 | 156,083 | |
| KDM Development Corp., 6.00%, 6/30/19 | 6/30/09 | 600,000 | |
| Labrador Ventures III LP | 8/11/98 - 4/2/01 | 360,875 | |
| Labrador Ventures IV LP | 12/14/99 - 8/27/07 | 900,510 | |
| Lumni, Inc., 6.00%, 10/5/15 | 10/6/10 | 100,000 | |
| Neighborhood Bancorp | 6/25/97 | 100,000 | |
| New Markets Growth Fund LLC, LP | 1/8/03 - 7/18/07 | 225,646 | |
| Rose Smart Growth Investment Fund I LP, 6.545%, | |||
| 4/1/21 | 4/10/06 | 1,000,000 | |
| Seventh Generation, Inc. | 4/12/00 - 5/6/03 | 230,500 | |
| SmarThinking, Inc. Contingent Deferred Distribution | 4/5/11 | - | |
| Solstice Capital LP | 6/26/01 - 6/17/08 | 288,705 | |
| Venture Strategy Partners LP | 8/21/98 - 2/26/03 | 187,205 | |
| Wild Planet Entertainment, Inc.: | |||
| Series B, Preferred | 7/12/94 | 200,000 | |
| Series E, Preferred | 4/9/98 | 180,725 | |
| Wind Harvest Co., Inc. | 5/16/94 | 100,000 | |
| BOND PORTFOLIO | |||
| RESTRICTED SECURITIES | ACQUISITION DATES | COST | |
| Calvert Social Investment Foundation Notes, 0.94%, 7/1/12 | 7/01/09 | $ | 3,087,392 |
See notes to financial statements.
www.calvert.com CALVERT SOCIAL INVESTMENT FUND ANNUAL REPORT 49
| STATEMENTS OF OPERATIONS | ||||||
| YEAR ENDED SEPTEMBER 30, 2011 | ||||||
| BALANCED | BOND | |||||
| NET INVESTMENT INCOME | PORTFOLIO | PORTFOLIO | ||||
| Investment Income: | ||||||
| Interest income | $ | 7,470,060 | $ | 31,942,589 | ||
| Dividend income | 3,234,516 | 121,603 | ||||
| Total investment income | 10,704,576 | 32,064,192 | ||||
| Expenses: | ||||||
| Investment advisory fee | 2,018,241 | 2,986,093 | ||||
| Transfer agency fees and expenses | 884,643 | 1,371,011 | ||||
| Administrative fees | 1,303,416 | 2,102,923 | ||||
| Distribution Plan expenses: | ||||||
| Class A | 1,015,168 | 1,100,015 | ||||
| Class B | 113,690 | 71,810 | ||||
| Class C | 257,745 | 499,230 | ||||
| Trustees’ fees and expenses | 45,337 | 79,487 | ||||
| Custodian fees | 126,331 | 129,313 | ||||
| Registration fees | 48,937 | 68,112 | ||||
| Reports to shareholders | 155,543 | 162,455 | ||||
| Professional fees | 43,942 | 58,418 | ||||
| Miscellaneous | 108,370 | 38,661 | ||||
| Total expenses | 6,121,363 | 8,667,528 | ||||
| Reimbursement from Advisor: | ||||||
| Class B | — | (1,237 | ) | |||
| Class I | (10,128 | ) | — | |||
| Fees paid indirectly | (1,519 | ) | (1,780 | ) | ||
| Net expenses | 6,109,716 | 8,664,511 | ||||
| NET INVESTMENT INCOME | 4,594,860 | 23,399,681 | ||||
| REALIZED AND UNREALIZED GAIN (LOSS) | ||||||
| Net realized gain (loss) on: | ||||||
| Investments | 23,265,763 | 23,131,156 | ||||
| Futures | (2,679,093 | ) | (12,854,793 | ) | ||
| 20,586,670 | 10,276,363 | |||||
| Change in unrealized appreciation (depreciation) on: | ||||||
| Investments | (16,104,364 | ) | (11,714,252 | ) | ||
| Futures | 592,291 | 1,490,148 | ||||
| (15,512,073 | ) | (10,224,104 | ) | |||
| NET REALIZED AND UNREALIZED | ||||||
| GAIN (LOSS) | (5,074,597 | ) | 52,259 | |||
| INCREASE (DECREASE) IN NET ASSETS | ||||||
| RESULTING FROM OPERATIONS | $ | 9,669,457 | $ | 23,451,940 | ||
See notes to financial statements.
www.calvert.com CALVERT SOCIAL INVESTMENT FUND ANNUAL REPORT 50
BALANCED PORTFOLIO STATEMENTS OF CHANGES IN NET ASSETS
| Year ended | Year ended | |||||
| September 30, | September 30, | |||||
| INCREASE (DECREASE) IN NET ASSETS | 2011 | 2010 | ||||
| Operations: | ||||||
| Net investment income | $ | 4,594,860 | $ | 4,541,427 | ||
| Net realized gain (loss) | 20,586,670 | 3,418,266 | ||||
| Change in unrealized appreciation (depreciation) | (15,512,073 | ) | 30,851,381 | |||
| INCREASE (DECREASE) IN NET ASSETS | ||||||
| RESULTING FROM OPERATIONS | 9,669,457 | 38,811,074 | ||||
| Distributions to shareholders from: | ||||||
| Net investment income: | ||||||
| Class A shares | (4,155,692 | ) | (4,302,238 | ) | ||
| Class B shares | - | (5,742 | ) | |||
| Class C shares | (25,083 | ) | (34,236 | ) | ||
| Class I shares | (24,050 | ) | (41,239 | ) | ||
| Total distributions | (4,204,825 | ) | (4,383,455 | ) | ||
| Capital share transactions: | ||||||
| Shares sold: | ||||||
| Class A shares | 26,784,860 | �� | 24,938,191 | |||
| Class B shares | 289,119 | 591,238 | ||||
| Class C shares | 3,683,371 | 3,864,650 | ||||
| Class I shares | 472,201 | 642,851 | ||||
| Reinvestment of distributions: | ||||||
| Class A shares | 3,863,611 | 3,996,487 | ||||
| Class B shares | - | 5,386 | ||||
| Class C shares | 19,672 | 27,038 | ||||
| Class I shares | 24,050 | 41,239 | ||||
| Redemption fees: | ||||||
| Class A shares | 793 | 769 | ||||
| Class B shares | - | 26 | ||||
| Class C shares | 24 | 1,349 | ||||
| Shares redeemed: | ||||||
| Class A shares | (49,239,050 | ) | (45,467,417 | ) | ||
| Class B shares | (3,377,957 | ) | (3,795,452 | ) | ||
| Class C shares | (3,886,379 | ) | (3,187,392 | ) | ||
| Class I shares | (199,209 | ) | (5,330,006 | ) | ||
| Total capital share transactions | (21,564,894 | ) | (23,671,043 | ) | ||
| TOTAL INCREASE (DECREASE) IN NET ASSETS | (16,100,261 | ) | 10,756,576 | |||
See notes to financial statements.
www.calvert.com CALVERT SOCIAL INVESTMENT FUND ANNUAL REPORT 51
BALANCED PORTFOLIO STATEMENTS OF CHANGES IN NET ASSETS
| Year ended | Year ended | |||||
| September 30, | September 30, | |||||
| NET ASSETS | 2011 | 2010 | ||||
| Beginning of year | $ | 457,277,089 | $ | 446,520,513 | ||
| End of year (including undistributed net investment income | ||||||
| and distributions in excess of net investment income of | ||||||
| $70,817 and $194,291, respectively) | $ | 441,176,828 | $ | 457,277,089 | ||
| CAPITAL SHARE ACTIVITY | ||||||
| Shares sold: | ||||||
| Class A shares | 970,314 | 991,044 | ||||
| Class B shares | 10,699 | 23,815 | ||||
| Class C shares | 136,042 | 156,496 | ||||
| Class I shares | 17,081 | 25,419 | ||||
| Reinvestment of distributions: | ||||||
| Class A shares | 140,309 | 157,724 | ||||
| Class B shares | - | 215 | ||||
| Class C shares | 738 | 1,081 | ||||
| Class I shares | 864 | 1,625 | ||||
| Shares redeemed: | ||||||
| Class A shares | (1,788,298 | ) | (1,823,048 | ) | ||
| Class B shares | (123,648 | ) | (152,605 | ) | ||
| Class C shares | (143,497 | ) | (129,681 | ) | ||
| Class I shares | (7,145 | ) | (211,414 | ) | ||
| Total capital share activity | (786,541 | ) | (959,329 | ) | ||
See notes to financial statements.
www.calvert.com CALVERT SOCIAL INVESTMENT FUND ANNUAL REPORT 52
BOND PORTFOLIO STATEMENTS OF CHANGES IN NET ASSETS
| Year ended | Year ended | |||||
| September 30, | September 30, | |||||
| INCREASE (DECREASE) IN NET ASSETS | 2011 | 2010 | ||||
| Operations: | ||||||
| Net investment income | $ | 23,399,681 | $ | 23,381,749 | ||
| Net realized gain (loss) | 10,276,363 | 5,148,969 | ||||
| Change in unrealized appreciation (depreciation) | (9,288,336 | )* | 47,601,142 | * | ||
| INCREASE (DECREASE) IN NET ASSETS | ||||||
| RESULTING FROM OPERATIONS | 24,387,708 | 76,131,860 | ||||
| Distributions to shareholders from: | ||||||
| Net investment income: | ||||||
| Class A shares | (14,921,479 | ) | (14,703,920 | ) | ||
| Class B shares | (118,524 | ) | (146,269 | ) | ||
| Class C shares | (956,692 | ) | (927,336 | ) | ||
| Class I shares | (7,631,583 | ) | (6,088,354 | ) | ||
| Class Y shares | (538,656 | ) | (123,441 | ) | ||
| Net realized gain: | ||||||
| Class A shares | (5,788,457 | ) | (3,994,598 | ) | ||
| Class B shares | (83,498 | ) | (75,873 | ) | ||
| Class C shares | (526,711 | ) | (374,363 | ) | ||
| Class I shares | (2,132,729 | ) | (1,230,879 | ) | ||
| Class Y shares | (136,077 | ) | (5,876 | ) | ||
| Total distributions | (32,834,406 | ) | (27,670,909 | ) | ||
| Capital share transactions: | ||||||
| Shares sold: | ||||||
| Class A shares | 99,956,413 | 129,934,154 | ||||
| Class B shares | 297,117 | 1,321,263 | ||||
| Class C shares | 8,343,018 | 10,659,183 | ||||
| Class I shares | 54,644,226 | 47,920,402 | ||||
| Class Y shares | 19,549,256 | 14,681,870 | ||||
| Reinvestment of distributions: | ||||||
| Class A shares | 18,147,915 | 16,008,978 | ||||
| Class B shares | 167,925 | 170,374 | ||||
| Class C shares | 1,005,694 | 865,475 | ||||
| Class I shares | 8,651,639 | 6,434,493 | ||||
| Class Y shares | 173,057 | 36,930 | ||||
| Redemption fees: | ||||||
| Class A shares | 7,782 | 9,738 | ||||
| Class B shares | 80 | 99 | ||||
| Class C shares | 518 | 373 | ||||
| Class I shares | 944 | 212 | ||||
| Class Y shares | 4,263 | 109 | ||||
www.calvert.com CALVERT SOCIAL INVESTMENT FUND ANNUAL REPORT 53
BOND PORTFOLIO STATEMENTS OF CHANGES IN NET ASSETS
| Year ended | Year ended | |||||
| September 30, | September 30, | |||||
| INCREASE (DECREASE) IN NET ASSETS - (CONT’D) | 2011 | 2010 | ||||
| Capital share transactions (cont’d): | ||||||
| Shares redeemed: | ||||||
| Class A shares | (187,674,944 | ) | (183,645,764 | ) | ||
| Class B shares | (3,564,151 | ) | (5,010,050 | ) | ||
| Class C shares | (15,888,179 | ) | (16,578,803 | ) | ||
| Class I shares | (50,497,873 | ) | (38,550,449 | ) | ||
| Class Y shares | (6,984,045 | ) | (1,414,594 | ) | ||
| Total capital share transactions | (53,659,345 | ) | (17,156,007 | ) | ||
| TOTAL INCREASE (DECREASE) IN NET ASSETS | (62,106,043 | ) | 31,304,944 | |||
| NET ASSETS | ||||||
| Beginning of year | 883,527,773 | * | 852,222,829 | * | ||
| End of year (including undistributed net investment income | ||||||
| of $0 and $23,109, respectively) | $ | 821,421,730 | $ | 883,527,773 | * | |
| CAPITAL SHARE ACTIVITY | ||||||
| Shares sold: | ||||||
| Class A shares | 6,350,011 | 8,382,972 | ||||
| Class B shares | 18,860 | 86,060 | ||||
| Class C shares | 533,781 | 691,903 | ||||
| Class I shares | 3,480,624 | 3,090,548 | ||||
| Class Y shares | 1,232,844 | 937,054 | ||||
| Reinvestment of distributions: | ||||||
| Class A shares | 1,157,506 | 1,036,260 | ||||
| Class B shares | 10,795 | 11,133 | ||||
| Class C shares | 64,555 | 56,449 | ||||
| Class I shares | 550,967 | 415,560 | ||||
| Class Y shares | 10,938 | 2,370 | ||||
| Shares redeemed: | ||||||
| Class A shares | (11,950,283 | ) | (11,854,783 | ) | ||
| Class B shares | (228,188 | ) | (326,079 | ) | ||
| Class C shares | (1,017,899 | ) | (1,077,318 | ) | ||
| Class I shares | (3,181,179 | ) | (2,487,778 | ) | ||
| Class Y shares | (441,584 | ) | (89,079 | ) | ||
| Total capital share activity | (3,408,252 | ) | (1,124,728 | ) | ||
*Amount was revised for changes to the value of certain security holdings as further described in Note F.
See notes to financial statements.
www.calvert.com CALVERT SOCIAL INVESTMENT FUND ANNUAL REPORT 54
NOTES TO FINANCIAL STATEMENTS
NOTE A — SIGNIFICANT ACCOUNTING POLICIES
General: The Calvert Social Investment Fund (the “Fund”) is registered under the Investment Company Act of 1940 as an open-end management investment company. The Fund operates as a series fund with eight separate portfolios, two of which are reported herein: Balanced and Bond. Balanced is registered as a diversified portfolio. Bond is registered as a non-diversified portfolio. The operation of each series is accounted for separately. Balanced and Bond have Class A, Class B, Class C, and Class I shares. Effective October 31, 2008, Bond began to offer Class Y shares. Class A shares are sold with a maximum front-end sales charge of 4.75% and 3.75% for Balanced and Bond, respectively. Class B shares are sold without a front-end sales charge. With certain exceptions, the Fund will impose a deferred sales charge at the time of redemption, depending on how long investors have owned the shares. Effective March 1, 2010, Class B shares are no longer offered for purchase, except through reinvestment of dividends and/or distributions and through certain exchanges. Class C shares are sold without a front-end sales charge. With certain exceptions, the Fund will impose a deferred sales charge on shares sold within one year of purchase. Class B and Class C shares have higher levels of expenses than Class A shares. Class I shares require a minimum account balance of $1,000,000. The $1 million minimum initial investment may be waived for certain institutional accounts, where it is believed to be in the best interest of the Fund and its shareholders. Class I shares have no front-end or deferred sales charge and have lower levels of expenses than Class A shares. Class Y shares are generally only available to wrap or similar fee-based programs offered by financial intermediaries that have entered into an agreement with the Fund’s Distributor to offer Class Y shares. Class Y shares have no front-end or deferred sales charge and have lower levels of expenses than Class A shares. Each class has different: (a) dividend rates, due to differences in Distribution Plan expenses and other class-specific expenses, (b) exchange privileges and (c) class-specific voting rights.
Security Valuation: Net asset value per share is determined every business day as of the close of the regular session of the New York Stock Exchange (generally 4:00 p.m. Eastern time). The Fund uses independent pricing services approved by the Board of Trustees to value its investments wherever possible. Investments for which market quotations are not available or deemed not reliable are fair valued in good faith under the direction of the Board of Trustees. In determining fair value, the Board considers all relevant qualitative and quantitative information available. These factors are subject to change over time and are reviewed periodically. The values assigned to fair value investments are based on available information and do not necessarily represent amounts that might ultimately be realized. Further, because of the inherent uncertainty of valuation, those estimated values may differ significantly from the values that would have been used had a ready market for the investments existed, and the differences could be material.
www.calvert.com CALVERT SOCIAL INVESTMENT FUND ANNUAL REPORT 55
The following securities were fair valued in good faith under the direction of the Board of Trustees as of September 30, 2011:
| TOTAL | ||
| INVESTMENTS | % OF NET ASSETS | |
| Balanced | $22,599,419 | 5.1% |
| Bond | 30,765,592 | 3.7% |
The Fund utilizes various methods to measure the fair value of its investments. Generally Accepted Accounting Principles (GAAP) establishes a disclosure hierarchy that categorizes the inputs to valuation techniques used to value assets and liabilities at measurement date. These inputs are summarized in the three broad levels listed below:
Level 1 – quoted prices in active markets for identical securities
Level 2 – other significant observable inputs (including quoted prices for similar securities, interest rates, prepayment speeds, credit risk, etc.)
Level 3 – significant unobservable inputs (including the Fund’s own assumptions in determining the fair value of investments)
The inputs or methodology used for valuing securities are not necessarily an indication of the risk associated with investing in those securities.
Changes in valuation techniques may result in transfers in or out of an investment’s assigned level within the hierarchy during the period. Valuation techniques used to value the Fund’s investments by major category are as follows.
Debt securities, including restricted securities, are valued based on evaluated prices received from independent pricing services or from dealers who make markets in such securities. For corporate bonds, floating rate loans, municipal securities, and U.S. government and government agency obligations, pricing services utilize matrix pricing which considers yield or price of bonds of comparable quality, coupon, maturity and type as well as dealer supplied prices and are generally categorized as Level 2 in the hierarchy. For asset backed securities, collateralized mortgage obligations, commercial mortgage securities and U.S. government agency mortgage securities, pricing services utilize matrix pricing which considers prepayment speed assumptions, attributes of the collateral, yield or price of bonds of comparable quality, coupon, maturity and type as well as dealer supplied prices and, accordingly, such securities are generally categorized as Level 2 in the hierarchy. Short-term securities with remaining maturities of sixty days or less for which quotations are not readily available are valued at amortized cost, which approximates fair value, and are categorized as Level 2 in the hierarchy When independent prices are unavailable or unreliable, debt securities may be valued utilizing pricing matrices which consider similar factors that would be used by independent pricing services. These are generally categorized as Level 2 in the hierarchy but may be Level 3 depending on the circumstances.
www.calvert.com CALVERT SOCIAL INVESTMENT FUND ANNUAL REPORT 56
Equity securities, including restricted securities and venture capital securities, for which market quotations are readily available, are valued at the last reported sale price or official closing price as reported by an independent pricing service on the primary market or exchange on which they are traded and are categorized as Level 1 in the hierarchy. In the event there were no sales during the day or closing prices are not available, securities are valued at the last quoted bid price or may be valued using the last available price and categorized as Level 2 in the hierarchy. Foreign securities are valued based on quotations from the principal market in which such securities are normally traded. If events occur after the close of the principal market in which foreign securities are traded, and before the close of business of the Fund, that are expected to materially affect the value of those securities, then they are valued at their fair value taking these events into account. For restricted securities and private placements where observable inputs are limited, assumptions about market activity and risk are used and are categorized as Level 3 in the hierarchy.
Venture capital securities for which market quotations are not readily available are fair valued by the Fund’s Board of Trustees and are categorized as Level 3 in the hierarchy. Venture capital direct equity securities are generally valued using the most appropriate and applicable method to measure fair value in light of each company’s situation. Methods may include market, income or cost approaches with discounts as appropriate based on assumptions of liquidation or exit risk. Examples of the market approach are subsequent rounds of financing, comparable transactions, and revenue times an industry multiple. An example of the income approach is the discounted cash flow. Examples of the cost approach are replacement cost, salvage value, or net asset percentage. Venture capital limited partnership (LP) securities are valued at the fair value reported by the general partner of the partnership adjusted as necessary to reflect subsequent capital calls and distributions and any other available information. In the absence of a reported LP unit value it may be estimated based on the Fund’s percentage equity in the partnership and/or other balance sheet information and portfolio value for the most recently available period reported by the general partner. In some cases adjustments may be made to account for daily pricing of material public holdings within the partnership. Venture capital debt securities are valued based on assumptions of credit and market risk. For venture capital securities denominated in foreign currency, the fair value is marked to the daily exchange rate.
The following is a summary of the inputs used to value the Fund’s net assets as of September 30, 2011.
| BALANCED | VALUATION INPUTS | |||||
| Investments In Securities | Level 1 | Level 2 | Level 3 | Total | ||
| Equity securities* | $244,596,132 | $1,830,500 | - | $246,426,632 | *** | |
| Venture capital | 6,600 | - | $9,243,666 | 9,250,266 | ||
| Asset backed securities | - | 4,985,475 | - | 4,985,475 | ||
| Collateralized mortgage-backed obligations | - | 2,503,101 | - | 2,503,101 | ||
| Commercial mortgage-backed securities | - | 12,254,071 | - | 12,254,071 | ||
| Corporate debt | - | 77,604,630 | 5,041,305 | 82,645,935 | ||
| Municipal obligations | - | 22,395,210 | - | 22,395,210 | ||
| U.S. government obligations | - | 37,173,779 | - | 37,173,779 | ||
| Other debt obligations | - | 19,145,500 | 4,111,359 | 23,256,859 | ||
| TOTAL | $244,602,732 | $177,892,266 | $18,396,330 | $440,891,328 | ||
| Other financial instruments** | $225,650 | - | - | $225,650 | ||
* For further breakdown of equity securities by industry, please refer to the Statement of Net Assets.
** Other financial instruments are derivative instruments not reflected in the Portfolio of Investments, such as futures, which are valued at the unrealized appreciation/depreciation on the instrument.
*** Exclusive of $5,011,149 venture capital equity shown in the venture capital heading.
www.calvert.com CALVERT SOCIAL INVESTMENT FUND ANNUAL REPORT 57The following is a reconciliation of Level 3 assets for which significant unobservable inputs were used to determine fair value:
| EQUITY | VENTURE | |||||
| SECURITIES | CAPITAL | |||||
| Balance as of 9/30/10 | $ | 1,340,000 | $ | 11,176,572 | ||
| Accrued discounts/premiums | - | - | ||||
| Realized gain (loss) | - | (793,468 | ) | |||
| Change in unrealized appreciation (depreciation) | (20,000 | ) | (145,610 | ) | ||
| Purchases | - | 162,771 | ||||
| Sales | - | (1,156,599 | ) | |||
| Transfers in and/or out of Level 31 | (1,320,000 | ) 2 | - | |||
| Balance as of 9/30/11 | - | $ | 9,243,666 | |||
| CORPORATE | OTHER DEBT | |||||
| DEBT | OBLIGATIONS | |||||
| Balance as of 9/30/10 | $ | 3,301,453 | $ | 4,123,690 | ||
| Accrued discounts/premiums | 58,925 | - | ||||
| Realized gain (loss) | 30 | |||||
| Change in unrealized appreciation (depreciation) | (20,366 | ) | (12,331 | ) | ||
| Purchases | 377,084 | - | ||||
| Sales | (3,251 | ) | - | |||
| Transfers in and/or out of Level 31 | 1,327,4303 | - | ||||
| Balance as of 9/30/11 | $ | 5,041,305 | $ | 4,111,359 | ||
| TOTAL | ||||||
| Balance as of 9/30/10 | $ | 19,941,715 | ||||
| Accrued discounts/premiums | 58,925 | |||||
| Realized gain (loss) | (793,438 | ) | ||||
| Change in unrealized appreciation (depreciation) | (198,307 | ) | ||||
| Purchases | 539,855 | |||||
| Sales | (1,159,850 | ) | ||||
| Transfers in and/or out of Level 31 | 7,430 | |||||
| Balance as of 9/30/11 | $ | 18,396,330 | ||||
1 The Fund’s policy is to recognize transfers into and transfers out of Level 3 as of the end of the reporting period.
2 Transferred from Level 3 to Level 2 because observable inputs were obtained for the securities.
3 Transferred from Level 2 to Level 3 because fair values were determined using valuation techniques utilizing unobservable inputs due to observable inputs being unavailable.
www.calvert.com CALVERT SOCIAL INVESTMENT FUND ANNUAL REPORT 58
For the year ended September 30, 2011, total change in unrealized gain (loss) on Level 3 securities included in the change in net assets was ($863,063). Total unrealized gain (loss) for all securities (including Level 1 and Level 2) can be found on the accompanying Statement of Operations.
| VALUATION INPUTS | |||||
| BOND | |||||
| Investments In Securities | Level 1 | Level 2 | Level 3 | Total | |
| Equity securities | - | $2,160,500 | - | $2,160,500 | |
| Asset backed securities | - | 22,238,343 | - | 22,238,343 | |
| Collateralized mortgage-backed obligations | - | 14,389,658 | - | 14,389,658 | |
| Commercial mortgage-backed securities | - | 33,842,187 | - | 33,842,187 | |
| Corporate debt | - | 380,085,509 | $14,397,121 | 394,482,630 | |
| Municipal obligations | - | 106,197,236 | - | 106,197,236 | |
| U.S. government obligations | - | 162,484,026 | - | 162,484,026 | |
| Other debt obligations | - | 96,721,294 | 2,975,011 | 99,696,305 | |
| TOTAL | - | $818,118,753 | $17,372,132 | $835,490,885 | |
| Other financial instruments* | $1,627,095 | - | - | $1,627,095 | |
* Other financial instruments are derivative instruments not reflected in the Portfolio of Investments, such as futures, which are valued at the unrealized appreciation/ depreciation on the instrument.
The following is a reconciliation of Level 3 assets for which significant unobservable inputs were used to determine fair value:
| EQUITY | VENTURE | |||||
| SECURITIES | CAPITAL | |||||
| Balance as of 9/30/10 | $ | 1,675,000 | $ | 2,983,933 | ||
| Accrued discounts/premiums | - | - | ||||
| Realized gain (loss) | - | - | ||||
| Change in unrealized appreciation (depreciation) | (25,000 | ) | (8,922 | ) | ||
| Purchases | - | - | ||||
| Sales | - | - | ||||
| Transfers in and/or out of Level 31 | (1,650,000 | ) 2 | - | |||
| Balance as of 9/30/11 | - | $ | 2,975,011 | |||
| CORPORATE | ||||||
| DEBT | TOTAL | |||||
| Balance as of 9/30/10 | $ | 9,983,249 | $ | 14,642,182 | ||
| Accrued discounts/premiums | 73,849 | 73,849 | ||||
| Realized gain (loss) | (60 | ) | (60 | ) | ||
| Change in unrealized appreciation (depreciation) | (219,520 | ) | (253,442 | ) | ||
| Purchases | 1,555,523 | 1,555,523 | ||||
| Sales | (15,335 | ) | (15,335 | ) | ||
| Transfers in and/or out of Level 31 | 3,019,4153 | 1,369,415 | ||||
| Balance as of 9/30/11 | $ | 14,397,121 | 17,372,132 | |||
1 The Fund’s policy is to recognize transfers into and transfers out of Level 3 as of the end of the reporting period.
2 Transferred from Level 3 to Level 2 because observable inputs were obtained for the securities.
3 Transferred from Level 2 to Level 3 because fair values were determined using valuation techniques utilizing unobservable inputs due to observable inputs being unavailable.
www.calvert.com CALVERT SOCIAL INVESTMENT FUND ANNUAL REPORT 59
For the year ended September 30, 2011, total change in unrealized gain (loss) on Level 3 securities included in the change in net assets was ($5,271,308). Total unrealized gain (loss) for all securities (including Level 1 and Level 2) can be found on the accompanying Statement of Operations.
Repurchase Agreements: The Fund may enter into repurchase agreements with recognized financial institutions or registered broker/dealers and, in all instances, holds underlying securities with a value exceeding the total repurchase price, including accrued interest. Although risk is mitigated by the collateral, the Fund could experience a delay in recovering its value and a possible loss of income or value if the counterparty fails to perform in accordance with the terms of the agreement.
Loan Participations and Assignments: The Fund may invest in direct debt instruments which are interests in amounts owed to lenders or lending syndicates by corporate, governmental, or other borrowers. A Fund’s investments in loans may be in the form of participations in loans or assignments of all or a portion of loans from third parties. A loan is often administered by a bank or other financial institution (the “lender”) that acts as agent for all holders. The agent administers the terms of the loan, as specified in the loan agreement. A Fund may invest in multiple series or tranches of a loan, which may have varying terms and carry different associated risks. A Fund generally has no right to enforce compliance with the terms of the loan agreement with the borrower. As a result, a Fund may be subject to the credit risk of both the borrower and the lender that is selling the loan agreement. When a Fund purchases assignments from lenders it acquires direct rights against the borrower of the loan. When investing in a loan participation, a Fund has the right to receive payments of principal, interest and any fees to which it is entitled only from the lender selling the loan agreement and only upon receipt of payments by the lender from the borrower.
Futures Contracts: The Fund may purchase and sell futures contracts, but only when, in the judgment of the Advisor, such a position acts as a hedge. The Fund may not enter into futures contracts for the purpose of speculation or leverage. These futures contracts may include, but are not limited to, futures contracts based on U.S. Government obligations. The Fund is subject to interest rate risk in the normal course of pursuing its investment objectives. The Fund may use futures contracts to hedge against changes in the value of interest rates. The Fund may enter into futures contracts agreeing to buy or sell a financial instrument for a set price at a future date. Initial margin deposits of either cash or securities as required by the broker are made upon entering into the contract. While the contract is open, daily variation margin payments are made to or received from the broker reflecting the daily change in market value of the contract and are recorded for financial reporting purposes as unrealized gains or losses by the Fund. When a futures contract is closed, a realized gain or loss is recorded equal to the
www.calvert.com CALVERT SOCIAL INVESTMENT FUND ANNUAL REPORT 60
difference between the opening and closing value of the contract. The risks associated with entering into futures contracts may include the possible illiquidity of the secondary market which would limit the Fund’s ability to close out a futures contract prior to the settlement date, an imperfect correlation between the value of the contracts and the underlying financial instruments, or that the counterparty will fail to perform its obligations under the contracts’ terms. Futures contracts are designed by boards of trade which are designated “contracts markets” by the Commodities Futures Trading Commission. Futures contracts trade on the contracts markets in a manner that is similar to the way a stock trades on a stock exchange and the boards of trade, through their clearing corporations, guarantee the futures contracts against default. As a result, there is minimal coun-terparty credit risk to the Fund. During the period, the Balanced and Bond Portfolios used U.S. Treasury Bond futures contracts to hedge against interest rate changes and to manage overall duration of the Fund. The Fund’s futures contracts, at period end are presented in the Statements of Net Assets.
During the period, the Bond Fund invested in 2 year, 5 year, 10 year and 30 year U.S. Treasury Bond Futures. The volume of activity has varied throughout the year with a weighted average of 794 contracts and $105,416,155 weighted average notional value. The quarterly weighted average contracts and notional values were as follows:
| QUARTER | WEIGHTED AVERAGE CONTRACTS | WEIGHTED AVERAGE NOTIONAL VALUE |
| 1st Quarter | 266 | $24,603,134 |
| 2nd Quarter | 357 | 2,521,865 |
| 3rd Quarter | 717 | 614,214 |
| 4th Quarter | 1,602 | 78,905,370 |
During the year the Balanced Fund invested in 2 year, 5 year, 10 year and 30 year U.S. Treasury Bond Futures. The volume of activity has varied throughout the year with a weighted average of 284 contracts and $18,202,172 weighted average notional value. The quarterly weighted average contracts and notional values were as follows:
| QUARTER | WEIGHTED AVERAGE CONTRACTS | WEIGHTED AVERAGE NOTIONAL VALUE |
| 1st Quarter | 219 | $11,099,116 |
| 2nd Quarter | 35 | 741,041 |
| 3rd Quarter | 209 | 2,985,974 |
| 4th Quarter | 279 | 9,347,989 |
Restricted Securities: The Fund may invest in securities that are subject to legal or contractual restrictions on resale. Generally, these securities may only be sold publicly upon registration under the Securities Act of 1933 or in transactions exempt from such registration. Information regarding restricted securities is included at the end of the Schedule of Investments.
Security Transactions and Net Investment Income: Security transactions are accounted for on trade date. Realized gains and losses are recorded on an identified cost basis and may include proceeds from litigation. Dividend income is recorded on the ex-dividend date or, in the case of dividends on certain foreign securities, as soon as the Fund is informed of the ex-dividend date. Distributions received on securities that represent a
www.calvert.com CALVERT SOCIAL INVESTMENT FUND ANNUAL REPORT 61
return of capital or capital gain are recorded as a reduction of cost of investments and/or as a realized gain. Interest income, which includes amortization of premium and accretion of discount on debt securities, is accrued as earned. Investment income and realized and unrealized gains and losses are allocated to separate classes of shares based upon the relative net assets of each class. Debt obligations may be placed on non-accrual status and related interest income may be reduced by ceasing current accruals and writing off interest receivables when the collection of all or a portion of interest has become doubtful based on consistently applied procedures. (See Notes to Statements of Net Assets on pages 47-48). A debt obligation may be removed from non-accrual status when the issuer resumes interest payments or when collectability of interest is reasonably assured. Expenses arising in connection with a class are charged directly to that class. Expenses common to the classes are allocated to each class in proportion to their relative net assets. Withholding taxes on foreign dividends have been provided for in accordance with management’s understanding of the applicable country’s tax rules and rates. The Fund earns certain fees in connection with its floating rate loan purchasing activities. These fees are in addition to interest payments earned and may include amendment fees, consent fees and prepayment fees. These fees are recorded as Income in the accompanying financial statements.
Foreign Currency Transactions: The Fund’s accounting records are maintained in U.S. dollars. For valuation of assets and liabilities on each date of net asset value determination, foreign denominations are translated into U.S. dollars using the current exchange rate. Security transactions, income and expenses are translated at the prevailing rate of exchange on the date of the event. The effect of changes in foreign exchange rates on securities is included in the net realized and unrealized gain or loss on securities.
Distributions to Shareholders: Distributions to shareholders are recorded by the Fund on ex-dividend date. Dividends from net investment income are accrued daily and paid monthly by Money Market. Dividends from net investment income are paid monthly by Bond and quarterly by Balanced. Distributions from net realized capital gains, if any, are paid at least annually. Distributions are determined in accordance with income tax regulations which may differ from generally accepted accounting principles; accordingly, periodic reclassifications are made within the Fund’s capital accounts to reflect income and gains available for distribution under income tax regulations.
Estimates: The preparation of the financial statements in conformity with accounting principles generally accepted in the United States requires management to make estimates and assumptions that affect the reported amounts of assets and liabilities and disclosure of contingent assets and liabilities at the date of the financial statements and the reported amounts of income and expenses during the reported period. Actual results could differ from those estimates.
Redemption Fees: The Balanced and Bond Portfolios charge a 2% redemption fee on redemptions, including exchanges, made within 30 days of purchase in the same Portfolio (within seven days for all Class I shares). The redemption fee is accounted for as an addition to paid-in capital. The fee is intended to discourage market-timers by ensuring that short-term trading costs are borne by the investors making the transactions and not the shareholders already in the Portfolio.
www.calvert.com CALVERT SOCIAL INVESTMENT FUND ANNUAL REPORT 62
Expense Offset Arrangements: The Fund has arrangements with its custodian banks whereby the custodian’s fees may be paid indirectly by credits earned on each Portfolio’s cash on deposit with the banks. These credits are used to reduce the Portfolios’ expenses. Such deposit arrangements may be an alternative to overnight investments.
Federal Income Taxes: No provision for federal income or excise tax is required since the Fund intends to continue to qualify as a regulated investment company under the Internal Revenue Code and to distribute substantially all of its taxable earnings.
Management has analyzed the Fund’s tax positions taken for all open federal income tax years and has concluded that no provision for federal income tax is required in the Fund’s financial statements. A Fund’s federal tax return is subject to examination by the Internal Revenue Service for a period of three years.
New Accounting Pronouncements: In May 2011, the Financial Accounting Standards Board (“FASB”) issued Accounting Standards Update (“ASU”) No. 2011-04, “Amendments to Achieve Common Fair Value Measurement and Disclosure Requirements in U.S. GAAP and IFRSs.” ASU No. 2011-04 requires disclosure of the amounts of any transfers between Level 1 and Level 2, and the reasons for the transfers. For Level 3 fair value measurements, ASU No. 2011-04 requires disclosure of quantitative information about the significant unobservable inputs used. In addition for Level 3 fair value measurements, ASU No. 2011-04 requires a description of the valuation processes used by the reporting entity and ASU No. 2011-04 requires a narrative description of the sensitivity of the fair value measurement to changes in unobservable inputs if a change in those inputs to a different amount might result in a significantly higher or lower fair value measurement. ASU No. 2011-04 is effective for financial statements issued for fiscal years and interim periods beginning after December 15, 2011. Management is currently evaluating the impact the adoption of ASU No. 2011-04 will have on the Portfolio’s financial statements and related disclosures.
NOTE B — RELATED PARTY TRANSACTIONS
Calvert Investment Management, Inc. (the “Advisor”) (formerly known as Calvert Asset Management Company, Inc.) is wholly-owned by Calvert Investments, Inc. (“Calvert”) (formerly known as Calvert Group, Ltd.), which is indirectly wholly owned by UNIFI Mutual Holding Company. The Advisor provides investment advisory services and pays the salaries and fees of officers and Trustees of the Fund who are employees of the Advisor or its affiliates.
For its services, the Advisor receives monthly fees based on the following annual rates of average daily net assets:
| Balanced: | |||
| First $500 Million | .425 | % | |
| Next $500 Million | .40 | % | |
| Over $1 Billion | .375 | % |
www.calvert.com CALVERT SOCIAL INVESTMENT FUND ANNUAL REPORT 63
Bond:
| First $1 Billion | .35 | % |
| Over $1 Billion | .325 | % |
Under the terms of the agreement, $158,873 and $244,249 was payable at year end for Balanced and Bond, respectively. In addition, $100,882 and $133,892, was payable at year end for operating expenses paid by the Advisor during September 2011 for Balanced and Bond, respectively.
The Advisor has contractually agreed to limit net annual fund operating expenses through January 31, 2012 for Balanced Class I and Bond Class Y. For the purpose of this expense limit, operating expenses do not include interest expense, brokerage commissions, taxes, and extraordinary expenses. This expense limitation does not limit any acquired fund fees and expenses. To the extent any expense offset credits are earned, the Advisor’s obligation under the contractual limitation may be reduced and the Advisor may benefit from the expense offset arrangement.
The contractual expense caps are as follows: for Balanced Class I, .72% and for Bond Class Y, .92%.
The Advisor voluntarily reimbursed Class B shares of Bond for expenses of $1,237 for the year ended September 30, 2011.
Calvert Investment Administrative Services, Inc. (“CIAS”) (formerly known as Calvert Administrative Services Company), an affiliate of the Advisor, provides administrative services for the Fund. For providing such services, CIAS receives an annual fee, payable monthly, based on the following annual rates of average daily net assets:
| Balanced (Class A, B, & C) | .275 | % |
| Balanced (Class I) | .125 | % |
| Bond (Class A, B, C & Y) | .30 | % |
| Bond (Class I) | .10 | % |
Under the terms of the agreement $102,577 and $169,476 was payable at year end for Balanced and Bond.
Calvert Investment Distributors, Inc. (“CID”) (formerly known as Calvert Distributors, Inc.), an affiliate of the Advisor, is the distributor and principal underwriter for the Fund. Distribution Plans, adopted by Class A, Class B, and Class C shares, allow the Portfolios to pay CID for expenses and services associated with distribution of shares. The expenses paid for Class A may not exceed .35% of Balanced and Bond’s annual average daily net assets. The amount actually paid by Class A of Balanced and Bond is an annualized fee, payable monthly of, .25% on assets over $30 million and .20%, respectively, of each Classes’ average daily net assets. The expenses paid for Class B and Class C may not exceed 1.00% of Balanced and Bond’s annual average daily net assets. The amount actu-
www.calvert.com CALVERT SOCIAL INVESTMENT FUND ANNUAL REPORT 64
ally paid, is an annualized fee, payable monthly of 1.00%, of each Classes’ average daily net assets. Class I for Balanced and Bond and Class Y for Bond do not have Distribution Plan expenses. Under the terms of the agreement $108,291 and $130,581 was payable at year end for Balanced and Bond, respectively.
CID received the following amounts as its portion of the commissions charged on sales of the Funds’ Class A shares for the year ended September 30, 2011: $111,362 for Balanced and $76,923 for Bond.
Calvert Investment Services, Inc. (“CIS”) (formerly known as Calvert Shareholder Services, Inc.), an affiliate of the Advisor, is the shareholder servicing agent for the Fund. For its services, CIS received fees of $200,735 and $170,436 for the year ended September 30, 2011 for Balanced and Bond, respectively. Boston Financial Data Services, Inc. is the transfer and dividend disbursing agent. Under the terms of the $15,956 and $13,411 was payable at year end for Balanced and Bond, respectively.
The Fund invests in Community Investment Notes issued by the Calvert Social Investment Foundation (the “CSI Foundation”). The CSI Foundation is a 501(c)(3) nonprofit organization that receives in-kind support from Calvert and its subsidiaries. The Fund has received from the Securities and Exchange Commission an exemptive order permitting the Fund to make investments in these notes under certain conditions.
Each Trustee of the Funds who is not an employee of the Advisor or its affiliates receives an annual retainer of $44,000 plus a meeting fee of $2,000 for each Board meeting attended. Additional fees of up to $5,000 annually may be paid to the Board chair and Committee chairs ($10,000 for Special Equities Committee chair) and $2,500 annually may be paid to Committee members, plus a Committee meeting fee of $500 for each Committee meeting attended. Trustee’s fees are allocated to each of the funds served.
NOTE C — INVESTMENT ACTIVITY
During the year, the cost of purchases and proceeds from sales of investments, other than U.S. Government and short-term securities, were:
| BALANCED | BOND | |
| Purchases | $284,950,525 | $630,204,437 |
| Sales | 301,116,376 | 626,493,765 |
U.S. Government security purchases and sales were:
| BALANCED | BOND | ||
| Purchases | $165,596,722 | $921,197,310 | |
| Sales | 167,897,204 | 926,475,797 | |
| CAPITAL LOSS CARRYFORWARDS | |||
| EXPIRATION DATE | BALANCED | ||
| 30-Sep-18 | ($30,180,557 | ) | |
www.calvert.com CALVERT SOCIAL INVESTMENT FUND ANNUAL REPORT 65
Capital losses may be utilized to offset future capital gains until expiration. Under the Regulated Investment Company Modernization Act of 2010, the Funds will soon be permitted to carry forward capital losses incurred in taxable years beginning after December 22, 2010 for an unlimited period. Losses incurred during those future years will be required to be utilized prior to the losses incurred in pre-enactment taxable years. As a result of this ordering rule, pre-enactment capital loss carryforwards may more likely expire unused. Also, post-enactment capital losses that are carried forward will retain their character as either short-term or long-term capital losses rather than being considered all short-term as under previous law.
Bond intends to elect to defer net capital losses of $704,791 incurred from November 1, 2010 through September 30, 2011 and treat them as arising in the fiscal year ending September 30, 2012.
The tax character of dividends and distributions for the years ended September 30, 2011 and September 30, 2010 was as follows:
| BALANCED | ||
| Distributions paid from: | 2011 | 2010 |
| Ordinary income | $4,204,825 | $4,383,455 |
| Total | $4,204,825 | $4,383,455 |
| BOND | ||
| Distributions paid from: | 2011 | 2010 |
| Ordinary income | $32,834,406 | $27,227,017 |
| Long-term capital gain | — | 443,892 |
| Total | $32,834,406 | $27,670,909 |
As of September 30, 2011, the tax basis components of distributable earnings/(accumulated losses) and the federal tax cost were as follows:
| BALANCED | BOND | |||
| Unrealized appreciation | $35,870,013 | $25,988,610 | ||
| Unrealized (depreciation) | (47,173,101 | ) | (39,750,125 | ) |
| Net unrealized appreciation/(depreciation) | ($11,303,088 | ) | ($13,761,515 | ) |
| Undistributed ordinary income | $70,817 | $7,668,362 | ||
| Capital loss carryforward | ($30,180,557 | ) | — | |
| Federal income tax cost of investments | $452,194,416 | $849,252,400 | ||
The differences between the components of distributable earnings on a tax basis and the amounts reflected in the statements of net assets are primarily due to temporary book-tax differences that will reverse in a subsequent period. For Balanced Portfolio, the differences are due to Section 1256 contracts, partnerships and wash sales. For Bond Portfolio, the differences are due to Section 1256 contracts, wash sales and post October losses.
www.calvert.com CALVERT SOCIAL INVESTMENT FUND ANNUAL REPORT 66
Reclassifications, as shown in the table below, have been made to the Funds’ components of net assets to reflect income and gains available for distribution (or available capital loss carryovers, as applicable) under income tax law and regulations. These reclassifications are due to permanent book-tax differences and have no impact on net assets. For Balanced Portfolio, the reclassifications are due to partnerships and asset-backed securities. For Bond Portfolio, the reclassifications are due to asset-backed securities, distributions in excess of net investment income, and tax-exempt income.
| BALANCED | BOND | |||
| Undistributed net investment income | ($124,927 | ) | $744,145 | |
| Accumulated net realized gain (loss) | 123,138 | (744,611 | ) | |
| Paid-in capital | 1,789 | 466 |
The Portfolios may sell or purchase securities to and from other Portfolios managed by the Advisor, typically short-term variable rate demand notes. Interportfolio transactions are primarily used for cash management purposes. Interportfolio transactions are made pursuant to Rule 17a-7 of the Investment Company Act of 1940. For the year ended September 30, 2011, the Portfolios had no such purchases and sales transactions.
NOTE D — LINE OF CREDIT
A financing agreement is in place with all Calvert Funds and State Street Corporation (“SSC”). Under the agreement, SSC provides an unsecured line of credit facility, in the aggregate amount of $50 million ($25 million committed and $25 million uncommitted), accessible by the Funds for temporary or emergency purposes only. Borrowings under the committed facility bear interest at the higher of the London Interbank Offered Rate, (LIBOR) or the overnight Federal Funds Rate plus 1.25% per annum. A commitment fee of .11% per annum is incurred on the unused portion of the committed facility, which is allocated to all participating funds. Balanced and Bond had no loans outstanding pursuant to this line of credit at September 30, 2011. For the year ended September 30, 2011, borrowings by the Portfolios under the Agreement were as follows:
| WEIGHTED | MONTH OF | |||
| AVERAGE | AVERAGE | MAXIMUM | MAXIMUM | |
| DAILY | INTEREST | AMOUNT | AMOUNT | |
| PORTFOLIO | BALANCE | RATE | BORROWED | BORROWED |
| Balanced | $9,979 | 1.50% | $844,854 | January 2011 |
| Bond | 73,115 | 1.50% | 4,664,860 | March 2011 |
NOTE E — AFFILIATED COMPANIES
An affiliated company is a company in which the Portfolios have a direct or indirect ownership of, control of, or voting power over 5 percent or more of the outstanding voting shares.
www.calvert.com CALVERT SOCIAL INVESTMENT FUND ANNUAL REPORT 67
| Affiliated companies of the Balanced Portfolio are as follows: | ||||
| AFFILIATES | COST | VALUE | ||
| Angels With Attitude I LLC LP | $ | 200,000 | $ | 76,451 |
| GEEMF Partners LP | — | 132,554 | ||
| TOTALS | $ | 200,000 | $ | 209,005 |
NOTE F – SUBSEQUENT EVENTS
On October 19, 2011, the Advisor determined that it was necessary to change the price at which one of the Balanced and Bond Funds' portfolio holdings was then being fair valued. The Advisor subsequently determined that it was appropriate to change the fair value prices at which that portfolio holding as well as certain related holdings had been carried from March 2008 through the Funds' fiscal year end. The adjustments also had the effect of changing the net asset value per share at which shareholder subscriptions and redemptions were executed during the period. Accordingly, in order to correct these shareholder trades, the Advisor contributed $206,623 and $3,320,907 to the Balanced and Bond Funds, respectively, on December 27, 2011, which will be used to purchase additional shares for affected shareholders. These contributions are reflected as a receivable from the Advisor and a payable to shareholders in the accompanying financial statements. The changes to the fair value prices of the affected portfolio holdings are reflected in the financial statements and Fund performance shown in this annual report. Immaterial adjustments to certain prior periods per share amounts, ratios and total return have also been reflected in the Financial Highlights of the Bond Fund. These adjustments had the effect of changing the net asset value of the Bond Fund by ($5,245,072), ($5,352,174), ($935,784), and ($5,305,803) (unaudited) as of September 30, 2008, 2009, 2010 and March 31, 2011, respectively.
NOTE G — OTHER
In connection with certain venture capital investments, the Balanced Portfolio is committed to future capital calls, which will increase the Portfolio’s investment in these securities. The aggregate amount of the future capital commitments totals $90,000 at September 30, 2011.
NOTICE TO SHAREHOLDERS (UNAUDITED)
For the year ended September 30, 2011, in order to meet certain requirements of the Internal Revenue Code, the Balanced Portfolio designates 72.8% of the ordinary dividends paid during the year as qualified dividend income in accordance with Section 854 of the Internal Revenue Code and as eligible for the corporate dividends received deduction in accordance with Section 854 of the Internal Revenue Code.
Additional information will be provided to shareholders in January 2012 for use in preparing 2011 income tax returns.
www.calvert.com CALVERT SOCIAL INVESTMENT FUND ANNUAL REPORT 68
| BALANCED PORTFOLIO | |||||||||
| FINANCIAL HIGHLIGHTS | |||||||||
| Years ended | |||||||||
| September 30, | September 30, | September 30, | |||||||
| Class A Shares | 2011 | (z) | 2010 | (z) | 2009 | ||||
| Net asset value, beginning | $ | 25.94 | $ | 24.02 | $ | 25.03 | |||
| Income from investment operations: | |||||||||
| Net investment income | .29 | .27 | .40 | ||||||
| Net realized and unrealized gain (loss) | .22 | 1.91 | (1.03 | ) | |||||
| Total from investment operations | .51 | 2.18 | (.63 | ) | |||||
| Distributions from: | |||||||||
| Net investment income | (.26 | ) | (.26 | ) | (.38 | ) | |||
| Net realized gain | — | — | *** | ||||||
| Total distributions | (.26 | ) | (.26 | ) | (.38 | ) | |||
| Total increase (decrease) in net asset value | .25 | 1.92 | (1.01 | ) | |||||
| Net asset value, ending | $ | 26.19 | $ | 25.94 | $ | 24.02 | |||
| Total return* | 1.94 | % | 9.12 | % | (2.29 | %) | |||
| Ratios to average net assets: A | |||||||||
| Net investment income | 1.04 | % | 1.08 | % | 1.87 | % | |||
| Total expenses | 1.22 | % | 1.23 | % | 1.28 | % | |||
| Expenses before offsets | 1.22 | % | 1.23 | % | 1.28 | % | |||
| Net expenses | 1.22 | % | 1.23 | % | 1.28 | % | |||
| Portfolio turnover | 100 | % | 75 | % | 57 | % | |||
| Net assets, ending (in thousands) | $ | 405,716 | $ | 419,363 | $ | 404,542 | |||
| Years ended | |||||||||
| September 30, | September 30, | ||||||||
| Class A Shares | 2008 | 2007 | |||||||
| Net asset value, beginning | $ | 31.37 | $ | 29.46 | |||||
| Income from investment operations: | |||||||||
| Net investment income | .57 | .60 | |||||||
| Net realized and unrealized gain (loss) | (4.72 | ) | 1.88 | ||||||
| Total from investment operations | (4.15 | ) | 2.48 | ||||||
| Distributions from: | |||||||||
| Net investment income | (.56 | ) | (.57 | ) | |||||
| Net realized gain | (1.63 | ) | — | ||||||
| Total distributions | (2.19 | ) | (.57 | ) | |||||
| Total increase (decrease) in net asset value | (6.34 | ) | 1.91 | ||||||
| Net asset value, ending | $ | 25.03 | $ | 31.37 | |||||
| Total return* | (14.13 | %) | 8.47 | % | |||||
| Ratios to average net assets: A | |||||||||
| Net investment income | 2.03 | % | 1.94 | % | |||||
| Total expenses | 1.21 | % | 1.20 | % | |||||
| Expenses before offsets | 1.21 | % | 1.20 | % | |||||
| Net expenses | 1.20 | % | 1.19 | % | |||||
| Portfolio turnover | 77 | % | 81 | % | |||||
| Net assets, ending (in thousands) | $ | 434,069 | $ | 542,659 | |||||
See notes to financial highlights.
www.calvert.com CALVERT SOCIAL INVESTMENT FUND ANNUAL REPORT 69
| BALANCED PORTFOLIO | |||||||||
| FINANCIAL HIGHLIGHTS | |||||||||
| Years ended | |||||||||
| September 30, | September 30, | September 30, | |||||||
| Class B Shares | 2011 | (z) | 2010 | (z) | 2009 | ||||
| Net asset value, beginning | $ | 25.73 | $ | 23.83 | $ | 24.84 | |||
| Income from investment operations: | |||||||||
| Net investment income | ****** | .01 | .13 | ||||||
| Net realized and unrealized gain (loss) | .23 | 1.90 | (.99 | ) | |||||
| Total from investment operations | .23 | 1.91 | (.86 | ) | |||||
| Distributions from: | |||||||||
| Net investment income | — | (.01 | ) | (.15 | ) | ||||
| Net realized gain | — | — | *** | ||||||
| Total distributions | — | (.01 | ) | (.15 | ) | ||||
| Total increase (decrease) in net asset value | .23 | 1.90 | (1.01 | ) | |||||
| Net asset value, ending | $ | 25.96 | $ | 25.73 | $ | 23.83 | |||
| Total return* | .89 | % | 8.02 | % | (3.35 | %) | |||
| Ratios to average net assets:A | |||||||||
| Net investment income | .01 | % | .04 | % | .82 | % | |||
| Total expenses | 2.24 | % | 2.27 | % | 2.36 | % | |||
| Expenses before offsets | 2.24 | % | 2.27 | % | 2.36 | % | |||
| Net expenses | 2.24 | % | 2.27 | % | 2.35 | % | |||
| Portfolio turnover | 100 | % | 75 | % | 57 | % | |||
| Net assets, ending (in thousands) | $ | 9,306 | $ | 12,127 | $ | 14,294 | |||
| Years ended | |||||||||
| September 30, | September 30, | ||||||||
| Class B Shares | 2008 | 2007 | |||||||
| Net asset value, beginning | $ | 31.13 | $ | 29.24 | |||||
| Income from investment operations: | |||||||||
| Net investment income | .28 | .28 | |||||||
| Net realized and unrealized gain (loss) | (4.66 | ) | 1.89 | ||||||
| Total from investment operations | (4.38 | ) | 2.17 | ||||||
| Distributions from: | |||||||||
| Net investment income | (.28 | ) | (.28 | ) | |||||
| Net realized gain | (1.63 | ) | — | ||||||
| Total distributions | (1.91 | ) | (.28 | ) | |||||
| Total increase (decrease) in net asset value | (6.29 | ) | 1.89 | ||||||
| Net asset value, ending | $ | 24.84 | $ | 31.13 | |||||
| Total return* | (14.93 | %) | 7.45 | % | |||||
| Ratios to average net assets:A | |||||||||
| Net investment income | 1.05 | % | .99 | % | |||||
| Total expenses | 2.19 | % | 2.15 | % | |||||
| Expenses before offsets | 2.19 | % | 2.15 | % | |||||
| Net expenses | 2.18 | % | 2.14 | % | |||||
| Portfolio turnover | 77 | % | 81 | % | |||||
| Net assets, ending (in thousands) | $ | 17,939 | $ | 24,767 | |||||
See notes to financial highlights.
www.calvert.com CALVERT SOCIAL INVESTMENT FUND ANNUAL REPORT 70
| BALANCED PORTFOLIO | |||||||||
| FINANCIAL HIGHLIGHTS | |||||||||
| Years ended | |||||||||
| September 30, | September 30, | September 30, | |||||||
| Class C Shares | 2011 | (z) | 2010 | (z) | 2009 | ||||
| Net asset value, beginning | $ | 25.47 | $ | 23.58 | $ | 24.58 | |||
| Income from investment operations: | |||||||||
| Net investment income | .05 | .05 | .19 | ||||||
| Net realized and unrealized gain (loss) | .23 | 1.88 | (1.01 | ) | |||||
| Total from investment operations | .28 | 1.93 | (.82 | ) | |||||
| Distributions from: | |||||||||
| Net investment income | (.03 | ) | (.04 | ) | (.18 | ) | |||
| Net realized gain | — | — | *** | ||||||
| Total distributions | (.03 | ) | (.04 | ) | (.18 | ) | |||
| Total increase (decrease) in net asset value | .25 | 1.89 | (1.00 | ) | |||||
| Net asset value, ending | $ | 25.72 | $ | 25.47 | $ | 23.58 | |||
| Total return* | 1.08 | % | 8.17 | % | (3.22 | %) | |||
| Ratios to average net assets:A | |||||||||
| Net investment income | .18 | % | .19 | % | .95 | % | |||
| Total expenses | 2.07 | % | 2.12 | % | 2.21 | % | |||
| Expenses before offsets | 2.07 | % | 2.12 | % | 2.21 | % | |||
| Net expenses | 2.07 | % | 2.12 | % | 2.21 | % | |||
| Portfolio turnover | 100 | % | 75 | % | 57 | % | |||
| Net assets, ending (in thousands) | $ | 24,335 | $ | 24,269 | $ | 21,810 | |||
| Years ended | |||||||||
| September 30. | September 30, | ||||||||
| Class C Shares | 2008 | 2007 | |||||||
| Net asset value, beginning | $ | 30.83 | $ | 28.95 | |||||
| Income from investment operations: | |||||||||
| Net investment income | .32 | .32 | |||||||
| Net realized and unrealized gain (loss) | (4.64 | ) | 1.85 | ||||||
| Total from investment operations | (4.32 | ) | 2.17 | ||||||
| Distributions from: | |||||||||
| Net investment income | (.30 | ) | (.29 | ) | |||||
| Net realized gain | (1.63 | ) | — | ||||||
| Total distributions | (1.93 | ) | (.29 | ) | |||||
| Total increase (decrease) in net asset value | (6.25 | ) | 1.88 | ||||||
| Net asset value, ending | $ | 24.58 | $ | 30.83 | |||||
| Total return* | (14.88 | %) | 7.53 | % | |||||
| Ratios to average net assets:A | |||||||||
| Net investment income | 1.15 | % | 1.07 | % | |||||
| Total expenses | 2.08 | % | 2.07 | % | |||||
| Expenses before offsets | 2.08 | % | 2.07 | % | |||||
| Net expenses | 2.08 | % | 2.06 | % | |||||
| Portfolio turnover | 77 | % | 81 | % | |||||
| Net assets, ending (in thousands) | $ | 24,631 | $ | 30,340 | |||||
See notes to financial highlights.
www.calvert.com CALVERT SOCIAL INVESTMENT FUND ANNUAL REPORT 71
| BALANCED PORTFOLIO | |||||||||
| FINANCIAL HIGHLIGHTS | |||||||||
| Years ended | |||||||||
| September 30, | September 30, | September 30, | |||||||
| Class I Shares | 2011 | (z) | 2010 | (z) | 2009 | ||||
| Net asset value, beginning | $ | 26.22 | $ | 24.25 | $ | 25.27 | |||
| Income from investment operations: | |||||||||
| Net investment income | .43 | .42 | .52 | ||||||
| Net realized and unrealized gain (loss) | .23 | 1.93 | (1.04 | ) | |||||
| Total from investment operations | .66 | 2.35 | (.52 | ) | |||||
| Distributions from: | |||||||||
| Net investment income | (.39 | ) | (.38 | ) | (.50 | ) | |||
| Net realized gain | — | — | *** | ||||||
| Total distributions | (.39 | ) | (.38 | ) | (.50 | ) | |||
| Total increase (decrease) in net asset value | .27 | 1.97 | (1.02 | ) | |||||
| Net asset value, ending | $ | 26.49 | $ | 26.22 | $ | 24.25 | |||
| Total return* | 2.45 | % | 9.72 | % | (1.76 | %) | |||
| Ratios to average net assets:A | |||||||||
| Net investment income | 1.54 | % | 1.62 | % | 2.42 | % | |||
| Total expenses | 1.33 | % | 1.09 | % | .89 | % | |||
| Expenses before offsets | .72 | % | .72 | % | .73 | % | |||
| Net expenses | .72 | % | .72 | % | .72 | % | |||
| Portfolio turnover | 100 | % | 75 | % | 57 | % | |||
| Net assets, ending (in thousands) | $ | 1,820 | $ | 1,518 | $ | 5,875 | |||
| Years ended | |||||||||
| September 30, | September 30, | ||||||||
| Class I Shares | 2008 | 2007 | |||||||
| Net asset value, beginning | $ | 31.64 | $ | 29.70 | |||||
| Income from investment operations: | |||||||||
| Net investment income | .70 | .76 | |||||||
| Net realized and unrealized gain (loss) | (4.75 | ) | 1.90 | ||||||
| Total from investment operations | (4.05 | ) | 2.66 | ||||||
| Distributions from: | |||||||||
| Net investment income | (.69 | ) | (.72 | ) | |||||
| Net realized gain | (1.63 | ) | — | ||||||
| Total distributions | (2.32 | ) | (.72 | ) | |||||
| Total increase (decrease) in net asset value | (6.37 | ) | 1.94 | ||||||
| Net asset value, ending | $ | 25.27 | $ | 31.64 | |||||
| Total return* | (13.69 | %) | 9.00 | % | |||||
| Ratios to average net assets:A | |||||||||
| Net investment income | 2.52 | % | 2.40 | % | |||||
| Total expenses | .80 | % | .77 | % | |||||
| Expenses before offsets | .72 | % | .73 | % | |||||
| Net expenses | .72 | % | .72 | % | |||||
| Portfolio turnover | 77 | % | 81 | % | |||||
| Net assets, ending (in thousands) | $ | 5,905 | $ | 8,721 | |||||
See notes to financial highlights.
www.calvert.com CALVERT SOCIAL INVESTMENT FUND ANNUAL REPORT 72
| BOND PORTFOLIO | |||||||||
| FINANCIAL HIGHLIGHTS | |||||||||
| Years ended | |||||||||
| September 30, | September 30, | September 30, | |||||||
| Class A Shares | 2011 | 2010 | ^^ | 2009 | ^^ | ||||
| Net asset value, beginning | $ | 16.00 | ^ | $ | 15.12 | $ | 15.06 | ^ | |
| Income from investment operations: | |||||||||
| Net investment income | .42 | .41 | .53 | ||||||
| Net realized and unrealized gain (loss) | .02 | ^ | .95 | ^ | .30 | ^ | |||
| Total from investment operations | .44 | 1.36 | .83 | ||||||
| Distributions from: | |||||||||
| Net investment income | (.43 | ) | (.38 | ) | (.51 | ) | |||
| Net realized gain | (.16 | ) | (.10 | ) | (.26 | ) | |||
| Total distributions | (.59 | ) | (.48 | ) | (.77 | ) | |||
| Total increase (decrease) in net asset value | (.15 | ) | .88 | .06 | |||||
| Net asset value, ending | $ | 15.85 | $ | 16.00 | ^ | $ | 15.12 | ^ | |
| Total return* | 2.83 | %^ | 9.19 | %^ | 5.97 | %^ | |||
| Ratios to average net assets:A | |||||||||
| Net investment income | 2.63 | % | 2.63 | % | 3.71 | % | |||
| Total expenses | 1.13 | % | 1.14 | % | 1.15 | % | |||
| Expenses before offsets | 1.13 | % | 1.14 | % | 1.15 | % | |||
| Net expenses | 1.13 | % | 1.14 | % | 1.14 | % | |||
| Portfolio turnover | 203 | % | 78 | % | 77 | % | |||
| Net assets, ending (in thousands) | $ | 516,884 | $ | 592,736 | ^ | $ | 597,246 | ^ | |
| Years ended | |||||||||
| September 30, | September 30, | ||||||||
| Class A Shares | 2008 | ^^ | 2007 | ||||||
| Net asset value, beginning | $ | 15.92 | $ | 15.83 | |||||
| Income from investment operations: | |||||||||
| Net investment income | .69 | .69 | |||||||
| Net realized and unrealized gain (loss) | (.62 | )^ | .13 | ||||||
| Total from investment operations | .07 | .82 | |||||||
| Distributions from: | |||||||||
| Net investment income | (.68 | ) | (.70 | ) | |||||
| Net realized gain | (.25 | ) | (.03 | ) | |||||
| Total distributions | (.93 | ) | (.73 | ) | |||||
| Total increase (decrease) in net asset value | (.86 | ) | .09 | ||||||
| Net asset value, ending | $ | 15.06 | ^ | $ | 15.92 | ||||
| Total return* | .33 | %^ | 5.31 | % | |||||
| Ratios to average net assets:A | |||||||||
| Net investment income | 4.40 | % | 4.41 | % | |||||
| Total expenses | 1.10 | % | 1.12 | % | |||||
| Expenses before offsets | 1.10 | % | 1.12 | % | |||||
| Net expenses | 1.10 | % | 1.11 | % | |||||
| Portfolio turnover | 147 | % | 190 | % | |||||
| Net assets, ending (in thousands) | $ | 607,266 | ^ | $ | 453,813 | ||||
See notes to financial highlights.
www.calvert.com CALVERT SOCIAL INVESTMENT FUND ANNUAL REPORT 73
| BOND PORTFOLIO | |||||||||
| FINANCIAL HIGHLIGHTS | |||||||||
| Years ended | |||||||||
| September 30, | September 30, | September 30, | |||||||
| Class B Shares | 2011 | 2010 | ^^ | 2009 | ^^ | ||||
| Net asset value, beginning | $ | 15.89 | ^ | $ | 15.03 | ^ | $ | 14.97 | ^ |
| Income from investment operations: | |||||||||
| Net investment income | .26 | .25 | .40 | ||||||
| Net realized and unrealized gain (loss) | .02 | ^ | .93 | ^ | .29 | ^ | |||
| Total from investment operations | .28 | 1.18 | .69 | ||||||
| Distributions from: | |||||||||
| Net investment income | (.27 | ) | (.22 | ) | (.37 | ) | |||
| Net realized gain | (.16 | ) | (.10 | ) | (.26 | ) | |||
| Total distributions | (.43 | ) | (.32 | ) | (.63 | ) | |||
| Total increase (decrease) in net asset value | (.15 | ) | .86 | .06 | |||||
| Net asset value, ending | $ | 15.74 | $ | 15.89 | ^ | $ | 15.03 | ^ | |
| Total return* | 1.78 | %^ | 7.98 | %^ | 5.00 | %^ | |||
| Ratios to average net assets:A | |||||||||
| Net investment income | 1.57 | % | 1.60 | % | 2.81 | % | |||
| Total expenses | 2.21 | % | 2.18 | % | 2.13 | % | |||
| Expenses before offsets | 2.19 | % | 2.18 | % | 2.13 | % | |||
| Net expenses | 2.19 | % | 2.18 | % | 2.11 | % | |||
| Portfolio turnover | 203 | % | 78 | % | 77 | % | |||
| Net assets, ending (in thousands) | $ | 5,635 | $ | 8,845 | ^ | $ | 11,803 | ^ | |
| Years ended | |||||||||
| September 30, | September 30, | ||||||||
| Class B Shares | 2008 | ^^ | 2007 | ||||||
| Net asset value, beginning | $ | 15.84 | $ | 15.76 | |||||
| Income from investment operations: | |||||||||
| Net investment income | .54 | .54 | |||||||
| Net realized and unrealized gain (loss) | (.63 | )^ | .12 | ||||||
| Total from investment operations | (.09 | ) | .66 | ||||||
| Distributions from: | |||||||||
| Net investment income | (.53 | ) | (.55 | ) | |||||
| Net realized gain | (.25 | ) | (.03 | ) | |||||
| Total distributions | (.78 | ) | (.58 | ) | |||||
| Total increase (decrease) in net asset value | (.87 | ) | .08 | ||||||
| Net asset value, ending | $ | 14.97 | $ | 15.84 | |||||
| Total return* | (.68 | %)^ | 4.29 | % | |||||
| Ratios to average net assets:A | |||||||||
| Net investment income | 3.43 | % | 3.43 | % | |||||
| Total expenses | 2.07 | % | 2.09 | % | |||||
| Expenses before offsets | 2.07 | % | 2.09 | % | |||||
| Net expenses | 2.06 | % | 2.08 | % | |||||
| Portfolio turnover | 147 | % | 190 | % | |||||
| Net assets, ending (in thousands) | $ | 17,196 | ^ | $ | 14,834 | ||||
See notes to financial highlights.
www.calvert.com CALVERT SOCIAL INVESTMENT FUND ANNUAL REPORT 74
| BOND PORTFOLIO | |||||||||
| FINANCIAL HIGHLIGHTS | |||||||||
| Years ended | |||||||||
| September 30, | September 30, | September 30, | |||||||
| Class C Shares | 2011 | 2010 | ^^ | 2009 | ^^ | ||||
| Net asset value, beginning | $ | 15.90 | ^ | $ | 15.04 | ^ | $ | 14.97 | ^ |
| Income from investment operations: | |||||||||
| Net investment income | .29 | .29 | .42 | ||||||
| Net realized and unrealized gain (loss) | .03 | ^ | .93 | ^ | .31 | ^ | |||
| Total from investment operations | .32 | 1.22 | .73 | ||||||
| Distributions from: | |||||||||
| Net investment income | (.30 | ) | (.26 | ) | (.40 | ) | |||
| Net realized gain | (.16 | ) | (.10 | ) | (.26 | ) | |||
| Total distributions | (.46 | ) | (.36 | ) | (.66 | ) | |||
| Total increase (decrease) in net asset value | (.14 | ) | .86 | .07 | |||||
| Net asset value, ending | $ | 15.76 | $ | 15.90 | ^ | $ | 15.04 | ^ | |
| Total return* | 2.08 | %^ | 8.24 | %^ | 5.23 | %^ | |||
| Ratios to average net assets:A | |||||||||
| Net investment income | 1.83 | % | 1.85 | % | 2.93 | % | |||
| Total expenses | 1.93 | % | 1.91 | % | 1.94 | % | |||
| Expenses before offsets | 1.93 | % | 1.91 | % | 1.94 | % | |||
| Net expenses | 1.93 | % | 1.91 | % | 1.92 | % | |||
| Portfolio turnover | 203 | % | 78 | % | 77 | % | |||
| Net assets, ending (in thousands) | $ | 47,123 | $ | 54,230 | ^ | $ | 56,223 | ^ | |
| Years ended | |||||||||
| September 30, | September 30, | ||||||||
| Class C Shares | 2008 | ^^ | 2007 | ||||||
| Net asset value, beginning | $ | 15.83 | $ | 15.75 | |||||
| Income from investment operations: | |||||||||
| Net investment income | .56 | .56 | |||||||
| Net realized and unrealized gain (loss) | (.62 | )^ | .12 | ||||||
| Total from investment operations | (.06 | ) | .68 | ||||||
| Distributions from: | |||||||||
| Net investment income | (.55 | ) | (.57 | ) | |||||
| Net realized gain | (.25 | ) | (.03 | ) | |||||
| Total distributions | (.80 | ) | (.60 | ) | |||||
| Total increase (decrease) in net asset value | (.86 | ) | .08 | ||||||
| Net asset value, ending | $ | 14.97 | ^ | $ | 15.83 | ||||
| Total return* | .49 | %^ | 4.41 | % | |||||
| Ratios to average net assets:A | |||||||||
| Net investment income | 3.60 | % | 3.61 | % | |||||
| Total expenses | 1.90 | % | 1.92 | % | |||||
| Expenses before offsets | 1.90 | % | 1.92 | % | |||||
| Net expenses | 1.89 | % | 1.91 | % | |||||
| Portfolio turnover | 147 | % | 190 | % | |||||
| Net assets, ending (in thousands) | $ | 52,555 | ^ | $ | 36,202 | ||||
See notes to financial highlights.
www.calvert.com CALVERT SOCIAL INVESTMENT FUND ANNUAL REPORT 75
| BOND PORTFOLIO | |||||||||
| FINANCIAL HIGHLIGHTS | |||||||||
| Years ended | |||||||||
| September 30, | September 30, | September 30, | |||||||
| Class I Shares | 2011 | 2010 | ^^ | 2009 | ^^ | ||||
| Net asset value, beginning | $ | 16.01 | ^ | $ | 15.13 | ^ | $ | 15.07 | ^ |
| Income from investment operations: | |||||||||
| Net investment income | .51 | .50 | .63 | ||||||
| Net realized and unrealized gain (loss) | .01 | ^ | .96 | ^ | .30 | ^ | |||
| Total from investment operations | .52 | 1.46 | .93 | ||||||
| Distributions from: | |||||||||
| Net investment income | (.52 | ) | (.48 | ) | (.61 | ) | |||
| Net realized gain | (.16 | ) | (.10 | ) | (.26 | ) | |||
| Total distributions | (.68 | ) | (.58 | ) | (.87 | ) | |||
| Total increase (decrease) in net asset value | (.16 | ) | .88 | .06 | |||||
| Net asset value, ending | $ | 15.85 | $ | 16.01 | ^ | $ | 15.13 | ^ | |
| Total return* | 3.39 | %^ | 9.84 | %^ | 6.67 | %^ | |||
| Ratios to average net assets:A | |||||||||
| Net investment income | 3.25 | % | 3.24 | % | 4.35 | % | |||
| Total expenses | .52 | % | .52 | % | .54 | % | |||
| Expenses before offsets | .52 | % | .52 | % | .54 | % | |||
| Net expenses | .52 | % | .52 | % | .52 | % | |||
| Portfolio turnover | 203 | % | 78 | % | 77 | % | |||
| Net assets, ending (in thousands) | $ | 224,792 | $ | 213,395 | ^ | $ | 186,327 | ^ | |
| Years ended | |||||||||
| September 30, | September 30, | ||||||||
| Class I Shares | 2008 | ^^ | 2007 | ||||||
| Net asset value, beginning | $ | 15.94 | $ | 15.85 | |||||
| Income from investment operations: | |||||||||
| Net investment income | .78 | .78 | |||||||
| Net realized and unrealized gain (loss) | (.63 | )^ | .13 | ||||||
| Total from investment operations | .15 | .91 | |||||||
| Distributions from: | |||||||||
| Net investment income | (.77 | ) | (.79 | ) | |||||
| Net realized gain | (.25 | ) | (.03 | ) | |||||
| Total distributions | (1.02 | ) | (.82 | ) | |||||
| Total increase (decrease) in net asset value | (.87 | ) | .09 | ||||||
| Net asset value, ending | $ | 15.07 | ^ | $ | 15.94 | ||||
| Total return* | .85 | %^ | 5.89 | % | |||||
| Ratios to average net assets:A | |||||||||
| Net investment income | 4.98 | % | 4.99 | % | |||||
| Total expenses | .52 | % | .53 | % | |||||
| Expenses before offsets | .52 | % | .53 | % | |||||
| Net expenses | .51 | % | .52 | % | |||||
| Portfolio turnover | 147 | % | 190 | % | |||||
| Net assets, ending (in thousands) | $ | 206,851 | ^ | $ | 152,871 | ||||
See notes to financial highlights.
www.calvert.com CALVERT SOCIAL INVESTMENT FUND ANNUAL REPORT 76
| BOND PORTFOLIO | |||||||||
| FINANCIAL HIGHLIGHTS | |||||||||
| Periods ended | |||||||||
| September 30, | September 30, | September 30, | |||||||
| Class Y Shares | 2011 | 2010 | ^^ | 2009 | #^^ | ||||
| Net asset value, beginning | $ | 16.06 | ^ | $ | 15.16 | ^ | $ | 14.33 | ^ |
| Income from investment operations: | |||||||||
| Net investment income | .46 | .41 | .48 | ||||||
| Net realized and unrealized gain (loss) | .03 | ^ | .98 | ^ | 1.08 | ^ | |||
| Total from investment operations | .49 | 1.39 | 1.56 | ||||||
| Distributions from: | |||||||||
| Net investment income | (.46 | ) | (.39 | ) | (.47 | ) | |||
| Net realized gain | (.16 | ) | (.10 | ) | (.26 | ) | |||
| Total distributions | (.62 | ) | (.49 | ) | (.73 | ) | |||
| Total increase (decrease) in net asset value | (.13 | ) | .90 | .83 | |||||
| Net asset value, ending | $ | 15.93 | $ | 16.06 | ^ | $ | 15.16 | ^ | |
| Total return* | 3.17 | %^ | 9.34 | %^ | 11.31 | %^ | |||
| Ratios to average net assets:A | |||||||||
| Net investment income | 2.91 | % | 2.71 | % | 3.36 | % (a) | |||
| Total expenses | .83 | % | 1.00 | % | 5.39 | % (a) | |||
| Expenses before offsets | .83 | % | .92 | % | .93 | % (a) | |||
| Net expenses | .83 | % | .92 | % | .92 | % (a) | |||
| Portfolio turnover | 203 | % | 78 | % | 69 | % | |||
| Net assets, ending (in thousands) | $ | 26,987 | $ | 14,321 | ^ | $ | 624 | ^ | |
| A | Total expenses do not reflect amounts reimbursed and/or waived by the Advisor or reductions from expense offset arrangements. Expenses before offsets reflect expenses after reimbursement and/or waiver by the Advisor but prior to reductions from expense offset arrangements. Net expenses are net of all reductions and represent the net expenses paid by the Portfolio. |
| * | Total return is not annualized for periods less than one year and does not reflect deduction of any front-end or deferred sales charge. |
| *** | Distribution was less than .01 per share. |
| ****** | Amount was less than .01 per share. |
| # | From October 31, 2008 inception. |
| (a) | Annualized. |
| (z) | Per share figures are calculated using the Average Shares Method. |
| ^ | Amount was revised for changes to the value of certain security holdings as further described in Note F. |
| ^^ | The Financial Highlights for years ended 2008 through 2010, along with components of the Statements of Changes in Net Assets for year ended September 30, 2010, have been restated to reflect an adjustment for an immaterial pricing adjustment. |
See notes to financial statements.
www.calvert.com CALVERT SOCIAL INVESTMENT FUND ANNUAL REPORT 77
EXPLANATION OF FINANCIAL TABLES
SCHEDULE OF INVESTMENTS
The Schedule of Investments is a snapshot of all securities held in the fund at their market value, on the last day of the reporting period. Securities are listed by asset type (e.g., common stock, corporate bonds, U.S. government obligations) and may be further broken down into sub-groups and by industry classification.
STATEMENT OF ASSETS AND LIABILITIES
The Statement of Assets and Liabilities is often referred to as the fund’s balance sheet. It lists the value of what the fund owns, is due and owes on the last day of the reporting period. The fund’s assets include the market value of securities owned, cash, receivables for securities sold and shareholder subscriptions, and receivables for dividends and interest payments that have been earned, but not yet received. The fund’s liabilities include payables for securities purchased and shareholder redemptions, and expenses owed but not yet paid. The statement also reports the fund’s net asset value (NAV) per share on the last day of the reporting period. The NAV is calculated by dividing the fund’s net assets (assets minus liabilities) by the number of shares outstanding. This statement is accompanied by a Schedule of Investments. Alternatively, if certain conditions are met, a Statement of Net Assets may be presented in lieu of this statement and the Schedule of Investments.
STATEMENT OF NET ASSETS
The Statement of Net Assets provides a detailed list of the fund’s holdings, including each security’s market value on the last day of the reporting period. The Statement of Net Assets includes a Schedule of Investments. Other assets are added and other liabilities subtracted from the investments total to calculate the fund’s net assets. Finally, net assets are divided by the outstanding shares of the fund to arrive at its share price, or Net Asset Value (NAV) per share.
At the end of the Statement of Net Assets is a table displaying the composition of the fund’s net assets. Paid in Capital is the money invested by shareholders and represents the bulk of net assets. Undistributed Net Investment Income and Accumulated Net Realized Gains usually approximate the amounts the fund had available to distribute to shareholders as of the statement date. Accumulated Realized Losses will appear as negative balances. Unrealized Appreciation (Depreciation) is the difference between the market value of the fund’s investments and their cost, and reflects the gains (losses) that would be realized if the fund were to sell all of its investments at their statement-date values.
www.calvert.com CALVERT SOCIAL INVESTMENT FUND ANNUAL REPORT (UNAUDITED) 78
STATEMENT OF OPERATIONS
The Statement of Operations summarizes the fund’s investment income earned and expenses incurred in operating the fund. Investment income includes dividends earned from stocks and interest earned from interest-bearing securities in the fund. Expenses incurred in operating the fund include the advisory fee paid to the investment advisor, administrative services fees, distribution plan expenses (if applicable), transfer agent fees, shareholder servicing expenses, custodial, legal, and audit fees, and the printing and postage expenses related to shareholder reports. Expense offsets (fees paid indirectly) are also shown. Credits earned from offset arrangements are used to reduce the fund’s expenses. This statement also shows net gains (losses) realized on the sale of investments and the increase or decrease in the unrealized appreciation (depreciation) on investments held during the period.
STATEMENT OF CHANGES IN NET ASSETS
The Statement of Changes in Net Assets shows how the fund’s total net assets changed during the two most recent reporting periods. Changes in the fund’s net assets are attributable to investment operations, distributions and capital share transactions.
The Operations section of the report summarizes information detailed in the Statement of Operations. The Distribution section shows the dividend and capital gain distributions made to shareholders. The amounts shown as distributions in this section may not match the net investment income and realized gains amounts shown in the Operations section because distributions are determined on a tax basis and certain investments or transactions may be treated differently for financial statement and tax purposes. The Capital Share Transactions section shows the amount shareholders invested in the fund, either by purchasing shares or by reinvesting distributions, and the amounts redeemed. The corresponding numbers of shares issued, reinvested and redeemed are shown at the end of the report.
FINANCIAL HIGHLIGHTS
The Financial Highlights table provides a per-share breakdown per class of the components that affect the fund’s net asset value for current and past reporting periods. The table provides total return, total distributions, expense ratios, portfolio turnover and net assets for the applicable period. Total return is a measure of a fund’s performance that encompasses all elements of return: dividends, capital gain distributions and changes in net asset value. Total return is the change in value of an investment over a given period, assuming reinvestment of any dividends and capital gain distributions, expressed as a percentage of the initial investment. Total distributions include distributions from net investment income and net realized gains. Long-term gains are earned on securities held in the fund more than one year. Short-term gains, on the sale of securities held less than one year, are treated as ordinary dividend income for tax purposes. The expense ratio is a fund’s cost of doing business, expressed as a percentage of net assets. These expenses directly reduce returns to shareholders. Portfolio turnover measures the trading activity in a fund’s investment portfolio – how often securities are bought and sold by a fund. Portfolio turnover is affected by market conditions, changes in the size of the fund, the nature of the fund’s investments and the investment style of the portfolio.
www.calvert.com CALVERT SOCIAL INVESTMENT FUND ANNUAL REPORT (UNAUDITED) 79
PROXY VOTING
The Proxy Voting Guidelines of the Calvert Funds that the Fund uses to determine how to vote proxies relating to portfolio securities are provided as an Appendix to the Fund’s Statement of Additional Information. The Statement of Additional Information can be obtained free of charge by calling the Fund at 1-800-368-2745, by visiting the Calvert website at www.calvert.com; or by visiting the SEC’s website at www.sec.gov.
Information regarding how the Fund voted proxies relating to portfolio securities during the most recent 12-month period ended June 30 is available on the Fund’s website at www.calvert.com and on the SEC’s website at www.sec.gov.
AVAILABILITY OF QUARTERLY PORTFOLIO HOLDINGS
The Fund files its complete schedule of portfolio holdings with the SEC for the first and third quarters of each fiscal year on Form N-Q. The Fund’s Form N-Q is available on the SEC’s website at www.sec.gov. The Fund’s Form N-Q may be reviewed and copied at the SEC’s Public Reference Room in Washington, DC; information on the operation of the Public Reference Room may be obtained by calling 1-800-SEC-0330.
www.calvert.com CALVERT SOCIAL INVESTMENT FUND ANNUAL REPORT (UNAUDITED) 80
This page intentionally left blank.
TRUSTEE AND OFFICER INFORMATION TABLE
(Not Applicable to Officers) | |||||||
Position | Position | # of Calvert | |||||
Name & | with | Start | Principal Occupation | Portfolios | Other | ||
Age | Fund | Date | During Last 5 Years | Overseen | Directorships | ||
INDEPENDENT TRUSTEES/DIRECTORS | |||||||
REBECCA L. ADAMSON AGE: 62 | Trustee
Director
Director
Director | 1989 CSIF
2000 IMPACT
2000 CSIS
2005 CWVF
| President of the national non-profit, First People’s Worldwide, formerly First Nations Financial Project. Founded by her in 1980, First People’s Worldwide is the only American Indian alternative development institute in the country. | 15 | · Bay & Paul Foundation
| ||
RICHARD L. BAIRD, JR. AGE: 63 | Trustee & Chair
Director & Chair
Director & Chair
Director & Chair
| 1982 CSIF
2000 CSIS
2005 CWVF
2005 Impact | President and CEO of Adagio Health Inc. in Pittsburgh, PA, a non-profit corporation which provides family planning services, nutrition, maternal/child health care, and various health screening services and community preventive health programs. | 25 | None | ||
JOHN G. GUFFEY, JR. AGE: 63 | Director
Trustee
Director
Director
| 1992 CWVF
1982 CSIF
2000 CSIS
2005 IMPACT
| President of Aurora Press Inc., a privately held publisher of trade paperbacks.
| 25 | · Ariel Funds (3) · Calvert Social Investment Foundation · Calvert Ventures, LLC
| ||
MILES DOUGLAS HARPER, III AGE: 48 | Director
Trustee
Director
Director | 2000 Impact
2005 CSIF
2005 CSIS
2005 CWVF | Partner, Gainer Donnelly & Desroches (public accounting firm) since January 1999. | 15 | · Bridgeway Funds (14) | ||
JOY V. JONES AGE: 61 | Director
Trustee
Director
Director | 2000 Impact
1990 CSIF
2000 CSIS
2005 CWVF | Attorney.
| 15 | · Director, Conduit Street Restaurants Limited | ||
TERRENCE J. MOLLNER, Ed.D. AGE: 66 | Director
Trustee
Director
Director | 1992 CWVF
1982 CSIF
2000 CSIS
2005 IMPACT | Founder, Chairperson, and President of Trusteeship Institute, Inc., a diverse foundation known principally for its consultation to corporations converting to cooperative employee-ownership and the development of socially and spiritually responsible investment vehicles. Chairperson, Stakeholders Capital, Inc., an asset management firm and financial services provider in Amherst, MA. | 15 | · Calvert Social Investment Foundation · Ben & Jerry's Homemade, Inc. · ArtNOW, Inc. · Yourolivebranch.org | ||
SYDNEY AMARA MORRIS AGE: 62 | Trustee
Director
Director
Director | 1982 CSIF
2000 CSIS
2005 CWVF
2005 IMPACT | Rev. Morris currently serves as Parish Minister to the Keweenaw Unitarian Universalist Fellowship in Houghton, MI. Rev. Morris is a graduate of Harvard Divinity School. She currently chairs the Umbrian Universalist Committee on Socially Responsible Investing. | 15 | None | ||
INTERESTED TRUSTEES/DIRECTORS | |||||||
BARBARA J. KRUMSIEK AGE: 59 | Director & President
Trustee & Senior Vice President
Director & Senior Vice President
Director & President | 1997 CWVF
1997 CSIF
2000 CSIS
2000 Impact | President, Chief Executive Officer and Chair of Calvert Investments, Inc.
| 42 | · Calvert Social Investment Foundation · Pepco Holdings, Inc. · Acacia Life Insurance Company (Chair) · Griffin Realty Corp. | ||
D. Wayne Silby, Esq. AGE: 63 | Director
Trustee & President
Director & President
Director | 1992 CWVF
1982 CSIF
2000 CSIS
2000 Impact | Mr. Silby is the founding Chair of the Calvert Funds. He is the Chair-Elect and a principal of Syntao.com, a Beijing-based company promoting corporate social responsibility. | 25 | · UNIFI Mutual Holding Company · Calvert Social Investment Foundation · Studio School Fund · Syntao.com China · The Ice Organization · Impact Assets | ||
OFFICERS | |||||||
KAREN BECKERAge: 58 | Chief Compliance Officer | 2005
| Chief Compliance Officer for the Calvert Funds. In March 2009, Ms. Becker also became Head of the Securities Operations Department for Calvert Investment Management, Inc. | ||||
SUSAN walker Bender, E sq. AGE: 52 | Assistant Vice-President & Assistant Secretary | 1988 CSIF
2000 CSIS
1992 CWVF 2000 Impact | Assistant Vice President, Assistant Secretary and Associate General Counsel of Calvert Investments, Inc. | ||||
THOMAS DAILEY AGE: 47 | Vice President | 2004
| Vice President of Calvert Investment Management, Inc.
| ||||
IVY WAFFORD DUKE, Esq. AGE: 43 | Assistant Vice-President & Assistant Secretary | 1996 CSIF
2000 CSIS
1996 CWVF 2000 Impact | Assistant Vice President, Assistant Secretary and Deputy General Counsel of Calvert Investments, Inc., and Chief Compliance Officer for Calvert Investment Management, Inc. and Calvert Investment Distributors, Inc.
| ||||
patrick faul AGE: 46 | Vice President | 2010 | Vice President of Calvert Investment Management, Inc. since 2008, and Head of Credit Research since 2009. Prior to 2009, Mr. Faul was Co-Head of Credit Research (2008) and a Senior Securities Analyst (prior to 2008). | ||||
TRACI L. GOLDT AGE: 37 | Assistant Secretary | 2004
| Electronic Filing Manager and Executive Assistant to General Counsel, Calvert Investments, Inc.
| ||||
GREGORY B. HABEEB AGE: 61 | Vice President (CSIF and CSIS ) | 2004 | Senior Vice President of Calvert Investment Management, Inc. | ||||
HUI PING HO, CPA AGE: 46 | Assistant Treasurer
| 2000
| Tax Compliance Manager of Calvert Investments, Inc.
| ||||
LANCELOT A. KING, Esq. AGE: 41 | Assistant Vice President & Assistant Secretary
| 2002
| Assistant Vice President, Assistant Secretary and Associate General Counsel of Calvert Investments, Inc.
| ||||
edith lillie aGE: 54 | Assistant Secretary
| 2007 | Assistant Secretary (since 2007) and Regulatory Matters Manager of Calvert Investments, Inc. | ||||
AUGUSTO DIVO MACEDO, Esq. AGE: 48 | Assistant Vice President & Assistant Secretary | 2007 | Assistant Vice President, Assistant Secretary, and Assistant Counsel Compliance of Calvert Investments, Inc. | ||||
JANE B. MAXWELL, Esq. AGE: 59 | Assistant Vice President & Assistant Secretary
| 2005 | Assistant Vice President, Assistant Secretary & Assistant General Counsel of Calvert Investments, Inc.
| ||||
ANDREW K. NIEBLER, Esq. AGE: 44 | Assistant Vice President & Assistant Secretary | 2006 | Assistant Vice President, Assistant Secretary & Associate General Counsel of Calvert Investments, Inc. | ||||
CATHERINE P. ROY AGE: 55
| Vice President | 2004
| Senior Vice President of Calvert Investment Management, Inc. and Chief Investment Officer – Fixed Income. | ||||
William M. Tartikoff, Esq. AGE: 64 | Vice President and Secretary | 1990 CSIF
2000 CSIS
1992 CWVF
2000 Impact
| Senior Vice President, Secretary, and General Counsel of Calvert Investments, Inc. | ||||
NATALIE TRUNOW AGE: 43 | Vice President | 2008 | Senior Vice President of Calvert Investment Management, Inc., and Chief Investment Officer - Equities. Prior to joining Calvert in August 2008, Ms. Trunow was the Section Head (2005-2008) and Portfolio Manager (2001-2008) for the Global Public Markets Group of General Motors Asset Management. | ||||
Ronald M. WolfsheimeRCPA AGE: 59 | Treasurer | 1982 CSIF
2000 CSIS
1992 CWVF 2000 Impact | Executive Vice President and Chief Financial and Administrative Officer of Calvert Investments, Inc. | ||||
MICHAEL V. YUHAS, JR., CPA AGE: 50 | Fund Controller | 1999 CSIF
2000 CSIS
1999 CWVF
2000 Impact | Vice President of Fund Administration of Calvert Investment Administrative Services, Inc. | ||||
The address of Trustees/Directors and Officers is 4550 Montgomery Avenue, Suite 1000N, Bethesda, Maryland 20814, except Mr. Silby’s address is 1715 18th Street, N.W., Washington, DC 20009. Ms. Krumsiek is an interested person of the Fund since she is an officer and director of the Fund’s advisor and certain affiliates. Mr. Silby is an interested person of the Fund since he is a director of the parent com- pany of the Fund’s advisor. Additional information about the Fund’s Trustees/Directors can be found in the Statement of Additional Information (SAI). You can get a free copy of the SAI at www.calvert.com, or by contacting your broker, or the Fund at 1-800-368-2745. |
To Open an Account
800-368-2748
Yields and Prices
Calvert Information Network
(24 hours, 7 days a week)
800-368-2745
Service for Existing Account
Shareholders: 800-368-2745
Brokers: 800-368-2746
TDD for Hearing Impaired
800-541-1524
Branch Office
4550 Montgomery Avenue
Suite 1000 North
Bethesda, Maryland 20814
Registered, Certified or Overnight Mail
Calvert Investments
c/o BFDS,
330 West 9th Street
Kansas City, MO 64105
Web Site
www.calvert.com
Principal Underwriter
Calvert Investment Distributors, Inc.
4550 Montgomery Avenue
Suite 1000 North
Bethesda, Maryland 20814
| CALVERT | CALVERT’S | Equity Funds |
| SOCIAL | FAMILY OF FUNDS | Enhanced Equity Portfolio |
| INVESTMENT | Equity Portfolio | |
| FUND | Tax-Exempt Money | Large Cap Value Fund |
| Market Funds | Social Index Fund | |
| CTFR Money Market Portfolio | Capital Accumulation Fund | |
| International Equity Fund | ||
| Taxable Money Market | Small Cap Fund | |
| Funds | Global Alternative Energy Fund | |
| First Government Money Market | Global Water Fund | |
| Fund | International Opportunities Fund | |
| Money Market Portfolio | Equity Income Fund | |
| Municipal Funds | Balanced and Asset | |
| Tax-Free Bond Fund | Allocation Funds | |
| Balanced Portfolio | ||
| Taxable Bond Funds | Conservative Allocation Fund | |
| Bond Portfolio | Moderate Allocation Fund | |
| Income Fund | Aggressive Allocation Fund | |
| Short Duration Income Fund | ||
| Long-Term Income Fund | ||
| Ultra-Short Income Fund | ||
| Government Fund | ||
| High-Yield Bond Fund | ||
This report is intended to provide fund information to shareholders. It is not authorized for distribution to prospective investors unless preceded or accompanied by a prospectus.
Note: The information on our website is not incorporated by reference into this report; our website address is included as an inactive textual reference only.
Investors should carefully consider the investment objectives, risks, charges and expenses of the Calvert Funds. This and other important information is contained in the fund’s summary prospectus and prospectus, which can be obtained from your financial professional and should be read carefully before investing. You may also call Calvert at 800/368-2745 or visit www. calvert.com.
Item 2. Code of Ethics.
(a) The registrant has adopted a code of ethics (the "Code of Ethics") that applies to its principal executive officer and principal financial officer (also referred to as “principal accounting officer”).
(b) No information need be disclosed under this paragraph.
(c) The registrant has not amended its Code of Ethics during the period covered by the shareholder report presented in Item 1 hereto.
(d) The registrant has not granted a waiver or implicit waiver from a provision of its Code of Ethics during the period covered by the shareholder report presented in Item 1 hereto.
(e) Not applicable.
(f) The registrant's Code of Ethics is attached as an Exhibit hereto.
Item 3. Audit Committee Financial Expert.
The registrant's Board of Trustees has determined that Miles D. Harper, III, an "independent" Trustee serving on the registrant's audit committee, is an "audit committee financial expert," as defined in Item 3 of Form N-CSR. Under applicable securities laws, a person who is determined to be an audit committee financial expert will not be deemed an "expert" for any purpose, including without limitation for the purposes of Section 11 of the Securities Act of 1933, as a result of being designated or identified as an audit committee financial expert. The designation or identification of a person as an audit committee financial expert does not impose on such person any duties, obligations, or liabilities that are greater than the duties, obligations, and liabilities imposed on such person as a member of the audit committee and Board of Trustees in the absence of such designation or identification.
Item 4. Principal Accountant Fees and Services.
Services fees paid to auditing firm:
| Fiscal Year | Fiscal Year | ||
| $ | %* | $ | % * |
(a) Audit Fees | $130,680 |
| $141,075 |
|
(b) Audit-Related Fees | $0 | 0% | $0 | 0% |
(c) Tax Fees (tax return preparation and filing for the registrant) | $23,980 | 0% | $22,560 | 0% |
(d) All Other Fees | $0 | 0% | $0 | 0% |
Total | $154,660 | 0% | $163,635 | 0% |
* Percentage of fees approved by the Audit Committee pursuant to (c)(7)(i)(C) of Rule 2-01 of Reg. S-X (statutory de minimis waiver of Committee’s requirement to pre-approve)
(e) Audit Committee pre-approval policies and procedures:
The Audit Committee is required to pre-approve all audit and non-audit services provided to the registrant by the auditors, and to the registrant’s investment advisor, and any entity controlling, controlled by, or under common control with the advisor that provides ongoing services to the registrant. In determining whether to pre-approve non-audit services, the Audit Committee considers whether the services are consistent with maintaining the independence of the auditors. The Committee may delegate its authority to pre-approve certain matters to one or more of its members. In this regard, the Committee has delegated authority jointly to the Audit Committee Chair together with another Committee member with respect to non-audit services not exceeding $25,000 in each instance. In addition, the Committee has pre-approved the retention of the auditors to provide tax-related services related to the tax treatment and tax accounting of newly acquired securities, upon request by the investment advisor in each instance.
(f) Not applicable.
(g) Aggregate non-audit fees billed by the registrant’s accountant for services rendered to the registrant, and rendered to the registrant’s investment advisor, and any entity controlling, controlled by, or under common control with the advisor that provides ongoing services to the registrant for each of the last two fiscal years of the registrant:
Fiscal Year | Fiscal Year | ||
$ | %* | $ | % * |
|
|
|
|
$11,000 | 0%* | $42,500 | 0%* |
* Percentage of fees approved by the Audit Committee pursuant to (c)(7)(i)(C) of Rule 2-01 of Reg. S-X (statutory de minimis waiver of Committee’s requirement to pre-approve)
(h) The registrant’s Audit Committee of the Board of Trustees has considered whether the provision of non-audit services that were rendered to the registrant’s investment advisor, and any entity controlling, controlled by, or under common control with the investment advisor that provides ongoing services to the registrant that were not pre-approved pursuant to paragraph (c) (7)(ii) of Rule 2-01 of Reg. S-X is compatible with maintaining the principal accountant’s independence and found that the provision of such services is compatible with maintaining the principal accountant’s independence.
Item 5. Audit Committee of Listed Registrants.
Not applicable.
Item 6. Schedule of Investments.
(a) This Schedule is included as part of the report to shareholders filed under Item 1 of this Form.
(b) Not applicable.
Item 7. Disclosure of Proxy Voting Policies and Procedures for Closed-End Management Investment Companies.
Not applicable.
Item 8. Portfolio Managers of Closed-End Management Investment Companies
Not applicable.
Item 9. Purchases of Equity Securities by Closed-End Management Investment Company and Affiliated Purchasers.
Not applicable.
Item 10. Submission of Matters to a Vote of Security Holders.
No material changes were made to the procedures by which shareholders may recommend nominees to the registrant’s Board of Trustees since registrant last provided disclosure in response to this Item.
Item 11. Controls and Procedures.
(a) The principal executive and financial officers concluded that the registrant's disclosure controls and procedures (as defined in Rule 30a-3(c) under the 1940 Act) are effective, based on the evaluation of these controls and procedures required by Rule 30a-3(b) under the 1940 Act and Rules 13a-15(b) or 15d-15(b) under the Exchange Act, as of a date within 90 days of the filing date of this report. This determination is based on the change to the registrant’s internal control over financial reporting described in Item 11(b) below.
(b) There was no change in the registrant's internal control over financial reporting (as defined in Rule 30a-3(d) under the 1940 Act) that occurred during the registrant's second fiscal quarter of the period covered by this report that has materially affected, or is reasonably likely to materially affect, the registrant's internal control over financial reporting. However, a change to the internal control over financial reporting was made subsequent to the end of the reporting period. This change provides for (1) the remodeling and testing of the models used for all fixed income securities that are being priced under fair value procedures by the Advisor; (2) conducting of back-testing that reasonably supports the assumptions used in fair valuing the securities; (3) modifying the internal compliance monitoring system to report the asset weighting of each fixed income security, providing the percentage of any security owned in an individual Fund and across the Fund complex; (4) implementing a manual control to monitor for and report to the internal pricing committee on any security where the primary and/or secondary pricing vendor has been overridden for more than seven days; and (5) developing enhanced escalation procedures to address any fair valuation concerns—these enhanced escalation procedures are expected to be completed by the registrant’s next filing on this Form.
Item 12. Exhibits.
(a)(1) A copy of the Registrant’s Code of Ethics.
Attached hereto.
(a)(2) A separate certification for each principal executive officer and principal financial officer of the registrant as required by Rule 30a-2 under the Act (17 CFR 270.30a-2).
Attached hereto.
(a)(3) Not applicable.
(b) A certification for the registrant's Principal Executive Officer and Principal Financial Officer, as required by Rule 30a-2(b) under the Investment Company Act of 1940, is attached hereto. The certification furnished pursuant to this paragraph is not deemed to be "filed" for purposes of Section 18 of the Securities Exchange Act of 1934, or otherwise subject to the liability of that section. Such certification is not deemed to be incorporated by reference into any filing under the Securities Act of 1933 or the Securities Exchange Act of 1934, except to the extent that the registrant specifically incorporates it by reference.
Pursuant to the requirements of the Securities Exchange Act of 1934 and the Investment Act of 1940, the registrant has duly caused this report to be signed on its behalf by the undersigned, thereunto duly authorized.
CALVERT SOCIAL INVESTMENT FUND
By: /s/ Barbara J. Krumsiek
Barbara J. Krumsiek
Senior Vice President -- Principal Executive Officer
Date: December 27, 2011
Pursuant to the requirements of the Securities Exchange Act of 1934 and the Investment Act of 1940, this report has been signed below by the following persons on behalf of the registrant and in the capacities and on the dates indicated.
/s/ Barbara J. Krumsiek
Barbara J. Krumsiek
Senior Vice President -- Principal Executive Officer
Date: December 27, 2011
/s/ D. Wayne Silby
D. Wayne Silby
President -- Principal Executive Officer
Date: December 27, 2011
/s/ Ronald M. Wolfsheimer
Ronald M. Wolfsheimer
Treasurer -- Principal Financial Officer
Date: December 27, 2011