UNITED STATES
SECURITIES AND EXCHANGE COMMISSION
Washington, D.C. 20549
FORM N-CSR
CERTIFIED SHAREHOLDER REPORT OF REGISTERED
MANAGEMENT INVESTMENT COMPANIES
Investment Company Act file number: 811-3334
CALVERT SOCIAL INVESTMENT FUND
(Exact name of registrant as specified in charter)
4550 Montgomery Avenue
Suite 1000N
Bethesda, Maryland 20814
(Address of Principal Executive Offices)
William M. Tartikoff, Esq.
4550 Montgomery Avenue
Suite 1000N
Bethesda, Maryland 20814
(Name and Address of Agent for Service)
Registrant's telephone number, including area code: (301) 951-4800
Date of fiscal year end: September 30
Date of reporting period: Twelve months ended September 30, 2010
Choose Planet-friendly E-delivery!
Sign up now for on-line statements, prospectuses, and fund reports. In less than five minutes you can help reduce paper mail and lower fund costs.
Just go to www.calvert.com, click on My Account, and select the documents you would like to receive via e-mail.
If you’re new to account access, you’ll be prompted to set up a personal identification number for your account. Once you’re in, click on the E-delivery sign-up at the bottom of the Account Portfolio page and follow the quick, easy steps.
TABLE
OF CONTENTS
4 Founding Chairman’s Letter
8 President’s Letter
11 Money Market Portfolio Management Discussion
14 Balanced Portfolio Management Discussion
19 Bond Portfolio Management Discussion
24 Equity Portfolio Management Discussion
29 Enhanced Equity Portfolio Management Discussion
34 Shareholder Expense Example
39 Report of Independent Registered Public Accounting Firm
40 Statements of Net Assets
75 Notes to Statements of Net Assets
80 Statements of Operations
82 Statements of Changes in Net Assets
91 Notes to Financial Statements
107 Financial Highlights
127 Explanation of Financial Tables
129 Proxy Voting and Availability of Quarterly Portfolio Holdings
130 Trustee and Officer Information Table
Dear Shareholder,
As this fiscal year comes to a close, the country is still a bit shell-shocked from the effects of the Great Recession. The high unemployment rate of 9.6% as of September shows little sign of improvement. Housing prices have not recovered and millions of homes are in foreclosure. People are angry about Wall Street’s greed and the lack of concern shown for investors. Neither those who invested in the banks nor the banks themselves overall have made much money in recent years. In spite of this, the bank executives continue to take home billions in salaries and bonuses.
The good news in this story is the changing attitudes of many in the younger generation who are beginning to think in terms of taking charge through self reliance, social business, making an impact, and other world views your fund has long supported. Indeed, the most popular club now at Harvard Business School is the Social Enterprise Club.
In My View
Some suggest we are in a process of deleveraging our debts that will take several years to complete. It’s true that the negative U.S. savings rate we saw before the financial crisis is now a healthy positive number. But the higher savings rate has come at the cost of lower overall demand, which is keeping the economy in the doldrums. Economists have not yet figured out how to send a memo about this imbalance to the financial economy while keeping the real economy on track.
The Obama administration’s economists, whom I do admire, haven’t been able to articulate a vision to inspire the country forward. In fact, for the first time in American history, the next generation does not expect to live as well as their parents. We need programs that will provide America the productivity for the future and take care of the many retirees.
We also need to change our immigration policies and encourage more talented entrepreneurs to come here. And frankly, we need to make it simple for the new rich throughout the world to buy second homes, spend money, and educate their children in the universities here. We have borrowed so much money from abroad to buy goods from abroad that letting people spend those earnings in our great country would be a pretty good deal for the United States.
Since Congress can’t seem to agree on anything, the Federal Reserve is using its few remaining bullets to flood the country with money through what they call “Quantitative Easing Program #2” (QE2)--in short, printing money and buying up certain types of bonds to drive down long-term rates and “encourage” people to take more risk with their money. But monetary policy can only do so much, and forcing people onto a risk curve by not paying them for holding onto their money is a dubious policy that may end with much disappointment. Due to this QE2 policy, bond prices have risen and interest rates have fallen. Many now think, as I do, that it may be better for long-term investors to keep a good portion of their assets in stocks, particularly in U.S. companies that have substantial earnings from abroad, and take advantage of the recovery of stock markets around the world over the next few years.
We need more bold approaches and out-of-the-box ideas to get the economy moving again. As I write this, I am at an Opportunity Collaboration conference in Mexico, which is focused on serving the poor around the world. Perhaps we should be making major social impact investments to relieve poverty through training and infrastructure--like clean water--to enfranchise billions into the world economy. We need to have a vision for a global economy. And we need to build up the much larger emerging world so that it can buy the higher-value U.S. products and services that create sustainable jobs.
In the meantime, Calvert continues to work hard to ensure that you have a say in charting new paths to a more prosperous future. Below are a few ways we have done so over the past 12 months.
Shareholder Resolutions
For the 2010 proxy season, Calvert filed a record 45 resolutions—including 30 as the lead filer. Resolution issues focused on climate change, board and employee diversity, executive compensation, sustainability reporting, and political contributions. Thus far, we have negotiated 31 successful withdrawals after the companies have agreed to address our objectives.
The resolutions featured two new issues this year—climate change adaptation and board chair independence. The first asked Dover Corporation to report on how it plans to assess and manage the impact of climate change on its business. Management agreed, so the resolution was successfully withdrawn.
On the second new issue, we recommended that Chesapeake Energy and Eaton Corporation separate the Board of Directors Chair and CEO positions to strengthen the Board’s oversight of company management and accountability to shareholders (which is emerging as a corporate governance best practice). Both resolutions were successfully withdrawn after management agreed to appoint a Lead Independent Director.
Community Investments
Many of our Funds participate in Calvert’s High Social Impact Investing program, which is administered through the Calvert Social Investment Foundation. This community investment program may allocate a small percentage of Fund assets at below-market interest rates to investments that provide economic opportunity for struggling populations.1
The Foundation recently launched its Green Strategies to Fight Poverty™ investment initiative, which allows investors to target their Community Investment Note investments to organizations and projects that both fight poverty and protect the environment. Finally, although we were sad to see her go, we’re excited that Calvert Foundation President Shari Berenbach was asked to join the Obama administration and lead microfinance initiatives for USAID.
Special Equities
A modest but important portion of certain funds is allocated to small private companies that are developing products or services that address important sustainability or environmental issues. CSIF Equity Portfolio has invested in Marrone Bio Innovations, which uses bio-based systems to control pests and weeds and recently received emergency-use approval from the EPA to sell its new invasive mussel control system in certain areas of the western U.S. The company also submitted a second organic herbicide product--for use on both organic and industrial farms--for approval to the EPA.
Calvert Large Cap Growth Fund invested in the Berkeley Renewable Energy Asia Fund, which brings renewable energy to areas of the world without access to a central power grid. Led by a management team with a long history in the industry, Berkeley mitigates the construction risk by helping communities build the plants and then sell them to a service provider once they’re up and running.2
Finally, I just want to say that so many people at these conferences I attend have said thank you for the work Calvert’s been doing in this area for such a long time. While I am happy to hear their appreciation, the thanks truly go to you--because your participation in the Fund has made this pioneering work possible.
Wayne Silby
Founding Chair
October 2010
1 As of September 30, 2010, Calvert Social Investment Foundation Community Investment Notes represented the following percentages of Fund net assets: Calvert Social Investment Fund (CSIF) Balanced Portfolio 0.94%, CSIF Bond Portfolio 0.34%, CSIF Equity Portfolio 0.52%, Calvert Capital Accumulation Fund 1.29%, Calvert World Values International Equity Fund 1.19%, Calvert New Vision Small Cap Fund 0.78%, and Calvert Large Cap Growth Fund 0.56%. The Calvert Social Investment Foundation is a 501(c)(3) nonprofit organization. The Foundation’s Community Investment Note Program is not a mutual fund and should not be confused with any Calvert Group-sponsored investment product.
2 As of September 30, 2010, Marrone Bio Innovations represented 0.05% of CSIF Equity Portfolio; Berkeley Renewable Energy Asia Fund represented 0.002% of Calvert Large Cap Growth Fund. All holdings are subject to change without notice.
As of September 30, 2010, the following companies represented the following percentages of Fund net assets: Dover Corporation represented 0.15% of Calvert Social Index Fund. Chesapeake Energy represented 0.22% of CSIF Balanced Portfolio, 0.79% of CSIF Bond Portfolio, and 0.22% of Calvert Social Index Fund. Eaton Corporation represented 0.52% of CSIF Enhanced Equity Portfolio and 0.20% of Calvert Social Index Fund. All holdings are subject to change without notice.
Dear Shareholders:
Over the 12-month reporting period, the U.S. financial markets and economy continued to recover, in fits and starts, from the “Great Recession.” As economic data vacillated between good and bad news on employment, housing trends, business strength, and consumer confidence, market volatility and investor sentiment also see-sawed.
During the winter, investors became less risk averse, pouring money into higher-yielding areas of the bond market as well as stocks, which reached 18-month highs in March. Later in the spring, however, investor sentiment took an abrupt turn as confidence in the global economic recovery waned and fears of a double-dip recession grew. Following a dismal August for the stock market, September saw a surge in stock prices lifted by strong corporate earnings reports and renewed investor interest in bargain-priced stocks. In the bond market, Treasury yields moved lower over the 12-month reporting period and corporate bonds generally performed well.
Economic Recovery Slow But on Track
Looking ahead, the pace of economic recovery has clearly slowed, causing Federal Reserve (Fed) Chairman Ben Bernanke to say that the Fed stands ready to use all of the tools at its disposal to reinvigorate the U.S. economy. In our view, while the country faces sobering challenges related to the unemployment rate, high levels of government debt, and the stumbling housing market, we also see encouraging signs of economic recovery. Overall, companies have strong balance sheets and cash positions, have reported stronger-than-expected corporate earnings, and are investing in their businesses. Consumers are generally “deleveraging” by saving more and paying down their debt. Financial reform is under way in the U.S. that may help reassure investors and stabilize the markets. Globally, central banks around the world are continuing to pursue extremely accommodative monetary policies to encourage economic recovery.
In this transitional environment, we believe that both the equity and fixed-income markets are likely to continue to be somewhat volatile. In our view, investment strategies that include sustainability criteria may be better positioned to weather these uncertainties and provide long-term value.
Markets Challenged, But Gain Ground
Despite the volatility over the course of the 12-month reporting period, domestic and international stocks had moved solidly ahead by the end of the period. U.S. stock indexes reported 12-month gains across all styles, strategies, and capitalization ranges. The large-cap Russell 1000 Index and the Standard & Poor’s 500 Index returned 10.75% and 10.16%, respectively. Mid-cap stocks were the top-performing category, with the Russell Midcap Index up 17.54%, while the small-cap Russell 2000 Index rose 13.35%. In terms of style, growth stocks moderately outpaced value stocks. On the international front, the MSCI EAFE Investable Market Index (IMI), a benchmark for international stocks, edged up 4.23%, and the MSCI Emerging Markets IMI was up 21.97%.
In the fixed-income markets, the Barclays Capital U.S. Credit Index, a market barometer for investment-grade bonds, was up 11.67%. In line with the Fed’s federal funds rate target of 0% to 0.25%, money market returns remained very low.
The Gulf of Mexico Oil Spill and the Extractives Industry
In the wake of the April 20 oil spill in the Gulf of Mexico, Americans have continued to grapple with the devastation caused by the spill and its long-term environmental, societal, and economic implications. Calvert shares the concern and the frustration felt by the millions of people affected by this tragedy.
Following the spill, Calvert met with BP officials, urging BP not only to clean up the current spill, but also to implement stronger safety and process management standards for its contractors. We are also evaluating how our advocacy objectives with deepwater oil-drilling companies may help prevent such disasters in the future.
In terms of extraction methodologies, Calvert has long recognized that as readily accessible supplies of oil and gas dry up, companies may be forced to seek mineral resources in countries with poor governance, weak rule of law, and high levels of corruption. Accordingly, over the past two years, we have been a leading advocate for transparency requirements for extractive industries. In July, the U.S. Congress passed legislation requiring companies to disclose payments that they make to the U.S. or foreign governments for the purpose of commercial development of oil, natural gas, or minerals. We believe this legislation is a milestone toward helping advance environmental sustainability in this industry.
In our view, the oil spill also underlines the urgency for expanded investment—with greater federal incentives—in alternative energy sources.
Financial Reform Under Way
Looking ahead, long-awaited financial reform is under way with Congressional passage of the largest financial reform bill since the Great Depression. The Dodd-Frank Wall Street Reform and Consumer Protection Act (Dodd-Frank Act) is designed to address inadequate regulation of Wall Street firms and the type of unrestrained environment that contributed to the credit crisis of 2008 and the ensuing global market meltdown. The Dodd-Frank Act seeks to establish strong consumer protections, shield taxpayers from future corporate bailouts, shine a light on the “shadow markets” and derivatives trading, and expand the role of shareholders in corporate governance. While these goals are laudable, the impact of the Dodd-Frank Act on the financial industry—and ultimately its ability to prevent another financial crisis—must stand the test of time.
As the Obama administration and Congress work to implement key financial reforms, we believe that over time these efforts may work to redress some systemic imbalances in the financial system and provide additional stability to the economy and markets.
Review Your Portfolio Allocations
In our view, the financial markets are likely to be in transition for some time as the government tackles financial reform, the global economy continues to recover, and political elections in the U.S. impact a variety of government policies. Now may be an opportune time to review your overall investment strategy and portfolio allocations with your financial advisor. Check to ensure that your target mix of U.S. and international stocks, bonds, and cash is well-diversified and appropriate given your investment goals, stage of life, and attitude toward risk.
For up-to-date economic and market commentary from Calvert professionals, along with information on current Calvert sustainability initiatives, please visit our website,
www.calvert.com.
As always, we appreciate your investing with Calvert.
Sincerely,
Barbara J. Krumsiek
President and CEO
Calvert Group, Ltd.
October 2010
CSIF Money Market Portfolio
September 30, 2010
Investment Performance
(Total Return)
| 6 Months | 12 Months |
| ended | ended |
| 9/30/10 | 9/30/10 |
Class A | 0.005% | 0.01% |
Lipper Money Market Funds Average | 0.02% | 0.03% |
Average Annual Total Returns |
|
One year | 0.01% |
Five year | 2.51% |
Ten year | 2.16% |
7-Day Simple/Effective Yield |
|
|
|
7-day simple yield | 0.01% |
7-day effective yield | 0.01% |
| % of Total |
Investment Allocation | Investments |
Variable Rate | 80% |
Demand Notes |
|
U.S. Government Agencies and Instrumentalities | 14.7% |
Commercial Paper | 3.1% |
U.S. Treasury | 2.1% |
Loans and Deposit Receipts Guaranteed by U.S. Government Agencies | 0.1% |
Total | 100% |
Total return assumes reinvestment of dividends. The performance data shown represents past performance and does not guarantee future results. Investment return will fluctuate so that current performance may be lower or higher than the performance data quoted. An investment in the Fund/portfolio is not insured or guaranteed by the Federal Deposit Insurance Corporation or any other government agency. Although the Fund/Portfolio seeks to preserve the value of your investment at $1.00 per share, it is possible to lose money by investing in the Fund/Portfolio. Visit www.calvert.com for current performance data.
Portfolio
Management
Discussion
Thomas A. Dailey of Calvert Asset Management Company
Investment Performance
For the 12-month period ended September 30, 2010, CSIF Money Market Portfolio returned 0.005%. Its benchmark, the Lipper Money Market Funds Average, returned 0.03% over the same period. The reporting period featured extremely low short-term interest rates.
Investment Climate
The 12-month period that ended September 30, 2010 was another eventful chapter in the history of the U.S. economy and financial markets. The period can be divided, roughly, into three parts. The first, from fall 2009 through winter 2010, featured solid economic growth driven by federal stimulus funding and corporate inventory replenishment. During this time, interest rates increased, with the yield on 10-year Treasury notes reaching 4% early in April.1 The Federal Reserve (Fed) began to passively withdraw monetary stimulus and prepared to more actively draw off excess reserves later in the year.
In the spring, the brewing European sovereign debt crisis boiled over and investors’ risk aversion returned. The European Union and European Central Bank struggled to establish control, which eventually affected U.S. markets. Yields on liquid, low-risk instruments like Treasuries declined, while the prices of stocks and riskier bonds fell. In addition, there was evidence that the U.S. recovery had stumbled. Indeed, economic growth, which had reached a 5% annualized rate during the last quarter of 2009,2 slowed to 1.7% annualized for the April through June period. The pace of private sector job creation also slowed, and the Fed shelved its plan to withdraw monetary stimulus.
In the summer, European leaders firmly took control of the debt crisis. Investors’ risk appetite revived and markets recovered globally. Savers sought to escape money-market yields, which were near zero percent, and investors sought higher-yielding opportunities. The U.S. economic outlook, however, remained uncertain. During the last three months of the reporting period, the Fed made it clear that low interest rates would persist. In addition, the Fed revived its Treasury purchase program during August. Bonds continued to rally, providing strong returns in the July through September quarter.
As of early October, estimates of economic growth from the Wall Street Journal survey of economic forecasters indicated that the economy grew 3.2% over the entire reporting period. This is in line with the long-term average growth rate for the United States, but is only about one-half the pace experienced during the recovery stages of past deep recessions. We believe that the recovery phase will probably end in the first quarter of 2011, when GDP growth will likely match or eclipse its 2007 high.
The core inflation rate dropped steadily during the first half of the reporting period before settling at 0.9%. It has remained at that level for the past several months.3 The dollar declined broadly, except against the euro, as investors expected the U.S. government and central bank to continue to pursue weak-dollar policies to support exports.
Portfolio Strategy
Since the Fed kept the federal funds rate at historic lows during the period, we continued to invest primarily in variable-rate demand notes and U.S. Treasury and agency securities. This strategy allowed us to provide liquidity and preserve principal without sacrificing credit quality or increasing interest-rate risk.
Outlook
Looking ahead, we think that the process of economic recovery, repair, and restructuring after the severe financial crisis of 2008 and 2009 will continue. However, deleveraging in the private sector will probably continue to act as a drag on economic growth, limiting the strength of the recovery. We expect the Fed to continue with its expansionary monetary policy to support the anemic economic recovery. On the other hand, in the current political environment, we don’t foresee the passage of any large new fiscal stimulus packages unless the economy falls into another recession.
Since the Fed has continued to use the fed funds rate to keep short-term interest rates pegged to the floor, money-market yields remain paltry. Regardless, taxable and tax-exempt money-market assets remain substantial at roughly $2.8 trillion. When the fed funds rate eventually begins to rise, the rates on variable-rate demand notes will immediately rise in response, quickly passing the income benefits on to our investors.
October 2010
1 Source for interest rate data: Federal Reserve
2 Bureau of Economic Analysis
3 Bureau of Labor Statistics
CSIF Balanced
portfolio
September 30, 2010
Investment Performance
(total return at NAV*)
| 6 Months | 12 Months |
| ended | ended |
| 9/30/10 | 9/30/10 |
Class A | 1.11% | 9.12% |
Class B | 0.63% | 8.02% |
Class C | 0.71% | 8.17% |
Class I | 1.42% | 9.72% |
Russell 1000 Index** | -1.21% | 10.75% |
Balanced Composite Benchmark | 2.50% | 11.12% |
Lipper Mixed-Asset Target Allocation Growth Funds Average | 1.20% | 9.34% |
Ten Largest Stock Holdings
| % of Net Assets |
EMC Corp. | 1.7% |
Nike, Inc., Class B | 1.7% |
Express Scripts, Inc. | 1.7% |
Microsoft Corp. | 1.5% |
Aflac, Inc. | 1.5% |
Cummins, Inc. | 1.5% |
AT&T, Inc. | 1.5% |
Colgate-Palmolive Co. | 1.5% |
FMC Technologies, Inc. | 1.5% |
Qualcomm, Inc. | 1.4% |
Total | 15.5% |
*Investment performance/return at NAV does not reflect the deduction of the Fund’s maximum 4.75% front-end sales charge or any deferred sales charge.
**In December 2009 the Fund changed its broad-based benchmark to the Russell 1000 Index from the Calvert Balanced Composite Benchmark Blend (the “Balanced Composite Benchmark”), 60% of which is comprised of the Russell 1000 Index and 40% of which is comprised of the Barclays Capital U.S. Credit Index, in order to adopt an index that is not blended. The Fund also continues to show the Balanced Composite Benchmark because it is more consistent with the Fund’s portfolio construction process and represents a more accurate reflection of the Fund’s anticipated risk and return patterns.
Portfolio Management Discussion
Natalie A. Trunow,
Senior Vice President, Chief Investment Officer - Equities of Calvert Asset Management Company
Performance
CSIF Balanced Portfolio Class A shares (at NAV) returned 9.12% for the 12-month period ended September 30, 2010, underperforming its benchmark, the Russell 1000 Index, which posted a return of 10.75%. The Portfolio’s stock and bond allocations both contributed to the underperformance.
In the Portfolio Strategy discussion below, we provide an analysis of the performance of the Portfolio relative to a secondary benchmark, which is more representative of the stock and bond allocation of this Portfolio.
Investment Climate
After a year of uncertainty about global economic recovery, stock markets worldwide ended the reporting period in positive territory. Overall, markets have largely built on the rally that started in early March 2009 as investors fluctuated between optimism and uncertainty about the sustainability of an economic recovery, including fears of a double-dip recession. However, we saw sharp sell-offs in the second quarter of 2010 after dramatic downgrades in the sovereign creditworthiness of Greece, Spain, and Dubai rattled global financial markets and escalated the economic uncertainty. But European leaders gained control of the debt crisis during the summer--reviving investors’ risk appetite and helping markets recover globally.
In the U.S., economic news throughout the period suggested a slow and sometimes uneven recovery was underway. GDP growth in the fourth quarter of 2009 turned positive for the first time since the second quarter of 2008, largely due to government stimulus efforts. However, economic recovery in the second half of 2010 has been slower than most original forecasts, with early estimates of 2.4% for the second quarter of 2010 lowered to 1.7%.
The housing market improved for a time but fell again after the first-time homebuyer credit expired, so depressed home prices continued to weigh on consumers’ shaky confidence. Since consumer spending makes up 75% of the economy, recovery will remain slow until consumers become more comfortable.
Savers sought to escape money-market yields near zero percent, and investors sought higher-yielding opportunities. During the last quarter of the period, the Fed made it clear that low interest rates would continue and also restored its U.S. Treasuries purchase program. Bonds continued to rally and provide strong returns through period end.
Early October estimates from the Wall Street Journal survey of economic forecasters indicated the economy grew 3.2% over the entire reporting period. While this is in line with the long-term average growth rate for the U.S., it is only about one-half the pace during the recovery stages of past deep recessions. We believe the recovery phase will probably end in the first quarter of 2011, when GDP growth will likely match or eclipse its 2007 high.
Portfolio Strategy
Calvert generally maintains a weighting of 60% stocks and 40% bonds in the Portfolio. With the high level of market volatility over the past year, the actual weighting has fluctuated as stock and bond returns varied. Calvert tracked the Portfolio’s stock and bond exposure throughout the period to make sure this weighting did not fluctuate excessively. Still, the sudden market shifts created a slight drag on performance during the reporting period.
Equities
The Portfolio’s stock allocation underperformed for the period primarily due to poor stock selection in the Financials and Consumer Discretionary sectors. In the Consumer Discretionary sector, Kohl’s and McGraw-Hill were among the biggest contributors to this underperformance. In Financials , investments in Goldman Sachs, Northern Trust, and Principal Financial underperformed.1
However, stock selection in the Energy and Industrials sectors benefited the Portfolio. In Energy, Smith International rose after being acquired. EOG Resources and FMC Technologies produced strong returns as well. In the Industrials sector, heavy equipment manufacturers Cummins and Deere each gained more than 60%.
Fixed Income
While the gains from our yield-curve and credit-quality strategies helped the performance of the fixed-income portion of the Portfolio, these gains were more than offset by a relatively short duration.
At the beginning of the period, we positioned the bond portion of the Portfolio for a flattening yield curve, which helped as the yield differential between two- and 10-year U.S. Treasuries compressed from 2.36 percentage points to 2.09 percentage points over the past year.
Since we also anticipated a rising interest rate environment, we allocated 6.95% of the Portfolio’s fixed-income allocation to high-yield bonds, which are not in the benchmark index. Again, this proved to be favorable as high-yield securities, as measured by the Barclays Capital U.S. Corporate High Yield Index, returned 18.44% versus 11.67% for the broad investment-grade benchmark index.
However, these gains were not enough to overcome the disadvantage of the Portfolio’s short duration relative to the benchmark. (Duration is a measure of a portfolio’s sensitivity to changes in interest rates. The longer the duration, the greater the change in price relative to interest rate movements.) The Portfolio uses Treasury futures to hedge its interest rate position. As two- and 10-year Treasury yields fell, bond prices rose. While this helped the Portfolio’s absolute returns, it helped the benchmark, with its longer relative duration, more.
Outlook
Looking ahead, we believe the process of economic recovery, repair, and restructuring will continue. However, it’s likely that deleveraging in the private sector will continue to act as a drag on economic growth and limit the strength of the recovery. But while we anticipate a somewhat more challenged earnings environment later this year, we believe that corporate sector strength is likely to persist and continue to support the overall economic recovery.
We also believe that, given relative valuations and capital flows, the sharp outperformance of bonds versus equities over the past several months is bound to reverse, with equities likely outperforming bonds over the next six to 18 months. Overall, our outlook continues to call for a slow, gradual pace to the economic recovery and a generally positive environment for the markets, barring any major geopolitical calamities.
October 2010
1All returns shown for individual holdings reflect that part of the reporting period the holdings were held.
As of September 30, 2010, the following companies represented the following percentages of Portfolio net assets: Kohl’s 0%, McGraw-Hill 1.29%, Goldman Sachs 2.35%, Northern Trust 0%, Principal Financial 0%, Smith International 0%, EOG Resources 0%, FMC Technologies 3.06%, Cummins 3.55%, and Deere 1.20%. All holdings are subject to change without notice.
CSIF Balanced
portfolio
September 30, 2010
Average Annual Total Returns
Class A Shares | (with max. load) |
One year | 4.01% |
Five year | 0.06% |
Ten year | 0.17% |
|
|
Class B Shares | (with max. load) |
One year | 3.15% |
Five year | -0.16% |
Ten year | -0.35% |
|
|
Class C Shares | (with max. load) |
One year | 7.30% |
Five year | 0.12% |
Ten year | -0.30% |
|
|
Class I Shares* |
|
One year | 9.72% |
Five year | 1.56% |
Ten year | 1.10% |
|
|
|
|
Asset Allocation | % of Total Investments |
Equity Investments | 63% |
Bonds | 37% |
| 100% |
* Note Regarding Class I Shares Total Returns: There were times during the reporting period when there were no shareholders in Class I. For purposes of reporting Average Annual Total Return, Class A performance at NAV (i.e. does not reflect deduction of the Class A front-end sales charge) is used during these periods in which there were no shareholders in Class I. For purposes of this Average Annual Total Return, the Class A performance at NAV was used during the period June 30, 2003 through December 27, 2004.
Growth of $10,000
The graph below shows the value of a hypothetical $10,000 investment in the fund over the past 10 fiscal year periods or since inception (for funds without 10-year records). The results shown are for Class A shares and reflect the deduction of the maximum front-end Class A sales charge of 4.75% and assume the reinvestment of dividends. The result is compared with benchmarks that include a broad based market index and a Lipper peer group average. Market indexes are unmanaged and their results do not reflect the effect of expenses or sales charges. The Lipper average reflects the deduction of the category’s average front-end sales charge. The value of an investment in a different share class would be different.
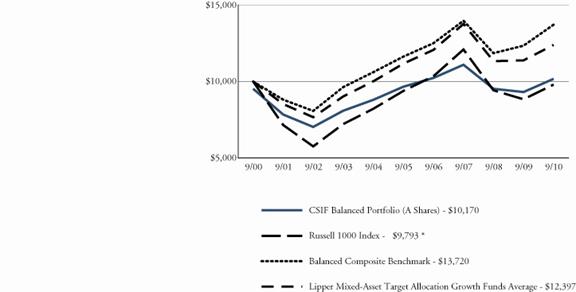
In December 2009 the Fund changed its broad-based benchmark to the Russell 1000 Index from the Calvert Balanced Composite Benchmark Blend (the “Balanced Composite Benchmark”), 60% of which is comprised of the Russell 1000 Index and 40% of which is comprised of the Barclays Capital U.S. Credit Index, in order to adopt an index that is not blended. The Fund also continues to show the Balanced Composite Benchmark because it is more consistent with the Fund’s portfolio construction process and represents a more accurate reflection of the Fund’s anticipated risk and return patterns.
All performance data shown, including the graph above and the adjacent table, represents past performance, does not guarantee future results, assumes reinvestment of dividends and distributions and does not reflect the deduction of taxes that a shareholder would pay on the Fund’s/Portfolio’s distributions or the redemption of the Fund/Portfolio shares. The investment return and principal value of an investment will fluctuate so that an investor’s shares, when redeemed, may be worth more or less than their original cost. Current performance may be lower or higher than the performance data quoted; for current performance data visit www.calvert.com. The gross expense ratio from the current prospectus for Class A shares is 1.31%. This number may differ from the expense ratio shown elsewhere in this report because it is based on a different tim e period and, if applicable, does not include fee or expense waivers. Performance data quoted already reflects the deduction of the Fund’s/Portfolio’s operating expenses.
CSIF Bond Portfolio
September 30, 2010
Investment Performance
(total return at NAV*)
| 6 Months | 12 Months |
| ended | ended |
| 9/30/10 | 9/30/10 |
Class A | 5.10% | 8.54% |
Class B | 4.58% | 7.47% |
Class C | 4.71% | 7.73% |
Class I | 5.48% | 9.26% |
Class Y | 5.24% | 8.83% |
Barclays Capital U.S. Credit Index | 8.07% | 11.67% |
Lipper A-Rated Corporate Debt Funds Average | 6.18% | 9.93% |
SEC Yields
| 30 days ended | |
| 9/30/10 | 9/30/09 |
Class A | 2.02% | 2.44% |
Class B | 1.06% | 1.58% |
Class C | 1.32% | 1.76% |
Class I | 2.71% | 3.15% |
Class Y | 2.32% | 2.76% |
* Investment performance/return at NAV does not reflect the deduction of the Fund’s maximum 3.75% front-end sales charge or any deferred sales charge.
Portfolio Management Discussion
Gregory Habeeb
Senior Vice President and Senior Portfolio Manager of Calvert Asset Management Company
Performance
For the 12-month reporting period ended September 30, 2010, CSIF Bond Portfolio Class (A shares at NAV) returned 8.54%, underperforming its benchmark, the Barclays Capital U.S. Credit Index (the “Index”), which returned 11.67% for the same period. The Fund’s relatively short duration was the primary reason for its underperformance.
Investment Climate
The 12-month period that ended September 30, 2010 was another eventful chapter in the history of the U.S. economy and financial markets. The period can be divided, roughly, into three parts. The first, from fall 2009 through winter 2010, featured solid economic growth driven by federal stimulus funding and corporate inventory replenishment. During this time, interest rates increased, with the yield on 10- year Treasury notes reaching 4% early in April.1 The Federal Reserve (Fed) began to passively withdraw monetary stimulus and prepared to more actively draw off excess reserves later in the year.
In the spring, the brewing European sovereign debt crisis boiled over and investors’ risk aversion returned. The European Union and European Central Bank struggled to establish control, which eventually affected U.S. markets. Yields on liquid, low-risk instruments like Treasuries declined, while the prices of stocks and riskier bonds fell. In addition, there was evidence that the U.S. recovery had stumbled. Indeed, economic growth, which had reached a 5% annualized rate during the last quarter of 2009,2 slowed to 1.7% annualized for the April through June period. The pace of private sector job creation also slowed, and the Fed shelved its plan to withdraw monetary stimulus.
In the summer, European leaders firmly took control of the debt crisis. Investors’ risk appetite revived and markets recovered globally. Savers sought to escape money-market yields, which were near zero percent, and investors sought higher-yielding opportunities. The U.S. economic outlook, however, remained uncertain. During the last three months of the reporting period, the Fed made it clear that low interest rates would persist. In addition, the Fed revived its Treasury purchase program during August. Bonds continued to rally, providing strong returns in the July through September quarter.
As of early October, estimates of economic growth from the Wall Street Journal survey of economic forecasters indicated that the economy grew 3.2% over the entire reporting period. This is in line with the long-term average growth rate for the United States, but is only about one-half the pace experienced during the recovery stages of past deep recessions. We believe that the recovery phase will probably end in the first quarter of 2011, when GDP growth will likely match or eclipse its 2007 high.
The core inflation rate dropped steadily during the first half of the reporting period before settling at 0.9%. It has remained at that level for the past several months.3 The dollar declined broadly, except against the euro, as investors expected the U.S. government and central bank to continue to pursue weak-dollar policies to support exports.
Portfolio Strategy
At the beginning of the reporting period, we expected the yield difference between long- and short-maturity Treasury securities to narrow. Consequently, we positioned the Portfolio for a flattening yield curve. As we thought, over the full reporting period the yield differential between two- and 10-year Treasuries compressed from 2.36 percentage points to 2.09 percentage points.
We also anticipated a rising interest rate environment in which returns on corporate and high-yield securities would continue to outpace Treasury returns. Accordingly, at the beginning of the reporting period, 6.95% of the Portfolio’s assets were allocated to high-yield bonds, which are not included in the benchmark index. High-yield securities, as measured by the Barclays Capital U.S. Corporate High Yield Index, returned 18.44% during the period, while the broad investment-grade benchmark index returned 11.67%.
Both our yield-curve and credit-quality strategies helped relative returns during the reporting period. However, these gains were more than offset by the Portfolio’s short duration relative to the benchmark. Duration is a measure of a portfolio’s sensitivity to changes in interest rates. The longer the duration, the greater the change in price relative to interest rate movements. The Portfolio uses Treasury futures to hedge its interest rate position. Over the 12-month reporting period, two- and 10-year Treasury yields fell by 52 and 80 basis points,4 respectively. Typically, when bond yields decline, bond prices increase. Consequently, the fund experienced a smaller increase in value than the benchmark because it had a shorter duration.
Outlook
Looking ahead, we think that the process of economic recovery, repair, and restructuring will persist. However, deleveraging in the private sector probably will continue to act as a drag on economic growth, limiting the strength of the recovery. We expect the Fed to continue to pursue expansionary monetary policy to support economic recovery. On the other hand, in the current political environment, we don’t foresee the passage of any large new fiscal stimulus packages unless the economy falls into another recession.
October 2010
1 Source for interest rate data: Federal Reserve
2 Bureau of Economic Analysis
3 Bureau of Labor Statistics
4 A basis point is 0.01 percentage points.
CSIF Bond Portfolio
September 30, 2010
| % of Total |
Economic Sectors | Investments |
Asset Backed Securities | 3.9% |
Communications | 1.9% |
Consumer, Cyclical | 1.1% |
Consumer, Non-cyclical | 2.0% |
Energy | 5.1% |
Financials | 35.5% |
Government | 41.8% |
Industrials | 2.7% |
Mortgage Securities | 4.8% |
Technology | 0.9% |
Utilities | 0.3% |
Total | 100% |
CSIF Bond Portfolio
September 30, 2010
Average Annual Total Returns
Class A Shares | (with max. load) |
One year | 4.42% |
Five year | 4.09% |
Ten year | 5.80% |
|
|
Class B Shares | (with max. load) |
One year | 3.40% |
Five year | 3.87% |
Ten year | 5.19% |
|
|
Class C Shares | (with max. load) |
One year | 6.67% |
Five year | 4.06% |
Ten year | 5.27% |
|
|
Class I Shares |
|
One year | 9.19% |
Five year | 5.52% |
Ten year | 6.83% |
|
|
Class Y Shares* |
|
One year | 8.76% |
Five year | 4.98% |
Ten year | 6.25% |
* Calvert Social Investment Fund Bond Portfolio first offered Class Y shares on October 31, 2008. Performance prior to that date reflects the performance of Class A shares at net asset value (NAV). Actual Class Y share performance would have been different.
Growth of $10,000
The graph below shows the value of a hypothetical $10,000 investment in the fund over the past 10 fiscal year periods or since inception (for funds without 10-year records). The results shown are for Class A shares and reflect the deduction of the maximum front-end sales Class A charge of 3.75% and assume the reinvestment of dividends. The result is compared with benchmarks that include a broad based market index and a Lipper peer group average. Market indexes are unmanaged and their results do not reflect the effect of expenses or sales charges. The Lipper average reflects the deduction of the category’s average front-end sales charge. The value of an investment in a different share class would be different.

All performance data shown, including the graph above and the adjacent table, represents past performance, does not guarantee future results, assumes reinvestment of dividends and distributions and does not reflect the deduction of taxes that a shareholder would pay on the Fund’s/Portfolio’s distributions or the redemption of the Fund/Portfolio shares. The investment return and principal value of an investment will fluctuate so that an investor’s shares, when redeemed, may be worth more or less than their original cost. Current performance may be lower or higher than the performance data quoted; for current performance data visit www.calvert.com. The gross expense ratio from the current prospectus for Class A shares is 1.15%. This number may differ from the expense ratio shown elsewhere in this report because it is based on a different tim e period and, if applicable, does not include fee or expense waivers. Performance data quoted already reflects the deduction of the Fund’s/Portfolio’s operating expenses.
CSIF Equity Portfolio
September 30, 2010
Investment Performance
(total return at NAV*)
| 6 Months | 12 Months |
| ended | ended |
| 9/30/10 | 9/30/10 |
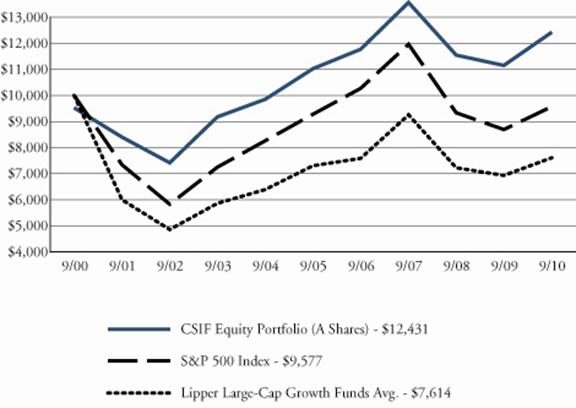
Class A | 0.93% | 11.44% |
Class B | 0.46% | 10.40% |
Class C | 0.54% | 10.57% |
Class I | 1.20% | 12.04% |
Class Y | 1.05% | 11.73% |
S&P 500 Index | -1.42% | 10.16% |
Lipper Large-Cap Growth Funds Avg. | -1.18% | 10.19% |
Ten Largest Stock Holdings
| % of Net Assets |
NetFlix, Inc. | 4.6% |
Apple, Inc. | 4.4% |
QUALCOMM, Inc. | 4.2% |
Novartis AG (ADR) | 3.6% |
Hewlett-Packard Co. | 3.6% |
CVS Caremark Corp. | 3.5% |
Target Corp. | 3.0% |
Google, Inc. | 2.7% |
Gilead Sciences, Inc. | 2.7% |
Cisco Systems, Inc. | 2.7% |
Total | 35.0% |
*Investment performance/return at NAV does not reflect the deduction of the Fund’s maximum 4.75% front-end sales charge or any deferred sales charge.
Portfolio Management Discussion
Richard England
of Atlanta Capital Management Company
Performance
For the 12 months ended September 30, 2010, CSIF Equity Portfolio Class A shares (at NAV) returned 11.44%, compared with a return of 10.16% for the Standard and Poor’s (S&P) 500 Index. Strong stock selection in the Consumer Discretionary and Industrial sectors was primarily responsible for the outperformance.
Investment Climate
According to the government, the most recent recession ended in the summer of 2009. While that may be technically true, you’d have a hard time convincing most Americans. Unemployment remains high, housing is still in a funk, and much of the domestic economy simply feels stuck in the mud, so consumers are understandably in a sour mood. This has been turning the political environment on its head and keeping consumer spending uneven.
With the economy slowly bumping along, the stock market has struggled to turn the surge that began in March 2009 into a sustainable advance. We saw mostly improving economic conditions, and progress was sufficient to keep stocks generally moving higher. All that changed by April of this year. Between new fears about sovereign debt in Europe, some softer economic data in the U.S., and the thoroughly depressing oil spill in the Gulf of Mexico, investors grew skeptical about the recovery’s durability and reduced their risk exposures. As a result, stocks slid sharply into early summer.
It’s been a roller coaster since then, as stocks have risen or fallen the same 10%-12% three times. We closed out this reporting period near the high end of that range. Not only are investors lacking confidence that the U.S. economy can sustain even the tepid recovery to date, they’re also not confident that foreign economies can make up for our weakness. Finally, confidence is rapidly decreasing that politicians and policymakers care about, understand, or are capable of responding to the challenges that businesses and consumers are facing. Markets hate uncertainty and, unfortunately, we’ve got a lot of it right now.
The market’s pronounced volatility over the past year makes it tough to draw meaningful conclusions about sector performance. Among the few things that do make sense, Financials brought up the rear with a 3% decline. We think these stocks are generally quite cheap, but they need stronger conviction about a recovery to do well. It’s also understandable that Energy and Health Care lagged the market. Energy is dependent on the perception of strong global growth and the spill in the Gulf has set back the sector’s fundamentals. Health Care fundamentals are slipping a bit, partly due to the early impact of health care reform.
Some less intuitive results include Consumer Discretionary and Telecommunications stocks fighting for the top spot. Consumer Discretionary includes more than retailers, but is nonetheless tied to consumers being willing to part with their dollars. On the other hand, Telecommunications is a classic defensive sector that usually only does well when the stock market is sinking. Finally, Industrials were also strong--reflecting better growth in developing markets and, more importantly, sector-wide operational improvements that resulted in much greater earnings and cash flow than during the last recession.
Portfolio Strategy
Repositioning the Portfolio in late 2008 for the recovery we anticipated in 2009 proved crucial to our outperformance over the reporting period, despite the economic recovery lagging expectations. The changes we have made over the last 12 months have been more subtle. Individual stock decisions were the primary source of our positive relative performance, but sector-level shifts have been a net plus too.
In fact, more than 25% of our holdings—16 stocks in all—rose by more than double the market average. Netflix led the pack by a wide margin, rising 251%.1 The company has vanquished nearly all of its DVD rental competition and has been staking out an equally dominant position in Internet movie delivery—the rental method of the future. Other large gainers included Deere, Apple, and Priceline, although the latter was more about Internet hotel reservations in Europe than the “name your price” model seen in U.S. television ads.
Unfortunately, a few of our stock picks didn’t fare as well--most notably, retailer GameStop. Price-cutting last holiday season caused the company’s profits to fall well short of expectations. Believing the problems may persist, we sold the stock in January. Gilead Sciences, the leading maker of biotech drugs for HIV treatment, declined as budget pressures in various government entities modestly reduced reimbursements. While the impact on profits has been small, the market is concerned about how robustly the company can continue to grow.
As for sector positioning, an increased weighting in Consumer Discretionary and reduced weighting in Health Care helped performance. An increased weighting in Financials has not yet paid off. However, we continue to believe Financials stocks are significantly undervalued and expect this position to help performance in the year ahead.
Outlook
The stock market seems to be at a crossroads. We believe it is a mistake for investors to reduce their stock exposure in the face of all this economic uncertainty, and that stocks are quite attractive. In fact, we believe there’s compelling evidence to suggest an above-average decade may be ahead for equities. In broad terms, the best time to invest is when few are willing--and following what seems fashionable or obvious has historically been a losing strategy for the long term.
Our base case is that the U.S. economy will avoid a double dip recession in the short term. We believe the recovery will continue to gather momentum, though we aren’t forecasting robust growth. Corporate America should continue to post solid earnings and cash flow. Balance sheets are already quite strong and cash will likely be channeled into increased share repurchases, dividends, and mergers and acquisitions. All of this supports higher stock prices.
While it’s always tough to forecast near-term movements in stock prices, we believe a gradual economic recovery and solid earnings growth should allow respectable gains over the coming 12 months. We continue to search for companies with the best combinations of strong earnings growth and reasonable valuation. Overall, we think the more muted economic environment in the near- to intermediate-term should favor the type of high-quality growth-oriented stocks that make up the Portfolio.
October 2010
1All returns shown for individual holdings reflect that part of the reporting period the holdings were held.
As of September 30, 2010, the following companies represented the following percentages of Fund net assets: Netflix 4.58%, Deere 0.83%, Apple 4.40%, Priceline 1.57%, GameStop 0%, and Gilead Sciences 2.69%. All holdings are subject to change without notice.
Equity Portfolio Statistics
September 30, 2010
| % of Total |
Economic Sectors | Investments |
Consumer Discretionary | 16.1% |
Consumer Staples | 9.0% |
Energy | 7.1% |
Financials | 13.4% |
Government | 2.9% |
Health Care | 14.6% |
Industrials | 9.8% |
Information Technology | 24.1% |
Limited Partnership Interest | 0.1% |
Materials | 2.3% |
Venture Capital | 0.6% |
Total | 100% |
CSIF Equity Portfolio
September 30, 2010
Average Annual Total Returns
Class A Shares | (with max. load) |
One year | 6.15% |
Five year | 1.43% |
Ten year | 2.20% |
|
|
Class B Shares | (with max. load) |
One year | 5.40% |
Five year | 1.34% |
Ten year | 1.79% |
|
|
Class C Shares | (with max. load) |
One year | 9.57% |
Five year | 1.63% |
Ten year | 1.88% |
|
|
Class I Shares |
|
One year | 12.04% |
Five year | 2.98% |
Ten year | 3.24% |
|
|
Class Y Shares* |
|
One year | 11.73% |
Five year | 2.54% |
Ten year | 2.76% |
*Calvert Social Investment Fund Equity Portfolio first offered Class Y shares on October 31, 2008. Performance prior to that date reflects the performance of Class A shares at net asset value (NAV). Actual Class Y share performance would have been different.
Growth of $10,000
The graph below shows the value of a hypothetical $10,000 investment in the fund over the past 10 fiscal year periods or since inception (for funds without 10-year records). The results shown are for Class A shares and reflect the deduction of the maximum front-end sales Class A charge of 4.75% and assume the reinvestment of dividends. The result is compared with benchmarks that include a broad based market index and a Lipper peer group average. Market indexes are unmanaged and their results do not reflect the effect of expenses or sales charges. The Lipper average reflects the deduction of the category’s average front-end sales charge. The value of an investment in a different share class would be different.
All performance data shown, including the graph above and the adjacent table, represents past performance, does not guarantee future results, assumes reinvestment of dividends and distributions and does not reflect the deduction of taxes that a shareholder would pay on the Fund’s/Portfolio’s distributions or the redemption of the Fund/Portfolio shares. The investment return and principal value of an investment will fluctuate so that an investor’s shares, when redeemed, may be worth more or less than their original cost. Current performance may be lower or higher than the performance data quoted; for current performance data visit www.calvert.com. The gross expense ratio from the current prospectus for Class A shares is 1.28%. This number may differ from the expense ratio shown elsewhere in this report because it is based on a different tim e period and, if applicable, does not include fee or expense waivers. Performance data quoted already reflects the deduction of the Fund’s/Portfolio’s operating expenses.
CSIF Enhanced Equity
Portfolio
September 30, 2010
Investment Performance
(total return at NAV*)
| 6 Months | 12 Months |
| ended | ended |
| 9/30/10 | 9/30/10 |
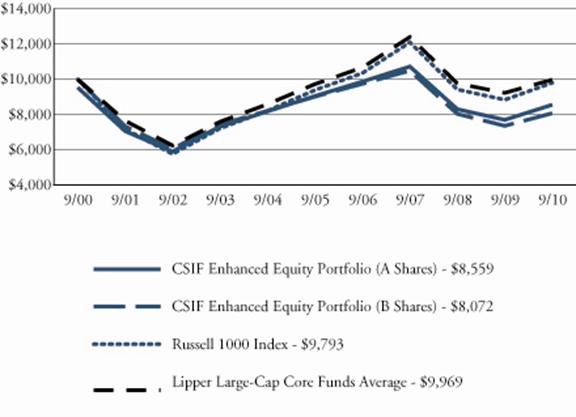
Class A | -1.89% | 11.10% |
Class B | -2.44% | 9.79% |
Class C | -2.27% | 10.18% |
Class I | -1.61% | 11.77% |
Russell 1000 Index | -1.21% | 10.75% |
Lipper Large-Cap Core Funds Average | -2.62% | 7.93% |
Ten Largest Stock Holdings
| % of Net Assets |
Apple, Inc. | 4.5% |
AT&T, Inc. | 3.7% |
Johnson & Johnson | 3.7% |
Microsoft Corp. | 3.6% |
JPMorgan Chase & Co. | 3.3% |
Bank of America Corp. | 3.1% |
Intel Corp. | 2.7% |
Home Depot, Inc. | 2.6% |
DIRECTV | 2.5% |
Costco Wholesale Corp. | 2.5% |
Total | 32.2% |
*Investment performance/return at NAV does not reflect the deduction of the Fund’s maximum 4.75% front-end sales charge or any deferred sales charge.
Portfolio Management Discussion
Natalie A. Trunow,
Senior Vice President, Chief Investment Officer - Equities of Calvert Asset Management Company
Performance
CSIF Enhanced Equity Portfolio Class A shares (at NAV) returned 11.10% for the 12-month period ended September 30, 2010, outperforming the 10.75% return of the Russell 1000 Index. The Fund’s outperformance was driven primarily by strong stock selection, although sector allocation also helped returns.
Investment Climate
After a year of uncertainty about global economic recovery, markets worldwide ended the reporting period in positive territory. In the U.S., the Standard & Poor’s 500 and Russell 1000 Indices returned 10.16% and 10.75%, respectively. Abroad, the Morgan Stanley Capital International Europe, Australasia, Far East Index (MSCI EAFE) rose 3.71% and the MSCI Emerging Markets Index gained 4.23%.
In general, growth stocks outperformed value stocks, as the Russell 1000 Growth Index outperformed the Russell 1000 Value Index with a return of 12.65% versus 8.90%. Mid-cap stocks were the best-performing domestic asset class for the year with a return of 17.54%, besting both large-cap stocks and the small-cap stocks of the Russell 2000 Index, which returned 13.35%.1
Overall, markets have largely built on the rally that started in early March 2009 as investors fluctuated between optimism and uncertainty about the sustainability of an economic recovery, including fears of a double-dip recession. However, we saw some market disruption, particularly sharp sell-offs in the second quarter of 2010, as the uncertainty escalated, causing the re-pricing of risk in both equity and fixed-income assets.
Dramatic downgrades in the sovereign creditworthiness of Greece, Spain, and Dubai rattled global financial markets in the spring of 2010--leading many to question the overall strength of the euro-zone’s economic recovery. In response, several European Union countries implemented austerity programs to slash their budget deficits and slow economic growth, and a new set of rules to toughen European banks’ capital and liquidity requirements was introduced.
China had some success with its attempt to engineer a soft landing for its overheated economy, which should improve global growth prospects--especially since it is now the world’s second-largest economy, eclipsing Japan in the second quarter of 2010, according to gross domestic product (GDP) data.
In the U.S., economic news throughout the period suggested a slow and sometimes uneven recovery was underway. GDP growth in the fourth quarter of 2009 turned positive for the first time since the second quarter of 2008, largely due to government stimulus efforts designed to increase consumer spending and inventory rebuilding. However, economic recovery in the second half of 2010 has been slower than most original forecasts, with early estimates of 2.4% for the second quarter of 2010 lowered to 1.7%.
Several conflicting trends have contributed to this slowdown. On the positive side, corporations have reported higher-than-expected earnings this year. Corporate sector strength also continues to boost company balance sheets and cash flow, fueling strong merger and acquisition (M&A) activity. Unfortunately, while M&A activity benefits many of the businesses involved and their stock prices, the net outcome is usually a reduction in the workforce, which exacerbates the already high unemployment rate.
The housing market improved for a time as home prices stabilized and purchases increased, but fell again after the first-time homebuyer credit expired. Depressed home prices and shrinking home equity, not to mention the uncertainties in the foreclosure process, weighed on consumers’ shaky confidence. Since consumer spending makes up 75% of the economy, recovery will remain slow until consumers become more comfortable. In the meantime, consumers continued to take on less debt, spend less, and save more.
Budget deficit levels are at unprecedented highs and remain a risk area. Despite the positive inflation numbers, the Federal Reserve (Fed) has maintained its commitment to keep interest rates low and away from deflationary territory.
Portfolio Strategy
For the reporting period, strong stock selection was the main driver of the Portfolio’s outperformance, particularly in the Energy, Utilities, and Industrials sectors. Stock selection was also positive in the Consumer Staples, Health Care, Telecommunications, and Materials sectors.
On an individual stock basis, Apple, Estee Lauder, and Lubrizol were the top contributors to relative performance over this period. Calvert’s environmental, social, and governance (ESG) criteria also added value, with the exclusion of ExxonMobil adding 0.57 percentage points to the Portfolio’s active return.
On the other hand, stock selection in the Financials, Information Technology, and Consumer Discretionary sectors hampered relative performance. Top stock detractors included JPMorgan Chase, Microsoft, EnCana, and Intel.
Given that our investment process is designed to emphasize stock selection, we do not expect sector selection to play a large role in performance. However, an overweight to Consumer Discretionary and an underweight to Energy slightly increased the Portfolio’s return for the period.
Outlook
We believe that, given relative valuations and capital flows, the sharp outperformance of bonds versus equities over the past several months is bound to reverse, with equities likely outperforming bonds over the next six to 18 months. In September, equity markets looked more attractive relative to bonds than they have since 1993 (except for the market bottom in March of 2009), with 10-year Treasuries yielding 2.51% versus the Dow Jones Industrial Average’s dividend yield of 2.6%, and an attractive forward price/earnings multiple of 12.2.
The economy has slowed, but sustained economic recovery continues. As we have said in the past, we don’t believe negative GDP growth is likely, which would constitute a double-dip recession. While we anticipate a somewhat more challenged earnings environment later this year, we believe that corporate sector strength is likely to persist and continue to support the overall economic recovery. Overall, our outlook continues to call for a slow, gradual pace to the economic recovery and a generally positive environment for stock picking, barring any major geopolitical calamities.
October 2010
1 Mid-cap stocks are represented by the Russell Mid Cap Index. Large cap stocks are represented by the Russell 1000 Index, which returned 10.75%
As of September 30, 2010, the following companies represented the following percentages of Fund net assets: Apple 4.51%, Estee Lauder 0%, Lubrizol, ExxonMobil 0%, JPMorgan Chase 3.31%, Microsoft 3.62%, EnCana 1.76%, and Intel 2.70%. All holdings are subject to change without notice.
CSIF Enhanced Equity Portfolio
September 30, 2010
| % of Total |
Economic Sectors | Investments |
Consumer Discretionary | 13.9% |
Consumer Staples | 7.5% |
Energy | 7.3% |
Financials | 15.0% |
Health Care | 14.8% |
Industrials | 13.9% |
Information Technology | 17.9% |
Materials | 1.0% |
Telecommunication Services | 4.2% |
Utilities | 4.5% |
Total | 100% |
Enhanced Equity
Portfolio Statistics
September 30, 2010
Average Annual Total Returns
Class A Shares | (with max. load) |
One year | 5.82% |
Five year | -2.07% |
Ten year | -1.54% |
|
|
Class B Shares | (with max. load) |
One year | 4.79% |
Five year | -2.38% |
Ten year | -2.12% |
|
|
Class C Shares | (with max. load) |
One year | 9.18% |
Five year | -1.97% |
Ten year | -2.00% |
|
|
Class I Shares* |
|
One year | 11.77% |
Five year | -0.65% |
Ten year | -0.72% |
* Note Regarding Class I Shares Total Returns: There were times during the reporting period when there were no shareholders in Class I. For purposes of reporting Average Annual Total Return, Class A performance at NAV (i.e. does not reflect deduction of the Class A front-end sales charge) is used during these periods in which there were no shareholders in Class I. For purposes of this Average Annual Total Return, the Class A performance at NAV was used during the period January 18, 2002 through April 29, 2005.
Growth of $10,000
The graph below shows the value of a hypothetical $10,000 investment in the fund over the past 10 fiscal year periods or since inception (for funds without 10-year records). The results shown are for Classes A and B shares and reflect the deduction of Class A’s the maximum front-end sales charge of 4.75% and assume the reinvestment of dividends. The result is compared with benchmarks that include a broad based market index and a Lipper peer group average. Market indexes are unmanaged and their results do not reflect the effect of expenses or sales charges. The Lipper average reflects the deduction of the category’s average front-end sales charge. The value of an investment in a different share class would be different.
All performance data shown, including the graph above and the adjacent table, represents past performance, does not guarantee future results, assumes reinvestment of dividends and distributions and does not reflect the deduction of taxes that a shareholder would pay on the Fund’s/Portfolio’s distributions or the redemption of the Fund/Portfolio shares. The investment return and principal value of an investment will fluctuate so that an investor’s shares, when redeemed, may be worth more or less than their original cost. Current performance may be lower or higher than the performance data quoted; for current performance data visit www.calvert.com. The gross expense ratio from the current prospectus for Class A shares is 1.54%. This number may differ from the expense ratio shown elsewhere in this report because it is based on a different tim e period and, if applicable, does not include fee or expense waivers. Performance data quoted already reflects the deduction of the Fund’s/Portfolio’s operating expenses.
Shareholder Expense Example
As a shareholder of the Portfolio, you incur two types of costs: (1) transaction costs, including sales charges and redemption fees; and (2) ongoing costs, including management fees; distribution (12b-1) fees; and other Portfolio expenses. This Example is intended to help you understand your ongoing costs (in dollars) of investing in the Portfolio and to compare these costs with the ongoing costs of investing in other mutual funds.
This Example is based on an investment of $1,000 invested at the beginning of the period and held for the entire period (April 1, 2010 to September 30, 2010).
Actual Expenses
The first line of the table below provides information about actual account values and actual expenses. You may use the information in this line, together with the amount you invested, to estimate the expenses that you paid over the period. Simply divide your account value by $1,000 (for example, an $8,600 account value divided by $1,000 = 8.6), then multiply the result by the number in the first line under the heading entitled “Expenses Paid During Period” to estimate the expenses you paid on your account during this period.
The Money Market Portfolio charges a monthly low balance account fee of $3 to those shareholders whose account balance is less than $2,000. The Enhanced Equity Portfolio charges an annual low balance account fee of $15 to those shareholders whose regular account balance is less than $5,000.
Hypothetical Example for Comparison Purposes
The second line of the table below provides information about hypothetical account values and hypothetical expenses based on the Portfolio’s actual expense ratios and an assumed rate of return of 5% per year before expenses, which is not the Portfolio’s actual return. The hypothetical account values and expenses may not be used to estimate the actual ending account balance or expenses you paid for the period. You may use this information to compare the ongoing costs of investing in the Portfolio and other funds. To do so, compare the 5% hypothetical example with the 5% hypothetical examples that appear in the shareholder reports of the other funds.
Please note that the expenses shown in the table are meant to highlight your ongoing costs only and do not reflect any transactional costs, such as sales charges (loads) or redemption fees. Therefore, the second line of the table is useful in comparing ongoing costs only, and will not help you determine the relative total costs of owning different funds. In addition, if these transactional costs were included, your costs would have been higher.
| Beginning | Ending Account | Expenses Paid |
| Account Value | Value | During Period* |
CSIF Money Market | 4/1/10 | 9/30/10 | 4/1/10 - 9/30/10 |
Actual | $1,000.00 | $1,000.05 | $2.36 |
Hypothetical | $1,000.00 | $1,022.71 | $2.38 |
(5% return per |
|
|
|
year before expenses) |
|
|
|
*Expenses for Money Market are equal to the annualized expense ratio of .47%, multiplied by the average account value over the period, multiplied by 183/365 (to reflect the one-half year period).
| Beginning | Ending Account | Expenses Paid |
| Account Value | Value | During Period* |
CSIF Balanced | 4/1/10 | 9/30/10 | 4/1/10 - 9/30/10 |
Class A |
|
|
|
Actual | $1,000.00 | $1,011.10 | $6.14 |
Hypothetical | $1,000.00 | $1,018.96 | $6.16 |
(5% return per |
|
|
|
year before expenses) |
|
|
|
Class B |
|
|
|
Actual | $1,000.00 | $1,006.30 | $11.34 |
Hypothetical | $1,000.00 | $1,013.76 | $11.38 |
(5% return per |
|
|
|
year before expenses) |
|
|
|
Class C |
|
|
|
Actual | $1,000.00 | $1,007.10 | $10.58 |
Hypothetical | $1,000.00 | $1,014.52 | $10.62 |
(5% return per |
|
|
|
year before expenses) |
|
|
|
Class I |
|
|
|
Actual | $1,000.00 | $1,014.20 | $3.64 |
Hypothetical | $1,000.00 | $1,021.46 | $3.65 |
(5% return per |
|
|
|
year before expenses) |
|
|
|
*Expenses for Balanced are equal to the annualized expense ratios of 1.22%, 2.26%, 2.10% and .72% for Class A, Class B, Class C and Class I, respectively, multiplied by the average account value over the period, multiplied by 183/365 (to reflect the one-half year period).
| Beginning | Ending Account | Expenses Paid |
| Account Value | Value | During Period* |
CSIF Bond | 4/1/10 | 9/30/10 | 4/1/10 - 9/30/10 |
Class A |
|
|
|
Actual | $1,000.00 | $1,051.00 | $5.80 |
Hypothetical | $1,000.00 | $1,019.42 | $5.71 |
(5% return per |
|
|
|
year before expenses) |
|
|
|
Class B |
|
|
|
Actual | $1,000.00 | $1,045.80 | $11.15 |
Hypothetical | $1,000.00 | $1,014.17 | $10.97 |
(5% return per |
|
|
|
year before expenses) |
|
|
|
Class C |
|
|
|
Actual | $1,000.00 | $1,047.10 | $9.82 |
Hypothetical | $1,000.00 | $1,015.47 | $9.67 |
(5% return per |
|
|
|
year before expenses) |
|
|
|
Class I |
|
|
|
Actual | $1,000.00 | $1,054.80 | $2.65 |
Hypothetical | $1,000.00 | $1,022.49 | $2.60 |
(5% return per |
|
|
|
year before expenses) |
|
|
|
Class Y |
|
|
|
Actual | $1,000.00 | $1,052.40 | $4.73 |
Hypothetical | $1,000.00 | $1,020.46 | $4.66 |
(5% return per |
|
|
|
year before expenses) |
|
|
|
*Expenses for Bond are equal to the annualized expense ratios of 1.13%, 2.17%, 1.91%, .51% and .92% for Class A, Class B, Class C, Class I and Class Y, respectively, multiplied by the average account value over the period, multiplied by 183/365 (to reflect the one-half year period).
| Beginning | Ending Account | Expenses Paid |
| Account Value | Value | During Period* |
CSIF Equity | 4/1/10 | 9/30/10 | 4/1/10 - 9/30/10 |
Class A |
|
|
|
Actual | $1,000.00 | $1,009.30 | $6.13 |
Hypothetical | $1,000.00 | $1,018.97 | $6.16 |
(5% return per |
|
|
|
year before expenses) |
|
|
|
Class B |
|
|
|
Actual | $1,000.00 | $1,004.60 | $10.63 |
Hypothetical | $1,000.00 | $1,014.47 | $10.68 |
(5% return per |
|
|
|
year before expenses) |
|
|
|
Class C |
|
|
|
Actual | $1,000.00 | $1,005.40 | $10.04 |
Hypothetical | $1,000.00 | $1,015.06 | $10.09 |
(5% return per |
|
|
|
year before expenses) |
|
|
|
Class I |
|
|
|
Actual | $1,000.00 | $1,012.00 | $3.39 |
Hypothetical | $1,000.00 | $1,021.70 | $3.41 |
(5% return per |
|
|
|
year before expenses) |
|
|
|
Class Y |
|
|
|
Actual | $1,000.00 | $1,010.50 | $4.84 |
Hypothetical | $1,000.00 | $1,020.26 | $4.86 |
(5% return per |
|
|
|
year before expenses) |
|
|
|
*Expenses for Equity are equal to the annualized expense ratios of 1.22%, 2.11%, 2.00%, .67%, and .96% for Class A, Class B, Class C, Class I and Class Y, respectively, multiplied by the average account value over the period, multiplied by 183/365 (to reflect the one-half year period).
| Beginning | Ending Account | Expenses Paid |
| Account Value | Value | During Period* |
CSIF Enhanced Equity | 4/1/10 | 9/30/10 | 4/1/10 - 9/30/10 |
Class A |
|
|
|
Actual | $1,000.00 | $981.10 | $6.81 |
Hypothetical | $1,000.00 | $1,018.19 | $6.94 |
(5% return per |
|
|
|
year before expenses) |
|
|
|
Class B |
|
|
|
Actual | $1,000.00 | $975.60 | $13.18 |
Hypothetical | $1,000.00 | $1,011.72 | $13.42 |
(5% return per |
|
|
|
year before expenses) |
|
|
|
Class C |
|
|
|
Actual | $1,000.00 | $977.30 | $11.49 |
Hypothetical | $1,000.00 | $1,013.45 | $11.70 |
(5% return per |
|
|
|
year before expenses) |
|
|
|
Class I |
|
|
|
Actual | $1,000.00 | $983.90 | $4.03 |
Hypothetical | $1,000.00 | $1,021.01 | $4.10 |
(5% return per |
|
|
|
year before expenses) |
|
|
|
*Expenses for Enhanced Equity are equal to the annualized expense ratios of 1.37%, 2.66%, 2.32% and .81% for Class A, Class B, Class C, and Class I respectively, multiplied by the average account value over the period, multiplied by 183/365 (to reflect the one-half year period).
report of independent registered public accounting firm
The Board of Trustees and Shareholders of Calvert Social Investment Fund:
We have audited the accompanying statements of net assets of the Calvert Money Market, Balanced, Bond, Equity, and Enhanced Equity Portfolios (collectively the Portfolios), each a series of the Calvert Social Investment Fund, as of September 30, 2010, and the related statements of operations for the year then ended, the statements of changes in net assets for each of the years in the two-year period then ended, and the financial highlights for each of the years in the five-year period then ended. These financial statements and financial highlights are the responsibility of the Portfolios’ management. Our responsibility is to express an opinion on these financial statements and financial highlights based on our audits.
We conducted our audits in accordance with the standards of the Public Company Accounting Oversight Board (United States). Those standards require that we plan and perform the audit to obtain reasonable assurance about whether the financial statements and financial highlights are free of material misstatement. An audit includes examining, on a test basis, evidence supporting the amounts and disclosures in the financial statements. Our procedures included confirmation of securities owned as of September 30, 2010, by correspondence with custodians and brokers or other appropriate auditing procedures. An audit also includes assessing the accounting principles used and significant estimates made by management, as well as evaluating the overall financial statement presentation. We believe that our audits provide a reasonable basis for our o pinion.
In our opinion, the financial statements and financial highlights referred to above present fairly, in all material respects, the financial position of the Calvert Money Market, Balanced, Bond, Equity, and Enhanced Equity Portfolios as of September 30, 2010, the results of their operations for the year then ended, the changes in their net assets for each of the years in the two-year period then ended, and the financial highlights for each of the years in the five-year period then ended, in conformity with U.S. generally accepted accounting principles.
/s/KPMG LLP
Philadelphia, Pennsylvania
November 24, 2010
MONEY MARKET PORTFOLIO
statement of net assets
september 30, 2010
U.S. Government Agencies |
| Principal |
| |
And Instrumentalities - 14.6% Fannie Mae Discount Notes: |
| Amount | Value | |
12/21/10 |
| $2,000,000 | $1,998,515 | |
1/3/11 |
| 2,000,000 | 1,997,963 | |
5/4/11 |
| 2,000,000 | 1,996,656 | |
Federal Farm Credit Bank, 0.656%, 11/24/10 (r) |
| 2,000,000 | 1,999,912 | |
Federal Home Loan Bank: |
|
|
| |
0.48%, 10/25/10 |
| 2,000,000 | 2,000,031 | |
0.69%, 11/8/10 (r) |
| 850,000 | 850,224 | |
0.28%, 11/10/10 |
| 2,000,000 | 1,999,873 | |
3.625%, 12/17/10 |
| 1,220,000 | 1,228,328 | |
0.35%, 4/1/11 |
| 1,000,000 | 999,721 | |
0.70%, 4/18/11 |
| 2,000,000 | 2,001,535 | |
0.80%, 5/6/11 |
| 2,000,000 | 2,002,877 | |
Freddie Mac Discount Notes, 11/16/10 |
| 2,000,000 | 1,999,259 | |
|
|
|
| |
Total U.S. Government Agencies and Instrumentalities (Cost $21,074,894) |
|
| 21,074,894 | |
|
|
|
| |
|
|
|
| |
|
|
|
| |
Depository Receipts for U.S. Government Guaranteed Loans - 0.1% Colson Services Corporation Loan Sets: |
|
|
| |
2.00%, 1/22/11 (c)(h)(r) |
| 924 | 924 | |
2.25%, 3/23/12 (c)(h)(r) |
| 30,726 | 30,743 | |
2.125%, 5/29/12 (c)(h)(r) |
| 73,447 | 73,446 | |
2.00%, 8/10/12 (c)(h)(r) |
| 94,958 | 95,082 | |
|
|
|
| |
Total Depository Receipts For U.S. Government Guaranteed Loans (Cost $200,195) |
|
| 200,195 | |
|
|
|
| |
|
|
|
| |
|
|
|
| |
Variable Rate Demand Notes - 79.4% 2880 Stevens Creek LLC, 0.30%, 11/1/33, LOC: Bank of the West (r) |
| 2,080,000 | 2,080,000 | |
Akron Hardware Consultants, Inc., 0.60%, 11/1/22, LOC: FirstMerit Bank, C/LOC: FHLB (r) |
| 1,512,000 | 1,512,000 | |
Bayfront Regional Development Corp., 0.28%, 11/1/27, LOC: PNC Bank (r) |
| 6,000,000 | 6,000,000 | |
Blount County Tennessee Public Building Authority Revenue, 0.31%, 6/1/26, LOC: KBC Bank (r) |
| 5,000,000 | 5,000,000 | |
Bochasanwais Shree Akshar Purushottam Swaminarayan Sanstha, |
| |||
Inc., 0.76%, 6/1/22, LOC: Comerica Bank (r) |
| 2,160,000 | 2,160,000 | |
Butler County Alabama IDA Revenue, 0.95%, 3/1/12, LOC: Whitney National Bank, C/LOC: FHLB (r) |
| 390,000 | 390,000 | |
| Principal |
| ||
Variable Rate Demand Notes - Cont’d | Amount | Value | ||
California Statewide Communities Development Authority MFH Revenue: |
|
|
| |
0.43%, 11/1/31, LOC: U.S. Bank (r) |
| $1,475,000 | $1,475,000 | |
0.27%, 3/15/34, LOC: Fannie Mae (r) |
| 1,650,000 | 1,650,000 | |
CIDC-Hudson House LLC New York Revenue, 0.90%, 12/1/34, |
|
| ||
LOC: Hudson River Bank & Trust, C/LOC: FHLB (r) |
| 405,000 | 405,000 | |
Florida State Housing Finance Corp. MFH Revenue: |
|
|
| |
0.26%, 10/15/32, LOC: Fannie Mae (r) |
| 230,000 | 230,000 | |
0.33%, 11/1/32, LOC: Freddie Mac (r) |
| 550,000 | 550,000 | |
Series B, 0.34%, 10/15/32, LOC: Fannie Mae (r) |
| 2,000,000 | 2,000,000 | |
Series J-2, 0.34%, 10/15/32, LOC: Fannie Mae (r) |
| 1,830,000 | 1,830,000 | |
HBPWH Building Co., 0.33%, 11/1/22, LOC: Wells Fargo Bank (r) | 795,000 | 795,000 | ||
HHH Investment Co., 0.30%, 7/1/29, LOC: Bank of the West (r) | 2,050,000 | 2,050,000 | ||
Hills City Iowa Health Facilities Revenue, 0.33%, 8/10/35, LOC: U.S. Bank (r) |
| 3,925,000 | 3,925,000 | |
Kaneville Road Joint Venture, Inc., 0.38%, 11/1/32, LOC: First American Bank, C/LOC: FHLB (r) |
| 6,975,000 | 6,975,000 | |
Kansas State Development Finance Authority MFH Revenue, 0.27%, 7/1/30, LOC: Freddie Mac (r) |
| 400,000 | 400,000 | |
Legacy Park LLC, 0.61%, 1/1/58, LOC: Fifth Third Bank (r) |
| 1,000,000 | 1,000,000 | |
Los Angeles California MFH Revenue, 0.24%, 12/15/34, LOC: Fannie Mae (r) |
| 800,000 | 800,000 | |
Main & Walton Development Co., 0.27%, 9/1/26, LOC: Sovereign Bank, C/LOC: FHLB (r) |
| 4,780,000 | 4,780,000 | |
Milpitas California MFH Revenue, 0.25%, 8/15/33, LOC: Fannie Mae (r) |
| 200,000 | 200,000 | |
Montgomery New York Industrial Development Board Pollution Control Revenue, 0.40%, 5/1/25, LOC: FHLB (r) |
| 2,780,000 | 2,780,000 | |
Ness Family Partners LP, 0.37%, 9/1/34, LOC: Bank of the West (r) | 915,000 | 915,000 | ||
New Jersey Economic Development Authority Revenue, 0.23%, 9/1/31, LOC: Lloyds TSB Bank, LOC: Bank of Nova Scotia (r) |
| 3,000,000 | 3,000,000 | |
New York City GO, 0.31%, 1/1/36, LOC: Dexia Credit Local (r) |
| 5,200,000 | 5,200,000 | |
New York City Housing Development Corp. MFH Revenue: |
|
|
| |
0.27%, 11/1/23, LOC: Freddie Mac (r) |
| 1,400,000 | 1,400,000 | |
0.25%, 11/15/31, LOC: Fannie Mae (r) |
| 1,450,000 | 1,450,000 | |
0.25%, 11/15/35, LOC: Fannie Mae (r) |
| 1,595,000 | 1,595,000 | |
0.25%, 12/1/35, LOC: Freddie Mac (r) |
| 10,810,000 | 10,810,000 | |
0.25%, 11/15/37, LOC: Fannie Mae (r) |
| 1,800,000 | 1,800,000 | |
New York State MMC Corp. Revenue, 0.90%, 11/1/35, LOC: JPMorgan Chase Bank (r) |
| 3,865,000 | 3,865,000 | |
Osprey Property Co., LLC, 0.28%, 6/1/27, LOC: Wells Fargo Bank (r) | 4,600,000 | 4,600,000 | ||
Peoploungers, Inc., 0.45%, 4/1/18, LOC: Bank of New Albany, C/LOC: FHLB (r) |
| 2,040,000 | 2,040,000 | |
Portage Indiana Industrial Pollution Control Revenue, 0.52%, 5/1/18, LOC: Bank of Tokyo-Mitsubishi UFJ (r) |
| 5,150,000 | 5,150,000 | |
Rathbone LLC, 0.35%, 1/1/38, LOC: Comerica Bank (r) |
| 3,575,000 | 3,575,000 | |
Scottsboro Alabama Industrial Development Board Revenue, 0.33%, 10/1/10, LOC: Wells Fargo Bank (r) |
| 180,000 | 180,000 | |
Shawnee Kansas Private Activity Revenue, 0.60%, 12/1/12, LOC: JPMorgan Chase Bank (r) |
| 2,230,000 | 2,230,000 | |
Sheridan Colorado Redevelopment Agency Tax Allocation, 0.75%, 12/1/29, LOC: Citibank (r) |
| 5,600,000 | 5,600,000 | |
| Principal |
| ||
Variable Rate Demand Notes - Cont’d | Amount | Value | ||
Spencer County Indiana Industrial Pollution Control Revenue, 0.52%, 11/1/18, LOC: Mizuho Corp. Bank Ltd. (r) |
| $1,500,000 | $1,500,000 | |
St. Joseph County Indiana Economic Development Revenue, 1.76%, 6/1/27, LOC: FHLB (r) |
| 275,000 | 275,000 | |
Utah State Housing Corp. MFH Revenue, 0.28%, 4/1/42, LOC: Freddie Mac (r) |
| 2,000,000 | 2,000,000 | |
Utah State Housing Corp. Single Family Revenue, 0.33%, 7/1/36, |
| |||
LOC: Fannie Mae & Freddie Mac (r) |
| 2,070,000 | 2,070,000 | |
Virginia Commonwealth University Health System Revenue, 0.26%, |
| |||
7/1/37, LOC: Branch Bank & Trust (r) |
| 2,000,000 | 2,000,000 | |
Washington State MFH Finance Commission Revenue: |
|
|
| |
0.32%, 6/15/32, LOC: Fannie Mae (r) |
| 815,000 | 815,000 | |
0.32%, 7/15/32, LOC: Fannie Mae (r) |
| 190,000 | 190,000 | |
0.28%, 7/15/34, LOC: Fannie Mae (r) |
| 1,470,000 | 1,470,000 | |
0.24%, 5/15/35, LOC: Fannie Mae (r) |
| 650,000 | 650,000 | |
0.24%, 5/1/37, LOC: Freddie Mac (r) |
| 1,350,000 | 1,350,000 | |
|
|
|
| |
Total Variable Rate Demand Notes (Cost $114,717,000) |
|
| 114,717,000 | |
|
|
|
| |
|
|
|
| |
|
|
|
| |
Commercial Paper - 3.1% |
|
|
| |
Metropolitan Washington DC Airport Authority System Revenue: |
| |||
0.55%, 10/13/10, LOC: Landesbank Baden-Wuerttemberg |
| 3,000,000 | 3,000,000 | |
0.63%, 11/4/10, LOC: Landesbank Baden-Wuerttemberg |
| 1,500,000 | 1,500,000 | |
|
|
|
| |
Total Commercial Paper (Cost $4,500,000) |
|
| 4,500,000 | |
|
|
|
| |
|
|
|
| |
|
|
|
| |
U.S. Treasury - 2.1% United States Treasury Notes: |
|
|
| |
1.25%, 11/30/10 |
| 1,000,000 | 1,001,769 | |
0.875%, 5/30/11 |
| 2,000,000 | 2,008,540 | |
|
|
|
| |
Total U.S. Treasury (Cost $3,010,309) |
|
| 3,010,309 | |
|
|
|
| |
|
|
|
| |
|
|
|
| |
TOTAL INVESTMENTS (Cost $143,502,398) - 99.3% |
|
| 143,502,398 | |
Other assets and liabilities, net - 0.7% |
|
| 1,072,637 | |
Net Assets - 100% |
|
| $144,575,035 | |
|
|
|
| |
|
|
|
| |
|
|
|
| |
|
|
|
| |
Net Assets Consist of: |
|
|
| |
Paid-in capital applicable to the following shares of beneficial interest |
| |||
unlimited number of no par value shares authorized, |
|
| 144,643,638 | |
shares outstanding |
|
| $144,584,191 | |
Undistributed net investment income |
|
| 6,532 | |
Accumulated net realized gain (loss) on investments |
|
| (15,688) | |
|
|
|
| |
|
|
|
| |
Net Assets |
|
| $144,575,035 | |
|
|
|
| |
Net Assets Value Per Share |
|
| $1.00 | |
See notes to financial statements.
BALANCED PORTFOLIO
statement of net assets
september 30, 2010
Equity Securities - 62.3% |
| Shares | Value |
|
Aerospace & Defense - 0.5% |
|
|
|
|
BE Aerospace, Inc.* |
| 50,485 | $1,530,200 |
|
Rockwell Collins, Inc. |
| 16,700 | 972,775 |
|
|
|
| 2,502,975 |
|
|
|
|
|
|
Air Freight & Logistics - 1.4% |
|
|
|
|
C.H. Robinson Worldwide, Inc. |
| 55,400 | 3,873,568 |
|
FedEx Corp. |
| 14,907 | 1,274,549 |
|
United Parcel Service, Inc., Class B |
| 21,515 | 1,434,835 |
|
|
|
| 6,582,952 |
|
|
|
|
|
|
Beverages - 0.3% |
|
|
|
|
PepsiCo, Inc. |
| 20,945 | 1,391,586 |
|
|
|
|
|
|
Biotechnology - 0.4% |
|
|
|
|
Amgen, Inc.* |
| 19,810 | 1,091,729 |
|
Gilead Sciences, Inc.* |
| 20,600 | 733,566 |
|
|
|
| 1,825,295 |
|
|
|
|
|
|
Capital Markets - 2.5% |
|
|
|
|
Federated Investors, Inc., Class B |
| 12,500 | 284,500 |
|
Franklin Resources, Inc. |
| 40,900 | 4,372,210 |
|
Goldman Sachs Group, Inc. |
| 33,600 | 4,857,888 |
|
SEI Investments Co. |
| 14,200 | 288,828 |
|
T. Rowe Price Group, Inc. |
| 29,314 | 1,467,605 |
|
|
|
| 11,271,031 |
|
|
|
|
|
|
Chemicals - 1.2% |
|
|
|
|
Ecolab, Inc. |
| 110,200 | 5,591,548 |
|
|
|
|
|
|
Commercial Banks - 2.1% |
|
|
|
|
PNC Financial Services Group, Inc. |
| 97,300 | 5,050,843 |
|
US Bancorp |
| 210,900 | 4,559,658 |
|
|
|
| 9,610,501 |
|
|
|
|
|
|
Communications Equipment - 2.7% |
|
|
|
|
Cisco Systems, Inc. * |
| 58,380 | 1,278,522 |
|
Harris Corp. |
| 46,400 | 2,055,056 |
|
Motorola, Inc.* |
| 253,600 | 2,163,208 |
|
QUALCOMM, Inc. |
| 147,090 | 6,636,701 |
|
|
|
| 12,133,487 |
|
|
|
|
|
|
|
|
|
|
|
Equity Securities - Cont’d |
| Shares | Value |
|
Computers & Peripherals - 3.2% |
|
|
|
|
Apple, Inc.* |
| 20,100 | $5,703,375 |
|
EMC Corp.* |
| 392,614 | 7,973,990 |
|
Western Digital Corp.* |
| 37,400 | 1,061,786 |
|
|
|
| 14,739,151 |
|
|
|
|
|
|
Consumer Finance - 1.5% |
|
|
|
|
American Express Co. |
| 31,000 | 1,302,930 |
|
Capital One Financial Corp. |
| 141,900 | 5,612,145 |
|
|
|
| 6,915,075 |
|
|
|
|
|
|
Diversified Financial Services - 1.5% |
|
|
|
|
Bank of America Corp. |
| 89,897 | 1,178,550 |
|
First Republic Preferred Capital Corp., Preferred (e) |
| 500 | 514,000 |
|
IntercontinentalExchange, Inc.* |
| 26,500 | 2,775,080 |
|
JPMorgan Chase & Co. |
| 25,245 | 961,077 |
|
Woodbourne Capital: |
|
|
|
|
Trust I, Preferred (b)(e) |
| 500,000 | 335,000 |
|
Trust II, Preferred (b)(e) |
| 500,000 | 335,000 |
|
Trust III, Preferred (b)(e) |
| 500,000 | 335,000 |
|
Trust IV, Preferred (b)(e) |
| 500,000 | 335,000 |
|
|
|
| 6,768,707 |
|
|
|
|
|
|
Diversified Telecommunication Services - 1.5% |
|
|
|
|
AT&T, Inc. |
| 237,615 | 6,795,789 |
|
|
|
|
|
|
Electronic Equipment & Instruments - 0.5% |
|
|
|
|
Amphenol Corp. |
| 25,600 | 1,253,888 |
|
Jabil Circuit, Inc. |
| 76,150 | 1,097,322 |
|
|
|
| 2,351,210 |
|
|
|
|
|
|
Energy Equipment & Services - 2.5% |
|
|
|
|
Cameron International Corp.* |
| 114,500 | 4,918,920 |
|
FMC Technologies, Inc.* |
| 97,300 | 6,644,617 |
|
|
|
| 11,563,537 |
|
|
|
|
|
|
Food & Staples Retailing - 1.3% |
|
|
|
|
Costco Wholesale Corp. |
| 14,080 | 908,019 |
|
Sysco Corp. |
| 183,900 | 5,244,828 |
|
|
|
| 6,152,847 |
|
|
|
|
|
|
Food Products - 1.8% |
|
|
|
|
General Mills, Inc. |
| 32,700 | 1,194,858 |
|
Hershey Co. |
| 114,600 | 5,453,814 |
|
Kellogg Co. |
| 15,800 | 798,058 |
|
McCormick & Co., Inc. |
| 19,500 | 819,780 |
|
|
|
| 8,266,510 |
|
|
|
|
|
|
Gas Utilities - 1.3% |
|
|
|
|
Oneok, Inc. (s) |
| 133,700 | 6,021,848 |
|
|
|
|
|
|
|
|
|
|
|
Equity Securities - Cont’d |
| Shares | Value |
|
Health Care Equipment & Supplies - 2.9% |
|
|
|
|
DENTSPLY International, Inc. |
| 34,600 | $1,106,162 |
|
Hologic, Inc.* |
| 105,560 | 1,690,016 |
|
Intuitive Surgical, Inc.* |
| 14,500 | 4,114,230 |
|
Medtronic, Inc. |
| 34,726 | 1,166,099 |
|
St. Jude Medical, Inc.* |
| 137,100 | 5,393,514 |
|
|
|
| 13,470,021 |
|
|
|
|
|
|
Health Care Providers & Services - 2.9% |
|
|
|
|
Express Scripts, Inc.* |
| 157,060 | 7,648,822 |
|
Laboratory Corp. of America Holdings* |
| 53,900 | 4,227,377 |
|
Lincare Holdings, Inc. |
| 27,350 | 686,212 |
|
Quest Diagnostics, Inc. |
| 11,024 | 556,381 |
|
|
|
| 13,118,792 |
|
|
|
|
|
|
Household Products - 1.7% |
|
|
|
|
Colgate-Palmolive Co. |
| 86,886 | 6,678,058 |
|
Procter & Gamble Co. |
| 18,200 | 1,091,454 |
|
|
|
| 7,769,512 |
|
|
|
|
|
|
Industrial Conglomerates - 1.2% |
|
|
|
|
3M Co. |
| 61,100 | 5,297,981 |
|
|
|
|
|
|
Insurance - 1.6% |
|
|
|
|
Aflac, Inc. |
| 133,500 | 6,903,285 |
|
CNO Financial Group, Inc.* |
| 48,476 | 268,557 |
|
|
|
| 7,171,842 |
|
|
|
|
|
|
Internet & Catalog Retail - 1.2% |
|
|
|
|
Amazon.com, Inc.* |
| 35,300 | 5,544,218 |
|
|
|
|
|
|
Internet Software & Services - 0.5% |
|
|
|
|
Akamai Technologies, Inc.* |
| 21,709 | 1,089,357 |
|
Google, Inc.* |
| 2,430 | 1,277,670 |
|
|
|
| 2,367,027 |
|
|
|
|
|
|
IT Services - 1.7% |
|
|
|
|
Fiserv, Inc.* |
| 5,000 | 269,100 |
|
International Business Machines Corp. |
| 9,800 | 1,314,572 |
|
Teradata Corp.* |
| 159,800 | 6,161,888 |
|
|
|
| 7,745,560 |
|
|
|
|
|
|
Life Sciences - Tools & Services - 1.3% |
|
|
|
|
Waters Corp.* |
| 83,226 | 5,890,736 |
|
|
|
|
|
|
Machinery - 2.2% |
|
|
|
|
Cummins, Inc. |
| 75,200 | 6,811,616 |
|
Deere & Co. |
| 37,400 | 2,609,772 |
|
Graco, Inc. |
| 14,800 | 469,604 |
|
|
|
| 9,890,992 |
|
|
|
|
|
|
Media - 0.6% |
|
|
|
|
McGraw-Hill Co.’s, Inc. |
| 88,400 | 2,922,504 |
|
|
|
|
|
|
Equity Securities - Cont’d |
| Shares | Value |
|
Multiline Retail - 1.3% |
|
|
|
|
Target Corp. |
| 110,300 | $5,894,432 |
|
|
|
|
|
|
Oil, Gas & Consumable Fuels - 2.2% |
|
|
|
|
Cimarex Energy Co. |
| 69,500 | 4,599,510 |
|
Plains Exploration & Production Co.* |
| 34,600 | 922,782 |
|
Southwestern Energy Co.* |
| 142,200 | 4,755,168 |
|
|
|
| 10,277,460 |
|
|
|
|
|
|
Personal Products - 1.2% |
|
|
|
|
Avon Products, Inc. |
| 172,600 | 5,542,186 |
|
|
|
|
|
|
Pharmaceuticals - 1.5% |
|
|
|
|
Forest Laboratories, Inc.* |
| 179,700 | 5,558,121 |
|
Johnson & Johnson |
| 18,900 | 1,171,044 |
|
|
|
| 6,729,165 |
|
|
|
|
|
|
Professional Services - 0.2% |
|
|
|
|
Manpower, Inc. |
| 16,601 | 866,572 |
|
|
|
|
|
|
Semiconductors & Semiconductor Equipment - 1.7% |
|
|
|
|
Intel Corp. |
| 61,596 | 1,184,491 |
|
NVIDIA Corp.* |
| 58,390 | 681,995 |
|
Texas Instruments, Inc. |
| 216,900 | 5,886,666 |
|
|
|
| 7,753,152 |
|
|
|
|
|
|
Software - 3.9% |
|
|
|
|
Adobe Systems, Inc.* |
| 115,155 | 3,011,303 |
|
Citrix Systems, Inc.* |
| 22,900 | 1,562,696 |
|
Intuit, Inc.* |
| 142,300 | 6,234,163 |
|
Microsoft Corp. |
| 283,970 | 6,954,426 |
|
|
|
| 17,762,588 |
|
|
|
|
|
|
Specialty Retail - 1.7% |
|
|
|
|
Best Buy Co., Inc. |
| 155,970 | 6,368,255 |
|
Home Depot, Inc. |
| 42,540 | 1,347,667 |
|
|
|
| 7,715,922 |
|
|
|
|
|
|
Textiles, Apparel & Luxury Goods - 1.7% |
|
|
|
|
Nike, Inc., Class B |
| 96,180 | 7,707,865 |
|
|
|
|
|
|
Venture Capital - 1.5% |
|
|
|
|
Agraquest, Inc.: |
|
|
|
|
Series B, Preferred (b)(i)* |
| 190,477 | 52,990 |
|
Series C, Preferred (b)(i)* |
| 117,647 | 37,910 |
|
Series H, Preferred (b)(i)* |
| 4,647,053 | 441,805 |
|
Allos Therapeutics, Inc.* |
| 42,819 | 202,106 |
|
CFBanc Corp. (b)(i)* |
| 27,000 | 410,832 |
|
Community Bank of the Bay* |
| 4,000 | 11,600 |
|
Consensus Orthopedics, Inc.: |
|
|
|
|
Common Stock (b)(i)* |
| 180,877 | - |
|
Series A-1, Preferred (b)(i)* |
| 420,683 | - |
|
Series B, Preferred (b)(i)* |
| 348,940 | 17,447 |
|
Series C, Preferred (b)(i)* |
| 601,710 | 120,342 |
|
|
|
|
|
|
Equity Securities - Cont’d |
| Shares | Value |
|
Venture Capital - Cont’d |
|
|
|
|
Distributed Energy Systems Corp.* |
| 14,937 | $60 |
|
Environmental Private Equity Fund II, Liquidating Trust (b)(i)* |
| 200,000 | 16,648 |
|
Evergreen Solar, Inc.* |
| 66,000 | 48,444 |
|
Neighborhood Bancorp (b)(i)* |
| 10,000 | 100,000 |
|
Plethora Technology, Inc.: |
|
|
|
|
Common Warrants (strike price $0.01/share, expires 4/29/15) (b)(i)* |
| 72,000 | - |
|
Series A, Preferred (a)(b)(i)* |
| 825,689 | - |
|
Series A, Preferred Warrants (strike price $0.85/share, |
|
|
|
|
expires 6/9/13) (b)(i)* |
| 176,471 | - |
|
Series A, Preferred Warrants (strike price $0.85/share, expires |
|
|
|
|
9/6/13) (b)(i)* |
| 88,236 | - |
|
Seventh Generation, Inc. (b)(i)* |
| 200,295 | 4,066,962 |
|
SmarThinking, Inc.: |
|
|
|
|
Series 1-A, Convertible Preferred (b)(i) |
| 104,297 | 318,794 |
|
Series 1-B, Convertible Preferred (b)(i) |
| 163,588 | 168,370 |
|
Series 1-B, Preferred Warrants (strike price $0.01/share, |
|
|
|
|
expires 5/31/15) (b)(i)* |
| 11,920 | 12,149 |
|
Series 1-B, Preferred Warrants (strike price $1.53/share, |
|
|
|
|
expires 6/1/15) (b)(i)* |
| 32,726 | - |
|
Wild Planet Entertainment, Inc.: |
|
|
|
|
Series B, Preferred (b)(i)* |
| 476,190 | 599,685 |
|
Series E, Preferred (b)(i)* |
| 129,089 | 162,567 |
|
Wind Harvest Co., Inc. (b)(i)* |
| 8,696 | 1 |
|
|
|
| 6,788,712 |
|
|
|
|
|
|
Wireless Telecommunication Services - 1.4% |
|
|
|
|
NII Holdings, Inc.* |
| 150,800 | 6,197,880 |
|
|
|
|
|
|
|
|
|
|
|
Total Equity Securities (Cost $256,990,667) |
|
| 284,909,168 |
|
|
|
|
|
|
|
| Principal |
|
|
Venture Capital Debt Obligations - 0.5% |
| Amount |
|
|
Access Bank plc, 8.477%, 8/29/12 (b)(i) |
| $500,000 | 520,442 |
|
KDM Development Corp., 6.00%, 6/30/19 (b)(i)(j) |
| 600,000 | 552,501 |
|
Plethora Technology, Inc., 12.00%, 12/31/06 (b)(i)(w)* |
| 150,000 | - |
|
Rose Smart Growth Investment Fund, 6.545%, 4/1/21 (b)(i) |
| 1,000,000 | 1,000,000 |
|
|
|
|
|
|
Total Venture Capital Debt Obligations (Cost $2,250,000) |
|
| 2,072,943 |
|
|
|
|
|
|
|
| Adjusted |
|
|
Limited Partnership Interest - 0.6% |
| Basis |
|
|
Angels With Attitude I LLC (a)(b)(i)* |
| 200,000 | 67,910 |
|
Coastal Venture Partners (b)(i)* |
| 103,561 | 79,668 |
|
Common Capital (b)(i)* |
| 445,606 | 219,573 |
|
First Analysis Private Equity Fund IV (b)(i)* |
| 563,131 | 848,091 |
|
GEEMF Partners (a)(b)(i)* |
| - | 160,117 |
|
Global Environment Emerging Markets Fund (b)(i)* |
| - | 506,831 |
|
|
|
|
|
|
|
| Adjusted |
|
|
Limited Partnership Interest - Cont’d |
| Basis | Value |
|
Infrastructure and Environmental Private Equity Fund III (b)(i)* |
| $315,224 | $185,511 |
|
Labrador Ventures III (b)(i)* |
| 360,875 | 44,123 |
|
Labrador Ventures IV (b)(i)* |
| 900,510 | 41,841 |
|
New Markets Growth Fund LLC (b)(i)* |
| 225,646 | 144,637 |
|
Solstice Capital (b)(i)* |
| 340,303 | 264,483 |
|
Venture Strategy Partners (b)(i)* |
| 188,182 | 14,342 |
|
|
|
|
|
|
Total Limited Partnership Interest (Cost $3,643,038) |
|
| 2,577,127 |
|
|
|
|
|
|
|
|
|
|
|
|
|
|
|
|
|
| Principal |
|
|
Asset-Backed Securities - 1.6% |
| Amount |
|
|
ACLC Business Loan Receivables Trust, 0.907%, 10/15/21 (e)(r) |
| 45,526 | 44,257 |
|
AmeriCredit Automobile Receivables Trust, 2.26%, 5/15/12 |
| 1,266,016 | 1,268,670 |
|
Capital Auto Receivables Asset Trust, 5.07%, 12/15/11 |
| 634,928 | 638,496 |
|
Chrysler Financial Lease Trust, 1.78%, 6/15/11 (e) |
| 2,000,000 | 2,005,771 |
|
CPS Auto Trust, 6.48%, 7/15/13 (e) |
| 1,256,916 | 1,294,153 |
|
DB Master Finance LLC, 5.779%, 6/20/31 (e) |
| 1,500,000 | 1,508,940 |
|
Enterprise Mortgage Acceptance Co. LLC, 7.143%, 1/15/27 (e)(r) |
| 1,159,347 | 608,657 |
|
Wachovia Auto Loan Owner Trust, 5.08%, 4/20/12 (e) |
| 74,332 | 74,485 |
|
|
|
|
|
|
Total Asset-Backed Securities (Cost $7,408,976) |
|
| 7,443,429 |
|
|
|
|
|
|
Collateralized Mortgage-Backed |
|
|
|
|
Obligations (Privately Originated) - 0.8% |
|
|
|
|
Chase Funding Mortgage Loan, 4.045%, 5/25/33 (r) |
| 8,251 | 8,217 |
|
GMAC Mortgage Corp. Loan Trust, 5.50%, 10/25/33 |
| 500,000 | 505,661 |
|
Impac CMB Trust, 0.88%, 5/25/35 (r) |
| 1,200,265 | 893,972 |
|
JP Morgan Mortgage Trust, 5.294%, 7/25/35 (r) |
| 271,347 | 266,867 |
|
Merrill Lynch Mortgage Investors, Inc., 4.749%, 12/25/35 (r) |
| 467,450 | 466,997 |
|
Residential Asset Securitization Trust, 6.25%, 11/25/36 |
| 196,537 | 134,975 |
|
WaMu Mortgage Pass Through Certificates, 4.771%, 10/25/35 (r) |
| 1,500,000 | 1,266,174 |
|
|
|
|
|
|
Total Collateralized Mortgage-Backed Obligations |
|
|
|
|
(Privately Originated) (Cost $3,664,884) |
|
| 3,542,863 |
|
|
|
|
|
|
|
|
|
|
|
Commercial Mortgage-Backed Securities - 0.4% |
|
|
|
|
GMAC Commercial Mortgage Asset Corp., 6.107%, 8/10/52 (e) |
| 1,900,000 | 1,689,385 |
|
|
|
|
|
|
Total Commercial Mortgage-Backed Securities (Cost $1,889,516) |
|
| 1,689,385 |
|
|
|
|
|
|
|
|
|
|
|
Corporate Bonds - 17.6% |
|
|
|
|
Achmea Hypotheekbank NV, 0.804%, 11/3/14 (e)(r) |
| 1,125,000 | 1,125,148 |
|
Alliance Mortgage Investments, 12.61%, 6/1/10 (b)(r)(x)* |
| 385,345 | - |
|
American Express Bank FSB, 0.39%, 5/29/12 (r) |
| 2,000,000 | 1,977,469 |
|
American National Red Cross, 5.362%, 11/15/11 |
| 3,215,000 | 3,256,023 |
|
Amphenol Corp., 4.75%, 11/15/14 |
| 1,000,000 | 1,083,026 |
|
|
|
|
|
|
|
| Principal |
|
|
Corporate Bonds - Cont’d |
| Amount | Value |
|
APL Ltd., 8.00%, 1/15/24 (b) |
| $550,000 | $440,000 |
|
Arrow Electronics, Inc., 6.875%, 6/1/18 |
| 1,500,000 | 1,700,711 |
|
Atlantic Marine Corp. Communities LLC, 6.158%, 12/1/51 (b)(e) |
| 1,000,000 | 1,067,670 |
|
Atlantic Mutual Insurance Co., 8.15%, 2/15/28 (b)(e)(p)* |
| 4,060,000 | - |
|
Aurora Military Housing LLC, 5.35%, 12/15/25 (e) |
| 2,500,000 | 2,463,325 |
|
Australia & New Zealand Banking Group Ltd., 0.818%, 10/21/11 (e)(r) |
| 500,000 | 500,974 |
|
BAC Capital Trust XV, 1.097%, 6/1/56 (r) |
| 1,500,000 | 943,333 |
|
Bank of Nova Scotia, 0.543%, 3/5/12 (r) |
| 1,000,000 | 1,000,000 |
|
Barclays Bank plc, 5.00%, 9/22/16 |
| 1,000,000 | 1,096,518 |
|
Bayview Research Center Finance Trust, 6.33%, 1/15/37 (b)(e) |
| 310,854 | 313,963 |
|
Charter One Bank, 5.50%, 4/26/11 |
| 500,000 | 511,019 |
|
Chesapeake Energy Corp., 7.625%, 7/15/13 (b) |
| 900,000 | 981,000 |
|
Commonwealth Bank of Australia, 0.745%, 11/4/11 (e)(r) |
| 500,000 | 499,800 |
|
CommonWealth REIT, 0.892%, 3/16/11 (r) |
| 1,250,000 | 1,244,803 |
|
COX Communications, Inc., 7.75%, 11/1/10 |
| 2,000,000 | 2,010,213 |
|
Credit Suisse USA, Inc., 0.576%, 8/16/11 (r) |
| 1,500,000 | 1,501,460 |
|
CVS Pass-Through Trust, 7.507%, 1/10/32 (e) |
| 741,830 | 870,433 |
|
Deutsche Bank Capital Funding Trust VII, 5.628% to 1/19/16, |
|
|
|
|
floating rate thereafter to 1/29/49 (e)(r) |
| 750,000 | 649,687 |
|
DISH DBS Corp., 6.375%, 10/1/11 |
| 500,000 | 517,500 |
|
Enterprise Products Operating LLC, 7.034% to 1/15/18, floating |
|
|
|
|
rate thereafter to 1/15/68 (r) |
| 2,500,000 | 2,487,500 |
|
Fleet Capital Trust V, 1.291%, 12/18/28 (r) |
| 1,000,000 | 718,294 |
|
Fort Knox Military Housing, 5.815%, 2/15/52 (e) |
| 1,000,000 | 973,430 |
|
GameStop Corp., 8.00%, 10/1/12 |
| 589,000 | 600,780 |
|
Glitnir Banki HF: |
|
|
|
|
2.95%, 10/15/08 (b)(y)* |
| 2,000,000 | 560,000 |
|
6.693% to 6/15/11, floating rate thereafter to 6/15/16 (b)(e)(r)(y)* |
| 1,500,000 | 15,000 |
|
Goldman Sachs Group, Inc., 6.15%, 4/1/18 |
| 500,000 | 556,086 |
|
Great River Energy, 5.829%, 7/1/17 (e) |
| 324,568 | 364,351 |
|
HCP, Inc., 5.95%, 9/15/11 |
| 500,000 | 522,292 |
|
Howard Hughes Medical Institute, 3.45%, 9/1/14 |
| 1,500,000 | 1,611,336 |
|
John Deere Capital Corp., 1.225%, 1/18/11 (r) |
| 2,000,000 | 2,004,156 |
|
JPMorgan Chase & Co.: |
|
|
|
|
0.539%, 12/26/12 (r) |
| 500,000 | 503,151 |
|
0.958%, 2/26/13 (r) |
| 500,000 | 501,093 |
|
JPMorgan Chase Bank, 0.623%, 6/13/16 (r) |
| 1,000,000 | 933,339 |
|
JPMorgan Chase Capital XXIII, 1.376%, 5/15/77 (r) |
| 750,000 | 539,891 |
|
Kaupthing Bank HF, 5.75%, 10/4/11 (e)(y)* |
| 2,750,000 | 735,625 |
|
LL & P Wind Energy, Inc. Washington Revenue Bonds, |
|
|
|
|
6.192%, 12/1/27 (e) |
| 2,000,000 | 2,040,600 |
|
Lumbermens Mutual Casualty Co.: |
|
|
|
|
9.15%, 7/1/26 (e)(m)* |
| 1,696,000 | 17,130 |
|
8.30%, 12/1/37 (e)(m)* |
| 6,130,000 | 61,913 |
|
8.45%, 12/1/49 (e)(m)* |
| 2,560,000 | 25,856 |
|
Masco Corp., 7.125%, 3/15/20 |
| 400,000 | 408,454 |
|
McGuire Air Force Base Military Housing Project, 5.611%, 9/15/51 (e) |
| 1,000,000 | 920,730 |
|
MMA Financial Holdings, Inc., 0.75%, 5/3/34 (b) |
| 2,540,000 | 508,000 |
|
Nationwide Health Properties, Inc.: |
|
|
|
|
6.50%, 7/15/11 |
| 500,000 | 519,407 |
|
6.90%, 10/1/37 |
| 1,000,000 | 1,026,737 |
|
Nordea Bank Finland plc, 0.827%, 4/13/12 (r) |
| 1,500,000 | 1,500,000 |
|
Ohana Military Communities LLC, 5.675%, 10/1/26 (e) |
| 2,250,000 | 2,360,362 |
|
|
|
|
|
|
|
| Principal |
|
|
Corporate Bonds - Cont’d |
| Amount | Value |
|
Orkney Re II plc, Series B, 6.096%, 12/21/35 (b)(e)(r)(w)* |
| $1,100,000 | $- |
|
PACCAR Financial Corp., 0.708%, 4/5/13 (r) |
| 1,000,000 | 1,000,253 |
|
Pacific Beacon LLC, 5.628%, 7/15/51 (e) |
| 1,250,000 | 1,008,650 |
|
Pacific Pilot Funding Ltd., 1.271%, 10/20/16 (e)(r) |
| 890,145 | 813,289 |
|
Pioneer Natural Resources Co.: |
|
|
|
|
5.875%, 7/15/16 |
| 500,000 | 513,939 |
|
6.65%, 3/15/17 |
| 350,000 | 372,426 |
|
7.20%, 1/15/28 |
| 700,000 | 728,969 |
|
PNC Funding Corp., 0.675%, 1/31/14 (r) |
| 500,000 | 487,532 |
|
Preferred Term Securities IX Ltd., 1.285%, 4/3/33 (e)(r) |
| 721,957 | 440,394 |
|
Prudential Holdings LLC, 7.245%, 12/18/23 (e) |
| 500,000 | 590,718 |
|
Redstone Arsenal Military Housing, 5.45%, 9/1/26 (e) |
| 1,165,000 | 1,115,045 |
|
Royal Bank of Scotland Group plc, 4.875%, 3/16/15 |
| 1,500,000 | 1,578,137 |
|
Salvation Army, 5.46%, 9/1/16 |
| 160,000 | 178,422 |
|
SBA Tower Trust, 4.254%, 4/15/40 (e) |
| 1,000,000 | 1,064,333 |
|
SPARCS Trust 99-1, STEP, 0.00% to 4/15/19, 7.697% |
|
|
|
|
thereafter to 10/15/97 (b)(e)(r) |
| 1,000,000 | 396,820 |
|
Suncorp-Metway Ltd., 0.667%, 12/17/10 (e)(r) |
| 1,000,000 | 1,000,004 |
|
SunTrust Bank: |
|
|
|
|
0.449%, 5/21/12 (r) |
| 2,500,000 | 2,446,606 |
|
0.619%, 8/24/15 (r) |
| 500,000 | 446,877 |
|
Svenska Handelsbanken AB, 1.292%, 9/14/12 (e)(r) |
| 1,500,000 | 1,505,781 |
|
TD Ameritrade Holding Corp., 4.15%, 12/1/14 |
| 500,000 | 531,411 |
|
Telefonica Emisiones SAU, 2.582%, 4/26/13 |
| 1,500,000 | 1,532,500 |
|
Toll Road Investors Partnership II LP, Zero Coupon: |
|
|
|
|
2/15/43 (b)(e) |
| 5,000,000 | 925,000 |
|
2/15/45 (b)(e) |
| 28,427,250 | 4,352,781 |
|
Vornado Realty LP, 4.75%, 12/1/10 |
| 1,310,000 | 1,313,358 |
|
Wachovia Capital Trust III, 5.80% to 3/15/11, floating rate thereafter |
|
|
|
|
to 3/29/49 (r) |
| 2,500,000 | 2,193,750 |
|
Westfield Capital Corp. Ltd., 4.375%, 11/15/10 (e) |
| 1,500,000 | 1,505,151 |
|
Westpac Banking Corp.: |
|
|
|
|
0.818%, 10/21/11 (e)(r) |
| 1,000,000 | 1,000,628 |
|
0.482%, 12/14/12 (e)(r) |
| 750,000 | 750,274 |
|
Wm. Wrigley Jr. Co., 1.913%, 6/28/11 (e)(r) |
| 2,000,000 | 2,004,184 |
|
|
|
|
|
|
Total Corporate Bonds (Cost $96,905,847) |
|
| 80,566,820 |
|
|
|
|
|
|
|
|
|
|
|
|
|
|
|
|
U.S. Government Agencies |
|
|
|
|
and Instrumentalities - 4.1% |
|
|
|
|
AgFirst FCB: |
|
|
|
|
6.585% to 6/15/12, floating rate thereafter to 6/29/49 (b)(e)(r) |
| 1,250,000 | 862,500 |
|
7.30%, 10/14/49 (e) |
| 1,500,000 | 1,290,391 |
|
Fannie Mae, 1.25%, 6/22/12 |
| 6,000,000 | 6,079,254 |
|
Federal Home Loan Bank Discount Notes, 10/1/10 |
| 7,600,000 | 7,600,000 |
|
Premier Aircraft Leasing EXIM 1 Ltd., 3.576%, 2/6/22 |
| 1,931,563 | 2,024,799 |
|
Private Export Funding Corp., 3.05%, 10/15/14 |
| 500,000 | 534,585 |
|
|
|
|
|
|
U.S. Government Agencies |
| Principal |
|
|
and Instrumentalities - 4.1% |
| Amount | Value |
|
U.S. Department of Housing and Urban Development, 3.44%, 8/1/11 |
| $250,000 | $256,485 |
|
US AgBank FCB, 6.11% to 7/10/12, floating rate thereafter |
|
|
|
|
to 12/31/49 (e)(r) |
| 300,000 | 224,250 |
|
|
|
|
|
|
Total U.S. Government Agencies |
|
|
|
|
and Instrumentalities (Cost $18,838,334) |
|
| 18,872,264 |
|
|
|
|
|
|
|
|
|
|
|
U.S. Government Agency |
|
|
|
|
Mortgage-Backed Securities - 0.0% |
|
|
|
|
Government National Mortgage Association, 5.50%, 1/16/32 |
| 1,110,163 | 78,947 |
|
|
|
|
|
|
Total U.S. Government Agency Mortgage-Backed Securities |
|
|
|
|
(Cost $135,996) |
|
| 78,947 |
|
|
|
|
|
|
|
|
|
|
|
Municipal Obligations - 5.4% |
|
|
|
|
California Statewide Communities Development Authority Revenue |
|
|
|
|
Bonds, 5.01%, 8/1/15 |
| 635,000 | 688,073 |
|
Escondido California Joint Powers Financing Authority Lease |
|
|
|
|
Revenue Bonds, 5.53%, 9/1/18 |
| 635,000 | 644,106 |
|
Illinois State MFH Development Authority Revenue Bonds, |
|
|
|
|
6.537%, 1/1/33 |
| 1,000,000 | 1,022,660 |
|
Inglewood California Pension Funding Revenue Bonds, 5.07%, 9/1/20 |
| 660,000 | 645,394 |
|
Malibu California Integrated Water Quality Improvement COPs, |
|
|
|
|
5.39%, 7/1/16 |
| 1,130,000 | 1,272,945 |
|
Maryland State Economic Development Corp. Revenue Bonds: |
|
|
|
|
Series B, 6.00%, 7/1/48 (f)* |
| 1,855,000 | 955,102 |
|
Series C, Zero Coupon, 7/1/48 (f) |
| 2,534,053 | 90,035 |
|
Moreno Valley California Public Financing Authority Revenue Bonds, |
|
|
|
|
5.549%, 5/1/27 |
| 750,000 | 738,705 |
|
Oakland California Redevelopment Agency Tax Allocation Bonds: |
|
|
|
|
5.252%, 9/1/16 |
| 1,375,000 | 1,395,281 |
|
5.263%, 9/1/16 |
| 640,000 | 646,272 |
|
5.383%, 9/1/16 |
| 3,000,000 | 3,196,470 |
|
Oceanside California PO Revenue Bonds, 5.04%, 8/15/17 |
| 750,000 | 750,825 |
|
Palm Springs California Community Redevelopment Agency |
|
|
|
|
Tax Allocation Bonds, 6.411%, 9/1/34 |
| 1,250,000 | 1,132,888 |
|
San Bernardino California Joint Powers Financing Authority |
|
|
|
|
Tax Allocation Bonds, 5.625%, 5/1/16 |
| 500,000 | 512,305 |
|
San Diego California Redevelopment Agency Tax Allocation |
|
|
|
|
Bonds, 5.66%, 9/1/16 |
| 1,040,000 | 1,063,514 |
|
San Diego County California PO Revenue Bonds, Zero |
|
|
|
|
Coupon, 8/15/12 |
| 1,790,000 | 1,699,695 |
|
|
|
|
|
|
|
| Principal |
|
|
Municipal Obligations - Cont’d |
| Amount | Value |
|
San Jose California Redevelopment Agency Tax Allocation Bonds, |
|
|
|
|
5.46%, 8/1/35 |
| $1,000,000 | $835,070 |
|
San Ramon California Public Financing Authority Tax Allocation |
|
|
|
|
Bonds, 5.65%, 2/1/21 |
| 1,775,000 | 1,718,218 |
|
Santa Fe Springs California Community Development Commission |
|
|
|
|
Tax Allocation Bonds, 5.35%, 9/1/18 |
| 1,500,000 | 1,508,235 |
|
Utah State Housing Corp. Military Housing Revenue Bonds, |
|
|
|
|
5.392%, 7/1/50 |
| 1,500,000 | 1,432,875 |
|
Vacaville California Redevelopment Agency Housing Tax Allocation |
|
|
|
|
Bonds, 6.125%, 9/1/20 |
| 665,000 | 644,106 |
|
Wells Fargo Bank NA Custodial Receipts Revenue Bonds, 6.734%, |
|
|
|
|
9/1/47 |
| 1,500,000 | 1,712,145 |
|
West Contra Costa California Unified School District COPs, |
|
|
|
|
4.90%, 1/1/15 |
| 555,000 | 570,168 |
|
|
|
|
|
|
Total Municipal Obligations (Cost $27,499,720) |
|
| 24,875,087 |
|
|
|
|
|
|
|
|
|
|
|
High Social Impact Investments - 0.9% |
|
|
|
|
Calvert Social Investment Foundation Notes, 1.17%, 7/1/13 (b)(i)(r) |
| 4,266,666 | 4,123,690 |
|
|
|
|
|
|
Total High Social Impact Investments (Cost $4,266,666) |
|
| 4,123,690 |
|
|
|
|
|
|
U.S. Treasury - 5.0% |
|
|
|
|
United States Treasury Bonds: |
|
|
|
|
4.375%, 5/15/40 |
| 2,750,000 | 3,088,594 |
|
3.875%, 8/15/40 |
| 11,500,000 | 11,889,922 |
|
United States Treasury Notes: |
|
|
|
|
0.375%, 8/31/12 |
| 1,150,000 | 1,148,922 |
|
1.25%, 8/31/15 |
| 3,920,000 | 3,918,775 |
|
2.625%, 8/15/20 |
| 2,585,000 | 2,609,234 |
|
|
|
|
|
|
Total U.S. Treasury (Cost $22,557,522) |
|
| 22,655,447 |
|
|
|
|
|
|
|
|
|
|
|
|
|
|
|
|
TOTAL INVESTMENTS (Cost $446,051,166) - 99.2% |
|
| 453,407,170 |
|
Other assets and liabilities, net - 0.8% |
|
| 3,869,919 |
|
Net Assets - 100% |
|
| $457,277,089 |
|
|
|
|
|
|
|
|
|
|
|
|
|
|
|
|
Net Assets Consist of: |
|
|
|
|
Paid-in capital applicable to the following shares of beneficial interest |
|
|
|
|
unlimited number of no par value shares authorized: |
|
|
|
|
Class A: 16,167,832 shares outstanding |
|
| $457,730,364 |
|
Class B: 471,364 shares outstanding |
|
| 15,644,201 |
|
Class C: 952,796 shares outstanding |
|
| 28,454,642 |
|
Class I: 57,902 shares outstanding |
|
| 2,323,553 |
|
Undistributed net investment income |
|
| (194,291) |
|
Accumulated net realized gain (loss) on investments |
|
| (53,670,743) |
|
Net unrealized appreciation (depreciation) on investments |
|
| 6,989,363 |
|
|
|
|
|
|
Net Assets |
|
| $457,277,089 |
|
|
|
|
|
|
Net Asset Value Per Share |
|
|
|
|
Class A (based on net assets of $419,362,800) |
|
| $25.94 |
|
Class B (based on net assets of $12,127,485) |
|
| $25.73 |
|
Class C (based on net assets of $24,268,660) |
|
| $25.47 |
|
Class I (based on net assets of $1,518,144) |
|
| $26.22 |
|
See notes to financial statements.
|
|
| Underlying | Unrealized |
| # of | Expiration | Face Amount | Appreciation |
Futures | Contracts | Date | at Value | (Depreciation) |
Purchased: |
|
|
|
|
30 Year U.S. Treasury Bonds | 59 | 12/10 | $7,889,406 | $92,716 |
|
|
|
|
|
Sold: |
|
|
|
|
2 Year U.S. Treasury Notes | 271 | 12/10 | $59,480,266 | ($156,220) |
5 Year U.S. Treasury Notes | 512 | 12/10 | 61,884,000 | (281,736) |
10 Year U.S. Treasury Notes | 24 | 12/10 | 3,025,125 | (21,401) |
Total Sold |
|
|
| ($459,357) |
See notes to financial statements.
BOND Portfolio
STATEMENT OF NET ASSETS
september 30, 2010
|
| Principal |
|
|
Asset-Backed Securities - 3.9% |
| Amount | Value |
|
ACLC Business Loan Receivables Trust, 0.907%, 10/15/21 (e)(r) |
| $45,526 | $44,257 |
|
AmeriCredit Automobile Receivables Trust: |
|
|
|
|
2.26%, 5/15/12 |
| 3,544,845 | 3,552,277 |
|
4.63%, 6/6/12 |
| 728,847 | 729,370 |
|
5.02%, 11/6/12 |
| 1,964,601 | 1,974,598 |
|
5.64%, 9/6/13 |
| 518,665 | 529,847 |
|
Americredit Prime Automobile Receivable, 5.22%, 6/8/12 |
| 160,456 | 160,678 |
|
Capital Auto Receivables Asset Trust, 5.07%, 12/15/11 |
| 1,269,857 | 1,276,991 |
|
Chrysler Financial Lease Trust, 1.78%, 6/15/11 (e) |
| 5,000,000 | 5,014,427 |
|
Community Reinvestment Revenue Notes, 5.90%, 6/1/31 (e) |
| 1,543,481 | 1,556,969 |
|
Countrywide Asset-Backed Certificates, 0.676%, 9/25/35 (r) |
| 350,000 | 317,759 |
|
CPS Auto Trust: |
|
|
|
|
6.48%, 7/15/13 (e) |
| 6,284,582 | 6,470,767 |
|
5.60%, 1/15/14 (e) |
| 2,045,636 | 2,108,986 |
|
DB Master Finance LLC, 5.779%, 6/20/31 (e) |
| 8,500,000 | 8,550,660 |
|
Enterprise Mortgage Acceptance Co. LLC, 7.143%, 1/15/27 (e)(r) |
| 3,091,593 | 1,623,086 |
|
Wachovia Auto Loan Owner Trust, 5.08%, 4/20/12 (e) |
| 260,163 | 260,696 |
|
|
|
|
|
|
Total Asset-Backed Securities (Cost $33,616,861) |
|
| 34,171,368 |
|
|
|
|
|
|
|
|
|
|
|
Collateralized Mortgage-Backed |
|
|
|
|
Obligations (Privately Originated) - 3.5% |
|
|
|
|
American Home Mortgage Assets, 1.346%, 9/25/46 (r) |
| 1,956,847 | 1,092,185 |
|
Bear Stearns Asset Backed Securities Trust, STEP, 5.00% to |
|
|
|
|
3/25/13, 5.50% thereafter to 1/25/34 (r) |
| 3,298,495 | 3,360,487 |
|
Chase Funding Mortgage Loan, 4.045%, 5/25/33 (r) |
| 8,251 | 8,217 |
|
Citicorp Mortgage Securities, Inc., 0.071%, 10/25/33 (r) |
| 87,275,335 | 106,685 |
|
Countrywide Alternative Loan Trust, 4.968%, 7/25/35 (b)(r) |
| 1,928,699 | 1,938,331 |
|
CS First Boston Mortgage Securities Corp.: |
|
|
|
|
2.888%, 12/25/33 (r) |
| 646,269 | 196,415 |
|
5.25%, 12/25/35 |
| 1,268,681 | 1,277,315 |
|
GMAC Mortgage Corp. Loan Trust, 5.50%, 10/25/33 |
| 5,000,000 | 5,056,610 |
|
Impac CMB Trust: |
|
|
|
|
0.88%, 5/25/35 (r) |
| 2,400,530 | 1,787,943 |
|
0.576%, 8/25/35 (r) |
| 721,766 | 542,213 |
|
JP Morgan Mortgage Trust: |
|
|
|
|
3.011%, 7/25/35 (r) |
| 495,879 | 466,134 |
|
5.294%, 7/25/35 (r) |
| 1,356,733 | 1,334,337 |
|
Merrill Lynch Mortgage Investors, Inc., 4.749%, 12/25/35 (r) |
| 1,713,982 | 1,712,322 |
|
Residential Accredit Loans, Inc., 6.00%, 12/25/35 |
| 1,534,485 | 1,092,552 |
|
Residential Asset Securitization Trust, 6.25%, 11/25/36 |
| 1,594,131 | 1,094,795 |
|
Structured Asset Mortgage Investments, Inc., 0.446%, 9/25/36 (r) |
| 719,003 | 394,906 |
|
Structured Asset Securities Corp., 5.00%, 6/25/35 |
| 2,791,763 | 2,275,669 |
|
WaMu Mortgage Pass Through Certificates, 4.771%, 10/25/35 (r) |
| 6,000,000 | 5,064,697 |
|
|
|
|
|
|
Collateralized Mortgage-Backed |
| Principal |
|
|
Obligations (Privately Originated) - Cont’d |
| Amount | Value |
|
Wells Fargo Mortgage Backed Securities Trust: |
|
|
|
|
2.873%, 1/25/35 (r) |
| $1,000,000 | $956,672 |
|
Class 1A10, 0.193%, 10/25/36 |
| 46,878,082 | 208,846 |
|
Class 1A9, 0.193%, 10/25/36 |
| 100,000,000 | 553,810 |
|
|
|
|
|
|
Total Collateralized Mortgage-Backed Obligations |
|
|
|
|
(Privately Originated) (Cost $30,764,762) |
|
| 30,521,141 |
|
|
|
|
|
|
Commercial Mortgage-Backed Securities - 1.3% |
|
|
|
|
Banc of America Commercial Mortgage, Inc., 4.576%, 7/10/42 |
| 500,000 | 505,640 |
|
GMAC Commercial Mortgage Asset Corp., 6.107%, 8/10/52 (e) |
| 5,000,000 | 4,445,750 |
|
JP Morgan Chase Commercial Mortgage Securities Corp., |
|
|
|
|
5.857%, 10/12/35 |
| 2,947,882 | 2,979,542 |
|
Prudential Mortgage Capital Funding LLC, 6.605%, 5/10/34 |
| 3,275,849 | 3,323,391 |
|
|
|
|
|
|
Total Commercial Mortgage-Backed Securities (Cost $11,862,789) |
|
| 11,254,323 |
|
|
|
|
|
|
Corporate Bonds - 48.1% |
|
|
|
|
Achmea Hypotheekbank NV, 0.804%, 11/3/14 (e)(r) |
| 3,000,000 | 3,000,393 |
|
Agilent Technologies, Inc., 5.00%, 7/15/20 |
| 1,500,000 | 1,591,999 |
|
Alliance Mortgage Investments: |
|
|
|
|
12.61%, 6/1/10 (b)(r)(x)* |
| 481,681 | - |
|
15.36%, 12/1/10 (b)(r)(x)* |
| 207,840 | - |
|
American Express Bank FSB, 0.39%, 5/29/12 (r) |
| 6,500,000 | 6,426,775 |
|
American Honda Finance Corp., 1.041%, 6/20/11 (e)(r) |
| 5,000,000 | 5,010,724 |
|
American National Red Cross: |
|
|
|
|
5.316%, 11/15/10 |
| 2,410,000 | 2,414,675 |
|
5.392%, 11/15/12 |
| 2,000,000 | 2,030,220 |
|
5.567%, 11/15/17 (b) |
| 1,500,000 | 1,559,850 |
|
Amphenol Corp., 4.75%, 11/15/14 |
| 2,000,000 | 2,166,051 |
|
ANZ National International Ltd.: |
|
|
|
|
0.615%, 8/5/11 (e)(r) |
| 500,000 | 500,404 |
|
2.375%, 12/21/12 (e) |
| 2,500,000 | 2,545,959 |
|
6.20%, 7/19/13 (e) |
| 1,000,000 | 1,115,043 |
|
AON Corp., 5.00%, 9/30/20 |
| 1,930,000 | 1,972,969 |
|
APL Ltd., 8.00%, 1/15/24 (b) |
| 2,685,000 | 2,148,000 |
|
Arrow Electronics, Inc., 6.875%, 6/1/18 |
| 4,000,000 | 4,535,230 |
|
Asciano Finance Ltd., 4.625%, 9/23/20 (e) |
| 1,500,000 | 1,524,915 |
|
Atlantic Marine Corp. Communities LLC, 6.158%, 12/1/51 (b)(e) |
| 2,500,000 | 2,669,175 |
|
Atlantic Mutual Insurance Co., 8.15%, 2/15/28 (b)(e)(p)* |
| 3,500,000 | - |
|
Australia & New Zealand Banking Group Ltd., 0.818%, 10/21/11 (e)(r) |
| 4,000,000 | 4,007,792 |
|
BAC Capital Trust XV, 1.097%, 6/1/56 (r) |
| 16,150,000 | 10,156,548 |
|
Bank of America Corp., 4.50%, 4/1/15 |
| 1,500,000 | 1,574,109 |
|
Bank of Nova Scotia: |
|
|
|
|
0.731%, 1/6/12 (r) |
| 4,000,000 | 4,000,000 |
|
0.543%, 3/5/12 (r) |
| 1,000,000 | 1,000,000 |
|
|
|
|
|
|
|
| Principal |
|
|
Corporate Bonds - Cont’d |
| Amount | Value |
|
Barclays Bank plc: |
|
|
|
|
2.50%, 1/23/13 |
| $2,000,000 | $2,043,997 |
|
2.50%, 9/21/15 (e) |
| 2,000,000 | 2,013,819 |
|
5.00%, 9/22/16 |
| 2,500,000 | 2,741,295 |
|
Bayview Research Center Finance Trust, 6.33%, 1/15/37 (b)(e) |
| 1,989,467 | 2,009,362 |
|
Bemis Co., Inc., 6.80%, 8/1/19 |
| 500,000 | 596,321 |
|
Capital One Bank, 8.80%, 7/15/19 |
| 1,500,000 | 1,917,185 |
|
Charter One Bank, 5.50%, 4/26/11 |
| 4,000,000 | 4,088,149 |
|
Chesapeake Energy Corp.: |
|
|
|
|
7.625%, 7/15/13 (b) |
| 4,500,000 | 4,905,000 |
|
6.50%, 8/15/17 |
| 1,000,000 | 1,033,750 |
|
6.875%, 11/15/20 |
| 1,000,000 | 1,053,750 |
|
Comerica, Inc., 3.00%, 9/16/15 |
| 1,500,000 | 1,518,851 |
|
Commonwealth Bank of Australia, 0.745%, 11/4/11 (e)(r) |
| 6,000,000 | 5,997,598 |
|
CommonWealth REIT, 0.892%, 3/16/11 (r) |
| 6,500,000 | 6,472,978 |
|
Con-way, Inc., 7.25%, 1/15/18 |
| 1,500,000 | 1,644,507 |
|
Corn Products International, Inc., 4.625%, 11/1/20 |
| 2,000,000 | 2,041,498 |
|
COX Communications, Inc., 7.75%, 11/1/10 |
| 3,000,000 | 3,015,320 |
|
Credit Suisse USA, Inc., 0.576%, 8/16/11 (r) |
| 5,000,000 | 5,004,867 |
|
Crown Castle Towers LLC, 4.174%, 8/15/17 (e) |
| 2,000,000 | 2,032,640 |
|
CVS Pass-Through Trust: |
|
|
|
|
6.943%, 1/10/30 |
| 1,887,578 | 2,113,222 |
|
7.507%, 1/10/32 (e) |
| 3,090,956 | 3,626,804 |
|
Deutsche Bank Capital Funding Trust VII, 5.628% to 1/19/16, |
|
|
|
|
floating rate thereafter to 1/29/49 (e)(r) |
| 2,000,000 | 1,732,500 |
|
DISH DBS Corp., 6.375%, 10/1/11 |
| 1,500,000 | 1,552,500 |
|
Enterprise Products Operating LLC: |
|
|
|
|
7.625%, 2/15/12 |
| 2,000,000 | 2,156,611 |
|
7.034% to 1/15/18, floating rate thereafter to 1/15/68 (r) |
| 13,305,000 | 13,238,475 |
|
First Niagara Financial Group, Inc., 6.75%, 3/19/20 |
| 1,000,000 | 1,106,953 |
|
Fleet Capital Trust V, 1.291%, 12/18/28 (r) |
| 3,000,000 | 2,154,882 |
|
Fort Knox Military Housing, 5.815%, 2/15/52 (e) |
| 3,500,000 | 3,407,005 |
|
GameStop Corp., 8.00%, 10/1/12 |
| 1,767,000 | 1,802,340 |
|
Glitnir Banki HF: |
|
|
|
|
2.95%, 10/15/08 (b)(y)* |
| 8,000,000 | 2,240,000 |
|
3.046%, 4/20/10 (e)(r)(y)* |
| 4,000,000 | 1,220,000 |
|
3.226%, 1/21/11 (e)(r)(y)* |
| 500,000 | 152,500 |
|
6.375%, 9/25/12 (e)(y)* |
| 2,000,000 | 610,000 |
|
6.693% to 6/15/11, floating rate thereafter to 6/15/16 (b)(e)(r)(y)* |
| 750,000 | 7,500 |
|
Goldman Sachs Group, Inc.: |
|
|
|
|
0.931%, 10/7/11 (r) |
| 3,000,000 | 2,998,518 |
|
0.668%, 11/9/11 (r) |
| 6,000,000 | 6,020,634 |
|
0.74%, 3/22/16 (r) |
| 2,000,000 | 1,849,051 |
|
6.15%, 4/1/18 |
| 1,000,000 | 1,112,172 |
|
6.75%, 10/1/37 |
| 1,500,000 | 1,569,394 |
|
Great River Energy, 5.829%, 7/1/17 (e) |
| 2,596,541 | 2,914,810 |
|
HCP, Inc., 5.95%, 9/15/11 |
| 1,000,000 | 1,044,585 |
|
Hewlett-Packard Co., 1.354%, 5/27/11 (r) |
| 7,000,000 | 7,048,770 |
|
Home Depot, Inc., 5.875%, 12/16/36 |
| 1,000,000 | 1,060,547 |
|
Howard Hughes Medical Institute, 3.45%, 9/1/14 |
| 3,000,000 | 3,222,672 |
|
International Business Machines Corp., 0.485%, 11/4/11 (r) |
| 1,000,000 | 1,001,224 |
|
Irwin Land LLC, 4.51%, 12/15/15 (e) |
| 2,025,000 | 2,018,540 |
|
John Deere Capital Corp., 1.225%, 1/18/11 (r) |
| 9,000,000 | 9,018,702 |
|
|
|
|
|
|
|
| Principal |
|
|
Corporate Bonds - Cont’d |
| Amount | Value |
|
JPMorgan Chase & Co.: |
|
|
|
|
0.522%, 6/15/12 (r) |
| $4,300,000 | $4,322,614 |
|
0.539%, 12/26/12 (r) |
| 10,000,000 | 10,063,012 |
|
0.958%, 2/26/13 (r) |
| 5,000,000 | 5,010,934 |
|
1.039%, 9/30/13 (r) |
| 4,000,000 | 4,011,764 |
|
JPMorgan Chase Bank, 0.623%, 6/13/16 (r) |
| 1,000,000 | 933,339 |
|
JPMorgan Chase Capital XXIII, 1.376%, 5/15/77 (r) |
| 2,000,000 | 1,439,710 |
|
Kaupthing Bank HF: |
|
|
|
|
3.491%, 1/15/10 (e)(r)(y)* |
| 1,000,000 | 267,500 |
|
5.75%, 10/4/11 (e)(y)* |
| 7,000,000 | 1,872,500 |
|
Kinder Morgan Finance Co. ULC, 5.35%, 1/5/11 |
| 3,000,000 | 3,045,000 |
|
Koninklijke Philips Electronics NV, 1.443%, 3/11/11 (r) |
| 7,000,000 | 7,025,925 |
|
LL & P Wind Energy, Inc. Washington Revenue Bonds, |
|
|
|
|
6.192%, 12/1/27 (e) |
| 5,000,000 | 5,101,500 |
|
Lloyds TSB Bank plc, 6.50%, 9/14/20 (e) |
| 1,000,000 | 1,016,998 |
|
Lumbermens Mutual Casualty Co.: |
|
|
|
|
9.15%, 7/1/26 (e)(m)* |
| 2,942,000 | 29,714 |
|
8.30%, 12/1/37 (e)(m)* |
| 3,500,000 | 35,350 |
|
Masco Corp., 7.125%, 3/15/20 |
| 1,500,000 | 1,531,703 |
|
MBNA Capital, 1.266%, 2/1/27 (r) |
| 1,500,000 | 1,025,972 |
|
McGuire Air Force Base Military Housing Project, 5.611%, 9/15/51 (e) |
| 2,420,000 | 2,228,167 |
|
MMA Financial Holdings, Inc., 0.75%, 5/3/34 (b) |
| 2,540,000 | 508,000 |
|
National City Corp., 4.00%, 2/1/11 |
| 2,000,000 | 2,013,960 |
|
Nationwide Building Society, 0.549%, 5/17/12 (e)(r) |
| 4,000,000 | 3,999,451 |
|
Nationwide Health Properties, Inc.: |
|
|
|
|
6.50%, 7/15/11 |
| 2,500,000 | 2,597,037 |
|
6.90%, 10/1/37 |
| 2,300,000 | 2,361,495 |
|
New Albertsons, Inc., 7.50%, 2/15/11 |
| 500,000 | 508,750 |
|
Nordea Bank Finland plc, 0.827%, 4/13/12 (r) |
| 5,000,000 | 5,000,000 |
|
Ohana Military Communities LLC: |
|
|
|
|
5.675%, 10/1/26 (e) |
| 5,580,000 | 5,853,699 |
|
6.00%, 10/1/51 (b)(e) |
| 5,260,000 | 5,503,065 |
|
OPTI Canada, Inc., 9.75%, 8/15/13 (e) |
| 2,000,000 | 2,030,000 |
|
Orkney Re II plc, Series B, 6.096%, 12/21/35 (b)(e)(r)(w)* |
| 1,700,000 | - |
|
PACCAR Financial Corp., 0.708%, 4/5/13 (r) |
| 3,000,000 | 3,000,758 |
|
Pacific Beacon LLC, 5.628%, 7/15/51 (e) |
| 2,750,000 | 2,219,030 |
|
Pacific Pilot Funding Ltd., 1.271%, 10/20/16 (e)(r) |
| 890,145 | 813,289 |
|
Pioneer Natural Resources Co.: |
|
|
|
|
5.875%, 7/15/16 |
| 5,000,000 | 5,139,386 |
|
6.65%, 3/15/17 |
| 3,000,000 | 3,192,224 |
|
7.50%, 1/15/20 |
| 2,000,000 | 2,200,000 |
|
7.20%, 1/15/28 |
| 1,000,000 | 1,041,384 |
|
PNC Funding Corp.: |
|
|
|
|
0.615%, 1/31/12 (r) |
| 1,000,000 | 996,653 |
|
0.733%, 4/1/12 (r) |
| 2,000,000 | 2,007,428 |
|
Preferred Term Securities IX Ltd., 1.285%, 4/3/33 (e)(r) |
| 721,957 | 440,394 |
|
Prudential Holdings LLC, 7.245%, 12/18/23 (e) |
| 1,700,000 | 2,008,440 |
|
Rabobank Nederland NV: |
|
|
|
|
0.635%, 8/5/11 (e)(r) |
| 2,000,000 | 1,999,406 |
|
3.20%, 3/11/15 (e) |
| 3,000,000 | 3,138,127 |
|
11.00% to 6/30/19, floating rate thereafter to 6/29/49 (e)(r) |
| 400,000 | 516,852 |
|
Royal Bank of Scotland Group plc, 4.875%, 3/16/15 |
| 5,830,000 | 6,133,694 |
|
Ryder System, Inc., 3.60%, 3/1/16 |
| 1,000,000 | 1,013,407 |
|
|
|
|
|
|
|
| Principal |
|
|
Corporate Bonds - Cont’d |
| Amount | Value |
|
Salvation Army, 5.46%, 9/1/16 |
| $310,000 | $345,693 |
|
SPARCS Trust 99-1, STEP, 0.00% to 4/15/19, 7.697% |
|
|
|
|
thereafter to 10/15/97 (b)(e)(r) |
| 1,000,000 | 396,820 |
|
Stadshypotek AB, 0.839%, 9/30/13 (e)(r) |
| 3,000,000 | 2,999,995 |
|
State Street Bank and Trust Co., 0.492%, 9/15/11 (r) |
| 5,000,000 | 5,012,116 |
|
Suncorp-Metway Ltd., 0.667%, 12/17/10 (e)(r) |
| 10,000,000 | 10,000,037 |
|
SunTrust Bank: |
|
|
|
|
6.375%, 4/1/11 |
| 5,000,000 | 5,135,605 |
|
0.449%, 5/21/12 (r) |
| 7,000,000 | 6,850,496 |
|
0.619%, 8/24/15 (r) |
| 1,000,000 | 893,755 |
|
Svenska Handelsbanken AB, 1.292%, 9/14/12 (e)(r) |
| 5,000,000 | 5,019,270 |
|
TD Ameritrade Holding Corp., 5.60%, 12/1/19 |
| 2,000,000 | 2,211,369 |
|
Telecom Italia Capital SA, 4.875%, 10/1/10 |
| 3,000,000 | 3,000,217 |
|
Telefonica Emisiones SAU: |
|
|
|
|
0.775%, 2/4/13 (r) |
| 3,000,000 | 2,929,408 |
|
2.582%, 4/26/13 |
| 4,000,000 | 4,086,667 |
|
TIERS Trust, 8.45%, 12/1/17 (b)(e)(n)* |
| 439,239 | 4,392 |
|
Time Warner Entertainment Co. LP, 8.875%, 10/1/12 |
| 1,300,000 | 1,475,488 |
|
Toll Road Investors Partnership II LP, Zero Coupon: |
|
|
|
|
2/15/18 (e) |
| 3,000,000 | 1,848,596 |
|
2/15/28 (b)(e) |
| 3,300,000 | 753,951 |
|
2/15/43 (b)(e) |
| 54,500,000 | 10,082,500 |
|
2/15/45 (b)(e) |
| 56,778,791 | 8,693,968 |
|
US Bank, 3.778% to 4/29/15, floating rate thereafter to 4/29/20 (r) |
| 7,000,000 | 7,321,431 |
|
Vornado Realty LP, 4.75%, 12/1/10 |
| 3,000,000 | 3,007,689 |
|
Wachovia Capital Trust III, 5.80% to 3/15/11, floating |
|
|
|
|
rate thereafter to 3/29/49 (r) |
| 13,650,000 | 11,977,875 |
|
Wells Fargo & Co., 0.512%, 6/15/12 (r) |
| 1,830,000 | 1,837,539 |
|
Westfield Capital Corp. Ltd., 4.375%, 11/15/10 (e) |
| 7,000,000 | 7,024,037 |
|
Westpac Banking Corp.: |
|
|
|
|
0.818%, 10/21/11 (e)(r) |
| 6,000,000 | 6,003,769 |
|
0.482%, 12/14/12 (e)(r) |
| 4,000,000 | 4,001,460 |
|
3.00%, 8/4/15 |
| 1,000,000 | 1,020,011 |
|
Wm. Wrigley Jr. Co., 1.913%, 6/28/11 (e)(r) |
| 6,000,000 | 6,012,553 |
|
|
|
|
|
|
Total Corporate Bonds (Cost $433,096,945) |
|
| 425,226,967 |
|
|
|
|
|
|
Municipal Obligations - 12.7% |
|
|
|
|
Adams-Friendship Area Wisconsin School District GO Bonds: |
|
|
|
|
5.28%, 3/1/14 |
| 155,000 | 172,743 |
|
5.32%, 3/1/15 |
| 165,000 | 185,749 |
|
5.47%, 3/1/18 |
| 190,000 | 218,699 |
|
Alameda California Corridor Transportation Authority Revenue |
|
|
|
|
Bonds, Zero Coupon, 10/1/11 |
| 11,655,000 | 11,206,166 |
|
Aurora Military Housing LLC, 5.32%, 12/15/20 (e) |
| 2,905,000 | 3,074,187 |
|
California Statewide Communities Development Authority |
|
|
|
|
Revenue Bonds: |
|
|
|
|
Zero Coupon, 6/1/12 |
| 1,530,000 | 1,416,795 |
|
Zero Coupon, 6/1/13 |
| 1,585,000 | 1,404,453 |
|
5.58%, 8/1/13 |
| 1,085,000 | 1,175,066 |
|
5.01%, 8/1/15 |
| 700,000 | 758,506 |
|
Zero Coupon, 6/1/19 |
| 2,910,000 | 1,683,697 |
|
|
|
|
|
|
|
| Principal |
|
|
Municipal Obligations - Cont’d |
| Amount | Value |
|
California Statewide Communities Development Authority |
|
|
|
|
Revenue Bonds: |
|
|
|
|
2004 Series A-2, Zero Coupon, 6/1/14 |
| $1,645,000 | $1,394,055 |
|
2006 Series A-2, Zero Coupon, 6/1/14 |
| 3,305,000 | 2,800,822 |
|
Canyon Texas Regional Water Authority Revenue Bonds, |
|
|
|
|
6.10%, 8/1/21 |
| 750,000 | 774,405 |
|
Cook County Illinois School District GO Bonds, Zero Coupon: |
|
|
|
|
12/1/14 |
| 1,975,000 | 1,723,898 |
|
12/1/19 (b) |
| 280,000 | 179,623 |
|
12/1/20 (b) |
| 700,000 | 423,584 |
|
12/1/21 (b) |
| 700,000 | 398,776 |
|
12/1/24 (b) |
| 620,000 | 295,343 |
|
Dallas-Fort Worth Texas International Airport Facilities Improvement |
|
|
|
|
Corp. Revenue Bonds, 6.60%, 11/1/12 |
| 1,635,000 | 1,702,019 |
|
Escondido California Joint Powers Financing Authority Lease Revenue |
|
|
|
|
Bonds, 5.53%, 9/1/18 |
| 1,060,000 | 1,075,200 |
|
Fairfield California PO Revenue Bonds, 5.22%, 6/1/20 (b) |
| 845,000 | 856,661 |
|
Florida State First Governmental Financing Commission Revenue |
|
|
|
|
Bonds, 5.30%, 7/1/19 |
| 1,340,000 | 1,413,445 |
|
Georgetown University Washington DC Revenue Bonds, 7.22%, |
|
|
|
|
4/1/19 |
| 2,990,000 | 3,567,219 |
|
Illinois State MFH Development Authority Revenue Bonds, |
|
|
|
|
6.537%, 1/1/33 |
| 3,330,000 | 3,405,458 |
|
Inglewood California Pension Funding Revenue Bonds, |
|
|
|
|
5.07%, 9/1/20 |
| 1,000,000 | 977,870 |
|
Jackson & Williamson Counties Illinois GO Bonds, Zero Coupon: |
|
|
|
|
12/1/18 |
| 180,000 | 119,632 |
|
12/1/19 |
| 180,000 | 110,817 |
|
12/1/20 |
| 180,000 | 102,357 |
|
12/1/22 |
| 180,000 | 88,301 |
|
12/1/23 |
| 180,000 | 80,773 |
|
12/1/24 |
| 180,000 | 74,765 |
|
Lancaster Pennsylvania Parking Authority Revenue Bonds, |
|
|
|
|
5.76%, 12/1/17 |
| 595,000 | 648,925 |
|
Lawrence Township Indiana School District GO Bonds, 5.80%, |
|
|
|
|
7/5/18 |
| 1,095,000 | 1,249,910 |
|
Long Beach California Bond Finance Authority Revenue Bonds: |
|
|
|
|
4.66%, 8/1/15 |
| 1,535,000 | 1,507,370 |
|
4.90%, 8/1/17 |
| 1,715,000 | 1,615,479 |
|
Los Angeles California Community Redevelopment Agency |
|
|
|
|
Tax Allocation Bonds, 5.27%, 7/1/13 |
| 970,000 | 1,011,264 |
|
Malibu California Integrated Water Quality Improvement |
|
|
|
|
COPs, 5.64%, 7/1/21 |
| 1,160,000 | 1,232,314 |
|
Maryland State Transportation Authority Revenue Bonds, |
|
|
|
|
5.604%, 7/1/30 |
| 3,000,000 | 3,281,130 |
|
Monrovia California Redevelopment Agency Tax Allocation |
|
|
|
|
Bonds, 5.30%, 5/1/17 |
| 1,160,000 | 1,149,351 |
|
Moreno Valley California Public Financing Authority Revenue |
|
|
|
|
Bonds, 5.549%, 5/1/27 |
| 1,500,000 | 1,477,410 |
|
Nekoosa Wisconsin School District GO Bonds, 5.74%, 4/1/16 |
| 350,000 | 387,457 |
|
Nevada State Department of Business & Industry Lease Revenue |
|
|
|
|
Bonds, 5.32%, 6/1/17 |
| 940,000 | 910,616 |
|
|
|
|
|
|
|
| Principal |
|
|
Municipal Obligations - Cont’d |
| Amount | Value |
|
New Jersey State Economic Development Authority State Pension |
|
|
|
|
Funding Revenue Bonds, Zero Coupon, 2/15/12 |
| $2,822,000 | $2,753,849 |
|
New York City IDA Revenue Bonds, 6.027%, 1/1/46 |
| 1,885,000 | 1,555,219 |
|
Oakland California PO Revenue Bonds, Zero Coupon, 12/15/20 |
| 1,490,000 | 805,732 |
|
Oakland California Redevelopment Agency Tax Allocation Bonds: |
|
|
|
|
5.263%, 9/1/16 |
| 1,280,000 | 1,292,544 |
|
5.383%, 9/1/16 |
| 5,565,000 | 5,929,452 |
|
5.411%, 9/1/21 |
| 2,270,000 | 2,152,823 |
|
Oceanside California PO Revenue Bonds, 5.04%, 8/15/17 |
| 1,000,000 | 1,001,100 |
|
Oregon State School Boards Association GO Bonds, |
|
|
|
|
Zero Coupon, 6/30/12 |
| 6,000,000 | 5,814,240 |
|
Palm Springs California Community Redevelopment Agency Tax |
|
|
|
|
Allocation Bonds, 6.411%, 9/1/34 |
| 3,355,000 | 3,040,670 |
|
Placer County California Redevelopment Agency Tax Allocation |
|
|
|
|
Bonds, 5.95%, 8/1/22 |
| 1,040,000 | 1,048,580 |
|
Pomona California Public Finance Authority Tax Allocation Bonds, |
|
|
|
|
5.23%, 2/1/16 |
| 1,640,000 | 1,729,380 |
|
Redlands California PO Revenue Bonds, Zero Coupon: |
|
|
|
|
8/1/18 |
| 120,000 | 76,458 |
|
8/1/19 |
| 135,000 | 80,294 |
|
8/1/20 |
| 145,000 | 79,786 |
|
8/1/21 |
| 160,000 | 80,282 |
|
San Bernardino California Joint Powers Financing Authority |
|
|
|
|
Tax Allocation Bonds, 5.625%, 5/1/16 |
| 1,000,000 | 1,024,610 |
|
San Diego California Redevelopment Agency Tax Allocation |
|
|
|
|
Bonds, 5.66%, 9/1/16 |
| 2,095,000 | 2,142,368 |
|
San Diego County California PO Revenue Bonds, Zero Coupon, |
|
|
|
|
8/15/12 |
| 4,000,000 | 3,798,200 |
|
San Jose California Redevelopment Agency Tax Allocation Bonds, |
|
|
|
|
5.10%, 8/1/20 |
| 2,555,000 | 2,486,398 |
|
Santa Fe Springs California Community Development Commission |
|
|
|
|
Tax Allocation Bonds, 5.35%, 9/1/18 |
| 2,500,000 | 2,513,725 |
|
Schenectady New York Metroplex Development Authority Revenue |
|
|
|
|
Bonds, 5.33%, 8/1/16 |
| 445,000 | 491,983 |
|
Secaucus New Jersey Municipal Utilities Authority Revenue Bonds, |
|
|
|
|
4.20%, 12/1/10 |
| 1,235,000 | 1,242,533 |
|
Sonoma County California PO Revenue Bonds, 6.625%, 6/1/13 |
| 1,605,000 | 1,706,083 |
|
Thorp Wisconsin School District GO Bonds, 6.15%, 4/1/26 |
| 560,000 | 603,467 |
|
Utah State Housing Corp. Military Housing Revenue Bonds, |
|
|
|
|
5.392%, 7/1/50 |
| 2,000,000 | 1,910,500 |
|
Vacaville California Redevelopment Agency Housing Tax Allocation |
|
|
|
|
Bonds, 6.00%, 9/1/18 |
| 1,185,000 | 1,165,187 |
|
Virginia State Housing Development Authority Revenue Bonds, |
|
|
|
|
6.32%, 8/1/19 |
| 3,255,000 | 3,638,667 |
|
Wells Fargo Bank NA Custodial Receipts Revenue Bonds, |
|
|
|
|
6.734%, 9/1/47 |
| 3,000,000 | 3,424,290 |
|
West Contra Costa California Unified School District COPs: |
|
|
|
|
4.71%, 1/1/11 |
| 455,000 | 457,448 |
|
4.76%, 1/1/12 |
| 475,000 | 485,773 |
|
4.82%, 1/1/13 |
| 500,000 | 517,670 |
|
|
|
|
|
|
Total Municipal Obligations (Cost $108,923,457) |
|
| 112,381,621 |
|
|
|
|
|
|
U.S. Government Agencies |
| Principal |
|
|
and Instrumentalities - 16.2% |
| Amount | Value |
|
AgFirst FCB: |
|
|
|
|
8.393% to 12/15/11, floating rate thereafter to 12/15/16 (r) |
| $5,000,000 | $4,862,500 |
|
6.585% to 6/15/12, floating rate thereafter to 6/29/49 (b)(e)(r) |
| 6,000,000 | 4,560,000 |
|
7.30%, 10/14/49 (e) |
| 2,000,000 | 1,720,521 |
|
Fannie Mae, 1.25%, 6/22/12 |
| 7,900,000 | 8,004,351 |
|
Federal Home Loan Bank: |
|
|
|
|
1.75%, 8/22/12 |
| 15,000,000 | 15,352,533 |
|
5.00%, 11/17/17 |
| 3,480,000 | 4,126,205 |
|
Federal Home Loan Bank Discount Notes, 10/1/10 |
| 91,000,000 | 91,000,000 |
|
Premier Aircraft Leasing EXIM 1 Ltd., 3.576%, 2/6/22 |
| 7,726,252 | 8,099,198 |
|
Private Export Funding Corp., 3.05%, 10/15/14 |
| 2,855,000 | 3,052,480 |
|
U.S. Department of Housing and Urban Development, 3.44%, 8/1/11 |
| 500,000 | 512,970 |
|
U.S. AgBank FCB, 6.11% to 7/10/12, floating rate thereafter |
|
|
|
|
to 12/31/49 (e)(r) |
| 2,700,000 | 2,018,250 |
|
|
|
|
|
|
Total U.S. Government Agencies and Instrumentalities |
|
|
|
|
(Cost $141,016,013) |
|
| 143,309,008 |
|
|
|
|
|
|
U.S. Government Agency Mortgage-Backed |
|
|
|
|
Securities - 0.0% |
|
|
|
|
Government National Mortgage Association, 5.50%, 1/16/32 |
| 2,235,128 | 158,946 |
|
|
|
|
|
|
Total U.S. Government Agency Mortgage-Backed |
|
|
|
|
Securities (Cost $285,149) |
|
| 158,946 |
|
|
|
|
|
|
U.S. Treasury - 10.2% |
|
|
|
|
United States Treasury Bonds: |
|
|
|
|
4.375%, 5/15/40 |
| 53,490,000 | 60,075,953 |
|
3.875%, 8/15/40 |
| 18,995,000 | 19,639,049 |
|
United States Treasury Notes: |
|
|
|
|
1.25%, 8/31/15 |
| 2,375,000 | 2,374,258 |
|
2.625%, 8/15/20 |
| 8,325,000 | 8,403,047 |
|
|
|
|
|
|
Total U.S. Treasury (Cost $87,104,520) |
|
| 90,492,307 |
|
|
|
|
|
|
Sovereign Government Bonds - 2.0% |
|
|
|
|
Province of Ontario Canada, 0.789%, 5/22/12 (r) |
| 18,000,000 | 18,015,939 |
|
|
|
|
|
|
Total Sovereign Government Bonds (Cost $18,000,000) |
|
| 18,015,939 |
|
|
|
|
|
|
|
| Principal |
|
|
High Social Impact Investments - 0.3% |
| Amount | Value |
|
Calvert Social Investment Foundation Notes, 1.17%, 7/1/12 (b)(i)(r) |
| $3,087,392 | $2,983,933 |
|
|
|
|
|
|
Total High Social Impact Investments (Cost $3,087,392) |
|
| 2,983,933 |
|
|
|
|
|
|
Equity Securities - 0.3% |
| Shares |
|
|
CNO Financial Group, Inc.* |
| 140,439 | 778,032 |
|
First Republic Preferred Capital Corp., Preferred (e) |
| 500 | 514,000 |
|
Woodbourne Capital: |
|
|
|
|
Trust I, Preferred (b)(e) |
| 625,000 | 418,750 |
|
Trust II, Preferred (b)(e) |
| 625,000 | 418,750 |
|
Trust III, Preferred (b)(e) |
| 625,000 | 418,750 |
|
Trust IV, Preferred (b)(e) |
| 625,000 | 418,750 |
|
|
|
|
|
|
Total Equity Securities (Cost $5,435,015) |
|
| 2,967,032 |
|
|
|
|
|
|
|
|
|
|
|
|
|
|
|
|
TOTAL INVESTMENTS (Cost $873,192,903) - 98.5% |
|
| 871,482,585 |
|
Other assets and liabilities, net - 1.5% |
|
| 12,980,956 |
|
Net Assets - 100% |
|
| $884,463,541 |
|
|
|
|
|
|
Net Assets Consist of: |
|
|
|
|
Paid-in capital applicable to the following shares of beneficial interest, |
|
|
|
|
unlimited number of no par value shares authorized: |
|
|
|
|
Class A: 37,054,980 shares outstanding |
|
| $592,223,956 |
|
Class B: 556,656 shares outstanding |
|
| 9,496,348 |
|
Class C: 3,410,429 shares outstanding |
|
| 53,572,411 |
|
Class I: 13,330,185 shares outstanding |
|
| 212,697,760 |
|
Class Y: 891,493 shares outstanding |
|
| 13,888,078 |
|
Undistributed net investment income |
|
| 23,109 |
|
Accumulated net realized gain (loss) on investments |
|
| 4,135,250 |
|
Net unrealized appreciation (depreciation) on investments |
|
| (1,573,371) |
|
|
|
|
|
|
Net Assets |
|
| $884,463,541 |
|
|
|
|
|
|
Net Asset Value Per Share |
|
|
|
|
Class A (based on net assets of $593,364,111) |
|
| $16.01 |
|
Class B (based on net assets of $8,853,648) |
|
| $15.91 |
|
Class C (based on net assets of $54,288,386) |
|
| $15.92 |
|
Class I (based on net assets of $213,621,371) |
|
| $16.03 |
|
Class Y (based on net assets of $14,336,025) |
|
| $16.08 |
|
See notes to financial statements.
|
|
| Underlying | Unrealized |
| # Of | Expiration | Face Amount | Appreciation |
Futures | Contracts | Date | At Value | (Depreciation) |
Purchased: |
|
|
|
|
30 Year U.S. Treasury Bonds | 317 | 12/10 | $42,388,844 | $1,355,964 |
Sold: |
|
|
|
|
2 Year U.S. Treasury Notes | 1,481 | 12/10 | $325,056,361 | ($483,583) |
5 Year U.S. Treasury Notes | 1,223 | 12/10 | 147,820,571 | (695,658) |
10 Year U.S. Treasury Notes | 24 | 12/10 | 3,025,125 | (39,776) |
Total Sold |
|
|
| ($1,219,017) |
See notes to financial statements.
EQUITY PORTFOLIO
statement of net assets
september 30, 2010
Equity Securities - 96.3% |
| Shares | Value |
Air Freight & Logistics - 2.9% |
|
|
|
C.H. Robinson Worldwide, Inc. |
| 356,400 | $24,919,488 |
Expeditors International of Washington, Inc. |
| 299,400 | 13,841,262 |
|
|
| 38,760,750 |
|
|
|
|
Beverages - 1.9% |
|
|
|
PepsiCo, Inc. |
| 385,100 | 25,586,044 |
|
|
|
|
Biotechnology - 2.7% |
|
|
|
Gilead Sciences, Inc.* |
| 999,800 | 35,602,878 |
|
|
|
|
Capital Markets - 6.2% |
|
|
|
Charles Schwab Corp. |
| 856,600 | 11,906,740 |
Franklin Resources, Inc. |
| 186,400 | 19,926,160 |
Lazard Ltd. |
| 495,600 | 17,385,648 |
Northern Trust Corp. |
| 434,500 | 20,960,280 |
T. Rowe Price Group, Inc. |
| 246,000 | 12,315,990 |
|
|
| 82,494,818 |
|
|
|
|
Chemicals - 2.3% |
|
|
|
Ecolab, Inc. |
| 597,200 | 30,301,928 |
|
|
|
|
Commercial Banks - 5.2% |
|
|
|
SunTrust Banks, Inc. |
| 955,000 | 24,667,650 |
Wells Fargo & Co. |
| 995,500 | 25,016,915 |
Zions Bancorporation |
| 909,100 | 19,418,376 |
|
|
| 69,102,941 |
|
|
|
|
Communications Equipment - 6.9% |
|
|
|
Cisco Systems, Inc.* |
| 1,623,100 | 35,545,890 |
QUALCOMM, Inc. |
| 1,235,900 | 55,763,808 |
|
|
| 91,309,698 |
|
|
|
|
Computers & Peripherals - 8.0% |
|
|
|
Apple, Inc.* |
| 205,100 | 58,197,125 |
Hewlett-Packard Co. |
| 1,133,700 | 47,694,759 |
|
|
| 105,891,884 |
|
|
|
|
Electrical Equipment - 1.9% |
|
|
|
Cooper Industries plc |
| 520,200 | 25,453,386 |
|
|
|
|
Energy Equipment & Services - 4.4% |
|
|
|
Cameron International Corp.* |
| 606,000 | 26,033,760 |
FMC Technologies, Inc.* |
| 189,700 | 12,954,613 |
Noble Corp. |
| 576,700 | 19,486,693 |
|
|
| 58,475,066 |
|
|
|
|
Equity Securities - Cont’d |
| Shares | Value |
Food & Staples Retailing - 5.0% |
|
|
|
Costco Wholesale Corp. |
| 308,000 | $19,862,920 |
CVS Caremark Corp. |
| 1,453,300 | 45,735,351 |
|
|
| 65,598,271 |
|
|
|
|
Health Care Equipment & Supplies - 6.7% |
|
|
|
DENTSPLY International, Inc. |
| 624,000 | 19,949,280 |
St. Jude Medical, Inc.* |
| 476,300 | 18,737,642 |
Stryker Corp. |
| 651,400 | 32,602,570 |
Varian Medical Systems, Inc.* |
| 297,000 | 17,968,500 |
|
|
| 89,257,992 |
|
|
|
|
Hotels, Restaurants & Leisure - 2.9% |
|
|
|
Chipotle Mexican Grill, Inc.* |
| 95,400 | 16,408,800 |
Starbucks Corp. |
| 869,800 | 22,249,484 |
|
|
| 38,658,284 |
|
|
|
|
Household Products - 2.1% |
|
|
|
Procter & Gamble Co. (t) |
| 462,900 | 27,760,113 |
|
|
|
|
Industrial Conglomerates - 2.4% |
|
|
|
3M Co. |
| 362,200 | 31,406,362 |
|
|
|
|
Insurance - 1.4% |
|
|
|
Aflac, Inc. |
| 360,800 | 18,656,968 |
|
|
|
|
Internet & Catalog Retail - 8.6% |
|
|
|
Amazon.com, Inc.* |
| 204,000 | 32,040,240 |
NetFlix, Inc.* |
| 374,100 | 60,664,056 |
priceline.com, Inc.* |
| 59,600 | 20,761,064 |
|
|
| 113,465,360 |
|
|
|
|
Internet Software & Services - 2.7% |
|
|
|
Google, Inc.* |
| 68,400 | 35,964,036 |
|
|
|
|
IT Services - 2.8% |
|
|
|
Cognizant Technology Solutions Corp.* |
| 334,700 | 21,578,109 |
MasterCard, Inc. |
| 69,300 | 15,523,200 |
|
|
| 37,101,309 |
|
|
|
|
Machinery - 2.6% |
|
|
|
Danaher Corp. |
| 585,800 | 23,789,338 |
Deere & Co. |
| 157,400 | 10,983,372 |
|
|
| 34,772,710 |
|
|
|
|
Multiline Retail - 4.6% |
|
|
|
Kohl’s Corp.* |
| 390,000 | 20,545,200 |
Target Corp. |
| 750,900 | 40,128,096 |
|
|
| 60,673,296 |
|
|
|
|
|
|
|
|
Equity Securities - Cont’d |
| Shares | Value |
Oil, Gas & Consumable Fuels - 2.7% |
|
|
|
QEP Resources, Inc. |
| 470,400 | $14,177,856 |
Suncor Energy, Inc. |
| 674,700 | 21,961,485 |
|
|
| 36,139,341 |
|
|
|
|
Pharmaceuticals - 5.2% |
|
|
|
Allergan, Inc. |
| 304,400 | 20,251,732 |
Novartis AG (ADR) |
| 829,400 | 47,831,498 |
|
|
| 68,083,230 |
|
|
|
|
Semiconductors & Semiconductor Equipment - 0.6% |
|
|
|
Linear Technology Corp. |
| 274,800 | 8,444,604 |
|
|
|
|
Software - 3.0% |
|
|
|
Microsoft Corp. |
| 1,213,900 | 29,728,411 |
Salesforce.com, Inc.* |
| 92,100 | 10,296,780 |
|
|
| 40,025,191 |
|
|
|
|
Venture Capital - 0.6% |
|
|
|
20/20 Gene Systems, Inc.: |
|
|
|
Common Stock (b)(i)* |
| 43,397 | 48,822 |
Warrants (strike price $.01/share, expires 8/27/13) (b)(i)* |
| 30,000 | 33,450 |
Chesapeake PERL, Inc.: |
|
|
|
Series A-2, Preferred (b)(i)* |
| 240,000 | 28,800 |
Series A-2, Preferred Warrants (strike price $1.25/share, |
|
|
|
expires 12/27/10) (b)(i)* |
| 45,000 | - |
Cylex, Inc.: |
|
|
|
Common Stock (b)(i)* |
| 285,706 | - |
Series B, Preferred (b)(i)* |
| 1,134,830 | - |
Series C-1, Preferred (b)(i)* |
| 2,542,915 | 830,742 |
Digital Directions International, Inc. (a)(b)(i)* |
| 354,389 | 531,583 |
Envisionier Medical Technologies, Inc., Warrants |
|
|
|
(strike price $.50/share, expires 8/6/20) (b)(i)* |
| 50,000 | - |
Global Resource Options, Inc.: |
|
|
|
Series A, Preferred (a)(b)(i)* |
| 750,000 | 2,518,275 |
Series B, Preferred (a)(b)(i)* |
| 244,371 | 820,525 |
Series C, Preferred (a)(b)(i)* |
| 297,823 | 1,000,000 |
Marrone Bio Innovations, Inc.: |
|
|
|
Series A, Preferred (b)(i)* |
| 240,761 | 407,853 |
Series B, Preferred (b)(i)* |
| 181,244 | 307,030 |
NeoDiagnostix, Inc.: |
|
|
|
Series AE, Convertible Preferred Contingent Deferred |
|
|
|
Distribution (b)(i)* |
| 300,000 | 50,578 |
Series AE, Convertible Preferred Warrants Contingent Deferred |
|
|
|
Distribution (b)(i)* |
| 600,000 | - |
Series B, Preferred Stock Contingent Deferred Distribution (b)(i)* |
| 179,723 | 235,485 |
New Day Farms, Inc., Series B, Preferred (a)(b)(i)* |
| 4,547,804 | 72,037 |
Sword Diagnostics, Series B, Preferred (b)(i)* |
| 640,697 | 250,000 |
|
|
| 7,135,180 |
|
|
|
|
|
|
|
|
Total Equity Securities (Cost $1,062,385,285) |
|
| 1,276,121,640 |
|
|
|
|
|
| Adjusted |
|
Limited Partnership Interest - 0.1% |
| Basis | Value |
Blackstone Cleantech Venture Partners (b)(i)* |
| $110,000 | $110,000 |
China Environment Fund 2004 (b)(i)* |
| - | 185,968 |
Core Innovations Capital I (b)(i)* |
| 52,343 | 23,117 |
Impact Ventures II (b)(i)* |
| 313,326 | 274,102 |
New Markets Venture Partners II (b)(i)* |
| 125,000 | 123,370 |
SEAF India International Growth Fund (b)(i)* |
| 481,432 | 388,137 |
Sustainable Jobs Fund II (b)(i)* |
| 525,000 | 514,045 |
|
|
|
|
Total Limited Partnership Interest (Cost $1,607,100) |
|
| 1,618,739 |
|
|
|
|
|
|
|
|
|
| Principal |
|
High Social Impact Investments - 0.5% |
| Amount |
|
Calvert Social Investment Foundation Notes, 1.17%, 7/1/12 (b)(i)(r) |
| 7,083,877 | 6,846,496 |
|
|
|
|
Total High Social Impact Investments (Cost $7,083,877) |
|
| 6,846,496 |
|
|
|
|
|
|
|
|
Venture Capital Debt Obligations - 0.1% |
|
|
|
Envisionier Medical Technologies, Inc.: |
|
|
|
Series A, 7.00%, 1/15/11 (b)(i) |
| 200,000 | 200,000 |
Series B, 7.00%, 1/15/11 (b)(i) |
| 100,000 | 100,000 |
Global Resource Options, Inc. Bridge Note, |
|
|
|
STEP, 30.00%, 2/5/12 (b)(i)(r) |
| 200,000 | 200,000 |
New Day Farms, Inc. Participation Interest Note, 9.00%, 9/1/12 (b)(i) |
| 6,225 | 6,225 |
Sword Diagnostics Convertible Bridge Note, 10.00%, 9/30/10 (b)(i) |
| 25,000 | 25,000 |
|
|
|
|
Total Venture Capital Debt Obligations (Cost $531,225) |
|
| 531,225 |
|
|
|
|
U.S. Government Agencies and Instrumentalities - 2.9% |
|
|
|
Federal Home Loan Bank Discount Notes, 10/1/10 |
| 38,500,000 | 38,500,000 |
|
|
|
|
Total U.S. Government Agencies |
|
|
|
and Instrumentalities (Cost $38,500,000) |
|
| 38,500,000 |
|
|
|
|
|
|
|
|
TOTAL INVESTMENTS (Cost $1,110,107,487) - 99.9% |
|
| 1,323,618,100 |
Other assets and liabilities, net - 0.1% |
|
| 1,071,738 |
Net Assets - 100% |
|
| $1,324,689,838 |
|
|
|
|
|
|
|
|
Net Assets Consist of: |
|
|
|
Paid-in capital applicable to the following shares of beneficial interest, |
|
|
|
unlimited number of no par value shares authorized: |
|
|
|
Class A: 30,117,815 shares outstanding |
|
| $833,837,726 |
Class B: 1,261,664 shares outstanding |
|
| 27,233,428 |
Class C: 3,746,387 shares outstanding |
|
| 93,578,728 |
Class I: 5,728,772 shares outstanding |
|
| 169,615,859 |
Class Y: 360,263 shares outstanding |
|
| 11,166,623 |
Accumulated net realized gain (loss) on investments |
|
| (24,253,139) |
Net unrealized appreciation (depreciation) on investments |
|
| 213,510,613 |
|
|
|
|
Net Assets |
|
| $1,324,689,838 |
|
|
|
|
Net Asset Value Per Share |
|
|
|
Class A (based on net assets of $980,604,932) |
|
| $32.56 |
Class B (based on net assets of $35,760,711) |
|
| $28.34 |
Class C (based on net assets of $97,960,688) |
|
| $26.15 |
Class I (based on net assets of $198,552,764) |
|
| $34.66 |
Class Y (based on net assets of $11,810,743) |
|
| $32.78 |
See notes to financial statements.
Enhanced Equity PORTFOLIO
statement of net assets
september 30, 2010
Equity Securities - 99.4% |
| Shares | Value |
|
Auto Components - 0.5% |
|
|
|
|
Autoliv, Inc. |
| 5,912 | $386,231 |
|
|
|
|
|
|
Biotechnology - 2.5% |
|
|
|
|
Amgen, Inc.* |
| 32,765 | 1,805,679 |
|
|
|
|
|
|
Capital Markets - 1.0% |
|
|
|
|
Goldman Sachs Group, Inc. |
| 237 | 34,265 |
|
State Street Corp. |
| 19,030 | 716,670 |
|
|
|
| 750,935 |
|
|
|
|
|
|
Commercial Services & Supplies - 0.4% |
|
|
|
|
United Stationers, Inc.* |
| 5,113 | 273,597 |
|
|
|
|
|
|
Communications Equipment - 0.9% |
|
|
|
|
Harris Corp. |
| 7,071 | 313,175 |
|
InterDigital, Inc.* |
| 10,578 | 313,214 |
|
|
|
| 626,389 |
|
|
|
|
|
|
Computers & Peripherals - 5.3% |
|
|
|
|
Apple, Inc.* |
| 11,723 | 3,326,401 |
|
Dell, Inc.* |
| 45,606 | 591,054 |
|
|
|
| 3,917,455 |
|
|
|
|
|
|
Construction & Engineering - 0.3% |
|
|
|
|
EMCOR Group, Inc.* |
| 7,555 | 185,777 |
|
|
|
|
|
|
Consumer Finance - 2.2% |
|
|
|
|
American Express Co. |
| 34,697 | 1,458,315 |
|
Capital One Financial Corp. |
| 4,668 | 184,619 |
|
|
|
| 1,642,934 |
|
|
|
|
|
|
Containers & Packaging - 0.4% |
|
|
|
|
Sealed Air Corp. |
| 13,767 | 309,482 |
|
|
|
|
|
|
Diversified Consumer Services - 0.4% |
|
|
|
|
DeVry, Inc. |
| 5,544 | 272,820 |
|
|
|
|
|
|
Diversified Financial Services - 6.4% |
|
|
|
|
Bank of America Corp. |
| 174,314 | 2,285,256 |
|
JPMorgan Chase & Co. |
| 64,224 | 2,445,008 |
|
|
|
| 4,730,264 |
|
|
|
|
|
|
Diversified Telecommunication Services - 3.7% |
|
|
|
|
AT&T, Inc. |
| 95,955 | 2,744,313 |
|
|
|
|
|
|
|
|
|
|
|
Equity Securities - Cont’d |
| Shares | Value |
|
Electric Utilities - 0.5% |
|
|
|
|
IDACORP, Inc. |
| 8,046 | $289,012 |
|
Portland General Electric Co. |
| 4,168 | 84,527 |
|
|
|
| 373,539 |
|
|
|
|
|
|
Electrical Equipment - 3.7% |
|
|
|
|
Emerson Electric Co. |
| 33,764 | 1,778,012 |
|
Regal-Beloit Corp. |
| 4,513 | 264,868 |
|
Roper Industries, Inc. |
| 5,348 | 348,583 |
|
Thomas & Betts Corp.* |
| 8,129 | 333,451 |
|
|
|
| 2,724,914 |
|
|
|
|
|
|
Electronic Equipment & Instruments - 0.5% |
|
|
|
|
Anixter International, Inc.* |
| 6,224 | 336,034 |
|
|
|
|
|
|
Energy Equipment & Services - 1.9% |
|
|
|
|
Bristow Group, Inc.* |
| 8,804 | 317,648 |
|
Exterran Holdings, Inc.* |
| 7,045 | 159,992 |
|
SEACOR Holdings, Inc.* |
| 3,924 | 334,168 |
|
Tidewater, Inc. |
| 7,379 | 330,653 |
|
Unit Corp.* |
| 7,058 | 263,193 |
|
|
|
| 1,405,654 |
|
|
|
|
|
|
Food & Staples Retailing - 5.3% |
|
|
|
|
Costco Wholesale Corp. |
| 28,313 | 1,825,905 |
|
CVS Caremark Corp. |
| 54,829 | 1,725,469 |
|
Walgreen Co. |
| 11,528 | 386,188 |
|
|
|
| 3,937,562 |
|
|
|
|
|
|
Gas Utilities - 2.5% |
|
|
|
|
Atmos Energy Corp. |
| 10,240 | 299,520 |
|
Energen Corp. |
| 6,578 | 300,746 |
|
Nicor, Inc. |
| 6,576 | 301,312 |
|
Oneok, Inc. |
| 6,768 | 304,831 |
|
Questar Corp. |
| 18,096 | 317,223 |
|
Southwest Gas Corp. |
| 8,990 | 301,974 |
|
|
|
| 1,825,606 |
|
|
|
|
|
|
Health Care Equipment & Supplies - 0.3% |
|
|
|
|
Integra LifeSciences Holdings Corp.* |
| 5,591 | 220,621 |
|
|
|
|
|
|
Health Care Providers & Services - 3.9% |
|
|
|
|
Cardinal Health, Inc. |
| 1,197 | 39,549 |
|
CIGNA Corp. |
| 10,840 | 387,855 |
|
Coventry Health Care, Inc.* |
| 1,868 | 40,218 |
|
Express Scripts, Inc.* |
| 19,474 | 948,384 |
|
Magellan Health Services, Inc.* |
| 1,338 | 63,207 |
|
McKesson Corp. |
| 22,217 | 1,372,566 |
|
|
|
| 2,851,779 |
|
|
|
|
|
|
Hotels, Restaurants & Leisure - 0.1% |
|
|
|
|
Starbucks Corp. |
| 3,856 | 98,636 |
|
|
|
|
|
|
|
|
|
|
|
Equity Securities - Cont’d |
| Shares | Value |
|
Household Products - 2.1% |
|
|
|
|
Church & Dwight Co., Inc. |
| 634 | $41,172 |
|
Colgate-Palmolive Co. |
| 19,784 | 1,520,598 |
|
|
|
| 1,561,770 |
|
|
|
|
|
|
Industrial Conglomerates - 1.5% |
|
|
|
|
Carlisle Co.’s, Inc. |
| 8,042 | 240,858 |
|
Koninklijke Philips Electronics NV, NY Shares |
| 28,536 | 893,747 |
|
|
|
| 1,134,605 |
|
|
|
|
|
|
Insurance - 4.9% |
|
|
|
|
Aflac, Inc. |
| 2,218 | 114,693 |
|
American Financial Group, Inc. |
| 10,214 | 312,344 |
|
Endurance Specialty Holdings Ltd. |
| 5,343 | 212,651 |
|
Prudential Financial, Inc. |
| 13,149 | 712,413 |
|
Travelers Co.’s, Inc. |
| 30,577 | 1,593,062 |
|
Unitrin, Inc. |
| 11,277 | 275,046 |
|
XL Group plc |
| 18,271 | 395,750 |
|
|
|
| 3,615,959 |
|
|
|
|
|
|
IT Services - 3.1% |
|
|
|
|
Computer Sciences Corp. |
| 7,066 | 325,036 |
|
DST Systems, Inc. |
| 7,650 | 343,026 |
|
Visa, Inc. |
| 22,030 | 1,635,948 |
|
|
|
| 2,304,010 |
|
|
|
|
|
|
Leisure Equipment & Products - 0.1% |
|
|
|
|
Polaris Industries, Inc. |
| 1,645 | 107,090 |
|
|
|
|
|
|
Machinery - 6.4% |
|
|
|
|
Barnes Group, Inc. |
| 3,375 | 59,366 |
|
Danaher Corp. |
| 39,422 | 1,600,927 |
|
Deere & Co. |
| 24,802 | 1,730,684 |
|
Eaton Corp. |
| 4,644 | 383,084 |
|
Snap-on, Inc. |
| 3,200 | 148,832 |
|
SPX Corp. |
| 2,625 | 166,110 |
|
Valmont Industries, Inc. |
| 3,915 | 283,446 |
|
Watts Water Technologies, Inc. |
| 9,276 | 315,848 |
|
|
|
| 4,688,297 |
|
|
|
|
|
|
Marine - 0.4% |
|
|
|
|
Alexander & Baldwin, Inc. |
| 8,990 | 313,212 |
|
|
|
|
|
|
Media - 6.2% |
|
|
|
|
DIRECTV* |
| 44,046 | 1,833,635 |
|
Scholastic Corp. |
| 3,414 | 94,977 |
|
Time Warner Cable, Inc. |
| 17,636 | 952,168 |
|
Time Warner, Inc. |
| 53,820 | 1,649,583 |
|
|
|
| 4,530,363 |
|
|
|
|
|
|
Metals & Mining - 0.2% |
|
|
|
|
Reliance Steel & Aluminum Co. |
| 1,906 | 79,156 |
|
Worthington Industries, Inc. |
| 3,134 | 47,104 |
|
|
|
| 126,260 |
|
|
|
|
|
|
Equity Securities - Cont’d |
| Shares | Value |
|
Multiline Retail - 2.7% |
|
|
|
|
Dollar Tree, Inc.* |
| 4,791 | $233,609 |
|
Target Corp. |
| 32,190 | 1,720,234 |
|
|
|
| 1,953,843 |
|
|
|
|
|
|
Multi-Utilities - 1.5% |
|
|
|
|
Consolidated Edison, Inc. |
| 3,368 | 162,405 |
|
Integrys Energy Group, Inc. |
| 6,470 | 336,828 |
|
MDU Resources Group, Inc. |
| 13,833 | 275,969 |
|
NiSource, Inc. |
| 19,265 | 335,211 |
|
|
|
| 1,110,413 |
|
|
|
|
|
|
Oil, Gas & Consumable Fuels - 5.3% |
|
|
|
|
Bill Barrett Corp.* |
| 8,906 | 320,616 |
|
Cenovus Energy, Inc. |
| 47,597 | 1,369,366 |
|
Cimarex Energy Co. |
| 2,446 | 161,876 |
|
EnCana Corp. |
| 42,877 | 1,296,172 |
|
Mariner Energy, Inc.* |
| 1,238 | 29,997 |
|
Southern Union Co. |
| 13,382 | 321,971 |
|
Teekay Corp. |
| 10,338 | 276,335 |
|
World Fuel Services Corp. |
| 6,114 | 159,025 |
|
|
|
| 3,935,358 |
|
|
|
|
|
|
Paper & Forest Products - 0.4% |
|
|
|
|
MeadWestvaco Corp. |
| 13,162 | 320,890 |
|
|
|
|
|
|
Pharmaceuticals - 8.1% |
|
|
|
|
Bristol-Myers Squibb Co. |
| 66,931 | 1,814,499 |
|
GlaxoSmithKline plc (ADR) |
| 36,980 | 1,461,450 |
|
Johnson & Johnson |
| 43,683 | 2,706,599 |
|
|
|
| 5,982,548 |
|
|
|
|
|
|
Road & Rail - 0.2% |
|
|
|
|
Ryder System, Inc. |
| 4,025 | 172,149 |
|
|
|
|
|
|
Semiconductors & Semiconductor Equipment - 4.5% |
|
|
|
|
Intel Corp. |
| 103,673 | 1,993,632 |
|
Texas Instruments, Inc. |
| 47,810 | 1,297,563 |
|
|
|
| 3,291,195 |
|
|
|
|
|
|
Software - 3.6% |
|
|
|
|
Microsoft Corp. |
| 108,987 | 2,669,092 |
|
|
|
|
|
|
Specialty Retail - 3.1% |
|
|
|
|
Advance Auto Parts, Inc. |
| 5,899 | 346,153 |
|
Home Depot, Inc. |
| 61,312 | 1,942,364 |
|
|
|
| 2,288,517 |
|
|
|
|
|
|
Textiles, Apparel & Luxury Goods - 0.6% |
|
|
|
|
Fossil, Inc.* |
| 7,800 | 419,562 |
|
|
|
|
|
|
Thrifts & Mortgage Finance - 0.3% |
|
|
|
|
Northwest Bancshares, Inc. |
| 21,060 | 235,661 |
|
|
|
|
|
|
Equity Securities - Cont’d |
| Shares | Value |
|
Trading Companies & Distributors - 1.1% |
|
|
|
|
Applied Industrial Technologies, Inc. |
| 10,276 | $314,446 |
|
W.W. Grainger, Inc. |
| 3,019 | 359,593 |
|
WESCO International, Inc.* |
| 3,409 | 133,940 |
|
|
|
| 807,979 |
|
|
|
|
|
|
Wireless Telecommunication Services - 0.4% |
|
|
|
|
Telephone & Data Systems, Inc. |
| 9,143 | 299,890 |
|
|
|
|
|
|
|
|
|
|
|
Total Equity Securities (Cost $68,213,362) |
|
| 73,288,884 |
|
|
|
|
|
|
|
|
|
|
|
|
|
|
|
|
TOTAL INVESTMENTS (Cost $68,213,362) - 99.4% |
|
| 73,288,884 |
|
Other assets and liabilities, net - 0.6% |
|
| 424,128 |
|
Net Assets - 100% |
|
| $73,713,012 |
|
|
|
|
|
|
|
|
|
|
|
Net Assets Consist of: |
|
|
|
|
Paid-in capital applicable to the following shares of beneficial interest, |
|
|
|
|
unlimited number of no par value shares authorized: |
|
|
|
|
Class A: 2,300,651 shares outstanding |
|
| $40,150,913 |
|
Class B: 171,671 shares outstanding |
|
| 2,722,468 |
|
Class C: 458,064 shares outstanding |
|
| 7,839,793 |
|
Class I: 1,995,775 shares outstanding |
|
| 35,794,591 |
|
Undistributed net investment income |
|
| 310,294 |
|
Accumulated net realized gain (loss) on investments |
|
| (18,180,557) |
|
Net unrealized appreciation (depreciation) on investments and |
|
|
|
|
assets and liabilities denominated in foreign currencies |
|
| 5,075,510 |
|
|
|
|
|
|
Net Assets |
|
| $73,713,012 |
|
|
|
|
|
|
Net Asset Value Per Share |
|
|
|
|
Class A (based on net assets of $34,562,998) |
|
| $15.02 |
|
Class B (based on net assets of $2,328,822) |
|
| $13.57 |
|
Class C (based on net assets of $6,296,971) |
|
| $13.75 |
|
Class I (based on net assets of $30,524,221) |
|
| $15.29 |
|
See notes to financial statements.
NOtes to statements of net assets
(a) Affiliated company.
(b) This security was valued by the Board of Trustees. See Note A.
(c) Colson Services Corporation is the collection and transfer agent for certain U.S. Government guaranteed variable rate loans. Each depository receipt pertains to a set, grouped by interest rate, of these loans.
(e) Security is exempt from registration under Rule 144A of the Securities Act of 1933. These securities may be resold in transactions exempt from registration, normally to qualified institutional buyers.
(f) Maryland State Economic Development Corp. Revenue Bonds Series B and C were issued in exchange for 3,750,000 par Maryland State Economic Development Corp. Revenue Bonds due 10/1/19 that were previously held by the Balanced Portfolio. Series B is not accruing interest.
(h) Represents rate in effect at September 30, 2010, after regularly scheduled adjustments on such date. Interest rates adjust generally at the beginning of the month, calendar quarter, or semiannually based on prime plus contracted adjustments. As of September 30, 2010, the prime rate was 3.25%.
(i) Restricted securities represent 3.3% of the net assets for Balanced Portfolio, 0.3% for Bond Portfolio, and 1.2% for Equity Portfolio.
(j) KDM Development Corp. Note has been restructured from an original maturity date of December 31, 2007.
(m) The Illinois Insurance Department prohibited Lumbermens from making interest payments. This security is no longer accruing interest.
(n) The Illinois Insurance Department prohibited Lumbermens from making interest payments. This TIERS security is based on interest payments from Lumbermens. This security is no longer accruing interest.
(p) The State of New York Insurance Department has prohibited Atlantic Mutual Insurance Co. from making interest payments. This security is no longer accruing interest.
(r) The coupon rate shown on floating or adjustable rate securities represents the rate at period end.
(s) 5,500 shares of Oneok, Inc. held by the Balanced Portfolio have been soft segregated in order to cover outstanding commitments to certain limited partnership investments within the Portfolio. There are no restrictions on the trading of this security.
(t) 125,000 shares of Procter & Gamble Co. held by the Equity Portfolio have been soft segregated in order to cover outstanding commitments to certain limited partnership investments within the Portfolio. There are no restrictions on the trading of this security.
(w) Security is in default and is no longer accruing interest.
(x) Alliance Bancorp and its affiliates filed for Chapter 7 bankruptcy on July 13, 2007. This security is no longer accruing interest.
(y) The government of Iceland took control of Glitnir Banki HF and Kaupthing Bank HF (the “Banks”) on October 8, 2008 and October 9, 2008, respectively. The government has prohibited the Banks from paying any claims owed to foreign entities. As of October 9, 2008, these securities are no longer accruing interest.
* Non-income producing security.
Explanation of Guarantees:
C/LOC: Confirming Letter of Credit
LOC: Letter of Credit
Abbreviations:
ADR: American Depositary Receipt
COPs: Certificates of Participation
FCB: Farm Credit Bank
FHLB: Federal Home Loan Bank
FSB: Federal Savings Bank
GO: General Obligation
IDA: Industrial Development Authority
LLC: Limited Liability Corporation
LP: Limited Partnership
MFH: Multi-Family Housing
PO: Pension Obligation
REIT: Real Estate Investment Trust
STEP: Stepped coupon bond for which the coupon rate of interest will adjust on specified future date(s)
ULC: Unlimited Liability Corporation
Balanced Portfolio |
|
|
|
|
Restricted Securities |
| Acquisition Dates | Cost |
|
Access Bank plc, 8.477%, 8/29/12 |
| 8/29/07 | $500,000 |
|
Agraquest, Inc.: |
|
|
|
|
Series B, Preferred |
| 2/26/97 | 200,001 |
|
Series C, Preferred |
| 3/11/98 | 200,000 |
|
Series H, Preferred |
| 5/25/05 - 1/11/07 | 316,894 |
|
Angels With Attitude I LLC, LP |
| 8/28/00 - 4/30/03 | 200,000 |
|
Calvert Social Investment Foundation Notes, |
|
|
|
|
1.17%, 7/1/13 |
| 7/1/10 | 4,266,666 |
|
CFBanc Corp. |
| 3/14/03 | 270,000 |
|
Coastal Venture Partners LP |
| 6/7/96 - 6/22/00 | 103,561 |
|
Common Capital LP |
| 2/15/01 - 4/29/08 | 445,606 |
|
Consensus Orthopedics, Inc.: |
|
|
|
|
Common Stock |
| 2/10/06 | 504,331 |
|
Series A-1, Preferred |
| 8/19/05 | 4,417 |
|
Series B, Preferred |
| 2/10/06 | 139,576 |
|
Series C, Preferred |
| 2/10/06 | 120,342 |
|
Environmental Private Equity Fund II, Liquidating |
|
|
|
|
Trust |
| 4/26/07 | 6,666 |
|
First Analysis Private Equity Fund IV LP |
| 2/25/02 - 6/15/10 | 563,131 |
|
GEEMF Partners LP |
| 2/28/97 | - |
|
Global Environment Emerging Markets Fund LP |
| 1/14/94 - 12/1/95 | - |
|
Infrastructure and Environmental Private Equity |
|
|
|
|
Fund III LP |
| 4/16/97- 2/12/01 | 315,224 |
|
KDM Development Corp., 6.00%, 6/30/19 |
| 6/30/09 | 600,000 |
|
Labrador Ventures III LP |
| 8/11/98 - 4/2/01 | 360,875 |
|
Labrador Ventures IV LP |
| 12/14/99 - 8/27/07 | 900,510 |
|
Neighborhood Bancorp |
| 6/25/97 | 100,000 |
|
New Markets Growth Fund LLC, LP |
| 1/8/03 - 7/18/07 | 225,646 |
|
Plethora Technology, Inc.: |
|
|
|
|
Common Warrants (strike price $0.01/share, |
|
|
|
|
expires 4/29/15) |
| 5/19/05 | 75,360 |
|
Series A, Preferred |
| 4/29/05 - 5/13/05 | 701,835 |
|
Series A, Preferred Warrants (strike price $0.85/share, |
|
|
|
|
expires 6/9/13) |
| 6/8/06 | - |
|
Series A, Preferred Warrants (strike price $0.85/share, |
|
|
|
|
expires 9/6/13) |
| 11/3/06 | - |
|
12.00%, 12/31/06 |
| 6/8/06 | 150,000 |
|
Rose Smart Growth Investment Fund, 6.545%, 4/1/21 |
| 4/10/06 | 1,000,000 |
|
Seventh Generation, Inc. |
| 4/12/00 - 5/6/03 | 230,500 |
|
SmarThinking, Inc.: |
|
|
|
|
Series 1-A, Convertible Preferred |
| 4/22/03 - 5/27/05 | 159,398 |
|
Series 1-B, Convertible Preferred |
| 6/10/03 | 250,000 |
|
Series 1-B, Preferred Warrants (strike price $0.01/share, |
|
|
|
|
expires 5/31/15) |
| 5/27/05 | - |
|
Series 1-B, Preferred Warrants (strike price $1.53/share, |
|
|
|
|
expires 6/1/15) |
| 9/19/00 | - |
|
Solstice Capital LP |
| 6/26/01 - 6/17/08 | 340,303 |
|
Venture Strategy Partners LP |
| 8/21/98 - 2/26/03 | 188,182 |
|
Wild Planet Entertainment, Inc.: |
|
|
|
|
Series B, Preferred |
| 7/12/94 | 200,000 |
|
Series E, Preferred |
| 4/9/98 | 180,725 |
|
Wind Harvest Co., Inc. |
| 5/16/94 | 100,000 |
|
|
|
|
|
|
Equity Portfolio |
|
|
|
|
Restricted Securities |
| Acquisition Dates | Cost |
|
20/20 Gene Systems, Inc.: |
|
|
|
|
Common Stock |
| 8/1/08 | $151,890 |
|
Warrants (strike price $.01/share, expires 8/27/13) |
| 8/29/03 | 14,700 |
|
Blackstone Cleantech Venture Partners LP |
| 7/29/10 | 110,000 |
|
Calvert Social Investment Foundation Notes, 1.17%, 7/1/12 |
| 7/1/09 - 7/1/10 | 7,083,877 |
|
Chesapeake PERL, Inc.: |
|
|
|
|
Series A-2, Preferred |
| 7/30/04 - 9/8/06 | 300,000 |
|
Series A-2, Preferred Warrants (strike price $1.25/share, |
|
|
|
|
expires 12/27/10) |
| 12/22/06 | - |
|
China Environment Fund 2004 LP |
| 9/15/05 - 4/1/09 | - |
|
Core Innovations Capital I LP |
| 8/11/10 | 52,343 |
|
Cylex, Inc.: |
|
|
|
|
Common Stock |
| 11/22/06 | 16,382 |
|
Series B, Preferred |
| 11/30/06 | 547,525 |
|
Series C-1, Preferred |
| 11/30/06 | 471,342 |
|
Digital Directions International, Inc. |
| 7/2/08 - 7/15/09 | 683,778 |
|
Envisionier Medical Technologies, Inc.: |
|
|
|
|
Warrants (strike price $.50/share, expires 8/6/20) |
| 8/6/10 | - |
|
Series A, 7.00%, 1/15/11 |
| 12/14/09 | 200,000 |
|
Series B, 7.00%, 1/15/11 |
| 8/5/10 | 100,000 |
|
Global Resource Options, Inc.: |
|
|
|
|
Bridge Note, STEP, 30.00%, 2/5/12 |
| 8/5/10 | 200,000 |
|
Series A, Preferred |
| 9/18/06 | 750,000 |
|
Series B, Preferred |
| 12/5/07 | 750,000 |
|
Series C, Preferred |
| 2/13/09 | 1,000,000 |
|
Impact Ventures II LP |
| 9/8/10 | 313,326 |
|
Marrone Bio Innovations, Inc.: |
|
|
|
|
Series A, Preferred |
| 4/25/07 | 200,000 |
|
Series B, Preferred |
| 8/28/08 | 280,000 |
|
NeoDiagnostix, Inc.: |
|
|
|
|
Series AE, Convertible Preferred Contingent Deferred |
|
|
|
|
Distribution |
| 9/9/08 | - |
|
Series AE, Convertible Preferred Warrants Contingent |
|
|
|
|
Deferred Distribution |
| 9/23/08 - 9/18/09 | - |
|
Series B, Preferred Stock Contingent Deferred Distribution |
| 7/31/09 | - |
|
New Day Farms, Inc.: |
|
|
|
|
Participation Interest Note, 9.00%, 9/1/12 |
| 11/25/09 | 6,225 |
|
Series B, Preferred |
| 3/12/09 | 500,000 |
|
New Markets Venture Partners II LP |
| 7/21/08 - 10/14/09 | 125,000 |
|
SEAF India International Growth Fund LP |
| 3/22/05 - 5/24/10 | 481,432 |
|
Sustainable Jobs Fund II LP |
| 2/14/06 - 12/8/09 | 525,000 |
|
Sword Diagnostics: |
|
|
|
|
Convertible Bridge Note, 10.00%, 9/30/10 |
| 10/29/09 | 25,000 |
|
Series B, Preferred |
| 12/26/06 | 250,000 |
|
|
|
|
|
|
|
|
|
|
|
Bond Portfolio |
|
|
|
|
Restricted Securities |
| Acquisition Dates | Cost |
|
Calvert Social Investment Foundation Notes, 1.17%, 7/1/12 |
| 07/01/09 | $3,087,392 |
|
See notes to financial statements.
Statements of Operations
year ended september 30, 2010
|
| Money |
|
|
|
| Market | Balanced | Bond |
Net Investment Income |
| Portfolio | Portfolio | Portfolio |
Investment Income: |
|
|
|
|
Interest income |
| $858,082 | $7,017,125 | $32,370,248 |
Dividend income |
| — | 3,407,749 | 122,427 |
Total investment income |
| 858,082 | 10,424,874 | 32,492,675 |
Expenses: |
|
|
|
|
Investment advisory fee |
| 467,517 | 1,915,171 | 3,020,969 |
Transfer agency fees and expenses |
| 352,485 | 886,657 | 1,461,886 |
Administrative fees |
| 311,678 | 1,235,328 | 2,194,578 |
Distribution Plan expenses: |
|
|
|
|
Class A |
| — | 953,815 | 1,191,908 |
Class B |
| — | 133,582 | 102,341 |
Class C |
| — | 231,445 | 548,760 |
Trustees’ fees and expenses |
| 18,038 | 56,835 | 105,122 |
Custodian fees |
| 28,928 | 116,369 | 124,228 |
Registration fees |
| 17,826 | 48,414 | 67,271 |
Reports to shareholders |
| 44,421 | 166,581 | 184,589 |
Professional fees |
| 30,122 | 48,857 | 72,378 |
Miscellaneous |
| 23,147 | 101,070 | 42,935 |
Total expenses |
| 1,294,162 | 5,894,124 | 9,116,965 |
Reimbursement from Advisor: |
|
|
|
|
Class O |
| (444,332) | — | — |
Class I |
| — | (9,674) | — |
Class Y |
| — | — | (3,921) |
Fees paid indirectly |
| (6,123) | (1,003) | (2,118) |
Net expenses |
| 843,707 | 5,883,447 | 9,110,926 |
|
|
|
|
|
Net Investment Income |
| 14,375 | 4,541,427 | 23,381,749 |
|
|
|
|
|
Realized and Unrealized Gain (Loss) |
|
|
|
|
Net realized gain (loss) on: |
|
|
|
|
Investments |
| 205 | 3,182,173 | (1,963,206) |
Futures |
| — | 236,093 | 7,112,175 |
|
| 205 | 3,418,266 | 5,148,969 |
|
|
|
|
|
Change in unrealized appreciation (depreciation) on: |
|
|
|
|
Investments |
| — | 31,127,585 | 43,385,687 |
Futures |
| — | (276,204) | (200,951) |
|
| — | 30,851,381 | 43,184,736 |
|
|
|
|
|
Net Realized and Unrealized |
|
|
|
|
Gain (Loss) |
| 205 | 34,269,647 | 48,333,705 |
|
|
|
|
|
Increase (Decrease) in Net Assets |
|
|
|
|
Resulting From Operations |
| $14,580 | $38,811,074 | $71,715,454 |
See notes to financial statements.
Statement of operations
year ended september 30, 2010
|
|
| Enhanced |
|
|
| Equity | Equity |
|
Net Investment Income |
| Portfolio | Portfolio |
|
Investment Income: |
|
|
|
|
Interest income |
| $210,254 | — |
|
Dividend income (net of foreign taxes withheld of |
|
|
|
|
$238,625 and $11,170, respectively) |
| 13,126,732 | $1,320,081 |
|
Total investment income |
| 13,336,986 | 1,320,081 |
|
Expenses: |
|
|
|
|
Investment advisory fee |
| 6,107,441 | 428,064 |
|
Transfer agency fees and expenses |
| 2,172,608 | 135,044 |
|
Administrative fees |
| 2,264,294 | 92,724 |
|
Distribution Plan expenses: |
|
|
|
|
Class A |
| 2,264,288 | 85,584 |
|
Class B |
| 411,490 | 25,962 |
|
Class C |
| 923,865 | 59,311 |
|
Trustees’ fees and expenses |
| 152,902 | 8,645 |
|
Custodian fees |
| 108,251 | 51,950 |
|
Registration fees |
| 70,112 | 42,134 |
|
Reports to shareholders |
| 378,431 | 24,773 |
|
Professional fees |
| 92,785 | 22,452 |
|
Miscellaneous |
| 111,767 | 8,002 |
|
Total expenses |
| 15,058,234 | 984,645 |
|
Reimbursement from Advisor: |
|
|
|
|
Class B |
| — | (438) |
|
Class I |
| — | (919) |
|
Class Y |
| (6,281) | — |
|
Fees waived |
| — | (71,344) |
|
Fees paid indirectly |
| (1,977) | (476) |
|
Net expenses |
| 15,049,976 | 911,468 |
|
|
|
|
|
|
Net Investment Income (Loss) |
| (1,712,990) | 408,613 |
|
|
|
|
|
|
Realized and Unrealized Gain (Loss) |
|
|
|
|
Net realized gain (loss) on: |
|
|
|
|
Investments |
| 42,454,473 | 11,379,935 |
|
Foreign currency transactions |
| 1,784 | 499 |
|
|
| 42,456,257 | 11,380,434 |
|
|
|
|
|
|
Change in unrealized appreciation (depreciation) on: |
|
|
|
|
Investments |
| 91,189,722 | (4,356,267) |
|
Assets and liabilities denominated in foreign currencies |
| — | (19) |
|
|
| 91,189,722 | (4,356,286) |
|
|
|
|
|
|
Net Realized and Unrealized |
|
|
|
|
Gain (Loss) |
| 133,645,979 | 7,024,148 |
|
|
|
|
|
|
Increase (Decrease) in Net Assets |
|
|
|
|
Resulting From Operations |
| $131,932,989 | $7,432,761 |
|
See notes to financial statements.
Money Market Portfolio
Statements of Changes in Net Assets
|
|
| Year Ended | Year Ended |
. |
|
| September 30, | September 30, |
Increase (Decrease) in Net Assets |
|
| 2010 | 2009 |
Operations: |
|
|
|
|
Net investment income |
|
| $14,375 | $2,198,764 |
Net realized gain (loss) |
|
| 205 | 1,748 |
|
|
|
|
|
Increase (Decrease) in Net Assets |
|
|
|
|
Resulting From Operations |
|
| 14,580 | 2,200,512 |
|
|
|
|
|
Distributions to shareholders from: |
|
|
|
|
Net investment income |
|
| (12,743) | (2,209,584) |
|
|
|
|
|
Capital share transactions: |
|
|
|
|
Shares sold |
|
| 80,538,541 | 143,308,714 |
Reinvestment of distributions |
|
| 12,239 | 2,184,286 |
Shares redeemed |
|
| (105,462,303) | (162,310,184) |
Total capital share transactions |
|
| (24,911,523) | (16,817,184) |
|
|
|
|
|
Total Increase (Decrease) in Net Assets |
|
| (24,909,686) | (16,826,256) |
|
|
|
|
|
Net Assets |
|
|
|
|
Beginning of year |
|
| 169,484,721 | 186,310,977 |
End of year (including undistributed net investment |
|
|
|
|
income of $6,532 and $6,338, respectively) |
|
| $144,575,035 | $169,484,721 |
|
|
|
|
|
Capital Share Activity |
|
|
|
|
Shares sold |
|
| 80,538,541 | 143,308,597 |
Reinvestment of distributions |
|
| 12,239 | 2,184,286 |
Shares redeemed |
|
| (105,462,303) | (162,310,184) |
Total capital share activity |
|
| (24,911,523) | (16,817,301) |
See notes to financial statements.
Balanced Portfolio
Statements of Changes in Net Assets
|
|
| Year Ended | Year Ended |
|
|
| September 30, | September 30, |
Increase (Decrease) in Net Assets |
|
| 2010 | 2009 |
Operations: |
|
|
|
|
Net investment income |
|
| $4,541,427 | $7,183,768 |
Net realized gain (loss) |
|
| 3,418,266 | (44,854,127) |
Change in unrealized appreciation (depreciation) |
|
| 30,851,381 | 22,671,456 |
|
|
|
|
|
Increase (Decrease) in Net Assets |
|
|
|
|
Resulting From Operations |
|
| 38,811,074 | (14,998,903) |
|
|
|
|
|
Distributions to shareholders from: |
|
|
|
|
Net investment income: |
|
|
|
|
Class A shares |
|
| (4,302,238) | (6,435,679) |
Class B shares |
|
| (5,742) | (100,535) |
Class C shares |
|
| (34,236) | (167,297) |
Class I shares |
|
| (41,239) | (117,020) |
Net realized gain: |
|
|
|
|
Class A shares |
|
| — | (1,818) |
Class B shares |
|
| — | (74) |
Class C shares |
|
| — | (102) |
Class I shares |
|
| — | (24) |
Total distributions |
|
| (4,383,455) | (6,822,549) |
|
|
|
|
|
Capital share transactions: |
|
|
|
|
Shares sold: |
|
|
|
|
Class A shares |
|
| 24,938,191 | 31,489,134 |
Class B shares |
|
| 591,238 | 1,114,303 |
Class C shares |
|
| 3,864,650 | 2,667,803 |
Class I shares |
|
| 642,851 | 574,607 |
Reinvestment of distributions: |
|
|
|
|
Class A shares |
|
| 3,996,487 | 5,977,652 |
Class B shares |
|
| 5,386 | 93,329 |
Class C shares |
|
| 27,038 | 132,222 |
Class I shares |
|
| 41,239 | 117,043 |
Redemption fees: |
|
|
|
|
Class A shares |
|
| 769 | 4,510 |
Class B shares |
|
| 26 | 2 |
Class C shares |
|
| 1,349 | 159 |
Shares redeemed: |
|
|
|
|
Class A shares |
|
| (45,467,417) | (47,762,495) |
Class B shares |
|
| (3,795,452) | (3,749,982) |
Class C shares |
|
| (3,187,392) | (4,341,876) |
Class I shares |
|
| (5,330,006) | (517,418) |
Total capital share transactions |
|
| (23,671,043) | (14,201,007) |
|
|
|
|
|
|
|
|
|
|
Total Increase (Decrease) in Net Assets |
|
| 10,756,576 | (36,022,459) |
See notes to financial statements.
Balanced Portfolio
Statements of Changes in Net Assets
|
| Year Ended | Year Ended |
|
|
| September 30, | September 30, |
|
Net Assets |
| 2010 | 2009 |
|
Beginning of year |
| $446,520,513 | $482,542,972 |
|
End of year (including net investment loss |
|
|
|
|
and distribution in excess of net investment |
|
|
|
|
income of $194,291 and $102,499, respectively) |
| $457,277,089 | $446,520,513 |
|
|
|
|
|
|
Capital Share Activity |
|
|
|
|
Shares sold: |
|
|
|
|
Class A shares |
| 991,044 | 1,496,785 |
|
Class B shares |
| 23,815 | 53,745 |
|
Class C shares |
| 156,496 | 129,117 |
|
Class I shares |
| 25,419 | 26,977 |
|
Reinvestment of distributions: |
|
|
|
|
Class A shares |
| 157,724 | 285,304 |
|
Class B shares |
| 215 | 4,591 |
|
Class C shares |
| 1,081 | 6,531 |
|
Class I shares |
| 1,625 | 5,507 |
|
Shares redeemed: |
|
|
|
|
Class A shares |
| (1,823,048) | (2,279,306) |
|
Class B shares |
| (152,605) | (180,674) |
|
Class C shares |
| (129,681) | (212,703) |
|
Class I shares |
| (211,414) | (23,886) |
|
Total capital share activity |
| (959,329) | (688,012) |
|
See notes to financial statements.
Bond Portfolio
Statements of Changes in Net Assets
|
| Year Ended | Year Ended |
|
| September 30, | September 30, |
Increase (Decrease) in Net Assets |
| 2010 | 2009 |
Operations: |
|
|
|
Net investment income |
| $23,381,749 | $30,996,130 |
Net realized gain (loss) |
| 5,148,969 | 550,184 |
Change in unrealized appreciation (depreciation) |
| 43,184,736 | 15,101,660 |
Increase (Decrease) in Net Assets |
|
|
|
Resulting From Operations |
| 71,715,454 | 46,647,974 |
|
|
|
|
Distributions to shareholders from: |
|
|
|
Net investment income: |
|
|
|
Class A shares |
| (14,703,920) | (20,267,907) |
Class B shares |
| (146,269) | (378,342) |
Class C shares |
| (927,336) | (1,474,714) |
Class I shares |
| (6,088,354) | (7,435,081) |
Class Y shares |
| (123,441) | (8,946) |
Net realized gain: |
|
|
|
Class A shares |
| (3,994,598) | (10,367,445) |
Class B shares |
| (75,873) | (289,630) |
Class C shares |
| (374,363) | (931,637) |
Class I shares |
| (1,230,879) | (3,317,155) |
Class Y shares |
| (5,876) | (19) |
Total distributions |
| (27,670,909) | (44,470,876) |
|
|
|
|
Capital share transactions: |
|
|
|
Shares sold: |
|
|
|
Class A shares |
| 129,934,154 | 171,888,010 |
Class B shares |
| 1,321,263 | 2,894,961 |
Class C shares |
| 10,659,183 | 17,219,472 |
Class I shares |
| 47,920,402 | 50,077,002 |
Class Y shares |
| 14,681,870 | 695,570 |
Reinvestment of distributions: |
|
|
|
Class A shares |
| 16,008,978 | 25,940,131 |
Class B shares |
| 170,374 | 547,377 |
Class C shares |
| 865,475 | 1,603,277 |
Class I shares |
| 6,434,493 | 10,247,517 |
Class Y shares |
| 36,930 | 8,965 |
Redemption fees: |
|
|
|
Class A shares |
| 9,738 | 47,364 |
Class B shares |
| 99 | 1,012 |
Class C shares |
| 373 | 1,807 |
Class I shares |
| 212 | 443 |
Class Y shares |
| 109 | 77 |
Bond Portfolio
Statements of Changes in Net Assets
|
| Year Ended | Year Ended |
|
| September 30, | September 30, |
Increase (Decrease) in Net Assets - (Cont’d) |
| 2010 | 2009 |
Capital share transactions (cont’d): |
|
|
|
Shares redeemed: |
|
|
|
Class A shares |
| ($183,645,764) | ($209,957,908) |
Class B shares |
| (5,010,050) | (8,656,346) |
Class C shares |
| (16,578,803) | (15,649,349) |
Class I shares |
| (38,550,449) | (80,502,751) |
Class Y shares |
| (1,414,594) | (120,849) |
Total capital share transactions |
| (17,156,007) | (33,714,218) |
|
|
|
|
Total Increase (Decrease) In Net Assets |
| 26,888,538 | (31,537,120) |
|
|
|
|
Net Assets |
|
|
|
Beginning of year |
| 857,575,003 | 889,112,123 |
End of year (including undistributed net investment |
|
|
|
income of $23,109 and $9,899, respectively) |
| $884,463,541 | $857,575,003 |
|
|
|
|
|
|
|
|
Capital Share Activity |
|
|
|
Shares sold: |
|
|
|
Class A shares |
| 8,382,972 | 11,973,561 |
Class B shares |
| 86,060 | 203,718 |
Class C shares |
| 691,903 | 1,210,768 |
Class I shares |
| 3,090,548 | 3,469,159 |
Class Y shares |
| 937,054 | 48,710 |
Reinvestment of distributions: |
|
|
|
Class A shares |
| 1,036,260 | 1,821,375 |
Class B shares |
| 11,133 | 38,810 |
Class C shares |
| 56,449 | 113,380 |
Class I shares |
| 415,560 | 719,024 |
Class Y shares |
| 2,370 | 612 |
Shares redeemed: |
|
|
|
Class A shares |
| (11,854,783) | (14,640,040) |
Class B shares |
| (326,079) | (605,901) |
Class C shares |
| (1,077,318) | (1,095,584) |
Class I shares |
| (2,487,778) | (5,599,150) |
Class Y shares |
| (89,079) | (8,174) |
Total capital share activity |
| (1,124,728) | (2,349,732) |
See notes to financial statements.
Equity Portfolio
Statements of Changes in Net Assets
|
| Year Ended | Year Ended |
|
| September 30, | September 30, |
Increase (Decrease) in Net Assets |
| 2010 | 2009 |
Operations: |
|
|
|
Net investment income (loss) |
| ($1,712,990) | $1,728,924 |
Net realized gain (loss) |
| 42,456,257 | (63,486,809) |
Change in unrealized appreciation (depreciation) |
| 91,189,722 | 30,189,108 |
|
|
|
|
Increase (Decrease) in Net Assets |
|
|
|
Resulting From Operations |
| 131,932,989 | (31,568,777) |
|
|
|
|
Distributions to shareholders from: |
|
|
|
Net investment income: |
|
|
|
Class A shares |
| (1,020,319) | (47,880,999) |
Class B shares |
| — | (3,688,194) |
Class C shares |
| — | (6,666,547) |
Class I shares |
| (584,901) | (6,897,440) |
Class Y shares |
| (265) | (70) |
Total distributions |
| (1,605,485) | (65,133,250) |
|
|
|
|
Capital share transactions: |
|
|
|
Shares sold: |
|
|
|
Class A shares |
| 199,788,671 | 176,902,110 |
Class B shares |
| 1,662,605 | 4,509,912 |
Class C shares |
| 14,998,567 | 11,881,206 |
Class I shares |
| 60,197,166 | 55,596,023 |
Class Y shares |
| 11,277,799 | 423,927 |
Reinvestment of distributions: |
|
|
|
Class A shares |
| 923,360 | 44,035,145 |
Class B shares |
| — | 3,242,846 |
Class C shares |
| — | 5,066,186 |
Class I shares |
| 484,505 | 6,223,867 |
Class Y shares |
| 203 | 70 |
Redemption fees: |
|
|
|
Class A shares |
| 12,199 | 47,999 |
Class B shares |
| 395 | 156 |
Class C shares |
| 498 | 581 |
Class I shares |
| 2,790 | 5,259 |
Shares redeemed: |
|
|
|
Class A shares |
| (153,933,488) | (145,075,195) |
Class B shares |
| (15,650,762) | (13,241,912) |
Class C shares |
| (13,675,307) | (14,606,408) |
Class I shares |
| (38,465,802) | (20,533,082) |
Class Y shares |
| (537,791) | (11) |
Total capital share transactions |
| 67,085,608 | 114,478,679 |
|
|
|
|
Total Increase (Decrease) in Net Assets |
| 197,413,112 | 17,776,652 |
See notes to financial statements.
Equity Portfolio
Statements of Changes in Net Assets
|
| Year Ended | Year Ended |
|
| September 30, | September 30, |
Net Assets |
| 2010 | 2009 |
Beginning of year |
| $1,127,276,726 | $1,109,500,074 |
End of year (including undistributed net investment |
|
|
|
income of $0 and $1,610,638, respectively) |
| $1,324,689,838 | $1,127,276,726 |
|
|
|
|
|
|
|
|
|
|
|
|
Capital Share Activity |
|
|
|
Shares sold: |
|
|
|
Class A shares |
| 6,487,327 | 7,346,447 |
Class B shares |
| 61,989 | 216,564 |
Class C shares |
| 600,536 | 610,026 |
Class I shares |
| 1,846,313 | 2,142,133 |
Class Y shares |
| 361,408 | 16,436 |
Reinvestment of distributions: |
|
|
|
Class A shares |
| 30,195 | 1,988,043 |
Class B shares |
| — | 165,536 |
Class C shares |
| — | 280,986 |
Class I shares |
| 14,944 | 266,091 |
Class Y shares |
| 7 | 3 |
Shares redeemed: |
|
|
|
Class A shares |
| (5,017,434) | (6,060,034) |
Class B shares |
| (578,597) | (621,436) |
Class C shares |
| (554,040) | (753,203) |
Class I shares |
| (1,172,079) | (792,956) |
Class Y shares |
| (17,591) | — |
Total capital share activity |
| 2,062,978 | 4,804,636 |
See notes to financial statements.
Enhanced Equity Portfolio
StatementS of Changes in Net Assets
|
|
| Year Ended | Year Ended |
|
|
| September 30, | September 30, |
Increase (Decrease) in Net Assets |
|
| 2010 | 2009 |
Operations: |
|
|
|
|
Net investment income |
|
| $408,613 | $704,199 |
Net realized gain (loss) |
|
| 11,380,434 | (24,446,838) |
Change in unrealized appreciation (depreciation) |
|
| (4,356,286) | 17,423,851 |
|
|
|
|
|
Increase (Decrease) in Net Assets |
|
|
|
|
Resulting From Operations |
|
| 7,432,761 | (6,318,788) |
|
|
|
|
|
Distributions to shareholders from: |
|
|
|
|
Net investment income: |
|
|
|
|
Class A shares |
|
| (256,846) | (529,171) |
Class C shares |
|
| — | (11,155) |
Class I shares |
|
| (299,926) | (394,153) |
Total distributions |
|
| (556,772) | (934,479) |
|
|
|
|
|
Capital share transactions: |
|
|
|
|
Shares sold: |
|
|
|
|
Class A shares |
|
| 4,472,689 | 5,672,701 |
Class B shares |
|
| 176,386 | 187,974 |
Class C shares |
|
| 976,156 | 764,606 |
Class I shares |
|
| 4,405,062 | 5,273,039 |
Reinvestment of distributions: |
|
|
|
|
Class A shares |
|
| 229,520 | 474,136 |
Class C shares |
|
| — | 8,580 |
Class I shares |
|
| 299,925 | 394,153 |
Redemption fees: |
|
|
|
|
Class A shares |
|
| 34 | 851 |
Class B shares |
|
| — | 37 |
Class C shares |
|
| 10 | 229 |
Shares redeemed: |
|
|
|
|
Class A shares |
|
| (6,501,674) | (13,608,953) |
Class B shares |
|
| (869,688) | (909,697) |
Class C shares |
|
| (1,008,399) | (1,011,858) |
Class I shares |
|
| (2,090,962) | (2,587,235) |
Total capital share transactions |
|
| 89,059 | (5,341,437) |
|
|
|
|
|
|
|
|
|
|
Total Increase (Decrease) in Net Assets |
|
| 6,965,048 | (12,594,704) |
|
|
|
|
|
Net Assets |
|
|
|
|
Beginning of year |
|
| 66,747,964 | 79,342,668 |
End of year (including undistributed net investment income |
|
|
|
|
of $310,294 and $464,508, respectively) |
|
| $73,713,012 | $66,747,964 |
See notes to financial statements.
enhanced equity portfolio
StatementS of Changes in Net Assets
|
| Year Ended | Year Ended |
|
| September 30, | September 30, |
Capital Share Activity |
| 2010 | 2009 |
Shares sold: |
|
|
|
Class A shares |
| 307,627 | 508,554 |
Class B shares |
| 13,539 | 18,580 |
Class C shares |
| 72,886 | 74,422 |
Class I shares |
| 298,452 | 453,894 |
Reinvestment of distributions: |
|
|
|
Class A shares |
| 15,873 | 44,520 |
Class C shares |
| — | 873 |
Class I shares |
| 20,473 | 36,631 |
Shares redeemed: |
|
|
|
Class A shares |
| (449,177) | (1,163,191) |
Class B shares |
| (65,770) | (91,012) |
Class C shares |
| (76,752) | (100,418) |
Class I shares |
| (143,163) | (215,188) |
Total capital share activity |
| (6,012) | (432,335) |
See notes to financial statements.
Notes to Financial Statements
Note A — Significant Accounting Policies
General: The Calvert Social Investment Fund (the “Fund”) is registered under the Investment Company Act of 1940 as an open-end management investment company. The Fund operates as a series fund with eight separate portfolios, five of which are reported herein: Money Market, Balanced, Bond, Equity, and Enhanced Equity. Money Market, Balanced, Equity and Enhanced Equity are registered as diversified portfolios. Bond is registered as a non-diversified portfolio. The operations of each series is accounted for separately. Money Market Class O shares are sold without a sales charge. Balanced, Bond, Equity, and Enhanced Equity have Class A, Class B, Class C, and Class I shares. Effective October 31, 2008 , Bond and Equity began to offer Class Y shares. Class A shares are sold with a maximum front-end sales charge of 4.75% (3.75% for Bond). Class B shares are sold without a front-end sales charge. With certain exceptions, the Fund will impose a deferred sales charge at the time of redemption, depending on how long investors have owned the shares. Effective March 1, 2010, Class B shares are no longer offered for purchase, except through reinvestment of dividends and/or distributions and through certain exchanges. Class C shares are sold without a front-end sales charge. With certain exceptions, the Fund will impose a deferred sales charge on shares sold within one year of purchase. Class B and Class C shares have higher levels of expenses than Class A shares. Class I shares require a minimum account balance of $1,000,000. The $1 million minimum initial investment may be waived for certain institutional accounts, where it is believed to be in the best interest of the Fund and its shareholders. Class I shares ha ve no front-end or deferred sales charge and have lower levels of expenses than Class A shares. Class Y shares are generally only available to wrap or similar fee-based programs offered by financial intermediaries that have entered into an agreement with the Fund’s Distributor to offer Class Y shares. Class Y shares have no front-end or deferred sales charge and have lower levels of expenses than Class A shares. Each class has different: (a) dividend rates, due to differences in Distribution Plan expenses and other class-specific expenses, (b) exchange privileges and (c) class-specific voting rights.
Security Valuation: Net asset value per share is determined every business day as of the close of the regular session of the New York Stock Exchange (generally 4:00 p.m. Eastern time). The Fund uses independent pricing services approved by the Board of Trustees to value its investments wherever possible. Securities for which market quotations are available are valued at last sale price or official closing price on the primary market or exchange in which they trade. Short-term notes are stated at amortized cost, which approximates fair value. Municipal securities are valued utilizing a matrix system (which considers such factors as security prices, yields, maturities and ratings) furnished by dealers throug h an independent pricing service. Foreign securities are valued based on quotations from the principal market in which such securities are normally traded. If events occur after the close of the principal market in which foreign securities are traded, and before the Fund’s net asset value is determined, that are expected to materially affect the value of those securities, then they are valued at their fair value taking these events into account. All securities held by Money Market are valued at amortized cost which approximates fair value in accordance with Rule 2a-7 of the Investment Company Act of 1940. The Fund may invest in securities whose resale is subject to restrictions. Investments for which market quotations are not available or deemed not reliable are fair valued in good faith under the direction of the Board of Trustees.
In determining fair value, the Board considers all relevant qualitative and quantitative information available. These factors are subject to change over time and are reviewed periodically. The values assigned to fair value investments are based on available information and do not necessarily represent amounts that might ultimately be realized. Further, because of the inherent uncertainty of valuation, those estimated values may differ significantly from the values that would have been used had a ready market for the investments existed, and the differences could be material.
The following securities were fair valued in good faith under the direction of the Board of Trustees as of September 30, 2010:
. | % of |
|
| Total Investments | Net Assets |
Balanced | $27,062,996 | 5.9% |
Bond | 54,792,834 | 6.2% |
Equity | 16,131,640 | 1.2% |
The Fund utilizes various methods to measure the fair value of its investments. Generally Accepted Accounting Principles (GAAP) establishes a disclosure hierarchy that categorizes the inputs to valuation techniques used to value assets and liabilities at measurement date. These inputs are summarized in the three broad levels listed below:
Level 1 – quoted prices in active markets for identical securities
Level 2 – other significant observable inputs (including quoted prices for similar securities, interest rates, prepayment speeds, credit risk, etc.)
Level 3 – significant unobservable inputs (including the Fund’s own assumptions in determining the fair value of investments)
The inputs or methodology used for valuing securities are not necessarily an indication of the risk associated with investing in those securities. For example, money market securities are valued using amortized cost, in accordance with rules under the Investment Company Act of 1940. Generally, amortized cost approximates the current fair value of a security, but since the value is not obtained from a quoted price in an active market, such securities are reflected as Level 2.
Changes in valuation techniques may result in transfers in or out of an investment’s assigned level within the hierarchy during the period. For additional information on the Fund’s policy regarding valuation of investments, please refer to the Fund’s most recent prospectus.
The following is a summary of the inputs used to value the Fund’s net assets as of September 30, 2010:
Money Market | Valuation Inputs | |||
Investments in Securities | Level 1 | Level 2 | Level 3 | Total |
U.S. government obligations | - | $24,085,203 | - | $24,085,203 |
Other debt obligations | - | 200,195 | - | 200,195 |
Commercial paper | - | 4,500,000 | - | 4,500,000 |
Variable rate demand notes | - | 114,717,000 | - | 114,717,000 |
TOTAL | - | $143,502,398 | - | $143,502,398 |
|
|
|
|
|
Balanced | Valuation Inputs | |||
Investments in Securities | Level 1 | Level 2 | Level 3 | Total |
Equity securities* | $277,042,666 | - | $7,866,502 | $284,909,168 |
Limited partnership interest | - | - | 2,577,127 | 2,577,127 |
Asset backed securities | - | $7,443,429 | - | 7,443,429 |
Collateralized mortgage- backed obligations | - | 3,542,863 | - | 3,542,863 |
Commercial mortgage-backed securities | - | 1,689,385 | - | 1,689,385 |
Corporate debt | - | 77,265,367 | 3,301,453 | 80,566,820 |
Municipal obligations | - | 24,875,087 | - | 24,875,087 |
U.S. government obligations | - | 41,606,658 | - | 41,606,658 |
Other debt obligations | - | - | 6,196,633 | 6,196,633 |
|
|
|
|
|
TOTAL | $277,042,666 | $156,422,789 | $19,941,715 | $453,407,170 |
Other financial instruments** | ($366,641) | - | - | ($366,641) |
* For further breakdown of equity securities by industry, please refer to the Statement of Net Assets.
** Other financial instruments are derivative instruments not reflected in the Portfolio of Investments, such as futures, which are valued at the unrealized appreciation/ depreciation on the instrument.
The following is a reconciliation of Level 3 assets for which significant unobservable inputs were used to determine fair value:
|
| Limited |
| Equity | Partnership |
| Securities | Interest |
Balance as of 9/30/09 | $7,978,655 | $2,909,106 |
Accrued discounts/premiums | - | - |
Realized gain (loss) | (500,014) | (867,581) |
Change in unrealized appreciation (depreciation) | 856,082 | 787,122 |
Net purchases (sales) | (468,221) | (251,520) |
Transfers in and/or out of Level 31 | - | - |
Balance as of 9/30/10 | $7,866,502 | $2,577,127 |
|
|
|
| Commercial |
|
| Mortgage-Backed | Corporate |
| Securities | Debt |
Balance as of 9/30/09 | $1,577,000 | $14,476,507 |
Accrued discounts/premiums | 250 | 428,309 |
Realized gain (loss) | - | (1,134,117) |
Change in unrealized appreciation (depreciation) | 112,135 | 2,217,827 |
Net purchases (sales) | - | (5,256,261) |
Transfers in and/or out of Level 31 | (1,689,385)2 | (7,430,812)2 |
Balance as of 9/30/10 | $ - | $3,301,453 |
|
|
|
| U.S. Government | Other Debt |
| Obligations | Obligations |
Balance as of 9/30/09 | $2,268,000 | $7,239,910 |
Accrued discounts/premiums | 792 | - |
Realized gain (loss) | (110,000) | (380,177) |
Change in unrealized appreciation (depreciation) | 608,349 | 421,100 |
Net purchases (sales) | (390,000) | (1,084,200) |
Transfers in and/or out of Level 31 | (2,377,141)2 | - |
Balance as of 9/30/10 | $- | $6,196,633 |
|
|
|
|
| Total |
Balance as of 9/30/09 |
| $36,449,178 |
Accrued discounts/premiums |
| 429,351 |
Realized gain (loss) |
| (2,991,889) |
Change in unrealized appreciation (depreciation) |
| 5,002,615 |
Net purchases (sales) |
| (7,450,202) |
Transfers in and/or out of Level 31 |
| (11,497,338) |
Balance as of 9/30/10 |
| $19,941,715 |
1 The Fund’s policy is to recognize transfers into and transfers out of Level 3 as of the end of the reporting period.
2 Transferred from Level 3 to Level 2 because observable inputs were obtained for the securities.
For the year ended September 30, 2010, total change in unrealized gain (loss) on Level 3 securities included in the change in net assets was $4,992,170. Total unrealized gain (loss) for all securities (including Level 1 and Level 2) can be found on the accompanying Statement of Operations.
Bond | Valuation Inputs | |||
Investments in Securities | Level 1 | Level 2 | Level 3 | Total |
Equity securities | $1,292,032 | - | $1,675,000 | $2,967,032 |
Asset backed securities | - | $34,171,368 | - | 34,171,368 |
Collateralized mortgage-backed obligations | - | 30,521,141 | - | 30,521,141 |
Commercial mortgage-backed securities | - | 11,254,323 | - | 11,254,323 |
Corporate debt | - | 415,243,718 | 9,983,249 | 425,226,967 |
Municipal obligations | - | 112,381,621 | - | 112,381,621 |
U.S. government obligations | - | 251,976,200 | - | 251,976,200 |
Other debt obligations | - | - | 2,983,933 | 2,983,933 |
TOTAL | $1,292,032 | $855,548,371 | $14,642,182** | $871,482,585 |
Other financial instruments* | $136,947 | - | - | $136,947 |
* Other financial instruments are derivative instruments not reflected in the Portfolio of Investments, such as futures, which are valued at the unrealized appreciation/ depreciation on the instrument.
** Level 3 securities represent 1.7% of net assets.
Equity | Valuation Inputs | |||
Investments in Securities | Level 1 | Level 2 | Level 3 | Total |
Equity securities* | $1,268,986,460 | - | $ 7,135,180 | $1,276,121,640 |
Limited partnership interest | - | - | 1,618,739 | 1,618,739 |
U.S. government obligations | - | $38,500,000 | - | 38,500,000 |
Other debt obligations | - | - | 7,377,721 | 7,377,721 |
TOTAL | $1,268,986,460 | $38,500,000 | $16,131,640** | $1,323,618,100 |
* For further breakdown of equity securities by industry, please refer to the Statement of Net Assets.
**Level 3 securities represent 1.2% of net assets.
Enhanced Equity | Valuation Inputs | |||
Investments in Securities | Level 1 | Level 2 | Level 3 | Total |
Equity securities* | $73,288,884 | - | - | $73,288,884 |
TOTAL | $73,288,884 | - | - | $73,288,884 |
* For further breakdown of equity securities by industry, please refer to the Statement of Net Assets.
Repurchase Agreements: The Fund may enter into repurchase agreements with recognized financial institutions or registered broker/dealers and, in all instances, holds underlying securities with a value exceeding the total repurchase price, including accrued interest. Although risk is mitigated by the collateral, the Fund could experience a delay in recovering its value and a possible loss of income or value if the counterparty fails to perform in accordance with the terms of the agreement.
Futures Contracts: The Fund may purchase and sell futures contracts, but only when, in the judgment of the Advisor, such a position acts as a hedge. The Fund may not enter into futures contracts for the purpose of speculation or leverage. These futures contracts may include, but are not limited to, futures contracts based on U.S. Government obligations. The Fund is subject to interest rate risk in the normal course of pursuing its investment objectives. The Fund may use futures contracts to hedge against changes in the value of interest rates. The Fund may enter into futures contracts agreeing to buy or sell a financial instrument for a set price at a future date. Initial margin deposits of either cash or securities as required by the broker are made upon entering into the contract. While the contract is open, daily variation margin payments are made to or received from the broker reflecting the daily change in market value of the contract and are recorded for financial reporting purposes as unrealized gains or losses by the Fund. When a futures contract is closed, a realized gain or loss is recorded equal to the difference between the opening and closing value of the contract. The risks associated with entering into futures contracts may include the possible illiquidity of the secondary market which would limit the Fund’s ability to close out a futures contract prior to the settlement date, an imperfect correlation between the value of the contracts and the underlying financial instruments, or that the counterparty will fail to perform its obligations under the contracts’ terms. Futures contracts are designed by boards of trade which are designated “contracts markets” by the Commodities Futures Trading Commission. Futures contracts trade on the contracts markets in a manner that is similar to the way a stock trades on a stock exchange and the boards of trade, through their clearing corporations, guarantee the futures contracts against default. As a result, there is minimal counterparty credit risk to the Fund.
Restricted Securities: The Fund may invest in securities that are subject to legal or contractual restrictions on resale. Generally, these securities may only be sold publicly upon registration under the Securities Act of 1933 or in transactions exempt from such registration. Information regarding restricted securities is included at the end of the Statements of Net Assets.
Security Transactions and Net Investment Income: Security transactions are accounted for on trade date. Realized gains and losses are recorded on an identified cost basis and may include proceeds from litigation. Dividend income is recorded on the ex-dividend date or, in the case of dividends on certain foreign securities, as soon as the Fund is informed of the ex-dividend date. Distributions received on securities that represent a return of capital or capital gain are recorded as a reduction of cost of investments and/or as a realized gain. Interest income, which includes amortization of premium and accretion of discount on debt securities, is accrued as earned. Investment income and realized and unrealized gains and losses are allocated to separate clas ses of shares based upon the relative net assets of each class. Debt obligations may be placed on non-accrual status and related interest income may be reduced by ceasing current accruals and writing off interest receivables when the collection of all or a portion of interest has become doubtful based on consistently applied procedures. (See Notes to Statements of Net Assets on page 75). A debt obligation may be removed from non-accrual status when the issuer resumes interest payments or when collectability of interest is reasonably assured. Expenses arising in connection with a class are charged directly to that class. Expenses common to the classes are allocated to each class in proportion to their relative net assets. Withholding taxes on foreign dividends have been provided for in accordance with management’s understanding of the applicable country’s tax rules and rates.
Foreign Currency Transactions: The Fund’s accounting records are maintained in U.S. dollars. For valuation of assets and liabilities on each date of net asset value determination, foreign denominations are translated into U.S. dollars using the current exchange rate. Security transactions, income and expenses are translated at the prevailing rate of exchange on the date of the event. The effect of changes in foreign exchange rates on securities is included in the net realized and unrealized gain or loss on securities.
Distributions to Shareholders: Distributions to shareholders are recorded by the Fund on ex-dividend date. Dividends from net investment income are accrued daily and paid monthly by Money Market. Dividends from net investment income are paid monthly by Bond, quarterly by Balanced and annually by Equity and Enhanced Equity. Distributions from net realized capital gains, if any, are paid at least annually. Distributions are determined in accordance with income tax regulations which may differ from generally accepted accounting principles; accordingly, periodic reclassifications are made within the Fund’s capital accounts to reflect income and gains available for distribution under income tax regulations.
Estimates: The preparation of the financial statements in conformity with accounting principles generally accepted in the United States requires management to make estimates and assumptions that affect the reported amounts of assets and liabilities and disclosure of contingent assets and liabilities at the date of the financial statements and the reported amounts of income and expenses during the reported period. Actual results could differ from those estimates.
Redemption Fees: The Balanced, Bond, Equity, and Enhanced Equity Portfolios charge a 2% redemption fee on redemptions, including exchanges, made within 30 days of purchase in the same Portfolio (within seven days for all Class I shares). The redemption fee is paid to the Class of the Portfolio from which the redemption is made and is accounted for as an addition to paid-in capital. The fee is intended to discourage market-timers by ensuring that short-term trading costs are borne by the investors making the transactions and not the shareholders already in the Portfolio.
Expense Offset Arrangements: The Fund has arrangements with its custodian banks whereby the custodian’s fees may be paid indirectly by credits earned on each Portfolio’s cash on deposit with the banks. These credits are used to reduce the Portfolios’ expenses. Such deposit arrangements may be an alternative to overnight investments.
Federal Income Taxes: No provision for federal income or excise tax is required since the Fund intends to continue to qualify as a regulated investment company under the Internal Revenue Code and to distribute substantially all of its taxable earnings.
Management has analyzed the Fund’s tax positions taken for all open federal income tax years and has concluded that no provision for federal income tax is required in the Fund’s financial statements. A Fund’s federal tax return is subject to examination by the Internal Revenue Service for a period of three years.
New Accounting Pronouncements: In January 2010, the Financial Accounting Standards Board (“FASB”) issued Accounting Standards Update (“ASU”) No. 2010-06 “Improving Disclosures about Fair Value Measurements”. ASU 2010-06 will require reporting entities to make new disclosures about amount and reasons for significant transfers in and out of Level 1 and Level 2 fair value measurements and input and valuation techniques used to measure fair value for both recurring and nonrecurring fair value measurements that fall in either Level 2 or Level 3, and information on purchases, sales, issuances, and settlements in the roll forward of activity in Level 3 fair value measures. The new and revised disclosures are effective fo r interim and annual reporting periods beginning after December 15, 2009 except for the disclosures about purchases, sales, issuances, and settlements in the roll forward of activity in Level 3 fair value measures, which are effective for fiscal years beginning after December 15, 2010. At this time, management is evaluating the implications of ASU No. 2010-06 disclosures about purchases, sales, issuances, and settlements in the roll forward of activity in Level 3 fair value measures and its impact on the financial statements has not been determined.
Note B — Related Party Transactions
Calvert Asset Management Company, Inc. (the “Advisor”) is wholly-owned by Calvert Group, Ltd. (“Calvert”), which is indirectly wholly owned by UNIFI Mutual Holding Company. The Advisor provides investment advisory services and pays the salaries and fees of officers and Trustees of the Fund who are employees of the Advisor or its affiliates.
For its services, the Advisor receives monthly fees based on the following annual rates of average daily net assets:
Money Market | .30% |
Balanced: |
|
First $500 Million | .425% |
Next $500 Million | .40% |
Over $1 Billion | .375% |
Bond: |
|
First $1 Billion | .35% |
Over $1 Billion | .325% |
Equity: |
|
First $2 Billion | .50% |
Next $1 Billion | .475% |
Over $3 Billion | .45% |
Enhanced Equity: |
|
First $250 Million | .60% |
Over $250 Million | .55% |
Under the terms of the agreement, $35,805, $157,787, $252,740, $526,291 and $29,789 was payable at year end for Money Market, Balanced, Bond, Equity and Enhanced Equity, respectively. In addition, $87,456, $128,794, $175,125 and $17,738 was payable at year end for operating expenses paid by the Advisor during September 2010 for Balanced, Bond, Equity and Enhanced Equity, respectively. In addition, $22,299 was receivable at year end from the Advisor for reimbursement of operating expenses for Money Market. For the year ended September 30, 2010, the Advisor waived $71,344 of its fee in Enhanced Equity.
The Advisor has contractually agreed to limit net annual fund operating expenses through January 31, 2011 for Money Market, Balanced Class I, Bond Class Y, Equity Class Y, and Enhanced Equity Class I. For the purpose of this expense limit, operating expenses do not include interest expense, brokerage commissions, taxes, and extraordinary expenses. This expense limitation does not limit any acquired fund fees and expenses. To the extent any expense offset credits are earned, the Advisor’s obligation under the contractual limitation may be reduced and the Advisor may benefit from the expense offset arrangement.
The contractual expense caps are as follows: for Money Market, .875%; for Balanced Class I, .72%; for Bond Class Y, .92%; for Equity Class Y, .96%; and for Enhanced Equity Class I, .81%.
The Advisor voluntarily reimbursed Class O shares of Money Market to maintain a positive yield, and voluntarily reimbursed Class B shares of Enhanced Equity for expenses of $444,332 and $438, respectively for the year ended September 30, 2010. Calvert Administrative Services Company (CASC), an affiliate of the Advisor, provides administrative services for the Fund. For providing such services, CASC receives an annual fee, payable monthly, based on the following annual rates of average daily net assets:
Money Market | .20% |
Balanced (Class A, B, & C) | .275% |
Balanced (Class I) | .125% |
Bond (Class A, B, C & Y) | .30% |
Bond (Class I) | .10% |
Equity (Class A, B, C & Y) | .20% |
Equity (Class I) | .10% |
Enhanced Equity (Class A, B, & C) | .15% |
Enhanced Equity (Class I) | .10% |
Under the terms of the agreement $23,870, $101,913, $181,992, $194,959 and $7,707 was payable at year end for Money Market, Balanced, Bond, Equity and Enhanced Equity, respectively.
Calvert Distributors, Inc., an affiliate of the Advisor, is the distributor and principal underwriter for the Fund. Distribution Plans, adopted by Class A, Class B, and Class C shares, allow the Portfolios to pay the Distributor for expenses and services associated with distribution of shares. The expenses of Money Market are limited to .25% annually of average daily net assets. The Distributor currently does not charge any Distribution Plan expenses for Money Market. The expenses paid for Class A may not exceed .25% of Enhanced Equity’s and .35% of Balanced, Bond and Equity’s annual average daily net assets. The amount actually paid by Class A of Enhanced Equity, Balanced, Bond and Equity, is an annualized fee, payable monthly of .25%, .25% on assets over $30 million, .20%, and .25%, respectively, of each Classes’ average daily net assets. The expenses paid for Class B and Class C may not exceed 1.00% of Enhanced Equity, Balanced, Bond and Equity’s annual average daily net assets. The amount actually paid, is an annualized fee, payable monthly of 1.00%, of each Classes’ average daily net assets. Class I for Balanced, Bond, Equity and Enhanced Equity and Class Y for Bond and Equity do not have Distribution Plan expenses. Under the terms of the agreement $108,527, $148,962, $302,508 and $13,988 was payable at year end for Balanced, Bond, Equity and Enhanced Equity, respectively.
The Distributor received the following amounts as its portion of the commissions charged on sales of the Funds’ Class A shares for the year ended September 30, 2010: $108,623 for Balanced, $111,960 for Bond, $200,366 for Equity and $12,701 for Enhanced Equity.
Calvert Shareholder Services, Inc. (CSSI), an affiliate of the Advisor, is the shareholder servicing agent for the Fund. For its services, CSSI received fees of $174,126, $208,145, $161,536, $376,330, and $29,155 for the year ended September 30, 2010 for Money Market, Balanced, Bond, Equity and Enhanced Equity, respectively. Under the terms of the agreement $13,347, $16,985, $14,589, $32,339 and $2,393 was payable at year end for Money Market, Balanced, Bond, Equity and Enhanced Equity, respectively. Boston Financial Data Services, Inc. is the transfer and dividend disbursing agent.
The Fund invests in Community Investment Notes issued by the Calvert Social Investment Foundation (the “CSI Foundation”). The CSI Foundation is a 501(c)(3) non-profit organization that receives in-kind support from the Calvert Group, Ltd. and its subsidiaries. The Fund has received from the Securities and Exchange Commission an exemptive order permitting the Fund to make investments in these notes under certain conditions.
Each Trustee of the Funds who is not an employee of the Advisor or its affiliates receives an annual retainer of $44,000 plus a meeting fee of $2,000 for each Board meeting attended. Additional fees of up to $5,000 annually may be paid to the Board chair and Committee chairs ($10,000 for Special Equities Committee chair) and $2,500 annually may be paid to committee members, plus a committee meeting fee of $500 for each committee meeting attended. Trustee’s fees are allocated to each of the funds served.
Note C — Investment Activity
During the year, the cost of purchases and proceeds from sales of investments, other than U.S. Government and short-term securities, were:
|
|
|
| Enhanced |
| Balanced | Bond | Equity | Equity |
Purchases | $285,219,907 | $463,406,444 | $510,882,047 | $76,279,642 |
Sales | 298,420,194 | 465,655,529 | 455,512,814 | 76,291,931 |
U.S. Government security purchases and sales were:
| Balanced |
|
| Bond |
Purchases | $30,029,576 |
|
| $148,834,758 |
Sales | 7,753,528 |
|
| 62,341,068 |
Money Market held only short-term investments.
Capital Loss Carryforwards
| Money |
|
| Enhanced |
Expiration Date | Market | Balanced | Equity | Equity |
30-Sep-11 | $6,847 | - | - | - |
30-Sep-13 | 6,183 | - | - | - |
30-Sep-14 | 211 | - | - | - |
30-Sep-15 | 2,100 | - | - | - |
30-Sep-17 | - | $12,659,635 | $12,754,798 | $6,328,690 |
30-Sep-18 | - | 32,682,953 | 11,411,068 | 11,653,879 |
Capital losses may be utilized to offset future capital gains until expiration.
Balanced, Bond, and Money Market Portfolios intend to elect to defer net capital losses of $5,310,821, $4,094,465 and $348, respectively, incurred from November 1, 2009 through September 30, 2010 and treat them as arising in the fiscal year ending September 30, 2011.
The tax character of dividends and distributions for the years ended September 30, 2010 and September 30, 2009 were as follows:
Money Market |
|
|
Distributions paid from: | 2010 | 2009 |
Ordinary income | $12,743 | $2,209,584 |
Total | $12,743 | $2,209,584 |
|
|
|
Balanced |
|
|
Distributions paid from: | 2010 | 2009 |
Ordinary income | $4,383,455 | $6,820,531 |
Long-term capital gain | — | 2,018 |
Total | $4,383,455 | $6,822,549 |
|
|
|
Bond |
|
|
Distributions paid from: | 2010 | 2009 |
Ordinary income | $27,227,017 | $34,842,872 |
Long-term capital gain | 443,892 | 9,628,004 |
Total | $27,670,909 | $44,470,876 |
|
|
|
Equity |
|
|
Distributions paid from: | 2010 | 2009 |
Ordinary income | $1,605,485 | — |
Long-term capital gain | — | $65,133,250 |
Total | $1,605,485 | $65,133,250 |
|
|
|
Enhanced Equity |
|
|
Distributions paid from: | 2010 | 2009 |
Ordinary income | $556,771 | $934,479 |
Total | $556,771 | $934,479 |
As of September 30, 2010, the tax basis components of distributable earnings/(accumulated losses) and the federal tax cost were as follows:
| Money |
|
|
| Market | Balanced | Bond |
Unrealized appreciation | — | $39,416,024 | $33,607,302 |
Unrealized (depreciation) | — | (35,398,210) | (35,592,162) |
Net unrealized appreciation/(depreciation) | — | $4,017,814 | ($1,984,860) |
|
|
|
|
Undistributed ordinary income | $6,532 | — | $8,838,754 |
Capital loss carryforward($15,341) | ($45,342,588) | — |
|
Federal income tax cost of investments | $143,502,398 | $449,389,356 | $873,467,445 |
|
| Enhanced |
| Equity | Equity |
Unrealized appreciation | $245,912,249 | $6,264,422 |
Unrealized (depreciation) | (32,488,910) | (1,386,887) |
Net unrealized appreciation/(depreciation) | $213,423,339 | $4,877,535 |
|
|
|
Undistributed ordinary income | — | $310,294 |
Capital loss carryforward($24,165,866) | ($17,982,569) |
|
Federal income tax cost of investments | $1,110,194,761 | $68,411,349 |
The differences between the components of distributable earnings on a tax basis and the amounts reflected in the statements of net assets are primarily due to temporary book-tax differences that will reverse in a subsequent period. For Balanced Portfolio, the differences are due to Section 1256 contracts, straddles, partnerships, wash sales, deferral of post October losses, and interest defaults. For Bond Portfolio, the differences are due to Section 1256 contracts, straddles, wash sales, deferral of post October losses, and interest defaults. For Enhanced Equity Portfolio, the difference is due to wash sales. For Equity Portfolio, the differences are due to wash sales and partnerships. For Money Market Portfolio, the differences are due to post October losses and distributions paid after fiscal year end.
Reclassifications, as shown in the table below, have been made to the Funds’ components of net assets to reflect income and gains available for distribution (or available capital loss carryovers, as applicable) under income tax law and regulations. These reclassifications are due to permanent book-tax differences and have no impact on net assets. For Money Market Portfolio, the reclassifications are due to tax-exempt income and expired capital losses. For Balanced Portfolio, the reclassifications are due to partnerships, asset-backed securities, and tax-exempt income. For Bond Portfolio, the reclassifications are due to asset-backed securities. For Enhanced Equity Portfolio, the reclassifications are due to real estate investment trusts and foreign currency transactions. For Equity Portfolio, the reclassifications are due to partnerships and net operating losses.
| Money Market | Balanced | Bond |
Undistributed net investment income | ($1,438) | ($249,764) | ($1,379,219) |
Accumulated net realized gain (loss) | 12,647 | 209,749 | 1,379,219 |
Paid-in capital | (11,209) | 40,015 | — |
|
| Enhanced |
|
| Equity | Equity |
|
Undistributed net investment income | $1,707,837 | ($6,055) |
|
Accumulated net realized gain (loss) | 44,320 | 6,055 |
|
Paid-in capital | (1,752,157) | — |
|
The Portfolios may sell or purchase securities to and from other Portfolios managed by the Advisor, typically short-term variable rate demand notes. Interportfolio transactions are primarily used for cash management purposes. Interportfolio transactions are made pursuant to Rule 17a-7 of the Investment Company Act of 1940. For the year ended September 30, 2010, such purchases and sales transactions were:
| Money |
|
|
| Market | Balanced | Bond |
Purchases | $121,185,00 | — | $1,039,212 |
Sales | 90,035,000 | $5,279,010 | 3,719,359 |
Net realized gain | — | 132,135 | 14,860 |
Note D — Line of Credit
A financing agreement is in place with all Calvert Group Funds and State Street Corporation (“SSC”). Under the agreement, SSC provides an unsecured line of credit facility, in the aggregate amount of $50 million ($25 million committed and $25 million uncommitted), accessible by the Funds for temporary or emergency purposes only. Borrowings under the committed facility bear interest at the higher of the London Interbank Offered Rate, (LIBOR) or the overnight Federal Funds Rate plus 1.25% per annum. A commitment fee of .125% per annum is incurred on the unused portion of the committed facility, which is allocated to all participating funds. Money Market, Balanced, Bond, and Equity had no loans outstanding pursuant to this line of credit at September 30, 2010. Enhanced Equity had no loans outstanding pursuant to this line of credit during the year ended September 30, 2010. For the year ended September 30, 2010, borrowings by the Portfolios under the Agreement were as follows:
|
| Weighted |
| Month of |
| Average | Average | Maximum | Maximum |
| Daily | Interest | Amount | Amount |
Portfolio | Balance | Rate | Borrowed | Borrowed |
Money Market | $32,792 | 1.48% | $1,834,287 | April 2010 |
Balanced | 32,503 | 1.47% | 1,810,369 | April 2010 |
Bond | 139,061 | 1.48% | 5,150,771 | January 2010 |
Equity | 44,352 | 1.48% | 4,192,865 | December 2009 |
Note E — Affiliated Companies
An affiliated company is a company in which the Portfolios have a direct or indirect ownership of, control of, or voting power over 5 percent or more of the outstanding voting shares.
Affiliated companies of the Balanced Portfolio are as follows:
Affiliates | Cost | Value |
Angels With Attitude I LLC LP | $200,000 | $67,910 |
GEEMF Partners LP | — | 160,117 |
Plethora Technology, Inc. | 701,835 | — |
TOTALS | $901,835 | $228,027 |
Affiliated companies of the Equity Portfolio are as follows:
Affiliates | Cost | Value |
Digital Directions International, Inc. | $683,778 | $531,583 |
Global Resource Options, Inc. | 2,500,000 | 4,338,800 |
New Day Farms, Inc. | 500,000 | 72,037 |
TOTALS | $3,683,778 | $4,942,420 |
Note F – Subsequent Events
In preparing the financial statements as of September 30, 2010, no subsequent events or transactions occurred that would have materially impacted the financial statements as presented.
Note G — Other
In connection with certain venture capital investments, the Balanced and Equity Portfolios are committed to future capital calls, which will increase the Portfolios’ investment in these securities. The aggregate amount of the future capital commitments totals $110,000 and $2,739,963 for the Balanced and Equity Portfolios, respectively, at September 30, 2010.
Notice to Shareholders (Unaudited)
For the fiscal year ended September 30, 2010, in order to meet certain requirements of the Internal Revenue Code, we are advising you that certain distributions paid during the year from the following funds are designated as:
Fund Name
| (a) | (b) | (c) |
CSIF Balanced Portfolio | -—
| 76.4%
| 76.5%
|
CSIF Bond Portfolio | $443,892
| —
| —
|
CSIF Equity Portfolio | —
| 100.0%
| 100.0%
|
CSIF Enhanced Equity Portfolio | —
| 100.0%
| 100.0%
|
(a) Each Fund designates the maximum amount allowable but not less than the amounts shown above as a capital gain dividend in accordance with Section
852(b)(3)(C) of the Internal Revenue Code.
(b) Each Fund designates the maximum amount allowable, but not less than the percentages shown above as ordinary income dividends paid during the year as qualified dividend income in accordance with Section 854 of the Internal Revenue Code.
(c) Each Fund designates the maximum amount allowable but not less than the percentages shown above of ordinary income dividends paid during the year as eligible for the corporate dividends received deduction in accordance with Section 854 of the Internal Revenue Code.
Money Market Portfolio
Financial Highlights
|
|
| Years Ended |
|
|
| September 30, | September 30, | September 30, |
|
| 2010 | 2009 | 2008 |
Net asset value, beginning |
| $1.00 | $1.00 | $1.00 |
Income from investment operations: |
|
|
|
|
Net investment income |
| **** | .011 | .029 |
Distributions from: |
|
|
|
|
Net investment income |
| ***** | (.011) | (.029) |
Net asset value, ending |
| $1.00 | $1.00 | $1.00 |
Total return* |
| .01% | 1.15% | 2.90% |
Ratios to average net assets:A |
|
|
|
|
Net investment income |
| .01% | 1.13% | 2.83% |
Total expenses |
| .83% | .84% | .79% |
Expenses before offsets |
| .55% | .84% | .79% |
Net expenses |
| .54% | .84% | .78% |
Net assets, ending (in thousands) |
| $144,575 | $169,485 | $186,311 |
|
|
|
|
|
|
|
|
|
|
|
|
| Years Ended | |
|
|
| September 30, | September 30, |
|
|
| 2007 | 2006 |
Net asset value, beginning |
|
| $1.00 | $1.00 |
Income from investment operations: |
|
|
|
|
Net investment income |
|
| .045 | .039 |
Distributions from: |
|
|
|
|
Net investment income |
|
| (.045) | (.039) |
Net asset value, ending |
|
| $1.00 | $1.00 |
|
|
|
|
|
Total return* |
|
| 4.64% | 3.97% |
Ratios to average net assets:A |
|
|
|
|
Net investment income |
|
| 4.53% | 3.90% |
Total expenses |
|
| .82% | .86% |
Expenses before offsets |
|
| .82% | .86% |
Net expenses |
|
| .80% | .85% |
Net assets, ending (in thousands) |
|
| $187,210 | $166,592 |
See notes to financial highlights.
Balanced Portfolio
Financial Highlights
|
|
| Years Ended |
|
|
| September 30, | September 30, | September 30, |
Class A Shares |
| 2010 (z) | 2009 | 2008 |
Net asset value, beginning |
| $24.02 | $25.03 | $31.37 |
Income from investment operations: |
|
|
|
|
Net investment income |
| .27 | .40 | .57 |
Net realized and unrealized gain (loss) |
| 1.91 | (1.03) | (4.72) |
Total from investment operations |
| 2.18 | (.63) | (4.15) |
Distributions from: |
|
|
|
|
Net investment income |
| (.26) | (.38) | (.56) |
Net realized gain |
| — | *** | (1.63) |
Total distributions |
| (.26) | (.38) | (2.19) |
Total increase (decrease) in net asset value |
| 1.92 | (1.01) | (6.34) |
Net asset value, ending |
| $25.94 | $24.02 | $25.03 |
|
|
|
|
|
Total return* |
| 9.12% | (2.29%) | (14.13%) |
Ratios to average net assets:A |
|
|
|
|
Net investment income |
| 1.08% | 1.87% | 2.03% |
Total expenses |
| 1.23% | 1.28% | 1.21% |
Expenses before offsets |
| 1.23% | 1.28% | 1.21% |
Net expenses |
| 1.23% | 1.28% | 1.20% |
Portfolio turnover |
| 75% | 57% | 77% |
Net assets, ending (in thousands) |
| $419,363 | $404,542 | $434,069 |
|
|
|
|
|
|
|
|
|
|
|
|
| Years Ended | |
|
|
| September 30, | September 30, |
Class A Shares |
|
| 2007 | 2006 (z) |
Net asset value, beginning |
|
| $29.46 | $28.25 |
Income from investment operations: |
|
|
|
|
Net investment income |
|
| .60 | .55 |
Net realized and unrealized gain (loss) |
|
| 1.88 | 1.12 |
Total from investment operations |
|
| 2.48 | 1.67 |
Distributions from: |
|
|
|
|
Net investment income |
|
| (.57) | (.46) |
Total distributions |
|
| (.57) | (.46) |
Total increase (decrease) in net asset value |
|
| 1.91 | 1.21 |
Net asset value, ending |
|
| $31.37 | $29.46 |
|
|
|
|
|
Total return* |
|
| 8.47% | 5.94% |
Ratios to average net assets:A |
|
|
|
|
Net investment income |
|
| 1.94% | 1.90% |
Total expenses |
|
| 1.20% | 1.21% |
Expenses before offsets |
|
| 1.20% | 1.21% |
Net expenses |
|
| 1.19% | 1.20% |
Portfolio turnover |
|
| 81% | 73% |
Net assets, ending (in thousands) |
|
| $542,659 | $525,740 |
Balanced Portfolio
Financial Highlights
|
|
| Years Ended |
|
|
| September 30, | September 30, | September 30, |
Class B Shares |
| 2010 (z) | 2009 | 2008 |
Net asset value, beginning |
| $23.83 | $24.84 | $31.13 |
Income from investment operations: |
|
|
|
|
Net investment income |
| .01 | .13 | .28 |
Net realized and unrealized gain (loss) |
| 1.90 | (.99) | (4.66) |
Total from investment operations |
| 1.91 | (.86) | (4.38) |
Distributions from: |
|
|
|
|
Net investment income |
| (.01) | (.15) | (.28) |
Net realized gain |
| — | *** | (1.63) |
Total distributions |
| (.01) | (.15) | (1.91) |
Total increase (decrease) in net asset value |
| 1.90 | (1.01) | (6.29) |
Net asset value, ending |
| $25.73 | $23.83 | $24.84 |
|
|
|
|
|
Total return* |
| 8.02% | (3.35%) | (14.93%) |
Ratios to average net assets:A |
|
|
|
|
Net investment income |
| .04% | .82% | 1.05% |
Total expenses |
| 2.27% | 2.36% | 2.19% |
Expenses before offsets |
| 2.27% | 2.36% | 2.19% |
Net expenses |
| 2.27% | 2.35% | 2.18% |
Portfolio turnover |
| 75% | 57% | 77% |
Net assets, ending (in thousands) |
| $12,127 | $14,294 | $17,939 |
|
|
|
|
|
|
|
|
|
|
|
|
| Years Ended | |
|
|
| September 30, | September 30, |
Class B Shares |
|
| 2007 | 2006 (z) |
Net asset value, beginning |
|
| $29.24 | $28.05 |
Income from investment operations: |
|
|
|
|
Net investment income |
|
| .28 | .27 |
Net realized and unrealized gain (loss) |
|
| 1.89 | 1.10 |
Total from investment operations |
|
| 2.17 | 1.37 |
Distributions from: |
|
|
|
|
Net investment income |
|
| (.28) | (.18) |
Total distributions |
|
| (.28) | (.18) |
Total increase (decrease) in net asset value |
|
| 1.89 | 1.19 |
Net asset value, ending |
|
| $31.13 | $29.24 |
|
|
|
|
|
Total return* |
|
| 7.45% | 4.90% |
Ratios to average net assets:A |
|
|
|
|
Net investment income |
|
| .99% | .95% |
Total expenses |
|
| 2.15% | 2.16% |
Expenses before offsets |
|
| 2.15% | 2.16% |
Net expenses |
|
| 2.14% | 2.15% |
Portfolio turnover |
|
| 81% | 73% |
Net assets, ending (in thousands) |
|
| $24,767 | $27,805 |
See notes to financial highlights.
Balanced Portfolio
Financial Highlights
|
|
| Years Ended |
|
|
| September 30, | September 30, | September 30, |
Class C Shares |
| 2010 (z) | 2009 | 2008 |
Net asset value, beginning |
| $23.58 | $24.58 | $30.83 |
Income from investment operations: |
|
|
|
|
Net investment income |
| .05 | .19 | .32 |
Net realized and unrealized gain (loss) |
| 1.88 | (1.01) | (4.64) |
Total from investment operations |
| 1.93 | (.82) | (4.32) |
Distributions from: |
|
|
|
|
Net investment income |
| (.04) | (.18) | (.30) |
Net realized gain |
| — | *** | (1.63) |
Total distributions |
| (.04) | (.18) | (1.93) |
Total increase (decrease) in net asset value |
| 1.89 | (1.00) | (6.25) |
Net asset value, ending |
| $25.47 | $23.58 | $24.58 |
|
|
|
|
|
Total return* |
| 8.17% | (3.22%) | (14.88%) |
Ratios to average net assets:A |
|
|
|
|
Net investment income |
| .19% | .95% | 1.15% |
Total expenses |
| 2.12% | 2.21% | 2.08% |
Expenses before offsets |
| 2.12% | 2.21% | 2.08% |
Net expenses |
| 2.12% | 2.21% | 2.08% |
Portfolio turnover |
| 75% | 57% | 77% |
Net assets, ending (in thousands) |
| $24,269 | $21,810 | $24,631 |
|
|
|
|
|
|
|
|
|
|
|
|
| Years Ended | |
|
|
| September 30, | September 30, |
Class C Shares |
|
| 2007 | 2006 (z) |
Net asset value, beginning |
|
| $28.95 | $27.79 |
Income from investment operations: |
|
|
|
|
Net investment income |
|
| .32 | .28 |
Net realized and unrealized gain (loss) |
|
| 1.85 | 1.07 |
Total from investment operations |
|
| 2.17 | 1.35 |
Distributions from: |
|
|
|
|
Net investment income |
|
| (.29) | (.19) |
Total distributions |
|
| (.29) | (.19) |
Total increase (decrease) in net asset value |
|
| 1.88 | 1.16 |
Net asset value, ending |
|
| $30.83 | $28.95 |
|
|
|
|
|
Total return* |
|
| 7.53% | 4.87% |
Ratios to average net assets:A |
|
|
|
|
Net investment income |
|
| 1.07% | .99% |
Total expenses |
|
| 2.07% | 2.11% |
Expenses before offsets |
|
| 2.07% | 2.11% |
Net expenses |
|
| 2.06% | 2.10% |
Portfolio turnover |
|
| 81% | 73% |
Net assets, ending (in thousands) |
|
| $30,340 | $27,547 |
See notes to financial highlights.
Balanced Portfolio
Financial Highlights
|
|
| Years Ended |
|
|
| September 30, | September 30, | September 30, |
Class I Shares |
| 2010 (z) | 2009 | 2008 |
Net asset value, beginning |
| $24.25 | $25.27 | $31.64 |
Income from investment operations: |
|
|
|
|
Net investment income |
| .42 | .52 | .70 |
Net realized and unrealized gain (loss) |
| 1.93 | (1.04) | (4.75) |
Total from investment operations |
| 2.35 | (.52) | (4.05) |
Distributions from: |
|
|
|
|
Net investment income |
| (.38) | (.50) | (.69) |
Net realized gain |
| — | *** | (1.63) |
Total distributions |
| (.38) | (.50) | (2.32) |
Total increase (decrease) in net asset value |
| 1.97 | (1.02) | (6.37) |
Net asset value, ending |
| $26.22 | $24.25 | $25.27 |
|
|
|
|
|
Total return* |
| 9.72% | (1.76%) | (13.69%) |
Ratios to average net assets:A |
|
|
|
|
Net investment income |
| 1.62% | 2.42% | 2.52% |
Total expenses |
| 1.09% | .89% | .80% |
Expenses before offsets |
| .72% | .73% | .72% |
Net expenses |
| .72% | .72% | .72% |
Portfolio turnover |
| 75% | 57% | 77% |
Net assets, ending (in thousands) |
| $1,518 | $5,875 | $5,905 |
|
|
|
|
|
|
|
|
|
|
|
|
| Years Ended | |
|
|
| September 30, | September 30, |
Class I Shares |
|
| 2007 | 2006 (z) |
Net asset value, beginning |
|
| $29.70 | $28.38 |
Income from investment operations: |
|
|
|
|
Net investment income |
|
| .76 | .64 |
Net realized and unrealized gain (loss) |
|
| 1.90 | 1.17 |
Total from investment operations |
|
| 2.66 | 1.81 |
Distributions from: |
|
|
|
|
Net investment income |
|
| (.72) | (.49) |
Net realized gain |
|
| — | — |
Total distributions |
|
| (.72) | (.49) |
Total increase (decrease) in net asset value |
|
| 1.94 | 1.32 |
Net asset value, ending |
|
| $31.64 | $29.70 |
|
|
|
|
|
Total return* |
|
| 9.00% | 6.43% |
Ratios to average net assets:A |
|
|
|
|
Net investment income |
|
| 2.40% | 2.44% |
Total expenses |
|
| .77% | 1.07% |
Expenses before offsets |
|
| .73% | .73% |
Net expenses |
|
| .72% | .72% |
Portfolio turnover |
|
| 81% | 73% |
Net assets, ending (in thousands) |
|
| $8,721 | $6,317 |
Bond Portfolio
Financial Highlights
|
|
| Years Ended |
|
|
| September 30, | September 30, | September 30, |
Class A Shares |
| 2010 | 2009 | 2008 |
Net asset value, beginning |
| $15.22 | $15.14 | $15.92 |
Income from investment operations: |
|
|
|
|
Net investment income |
| .41 | .53 | .69 |
Net realized and unrealized gain (loss) |
| .86 | .32 | (.54) |
Total from investment operations |
| 1.27 | .85 | .15 |
Distributions from: |
|
|
|
|
Net investment income |
| (.38) | (.51) | (.68) |
Net realized gain |
| (.10) | (.26) | (.25) |
Total distributions |
| (.48) | (.77) | (.93) |
Total increase (decrease) in net asset value |
| .79 | .08 | (.78) |
Net asset value, ending |
| $16.01 | $15.22 | $15.14 |
|
|
|
|
|
Total return* |
| 8.54% | 6.11% | .86% |
Ratios to average net assets:A |
|
|
|
|
Net investment income |
| 2.63% | 3.71% | 4.40% |
Total expenses |
| 1.14% | 1.15% | 1.10% |
Expenses before offsets |
| 1.14% | 1.15% | 1.10% |
Net expenses |
| 1.14% | 1.14% | 1.10% |
Portfolio turnover |
| 78% | 77% | 147% |
Net assets, ending (in thousands) |
| $593,364 | $600,995 | $610,869 |
|
|
|
|
|
|
|
|
|
|
|
|
| Years Ended | |
|
|
| September 30, | September 30, |
Class A Shares |
|
| 2007 | 2006 |
Net asset value, beginning |
|
| $15.83 | $16.18 |
Income from investment operations: |
|
|
|
|
Net investment income |
|
| .69 | .64 |
Net realized and unrealized gain (loss) |
|
| .13 | (.05) |
Total from investment operations |
|
| .82 | .59 |
Distributions from: |
|
|
|
|
Net investment income |
|
| (.70) | (.64) |
Net realized gain |
|
| (.03) | (.30) |
Total distributions |
|
| (.73) | (.94) |
Total increase (decrease) in net asset value |
|
| .09 | (.35) |
Net asset value, ending |
|
| $15.92 | $15.83 |
|
|
|
|
|
Total return* |
|
| 5.31% | 3.82% |
Ratios to average net assets:A |
|
|
|
|
Net investment income |
|
| 4.41% | 4.16% |
Total expenses |
|
| 1.12% | 1.14% |
Expenses before offsets |
|
| 1.12% | 1.14% |
Net expenses |
|
| 1.11% | 1.13% |
Portfolio turnover |
|
| 190% | 150% |
Net assets, ending (in thousands) |
|
| $453,813 | $336,698 |
See notes to financial highlights.
|
|
| Years Ended |
|
|
| September 30, | September 30, | September 30, |
Class B Shares |
| 2010 | 2009 | 2008 |
Net asset value, beginning |
| $15.12 | $15.06 | $15.84 |
Income from investment operations: |
|
|
|
|
Net investment income |
| .25 | .40 | .54 |
Net realized and unrealized gain (loss) |
| .86 | .29 | (.54) |
Total from investment operations |
| 1.11 | .69 | — |
Distributions from: |
|
|
|
|
Net investment income |
| (.22) | (.37) | (.53) |
Net realized gain |
| (.10) | (.26) | (.25) |
Total distributions |
| (.32) | (.63) | (.78) |
Total increase (decrease) in net asset value |
| .79 | .06 | (.78) |
Net asset value, ending |
| $15.91 | $15.12 | $15.06 |
|
|
|
|
|
Total return* |
| 7.47% | 5.00% | (.09%) |
Ratios to average net assets:A |
|
|
|
|
Net investment income |
| 1.60% | 2.81% | 3.43% |
Total expenses |
| 2.18% | 2.13% | 2.07% |
Expenses before offsets |
| 2.18% | 2.13% | 2.07% |
Net expenses |
| 2.18% | 2.11% | 2.06% |
Portfolio turnover |
| 78% | 77% | 147% |
Net assets, ending (in thousands) |
| $8,854 | $11,878 | $17,298 |
|
|
|
|
|
|
|
|
|
|
|
|
|
|
|
|
|
| Years Ended | |
|
|
| September 30, | September 30, |
Class B Shares |
|
| 2007 | 2006 |
Net asset value, beginning |
|
| $15.76 | $16.11 |
Income from investment operations: |
|
|
|
|
Net investment income |
|
| .54 | .50 |
Net realized and unrealized gain (loss) |
|
| .12 | (.05) |
Total from investment operations |
|
| .66 | .45 |
Distributions from: |
|
|
|
|
Net investment income |
|
| (.55) | (.50) |
Net realized gain |
|
| (.03) | (.30) |
Total distributions |
|
| (.58) | (.80) |
Total increase (decrease) in net asset value |
|
| .08 | (.35) |
Net asset value, ending |
|
| $15.84 | $15.76 |
|
|
|
|
|
Total return* |
|
| 4.29% | 2.89% |
Ratios to average net assets:A |
|
|
|
|
Net investment income |
|
| 3.43% | 3.17% |
Total expenses |
|
| 2.09% | 2.09% |
Expenses before offsets |
|
| 2.09% | 2.09% |
Net expenses |
|
| 2.08% | 2.08% |
Portfolio turnover |
|
| 190% | 150% |
Net assets, ending (in thousands) |
|
| $14,834 | $17,154 |
See notes to financial highlights.
Bond Portfolio
Financial Highlights
|
|
| Years Ended |
|
|
| September 30, | September 30, | September 30, |
Class C Shares |
| 2010 | 2009 | 2008 |
Net asset value, beginning |
| $15.13 | $15.06 | $15.83 |
Income from investment operations: |
|
|
|
|
Net investment income |
| .29 | .42 | .56 |
Net realized and unrealized gain (loss) |
| .86 | .31 | (.53) |
Total from investment operations |
| 1.15 | .73 | .03 |
Distributions from: |
|
|
|
|
Net investment income |
| (.26) | (.40) | (.55) |
Net realized gain |
| (.10) | (.26) | (.25) |
Total distributions |
| (.36) | (.66) | (.80) |
Total increase (decrease) in net asset value |
| .79 | .07 | (.77) |
Net asset value, ending |
| $15.92 | $15.13 | $15.06 |
|
|
|
|
|
Total return* |
| 7.73% | 5.22% | .11% |
Ratios to average net assets:A |
|
|
|
|
Net investment income |
| 1.85% | 2.93% | 3.60% |
Total expenses |
| 1.91% | 1.94% | 1.90% |
Expenses before offsets |
| 1.91% | 1.94% | 1.90% |
Net expenses |
| 1.91% | 1.92% | 1.89% |
Portfolio turnover |
| 78% | 77% | 147% |
Net assets, ending (in thousands) |
| $54,288 | $56,578 | $52,869 |
|
|
|
|
|
|
|
|
|
|
|
|
| Years Ended | |
|
|
| September 30, | September 30, |
Class C Shares |
|
| 2007 | 2006 |
Net asset value, beginning |
|
| $15.75 | $16.09 |
Income from investment operations: |
|
|
|
|
Net investment income |
|
| .56 | .51 |
Net realized and unrealized gain (loss) |
|
| .12 | (.04) |
Total from investment operations |
|
| .68 | .47 |
Distributions from: |
|
|
|
|
Net investment income |
|
| (.57) | (.51) |
Net realized gain |
|
| (.03) | (.30) |
Total distributions |
|
| (.60) | (.81) |
Total increase (decrease) in net asset value |
|
| .08 | (.34) |
Net asset value, ending |
|
| $15.83 | $15.75 |
|
|
|
|
|
Total return* |
|
| 4.41% | 3.01% |
Ratios to average net assets:A |
|
|
|
|
Net investment income |
|
| 3.61% | 3.31% |
Total expenses |
|
| 1.92% | 1.99% |
Expenses before offsets |
|
| 1.92% | 1.99% |
Net expenses |
|
| 1.91% | 1.98% |
Portfolio turnover |
|
| 190% | 150% |
Net assets, ending (in thousands) |
|
| $36,202 | $27,447 |
See notes to financial highlights.
Bond Portfolio
Financial Highlights
|
|
| Years Ended |
|
|
| September 30, | September 30, | September 30, |
Class I Shares |
| 2010 | 2009 | 2008 |
Net asset value, beginning |
| $15.23 | $15.16 | $15.94 |
Income from investment operations: |
|
|
|
|
Net investment income |
| .50 | .63 | .78 |
Net realized and unrealized gain (loss) |
| .88 | .31 | (.54) |
Total from investment operations |
| 1.38 | .94 | .24 |
Distributions from: |
|
|
|
|
Net investment income |
| (.48) | (.61) | (.77) |
Net realized gain |
| (.10) | (.26) | (.25) |
Total distributions |
| (.58) | (.87) | (1.02) |
Total increase (decrease) in net asset value |
| .80 | .07 | (.78) |
Net asset value, ending |
| $16.03 | $15.23 | $15.16 |
|
|
|
|
|
Total return* |
| 9.26% | 6.74% | 1.45% |
Ratios to average net assets:A |
|
|
|
|
Net investment income |
| 3.24% | 4.35% | 4.98% |
Total expenses |
| .52% | .54% | .52% |
Expenses before offsets |
| .52% | .54% | .52% |
Net expenses |
| .52% | .52% | .51% |
Portfolio turnover |
| 78% | 77% | 147% |
Net assets, ending (in thousands) |
| $213,621 | $187,496 | $208,076 |
|
|
|
|
|
|
|
|
|
|
|
|
| Years Ended | |
|
|
| September 30, | September 30, |
Class I Shares |
|
| 2007 | 2006 |
Net asset value, beginning |
|
| $15.85 | $16.18 |
Income from investment operations: |
|
|
|
|
Net investment income |
|
| .78 | .73 |
Net realized and unrealized gain (loss) |
|
| .13 | (.04) |
Total from investment operations |
|
| .91 | .69 |
Distributions from: |
|
|
|
|
Net investment income |
|
| (.79) | (.72) |
Net realized gain |
|
| (.03) | (.30) |
Total distributions |
|
| (.82) | (1.02) |
Total increase (decrease) in net asset value |
|
| .09 | (.33) |
Net asset value, ending |
|
| $15.94 | $15.85 |
|
|
|
|
|
Total return* |
|
| 5.89% | 4.48% |
Ratios to average net assets:A |
|
|
|
|
Net investment income |
|
| 4.99% | 4.77% |
Total expenses |
|
| .53% | .56% |
Expenses before offsets |
|
| .53% | .56% |
Net expenses |
|
| .52% | .55% |
Portfolio turnover |
|
| 190% | 150% |
Net assets, ending (in thousands) |
|
| $152,871 | $74,714 |
See notes to financial highlights.
Bond Portfolio
Financial Highlights
|
|
| Periods Ended | |
|
|
| September 30, | September 30, |
Class Y Shares |
|
| 2010 | 2009# |
Net asset value, beginning |
|
| $15.25 | $14.33 |
Income from investment operations: |
|
|
|
|
Net investment income |
|
| .41 | .48 |
Net realized and unrealized gain (loss) |
|
| .91 | 1.17 |
Total from investment operations |
|
| 1.32 | 1.65 |
Distributions from: |
|
|
|
|
Net investment income |
|
| (.39) | (.47) |
Net realized gain |
|
| (.10) | (.26) |
Total distributions |
|
| (.49) | (.73) |
Total increase (decrease) in net asset value |
|
| .83 | .92 |
Net asset value, ending |
|
| $16.08 | $15.25 |
|
|
|
|
|
Total return* |
|
| 8.83% | 11.97% |
Ratios to average net assets:A |
|
|
|
|
Net investment income |
|
| 2.71% | 3.36% (a) |
Total expenses |
|
| 1.00% | 5.39% (a) |
Expenses before offsets |
|
| .92% | .93% (a) |
Net expenses |
|
| .92% | .92% (a) |
Portfolio turnover |
|
| 78% | 69% |
Net assets, ending (in thousands) |
|
| $14,336 | $628 |
See notes to financial highlights.
Equity Portfolio
Financial Highlights
|
|
| Years Ended |
|
|
| September 30, | September 30, | September 30, |
Class A Shares |
| 2010 (z) | 2009 (z) | 2008 |
Net asset value, beginning |
| $29.25 | $32.92 | $41.06 |
Income from investment operations: |
|
|
|
|
Net investment income (loss) |
| (.04) | .06 | (.02) |
Net realized and unrealized gain (loss) |
| 3.39 | (1.81) | (5.69) |
Total from investment operations |
| 3.35 | (1.75) | (5.71) |
Distributions from: |
|
|
|
|
Net investment income |
| (.04) | — | — |
Net realized gain |
| — | (1.92) | (2.43) |
Total distributions |
| (.04) | (1.92) | (2.43) |
Total increase (decrease) in net asset value |
| 3.31 | (3.67) | (8.14) |
Net asset value, ending |
| $32.56 | $29.25 | $32.92 |
|
|
|
|
|
Total return* |
| 11.44% | (3.46%) | (14.85%) |
Ratios to average net assets:A |
|
|
|
|
Net investment income (loss) |
| (.13%) | .23% | (.05%) |
Total expenses |
| 1.22% | 1.28% | 1.21% |
Expenses before offsets |
| 1.22% | 1.28% | 1.21% |
Net expenses |
| 1.22% | 1.28% | 1.20% |
Portfolio turnover |
| 39% | 38% | 51% |
Net assets, ending (in thousands) |
| $980,605 | $837,205 | $834,312 |
|
|
|
|
|
|
| �� |
|
|
|
|
|
|
|
|
|
|
|
|
|
|
| Years Ended | |
|
|
| September 30, | September 30, |
Class A Shares |
|
| 2007 | 2006 |
Net asset value, beginning |
|
| $37.15 | $35.38 |
Income from investment operations: |
|
|
|
|
Net investment income (loss) |
|
| ** | (.02) |
Net realized and unrealized gain (loss) |
|
| 5.50 | 2.38 |
Total from investment operations |
|
| 5.50 | 2.36 |
Distributions from: |
|
|
|
|
Net realized gain |
|
| (1.59) | (.59) |
Total distributions |
|
| (1.59) | (.59) |
Total increase (decrease) in net asset value |
|
| 3.91 | 1.77 |
Net asset value, ending |
|
| $41.06 | $37.15 |
|
|
|
|
|
Total return* |
|
| 15.23% | 6.74% |
Ratios to average net assets:A |
|
|
|
|
Net investment income (loss) |
|
| (.01%) | (.06%) |
Total expenses |
|
| 1.21% | 1.23% |
Expenses before offsets |
|
| 1.21% | 1.23% |
Net expenses |
|
| 1.21% | 1.23% |
Portfolio turnover |
|
| 35% | 35% |
Net assets, ending (in thousands) |
|
| $1,000,992 | $907,459 |
See notes to financial highlights.
Equity Portfolio
Financial Highlights
|
|
| Years Ended |
|
|
| September 30, | September 30, | September 30, |
Class B Shares |
| 2010 (z) | 2009 (z) | 2008 |
Net asset value, beginning |
| $25.67 | $29.46 | $37.29 |
Income from investment operations: |
|
|
|
|
Net investment income (loss) |
| (.28) | (.15) | (.33) |
Net realized and unrealized gain (loss) |
| 2.95 | (1.72) | (5.07) |
Total from investment operations |
| 2.67 | (1.87) | (5.40) |
Distributions from: |
|
|
|
|
Net realized gain |
| — | (1.92) | (2.43) |
Total distributions |
| — | (1.92) | (2.43) |
Total increase (decrease) in net asset value |
| 2.67 | (3.79) | (7.83) |
Net asset value, ending |
| $28.34 | $25.67 | $29.46 |
|
|
|
|
|
Total return* |
| 10.40% | (4.34%) | (15.56%) |
Ratios to average net assets:A |
|
|
|
|
Net investment income (loss) |
| (1.03%) | (.69%) | (.89%) |
Total expenses |
| 2.13% | 2.22% | 2.05% |
Expenses before offsets |
| 2.13% | 2.22% | 2.05% |
Net expenses |
| 2.13% | 2.22% | 2.05% |
Portfolio turnover |
| 39% | 38% | 51% |
Net assets, ending (in thousands) |
| $35,761 | $45,648 | $59,438 |
|
|
|
|
|
|
|
|
|
|
|
|
| Years Ended | |
|
|
| September 30, | September 30, |
Class B Shares |
|
| 2007 | 2006 |
Net asset value, beginning |
|
| $34.15 | $32.84 |
Income from investment operations: |
|
|
|
|
Net investment income (loss) |
|
| (.33) | (.32) |
Net realized and unrealized gain (loss) |
|
| 5.06 | 2.22 |
Total from investment operations |
|
| 4.73 | 1.90 |
Distributions from: |
|
|
|
|
Net realized gain |
|
| (1.59) | (.59) |
Total distributions |
|
| (1.59) | (.59) |
Total increase (decrease) in net asset value |
|
| 3.14 | 1.31 |
Net asset value, ending |
|
| $37.29 | $34.15 |
|
|
|
|
|
Total return* |
|
| 14.28% | 5.85% |
Ratios to average net assets:A |
|
|
|
|
Net investment income (loss) |
|
| (.84%) | (.90%) |
Total expenses |
|
| 2.04% | 2.06% |
Expenses before offsets |
|
| 2.04% | 2.06% |
Net expenses |
|
| 2.04% | 2.06% |
Portfolio turnover |
|
| 35% | 35% |
Net assets, ending (in thousands) |
|
| $87,476 | $95,903 |
See notes to financial highlights.
Equity Portfolio
Financial Highlights
|
|
| Years Ended |
|
|
| September 30, | September 30, | September 30, |
Class C Shares |
| 2010 (z) | 2009 (z) | 2008 |
Net asset value, beginning |
| $23.65 | $27.32 | $34.73 |
Income from investment operations:. |
|
|
|
|
Net investment income (loss) |
| (.23) | (.11) | (.25) |
Net realized and unrealized gain (loss) |
| 2.73 | (1.64) | (4.73) |
Total from investment operations |
| 2.50 | (1.75) | (4.98) |
Distributions from: |
|
|
|
|
Net realized gain |
| — | (1.92) | (2.43) |
Total distributions |
| — | (1.92) | (2.43) |
Total increase (decrease) in net asset value |
| 2.50 | (3.67) | (7.41) |
Net asset value, ending |
| $26.15 | $23.65 | $27.32 |
|
|
|
|
|
Total return* |
| 10.57% | (4.23%) | (15.49%) |
Ratios to average net assets:A |
|
|
|
|
Net investment income (loss) |
| (.92%) | (.57%) | (.81%) |
Total expenses |
| 2.01% | 2.09% | 1.97% |
Expenses before offsets |
| 2.01% | 2.09% | 1.97% |
Net expenses |
| 2.01% | 2.08% | 1.96% |
Portfolio turnover |
| 39% | 38% | 51% |
Net assets, ending (in thousands) |
| $97,961 | $87,512 | $97,327 |
|
|
|
|
|
|
|
|
|
|
|
|
| Years Ended | |
|
|
| September 30, | September 30, |
Class C Shares |
|
| 2007 | 2006 |
Net asset value, beginning |
|
| $31.89 | $30.68 |
Income from investment operations:. |
|
|
|
|
Net investment income (loss) |
|
| (.25) | (.26) |
Net realized and unrealized gain (loss) |
|
| 4.68 | 2.06 |
Total from investment operations |
|
| 4.43 | 1.80 |
Distributions from: |
|
|
|
|
Net realized gain |
|
| (1.59) | (.59) |
Total distributions |
|
| (1.59) | (.59) |
Total increase (decrease) in net asset value |
|
| 2.84 | 1.21 |
Net asset value, ending |
|
| $34.73 | $31.89 |
|
|
|
|
|
Total return* |
|
| 14.35% | 5.93% |
Ratios to average net assets:A |
|
|
|
|
Net investment income (loss) |
|
| (.76%) | (.82%) |
Total expenses |
|
| 1.96% | 1.99% |
Expenses before offsets |
|
| 1.96% | 1.99% |
Net expenses |
|
| 1.96% | 1.98% |
Portfolio turnover |
|
| 35% | 35% |
Net assets, ending (in thousands) |
|
| $119,917 | $109,468 |
See notes to financial highlights.
Equity Portfolio
Financial Highlights
|
|
| Years Ended |
|
|
| September 30, | September 30, | September 30, |
Class I Shares |
| 2010 (z) | 2009 (z) | 2008 |
Net asset value, beginning |
| $31.04 | $34.58 | $42.79 |
Income from investment operations: |
|
|
|
|
Net investment income |
| .14 | .21 | .20 |
Net realized and unrealized gain (loss) |
| 3.59 | (1.83) | (5.98) |
Total from investment operations |
| 3.73 | (1.62) | (5.78) |
Distributions from: |
|
|
|
|
Net investment income |
| (.11) | — | — |
Net realized gain |
| — | (1.92) | (2.43) |
Total distributions |
| (.11) | (1.92) | (2.43) |
Total increase (decrease) in net asset value |
| 3.62 | (3.54) | (8.21) |
Net asset value, ending |
| $34.66 | $31.04 | $34.58 |
|
|
|
|
|
Total return* |
| 12.04% | (2.88%) | (14.39%) |
Ratios to average net assets:A |
|
|
|
|
Net investment income |
| .42% | .79% | .49% |
Total expenses |
| .68% | .70% | .67% |
Expenses before offsets |
| .68% | .70% | .67% |
Net expenses |
| .68% | .70% | .67% |
Portfolio turnover |
| 39% | 38% | 51% |
Net assets, ending (in thousands) |
| $198,553 | $156,430 | $118,423 |
|
|
|
|
|
|
|
|
|
|
|
|
| Years Ended | |
|
|
| September 30, | September 30, |
Class I Shares |
|
| 2007 | 2006 |
Net asset value, beginning |
|
| $38.44 | $36.40 |
Income from investment operations: |
|
|
|
|
Net investment income |
|
| .21 | .17 |
Net realized and unrealized gain (loss) |
|
| 5.73 | 2.46 |
Total from investment operations |
|
| 5.94 | 2.63 |
Distributions from: |
|
|
|
|
Net realized gain |
|
| (1.59) | (.59) |
Total distributions |
|
| (1.59) | (.59) |
Total increase (decrease) in net asset value |
|
| 4.35 | 2.04 |
Net asset value, ending |
|
| $42.79 | $38.44 |
|
|
|
|
|
Total return* |
|
| 15.88% | 7.30% |
Ratios to average net assets:A |
|
|
|
|
Net investment income |
|
| .53% | .49% |
Total expenses |
|
| .67% | .68% |
Expenses before offsets |
|
| .67% | .68% |
Net expenses |
|
| .66% | .67% |
Portfolio turnover |
|
| 35% | 35% |
Net assets, ending (in thousands) |
|
| $170,767 | $163,685 |
See notes to financial highlights.
Equity Portfolio
Financial Highlights
|
| Periods Ended |
| |
|
| September 30, | September 30, |
|
Class Y Shares |
| 2010 (z) | 2009# (z) |
|
Net asset value, beginning |
| $29.35 | $27.35 |
|
Income from investment operations: |
|
|
|
|
Net investment income |
| .02 | .08 |
|
Net realized and unrealized gain (loss) |
| 3.42 | 3.84 |
|
Total from investment operations |
| 3.44 | 3.92 |
|
Distributions from: |
|
|
|
|
Net investment income |
| (.01) | — |
|
Net realized gain |
| — | (1.92) |
|
Total distributions |
| (.01) | (1.92) |
|
Total increase (decrease) in net asset value |
| 3.43 | 2.00 |
|
Net asset value, ending |
| $32.78 | $29.35 |
|
|
|
|
|
|
Total return* |
| 11.73% | 16.59% |
|
Ratios to average net assets:A |
|
|
|
|
Net investment income |
| .08% | .34% (a) |
|
Total expenses |
| 1.14% | 11.72% (a) |
|
Expenses before offsets |
| .96% | .96% (a) |
|
Net expenses |
| .96% | .96% (a) |
|
Portfolio turnover |
| 39% | 35% |
|
Net assets, ending (in thousands) |
| $11,811 | $483 |
|
See notes to financial highlights.
Enhanced Equity Portfolio
Financial Highlights
|
|
| Years Ended |
|
|
| September 30, | September 30, | September 30, |
Class A Shares |
| 2010 (z) | 2009 (z) | 2008 (z) |
Net asset value, beginning |
| $13.62 | $14.93 | $20.49 |
Income from investment operations: |
|
|
|
|
Net investment income |
| .07 | .12 | .15 |
Net realized and unrealized gain (loss) |
| 1.44 | (1.25) | (4.52) |
Total from investment operations |
| 1.51 | (1.13) | (4.37) |
Distributions from: |
|
|
|
|
Net investment income |
| (.11) | (.18) | (.11) |
Net realized gain |
| — | — | (1.08) |
Total distributions |
| (.11) | (.18) | (1.19) |
Total increase (decrease) in net asset value |
| 1.40 | (1.31) | (5.56) |
Net asset value, ending |
| $15.02 | $13.62 | $14.93 |
|
|
|
|
|
Total return* |
| 11.10% | (7.22%) | (22.57%) |
Ratios to average net assets:A |
|
|
|
|
Net investment income |
| .47% | 1.10% | .84% |
Total expenses |
| 1.48% | 1.54% | 1.36% |
Expenses before offsets |
| 1.38% | 1.44% | 1.26% |
Net expenses |
| 1.38% | 1.43% | 1.24% |
Portfolio turnover |
| 109% | 111% | 46% |
Net assets, ending (in thousands) |
| $34,563 | $33,040 | $45,345 |
|
|
|
|
|
|
|
|
|
|
|
|
| Years Ended | |
|
|
| September 30, | September 30, |
Class A Shares |
|
| 2007 (z) | 2006 (z) |
Net asset value, beginning |
|
| $19.75 | $18.76 |
Income from investment operations: |
|
|
|
|
Net investment income |
|
| .13 | .10 |
Net realized and unrealized gain (loss) |
|
| 1.53 | 1.51 |
Total from investment operations |
|
| 1.66 | 1.61 |
Distributions from: |
|
|
|
|
Net investment income |
|
| (.09) | (.06) |
Net realized gain |
|
| (.83) | (.56) |
Total distributions |
|
| (.92) | (.62) |
Total increase (decrease) in net asset value |
|
| .74 | .99 |
Net asset value, ending |
|
| $20.49 | $19.75 |
|
|
|
|
|
Total return* |
|
| 8.58% | 8.79% |
Ratios to average net assets:A |
|
|
|
|
Net investment income |
|
| .66% | .56% |
Total expenses |
|
| 1.33% | 1.36% |
Expenses before offsets |
|
| 1.23% | 1.26% |
Net expenses |
|
| 1.20% | 1.23% |
Portfolio turnover |
|
| 56% | 47% |
Net assets, ending (in thousands) |
|
| $65,209 | $58,020 |
See notes to financial highlights.
Enhanced Equity Portfolio
Financial Highlights
|
|
| Years Ended |
|
|
| September 30, | September 30, | September 30, |
Class B Shares |
| 2010 (z) | 2009 (z) | 2008 (z) |
Net asset value, beginning |
| $12.36 | $13.51 | $18.72 |
Income from investment operations: |
|
|
|
|
Net investment income (loss) |
| (.11) | (.03) | (.04) |
Net realized and unrealized gain (loss) |
| 1.32 | (1.12) | (4.09) |
Total from investment operations |
| 1.21 | (1.15) | (4.13) |
Distributions from: |
|
|
|
|
Net realized gain |
| — | — | (1.08) |
Total distributions |
| — | — | (1.08) |
Total increase (decrease) in net asset value |
| 1.21 | (1.15) | (5.21) |
Net asset value, ending |
| $13.57 | $12.36 | $13.51 |
|
|
|
|
|
Total return* |
| 9.79% | (8.51%) | (23.36%) |
Ratios to average net assets:A |
|
|
|
|
Net investment income (loss) |
| (.82%) | (.26%) | (.23%) |
Total expenses |
| 2.78% | 2.97% | 2.41% |
Expenses before offsets |
| 2.67% | 2.83% | 2.31% |
Net expenses |
| 2.67% | 2.83% | 2.30% |
Portfolio turnover |
| 109% | 111% | 46% |
Net assets, ending (in thousands) |
| $2,329 | $2,768 | $4,003 |
|
|
|
|
|
|
|
|
|
|
|
|
| Years Ended | |
|
|
| September 30, | September 30, |
Class B Shares |
|
| 2007 (z) | 2006 (z) |
Net asset value, beginning |
|
| $18.20 | $17.43 |
Income from investment operations: |
|
|
|
|
Net investment income (loss) |
|
| (.06) | (.07) |
Net realized and unrealized gain (loss) |
|
| 1.41 | 1.40 |
Total from investment operations |
|
| 1.35 | 1.33 |
Distributions from: |
|
|
|
|
Net realized gain |
|
| (.83) | (.56) |
Total distributions |
|
| (.83) | (.56) |
Total increase (decrease) in net asset value |
|
| .52 | .77 |
Net asset value, ending |
|
| $18.72 | $18.20 |
|
|
|
|
|
Total return* |
|
| 7.55% | 7.78% |
Ratios to average net assets:A |
|
|
|
|
Net investment income (loss) |
|
| (.30%) | (.38%) |
Total expenses |
|
| 2.29% | 2.30% |
Expenses before offsets |
|
| 2.19% | 2.20% |
Net expenses |
|
| 2.16% | 2.17% |
Portfolio turnover |
|
| 56% | 47% |
Net assets, ending (in thousands) |
|
| $7,257 | $8,156 |
See notes to financial highlights.
Enhanced Equity Portfolio
Financial Highlights
|
|
| Years Ended |
|
|
| September 30, | September 30, | September 30, |
Class C Shares |
| 2010 (z) | 2009 (z) | 2008 (z) |
Net asset value, beginning |
| $12.48 | $13.61 | $18.82 |
Income from investment operations: |
|
|
|
|
Net investment income (loss) |
| (.06) | .01 | — |
Net realized and unrealized gain (loss) |
| 1.33 | (1.12) | (4.13) |
Total from investment operations |
| 1.27 | (1.11) | (4.13) |
Distributions from: |
|
|
|
|
Net investment income |
| — | (.02) | — |
Net realized gain |
| — | — | (1.08) |
Total distributions |
| — | (.02) | (1.08) |
Total increase (decrease) in net asset value |
| 1.27 | (1.13) | (5.21) |
Net asset value, ending |
| $13.75 | $12.48 | $13.61 |
Total return* |
| 10.18% | (8.09%) | (23.23%) |
Ratios to average net assets:A |
|
|
|
|
Net investment income (loss) |
| (.46%) | .12% | (.03%) |
Total expenses |
| 2.42% | 2.52% | 2.22% |
Expenses before offsets |
| 2.32% | 2.41% | 2.12% |
Net expenses |
| 2.32% | 2.41% | 2.10% |
Portfolio turnover |
| 109% | 111% | 46% |
Net assets, ending (in thousands) |
| $6,297 | $5,767 | $6,631 |
|
|
|
|
|
|
|
|
|
|
|
|
|
|
|
|
|
| Years Ended | |
|
|
| September 30, | September 30, |
Class C Shares |
|
| 2007 (z) | 2006 (z) |
Net asset value, beginning |
|
| $18.27 | $17.50 |
Income from investment operations: |
|
|
|
|
Net investment income (loss) |
|
| (.04) | (.06) |
Net realized and unrealized gain (loss) |
|
| 1.42 | 1.39 |
Total from investment operations |
|
| 1.38 | 1.33 |
Distributions from: |
|
|
|
|
Net realized gain |
|
| (.83) | (.56) |
Total distributions |
|
| (.83) | (.56) |
Total increase (decrease) in net asset value |
|
| .55 | .77 |
Net asset value, ending |
|
| $18.82 | $18.27 |
|
|
|
|
|
Total return* |
|
| 7.69% | 7.75% |
Ratios to average net assets:A |
|
|
|
|
Net investment income (loss) |
|
| (.20%) | (.33%) |
Total expenses |
|
| 2.19% | 2.25% |
Expenses before offsets |
|
| 2.09% | 2.15% |
Net expenses |
|
| 2.06% | 2.12% |
Portfolio turnover |
|
| 56% | 47% |
Net assets, ending (in thousands) |
|
| $10,089 | $7,846 |
See notes to financial highlights.
Enhanced Equity Portfolio
Financial Highlights
|
|
| Years Ended |
|
|
| September 30, | September 30, | September 30, |
Class I Shares |
| 2010 (z) | 2009 (z) | 2008 (z) |
Net asset value, beginning |
| $13.83 | $15.13 | $20.67 |
Income from investment operations: |
|
|
|
|
Net investment income |
| .15 | .20 | .24 |
Net realized and unrealized gain (loss) |
| 1.47 | (1.27) | (4.56) |
Total from investment operations |
| 1.62 | (1.07) | (4.32) |
Distributions from: |
|
|
|
|
Net investment income |
| (.16) | (.23) | (.14) |
Net realized gain |
| — | — | (1.08) |
Total distributions |
| (.16) | (.23) | (1.22) |
Total increase (decrease) in net asset value |
| 1.46 | (1.30) | (5.54) |
Net asset value, ending |
| $15.29 | $13.83 | $15.13 |
|
|
|
|
|
Total return* |
| 11.77% | (6.64%) | (22.13%) |
Ratios to average net assets:A |
|
|
|
|
Net investment income |
| 1.04% | 1.70% | 1.36% |
Total expenses |
| .91% | .95% | .85% |
Expenses before offsets |
| .81% | .81% | .75% |
Net expenses |
| .81% | .81% | .74% |
Portfolio turnover |
| 109% | 111% | 46% |
Net assets, ending (in thousands) |
| $30,524 | $25,174 | $23,364 |
|
|
|
|
|
|
|
|
|
|
|
|
| Years Ended | |
|
|
| September 30, | September 30, |
Class I Shares |
|
| 2007 (z) | 2006(z) |
Net asset value, beginning |
|
| $19.83 | $18.75 |
Income from investment operations: |
|
|
|
|
Net investment income |
|
| .22 | .19 |
Net realized and unrealized gain (loss) |
|
| 1.55 | 1.50 |
Total from investment operations |
|
| 1.77 | 1.69 |
Distributions from: |
|
|
|
|
Net investment income |
|
| (.10) | (.05) |
Net realized gain |
|
| (.83) | (.56) |
Total distributions |
|
| (.93) | (.61) |
Total increase (decrease) in net asset value |
|
| .84 | 1.08 |
Net asset value, ending |
|
| $20.67 | $19.83 |
|
|
|
|
|
Total return* |
|
| 9.09% | 9.19% |
Ratios to average net assets:A |
|
|
|
|
Net investment income |
|
| 1.09% | .99% |
Total expenses |
|
| .88% | 1.20% |
Expenses before offsets |
|
| .78% | .84% |
Net expenses |
|
| .76% | .81% |
Portfolio turnover |
|
| 56% | 47% |
Net assets, ending (in thousands) |
|
| $24,663 | $9,464 |
See notes to financial highlights.
A Total expenses do not reflect amounts reimbursed and/or waived by the Advisor or reductions from expense offset arrangements. Expenses before offsets reflect expenses after reimbursement and/or waiver by the Advisor but prior to reductions from expense offset arrangements. Net expenses are net of all reductions and represent the net expenses paid by the Portfolio.
* Total return is not annualized for periods less than one year and does not reflect deduction of any front-end or deferred sales charge.
** Amount was less than (.01) per share.
*** Distribution was less than .01 per share.
**** Amount was less than .001 per share.
***** Distribution was less than .001 per share.
# From October 31, 2008 inception.
(a) Annualized.
(z) Per share figures are calculated using the Average Shares Method.
See notes to financial statements.
Explanation of Financial Tables
Schedule of Investments
The Schedule of Investments is a snapshot of all securities held in the fund at their market value, on the last day of the reporting period. Securities are listed by asset type (e.g., common stock, corporate bonds, U.S. government obligations) and may be further broken down into sub-groups and by industry classification.
Statement of Assets and Liabilities
The Statement of Assets and Liabilities is often referred to as the fund’s balance sheet. It lists the value of what the fund owns, is due and owes on the last day of the reporting period. The fund’s assets include the market value of securities owned, cash, receivables for securities sold and shareholder subscriptions, and receivables for dividends and interest payments that have been earned, but not yet received. The fund’s liabilities include payables for securities purchased and shareholder redemptions, and expenses owed but not yet paid. The statement also reports the fund’s net asset value (NAV) per share on the last day of the reporting period. The NAV is calculated by dividing the fund’s net assets (assets minus liabilities) by the number of shares outstanding. This statement is accompani ed by a Schedule of Investments. Alternatively, if certain conditions are met, a Statement of Net Assets may be presented in lieu of this statement and the Schedule of Investments.
Statement of Net Assets
The Statement of Net Assets provides a detailed list of the fund’s holdings, including each security’s market value on the last day of the reporting period. The Statement of Net Assets includes a Schedule of Investments. Other assets are added and other liabilities subtracted from the investments total to calculate the fund’s net assets. Finally, net assets are divided by the outstanding shares of the fund to arrive at its share price, or Net Asset Value (NAV) per share.
At the end of the Statement of Net Assets is a table displaying the composition of the fund’s net assets. Paid in Capital is the money invested by shareholders and represents the bulk of net assets. Undistributed Net Investment Income and Accumulated Net Realized Gains usually approximate the amounts the fund had available to distribute to shareholders as of the statement date. Accumulated Realized Losses will appear as negative balances. Unrealized Appreciation (Depreciation) is the difference between the market value of the fund’s investments and their cost, and reflects the gains (losses) that would be realized if the fund were to sell all of its investments at their statement-date -values.
Statement of Operations
The Statement of Operations summarizes the fund’s investment income earned and expenses incurred in operating the fund. Investment income includes dividends earned from stocks and interest earned from interest-bearing securities in the fund. Expenses incurred in operating the fund include the advisory fee paid to the investment advisor, administrative services fees, distribution plan expenses (if applicable), transfer agent fees, shareholder servicing expenses, custodial, legal, and audit fees, and the printing and postage expenses related to shareholder reports. Expense offsets (fees paid indirectly) are also shown. Credits earned from offset arrangements are used to reduce the fund’s expenses. This statement also shows net gains (losses) realized on the sale of investments and the increase or decrease in the unrealized appreciation (depreciation) on investments held during the period.
Statement of Changes in Net Assets
The Statement of Changes in Net Assets shows how the fund’s total net assets changed during the two most recent reporting periods. Changes in the fund’s net assets are attributable to investment operations, distributions and capital share transactions.
The Operations section of the report summarizes information detailed in the Statement of Operations. The Distribution section shows the dividend and capital gain distributions made to shareholders. The amounts shown as distributions in this section may not match the net investment income and realized gains amounts shown in the Operations section because distributions are determined on a tax basis and certain investments or transactions may be treated differently for financial statement and tax purposes. The Capital Share Transactions section shows the amount shareholders invested in the fund, either by purchasing shares or by reinvesting distributions, and the amounts redeemed. The corresponding numbers of shares issued, reinvested and redeemed are shown at the end of the report.
Financial Highlights
The Financial Highlights table provides a per-share breakdown per class of the components that affect the fund’s net asset value for current and past reporting periods. The table provides total return, total distributions, expense ratios, portfolio turnover and net assets for the applicable period. Total return is a measure of a fund’s performance that encompasses all elements of return: dividends, capital gain distributions and changes in net asset value. Total return is the change in value of an investment over a given period, assuming reinvestment of any dividends and capital gain distributions, expressed as a percentage of the initial investment. Total distributions include distributions from net investment income and net realized gains. Long-term gains are earned on securities held in the fund more than one year. Short-term gains, on the sale of securities held less than one year, are treated as ordinary dividend income for tax purposes. The expense ratio is a fund’s cost of doing business, expressed as a percentage of net assets. These expenses directly reduce returns to shareholders. Portfolio turnover measures the trading activity in a fund’s investment portfolio – how often securities are bought and sold by a fund. Portfolio turnover is affected by market conditions, changes in the size of the fund, the nature of the fund’s investments and the investment style of the portfolio.
PROXY VOTING
The Proxy Voting Guidelines of the Calvert Funds that the Fund uses to determine how to vote proxies relating to portfolio securities are provided as an Appendix to the Fund’s Statement of Additional Information. The Statement of Additional Information can be obtained free of charge by calling the Fund at 1-800-368-2745, by visiting the Calvert website at www.calvert.com; or by visiting the SEC’s website at www.sec.gov.
Information regarding how the Fund voted proxies relating to portfolio securities during the most recent 12-month period ended June 30 is available on the Fund’s website at www.calvert.com and on the SEC’s website at www.sec.gov.
Availability of Quarterly Portfolio Holdings
The Fund files its complete schedule of portfolio holdings with the SEC for the first and third quarters of each fiscal year on Form N-Q. The Fund’s Form N-Q is available on the SEC’s website at www.sec.gov. The Fund’s Form N-Q may be reviewed and copied at the SEC’s Public Reference Room in Washington, DC; information on the operation of the Public Reference Room may be obtained by calling 1-800-SEC-0330.
Trustee and Officer Information Table
| # of | Other | |||
Name & | Position | Position | Principal Occupation | ||
INDEPENDENT TRUSTEES/DIRECTORS | |||||
REBECCA L. ADAMSON | Trustee Director Director Director | 1989 2000 2000 2005 | President of the national nonprofit, First People’s Worldwide, formerly First Nations Financial Project. Founded by her in 1980, First People’s Worldwide is the only American Indian alternative development institute in the country. | 17 | • Bay & Paul Foundation |
RICHARD L. BAIRD, JR. | Trustee & Director & Director & Director & | 1982 2000 2005 2005 | President and CEO of Adagio Health Inc. in Pittsburgh, PA, a non-profit corporation which provides family planning services, nutrition, maternal/child health care, and various health screening services and community preventive health programs. | 29 | None |
JOHN G. GUFFEY, JR. | Director Trustee Director Director | 1992 1982 2000 2005 | Treasurer and Director of Silby, Guffey and Co., Inc., a venture capital firm (inactive as of 2003) and President of Aurora Press Inc., a privately held publisher of trade paperbacks. | 29 | • Ariel Funds (3) • Calvert Social Investment Foundation • Calvert Ventures, LLC |
MILES DOUGLAS HARPER, III | Director Trustee Director Director | 2000 2005 2005 2005 | Partner, Gainer Donnelly & Desroches (public accounting firm) since January 1999. | 17 | • Bridgeway Funds (14) |
JOY V. JONES AGE:60
| Director Trustee Director Director | 2000 1990 2000 2005 | Attorney. | 17 | • Director, Conduit Street Restaurants Limited |
TERRENCE J. MOLLNER, Ed.D. AGE: 65 | Director Trustee Director Director | 1992 1982 2000 2005 | Founder, Chairperson, and President of Trusteeship Institute, Inc., a diverse foundation known principally for its consultation to corporations converting to cooperative employee-ownership and the development of socially and spiritually responsible investment vehicles. Chairperson, Stakeholders Capital, Inc., an asset management firm and financial services provider in Amherst, MA. | 17 | • Calvert Social Investment Foundation • Ben & Jerry's Homemade, Inc. • ArtNOW, Inc. • Yourolivebranch.org |
SYDNEY AMARA MORRIS | Trustee Director Director Director | 1982 2000 2005 2005 | Rev. Morris currently serves as Parish Minister to the Keweenaw Unitarian Universalist Fellowship in Houghton, MI. Rev. Morris is a graduate of Harvard Divinity School. She currently chairs the Umbrian Universalist Committee on Socially Responsible Investing. | 17 | None |
INTERESTED TRUSTEES/DIRECTORS | |||||||
BARBARA J. KRUMSIEK | Director & Trustee & Director & Director & | 1997 1997 2000 2000 | President, Chief Executive Officer and Chair of Calvert Group, Ltd. | 51 | • Calvert Social Investment Foundation • Pepco Holdings, Inc. • Acacia Life Insurance Company (Chair) | ||
D. WAYNE SILBY, Esq. | Director Trustee & Director & Director | 1992 1982 2000 2000 | Mr. Silby is the founding Chair of the Calvert Funds. He is the Chair-Elect and a principal of Syntao.com, a Beijing-based company promoting corporate social responsibility. He was an officer and director of Silby, Guffey and Co., Inc., a venture capital firm (inactive as of 2003). | 29 | • UNIFI Mutual Holding Company • Calvert Social Investment Foundation • Giving Assets, Inc. • Studio School Fund • Syntao.com China • The Ice Organization | ||
OFFICERS | |||||||
KAREN BECKER | Chief Compliance Officer | 2005 | Chief Compliance Officer for the Calvert Funds. In March 2009, Ms. Becker also became Head of the Securities Operations Department for Calvert Asset Management Company, Inc. | ||||
SUSAN WALKER BENDER, Esq. | Assistant Vice-President & Assistant Secretary | 1988 2000 1992 2000 | Assistant Vice President, Assistant Secretary and Associate General Counsel of Calvert Group, Ltd. | ||||
JENNIFER BERG | Assistant Fund Controller | 2009 | Fund Administration Manager for Calvert Group, Ltd. | ||||
THOMAS DAILEY | Vice President | 2004 | Vice President of Calvert Asset Management Company, Inc. | ||||
IVY WAFFORD DUKE, Esq. | Assistant Vice-President & Assistant Secretary | 1996 2000 1996 2000 | Assistant Vice President, Assistant Secretary and Deputy General Counsel of Calvert Group, Ltd., and Chief Compliance Officer for Calvert Asset Management Company, Inc. and Calvert Distributors, Inc. |
PATRICK FAUL | Vice President | 2010 | Vice President of Calvert Asset Management Company, Inc. (“CAMCO”) since 2008, and Head of Credit Research for CAMCO since 2009. Prior to 2009, Mr. Faul was Co-Head of Credit Research (2008) and a Senior Securities Analyst (prior to 2008) for CAMCO. |
TRACI L. GOLDT | Assistant Secretary | 2004 | Executive Assistant to General Counsel, Calvert Group, Ltd. |
GREGORY B. HABEEB | Vice President | 2004 | Senior Vice President of Calvert Asset Management Company, Inc. |
HUI PING HO, CPA | Assistant Treasurer | 2000 | Tax Compliance Manager of Calvert Group, Ltd. |
LANCELOT A. KING, Esq. | Assistant Vice President & Assistant Secretary | 2002 | Assistant Vice President, Assistant Secretary and Associate General Counsel of Calvert Group, Ltd. |
EDITH LILLIE | Assistant Secretary | 2007 | Assistant Secretary (since 2007) and Regulatory Matters Manager of Calvert Group, Ltd. |
AUGUSTO DIVO MACEDO, Esq. | Assistant Vice President & Assistant Secretary | 2007 | Assistant Vice President, Assistant Secretary, and Assistant Counsel Compliance of Calvert Group, Ltd. |
JANE B. MAXWELL Esq. | Assistant Vice President & Assistant Secretary | 2005 | Assistant Vice President, Assistant Secretary & Assistant General Counsel of Calvert Group, Ltd. |
ANDREW K. NIEBLER, Esq. | Assistant Vice President & Assistant Secretary | 2006 | Assistant Vice President, Assistant Secretary & Associate General Counsel of Calvert Group, Ltd. |
CATHERINE P. ROY | Vice President | 2004 | Senior Vice President of Calvert Asset Management Company, Inc. and Chief Investment Officer – Fixed Income. |
WILLIAM M. TARTIKOFF, Esq. | Vice President and Secretary | 1990 2000 1992 2000 | Senior Vice President, Secretary, and General Counsel of Calvert Group, Ltd. |
NATALIE TRUNOW | Vice resident | 2008 | Senior Vice President of Calvert Asset Management Company, Inc., and Chief Investment Officer -Equities. Prior to joining Calvert in August 2008, Ms. Trunow was the Section Head (2005-2008) and Portfolio Manager (2001-2008) for the Global Public Markets Group of General Motors Asset Management. |
RONALD M. WOLFSHEIMER CPA | Treasurer | 1982 2000 1992 2000 | Senior Vice President and Chief Financial and Administrative Officer of Calvert Group, Ltd. |
MICHAEL V. YUHAS JR., CPA | Fund Controller | 1999 2000 1999 2000 | Vice President of Calvert Administrative Services Company. |
The address of Trustees/Directors and Officers is 4550 Montgomery Avenue, Suite 1000N, Bethesda, Maryland 20814, except Mr. Silby’s address is 1715 18th Street, N.W., Washington, DC 20009. Ms. Krumsiek is an interested person of the Fund since she is an officer and director of the Fund’s advisor and certain affiliates. Mr. Silby is an interested person of the Fund since he is a director of the parent company of the Fund’s advisor.
Additional information about the Fund’s Trustees/Directors can be found in the Statement of Additional Information (SAI). You can get a free copy of the SAI at www.calvert.com, or by contacting your broker, or the Fund at 1-800-368-2745.
Calvert
social investment fund
Calvert’s
Family of Funds
Tax-Exempt Money
Market Funds
CTFR Money Market Portfolio
Taxable Money Market Funds
First Government Money Market Fund
CSIF Money Market Portfolio
Municipal Funds
Calvert Tax-Free Bond Fund
Taxable Bond Funds
CSIF Bond Portfolio
Income Fund
Short Duration Income Fund
Long-Term Income Fund
Ultra-Short Income Fund
Government Fund
Short-Term Government Fund
High Yield Bond Fund
Equity Funds
CSIF Enhanced Equity Portfolio
CSIF Equity Portfolio
Calvert Large Cap Growth Fund
Calvert Large Cap Value Fund
Calvert Social Index Fund
Capital Accumulation Fund
CWV International Equity Fund
New Vision Small Cap Fund
Small Cap Value Fund
Mid Cap Value Fund
Global Alternative Energy Fund
Global Water Fund
International Opportunities Fund
Balanced and Asset
Allocation Funds
CSIF Balanced Portfolio
Calvert Conservative Allocation Fund
Calvert Moderate Allocation Fund
Calvert Aggressive Allocation Fund
This report is intended to provide fund information to shareholders. It is not authorized for distribution to prospective investors unless preceded or
accompanied by a prospectus.
Note: The information on our website is not incorporated by reference into this report; our website address is included as an
Investors should carefully consider the investment objectives, risks, charges and expenses of the Calvert Funds. This and other important information is contained in the fund’s summary prospectus and prospectus, which can be obtained from your financial professional and should be read carefully before investing. You may also call Calvert at 800/368-2745 or visit www. calvert.com.
To Open an Account
800-368-2748
Yields and Prices
Calvert Information Network
(24 hours, 7 days a week)
800-368-2745
Service for Existing Account
Shareholders: 800-368-2745
Brokers: 800-368-2746
TDD for Hearing Impaired
800-541-1524
Branch Office
4550 Montgomery Avenue
Suite 1000 North
Bethesda, Maryland 20814
Registered, Certified
or Overnight Mail
Calvert Group
c/o BFDS,
330 West 9th Street
Kansas City, MO 64105
Web Site
www.calvert.com
Principal Underwriter
Calvert Distributors, Inc.
4550 Montgomery Avenue
Suite 1000 North
Bethesda, Maryland 20814
Calvert Asset
Allocation Funds
Conservative Allocation Fund
Moderate Allocation Fund
Aggressive Allocation Fund
Annual Report
September 30, 2010
Choose Planet-friendly E-delivery!
Sign up now for on-line statements, prospectuses, and fund reports. In less than five minutes you can help reduce paper mail and lower fund costs.
Just go to www.calvert.com, click on My Account, and select the documents you would like to receive via e-mail.
If you’re new to account access, you’ll be prompted to set up a personal identification number for your account. Once you’re in, click on the E-delivery sign-up at the bottom of the Account Portfolio page and follow the quick, easy steps.
TABLE
OF CONTENTS
4 President’s Letter
7 SRI Update
9 Portfolio Management Discussion
18 Shareholder Expense Example
21 Report of Independent Registered Public Accounting Firm
22 Statements of Net Assets
25 Statements of Operations
26 Statements of Changes in Net Assets
31 Notes to Financial Statements
39 Financial Highlights
47 Explanation of Financial Tables
49 Proxy Voting and Availability of Quarterly Portfolio Holdings
50 Trustee and Officer Information Table
Dear Shareholder:
Over the 12-month reporting period, the U.S. financial markets and economy continued to recover, in fits and starts, from the “Great Recession.” As economic data vacillated between good and bad news on employment, housing trends, business strength, and consumer confidence, market volatility and investor sentiment also see-sawed.
During the winter, investors became less risk averse, pouring money into higher-yielding areas of the bond market as well as stocks, which reached 18-month highs in March. Later in the spring, however, investor sentiment took an abrupt turn as confidence in the global economic recovery waned and fears of a double-dip recession grew. Following a dismal August for the stock market, September saw a surge in stock prices lifted by strong corporate earnings reports and renewed investor interest in bargain-priced stocks. In the bond market, Treasury yields moved lower over the 12-month reporting period and corporate bonds generally performed well.
Economic Recovery Slow But on Track
Looking ahead, the pace of economic recovery has clearly slowed, causing Federal Reserve (Fed) Chairman Ben Bernanke to say that the Fed stands ready to use all of the tools at its disposal to reinvigorate the U.S. economy. In our view, while the country faces sobering challenges related to the unemployment rate, high levels of government debt, and the stumbling housing market, we also see encouraging signs of economic recovery. Overall, companies have strong balance sheets and cash positions, have reported stronger-than-expected corporate earnings, and are investing in their businesses. Consumers are generally “deleveraging” by saving more and paying down their debt. Financial reform is under way in the U.S. that may help reassure investors and stabilize the markets. Globally, central banks around the world are continuing to pursue extremely accommodative monetary policies to encourage economic recovery.
In this transitional environment, we believe that both the equity and fixed-income markets are likely to continue to be somewhat volatile. In our view, investment strategies that include sustainability criteria may be better positioned to weather these uncertainties and provide long-term value.
Markets Challenged, But Gain Ground
Despite the volatility over the course of the 12-month reporting period, domestic and international stocks had moved solidly ahead by the end of the period. U.S. stock indexes reported 12-month gains across all styles, strategies, and capitalization ranges. The large-cap Russell 1000 Index and the Standard & Poor’s 500 Index returned 10.75% and 10.16%, respectively. Mid-cap stocks were the top-performing category, with the Russell Midcap Index up 17.54%, while the small-cap Russell 2000 Index rose 13.35%. In terms of style, growth stocks moderately outpaced value stocks. On the international front, the MSCI EAFE Investable Market Index (IMI), a benchmark for international stocks, edged up 4.23%, and the MSCI Emerging Markets IMI was up 21.97%.
In the fixed-income markets, the Barclays Capital U.S. Credit Index, a market barometer for investment-grade bonds, was up 11.67%. In line with the Fed’s federal funds rate target of 0% to 0.25%, money market returns remained very low.
The Gulf of Mexico Oil Spill and the Extractives Industry
In the wake of the April 20 oil spill in the Gulf of Mexico, Americans have continued to grapple with the devastation caused by the spill and its long-term environmental, societal, and economic implications. Calvert shares the concern and the frustration felt by the millions of people affected by this tragedy.
Following the spill, Calvert met with BP officials, urging BP not only to clean up the current spill, but also to implement stronger safety and process management standards for its contractors. We are also evaluating how our advocacy objectives with deepwater oil-drilling companies may help prevent such disasters in the future.
In terms of extraction methodologies, Calvert has long recognized that as readily accessible supplies of oil and gas dry up, companies may be forced to seek mineral resources in countries with poor governance, weak rule of law, and high levels of corruption. Accordingly, over the past two years, we have been a leading advocate for transparency requirements for extractive industries. In July, the U.S. Congress passed legislation requiring companies to disclose payments that they make to the U.S. or foreign governments for the purpose of commercial development of oil, natural gas, or minerals. We believe this legislation is a milestone toward helping advance environmental sustainability in this industry.
In our view, the oil spill also underlines the urgency for expanded investment—with greater federal incentives—in alternative energy sources.
Financial Reform Under Way
Looking ahead, long-awaited financial reform is under way with Congressional passage of the largest financial reform bill since the Great Depression. The Dodd-Frank Wall Street Reform and Consumer Protection Act (Dodd-Frank Act) is designed to address inadequate regulation of Wall Street firms and the type of unrestrained environment that contributed to the credit crisis of 2008 and the ensuing global market meltdown. The Dodd-Frank Act seeks to establish strong consumer protections, shield taxpayers from future corporate bailouts, shine a light on the “shadow markets” and derivatives trading, and expand the role of shareholders in corporate governance. While these goals are laudable, the impact of the Dodd-Frank Act on the financial industry—and ultimately its ability to prevent another financial crisis—must stand the test of time.
As the Obama administration and Congress work to implement key financial reforms, we believe that over time these efforts may work to redress some systemic imbalances in the financial system and provide additional stability to the economy and markets.
Review Your Portfolio Allocations
In our view, the financial markets are likely to be in transition for some time as the government tackles financial reform, the global economy continues to recover, and political elections in the U.S. impact a variety of government policies. Now may be an opportune time to review your overall investment strategy and portfolio allocations with your financial advisor. Check to ensure that your target mix of U.S. and international stocks, bonds, and cash is well-diversified and appropriate given your investment goals, stage of life, and attitude toward risk.
For up-to-date economic and market commentary from Calvert professionals, along with information on current Calvert sustainability initiatives, please visit our website,
www.calvert.com.
As always, we appreciate your investing with Calvert.
Sincerely,
Barbara J. Krumsiek
President and CEO
Calvert Group, Ltd.
October 2010
SRi
Update
from the Calvert Sustainability Research Department
As the fallout from the financial crisis continues to prove, responsible management of environmental, social, and governance (ESG) factors isn’t just “nice to do”—it’s essential to keeping our companies and our economy healthy and strong. Therefore, Calvert continues to work hard to ensure that you have a say in charting new paths to a more prosperous future.
Shareholder Advocacy
For the 2010 proxy season, Calvert filed a record 45 resolutions—including 30 as the lead filer. Issues covered by the resolutions focused on climate change, board and employee diversity, executive compensation, sustainability reporting, and political contributions. Thus far, we have negotiated 31 successful withdrawals after the companies have agreed to address our objectives.
The resolutions featured two new issues this year—climate change adaptation and board chair independence. Our resolutions on the first topic asked Kroger and Dover Corporation to report on how each plans to assess and manage the business impacts of climate change. Dover management agreed, so the resolution was successfully withdrawn. At Kroger, the resolution received strong support with 40% of shareholders voting in favor of it.
The second new issue recommended that Chesapeake Energy and Eaton Corporation separate the Board of Directors Chair and CEO positions to strengthen the Board’s oversight of company management and accountability to shareholders (which is emerging as a corporate governance best practice). Both resolutions were successfully withdrawn after management agreed to appoint a Lead Independent Director.
Community Investments
Many of our Funds participate in Calvert’s High Social Impact Investing program, which is administered through the Calvert Social Investment Foundation. This community investment program may allocate a small percentage of Fund assets at below-market interest rates to investments that provide economic opportunity for struggling populations.1
The Foundation recently launched its Green Strategies to Fight Poverty™ investment initiative, which allows investors to target their Community Investment Note investments to organizations and projects that both fight poverty and protect the environment.
Special Equities
A modest but important portion of certain funds is allocated to small private companies that are developing products or services that address important sustainability or environmental issues. CSIF Equity Portfolio has invested in Marrone Bio Innovations, which uses bio-based systems to control pests and weeds and recently received emergency-use approval from the EPA to sell its new invasive mussel control system in certain areas of the western U.S. The company also submitted a second organic herbicide product, for use on both organic and industrial farms, for approval to the EPA.
Calvert Large Cap Growth Fund invested in the Berkeley Renewable Energy Asia Fund, which brings power to areas of the world without access to a central power grid. Led by a management team with a long history in the industry, Berkeley mitigates construction risk by helping communities build the plants and then selling them to a service provider once they’re up and running.2
1 As of September 30, 2010, Calvert Social Investment Foundation Community Investment Notes represented the following percentages of Fund net assets: Calvert Social Investment Fund (CSIF) Balanced Portfolio 0.94%, CSIF Bond Portfolio 0.34%, CSIF Equity Portfolio 0.52%, Calvert Capital Accumulation Fund 1.29%, Calvert World Values International Equity Fund 1.19%, Calvert New Vision Small Cap Fund 0.78%, and Calvert Large Cap Growth Fund 0.56%. The Calvert Social Investment Foundation is a 501(c)(3) nonprofit organization. The Foundation’s Community Investment Note Program is not a mutual fund and should not be confused with any Calvert Group-sponsored investment product.
2 As of September 30, 2010, Marrone Bio Innovations represented 0.05% of CSIF Equity Portfolio; Berkeley Renewable Energy Asia Fund represented 0.002% of Calvert Large Cap Growth Fund. All holdings are subject to change without notice.
As of September 30, 2010, the following companies represented the following percentages of Fund net assets:
Kroger represented 0% of all Calvert SRI funds. Dover Corporation represented 0.15% of Calvert Social Index
Fund. Chesapeake Energy represented 0.22% of CSIF Balanced Portfolio, 0.79% of CSIF Bond Portfolio,
and 0.22% of Calvert Social Index Fund. Eaton Corporation represented 0.52% of CSIF Enhanced Equity
Portfolio and 0.20% of Calvert Social Index Fund. All holdings are subject to change without notice.
calvert Conservative
allocation fund
September 30, 2010
Asset Allocation | % of total investments |
Domestic Equity Mutual Funds | 23% |
International and Global Equity Mutual Funds | 8% |
Fixed Income Mutual Funds | 69% |
Total | 100% |
Investment |
| 6 Months | 12 Months |
Performance |
| Ended | Ended |
(TOTAL RETURN AT NAV*) |
| 9/30/10 | 9/30/10 |
Class A |
| 3.33% | 8.69% |
Class C |
| 2.68% | 7.39% |
Barclays Capital U.S. Credit Index** |
| 8.07% | 11.67% |
Conservative Allocation Composite Index** |
| 4.69% | 9.76% |
Lipper Mixed-Asset Target Alloc. Cons. Funds Avg |
| 3.48% | 9.35% |
Portfolio Management Discussion
Natalie A. Trunow,
Senior Vice President,
Chief Investment Officer -- Equities, Calvert Asset Management Company
Performance
The Calvert Asset Allocation Funds underperformed for the 12-month period ended September 30, 2010. Here are the results relative to their benchmarks:
Calvert Conservative Allocation Fund Class A shares (at NAV) returned 8.69% during the period, underperforming its benchmark, the Barclays Capital U.S. Credit Index, which returned 11.67% for the period. The Fund invests in both stocks and bonds through investments in a variety of Calvert mutual funds. A blended return from a mix of market indexes,1 which more closely reflects how Calvert manages the Fund, returned 9.76%.
Calvert Moderate Allocation Fund Class A shares (at NAV) returned 7.76% during the period, underperforming its benchmark, the Russell 3000 Index, which returned 10.96% for the period. The Fund invests in both stocks and bonds through investments in a variety of Calvert mutual funds. A blended return from a mix of market indexes,2 which more closely reflects how Calvert manages the Fund, returned 9.42%.
* Investment performance/return at NAV does not reflect the deduction of the Fund’s maximum 4.75% front-end sales charge or any deferred sales charge.
** In December 2009 the Fund changed its broad-based benchmark to the Barclays Capital U.S. Credit Index from the Conservative Allocation Composite Index, in order to adopt an index that is not blended. The Fund also continues to show the Conservative Allocation Composite Index because it is more consistent with the Fund's portfolio construction process and represents a more accurate reflection of the Fund's anticipated risk and return patterns.
calvert Moderate
allocation Fund
September 30, 2010
Asset Allocation | % of total investments |
Domestic Equity Mutual Funds | 47% |
International and Global Equity Mutual Funds | 19% |
Fixed Income Mutual Funds | 34% |
Total | 100% |
Investment | 6 Months | 12 Months |
Performance | Ended | Ended |
(TOTAL RETURN AT NAV*) | 9/30/10 | 9/30/10 |
Class A | 1.00% | 7.76% |
Class C | 0.62% | 6.95% |
Class I | 1.25% | 8.29% |
Russell 3000 Index** | -1.10% | 10.96% |
Moderate Allocation Composite Index** | 2.08% | 9.42% |
Lipper Mixed-Asset Target Alloc. Growth Funds Avg | 1.20% | 9.34% |
calvert Aggressive
allocation Fund
September 30, 2010
Asset Allocation | % of total investments |
Domestic Equity Mutual Funds | 65% |
International and Global Equity Mutual Funds | 26% |
Fixed Income Mutual Funds | 9% |
Total | 100% |
Investment | 6 Months | 12 Months |
Performance | Ended | Ended |
(TOTAL RETURN AT NAV*) | 9/30/10 | 9/30/10 |
Class A | -0.36% | 7.61% |
Class C | -1.05% | 6.14% |
Class I | -0.21% | 7.83% |
Russell 3000 Index*** | -1.10% | 10.96% |
Aggressive Allocation Composite Index*** | 0.35% | 9.28% |
Lipper Multi-Cap Core Funds Avg | -1.03% | 9.95% |
* Investment performance/return at NAV does not reflect the deduction of the Fund’s maximum 4.75% front-end sales charge or any deferred sales charge.
** In December 2009 the Fund changed its broad-based benchmark to the Russell 3000 Index from the Moderate Allocation Composite Index, in order to adopt an index that is not blended. The Fund also continues to show the Moderate Allocation Composite Index because it is more consistent with the Fund's portfolio construction process and represents a more accurate reflection of the Fund's anticipated risk and return patterns.
*** In December 2009 the Fund charged its broad-based benchmark to the Russell 3000 Index from the Aggressive Allocation Composite Index, in order to adopt an index that is not blended. The Fund also continues to show the Aggressive Allocation Composite Index because it is more consistent with the Fund's portfolio construction process and represents a more accurate reflection of the Fund's anticipated risk and return patterns.
Calvert Aggressive Allocation Fund Class A shares (at NAV) returned 7.61% during the period, underperforming its benchmark, the Russell 3000 Index, which returned 10.96% for the period. The Fund invests in both stocks and bonds through investments in a variety of Calvert mutual funds. A blended return from a mix of market indexes,3 which more closely reflects how Calvert manages the Fund, returned 9.28%.
Investment Climate
After a year of uncertainty about global economic recovery, markets worldwide ended the reporting period in positive territory. In the U.S., the Standard & Poor's 500 and Russell 1000 Indices returned 10.16% and 10.75%, respectively. Abroad, the Morgan Stanley Capital International Europe, Australasia, Far East Index (MSCI EAFE) rose 3.71% and the MSCI Emerging Markets Index gained 4.23%.
In general, growth stocks outperformed value stocks, as the Russell 1000 Growth Index outperformed the Russell 1000 Value Index with a return of 12.65% versus 8.90%. Mid-cap stocks were the best-performing domestic asset class for the year with a return of 17.54%, besting both large-cap stocks and the small-cap stocks of the Russell 2000 Index, which returned 13.35%.
Overall, markets have largely built on the rally that started in early March 2009 as investors fluctuated between optimism and uncertainty about the sustainability of an economic recovery, including fears of a double-dip recession. However, we saw some market disruption, particularly sharp sell-offs in the second quarter of 2010, as the uncertainty escalated, causing the re-pricing of risk in both equity and fixed-income assets.
Dramatic downgrades in the sovereign creditworthiness of Greece, Spain, and Dubai rattled global financial markets in the spring of 2010--leading many to question the overall strength of the euro-zone's economic recovery. In response, several European Union countries implemented austerity programs to slash their budget deficits and slow economic growth, and a new set of rules to toughen European banks’ capital and liquidity requirements was introduced.
China had some success with its attempt to engineer a soft landing for its overheated economy, which should improve global growth prospects--especially since it is now the world’s second-largest economy, eclipsing Japan in the second quarter of 2010, according to gross domestic product (GDP) data.
In the U.S., economic news throughout the period suggested a slow and sometimes uneven recovery was underway. GDP growth in the fourth quarter of 2009 turned positive for the first time since the second quarter of 2008, largely due to government stimulus efforts designed to increase consumer spending and inventory rebuilding. However, economic recovery in the second half of 2010 has been slower than most original forecasts, with early estimates of 2.4% for the second quarter of 2010 lowered to 1.7%.
Several conflicting trends have contributed to this slowdown. On the positive side, corporations have reported higher-than-expected earnings this year. Corporate sector strength also continues to boost company balance sheets and cash flow, fueling strong merger and acquisition (M&A) activity. Unfortunately, while M&A activity benefits many of the businesses involved and their stock prices, the net outcome is usually a reduction in the workforce, which exacerbates the already high unemployment rate.
The housing market improved for a time as home prices stabilized and purchases increased, but fell again after the first-time homebuyer credit expired. Depressed home prices and shrinking home equity, not to mention the uncertainties in the foreclosure process, weighed on consumers' shaky confidence. Since consumer spending makes up 75% of the economy, recovery will remain slow until consumers become more comfortable. In the meantime, consumers continued to take on less debt, spend less, and save more.
Budget deficit levels are at unprecedented highs and remain a risk area. Despite the positive inflation numbers, the Federal Reserve (Fed) has maintained its commitment to keep interest rates low and away from deflationary territory.
Portfolio Strategy
Calvert Conservative Allocation Fund underperformed the Barclays Capital U.S. Credit Index due to the poor relative returns of CSIF Bond Portfolio and the Fund’s normal 30% allocation to U.S. and international stocks. It also underperformed relative to a blend of indices that reflects the long-term allocation strategy of the Fund. Again, this was primarily due to the poor performance of CSIF Bond Portfolio relative to its specific benchmark, the Barclays Capital U.S. Credit Index.
Despite its exposure to the better-performing bond market, Calvert Moderate Allocation Fund underperformed its benchmark, the Russell 3000 Index, as well. The poor relative performance of international equities in general and CSIF Bond Portfolio specifically accounted for the Fund’s underperformance relative to its official benchmark.
calvert
conservative
allocation fund
September 30, 2010
Average Annual Total Returns
Class A Shares | (with max. load) |
One year | 3.55% |
Five year | 2.62% |
Since inception (4/29/2005) | 3.03% |
|
|
Class C Shares | (with max. load) |
One year | 6.32% |
Five year | 2.25% |
Since inception (4/29/2005) | 2.61% |
Growth of $10,000
The graph below shows the value of a hypothetical $10,000 investment in the fund over the past 10 fiscal year periods or since inception (for funds without 10-year records). The results shown are for Classes A and C shares and reflect the deduction of the maximum front-end Class A sales charge of 4.75%, or deferred sales charge, as applicable and assume the reinvestment of dividends. The result is compared with benchmarks that include a broad based market index and a Lipper peer group average. Market indexes are unmanaged and their results do not reflect the effect of expenses or sales charges. The Lipper average reflects the deduction of the category’s average front-end sales charge. The value of an investment in a different share class would be different.
* In December 2009 the Fund changed its broad-based benchmark to the Barclays Capital U.S. Credit Index from the Conservative Allocation Composite Index, in order to adopt an index that is not blended. The Fund also continues to show the Conservative Allocation Composite Index because it is more consistent with the Fund's portfolio construction process and represents a more accurate reflection of the Fund's anticipated risk and return patterns.
All performance data shown, including the graph above and the adjacent table, represents past performance, does not guarantee future results, assumes reinvestment of dividends and distributions and does not reflect the deduction of taxes that a shareholder would pay on the Fund’s/Portfolio’s distributions or the redemption of the Fund/Portfolio shares. The investment return and principal value of an investment will fluctuate so that an investor’s shares, when redeemed, may be worth more or less than their original cost. Current performance may be lower or higher than the performance data quoted; for current performance data visit www.calvert.com. The gross expense ratio from the current prospectus for Class A shares is 1.65%. This number may differ from the expense ratio shown elsewhere in this report because it is based on a different time period and, if applicable, d oes not include fee or expense waivers. Performance data quoted already reflects the deduction of the Fund’s/Portfolio’s operating expenses.
Calvert moderate
allocation fund
September 30, 2010
Average Annual Total Returns |
|
Class A Shares | (with max. load) |
One year | 2.61% |
Five year | 0.41% |
Since inception (4/29/2005) | 1.45% |
|
|
Class C Shares | (with max. load) |
One year | 5.88% |
Five year | 0.58% |
Since inception (4/29/2005) | 1.50% |
|
|
Class I Shares* |
|
One year | 8.29% |
Five year | 1.68% |
Since inception (4/29/2005) | 2.63% |
* The Calvert Moderate Allocation Fund first offered Class I shares beginning on January 31, 2008. Performance results for Class I prior to January 31, 2008 reflect the performance of Class A shares at net asset value (NAV). Actual Class I share performance would have been higher due to class specific expenses.
The Fund also underperformed when compared to a blend of indices that reflects the long-term allocation strategy of the Fund. Again, this was due to the poor performance of CSIF Bond Portfolio relative to its specific benchmark, the Barclays Capital U.S. Credit Index, and the poor performance of two of the Fund’s international equity holdings, Calvert World Values International Equity Fund and Calvert Global Alternative Energy Fund, both of which fell short of the MSCI EAFE Investable Market Index's return for the period.
Calvert Aggressive Allocation Fund also underperformed its benchmark, the Russell 3000 Index, despite a small exposure to the better-performing bond market. The poor relative performance of international equities in general accounted for this relative underperformance.
The Fund also underperformed when compared to a blend of indices that reflects the long-term allocation strategy of the Fund. This was largely due to the poor performance of two of the Fund’s international equity holdings, Calvert World Values International Equity Fund and Calvert Global Alternative Energy Fund, both of which underperformed the MSCI EAFE Investable Market Index.
Outlook
We believe that, given relative valuations and capital flows, the sharp outperformance of bonds versus equities over the past several months is bound to reverse, with equities likely outperforming bonds over the next six to 18 months. In September, equity markets looked more attractive relative to bonds than they have since 1993 (except for the market bottom in March of 2009), with 10-year Treasuries yielding 2.51% versus the Dow Jones Industrial Average’s dividend yield of 2.6%, and an attractive forward price/earnings multiple of 12.2.
Growth of $10,000
The graph below shows the value of a hypothetical $10,000 investment in the fund over the past 10 fiscal year periods or since inception (for funds without 10-year records). The results shown are for Classes A and C shares and reflect the deduction of the maximum front-end Class A sales charge of 4.75%, or deferred sales charge, as applicable and assume the reinvestment of dividends. The result is compared with benchmarks that include a broad based market index and a Lipper peer group average. Market indexes are unmanaged and their results do not reflect the effect of expenses or sales charges. The Lipper average reflects the deduction of the category’s average front-end sales charge. The value of an investment in a different share class would be different.
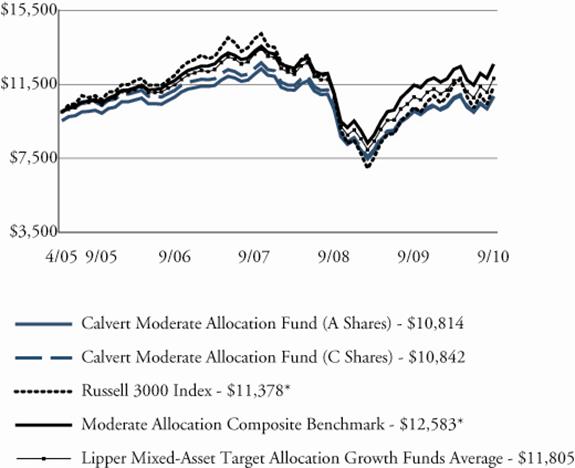
* In December 2009 the Fund changed its broad-based benchmark to the Barclays Capital U.S. Credit Index from the Conservative Allocation Composite Index, in order to adopt an index that is not blended. The Fund also continues to show the Conservative Allocation Composite Index because it is more consistent with the Fund's portfolio construction process and represents a more accurate reflection of the Fund's anticipated risk and return patterns.
All performance data shown, including the graph above and the adjacent table, represents past performance, does not guarantee future results, assumes reinvestment of dividends and distributions and does not reflect the deduction of taxes that a shareholder would pay on the Fund’s/Portfolio’s distributions or the redemption of the Fund/Portfolio shares. The investment return and principal value of an investment will fluctuate so that an investor’s shares, when redeemed, may be worth more or less than their original cost. Current performance may be lower or higher than the performance data quoted; for current performance data visit www.calvert.com. The gross expense ratio from the current prospectus for Class A shares is 1.58%. This number may differ from the expense ratio shown elsewhere in this report because it is based on a different time peri od and, if applicable, does not include fee or expense waivers. Performance data quoted already reflects the deduction of the Fund’s/Portfolio’s operating expenses.
calvert Aggressive
allocation fund
Statistics
September 30, 2010
Average Annual Total Returns
Class A Shares | (with max. load) |
One year | 2.50% |
Five year | -1.02% |
Since inception (6/30/2005) | -0.21% |
|
|
Class C Shares | (with max. load) |
One year | 5.14% |
Five year | -1.37% |
Since inception (6/30/2005) | -0.58% |
|
|
Class I Shares* |
|
One year | 7.83% |
Five year | 0.06% |
Since inception (6/30/2005) | 0.83% |
* The Calvert Aggressive Allocation Fund first offered Class I shares beginning on January 31, 2008. Performance results for Class I prior to January 31, 2008 reflect the performance of Class A shares at net asset value (NAV). Actual Class I share performance would have been higher due to class specific expenses.
The economy has slowed, but sustained economic recovery continues. As we have said in the past, we don’t believe negative GDP growth is likely, which would constitute a double-dip recession. While we anticipate a somewhat more challenged earnings environment later this year, we believe that corporate sector strength is likely to persist and continue to support the overall economic recovery. Overall, our outlook continues to call for a slow, gradual pace to the economic recovery and a generally positive environment for stock picking, barring any major geopolitical calamities.
October 2010
1. For Calvert Conservative Allocation Composite Index: 60% Barclays Capital U.S. Credit Index, 22% Russell 3000 Index, 8% MSCI EAFE IMI, 10% Barclays Capital 3-month T-Bill Bellwether Index.
2. For Calvert Moderate Allocation Composite Index: 30% Barclays Capital U.S. Credit Index, 47% Russell 3000 Index, 18% MSCI EAFE IMI, 5% Barclays Capital 3-month T-Bill Bellwether Index.
3. For Calvert Aggressive Allocation Composite Index: 10% Barclays Capital U.S. Credit Index, 64% Russell 3000 Index, 26% MSCI EAFE IMI.
Growth of $10,000
The graph below shows the value of a hypothetical $10,000 investment in the fund over the past 10 fiscal year periods or since inception (for funds without 10-year records). The results shown are for Classes A and C shares and reflect the deduction of the maximum front-end Class A sales charge of 4.75%, or deferred sales charge, as applicable and assume the reinvestment of dividends. The result is compared with benchmarks that include a broad based market index and a Lipper peer group average. Market indexes are unmanaged and their results do not reflect the effect of expenses or sales charges. The Lipper average reflects the deduction of the category’s average front-end sales charge. The value of an investment in a different share class would be different.

* In December 2009 the Fund charged its broad-based benchmark to the Russell 3000 Index from the Aggressive Allocation Composite Index, in order to adopt an index that is not blended. The Fund also continues to show the Aggressive Allocation Composite Index because it is more consistent with the Fund's portfolio construction process and represents a more accurate reflection of the Fund's anticipated risk and return patterns.
All performance data shown, including the graph above and the adjacent table, represents past performance, does not guarantee future results, assumes reinvestment of dividends and distributions and does not reflect the deduction of taxes that a shareholder would pay on the Fund’s/Portfolio’s distributions or the redemption of the Fund/Portfolio shares. The investment return and principal value of an investment will fluctuate so that an investor’s shares, when redeemed, may be worth more or less than their original cost. Current performance may be lower or higher than the performance data quoted; for current performance data visit www.calvert.com. The gross expense ratio from the current prospectus for Class A shares is 1.91%. This number may differ from the expense ratio shown elsewhere in this report because it is based on a different time period and, if applicable, does not include fee or expense waivers. Performance data quoted already reflects the deduction of the Fund’s/Portfolio’s operating expenses.
Shareholder Expense Example
As a shareholder of the Fund, you incur two types of costs: (1) transaction costs, including sales charges and redemption fees; and (2) ongoing costs, including management fees; distribution (12b-1) fees; and other Fund expenses. This Example is intended to help you understand your ongoing costs (in dollars) of investing in the Fund and to compare these costs with the ongoing costs of investing in other mutual funds.
This Example is based on an investment of $1,000 invested at the beginning of the period and held for the entire period (April 1, 2010 to September 30, 2010).
Actual Expenses
The first line of the table below provides information about actual account values and actual expenses. You may use the information in this line, together with the amount you invested, to estimate the expenses that you paid over the period. Simply divide your account value by $1,000 (for example, an $8,600 account value divided by $1,000 = 8.6), then multiply the result by the number in the first line under the heading entitled “Expenses Paid During Period” to estimate the expenses you paid on your account during this period. In addition, each Fund, as a shareholder in underlying Calvert funds, will indirectly bear its pro rata share of the fees and expenses incurred by the underlying Calvert funds. These fees and expenses are not included in each Fund’s annualized expense ratio used to calculate the expense estimates in the table below. If they were, the estimate of expense you paid during the period would be higher, and your ending account value lower.
Hypothetical Example for Comparison Purposes
The second line of the table below provides information about hypothetical account values and hypothetical expenses based on the Fund’s actual expense ratio and an assumed rate of return of 5% per year before expenses, which is not the Fund’s actual return. The hypothetical account values and expenses may not be used to estimate the actual ending account balance or expenses you paid for the period. You may use this information to compare the ongoing costs of investing in the Fund and other funds. To do so, compare the 5% hypothetical example with the 5% hypothetical examples that appear in the shareholder reports of the other funds. In addition, each Fund, as a shareholder in underlying Calvert funds, will indirectly bear its pro rata share of the fees and expenses incurred by the underlying Calvert funds. These fees and expenses are not included in each Fund’s annualized expense ratio used to calculate the expense estimates in the table below. If they were, the estimate of expense you paid during the period would be higher, and your ending account value lower.
Please note that the expenses shown in the table are meant to highlight your ongoing costs only and do not reflect any transactional costs, such as sales charges (loads), or redemption fees. Therefore, the second line of the table is useful in comparing ongoing costs only, and will not help you determine the relative total costs of owning different funds. In addition, if these transactional costs were included, your costs would have been higher.
| Beginning | Ending Account | Expenses Paid |
| Account Value | Value | During Period* |
Conservative | 4/1/10 | 9/30/10 | 4/1/10 - 9/30/10 |
|
|
|
|
Class A |
|
|
|
Actual | $1,000.00 | $1,033.30 | $2.24 |
Hypothetical | $1,000.00 | $1,022.86 | $2.23 |
(5% return per |
|
|
|
year before expenses) |
|
|
|
|
|
|
|
Class C |
|
|
|
Actual | $1,000.00 | $1,026.80 | $8.31 |
Hypothetical | $1,000.00 | $1,016.87 | $8.27 |
(5% return per |
|
|
|
year before expenses) |
|
|
|
*Expenses for Conservative are equal to the annualized expense ratios of .44% and 1.64% for Class A and Class C respectively, multiplied by the average account value over the period, multiplied by 183/365 (to reflect the one-half year period). The fees and expenses of the underlying Calvert funds in which the Fund invests are not included in the annualized expense ratios.
| Beginning | Ending Account | Expenses Paid |
| Account Value | Value | During Period* |
Moderate | 4/1/10 | 9/30/10 | 4/1/10 - 9/30/10 |
|
|
|
|
Class A |
|
|
|
Actual | $1,000.00 | $1,010.00 | $3.72 |
Hypothetical | $1,000.00 | $1,021.36 | $3.75 |
(5% return per |
|
|
|
year before expenses) |
|
|
|
|
|
|
|
Class C |
|
|
|
Actual | $1,000.00 | $1,006.20 | $7.52 |
Hypothetical | $1,000.00 | $1,017.57 | $7.56 |
(5% return per |
|
|
|
year before expenses) |
|
|
|
|
|
|
|
| Beginning | Ending Account | Expenses Paid |
| Account Value | Value | During Period* |
Moderate | 4/1/10 | 9/30/10 | 4/1/10 - 9/30/10 |
|
|
|
|
Class I |
|
|
|
Actual | $1,000.00 | $1012.50 | $1.16 |
Hypothetical | $1,000.00 | $1,023.92 | $1.17 |
(5% return per |
|
|
|
year before expenses) |
|
|
|
*Expenses for Moderate are equal to the annualized expense ratios of .74%, 1.49% and .23% for Class A, Class C and Class I respectively, multiplied by the average account value over the period, multiplied by 183/365 (to reflect the one-half year period). The fees and expenses of the underlying Calvert funds in which the Fund invests are not included in the annualized expense ratios.
| Beginning | Ending Account | Expenses Paid |
| Account Value | Value | During Period* |
Aggressive | 4/1/10 | 9/30/10 | 4/1/10 - 9/30/10 |
|
|
|
|
Class A |
|
|
|
Actual | $1,000.00 | $996.40 | $2.15 |
Hypothetical | $1,000.00 | $1,022.91 | $2.18 |
(5% return per |
|
|
|
year before expenses) |
|
|
|
|
|
|
|
Class C |
|
|
|
Actual | $1,000.00 | $989.50 | $8.72 |
Hypothetical | $1,000.00 | $1,016.31 | $8.83 |
(5% return per |
|
|
|
year before expenses) |
|
|
|
|
|
|
|
Class I |
|
|
|
Actual | $1,000.00 | $997.90 | $1.15 |
Hypothetical | $1,000.00 | $1,023.92 | $1.17 |
(5% return per |
|
|
|
year before expenses) |
|
|
|
*Expenses for Aggressive are equal to the annualized expense ratios of .43%, 1.75% and .23% for Class A, Class C and Class I respectively, multiplied by the average account value over the period, multiplied by 183/365 (to reflect the one-half year period). The fees and expenses of the underlying Calvert funds in which the Fund invests are not included in the annualized expense ratios.
report of independent registered public accounting firm
The Board of Trustees of Calvert Social Investment Fund and Shareholders of the Calvert Allocation Funds:
We have audited the accompanying statements of net assets of the Calvert Conservative Allocation Fund, Calvert Moderate Allocation Fund, and Calvert Aggressive Allocation Fund (collectively the Funds), each a series of the Calvert Social Investment Fund, as of September 30, 2010, and the related statements of operations for the year then ended, the statements of changes in net assets for each of the years in the two-year period then ended, and the financial highlights for each of the years in the five-year period then ended. These financial statements and financial highlights are the responsibility of the Funds’ management. Our responsibility is to express an opinion on these financial statements and financial highlights based on our audits.
We conducted our audits in accordance with the standards of the Public Company Accounting Oversight Board (United States). Those standards require that we plan and perform the audit to obtain reasonable assurance about whether the financial statements and financial highlights are free of material misstatement. An audit includes examining, on a test basis, evidence supporting the amounts and disclosures in the financial statements. Our procedures included confirmation of securities owned as of September 30, 2010, by correspondence with custodians and brokers or other appropriate auditing procedures. An audit also includes assessing the accounting principles used and significant estimates made by management, as well as evaluating the overall financial statement presentation. We believe that our audits provide a reasonable basis for our opinion.
In our opinion, the financial statements and financial highlights referred to above present fairly, in all material respects, the financial position of the Calvert Conservative Allocation Fund, Calvert Moderate Allocation Fund, and Calvert Aggressive Allocation Fund as of September 30, 2010, the results of their operations for the year then ended, the changes in their net assets for each of the years in the two-year period then ended, and the financial highlights for each of the years in the five-year period then ended, in conformity with U.S. generally accepted accounting principles.
/s/KPMG LLP
Philadelphia, Pennsylvania
November 24, 2010
CONSERVATIVE ALLOCATION FUND
STATEMENT OF NET ASSETS
September 30, 2010
Mutual Funds - 100.1% |
| Shares | Value |
Calvert Impact Fund, Inc.: |
|
|
|
Calvert Large Cap Growth Fund, Class I |
| 47,975 | $1,294,849 |
Calvert Mid Cap Value Fund, Class I |
| 51,328 | 845,891 |
Calvert Small Cap Value Fund, Class I* |
| 25,518 | 411,857 |
Calvert Social Index Series, Inc.: |
|
|
|
Calvert Social Index Fund, Class I |
| 160,620 | 1,710,598 |
Calvert Social Investment Fund: |
|
|
|
Bond Portfolio, Class I** |
| 1,760,824 | 28,208,398 |
Enhanced Equity Portfolio, Class I |
| 221,569 | 3,387,795 |
Equity Portfolio, Class I |
| 37,467 | 1,298,616 |
Calvert World Values Fund, Inc.: |
|
|
|
Calvert Capital Accumulation Fund, Class I* |
| 16,922 | 449,956 |
International Equity Fund, Class I |
| 228,163 | 3,379,087 |
|
|
|
|
Total Mutual Funds (Cost $38,740,586) |
|
| 40,987,047 |
|
|
|
|
|
|
|
|
|
|
|
|
TOTAL INVESTMENTS (Cost $38,740,586) - 100.1% |
|
| 40,987,047 |
Other assets and liabilities, net - (0.1%) |
|
| (30,028) |
Net Assets - 100% |
|
| $40,957,019 |
|
|
|
|
|
|
|
|
|
|
|
|
Net Assets Consist of: |
|
|
|
Paid-in capital applicable to the following shares of beneficial interest, |
|
|
|
unlimited number of no par value shares authorized: |
|
|
|
Class A: 2,146,278 shares outstanding |
|
| $32,128,719 |
Class C: 555,933 shares outstanding |
|
| 8,244,330 |
Undistributed net investment income |
|
| 10,496 |
Accumulated net realized gain (loss) on investments |
|
| (1,672,987) |
Net unrealized appreciation (depreciation) on investments |
|
| 2,246,461 |
|
|
|
|
Net Assets |
|
| $40,957,019 |
|
|
|
|
|
|
|
|
Net Asset Value Per Share |
|
|
|
Class A (based on net assets of $32,564,508) |
|
| $15.17 |
Class C (based on net assets of $8,392,511) |
|
| $15.10 |
* Non-income producing security.
**The Fund’s investment in the Calvert Social Investment Fund Bond Portfolio, Class I represents 69% of the Fund’s total investments. The Calvert Conservative Allocation Fund seeks current income and capital appreciation, consistent with the preservation of capital. For further financial information, available upon request at no charge, on the Calvert Social Investment Fund Bond Portfolio please go to the U.S. Securities and Exchange Commission’s website at http://www.sec.gov or call 1-800-368-2745.
See notes to financial statements.
MODERATE ALLOCATION FUND
STATEMENT OF NET ASSETS
september 30, 2010
Mutual Funds - 100.1% |
| Shares | Value |
Calvert Impact Fund, Inc.: |
|
|
|
Calvert Global Alternative Energy Fund, Class I* |
| 269,412 | $2,246,894 |
Calvert Large Cap Growth Fund, Class I |
| 396,646 | 10,705,466 |
Calvert Mid Cap Value Fund, Class I |
| 220,378 | 3,631,829 |
Calvert Small Cap Value Fund, Class I* |
| 218,457 | 3,525,891 |
Calvert Social Index Series, Inc.: |
|
|
|
Calvert Social Index Fund, Class I |
| 437,504 | 4,659,419 |
Calvert Social Investment Fund: |
|
|
|
Bond Portfolio, Class I |
| 2,431,578 | 38,953,884 |
Enhanced Equity Portfolio, Class I |
| 1,085,635 | 16,599,366 |
Equity Portfolio, Class I |
| 343,941 | 11,920,984 |
Calvert World Values Fund, Inc.: |
|
|
|
Calvert Capital Accumulation Fund, Class I* |
| 48,572 | 1,291,531 |
Calvert International Opportunities Fund, Class I |
| 192,483 | 2,342,514 |
International Equity Fund, Class I |
| 1,103,071 | 16,336,488 |
The Calvert Fund: |
|
|
|
Calvert New Vision Small Cap Fund, Class I* |
| 244,424 | 3,485,488 |
|
|
|
|
Total Mutual Funds (Cost $120,510,570) |
|
| 115,699,754 |
|
|
|
|
|
|
|
|
TOTAL INVESTMENTS (Cost $120,510,570) - 100.1% |
|
| 115,699,754 |
Other assets and liabilities, net - (0.1%) |
|
| (112,107) |
Net Assets - 100% |
|
| $115,587,647 |
|
|
|
|
|
|
|
|
Net Assets Consist of: |
|
|
|
Paid-in capital applicable to the following shares of beneficial interest, |
|
|
|
unlimited number of no par value shares authorized: |
|
|
|
Class A: 6,247,250 shares outstanding |
|
| $101,460,271 |
Class C: 1,425,944 shares outstanding |
|
| 22,786,069 |
Class I: 120,034 shares outstanding |
|
| 1,787,314 |
Undistributed net investment income |
|
| 14,110 |
Accumulated net realized gain (loss) on investments |
|
| (5,649,301) |
Net unrealized appreciation (depreciation) on investments |
|
| (4,810,816) |
|
|
|
|
Net Assets |
|
| $115,587,647 |
|
|
|
|
|
|
|
|
Net Asset Value Per Share |
|
|
|
Class A (based on net assets of $92,913,249) |
|
| $14.87 |
Class C (based on net assets of $20,883,291) |
|
| $14.65 |
Class I (based on net assets of $1,791,107) |
|
| $14.92 |
* Non-income producing security.
See notes to financial statements.
Aggressive Allocation Fund
statement of net assets
september 30, 2010
Mutual Funds - 100.1% |
| Shares | Value |
Calvert Impact Fund, Inc.: |
|
|
|
Calvert Global Alternative Energy Fund, Class I* |
| 209,639 | $1,748,388 |
Calvert Large Cap Growth Fund, Class I |
| 248,764 | 6,714,133 |
Calvert Mid Cap Value Fund, Class I |
| 146,773 | 2,418,819 |
Calvert Small Cap Value Fund, Class I* |
| 229,201 | 3,699,304 |
Calvert Social Index Series, Inc.: |
|
|
|
Calvert Social Index Fund, Class I |
| 229,621 | 2,445,464 |
Calvert Social Investment Fund: |
|
|
|
Bond Portfolio, Class I |
| 356,920 | 5,717,866 |
Enhanced Equity Portfolio, Class I |
| 688,570 | 10,528,238 |
Equity Portfolio, Class I |
| 249,034 | 8,631,523 |
Calvert World Values Fund, Inc.: |
|
|
|
Calvert Capital Accumulation Fund, Class I* |
| 38,291 | 1,018,145 |
Calvert International Opportunities Fund, Class I |
| 151,034 | 1,838,086 |
International Equity Fund, Class I |
| 805,826 | 11,934,276 |
The Calvert Fund: |
|
|
|
Calvert New Vision Small Cap Fund, Class I* |
| 255,931 | 3,649,573 |
|
|
|
|
Total Mutual Funds (Cost $67,084,623) |
|
| 60,343,815 |
|
|
|
|
|
|
|
|
TOTAL INVESTMENTS (Cost $67,084,623) - 100.1% |
|
| 60,343,815 |
Other assets and liabilities, net - (0.1%) |
|
| (36,817) |
Net Assets - 100% |
|
| $60,306,998 |
|
|
|
|
Net Assets Consist of: |
|
|
|
Paid-in capital applicable to the following shares of beneficial interest, |
|
|
|
unlimited number of no par value shares authorized: |
|
|
|
Class A: 3,738,538 shares outstanding |
|
| $61,023,519 |
Class C: 619,970 shares outstanding |
|
| 9,412,530 |
Class I: 63.63 shares outstanding |
|
| 1,045 |
Accumulated net realized gain (loss) on investments |
|
| (3,389,288) |
Net unrealized appreciation (depreciation) on investments |
|
| (6,740,808) |
|
|
|
|
Net Assets |
|
| $60,306,998 |
|
|
|
|
Net Asset Value Per Share |
|
|
|
Class A (based on net assets of $52,131,876) |
|
| $13.94 |
Class C (based on net assets of $8,174,231) |
|
| $13.18 |
Class I (based on net assets of $891) |
|
| $14.00 |
*Non-income producing security.
See notes to financial statements.
Statements of Operations
year Ended september 30, 2010
|
| Conservative | Moderate | Aggressive |
|
| Allocation | Allocation | Allocation |
Net Investment Income |
| Fund | Fund | Fund |
Investment Income: |
|
|
|
|
Dividend income |
| $984,321 | $1,944,676 | $623,690 |
Total investment income |
| 984,321 | 1,944,676 | 623,690 |
Expenses: |
|
|
|
|
Transfer agency fees and expenses |
| 79,564 | 226,487 | 172,285 |
Administrative fees |
| 52,637 | 160,565 | 85,308 |
Distribution Plan expenses: |
|
|
|
|
Class A |
| 69,798 | 215,542 | 122,287 |
Class C |
| 71,723 | 192,811 | 79,565 |
Trustees' fees and expenses |
| 4,458 | 13,261 | 7,009 |
Registration fees |
| 24,288 | 37,606 | 35,524 |
Reports to shareholders |
| 11,320 | 43,651 | 32,495 |
Professional fees |
| 20,357 | 24,322 | 21,626 |
Accounting fees |
| 34,464 | 40,992 | 41,000 |
Miscellaneous |
| 2,115 | 5,496 | 3,803 |
Total expenses |
| 370,724 | 960,733 | 600,902 |
Reimbursement from Advisor: |
|
|
|
|
Class A |
| (127,523) | — | (237,953) |
Class C |
| — | — | — |
Class I |
| — | (12,265) | (11,501) |
Net expenses |
| 243,201 | 948,468 | 351,448 |
|
|
|
|
|
Net Investment Income |
| 741,120 | 996,208 | 272,242 |
|
|
|
|
|
Realized and Unrealized |
|
|
|
|
Gain (Loss) on Investments |
|
|
|
|
Net realized gain (loss) |
| (385,951) | (1,170,179) | (1,323,550) |
Change in unrealized appreciation (depreciation) |
| 2,504,779 | 7,924,482 | 5,062,653 |
|
|
|
|
|
Net Realized and Unrealized |
|
|
|
|
Gain (Loss) on Investments |
| 2,118,828 | 6,754,303 | 3,739,103 |
|
|
|
|
|
Increase (Decrease) in Net Assets |
|
|
|
|
Resulting From Operations |
| $2,859,948 | $7,750,511 | $4,011,345 |
See notes to financial statements.
conservative Allocation Fund
Statements of Changes in Net Assets
|
| Year Ended | Year Ended |
|
| September 30, | September 30, |
Increase (Decrease) in Net Assets |
| 2010 | 2009 |
Operations: |
|
|
|
Net investment income |
| $741,120 | $726,193 |
Net realized gain (loss) |
| (385,951) | (1,192,748) |
Change in unrealized appreciation (depreciation) |
| 2,504,779 | 1,825,314 |
|
|
|
|
Increase (Decrease) in Net Assets |
|
|
|
Resulting From Operations |
| 2,859,948 | 1,358,759 |
|
|
|
|
Distributions to shareholders from: |
|
|
|
Net investment income: |
|
|
|
Class A shares |
| (656,513) | (636,240) |
Class C shares |
| (78,949) | (87,529) |
Net realized gain: |
|
|
|
Class A shares |
| — | (238,077) |
Class C shares |
| — | (57,126) |
Total distributions |
| (735,462) | (1,018,972) |
|
|
|
|
Capital share transactions: |
|
|
|
Shares sold: |
|
|
|
Class A shares |
| 11,882,987 | 9,457,967 |
Class C shares |
| 3,632,683 | 2,374,257 |
Reinvestment of distributions: |
|
|
|
Class A shares |
| 621,525 | 806,999 |
Class C shares |
| 63,679 | 121,116 |
Redemption fees: |
|
|
|
Class A shares |
| 828 | 1,196 |
Class C shares |
| 12 | 516 |
Shares redeemed: |
|
|
|
Class A shares |
| (4,932,114) | (4,790,793) |
Class C shares |
| (1,483,747) | (1,223,383) |
Total capital share transactions |
| 9,785,853 | 6,747,875 |
|
|
|
|
Total Increase (Decrease) in Net Assets |
| 11,910,339 | 7,087,662 |
|
|
|
|
Net Assets |
|
|
|
Beginning of year |
| 29,046,680 | 21,959,018 |
End of year (including undistributed net |
|
|
|
investment income of $10,496 and 4,838, respectively) |
| $40,957,019 | $29,046,680 |
|
|
|
|
Capital Share Activity |
|
|
|
Shares sold: |
|
|
|
Class A shares |
| 809,864 | 731,890 |
Class C shares |
| 249,259 | 184,546 |
Reinvestment of distributions: |
|
|
|
Class A shares |
| 42,444 | 63,321 |
Class C shares |
| 4,396 | 9,655 |
Shares redeemed: |
|
|
|
Class A shares |
| (336,498) | (373,838) |
Class C shares |
| (101,602) | (95,309) |
Total capital share activity |
| 667,863 | 520,265 |
See notes to financial statements.
moderate allocation Fund
Statements of Changes in Net Assets
|
| Year Ended | Year Ended |
|
| September 30, | September 30, |
Increase (Decrease) in Net Assets |
| 2010 | 2009 |
Operations: |
|
|
|
Net investment income |
| $996,208 | $1,370,369 |
Net realized gain (loss) |
| (1,170,179) | (4,288,304) |
Change in unrealized appreciation (depreciation) |
| 7,924,482 | 2,559,144 |
|
|
|
|
Increase (Decrease) in Net Assets |
|
|
|
Resulting From Operations |
| 7,750,511 | (358,791) |
|
|
|
|
Distributions to shareholders from: |
|
|
|
Net investment income: |
|
|
|
Class A shares |
| (848,373) | (1,164,849) |
Class C shares |
| (123,248) | (183,064) |
Class I shares |
| (19,899) | (19,530) |
Net realized gain: |
|
|
|
Class A shares |
| — | (1,932,032) |
Class C shares |
| — | (440,213) |
Class I shares |
| — | (24,825) |
Total distributions |
| (991,520) | (3,764,513) |
|
|
|
|
Capital share transactions: |
|
|
|
Shares sold: |
|
|
|
Class A shares |
| 21,283,912 | 16,316,969 |
Class C shares |
| 5,340,143 | 3,565,253 |
Class I shares |
| 824,403 | — |
Reinvestment of distributions: |
|
|
|
Class A shares |
| 802,909 | 2,922,993 |
Class C shares |
| 103,495 | 519,829 |
Class I shares |
| 19,899 | 44,355 |
Redemption fees: |
|
|
|
Class A shares |
| 545 | 656 |
Class C shares |
| 1,285 | 6 |
Shares redeemed: |
|
|
|
Class A shares |
| (12,481,452) | (13,102,429) |
Class C shares |
| (3,304,227) | (2,569,222) |
Class I shares |
| (76,535) | (27,052) |
Total capital share transactions |
| 12,514,377 | 7,671,358 |
|
|
|
|
Total Increase (Decrease) in Net Assets |
| 19,273,368 | 3,548,054 |
|
|
|
|
Net Assets |
|
|
|
Beginning of year |
| 96,314,279 | 92,766,225 |
End of year (including undistributed net |
|
|
|
investment income of $14,110 and $9,422, respectively) |
| $115,587,647 | $96,314,279 |
See notes to financial statements.
moderate allocation Fund
Statements of Changes in Net Assets
|
| Year Ended | Year Ended |
|
| September 30, | September 30, |
Capital Share Activity |
| 2010 | 2009 |
Shares sold: |
|
|
|
Class A shares |
| 1,483,778 | 1,359,144 |
Class C shares |
| 377,822 | 299,081 |
Class I shares |
| 57,656 | — |
Reinvestment of distributions: |
|
|
|
Class A shares |
| 56,169 | 255,288 |
Class C shares |
| 7,350 | 45,964 |
Class I shares |
| 1,379 | 3,836 |
Shares redeemed: |
|
|
|
Class A shares |
| (872,779) | (1,088,889) |
Class C shares |
| (234,491) | (213,577) |
Class I shares |
| (5,300) | (2,028) |
Total capital share activity |
| 871,584 | 658,819 |
See notes to financial statements.
aggressive allocation fund
Statements of Changes in Net Assets
|
| Year Ended | Year Ended |
|
| September 30, | September 30, |
Increase (Decrease) in Net Assets |
| 2010 | 2009 |
Operations: |
|
|
|
Net investment income |
| $272,242 | $483,601 |
Net realized gain (loss) |
| (1,323,550) | (1,992,919) |
Change in unrealized appreciation (depreciation) |
| 5,062,653 | (43,521) |
|
|
|
|
|
|
|
|
Increase (Decrease) in Net Assets |
|
|
|
Resulting From Operations |
| 4,011,345 | (1,552,839) |
|
|
|
|
Distributions to shareholders from: |
|
|
|
Net investment income: |
|
|
|
Class A shares |
| (278,521) | (399,484) |
Class C shares |
| (46,455) | (41,681) |
Class I shares |
| (5) | (8) |
Net realized gain: |
|
|
|
Class A shares |
| — | (1,391,004) |
Class C shares |
| — | (224,716) |
Class I shares |
| — | (27) |
Total distributions |
| (324,981) | (2,056,920) |
|
|
|
|
Capital share transactions: |
|
|
|
Shares sold: |
|
|
|
Class A shares |
| 10,383,948 | 9,047,343 |
Class C shares |
| 2,141,584 | 2,293,592 |
Reinvestment of distributions: |
|
|
|
Class A shares |
| 264,841 | 1,719,545 |
Class C shares |
| 41,061 | 226,518 |
Class I shares |
| 5 | 35 |
Redemption fees: |
|
|
|
Class A shares |
| 133 | 170 |
Class C shares |
| 525 | 394 |
Shares redeemed: |
|
|
|
Class A shares |
| (7,088,093) | (5,939,885) |
Class C shares |
| (1,876,181) | (1,327,696) |
Total capital share transactions |
| 3,867,823 | 6,020,016 |
|
|
|
|
Total Increase (Decrease) in Net Assets |
| 7,554,187 | 2,410,257 |
|
|
|
|
Net Assets |
|
|
|
Beginning of year |
| 52,752,811 | 50,342,554 |
End of year (including undistributed net |
|
|
|
investment income of $0 and $42,428, respectively) |
| $60,306,998 | $52,752,811 |
See notes to financial statements.
aggressive allocation fund
Statements of Changes in Net Assets
|
| Year Ended | Year Ended |
|
| September 30, | September 30, |
Capital Share Activity |
| 2010 | 2009 |
Shares sold: |
|
|
|
Class A shares |
| 773,899 | 827,100 |
Class C shares |
| 167,164 | 218,145 |
Reinvestment of distributions: |
|
|
|
Class A shares |
| 19,691 | 169,358 |
Class C shares |
| 3,195 | 23,082 |
Class I shares |
| — | 3 |
Shares redeemed: |
|
|
|
Class A shares |
| (531,155) | (540,570) |
Class C shares |
| (146,477) | (123,738) |
Total capital share activity |
| 286,317 | 573,380 |
See notes to financial statements.
Notes to Financial Statements
Note A — Significant Accounting Policies
General: The Calvert Conservative Allocation Fund, Calvert Moderate Allocation Fund, and Calvert Aggressive Allocation Fund (the “Funds”), each a series of the Calvert Social Investment Fund, are registered under the Investment Company Act of 1940 as non-diversified, open-end management investment companies. The operations of each series are accounted for separately. The Funds invest primarily in a combination of other Calvert equity and fixed income funds (the “Underlying Funds”). Each Fund offers Class A and Class C shares. Effective January 31, 2008, Moderate and Aggressive began to offer Class I shares. Class A shares are sold with a maximum front-end sales charge of 4.75%. Class C shares are sold without a front-end sales charge. With certain exceptions, the Funds will impose a deferred sales charge on shares sold within one year of purchase. Class C shares have higher levels of expenses than Class A shares. Class I shares require a minimum account balance of $1,000,000. The $1 million minimum initial investment may be waived for certain institutional accounts, where it is believed to be in the best interest of the Fund and its shareholders. Class I shares have no front-end or deferred sales charge and have lower levels of expenses than Class A shares. Each class has different: (a) dividend rates, due to differences in Distribution Plan expenses and other class-specific expenses, (b) exchange privileges and (c) class-specific voting rights.
Security Valuation: Net asset value per share is determined every business day as of the close of the regular session of the New York Stock Exchange (generally 4:00 p.m. Eastern time). Investments in the Underlying Funds are valued at their net asset value each business day. Investments for which market quotations are not available or deemed not reliable are fair valued in good faith under the direction of the Board of Trustees.
The Fund utilizes various methods to measure the fair value of its investments. Generally Accepted Accounting Principles (GAAP) establishes a disclosure hierarchy that categorizes the inputs to valuation techniques used to value assets and liabilities at measurement date. These inputs are summarized in the three broad levels listed below:
Level 1 – quoted prices in active markets for identical securities
Level 2 – other significant observable inputs (including quoted prices for similar securities, interest rates, prepayment speeds, credit risk, etc.)
Level 3 – significant unobservable inputs (including the Funds’ own assumptions in determining the fair value of investments)
The inputs or methodology used for valuing securities are not necessarily an indication of the risk associated with investing in those securities.
Changes in valuation techniques may result in transfers in or out of an investment’s assigned level within the hierarchy during the year. For additional information on the Funds’ policy regarding valuation of investments, please refer to the Funds’ most recent prospectus.
The following is a summary of the inputs used to value the Funds’ net assets as of September 30, 2010:
Conservative | Valuation Inputs | |||
Investments in Securities | Level 1 | Level 2 | Level 3 | Total |
Mutual Funds | $40,987,047 | - | - | $40,987,047 |
TOTAL | $40,987,047 | - | - | $40,987,047 |
Moderate | Valuation Inputs | |||
Investments in Securities | Level 1 | Level 2 | Level 3 | Total |
Mutual Funds | $115,699,754 | - | - | $115,699,754 |
TOTAL | $115,699,754 | - | - | $115,699,754 |
Aggressive | Valuation Inputs | |||
Investments in Securities | Level 1 | Level 2 | Level 3 | Total |
Mutual Funds | $60,343,815 | - | - | $60,343,815 |
TOTAL | $60,343,815 | - | - | $60,343,815 |
Security Transactions and Net Investment Income: Security transactions, normally shares of the Underlying Funds, are accounted for on trade date. Realized gains and losses are recorded on an identified cost basis. Income and capital gain distributions from the Underlying Funds, if any, are recorded on the ex-dividend date. Interest income, which includes amortization of premium and accretion of discount on debt securities, is accrued as earned. Investment income and realized and unrealized gains and losses are allocated to separate classes of shares based upon the relative net assets of each class. Expenses arising in connection with a class are charged directly to that class. Expenses common to the classes are allocated to each class in proportion to the ir relative net assets. Expenses included in the accompanying financial statements reflect the expenses of each Fund and do not include any expenses associated with the Underlying Funds.
Distributions to Shareholders: Distributions to shareholders are recorded by the Funds on ex-dividend date. Dividends from net investment income are paid quarterly. Distributions from net realized capital gains, if any, are paid at least annually. Distributions are determined in accordance with income tax regulations which may differ from generally accepted accounting principles; accordingly, periodic reclassifications are made within the Funds’ capital accounts to reflect income and gains available for distribution under income tax regulations.
Estimates: The preparation of the financial statements in conformity with accounting principles generally accepted in the United States requires management to make estimates and assumptions that affect the reported amounts of assets and liabilities and disclosure of contingent assets and liabilities at the date of the financial statements and the reported amounts of income and expenses during the reported period. Actual results could differ from those estimates.
Redemption Fees: The Funds charge a 2% redemption fee on redemptions, including exchanges, made within 30 days of purchase in the same Fund (within seven days for Class I shares). The redemption fee is paid to the Class of the Fund from which the redemption is made and is accounted for as an addition to paid-in capital. The fee is intended to discourage market-timers by ensuring that short-term trading costs are borne by the investors making the transactions and not the shareholders already in the Fund.
Expense Offset Arrangements: The Funds have an arrangement with their custodian bank whereby the custodian’s fees may be paid indirectly by credits earned on each Fund’s cash on deposit with the bank. These credits are used to reduce the Fund’s expenses. Such a deposit arrangement may be an alternative to overnight investments.
Federal Income Taxes: No provision for federal income or excise tax is required since the Fund intends to continue to qualify as a regulated investment company under the Internal Revenue Code and to distribute substantially all of its taxable earnings.
Management has analyzed the Fund’s tax positions taken for all open federal income tax years and has concluded that no provision for federal income tax is required in the Fund’s financial statements. A Fund’s federal tax return is subject to examination by the Internal Revenue Service for a period of three years.
New Accounting Pronouncements: In January 2010, the Financial Accounting Standards Board (“FASB”) issued Accounting Standards Update (“ASU”) No. 2010-06 “Improving Disclosures about Fair Value Measurements”. ASU 2010-06 will require reporting entities to make new disclosures about amount and reasons for significant transfers in and out of Level 1 and Level 2 fair value measurements and input and valuation techniques used to measure fair value for both recurring and nonrecurring fair value measurements that fall in either Level 2 or Level 3, and information on purchases, sales, issuances, and settlements in the roll forward of activity in Level 3 fair value measures. The new and revised disclosures are effective for interim and annual reporting periods beginning after December 15, 2009 except for the disclosures about purchases, sales, issuances, and settlements in the roll forward of activity in Level 3 fair value measures, which are effective for fiscal years beginning after December 15, 2010. At this time, management is evaluating the implications of ASU No. 2010-06 disclosures about purchases, sales, issuances, and settlements in the roll forward of activity in Level 3 fair value measures and its impact on the financial statements has not been determined.
Note B — Related Party Transactions
Calvert Asset Management Company, Inc. (the “Advisor”) is wholly-owned by Calvert Group, Ltd. (“Calvert”), which is indirectly wholly owned by UNIFI Mutual Holding Company. The Advisor provides investment advisory services for the Funds and the Underlying Funds in which the Funds invest. The Advisor also pays the salaries and fees of officers and Trustees of the Funds who are employees of the Advisor or its affiliates. The Funds do not pay advisory fees to the Advisor for performing investment advisory services. The Advisor, however, will receive advisory fees from managing the Underlying Funds. At year end, $2,595, $22,921 and $825 was payable to the Advisor from Conservative, Moderate and Aggressive, respectively, for operating expenses paid by the Advisor during September 2010.
The Advisor has contractually agreed to limit direct ordinary operating expenses through January 31, 2011. The contractual expense cap is .44%, .80%, and .43% for Class A shares of Conservative, Moderate, and Aggressive, respectively. The contractual expense cap is 2.00% for Class C shares of each Fund. The contractual expense cap is .23% for Class I Shares of both Moderate and Aggressive. This expense limitation does not include the Underlying Fund expenses indirectly incurred by the Funds. For the purpose of this expense limit, operating expenses do not include interest expense, brokerage commissions, taxes, and extraordinary expenses. To the extent any expense offset credits are earned, the Advisor’s obligation under the contractual limitation may be reduced and the Advisor may benefit from the expense offset arrangement.
Calvert Administrative Services Company (“CASC”), an affiliate of the Advisor, provides administrative services to the Funds for an annual fee. Class A, Class C and Class I of each Fund pay an annual rate of .15%, based on their average daily net assets. Under the terms of the agreement, $4,972, $13,958 and $7,282 was payable at year end for Conservative, Moderate, and Aggressive, respectively.
Calvert Distributors, Inc., an affiliate of the Advisor, is the distributor and principal underwriter for the Funds. Distribution Plans, adopted by Class A and Class C shares, allow the Funds to pay the Distributor for expenses and services associated with distribution of shares. The expenses paid may not exceed .35% and 1.00% annually of average daily net assets of Class A and Class C, respectively, for each Fund. The amount actually paid by the Funds is an annualized fee, payable monthly of .25% and 1.00% of the Funds’ average daily net assets of Class A and Class C, respectively. Class I shares do not have Distribution Plan expenses. Under the terms of the agreement, $13,426, $35,518, and $17,086 was payable at year end for Conservative, Moderate, and Aggressive, respectively.
The Distributor received $35,142, $88,989, and $50,080 as its portion of the commissions charged on the sales of Conservative, Moderate, and Aggressive Class A shares, respectively, for the year ended September 30, 2010.
Calvert Shareholder Services, Inc. (“CSSI”), an affiliate of the Advisor, acts as shareholder servicing agent for the Funds. For its services, CSSI received fees of $12,325, $51,126 and $39,557 for the year ended September 30, 2010 for Conservative, Moderate, and Aggressive, respectively. Under the terms of the agreement, $1,197, $4,447 and $3,369 was payable at year end for Conservative, Moderate and Aggressive, respectively. Boston Financial Data Services, Inc. is the transfer and dividend disbursing agent.
Each Trustee of the Funds who is not an employee of the Advisor or its affiliates receives an annual retainer of $44,000 plus a meeting fee of $2,000 for each Board meeting attended. Additional fees of up to $5,000 annually may be paid to the Board chair and Committee chairs ($10,000 for Special Equities Committee chair) and $2,500 annually may be paid to committee members, plus a committee meeting fee of $500 for each committee meeting attended. Trustee’s fees are allocated to each of the funds served.
Note C – Investment Activity
During the year, the cost of purchases and proceeds from sales of the Underlying Funds were:
| Conservative | Moderate | Aggressive |
Purchases …………………………… | $13,024,040 | $19,573,058 | $8,379,003 |
Sales ……………………………… | 3,189,655 | 7,048,029 | 4,563,830 |
Capital Loss Carryforwards
Expiration Date | Conservative | Moderate | Aggressive |
30-Sep-17 | $2,765 | $505,630 | $121,097 |
30-Sep-18 | — | 244,394 | 2,287 |
Capital loss carryforwards may be utilized to offset future capital gains until expiration.
Aggressive Fund intends to elect to defer net capital losses of $95,980 incurred from November 1, 2009 through September 30, 2010 and treat them as arising in the fiscal year ending September 30, 2011.
The tax character of dividends and distributions paid during the years ended September 30, 2010 and September 30, 2009 were as follows:
Conservative |
|
|
|
Distributions paid from: |
| 2010 | 2009 |
Ordinary income |
| $735,462 | $723,769 |
Long-term capital gain |
| - | 295,203 |
Total |
| $735,462 | $1,018,972 |
|
|
|
|
Moderate |
|
|
|
Distributions paid from: |
| 2010 | 2009 |
Ordinary income |
| $991,520 | $1,373,474 |
Long-term capital gain |
| - | 2,391,039 |
Total |
| $991,520 | $3,764,513 |
|
|
|
|
Aggressive |
|
|
|
Distributions paid from: |
| 2010 | 2009 |
Ordinary income |
| $324,981 | $441,173 |
Long-term capital gain |
| - | 1,615,747 |
Total |
| $324,981 | $2,056,920 |
As of September 30, 2010, the tax basis components of distributable earnings/(accumulated losses) and the federal tax cost were as follows:
| Conservative | Moderate | Aggressive |
Unrealized appreciation | $1,031,066 | $926,646 | $206,068 |
Unrealized (depreciation) | (454,828) | (10,636,739) | (10,116,799) |
Net unrealized appreciation/(depreciation) | $576,238 | ($9,710,093) | ($9,910,731) |
Undistributed ordinary income | $10,496 | $14,110 | $0 |
Capital loss carryforward | ($2,765) | ($750,024) | ($123,384) |
Federal income tax cost of investments | $40,410,809 | $125,409,847 | $70,254,546 |
The differences between the components of distributable earnings on a tax basis and the amounts reflected in the statements of net assets are primarily due to temporary book-tax differences that will reverse in a subsequent period. These differences are mainly due to wash sales for all funds. The differences are also due to the deferral of post October losses for Aggressive.
Reclassifications, as shown in the table below, have been made to the Aggressive Fund's components of net assets to reflect income and gains available for distribution (or available capital loss carryovers, as applicable) under income tax law and regulations. These reclassifications are due to permanent book-tax differences and have no impact on net assets. The primary permanent differences causing such reclassifications are due to excess distributions.
| Aggressive |
Undistributed net investment income | $10,311 |
Paid-in capital | (10,311) |
Note D – Line of Credit
A financing agreement is in place with all Calvert Group Funds and State Street Corporation (“SSC”). Under the agreement, SSC provides an unsecured line of credit facility, in the aggregate amount of $50 million ($25 million committed and $25 million uncommitted), accessible by the Funds for temporary or emergency purposes only. Borrowings under the committed facility bear interest at the higher of the London Interbank Offered Rate, (LIBOR) or the overnight Federal Funds Rate plus 1.25% per annum. A commitment fee of .125% per annum is incurred on the unused portion of the committed facility, which is allocated to all participating funds. The Funds had no loans outstanding pursuant to this line of credit during the year ended September 30, 2010.
Note E – Subsequent Events
In preparing the financial statements as of September 30, 2010, no subsequent events or transactions occurred that would have materially impacted the financial statements as presented.
Notice to Shareholders (Unaudited)
For the fiscal year ended September 30, 2010, in order to meet certain requirements of the Internal Revenue Code, we are advising you that certain distributions paid during the year from the following funds are designated as:
Fund Name
| (a) | (b) |
Conservative Allocation Fund | 12.7% | 7.4% |
Moderate Allocation Fund | 58.6% | 32.6% |
Aggressive Allocation Fund | 100.0% | 73.9% |
(a) Each Fund designates the maximum amount allowable, but not less than the percentages shown above as ordinary income dividends paid during the year as qualified dividend income in accordance with Section 854 of the Internal Revenue Code.
(b) Each Fund designates the maximum amount allowable but not less than the percentages shown above of ordinary income dividends paid during the year as eligible for the corporate dividends received deduction in accordance with Section 854 of the Internal Revenue Code.
Additional information will be provided to shareholders in January 2011 for use in preparing 2010 income tax returns.
conservative allocation Fund
Financial Highlights
|
|
| Years Ended |
|
|
| September 30, | September 30, | September 30, |
Class A Shares |
| 2010 | 2009 | 2008 |
Net asset value, beginning |
| $14.29 | $14.52 | $16.45 |
Income from investment operations: |
|
|
|
|
Net investment income |
| .35 | .45 | .62 |
Net realized and unrealized gain (loss) |
| .88 | (.04) | (1.70) |
Total from investment operations |
| 1.23 | .41 | (1.08) |
Distributions from: |
|
|
|
|
Net investment income |
| (.35) | (.45) | (.62) |
Net realized gain |
| — | (.19) | (.23) |
Total distributions |
| (.35) | (.64) | (.85) |
Total increase (decrease) in net asset value |
| .88 | (.23) | (1.93) |
Net asset value, ending |
| $15.17 | $14.29 | $14.52 |
Total return* |
| 8.69% | 3.48% | (6.90%) |
Ratios to average net assets: A,B |
|
|
|
|
Net investment income |
| 2.37% | 3.41% | 3.92% |
Total expenses |
| .90% | 1.04% | 1.07% |
Expenses before offsets |
| .44% | .44% | .44% |
Net expenses |
| .44% | .44% | .44% |
Portfolio turnover |
| 9% | 24% | 13% |
Net assets, ending (in thousands) |
| $32,565 | $23,300 | $17,551 |
|
|
|
|
|
|
|
|
|
|
|
|
| Years Ended | |
|
|
| September 30, | September 30, |
Class A Shares |
|
| 2007 | 2006 |
Net asset value, beginning |
|
| $15.81 | $15.42 |
Income from investment operations: |
|
|
|
|
Net investment income |
|
| .55 | .42 |
Net realized and unrealized gain (loss) |
|
| .74 | .40 |
Total from investment operations |
|
| 1.29 | .82 |
Distributions from: |
|
|
|
|
Net investment income |
|
| (.55) | (.42) |
Net realized gain |
|
| (.10) | (.01) |
Total distributions |
|
| (.65) | (.43) |
Total increase (decrease) in net asset value |
|
| .64 | .39 |
Net asset value, ending |
|
| $16.45 | $15.81 |
Total return* |
|
| 8.27% | 5.40% |
Ratios to average net assets: A,B |
|
|
|
|
Net investment income |
|
| 3.55% | 2.91% |
Total expenses |
|
| 1.35% | 2.62% |
Expenses before offsets |
|
| .44% | .87% |
Net expenses |
|
| .44% | .87% |
Portfolio turnover |
|
| 11% | 9% |
Net assets, ending (in thousands) |
|
| $12,265 | $6,258 |
See notes to financial highlights.
conservative allocation fund
Financial Highlights
|
|
| Years Ended |
|
|
| September 30, | September 30, | September 30, |
Class C Shares |
| 2010 | 2009 | 2008 |
Net asset value, beginning |
| $14.23 | $14.45 | $16.40 |
Income from investment operations: |
|
|
|
|
Net investment income |
| .17 | .26 | .41 |
Net realized and unrealized gain (loss) |
| .87 | (.03) | (1.72) |
Total from investment operations |
| 1.04 | .23 | (1.31) |
Distributions from: |
|
|
|
|
Net investment income |
| (.17) | (.26) | (.41) |
Net realized gain |
| — | (.19) | (.23) |
Total distributions |
| (.17) | (.45) | (.64) |
Total increase (decrease) in net asset value |
| .87 | (.22) | (1.95) |
Net asset value, ending |
| $15.10 | $14.23 | $14.45 |
Total return* |
| 7.39% | 2.05% | (8.28%) |
Ratios to average net assets: A,B |
|
|
|
|
Net investment income |
| 1.12% | 1.99% | 2.54% |
Total expenses |
| 1.68% | 1.88% | 1.85% |
Expenses before offsets |
| 1.68% | 1.88% | 1.85% |
Net expenses |
| 1.68% | 1.88% | 1.85% |
Portfolio turnover |
| 9% | 24% | 13% |
Net assets, ending (in thousands) |
| $8,393 | $5,747 | $4,408 |
|
|
|
|
|
|
|
|
|
|
|
|
| Years Ended | |
|
|
| September 30, | September 30, |
Class C Shares |
|
| 2007 | 2006 |
Net asset value, beginning |
|
| $15.77 | $15.40 |
Income from investment operations: |
|
|
|
|
Net investment income |
|
| .31 | .28 |
Net realized and unrealized gain (loss) |
|
| .73 | .38 |
Total from investment operations |
|
| 1.04 | .66 |
Distributions from: |
|
|
|
|
Net investment income |
|
| (.31) | (.28) |
Net realized gain |
|
| (.10) | (.01) |
Total distributions |
|
| (.41) | (.29) |
Total increase (decrease) in net asset value |
|
| .63 | .37 |
Net asset value, ending |
|
| $16.40 | $15.77 |
Total return* |
|
| 6.67% | 4.28% |
Ratios to average net assets: A,B |
|
|
|
|
Net investment income |
|
| 1.99% | 1.87% |
Total expenses |
|
| 2.09% | 3.42% |
Expenses before offsets |
|
| 2.00% | 2.00% |
Net expenses |
|
| 2.00% | 2.00% |
Portfolio turnover |
|
| 11% | 9% |
Net assets, ending (in thousands) |
|
| $4,036 | $2,314 |
See notes to financial highlights.
Moderate allocation fund
Financial Highlights
|
|
| Years Ended |
|
|
| September 30, | September 30, | September 30, |
Class A Shares |
| 2010 | 2009 | 2008 |
Net asset value, beginning |
| $13.94 | $14.83 | $18.30 |
Income from investment operations: |
|
|
|
|
Net investment income |
| .16 | .23 | .37 |
Net realized and unrealized gain (loss) |
| .92 | (.51) | (3.17) |
Total from investment operations |
| 1.08 | (.28) | (2.80) |
Distributions from: |
|
|
|
|
Net investment income |
| (.15) | (.22) | (.37) |
Net realized gain |
| — | (.39) | (.30) |
Total distributions |
| (.15) | (.61) | (.67) |
Total increase (decrease) in net asset value |
| .93 | (.89) | (3.47) |
Net asset value, ending |
| $14.87 | $13.94 | $14.83 |
Total return* |
| 7.76% | (.95%) | (15.82%) |
Ratios to average net assets: A,B |
|
|
|
|
Net investment income |
| 1.06% | 1.85% | 2.12% |
Total expenses |
| .76% | .83% | .71% |
Expenses before offsets |
| .76% | .80% | .71% |
Net expenses |
| .76% | .80% | .71% |
Portfolio turnover |
| 7% | 25% | 5% |
Net assets, ending (in thousands) |
| $92,913 | $77,805 | $74,972 |
|
|
|
|
|
|
|
|
|
|
|
|
| Years Ended | |
|
|
| September 30, | September 30, |
Class A Shares |
|
| 2007 | 2006 |
Net asset value, beginning |
|
| $16.81 | $15.88 |
Income from investment operations: |
|
|
|
|
Net investment income |
|
| .32 | .18 |
Net realized and unrealized gain (loss) |
|
| 1.59 | .92 |
Total from investment operations |
|
| 1.91 | 1.10 |
Distributions from: |
|
|
|
|
Net investment income |
|
| (.32) | (.17) |
Net realized gain |
|
| (.10) | ** |
Total distributions |
|
| (.42) | (.17) |
Total increase (decrease) in net asset value |
|
| 1.49 | .93 |
Net asset value, ending |
|
| $18.30 | $16.81 |
Total return* |
|
| 11.46% | 7.00% |
Ratios to average net assets: A,B |
|
|
|
|
Net investment income |
|
| 1.71% | 1.08% |
Total expenses |
|
| .75% | 1.12% |
Expenses before offsets |
|
| .75% | .95% |
Net expenses |
|
| .75% | .95% |
Portfolio turnover |
|
| 3% | 5% |
Net assets, ending (in thousands) |
|
| $71,746 | $33,279 |
See notes to financial highlights.
Moderate allocation fund
Financial Highlights
|
|
| Years Ended |
|
|
| September 30, | September 30, | September 30, |
Class C Shares |
| 2010 | 2009 | 2008 |
Net asset value, beginning |
| $13.79 | $14.72 | $18.16 |
Income from investment operations: |
|
|
|
|
Net investment income |
| .05 | .13 | .24 |
Net realized and unrealized gain (loss) |
| .90 | (.52) | (3.14) |
Total from investment operations |
| .95 | (.39) | (2.90) |
Distributions from: |
|
|
|
|
Net investment income |
| (.09) | (.15) | (.24) |
Net realized gain |
| — | (.39) | (.30) |
Total distributions |
| (.09) | (.54) | (.54) |
Total increase (decrease) in net asset value |
| .86 | (.93) | (3.44) |
Net asset value, ending |
| $14.65 | $13.79 | $14.72 |
Total return* |
| 6.95% | (1.79%) | (16.43%) |
Ratios to average net assets: A,B |
|
|
|
|
Net investment income |
| .30% | 1.03% | 1.38% |
Total expenses |
| 1.52% | 1.60% | 1.48% |
Expenses before offsets |
| 1.52% | 1.60% | 1.48% |
Net expenses |
| 1.52% | 1.60% | 1.48% |
Portfolio turnover |
| 7% | 25% | 5% |
Net assets, ending (in thousands) |
| $20,883 | $17,582 | $16,835 |
|
|
|
|
|
|
|
|
|
|
|
|
| Years Ended | |
|
|
| September 30, | September 30, |
Class C Shares |
|
| 2007 | 2006 |
Net asset value, beginning |
|
| $16.69 | $15.80 |
Income from investment operations: |
|
|
|
|
Net investment income |
|
| .20 | .05 |
Net realized and unrealized gain (loss) |
|
| 1.56 | .91 |
Total from investment operations |
|
| 1.76 | .96 |
Distributions from: |
|
|
|
|
Net investment income |
|
| (.19) | (.07) |
Net realized gain |
|
| (.10) | ** |
Total distributions |
|
| (.29) | (.07) |
Total increase (decrease) in net asset value |
|
| 1.47 | .89 |
Net asset value, ending |
|
| $18.16 | $16.69 |
Total return* |
|
| 10.62% | 6.08% |
Ratios to average net assets: A,B |
|
|
|
|
Net investment income |
|
| .97% | .07% |
Total expenses |
|
| 1.50% | 1.95% |
Expenses before offsets |
|
| 1.50% | 1.94% |
Net expenses |
|
| 1.50% | 1.94% |
Portfolio turnover |
|
| 3% | 5% |
Net assets, ending (in thousands) |
|
| $17,564 | $8,508 |
See notes to financial highlights.
Moderate allocation fund
Financial Highlights
|
| Periods Ended | ||
|
| September 30, | September 30, | September 30, |
Class I Shares |
| 2010 | 2009 | 2008 ### |
Net asset value, beginning |
| $13.99 | $14.88 | $16.73 |
Income from investment operations: |
|
|
|
|
Net investment income |
| .23 | .30 | .13 |
Net realized and unrealized gain (loss) |
| .92 | (.51) | (1.85) |
Total from investment operations |
| 1.15 | (.21) | (1.72) |
Distributions from: |
|
|
|
|
Net investment income |
| (.22) | (.29) | (.13) |
Net realized gain |
| — | (.39) | — |
Total distributions |
| (.22) | (.68) | (.13) |
Total increase (decrease) in net asset value |
| .93 | (.89) | (1.85) |
Net asset value, ending |
| $14.92 | $13.99 | $14.88 |
Total return* |
| 8.29% | (.38%) | (10.34%) |
Ratios to average net assets: A,B |
|
|
|
|
Net investment income |
| 1.37% | 2.45% | 2.04% (a) |
Total expenses |
| 1.02% | 2.08% | 20.84% (a) |
Expenses before offsets |
| .23% | .23% | .23% (a) |
Net expenses |
| .23% | .23% | .23% (a) |
Portfolio turnover |
| 7% | 25% | 4% |
Net assets, ending (in thousands) |
| $1,791 | $927 | $960 |
See notes to financial highlights.
Aggressive allocation Fund
Financial Highlights
|
|
| Years Ended |
|
|
| September 30, | September 30, | September 30, |
Class A Shares |
| 2010 | 2009 | 2008 |
Net asset value, beginning |
| $13.03 | $14.45 | $19.00 |
Income from investment operations: |
|
|
|
|
Net investment income |
| .09 | .15 | .23 |
Net realized and unrealized gain (loss) |
| .90 | (1.00) | (4.21) |
Total from investment operations |
| .99 | (.85) | (3.98) |
Distributions from: |
|
|
|
|
Net investment income |
| (.08) | (.12) | (.21) |
Net realized gain |
| — | (.45) | (.36) |
Total distributions |
| (.08) | (.57) | (.57) |
Total increase (decrease) in net asset value |
| .91 | (1.42) | (4.55) |
Net asset value, ending |
| $13.94 | $13.03 | $14.45 |
Total return* |
| 7.61% | (4.67%) | (21.59%) |
Ratios to average net assets: A,B |
|
|
|
|
Net investment income |
| .66% | 1.35% | 1.27% |
Total expenses |
| .92% | 1.06% | .87% |
Expenses before offsets |
| .43% | .43% | .43% |
Net expenses |
| .43% | .43% | .43% |
Portfolio turnover |
| 8% | 15% | 4% |
Net assets, ending (in thousands) |
| $52,132 | $45,307 | $43,632 |
|
|
|
|
|
|
|
|
|
|
|
|
| Years Ended | |
|
|
| September 30, | September 30, |
Class A Shares |
|
| 2007 | 2006 |
Net asset value, beginning |
|
| $16.91 | $15.62 |
Income from investment operations: |
|
|
|
|
Net investment income |
|
| .22 | .03 |
Net realized and unrealized gain (loss) |
|
| 2.16 | 1.31 |
Total from investment operations |
|
| 2.38 | 1.34 |
Distributions from: |
|
|
|
|
Net investment income |
|
| (.21) | (.05) |
Net realized gain |
|
| (.08) | — |
Total distributions |
|
| (.29) | (.05) |
Total increase (decrease) in net asset value |
|
| 2.09 | 1.29 |
Net asset value, ending |
|
| $19.00 | $16.91 |
Total return* |
|
| 14.18% | 8.59% |
Ratios to average net assets: A,B |
|
|
|
|
Net investment income (loss) |
|
| .96% | (.11%) |
Total expenses |
|
| .98% | 2.08% |
Expenses before offsets |
|
| .43% | .83% |
Net expenses |
|
| .43% | .83% |
Portfolio turnover |
|
| 2% | 9% |
Net assets, ending (in thousands) |
|
| $44,004 | $15,170 |
Aggressive allocation Fund
Financial Highlights
|
|
| Years Ended |
|
|
| September 30, | September 30, | September 30, |
Class C Shares |
| 2010 | 2009 | 2008 |
Net asset value, beginning |
| $12.49 | $14.02 | $18.63 |
Income from investment operations: |
|
|
|
|
Net investment income (loss) |
| (.08) | (.01) | .02 |
Net realized and unrealized gain (loss) |
| .85 | (.99) | (4.12) |
|
|
|
|
|
Total from investment operations |
| .77 | (1.00) | (4.10) |
Distributions from: |
|
|
|
|
Net investment income |
| (.08) | (.08) | (.15) |
Net realized gain |
| — | (.45) | (.36) |
Total distributions |
| (.08) | (.53) | (.51) |
|
|
|
|
|
Total increase (decrease) in net asset value |
| .69 | (1.53) | (4.61) |
Net asset value, ending |
| $13.18 | $12.49 | $14.02 |
|
|
|
|
|
Total return* |
| 6.14% | (6.06%) | (22.62%) |
|
|
|
|
|
Ratios to average net assets: A,B |
|
|
|
|
Net investment income (loss) |
| (.66%) | (.19%) | (.01%) |
|
|
|
|
|
Total expenses |
| 1.77% | 1.94% | 1.72% |
|
|
|
|
|
Expenses before offsets |
| 1.77% | 1.92% | 1.72% |
Net expenses |
| 1.77% | 1.92% | 1.72% |
|
|
|
|
|
Portfolio turnover |
| 8% | 15% | 4% |
|
|
|
|
|
Net assets, ending (in thousands) |
| $8,174 | $7,445 | $6,709 |
|
|
|
|
|
|
|
| Years Ended | |
|
|
| September 30, | September 30, |
Class C Shares |
|
| 2007 | 2006 |
Net asset value, beginning |
|
| $16.74 | $15.59 |
Income from investment operations: |
|
|
|
|
Net investment income (loss) |
|
| ** | (.11) |
Net realized and unrealized gain (loss) |
|
| 2.09 | 1.27 |
Total from investment operations |
|
| 2.09 | 1.16 |
Distributions from: |
|
|
|
|
Net investment income |
|
| (.12) | (.01) |
Net realized gain |
|
| (.08) | — |
Total distributions |
|
| (.20) | (.01) |
Total increase (decrease) in net asset value |
|
| 1.89 | 1.15 |
Net asset value, ending |
|
| $18.63 | $16.74 |
|
|
|
|
|
Total return* |
|
| 12.56% | 7.43% |
|
|
|
|
|
Ratios to average net assets: A,B |
|
|
|
|
Net investment income (loss) |
|
| (.32%) | (1.24%) |
|
|
|
|
|
Total expenses |
|
| 1.77% | 3.04% |
|
|
|
|
|
Expenses before offsets |
|
| 1.77% | 2.00% |
Net expenses |
|
| 1.77% | 2.00% |
|
|
|
|
|
Portfolio turnover |
|
| 2% | 9% |
|
|
|
|
|
Net assets, ending (in thousands) |
|
| $7,605 | $3,240 |
Aggressive allocation fund
Financial Highlights
|
|
| Years Ended |
|
|
| September 30, | September 30, | September 30, |
Class I Shares |
| 2010 | 2009 | 2008 ### |
Net asset value, beginning |
| $13.06 | $14.46 | $16.73 |
Income from investment operations: |
|
|
|
|
Net investment income |
| .12 | .18 | .03 |
Net realized and unrealized gain (loss) |
| .90 | (.99) | (2.30) |
Total from investment operations |
| 1.02 | (.81) | (2.27) |
Distributions from: |
|
|
|
|
Net investment income |
| (.08) | (.14) | — |
Net realized gain |
| — | (.45) | — |
Total distributions |
| (.08) | (.59) | — |
Total increase (decrease) in net asset value |
| .94 | (1.40) | (2.27) |
Net asset value, ending |
| $14.00 | $13.06 | $14.46 |
Total return* |
| 7.83% | (4.41%) | (13.57%) |
Ratios to average net assets: A,B |
|
|
|
|
Net investment income |
| .89% | 1.59% | .30% (a) |
Total expenses |
| 1,348% | 2,098.82% | 1,924.45% (a) |
Expenses before offsets |
| .23% | .23% | .23% (a) |
Net expenses |
| .23% | .23% | .23% (a) |
Portfolio turnover |
| 8% | 15% | 2% |
Net assets, ending (in thousands) |
| $1 | $1 | $1 |
See notes to financial highlights.
See notes to financial highlights.
A Total expenses do not reflect amounts reimbursed and/or waived by the Advisor or reductions from expense offset arrangements. Expenses before offsets reflect expenses after reimbursement and/or waiver by the Advisor but prior to reductions from expense offset arrangements. Net expenses are net of all reductions and represent the net expenses paid by the Fund.
B Amounts do not include the activity of the underlying funds.
(a) Annualized.
* Total return is not annualized for periods less than one year and does not reflect deduction of any front-end or deferred sales charge.
** Less than $.01 per share.
### From January 31, 2008 inception.
See notes to financial statements.
Explanation of Financial Tables
Schedule of Investments
The Schedule of Investments is a snapshot of all securities held in the fund at their market value, on the last day of the reporting period. Securities are listed by asset type (e.g., common stock, corporate bonds, U.S. government obligations) and may be further broken down into sub-groups and by industry classification.
Statement of Assets and Liabilities
The Statement of Assets and Liabilities is often referred to as the fund’s balance sheet. It lists the value of what the fund owns, is due and owes on the last day of the reporting period. The fund’s assets include the market value of securities owned, cash, receivables for securities sold and shareholder subscriptions, and receivables for dividends and interest payments that have been earned, but not yet received. The fund’s liabilities include payables for securities purchased and shareholder redemptions, and expenses owed but not yet paid. The statement also reports the fund’s net asset value (NAV) per share on the last day of the reporting period. The NAV is calculated by dividing the fund’s net assets (assets minus liabilities) by the number of shares outstanding. This statement is accompanied by a Schedule of Investments. Alt ernatively, if certain conditions are met, a Statement of Net Assets may be presented in lieu of this statement and the Schedule of Investments.
Statement of Net Assets
The Statement of Net Assets provides a detailed list of the fund’s holdings, including each security’s market value on the last day of the reporting period. The Statement of Net Assets includes a Schedule of Investments. Other assets are added and other liabilities subtracted from the investments total to calculate the fund’s net assets. Finally, net assets are divided by the outstanding shares of the fund to arrive at its share price, or Net Asset Value (NAV) per share.
At the end of the Statement of Net Assets is a table displaying the composition of the fund’s net assets. Paid in Capital is the money invested by shareholders and represents the bulk of net assets. Undistributed Net Investment Income and Accumulated Net Realized Gains usually approximate the amounts the fund had available to distribute to shareholders as of the statement date. Accumulated Realized Losses will appear as negative balances. Unrealized Appreciation (Depreciation) is the difference between the market value of the fund’s investments and their cost, and reflects the gains (losses) that would be realized if the fund were to sell all of its investments at their statement-date -values.
Statement of Operations
The Statement of Operations summarizes the fund’s investment income earned and expenses incurred in operating the fund. Investment income includes dividends earned from stocks and interest earned from interest-bearing securities in the fund. Expenses incurred in operating the fund include the advisory fee paid to the investment advisor (not applicable to the Asset Allocation Funds), administrative services fees, distribution plan expenses (if applicable), transfer agent fees, shareholder servicing expenses, custodial, legal, and audit fees, and the printing and postage expenses related to shareholder reports. Expense offsets (fees paid indirectly) are also shown. Credits earned from offset arrangements are used to reduce the fund’s expenses. This statement also shows net gains (losses) realized on the sale of investments and the increase or decre ase in the unrealized appreciation (depreciation) on investments held during the period.
Statement of Changes in Net Assets
The Statement of Changes in Net Assets shows how the fund’s total net assets changed during the two most recent reporting periods. Changes in the fund’s net assets are attributable to investment operations, distributions and capital share transactions.
The Operations section of the report summarizes information detailed in the Statement of Operations. The Distribution section shows the dividend and capital gain distributions made to shareholders. The amounts shown as distributions in this section may not match the net investment income and realized gains amounts shown in the Operations section because distributions are determined on a tax basis and certain investments or transactions may be treated differently for financial statement and tax purposes. The Capital Share Transactions section shows the amount shareholders invested in the fund, either by purchasing shares or by reinvesting distributions, and the amounts redeemed. The corresponding numbers of shares issued, reinvested and redeemed are shown at the end of the report.
Financial Highlights
The Financial Highlights table provides a per-share breakdown per class of the components that affect the fund’s net asset value for current and past reporting periods. The table provides total return, total distributions, expense ratios, portfolio turnover and net assets for the applicable period. Total return is a measure of a fund’s performance that encompasses all elements of return: dividends, capital gain distributions and changes in net asset value. Total return is the change in value of an investment over a given period, assuming reinvestment of any dividends and capital gain distributions, expressed as a percentage of the initial investment. Total distributions include distributions from net investment income and net realized gains. Long-term gains are earned on securities held in the fund more than one year. Short-term gains, on the sal e of securities held less than one year, are treated as ordinary dividend income for tax purposes. The expense ratio is a fund’s cost of doing business, expressed as a percentage of net assets. These expenses directly reduce returns to shareholders. Portfolio turnover measures the trading activity in a fund’s investment portfolio – how often securities are bought and sold by a fund. Portfolio turnover is affected by market conditions, changes in the size of the fund, the nature of the fund’s investments and the investment style of the portfolio manager.
PROXY VOTING
The Proxy Voting Guidelines of the Calvert Funds that the Fund uses to determine how to vote proxies relating to portfolio securities are provided as an Appendix to the Fund’s Statement of Additional Information. The Statement of Additional Information can be obtained free of charge by calling the Fund at 1-800-368-2745, by visiting the Calvert website at www.calvert.com; or by visiting the SEC’s website at www.sec.gov.
Information regarding how the Fund voted proxies relating to portfolio securities during the most recent 12-month period ended June 30 is available on the Fund’s website at www.calvert.com and on the SEC’s website at www.sec.gov.
Availability of Quarterly Portfolio Holdings
The Fund files its complete schedule of portfolio holdings with the SEC for the first and third quarters of each fiscal year on Form N-Q. The Fund’s Form N-Q is available on the SEC’s website at www.sec.gov. The Fund’s Form N-Q may be reviewed and copied at the SEC’s Public Reference Room in Washington, DC; information on the operation of the Public Reference Room may be obtained by calling 1-800-SEC-0330.
Trustee and Officer Information Table
| # of | Other | |||
Name & | Position | Position | Principal Occupation | ||
INDEPENDENT TRUSTEES/DIRECTORS | |||||
REBECCA L. ADAMSON | Trustee Director Director Director | 1989 2000 2000 2005 | President of the national nonprofit, First People’s Worldwide, formerly First Nations Financial Project. Founded by her in 1980, First People’s Worldwide is the only American Indian alternative development institute in the country. | 17 | • Bay & Paul Foundation |
RICHARD L. BAIRD, JR. | Trustee & Director & Director & Director & | 1982 2000 2005 2005 | President and CEO of Adagio Health Inc. in Pittsburgh, PA, a non-profit corporation which provides family planning services, nutrition, maternal/child health care, and various health screening services and community preventive health programs. | 29 | None |
JOHN G. GUFFEY, JR. | Director Trustee Director Director | 1992 1982 2000 2005 | Treasurer and Director of Silby, Guffey and Co., Inc., a venture capital firm (inactive as of 2003) and President of Aurora Press Inc., a privately held publisher of trade paperbacks. | 29 | • Ariel Funds (3) • Calvert Social Investment Foundation • Calvert Ventures, LLC |
MILES DOUGLAS HARPER, III | Director Trustee Director Director | 2000 2005 2005 2005 | Partner, Gainer Donnelly & Desroches (public accounting firm) since January 1999. | 17 | • Bridgeway Funds (14) |
JOY V. JONES AGE:60
| Director Trustee Director Director | 2000 1990 2000 2005 | Attorney. | 17 | • Director, Conduit Street Restaurants Limited |
TERRENCE J. MOLLNER, Ed.D. AGE: 65 | Director Trustee Director Director | 1992 1982 2000 2005 | Founder, Chairperson, and President of Trusteeship Institute, Inc., a diverse foundation known principally for its consultation to corporations converting to cooperative employee-ownership and the development of socially and spiritually responsible investment vehicles. Chairperson, Stakeholders Capital, Inc., an asset management firm and financial services provider in Amherst, MA. | 17 | • Calvert Social Investment Foundation • Ben & Jerry's Homemade, Inc. • ArtNOW, Inc. • Yourolivebranch.org |
SYDNEY AMARA MORRIS | Trustee Director Director Director | 1982 2000 2005 2005 | Rev. Morris currently serves as Parish Minister to the Keweenaw Unitarian Universalist Fellowship in Houghton, MI. Rev. Morris is a graduate of Harvard Divinity School. She currently chairs the Umbrian Universalist Committee on Socially Responsible Investing. | 17 | None |
INTERESTED TRUSTEES/DIRECTORS | |||||||
BARBARA J. KRUMSIEK | Director & Trustee & Director & Director & | 1997 1997 2000 2000 | President, Chief Executive Officer and Chair of Calvert Group, Ltd. | 51 | • Calvert Social Investment Foundation • Pepco Holdings, Inc. • Acacia Life Insurance Company (Chair) | ||
D. WAYNE SILBY, Esq. | Director Trustee & Director & Director | 1992 1982 2000 2000 | Mr. Silby is the founding Chair of the Calvert Funds. He is the Chair-Elect and a principal of Syntao.com, a Beijing-based company promoting corporate social responsibility. He was an officer and director of Silby, Guffey and Co., Inc., a venture capital firm (inactive as of 2003). | 29 | • UNIFI Mutual Holding Company • Calvert Social Investment Foundation • Giving Assets, Inc. • Studio School Fund • Syntao.com China • The Ice Organization | ||
OFFICERS | |||||||
KAREN BECKER | Chief Compliance Officer | 2005 | Chief Compliance Officer for the Calvert Funds. In March 2009, Ms. Becker also became Head of the Securities Operations Department for Calvert Asset Management Company, Inc. | ||||
SUSAN WALKER BENDER, Esq. | Assistant Vice-President & Assistant Secretary | 1988 2000 1992 2000 | Assistant Vice President, Assistant Secretary and Associate General Counsel of Calvert Group, Ltd. | ||||
JENNIFER BERG | Assistant Fund Controller | 2009 | Fund Administration Manager for Calvert Group, Ltd. | ||||
THOMAS DAILEY | Vice President | 2004 | Vice President of Calvert Asset Management Company, Inc. | ||||
IVY WAFFORD DUKE, Esq. | Assistant Vice-President & Assistant Secretary | 1996 2000 1996 2000 | Assistant Vice President, Assistant Secretary and Deputy General Counsel of Calvert Group, Ltd., and Chief Compliance Officer for Calvert Asset Management Company, Inc. and Calvert Distributors, Inc. |
PATRICK FAUL | Vice President | 2010 | Vice President of Calvert Asset Management Company, Inc. (“CAMCO”) since 2008, and Head of Credit Research for CAMCO since 2009. Prior to 2009, Mr. Faul was Co-Head of Credit Research (2008) and a Senior Securities Analyst (prior to 2008) for CAMCO. |
TRACI L. GOLDT | Assistant Secretary | 2004 | Executive Assistant to General Counsel, Calvert Group, Ltd. |
GREGORY B. HABEEB | Vice President | 2004 | Senior Vice President of Calvert Asset Management Company, Inc. |
HUI PING HO, CPA | Assistant Treasurer | 2000 | Tax Compliance Manager of Calvert Group, Ltd. |
LANCELOT A. KING, Esq. | Assistant Vice President & Assistant Secretary | 2002 | Assistant Vice President, Assistant Secretary and Associate General Counsel of Calvert Group, Ltd. |
EDITH LILLIE | Assistant Secretary | 2007 | Assistant Secretary (since 2007) and Regulatory Matters Manager of Calvert Group, Ltd. |
AUGUSTO DIVO MACEDO, Esq. | Assistant Vice President & Assistant Secretary | 2007 | Assistant Vice President, Assistant Secretary, and Assistant Counsel Compliance of Calvert Group, Ltd. |
JANE B. MAXWELL Esq. | Assistant Vice President & Assistant Secretary | 2005 | Assistant Vice President, Assistant Secretary & Assistant General Counsel of Calvert Group, Ltd. |
ANDREW K. NIEBLER, Esq. | Assistant Vice President & Assistant Secretary | 2006 | Assistant Vice President, Assistant Secretary & Associate General Counsel of Calvert Group, Ltd. |
CATHERINE P. ROY | Vice President | 2004 | Senior Vice President of Calvert Asset Management Company, Inc. and Chief Investment Officer – Fixed Income. |
WILLIAM M. TARTIKOFF, Esq. | Vice President and Secretary | 1990 2000 1992 2000 | Senior Vice President, Secretary, and General Counsel of Calvert Group, Ltd. |
NATALIE TRUNOW | Vice resident | 2008 | Senior Vice President of Calvert Asset Management Company, Inc., and Chief Investment Officer -Equities. Prior to joining Calvert in August 2008, Ms. Trunow was the Section Head (2005-2008) and Portfolio Manager (2001-2008) for the Global Public Markets Group of General Motors Asset Management. |
RONALD M. WOLFSHEIMER CPA | Treasurer | 1982 2000 1992 2000 | Senior Vice President and Chief Financial and Administrative Officer of Calvert Group, Ltd. |
MICHAEL V. YUHAS JR., CPA | Fund Controller | 1999 2000 1999 2000 | Vice President of Calvert Administrative Services Company. |
The address of Trustees/Directors and Officers is 4550 Montgomery Avenue, Suite 1000N, Bethesda, Maryland 20814, except Mr. Silby’s address is 1715 18th Street, N.W., Washington, DC 20009. Ms. Krumsiek is an interested person of the Fund since she is an officer and director of the Fund’s advisor and certain affiliates. Mr. Silby is an interested person of the Fund since he is a director of the parent company of the Fund’s advisor.
Additional information about the Fund’s Trustees/Directors can be found in the Statement of Additional Information (SAI). You can get a free copy of the SAI at www.calvert.com, or by contacting your broker, or the Fund at 1-800-368-2745.
To Open an Account
800-368-2748
Yields and Prices
Calvert Information Network
(24 hours, 7 days a week)
800-368-2745
Service for Existing Account
Shareholders: 800-368-2745
Brokers: 800-368-2746
TDD for Hearing Impaired
800-541-1524
Branch Office
4550 Montgomery Avenue
Suite 1000 North
Bethesda, Maryland 20814
Registered, Certified
or Overnight Mail
Calvert Group
c/o BFDS,
330 West 9th Street
Kansas City, MO 64105
Web Site
www.calvert.com
Principal Underwriter
Calvert Distributors, Inc.
4550 Montgomery Avenue
Suite 1000 North
Bethesda, Maryland 20814
Calvert
Asset
Allocation Funds
Calvert’s
Family of Funds
Tax-Exempt Money
Market Funds
CTFR Money Market Portfolio
Taxable Money Market Funds
First Government Money Market Fund
CSIF Money Market Portfolio
Municipal Funds
Calvert Tax-Free Bond Fund
Taxable Bond Funds
CSIF Bond Portfolio
Income Fund
Short Duration Income Fund
Long-Term Income Fund
Ultra-Short Income Fund
Government Fund
Short-Term Government Fund
High Yield Bond Fund
Equity Funds
CSIF Enhanced Equity Portfolio
CSIF Equity Portfolio
Calvert Large Cap Growth Fund
Calvert Large Cap Value Fund
Calvert Social Index Fund
Capital Accumulation Fund
CWV International Equity Fund
New Vision Small Cap Fund
Small Cap Value Fund
Mid Cap Value Fund
Global Alternative Energy Fund
Global Water Fund
International Opportunities Fund
Balanced and Asset
Allocation Funds
CSIF Balanced Portfolio
Calvert Conservative Allocation Fund
Calvert Moderate Allocation Fund
Calvert Aggressive Allocation Fund
This report is intended to provide fund information to shareholders. It is not authorized for distribution to prospective investors unless preceded or
accompanied by a prospectus.
Note: The information on our website is not incorporated by reference into this report; our website address is included as an inactive textual reference only.
Investors should carefully consider the investment objectives, risks, charges and expenses of the Calvert Funds. This and other important information is contained in the fund’s summary prospectus and prospectus, which can be obtained from your financial professional and should be read carefully before investing. You may also call Calvert at 800/368-2745 or visit www. calvert.com.
Item 2. Code of Ethics.
(a) The registrant has adopted a code of ethics (the "Code of Ethics") that applies to its principal executive officer and principal financial officer (also referred to as “principal accounting officer”).
(b) No information need be disclosed under this paragraph.
(c) The registrant has not amended its Code of Ethics during the period covered by the shareholder report presented in Item 1 hereto.
(d) The registrant has not granted a waiver or implicit waiver from a provision of its Code of Ethics during the period covered by the shareholder report presented in Item 1 hereto.
(e) Not applicable.
(f) The registrant's Code of Ethics is attached as an Exhibit hereto.
Item 3. Audit Committee Financial Expert.
The registrant's Board of Trustees has determined that Miles D. Harper, III, an "independent" Trustee serving on the registrant's audit committee, is an "audit committee financial expert," as defined in Item 3 of Form N-CSR. Under applicable securities laws, a person who is determined to be an audit committee financial expert will not be deemed an "expert" for any purpose, including without limitation for the purposes of Section 11 of the Securities Act of 1933, as a result of being designated or identified as an audit committee financial expert. The designation or identification of a person as an audit committee financial expert does not impose on such person any duties, obligations, or liabilities that are greater than the duties, obligations, and liabilities imposed on such person as a member of the audit committee and Board of Trustees in the absence of such designation or identification.
Item 4. Principal Accountant Fees and Services.
Services fees paid to auditing firm:
| Fiscal Year | Fiscal Year | ||
| $ | %* | $ | % * |
|
|
|
|
|
(a) Audit Fees | $130,680 |
| $120,450 |
|
(b) Audit-Related Fees | $0 | 0% | $0 | 0% |
(c) Tax Fees (tax return preparation and filing for the registrant) | $23,980 | 0% | $22,748 | 0% |
(d) All Other Fees | $0 | 0% | $0 | 0% |
|
|
|
|
|
Total | $154,660 | 0% | $143,198 | 0% |
* Percentage of fees approved by the Audit Committee pursuant to (c)(7)(i)(C) of Rule 2-01 of Reg. S-X (statutory de minimis waiver of Committee’s requirement to pre-approve)
(e) Audit Committee pre-approval policies and procedures:
The Audit Committee is required to pre-approve all audit and non-audit services provided to the registrant by the auditors, and to the registrant’s investment advisor, and any entity controlling, controlled by, or under common control with the advisor that provides ongoing services to the registrant. In determining whether to pre-approve non-audit services, the Audit Committee considers whether the services are consistent with maintaining the independence of the auditors. The Committee may delegate its authority to pre-approve certain matters to one or more of its members. In this regard, the Committee has delegated authority jointly to the Audit Committee Chair together with another Committee member with respect to non-audit services not exceeding $25,000 in each instance. In addition, the Committee has pre-approved the retention of the auditors to provide tax-related s ervices related to the tax treatment and tax accounting of newly acquired securities, upon request by the investment advisor in each instance.
(f) Not applicable.
(g) Aggregate non-audit fees billed by the registrant’s accountant for services rendered to the registrant, and rendered to the registrant’s investment advisor, and any entity controlling, controlled by, or under common control with the advisor that provides ongoing services to the registrant for each of the last two fiscal years of the registrant:
| Fiscal Year | Fiscal Year | ||
| $ | %* | $ | % * |
| $11,000 | 0%* | $26,000 | 0%* |
* Percentage of fees approved by the Audit Committee pursuant to (c)(7)(i)(C) of Rule 2-01 of Reg. S-X (statutory de minimis waiver of Committee’s requirement to pre-approve)
(h) The registrant’s Audit Committee of the Board of Trustees has considered whether the provision of non-audit services that were rendered to the registrant’s investment advisor, and any entity controlling, controlled by, or under common control with the investment advisor that provides ongoing services to the registrant that were not pre- approved pursuant to paragraph (c) (7)(ii) of Rule 2-01 of Reg. S-X is compatible with maintaining the principal accountant’s independence and found that the provision of such services is compatible with maintaining the principal accountant’s independence.
Item 5. Audit Committee of Listed Registrants.
Not applicable.
Item 6. Schedule of Investments.
(a) This Schedule is included as part of the report to shareholders filed under Item 1 of this Form.
(b) Not applicable.
Item 7. Disclosure of Proxy Voting Policies and Procedures for Closed-End Management Investment Companies.
Not applicable.
Item 8. Portfolio Managers of Closed-End Management Investment Companies
Not applicable.
Item 9. Purchases of Equity Securities by Closed-End Management Investment Company and Affiliated Purchasers.
Not applicable.
Item 10. Submission of Matters to a Vote of Security Holders.
No material changes were made to the procedures by which shareholders may recommend nominees to the registrant’s Board of Trustees since registrant last provided disclosure in response to this Item.
Item 11. Controls and Procedures.
(a) The principal executive and financial officers concluded that the registrant's disclosure controls and procedures (as defined in Rule 30a-3(c) under the 1940 Act) are effective, based on the evaluation of these controls and procedures required by Rule 30a-
3(b) under the 1940 Act and Rules 13a-15(b) or 15d-15(b) under the Exchange Act, as of a date within 90 days of the filing date of this report.
(b) There was no change in the registrant's internal control over financial reporting (as defined in Rule 30a-3(d) under the 1940 Act) that occurred during the registrant's second fiscal quarter of the period covered by this report that has materially affected, or is reasonably likely to materially affect, the registrant's internal control over financial reporting.
Item 12. Exhibits.
(a)(1) A copy of the Registrant’s Code of Ethics.
Attached hereto.
(a)(2) A separate certification for each principal executive officer and principal financial officer of the registrant as required by Rule 30a-2 under the Act (17 CFR 270.30a-2).
Attached hereto.
(a)(3) Not applicable.
(b) A certification for the registrant's Principal Executive Officer and Principal Financial Officer, as required by Rule 30a-2(b) under the Investment Company Act of 1940, is attached hereto. The certification furnished pursuant to this paragraph is not deemed to be "filed" for purposes of Section 18 of the Securities Exchange Act of 1934, or otherwise subject to the liability of that section. Such certification is not deemed to be incorporated by reference into any filing under the Securities Act of 1933 or the Securities Exchange Act of 1934, except to the extent that the registrant specifically incorporates it by reference.
Pursuant to the requirements of the Securities Exchange Act of 1934 and the Investment Act of 1940, the registrant has duly caused this report to be signed on its behalf by the undersigned, thereunto duly authorized.
CALVERT SOCIAL INVESTMENT FUND
By: /s/ Barbara J. Krumsiek
Barbara J. Krumsiek
Senior Vice President -- Principal Executive Officer
Date: December 01, 2010
Pursuant to the requirements of the Securities Exchange Act of 1934 and the Investment Act of 1940, this report has been signed below by the following persons on behalf of the registrant and in the capacities and on the dates indicated.
/s/ Barbara J. Krumsiek
Barbara J. Krumsiek
Senior Vice President -- Principal Executive Officer
Date: December 01, 2010
/s/ D. Wayne Silby
D. Wayne Silby
President -- Principal Executive Officer
Date: December 01, 2010
/s/ Ronald M. Wolfsheimer
Ronald M. Wolfsheimer
Treasurer -- Principal Financial Officer
Date: December 01, 2010