UNITED STATES
SECURITIES AND EXCHANGE COMMISSION
Washington, D.C. 20549
FORM N-CSR
CERTIFIED SHAREHOLDER REPORT OF REGISTERED
MANAGEMENT INVESTMENT COMPANIES
Investment Company Act file number: 811-3334
CALVERT SOCIAL INVESTMENT FUND
(Exact name of registrant as specified in charter)
4550 Montgomery Avenue
Suite 1000N
Bethesda, Maryland 20814
(Address of Principal Executive Offices)
William M. Tartikoff, Esq.
4550 Montgomery Avenue
Suite 1000N
Bethesda, Maryland 20814
(Name and Address of Agent for Service)
Registrant's telephone number, including area code: (301) 951-4800
Date of fiscal year end: September 30
Date of reporting period: Twelve months ended September 30, 2011
<PAGE>
Item 1. Report to Stockholders. (Calvert Money Market Portfolio, Calvert Equity Portfolio and Calvert Enhanced Equity Portfolio only)
INFORMATION REGARDING CALVERT OPERATING COMPANY
NAME CHANGES
Effective on April 30, 2011, the following Calvert operating companies changed their names as indicated:
| Old Name | New Name | Company Description |
| Calvert Group, Ltd. | Calvert Investments, Inc. | Corporate parent of each |
| operating company listed | ||
| below | ||
| Calvert Asset Management | Calvert Investment | Investment advisor to the |
| Company, Inc. | Management, Inc. | Calvert Funds |
| Calvert Distributors, Inc. | Calvert Investment Distributors, | Principal underwriter |
| Inc. | and distributor for the | |
| Calvert Funds | ||
| Calvert Administrative | Calvert Investment | Administrative services |
| Services Company | Administrative Services, Inc. | provider for the Calvert |
| Funds | ||
| Calvert Shareholder | Calvert Investment Services, | Shareholder servicing |
| Services, Inc. | Inc. | provider for the Calvert |
| Funds | ||
Choose Planet-friendly E-delivery!
Sign up now for on-line statements, prospectuses, and fund reports. In less than five minutes you can help reduce paper mail and lower fund costs.
Just go to www.calvert.com. If you already have an online account at Calvert, click on My Account, and select the documents you would like to receive via e-mail.
If you’re new to online account access, click on Login/Register to open an online account. Once you’re in, click on the E-delivery sign-up at the bottom of the Account Portfolio page and follow the quick, easy steps. Note: if your shares are not held directly at Calvert but through a brokerage firm, you must contact your broker for electronic delivery options available through their firm.

TABLE
OFCONTENTS
4 Founding Chairman’s Letter
7 President’s Letter
10 SRI Update
12 Calvert Money Market Portfolio Management Discussion
15 Calvert Equity Portfolio Management Discussion
20 Calvert Enhanced Equity Portfolio Management Discussion
25 Shareholder Expense Example
28 Report of Independent Registered Public Accounting Firm
29 Statements of Net Assets
40 Notes to Statements of Net Assets
43 Statements of Operations
44 Statements of Changes in Net Assets
49 Notes to Financial Statements
63 Financial Highlights
74 Explanation of Financial Tables
76 Proxy Voting and Availability of Quarterly Portfolio Holdings
78 Trustee and Officer Information Table

Dear Investor,
Financial markets have been very volatile over the past year. While your Calvert Portfolios have provided modest positive returns, investors overall are understandably nervous.
All investments entail a higher degree of uncertainty right now as markets are highly correlated and continue to suffer from the “risk on, risk off” syndrome—where investors seek risk everywhere when they’re feeling better about the economy and shun it completely when fears renew. The good news is so much money sits on the sidelines at the moment that any improvement in sentiment can quickly rally the markets.
While markets are typically driven by the financial economy, today they’re much more concerned with the political economy. America’s loss of its Standard & Poor’s AAA credit rating had more to do with political gridlock in Washington than inherent financial problems. European politicians seem to be delaying the necessary bazooka-like changes to resolve ongoing sovereign debt issues, although the financial markets no longer believe they have much road left for “kicking the can.” China is undergoing its scheduled leadership change, which often impedes needed progressive reforms and encourages the hardlin-ers.
In My Opinion
In these times, we need our leaders to articulate a strong vision. Instead, our leaders seem to have a vision of political compromises, which leaves everyone confused as to the underlying plan. The Tea Party and Occupy Wall Street are sparking important conversations about values in this increasingly globalized world. The question is: are the participants just estranged from the system or did the system become estranged from them?
One in four Americans does not graduate high school in four years. One percent of the population has more than 40% of the financial wealth. Wall Street is no longer about the responsible allocation of capital, but about personal bonuses—the largest of which are derived from playing zero-sum games. A few bad apples cause a proliferation of regulations that are burdensome to business and increase consumer costs. Given all this, it’s easy to see how the system may have contributed to the public’s growing alienation.
Meanwhile, the list of issues our government needs to address keeps growing, such as climate change, military spending, the housing crisis, entitlement reform, energy policy, and immigration reform. I can’t remember a time when our financial economy has been so dependent on political resolve. On one level, it’s good the public has awakened around our more intractable issues. But globalization is a reality and the unskilled jobs are not coming back.
www.calvert.com CALVERT SOCIAL INVESTMENT FUND ANNUAL REPORT 4
Sustainable and Responsible Investing in Turbulent Times
As stewards of your money in these turbulent times, Calvert continues to engage with companies about taking the high road with environmental, social, and governance factors.
Shareholder Advocacy
Calvert filed 38 resolutions in the 2011 proxy season with 28 successfully withdrawn after companies agreed to the terms of the resolution. Topics included climate change risks and principles, sustainability reporting, board diversity, disclosure of political contributions, and majority voting procedures.
As the impact of climate change becomes increasingly evident, the consequences on vulnerable, impoverished communities around the world cannot be ignored. We believe businesses can contribute to—and benefit from—their own preparation efforts. To that end, Calvert has joined with leading companies to launch the Partnership for Resilience and Environmental Preparedness (PREP), which promotes business practices that help companies and communities gear up for climate change. PREP also advocates for climate adaptation and resilience-building public policies to mitigate the risk of climate variability.
In October, Calvert will co-host UNEP FI, a United Nations initiative to bring investors and companies together on more detailed initiatives and best practices, such as energy efficiency in buildings. Barbara Krumsiek, Calvert’s CEO, is providing leadership among the more than 300 attendees and serves as co-chair.
Special Equities
A small part of your fund’s investment goes into small new companies that are not yet public but aim to be financially rewarding and have strong social impact that addresses real human needs.1 One recent investment was PresenceLearning, a firm that provides live, online speech therapy to students via web-based video conference technology. A national shortage of speech therapists prevents many students with severe communication disorders from receiving therapy. Now, the company’s distributed network technology enables specialists to serve more students in a more cost-efficient manner.
Another recent investment was DBL Equity Fund. DBL is a women-led firm that stands for “double bottom line” and invests in companies seeking to deliver venture capital returns while working with their companies to create social, environmental, and economic improvement in their region.
Community Investments
Many of our Funds participate in Calvert’s High Social Impact Investing program, which is administered through the Calvert Foundation.2 This community investment program may allocate a small percentage of Fund assets at below-market interest rates to investments that provide economic opportunity for struggling populations.
www.calvert.com CALVERT SOCIAL INVESTMENT FUND ANNUAL REPORT 5
Local banks were unwilling to help South African company Bio2Watt, which converts manure into energy, but Foundation partner E + Co supported the company with funding as well as technology assistance. Today, Bio2Watt can generate enough power round-the-clock for 1,000 homes. It is also decentralizing the power supply, alleviating landfill burdens and water pollution, and generating jobs for locals.
St. John’s Bread & Life in Brooklyn, New York was able to expand to serving 450,000 meals a year thanks to funding from Foundation borrower Low Income Investment Fund. St. John’s also provides nutrition counseling, health and hygiene products, workforce development, literacy training, psychiatric services, and substance abuse counseling to its clients. Client Naishaune Spencer said, “I ran with the wrong crowd and ended up homeless, jobless, and in a whole lot of trouble. With the help of St. Johns, I was able to go back to school, get a great job, have a steady income and, most significantly, get my first apartment.” You can read more about the Foundation’s activities at its website.
We thank you again for your investment, which has enabled Calvert to be a leader in the area of corporate responsibility and the growing impact investing movement through the innovative programs named above. The values expressed by our work and your investments create positive models for governments in these times of global political crisis.

D. Wayne Silby
Founding Chair
1 As of September 30, 2011, PresenceLearning and DBL Equity Fund represented 0.01% and 0.02% of Calvert Equity Portfolio. All holdings are subject to change without notice.
2 As of September 30, 2011, Calvert Social Investment Foundation (“Calvert Foundation” or “Foundation”) Community Investment Notes represented 0.50% of the net assets of Calvert Equity Portfolio. The Calvert Foundation is a 501(c)(3) nonprofit organization. The Foundation’s Community Investment Note Program is not a mutual fund and should not be confused with any Calvert Investments-sponsored investment product.
www.calvert.com CALVERT SOCIAL INVESTMENT FUND ANNUAL REPORT 6
Dear Shareholders:
After a strong finish to 2010 and start of the new year, the U.S. economy lost its footing in the summer of 2011. Hope for a second-half rebound gave way to concerns we were heading into another recession as consumer insecurity, a weak job market, the looming sovereign debt crisis in Europe, and uncertainty about the direction of U.S. and European policy weighed on economic growth and turned markets into a roller coaster.
The final months of the reporting period were particularly difficult for equities amid significant market volatility in the financial markets. After U.S. government debt lost its Standard & Poor’s triple A rating for the first time in history, already anxious investors flocked to the relative safety of cash and Treasuries, despite very low short-term yields. In the end, third-quarter market turmoil more than erased stock market gains made through the first six months of 2011. In fact, the -13.87% third-quarter return for the Standard & Poor’s 500 Index was the biggest quarterly drop for that index since the financial meltdown in the fourth quarter of 2008.
The 2008-2009 Financial Crisis -- Where Are We Now?
There have been many media comparisons to the third quarter of 2008 recently, so I think it’s worth noting some key differences. Despite third-quarter events, equity markets are still generally ahead of where they were in the depths of the financial crisis, as the S&P 500 Index and Russell Mid-Cap Index returned an annualized 1.23% and 3.96% for the three-year period ended September 30, 2011. Also, unlike 2008, the stock market seems to be rebounding quickly, having regained much of the lost ground in the first two weeks of October.
While still high, the unemployment rate has decreased a full percentage point from its recession peak. And in a direct month-to-month comparison, the United States added 103,000 jobs in September 2011 (58,000 if you exclude the return of striking Verizon workers) versus losing 434,000 jobs in September 2008.1 In housing, builder confidence in the current market for new single-family homes as measured by the National Association of Home Builders/Wells Fargo Housing Market Index (HMI) rose four points to 18 for October 2011--a sign that pockets of recovery in housing may be starting to emerge across the country. The HMI index is also four points higher than it was in October 2008.
Energy prices have fallen, too--after soaring to $150 a barrel, crude oil hovered around $80 a barrel at the end of September 2011. While prices at the pump did not decrease proportionately, they are lower, which is good for consumers’ wallets and oil-dependent industries. In fact, reports show retail sales have notched up in recent weeks--a sign that consumers are starting to spend a bit more freely now. And although household debt still exceeds consumers’ after-tax income, it fell 12% between its record high in September 2007 and June of this year.2
www.calvert.com CALVERT SOCIAL INVESTMENT FUND ANNUAL REPORT 7
The bottom line is that economic recovery may continue to be more two-steps-forward-one-step-back rather than the straight line progress we’d all prefer, but the recovery is happening. In the meantime, the expertise of your Calvert fund managers will help guide your investments through the ups and downs that may lie ahead.
Board Diversity and Company Competitiveness
As always, we filed several shareholder resolutions this year asking companies to consider diverse candidates during their board selection. Most were successfully withdrawn after the companies agreed to add specific considerations of race, gender and ethnicity to their selection process. However, Urban Outfitters was one of two companies that opposed the resolution that we filed.
Unlike its five biggest apparel-industry competitors, Urban Outfitters doesn’t have any women or minorities on its board. This is particularly disconcerting since 53% of its North American net retail store sales in fiscal 2011 came from its Anthropologie and Free People stores for women. Of course, the Urban Outfitters flagship store heavily caters to women too. Smart companies understand the importance of having management that reflects their target audiences and Urban Outfitters is certainly missing the mark.
We pressed on and 22% of shareholders voted in favor of the resolution. The battle received a good deal of attention in the press, although it remains to be seen if the company will heed the call of its shareholders.
Your Financial Advisor Is Always Available
It’s easy to be a long-term investor when markets are strong. The challenge is to remain one when markets are going through a protracted period of uncertainty. While it may take longer than we’d like, markets have always recovered in the past and I am confident they will do so again. These cycles are simply the nature of the market.
In times like these, it’s best to stay the course, maintaining a well-diversified mix of U.S. and international stocks, bonds, and cash appropriate for your goals and risk tolerance. However, if you think your financial needs or risk tolerance have changed, your financial advisor is always available to discuss your concerns.
www.calvert.com CALVERT SOCIAL INVESTMENT FUND ANNUAL REPORT 8
We also invite you to visit our website, www.calvert.com, for fund information, portfolio updates, and commentary from Calvert professionals. As always, we thank you for entrusting your investments to Calvert.

Barbara J. Krumsiek
President and CEO
Calvert Investments, Inc.
October 2011
1 Bureau of Labor Statistics
2 Center for American Progress, Economic Snapshot for September 2011
www.calvert.com CALVERT SOCIAL INVESTMENT FUND ANNUAL REPORT 9
As always, Calvert continues to work hard to ensure you have a say in the responsible management of environmental, social, and governance (ESG) factors for the companies in which we invest. While some highlights from the reporting period were noted in the Founding Chairman’s letter, more are detailed below.
Majority Vote in Director Elections
Shareholders’ role in electing a board of directors is a fundamental part of ensuring accountability. Unfortunately, many companies weaken this role by conducting elections under a plurality rather than a majority standard—which essentially means a director nominee can be elected with only his or her own affirmative vote.
Calvert filed four shareholder proposals calling for companies to adopt majority voting this year. Those at Plains Exploration and Production, Global Payments, and Agco were withdrawn after the companies agreed to the requested changes. Hansen Natural responded with minor improvements to their election process. But we felt they were insufficient, so we kept the resolution on the ballot and 48% of shareholders voted in favor of it.
Update on Board Diversity
Persuading companies to make their boards more representative of their customers, employees and other target audiences continues to be an important initiative. In August, Calvert Senior Sustainability Analyst Aditi Mohapatra published an article in Forbes magazine, “Are There Really Boards With No Women?” The article highlighted the fact that women still hold only 18% of corporate board posts at S&P 100 companies, despite a growing body of evidence proving the business case for diverse boards.
Also, five resolutions seeking a proactive commitment to include women and minorities as part of every board director search were filed this year. Three were successfully withdrawn before the annual meeting. The remaining two—at Urban Outfitters and American Financial Group—received strong support with 22% and 27% of shareholder votes.
First U.S. Automaker Added to Calvert Social Index
Another notable event was Ford Motor becoming the first U.S. automaker to qualify for Calvert Signature Funds and be added to the Calvert Social Index. Ford has emerged in recent years as the fuel efficiency leader among the big three U.S. auto manufacturers. A review of Ford’s key industry impacts, as well as our engagement with the company over the past four years, ensured that it met our environment, social, and governance (ESG) criteria for investment.
www.calvert.com CALVERT SOCIAL INVESTMENT FUND ANNUAL REPORT 10
While we remain concerned about the overall impact of automobile companies on issues such as greenhouse emissions, we believe Ford and the foreign automakers Calvert invests in are taking meaningful steps to reduce the negative environmental impacts of their products. Of course, we will continue to seek improvement on key issues by working with senior management of all these companies.
As of September 30, 2011, the following companies represented the following percentages of net assets: Global Payments 0%, Agco 0%, Hansen Natural 0%, Urban Outfitters 0%, American Financial Group 2.18% of Calvert Enhanced Equity Portfolio, and Ford 0%. All holdings are subject to change with out notice.
www.calvert.com CALVERT SOCIAL INVESTMENT FUND ANNUAL REPORT 11
| CALVERT MONEY MARKET PORTFOLIO September 30, 2011 Investment performance (total return) | |||||
| 6 months | 12 months | ||||
| ended | ended | ||||
| 9/30/11 | 9/30/11 | ||||
| Class O | 0.005 | % | 0.01 | % | |
| Lipper Money Market Funds Average | 0.01 | % | 0.02 | % | |
| Performance For the 12-month period ended September 30, 2011, Calvert Money Market Portfolio returned 0.01% compared to 0.02% for its benchmark, the Lipper Money Market Funds Average. | |||||
| Average Annual Total Returns | |||||
| One year | 0.01 | % | |||
| Five year | 1.72 | % | |||
| Ten year | 1.70 | % | |||
| 7-day Simple/Effective Yield | |||||
| Investment Climate | 7-day simple yield | 0.01 | % | ||
| The 12-month period that ended September 30, 2011 was marked by unexpected turns and financial market volatility. U.S. economic growth slowed to an estimated 1.5% annual rate during the reporting period,1 while the inflation rate rose. The core consumer price index (CPI) annual rate was 2.0% by August 2011.2 | |||||
| 7-day effective yield | 0.01 | % | |||
| Investment Allocation | % of Total Investments | ||||
| Variable Rate | 85.7 | % | |||
| Demand Notes | |||||
| U.S. Government Agencies and Instrumentalities | 8.8 | % | |||
| Municipal Obligations | 3.0 | % | |||
| Total return assumes reinvestment of represents past performance and does not guarantee future results. Investment return will fluctuate so that current performance may be lower or higher than the performance data quoted. An investment in the Portfolio is not insured or guaranteed by the Federal Deposit Insurance Corporation or any other government agency. Although the Portfolio seeks to preserve the value of your invest- ment at $1.00 per share, it is possible to lose money by investing in the Portfolio. Visit www.calvert.com for current performance data. | U.S. Treasury | 2.2 | % | ||
| Time Deposit | 0.2 | % | |||
| Loans and Deposit Receipts | |||||
| Guaranteed by U.S. | |||||
| Government Agencies | 0.1 | % | |||
| Total | 100 | % | |||
www.calvert.com CALVERT SOCIAL INVESTMENT FUND ANNUAL REPORT 12
After completing its second round of quantitative easing (known as QE2), the Federal Reserve (Fed) was expected to move to the sidelines. However, it proceeded to introduce two additional easing measures. In August, shortly after QE2 ended, the Fed announced that it would extend the promise of near-zero short-term interest rates perhaps until mid-2013. Then, in September, the Fed introduced “operation twist,” a program to sell $400 billion of shorter-maturity Treasuries and buy longer-maturity Treasuries with the proceeds.
After a period of calm, the euro-area debt crisis surged to the forefront of investors’ concerns once again in mid-2011. Widespread unease about the effects of sovereign debt on European banks flowed over into non-European markets. This made for a rough trading summer, as stocks and bonds with credit risk fell. The U.S. Congress’s mid-year flirt with voluntary default on U.S. government debt heightened investors’ anxiety. Policy tightening by central banks in emerging countries, where stronger growth has pushed inflation higher, also contributed to concerns about global growth.
In this uncertain environment, major U.S. bond market sector indices delivered positive returns for the reporting period.3 Interest rates generally moved lower over the reporting period. The three-month Treasury bill yield fell to 0.02% from 0.16%. The benchmark 10-year Treasury note yield declined 0.61 percentage points to finish the reporting period at 1.92%. The average yield for Moody’s Baa-rated corporate bonds was 5.22% at the end of September 2011, down 0.36 percentage points. Finally, the average rate on a 30-year conventional mortgage fell 0.31 percentage points to 4.01%.4
Portfolio Strategy
Since money-market rates remained at historically low levels, we maintained our strategy of investing in high-grade, conservative securities. The Portfolio’s primary investments include liquid variable-rate demand notes and U.S. government securities, including agencies and Treasuries. We believe the strategy helps us provide liquidity and preserve principal, while remaining true to the Fund’s sustainable investment criteria.
Our Fund, like all money-market funds, is subject to the stringent guidelines of Rule 2a-7, which was established under the Investment Company Act of 1940 and influences the credit quality, maturity, and liquidity of investments in money-market funds. Recent changes to the rule have created even stronger guidelines designed to further enhance credit, liquidity, and transparency. Calvert’s internal diversification guidelines are designed to limit risk even further.
www.calvert.com CALVERT SOCIAL INVESTMENT FUND ANNUAL REPORT 13
Outlook
We expect the rest of 2011 to unfold with financial markets fitfully trying to understand and adjust to the ongoing debt struggles of the major western nations and Japan. Policymakers’ decisions will continue to have great potential to move global financial markets. Government footprints in credit markets will remain large. The U.S. gross domestic product growth rate is likely to remain modest and choppy as the country continues to recover from the severe financial crisis of 2007 through 2009. History suggests that recovery from a severe financial crisis that was rooted in excessive debt will take several more years at least. It also indicates that rates of economic growth and consumer price inflation will tend to run below pre-crisis averages. This does not, however, preclude stretches of stronger growth, something markets have heavily discounted.
Within this bigger picture, we expect the issues that have driven markets in 2011 to remain intact. First, the potential for very slow U.S. economic growth remains high, and there is a higher risk of recession amid tightening U.S. fiscal policy and little additional capacity for strong monetary stimulus. Second, it is likely that we will experience ongoing financial market volatility stemming from the euro-area debt crisis. Finally, tighter monetary policies in emerging countries may constrain global growth. As investors’ perceptions of these factors change, markets will react, at times sharply. We expect to experience generally heightened levels of financial market volatility. There is potential for acute bouts of great volatility.
The Fed has taken the highly unusual stance of forecasting its intention to keep the federal funds rate low until mid-2013. Therefore, we foresee continuing with our current strategy of conservative investing with the objective of preserving principal. We believe this is what many investors are seeking, as approximately $2.6 trillion was invested in taxable and tax-exempt money-market funds as of September 2011.
October 2011
1 Calculated based on data from the Commerce Department and the Wall Street Journal Survey of Economic Forecasters.
2 Bureau of Labor Statistics
3 Barclays Capital
4 Source for all interest rates: Federal Reserve H.15 report
www.calvert.com CALVERT SOCIAL INVESTMENT FUND ANNUAL REPORT 14
PORTFOLIO MANAGEMENT DISCUSSION
Richard England
of Atlanta Capital Management Company
Investment Performance
For the 12 months ended September 30, 2011, Calvert Equity Portfolio’s Class A shares (at NAV) returned 1.07% compared with a return of 1.14% for the Standard and Poor’s (S&P) 500 Index.
Investment Climate
Here we go again. As I write this letter in early October, the markets struggle to find their footing and gloom about the global economy seems to grow almost every day. The relative calm of fall 2010 seems long ago. Renewal of the so-called Bush tax cuts provided a rare moment of bipartisanship and helped the economy and market gather a bit of steam. But that was about as good as it got.
The push for political freedom in the Middle East and North Africa, higher oil prices, disasters in Japan, and the resurfacing sovereign debt crisis in Europe affected companies and economies around the globe as softening data painted a picture of an economy sliding backward.
| CALVERT EQUITY |
| PORTFOLIO |
| September 30, 2011 |
| Investment performance | ||||
| (total return at NAV*) | ||||
| 6 months | 12 months | |||
| ended | ended | |||
| 9/30/11 | 9/30/11 | |||
| Class A | -14.01 | % | 1.07 | % |
| Class B | -14.38 | % | 0.21 | % |
| Class C | -14.30 | % | 0.34 | % |
| Class I | -13.76 | % | 1.62 | % |
| Class Y | -13.86 | % | 1.43 | % |
| S&P 500 Index | -13.78 | % | 1.14 | % |
| Lipper Large-Cap | ||||
| Growth Funds | ||||
| Average | -14.59 | % | 0.27 | % |
| Ten Largest Stock Holdings | % of Net Assets | |
| Allergan, Inc. | 4.9 | % |
| Apple, Inc. | 4.8 | % |
| QUALCOMM, Inc. | 4.3 | % |
| Cameron International Corp. | 3.2 | % |
| T. Rowe Price Group, Inc. | 3.2 | % |
| Gilead Sciences, Inc. | 2.9 | % |
| Cognizant Technology | ||
| Solutions Corp. | 2.6 | % |
| Novartis AG (ADR) | 2.5 | % |
| CVS Caremark Corp. | 2.5 | % |
| International Business | ||
| Machines Corp. | 2.5 | % |
| Total | 33.4 | % |
*Investment performance/return at NAV does not reflect the deduction of the Fund’s maximum 4.75% front-end sales charge or any deferred sales charge.
www.calvert.com CALVERT SOCIAL INVESTMENT FUND ANNUAL REPORT 15
The final straw for investors was the game of chicken Republicans and Democrats played over the debt ceiling and subsequent downgrade of U.S. sovereign debt by Standard and Poor’s. If we have to worry about whether the United States can pay its debts, how can anything be counted on? Uncertainty reigns so the markets remain extremely volatile.
More recently, a toxic brew of fear, uncertainty and politics combined to drive stocks even lower. The market can adjust to what it understands, but investors eventually throw up their hands and head for the exits when the ability to reasonably forecast is absent. That’s exactly what we got.
The extreme market volatility since early June dominated sector returns for the year. While the S&P 500 Index as a whole rose about 1%, the spread between the best and worst sectors was very wide. Financials was by far the worst, falling over 16%, although Materials and Industrials declined moderately as well. On the other hand, the ultra-safe Utilities sector rose nearly 12% and Consumer Staples did almost as well, rising nearly 10%. Everything else was fairly tightly clustered around a 4% to 6% increase.
Portfolio Strategy
Throughout the period, we remained positioned to benefit from continued growth in the global economy. We realize growth is hardly robust, but in many cases our stocks are outgrowing their peers and industries or creating new markets. The nicks and dings to economic growth through the spring and early summer were largely shrugged off by our holdings. However, that changed in mid-August.
Since the U.S. debt downgrade and resulting big sell-off, the market has risen or fallen almost 10% eight different times. That’s a historic amount of volatility and reflects ris-
CALVERT EQUITY PORTFOLIO
September 30, 2011
Average Annual Total Returns
| Class A Shares | (with max. load) | |
| One year | -3.72 | % |
| Five year | 0.33 | % |
| Ten year | 3.60 | % |
| Class B Shares | (with max. load) | |
| One year | -4.79 | % |
| Five year | 0.22 | % |
| Ten year | 3.21 | % |
| Class C Shares | (with max. load) | |
| One year | -0.66 | % |
| Five year | 0.53 | % |
| Ten year | 3.30 | % |
| Class I Shares | ||
| One year | 1.62 | % |
| Five year | 1.87 | % |
| Ten year | 4.68 | % |
| Class Y Shares* | ||
| One year | 1.43 | % |
| Five year | 1.50 | % |
| Ten year | 4.21 | % |
*Calvert Equity Portfolio first offered Class Y shares on October 31, 2008. Performance prior to that date reflects the performance of Class A shares at net asset value (NAV). Actual Class Y share performance would have been different.
www.calvert.com CALVERT SOCIAL INVESTMENT FUND ANNUAL REPORT 16
Growth of $10,000
The graph below shows the value of a hypothetical $10,000 investment in the fund over the past 10 fiscal year periods. The results shown are for Class A shares and reflect the deduction of the maximum front-end sales Class A charge of 4.75% and assume the reinvestment of dividends. The result is compared with benchmarks that include a broad based market index and a Lipper peer group average. Market indexes are unmanaged and their results do not reflect the effect of expenses or sales charges. The Lipper average reflects the deduction of the category’s average front-end sales charge. The value of an investment in a different share class would be different.
All performance data shown, including the graph above and the adjacent table, represents past performance, does not guarantee future results, assumes reinvestment of dividends and distributions and does not reflect the deduction of taxes that a shareholder would pay on the Portfolio’s distributions or the redemption of the Portfolio shares. The investment return and principal value of an investment will fluctuate so that an investor’s shares, when redeemed, may be worth more or less than their original cost. Current performance may be lower or higher than the performance data quoted; for current performance data visit www.calvert.com. The gross expense ratio from the current prospectus for Class A shares is 1.23%. This number may differ from the expense ratio shown elsewhere in this report because it is based on a different time period and, if applicable, does not include fee or expense waivers. Performance data quoted already reflects the deduction of the Portfolio’s operating expenses.
www.calvert.com CALVERT SOCIAL INVESTMENT FUND ANNUAL REPORT 17
ing uncertainty and pessimism and increasing acceptance that another recession is inevitable. The results have been both a rush for the exits and a push into very defensive sectors where investors stayed invested. Our growth-oriented holdings did not fare as well during this churning.
Positive performance primarily came from stocks that fared better than their peers. The leading performer was Green Mountain Coffee Roasters, as deals to deliver Dunkin’ Donuts and Starbucks products with Green Mountain’s Keurig single-serve brewing system bolstered the company’s growth. Chipotle Mexican Grill, Amazon.com and Allergan also made very significant contributions.
We had poor performers too, as Suncor and several other Energy companies fell sharply in the last quarter due to deteriorating expectations for global growth. In that environment, big, slow-growing, integrated producers we don’t own (like ExxonMobil) outperformed.
Peculiarly, some of our worst performers were banks. We have been favorably disposed to them based on extremely low valuations, improving credit performance, and growing returns of capital to shareholders. While our expectations for the fundamentals have largely been met, the stocks have still performed poorly due to mounting fears of a renewed recession. However, many of the banks we didn’t own fared even worse.
CALVERT EQUITY PORTFOLIO STATISTICS
September 30, 2011
| % of Total | ||
| Economic Sectors | Investments | |
| Consumer Discretionary | 14.1 | % |
| Consumer Staples | 8.8 | % |
| Energy | 8.4 | % |
| Financials | 13.8 | % |
| Health Care | 14.0 | % |
| Industrials | 8.9 | % |
| Information Technology | 26.4 | % |
| Limited Partnership Interest | 0.3 | % |
| Materials | 2.2 | % |
| Time Deposit | 2.6 | % |
| Venture Capital | 0.5 | % |
| Total | 100 | % |
I’d be remiss if I didn’t comment on Netflix, a large Portfolio holding, which stubbed its toe badly in mid-September. The dramatic decline cost us significant performance, although its previous strong performance still led to a positive return for the period. That doesn’t make me feel much better, but it’s worth noting. I have issues with the company’s moves and as I write these words, I’m on a plane to meet with the CEO and CFO and get some key questions answered. It’s hard not to believe in the company’s long-term
www.calvert.com CALVERT SOCIAL INVESTMENT FUND ANNUAL REPORT 18
positioning, but we’ll see.
Outlook
It’s hard not to be pessimistic. Unemployment seems intractable. Housing is still in the doldrums. Both political parties are in campaign mode, not solutions mode. Europe seems very complicated, opaque, and difficult to handicap. Emerging markets today are slowing and may slow too much to provide a dependable source of global growth. The average American and European increasingly feels like the system, be it political or economic, doesn’t work any more.
From an intermediate- to longer-term perspective, the best time to purchase any asset is when it feels most uncomfortable. I’m not really sure what three months from now looks like; the three-year view is a lot clearer. After all, it doesn’t make much sense to me that investors would buy a 10-year U.S. Treasury note with a certain 1.9% yield instead of the S&P 500 Index, which has a near-certain yield of 2.0% and gives you a call option on appreciation of the underlying stocks over the coming 10 years. But that’s the math of extreme fear and uncertainty.
More practically, we do not expect a new recession. The U.S. economy is muddling through, and as long as Europe does not implode, we expect that to continue. It will be harder for Europe to avoid recession, but we believe stock markets around the world already discount a renewed recession. If it does not arrive, the stock market right now is very cheap.
It’s tough out there right now. The silver lining in the current stock market cloud is that it creates opportunities to position the Portfolio for the rebound to come—whenever it comes. The companies we own are well-positioned to prosper in the years ahead. When the fear recedes, their advantages will again be recognized.
October 2011
The following companies represented the following percentages of net assets as of September 30, 2011: Green Mountain Coffee Roasters 2.35%, Chipotle 1.71%, Suncor 2.44%, Amazon 1.50%, Allergan 4.85%, ExxonMobil 0%, and Netflix 0.92%. Holdings are subject to change without notice.
www.calvert.com CALVERT SOCIAL INVESTMENT FUND ANNUAL REPORT 19
PORTFOLIO MANAGEMENT DISCUSSION

Natalie A.
Trunow,
Senior Vice President, Chief Investment Officer - Equities of Calvert Investment Management, Inc.
Investment Performance
Calvert Enhanced Equity Portfolio Class A shares (at NAV) returned 1.43% for the 12-month period ended September 30, 2011, outperforming the 0.91% return of the Russell 1000 Index. The Fund’s outperformance was driven primarily by strong stock selection, although sector allocation also helped returns.
Investment Climate
A strong performance by equity markets in the fourth quarter of 2010 and modest gains in the first half of 2011 were largely erased by stocks’ dismal performance in the third quarter of 2011. Despite healthy earnings from U.S. companies, macroeconomic troubles became the focus of attention and weighed on investor sentiment.
Over the past four quarters, the Standard & Poor’s 500 and Russell 1000 Indices returned 1.14% and 0.91%, respectively. International stocks fared considerably worse with the MSCI EAFE IMI and MSCI Emerging Markets IMI Indices returning
CALVERT ENHANCED EQUITY PORTFOLIO
September 30, 2011
Investment Performance
(total return at NAV*)
| 6 months | 12 months | |||
| ended | ended | |||
| 9/30/11 | 9/30/11 | |||
| Class A | -11.50 | % | 1.43 | % |
| Class B | -12.17 | % | 0.00 | % |
| Class C | -11.93 | % | 0.51 | % |
| Class I | -11.32 | % | 2.02 | % |
| Russell 1000 Index | -14.58 | % | 0.91 | % |
| Lipper Large-Cap | ||||
| Core Funds | ||||
| Average | -15.16 | % | -1.51 | % |
| Ten Largest Stock Holdings | % of Net Assets | |
| Apple, Inc. | 5.6 | % |
| International Business | ||
| Machines Corp. | 4.6 | % |
| Microsoft Corp. | 4.2 | % |
| Johnson & Johnson | 4.1 | % |
| AT&T, Inc. | 3.4 | % |
| Bristol-Myers Squibb Co. | 3.4 | % |
| Kimberly-Clark Corp. | 3.2 | % |
| ACE Ltd. | 2.9 | % |
| Prudential Financial, Inc. | 2.9 | % |
| Time Warner Cable, Inc. | 2.7 | % |
| Total | 37.0 | % |
*Investment performance/return at NAV does not reflect the deduction of the Fund’s maximum 4.75% front-end sales charge or any deferred sales charge.
www.calvert.com CALVERT SOCIAL INVESTMENT FUND ANNUAL REPORT 20
-8.51% and -16.46%. Small caps under-
| ||||
| CALVERT ENHANCED | ||||
| EQUITY PORTFOLIO | ||||
| September 30, 2011 | ||||
| % of Total | ||||
| Economic Sectors | Investments | |||
| Consumer Discretionary | 10.5 | % | ||
| Consumer Staples | 12.1 | % | ||
| Energy | 8.5 | % | ||
| Financials | 13.7 | % | ||
| Health Care | 12.8 | % | ||
| Industrials | 9.8 | % | ||
| Information Technology | 19.6 | % | ||
| Materials | 3.3 | % | ||
| Telecommunication Services | 3.4 | % | ||
| Utilities | 6.3 | % | ||
| Total | 100 | % | ||
In general, most U.S. companies, led by those in the Technology and Health Care sectors, continued to show financial strength, and to rely on their healthy balance sheets and impressive cash reserves for mergers and acquisitions.
The eurozone crisis continued to unfold, weighed down by struggling peripheral economies. Although leaders attempted to assure investors that the proposed long-term solutions to the debt crisis were viable, the fear of contagion intensified. Germany and France braced for a Greek default by taking steps to insulate their financial institutions from large losses. While we don’t see a high probability of a Greek default driving the U.S. into recession, the possibility still seemed to drive market sentiment.
European bank stocks continued to be among those most adversely impacted by the eurozone debt crisis, driven by longer-term funding stress, as well as by U.S. money market funds’ further reductions in their exposure to these banks.
The S&P downgrade of U.S. government debt on August 5 was another blow to investor confidence, contributing to a global equity market sell-off and pushing U.S. Treasury yields down as risk aversion in the markets increased. The resulting equity market volatility was also fed by concerns about the political stalemate in Washington, the European sovereign debt issues, and a significant slowdown in U.S. economic growth—or, more ominously, the possibility of a double-dip recession in the United States.
After the completion of QE2 in June, the Federal Reserve (Fed) supplemented its accommodative policy with the well-timed September 21 announcement of “operation twist,” a plan to sell $400 billion in short-term Treasuries while purchasing the same amount of longer-term Treasuries. This could boost investment and refinancing in the U.S. by
www.calvert.com CALVERT SOCIAL INVESTMENT FUND ANNUAL REPORT 21
Growth of $10,000
The graph below shows the value of a hypothetical $10,000 investment in the fund over the past 10 fiscal year periods. The results shown are for Classes A and B shares and reflect the deduction of Class A’s the maximum front-end sales charge of 4.75% and assume the reinvestment of dividends. The result is compared with benchmarks that include a broad based market index and a Lipper peer group average. Market indexes are unmanaged and their results do not reflect the effect of expenses or sales charges. The Lipper average reflects the deduction of the category’s average front-end sales charge. The value of an investment in a different share class would be different.
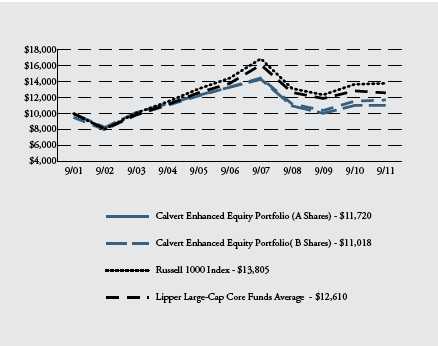
All performance data shown, including the graph above and the adjacent table, represents past performance, does not guarantee future results, assumes reinvestment of dividends and distributions and does not reflect the deduction of taxes that a shareholder would pay on the Portfolio’s distributions or the redemption of the Portfolio shares. The investment return and principal value of an investment will fluctuate so that an investor’s shares, when redeemed, may be worth more or less than their original cost. Current performance may be lower or higher than the performance data quoted; for current performance data visit www.calvert.com. The gross expense ratio from the current prospectus for Class A shares is 1.48%. This number may differ from the expense ratio shown elsewhere in this report because it is based on a different time period and, if applicable, does not include fee or expense waivers. Performance data quoted already reflects the deduction of the Portfolio’s operating expenses.
www.calvert.com CALVERT SOCIAL INVESTMENT FUND ANNUAL REPORT 22
reducing long-term interest rates. The Fed also promised to keep interest rates low for the next two years. However, the announcement was accompanied by alarming statements about U.S. economic weakness, which further unsettled markets.
In fact, worries about anemic global economic growth intensified over the last 12 months, with U.S. gross domestic product (GDP) growth numbers revised down for the first half of the year to less than a 1% average annual growth rate, according to the Bureau of Economic Analysis.
The most recent release of employment figures by the Bureau of Labor Statistics showed that the unemployment rate remained at 9.1% in August. Jobs data is likely to be a lagging indicator of economic activity in this economic cycle and may not improve until other economic indicators are more firmly in positive territory.
Although the secular upward trend in commodity prices may persist in the long term, decreasing commodity prices are a positive for global economic growth in the near term. A continued price break should reduce risks to top-line inflation, lift the drag on economic growth, and provide additional stability to the Fed’s actions.
In China, the threat of inflation still looms and may make it difficult for that country and other emerging markets to implement more accommodative monetary policy in the near term. However, recent industrial production numbers in China were positive and although manufacturing data was slightly contractionary, it was not at hard landing levels.
CALVERT ENHANCED EQUITY PORTFOLIO STATISTICS
September 30, 2011
Average Annual Total Returns
| Class A Shares | (with max. load) | |
| One year | -3.40 | % |
| Five year | -3.48 | % |
| Ten year | 1.60 | % |
| Class B Shares | (with max. load) | |
| One year | -5.00 | % |
| Five year | -3.90 | % |
| Ten year | 0.97 | % |
| Class C Shares | (with max. load) | |
| One year | -0.56 | % |
| Five year | -3.41 | % |
| Ten year | 1.13 | % |
| Class I Shares* | ||
| One year | 2.02 | % |
| Five year | -2.01 | % |
| Ten year | 2.43 | % |
* Note Regarding Class I Shares Total Returns: There were times during the reporting period when there were no shareholders in Class I. For purposes of reporting Average Annual Total Return, Class A performance at NAV (i.e. does not reflect deduction of the Class A front-end sales charge) is used during these periods in which there were no shareholders in Class I. For purposes of this Average Annual Total Return, the Class A performance at NAV was used during the period January 18, 2002 through April 29, 2005.
www.calvert.com CALVERT SOCIAL INVESTMENT FUND ANNUAL REPORT 23
Portfolio Strategy
For the reporting period, strong stock selection, particularly in the Information Technology and Financials sectors, was the main driver of the Portfolio’s outperformance of the Russell 1000 Index.
On an individual stock basis, NiSource, W. W. Grainger, Dell, Apple, and Bristol-Myers Squibb were the top contributors to relative performance over this period. Stock selection was negative only in the Energy sector. Detractors in Energy included EnCana and SEACOR Holdings. Other top stock detractors included Avery Dennison, JPMorgan Chase, and VISA.
Calvert’s environmental, social, and governance (ESG) criteria modestly detracted over the last 12 months, primarily in the Energy sector. However, ESG criteria in the Financials sector generated a modest performance boost.
Given that our investment process is designed to emphasize stock selection, we do not expect sector selection to play a large role in performance. However, an overweight to Utilities increased the Portfolio’s return for the period.
Outlook
While we may see further volatility in the equity markets, those who step in to buy the dips in a time of uncertainty could have the potential for greater returns. Combined with generally positive U.S. economic data and attractive equity valuations--the 12-month forward price/earnings ratio for the S&P 500 Index was 10.61 after market close on September 30--as well as signs that China’s growth momentum has not stalled, we continue to believe the market can see a healthy recovery in the next few months. We remain cautiously optimistic on U.S. economic growth, albeit less so on European and global growth.
We also believe the U.S. earnings season that started on October is likely to provide positive earnings surprises and serve as a positive catalyst for the U.S. and possibly global equity markets, especially given current valuation levels, which may present some of the best buying opportunities in the equity markets.
October 2011
The following companies represented the following percentages of Portfolio net assets as of September 30, 2011: NiSource 2.43%, W. W. Grainger 2.61%, Dell 0.87%, Apple 5.61%, Bristol-Myers Squibb 3.41%, EnCana 1.93%, SEACOR 1.97%, Avery Dennison 0%, JPMorgan Chase 2.26% and VISA 0.84%. Holdings are subject to change without notice.
www.calvert.com CALVERT SOCIAL INVESTMENT FUND ANNUAL REPORT 24
SHAREHOLDER EXPENSE EXAMPLE
As a shareholder of the Portfolio, you incur two types of costs: (1) transaction costs, including sales charges and redemption fees; and (2) ongoing costs, including management fees; distribution (12b-1) fees; and other Portfolio expenses. This Example is intended to help you understand your ongoing costs (in dollars) of investing in the Portfolio and to compare these costs with the ongoing costs of investing in other mutual funds.
This Example is based on an investment of $1,000 invested at the beginning of the period and held for the entire period (April 1, 2011 to September 30, 2011).
Actual Expenses
The first line of the table below provides information about actual account values and actual expenses. You may use the information in this line, together with the amount you invested, to estimate the expenses that you paid over the period. Simply divide your account value by $1,000 (for example, an $8,600 account value divided by $1,000 = 8.6), then multiply the result by the number in the first line under the heading entitled “Expenses Paid During Period” to estimate the expenses you paid on your account during this period.
The Money Market Portfolio charges a monthly low balance account fee of $3 to those shareholders whose account balance is less than $2,000. The Enhanced Equity Portfolio charges an annual low balance account fee of $15 to those shareholders whose regular account balance is less than $5,000.
Hypothetical Example for Comparison Purposes
The second line of the table below provides information about hypothetical account values and hypothetical expenses based on the Portfolio’s actual expense ratios and an assumed rate of return of 5% per year before expenses, which is not the Portfolio’s actual return. The hypothetical account values and expenses may not be used to estimate the actual ending account balance or expenses you paid for the period. You may use this information to compare the ongoing costs of investing in the Portfolio and other funds. To do so, compare the 5% hypothetical example with the 5% hypothetical examples that appear in the shareholder reports of the other funds.
Please note that the expenses shown in the table are meant to highlight your ongoing costs only and do not reflect any transactional costs, such as sales charges (loads) or redemption fees. Therefore, the second line of the table is useful in comparing ongoing costs only, and will not help you determine the relative total costs of owning different funds. In addition, if these transactional costs were included, your costs would have been higher.
www.calvert.com CALVERT SOCIAL INVESTMENT FUND ANNUAL REPORT 25
| BEGINNING | ENDING | EXPENSES PAID | |
| ACCOUNT VALUE | ACCOUNT VALUE | DURING PERIOD* | |
| MONEY MARKET | 4/1/11 | 9/30/11 | 4/1/11 - 9/30/11 |
| Actual | $1,000.00 | $1,000.05 | $1.19 |
| Hypothetical | $1,000.00 | $1,023.88 | $1.20 |
| (5% return per | |||
| year before expenses) |
*Expenses for Money Market are equal to the annualized expense ratio of .24%, multiplied by the average account value over the period, multiplied by 183/365 (to reflect the one-half year period).
| BEGINNING | ENDING | EXPENSES PAID | |
| ACCOUNT VALUE | ACCOUNT VALUE | DURING PERIOD* | |
| EQUITY | 4/1/11 | 9/30/11 | 4/1/11 - 9/30/11 |
| CLASS A | |||
| Actual | $1,000.00 | $859.90 | $5.61 |
| Hypothetical | $1,000.00 | $1,019.03 | $6.09 |
| (5% return per | |||
| year before expenses) | |||
| CLASS B | |||
| Actual | $1,000.00 | $856.20 | $9.62 |
| Hypothetical | $1,000.00 | $1,014.70 | $10.44 |
| (5% return per | |||
| year before expenses) | |||
| CLASS C | |||
| Actual | $1,000.00 | $857.00 | $9.02 |
| Hypothetical | $1,000.00 | $1,015.36 | $9.79 |
| (5% return per | |||
| year before expenses) | |||
| CLASS I | |||
| Actual | $1,000.00 | $862.40 | $3.09 |
| Hypothetical | $1,000.00 | $1,021.75 | $3.36 |
| (5% return per | |||
| year before expenses) | |||
| CLASS Y | |||
| Actual | $1,000.00 | $861.40 | $3.83 |
| Hypothetical | $1,000.00 | $1,020.95 | $4.16 |
| (5% return per | |||
| year before expenses) |
*Expenses for Equity are equal to the annualized expense ratios of 1.20%, 2.07%, 1.94%, .66%, and .82% for Class A, Class B, Class C, Class I and Class Y, respectively, multiplied by the average account value over the period, multiplied by 183/365 (to reflect the one-half year period).
www.calvert.com CALVERT SOCIAL INVESTMENT FUND ANNUAL REPORT 26
| BEGINNING | ENDING | EXPENSES PAID | |
| ACCOUNT VALUE | ACCOUNT VALUE | DURING PERIOD* | |
| ENHANCED EQUITY | 4/1/11 | 9/30/11 | 4/1/11 - 9/30/11 |
| CLASS A | |||
| Actual | $1,000.00 | $885.00 | $6.26 |
| Hypothetical | $1,000.00 | $1,018.42 | $6.71 |
| (5% return per | |||
| year before expenses) | |||
| CLASS B | |||
| Actual | $1,000.00 | $878.30 | $12.65 |
| Hypothetical | $1,000.00 | $1,011.60 | $13.54 |
| (5% return per | |||
| year before expenses) | |||
| CLASS C | |||
| Actual | $1,000.00 | $880.70 | $10.42 |
| Hypothetical | $1,000.00 | $1,013.99 | $11.15 |
| (5% return per | |||
| year before expenses) | |||
| CLASS I | |||
| Actual | $1,000.00 | $886.80 | $3.69 |
| Hypothetical | $1,000.00 | $1,021.15 | $3.95 |
| (5% return per | |||
| year before expenses) | |||
*Expenses for Enhanced Equity are equal to the annualized expense ratios of 1.33%, 2.69%, 2.21% and .78% for Class A, Class B, Class C, and Class I respectively, multiplied by the average account value over the period, multiplied by 183/365 (to reflect the one-half year period).
www.calvert.com CALVERT SOCIAL INVESTMENT FUND ANNUAL REPORT 27
REPORT OF INDEPENDENT REGISTERED PUBLIC ACCOUNTING FIRM
The Board of Trustees and Shareholders of Calvert Social Investment Fund: We have audited the accompanying statements of net assets of the Calvert Money Market, Equity, and Enhanced Equity Portfolios (collectively the Portfolios), each a series of the Calvert Social Investment Fund, as of September 30, 2011, and the related statements of operations for the year then ended, the statements of changes in net assets for each of the years in the two-year period then ended, and the financial highlights for each of the years or periods in the five-year period then ended. These financial statements and financial highlights are the responsibility of the Portfolios’ management. Our responsibility is to express an opinion on these financial statements and financial highlights based on our audits.
We conducted our audits in accordance with the standards of the Public Company Accounting Oversight Board (United States). Those standards require that we plan and perform the audit to obtain reasonable assurance about whether the financial statements and financial highlights are free of material misstatement. An audit includes examining, on a test basis, evidence supporting the amounts and disclosures in the financial statements. Our procedures included confirmation of securities owned as of September 30, 2011, by correspondence with the custodians, and brokers or other appropriate auditing procedures. An audit also includes assessing the accounting principles used and significant estimates made by management, as well as evaluating the overall financial statement presentation. We believe that our audits provide a reasonable basis for our opinion.
In our opinion, the financial statements and financial highlights referred to above present fairly, in all material respects, the financial position of the Calvert Money Market, Equity, and Enhanced Equity Portfolios as of September 30, 2011, the results of their operations for the year then ended, the changes in their net assets for each of the years in the two-year period then ended, and the financial highlights for each of the years or periods in the five-year period then ended, in conformity with U.S. generally accepted accounting principles.

Philadelphia, Pennsylvania
November 28, 2011
www.calvert.com CALVERT SOCIAL INVESTMENT FUND ANNUAL REPORT 28
| MONEY MARKET PORTFOLIO | ||||
| STATEMENT OF NET ASSETS | ||||
| September 30, 2011 | ||||
| DEPOSITORY RECEIPTS FOR U.S. GOVERNMENT | PRINCIPAL | |||
| GUARANTEED LOANS - 0.0% | AMOUNT | VALUE | ||
| Colson Services Corporation Loan Sets: | ||||
| 2.125%, 5/29/12 (c)(h)(r) | $ | 28,992 | $ | 28,991 |
| 2.00%, 8/10/12 (c)(h)(r) | 23,460 | 23,474 | ||
| Total Depository Receipts For U.S. Government | ||||
| Guaranteed Loans (Cost $52,465) | 52,465 | |||
| VARIABLE RATE DEMAND NOTES - 81.7% | ||||
| 2880 Stevens Creek LLC, 0.45%, 11/1/33, LOC: Bank of the West (r) 3,220,000 | 3,220,000 | |||
| Akron Hardware Consultants, Inc., 0.45%, 11/1/22, | ||||
| LOC: FirstMerit Bank, C/LOC: FHLB (r) | 1,433,000 | 1,433,000 | ||
| Bayfront Regional Development Corp., 0.19%, 11/1/27, | ||||
| LOC: PNC Bank (r) | 5,500,000 | 5,500,000 | ||
| Bochasanwais Shree Akshar Purushottam Swaminarayan Sanstha, | ||||
| Inc., 0.25%, 6/1/22, LOC: Comerica Bank (r) | 1,875,000 | 1,875,000 | ||
| Butler County Alabama IDA Revenue, 0.90%, 3/1/12, | ||||
| LOC: Whitney National Bank, C/LOC: FHLB (r) | 220,000 | 220,000 | ||
| California Statewide Communities Development Authority MFH Revenue: | ||||
| 0.28%, 11/1/31, LOC: U.S. Bank (r) | 1,300,000 | 1,300,000 | ||
| 0.18%, 3/15/34, CEI: Fannie Mae (r) | 2,250,000 | 2,250,000 | ||
| CIDC-Hudson House LLC New York Revenue, 0.65%, 12/1/34, | ||||
| LOC: Hudson River Bank & Trust, C/LOC: FHLB (r) | 385,000 | 385,000 | ||
| Colorado State HFA Revenue, 0.13%, 10/15/16, CEI: Fannie Mae (r) | 500,000 | 500,000 | ||
| District of Columbia HFA MFH Revenue, 0.14%, 11/1/38, | ||||
| CEI: Freddie Mac (r) | 200,000 | 200,000 | ||
| Florida State Housing Finance Corp. MFH Revenue: | ||||
| Series B, 0.27%, 10/15/32, CEI: Fannie Mae (r) | 2,400,000 | 2,400,000 | ||
| Series J-1, 0.16%, 10/15/32, CEI: Fannie Mae (r) | 900,000 | 900,000 | ||
| Series J-2, 0.27%, 10/15/32, CEI: Fannie Mae (r) | 1,430,000 | 1,430,000 | ||
| Series N-2, 0.28%, 11/1/32, CEI: Freddie Mac (r) | 350,000 | 350,000 | ||
| Hawaii State Department of Budget & Finance Revenue, 0.25%, | ||||
| 12/1/21, LOC: Union Bank (r) | 3,200,000 | 3,200,000 | ||
| HBPWH Building Co., 0.27%, 11/1/22, | ||||
| LOC: Wells Fargo Bank (r) | 750,000 | 750,000 | ||
| HHH Investment Co., 0.28%, 7/1/29, LOC: Bank of the West (r) | 2,030,000 | 2,030,000 | ||
| Hills City Iowa Health Facilities Revenue, 0.16%, 8/1/35, | ||||
| LOC: U.S. Bank (r) | 5,090,000 | 5,090,000 | ||
| Illinois State Toll Highway Authority Revenue, 0.11%, 7/1/30, | ||||
| LOC: Northern Trust Co. (r) | 5,900,000 | 5,900,000 | ||
| Kaneville Road Joint Venture, Inc., 0.27%, 11/1/32, | ||||
| LOC: First American Bank, C/LOC: FHLB (r) | 6,475,000 | 6,475,000 | ||
| Kansas State Development Finance Authority MFH Revenue, | ||||
| 0.16%, 7/1/30, CEI: Freddie Mac (r) | 400,000 | 400,000 | ||
| Legacy Park LLC, 0.36%, 1/1/58, LOC: Fifth Third Bank (r) | 2,500,000 | 2,500,000 | ||
| Los Angeles California MFH Revenue, 0.32%, 12/15/34, | ||||
| CEI: Fannie Mae (r) | 1,375,000 | 1,375,000 | ||
www.calvert.com CALVERT SOCIAL INVESTMENT FUND ANNUAL REPORT 29
| PRINCIPAL | ||||
| VARIABLE RATE DEMAND NOTES - CONT’D | AMOUNT | VALUE | ||
| Milpitas California MFH Revenue, 0.16%, 8/15/33, | ||||
| CEI: Fannie Mae (r) | $ | 2,200,000 | $ | 2,200,000 |
| Missouri State Health & Educational Facilities Authority Revenue: | ||||
| 0.22%, 11/1/32, LOC: Bank of America (r) | 4,400,000 | 4,400,000 | ||
| 0.17%, 12/1/35, LOC: Commerce Bank (r) | 4,500,000 | 4,500,000 | ||
| Montgomery New York Industrial Development Board Pollution | ||||
| Control Revenue, 0.38%, 5/1/25, LOC: FHLB (r) | 2,670,000 | 2,670,000 | ||
| Ness Family Partners LP, 0.40%, 9/1/34, LOC: Bank of the West (r) | 390,000 | 390,000 | ||
| Nevada State Housing Division Revenue, 0.15%, 4/15/39, | ||||
| CEI: Fannie Mae (r) | 4,400,000 | 4,400,000 | ||
| New York City Housing Development Corp. MFH Mortgage | ||||
| Revenue, 0.16%, 5/15/39, CEI: Fannie Mae (r) | 1,235,000 | 1,235,000 | ||
| New York City Housing Development Corp. MFH Rent Revenue: | ||||
| 0.17%, 11/15/31, CEI: Fannie Mae (r) | 1,450,000 | 1,450,000 | ||
| 0.17%, 6/15/34, CEI: Fannie Mae (r) | 1,300,000 | 1,300,000 | ||
| 0.17%, 11/15/35, CEI: Fannie Mae (r) | 1,495,000 | 1,495,000 | ||
| 0.17%, 12/1/35, CEI: Freddie Mac (r) | 5,130,000 | 5,130,000 | ||
| New York City Housing Development Corp. MFH Revenue: | ||||
| 0.18%, 11/15/37, CEI: Fannie Mae (r) | 1,200,000 | 1,200,000 | ||
| 0.16%, 11/1/38, CEI: Freddie Mac (r) | 4,000,000 | 4,000,000 | ||
| New York City IDA Revenue, 0.22%, 2/1/35, | ||||
| LOC: M&T Trust Co. (r) | 1,670,000 | 1,670,000 | ||
| New York State MMC Corp. Revenue, 0.65%, 11/1/35, | ||||
| LOC: JPMorgan Chase Bank (r) | 3,395,000 | 3,395,000 | ||
| Osprey Property Co., LLC, 0.22%, 6/1/27, LOC: Wells Fargo Bank (r) . 3,800,000 | 3,800,000 | |||
| Peoploungers, Inc., 0.40%, 4/2/18, LOC: Bank of New Albany, | ||||
| C/LOC: FHLB (r) | 1,880,000 | 1,880,000 | ||
| Portage Indiana Industrial Pollution Control Revenue, 0.36%, | ||||
| 5/1/18, LOC: Bank of Tokyo-Mitsubishi UFJ (r) | 5,150,000 | 5,150,000 | ||
| Rathbone LLC, 0.28%, 1/1/38, LOC: Comerica Bank (r) | 2,600,000 | 2,600,000 | ||
| Shawnee Kansas Private Activity Revenue, 0.60%, 12/1/12, | ||||
| LOC: JPMorgan Chase Bank (r) | 1,575,000 | 1,575,000 | ||
| Spencer County Indiana Industrial Pollution Control Revenue, | ||||
| 0.36%, 11/1/18, LOC: Mizuho Corp. Bank Ltd. (r) | 3,680,000 | 3,680,000 | ||
| St. Joseph County Indiana Economic Development Revenue, | ||||
| 1.73%, 6/1/27, LOC: FHLB (r) | 235,000 | 235,000 | ||
| Utah State Housing Corp. MFH Revenue, 0.21%, 4/1/42, | ||||
| CEI: Freddie Mac (r) | 225,000 | 225,000 | ||
| Utah State Housing Corp. Single Family Revenue, 0.18%, | ||||
| 7/1/36, CEI: Fannie Mae & Freddie Mac (r) | 2,220,000 | 2,220,000 | ||
| Virginia Commonwealth University Health System Revenue, 0.12%, | ||||
| 7/1/37, LOC: Branch Bank & Trust (r) | 2,000,000 | 2,000,000 | ||
| Washington State MFH Finance Commission Revenue: | ||||
| 0.23%, 6/15/32, CEI: Fannie Mae (r) | 665,000 | 665,000 | ||
| 0.23%, 7/15/32, CEI: Fannie Mae (r) | 605,000 | 605,000 | ||
| 0.18%, 7/15/34, CEI: Fannie Mae (r) | 1,365,000 | 1,365,000 | ||
| 0.22%, 5/1/37, CEI: Freddie Mac (r) | 1,350,000 | 1,350,000 | ||
| Total Variable Rate Demand Notes (Cost $116,468,000) | 116,468,000 | |||
www.calvert.com CALVERT SOCIAL INVESTMENT FUND ANNUAL REPORT 30
| PRINCIPAL | |||||
| MUNICIPAL OBLIGATIONS - 2.9% | AMOUNT | VALUE | |||
| Oregon State GO Bonds, 2.00%, 6/29/12 | $ | 2,000,000 | $ | 2,026,423 | |
| Wisconsin GO Bonds, 5.25%, 5/1/17 (prerefunded 5/01/12 @ 100) | 2,000,000 | 2,056,936 | |||
| Total Municipal Obligations (Cost $4,083,359) | 4,083,359 | ||||
| U.S. GOVERNMENT AGENCIES AND INSTRUMENTALITIES - 8.4% | |||||
| Fannie Mae Discount Notes, 6/18/12 | 3,000,000 | 2,996,303 | |||
| Federal Home Loan Bank: | |||||
| 0.30%, 9/10/12 | 2,000,000 | 2,000,000 | |||
| 0.375%, 10/3/12 | 2,000,000 | 2,000,000 | |||
| Federal Home Loan Bank Discount Notes: | |||||
| 10/25/11 | 3,000,000 | 2,999,600 | |||
| 8/3/12 | 2,000,000 | 1,996,077 | |||
| Total U.S. Government Agencies And Instrumentalities | |||||
| (Cost $11,991,980) | 11,991,980 | ||||
| U.S. TREASURY - 2.1% | |||||
| United States Treasury Notes, 0.375%, 8/31/12 | 3,000,000 | 3,006,289 | |||
| Total U.S. Treasury (Cost $3,006,289) | 3,006,289 | ||||
| TIME DEPOSIT - 0.1% | |||||
| State Street Time Deposit, 0.113%, 10/3/11 | 211,952 | 211,952 | |||
| Total Time Deposit (Cost $211,952) | 211,952 | ||||
| TOTAL INVESTMENTS (Cost $135,814,045) - 95.2% | 135,814,045 | ||||
| Other assets and liabilities, net - 4.8% | 6,780,910 | ||||
| NET ASSETS - 100% | $ | 142,594,955 | |||
| NET ASSETS CONSIST OF: | |||||
| Paid-in capital applicable to the following shares of beneficial interest | |||||
| unlimited number of no par value shares authorized, | |||||
| 142,664,064 shares outstanding | $ | 142,598,057 | |||
| Undistributed net investment income | 5,973 | ||||
| Accumulated net realized gain (loss) on investments | (9,075 | ) | |||
| NET ASSETS | $ | 142,594,955 | |||
| NET ASSET VALUE PER SHARE | $ | 1.00 | |||
See notes to statements of net assets and notes to financial statements.
www.calvert.com CALVERT SOCIAL INVESTMENT FUND ANNUAL REPORT 31
| EQUITY PORTFOLIO | |||
| STATEMENT OF NET ASSETS | |||
| September 30, 2011 | |||
| EQUITY SECURITIES - 95.5% | SHARES | VALUE | |
| Air Freight & Logistics - 3.6% | |||
| C.H. Robinson Worldwide, Inc | 646,333 | $ | 44,254,421 |
| Expeditors International of Washington, Inc. | 766,897 | 31,097,673 | |
| 75,352,094 | |||
| Auto Components - 0.7% | |||
| Johnson Controls, Inc | 513,967 | 13,553,310 | |
| Beverages - 1.8% | |||
| PepsiCo, Inc | 588,549 | 36,431,183 | |
| Biotechnology - 2.9% | |||
| Gilead Sciences, Inc.* | 1,528,258 | 59,296,410 | |
| Capital Markets - 3.9% | |||
| Charles Schwab Corp | 1,230,706 | 13,870,057 | |
| T. Rowe Price Group, Inc | 1,381,233 | 65,981,500 | |
| 79,851,557 | |||
| Chemicals - 2.2% | |||
| Ecolab, Inc. | 926,715 | 45,307,096 | |
| Commercial Banks - 3.4% | |||
| SunTrust Banks, Inc. | 2,013,848 | 36,148,572 | |
| Wells Fargo & Co | 1,422,627 | 34,313,763 | |
| 70,462,335 | |||
| Communications Equipment - 5.5% | |||
| Acme Packet, Inc.* | 616,702 | 26,265,338 | |
| QUALCOMM, Inc. | 1,817,290 | 88,374,813 | |
| 114,640,151 | |||
| Computers & Peripherals - 4.7% | |||
| Apple, Inc.* | 257,872 | 98,295,649 | |
| Consumer Finance - 2.2% | |||
| American Express Co. | 1,007,539 | 45,238,501 | |
| Diversified Financial Services - 3.2% | |||
| IntercontinentalExchange, Inc.* | 320,310 | 37,879,861 | |
| JPMorgan Chase & Co. | 946,206 | 28,499,725 | |
| 66,379,586 | |||
| Electrical Equipment - 1.6% | |||
| Cooper Industries plc | 719,971 | 33,205,063 | |
www.calvert.com CALVERT SOCIAL INVESTMENT FUND ANNUAL REPORT 32
| EQUITY SECURITIES - CONT’D | SHARES | VALUE | |
| Energy Equipment & Services - 4.5% | |||
| Cameron International Corp.* | 1,596,608 | $ | 66,323,096 |
| Noble Corp.* | 891,209 | 26,156,984 | |
| 92,480,080 | |||
| Food & Staples Retailing - 3.9% | |||
| Costco Wholesale Corp | 339,747 | 27,900,024 | |
| CVS Caremark Corp. | 1,558,899 | 52,347,828 | |
| 80,247,852 | |||
| Food Products - 2.4% | |||
| Green Mountain Coffee Roasters, Inc.* | 524,454 | 48,742,755 | |
| Health Care Equipment & Supplies - 3.6% | |||
| Edwards Lifesciences Corp.* | 344,900 | 24,584,472 | |
| Intuitive Surgical, Inc.* | 63,500 | 23,131,780 | |
| St. Jude Medical, Inc. | 724,963 | 26,236,411 | |
| 73,952,663 | |||
| Hotels, Restaurants & Leisure - 5.2% | |||
| Chipotle Mexican Grill, Inc.* | 116,776 | 35,377,289 | |
| Darden Restaurants, Inc | 650,702 | 27,817,511 | |
| Starbucks Corp. | 1,170,212 | 43,637,205 | |
| 106,832,005 | |||
| Household Products - 0.8% | |||
| Procter & Gamble Co. (t) | 250,094 | 15,800,939 | |
| Industrial Conglomerates - 3.5% | |||
| 3M Co. | 490,609 | 35,220,820 | |
| Danaher Corp. | 898,916 | 37,700,537 | |
| 72,921,357 | |||
| Insurance - 0.5% | |||
| Aflac, Inc. | 292,856 | 10,235,317 | |
| Internet & Catalog Retail - 4.4% | |||
| Amazon.com, Inc.* | 143,484 | 31,025,545 | |
| Netflix, Inc.* | 168,280 | 19,042,565 | |
| priceline.com, Inc.* | 91,116 | 40,952,997 | |
| 91,021,107 | |||
| Internet Software & Services - 3.3% | |||
| Google, Inc.* | 83,580 | 42,991,880 | |
| MercadoLibre, Inc. | 472,260 | 25,383,975 | |
| 68,375,855 | |||
| IT Services - 5.1% | |||
| Cognizant Technology Solutions Corp.* | 870,568 | 54,584,614 | |
| International Business Machines Corp. | 289,948 | 50,749,598 | |
| 105,334,212 | |||
www.calvert.com CALVERT SOCIAL INVESTMENT FUND ANNUAL REPORT 33
| EQUITY SECURITIES - CONT’D | SHARES | VALUE | |
| Multiline Retail - 2.0% | |||
| Kohl’s Corp. | 853,934 | $ | 41,928,159 |
| Oil, Gas & Consumable Fuels - 3.8% | |||
| QEP Resources, Inc. | 1,042,531 | 28,221,314 | |
| Suncor Energy, Inc. | 1,983,156 | 50,451,489 | |
| 78,672,803 | |||
| Pharmaceuticals - 7.4% | |||
| Allergan, Inc | 1,218,146 | 100,350,867 | |
| Novartis AG (ADR) | 938,927 | 52,363,959 | |
| 152,714,826 | |||
| Software - 7.4% | |||
| Informatica Corp.* | 447,670 | 18,332,087 | |
| Intuit, Inc.* | 762,340 | 36,165,410 | |
| Microsoft Corp. | 937,082 | 23,323,971 | |
| Salesforce.com, Inc.* | 392,380 | 44,841,186 | |
| VMware, Inc.* | 384,550 | 30,910,129 | |
| 153,572,783 | |||
| Specialty Retail - 1.7% | |||
| CarMax, Inc.* | 1,513,463 | 36,096,093 | |
| Venture Capital - 0.3% | |||
| 20/20 Gene Systems, Inc.: | |||
| Common Stock (b)(i)* | 43,397 | 48,822 | |
| Warrants (strike price $.01/share, expires 8/27/13) (b)(i)* | 30,000 | 33,450 | |
| Better Energy Systems, Inc.: | |||
| Series B, Preferred (b)(i)* | 992,555 | 266,997 | |
| Series B, Preferred Warrants (strike price $0.75/share, | |||
| expires 8/3/13) (b)(i)* | 133,333 | - | |
| Chesapeake PERL, Inc., Series A-2, Preferred (b)(i)* | 240,000 | 2,400 | |
| Cylex, Inc.: | |||
| Common Stock (b)(i)* | 285,706 | - | |
| Series B, Preferred (b)(i)* | 1,134,830 | - | |
| Series C-1, Preferred (b)(i)* | 2,542,915 | 679,299 | |
| Digital Directions International, Inc. (a)(b)(i)* | 354,389 | 531,585 | |
| Envisionier Medical Technologies, Inc., Warrants (strike price | |||
| $.50/share, expires 8/6/20) (b)(i)* | 50,000 | - | |
| Global Resource Options, Inc.: | |||
| Series A, Preferred (a)(b)(i)* | 750,000 | 155,357 | |
| Series B, Preferred (a)(b)(i)* | 244,371 | 155,357 | |
| Series C, Preferred (a)(b)(i)* | 297,823 | 207,143 | |
| Series D, Preferred (a)(b)(i)* | 228,138 | 1,424,533 | |
| Marrone Bio Innovations, Inc.: | |||
| Series A, Preferred (b)(i)* | 240,761 | 407,853 | |
| Series B, Preferred (b)(i)* | 181,244 | 307,030 | |
| Series C, Preferred (b)(i)* | 295,157 | 500,000 | |
| Napo Pharmaceuticals, Inc.: | |||
| Common Stock (b)(i)* | 294,196 | 588,392 | |
| Common Warrants (strike price $0.55/share, expires 9/15/14) (b)(i)* 54,061 | 78,388 | ||
www.calvert.com CALVERT SOCIAL INVESTMENT FUND ANNUAL REPORT 34
| EQUITY SECURITIES - CONT’D | SHARES | VALUE | ||
| NeoDiagnostix, Inc.: | ||||
| Series AE, Preferred Contingent Deferred Distribution (b)(i)* | 300,000 | $ | 61,373 | |
| Series AE, Preferred Warrants Contingent Deferred | ||||
| Distribution (b)(i)* | 600,000 | - | ||
| Series B, Preferred Contingent Deferred Distribution (b)(i)* | 179,723 | 235,485 | ||
| New Day Farms, Inc., Series B, Preferred (a)(b)(i)* | 4,547,804 | 72,037 | ||
| Orteq Bioengineering Ltd., Series A, Preferred (b)(i)* | 74,910 | 760,707 | ||
| PresenceLearning, Inc., Series A, Preferred (b)(i)* | 600,000 | 300,000 | ||
| Sword Diagnostics, Series B, Preferred (b)(i)* | 640,697 | - | ||
| Village Laundry Services, Inc. (b)(i)* | 9,444 | 30,599 | ||
| 6,846,807 | ||||
| Total Equity Securities (Cost $1,918,166,420) | 1,973,788,548 | |||
| VENTURE CAPITAL LIMITED | ADJUSTED | |||
| PARTNERSHIP INTEREST - 0.3% | BASIS | |||
| Blackstone Cleantech Venture Partners (b)(i)* | $ | 335,646 | 258,996 | |
| China Environment Fund 2004 (b)(i)* | - | 500,193 | ||
| China Environment Fund III (b)(i)* | 923,658 | 1,076,165 | ||
| Core Innovations Capital I (b)(i)* | 153,721 | 96,310 | ||
| DBL Equity Fund - BAEF II (b)(i)* | 424,621 | 411,417 | ||
| Ignia Fund I (b)(i)* | 523,833 | 398,705 | ||
| Impact Ventures II (b)(i)* | 544,757 | 689,090 | ||
| LeapFrog Financial Inclusion Fund (b)(i)* | 304,813 | 259,517 | ||
| New Markets Venture Partners II (b)(i)* | 250,000 | 270,963 | ||
| Renewable Energy Asia Fund (b)(i)* | 512,648 | 382,383 | ||
| SEAF India International Growth Fund (b)(i)* | 394,032 | 403,585 | ||
| Sustainable Jobs Fund II (b)(i)* | 608,991 | 900,391 | ||
| New Markets Education Partners, (a)(b)(i)* | 175,000 | 175,000 | ||
| Total Venture Capital Limited Partnership | ||||
| Interest (Cost $5,151,719) | 5,822,715 | |||
| PRINCIPAL | ||||
| HIGH SOCIAL IMPACT INVESTMENTS - 0.5% | AMOUNT | |||
| Calvert Social Investment Foundation Notes, 0.94%, 7/1/12 (b)(i)(r) | 10,833,877 | 10,439,524 | ||
| Total High Social Impact Investments (Cost $10,833,877) | 10,439,524 | |||
| VENTURE CAPITAL DEBT OBLIGATIOINS - 0.2% | ||||
| Envisionier Medical Technologies, Inc.: | ||||
| Note I, 7.00%, 12/31/11 (b)(i)(xx)* | 200,000 | 100,000 | ||
| Note II, 7.00%, 12/31/11 (b)(i)(xx)* | 100,000 | 50,000 | ||
| New Day Farms Participation Interest Note, 9.00%, 9/1/12 (a)(b)(i) | 6,225 | 6,225 | ||
| Quantum Intech, Inc., 11.50%, 9/10/15 (b)(i) | 101,870 | 101,870 | ||
www.calvert.com CALVERT SOCIAL INVESTMENT FUND ANNUAL REPORT 35
| PRINCIPAL | |||||||
| VENTURE CAPITAL DEBT OBLIGATIONS - CONT’D | AMOUNT | VALUE | |||||
| SEAF Global SME Facility: | |||||||
| 9.00%, 12/16/14 (b)(i) | $ | 1,500,000 | $ | 1,500,000 | |||
| 9.00%, 4/20/15 (b)(i) | 1,000,000 | 1,000,000 | |||||
| 9.00%, 11/5/15 (b)(i) | 1,000,000 | 655,849 | |||||
| 9.00%, 3/31/16 (b)(i) | 450,000 | 450,000 | |||||
| 9.00%, 6/14/16 (b)(i) | 400,000 | 400,000 | |||||
| 9.00%, 7/12/16 (b)(i) | 650,000 | 650,000 | |||||
| Sword Diagnostics Series C Convertible Bridge Note, 10.00%, | |||||||
| 7/31/12 (b)(i)(zz)* | 25,000 | 18,750 | |||||
| Sword Diagnostics Series C Convertible Bridge Note II, 10.00%, | |||||||
| 7/31/12 (b)(i)(zz)* | 100,000 | 75,000 | |||||
| Total Venture Capital Debt Obligations (Cost $5,533,095) | 5,007,694 | ||||||
| TIME DEPOSIT - 2.6% | |||||||
| State Street Time Deposit, 0.113%, 10/3/11 | 54,371,685 | 54,371,685 | |||||
| Total Time Deposit (Cost $54,371,685) | 54,371,685 | ||||||
| TOTAL INVESTMENTS (Cost $1,994,056,796) - 99.1% | 2,049,430,166 | ||||||
| Other assets and liabilities, net - 0.9% | 18,601,735 | ||||||
| NET ASSETS - 100% | $ | 2,068,031,901 | |||||
| NET ASSETS CONSIST OF: | |||||||
| Paid-in capital applicable to the following shares of beneficial interest, | |||||||
| unlimited number of no par value shares authorized: | |||||||
| Class A: 39,419,494 shares outstanding | $ | 1,231,343,356 | |||||
| Class B: 1,262,505 shares outstanding | 24,102,692 | ||||||
| Class C: 5,056,423 shares outstanding | 139,631,243 | ||||||
| Class I: 15,212,884 shares outstanding | 601,753,754 | ||||||
| Class Y: 1,996,188 shares outstanding | 77,505,704 | ||||||
| Accumulated net realized gain (loss) on investments | (61,678,218 | ) | |||||
| Net unrealized appreciation (depreciation) on investments | 55,373,370 | ||||||
| NET ASSETS | $ | 2,068,031,901 | |||||
| NET ASSET VALUE PER SHARE | |||||||
| Class A | (based on net assets of $1,297,315,275) | $ | 32.91 | ||||
| Class B | (based on net assets of $35,852,078) | $ | 28.40 | ||||
| Class C | (based on net assets of $132,658,291) | $ | 26.24 | ||||
| Class I | (based on net assets of $535,829,055) | $ | 35.22 | ||||
| Class Y | (based on net assets of $66,377,202) | $ | 33.25 | ||||
| See notes to statements of net assets and notes to financial statements. | |||||||
| www.calvert.com CALVERT SOCIAL INVESTMENT FUND ANNUAL REPORT 36 | |||||||
| ENHANCED EQUITY PORTFOLIO | |||
| STATEMENT OF NET ASSETS | |||
| September 30, 2011 | |||
| EQUITY SECURITIES - 100.1% | SHARES | VALUE | |
| Air Freight & Logistics - 2.2% | |||
| FedEx Corp | 22,889 | $ | 1,549,128 |
| Biotechnology - 1.3% | |||
| Amgen, Inc. | 16,292 | 895,246 | |
| Commercial Banks - 0.9% | |||
| Wells Fargo & Co | 27,020 | 651,722 | |
| Computers & Peripherals - 6.5% | |||
| Apple, Inc.* | 10,451 | 3,983,712 | |
| Dell, Inc.* | 43,512 | 615,695 | |
| 4,599,407 | |||
| Containers & Packaging - 1.3% | |||
| Ball Corp. | 28,706 | 890,460 | |
| Diversified Financial Services - 2.9% | |||
| CME Group, Inc. | 1,734 | 427,258 | |
| JPMorgan Chase & Co. | 53,268 | 1,604,432 | |
| 2,031,690 | |||
| Diversified Telecommunication Services - 3.4% | |||
| AT&T, Inc. | 85,398 | 2,435,551 | |
| Electric Utilities - 2.3% | |||
| Portland General Electric Co. | 69,544 | 1,647,497 | |
| Electrical Equipment - 2.3% | |||
| Roper Industries, Inc | 23,268 | 1,603,398 | |
| Electronic Equipment & Instruments - 0.9% | |||
| Corning, Inc. | 54,715 | 676,277 | |
| Energy Equipment & Services - 2.0% | |||
| SEACOR Holdings, Inc | 17,459 | 1,400,386 | |
| Food & Staples Retailing - 5.0% | |||
| Costco Wholesale Corp | 15,770 | 1,295,032 | |
| CVS Caremark Corp. | 24,399 | 819,318 | |
| Walgreen Co. | 43,803 | 1,440,681 | |
| 3,555,031 | |||
| Food Products - 2.3% | |||
| General Mills, Inc. | 42,876 | 1,649,440 | |
www.calvert.com CALVERT SOCIAL INVESTMENT FUND ANNUAL REPORT 37
| EQUITY SECURITIES - CONT’D | SHARES | VALUE | |
| Gas Utilities - 1.4% | |||
| Atmos Energy Corp. | 30,263 | $ | 982,034 |
| Health Care Providers & Services - 3.5% | |||
| Cardinal Health, Inc. | 21,621 | 905,488 | |
| CIGNA Corp | 5,813 | 243,797 | |
| McKesson Corp. | 18,471 | 1,342,842 | |
| 2,492,127 | |||
| Household Products - 4.8% | |||
| Colgate-Palmolive Co. | 13,037 | 1,156,121 | |
| Kimberly-Clark Corp. | 31,710 | 2,251,727 | |
| 3,407,848 | |||
| Industrial Conglomerates - 2.7% | |||
| 3M Co. | 26,935 | 1,933,664 | |
| Insurance - 9.9% | |||
| ACE Ltd. | 34,394 | 2,084,277 | |
| American Financial Group, Inc | 49,829 | 1,548,187 | |
| Prudential Financial, Inc. | 43,414 | 2,034,380 | |
| XL Group plc | 71,578 | 1,345,666 | |
| 7,012,510 | |||
| IT Services - 6.3% | |||
| DST Systems, Inc. | 14,118 | 618,792 | |
| International Business Machines Corp. | 18,577 | 3,251,532 | |
| Visa, Inc. | 6,964 | 596,954 | |
| 4,467,278 | |||
| Life Sciences - Tools & Services - 0.6% | |||
| Thermo Fisher Scientific, Inc.* | 8,210 | 415,754 | |
| Media - 9.1% | |||
| CBS Corp., Class B | 56,509 | 1,151,654 | |
| DIRECTV* | 33,053 | 1,396,489 | |
| DISH Network Corp.* | 15,569 | 390,159 | |
| John Wiley & Sons, Inc | 35,460 | 1,575,133 | |
| Time Warner Cable, Inc. | 30,993 | 1,942,331 | |
| 6,455,766 | |||
| Multiline Retail - 1.4% | |||
| Target Corp. | 19,684 | 965,303 | |
| Multi-Utilities - 2.4% | |||
| NiSource, Inc | 80,725 | 1,725,901 | |
| Oil, Gas & Consumable Fuels - 6.7% | |||
| Chesapeake Energy Corp. | 62,472 | 1,596,160 | |
| EnCana Corp | 71,189 | 1,367,541 | |
| Energen Corp | 2,919 | 119,358 | |
| Spectra Energy Corp. | 67,706 | 1,660,828 | |
| 4,743,887 | |||
www.calvert.com CALVERT SOCIAL INVESTMENT FUND ANNUAL REPORT 38
| EQUITY SECURITIES - CONT’D | SHARES | VALUE | |||
| Paper & Forest Products - 2.1% | |||||
| MeadWestvaco Corp | 59,295 | $ | 1,456,285 | ||
| Pharmaceuticals - 7.5% | |||||
| Bristol-Myers Squibb Co. | 77,068 | 2,418,394 | |||
| Johnson & Johnson | 45,316 | 2,887,082 | |||
| 5,305,476 | |||||
| Semiconductors & Semiconductor Equipment - 1.6% | |||||
| Intel Corp. | 53,618 | 1,143,672 | |||
| Software - 4.2% | |||||
| Microsoft Corp. | 120,075 | 2,988,667 | |||
| Specialty Retail - 0.0% | |||||
| Lowe’s Co.’s, Inc | 770 | 14,892 | |||
| Trading Companies & Distributors - 2.6% | |||||
| W.W. Grainger, Inc | 12,390 | 1,852,801 | |||
| Total Equity Securities (Cost $71,403,966) | 70,949,098 | ||||
| TOTAL INVESTMENTS (Cost $71,403,966) - 100.1% | 70,949,098 | ||||
| Other assets and liabilities, net - (0.1%) | (64,257 | ) | |||
| NET ASSETS - 100% | $ | 70,884,841 | |||
| NET ASSETS CONSIST OF: | |||||
| Paid-in capital applicable to the following shares of beneficial interest, | |||||
| unlimited number of no par value shares authorized, | |||||
| Class A: 2,122,974 shares outstanding | $ | 37,245,098 | |||
| Class B: 125,562 shares outstanding | 2,029,207 | ||||
| Class C: 431,540 shares outstanding | 7,427,175 | ||||
| Class I: 2,009,068 shares outstanding | 35,857,457 | ||||
| Undistributed net investment income | 446,604 | ||||
| Accumulated net realized gain (loss) on investments | (11,665,832 | ) | |||
| Net unrealized appreciation (depreciation) on investments and | |||||
| assets and liabilities denominated in foreign currencies | (454,868 | ) | |||
| NET ASSETS | $ | 70,884,841 | |||
| NET ASSET VALUE PER SHARE | |||||
| Class A | (based on net assets of $32,183,831) | $ | 15.16 | ||
| Class B | (based on net assets of $1,704,375) | $ | 13.57 | ||
| Class C | (based on net assets of $5,962,080) | $ | 13.82 | ||
| Class I | (based on net assets of $31,034,555) | $ | 15.45 | ||
| See notes to statements of net assets and notes to financial statements. | |||||
www.calvert.com CALVERT SOCIAL INVESTMENT FUND ANNUAL REPORT 39
NOTES TO STATEMENTS OF NET ASSETS
| (a) | Affiliated company. |
| (b) | This security was valued by the Board of Trustees. See Note A. |
| (c) | Colson Services Corporation is the collection and transfer agent for certain U.S. Government guaranteed variable rate loans. Each depository receipt pertains to a set, grouped by interest rate, of these loans. |
| (h) | Represents rate in effect at September 30, 2011, after regularly scheduled adjustments on such date. Interest rates adjust generally at the beginning of the month, calendar quarter, or semiannually based on prime plus contracted adjustments. As of September 30, 2011, the prime rate was 3.25%. |
| (i) | Restricted securities represent 1.4% of net assets for the Equity Portfolio. |
| (r) | The coupon rate shown on floating or adjustable rate securities represents the rate at period end. |
| (t) | 125,000 shares of Procter & Gamble Co. held by the Equity Portfolio have been soft segregated in order to cover outstanding commitments to certain limited partnership investments within the Portfolio. There are no restrictions on the trading of this security. |
| (xx) | Restructured from an original maturity date of September 15, 2010. These securities are no longer accruing interest and during the year, $22,750 and $6,883 of accrued interest was written off for Note I and Note II, respectively. |
| (zz) | Restructured from an original maturity date of September 30, 2010. These securities are no longer accruing interest and during the year, $4,370 and $7,178 of accrued interest was written off for Note I and Note II, respectively. |
| * | Non-income producing security. |
Explanation of Guarantees:
C/LOC: Confirming Letter of Credit
CEI: Credit Enhancement Instrument
LOC: Letter of Credit
Abbreviations:
ADR: American Depositary Receipts
FHLB: Federal Home Loan Bank
GO: General Obligation
HFA: Housing Finance Agency/Authority
IDA: Industrial Development Agency/Authority
LLC: Limited Liability Corporation
LP: Limited Partnership
MFH: Multi-Family Housing
www.calvert.com CALVERT SOCIAL INVESTMENT FUND ANNUAL REPORT 40
| EQUITY PORTFOLIO | |||
| RESTRICTED SECURITIES | ACQUISITION DATES | COST | |
| 20/20 Gene Systems, Inc.: | |||
| Common Stock | 8/1/08 | $ | 151,890 |
| Warrants (strike price $.01/share, expires 8/27/13) | 8/29/03 | 14,700 | |
| Better Energy Systems, Inc.: | |||
| Series B, Preferred | 8/3/10 | 400,000 | |
| Series B, Preferred Warrants (strike price $0.75/share, | |||
| expires 8/3/13) | 8/4/10 | - | |
| Blackstone Cleantech Venture Partners LP | 7/29/10 - 7/29/11 | 335,646 | |
| Calvert Social Investment Foundation Notes, | |||
| 0.94%, 7/1/12 | 7/1/09 - 7/1/10 | 10,833,877 | |
| Chesapeake PERL, Inc., Series A-2, Preferred | 7/30/04 - 9/8/06 | 300,000 | |
| China Environment Fund 2004 LP | 9/15/05 - 4/1/09 | - | |
| China Environment Fund III LP | 1/24/08 - 7/20/11 | 923,658 | |
| Core Innovations Capital I LP | 8/11/10 - 7/1/11 | 153,721 | |
| Cylex, Inc.: | |||
| Common Stock | 11/22/06 | 16,382 | |
| Series B, Preferred | 11/30/06 | 547,525 | |
| Series C-1, Preferred | 11/30/06 | 471,342 | |
| DBL Equity Fund - BAEF II LP | 3/30/11 - 9/28/11 | 424,621 | |
| Digital Directions International, Inc. | 7/2/08 - 7/15/09 | 683,778 | |
| Envisionier Medical Technologies, Inc.: | |||
| Warrants (strike price $.50/share, expires 8/6/20) | 8/6/10 | - | |
| Note I, 7.00%, 12/31/11 | 12/14/09 | 200,000 | |
| Note II, 7.00%, 12/31/11 | 8/5/10 | 100,000 | |
| Global Resource Options, Inc.: | |||
| Series A, Preferred | 9/18/06 | 750,000 | |
| Series B, Preferred | 12/5/07 | 750,000 | |
| Series C, Preferred | 2/13/09 | 1,000,000 | |
| Series D, Preferred | 12/30/10 - 5/24/11 | 700,178 | |
| Ignia Fund I LP | 1/28/10 - 5/20/11 | 523,833 | |
| Impact Ventures II LP | 9/8/10 - 7/6/11 | 544,757 | |
| LeapFrog Financial Inclusion Fund LP | 1/20/10 - 9/13/11 | 304,813 | |
| Marrone Bio Innovations, Inc.: | |||
| Series A, Preferred | 4/25/07 | 200,000 | |
| Series B, Preferred | 8/28/08 | 280,000 | |
| Series C, Preferred | 11/19/10 | 500,000 | |
| Napo Pharmaceuticals, Inc.: | |||
| Common Stock | 2/21/07 - 9/23/09 | 419,720 | |
| Common Warrants (strike price $0.55/share, | |||
| expires 9/15/14) | 9/23/09 | 16,908 | |
| NeoDiagnostix, Inc.: | |||
| Series AE, Preferred Contingent Deferred Distribution | 9/9/08 | - | |
| Series AE, Preferred Warrants Contingent | |||
| Deferred Distribution | 9/23/08 - 9/18/09 | - | |
| Series B, Preferred Contingent Deferred Distribution | 7/31/09 | - | |
| New Day Farms, Inc.: | |||
| Participation Interest Note, 9.00%, 9/1/12 | 11/25/09 | 6,225 | |
| Series B, Preferred | 3/12/09 | 500,000 | |
| New Markets Education Partners, LP | 9/27/11 | 175,000 | |
| New Markets Venture Partners II LP | 7/21/08 - 5/3/11 | 250,000 | |
| Orteq Bioengineering Ltd., Series A, Preferred | 7/19/07 | 998,102 | |
| PresenceLearning, Inc., Series A, Preferred | 9/29/11 | 300,000 | |
| Quantum Intech, Inc., 11.50%, 9/10/15 | 10/5/10 - 7/1/11 | 101,870 |
www.calvert.com CALVERT SOCIAL INVESTMENT FUND ANNUAL REPORT 41
| EQUITY PORTFOLIO | |||
| RESTRICTED SECURITIES - CONT’D | ACQUISITION DATES | COST | |
| Renewable Energy Asia Fund LP | 1/6/10 - 7/20/11 | 512,648 | |
| SEAF Global SME Facility: | |||
| 9.00%, 12/16/14 | 12/16/09 | $ | 1,500,000 |
| 9.00%, 4/20/15 | 4/20/10 | 1,000,000 | |
| 9.00%, 11/5/15 | 11/4/10 | 1,000,000 | |
| 9.00%, 3/31/16 | 3/29/11 | 450,000 | |
| 9.00%, 6/14/16 | 6/13/11 | 400,000 | |
| 9.00%, 7/12/16 | 7/11/11 | 650,000 | |
| SEAF India International Growth Fund LP | 3/22/05 - 5/24/10 | 394,032 | |
| Sustainable Jobs Fund II LP | 2/14/06 - 6/8/11 | 608,991 | |
| Sword Diagnostics: | |||
| Series B, Preferred | 12/26/06 | 250,000 | |
| Series C Convertible Bridge Note, 10.00%, | |||
| 7/31/12 | 10/29/09 | 25,000 | |
| Series C Convertible Bridge Note II, 10.00%, | |||
| 7/31/12 | 11/9/10 | 100,000 | |
| Village Laundry Services, Inc. | 7/22/09 | 500,000 |
See notes to financial statements.
www.calvert.com CALVERT SOCIAL INVESTMENT FUND ANNUAL REPORT 42
| STATEMENTS OF OPERATIONS | |||||||||
| YEAR ENDED SEPTEMBER 30, 2011 | |||||||||
| Money | Enhanced | ||||||||
| Market | Equity | Equity | |||||||
| NET INVESTMENT INCOME | PortfolIo | PortfolIo | PortfolIo | ||||||
| Investment Income: | |||||||||
| Interest income | $ | 440,719 | $ | 59,364 | $ | 102 | |||
| Dividend income (net of foreign taxes withheld of | |||||||||
| $0, $364,160 and $1,514, respectively) | — | 15,475,583 | 1,608,259 | ||||||
| Total investment income | 440,719 | 15,534,947 | 1,608,361 | ||||||
| Expenses: | |||||||||
| Investment advisory fee | 432,057 | 8,179,345 | 479,245 | ||||||
| Transfer agency fees and expenses | 329,088 | 2,556,859 | 130,904 | ||||||
| Administrative fees | 288,038 | 2,988,478 | 102,632 | ||||||
| Distribution Plan expenses: | |||||||||
| Class A | — | 2,931,804 | 91,267 | ||||||
| Class B | — | 336,825 | 21,992 | ||||||
| Class C | — | 1,126,028 | 68,086 | ||||||
| Trustees’ fees and expenses | 12,976 | 164,015 | 7,747 | ||||||
| Custodian fees | 30,267 | 134,959 | 40,646 | ||||||
| Registration fees | 18,929 | 124,228 | 42,649 | ||||||
| Reports to shareholders | 35,435 | 387,130 | 25,385 | ||||||
| Professional fees | 26,816 | 92,510 | 23,589 | ||||||
| Miscellaneous | 33,257 | 129,785 | 18,382 | ||||||
| Total expenses | 1,206,863 | 19,151,966 | 1,052,524 | ||||||
| Reimbursement from Advisor: | |||||||||
| Class O | (774,893 | ) | — | — | |||||
| Class B | — | — | (677 | ) | |||||
| Fees waived | — | — | (79,874 | ) | |||||
| Fees paid indirectly | (5,198 | ) | (2,397 | ) | (1,741 | ) | |||
| Net expenses | 426,772 | 19,149,569 | 970,232 | ||||||
| NET INVESTMENT INCOME (LOSS) | 13,947 | (3,614,622 | ) | 638,129 | |||||
| REALIZED AND UNREALIZED GAIN (LOSS) | |||||||||
| Net realized gain (loss) on: | |||||||||
| Investments | (234 | ) | 90,174,601 | 6,514,725 | |||||
| Foreign currency transactions | — | (12,769 | ) | 82 | |||||
| (234 | ) | 90,161,832 | 6,514,807 | ||||||
| Change in unrealized appreciation (depreciation) on: | |||||||||
| Investments | — | (146,191,552 | ) | (5,530,390 | ) | ||||
| Assets and liabilities denominated | |||||||||
| in foreign currencies | — | — | 12 | ||||||
| — | (146,191,552 | ) | (5,530,378 | ) | |||||
| NET REALIZED AND UNREALIZED | |||||||||
| GAIN (LOSS) | (234 | ) | (56,029,720 | ) | 984,429 | ||||
| INCREASE (DECREASE) IN NET ASSETS | |||||||||
| RESULTING FROM OPERATIONS | $ | 13,713 | ($ | 59,644,342 | ) | $ | 1,622,558 | ||
See notes to financial statements.
www.calvert.com CALVERT SOCIAL INVESTMENT FUND ANNUAL REPORT 43
| MONEY MARKET PORTFOLIO STATEMENTS OF CHANGES IN NET ASSETS | ||||||
| Year ended | Year ended | |||||
| September 30, | September 30, | |||||
| INCREASE (DECREASE) IN NET ASSETS | 2011 | 2010 | ||||
| Operations: | ||||||
| Net investment income | $ | 13,947 | $ | 14,375 | ||
| Net realized gain (loss) | (234 | ) | 205 | |||
| INCREASE (DECREASE) IN NET ASSETS | ||||||
| RESULTING FROM OPERATIONS | 13,713 | 14,580 | ||||
| Distributions to shareholders from: | ||||||
| Net investment income | (14,219 | ) | (12,743 | ) | ||
| Capital share transactions: | ||||||
| Shares sold | 85,896,069 | 80,538,541 | ||||
| Reinvestment of distributions | 12,723 | 12,239 | ||||
| Shares redeemed | (87,888,366 | ) | (105,462,303 | ) | ||
| Total capital share transactions | (1,979,574 | ) | (24,911,523 | ) | ||
| TOTAL INCREASE (DECREASE) IN NET ASSETS | (1,980,080 | ) | (24,909,686 | ) | ||
| NET ASSETS | ||||||
| Beginning of year | 144,575,035 | 169,484,721 | ||||
| End of year (including undistributed net investment | ||||||
| income of $5,973 and $6,532, respectively) | $ | 142,594,955 | $ | 144,575,035 | ||
| CAPITAL SHARE ACTIVITY | ||||||
| Shares sold | 85,896,069 | 80,538,541 | ||||
| Reinvestment of distributions | 12,723 | 12,239 | ||||
| Shares redeemed | (87,888,366 | ) | (105,462,303 | ) | ||
| Total capital share activity | (1,979,574 | ) | (24,911,523 | ) | ||
See notes to financial statements.
www.calvert.com CALVERT SOCIAL INVESTMENT FUND ANNUAL REPORT 44
| EQUITY PORTFOLIO STATEMENTS OF CHANGES IN NET ASSETS | ||||||
| Year ended | Year ended | |||||
| Septmeber 30, | September 30, | |||||
| INCREASE (DECREASE) IN NET ASSETS | 2011 | 2010 | ||||
| Operations: | ||||||
| Net investment income (loss) | ($ | 3,614,622 | ) | ($ | 1,712,990 | ) |
| Net realized gain (loss) | 90,161,832 | 42,456,257 | ||||
| Change in unrealized appreciation (depreciation) | (146,191,552 | ) | 91,189,722 | |||
| INCREASE (DECREASE) IN NET ASSETS | ||||||
| RESULTING FROM OPERATIONS | (59,644,342 | ) | 131,932,989 | |||
| Distributions to shareholders from: | ||||||
| Net investment income: | ||||||
| Class A shares | — | (1,020,319 | ) | |||
| Class I shares | — | (584,901 | ) | |||
| Class Y shares | — | (265 | ) | |||
| Total distributions | — | (1,605,485 | ) | |||
| Capital share transactions: | ||||||
| Shares sold: | ||||||
| Class A shares | 367,600,818 | 199,788,671 | ||||
| Class B shares | 958,072 | 1,662,605 | ||||
| Class C shares | 17,434,588 | 14,998,567 | ||||
| Class I shares | 176,644,543 | 60,197,166 | ||||
| Class Y shares | 61,337,872 | 11,277,799 | ||||
| Shares issued from merger (See Note H): | ||||||
| Class A shares | 234,905,369 | — | ||||
| Class B shares | 13,254,598 | — | ||||
| Class C shares | 35,121,331 | — | ||||
| Class I shares | 252,743,032 | — | ||||
| Class Y shares | 6,970,268 | — | ||||
| Reinvestment of distributions: | ||||||
| Class A shares | — | 923,360 | ||||
| Class I shares | — | 484,505 | ||||
| Class Y shares | — | 203 | ||||
| Redemption fees: | ||||||
| Class A shares | 35,642 | 12,199 | ||||
| Class B shares | — | 395 | ||||
| Class C shares | 139 | 498 | ||||
| Class I shares | 2,555 | 2,790 | ||||
| Class Y shares | 807 | — | ||||
| Shares redeemed: | ||||||
| Class A shares | (265,714,903 | ) | (153,933,488 | ) | ||
| Class B shares | (14,460,408 | ) | (15,650,762 | ) | ||
| Class C shares | (14,969,389 | ) | (13,675,307 | ) | ||
| Class I shares | (62,206,664 | ) | (38,465,802 | ) | ||
| Class Y shares | (6,671,865 | ) | (537,791 | ) | ||
| Total capital share transactions | 802,986,405 | 67,085,608 | ||||
| TOTAL INCREASE (DECREASE) IN NET ASSETS | 743,342,063 | 197,413,112 | ||||
See notes to financial statements.
www.calvert.com CALVERT SOCIAL INVESTMENT FUND ANNUAL REPORT 45
| EQUITY PORTFOLIO STATEMENTS OF CHANGES IN NET ASSETS | ||||||
| Year ended | Year ended | |||||
| September 30, | September 30, | |||||
| NET ASSETS | 2011 | 2010 | ||||
| Beginning of year | $ | 1,324,689,838 | $ | 1,127,276,726 | ||
| End of year | $ | 2,068,031,901 | $ | 1,324,689,838 | ||
| CAPITAL SHARE ACTIVITY | ||||||
| Shares sold: | ||||||
| Class A shares | 9,994,267 | 6,487,327 | ||||
| Class B shares | 30,605 | 61,989 | ||||
| Class C shares | 594,707 | 600,536 | ||||
| Class I shares | 4,507,153 | 1,846,313 | ||||
| Class Y shares | 1,624,415 | 361,408 | ||||
| Reinvestment of distributions: | ||||||
| Class A shares | — | 30,195 | ||||
| Class I shares | — | 14,944 | ||||
| Class Y shares | — | 7 | ||||
| Shares issued from merger (See Note H): | ||||||
| Class A shares | 6,547,519 | — | ||||
| Class B shares | 428,050 | — | ||||
| Class C shares | 1,227,352 | — | ||||
| Class I shares | 6,582,940 | — | ||||
| Class Y shares | 192,316 | — | ||||
| Shares redeemed: | ||||||
| Class A shares | (7,240,107 | ) | (5,017,434 | ) | ||
| Class B shares | (457,814 | ) | (578,597 | ) | ||
| Class C shares | (512,023 | ) | (554,040 | ) | ||
| Class I shares | (1,605,981 | ) | (1,172,079 | ) | ||
| Class Y shares | (180,806 | ) | (17,591 | ) | ||
| Total capital share activity | 21,732,593 | 2,062,978 | ||||
See notes to financial statements.
www.calvert.com CALVERT SOCIAL INVESTMENT FUND ANNUAL REPORT 46
| ENHANCED EQUITY PORTFOLIO STATEMENTS OF CHANGES IN NET ASSETS | ||||||
| Year ended | Year ended | |||||
| September 30, | September 30, | |||||
| INCREASE (DECREASE) IN NET ASSETS | 2011 | 2010 | ||||
| Operations: | ||||||
| Net investment income | $ | 638,129 | $ | 408,613 | ||
| Net realized gain (loss) | 6,514,807 | 11,380,434 | ||||
| Change in unrealized appreciation (depreciation) | (5,530,378 | ) | (4,356,286 | ) | ||
| INCREASE (DECREASE) IN NET ASSETS | ||||||
| RESULTING FROM OPERATIONS | 1,622,558 | 7,432,761 | ||||
| Distributions to shareholders from: | ||||||
| Net investment income: | ||||||
| Class A shares | (179,467 | ) | (256,846 | ) | ||
| Class I shares | (322,434 | ) | (299,926 | ) | ||
| Total distributions | (501,901 | ) | (556,772 | ) | ||
| Capital share transactions: | ||||||
| Shares sold: | ||||||
| Class A shares | 4,850,966 | 4,472,689 | ||||
| Class B shares | 46,554 | 176,386 | ||||
| Class C shares | 929,713 | 976,156 | ||||
| Class I shares | 4,721,887 | 4,405,062 | ||||
| Reinvestment of distributions: | ||||||
| Class A shares | 158,235 | 229,520 | ||||
| Class I shares | 322,434 | 299,925 | ||||
| Redemption fees: | ||||||
| Class A shares | 263 | 34 | ||||
| Class C shares | 161 | — | ||||
| Class I shares | — | 10 | ||||
| Shares redeemed: | ||||||
| Class A shares | (7,915,279 | ) | (6,501,674 | ) | ||
| Class B shares | (739,815 | ) | (869,688 | ) | ||
| Class C shares | (1,342,492 | ) | (1,008,399 | ) | ||
| Class I shares | (4,981,455 | ) | (2,090,962 | ) | ||
| Total capital share transactions | (3,948,828 | ) | 89,059 | |||
| TOTAL INCREASE (DECREASE) IN NET ASSETS | (2,828,171 | ) | 6,965,048 | |||
| NET ASSETS | ||||||
| Beginning of year | 73,713,012 | 66,747,964 | ||||
| End of year (including undistributed net investment | ||||||
| income of $446,604 and $310,294, respectively) | $ | 70,884,841 | $ | 73,713,012 | ||
See notes to financial statements.
www.calvert.com CALVERT SOCIAL INVESTMENT FUND ANNUAL REPORT 47
| ENHANCED EQUITY PORTFOLIO STATEMENTS OF CHANGES IN NET ASSETS | ||||
| Year ended | Year ended | |||
| September 30, | September 30, | |||
| CAPITAL SHARE ACTIVITY | 2011 | 2010 | ||
| Shares sold: | ||||
| Class A shares | 294,752 | 307,627 | ||
| Class B shares | 3,130 | 13,539 | ||
| Class C shares | 61,404 | 72,886 | ||
| Class I shares | 287,722 | 298,452 | ||
| Reinvestment of distributions: | ||||
| Class A shares | 9,714 | 15,873 | ||
| Class I shares | 19,506 | 20,473 | ||
| Shares redeemed: | ||||
| Class A shares | (482,143 | ) | (449,177 | ) |
| Class B shares | (49,239 | ) | (65,770 | ) |
| Class C shares | (87,928 | ) | (76,752 | ) |
| Class I shares | (293,935 | ) | (143,163 | ) |
| Total capital share activity | (237,017 | ) | (6,012 | ) |
See notes to financial statements.
www.calvert.com CALVERT SOCIAL INVESTMENT FUND ANNUAL REPORT 48
NOTES TO FINANCIAL STATEMENTS
NOTE A — SIGNIFICANT ACCOUNTING POLICIES
General: The Calvert Social Investment Fund (the “Fund”) is registered under the Investment Company Act of 1940 as an open-end management investment company. The Fund operates as a series fund with eight separate portfolios, three of which are reported herein: Money Market, Equity, and Enhanced Equity. Money Market, Equity and Enhanced Equity are registered as diversified portfolios. The operation of each series is accounted for separately. Money Market Class O shares are sold without a sales charge. Equity and Enhanced Equity have Class A, Class B, Class C, and Class I shares. Effective October 31, 2008, Equity began to offer Class Y shares. Class A shares are sold with a maximum front-end sales charge of 4.75%. Class B shares are sold without a front-end sales charge. With certain exceptions, the Fund will impose a deferred sales charge at the time of redemption, depending on how long investors have owned the shares. Effective March 1, 2010, Class B shares are no longer offered for purchase, except through reinvestment of dividends and/or distributions and through certain exchanges. Class C shares are sold without a front-end sales charge. With certain exceptions, the Fund will impose a deferred sales charge on shares sold within one year of purchase. Class B and Class C shares have higher levels of expenses than Class A shares. Class I shares require a minimum account balance of $1,000,000. The $1 million minimum initial investment may be waived for certain institutional accounts, where it is believed to be in the best interest of the Fund and its shareholders. Class I shares have no front-end or deferred sales charge and have lower levels of expenses than Class A shares. Class Y shares are generally only available to wrap or similar fee-based programs offered by financial intermediaries that have entered into an agreement with the Fund’s Distributor to offer Class Y shares. Class Y shares have no front-end or deferred sales charge and have lower levels of expenses than Class A shares. Each class has different: (a) dividend rates, due to differences in Distribution Plan expenses and other class-specific expenses, (b) exchange privileges and (c) class-specific voting rights.
Security Valuation: Net asset value per share is determined every business day as of the close of the regular session of the New York Stock Exchange (generally 4:00 p.m. Eastern time). The Fund uses independent pricing services approved by the Board of Trustees to value its investments wherever possible. Investments for which market quotations are not available or deemed not reliable are fair valued in good faith under the direction of the Board of Trustees. In determining fair value, the Board considers all relevant qualitative and quantitative information available. These factors are subject to change over time and are reviewed periodically. The values assigned to fair value investments are based on available information and do not necessarily represent amounts that might ultimately be realized. Further, because of the inherent uncertainty of valuation, those estimated values may differ significantly from the values that would have been used had a ready market for the investments existed, and the differences could be material.
www.calvert.com CALVERT SOCIAL INVESTMENT FUND ANNUAL REPORT 49
The following securities were fair valued in good faith under the direction of the Board of Trustees as of September 30, 2011:
| Total | ||
| Investments | % of Net Assets | |
| Equity | $28,116,740 | 1.4% |
The Fund utilizes various methods to measure the fair value of its investments. Generally Accepted Accounting Principles (GAAP) establishes a disclosure hierarchy that categorizes the inputs to valuation techniques used to value assets and liabilities at measurement date. These inputs are summarized in the three broad levels listed below:
Level 1 – quoted prices in active markets for identical securities
Level 2 – other significant observable inputs (including quoted prices for similar securities, interest rates, prepayment speeds, credit risk, etc.)
Level 3 – significant unobservable inputs (including the Fund’s own assumptions in determining the fair value of investments)
The inputs or methodology used for valuing securities are not necessarily an indication of the risk associated with investing in those securities. For example, money market securities are valued using amortized cost, in accordance with Rule 2a-7 under the Investment Company Act of 1940. Generally, if the credit quality is sufficient, amortized cost approximates the current fair value of a security, but since the value is not obtained from a quoted price in an active market, such securities are reflected as Level 2.
Changes in valuation techniques may result in transfers in or out of an investment’s assigned level within the hierarchy during the period. Valuation techniques used to value the Fund’s investments by major category are as follows.
Debt securities, including restricted securities, are valued based on evaluated prices received from independent pricing services or from dealers who make markets in such securities. For municipal securities and U.S. government and government agency obligations, pricing services utilize matrix pricing which considers yield or price of bonds of comparable quality, coupon, maturity and type as well as dealer supplied prices and are generally categorized as Level 2 in the hierarchy. Short-term instruments of sufficient credit quality, with a maturity at issuance of 60 days or less, generally are valued at amortized cost, which approximates fair value; those for which quotations are not readily available are categorized as Level 2 in the hierarchy. All securities held by Money Market are valued at amortized cost which approximates fair value in accordance with Rule 2a-7 of the Investment Company Act of 1940.
When independent prices are unavailable or unreliable, debt securities may be valued utilizing pricing matrices which consider similar factors that would be used by inde-
www.calvert.com CALVERT SOCIAL INVESTMENT FUND ANNUAL REPORT 50
pendent pricing services. These are generally categorized as Level 2 in the hierarchy but may be Level 3 depending on the circumstances.
Equity securities, including restricted securities and venture capital securities, for which market quotations are readily available, are valued at the last reported sale price or official closing price as reported by an independent pricing service on the primary market or exchange on which they are traded and are categorized as Level 1 in the hierarchy. Foreign securities are valued based on quotations from the principal market in which such securities are normally traded. If events occur after the close of the principal market in which foreign securities are traded, and before the close of business of the Fund, that are expected to materially affect the value of those securities, then they are valued at their fair value taking these events into account. For restricted securities and private placements where observable inputs are limited, assumptions about market activity and risk are used and are categorized as Level 3 in the hierarchy.
Venture capital securities for which market quotations are not readily available are fair valued by the Fund’s Board of Trustees and are categorized as Level 3 in the hierarchy. Venture capital direct equity securities are generally valued using the most appropriate and applicable method to measure fair value in light of each company’s situation. Methods may include market, income or cost approaches with discounts as appropriate based on assumptions of liquidation or exit risk. Examples of the market approach are subsequent rounds of financing, comparable transactions, and revenue times an industry multiple. An example of the income approach is the discounted cash flow. Examples of the cost approach are replacement cost, salvage value, or net asset percentage. Venture capital limited partnership (LP) securities are valued at the fair value reported by the general partner of the partnership adjusted as necessary to reflect subsequent capital calls and distributions and any other available information. In the absence of a reported LP unit value it may be estimated based on the Fund’s percentage equity in the partnership and/or other balance sheet information and portfolio value for the most recently available period reported by the general partner. In some cases adjustments may be made to account for daily pricing of material public holdings within the partnership. Venture capital debt securities are valued based on assumptions of credit and market risk. For venture capital securities denominated in foreign currency, the fair value is marked to the daily exchange rate.
The following is a summary of the inputs used to value the Fund’s net assets as of September 30, 2011.
| MONEY MARKET | VALUATION INPUTS | |||
| Investments In SecuritieS | level 1 | level 2 | level 3 | total |
| Municipal obligations | - | $4,083,359 | - | $4,083,359 |
| U.S. government obligations | - | 14,998,269 | - | 14,998,269 |
| Other debt obligations | - | 264,417 | - | 264,417 |
| Variable rate demand notes | - | 116,468,000 | - | 116,468,000 |
| TOTAL | - | $135,814,045 | - | $135,814,045 |
www.calvert.com CALVERT SOCIAL INVESTMENT FUND ANNUAL REPORT 51
| EQUITY Investments In SecuritieS | VALUATION INPUTS | ||||
| level 1 | level 2 | level 3 | total | ||
| Equity securities* | $1,966,941,741 | - | - | $1,966,941,741 | ** |
| Venture capital | - | - | $17,677,216 | 17,677,216 | |
| Other debt obligations | - | $54,371,685 | 10,439,524 | 64,811,209 | |
| TOTAL | $1,966,941,741 | $54,371,685 | $28,116,740 | $2,049,430,166 | |
| * | For further breakdown of equity securities by industry, please refer to the Statements of Net Assets. |
| ** | Exclusive of $6,846,807 venture capital equity shown in the venture capital heading. |
The following is a reconciliation of Level 3 assets for which significant unobservable inputs were used to determine fair value:
| Venture | Other Debt | |||||
| Capital | ObligationS | |||||
| Balance as of 9/30/10 | $ | 9,285,144 | $ | 6,846,496 | ||
| Accrued discounts/premiums | - | - | ||||
| Realized gain (loss) | ||||||
| Change in unrealized appreciation (depreciation) | (3,989,325 | ) | (156,972 | ) | ||
| Purchases | 12,736,539 | 3,750,000 | ||||
| Sales | (355,142 | ) | - | |||
| Transfers in and/or out of Level 31 | - | - | ||||
| Balance as of 9/30/11 | $ | 17,677,216 | $ | 10,439,524 | ||
| Total | ||||||
| Balance as of 9/30/10 | $ | 16,131,640 | ||||
| Accrued discounts/premiums | - | |||||
| Realized gain (loss) | - | |||||
| Change in unrealized appreciation (depreciation) | (4,146,297 | ) | ||||
| Purchases | 16,486,539 | |||||
| Sales | (355,142 | ) | ||||
| Transfers in and/or out of Level 31 | - | |||||
| Balance as of 9/30/11 | $ | 28,116,740 | ||||
1 The Fund’s policy is to recognize transfers into and transfers out of Level 3 as of the end of the reporting period.
www.calvert.com CALVERT SOCIAL INVESTMENT FUND ANNUAL REPORT 52
For the period ended September 30, 2011, total change in unrealized gain (loss) on Level 3 securities that would be in the change in net assets was ($4,146,297) for Equity. Total unrealized gain (loss) for all securities (including Level 1 and Level 2) can be found on the accompanying Statement of Operations.
| VALUATION INPUTS | ||||
| ENHANCED EQUITY | ||||
| Investments In Securities | level 1 | level 2 | level 3 | total |
| Equity securities* | $70,949,098 | - | - | $70,949,098 |
| TOTAL | $70,949,098 | - | - | $70,949,098 |
* For further breakdown of equity securities by industry, please refer to the Statements of Net Assets.
Repurchase Agreements: The Fund may enter into repurchase agreements with recognized financial institutions or registered broker/dealers and, in all instances, holds underlying securities with a value exceeding the total repurchase price, including accrued interest. Although risk is mitigated by the collateral, the Fund could experience a delay in recovering its value and a possible loss of income or value if the counterparty fails to perform in accordance with the terms of the agreement.
Restricted Securities: The Fund may invest in securities that are subject to legal or contractual restrictions on resale. Generally, these securities may only be sold publicly upon registration under the Securities Act of 1933 or in transactions exempt from such registration. Information regarding restricted securities is included at the end of the Schedule of Investments.
Security Transactions and Net Investment Income: Security transactions are accounted for on trade date. Realized gains and losses are recorded on an identified cost basis and may include proceeds from litigation. Dividend income is recorded on the ex-dividend date or, in the case of dividends on certain foreign securities, as soon as the Fund is informed of the ex-dividend date. Distributions received on securities that represent a return of capital or capital gain are recorded as a reduction of cost of investments and/or as a realized gain. Interest income, which includes amortization of premium and accretion of discount on debt securities, is accrued as earned. Investment income and realized and unrealized gains and losses are allocated to separate classes of shares based upon the relative net assets of each class. Debt obligations may be placed on non-accrual status and related interest income may be reduced by ceasing current accruals and writing off interest receivables when the collection of all or a portion of interest has become doubtful based on consistently applied procedures. (See Notes to Statements of Net Assets on page 40). A debt obligation may be removed from non-accrual status when the issuer resumes interest payments or when collectability of interest is reasonably assured. Expenses arising in connection with a class are charged directly to that class. Expenses common to the classes are allocated to each class in proportion to their relative net assets. Withholding
www.calvert.com CALVERT SOCIAL INVESTMENT FUND ANNUAL REPORT 53
taxes on foreign dividends have been provided for in accordance with management’s understanding of the applicable country’s tax rules and rates.
Foreign Currency Transactions: The Fund’s accounting records are maintained in U.S. dollars. For valuation of assets and liabilities on each date of net asset value determination, foreign denominations are translated into U.S. dollars using the current exchange rate. Security transactions, income and expenses are translated at the prevailing rate of exchange on the date of the event. The effect of changes in foreign exchange rates on securities is included in the net realized and unrealized gain or loss on securities.
Distributions to Shareholders: Distributions to shareholders are recorded by the Fund on ex-dividend date. Dividends from net investment income are accrued daily and paid monthly by Money Market. Dividends from net investment income are paid annually by Equity and Enhanced Equity. Distributions from net realized capital gains, if any, are paid at least annually. Distributions are determined in accordance with income tax regulations which may differ from generally accepted accounting principles; accordingly, periodic reclassifications are made within the Fund’s capital accounts to reflect income and gains available for distribution under income tax regulations.
Estimates: The preparation of the financial statements in conformity with accounting principles generally accepted in the United States requires management to make estimates and assumptions that affect the reported amounts of assets and liabilities and disclosure of contingent assets and liabilities at the date of the financial statements and the reported amounts of income and expenses during the reported period. Actual results could differ from those estimates.
Redemption Fees: The Equity and Enhanced Equity Portfolios charge a 2% redemption fee on redemptions, including exchanges, made within 30 days of purchase in the same Portfolio (within seven days for all Class I shares). The redemption fee is accounted for as an addition to paid-in capital. The fee is intended to discourage market-timers by ensuring that short-term trading costs are borne by the investors making the transactions and not the shareholders already in the Portfolio.
Expense Offset Arrangements: The Fund has arrangements with its custodian banks whereby the custodian’s fees may be paid indirectly by credits earned on each Portfolio’s cash on deposit with the banks. These credits are used to reduce the Portfolios’ expenses. Such deposit arrangements may be an alternative to overnight investments.
Federal Income Taxes: No provision for federal income or excise tax is required since the Fund intends to continue to qualify as a regulated investment company under the Internal Revenue Code and to distribute substantially all of its taxable earnings.
Management has analyzed the Fund’s tax positions taken for all open federal income tax years and has concluded that no provision for federal income tax is required in the Fund’s financial statements. A Fund’s federal tax return is subject to examination by the Internal Revenue Service for a period of three years.
New Accounting Pronouncements: In May 2011, the Financial Accounting Standards Board (“FASB”) issued Accounting Standards Update (“ASU”) No. 2011-04, “Amendments to Achieve Common Fair Value Measurement and Disclosure Requirements in U.S. GAAP and IFRSs.” ASU No. 2011-04 requires disclosure of the
www.calvert.com CALVERT SOCIAL INVESTMENT FUND ANNUAL REPORT 54
amounts of any transfers between Level 1 and Level 2, and the reasons for the transfers. For Level 3 fair value measurements, ASU No. 2011-04 requires disclosure of quantitative information about the significant unobservable inputs used. In addition for Level 3 fair value measurements, ASU No. 2011-04 requires a description of the valuation processes used by the reporting entity and ASU No. 2011-04 requires a narrative description of the sensitivity of the fair value measurement to changes in unobservable inputs if a change in those inputs to a different amount might result in a significantly higher or lower fair value measurement. ASU No. 2011-04 is effective for financial statements issued for fiscal years and interim periods beginning after December 15, 2011. Management is currently evaluating the impact the adoption of ASU No. 2011-04 will have on the Portfolio’s financial statements and related disclosures.
NOTE B — RELATED PARTY TRANSACTIONS
Calvert Investment Management, Inc. (the “Advisor”) (formerly known as Calvert Asset Management Company, Inc.) is wholly-owned by Calvert Investments, Inc. (“Calvert”) (formerly known as Calvert Group, Ltd.), which is indirectly wholly owned by UNIFI Mutual Holding Company. The Advisor provides investment advisory services and pays the salaries and fees of officers and Trustees of the Fund who are employees of the Advisor or its affiliates.
For its services, the Advisor receives monthly fees based on the following annual rates of average daily net assets:
| Money Market | 30 | % |
| Equity: | ||
| First $2 Billion | .50 | % |
| Next $1 Billion | .475 | % |
| Over $3 Billion | .45 | % |
| Enhanced Equity: | ||
| First $250 Million | .60 | % |
| Over $250 Million | .55 | % |
Under the terms of the agreement, $35,226, $762,652 and $30,145 was payable at year end for Money Market, Equity and Enhanced Equity, respectively. In addition, $449,057 and $19,828 was payable at year end for operating expenses paid by the Advisor during September 2011 for Equity and Enhanced Equity, respectively. In addition, $33,235 was receivable at year end from the Advisor for reimbursement of operating expenses for Money Market. For the year ended September 30, 2011, the Advisor waived $79,874 of its fee in Enhanced Equity.
The Advisor has contractually agreed to limit net annual fund operating expenses through January 31, 2012 for Money Market, Equity Class Y, and Enhanced Equity Class I. For the purpose of this expense limit, operating expenses do not include interest expense, brokerage commissions, taxes, and extraordinary expenses. This expense limitation does
www.calvert.com CALVERT SOCIAL INVESTMENT FUND ANNUAL REPORT 55
not limit any acquired fund fees and expenses. To the extent any expense offset credits are earned, the Advisor’s obligation under the contractual limitation may be reduced and the Advisor may benefit from the expense offset arrangement.
The contractual expense caps are as follows: for Money Market, .875%; for Equity Class Y, .96%; and for Enhanced Equity Class I, .81%.
The Advisor voluntarily reimbursed Class O shares of Money Market to maintain a positive yield of $774,893 for the year ended September 30, 2011.
Calvert Investment Administrative Services, Inc. (“CIAS”) (formerly known as Calvert Administrative Services Company), an affiliate of the Advisor, provides administrative services for the Fund. For providing such services, CIAS receives an annual fee, payable monthly, based on the following annual rates of average daily net assets:
| Money Market | .20 | % |
| Equity (Class A, B, C & Y) | .20 | % |
| Equity (Class I) | .10 | % |
| Enhanced Equity (Class A, B, & C) | .15 | % |
| Enhanced Equity (Class I) | .10 | % |
Under the terms of the agreement $23,484, $311,337 and $7,722 was payable at year end for Money Market, Equity and Enhanced Equity, respectively.
Calvert Investment Distributors, Inc. (“CID”) (formerly known as Calvert Distributors, Inc.), an affiliate of the Advisor, is the distributor and principal underwriter for the Fund. Distribution Plans, adopted by Class A, Class B, and Class C shares, allow the Portfolios to pay CID for expenses and services associated with distribution of shares. The expenses of Money Market are limited to .25% annually of average daily net assets. CID currently does not charge any Distribution Plan expenses for Money Market. The expenses paid for Class A may not exceed .35% of Equity’s and .25% of Enhanced Equity’s annual average daily net assets. The amount actually paid by Class A of Equity and Enhanced Equity, is an annualized fee, payable monthly of .25% of average daily net assets. The expenses paid for Class B and Class C may not exceed 1.00% of Equity and Enhanced Equity’s annual average daily net assets. The amount actually paid, is an annualized fee, payable monthly of 1.00%, of each Classes’ average daily net assets. Class I for Equity and Enhanced Equity and Class Y for Equity do not have Distribution Plan expenses. Under the terms of the agreement $427,766 and $13,399 was payable at year end for Equity and Enhanced Equity, respectively.
CID received the following amounts as its portion of the commissions charged on sales of the Funds’ Class A shares for the year ended September 30, 2011: $222,541 for Equity and $10,344 for Enhanced Equity.
www.calvert.com CALVERT SOCIAL INVESTMENT FUND ANNUAL REPORT 56
Calvert Investment Services, Inc. (“CIS”) (formerly known as Calvert Shareholder Services, Inc.), an affiliate of the Advisor, is the shareholder servicing agent for the Fund. For its services, CIS received fees of $154,919, $400,939, and $27,822 for the year ended September 30, 2011 for Money Market, Equity and Enhanced Equity, respectively. Boston Financial Data Services, Inc. is the transfer and dividend disbursing agent. Under the terms of the agreement, $12,212, $46,180 and $2,151 was payable at year end for Money Market, Equity and Enhanced Equity, respectively.
The Fund invests in Community Investment Notes issued by the Calvert Social Investment Foundation (the “CSI Foundation”). The CSI Foundation is a 501(c)(3) nonprofit organization that receives in-kind support from Calvert and its subsidiaries. The Fund has received from the Securities and Exchange Commission an exemptive order permitting the Fund to make investments in these notes under certain conditions.
Each Trustee of the Funds who is not an employee of the Advisor or its affiliates receives an annual retainer of $44,000 plus a meeting fee of $2,000 for each Board meeting attended. Additional fees of up to $5,000 annually may be paid to the Board chair and Committee chairs ($10,000 for Special Equities Committee chair) and $2,500 annually may be paid to Committee members, plus a Committee meeting fee of $500 for each Committee meeting attended. Trustee’s fees are allocated to each of the funds served.
NOTE C — INVESTMENT ACTIVITY
During the year, the cost of purchases and proceeds from sales of investments, other than U.S. Government and short-term securities, were:
| ENHANCED | |||||||
| EQUITY | EQUITY | ||||||
| $900,424,098 | $86,513,568 | ||||||
| 664,401,934 | 89,806,968 | ||||||
| Purchases | |||||||
| Sales | |||||||
| Money Market held only short-term investments. | |||||||
| Capital Loss Carryforwards | |||||||
| MONEY | ENHANCED | ||||||
| Expiration Date | MARKET | EQUITY | EQUITY | ||||
| 30-Sep-13 | ($6,183 | ) | - | - | |||
| 30-Sep-14 | (211 | ) | - | - | |||
| 30-Sep-15 | (2,100 | ) | - | - | |||
| 30-Sep-17 | - | ($126,561,476 | ) | - | |||
| 30-Sep-18 | - | - | ($11,643,050 | ) | |||
| 30-Sep-19 | (348 | ) | - | - | |||
www.calvert.com CALVERT SOCIAL INVESTMENT FUND ANNUAL REPORT 57
Capital losses may be utilized to offset future capital gains until expiration; however Equity Portfolio’s use of net capital loss carryforwards acquired from Calvert Large Cap Growth Fund may be limited under certain tax provisions. Under the Regulated Investment Company Modernization Act of 2010, the Funds will soon be permitted to carry forward capital losses incurred in taxable years beginning after December 22, 2010 for an unlimited period. Losses incurred during those future years will be required to be utilized prior to the losses incurred in pre-enactment taxable years. As a result of this ordering rule, pre-enactment capital loss carryfor-wards may more likely expire unused. Also, post-enactment capital losses that are carried forward will retain their character as either short-term or long-term capital losses rather than being considered all short-term as under previous law.
The Money Market Portfolio intends to elect to defer net capital losses of $234 incurred from November 1, 2010 through September 30, 2011 and treat them as arising in the fiscal year ending September 30, 2012.
The tax character of dividends and distributions for the years ended September 30, 2011 and September 30, 2010 was as follows:
| MONEY MARKET | ||
| Distributions paid from: | 2011 | 2010 |
| Ordinary income | $14,219 | $12,743 |
| Total | $14,219 | $12,743 |
| EQUITY | ||
| Distributions paid from: | 2011 | 2010 |
| Ordinary income | — | $1,605,485 |
| Total | — | $1,605,485 |
| ENHANCED EQUITY | ||
| Distributions paid from: | 2011 | 2010 |
| Ordinary income | $501,901 | $556,771 |
| Total | $501,901 | $556,771 |
www.calvert.com CALVERT SOCIAL INVESTMENT FUND ANNUAL REPORT 58
As of September 30, 2011, the tax basis components of distributable earnings/(accumulated losses) and the federal tax cost were as follows:
| MONEY | ENHANCED | |||||
| MARKET | EQUITY | EQUITY | ||||
| Unrealized appreciation | — | $225,592,317 | $3,522,083 | |||
| Unrealized (depreciation) | — | (176,969,963 | ) | (3,999,732 | ) | |
| Net unrealized appreciation/(depreciation) | — | $48,622,354 | ($477,649 | ) | ||
| Undistributed ordinary income | $7,736 | — | $446,604 | |||
| Undistributed long term capital gain | — | $71,634,274 | — | |||
| Capital loss carryforward | ($8,842) | ($126,561,476) | ($11,643,050) | |||
| Federal income tax cost of investments | $135,814,045 | $2,000,807,812 | $71,426,747 | |||
The differences between the components of distributable earnings on a tax basis and the amounts reflected in the statements of net assets are primarily due to temporary book-tax differences that will reverse in a subsequent period. For Enhanced Equity Portfolio, the difference is due to wash sales. For Equity Portfolio, the differences are due to wash sales, partnerships and capital loss limitations under Internal Revenue Code Section 382. For Money Market Portfolio, the differences are due to post October losses and distributions paid after fiscal year end.
Reclassifications, as shown in the table below, have been made to the Funds’ components of net assets to reflect income and gains available for distribution (or available capital loss carryovers, as applicable) under income tax law and regulations. These reclassifications are due to permanent book-tax differences and have no impact on net assets. For Money Market Portfolio, the reclassifications are due to tax-exempt income and expired capital losses. For Equity Portfolio, the reclassifications are due to foreign currency transactions, partnerships and net operating losses. For Enhanced Equity Portfolio, the reclassifications are due to foreign currency transactions.
| MONEY | ENHANCED | |||||
| MARKET | EQUITY | EQUITY | ||||
| Undistributed net investment income | ($287 | ) | $3,614,622 | $82 | ||
| Accumulated net realized gain (loss) | 6,847 | 123,932 | (82 | ) | ||
| Paid-in capital | (6,560 | ) | ($3,738,554 | ) | — |
www.calvert.com CALVERT SOCIAL INVESTMENT FUND ANNUAL REPORT 59
The Portfolios may sell or purchase securities to and from other Portfolios managed by the Advisor, typically short-term variable rate demand notes. Interportfolio transactions are primarily used for cash management purposes. Interportfolio transactions are made pursuant to Rule 17a-7 of the Investment Company Act of 1940. For the year ended September 30, 2011, such purchases and sales transactions were:
| MONEY | |
| MARKET | |
| Purchases | $102,020,000 |
| Sales | 60,125,000 |
NOTE D — LINE OF CREDIT
A financing agreement is in place with all Calvert Funds and State Street Corporation (“SSC”). Under the agreement, SSC provides an unsecured line of credit facility, in the aggregate amount of $50 million ($25 million committed and $25 million uncommitted), accessible by the Funds for temporary or emergency purposes only. Borrowings under the committed facility bear interest at the higher of the London Interbank Offered Rate, (LIBOR) or the overnight Federal Funds Rate plus 1.25% per annum. A commitment fee of .11% per annum is incurred on the unused portion of the committed facility, which is allocated to all participating funds. Money Market and Equity had no loans outstanding pursuant to this line of credit at September 30, 2011. Enhanced Equity had no borrowings under the agreement during the year ended September 30, 2011. For the year ended September 30, 2011, borrowings by the Portfolios under the Agreement were as follows:
| WEIGHTED | MONTH OF | |||
| AVERAGE | AVERAGE | MAXIMUM | MAXIMUM | |
| DAILY | INTEREST | AMOUNT | AMOUNT | |
| PORTFOLIO | BALANCE | RATE | BORROWED | BORROWED |
| Money Market | $1,290 | 1.49% | $130,852 | September 2011 |
| Equity | 45,663 | 1.51% | 10,384,310 | January 2011 |
NOTE E — AFFILIATED COMPANIES
An affiliated company is a company in which the Portfolios have a direct or indirect ownership of, control of, or voting power over 5 percent or more of the outstanding voting shares.
Affiliated companies of the Equity Portfolio are as follows:
| AFFILIATES | COST | VALUE |
| Digital Directions International, Inc. | $683,778 | $531,585 |
| Global Resource Options, Inc. | 3,200,178 | 1,942,390 |
| New Day Farms, Inc. | 506,225 | 78,262 |
| New Markets Education Partners, LP | 175,000 | 175,000 |
| TOTALS | $4,565,181 | $2,727,237 |
www.calvert.com CALVERT SOCIAL INVESTMENT FUND ANNUAL REPORT 60
NOTE F – SUBSEQUENT EVENTS
In preparing the financial statements as of September 30, 2011, no subsequent events or transactions occurred that would have materially impacted the financial statements as presented.
NOTE G — OTHER
In connection with certain venture capital investments, the Equity Portfolio is committed to future capital calls, which will increase the Portfolio’s investment in these securities. The aggregate amount of the future capital commitments totals $90,000 at September 30, 2011.
NOTE H — REORGANIZATION
On May 2, 2011, the Board of Directors approved an Agreement and Plan of Reorganization (the “Plan”) which provides for the transfer of all the assets of the Calvert Large Cap Growth Fund (“Large Cap”) for shares of the acquiring portfolio, Calvert Social Investment Fund, Equity Portfolio (“Equity”) and the assumption of the liabilities of Large Cap. Shareholders approved the Plan at a meeting on August 26, 2011 and the reorganization took place on September 16, 2011.
The acquisition was accomplished by a tax-free exchange of the following shares:
| Merged Portfolio | Shares | Acquiring Portfolio | Shares | Value | |
| Large Cap, Class A | 8,381,198 | Equity, Class A | 6,547,519 | $234,905,369 | |
| Large Cap, Class B | 522,123 | Equity, Class B | 428,050 | $13,254,598 | |
| Large Cap, Class C | 1,366,856 | Equity, Class C | 1,227,352 | $35,121,331 | |
| Large Cap, Class I | 8,503,334 | Equity, Class I | 6,582,940 | $252,743,032 | |
| Large Cap, Class Y | 246,689 | Equity, Class Y | 192,316 | $6,970,268 |
For financial reporting purposes, assets received and shares issued by Equity were recorded at fair value; however, the cost basis of the investments received from Large Cap were carried forward to align ongoing reporting of Equity’s realized and unrealized gains and losses with amounts distributable to shareholders for tax purposes.
The net assets and net unrealized appreciation (depreciation) immediately before the acquisitions were as follows:
| Unrealized | |||||
| Merged | Appreciation | ||||
| Portfolio | Net Assets | (Depreciation) | Acquiring Portfolio | Value | |
| Large Cap | $542,994,598 | ($11,945,691) | Equity | $1,710,197,022 |
www.calvert.com CALVERT SOCIAL INVESTMENT FUND ANNUAL REPORT 61
Assuming the acquisition had been completed on October 1, 2010, Equity’s results of operations for the year ended September 30, 2011 would have been as follows:
| Net investment income | ($4,064,709) | (a) |
| Net realized and change in unrealized gain (loss) on investments | $12,213,080 | (b) |
| Net increase (decrease) in assets from operations | $8,148,371 |
Because Equity and Large Cap sold and redeemed shares throughout the period, it is not practicable to provide pro-forma information on a per-share basis.
Because the combined investment portfolios have been managed as a single integrated portfolio since the acquisition was completed, it is also not practicable to separate the amounts of revenue and earnings of Large Cap that have been included in Equity’s Statement of Operations since September 16, 2011
| (a) | ($3,614,622) as reported, plus ($450,087) from Large Cap pre-merger. |
| (b) | ($56,029,720) as reported, plus $68,242,800 from Large Cap pre-merger. |
NOTICE TO SHAREHOLDERS (UNAUDITED)
For the fiscal year ended September 30, 2011, in order to meet certain requirements of the Internal Revenue Code, we are advising you that certain distributions paid during the year from the following funds are designated as:
| Fund Name | (a) | (b) | ||
| Qualified Dividend | (for corporate shareholders) | |||
| Income % | Dividends Received Deduction % | |||
| Enhanced | 100.0 | % | 100.0 | % |
| Equity Portfolio |
(a) Each Fund designates the maximum amount allowable, but not less than the percentages shown above as ordinary income dividends paid during the year as qualified dividend income in accordance with Section 854 of the Internal Revenue Code.
(b) Each Fund designates the maximum amount allowable but not less than the percentages shown above of ordinary income dividends paid during the year as eligible for the corporate dividends received deduction in accordance with Section 854 of the Internal Revenue Code.
Additional information will be provided to shareholders in January 2012 for use in preparing 2011 income tax returns.
www.calvert.com CALVERT SOCIAL INVESTMENT FUND ANNUAL REPORT 62
| MONEY MARKET PORTFOLIO | |||||||||
| FINANCIAL HIGHLIGHTS | |||||||||
| Years ended | |||||||||
| September 30, | September 30, | September 30, | |||||||
| 2011 | 2010 | 2009 | |||||||
| Net asset value, beginning | $ | 1.00 | $ | 1.00 | $ | 1.00 | |||
| Income from investment operations: | |||||||||
| Net investment income | **** | **** | .011 | ||||||
| Distributions from: | |||||||||
| Net investment income | ***** | ***** | (.011 | ) | |||||
| Net asset value, ending | $ | 1.00 | $ | 1.00 | $ | 1.00 | |||
| Total return* | .01 | % | .01 | % | 1.15 | % | |||
| Ratios to average net assets:A | |||||||||
| Net investment income | .01 | % | .01 | % | 1.13 | % | |||
| Total expenses | .84 | % | .83 | % | .84 | % | |||
| Expenses before offsets | .30 | % | .55 | % | .84 | % | |||
| Net expenses | .30 | % | .54 | % | .84 | % | |||
| Net assets, ending (in thousands) | $ | 142,595 | $ | 144,575 | $ | 169,485 | |||
| Years ended | |||||||||
| September 30, | September 30, | ||||||||
| 2008 | 2007 | ||||||||
| Net asset value, beginning | $ | 1.00 | $ | 1.00 | |||||
| Income from investment operations: | |||||||||
| Net investment income | .029 | .045 | |||||||
| Distributions from: | |||||||||
| Net investment income | (.029 | ) | (.045 | ) | |||||
| Net asset value, ending | $ | 1.00 | $ | 1.00 | |||||
| Total return* | 2.90 | % | 4.64 | % | |||||
| Ratios to average net assets:A | |||||||||
| Net investment income | 2.83 | % | 4.53 | % | |||||
| Total expenses | .79 | % | .82 | % | |||||
| Expenses before offsets | .79 | % | .82 | % | |||||
| Net expenses | .78 | % | .80 | % | |||||
| Net assets, ending (in thousands) | $ | 186,311 | $ | 187,210 | |||||
See notes to financial highlights.
www.calvert.com CALVERT SOCIAL INVESTMENT FUND ANNUAL REPORT 63
| EQUITY PORTFOLIO | |||||||||
| FINANCIAL HIGHLIGHTS | |||||||||
| Years ended | |||||||||
| September 30, | September 30, | September 30, | |||||||
| Class A Shares | 2011 | (z) | 2010 | (z) | 2009 | (z) | |||
| Net asset value, beginning | $ | 32.56 | $ | 29.25 | $ | 32.92 | |||
| Income from investment operations: | |||||||||
| Net investment income (loss) | (.09 | ) | (.04 | ) | .06 | ||||
| Net realized and unrealized gain (loss) | .44 | 3.39 | (1.81 | ) | |||||
| Total from investment operations | .35 | 3.35 | (1.75 | ) | |||||
| Distributions from: | |||||||||
| Net investment income | — | (.04 | ) | — | |||||
| Net realized gain | — | — | (1.92 | ) | |||||
| Total distributions | — | (.04 | ) | (1.92 | ) | ||||
| Total increase (decrease) in net asset value | .35 | 3.31 | (3.67 | ) | |||||
| Net asset value, ending | $ | 32.91 | $ | 32.56 | $ | 29.25 | |||
| Total return* | 1.07 | % | 11.44 | % | (3.46 | %) | |||
| Ratios to average net assets:A | |||||||||
| Net investment income (loss) | (.25 | %) | (.13 | %) | .23 | % | |||
| Total expenses | 1.20 | % | 1.22 | % | 1.28 | % | |||
| Expenses before offsets | 1.20 | % | 1.22 | % | 1.28 | % | |||
| Net expenses | 1.20 | % | 1.22 | % | 1.28 | % | |||
| Portfolio turnover | 41 | % | 39 | % | 38 | % | |||
| Net assets, ending (in thousands) | $ | 1,297,315 | $ | 980,605 | $ | 837,205 | |||
| Years ended | |||||||||
| September 30, | September 30, | ||||||||
| Class A Shares | 2008 | 2007 | |||||||
| Net asset value, beginning | $ | 41.06 | $ | 37.15 | |||||
| Income from investment operations: | |||||||||
| Net investment income (loss) | (.02 | ) | ** | ||||||
| Net realized and unrealized gain (loss) | (5.69 | ) | 5.50 | ||||||
| Total from investment operations | (5.71 | ) | 5.50 | ||||||
| Distributions from: | |||||||||
| Net realized gain | (2.43 | ) | (1.59 | ) | |||||
| Total distributions | (2.43 | ) | (1.59 | ) | |||||
| Total increase (decrease) in net asset value | (8.14 | ) | 3.91 | ||||||
| Net asset value, ending | $ | 32.92 | $ | 41.06 | |||||
| Total return* | (14.85 | %) | 15.23 | % | |||||
| Ratios to average net assets:A | |||||||||
| Net investment income (loss) | (.05 | %) | (.01 | %) | |||||
| Total expenses | 1.21 | % | 1.21 | % | |||||
| Expenses before offsets | 1.21 | % | 1.21 | % | |||||
| Net expenses | 1.20 | % | 1.21 | % | |||||
| Portfolio turnover | 51 | % | 35 | % | |||||
| Net assets, ending (in thousands) | $ | 834,312 | $ | 1,000,992 | |||||
See notes to financial highlights.
www.calvert.com CALVERT SOCIAL INVESTMENT FUND ANNUAL REPORT 64
| EQUITY PORTFOLIO | |||||||||
| FINANCIAL HIGHLIGHTS | |||||||||
| Years ended | |||||||||
| September 30, | September 30, | September 30, | |||||||
| Class B Shares | 2011 | (z) | 2010 | (z) | 2009 | (z) | |||
| Net asset value, beginning | $ | 28.34 | $ | 25.67 | $ | 29.46 | |||
| Income from investment operations: | |||||||||
| Net investment income (loss) | (.36 | ) | (.28 | ) | (.15 | ) | |||
| Net realized and unrealized gain (loss) | .42 | 2.95 | (1.72 | ) | |||||
| Total from investment operations | .06 | 2.67 | (1.87 | ) | |||||
| Distributions from: | |||||||||
| Net realized gain | — | — | (1.92 | ) | |||||
| Total distributions | — | — | (1.92 | ) | |||||
| Total increase (decrease) in net asset value | .06 | 2.67 | (3.79 | ) | |||||
| Net asset value, ending | $ | 28.40 | $ | 28.34 | $ | 25.67 | |||
| Total return* | .21 | % | 10.40 | % | (4.34 | %) | |||
| Ratios to average net assets:A | |||||||||
| Net investment income (loss) | (1.14 | %) | (1.03 | %) | (.69 | %) | |||
| Total expenses | 2.08 | % | 2.13 | % | 2.22 | % | |||
| Expenses before offsets | 2.08 | % | 2.13 | % | 2.22 | % | |||
| Net expenses | 2.08 | % | 2.13 | % | 2.22 | % | |||
| Portfolio turnover | 41 | % | 39 | % | 38 | % | |||
| Net assets, ending (in thousands) | $ | 35,852 | $ | 35,761 | $ | 45,648 | |||
| Years ended | |||||||||
| September 30, | September 30, | ||||||||
| Class B Shares | 2008 | 2007 | |||||||
| Net asset value, beginning | $ | 37.29 | $ | 34.15 | |||||
| Income from investment operations: | |||||||||
| Net investment income (loss) | (.33 | ) | (.33 | ) | |||||
| Net realized and unrealized gain (loss) | (5.07 | ) | 5.06 | ||||||
| Total from investment operations | (5.40 | ) | 4.73 | ||||||
| Distributions from: | |||||||||
| Net realized gain | (2.43 | ) | (1.59 | ) | |||||
| Total distributions | (2.43 | ) | (1.59 | ) | |||||
| Total increase (decrease) in net asset value | (7.83 | ) | 3.14 | ||||||
| Net asset value, ending | $ | 29.46 | $ | 37.29 | |||||
| Total return* | (15.56 | %) | 14.28 | % | |||||
| Ratios to average net assets:A | |||||||||
| Net investment income (loss) | (.89 | %) | (.84 | %) | |||||
| Total expenses | 2.05 | % | 2.04 | % | |||||
| Expenses before offsets | 2.05 | % | 2.04 | % | |||||
| Net expenses | 2.05 | % | 2.04 | % | |||||
| Portfolio turnover | 51 | % | 35 | % | |||||
| Net assets, ending (in thousands) | $ | 59,438 | $ | 87,476 | |||||
See notes to financial highlights.
www.calvert.com CALVERT SOCIAL INVESTMENT FUND ANNUAL REPORT 65
| EQUITY PORTFOLIO | |||||||||
| FINANCIAL HIGHLIGHTS | |||||||||
| Years ended | |||||||||
| September 30, | September 30, | September 30, | |||||||
| Class C Shares | 2011 | (z) | 2010 | (z) | 2009 | (z) | |||
| Net asset value, beginning | $ | 26.15 | $ | 23.65 | $ | 27.32 | |||
| Income from investment operations: | |||||||||
| Net investment income (loss) | (.29 | ) | (.23 | ) | (.11 | ) | |||
| Net realized and unrealized gain (loss) | .38 | 2.73 | (1.64 | ) | |||||
| Total from investment operations | .09 | 2.50 | (1.75 | ) | |||||
| Distributions from: | |||||||||
| Net realized gain | — | — | (1.92 | ) | |||||
| Total distributions | — | — | (1.92 | ) | |||||
| Total increase (decrease) in net asset value | .09 | 2.50 | (3.67 | ) | |||||
| Net asset value, ending | $ | 26.24 | $ | 26.15 | $ | 23.65 | |||
| Total return* | .34 | % | 10.57 | % | (4.23 | %) | |||
| Ratios to average net assets:A | |||||||||
| Net investment income (loss) | (1.01 | %) | (.92 | %) | (.57 | %) | |||
| Total expenses | 1.95 | % | 2.01 | % | 2.09 | % | |||
| Expenses before offsets | 1.95 | % | 2.01 | % | 2.09 | % | |||
| Net expenses | 1.95 | % | 2.01 | % | 2.08 | % | |||
| Portfolio turnover | 41 | % | 39 | % | 38 | % | |||
| Net assets, ending (in thousands) | $ | 132,658 | $ | 97,961 | $ | 87,512 | |||
| Years ended | |||||||||
| September 30, | September 30, | ||||||||
| Class C Shares | 2008 | 2007 | |||||||
| Net asset value, beginning | $ | 34.73 | $ | 31.89 | |||||
| Income from investment operations:. | |||||||||
| Net investment income (loss) | (.25 | ) | (.25 | ) | |||||
| Net realized and unrealized gain (loss) | (4.73 | ) | 4.68 | ||||||
| Total from investment operations | (4.98 | ) | 4.43 | ||||||
| Distributions from: | |||||||||
| Net realized gain | (2.43 | ) | (1.59 | ) | |||||
| Total distributions | (2.43 | ) | (1.59 | ) | |||||
| Total increase (decrease) in net asset value | (7.41 | ) | 2.84 | ||||||
| Net asset value, ending | $ | 27.32 | $ | 34.73 | |||||
| Total return* | (15.49 | %) | 14.35 | % | |||||
| Ratios to average net assets:A | |||||||||
| Net investment income (loss) | (.81 | %) | (.76 | %) | |||||
| Total expenses | 1.97 | % | 1.96 | % | |||||
| Expenses before offsets | 1.97 | % | 1.96 | % | |||||
| Net expenses | 1.96 | % | 1.96 | % | |||||
| Portfolio turnover | 51 | % | 35 | % | |||||
| Net assets, ending (in thousands) | $ | 97,327 | $ | 119,917 | |||||
See notes to financial highlights.
www.calvert.com CALVERT SOCIAL INVESTMENT FUND ANNUAL REPORT 66
| EQUITY PORTFOLIO | |||||||||
| FINANCIAL HIGHLIGHTS | |||||||||
| Years ended | |||||||||
| September 30, | September 30, | September 30, | |||||||
| Class I Shares | 2011 | (z) | 2010 | (z) | 2009 | (z) | |||
| Net asset value, beginning | $ | 34.66 | $ | 31.04 | $ | 34.58 | |||
| Income from investment operations: | |||||||||
| Net investment income | .10 | .14 | .21 | ||||||
| Net realized and unrealized gain (loss) | .46 | 3.59 | (1.83 | ) | |||||
| Total from investment operations | .56 | 3.73 | (1.62 | ) | |||||
| Distributions from: | |||||||||
| Net investment income | — | (.11 | ) | — | |||||
| Net realized gain | — | — | (1.92 | ) | |||||
| Total distributions | — | (.11 | ) | (1.92 | ) | ||||
| Total increase (decrease) in net asset value | .56 | 3.62 | (3.54 | ) | |||||
| Net asset value, ending | $ | 35.22 | $ | 34.66 | $ | 31.04 | |||
| Total return* | 1.62 | % | 12.04 | % | (2.88 | %) | |||
| Ratios to average net assets:A | |||||||||
| Net investment income | .28 | % | .42 | % | .79 | % | |||
| Total expenses | .67 | % | .68 | % | .70 | % | |||
| Expenses before offsets | .67 | % | .68 | % | .70 | % | |||
| Net expenses | .67 | % | .68 | % | .70 | % | |||
| Portfolio turnover | 41 | % | 39 | % | 38 | % | |||
| Net assets, ending (in thousands) | $ | 535,829 | $ | 198,553 | $ | 156,430 | |||
| Years ended | |||||||||
| September 30, | September 30, | ||||||||
| Class I Shares | 2008 | 2007 | |||||||
| Net asset value, beginning | $ | 42.79 | $ | 38.44 | |||||
| Income from investment operations: | |||||||||
| Net investment income | .20 | .21 | |||||||
| Net realized and unrealized gain (loss) | (5.98 | ) | 5.73 | ||||||
| Total from investment operations | (5.78 | ) | 5.94 | ||||||
| Distributions from: | |||||||||
| Net realized gain | (2.43 | ) | (1.59 | ) | |||||
| Total distributions | (2.43 | ) | (1.59 | ) | |||||
| Total increase (decrease) in net asset value | (8.21 | ) | 4.35 | ||||||
| Net asset value, ending | $ | 34.58 | $ | 42.79 | |||||
| Total return* | (14.39 | %) | 15.88 | % | |||||
| Ratios to average net assets:A | |||||||||
| Net investment income | .49 | % | .53 | % | |||||
| Total expenses | .67 | % | .67 | % | |||||
| Expenses before offsets | .67 | % | .67 | % | |||||
| Net expenses | .67 | % | .66 | % | |||||
| Portfolio turnover | 51 | % | 35 | % | |||||
| Net assets, ending (in thousands) | $ | 118,423 | $ | 170,767 | |||||
See notes to financial highlights.
www.calvert.com CALVERT SOCIAL INVESTMENT FUND ANNUAL REPORT 67
| EQUITY PORTFOLIO FINANCIAL HIGHLIGHTS | |||||||||
| Periods ended | |||||||||
| September 30, | September 30, | September 30, | |||||||
| Class Y Shares | 2011 | (z) | 2010 | (z) | 2009 | # (z) | |||
| Net asset value, beginning | $ | 32.78 | $ | 29.35 | $ | 27.35 | |||
| Income from investment operations: | |||||||||
| Net investment income | .04 | .02 | .08 | ||||||
| Net realized and unrealized gain | .43 | 3.42 | 3.84 | ||||||
| Total from investment operations | .47 | 3.44 | 3.92 | ||||||
| Distributions from: | |||||||||
| Net investment income | — | (.01 | ) | — | |||||
| Net realized gain | — | — | (1.92 | ) | |||||
| Total distributions | — | (.01 | ) | (1.92 | ) | ||||
| Total increase (decrease) in net asset value | .47 | 3.43 | 2.00 | ||||||
| Net asset value, ending | $ | 33.25 | $ | 32.78 | $ | 29.35 | |||
| Total return* | 1.43 | % | 11.73 | % | 16.59 | % | |||
| Ratios to average net assets:A | |||||||||
| Net investment income | .10 | % | .08 | % | .34 | % (a) | |||
| Total expenses | .84 | % | 1.14 | % | 11.72 | % (a) | |||
| Expenses before offsets | .84 | % | .96 | % | .96 | % (a) | |||
| Net expenses | .84 | % | .96 | % | .96 | % (a) | |||
| Portfolio turnover | 41 | % | 39 | % | 35 | % | |||
| Net assets, ending (in thousands) | $ | 66,377 | $ | 11,811 | $ | 483 | |||
See notes to financial highlights.
www.calvert.com CALVERT SOCIAL INVESTMENT FUND ANNUAL REPORT 68
| ENHANCED EQUITY PORTFOLIO | |||||||||
| FINANCIAL HIGHLIGHTS | |||||||||
| Years ended | |||||||||
| September 30, | September 30, | September 30, | |||||||
| Class A Shares | 2011 | (z) | 2010 | (z) | 2009 | (z) | |||
| Net asset value, beginning | $ | 15.02 | $ | 13.62 | $ | 14.93 | |||
| Income from investment operations: | |||||||||
| Net investment income | .11 | .07 | .12 | ||||||
| Net realized and unrealized gain (loss) | .11 | 1.44 | (1.25 | ) | |||||
| Total from investment operations | .22 | 1.51 | (1.13 | ) | |||||
| Distributions from: | |||||||||
| Net investment income | (.08 | ) | (.11 | ) | (.18 | ) | |||
| Total distributions | (.08 | ) | (.11 | ) | (.18 | ) | |||
| Total increase (decrease) in net asset value | .14 | 1.40 | (1.31 | ) | |||||
| Net asset value, ending | $ | 15.16 | $ | 15.02 | $ | 13.62 | |||
| Total return* | 1.43 | % | 11.10 | % | (7.22 | %) | |||
| Ratios to average net assets:A | |||||||||
| Net investment income | .68 | % | .47 | % | 1.10 | % | |||
| Total expenses | 1.44 | % | 1.48 | % | 1.54 | % | |||
| Expenses before offsets | 1.34 | % | 1.38 | % | 1.44 | % | |||
| Net expenses | 1.34 | % | 1.38 | % | 1.43 | % | |||
| Portfolio turnover | 111 | % | 109 | % | 111 | % | |||
| Net assets, ending (in thousands) | $ | 32,184 | $ | 34,563 | $ | 33,040 | |||
| Years ended | |||||||||
| September 30, | September 30, | ||||||||
| Class A Shares | 2008 | (z) | 2007 | (z) | |||||
| Net asset value, beginning | $ | 20.49 | $ | 19.75 | |||||
| Income from investment operations: | |||||||||
| Net investment income | .15 | .13 | |||||||
| Net realized and unrealized gain (loss) | (4.52 | ) | 1.53 | ||||||
| Total from investment operations | (4.37 | ) | 1.66 | ||||||
| Distributions from: | |||||||||
| Net investment income | (.11 | ) | (.09 | ) | |||||
| Net realized gain | (1.08 | ) | (.83 | ) | |||||
| Total distributions | (1.19 | ) | (.92 | ) | |||||
| Total increase (decrease) in net asset value | (5.56 | ) | .74 | ||||||
| Net asset value, ending | $ | 14.93 | $ | 20.49 | |||||
| Total return* | (22.57 | %) | 8.58 | % | |||||
| Ratios to average net assets:A | |||||||||
| Net investment income | .84 | % | .66 | % | |||||
| Total expenses | 1.36 | % | 1.33 | % | |||||
| Expenses before offsets | 1.26 | % | 1.23 | % | |||||
| Net expenses | 1.24 | % | 1.20 | % | |||||
| Portfolio turnover | 46 | % | 56 | % | |||||
| Net assets, ending (in thousands) | $ | 45,345 | $ | 65,209 | |||||
See notes to financial highlights.
www.calvert.com CALVERT SOCIAL INVESTMENT FUND ANNUAL REPORT 69
| ENHANCED EQUITY PORTFOLIO | |||||||||
| FINANCIAL HIGHLIGHTS | |||||||||
| Years ended | |||||||||
| September 30, | September 30, | September 30, | |||||||
| Class B Shares | 2011 | (z) | 2010 | (z) | 2009 | (z) | |||
| Net asset value, beginning | $ | 13.57 | $ | 12.36 | $ | 13.51 | |||
| Income from investment operations: | |||||||||
| Net investment income (loss) | (.10 | ) | (.11 | ) | (.03 | ) | |||
| Net realized and unrealized gain (loss) | .10 | 1.32 | (1.12 | ) | |||||
| Total from investment operations | — | 1.21 | (1.15 | ) | |||||
| Total increase (decrease) in net asset value | — | 1.21 | (1.15 | ) | |||||
| Net asset value, ending | $ | 13.57 | $ | 13.57 | $ | 12.36 | |||
| Total return* | .00 | % | 9.79 | % | (8.51 | %) | |||
| Ratios to average net assets:A | |||||||||
| Net investment income (loss) | (.65 | %) | (.82 | %) | (.26 | %) | |||
| Total expenses | 2.80 | % | 2.78 | % | 2.97 | % | |||
| Expenses before offsets | 2.67 | % | 2.67 | % | 2.83 | % | |||
| Net expenses | 2.67 | % | 2.67 | % | 2.83 | % | |||
| Portfolio turnover | 111 | % | 109 | % | 111 | % | |||
| Net assets, ending (in thousands) | $ | 1,704 | $ | 2,329 | $ | 2,768 | |||
| Years ended | |||||||||
| September 30, | September 30, | ||||||||
| Class B Shares | 2008 | (z) | 2007 | (z) | |||||
| Net asset value, beginning | $ | 18.72 | $ | 18.20 | |||||
| Income from investment operations: | |||||||||
| Net investment income (loss) | (.04 | ) | (.06 | ) | |||||
| Net realized and unrealized gain (loss) | (4.09 | ) | 1.41 | ||||||
| Total from investment operations | (4.13 | ) | 1.35 | ||||||
| Distributions from: | |||||||||
| Net realized gain | (1.08 | ) | (.83 | ) | |||||
| Total distributions | (1.08 | ) | (.83 | ) | |||||
| Total increase (decrease) in net asset value | (5.21 | ) | .52 | ||||||
| Net asset value, ending | $ | 13.51 | $ | 18.72 | |||||
| Total return* | (23.36 | %) | 7.55 | % | |||||
| Ratios to average net assets:A | |||||||||
| Net investment income (loss) | (.23 | %) | (.30 | %) | |||||
| Total expenses | 2.41 | % | 2.29 | % | |||||
| Expenses before offsets | 2.31 | % | 2.19 | % | |||||
| Net expenses | 2.30 | % | 2.16 | % | |||||
| Portfolio turnover | 46 | % | 56 | % | |||||
| Net assets, ending (in thousands) | $ | 4,003 | $ | 7,257 | |||||
See notes to financial highlights.
www.calvert.com CALVERT SOCIAL INVESTMENT FUND ANNUAL REPORT 70
| ENHANCED EQUITY PORTFOLIO | |||||||||
| FINANCIAL HIGHLIGHTS | |||||||||
| Years ended | |||||||||
| September 30, | September 30, | September 30, | |||||||
| Class C Shares | 2011 | (z) | 2010 | (z) | 2009 | (z) | |||
| Net asset value, beginning | $ | 13.75 | $ | 12.48 | $ | 13.61 | |||
| Income from investment operations: | |||||||||
| Net investment income (loss) | (.03 | ) | (.06 | ) | .01 | ||||
| Net realized and unrealized gain (loss) | .10 | 1.33 | (1.12 | ) | |||||
| Total from investment operations | .07 | 1.27 | (1.11 | ) | |||||
| Distributions from: | |||||||||
| Net investment income | — | — | (.02 | ) | |||||
| Total distributions | — | — | (.02 | ) | |||||
| Total increase (decrease) in net asset value | .07 | 1.27 | (1.13 | ) | |||||
| Net asset value, ending | $ | 13.82 | $ | 13.75 | $ | 12.48 | |||
| Total return* | .51 | % | 10.18 | % | (8.09 | %) | |||
| Ratios to average net assets:A | |||||||||
| Net investment income (loss) | (.22 | %) | (.46 | %) | .12 | % | |||
| Total expenses | 2.33 | % | 2.42 | % | 2.52 | % | |||
| Expenses before offsets | 2.23 | % | 2.32 | % | 2.41 | % | |||
| Net expenses | 2.23 | % | 2.32 | % | 2.41 | % | |||
| Portfolio turnover | 111 | % | 109 | % | 111 | % | |||
| Net assets, ending (in thousands) | $ | 5,962 | $ | 6,297 | $ | 5,767 | |||
| Years ended | |||||||||
| September 30, | September 30, | ||||||||
| Class C Shares | 2008 | (z) | 2007 | (z) | |||||
| Net asset value, beginning | $ | 18.82 | $ | 18.27 | |||||
| Income from investment operations: | |||||||||
| Net investment income (loss) | — | (.04 | ) | ||||||
| Net realized and unrealized gain (loss) | (4.13 | ) | 1.42 | ||||||
| Total from investment operations | (4.13 | ) | 1.38 | ||||||
| Distributions from: | |||||||||
| Net realized gain | (1.08 | ) | (.83 | ) | |||||
| Total distributions | (1.08 | ) | (.83 | ) | |||||
| Total increase (decrease) in net asset value | (5.21 | ) | .55 | ||||||
| Net asset value, ending | $ | 13.61 | $ | 18.82 | |||||
| Total return* | (23.23 | %) | 7.69 | % | |||||
| Ratios to average net assets:A | |||||||||
| Net investment income (loss) | (.03 | %) | (.20 | %) | |||||
| Total expenses | 2.22 | % | 2.19 | % | |||||
| Expenses before offsets | 2.12 | % | 2.09 | % | |||||
| Net expenses | 2.10 | % | 2.06 | % | |||||
| Portfolio turnover | 46 | % | 56 | % | |||||
| Net assets, ending (in thousands) | $ | 6,631 | $ | 10,089 | |||||
See notes to financial highlights.
www.calvert.com CALVERT SOCIAL INVESTMENT FUND ANNUAL REPORT 71
| ENHANCED EQUITY PORTFOLIO | |||||||||
| FINANCIAL HIGHLIGHTS | |||||||||
| Years ended | |||||||||
| September 30, | September 30, | September 30, | |||||||
| Class I Shares | 2011 | (z) | 2010 | (z) | 2009 | (z) | |||
| Net asset value, beginning | $ | 15.29 | $ | 13.83 | $ | 15.13 | |||
| Income from investment operations: | |||||||||
| Net investment income | .21 | .15 | .20 | ||||||
| Net realized and unrealized gain (loss) | .11 | 1.47 | (1.27 | ) | |||||
| Total from investment operations | .32 | 1.62 | (1.07 | ) | |||||
| Distributions from: | |||||||||
| Net investment income | (.16 | ) | (.16 | ) | (.23 | ) | |||
| Total distributions | (.16 | ) | (.16 | ) | (.23 | ) | |||
| Total increase (decrease) in net asset value | .16 | 1.46 | (1.30 | ) | |||||
| Net asset value, ending | $ | 15.45 | $ | 15.29 | $ | 13.83 | |||
| Total return* | 2.02 | % | 11.77 | % | (6.64 | %) | |||
| Ratios to average net assets:A | |||||||||
| Net investment income | 1.22 | % | 1.04 | % | 1.70 | % | |||
| Total expenses | .89 | % | .91 | % | .95 | % | |||
| Expenses before offsets | .79 | % | .81 | % | .81 | % | |||
| Net expenses | .79 | % | .81 | % | .81 | % | |||
| Portfolio turnover | 111 | % | 109 | % | 111 | % | |||
| Net assets, ending (in thousands) | $ | 31,035 | $ | 30,524 | $ | 25,174 | |||
| Years ended | |||||||||
| September 30, | September 30, | ||||||||
| Class I Shares | 2008 | (z) | 2007 | (z) | |||||
| Net asset value, beginning | $ | 20.67 | $ | 19.83 | |||||
| Income from investment operations: | |||||||||
| Net investment income | .24 | .22 | |||||||
| Net realized and unrealized gain (loss) | (4.56 | ) | 1.55 | ||||||
| Total from investment operations | (4.32 | ) | 1.77 | ||||||
| Distributions from: | |||||||||
| Net investment income | (.14 | ) | (.10 | ) | |||||
| Net realized gain | (1.08 | ) | (.83 | ) | |||||
| Total distributions | (1.22 | ) | (.93 | ) | |||||
| Total increase (decrease) in net asset value | (5.54 | ) | .84 | ||||||
| Net asset value, ending | $ | 15.13 | $ | 20.67 | |||||
| Total return* | (22.13 | %) | 9.09 | % | |||||
| Ratios to average net assets:A | |||||||||
| Net investment income | 1.36 | % | 1.09 | % | |||||
| Total expenses | .85 | % | .88 | % | |||||
| Expenses before offsets | .75 | % | .78 | % | |||||
| Net expenses | .74 | % | .76 | % | |||||
| Portfolio turnover | 46 | % | 56 | % | |||||
| Net assets, ending (in thousands) | $ | 23,364 | $ | 24,663 | |||||
See notes to financial highlights.
www.calvert.com CALVERT SOCIAL INVESTMENT FUND ANNUAL REPORT 72
| A | Total expenses do not reflect amounts reimbursed and/or waived by the Advisor or reductions from expense offset arrangements. Expenses before offsets reflect expenses after reimbursement and/or waiver by the Advisor but prior to reductions from expense offset arrangements. Net expenses are net of all reductions and represent the net expenses paid by the Portfolio. |
| * | Total return is not annualized for periods less than one year and does not reflect deduction of any front-end or deferred sales charge. |
| ** | Amount was less than (.01) per share. |
| **** | Amount was less than .001 per share. |
| ***** | Distribution was less than .001 per share. |
| # | From October 31, 2008 inception. |
| (a) | Annualized. |
| (z) | Per share figures are calculated using the Average Shares Method. |
See notes to financial statements.
www.calvert.com CALVERT SOCIAL INVESTMENT FUND ANNUAL REPORT 73
EXPLANATION OF FINANCIAL TABLES
SCHEDULE OF INVESTMENTS
The Schedule of Investments is a snapshot of all securities held in the fund at their market value, on the last day of the reporting period. Securities are listed by asset type (e.g., common stock, corporate bonds, U.S. government obligations) and may be further broken down into sub-groups and by industry classification.
STATEMENT OF ASSETS AND LIABILITIES
The Statement of Assets and Liabilities is often referred to as the fund’s balance sheet. It lists the value of what the fund owns, is due and owes on the last day of the reporting period. The fund’s assets include the market value of securities owned, cash, receivables for securities sold and shareholder subscriptions, and receivables for dividends and interest payments that have been earned, but not yet received. The fund’s liabilities include payables for securities purchased and shareholder redemptions, and expenses owed but not yet paid. The statement also reports the fund’s net asset value (NAV) per share on the last day of the reporting period. The NAV is calculated by dividing the fund’s net assets (assets minus liabilities) by the number of shares outstanding. This statement is accompanied by a Schedule of Investments. Alternatively, if certain conditions are met, a Statement of Net Assets may be presented in lieu of this statement and the Schedule of Investments.
STATEMENT OF NET ASSETS
The Statement of Net Assets provides a detailed list of the fund’s holdings, including each security’s market value on the last day of the reporting period. The Statement of Net Assets includes a Schedule of Investments. Other assets are added and other liabilities subtracted from the investments total to calculate the fund’s net assets. Finally, net assets are divided by the outstanding shares of the fund to arrive at its share price, or Net Asset Value (NAV) per share.
At the end of the Statement of Net Assets is a table displaying the composition of the fund’s net assets. Paid in Capital is the money invested by shareholders and represents the bulk of net assets. Undistributed Net Investment Income and Accumulated Net Realized Gains usually approximate the amounts the fund had available to distribute to shareholders as of the statement date. Accumulated Realized Losses will appear as negative balances. Unrealized Appreciation (Depreciation) is the difference between the market value of the fund’s investments and their cost, and reflects the gains (losses) that would be realized if the fund were to sell all of its investments at their statement-date values.
www.calvert.com CALVERT SOCIAL INVESTMENT FUND ANNUAL REPORT (UNAUDITED) 74
STATEMENT OF OPERATIONS
The Statement of Operations summarizes the fund’s investment income earned and expenses incurred in operating the fund. Investment income includes dividends earned from stocks and interest earned from interest-bearing securities in the fund. Expenses incurred in operating the fund include the advisory fee paid to the investment advisor, administrative services fees, distribution plan expenses (if applicable), transfer agent fees, shareholder servicing expenses, custodial, legal, and audit fees, and the printing and postage expenses related to shareholder reports. Expense offsets (fees paid indirectly) are also shown. Credits earned from offset arrangements are used to reduce the fund’s expenses. This statement also shows net gains (losses) realized on the sale of investments and the increase or decrease in the unrealized appreciation (depreciation) on investments held during the period.
STATEMENT OF CHANGES IN NET ASSETS
The Statement of Changes in Net Assets shows how the fund’s total net assets changed during the two most recent reporting periods. Changes in the fund’s net assets are attributable to investment operations, distributions and capital share transactions.
The Operations section of the report summarizes information detailed in the Statement of Operations. The Distribution section shows the dividend and capital gain distributions made to shareholders. The amounts shown as distributions in this section may not match the net investment income and realized gains amounts shown in the Operations section because distributions are determined on a tax basis and certain investments or transactions may be treated differently for financial statement and tax purposes. The Capital Share Transactions section shows the amount shareholders invested in the fund, either by purchasing shares or by reinvesting distributions, and the amounts redeemed. The corresponding numbers of shares issued, reinvested and redeemed are shown at the end of the report.
FINANCIAL HIGHLIGHTS
The Financial Highlights table provides a per-share breakdown per class of the components that affect the fund’s net asset value for current and past reporting periods. The table provides total return, total distributions, expense ratios, portfolio turnover and net assets for the applicable period. Total return is a measure of a fund’s performance that encompasses all elements of return: dividends, capital gain distributions and changes in net asset value. Total return is the change in value of an investment over a given period, assuming reinvestment of any dividends and capital gain distributions, expressed as a percentage of the initial investment. Total distributions include distributions from net investment income and net realized gains. Long-term gains are earned on securities held in the fund more than one year. Short-term gains, on the sale of securities held less than one year, are treated as ordinary dividend income for tax purposes. The expense ratio is a fund’s cost of doing business, expressed as a percentage of net assets. These expenses directly reduce returns to shareholders. Portfolio turnover measures the trading activity in a fund’s investment portfolio – how often securities are bought and sold by a fund. Portfolio turnover is affected by market conditions, changes in the size of the fund, the nature of the fund’s investments and the investment style of the portfolio.
www.calvert.com CALVERT SOCIAL INVESTMENT FUND ANNUAL REPORT (UNAUDITED) 75
PROXY VOTING
The Proxy Voting Guidelines of the Calvert Funds that the Fund uses to determine how to vote proxies relating to portfolio securities are provided as an Appendix to the Fund’s Statement of Additional Information. The Statement of Additional Information can be obtained free of charge by calling the Fund at 1-800-368-2745, by visiting the Calvert website at www.calvert.com; or by visiting the SEC’s website at www.sec.gov.
Information regarding how the Fund voted proxies relating to portfolio securities during the most recent 12-month period ended June 30 is available on the Fund’s website at www.calvert.com and on the SEC’s website at www.sec.gov.
AVAILABILITY OF QUARTERLY PORTFOLIO HOLDINGS
The Fund files its complete schedule of portfolio holdings with the SEC for the first and third quarters of each fiscal year on Form N-Q. The Fund’s Form N-Q is available on the SEC’s website at www.sec.gov. The Fund’s Form N-Q may be reviewed and copied at the SEC’s Public Reference Room in Washington, DC; information on the operation of the Public Reference Room may be obtained by calling 1-800-SEC-0330.
www.calvert.com CALVERT SOCIAL INVESTMENT FUND ANNUAL REPORT (UNAUDITED) 76
This page intentionally left blank.
TRUSTEE AND OFFICER INFORMATION TABLE
(Not Applicable to Officers) | |||||||
Position | Position | # of Calvert | |||||
Name & | with | Start | Principal Occupation | Portfolios | Other | ||
Age | Fund | Date | During Last 5 Years | Overseen | Directorships | ||
INDEPENDENT TRUSTEES/DIRECTORS | |||||||
REBECCA L. ADAMSON AGE: 62 | Trustee
Director
Director
Director | 1989 CSIF
2000 IMPACT
2000 CSIS
2005 CWVF
| President of the national non-profit, First People’s Worldwide, formerly First Nations Financial Project. Founded by her in 1980, First People’s Worldwide is the only American Indian alternative development institute in the country. | 15 | · Bay & Paul Foundation
| ||
RICHARD L. BAIRD, JR. AGE: 63 | Trustee & Chair
Director & Chair
Director & Chair
Director & Chair
| 1982 CSIF
2000 CSIS
2005 CWVF
2005 Impact | President and CEO of Adagio Health Inc. in Pittsburgh, PA, a non-profit corporation which provides family planning services, nutrition, maternal/child health care, and various health screening services and community preventive health programs. | 25 | None | ||
JOHN G. GUFFEY, JR. AGE: 63 | Director
Trustee
Director
Director
| 1992 CWVF
1982 CSIF
2000 CSIS
2005 IMPACT
| President of Aurora Press Inc., a privately held publisher of trade paperbacks.
| 25 | · Ariel Funds (3) · Calvert Social Investment Foundation · Calvert Ventures, LLC
| ||
MILES DOUGLAS HARPER, III AGE: 48 | Director
Trustee
Director
Director | 2000 Impact
2005 CSIF
2005 CSIS
2005 CWVF | Partner, Gainer Donnelly & Desroches (public accounting firm) since January 1999. | 15 | · Bridgeway Funds (14) | ||
JOY V. JONES AGE: 61 | Director
Trustee
Director
Director | 2000 Impact
1990 CSIF
2000 CSIS
2005 CWVF | Attorney.
| 15 | · Director, Conduit Street Restaurants Limited | ||
TERRENCE J. MOLLNER, Ed.D. AGE: 66 | Director
Trustee
Director
Director | 1992 CWVF
1982 CSIF
2000 CSIS
2005 IMPACT | Founder, Chairperson, and President of Trusteeship Institute, Inc., a diverse foundation known principally for its consultation to corporations converting to cooperative employee-ownership and the development of socially and spiritually responsible investment vehicles. Chairperson, Stakeholders Capital, Inc., an asset management firm and financial services provider in Amherst, MA. | 15 | · Calvert Social Investment Foundation · Ben & Jerry's Homemade, Inc. · ArtNOW, Inc. · Yourolivebranch.org | ||
SYDNEY AMARA MORRIS AGE: 62 | Trustee
Director
Director
Director | 1982 CSIF
2000 CSIS
2005 CWVF
2005 IMPACT | Rev. Morris currently serves as Parish Minister to the Keweenaw Unitarian Universalist Fellowship in Houghton, MI. Rev. Morris is a graduate of Harvard Divinity School. She currently chairs the Umbrian Universalist Committee on Socially Responsible Investing. | 15 | None | ||
INTERESTED TRUSTEES/DIRECTORS | |||||||
BARBARA J. KRUMSIEK AGE: 59 | Director & President
Trustee & Senior Vice President
Director & Senior Vice President
Director & President | 1997 CWVF
1997 CSIF
2000 CSIS
2000 Impact | President, Chief Executive Officer and Chair of Calvert Investments, Inc.
| 42 | · Calvert Social Investment Foundation · Pepco Holdings, Inc. · Acacia Life Insurance Company (Chair) · Griffin Realty Corp. | ||
D. Wayne Silby, Esq. AGE: 63 | Director
Trustee & President
Director & President
Director | 1992 CWVF
1982 CSIF
2000 CSIS
2000 Impact | Mr. Silby is the founding Chair of the Calvert Funds. He is the Chair-Elect and a principal of Syntao.com, a Beijing-based company promoting corporate social responsibility. | 25 | · UNIFI Mutual Holding Company · Calvert Social Investment Foundation · Studio School Fund · Syntao.com China · The Ice Organization · Impact Assets | ||
OFFICERS | |||||||
KAREN BECKERAge: 58 | Chief Compliance Officer | 2005
| Chief Compliance Officer for the Calvert Funds. In March 2009, Ms. Becker also became Head of the Securities Operations Department for Calvert Investment Management, Inc. | ||||
SUSAN walker Bender, E sq. AGE: 52 | Assistant Vice-President & Assistant Secretary | 1988 CSIF
2000 CSIS
1992 CWVF 2000 Impact | Assistant Vice President, Assistant Secretary and Associate General Counsel of Calvert Investments, Inc. | ||||
THOMAS DAILEY AGE: 47 | Vice President | 2004
| Vice President of Calvert Investment Management, Inc.
| ||||
IVY WAFFORD DUKE, Esq. AGE: 43 | Assistant Vice-President & Assistant Secretary | 1996 CSIF
2000 CSIS
1996 CWVF 2000 Impact | Assistant Vice President, Assistant Secretary and Deputy General Counsel of Calvert Investments, Inc., and Chief Compliance Officer for Calvert Investment Management, Inc. and Calvert Investment Distributors, Inc.
| ||||
patrick faul AGE: 46 | Vice President | 2010 | Vice President of Calvert Investment Management, Inc. since 2008, and Head of Credit Research since 2009. Prior to 2009, Mr. Faul was Co-Head of Credit Research (2008) and a Senior Securities Analyst (prior to 2008). | ||||
TRACI L. GOLDT AGE: 37 | Assistant Secretary | 2004
| Electronic Filing Manager and Executive Assistant to General Counsel, Calvert Investments, Inc.
| ||||
GREGORY B. HABEEB AGE: 61 | Vice President (CSIF and CSIS ) | 2004 | Senior Vice President of Calvert Investment Management, Inc. | ||||
HUI PING HO, CPA AGE: 46 | Assistant Treasurer
| 2000
| Tax Compliance Manager of Calvert Investments, Inc.
| ||||
LANCELOT A. KING, Esq. AGE: 41 | Assistant Vice President & Assistant Secretary
| 2002
| Assistant Vice President, Assistant Secretary and Associate General Counsel of Calvert Investments, Inc.
| ||||
edith lillie aGE: 54 | Assistant Secretary
| 2007 | Assistant Secretary (since 2007) and Regulatory Matters Manager of Calvert Investments, Inc. | ||||
AUGUSTO DIVO MACEDO, Esq. AGE: 48 | Assistant Vice President & Assistant Secretary | 2007 | Assistant Vice President, Assistant Secretary, and Assistant Counsel Compliance of Calvert Investments, Inc. | ||||
JANE B. MAXWELL, Esq. AGE: 59 | Assistant Vice President & Assistant Secretary
| 2005 | Assistant Vice President, Assistant Secretary & Assistant General Counsel of Calvert Investments, Inc.
| ||||
ANDREW K. NIEBLER, Esq. AGE: 44 | Assistant Vice President & Assistant Secretary | 2006 | Assistant Vice President, Assistant Secretary & Associate General Counsel of Calvert Investments, Inc. | ||||
CATHERINE P. ROY AGE: 55
| Vice President | 2004
| Senior Vice President of Calvert Investment Management, Inc. and Chief Investment Officer – Fixed Income. | ||||
William M. Tartikoff, Esq. AGE: 64 | Vice President and Secretary | 1990 CSIF
2000 CSIS
1992 CWVF
2000 Impact
| Senior Vice President, Secretary, and General Counsel of Calvert Investments, Inc. | ||||
NATALIE TRUNOW AGE: 43 | Vice President | 2008 | Senior Vice President of Calvert Investment Management, Inc., and Chief Investment Officer - Equities. Prior to joining Calvert in August 2008, Ms. Trunow was the Section Head (2005-2008) and Portfolio Manager (2001-2008) for the Global Public Markets Group of General Motors Asset Management. | ||||
Ronald M. WolfsheimeR, CPA AGE: 59 | Treasurer | 1982 CSIF
2000 CSIS
1992 CWVF 2000 Impact | Executive Vice President and Chief Financial and Administrative Officer of Calvert Investments, Inc. | ||||
MICHAEL V. YUHAS, JR., CPA AGE: 50 | Fund Controller | 1999 CSIF
2000 CSIS
1999 CWVF
2000 Impact | Vice President of Fund Administration of Calvert Investment Administrative Services, Inc. | ||||
The address of Trustees/Directors and Officers is 4550 Montgomery Avenue, Suite 1000N, Bethesda, Maryland 20814, except Mr. Silby’s address is 1715 18th Street, N.W., Washington, DC 20009. Ms. Krumsiek is an interested person of the Fund since she is an officer and director of the Fund’s advisor and certain affiliates. Mr. Silby is an interested person of the Fund since he is a director of the parent com- pany of the Fund’s advisor. Additional information about the Fund’s Trustees/Directors can be found in the Statement of Additional Information (SAI). You can get a free copy of the SAI at www.calvert.com, or by contacting your broker, or the Fund at 1-800-368-2745. |
This page intentionally left blank.
This page intentionally left blank.
This page intentionally left blank.
This page intentionally left blank.
To Open an Account
800-368-2748
Yields and Prices
Calvert Information Network
(24 hours, 7 days a week)
800-368-2745
Service for Existing Account
Shareholders: 800-368-2745
Brokers: 800-368-2746
TDD for Hearing Impaired
800-541-1524
Branch Office
4550 Montgomery Avenue
Suite 1000 North
Bethesda, Maryland 20814
Registered, Certified or Overnight Mail
Calvert Investments
c/o BFDS,
330 West 9th Street
Kansas City, MO 64105
Web Site
www.calvert.com
Principal Underwriter
Calvert Investment Distributors, Inc.
4550 Montgomery Avenue
Suite 1000 North
Bethesda, Maryland 20814
| CALVERT | CALVERT’S | Equity Funds |
| SOCIAL | FAMILY OF FUNDS | Enhanced Equity Portfolio |
| INVESTMENT | Equity Portfolio | |
| FUND | Tax-Exempt Money | Large Cap Value Fund |
| Market Funds | Social Index Fund | |
| CTFR Money Market Portfolio | Capital Accumulation Fund | |
| International Equity Fund | ||
| Taxable Money Market | Small Cap Fund | |
| Funds | Global Alternative Energy Fund | |
| First Government Money Market | Global Water Fund | |
| Fund | International Opportunities Fund | |
| Money Market Portfolio | Equity Income Fund | |
| Municipal Funds | Balanced and Asset | |
| Tax-Free Bond Fund | Allocation Funds | |
| Balanced Portfolio | ||
| Taxable Bond Funds | Conservative Allocation Fund | |
| Bond Portfolio | Moderate Allocation Fund | |
| Income Fund | Aggressive Allocation Fund | |
| Short Duration Income Fund | ||
| Long-Term Income Fund | ||
| Ultra-Short Income Fund | ||
| Government Fund | ||
| High-Yield Bond Fund | ||
This report is intended to provide fund information to shareholders. It is not authorized for distribution to prospective investors unless preceded or accompanied by a prospectus.
Note: The information on our website is not incorporated by reference into this report; our website address is included as an inactive textual reference only.
Investors should carefully consider the investment objectives, risks, charges and expenses of the Calvert Funds. This and other important information is contained in the fund’s summary prospectus and prospectus, which can be obtained from your financial professional and should be read carefully before investing. You may also call Calvert at 800/368-2745 or visit www. calvert.com.
Item 2. Code of Ethics.
(a) The registrant has adopted a code of ethics (the "Code of Ethics") that applies to its principal executive officer and principal financial officer (also referred to as “principal accounting officer”).
(b) No information need be disclosed under this paragraph.
(c) The registrant has not amended its Code of Ethics during the period covered by the shareholder report presented in Item 1 hereto.
(d) The registrant has not granted a waiver or implicit waiver from a provision of its Code of Ethics during the period covered by the shareholder report presented in Item 1 hereto.
(e) Not applicable.
(f) The registrant's Code of Ethics is attached as an Exhibit hereto.
Item 3. Audit Committee Financial Expert.
The registrant's Board of Trustees has determined that Miles D. Harper, III, an "independent" Trustee serving on the registrant's audit committee, is an "audit committee financial expert," as defined in Item 3 of Form N-CSR. Under applicable securities laws, a person who is determined to be an audit committee financial expert will not be deemed an "expert" for any purpose, including without limitation for the purposes of Section 11 of the Securities Act of 1933, as a result of being designated or identified as an audit committee financial expert. The designation or identification of a person as an audit committee financial expert does not impose on such person any duties, obligations, or liabilities that are greater than the duties, obligations, and liabilities imposed on such person as a member of the audit committee and Board of Trustees in the absence of such designation or identification.
Item 4. Principal Accountant Fees and Services.
Services fees paid to auditing firm:
| Fiscal Year ended 9/30/10 | Fiscal Year ended 9/30/11 | ||
| $ | %* | $ | % * |
|
|
|
|
|
(a) Audit Fees | $130,680 |
| $141,075 |
|
(b) Audit-Related Fees | $0 | 0% | $0 | 0% |
(c) Tax Fees (tax return preparation and filing for the registrant) | $23,980 | 0% | $22,560 | 0% |
(d) All Other Fees | $0 | 0% | $0 | 0% |
|
|
|
|
|
Total | $154,660 | 0% | $163,635 | 0% |
* Percentage of fees approved by the Audit Committee pursuant to (c)(7)(i)(C) of Rule 2-01 of Reg. S-X (statutory de minimis waiver of Committee’s requirement to pre-approve)
(e) Audit Committee pre-approval policies and procedures:
The Audit Committee is required to pre-approve all audit and non-audit services provided to the registrant by the auditors, and to the registrant’s investment advisor, and any entity controlling, controlled by, or under common control with the advisor that provides ongoing services to the registrant. In determining whether to pre-approve non-audit services, the Audit Committee considers whether the services are consistent with maintaining the independence of the auditors. The Committee may delegate its authority to pre-approve certain matters to one or more of its members. In this regard, the Committee has delegated authority jointly to the Audit Committee Chair together with another Committee member with respect to non-audit services not exceeding $25,000 in each instance. In addition, the Committee has pre-approved the retention of the auditors to provide tax-related services related to the tax treatment and tax accounting of newly acquired securities, upon request by the investment advisor in each instance.
(f) Not applicable.
(g) Aggregate non-audit fees billed by the registrant’s accountant for services rendered to the registrant, and rendered to the registrant’s investment advisor, and any entity controlling, controlled by, or under common control with the advisor that provides ongoing services to the registrant for each of the last two fiscal years of the registrant:
| Fiscal Year ended 9/30/10 | Fiscal Year ended 9/30/11 | ||
| $ | %* | $ | % * |
|
|
|
|
|
| $11,000 | 0%* | $42,500 | 0%* |
* Percentage of fees approved by the Audit Committee pursuant to (c)(7)(i)(C) of Rule 2-01 of Reg. S-X (statutory de minimis waiver of Committee’s requirement to pre-approve)
(h) The registrant’s Audit Committee of the Board of Trustees has considered whether the provision of non-audit services that were rendered to the registrant’s investment advisor, and any entity controlling, controlled by, or under common control with the investment advisor that provides ongoing services to the registrant that were not pre-approved pursuant to paragraph (c) (7)(ii) of Rule 2-01 of Reg. S-X is compatible with maintaining the principal accountant’s independence and found that the provision of such services is compatible with maintaining the principal accountant’s independence.
Item 5. Audit Committee of Listed Registrants.
Not applicable.
Item 6. Schedule of Investments.
(a) This Schedule is included as part of the report to shareholders filed under Item 1 of this Form.
(b) Not applicable.
Item 7. Disclosure of Proxy Voting Policies and Procedures for Closed-End Management Investment Companies.
Not applicable.
Item 8. Portfolio Managers of Closed-End Management Investment Companies
Not applicable.
Item 9. Purchases of Equity Securities by Closed-End Management Investment Company and Affiliated Purchasers.
Not applicable.
Item 10. Submission of Matters to a Vote of Security Holders.
No material changes were made to the procedures by which shareholders may recommend nominees to the registrant’s Board of Trustees since registrant last provided disclosure in response to this Item.
Item 11. Controls and Procedures.
(a) The principal executive and financial officers concluded that the registrant's disclosure controls and procedures (as defined in Rule 30a-3(c) under the 1940 Act) are effective, based on the evaluation of these controls and procedures required by Rule 30a-3(b) under the 1940 Act and Rules 13a-15(b) or 15d-15(b) under the Exchange Act, as of a date within 90 days of the filing date of this report.
(b) There was no change in the registrant's internal control over financial reporting (as defined in Rule 30a-3(d) under the 1940 Act) that occurred during the registrant's second fiscal quarter of the period covered by this report that has materially affected, or is reasonably likely to materially affect, the registrant's internal control over financial reporting.
Item 12. Exhibits.
(a)(1) A copy of the Registrant’s Code of Ethics.
Attached hereto.
(a)(2) A separate certification for each principal executive officer and principal financial officer of the registrant as required by Rule 30a-2 under the Act (17 CFR 270.30a-2).
Attached hereto.
(a)(3) Not applicable.
(b) A certification for the registrant's Principal Executive Officer and Principal Financial Officer, as required by Rule 30a-2(b) under the Investment Company Act of 1940, is attached hereto. The certification furnished pursuant to this paragraph is not deemed to be "filed" for purposes of Section 18 of the Securities Exchange Act of 1934, or otherwise subject to the liability of that section. Such certification is not deemed to be incorporated by reference into any filing under the Securities Act of 1933 or the Securities Exchange Act of 1934, except to the extent that the registrant specifically incorporates it by reference.
Pursuant to the requirements of the Securities Exchange Act of 1934 and the Investment Act of 1940, the registrant has duly caused this report to be signed on its behalf by the undersigned, thereunto duly authorized.
CALVERT SOCIAL INVESTMENT FUND
By: /s/ Barbara J. Krumsiek
Barbara J. Krumsiek
Senior Vice President -- Principal Executive Officer
Date: December 6, 2011
Pursuant to the requirements of the Securities Exchange Act of 1934 and the Investment Act of 1940, this report has been signed below by the following persons on behalf of the registrant and in the capacities and on the dates indicated.
/s/ Barbara J. Krumsiek
Barbara J. Krumsiek
Senior Vice President -- Principal Executive Officer
Date: December 6, 2011
/s/ D. Wayne Silby
D. Wayne Silby
President -- Principal Executive Officer
Date: December 6, 2011
/s/ Ronald M. Wolfsheimer
Ronald M. Wolfsheimer
Treasurer -- Principal Financial Officer
Date: December 6, 2011