UNITED STATES
SECURITIES AND EXCHANGE COMMISSION
Washington, D.C. 20549
FORM 10-K
(Mark One)
| x | ANNUAL REPORT PURSUANT TO SECTION 13 OR 15(d) OF THE SECURITIES EXCHANGE ACT OF 1934 |
For the fiscal year ended July 31, 2008
OR
| ¨ | TRANSITION REPORT PURSUANT TO SECTION 13 OR 15(d) OF THE SECURITIES EXCHANGE ACT OF 1934 |
For the transition period from to
Commission File No. 000-10761
LTX-Credence Corporation
(Exact name of registrant as specified in its charter)
| | |
| MASSACHUSETTS | | 04-2594045 |
(State or other jurisdiction of Incorporation or Organization) | | (I.R.S. Employer Identification No.) |
1421 California Circle
Milpitas, California 95035
(408) 635-4300
(Address, including zip code, and telephone number, including area code, of registrant’s principal executive offices)
Securities registered pursuant to Section 12(b) of the Act:
| | |
Title of each class | | Name of each exchange on which registered |
| Common Stock, par value $0.05 per share | | Nasdaq Global Market |
Securities registered pursuant to Section 12(g) of the Act:
None
Indicate by check mark if the registrant is a well-known seasoned issuer, as defined in Rule 405 of the Securities Act. Yes ¨ No x
Indicate by check mark if the registrant is not required to file reports pursuant to Section 13 or Section 15(d) of the Act. Yes ¨ No x
Indicate by check mark whether the registrant (1) has filed all reports required to be filed by Section 13 or 15(d) of the Securities Exchange Act of 1934 during the preceding 12 months (or for such shorter period that the registrant was required to file such reports) and (2) has been subject to such filing requirements for the past 90 days. Yes x No ¨
Indicate by check mark if disclosure of delinquent filers pursuant to Item 405 of Regulation S-K is not contained herein, and will not be contained, to the best of registrant’s knowledge, in definitive proxy or information statements incorporated by reference in Part III of this Form 10-K or any amendment to this Form 10-K. x
Indicate by check mark whether the registrant is a large accelerated filer, an accelerated filer, or a non-accelerated filer. See definition of “accelerated filer and large accelerated filer’ in Rule 12b-2 of the Exchange Act. (Check one):
Large Accelerated Filer ¨ Accelerated Filer x Non-Accelerated Filer ¨
Indicate by check mark whether the registrant is a shell company (as defined in Rule 12b-2 of the Exchange Act.): Yes ¨ No x
The aggregate market value of the Common Stock held by non-affiliates of the registrant on January 31, 2008 was $157,806,997.
Number of shares outstanding of each of the issuer’s classes of Common Stock as of September 26, 2008:
Common Stock, Par Value $0.05 Per Share, 126,168,743 shares.
DOCUMENTS INCORPORATED BY REFERENCE
Portions of the Registrant’s Proxy Statement in connection with its 2008 Annual Meeting of Stockholders are incorporated by reference into Part III of this Form 10-K Report.
LTX-CREDENCE CORPORATION
INDEX
PART I
Introduction
Formed by the August 2008 merger of LTX Corporation and Credence Systems Corporation, LTX-Credence Corporation (“LTX-Credence” or the “Company”), provides focused, cost-optimized automated test equipment (ATE) solutions. We design, manufacture, market and service ATE solutions that address the broad, divergent test requirements of the wireless, computing, automotive and entertainment market segments. Semiconductor designers and manufacturers worldwide use our equipment to test their devices during the manufacturing process. After testing, these devices are then incorporated in a wide range of products, including computers, mobile internet equipment such as wireless access points and interfaces, broadband access products such as cable modems and DSL modems, personal communication products such as cell phones and personal digital assistants, consumer products such as televisions, videogame systems, digital cameras and automobile electronics, and for power management in portable and automotive electronics.
LTX-Credence focuses its marketing and sales efforts on integrated device manufacturers (IDMs), outsource assembly and test providers (OSATs), which perform manufacturing services for the semiconductor industry, and fabless companies, which design integrated circuits but have no manufacturing capability. We provide our customers with a comprehensive portfolio of test systems and a global network of strategically deployed applications and support resources.
LTX-Credence Corporation was incorporated in Massachusetts in 1976. Our executive offices are located at 1421 California Circle, Milpitas, California 95035 and our telephone number is 408-635-4300. The terms “LTX-Credence” and the “Company” refer to LTX-Credence Corporation and its wholly owned subsidiaries unless the context otherwise indicates. The Company makes its annual reports on Form 10-K, quarterly reports on Form 10-Q, current reports on Form 8-K and all amendments to those reports available, free of charge, in the Investor Relations section of the Company’s website at www.ltx-credence.com as soon as reasonably practicable after such material is electronically filed with, or furnished to, the Securities and Exchange Commission.
Unless otherwise noted, all historical financial results in this report are for LTX Corporation only, without any effect from the August 2008 merger of LTX Corporation and Credence Systems Corporation.
1
Industry Overview
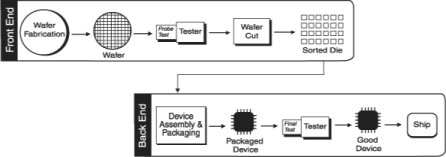
Today, most electronic products contain a combination of integrated circuits (ICs). Each of these ICs has electrical circuitry that requires validation or testing during and after the manufacturing process. The final usability of the IC is determined by ATE. The testing of devices is a critical step during the semiconductor production process. Typically, semiconductor companies test each device at two different stages during the manufacturing process to ensure its functional and electrical performance prior to shipment to the device user. These companies use semiconductor testing equipment to first test a device after it has been fabricated but before it has been packaged to eliminate non-functioning parts. Then, after the functioning devices are packaged, they are tested again to determine if they fully meet performance specifications. Testing is an important step in the manufacturing process because it allows devices to be fabricated at both maximum density and performance—a key to the competitiveness of semiconductor manufacturers. Shown below is a schematic depiction of the major steps in the semiconductor fabrication and test process.
Three primary factors ultimately drive demand for semiconductor test equipment:
| | • | | increases in unit production of semiconductor devices; |
| | • | | increases in the complexity and performance level of devices used in electronic products; and |
| | • | | the emergence of next generation device technologies. |
Increases in unit production result primarily from the proliferation of the personal computer, growth of the telecommunications industry, consumer electronics, the mobile internet, broadband network access, the increased use of digital signal processing (DSP) devices, and automotive and power management applications. These increases in unit production, in turn lead to a corresponding increase in the need for test equipment.
Furthermore, demand is increasing worldwide for smaller, more highly integrated electronic products. This has led to ever higher performance and more complex semiconductor devices, which, in turn, results in a corresponding increase in the demand for equally sophisticated test equipment.
Finally, the introduction and adoption of a new generation of end-user products requires the development of next generation device technologies. For example, access to information is migrating from the stand-alone desktop computer, which might be physically linked to a local network, to the seamless, virtual network of the internet, which is accessible from anywhere by a variety of new portable electronic communication products. A critical enabling technology for this network and multimedia convergence is system in package (SIP). SIP provides the benefits of lower cost, smaller size and higher performance by combining advanced digital, analog and embedded memory technologies on a single device. Historically, these discrete technologies were only available on several separate semiconductor devices, each performing a specific function. By integrating these functions in a single package, SIP enables lower cost, smaller size, higher performance, and lower power consumption.
2
The increases in unit production of devices, the increase in complexity of those devices, and, ultimately, the emergence of new semiconductor device technology have mandated changes in the design, architecture and complexity of such test equipment. Semiconductor device manufacturers must still be able to test the increasing volume and complexity of devices in a reliable, cost-effective, efficient and flexible manner. However, the increased pace of technological change, together with the large capital investments required to achieve economies of scale, are changing the nature and urgency of the challenges faced by device designers and manufacturers.
The combination of ever increasing price pressure and the fact that technology that is not always cost effective to integrate into SIP has led to the need for testing solutions that cover segments of the semiconductor market. There is a need to maximize utilization on the semiconductor test floor and at the same time have the most cost effective test solution for various points or integration levels in technology. This requires a suite of test solution products that are optimized in technology and cost for the segment they are addressing thus maximizing efficiency and minimizing overall cost of test.
The Merger of LTX Corporation and Credence Systems Corporation
On August 29, 2008, LTX Corporation and Credence Systems Corporation completed a merger of equals. In connection with the merger, LTX Corporation changed its name to “LTX-Credence Corporation” and changed the symbol under which its common stock trades on the NASDAQ Global Market to “LTXC” and Credence Systems Corporation became a wholly-owned subsidiary of LTX-Credence.
The strategic rationale for the merger included the following:
Bringing together complementary technology.
The merger brings together a comprehensive portfolio of proven technologies with little overlap. Our broad product offerings provide focused, cost-effective solutions for our customers today, and a strong framework for future product development and innovation.
Building customer diversity.
The merger brings together the strong customer bases of the two companies with minimal overlap in customers and markets, immediately broadening the customer base and reducing customer concentration. It also allows us the ability to provide more comprehensive solutions to our established customers through our expanded product offerings.
Streamlining the business.
The merger provides us with the opportunity to eliminate redundancies, minimize costs, leverage technologies, and establish efficient operations that enable us to bring solutions to market quickly and profitably. It also provides us the size and scope we believe is necessary to enable financial strength and growth in our industry.
Business Strategy
Our objective is to be the leading supplier of focused, cost-optimized ATE solutions for the wireless, computing, automotive and entertainment markets. Key elements of our business strategy include:
Advance our offering of focused, cost-optimized ATE solutions. We believe that providing a range of scalable test platforms targeted at the specific test requirements of individual market segments is the best approach to enable our customers to address the technical, business and cost requirements of their devices.
3
Our customers’ focus on test costs demands this segment-focused scalability approach, we are strongly positioned to address our customers’ requirements. We intend to leverage our proven technologies efficiently across our platforms to accelerate the availability of new capabilities, with a focus on optimizing the cost of our solutions for the individual market segments we address.
Concentrate our sales, applications consulting, and service efforts on key accounts. We recognize that large, diversified IDMs and OSATs, and certain fabless companies purchase most of the world’s test equipment, and that the level of support we are able to provide to them has a direct impact on future business. We believe that focusing our sales and support resources on these key semiconductor companies is the most efficient way to maximize revenue. Therefore, we have organized our sales, field service, and field applications organizations around these key companies and located our resources close to their facilities. This has helped us to increase our responsiveness to customers’ needs and has enabled us to develop collaborative relationships that help guide us in developing future technologies.
Further improve the flexibility of our business model. In order to focus our resources, improve our responsiveness to customer needs, reduce fixed costs and working capital requirements, and manage the cyclicality of our industry more effectively, we have implemented a lean, flexible business model. Key to this business model is our outsourced manufacturing, with substantially all of our manufacturing functions outsourced to third parties. Through strategic alliances, we have also outsourced certain distribution, repair and support functions. In addition, we engage contract employees to address periods of peak demand. Our business model allows us to maintain tight control over all expense items. Overall, we intend to continue to identify and implement programs which enhance our ability to meet customers’ needs while reducing fixed costs.
Product Strategy
Our product strategy is driven by our objective to be the leading supplier of focused, cost-optimized ATE solutions for the wireless, computing, automotive and entertainment markets. We concentrate on the technical, business and cost requirements of the core technologies within those markets, which include: CPU, chipset and graphics, DSP and ASIC, MCU, mobility RF, and power and mixed signal.
To address the divergent, segmented requirements of these technologies, LTX-Credence offers four segment focused, scalable platforms to enable us to address our customers’ technical performance requirements, while at the same time providing a cost-optimized solution. This segment-focused approach allows prioritization of segment-specific test requirements, including:
| | • | | Capital cost and zero-pin infrastructure cost |
| | • | | Equipment size and footprint |
| | • | | Instrument capability and scope |
| | • | | Software functionality and usage |
| | • | | Multi-site test capability |
Each of our four platforms addresses a specific market segment with relatively little overlap in capability and pricing. The Sapphire platform provides optimized performance for CPU, graphics and high end digital testing. The Diamond platform offers high density packaging for low cost testing of microcontrollers and cost sensitive digital consumer devices. The X-Series test platform offers configurations for optimal testing of DSP, power, automotive, mixed signal and RF applications. The ASL platform is a market leader for testing linear, low-end mixed signal and power management devices.
4
Product Portfolio Overview
Our product portfolio consists of four segment focused, scalable platforms:
Sapphire Platform
The Sapphire platform provides optimized performance for CPU, graphics and high-end digital testing. It is designed to be a highly reconfigurable and scalable functional and structural tester for a wide range of high performance ICs. Sapphire is used for silicon debug and validation, characterization, wafer sort and final test. The platform allows a variety of digital and mixed signal instruments to be easily configured to test devices demanding compelling performance.
Diamond Platform
The Diamond platform offers high density packaging for low cost testing of microcontrollers and cost sensitive digital consumer devices. Diamond leverages electronics integration and air-cooling to produce a compact form factor and utilizes high density technology in a variety of instruments for digital and mixed signal addressing embedded analog testing. It is used for engineering as well as wafer sort and final production testing.
X-Series Platform
The X-Series platform offers configurations for optimal testing of DSP, power, automotive, mixed signal and RF applications. The X-Series offers four scalable, compatible configurations, each using common instrumentation and software, to enable flexible deployment while optimizing capital investment. It offers a wide range of digital, analog, RF and DSP test hardware coupled with our enVision software to provide a flexible, scalable test environment that addresses the test requirements of complex mixed signal and RF devices on a single system.
ASL Platform
The ASL platform is the market leader for testing linear, low end mixed signal and power management devices. The ASL tests traditional analog function blocks such as amplifiers, regulators, switches and converters, either as individual ICs or as larger function ICs such as battery power management devices in portable electronics devices. It is highly configurable and relatively low cost, matching the test requirements of low ASP devices.
Service
Our worldwide service organization is capable of performing installations and all necessary maintenance of test systems sold by us, including routine servicing of components manufactured by third parties. We provide various parts and labor warranties on test systems or options designed and manufactured by us, and warranties on components that have been purchased from other manufacturers and incorporated into our test systems. We also provide training on the maintenance and operation of test systems we sell.
Our service revenues (which do not include the service revenues of Credence Systems Corporation) were $27.4 million, or 20.2% of net sales, in fiscal 2008, $29.3 million, or 19.9% of net sales, in fiscal 2007, and $33.2 million, or 15.3% of net sales, in fiscal 2006.
We offer a wide range of service contracts, which gives our customers the flexibility to select the maintenance program best suited to their needs. Customers may purchase service contracts which extend maintenance beyond the initial warranty period. Many customers enter into annual or multiple-year service contracts over the life of the equipment. The pricing of contracts is based upon the level of service provided to the customer and the time period of the service contract. We believe that service revenues should be less affected
5
by the cyclical nature of the semiconductor industry than sales of test equipment. We maintain service centers around the world, both directly and through strategic alliances with companies that are located in the United States, Europe and Asia.
Engineering and Product Development
The test equipment market is characterized by rapid technological change and new product introductions, as well as advancing industry standards. Our competitive position will depend upon our ability to successfully enhance our test platforms, develop new instrumentation, and introduce these new products on a timely and cost-effective basis. We seek to maintain close relationships with our customers in order to be responsive to their product development and production needs.
Our engineering strategy is to focus on development of our Sapphire, Diamond, X-Series and ASL platforms. Consolidation of platform technologies, both hardware and software, is anticipated for the future by leveraging the combined company’s knowledge and expertise into cost-effective solutions.
Engineering and product development expenses (which do not include expenditures of Credence Systems Corporation) were $46.0 million, $50.0 million, and $53.8 million, during fiscal 2008, 2007, and 2006, respectively.
Sales and Distribution
We sell our products through a worldwide direct sales organization and with use through distributors. Our direct sales organization is structured around key accounts, with a sales force of 46 people as of October 14, 2008. We also use distributors to sell our products in certain markets such as in Taiwan/China (Spirox), Southeast Asia (UST), Japan (F-Brain) and Korea (Neosem).
Our sales to customers outside the United States are primarily denominated in United States dollars. Our sales outside North America (which do not include sales of Credence Systems Corporation) were 61%, 67%, and 59%, of total net sales in fiscal 2008, 2007, and 2006, respectively. See Note 8 to the Company’s Consolidated Financial Statements for additional information relating to foreign revenues.
Customers
Our customers include many of the world’s leading semiconductor device manufacturers. In fiscal years 2008, 2007 and 2006, Texas Instruments accounted for 30%, 38%, and 56%, respectively, of our net sales (which do not include sales of Credence Systems Corporation). In fiscal year 2008, STMicroelectronics accounted for 11% of our net sales. A representative list of combined LTX-Credence customers follows:
| | | | |
| Advanced Micro Devices | | Intel | | Silicon Laboratories |
| Amkor | | KYEC | | Skyworks |
| Anadigics | | Maxim Integrated Products | | SMSC |
| Atmel | | Mediatek | | STATSChipPac |
| austriamicrosystems | | Melexis | | SPIL |
| ASE | | NEC | | STMicroelectronics |
| Carsem | | Ralink | | Texas Instruments |
| Fairchild | | Renesas | | Triquint |
| Giga Solution | | RF Micro Devices | | Unisem |
| Infineon Technologies | | Sigurd | | UTAC |
Because a relatively small number of semiconductor companies purchase most of the world’s semiconductor test equipment, we have concentrated our sales and support efforts on these key customers. We believe that sales to a limited number of customers will continue to account for a high percentage of net sales for the foreseeable future.
6
Manufacturing and Supply
We outsource our final assembly, system integration, and testing operations of our X-Series, ASL and Diamond products, to Jabil Circuit and Plexus Manufacturing. We outsource certain components and subassemblies to other contract manufacturers as well. We use standard components and prefabricated parts manufactured to our specifications. These components and subassemblies are used to produce testers in configurations specified by our customers. Some of the components for our products are available from a number of different suppliers; however, many components are purchased from a single supplier or a limited group of suppliers. Although we believe that all single source components currently are available in adequate amounts, we cannot be certain that shortages will not develop in the future. We are dependent on certain semiconductor device manufacturers, who are sole source suppliers of custom components for our products. We have no written supply agreements with these sole source suppliers and purchase our custom components through individual purchase orders. We continuously evaluate sources for our custom components. We cannot assure you that such alternative sources will be qualified or available to us.
Our facilities in Norwood, Massachusetts and Milpitas, California perform research and development activities, which include assembly, system integration and testing for prototypes. Our facility in Hillsboro, Oregon continues to support the final integration of the Sapphire product and performs research and development activities, which include assembly, system integration and testing for prototypes.
Competition
Many other domestic and foreign companies participate in the markets for each of our products and the industry is highly competitive. We compete principally on the basis of performance, cost of test, reliability, customer service, applications support, price and ability to deliver our products on a timely basis. Our competitors in the market for test systems include Advantest Corporation, Eagle Test Systems, Inc., Teradyne Inc., Verigy Ltd. and Yokogawa Electric Corporation. Certain of these companies have a substantially larger share of our addressable market than we do and the majority of our major competitors have greater financial and other resources than we do. A majority of these competitors have a larger installed base of equipment than we do. All of our major competitors are suppliers of other types of ATE and also supply products to other markets. We expect our competitors to enhance their current products and they could introduce new products with comparable or better price and performance. In addition, new competitors, including semiconductor manufacturers themselves, may offer new technologies, which may in turn reduce the value of our product lines.
Backlog
At July 31, 2008, our backlog of unfilled orders for all products and services (which does not include the backlog of Credence Systems Corporation) was $35.8 million, compared with $29.4 million at July 31, 2007. Historically, test systems generally ship within twelve months of receipt of a customer’s purchase order. While backlog is calculated on the basis of firm orders, orders may be subject to cancellation or delay by the customer with limited or no penalty. Our backlog at any particular date, therefore, is not necessarily indicative of actual sales which may be generated for any succeeding period. Historically, our backlog levels have fluctuated based upon the ordering patterns of our customers and changes in our manufacturing capacity.
Proprietary Rights
The development of our products is largely based on proprietary information. We rely upon a combination of contract provisions, copyright, trademark and trade secret laws to protect our proprietary rights in products. We also have a policy of seeking patents on technology considered of particular strategic importance. The earliest expiration date of any of our patents is March 2, 2010. Our other patents have later expiration dates and relate to various technologies, including technology relating to proprietary instrumentation and pin electronics. Although we believe that the copyrights, trademarks and patents we own are of value, we believe that they will
7
not determine our success, which depends principally upon our management, engineering, applications, manufacturing, marketing and service skills. However, we intend to protect our rights when, in our view, these rights are infringed upon.
The use of patents to protect hardware and software has increased in the test equipment industry. We have at times been notified of claims that we may be infringing patents issued to others. Although there are no pending actions against us regarding any patents, no assurance can be given that infringement claims by third parties will not negatively impact our business and results of operations. As to any claims asserted against us, we may seek or be required to obtain a license under the third party’s intellectual property rights. There can be no assurance, however, that a license will be available under reasonable terms or at all. In addition, we could decide to engage in litigation to challenge such claims or a third party could engage in litigation to enforce such claims. Such litigation could be expensive and time consuming and could negatively impact our business and results of operations.
Employees
At July 31, 2008, LTX on a stand-alone basis employed 466 employees and 16 temporary workers. None of our employees are represented by a labor union, and we have experienced no work stoppages. Many of our employees are highly skilled, and we believe our future success will depend in large part on our ability to attract and retain these employees. We consider relations with our employees to be good.
Environmental Affairs
Our manufacturing facilities are subject to numerous laws and regulations designed to protect the environment. We do not anticipate that compliance with these laws and regulations will have a material effect on our capital expenditures, earnings or competitive position.
This report includes or incorporates forward-looking statements that involve substantial risks and uncertainties and fall within the meaning of Section 27A of the Securities Act of 1933 and Section 21E of the Securities Exchange Act of 1934. You can identify these forward-looking statements by our use of the words “believes,” “anticipates,” “plans,” “expects,” “may,” “will,” “would,” “intends,” “estimates,” and similar expressions, whether in the negative or affirmative. We cannot guarantee that we actually will achieve these plans, intentions or expectations. Actual results or events could differ materially from the plans, intentions and expectations disclosed in the forward-looking statements we make. We have included important factors in the cautionary statements, particularly under the heading “Business Risks,” that we believe could cause our actual results to differ materially from the forward-looking statements that we make. We do not assume any obligation to update any forward-looking statement we make.
Our sole market is the highly cyclical semiconductor industry, which causes a cyclical impact on our financial results.
We sell capital equipment to companies that design, manufacture, assemble, and test semiconductor devices. The semiconductor industry is highly cyclical, causing in turn a cyclical impact on our financial results. In fiscal 2006, the industry entered a growth period that was reflected in our improving operating results during fiscal 2006. However, our incoming product orders in the fourth quarter of fiscal 2006 decreased from the third quarter’s levels and continued to decrease in the first two quarters of fiscal 2007. Industry order rates did not increase significantly in fiscal 2008. The timing and level of an industry recovery is uncertain at this time as we enter our fiscal 2009. Any failure to expand in cycle upturns to meet customer demand and delivery requirements or contract in cycle downturns at a pace consistent with cycles in the industry could have an adverse effect on our business.
8
Any significant downturn in the markets for our customers’ semiconductor devices or in general economic conditions would likely result in a reduction in demand for our products and would hurt our business. From the fourth quarter of fiscal 2006 through the end of fiscal 2008, our revenue and operating results were negatively impacted by a downturn in the semiconductor industry. Downturns in the semiconductor test equipment industry have been characterized by diminished product demand, excess production capacity, accelerated erosion of selling prices and excessive inventory levels. We believe the markets for newer generations of devices, including system in package (“SIP”), will also experience similar characteristics. Our market is also characterized by rapid technological change and changes in customer demand. In the past, we have experienced delays in commitments, delays in collecting accounts receivable and significant declines in demand for our products during these downturns, and we cannot be certain that we will be able to maintain or exceed our current level of sales.
Additionally, as a capital equipment provider, our revenue is driven by the capital expenditure budgets and spending patterns of our customers who often delay or accelerate purchases in reaction to variations in their businesses. Because a high portion of our costs are fixed, we are limited in our ability to reduce expenses and inventory purchases quickly in response to decreases in orders and revenues. In a contraction, we may not be able to reduce our significant fixed costs, such as continued investment in research and development and capital equipment requirements and materials purchases from our suppliers.
We may be unable to integrate successfully the businesses of LTX and Credence and realize the anticipated benefits of the merger.
The recent merger of LTX and Credence involved the combination of two organizations that have operated as independent public companies. We will be required to devote significant management attention and resources to integrating the two companies and delays in this process could adversely affect our business, financial results, financial condition and stock price.
Achieving the anticipated benefits of the merger will depend, in part, on our ability to integrate operations, personnel and technology of LTX and Credence. If we are unable to successfully combine the businesses of LTX and Credence in a manner that permits us to achieve the cost savings and operating synergies anticipated to result from the merger, the anticipated benefits of the merger may not be realized fully or at all or may take longer to realize than expected.
Potential difficulties we may encounter in the integration process include the following:
| | • | | lost sales and customers as a result of certain customers of either of LTX or Credence deciding not to do business with us; |
| | • | | the inability to procure goods and services on favorable terms as a result of suppliers of either of LTX or Credence deciding not to do business with us; |
| | • | | the inability to retain, recruit or motivate key personnel; |
| | • | | complexities associated with managing our combined businesses; |
| | • | | difficulties associated with integrating personnel from diverse corporate cultures while maintaining focus on providing consistent, high quality products and customer service; |
| | • | | potential unknown liabilities and unforeseen increased expenses or delays associated with the merger; |
| | • | | disruption or interruption of, or loss of momentum in, our ongoing businesses; and |
| | • | | inconsistencies in standards, controls, procedures and policies. |
Any of these difficulties could adversely affect our ability to maintain relationships with suppliers, customers and employees or our ability to achieve the anticipated benefits of the merger, or could reduce our earnings or otherwise adversely affect the our business and financial results.
9
Even if we are able to integrate the business operations successfully, this integration may not result in the realization of the full benefits of synergies, cost savings, innovation and operational efficiencies that may be possible from this integration and these benefits may not be achieved within a reasonable period of time.
The market for semiconductor test equipment is highly concentrated, and we have limited opportunities to sell our products.
The semiconductor industry is highly concentrated, and a small number of semiconductor device manufacturers and contract assemblers account for a substantial portion of the purchases of semiconductor test equipment generally, including our test equipment. Sales to Texas Instruments accounted for 30% of our net sales in fiscal 2008 and 38% of our net sales in fiscal 2007. Sales to our ten largest customers accounted for 78% of revenues in fiscal year 2008 and 79% in fiscal year 2007. Our customers may cancel orders with few or no penalties. If a major customer reduces orders for any reason, our revenues, operating results, and financial condition will be affected.
Our ability to increase our sales will depend in part upon our ability to obtain orders from new customers. Semiconductor manufacturers select a particular vendor’s test system for testing the manufacturer’s new generations of devices and make substantial investments to develop related test program software and interfaces. Once a manufacturer has selected one test system vendor for a generation of devices, that manufacturer is more likely to purchase test systems from that vendor for that generation of devices, and, possibly, subsequent generations of devices as well. Therefore, the opportunities to obtain orders from new customers may be limited.
Our sales and operating results have fluctuated significantly from period to period, including from one quarter to another, and they may continue to do so.
Our quarterly and annual operating results are affected by a wide variety of factors that could adversely affect sales or profitability or lead to significant variability in our operating results or our stock price. This may be caused by a combination of factors, including the following:
| | • | | sales of a limited number of test systems account for a substantial portion of our net sales in any particular fiscal quarter, and a small number of transactions could therefore have a significant impact; |
| | • | | order cancellations by customers; |
| | • | | lower gross margins in any particular period due to changes in: |
| | • | | the configurations of test systems sold, |
| | • | | the customers to whom we sell these systems, or |
| | • | | a long sales cycle, due to the high selling price of our test systems, the significant investment made by our customers, and the time required to incorporate our systems into our customers’ design or manufacturing process; and |
| | • | | changes in the timing of product orders due to: |
| | • | | unexpected delays in the introduction of products by our customers, |
| | • | | shorter than expected lifecycles of our customers’ semiconductor devices, |
| | • | | uncertain market acceptance of products developed by our customers, or |
| | • | | our own research and development. |
10
We cannot predict the impact of these and other factors on our sales and operating results in any future period. Results of operations in any period, therefore, should not be considered indicative of the results to be expected for any future period. Because of this difficulty in predicting future performance, our operating results may fall below expectations of securities analysts or investors in some future quarter or quarters. Our failure to meet these expectations would likely adversely affect the market price of our common stock.
A substantial amount of the shipments of our test systems for a particular quarter occur late in the quarter. Our shipment pattern exposes us to significant risks in the event of problems during the complex process of final integration, test and acceptance prior to shipment. If we were to experience problems of this type late in our quarter, shipments could be delayed and our operating results could fall below expectations.
Our dependence on subcontractors and sole source suppliers may prevent us from delivering an acceptable product on a timely basis.
We rely on subcontractors to manufacture our test systems and many of the components and subassemblies for our products, and we rely on sole source suppliers for certain components. We may be required to qualify new or additional subcontractors and suppliers due to capacity constraints, competitive or quality concerns or other risks that may arise, including a result of a change in control of, or deterioration in the financial condition of, a supplier or subcontractor. The process of qualifying subcontractors and suppliers is a lengthy process. Our reliance on subcontractors gives us less control over the manufacturing process and exposes us to significant risks, especially inadequate capacity, late delivery, substandard quality, and high costs. In addition, the manufacture of certain of these components and subassemblies is an extremely complex process. If a supplier became unable to provide parts in the volumes needed or at an acceptable price, we would have to identify and qualify acceptable replacements from alternative sources of supply, or manufacture such components internally. The failure to qualify acceptable replacements quickly would delay the manufacturing and delivery of our products, which could cause us to lose revenues and customers.
We also may be unable to engage alternative production and testing services on a timely basis or upon terms favorable to us, if at all. If we are required for any reason to seek a new manufacturer of our test systems, an alternate manufacturer may not be available and, in any event, transitioning to a new manufacturer would require a significant lead time of six months or more and would involve substantial expense and disruption of our business. Our test systems are highly sophisticated and complex capital equipment, with many custom components, and require specific technical know-how and expertise. These factors could make it more difficult for us to find a new manufacturer of our test systems if our relationship with our outsource suppliers is terminated for any reason, which would cause us to lose revenues and customers.
We are dependent on certain semiconductor device manufacturers as sole source suppliers of components manufactured in accordance with our proprietary design and specifications. We have no written supply agreement with these sole source suppliers and purchase our custom components through individual purchase orders.
Compliance with current and future environmental regulations may be costly and disruptive to our operations.
We may be subject to environmental and other regulations due to our production and marketing of products in certain states and countries. We are in the process of planning for and evaluating the impact of a directive to reduce the amount of hazardous materials in certain electronic components such as printed circuit boards. The directive is known as Directive 2002/95/EC of the European Parliament and of the Council of 27 January 2003 on the restriction of the use of certain hazardous substances in electrical and electronic equipment. “RoHS” is short for restriction of hazardous substances. The RoHS Directive banned the placing on the EU market of new electrical and electronic equipment containing more than agreed levels of lead, cadmium, mercury, hexavalent chromium, polybrominated biphenyl (PBB) and polybrominated diphenyl ether (PBDE), except where exemptions apply, from 1 July 2006. Manufacturers are required to ensure that their products, including their
11
constituent materials and components, do not contain more than the minimum levels of the six restricted materials in order to be allowed to export goods into the Single Market (i.e. of the European Community’s 25 Member States). We are uncertain as to the impact of compliance on future expenses and supply of materials used to manufacture our equipment. Any interruption in supply due to the unavailability of lead free products could have a significant impact on the manufacturing and delivery of our products. If a supplier became unable to provide parts in the volumes needed or at an acceptable price, we would have to identify and qualify acceptable replacements from alternative sources of supply or manufacture such components internally. The failure to qualify acceptable replacements quickly would delay the manufacturing and delivery of our products, which could cause us to lose revenues and customers.
Future acquisitions may be difficult to integrate, disrupt our business, dilute stockholder value or divert management attention.
We have in the past, and may in the future, seek to acquire or invest in additional complementary businesses, products, technologies or engineers. For example, in August 2008 we completed our merger with Credence Systems Corporation and in June 2003, we completed our acquisition of StepTech, Inc. We may have to issue debt or equity securities to pay for future acquisitions, which could be dilutive to then current stockholders. We have also incurred and may continue to incur certain liabilities or other expenses in connection with acquisitions, which could continue to materially adversely affect our business, financial condition and results of operations.
Mergers and acquisitions of high-technology companies are inherently risky, and no assurance can be given that future acquisitions will be successful and will not materially adversely affect our business, operating results or financial condition. Our past and future acquisitions may involve many risks, including:
| | • | | difficulties in managing our growth following acquisitions; |
| | • | | difficulties in the integration of the acquired personnel, operations, technologies, products and systems of the acquired companies; |
| | • | | uncertainties concerning the intellectual property rights we purport to acquire; |
| | • | | unanticipated costs or liabilities associated with the acquisitions; |
| | • | | diversion of managements’ attention from other business concerns; |
| | • | | adverse effects on our existing business relationships with our or our acquired companies’ customers; |
| | • | | potential difficulties in completing projects associated with purchased in-process research and development; and |
| | • | | inability to retain employees of acquired companies. |
Any of the events described in the foregoing paragraphs could have an adverse effect on our business, financial condition and results of operations and could cause the price of our common stock to decline.
We may not be able to deliver custom hardware options and software applications to satisfy specific customer needs in a timely manner.
We must develop and deliver customized hardware and software to meet our customers’ specific test requirements. Our test equipment may fail to meet our customers’ technical or cost requirements and may be replaced by competitive equipment or an alternative technology solution. Our inability to provide a test system that meets requested performance criteria when required by a device manufacturer would severely damage our reputation with that customer. This loss of reputation may make it substantially more difficult for us to sell test systems to that manufacturer for a number of years. We have, in the past, experienced delays in introducing some of our products and enhancements.
12
Our dependence on international sales and non-U.S. suppliers involves significant risk.
International sales have constituted a significant portion of our revenues in recent years, and we expect that this composition will continue. International sales accounted for 61% of our revenues for fiscal year 2008 and 67% of our revenues for fiscal year 2007. In addition, we rely on non-U.S. suppliers for several components of the equipment we sell. As a result, a major part of our revenues and the ability to manufacture our products are subject to the risks associated with international commerce. A reduction in revenues or a disruption or increase in the cost of our manufacturing materials could hurt our operating results. These international relationships make us particularly sensitive to changes in the countries from which we derive sales and obtain supplies. Our recently announced plans to transition our outsource manufacturing to Penang, Malaysia increases our exposure to these types of international risks. International sales and our relationships with suppliers may be hurt by many factors, including:
| | • | | changes in law or policy resulting in burdensome government controls, tariffs, restrictions, embargoes or export license requirements; |
| | • | | political and economic instability in our target international markets; |
| | • | | longer payment cycles common in foreign markets; |
| | • | | difficulties of staffing and managing our international operations; |
| | • | | less favorable foreign intellectual property laws making it harder to protect our technology from appropriation by competitors; and |
| | • | | difficulties collecting our accounts receivable because of the distance and different legal rules. |
In the past, we have incurred expenses to meet new regulatory requirements in Europe, experienced periodic difficulties in obtaining timely payment from non-U.S. customers, and been affected by economic conditions in several Asian countries. Our foreign sales are typically invoiced and collected in U.S. dollars. A strengthening in the dollar relative to the currencies of those countries where we do business would increase the prices of our products as stated in those currencies and could hurt our sales in those countries. Significant fluctuations in the exchange rates between the U.S. dollar and foreign currencies could cause us to lower our prices and thus reduce our profitability. These fluctuations could also cause prospective customers to push out or delay orders because of the increased relative cost of our products. In the past, there have been significant fluctuations in the exchange rates between the dollar and the currencies of countries in which we do business. While we have not entered into significant foreign currency hedging arrangements, we may do so in the future. If we do enter into foreign currency hedging arrangements, they may not be effective.
Our market is highly competitive, and we have limited resources to compete.
The test equipment industry is highly competitive in all areas of the world. Many other domestic and foreign companies participate in the markets for each of our products, and the industry is highly competitive. Our competitors in the market for semiconductor test equipment include Advantest, Eagle Test Systems, Teradyne, Verigy and Yokogawa. Certain of these major competitors have substantially greater financial resources and more extensive engineering, manufacturing, marketing, and customer support capabilities.
We expect our competitors to enhance their current products and to introduce new products with comparable or better price and performance. The introduction of competing products could hurt sales of our current and future products. In addition, new competitors, including semiconductor manufacturers themselves, may offer new testing technologies, which may in turn reduce the value of our product lines. Increased competition could lead to intensified price-based competition, which would hurt our business and results of operations. Unless we are able to invest significant financial resources in developing products and maintaining customer support centers worldwide, we may not be able to compete effectively.
13
Development of our products requires significant lead-time, and we may fail to correctly anticipate the technical needs of our customers.
Our customers make decisions regarding purchases of our test equipment while their devices are still in development. Our test systems are used by our customers to develop, test and manufacture their new devices. We therefore must anticipate industry trends and develop products in advance of the commercialization of our customers’ devices, requiring us to make significant capital investments to develop new test equipment for our customers well before their devices are introduced. If our customers fail to introduce their devices in a timely manner or the market does not accept their devices, we may not recover our capital investment through sales in significant volume. In addition, even if we are able to successfully develop enhancements or new generations of our products, these enhancements or new generations of products may not generate revenue in excess of the costs of development, and they may be quickly rendered obsolete by changing customer preferences or the introduction of products embodying new technologies or features by our competitors. Furthermore, if we were to make announcements of product delays, or if our competitors were to make announcements of new test systems, these announcements could cause our customers to defer or forego purchases of our existing test systems, which would also hurt our business.
Our success depends on attracting and retaining key personnel.
Our success will depend substantially upon the continued service of our executive officers and key personnel, none of whom are bound by an employment or non-competition agreement. Our success will depend on our ability to attract and retain highly qualified managers and technical, engineering, marketing, sales and support personnel. Competition for such specialized personnel is intense, and it may become more difficult for us to hire or retain them. Our volatile business cycles only aggravate this problem. Layoffs in any industry downturn could make it more difficult for us to hire or retain qualified personnel. Our business, financial condition and results of operations could be materially adversely affected by the loss of any of our key employees, by the failure of any key employee to perform in his or her current positions, or by our inability to attract and retain skilled employees.
We may not be able to protect our intellectual property rights.
Our success depends in part on our ability to obtain intellectual property rights and licenses and to preserve other intellectual property rights covering our products and development and testing tools. To that end, we have obtained certain domestic patents and may continue to seek patents on our inventions when appropriate. We have also obtained certain trademark registrations. To date, we have not sought patent protection in any countries other than the United States, which may impair our ability to protect our intellectual property in foreign jurisdictions. The process of seeking intellectual property protection can be time consuming and expensive. We cannot ensure that:
| | • | | patents will issue from currently pending or future applications; |
| | • | | our existing patents or any new patents will be sufficient in scope or strength to provide meaningful protection or any commercial advantage to us; |
| | • | | foreign intellectual property laws will protect our intellectual property rights; or |
| | • | | others will not independently develop similar products, duplicate our products or design around our technology. |
If we do not successfully enforce our intellectual property rights, our competitive position could suffer, which could harm our operating results. We also rely on trade secrets, proprietary know-how and confidentiality provisions in agreements with employees and consultants to protect our intellectual property. Other parties may not comply with the terms of their agreements with us, and we may not be able to adequately enforce our rights against these people.
14
Third parties may claim we are infringing their intellectual property, and we could suffer significant litigation costs, licensing expenses or be prevented from selling our products.
Intellectual property rights are uncertain and involve complex legal and factual questions. We may be unknowingly infringing on the intellectual property rights of others and may be liable for that infringement, which could result in significant liability for us. If we do infringe the intellectual property rights of others, we could be forced to either seek a license to intellectual property rights of others or alter our products so that they no longer infringe the intellectual property rights of others. A license could be very expensive to obtain or may not be available at all. Similarly, changing our products or processes to avoid infringing the rights of others may be costly or impractical.
We are responsible for any patent litigation costs. If we were to become involved in a dispute regarding intellectual property, whether ours or that of another company, we may have to participate in legal proceedings. These types of proceedings may be costly and time consuming for us, even if we eventually prevail. If we do not prevail, we might be forced to pay significant damages, obtain licenses, modify our products or processes, stop making products or stop using processes.
Our stock price is volatile.
In the twelve-month period ending on July 31, 2008, our stock price ranged from a low of $2.04 to a high of $4.29. The price of our common stock has been and likely will continue to be subject to wide fluctuations in response to a number of events and factors, such as:
| | • | | quarterly variations in operating results; |
| | • | | variances of our quarterly results of operations from securities analyst estimates; |
| | • | | changes in financial estimates and recommendations by securities analysts; |
| | • | | announcements of technological innovations, new products, or strategic alliances; and |
| | • | | news reports relating to trends in our markets. |
In addition, the stock market in general, and the market prices for semiconductor-related companies in particular, have experienced significant price and volume fluctuations that often have been unrelated to the operating performance of the companies affected by these fluctuations. These broad market fluctuations may adversely affect the market price of our common stock, regardless of our operating performance.
We have substantial indebtedness.
As of the date of this report, we have $54.2 million principal amount of 3.50% Credence Convertible Senior Subordinated Notes (the “Notes”) due 2010 as well as $17.9 million in principal outstanding as of July 31, 2008 under a commercial loan. We may incur substantial additional indebtedness in the future. The level of indebtedness, among other things, could
| | • | | make it difficult for us to make payments on our debt and other obligations; |
| | • | | make it difficult for us to obtain any necessary future financing for working capital, capital expenditures, debt service requirements or other purposes; |
| | • | | require the dedication of a substantial portion of any cash flow from operations to service for indebtedness, thereby reducing the amount of cash flow available for other purposes, including capital expenditures; |
| | • | | limit our flexibility in planning for, or reacting to changes in, our business and the industries in which we compete; |
15
| | • | | place us at a possible competitive disadvantage with respect to less leveraged competitors and competitors that have better access to capital resource; and |
| | • | | make us more vulnerable in the event of a further downturn in our business. |
There can be no assurance that we will be able to meet our debt service obligations, including our obligations under the Notes.
We may not be able to pay our debt and other obligations.
If our cash flow is inadequate to meet our obligations, we could face substantial liquidity problems. During our first quarter of fiscal 2009, we repurchased $69.3 million principal amount of Credence’s 3.5% Convertible Senior Subordinated Notes due 2010, reducing our cash and cash equivalents. In addition, we have monthly principal and interest payments through December 2010 related to our $20.0 million term loan from a commercial lender. If we are unable to generate sufficient cash flow or otherwise obtain funds necessary to make required payment on the term loan, or certain of our other obligations, we would be in default under the terms thereof, which could permit the holders of those obligations to accelerate their maturity and also could cause default under future indebtedness we may incur. Any such default could have material adverse effect on our business, prospects, financial position and operating results. In addition, we may not be able to repay amounts due in respect of our obligations, if payment of those obligations were to be accelerated following the occurrence of any other event of default as defined in the instruments creating those obligations.
We may need additional financing, which could be difficult to obtain.
We expect that our existing cash and cash equivalents and marketable securities, and borrowings from available bank financings, will be sufficient to meet our cash requirements to fund operations and expected capital expenditures for the foreseeable future. In the event we need to raise additional funds, we cannot be certain that we will be able to obtain such additional financing on favorable terms, if at all. Further, if we issue additional equity securities, stockholders may experience additional dilution or the new equity securities may have rights, preferences or privileges senior to those of existing holders of common stock. Future financings may place restrictions on how we operate our business. If we cannot raise funds on acceptable terms, if and when needed, we may not be able to develop or enhance our products and services, take advantage of future opportunities, grow our business or respond to competitive pressures, which could seriously harm our business.
Uncertainty about the recently completed merger of LTX and Credence may adversely affect our relationships with customers, suppliers and employees.
In response to the merger of LTX and Credence, existing or prospective customers or suppliers of LTX-Credence may:
| | • | | delay, defer or cease purchasing goods or services from or providing goods or services to us; |
| | • | | delay or defer other decisions concerning LTX-Credence, or refuse to extend credit to us; or |
| | • | | otherwise seek to change the terms on which they do business with us. |
Any such delays or changes to terms could seriously harm the business of the Company.
In addition, as a result of the merger current and prospective employees could experience uncertainty about their future with the Company. These uncertainties may impair our ability to retain, recruit or motivate key personnel.
16
We have and expect to continue to incur significant costs in connection with the merger.
We have and expect to continue to incur substantial expenses related to the merger. We estimate that we will incur direct transaction costs of approximately $11 million in connection with the merger.
In addition, there are a large number of systems that must be integrated, including management information, purchasing, accounting and finance, sales, billing, payroll and benefits, fixed assets and lease administration systems, and regulatory compliance. While we have assumed that a certain level of expenses would be incurred from the integration of the companies, there are a number of factors beyond our control that could affect the total amount or the timing of all the expected integration expenses. Moreover, many of the expenses that will be incurred, by their nature, are impracticable to estimate. These expenses could, particularly in the near term, exceed the savings that we expect to achieve from the elimination of duplicative expenses, the realization of economies of scale, and cost savings and revenue synergies related to the integration of the two companies following the completion of the merger. The amount and timing of any these charges are uncertain at the present. In addition, we may incur additional material charges in subsequent fiscal quarters to reflect additional costs in connection with the merger.
The combined company will face uncertainties related to the effectiveness of internal controls.
Public companies in the United States are required to review their internal controls over financial reporting under Section 404 of the Sarbanes-Oxley Act of 2002. Any system of controls, however well designed and operated, can provide only reasonable, and not absolute, assurance that the objectives of the system are met. In addition, the design of any control system is based in part upon certain assumptions about the likelihood of future events. Because of these and other inherent limitations of control systems, any design may not achieve its stated goal under all potential future conditions, regardless of how remote.
Although in the past each of LTX’s and Credence’s management has determined, and each of their respective independent registered public accounting firms have attested, that their respective internal controls were effective as of the end of their most recent fiscal years, the integration of LTX and Credence, and their respective internal control systems and procedures, may result in or lead to a future material weakness in our internal controls, or we or our independent registered public accounting firm may identify a material weakness in our internal controls in the future. A material weakness in internal controls over financial reporting would require management and our independent public accounting firm to evaluate our internal controls as ineffective. If our internal controls over financial reporting are not considered adequate, we may experience a loss of public confidence, which could have an adverse effect on our business and stock price.
Internal control deficiencies or weaknesses that are not yet identified could emerge.
Over time we may identify and correct deficiencies or weaknesses in our internal controls and, where and when appropriate, report on the identification and correction of these deficiencies or weaknesses. However, the internal control procedures can provide only reasonable, and not absolute, assurance that deficiencies or weaknesses are identified. Deficiencies or weaknesses that have not been identified by us could emerge and the identification and correction of these deficiencies or weaknesses could have a material impact on our results of operations.
Charges to earnings resulting from the application of the purchase method of accounting may adversely affect the market value of our common stock following the completion of the merger.
In accordance with United States generally accepted accounting principles, which we refer to in this Report as GAAP, the merger of LTX and Credence has been accounted for using the purchase method of accounting, which will result in charges to earnings that could have an adverse impact on the market value of our common stock following the completion of the merger. Under the purchase method of accounting, the total estimated
17
purchase price will be allocated to Credence’s net tangible assets, identifiable intangible assets or expense for in-process research and development based on their respective fair values as of August 29, 2008. Any excess of the fair values over the purchase price of those assets has been preliminarily recorded as a pro rata reduction of qualifying assets principally noncurrent tangible and intangible assets. We will incur additional amortization expense based on the identifiable amortizable intangible assets acquired in connection with the merger agreement and their relative useful lives. Additionally, to the extent the value of goodwill or identifiable intangible assets or other long-lived assets may become impaired, we will be required to incur material charges relating to the impairment. These amortization and potential impairment charges could have a material impact on our results of operations.
| Item 1B. | Unresolved Staff Comments |
None.
All of our facilities are leased. We have achieved worldwide ISO 9001:2000 certification at our facilities. We maintain our headquarters in Milpitas, California, where corporate administration, sales and customer support, research and development are located in an 180,000 square foot facility under a lease, which expires in 2017. We lease a 56,380 square foot facility in Norwood, Massachusetts for administration, sales and support, research and development pursuant to a lease that expires in 2016. We also lease a 180,000 square foot manufacturing facility in Hillsboro, Oregon pursuant to a lease that expires in January, 2010. We also lease sales and customer support offices at various locations in the United States totaling approximately 18,000 square feet.
Our European headquarters is located in Munich, Germany, and our Asian headquarters is located in Singapore. We also maintain sales and support offices at other locations in Europe and in Asia. Office space leased in Asia and Europe totals approximately 170,000 square feet.
We believe that our existing facilities are adequate to meet our current and foreseeable future requirements.
We have no material pending legal proceedings.
| Item 4. | Submission of Matters to a Vote of Security Holders |
None.
18
PART II
| Item 5. | Market for Registrant’s Common Equity, Related Stockholder Matters and Issuer Purchases of Equity Securities |
Effective with the closing of our merger agreement with Credence Systems Corporation on August 29, 2008, the symbol for our common stock on the Nasdaq National Market changed to “LTXC”. Prior to that date, our common stock traded on the Nasdaq National Market under the symbol “LTXX”. The following table shows the high and low closing sale prices per share of our common stock, as reported on the Nasdaq National Market, for the periods indicated:
| | | | | | |
Period | | High | | Low |
Fiscal Year Ended July 31, 2008 | | | | | | |
First Quarter | | $ | 4.29 | | $ | 3.26 |
Second Quarter | | | 3.33 | | | 2.28 |
Third Quarter | | | 3.71 | | | 2.55 |
Fourth Quarter | | | 3.30 | | | 2.04 |
Fiscal Year Ended July 31, 2007 | | | | | | |
First Quarter | | $ | 5.65 | | $ | 4.45 |
Second Quarter | | | 5.81 | | | 4.52 |
Third Quarter | | | 6.72 | | | 5.29 |
Fourth Quarter | | | 6.29 | | | 4.59 |
We have never declared or paid any dividends on our common stock. We currently intend to retain future earnings to fund the development and growth of our business and, therefore, we do not anticipate paying any cash dividends in the foreseeable future. In addition, our credit agreement with a bank contains certain covenants that prohibit us from paying cash dividends.
As of September 26, 2008, we had approximately 833 stockholders of record of our common stock.
Compensation Plans
The following table shows information relating to our compensation plans as of July 31, 2008:
| | | | | | | | |
| | | Equity Compensation Plan Information | |
Plan Category | | Number of securities
to be issued upon
exercise of
outstanding options,
warrants and rights | | Weighted average
exercise price of
outstanding options,
warrants and rights | | Number of securities remaining
available for future issuance
under equity compensation
plans (excluding securities in
first column) | |
Equity compensation plans approved by security holders | | 7,968,867 | | $ | 10.17 | | 2,727,865 | * |
Equity compensation plans not approved by security holders | | — | | | — | | — | |
| | | | | | | | |
Total | | 7,968,867 | | $ | 10.17 | | 2,727,865 | * |
| | | | | | | | |
| * | Includes 220,632 shares available for issuance under an employee stock purchase plan which is intended to qualify as such under Section 423 of the Internal Revenue Code. |
This table excludes an aggregate of 21,841 shares issuable upon exercise of outstanding options assumed by us in connection with the StepTech acquisition. The weighted average exercise price of the excluded options is $1.06.
19
| Item 6. | Selected Financial Data |
The following table contains our selected consolidated financial data and is qualified by the more detailed consolidated financial statements and notes thereto included elsewhere in this report. The selected consolidated financial data for and as of the end of each of the five fiscal years in the period ended July 31, 2008 are derived from our audited consolidated financial statements.
| | | | | | | | | | | | | | | | | | | | |
| | | Fiscal Years ended July 31,
(In thousands) | |
| | | 2008 | | | 2007 | | | 2006 | | | 2005 | | | 2004 | |
Consolidated Statements of Operations Data: | | | | | | | | | | | | | | | | | | | | |
Net sales | | $ | 135,825 | | | $ | 147,639 | | | $ | 216,503 | | | $ | 134,531 | | | $ | 255,801 | |
Cost of sales | | | 67,981 | | | | 77,441 | | | | 109,975 | | | | 90,806 | | | | 154,672 | |
Inventory-related provision (a) | | | — | | | | 4,175 | | | | 221 | | | | 47,457 | | | | — | |
Engineering and product development expenses | | | 46,020 | | | | 50,044 | | | | 53,807 | | | | 66,302 | | | | 67,655 | |
Selling, general and administrative expenses | | | 26,563 | | | | 26,770 | | | | 31,135 | | | | 29,366 | | | | 28,037 | |
Reorganization costs (credit) (a) | | | — | | | | (377 | ) | | | 6,282 | | | | 31,726 | | | | — | |
| | | | | | | | | | | | | | | | | | | | |
Income (loss) from operations | | | (4,739 | ) | | | (10,414 | ) | | | 15,083 | | | | (131,126 | ) | | | 5,437 | |
Other income (expense) | | | 1,048 | | | | (252 | ) | | | (2,842 | ) | | | (1,600 | ) | | | (3,476 | ) |
| | | | | | | | | | | | | | | | | | | | |
Income (loss) before income taxes | | $ | (3,691 | ) | | $ | (10,666 | ) | | $ | 12,241 | | | $ | (132,726 | ) | | $ | 1,961 | |
Provision (benefit) for income taxes | | | (3,091 | ) | | | — | | | | — | | | | — | | | | — | |
| | | | | | | | | | | | | | | | | | | | |
Net income (loss) | | $ | (600 | ) | | $ | (10,666 | ) | | $ | 12,241 | | | $ | (132,726 | ) | | $ | 1,961 | |
| | | | | | | | | | | | | | | | | | | | |
Net income (loss) per share: | | | | | | | | | | | | | | | | | | | | |
Basic | | $ | (0.01 | ) | | $ | (0.17 | ) | | $ | 0.20 | | | $ | (2.17 | ) | | $ | 0.04 | |
Diluted | | $ | (0.01 | ) | | $ | (0.17 | ) | | $ | 0.20 | | | $ | (2.17 | ) | | $ | 0.03 | |
Weighted average common shares used in computing net income (loss) per share: | | | | | | | | | | | | | | | | | | | | |
Basic | | | 62,611 | | | | 62,130 | | | | 61,684 | | | | 61,144 | | | | 55,927 | |
Diluted | | | 62,611 | | | | 62,130 | | | | 62,207 | | | | 61,144 | | | | 58,057 | |
Consolidated Balance Sheet Data: | | | | | | | | | | | | | | | | | | | | |
Working capital | | $ | 86,506 | | | $ | 87,279 | | | $ | 143,287 | | | $ | 182,957 | | | $ | 292,906 | |
Property and equipment, net | | | 27,213 | | | | 32,483 | | | | 37,633 | | | | 47,135 | | | | 71,329 | |
Total assets | | | 169,727 | | | | 201,122 | | | | 327,690 | | | | 316,392 | | | | 459,564 | |
Total debt | | | 17,900 | | | | 47,222 | | | | 147,691 | | | | 148,293 | | | | 150,321 | |
Stockholders’ equity | | | 117,280 | | | | 113,108 | | | | 117,639 | | | | 99,900 | | | | 234,254 | |
Other Information (unaudited): | | | | | | | | | | | | | | | | | | | | |
Current ratio | | | 3.43 | | | | 2.32 | | | | 2.13 | | | | 3.78 | | | | 4.89 | |
Asset turnover | | | 0.80 | | | | 0.73 | | | | 0.66 | | | | 0.43 | | | | 0.56 | |
Debt as a percentage of total capitalization | | | 13.2 | % | | | 29.3 | % | | | 56.0 | % | | | 60.0 | % | | | 39.1 | % |
Additions to property and equipment (net) | | | 7,527 | | | | 8,399 | | | | 6,743 | | | | 11,616 | | | | 17,496 | |
Depreciation and amortization | | | 11,933 | | | | 13,867 | | | | 14,403 | | | | 18,494 | | | | 18,699 | |
| (a) | See Note 10 to the Consolidated Financial Statements. |
20
| Item 7. | Management’s Discussion and Analysis of Financial Condition and Results of Operations |
The following discussion should be read together with the Consolidated Financial Statements and Notes thereto appearing elsewhere in this annual report on Form 10-K. Certain statements in “Management’s Discussion and Analysis of Financial Condition and Results of Operations” are forward-looking statements that involve risks and uncertainties. Words such as may, will, should, would, anticipates, expects, intends, plans, believes, seeks, estimates and similar expressions identify such forward-looking statements. The forward-looking statements contained herein are based on current expectations and entail various risks and uncertainties that could cause actual results to differ materially from those expressed in such forward-looking statements. Factors that might cause such a difference include, among other things, those set forth under “Risk Factors” and those appearing elsewhere in this Form 10-K. Readers are cautioned not to place undue reliance on these forward-looking statements, which reflect management’s analysis only as of the date hereof. We assume no obligations to update these forward-looking statements to reflect actual results or changes in factors or assumptions affecting forward-looking statements.
Overview
We design, manufacture, market and service semiconductor test solutions worldwide to leading companies in the semiconductor industry. Our Fusion semiconductor test equipment can test a broad range of analog, digital, mixed signal (a combination of analog and digital) and system in package, or SIP, semiconductor devices, all on a single test platform.
We focus our marketing and sales on integrated device manufacturers (IDMs), subcontractors, which perform manufacturing services for the semiconductor industry, foundries, which provide wafer manufacturing capability, and fabless companies, which design integrated circuits but have no manufacturing capability.
Merger with Credence Systems Corporation
On August 29, 2008, we completed a merger of equals with Credence Systems Corporation (“Credence”) and changed our name to LTX-Credence Corporation. However, because the merger with Credence was completed after the July 31 end of our 2008 fiscal year, our financial information for fiscal 2008 and previous fiscal years does not include the financial information or results of operations of Credence.
Industry Conditions and Outlook
We sell capital equipment and services to companies that design, manufacture, assemble or test semiconductor devices. The semiconductor industry is highly cyclical, causing in turn a cyclical impact on our financial results. As a capital equipment provider, our revenue is driven by the capital expenditure budgets and spending patterns of our customers, who often delay or accelerate purchases in reaction to variations in their business. The level of capital expenditures by these semiconductor companies depends on the current and anticipated market demand for semiconductor devices and the products that incorporate them. Therefore, demand for our semiconductor test equipment is dependent on growth in the semiconductor industry. In particular, three primary characteristics of the semiconductor industry drive the demand for semiconductor test equipment:
| | • | | increases in unit production of semiconductor devices; |
| | • | | increases in the complexity of semiconductor devices used in electronic products; and |
| | • | | the emergence of next generation device technologies, such as SIP. |
21
The following graph shows the cyclicality in semiconductor test equipment orders and shipments from fiscal 1997 through fiscal 2008 (using the three month moving average), as calculated by SEMI, an industry trade organization:

Consistent with our business strategy, we have continued to invest significant amounts in engineering and product development to develop and enhance our Fusion platform during industry slowdowns. In fiscal 2008, engineering and product development expense was $46.0 million, or 33.9% of net sales, as compared to $50.0 million, or 33.9% of net sales, in fiscal 2007. Our engineering and development expense decreased sequentially on a quarterly basis as next generation Fusion product development projects were completed. Engineering and development expense for the first quarter of fiscal 2008 was $11.6 million and has dropped to $11.2 million in our fourth quarter of fiscal 2008. We believe that our competitive advantage in the semiconductor test industry is primarily driven by the ability of our Fusion platform to meet or exceed the technical specifications required for the testing of advanced semiconductor devices in a cost-efficient manner. Our current investment in engineering and product development is focused on enhancements to and additions to our product offerings with new options and instruments designed for specific market segments. We believe this will continue to differentiate the Fusion platform from the product offerings of our competitors.
In addition, over the past several years, we have increasingly transitioned the manufacture of certain components and subassemblies to contract manufacturers, thereby reducing our fixed manufacturing costs associated with direct labor and overhead. In fiscal 2002, we completed the transition of our final assembly, system integration and testing operations for Fusion HF to Jabil Circuit. In fiscal 2004, we completed the transition of our Fusion HFi, CX and DX manufacturing to Jabil Circuit. In fiscal 2005, we added Fusion EX, in fiscal 2006, we added Fusion MX and in fiscal 2007, we added Fusion LX. This strategy has further reduced our fixed manufacturing costs. We believe that transforming product manufacturing costs into variable costs will in the future allow us to improve our performance during cyclical downturns while preserving our historic gross margins during cyclical upturns.
22
During fiscal years 2005 and 2006, we took several additional cost reduction measures to further mitigate the adverse effect of cyclical downturns on our results of operations. Our total worldwide headcount was reduced from 635 employees and 55 temporary workers at the end of fiscal 2004 to 466 employees and 16 temporary workers at the end of fiscal 2008. In addition, we continued to maintain other cost reduction measures, such as the strict oversight and reduction in discretionary travel and other variable overhead expenses. We believe that these reductions in operating costs have reduced our costs while preserving our ability to fund critical product research and development efforts and continue to provide our customers with the levels of responsiveness and service they require.
We are also exposed to the risks associated with the volatility of the U.S. and global economies. The lack of visibility regarding whether or when there will be sustained growth periods for the sale of electronic goods and information technology equipment, and uncertainty regarding the amount of sales, underscores the need for caution in predicting growth in the semiconductor test equipment industry in general and in our revenues and profits specifically. Slow or negative growth in the domestic economy may continue to materially and adversely affect our business, financial condition and results of operations for the foreseeable future. Our results of operations would be further adversely affected if we were to experience lower than anticipated order levels, cancellations of orders in backlog, extended customer delivery requirements or pricing pressure as a result of a slowdown. At lower levels of revenue, there is a higher likelihood that these types of changes in our customers’ requirements would adversely affect our results of operations because in any particular quarter a limited number of transactions accounts for an even greater portion of sales for the quarter.
Critical Accounting Policies and the Use of Estimates
The preparation of financial statements in conformity with generally accepted accounting principles requires management to make estimates and assumptions that affect the reported amount of assets, liabilities, revenues and expenses, and related disclosure of contingent assets and liabilities. We based these estimates and assumptions on historical experience, and evaluate them on an on-going basis to ensure they remain reasonable under current conditions. Actual results could differ from those estimates. We believe that our most critical accounting policies upon which our financial reporting depends on and which involve the most complex and subjective decisions or assessments are as follows: revenue recognition, inventory reserves, income taxes, warranty, goodwill and other intangibles, impairment of long-lived assets and allowances for doubtful accounts.
Revenue Recognition
Our revenue recognition policy is described in Note 2, Summary of Significant Accounting Policies, contained in the Notes to Consolidated Financial Statements included in this report. We recognize revenue when persuasive evidence of an arrangement exists, delivery or customer acceptance, if required, has occurred or services have been rendered, the seller’s price is fixed or determinable and collectability is reasonably assured. In the future, if acceptance provisions significantly change, the timing of the revenue recognition could be affected.
Inventory
We sell capital equipment to companies that design, manufacture, assemble, and test semiconductor devices. We are exposed to a number of economic and industry factors that could result in portions of our inventory becoming either obsolete or in excess of anticipated usage. These factors include, but are not limited to, changes in our customers’ capital expenditures, technological changes in our markets, our ability to meet changing customer requirements, competitive pressures in products and prices, and the availability of key components from our suppliers. Our policy is to establish inventory reserves when conditions exist that suggest our inventory may be in excess of anticipated demand or is obsolete based upon our assumptions about future demand for our products or market conditions. We regularly evaluate the ability to realize the value of our inventory based on a combination of factors including the following: historical usage rates, forecasted sales or usage, estimated product end of life dates, estimated current and future market values and new product introductions. Purchasing
23
and alternative usage options are also explored to mitigate inventory exposure. When recorded, our reserves are intended to reduce the carrying value of our inventory to its net realizable value. Pursuant to SAB Topic 5-BB, inventory reserves establish a new cost basis for inventory. Such reserves are not reversed until the related inventory is sold or otherwise disposed. For the twelve months ended July 31, 2008, we recorded $1.2 million of sales related to previously reserved items. There was $4.4 million of sales related to previously reserved items recorded for the twelve months ended July 31, 2007 and $2.5 million for the twelve months ended July 31, 2006. The net incremental gross margin and net income for these transactions did not have a significant impact on operating margins and overall operating results. As of July 31, 2008, our inventory of $22.5 million is stated net of inventory reserves of $35.2 million and consists of Fusion products and engineering materials. Of the $22.5 million inventory balance at July 31, 2008, $7.5 million consists of “last time buy” custom components primarily for Fusion HFi and $9.7 million consists of materials and components to support current requirements for Fusion HFi and X-Series, $5.3 million consists of evaluation inventory at customers. There were no deferred costs related to shipment of inventory where revenue recognition is subject to product acceptance at July 31, 2008. If actual demand for our products deteriorates or market conditions are less favorable than those that we project, additional inventory reserves may be required. See Notes 2 and 10 to our Consolidated Financial Statements.
Income Taxes
In accordance with Statement of Financial Accounting Standards No. 109, “Accounting for Income Taxes”, (“SFAS No. 109”) we recognize deferred income taxes based on the expected future tax consequences of differences between the financial statement basis and the tax bases of assets and liabilities, calculated using enacted tax rates for the year in which the differences are expected to be reflected in the tax return. Valuation allowances are established when necessary to reduce deferred taxes to the amount expected to be realized.
We have deferred tax assets resulting from tax credit carryforwards, net operating losses and other deductible temporary differences, which will reduce taxable income in future periods. SFAS No. 109 requires that a valuation allowance be established when it is “more likely than not” that all or a portion of deferred tax assets will not be realized. A review of all available positive and negative evidence needs to be considered, including a company’s performance, the market environment in which we operate, length of carryback and carryforward periods, existing sales backlog and future sales projections. Where there are cumulative losses in recent years, SFAS No. 109 creates a strong presumption that a valuation allowance is needed. This presumption can be overcome in very limited circumstances. As a result of our cumulative loss position in recent years and the increased uncertainty relative to the timing of profitability in future periods, we continue to maintain a valuation allowance for our entire net deferred tax assets. The valuation allowance for deferred tax assets increased from $229.9 million at July 31, 2007, to $231.1 million at July 31, 2008. We expect to record a full valuation allowance on future tax benefits until we can sustain an appropriate level of profitability. Until such time, we would not expect to recognize any significant tax benefits in our future results of operations. We will continue to monitor the recoverability of our deferred tax assets on a periodic basis. As a result of the merger and Internal Revenue Service Code Section 382 guidance, the future utilization of the combined company’s net operating loss deductions will be significantly limited. See Note 5 to our Consolidated Financial Statements.
We adopted Financial Accounting Standards Board Interpretation Number 48, “Accounting for Uncertain Tax Positions” (“FIN 48”) on August 1, 2007. FIN 48 clarifies the accounting for uncertainty in income taxes recognized in an enterprise’s financial statements in accordance with FASB Statement No. 109,” Accounting for Income Taxes.” FIN 48 prescribes a recognition threshold and measurement of a tax position taken or expected to be taken in a tax return. There were no adjustments to our accumulated deficit as a result of the implementation of FIN 48.
Warranty
We provide standard warranty coverage on our systems, providing labor and parts necessary to repair the systems during the warranty period. We account for the estimated warranty cost as a charge to cost of sales when
24
the revenue is recognized. The estimated warranty cost is based on historical product performance and field expenses. We use actual service hours, and parts expense per system, and apply the actual labor and overhead rates to estimate the warranty charge. The actual product performance and/or field expense profiles may differ, and in those cases we adjust the warranty accrual accordingly.
Goodwill and Other Intangible Assets
We have adopted the provisions of SFAS No. 142, “Goodwill and Other Intangible Assets”, which requires that goodwill and intangible assets with indefinite useful lives no longer be amortized. Intangible assets with a definite useful life are amortized over their estimated useful life. Assets recorded in these categories are tested for impairment at least annually or when a change in circumstances may result in future impairment. Intangible assets are recorded at historical cost. Intangible assets acquired in an acquisition, including research and development, are recorded using the purchase method of accounting. Assets acquired in an acquisition are recorded at their estimated fair values at the date of acquisition. If the carrying value of the asset is in excess of its fair value based on a combination of the entity-wide and discounted cash flow approaches, the carrying value is written down to fair value in the period identified.
Impairment of Long-Lived Assets
On an ongoing basis, we review the value and period of amortization or depreciation of long-lived assets. Included in long-lived assets is machinery, equipment, spare parts used for service, office furniture, office equipment and leasehold improvements. During the review, we reevaluate the significant assumptions used in determining the original cost of long-lived assets. Although the assumptions may vary from transaction to transaction, they generally include revenue growth, operating results, cash flows and other indicators of value. We then determine whether there has been a permanent impairment of the value of long-lived assets based upon events or circumstances that have occurred since acquisition. The extent of the impairment amount recognized is based upon a determination of the fair value of the impaired asset.
Allowance for Doubtful Accounts
A majority of our trade receivables are derived from sales to large multinational semiconductor manufacturers throughout the world. In order to monitor potential credit losses, we perform ongoing credit evaluations of our customers’ financial condition. An allowance for doubtful accounts is maintained for potential credit losses based upon assessment of the expected collectability of all accounts receivable. The allowance for doubtful accounts is reviewed periodically to assess the adequacy of the allowances. In any circumstances in which we are aware of a customer’s inability to meet its financial obligations, we provide an allowance, which is based on the age of the receivables, the circumstances surrounding the customer’s financial situation and our historical experience. If circumstances change, and the financial condition of our customers were adversely affected resulting in their inability to meet their financial obligations to us, we may need to record additional allowances.
25
Results of Operations
The following table sets forth for the periods indicated the principal items included in the Consolidated Statements of Operations data.
| | | | | | | | | | | | |
| | | Year Ended July 31, | |
| | | 2008 | | | 2007 | | | 2006 | |
| | | (in thousands, except per share data) | |
Net sales | | $ | 135,825 | | | $ | 147,639 | | | $ | 216,503 | |
Cost of sales | | | 67,981 | | | | 77,441 | | | | 109,975 | |
Inventory-related provision | | | — | | | | 4,175 | | | | 221 | |
| | | | | | | | | | | | |
Gross profit | | | 67,844 | | | | 66,023 | | | | 106,307 | |
Engineering and product development expenses | | | 46,020 | | | | 50,044 | | | | 53,807 | |
Selling, general and administrative expenses | | | 26,563 | | | | 26,770 | | | | 31,135 | |
Reorganization costs (credit) | | | — | | | | (377 | ) | | | 6,282 | |
| | | | | | | | | | | | |
Income (loss) from operations | | | (4,739 | ) | | | (10,414 | ) | | | 15,083 | |
Interest expense | | | (1,136 | ) | | | (4,909 | ) | | | (8,956 | ) |
Investment income | | | 2,184 | | | | 4,657 | | | | 6,114 | |
| | | | | | | | | | | | |
Income (loss) before income taxes | | | (3,691 | ) | | | (10,666 | ) | | | 12,241 | |
Provision (benefit) for income taxes | | | (3,091 | ) | | | — | | | | — | |
| | | | | | | | | | | | |
Net income (loss) | | $ | (600 | ) | | $ | (10,666 | ) | | $ | 12,241 | |
| | | | | | | | | | | | |
Net income (loss) per share: | | | | | | | | | | | | |
Basic | | $ | (0.01 | ) | | $ | (0.17 | ) | | $ | 0.20 | |
Diluted | | $ | (0.01 | ) | | $ | (0.17 | ) | | $ | 0.20 | |
The following table sets forth for the periods indicated the principal items included in the Consolidated Statements of Operations as percentages of total net sales.
| | | | | | | | | |
| | | Percentage of Net Sales
Year Ended July 31, | |
| | | 2008 | | | 2007 | | | 2006 | |
Net sales | | 100.0 | % | | 100.0 | % | | 100.0 | % |
Cost of sales | | 50.1 | | | 52.5 | | | 50.8 | |
Inventory related provision | | — | | | 2.8 | | | 0.1 | |
| | | | | | | | | |
Gross profit | | 49.9 | | | 44.7 | | | 49.1 | |
Engineering and product development expenses | | 33.9 | | | 33.9 | | | 24.9 | |
Selling, general and administrative expenses | | 19.6 | | | 18.0 | | | 14.3 | |
Reorganization costs (credit) | | — | | | (0.3 | ) | | 2.9 | |
| | | | | | | | | |
Income (loss) from operations | | (3.5 | ) | | (7.1 | ) | | 7.0 | |
Interest expense | | (0.8 | ) | | (3.3 | ) | | (4.1 | ) |
Investment income | | 1.6 | | | 3.2 | | | 2.8 | |
| | | | | | | | | |
Income (loss) before income taxes | | (2.7 | ) | | (7.2 | ) | | 5.7 | |
Provision (benefit) for income taxes | | 2.3 | | | — | | | — | |
| | | | | | | | | |
Net income (loss) | | (0.4 | )% | | (7.2 | )% | | 5.7 | % |
| | | | | | | | | |
Fiscal 2008 Compared to Fiscal 2007
Net Sales. Net sales consist of semiconductor test equipment, related hardware and system support, and maintenance services, net of returns and allowances. Net sales were $135.8 million in fiscal 2008 and $147.6 million in fiscal 2007. The decrease in net sales year over year is primarily a result of an overall industry wide
26
slowdown which began to impact net sales during the fourth quarter of fiscal year 2006 and has continued into the fourth quarter of fiscal year 2008. Semiconductor device manufacturers have reduced their capital equipment spending levels in line with these adverse conditions resulting in a decreased demand for new purchases of semiconductor test equipment. Sales to our ten largest customers accounted for 78% and 79.4% of revenues for the twelve months ended July 31, 2008 and July 31, 2007, respectively. Sales from X-Series products totaled $80.3 million or 74% of product revenue in fiscal year 2008, and $89.0 million, or 75% of product revenue in fiscal year 2007. See Note 8 to our Consolidated Financial Statements.
Service revenue, consisting of sales of replacement and spare parts and labor charges, totaled $27.4 million, or 20.2% of net sales, in fiscal 2008 and $29.3 million, or 19.8% of net sales, in fiscal 2007. The decrease in service revenue is directly attributable to customer adjustments to their level of service needed to support equipment utilization operating rates and lower overall new equipment sales. The decrease is also attributable to the movement of customers to the X-Series products and their inherently lower service costs.
Geographically, sales to customers outside the United States were $83.1 million, or 61.2% of net sales, in fiscal 2008 and $98.8 million, or 66.9% of net sales, in fiscal 2007.
Cost of Sales. Cost of sales consists of material, outsourced manufacturing costs, labor, depreciation and associated overhead. Cost of sales decreased by $9.4 million to $68.0 million in fiscal 2008 from $77.4 million in fiscal 2007. As a percentage of net sales, cost of sales was 50.1% of net sales in fiscal 2008 as compared to 52.5% of net sales in fiscal 2007. Cost of sales as a percentage of net sales decreased 2.4 percentage points year over year in fiscal 2008. The decrease in cost of sales as a percentage of net sales when comparing fiscal 2008 to fiscal 2007 is mainly due to favorable product mix and improved gross profit margin from new X-Series product options.
Inventory Related Provision.We review excess and obsolete inventory when conditions exist that suggest our inventory may be in excess of anticipated demand or is obsolete based upon our assumptions about future demand for our products or market conditions. We also evaluate our excess and obsolete inventory on a quarterly basis identifying and addressing significant events that might have an impact on inventories and related reserves. The major variables impacting inventory usage are the demand for current products, overall industry conditions, key sales initiatives and the impact that our new product introductions have on current product demand.
For the quarter ended April 30, 2007, we recorded a $4.2 million inventory related provision related to the Fusion HFi product line. The provision was required as a result of two major factors that materialized during the quarter. First, the Company reassessed its Fusion HFi customers demand for HFi due to the lower demand in the markets they serve and second, re-evaluated the impact from our customers who have increased adoption of our X-Series platform by transferring test capacity from HFi to a lower cost to test X-Series alternative. These developments are attributable to the favorable performance/price characteristics of our X-Series testers has enabled customers to transition certain devices currently being tested on the Fusion HFi platform to our X-Series testers. This has resulted in increased available HFi capacity at our customers and has reduced HFi sales in FY 2008 and expected HFi sales in the future.
Engineering and Product Development Expenses. Engineering and product development expenses were $46.0 million, or 33.9% of net sales, in fiscal 2008 as compared to $50.0 million, or 33.9% of net sales, in fiscal 2007. The $4.0 million decrease in engineering and product development expenses in 2008 from 2007 was a result of completion of next generation Fusion product development projects which enabled us to reduce the level of materials used in engineering development projects. Additionally, we have been able to leverage and re-use X-Series engineering development across a broader range of applications than in the past with our Fusion HF and HFi products. This trend has continued in fiscal year 2008 resulting in more efficient use of engineering resources and lower costs.
27
Selling, General and Administrative Expenses. Selling, general and administrative expenses were $26.6 million, or 19.6% of net sales, in fiscal 2008 as compared to $26.8 million, or 18.0% of net sales, in fiscal 2007. The $0.2 million decrease in selling, general and administrative expenses was primarily due to lower variable expenses on lower sales volume, such as lower sales commissions.
Reorganization Costs.There were no reorganization charges for the year ended July 31, 2008. For the twelve months ended July 31, 2007, we re-evaluated the requirements of our reorganization accrual for severance and recognized a gain of $0.4 million in the quarter ended April 30, 2007. The gain was due primarily to several of the workforce reductions and related expenses that were not required, due to less than expected post termination outplacement services provided to terminated employees.
Interest Expense. Interest expense for fiscal year 2008 was $1.1 million as compared to $4.9 million for fiscal year 2007. The decrease in interest expense is a result of a $29.3 million decrease in total outstanding interest bearing debt. Total interest bearing debt was $17.9 million as of July 31, 2008 as compared to $47.2 million as of July 31, 2007.
Investment Income. Investment income was $2.2 million for fiscal 2008 as compared to $4.7 million for fiscal 2007. The decrease in investment income is due to lower available cash, cash equivalents and marketable securities balances due to the pay down of $29.3 million of interest bearing debt obligations during the year.
Income Tax.We recorded $0.2 million of income tax expense relating to taxable income in foreign locations for the year ended July 31, 2008. We recorded a one time tax benefit of $3.3 million for the three months ended October 31, 2007 related to the de-recognition of a liability related to an uncertain tax position. The uncertain tax position related to potential dual taxation of a gain recorded in fiscal 2002 as part of the settlement with a former supplier. The statute of limitations expired on the potential tax exposure on September 14, 2007, triggering the reversal of the reserve and recognition of a non-cash benefit recorded in the quarter ended October 31, 2007. No provision for income taxes was recorded in 2007 due to the net loss recorded in the year ended July 31, 2007.
We have recorded no US income tax benefit for the years ended July 31, 2008 and July 31, 2007 due to the uncertainty related to utilization of net operating loss carry forwards. As a result of a review undertaken at July 31, 2008 and July 31, 2007 and our cumulative loss position at those dates, management concluded that it was appropriate to maintain a full valuation allowance for our net operating loss carry forwards and our other net deferred tax assets. We will continue to record a 100% valuation allowance until it is more likely than not we will utilize the net operating loss and other carry forwards, and deferred tax assets. The gross deferred tax asset was valued at $231.1 million as of July 31, 2008 and $229.9 million as of July 31, 2007, both of which are offset by a 100% valuation allowance.
Fiscal 2007 Compared to Fiscal 2006
Net Sales. Net sales consist of semiconductor test equipment, related hardware and system support, and maintenance services, net of returns and allowances. Net sales were $147.6 million in fiscal 2007 and $216.5 million in fiscal 2006. The decrease in net sales year over year is primarily a result of an overall industry wide slowdown which began to impact net sales during the fourth quarter of fiscal year 2006 and has continued into the fourth quarter of fiscal year 2007. During the second half of calendar year 2006, which is our first half of our fiscal 2007, semiconductor device manufacturers reduced their capital equipment spending levels in line with these adverse conditions resulting in a decreased demand for new purchases of semiconductor test equipment.
Sales to our ten largest customers accounted for 79.4% and 82.1% of revenues for the twelve months ended July 31, 2007 and July 31, 2006, respectively. Sales from X-Series products totaled $89.0 million or 75% of product revenue in fiscal year 2007, and $89.2 million, or 49% of product revenue in fiscal year 2006. See Note 8 to our Consolidated Financial Statements.
28
Service revenue, consisting of sales of replacement and spare parts and labor charges, totaled $29.3 million, or 19.8% of net sales, in fiscal 2007 and $33.2 million, or 15.3% of net sales, in fiscal 2006. The decrease in service revenue is directly attributable to customer adjustments to their level of service needed to support equipment utilization operating rates and lower overall new equipment sales.
Geographically, sales to customers outside the United States were $98.8 million, or 66.9% of net sales, in fiscal 2007 and $127.6 million, or 58.9% of net sales, in fiscal 2006.
Cost of Sales. Cost of sales consists of material, outsourced manufacturing costs, labor, depreciation and associated overhead. Cost of sales decreased by $32.6 million to $77.4 million in fiscal 2007 from $110.0 million in fiscal 2006. As a percentage of net sales, cost of sales was 52.5% of net sales in fiscal 2007 as compared to 50.8% of net sales in fiscal 2006. Cost of sales as a percentage of net sales increased 1.7 percentage points year over year in fiscal 2007. The increase in cost of sales as a percentage of net sales when comparing fiscal 2007 to fiscal 2006, is mainly due to the decline in fixed cost year over year which was not in the same proportion as the decline in year over year net sales. This resulted in the fixed cost component of cost of sales to be a greater percentage of net sales in fiscal 2007 as compared to fiscal 2006.
Inventory Related Provision.We review excess and obsolete inventory when conditions exist that suggest our inventory may be in excess of anticipated demand or is obsolete based upon our assumptions about future demand for our products or market conditions. We also evaluate our excess and obsolete inventory on a quarterly basis identifying and addressing significant events that might have an impact on inventories and related reserves. The major variables impacting inventory usage are the demand for current products, overall industry conditions, key sales initiatives and the impact that our new product introductions have on current product demand.
For the quarter ended April 30, 2007, we recorded a $4.2 million inventory related provision related to the Fusion HFi product line. The provision was required as a result of two major factors that materialized during the quarter. First, the Company reassessed its Fusion HFi customers demand for HFi due to the lower demand in the markets they serve and second, re-evaluated the impact from our customers who have increased adoption of our X-Series platform by transferring test capacity from HFi to a lower cost to test X-Series alternative. These developments are attributable to the favorable performance/price characteristics of our X-Series testers has enabled customers to transition certain devices currently being tested on the Fusion HFi platform to our X-Series testers. This is expected to result in increased available HFi capacity at our customers and will likely reduce HFi purchases in the future.
There were no significant inventory provisions recorded in fiscal 2006.
Engineering and Product Development Expenses. Engineering and product development expenses were $50.0 million, or 33.9% of net sales, in fiscal 2007 as compared to $53.8 million, or 24.9% of net sales, in fiscal 2006. The $3.8 million decrease in engineering and product development expenses in 2007 from 2006 was a result of completion of next generation Fusion product development projects which enabled us to initiate workforce reductions in fiscal year 2006 and 2005. Additionally, we have been able to leverage and re-use X-Series engineering development across a broader range of applications than in the past with our Fusion HF and HFi products. This trend has continued in fiscal year 2007 resulting in more efficient use of engineering resources and lower costs.
Selling, General and Administrative Expenses. Selling, general and administrative expenses were $26.8 million, or 18.0% of net sales, in fiscal 2007 as compared to $31.1 million, or 14.3% of net sales, in fiscal 2006. The decrease in selling, general and administrative expenses was primarily due to lower variable expenses on lower sales volume, such as lower sales commissions and employee profit sharing.
Reorganization Costs. For the twelve months ended July 31, 2007, we re-evaluated the requirements of our reorganization accrual for severance and recognized a gain of $0.4 million in the quarter ended April 30, 2007. The gain was due primarily to several of the workforce reductions and related expenses that were not required,
29
due to less than expected post termination outplacement services provided to terminated employees. There were $6.3 million in reorganization costs recorded for the prior year ended July 31, 2006. The $6.3 million of reorganization cost recorded in fiscal 2006 related to $1.9 million in severance and facilities charges primarily resulting from the closure of our facility in the United Kingdom, and $4.2 million for severance cost related to our October 25, 2005 workforce reduction and $0.2 million recorded in the quarter ended July 31, 2006 relating to the relocation of our corporate headquarters.
Interest Expense. Interest expense for fiscal year 2007 was $4.9 million as compared to $9.0 million for fiscal year 2006. The decrease in interest expense is a result of a $100.5 million decrease in total outstanding interest bearing debt. Total interest bearing debt was $47.2 million as of July 31, 2007 as compared to $147.7 million as of July 31, 2006.
Investment Income. Investment income was $4.7 million for fiscal 2007 as compared to $6.1 million for fiscal 2006. The decrease in investment income is due to lower available cash, cash equivalents and marketable securities balances due to the pay down of debt obligations during the year.
Income Tax. No provision for income taxes was recorded in 2007 and 2006 due to the net loss recorded in fiscal 2007 and utilization of net operating loss carry forwards to offset taxable income in fiscal 2006. Due to our cumulative loss position, management concluded that it was appropriate to continue to maintain a full valuation allowance for our net operating loss and other carryforwards, and net deferred tax assets. We recorded no income tax benefit for fiscal year 2007 due to the increase in the valuation allowance to fully reserve net operating loss and other carryforwards, and net deferred tax assets. We will continue to record a 100% valuation allowance until it is more likely than not we will utilize the net operating loss and other carry forwards, and deferred tax assets. The gross deferred tax asset was valued at $229.9 million as of July 31, 2007 offset by a 100% valuation allowance.
Liquidity and Capital Resources
As of July 31, 2008, we had $71.5 million in cash and cash equivalents and marketable securities and net working capital of $86.5 million, as compared to $98.5 million of cash and cash equivalents and marketable securities and $87.3 million of net working capital at July 31, 2007. The decrease in the cash and cash equivalents and marketable securities was due primarily to the principal payment of $27.2 million of the 4.25% Convertible Subordinated Notes in August 2007.
Accounts receivable from trade customers, net of allowances, was $24.2 million at July 31, 2008, as compared to $22.5 million at July 31, 2007. The principal reason for the $1.7 million increase in accounts receivable is a result of increased sales in our fourth quarter ended July 31, 2008 as compared to our fourth quarter ended July 31, 2007. The allowance for doubtful accounts was $0.7 million, or 2.7% of gross trade accounts receivable, at July 31, 2008 and $1.3 million, or 5.3% of gross trade accounts receivable at July 31, 2007. The decrease in the allowance of $0.6 million was principally the result of the write off of amounts previously provided for as uncollectible.
Accounts receivable from other sources decreased $0.3 million to $1.2 million at July 31, 2008, as compared to $1.5 million at July 31, 2007. The decrease was attributed to the decrease in sales and increase in cash collections of component inventory transferred to our outsource suppliers.
Net inventories decreased by $4.6 million to $22.5 million at July 31, 2008 as compared to $27.1 million at July 31, 2007. The major reason for the decrease in net inventories is our continued utilization of slower moving but active inventory in our manufacturing process, as well as a decrease in placement of consigned inventory of $1.6 million from the year ended July 31, 2007 to the year ended July 31, 2008.
30
Prepaid expenses and other current assets decreased by $1.0 million to $2.8 million at July 31, 2008 as compared to $3.8 million at July 31, 2007. The decrease is due to the repayment of $0.8 million of assets to employee participants of our deferred compensation plan which was terminated in fiscal year 2008, as well as $0.2 million of amortization of prepaid expenses and maintenance contracts.
Capital expenditures totaled $7.5 million for the twelve months ended July 31, 2008, as compared to $8.4 million for the twelve months ended July 31, 2007. The principal reasons for the capital expenditures is attributed to the leasehold improvements made to our facilities in Milpitas, California, spare parts for X-Series products and application development equipment used internally to support new targeted growth opportunities.
In December 2006, we entered into a new Loan and Security Agreement (the “2006 Loan Agreement”), dated as of December 7, 2006, with Silicon Valley Bank (“SVB”). Under the terms of the 2006 Loan Agreement, we borrowed $20.0 million under a term loan at an interest rate of prime minus 1.25% with interest-only payable during the first 12 months. The loan is secured by all of our assets located in the United States. Principal of this term loan is repayable over four years as follows:
| | • | | months 13 to 24: $300,000.00 per month |
| | • | | months 25 to 36: $600,000.00 per month |
| | • | | months 37 to 48: $766,666.67 per month |
The financing arrangement under the 2006 Loan Agreement also provides us with a $30.0 million revolving credit facility. No amount was outstanding under the revolving credit facility as of July 31, 2008.
We had a second credit facility with another lender for a revolving credit line of $5.0 million that was secured by cash and marketable securities. The facility relating to this line of credit, which was used to secure obligations of operating leases and existing stand-by letters of credit, expired on October 31, 2007 and was not renewed.
We had a non-qualified deferred compensation plan for senior management and other highly compensated employees. We had two plans that have been discontinued with respect to new deferrals: (i) the LTX Corporation Deferred Compensation Plan that was adopted effective December 1, 2001, (referred to herein as the “Frozen Plan”) and (ii) a newer plan that complies with the requirements of Code Section 409A and related Treasury guidance and that governs all amounts deferred on or after January 1, 2005 (referred to herein as the “New Plan”). The Frozen Plan’s and New Plan’s accumulated balances were distributed in a lump sum payment of approximately $2.3 million and $0.8 million in January 2007 and January 2008, respectively, with the proceeds from the cash surrender value of the insurance policy used to fund this plan. The plan was closed during the quarter ended January 31, 2008 with no assets or liabilities remaining.
We have a defined benefit pension plan for our operation in the United Kingdom. The plan was constituted in October 1981 to provide defined benefit pension and lump sum benefits, payable on retirement, for employees of LTX(Europe) Limited, (“UK”). The plan has 71 participants of which 2 remain as active employee members and 69 are non-active former employees but for whom benefits are preserved. The plan has been closed to all new members since December 31, 2000. Annually, the Company obtains an actuarial valuation of the pension plan. The plan was under-funded as of July 31, 2008 by $4.2 million. We have recorded this liability as other long-term liabilities of $3.9 million and accrued short-term liabilities of $0.3 million on the consolidated balance sheet as of July 31, 2008. Cash payments are projected to be $0.3 million in fiscal 2009 and actual cash payments were $0.5 million in fiscal 2008. The net pension expense recorded was not significant for the twelve months ended July 31, 2008.
On August 29, 2008, we completed a merger with Credence Systems Corporation, which had then outstanding $122.5 aggregate principal amount of 3.5% Convertible Senior Subordinated Notes due 2010 (the “Notes”). Net assets acquired included approximately $140.0 million of cash, cash equivalents and marketable
31
securities. Following the merger, we repurchased $69.3 million aggregate principal amount of the Notes at a discount to their par value. In connection with the merger, we expect to incur significant restructuring costs related to employee termination actions. See Note 12 to our Consolidated Financial Statements for more information.
We operate in a highly cyclical industry and we may experience, with relatively short notice, significant fluctuations in demand for our products. This could result in a material effect on our liquidity position. To mitigate the risk, we have completed a substantial and lengthy process of converting our manufacturing process to an outsource model. In addition, we continue to maintain other cost reduction measures, such as the strict oversight of discretionary travel and other variable overhead expenses. We believe that these reductions in operating costs have reduced our costs while preserving our ability to fund critical product research and development efforts and continue to provide our customers with the levels of responsiveness and service they require. As such, we believe we can react to a downturn or a significant upturn much faster than in the past. We believe that our balances of cash and cash equivalents and marketable securities, cash flows expected to be generated by future operating activities, and funds available under our existing credit facilities will be sufficient to meet our cash requirements over the next twelve to twenty-four months.
Commitments and Contingencies
Our major outstanding contractual obligations are related to our term loan, facility leases and other operating leases. As of July 31, 2008, we also have $17.9 million in principal outstanding under a commercial loan.
The aggregate outstanding amount of the contractual obligations is $48.6 million as of July 31, 2008. These obligations and commitments represent maximum payments based on current cash flow forecasts. Certain of the commitments could be reduced if changes to our operating forecasts occur in the future.
We have approximately $14.0 million of non-cancelable inventory commitments with our outsource suppliers as of July 31, 2008. We expect to consume this inventory through normal operating activity over the next three to six months.
The following summarizes our contractual obligations (excluding Credence obligations assumed subsequent to July 31, 2008 as a result of the merger with Credence), at July 31, 2008 and the effect such obligations are expected to have on our liquidity and cash flow in the future periods:
| | | | | | | | | | | | | | | |
| | | Total | | 2009 | | 2010 – 2011 | | 2012 – 2013 | | Thereafter |
| | | (in thousands) |
Financial Obligations: | | | | | | | | | | | | | | | |
Term loan and accrued interest | | $ | 18,837 | | $ | 6,264 | | $ | 12,573 | | $ | — | | $ | — |
Operating leases | | | 11,061 | | | 2,417 | | | 3,129 | | | 2,739 | | | 3,136 |
Pensions | | | 4,200 | | | 341 | | | 682 | | | 682 | | | 2,495 |
Inventory commitments | | | 13,985 | | | 13,985 | | | — | | | — | | | — |
| | | | | | | | | | | | | | | |
Total Financial Obligations | | $ | 48,083 | | $ | 23,007 | | $ | 16,384 | | $ | 3,061 | | $ | 5,631 |
| | | | | | | | | | | | | | | |
In addition to the 2009 financial obligations above, we (excluding Credence) expect to expend approximately $7 million on capital expenditures in fiscal 2009
Recent Accounting Pronouncements
In April 2008, the FASB issued Staff Position No.142-3 (FSP No. 142-3), “Determination of the Useful Life of Intangible Assets”. This FSP amends the guidance in FASB Statement No. 142, “Goodwill and Other Intangible Assets”, about estimating useful lives of recognized intangible assets and requires additional disclosures related to renewing or extending the terms of a recognized intangible asset. In estimating the useful life of a recognized intangible asset, the FSP requires companies to consider their historical experience in
32
renewing or extending similar arrangements together with the asset’s intended use, regardless of whether the arrangements have explicit renewal or extension provisions. The FSP is effective for fiscal years beginning after December 15, 2008 and is to be applied prospectively to intangible assets acquired after the effective date. The disclosure requirements are to be applied prospectively to all intangible assets. We are currently evaluating the potential impact that the adoption of FSP No. 142-3 will have on our consolidated financial statements.
In March 2008, the Financial Accounting Standards Board issued Statement of Financial Accounting Standards (SFAS) No. 161, “Disclosures about Derivative Instruments and Hedging Activities-an amendment of FASB Statement No. 133”. SFAS No. 161 expands the current disclosure requirements of SFAS No. 133, “Accounting for Derivative Instruments and Hedging Activities”, such that entities must now provide enhanced disclosures on a quarterly basis regarding how and why the entity uses derivatives; how derivatives and related hedged items are accounted for under SFAS No. 133 and how derivatives and related hedged items affect the entity’s financial position, performance and cash flow. SFAS No. 161 is effective prospectively for periods beginning on or after November 15, 2008. The adoption of this standard is not expected to have any impact on our financial condition or results of operations.
In December 2007, the FASB issued Statement No. 141(R), Business Combinations (“Statement 141(R)”), a replacement of FASB Statement No. 141. Statement 141(R) is effective for fiscal years beginning on or after December 15, 2008 and applies to all business combinations. Statement 141(R) provides that, upon initially obtaining control, an acquirer shall recognize 100 percent of the fair values of acquired assets, including goodwill, and assumed liabilities, with only limited exceptions, even if the acquirer has not acquired 100 percent of its target. As a consequence, the current step acquisition model will be eliminated. Additionally, Statement 141(R) changes current practice, in part, as follows: (1) contingent consideration arrangements will be fair valued at the acquisition date and included on that basis in the purchase price consideration; (2) transaction costs will be expensed as incurred, rather than capitalized as part of the purchase price; (3) pre-acquisition contingencies, such as legal issues, will generally have to be accounted for in purchase accounting at fair value; and (4) in order to accrue for a restructuring plan in purchase accounting, the requirements in FASB Statement No. 146, Accounting for Costs Associated with Exit or Disposal Activities, would have to be met at the acquisition. While there is no expected impact to our consolidated financial statements on the accounting for acquisitions completed prior to July 31, 2009, the adoption of SFAS 141(R) on August 1, 2009 could materially change the accounting for business combinations consummated subsequent to that date.
In December 2007, the FASB issued SFAS No. 160, Noncontrolling Interests in Consolidated Financial Statements, an amendment of ARB 51, which changes the accounting and reporting requirements for minority interests. Under the provisions of SFAS No. 160, minority interests will be re-characterized as “noncontrolling interests” and reported as a component of equity separate from our equity. Subsequently, we would be required to record all changes in interests that do not result in changes in control as equity transactions. In addition, we would report net income attributable to noncontrolling interests on the face of our consolidated Statements of Income. Upon a loss of control, we would record the interest sold, as well as any interest retained, at fair value with recognition of any gain or loss in earnings. SFAS No. 160 is effective for us on, but not before, August 1, 2009, the beginning of our 2010 reporting periods. SFAS No. 160 will apply prospectively, except for the presentation and disclosure requirements, which will apply retrospectively. We do not expect the adoption of SFAS No. 160 will have a material impact on our results of operations, cash flows or financial position.
In September 2006, the FASB issued SFAS No. 157, “Fair Value Measurements” (“SFAS No. 157”). SFAS No. 157 provides guidance for using fair value to measure assets and liabilities. The Standard also responds to investors’ requests for more information about (1) the extent to which companies measure assets and liabilities at fair value, (2) the information used to measure fair value, and (3) the effect that fair-value measurements have on earnings. SFAS No. 157 will apply whenever another standard requires (or permits) assets or liabilities to be measured at fair value. The standard does not expand the use of fair value to any new circumstances. SFAS No. 157 is effective for financial statements issued for fiscal years beginning after November 15, 2007. In February 2008, the FASB issued FASB Staff Position (“FSP”) No. FAS 157-1, “Application of FASB Statement No. 157 to FASB Statement No. 13 and Other Accounting Pronouncements That Address Fair Value
33
Measurements for Purposes of Lease Classification or Measurement under Statement 13” and FSP No. FAS 157-2, “Effective Date of FASB Statement No. 157.” Collectively, these Staff Positions allow a one-year deferral of adoption of SFAS 157 for nonfinancial assets and liabilities that are recognized or disclosed at fair value in the financial statements on a non-recurring basis and amend SFAS 157 to exclude FASB Statement No. 13 and its related interpretive accounting pronouncements that address leasing transactions. Accordingly, we need to determine the period in which we will adopt this requirement. We are also currently evaluating the potential impact that the adoption of SFAS No. 157 will have on our consolidated financial statements.
| Item 7A. | Quantitative and Qualitative Disclosures About Market Risk |
Financial instruments that potentially subject us to concentrations of credit-risk consist principally of investments in cash equivalents, short-term investments and trade receivables. We place our investments with high-quality financial institutions, limit the amount of credit exposure to any one institution and have established investment guidelines relative to diversification and maturities designed to maintain safety and liquidity.
Our primary exposures to market risks include fluctuations in interest rates on our short-term and long-term debt of approximately $17.9 million as of July 31, 2008, and in foreign currency exchange rates. We are subject to interest rate risk on our short-term and long-term borrowings under our credit and loan facilities. Our short- term and long-term bank debt bears interest at the lender’s variable prime rate.
Foreign Currency Exchange Risk
Operating in international markets involves exposure to movements in currency exchange rates. Currency exchange rate movements typically also reflect economic growth, inflation, interest rates, government actions and other factors. We transact business in various foreign currencies and, accordingly, we are subject to exposure from adverse movements in foreign currency exchange rates. As currency exchange rates fluctuate, translation of the statements of operations of our international businesses into U.S. dollars may affect year-over-year comparability and could cause us to adjust our financing and operating strategies. To date, the effect of changes in foreign currency exchange rates on revenues and operating expenses have not been material. Substantially all of our revenues are invoiced and collected in U.S. dollars. Our trade receivables result primarily from sales to semiconductor manufacturers located in North America, Japan, the Pacific Rim and Europe. In fiscal 2008, our revenues derived from sales outside the United States constituted 61% of our total revenues. Accounts receivable in currencies other than U.S. dollars comprise 9.4% of the outstanding accounts receivable trade balance at July 31, 2008. Receivables are from major corporations or are supported by letters of credit. We maintain reserves for potential credit losses and such losses have been immaterial. Accounts payable in currencies other than U.S. dollars comprise 7.0% of the outstanding accounts payable balance at July 31, 2008.
Based on a hypothetical 10% adverse movement in foreign currency exchange rates, the potential losses in future earnings, fair value of risk-sensitive financial instruments, and cash flows are immaterial, although the actual effects may differ materially from the hypothetical analysis.
Interest Rate Risk
Our $20.0 million term loan bears interest at the lender’s variable prime rate minus 1.25%. We may also, from time to time, have other outstanding short-term and long-term borrowings with variable interest rates. We expect that a 1% change in interest rates would affect our interest expense by $0.2 million per year.
34
| Item 8. | Financial Statements and Supplementary Data |
LTX CORPORATION
CONSOLIDATED BALANCE SHEETS
(In thousands, except share data)
| | | | | | | | |
| | | July 31, | |
| | | 2008 | | | 2007 | |
| ASSETS | | | | | | | | |
Current assets: | | | | | | | | |
Cash and cash equivalents | | $ | 51,052 | | | $ | 63,302 | |
Marketable securities | | | 20,410 | | | | 35,236 | |
Accounts receivable—trade, net of allowances of $659 and $1,250, respectively | | | 24,160 | | | | 22,479 | |
Accounts receivable—other, net of allowances of $7 and $290, respectively | | | 1,245 | | | | 1,475 | |
Inventories | | | 22,505 | | | | 27,102 | |
Prepaid expenses and other current assets | | | 2,750 | | | | 3,783 | |
| | | | | | | | |
Total current assets | | | 122,122 | | | | 153,377 | |
Property and equipment, net | | | 27,213 | | | | 32,483 | |
Goodwill | | | 14,368 | | | | 14,762 | |
Other assets | | | 6,024 | | | | 500 | |
| | | | | | | | |
Total assets | | $ | 169,727 | | | $ | 201,122 | |
| | | | | | | | |
| LIABILITIES AND STOCKHOLDERS’ EQUITY | | | | | | | | |
Current liabilities: | | | | | | | | |
Current portion of long-term debt | | $ | 5,700 | | | $ | 29,322 | |
Accounts payable | | | 14,058 | | | | 15,334 | |
Deferred revenues and customer advances | | | 1,777 | | | | 1,838 | |
Other accrued expenses | | | 14,081 | | | | 19,605 | |
| | | | | | | | |
Total current liabilities | | | 35,616 | | | | 66,098 | |
Long-term debt, less current portion | | | 12,200 | | | | 17,900 | |
Long-term liabilities other | | | 4,631 | | | | 4,016 | |
Commitments and contingent liabilities (Note 9) | | | | | | | | |
Stockholders’ equity: | | | | | | | | |
Common stock, $0.05 par value: | | | | | | | | |
200,000,000 shares authorized; 62,984,844 in 2008 and 62,444,947 in 2007 shares issued and outstanding, respectively | | | 3,150 | | | | 3,123 | |
Additional paid-in capital | | | 573,736 | | | | 568,966 | |
Accumulated other comprehensive loss | | | (865 | ) | | | (840 | ) |
Accumulated deficit | | | (458,741 | ) | | | (458,141 | ) |
| | | | | | | | |
Total stockholders’ equity | | | 117,280 | | | | 113,108 | |
| | | | | | | | |
Total liabilities and stockholders’ equity | | $ | 169,727 | | | $ | 201,122 | |
| | | | | | | | |
The accompanying notes are an integral part of these consolidated financial statements.
35
LTX CORPORATION
CONSOLIDATED STATEMENTS OF OPERATIONS AND COMPREHENSIVE INCOME (LOSS)
(In thousands, except per share data)
| | | | | | | | | | | | |
| | | Year ended July 31, | |
| | | 2008 | | | 2007 | | | 2006 | |
Net product sales | | $ | 108,448 | | | $ | 118,317 | | | $ | 183,290 | |
Net service sales | | | 27,377 | | | | 29,322 | | | | 33,213 | |
| | | | | | | | | | | | |
Net sales | | | 135,825 | | | | 147,639 | | | | 216,503 | |
Cost of sales | | | 67,981 | | | | 77,441 | | | | 109,975 | |
Inventory-related provision | | | — | | | | 4,175 | | | | 221 | |
| | | | | | | | | | | | |
Gross profit | | | 67,844 | | | | 66,023 | | | | 106,307 | |
Engineering and product development expenses | | | 46,020 | | | | 50,044 | | | | 53,807 | |
Selling, general and administrative expenses | | | 26,563 | | | | 26,770 | | | | 31,135 | |
Reorganization costs (credit) | | | — | | | | (377 | ) | | | 6,282 | |
| | | | | | | | | | | | |
Income (loss) from operations | | | (4,739 | ) | | | (10,414 | ) | | | 15,083 | |
Other income (expense): | | | | | | | | | | | | |
Interest expense | | | (1,136 | ) | | | (4,909 | ) | | | (8,956 | ) |
Investment income | | | 2,184 | | | | 4,657 | | | | 6,114 | |
| | | | | | | | | | | | |
Income (loss) before income taxes | | | (3,691 | ) | | | (10,666 | ) | | | 12,241 | |
Benefit for income taxes | | | (3,091 | ) | | | — | | | | — | |
| | | | | | | | | | | | |
Net income (loss) | | $ | (600 | ) | | $ | (10,666 | ) | | $ | 12,241 | |
| | | | | | | | | | | | |
Net income (loss) per share: | | | | | | | | | | | | |
Basic | | $ | (0.01 | ) | | $ | (0.17 | ) | | $ | 0.20 | |
| | | | | | | | | | | | |
Diluted | | $ | (0.01 | ) | | $ | (0.17 | ) | | $ | 0.20 | |
| | | | | | | | | | | | |
Weighted-average common shares used in computing net income (loss) per share: | | | | | | | | | | | | |
Basic | | | 62,611 | | | | 62,130 | | | | 61,684 | |
| | | | | | | | | | | | |
Diluted | | | 62,611 | | | | 62,130 | | | | 62,207 | |
| | | | | | | | | | | | |
Comprehensive income (loss): | | | | | | | | | | | | |
Net income (loss) | | $ | (600 | ) | | $ | (10,666 | ) | | $ | 12,241 | |
Unrealized gain (loss) on marketable securities | | | 471 | | | | 977 | | | | (11 | ) |
Pension liability gain (loss) | | | (496 | ) | | | 902 | | | | (372 | ) |
| | | | | | | | | | | | |
Comprehensive income (loss) | | $ | (625 | ) | | $ | (8,787 | ) | | $ | 11,858 | |
| | | | | | | | | | | | |
The accompanying notes are an integral part of these consolidated financial statements.
36
LTX CORPORATION
CONSOLIDATED STATEMENTS OF STOCKHOLDERS’ EQUITY
(In thousands, except share data)
| | | | | | | | | | | | | | | | | | | | |
| | | Common Stock | | Additional
Paid–In
Capital | | Accumulated
Other
Comprehensive
Income (Loss) | | | Accumulated
Deficit | | | Total
Stockholders’
Equity | |
| | | Shares | | Amount | | | | |
Balance at July 31, 2005 | | 61,531,881 | | $ | 3,077 | | $ | 558,192 | | $ | (1,563 | ) | | $ | (459,716 | ) | | $ | 99,990 | |
Exercise of stock options | | 188,785 | | | 10 | | | 669 | | | — | | | | — | | | | 679 | |
Vesting of stock based awards | | 163,874 | | | 8 | | | 4,543 | | | — | | | | — | | | | 4,551 | |
Issuance of shares under employees’ stock purchase plan and other | | 121,881 | | | 6 | | | 555 | | | — | | | | — | | | | 561 | |
Unrealized loss on marketable securities | | — | | | — | | | — | | | (11 | ) | | | — | | | | (11 | ) |
Change in pension liability | | — | | | — | | | — | | | (372 | ) | | | — | | | | (372 | ) |
Net income | | — | | | — | | | — | | | — | | | | 12,241 | | | | 12,241 | |
| | | | | | | | | | | | | | | | | | | | |
Balance at July 31, 2006 | | 62,006,421 | | | 3,101 | | | 563,959 | | | (1,946 | ) | | | (447,475 | ) | | | 117,639 | |
Exercise of stock options | | 144,350 | | | 8 | | | 601 | | | — | | | | — | | | | 609 | |
Vesting of stock based awards | | 154,915 | | | 7 | | | 3,834 | | | — | | | | — | | | | 3,841 | |
Issuance of shares under employees’ stock purchase plan and other | | 139,261 | | | 7 | | | 572 | | | — | | | | — | | | | 579 | |
Unrealized gain on marketable securities | | — | | | — | | | — | | | 977 | | | | — | | | | 977 | |
Change in pension liability | | — | | | — | | | — | | | 902 | | | | — | | | | 902 | |
Cumulative adjustment for SFAS No. 158 transition | | — | | | — | | | — | | | (773 | ) | | | — | | | | (773 | ) |
Net loss | | — | | | — | | | — | | | — | | | | (10,666 | ) | | | (10,666 | ) |
| | | | | | | | | | | | | | | | | | | | |
Balance at July 31, 2007 | | 62,444,947 | | | 3,123 | | | 568,966 | | | (840 | ) | | | (458,141 | ) | | | 113,108 | |
Exercise of stock options | | 17,648 | | | 1 | | | 28 | | | — | | | | — | | | | 29 | |
Vesting of stock based awards | | 242,369 | | | 12 | | | 4,180 | | | — | | | | — | | | | 4,192 | |
Issuance of shares under employees’ stock purchase plan and other | | 279,880 | | | 14 | | | 562 | | | — | | | | — | | | | 576 | |
Unrealized gain on marketable securities | | — | | | — | | | — | | | 471 | | | | — | | | | 471 | |
Change in pension liability | | — | | | — | | | — | | | (496 | ) | | | — | | | | (496 | ) |
Net loss | | — | | | — | | | — | | | — | | | | (600 | ) | | | (600 | ) |
| | | | | | | | | | | | | | | | | | | | |
Balance at July 31, 2008 | | 62,984,844 | | $ | 3,150 | | $ | 573,736 | | $ | (865 | ) | | $ | (458,741 | ) | | $ | 117,280 | |
| | | | | | | | | | | | | | | | | | | | |
The accompanying notes are an integral part of these consolidated financial statements.
37
LTX CORPORATION
CONSOLIDATED STATEMENTS OF CASH FLOWS
(In thousands)
| | | | | | | | | | | | |
| | | Year ended July 31, | |
| | | 2008 | | | 2007 | | | 2006 | |
Cash Flows from Operating Activities: | | | | | | | | | | | | |
Net income (loss) | | $ | (600 | ) | | $ | (10,666 | ) | | $ | 12,241 | |
Add (deduct) non-cash items: | | | | | | | | | | | | |
Depreciation and amortization | | | 11,933 | | | | 13,867 | | | | 14,403 | |
Stock-based compensation | | | 4,393 | | | | 4,059 | | | | 5,007 | |
Non-cash restructuring charges (credits) | | | — | | | | (377 | ) | | | 195 | |
Loss on disposal of property and equipment | | | 904 | | | | — | | | | — | |
Charge for inventory related provision | | | — | | | | 4,175 | | | | 221 | |
Benefit for income taxes | | | 3,251 | | | | — | | | | — | |
Other | | | 664 | | | | 411 | | | | 201 | |
Changes in operating assets and liabilities: | | | | | | | | | | | | |
Accounts receivable | | | (1,120 | ) | | | 18,083 | | | | (16,678 | ) |
Inventories | | | 4,620 | | | | (1,409 | ) | | | 13,149 | |
Prepaid expenses | | | 1,049 | | | | 1,321 | | | | 878 | |
Other assets | | | (42 | ) | | | 2,317 | | | | 622 | |
Accounts payable | | | (3,494 | ) | | | (5,680 | ) | | | (6,947 | ) |
Accrued expenses | | | (11,517 | ) | | | (12,704 | ) | | | (207 | ) |
Deferred revenues and customer advances | | | (177 | ) | | | (2,404 | ) | | | (651 | ) |
| | | | | | | | | | | | |
Net cash provided by operating activities | | | 9,864 | | | | 10,993 | | | | 22,434 | |
Cash Flows from Investing Activities: | | | | | | | | | | | | |
Expenditures for property and equipment | | | (7,527 | ) | | | (8,399 | ) | | | (6,743 | ) |
Acquisition costs paid in connection with merger | | | (105 | ) | | | — | | | | — | |
Purchases of marketable securities | | | — | | | | — | | | | (49,747 | ) |
Proceeds from sale of marketable securities | | | 14,827 | | | | 53,517 | | | | 84,165 | |
| | | | | | | | | | | | |
Net cash provided by investing activities | | | 7,195 | | | | 45,118 | | | | 27,675 | |
Cash Flows from Financing Activities: | | | | | | | | | | | | |
Proceeds from employees’ stock purchase plan | | | 576 | | | | 579 | | | | 561 | |
Payments of tax withholdings for vested RSUs, net of proceeds from stock option exercises | | | (338 | ) | | | 389 | | | | 679 | |
Payments of debt | | | (27,222 | ) | | | (74,868 | ) | | | (602 | ) |
Proceeds from term loan | | | — | | | | 20,000 | | | | — | |
Payments of term loan | | | (2,100 | ) | | | (45,601 | ) | | | — | |
| | | | | | | | | | | | |
Net cash provided by (used in) financing activities | | | (29,084 | ) | | | (99,501 | ) | | | 638 | |
Effect of exchange rate changes on cash | | | (225 | ) | | | 247 | | | | 429 | |
| | | | | | | | | | | | |
Net increase (decrease) in cash and cash equivalents | | | (12,250 | ) | | | (43,143 | ) | | | 51,176 | |
Cash and cash equivalents at beginning of year | | | 63,302 | | | | 106,445 | | | | 55,269 | |
| | | | | | | | | | | | |
Cash and cash equivalents at end of year | | $ | 51,052 | | | $ | 63,302 | | | $ | 106,445 | |
| | | | | | | | | | | | |
Supplemental Disclosures of Cash Flow Information: | | | | | | | | | | | | |
Cash paid during the year for interest | | $ | 3,342 | | | $ | 6,293 | | | $ | 7,822 | |
| | | | | | | | | | | | |
Non-cash investing activities: | | | | | | | | | | | | |
Acquisition costs accrued in connection with merger | | $ | 5,375 | | | $ | — | | | $ | — | |
| | | | | | | | | | | | |
Decrease in goodwill | | $ | 394 | | | $ | — | | | $ | — | |
| | | | | | | | | | | | |
The accompanying notes are an integral part of these consolidated financial statements.
38
LTX CORPORATION
NOTES TO CONSOLIDATED FINANCIAL STATEMENTS
1. THE COMPANY
Formed by the August 2008 merger of LTX Corporation and Credence Systems Corporation, LTX-Credence Corporation (“LTX-Credence” or the “Company”), provides focused, cost-optimized automated test equipment (ATE) solutions. We design, manufacture, market and service ATE solutions that address the broad, divergent test requirements of the wireless, computing, automotive and entertainment market segments. Semiconductor designers and manufacturers worldwide use our equipment to test their devices during the manufacturing process. After testing, these devices are then incorporated in a wide range of products, including computers, mobile internet equipment such as wireless access points and interfaces, broadband access products such as cable modems and DSL modems, personal communication products such as cell phones and personal digital assistants, consumer products such as televisions, videogame systems, digital cameras and automobile electronics, and for power management in portable and automotive electronics. The Company also sells hardware and software support and maintenance services for its test systems. The Company is headquartered, and has a development facility in Milpitas, California, a development facility in Norwood, Massachusetts, and worldwide sales and service facilities to support its customer base.
On August 29, 2008, LTX Corporation and Credence Systems Corporation completed a merger of equals. In connection with the merger, LTX Corporation changed its name to “LTX-Credence Corporation” and changed the symbol under which its common stock trades on the NASDAQ Global Market to “LTXC” and Credence Systems Corporation became a wholly-owned subsidiary of LTX-Credence. Since the merger closed after the July 31 end of the 2008 fiscal year, all historical information related to financial position and results of operations contained in this Report relates to LTX Corporation only, without any effect given to the August 2008 merger of LTX Corporation and Credence Systems Corporation.
2. SUMMARY OF SIGNIFICANT ACCOUNTING POLICIES
Basis of Presentation
The consolidated financial statements include the accounts of the Company and its wholly owned subsidiaries. All significant inter-company transactions and balances have been eliminated in consolidation.
Preparation of Financial Statements and Use of Estimates
The accompanying financial statements have been prepared by the Company, and reflect all adjustments, which, in the opinion of management, are necessary for fair presentation. The preparation of financial statements in conformity with generally accepted accounting principles requires management to make estimates and assumptions that affect the reported amounts of assets and liabilities and disclosures of contingent assets and liabilities as of the date of the financial statements and the reported amounts of income and expenses during the reporting periods. Actual results in effect at the transaction dates may differ from those estimates and such differences may be material to the consolidated financial statements. Such estimates relate to revenue recognition, the allowance for doubtful accounts, inventory valuation, depreciation, product warranty costs, stock-based compensation and income taxes.
Foreign Currency Remeasurement
The financial statements of the Company’s foreign subsidiaries are remeasured in accordance with Statement of Financial Accounting Standards (“SFAS”) No. 52, “Foreign Currency Translation”. The Company’s functional currency is the U.S. dollar. Accordingly, the Company’s foreign subsidiaries remeasure monetary assets and liabilities at year-end exchange rates while non-monetary items are remeasured at historical rates. Income and expense accounts are remeasured at the average rates in effect during the year, except for sales, cost of sales and depreciation, which are primarily remeasured at actual rates in effect at the transaction dates. Net realized gains or losses resulting from foreign currency re-measurement and transaction gains or losses were a
39
LTX CORPORATION
NOTES TO CONSOLIDATED FINANCIAL STATEMENTS (Continued)
gain of $144,000, a loss of $388,000 and a gain of $258,000 in fiscal 2008, 2007 and 2006, respectively, and are included in the consolidated results of operations as a component of selling, general and administrative expenses.
Revenue Recognition
The Company recognizes revenue based on guidance provided in SEC Staff Accounting Bulletin No. 104, (“SAB 104”), “Revenue Recognition” and EITF No. 00-21 “Revenue Arrangements with Multiple Deliverables”. The Company recognizes revenue when persuasive evidence of an arrangement exists, delivery has occurred or services have been rendered, the seller’s price is fixed or determinable and collectability is reasonably assured.
Revenue related to equipment sales is recognized when: (a) the Company has a written sales agreement; (b) delivery has occurred; (c) the price is fixed or determinable; (d) collectability is reasonably assured; (e) the product delivered is standard product with historically demonstrated acceptance; and (f) there is no unique customer acceptance provision or payment tied to acceptance or an undelivered element significant to the functionality of the system. Generally, payment terms are time based after product shipment. Certain sales include payment terms tied to customer acceptance. If a portion of the payment is linked to product acceptance, which is 20% or less, the revenue is deferred only to the extent of the percentage holdback until payment is received or written evidence of acceptance is delivered to the Company. If the portion of the holdback is greater than 20%, the full value of the equipment is deferred until payment is received or written evidence of acceptance is delivered to the Company. When sales to a customer involve multiple elements, revenue is recognized on the delivered element provided that (1) the undelivered element is a proven technology, (2) there is a history of acceptance on the product with the customer, (3) the undelivered element is not essential to the customer’s application, (4) the delivered item(s) has value to the customer on a stand-alone basis, (5) objective and reliable evidence of the fair value of the undelivered item(s) exists, (6) if the arrangement included a general right of return relative to the delivered item(s), delivery or performance of the undelivered item(s) is considered probable and substantially in the control of the Company, and (7) if objective and reliable evidence of fair value exists for all units of accounting in the arrangement, the arrangement consideration is allocated based on the relative fair values of each unit of accounting. If the fair value of a delivered item is unknown, but the fair value of undelivered items are known, the residual method is used for allocating arrangement consideration which requires discounts in the sales value of the entire arrangement to be recognized in connection with the sale of the delivered items only. Revenue related to spare parts is recognized on shipment. Revenue related to maintenance and service contracts is recognized ratably over the duration of the contracts.
The Company has embedded software in its semiconductor manufacturing equipment. The Company believes this embedded software is incidental to its products and therefore it is excluded from the scope of Statement of Position 97-2, “Software Revenue Recognition” (SOP 97-2), since the embedded software in the Company’s products is not sold separately, cannot be used on another vendor’s products, and the Company cannot fundamentally enhance or expand the capability of the equipment with new or revised embedded software. In addition, the equipment’s principal performance characteristics are governed by digital speed and pin count, which are primarily a function of the hardware.
The Company warrants its products to its customers. In addition to the provision of standard warranties, the Company may offer customers extended warranty services with a fixed fee. The fixed fees are recognized as revenue on a straight-line basis over the applicable term of the contract. Costs related to extended warranty services are recorded as incurred.
For certain customers, typically those with whom the Company has long-term relationships, the Company may grant extended payment terms. Certain of the Company’s receivables have due dates in excess of 90 days and the Company has a history of successfully collecting these extended payment term accounts receivable.
40
LTX CORPORATION
NOTES TO CONSOLIDATED FINANCIAL STATEMENTS (Continued)
Allowance for Doubtful Accounts
An allowance for doubtful accounts is maintained for potential credit losses based upon assessment of the expected collectability of all accounts receivable. The allowance for doubtful accounts is reviewed periodically to assess the adequacy of the allowances. In any circumstances in which the Company is aware of a customer’s inability to meet its financial obligations, an allowance is provided, which is based on the age of the receivables, the circumstances surrounding the customer’s financial situation and historical experience. If circumstances change, and the financial condition of customers is adversely affected resulting in their inability to meet their financial obligations to the Company additional allowances may be recorded.
Engineering and Product Development Costs
The Company expenses all engineering, research and development costs as incurred. Expenses subject to capitalization in accordance with the SFAS No. 86, “Accounting for the Costs of Computer Software To Be Sold, Leased or Otherwise Marketed”, relating to certain software development costs, were insignificant.
Shipping and Handling Costs
Shipping and handling costs are included in cost of sales in the consolidated statements of operations. Shipping and handling costs were $0.8 million, $0.8 million, and $0.9 million for fiscal years July 31, 2008, 2007, and 2006, respectively. These costs, when included in the sales price charged for products, are recognized in net sales.
Income Taxes
The Company records income taxes using the asset and liability method. Deferred income tax assets and liabilities are recognized for the future tax consequences attributable to differences between the financial statements carrying amounts of existing assets and liabilities and their respective income tax bases, and operating loss and tax credit carry forwards. The Company’s Consolidated Financial Statements contain certain deferred tax assets which have arisen primarily as a result of operating losses, as well as other temporary differences between financial and tax accounting. SFAS No. 109 “Accounting for Income Taxes”, requires the Company to establish a valuation allowance if the likelihood of realization of the deferred tax assets is reduced based on an evaluation of objective verifiable evidence. Significant management judgment is required in determining the Company’s provision of income taxes, the Company’s deferred tax assets and liabilities and any valuation allowance recorded against those net deferred at assets. The Company evaluates the weight of all available evidence to determine whether it is more likely than not that some portion or all of the net deferred income tax assets will not be realized.
Income taxes include the largest amount of tax benefit for an uncertain tax position that is more likely than not to be sustained upon audit based upon the technical merits of the tax position. Settlements with tax authorities, the expiration of statutes of limitations for particular tax positions, or obtaining new information on particular tax positions may cause a change to the effective tax rate. The Company recognized interest expense and penalties related to unrecognized tax benefits as income tax expense.
Accounting for Stock-Based Compensation
The Company has five active stock option plans: the 2004 Stock Plan (“2004 Plan”), the 2001 Stock Plan (“2001 Plan”), the 1999 Stock Plan (“1999 Plan”), the 1995 LTX (Europe) Ltd. Approved Stock Option Plan (“U.K. Plan”) and, in addition, the Company assumed the StepTech, Inc. Stock Option Plan (the “STI 2000 Plan”) as part of its acquisition of StepTech. The Company can only grant options from the 2004 Plan. Under the
41
LTX CORPORATION
NOTES TO CONSOLIDATED FINANCIAL STATEMENTS (Continued)
terms of the 2004 Plan, any unused shares of Common Stock as a result of termination, surrender, cancellation or forfeiture of options from the 2001 Plan and the 1999 Plan will be available for grant of equity awards under the 2004 Plan. The 2004 Plan provides for the granting of options to employees to purchase shares of common stock at not less than 100% of the fair market value at the date of grant. The 2004 Plan also provides for the granting of options to an employee, director or consultant of the Company or its subsidiaries to purchase shares of common stock at prices to be determined by the Board of Directors and also allows both restricted stock awards and stock awards. Options under this plan are exercisable over vesting periods, which typically have been three to four years from the date of grant. The general term of stock options is ten years. The Company policy of providing shares is to either buy shares in the open market or issue new shares.
Effective August 1, 2005, the Company adopted Statement of Financial Accounting Standard No. 123 (revised 2004), “Share Based Payment” (“SFAS No. 123R”). Under SFAS No. 123R, the Company is required to recognize, as expense, the estimated fair value of all share-based payments to employees. In accordance with this standard, the Company has elected to recognize the compensation cost of all service based awards on a straight-line basis over the vesting period of the award. Performance based awards are recognized ratably for each vesting tranche based on the implied service period under the accelerated method pursuant to SFAS No. 123R. For the years ended July 31, 2008, 2007, and 2006, the Company recorded stock-based compensation expense as follows:
| | | | | | | | | |
| | | Year ended July 31, |
| | | 2008 | | 2007 | | 2006 |
Cost of sales | | $ | 117 | | $ | 107 | | $ | 161 |
Engineering and product development expenses | | | 1,294 | | | 1,098 | | | 1,049 |
Selling, general and administrative expenses | | | 2,982 | | | 2,854 | | | 3,463 |
Reorganization costs | | | — | | | — | | | 334 |
| | | | | | | | | |
Total stock-based compensation expense | | $ | 4,393 | | $ | 4,059 | | $ | 5,007 |
| | | | | | | | | |
As of July 31, 2008, there is approximately $5.1 million of unrecognized compensation expense related to share-based payments to employees that will be recognized over the next 16 quarters.
The Company adopted SFAS No. 123R under the modified prospective method. Under this method, the Company recognized compensation cost for all share-based payments to employees based on the grant date estimate of fair value for those awards, beginning on August 1, 2005. Options granted prior to August 1, 2005 were valued using a binomial Black-Scholes model at the date of grant. Options granted subsequent to the adoption of SFAS No. 123R were valued using a trinomial lattice model.
The Company chose a trinomial lattice model upon adoption of SFAS No. 123R versus the binomial Black-Scholes method used for the periods prior to the adoptions of SFAS No. 123R for the following reasons: 1) the trinomial lattice supports a changing volatility assumption with little computation complexity and 2) the trinomial lattice accounts for changing employee behavior as the stock price changes, as behavior is solely represented by a time component. The use of a lattice model captures the observed pattern of increasing rates of exercise as the stock price increases. The Black-Scholes model does not contain the interaction among economic and behavioral assumptions. The volatility assumption used in our trinomial lattice model uses a term structure of expected volatilities reflecting a 1-to-10 year average volatility based on historical stock prices. The Company’s volatility assumption is redeveloped quarterly and calculated using the stock price history ending on the last day of the prior quarter. The forfeiture assumption is based on our historical employee behavior over the last 15 years, which is largely driven by stock price increase.
42
LTX CORPORATION
NOTES TO CONSOLIDATED FINANCIAL STATEMENTS (Continued)
Following are the weighted-average assumptions used in determining fair value of option grants for 2006. There have been no option grants for the years ended July 31, 2008 and July 31, 2007.
| | |
| | | 2006 (1) |
Volatility | | 54 – 86% |
Dividend yield | | 0% |
Risk-free interest rate | | 3.84 – 4.75% |
Expected life of options | | 7.11 – 7.21 years |
| (1) | Assumptions used in trinomial lattice option-pricing model valuation. |
Product Warranty Costs
The Company’s products are sold with warranty provisions that require it to remedy deficiencies in quality or performance of products over a specified period of time at no cost to our customers. The Company offers a one or two year warranty for all of its products, the terms and conditions of which are based on the product sold and the customer. For all testers sold, the Company accrues a liability for the estimated cost of standard warranty at the time of tester shipment and defers the portion of product revenue attributed to the fair value of non-standard warranty. Costs for non-standard warranty are expensed as incurred. Factors that impact the warranty liability include the number of installed units, historical and anticipated product failure rates, material usage and service labor costs. The Company periodically assesses the adequacy of its recorded liability and adjusts amounts as necessary.
The following table shows the change in the product warranty liability, as required by FASB Interpretation No. (FIN) 45, “Guarantor’s Accounting and Disclosure Requirements for Guarantees, Including Indirect Guarantees of Indebtedness of Others”, for the fiscal years ended July 31, 2008 and 2007:
| | | | | | | | |
Product Warranty Activity | | (in thousands) | |
| | 2008 | | | 2007 | |
Balance at beginning of period | | $ | 1,819 | | | $ | 3,543 | |
Warranty expenditures for current period | | | (2,008 | ) | | | (3,026 | ) |
Changes in liability related to pre-existing warranties | | | (531 | ) | | | (842 | ) |
Provision for warranty costs in the period | | | 1,628 | | | | 2,144 | |
| | | | | | | | |
Balance at end of period | | $ | 908 | | | $ | 1,819 | |
| | | | | | | | |
Comprehensive Income (Loss)
Comprehensive income (loss) is comprised of two components, net income (loss) and other comprehensive income (loss). Other comprehensive income (loss) consists of unrealized gains and losses on the Company’s marketable securities and the effects of the changes in the pension liability.
The following table shows the cumulative components of other comprehensive income (loss) for the fiscal years ended July 31, 2008, 2007 and 2006:
| | | | | | | | | | | | |
| | | (in thousands) | |
| | | 2008 | | | 2007 | | | 2006 | |
Unrealized loss on marketable securities | | $ | (126 | ) | | $ | (597 | ) | | $ | (1,574 | ) |
Pension liability loss | | | (739 | ) | | | (243 | ) | | | (372 | ) |
| | | | | | | | | | | | |
Total | | $ | (865 | ) | | $ | (840 | ) | | $ | (1,946 | ) |
| | | | | | | | | | | | |
43
LTX CORPORATION
NOTES TO CONSOLIDATED FINANCIAL STATEMENTS (Continued)
Net Income (Loss) per Share
Basic net income (loss) per common share is computed by dividing net income (loss) available to common stockholders by the weighted average number of common shares outstanding for the period. Diluted income (loss) per common share reflects the maximum dilution that would have resulted from the assumed exercise and share repurchase related to dilutive stock options and is computed by dividing net income (loss) by the weighted average number of common shares and all dilutive securities outstanding.
Reconciliation between basic and diluted earnings (loss) per share is as follows:
| | | | | | | | | | | |
| | | Fiscal Year Ended July 31, |
| | | 2008 | | | 2007 | | | 2006 |
| | | (in thousands, except per share data) |
Net income (loss) | | $ | (600 | ) | | $ | (10,666 | ) | | $ | 12,241 |
Basic EPS | | | | | | | | | | | |
Weighted average shares outstanding—basic | | | 62,611 | | | | 62,130 | | | | 61,684 |
Basic EPS | | $ | (0.01 | ) | | $ | (0.17 | ) | | $ | 0.20 |
Diluted EPS | | | | | | | | | | | |
Weighted average shares outstanding—basic | | | 62,611 | | | | 62,130 | | | | 61,684 |
Plus: impact of stock options and warrants | | | — | | | | — | | | | 523 |
| | | | | | | | | | | |
Weighted average shares outstanding—diluted | | | 62,611 | | | | 62,130 | | | | 62,207 |
Diluted EPS | | $ | (0.01 | ) | | $ | (0.17 | ) | | $ | 0.20 |
Options to purchase 7,967,267, 6,669,336, and 7,146,337 of common stock were outstanding at July 31, 2008, 2007 and 2006 respectively, but were not included in the calculation of diluted shares because the effect of including the options would have been anti-dilutive. These options could be dilutive in the future. The calculation of diluted net income (loss) per share excludes 653,000, 653,000 and 721,000 RSUs at July 31, 2008, 2007 and 2006, respectively, in accordance with the contingently issuable shares guidance of SFAS No. 128, “Earnings Per Share”.
Cash and Cash Equivalents and Marketable Securities
The Company considers all highly liquid investments that are readily convertible to cash and that have original maturity dates of three months or less to be cash equivalents. Cash and cash equivalents consist primarily of repurchase agreements and commercial paper. Marketable securities consist primarily of debt securities that are classified as available-for-sale, in accordance with the SFAS No. 115, “Accounting for Certain Investments in Debt and Equity Securities” (“SFAS No. 115”). Securities available for sale include corporate and governmental obligations with various contractual maturity dates some of which are greater than one year. The Company considers the securities to be liquid and convertible to cash within 30 days. The Company has the ability and intent, if necessary, to liquidate any security that the Company holds to fund operations over the next twelve months and as such has classified these securities as short-term. Governmental obligations include U.S. Government, State, Municipal and Federal Agency securities.
44
LTX CORPORATION
NOTES TO CONSOLIDATED FINANCIAL STATEMENTS (Continued)
The market value and maturities of the Company’s marketable securities are as follows:
| | | |
| | | Total Amount |
| | | (in thousands) |
July 31, 2008 | | | |
Due in less than one year | | $ | 10,988 |
Due in 1 to 3 years | | | 6,073 |
Due in 3 to 5 years | | | 3,349 |
Due in 5 to 10 years | | | — |
Due in greater than 10 years | | | — |
| | | |
Total | | $ | 20,410 |
| | | |
The market value and amortized cost of marketable securities are as follows:
| | | | | | |
| | | Market
Value | | Amortized
Cost |
| | | (in thousands) |
July 31, 2008 | | | | | | |
Corporate | | $ | 9,809 | | $ | 9,863 |
Government | | | 10,601 | | | 10,673 |
| | | | | | |
| | $ | 20,410 | | $ | 20,536 |
| | | | | | |
July 31, 2007 | | | | | | |
Corporate | | $ | 29,873 | | $ | 30,376 |
Government | | | 5,363 | | | 5,457 |
| | | | | | |
| | $ | 35,236 | | $ | 35,833 |
| | | | | | |
Gross unrealized losses were $0.2 million in fiscal 2008 and $0.6 million in fiscal 2007. The realized profits, losses and interest are included in investment income in the Statements of Operations. Unrealized gains and losses are reflected as a separate component of comprehensive income (loss) and are included in Stockholders’ Equity. The gross unrealized losses were primarily a result of changing interest rates. The Company evaluates its portfolio for impairment based on certain factors including, credit quality, structure of the security and the ability to hold the security to maturity.
The following table summarizes marketable securities and related unrealized gains and losses as of July 31, 2008:
| | | | | | | |
(in thousands) | | Market
Value | | Unrealized
loss | |
Securities < 12 months unrealized loss | | $ | 5,492 | | $ | (23 | ) |
Securities > 12 months unrealized loss | | | 7,787 | | | (162 | ) |
Securities < 12 months unrealized gains | | | 2,300 | | | 13 | |
Securities > 12 months unrealized gains | | | 4,831 | | | 46 | |
| | | | | | | |
Total | | $ | 20,410 | | $ | (126 | ) |
| | | | | | | |
45
LTX CORPORATION
NOTES TO CONSOLIDATED FINANCIAL STATEMENTS (Continued)
The following interest income and realized gains and losses from sales of marketable securities are as follows:
| | | | | | | | | | | | |
| | | Fiscal Year Ended July 31, | |
| | | 2008 | | | 2007 | | | 2006 | |
| | | (in thousands) | |
Interest income | | $ | 1,288 | | | $ | 2,617 | | | $ | 5,619 | |
Realized loss from sales of available-for-sale securities | | | (21 | ) | | | (22 | ) | | | (94 | ) |
| | | | | | | | | | | | |
| | $ | 1,267 | | | $ | 2,595 | | | $ | 5,525 | |
| | | | | | | | | | | | |
Fair Value of Financial Instruments
SFAS No. 107, “Disclosures About Fair Value of Financial Instruments”, requires that disclosure be made of estimates of the fair value of financial instruments. The carrying amounts of certain of the Company’s financial instruments, including cash equivalents, accounts receivable, accounts payable and other accrued liabilities approximate fair value due to their short maturities. In accordance with SFAS No. 115, marketable securities classified as available-for-sale are all debt securities and are recorded at fair value based upon quoted market prices.
The fair value of the Company’s debt and long-term liabilities is estimated based on quoted market prices for the same or similar issues or on current rates offered to the Company for debt of the same remaining maturities.
Concentration of Credit Risk
Revenue from our top ten customers accounted for 78%, 79%, and 82% of total revenues in fiscal 2008, 2007, and 2006, respectively. Accounts receivable from these customers amounted to approximately $15.9 million and $17.6 million at July 31, 2008 and 2007, respectively. Sales to customers outside the United States were $83.1 million, or 61% of net sales in fiscal 2008, $98.8 million, or 67% of net sales in fiscal 2007, $127.6 million, or 59% of net sales, in fiscal 2006.
Financial instruments, which potentially subject the Company to concentrations of credit risk, are cash equivalents, marketable securities and accounts receivable. All of the Company’s cash equivalents and marketable securities are maintained by major financial institutions. The Company periodically reviews these investments to evaluate and minimize credit risk. Concentration of credit risk with respect to accounts receivable is limited to certain customers to whom the Company makes substantial sales. To reduce risk, the Company routinely assesses the financial strength of its customers. The Company does not require collateral, although the Company does obtain a letter of credit on sales to certain foreign customers. Write-offs related to accounts receivable have been within management’s expectations.
Inventories
Inventories are stated at the lower of cost or market, determined on the first-in, first-out (“FIFO”) method, and include materials, labor and manufacturing overhead. The components of inventories are as follows:
| | | | | | |
| | | As of July 31, |
| | | 2008 | | 2007 |
| | | (in thousands) |
Material and purchased components | | $ | 12,451 | | $ | 20,317 |
Work-in-process | | | 2,777 | | | 529 |
Finished goods, including inventory consigned to customers | | | 7,277 | | | 6,256 |
| | | | | | |
Total inventories | | $ | 22,505 | | $ | 27,102 |
| | | | | | |
46
LTX CORPORATION
NOTES TO CONSOLIDATED FINANCIAL STATEMENTS (Continued)
The Company establishes inventory reserves when conditions exist that suggest inventory may be in excess of anticipated demand or is obsolete based upon our assumptions about future demand for products or market conditions. The Company regularly evaluates the ability to realize the value of inventory based on a combination of factors including the following: forecasted sales or usage, estimated product end of life dates, estimated current and future market value and new product introductions. Purchasing and alternative usage options are also explored to mitigate inventory exposure. When recorded, reserves are intended to reduce the carrying value of inventory to its net realizable value. As of July 31, 2008 and 2007, inventory is stated net of inventory reserves of $35.2 million and $41.4 million, respectively. If actual demand for products deteriorates or market conditions are less favorable than those projected, additional inventory reserves may be required. Such reserves are not reversed until the related inventory is sold or otherwise disposed. During fiscal year 2008, the Company utilized $1.2 million of reserves related to the disposal or sale of previously reserved items. Of the $22.5 million inventory balance at July 31, 2008, $7.5 million consists of “last time buy” custom components for Fusion HFi, $9.7 million consists of materials and components to support current requirements for Fusion HFi and X-Series, and $5.3 million consists of evaluation inventory at customers. There were no deferred costs related to shipment of inventory where revenue recognition is subject to product acceptance at July 31, 2008.
For the quarter ended April 30, 2007, the Company recorded a $4.2 million inventory related provision related to the Fusion HFi product line. The provision was required as a result of two major factors that materialized during the quarter. First, the Company reassessed its Fusion HFi customers demand for HFi due to low demand in the markets they serve and second, re-evaluated the impact from customers who have increased adoption of the X-Series platform by transferring test capacity from HFi to a lower cost to test X-Series alternative. These developments are attributed to the favorable performance/price characteristics of the X-Series testers has enabled customers to transition certain devices currently being tested on the Fusion HFi platform to the X-Series testers. This has resulted in increased available HFi capacity at existing customers and has reduced HFi sales in FY 2008 and expected HFi sales in the future.
There were $1.2 million and $4.4 million in sales of previously written off inventory for the twelve months ended July 31, 2008 and 2007, respectively. The $1.2 million and $4.4 million recorded for the twelve months ended July 31, 2008 and 2007, respectively represents the gross cash received from the customer. The net incremental gross margin and net income effect for these transactions did not have a significant impact on operating margins.
47
LTX CORPORATION
NOTES TO CONSOLIDATED FINANCIAL STATEMENTS (Continued)
Property and Equipment
Property and equipment is recorded at cost. The Company provides for depreciation and amortization on the straight-line method. Charges are made to operating expenses in amounts that are sufficient to amortize the cost of the assets over their estimated useful lives. Equipment spares are used for service and internally manufactured test systems are used for testing components, engineering and applications development. Machinery, equipment and internally manufactured systems are recorded at cost and depreciated over 3 to 7 years. Repairs and maintenance costs that do not extend the lives of property and equipment are expensed as incurred. Property and equipment are summarized as follows:
| | | | | | | | | | |
| | | As of July 31, | | | Depreciable Life in
Years |
| | | 2008 | | | 2007 | | |
| | | (in thousands) | | | |
Equipment spares | | $ | 52,978 | | | $ | 54,959 | | | 7 |
Machinery, equipment and internally manufactured systems | | | 40,246 | | | | 43,868 | | | 3-7 |
Office furniture and equipment | | | 2,168 | | | | 3,035 | | | 3-7 |
Leasehold improvements | | | 9,958 | | | | 8,659 | | | 10 or term of lease |
| | | | | | | | | | |
Property and equipment, gross | | | 105,350 | | | | 110,521 | | | |
Accumulated depreciation and amortization | | | (78,137 | ) | | | (78,037 | ) | | |
| | | | | | | | | | |
Property and equipment, net | | $ | 27,213 | | | $ | 32,483 | | | |
| | | | | | | | | | |
Depreciation expense was $11.9 million, $13.7 million, and $13.7 million for the years ended July 31, 2008, 2007 and 2006, respectively.
Goodwill
The Company has adopted the provisions of Statement No. 142, “Goodwill and Other Intangible Assets”, which requires that goodwill and intangible assets with indefinite useful lives are not amortized. Intangible assets with a definitive useful life are amortized over their estimated useful life. Assets recorded in these categories are tested for impairment at least annually or when a change in circumstances may result in future impairment. Identified intangible assets are recorded at historical cost. These assets, if acquired in an acquisition, including purchased research and development, are recorded at fair value in accordance with the purchase method of accounting at the date of acquisition. Since the Company has one reporting segment under SFAS 142, it utilizes a combination of the entity-wide and discounted cash flows approaches for assessing goodwill for impairment and compares the Company’s market value to its net book value to determine if impairment exists.
Goodwill totaling $14.4 million at July 31, 2008 and $14.8 million at July 31, 2007, represents the excess of acquisition costs over the estimated fair value of the net assets acquired from StepTech, Inc. on June 10, 2003. In the year ended July 31, 2008, the Company reduced by $0.4 million its accrued tax liabilities acquired from StepTech, Inc. due to the lapsing of the statute of limitations for certain tax liabilities accrued for uncertain tax exposures. Since the accrued tax liabilities were valued in the acquisition of StepTech, Inc., this adjustment reduced Goodwill.
No impairment of goodwill resulted from the Company’s evaluation conducted as of July 31, 2008 and July 31, 2007.
48
LTX CORPORATION
NOTES TO CONSOLIDATED FINANCIAL STATEMENTS (Continued)
Impairment of Long-Lived Assets Other Than Goodwill
On an on-going basis, management reviews the value and period of amortization or depreciation of long-lived assets. In accordance with SFAS No. 144, “Accounting for Impairment or Disposal of Long-Lived Assets”, the Company reviews whether impairment losses exist on long-lived assets when indicators of impairment are present. During this review, the Company reevaluates the significant assumptions used in determining the original cost of long-lived assets. Although the assumptions may vary, they generally include revenue growth, operating results, cash flows and other indicators of value. Management then determines whether there has been a permanent impairment of the value of long-lived assets based upon events or circumstances that have occurred since acquisition. The extent of the impairment amount recognized is based upon a determination of the impaired asset’s fair value. There were no impairment charges recorded in the year ended July 31, 2008 or the year ended July 31, 2007.
Recent Accounting Pronouncements
In April 2008, the FASB issued Staff Position No.142-3 (FSP No. 142-3), “Determination of the Useful Life of Intangible Assets”. This FSP amends the guidance in FASB Statement No. 142, “Goodwill and Other Intangible Assets”, about estimating useful lives of recognized intangible assets and requires additional disclosures related to renewing or extending the terms of a recognized intangible asset. In estimating the useful life of a recognized intangible asset, the FSP requires companies to consider their historical experience in renewing or extending similar arrangements together with the asset’s intended use, regardless of whether the arrangements have explicit renewal or extension provisions. The FSP is effective for fiscal years beginning after December 15, 2008 and is to be applied prospectively to intangible assets acquired after the effective date. The disclosure requirements are to be applied prospectively to all intangible assets. The Company is currently evaluating the potential impact that the adoption of FSP No. 142-3 will have on its consolidated financial statements.
In March 2008, the Financial Accounting Standards Board issued Statement of Financial Accounting Standards (SFAS) No. 161, “Disclosures about Derivative Instruments and Hedging Activities-an amendment of FASB Statement No. 133”. SFAS No. 161 expands the current disclosure requirements of SFAS No. 133, “Accounting for Derivative Instruments and Hedging Activities”, such that entities must now provide enhanced disclosures on a quarterly basis regarding how and why the entity uses derivatives; how derivatives and related hedged items are accounted for under SFAS No. 133 and how derivatives and related hedged items affect the entity’s financial position, performance and cash flow. SFAS No. 161 is effective prospectively for periods beginning on or after November 15, 2008. The adoption of this standard is not expected to have any impact on the Company’s financial condition or results of operations.
In December 2007, the FASB issued Statement No. 141(R), Business Combinations (“Statement 141(R)”), a replacement of FASB Statement No. 141. Statement 141(R) is effective for fiscal years beginning on or after December 15, 2008 and applies to all business combinations. Statement 141(R) provides that, upon initially obtaining control, an acquirer shall recognize 100 percent of the fair values of acquired assets, including goodwill, and assumed liabilities, with only limited exceptions, even if the acquirer has not acquired 100 percent of its target. As a consequence, the current step acquisition model will be eliminated. Additionally, Statement 141(R) changes current practice, in part, as follows: (1) contingent consideration arrangements will be fair valued at the acquisition date and included on that basis in the purchase price consideration; (2) transaction costs will be expensed as incurred, rather than capitalized as part of the purchase price; (3) pre-acquisition contingencies, such as legal issues, will generally have to be accounted for in purchase accounting at fair value; and (4) in order to accrue for a restructuring plan in purchase accounting, the requirements in FASB Statement No. 146, “Accounting for Costs Associated with Exit or Disposal Activities”, would have to be met at the acquisition.
49
LTX CORPORATION
NOTES TO CONSOLIDATED FINANCIAL STATEMENTS (Continued)
While there is no expected impact to the Company’s consolidated financial statements on the accounting for acquisitions completed prior to July 31, 2009, the adoption of SFAS 141(R) on August 1, 2009 could materially change the accounting for business combinations consummated subsequent to that date.
In December 2007, the FASB issued SFAS No. 160, “Noncontrolling Interests in Consolidated Financial Statements, an amendment of ARB 51”, which changes the accounting and reporting requirements for minority interests. Under the provisions of SFAS No. 160, minority interests will be re-characterized as “noncontrolling interests” and reported as a component of equity separate from our equity. Subsequently, the Company would be required to record all changes in interests that do not result in changes in control as equity transactions. In addition, the Company would report net income attributable to noncontrolling interests on the face of its consolidated statements of operations. Upon a loss of control, the Company would record the interest sold, as well as any interest retained, at fair value with recognition of any gain or loss in earnings. SFAS No. 160 is effective for the Company on, but not before, August 1, 2009. SFAS No. 160 will apply prospectively, except for the presentation and disclosure requirements, which will apply retrospectively. The Company does not expect the adoption of SFAS No. 160 to have a material impact on its results of operations, cash flows or financial position.
In September 2006, the FASB issued SFAS No. 157, “Fair Value Measurements” (“SFAS No. 157”). SFAS No. 157 provides guidance for using fair value to measure assets and liabilities. The standard also responds to investors’ requests for more information about (1) the extent to which companies measure assets and liabilities at fair value, (2) the information used to measure fair value, and (3) the effect that fair-value measurements have on earnings. SFAS No. 157 will apply whenever another standard requires (or permits) assets or liabilities to be measured at fair value. The standard does not expand the use of fair value to any new circumstances. SFAS No. 157 is effective for financial statements issued for fiscal years beginning after November 15, 2007. The Company will adopt this requirement for our fiscal year beginning August 1, 2008. The Company is currently evaluating the potential impact that the adoption of SFAS No. 157 will have on its financial statements. In February 2008, the FASB issued FASB Staff Position (“FSP”) No. FAS 157-1, “Application of FASB Statement No. 157 to FASB Statement No. 13 and Other Accounting Pronouncements That Address Fair Value Measurements for Purposes of Lease Classification or Measurement under Statement 13” and FSP No. FAS 157-2, “Effective Date of FASB Statement No. 157”. Collectively, these Staff Positions allow a one-year deferral of adoption of SFAS No. 157 for nonfinancial assets and liabilities that are recognized or disclosed at fair value in the financial statements on a non-recurring basis and amend SFAS No. 157 to exclude FASB Statement No. 13 and its related interpretive accounting pronouncements that address leasing transactions. Accordingly, the Company needs to determine the period in which it will adopt this requirement. The Company is also currently evaluating the potential impact that the adoption of SFAS No. 157 will have on its consolidated financial statements.
3. OTHER ACCRUED EXPENSES
Other accrued expenses consisted of the following at July 31, 2008 and July 31, 2007:
| | | | | | |
| | | (in thousands) |
| | | 2008 | | 2007 |
Accrued compensation | | $ | 4,636 | | $ | 4,823 |
Accrued income and local taxes | | | 2,249 | | | 5,596 |
Warranty reserve | | | 908 | | | 1,819 |
Accrued restructuring | | | 915 | | | 2,223 |
Accrued interest | | | 58 | | | 2,280 |
Accrued professional fees | | | 3,213 | | | 24 |
Other accrued expenses | | | 2,102 | | | 2,840 |
| | | | | | |
Total accrued expenses | | $ | 14,081 | | $ | 19,605 |
| | | | | | |
50
LTX CORPORATION
NOTES TO CONSOLIDATED FINANCIAL STATEMENTS (Continued)
4. LONG-TERM DEBT
Long-term debt consists of the following:
| | | | | | | | |
| | | As of July 31, | |
| | | (in thousands) | |
| | | 2008 | | | 2007 | |
Convertible subordinated notes | | $ | — | | | $ | 27,220 | |
Bank term loan | | | 17,900 | | | | 20,000 | |
Lease purchase obligations, net of deferred interest | | | — | | | | 2 | |
| | | | | | | | |
Total debt | | | 17,900 | | | | 47,222 | |
Less: current portion | | | (5,700 | ) | | | (29,322 | ) |
| | | | | | | | |
Long-term portion | | $ | 12,200 | | | $ | 17,900 | |
| | | | | | | | |
On August 8, 2001, the Company received net proceeds of $145.2 million from a private placement of $150 million, 4.25% Convertible Subordinated Notes (“the Notes”) due 2006. The private placement was effected through a Rule 144A offering to qualified institutional buyers. Interest on the Notes is payable on February 15 and August 15 of each year, commencing February 15, 2002. The Notes were convertible into shares of the Company’s common stock at any time prior to the close of business on August 15, 2006, unless previously redeemed, at a conversion price of $29.04 per share, subject to certain adjustments. Prior to August 19, 2004, the Company could have redeemed any of the Notes at a certain redemption price, plus accrued interest, if the closing price of the common stock exceeded 150% of the conversion price for at least 20 trading days in any consecutive 30-day trading period and certain other conditions are satisfied. On or after August 19, 2004, the Company could have redeemed any of the Notes at designated redemption prices, plus accrued interest. The Notes are unsecured and subordinated in right of payment in full to all existing and future senior indebtedness of the Company. Expenses associated with the offering of approximately $4.8 million are being amortized using the straight-line method, which approximates the effective interest method, over the term of the Notes. The stated interest rate is 4.25% and the effective rate is 4.39% due to the amortization of capitalized costs associated with the offering. During the fourth fiscal quarter of 2005, the Company repurchased $61.7 million of the outstanding principal balance. On November 14, 2005, the Company refinanced this debt by exchanging $27.2 million in aggregate principal amount of existing notes plus all accrued and unpaid interest on the outstanding notes for an equal principal amount of new notes due August 2007 with an interest rate of 4.25%. The principal balance of these notes of $27.2 million was paid in full on August 15, 2007.
On June 3, 2005, the Company closed a $60.0 million term loan with a commercial lender (the “2005 Loan Agreement”). The loan had a five-year term. Interest was at the lender’s variable prime rate and was payable monthly. The Company entered into a new Loan and Security Agreement (the “2006 Loan Agreement”), dated as of December 7, 2006, with Silicon Valley Bank (“SVB”) to modify the existing $60.0 million term loan. Under the terms of the 2006 Loan Agreement, the Company borrowed $20.0 million under a term loan at an interest rate of prime minus 1.25% with interest-only payable during the first 12 months. The loan is secured by all assets of the Company located in the United States. Principal of this term loan is repayable over four years as follows:
| | • | | months 13 to 24: $300,000.00 per month |
| | • | | months 25 to 36: $600,000.00 per month |
| | • | | months 37 to 48: $766,666.67 per month |
The financing arrangement under the 2006 Loan Agreement also provides the Company with a $30.0 million revolving credit facility. No amount was outstanding under the revolving credit facility as of July 31, 2008.
51
LTX CORPORATION
NOTES TO CONSOLIDATED FINANCIAL STATEMENTS (Continued)
The Company had a second credit facility with another lender for a revolving credit line of $5.0 million. This facility was secured by cash and marketable securities. This line of credit was used to secure obligations of operating leases and existing stand-by letters of credit. The facility expired on October 31, 2007 and was not renewed.
5. INCOME TAXES
The components of net income (loss) before income taxes and the provision (benefit) for income taxes consist of the following (in thousands):
| | | | | | | | | | | | |
| | | Fiscal Year Ended July 31, | |
| | | 2008 | | | 2007 | | | 2006 | |
Net income (loss) before income taxes | | | | | | | | | | | | |
U.S. | | $ | (12,711 | ) | | $ | (8,119 | ) | | $ | 21,466 | |
Foreign | | | 9,020 | | | | (2,547 | ) | | | (9,225 | ) |
| | | | | | | | | | | | |
Total net income (loss) before income taxes | | $ | (3,691 | ) | | $ | (10,666 | ) | | $ | 12,241 | |
Benefit for income taxes: | | | | | | | | | | | | |
Current: | | | | | | | | | | | | |
Federal | | $ | (49 | ) | | $ | — | | | $ | — | |
State | | | — | | | | — | | | | — | |
Foreign | | | (3,042 | ) | | | — | | | | — | |
| | | | | | | | | | | | |
Total Current | | $ | (3,091 | ) | | $ | — | | | $ | — | |
| | | | | | | | | | | | |
Deferred | | | | | | | | | | | | |
Federal | | $ | — | | | $ | — | | | $ | — | |
State | | | — | | | | — | | | | — | |
Foreign | | | — | | | | — | | | | — | |
| | | | | | | | | | | | |
Total Deferred | | $ | — | | | $ | — | | | $ | — | |
| | | | | | | | | | | | |
Total Benefit for income taxes | | $ | (3,091 | ) | | $ | — | | | $ | — | |
| | | | | | | | | | | | |
Reconciliation of the U.S. federal statutory rate to the Company’s effective tax rate is as follows:
| | | | | | | | | |
| | | Year ended July 31, | |
| | | 2008 | | | 2007 | | | 2006 | |
U.S. Federal statutory rate | | 35.0 | % | | 35.0 | % | | 35.0 | % |
Change in valuation allowance/utilization of net operating loss carryforwards | | (94.2 | ) | | (54.8 | ) | | (55.9 | ) |
Tax credits | | 44.9 | | | 19.8 | | | 20.9 | |
Change in FIN 48 reserve | | 97.9 | | | — | | | — | |
| | | | | | | | | |
Effective tax rate | | 83.6 | % | | 0.0 | % | | 0.0 | % |
| | | | | | | | | |
52
LTX CORPORATION
NOTES TO CONSOLIDATED FINANCIAL STATEMENTS (Continued)
The temporary differences and carry forwards that created the deferred tax assets as of July 31, 2008, and 2007 are as follows:
| | | | | | | | |
| | | As of July 31, | |
| | | 2008 | | | 2007 | |
| | | (in thousands) | |
Deferred tax assets: | | | | | | | | |
Net operating loss carryforwards | | $ | 157,390 | | | $ | 156,473 | |
Tax credits | | | 49,221 | | | | 45,007 | |
Inventory valuation reserves | | | 14,075 | | | | 15,765 | |
Deferred revenue | | | — | | | | 117 | |
Other | | | 10,367 | | | | 12,511 | |
| | | | | | | | |
Total deferred tax assets | | | 231,053 | | | | 229,873 | |
Valuation allowance | | | (231,053 | ) | | | (229,873 | ) |
| | | | | | | | |
Net deferred tax assets | | $ | — | | | $ | — | |
| | | | | | | | |
Compliance with SFAS No. 109 requires the Company to periodically evaluate the necessity of establishing or increasing a valuation allowance for deferred tax assets depending on whether it is more likely than not that a related benefit will be realized in future periods. Because of the cumulative loss position of the Company at July 31, 2002 and the uncertainty of the time of profitability in future periods, the Company increased its valuation allowance to 100% of net deferred tax assets in the fourth quarter of fiscal year 2002. At July 31, 2008, the Company continues to maintain a full valuation allowance against its deferred tax assets. The valuation allowance totaled $231.1 million and $229.9 million as of July 31, 2008 and 2007, respectively. Included in the valuation allowance is approximately $4.1 million related to certain net operating loss carryforwards resulting from the exercise of stock options, the benefit of which, when recognized, will be accounted for as a credit to additional paid in capital rather than a reduction in income tax expense.
As of July 31, 2008, the Company had federal net operating loss carryforwards of $429.6 million which expire from 2012 to 2028, Federal tax credit carryforwards of $25.9 million which expire from 2020 to 2028, and state tax credits and carryforwards of $23.3 million which began expiring in 2007 to 2022. The Company also has foreign net operating loss carryforwards of approximately $1.0 million in the United Kingdom and approximately $1.9 million in Japan.
The utilization of the Company’s net operating loss carryforwards and research and development credit carryforwards could be subject to substantial limitations under IRC Section 382. These limitations can apply to companies that undergo ownership changes in any loss carryforward years. As of July 31, 2008, the Company is not subject to any limitations on its carryover attributes. As a result of the merger with Credence Systems Corporation on August 29, 2008, a greater than 50% cumulative ownership change in both entities has triggered a significant limitation in net operating loss carryforward utilization. The Company will continue to assess the realizability of these carryforwards in subsequent periods.
53
LTX CORPORATION
NOTES TO CONSOLIDATED FINANCIAL STATEMENTS (Continued)
The Company adopted Financial Accounting Standards Board Interpretation No. 48, “Accounting for Uncertain Tax Positions” (“FIN 48”) on August 1, 2007. FIN 48 clarifies the accounting for uncertainty in income taxes recognized in an enterprise’s financial statements in accordance with FASB Statement No. 109,” Accounting for Income Taxes.” FIN 48 prescribes a recognition threshold and measurement of a tax position taken or expected to be taken in a tax return. There were no adjustments to the Company’s accumulated deficit as a result of the implementation of FIN 48. A summary of the Company’s adjustments to its uncertain tax positions in the current year is as follows (in thousands):
| | | | |
Balance at August 1, 2007 (adoption of FIN 48) | | $ | 4,003 | |
Increase/ (decrease) for tax positions related to the current year | | | 102 | |
Increase/ (decrease) for tax positions related to prior years | | | — | |
Decreases for settlements with applicable taxing authorities | | | (321 | ) |
Decreases for lapses of statutes of limitations | | | (3,004 | ) |
| | | | |
Balance at July 31, 2008 | | $ | 780 | |
| | | | |
The $0.8 million of unrecognized tax benefits as of July 31, 2008 will impact the effective income tax rate if ultimately recognized.
The Company files income tax returns with the U.S. federal government and various state and international jurisdictions. With few exceptions, the Company’s 1997 and subsequent federal and state tax years remain open by statute, principally relating to net operating loss carryforwards. International jurisdictions generally remain open for 2003 and subsequent periods. The Company recognizes interest and penalties related to uncertain tax positions in income tax expense. The Company has accrued $0.2 million and $1.0 million for the potential payment of interest and penalties at July 31, 2008 and August 1, 2007, respectively. The Company anticipates that the reserve for uncertain tax positions will be reduced over the next 12 month period, as the Company settles disputed items with the appropriate taxing authorities.
6. STOCKHOLDERS’ EQUITY
Rights Agreement
The Company has a Rights Agreement whereby each common stock shareholder has one common share purchase right for each share of common stock held. The rights will become exercisable only if a person or group acquires 15% or more of the Company’s common stock or announces a tender offer that would result in ownership of 15% or more of the common stock. Initially, each right will entitle a stockholder to buy one share of common stock of the Company at a purchase price of $45.00 per share, subject to significant adjustment depending on the occurrence thereafter of certain events. Before any person or group has acquired 15% or more of the common stock of the Company, the rights are redeemable by the Board of Directors at $0.001 per right. The rights expire on April 30, 2009 unless redeemed by the Company prior to that date.
Reserved Unissued Shares
At July 31, 2008, the Company had reserved 12,905,489 unissued shares of its common stock for possible issuance under stock-based compensation plans and the Company’s Employee Stock Purchase Plan. At July 31, 2007, the Company had reserved 937,328 shares of its common stock for issuance relating to the Company’s 4.25% Convertible Subordinated Notes. On August 15, 2007, the Company paid the principal amount of $27.2 million and accrued interest of $1.9 million of the 4.25% Convertible Subordinated Notes, which reduced the amount of shares reserved for the Convertible Notes to zero.
54
LTX CORPORATION
NOTES TO CONSOLIDATED FINANCIAL STATEMENTS (Continued)
7. EMPLOYEE BENEFIT PLANS
Stock Option Plans
In connection with the Company’s Stock Option Plans, at July 31, 2008, 2,507,237 shares were subject to future grant under the 2004 Plan and no shares were available for future grant under any of the other Company Stock Option Plans.
Stock Option Activity
| | | | | | | | | | | | | | | | | | |
| | | 2008 | | 2007 | | 2006 |
| | | Number of
Shares (1) | | | Weighted
Average
Exercise Price | | Number of
Shares (1) | | | Weighted
Average
Exercise Price | | Number of
Shares (1) | | | Weighted
Average
Exercise Price |
Options outstanding, beginning of year | | 8,205,197 | | | $ | 9.17 | | 8,534,284 | | | $ | 9.17 | | 10,723,005 | | | $ | 10.40 |
Granted | | — | | | | — | | — | | | | — | | 169,500 | | | | 3.81 |
Exercised | | (17,648 | ) | | | 1.50 | | (144,350 | ) | | | 5.05 | | (188,785 | ) | | | 3.59 |
Forfeited | | (196,841 | ) | | | 8.52 | | (184,737 | ) | | | 7.84 | | (2,169,436 | ) | | | 10.99 |
| | | | | | | | | | | | | | | | | | |
Options outstanding, end of year | | 7,990,708 | | | | 10.17 | | 8,205,197 | | | | 9.27 | | 8,534,284 | | | | 9.17 |
| | | | | | | | | | | | | | | | | | |
Options exercisable | | 7,742,717 | | | | 10.33 | | 7,687,983 | | | | 10.45 | | 7,147,159 | | | | 10.75 |
| | | | | | | | | | | | | | | | | | |
Options available for grant | | 2,507,237 | | | | | | 3,225,824 | | | | | | 3,860,839 | | | | |
| | | | | | | | | | | | | | | | | | |
Weighted average fair value of options granted during year | | | | | $ | 0.00 | | | | | $ | 0.00 | | | | | $ | 2.68 |
| | | | | | | | | | | | | | | | | | |
| (1) | Does not include 220,632 shares for employee stock purchase plan in 2008, 500,512 shares in 2007, and 639,773 shares in 2006. |
As of July 31, 2008, the status of the Company’s outstanding and exercisable options is as follows:
| | | | | | | | | | | | |
| Options Outstanding | | Options Exercisable |
Range of Exercise Price ($) | | Number
Outstanding | | Weighted
Average
Remaining
Contractual Life | | Weighted
Average
Exercise Price ($) | | Number
Exercisable | | Weighted
Average
Exercise Price ($) |
| $ 0.05 – 4.81 | | 1,148,174 | | 4.20 | | $ | 3.93 | | 1,079,624 | | $ | 4.18 |
| 5.13 – 8.94 | | 2,719,606 | | 4.34 | | | 7.09 | | 2,540,165 | | | 7.59 |
| 10.85 – 14.94 | | 3,691,028 | | 3.39 | | | 13.05 | | 3,691,028 | | | 13.05 |
| 16.46 – 18.25 | | 140,900 | | 2.27 | | | 17.53 | | 140,900 | | | 17.53 |
| 20.86 – 23.83 | | 244,000 | | 2.55 | | | 21.09 | | 244,000 | | | 21.09 |
| 26.20 – 28.34 | | 16,000 | | 3.61 | | | 26.20 | | 16,000 | | | 26.20 |
| 33.63 | | 15,500 | | 1.84 | | | 33.63 | | 15,500 | | | 33.63 |
| $37.75 – 46.25 | | 15,500 | | 1.60 | | | 46.25 | | 15,500 | | | 46.25 |
| | | | | | | | | | | | |
| | 7,990,708 | | 3.78 | | $ | 10.17 | | 7,742,717 | | $ | 10.33 |
| | | | | | | | | | | | |
55
LTX CORPORATION
NOTES TO CONSOLIDATED FINANCIAL STATEMENTS (Continued)
RSU Activity
The Company’s general practice has been to issue new shares upon the exercise of options. In fiscal 2005, the Company granted 533,750 options tied to certain performance milestones. As of April 30, 2008, 100% of these options have vested as they have met the performance milestones. During the quarter ended January 31, 2006, the Company granted 983,600 restricted stock units (“RSUs”). Of the 983,600 RSUs, vesting for 742,600 is tied to certain profit break-even milestones for executives. The first milestone was achieved May 16, 2006, resulting in 185,650 shares vesting on May 16, 2006. The remaining executive RSUs vest annually over three years on May 16 of each year which started on May 16, 2007. The remaining 241,000 RSUs are service vested for key employees over a four year period, including 60,250 shares that vested on May 16, 2006, when the Company achieved a profit break-even milestone. The remaining shares vest annually over three years on May 16 of each year which started on May 16, 2007. During the quarter ended October 31, 2006, the Company granted 973,000 RSUs. Of the 973,000 RSUs, vesting for 721,000 was tied to certain profit milestones for executives. As of July 31, 2008, none of the performance milestones have been met. However, on October 8, 2008, the vesting of 578,000 of these RSUs was changed to time-based in connection with the waivers of change of control employment agreements by certain executives. The remaining 252,000 RSUs are service vested for key employees and are earned over a four year period. For the quarter ended January 31, 2007, 62,300 RSUs were granted to directors to vest over three years, and 5,000 RSUs were granted to employees to vest over four years. For the quarter ended April 30, 2007, 15,000 RSUs were granted to employees to vest over four years. For the quarter ended July 31, 2007, 7,000 RSUs were granted to employees to vest over four years.
During the quarter ended October 31, 2007, the Company granted 925,000 RSUs that will vest over a four year period beginning on September 19, 2008. Of the 925,000 RSUs granted during the quarter ended October 31, 2007, 645,000 were granted to executives. For the quarter ended January 31, 2008, 84,000 RSUs were granted to directors to vest over three years, and 5,000 RSUs were granted to employees to vest over four years. For the quarter ended April 30, 2008, 19,500 RSUs were granted to employees to vest over four years. For the quarter ended July 31, 2008, 24,500 RSUs were granted to employees to vest over four years.
| | | | | | | | | | | | |
| | | 2008 | | 2007 |
| | | Number of
Shares | | | Weighted Average
Grant-Date
Fair Value | | Number of
Shares | | | Weighted Average
Grant-Date
Fair Value |
RSUs outstanding, beginning of year | | 1,527,335 | | | $ | 4.77 | | 759,900 | | | $ | 4.50 |
Granted | | 1,058,000 | | | | 3.77 | | 1,062,300 | | | | 4.91 |
Vested | | (242,369 | ) | | | 4.60 | | (154,915 | ) | | | 4.51 |
Forfeited | | (30,500 | ) | | | 4.53 | | (139,950 | ) | | | 4.67 |
| | | | | | | | | | | | |
RSUs outstanding, end of year | | 2,312,466 | | | $ | 4.29 | | 1,527,335 | | | $ | 4.77 |
| | | | | | | | | | | | |
Employees’ Stock Purchase Plan
The Company instituted an employee stock purchase plan in 1993 (“1993 ESPP”). Under the 1993 ESPP, eligible employees may contribute up to 15% of their annual compensation for the purchase of common stock of the Company, subject to an annual limit of $25,000. The price paid for the common stock is equal to 85% of the lower of the fair market value of LTX’s common stock on the first business day or the last business day of a six-month offering period. The 1993 ESPP limits the number of shares that can be issued over the term of the plan to 3,000,000 shares. In December 2003, the 1993 ESPP expired and at the annual meeting on December 10, 2003 the shareholders approved a new employee stock purchase plan (“2004 ESPP”). The 2004 ESPP provides the same provisions as the 1993 ESPP and allows for the issuance of 1,200,000 shares of common stock to eligible employees. In September 2005, the Company amended the 2004 ESPP to provide that the price paid for
56
LTX CORPORATION
NOTES TO CONSOLIDATED FINANCIAL STATEMENTS (Continued)
the common stock is equal to 85% of the fair market value of LTX’s common stock on the last business day of a six month offering period. In fiscal years 2008, 2007, and 2006, shares issued under these employee stock purchase plans were 279,880, 139,261 and 121,881, respectively.
Other Compensation Plans
The Company has established a Profit Sharing Bonus Plan, wherein a percentage of pretax profits are distributed quarterly to all non-executive employees. Under the Profit Sharing Bonus Plan, the Company recorded profit sharing expense for all eligible employees of approximately $0.1 million, $0.2 million, and $1.6 million, for fiscal years 2008, 2007, and 2006, respectively.
The Company has an Executive Profit Sharing Plan based on certain profitability milestones. Employees included in this plan are excluded from the Profit Sharing Bonus Plan. The Company had no executive profit sharing expense in the fiscal years ended July 31, 2008 and 2007. The Company recognized expense associated with this plan of $1.3 million for the year ended July 31, 2006.
The Company has a 401(k) Growth and Investment Program (“401(k) Plan”). Eligible employees may make voluntary contributions to the 401(k) Plan through a salary reduction contract up to the statutory limit or 20% of their annual compensation. The Company matches employees’ voluntary contributions, up to certain prescribed limits. Company contributions vest at a rate of 20% per year. The Company suspended the match as of June of fiscal year 2001. The Company match was reinstated beginning August 2005. The Company recorded related expense of $0.8 million and $0.8 million for the fiscal years ended July 31, 2008 and July 31, 2007, respectively.
The Company has a defined benefit pension plan for its operations in the United Kingdom. The plan was constituted in October 1981 to provide defined benefit pension and lump sum benefits, payable on retirement, for employees of LTX(Europe) Limited, (“UK”). The plan has 71 participants of which 2 remain as active employee members and 69 are non-active former employees but for whom benefits are preserved. The plan has been closed to all new members since December 31, 2000. During fiscal 1998 the Company initiated a significant worldwide headcount reduction. This restructuring involved the termination of 28 of the then 71 UK pension plan participants. Additionally, the Company announced the intent to divest its iPTest business in the UK in August 1998. The Company subsequently sold its iPTest subsidiary in the UK in fiscal 2000. These actions resulted in the termination of 19 of the then 43 active UK pension plan participants. The Company has concluded that these actions met the requirements of paragraph 6 of SFAS No. 88, “Employers’ Accounting for Settlements and Curtailments of Defined Benefit Pension Plans and Termination Benefits” in fiscal 1998 and resulted in a curtailment of this plan at that date. The plan was under-funded as of July 31, 2008 by $4.2 million. The Company has recorded this liability as other long-term liabilities in the amount of $3.9 million and accrued short-term liabilities of $0.3 million on the consolidated balance sheet as of July 31, 2008. Additionally, the Company has recorded a $0.7 million accumulated other comprehensive loss in stockholders’ equity. The Company does not anticipate significant pension expense in each of the fiscal years succeeding July 31, 2008. Factors that could impact the amount of pension expense recorded include but are not limited to: 1) the rate of return on the assets invested or 2) the discount rate used to determine the net present value of the future liabilities. As of July 31, 2008, the expected rate of return on assets is 6.0% and the discount rate is 6.4%. Cash payments are projected to be $0.3 million in fiscal 2009 and actual cash payments were $0.5 million in fiscal 2008.
8. INDUSTRY AND GEOGRAPHIC SEGMENT INFORMATION
The Company operates predominantly in one industry segment: the design, manufacture and marketing of automated test equipment for the semiconductor industry that is used to test system-on-a-chip, digital, analog and mixed signal integrated circuits.
57
LTX CORPORATION
NOTES TO CONSOLIDATED FINANCIAL STATEMENTS (Continued)
In fiscal years 2008, 2007, and 2006, Texas Instruments accounted for 30%, 38%, and 56%, of net sales, respectively. STMicroelectronics accounted for 11% of net sales during fiscal year 2008. Sales to the top ten customers were 78%, 79%, and 82%, of net sales in fiscal 2008, 2007, and 2006, respectively.
The Company’s operations by geographic segment for the three years ended July 31, 2008 are summarized as follows:
| | | | | | | | | |
| | | Year ended July 31, |
| | | 2008 | | 2007 | | 2006 |
| | | (in thousands) |
Sales to unaffiliated customers: | | | | | | | | | |
United States | | $ | 52,707 | | $ | 48,830 | | $ | 88,896 |
Taiwan | | | 7,744 | | | 5,496 | | | 10,538 |
Japan | | | 6,574 | | | 5,241 | | | 2,840 |
Singapore | | | 22,850 | | | 15,598 | | | 45,632 |
Philippines | | | 11,928 | | | 37,584 | | | 55,176 |
All other countries | | | 34,022 | | | 34,890 | | | 13,421 |
| | | | | | | | | |
Total sales to unaffiliated customers | | $ | 135,825 | | $ | 147,639 | | $ | 216,503 |
| | | | | | | | | |
Long-lived assets | | | | | | | | | |
United States | | $ | 37,765 | | $ | 43,881 | | $ | 49,618 |
Taiwan | | | 45 | | | 65 | | | 394 |
Japan | | | 158 | | | 232 | | | 54 |
Singapore | | | 1,717 | | | 1,845 | | | 1,545 |
All other countries | | | 1,896 | | | 1,222 | | | 784 |
| | | | | | | | | |
Total long-lived assets | | $ | 41,581 | | $ | 47,245 | | $ | 52,395 |
| | | | | | | | | |
Transfer prices on products sold to foreign subsidiaries are intended to produce profit margins that correspond to the subsidiary’s sales and support efforts. Sales to customers in North America are 100% within the United States.
9. COMMITMENTS AND CONTINGENT LIABILITIES
The Company has operating lease commitments for certain facilities and equipment that expire at various dates through 2016. The Company has an option to extend the term for its Norwood, Massachusetts facility lease for two (2) additional five (5) year periods provided that the Company notifies its landlord at least four hundred twenty-five (425) days prior to expiration of the original term. Minimum lease payments under noncancelable leases at July 31, 2008, are as follows:
| | | | | | | | | |
Year ending July 31, | | Facilities | | Equipment | | Total
Operating
Leases |
| | | (in thousands) |
2009 | | $ | 2,056 | | $ | 361 | | $ | 2,417 |
2010 | | | 1,512 | | | 226 | | | 1,738 |
2011 | | | 1,326 | | | 65 | | | 1,391 |
2012 | | | 1,311 | | | 12 | | | 1,323 |
2013 | | | 1,056 | | | — | | | 1,056 |
Thereafter | | | 3,136 | | | — | | | 3,136 |
| | | | | | | | | |
Total minimum lease payments | | $ | 10,397 | | $ | 664 | | $ | 11,061 |
| | | | | | | | | |
58
LTX CORPORATION
NOTES TO CONSOLIDATED FINANCIAL STATEMENTS (Continued)
Total rent expense for fiscal 2008, 2007, and 2006 was $2.4 million, $3.1 million, and $3.3 million, respectively.
The Company is, from time to time, subject to legal proceedings, claims and investigations that arise in the ordinary course of business. There are no such matters that the Company believes are material with respect to its business, financial position or results of operations.
10. REORGANIZATION CHARGES AND INVENTORY PROVISIONS
For the quarter ended April 30, 2007, the Company recorded a $4.2 million inventory related provision related to the Fusion HFi product line. The provision was required as a result of two major factors that materialized during the quarter. First, the Company reassessed its Fusion HFi customers demand for HFi due to low demand in the markets they serve and second, re-evaluated the impact from customers who have increased adoption of the X-Series platform by transferring test capacity from HFi to a lower cost to test X-Series alternative. The favorable performance/price characteristics of the X-Series testers has enabled customers to transition certain devices currently being tested on the Fusion HFi platform to the X-Series testers. This has resulted in increased available HFi capacity at customers and will likely reduce HFi purchases in the future.
For the quarter ended July 31, 2006, the Company recorded a reorganization charge of approximately $0.2 million, relating primarily to the relocation of the Company’s corporate headquarters.
For the quarter ended January 31, 2006, the Company recorded a reorganization charge of approximately $1.9 million, of which $0.6 million consisted of severance and employee benefit costs relating to Europe workforce reductions, $1.2 million for future lease obligations and $0.3 million of plant closure expenses and legal costs related to the closure of the Company’s facilities in the United Kingdom. These expenses were partially offset by a $0.2 million reversal of a previously recorded liability for the remaining lease payments of the Company’s Westwood, Massachusetts facility. The Company signed an agreement during the quarter ended January 31, 2006 which reduced the future liability previously recorded in fiscal 2005.
On October 25, 2005, the Company took actions to reduce its operating expenses, including reducing its worldwide workforce by approximately 15%, eliminating 77 positions. Of the 77 positions, 74% were from engineering, 14% from administration, 7% from manufacturing and 5% were from sales and marketing. The Company took these actions based on a continuing review of its business plans and operations. The Company has realized annual savings in operating expenses of approximately $8.0 million as a result of these actions. For the quarter ended October 31, 2005, the Company recorded a reorganization charge relating to workforce reductions and the separation agreement with its Chief Executive Officer of $4.2 million, of which $2.3 million consisted of severance costs relating to a worldwide workforce reduction, which was paid during the fiscal year ended July 31, 2006, and a $1.9 million charge relating to the separation of the Company’s Chief Executive Officer. The separation agreement with the Company’s Chief Executive Officer has a $1.2 million cash component, and a non-cash component consisting of the acceleration of stock option expense of $0.7 million.
59
LTX CORPORATION
NOTES TO CONSOLIDATED FINANCIAL STATEMENTS (Continued)
The following table sets forth the Company’s restructuring activity and related accrual for the fiscal years ended 2008, 2007 and 2006 (in millions):
| | | | | | | | | | | | | | | | | | | | |
| | | Severance
Costs | | | Equipment
leases | | | Facility
leases | | | Asset
impairment | | | Total | |
| | | (in millions) | |
Balance July 31, 2005 | | $ | 0.7 | | | $ | 6.6 | | | $ | 2.7 | | | $ | — | | | $ | 10.0 | |
Additions to expense | | | 4.9 | | | | (0.1 | ) | | | 1.4 | | | | 0.1 | | | | 6.3 | |
Elimination of deferred gain | | | — | | | | (0.7 | ) | | | — | | | | — | | | | (0.7 | ) |
Non-cash utilization | | | (0.3 | ) | | | — | | | | (0.1 | ) | | | (0.1 | ) | | | (0.5 | ) |
Cash paid | | | (3.2 | ) | | | (1.7 | ) | | | (2.2 | ) | | | — | | | | (7.1 | ) |
| | | | | | | | | | | | | | | | | | | | |
Balance July 31, 2006 | | $ | 2.1 | | | $ | 4.1 | | | $ | 1.8 | | | $ | — | | | $ | 8.0 | |
| | | | | | | | | | | | | | | | | | | | |
Additions (reductions) to expense | | | (0.4 | ) | | | — | | | | — | | | | — | | | | (0.4 | ) |
Elimination of deferred gain | | | — | | | | (1.6 | ) | | | — | | | | — | | | | (1.6 | ) |
Non-cash utilization | | | (0.4 | ) | | | — | | | | 0.2 | | | | — | | | | (0.2 | ) |
Cash paid | | | (0.7 | ) | | | (1.7 | ) | | | (1.0 | ) | | | — | | | | (3.4 | ) |
| | | | | | | | | | | | | | | | | | | | |
Balance July 31, 2007 | | $ | 0.6 | | | $ | 0.8 | | | $ | 1.0 | | | $ | — | | | $ | 2.4 | |
| | | | | | | | | | | | | | | | | | | | |
Elimination of deferred gain | | | — | | | | (0.2 | ) | | | — | | | | — | | | | (0.2 | ) |
Cash paid | | | (0.3 | ) | | | (0.6 | ) | | | (0.4 | ) | | | — | | | | (1.3 | ) |
| | | | | | | | | | | | | | | | | | | | |
Balance July 31, 2008 | | $ | 0.3 | | | $ | — | | | $ | 0.6 | | | $ | — | | | $ | 0.9 | |
| | | | | | | | | | | | | | | | | | | | |
11. QUARTERLY RESULTS OF OPERATIONS (unaudited)
| | | | | | | | | | | | | | | | |
| | | Year Ended July 31, 2008 | |
| | | First
Quarter | | | Second
Quarter | | | Third
Quarter | | | Fourth
Quarter | |
| | | (in thousands, except per share data) | |
Net sales | | $ | 29,635 | | | $ | 31,022 | | | $ | 39,320 | | | $ | 35,848 | |
Gross profit | | | 14,456 | | | | 14,828 | | | | 20,417 | | | | 18,144 | |
Net income (loss) | | | (224 | ) | | | (3,178 | ) | | | 2,172 | | | | 630 | |
Net income (loss) per share: | | | | | | | | | | | | | | | | |
Basic | | $ | 0.00 | | | $ | (0.05 | ) | | $ | 0.03 | | | $ | 0.01 | |
Diluted | | $ | 0.00 | | | $ | (0.05 | ) | | $ | 0.03 | | | $ | 0.01 | |
| |
| | | Year Ended July 31, 2007 | |
| | | First
Quarter | | | Second
Quarter (1) | | | Third
Quarter | | | Fourth
Quarter | |
| | | (in thousands, except per share data) | |
Net sales | | $ | 49,840 | | | $ | 34,671 | | | $ | 33,014 | | | $ | 30,114 | |
Gross profit | | | 25,136 | | | | 16,042 | | | | 10,839 | | | | 14,006 | |
Net income (loss) | | | 4,590 | | | | (3,079 | ) | | | (7,991 | ) | | | (4,185 | ) |
Net income (loss) per share: | | | | | | | | | | | | | | | | |
Basic | | $ | 0.07 | | | $ | (0.05 | ) | | $ | (0.13 | ) | | $ | (0.07 | ) |
Diluted | | $ | 0.07 | | | $ | (0.05 | ) | | $ | (0.13 | ) | | $ | (0.07 | ) |
| (1) | Includes inventory related provisions of $4.2 million. |
60
LTX CORPORATION
NOTES TO CONSOLIDATED FINANCIAL STATEMENTS (Continued)
12. SUBSEQUENT EVENTS (unaudited)
On August 29, 2008, LTX-Credence Corporation, formerly known as LTX Corporation (the “Company” or “LTX-Credence”), and Credence Systems Corporation (“Credence”) completed the merger of equals (the “Merger”) contemplated by the Agreement and Plan of Merger, dated as of June 20, 2008 (the “Merger Agreement”), among the Company, Zoo Merger Corporation, a wholly-owned subsidiary of the Company, and Credence. In connection with the Merger, the Company increased the number of authorized shares of common stock from 200,000,000 to 400,000,000, changed its name to “LTX-Credence Corporation” and changed the symbol under which its common stock trades on the NASDAQ Global Market to “LTXC”. Credence is now a wholly-owned subsidiary of the Company as a result of the Merger.
The following is a summary of the preliminary estimate of the purchase price for Credence as of August 29, 2008:
| | | | | | |
| | | (in thousands, except
exchange ratio) |
Number of Credence shares to be acquired | | | 102,824 | | | |
Multiplied by the exchange ratio | | | 0.6129 | | | |
| | | | | | |
Number of shares of LTX-Credence common stock to be issued to the holders of Credence common stock | | | 63,021 | | | |
Multiplied by the assumed price per share of LTX-Credence common stock | | $ | 1.87 | | $ | 117,723 |
| | | | | | |
Estimated fair value of outstanding Credence stock options and restricted stock to be exchanged for LTX-Credence stock options and restricted stock (options calculated using the Black-Scholes option pricing
model) (1) | | | | | | 1,700 |
Compensation costs attributable to the Merger | | | | | | 1,631 |
Direct Merger costs | | | | | | 5,600 |
| | | | | | |
Total estimated purchase price | | | | | $ | 126,653 |
| | | | | | |
61
LTX CORPORATION
NOTES TO CONSOLIDATED FINANCIAL STATEMENTS (Continued)
The above purchase price has been allocated based on a preliminary estimate of the fair value of net assets acquired. Upon completion of the fair value assessment of certain assets and liabilities, the Company anticipates that the ultimate price allocation will differ from the preliminary assessment. Any changes to the initial estimates of the fair value of the assets and liabilities will be recorded as adjustments to those assets and liabilities and residual amounts will be allocated to goodwill or qualifying assets to the extent of negative goodwill. The purchase price allocation will be finalized once the Company has all necessary information to complete its estimate, but generally no later than one year from the date of acquisition.
| | | | |
Allocation of purchase consideration | | | (in thousands | ) |
Estimated net book value of assets acquired as of August 29, 2008 | | $ | 168,314 | |
Less: write-off of existing Credence intangible assets | | | (51,039 | ) |
| | | | |
Adjusted net book value of assets acquired as of August 29, 2008 | | $ | 117,275 | |
Remaining allocation: | | | | |
Identifiable intangible assets at fair value (2) (4) | | | 28,222 | |
Acquired in-process research and development (2) (4) | | | 6,314 | |
Decrease property and equipment to fair value(4) | | | (15,082 | ) |
Decrease equipment spares to fair value(4) | | | (9,322 | ) |
Decrease deferred revenue to fair value | | | 5,051 | |
Assumed unfavorable lease | | | (7,510 | ) |
Decrease convertible notes to fair value | | | 1,705 | |
Restructuring costs (3) | | | | |
| | | | |
Estimated purchase price | | $ | 126,653 | |
| | | | |
| (1) | Sufficient information is not available at this time to provide specifics with regard to the fair value of outstanding and unvested Credence stock options, restricted stock and restricted stock units to be exchanged for LTX-Credence stock options, restricted stock and restricted stock units. The estimate provided in the consideration is based upon the fair value of unvested Credence share-based awards as of August 29, 2008. The fair value of awards exchanged will be determined based upon the Black-Scholes option pricing model on August 29, 2008, based upon the fair value of the LTX-Credence common shares at that time. The average LTX-Credence closing stock price of $1.87 per share was used to estimate the number of LTX-Credence options and restricted stock awards issued upon the conversion of Credence stock options and restricted stock awards and the related fair value. |
| (2) | Sufficient information is not available at this time to provide specifics with regard to individual assets, valuation methods and appraisal methods. |
The estimated allocation to acquired identifiable intangible assets and in-process research and development is expected to be within (but not limited to) the following general categories:
| | • | | currently-marketed products, including patented and unpatented as well as, core and completed technology; |
| | • | | distributor agreements; |
| | • | | trademarks and trade names; and |
| | • | | customer contracts/relationships. |
The estimated purchase price allocation includes estimated identifiable intangible assets with a fair value aggregating $28.2 million, which will be amortized based on the pattern in which the economic benefits of the intangible assets are consumed. The current estimated weighted average years is 3.9 years. Independent valuation advisors are being used to assist with the estimate of the identifiable intangible asset value. The
62
LTX CORPORATION
NOTES TO CONSOLIDATED FINANCIAL STATEMENTS (Continued)
estimated identifiable intangible asset value is primarily based on information and assumptions developed by LTX-Credence management, certain publicly available information, and discussions with Credence’s management. These estimates will be adjusted based upon the final valuation. The final valuation is expected to be completed within 12 months of August 29, 2008, the closing of the merger.
In accordance with the requirements of Statement of Financial Accounting Standards No. 142, “Goodwill and Other Intangible Assets”, any goodwill and acquired indefinite-lived intangible assets associated with the merger will not be amortized.
As required by Financial Accounting Standards Board Interpretation No. 4, “Applicability of FASB Statement No. 2 to Business Combinations Accounted for by the Purchase Method”, any portion of the purchase price allocated to in-process research and development will be expensed immediately upon the closing of the merger. It is reasonable to assume that an in-process research and development charge will be recorded in conjunction with the final purchase accounting. The current estimate included in the estimated purchase price allocation is $6.3 million.
| (3) | Certain restructuring and integration charges will be recorded subsequent to the merger that, under purchase accounting, may or may not be treated as part of the purchase price. Any such costs are not factually supportable at this time and therefore have not been reflected in the estimated purchase price allocation. |
| (4) | The estimated purchase price allocation included above is based upon a purchase price of approximately $126.7 million. This amount was derived from the number of shares of LTX-Credence common stock issued of approximately 63.0 million, based on the outstanding shares of Credence common stock, stock options and restricted stock on August 29, 2008, and the exchange ratio of 0.6129 per each Credence share, at a price of $1.87 per share, the average closing price of LTX-Credence shares of common stock for the five-trading day period beginning August 27, 2008, which is two trading days prior to the closing of the merger. |
Based on the current estimated purchase price, the estimated net fair value of the assets acquired exceeded the purchase consideration. Consequently, the initial estimated purchase price allocation resulted in negative goodwill of approximately $50.0 million. In accordance with SFAS 141, LTX-Credence reduced the estimated fair values of the following qualifying assets on a pro rata basis and allocated the negative goodwill as follows:
| | | |
Qualifying asset | | (in thousands) |
Property and equipment | | $ | 24,580 |
Other intangible assets, net | | | 15,578 |
In-process research and development | | | 3,486 |
Other assets | | | 6,396 |
| | | |
Total allocated | | $ | 50,040 |
| | | |
Upon completion of the fair value assessment after the merger, LTX-Credence anticipates that the ultimate purchase price allocation will differ from the preliminary assessment outlined above. Any changes to the initial estimates of the fair value of the assets and liabilities will be recorded as adjustments to those assets and liabilities and residual amounts will be allocated to goodwill.
63
LTX CORPORATION
NOTES TO CONSOLIDATED FINANCIAL STATEMENTS (Continued)
The following unaudited pro forma information presents the consolidated results of operations of the Company and Credence as if the acquisitions had occurred at the beginning of fiscal 2007, with pro forma adjustments to give effect to amortization of intangible assets and certain other adjustments:
| | | | |
(amounts in thousands except per share data) | | Year Ended
July 31, 2008 | |
Net revenue | | $ | 423,377 | |
Net loss | | $ | (82,085 | ) |
Net loss per share—basic | | $ | (0.65 | ) |
Net loss per share—diluted | | $ | (0.65 | ) |
The unaudited pro forma results are not necessarily indicative of the operating results that would have occurred if the merger had been completed at the beginning of the period indicated.
In connection with the merger, on September 2, 2008, management of the Company approved a plan to terminate employees in various locations in connection with the implementation of its integration plan following the merger of equals of the Company and Credence Systems Corporation (the “Merger”) that was completed on August 29, 2008. The Company completed notifying affected employees on September 9, 2008, with the exception of employees in certain international locations.
As a result of this plan of termination, the Company expects to incur approximately $17.3 million related to employee termination actions, a portion of which will be recorded as restructuring charges in the quarter ending October 31, 2008 and a portion of which will be recorded as an adjustment to the allocation of the purchase price paid by the Company in connection with the Merger under the purchase method of accounting. Substantially all of these amounts will result in future cash expenditures which the Company expects will be paid within the next 12 months.
At the time of the completion of the Merger, Credence had outstanding $122.5 million aggregate principal amount of 3.5% Convertible Senior Subordinated Notes due 2010 (“Notes”). In the first quarter of fiscal 2009, the Company repurchased $69.3 million of principal amount of the Notes at a discount to their par value.
64
Report of Independent Registered Public Accounting Firm
The Board of Directors and Stockholders of LTX-Credence Corporation
We have audited the accompanying consolidated balance sheets of LTX-Credence Corporation (formerly LTX Corporation) (the “Company”) as of July 31, 2008 and 2007, and the related consolidated statements of operations and comprehensive income (loss), stockholders’ equity, and cash flows for each of the three years in the period ended July 31, 2008. Our audits also included the financial statement schedule listed in the index at Item 15(a). These financial statements and schedule are the responsibility of the Company’s management. Our responsibility is to express an opinion on these financial statements and schedule based on our audits.
We conducted our audits in accordance with the standards of the Public Company Accounting Oversight Board (United States). Those standards require that we plan and perform the audit to obtain reasonable assurance about whether the financial statements are free of material misstatement. An audit includes examining, on a test basis, evidence supporting the amounts and disclosures in the financial statements. An audit also includes assessing the accounting principles used and significant estimates made by management, as well as evaluating the overall financial statement presentation. We believe that our audits provide a reasonable basis for our opinion.
In our opinion, the consolidated financial statements referred to above present fairly, in all material respects, the consolidated financial position of LTX-Credence Corporation (formerly LTX Corporation) at July 31, 2008 and 2007, and the consolidated results of its operations and its cash flows for each of the three years in the period ended July 31, 2008, in conformity with U.S. generally accepted accounting principles. Also, in our opinion, the related financial statement schedule, when considered in relation to the basic financial statements taken as a whole, presents fairly in all material respects the information set forth therein.
As discussed in Note 5 to the consolidated financial statements, effective August 1, 2007, the Company adopted Financial Accounting Standards Board Interpretation Number 48,Accounting for Uncertainty in Income Taxes.
We also have audited, in accordance with the standards of the Public Company Accounting Oversight Board (United States), LTX-Credence Corporation’s (formerly LTX Corporation) internal control over financial reporting as of July 31, 2008, based on criteria established in Internal Control-Integrated Framework issued by the Committee of Sponsoring Organizations of the Treadway Commission and our report dated October 14, 2008 expressed an unqualified opinion thereon.
/s/ Ernst & Young LLP
Boston, Massachusetts
October 14, 2008
65
| Item 9. | Changes in and Disagreements with Accountants on Accounting and Financial Disclosure |
There has been no change of accountants nor any disagreements with accountants on any matter of accounting principles or practices or financial disclosure required to be reported under this Item.
| Item 9A. | Controls and Procedures |
Evaluation of Disclosure Controls and Procedures
The Company’s management, with the participation of the Company’s Chief Executive Officer and Chief Financial Officer, evaluated the effectiveness of the Company’s disclosure controls and procedures as of July 31, 2008. The term “disclosure controls and procedures,” as defined in Rules 13a-15(e) and 15d-15(e) under the Exchange Act, means controls and other procedures of a company that are designed to ensure that information required to be disclosed by a company in the reports that it files or submits under the Exchange Act is recorded, processed, summarized and reported, within the time period specified in the SEC’s rules and forms. Disclosure controls and procedures include, without limitation, controls and procedures designed to ensure that information required to be disclosed by a company in the reports that it files or submits under the Exchange Act is accumulated and communicated to the company’s management, including its principal executive and principal financial officers, as appropriate to allow timely decisions regarding required disclosure. Management recognizes that any controls and procedures, no matter how well designed and operated, can provide only reasonable assurance of achieving their objectives and management necessarily applies its judgment in evaluating the cost-benefit relationship of possible controls and procedures. Based on the evaluation of the Company’s disclosure controls and procedures as of July 31, 2008, the Company’s Chief Executive Officer and Chief Financial Officer concluded that, as of such date, the Company’s disclosure controls and procedures were effective at the reasonable assurance levels.
Management’s report on the Company’s internal control over financial reporting (as defined in Rules 13a-15(f) and 15d-15(f) under the Exchange Act) and the independent registered public accounting firm’s related audit report are included in this Item 9.
Management’s Annual Report on Internal Control Over Financial Reporting
The management of the Company is responsible for establishing and maintaining adequate internal control over financial reporting for the Company. Internal control over financial reporting is defined in Rule 13a-15(f) or 15d-15(f) promulgated under the Securities Exchange Act of 1934 as a process designed by, or under the supervision of, the Company’s principal executive and principal financial officers and effected by the Company’s board of directors, management and other personnel, to provide reasonable assurance regarding the reliability of financial reporting and the preparation of financial statements for external purposes in accordance with generally accepted accounting principles and includes those policies and procedures that:
| | • | | Pertain to the maintenance of records that in reasonable detail accurately and fairly reflect the transactions and dispositions of the assets of the Company; |
| | • | | Provide reasonable assurance that transactions are recorded as necessary to permit preparation of financial statements in accordance with generally accepted accounting principles, and that receipts and expenditures of the Company are being made only in accordance with authorizations of management and directors of the Company; and |
| | • | | Provide reasonable assurance regarding prevention or timely detection of unauthorized acquisition, use or disposition of the Company’s assets that could have a material effect on the financial statements. |
Because of its inherent limitations, internal control over financial reporting may not prevent or detect misstatements. Projections of any evaluation of effectiveness to future periods are subject to the risk that controls may become inadequate because of changes in conditions, or that the degree of compliance with the policies or procedures may deteriorate.
66
The Company’s management assessed the effectiveness of the Company’s internal control over financial reporting as of July 31, 2008. In making this assessment, the Company’s management used the criteria set forth by the Committee of Sponsoring Organizations of the Treadway Commission (COSO) in Internal Control-Integrated Framework.
Based on our assessment, management concluded that, as of July 31, 2008, the Company’s internal control over financial reporting is effective based on those criteria.
The Company’s independent registered public accounting firm has issued a report on its assessment of the Company’s internal control over financial reporting. This report appears below.
67
Report of Independent Registered Public Accounting Firm
The Board of Directors and Shareholders of LTX-Credence Corporation (formerly LTX Corporation)
We have audited LTX-Credence Corporation’s (formerly LTX Corporation) internal control over financial reporting as of July 31, 2008, based on criteria established in Internal Control—Integrated Framework issued by the Committee of Sponsoring Organizations of the Treadway Commission (the COSO criteria). LTX-Credence Corporation’s (formerly LTX Corporation) management is responsible for maintaining effective internal control over financial reporting, and for its assessment of the effectiveness of internal control over financial reporting included in the accompanying management’s annual report on internal control over financial reporting. Our responsibility is to express an opinion on the Company’s internal control over financial reporting based on our audit.
We conducted our audit in accordance with the standards of the Public Company Accounting Oversight Board (United States). Those standards require that we plan and perform the audit to obtain reasonable assurance about whether effective internal control over financial reporting was maintained in all material respects. Our audit included obtaining an understanding of internal control over financial reporting, assessing the risk that a material weakness exists, testing and evaluating the design and operating effectiveness of internal control based on the assessed risk, and performing such other procedures as we considered necessary in the circumstances. We believe that our audit provides a reasonable basis for our opinion.
A company’s internal control over financial reporting is a process designed to provide reasonable assurance regarding the reliability of financial reporting and the preparation of financial statements for external purposes in accordance with generally accepted accounting principles. A company’s internal control over financial reporting includes those policies and procedures that (1) pertain to the maintenance of records that, in reasonable detail, accurately and fairly reflect the transactions and dispositions of the assets of the company; (2) provide reasonable assurance that transactions are recorded as necessary to permit preparation of financial statements in accordance with generally accepted accounting principles, and that receipts and expenditures of the company are being made only in accordance with authorizations of management and directors of the company; and (3) provide reasonable assurance regarding prevention or timely detection of unauthorized acquisition, use or disposition of the company’s assets that could have a material effect on the financial statements.
Because of its inherent limitations, internal control over financial reporting may not prevent or detect misstatements. Also, projections of any evaluation of effectiveness to future periods are subject to the risk that controls may become inadequate because of changes in conditions, or that the degree of compliance with the policies or procedures may deteriorate.
In our opinion, LTX-Credence Corporation (formerly LTX Corporation) maintained, in all material respects, effective internal control over financial reporting as of July 31, 2008, based on the COSO criteria.
We also have audited, in accordance with the standards of the Public Company Accounting Oversight Board (United States), the consolidated balance sheets of LTX-Credence Corporation (formerly LTX Corporation) as of July 31, 2008 and 2007, and the related Consolidated statements of operations and comprehensive income (loss), stockholder’s equity, and cash flows for each of the three years in the period ended July 31, 2008 of LTX-Credence Corporation (formerly LTX Corporation) and our report dated October 14, 2008 expressed an unqualified opinion thereon.
/s/ Ernst & Young LLP
Boston, Massachusetts
October 14, 2008
68
Changes in Internal Controls
There was no change in the Company’s internal control over financial reporting during the fourth fiscal quarter ended July 31, 2008 that has materially affected, or is reasonably likely to materially affect, the Company’s internal control over financial reporting.
| Item 9B. | Other Information |
None.
PART III
| Item 10. | Directors, Executive Officers and Corporate Governance |
Certain information relating to our directors and executive officers, committee information, reports and charters, executive compensation, security ownership of certain beneficial owners and management and related stockholder matters, and certain relationships and related transactions is incorporated by reference herein from our definitive proxy statement in connection with our 2008 Annual Meeting of Stockholders (the “2008 Proxy Statement”). The 2008 Proxy Statement will be filed with the SEC not later than 120 days after the close of the fiscal year. For this purpose, the Compensation Committee Report included in the 2008 Proxy Statement is specifically not incorporated herein.
| Item 11. | Executive Compensation |
Certain information relating to our directors and executive officers, executive compensation, security ownership of certain beneficial owners and management and related stockholder matters, and certain relationships and related transactions is incorporated by reference herein from our 2008 Proxy Statement. For this purpose, the Compensation Committee Report included in the 2008 Proxy Statement is specifically not incorporated herein.
| Item 12. | Security Ownership of Certain Beneficial Owners and Management and Related Stockholder Matters |
Certain information relating to our directors and executive officers, executive compensation, security ownership of certain beneficial owners and management and related stockholder matters, and certain relationships and related transactions is incorporated by reference herein from our 2008 Proxy Statement.
| Item 13. | Certain Relationships and Related Transactions, and Director Independence |
Certain information relating to our directors and executive officers, executive compensation, security ownership of certain beneficial owners and management and related stockholder matters, and certain relationships and related transactions is incorporated by reference herein from our 2008 Proxy Statement.
| Item 14. | Principal Accountant Fees and Services |
Certain information relating to audit fees and other of LTX-Credence’s independent registered public accounting firm is incorporated by reference herein from our 2008 Proxy Statement. For this purpose, the Audit Committee Report included in the 2008 Proxy Statement is specifically not incorporated herein.
69
PART IV
| Item 15. | Exhibits and Financial Statement Schedules |
(A) 1. Financial Statements
The following consolidated financial statements of the Company for the fiscal year ended July 31, 2008, are included in Item 8, herein.
| | |
Report of Ernst & Young LLP, Independent Registered Public Accounting Firm | | 65 |
| |
Consolidated Balance Sheets—July 31, 2008 and 2007 | | 35 |
| |
Consolidated Statements of Operations and Comprehensive Income (Loss) for the years ended July 31, 2008, 2007, and 2006 | | 36 |
| |
Consolidated Statements of Stockholders’ Equity for the years ended July 31, 2008, 2007, and 2006 | | 37 |
| |
Consolidated Statements of Cash Flows for the years ended July 31, 2008, 2007, and 2006 | | 38 |
| |
Notes to the Consolidated Financial Statements | | 39 |
(A) 2. Financial Statement Schedules
Consolidated financial statement Schedule II for the Company is included in Item 15(c). All other schedules for which provision is made in the applicable security regulation of the Securities and Exchange Commission are not required under the related instructions or are inapplicable and therefore have been omitted.
(A) 3. Exhibits
Certain of the exhibits listed hereunder have previously been filed with the Commission as exhibits to the Company’s Registration Statement No. 2-75470 on Form S-1 filed December 23, 1981, as amended (the 1981 Registration Statement); to the Company’s Registration Statement No. 2-94218 on Form S-1 filed November 8, 1984, as amended (the 1984 Registration Statement); to the Company’s Registration Statement No. 33-35401 on Form S-4 filed June 26, 1990, as amended (the 1990 Registration Statement No. 1); to the Company’s Registration Statement No. 33-39610 on Form S-3 filed June 10, 1991, as amended (the 1991 Registration Statement No. 1); to the Company’s Amendment No. 1 to Registration Statement No. 33-62125 on Form S-3 filed September 11, 1995 (the 1995 Registration Statement No. 1); to the Company’s Registration No. 333-106163 on Form S-8 filed June 16, 2003 (the “2003 S-8”); to the Company’s Registration No. 333-11814 on Form S-8 filed January 9, 2004 (the “2004 S-8”); to the Company’s Registration Statement No. 333-121379 on Form S-8 filed on December 12, 2004 (the “December 2004 S-8”); to the Company’s Form 8A/A filed September 30, 1993 amending the Company’s Registration Statement on Form 8-A filed November 24, 1982 (the 1993 8A/A); to the Company’s Current Reports on Form 8-K filed May 11, 1989 and April 3, 2002; the Company’s Annual Reports on Form 10-K for one of the years ended July 31, 2004, 2003, 2002, 2001, 1998, 1997, 1996, 1995, 1994, 1993, 1992, 1991, 1990, 1989, 1988, 1987, 1986, 1985, 1984 and 1983; or the Company’s Quarterly Reports on 10-Q for one of the quarters ended October 31, 1997, January 31, 1998, April 30, 1998, January 31, October 31, 1999 and January 31, 2000, April 30, 2001, January 31, 2002, January 31, 2003, January 31, 2004, October 31, 2004, April 30, 2005, October 31, 2005, January 31, 2006 and January 31, 2007 and are hereby incorporated by reference. The location of each document so incorporated by reference is noted parenthetically.
(A) Listing of Exhibits
| | |
Exhibit No. | | Description |
| 2.1 | | Agreement and Plan of Merger, dated as of June 20, 2008, by and among the Registrant, Zoo Merger Corporation and Credence Systems Corporation (Incorporated by reference to Exhibit 2.1 to the Registrant’s Current Report on Form 8-K filed on June 23, 2008) |
| |
| 3.1 | | Articles of Organization, as amended (Incorporated by reference to Exhibit 3.1 to the Registrant’s Registration Statement on Form S-3, as amended (File No. 033-62125)) |
70
| | |
Exhibit No. | | Description |
| 3.2 | | Articles of Amendment to Articles of Organization (Incorporated by reference to Exhibit 3.1 to the Registrant’s Current Report on Form 8-K filed on September 2, 2008) |
| |
| 3.3 | | By-laws, as amended (Incorporated by reference to Exhibit 3.2 to the Registrant’s Quarterly Report on Form 10-Q for the fiscal quarter ended October 31, 2007) |
| |
| 4.1 | | Rights Agreement, dated as of April 30, 1999, between the Registrant and BankBoston, N.A., as rights agent (Incorporated by reference to Exhibit 4.1 to the Registrant’s Current Report on Form 8-K filed on May 3, 1999) |
| |
| 4.2 | | Amendment to Rights Agreement, dated as of February 14, 2003, between the Registrant and EquiServe Trust Company, N.A. (as successor Rights Agent to BankBoston, N.A.), as rights agent (Incorporated by reference to Exhibit 4.1 to the Registrant’s Current Report on Form 8-K filed on February 14, 2003) |
| |
| 4.3 | | Amendment No. 2 to Rights Agreement, dated as of January 27, 2004, between the Registrant and EquiServe Trust Company, N.A., as rights agent (Incorporated by reference to Exhibit 4.1 to the Registrant’s Current Report on Form 8-K filed on January 28, 2004) |
| |
| 4.4 | | Amendment No. 3 to Rights Agreement, dated as of March 7, 2008, between the Registrant and Computershare Trust Company, N.A. (formerly known as EquiServe Trust Company, N.A.), as rights agent (Incorporated by reference to Exhibit 4.1 to the Registrant’s Quarterly Report on Form 10-Q for the fiscal quarter ended January 31, 2008) |
| |
| 4.5 | | Amendment No. 4 to Rights Agreement, dated as of June 20, 2008, between the Registrant and Computershare Trust Company, N.A., as rights agent (Incorporated by reference to Exhibit 4.1 to the Registrant’s Current Report on Form 8-K filed on June 23, 2008) |
| |
| 4.6 | | Indenture, dated as of August 8, 2001, between the Registrant and State Street Bank & Trust Company, as Trustee (Incorporated by reference to Exhibit 4.1 to the Registrant’s Annual Report on Form 10-K for the fiscal year ended July 31, 2001) |
| |
| 4.7 | | Indenture, dated as of December 20, 2006, between Credence Systems Corporation and The Bank of New York, as Trustee (Incorporated by reference to Exhibit 4.1 to Credence System Corporation’s Current Report on Form 8-K filed on December 21, 2006) |
| |
| 4.8 | | Form of Global 3.5% Convertible Senior Subordinated Note due 2010, issued on December 20, 2006 by Credence Systems Corporation (Incorporated by reference to Exhibit 4.2 to Credence System Corporation’s Current Report on Form 8-K filed on December 21, 2006) |
| |
| 4.9 | | Supplemental Indenture, dated as of August 29, 2008, among the Registrant, Credence Systems Corporation and The Bank of New York Mellon Trust Company, N.A. (Incorporated by reference to Exhibit 4.1 to the Registrant’s Current Report on Form 8-K filed on September 2, 2008) |
| |
| 10.1+ | | 1990 Stock Option Plan (Incorporated by reference to Exhibit 10(B) to the Registrant’s Quarterly Report on Form 10-Q for the quarter ended January 31, 1998) |
| |
| 10.2+ | | 1999 Stock Plan (Incorporated by reference to Exhibit 10(CC) to the Registrant’s Quarterly Report on Form 10-Q for the quarter ended October 31, 1999) |
| |
| 10.3+ | | STI 2000 Stock Option Plan (Incorporated by reference to Exhibit 4 to the Registrant’s Registration Statement on Form S-8 (File No. 333-106163)) |
| |
| 10.4+ | | 2001 Stock Plan (Incorporated by reference to Exhibit 10(FF) to the Registrant’s Quarterly Report on Form 10-Q for the quarter ended January 31, 2003) |
| |
| 10.5+ | | 2004 Stock Plan (Incorporated by reference to Exhibit 10.15 to the Registrant’s Quarterly Report on Form 10-Q for the quarter ended October 31, 2004) |
| |
| 10.6+ | | 2004 Employee Stock Purchase Plan (Incorporated by reference to Exhibit 4 to the Registrant’s Registration Statement on Form S-8 (File No. 333-111814)) |
71
| | |
Exhibit No. | | Description |
| 10.7+ | | Form of Nonstatutory Stock Agreement for Non-Employee Directors under the 2004 Stock Plan (Incorporated by reference to Exhibit 10.16 to the Registrant’s Quarterly Report on Form 10-Q for the quarter ended October 31, 2004) |
| |
| 10.8+ | | Form of Incentive Stock Option Agreement for Employees under the 2004 Stock Plan (Incorporated by reference to Exhibit 10.17 to the Registrant’s Quarterly Report on Form 10-Q for the quarter ended October 31, 2004) |
| |
| 10.9+ | | Form of Restricted Stock Unit Agreement (performance vested) under the 2004 Stock Plan (Incorporated by reference to Exhibit 10.20 to the Registrant’s Quarterly Report on Form 10-Q for the quarter ended January 31, 2006) |
| |
| 10.10+ | | Form of Restricted Stock Unit Agreement (time vested) under the 2004 Stock Plan (Incorporated by reference to Exhibit 10.21 to the Registrant’s Quarterly Report on Form 10-Q for the quarter ended January 31, 2006) |
| |
| 10.11+ | | Credence Systems Corporation 2005 Stock Incentive Plan, as amended (Incorporated by reference to Exhibit 10.1 to Credence System Corporation’s Current Report on Form 8-K filed on April 7, 2008) |
| |
| 10.12+ | | Deferred Compensation Plan effective as of December 1, 2001 (Incorporated by reference to Exhibit 10(GG) to the Registrant’s Quarterly Report on Form 10-Q for the quarter ended January 31, 2002) |
| |
| 10.13+ | | LTX 401(k) Adoption Agreement, Retirement Plan and Trust Agreement (Incorporated by reference to Exhibit 10(F) to the Registrant’s Annual Report on Form 10-K for the fiscal year ended July 31, 2002) |
| |
| 10.14+ | | Summary of Executive Bonus Plan (Incorporated by reference to Exhibit 10.8 to the Registrant’s Quarterly Report on Form 10-Q for the quarter ended January 31, 2006) |
| |
| 10.15+ | | Form of Change of Control Agreement entered into with certain executive officers (Incorporated by reference to Exhibit 10(Y) to the Registrant’s Quarterly Report on Form 10-Q for the quarter ended January 31, 1998) |
| |
| 10.16+ | | Form of Indemnification Agreement between the Registrant and each of its directors and officers (Incorporated by reference to Exhibit 10.1 to the Registrant’s Current Report on Form 8-K filed on September 23, 2008) |
| |
| 10.17+ | | Waiver Letter, dated as of June 20, 2008, by and between the Registrant and David G. Tacelli (Incorporated by reference to Exhibit 10.3 to the Registrant’s Current Report on Form 8-K filed on June 23, 2008) |
| |
| 10.18+ | | Waiver Letter, dated as of June 20, 2008, by and between the Registrant and Mark J. Gallenberger (Incorporated by reference to Exhibit 10.4 to the Registrant’s Current Report on Form 8-K filed on June 23, 2008) |
| |
| 10.19+ | | Retention Agreement, dated July 29, 2008, between the Registrant and Mark J. Gallenberger (Incorporated by reference to Exhibit 10.1 to the Registrant’s Current Report on Form 8-K filed on July 29, 2008) |
| 10.20+ | | Letter Agreement, dated July 29, 2008, between the Registrant and David G. Tacelli (Incorporated by reference to Exhibit 10.2 to the Registrant’s Current Report on Form 8-K filed on July 29, 2008) |
| |
| 10.21+ | | Letter Agreement, dated July 29, 2008, between the Registrant and Mark J. Gallenberger (Incorporated by reference to Exhibit 10.3 to the Registrant’s Current Report on Form 8-K filed on July 29, 2008) |
| |
| 10.22+ | | Executive Employment Agreement, dated as of June 11, 2008, by and between Credence Systems Corporation and Rance Hale (Incorporated by reference to Exhibit 10.1 to Credence Systems Corporation’s Current Report on Form 8-K filed on June 17, 2008) |
| |
| 10.23+ | | Executive Employment Agreement, dated as of March 13, 2006, by and between Credence Systems Corporation and Lavi Lev (Incorporated by reference to Exhibit 10.6 to Credence Systems Corporation’s Quarterly Report on Form 10-Q for the quarter ended February 3, 2007) |
72
| | |
Exhibit No. | | Description |
| 10.24+ | | Amendment No. 1 to Executive Employment Agreement, dated as of June 11, 2008, by and between Credence Systems Corporation and Lavi Lev (Incorporated by reference to Exhibit 10.2 to Credence System Corporation’s Current Report on Form 8-K filed on June 17, 2008) |
| |
| 10.25+ | | Executive Employment Agreement, dated January 1, 2008, by and between Credence Systems Corporation and Kevin C. Eichler (Incorporated by reference to Exhibit 10.1 to Credence System Corporation’s Current Report on Form 8-K filed on January 8, 2008) |
| |
| 10.26+ | | Amendment No. 1 to Executive Employment Agreement, dated as of June 11, 2008, by and between Credence Systems Corporation and Casey Eichler (Incorporated by reference to Exhibit 10.3 to Credence Systems Corporation’s Current Report on Form 8-K filed on June 17, 2008) |
| |
| 10.27+ | | Transition Services Agreement, dated June 20, 2008, by and between Lavi Lev and Credence Systems Corporation (Incorporated by reference to Exhibit 10.3 to Credence Systems Corporation’s Current Report on Form 8-K filed on June 23, 2008) |
| |
| 10.28+ | | Transition Services Agreement, dated June 20, 2008, by and between Kevin C. Eichler and Credence Systems Corporation (Incorporated by reference to Exhibit 10.4 to Credence System Corporation’s Current Report on Form 8-K filed on June 23, 2008) |
| |
| 10.29 | | Net Lease, dated December 21, 2005, by and between CFRI/Doherty University Avenue, L.L.C. and the Registrant, dated December 21, 2005 (Incorporated by reference to Exhibit 10.1 to the Registrant’s Current Report on Form 8-K filed on December 21, 2005) |
| |
| 10.30 | | Lease, dated February 27, 2007, between NRFC Milpitas Holdings, LLC and Credence Systems Corporation (Incorporated by reference to Exhibit 10.5 to Credence Systems Corporation’s Quarterly Report on Form 10-Q for the fiscal quarter ended February 3, 2007) |
| |
| 10.31 | | Absolutely Net Office Lease, dated January 7, 2008, by and between Credence Systems Corporation and Five Oaks Flex, LLC (Incorporated by reference to Exhibit 10.33 to Credence Systems Corporation’s Annual Report on Form 10-K for the fiscal year ended November 3, 2007) |
| |
| 10.32 | | Absolutely Net Office Lease, dated January 7, 2008, by and between Credence Systems Corporation and Five Oaks Office, LLC (Incorporated by reference to Exhibit 10.34 to Credence Systems Corporation’s Annual Report on Form 10-K for the fiscal year ended November 3, 2007) |
| |
| 10.33 | | Loan and Security Agreement dated as of December 7, 2006 between the Registrant and Silicon Valley Bank (Incorporated by reference to Exhibit 10.9 to the Registrant’s Quarterly Report on Form 10-Q for the fiscal quarter ended January 31, 2007) |
| |
| 10.34 | | Form of Credence Systems Corporation Stockholder Voting Agreement (Incorporated by reference to Exhibit 10.1 to the Registrant’s Current Report on Form 8-K filed on June 23, 2008) |
| |
| 10.35 | | Form of LTX Stockholder Voting Agreement (Incorporated by reference to Exhibit 10.2 to the Registrant’s Current Report on Form 8-K filed on June 23, 2008) |
| |
| 21.1 | | Subsidiaries of the Registrant |
| |
| 23.1 | | Consent of Ernst & Young LLP |
| |
| 31.1 | | Rule 13-a-14(a) Certification of David G. Tacelli, CEO |
| |
| 31.2 | | Rule 13-a-14(a) Certification of Mark J. Gallenberger, CFO |
| |
| 32.1 | | Section 1350 Certification of CEO and CFO |
| + | This exhibit is a compensatory plan or arrangement in which executive officers or directors of the Registrant participate. |
Pursuant to Item 601 of Regulation S-K, certain instruments with respect to long-term debt not exceeding 10% of the total assets of the Company and its subsidiaries on a consolidated basis are not filed herewith. The Company hereby agrees to furnish to the Commission a copy of each such instrument upon request.
73
Item 15(b). Exhibits
Exhibit 21—Subsidiaries of Registrant
Subsidiaries of Registrant
| | | | |
Entity Name | | Jurisdiction
of Organization | | % Ownership |
LTX (Europe) Limited | | United Kingdom | | 100 |
LTX International Inc., Domestic International Sales Corporation (DISC) | | Delaware | | 100 |
LTX (Deutschland) GmBH | | Germany | | 100 |
LTX France S.A. | | France | | 100 |
LTX Test Systems Corporation | | Delaware | | 100 |
LTX (Italia) S.r. | | Italy | | 100 |
LTX (Foreign Sales Corporation) B.V. | | The Netherlands | | 100 |
LTX Asia International, Inc. | | Delaware | | 100 |
LTX Israel Limited | | Israel | | 100 |
LTX (Malaysia) SDN.BHD | | Malaysia | | 100 |
LTX LLC | | Delaware | | 100 |
LTX (Shanghai) Co., Ltd. | | China | | 100 |
The subsidiaries of LTX-Credence Corporation listed above are all included in the consolidated financial statements of the Registrant.
On August 29, 2008, LTC-Credence Corporation completed the a merger with Credence Systems Corporation, pursuant to which Credence Systems Corporation became a wholly owned subsidiary of LTX-Credence Corporation. Set forth below is information with respect to Credence Systems Corporation and its subsidiaries, all of which became subsidiaries of the Registrant on August 29, 2008.
| | | | |
Entity Name | | Jurisdiction
of Organization | | % Ownership |
Credence Systems Corporation | | Delaware | | 100 |
Wholly owned subsidiaries: | | | | |
Credence Capital Corporation | | California | | 100 |
Credence International Limited, Inc. | | Delaware | | 100 |
Wholly owned subsidiary: | | | | |
Credence Korea Ltd. | | South Korea | | 100 |
Credence International Ltd. | | British Virgin Islands | | 100 |
Wholly owned subsidiaries: | | | | |
Credence Systems Pte Ltd. | | Singapore | | 100 |
NPTest (Philippines) Inc. | | Philippines | | 100 |
NPTest UK Ltd. | | United Kingdom | | 100 |
Wholly owned subsidiary: | | | | |
Credence France SAS | | France | | 100 |
Credence Systems KK | | Japan | | 100 |
Credence Systems (M) Sdn BhD | | Malaysia | | 100 |
Credence Systems (P), Inc. | | Philippines | | 100 |
Credence Europa Ltd | | United Kingdom | | 100 |
Wholly owned subsidiaries: | | | | |
Credence Systems GmbH | | Germany | | 100 |
Credence Systems (UK) Limited | | United Kingdom | | 100 |
Credence Italia Srl | | Italy | | 100 |
Credence Systems Armenia L.L.C. | | Republic of Armenia | | 100 |
Hypervision, Inc. | | California | | 100 |
74
Item 15(c)
SCHEDULE II
LTX CORPORATION
VALUATION AND QUALIFYING ACCOUNTS
For Years Ended July 31, 2008, 2007 and 2006
(in thousands)
| | | | | | | | | | | | | |
Description | | Balance at
beginning
of period | | Charged
to expense | | Deductions (1) | | | Balance
at end
of period |
Reserve for sales returns, allowances and doubtful accounts | | | | | | | | | | | | | |
July 31, 2008 | | $ | 1,250 | | $ | 100 | | $ | (691 | ) | | $ | 659 |
July 31, 2007 | | $ | 1,303 | | $ | 0 | | $ | (53 | ) | | $ | 1,250 |
July 31, 2006 | | $ | 1,648 | | $ | 0 | | $ | (345 | ) | | $ | 1,303 |
Reserve for other accounts receivable | | | | | | | | | | | | | |
July 31, 2008 | | $ | 290 | | $ | 221 | | $ | (504 | ) | | $ | 7 |
July 31, 2007 | | $ | 88 | | $ | 280 | | $ | (78 | ) | | $ | 290 |
July 31, 2006 | | $ | 258 | | $ | 0 | | $ | (170 | ) | | $ | 88 |
Reserve for excess and obsolete inventory (2) | | | | | | | | | | | | | |
July 31, 2008 | | $ | 41,417 | | $ | 904 | | $ | (7,133 | ) | | $ | 35,188 |
July 31, 2007 | | $ | 46,472 | | $ | 4,874 | | $ | (9,935 | ) | | $ | 41,417 |
July 31, 2006 | | $ | 99,644 | | $ | 1,684 | | $ | (54,856 | ) | | $ | 46,472 |
| (1) | Represents amounts written off or utilization of reserve. |
| (2) | Amounts charged to expense include inventory provisions related to product transitions and adverse business conditions of $0.4 million, $4.2 million and $0.2 million for fiscal years 2008, 2007 and 2006, respectively. Also included in amounts charged to expense and recorded in cost of sales are inventory reserves established relating to product deemed defective or unusable during the normal manufacturing process of $0.5 million, $0.7 million and $1.5 million for the fiscal years 2008, 2007 and 2006, respectively. |
75
SIGNATURES
Pursuant to the requirements of Section 13 or 15(d) of the Securities Exchange Act of 1934, the registrant has duly caused this report to be signed on its behalf by the undersigned, thereunto duly authorized.
| | |
| LTX-Credence CORPORATION |
| |
| By: | | /s/ DAVID G. TACELLI |
| | David G. Tacelli |
| | President and Chief Executive Officer |
October 14, 2008
Pursuant to the requirements of the Securities and Exchange Act of 1934, this report has been signed below by the following persons on behalf of the registrant and in the capacities and on the dates indicated.
| | | | |
| | |
/S/ LAVI A. LEV Lavi A. Lev | | Executive Chairman of the Board | | October 14, 2008 |
| | |
/S/ DAVID G. TACELLI David G. Tacelli | | President and Chief Executive Officer (Principal Executive Officer) | | October 14, 2008 |
| | |
/S/ MARK J. GALLENBERGER Mark J. Gallenberger | | Vice President, Chief Financial Officer and Treasurer (Principal Financial Officer) | | October 14, 2008 |
| | |
/S/ DANIEL V. WALLACE Daniel V. Wallace | | Controller, (Principal Accounting Officer) | | October 14, 2008 |
| | |
/S/ MARK S. AIN Mark S. Ain | | Director | | October 14, 2008 |
| | |
/S/ ROGER W. BLETHEN Roger W. Blethen | | Director | | October 14, 2008 |
| | |
/S/ LORI HOLLAND Lori Holland | | Director | | October 11, 2008 |
| | |
/S/ STEPHEN M. JENNINGS Stephen M. Jennings | | Director | | October 14, 2008 |
| | |
/S/ ROGER J. MAGGS Roger J. Maggs | | Director | | October 14, 2008 |
| | |
/S/ BRUCE R. WRIGHT Bruce R. Wright | | Director | | October 14, 2008 |
| | |
Ping Yang | | Director | | October , 2008 |
76