UNITED STATES
SECURITIES AND EXCHANGE COMMISSION
Washington, D.C. 20549
FORM N-CSR
CERTIFIED SHAREHOLDER REPORT OF REGISTERED
MANAGEMENT INVESTMENT COMPANIES
Investment Company Act file number 811-03361
Fidelity Massachusetts Municipal Trust
(Exact name of registrant as specified in charter)
245 Summer St., Boston, MA 02210
(Address of principal executive offices) (Zip code)
Margaret Carey, Secretary
245 Summer St.
Boston, Massachusetts 02210
(Name and address of agent for service)
Registrant's telephone number, including area code:
617-563-7000
| |
Date of fiscal year end: | January 31 |
|
|
Date of reporting period: | July 31, 2023 |
Item 1.
Reports to Stockholders
Fidelity® Massachusetts Municipal Money Market Fund
Semi-Annual Report
July 31, 2023
Contents
To view a fund's proxy voting guidelines and proxy voting record for the 12-month period ended June 30, visit http://www.fidelity.com/proxyvotingresults or visit the Securities and Exchange Commission's (SEC) web site at http://www.sec.gov.
You may also call 1-800-544-8544, or for Institutional, call 1-877-208-0098, to request a free copy of the proxy voting guidelines.
Standard & Poor's, S&P and S&P 500 are registered service marks of The McGraw-Hill Companies, Inc. and have been licensed for use by Fidelity Distributors Corporation.
Other third-party marks appearing herein are the property of their respective owners.
All other marks appearing herein are registered or unregistered trademarks or service marks of FMR LLC or an affiliated company. © 2023 FMR LLC. All rights reserved.
This report and the financial statements contained herein are submitted for the general information of the shareholders of the Fund. This report is not authorized for distribution to prospective investors in the Fund unless preceded or accompanied by an effective prospectus.
A fund files its complete schedule of portfolio holdings with the SEC for the first and third quarters of each fiscal year on Form N-PORT. Forms N-PORT are available on the SEC's web site at http://www.sec.gov. A fund's Forms N-PORT may be reviewed and copied at the SEC's Public Reference Room in Washington, DC. Information regarding the operation of the SEC's Public Reference Room may be obtained by calling 1-800-SEC-0330.
For a complete list of a fund's portfolio holdings, view the most recent holdings listing, semiannual report, or annual report on Fidelity's web site at http://www.fidelity.com, http://www.institutional.fidelity.com, or http://www.401k.com, as applicable.
NOT FDIC INSURED •MAY LOSE VALUE •NO BANK GUARANTEE
Neither the Fund nor Fidelity Distributors Corporation is a bank.
| Current 7-Day Yields |
| | | |
| Fidelity® Massachusetts Municipal Money Market Fund | 3.07% | |
| Institutional Class | 3.28% | |
| Premium Class | 3.19% | |
| | | |
Yield refers to the income paid by the Fund over a given period. Yield for money market funds is usually for seven-day periods, as it is here, though it is expressed as an annual percentage rate. Past performance is no guarantee of future results. Yield will vary and it's possible to lose money investing in the Fund. A portion of the Fund's expenses was reimbursed and/or waived. Absent such reimbursements and/or waivers the yield for the period ending July 31, 2023, the most recent period shown in the table, would have been 3.24% for Institutional Class. | |
| Effective Maturity Diversification (% of Fund's Investments) |
| Days |
| 1 - 7 | 74.3 | |
| 8 - 30 | 2.6 | |
| 31 - 60 | 6.8 | |
| 61 - 90 | 6.4 | |
| 91 - 180 | 4.7 | |
| > 180 | 5.2 | |
| Effective maturity is determined in accordance with the requirements of Rule 2a-7 under the Investment Company Act of 1940. |
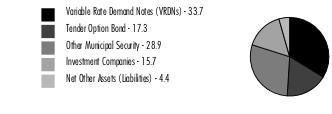
Asset Allocation (% of Fund's net assets) |
|
|
Showing Percentage of Net Assets
| Variable Rate Demand Note - 33.7% |
| | | Principal Amount (a) | Value ($) |
| Alabama - 0.4% | | | |
| Decatur Indl. Dev. Board Exempt Facilities Rev. (Nucor Steel Decatur LLC Proj.) Series 2003 A, 4.52% 8/7/23, VRDN (b)(c) | | 9,643,000 | 9,643,000 |
| Arizona - 0.2% | | | |
| Maricopa County Poll. Cont. Rev. Series 2009 C, 4.1% 8/7/23, VRDN (b) | | 5,400,000 | 5,400,000 |
| Arkansas - 0.0% | | | |
| Blytheville Indl. Dev. Rev. (Nucor Corp. Proj.) Series 1998, 4.52% 8/7/23, VRDN (b)(c) | | 400,000 | 400,000 |
| Delaware - 0.0% | | | |
| Delaware Econ. Dev. Auth. Rev. (Delmarva Pwr. & Lt. Co. Proj.) Series 1993 C, 4.17% 8/7/23, VRDN (b) | | 100,000 | 100,000 |
| Indiana - 0.0% | | | |
| Indiana Dev. Fin. Auth. Envir. Rev. (PSI Energy Proj.) Series 2003 B, 4.17% 8/7/23, VRDN (b)(c) | | 900,000 | 900,000 |
| Kansas - 0.1% | | | |
| Burlington Envir. Impt. Rev. (Kansas City Pwr. and Lt. Co. Proj.): | | | |
| Series 2007 A, 4.09% 8/7/23, VRDN (b) | | 2,200,000 | 2,200,000 |
| Series 2007 B, 4.09% 8/7/23, VRDN (b) | | 1,000,000 | 1,000,000 |
| Wamego Kansas Poll. Cont. Rfdg. Rev. (Western Resources, Inc. Proj.) Series 1994, 4.05% 8/7/23, VRDN (b) | | 700,000 | 700,000 |
TOTAL KANSAS | | | 3,900,000 |
| Louisiana - 0.3% | | | |
| Saint James Parish Gen. Oblig. (Nucor Steel Louisiana LLC Proj.) Series 2010 B1, 4.3% 8/7/23, VRDN (b) | | 6,480,000 | 6,480,000 |
| Massachusetts - 32.4% | | | |
| Boston Wtr. & Swr. Commission Rev. Series 1994 A, 3.71% 8/7/23, LOC State Street Bank & Trust Co., Boston, VRDN (b) | | 3,410,000 | 3,410,000 |
| Massachusetts Bay Trans. Auth. Series 2022 A1, 4% 8/7/23 (Liquidity Facility TD Banknorth, NA), VRDN (b) | | 26,000,000 | 26,000,000 |
| Massachusetts Bay Trans. Auth. Sales Tax Rev. Series 2022 A, 4% 8/7/23 (Liquidity Facility TD Banknorth, NA), VRDN (b) | | 1,500,000 | 1,500,000 |
| Massachusetts Dept. of Trans. Metropolitan Hwy. Sys. Rev.: | | | |
| Series 2010 A1, 4.03% 8/7/23, LOC TD Banknorth, NA, VRDN (b) | | 42,300,000 | 42,300,000 |
| Series 2010 A2, 4% 8/7/23, LOC TD Banknorth, NA, VRDN (b) | | 72,785,000 | 72,785,000 |
| Series 2022 A1, 4.07% 8/7/23 (Liquidity Facility TD Banknorth, NA), VRDN (b) | | 27,895,000 | 27,895,000 |
| Massachusetts Dev. Fin. Agcy. Rev.: | | | |
| (Babson College Proj.) Series 2008 A, 3.8% 8/7/23, LOC Bank of America NA, VRDN (b) | | 19,910,000 | 19,910,000 |
| (Boston Univ. Proj.) Series U-6E, 4.45% 8/1/23, LOC TD Banknorth, NA, VRDN (b) | | 10,675,000 | 10,675,000 |
| (College of the Holy Cross Proj.) Series 2008 A, 4.4% 8/1/23, LOC Bank of America NA, VRDN (b) | | 22,635,000 | 22,635,000 |
| (ISO New England, Inc. Proj.) Series 2005, 3.98% 8/7/23, LOC TD Banknorth, NA, VRDN (b) | | 15,825,000 | 15,825,000 |
| (Worcester Polytechnic Institute Proj.) Series 2008 A, 3.81% 8/7/23, LOC TD Banknorth, NA, VRDN (b) | | 29,890,000 | 29,890,000 |
| Series 2006: | | | |
3.98% 8/7/23, LOC TD Banknorth, NA, VRDN (b) | | 1,260,000 | 1,260,000 |
4.1% 8/7/23, LOC PNC Bank NA, VRDN (b) | | 22,005,000 | 22,005,000 |
| Massachusetts Health & Edl. Facilities Auth. Rev.: | | | |
| (Amherst College Proj.): | | | |
Series 2005 I, 3.75% 8/7/23, VRDN (b) | | 13,550,000 | 13,550,000 |
Series 2005 J1, 3.75% 8/7/23, VRDN (b) | | 29,450,000 | 29,450,000 |
Series 2005 J2, 4.45% 8/1/23, VRDN (b) | | 12,750,000 | 12,750,000 |
| (Baystate Health Sys. Proj.): | | | |
Series 2009 J1, 4.01% 8/7/23, LOC TD Banknorth, NA, VRDN (b) | | 33,000,000 | 33,000,000 |
Series 2009 J2, 4.45% 8/1/23, LOC TD Banknorth, NA, VRDN (b) | | 3,000,000 | 3,000,000 |
Series 2009 K, 4.01% 8/7/23, LOC Bank of America NA, VRDN (b) | | 26,265,000 | 26,265,000 |
| (Harvard Univ. Proj.): | | | |
Series R, 3.95% 8/1/23, VRDN (b) | | 15,325,000 | 15,325,000 |
Series Y, 3.8% 8/7/23, VRDN (b) | | 94,630,000 | 94,630,000 |
| (Massachusetts Institute of Technology Proj.): | | | |
Series 2001 J1, 3.9% 8/7/23, VRDN (b) | | 40,800,000 | 40,800,000 |
Series 2001 J2, 3.8% 8/7/23, VRDN (b) | | 69,270,000 | 69,270,000 |
| (Partners HealthCare Sys., Inc. Proj.) Series 2005 F, 3.96% 8/7/23, LOC TD Banknorth, NA, VRDN (b) | | 14,800,000 | 14,800,000 |
| (Williams College Proj.) Series J, 3.76% 8/7/23, VRDN (b) | | 9,214,000 | 9,214,000 |
| Series 2009 O-1, 3.88% 8/7/23, LOC Fed. Home Ln. Bank of Boston, VRDN (b) | | 6,765,000 | 6,765,000 |
| Massachusetts Hsg. Fin. Agcy. Hsg. Rev.: | | | |
| (Princeton Westford Proj.) Series 2015 A, 3.98% 8/7/23, LOC Bank of America NA, VRDN (b) | | 29,570,000 | 29,570,000 |
| Series 208, 3.95% 8/7/23 (Liquidity Facility Royal Bank of Canada), VRDN (b) | | 5,800,000 | 5,800,000 |
| Massachusetts Hsg. Fin. Agcy. Multi-Family Rev. Series 2013 F, 4.05% 8/7/23, LOC TD Banknorth, NA, VRDN (b)(c) | | 21,465,000 | 21,465,000 |
| Massachusetts Wtr. Resources Auth. Wtr. & Swr. Rev.: | | | |
| Series 1999 B, 4% 8/7/23, LOC TD Banknorth, NA, VRDN (b) | | 29,000,000 | 29,000,000 |
| Series 2008 C2, 3.45% 8/7/23 (Liquidity Facility Barclays Bank PLC), VRDN (b) | | 25,160,000 | 25,160,000 |
| FHLMC Massachusetts Dev. Fin. Agcy. Multi-family Hsg. Rev. (Tammy Brook Apts. Proj.) Series 2009, 3.95% 8/7/23, LOC Freddie Mac, VRDN (b) | | 8,515,000 | 8,515,000 |
| FNMA Massachusetts Dev. Fin. Agcy. Multi-family Hsg. Rev. (Avalon Acton Apts. Proj.) Series 2006, 4% 8/7/23, LOC Fannie Mae, VRDN (b)(c) | | 45,000,000 | 45,000,000 |
TOTAL MASSACHUSETTS | | | 829,419,000 |
| Nebraska - 0.2% | | | |
| Stanton County Indl. Dev. Rev.: | | | |
| (Nucor Corp. Proj.) Series 1996, 4.52% 8/7/23, VRDN (b)(c) | | 3,700,000 | 3,700,000 |
| Series 1998, 4.52% 8/7/23, VRDN (b)(c) | | 300,000 | 300,000 |
TOTAL NEBRASKA | | | 4,000,000 |
| Tennessee - 0.1% | | | |
| Memphis-Shelby County Indl. Dev. Board Facilities Rev. Series 2007, 4.52% 8/7/23, VRDN (b)(c) | | 2,330,000 | 2,330,000 |
| TOTAL VARIABLE RATE DEMAND NOTE (Cost $862,572,000) | | | 862,572,000 |
| | | | |
| Tender Option Bond - 17.3% |
| | | Principal Amount (a) | Value ($) |
| Florida - 0.1% | | | |
| Palm Beach County Health Facilities Auth. Hosp. Rev. Participating VRDN Series XG 03 70, 4.08% 8/7/23 (Liquidity Facility Bank of America NA) (b)(d)(e) | | 1,860,000 | 1,860,000 |
| South Miami Health Facilities Auth. Hosp. Rev. Participating VRDN Series XM 08 68, 4.18% 8/7/23 (Liquidity Facility JPMorgan Chase Bank) (b)(d)(e) | | 700,000 | 700,000 |
TOTAL FLORIDA | | | 2,560,000 |
| Georgia - 0.0% | | | |
| Fulton County Dev. Auth. Rev. Participating VRDN Series XL 02 68, 4.08% 8/7/23 (Liquidity Facility Bank of America NA) (b)(d)(e) | | 270,000 | 270,000 |
| Maryland - 0.1% | | | |
| Baltimore Proj. Rev. Bonds Series Floaters G 28, 4.18%, tender 1/2/24 (Liquidity Facility Royal Bank of Canada) (b)(d)(e)(f) | | 300,000 | 300,000 |
| Maryland Stadium Auth. Rev. Bonds Series 2023, 4.18%, tender 11/1/23 (Liquidity Facility Royal Bank of Canada) (b)(d)(e) | | 1,200,000 | 1,200,000 |
TOTAL MARYLAND | | | 1,500,000 |
| Massachusetts - 16.8% | | | |
| Massachusetts Commonwealth Trans. Fund Rev. Participating VRDN: | | | |
| Series 2022 XL 03 70, 3.99% 8/7/23 (Liquidity Facility Morgan Stanley Bank, West Valley City Utah) (b)(d)(e) | | 5,625,000 | 5,625,000 |
| Series 30 06 DB, 4.5% 8/1/23 (Liquidity Facility JPMorgan Chase Bank) (b)(d)(e) | | 21,520,000 | 21,520,000 |
| Series Floaters XF 06 10, 4.01% 8/7/23 (Liquidity Facility JPMorgan Chase Bank) (b)(d)(e) | | 13,495,000 | 13,495,000 |
| Series XM 10 79, 4.5% 8/7/23 (Liquidity Facility JPMorgan Chase Bank) (b)(d)(e) | | 4,000,000 | 4,000,000 |
| Massachusetts Dev. Fin. Agcy. Rev. Participating VRDN: | | | |
| Series 15 XF0245, 4.01% 8/7/23 (Liquidity Facility JPMorgan Chase Bank) (b)(d)(e) | | 12,800,000 | 12,800,000 |
| Series 2016 XF2207, 4.02% 8/7/23 (Liquidity Facility Toronto-Dominion Bank) (b)(d)(e) | | 4,000,000 | 4,000,000 |
| Series 2016 XM0137, 4.01% 8/7/23 (Liquidity Facility JPMorgan Chase Bank) (b)(d)(e) | | 7,815,000 | 7,815,000 |
| Series 2018 XF 26 55, 4.02% 8/7/23 (Liquidity Facility Bank of America NA) (b)(d)(e) | | 4,740,000 | 4,740,000 |
| Series 2022 XL 03 65, 4.01% 8/7/23 (Liquidity Facility UBS AG) (b)(d)(e) | | 4,340,000 | 4,340,000 |
| Series Floaters E 130, 4.01% 8/7/23 (Liquidity Facility Royal Bank of Canada) (b)(d)(e) | | 28,535,000 | 28,535,000 |
| Series Floaters YX 10 74, 3.84% 8/7/23 (Liquidity Facility Barclays Bank PLC) (b)(d)(e) | | 8,560,000 | 8,560,000 |
| Series MS 3373, 4% 8/7/23 (Liquidity Facility Toronto-Dominion Bank) (b)(d)(e) | | 8,000,000 | 8,000,000 |
| Massachusetts Edl. Fing. Auth. Rev. Participating VRDN: | | | |
| Series Floaters XF 25 11, 4.03% 8/7/23 (Liquidity Facility Barclays Bank PLC) (b)(c)(d)(e) | | 1,685,000 | 1,685,000 |
| Series Floaters XG 01 39, 4.03% 8/7/23 (Liquidity Facility Barclays Bank PLC) (b)(c)(d)(e) | | 13,055,000 | 13,055,000 |
| Series XM 07 57, 4.05% 8/7/23 (Liquidity Facility Royal Bank of Canada) (b)(c)(d)(e) | | 6,665,000 | 6,665,000 |
| Massachusetts Gen. Oblig. Participating VRDN: | | | |
| Series 16 XM0221, 4.01% 8/7/23 (Liquidity Facility JPMorgan Chase Bank) (b)(d)(e) | | 21,630,000 | 21,630,000 |
| Series 2022 ZL 03 66, 4.01% 8/7/23 (Liquidity Facility Morgan Stanley Bank, West Valley City Utah) (b)(d)(e) | | 5,000,000 | 5,000,000 |
| Series E 144, 4.01% 8/7/23 (Liquidity Facility Royal Bank of Canada) (b)(d)(e) | | 50,000,000 | 50,000,000 |
| Series E 148, 4.01% 8/7/23 (Liquidity Facility Royal Bank of Canada) (b)(d)(e) | | 40,000,000 | 40,000,000 |
| Series Floaters XF 05 30, 4.02% 8/7/23 (Liquidity Facility Toronto-Dominion Bank) (b)(d)(e) | | 6,665,000 | 6,665,000 |
| Series Floaters XF 27 06, 3.98% 8/7/23 (Liquidity Facility Barclays Bank PLC) (b)(d)(e) | | 26,400,000 | 26,400,000 |
| Series ZL 03 39, 4.01% 8/7/23 (Liquidity Facility Morgan Stanley Bank, West Valley City Utah) (b)(d)(e) | | 6,000,000 | 6,000,000 |
| Massachusetts Health & Edl. Facilities Auth. Rev. Participating VRDN: | | | |
| Series 16 XG0014, 4% 8/7/23 (Liquidity Facility Bank of America NA) (b)(d)(e) | | 5,550,000 | 5,550,000 |
| Series Floaters XM 02 32, 4% 8/7/23 (Liquidity Facility Bank of America NA) (b)(d)(e) | | 6,010,000 | 6,010,000 |
| Massachusetts Port Auth. Rev. Participating VRDN: | | | |
| Series 2022 039, 4.58% 8/1/23 (Liquidity Facility Barclays Bank PLC) (b)(c)(d)(e) | | 1,240,000 | 1,240,000 |
| Series 2022 XF 30 54, 4.03% 8/7/23 (Liquidity Facility Morgan Stanley Bank, West Valley City Utah) (b)(c)(d)(e) | | 11,250,000 | 11,250,000 |
| Series XL 00 73, 4.52% 8/1/23 (Liquidity Facility JPMorgan Chase Bank) (b)(c)(d)(e) | | 8,100,000 | 8,100,000 |
| Massachusetts School Bldg. Auth. Dedicated Sales Tax Rev. Participating VRDN: | | | |
| Series 2022 XL 03 71, 4.5% 8/1/23 (Liquidity Facility JPMorgan Chase Bank) (b)(d)(e) | | 2,535,000 | 2,535,000 |
| Series EGL 15 0004, 4% 8/7/23 (Liquidity Facility Citibank NA) (b)(d)(e) | | 63,360,000 | 63,360,000 |
| Series Floaters XF 27 75, 4.01% 8/7/23 (Liquidity Facility Morgan Stanley Bank, West Valley City Utah) (b)(d)(e) | | 9,750,000 | 9,750,000 |
| Series XM 10 51, 3.99% 8/7/23 (Liquidity Facility Royal Bank of Canada) (b)(d)(e) | | 13,425,000 | 13,425,000 |
| Saugus Gen. Oblig. Participating VRDN Series Floaters XF 06 81, 4.02% 8/3/23 (Liquidity Facility Toronto-Dominion Bank) (b)(d)(e) | | 7,615,000 | 7,615,000 |
TOTAL MASSACHUSETTS | | | 429,365,000 |
| Michigan - 0.0% | | | |
| Mclaren Health Care Corp. Participating VRDN Series XL 02 71, 4.08% 8/7/23 (Liquidity Facility Bank of America NA) (b)(d)(e) | | 185,000 | 185,000 |
| Nevada - 0.0% | | | |
| Clark County School District Participating VRDN Series XF 14 73, 4.1% 8/7/23 (Liquidity Facility JPMorgan Chase Bank) (b)(d)(e) | | 900,000 | 900,000 |
| New York - 0.0% | | | |
| New York City Gen. Oblig. Participating VRDN Series 2020 003, 4.13% 9/11/23 (Liquidity Facility Wells Fargo Bank NA) (b)(d)(e) | | 700,000 | 700,000 |
| Ohio - 0.0% | | | |
| Cuyahoga County Ctfs. of Prtn. Participating VRDN Series Floaters XG 02 06, 4.08% 8/7/23 (Liquidity Facility Bank of America NA) (b)(d)(e) | | 200,000 | 200,000 |
| Pennsylvania - 0.1% | | | |
| Lehigh County Gen. Purp. Hosp. Rev. Participating VRDN Series BAML 23 50 39, 4.23% 9/5/23 (Liquidity Facility Bank of America NA) (b)(d)(e) | | 1,135,000 | 1,135,000 |
| Texas - 0.1% | | | |
| El Paso Wtr. & Swr. Rev. Bonds Series G 124, 4.18%, tender 9/1/23 (Liquidity Facility Royal Bank of Canada) (b)(d)(e)(f)(g) | | 705,000 | 705,000 |
| North Ft. Bend Wtr. Auth. Participating VRDN Series XL 04 22, 4.09% 8/7/23 (Liquidity Facility Wells Fargo Bank NA) (b)(d)(e) | | 2,315,000 | 2,315,000 |
TOTAL TEXAS | | | 3,020,000 |
| Virginia - 0.0% | | | |
| Virginia Pub. Bldg. Auth. Pub. Facilities Rev. Bonds Series Floaters G 40, 4.18%, tender 8/1/23 (Liquidity Facility Royal Bank of Canada) (b)(d)(e)(f) | | 100,000 | 100,000 |
| Washington - 0.1% | | | |
| Central Puget Sound Reg'l. Trans. Auth. Sales & Use Tax Rev. Bonds Series G 123, 4.18%, tender 11/1/23 (Liquidity Facility Royal Bank of Canada) (b)(d)(e)(f) | | 600,000 | 600,000 |
| Port of Seattle Rev. Participating VRDN Series XM 10 27, 4.12% 8/7/23 (Liquidity Facility JPMorgan Chase Bank) (b)(c)(d)(e) | | 2,000,000 | 2,000,000 |
TOTAL WASHINGTON | | | 2,600,000 |
| TOTAL TENDER OPTION BOND (Cost $442,535,000) | | | 442,535,000 |
| | | | |
| Other Municipal Security - 28.9% |
| | | Principal Amount (a) | Value ($) |
| Guam - 0.4% | | | |
| Guam Int'l. Arpt. Auth. Rev. Bonds Series 2013 C: | | | |
| 6.125% 10/1/23 (Pre-Refunded to 10/1/23 @ 100) (c) | | 1,855,000 | 1,863,633 |
| 6.25% 10/1/23 (Pre-Refunded to 10/1/23 @ 100) (c) | | 2,180,000 | 2,189,109 |
| 6.375% 10/1/23 (Pre-Refunded to 10/1/23 @ 100) (c) | | 5,200,000 | 5,229,658 |
TOTAL GUAM | | | 9,282,400 |
| Massachusetts - 28.5% | | | |
| Andover Gen. Oblig. Bonds Series 2021, 5% 9/15/23 | | 190,000 | 190,409 |
| Arlington Gen. Oblig. Bonds Series 2022, 5% 10/15/23 | | 400,000 | 401,231 |
| Ayer Massachusetts BAN Series 2023, 4.5% 10/12/23 | | 6,095,803 | 6,108,750 |
| Billerica Gen. Oblig. BAN Series 2023, 4% 9/18/23 | | 25,432,000 | 25,467,777 |
| Blue Hills Reg'l. Technical BAN Series 2022, 4.25% 11/3/23 | | 1,000,000 | 1,001,758 |
| Boston Gen. Oblig. Bonds Series 2023 A, 5% 11/1/23 | | 33,455,000 | 33,648,638 |
| Boston Wtr. & Swr. Commission Rev.: | | | |
| Bonds Series 2016 B, 5% 11/1/23 (Pre-Refunded to 11/1/23 @ 100) | | 100,000 | 100,354 |
| Series 2023 A, 3.23% 8/14/23, LOC TD Banknorth, NA, CP | | 38,500,000 | 38,500,000 |
| Bourne Gen. Oblig. BAN Series 2023, 4% 2/1/24 | | 465,000 | 466,169 |
| Burlington Gen. Oblig. BAN Series 2023, 5% 4/25/24 | | 12,200,000 | 12,360,237 |
| Central Berkshire Reg'l. School District Gen. Oblig. BAN Series 2022, 4% 9/29/23 | | 720,000 | 720,536 |
| Danvers Gen. Oblig. Bonds Series 2017, 5% 8/15/23 | | 120,000 | 120,055 |
| Deerfield Massachusetts BAN Series 2023, 4.5% 12/8/23 | | 9,781,000 | 9,809,751 |
| Dennis-Yarmouth Reg'l. School District BAN Series 2022, 4.5% 11/14/23 | | 1,000,000 | 1,004,342 |
| Duxbury Gen. Oblig. BAN Series 2023, 5% 5/1/24 | | 2,800,000 | 2,837,584 |
| Easthampton Massachusetts BAN Series 2023, 5% 7/9/24 | | 9,705,203 | 9,845,266 |
| Easton Gen. Oblig. BAN Series 2023, 5% 3/7/24 | | 10,000,000 | 10,101,961 |
| Falmouth Gen. Oblig. BAN Series 2023, 5% 10/13/23 | | 4,911,485 | 4,929,784 |
| Gloucester Gen. Oblig. BAN: | | | |
| Series 2022, 4% 9/15/23 | | 23,175,000 | 23,218,205 |
| Series 2023, 4.5% 9/15/23 | | 16,625,000 | 16,644,087 |
| Great Barrington BAN Series 2023, 5% 12/14/23 | | 6,997,290 | 7,027,925 |
| Greater Fall River Vocational BAN Series 2022, 4.5% 12/1/23 | | 10,000,000 | 10,039,800 |
| Hingham Gen. Oblig. BAN: | | | |
| Series 2023 B, 4% 2/16/24 | | 5,300,000 | 5,321,744 |
| Series 2023, 4% 2/16/24 | | 2,365,000 | 2,373,264 |
| Ipswich Gen. Oblig. BAN Series 2023, 5% 8/8/24 (h) | | 19,830,236 | 20,138,398 |
| Littleton Gen. Oblig. BAN Series 2023 B, 4.5% 11/17/23 | | 7,578,989 | 7,606,748 |
| Lynnfield Gen. Oblig. BAN Series 2023, 3% 2/8/24 | | 1,165,000 | 1,164,726 |
| Massachusetts Clean Wtr. Trust Bonds: | | | |
| Series 2004 A, 5.25% 8/1/23 | | 580,000 | 580,000 |
| Series 2014: | | | |
4% 8/1/23 | | 955,000 | 955,000 |
5% 8/1/23 | | 6,150,000 | 6,150,000 |
| Series 2017, 5% 8/1/23 | | 350,000 | 350,000 |
| Massachusetts Dev. Fin. Agcy. Elec. Util. Rev. Bonds Series 2023, 3.5% tender 8/3/23 (Massachusetts Elec. Co. Guaranteed), CP mode (c) | | 13,300,000 | 13,300,000 |
| Massachusetts Dev. Fin. Agcy. Hosp. Rev. Bonds Series 2013: | | | |
| 5.25% 11/15/23 (Pre-Refunded to 11/15/23 @ 100) | | 1,195,000 | 1,202,761 |
| 5.25% 11/15/23 (Pre-Refunded to 11/15/23 @ 100) | | 385,000 | 387,061 |
| Massachusetts Dev. Fin. Agcy. Rev. Bonds: | | | |
| (Partners Healthcare Sys., Inc. Proj.) Series 2017 S-4, 5%, tender 1/25/24 (b) | | 725,000 | 730,561 |
| Series 2013 A: | | | |
6.25% 11/15/23 (Pre-Refunded to 11/15/23 @ 100) (i) | | 500,000 | 504,105 |
6.5% 11/15/23 (Pre-Refunded to 11/15/23 @ 100) (i) | | 1,715,000 | 1,730,410 |
| Series 2014 A: | | | |
5% 9/1/23 (Pre-Refunded to 9/1/23 @ 100) | | 190,000 | 190,227 |
5% 9/1/23 (Pre-Refunded to 9/1/23 @ 100) | | 600,000 | 600,870 |
| Series 2019 DD 1, 5%, tender 10/2/23 (b) | | 2,650,000 | 2,664,199 |
| Series 2019 DD 2, 5%, tender 10/2/23 (b) | | 610,000 | 613,022 |
| Massachusetts Edl. Fing. Auth. Rev. Bonds Series 2015 A, 5% 1/1/24 (c) | | 3,500,000 | 3,526,957 |
| Massachusetts Gen. Oblig. Bonds: | | | |
| Series 2004 C, 5.5% 12/1/23 | | 3,480,000 | 3,506,685 |
| Series 2004, 5.25% 8/1/23 | | 10,200,000 | 10,200,000 |
| Series 2006 B, 5.25% 9/1/23 | | 9,505,000 | 9,522,873 |
| Series 2013 B, 5% 8/1/23 | | 5,495,000 | 5,495,000 |
| Series 2017 C, 5% 10/1/23 | | 330,000 | 331,005 |
| Series 2018 B, 5% 1/1/24 | | 130,000 | 130,904 |
| Series 2018 C, 5% 9/1/23 | | 2,000,000 | 2,003,576 |
| Series 2018 E, 5% 9/1/23 | | 175,000 | 175,268 |
| Series 2019 E, 3% 12/1/23 | | 24,785,000 | 24,798,363 |
| Series 2021 A, 5% 9/1/23 | | 9,785,000 | 9,801,722 |
| Series E, 5% 11/1/23 | | 965,000 | 969,969 |
| Massachusetts Health & Edl. Facilities Auth. Rev.: | | | |
| Bonds: | | | |
Series 2023 H1: | | | |
3.2% tender 10/4/23, CP mode | | 10,995,000 | 10,995,000 |
3.25% tender 8/2/23, CP mode | | 15,660,000 | 15,660,000 |
3.4% tender 8/1/23, CP mode | | 16,050,000 | 16,050,000 |
3.5% tender 8/3/23, CP mode | | 18,595,000 | 18,595,000 |
Series 2023 H2: | | | |
3.2% tender 10/5/23, CP mode | | 17,385,000 | 17,385,000 |
3.2% tender 10/10/23, CP mode | | 11,030,000 | 11,030,000 |
3.25% tender 8/7/23, CP mode | | 17,750,000 | 17,750,000 |
Series 2023: | | | |
3.18% tender 9/12/23, CP mode | | 12,640,000 | 12,640,000 |
3.22% tender 10/11/23, CP mode | | 19,585,000 | 19,585,000 |
| Series 2023 EE, 3% 8/9/23, CP | | 25,000,000 | 25,000,000 |
| Massachusetts Port Auth. Rev. Bonds: | | | |
| Series 2019 A, 5% 7/1/24 (c) | | 1,000,000 | 1,013,253 |
| Series 2019 C, 5% 7/1/24 (c) | | 685,000 | 693,359 |
| Massachusetts School Bldg. Auth. Dedicated Sales Tax Rev. Bonds Series 2018 A, 5% 2/15/24 (Pre-Refunded to 2/15/24 @ 100) | | 1,350,000 | 1,363,612 |
| Massachusetts Wtr. Resources Auth. Wtr. & Swr. Rev. Bonds: | | | |
| Series 2007 B, 5.25% 8/1/23 | | 8,350,000 | 8,350,000 |
| Series 2013 A: | | | |
5% 8/1/23 | | 595,000 | 595,000 |
5% 8/1/23 (Pre-Refunded to 8/1/23 @ 100) | | 220,000 | 220,000 |
| Series 2016 B, 4% 8/1/23 | | 100,000 | 100,000 |
| Series 2016 C, 5% 8/1/23 | | 515,000 | 515,000 |
| Series 2017 C, 5% 8/1/23 | | 1,945,000 | 1,945,000 |
| Series 2021 B, 5% 8/1/23 | | 255,000 | 255,000 |
| Melrose Gen. Oblig. BAN Series 2022, 4% 9/21/23 | | 6,162,471 | 6,174,214 |
| Nantucket Gen. Oblig. Bonds Series 2016, 5% 11/1/23 | | 355,000 | 356,463 |
| Needham Gen. Oblig. BAN Series 2023 B, 4.5% 10/16/23 | | 3,060,000 | 3,065,920 |
| Norfolk MA BAN Series 2023, 5% 5/3/24 | | 18,000,000 | 18,230,112 |
| North Reading Gen. Oblig. BAN Series 2023, 5% 5/23/24 | | 6,589,577 | 6,667,812 |
| Northbridge Gen. Oblig. BAN Series 2023, 5% 6/21/24 | | 15,950,000 | 16,141,400 |
| Orleans Gen. Oblig. Anticipation Notes BAN Series 2023, 4% 1/26/24 | | 675,000 | 676,831 |
| Plainville Gen. Oblig. BAN Series 2023, 5% 1/26/24 | | 3,250,000 | 3,270,520 |
| Salisbury Gen. Oblig. BAN Series 2022, 4% 9/8/23 | | 3,568,010 | 3,573,445 |
| Sudbury Gen. Oblig. BAN Series 2023, 5% 2/7/24 | | 5,000,000 | 5,035,837 |
| Town of Millbury BAN Series 2023, 4.5% 9/1/23 | | 20,000,000 | 20,032,755 |
| Town of Provincetown BAN Series 2023, 5% 6/21/24 | | 11,991,000 | 12,134,818 |
| Town of Southborough BAN Series 2023, 4.25% 10/12/23 | | 3,603,406 | 3,612,125 |
| Tyngsborough Gen. Oblig. BAN Series 2022, 4.25% 11/9/23 | | 130,000 | 130,285 |
| Waltham Gen. Oblig. BAN Series 2023: | | | |
| 4% 10/12/23 | | 60,665,000 | 60,823,761 |
| 4.5% 10/12/23 | | 5,924,585 | 5,932,041 |
| Weymouth Gen. Oblig. BAN Series 2022, 3.5% 8/25/23 | | 415,000 | 415,017 |
| Woods Hole, Martha's Vineyard & Nantucket Steamship Auth. BAN Series 2023, 5% 9/25/23 (Massachusetts Gen. Oblig. Guaranteed) | | 33,000,000 | 33,105,960 |
TOTAL MASSACHUSETTS | | | 730,689,577 |
| Michigan - 0.0% | | | |
| Kent Hosp. Fin. Auth. Hosp. Facilities Rev. Bonds (Spectrum Health Sys. Proj.) Series 2015 A, SIFMA Municipal Swap Index + 0.250% 4.23%, tender 2/26/24 (b)(g) | | 1,100,000 | 1,100,000 |
| TOTAL OTHER MUNICIPAL SECURITY (Cost $741,071,977) | | | 741,071,977 |
| | | | |
| Investment Company - 15.7% |
| | | Shares | Value ($) |
Fidelity Municipal Cash Central Fund 4.30% (j)(k) (Cost $403,165,966) | | 403,092,075 | 403,165,966 |
| | | | |
| TOTAL INVESTMENT IN SECURITIES - 95.6% (Cost $2,449,344,943) | 2,449,344,943 |
NET OTHER ASSETS (LIABILITIES) - 4.4% | 111,467,243 |
| NET ASSETS - 100.0% | 2,560,812,186 |
| | |
Security Type Abbreviations
| BAN | - | BOND ANTICIPATION NOTE |
| CP | - | COMMERCIAL PAPER |
| VRDN | - | VARIABLE RATE DEMAND NOTE (A debt instrument that is payable upon demand, either daily, weekly or monthly) |
The date shown for securities represents the date when principal payments must be paid, taking into account any call options exercised by the issuer and any permissible maturity shortening features other than interest rate resets.
Legend
| (a) | Amount is stated in United States dollars unless otherwise noted. |
| (b) | Coupon rates for floating and adjustable rate securities reflect the rates in effect at period end. |
| (c) | Private activity obligations whose interest is subject to the federal alternative minimum tax for individuals. |
| (d) | Provides evidence of ownership in one or more underlying municipal bonds. |
| (e) | Coupon rates are determined by re-marketing agents based on current market conditions. |
| (f) | Restricted securities (including private placements) - Investment in securities not registered under the Securities Act of 1933 (excluding 144A issues). At the end of the period, the value of restricted securities (excluding 144A issues) amounted to $1,705,000 or 0.1% of net assets. |
| (g) | Coupon is indexed to a floating interest rate which may be multiplied by a specified factor and/or subject to caps or floors. |
| (h) | Security or a portion of the security purchased on a delayed delivery or when-issued basis. |
| (i) | Security exempt from registration under Rule 144A of the Securities Act of 1933. These securities may be resold in transactions exempt from registration, normally to qualified institutional buyers. At the end of the period, the value of these securities amounted to $2,234,515 or 0.1% of net assets. |
| (j) | Information in this report regarding holdings by state and security types does not reflect the holdings of the Fidelity Municipal Cash Central Fund. |
| (k) | Affiliated fund that is generally available only to investment companies and other accounts managed by Fidelity Investments. The rate quoted is the annualized seven-day yield of the fund at period end. A complete unaudited listing of the fund's holdings as of its most recent quarter end is available upon request. In addition, each Fidelity Central Fund's financial statements are available on the SEC's website or upon request. |
| Additional information on each restricted holding is as follows: |
| Security | Acquisition Date | Cost ($) |
| Baltimore Proj. Rev. Bonds Series Floaters G 28, 4.18%, tender 1/2/24 (Liquidity Facility Royal Bank of Canada) | 1/03/23 | 300,000 |
| | | |
| Central Puget Sound Reg'l. Trans. Auth. Sales & Use Tax Rev. Bonds Series G 123, 4.18%, tender 11/1/23 (Liquidity Facility Royal Bank of Canada) | 2/09/23 | 600,000 |
| | | |
| El Paso Wtr. & Swr. Rev. Bonds Series G 124, 4.18%, tender 9/1/23 (Liquidity Facility Royal Bank of Canada) | 2/09/23 | 705,000 |
| | | |
| Virginia Pub. Bldg. Auth. Pub. Facilities Rev. Bonds Series Floaters G 40, 4.18%, tender 8/3/23 (Liquidity Facility Royal Bank of Canada) | 2/01/21 | 100,000 |
| | | |
Affiliated Central Funds
Fiscal year to date information regarding the Fund's investments in Fidelity Central Funds, including the ownership percentage, is presented below.
| Affiliate | Value, beginning of period ($) | Purchases ($) | Sales Proceeds ($) | Dividend Income ($) | Realized Gain (loss) ($) | Change in Unrealized appreciation (depreciation) ($) | Value, end of period ($) | % ownership, end of period |
| Fidelity Municipal Cash Central Fund 4.30% | 360,141,969 | 610,260,997 | 567,237,000 | 5,597,976 | - | - | 403,165,966 | 14.0% |
| Total | 360,141,969 | 610,260,997 | 567,237,000 | 5,597,976 | - | - | 403,165,966 | |
| | | | | | | | | |
Amounts in the dividend income column in the above table include any capital gain distributions from underlying funds, which are presented in the corresponding line item in the Statement of Operations, if applicable.
Amounts included in the purchases and sales proceeds columns may include in-kind transactions, if applicable.
Investment Valuation
All investments are categorized as Level 2 under the Fair Value Hierarchy. The inputs or methodology used for valuing securities may not be an indication of the risk associated with investing in these securities. For more information on valuation inputs, refer to the Investment Valuation section in the accompanying Notes to Financial Statements.
| Statement of Assets and Liabilities |
| | | | July 31, 2023 (Unaudited) |
| | | | | |
| Assets | | | | |
| Investment in securities, at value - See accompanying schedule: | | | | |
Unaffiliated issuers (cost $2,046,178,977) | $ | 2,046,178,977 | | |
Fidelity Central Funds (cost $403,165,966) | | 403,165,966 | | |
| | | | | |
| | | | | |
| Total Investment in Securities (cost $2,449,344,943) | | | $ | 2,449,344,943 |
| Cash | | | | 108,825,691 |
| Receivable for fund shares sold | | | | 24,016,192 |
| Interest receivable | | | | 14,011,023 |
| Distributions receivable from Fidelity Central Funds | | | | 1,061,764 |
| Receivable from investment adviser for expense reductions | | | | 54,092 |
| Other receivables | | | | 5,291 |
Total assets | | | | 2,597,318,996 |
| Liabilities | | | | |
| Payable for investments purchased | | | | |
Regular delivery | $ | 10,385,724 | | |
Delayed delivery | | 20,138,398 | | |
| Payable for fund shares redeemed | | 4,556,662 | | |
| Distributions payable | | 856,520 | | |
| Accrued management fee | | 416,787 | | |
| Other affiliated payables | | 152,719 | | |
| Total Liabilities | | | | 36,506,810 |
| Net Assets | | | $ | 2,560,812,186 |
| Net Assets consist of: | | | | |
| Paid in capital | | | $ | 2,560,728,325 |
| Total accumulated earnings (loss) | | | | 83,861 |
| Net Assets | | | $ | 2,560,812,186 |
| | | | | |
| Net Asset Value and Maximum Offering Price | | | | |
| Fidelity Massachusetts Municipal Money Market Fund : | | | | |
Net Asset Value, offering price and redemption price per share ($9,715,874 ÷ 9,716,848 shares) | | | $ | 1.00 |
| Institutional Class : | | | | |
Net Asset Value, offering price and redemption price per share ($1,436,353,427 ÷ 1,434,738,359 shares) | | | $ | 1.00 |
| Premium Class : | | | | |
Net Asset Value, offering price and redemption price per share ($1,114,742,885 ÷ 1,113,041,051 shares) | | | $ | 1.00 |
| Statement of Operations |
| | | | Six months ended July 31, 2023 (Unaudited) |
| Investment Income | | | | |
| Interest | | | $ | 30,612,659 |
| Income from Fidelity Central Funds | | | | 5,597,976 |
| Total Income | | | | 36,210,635 |
| Expenses | | | | |
| Management fee | $ | 2,397,144 | | |
| Transfer agent fees | | 890,922 | | |
| Independent trustees' fees and expenses | | 4,032 | | |
| Total expenses before reductions | | 3,292,098 | | |
| Expense reductions | | (335,681) | | |
| Total expenses after reductions | | | | 2,956,417 |
| Net Investment income (loss) | | | | 33,254,218 |
| Realized and Unrealized Gain (Loss) | | | | |
| Net realized gain (loss) on: | | | | |
| Investment Securities: | | | | |
| Unaffiliated issuers | | 22,369 | | |
| Total net realized gain (loss) | | | | 22,369 |
| Net increase in net assets resulting from operations | | | $ | 33,276,587 |
| Statement of Changes in Net Assets |
| |
| | Six months ended July 31, 2023 (Unaudited) | | Year ended January 31, 2023 |
| Increase (Decrease) in Net Assets | | | | |
| Operations | | | | |
| Net investment income (loss) | $ | 33,254,218 | $ | 22,066,248 |
| Net realized gain (loss) | | 22,369 | | 15,836 |
Net increase in net assets resulting from operations | | 33,276,587 | | 22,082,084 |
| Distributions to shareholders | | (33,248,999) | | (22,053,863) |
| | | | | |
| Share transactions - net increase (decrease) | | 192,837,498 | | 1,257,661,702 |
| Total increase (decrease) in net assets | | 192,865,086 | | 1,257,689,923 |
| | | | | |
| Net Assets | | | | |
| Beginning of period | | 2,367,947,100 | | 1,110,257,177 |
| End of period | $ | 2,560,812,186 | $ | 2,367,947,100 |
| | | | | |
| | | | | |
| Fidelity® Massachusetts Municipal Money Market Fund |
| |
| | Six months ended (Unaudited) July 31, 2023 | | Years ended January 31, 2023 A |
Selected Per-Share Data | | | | |
| Net asset value, beginning of period | $ | 1.00 | $ | 1.00 |
| Income from Investment Operations | | | | |
Net investment income (loss) B | | .013 | | .007 |
Net realized and unrealized gain (loss) C | | - | | - |
| Total from investment operations | | .013 | | .007 |
| Distributions from net investment income | | (.013) | | (.007) |
| Total distributions | | (.013) | | (.007) |
| Net asset value, end of period | $ | 1.00 | $ | 1.00 |
Total Return D,E | | 1.31% | | .69% |
Ratios to Average Net Assets B,F,G | | | | |
| Expenses before reductions | | .42% H | | .42% H |
| Expenses net of fee waivers, if any | | .42% H | | .42% H |
| Expenses net of all reductions | | .42% H | | .41% H |
| Net investment income (loss) | | 2.62% H | | 1.71% H |
| Supplemental Data | | | | |
| Net assets, end of period (000 omitted) | $ | 9,716 | $ | 3,949 |
AFor the period September 22, 2022 (commencement of sale of shares) through January 31, 2023.
BNet investment income (loss) is affected by the timing of the declaration of dividends by any underlying mutual funds or exchange-traded funds (ETFs). Net investment income (loss) of any mutual funds or ETFs is not included in the Fund's net investment income (loss) ratio.
CAmount represents less than $.0005 per share.
DTotal returns for periods of less than one year are not annualized.
ETotal returns would have been lower if certain expenses had not been reduced during the applicable periods shown.
FFees and expenses of any underlying mutual funds or exchange-traded funds (ETFs) are not included in the Fund's expense ratio. The Fund indirectly bears its proportionate share of these expenses. For additional expense information related to investments in Fidelity Central Funds, please refer to the "Investments in Fidelity Central Funds" note found in the Notes to Financial Statements section of the most recent Annual or Semi-Annual report.
GExpense ratios reflect operating expenses of the class. Expenses before reductions do not reflect amounts reimbursed, waived, or reduced through arrangements with the investment adviser, brokerage services, or other offset arrangements, if applicable, and do not represent the amount paid by the class during periods when reimbursements, waivers or reductions occur.
HAnnualized.
| Fidelity® Massachusetts Municipal Money Market Fund Institutional Class |
| |
| | Six months ended (Unaudited) July 31, 2023 | | Years ended January 31, 2023 | | 2022 | | 2021 | | 2020 | | 2019 |
Selected Per-Share Data | | | | | | | | | | | | |
| Net asset value, beginning of period | $ | 1.00 | $ | 1.00 | $ | 1.00 | $ | 1.00 | $ | 1.00 | $ | 1.00 |
| Income from Investment Operations | | | | | | | | | | | | |
Net investment income (loss) A | | .014 | | .011 | | - B | | .004 | | .013 | | .012 |
Net realized and unrealized gain (loss) B | | - | | - | | - | | - | | - | | - |
| Total from investment operations | | .014 | | .011 | | - B | | .004 | | .013 | | .012 |
| Distributions from net investment income | | (.014) | | (.011) | | - B | | (.004) | | (.013) | | (.012) |
| Distributions from net realized gain | | - | | - | | - B | | - B | | - B | | - |
| Total distributions | | (.014) | | (.011) | | - B | | (.004) | | (.013) | | (.012) |
| Net asset value, end of period | $ | 1.00 | $ | 1.00 | $ | 1.00 | $ | 1.00 | $ | 1.00 | $ | 1.00 |
Total Return C,D | | 1.42% | | 1.14% | | .02% | | .36% | | 1.27% | | 1.25% |
Ratios to Average Net Assets A,E,F | | | | | | | | | | | | |
| Expenses before reductions | | .25% G | | .25% | | .25% | | .25% | | .25% | | .25% |
| Expenses net of fee waivers, if any | | .20% G | | .20% | | .07% | | .19% | | .20% | | .20% |
| Expenses net of all reductions | | .20% G | | .20% | | .07% | | .18% | | .20% | | .20% |
| Net investment income (loss) | | 2.84% G | | 1.39% | | .01% | | .40% | | 1.25% | | 1.25% |
| Supplemental Data | | | | | | | | | | | | |
| Net assets, end of period (000 omitted) | $ | 1,436,353 | $ | 1,201,472 | $ | 907,646 | $ | 1,073,961 | $ | 1,741,405 | $ | 1,508,445 |
ANet investment income (loss) is affected by the timing of the declaration of dividends by any underlying mutual funds or exchange-traded funds (ETFs). Net investment income (loss) of any mutual funds or ETFs is not included in the Fund's net investment income (loss) ratio.
BAmount represents less than $.0005 per share.
CTotal returns for periods of less than one year are not annualized.
DTotal returns would have been lower if certain expenses had not been reduced during the applicable periods shown.
EFees and expenses of any underlying mutual funds or exchange-traded funds (ETFs) are not included in the Fund's expense ratio. The Fund indirectly bears its proportionate share of these expenses. For additional expense information related to investments in Fidelity Central Funds, please refer to the "Investments in Fidelity Central Funds" note found in the Notes to Financial Statements section of the most recent Annual or Semi-Annual report.
FExpense ratios reflect operating expenses of the class. Expenses before reductions do not reflect amounts reimbursed, waived, or reduced through arrangements with the investment adviser, brokerage services, or other offset arrangements, if applicable, and do not represent the amount paid by the class during periods when reimbursements, waivers or reductions occur.
GAnnualized.
| Fidelity® Massachusetts Municipal Money Market Fund Premium Class |
| |
| | Six months ended (Unaudited) July 31, 2023 | | Years ended January 31, 2023 | | 2022 | | 2021 | | 2020 | | 2019 |
Selected Per-Share Data | | | | | | | | | | | | |
| Net asset value, beginning of period | $ | 1.00 | $ | 1.00 | $ | 1.00 | $ | 1.00 | $ | 1.00 | $ | 1.00 |
| Income from Investment Operations | | | | | | | | | | | | |
Net investment income (loss) A | | .014 | | .010 | | - B | | .003 | | .012 | | .011 |
Net realized and unrealized gain (loss) B | | - | | - | | - | | - | | - | | - |
| Total from investment operations | | .014 | | .010 | | - B | | .003 | | .012 | | .011 |
| Distributions from net investment income | | (.014) | | (.010) | | - B | | (.003) | | (.012) | | (.011) |
| Distributions from net realized gain | | - | | - | | - B | | - B | | - B | | - |
| Total distributions | | (.014) | | (.010) | | - B | | (.003) | | (.012) | | (.011) |
| Net asset value, end of period | $ | 1.00 | $ | 1.00 | $ | 1.00 | $ | 1.00 | $ | 1.00 | $ | 1.00 |
Total Return C,D | | 1.37% | | 1.05% | | .02% | | .31% | | 1.17% | | 1.15% |
Ratios to Average Net Assets A,E,F | | | | | | | | | | | | |
| Expenses before reductions | | .30% G | | .30% | | .30% | | .30% | | .30% | | .30% |
| Expenses net of fee waivers, if any | | .30% G | | .29% | | .07% | | .23% | | .30% | | .30% |
| Expenses net of all reductions | | .30% G | | .29% | | .07% | | .23% | | .30% | | .30% |
| Net investment income (loss) | | 2.74% G | | 1.30% | | .01% | | .35% | | 1.15% | | 1.15% |
| Supplemental Data | | | | | | | | | | | | |
| Net assets, end of period (000 omitted) | $ | 1,114,743 | $ | 1,162,526 | $ | 202,508 | $ | 232,777 | $ | 293,167 | $ | 282,538 |
ANet investment income (loss) is affected by the timing of the declaration of dividends by any underlying mutual funds or exchange-traded funds (ETFs). Net investment income (loss) of any mutual funds or ETFs is not included in the Fund's net investment income (loss) ratio.
BAmount represents less than $.0005 per share.
CTotal returns would have been lower if certain expenses had not been reduced during the applicable periods shown.
DTotal returns for periods of less than one year are not annualized.
EFees and expenses of any underlying mutual funds or exchange-traded funds (ETFs) are not included in the Fund's expense ratio. The Fund indirectly bears its proportionate share of these expenses. For additional expense information related to investments in Fidelity Central Funds, please refer to the "Investments in Fidelity Central Funds" note found in the Notes to Financial Statements section of the most recent Annual or Semi-Annual report.
FExpense ratios reflect operating expenses of the class. Expenses before reductions do not reflect amounts reimbursed, waived, or reduced through arrangements with the investment adviser, brokerage services, or other offset arrangements, if applicable, and do not represent the amount paid by the class during periods when reimbursements, waivers or reductions occur.
GAnnualized.
For the period ended July 31, 2023
1. Organization.
Fidelity Massachusetts Municipal Money Market Fund (the Fund) is a fund of Fidelity Massachusetts Municipal Trust (the Trust) and is authorized to issue an unlimited number of shares. The Trust is registered under the Investment Company Act of 1940, as amended (the 1940 Act), as an open-end management investment company organized as a Massachusetts business trust. The Fund offers Fidelity Massachusetts Municipal Money Market Fund, Institutional Class and Premium Class shares, each of which has equal rights as to assets and voting privileges. Each class has exclusive voting rights with respect to matters that affect that class. Shares of the Fund are only available for purchase by retail shareholders. The Fund may be affected by economic and political developments in the state of Massachusetts.
2. Investments in Fidelity Central Funds.
Funds may invest in Fidelity Central Funds, which are open-end investment companies generally available only to other investment companies and accounts managed by the investment adviser and its affiliates. The Schedule of Investments lists any Fidelity Central Funds held as an investment as of period end, but does not include the underlying holdings of each Fidelity Central Fund. An investing fund indirectly bears its proportionate share of the expenses of the underlying Fidelity Central Funds.
Based on its investment objective, each Fidelity Central Fund may invest or participate in various investment vehicles or strategies that are similar to those of the investing fund. These strategies are consistent with the investment objectives of the investing fund and may involve certain economic risks which may cause a decline in value of each of the Fidelity Central Funds and thus a decline in the value of the investing fund.
| Fidelity Central Fund | Investment Manager | Investment Objective | Investment Practices | Expense RatioA |
| Fidelity Money Market Central Funds | Fidelity Management & Research Company LLC (FMR) | Each fund seeks to obtain a high level of current income consistent with the preservation of capital and liquidity. | Short-term Investments | Less than .005% |
A Expenses expressed as a percentage of average net assets and are as of each underlying Central Fund's most recent annual or semi-annual shareholder report.
A complete unaudited list of holdings for each Fidelity Central Fund is available upon request or at the Securities and Exchange Commission website at www.sec.gov. In addition, the financial statements of the Fidelity Central Funds which contain the significant accounting policies (including investment valuation policies) of those funds, and are not covered by the Report of Independent Registered Public Accounting Firm, are available on the Securities and Exchange Commission website or upon request.
3. Significant Accounting Policies.
The Fund is an investment company and applies the accounting and reporting guidance of the Financial Accounting Standards Board (FASB) Accounting Standards Codification Topic 946 Financial Services - Investment Companies. The financial statements have been prepared in conformity with accounting principles generally accepted in the United States of America (GAAP), which require management to make certain estimates and assumptions at the date of the financial statements. Actual results could differ from those estimates. Subsequent events, if any, through the date that the financial statements were issued have been evaluated in the preparation of the financial statements. The Fund's Schedule of Investments lists any underlying mutual funds or exchange-traded funds (ETFs) but does not include the underlying holdings of these funds. The following summarizes the significant accounting policies of the Fund:
Investment Valuation. The Fund categorizes the inputs to valuation techniques used to value its investments into a disclosure hierarchy consisting of three levels as shown below:
Level 1 - unadjusted quoted prices in active markets for identical investments
Level 2 - other significant observable inputs (including quoted prices for similar investments, interest rates, prepayment speeds, etc.)
Level 3 - unobservable inputs (including the Fund's own assumptions based on the best information available)
As permitted by compliance with certain conditions under Rule 2a-7 of the 1940 Act, securities are valued at amortized cost, which approximates fair value. The amortized cost of an instrument is determined by valuing it at its original cost and thereafter amortizing any discount or premium from its face value at a constant rate until maturity. Securities held by a money market fund are generally high quality and liquid; however, they are reflected as Level 2 because the inputs used to determine fair value are not quoted prices in an active market.
Investment Transactions and Income. The net asset value per share for processing shareholder transactions is calculated as of the close of business of the New York Stock Exchange (NYSE), normally 4:00 p.m. Eastern time. Security transactions, including the Fund's investment activity in the Fidelity Central Funds, are accounted for as of trade date. Gains and losses on securities sold are determined on the basis of identified cost. Income and capital gain distributions from Fidelity Central Funds, if any, are recorded on the ex-dividend date. Interest income is accrued as earned and includes coupon interest and amortization of premium and accretion of discount on debt securities as applicable.
Class Allocations and Expenses. Investment income, realized and unrealized capital gains and losses, common expenses of a fund, and certain fund-level expense reductions, if any, are allocated daily on a pro-rata basis to each class based on the relative net assets of each class to the total net assets of a fund. Each class differs with respect to transfer agent and distribution and service plan fees incurred, as applicable. Certain expense reductions may also differ by class, if applicable. For the reporting period, the allocated portion of income and expenses to each class as a percent of its average net assets may vary due to the timing of recording these transactions in relation to fluctuating net assets of the classes. Expenses directly attributable to a fund are charged to that fund. Expenses attributable to more than one fund are allocated among the respective funds on the basis of relative net assets or other appropriate methods. Expenses included in the accompanying financial statements reflect the expenses of that fund and do not include any expenses associated with any underlying mutual funds or exchange-traded funds (ETFs). Although not included in a fund's expenses, a fund indirectly bears its proportionate share of these expenses through the net asset value of each underlying mutual fund or exchange-traded fund (ETF). Expense estimates are accrued in the period to which they relate and adjustments are made when actual amounts are known.
Income Tax Information and Distributions to Shareholders. Each year, the Fund intends to qualify as a regulated investment company under Subchapter M of the Internal Revenue Code, including distributing substantially all of its taxable income and realized gains. As a result, no provision for U.S. Federal income taxes is required. The Fund files a U.S. federal tax return, in addition to state and local tax returns as required. The Fund's federal income tax returns are subject to examination by the Internal Revenue Service (IRS) for a period of three fiscal years after they are filed. State and local tax returns may be subject to examination for an additional fiscal year depending on the jurisdiction.
Distributions are declared and recorded daily and paid monthly from net investment income. Distributions from realized gains, if any, are declared and recorded on the ex-dividend date. Income and capital gain distributions are declared separately for each class. Income and capital gain distributions are determined in accordance with income tax regulations, which may differ from GAAP.
Capital accounts within the financial statements are adjusted for permanent book-tax differences. These adjustments have no impact on net assets or the results of operations. Capital accounts are not adjusted for temporary book-tax differences which will reverse in a subsequent period.
Book-tax differences are primarily due to capital loss carryforwards and losses deferred due to wash sales and excise tax regulations.
The Fund purchases municipal securities whose interest, in the opinion of the issuer, is free from federal income tax. There is no assurance that the IRS will agree with this opinion. In the event the IRS determines that the issuer does not comply with relevant tax requirements, interest payments from a security could become federally taxable, possibly retroactively to the date the security was issued.
As of period end, the cost and unrealized appreciation (depreciation) in securities for federal income tax purposes were as follows:
| Gross unrealized appreciation | $- |
| Gross unrealized depreciation | - |
| Net unrealized appreciation (depreciation) | $- |
| Tax cost | $2,449,344,943 |
Capital loss carryforwards are only available to offset future capital gains of the Fund to the extent provided by regulations and may be limited. The capital loss carryforward information presented below, including any applicable limitation, is estimated as of fiscal period end and is subject to adjustment.
Short-term | $(60,859) |
Long-term | - |
| Total capital loss carryforward | $(60,859) |
The Fund elected to defer to its next fiscal year $542 of capital losses recognized during the period November 1, 2022 to January 31,2023.
Delayed Delivery Transactions and When-Issued Securities. During the period, certain Funds transacted in securities on a delayed delivery or when-issued basis. Payment and delivery may take place after the customary settlement period for that security. The price of the underlying securities and the date when the securities will be delivered and paid for are fixed at the time the transaction is negotiated. Securities purchased on a delayed delivery or when-issued basis are identified as such in the Schedule of Investments. Compensation for interest forgone in the purchase of a delayed delivery or when-issued debt security may be received. With respect to purchase commitments, each applicable Fund identifies securities as segregated in its records with a value at least equal to the amount of the commitment. Payables and receivables associated with the purchases and sales of delayed delivery securities having the same coupon, settlement date and broker are offset. Delayed delivery or when-issued securities that have been purchased from and sold to different brokers are reflected as both payables and receivables in the Statement of Assets and Liabilities under the caption "Delayed delivery", as applicable. Losses may arise due to changes in the value of the underlying securities or if the counterparty does not perform under the contract's terms, or if the issuer does not issue the securities due to political, economic, or other factors.
Restricted Securities (including Private Placements). Funds may invest in securities that are subject to legal or contractual restrictions on resale. These securities generally may be resold in transactions exempt from registration or to the public if the securities are registered. Disposal of these securities may involve time-consuming negotiations and expense, and prompt sale at an acceptable price may be difficult. Information regarding restricted securities held at period end is included at the end of the Schedule of Investments, if applicable.
4. Fees and Other Transactions with Affiliates.
Management Fee and Expense Contract. Fidelity Management & Research Company LLC (the investment adviser) and its affiliates provide the Fund with investment management related services for which the Fund pays a monthly management fee that is based on an annual rate of .20% of the Fund's average net assets. Under the management contract, the investment adviser pays all other fund-level expenses, except the compensation of the independent Trustees and certain other expenses such as interest expense. The management fee is reduced by an amount equal to the fees and expenses paid by the Fund to the independent Trustees.
In addition, under the expense contract, the investment adviser pays class-level expenses for Premium Class so that the total expenses do not exceed .35%, expressed as a percentage of class average net assets, with certain exceptions such as interest expense.
Transfer Agent Fees. Fidelity Investments Institutional Operations Company LLC (FIIOC), an affiliate of the investment adviser, is the transfer, dividend disbursing and shareholder servicing agent for the Fund. FIIOC receives asset-based fees with respect to each account. FIIOC pays for typesetting, printing and mailing of shareholder reports, except proxy statements. For the period, transfer agent fees for each class were as follows:
| | Amount | % of Class-Level Average Net AssetsA |
| Fidelity Massachusetts Municipal Money Market Fund | $7,874 | .22 |
| Institutional Class | 313,989 | .05 |
| Premium Class | 569,059 | .10 |
| | $890,922 | |
A Annualized
Interfund Trades. Funds may purchase from or sell securities to other Fidelity Funds under procedures adopted by the Board. The procedures have been designed to ensure these interfund trades are executed in accordance with Rule 17a-7 of the 1940 Act. Interfund trades during the period are noted in the table below.
| | Purchases ($) | Sales ($) | Realized Gain (Loss) ($) |
| Fidelity Massachusetts Municipal Money Market Fund | 51,535,000 | 40,435,000 | - |
5. Expense Reductions.
The investment adviser contractually agreed to reimburse Institutional Class to the extent annual operating expenses, expressed as a percentage of average net assets, exceed .20%. Some expenses, for example the compensation of the independent Trustees, and certain other expenses such as interest expense, are excluded from this reimbursement. During the period, this reimbursement reduced Institutional Class expenses by $324,772.
Through arrangements with the Fund's custodian, credits realized as a result of certain uninvested cash balances were used to reduce the Fund's expenses. During the period, custodian credits reduced the Fund's expenses by $10,909.
6. Distributions to Shareholders.
Distributions to shareholders of each class were as follows:
| | Six months ended July 31, 2023 | Year ended January 31, 2023A |
| Fidelity Massachusetts Municipal Money Market Fund | | |
| Distributions to shareholders | | |
| Fidelity Massachusetts Municipal Money Market Fund | $93,770 | $5,309 |
| Institutional Class | 17,706,963 | 12,692,922 |
| Premium Class | 15,448,266 | 9,355,510 |
| Service Class | - | 122 |
| Total | $33,248,999 | $22,053,863 |
A Distributions for Fidelity Massachusetts Municipal Money Market Fund are for the period September 16, 2022 (commencement of sale of shares) through January 31, 2023.
7. Share Transactions.
Share transactions for each class of shares at a $1.00 per share were as follows and may contain in-kind transactions, automatic conversions between classes or exchanges between affiliated funds:
| | Shares | Shares | Dollars | Dollars |
| | Six months ended July 31, 2023 | Year ended January 31, 2023A | Six months ended July 31, 2023 | Year ended January 31, 2023A |
| Fidelity Massachusetts Municipal Money Market Fund | | | | |
| Fidelity Massachusetts Municipal Money Market Fund | | | | |
| Shares sold | 8,921,575 | 4,771,313 | $8,921,575 | $4,771,313 |
| Reinvestment of distributions | 85,588 | 5,227 | 85,588 | 5,227 |
| Shares redeemed | (3,239,995) | (826,860) | (3,239,995) | (826,860) |
| Net increase (decrease) | 5,767,168 | 3,949,680 | $5,767,168 | $3,949,680 |
| Institutional Class | | | | |
| Shares sold | 1,556,026,358 | 1,351,755,115 | $1,556,026,358 | $1,351,755,115 |
| Reinvestment of distributions | 13,461,530 | 10,369,998 | 13,461,530 | 10,369,998 |
| Shares redeemed | (1,334,771,867) | (1,068,719,353) | (1,334,771,867) | (1,068,719,353) |
| Net increase (decrease) | 234,716,021 | 293,405,760 | $234,716,021 | $293,405,760 |
| Premium Class | | | | |
| Shares sold | 226,341,722 | 248,999,145 | $226,341,721 | $248,999,800 |
| Issued in exchange for the shares of the Target Fund(s) | - | 1,009,038,794 | - | 1,010,960,863 |
| Reinvestment of distributions | 14,462,001 | 8,765,318 | 14,462,001 | 8,765,318 |
| Shares redeemed | (288,449,414) | (308,316,548) | (288,449,413) | (308,316,548) |
| Net increase (decrease) | (47,645,691) | 958,486,709 | $(47,645,691) | $960,409,433 |
| Service Class | | | | |
| Reinvestment of distributions | - | 90 | $- | $90 |
| Shares redeemed | - | (103,153) | - | (103,261) |
| Net increase (decrease) | - | (103,063) | $- | $(103,171) |
A Share transactions for Fidelity Massachusetts Municipal Money Market Fund are for the period September 16, 2022 (commencement of sale of shares) through January 31, 2023.
8. Other.
A fund's organizational documents provide former and current trustees and officers with a limited indemnification against liabilities arising in connection with the performance of their duties to the fund. In the normal course of business, a fund may also enter into contracts that provide general indemnifications. A fund's maximum exposure under these arrangements is unknown as this would be dependent on future claims that may be made against a fund. The risk of material loss from such claims is considered remote.
9. Risk and Uncertainties.
Many factors affect a fund's performance. Developments that disrupt global economies and financial markets, such as pandemics, epidemics, outbreaks of infectious diseases, war, terrorism, and environmental disasters, may significantly affect a fund's investment performance. The effects of these developments to a fund will be impacted by the types of securities in which a fund invests, the financial condition, industry, economic sector, and geographic location of an issuer, and a fund's level of investment in the securities of that issuer. Significant concentrations in security types, issuers, industries, sectors, and geographic locations may magnify the factors that affect a fund's performance.
10. Prior Fiscal Year Merger Information.
On September 16, 2022, Fidelity Massachusetts Municipal Money Market Fund (formerly Fidelity Massachusetts AMT Tax-Free Money Market Fund) acquired all of the assets and assumed all of the liabilities of Fidelity Massachusetts Municipal Money Market Fund ("Target Fund") pursuant to an Agreement and Plan of Reorganization ("Agreements") approved by the Board of Trustees ("The Board"). The securities held by the Target Fund were the primary assets acquired by Fidelity Massachusetts Municipal Money Market Fund. The acquisition was accomplished by an exchange of Premium Class (formerly Fidelity Massachusetts AMT Tax-Free Money Market Fund) of Fidelity Massachusetts Municipal Money Market Fund for shares outstanding of the Target Fund at its respective net asset value on the acquisition date. The reorganization provides shareholders of the Target Fund access to a larger portfolio with a similar investment objective and lower projected expenses. For financial reporting purposes, the assets and liabilities of the Target Fund and shares issued by Fidelity Massachusetts Municipal Money Market Fund were recorded at fair value; however, the cost basis of the investments received from the Target Fund were carried forward and will be utilized for purposes of Fidelity Massachusetts Municipal Money Market Fund ongoing reporting of realized and unrealized gains and losses to more closely align subsequent reporting of realized gains with amounts distributable to shareholders for tax purposes. The reorganization qualified as a tax-free reorganization for federal income tax purposes with no gain or loss recognized to the funds or their shareholders.
| Target Fund | Investments $ | Unrealized appreciation (depreciation) $ | Net Assets $ | Shares Exchanged | Shares Exchanged Ratio |
| Fidelity Massachusetts Municipal Money Market Fund | 1,008,064,249 | 0 | 1,010,960,863 | 1,009,038,794 | 1.0000 |
| Surviving Fund | Net Assets $ | Total net assets after the acquisition $ |
| Fidelity Massachusetts Municipal Money Market Fund (formerly Fidelity Massachusetts AMT Tax-Free Money Market Fund) | 1,264,821,342 | 2,275,782,205 |
Pro forma results of operations of the combined entity for the entire period ended January 31, 2023, as though the acquisition had occurred as of the beginning of the year (rather than on the actual acquisition date, are as follows:
| Net investment income (loss) | $25,310,746 |
| Total net realized gain (loss) | (52,595) |
| Total change in net unrealized appreciation (depreciation) | - |
| Net increase (decrease) in net assets resulting from operations | $25,258,151 |
Because the combined investment portfolios have been managed as a single portfolio since the acquisition was completed, it is not practicable to separate the amounts of revenue and earnings of the acquired fund that have been included in the Fund's Statement of Operations since September 16, 2022.
As a shareholder, you incur two types of costs: (1) transaction costs, which may include sales charges (loads) on purchase payments or redemption proceeds, as applicable and (2) ongoing costs, which generally include management fees, distribution and/or service (12b-1) fees and other Fund expenses. This Example is intended to help you understand your ongoing costs (in dollars) of investing in a fund and to compare these costs with the ongoing costs of investing in other mutual funds.
| The Example is based on an investment of $1,000 invested at the beginning of the period and held for the entire period (February 1, 2023 to July 31, 2023). |
Actual Expenses
The first line of the accompanying table provides information about actual account values and actual expenses. You may use the information in this line, together with the amount you invested, to estimate the expenses that you paid over the period. Simply divide your account value by $1,000.00 (for example, an $8,600 account value divided by $1,000.00 = 8.6), then multiply the result by the number in the first line for a class/Fund under the heading entitled "Expenses Paid During Period" to estimate the expenses you paid on your account during this period. If any fund is a shareholder of any underlying mutual funds or exchange-traded funds (ETFs) (the Underlying Funds), such fund indirectly bears its proportional share of the expenses of the Underlying Funds in addition to the direct expenses incurred presented in the table. These fees and expenses are not included in the annualized expense ratio used to calculate the expense estimate in the table below.
Hypothetical Example for Comparison Purposes
The second line of the accompanying table provides information about hypothetical account values and hypothetical expenses based on the actual expense ratio and an assumed rate of return of 5% per year before expenses, which is not the actual return. The hypothetical account values and expenses may not be used to estimate the actual ending account balance or expenses you paid for the period. You may use this information to compare the ongoing costs of investing in the Fund and other funds. To do so, compare this 5% hypothetical example with the 5% hypothetical examples that appear in the shareholder reports of the other funds. If any fund is a shareholder of any Underlying Funds, such fund indirectly bears its proportional share of the expenses of the Underlying Funds in addition to the direct expenses as presented in the table. These fees and expenses are not included in the annualized expense ratio used to calculate the expense estimate in the table below.
Please note that the expenses shown in the table are meant to highlight your ongoing costs only and do not reflect any transaction costs. Therefore, the second line of the table is useful in comparing ongoing costs only, and will not help you determine the relative total costs of owning different funds. In addition, if these transactional costs were included, your costs would have been higher.
| | | | | Annualized Expense Ratio- A | | Beginning Account Value February 1, 2023 | | Ending Account Value July 31, 2023 | | Expenses Paid During Period- C February 1, 2023 to July 31, 2023 |
| Fidelity® Massachusetts Municipal Money Market Fund | | | | | | | | | | |
| Fidelity® Massachusetts Municipal Money Market Fund | | | | .42% | | | | | | |
| Actual | | | | | | $ 1,000 | | $ 1,013.10 | | $ 2.10 |
Hypothetical-B | | | | | | $ 1,000 | | $ 1,022.71 | | $ 2.11 |
| Institutional Class | | | | .20% | | | | | | |
| Actual | | | | | | $ 1,000 | | $ 1,014.20 | | $ 1.00 |
Hypothetical-B | | | | | | $ 1,000 | | $ 1,023.80 | | $ 1.00 |
| Premium Class | | | | .30% | | | | | | |
| Actual | | | | | | $ 1,000 | | $ 1,013.70 | | $ 1.50 |
Hypothetical-B | | | | | | $ 1,000 | | $ 1,023.31 | | $ 1.51 |
| |
A Annualized expense ratio reflects expenses net of applicable fee waivers.
B 5% return per year before expenses
C Expenses are equal to the annualized expense ratio, multiplied by the average account value over the period, multiplied by 181/ 365 (to reflect the one-half year period). The fees and expenses of any Underlying Funds are not included in each annualized expense ratio.
1.854004.116
SMA-SANN-0923
Fidelity® Massachusetts Municipal Income Fund
Semi-Annual Report
July 31, 2023
Contents
To view a fund's proxy voting guidelines and proxy voting record for the 12-month period ended June 30, visit http://www.fidelity.com/proxyvotingresults or visit the Securities and Exchange Commission's (SEC) web site at http://www.sec.gov.
You may also call 1-800-544-8544 to request a free copy of the proxy voting guidelines.
Standard & Poor's, S&P and S&P 500 are registered service marks of The McGraw-Hill Companies, Inc. and have been licensed for use by Fidelity Distributors Corporation.
Other third-party marks appearing herein are the property of their respective owners.
All other marks appearing herein are registered or unregistered trademarks or service marks of FMR LLC or an affiliated company. © 2023 FMR LLC. All rights reserved.
This report and the financial statements contained herein are submitted for the general information of the shareholders of the Fund. This report is not authorized for distribution to prospective investors in the Fund unless preceded or accompanied by an effective prospectus.
A fund files its complete schedule of portfolio holdings with the SEC for the first and third quarters of each fiscal year on Form N-PORT. Forms N-PORT are available on the SEC's web site at http://www.sec.gov. A fund's Forms N-PORT may be reviewed and copied at the SEC's Public Reference Room in Washington, DC. Information regarding the operation of the SEC's Public Reference Room may be obtained by calling 1-800-SEC-0330.
For a complete list of a fund's portfolio holdings, view the most recent holdings listing, semiannual report, or annual report on Fidelity's web site at http://www.fidelity.com, http://www.institutional.fidelity.com, or http://www.401k.com, as applicable.
NOT FDIC INSURED •MAY LOSE VALUE •NO BANK GUARANTEE
Neither the Fund nor Fidelity Distributors Corporation is a bank.
| Revenue Sources (% of Fund's net assets) |
| Education | 21.3 | |
| General Obligations | 21.2 | |
| Health Care | 13.8 | |
| Special Tax | 12.8 | |
| Other | 12.5 | |
| Transportation | 12.4 | |
| Others* (Individually Less Than 5%) | 6.0 | |
| | 100.0 | |
| |
| *Includes net other assets | | |
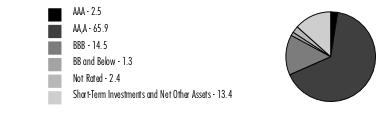
Quality Diversification (% of Fund's net assets) |
|
| |
| We have used ratings from Moody's Investors Service, Inc. Where Moody's® ratings are not available, we have used S&P® ratings. All ratings are as of the date indicated and do not reflect subsequent changes. |
Showing Percentage of Net Assets
| Municipal Bonds - 86.6% |
| | | Principal Amount (a) | Value ($) |
| Massachusetts - 85.0% | | | |
| Ashland Gen. Oblig. Series 2022, 4% 8/1/39 | | 1,685,000 | 1,729,879 |
| Attleboro Gen. Oblig.: | | | |
| Series 2020 B, 3% 10/15/36 | | 2,630,000 | 2,417,598 |
| Series 2020, 2.625% 10/15/50 | | 6,880,000 | 4,719,789 |
| Series 70 B, 5% 10/15/29 | | 1,585,000 | 1,754,623 |
| Berkshire Wind Pwr. Coop. Corp. Series 2017 2: | | | |
| 5% 7/1/25 | | 505,000 | 521,419 |
| 5% 7/1/26 | | 925,000 | 971,697 |
| 5% 7/1/27 | | 700,000 | 750,261 |
| 5% 7/1/30 | | 480,000 | 518,352 |
| Boston Gen. Oblig. Series 2020 A, 2% 11/1/39 | | 2,495,000 | 1,844,039 |
| Braintree Gen. Oblig. Series 2015, 5% 5/15/28 | | 600,000 | 660,448 |
| Cambridge Gen. Oblig. Series 12, 5% 1/1/24 | | 340,000 | 340,465 |
| Framingham Gen. Oblig. Series 2012 A, 4% 12/1/24 | | 1,360,000 | 1,360,973 |
| Lowell Gen. Oblig. Series 2019, 5% 9/1/29 | | 700,000 | 773,179 |
| Ludlow Gen. Oblig. Series 2019, 3% 2/1/49 | | 1,885,000 | 1,447,051 |
| Lynn Wtr. & Swr. Commission Gen. Rev. Series 2003 A, 5% 12/1/32 (Nat'l. Pub. Fin. Guarantee Corp. Insured) | | 440,000 | 440,559 |
| Massachusetts Bay Trans. Auth. Sales Tax Rev. Series 2020 B1, 5% 7/1/50 | | 2,750,000 | 2,897,299 |
| Massachusetts Clean Wtr. Trust: | | | |
| Series 2021 23A: | | | |
5% 2/1/39 | | 5,000,000 | 5,607,557 |
5% 2/1/40 | | 4,750,000 | 5,307,807 |
| Series 2021 23B, 5% 2/1/39 | | 12,940,000 | 14,512,356 |
| Series 2021 B, 5% 2/1/41 | | 2,000,000 | 2,228,125 |
| Series 22, 5% 8/1/37 | | 4,110,000 | 4,555,394 |
| Series 6, 5.5% 8/1/30 | | 410,000 | 410,000 |
| Massachusetts Commonwealth Trans. Fund Rev.: | | | |
| (Rail Enhacement Prog.) Series 2022 A, 5% 6/1/50 | | 3,500,000 | 3,790,821 |
| (Rail Enhancement & Accelerated Bridge Prog.) Series 2018 A: | | | |
5% 6/1/35 | | 2,885,000 | 3,153,639 |
5% 6/1/36 | | 3,035,000 | 3,297,943 |
| (Rail Enhancement & Accelerated Bridge Programs) Series 2019 A, 5% 6/1/49 | | 24,600,000 | 26,173,409 |
| (Rail Enhancement & Accelerated Bridge Progs.) Series 2018 A, 5.25% 6/1/43 | | 14,575,000 | 15,676,930 |
| (Rail Enhancement Prog.) Series 2021 B: | | | |
5% 6/1/41 | | 6,000,000 | 6,409,718 |
5% 6/1/42 | | 15,370,000 | 16,769,877 |
| Series 2021 A: | | | |
5% 6/1/41 | | 8,140,000 | 9,003,651 |
5% 6/1/42 | | 5,750,000 | 6,340,544 |
5% 6/1/43 | | 3,000,000 | 3,305,180 |
5% 6/1/51 | | 5,435,000 | 5,829,971 |
| Series 2021 B, 5% 6/1/46 | | 7,615,000 | 8,202,764 |
| Series 2022 B, 5% 6/1/52 | | 20,000,000 | 21,742,184 |
| Massachusetts Dept. of Trans. Metropolitan Hwy. Sys. Rev.: | | | |
| Series A: | | | |
5% 1/1/35 | | 3,500,000 | 3,862,370 |
5% 1/1/37 | | 2,000,000 | 2,174,003 |
| Series C, 5% 1/1/34 | | 8,585,000 | 9,585,634 |
| Massachusetts Dev. Fin. Agcy. Rev.: | | | |
| (Boston College Proj.) Series T: | | | |
5% 7/1/37 | | 1,415,000 | 1,512,230 |
5% 7/1/38 | | 3,685,000 | 3,926,361 |
5% 7/1/39 | | 4,450,000 | 4,731,140 |
5% 7/1/42 | | 2,805,000 | 2,961,870 |
| (Broad Institute Proj.) Series 2017: | | | |
5% 4/1/33 | | 10,145,000 | 10,957,125 |
5% 4/1/34 | | 2,500,000 | 2,698,980 |
5% 4/1/35 | | 2,455,000 | 2,643,927 |
5% 4/1/37 | | 1,500,000 | 1,600,935 |
| (Broad Institute Proj.) Series 2017, 5% 4/1/36 | | 2,205,000 | 2,364,472 |
| (Lesley Univ. Proj.) Series 2016: | | | |
5% 7/1/29 | | 1,640,000 | 1,682,549 |
5% 7/1/32 | | 1,905,000 | 1,950,232 |
| (Newbridge On The Charles Proj.) Series 2017: | | | |
4% 10/1/24 (b) | | 500,000 | 494,942 |
4% 10/1/25 (b) | | 500,000 | 490,338 |
4% 10/1/26 (b) | | 500,000 | 485,507 |
4% 10/1/27 (b) | | 350,000 | 336,334 |
4% 10/1/32 (b) | | 1,250,000 | 1,133,167 |
4.125% 10/1/42 (b) | | 6,000,000 | 4,792,725 |
5% 10/1/37 (b) | | 2,000,000 | 1,913,722 |
5% 10/1/47 (b) | | 1,000,000 | 897,832 |
| (Partners Healthcare Sys., Inc. Proj.) Series 2017 S: | | | |
5% 7/1/25 | | 1,000,000 | 1,033,077 |
5% 7/1/31 | | 21,180,000 | 22,991,148 |
5% 7/1/32 | | 985,000 | 1,068,587 |
5% 7/1/34 | | 750,000 | 812,072 |
| (Suffolk Univ. Proj.) Series 2017: | | | |
5% 7/1/24 | | 2,000,000 | 2,018,369 |
5% 7/1/25 | | 1,500,000 | 1,522,265 |
5% 7/1/26 | | 1,935,000 | 1,995,639 |
5% 7/1/27 | | 2,085,000 | 2,179,023 |
5% 7/1/28 | | 4,300,000 | 4,502,201 |
| (Suffolk Univ., Proj.) Series 2017, 5% 7/1/32 | | 1,000,000 | 1,045,245 |
| (UMASS Boston Student Hsg. Proj.) Series 2016: | | | |
5% 10/1/29 | | 3,120,000 | 3,183,782 |
5% 10/1/30 | | 1,100,000 | 1,121,506 |
5% 10/1/31 | | 1,200,000 | 1,222,746 |
5% 10/1/32 | | 1,240,000 | 1,262,778 |
5% 10/1/33 | | 1,235,000 | 1,256,344 |
| (UMass Memorial Health Care Proj.) Series K: | | | |
5% 7/1/28 | | 1,260,000 | 1,308,861 |
5% 7/1/29 | | 1,320,000 | 1,373,838 |
5% 7/1/30 | | 1,390,000 | 1,447,935 |
5% 7/1/38 | | 3,750,000 | 3,824,602 |
| (Univ. of Massachusetts Health Cr., Inc. Proj.) Series 2017 L, 4% 7/1/44 | | 7,000,000 | 6,360,677 |
| (Wentworth Institute of Technology Proj.) Series 2017: | | | |
5% 10/1/34 | | 1,425,000 | 1,450,837 |
5% 10/1/35 | | 1,495,000 | 1,517,515 |
5% 10/1/46 | | 4,250,000 | 4,164,287 |
| (Wheaton College, MA. Proj.) Series 2017 H: | | | |
5% 1/1/29 | | 1,435,000 | 1,483,946 |
5% 1/1/31 | | 1,580,000 | 1,631,436 |
5% 1/1/32 | | 1,665,000 | 1,715,595 |
5% 1/1/33 | | 1,745,000 | 1,794,261 |
5% 1/1/34 | | 1,835,000 | 1,881,419 |
5% 1/1/35 | | 1,000,000 | 1,025,078 |
5% 1/1/36 | | 1,000,000 | 1,018,678 |
5% 1/1/42 | | 5,775,000 | 5,774,959 |
5% 1/1/47 | | 1,895,000 | 1,860,396 |
5% 1/1/53 | | 3,425,000 | 3,312,000 |
| Bonds Series A1, 5%, tender 1/31/30 (c) | | 15,280,000 | 16,920,988 |
| Series 2008 B: | | | |
0% 1/1/37 (Assured Guaranty Corp. Insured) | | 1,745,000 | 1,034,675 |
0% 1/1/40 (Assured Guaranty Corp. Insured) | | 5,000,000 | 2,505,496 |
0% 1/1/41 (Assured Guaranty Corp. Insured) | | 5,000,000 | 2,382,700 |
0% 1/1/42 (Assured Guaranty Corp. Insured) | | 5,000,000 | 2,276,403 |
| Series 2013 F: | | | |
4% 7/1/32 | | 2,050,000 | 2,049,981 |
4% 7/1/43 | | 21,685,000 | 20,896,904 |
5% 7/1/27 | | 1,300,000 | 1,300,999 |
5% 7/1/37 | | 3,925,000 | 3,927,274 |
| Series 2013 G, 5% 7/1/44 | | 10,360,000 | 9,995,116 |
| Series 2014 A: | | | |
5% 3/1/32 | | 1,700,000 | 1,716,951 |
5% 3/1/33 | | 1,250,000 | 1,262,176 |
5% 3/1/34 | | 4,375,000 | 4,415,851 |
5% 3/1/39 | | 4,000,000 | 4,026,318 |
| Series 2014 F: | | | |
5% 7/15/24 | | 400,000 | 400,295 |
5% 7/15/25 | | 550,000 | 550,311 |
5% 7/15/26 | | 500,000 | 500,349 |
5% 7/15/27 | | 200,000 | 200,161 |
5% 7/15/28 | | 320,000 | 320,282 |
5.625% 7/15/36 | | 800,000 | 779,982 |
5.75% 7/15/43 | | 4,700,000 | 4,568,122 |
| Series 2015 D, 5% 7/1/44 | | 5,975,000 | 6,027,898 |
| Series 2015 H1: | | | |
5% 7/1/26 | | 3,585,000 | 3,688,198 |
5% 7/1/29 | | 3,750,000 | 3,873,832 |
5% 7/1/30 | | 1,800,000 | 1,860,368 |
5% 7/1/31 | | 1,190,000 | 1,230,090 |
5% 7/1/32 | | 1,000,000 | 1,033,405 |
5% 7/1/33 | | 1,000,000 | 1,032,677 |
| Series 2015 K, 4% 10/1/30 | | 500,000 | 493,380 |
| Series 2015 Q: | | | |
5% 8/15/28 | | 1,000,000 | 1,034,689 |
5% 8/15/29 | | 1,000,000 | 1,034,489 |
5% 8/15/32 | | 1,500,000 | 1,549,936 |
5% 8/15/33 | | 1,550,000 | 1,600,055 |
5% 8/15/34 | | 1,790,000 | 1,843,887 |
5% 8/15/38 | | 1,690,000 | 1,729,837 |
| Series 2015: | | | |
5% 1/1/25 | | 3,525,000 | 3,556,075 |
5% 1/1/27 | | 2,695,000 | 2,738,869 |
5% 1/1/28 | | 1,850,000 | 1,881,958 |
5% 1/1/29 | | 2,945,000 | 2,997,357 |
| Series 2016 A: | | | |
5% 1/1/31 | | 5,000 | 5,182 |
5.25% 1/1/42 | | 7,000,000 | 7,115,626 |
| Series 2016 E: | | | |
5% 7/1/31 | | 1,000,000 | 1,037,516 |
5% 7/1/32 | | 2,200,000 | 2,281,604 |
5% 7/1/33 | | 1,500,000 | 1,554,434 |
5% 7/1/34 | | 1,500,000 | 1,551,497 |
5% 7/1/35 | | 1,500,000 | 1,545,466 |
5% 7/1/36 | | 1,000,000 | 1,025,608 |
5% 7/1/37 | | 2,000,000 | 2,042,249 |
| Series 2016 I: | | | |
4% 7/1/36 | | 9,705,000 | 9,189,549 |
5% 7/1/25 | | 510,000 | 518,697 |
5% 7/1/27 | | 1,150,000 | 1,189,309 |
5% 7/1/27 | | 1,100,000 | 1,139,753 |
5% 7/1/29 | | 1,680,000 | 1,747,962 |
5% 7/1/30 | | 2,400,000 | 2,488,154 |
5% 7/1/31 | | 2,500,000 | 2,593,791 |
5% 7/1/32 | | 1,960,000 | 2,030,506 |
5% 7/1/34 | | 3,035,000 | 3,157,064 |
5% 7/1/36 | | 2,000,000 | 2,066,215 |
5% 7/1/37 | | 1,470,000 | 1,513,243 |
5% 7/1/38 | | 1,000,000 | 1,027,069 |
5% 7/1/41 | | 14,790,000 | 14,964,300 |
| Series 2016 N: | | | |
5% 12/1/34 | | 1,000,000 | 1,052,251 |
5% 12/1/36 | | 2,520,000 | 2,623,754 |
| Series 2016: | | | |
4% 10/1/36 | | 1,250,000 | 1,255,419 |
5% 7/1/26 | | 1,710,000 | 1,763,588 |
5% 7/1/29 | | 2,000,000 | 2,073,046 |
5% 7/1/30 | | 2,000,000 | 2,074,583 |
5% 7/1/31 | | 1,700,000 | 1,763,778 |
5% 10/1/32 | | 1,760,000 | 1,842,735 |
5% 9/1/33 | | 475,000 | 495,239 |
5% 10/1/33 | | 1,500,000 | 1,569,418 |
5% 10/1/34 | | 1,500,000 | 1,568,686 |
5% 9/1/35 | | 375,000 | 390,978 |
5% 10/1/35 | | 1,500,000 | 1,564,384 |
5% 7/1/36 | | 3,000,000 | 3,076,824 |
5% 9/1/36 | | 315,000 | 327,768 |
5% 9/1/37 | | 840,000 | 871,057 |
5% 10/1/37 | | 2,000,000 | 2,068,172 |
5% 10/1/39 | | 5,000,000 | 5,145,969 |
5% 7/1/40 | | 5,325,000 | 5,464,874 |
5% 7/1/41 | | 5,145,000 | 5,200,040 |
5% 10/1/43 | | 5,000,000 | 4,935,500 |
5% 9/1/46 | | 3,235,000 | 3,334,676 |
5% 10/1/48 | | 6,000,000 | 5,751,004 |
| Series 2017 A: | | | |
5% 1/1/35 | | 2,000,000 | 2,070,449 |
5% 1/1/40 | | 1,000,000 | 1,013,615 |
| Series 2017 H: | | | |
5% 1/1/24 | | 260,000 | 261,436 |
5% 1/1/24 (Escrowed to Maturity) | | 840,000 | 845,643 |
| Series 2017: | | | |
5% 7/1/25 | | 1,105,000 | 1,134,301 |
5% 7/1/26 | | 160,000 | 163,728 |
5% 7/1/27 | | 1,000,000 | 1,063,441 |
5% 10/1/28 | | 465,000 | 497,548 |
5% 10/1/29 | | 735,000 | 785,071 |
5% 7/1/37 | | 600,000 | 609,877 |
5% 7/1/42 | | 2,110,000 | 2,121,313 |
5% 10/1/42 | | 4,000,000 | 4,136,445 |
5% 7/1/47 | | 2,250,000 | 2,253,247 |
5% 10/1/47 | | 5,510,000 | 5,622,735 |
| Series 2018 J2, 5% 7/1/48 | | 2,365,000 | 2,434,615 |
| Series 2018: | | | |
5% 9/1/27 | | 1,010,000 | 1,024,030 |
5% 9/1/29 | | 1,390,000 | 1,408,039 |
5% 1/1/30 | | 10,000 | 10,446 |
5% 9/1/31 | | 1,530,000 | 1,546,935 |
5% 9/1/33 | | 1,185,000 | 1,193,482 |
5% 9/1/38 | | 4,805,000 | 4,663,555 |
5% 6/1/43 | | 4,740,000 | 4,964,612 |
5% 9/1/43 | | 4,445,000 | 4,159,904 |
| Series 2019 A: | | | |
5% 7/1/30 | | 1,350,000 | 1,392,634 |
5% 7/1/31 | | 1,350,000 | 1,392,504 |
5% 7/1/32 | | 2,000,000 | 2,060,526 |
5% 7/1/33 | | 2,300,000 | 2,368,635 |
5% 7/1/34 | | 1,400,000 | 1,439,060 |
5% 7/1/34 | | 1,015,000 | 1,052,029 |
5% 7/1/36 | | 1,120,000 | 1,147,115 |
5% 7/1/38 | | 735,000 | 744,528 |
5% 7/1/44 | | 2,250,000 | 2,251,065 |
5% 7/1/49 | | 7,250,000 | 7,128,772 |
| Series 2019 K: | | | |
5% 7/1/24 | | 500,000 | 505,310 |
5% 7/1/25 | | 1,250,000 | 1,283,847 |
5% 7/1/26 | | 1,250,000 | 1,304,950 |
5% 7/1/33 | | 2,000,000 | 2,167,376 |
5% 7/1/35 | | 2,135,000 | 2,295,418 |
| Series 2019 S1: | | | |
5% 10/1/25 | | 1,965,000 | 2,041,026 |
5% 10/1/26 | | 2,535,000 | 2,687,915 |
| Series 2019 S2: | | | |
5% 10/1/32 | | 1,410,000 | 1,555,195 |
5% 10/1/33 | | 1,935,000 | 2,133,849 |
5% 10/1/34 | | 2,165,000 | 2,386,776 |
| Series 2020 A: | | | |
4% 7/1/39 | | 2,455,000 | 2,275,174 |
4% 7/1/40 | | 7,920,000 | 7,265,481 |
| Series 2021 A: | | | |
4% 7/1/34 | | 1,000,000 | 1,021,484 |
4% 7/1/35 | | 1,000,000 | 1,011,593 |
4% 7/1/36 | | 825,000 | 826,755 |
4% 7/1/37 | | 1,000,000 | 986,257 |
4% 7/1/38 | | 700,000 | 677,393 |
4% 7/1/39 | | 1,400,000 | 1,329,375 |
5% 7/1/32 | | 1,000,000 | 1,129,751 |
| Series 2021 B: | | | |
4% 7/1/42 | | 475,000 | 422,711 |
4% 7/1/50 | | 2,135,000 | 1,792,024 |
| Series 2021: | | | |
4% 7/1/40 | | 4,160,000 | 3,569,050 |
4% 7/1/45 | | 1,200,000 | 973,662 |
4% 7/1/50 | | 1,750,000 | 1,365,043 |
| Series 2022: | | | |
5% 7/1/37 | | 800,000 | 829,636 |
5% 7/1/42 | | 740,000 | 750,650 |
5% 7/1/52 | | 2,300,000 | 2,286,861 |
| Series 2023 N: | | | |
5% 10/1/43 (d) | | 1,750,000 | 1,736,134 |
5.25% 10/1/36 (d) | | 500,000 | 522,735 |
5.25% 10/1/37 (d) | | 545,000 | 564,337 |
5.25% 10/1/38 (d) | | 550,000 | 566,770 |
5.25% 10/1/39 (d) | | 580,000 | 597,156 |
| Series A, 5% 6/1/39 (Pre-Refunded to 6/1/29 @ 100) | | 6,760,000 | 7,620,252 |
| Series B, 0% 1/1/39 (Assured Guaranty Corp. Insured) | | 3,200,000 | 1,687,079 |
| Series G: | | | |
5% 7/15/24 (b) | | 130,000 | 130,817 |
5% 7/15/25 (b) | | 120,000 | 119,760 |
5% 7/15/26 (b) | | 160,000 | 159,801 |
5% 7/15/27 (b) | | 170,000 | 169,909 |
5% 7/1/28 | | 350,000 | 374,358 |
5% 7/15/28 (b) | | 175,000 | 174,813 |
5% 7/15/29 (b) | | 320,000 | 318,959 |
5% 7/1/30 | | 225,000 | 247,614 |
5% 7/15/30 (b) | | 320,000 | 317,447 |
5% 7/15/31 (b) | | 350,000 | 347,046 |
5% 7/15/32 (b) | | 400,000 | 393,025 |
5% 7/1/33 | | 550,000 | 603,228 |
5% 7/15/33 (b) | | 320,000 | 311,325 |
5% 7/1/34 | | 250,000 | 273,114 |
5% 7/15/34 (b) | | 300,000 | 288,583 |
5% 7/15/35 (b) | | 270,000 | 255,713 |
5% 7/1/36 | | 475,000 | 510,335 |
5% 7/15/36 (b) | | 235,000 | 217,557 |
5% 7/1/37 | | 1,275,000 | 1,357,998 |
5% 7/15/37 (b) | | 250,000 | 229,339 |
5% 7/15/46 (b) | | 9,540,000 | 8,242,440 |
5% 7/1/50 | | 4,700,000 | 4,772,176 |
| Series J2: | | | |
5% 7/1/43 | | 11,540,000 | 11,954,653 |
5% 7/1/53 | | 4,500,000 | 4,605,917 |
| Series K, 5% 7/1/27 | | 1,150,000 | 1,191,164 |
| Massachusetts Edl. Fing. Auth. Rev.: | | | |
| Series 2014 I: | | | |
5% 1/1/25 (e) | | 2,660,000 | 2,694,382 |
5% 1/1/26 (e) | | 8,350,000 | 8,472,859 |
5% 1/1/27 (e) | | 1,000,000 | 1,011,416 |
| Series 2015 A, 5% 1/1/25 (e) | | 5,715,000 | 5,788,869 |
| Series 2016, 5% 7/1/24 (e) | | 7,120,000 | 7,179,017 |
| Series 2017 A: | | | |
5% 7/1/24 (e) | | 3,000,000 | 3,027,554 |
5% 7/1/25 (e) | | 4,500,000 | 4,583,388 |
5% 7/1/26 (e) | | 3,935,000 | 4,049,562 |
| Series 2018 B: | | | |
5% 7/1/27 (e) | | 9,240,000 | 9,608,885 |
5% 7/1/28 (e) | | 2,325,000 | 2,443,852 |
| Series 2019 B: | | | |
5% 7/1/24 (e) | | 1,000,000 | 1,009,185 |
5% 7/1/25 (e) | | 1,365,000 | 1,390,294 |
5% 7/1/26 (e) | | 1,215,000 | 1,250,373 |
5% 7/1/28 (e) | | 1,000,000 | 1,053,408 |
5% 7/1/29 (e) | | 3,500,000 | 3,723,173 |
| Series 2020 C: | | | |
5% 7/1/28 (e) | | 2,000,000 | 2,106,815 |
5% 7/1/29 (e) | | 1,950,000 | 2,074,339 |
5% 7/1/30 (e) | | 1,950,000 | 2,096,147 |
| Series 2021 B: | | | |
5% 7/1/27 (e) | | 1,950,000 | 2,033,605 |
5% 7/1/28 (e) | | 1,850,000 | 1,948,804 |
5% 7/1/29 (e) | | 1,825,000 | 1,941,369 |
5% 7/1/30 (e) | | 1,125,000 | 1,209,316 |
5% 7/1/31 (e) | | 1,500,000 | 1,627,279 |
| Series 2023 B: | | | |
5% 7/1/30 (e) | | 10,000,000 | 10,692,931 |
5% 7/1/31 (e) | | 6,515,000 | 6,989,384 |
5% 7/1/32 (e) | | 5,000,000 | 5,396,736 |
5% 7/1/33 (e) | | 6,500,000 | 7,041,757 |
| Massachusetts Gen. Oblig.: | | | |
| Series 2004 A, 5.5% 8/1/30 | | 2,000,000 | 2,326,422 |
| Series 2018 B, 5% 1/1/32 | | 5,000,000 | 5,462,968 |
| Series 2019 A: | | | |
5% 1/1/35 | | 5,000,000 | 5,530,865 |
5% 1/1/37 | | 10,000,000 | 10,921,936 |
5% 1/1/49 | | 10,000,000 | 10,563,407 |
5.25% 1/1/33 | | 21,110,000 | 23,781,063 |
| Series 2019 D, 3% 5/1/36 | | 5,000,000 | 4,669,007 |
| Series 2020 C: | | | |
3% 3/1/47 | | 5,810,000 | 4,638,342 |
3% 3/1/49 | | 5,000,000 | 3,924,480 |
| Series 2020 D: | | | |
3% 7/1/35 | | 3,000,000 | 2,852,602 |
3% 7/1/39 | | 3,460,000 | 3,037,542 |
3% 11/1/42 | | 3,500,000 | 2,928,608 |
4% 11/1/36 | | 1,500,000 | 1,560,969 |
4% 11/1/41 | | 4,000,000 | 4,014,305 |
5% 7/1/48 | | 18,695,000 | 20,073,407 |
| Series 2021 B: | | | |
3% 4/1/48 | | 21,500,000 | 17,005,324 |
3% 4/1/49 | | 13,500,000 | 10,591,981 |
| Series 2021 C: | | | |
3% 9/1/34 | | 2,300,000 | 2,245,140 |
3% 9/1/36 | | 5,000,000 | 4,634,007 |
| Series 2021 D: | | | |
5% 9/1/48 | | 6,880,000 | 7,460,703 |
5% 9/1/49 | | 50,000,000 | 54,150,790 |
5% 9/1/50 | | 1,785,000 | 1,930,954 |
| Series 2022 B, 3% 2/1/48 | | 38,250,000 | 30,278,325 |
| Series 2022 C, 5.25% 10/1/52 | | 1,690,000 | 1,874,262 |
| Series 2022 E: | | | |
5% 11/1/49 | | 13,805,000 | 15,089,245 |
5% 11/1/52 | | 52,445,000 | 57,108,006 |
| Series B: | | | |
5% 7/1/33 | | 3,500,000 | 3,998,799 |
5% 7/1/34 | | 2,000,000 | 2,279,619 |
| Series C, 3% 3/1/48 | | 5,000,000 | 3,956,316 |
| Series D, 5% 7/1/45 | | 3,415,000 | 3,687,431 |
| Series E: | | | |
5% 9/1/29 | | 7,115,000 | 7,894,408 |
5% 11/1/45 | | 8,065,000 | 8,735,302 |
5% 11/1/50 | | 23,480,000 | 25,227,182 |
| Massachusetts Hsg. Fin. Agcy. Hsg. Rev.: | | | |
| Series 183, 3.5% 12/1/46 | | 470,000 | 463,977 |
| Series 2011, 3.5% 12/1/49 | | 2,920,000 | 2,859,170 |
| Series 2017, 4% 6/1/43 (e) | | 690,000 | 681,937 |
| Series 2020 A, 0.875% 12/1/23 | | 1,990,000 | 1,973,213 |
| Series 207, 4% 6/1/49 | | 1,535,000 | 1,522,603 |
| Series 214, 3.75% 12/1/49 | | 4,060,000 | 3,999,502 |
| Series 218, 3% 12/1/50 | | 1,640,000 | 1,581,754 |
| Massachusetts Hsg. Fin. Agcy. Multi-Family Rev. Series 2018 A, 3.7% 12/1/38 | | 500,000 | 470,026 |
| Massachusetts Hsg. Fin. Auth.: | | | |
| Series 2021 221, 3% 12/1/50 | | 3,515,000 | 3,386,571 |
| Series 2021 A2: | | | |
0.4% 6/1/24 | | 875,000 | 849,346 |
0.45% 12/1/24 | | 1,000,000 | 956,823 |
| Series 2021 B1, 2.875% 12/1/51 | | 4,000,000 | 2,751,177 |
| Series 2021, 3% 6/1/51 | | 3,750,000 | 3,590,523 |
| Series 2022 224, 5% 6/1/50 | | 1,750,000 | 1,799,811 |
| Series 220: | | | |
3% 12/1/50 | | 3,070,000 | 2,958,568 |
5% 12/1/23 | | 100,000 | 100,467 |
5% 6/1/24 | | 150,000 | 151,851 |
5% 12/1/24 | | 215,000 | 219,405 |
5% 6/1/25 | | 425,000 | 437,380 |
5% 12/1/25 | | 150,000 | 155,780 |
5% 6/1/26 | | 100,000 | 104,733 |
5% 12/1/26 | | 125,000 | 132,192 |
5% 6/1/27 | | 100,000 | 106,621 |
5% 12/1/27 | | 185,000 | 199,140 |
5% 6/1/28 | | 75,000 | 81,327 |
5% 12/1/28 | | 230,000 | 251,068 |
5% 6/1/29 | | 100,000 | 110,111 |
| Massachusetts Port Auth. Rev.: | | | |
| Series 2014 B, 5% 7/1/29 (e) | | 1,270,000 | 1,286,882 |
| Series 2014 C: | | | |
5% 7/1/28 | | 3,000,000 | 3,049,597 |
5% 7/1/29 | | 4,205,000 | 4,276,871 |
| Series 2015 A: | | | |
5% 7/1/28 | | 460,000 | 476,563 |
5% 7/1/28 (e) | | 500,000 | 513,682 |
5% 7/1/29 (e) | | 1,245,000 | 1,279,108 |
5% 7/1/30 (e) | | 1,450,000 | 1,490,467 |
5% 7/1/40 (e) | | 2,000,000 | 2,030,743 |
5% 7/1/45 (e) | | 3,500,000 | 3,541,085 |
| Series 2015 B, 5% 7/1/33 (e) | | 1,015,000 | 1,043,028 |
| Series 2016 A: | | | |
5% 7/1/26 | | 695,000 | 735,053 |
5% 7/1/28 | | 760,000 | 801,055 |
| Series 2016 B: | | | |
4% 7/1/46 (e) | | 12,950,000 | 11,999,337 |
5% 7/1/43 (e) | | 11,410,000 | 11,653,524 |
| Series 2017 A: | | | |
5% 7/1/30 (e) | | 1,280,000 | 1,352,096 |
5% 7/1/31 (e) | | 1,095,000 | 1,157,005 |
5% 7/1/32 (e) | | 1,370,000 | 1,446,801 |
5% 7/1/33 (e) | | 1,250,000 | 1,319,667 |
5% 7/1/35 (e) | | 2,000,000 | 2,099,935 |
5% 7/1/36 (e) | | 1,720,000 | 1,797,024 |
5% 7/1/42 (e) | | 4,540,000 | 4,678,083 |
| Series 2019 A: | | | |
5% 7/1/24 (e) | | 4,140,000 | 4,188,432 |
5% 7/1/30 (e) | | 725,000 | 786,311 |
5% 7/1/33 (e) | | 4,085,000 | 4,426,865 |
5% 7/1/34 (e) | | 5,605,000 | 6,052,264 |
5% 7/1/36 (e) | | 1,995,000 | 2,125,236 |
5% 7/1/37 (e) | | 1,100,000 | 1,163,882 |
5% 7/1/40 (e) | | 4,450,000 | 4,659,669 |
| Series 2019 B, 5% 7/1/44 | | 5,000,000 | 5,356,036 |
| Series 2019 C: | | | |
5% 7/1/31 (e) | | 3,500,000 | 3,797,546 |
5% 7/1/32 (e) | | 2,700,000 | 2,927,262 |
5% 7/1/38 (e) | | 11,275,000 | 11,902,561 |
5% 7/1/39 (e) | | 5,000,000 | 5,251,032 |
5% 7/1/49 (e) | | 2,500,000 | 2,578,989 |
| Series 2021 A: | | | |
5% 7/1/38 | | 2,125,000 | 2,369,227 |
5% 7/1/39 | | 1,125,000 | 1,249,233 |
5% 7/1/40 | | 1,045,000 | 1,155,993 |
| Series 2021 B, 5% 7/1/39 (e) | | 1,325,000 | 1,414,405 |
| Series 2021 D: | | | |
5% 7/1/46 | | 3,180,000 | 3,459,104 |
5% 7/1/51 | | 5,740,000 | 6,210,098 |
| Series 2021 E: | | | |
5% 7/1/33 (e) | | 3,440,000 | 3,812,910 |
5% 7/1/40 (e) | | 4,000,000 | 4,253,808 |
5% 7/1/41 (e) | | 1,940,000 | 2,056,648 |
5% 7/1/51 (e) | | 11,775,000 | 12,256,866 |
| Series 2022 A: | | | |
5% 7/1/31 (e) | | 2,630,000 | 2,929,332 |
5% 7/1/36 (e) | | 2,450,000 | 2,686,379 |
5% 7/1/39 (e) | | 1,460,000 | 1,568,913 |
5% 7/1/40 (e) | | 2,780,000 | 2,974,969 |
| Massachusetts Port Auth. Spl. Facilities Rev.: | | | |
| (Bosfuel Proj.) Series 2019 A: | | | |
5% 7/1/24 (e) | | 615,000 | 621,863 |
5% 7/1/25 (e) | | 1,000,000 | 1,021,122 |
5% 7/1/28 (e) | | 1,500,000 | 1,594,627 |
5% 7/1/32 (e) | | 500,000 | 537,925 |
5% 7/1/34 (e) | | 1,250,000 | 1,341,458 |
5% 7/1/49 (e) | | 5,620,000 | 5,765,181 |
| Series 2019 A, 4% 7/1/44 (e) | | 5,000,000 | 4,748,055 |
| Massachusetts School Bldg. Auth. Dedicated Sales Tax Rev.: | | | |
| Series 2019 A, 5% 2/15/44 | | 11,510,000 | 12,360,064 |
| Series 2020 A, 3% 8/15/50 | | 5,030,000 | 3,866,184 |
| Series A: | | | |
5% 8/15/31 | | 1,850,000 | 2,127,305 |
5% 8/15/32 | | 1,500,000 | 1,723,118 |
5% 8/15/33 | | 1,675,000 | 1,923,054 |
5% 8/15/34 | | 3,000,000 | 3,424,410 |
5% 8/15/35 | | 2,000,000 | 2,266,348 |
5% 8/15/37 | | 1,400,000 | 1,560,951 |
5% 8/15/45 | | 10,000,000 | 10,894,365 |
5% 8/15/50 | | 16,615,000 | 17,980,401 |
| Series B, 5% 11/15/39 | | 1,975,000 | 2,063,201 |
| Massachusetts Spl. Oblig. Dedicated Tax Rev. Series 2005: | | | |
| 5.5% 1/1/27 (Nat'l. Pub. Fin. Guarantee Corp. Insured) | | 2,500,000 | 2,696,740 |
| 5.5% 1/1/28 (Nat'l. Pub. Fin. Guarantee Corp. Insured) | | 2,575,000 | 2,845,725 |
| 5.5% 1/1/30 (Nat'l. Pub. Fin. Guarantee Corp. Insured) | | 19,080,000 | 21,950,979 |
| 5.5% 1/1/34 (Nat'l. Pub. Fin. Guarantee Corp. Insured) | | 14,770,000 | 17,375,298 |
| Massachusetts State College Bldg. Auth. Rev.: | | | |
| Series 1999 A, 0% 5/1/28 (Escrowed to Maturity) | | 1,700,000 | 1,464,742 |
| Series 2003 B, 0% 5/1/28 (Assured Guaranty Corp. Insured) | | 6,080,000 | 5,189,895 |
| Series 2021 A, 2% 5/1/37 | | 1,060,000 | 793,651 |
| Series 2022 A: | | | |
4% 5/1/36 | | 600,000 | 625,420 |
4% 5/1/38 | | 750,000 | 763,305 |
4% 5/1/40 | | 1,000,000 | 1,012,119 |
4% 5/1/41 | | 625,000 | 630,246 |
4% 5/1/42 | | 550,000 | 552,599 |
5% 5/1/32 | | 600,000 | 702,130 |
5% 5/1/33 | | 500,000 | 584,677 |
5% 5/1/34 | | 500,000 | 584,500 |
| Massachusetts Tpk. Auth. Metropolitan Hwy. Sys. Rev. Sr. Series A: | | | |
| 0% 1/1/25 (Nat'l. Pub. Fin. Guarantee Corp. Insured) | | 5,110,000 | 4,841,269 |
| 0% 1/1/28 (Nat'l. Pub. Fin. Guarantee Corp. Insured) | | 12,700,000 | 10,806,312 |
| 0% 1/1/29 (Nat'l. Pub. Fin. Guarantee Corp. Insured) | | 33,195,000 | 27,225,510 |
| Massachusetts Wtr. Resources Auth. Wtr. & Swr. Rev. Series 2020 B: | | | |
| 5% 8/1/41 | | 3,155,000 | 3,460,411 |
| 5% 8/1/42 | | 7,415,000 | 8,105,271 |
| Norwood Gen. Oblig. Series 2016, 2.125% 7/15/30 | | 1,020,000 | 924,378 |
| Quincy Gen. Oblig.: | | | |
| Series 2021, 2% 1/15/46 | | 1,755,000 | 1,083,809 |
| Series 2022 B, 5% 7/1/47 | | 4,995,000 | 5,478,278 |
| Swampscott Gen. Oblig. Series 2022, 3% 3/1/36 | | 1,000,000 | 941,096 |
| Town of Tisbury Gen. Oblig. Series 2022: | | | |
| 4% 8/15/36 | | 1,780,000 | 1,853,665 |
| 4% 8/15/40 | | 1,995,000 | 2,012,756 |
| 4% 8/15/41 | | 2,085,000 | 2,091,067 |
| Univ. of Massachusetts Bldg. Auth. Facilities Rev. Series 2020 1, 5% 11/1/50 | | 4,015,000 | 4,261,162 |
| Univ. of Massachusetts Bldg. Auth. Rev. Series 2019 1: | | | |
| 5% 5/1/34 | | 600,000 | 666,670 |
| 5% 5/1/35 | | 2,000,000 | 2,210,929 |
| 5% 5/1/36 | | 3,400,000 | 3,732,935 |
| 5% 5/1/37 | | 3,200,000 | 3,489,757 |
| 5% 5/1/38 | | 3,000,000 | 3,254,190 |
| 5% 5/1/39 | | 2,000,000 | 2,162,804 |
TOTAL MASSACHUSETTS | | | 1,623,366,315 |
| Puerto Rico - 1.6% | | | |
| Puerto Rico Commonwealth Aqueduct & Swr. Auth. Series 2021 B, 5% 7/1/37 (b) | | 4,885,000 | 4,913,334 |
| Puerto Rico Commonwealth Pub. Impt. Gen. Oblig. Series 2021 A1: | | | |
| 0% 7/1/33 | | 5,238,348 | 3,191,977 |
| 5.625% 7/1/27 | | 625,000 | 656,811 |
| 5.625% 7/1/29 | | 1,925,000 | 2,056,866 |
| 5.75% 7/1/31 | | 4,525,000 | 4,931,230 |
| Puerto Rico Hsg. Fin. Auth. Series 2020, 5% 12/1/27 | | 4,435,000 | 4,727,632 |
| Puerto Rico Sales Tax Fing. Corp. Sales Tax Rev.: | | | |
| Series 2018 A1, 0% 7/1/31 | | 5,010,000 | 3,571,527 |
| Series 2019 A2, 4.329% 7/1/40 | | 6,880,000 | 6,476,381 |
TOTAL PUERTO RICO | | | 30,525,758 |
| TOTAL MUNICIPAL BONDS (Cost $1,737,336,000) | | | 1,653,892,073 |
| | | | |
| Municipal Notes - 5.1% |
| | | Principal Amount (a) | Value ($) |
| Massachusetts - 5.1% | | | |
| Massachusetts Dev. Fin. Agcy. Rev.: | | | |
| (Boston Univ. Proj.): | | | |
Series U-6C, 4.45% 8/1/23, LOC TD Banknorth, NA, VRDN (c) | | 22,995,000 | 22,995,000 |
Series U-6E, 4.45% 8/1/23, LOC TD Banknorth, NA, VRDN (c) | | 3,400,000 | 3,400,000 |
| (College of the Holy Cross Proj.) Series 2008 A, 4.4% 8/1/23, LOC Bank of America NA, VRDN (c) | | 1,200,000 | 1,200,000 |
| Massachusetts Health & Edl. Facilities Auth. Rev.: | | | |
| (Baystate Health Sys. Proj.) Series 2009 J2, 4.45% 8/1/23, LOC TD Banknorth, NA, VRDN (c) | | 2,000,000 | 2,000,000 |
| Series 2007 A1, 4.5% 8/1/23 (Liquidity Facility Bank of America NA), VRDN (c) | | 45,240,000 | 45,240,000 |
| RIB Floater Trust Various States Participating VRDN Series 2022 D1: | | | |
| 4.56% 8/1/23 (Liquidity Facility Barclays Bank PLC) (c)(f)(g) | | 14,945,000 | 14,945,000 |
| 4.56% 8/1/23 (Liquidity Facility Barclays Bank PLC) (c)(f)(g) | | 7,500,000 | 7,500,000 |
| | | | |
| TOTAL MUNICIPAL NOTES (Cost $97,280,000) | | | 97,280,000 |
| | | | |
| Money Market Funds - 7.9% |
| | | Shares | Value ($) |
Fidelity Municipal Cash Central Fund 4.30% (h)(i) (Cost $151,729,004) | | 151,698,660 | 151,728,987 |
| | | | |
| TOTAL INVESTMENT IN SECURITIES - 99.6% (Cost $1,986,345,004) | 1,902,901,060 |
NET OTHER ASSETS (LIABILITIES) - 0.4% | 8,217,215 |
| NET ASSETS - 100.0% | 1,911,118,275 |
| | |
Security Type Abbreviations
| VRDN | - | VARIABLE RATE DEMAND NOTE (A debt instrument that is payable upon demand, either daily, weekly or monthly) |
Legend
| (a) | Amount is stated in United States dollars unless otherwise noted. |
| (b) | Security exempt from registration under Rule 144A of the Securities Act of 1933. These securities may be resold in transactions exempt from registration, normally to qualified institutional buyers. At the end of the period, the value of these securities amounted to $27,134,435 or 1.4% of net assets. |
| (c) | Coupon rates for floating and adjustable rate securities reflect the rates in effect at period end. |
| (d) | Security or a portion of the security purchased on a delayed delivery or when-issued basis. |
| (e) | Private activity obligations whose interest is subject to the federal alternative minimum tax for individuals. |
| (f) | Provides evidence of ownership in one or more underlying municipal bonds. |
| (g) | Coupon rates are determined by re-marketing agents based on current market conditions. |
| (h) | Information in this report regarding holdings by state and security types does not reflect the holdings of the Fidelity Municipal Cash Central Fund. |
| (i) | Affiliated fund that is generally available only to investment companies and other accounts managed by Fidelity Investments. The rate quoted is the annualized seven-day yield of the fund at period end. A complete unaudited listing of the fund's holdings as of its most recent quarter end is available upon request. In addition, each Fidelity Central Fund's financial statements are available on the SEC's website or upon request. |
Affiliated Central Funds
Fiscal year to date information regarding the Fund's investments in Fidelity Central Funds, including the ownership percentage, is presented below.
| Affiliate | Value, beginning of period ($) | Purchases ($) | Sales Proceeds ($) | Dividend Income ($) | Realized Gain (loss) ($) | Change in Unrealized appreciation (depreciation) ($) | Value, end of period ($) | % ownership, end of period |
| Fidelity Municipal Cash Central Fund 4.30% | - | 193,508,004 | 41,779,000 | 716,639 | - | (17) | 151,728,987 | 5.3% |
| Total | - | 193,508,004 | 41,779,000 | 716,639 | - | (17) | 151,728,987 | |
| | | | | | | | | |
Amounts in the dividend income column in the above table include any capital gain distributions from underlying funds, which are presented in the corresponding line item in the Statement of Operations, if applicable.
Amounts included in the purchases and sales proceeds columns may include in-kind transactions, if applicable.
Investment Valuation
The following is a summary of the inputs used, as of July 31, 2023, involving the Fund's assets and liabilities carried at fair value. The inputs or methodology used for valuing securities may not be an indication of the risk associated with investing in those securities. For more information on valuation inputs, and their aggregation into the levels used below, please refer to the Investment Valuation section in the accompanying Notes to Financial Statements.
| Valuation Inputs at Reporting Date: |
| Description | Total ($) | Level 1 ($) | Level 2 ($) | Level 3 ($) |
Investments in Securities: | | | | |
|
| Municipal Securities | 1,751,172,073 | - | 1,751,172,073 | - |
|
| Money Market Funds | 151,728,987 | 151,728,987 | - | - |
| Total Investments in Securities: | 1,902,901,060 | 151,728,987 | 1,751,172,073 | - |
| Statement of Assets and Liabilities |
| | | | July 31, 2023 (Unaudited) |
| | | | | |
| Assets | | | | |
| Investment in securities, at value - See accompanying schedule: | | | | |
Unaffiliated issuers (cost $1,834,616,000) | $ | 1,751,172,073 | | |
Fidelity Central Funds (cost $151,729,004) | | 151,728,987 | | |
| | | | | |
| | | | | |
| Total Investment in Securities (cost $1,986,345,004) | | | $ | 1,902,901,060 |
| Cash | | | | 167,472 |
| Receivable for fund shares sold | | | | 1,319,058 |
| Interest receivable | | | | 14,165,164 |
| Distributions receivable from Fidelity Central Funds | | | | 412,841 |
| Prepaid expenses | | | | 1,402 |
| Other receivables | | | | 4,158 |
Total assets | | | | 1,918,971,155 |
| Liabilities | | | | |
| Payable for investments purchased on a delayed delivery basis | $ | 3,977,782 | | |
| Payable for fund shares redeemed | | 1,203,502 | | |
| Distributions payable | | 1,908,160 | | |
| Accrued management fee | | 553,563 | | |
| Other affiliated payables | | 177,643 | | |
| Other payables and accrued expenses | | 32,230 | | |
| Total Liabilities | | | | 7,852,880 |
| Net Assets | | | $ | 1,911,118,275 |
| Net Assets consist of: | | | | |
| Paid in capital | | | $ | 2,015,329,372 |
| Total accumulated earnings (loss) | | | | (104,211,097) |
| Net Assets | | | $ | 1,911,118,275 |
Net Asset Value, offering price and redemption price per share ($1,911,118,275 ÷ 169,833,231 shares) | | | $ | 11.25 |
| Statement of Operations |
| | | | Six months ended July 31, 2023 (Unaudited) |
| Investment Income | | | | |
| Interest | | | $ | 27,263,378 |
| Income from Fidelity Central Funds | | | | 716,639 |
| Total Income | | | | 27,980,017 |
| Expenses | | | | |
| Management fee | $ | 3,347,308 | | |
| Transfer agent fees | | 897,273 | | |
| Accounting fees and expenses | | 176,328 | | |
| Custodian fees and expenses | | 10,270 | | |
| Independent trustees' fees and expenses | | 3,263 | | |
| Registration fees | | 22,036 | | |
| Audit | | 26,134 | | |
| Legal | | 6,332 | | |
| Miscellaneous | | 4,961 | | |
| Total expenses before reductions | | 4,493,905 | | |
| Expense reductions | | (41,867) | | |
| Total expenses after reductions | | | | 4,452,038 |
| Net Investment income (loss) | | | | 23,527,979 |
| Realized and Unrealized Gain (Loss) | | | | |
| Net realized gain (loss) on: | | | | |
| Investment Securities: | | | | |
| Unaffiliated issuers | | (1,515,795) | | |
| Total net realized gain (loss) | | | | (1,515,795) |
| Change in net unrealized appreciation (depreciation) on: | | | | |
| Investment Securities: | | | | |
| Unaffiliated issuers | | (24,783,774) | | |
| Fidelity Central Funds | | (17) | | |
| Total change in net unrealized appreciation (depreciation) | | | | (24,783,791) |
| Net gain (loss) | | | | (26,299,586) |
| Net increase (decrease) in net assets resulting from operations | | | $ | (2,771,607) |
| Statement of Changes in Net Assets |
| |
| | Six months ended July 31, 2023 (Unaudited) | | Year ended January 31, 2023 |
| Increase (Decrease) in Net Assets | | | | |
| Operations | | | | |
| Net investment income (loss) | $ | 23,527,979 | $ | 40,361,379 |
| Net realized gain (loss) | | (1,515,795) | | (20,291,630) |
| Change in net unrealized appreciation (depreciation) | | (24,783,791) | | (121,383,216) |
| Net increase (decrease) in net assets resulting from operations | | (2,771,607) | | (101,313,467) |
| Distributions to shareholders | | (23,138,652) | | (40,155,247) |
| | | | | |
| Share transactions | | | | |
| Proceeds from sales of shares | | 174,171,765 | | 1,227,072,147 |
| Reinvestment of distributions | | 12,403,836 | | 23,902,311 |
| Cost of shares redeemed | | (222,385,061) | | (1,414,849,935) |
| | | | | |
Net increase (decrease) in net assets resulting from share transactions | | (35,809,460) | | (163,875,477) |
| Total increase (decrease) in net assets | | (61,719,719) | | (305,344,191) |
| | | | | |
| Net Assets | | | | |
| Beginning of period | | 1,972,837,994 | | 2,278,182,185 |
| End of period | $ | 1,911,118,275 | $ | 1,972,837,994 |
| | | | | |
| Other Information | | | | |
| Shares | | | | |
| Sold | | 15,475,687 | | 108,695,832 |
| Issued in reinvestment of distributions | | 1,103,741 | | 2,111,674 |
| Redeemed | | (19,804,675) | | (125,061,450) |
| Net increase (decrease) | | (3,225,247) | | (14,253,944) |
| | | | | |
| Fidelity® Massachusetts Municipal Income Fund |
| |
| | Six months ended (Unaudited) July 31, 2023 | | Years ended January 31, 2023 | | 2022 | | 2021 | | 2020 | | 2019 |
Selected Per-Share Data | | | | | | | | | | | | |
| Net asset value, beginning of period | $ | 11.40 | $ | 12.16 | $ | 12.71 | $ | 12.62 | $ | 11.95 | $ | 12.07 |
| Income from Investment Operations | | | | | | | | | | | | |
Net investment income (loss) A,B | | .137 | | .242 | | .248 | | .280 | | .316 | | .327 |
| Net realized and unrealized gain (loss) | | (.152) | | (.762) | | (.469) | | .111 | | .678 | | (.075) |
| Total from investment operations | | (.015) | | (.520) | | (.221) | | .391 | | .994 | | .252 |
| Distributions from net investment income | | (.135) | | (.240) | | (.248) | | (.280) | | (.316) | | (.327) |
| Distributions from net realized gain | | - | | - | | (.081) | | (.021) | | (.008) | | (.045) |
| Total distributions | | (.135) | | (.240) | | (.329) | | (.301) | | (.324) | | (.372) |
| Net asset value, end of period | $ | 11.25 | $ | 11.40 | $ | 12.16 | $ | 12.71 | $ | 12.62 | $ | 11.95 |
Total Return C,D | | (.12)% | | (4.24)% | | (1.79)% | | 3.16% | | 8.41% | | 2.15% |
Ratios to Average Net Assets B,E,F | | | | | | | | | | | | |
| Expenses before reductions | | .47% G | | .46% | | .45% | | .45% | | .45% | | .46% |
| Expenses net of fee waivers, if any | | .47% G | | .46% | | .45% | | .45% | | .45% | | .46% |
| Expenses net of all reductions | | .47% G | | .45% | | .45% | | .45% | | .45% | | .45% |
| Net investment income (loss) | | 2.46% G | | 2.13% | | 1.97% | | 2.24% | | 2.56% | | 2.75% |
| Supplemental Data | | | | | | | | | | | | |
| Net assets, end of period (000 omitted) | $ | 1,911,118 | $ | 1,972,838 | $ | 2,278,182 | $ | 2,386,142 | $ | 2,369,049 | $ | 2,140,001 |
Portfolio turnover rate H | | 11% G | | 25% | | 11% | | 20% | | 12% | | 12% |
ACalculated based on average shares outstanding during the period.
BNet investment income (loss) is affected by the timing of the declaration of dividends by any underlying mutual funds or exchange-traded funds (ETFs). Net investment income (loss) of any mutual funds or ETFs is not included in the Fund's net investment income (loss) ratio.
CTotal returns for periods of less than one year are not annualized.
DTotal returns would have been lower if certain expenses had not been reduced during the applicable periods shown.
EFees and expenses of any underlying mutual funds or exchange-traded funds (ETFs) are not included in the Fund's expense ratio. The Fund indirectly bears its proportionate share of these expenses. For additional expense information related to investments in Fidelity Central Funds, please refer to the "Investments in Fidelity Central Funds" note found in the Notes to Financial Statements section of the most recent Annual or Semi-Annual report.
FExpense ratios reflect operating expenses of the class. Expenses before reductions do not reflect amounts reimbursed, waived, or reduced through arrangements with the investment adviser, brokerage services, or other offset arrangements, if applicable, and do not represent the amount paid by the class during periods when reimbursements, waivers or reductions occur.
GAnnualized.
HAmount does not include the portfolio activity of any underlying mutual funds or exchange-traded funds (ETFs).
For the period ended July 31, 2023
1. Organization.
Fidelity Massachusetts Municipal Income Fund (the Fund) is a non-diversified fund of Fidelity Massachusetts Municipal Trust (the Trust) and is authorized to issue an unlimited number of shares. Share transactions on the Statement of Changes in Net Assets may contain exchanges between affiliated funds. The Trust is registered under the Investment Company Act of 1940, as amended (the 1940 Act), as an open-end management investment company organized as a Massachusetts business trust. The Fund may be affected by economic and political developments in the state of Massachusetts.
2. Investments in Fidelity Central Funds.
Funds may invest in Fidelity Central Funds, which are open-end investment companies generally available only to other investment companies and accounts managed by the investment adviser and its affiliates. The Schedule of Investments lists any Fidelity Central Funds held as an investment as of period end, but does not include the underlying holdings of each Fidelity Central Fund. An investing fund indirectly bears its proportionate share of the expenses of the underlying Fidelity Central Funds.
Based on its investment objective, each Fidelity Central Fund may invest or participate in various investment vehicles or strategies that are similar to those of the investing fund. These strategies are consistent with the investment objectives of the investing fund and may involve certain economic risks which may cause a decline in value of each of the Fidelity Central Funds and thus a decline in the value of the investing fund.
| Fidelity Central Fund | Investment Manager | Investment Objective | Investment Practices | Expense RatioA |
| Fidelity Money Market Central Funds | Fidelity Management & Research Company LLC (FMR) | Each fund seeks to obtain a high level of current income consistent with the preservation of capital and liquidity. | Short-term Investments | Less than .005% |
A Expenses expressed as a percentage of average net assets and are as of each underlying Central Fund's most recent annual or semi-annual shareholder report.
A complete unaudited list of holdings for each Fidelity Central Fund is available upon request or at the Securities and Exchange Commission website at www.sec.gov. In addition, the financial statements of the Fidelity Central Funds which contain the significant accounting policies (including investment valuation policies) of those funds, and are not covered by the Report of Independent Registered Public Accounting Firm, are available on the Securities and Exchange Commission website or upon request.
3. Significant Accounting Policies.
The Fund is an investment company and applies the accounting and reporting guidance of the Financial Accounting Standards Board (FASB) Accounting Standards Codification Topic 946 Financial Services - Investment Companies. The financial statements have been prepared in conformity with accounting principles generally accepted in the United States of America (GAAP), which require management to make certain estimates and assumptions at the date of the financial statements. Actual results could differ from those estimates. Subsequent events, if any, through the date that the financial statements were issued have been evaluated in the preparation of the financial statements. The Fund's Schedule of Investments lists any underlying mutual funds or exchange-traded funds (ETFs) but does not include the underlying holdings of these funds. The following summarizes the significant accounting policies of the Fund:
Investment Valuation. Investments are valued as of 4:00 p.m. Eastern time on the last calendar day of the period. The Board of Trustees (the Board) has designated the Fund's investment adviser as the valuation designee responsible for the fair valuation function and performing fair value determinations as needed. The investment adviser has established a Fair Value Committee (the Committee) to carry out the day-to-day fair valuation responsibilities and has adopted policies and procedures to govern the fair valuation process and the activities of the Committee. In accordance with these fair valuation policies and procedures, which have been approved by the Board, the Fund attempts to obtain prices from one or more third party pricing services or brokers to value its investments. When current market prices, quotations or currency exchange rates are not readily available or reliable, investments will be fair valued in good faith by the Committee, in accordance with the policies and procedures. Factors used in determining fair value vary by investment type and may include market or investment specific events, transaction data, estimated cash flows, and market observations of comparable investments. The frequency that the fair valuation procedures are used cannot be predicted and they may be utilized to a significant extent. The Committee manages the Fund's fair valuation practices and maintains the fair valuation policies and procedures. The Fund's investment adviser reports to the Board information regarding the fair valuation process and related material matters.
The Fund categorizes the inputs to valuation techniques used to value its investments into a disclosure hierarchy consisting of three levels as shown below:
Level 1 - unadjusted quoted prices in active markets for identical investments
Level 2 - other significant observable inputs (including quoted prices for similar investments, interest rates, prepayment speeds, etc.)
Level 3 - unobservable inputs (including the Fund's own assumptions based on the best information available)
Valuation techniques used to value the Fund's investments by major category are as follows:
Debt securities, including restricted securities, are valued based on evaluated prices received from third party pricing services or from brokers who make markets in such securities. Municipal securities are valued by pricing services who utilize matrix pricing which considers yield or price of bonds of comparable quality, coupon, maturity and type or by broker-supplied prices. When independent prices are unavailable or unreliable, debt securities may be valued utilizing pricing methodologies which consider similar factors that would be used by third party pricing services. Debt securities are generally categorized as Level 2 in the hierarchy but may be Level 3 depending on the circumstances.
Investments in open-end mutual funds, including the Fidelity Central Funds, are valued at their closing net asset value (NAV) each business day and are categorized as Level 1 in the hierarchy.
Changes in valuation techniques may result in transfers in or out of an assigned level within the disclosure hierarchy. The aggregate value of investments by input level as of July 31, 2023 is included at the end of the Fund's Schedule of Investments.
Investment Transactions and Income. For financial reporting purposes, the Fund's investment holdings and NAV include trades executed through the end of the last business day of the period. The NAV per share for processing shareholder transactions is calculated as of the close of business of the New York Stock Exchange (NYSE), normally 4:00 p.m. Eastern time and includes trades executed through the end of the prior business day. Gains and losses on securities sold are determined on the basis of identified cost. Income and capital gain distributions from Fidelity Central Funds, if any, are recorded on the ex-dividend date. Interest income is accrued as earned and includes coupon interest and amortization of premium and accretion of discount on debt securities as applicable. Debt obligations may be placed on non-accrual status and related interest income may be reduced by ceasing current accruals and writing off interest receivables when the collection of all or a portion of interest has become doubtful based on consistently applied procedures. A debt obligation is removed from non-accrual status when the issuer resumes interest payments or when collectability of interest is reasonably assured.
Expenses. Expenses directly attributable to a fund are charged to that fund. Expenses attributable to more than one fund are allocated among the respective funds on the basis of relative net assets or other appropriate methods. Expenses included in the accompanying financial statements reflect the expenses of that fund and do not include any expenses associated with any underlying mutual funds or exchange-traded funds. Although not included in a fund's expenses, a fund indirectly bears its proportionate share of these expenses through the net asset value of each underlying mutual fund or exchange-traded fund. Expense estimates are accrued in the period to which they relate and adjustments are made when actual amounts are known.
Income Tax Information and Distributions to Shareholders. Each year, the Fund intends to qualify as a regulated investment company under Subchapter M of the Internal Revenue Code, including distributing substantially all of its taxable income and realized gains. As a result, no provision for U.S. Federal income taxes is required. The Fund files a U.S. federal tax return, in addition to state and local tax returns as required. The Fund's federal income tax returns are subject to examination by the Internal Revenue Service (IRS) for a period of three fiscal years after they are filed. State and local tax returns may be subject to examination for an additional fiscal year depending on the jurisdiction.
Distributions are declared and recorded daily and paid monthly from net investment income. Distributions from realized gains, if any, are declared and recorded on the ex-dividend date. Income and capital gain distributions are determined in accordance with income tax regulations, which may differ from GAAP.
Capital accounts within the financial statements are adjusted for permanent book-tax differences. These adjustments have no impact on net assets or the results of operations. Capital accounts are not adjusted for temporary book-tax differences which will reverse in a subsequent period.
Book-tax differences are primarily due to market discount, capital loss carryforwards and losses deferred due to excise tax regulations.
The Fund purchases municipal securities whose interest, in the opinion of the issuer, is free from federal income tax. There is no assurance that the IRS will agree with this opinion. In the event the IRS determines that the issuer does not comply with relevant tax requirements, interest payments from a security could become federally taxable, possibly retroactively to the date the security was issued.
As of period end, the cost and unrealized appreciation (depreciation) in securities, and derivatives if applicable, for federal income tax purposes were as follows:
| Gross unrealized appreciation | $11,110,067 |
| Gross unrealized depreciation | (93,751,880) |
| Net unrealized appreciation (depreciation) | $(82,641,813) |
| Tax cost | $1,985,542,873 |
Capital loss carryforwards are only available to offset future capital gains of the Fund to the extent provided by regulations and may be limited. The capital loss carryforward information presented below, including any applicable limitation, is estimated as of prior fiscal period end and is subject to adjustment.
| Short-term | $(2,769,191) |
| Long-term | (17,623,942) |
| Total capital loss carryforward | $(20,393,133) |
Delayed Delivery Transactions and When-Issued Securities. During the period, certain Funds transacted in securities on a delayed delivery or when-issued basis. Payment and delivery may take place after the customary settlement period for that security. The price of the underlying securities and the date when the securities will be delivered and paid for are fixed at the time the transaction is negotiated. Securities purchased on a delayed delivery or when-issued basis are identified as such in the Schedule of Investments. Compensation for interest forgone in the purchase of a delayed delivery or when-issued debt security may be received. With respect to purchase commitments, each applicable Fund identifies securities as segregated in its records with a value at least equal to the amount of the commitment. Payables and receivables associated with the purchases and sales of delayed delivery securities having the same coupon, settlement date and broker are offset. Delayed delivery or when-issued securities that have been purchased from and sold to different brokers are reflected as both payables and receivables in the Statement of Assets and Liabilities under the caption "Delayed delivery", as applicable. Losses may arise due to changes in the value of the underlying securities or if the counterparty does not perform under the contract's terms, or if the issuer does not issue the securities due to political, economic, or other factors.
Restricted Securities (including Private Placements). Funds may invest in securities that are subject to legal or contractual restrictions on resale. These securities generally may be resold in transactions exempt from registration or to the public if the securities are registered. Disposal of these securities may involve time-consuming negotiations and expense, and prompt sale at an acceptable price may be difficult. Information regarding restricted securities held at period end is included at the end of the Schedule of Investments, if applicable.
4. Purchases and Sales of Investments.
Purchases and sales of securities, other than short-term securities and in-kind transactions, as applicable, are noted in the table below.
| | Purchases ($) | Sales ($) |
| Fidelity Massachusetts Municipal Income Fund | 89,252,026 | 92,690,346 |
5. Fees and Other Transactions with Affiliates.
Management Fee. Fidelity Management & Research Company LLC (the investment adviser) and its affiliates provide the Fund with investment management related services for which the Fund pays a monthly management fee. The management fee is the sum of an individual fund fee rate that is based on an annual rate of .25% of the Fund's average net assets and an annualized group fee rate that averaged .10% during the period. The group fee rate is based upon the monthly average net assets of a group of registered investment companies with which the investment adviser has management contracts. The group fee rate decreases as assets under management increase and increases as assets under management decrease. For the reporting period, the total annualized management fee rate was .35% of the Fund's average net assets.
Transfer Agent Fees. Fidelity Investments Institutional Operations Company LLC (FIIOC), an affiliate of the investment adviser, is the transfer, dividend disbursing and shareholder servicing agent for the Fund. FIIOC receives account fees and asset-based fees that vary according to account size and type of account. FIIOC pays for typesetting, printing and mailing of shareholder reports, except proxy statements. For the period, transfer agent fees were equivalent to an annualized rate of .09% of average net assets.
Accounting Fees. Fidelity Service Company, Inc. (FSC), an affiliate of the investment adviser, maintains the Fund's accounting records. The accounting fee is based on the level of average net assets for each month. For the period, the fees were equivalent to the following annualized rates:
| | % of Average Net Assets |
| Fidelity Massachusetts Municipal Income Fund | .02 |
Interfund Trades. Funds may purchase from or sell securities to other Fidelity Funds under procedures adopted by the Board. The procedures have been designed to ensure these interfund trades are executed in accordance with Rule 17a-7 of the 1940 Act. Any interfund trades are included within the respective purchases and sales amounts shown in the Purchases and Sales of Investments note. Interfund trades during the period are noted in the table below.
| | Purchases ($) | Sales ($) | Realized Gain (Loss) ($) |
| Fidelity Massachusetts Municipal Income Fund | 7,540,000 | - | - |
6. Committed Line of Credit.
Certain Funds participate with other funds managed by the investment adviser or an affiliate in a $4.25 billion credit facility (the "line of credit") to be utilized for temporary or emergency purposes to fund shareholder redemptions or for other short-term liquidity purposes. The participating funds have agreed to pay commitment fees on their pro-rata portion of the line of credit, which are reflected in Miscellaneous expenses on the Statement of Operations, and are listed below. During the period, there were no borrowings on this line of credit.
| | Amount |
| Fidelity Massachusetts Municipal Income Fund | $1,846 |
7. Expense Reductions.
Through arrangements with the Fund's custodian, credits realized as a result of certain uninvested cash balances were used to reduce the Fund's expenses by $10,270.
In addition, during the period the investment adviser or an affiliate reimbursed and/or waived a portion of operating expenses in the amount of $31,597.
8. Other.
A fund's organizational documents provide former and current trustees and officers with a limited indemnification against liabilities arising in connection with the performance of their duties to the fund. In the normal course of business, a fund may also enter into contracts that provide general indemnifications. A fund's maximum exposure under these arrangements is unknown as this would be dependent on future claims that may be made against a fund. The risk of material loss from such claims is considered remote.
9. Risk and Uncertainties.
Many factors affect a fund's performance. Developments that disrupt global economies and financial markets, such as pandemics, epidemics, outbreaks of infectious diseases, war, terrorism, and environmental disasters, may significantly affect a fund's investment performance. The effects of these developments to a fund will be impacted by the types of securities in which a fund invests, the financial condition, industry, economic sector, and geographic location of an issuer, and a fund's level of investment in the securities of that issuer. Significant concentrations in security types, issuers, industries, sectors, and geographic locations may magnify the factors that affect a fund's performance.
As a shareholder, you incur two types of costs: (1) transaction costs, which may include sales charges (loads) on purchase payments or redemption proceeds, as applicable and (2) ongoing costs, which generally include management fees, distribution and/or service (12b-1) fees and other Fund expenses. This Example is intended to help you understand your ongoing costs (in dollars) of investing in a fund and to compare these costs with the ongoing costs of investing in other mutual funds.
| The Example is based on an investment of $1,000 invested at the beginning of the period and held for the entire period (February 1, 2023 to July 31, 2023). |
Actual Expenses
The first line of the accompanying table provides information about actual account values and actual expenses. You may use the information in this line, together with the amount you invested, to estimate the expenses that you paid over the period. Simply divide your account value by $1,000.00 (for example, an $8,600 account value divided by $1,000.00 = 8.6), then multiply the result by the number in the first line for a class/Fund under the heading entitled "Expenses Paid During Period" to estimate the expenses you paid on your account during this period. If any fund is a shareholder of any underlying mutual funds or exchange-traded funds (ETFs) (the Underlying Funds), such fund indirectly bears its proportional share of the expenses of the Underlying Funds in addition to the direct expenses incurred presented in the table. These fees and expenses are not included in the annualized expense ratio used to calculate the expense estimate in the table below.
Hypothetical Example for Comparison Purposes
The second line of the accompanying table provides information about hypothetical account values and hypothetical expenses based on the actual expense ratio and an assumed rate of return of 5% per year before expenses, which is not the actual return. The hypothetical account values and expenses may not be used to estimate the actual ending account balance or expenses you paid for the period. You may use this information to compare the ongoing costs of investing in the Fund and other funds. To do so, compare this 5% hypothetical example with the 5% hypothetical examples that appear in the shareholder reports of the other funds. If any fund is a shareholder of any Underlying Funds, such fund indirectly bears its proportional share of the expenses of the Underlying Funds in addition to the direct expenses as presented in the table. These fees and expenses are not included in the annualized expense ratio used to calculate the expense estimate in the table below.
Please note that the expenses shown in the table are meant to highlight your ongoing costs only and do not reflect any transaction costs. Therefore, the second line of the table is useful in comparing ongoing costs only, and will not help you determine the relative total costs of owning different funds. In addition, if these transactional costs were included, your costs would have been higher.
| | | | | Annualized Expense Ratio- A | | Beginning Account Value February 1, 2023 | | Ending Account Value July 31, 2023 | | Expenses Paid During Period- C February 1, 2023 to July 31, 2023 |
| | | | | | | | | | |
| Fidelity® Massachusetts Municipal Income Fund | | | | .47% | | | | | | |
| Actual | | | | | | $ 1,000 | | $ 998.80 | | $ 2.33 |
Hypothetical-B | | | | | | $ 1,000 | | $ 1,022.46 | | $ 2.36 |
| |
A Annualized expense ratio reflects expenses net of applicable fee waivers.
B 5% return per year before expenses
C Expenses are equal to the annualized expense ratio, multiplied by the average account value over the period, multiplied by 181/ 365 (to reflect the one-half year period). The fees and expenses of any Underlying Funds are not included in each annualized expense ratio.
1.536216.126
MAS-SANN-0923
Item 2.
Code of Ethics
Not applicable.
Item 3.
Audit Committee Financial Expert
Not applicable.
Item 4.
Principal Accountant Fees and Services
Not applicable.
Item 5.
Audit Committee of Listed Registrants
Not applicable.
Item 6.
Investments
(a)
Not applicable.
(b)
Not applicable
Item 7.
Disclosure of Proxy Voting Policies and Procedures for Closed-End Management Investment Companies
Not applicable.
Item 8.
Portfolio Managers of Closed-End Management Investment Companies
Not applicable.
Item 9.
Purchase of Equity Securities by Closed-End Management Investment Company and Affiliated Purchasers
Not applicable.
Item 10.
Submission of Matters to a Vote of Security Holders
There were no material changes to the procedures by which shareholders may recommend nominees to the Fidelity Massachusetts Municipal Trust’s Board of Trustees.
Item 11.
Controls and Procedures
(a)(i) The President and Treasurer and the Chief Financial Officer have concluded that the Fidelity Massachusetts Municipal Trust’s (the “Trust”) disclosure controls and procedures (as defined in Rule 30a-3(c) under the Investment Company Act) provide
reasonable assurances that material information relating to the Trust is made known to them by the appropriate persons, based on their evaluation of these controls and procedures as of a date within 90 days of the filing date of this report.
(a)(ii) There was no change in the Trust’s internal control over financial reporting (as defined in Rule 30a-3(d) under the Investment Company Act) that occurred during the period covered by this report that has materially affected, or is reasonably likely to materially affect, the Trust’s internal control over financial reporting.
Item 12.
Disclosure of Securities Lending Activities for Closed-End Management
Investment Companies
Not applicable.
Item 13.
Exhibits
SIGNATURES
Pursuant to the requirements of the Securities Exchange Act of 1934 and the Investment Company Act of 1940, the registrant has duly caused this report to be signed on its behalf by the undersigned, thereunto duly authorized.
Fidelity Massachusetts Municipal Trust
| |
By: | /s/Laura M. Del Prato |
| Laura M. Del Prato |
| President and Treasurer |
|
|
Date: | September 21, 2023 |
Pursuant to the requirements of the Securities Exchange Act of 1934 and the Investment Company Act of 1940, this report has been signed below by the following persons on behalf of the registrant and in the capacities and on the dates indicated.
| |
By: | /s/Laura M. Del Prato |
| Laura M. Del Prato |
| President and Treasurer |
|
|
Date: | September 21, 2023 |
| |
By: | /s/John J. Burke III |
| John J. Burke III |
| Chief Financial Officer |
|
|
Date: | September 21, 2023 |