UNITED STATES
SECURITIES AND EXCHANGE COMMISSION
Washington, D.C. 20549
FORM N-CSR
CERTIFIED SHAREHOLDER REPORT OF REGISTERED
MANAGEMENT INVESTMENT COMPANIES
Investment Company Act file number: 811-3373
Westcore Trust
(exact name of registrant as specified in charter)
1290 Broadway, Suite 1100, Denver, Colorado 80203
(Address of principal executive offices) (Zip code)
JoEllen L. Legg, Secretary
Westcore Trust
1290 Broadway, Suite 1100
Denver, Colorado 80203
(Name and address of agent for service)
Registrant’s telephone number, including area code: 303-623-2577
Date of fiscal year end: December 31
Date of reporting period: January 1, 2008 - June 30, 2008
Item 1. Reports to Stockholders.
| | June 30, 2008 |
| | |
| | Westcore Equity Funds |
| | Westcore MIDCO Growth Fund |
| | Westcore Growth Fund |
| | Westcore Select Fund |
| | Westcore International Frontier Fund |
| | Westcore Blue Chip Fund |
| | Westcore Mid-Cap Value Fund |
| | Westcore Small-Cap Opportunity Fund |
| | Westcore Small-Cap Value Fund |
| | Westcore Micro-Cap Opportunity Fund |
| | |
| | Westcore Bond Funds |
| | Westcore Flexible Income Fund |
| | Westcore Plus Bond Fund |
| | Westcore Colorado Tax-Exempt Fund |
| | |
| | |
| Westcore Funds are managed by | |
| Denver Investment Advisors LLC. | |


| Shareholder Letter | 2 | |
| Average Annual Total Returns | 4 | |
| Fund Expenses | 7 | |
| Morningstar Ratings | 9 | |
| Manager’s Overview | | |
| Westcore MIDCO Growth Fund | 12 | |
| Westcore Growth Fund | 16 | |
| Westcore Select Fund | 20 | |
| Westcore International Frontier Fund | 24 | |
| Westcore Blue Chip Fund | 28 | |
| Westcore Mid-Cap Value Fund | 32 | |
| Westcore Small-Cap Opportunity Fund | 36 | |
| Westcore Small-Cap Value Fund | 40 | |
| Westcore Micro-Cap Opportunity Fund | 44 | |
| Westcore Flexible Income Fund | 48 | |
| Westcore Plus Bond Fund | 52 | |
| Westcore Colorado Tax-Exempt Fund | 56 | |
| Financial Statements | | |
| Statements of Investments | 61 | |
| Statements of Assets and Liabilities | 122 | |
| Statements of Operations | 127 | |
| Statements of Changes in Net Assets | 132 | |
| Financial Highlights | 144 | |
| Notes to Financial Statements | 175 | |
| Other Important Information | 206 | |
 | 1-800-392-CORE (2673) ■ www.westcore.com | 1 |

Dear Fellow Shareholders:
As you well know, good news is often accompanied by bad news – especially when it comes to economic matters. For example, while worldwide individual incomes rose at the fastest rate in history between 2000 and 2007, worldwide economic growth has slowed, with the U.S. on the verge of a recession and many countries enduring bear markets.
Every market environment – good or bad – produces challenges. Investing successfully requires creativity, discipline and experience regardless of current conditions. To this end, each of the 12 Westcore Funds is managed by a team of investment professionals who strive to balance investment opportunities and risks to create a sound portfolio based on the best research and judgment we can offer.
Our newest fund—the Westcore Micro-Cap Opportunity Fund—began trading June 23, 2008. This fund focuses on the smallest companies trading on the major U.S. stock exchanges. Although this group of companies has provided above-average investment returns over long periods of time, many investors overlook this asset class because they are unfamiliar with it. The Westcore Micro-Cap Opportunity Fund is designed to take advantage of the opportunities that this under-researched asset class may offer.
While it is an interesting time to launch a new fund, as long-term investors, we view bear markets as periods of opportunity. The last bear market bottomed in the middle of 2002, with the Dow Jones Industrial Average falling below 8,000. In general, investments made during that period have performed better than investments made at market peaks, such as those in early 2000 and 2007. And while the late great investor John Templeton offered the sage advice of buying stocks at the point of “maximum fear,” we believe dollar-cost averaging can achieve similar results with more ease and less fear.
In this semi-annual report, each investment team has prepared a letter discussing the factors that affected current fund performance, along with a brief outlook. With daily headlines that underscore the impact of issues within the banking industry and high energy prices, it’s likely you can appreciate just how challenging the period was.
| 2 | Semi-Annual Report June 30, 2008 (Unaudited) | |
Although the financial markets continue to struggle on many fronts, we remain optimistic about the years ahead. The adviser to the Westcore Funds, Denver Investment Advisors LLC, has a half-century of experience navigating through both good and bad market conditions. We are confident that this investment expertise will see the Funds through the current challenges and ultimately get you closer to your financial goals.

The Shareholder Letter and the Manager Overviews included in this shareholder report contain certain forward-looking statements about the factors that may affect the performance of the Funds in the future. These statements are based on Fund management’s predictions and expectations concerning certain future events and their expected impact on the Funds, such as performance of the economy as a whole and of specific industry sectors, changes in the levels of interest rates, the impact of developing world events, and other factors that may influence the future performance of the Funds. Management believes these forward-looking statements to be reasonable, although they are inherently uncertain and difficult to predict. Actual events may cause adjustments in portfolio management strategies from those currently expected to be employed.
| 1-800-392-CORE (2673) ■ www.westcore.com | 3 |

| Average Annual Total Returns as of 6/30/08 |
| Westcore MIDCO | | | | | | | | | | | Since Incep. |
| Growth Fund | 6-month | | 1-Year | | 3-Year | | 5-Year | | 10-Year | | 8/1/86 |
| Retail Class | -10.81% | | -9.97% | | 6.74% | | 8.57% | | 6.17% | | 11.30% |
| Institutional Class* | -10.79% | | -9.85% | | 6.79% | | 8.60% | | 6.18% | | 11.31% |
| Russell Midcap Growth Index | -6.81% | | -6.42% | | 8.19% | | 12.32% | | 5.64% | | 10.74% |
| Lipper Mid-Cap Growth Index | -8.42% | | -3.08% | | 10.93% | | 12.52% | | 5.75% | | 10.19% |
| | | | | | | | | | | | |
| | | | | | | | | | | | Since Incep. |
| Westcore Growth Fund | 6-month | | 1-Year | | 3-Year | | 5-Year | | 10-Year | | 6/1/88 |
| Retail Class | -13.40% | | -4.02% | | 6.68% | | 9.22% | | 5.51% | | 9.46% |
| Institutional Class* | -13.33% | | -3.96% | | 6.70% | | 9.24% | | 5.52% | | 9.46% |
| Russell 1000 Growth Index | -9.06% | | -5.96% | | 5.92% | | 7.33% | | 0.96% | | 9.94% |
| Lipper Large-Cap Growth Index | -10.30% | | -4.21% | | 5.58% | | 7.24% | | 0.62% | | 9.25% |
| | | | | | | | | | | | |
| | | | | | | | | | | | Since Incep. |
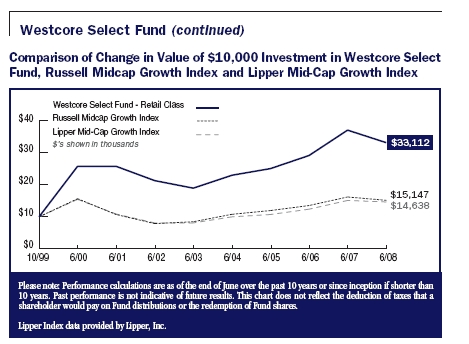
| Westcore Select Fund | 6-month | | 1-Year | | 3-Year | | 5-Year | | 10-Year | | 10/1/99 |
| Retail Class | -11.65% | | -10.52% | | 9.79% | | 11.83% | | NA | | 14.67% |
| Russell Midcap Growth Index | -6.81% | | -6.42% | | 8.19% | | 12.32% | | NA | | 4.86% |
| Lipper Mid-Cap Growth Index | -8.42% | | -3.08% | | 10.93% | | 12.52% | | NA | | 4.45% |
| | | | | | | | | | | | |
| Westcore International | | | | | | | | | | | Since Incep. |
| Frontier Fund | 6-month | | 1-Year | | 3-Year | | 5-Year | | 10-Year | | 12/15/99 |
| Retail Class | -13.67% | | -20.42% | | 5.70% | | 11.67% | | NA | | 3.49% |
| MSCI EAFE Small-Cap Index | -10.49% | | -18.65% | | 9.36% | | 18.89% | | NA | | 9.52% |
| Lipper International Small-Cap Index | -10.77% | | -14.62% | | 14.47% | | 21.40% | | NA | | 8.53% |
| | | | | | | | | | | | |
| | | | | | | | | | | | Since Incep. |
| Westcore Blue Chip Fund | 6-month | | 1-Year | | 3-Year | | 5-Year | | 10-Year | | 6/1/88 |
| Retail Class | -7.13% | | -10.12% | | 4.79% | | 8.88% | | 3.09% | | 9.68% |
| Institutional Class* | -7.06% | | -9.99% | | 4.84% | | 8.91% | | 3.11% | | 9.68% |
| S&P 500 Index | -11.91% | | -13.12% | | 4.41% | | 7.58% | | 2.88% | | 10.40% |
| Lipper Large-Cap Core Index | -10.80% | | -11.38% | | 4.82% | | 6.94% | | 2.32% | | 9.63% |
| | | | | | | | | | | | |
| Westcore Mid-Cap | | | | | | | | | | | Since Incep. |
| Value Fund | 6-month | | 1-Year | | 3-Year | | 5-Year | | 10-Year | | 10/1/98 |
| Retail Class | -9.87% | | -16.93% | | 3.99% | | 11.94% | | NA | | 10.57% |
| Russell Midcap Value Index | -8.58% | | -17.09% | | 4.97% | | 13.00% | | NA | | 10.32% |
| Lipper Mid-Cap Value Index | -7.62% | | -14.03% | | 5.56% | | 11.89% | | NA | | 10.20% |
| | | | | | | | | | | | |
| Westcore Small-Cap | | | | | | | | | | | Since Incep. |
| Opportunity Fund | 6-month | | 1-Year | | 3-Year | | 5-Year | | 10-Year | | 12/28/93 |
| Retail Class | -9.20% | | -24.18% | | 3.43% | | 10.37% | | 4.98% | | 9.44% |
| Institutional Class* | -9.14% | | -24.08% | | 3.47% | | 10.40% | | 5.00% | | 9.45% |
| Russell 2000 Index | -9.37% | | -16.19% | | 3.79% | | 10.29% | | 5.53% | | 8.42% |
| Lipper Small-Cap Core Index | -7.04% | | -13.50% | | 5.09% | | 11.07% | | 6.95% | | 9.91% |
| 4 | Semi-Annual Report June 30, 2008 (Unaudited) | |
| Average Annual Total Returns as of 6/30/08 (continued) |
| Westcore Small-Cap | | | | | | | | | | | Since Incep. |
| Value Fund | 6-month | | 1-Year | | 3-Year | | 5-Year | | 10-Year | | 12/13/04 |
| Retail Class | -8.71% | | -18.95% | | 3.90% | | NA | | NA | | 3.95% |
| Institutional Class* | -8.71% | | -18.90% | | 3.92% | | NA | | NA | | 3.97% |
| Russell 2000 Value Index | -9.84% | | -21.63% | | 1.39% | | NA | | NA | | 1.83% |
| Lipper Small-Cap Value Index | -8.26% | | -19.38% | | 2.83% | | NA | | NA | | 3.71% |
| | | | | | | | | | | | |
| Westcore Micro-Cap | | | | | | | | | | | Since Incep. |
| Opportunity Fund | 6-month | | 1-Year | | 3-Year | | 5-Year | | 10-Year | | 6/23/08 |
| Retail Class | NA | | NA | | NA | | NA | | NA | | -5.50% |
| Russell Micro-Cap Index | NA | | NA | | NA | | NA | | NA | | -6.17% |
| Lipper Small-Cap Core Index | NA | | NA | | NA | | NA | | NA | | -4.10% |
| | | | | | | | | | | | |
| Westcore Flexible | | | | | | | | | | | Since Incep. |
| Income Fund | 6-month | | 1-Year | | 3-Year | | 5-Year | | 10-Year | | 6/1/88 |
| Retail Class | -5.24% | | -11.57% | | 1.32% | | 4.99% | | 5.21% | | 7.91% |
| Institutional Class* | -5.08% | | -11.47% | | 1.36% | | 5.02% | | 5.22% | | 7.92% |
| Lehman Brothers U.S. Corporate | | | | | | | | | | | |
| High Yield Ba Index | -0.14% | | 0.39% | | 4.06% | | 6.15% | | 5.97% | | 8.56% |
| Westcore Flexible Income Fund | | | | | | | | | | | |
| Custom Index 1 | -0.14% | | 0.39% | | 4.06% | | 6.15% | | 5.96% | | 8.69% |
| Lipper High Current Yield Index | -2.02% | | -3.14% | | 4.12% | | 6.46% | | 3.27% | | 6.89% |
| | | | | | | | | | | | |
| | | | | | | | | | | | Since Incep. |
| Westcore Plus Bond Fund | 6-month | | 1-Year | | 3-Year | | 5-Year | | 10-Year | | 6/1/88 |
| Retail Class | 0.14% | | 4.43% | | 3.94% | | 4.89% | | 5.88% | | 6.86% |
| Institutional Class* | 0.28% | | 4.61% | | 4.00% | | 4.92% | | 5.90% | | 6.87% |
| Lehman Brothers Aggregate Index | 1.13% | | 7.12% | | 4.08% | | 3.86% | | 5.68% | | 7.46% |
| Lipper Intermediate Investment | | | | | | | | | | | |
| Grade Index | -0.98% | | 3.65% | | 2.89% | | 3.18% | | 5.04% | | 6.62% |
| | | | | | | | | | | | |
| Westcore Colorado | | | | | | | | | | | Since Incep. |
| Tax-Exempt Fund | 6-month | | 1-Year | | 3-Year | | 5-Year | | 10-Year | | 6/1/91 |
| Retail Class | 0.46% | | 3.19% | | 2.49% | | 2.48% | | 3.83% | | 4.98% |
| Lehman Brothers 10-Year | | | | | | | | | | | |
| Municipal Bond Index | 0.36% | | 4.66% | | 3.17% | | 3.49% | | 4.99% | | 6.21% |
| Lipper Intermediate Municipal | | | | | | | | | | | |
| Debt Index | 0.25% | | 3.22% | | 2.55% | | 2.66% | | 4.00% | | 5.05% |
| | | | | | | | | | | | |
| *The inception date for each Fund's institutional class is September 28, 2007. The institutional class' returns prior to their inception date reflect the returns of the Fund's retail class. |
| 1-800-392-CORE (2673) ■ www.westcore.com | 5 |
| (1) | Westcore Flexible Income Fund Custom Index is comprised of the Lehman Brothers Long-Term Government/Corporate Bond Index for the time period 6/1/88 - 9/30/00 and the Lehman Brothers U.S. Corporate High Yield Ba Index for the time period 10/1/00 - 6/30/08 to reflect the change in the Fund’s investment strategy on 10/1/00. The Adviser believes that the Custom Index is the best benchmark measurement for historical performance over five years. |
The performance data quoted represent past performance. Past performance does not guarantee future results and current performance may be lower or higher than the performance quoted. To obtain current performance as of the most recent month-end, please call 1-800-392-CORE (2673) or visit us online at www.westcore.com. Average annual total returns and yield figures reflect the reinvestment of dividends, capital gains distributions, all fee waivers and expense reimbursements. Without the fee waivers and expense reimbursements, total return and yield figures would have been lower. The performance data quoted does not reflect the deduction of the 2% redemption fee imposed if shares are redeemed or exchanged within 90 days of purchase. If imposed, the fee would reduce the performance quoted. Total return and yield figures represent past performance. Investment return and principal value will vary, and shares, when redeemed, may be worth more or less than their original cost. Westcore fund shares are not insured by the FDIC, the Federal Reserve Board or any other agency and are subject to investment risk.
Certain risks that may affect performance are described below. These risks and other risks are described in the prospectus.
Westcore Select Fund:
This Fund may participate in the Initial Public Offering (“IPO”) market, and a significant portion of the Fund’s since inception return is attributable to its investment in IPOs, which in turn have had a magnified impact due to the Fund’s relatively small asset base. As the Fund’s assets continue to grow, it will be increasingly less likely to experience substantially similar performance by investing in IPOs.
Westcore International Frontier, Small-Cap Opportunity, Small-Cap Value and Micro-Cap Opportunity Funds:
Investing in smaller-cap funds generally will be more volatile and loss of principal could be greater than investing in larger-cap funds
Westcore Select Fund:
Investing in non-diversified funds generally will be more volatile and loss of principal could be greater than investing in more diversified funds
Westcore International Frontier Fund:
Investing in foreign securities entails special risks, such as currency fluctuations and political uncertainties, which are described in more detail in the prospectus
Westcore Flexible Income and Plus Bond Funds:
These Funds are subject to additional risk in that they may invest in high-yield/high-risk bonds and are subject to greater levels of liquidity risk.
Westcore Colorado Tax-Exempt Fund:
This Fund invests primarily in instruments issued by or on behalf of one state and generally will be more volatile and loss of principal could be greater due to state specific risk.
| 6 | Semi-Annual Report June 30, 2008 (Unaudited) | |

Expenses are equal to the Fund’s annualized expense ratio multiplied by the average account value over the period, multiplied by the number of days in the last six months of the fiscal half-year/366 (to reflect the half-year period). The annualized expense ratios for the last six months were as follows:
| Fund | Retail Class | | Institutional Class | |
| Westcore MIDCO Growth Fund | 1.03% | | 0.93% | |
| Westcore Growth Fund | 1.02% | | 0.92% | |
| Westcore Select Fund | 1.15% | | N/A | |
| Westcore International Frontier Fund | 1.50% | | N/A | |
| Westcore Blue Chip Fund | 1.09% | | 0.99% | |
| Westcore Mid-Cap Value Fund | 1.16% | | N/A | |
| Westcore Small-Cap Opportunity Fund | 1.30% | | 1.09% | |
| Westcore Small-Cap Value Fund | 1.30% | | 1.22% | |
| Westcore Micro-Cap Opportunity Fund | 1.30% | | N/A | |
| Westcore Flexible Income Fund | 0.85% | | 0.75% | |
| Westcore Plus Bond Fund | 0.55% | | 0.46% | |
| Westcore Colorado Tax-Exempt Fund | 0.65% | | N/A | |
Disclosure Of Fund Expenses (Unaudited)
As a shareholder of a Fund, you incur two types of costs: (1) transaction costs (such as the 2% fee on redemption of Fund shares made within 90 days of purchase; and (2) ongoing costs, including management fees and other Fund expenses. The examples on the next page are intended to help you understand your ongoing costs (in dollars) of investing in a Fund and to compare these costs with the ongoing costs of investing in other mutual funds. The examples are based on an investment of $1,000 invested on January 1, 2008 and held until June 30, 2008.
Actual Return. The first line of the table on the next page provides information about actual account values and actual expenses. You may use the information in this line, together with the amount you invested, to estimate the expenses that you paid over the period. Simply divide your account value by $1,000 (for example, an $8,600 account value divided by $1,000 = 8.6), then multiply the result by the number in the first line under the heading “Expense Paid During Period” to estimate the expenses you paid on your account during this period.
Hypothetical 5% Return. The second line of the table on the next page provides information about hypothetical account values and hypothetical expenses based on the Fund’s actual expense ratio and an assumed rate of return of 5% per year before expenses, which is not the Fund’s actual return. The hypothetical account values and expenses may not be used to estimate the actual ending account balance or expenses you paid for the period. You may use this information to compare the ongoing costs of investing in a Fund and other mutual funds. To do so, compare this 5% hypothetical example with the 5% hypothetical examples that appear in the shareholder reports of other funds.
The expenses shown in the table on the next page are meant to highlight ongoing Fund costs only and do not reflect transaction costs, such as redemption fees. Therefore, the second line of the table is useful in comparing ongoing costs only, and may not help you determine the relative total costs of owning different funds. In addition, if these transactional costs were included, your costs would have been higher.
| 1-800-392-CORE (2673) ■ www.westcore.com | 7 |
| | | Beginning | | Ending | | Expense Paid |
| | | Account | | Account | | During Period |
| | | Value | | Value | | 1/1/08 to |
| Fund | | 1/1/08 | | 6/30/08 | | 6/30/08 |
| Westcore MIDCO Growth Fund | | | | | | | | | |
| Retail Class | Actual Fund Return | $ | 1,000.00 | | $ | | 891.90 | | $ | 4.83 |
| | Hypothetical Fund Return | $ | 1,000.00 | | $ | 1,019.76 | | $ | 5.15 |
| Institutional Class | Actual Fund Return | $ | 1,000.00 | | $ | | 892.10 | | $ | 4.40 |
| | Hypothetical Fund Return | $ | 1,000.00 | | $ | 1,020.22 | | $ | 4.69 |
| Westcore Growth Fund | | | | | | | | | |
| Retail Class | Actual Fund Return | $ | 1,000.00 | | $ | | 866.00 | | $ | 4.74 |
| | Hypothetical Fund Return | $ | 1,000.00 | | $ | 1,019.78 | | $ | 5.13 |
| Institutional Class | Actual Fund Return | $ | 1,000.00 | | $ | | 866.70 | | $ | 4.27 |
| | Hypothetical Fund Return | $ | 1,000.00 | | $ | 1,020.29 | | $ | 4.62 |
| Westcore Select Fund | | | | | | | | | |
| Retail Class | Actual Fund Return | $ | 1,000.00 | | $ | | 883.50 | | $ | 5.39 |
| | Hypothetical Fund Return | $ | 1,000.00 | | $ | 1,019.14 | | $ | 5.78 |
| Westcore International | | | | | | | | | |
| Frontier Fund | | | | | | | | | |
| Retail Class | Actual Fund Return | $ | 1,000.00 | | $ | | 863.30 | | $ | 6.95 |
| | Hypothetical Fund Return | $ | 1,000.00 | | $ | 1,017.40 | | $ | 7.52 |
| Westcore Blue Chip Fund | | | | | | | | | |
| Retail Class | Actual Fund Return | $ | 1,000.00 | | $ | | 928.70 | | $ | 5.24 |
| | Hypothetical Fund Return | $ | 1,000.00 | | $ | 1,019.43 | | $ | 5.48 |
| Institutional Class | Actual Fund Return | $ | 1,000.00 | | $ | | 929.40 | | $ | 4.75 |
| | Hypothetical Fund Return | $ | 1,000.00 | | $ | 1,019.94 | | $ | 4.97 |
| Westcore Mid-Cap | | | | | | | | | |
| Value Fund | | | | | | | | | |
| Retail Class | Actual Fund Return | $ | 1,000.00 | | $ | | 901.30 | | $ | 5.48 |
| | Hypothetical Fund Return | $ | 1,000.00 | | $ | 1,019.10 | | $ | 5.82 |
| Westcore Small-Cap | | | | | | | | | |
| Opportunity Fund | | | | | | | | | |
| Retail Class | Actual Fund Return | $ | 1,000.00 | | $ | | 908.00 | | $ | 6.17 |
| | Hypothetical Fund Return | $ | 1,000.00 | | $ | 1,018.40 | | $ | 6.53 |
| Institutional Class | Actual Fund Return | $ | 1,000.00 | | $ | | 908.60 | | $ | 5.17 |
| | Hypothetical Fund Return | $ | 1,000.00 | | $ | 1,019.44 | | $ | 5.47 |
| Westcore Small-Cap | | | | | | | | | |
| Value Fund | | | | | | | | | |
| Retail Class | Actual Fund Return | $ | 1,000.00 | | $ | | 912.90 | | $ | 6.20 |
| | Hypothetical Fund Return | $ | 1,000.00 | | $ | 1,018.38 | | $ | 6.54 |
| Institutional Class | Actual Fund Return | $ | 1,000.00 | | $ | | 912.90 | | $ | 5.77 |
| | Hypothetical Fund Return | $ | 1,000.00 | | $ | 1,018.82 | | $ | 6.10 |
| Westcore Micro-Cap | | | | | | | | | |
| Opportunity Fund | | | | | | | | | |
| Retail Class | Actual Fund Return | $ | 1,000.00 | | $ | | 945.00 | | $ | 0.24 |
| | Hypothetical Fund Return | $ | 1,000.00 | | $ | 1,000.71 | | $ | 0.25 |
| Westcore Flexible | | | | | | | | | |
| Income Fund | | | | | | | | | |
| Retail Class | Actual Fund Return | $ | 1,000.00 | | $ | | 947.60 | | $ | 4.12 |
| | Hypothetical Fund Return | $ | 1,000.00 | | $ | 1,020.64 | | $ | 4.27 |
| Institutional Class | Actual Fund Return | $ | 1,000.00 | | $ | | 949.20 | | $ | 3.63 |
| | Hypothetical Fund Return | $ | 1,000.00 | | $ | 1,021.14 | | $ | 3.76 |
| Westcore Plus Bond Fund | | | | | | | | | |
| Retail Class | Actual Fund Return | $ | 1,000.00 | | $ | 1,001.40 | | $ | 2.74 |
| | Hypothetical Fund Return | $ | 1,000.00 | | $ | 1,022.13 | | $ | 2.77 |
| Institutional Class | Actual Fund Return | $ | 1,000.00 | | $ | 1,001.90 | | $ | 2.29 |
| | Hypothetical Fund Return | $ | 1,000.00 | | $ | 1,022.58 | | $ | 2.31 |
| Westcore Colorado | | | | | | | | | |
| Tax-Exempt Fund | | | | | | | | | |
| Retail Class | Actual Fund Return | $ | 1,000.00 | | $ | 1,004.60 | | $ | 3.24 |
| | Hypothetical Fund Return | $ | 1,000.00 | | $ | 1,021.63 | | $ | 3.27 |
| 8 | Semi-Annual Report June 30, 2008 (Unaudited) | |

| Morningstar RatingsTM as of 6/30/08 |
| Fund | Overall | 3-Year | 5-Year | 10-Year |
| Westcore MIDCO Growth Fund | |
| Retail Class | ««« | ««« | «« | ««« |
| Institutional Class | ««« | ««« | «« | ««« |
| | out of 813 | out of 813 | out of 684 | out of 325 |
| | Mid-Cap | Mid-Cap | Mid-Cap | Mid-Cap |
| | Growth Funds | Growth Funds | Growth Funds | Growth Funds |
| Westcore Growth Fund | |
| Retail Class | «««« | ««« | «««« | «««« |
| Institutional Class | «««« | ««« | «««« | «««« |
| | out of 1,488 | out of 1,488 | out of 1,215 | out of 589 |
| | Large | Large | Large | Large |
| | Growth Funds | Growth Funds | Growth Funds | Growth Funds |
| Westcore Select Fund | |
| Retail Class | ««« | «««« | ««« | |
| | out of 813 | out of 813 | out of 684 | N/A |
| | Mid-Cap | Mid-Cap | Mid-Cap | |
| | Growth Funds | Growth Funds | Growth Funds | |
| Westcore International | |
| Frontier Fund | | | | |
| Retail Class | « | « | « | |
| | out of 86 | out of 86 | out of 76 | N/A |
| | Foreign Small/ | Foreign Small/ | Foreign Small/ | |
| | Mid Growth Funds | Mid Growth Funds | Mid Growth Funds | |
| Westcore Blue Chip Fund | |
| Retail Class | ««« | ««« | «««« | ««« |
| Institutional Class | ««« | ««« | «««« | ««« |
| | out of 1,715 | out of 1,715 | out of 1,325 | out of 660 |
| | Large | Large | Large | Large |
| | Blend Funds | Blend Funds | Blend Funds | Blend Funds |
| Westcore Mid-Cap Value Fund | |
| Retail Class | ««« | ««« | ««« | |
| | out of 410 | out of 410 | out of 323 | N/A |
| | Mid-Cap | Mid-Cap | Mid-Cap | |
| | Blend Funds | Blend Funds | Blend Funds | |
| Westcore Small-Cap | |
| Opportunity Fund | | | | |
| Retail Class | ««« | ««« | ««« | «« |
| Institutional Class | ««« | ««« | ««« | «« |
| | out of 549 | out of 549 | out of 429 | out of 185 |
| | Small | Small | Small | Small |
| | Blend Funds | Blend Funds | Blend Funds | Blend Funds |
| Westcore Small-Cap Value Fund | |
| Retail Class | «««« | «««« | | |
| Institutional Class | «««« | «««« | N/A | N/A |
| | out of 331 | out of 331 | | |
| | Small | Small | | |
| | Value Funds | Value Funds | | |
| 1-800-392-CORE (2673) ■ www.westcore.com | 9 |
| Morningstar RatingsTM as of 06/30/08 |
| Fund | Overall | 3-Year | 5-Year | 10-Year |
| Westcore Flexible Income Fund | |
| Retail Class | « « | « | « « | «««« |
| Institutional Class | « « | « | « « | «««« |
| | out of 476 | out of 476 | out of 413 | out of 214 |
| | High Yield | High Yield | High Yield | High Yield |
| | Bond Funds | Bond Funds | Bond Funds | Bond Funds |
| Westcore Plus Bond Fund | |
| Retail Class | «««« « | «««« | «««« « | «««« « |
| Institutional Class | «««« « | «««« | «««« « | «««« « |
| | out of 990 | out of 990 | out of 831 | out of 438 |
| | Intermediate- | Intermediate- | Intermediate- | Intermediate- |
| | Term Bond | Term Bond | Term Bond | Term Bond |
| | Funds | Funds | Funds | Funds |
| Westcore Colorado | |
| Tax-Exempt Fund | |
| Retail Class | ««« | ««« | ««« | «« |
| | out of 265 Muni | out of 265 Muni | out of 256 Muni | out of 203 Muni |
| | Single State | Single State | Single State | Single State |
| | Interm Funds | Interm Funds | Interm Funds | Interm Funds |
Please see the Average Annual Total Returns chart beginning on page 4 for complete performance.
©2008 Morningstar, Inc. All Rights Reserved. The information contained herein is: (1) proprietary to Morningstar; (2) may not be copied or distributed; and (3) is not warranted to be accurate, complete or timely. Neither Morningstar nor its content providers are responsible for any damages or losses arising from any use of this information. Past performance is no guarantee of future results.
Morningstar proprietary ratings reflect historical risk-adjusted performance as of 6/30/08 and are subject to change every month. For each fund with at least a 3-year history, Morningstar calculates a rating based on a Morningstar Risk-Adjusted Return measure that accounts for variation in a fund’s monthly performance (including the effects of sales charges and redemption fees), placing more emphasis on downward variations and rewarding consistent performance. The top 10% of funds in each category receive a Morningstar RatingTM of 5 stars, the next 22.5% receive 4 stars, the next 35% receive 3 stars, the next 22.5% receive 2 stars and the bottom 10% receive 1 star. (Each share class is counted as a fraction of one fund within this scale and rated separately, which may cause slight variations in the distribution percentages.) The Overall Morningstar Rating for a fund is derived from a weighted average of the performance figures associated with its 3-, 5- and 10-year (if applicable) Morningstar Rating metrics. During periods on which ratings are based, service providers of the Fund waived fees. This waiver had a material impact on the funds’ average annual returns. In the absence of fee waivers, performance would have been lower.
Morningstar ratings for the institutional class reflect historical data of the retail class for periods prior to the September 28, 2007 inception of the institutional class.
| 10 | Semi-Annual Report June 30, 2008 (Unaudited) | |

| 1-800-392-CORE (2673) ■ www.westcore.com | 11 |

Westcore MIDCO Growth Fund
FUND STRATEGY: Investing in a diversified portfolio of primarily medium-sized companies with growth potential.
 For the six months ended June 30, 2008, retail class shares of the Westcore MIDCO Growth Fund declined (10.81)%, while institutional class shares declined (10.79)%. This lagged its benchmark, the Russell Midcap Growth Index, which was down (6.81)% and also underperformed its peer group, as measured by the Lipper Mid-Cap Growth Index, which declined (8.42)%.
The Fund’s performance was hurt primarily by our underestimation of how high the price of oil and other commodities would rise during the period. A barrel of oil cost $96 at the beginning of the year, and at the end of June it was selling for $140. The rise was even more astounding when you consider that, at the beginning of 2002, oil was only $20 a barrel. In light of the current global economic slowdown, we simply didn’t anticipate such a sharp increase during the period.
With oil prices what they were, our underweight position versus the benchmark in energy stocks proved detrimental to the Fund’s relative performance during the period, as did our airline holdings and auto supply stocks. However, it’s notable that, although we missed out on some of the gains enjoyed by energy stocks during the six months, since mid-July, the price of oil has corrected sharply, and many oil and energy-related stocks are down (30)%.
Meanwhile, our relative performance was aided by our technology and healthcare holdings, which outperformed their constituents in the Russell Midcap Growth Index. Within the technology group, video game producer Take-Two Interactive Software, Inc. and semiconductor companies Marvell Technology Group Ltd. and Broadcom Corp. all had meaningful upward moves during the period. Drug companies Millennium Pharmaceuticals Inc. and Pharmion Corp. also contributed positively to our results when competitors acquired them at a premium to their stock prices. We believe these stocks are excellent examples of our ability to identify undervalued mid-cap growth companies.
| 12 | Semi-Annual Report June 30, 2008 (Unaudited) | |

Looking ahead, we find healthcare stocks attractive and the portfolio is meaningfully overweight the benchmark in this sector. A few of our favorites are Cephalon Inc., Humana Inc., Amylin Pharmaceuticals Inc. and Illumina Inc.
We’re also optimistic about our retail holdings, and have tried to strategically position the portfolio for an economic slowdown by investing in those we believe can profit even in the most challenging times, such as TJX Companies Inc. While consumers may be spending less, we think the money they do spend will be at discount retailers, where they can get more for their money.
In closing, we expect the second half of 2008 to be shaped by slowing worldwide economic growth. We believe this should mean lower oil and commodity prices and slower consumer spending. We also expect the magnitude of the current mortgage/banking crises to become clearer, which hopefully will help stabilize the stock market. Against this backdrop, we believe many attractive mid-cap growth stocks can be found, and we will continue to rely on our fundamental research to lead us to them.
| 1-800-392-CORE (2673) ■ www.westcore.com | 13 |
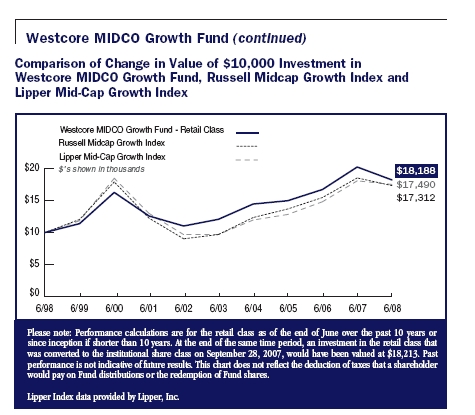
Russell Midcap Growth Index is an unmanaged index and measures the performance of those Russell Midcap companies with higher price-to-book ratios and higher forecasted growth values in the Russell 1000 Index. Lipper Mid-Cap Growth Index is an unmanaged index comprised of the 30 largest mutual funds in the Lipper Mid-Cap Growth Funds classification. This classification consists of funds that invest at least 75% of their equity assets in companies with market capitalizations (on a three-year weighted basis) less than 300% of the dollar-weighted median market capitalization of the middle 1,000 securities of the S&P SuperComposite 1500 Index. Mid-cap growth funds typically have an above-average price-to-earnings ratio, price-to-book ratio, and three-year sales-per-share growth value, compared to the S&P MidCap 400 Index.
An investment cannot be made directly in an index.
Please see Average Annual Total Return information on pages 4 and 5.
| 14 | Semi-Annual Report June 30, 2008 (Unaudited) | |
| Top 10 Holdings as of June 30, 2008 |
| 2.66% | T. Rowe Price Group Inc. (TROW) An asset management firm that provides investment, |
| | record keeping and communications services to corporate and public retirement plans |
| 2.49% | Cephalon Inc. (CEPH) Discovers, develops and markets biopharmaceutical products to |
| | treat neurological disorders and cancer |
| 2.28% | Cameron International Corp. (CAM) Manufactures oil and gas pressure control |
| | equipment for use in oil and gas drilling, production, and transmission to onshore, |
| | offshore and subsea applications |
| 2.28% | Eaton Vance Corp. (EV) Creates, markets and manages mutual funds |
| 2.27% | TJX Companies Inc. (TJX) Retails off-price apparel and home fashions |
| 2.23% | Oceaneering International Inc. (OII) A global provider of engineered services and |
| | products to the offshore oil and gas industry |
| 2.13% | Ultra Petroleum Corp. (UPL) A natural gas exploration and production company focused |
| | on the Green River Basin of Wyoming in the U.S. |
| 2.10% | Denbury Resources Inc. (DNR) Acquires, develops, operates and explores oil and gas |
| | properties primarily in the Gulf Coast region of the U.S. |
| 2.08% | Noble Corp. (NE) Provides diversified services for the oil and gas industry |
| 2.08% | Celanese Corp. Series A (CE) A global industrial chemicals company |
| Percent of Net Assets in Top Ten Holdings: 22.60% |
| Top ten holdings do not include any cash, cash equivalent or exchange traded fund investments and are subject to change. There are no guarantees that the Fund will continue to remain invested in any particular holding. |
| 1-800-392-CORE (2673) ■ www.westcore.com | 15 |
Westcore Growth Fund
FUND STRATEGY: Investing primarily in large companies with growth potential
 “We cannot create the opportunity for greatness. That either strikes us or passes us by. We can, however, prepare ourselves against the event of opportunity’s finding us unready.” – Great Captains Before Napoleon
Deteriorating economic conditions in the United States and a potential global downturn gripped the financial markets over the past six months. Investors, consumers and government regulators alike became anxious as the mounting turmoil from tightening credit, rising energy prices and a softening labor market created a very unsettling environment with little visibility.
The first three months of the year were dominated by swift sell-offs in the market and “emergency” interest rate cuts by the U.S. Federal Reserve. Although the Fed’s rate cuts did not stop until the target interest rate reached 2%, it was arguably the Fed’s act of partnering with JPMorgan Chase in its expedited acquisition of Bear Stearns that helped stabilize the equity markets in mid-March. Not to be overlooked, the fiscal stimulus package elevated hopes that consumer spending could continue and aid in the economic recovery.
Nevertheless, the S&P 500, the Russell 1000 Growth and the Lipper Large-Cap Growth indices closed the period in the red, declining (11.91)%, (9.06)% and (10.30)%, respectively for the six month period ended June 30, 2008. After a very strong 2007, the Westcore Growth Fund was unable to avoid the damage, and the Fund’s retail class shares ended the period with a (13.40)% loss, while its institutional class shares declined (13.33)%.
While we are disappointed with the Fund’s performance during the first six months of this year, our long-term objective remains in place, as evidenced by the Fund’s solid relative performance for the one-year period. For the 12 months ended June 30, 2008, the Fund’s retail class and institutional class shares declined (4.02)% and (3.96)%, respectively, versus a (5.96)% loss for the Russell 1000 Growth Index and a (13.12)% loss for the S&P 500 Index.
| 16 | Semi-Annual Report June 30, 2008 (Unaudited) | |
The Fund’s greatest detractors came from the consumer discretionary and financials sectors. More specifically, it was our lack of an investment in Wal-Mart Stores, Inc that impacted the performance of the Fund’s consumer discretionary weighting relative to the benchmark. Wal-Mart Stores’ share price climbed 18% in the period as it proved to be the prime beneficiary of consumer “trade-down”. Among our financial holdings, IntercontinentalExchange, Inc., a global electronic marketplace for trading in futures and over-the-counter commodities, declined (39)%, as investors became concerned that the government’s effort to curtail “speculation” in commodities would lead to increased scrutiny and limit trading volumes.
Positive returns on a sector basis were hard to come by. Materials and energy were the only two sectors to post positive returns for both the Fund and its benchmark. Relative to the benchmark, the Fund’s investments in the materials and healthcare sectors made positive contributions. Potash Corp. of Saskatchewan Inc., a manufacturer of solid and liquid phosphate fertilizers, rose 58%, as the food supply shortage became a global issue. Given the limited supply of potash in the world, we believe the company’s growth prospects remain undervalued. Within healthcare, Covidien Ltd., a diversified medical device and pharmaceutical company, which was spun-out from Tyco Inc. a little over a year ago, climbed 8%. We believe the top-line and margin prospects will truly begin to show through for Covidien starting in 2009.
Although the current economic conditions remain challenging, our research team continues to proactively search for the best opportunities and we believe we are beginning to see signs of healing. Nonetheless, our disciplined process has taught us to be patient as “opportunity may knock, but temptation leans on the bell.” In the first quarter alone, we conducted face-to-face meetings with more that 80% of the companies in which the Fund is invested, including Google Inc., Apple Inc., Covidien Ltd. and Visa Inc. Higher conviction was born out of this effort and was reflected in the active reduction in the number of investments in the Fund. Proceeds from the sales were reinvested in the companies we believe have the highest-quality prospects supported by catalysts for growth and sustainable competitive advantages.
Currently, we see significant opportunity for the long term in the financial sector, especially in those companies with no need to raise additional capital. We also see select opportunities in the industrials sector, particularly mining equipment companies whose earnings growth we believe will accelerate as the world attempts to increase production to keep up with growing global demand. Although investment in such companies may not bear fruit in the next week or month, we are optimistic it will position the Fund so that when opportunity knocks, we will be at the door.
| 1-800-392-CORE (2673) ■ www.westcore.com | 17 |
Westcore Growth Fund (continued)
In closing, we remain committed to our investment philosophy and will continue the search for what we believe are well-positioned, large-cap growth companies that have identifiable catalysts for growth. Even as earnings growth slows for the broader market, we believe investors will become more focused on companies that can deliver superior growth regardless of the economic environment. In our opinion, this bodes well for large-cap growth companies in general and our large-cap growth holdings in particular. Thank you for your investment in and support of the Westcore Growth Fund.

Russell 1000 Growth Index is an unmanaged index that measures the performance of the largest 1,000 firms in the Russell 3000 Index, which represents approximately 98% of the investable U.S. equity market.
Lipper Large-Cap Growth Index is an unmanaged index comprised of the 30 largest mutual funds in the Lipper Large-Cap Growth Funds classification. This classification consists of funds that, by portfolio practice, invest at least 75% of their equity assets in companies with market capitalizations (on a three-year weighted basis) greater than 300% of the dollar-weighted median market capitalization of the middle 1,000 securities of the S&P SuperComposite 1500 Index. Large-cap growth funds typically have an above-average price-to-earnings ratio, price-to-book ratio, and three-year sales-per-share growth value, compared to the S&P 500 Index.
An investment cannot be made directly in an index.
Please see Average Annual Total Return information on pages 4 and 5.
| 18 | Semi-Annual Report June 30, 2008 (Unaudited) | |
| Top 10 Holdings as of June 30, 2008 |
| 4.52% | Apple Inc. (AAPL) Designs, manufactures and markets personal computers and related |
| | personal computing and communicating solutions |
| 4.49% | Google Inc. (GOOG) Provides a web-based search engine through its Google.com website |
| 3.13% | Research In Motion Ltd. (RIMM) Designs, manufactures and markets wireless consumer |
| | and business-to-business electronic technology for the mobile personal communications |
| | market |
| 3.03% | MasterCard Inc. Class A (MA) Offers transaction processing services for credit and |
| | debit cards and related services |
| 2.52% | Cisco Systems Inc. (CSCO) Supplies data networking products to the corporate enterprise |
| | and public wide area service provider markets |
| 2.51% | Monsanto Co. (MON) Provides technology-based solutions and agricultural products for |
| | growers and downstream customers in the agricultural markets |
| 2.41% | Gilead Sciences Inc. (GILD) Discovers, develops and commercializes therapeutics for viral |
| | diseases |
| 2.39% | Microsoft Corp. (MSFT) Develops, manufactures, licenses, sells and supports |
| | software products |
| 2.32% | Visa Inc. Class A (V) Operates a retail electronic payment network and manages global |
| | financial services |
| 2.17% | Exxon Mobil Corp. (XOM) Operates petroleum and petrochemical businesses on a |
| | worldwide basis |
| Percent of Net Assets in Top Ten Holdings: 29.49% |
Top ten holdings do not include any cash, cash equivalent or exchange traded fund investments and are subject to change. There are no guarantees that the Fund will continue to remain invested in any particular holding. |
| 1-800-392-CORE (2673) ■ www.westcore.com | 19 |
Westcore Select Fund
FUND STRATEGY: Investing in a limited number of primarily medium-sized companies selected for their growth potential.
 After a challenging first quarter, U.S. equities gained strength in April and May, only to suffer a significant correction again in June. Midway through the year it was clear to us that the negative economic headwinds we’ve highlighted over the last 6-12 months have not only prevailed, but also intensified on a global scale.
Until recently, economic growth outside of the U.S. has helped to cushion the U.S. slowdown. However, what was once limited to write-offs in the subprime mortgage market is now a full-scale, global credit crisis. The other critical factor that has created tremendous economic pressure is the substantial rise in oil prices. Increases in the prices of numerous other commodities along with rising food prices suggest that material inflationary pressures are mounting. Against this backdrop, the U.S. Federal Reserve has attempted to maintain a delicate balancing act in an effort to stimulate economic growth without fueling inflation and precipitating further weakness in the U.S. dollar. We’re finding that there is not a quick and easy solution to turn things around in a short period of time.
Navigating through these volatile times has been especially challenging. The overall market declines have been broad-based with few places to hide. During the six months ended June 30, 2008, mid-cap growth stocks held up relatively well compared to other segments of the market. Although the Westcore Select Fund outperformed the Russel Midcap Growth Index in the first quarter, a disappointing second quarter pressured the Fund to a (11.65)% loss for the six-month period and caused it to underperform its benchmark, the Russell Midcap Growth Index, which declined (6.81)%. The Fund’s performance also lagged its peer group, the Lipper Mid-Cap Growth Index, which lost (8.42)%.
Our underperformance was largely a result of positioning the Fund in anticipation of a decline in oil prices during the period. In particular, we held a significantly smaller weighting than the benchmark Index in energy stocks. We also invested in Continental Airlines Inc. and Delta Air Lines Inc. on the premise that they would benefit substantially if oil prices declined. In addition, we had meaningful exposure in the consumer discretionary sector, investing in retailers like Crocs Inc., best known for its footwear, and gaming stocks like International Game Technology, a manufacturer of computerized gaming equipment. Thus far this positioning hasn’t played out well, as oil continued to be strong during the period. However, we think we’re nearing an inflection point that could cause oil prices to pull back from recent highs and believe this would bode well for the Fund’s performance.
| 20 | Semi-Annual Report June 30, 2008 (Unaudited) | |
A few areas in the Fund where our stock selection was particularly strong compared to the Index were healthcare, information technology and telecommunications. Healthcare was one of the largest positions in the Fund and an area in which we were significantly overweight relative to the benchmark. Although, collectively, our holdings in this sector produced a negative total return during the first half, they outperformed the benchmark constituents largely due to the recent buyout of Millennium Pharmaceuticals Inc.. Millennium was purchased by Japan-based Takeda Pharmaceutical at a significant premium to its stock price.
Strong stock selection within the information technology sector also bolstered our relative performance. We were especially pleased with the impressive results posted by Take-Two Interactive Software, Inc., a developer of interactive software games for personal computers, and Broadcom Corp., a manufacturer of semiconductors for the wireless communications market.
The Fund also benefited from several well-chosen stocks within the telecommunications sector. Our position in NII Holdings Inc., a wireless communications provider, was up significantly, contributing to the Fund’s overall performance.
As mentioned earlier in this letter, our underweight position in the energy sector during the period resulted in a meaningful opportunity cost. There is much debate and speculation in the industry over the future direction of oil prices, with persuasive arguments on both sides. We continue to look for new ideas in this sector, but we’ll likely remain underweight until greater clarity arises.
We also believe that good values can be found in the consumer discretionary group, but that serious headwinds remain. It appears that consumers are changing their behaviors to cope with these difficult times and are increasingly cautious in their outlook. While the near-term economic conditions remain negative, we will continue to look diligently for new ideas that we believe will result in longer-term rewards for our shareholders.
As we enter the second half of the year, it’s apparent to us that investor confidence has waned due to the unlikelihood of a quick turnaround in the economy. Despite the current challenges, we remain focused on our research and uncovering compelling opportunities over the long term. We encourage shareholders to think long term as well, and believe that staying true to their asset allocation goals and diversification guidelines will serve them well over time.
| 1-800-392-CORE (2673) ■ www.westcore.com | 21 |
Russell Midcap Growth Index is an unmanaged index and measures the performance of those Russell Midcap companies with higher price-to-book ratios and higher forecasted growth values in the Russell 1000 Index.
Lipper Mid-Cap Growth Index is an unmanaged index comprised of the 30 largest mutual funds in the Lipper Mid-Cap Growth Funds classification. This classification consists of funds that invest at least 75% of their equity assets in companies with market capitalizations (on a three-year weighted basis) less than 300% of the dollar-weighted median market capitalization of the middle 1,000 securities of the S&P SuperComposite 1500 Index. Mid-cap growth funds typically have an above-average price-to-earnings ratio, price-to-book ratio, and three-year sales-per-share growth value, compared to the S&P MidCap 400 Index.
Westcore Select Fund may participate in the Initial Public Offering (“IPO”) market, and a significant portion of the Fund’s since inception return is attributable to its investment in IPOs, which in turn have had a magnified impact due to the Fund’s relatively small asset base. As the Fund’s assets continue to grow, it will be increasingly less likely to experience substantially similar performance by investing in IPOs.
An investment cannot be made directly in an index.
Please see Average Annual Total Return information on pages 4 and 5
| 22 | Semi-Annual Report June 30, 2008 (Unaudited) | |
| Top 10 Holdings as of June 30, 2008 |
| 5.89% | Broadcom Corp. (BRCM) Provides integrated silicon solutions that enable broadband |
| | digital transmission of voice, data and video content to homes and businesses |
| 5.27% | Cephalon Inc. (CEPH) Discovers, develops and markets biopharmaceutical products to |
| | treat neurological disorders and cancer |
| 5.21% | Delta Air Lines Inc. (DAL) Provides scheduled air transportation for passengers, freight |
| | and mail throughout the U.S. and internationally |
| 5.03% | Marvell Technology Group Ltd. (MRVL) Designs, develops and markets integrated circuits |
| | for communications-related markets |
| 4.85% | Invesco Ltd. (IVZ) An independent investment management group specializing in investment |
| | management services, covering equities, fixed income and real estate properties |
| 4.85% | NII Holdings Inc. (NIHD) Provides mobile communications for business customers in |
| | Latin America |
| 4.84% | TJX Companies Inc. (TJX) Retails off-price apparel and home fashions |
| 4.79% | Polycom Inc. (PLCM) Develops, manufactures and markets a line of video, voice, data and |
| | web conferencing collaboration solutions |
| 4.73% | Newfield Exploration Co. (NFX) An independent oil and gas company which explores, |
| | develops and acquires oil and natural gas properties |
| 4.43% | Akamai Technologies Inc. (AKAM) Provides global delivery services for internet content, |
| | streaming media and applications and global internet traffic management |
| Percent of Net Assets in Top Ten Holdings: 49.89% |
Top ten holdings do not include any cash, cash equivalent or exchange traded fund investments and are subject to change. There are no guarantees that the Fund will continue to remain invested in any particular holding. |

| 1-800-392-CORE (2673) ■ www.westcore.com | 23 |
Westcore International Frontier Fund
FUND STRATEGY: Investing in small, international companies that are poised for growth.
 The Westcore International Frontier Fund was unsuccessful at avoiding the market turmoil of the six-month period ended June 30, 2008, and declined (13.67)%. By comparison, its benchmark, the MSCI EAFE Small-Cap Index lost (10.49)% and its peer group, the Lipper International Small Cap Index declined (10.77)%. Needless to say, we are disappointed by the Fund’s underperformance and negative returns. History shows that markets do not move in a straight line and this volatility has been more pronounced over the past year. While we may see brief, unsustainable rallies, such as those we enjoyed in April and May, it seems more likely to us, over the next few quarters, the markets will continue to suffer as investors respond to concerns surrounding the credit crisis and rapid inflation in energy and agricultural commodities.
With that said, we expect our investment process to continue leading us to growing companies with healthy balance sheets and strong free cash flow generation. While we view these as key components to successful long-term stock performance, we are mindful that even financially strong companies are not immune to severe price corrections. Such was the case with the Fund’s three largest detractors during the period: Esprinet S.p.A., Rightmove PLC and En-Japan Inc.
Esprinet S.p.A. is a Southern European information technology distributor that is struggling through the near-recessionary environments in Italy and Spain. Management recovered from a logistics integration problem a year ago but given the slowing end-demand in this region, Esprinet has not yet been able to translate the operational improvement into financial improvement. We believe that over time the company will deliver value as it has done historically.
Rightmove PLC is the largest web portal for residential properties in the U.K, providing details of all properties available to buy or rent. Its direct exposure to the U.K. housing market caused it to decline during the period. Although some of Rightmove’s clients, which include estate agents, rental agents and new home developers, have closed their offices in response to the weak environment, we believe history indicates they will re-open them when the market returns to normal. Despite the weak environment, we think the company’s subscription-based model gives it good visibility, and Rightmove remained a holding in the Fund at the end of the period.
| 24 | Semi-Annual Report June 30, 2008 (Unaudited) | |
En-Japan Inc. is an internet-based recruiting company. The company has grown operating income per share 55% annualized over the past seven years and generated more free cash flow than net income over the same period. However En-Japan’s stock is trading at an all-time low price-to-earnings valuation. Growth has slowed, but we strongly believe the market has over-reacted and En-Japan will continue to generate free cash flow. We feel its success will not continue to be overlooked for long.
Another holding, German-based Wirecard AG, was down 33% during the last three trading days of the quarter due to rumors of balance sheet and cash flow manipulation, insider selling, and exposure to illegal online gambling. Wirecard’s primary business is payment processing for Internet transactions. We conducted two extensive interviews with management since the rumors began and remain confident in the business and its financial reporting. Following the market rumors, management reported strong first half growth.
The Fund’s strongest contributors to performance during the period were Interhyp AG and D+S europe AG, two German-based companies recently involved in mergers and acquisitions activity. Interhyp is the leading online mortgage broker in Germany. Like many mortgage-related companies, its share price has suffered through the current credit crisis. However, Interhyp has no balance sheet risk to the real estate industry and continued to show growth in revenues and profits by taking market share from the large, traditional industry players – namely banks. Its growth profile and low valuation attracted the attention of the Dutch bank ING, which launched a public offer at a 36% premium to Interhyp’s share price.
D+S europe AG is a fast-growing provider of e-commerce service. Despite strong operational performance, its share price dwindled during the current market sell-off. This time, however, rather than an industrial buyer, a private equity firm, Apax Partners gained a controlling stake of D+S europe at a 29% premium to its share price.
With the severe correction in share prices, the Fund’s holdings are now trading at valuations we have not seen since 2002. Yet we are encouraged that our companies are performing well operationally and we are optimistic that they will generate value over the long-term. In the meantime, we remain focused on seeking to ensure that our investments are sound and continue to exercise patience until other investors recognize their value.
| 1-800-392-CORE (2673) ■ www.westcore.com | 25 |
Westcore International Frontier Fund (continued)
| |
| Country Breakdown as of June 30, 2008 |
| |
| Country | Market Value | | % | | Country | Market Value | | % |
| United Kingdom | $ | 8,453,603 | | 24.81% | | Sweden | | 1,021,254 | | 3.00% |
| Japan | | 5,714,866 | | 16.77% | | China-Hong Kong | | 893,493 | | 2.62% |
| Germany | | 3,695,203 | | 10.85% | | France | | 860,191 | | 2.52% |
| Singapore | | 3,138,274 | | 9.21% | | Cyprus | | 853,283 | | 2.51% |
| Australia | | 2,756,895 | | 8.09% | | Belgium | | 490,197 | | 1.44% |
| Italy | | 2,039,667 | | 5.99% | | Canada | | 116,211 | | 0.34% |
| Greece | | 1,874,144 | | 5.50% | | Total Investments | | 35,665,459 | | 104.68% |
| United States | | 1,538,620 | | 4.52% | | Liabilities in Excess | | | | |
| Austria | | 1,172,860 | | 3.44% | | of Other Assets | | (1,595,513) | | (4.68%) |
| Netherlands | | 1,046,698 | | 3.07% | | Net Assets | $ | 34,069,946 | | 100.00% |
| | | | | | | | | | | |
| Please note the country classification is based on the company headquarters. | | | | |

MSCI EAFE Small Cap Index is unmanaged and is an arithmetic, market value-weighted average of the performance of securities of small cap companies listed on the stock exchanges of 21 developed markets outside of North America with a capitalization range of $200 million - $1.5 billion.
Lipper International Small-Cap Index is an unmanaged index comprised of the 30 largest mutual funds in the Lipper International Small-Cap Funds classification. This classification consists of funds that invest at least 65% of their assets in equity securities of non-United States companies with market capitalizations less than $1 billion (U.S.) at the time of purchase.
An investment cannot be made directly in an index.
Please see Average Annual Total Return information on pages 4 and 5.
| 26 | Semi-Annual Report June 30, 2008 (Unaudited) | |
| Top 10 Holdings as of June 30, 2008 |
| 5.03% | KS Energy Services Ltd. (Singapore) Sources and distributes oil and gas equipment, |
| | general hardware hydraulic equipment, instrumentation, and spare parts |
| 4.72% | Cardno Ltd. (Australia) Provides professional services, including engineering, design, plan- |
| | ning, and surveying, for the construction, infrastructure, and natural environments industries |
| 4.35% | CTS Eventim AG (Germany) Acts as a promoter for the live entertainment business in |
| | Germany and other European countries |
| 4.27% | Savills PLC (United Kingdom) Provides consulting services and advice in matters related to |
| | commercial, agricultural and residential property to customers of the United Kingdom |
| 4.21% | En-Japan Inc. (Japan) Operates recruiting websites for job seekers, and offers education |
| | and evaluation-related services, such as job trainings and testing services in Japan |
| 4.19% | Kenedix Inc. (Japan) An asset management company investing in real estate and |
| | nonperforming loans mainly in Japan |
| 3.74% | Raffles Education Corp. Ltd. (Singapore) Provides college-level education programs and |
| | degrees in the areas of design and management across Asia |
| 3.70% | Azimut Holding S.p.A (Italy) Manages open-end mutual and pension funds for clients in |
| | central and northern Italy |
| 3.53% | Diploma PLC (United Kingdom) A company engaged in the distribution of specialized |
| | products and services through three business segments: life sciences, seals and controls |
| 3.45% | IG Group Holdings PLC (United Kingdom) Offers spread betting mostly on financial markets |
| Percent of Net Assets in Top Ten Holdings: 41.19% |
Top ten holdings do not include any cash, cash equivalent or exchange traded fund investments and are subject to change. There are no guarantees that the Fund will continue to remain invested in any particular holding. |
| 1-800-392-CORE (2673) ■ www.westcore.com | 27 |
Westcore Blue Chip Fund
FUND STRATEGY: Investing in large, well-established companies whose stocks appear to be undervalued.
 The investing environment during the first half of 2008 was perhaps best characterized by fear of the financial fallout from the mortgage crisis and the continued propensity of investors to buy stocks in sectors that had performed well in the recent past, such as energy and commodities. Against this backdrop, we continued to manage the Westcore Blue Chip Fund by choosing stocks that we believe have strong free cash flow, earn good returns on capital and are reasonably priced relative to their earnings. For the six months ended June 30, 2008, this resulted in a decline of (7.13)% for the Fund’s retail class shares and (7.06)% for the Fund’s institutional class shares. During this same period, our benchmark, the S&P 500 Index, lost (11.91)%, and our peer group, as measured by the Lipper Large Core Index, declined (10.80)%.
The exceptional performance of several of our healthcare holdings made this the strongest contributing sector to the Fund’s overall performance during the period. Collectively, our healthcare holdings were down only (2.08)% while healthcare stocks in the S&P 500 Index declined (12.81)%. Standout performers included biotech company Amgen, Inc. and Zimmer Holdings, Inc., a manufacturer of orthopedic implants. Both companies enjoyed improving profitability and appear to us to have good prospects for continued growth.
Another strong contributor to the Fund’s performance was Quanta Services, Inc., a contracting services company that offers various network infrastructure solutions to the electric power, gas, telecommunications and cable television industries. We believe Quanta stands to benefit meaningfully from necessary upgrades to power grids. It continues to win contracts, driving revenues and cash flows higher. As a result of a 26% increase in Quanta’s stock price over the past six months, the commercial services sector was the Fund’s second largest contributor to our relative performance.
While it is clear that high energy prices and a difficult housing market are affecting consumer attitudes, our holdings of discount retailer TJX Companies Inc. and casual dining operator Darden Restaurants Inc. were both up in the first half of the year. The gains posted by these two stocks helped to buffer the losses of the consumer cyclical sector as a whole, which in the Fund declined only (3.77)% compared to a (9.72)% decline in the same sector in the S&P 500 Index.
| 28 | Semi-Annual Report June 30, 2008 (Unaudited) | |

Our largest individual contributor to performance was oil and gas exploration company XTO Energy Inc., which gained 33%. Aided by the strong performance of integrated oil and gas company Occidental Petroleum Corp., our collective energy holdings outperformed those in the benchmark index. However, we remain somewhat cautious on the sustainability of the recent spike in energy prices and therefore owned a slightly smaller weighting in energy than the S&P 500 Index during the period. As a result, energy created a nominal drag on the Fund’s performance relative to the benchmark.
Fund holding Wachovia Corp., a provider of commercial and retail banking services, lost 57% during the first half of the year. This caused the Fund’s absolute performance in the interest-rate sensitive sector to lag the S&P 500 Index. Helping to offset this underperformance was our decision to underweight the sector versus the benchmark. While we believe there is significant value in interest-rate sensitive stocks over time, near-term uncertainties convinced us to be cautious in this area.
Although the market continues to struggle with the slowing economy, we believe there are increasing opportunities to own companies with strong operations and balance sheets at attractive valuations. Over the next several quarters, we believe concerns about the degree of slowing should be clarified, and we expect the market will begin to improve. In the meantime, we remain focused on finding attractive investments for the Fund.
| 1-800-392-CORE (2673) ■ www.westcore.com | 29 |

S&P 500 Index is a broad-based measurement of changes in stock market conditions based on the average performance of 500 widely held common stocks. It is an unmanaged index.
Lipper Large-Cap Core Index is an unmanaged index comprised of the 30 largest mutual funds in the Lipper Large-Cap Core Funds classification. This classification consists of funds that, by portfolio practice, invest at least 75% of their equity assets in companies with market capitalizations (on a three-year weighted basis) greater than 300% of the dollar-weighted median market capitalization of the middle 1,000 securities of the S&P SuperComposite 1500 Index. Large-cap core funds have more latitude in the companies in which they invest. These funds typically have an average price-to-earnings ratio, price-to-book ratio, and three-year sales-per-share growth value, compared to the S&P 500 Index.
An investment cannot be made directly in an index.
Please see Average Annual Total Return information on pages 4 and 5.
| 30 | Semi-Annual Report June 30, 2008 (Unaudited) | |
| Top 10 Holdings as of June 30, 2008 |
| 4.38% | Transocean Inc. (RIG) An offshore drilling contractor located throughout the world’s |
| | major oil and gas drilling regions |
| 4.05% | Cisco Systems Inc. (CSCO) Supplies data networking products to the corporate enterprise |
| | and public wide area service provider markets |
| 3.95% | International Business Machines Corp. (IBM) Provides computer solutions including |
| | systems, software, services and financing globally |
| 3.88% | Abbott Laboratories (ABT) Discovers, develops, manufactures and sells a broad and |
| | diversified line of healthcare products and services |
| 3.84% | Occidental Petroleum Corp. (OXY) Explores for, develops, produces and markets crude oil |
| | and natural gas and manufactures and markets a variety of basic chemicals, including chlorine |
| 3.56% | Teva Pharmaceutical Industries Ltd. (TEVA) Develops, manufactures and markets generic |
| | and branded pharmaceuticals for treatment of post-menopausal bone loss in women and |
| | treatment of multiple sclerosis |
| 3.45% | XTO Energy Inc. (XTO) A natural gas producer involved in the acquisition, exploration and |
| | development of long-lived producing oil and gas properties |
| 3.15% | QUALCOMM Inc. (QCOM) Develops and delivers digital wireless communications products |
| | and services based on the company’s proprietary digital technology |
| 3.04% | Zimmer Holdings Inc. (ZMH) Designs, develops, manufactures and markets orthopedic |
| | reconstructive implants and fracture management products |
| 2.99% | Marathon Oil Corp. (MRO) Explores for and produces crude oil and natural gas on a |
| | worldwide basis |
| Percent of Net Assets in Top Ten Holdings: 36.29% |
Top ten holdings do not include any cash, cash equivalent or exchange traded fund investments and are subject to change. There are no guarantees that the Fund will continue to remain invested in any particular holding. |
| 1-800-392-CORE (2673) ■ www.westcore.com | 31 |
Westcore Mid-Cap Value Fund
FUND STRATEGY: Investing primarily in medium-sized companies whose stocks appear to be undervalued.
We are pleased that, in the second quarter of the year, we outperformed our benchmark, the Russell Midcap Value Index, and produced a small positive return. However, it was not enough to overcome a disappointing first quarter. During the six-month period ended June 30, 2008, Westcore Mid-Cap Value Fund trailed its benchmark with a return of (9.87)% versus the (8.58)% return of the Index. We also underperformed our peer group during this period, as illustrated by the Lipper Mid-Cap Value Index return of (7.62)%. We are intent on overcoming these shortfalls as we head into the second half of the year.
Despite the Fund’s lackluster performance, there were three areas in which our holdings produced particularly strong gains. These were the consumer cyclical, commercial services and communications sectors. Darden Restaurants Inc., a casual dining company operating well-known restaurants that include Olive Garden, Red Lobster and Longhorn Steakhouse, has been a bright spot within the struggling restaurant industry. By effectively managing marketing and food costs in a difficult operating environment, Darden has improved same-store sales and posted better-than-expected margins. The company continues to return cash to shareholders through share repurchases and a dividend increase.
A standout performer within the commercial services sector was Quanta Services Inc., a leading provider of specialized contracting services that delivers end-to-end network solutions for the electric power, telecommunications, broadband cable, and gas pipeline industries. Strong quarterly results along with pending electric power and distribution contracts fueled the stock’s appreciation. We believe the company continues to be well positioned to capitalize on the need to improve the country’s electric power grid.
Within the communication sector, Adtran Inc., a telecom equipment company, provided a return exceeding 12% for the first half of the year. New products introduced in 2007 have translated into new customer orders in 2008, which are driving returns and cash flows higher.
| 32 | Semi-Annual Report June 30, 2008 (Unaudited) | |
The strongest headwinds that challenged the Fund in the first half of 2008 came from the capital goods, medical/ healthcare and energy sectors. While CNH Global N.V., a holding within the capital goods sector, is experiencing strong demand for its agricultural equipment, material inflation and supply chain inefficiencies have more than offset the robust demand year to date. CNH announced another price increase to offset higher raw material costs, and we expect the on-going restructuring will help alleviate industrial inefficiencies.
Within healthcare, Mentor Corp., a developer, manufacturer and marketer of aesthetic medical products, has not escaped the decline in consumer spending. While Mentor’s products largely appeal to the higher-end consumer, even they have, to some extent, cut back spending in light of the uncertainties plaguing the economy.
Given that our returns in the energy sector were in the 28% range for the first six months of 2008, it seems unjust to classify this as an area of weakness in the Fund. However, on a relative basis, that’s exactly what it was, as record oil prices enabled the Russell Midcap Value Index to return more than 31% in this sector. That said, it’s worth noting that Forest Oil Corp. was one of the largest individual contributors to the portfolio, with a return of more than 46%.
Looking ahead to the second half of 2008 and beyond, it remains unclear as to when the housing market will stabilize, commodity prices will plateau and lending institutions will purge themselves of non-performing loans. Further clouding the picture is a looming Presidential election in the fall. No one said investing is easy, but we believe our approach to investing in mid-cap stocks, with a focus on high-quality companies that are generating free-cash flow, will serve our investors well in the future.
| 1-800-392-CORE (2673) ■ www.westcore.com | 33 |

The Russell Midcap Value Index is an unmanaged index that measures the performance of those Russell Midcap companies with lower price-to-book ratios and lower forecasted growth values.
Lipper Mid-Cap Value Index is an unmanaged index comprised of the 30 largest mutual funds in the Lipper Mid-Cap Value Funds classification. This classification consists of funds that invest in companies to be undervalued relative to a major stock index.
An investment cannot be made directly in an index.
Please see Average Annual Total Return information on pages 4 and 5
| 34 | Semi-Annual Report June 30, 2008 (Unaudited) | |
| Top 10 Holdings as of June 30, 2008 |
| 4.03% | Quanta Services Inc. (PWR) Provides specialized contracting services to electric utilities, |
| | telecommunication and cable television operators and governmental entities |
| 3.74% | General Cable Corp. (BGC) Designs, develops, manufactures, markets and distributes |
| | copper, aluminum and fiber optic wire and cable products for communications, electrical |
| | and energy markets around the world |
| 3.59% | CommScope Inc. (CTV) Designs, manufactures and markets coaxial cables and |
| | other high-performance electronic and fiber optic cable products primarily for |
| | communication applications |
| 3.20% | Invesco Ltd. (IVZ) An independent investment management group specializing in investment |
| | management services, covering equities, fixed income and real estate properties |
| 3.00% | Crown Holdings Inc. (CCK) Manufactures packaging products for household and |
| | consumer goods |
| 2.78% | PPL Corp. (PPL) Through its subsidiaries, generates and markets electricity from power |
| | plants in the northeastern and western U.S. |
| 2.68% | Darden Restaurants Inc. (DRI) Owns and operates seafood and Italian casual dining |
| | restaurants in North America |
| 2.63% | Range Resources Corp. (RRC) An independent oil and gas company, conducts operations |
| | in the Appalachian, Permian, Midcontinent and Gulf Coast regions |
| 2.55% | Affiliated Managers Group Inc. (AMG) An asset management holding company that |
| | acquires majority interests in mid-sized investment management firms |
| 2.50% | Ingram Micro Inc. (IM) A wholesale distributor of information technology products |
| | and services |
| Percent of Net Assets in Top Ten Holdings: 30.70% |
Top ten holdings do not include any cash, cash equivalent or exchange traded fund investments and are subject to change. There are no guarantees that the Fund will continue to remain invested in any particular holding. |

| 1-800-392-CORE (2673) ■ www.westcore.com | 35 |
Westcore Small-Cap Opportunity Fund
FUND STRATEGY: Investing in small-company stocks that appear to be undervalued.
For the six months ended June 30, 2008, the retail class of the Westcore Small-Cap Opportunity Fund declined (9.20)% and the institutional class gave up (9.14)%, while its benchmark, the Russell 2000 Index, declined (9.37)%. During this same period, the Fund’s peer group, the Lipper Small Cap Index, lost (7.04)%. Although we are pleased that the Fund outperformed the Russell 2000 Index, it is somewhat of a hollow victory, as a difficult market environment has resulted in negative absolute returns for our shareholders. Rest assured that we remain committed to our goal of producing positive, long-term returns for our shareholders.
In terms of relative performance, the Fund’s top contributors during the period came primarily from the consumer cyclicals, communications and basic materials sectors. Our strongest performer in the consumer cyclicals group was Aeropostale Inc., a specialty retailer of clothing and accessories. Aeropostale bucked the trend of most retailers by posting a return slightly over 18%. We believe the company has benefited from its focus on the teen segment of the market as they are traditionally one of the last consumer groups to give up discretionary spending on clothes.
The Fund’s leading contributor within the communications sector was Superior Essex Inc., a manufacturer of wire and cable products for the communications, energy, automotive, industrial, and commercial/residential end-markets. During the second quarter, the company announced that LS Cable Ltd., a Korean company, was acquiring it. Superior Essex’s stock was up sharply even prior to the announcement and finished the first half of the year as our top performer, returning 85%.
Among our basic materials holdings, Schnitzer Steel Industries Inc. was a standout performer. Schnitzer manufactures steel products from lower-cost recycled metals and continues to generate strong free cash flow. The company is benefiting from strong demand for steel, particularly in Asia.
| 36 | Semi-Annual Report June 30, 2008 (Unaudited) | |
Fund performance for the first half of the 2008 was hampered by select holdings within the medical/healthcare, interest-rate sensitive and consumer staples sectors. Within medical/healthcare, Orthofix International N.V. explored the potential divestiture of certain assets in its orthopedic division. Bids for the assets led them to reconsider and while we believe business fundamentals remain positive, the stock price reflected investor disappointment in the cancelled sale.
The interest-rate sensitive sector, particularly banks, remained in a take-no-prisoners environment throughout the period. PacWest Bancorp, formerly known as First Community Bancorp, is a commercial bank located in southern California that experienced what we feel is a temporary downturn. We believe investors have unfairly punished the stock, largely because it is located in one of several epicenters of home foreclosures. The bank is well capitalized and well managed. Non-performing assets have been modest and are well below current reserves.
Returns in the consumer staple sector were weak as evidenced by the (8.2)% return within the Russell 2000 Index. Although there were no individual consumer staples holdings in the Fund that stood out as being particularly weak performers, collectively these stocks performed poorly relative to the Index.
Looking ahead to the second half of 2008 and beyond, it remains unclear as to when the housing market will stabilize, commodity prices will plateau and lending institutions will purge themselves of non-performing loans. Further clouding the picture is a looming Presidential election in the fall. Despite all of these uncertainties, we are excited by the attractive new ideas we are finding in this volatile market environment.
| 1-800-392-CORE (2673) ■ www.westcore.com | 37 |

Russell 2000 Index is an unmanaged index that measures the performance of the 2,000 smallest companies in the Russell 3000 Index, which represents approximately 11% of the total market capitalization of the Russell 3000 Index.
Lipper Small-Cap Core Index is an unmanaged index comprised of the 30 largest mutual funds in the Lipper Small-Cap Core Funds classification. This classification consists of funds that invest at least 75% of their equity assets in companies with market capitalizations (on a three-year weighted basis) less than 250% of the dollar-weighted median of the smallest 500 of the middle 1,000 securities of the S&P SuperComposite 1500 Index. Small-cap core funds have more latitude in the companies in which they invest. These funds typically have an average price-to-earnings ratio, price-to-book ratio, and three-year sales-per-share growth value, compared to the S&P SmallCap 600 Index.
An investment cannot be made directly in an index.
Please see Average Annual Total Return information on pages 4 and 5.
| 38 | Semi-Annual Report June 30, 2008 (Unaudited) | |
| Top 10 Holdings as of June 30, 2008 |
| 3.84% | Superior Essex Inc. (SPSX) Manufactures wire and cable products found in automobiles, |
| | televisions, computers, telephones, motors and other items |
| 3.71% | Waste Connections Inc. (WCN) Provides solid waste collection, transfer, disposal, and |
| | recycling services in secondary markets of the western U.S. |
| 3.58% | T-3 Energy Services Inc. (TTES) Serves major and independent oil and gas companies |
| | involved in the exploration, production and development of oil and gas properties offshore |
| | in the Gulf of Mexico |
| 2.92% | Oil States International Inc. (OIS) Provides specialty products and services to oil and gas |
| | drilling and production companies |
| 2.86% | Schnitzer Steel Industries Inc. (SCHN) Operates a steel scrap recycling business in the |
| | western U.S. |
| 2.58% | Sciele Pharma Inc. (SCRX) A pharmaceutical company focused on the sales, marketing |
| | and development of branded prescription products for the treatment of cardiovascular/ |
| | metabolic and women’s health |
| 2.55% | Belden Inc. (BDC) Manufactures high-speed electronic cables focusing on products for the |
| | specialty electronics and date networking markets |
| 2.40% | STERIS Corp. (STE) Markets a line of cleaning, decontamination and sterilization systems |
| | for medical device, pharmaceutical, food safety and industrial markets |
| 2.28% | CommScope Inc. (CTV) Designs, manufactures and markets coaxial cables and other high- |
| | performance electronic and fiber optic cable products primarily for communication applications |
| 2.23% | Kendle International Inc. (KNDL) Provides a broad range of Phase I through Phase IV clinical |
| | research and drug development services to pharmaceutical and biotechnology industries |
| Percent of Net Assets in Top Ten Holdings: 28.95% |
Top ten holdings do not include any cash, cash equivalent or exchange traded fund investments and are subject to change. There are no guarantees that the Fund will continue to remain invested in any particular holding. |

| 1-800-392-CORE (2673) ■ www.westcore.com | 39 |
Westcore Small-Cap Value Fund
FUND STRATEGY: Investing primarily in small, dividend paying company stocks that appear to be undervalued.
The six-month period ended June 30, 2008 was tumultuous for investors, as discouraging news on home foreclosures, rising commodity prices, credit availability, and job creation buffeted the stock market. The environment was made even more challenging by high fuel and food prices, which convinced consumers to curtail spending on everything from homes and autos to high-end consumer discretionary items. Further clouding the picture was rhetoric around the upcoming presidential election. Nonetheless, the combination of economic stimulus checks, aggressive interest rate reductions by the Federal Reserve and solid international exports leads us to believe that the second half of 2008 and beyond will be a more positive environment for stocks.
For the semiannual period ended June 30, 2008, the Westcore Small-Cap Value Fund declined (8.71)% for both the retail and institutional classes. This compares to a (9.84)% loss posted by the Fund’s benchmark, the Russell 2000 Value Index, and a (8.26)% loss posted by our peer group, the Lipper Small-Cap Value Index.
The sectors with the largest contributions to the Fund’s relative performance during this period included the interest-rate sensitive, transportation and communications groups. While the interest-rate sensitive sector was one of the overall market’s weakest during the period, we were able to capture good performance from two of our holdings in this group. Southwest Securities Group Inc. and Westamerica Bancorp had double-digit returns for the period, enabling the Fund to outperform its benchmark in this sector. We were particularly pleased with Southwest Securities, which posted two solid quarters as a result of strong broker/dealer operations, a clearing operation that has stabilized under new management; a thriving thrift business benefiting from low-cost deposits, and a relatively conservative loan portfolio.
| 40 | Semi-Annual Report June 30, 2008 (Unaudited) | |
Within the transportation sector, our holdings in the dry bulk shipping area offered the largest contribution to the Fund’s results. In particular, Eagle Bulk Shipping Inc. and Genco Shipping & Trading Ltd. performed well, both benefiting from the tight supply of vessels, coupled with the continued strong demand for iron ore, coal and grains in Asia.
A standout among our communications holdings was Adtran Inc., a telecom equipment company. New products introduced in 2007 translated into new customer orders in 2008, which drove returns and cash flows higher.
Technology, basic materials and energy were three areas where we struggled relative to the benchmark. Within technology, Technitrol Inc., an electronic components manufacturer, was a disappointment. The company is in the midst of moving plant locations to regions with lower labor costs. In the short term, management has found it difficult to overcome some of the resulting redundant operating costs. Nonetheless, we believe there will be longer-term benefits from these relocations.
The negative impact of our basic materials holdings can best be explained by our relatively modest exposure to this group. It has been difficult to find stocks within the basic materials sector that meet our strict criteria for selection, and therefore we maintained an underweight position in this sector relative to the Russell 2000 Value Index.
With our absolute returns in the energy sector in the 34% range for the first six months of 2008, it is almost unfair to categorize it as an area of weakness in the Fund. In fact, Gulf Island Fabrication Inc. was one of the strongest individual contributors to our performance, with a return of more than 55%. Nonetheless, the Russell 2000 Value Index return for this sector exceeded 46% during the period.
Looking ahead to the second half of 2008 and beyond, it remains unclear as to when the housing market will stabilize, commodity prices will plateau and lending institutions will purge themselves of non-performing loans. Despite all of these uncertainties, we are excited by the attractive new ideas we are finding in this volatile market environment.
| 1-800-392-CORE (2673) ■ www.westcore.com | 41 |
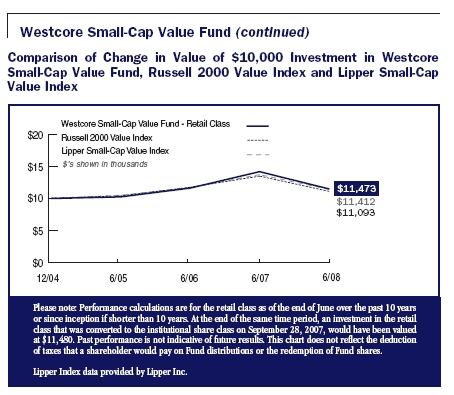
Russell 2000 Value Index is the Fund’s benchmark index. It is an unmanaged index that measures the performance of companies within the Russell 2000 Index having lower price-to-book ratios and lower forecasted growth values. The Russell 2000 Index includes the 2000 firms from the Russell 3000 Index with the smallest market capitalizations. The Russell 3000 Index represents 98% of the of the investable US equity market.
Lipper Small-Cap Value Index is an unmanaged index comprised of the 30 largest mutual funds in the Lipper Small-Cap Value Funds classification. This classification consists of funds that invest at least 75% of their equity assets in companies with market capitalizations (on a three-year weighted basis) less than 250% of the dollar-weighted median of the smallest 500 of the middle 1,000 securities of the S&P SuperComposite 1500 Index. Small-cap value funds typically have a below-average price-to-earnings ratio, price-to-book ratio, and three-year sales-per-share growth value, compared to the S&P SmallCap 600 Index.
An investment cannot be made directly in an index.
Please see Average Annual Total Return information on pages 4 and 5.
| 42 | Semi-Annual Report June 30, 2008 (Unaudited) | |
| Top 10 Holdings as of June 30, 2008 |
| 3.51% | Berry Petroleum Co. (BRY) Produces, explores for and markets crude oil and natural gas |
| | in California |
| 3.48% | Belden Inc. (BDC) Manufactures high-speed electronic cables focusing on products for the |
| | specialty electronics and data networking markets |
| 3.15% | Lincoln Electric Holdings Inc. (LECO) Designs and manufactures welding and cutting |
| | products |
| 3.00% | Gulf Island Fabrication Inc. (GIFI) Makes offshore drilling and production platforms and other |
| | specialized structures used in the development and production of offshore oil and gas reserves |
| 2.90% | Sauer-Danfoss Inc. (SHS) Designs, manufactures and sells hydraulic systems and |
| | components for use primarily in applications of off-highway mobile equipment |
| 2.62% | Owens & Minor Inc. (OMI) Distributes medical/surgical supplies throughout the U.S. |
| 2.50% | Adtran Inc. (ADTN) Designs, develops, manufactures, markets and services high-speed |
| | digital transmission products |
| 2.39% | Westamerica Bancorp (WABC) Provides a full range of banking services to individual and |
| | corporate customers in northern and central California |
| 2.33% | Bob Evans Farms Inc. (BOBE) Owns and operates full-service, family restaurants |
| 2.27% | STERIS Corp. (STE) Markets a line of cleaning, decontamination and sterilization systems |
| | for medical device, pharmaceutical, food safety and industrial markets |
| Percent of Net Assets in Top Ten Holdings: 28.15% |
Top ten holdings do not include any cash, cash equivalent or exchange traded fund investments and are subject to change. There are no guarantees that the Fund will continue to remain invested in any particular holding. |
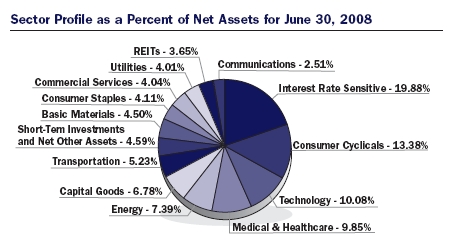
| 1-800-392-CORE (2673) ■ www.westcore.com | 43 |
Westcore Micro-Cap Opportunity Fund
FUND STRATEGY: Investing primarily in micro-cap companies whose stocks appear to be undervalued.

On June 23, 2008, Westcore Funds launched the newest addition to our family, the Westcore Micro-Cap Opportunity Fund. The Fund typically focuses on the stocks of micro-cap companies with market capitalizations of less than $500 million.
While micro-cap stocks make up approximately half of the names listed on the major stock exchanges, they typically represent less than 10% of the markets’ average daily trading volume. Additionally, because micro-caps are often overlooked by investors and under-researched by financial professionals, their share prices may diverge from the underlying values of the companies. The Westcore Micro-Cap Opportunity Fund was launched in recognition of the opportunities that such a large group of under-researched securities may provide.
Employing a disciplined, repeatable investment approach that capitalizes on the Denver Investment Advisors’ 25 years of financial modeling experience and the portfolio managers’ combined 50+ years of experience, the Fund is broadly diversified, holding approximately 150 securities at the end of the period. Our quantitative model was designed to capture the strong upside potential that the market’s smallest companies may possess. We use a carefully selected group of metrics to search for micro-cap companies with lower valuation characteristics that we believe are higher quality and have strong prospects for growth.
| 44 | Semi-Annual Report June 30, 2008 (Unaudited) | |
From the Fund’s inception on June 23, 2008, through June 30, 2008, it returned (5.50)%, while its benchmark, the Russell Micro-Cap Index, returned (6.17)%. During this same period, the Fund’s peer group, the Lipper Small-Cap Core Index, returned (4.10)%. It’s worth noting that this performance represents only a six-day period in a very volatile market environment.
Looking ahead, it remains unclear as to when the housing market will stabilize, commodity prices will plateau and lending institutions will rid themselves of non-performing loans. Further clouding the picture is the Presidential election in the fall. Despite all of these uncertainties, we are excited by the opportunities the micro-cap asset class provides and look forward to being a part of your long-term investment goals.
| 1-800-392-CORE (2673) ■ www.westcore.com | 45 |
Westcore Micro-Cap Opportunity Fund (continued)
Comparison of Change in Value of $10,000 Investment in Westcore Micro-Cap Opportunity Fund
There is no comparison of change in value of $10,000 investment in Westcore Micro-Cap Opportunity Fund’s benchmark and peer group indexes because of its recent inception date.
| Top 10 Holdings as of June 30, 2008 |
| 1.43% | RehabCare Group Inc. (RHB) Provides acute rehabilitation, subacute, outpatient, temporary |
| | and permanent therapist and nurse staffing services on a contract basis |
| 1.29% | MainSource Financial Group Inc. (MSFG) The holding company for MainSource Bank, |
| | Peoples Trust company and MainSource Bank of Illinois |
| 1.27% | Westmoreland Coal Co. (WLB) An independent coal company operating in various |
| | western states |
| 1.26% | Mesabi Trust (MSB) Owns mining rights on taconite properties in Minnesota |
| 1.25% | Boston Beer Company Inc. (SAM) Produces a variety of craft-brewed beers and cider products |
| | under such names as Boston Beer Company, Samuel Adams and HardCore |
| 1.24% | Advanced Energy Industries Inc. (AEIS) Manufactures power conversion and control |
| | systems used in plasma-based thin film production equipment |
| 1.24% | Micrel Inc. (MCRL) Designs, develops, manufactures and markets analog power integrated |
| | circuits and digital integrated circuits |
| 1.22% | Ramco-Gershenson Properties Trust (RPT) Owns, develops, acquires, manages and |
| | leases regional malls, community shopping centers and single tenant properties, nationally |
| 1.22% | Symyx Technologies Inc. (SMMX) Develops high-speed technologies that aid in the |
| | discovery of new materials for industrial customers |
| 1.21% | CTS Corp. (CTS) Designs, manufactures and sells electronic components and custom |
| | electronic assemblies |
| Percent of Net Assets in Top Ten Holdings: 12.63% |
Top ten holdings do not include any cash, cash equivalent or exchange traded fund investments and are subject to change. There are no guarantees that the Fund will continue to remain invested in any particular holding. |
| 46 | Semi-Annual Report June 30, 2008 (Unaudited) | |
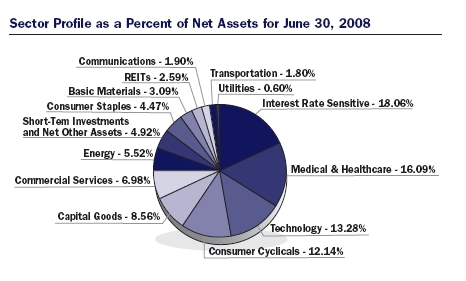
| 1-800-392-CORE (2673) ■ www.westcore.com | 47 |
Westcore Flexible Income Fund
FUND STRATEGY: A more aggressive fixed-income fund focusing on higher-yielding securities.
 The first six months of 2008 provided a volatile backdrop for the financial markets in general and high yield bonds in particular. Early on, concerns centered on a potential slowing economy and an anticipated up-tick in high yield bond default rates. Understandably, fixed income investors required higher yields to compensate for the increased risk of default during this period.
Throughout the first quarter, concerns mounted over the declining housing market and the associated fall-out within the financial sector. The net effect was waning confidence in the financial system and its safeguards, including regulators, credit rating agencies and professional investors. In turn, high yield spreads continued to move wider, approaching levels not seen in five years. The Federal Reserve introduced multiple avenues of liquidity, while also utilizing the more traditional method of lowering the Fed Funds Rate.
As the first quarter wound down, the increasing credit spread level, along with the market’s underlying concern for the financial system and counterparty risk, grew serious enough to warrant action by the Federal Reserve. As such, policymakers stepped in and brokered the “take-under” of Bear Stearns. Many investors believed this transaction marked a peak in the financial stress and looked toward the second quarter with optimism that the housing correction might play out without forcing the U.S. economy into a recession. Credit spreads tightened somewhat as high-yield bonds began making a comeback. The movement was short-lived, however, as June brought with it more signs of financial stress, indicating that the U.S. economy ultimately may not be able to avoid a housing-induced recession and mounting inflationary pressure.
Throughout the period we positioned the Westcore Flexible Income Fund for a difficult market through our credit evaluation process, which resulted in exposure to higher-quality issuers in the energy, utilities and consumer staples industries. The Fund also maintained a position in REIT preferred stock and gaming companies — a sector that historically has held up well during periods of economic stress. While the preferred stock is lower in the capital structure than debt, we think the higher covenant standards across the REIT industry would provide protection from over-levering as we entered a slowing commercial real estate market. We also held a sizeable cash balance so that we could take advantage of the attractive investment opportunities that often present themselves during volatile markets.
| 48 | Semi-Annual Report June 30, 2008 (Unaudited) | |
Unfortunately, our efforts resulted in the Westcore Flexible Income Fund lagging its benchmark during the first half of 2008, posting a negative (5.24)% return for its retail shares and a negative (5.08)% return for its institutional shares. This compares to the (0.14)% decline posted by the Fund’s benchmark, the Lehman Brothers U.S. Corporate High Yield Ba Index, and a (2.02)% loss posted by its peer group, the Lipper High Current Yield Index.
Stress in the financial markets was particularly detrimental to our REIT holdings, which are considered financial entities and are particularly vulnerable to refinance risk. While the majority of our REIT credit exposure is through investment-grade entities, credit spreads widened severely across varying issuers of REIT bonds.
We were also adversely affected by our exposure to the gaming sector, which no longer demonstrates as resilient a revenue base that it possessed during previous economic slowdowns. We believe our specific holdings in the gaming sector will perform well over their term to maturity despite the industry-wide re-pricing.
While our credit evaluation process involves a long-term view, we are experiencing a high yield market in which many investors take a short-term view. We believe this nearsighted perspective can result in wide and frequent price swings in even the high-quality issues we’ve chosen for the Fund. Over the long term, we believe these swings have provided us with good buying opportunities, yet in the near term, this volatility can also cause us to underperform our benchmark. It is times like these when we take comfort in our long-term performance and recall the wisdom of leading financial thinkers such as the late Sir John Templeton, who stated that periods of underperformance are unavoidable and investing at the point of greatest fear creates wealth over time.
We remain steadfast in our approach to investing; focusing on the underlying fundamentals of each specific issuer. While we may alter our exposure and re-evaluate issuers in light of the current and expected market conditions, over time we feel our investment discipline and its associated low turnover will benefit the Fund and its investors. Furthermore, we anticipate our holdings will contribute meaningfully to performance when the financial markets begin to focus on an ultimate recovery of the U.S. economy.
| 1-800-392-CORE (2673) ■ www.westcore.com | 49 |
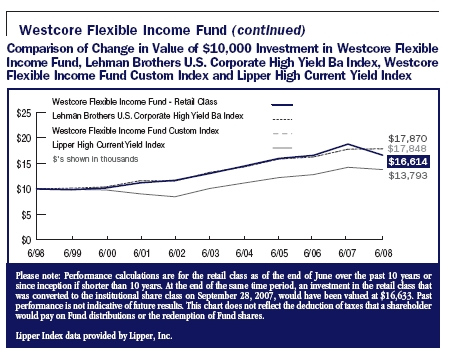
Lehman Brothers U.S. Corporate High Yield Ba Index is an unmanaged index that measures the performance of intermediate (1 to 10 year) U.S. high yield issues. It includes fixed-rate, noninvestment grade debt issues rated Ba1 or lower by Moody’s, rated BB+ or lower by S&P, rated below investment grade by Fitch Investor’s Service or if unrated previously held a high yield rating or have been associated with a high yield issuer, and must trade accordingly.
Note: Westcore Flexible Income Fund Custom Index is comprised of the Lehman Brothers Long-Term Government/Corporate Bond Index for the time period 6/1/88 - 9/30/00 and the Lehman Brothers U.S. Corporate High Yield Ba Index for the time period 10/1/00 - 6/30/08 to reflect the change in the Fund’s investment strategy on 10/1/00. The Adviser believes that the Custom Index is the best benchmark measurement for historical performance over five years.
Lehman Brothers Long-Term Government/Corporate Bond Index is an unmanaged index that includes fixed rate debt issues rated investment grade or higher by Moody’s Investors Services, Standard & Poor’s Corporation or Fitch Investor’s Service, in order. Long-term indices include bonds with maturities of ten years or longer. Lipper High Current Yield Index is comprised of the 30 largest funds in the Lipper High Current Yield Funds classification. This classification consists of funds that aim at high (relative) current yield from fixed-income securities, has no quality or maturity restrictions, and tends to invest in lower grade debt issues.
Note: Lipper categorizes Westcore Flexible Income Fund in the Lipper Flexible Income category. However, Lipper does not calculate a Lipper Index for this category. Therefore Westcore Funds selected Lipper High Current Yield Index as the most comparable index.
An investment cannot be made directly in an index.
Please see Average Annual Total Return information on pages 4 and 5.
| 50 | Semi-Annual Report June 30, 2008 (Unaudited) | |
| Top 10 Corporate Credit Exposure | | Top 10 Sectors as of |
| as of June 30, 2008 | | June 30, 2008 |
| 4.07% | Ford Motor Co. | | 13.53% | Energy (non-util) |
| 3.63% | Leucadia National Corp. | | 13.23% | Leisure |
| 3.56% | MGM Mirage Resorts Inc. | | 12.13% | Other Industrials |
| 3.15% | Qwest Corp. | | 8.78% | Autos |
| 2.84% | Aramark Corp. | | 6.48% | Financial Services |
| 2.54% | Royal Caribbean Cruises Ltd. | | 4.21% | REITS-Healthcare |
| 2.06% | CSX Corp. | | 3.86% | Telecom & Related |
| 2.01% | Omega Healthcare | | 3.32% | REITS-Regional Malls |
| 1.99% | Las Vegas Sands Corp. | | 2.97% | REITS-Hotels |
| 1.95% | Freeport-McMoran Corp. | | 2.73% | Transportation |
| Percent of Net Assets in Top Ten Corporate Credit Exposure: 27.80% | | Percent of Net Assets in Top Ten Sectors: 71.24% |
Percentages represent the Fund’s aggregate holdings in the same corporate issuer and its affiliates. Top ten corporate credit exposure and sectors are subject to change. There are no guarantees that the Fund will continue to remain invested in any particular security, issuer or sector. |

The ratings allocation reflects the Standard & Poor’s equivalent ratings category for the highest credit-quality rating assigned by either Standard & Poor’s or Moody’s.
| 1-800-392-CORE (2673) ■ www.westcore.com | 51 |
Westcore Plus Bond Fund
FUND STRATEGY: A more moderate fixed-income fund focusing on investment quality bonds of varying maturities.
The first half of 2008 opened with hopes that the credit crisis would stay contained within the subprime segment of the mortgage market. However, those hopes were dashed as the crisis proved more extensive and challenged the broader investment markets. Despite early capital-raising by many financial institutions and investments by sovereign wealth funds and other private equity, it soon became evident that this was a much deeper corrective episode. As the year progressed, credit spreads continued to widen and treasury yields declined.
With financial institutions highly levered, the rapid and severe decline in subprime had an extreme constricting effect on larger and more expansive financial intermediaries. The situation was notably present in Bear Stearns, which required a Federal Reserve orchestrated acquisition by JP Morgan, and bond insurer MBIA, which lost its vital AAA rating.
Many investors saw the JP Morgan acquisition of Bear Stearns as a positive sign. Other evidence that the tide may be turning included cuts in the short-term lending and discount rates, which at period-end were 2.0% and 2.25%, respectively, as well as the creation of the Term Auction Facility for depository institutions and the Term Securities Lending Facility for Primary Dealers. Credit spreads began to stabilize and treasury yields started to rise as the market conceived the idea that the worst in the credit situation had passed, and inflation, led by rapidly increasing oil prices, was the dominant threat to fixed-income markets.
However, these hopes proved premature as write-downs of asset values by financial institutions continued, Fannie Mae and Freddie Mac struggled with further declines in housing prices, and treasury rates again declined as the second quarter came to a close.
While credit quality and employment data are important to monitor as we attempt to judge the state of the bond market, we recognize that further stimulus from the government, extensive declines in home and equity prices, and the weaker dollar may attract enough new capital to lift the economy. Despite our optimism, we remain cautious as housing prices have yet to stabilize and higher commodity prices pressure consumer discretionary income.
| 52 | Semi-Annual Report June 30, 2008 (Unaudited) | |
In credit crises like the one we are living through now, bonds generally perform well as interest rates decline and bond prices rise. In this environment, however, non-treasury bonds tend to underperform as the market prices in higher credit and liquidity risk.
The Fund entered the year with a neutral stance relative to the benchmark in both its weighting in non-treasury securities and exposure to interest rates. As the credit crisis progressed, we trimmed exposure to the real estate market, auto industry, and financial institutions, and made selective purchases in what we feel are under-priced, high quality securities.
Additions to the portfolio in the first half of 2008 included Wal-Mart Stores, Inc., ConocoPhillips, Coca-Cola Co., Harley Davidson Motorcycle Trust, and Vanderbilt Mortgage, which is owned by Clayton Homes, a Berkshire Hathaway company. Securities sold from the portfolio included Starwood Hotels and Resorts, IStar Financial, and our holdings in the auto parts suppliers American Axle, Visteon Corporation, and Dana Corporation, to name a few.
The Fund’s holdings in below-investment grade securities remained at near-historic lows throughout the first half of 2008, closing the period at 6.3%. We anticipate increasing this exposure when we are confident that the credit markets have priced in the full extent of the economic downturn.
The Fund’s holdings in mortgage-backed securities remain significantly underweighted relative to the benchmark, as we have chosen to hold other non-treasury securities to achieve our neutral exposure. The potential variability in pre-payments due to interest rate moves, the weakening housing market, and the financial difficulties in government-sponsored enterprises Fannie Mae and Freddie Mac led us to assess better value in other investments.
When all was said and done, for the six months ended June 30, 2008, the Westcore Plus Bond Fund returned 0.14% for its retail shares and 0.28% for its institutional shares. By comparison, the Fund’s benchmark, the Lehman Brothers Aggregate Index, returned 1.13% and the Fund’s peer group, the Lipper Intermediate Investment Grade Index, declined (0.98)% over the same period.
Despite the significant swings in treasury yields over the first half, our neutral exposure to interest rates proved appropriate, as the yield on the 10-year treasury note remained effectively unchanged over the period.
With our holdings of higher quality corporate bonds and neutral interest rate exposure, we believe the Fund is well positioned in the current liquidity crisis. If the U.S. equity market suffers further declines, we believe higher quality intermediate bonds will continue to play an important stabilizing role in a diversified portfolio.
| 1-800-392-CORE (2673) ■ www.westcore.com | 53 |
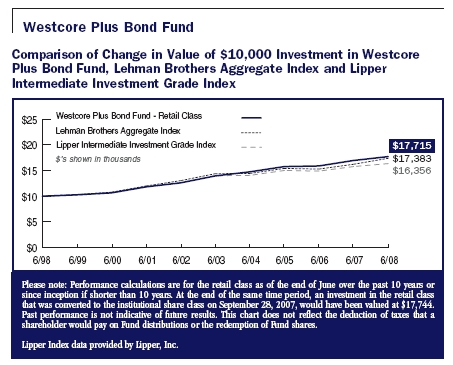
Lehman Brothers Aggregate Index is an unmanaged index that includes investment-grade fixed-rate debt issues, including government, corporate, asset-backed, and mortgage-backed securities, with maturities of at least one year.
Lipper Intermediate Investment Grade Index is comprised of the 30 largest mutual funds in the Lipper Intermediate Investment Grade Debt Funds classification. This classification consists of funds that invest at least 65% of their assets in investment grade debt issues (rated in top four grades) with dollar-weighted average maturities of five to ten years.
Note: For the time period 6/1/88 - 11/30/89, the Lipper Intermediate Investment Grade Index was not in existence. Westcore Funds selected the Lipper Corporate Debt BBB Index as the most comparable Lipper Index for this time period.
Lipper Intermediate Investment Grade Index is comprised of the 30 largest mutual funds in the Lipper Intermediate Investment Grade Funds classification. This classification consists of funds that invest at least 65% of their assets in investment-grade debt issues (rated in the top four grades) with dollar-weighted average maturities of five to ten years.
An investment cannot be made directly in an index.
Please see Average Annual Total Return information on pages 4 and 5.
| 54 | Semi-Annual Report June 30, 2008 (Unaudited) | |
| Top 10 Corporate Credit Exposure | | Top 10 Sectors as of |
| as of June 30, 2008 | | June 30, 2008 |
| 1.56% | CSX Corp. | | 24.79% | Agency Mortgaged |
| 1.10% | ConocoPhillips | | | Backed Securities |
| 1.02% | Burlington Northern Santa Fe Corp. | | 18.09% | U.S. Government & |
| 1.01% | Nevada Power Co. | | | Agency Obligations |
| 1.00% | BMW US Capital Inc. | | 7.59% | Energy (non-util) |
| 0.94% | Simon Property Group | | 6.11% | Asset Backed Securities |
| 0.94% | Wells Fargo & Co. | | 4.84% | Financial Services |
| 0.93% | The Coca-Cola Co. | | 4.50% | Utilities |
| 0.92% | Wal-Mart Stores, Inc. | | 4.16% | Other Industrials |
| 0.92% | BHP Billiton Finance | | 3.04% | Autos |
| | | | 2.60% | Pharmaceuticals |
| | | | 2.58% | Transportation |
| Percent of Net Assets in Top Ten Corporate Credit Exposure: 10.34% | | Percent of Net Assets in Top Ten Sectors: 78.30% |
Percentages represent the Fund’s aggregate holdings in the same corporate issuer and its affiliates. Top ten corporate credit exposure and sectors are subject to change. There are no guarantees that the Fund will continue to remain invested in any particular security, issuer or sector. |
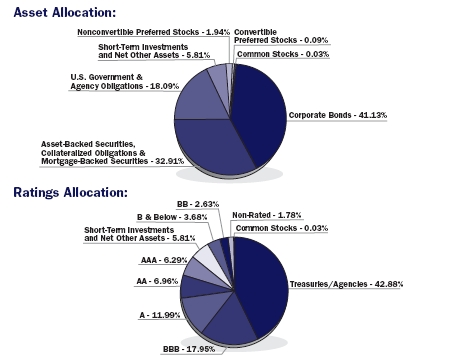
The ratings allocation reflects the Standard & Poor’s equivalent ratings category for the highest credit-quality rating assigned by either Standard & Poor’s or Moody’s.
| 1-800-392-CORE (2673) ■ www.westcore.com | 55 |
Westcore Colorado Tax-Exempt Fund
FUND STRATEGY: Offering Colorado investors double tax-exempt income through investing in municipal bonds of investment quality.
 After dramatically reducing short-term borrowing rates by 3.25% in just nine months, the U.S. Federal Reserve now seems inclined to pause in its policy deliberations. In lieu of raising interest rates to pre-empt perceived rising inflationary expectations, the Fed’s priorities at present appear to revolve around maintaining financial stability within the nation’s two largest mortgage lenders: Federal National Mortgage Association and Federal Home Loan Mortgage Corporation. This, combined with lower capital market valuations, rising unemployment, a tepid economy, and an exceedingly pessimistic consumer confidence indicator, all point to maintaining the current Federal Funds Rate, which at this writing is 2.00%.
Against this backdrop, municipal bond performance during the first half of 2008 lagged that of the highest quality, most liquid U.S. Treasury securities. While the yield on the 10-year U.S. Treasury declined modestly from 4.03% to 3.97% from December 31, 2007, to June 30, 2008, the average yield of the Municipal 20 Bond Buyer Index, a gauge of AAA-rated general obligation bonds, rose from 4.44% to 4.83%.
During this same period, the Westcore Colorado Tax-Exempt Fund returned 0.46% after fund expenses. This compares favorably to the 0.36% return for the Lehman Brothers 10-year Municipal Bond Index and a 0.25% return for the Fund’s peer group, the Lipper Intermediate Municipal Debt Index. By way of single-state comparison, Lehman Brothers Colorado-only index of 757 issues registered a six-month return of (0.88)%, suggesting Colorado-specific securities fared much more poorly for the period than other state-specific securities. As fund managers, we saw no explicable rationale for this seemingly large dichotomy. The Fund’s higher relative return may be attributed to the approximate 13.5% weighting in one-year and shorter maturities in a period of high volatility and generally rising municipal bond yields.
With municipal bond yields in excess of 100% of comparable maturity U.S. Treasury securities, our investment strategy during the period was to take advantage of this anomaly in the marketplace to purchase longer maturity, 5%+ coupon issues. Two examples of Colorado obligations we purchased were Baa1 rated University of Colorado Hospital Revenue Bonds 5.25% due 11/15/2022 and AA rated El Paso County Certificates of Participation Detention Facility Project 5.375% due on 12/01/2019.
| 56 | Semi-Annual Report June 30, 2008 (Unaudited) | |
We purchased our University of Colorado Revenue bonds at a 5.00% yield basis to the anticipated 11/15/09 call date. This translates into a 7.69% taxable equivalent yield for investors in a 35% federal marginal tax bracket and, at the time of purchase, represented 217% of the comparable U.S. Treasury yield. Should the issue be held to the final stated maturity date in 2022, the taxable equivalent yield rises to 8.02% and the yield to maturity, at 5.22%, represents 114% of the comparable U.S. Treasury security.
Our El Paso Detention Facility bonds were purchased at a yield of 4.60% to the 12/01/2012 call date, carrying a taxable equivalent yield of 7.08% and representing a yield of 131% of a comparable 4-year U.S. Treasury security. Again, should the security not be redeemed on its anticipated 2012 call date, the taxable equivalent yield jumps to 7.72% in 2019 and yields 115% over a similar U.S. Treasury issue. Neither of these credits is subject to the alternative minimum tax and both are examples of the types of investment opportunities that we believe provide value to shareholders.
We continue to look for Colorado credits carrying a coupon of 5% or higher of investment-grade quality. Due to the credit deterioration of the third-party monoline insurers (insurance companies offering a single type of insurance contract) such as MBIA, AMBAC and XLCA, it is imperative that we scrutinize any investments being considered for the Fund to ensure that underlying, or “stand-alone” ratings issued by the three major rating agencies, Moody’s, Standard & Poor’s and Fitch, are verifiable. The average dollar weighted credit quality of the Fund as of June 30, 2008 was Aa3/AA-.
In our last letter to you, we discussed the potential for a short-term dislocation in the municipal bond market following a pending decision by the U.S. Supreme Court on Kentucky vs. Davis, a court case dealing with the sovereignty of states to tax out-of-state municipal income earned by in-state residents. On May 19, 2008, in a 7-2 ruling, the Supreme Court upheld the decision of the lower court, maintaining the status quo. The decision is important for the Fund, as it reinforces the structural integrity of owning state-specific debt obligations. Had the ruling been otherwise, the value of owning Colorado-only tax-exempt obligations in the Fund would have been diminished. As it is, we will continue with business as usual.
Looking forward, we believe a severe economic slowdown in the face of rising core inflation is a distinct possibility. It is our opinion that the consumer is in the midst of retrenching. As the impact of stimulus checks wane, we believe consumers will concentrate on cutting costs as unemployment grinds higher. The housing situation has not stabilized, and the July 11 failure of Indymac Bank, the seventh largest mortgage originator in the U.S., has consumers anxious.
| 1-800-392-CORE (2673) ■ www.westcore.com | 57 |
Westcore Colorado Tax-Exempt Fund (continued)
Despite these real concerns, we believe capital preservation and double-tax exemption of interest for Colorado residents presents a great alternative for investors. With this in mind, we will continue to focus on higher-coupon bonds and to apply our intensive research process toward ensuring that every security currently held in the Fund or being considered for investment meets our credit parameters.
Comparison of Change in Value of $10,000 Investment in Westcore Colorado Tax-Exempt Fund, Lehman Brothers 10-Year Municipal Bond Index and Lipper Intermediate Municipal Debt Index
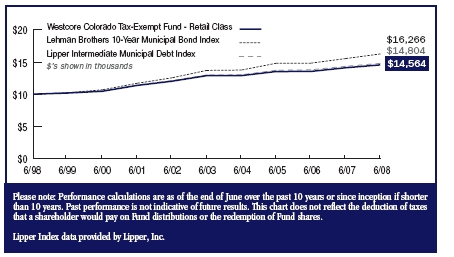
Lehman Brothers 10-Year Municipal Bond Index is an unmanaged index that includes investment grade (Moody’s Investor Services Aaa to Baa, Standard & Poor’s Corporation AAA to BBB) tax-exempt bonds with maturities between eight and twelve years.
Lipper Intermediate Municipal Debt Index is comprised of the 30 largest mutual funds in the Lipper Intermediate Municipal Debt Funds classification. This classification consists of funds that invest in municipal debt issues with dollar-weighted average maturities of five to ten years.
Note: Lipper categorizes Westcore Colorado Tax-Exempt Fund in the Lipper Other States Municipal Debt category. However, Lipper does not calculate a Lipper Index for this category. Therefore, Westcore Funds selected the Lipper Intermediate Municipal Debt Index as the most comparable Lipper Index.
An investment cannot be made directly in an index.
Please see Average Annual Total Return information on pages 4 and 5.
| 58 | Semi-Annual Report June 30, 2008 (Unaudited) | |
| Top 10 Holdings as of June 30, 2008 |
| 1.81% | Arkansas River Power Authority, 5.875%, 10/01/2026 |
| 1.79% | Larimer County, Poudre School District R-1, 6.00%, 12/15/2017 |
| 1.78% | Douglas & Elbert Counties School District Re-1, 5.25%, 12/15/2017 |
| 1.76% | El Paso County School District 12, 5.00%, 09/15/2013 |
| 1.73% | Aurora County Hospital, 5.000%, 12/01/2022 |
| 1.71% | Jefferson County School District R-1, 5.00%, 12/15/2024 |
| 1.71% | Regional Transportation District CO CTFS Partnership, 5.00%, 12/01/2022 |
| 1.69% | Denver City & County, 5.00%, 11/15/2018 |
| 1.68% | Adams 12 Five Star Schools, Zero Coupon, 12/15/2024 |
| 1.67% | University of Colorado Hospital Authority, 5.250%, 11/15/2022 |
| Percent of Net Assets in Top Ten Holdings: 17.33% |
Top ten holdings do not include any cash or cash equivalent investments and are subject to change. There are no guarantees that the Fund will continue to remain invested in any particular holding. |

The ratings allocation reflects the Standard & Poor’s equivalent ratings category for the highest credit-quality rating assigned by either Standard & Poor’s or Moody’s.
| 1-800-392-CORE (2673) ■ www.westcore.com | 59 |

| Statement of Investments | | |
| | | |
| Westcore MIDCO Growth Fund | 61 | |
| | | |
| Westcore Growth Fund | 64 | |
| | | |
| Westcore Select Fund | 67 | |
| | | |
| Westcore International Frontier Fund | 69 | |
| | | |
| Westcore Blue Chip Fund | 72 | |
| | | |
| Westcore Mid-Cap Value Fund | 75 | |
| | | |
| Westcore Small-Cap Opportunity Fund | 78 | |
| | | |
| Westcore Small-Cap Value Fund | 81 | |
| | | |
| Westcore Micro-Cap Opportunity Fund | 84 | |
| | | |
| Westcore Flexible Income Fund | 89 | |
| | | |
| Westcore Plus Bond Fund | 99 | |
| | | |
| Westcore Colorado Tax-Exempt Fund | 112 | |
| | | |
| Statements of Assets and Liabilities | 122 | |
| | | |
| Statements of Operations | 127 | |
| | | |
| Statements of Changes in Net Assets | 132 | |
| | | |
| Financial Highlights | 144 | |
| | | |
| Notes to Financial Statements | 175 | |
| | | |
| Other Important Information | 206 | |
| 60 | Semi-Annual Report June 30, 2008 (Unaudited) | |

Westcore MIDCO Growth Fund as of June 30, 2008
| | Shares | | Market Value | |
| | | | | |
| Common Stocks 95.93% | |
| Consumer Discretionary 14.49% | |
| Auto Components 1.79% | |
| ArvinMeritor Inc. | 229,400 | $ | 2,862,912 | |
| | | | | |
| Distributors 0.55% | | | | |
| Central European | | | | |
| Distribution Corp.** | 11,900 | | 882,385 | |
| | | | | |
| Hotels, Restaurants & Leisure 2.52% | |
| Bally Technologies Inc.** | 57,400 | | 1,940,120 | |
| Melco PBL Entertainment | | | | |
| Ltd. - ADR | | | | |
| (China-Hong Kong)** | 223,500 | | 2,083,020 | |
| | | | 4,023,140 | |
| | | | | |
| Internet & Catalog Retail 0.86% | | | |
| NetFlix Inc.** | 52,900 | | 1,379,103 | |
| | | | |
| | | | | |
| Media 1.54% | |
| Central European Media | | | | |
| Enterprises Ltd. | | | | |
| (Bermuda)** | 27,200 | | 2,462,416 | |
| | | | | |
| Specialty Retail 4.76% | |
| Abercrombie & Fitch | | | | |
| Co. - Class A | 30,600 | | 1,918,008 | |
| GameStop Corp.** | 50,900 | | 2,056,360 | |
| TJX Companies Inc. | 115,400 | | 3,631,638 | |
| | | | 7,606,006 | |
| | | | |
| | | | | |
| Textiles Apparel & Luxury Goods 2.47% | |
| Coach Inc.** | 78,200 | | 2,258,416 | |
| Phillips-Van Heusen Corp. | 46,300 | | 1,695,506 | |
| | | | 3,953,922 | |
| | | | | |
| Total Consumer Discretionary | |
| (Cost $24,792,400) | | | 23,169,884 | |
| | | | |
| | Shares | | Market Value |
| | | | |
| Energy 15.10% |
| Energy Equipment & Services 7.20% |
| Cameron | | | |
| International Corp.** | 66,000 | $ | 3,653,100 |
| Noble Corp. | 51,300 | | 3,332,448 |
| Oceaneering | | | |
| International Inc.** | 46,300 | | 3,567,415 |
| Superior Energy | | | |
| Services Inc.** | 17,200 | | 948,408 |
| | | | 11,501,371 |
| | | | |
| Oil, Gas & Consumable Fuels 7.90% |
| Denbury Resources Inc.** | 92,000 | | 3,358,000 |
| Newfield Exploration Co.** | 50,300 | | 3,282,075 |
| Range Resources Corp. | 39,500 | | 2,588,830 |
| Ultra Petroleum Corp.** | 34,700 | | 3,407,540 |
| | | | 12,636,445 |
| Total Energy |
| (Cost $14,396,151) | | | 24,137,816 |
| | | | |
| Financials 8.89% |
| Capital Markets 8.89% |
| Eaton Vance Corp. | 91,500 | | 3,638,040 |
| Invesco Ltd. - ADR | 123,200 | | 2,954,336 |
| Jefferies Group Inc. | 70,800 | | 1,190,856 |
| Lazard Ltd. (Bermuda) | 63,700 | | 2,175,355 |
| T. Rowe Price Group Inc. | 75,300 | | 4,252,191 |
| | | | 14,210,778 |
| Total Financials |
| (Cost $10,934,337) | | | 14,210,778 |
| | | | |
| Healthcare 16.45% |
| Biotechnology 5.87% |
| Amylin | | | |
| Pharmaceuticals Inc.** | 39,900 | | 1,013,061 |
| BioMarin | | | |
| Pharmaceutical Inc.** | 77,300 | | 2,240,154 |
| Cephalon Inc.** | 59,800 | | 3,988,062 |
| United | | | |
| Therapeutics Corp.** | 21,900 | | 2,140,725 |
| | | | 9,382,002 |
| 1-800-392-CORE (2673) ■ www.westcore.com | 61 |
Westcore MIDCO Growth Fund as of June 30, 2008 (continued)
| | Shares | | Market Value | |
| | | | | |
| Healthcare Equipment & Supplies 4.59% | |
| ArthroCare Corp.** | 64,500 | $ | 2,632,245 | |
| Orthofix Intl. N.V. | | | | |
| (Netherlands)** | 71,800 | | 2,078,610 | |
| St. Jude Medical Inc.** | 32,300 | | 1,320,424 | |
| Zimmer Holdings Inc.** | 19,100 | | 1,299,755 | |
| | | | 7,331,034 | |
| | | | | |
| Healthcare Providers & Services 3.61% | |
| DaVita Inc.** | 35,750 | | 1,899,398 | |
| Humana Inc.** | 35,700 | | 1,419,789 | |
| Laboratory Corporation | | | | |
| of America ** | 35,100 | | 2,444,013 | |
| | | | 5,763,200 | |
| | | | | |
| Life Sciences Tools & Services 0.90% | |
| Illumina Inc.** | 16,500 | | 1,437,315 | |
| | | | | |
| Pharmaceuticals 1.50% | |
| Endo Pharmaceuticals | | | | |
| Holdings Inc.** | 98,900 | | 2,392,391 | |
| | | | | |
| Total Healthcare | | | | |
| (Cost $24,955,176) | | | 26,305,942 | |
| | | | | |
| Industrials 17.44% | |
| Aerospace & Defense 2.17% | |
| BE Aerospace Inc.** | 60,800 | | 1,416,032 | |
| Spirit Aerosystems | | | | |
| Holdings Inc.** | 107,500 | | 2,061,850 | |
| | | | 3,477,882 | |
| | | | | |
| Air Freight & Logistics 1.70% | |
| HUB Group Inc.** | 79,600 | | 2,716,748 | |
| | | | | |
| Airlines 1.08% | |
| Continental Airlines Inc.** | 81,000 | | 818,910 | |
| Delta Air Lines Inc.** | 159,900 | | 911,430 | |
| | | | 1,730,340 | |
| | Shares | | Market Value |
| | | | |
| Commercial Services & Supplies 3.16% |
| FTI Consulting Inc.** | 27,200 | $ | 1,862,112 |
| Monster Worldwide Inc.** | 57,200 | | 1,178,892 |
| The Brink’s Co. | 30,700 | | 2,008,394 |
| | | | 5,049,398 |
| | | | |
| Construction & Engineering 1.18% |
| Jacobs Engineering | | | |
| Group Inc.** | 23,400 | | 1,888,380 |
| | | | |
| Electrical Equipment 0.82% |
| First Solar Inc.** | 4,800 | | 1,309,536 |
| | | | |
| Machinery 5.21% |
| AGCO Corp.** | 42,800 | | 2,243,148 |
| Cummins Inc. | 12,000 | | 786,240 |
| Joy Global Inc. | 33,400 | | 2,532,722 |
| Pentair Inc. | 78,900 | | 2,763,077 |
| | | | 8,325,187 |
| | | | |
| Road & Rail 2.12% |
| JB Hunt Transport | | | |
| Services Inc. | 52,600 | | 1,750,528 |
| Kansas City Southern** | 37,300 | | 1,640,827 |
| | | | 3,391,355 |
| | | | |
| Total Industrials |
| (Cost $32,274,474) | | | 27,888,826 |
| | | |
| | | | |
| Information Technology 17.22% |
| Communications Equipment 1.57% |
| Polycom Inc.** | 103,000 | | 2,509,080 |
| | | | |
| Electronic Equipment & Instruments 3.16% |
| Dolby Laboratories Inc.** | 67,900 | | 2,736,370 |
| Itron Inc.** | 23,600 | | 2,321,060 |
| | | | 5,057,430 |
| | | | |
| Internet Software & Services 3.49% |
| Akamai Technologies Inc.** | 93,800 | | 3,263,302 |
| Equinix Inc.** | 26,000 | | 2,319,720 |
| | | | 5,583,022 |
| 62 | Semi-Annual Report June 30, 2008 (Unaudited) | |
Westcore MIDCO Growth Fund as of June 30, 2008 (continued)
| | Shares | | Market Value | |
| | | | | |
| Semiconductors & | |
| Semiconductor Equipment 6.06% | |
| Broadcom Corp. - | | | | |
| Class A** | 103,800 | $ | 2,832,702 | |
| Intersil Corp. | 75,000 | | 1,824,000 | |
| Marvell Technology Group | | | | |
| Ltd. (Bermuda)** | 184,500 | | 3,258,270 | |
| Silicon Laboratories Inc.** | 49,300 | | 1,779,237 | |
| | | | 9,694,209 | |
| | | | |
| | | | | |
| Software 2.94% | |
| Electronic Arts Inc. ** | 35,000 | | 1,555,050 | |
| THQ Inc.** | 154,700 | | 3,134,222 | |
| | | | 4,689,272 | |
| | | | | |
| Total Information Technology | |
| (Cost $27,568,140) | | | 27,533,013 | |
| | | | | |
| Materials 2.08% | |
| Chemicals 2.08% | |
| Celanese Corp. | 72,800 | | 3,324,048 | |
| | | | | |
| Total Materials | |
| (Cost $2,319,784) | | | 3,324,048 | |
| | | | | |
| Telecommunication Services 4.26% | |
| Wireless Telecommunication Services 4.26% | |
| MetroPCS | | | | |
| Communications Inc.** | 133,000 | | 2,355,430 | |
| NII Holdings Inc.** | 57,400 | | 2,725,926 | |
| SBA Communications | | | | |
| Corp.** | 48,200 | | 1,735,682 | |
| | | | 6,817,038 | |
| | | | | |
| Total Telecommunication Services | |
| (Cost $6,929,477) | | | 6,817,038 | |
| | | | | |
| Total Common Stocks | |
| (Cost $144,169,939) | 153,387,345 | |
| | | Shares | | Market Value |
| | | | | |
| Money Market Mutual Funds 1.90% |
| Goldman Sachs | | | | | |
| Financial Square | | | | | |
| Prime Obligations | | | | | |
| Fund - FST Shares | | | | | |
| (7 Day Yield 2.380%) | 3,031,009 | | $ | 3,031,009 |
| | | | |
| | | | | | |
| Total Money Market Mutual Funds |
| (Cost $3,031,009) | | | 3,031,009 |
| | | | | | |
| Total Investments | | | | | |
| (Cost $147,200,948) | 97.83% | | | 156,418,354 |
| | | | | | |
| Other Assets in | | | | | |
| Excess of Liabilities | | 2.17% | | | 3,467,430 |
| | | | | | |
| Net Assets | 100.00% | | $ | 159,885,784 |
| | | | | |
See Notes to Statements of Investments on page 120 and Notes to Financial Statements beginning on page 175. |
| | | | | | |
| Westcore MIDCO Growth Fund |
| Country Breakdown as of June 30, 2008 |
| Country | | Market Value | | | % |
| United States | $ 144,360,683 | | | 90.29% |
| Bermuda | | 7,896,041 | | | 4.94% |
| China-Hong Kong | | 2,083,020 | | | 1.30% |
| Netherlands | | 2,078,610 | | | 1.30% |
| Total Investments | | 156,418,354 | | | 97.83% |
| Other Assets in Excess | | | | | |
| of Liabilities | | 3,467,430 | | | 2.17% |
| Net Assets | $ 159,885,784 | | | 100.00% |
| | | | |
| Please note the country classification is based on the company headquarters. |
| |
| All of the Fund’s investments are traded on U.S. exchanges. |
| 1-800-392-CORE (2673) ■ www.westcore.com | 63 |
Westcore Growth Fund as of June 30, 2008
| | Shares | | Market Value | |
| | | | | |
| Common Stocks 95.16% | |
| Consumer Discretionary 4.80% | |
| | | |
| Hotels, Restaurants & Leisure 3.11% | |
| McDonald’s Corp. | 61,430 | $ | 3,453,595 | |
| Wynn Resorts Ltd. | 15,340 | | 1,247,909 | |
| Yum! Brands Inc. | 86,926 | | 3,050,233 | |
| | | | 7,751,737 | |
| Multiline Retail 0.73% | |
| Target Corp. | 39,122 | | 1,818,782 | |
| | | | | |
| Textile Apparel & Luxury Goods 0.96% | |
| Nike Inc. - Class B | 40,203 | | 2,396,501 | |
| | | | | |
| Total Consumer Discretionary | |
| (Cost $11,819,343) | | | 11,967,020 | |
| | | | | |
| Consumer Staples 5.28% | |
| Beverages 1.29% | |
| Molson Coors Brewing Co. | 59,170 | | 3,214,706 | |
| | | | | |
| Food & Staples Retailing 3.99% | |
| Costco Wholesale Corp. | 71,880 | | 5,041,663 | |
| CVS Caremark Corp. | 124,440 | | 4,924,091 | |
| | | | 9,965,754 | |
| Total Consumer Staples | |
| (Cost $12,251,430) | | | 13,180,460 | |
| | | | | |
| Energy 13.13% | |
| Energy Equipment & Services 8.18% | |
| Cameron | | | | |
| International Corp.** | 80,043 | | 4,430,380 | |
| Halliburton Co. | 70,089 | | 3,719,623 | |
| Schlumberger Ltd. | 43,470 | | 4,669,983 | |
| Transocean Inc.** | 28,622 | | 4,361,707 | |
| Weatherford | | | | |
| International Ltd.** | 64,758 | | 3,211,349 | |
| | | | 20,393,042 | |
| | | | | |
| Oil, Gas & Consumable Fuels 4.95% | |
| Arch Coal, Inc. | 42,308 | | 3,174,369 | |
| Exxon Mobil Corp. | 61,490 | | 5,419,113 | |
| Newfield Exploration Co.** | 57,734 | | 3,767,144 | |
| | | | 12,360,626 | |
| | Shares | | Market Value |
| | | | |
| Total Energy |
| (Cost $27,072,973) | | | $ | 32,753,668 |
| | | | | |
| Financials 4.45% |
| Capital Markets 4.45% |
| Charles Schwab Corp. | 152,836 | | | 3,139,251 |
| Franklin Resources Inc. | 15,210 | | | 1,393,997 |
| Goldman Sachs Group Inc. | 22,113 | | | 3,867,563 |
| Janus Capital Group Inc. | 101,644 | | | 2,690,517 |
| | | | | 11,091,328 |
| Total Financials |
| (Cost $10,410,073) | | | | 11,091,328 |
| | | | | |
| Healthcare 15.18% |
| Biotechnology 5.13% |
| Celgene Corp.** | 32,620 | | | 2,083,439 |
| Genentech Inc.** | 32,970 | | | 2,502,423 |
| Genzyme Corp.** | 30,670 | | | 2,208,853 |
| Gilead Sciences Inc.** | 113,320 | | | 6,000,294 |
| | | | | 12,795,009 |
| Healthcare Equipment & Supplies 4.22% |
| Baxter International Inc. | 50,470 | | | 3,227,052 |
| Covidien Ltd. | 105,334 | | | 5,044,445 |
| Medtronic Inc. | 43,690 | | | 2,260,958 |
| | | | | 10,532,455 |
| | | | | |
| Healthcare Providers & Services 2.06% |
| Aetna Inc. | 28,670 | | | 1,161,995 |
| Cigna Corp. | 32,720 | | | 1,157,961 |
| Medco Health | | | | |
| Solutions Inc.** | 59,440 | | | 2,805,568 |
| | | | | 5,125,524 |
| | | | | |
| Life Sciences Tools & Services 0.77% |
| Thermo Fisher | | | | |
| Scientific Inc.** | 34,270 | | | 1,909,867 |
| | | | | |
| Pharmaceuticals 3.00% |
| Abbott Laboratories | 62,215 | | | 3,295,528 |
| Merck & Co. Inc | 60,140 | | | 2,266,677 |
| Schering-Plough Corp. | 97,730 | | | 1,924,304 |
| | | | | 7,486,509 |
| | | | | |
| 64 | Semi-Annual Report June 30, 2008 (Unaudited) | |
Westcore Growth Fund as of June 30, 2008 (continued)
| | Shares | | Market Value | |
| | | | | |
| Total Healthcare | |
| (Cost $34,667,760) | | | $ | 37,849,364 | |
| | | | | | |
| Industrials 10.23% | |
| Aerospace & Defense 5.44% | |
| Boeing Co. | 28,476 | | | 1,871,443 | |
| Honeywell International Inc. | 49,330 | | | 2,480,312 | |
| Lockheed Martin Corp. | 37,610 | | | 3,710,602 | |
| Precision Castparts Corp. | 16,975 | | | 1,635,881 | |
| Raytheon Co. | 36,220 | | | 2,038,462 | |
| United Technologies Corp. | 29,670 | | | 1,830,639 | |
| | | | | 13,567,339 | |
| | | | | | |
| Industrial Conglomerates 1.52% | |
| McDermott | | | | | |
| International Inc.** | 61,410 | | | 3,800,665 | |
| | | | | | |
| Machinery 2.10% | |
| Deere & Co. | 56,020 | | | 4,040,723 | |
| Joy Global Inc. | 15,640 | | | 1,185,981 | |
| | | | | 5,226,704 | |
| | | | | | |
| Road & Rail 1.17% | |
| Norfolk Southern Corp. | 46,457 | | | 2,911,460 | |
| | | | | |
| | | | | | |
| Total Industrials | |
| (Cost $25,154,363) | | | | 25,506,168 | |
| | | | | | |
| Information Technology 32.61% | |
| Communications Equipment 8.66% | |
| Cisco Systems Inc.** | 270,180 | | | 6,284,387 | |
| Corning Inc. | 207,080 | | | 4,773,194 | |
| QUALCOMM Inc. | 61,630 | | | 2,734,523 | |
| Research In Motion | | | | | |
| Ltd. (Canada)** | 66,818 | | | 7,811,023 | |
| | | | | 21,603,127 | |
| | | | | | |
| Computers & Peripherals 6.58% | |
| Apple Inc.** | 67,285 | | | 11,266,200 | |
| Hewlett-Packard Co. | 116,336 | | | 5,143,215 | |
| | | | | 16,409,415 | |
| | Shares | | Market Value |
| | | | |
| Internet Software & Services 4.49% |
| Google Inc. - Class A** | 21,287 | $ | 11,205,903 |
| | | | |
| IT Services 5.35% |
| MasterCard Inc. | 28,460 | | 7,556,699 |
| Visa Inc.** | 71,123 | | 5,783,011 |
| | | | 13,339,710 |
| | | | |
| Semiconductors & |
| Semiconductor Equipment 4.04% |
| Applied Materials Inc. | 126,110 | | 2,407,440 |
| Intel Corp. | 185,150 | | 3,977,022 |
| Marvell Technology Group | | | |
| Ltd. (Bermuda)** | 90,840 | | 1,604,234 |
| National | | | |
| Semiconductor Corp. | 101,807 | | 2,091,116 |
| | | | |
| | | | 10,079,812 |
| Software 3.49% |
| Microsoft Corp. | 216,850 | | 5,965,544 |
| Oracle Corp.** | 130,440 | | 2,739,240 |
| | | | 8,704,784 |
| | | | |
| Total Information Technology | | |
| (Cost $64,487,584) | | | 81,342,751 |
| | | | |
| Materials 7.86% |
| Chemicals 7.04% |
| Air Products & | | | |
| Chemicals Inc. | 39,461 | | 3,901,114 |
| Monsanto Co. | 49,517 | | 6,260,930 |
| Potash Corp. of | | | |
| Saskatchewan Inc. | | | |
| (Canada) | 22,720 | | 5,193,110 |
| Syngenta AG - ADR | | | |
| (Switzerland) | 34,064 | | 2,203,941 |
| | | | 17,559,095 |
| | | | |
| Containers & Packaging 0.82% |
| Owens-Illinois Inc.** | 48,897 | | 2,038,516 |
| | | | |
| Total Materials |
| (Cost $13,334,929) | | | 19,597,611 |
| 1-800-392-CORE (2673) ■ www.westcore.com | 65 |
Westcore Growth Fund as of June 30, 2008 (continued)
| | Shares | Market Value | |
| | | | |
| Telecommunication Services 1.62% | |
| Wireless Telecommunication Services 1.62% | |
| America Movil SAB de CV - | | | |
| ADR (Mexico) | 38,630 | $ | 2,037,732 | |
| Mobile Telesystems | | | | |
| OJSC (Russia) | 26,290 | | 2,014,077 | |
| | | | 4,051,809 | |
| | | | | |
| Total Telecommunication Services | |
| (Cost $2,511,616) | | | 4,051,809 | |
| | | | | |
| Total Common Stocks | |
| (Cost $201,710,071) | | | 237,340,179 | |
| | | | |
| Money Market Mutual Funds 3.00% | |
| Goldman Sachs | | | | |
| Financial Square | | | | |
| Prime Obligations | | | | |
| Fund - FST Shares | | | | |
| (7 Day Yield 2.380%) | 7,466,122 | | 7,466,122 | |
| | | | |
| | | | | |
| Total Money Market Mutual Funds | |
| (Cost $7,466,122) | | | 7,466,122 | |
| | | | |
| | | | | |
| Total Investments | | | | |
| (Cost $209,176,193) | 98.16% | | 244,806,301 | |
| | | | | |
| Other Assets in Excess | | | | |
| of Liabilities | 1.84% | | 4,598,529 | |
| | | | | |
| | | | | |
| Net Assets | 100.00% | $ | 249,404,830 | |
| | | | |
| | | | | |
See Notes to Statements of Investments on page 120 and Notes to Financial Statements beginning on page 175. | |
| |
| |
| Westcore Growth Fund |
| Country Breakdown as of June 30, 2008 |
| Country | Market Value | | % |
| United States | $ | 223,942,184 | | 89.79% |
| Canada | | 13,004,133 | | 5.22% |
| Switzerland | | 2,203,941 | | 0.88% |
| Mexico | | 2,037,732 | | 0.82% |
| Russia | | 2,014,077 | | 0.81% |
| Bermuda | | 1,604,234 | | 0.64% |
| Total Investments | | 244,806,301 | | 98.16% |
| Other Assets in | | | | |
| Excess of Liabilities | 4,598,529 | | 1.84% |
| Net Assets | $ | 249,404,830 | | 100.00% |
| | | | |
| | | | | |
Please note the country classification is based on the company headquarters. |
| | | | | |
All of the Fund’s investments are traded on U.S. exchanges. |
| | | | | |
| | | | | |
| | | | | |
| | | | | |
| | | | | |
| | | | | |
| | | | | |
| | | | | |
| | | | | |
| | | | | |
| | | | | |
| | | | | |
| | | | | |
| | | | | |
| | | | | |
| | | | | |
| | | | | |
| | | | | |
| | | | | |
| | | | | |
| | | | | |
| | | | | |
| | | | | |
| | | | | |
| | | | | |
| 66 | Semi-Annual Report June 30, 2008 (Unaudited) | |
Westcore Select Fund as of June 30, 2008
| | Shares | | Market Value | |
| | | | | |
| Common Stocks 95.61% | |
| Consumer Discretionary 17.54% | |
| Specialty Retail 9.23% | |
| Abercrombie & Fitch | | | | |
| Co. - Class A | 26,500 | $ | 1,661,020 | |
| TJX Companies Inc. | 58,200 | | 1,831,554 | |
| | | | 3,492,574 | |
| | | | | |
| Textiles, Apparel & Luxury Goods 8.31% | |
| Coach Inc.** | 52,500 | | 1,516,200 | |
| Phillips-Van Heusen Corp. | 44,400 | | 1,625,928 | |
| | | | 3,142,128 | |
| | | | | |
| Total Consumer Discretionary | |
| (Cost $7,742,514) | | | 6,634,702 | |
| | | | | |
| Energy 4.73% | |
| Oil & Gas 4.73% | |
| Newfield | | | | |
| Exploration Co.** | 27,400 | | 1,787,850 | |
| | | | | |
| Total Energy | |
| (Cost $1,839,644) | | | 1,787,850 | |
| | | | | |
| Financials 9.28% | |
| Capital Markets 9.28% | |
| Invesco Ltd. - ADR | 76,500 | | 1,834,470 | |
| Lazard Ltd. (Bermuda) | 49,100 | | 1,676,765 | |
| | | | 3,511,235 | |
| | | | | |
| Total Financials | |
| (Cost $3,764,224) | | | 3,511,235 | |
| | | | | |
| Healthcare 17.19% | |
| Biotechnology 8.87% | |
| BioMarin | | | | |
| Pharmaceutical Inc.** | 47,000 | | 1,362,060 | |
| Cephalon Inc. ** | 29,900 | | 1,994,031 | |
| | | | 3,356,091 | |
| | | | |
| | | | | |
| Healthcare Providers & Services 4.09% | |
| Laboratory Corporation | | | | |
| of America ** | 22,200 | | 1,545,786 | |
| | Shares | | Market Value |
| | | | |
| Pharmaceuticals 4.23% |
| Endo Pharmaceuticals | | | |
| Holdings Inc.** | 66,200 | $ | 1,601,378 |
| | | | |
| Total Healthcare |
| (Cost $6,524,288) | | | 6,503,255 |
| | | | |
| Industrials 13.58% |
| Airlines 5.21% |
| Delta Air Lines Inc.** | 345,700 | | 1,970,490 |
| | | | |
| Commercial Services & Supplies 4.04% |
| Monster | | | |
| Worldwide Inc.** | 74,200 | | 1,529,262 |
| | | | |
| Machinery 4.33% |
| Cummins Inc. | 25,000 | | 1,638,000 |
| | | | |
| Total Industrials |
| (Cost $7,259,808) | | | 5,137,752 |
| | | | |
| Information Technology 24.10% |
| Communications Equipment 4.79% |
| Polycom Inc.** | 74,400 | | 1,812,384 |
| | | | |
| Internet Software & Services 4.43% |
| Akamai | | | |
| Technologies Inc.** | 48,200 | | 1,676,878 |
| | | | |
| Semiconductors & |
| Semiconductor Equipment 10.92% |
| Broadcom Corp.** | 81,600 | | 2,226,864 |
| Marvell Technology Group | | | |
| Ltd. (Bermuda)** | 107,800 | | 1,903,748 |
| | | | 4,130,612 |
| Software 3.96% |
| THQ Inc.** | 74,000 | | 1,499,240 |
| | | | |
| Total Information Technology |
| (Cost $8,497,343) | | | 9,119,114 |
| | | | |
| | | | |
| | | | |
| | | | |
| | | | |
| | | | |
| | | | |
| 1-800-392-CORE (2673) ■ www.westcore.com | 67 |
Westcore Select Fund as of June 30, 2008 (continued)
| | Shares | Market Value | |
| | | | |
| Materials 4.34% | |
| Chemicals 4.34% | |
| Celanese Corp. | 36,000 | $ 1,643,760 | |
| | | | |
| Total Materials | |
| (Cost $1,447,495) | | 1,643,760 | |
| | | | |
| Telecommunication Services 4.85% | |
| Wireless Telecommunication Services 4.85% | |
| NII Holdings Inc.** | 38,600 | 1,833,114 | |
| | | | |
| Total Telecommunication Services | |
| (Cost $1,512,594) | | 1,833,114 | |
| | | | |
| Total Common Stocks | |
| (Cost $38,587,910) | | 36,170,782 | |
| | | | |
| Money Market Mutual Funds 1.99% | |
| Goldman Sachs | | | |
| Financial Square | | | |
| Prime Obligations | | | |
| Fund - FST Shares | | | |
| (7 Day Yield 2.380%) | 754,301 | 754,301 | |
| | | |
| | | | |
| Total Money Market Mutual Funds | |
| (Cost $754,301) | | 754,301 | |
| | | | |
| Total Investments | | | |
| (Cost $39,342,211) | 97.60% | 36,925,083 | |
| | | | |
| Other Assets in | | | |
| Excess of Liabilities | 2.40% | 905,933 | |
| | | | |
| | | | |
| Net Assets | 100.00% | $ 37,831,016 | |
| | | |
| | | | |
| See Notes to Statements of Investments on page 120 and Notes to Financial Statements beginning on page 175. | |
| |
| |
| Westcore Select Fund |
| Country Breakdown as of June 30, 2008 |
| Country | Market Value | | % |
| United States | $ | 33,344,570 | | 88.14% |
| Bermuda | | 3,580,513 | | 9.46% |
| Total Investments | | 36,925,083 | | 97.60% |
| Other Assets in | | | | |
| Excess of Liabilities | 905,933 | | 2.40% |
| Net Assets | $ | 37,831,016 | | 100.00% |
| | | | |
| | | | | |
| Please note the country classification is based on the company headquarters. |
| | | | | |
| All of the Fund’s investments are traded on U.S. exchanges. |
| |
| |
| |
| |
| |
| |
| |
| |
| |
| |
| |
| |
| |
| |
| |
| |
| |
| |
| |
| |
| |
| |
| |
| |
| |
| |
| |
| |
| |
| |
| 68 | Semi-Annual Report June 30, 2008 (Unaudited) | |
Westcore International Frontier Fund as of June 30, 2008
| | Shares | | Market Value | |
| | | | | |
| Common Stocks 100.17% | |
| Commercial Services 26.78% | |
| Advertising & Marketing Services 2.24% | |
| Rightmove PLC | | | | |
| (United Kingdom) | 107,000 | $ | 571,178 | |
| So-net M3 Inc. (Japan) | 50 | | 192,118 | |
| | | | 763,296 | |
| | | | | |
| Miscellaneous Commercial Services 20.34% | |
| CTS Eventim AG | | | | |
| (Germany) | 37,000 | | 1,482,586 | |
| GST Holdings Ltd. | | | | |
| (China - Hong Kong) | 1,315,700 | | 455,595 | |
| Raffles Education Corp. | | | | |
| Ltd. (Singapore) | 1,533,600 | | 1,273,726 | |
| SAI Global Ltd. | | | | |
| (Australia) | 516,300 | | 1,148,290 | |
| Savills PLC | | | | |
| (United Kingdom) | 330,100 | | 1,456,372 | |
| Wirecard AG | | | | |
| (Germany)** | 87,245 | | 1,112,644 | |
| | | | 6,929,213 | |
| | | | |
| | | | | |
| Personnel Services 4.20% | |
| En-japan Inc. (Japan) | 850 | | 1,432,877 | |
| | | | | |
| Total Commercial Services | |
| (Cost $11,319,089) | | | 9,125,386 | |
| | | | | |
| Communications 0.82% | |
| Wireless Telecommunications 0.82% | |
| Okinawa Cellular Telephone | | | |
| Co. (Japan) | 170 | | 280,171 | |
| | | | | |
| Total Communications | |
| (Cost $514,307) | | | 280,171 | |
| | | | | |
| Consumer Durables 2.55% | |
| Recreational Products 2.55% | |
| Jumbo S.A. (Greece) | 30,900 | | 867,928 | |
| | | | | |
| Total Consumer Durables | |
| (Cost $759,925) | | | 867,928 | |
| | | | |
| | Shares | | Market Value |
| | | | |
| Consumer Non-Durables 5.33% |
| Food: Meat, Fish & Dairy 3.31% |
| Cranswick PLC | | | |
| (United Kingdom) | 87,400 | $ | 1,128,949 |
| | | | |
| Food: Specialty & Candy 2.02% |
| Omega Pharma S.A. | | | |
| (Belgium) | 11,600 | | 490,197 |
| Unicharm Petcare | | | |
| Corp. (Japan) | 6,600 | | 197,033 |
| | | | 687,230 |
| | | | |
| Total Consumer Non-Durables |
| (Cost $2,115,046) | | | 1,816,179 |
| | | | |
| Consumer Services 2.69% |
| Restaurants 2.69% |
| Domino’s Pizza Group Ltd. | | |
| (United Kingdom) | 252,900 | | 916,797 |
| | | | |
| Total Consumer Services |
| (Cost $1,016,181) | | | 916,797 |
| | | | |
| Distribution Services 10.84% |
| Electronics Distributors 5.81% |
| Diploma PLC | | | |
| (United Kingdom) | 370,310 | | 1,202,281 |
| Esprinet S.p.A. (Italy) | 122,800 | | 778,206 |
| | | | 1,980,487 |
| | | | |
| Wholesale Distributors 5.03% |
| KS Energy Services Ltd. | | | |
| (Singapore) | 1,232,880 | | 1,712,648 |
| | | | |
| Total Distribution Services |
| (Cost $5,115,850) | | | 3,693,135 |
| | | | |
| Electronic Technology 2.72% |
| Computer Peripherals 2.72% |
| Roland DG Corp. (Japan) | 35,000 | | 927,862 |
| | | | |
| Total Electronic Technology |
| (Cost $1,156,618) | | | 927,862 |
| | | | |
| | | | |
| | | | |
| | | | |
| | | | |
| | | | |
| 1-800-392-CORE (2673) ■ www.westcore.com | 69 |
Westcore International Frontier Fund as of June 30, 2008 (continued)
| | Shares | | Market Value | |
| | | | | |
| Finance 17.94% | |
| Financial Conglomerates 3.70% | |
| | | |
| Azimut Holding S.p.A. | | | | |
| (Italy) | 143,200 | $ | 1,261,461 | |
| | | | | |
| Investment Banks & Brokers 7.18% | |
| IG Group Holdings PLC | | | | |
| (United Kingdom) | 178,900 | | 1,176,810 | |
| London Capital Group | | | | |
| Holdings PLC | | | | |
| (United Kingdom) | 180,700 | | 1,103,168 | |
| Nordnet AB (Sweden) | 71,500 | | 165,024 | |
| | | | 2,445,002 | |
| | | | | |
| Real Estate Development 6.72% | |
| Kenedix Inc. (Japan) | 1,166 | | 1,427,509 | |
| Maisons France Confort | | | | |
| (France) | 22,200 | | 860,191 | |
| | | | 2,287,700 | |
| | | | | |
| Regional Banks 0.34% | |
| Home Capital Group Inc | | | | |
| (Canada) | 3,000 | | 116,211 | |
| | | | | |
| Total Finance | |
| (Cost $6,632,576) | | | 6,110,374 | |
| | | | | |
| Health Technology 1.08% | |
| Medical Specialties 0.52% | |
| Mani Inc. (Japan) | 2,800 | | 176,145 | |
| | | | | |
| Pharmaceuticals: Other 0.56% | |
| EPS Co. Ltd. (Japan) | 44 | | 191,854 | |
| | | | | |
| Total Health Technology | |
| (Cost $299,163) | | | 367,999 | |
| | | | | |
| Industrial Services 7.36% | |
| Engineering & Construction 7.36% | |
| Cardno Ltd. (Australia) | 369,600 | | 1,608,605 | |
| Mears Group PLC | | | | |
| (United Kingdom) | 164,100 | | 898,048 | |
| | | | 2,506,653 | |
| | Shares | | Market Value |
| | | | |
| Total Industrial Services |
| (Cost $2,606,217) | | | $ | 2,506,653 |
| | | | | |
| Process Industries 0.45% |
| Containers & Packaging 0.45% |
| Goodpack Ltd. | | | | |
| (Singapore) | 134,200 | | | 151,900 |
| | | | | |
| Total Process Industries |
| (Cost $135,954) | | | | 151,900 |
| | | | | |
| Producer Manufacturing 11.98% |
| Industrial Machinery 9.03% |
| Aalberts Industries N.V. | | | | |
| (Netherlands) | 55,400 | | | 1,046,698 |
| Andritz AG (Austria) | 18,600 | | | 1,172,860 |
| Indutrade AB (Sweden) | 43,700 | | | 856,230 |
| | | | | 3,075,788 |
| | | | | |
| Metal Fabrication 2.95% |
| Metka S.A. (Greece) | 47,200 | | | 1,006,216 |
| | | | | |
| Total Producer Manufacturing |
| (Cost $3,766,123) | | | | 4,082,004 |
| | | | | |
| Retail Trade 2.61% |
| Apparel & Footwear Retail 1.22% |
| Point Inc. (Japan) | 14,500 | | | 415,125 |
| | | | | |
| Specialty Stores 1.39% |
| Village Vanguard Co. | | | | |
| Ltd. (Japan) | 95 | | | 474,172 |
| | | | | |
| Total Retail Trade |
| (Cost $1,277,474) | | | | 889,297 |
| | | | | |
| Technology Services 4.51% |
| Internet Software/Services 3.23% |
| D+S europe AG | | | | |
| (Germany)** | 53,700 | | | 1,099,973 |
| | | | | |
| | | | | |
| | | | | |
| | | | | |
| | | | | |
| | | | | |
| | | | | |
| 70 | Semi-Annual Report June 30, 2008 (Unaudited) | |
Westcore International Frontier Fund as of June 30, 2008 (continued)
| | Shares | Market Value | |
| | | | |
| Packaged Software 1.28% | |
| Kingdee International | | | | |
| Software Group Co. Ltd. | | | |
| (China - Hong Kong) | 2,134,000 | $ | 437,898 | |
| | | | | |
| Total Technology Services | |
| (Cost $1,043,045) | | | 1,537,871 | |
| | | | | |
| Transportation 2.51% | |
| Marine Shipping 2.51% | |
| Prosafe Production Public | | | |
| Ltd. (Cyprus)** | 147,320 | | 853,283 | |
| | | | | |
| Total Transportation | |
| (Cost $899,882) | | | 853,283 | |
| | | | | |
| Total Common Stocks | |
| (Cost $38,657,450) | | | 34,126,839 | |
| | | | |
| Money Market Mutual Funds 4.51% | |
| Goldman Sachs | | | | |
| Financial Square | | | | |
| Prime Obligations | | | | |
| Fund - FST Shares | | | | |
| (7 Day Yield 2.380%) | 1,538,620 | | 1,538,620 | |
| | | | | |
| Total Money Market Mutual Funds | |
| (Cost $1,538,620) | | | 1,538,620 | |
| | | | | |
| Total Investments | | | | |
| (Cost $40,196,070) | 104.68% | | 35,665,459 | |
| | | | | |
| Liabilities in Excess | | | | |
| of Other Assets | (4.68%) | | (1,595,513) | |
| | | | | |
| Net Assets | 100.00% | $ | 34,069,946 | |
| | | | | |
| See Notes to Statements of Investments on page 120 and Notes to Financial Statements beginning on page 175. | |
| |
| |
| Westcore International Frontier Fund |
| Country Breakdown as of June 30, 2008 |
| Country | Market Value | | % |
| United Kingdom | $ | 8,453,603 | | 24.81% |
| Japan | | 5,714,866 | | 16.77% |
| Germany | | 3,695,203 | | 10.85% |
| Singapore | | 3,138,274 | | 9.21% |
| Australia | | 2,756,895 | | 8.09% |
| Italy | | 2,039,667 | | 5.99% |
| Greece | | 1,874,144 | | 5.50% |
| United States | | 1,538,620 | | 4.52% |
| Austria | | 1,172,860 | | 3.44% |
| Netherlands | | 1,046,698 | | 3.07% |
| Sweden | | 1,021,254 | | 3.00% |
| China-Hong Kong | | 893,493 | | 2.62% |
| France | | 860,191 | | 2.52% |
| Cyprus | | 853,283 | | 2.51% |
| Belgium | | 490,197 | | 1.44% |
| Canada | | 116,211 | | 0.34% |
| Total Investments | | 35,665,459 | | 104.68% |
| Liabilities in Excess | | | | |
| of Other Assets | | (1,595,513) | | (4.68%) |
| Net Assets | $ | 34,069,946 | | 100.00% |
| | | | |
| | | | | |
| Please note the country classification is based on the company headquarters. |
| |
| |
| |
| |
| |
| |
| |
| |
| |
| |
| |
| |
| |
| |
| |
| |
| |
| 1-800-392-CORE (2673) ■ www.westcore.com | 71 |
Westcore Blue Chip Fund as of June 30, 2008
| | Shares | | Market Value | |
| | | | | |
| Common Stocks 99.21% | |
| Basic Materials 2.78% | |
| Forestry & Paper 2.78% | |
| Ball Corp. | 30,900 | $ | 1,475,166 | |
| | | | | |
| Total Basic Materials | |
| (Cost $1,623,961) | | | 1,475,166 | |
| | | | | |
| Capital Goods 9.64% | |
| Aerospace & Defense 3.82% | |
| General Dynamics Corp. | 13,000 | | 1,094,600 | |
| Raytheon Co. | 16,600 | | 934,248 | |
| | | | 2,028,848 | |
| | | | | |
| Farm Equipment 1.39% | |
| CNH Global N.V. - ADS | | | | |
| (Netherlands) | 21,700 | | 737,149 | |
| | | | | |
| Industrial Products 4.43% | |
| ITT Corp. | 17,400 | | 1,101,942 | |
| Parker Hannifin Corp. | 17,500 | | 1,248,100 | |
| | | | 2,350,042 | |
| | | | | |
| Total Capital Goods | |
| (Cost $3,222,494) | | | 5,116,039 | |
| | | | | |
| Commercial Services 5.16% | |
| Business Products & Services 2.58% | |
| Quanta Services Inc. ** | 41,100 | | 1,367,397 | |
| | | | | |
| IT Services 1.05% | |
| Computer | | | | |
| Sciences Corp.** | 11,900 | | 557,396 | |
| | | | | |
| Transaction Processing 1.53% | |
| The Western Union Co. | 32,950 | | 814,524 | |
| | | | | |
| Total Commercial Services | |
| (Cost $2,342,988) | | | 2,739,317 | |
| | | | | |
| Communications 8.04% | |
| Networking 4.06% | |
| Cisco Systems Inc.** | 92,500 | | 2,151,550 | |
| | Shares | | Market Value |
| | | | |
| Telecomm Equipment & Solutions 3.98% |
| Nokia Corp. - ADR | | | |
| (Finland) | 18,000 | $ | 441,000 |
| QUALCOMM Inc. | 37,700 | | 1,672,749 |
| | | | 2,113,749 |
| | | | |
| Total Communications |
| (Cost $4,107,981) | | | 4,265,299 |
| | | | |
| Consumer Cyclicals 9.93% |
| Clothing & Accessories 2.38% |
| TJX Companies Inc. | 40,200 | | 1,265,094 |
| | | | |
| Hotels & Gaming 1.88% |
| Starwood Hotels & Resorts | | | |
| Worldwide Inc. | 24,900 | | 997,743 |
| | | | |
| Other Consumer Services 1.16% |
| Expedia Inc.** | 33,500 | | 615,730 |
| | | | |
| Publishing & Media 2.11% |
| Walt Disney Co. | 35,800 | | 1,116,960 |
| | | | |
| Restaurants 2.40% |
| Darden Restaurants Inc. | 39,800 | | 1,271,212 |
| | | | |
| Total Consumer Cyclicals |
| (Cost $4,154,238) | | | 5,266,739 |
| | | | |
| Consumer Discretionary 2.17% |
| Apparel & Footwear Manufacturing 2.17% |
| Nike Inc. - Class B | 19,350 | | 1,153,454 |
| | | | |
| Total Consumer Discretionary |
| (Cost $1,215,414) | | | 1,153,454 |
| | | | |
| Consumer Staples 8.03% |
| Consumer Products 2.73% |
| Colgate-Palmolive Co. | 21,000 | | 1,451,100 |
| | | | |
| | | | |
| | | | |
| | | | |
| | | | |
| | | | |
| | | | |
| 72 | Semi-Annual Report June 30, 2008 (Unaudited) | |
Westcore Blue Chip Fund as of June 30, 2008 (continued)
| | Shares | | Market Value | |
| | | | | |
| Food & Agricultural Products 5.30% | |
| Bunge Ltd. | 6,700 | $ | 721,523 | |
| Campbell Soup Co. | 26,000 | | 869,960 | |
| Unilever N.V. | | | | |
| (Netherlands) | 42,900 | | 1,218,360 | |
| | | | 2,809,843 | |
| | | | | |
| Total Consumer Staples | |
| (Cost $3,647,799) | | | 4,260,943 | |
| | | | | |
| Energy 14.66% | |
| Exploration & Production 7.29% | |
| Occidental | | | | |
| Petroleum Corp. | 22,700 | | 2,039,821 | |
| XTO Energy Inc. | 26,725 | | 1,830,930 | |
| | | | 3,870,751 | |
| | | | | |
| Integrated Oils 2.99% | |
| Marathon Oil Corp. | 30,600 | | 1,587,222 | |
| | | | | |
| Oil Services 4.38% | |
| Transocean Inc.** | 15,242 | | 2,322,728 | |
| | | | | |
| Total Energy | |
| (Cost $2,795,411) | | | 7,780,701 | |
| | | | | |
| Interest Rate Sensitive 10.37% | |
| Integrated Financial Services 1.36% | |
| JPMorgan Chase & Co. | 21,100 | | 723,941 | |
| | | | | |
| Money Center Banks 0.71% | |
| Bank of America Corp. | 15,700 | | 374,759 | |
| | | | | |
| Property & Casualty Insurance 2.75% | |
| ACE Ltd. (Bermuda) | 9,200 | | 506,828 | |
| American International | | | | |
| Group Inc. | 17,600 | | 465,696 | |
| The Travelers Cos Inc. | 11,200 | | 486,080 | |
| | | | 1,458,604 | |
| | | | | |
| Regional Banks 0.65% | |
| Wachovia Corp. | 22,300 | | 346,319 | |
| | Shares | | Market Value |
| | | | |
| Securities & Asset Management 4.90% |
| Invesco Ltd. - ADR | 41,000 | $ | 983,180 |
| Legg Mason Inc. | 10,500 | | 457,485 |
| Morgan Stanley | 8,900 | | 321,023 |
| State Street Corp. | 13,100 | | 838,269 |
| | | | 2,599,957 |
| | | | |
| Total Interest Rate Sensitive |
| (Cost $7,354,644) | | | 5,503,580 |
| | | | |
| Medical & Healthcare 12.33% |
| Medical Technology 3.04% |
| Zimmer | | | |
| Holdings Inc.** | 23,700 | | 1,612,785 |
| | | | |
| Pharmaceuticals 9.29% |
| Abbott Laboratories | 38,850 | | 2,057,885 |
| Amgen Inc.** | 20,900 | | 985,644 |
| Teva Pharmaceutical | | | |
| Industries Ltd. - | | | |
| ADR (Israel) | 41,200 | | 1,886,960 |
| | | | 4,930,489 |
| | | | |
| Total Medical & Healthcare |
| (Cost $5,386,789) | | | 6,543,274 |
| | | | |
| Technology 10.70% |
| Computer Software 2.27% |
| Microsoft Corp. | 43,800 | | 1,204,938 |
| | | | |
| PC’s & Servers 3.96% |
| International Business | | | |
| Machines Corp. | 17,700 | | 2,097,981 |
| | | | |
| Semiconductors 4.47% |
| Altera Corp. | 46,700 | | 966,690 |
| Intel Corp. | 65,400 | | 1,404,792 |
| | | | 2,371,482 |
| | | | |
| Total Technology |
| (Cost $4,671,418) | | | 5,674,401 |
| | | |
| 1-800-392-CORE (2673) ■ www.westcore.com | 73 |
Westcore Blue Chip Fund as of June 30, 2008 (continued)
| | Shares | Market Value | |
| | | | |
| Transportation 2.69% | |
| Railroads 2.69% | |
| Norfolk Southern Corp. | 22,750 | $ 1,425,743 | |
| | | | |
| Total Transportation | |
| (Cost $818,220) | | 1,425,743 | |
| | | | |
| Utilities 2.71% | |
| Regulated Electric 2.71% | | |
| PPL Corp. | 27,500 | 1,437,425 | |
| | | | |
| Total Utilities | |
| (Cost $1,291,907) | | 1,437,425 | |
| | | | |
| Total Common Stocks | |
| (Cost $42,633,264) | | 52,642,081 | |
| | | |
| Money Market Mutual Funds 0.82% | |
| Goldman Sachs | | | |
| Financial Square | | | |
| Prime Obligations | | | |
| Fund - FST Shares | | | |
| (7 Day Yield 2.380%) | 436,414 | 436,414 | |
| | | |
| | | | |
| Total Money Market Mutual Funds | |
| (Cost $436,414) | | 436,414 | |
| | | | |
| Total Investments | | | |
| (Cost $43,069,678) | 100.03% | 53,078,495 | |
| | | | |
| Liabilities in Excess | | | |
| of Other Assets | (0.03%) | (17,924) | |
| | | | |
| | | | |
| Net Assets | 100.00% | $ 53,060,571 | |
| | | |
| See Notes to Statements of Investments on page 120 and Notes to Financial Statements beginning on page 175. | |
| Westcore Blue Chip Fund |
| Country Breakdown as of June 30, 2008 |
| Country | Market Value | | % |
| | | |
| United States | $ | 48,288,198 | | 91.01% |
| Netherlands | | 1,955,509 | | 3.68% |
| Israel | | 1,886,960 | | 3.56% |
| Bermuda | | 506,828 | | 0.95% |
| Finland | | 441,000 | | 0.83% |
| Total Investments | | 53,078,495 | | 100.03% |
| Liabilities in Excess | | | | |
| of Other Assets | | (17,924) | | (0.03%) |
| Net Assets | $ | 53,060,571 | | 100.00% |
| | | | |
| Please note the country classification is based on the company headquarters. |
| | | | | |
| All of the Fund’s investments are traded on U.S. exchanges. |
| |
| |
| |
| |
| |
| |
| |
| |
| |
| |
| |
| |
| |
| |
| |
| |
| |
| |
| |
| |
| |
| |
| |
| |
| 74 | Semi-Annual Report June 30, 2008 (Unaudited) | |
Westcore Mid-Cap Value Fund as of June 30, 2008
| | Shares | | Market Value | |
| | | | | |
| Common Stocks 97.54% | |
| Basic Materials 4.22% | |
| Other Materials (Rubber & Plastic) 4.22% | |
| Crown Holdings Inc.** | 96,250 | $ | 2,501,537 | |
| Pactiv Corp.** | 48,050 | | 1,020,102 | |
| | | | 3,521,639 | |
| | | | | |
| Total Basic Materials | |
| (Cost $2,232,320) | | | 3,521,639 | |
| | | | | |
| Capital Goods 8.83% | |
| Electric Equipment 3.74% | |
| General Cable Corp.** | 51,300 | | 3,121,604 | |
| | | | | |
| Farm Equipment 1.74% | |
| CNH Global N.V. | | | | |
| - ADS (Netherlands) | 42,705 | | 1,450,689 | |
| | | | | |
| Industrial Products 1.08% | |
| Parker Hannifin Corp. | 12,625 | | 900,415 | |
| | | | | |
| Machinery 2.27% | |
| Manitowoc Co. Inc. | 58,250 | | 1,894,873 | |
| | | | | |
| Total Capital Goods | |
| (Cost $6,865,299) | | | 7,367,581 | |
| | | | | |
| Commercial Services 7.59% | |
| Business Products & Services 4.03% | |
| Quanta Services Inc. ** | 101,075 | | 3,362,765 | |
| | | | | |
| Environmental & Pollution Control 2.11% | |
| Waste Connections Inc.** | 55,190 | | 1,762,217 | |
| | | | | |
| Transaction Processing 1.45% | |
| Metavante | | | | |
| Technologies Inc.** | 53,383 | | 1,207,523 | |
| | | | | |
| Total Commercial Services | |
| (Cost $5,269,858) | | | 6,332,505 | |
| | | | |
| | Shares | | Market Value |
| | | | |
| Communications 4.76% |
| Telecomm Equipment & Solutions 4.76% |
| Adtran Inc. | 41,150 | $ | 981,016 |
| CommScope Inc.** | 56,700 | | 2,992,059 |
| | | | 3,973,075 |
| | | | |
| Total Communications |
| (Cost $2,560,164) | | | 3,973,075 |
| | | | |
| Consumer Cyclicals 10.71% | | |
| Clothing & Accessories 3.08% |
| Abercrombie & Fitch | | | |
| Co. - Class A | 13,100 | | 821,108 |
| TJX Companies Inc. | 55,600 | | 1,749,732 |
| | | | 2,570,840 |
| | | | |
| Hotels & Gaming 1.54% |
| Starwood Hotels & Resorts | | | |
| Worldwide Inc. | 32,050 | | 1,284,244 |
| | | | |
| Motor Vehicle Parts 1.81% |
| Autoliv Inc. (Sweden) | 32,400 | | 1,510,488 |
| | | | |
| Restaurants 2.68% |
| Darden Restaurants Inc. | 70,050 | | 2,237,397 |
| | | | |
| Specialty Retail 1.60% |
| Tiffany & Co. | 32,660 | | 1,330,895 |
| | | | |
| Total Consumer Cyclicals |
| (Cost $8,860,740) | | | 8,933,864 |
| | | | |
| Consumer Staples 4.97% |
| Food & Agricultural Products 4.97% |
| Bunge Ltd. | 10,550 | | 1,136,130 |
| Dean Foods Co.** | 45,600 | | 894,672 |
| Smithfield Foods Inc.** | 37,600 | | 747,488 |
| Tyson Foods Inc. - Class A | 91,250 | | 1,363,275 |
| | | | 4,141,565 |
| | | | |
| Total Consumer Staples |
| (Cost $3,921,663) | | | 4,141,565 |
| | | |
| 1-800-392-CORE (2673) ■ www.westcore.com | 75 |
Westcore Mid-Cap Value Fund as of June 30, 2008 (continued)
| | Shares | | Market Value | |
| | | | | |
| Energy 7.88% | |
| Exploration & Production 6.99% | |
| Denbury | | | | |
| Resources Inc.** | 46,400 | $ | 1,693,600 | |
| Forest Oil Corp.** | 26,100 | | 1,944,450 | |
| Range Resources Corp. | 33,450 | | 2,192,313 | |
| | | | 5,830,363 | |
| | | | | |
| Refining & Marketing 0.89% | |
| Holly Corp. | 20,100 | | 742,092 | |
| | | | | |
| Total Energy | |
| (Cost $2,472,035) | | | 6,572,455 | |
| | | | | |
| Interest Rate Sensitive 18.01% | |
| Life & Health Insurance 3.32% | |
| Nationwide Financial | | | | |
| Services Inc. | 26,600 | | 1,277,066 | |
| Reinsurance Group of | | | | |
| America Inc. | 34,300 | | 1,492,736 | |
| | | | 2,769,802 | |
| | | | | |
| Other Banks 0.78% | |
| Colonial BancGroup Inc. | 146,650 | | 648,193 | |
| | | | | |
| Property Casualty Insurance 3.46% | |
| Assured Guaranty | | | | |
| Ltd. (Bermuda) | 82,800 | | 1,489,572 | |
| PartnerRe Ltd. (Bermuda) | 20,240 | | 1,399,191 | |
| | | | 2,888,763 | |
| | | | | |
| Regional Banks 1.87% | |
| Marshall & Ilsley Corp. | 53,249 | | 816,307 | |
| Zions Bancorporation | 23,700 | | 746,313 | |
| | | | 1,562,620 | |
| | | | | |
| Securities & Asset Management 5.75% | |
| Affiliated Managers | | | | |
| Group Inc.** | 23,650 | | 2,129,919 | |
| Invesco Ltd. - ADR | 111,200 | | 2,666,575 | |
| | | | 4,796,494 | |
| | Shares | | Market Value |
| | | | |
| Specialty Finance 0.81% |
| American Capital | | | |
| Strategies Ltd. | 28,550 | $ | 678,634 |
| | | | |
| Thrifts 2.02% |
| Annaly Capital | | | |
| Management Inc. | 108,400 | | 1,681,284 |
| | | | |
| Total Interest Rate Sensitive |
| (Cost $18,423,364) | | | 15,025,790 |
| | | | |
| Medical & Healthcare 6.07% |
| Medical Products & Supplies 1.79% |
| Mentor Corp. | 53,580 | | 1,490,596 |
| | | | |
| Medical Technology 2.16% |
| Invitrogen Corp.** | 46,030 | | 1,807,137 |
| | | | |
| Pharmaceuticals 2.12% |
| Cephalon Inc. ** | 26,500 | | 1,767,285 |
| | | | |
| Total Medical & Healthcare |
| (Cost $4,971,274) | | | 5,065,018 |
| | | | |
| Real Estate Investment Trusts (REITs) 5.53% |
| Healthcare 1.61% |
| Ventas Inc. | 31,600 | | 1,345,212 |
| | | | |
| Industrial Property 0.99% |
| AMB Property Corp. | 16,350 | | 823,713 |
| | | | |
| Multi-Family Housing 1.39% |
| Camden Property Trust | 26,100 | | 1,155,186 |
| | | | |
| Real Estate Investment Trusts 1.54% |
| Alexandria Real Estate | | | |
| Equities Inc. | 13,200 | | 1,284,888 |
| | | | |
| Total Real Estate Investment Trusts (REITs) |
| (Cost $4,900,350) | | | 4,608,999 |
| | | | |
| | | | |
| | | | |
| | | | |
| 76 | Semi-Annual Report June 30, 2008 (Unaudited) | |
Westcore Mid-Cap Value Fund as of June 30, 2008 (continued)
| | Shares | | Market Value | |
| | | | | |
| Technology 6.61% | |
| Electronic Equipment 0.82% | |
| Belden Inc. | 20,100 | $ | 680,988 | |
| | | | | |
| Semiconductors 3.29% | |
| Altera Corp. | 73,580 | | 1,523,106 | |
| Fairchild Semiconductor | | | | |
| International Inc. | | | | |
| - Class A** | 104,500 | | 1,225,785 | |
| | | | 2,748,891 | |
| | | | |
| | | | | |
| Technology Resellers & Distributors 2.50% | |
| |
| Ingram Micro Inc. | | | | |
| - Class A** | 117,350 | | 2,082,963 | |
| | | | | |
| Total Technology | |
| (Cost $6,102,947) | | | 5,512,842 | |
| | | | | |
| Transportation 1.16% | |
| Trucking, Shipping & Air Freight 1.16% | |
| Diana Shipping Inc. | | | | |
| (Greece) | 31,600 | | 970,436 | |
| | | | | |
| Total Transportation | |
| (Cost $847,629) | | | 970,436 | |
| | | | | |
| Utilities 11.20% | |
| Integrated Gas 1.95% | |
| UGI Corp. | 56,555 | | 1,623,694 | |
| | | | | |
| Regulated Electric 7.29% | |
| CenterPoint Energy Inc. | 118,435 | | 1,900,882 | |
| PPL Corp. | 44,430 | | 2,322,356 | |
| Westar Energy Inc. | 86,500 | | 1,860,615 | |
| | | | 6,083,853 | |
| | | | | |
| Regulated Gas 1.96% | |
| NiSource Inc. | 91,500 | | 1,639,680 | |
| | | | | |
| Total Utilities | |
| (Cost $8,554,424) | | | 9,347,227 | |
| | Shares | | Market Value |
| | | | |
| Total Common Stocks |
| (Cost $75,982,067) | | | $ | 81,372,996 |
| | | | |
| Money Market Mutual Funds 2.04% |
| Goldman Sachs | | | | |
| Financial Square | | | | |
| Prime Obligations | | | | |
| Fund - FST Shares | | | | |
| (7 Day Yield 2.380%) | 1,704,866 | | | 1,704,866 |
| | | | | |
| Total Money Market Mutual Funds |
| (Cost $1,704,866) | | | | 1,704,866 |
| | | | | |
| Total Investments | | | | |
| (Cost $77,686,933) | 99.58% | | | 83,077,862 |
| | | | | |
| Other Assets in | | | | |
| Excess of Liabilities | 0.42% | | | 346,854 |
| | | | | |
| Net Assets | 100.00% | | $ | 83,424,716 |
| | | | | |
See Notes to Statements of Investments on page 120 and Notes to Financial Statements beginning on page 175. |
| | | | | |
| Westcore Mid-Cap Value Fund |
| Country Breakdown as of June 30, 2008 |
| Country | Market Value | | | % |
| United States | 76,257,486 | | | 91.41% |
| Bermuda | 2,888,763 | | | 3.46% |
| Sweden | 1,510,488 | | | 1.81% |
| Netherlands | 1,450,689 | | | 1.74% |
| Greece | 970,436 | | | 1.16% |
| Total Investments | 83,077,862 | | | 99.58% |
| Other Assets in | | | | |
| Excess of Liabilities | 346,854 | | | 0.42% |
| Net Assets | 83,424,716 | | | 100.00% |
| | | | | |
| Please note the country classification is based on the company headquarters. |
| | | | | |
| All of the Fund’s investments are traded on U.S. exchanges. |
| |
| |
| |
| |
| |
| 1-800-392-CORE (2673) ■ www.westcore.com | 77 |
Westcore Small-Cap Opportunity Fund as of June 30, 2008
| | Shares | | Market Value | |
| | | | | |
| Common Stocks 97.70% | |
| Basic Materials 3.62% | |
| Specialty Chemicals 0.76% | |
| NewMarket Corp. | 2,700 | $ | 178,821 | |
| | | | | |
| Steel 2.86% | |
| Schnitzer Steel | | | | |
| Industries Inc. | 5,900 | | 676,140 | |
| | | | | |
| Total Basic Materials | |
| (Cost $560,996) | | | 854,961 | |
| | | | | |
| Capital Goods 8.14% | |
| Electrical Equipment 1.78% | |
| General Cable Corp.** | 6,895 | | 419,561 | |
| | | | | |
| Engineering & Construction 3.54% | |
| EMCOR Group Inc.** | 17,670 | | 504,124 | |
| Integrated Electrical | | | | |
| Services Inc.** | 19,330 | | 332,476 | |
| | | | 836,600 | |
| Industrial Products 0.76% | |
| EnPro Industries Inc.** | 4,800 | | 179,232 | |
| | | | | |
| Machinery 2.06% | |
| Columbus | | | | |
| McKinnon Corp.** | 20,170 | | 485,694 | |
| | | | | |
| Total Capital Goods | |
| (Cost $1,529,175) | | | 1,921,087 | |
| | | | | |
| Commercial Services 3.71% | |
| Environmental & Pollution Control 3.71% | |
| Waste | | | | |
| Connections Inc. ** | 27,410 | | 875,201 | |
| | | | | |
| Total Commercial Services | |
| (Cost $643,565) | | | 875,201 | |
| | | | | |
| Communications 9.30% | |
| Telecomm Equipment & Solutions 9.30% | |
| CommScope Inc.** | 10,190 | | 537,726 | |
| Novatel Wireless Inc.** | 44,555 | | 495,897 | |
| | Shares | | Market Value |
| | | | |
| Superior Essex Inc.** | 20,310 | $ | 906,436 |
| Syniverse Holdings Inc.** | 15,700 | | 254,340 |
| | | | 2,194,399 |
| | | | |
| Total Communications |
| (Cost $1,689,510) | | | 2,194,399 |
| | | | |
| Consumer Cyclicals 8.15% |
| Apparel & Footwear Manufacturers 1.94% |
| Wolverine World Wide Inc. | 17,160 | | 457,657 |
| | | | |
| Clothing & Accessories 4.51% |
| Aeropostale Inc.** | 12,815 | | 401,494 |
| Kenneth Cole | | | |
| Productions Inc. | 15,050 | | 191,135 |
| Steven Madden Ltd.** | 25,650 | | 471,448 |
| | | | 1,064,077 |
| | | | |
| Recreation & Leisure 1.70% |
| WMS Industries Inc. ** | 13,485 | | 401,448 |
| | | | |
| Total Consumer Cyclicals |
| (Cost $1,728,139) | | | 1,923,182 |
| | | | |
| Consumer Staples 3.67% |
| Consumer Products 0.86% |
| Elizabeth Arden Inc.** | 13,410 | | 203,564 |
| | | | |
| Food & Agricultural Products 0.86% |
| Calavo Growers Inc. | 16,620 | | 203,595 |
| | | |
| | | | |
| Grocery & Convenience 1.95% |
| Casey’s General Stores Inc. | 19,870 | | 460,388 |
| | | | |
| Total Consumer Staples |
| (Cost $990,383) | | | 867,547 |
| | | | |
| Energy 12.22% |
| Alternative Energy 1.67% | | |
| Headwaters Inc.** | 33,510 | | 394,413 |
| | | | |
| Exploration & Production 4.05% |
| ATP Oil and Gas Corp.** | 5,630 | | 222,216 |
| | | | |
| | | | |
| 78 | Semi-Annual Report June 30, 2008 (Unaudited) | |
Westcore Small-Cap Opportunity Fund as of June 30, 2008 (continued)
| | Shares | | Market Value | |
| | | | | |
| Berry Petroleum Co. | | | | |
| - Class A | 4,555 | $ | 268,198 | |
| Carrizo Oil & Gas Inc.** | 6,825 | | 464,715 | |
| | | | 955,129 | |
| | | | | |
| Oil Services 6.50% | |
| Oil States | | | | |
| International Inc.** | 10,860 | | 688,958 | |
| T-3 Energy Services Inc.** | 10,640 | | 845,560 | |
| | | | 1,534,518 | |
| | | | | |
| Total Energy | |
| (Cost $1,580,242) | | | 2,884,060 | |
| | | | | |
| Interest Rate Sensitive 12.71% | |
| Life & Health Insurance 1.56% | |
| The Phoenix | | | | |
| Companies Inc. | 48,340 | | 367,867 | |
| | | | | |
| Other Banks 1.25% | |
| First State Bancorporation | 13,900 | | 76,450 | |
| PacWest Bancorp | 14,710 | | 218,885 | |
| | | | 295,335 | |
| | | | | |
| Property Casualty Insurance 4.49% | |
| IPC Holdings Ltd. | | | | |
| (Bermuda) | 11,610 | | 308,246 | |
| Max Capital Group Ltd. | | | | |
| (Bermuda) | 21,810 | | 465,206 | |
| The Hanover Insurance | | | | |
| Group Inc. | 6,750 | | 286,875 | |
| | | | 1,060,327 | |
| | | | | |
| Securities & Asset Management 1.27% | |
| Piper Jaffray Cos. ** | 10,235 | | 300,193 | |
| | | | | |
| Specialty Finance 2.16% | |
| First Cash Financial | | | | |
| Services Inc.** | 33,960 $ | | 509,060 | |
| | | | | |
| Thrifts 1.98% | |
| Anworth Mortgage | | | | |
| Asset Corp. | 71,700 | | 466,767 | |
| | Shares | | Market Value |
| | | | |
| Total Interest Rate Sensitive |
| (Cost $3,870,613) | | | $ | 2,999,549 |
| | | | | |
| Medical & Healthcare 13.79% |
| Healthcare-Services 3.77% |
| Centene Corp.** | 7,450 | | | 125,086 |
| Kendle International Inc.** | 14,500 | | | 526,784 |
| Life Sciences | | | | |
| Research Inc.** | 8,400 | | | 237,216 |
| | | | | 889,086 |
| | | | | |
| Medical Products & Supplies 4.61% |
| Orthofix Intl. | | | | |
| N.V. (Netherlands)** | 18,050 | | | 522,548 |
| STERIS Corp. | 19,720 | | | 567,147 |
| | | | | 1,089,695 |
| | | | | |
| Medical Technology 1.77% |
| SurModics Inc.** | 9,320 | | | 417,909 |
| | | | | |
| Pharmaceuticals 3.64% | | | | |
| K-V Pharmaceutical | | | | |
| Co. - Class A** | 12,875 | | | 248,874 |
| Sciele Pharma Inc. | 31,485 | | | 609,234 |
| | | | | 858,108 |
| | | | | |
| Total Medical & Healthcare |
| (Cost $3,357,432) | | | | 3,254,798 |
| | | | | |
| Real Estate Investment Trusts (REITS) 3.35% |
| DCT Industrial Trust Inc. | 46,050 | | | 381,294 |
| PS Business Parks Inc. | 7,965 | | | 410,994 |
| | | | | 792,288 |
| | | | | |
| Total Real Estate Investment Trusts (REITS) |
| (Cost $912,820) | | | | 792,288 |
| | | | | |
| Technology 9.89% |
| Computer Software 1.58% |
| Epicor Software Corp.** | 53,950 | | | 372,795 |
| | | | | |
| | | | | |
| | | | | |
| | | | | |
| | | | | |
| 1-800-392-CORE (2673) ■ www.westcore.com | 79 |
Westcore Small-Cap Opportunity Fund as of June 30, 2008 (continued)
| | Shares | | Market Value | |
| | | | | |
| Electronic Equipment 3.68% | |
| Belden Inc. | 17,750 | $ | 601,369 | |
| Rofin-Sinar | | | | |
| Technologies Inc.** | 8,850 | | 267,270 | |
| | | | 868,639 | |
| | | | | |
| Semiconductor Capital Equipment 2.57% | |
| Advanced Energy | | | | |
| Industries Inc.** | 25,490 | | 349,213 | |
| Veeco Instruments Inc.** | 15,960 | | 256,637 | |
| | | | 605,850 | |
| Semiconductors 2.06% | |
| Fairchild Semiconductor | | | | |
| International Inc. | | | | |
| - Class A** | 41,490 | | 486,678 | |
| | | | | |
| Total Technology | |
| (Cost $2,675,655) | | | 2,333,962 | |
| | | | | |
| Transportation 5.92% | |
| Trucking, Shipping & Air Freight 5.92% | |
| Eagle Bulk Shipping Inc. | 16,040 | | 474,303 | |
| Navios Maritime Holdings | | | | |
| Inc. (Greece) | 24,050 | | 233,045 | |
| Tsakos Energy Navigation | | | | |
| Ltd. (Greece) | 10,400 | | 385,632 | |
| Ultrapetrol Bahamas | | | | |
| Ltd. (Bahamas)** | 24,120 | | 304,153 | |
| | | | 1,397,133 | |
| Total Transportation | |
| (Cost $1,263,133) | | | 1,397,133 | |
| | | | | |
| Utilities 3.23% | |
| Regulated Electric 1.08% | |
| Westar Energy Inc. | 11,830 | | 254,463 | |
| | | | | |
| Regulated Gas 2.15% | |
| South Jersey Industries Inc. | 13,570 | | 506,976 | |
| | | | | |
| Total Utilities | |
| (Cost $716,791) | | | 761,439 | |
| | | | |
| | Shares | | Market Value |
| | | | |
| Total Common Stocks |
| (Cost $21,518,454) | | | | $ | 23,059,606 |
| | | | | |
| Money Market Mutual Funds 5.02% |
| Goldman Sachs | | | | | |
| Financial Square | | | | | |
| Prime Obligations | | | | | |
| Fund - FST Shares | | | | | |
| (7 Day Yield 2.380%) | 1,185,118 | | | 1,185,118 |
| | | | |
| | | | | | |
| Total Money Market Mutual Funds |
| (Cost $1,185,118) | | | | | 1,185,118 |
| | | | | | |
| Total Investments | | | | | |
| (Cost $22,703,572) | | 102.72% | | | 24,244,724 |
| | | | | | |
| Liabilities in Excess | | | | | |
| of Other Assets | | (2.72%) | | | (642,845) |
| | | | | | |
| Net Assets | | 100.00% | | $ | 23,601,879 |
| | | | | | |
See Notes to Statements of Investments on page 120 and Notes to Financial Statements beginning on page 175. |
| | | | | | |
| Westcore Small Cap Opportunity Fund |
| Country Breakdown as of June 30, 2008 |
| Country | Market Value | | | % |
| United States | $ | 22,025,894 | | | 93.32% |
| Bermuda | | 773,452 | | | 3.28% |
| Greece | | 618,677 | | | 2.62% |
| Netherlands | | 522,548 | | | 2.21% |
| Bahamas | | 304,153 | | | 1.29% |
| Total Investments | | 24,244,724 | | | 102.72% |
| Liabilities in Excess | | | | | |
| of Other Assets | | (642,865) | | | (2.72%) |
| Net Assets | $ | 23,601,879 | | | 100.00% |
| | | | | |
| | | | | | |
Please note the country classification is based on the company headquarters. |
| | | | | | |
All of the Fund’s investments are traded on U.S. exchanges. |
| 80 | Semi-Annual Report June 30, 2008 (Unaudited) | |
Westcore Small-Cap Value Fund as of June 30, 2008
| | Shares | Market Value | |
| | | | |
| Common Stocks 95.41% | |
| Basic Materials 4.50% | |
| Chemicals 1.45% | |
| Ferro Corp. | 140,600 | $ 2,637,656 | |
| | | | |
| Forestry & Paper 1.85% | |
| Albany International | | | |
| Corp. - Class A | 116,370 | 3,374,730 | |
| | | | |
| Steel 1.20% | |
| Worthington Industries Inc. | 106,700 | 2,187,350 | |
| | | | |
| Total Basic Materials | |
| (Cost $8,702,700) | | 8,199,736 | |
| | | | |
| Capital Goods 6.78% | |
| Electrical Equipment 0.73% | |
| LSI Industries Inc. | 163,600 | 1,328,432 | |
| | | | |
| Industrial Products 6.05% | |
| Lincoln Electric | | | |
| Holdings Inc. | 72,870 | 5,734,869 | |
| Sauer-Danfoss Inc. | 169,560 | 5,281,794 | |
| | | 11,016,663 | |
| | | | |
| Total Capital Goods | |
| (Cost $11,289,308) | | 12,345,095 | |
| | | | |
| Commercial Services 4.04% | |
| Business Products & Services 4.04% | |
| CDI Corp. | 145,935 | 3,712,586 | |
| Ennis Inc. | 232,710 | 3,641,912 | |
| | | 7,354,498 | |
| | | | |
| Total Commercial Services | |
| (Cost $8,394,358) | | 7,354,498 | |
| | | | |
| Communications 2.51% | |
| Telecomm Equipment & Solutions 2.51% | |
| Adtran Inc. | 191,250 | 4,559,400 | |
| | | | |
| Total Communications | |
| (Cost $4,134,170) | | 4,559,400 | |
| | | |
| | Shares | | Market Value |
| | | | |
| Consumer Cyclicals 13.38% |
| Clothing & Accessories 1.35% |
| Stage Stores Inc. | 211,360 | | $ 2,466,571 |
| | | | |
| Consumer Durables 3.28% |
| Knoll Inc. | 283,850 | | 3,448,777 |
| Toro Co. | 75,900 | | 2,525,193 |
| | | | 5,973,970 |
| | | | |
| Hard Goods Retail 1.98% |
| Aaron Rents Inc. | 106,410 | | 2,376,135 |
| Tempur-Pedic | | | |
| International Inc. | 156,670 | | 1,223,593 |
| | | | 3,599,728 |
| | | | |
| Motor Vehicle Parts 1.58% |
| ArvinMeritor Inc. | 230,600 | | 2,877,888 |
| | | | |
| Motor Vehicles 0.82% |
| Asbury Automotive | | | |
| Group Inc. | 116,300 | | 1,494,455 |
| | | | |
| Restaurants 2.33% |
| Bob Evans Farms Inc. | 148,555 | | 4,248,673 |
| | | | |
| Specialty Retail 2.04% |
| Movado Group Inc. | 187,295 | | 3,708,441 |
| | | | |
| Total Consumer Cyclicals |
| (Cost $32,678,512) | | | 24,369,726 |
| | | | |
| Consumer Staples 4.11% |
| Food & Agriculture Products 0.97% |
| Lancaster Colony Corp. | 58,140 | | 1,760,479 |
| | | | |
| Grocery & Convenience 2.03% |
| Casey’s General Stores Inc. | 159,765 | | 3,701,755 |
| | | | |
| Home Products 1.11% |
| Tupperware Brands Corp. | 59,150 | | 2,024,113 |
| | | | |
| Total Consumer Staples |
| (Cost $8,230,884) | | | 7,486,347 |
| | | |
| 1-800-392-CORE (2673) ■ www.westcore.com | 81 |
Westcore Small-Cap Value Fund as of June 30, 2008 (continued)
| | Shares | | Market Value | |
| | | | | |
| Energy 7.39% | |
| Exploration & Production 3.51% | |
| Berry Petroleum | | | | |
| Co. - Class A | 108,510 | $ | 6,389,069 | |
| | | | | |
| Oil Services 3.00% | |
| Gulf Island | | | | |
| Fabrication Inc. | 111,755 | | 5,468,172 | |
| | | | | |
| Refining & Marketing 0.88% | |
| Holly Corp. | 43,400 | | 1,602,328 | |
| | | | | |
| Total Energy | | | | |
| (Cost $8,820,278) | | | 13,459,569 | |
| | | | |
| Interest Rate Sensitive 19.88% | |
| Life & Health Insurance 1.86% | |
| American Equity | | | | |
| Investment Life | | | | |
| Holding Co. | 415,950 | | 3,389,993 | |
| | | | | |
| Other Banks 3.89% | |
| Colonial BancGroup Inc. | 283,800 | | 1,254,396 | |
| PacWest Bancorp | 98,555 | | 1,466,498 | |
| Westamerica Bancorp | 82,820 | | 4,355,503 | |
| | | | 7,076,397 | |
| Property Casualty Insurance 6.54% | |
| Assured Guaranty | | | | |
| Ltd. (Bermuda) | 181,745 | | 3,269,593 | |
| Max Capital Group | | | | |
| Ltd. (Bermuda) | 145,765 | | 3,109,167 | |
| Platinum Underwriters | | | | |
| Holdings Ltd. | | | | |
| (Bermuda) | 111,375 | | 3,631,938 | |
| Safety Insurance | | | | |
| Group Inc. | 53,200 | | 1,896,580 | |
| | | | 11,907,278 | |
| Securities & Asset Management 1.89% | |
| SWS Group Inc. | 206,975 | | 3,437,855 | |
| | | | | |
| Specialty Finance 2.43% | |
| Cash America | | | | |
| International Inc. | 113,560 | | 3,520,360 | |
| | Shares | | Market Value |
| | | | |
| MCG Capital Corp. | 226,350 | $ | 900,873 |
| | | | 4,421,233 |
| Thrifts & Mortgage REITs 3.27% |
| First Niagara Financial | | | |
| Group Inc. | 153,800 | | 1,977,868 |
| MFA Mortgage | | | |
| Investments Inc. | 611,540 | | 3,987,241 |
| | | | 5,965,109 |
| Total Interest Rate Sensitive |
| (Cost $45,079,625) | | | 36,197,865 |
| | | |
| Medical & Healthcare 9.85% |
| Healthcare Services 2.63% |
| Owens & Minor Inc. | 104,510 | | 4,775,062 |
| | | | |
| Medical Products & Supplies 7.22% |
| Cooper Companies Inc. | 67,050 | | 2,490,908 |
| Mentor Corp. | 114,300 | | 3,179,826 |
| Meridian Bioscience Inc. | 124,175 | | 3,342,791 |
| STERIS Corp. | 143,850 | | 4,137,125 |
| | | | 13,150,650 |
| Total Medical & Healthcare |
| (Cost $17,622,206) | | | 17,925,712 |
| | | |
| Real Estate Investment Trusts (REITs) 3.65% |
| Hotels 0.99% | | | |
| DiamondRock | | | |
| Hospitality Co. | 165,300 | | 1,800,117 |
| | | | |
| Multi-Family 1.25% |
| Associated Estates | | | |
| Realty Corp. | 212,965 | | 2,280,855 |
| | | | |
| Office - Industrial 1.41% |
| Parkway Properties Inc. | 75,895 | | 2,559,939 |
| | | | |
| Total Real Estate Investment Trusts (REITs) |
| (Cost $7,633,934) | | | 6,640,911 |
| | | |
| Technology 10.08% |
| Computer Software 1.25% |
| Blackbaud Inc. | 106,445 | | 2,277,923 |
| 82 | Semi-Annual Report June 30, 2008 (Unaudited) | |
Westcore Small-Cap Value Fund as of June 30, 2008 (continued)
| | Shares | | Market Value | |
| | | | | |
| Electronic Equipment 7.77% | |
| Bel Fuse Inc. - Class B | 57,190 | | $ 1,413,165 | |
| Belden Inc. | 187,300 | | 6,345,724 | |
| Park | | | | |
| Electrochemical Corp. | 116,300 | | 2,827,253 | |
| Technitrol Inc. | 209,910 | | 3,566,371 | |
| | | | 14,152,513 | |
| | | | |
| Semiconductor Equipment 1.06% | |
| Cohu Inc. | 131,100 | | 1,924,548 | |
| | | | | |
| Total Technology | | | | |
| (Cost $21,740,152) | | | 18,354,984 | |
| | | | |
| Transportation 5.23% | |
| Trucking, Shipping & Air Freight 5.23% | |
| Diana Shipping | | | | |
| Inc. (Greece) | 65,050 | | 1,997,686 | |
| Eagle Bulk Shipping Inc. | 126,200 | | 3,731,734 | |
| Genco Shipping | | | | |
| & Trading Ltd. | 58,210 | | 3,795,292 | |
| | | | 9,524,712 | |
| Total Transportation | |
| (Cost $5,829,697) | | | 9,524,712 | |
| | | | |
| Utilities 4.01% | |
| Electric 0.89% | |
| UIL Holdings Corp. | 55,200 | | 1,623,433 | |
| | | | | |
| Regulated Gas 3.12% | |
| Northwest Natural Gas Co. | 51,260 | | 2,371,288 | |
| South Jersey Industries Inc.88,675 | | 3,312,898 | |
| | | | 5,684,186 | |
| Total Utilities | |
| (Cost $7,163,851) | | | 7,307,619 | |
| | | | |
| Total Common Stocks | |
| (Cost $187,319,675) | | | 173,726,174 | |
| | | | |
| Money Market Mutual Funds 5.00% | |
| Goldman Sachs | | | | |
| Financial Square | | | | |
| Prime Obligations | | | | |
| Fund - FST Shares | | | | |
| (7 Day Yield 2.380%) | 6,397,839 | | 6,397,839 | |
| | | | |
| | Shares | Market Value |
| | | |
| Morgan Stanley | | | |
| Institutional Liquidity | | |
| Funds Prime Portfolio | | |
| (7 Day Yield 2.578%) 2,709,531 | | $ 2,709,531 |
| | | | |
| Total Money Market Mutual Funds |
| (Cost $9,107,370) | | | 9,107,370 |
| | | |
| Total Investments | | | |
| (Cost $196,427,045) | 100.41% | | 182,833,544 |
| | | | |
| Liabilities in Excess | | | |
| of Other Assets | (0.41%) | | (741,680) |
| | | | |
| Net Assets | 100.00% | | $ 182,091,864 |
| | | | |
| | | | |
See Notes to Statements of Investments on page 120 and Notes to Financial Statements beginning on page 175. |
| | | | |
| Westcore Small-Cap Value Fund |
| Country Breakdown as of June 30, 2008 |
| Country | Market Value | | % |
| United States | $ 170,825,160 | | 93.81% |
| Bermuda | 10,010,698 | | 5.50% |
| Greece | 1,997,686 | | 1.10% |
| Total Investments | 182,833,544 | | 100.41% |
| Liabilities in Excess | | | |
| of Other Assets | (741,680) | | (0.41%) |
| Net Assets | $ 182,091,864 | | 100.00% |
| | | | |
| | | | |
| Please note the country classification is based on the company headquarters. |
| | | | |
| All of the Fund’s investments are traded on U.S. exchanges. |
| 1-800-392-CORE (2673) ■ www.westcore.com | 83 |
Westcore Micro-Cap Opportunity Fund as of June 30, 2008
| | Shares | Market Value | |
| | | | |
| Common Stocks 95.08% | |
| Basic Materials 3.09% | |
| Forestry & Paper 0.69% | |
| Buckeye | | | |
| Technologies Inc.** | 379 | $ 3,206 | |
| | | |
| | | | |
| Other Materials (Rubber & Plastic) 0.09% | |
| Myers Industries Inc. | 49 | 399 | |
| | | | |
| Specialty Chemicals 0.72% | |
| Calgon Carbon Corp.** | 215 | 3,324 | |
| | | | |
| Steel 1.59% | |
| Mesabi Trust | 189 | 5,821 | |
| Universal Stainless & | | | |
| Alloy Products Inc.** | 42 | 1,556 | |
| | | 7,377 | |
| | | | |
| Total Basic Materials | |
| (Cost $14,714) | | 14,306 | |
| | | | |
| Capital Goods 8.56% | |
| Aerospace/Defense Suppliers 4.63% | |
| Applied Signal | | | |
| Technology Inc. | 193 | 2,636 | |
| GenCorp Inc.** | 397 | 2,843 | |
| Hawk Corp.** | 234 | 4,352 | |
| Herley Industries Inc.** | 373 | 4,953 | |
| Integral Systems Inc. | 140 | 5,419 | |
| Ladish Co. Inc** | 62 | 1,277 | |
| | | 21,480 | |
| | | |
| | | | |
| Electrical Equipment 2.49% | |
| AAON Inc. | 145 | 2,793 | |
| AZZ Inc.** | 32 | 1,277 | |
| Powell Industries, Inc.** | 32 | 1,613 | |
| Quixote Corp. | 528 | 4,345 | |
| Ultralife Corp.** | 139 | 1,486 | |
| | | 11,514 | |
| | | | |
| Industrial Products 1.44% | |
| Chase Corp. | 85 | 1,593 | |
| Flanders Corp. ** | 634 | 3,835 | |
| | Shares | | Market Value |
| | | | |
| Graham Corp. | 10 | | $ | 741 |
| Lydall Inc.** | 41 | | | 515 |
| | | | | 6,684 |
| | | | | |
| Total Capital Goods |
| (Cost $42,319) | | | | 39,678 |
| | | | | |
| Commercial Services 6.98% |
| Business Products & Services 2.82% |
| Asta Funding Inc. | 497 | | | 4,504 |
| COMSYS IT Partners Inc.** | 479 | | | 4,368 |
| MAXIMUS Inc. | 121 | | | 4,213 |
| | | | | 13,085 |
| | | | | |
| Distributors & Wholesalers 1.18% |
| Park-Ohio | | | | |
| Holdings Corp.** | 369 | | | 5,446 |
| | | | | |
| Environmental / Pollution Control 0.29% |
| Landauer Inc. | 24 | | | 1,350 |
| | | | |
| | | | | |
| IT Services 2.07% |
| AsiaInfo Holdings Inc.** | 359 | | | 4,243 |
| Infospace Inc. | 487 | | | 4,057 |
| SI International Inc.** | 62 | | | 1,298 |
| | | | | 9,598 |
| | | | | |
| Transaction Processing 0.62% | | | |
| Cass Information Systems Inc. | 90 | | | 2,883 |
| | | | | |
| Total Commercial Services |
| (Cost $33,015) | | | | 32,362 |
| | | | | |
| Communications 1.90% |
| Telecomm Equipment & Solutions 1.22% |
| Novatel Wireless Inc.** | 271 | | | 3,016 |
| Tollgrade | | | | |
| Communications Inc.** | 585 | | | 2,627 |
| | | | | 5,643 |
| | | | | |
| Telecomm Service Providers 0.68% |
| USA Mobility Inc.** | 418 | | | 3,156 |
| | | | | |
| | | | | |
| | | | | |
| | | | | |
| 84 | Semi-Annual Report June 30, 2008 (Unaudited) | |
Westcore Micro-Cap Opportunity Fund
as of June 30, 2008 (continued)
| | Shares | | Market Value | |
| | | | | |
| Total Communications | |
| (Cost $9,550) | | | $ | 8,799 | |
| | | | | | |
| Consumer Cyclicals 12.14% | |
| Apparel & Footwear Manufacturing 0.24% | |
| Maidenform Brands Inc.** | 81 | | | 1,094 | |
| | | | | | |
| Clothing & Accessories 0.26% | |
| JOS A Bank | | | | | |
| Clothiers Inc.** | 45 | | | 1,204 | |
| | | | | | |
| Consumer Durables 0.80% | |
| Knoll Inc. | 305 | | | 3,706 | |
| | | | | | |
| Homebuilders & Suppliers 0.43% | | |
| Encore Wire Corp. | 73 | | | 1,547 | |
| M/I Homes Inc. | 28 | | | 440 | |
| | | | | 1,987 | |
| | | | | | |
| Motor Vehicle Parts 2.00% | |
| Apogee Enterprises Inc. | 66 | | | 1,067 | |
| ATC Technology Corp.** | 174 | | | 4,050 | |
| Drew Industries Inc.** | 79 | | | 1,260 | |
| Midas Inc.** | 215 | | | 2,903 | |
| | | | | 9,280 | |
| | | | | | |
| Motor Vehicles 0.34% | |
| Asbury Automotive Group Inc. | 122 | | | 1,568 | |
| | | | | | |
| Other Consumer Services 0.74% | |
| Pre-Paid Legal Services Inc.** | 84 | | | 3,412 | |
| | | | | | |
| Publishing & Media 2.07% | |
| Courier Corp. | 53 | | | 1,064 | |
| Fisher | | | | | |
| Communications Inc.** | 133 | | | 4,581 | |
| LIN TV Corp.** | 239 | | | 1,424 | |
| Saga Communications Inc.** | 508 | | | 2,545 | |
| | | | | 9,614 | |
| | | | | | |
| Recreation & Leisure 0.93% | |
| Steinway Musical | | | | | |
| Instruments Inc.** | 163 | | | 4,303 | |
| | Shares | | Market Value |
| | | | |
| Restaurants 0.81% |
| Luby’s Inc.** | 619 | $ | 3,776 |
| | | |
| | | | |
| Specialty Retail 3.52% |
| 1-800-FLOWERS.COM Inc.** | 618 | | 3,985 |
| Franklin Covey Co.** | 406 | | 3,524 |
| Monro Muffler Inc. | 93 | | 1,441 |
| Movado Group Inc. | 194 | | 3,841 |
| PEP Boys-Manny Moe & Jack | 108 | | 942 |
| Rex Stores Corp.** | 226 | | 2,610 |
| | | | 16,343 |
| | | | |
| Total Consumer Cyclicals |
| (Cost $59,239) | | | 56,287 |
| | | | |
| Consumer Staples 4.47% |
| Beverages: Alcoholic 1.26% |
| Boston Beer Co. Inc.** | 143 | | 5,817 |
| | | | |
| Beverages: Non-Alcoholic 2.02% |
| Coca-Cola Bottling Co. | 136 | | 5,030 |
| National Beverage Corp. | 598 | | 4,347 |
| | | | 9,377 |
| | | | |
| Consumer Products 0.31% |
| Oil-Dri Corp. of America | 79 | | 1,418 |
| | | | |
| Home Products 0.88% |
| WD-40 Co. | 140 | | 4,095 |
| | | | |
| Total Consumer Staples |
| (Cost $21,726) | | | 20,707 |
| | | | |
| Energy 5.52% |
| Coal 1.28% |
| Westmoreland Coal Co.** | 280 | | 5,911 |
| | | | |
| Energy Lp/Trusts 0.94% |
| North European Oil | | | |
| Royalty Trust | 113 | | 4,367 |
| 1-800-392-CORE (2673) ■ www.westcore.com | 85 |
Westcore Micro-Cap Opportunity Fund
as of June 30, 2008 (continued)
| | Shares | | Market Value | |
| | | | | |
| Exploration & Production 1.32% | |
| Energy Partners Ltd.** | 130 | $ | 1,940 | |
| Panhandle Oil and Gas Inc. | 124 | | 4,198 | |
| | | | 6,138 | |
| | | | | |
| Oil Services 1.58% | |
| Bolt Technology Corp.** | 73 | | 1,648 | |
| Dawson Geophysical Co.** | 17 | | 1,011 | |
| Mitcham Industries Inc.** | 236 | | 4,030 | |
| Trico Marine Services Inc.** | 18 | | 656 | |
| | | | 7,345 | |
| Refining & Marketing 0.40% | |
| Adams Resources | | | | |
| & Energy Inc. | 54 | | 1,831 | |
| | | | | |
| Total Energy | |
| (Cost $25,788) | | | 25,592 | |
| | | | | |
| Interest Rate Sensitive 18.06% | |
| Life & Health Insurance 0.63% | |
| American Equity Investment | | | | |
| Life Holding Co. | 359 | | 2,926 | |
| | | | | |
| Other Banks 8.74% | |
| First Merchants Corp. | 301 | | 5,464 | |
| First Place Financial Corp. | 197 | | 1,852 | |
| Intervest Bancshares Corp. | 884 | | 4,526 | |
| Lakeland Bancorp Inc. | 255 | | 3,106 | |
| Lakeland Financial Corp. | 62 | | 1,183 | |
| Old Second Bancorp Inc. | 402 | | 4,671 | |
| Peoples Bancorp, Inc. | 180 | | 3,416 | |
| Republic Bancorp, Inc. | 102 | | 2,509 | |
| Simmons First National Corp. | 161 | | 4,503 | |
| Sun Bancorp Inc.** | 526 | | 5,339 | |
| Tompkins Financial Corp. | 106 | | 3,943 | |
| | | | 40,512 | |
| Property Casualty Insurance 2.32% | |
| Amerisafe Inc.** | 252 | | 4,017 | |
| Hallmark Financial | | | | |
| Services Inc.** | 206 | | 1,992 | |
| SCPIE Holdings Inc.** | 169 | | 4,730 | |
| | | | 10,739 | |
| | Shares | | Market Value |
| | | | |
| Securities & Asset Management 1.24% |
| TradeStation Group Inc.** | 279 | $ | 2,832 |
| Westwood Holdings Group Inc. | 74 | | 2,945 |
| | | | 5,777 |
| Thrifts 5.13% |
| Anthracite Capital Inc. | 640 | | 4,506 |
| Anworth Mortgage Asset Corp. | 660 | | 4,297 |
| Capstead Mortgage Corp. | 388 | | 4,210 |
| FirstFed Financial Corp.** | 452 | | 3,634 |
| MainSource Financial | | | |
| Group Inc. | 387 | | 5,998 |
| RAIT Financial Trust | 153 | | 1,135 |
| | | | 23,780 |
| | | | |
| Total Interest Rate Sensitive |
| (Cost $90,479) | | | 83,734 |
| | | | |
| Medical & Healthcare 16.09% |
| Healthcare Services 5.54% |
| American Dental | | | |
| Partners Inc.** | 134 | | 1,591 |
| Assisted Living | | | |
| Concepts Inc.** | 147 | | 809 |
| Medcath Corp.** | 215 | | 3,866 |
| National Healthcare Corp. | 121 | | 5,545 |
| RehabCare Group Inc.** | 414 | | 6,637 |
| Sun Healthcare Group Inc.** | 119 | | 1,593 |
| Symyx Technologies Inc.** | 809 | | 5,647 |
| | | | 25,688 |
| | | | |
| Medical Products & Supplies 3.20% |
| Cypress Bioscience Inc.** | 335 | | 2,409 |
| Given Imaging Ltd. (Israel)** | 321 | | 4,732 |
| Medical Action | | | |
| Industries Inc.** | 212 | | 2,198 |
| Osteotech Inc.** | 602 | | 3,425 |
| Young Innovations Inc. | 99 | | 2,061 |
| | | | 14,825 |
| | | | |
| Medical Technology 3.14% |
| Bio-Imaging | | | |
| Technologies Inc.** | 51 | | 377 |
| Cutera Inc.** | 332 | | 2,998 |
| 86 | Semi-Annual Report June 30, 2008 (Unaudited) | |
Westcore Micro-Cap Opportunity Fund as of June 30, 2008 (continued)
| | Shares | | Market Value | |
| | | | | |
| Cynosure Inc.** | 76 | $ | 1,506 | |
| Vital Images Inc.** | 410 | | 5,101 | |
| Vivus Inc.** | 687 | | 4,589 | |
| | | | 14,571 | |
| | | | | |
| Pharmaceuticals 4.21% | |
| Albany Molecular | | | | |
| Research Inc.** | 194 | | 2,574 | |
| Bentley | | | | |
| Pharmaceuticals Inc.** | 268 | | 4,328 | |
| GTx Inc.** | 258 | | 3,702 | |
| InterMune Inc.** | 308 | | 4,041 | |
| Progenics | | | | |
| Pharmaceuticals Inc.** | 93 | | 1,476 | |
| Salix Pharmaceuticals Ltd.** | 231 | | 1,624 | |
| Trimeris Inc. | 376 | | 1,775 | |
| | | | 19,520 | |
| | | | | |
| Total Medical & Healthcare | |
| (Cost $77,462) | | | 74,604 | |
| | | | | |
| Real Estate Investment Trusts (REITs) 2.59% | |
| Multi-Family 0.28% | |
| Associated Estates Realty Corp. | 122 | | 1,307 | |
| | | | | |
| Real Estate Investment Trusts 2.30% | |
| BRT Realty Trust | 417 | | 5,004 | |
| Ramco-Gershenson | | | | |
| Properties Trust | 276 | | 5,669 | |
| | | | 10,673 | |
| | | | | |
| Total Real Estate Investment Trusts (REITs) | |
| (Cost $13,044) | | | 11,980 | |
| | | | | |
| Technology 13.28% | |
| Computer Software 1.14% | |
| i2 Technologies Inc.** | 131 | | 1,629 | |
| Interwoven Inc.** | 100 | | 1,201 | |
| Seachange | | | | |
| International Inc.** | 120 | | 859 | |
| Vignette Corp.** | 133 | | 1,596 | |
| | | | 5,285 | |
| | | | | |
| | | | | |
| | Shares | | Market Value |
| | | | |
| Electronic Equipment 4.38% |
| American Science & | | | |
| Engineering, Inc. | 76 | $ | 3,916 |
| CTS Corp. | 558 | | 5,608 |
| GSI Group, Inc. (Canada)** | 126 | | 978 |
| Intevac Inc.** | 241 | | 2,718 |
| Mercury Computer | | | |
| Systems Inc.** | 18 | | 136 |
| Spectrum Control Inc.** | 678 | | 5,560 |
| Zygo Corp.** | 145 | | 1,425 |
| | | | 20,341 |
| | | | |
| Peripherals 0.35% |
| Hutchinson Technology, Inc.** | 120 | | 1,613 |
| | | | |
| Semiconductor Capital Equipment 2.87% |
| Advanced Energy | | | |
| Industries Inc.** | 421 | | 5,767 |
| Kulicke & Soffa | | | |
| Industries Inc.** | 219 | | 1,597 |
| Newport Corp.** | 345 | | 3,929 |
| Ultra Clean Holdings Inc.** | 179 | | 1,425 |
| Ultratech Inc.** | 38 | | 590 |
| | | | 13,308 |
| | | | |
| Semiconductors 4.43% |
| Applied Micro | | | |
| Circuits Corp.** | 177 | | 1,515 |
| Ceva Inc.** | 27 | | 215 |
| Exar Corp.** | 714 | | 5,384 |
| Micrel Inc. | 627 | | 5,736 |
| O2Micro International Ltd. | | | |
| (Cayman Islands)** | 757 | | 5,034 |
| Sigma Designs Inc.** | 104 | | 1,445 |
| SiRF Technology | | | |
| Holdings Inc.** | 278 | | 1,201 |
| | | | 20,530 |
| | | | |
| Technology Resellers - Distributors 0.11% |
| Richardson Electronics Ltd. | 85 | | 504 |
| | | | |
| Total Technology |
| (Cost $65,420) | | | 61,581 |
| | | |
| 1-800-392-CORE (2673) ■ www.westcore.com | 87 |
Westcore Micro-Cap Opportunity Fund as of June 30, 2008 (continued)
| | Shares | Market Value | |
| | | | |
| Transportation 1.80% | |
| Trucking, Shipping & Air Freight 1.80% | |
| Dynamex Inc.** | 207 | $ 5,550 | |
| International | | | |
| Shipholding Corp.** | 119 | 2,789 | |
| | | 8,339 | |
| | | | |
| Total Transportation | |
| (Cost $8,656) | | 8,339 | |
| | | | |
| Utilities 0.60% | |
| Water Utilities 0.60% | |
| American States Water Co. | 80 | 2,795 | |
| | | | |
| Total Utilities | |
| (Cost $2,886) | | 2,795 | |
| | | | |
| Total Common Stocks | |
| (Cost $464,298) | | 440,764 | |
| | | |
| Money Market Mutual Funds 19.54% | |
| Goldman Sachs | | | |
| Financial Square | | | |
| Prime Obligations | | | |
| Fund - FST Shares | | | |
| (7 Day Yield 2.380%) | 71,866 | 71,866 | |
| Morgan Stanley | | | |
| Institutional Liquidity | | | |
| Funds Prime Portfolio | | | |
| (7 Day Yield 2.578%) | 18,750 | 18,750 | |
| | | | |
| Total Money Market Mutual Funds | |
| (Cost $90,616) | | 90,616 | |
| | | |
| | | | Market Value |
| | | | |
| Total Investments | | | | |
| (Cost $554,914) | | 114.62% | $ | 531,380 |
| | | | | |
| Liabilities in Excess | | | | |
| of Other Assets | | (14.62%) | | (67,787) |
| | | | | |
| Net Assets | | 100.00% $ | | 463,593 |
| | | | | |
See Notes to Statements of Investments on page 120 and Notes to Financial Statements beginning on page 175. |
| | | | | |
| Westcore Micro-Cap Opportunity Fund |
| Country Breakdown as of June 30, 2008 |
| Country | Market Value | | % |
| United States | | $ 520,636 | | 112.30% |
| Cayman Islands | | 5,034 | | 1.09% |
| Israel | | 4,732 | | 1.02% |
| Canada | | 978 | | 0.21% |
| Total Investments | | 531,380 | | 114.62% |
| Liabilities in Excess | | | | |
| of Other Assets | | (67,787) | | (14.62%) |
| Net Assets | | $ 463,593 | | 100.00% |
| | | | | |
Please note the country classification is based on the company headquarters. |
| | | | | |
All of the Fund’s investments are traded on U.S. exchanges. |
| |
| |
| |
| |
| |
| |
| |
| |
| |
| |
| 88 | Semi-Annual Report June 30, 2008 (Unaudited) | |
Westcore Flexible Income Fund as of June 30, 2008
| | Shares | | Market Value | |
| | | | | |
| Common Stocks 4.36% | |
| Financial 2.66% | |
| Financial Services 0.73% | |
| Apollo Investment Co. | 27,001 | $ | 386,924 | |
| Crystal River Capital Inc. | 37,000 | | 135,420 | |
| Tortoise Capital Partners | 45,625 | | 542,938 | |
| | | | 1,065,282 | |
| | | | | |
| Real Estate Investment Trusts (REITs) 1.94% | |
| Healthcare 0.58% | | | | |
| Healthcare Realty Trust Inc. | 35,600 | | 846,212 | |
| | | | | |
| Office Property 0.77% | |
| Hospitality | | | | |
| Properties Trust | 27,000 | | 660,420 | |
| HRPT Properties Trust | 70,000 | | 473,900 | |
| | | | 1,134,320 | |
| Timber 0.58% | |
| Rayonier Inc. | 20,100 | | 853,446 | |
| | | | | |
| Total Financial | |
| (Cost $5,658,243) | | | 3,899,260 | |
| | | | | |
| Industrial 0.51% | |
| Autos 0.17% | |
| Dana Holding Corp.** | 46,706 | | 249,877 | |
| | | | | |
| Other Industrial 0.34% | |
| B&G Foods Inc.(8) | 22,000 | | 374,000 | |
| Centerplate Inc. | 26,000 | | 125,580 | |
| | | | 499,580 | |
| Total Industrial | |
| (Cost $1,700,694) | | | 749,457 | |
| | | | | |
| Utilities & Energy 1.19% | |
| Energy-Non Utility 1.19% | |
| Enbridge Energy | | | | |
| Partners LP | 34,500 | | 1,735,695 | |
| | | | | |
| Total Utilities & Energy | |
| (Cost $1,579,028) | | | 1,735,695 | |
| | | Market Value |
| | | |
| Total Common Stocks | | |
| (Cost $8,937,965) | $ | 6,384,412 |
| | | |
| | | | |
| | | | |
| | | | |
| | | | |
| | | | |
| | | | |
| | | | |
| | | | |
| | | | |
| | | | |
| | | | |
| | | | |
| | | | |
| | | | |
| | | | |
| | | | |
| | | | |
| | | | |
| | | | |
| | | | |
| | | | |
| | | | |
| | | | |
| | | | |
| | | | |
| | | | |
| | | | |
| | | | |
| | | | |
| | | | |
| | | | |
| | | | |
| | | | |
| | | | |
| | | | |
| | | | |
| | | | |
| | | | |
| 1-800-392-CORE (2673) ■ www.westcore.com | 89 |
Westcore Flexible Income Fund as of June 30, 2008 (continued)
| | Bond Rating | Principal | | |
| | Moody’s/S&P | Amount | | Market Value |
| | | | | |
| Convertible Preferred Stocks 3.62% |
| Financial 0.33% |
| Real Estate Investment Trusts (REITs) 0.33% |
| Hotels 0.33% |
| FelCor Lodging Trust Inc., Series A, 1.950% | B2/B- | $ | 25,000 | | $ | 478,750 |
| | | | | | | |
| Total Financial |
| (Cost $616,400) | | | | | | 478,750 |
| | | | | | | |
| Industrial 2.42% |
| Airlines 0.07% |
| Continental Airlines Finance Trust II, 6.000%, 11/15/2030 | Caa1/CCC | | 7,500 | | | 112,031 |
| | | | | | | |
| Autos 2.35% |
| Ford Motor Co. Capital Trust II, 6.500%, 1/15/2032 | Caa2/CCC- | | 73,000 | | | 2,018,450 |
| General Motors Corp., 6.250%, 7/15/2033 | Caa1/B | | 107,000 | | | 1,418,820 |
| | | | | | | |
| | | | | | | 3,437,270 |
| Total Industrial |
| (Cost $5,619,660) | | | | | | 3,549,301 |
| | | | | | | |
| Utilities & Energy 0.87% |
| Energy-Non Utility 0.87% |
| AES Trust III, 6.750%, 10/15/2029 | B3/B- | | 26,100 | | | 1,265,850 |
| | | | | | | |
| Total Utilities & Energy |
| (Cost $1,140,080) | | | | | | 1,265,850 |
| | | | | | | |
| Total Convertible Preferred Stocks |
| (Cost $7,376,140) | | | | | | 5,293,901 |
| | | | | | |
| Nonconvertible Preferred Stocks 14.46% |
| Financial 14.37% |
| Financial Services 1.14% |
| First Republic Capital Trust II, Series B, 8.750%(1)(2) | NR/A- | | 20,000 | | | 503,750 |
| Invesco Navigator Fund 2005-1, 8.000%(1)(2)(3) | NR/NR | | 2,000 | | | 1,164,260 |
| | | | | | | 1,668,010 |
| Government Sponsored Entity 1.44% |
| Federal Home Loan Mortgage Corp., 8.375% | Aa3/AA- | | 86,680 | | | 2,106,324 |
| | | | | | | |
| Insurance 0.16% |
| Delphi Financial Group Inc., 8.000%, 5/15/2033 | Baa3/BBB+ | | 10,000 | | | 228,900 |
| 90 | Semi-Annual Report June 30, 2008 (Unaudited) | |
Westcore Flexible Income Fund as of June 30, 2008 (continued)
| | Bond Rating | Principal | | |
| | Moody’s/S&P | Amount | | Market Value |
| | | | | |
| Real Estate Investment Trusts (REITs) 11.63% |
| Apartments 1.09% |
| Apartment Investment & Management Co.: | | | | | | |
| Series T, 8.000% | Ba3/B+ | $ | 60,000 | | $ | 1,368,000 |
| Series V, 8.000% | Ba3/B+ | | 10,000 | | | 232,500 |
| | | | | | | 1,600,500 |
| | | | | | | |
| Diversified 1.30% |
| Cousins Properties Inc.: | | | | | | |
| 7.500% | NR/NR | | 25,000 | | | 544,500 |
| 7.750% | NR/NR | | 25,000 | | | 562,500 |
| Digital Realty Trust Inc., 8.500% | NR/NR | | 26,000 | | | 600,080 |
| Vornado Realty Trust, Series E, 7.000% | Baa3/BBB- | | 9,400 | | | 197,400 |
| | | | | | | 1,904,480 |
| | | | | | | |
| Healthcare 2.11% |
| HCP Inc., Series F, 7.100% | Ba1/BBB- | | 30,000 | | | 604,500 |
| Health Care REIT Inc., Series F, 7.625% | Baa3/BB+ | | 55,000 | | | 1,287,000 |
| LTC Properties Inc., Series F, 8.000% | WR/NR | | 20,625 | | | 475,819 |
| Omega Healthcare Investors Inc., Series D, 8.375% | B2/B+ | | 30,000 | | | 720,000 |
| | | | | | | 3,087,319 |
| Hotels 1.22% |
| Hospitality Properties Trust, Series B, 8.875% | Baa3/BB+ | | 25,000 | | | 573,750 |
| Host Hotels & Resorts Inc., Series E, 8.875% | Ba2/B | | 6,400 | | | 160,000 |
| Strategic Hotels & Resorts Inc., Series C, 8.250% | NR/NR | | 55,000 | | | 1,056,000 |
| | | | | | | 1,789,750 |
| Manufactured Homes 0.12% | | | | | | |
| Hilltop Holdings Inc., 8.250% | NR/NR | | 9,000 | | | 171,000 |
| | | | | | | |
| Office Property 1.72% | | | | | | |
| Brandywine Realty: | | | | | | |
| Series C, 7.500% | NR/BBB- | | 16,300 | | | 342,300 |
| Series D, 7.375% | NR/BBB- | | 40,000 | | | 816,800 |
| Maguire Properties Inc., Series A, 7.625% | NR/B+ | | 50,500 | | | 691,850 |
| SL Green Realty Corp., Series C, 7.625% | NR/NR | | 30,000 | | | 669,150 |
| | | | | | | 2,520,100 |
| | | | | | | |
| Regional Malls 1.77% | | | | | | |
| CBL & Associates Properties Inc., Series D, 7.375% | NR/NR | | 40,000 | | | 817,200 |
| Taubman Centers Inc.: | | | | | | |
| Series G, 8.000% | B1/NR | | 27,200 | | | 636,480 |
| Series H, 7.625% | B1/NR | | 49,100 | | | 1,128,809 |
| | | | | | | 2,582,489 |
| 1-800-392-CORE (2673) ■ www.westcore.com | 91 |
Westcore Flexible Income Fund as of June 30, 2008 (continued)
| | Bond Rating | Principal | | |
| | Moody’s/S&P | Amount | | Market Value |
| | | | | |
| Shopping Centers 1.13% | | | | | | |
| Regency Centers Corp., Series D, 7.250% | Baa3/BBB | $ | 24,500 | | $ | 527,975 |
| Tanger Factory Outlet Centers Inc., Series C, 7.500% | Ba1/BB+ | | 49,800 | | | 1,128,966 |
| | | | | | | 1,656,941 |
| Warehouse-Industrial 1.17% | | | | | | |
| CenterPoint Properties Trust, 5.377%(2)(3) | WR/NR | | 1,500 | | | 1,050,000 |
| First Industrial Realty Trust Inc.: | | | | | | |
| 6.236%(2)(3) | Baa3/BBB- | | 250 | | | 187,500 |
| 7.250% | Baa3/BBB- | | 22,100 | | | 467,415 |
| | | | | | | 1,704,915 |
| | | | | | | |
| Total Financial | | | | | | |
| (Cost $25,331,427) | | | | | | 21,020,728 |
| | | | | | | |
| Industrial 0.09% | | | | | | |
| Airlines 0.09% | | | | | | |
| AMR Corp., 7.875%, 7/13/2039 | Caa1/B | | 10,000 | | | 134,900 |
| | | | | | | |
| Total Industrial | | | | | | |
| (Cost $171,413) | | | | | | 134,900 |
| | | | | | | |
| Total Nonconvertible Preferred Stocks | | | | | | |
| (Cost $25,502,840) | | | | | | 21,155,628 |
| | | | | | |
| Convertible Bonds 0.05% | | | | | | |
| Industrial 0.05% | | | | | | |
| Cable & Media 0.05% | | | | | | |
| Charter Communications Holdings Capital Corp., | | | | | | |
| 5.875%, 11/16/2009(1) | Ca/CCC | | 100,000 | | | 76,250 |
| | | | | | | |
| Total Industrial | | | | | | |
| (Cost $100,000) | | | | | | 76,250 |
| | | | | | | |
| Total Convertible Bonds | | | | | | |
| (Cost $100,000) | | | | | | 76,250 |
| | | | | | |
| Corporate Bonds 65.59% | | | | | | |
| Financial 12.19% | | | | | | |
| Financial Services 4.61% | | | | | | |
| Allied Capital Corp., 6.340%, 10/13/2012(1)(2)(3) | NR/BBB+ | | 1,000,000 | | | 928,090 |
| Emigrant Capital Trust II, 4.574%, 4/14/2034(1)(2)(4) | NR/NR | | 500,000 | | | 500,354 |
| Finova Capital Corp., 7.500%, 11/15/2009 | NR/NR | | 7,200.06 | | | 882 |
| 92 | Semi-Annual Report June 30, 2008 (Unaudited) | |
Westcore Flexible Income Fund
as of June 30, 2008 (continued)
| | Bond Rating | Principal | | |
| | Moody’s/S&P | Amount | | Market Value |
| | | | | |
| Leucadia National Corp.: |
| 7.000%, 8/15/2013 | Ba2/BB+ | $ | 3,800,000 | | $ | 3,705,000 |
| 7.750%, 8/15/2013 | Ba2/BB+ | | 1,140,000 | | | 1,128,600 |
| 7.125%, 3/15/2017 | Ba2/BB+ | | 500,000 | | | 480,000 |
| | | | | | | 6,742,926 |
| | | | | | | |
| Insurance 1.10% | | | | | | |
| Zurich Reinsurance Inc., 7.125%, 10/15/2023 | Baa3/BBB | | 1,700,000 | | | 1,603,194 |
| | | | | | | |
| Savings & Loans 1.26% | | | | | | |
| Washington Mutual Bank, 5.550%, 6/16/2010 | Baa2/NR | | 2,000,000 | | | 1,850,836 |
| | | | | | | |
| Real Estate Investment Trusts (REITs) 5.22% | | | | | | |
| Healthcare 1.52% | | | | | | |
| Omega Healthcare Investors Inc., 7.000%, 1/15/2016 | Ba3/BB+ | | 2,350,000 | | | 2,220,749 |
| | | | | | | |
| Hotels 1.42% | | | | | | |
| Host Marriott Corp., Series Q, 6.750%, 6/1/2016 | Ba1/BB | | 2,325,000 | | | 2,075,063 |
| | | | | | | |
| Regional Malls 1.55% | | | | | | |
| Rouse Co. Inc., 6.750%, 5/1/2013(1) | Ba2/BB- | | 2,500,000 | | | 2,266,592 |
| | | | | | | |
| Restaurants 0.73% | | | | | | |
| Trustreet Properties Inc., 7.500%, 4/1/2015 | Aaa/AAA | | 1,000,000 | | | 1,068,421 |
| | | | | | | |
| Total Financial | | | | | | |
| (Cost $18,033,625) | | | | | | 17,827,781 |
| | | | | | | |
| Industrial 41.33% | | | | | | |
| Airlines 0.34% | | | | | | |
| American Airlines Inc. Pass-Through Trust 1999, | | | | | | |
| Series 99-1, 7.024%, 10/15/2009 | Baa2/BBB+ | | 265,000 | | | 258,375 |
| Atlas Air Inc., Pass-Through Certificates, | | | | | | |
| Series 1999-1, Class A-1, 7.200%, 1/2/2019(5) | WR/NR | | 68,578 | | | 63,777 |
| Continental Airlines Inc.: | | | | | | |
| Pass-Through Certificates, Series 2000-1, | | | | | | |
| Class C, 7.033%, 6/15/2011(5) | B1/B+ | | 20,946 | | | 17,385 |
| Pass-Through Certificates, Series 1997-1, | | | | | | |
| Class B, 7.461%, 4/1/2013(5) | Ba3/B- | | 34,476 | | | 30,684 |
| Pass-Through Certificates, Series 1999-1, | | | | | | |
| Class B, 6.795%, 8/2/2018(5) | Ba1/BBB- | | 154,611 | | | 122,143 |
| | | | | | | 492,364 |
| 1-800-392-CORE (2673) ■ www.westcore.com | 93 |
Westcore Flexible Income Fund
as of June 30, 2008 (continued)
| | Bond Rating | Principal | | |
| | Moody’s/S&P | Amount | | Market Value |
| | | | | |
| Autos 6.26% | | | | | | |
| Dana Corp., Escrow Units**(2)(3)(6) | NR/NR | $ | 1,300,000 | | $ | – |
| Delphi Corp.: | | | | | | |
| 6.500%, 5/1/2009**(6) | WR/NR | | 1,375,000 | | | 299,063 |
| 8.250%, 10/15/2033**(6) | WR/NR | | 1,015,000 | | | 96,425 |
| Ford Motor Co.: | | | | | | |
| 9.215%, 9/15/2021 | Caa1/CCC+ | | 800,000 | | | 540,000 |
| 7.450%, 7/16/2031 | Caa1/CCC+ | | 3,000,000 | | | 1,762,500 |
| Ford Motor Credit Co. LLC: | | | | | | |
| 7.875%, 6/15/2010 | B1/B | | 500,000 | | | 431,835 |
| 8.000%, 12/15/2016 | B1/B | | 1,650,000 | | | 1,202,131 |
| General Motors Acceptance Corp., 8.000%, 11/1/2031 | B3/B | | 4,000,000 | | | 2,609,523 |
| General Motors Corp., 8.250%, 7/15/2023 | Caa1/B | | 1,000,000 | | | 587,500 |
| Sonic Automotive Inc., Series B, 8.625%, 8/15/2013 | B1/B | | 1,750,000 | | | 1,627,500 |
| | | | | | | 9,156,477 |
| Chemicals 1.14% | | | | | | |
| Borden Inc., 7.875%, 2/15/2023 | Caa1/CCC+ | | 575,000 | | | 330,625 |
| Ferro Corp., 9.125%, 1/1/2009 | B1/B+ | | 1,050,000 | | | 1,088,446 |
| Union Carbide Chemical & Plastics Co. Inc., | | | | | | |
| 7.875%, 4/1/2023 | Ba2/BBB- | | 250,000 | | | 250,601 |
| | | | | | | 1,669,672 |
| Healthcare 0.74% | | | | | | |
| Eszopiclone Royalty Sub LLC , Series IV, | | | | | | |
| 12.000%, 3/15/2014(1)(2)(3) | NR/NR | | 1,055,799 | | | 1,076,915 |
| | | | | | | |
| Leisure 13.23% | | | | | | |
| Fontainebleau Las Vegas Holdings LLC, 10.250%, 6/15/2015(1) | Caa1/CCC+ | | 3,000,000 | | | 1,965,000 |
| Harrah’s Operating Co. Inc, 10.750%, 2/1/2016(1) | B3/B+ | | 1,950,000 | | | 1,628,250 |
| Las Vegas Sands Corp., 6.375%, 2/15/2015 | Ba3/BB | | 3,400,000 | | | 2,906,999 |
| MGM Mirage Resorts Inc., 7.250%, 8/1/2017 | Ba2/BB | | 6,000,000 | | | 5,204,999 |
| Mohegan Tribal Gaming Authority, 6.875%, 2/15/2015 | Ba3/B | | 2,050,000 | | | 1,629,750 |
| Pinnacle Entertainment Inc., 8.250%, 3/15/2012 | B3/B+ | | 875,000 | | | 864,063 |
| Premier Ent. Biloxi, 10.750%, 2/1/2012(2)(3) | NR/NR | | 250,000 | | | – |
| Royal Caribbean Cruises Ltd.: | | | | | | |
| 8.000%, 5/15/2010 | Ba1/BB+ | | 1,500,000 | | | 1,522,500 |
| 6.875%, 12/1/2013 | Ba1/BB+ | | 2,500,000 | | | 2,187,500 |
| Seneca Gaming Corp., 7.250%, 5/1/2012 | Ba2/BB | | 100,000 | | | 94,250 |
| Station Casinos Inc., 6.875%, 3/1/2016 | Caa1/B- | | 2,450,000 | | | 1,350,563 |
| | | | | | | 19,353,874 |
| 94 | Semi-Annual Report June 30, 2008 (Unaudited) | |
Westcore Flexible Income Fund
as of June 30, 2008 (continued)
| | Bond Rating | Principal | | |
| | Moody’s/S&P | Amount | | Market Value |
| | | | | |
| Other Industrial 11.78% | | | | | | |
| Advanced Micro Devices Inc., 7.750%, 11/1/2012 | B2/B | $ | 2,233,000 | | $ | 1,931,545 |
| Allegheny Ludlum Corp., 6.950%, 12/15/2025 | Baa3/BBB- | | 1,580,000 | | | 1,541,783 |
| Amerigas Partners LP, 7.250%, 5/20/2015 | B1/NR | | 1,510,000 | | | 1,419,400 |
| Aramark Corp., 8.500%, 2/1/2015 | B3/B | | 4,225,000 | | | 4,161,625 |
| Federal Express Corp. 1997 Pass Through Trust, | | | | | | |
| Series 97-C, 7.650%, 1/15/2014 | Baa2/BBB | | 1,734,397 | | | 1,717,053 |
| Freeport-McMoRan Copper & Gold Inc.: | | | | | | |
| 6.875%, 2/1/2014 | Baa1/BBB- | | 1,000,000 | | | 1,036,210 |
| 8.375%, 4/1/2017 | Ba2/BBB- | | 1,725,000 | | | 1,822,704 |
| Goodyear Tire & Rubber Co.: | | | | | | |
| 7.857%, 8/15/2011 | B2/BB- | | 1,060,000 | | | 1,058,675 |
| 8.625%, 12/1/2011 | Ba3/BB- | | 167,000 | | | 169,505 |
| Levi Strauss & Co., 9.750%, 1/15/2015 | B2/B+ | | 2,000,000 | | | 2,020,000 |
| Novelis Inc., 7.250%, 2/15/2015 | B3/B | | 225,000 | | | 213,750 |
| Winn-Dixie Stores Inc., Escrow Units**(3)(6) | NR/NR | | 2,150,000 | | | 150,500 |
| | | | | | | 17,242,750 |
| Pharmaceuticals 1.25% | | | | | | |
| Medco Health Solutions Inc., 6.125%, 3/15/2013 | Baa3/BBB | | 1,825,000 | | | 1,833,665 |
| | | | | | | |
| Telecomm & Related 3.86% | | | | | | |
| American Tower Corp., 7.500%, 5/1/2012 | Ba1/BB+ | | 500,000 | | | 507,500 |
| Qwest Capital Funding Inc., 7.900%, 8/15/2010 | B1/B+ | | 2,500,000 | | | 2,506,250 |
| Qwest Communications International Inc., | | | | | | |
| 6.565%, 2/15/2009(4) | Ba3/B+ | | 333,000 | | | 333,000 |
| Qwest Corp.: | | | | | | |
| 7.500%, 6/15/2023 | Ba1/BBB- | | 375,000 | | | 335,625 |
| 6.875%, 9/15/2033 | Ba1/BBB- | | 1,726,000 | | | 1,432,580 |
| Rogers Wireless Inc., 7.500%, 3/15/2015 | Baa3/BBB- | | 500,000 | | | 530,384 |
| | | | | | | 5,645,339 |
| Transportation 2.73% | | | | | | |
| Burlington Northern Santa Fe Corp., 5.750%, 3/15/2018 | Baa1/BBB | | 1,000,000 | | | 980,634 |
| CSX Corp., 6.250%, 10/15/2008 | Baa3/BBB- | | 3,000,000 | | | 3,016,641 |
| | | | | | | 3,997,275 |
| Total Industrial | | | | | | |
| (Cost $69,740,731) | | | | | | 60,468,331 |
| | | | | | | |
| Utilities & Energy 12.07% | | | | | | |
| Energy-Non Utility 11.47% | | | | | | |
| ConocoPhillips, 8.750%, 5/25/2010 | A1/A | | 2,000,000 | | | 2,177,840 |
| Forest Oil Corp., 7.250%, 6/15/2019 | B1/B+ | | 2,950,000 | | | 2,846,750 |
| Kerr-McGee Corp., 6.950%, 7/1/2024 | Baa3/BBB- | | 1,050,000 | | | 1,092,833 |
| Southwestern Energy Co., 7.500%, 2/1/2018(1) | Ba2/BB+ | | 1,510,000 | | | 1,562,685 |
| 1-800-392-CORE (2673) ■ www.westcore.com | 95 |
Westcore Flexible Income Fund
as of June 30, 2008 (continued)
| | Bond Rating | Principal | | |
| | Moody’s/S&P | Amount | | Market Value |
| | | | | |
| Tennessee Gas Pipeline Co.: | | | | | | |
| 7.500%, 4/1/2017 | Baa3/BB | $ | 400,000 | | $ | 423,832 |
| 7.000%, 3/15/2027 | Baa3/BB | | 1,850,000 | | | 1,818,308 |
| Transcontinental Gas Pipe Line Corp., | | | | | | |
| 6.400%, 4/15/2016 | Baa2/BBB- | | 2,100,000 | | | 2,107,875 |
| Valero Energy Corp., 6.125%, 6/15/2017 | Baa3/BBB | | 2,350,000 | | | 2,276,506 |
| Weatherford International Ltd. (Bermuda), | | | | | | |
| 5.150%, 3/15/2013 | Baa1/BBB+ | | 1,540,000 | | | 1,533,242 |
| Whiting Petroleum Corp., 7.000%, 2/1/2014 | B1/BB- | | 950,000 | | | 936,938 |
| | | | | | | 16,776,809 |
| Utilities 0.60% | | | | | | |
| Indianapolis Power & Light Co., 6.300%, 7/1/2013(1) | Baa1/BBB | | 100,000 | | | 103,232 |
| Portland General Electric Co., 7.875%, 3/15/2010 | Baa2/BBB | | 100,000 | | | 104,955 |
| WPD Holdings Inc., 7.250%, 12/15/2017(1) | Baa3/BBB- | | 600,000 | | | 670,038 |
| | | | | | | 878,225 |
| Total Utilities & Energy | | | | | | |
| (Cost $17,708,232) | | | | | | 17,655,034 |
| | | | | | |
| | | | | | | |
| Total Corporate Bonds | | | | | | |
| (Cost $105,482,588) | | | | | | 95,951,146 |
| | | | | | | |
| Asset-Backed Securities, Collateralized Obligations & Mortgage-Backed Securities 6.72% |
| Asset-Backed Securities 2.48% | | | | | | |
| Harley-Davidson Motorcycle Trust, | | | | | | |
| Series 2007-1, Class C, 5.540%, 4/15/2015 | Baa2/BBB | | 1,850,000 | | | 1,538,310 |
| Vanderbilt Mortgage and Finance Inc.: | | | | | | |
| Series 2002-B, Class B1, 5.850%, 4/7/2018 | Baa2/BBB | | 270,179 | | | 261,241 |
| Series 1997-C, Class 2B3, 3.598%, 8/7/2027 | Baa1/NR | | 2,000,000 | | | 1,825,713 |
| | | | | | | |
| | | | | | | 3,625,264 |
| | | | | | | |
| Collateralized Debt Obligations 2.54% | | | | | | |
| Anthracite CDO Ltd. (Cayman Islands), | | | | | | |
| Series 2004-1A, Class G, 5.431%, 2/24/2014(1)(2)(3)(4)(5) | NR/BBB- | | 500,000 | | | 85,000 |
| Crest Ltd. Series 2003-1A (Cayman Islands), | | | | | | |
| Class PS, 8.500%, 8/28/2012(1)(2)(5)(7) | NR/BB- | | 200,000 | | | 82,536 |
| Crest Ltd. Series 2003-2A (Cayman Islands): | | | | | | |
| Class E1, 7.521%, 12/28/2013(1)(2)(4)(5) | Ba1/BB | | 250,000 | | | 139,573 |
| Class PS, 6.000%, 12/28/2013(1)(2)(5)(7) | NR/NR | | 413,450 | | | 138,469 |
| Crest Ltd. Series 2004-1A (Cayman Islands): | | | | | | |
| Class PS, 7.667%, 12/28/2013(1)(2)(5)(7) | NR/NR | | 1,064,633 | | | 322,126 |
| Class H2, 7.334%, 10/28/2014(1)(2)(5) | Ba2/BB | | 300,000 | | | 146,511 |
| Exeter Street Solar, Class E1, 6.421%, 10/28/2014(1)(2)(4)(5) | NR/BB+ | | 418,853 | | | 224,438 |
| Fairfield Street Solar, Class F, 7.955%, 12/28/2014 | (1)(2)(4)(5) NR/BB- | | 1,087,500 | | | 460,490 |
| 96 | Semi-Annual Report June 30, 2008 (Unaudited) | |
Westcore Flexible Income Fund
as of June 30, 2008 (continued)
| | Bond Rating | Principal | | |
| | Moody’s/S&P | Amount | | Market Value |
| | | | | |
| I-Preferred Term Securities I Ltd. (Cayman Islands), | | | | | | |
| Subordinate Income Notes, 0.000%, 12/4/2012(1)(2)(5)(7) | NR/NR | $ | 100,000 | | $ | 33,612 |
| N-Star Real Estate CDO Ltd. (Cayman Islands), | | | | | | |
| Series 2004-2A, Class C2B, 6.591%, 6/28/2014(1)(2)(3)(5) | NR/BBB+ | | 500,000 | | | 330,450 |
| Preferred Term Securities VI Ltd. (Cayman Islands), | | | | | | |
| Subordinate Income Notes, 3.000%, 7/3/2012(1)(2)(5)(7) | NR/NR | | 100,000 | | | 37,119 |
| Preferred Term Securities X Ltd. (Cayman Islands), | | | | | | |
| Subordinate Income Notes, 19.000%, 7/3/2013(1)(2)(5)(7) | NR/NR | | 150,000 | | | 94,184 |
| Preferred Term Securities XI Ltd. (Cayman Islands), | | | | | | |
| Subordinate Income Notes, 19.000%, 10/3/2013(1)(2)(5)(7) | NR/NR | | 150,000 | | | 90,888 |
| Preferred Term Securities XII Ltd. (Cayman Islands), | | | | | | |
| Subordinate Income Notes, 0.000%, 12/24/2013(1)(2)(5)(7) | NR/NR | | 750,000 | | | 397,613 |
| Preferred Term Securities XIV Ltd. (Cayman Islands), | | | | | | |
| Subordinate Income Notes, 0.000%, 6/17/2014(1)(2)(5)(7) | NR/NR | | 500,000 | | | 263,615 |
| Regional Diversified Funding (Cayman Islands): | | | | | | |
| Series 2004-1, 0.000%, 2/15/2014(1)(2)(5)(7) | NR/NR | | 500,000 | | | 40,000 |
| Series 2005-1, 0.000%, 3/15/2015**(1)(2)(5)(7) | NR/NR | | 750,000 | | | 112,500 |
| River North CDO Ltd. (Cayman Islands), | | | | | | |
| Series 2005-1A, Class SUB, 0.000%, 2/6/2014**(1)(2)(3)(5)(7) | Ca/NR | | 600,000 | | | 6,000 |
| Soloso Bank Pref 2005 (Cayman Islands), | | | | | | |
| 15.000%, 10/15/2015(1)(2)(3)(5)(7) | NR/NR | | 750,000 | | | 300,000 |
| TIAA Real Estate CDO Ltd. (Cayman Islands), | | | | | | |
| Series 2003-1A, Class PS, 16.000%, 9/30/2013(1)(2)(5)(7) | NR/NR | | 250,000 | | | 133,840 |
| Tricadia (Cayman Islands): | | | | | | |
| Series 2003-1A, Class PS, 17.575%, 12/15/2013(1)(2)(3)(5)(7) | NR/NR | | 250,000 | | | 75,000 |
| Series 2004-2A, Class C, 8.876%, 12/23/2019(1)(2)(3)(4)(5) | Baa1/BBB+ | | 479,808 | | | 199,120 |
| | | | | | | 3,713,084 |
| | | | | | | |
| Commercial Mortgage-Backed Securities 1.70% | | | | | | |
| Crown Castle Towers LLC, | | | | | | |
| Series 2005-1A, Class C, 5.074%, 6/15/2010(3)(5) | A2/NR | | 1,500,000 | | | 1,442,820 |
| Global Signal Trust, | | | | | | |
| Series 2004-2A, Class G, 7.113%, 12/15/2014(1)(3)(5) | Ba2/NR | | 1,000,000 | | | 947,810 |
| Times Square Hotel Trust, 8.528%, 8/1/2026(1)(2)(3) | Baa3/BB+ | | 89,203 | | | 102,022 |
| | | | | | | 2,492,652 |
| | | | | | | |
| Total Asset-Backed Securities, Collateralized Obligations & Mortgage-Backed Securities |
| (Cost $15,332,449) | | | | | | 9,831,000 |
| | | | | | |
| 1-800-392-CORE (2673) ■ www.westcore.com | 97 |
Westcore Flexible Income Fund
as of June 30, 2008 (continued)
| | Shares | | Market Value |
| | | | |
| Money Market Mutual Funds 4.86% | | | | | |
| Goldman Sachs Financial Square Prime Obligations | | | | | |
| Fund - FST Shares (7 Day Yield 2.380%) | | 4,455,873 | | $ | 4,455,873 |
| Morgan Stanley Institutional Liquidity Funds Prime | | | | | |
| Portfolio (7 Day Yield 2.578%) | | 2,654,633 | | | 2,654,633 |
| | | | | |
| | | | | | |
| Total Money Market Mutual Funds | | | | | |
| (Cost $7,110,506) | | | | | 7,110,506 |
| | | | | |
| | | | | | |
| Total Investments | | | | | |
| (Cost $169,842,488) | | 99.66% | | 145,802,843 |
| | | | | | |
| Other Assets in Excess of Liabilities | | 0.34% | | | 496,264 |
| | | | | | |
| Net Assets | | 100.00% | | $ | 146,299,107 |
| | | | | |
| | | | | | |
| See Notes to Statements of Investments on page 120 and Notes to Financial Statements beginning on page 175. |
| | | | | | |
| | | | | | |
| Westcore Flexible Income Fund |
Country Breakdown as of June 30, 2008 |
| Country | Market Value | | | % |
| United States | $ | 140,556,517 | | | 96.07% |
| Cayman Islands | | 3,713,084 | | | 2.54% |
| Bermuda | | 1,533,242 | | | 1.05% |
| Total Investments | | 145,802,843 | | | 99.66% |
| Other Assets in Excess of Liabilities | | 496,264 | | | 0.34% |
| Net Assets | $ | 146,299,107 | | | 100.00% |
| | | | | |
| | | | | | |
| Please note the country classification is based on the domicile of the issuer. |
| | | | | | |
| All of the Fund’s investments are traded on U.S. exchanges. |
| 98 | Semi-Annual Report June 30, 2008 (Unaudited) | |
Westcore Plus Bond Fund as of June 30, 2008
| | | Shares | Market Value |
| | | | |
| Common Stocks 0.03% | | | | | |
| Industrial 0.03% | | | | | |
| Autos 0.03% | | | | | |
| Dana Holding Corp.** | | | 57,484 | $ | 307,539 |
| | | | | | |
| Total Industrial | | | | | |
| (Cost $1,403,828) | | | | | 307,539 |
| | | | | |
| Total Common Stocks | | | | | |
| (Cost $1,403,828) | | | | | 307,539 |
| | | | | | |
| | Bond Rating | | Principal | | |
| | Moody’s/S&P* | | Amount | Market Value |
| | | | | | |
| | | | | | |
| Convertible Preferred Stocks 0.09% | | | | | |
| Industrial 0.09% | | | | | |
| Autos 0.09% | | | | | |
| Ford Motor Co. Capital Trust II, 6.500%, 1/15/2032 | Caa2/CCC- | $ | 22,000 | $ | 608,300 |
| General Motors Corp., Series C, 6.250%, 7/15/2033 | Caa1/B | | 35,000 | | 464,100 |
| | | | | | 1,072,400 |
| | | | | | |
| Total Industrial | | | | | |
| (Cost $1,780,966) | | | | | 1,072,400 |
| | | | | | |
| Total Convertible Preferred Stocks | | | | | |
| (Cost $1,780,966) | | | | | 1,072,400 |
| | | | | |
| Nonconvertible Preferred Stocks 1.94% | | | | | |
| Financial 1.86% | | | | | |
| Financial Services 0.16% | | | | | |
| First Tennessee Bank, 6.103%(1)(2)(4) | Baa2/BBB | | 1,500 | | 1,098,750 |
| Goldman Sachs, 6.200% | A2/A | | 40,000 | | 859,200 |
| | | | | | 1,957,950 |
| Government Sponsored Entity 0.89% | | | | | |
| Federal Home Loan Mortgage Corp., 8.375% | Aa3/AA- | | 433,796 | | 10,541,242 |
| | | | | | |
| Real Estate Investment Trusts (REITs) 0.81% | | | | | |
| Apartments 0.11% | | | | | |
| Apartment Investment & Management Co.: | | | | | |
| Series T, 8.000% | Ba3/B+ | | 9,000 | | 209,250 |
| Series V, 8.000% | Ba3/B+ | | 34,000 | | 775,200 |
| Cousins Properties Inc., 7.500% | NR/NR | | 15,000 | | 326,700 |
| | | | | | 1,311,150 |
| 1-800-392-CORE (2673) ■ www.westcore.com | 99 |
Westcore Plus Bond Fund as of June 30, 2008 (continued)
| | Bond Rating | Principal | | |
| | Moody’s/S&P | Amount | | Market Value |
| | | | | |
| Healthcare 0.10% | | | | | | |
| Health Care REIT Inc., Series F, 7.625% | Baa3/BB+ | $ | 40,000 | | $ | 936,000 |
| Omega Healthcare Investors, Series D, 8.375% | B2/B+ | | 12,500 | | | 300,000 |
| | | | | | | 1,236,000 |
| | | | | | | |
| Manufactured Homes 0.03% | | | | | | |
| Hilltop Holdings Inc., 8.250% | NR/NR | | 19,500 | | | 370,500 |
| | | | | | | |
| Mortgage 0.12% | | | | | | |
| Anthracite Capital Inc., 8.250% | NR/NR | | 100,000 | | | 1,420,000 |
| | | | | | | |
| Shopping Centers 0.18% | | | | | | |
| Tanger Factory Outlet, Series C, 7.500% | Ba1/BB+ | | 36,000 | | | 816,120 |
| Taubman Centers Inc.: | | | | | | |
| Series G, 8.000% | B1/NR | | 20,000 | | | 468,000 |
| Series H, 7.625% | B1/NR | | 36,100 | | | 829,939 |
| | | | | | | 2,114,059 |
| | | | | | | |
| Warehouse-Industrial 0.27% | | | | | | |
| CenterPoint Properties Trust, 5.377%(2)(3) | WR/NR | | 3,900 | | | 2,730,000 |
| First Industrial Realty Trust Inc., 6.236%(2)(3) | Baa3/BBB- | | 675 | | | 506,250 |
| | | | | | | 3,236,250 |
| Total Financial | | | | | | |
| (Cost $26,111,428) | | | | | | 22,187,151 |
| | | | | | | |
| Utilities & Energy 0.08% | | | | | | |
| Utilities 0.08% | | | | | | |
| Southern California Edison, 5.349% | Baa2/BBB- | | 9,400 | | | 918,263 |
| | | | | | | |
| Total Utilities & Energy | | | | | | |
| (Cost $940,000) | | | | | | 918,263 |
| | | | | | |
| Total Nonconvertible Preferred Stocks | | | | | | |
| (Cost $27,051,428) | | | | | | 23,105,414 |
| | | | | | |
| Corporate Bonds 41.13% | | | | | | |
| Financial 10.39% | | | | | | |
| Financial Services 4.67% | | | | | | |
| Allied Capital, 6.340%, 10/13/2012(1)(2)(3) | NR/BBB+ | | 4,000,000 | | | 3,712,360 |
| BHP Billiton Finance, 5.000%, 12/15/2010 | A1/A+ | | 10,835,000 | | | 10,962,202 |
| Charles Schwab Corp., 8.050%, 3/1/2010 | A2/A | | 210,000 | | | 219,651 |
| Emigrant Capital Trust II, 4.574%, 4/14/2034(1)(2)(4) | NR/NR | | 850,000 | | | 850,601 |
| FIA Card Services NA, 6.625%, 6/15/2012 | Aa1/AA | | 2,700,000 | | | 2,832,962 |
| 100 | Semi-Annual Report June 30, 2008 (Unaudited) | |
Westcore Plus Bond Fund as of June 30, 2008 (continued)
| | Bond Rating | Principal | | |
| | Moody’s/S&P | Amount | | Market Value |
| | | | | |
| Fifth Third Bancorp, 4.500%, 6/1/2018 | A1/A | $ | 65,000 | | $ | 47,077 |
| First Empire Capital Trust, 8.277%, 6/1/2027 | A3/BBB | | 25,000 | | | 25,082 |
| FMR LLC, 7.490%, 6/15/2019(1) | A1/AA- | | 5,000,000 | | | 5,485,275 |
| General Electric Capital Corp., Series A, 5.875%, 1/15/2010 Aaa/AAA | | 2,250,000 | | | 2,336,981 |
| HSBC Holdings PLC, 6.500%, 5/2/2036 | Aa3/A+ | | 200,000 | | | 186,756 |
| Leucadia National Corp.: | | | | | | |
| 7.000%, 8/15/2013 | Ba2/BB+ | | 1,500,000 | | | 1,462,500 |
| 7.125%, 3/15/2017 | Ba2/BB+ | | 8,500,000 | | | 8,159,999 |
| 8.650%, 1/15/2027 | B1/B+ | | 635,000 | | | 631,825 |
| Manufacturers & Traders Trust Co., 4.198%, 4/1/2013(1) | A2/A- | | 526,000 | | | 504,466 |
| Marshall & Ilsley Bank, 2.900%, 8/18/2009 | Aa3/A+ | | 354,545 | | | 350,958 |
| Union Bank of California, 5.950%, 5/11/2016 | A1/A | | 3,000,000 | | | 2,853,894 |
| USAA Capital Corp., Series MTNB, 4.640%, 12/15/2009(1) | Aa1/AAA | | 1,500,000 | | | 1,505,364 |
| Wachovia Capital Trust III, 5.800%, 8/29/2049 | A2/A- | | 3,300,000 | | | 2,245,264 |
| Wells Fargo & Co., 5.625%, 12/11/2017 | Aa1/AA+ | | 11,500,000 | | | 11,162,832 |
| | | | | | | 55,536,049 |
| | | | | | | |
| Foreign Financials 0.21% | | | | | | |
| Swedish Export Credit (Sweden), | | | | | | |
| Series MTNC, 4.125%, 10/15/2008 | Aa1/AA+ | | 2,500,000 | | | 2,511,215 |
| | | | | | | |
| Insurance 0.58% | | | | | | |
| Berkshire Hathaway, 4.850%, 1/15/2015 | Aaa/AAA | | 1,000,000 | | | 987,720 |
| Fund American Companies Inc., 5.875%, 5/15/2013 | Baa2/BBB | | 4,375,000 | | | 4,238,452 |
| Prudential Financial, Series MTNB, 4.350%, 5/12/2015 | A3/A+ | | 1,472,952 | | | 1,471,077 |
| Zurich Reinsurance, 7.125%, 10/15/2023 | Baa3/BBB | | 200,000 | | | 188,611 |
| | | | | | | 6,885,860 |
| Savings & Loans 0.08% | | | | | | |
| Washington Mutual Bank, 5.550%, 6/16/2010 | Baa2/NR | | 1,000,000 | | | 925,418 |
| | | | | | | |
| Real Estate Investment Trusts (REITs) 4.85% | | | | | | |
| Apartments 0.42% | | | | | | |
| BRE Properties Inc., 7.450%, 1/15/2011 | Baa2/BBB | | 1,200,000 | | | 1,234,121 |
| Colonial Realty LP, 4.750%, 2/1/2010 | Baa3/BBB- | | 3,210,000 | | | 3,127,028 |
| United Dominion Realty Trust, | | | | | | |
| Series MTNE, 3.900%, 3/15/2010 | Baa2/BBB | | 625,000 | | | 601,551 |
| | | | | | | 4,962,700 |
| Diversified 0.73% | | | | | | |
| National Retail Properties Inc., 6.250%, 6/15/2014 | Baa2/BBB- | | 975,000 | | | 934,749 |
| Prime Property Funding, 5.600%, 6/15/2011(1) | A3/A | | 2,410,000 | | | 2,384,155 |
| Vornado Realty LP, 4.750%, 12/1/2010 | Baa2/BBB | | 2,101,000 | | | 1,983,976 |
| Washington REIT, 5.250%, 1/15/2014 | Baa1/BBB+ | | 3,850,000 | | | 3,445,866 |
| | | | | | | 8,748,746 |
| 1-800-392-CORE (2673) ■ www.westcore.com | 101 |
Westcore Plus Bond Fund as of June 30, 2008 (continued)
| | Bond Rating | Principal | | |
| | Moody’s/S&P | Amount | | Market Value |
| | | | | |
| Healthcare 0.45% | | | | | | |
| Healthcare Realty Trust Inc.: | | | | | | |
| 8.125%, 5/1/2011 | Baa3/BBB- | $ | 375,000 | | $ | 386,352 |
| 5.125%, 4/1/2014 | Baa3/BBB- | | 3,125,000 | | | 2,772,256 |
| Nationwide Health, 6.000%, 5/20/2015 | Baa3/BBB- | | 2,000,000 | | | 1,855,444 |
| Senior Housing Properties Trust, 8.625%, 1/15/2012 | Ba1/BB+ | | 325,000 | | | 339,625 |
| | | | | | | 5,353,677 |
| Hotels 0.23% | | | | | | |
| Host Marriott Corp., Series Q, 6.750%, 6/1/2016 | Ba1/BB | | 3,075,000 | | | 2,744,438 |
| | | | | | | |
| Office Property 0.03% | | | | | | |
| Boston Properties LP, 5.000%, 6/1/2015 | Baa2/A- | | 375,000 | | | 345,060 |
| | | | | | | |
| Regional Malls 1.01% | | | | | | |
| Rouse Co., 8.000%, 4/30/2009 | Ba2/BB- | | 775,000 | | | 769,596 |
| Simon Property Group: | | | | | | |
| 5.250%, 12/1/2016 | A3/A- | | 8,950,000 | | | 8,246,914 |
| 7.375%, 6/15/2018 | A3/A- | | 2,868,000 | | | 2,978,332 |
| | | | | | | 11,994,842 |
| Restaurants 0.07% | | | | | | |
| Trustreet Properties Inc., 7.500%, 4/1/2015 | Aaa/AAA | | 850,000 | | | 908,158 |
| | | | | | | |
| Shopping Centers 1.19% | | | | | | |
| Developers Diversified Realty, 5.375%, 10/15/2012 | Baa2/BBB | | 2,200,000 | | | 2,066,607 |
| Kimco Realty Corp.: | | | | | | |
| Series MTNC, 5.980%, 7/30/2012 | Baa1/A- | | 1,800,000 | | | 1,767,483 |
| 5.783%, 3/15/2016 | Baa1/A- | | 2,000,000 | | | 1,850,178 |
| Weingarten Realty Investors: | | | | | | |
| 7.000%, 7/15/2011 | Baa1/BBB+ | | 550,000 | | | 542,332 |
| 4.857%, 1/15/2014 | Baa1/BBB+ | | 2,015,000 | | | 1,826,473 |
| 6.640%, 7/15/2026 | Baa1/BBB+ | | 545,000 | | | 463,985 |
| Westfield Capital (Australia), 5.700%, 10/1/2016(1) | A2/A- | | 6,000,000 | | | 5,617,049 |
| | | | | | | 14,134,107 |
| Timber 0.18% | | | | | | |
| Plum Creek Timberland, 5.875%, 11/15/2015 | Baa3/BBB- | | 2,400,000 | | | 2,194,380 |
| | | | | | | |
| Warehouse-Industrial 0.54% | | | | | | |
| Prologis Trust: | | | | | | |
| 5.500%, 4/1/2012 | Baa1/BBB+ | | 4,375,000 | | | 4,277,381 |
| 7.810%, 2/1/2015 | Baa1/BBB+ | | 1,000,000 | | | 1,005,175 |
| 7.625%, 7/1/2017 | Baa1/BBB+ | | 1,100,000 | | | 1,136,790 |
| | | | | | | 6,419,346 |
| 102 | Semi-Annual Report June 30, 2008 (Unaudited) | |
Westcore Plus Bond Fund as of June 30, 2008 (continued)
| | Bond Rating | Principal | | |
| | Moody’s/S&P | Amount | | Market Value |
| | | | | |
| Total Financial | | | | | |
| (Cost $129,573,844) | | | | $ | 123,663,996 |
| | | | | | |
| Industrial 18.73% | | | | | |
| Airlines 0.15% | | | | | |
| Southwest Airlines Co. 2007-1 Pass Through Trust, | | | | | |
| Series 2007-1, 6.150%, 8/1/2022(3) | Aa3/AA- | $ | 1,916,221 | | 1,822,441 |
| | | | | | |
| Autos 2.92% | | | | | |
| American Honda Finance Corp., 5.125%, 12/15/2010(1) | Aa3/A+ | | 3,600,000 | | 3,711,859 |
| BMW US Capital Inc., 5.730%, 11/1/2015(1)(2)(3) | NR/NR | | 12,000,000 | | 11,888,880 |
| DaimlerChrysler CPI Notes, | | | | | |
| Structured Repackaged Asset-Backed Trust Securities, | | | | | |
| Series DCX, 5.937%, 11/15/2013(1)(2)(4) | NR/A- | | 3,465,000 | | 3,428,999 |
| DaimlerChrysler NA Holdings Corp., 6.500%, 11/15/2013 | A3/A- | | 3,075,000 | | 3,194,279 |
| Dana Corp., Escrow Units**(2)(3)(6) | NR/NR | | 1,600,000 | | – |
| Delphi Corp., 6.500%, 5/1/2009**(6) | WR/NR | | 1,000,000 | | 217,500 |
| Ford Capital BV (Netherlands), 9.500%, 6/1/2010 | Caa1/CCC+ | | 1,200,000 | | 984,000 |
| Ford Motor Co., 7.450%, 7/16/2031 | Caa1/CCC+ | | 2,775,000 | | 1,630,313 |
| Ford Motor Credit Co. LLC: | | | | | |
| 7.875%, 6/15/2010 | B1/B | | 2,000,000 | | 1,727,340 |
| 8.000%, 12/15/2016 | B1/B | | 3,250,000 | | 2,367,833 |
| General Motors Acceptance Corp., 6.750%, 12/1/2014 | B3/B | | 5,900,000 | | 3,905,552 |
| General Motors Corp., 8.250%, 7/15/2023 | Caa1/B | | 2,850,000 | | 1,674,375 |
| | | | | | 34,730,930 |
| | | | | | |
| Beverages 1.73% | | | | | |
| Diageo Finance BV (Netherlands), 5.300%, 10/28/2015 | A3/A- | | 9,700,000 | | 9,472,438 |
| The Coca-Cola Co., 5.350%, 11/15/2017 | Aa3/A+ | | 10,950,000 | | 11,073,888 |
| | | | | | 20,546,326 |
| Brewery 0.44% | | | | | |
| Anheuser-Busch Companies Inc.: | | | | | |
| 4.950%, 1/15/2014 | A2/A | | 175,000 | | 164,984 |
| 5.050%, 10/15/2016 | A2/A | | 450,000 | | 413,129 |
| 5.500%, 1/15/2018 | A2/A | | 4,900,000 | | 4,610,327 |
| | | | | | 5,188,440 |
| Cable & Media 1.04% | | | | | |
| AT&T Broadband Corp., 8.375%, 3/15/2013 | Baa2/BBB+ | | 2,975,000 | | 3,279,393 |
| Cox Communications Inc., 7.250%, 11/15/2015 | Baa3/BBB- | | 3,000,000 | | 3,197,793 |
| Cox Enterprises Inc., 7.875%, 9/15/2010(1) | Baa3/BB+ | | 3,000,000 | | 3,164,544 |
| Time Warner Inc., 9.150%, 2/1/2023 | Baa2/BBB+ | | 2,410,000 | | 2,774,787 |
| | | | | | 12,416,517 |
| | | | | | |
| 1-800-392-CORE (2673) ■ www.westcore.com | 103 |
Westcore Plus Bond Fund as of June 30, 2008 (continued)
| | Bond Rating | | Principal | | |
| | Moody’s/S&P | | Amount | | Market Value |
| | | | | | |
| Chemicals 0.24% | | | | | | | |
| Borden Inc., 7.875%, 2/15/2023 | Caa1/CCC+ | | $ | 775,000 | | $ | 445,625 |
| Dow Chemical Co.,6.125%, 2/1/2011 | A3/A- | | | 350,000 | | | 361,802 |
| Ferro Corp., 9.125%, 1/1/2009 | B1/B+ | | | 1,325,000 | | | 1,373,515 |
| PPG Industries Inc., 6.875%, 2/15/2012 | A3/A- | | | 688,000 | | | 741,997 |
| | | | | | | | 2,922,939 |
| | | | | | | | |
| Food 0.41% | | | | | | | |
| Tesco PLC (United Kingdom), 5.500%, 11/15/2017 | A1/A | | | 5,000,000 | | | 4,878,645 |
| | | | | | | | |
| Healthcare 1.00% | | | | | | | |
| Baxter FinCo BV (Netherlands), 4.750%, 10/15/2010 | A3/A+ | | | 1,175,000 | | | 1,189,193 |
| Eli Lilly & Co., 5.500%, 3/15/2027 | Aa3/AA | | | 10,000,000 | | | 9,611,040 |
| Eszopiclone Royalty Sub LLC, | | | | | | | |
| Series IV, 12.000%, 3/15/2014(1)(2)(3) | NR/NR | | | 1,055,799 | | | 1,076,915 |
| | | | | | | | 11,877,148 |
| | | | | | | | |
| Leisure 1.23% | | | | | | | |
| Fontainebleau Las Vegas Holdings LLC, 10.250%, 6/15/2015(1) | Caa1/CCC+ | | | 8,220,000 | | | 5,384,100 |
| Harrah’s Operating Co. Inc, 10.750%, 2/1/2016(1) | B3/B+ | | | 3,400,000 | | | 2,839,000 |
| MGM Mirage: | | | | | | | |
| 7.625%, 7/15/2013 | B1/B+ | | | 1,500,000 | | | 1,267,500 |
| 7.250%, 8/1/2017 | Ba2/BB | | | 4,050,000 | | | 3,513,375 |
| Station Casinos Inc., 6.875%, 3/1/2016 | Caa1/B- | | | 2,900,000 | | | 1,598,625 |
| | | | | | | | 14,602,600 |
| | | | | | | | |
| Other Industrial 4.15% | | | | | | | |
| Advanced Micro Devices Inc., 7.750%, 11/1/2012 | B2/B | | | 645,000 | | | 557,925 |
| Amerigas Partners, 7.250%, 5/20/2015 | B1/NR | | | 1,250,000 | | | 1,175,000 |
| Aramark Corp., 8.500%, 2/1/2015 | B3/B | | | 3,575,000 | | | 3,521,375 |
| BAE Systems Holdings Inc., 4.750%, 8/15/2010(1) | Baa2/BBB+ | | | 1,775,000 | | | 1,797,551 |
| Burlington Resources Inc., 6.875%, 2/15/2026 | A2/A | | | 1,000,000 | | | 1,098,299 |
| Costco Wholesale Corp., 5.500%, 3/15/2017 | A2/A | | | 2,800,000 | | | 2,851,086 |
| Federal Express Corp. | | | | | | | |
| 1994 Pass Through Trust, | | | | | | | |
| Series A2, 7.890%, 9/23/2008(3) | Baa1/NR | | | 76,496 | | | 76,496 |
| 1997 Pass Through Trust, | | | | | | | |
| Series 1997-A, 7.500%, 1/15/2018(5) | A3/A+ | | | 688,310 | | | 717,563 |
| Freeport-McMoRan Copper & Gold Inc., 8.375%, 4/1/2017 | Ba2/BBB- | | | 2,800,000 | | | 2,958,592 |
| General Electric Co., 5.250%, 12/6/2017 | Aaa/AAA | | | 5,000,000 | | | 4,822,480 |
| Kennametal Inc., 7.200%, 6/15/2012 | Baa3/BBB | | | 7,880,000 | | | 8,354,660 |
| Levi Strauss & Co., 9.750%, 1/15/2015 | B2/B+ | | | 500,000 | | | 505,000 |
| 104 | Semi-Annual Report June 30, 2008 (Unaudited) | |
Westcore Plus Bond Fund as of June 30, 2008 (continued)
| | Bond Rating | Principal | | |
| | Moody’s/S&P | Amount | | Market Value |
| | | | | |
| Science Applications: | | | | | | |
| 6.250%, 7/1/2012 | A3/A- | $ | 2,700,000 | | $ | 2,805,500 |
| 5.500%, 7/1/2033 | A3/A- | | 1,225,000 | | | 1,039,351 |
| Sweetwater Investors LLC, 5.875%, 5/15/2014(1)(2) | NR/BBB- | | 484,078 | | | 508,030 |
| Wal-Mart Stores, Inc.: | | | | | | |
| 4.250%, 4/15/2013 | Aa2/AA | | 3,850,000 | | | 3,834,196 |
| 5.800%, 2/15/2018 | Aa2/AA | | 6,900,000 | | | 7,167,906 |
| West Fraser Timber Co. Ltd. (Canada), 5.200%, 10/15/2014(1) | Baa3/BBB- | | 5,400,000 | | | 4,501,586 |
| WM Wrigley Jr Co., 4.650%, 7/15/2015 | A1/A+ | | 1,125,000 | | | 1,093,341 |
| | | | | | | 49,385,937 |
| Pharmaceuticals 2.60% | | | | | | |
| Abbott Laboratories, 5.150%, 11/30/2012 | A1/AA | | 10,125,000 | | | 10,436,101 |
| GlaxoSmithKline Capital Inc., 4.850%, 5/15/2013 | A1/A+ | | 10,375,000 | | | 10,376,587 |
| Medco Health Solutions, Inc., 6.125%, 3/15/2013 | Baa3/BBB | | 10,075,000 | | | 10,122,836 |
| | | | | | | 30,935,524 |
| | | | | | | |
| Retail-Drug Stores 0.17% | | | | | | |
| CVS/Caremark Corp., 5.750%, 6/1/2017 | Baa2/BBB+ | | 2,000,000 | | | 1,973,198 |
| | | | | | | |
| Telecom & Related 0.07% | | | | | | |
| American Tower Corp., 7.500%, 5/1/2012 | Ba1/BB+ | | 500,000 | | | 507,500 |
| Qwest Communications International Inc., | | | | | | |
| 6.176%, 2/15/2009(4) | Ba3/B+ | | 167,000 | | | 167,000 |
| Verizon Global, 4.375%, 6/1/2013 | A3/A | | 125,000 | | | 120,418 |
| | | | | | | 794,918 |
| Transportation 2.58% | | | | | | |
| Burlington Northern Santa Fe Corp., | | | | | | |
| 5.750%, 3/15/2018 | Baa1/BBB | | 11,000,000 | | | 10,786,974 |
| 4.575%, 1/15/2021 | Aa2/A | | 1,485,111 | | | 1,354,810 |
| CSX Corp., 6.250%, 10/15/2008 | Baa3/BBB- | | 17,000,000 | | | 17,094,299 |
| CSX Transportation Inc., 9.750%, 6/15/2020 | Baa3/BBB- | | 1,250,000 | | | 1,509,363 |
| | | | | | | 30,745,446 |
| Total Industrial | | | | | | |
| (Cost $233,385,109) | | | | | 222,821,009 |
| | | | | | | |
| Utilities & Energy 12.01% | | | | | | |
| Energy-Non Utility 7.59% | | | | | | |
| Ametek Inc., 7.200%, 7/15/2008 | Baa3/BBB | | 2,035,000 | | | 2,037,584 |
| Consumers Energy Co.: | | | | | | |
| Series B, 6.875%, 3/1/2018 | Baa1/BBB | | 1,564,000 | | | 1,664,368 |
| 5.650%, 4/15/2020 | Baa1/BBB | | 1,225,000 | | | 1,200,250 |
| ConocoPhillips, 8.750%, 5/25/2010 | A1/A | | 11,000,000 | | | 11,978,120 |
| | | | | | |
| 1-800-392-CORE (2673) ■ www.westcore.com | 105 |
Westcore Plus Bond Fund as of June 30, 2008 (continued)
| | Bond Rating | Principal | | |
| | Moody’s/S&P | Amount | | Market Value |
| | | | | |
| Duke Energy Carolinas LLC, 5.300%, 10/1/2015 | A2/A | $ | 10,150,000 | | $ | 10,246,963 |
| Forest Oil Corp., 7.250%, 6/15/2019 | B1/B+ | | 9,825,000 | | | 9,481,125 |
| Kerr-McGee Corp., 6.950%, 7/1/2024 | Baa3/BBB- | | 4,500,000 | | | 4,683,569 |
| Northern Border Partners LP: | | | | | | |
| Series A, 8.875%, 6/15/2010 | Baa2/BBB | | 1,000,000 | | | 1,072,315 |
| 7.100%, 3/15/2011 | Baa2/BBB | | 1,000,000 | | | 1,040,798 |
| Northern Natural Gas Co., 5.375%, 10/31/2012(1) | A2/A | | 350,000 | | | 354,344 |
| Southwestern Energy Co., 7.500%, 2/1/2018(1) | Ba2/BB+ | | 8,295,000 | | | 8,584,421 |
| Tennessee Gas Pipeline Co.: | | | | | | |
| 7.000%, 3/15/2027 | Baa3/BB | | 75,000 | | | 73,715 |
| 7.000%, 10/15/2028 | Baa3/BB | | 9,775,000 | | | 9,599,265 |
| Transcontinental Gas Pipe Line, 6.400%, 4/15/2016 | Baa2/BBB- | | 5,725,000 | | | 5,746,469 |
| Valero Energy Corp., 6.125%, 6/15/2017 | Baa3/BBB | | 3,175,000 | | | 3,075,705 |
| Weatherford International, Ltd. (Bermuda), | | | | | | |
| 5.150%, 3/15/2013 | Baa1/BBB+ | | 8,485,000 | | | 8,447,768 |
| Whiting Petroleum Corp., 7.000%, 2/1/2014 | B1/BB- | | 1,000,000 | | | 986,250 |
| XTO Energy Inc., 4.625%, 6/15/2013 | Baa2/BBB | | 10,300,000 | | | 9,972,192 |
| | | | | | | 90,245,221 |
| Utilities 4.42% | | | | | | |
| Centerpoint Energy Inc., Series B, 7.250%, 9/1/2010 | Ba1/BBB- | | 2,350,000 | | | 2,425,863 |
| Commonwealth Edison Co., Series 104, 5.950%, 8/15/2016 | Baa2/BBB | | 5,275,000 | | | 5,261,512 |
| FPL Group Capital Inc.: | | | | | | |
| 5.625%, 9/1/2011 | A2/A- | | 3,175,000 | | | 3,272,339 |
| 6.350%, 10/1/2066 | A3/BBB+ | | 3,900,000 | | | 3,411,818 |
| Georgia Power Co., Series 07-A, 5.650%, 3/1/2037(1) | A2/A | | 850,000 | | | 807,113 |
| Indianapolis Power & Light Co., 6.300%, 7/1/2013(1) | Baa1/BBB | | 400,000 | | | 412,929 |
| Midamerican Energy Holdings Co., 5.875%, 10/1/2012 | Baa1/BBB+ | | 200,000 | | | 205,984 |
| Nevada Power Co.: | | | | | | |
| Series M, 5.950%, 3/15/2016 | Baa3/BBB | | 9,287,000 | | | 9,268,073 |
| Series R, 6.750%, 7/1/2037 | Baa3/BBB | | 2,850,000 | | | 2,805,352 |
| Oncor Electric Delivery Co., 7.000%, 9/1/2022 | WR/BBB- | | 10,577,000 | | | 10,352,090 |
| Pacific Gas & Electric, 4.800%, 3/1/2014 | A3/BBB+ | | 700,000 | | | 683,393 |
| Pacificorp, 6.900%, 11/15/2011 | A3/A- | | 2,107,000 | | | 2,246,254 |
| Portland General Electric, 7.875%, 3/15/2010 | Baa2/BBB | | 200,000 | | | 209,911 |
| Power Contract Financing LLC, 6.256%, 2/1/2010(1) | Baa2/BBB | | 134,706 | | | 136,320 |
| Power Receivables Finance LLC, 6.290%, 1/1/2012(1) | Baa2/BBB | | 56,174 | | | 57,514 |
| Public Service Co. of Oklahoma, 6.150%, 8/1/2016 | Baa1/BBB | | 3,075,000 | | | 3,057,648 |
| San Diego Gas & Electric Co., 6.000%, 6/1/2026 | A1/A+ | | 3,550,000 | | | 3,545,523 |
| Tenaska Alabama II Partners LP, 6.125%, 3/30/2023(1) | Baa3/BBB- | | 260,610 | | | 265,372 |
| Tenaska Virginia Partners LP, 6.119%, 3/30/2024(1) | Baa3/BBB- | | 227,894 | | | 229,255 |
| Westar Energy Inc., 5.100%, 7/15/2020 | Baa2/BBB | | 3,265,000 | | | 2,966,324 |
| WPD Holdings, 7.250%, 12/15/2017(1) | Baa3/BBB- | | 875,000 | | | 977,138 |
| | | | | | | 52,597,725 |
| | | | | | | |
| 106 | Semi-Annual Report June 30, 2008 (Unaudited) | |
Westcore Plus Bond Fund as of June 30, 2008 (continued)
| | Bond Rating | Principal | | |
| | Moody’s/S&P | Amount | | Market Value |
| | | | | |
| Total Utilities & Energy |
| (Cost $145,653,299) | | | | $ | 142,842,946 |
| | | | | | |
| Total Corporate Bonds |
| (Cost $508,612,252) | | | | | 489,327,951 |
| | | | | | |
| Asset-Backed Securities, Collateralized Obligations & Mortgage-Backed Securities 32.91% |
| Asset Backed Securities 6.11% |
| AmeriCredit Automobile Receivables Trust, | | | | | |
| Series 2007-BF, Class A3A, 5.160%, 4/6/2012 | Aaa/AAA | 4,000,000 | | | 3,998,620 |
| Banc of America Funding Corp.: | | | | | |
| Series 2005-4, Class 1A4, 5.500%, 8/1/2035 | Aa1/AAA | 500,000 | | | 439,354 |
| Series 2005-4, Class 2A4, 5.500%, 8/1/2035 | Aa1/AAA | 1,000,000 | | | 878,234 |
| Bank of America Alternative Loan Trust, | | | | | |
| Series 2005-4, Class CB9, 5.500%, 4/25/2020(5) | Aa1/NR | 833,000 | | | 694,489 |
| Bear Stearns Co., | | | | | |
| Series 2003-7, Class 4A, 4.908%, 10/25/2033(4) | Aaa/AAA | 229,768 | | | 210,328 |
| Carmax Auto Owner Trust, | | | | | |
| Series 2005-3, Class A4, 4.910%, 1/18/2011 | Aaa/AAA | 1,100,000 | | | 1,113,169 |
| Chase Mortgage Finance Corp., | | | | | |
| Series 2007-S2, Class 2A1, 5.500%, 3/25/2037 | Aaa/AAA | 13,879,356 | | | 13,411,898 |
| CenterPoint Energy Transition Bond Co. LLC, | | | | | |
| Series 2008-A, Class A1, 4.192%, 2/1/2020 | Aaa/AAA | 5,425,000 | | | 5,281,758 |
| Citibank Credit Card Issuance Trust, | | | | | |
| Series 2005-B1, Class B1, 4.400%, 9/15/2010 | A2/A | 2,500,000 | | | 2,506,560 |
| Community Reinvestment Revenue Notes, | | | | | |
| Series 2006-18, Class A2, 5.730%, 6/1/2031(1)(2) | NR/AAA | 1,049,034 | | | 1,062,014 |
| Countrywide Home Loan Mortgage Pass Through Trust, | | | | | |
| Series 2004-2, Class 3A1, 5.480%, 11/25/2014(5) | Aaa/AAA | 299,484 | | | 285,398 |
| Detroit Edison Securitization Funding LLC, | | | | | |
| Series 2001-1, Class A4, 6.190%, 3/1/2011(5) | Aaa/AAA | 400,000 | | | 413,534 |
| Diversified REIT Trust, | | | | | |
| Series 1999-1A, Class D, 6.780%, 3/18/2011(3) | Baa3/NR | 300,000 | | | 301,125 |
| Ford Credit Auto, | | | | | |
| Series 2005-C, Class B, 4.520%, 9/15/2010 | Aaa/AAA | 3,000,000 | | | 3,026,220 |
| Harley-Davidson Motorcycle Trust, | | | | | |
| Series 2007-1, Class B, 5.370%, 1/15/2011(5) | A1/A | 1,000,000 | | | 957,695 |
| Series 2007-1, Class C, 5.540%, 4/15/2015 | Baa2/BBB | 1,500,000 | | | 1,247,279 |
| Honda Auto Receivables Owner Trust, | | | | | |
| Series 2007-2, Class A3, 5.460%, 5/23/2011 | Aaa/NR | 12,000,000 | | | 12,237,072 |
| John Deere Owner Trust, | | | | | |
| Series 2008-A, Class A3, 4.400%, 4/15/2011 | Aaa/AAA | 10,150,000 | | | 10,148,265 |
| 1-800-392-CORE (2673) ■ www.westcore.com | 107 |
Westcore Plus Bond Fund as of June 30, 2008 (continued)
| | Bond Rating | Principal | | |
| | Moody’s/S&P | Amount | | Market Value |
| | | | |
| | | |
| Marriott Vacation Club Owner Trust, | | | | | | |
| Series 2006-2A, Class A, 5.362%, 4/20/2014(1)(5) | Aaa/AAA | $ | 499,788 | | $ | 481,437 |
| Provident Funding Mortgage Loan Trust, | | | | | | |
| Series 2004-1, Class 1A1, 4.038%, 4/25/2034 | Aaa/AAA | | 225,654 | | | 224,807 |
| Vanderbilt Mortgage and Finance Inc., | | | | | | |
| Series 1997-B, Class 2B3, 3.598%, 7/7/2013 | Baa1/NR | | 4,799,461 | | | 4,418,753 |
| Series 2002-B, Class B1, 5.850%, 4/7/2018 | Baa2/BBB | | 396,263 | | | 383,154 |
| Series 1997-C, Class 2B3, 3.598%, 8/7/2027 | Baa1/NR | | 3,826,000 | | | 3,492,587 |
| Washington Mutual, | | | | | | |
| Series 2003-AR3, Class B1, 5.549%, 4/25/2033 | Aaa/AAA | | 56,788 | | | 55,749 |
| Wells Fargo Mortgage Backed Securities Trust: | | | | | | |
| Series 2003-M, Class A1, 4.710%, 12/25/2033 | NR/AAA | | 871,329 | | | 824,214 |
| Series 2004-O, Class A1, 4.897%, 8/25/2034 | Aaa/AAA | | 4,500,147 | | | 4,261,409 |
| Series 2004-E, Class A1, 4.870%, 11/25/2039 | Aaa/AAA | | 317,466 | | | 300,828 |
| | | | | | | 72,655,950 |
| | | | | | | |
| Collateralized Debt Obligations 0.38% | | | | | | |
| Anthracite CDO Ltd. (Cayman Islands), | | | | | | |
| Series 2004-1A, Class G, 5.431%, 2/24/2014(1)(2)(3)(4)(5) | NR/BBB- | | 500,000 | | | 85,000 |
| Crest Ltd. Series 2003-1A (Cayman Islands), | | | | | | |
| Class PS, 8.500%, 8/28/2012(1)(2)(5)(7) | NR/BB- | | 800,000 | | | 330,144 |
| Crest Ltd. Series 2003-2A (Cayman Islands), | | | | | | |
| Class PS, 6.000%, 12/28/2013(1)(2)(5)(7) | NR/NR | | 620,174 | | | 207,702 |
| Crest Ltd. Series 2004-1A (Cayman Islands): | | | | | | |
| Class H2, 7.334%, 10/28/2014(1)(2)(5) | Ba2/BB | | 750,000 | | | 366,278 |
| Fairfield Street Solar, Class F, 7.514%, 12/28/2014(1)(2)(4)(5) | NR/BB- | | 1,000,000 | | | 423,440 |
| I-Preferred Term Securities I Ltd. (Cayman Islands), | | | | | | |
| Subordinate Income Notes, 0.000%, 12/4/2012(1)(2)(5)(7) | NR/NR | | 150,000 | | | 50,418 |
| N-Star Real Estate CDO Ltd. (Cayman Islands), | | | | | | |
| Series 2004-2A, Class C2B, 6.591%, 6/28/2014(1)(2)(3)(5) | NR/BBB+ | | 600,000 | | | 396,540 |
| Preferred Term Securities VI Ltd. (Cayman Islands), | | | | | | |
| Subordinate Income Notes, 3.000%, 7/3/2012(1)(2)(5)(7) | NR/NR | | 250,000 | | | 92,798 |
| Preferred Term Securities X Ltd. (Cayman Islands), | | | | | | |
| Subordinate Income Notes, 19.000%, 7/3/2013(1)(2)(5)(7) | NR/NR | | 350,000 | | | 219,762 |
| Preferred Term Securities XI B-3 Ltd. (Cayman Islands), | | | | | | |
| Subordinate Income Notes, 5.300%, 9/24/2008(1)(2)(3)(4)(5) | A2/NR | | 500,000 | | | 426,374 |
| Preferred Term Securities XI Ltd. (Cayman Islands), | | | | | | |
| Subordinate Income Notes, 19.000%, 10/3/2013(1)(2)(5)(7) | NR/NR | | 350,000 | | | 212,072 |
| Preferred Term Securities XII Ltd. (Cayman Islands), | | | | | | |
| Subordinate Income Notes, 0.000%, 12/24/2013(1)(2)(5)(7) | NR/NR | | 500,000 | | | 265,075 |
| Preferred Term Securities XIII Ltd. (Cayman Islands), | | | | | | |
| Subordinate Income Notes, 0.000%, 3/24/2014(1)(2)(5)(7) | NR/NR | | 500,000 | | | 264,575 |
| 108 | Semi-Annual Report June 30, 2008 (Unaudited) | |
Westcore Plus Bond Fund as of June 30, 2008 (continued)
| | Bond Rating | Principal | | |
| | Moody’s/S&P | Amount | | Market Value |
| | | | | |
| Preferred Term Securities XIV Ltd. (Cayman Islands), | | | | | | |
| Subordinate Income Notes, 0.000%, 6/17/2014(1)(2)(5)(7) | NR/NR | $ | 500,000 | | $ | 263,615 |
| Regional Diversified Funding (Cayman Islands): | | | | | | |
| Series 2004-1, 0.000%, 2/15/2014(1)(2)(5)(7) | NR/NR | | 500,000 | | | 40,000 |
| Series 2005-1, 0.000%, 3/15/2015**(1)(2)(5)(7) | NR/NR | | 750,000 | | | 112,500 |
| River North CDO Ltd. (Cayman Islands), | | | | | | |
| Series 2005-1A, Class SUB, 0.000%, 2/6/2014**(1)(2)(3)(5)(7) | Ca/NR | | 800,000 | | | 8,000 |
| Soloso Bank Pref (Cayman Islands), | | | | | | |
| 15.000%, 10/15/2015(1)(2)(3)(5)(7) | NR/NR | | 750,000 | | | 300,000 |
| TIAA Real Estate CDO Ltd. (Cayman Islands), | | | | | | |
| Series 2003-1A, Class PS, 16.000%, 9/30/2013(1)(2)(5)(7) | NR/NR | | 250,000 | | | 133,840 |
| Tricadia (Cayman Islands): | | | | | | |
| Series 2003-1, Class PS, 17.575%, 12/15/2013(1)(2)(3)(5)(7) | NR/NR | | 250,000 | | | 75,000 |
| Series 2004-2A, Class C, 8.245%, 12/15/2019(1)(2)(3)(4)(5) | Baa1/BBB+ | | 479,808 | | | 199,120 |
| | | | | | | 4,472,253 |
| | | | | | | |
| Collateralized Mortgage Obligations 0.10% |
| Banc of America Mortgage Securities Inc.: | | | | | | |
| Series 2005-2, Class 1A12, 5.500%, 3/25/2035 | NR/AAA | | 328,624 | | | 293,482 |
| Series 2005-8, Class A14, 5.500%, 9/25/2035 | Aa1/AAA | | 1,000,000 | | | 886,775 |
| | | | | | | 1,180,257 |
| | | | | | | |
| Commercial Mortgage-Backed Securities 1.53% |
| Crown Castle Towers LLC, | | | | | | |
| Series 2005-1A, Class C, 5.074%, 6/15/2010(3)(5) | A2/NR | | 8,500,000 | | | 8,175,980 |
| Global Signal Trust: | | | | | | |
| Series 2004-2A, Class G, 7.113%, 12/15/2014(1)(3)(5) | Ba2/NR | | 1,225,000 | | | 1,161,067 |
| Series 2006-1, Class E, 6.495%, 2/15/2036(1)(3)(5) | Baa3/NR | | 1,000,000 | | | 929,300 |
| SBA CMBS Trust: | | | | | | |
| Series 2006-1A, Class C, 5.559%, 11/15/2036(1)(3) | A2/NR | | 3,300,000 | | | 3,099,954 |
| Series 2006-1A, Class A, 5.314%, 11/15/2036(1) | Aaa/NR | | 4,570,000 | | | 4,453,557 |
| Times Square Hotel Trust, 8.528%, 8/1/2026(1)(2)(3) | Baa3/BB+ | | 379,113 | | | 433,595 |
| | | | | | | 18,253,453 |
| | | | | | | |
| Agency Mortgage-Backed Securities 24.79% |
| FHLMC: | | | | | | |
| Gold Pool #G00336, 6.000%, 10/1/2024 | | | 195,424 | | | 199,237 |
| Pool #781804, 5.062%, 7/1/2034 | | | 2,783,811 | | | 2,779,039 |
| Pool #781811, 5.120%, 7/1/2034 | | | 1,295,876 | | | 1,295,760 |
| Pool #781958, 5.075%, 9/1/2034 | | | 3,536,702 | | | 3,531,284 |
| Gold Pool #G08061, 5.500%, 6/1/2035 | | | 1,589,759 | | | 1,570,881 |
| Gold Pool #G01960, 5.000%, 12/1/2035 | | | 7,444,252 | | | 7,159,420 |
| Gold Pool #A41748, 5.000%, 1/1/2036 | | | 9,622,941 | | | 9,254,748 |
| 1-800-392-CORE (2673) ■ www.westcore.com | 109 |
Westcore Plus Bond Fund as of June 30, 2008 (continued)
| | Principal | | |
| | Amount | | Market Value |
| | | | |
| Gold Pool #A42128, 5.500%, 1/1/2036 | | $14,460,869 | | | $14,289,146 |
| Gold Pool #G02064, 5.000%, 2/1/2036 | | 12,395,516 | | | 11,921,239 |
| Gold Pool #G02386, 6.000%, 11/1/2036 | | 28,344,839 | | | 28,676,445 |
| Pool #1G1317, 5.992%, 11/1/2036 | | 19,221,269 | | | 19,527,483 |
| Gold Pool #G03189, 6.500%, 9/1/2037 | | 42,800,354 | | | 44,170,479 |
| FNMA: | | | | | |
| Pool #356801, 6.000%, 12/1/2008 | | 853 | | | 855 |
| Pool #703703, 5.025%, 1/1/2033(4) | | 100,662 | | | 101,411 |
| Pool #555717, 4.341%, 8/1/2033(4) | | 306,450 | | | 308,986 |
| Pool #779610, 4.000%, 6/1/2034(4) | | 424,067 | | | 429,869 |
| Pool #725705, 5.000%, 8/1/2034 | | 3,095,818 | | | 2,987,941 |
| Pool #809893, 5.062%, 3/1/2035(4) | | 1,741,834 | | | 1,764,049 |
| Pool #809894, 4.938%, 3/1/2035(4) | | 2,111,157 | | | 2,126,475 |
| Pool #255706, 5.500%, 5/1/2035 | | 17,501,127 | | | 17,306,637 |
| Pool #836496, 5.000%, 10/1/2035 | | 15,053,513 | | | 14,482,247 |
| Pool #735897, 5.500%, 10/1/2035 | | 9,146,758 | | | 9,045,110 |
| Pool #850582, 5.500%, 1/1/2036 | | 5,470,023 | | | 5,409,235 |
| Pool #845471, 5.000%, 5/1/2036 | | 1,528,221 | | | 1,436,080 |
| Pool #190377, 5.000%, 11/1/2036 | | 19,093,932 | | | 18,369,337 |
| Pool #907772, 6.000%, 12/1/2036 | | 11,439,271 | | | 11,467,789 |
| Pool #888405, 5.000%, 12/1/2036 | | 4,706,390 | | | 4,527,787 |
| Pool #256526, 6.000%, 12/1/2036 | | 32,532,253 | | | 32,613,356 |
| Pool #910881, 5.000%, 2/1/2037 | | 13,912,906 | | | 13,074,056 |
| GNMA: | | | | | |
| Pool #780019, 9.500%, 12/15/2009 | | 17,515 | | | 17,829 |
| Pool #550656, 5.000%, 9/15/2035 | | 2,316,341 | | | 2,251,488 |
| Pool #658568, 5.000%, 8/15/2036 | | 318,107 | | | 308,898 |
| Pool #658056, 5.000%, 8/15/2036 | | 3,847,639 | | | 3,736,258 |
| Pool #609003, 5.000%, 8/15/2036 | | 9,063,046 | | | 8,800,689 |
| | | | | 294,941,543 |
| | | | |
| Total Asset-Backed Securities, Collateralized Obligations & Mortgage-Backed Securities |
| (Cost $398,876,564) | | | | 391,503,456 |
| | | | |
| U.S. Government & Agency Obligations 18.09% |
| FHLB: | | | | | |
| Series P713, 5.125%, 11/18/2013 | | 75,000 | | | 75,527 |
| Structured Repackaged Asset-Backed Trust Securities, | | | | | |
| Series FHLB, 5.905%, 8/15/2019(1)(2)(4) | | 2,150,000 | | | 1,921,907 |
| FNMA: | | | | | |
| 5.121%, 2/17/2009(4) | | 2,000,000 | | | 2,024,320 |
| 8.200%, 3/10/2016 | | 55,000 | | | 67,777 |
| U.S. Treasury Bond, 6.000%, 2/15/2026 | | 25,100,000 | | | 29,445,463 |
| U.S. Treasury Note, 4.250%, 1/15/2011 | 175,000,000 | | 181,726,649 |
| | | |
| 110 | Semi-Annual Report June 30, 2008 (Unaudited) | |
Westcore Plus Bond Fund as of June 30, 2008 (continued)
| | | |
| | | |
| | | Shares | Market Value |
| Total U.S. Government & Agency Obligations | | | |
| (Cost $207,950,725) | | | $ 215,261,643 |
| | | |
| | | | |
| Money Market Mutual Funds 5.03% | | | |
| Goldman Sachs Financial Square Prime | | | |
| Obligations Fund - FST Shares (7 Day Yield 2.380%) | 54,342,460 | 54,342,460 |
| Morgan Stanley Institutional Liquidity Funds Prime | | | |
| Portfolio (7 Day Yield 2.578%) | 5,550,897 | 5,550,897 |
| | | | |
| Total Money Market Mutual Funds | | | |
| (Cost $59,893,357) | | | 59,893,357 |
| | | |
| | | | |
| Total Investments | | | |
| (Cost $1,205,569,121) | 99.22% | 1,180,471,760 |
| | | | |
| Other Assets in Excess of Liabilities | 0.78% | 9,232,338 |
| | | |
| | | | |
| Net Assets | 100.00% | $ 1,189,704,098 |
| | |
| | | | |
| See Notes to Statements of Investments on page 120 and Notes to Financial Statements beginning on page 175. |
| | | | |
| Westcore Plus Bond Fund |
| Country Breakdown as of June 30, 2008 |
| Country | Market Value | % |
| United States | $ | 1,138,397,613 | 95.68% |
| Netherlands | | 11,645,631 | 0.98% |
| Bermuda | | 8,447,768 | 0.71% |
| Australia | | 5,617,049 | 0.47% |
| United Kingdom | | 4,878,645 | 0.41% |
| Canada | | 4,501,586 | 0.38% |
| Cayman Islands | | 4,472,253 | 0.38% |
| Sweden | | 2,511,215 | 0.21% |
| Total Investments | | 1,180,471,760 | 99.22% |
| Other Assets in Excess of Liabilities | | 9,232,338 | 0.78% |
| Net Assets | $ | 1,189,704,098 | 100.00% |
| | | |
| | | | |
| Please note the country classification is based on the domicile of the issuer. | |
| 1-800-392-CORE (2673) ■ www.westcore.com | 111 |
Westcore Colorado Tax-Exempt Fund as of June 30, 2008
| | Bond Rating | Principal | | |
| | Moody’s/S&P | Amount | | Market Value |
| | | | | |
| Certificates of Participation 5.81% | | | | | | |
| Adams 12 Five Star Schools, Certificates of Participation, | | | | | | |
| 4.500%, 12/1/2027, Optional 12/1/2018 @ 100.00 | A1/A+ | $ | 600,000 | | $ | 557,202 |
| Colorado State Certificate of Participation University of | | | | | | |
| Colorado at Denver Health Sciences Center Fitzsimons | | | | | | |
| Academic, 5.000%, 11/1/2018, Optional 11/1/2015, MBIA | A2/AA | | 700,000 | | | 732,270 |
| El Paso County, Certificates of Participation, | | | | | | |
| 5.375%, 12/1/2019 | Aa3/AA | | 500,000 | | | 515,090 |
| Larimer County, Certificate of Participation, Courthouse | | | | | | |
| & Jail Facilities Lease Purchase Agreement, | | | | | | |
| 4.750%, 12/15/2009, Optional anytime @ 100.00, FSA | Aaa/AAA | | 500,000 | | | 504,295 |
| Regional Transportation District, | | | | | | |
| 5.000%, 12/1/2022, 12/1/2017 @ 100.00, | Aa3/AAA | | 1,000,000 | | | 1,027,930 |
| University of Colorado Certificates of Participation, | | | | | | |
| 5.000%, 6/1/2023, Optional 6/1/2013 @ 100.00, AMBAC | Aa3/AA | | 150,000 | | | 160,208 |
| | | | | | | |
| | | | | | | |
| Total Certificates of Participation | | | | | | |
| (Cost $3,527,915) | | | | | | 3,496,995 |
| | | | | | |
| | | | | | | |
| General Obligation Bonds 33.34% | | | | | | |
| County-City-Special District-School District 33.34% | | | | | | |
| Adams & Arapahoe Counties Joint School District 28J, | | | | | | |
| 5.350%, 12/1/2015, Escrowed to Maturity | Aa3/AA- | | 260,000 | | | 289,180 |
| Adams & Weld Counties School District 27J, | | | | | | |
| 4.750%, 12/1/2017, | | | | | | |
| Prerefunded 12/1/2014 @ 100.00, FGIC | Aa3/AA- | | 500,000 | | | 522,445 |
| Adams 12 Five Star Schools, | | | | | | |
| zero coupon, 12/15/2024, | | | | | | |
| Optional 12/15/2016 @ 67.784, FGIC | Aa3/AA- | | 2,385,000 | | | 1,010,358 |
| Adams County School District 12, Series A: | | | | | | |
| 5.000%, 12/15/2020, Prerefunded | | | | | | |
| 12/15/2011 @ 100.00, MBIA | Aa3/AAA | | 500,000 | | | 529,335 |
| 5.000%, 12/15/2021, Prerefunded | | | | | | |
| 12/15/2011 @ 100.00, MBIA | Aaa/NR | | 200,000 | | | 217,184 |
| Basalt Colorado Sanitation District, | | | | | | |
| 5.000%, 12/1/2018, | | | | | | |
| Optional 12/1/2011 @ 100.00, AMBAC | Aa3/NR | | 125,000 | | | 130,525 |
| Boulder & Gilpin Counties, Boulder Valley School District Re-2, | | | | | | |
| 5.125%, 12/1/2017, Optional 12/1/2009 @ 100.00 | Aa3/AA | | 300,000 | | | 305,319 |
| Boulder County Open Space Open Space Capital | | | | | | |
| Improvement Tr Fd, | | | | | | |
| 5.400%, 8/15/2015, Prerefunded 8/15/2010 @ 100.00 | Aa1/AA+ | | 500,000 | | | 527,790 |
| 112 | Semi-Annual Report June 30, 2008 (Unaudited) | |
Westcore Colorado Tax-Exempt Fund as of June 30, 2008 (continued)
| | Bond Rating | Principal | | |
| | Moody’s/S&P | Amount | | Market Value |
| | | | | |
| City & County of Denver Board Water Commissioners, | | | | | | |
| 5.500%, 10/1/2011 | Aa1/AA+ | $ | 250,000 | | $ | 268,053 |
| City & County of Denver Justice System, | | | | | | |
| 5.000%, 8/1/2025, Optional 8/1/2018 @ 100.00 | Aa1/AA+ | | 750,000 | | | 779,475 |
| City & County of Denver, School District No. 1, Series A: | | | | | | |
| 5.000%, 12/1/2017, Optional 12/1/2014 @ 100.00, FGIC | Aa3/AA- | | 500,000 | | | 528,010 |
| 5.500%, 12/1/2022, FGIC | Aa3/AA- | | 500,000 | | | 551,460 |
| Clear Creek County School District Re-1, | | | | | | |
| 4.300%, 12/1/2013, Optional 12/1/2012 @ 100.00, FSA | Aaa/AAA | | 125,000 | | | 129,206 |
| Denver West Metropolitan District: | | | | | | |
| 4.050%, 12/1/2013 | NR/NR | | 500,000 | | | 498,065 |
| 4.250%, 12/1/2016, Optional 12/1/2015 @ 100.00 | NR/NR | | 140,000 | | | 130,483 |
| Douglas & Elbert Counties School District Re-1: | | | | | | |
| 5.250%, 12/15/2016, | | | | | | |
| Prerefunded 12/15/2011 @ 100.00, MBIA | Aa2/AA | | 500,000 | | | 535,075 |
| 5.250%, 12/15/2017, | | | | | | |
| Prerefunded 12/15/2011 @ 100.00, MBIA | Aa2/AA | | 1,000,000 | | | 1,070,149 |
| Eagle Bend, Metropolitan District 2, | | | | | | |
| 4.500%, 12/1/2025, | | | | | | |
| Optional 12/1/2015 @ 100.00, RADIAN | NR/A | | 400,000 | | | 357,956 |
| Eagle, Garfield & Routt Counties School District Re-50J: | | | | | | |
| 5.250%, 12/1/2015, Optional, Unrefunded portion, | | | | | | |
| 12/1/2009 @ 101.00, FGIC | Aa3/AA- | | 290,000 | | | 300,086 |
| 5.250%, 12/1/2015, | | | | | | |
| Prerefunded 12/1/2009 @ 101.00, FGIC | Aa3/AA- | | 710,000 | | | 745,372 |
| El Paso County School District 2: | | | | | | |
| 5.250%, 12/1/2012, Optional 12/1/2010 @ 100.00, MBIA | Aa3/AA | | 250,000 | | | 262,090 |
| 5.000%, 12/1/2023, Optional 12/1/2012 @ 100.00, MBIA | Aa3/NR | | 250,000 | | | 256,248 |
| El Paso County School District 12, | | | | | | |
| 5.000%, 9/15/2013, Optional 9/15/2012 @ 100.00 | Aa1/NR | | 1,000,000 | | | 1,059,670 |
| Evergreen Park & Recreation District, | | | | | | |
| 5.250%, 12/1/2017, | | | | | | |
| Prerefunded 12/1/2010 @ 100.00, AMBAC | Aa3/NR | | 115,000 | | | 121,660 |
| Fraser Valley, Metropolitan Recreation District, | | | | | | |
| 5.000%, 12/1/2025, Optional 12/1/2017 @ 100.00 | NR/A | | 500,000 | | | 500,350 |
| Garfield County, Garfield School District Re-2 , | | | | | | |
| 5.000%, 12/1/2027, Optional 12/1/2016 @ 100.00, FSA | Aaa/NR | | 250,000 | | | 257,075 |
| Garfield, Pitkin & Eagle Counties Roaring | | | | | | |
| Fork School District Re-1, | | | | | | |
| 5.000%, 12/15/2020, Optional 12/15/2014 @ 100.00, FSA | Aaa/AAA | | 500,000 | | | 523,535 |
| Jefferson County School District R-1: | | | | | | |
| 5.250%, 12/15/2011, | | | | | | |
| Prerefunded 12/15/2008 @ 101.00, FGIC | Aa3/AA- | | 750,000 | | | 769,148 |
| 1-800-392-CORE (2673) ■ www.westcore.com | 113 |
Westcore Colorado Tax-Exempt Fund
as of June 30, 2008 (continued)
| | Bond Rating | Principal | | |
| | Moody’s/S&P | Amount | | Market Value |
| | | | | |
| 5.000%, 12/15/2018, | | | | | | |
| Optional 12/15/2014 @ 100.00, FSA | Aaa/AAA | $ | 800,000 | | $ | 842,280 |
| 5.000%, 12/15/2024, | | | | | | |
| Optional 12/15/2014 @ 100.00, FSA | Aaa/AAA | | 1,000,000 | | | 1,029,390 |
| La Plata County School District 9-R Durango, | | | | | | |
| 5.250%, 11/1/2020, | | | | | | |
| Prerefunded 11/1/2012 @ 100.00, MBIA | Aa3/NR | | 125,000 | | | 134,750 |
| Larimer County, Poudre School District R-1: | | | | | | |
| 5.500%, 12/15/2008 | Aa3/AAA | | 500,000 | | | 508,135 |
| 5.000%, 12/15/2016, | | | | | | |
| Optional 12/15/2008 @ 100.00, FSA | NR/AAA | | 700,000 | | | 704,809 |
| 6.000%, 12/15/2017, | | | | | | |
| Prerefunded 12/15/2010 @ 100.00, FGIC | Aa3/NR | | 1,000,000 | | | 1,076,479 |
| Lincoln Park, Metropolitan District, | | | | | | |
| 5.625%, 12/1/2020, Optional 12/1/2017 @ 100.00 | NR/BBB- | | 250,000 | | | 254,095 |
| Mesa County Valley School District 51 Grand Junction: | | | | | | |
| 5.000%, 12/1/2021, | | | | | | |
| Optional 12/1/2014 @ 100.00, MBIA | Aa3/NR | | 500,000 | | | 517,995 |
| 5.000%, 12/1/2022, | | | | | | |
| Optional 12/1/2013 @ 100.00, MBIA | Aa3/NR | | 300,000 | | | 312,159 |
| 5.000%, 12/1/2024, | | | | | | |
| Optional 12/1/2014 @ 100.00, MBIA | Aa3/NR | | 565,000 | | | 580,244 |
| Pitkin County Open Space Acquisition, | | | | | | |
| 5.250%, 12/1/2018, | | | | | | |
| Prerefunded 12/1/2010 @ 100.00, AMBAC | Aa2/NR | | 340,000 | | | 359,689 |
| Pitkin County School District No. 001, Aspen | | | | | | |
| 5.000%, 12/1/2020, | | | | | | |
| Prerefunded 12/1/2011 @ 100.00, FGIC | Aa2/AA- | | 150,000 | | | 158,955 |
| Pueblo County School District 70, | | | | | | |
| 5.000%, 12/1/2015, | | | | | | |
| Optional 12/1/2011 @ 100.00, FGIC | A2/AA- | | 165,000 | | | 170,579 |
| South Suburban Park and Recreation District, | | | | | | |
| Arapahoe, Douglas & Jefferson Counties, | | | | | | |
| 5.000%, 12/15/2012, | | | | | | |
| Optional 12/15/2008 @ 100.00, FGIC | Aa3/NR | | 250,000 | | | 252,065 |
| | | | | | | |
| Total General Obligation Bonds | | | | | | |
| (Cost $19,982,051) | | | | | | 20,076,926 |
| | | | | | | |
| Revenue Bonds 55.78% | | | | | | |
| Airports 0.75% | | | | | | |
| Walker Field CO Public Airport Authority, | | | | | | |
| 5.000%, 12/1/2022, Optional 12/1/2017 | Baa3/NR | | 500,000 | | | 453,985 |
| 114 | Semi-Annual Report June 30, 2008 (Unaudited) | |
Westcore Colorado Tax-Exempt Fund
as of June 30, 2008 (continued)
| | Bond Rating | Principal | | |
| | Moody’s/S&P | Amount | | Market Value |
| | | | | |
| General 0.40% | | | | | | |
| Park Meadows Business Improvement District Sinking Fund, | | | | | | |
| 5.000%, 12/1/2017, Average Life 9/1/2014 | NR/NR | $ | 250,000 | | $ | 243,225 |
| | | | | | | |
| Higher Education 8.96% | | | | | | |
| Colorado School of Mines Auxiliary Facility Revenue Enterprise: | | | | | |
| 5.250%, 12/1/2020, AMBAC | Aaa/AA | | 85,000 | | | 88,731 |
| 5.250%, 12/1/2020, | | | | | | |
| Prerefunded 12/1/2012 @ 100.00, AMBAC | Aaa/AA | | 420,000 | | | 453,352 |
| Colorado State Board of Governors, | | | | | | |
| 5.250%, 3/1/2024, Optional 3/1/2017, FGIC | A1/A+ | | 500,000 | | | 522,245 |
| Colorado State Board of Governors University | | | | | | |
| - Enterprise Revenue Bonds, | | | | | | |
| 5.000%, 12/1/2020, | | | | | | |
| Prerefunded 12/1/2015 @ 100.00, XLCA | A2/NR | | 500,000 | | | 543,130 |
| Colorado State College Board of Trustees, Auxiliary | | | | | | |
| Facilities System - Enterprise Revenue Bonds, | | | | | | |
| 5.000%, 5/15/2022, Optional 5/15/2013, MBIA | A2/AA | | 660,000 | | | 676,275 |
| Fort Lewis College Board, | | | | | | |
| 4.625%, 10/1/2026, | | | | | | |
| Optional 10/17/2017 @ 100.00, FGIC | A3/NR | | 500,000 | | | 457,510 |
| University of Colorado, | | | | | | |
| 5.375%, 6/1/2026, Optional 6/1/2011 | Aa3/AA- | | 325,000 | | | 334,542 |
| University of Colorado Enterprise Systems Revenue Series A, | | | | | | |
| 5.100%, 6/1/2016, Optional 6/1/2011 @ 100.00 | Aa3/AA- | | 150,000 | | | 155,531 |
| University of Colorado Enterprise Systems Revenue Series B: | | | | | |
| 5.000%, 6/1/2024, | | | | | | |
| Prerefunded 6/1/2013 @ 100.00, FGIC | Aa3/AA- | | 150,000 | | | 160,208 |
| 5.000%, 6/1/2026, | | | | | | |
| Optional 6/1/2013 @ 100.00, FGIC | Aa3/AA- | | 750,000 | | | 761,347 |
| University of Colorado Hospital Authority, | | | | | | |
| 5.600%, 11/15/2031, | | | | | | |
| Prerefunded 11/15/2011 @100.00 | Baa1/NR | | 445,000 | | | 477,489 |
| University of Northern Colorado Auxiliary Facilities: | | | | | | |
| 5.000%, 6/1/2016, | | | | | | |
| Optional 6/1/2011 @ 100.00, AMBAC | Aa3/AA | | 500,000 | | | 513,180 |
| 5.000%, 6/1/2023, | | | | | | |
| Optional 6/1/2011 @ 100.00, AMBAC | Aa3/AA | | 250,000 | | | 252,550 |
| | | | | | | 5,396,090 |
| Medical 17.05% | | | | | | |
| Aurora Colorado Hospital Revenue, Children’s Hospital, | | | | | | |
| 5.000%, 12/1/2022, | | | | | | |
| Optional 12/1/2018 @ 100.00, FSA | Aaa/AAA | | 1,000,000 | | | 1,042,849 |
| | | | | | |
| 1-800-392-CORE (2673) ■ www.westcore.com | 115 |
Westcore Colorado Tax-Exempt Fund
as of June 30, 2008 (continued)
| | Bond Rating | Principal | | |
| | Moody’s/S&P | Amount | | Market Value |
| | | | | |
| Aspen Valley Hospital District, | | | | | | |
| 5.000%, 10/15/2021, Optional 10/15/2016 @ 100.00 | Baa3/NR | $ | 600,000 | | $ | 566,532 |
| Colorado Health Facilities Authority, | | | | | | |
| Poudre Valley Health, Series A: | | | | | | |
| 5.625%, 12/1/2019, | | | | | | |
| Prerefunded 12/1/2009 @ 101.00, FSA | Aaa/NR | | 500,000 | | | 525,705 |
| 5.000%, 3/1/2025, Optional 3/1/2015 @ 100.00 | Baa1/BBB+ | | 1,000,000 | | | 949,910 |
| Colorado Health Facilities Authority Revenue, Adventist Sunbelt, | | | | | |
| 5.125%, 11/15/2020, Optional 11/15/2016 @ 100.00 | A1/A+ | | 500,000 | | | 504,200 |
| Colorado Health Facilities Authority Revenue, | | | | | | |
| Catholic Health Initiatives, | | | | | | |
| 5.250%, 9/1/2021, Prerefunded 9/1/2011 @ 100.00 | Aa2/AA | | 500,000 | | | 527,630 |
| Colorado Health Facilities Authority Revenue, | | | | | | |
| Covenant Retirement Communities Inc., | | | | | | |
| 5.250%, 12/1/2025, Optional 12/1/2015 @ 100.00 | NR/BBB | | 500,000 | | | 464,900 |
| Colorado Health Facilities Authority Revenue, | | | | | | |
| Evangelical Lutheran: | | | | | | |
| 5.250%, 6/1/2020, Optional 6/1/2016 @ 100.00 | A3/A- | | 500,000 | | | 500,295 |
| 5.250%, 6/1/2023, Optional 6/1/2016 @100.00 | A3/A- | | 400,000 | | | 393,888 |
| Colorado Health Facilities Authority Revenue, | | | | | | |
| Park View Medical Center: | | | | | | |
| 5.000%, 9/1/2010 | A3/NR | | 205,000 | | | 210,519 |
| 5.000%, 9/1/2011 | A3/NR | | 210,000 | | | 215,664 |
| 5.000%, 9/1/2020, Optional 9/15/2015 @ 100.00 | A3/NR | | 450,000 | | | 440,343 |
| 5.000%, 9/1/2025, Optional 9/1/2017 @100.00 | A3/NR | | 450,000 | | | 424,026 |
| Colorado Health Facilities Authority Revenue, | | | | | | |
| Vail Valley Medical Center: | | | | | | |
| 5.000%, 1/15/2010 | NR/BBB+ | | 200,000 | | | 202,854 |
| 5.000%, 1/15/2020, Optional 1/15/2015 @ 100.00 | NR/BBB+ | | 440,000 | | | 432,428 |
| Colorado Health Facilities Authority Revenue, | | | | | | |
| Valley View Hospital Association | | | | | | |
| 5.000%, 5/15/2027, Optional 5/15/2017 @ 100.00 | NR/BBB | | 250,000 | | | 233,475 |
| Colorado Health Facilities Authority Revenue, | | | | | | |
| Yampa Valley Medical Center | | | | | | |
| 5.000%, 9/15/2022, Optional 9/15/2017 @ 100.00 | NR/BBB- | | 700,000 | | | 645,624 |
| Denver Health & Hospital Authority: | | | | | | |
| 5.000%, 12/1/2018, Optional 12/1/2016 | NR/BBB | | 500,000 | | | 497,970 |
| 5.000%, 12/1/2020, Optional 12/1/2016 | NR/BBB | | 500,000 | | | 488,680 |
| University of Colorado Hospital Authority, | | | | | | |
| 5.250%, 11/15/2022, | | | | | | |
| Optional 11/15/2009 @ 100.00, AMBAC | Aa3/NR | | 1,000,000 | | | 1,003,410 |
| | | | | | | 10,270,902 |
| 116 | Semi-Annual Report June 30, 2008 (Unaudited) | |
Westcore Colorado Tax-Exempt Fund
as of June 30, 2008 (continued)
| | Bond Rating | Principal | | |
| | Moody’s/S&P | Amount | | Market Value |
| | | | | |
| Other 0.34% | | | | | | |
| Boulder County, (Atmospheric Research), | | | | | | |
| 5.000%, 9/1/2022, Optional 9/1/2011 @ 100.00, MBIA | A2/AA | $ | 200,000 | | $ | 203,376 |
| | | | | | | |
| Special Tax 18.79% | | | | | | |
| Aspen Colorado Sales Tax, | | | | | | |
| 5.000%, 11/1/2010, Prerefunded 11/1/2009 @ 100.00 | NR/NR | | 120,000 | | | 123,985 |
| Aurora Colorado Golf Course Enterprise: | | | | | | |
| 4.125%, 12/1/2013 | Baa2/NR | | 110,000 | | | 108,867 |
| 4.250%, 12/1/2014 | Baa2/NR | | 125,000 | | | 123,615 |
| 4.375%, 12/1/2015 | Baa2/NR | | 125,000 | | | 123,478 |
| Broomfield Sales & Use Tax, | | | | | | |
| 5.200%, 12/1/2017, | | | | | | |
| Optional 12/1/2012 @ 100.00, AMBAC | Aa3/NR | | 500,000 | | | 528,789 |
| City and County of Denver Airport Series A Revenue, | | | | | | |
| 5.000%, 11/15/2018, | | | | | | |
| Optional 11/15/2015 @ 100.00, XLCA | A1/A+ | | 1,000,000 | | | 1,019,069 |
| City of Colorado Springs, Revenue Refunding Bonds, | | | | | | |
| The Colorado College Project, | | | | | | |
| 4.375%, 6/1/2026, Optional 6/1/2015 @ 100.00 | Aa3/AA- | | 500,000 | | | 471,770 |
| Colorado Department of Transportation, | | | | | | |
| 4.200%, 6/15/2009, MBIA | Aa3/AA | | 225,000 | | | 229,741 |
| Colorado Educational & Cultural Facilities Authority: | | | | | | |
| 6.000%, 12/1/2016, | | | | | | |
| Prerefunded 12/1/2010 @ 100.00, RADIAN | NR/A | | 125,000 | | | 134,109 |
| 5.000%, 3/1/2018, | | | | | | |
| Optional 9/1/2015 @100.00, FGIC | A1/A | | 500,000 | | | 522,600 |
| 5.000%, 6/1/2020, | | | | | | |
| Optional 6/1/2011 @ 100.00, AMBAC | Aa3/AA | | 200,000 | | | 203,730 |
| 5.000%, 12/1/2021, | | | | | | |
| Optional 12/1/2011 @ 100.00, AMBAC | Aa3/NR | | 150,000 | | | 152,247 |
| 5.000%, 12/15/2021, | | | | | | |
| Optional 12/15/2015 @ 100.00, MORAL OBLG | NR/A | | 180,000 | | | 171,868 |
| 5.125%, 9/15/2025, | | | | | | |
| Optional 9/15/2015 @ 100.00, XLCA | NR/A | | 500,000 | | | 513,435 |
| 4.625%, 12/15/2028, | | | | | | |
| Optional 12/15/2015 @ 100.00, MORAL OBLG | NR/A | | 250,000 | | | 219,153 |
| Denver City & County Excise Tax, | | | | | | |
| 5.250%, 9/1/2008, FSA | Aaa/AAA | | 500,000 | | | 502,745 |
| Denver City & County Golf Enterprise: | | | | | | |
| 5.000%, 9/1/2018, Optional 9/1/2016 @ 100.00 | Baa2/NR | | 350,000 | | | 350,907 |
| 5.000%, 9/1/2019, Optional 9/1/2016 @ 100.00 | Baa2/NR | | 500,000 | | | 497,010 |
| 1-800-392-CORE (2673) ■ www.westcore.com | 117 |
Westcore Colorado Tax-Exempt Fund
as of June 30, 2008 (continued)
| | Bond Rating | Principal | | |
| | Moody’s/S&P | Amount | | Market Value |
| | | | | |
| Douglas County Sales & Use Tax Open Space, | | | | | | |
| 6.000%, 10/15/2009, FSA | Aaa/AAA | $ | 500,000 | | $ | 520,135 |
| Durango Colorado Sales & Use Tax, | | | | | | |
| 5.500%, 12/1/2016, Optional 12/1/2009 @ 100.00, FGIC | NR/A | | 200,000 | | | 204,622 |
| Grand Junction Leasing Authority Capital Improvement: | | | | | | |
| 5.000%, 6/15/2020, | | | | | | |
| Optional 6/15/2016 @ 100.00, MBIA | A2/AA | | 390,000 | | | 407,944 |
| 5.000%, 6/15/2023, | | | | | | |
| Optional 6/15/2016 @ 100.00, MBIA | A2/AA | | 390,000 | | | 402,375 |
| Greeley, Weld County Sales & Use Tax: | | | | | | |
| 5.150%, 10/1/2015, | | | | | | |
| Prerefunded 10/1/2010 @ 100.00, MBIA | A2/AA | | 500,000 | | | 526,705 |
| 4.800%, 10/1/2015, | | | | | | |
| Prerefunded 10/1/2008 @ 100.00, MBIA | A2/AA | | 250,000 | | | 251,875 |
| Jefferson County Open Space Sales & Use Tax: | | | | | | |
| 5.000%, 11/1/2012, | | | | | | |
| Optional 11/1/2009 @ 100.00, FGIC | Aa3/AA- | | 500,000 | | | 512,045 |
| 5.000%, 11/1/2019, | | | | | | |
| Optional 11/1/2009 @ 100.00, FGIC | Aa3/AA- | | 100,000 | | | 101,262 |
| Longmont, Boulder County Sales & Use Tax, | | | | | | |
| 5.500%, 11/15/2015, Prerefunded 11/15/2010 @ 100.00 | NR/AA+ | | 300,000 | | | 318,768 |
| Northwest Parkway Public Highway Authority Revenue, | | | | | | |
| zero coupon until 6/15/2025, convertible to 5.80% | | | | | | |
| until 6/15/2025, Optional 6/15/2016 @ 100.00, FSA | Aaa/AAA | | 960,000 | | | 885,925 |
| Superior Open Space Sales & Use Tax: | | | | | | |
| 4.625%, 6/1/2015 | NR/A- | | 100,000 | | | 101,982 |
| 4.750%, 6/1/2017, Optional 6/1/2016 @ 100.00 | NR/A- | | 325,000 | | | 329,914 |
| Thornton, Adams County Sales & Use Tax, Open Space & Parks, | | | | | | |
| 5.250%, 9/1/2016, Optional 9/1/2011 @ 100.00, FSA | Aaa/AAA | | 500,000 | | | 523,655 |
| Westminster Sales & Use Tax, | | | | | | |
| 5.000%, 12/1/2014, Optional 12/1/2011 @ 100.00 | NR/AA+ | | 220,000 | | | 229,438 |
| | | | | | | 11,313,763 |
| | | | | | | |
| Utility 9.49% | | | | | | |
| Arkansas River Power Authority, | | | | | | |
| 5.875%, 10/1/2026, SF 10/1/2022, XLCA | NR/BBB | | 1,000,000 | | | 1,088,609 |
| Boulder County Water & Sewer, | | | | | | |
| 5.300%, 12/1/2012, Prerefunded 12/1/2010 @ 100.00 | Aa2/AA+ | | 125,000 | | | 132,384 |
| Broomfield Water Activity Enterprise: | | | | | | |
| 5.500%, 12/1/2018, | | | | | | |
| Optional 12/1/2010 @ 101.00, MBIA | A2/NR | | 500,000 | | | 526,085 |
| 4.750%, 12/1/2022, | | | | | | |
| Optional 12/1/2012 @ 100.00, MBIA | A2/NR | | 125,000 | | | 127,083 |
| 118 | Semi-Annual Report June 30, 2008 (Unaudited) | |
Westcore Colorado Tax-Exempt Fund
as of June 30, 2008 (continued)
| | Bond Rating | Principal | | |
| | Moody’s/S&P | Amount/Shares | | Market Value |
| | | | | |
| Colorado Water Resources & Power Development | | | | | | |
| Authority, Drinking Water, | | | | | | |
| 5.000%, 9/1/2017, Optional 9/1/2012 @ 100.00 | Aaa/AAA | $ | 500,000 | | $ | 523,260 |
| Colorado Water Resources & Power Development | | | | | | |
| Authority, Parker Water & Sanitation District, | | | | | | |
| 5.000%, 9/1/2026, Optional 9/1/2014 @ 100.00, MBIA | A2/AA | | 500,000 | | | 509,520 |
| Colorado Water Resources & Power Development Authority, | | | | | |
| Small Water Resources: | | | | | | |
| 5.700%, 11/1/2015, | | | | | | |
| Optional 11/1/2010 @ 100.00, FGIC | NR/NR | | 265,000 | | | 276,040 |
| 5.700%, 11/1/2015, | | | | | | |
| Prerefunded 11/1/2010 @ 100.00, FGIC | NR/NR | | 235,000 | | | 250,080 |
| Colorado Water Resources & Power Development | | | | | | |
| Authority, Waste Water Revolving Fund, | | | | | | |
| 5.500%, 9/1/2019 | Aa1/AA | | 500,000 | | | 561,685 |
| Fort Collins, Larimer County Colorado Stormwater Utilities, | | | | | | |
| 4.875%, 12/1/2020, | | | | | | |
| Optional 12/1/2012 @ 100.00, AMBAC | Aa3/AA | | 250,000 | | | 256,620 |
| Fort Collins, Larimer County Water Utility Enterprise, | | | | | | |
| 4.250%, 12/1/2009, | | | | | | |
| Optional 12/1/2008 @ 100.00, FSA | Aaa/AAA | | 500,000 | | | 503,030 |
| Golden Colorado Water & Waste Treatment, | | | | | | |
| 4.950%, 11/15/2022, | | | | | | |
| Optional 11/15/2013 @ 100.00, FSA | Aaa/NR | | 150,000 | | | 158,000 |
| Pueblo Colorado Board Waterworks: | | | | | | |
| 5.250%, 11/1/2009, FSA | Aaa/AAA | | 120,000 | | | 124,358 |
| 5.100%, 1/1/2019, Optional 1/1/2009 @ 102.00, AMBAC | Aa3/AA | | 150,000 | | | 153,734 |
| Thornton Colorado Water Enterprise, | | | | | | |
| 5.000%, 12/1/2021, | | | | | | |
| Optional 12/1/2014 @ 100.00, MBIA | A1/AA | | 500,000 | | | 521,690 |
| | | | | | | 5,712,178 |
| | | | | | | |
| Total Revenue Bonds |
| (Cost $33,947,341) | | | | | | 33,593,519 |
| | | | | | |
| Money Market Mutual Funds 3.61% |
| Goldman Sachs Financial Square Tax Free Money Market Fund | | | | | |
| (7 Day Yield 1.550%) | | | 2,172,749 | | | 2,172,749 |
| | | | | | | |
| Total Money Market Mutual Funds |
| (Cost $2,172,749) | | | | | | 2,172,749 |
| | | | | | |
| 1-800-392-CORE (2673) ■ www.westcore.com | 119 |
Westcore Colorado Tax-Exempt Fund
as of June 30, 2008 (continued)
| | | | | Market Value |
| | | | | |
| Total Investments | | | | | |
| (Cost $59,630,056) | | 98.54% | | $ | 59,340,189 |
| | | | | | | |
| Other Assets in Excess of Liabilities | | 1.46% | | | 882,138 |
| | | | | | | |
| Net Assets | | 100.00% | | $ | 60,222,327 |
| | | | | |
| | | | | | | |
| See Notes to Statements of Investments below and Notes to Financial Statements beginning on page 175. |
| | | | | | | |
| Westcore Colorado Tax Exempt Fund |
Country Breakdown as of June 30, 2008 |
| Country | Market Value | | | % |
| | | | |
| United States | $ | 59,340,189 | | | 98.54% |
| Total Investments | | 59,340,189 | | | 98.54% |
| Other Assets in Excess of Liabilities | | 882,138 | | | 1.46% |
| Net Assets | $ | 60,222,327 | | | 100.00% |
| | | | | |
| Please note the country classification is based on the domicile of the issuer. |
Notes to Statements of Investments
** Non-income producing security.
(1) Security exempt from registration under Rule 144A of the Securities Act of 1933. These securities may be resold in transactions exempt from registration, normally to qualified institutional buyers. For those securities that are illiquid restricted securities, see Note 7 to the Notes to Financial Statements.
(2) This security is considered illiquid by the investment adviser. See Note 7 to the Notes to Financial Statements.
(3) This security has been valued in good faith by or under the direction of the Board of Trustees. See Note 1 to Notes to Financial Statements.
(4) The coupon rate shown on floating or adjustable rate securities represents the rate at period end. (5) The expected maturity date listed herein differs from the legal maturity date due to call or put features or due to the expected schedule of principal payments.
(6) Income is not being accrued on this security due to the issuer’s default or expected default on interest payments.
(7) This security represents a junior tranche whereby the holder is entitled to all residual interest, if any, which can vary. The rate listed is the investment adviser’s estimated rate of residual interest as of the reporting date.
(8) Each share is an Enhanced Income Security which consists of one share of Class A common stock and one unit ($7.15 principal amount) of a 12.0% senior subordinated note.
| 120 | Semi-Annual Report June 30, 2008 (Unaudited) |
|
| Common Abbreviations: |
| | |
| AB | Aktiebolag is the Swedish equivalent of the term corporation. |
| ADR | American Depositary Receipt |
| ADS | American Depositary Shares |
| AG | Aktiengesellschaft is a German term that refers to a corporation that is limited by shares, i.e.,owned by shareholders. |
| AMBAC | Ambac Financial Group Inc. |
| BV | Besloten Vennootschap is a Dutch private limited liability company. |
| CDO | Collateralized Debt Obligation |
| CMBS | Commercial Mortgage-Backed Securities |
| CPI | Consumer Price Index |
| FGIC | Financial Guaranty Insurance Co. |
| FHLB | Federal Home Loan Bank |
| FHLMC | Federal Home Loan Mortgage Corp. |
| FNMA | Federal National Mortgage Association |
| FSA | Farm Service Agency |
| GNMA | Government National Mortgage Association |
| LLC | Limited Liability Corp. |
| LP | Limited Partnership |
| Ltd. | Limited |
| MBIA | MBIA Inc. delivers credit enhancement for the obligations of debt such as municipal bonds. The purchase of municipal bond insurance is used to improve or enhance the credit rating of a borrower’s debt financing. |
| MORAL OBLG | Charter School Moral Obligation Program. Moral Obligation bonds are revenue-backed, state-issued municipal bonds, whose principal and interest is backed by the moral, but not legal, obligation of a state government. |
| MTN | Medium Term Note followed by applicable series |
| N.V. | Naamloze Vennootchap is the Dutch term for a public limited liability corporation. |
| OJSC | Open Joint Stock Company |
| PLC | Public Limited Co. |
| RADIAN | Radian Group Inc. |
| REIT | Real Estate Investment Trust |
| S.A. | Generally designates corporations in various countries, mostly those employing the civil law. This translates literally in all languages mentioned as anonymous company. |
| SAB de CV | A variable capital company |
| SBA | Small Business Administration |
| SF | Sinking Fund |
| S.p.A. | Società Per Azioni is an Italian shared company. |
| SUB | Subordinated Income Note |
| XLCA | XL Capital Assurance Inc. delivers credit enhancement for the obligations of debt such as municipal bonds |
| 1-800-392-CORE (2673) ■ www.westcore.com | 121 |

Westcore Equity Funds as of June 30, 2008
| | Westcore | | Westcore |
| | MIDCO | | Growth |
| | Growth Fund | | Fund |
| Assets | | | | | |
| Investments at value (cost - see below) | $ | 156,418,354 | | $ | 244,806,301 |
| Receivable for investment securities sold | | 5,158,903 | | | 13,468,620 |
| Dividends and interest receivable | | 13,822 | | | 144,558 |
| Receivable for fund shares subscribed | | 13,639 | | | 357,074 |
| Investment for trustee deferred compensation plan | | 345,776 | | | 24,961 |
| Prepaid and other assets | | 25,070 | | | 29,174 |
| Total Assets | | 161,975,564 | | | 258,830,688 |
| | | | | | |
| Liabilities | | | | | |
| Payable for investment securities purchased | | 1,496,274 | | | 8,839,317 |
| Payable for fund shares redeemed | | 55,199 | | | 291,577 |
| Payable for investment advisory fee | | 91,065 | | | 138,200 |
| Payable for administration fee | | 24,083 | | | 38,431 |
| Payable for shareholder servicing | | 5,642 | | | 18,015 |
| Payable for trustee deferred compensation plan | | 345,776 | | | 24,961 |
| Payable for chief compliance officer fee | | 914 | | | 1,433 |
| Other payables | | 70,827 | | | 73,924 |
| Total Liabilities | | 2,089,780 | | | 9,425,858 |
| Net Assets | $ | 159,885,784 | | $ | 249,404,830 |
| | | | | | |
| Composition of Net Assets | | | | | |
| Paid-in capital | $ | 143,759,942 | | $ | 200,140,579 |
| Overdistributed net investment income | | (764,386) | | | (115,922) |
| Accumulated net realized gain on investments | | 7,672,822 | | | 13,750,065 |
| Net unrealized appreciation on investments | | 9,217,406 | | | 35,630,108 |
| Net Assets | $ | 159,885,784 | | $ | 249,404,830 |
| | | | | | |
| Net Asset Value Per Share | | | | | |
| Retail Class | | | | | |
| Net assets | $ | 122,043,146 | | $ | 246,263,132 |
| Shares of beneficial interest outstanding | | 19,711,276 | | | 18,407,770 |
| Net asset value per share | $ | 6.19 | | $ | 13.38 |
| Institutional Class | | | | | |
| Net assets | $ | 37,842,638 | | $ | 3,141,698 |
| Shares of beneficial interest outstanding | | 6,105,009 | | | 234,690 |
| Net asset value per share | $ | 6.20 | | $ | 13.39 |
| Cost of Investments | $ | 147,200,948 | | $ | 209,176,193 |
| | | | | | |
| See Notes to Financial Statements. | | | | | |
| 122 | Semi-Annual Report June 30, 2008 (Unaudited) | |
Westcore Equity Funds as of June 30, 2008 (continued)
| | Westcore | | Westcore |
| | Select | | International |
| | Fund | | Frontier Fund |
| Assets | | | | | |
| Investments at value (cost - see below) | $ | 36,925,083 | | $ | 35,665,459 |
| Foreign cash at value (Cost $0 and $133, respectively) | | 0 | | | 136 |
| Receivable for investment securities sold | | 1,223,379 | | | 261,578 |
| Dividends and interest receivable | | 8,862 | | | 44,441 |
| Receivable for fund shares subscribed | | 36,801 | | | 3,096 |
| Investment for trustee deferred compensation plan | | 7,787 | | | 6,925 |
| Prepaid and other assets | | 16,206 | | | 13,175 |
| Total Assets | | 38,218,118 | | | 35,994,810 |
| | | | | | |
| Liabilities | | | | | |
| Payable for investment securities purchased | | 0 | | | 1,748,874 |
| Payable for fund shares redeemed | | 334,036 | | | 100,730 |
| Payable for investment advisory fee | | 17,361 | | | 22,621 |
| Payable for administration fee | | 5,481 | | | 4,887 |
| Payable for shareholder servicing | | 2,086 | | | 1,705 |
| Payable for trustee deferred compensation plan | | 7,787 | | | 6,925 |
| Payable for chief compliance officer fee | | 209 | | | 200 |
| Other payables | | 20,142 | | | 38,922 |
| Total Liabilities | | 387,102 | | | 1,924,864 |
| Net Assets | $ | 37,831,016 | | $ | 34,069,946 |
| | | | | | |
| Composition of Net Assets | | | | | |
| Paid-in capital | $ | 41,771,497 | | $ | 38,569,185 |
| (Over)/Undistributed net investment income | | (115,286) | | | 310,234 |
| Accumulated net realized loss on investments and foreign | | | | | |
| currency transactions | | (1,408,067) | | | (287,325) |
| Net unrealized depreciation on investments and | | | | | |
| translation of assets and liabilities denominated | | | | | |
| in foreign currencies | | (2,417,128) | | | (4,522,148) |
| Net Assets | $ | 37,831,016 | | $ | 34,069,946 |
| | | | | | |
| Net Asset Value Per Share | | | | | |
| Retail Class | | | | | |
| Net assets | $ | 37,831,016 | | $ | 34,069,946 |
| Shares of beneficial interest outstanding | | 2,455,975 | | | 2,737,976 |
| Net asset value per share | $ | 15.40 | | $ | 12.44 |
| Cost of Investments | $ | 39,342,211 | | $ | 40,196,070 |
| | | | | | |
| See Notes to Financial Statements. | | | | | |
| 1-800-392-CORE (2673) ■ www.westcore.com | 123 |
Westcore Equity Funds as of June 30, 2008 (continued)
| | Westcore | | Westcore |
| | Blue Chip | | Mid-Cap |
| | Fund | | Value Fund |
| Assets | | | | | |
| Investments at value (cost - see below) | $ | 53,078,495 | | $ | 83,077,862 |
| Receivable for investment securities sold | | 0 | | | 352,045 |
| Dividends and interest receivable | | 36,292 | | | 200,543 |
| Receivable for fund shares subscribed | | 3,130 | | | 36,472 |
| Investment for trustee deferred compensation plan | | 39,511 | | | 4,403 |
| Prepaid and other assets | | 16,952 | | | 15,017 |
| Total Assets | | 53,174,380 | | | 83,686,342 |
| | | | | | |
| Liabilities | | | | | |
| Payable for fund shares redeemed | | 0 | | | 156,018 |
| Payable for investment advisory fee | | 29,348 | | | 54,639 |
| Payable for administration fee | | 8,276 | | | 12,670 |
| Payable for shareholder servicing | | 2,079 | | | 4,840 |
| Payable for trustee deferred compensation plan | | 39,511 | | | 4,403 |
| Payable for chief compliance officer fee | | 303 | | | 485 |
| Other payables | | 34,292 | | | 28,571 |
| Total Liabilities | | 113,809 | | | 261,626 |
| Net Assets | $ | 53,060,571 | | $ | 83,424,716 |
| | | | | | |
| Composition of Net Assets | | | | | |
| Paid-in capital | $ | 42,935,030 | | $ | 79,713,753 |
| Undistributed net investment income | | 103,418 | | | 295,705 |
| Accumulated net realized gain/(loss) on investments | | 13,306 | | | (1,975,671) |
| Net unrealized appreciation on investments | | 10,008,817 | | | 5,390,929 |
| Net Assets | $ | 53,060,571 | | $ | 83,424,716 |
| | | | | | |
| Net Asset Value Per Share | | | | | |
| Retail Class | | | | | |
| Net assets | $ | 26,394,003 | | $ | 83,424,716 |
| Shares of beneficial interest outstanding | | 2,156,746 | | | 4,500,921 |
| Net asset value per share | $ | 12.24 | | $ | 18.54 |
| Institutional Class | | | | | |
| Net assets | $ | 26,666,568 | | | N/A |
| Shares of beneficial interest outstanding | | 2,177,031 | | | N/A |
| Net asset value per share | $ | 12.25 | | | |
| Cost of Investments | $ | 43,069,678 | | $ | 77,686,933 |
| | | | | | |
| See Notes to Financial Statements. | | | | | |
| 124 | Semi-Annual Report June 30, 2008 (Unaudited) | |
Westcore Equity Funds as of June 30, 2008 (continued)
| | Westcore | | Westcore | | Westcore |
| | Small-Cap | | Small-Cap | | Micro-Cap |
| | Opportunity Fund | | Value Fund | | Opportunity Fund |
| Assets | | | | | | | | |
| Investments at value (cost - see below) | $ | 24,244,724 | | $ | 182,833,544 | | $ | 531,380 |
| Receivable for investment securities sold | | 700,871 | | | 484,007 | | | 0 |
| Dividends and interest receivable | | 20,509 | | | 285,274 | | | 322 |
| Receivable for fund shares subscribed | | 1,817 | | | 488,211 | | | 0 |
| Investment for trustee deferred compensation plan | 34,794 | | | 1,290 | | | 0 |
| Receivable due from advisor | | 0 | | | 0 | | | 1,980 |
| Prepaid and other assets | | 22,464 | | | 22,560 | | | 0 |
| Total Assets | | 25,025,179 | | | 184,114,886 | | | 533,682 |
| | | | | | | | | |
| Liabilities | | | | | | | | |
| Payable for investment securities purchased | | 1,262,004 | | | 1,690,423 | | | 57,987 |
| Payable for fund shares redeemed | | 70,115 | | | 126,483 | | | 0 |
| Payable for investment advisory fee | | 26,220 | | | 125,880 | | | 0 |
| Payable for administration fee | | 4,681 | | | 27,061 | | | 47 |
| Reimbursement for shareholder servicing | | 887 | | | 10,109 | | | 1 |
| Payable for trustee deferred compensation plan | 34,794 | | | 1,290 | | | 0 |
| Payable for chief compliance officer fee | | 149 | | | 964 | | | 2 |
| Other payables | | 24,450 | | | 40,812 | | | 12,052 |
| Total Liabilities | | 1,423,300 | | | 2,023,022 | | | 70,089 |
| Net Assets | $ | 23,601,879 | | $ | 182,091,864 | | $ | 463,593 |
| | | | | | | | | |
| Composition of Net Assets | | | | | | | | |
| Paid-in capital | $ | 23,819,551 | | $ | 202,241,467 | | $ | 486,906 |
| (Over)/Undistributed net investment income | | (69,932) | | | 1,218,152 | | | 221 |
| Accumulated net realized loss on investments | (1,688,893) | | | (7,774,254) | | | 0 |
| Net unrealized appreciation/(depreciation) | | | | | | | | |
| on investments | | 1,541,153 | | | (13,593,501) | | | (23,534) |
| Net Assets | $ | 23,601,879 | | $ | 182,091,864 | | $ | 463,593 |
| | | | | | | | | |
| Net Asset Value Per Share | | | | | | | | |
| Retail Class | | | | | | | | |
| Net assets | $ | 20,263,425 | | $ | 173,437,963 | | | 463,593 |
| Shares of beneficial interest outstanding | | 649,976 | | | 15,752,946 | | | 49,035 |
| Net asset value per share | $ | 31.18 | | $ | 11.01 | | $ | 9.45 |
| Institutional Class | | | | | | | | |
| Net assets | $ | 3,338,454 | | $ | 8,653,901 | | | N/A |
| Shares of beneficial interest outstanding | | 106,937 | | | 785,848 | | | N/A |
| Net asset value per share | $ | 31.22 | | $ | 11.01 | | | |
| Cost of Investments | $ | 22,703,571 | | $ | 196,427,045 | | $ | 554,914 |
| | | | | | | | | |
| See Notes to Financial Statements. | | | | | | | | |
| 1-800-392-CORE (2673) ■ www.westcore.com | 125 |
Westcore Bond Funds as of June 30, 2008
| | Westcore | | Westcore | | Westcore |
| | Flexible | | Plus Bond | | Colorado |
| | Income Fund | | Fund | | Tax-Exempt Fund |
| | | | | | |
| Assets | | | | | | | | |
| Investments at value (cost - see below) | $ | 145,802,843 | | $ | 1,180,471,760 | | $ | 59,340,189 |
| Receivable for investment securities sold | | 354,842 | | | 0 | | | 501,736 |
| Dividends and interest receivable | | 2,598,991 | | | 13,951,999 | | | 413,617 |
| Receivable for fund shares subscribed | | 243,362 | | | 1,986,769 | | | 12,141 |
| Investment for trustee deferred compensation plan | 23,256 | | | 54,006 | | | 25,258 |
| Prepaid and other assets | | 26,732 | | | 55,752 | | | 3,184 |
| Total Assets | | 149,050,026 | | | 1,196,520,286 | | | 60,296,125 |
| | | | | | | | | |
| Liabilities | | | | | | | | |
| Payable for fund shares redeemed | | 2,542,388 | | | 6,165,450 | | | 0 |
| Payable for investment advisory fee | | 63,219 | | | 158,532 | | | 9,049 |
| Payable for administration fee | | 25,462 | | | 157,779 | | | 7,926 |
| Payable for shareholder servicing | | 10,938 | | | 65,458 | | | 3,038 |
| Payable for trustee deferred compensation plan | 23,256 | | | 54,006 | | | 25,258 |
| Payable for chief compliance officer fee | | 976 | | | 6,466 | | | 324 |
| Other payables | | 84,680 | | | 208,497 | | | 28,203 |
| Total Liabilities | | 2,750,919 | | | 6,816,188 | | | 73,798 |
| Net Assets | $ | 146,299,107 | | $ | 1,189,704,098 | | $ | 60,222,327 |
| | | | | | | | | |
| Composition of Net Assets | | | | | | | | |
| Paid-in capital | $ | 178,430,040 | | $ | 1,218,506,558 | | $ | 60,562,095 |
| (Over)/Undistributed net investment income | | 541,316 | | | 245,507 | | | (17,534) |
| Accumulated net realized loss on investments | (8,632,604) | | | (3,950,606) | | | (32,367) |
| Net unrealized depreciation on investments | | (24,039,645) | | | (25,097,361) | | | (289,867) |
| Net Assets | $ | 146,299,107 | | $ | 1,189,704,098 | | $ | 60,222,327 |
| | | | | | | | | |
| Net Asset Value Per Share | | | | | | | | |
| Retail Class | | | | | | | | |
| Net assets | $ | 145,143,724 | | $ | 1,117,947,005 | | $ | 60,222,327 |
| Shares of beneficial interest outstanding | | 16,733,029 | | | 108,388,957 | | | 5,537,368 |
| Net asset value per share | $ | 8.67 | | $ | 10.31 | | $ | 10.88 |
| Institutional Class | | | | | | | | |
| Net assets | $ | 1,155,383 | | $ | 71,757,093 | | | N/A |
| Shares of beneficial interest outstanding | | 133,328 | | | 6,956,989 | | | N/A |
| Net asset value per share | $ | 8.67 | | $ | 10.31 | | | |
| Cost of Investments | $ | 169,842,488 | | $ | 1,205,569,121 | | $ | 59,630,056 |
| See Notes to Financial Statements. | | | | | | | | |
| 126 | Semi-Annual Report June 30, 2008 (Unaudited) | |

| Westcore Equity Funds |
| For the Six Months Ended June 30, 2008 |
| | Westcore | | Westcore |
| | MIDCO | | Growth |
| | Growth Fund | | Fund |
| Investment Income | | | | | |
| Dividends (net of foreign withholding taxes of | | | | | |
| $0 and $3,984, respectively) | $ | 363,308 | | $ | 1,093,606 |
| Interest | | 104,618 | | | 160,641 |
| Total Income | | 467,926 | | | 1,254,247 |
| | | | | | |
| Expenses | | | | | |
| Investment advisory fee | | 543,311 | | | 854,819 |
| Administrative fee | | 146,506 | | | 234,174 |
| Shareholder servicing reimbursement - Retail Class | | 38,418 | | | 109,745 |
| Transfer agent fees | | 29,284 | | | 19,882 |
| Fund accounting fees and expenses | | 28,007 | | | 48,969 |
| Legal fees | | 4,979 | | | 4,007 |
| Printing fees | | 13,167 | | | 20,541 |
| Registration fees | | 4,447 | | | 11,812 |
| Audit and tax preparation fees | | 13,964 | | | 14,742 |
| Custodian fees | | 8,548 | | | 9,600 |
| Insurance | | 2,715 | | | 4,250 |
| Trustee fees and expenses | | 7,368 | | | 11,490 |
| Chief compliance officer fee | | 3,169 | | | 4,984 |
| Other | | 4,253 | | | 4,913 |
| Total expenses before waivers | | 848,136 | | | 1,353,928 |
| Expenses waived by: | | | | | |
| Investment advisor - Institutional Class | | (7,742) | | | (11,663) |
| Net Expenses | | 840,394 | | | 1,342,265 |
| Net Investment Loss | | (372,468) | | | (88,018) |
| | | | | | |
| Realized and Unrealized Gain/(Loss) | | | | | |
| Net realized gain from: | | | | | |
| Investments | | 2,822,911 | | | 4,305,628 |
| Net realized gain | | 2,822,911 | | | 4,305,628 |
| Net change in unrealized depreciation on: | | | | | |
| Investments | | (22,401,263) | | | (44,424,355) |
| Net change | | (22,401,263) | | | (44,424,355) |
| Net Realized And Unrealized Loss | | (19,578,352) | | | (40,118,727) |
| Net Decrease In Net Assets Resulting | | | | | |
| From Operations | $ | (19,950,820) | | $ | (40,206,745) |
| | | | | | |
| See Notes to Financial Statements. | | | | | |
| 1-800-392-CORE (2673) ■ www.westcore.com | 127 |
| Westcore Equity Funds (continued) |
| For the Six Months Ended June 30, 2008 |
| | Westcore | | Westcore |
| | Select | | International |
| | Fund | | Frontier Fund |
| Investment Income | | | | | |
| Dividends (net of foreign withholding taxes | | | | | |
| of $0 and $58,259, respectively) | $ | 78,198 | | $ | 575,007 |
| Interest | | 22,826 | | | 18,645 |
| Total Income | | 101,024 | | | 593,652 |
| | | | | | |
| Expenses | | | | | |
| Investment advisory fee | | 120,777 | | | 222,250 |
| Administrative fee | | 31,576 | | | 32,278 |
| Shareholder servicing reimbursement | | 12,389 | | | 13,772 |
| Transfer agent fees | | 10,161 | | | 9,134 |
| Fund accounting fees and expenses | | 16,425 | | | 23,351 |
| Legal fees | | 454 | | | 479 |
| Printing fees | | 2,807 | | | 2,989 |
| Registration fees | | 7,872 | | | 6,705 |
| Audit and tax preparation fees | | 4,393 | | | 5,754 |
| Custodian fees | | 1,603 | | | 24,867 |
| Insurance | | 528 | | | 602 |
| Trustee fees and expenses | | 1,570 | | | 1,669 |
| Chief compliance officer fee | | 687 | | | 702 |
| Other | | 2,228 | | | 2,081 |
| Total expenses before waivers | | 213,470 | | | 346,633 |
| Expenses waived by: | | | | | |
| Investment advisor | | (4,638) | | | (67,177) |
| Administrator | | (199) | | | (1,645) |
| Net Expenses | | 208,633 | | | 277,811 |
| Net Investment Income/(Loss) | | (107,609) | | | 315,841 |
| | | | | | |
| Realized and Unrealized Gain/(Loss) | | | | | |
| Net realized gain/(loss) from: | | | | | |
| Investments | | (1,008,607) | | | (1,359,651) |
| Foreign currency transactions | | 0 | | | 1,190,258 |
| Net realized loss | | (1,008,607) | | | (169,393) |
| Net change in unrealized appreciation/(depreciation) on: | | | | | |
| Investments | | (3,730,908) | | | (6,645,648) |
| Translation of assets and liabilities | | | | | |
| denominated in foreign currencies | | 0 | | | 1,061,750 |
| Net change | | (3,730,908) | | | (5,583,898) |
| Net Realized And Unrealized Loss | | (4,739,515) | | | (5,753,291) |
| Net Decrease In Net Assets Resulting | | | | | |
| From Operations | $ | (4,847,124) | | $ | (5,437,450) |
| | | | | | |
| See Notes to Financial Statements. | | | | | |
| 128 | Semi-Annual Report June 30, 2008 (Unaudited) | |
| Westcore Equity Funds (continued) |
| For the Six Months Ended June 30, 2008 |
| | Westcore | | Westcore |
| | Blue Chip | | Mid-Cap |
| | Fund | | Value Fund |
| Investment Income | | | | | |
| Dividends (net of foreign withholding taxes | | | | | |
| of $10,267 and $3,338, respectively) | $ | 403,168 | | $ | 760,846 |
| Interest | | 8,777 | | | 24,125 |
| Total Income | | 411,945 | | | 784,971 |
| | | | | | |
| Expenses | | | | | |
| Investment advisory fee | | 181,647 | | | 335,062 |
| Administrative fee | | 51,409 | | | 77,861 |
| Shareholder servicing reimbursement - Retail Class | | 5,699 | | | 33,778 |
| Transfer agent fees | | 11,852 | | | 12,908 |
| Fund accounting fees and expenses | | 19,053 | | | 18,066 |
| Legal fees | | 2,411 | | | 1,118 |
| Printing fees | | 4,506 | | | 7,043 |
| Registration fees | | 5,179 | | | 11,272 |
| Audit and tax preparation fees | | 8,687 | | | 6,889 |
| Custodian fees | | 2,456 | | | 4,282 |
| Insurance | | 834 | | | 1,429 |
| Trustee fees and expenses | | 2,536 | | | 3,943 |
| Chief compliance officer fee | | 1,060 | | | 1,694 |
| Other | | 3,410 | | | 2,455 |
| Total expenses before waivers | | 300,739 | | | 517,800 |
| Expenses waived by: | | | | | |
| Investment advisor - Institutional Class | | (8,280) | | | 0 |
| Net Expenses | | 292,459 | | | 517,800 |
| Net Investment Income | | 119,486 | | | 267,171 |
| | | | | | |
| Realized and Unrealized Gain/(Loss) | | | | | |
| Net realized gain/(loss) from: | | | | | |
| Investments | | 176,829 | | | (1,734,711) |
| Net realized gain/(loss) | | 176,829 | | | (1,734,711) |
| Net change in unrealized depreciation on: | | | | | |
| Investments | | (4,441,272) | | | (8,355,207) |
| Net change | | (4,441,272) | | | (8,355,207) |
| Net Realized And Unrealized Loss | | (4,264,443) | | | (10,089,918) |
| Net Decrease In Net Assets Resulting | | | | | |
| From Operations | $ | (4,144,957) | | $ | (9,822,747) |
| | | | | | |
| See Notes to Financial Statements. | | | | | |
| 1-800-392-CORE (2673) ■ www.westcore.com | 129 |
| Westcore Equity Funds (continued) |
| For the Six Months Ended June 30, 2008 |
| | Westcore | | Westcore | | Westcore |
| | Small-Cap | | Small-Cap | | Micro-Cap |
| | Opportunity Fund | | Value Fund | | Opportunity Fund* |
| Investment Income | | | | | | | | |
| Dividends | $ | 134,299 | | $ | 2,150,911 | | $ | 229 |
| Interest | | 8,732 | | | 112,588 | | | 93 |
| Total Income | | 143,031 | | | 2,263,499 | | | 322 |
| | | | | | | | | |
| Expenses | | | | | | | | |
| Investment advisory fee | | 139,211 | | | 831,286 | | | 77 |
| Administrative fee | | 28,386 | | | 149,834 | | | 14 |
| Shareholder servicing reimbursement - Retail Class | 6,080 | | | 54,148 | | | 1 |
| Transfer agent fees | | 11,707 | | | 9,243 | | | 350 |
| Fund accounting fees and expenses | | 21,659 | | | 34,231 | | | 694 |
| Legal fees | | 936 | | | 2,845 | | | 7 |
| Printing fees | | 2,232 | | | 12,775 | | | 63 |
| Registration fees | | 15,860 | | | 12,189 | | | 0 |
| Audit and tax preparation fees | | 7,400 | | | 7,444 | | | 315 |
| Custodian fees | | 2,642 | | | 9,263 | | | 77 |
| Insurance | | 468 | | | 2,021 | | | 0 |
| Trustee fees and expenses | | 1,235 | | | 7,132 | | | 21 |
| Shareholder meeting expenses | | 0 | | | 0 | | | 0 |
| Chief compliance officer fee | | 528 | | | 3,153 | | | 2 |
| Offering costs - Retail Class | | 0 | | | 0 | | | 39,492 |
| Other | | 3,217 | | | 6,526 | | | 111 |
| Total expenses before waivers | | 241,561 | | | 1,142,090 | | | 41,224 |
| Expenses waived by: | | | | | | | | |
| Investment advisor | | | | | | | | |
| Retail Class | | (45,388) | | | (46,973) | | | (41,067) |
| Institutional Class | | (17,003) | | | (14,043) | | | |
| Administrator - Retail Class | | (1,253) | | | (1,302) | | | (56) |
| Net Expenses | | 177,917 | | | 1,079,772 | | | 101 |
| Net Investment Income/(Loss) | | (34,886) | | | 1,183,727 | | | 221 |
| | | | | | | | | |
| Realized and Unrealized Gain/(Loss) | | | | | | | | |
| Net realized loss from: | | | | | | | | |
| Investments | | (734,088) | | | (7,562,302) | | | 0 |
| Net realized loss | | (734,088) | | | (7,562,302) | | | 0 |
| Net change in unrealized depreciation on: | | | | | | | | |
| Investments | | (2,056,621) | | | (10,993,032) | | | (23,534) |
| Net change | | (2,056,621) | | | (10,993,032) | | | (23,534) |
| Net Realized And Unrealized Loss | | (2,790,709) | | | (18,555,334) | | | (23,534) |
| Net Decrease In Net Assets Resulting | | | | | | | |
| From Operations | $ | (2,825,595) | | $ | (17,371,607) | | $ | (23,313) |
| |
| * Period from June 23, 2008 (inception date) through June 30, 2008. |
| | | | | | | | | |
| See Notes to Financial Statements. |
| 130 | Semi-Annual Report June 30, 2008 (Unaudited) | |
| Westcore Bond Funds |
| For the Six Months Ended June 30, 2008 |
| | Westcore | | Westcore | | Westcore |
| | Flexible | | Plus Bond | | Colorado |
| | Income Fund | | Fund | | Tax-Exempt Fund |
| Investment Income | | | | | | | | |
| Dividends | $ | 1,684,706 | | $ | 1,420,420 | | $ | 0 |
| Interest | | 5,418,441 | | | 31,220,464 | | | 1,327,095 |
| Other income | | 184,995 | | | 130,684 | | | 0 |
| Total Income | | 7,288,142 | | | 32,771,568 | | | 1,327,095 |
| | | | | | | | | |
| Expenses | | | | | | | | |
| Investment advisory fee | | 419,528 | | | 2,659,216 | | | 146,311 |
| Administrative fee | | 167,483 | | | 1,030,015 | | | 51,135 |
| Shareholder servicing | | | | | | | | |
| reimbursement - Retail Class | | 71,897 | | | 391,602 | | | 17,868 |
| Transfer agent fees | | 24,472 | | | 138,986 | | | 8,641 |
| Fund accounting fees and expenses | | 43,994 | | | 154,062 | | | 22,987 |
| Legal fees | | 2,929 | | | 23,335 | | | 764 |
| Printing fees | | 15,326 | | | 102,135 | | | 4,770 |
| Registration fees | | 7,950 | | | 14,665 | | | 1,276 |
| Audit and tax preparation fees | | 22,172 | | | 17,546 | | | 6,839 |
| Custodian fees | | 8,077 | | | 29,228 | | | 1,668 |
| Insurance | | 3,183 | | | 15,765 | | | 790 |
| Trustee fees and expenses | | 8,625 | | | 56,305 | | | 2,675 |
| Chief compliance officer fee | | 3,534 | | | 22,424 | | | 1,113 |
| Other | | 40,038 | | | 14,857 | | | 2,543 |
| Total expenses before waivers | | 839,208 | | | 4,670,141 | | | 269,380 |
| Expenses waived by: | | | | | | | | |
| Investment advisor | | | | | | | | |
| Retail Class | | (34,093) | | | (1,293,646) | | | (74,987) |
| Institutional Class | | (11,624) | | | (93,852) | | | 0 |
| Administrator - Retail Class | | (1,711) | | | (63,144) | | | (3,421) |
| Net Expenses | | 791,780 | | | 3,219,499 | | | 190,972 |
| Net Investment Income | | 6,496,362 | | | 29,552,069 | | | 1,136,123 |
| | | | | | | | | |
| Realized and Unrealized Gain/(Loss) | | | | | | | | |
| Net realized loss from: | | | | | | | | |
| Investments | | (9,532,630) | | | (2,974,029) | | | (35,957) |
| Net realized loss | | (9,532,630) | | | (2,974,029) | | | (35,957) |
| Net change in unrealized depreciation on: | | | | | | | | |
| Investments | | (6,684,476) | | | (24,618,800) | | | (888,375) |
| Net change | | (6,684,476) | | | (24,618,800) | | | (888,375) |
| Net Realized And Unrealized Loss | | (16,217,106) | | | (27,592,829) | | | (924,332) |
| Net Increase/(Decrease) In Net | | | | | | | | |
| Assets Resulting From Operations | $ | (9,720,744) | | $ | 1,959,240 | | $ | 211,791 |
| | | | | | | | | |
| See Notes to Financial Statements. | | | | | | | | |
| 1-800-392-CORE (2673) ■ www.westcore.com | 131 |

| Westcore MIDCO Growth Fund |
| | Six Months Ended | | Year Ended |
| | June 30, 2008(1) | | December 31, 2007(2) |
| | | | |
| Operations | | | | | |
| Net investment loss | $ | (372,468) | | $ | (1,102,797) |
| Net realized gain from investment transactions | | 2,822,911 | | | 30,027,419 |
| Change in unrealized net appreciation or | | | | | |
| depreciation of investments | | (22,401,263) | | | (7,595,184) |
| Net increase/decrease in net assets resulting from operations | | (19,950,820) | | | 21,329,438 |
| | | | | | |
| Dividends and Distributions (Note 1) | | | | | |
| From net realized gain from investment transactions | | 0 | | | (30,740,870) |
| Decrease in net assets from dividends and distributions | | 0 | | | (30,740,870) |
| | | | | | |
| Beneficial Interest Transactions (Note 2) | | | | | |
| Shares sold | | 37,122,608 | | | 41,500,019 |
| Shares issued in reinvestment of dividends and distributions | | 0 | | | 28,111,812 |
| | | 37,122,608 | | | 69,611,831 |
| Shares redeemed | | (43,259,963) | | | (58,343,390) |
| Net increase/(decrease) from beneficial interest transactions | | (6,137,355) | | | 11,268,441 |
| Redemption fees - Retail Class | | 15,997 | | | 4,097 |
| | | | | | |
| Net Increase/(Decrease) In Net Assets | | (26,072,178) | | | 1,861,106 |
| | | | | | |
| Net Assets: | | | | | |
| Beginning of period | | 185,957,962 | | | 184,096,856 |
| End of period (Including overdistributed net investment | | | | | |
| income of ($764,386) and ($391,918), respectively) | $ | 159,885,784 | | $ | 185,957,962 |
| | | | | | |
| (1) Unaudited | | | | | |
| (2) The Fund began offering Institutional Class shares on September 28, 2007. | | | |
| | | | | | |
| | | | | | |
| See Notes to Financial Statements. | | | | | |
| 132 | Semi-Annual Report June 30, 2008 (Unaudited) | |
| Westcore Growth Fund |
| | Six Months Ended | | Year Ended |
| | June 30, 2008(1) | | December 31, 2007(2) |
| | | | |
| Operations | | | | | |
| Net investment loss | $ | (88,018) | | $ | (156,893) |
| Net realized gain from investment transactions | | 4,305,628 | | | 24,605,883 |
| Change in unrealized net appreciation or | | | | | |
| depreciation of investments | | (44,424,355) | | | 37,172,102 |
| Net increase/(decrease) in net assets resulting from operations | (40,206,745) | | | 61,621,092 |
| | | | | | |
| Dividends and Distributions (Note 1) | | | | | |
| From net realized gain from investment transactions | | 0 | | | (15,979,759) |
| Decrease in net assets from dividends and distributions | | 0 | | | (15,979,759) |
| | | | | | |
| Beneficial Interest Transactions (Note 2) | | | | | |
| Shares sold | | 46,569,184 | | | 90,104,433 |
| Shares issued in reinvestment of dividends and distributions | | 0 | | | 15,863,682 |
| | | 46,569,184 | | | 105,968,115 |
| Shares redeemed | | (59,922,782) | | | (122,695,982) |
| Net decrease from beneficial interest transactions | | (13,353,598) | | | (16,727,867) |
| Redemption fees | | 12,345 | | | 3,999 |
| | | | | | |
| Net Increase/(Decrease) In Net Assets | | (53,547,998) | | | 28,917,465 |
| | | | | | |
| Net Assets: | | | | | |
| Beginning of period | | 302,952,828 | | | 274,035,363 |
| End of period (Including overdistributed net investment | | | | | |
| income of ($115,922) and ($27,904), respectively) | $ | 249,404,830 | | $ | 302,952,828 |
| | | | | | |
| (1) Unaudited | | | | | |
| (2) The Fund began offering Institutional Class shares on September 28, 2007. | | | |
| | | | | | |
| | | | | | |
| See Notes to Financial Statements. | | | | | |
| 1-800-392-CORE (2673) ■ www.westcore.com | 133 |
| Westcore Select Fund |
| | Six Months Ended | | Year Ended |
| | June 30, 2008(1) | | December 31, 2007 |
| | | | |
| Operations | | | | | |
| Net investment loss | $ | (107,609) | | $ | (120,432) |
| Net realized gain/(loss) from investment transactions | | (1,008,607) | | | 3,710,452 |
| Change in unrealized net appreciation or | | | | | |
| depreciation of investments | | (3,730,908) | | | (142,011) |
| Net increase/(decrease) in net assets resulting from operations | (4,847,124) | | | 3,448,009 |
| | | | | | |
| Dividends and Distributions (Note 1) | | | | | |
| From net realized gain from investment transactions | | 0 | | | (3,522,227) |
| Decrease in net assets from dividends and distributions | | 0 | | | (3,522,227) |
| | | | | | |
| Beneficial Interest Transactions (Note 2) | | | | | |
| Shares sold | | 11,453,776 | | | 22,897,378 |
| Shares issued in reinvestment of dividends and distributions | | 0 | | | 3,426,634 |
| | | 11,453,776 | | | 26,324,012 |
| Shares redeemed | | (6,367,485) | | | (11,657,790) |
| Net increase from beneficial interest transactions | | 5,086,291 | | | 14,666,222 |
| Redemption fees | | 12,565 | | | 24,694 |
| | | | | | |
| Net Increase In Net Assets | | 251,732 | | | 14,616,698 |
| | | | | | |
| Net Assets: | | | | | |
| Beginning of period | | 37,579,284 | | | 22,962,586 |
| End of period (Including overdistributed net investment | | | | | |
| income of ($115,286) and ($7,677), respectively) | $ | 37,831,016 | | $ | 37,579,284 |
| | | | | | |
| (1) Unaudited | | | | | |
| | | | | | |
| See Notes to Financial Statements. | | | | | |
| 134 | Semi-Annual Report June 30, 2008 (Unaudited) | |
| Westcore International Frontier Fund |
| | Six Months Ended | | Year Ended |
| | June 30, 2008(1) | | December 31, 2007 |
| | | | |
| Operations | | | | | |
| Net investment income | $ | 315,841 | | $ | 167,455 |
| Net realized gain/(loss) from investment and foreign | | | | | |
| currency transactions | | (169,393) | | | 3,699,665 |
| Change in unrealized net appreciation or depreciation | | | | | |
| of investments and translation of assets and liabilities | | | | | |
| denominated in foreign currencies | | (5,583,898) | | | (2,936,418) |
| Net increase/(decrease) in net assets resulting from operations | | (5,437,450) | | | 930,702 |
| | | | | | |
| Dividends and Distributions (Note 1) | | | | | |
| From net investment income | | 0 | | | (238,133) |
| From net realized gain from investment transactions | | 0 | | | (861,491) |
| Decrease in net assets from dividends and distributions | | 0 | | | (1,099,624) |
| | | | | | |
| Beneficial Interest Transactions (Note 2) | | | | | |
| Shares sold | | 2,256,815 | | | 11,165,416 |
| Shares issued in reinvestment of dividends and distributions | | 0 | | | 836,570 |
| | | 2,256,815 | | | 12,001,986 |
| Shares redeemed | | (3,431,414) | | | (6,783,935) |
| Net increase/(decrease) from beneficial interest transactions | | (1,174,599) | | | 5,218,051 |
| Redemption fees | | 2,170 | | | 1,713 |
| | | | | | |
| Net Increase/(Decrease) In Net Assets | | (6,609,879) | | | 5,050,842 |
| | | | | | |
| Net Assets: | | | | | |
| Beginning of period | | 40,679,825 | | | 35,628,983 |
| End of period (Including (over)/undistributed net investment | | | | | |
| income of $310,234 and ($5,607), respectively) | $ | 34,069,946 | | $ | 40,679,825 |
| | | | | | |
| (1) Unaudited | | | | | |
| | | | | | |
| | | | | | |
| See Notes to Financial Statements. | | | | | |
| 1-800-392-CORE (2673) ■ www.westcore.com | 135 |
| Westcore Blue Chip Fund |
| | Six Months Ended | | Year Ended |
| | June 30, 2008(1) | | December 31, 2007(2) |
| | | | |
| Operations | | | | | |
| Net investment income | $ | 119,486 | | $ | 318,601 |
| Net realized gain from investment transactions | | 176,829 | | | 3,711,038 |
| Change in unrealized net appreciation or | | | | | |
| depreciation of investments | | (4,441,272) | | | (1,651,505) |
| Net increase/(decrease) in net assets resulting from operations | | (4,144,957) | | | 2,378,134 |
| | | | | | |
| Dividends and Distributions (Note 1) | | | | | |
| From net investment income | | 0 | | | (400,410) |
| From net realized gain from investment transactions | | 0 | | | (3,802,684) |
| Decrease in net assets from dividends and distributions | | 0 | | | (4,203,094) |
| | | | | | |
| Beneficial Interest Transactions (Note 2) | | | | | |
| Shares sold | | 22,795,227 | | | 11,776,939 |
| Shares issued in reinvestment of dividends and distributions | | 0 | | | 4,039,429 |
| | | 22,795,227 | | | 15,816,368 |
| Shares redeemed | | (25,426,107) | | | (20,558,845) |
| Net decrease from beneficial interest transactions | | (2,630,880) | | | (4,742,477) |
| Redemption fees | | 530 | | | 1,781 |
| | | | | | |
| Net Decrease In Net Assets | | (6,775,307) | | | (6,565,656) |
| | | | | | |
| Net Assets: | | | | | |
| Beginning of period | | 59,835,878 | | | 66,401,534 |
| End of period (Including (over)/undistributed net investment | | | | | |
| income of $103,418 and ($16,068), respectively) | $ | 53,060,571 | | $ | 59,835,878 |
| | | | | | |
| (1) Unaudited | | | | | |
| (2) The Fund began offering Institutional Class shares on September 28, 2007. | | | |
| | | | | | |
| | | | | | |
| See Notes to Financial Statements. | | | | | |
| 136 | Semi-Annual Report June 30, 2008 (Unaudited) | |
| Westcore Mid-Cap Value Fund |
| | Six Months Ended | | Year Ended |
| | June 30, 2008(1) | | December 31, 2007(2) |
| | | | |
| Operations | | | | | |
| Net investment income | $ | 267,171 | | $ | 129,232 |
| Net realized gain/(loss) from investment transactions | | (1,734,711) | | | 436,692 |
| Change in unrealized net appreciation or | | | | | |
| depreciation of investments | | (8,355,207) | | | 177,439 |
| Net increase/(decrease) in net assets resulting from operations | | (9,822,747) | | | 743,363 |
| | | | | | |
| Dividends and Distributions (Note 1) | | | | | |
| From net investment income | | 0 | | | (114,787) |
| From net realized gain from investment transactions | | 0 | | | (1,094,679) |
| Decrease in net assets from dividends and distributions | | 0 | | | (1,209,466) |
| | | | | | |
| Beneficial Interest Transactions (Note 2) | | | | | |
| Shares sold | | 8,599,680 | | | 43,107,499 |
| Shares issued in reinvestment of dividends and distributions | | 0 | | | 1,024,456 |
| | | 8,599,680 | | | 44,131,955 |
| Shares redeemed | | (16,224,128) | | | (30,382,900) |
| Net increase/(decrease) from beneficial interest transactions | | (7,624,448) | | | 13,749,055 |
| Redemption fees | | 9,136 | | | 8,846 |
| | | | | | |
| Net Increase/(Decrease) In Net Assets | | (17,438,059) | | | 13,291,798 |
| | | | | | |
| Net Assets: | | | | | |
| Beginning of period | | 100,862,775 | | | 87,570,977 |
| End of period (Including undistributed net investment | | | | | |
| income of $295,705 and $28,534, respectively) | $ | 83,424,716 | | $ | 100,862,775 |
| | | | | | |
| (1) Unaudited | | | | | |
| (2) The Fund began offering Institutional Class shares on September 28, 2007. | | | |
| | | | | | |
| | | | | | |
| See Notes to Financial Statements. | | | | | |
| 1-800-392-CORE (2673) ■ www.westcore.com | 137 |
| Westcore Small-Cap Opportunity Fund |
| | Six Months Ended | | Year Ended |
| | June 30, 2008(1) | | December 31, 2007(2) |
| | | | |
| Operations | | | | | |
| Net investment loss | $ | (34,886) | | $ | (131,355) |
| Net realized loss from investment transactions | | (734,088) | | | (663,264) |
| Change in unrealized net appreciation or | | | | | |
| depreciation of investments | | (2,056,621) | | | (1,162,989) |
| Net decrease in net assets resulting from operations | | (2,825,595) | | | (1,957,608) |
| | | | | | |
| Dividends and Distributions (Note 1) | | | | | |
| From net realized gain from investment transactions | | 0 | | | (614,548) |
| Decrease in net assets from dividends and distributions | | 0 | | | (614,548) |
| | | | | | |
| Beneficial Interest Transactions (Note 2) | | | | | |
| Shares sold | | 2,221,754 | | | 26,086,385 |
| Shares issued in reinvestment of dividends and distributions | | 0 | | | 607,212 |
| | | 2,221,754 | | | 26,693,597 |
| Shares redeemed | | (7,527,508) | | | (16,468,095) |
| Net increase/(decrease) from beneficial interest transactions | | (5,305,754) | | | 10,225,502 |
| Redemption fees | | 62,234 | | | 2,299 |
| | | | | |
| | | | | | |
| Net Increase/(Decrease) In Net Assets | | (8,069,115) | | | 7,655,645 |
| | | | | | |
| Net Assets: | | | | | |
| Beginning of period | | 31,670,994 | | | 24,015,349 |
| End of period (Including overdistributed net investment | | | | | |
| income of ($69,932) and ($35,046), respectively) | $ | 23,601,879 | | $ | 31,670,994 |
| | | | | | |
| (1) Unaudited | | | | | |
| (2) The Fund began offering Institutional Class shares on September 28, 2007. | | | |
| | | | | | |
| | | | | | |
| See Notes to Financial Statements. | | | | | |
| 138 | Semi-Annual Report June 30, 2008 (Unaudited) | |
| Westcore Small-Cap Value Fund |
| | Six Months Ended | | Year Ended |
| | June 30, 2008(1) | | December 31, 2007(2) |
| | | | |
| Operations | | | | | |
| Net investment income | $ | 1,183,727 | | $ | 1,573,303 |
| Net realized gain/(loss) from investment transactions | | (7,562,302) | | | 367,266 |
| Change in unrealized net appreciation or depreciation | | | | | |
| of investments | | (10,993,032) | | | (11,316,592) |
| Net decrease in net assets resulting from operations | | (17,371,607) | | | (9,376,023) |
| | | | | | |
| Dividends and Distributions (Note 1) | | | | | |
| From net investment income | | 0 | | | (1,529,794) |
| From net realized gain from investment transactions | | 0 | | | (1,157,353) |
| Decrease in net assets from dividends and distributions | | 0 | | | (2,687,147) |
| | | | | | |
| Beneficial Interest Transactions (Note 2) | | | | | |
| Shares sold | | 67,907,542 | | | 149,060,480 |
| Shares issued in reinvestment of dividends and distributions | | 0 | | | 2,603,095 |
| | | 67,907,542 | | | 151,663,575 |
| Shares redeemed | | (36,289,639) | | | (30,111,424) |
| Net increase from beneficial interest transactions | | 31,617,903 | | | 121,552,151 |
| Redemption fees | | 2,484 | | | 10,765 |
| | | | | | |
| Net Increase In Net Assets | | 14,248,780 | | | 109,499,746 |
| | | | | | |
| Net Assets: | | | | | |
| Beginning of period | | 167,843,084 | | | 58,343,338 |
| End of period (Including undistributed net investment | | | | | |
| income of $1,218,152 and $34,425, respectively) | $ | 182,091,864 | | $ | 167,843,084 |
| | | | | | |
| (1) Unaudited | | | | | |
| (2) The Fund began offering Institutional Class shares on September 28, 2007. | | | |
| | | | | | |
| | | | | | |
| See Notes to Financial Statements. | | | | | |
| 1-800-392-CORE (2673) ■ www.westcore.com | 139 |
| Westcore Micro-Cap Opportunity Fund |
| | | Period Ended |
| | | June 30, 2008(1)(2) |
| | | |
| Operations | | | |
| Net investment income | $ | 221 |
| Change in unrealized net appreciation or depreciation of investments | | (23,534) |
| Net decrease in net assets resulting from operations | | (23,313) |
| | | | |
| Beneficial Interest Transactions (Note 2) | | |
| Shares sold | | | 486,906 |
| Net increase from beneficial interest transactions | | 486,906 |
| | | | |
| Net Increase In Net Assets | | 463,593 |
| | | | |
| Net Assets: | | | |
| Beginning of period | | 0 |
| End of period (Including undistributed net investment | | |
| income of $221) | | $ | 463,593 |
| | | | |
| (1) Unaudited | | | |
| (2) Period from June 23, 2008 (Inception date) through June 30, 2008. | | |
| | | | |
| | | | |
| See Notes to Financial Statements. | | |
| 140 | Semi-Annual Report June 30, 2008 (Unaudited) | |
| Westcore Flexible Income Fund |
| | Six Months Ended | | Year Ended |
| | June 30, 2008(1) | | December 31, 2007(2) |
| | | | |
| Operations | | | | | |
| Net investment income | $ | 6,496,362 | | $ | 16,832,659 |
| Net realized loss from investment transactions | | (9,532,630) | | | (1,196,471) |
| Change in unrealized net appreciation or | | | | | |
| depreciation of investments | | (6,684,476) | | | (23,463,785) |
| Net decrease in net assets resulting from operations | | (9,720,744) | | | (7,827,597) |
| | | | | | |
| Dividends and Distributions (Note 1) | | | | | |
| From net investment income | | (5,727,882) | | | (15,528,064) |
| From net realized gain from investment transactions | | 0 | | | (746,892) |
| From paid-in capital | | 0 | | | (203,809) |
| Decrease in net assets from dividends and distributions | | (5,727,882) | | | (16,478,765) |
| | | | | | |
| Shares sold | | | | | |
| Shares sold | | 18,964,327 | | | 103,888,474 |
| Shares issued in reinvestment of dividends and distributions | | 5,506,860 | | | 15,858,723 |
| | | 24,471,187 | | | 119,747,197 |
| Shares redeemed | | (71,200,361) | | | (156,284,946) |
| Net decrease from beneficial interest transactions | | (46,729,174) | | | (36,537,749) |
| Redemption fees | | 8,747 | | | 68,399 |
| | | | | | |
| Net Decrease In Net Assets | | (62,169,053) | | | (60,775,712) |
| | | | | | |
| Net Assets: | | | | | |
| Beginning of period | | 208,468,160 | | | 269,243,872 |
| End of period (Including (over)/undistributed net investment | | | | | |
| income of $541,316 and ($227,164), respectively) | $ | 146,299,107 | | $ | 208,468,160 |
| | | | | | |
| (1) Unaudited | | | | | |
| (2) The Fund began offering Institutional Class shares on September 28, 2007. | | | |
| | | | | | |
| | | | | | |
| See Notes to Financial Statements. | | | | | |
| 1-800-392-CORE (2673) ■ www.westcore.com | 141 |
| Westcore Plus Bond Fund |
| | Six Months Ended | | Year Ended |
| | June 30, 2008(1) | | December 31, 2007(2) |
| | | | |
| Operations | | | | | |
| Net investment income | $ | 29,552,069 | | $ | 50,658,083 |
| Net realized gain/(loss) from investment transactions | | (2,974,029) | | | 138,943 |
| Change in unrealized net appreciation or | | | | | |
| depreciation of investments | | (24,618,800) | | | 744,517 |
| Net increase in net assets resulting from operations | | 1,959,240 | | | 51,541,543 |
| | | | | | |
| Dividends and Distributions (Note 1) | | | | | |
| From net investment income | | (29,106,584) | | | (50,950,386) |
| Decrease in net assets from dividends and distributions | | (29,106,584) | | | (50,950,386) |
| | | | | | |
| Beneficial Interest Transactions (Note 2) | | | | | |
| Shares sold | | 276,463,024 | | | 660,598,318 |
| Shares issued in reinvestment of dividends and distributions | | 24,702,254 | | | 43,119,471 |
| | | 301,165,278 | | | 703,717,789 |
| Shares redeemed | | (222,592,407) | | | (297,928,829) |
| Net increase from beneficial interest transactions | | 78,572,871 | | | 405,788,960 |
| Redemption fees | | 115,116 | | | 155,264 |
| | | | | | |
| Net Increase In Net Assets | | 51,540,643 | | | 406,535,381 |
| | | | | | |
| Net Assets: | | | | | |
| Beginning of period | | 1,138,163,455 | | | 731,628,074 |
| End of period (Including (over)/undistributed net investment | | | | | |
| income of $245,507 and ($199,978), respectively) | $ | 1,189,704,098 | | $ | 1,138,163,455 |
| | | | | | |
| (1) Unaudited | | | | | |
| (2) The Fund began offering Institutional Class shares on September 28, 2007. | | | |
| | | | | | |
| | | | | | |
| See Notes to Financial Statements. | | | | | |
| 142 | Semi-Annual Report June 30, 2008 (Unaudited) | |
| Westcore Colorado Tax-Exempt Fund |
| | Six Months Ended | | Year Ended |
| | June 30, 2008(1) | | December 31, 2007 |
| | | | |
| Operations | | | | | |
| Net investment income | $ | 1,136,123 | | $ | 2,192,030 |
| Net realized gain/(loss) from investment transactions | | (35,957) | | | 13,678 |
| Change in unrealized net appreciation or | | | | | |
| depreciation of investments | | (888,375) | | | (661,371) |
| Net increase in net assets resulting from operations | | 211,791 | | | 1,544,337 |
| | | | | | |
| Dividends and Distributions (Note 1) | | | | | |
| From net investment income | | (1,132,304) | | | (2,211,245) |
| Decrease in net assets from dividends and distributions | | (1,132,304) | | | (2,211,245) |
| | | | | | |
| Beneficial Interest Transactions (Note 2) | | | | | |
| Shares sold | | 8,252,546 | | | 10,782,599 |
| Shares issued in reinvestment of dividends and distributions | | 1,025,679 | | | 1,927,980 |
| | | 9,278,225 | | | 12,710,579 |
| Shares redeemed | | (5,339,630) | | | (10,736,823) |
| Net increase from beneficial interest transactions | | 3,938,595 | | | 1,973,756 |
| Redemption fees | | 519 | | | 2,374 |
| | | | | | |
| Net Increase In Net Assets | | 3,018,601 | | | 1,309,222 |
| | | | | | |
| Net Assets: | | | | | |
| Beginning of period | | 57,203,726 | | | 55,894,504 |
| End of period (Including overdistributed net investment | | | | | |
| income of ($17,534) and ($21,353), respectively) | $ | 60,222,327 | | $ | 57,203,726 |
| | | | | | |
| (1) Unaudited | | | | | |
| | | | | | |
| | | | | | |
| See Notes to Financial Statements. | | | | | |
| 1-800-392-CORE (2673) ■ www.westcore.com | 143 |

| Westcore MIDCO Growth Fund - Retail Class |
| Selected data for a share of beneficial interest outstanding throughout the period indicated. |
| | Six Months Ended | | Year Ended |
| | June 30, 2008(1) | | December 31, 2007 |
| Net asset value - beginning of the period | $ | | 6.94 | | $ | | 7.45 |
| | | | | | | | |
| Income from Investment Operations | | | | | | | |
| Net investment loss | | (0.02) | | | (0.04) |
| Net realized and unrealized gain/(loss) on investments | | (0.73) | | | | 0.89 |
| Total income/(loss) from investment operations | | (0.75) | | | | 0.85 |
| | | | | | | | |
| Distributions | | | | | | | |
| Dividends from net realized gain on investments | | (0.00)(3) | | | (1.36) |
| Total distributions | | (0.00) | | | (1.36) |
| Paid-in capital from redemption fees | | | 0.00(3) | | | | 0.00(3) |
| Net asset value - end of period | $ | | 6.19 | | $ | | 6.94 |
| Total return | | (10.81)%(4) | | | 11.37% |
| | | | | | | | |
| Ratios/Supplemental Data | | | | | | | |
| Net assets, end of period (in thousands) | $ | 122,043 | | $ | 173,482 |
| Ratio of expenses to average net assets | | | 1.03%(5) | | | | 1.03% |
| Ratio of expenses to average net assets without fee waivers | | | 1.03%(5) | | | | 1.03% |
| Ratio of net investment loss to average net assets | | (0.47)%(5) | | | (0.56)% |
| Ratio of net investment loss to average net assets without fee waivers | | (0.47)%(5) | | | (0.56)% |
| Portfolio turnover rate | | 66.19% | | | 116.04% |
(1) Unaudited.
(2) Effective December 31, 2006, the Westcore Funds have changed their fiscal year end from May 31 to December 31.
(3) Less than $0.005 per share.
(4) Total return not annualized for periods less than one full year.
(5) Annualized.
See Notes to Financial Statements.
| 144 | Semi-Annual Report June 30, 2008 (Unaudited) | |
| For the Period | | | | | | | | | | | | | | | | |
| June 1, 2006 to | | Year Ended | | Year Ended | | Year Ended | | Year Ended |
| December 31, 2006 (2) | | May 31, 2006 | | May 31, 2005 | | May 31, 2004 | | May 31, 2003 |
| | $ | 7.99 | | $ | | 7.03 | | $ | | 6.79 | | $ | | 5.69 | | $ | | 5.81 |
| | | | | | | | | | | | | | | | | | | |
| | | | | | | | | | | | | | | | | | | |
| | (0.00)(3) | | | (0.03) | | | (0.04) | | | (0.03) | | | (0.02) |
| | | 0.78 | | | | 1.01 | | | | 0.28 | | | | 1.13 | | | (0.10) |
| | | 0.78 | | | | 0.98 | | | | 0.24 | | | | 1.10 | | | (0.12) |
| | | | | | | | | | | | | | | | | | | |
| | | | | | | | | | | | | | | | | | | |
| | (1.32) | | | (0.02) | | | (0.00) | | | (0.00) | | | (0.00) |
| | (1.32) | | | (0.02) | | | (0.00) | | | (0.00) | | | (0.00) |
| | | 0.00(3) | | | | 0.00(3) | | | | 0.00(3) | | | - | | | - |
| | $ | 7.45 | | $ | | 7.99 | | $ | | 7.03 | | $ | | 6.79 | | $ | | 5.69 |
| | | 9.63%(4) | | | 13.90% | | | | 3.53% | | | 19.33% | | | (2.07)% |
| | | | | | | | | | | | | | | | | | | |
| | | | | | | | | | | | | | | | | | | |
| $ | 184,097 | | $ | 193,647 | | $ | 183,085 | | $ | 180,159 | | $ | 124,309 |
| | | 1.08%(5) | | | | 1.09% | | | | 1.11% | | | | 1.14% | | | | 1.15% |
| | | 1.08%(5) | | | | 1.09% | | | | 1.11% | | | | 1.18% | | | | 1.41% |
| | (0.37)%(5) | | | (0.34)% | | | (0.62)% | | | (0.62)% | | | (0.57)% |
| | (0.37)%(5) | | | (0.34)% | | | (0.62)% | | | (0.62)% | | | (0.83)% |
| | 76.44% | | | 126.52% | | | 83.60% | | | 53.11% | | | 49.48% |
| 1-800-392-CORE (2673) ■ www.westcore.com | 145 |
| Westcore Growth Fund - Retail Class |
| Selected data for a share of beneficial interest outstanding throughout the period indicated. |
| | Six Months Ended | | Year Ended |
| | June 30, 2008(1) | | December 31, 2007 |
| Net asset value - beginning of the period | $ | 15.45 | | $ | 13.31 |
| | | | | | |
| Income from Investment Operations | | | | | |
| Net investment income/(loss) | | (0.00)(3) | | | (0.01) |
| Net realized and unrealized gain/(loss) on investments | | (2.07) | | | 3.01 |
| Total income/(loss) from investment operations | | (2.07) | | | 3.00 |
| | | | | | |
| | | | | | |
| Distributions | | | | | |
| Dividends from net investment income | | (0.00) | | | (0.00) |
| Dividends from net realized gain on investments | | (0.00) | | | (0.86) |
| Total distributions | | (0.00) | | | (0.86) |
| Paid-in capital from redemption fees | | 0.00(3) | | | 0.00(3) |
| Net asset value - end of period | $ | 13.38 | | $ | 15.45 |
| Total return | (13.40)%(4) | | | 22.48% |
| | | | | | |
| | | | | | |
| Ratios/Supplemental Data | | | | | |
| Net assets, end of period (in thousands) | $ | 246,263 | | $ | 299,659 |
| Ratio of expenses to average net assets | | 1.02%(5) | | | 1.05% |
| Ratio of expenses to average net assets without fee waivers | | 1.02%(5) | | | 1.05% |
| Ratio of net investment income/(loss) to average net assets | | (0.07)%(5) | | | (0.05)% |
| Ratio of net investment income/(loss) to average net assets | | | | | |
| without fee waivers | | (0.07)%(5) | | | (0.05)% |
| Portfolio turnover rate | | 97.30% | | 126.89% |
(1) Unaudited.
(2) Effective December 31, 2006, the Westcore Funds have changed their fiscal year end from May 31 to December 31.
(3) Less than $0.005 per share.
(4) Total return not annualized for periods less than one full year.
(5) Annualized.
See Notes to Financial Statements.
| 146 | Semi-Annual Report June 30, 2008 (Unaudited) | |
| For the Period | | | | | | | | | | | | |
| June 1, 2006 to | | Year Ended | | Year Ended | | Year Ended | | Year Ended |
| December 31, 2006(2) | | May 31, 2006 | | May 31, 2005 | | May 31, 2004 | | May 31, 2003 |
| $ | 12.58 | | $ | 11.74 | | $ | 11.01 | | $ | 9.25 | | $ | 10.48 |
| | | | | | | | | | | | | | |
| | | | | | | | | | | | | | |
| | (0.00)(3) | | | (0.03) | | | 0.01 | | (0.02) | | (0.01) |
| | 0.74 | | | 0.93 | | | 0.94 | | | 1.78 | | (1.22) |
| | 0.74 | | | 0.90 | | | 0.95 | | | 1.76 | | (1.23) |
| | | | | | | | | | | | | | |
| | | | | | | | | | | | | | |
| | | | | | | | | | | | | | |
| | (0.00) | | | (0.00)(3) | | | (0.01) | | (0.00) | | (0.00) |
| | (0.01) | | | (0.06) | | | (0.21) | | (0.00) | | (0.00) |
| | (0.01) | | | (0.06) | | | (0.22) | | (0.00) | | (0.00) |
| | 0.00(3) | | | 0.00(3) | | | 0.00(3) | | - | | - |
| $ | 13.31 | | $ | 12.58 | | $ | 11.74 | | $ | 11.01 | | $ | 9.25 |
| | 5.85%(4) | | | 7.67% | | | 8.61% | | 19.03% | | (11.74)% |
| | | | | | | | | | | | | | |
| | | | | | | | | | | | | | |
| | | | | | | | | | | | | | |
| $ | 274,035 | | $ | 255,343 | | $ | 179,698 | | $ | 82,013 | | $ | 32,864 |
| | 1.11%(5) | | | 1.08% | | | 1.13% | | | 1.15% | | | 1.15% |
| | 1.11%(5) | | | 1.08% | | | 1.13% | | | 1.26% | | | 1.52% |
| | (0.16)%(5) | | | (0.24)% | | | 0.13% | | (0.26)% | | (0.17)% |
| | | | | | | | | | | | | | |
| | (0.16)%(5) | | | (0.24)% | | | 0.13% | | (0.37)% | | (0.54)% |
| | 87.11% | | 111.44% | | 113.23% | | 48.66% | | 41.19% |
| 1-800-392-CORE (2673) ■ www.westcore.com | 147 |
| Westcore Select Fund - Retail Class |
| Selected data for a share of beneficial interest outstanding throughout the period indicated. |
| | | Six Months Ended | | | Year Ended |
| | | June 30, 2008(1) | | | December 31, 2007 |
| Net asset value - beginning of the period | $ | 17.43 | | $ | 16.66 |
| | | | | | |
| Income from Investment Operations | | | | | |
| Net investment income/(loss) | | (0.04) | | | (0.05) |
| Net realized and unrealized gain/(loss) on investments | | (2.00) | | | 2.59 |
| Total income/(loss) from investment operations | | (2.04) | | | 2.54 |
| | | | | | |
| Distributions | | | | | |
| Dividends from net realized gain on investments | | (0.00) | | | (1.78) |
| Total distributions | | (0.00) | | | (1.78) |
| Paid-in capital from redemption fees | | 0.01 | | | 0.01 |
| Net asset value - end of period | $ | 15.40 | | $ | 17.43 |
| Total return | (11.65)%(4) | | | 15.25% |
| | | | | | |
| Ratios/Supplemental Data | | | | | |
| Net assets, end of period (in thousands) | $ | 37,831 | | $ | 37,579 |
| Ratio of expenses to average net assets | | 1.15%(5) | | | 1.15% |
| Ratio of expenses to average net assets without fee waivers | | 1.18%(5) | | | 1.27% |
| Ratio of net investment income/(loss) to average net assets | | (0.59)%(5) | | | (0.40)% |
| Ratio of net investment loss to average net assets without fee waivers | | (0.62)%(5) | | | (0.50)% |
| Portfolio turnover rate | 132.84% | | 168.06% |
(1) Unaudited.
(2) Effective December 31, 2006, the Westcore Funds have changed their fiscal year end from May 31 to December 31.
(3) Less than $0.005 per share.
(4) Total return not annualized for periods less than one full year.
(5) Annualized.
See Notes to Financial Statements.
| 148 | Semi-Annual Report June 30, 2008 (Unaudited) | |
| For the Period | | | | | | | | | | | | |
| June 1, 2006 to | | Year Ended | | Year Ended | | Year Ended | | Year Ended |
| December 31, 2006(2) | | May 31, 2006 | | May 31, 2005 | | May 31, 2004 | | May 31, 2003 |
| $ | 15.04 | | $ | 12.23 | | $ | 11.46 | | $ | 9.46 | | $ | 11.43 |
| | | | | | | | | | | | | | |
| | | | | | | | | | | | | | |
| | 0.01 | | | (0.07) | | | (0.08) | | (0.08) | | (0.08) |
| | 1.61 | | | 2.88 | | | 0.85 | | | 2.08 | | (1.89) |
| | 1.62 | | | 2.81 | | | 0.77 | | | 2.00 | | (1.97) |
| | | | | | | | | | | | | | |
| | | | | | | | | | | | | | |
| | (0.00) | | | (0.00) | | | (0.00) | | (0.00) | | (0.00) |
| | (0.00) | | | (0.00) | | | (0.00) | | (0.00) | | (0.00) |
| | 0.00(3) | | | 0.00(3) | | | 0.00(3) | | - | | - |
| $ | 16.66 | | $ | 15.04 | | $ | 12.23 | | $ | 11.46 | | $ | 9.46 |
| | 10.77%(4) | | | 22.98% | | | 6.72% | | 21.14% | | (17.24)% |
| | | | | | | | | | | | | | |
| | | | | | | | | | | | | | |
| $ | 22,963 | | $ | 9,499 | | $ | 9,179 | | $ | 7,532 | | $ | 7,323 |
| | 1.15%(5) | | | 1.15% | | | 1.15% | | | 1.15% | | | 1.15% |
| | 1.53%(5) | | | 1.75% | | | 1.83% | | | 2.08% | | | 2.19% |
| | (0.11)%(5) | | | (0.45)% | | | (0.72)% | | (0.68)% | | | 0.59% |
| | (0.50)%(5) | | | (1.05)% | | | (1.40)% | | (1.61)% | | (1.63)% |
| | 65.46% | | 148.48% | | 107.49% | | 80.76% | | 105.70% |
| 1-800-392-CORE (2673) ■ www.westcore.com | 149 |
| Westcore International Frontier Fund - Retail Class |
| Selected data for a share of beneficial interest outstanding throughout the period indicated. |
| | Six Months Ended | | Year Ended |
| | June 30, 2008(1) | | December 31, 2007 |
| Net asset value - beginning of the period | $ | 14.41 | | $ | 14.39 |
| | | | | | |
| Income from Investment Operations | | | | | |
| Net investment income | | 0.12 | | | 0.06 |
| Net realized and unrealized gain/(loss) on investments | | (2.09) | | | 0.36 |
| Total income/(loss) from investment operations | | (1.97) | | | 0.42 |
| | | | | | |
| Distributions | | | | | |
| Dividends from net investment income | | (0.00) | | | (0.09) |
| Dividends from net realized gain on investments | | (0.00) | | | (0.31) |
| Total distributions | | (0.00) | | | (0.40) |
| Paid-in capital from redemption fees | | 0.00 (3) | | | 0.00(3) |
| Net asset value - end of period | $ | 12.44 | | $ | 14.41 |
| Total return | (13.67)%(4) | | | 2.94% |
| | | | | | |
| Ratios/Supplemental Data | | | | | |
| Net assets, end of period (in thousands) | $ | 34,070 | | $ | 40,680 |
| Ratio of expenses to average net assets | | 1.50%(5) | | | 1.50% |
| Ratio of expenses to average net assets without fee waivers | | 1.87%(5) | | | 1.87% |
| Ratio of net investment income to average net assets | | 1.71%(5) | | | 0.40% |
| Ratio of net investment income/(loss) to average net assets | | | | | |
| without fee waivers | | 1.33%(5) | | | 0.03% |
| Portfolio turnover rate | | 37.89% | | | 77.77% |
(1) Unaudited.
(2) Effective December 31, 2006, the Westcore Funds have changed their fiscal year end from May 31 to December 31.
(3) Less than $0.005 per share.
(4) Total return not annualized for periods less than one full year.
(5) Annualized.
See Notes to Financial Statements.
| 150 | Semi-Annual Report June 30, 2008 (Unaudited) | |
| For the Period | | | | | | | | | | | | | |
| June 1, 2006 to | | Year Ended | | Year Ended | | Year Ended | | Year Ended |
| December 31, 2006(2) | | May 31, 2006 | | May 31, 2005 | | May 31, 2004 | | May 31, 2003 |
| $ | 13.40 | | $ | 10.43 | | $ | 9.97 | | | $ | 7.38 | | $ | 7.49 |
| | | | | | | | | | | | | | | |
| | | | | | | | | | | | | | | |
| | 0.04 | | | 0.11 | | | 0.03 | | | | 0.02 | | | 0.01 |
| | 1.07 | | | 2.89 | | | 0.44 | | | | 2.57 | | (0.12) |
| | 1.11 | | | 3.00 | | | 0.47 | | | | 2.59 | | (0.11) |
| | | | | | | | | | | | | | | |
| | | | | | | | | | | | | | | |
| | (0.12) | | | (0.00) | | (0.01) | | | (0.00)(3) | | (0.00) |
| | (0.00) | | | (0.03) | | (0.00) | | | (0.00) | | (0.00) |
| | (0.12) | | | (0.03) | | (0.01) | | | (0.00) | | (0.00) |
| | 0.00(3) | | | 0.00(2) | | | 0.00(3) | | | - | | - |
| $ | 14.39 | | $ | 13.40 | | $ | 10.43 | | | $ | 9.97 | | $ | 7.38 |
| | 8.33%(4) | | | 28.78% | | | 4.73% | | | 35.16% | | (1.47)% |
| | | | | | | | | | | | | | | |
| | | | | | | | | | | | | | | |
| $ | 35,629 | | $ | 36,517 | | $ | 21,397 | | $ | 13,921 | | $ | 9,982 |
| | 1.50%(5) | | | 1.50% | | | 1.50% | | | | 1.50% | | | 1.50% |
| | 2.26%(5) | | | 1.98% | | | 2.12% | | | | 2.39% | | | 3.27% |
| | 0.33%(5) | | | 1.12% | | | 0.31% | | | | 0.21% | | | 0.28% |
| | | | | | | | | | | | | | | |
| | (0.43)%(5) | | | 0.64% | | (0.31)% | | | (0.68)% | | (1.49)% |
| | 92.65% | | | 38.39% | | 51.95% | | | 63.47% | | 42.73% |
| 1-800-392-CORE (2673) ■ www.westcore.com | 151 |
| Westcore Blue Chip Fund - Retail Class |
| Selected data for a share of beneficial interest outstanding throughout the period indicated. |
| | Six Months Ended | | Year Ended |
| | June 30, 2008(1) | | December 31, 2007 |
| Net asset value - beginning of the period | $ | 13.18 | | $ | 13.73 |
| | | | | | |
| Income from Investment Operations | | | | | |
| Net investment income | | 0.03 | | | 0.08 |
| Net realized and unrealized gain/(loss) on investments | | (0.97) | | | 0.35 |
| Total income/(loss) from investment operations | | (0.94) | | | 0.43 |
| | | | | | |
| Distributions | | | | | |
| Dividends from net investment income | | (0.00) | | | (0.09) |
| Dividends from net realized gain on investments | | (0.00) | | | (0.89) |
| Total distributions | | (0.00) | | | (0.98) |
| Paid-in capital from redemption fees | | 0.00(3) | | | 0.00(3) |
| Net asset value - end of period | $ | 12.24 | | $ | 13.18 |
| Total return | | (7.13)%(4) | | | 3.13% |
| | | | | | |
| Ratios/Supplemental Data | | | | | |
| Net assets, end of period (in thousands) | $ | 26,394 | | $ | 53,321 |
| Ratio of expenses to average net assets | | 1.09%(5) | | | 1.05% |
| Ratio of expenses to average net assets without fee waivers | | 1.09%(5) | | | 1.05% |
| Ratio of net investment income to average net assets | | 0.34%(5) | | | 0.49% |
| Ratio of net investment income/(loss) to average net assets | | | | | |
| without fee waivers | | 0.34%(5) | | | 0.49% |
| Portfolio turnover rate | | 10.27% | | | 41.52% |
(1) Unaudited.
(2) Effective December 31, 2006, the Westcore Funds have changed their fiscal year end from May 31 to December 31.
(3) Less than $0.005 per share.
(4) Total return not annualized for periods less than one full year. (
5) Annualized.
See Notes to Financial Statements.
| 152 | Semi-Annual Report June 30, 2008 (Unaudited) | |
| For the Period | | | | | | | | | | | | |
| June 1, 2006 to | | Year Ended | | Year Ended | | Year Ended | | Year Ended |
| December 31, 2006(2) | | May 31, 2006 | | May 31, 2005 | | May 31, 2004 | | May 31, 2003 |
| $ | 13.24 | | $ | 13.02 | | $ | 11.62 | | $ | 9.79 | | $ | 11.28 |
| | | | | | | | | | | | | | |
| | | | | | | | | | | | | | |
| | 0.04 | | | 0.06 | | | 0.06 | | | 0.01 | | | 0.04 |
| | 1.24 | | | 1.24 | | | 1.34 | | | 1.83 | | (1.47) |
| | 1.28 | | | 1.30 | | | 1.40 | | | 1.84 | | (1.43) |
| | | | | | | | | | | | | | |
| | | | | | | | | | | | | | |
| | (0.08) | | | (0.07) | | | (0.00) | | (0.01) | | (0.06) |
| | (0.71) | | | (1.01) | | | (0.00) | | (0.00) | | (0.00) |
| | (0.79) | | | (1.08) | | | (0.00) | | (0.01) | | (0.06) |
| | 0.00(3) | | | 0.00(3) | | | 0.00(3) | | - | | - |
| $ | 13.73 | | $ | 13.24 | | $ | 13.02 | | $ | 11.62 | | $ | 9.79 |
| | 9.65%(4) | | | 10.09% | | | 12.05% | | 18.83% | | (12.63)% |
| | | | | | | | | | | | | | |
| | | | | | | | | | | | | | |
| $ | 66,402 | | $ | 63,775 | | $ | 63,118 | | $ | 33,439 | | $ | 30,782 |
| | 1.09%(5) | | | 1.11% | | | 1.15% | | | 1.15% | | | 1.15% |
| | 1.09%(5) | | | 1.11% | | | 1.26% | | | 1.34% | | | 1.52% |
| | 0.49%(5) | | | 0.43% | | | 0.57% | | | 0.07% | | | 0.47% |
| | | | | | | | | | | | | | |
| | 0.49%(5) | | | 0.43% | | | 0.46% | | (0.12)% | | | 0.10% |
| | 27.88% | | | 49.55% | | | 58.40% | | 56.46% | | 49.12% |
| 1-800-392-CORE (2673) ■ www.westcore.com | 153 |
| Westcore Mid-Cap Value Fund - Retail Class |
| Selected data for a share of beneficial interest outstanding throughout the period indicated. |
| | Six Months Ended | | Year Ended |
| | June 30, 2008(1) | | December 31, 2007 |
| Net asset value - beginning of the period | $ | 20.57 | | $ | 20.48 |
| | | | | | |
| Income from Investment Operations | | | | | |
| Net investment income/(loss) | | 0.07 | | | 0.03 |
| Net realized and unrealized gain/(loss) on investments | | (2.10) | | | 0.31 |
| Total income/(loss) from investment operations | | (2.03) | | | 0.34 |
| | | | | | |
| Distributions | | | | | |
| Dividends from net investment income | | (0.00)(3) | | | (0.02) |
| Dividends from net realized gain on investments | | (0.00) | | | (0.23) |
| Total distributions | | (0.00) | | | (0.25) |
| Paid-in capital from redemption fees | | 0.00(3) | | | 0.00(3) |
| Net asset value - end of period | $ | 18.54 | | $ | 20.57 |
| Total return | | (9.87)%(4) | | | 1.66% |
| | | | | | |
| Ratios/Supplemental Data | | | | | |
| Net assets, end of period (in thousands) | $ | 83,425 | | $ | 100,863 |
| Ratio of expenses to average net assets | | 1.16%(5) | | | 1.17% |
| Ratio of expenses to average net assets without fee waivers | | 1.16%(5) | | | 1.17% |
| Ratio of net investment income to average net assets | | 0.60%(5) | | | 0.12% |
| Ratio of net investment income/(loss) to average net assets | | | | | |
| without fee waivers | | 0.60%(5) | | | 0.12% |
| Portfolio turnover rate | | 15.27% | | | 40.19% |
(1) Unaudited.
(2) Effective December 31, 2006, the Westcore Funds have changed their fiscal year end from May 31 to December 31.
(3) Less than $0.005 per share.
(4) Total return not annualized for periods less than one full year.
(5) Annualized.
See Notes to Financial Statements.
| 154 | Semi-Annual Report June 30, 2008 (Unaudited) | |
| For the Period | | | | | | | | | | | | |
| June 1, 2006 to | | Year Ended | | Year Ended | | Year Ended | | Year Ended |
| December 31, 2006(2) | | May 31, 2006 | | May 31, 2005 | | May 31, 2004 | | May 31, 2003 |
| $ | 18.96 | | $ | 17.54 | | $ | 15.28 | | $ | 11.95 | | $ | 13.26 |
| | | | | | | | | | | | | | |
| | | | | | | | | | | | | | |
| | 0.06 | | | 0.06 | | | 0.03 | | | (0.02) | | | 0.00(3) |
| | 1.82 | | | 2.63 | | | 3.00 | | | 3.35 | | | (1.31) |
| | 1.88 | | | 2.69 | | | 3.03 | | | 3.33 | | | (1.31) |
| | | | | | | | | | | | | | |
| | | | | | | | | | | | | | |
| | (0.10) | | | (0.04) | | | (0.00) | | | (0.00)(3) | | | (0.00)(3) |
| | (0.26) | | | (1.23) | | | (0.77) | | | (0.00) | | | (0.00) |
| | (0.36) | | | (1.27) | | | (0.77) | | | (0.00) | | | (0.00) |
| | 0.00(3) | | | 0.00(3) | | | 0.00(3) | | | - | | | - |
| $ | 20.48 | | $ | 18.96 | | $ | 17.54 | | $ | 15.28 | | $ | 11.95 |
| | 9.90%(4) | | | 15.44% | | | 20.02% | | | 27.87% | | | (9.85)% |
| | | | | | | | | | | | | | |
| | | | | | | | | | | | | | |
| $ | 87,571 | | $ | 71,040 | | $ | 30,733 | | $ | 17,568 | | $ | 10,635 |
| | 1.23%(5) | | | 1.25% | | | 1.25% | | | 1.25% | | | 1.25% |
| | 1.23%(5) | | | 1.26% | | | 1.45% | | | 1.66% | | | 2.26% |
| | 0.64%(5) | | | 0.49% | | | 0.26% | | | (0.12)% | | | 0.03% |
| | | | | | | | | | | | | | |
| | 0.64%(5) | | | 0.48% | | | 0.07% | | | (0.53)% | | | (0.98)% |
| | 32.79% | | | 49.24% | | | 63.31% | | | 71.05% | | | 50.36% |
| 1-800-392-CORE (2673) ■ www.westcore.com | 155 |
| Westcore Small-Cap Opportunity Fund - Retail Class |
| Selected data for a share of beneficial interest outstanding throughout the period indicated. |
| | | |
| | | |
| | | Six Months Ended | | Year Ended |
| | | June 30, 2008(1) | | December 31, 2007 |
| Net asset value - beginning of the period | $ | 34.34 | | $ | 36.22 |
| | | | | | |
| Income from Investment Operations | | | | | |
| Net investment income/(loss) | | (0.07) | | | (0.15) |
| Net realized and unrealized gain/(loss) on investments | | (3.18) | | | (1.05) |
| Total income/(loss) from investment operations | | (3.25) | | | (1.20) |
| | | | | | |
| Distributions | | | | | |
| Dividends from net realized gain on investments | | (0.00) | | | (0.68) |
| Total distributions | | (0.00) | | | (0.68) |
| Paid-in capital from redemption fees | | 0.09 | | | 0.00(3) |
| Net asset value - end of period | $ | 31.18 | | $ | 34.34 |
| Total return | | (9.20)%(4) | | | (3.33)% |
| | | | | | |
| Ratios/Supplemental Data | | | | | |
| Net assets, end of period (in thousands) | $ | 20,263 | | $ | 28,482 |
| Ratio of expenses to average net assets | | 1.30%(5) | | | 1.30% |
| Ratio of expenses to average net assets without fee waivers | | 1.68%(5) | | | 1.58% |
| Ratio of net investment loss to average net assets | | (0.27)%(5) | | | (0.42)% |
| Ratio of net investment loss to average net assets without fee waivers | | (0.65)%(5) | | | (0.70)% |
| Portfolio turnover rate | | 18.42% | | | 70.65% |
(1) Unaudited.
(2) Effective December 31, 2006, the Westcore Funds have changed their fiscal year end from May 31 to December 31.
(3) Less than $0.005 per share.
(4) Total return not annualized for periods less than one full year.
(5) Annualized.
See Notes to Financial Statements.
| 156 | Semi-Annual Report June 30, 2008 (Unaudited) | |
| For the Period | | | | | | | | | | | | |
| June 1, 2006 to | | Year Ended | | Year Ended | | Year Ended | | Year Ended |
| December 31, 2006(2) | | May 31, 2006 | | May 31, 2005 | | May 31, 2004 | | May 31, 2003 |
| $ | 36.24 | | $ | 34.96 | | $ | 32.71 | | $ | 24.21 | | $ | 27.47 |
| | | | | | | | | | | | | | |
| | | | | | | | | | | | | | |
| | 0.01 | | | (0.12) | | | (0.30) | | | (0.20) | | | (0.06) |
| | 3.23 | | | 6.48 | | | 3.74 | | | 8.70 | | | (3.20) |
| | 3.24 | | | 6.36 | | | 3.44 | | | 8.50 | | | (3.26) |
| | | | | | | | | | | | | | |
| | | | | | | | | | | | | | |
| | (3.26) | | | (5.08) | | | (1.19) | | | (0.00) | | | (0.00) |
| | (3.26) | | | (5.08) | | | (1.19) | | | (0.00) | | | (0.00) |
| | 0.00(3) | | | 0.00(3) | | | 0.00(3) | | | - | | | - |
| $ | 36.22 | | $ | 36.24 | | $ | 34.96 | | $ | 32.71 | | $ | 24.21 |
| | 8.86%(4) | | | 19.04% | | | 10.33% | | | 35.11% | | (11.87)% |
| | | | | | | | | | | | | | |
| | | | | | | | | | | | | | |
| $ | 24,015 | | $ | 20,473 | | $ | 18,394 | | $ | 34,040 | | $ | 26,899 |
| | 1.30%(5) | | | 1.30% | | | 1.30% | | | 1.30% | | | 1.30% |
| | 1.73%(5) | | | 1.77% | | | 1.69% | | | 1.73% | | | 1.96% |
| | (0.27)%(5) | | | (0.34)% | | | (0.55)% | | | (0.65)% | | | (0.25)% |
| | (0.72)%(5) | | | (0.81)% | | | (0.94)% | | | (1.08)% | | | (0.91)% |
| | 32.09% | | | 75.44% | | | 70.18% | | 110.33% | | | 38.79% |
| 1-800-392-CORE (2673) ■ www.westcore.com | 157 |
| Westcore Small-Cap Value Fund - Retail Class |
| Selected data for a share of beneficial interest outstanding throughout the period indicated. |
| | Six Months Ended | | Year Ended |
| | June 30, 2008(1) | | December 31, 2007 |
| Net asset value - beginning of the period | $ | 12.06 | | $ | 12.69 |
| | | | | | |
| Income from Investment Operations | | | | | |
| Net investment income | | 0.07 | | | 0.12 |
| Net realized and unrealized gain/(loss) on investments | | (1.12) | | | (0.54) |
| Total income/(loss) from investment operations | | (1.05) | | | (0.42) |
| | | | | | |
| Distributions | | | | | |
| Dividends from net investment income | | (0.00) | | | (0.12) |
| Dividends from net realized gain on investments | | (0.00) | | | (0.09) |
| Total distributions | | (0.00) | | | (0.21) |
| Paid-in capital from redemption fees | | 0.00(3) | | | 0.00(3) |
| Net asset value - end of period | $ | 11.01 | | $ | 12.06 |
| Total return | | (8.71)%(4) | | | (3.38)% |
| | | | | | |
| Ratios/Supplemental Data | | | | | |
| Net assets, end of period (in thousands) | $ | 173,438 | | $ | 161,792 |
| Ratio of expenses to average net assets | | 1.30%(5) | | | 1.30% |
| Ratio of expenses to average net assets without fee waivers | | 1.36%(5) | | | 1.38% |
| Ratio of net investment income to average net assets | | 1.42%(5) | | | 1.25% |
| Ratio of net investment income/(loss) to average net assets | | | | | |
| without fee waivers | | 1.36%(5) | | | 1.16% |
| Portfolio turnover rate | | 25.99% | | | 35.22% |
(1) Unaudited
(2) Effective December 31, 2006, the Westcore Funds have changed their fiscal year end from May 31 to December 31.
(3) Less than $0.005 per share.
(4) Total return not annualized for periods less than one full year.
(5) Annualized
See Notes to Financial Statements.
| 158 | Semi-Annual Report June 30, 2008 (Unaudited) | |
| | | For the Period | | |
For the Period June 1, 2006 | | Year Ended | | December 13, 2004 |
December 31, 2006(2) | | May 31, 2006 | | (inception) to May 31, 2005 |
| $ | 11.10 | | $ | 9.80 | | $ | 10.00 |
| | | | | | | | |
| | | | | | | | |
| | 0.06 | | | 0.14 | | | 0.03 |
| | 1.62 | | | 1.34 | | (0.23) |
| | 1.68 | | | 1.48 | | (0.20) |
| | | | | | | | |
| | | | | | | | |
| | (0.09) | | (0.11) | | (0.00) |
| | (0.00) | | (0.07) | | (0.00) |
| | (0.09) | | (0.18) | | (0.00) |
| | 0.00(3) | | | 0.00(3) | | | 0.00(3) |
| $ | 12.69 | | $ | 11.10 | | $ | 9.80 |
| | 15.19%(4) | | 15.22% | | (2.00)%(4) |
| | | | | | | | |
| | | | | | | | |
| $ | 58,343 | | $ | 37,797 | | $ | 16,032 |
| | 1.30%(5) | | | 1.30% | | | 1.30%(5) |
| | 1.53%(5) | | | 1.61% | | | 2.94%(5) |
| | 1.24%(5) | | | 1.47% | | | 1.33%(5) |
| | | | | | | | |
| | 1.01%(5) | | | 1.16% | | (0.31)%(5) |
| | 18.65% | | 42.54% | | 27.42% |
| 1-800-392-CORE (2673) ■ www.westcore.com | 159 |
| Westcore Micro-Cap Opportunity Fund - Retail Class |
| Selected data for a share of beneficial interest outstanding throughout the period indicated. |
| | | |
| | For the Period June 23, 2008 |
| | (inception) to June 30, 2008(1) |
| | |
| Net asset value - beginning of the period | $ | 10.00 |
| | | |
| Income from Investment Operations | | |
| Net investment loss | (0.00)(2) |
| Net realized and unrealized loss on investments | (0.55) |
| Total loss from investment operations | (0.55) |
| Paid-in capital from redemption fees | | 0.00(2) |
| Net asset value - end of period | $ | 9.45 |
| Total return | (5.50)%(3) |
| | | |
| Ratios/Supplemental Data | | |
| Net assets, end of period (in thousands) | $ | 464 |
| Ratio of expenses to average net assets | | 1.30%(4) |
| Ratio of expenses to average net assets without fee waivers | 533.32%(4) |
| Ratio of net investment loss to average net assets | (2.95)%(4) |
| Ratio of net investment loss to average net assets without fee waivers | (534.97)%(4) |
| Portfolio turnover rate | | 0.00% |
(1) Unaudited.
(2) Less than $0.005 per share.
(3) Total return not annualized for periods less than one full year.
(4) Annualized.
See Notes to Financial Statements.
| 160 | Semi-Annual Report June 30, 2008 (Unaudited) | |
This Page Intentionally Left Blank
| 1-800-392-CORE (2673) ■ www.westcore.com | 161 |
| Westcore Flexible Income Fund - Retail Class |
| Selected data for a share of beneficial interest outstanding throughout the period indicated. |
| | Six Months Ended | | Year Ended |
| | June 30, 2008(1) | | December 31, 2007 |
| Net asset value - beginning of the period | | $ | 9.44 | | $ | 10.41 |
| | | | | | | |
| Income from Investment Operations | | | | | | |
| Net investment income | | | 0.32 | | | 0.66 |
| Net realized and unrealized gain/(loss) on investments | | (0.81) | | (0.99) |
| Total income/(loss) from investment operations | | (0.49) | | (0.33) |
| | | | | | | |
| Distributions | | | | | | |
| Dividends from net investment income | | (0.28) | | (0.60) |
| Dividends from net realized gain on investments | | (0.00) | | (0.03) |
| Tax return of capital | | (0.00) | | (0.01) |
| Total distributions | | (0.28) | | (0.64) |
| Paid-in capital from redemption fees | | | 0.00(3) | | | 0.00(3) |
| Net asset value - end of period | | $ | 8.67 | | $ | 9.44 |
| Total return | | (5.24)%(4) | | (3.45)% |
| | | | | | | |
| Ratios/Supplemental Data | | | | | | |
| Net assets, end of period (in thousands) | $ | 145,144 | | $ | 207,038 |
| Ratio of expenses to average net assets | | | 0.85%(5) | | | 0.85% |
| Ratio of expenses to average net assets without fee waivers | | | 0.89%(5) | | | 0.92% |
| Ratio of net investment income to average net assets | | | | | | |
| without fee waivers | | | 6.97%(5) | | | 6.30% |
| Ratio of net investment income to average net assets | | | | | | |
| without fee waivers | | | 6.93%(5) | | | 6.23% |
| Portfolio turnover rate | | 16.71% | | 20.87% |
(1) Unaudited.
(2) Effective December 31, 2006, the Westcore Funds have changed their fiscal year end from May 31 to December 31.
(3) Less than $0.005 per share.
(4) Total return not annualized for periods less than one full year.
(5) Annualized.
See Notes to Financial Statements.
| 162 | Semi-Annual Report June 30, 2008 (Unaudited) | |
| For the Period | | | | | | | | | | | | | | | |
| June 1, 2006 to | | Year Ended | | Year Ended | | Year Ended | | Year Ended |
| December 31, 2006(2) | | May 31, 2006 | | May 31, 2005 | | May 31, 2004 | | May 31, 2003 |
| $ | 9.86 | | | $ | 9.97 | | | $ | 9.76 | | | $ | 9.19 | | $ | 9.48 |
| | | | | | | | | | | | | | | | | |
| | | | | | | | | | | | | | | | | |
| | 0.39 | | | | 0.74 | | | | 0.71 | | | | 0.69 | | | 0.75 |
| | 0.56 | | | (0.17) | | | | 0.17 | | | | 0.54 | | (0.29) |
| | 0.95 | | | | 0.57 | | | | 0.88 | | | | 1.23 | | | 0.46 |
| | | | | | | | | | | | | | | | | |
| | | | | | | | | | | | | | | | | |
| (0.40) | | | (0.68) | | | (0.67) | | | (0.66) | | (0.71) |
| (0.00) | | | (0.00) | | | (0.00) | | | (0.00) | | | 0.00 |
| (0.00) | | | (0.00) | | | (0.00) | | | (0.00) | | (0.04) |
| (0.40) | | | (0.68) | | | (0.67) | | | (0.66) | | (0.75) |
| | 0.00(3) | | | | 0.00(3) | | | | 0.00(3) | | | - | | - |
| $ | 10.41 | | | $ | 9.86 | | | $ | 9.97 | | | $ | 9.76 | | $ | 9.19 |
| | 9.80%(4) | | | | 5.94% | | | | 9.15% | | | 13.57% | | | 5.71% |
| | | | | | | | | | | | | | | | | |
| | | | | | | | | | | | | | | | | |
| $ | 269,243 | | $ | 171,116 | | $ | 163,158 | | $ | 61,302 | | $ | 9,726 |
| | 0.85%(5) | | | | 0.85% | | | | 0.85% | | | | 0.85% | | | 0.85% |
| | 0.96%(5) | | | | 0.93% | | | | 0.97% | | | | 1.06% | | | 2.06% |
| | | | | | | | | | | | | | | | | |
| | 7.34%(5) | | | | 7.44% | | | | 7.12% | | | | 7.12% | | | 7.92% |
| | | | | | | | | | | | | | | | | |
| | 7.23%(5) | | | | 7.36% | | | | 7.00% | | | | 6.91% | | | 6.71% |
| 15.20% | | | 25.48% | | | 22.04% | | | 37.03% | | 37.01% |
| 1-800-392-CORE (2673) ■ www.westcore.com | 163 |
| Westcore Plus Bond Fund - Retail Class |
| Selected data for a share of beneficial interest outstanding throughout the period indicated. |
| | Six Months Ended | | Year Ended |
| | June 30, 2008(1) | | December 31, 2007 |
| Net asset value - beginning of the period | $ | | 10.55 | | $ | | 10.54 |
| | | | | | | | |
| Income from Investment Operations | | | | | | | |
| Net investment income | | | 0.26 | | | | 0.55 |
| Net realized and unrealized gain/(loss) on investments | | | (0.24) | | | | 0.01 |
| Total income from investment operations | | | 0.02 | | | | 0.56 |
| | | | | | | | |
| Distributions | | | | | | | |
| Dividends from net investment income | | | (0.26) | | | | (0.55) |
| Dividends from net realized gain on investments | | | (0.00) | | | | (0.00) |
| Tax return of capital | | | (0.00) | | | | (0.00) |
| Total distributions | | | (0.26) | | | | (0.55) |
| Paid-in capital from redemption fees | | | 0.00(3) | | | | 0.00(3) |
| Net asset value - end of period | $ | | 10.31 | | $ | | 10.55 |
| Total return | | | 0.14%(4) | | | | 5.42% |
| | | | | | | | |
| Ratios/Supplemental Data | | | | | | | |
| Net assets, end of period (in thousands) | $ | 1,117,947 | | $ | 1,102,647 |
| Ratio of expenses to average net assets | | | 0.55%(5) | | | | 0.55% |
| Ratio of expenses to average net assets without fee waivers | | | 0.79%(5) | | | | 0.82% |
| Ratio of net investment income to average net assets | | | | | | | |
| without fee waivers | | | 4.99%(5) | | | | 5.21% |
| Ratio of net investment income to average net assets | | | | | | | |
| without fee waivers | | | 4.75%(5) | | | | 4.94% |
| Portfolio turnover rate | | | 9.56% | | | | 47.69% |
(1) Unaudited.
(2) Effective December 31, 2006, the Westcore Funds have changed their fiscal year end from May 31 to December 31.
(3) Less than $0.005 per share.
(4) Total return not annualized for periods less than one full year.
(5) Annualized.
See Notes to Financial Statements.
| 164 | Semi-Annual Report June 30, 2008 (Unaudited) | |
| For the Period | | | | | | | | | | | | |
| June 1, 2006 to | | Year Ended | | Year Ended | | Year Ended | | Year Ended |
| December 31, 2006(2) | | May 31, 2006 | | May 31, 2005 | | May 31, 2004 | | May 31, 2003 |
| $ | 10.28 | | $ | 10.70 | | $ | 10.62 | | $ | 10.67 | | $ | 10.34 |
| | | | | | | | | | | | | | |
| | | | | | | | | | | | | | |
| | 0.33 | | | 0.57 | | | 0.59 | | | 0.62 | | | 0.71 |
| | 0.25 | | | (0.41) | | | 0.14 | | | (0.05) | | | 0.33 |
| | 0.58 | | | 0.16 | | | 0.73 | | | 0.57 | | | 1.04 |
| | | | | | | | | | | | | | |
| | | | | | | | | | | | | | |
| | (0.32) | | | (0.58) | | | (0.58) | | | (0.60) | | | (0.68) |
| | (0.00) | | | (0.00)(3) | | | (0.07) | | | (0.02) | | | (0.00) |
| | (0.00) | | | (0.00) | | | (0.00) | | | (0.00) | | | (0.03) |
| | (0.32) | | | (0.58) | | | (0.65) | | | (0.62) | | | (0.71) |
| | 0.00(3) | | | 0.00(3) | | | 0.00(3) | | | - | | | - |
| $ | 10.54 | | $ | 10.28 | | $ | 10.70 | | $ | 10.62 | | $ | 10.67 |
| | 5.75%(4) | | | 1.48% | | | 6.97% | | | 5.52% | | | 10.52% |
| | | | | | | | | | | | | | |
| | | | | | | | | | | | | | |
| $ | 731,616 | | $ | 460,509 | | $ | 226,609 | | $ | 86,705 | | $ | 52,727 |
| | 0.55%(5) | | | 0.55% | | | 0.55% | | | 0.55% | | | 0.55% |
| | 0.86%(5) | | | 0.89% | | | 1.00% | | | 1.03% | | | 1.14% |
| | | | | | | | | | | | | | |
| | 5.49%(5) | | | 5.58% | | | 5.61% | | | 5.79% | | | 6.38% |
| | | | | | | | | | | | | | |
| | 5.17%(5) | | | 5.24% | | | 5.16% | | | 5.31% | | | 5.79% |
| | 11.46% | | | 32.35% | | | 30.87% | | | 50.32% | | | 62.10% |
| 1-800-392-CORE (2673) ■ www.westcore.com | 165 |
| Westcore Colorado Tax-Exempt Fund - Retail Class |
| Selected data for a share of beneficial interest outstanding throughout the period indicated. |
| | Six Months Ended | | Year Ended |
| | June 30, 2008(1) | | December 31, 2007 |
| Net asset value - beginning of the period | $ | 11.04 | | $ | 11.16 |
| | | | | | |
| Income from Investment Operations | | | | | |
| Net investment income | | 0.21 | | | 0.43 |
| Net realized and unrealized gain/(loss) on investments | | (0.16) | | | (0.12) |
| Total income/(loss) from investment operations | | 0.05 | | | 0.31 |
| | | | | | |
| Distributions | | | | | |
| Dividends from net investment income | | (0.21) | | | (0.43) |
| Total distributions | | (0.21) | | | (0.43) |
| Paid-in capital from redemption fees | | 0.00(3) | | | 0.00(3) |
| Net asset value - end of period | $ | 10.88 | | $ | 11.04 |
| Total return | | 0.46%(4) | | | 2.84% |
| | | | | | |
| Ratios/Supplemental Data | | | | | |
| Net assets, end of period (in thousands) | $ | 60,222 | | $ | 57,204 |
| Ratio of expenses to average net assets | | 0.65%(5) | | | 0.65% |
| Ratio of expenses to average net assets without fee waivers | | 0.92%(5) | | | 0.95% |
| Ratio of net investment income to average net assets | | 3.87%(5) | | | 3.84% |
| Ratio of net investment income to average net assets | | | | | |
| without fee waivers | | 3.61%(5) | | | 3.54% |
| Portfolio turnover rate | | 6.85% | | | 13.78% |
(1) Unaudited.
(2) Effective December 31, 2006, the Westcore Funds have changed their fiscal year end from May 31 to December 31
(3) Less than $0.005 per share
(4) Total return not annualized for periods less than one full year.
(5) Annualized.
See Notes to Financial Statements.
| 166 | Semi-Annual Report June 30, 2008 (Unaudited) | |
| For the Period | | | | | | | | | | | | |
| June 1, 2006 to | | Year Ended | | Year Ended | | Year Ended | | Year Ended |
| December 31, 2006(2) | | May 31, 2006 | | May 31, 2005 | | May 31, 2004 | | May 31, 2003 |
| $ | 11.00 | | $ | 11.32 | | $ | 11.23 | | $ | 11.72 | | $ | 11.18 |
| | | | | | | | | | | | | | |
| | | | | | | | | | | | | | |
| | 0.25 | | | 0.42 | | | 0.41 | | | 0.42 | | | 0.42 |
| | 0.16 | | | (0.32) | | | 0.10 | | | (0.49) | | | 0.54 |
| | 0.41 | | | 0.10 | | | 0.51 | | | (0.07) | | | 0.96 |
| | | | | | | | | | | | | | |
| | | | | | | | | | | | | | |
| | (0.25) | | | (0.42) | | | (0.42) | | | (0.42) | | | (0.42) |
| | (0.25) | | | (0.42) | | | (0.42) | | | (0.42) | | | (0.42) |
| | 0.00(3) | | | 0.00(3) | | | 0.00(3) | | | - | | | - |
| $ | 11.16 | | $ | 11.00 | | $ | 11.32 | | $ | 11.23 | | $ | 11.72 |
| | 3.77%(4) | | | 0.93% | | | 4.55% | | | (0.59)% | | | 8.77% |
| | | | | | | | | | | | | | |
| | | | | | | | | | | | | | |
| $ | 55,895 | | $ | 55,529 | | $ | 59,346 | | $ | 50,227 | | $ | 55,461 |
| | 0.65%(5) | | | 0.65% | | | 0.65% | | | 0.65% | | | 0.65% |
| | 0.98%(5) | | | 0.98% | | | 1.07% | | | 1.11% | | | 1.15% |
| | 3.87%(5) | | | 3.77% | | | 3.68% | | | 3.67% | | | 3.65% |
| | | | | | | | | | | | | | |
| | 3.53%(5) | | | 3.44% | | | 3.26% | | | 3.21% | | | 3.15% |
| | 8.06% | | | 22.20% | | | 32.94% | | | 6.60% | | | 8.69% |
| 1-800-392-CORE (2673) ■ www.westcore.com | 167 |
| Westcore MIDCO Growth Fund - Institutional Class |
| Selected data for a share of beneficial interest outstanding throughout the period indicated. |
| | | | | For the Period |
| | | | | September 28, 2007 |
| | Six Months Ended | | (inception) to |
| | June 30, 2008(1) | | December 31, 2007 |
| Net asset value - beginning of the period | $ | | 6.95 | | $ | | 8.55 |
| | | | | | | | |
| Income from Investment Operations | | | | | | | |
| Net investment loss | | (0.04) | | | (0.01) |
| Net realized and unrealized loss on investments | | (0.71) | | | (0.23) |
| Total loss from investment operations | | (0.75) | | | (0.24) |
| | | | | | | | |
| Distributions | | | | | | | |
| Dividends from net realized gain on investments | | | 0.00 | | | (1.36) |
| Total distributions | | | 0.00 | | | (1.36) |
| Paid-in capital from redemption fees | | | 0.00(2) | | | | 0.00(2) |
| Net asset value - end of period | $ | | 6.20 | | $ | | 6.95 |
| Total return | (10.79)%(3) | | | (2.84)%(3) |
| | | | | | | | |
| Ratios/Supplemental Data | | | | | | | |
| Net assets, end of period (in thousands) | $ | 37,843 | | $ | 12,477 |
| Ratio of expenses to average net assets | | | 0.93%(4) | | | | 0.98%(4) |
| Ratio of expenses to average net assets without fee waivers | | | 0.98%(4) | | | | 2.08%(4) |
| Ratio of net investment loss to average net assets | | (0.36)%(4) | | | (0.47)%(4) |
| Ratio of net investment loss to average net assets | | | | | | | |
| without fee waivers | | (0.40)%(4) | | | (1.58)%(4) |
| Portfolio turnover rate | | 66.19% | | 116.04%(5) |
(1) Unaudited.
(2) Less than $0.005 per share.
(3) Total return not annualized for periods less than one full year.
(4) Annualized.
(5) Portfolio turnover rate is calculated at the Fund level and represents the year ended December 31, 2007.
See Notes to Financial Statements.
| 168 | Semi-Annual Report June 30, 2008 (Unaudited) | |
| Westcore Growth Fund - Institutional Class |
| Selected data for a share of beneficial interest outstanding throughout the period indicated. |
| | | | For the Period |
| | | | September 28, 2007 |
| | Six Months Ended | | (inception) to |
| | June 30, 2008(1) | | December 31, 2007 |
| Net asset value - beginning of the period | $ | 15.45 | | $ | 15.96 |
| | | | | | |
| Income from Investment Operations | | | | | |
| Net investment loss | | (0.00)(2) | | | (0.00)(2) |
| Net realized and unrealized gain/(loss) on investments | | (2.06) | | | 0.35 |
| Total income/(loss) from investment operations | | (2.06) | | | 0.35 |
| | | | | | |
| Distributions | | | | | |
| Dividends from net realized gain on investments | | (0.00) | | | (0.86) |
| Total distributions | | (0.00) | | | (0.86) |
| Paid-in capital from redemption fees | | 0.00(2) | | | 0.00(2) |
| Net asset value - end of period | $ | 13.39 | | $ | 15.45 |
| Total return | (13.33)%(3) | | | 2.14%(3) |
| | | | | | |
| Ratios/Supplemental Data | | | | | |
| Net assets, end of period (in thousands) | $ | 3,142 | | $ | 3,294 |
| Ratio of expenses to average net assets | | 0.92%(4) | | | 0.98%(4) |
| Ratio of expenses to average net assets without fee waivers | | 1.67%(4) | | | 4.64%(4) |
| Ratio of net investment income/(loss) to average net assets | | 0.04%(4) | | | (0.01)%(4) |
| Ratio of net investment loss to average net assets | | | | | |
| without fee waivers | | (0.72)%(4) | | | (3.68)%(4) |
| Portfolio turnover rate | | 97.30% | | 126.89%(5) |
(1) Unaudited
(2) Less than $0.005 per share.
(3) Total return not annualized for periods less than one full year.
(4) Annualized
(5) Portfolio turnover rate is calculated at the Fund level and represents the year ended December 31, 2007.
See Notes to Financial Statements.
| 1-800-392-CORE (2673) ■ www.westcore.com | 169 |
| Westcore Blue Chip Fund - Institutional Class |
| Selected data for a share of beneficial interest outstanding throughout the period indicated. |
| | | | For the Period |
| | | | September 28, 2007 |
| | Six Months Ended | | (inception) to |
| | June 30, 2008(1) | | December 31, 2007 |
| Net asset value - beginning of the period | $ | 13.18 | | $ | 14.88 |
| | | | | | |
| Income from Investment Operations | | | | | |
| Net investment income | | 0.08 | | | 0.02 |
| Net realized and unrealized loss on investments | | (1.02) | | | (0.73) |
| Total loss from investment operations | | (0.94) | | | (0.71) |
| | | | | | |
| Distributions | | | | | |
| Dividends from net investment income | | (0.00) | | | (0.10) |
| Dividends from net realized gain on investments | | (0.00) | | | (0.89) |
| Total distributions | | (0.00) | | | (0.99) |
| Paid-in capital from redemption fees | | 0.00(2) | | | 0.00 |
| Net asset value - end of period | $ | 12.24 | | $ | 13.18 |
| Total return | | (7.06)%(3) | | | 4.78%(3) |
| | | | | | |
| Ratios/Supplemental Data | | | | | |
| Net assets, end of period (in thousands) | $ | 26,667 | | $ | 6,515 |
| Ratio of expenses to average net assets | | 0.99%(4) | | | 0.98%(4) |
| Ratio of expenses to average net assets without fee waivers | | 1.06%(4) | | | 1.85%(4) |
| Ratio of net investment income to average net assets | | 0.54%(4) | | | 0.61%(4) |
| Ratio of net investment income/(loss) to average net assets | | | | | |
| without fee waivers | | 0.47%(4) | | | (0.25)%(4) |
| Portfolio turnover rate | | 10.27% | | | 41.52%(5) |
(1) Unaudited.
(2) Less than $0.005 per share.
(3) Total return not annualized for periods less than one full year.
(4) Annualized.
(5) Portfolio turnover rate is calculated at the Fund level and represents the year ended December 31, 2007.
See Notes to Financial Statements.
| 170 | Semi-Annual Report June 30, 2008 (Unaudited) | |
| Westcore Small-Cap Opportunity Fund - Institutional Class |
| Selected data for a share of beneficial interest outstanding throughout the period indicated. |
| | | | For the Period |
| | | | September 28, 2007 |
| | Six Months Ended | | (inception) to |
| | June 30, 2008(1) | | December 31, 2007 |
| Net asset value - beginning of the period | $ | 34.36 | | $ | 38.40 |
| | | | | | |
| Income from Investment Operations | | | | | |
| Net investment loss | | (0.03) | | | (0.00)(2) |
| Net realized and unrealized loss on investments | | (3.17) | | | (3.36) |
| Total loss from investment operations | | (3.20) | | | (3.36) |
| | | | | | |
| Distributions | | | | | |
| Dividends from net realized gain on investments | | (0.00) | | | (0.68) |
| Total distributions | | (0.00) | | | (0.68) |
| Paid-in capital from redemption fees | | 0.06 | | | 0.00(2) |
| Net asset value - end of period | $ | 31.22 | | $ | 34.36 |
| Total return | | (9.14)%(3) | | | (8.76)%(3) |
| | | | | | |
| Ratios/Supplemental Data | | | | | |
| Net assets, end of period (in thousands) | $ | 3,340 | | $ | 3,189 |
| Ratio of expenses to average net assets | | 1.09%(4) | | | 1.22%(4) |
| Ratio of expenses to average net assets without fee waivers | | 2.24%(4) | | | 6.09%(4) |
| Ratio of net investment loss to average net assets | | (0.06)%(4) | | | (0.09)%(4) |
| Ratio of net investment loss to average net assets | | | | | |
| without fee waivers | | (1.21)%(4) | | | (4.95)%(4) |
| Portfolio turnover rate | | 18.42% | | | 70.65%(5) |
(1) Unaudited.
(2) Less than $0.005 per share.
(3) Total return not annualized for periods less than one full year.
(4) Annualized.
(5) Portfolio turnover rate is calculated at the Fund level and represents the year ended December 31, 2007.
See Notes to Financial Statements.
| 1-800-392-CORE (2673) ■ www.westcore.com | 171 |
| Westcore Small-Cap Value Fund - Institutional Class |
| Selected data for a share of beneficial interest outstanding throughout the period indicated. |
| | | | For the Period |
| | | | September 28, 2007 |
| | Six Months Ended | | (inception) to |
| | June 30, 2008(1) | | December 31, 2007 |
| Net asset value - beginning of the period | $ | 12.06 | | $ | 13.42 |
| | | | | | |
| Income from Investment Operations | | | | | |
| Net investment income | | 0.11 | | | 0.05 |
| Net realized and unrealized loss on investments | | (1.16) | | | (1.20) |
| Total loss from investment operations | | (1.05) | | | (1.15) |
| | | | | | |
| Distributions | | | | | |
| Dividends from net investment income | | (0.00) | | | (0.12) |
| Dividends from net realized gain on investments | | (0.00) | | | (0.09) |
| Total distributions | | (0.00) | | | (0.21) |
| Paid-in capital from redemption fees | | 0.00(2) | | | 0.00(2) |
| Net asset value - end of period | $ | 11.01 | | $ | 12.06 |
| Total return | | (8.71)%(3) | | | (8.58)%(3) |
| | | | | | |
| Ratios/Supplemental Data | | | | | |
| Net assets, end of period (in thousands) | $ | 8,654 | | $ | 6,051 |
| Ratio of expenses to average net assets | | 1.22%(4) | | | 1.21%(4) |
| Ratio of expenses to average net assets without fee waivers | | 1.57%(4) | | | 4.50%(4) |
| Ratio of net investment income to average net assets | | 1.55%(4) | | | 1.76%(4) |
| Ratio of net investment income/(loss) to average net assets | | | | | |
| without fee waivers | | 1.19%(4) | | | (1.55)%(4) |
| Portfolio turnover rate | | 25.99% | | | 35.22%(5) |
(1) Unaudited.
(2) Less than $0.005 per share.
(3) Total return not annualized for periods less than one full year.
(4) Annualized.
(5) Portfolio turnover rate is calculated at the Fund level and represents the year ended December 31, 2007.
See Notes to Financial Statements.
| 172 | Semi-Annual Report June 30, 2008 (Unaudited) | |
| Westcore Flexible Income Fund - Institutional Class |
| Selected data for a share of beneficial interest outstanding throughout the period indicated. |
| | | | For the Period |
| | | | September 28, 2007 |
| | Six Months Ended | | (inception) to |
| | June 30, 2008(1) | | December 31, 2007 |
| Net asset value - beginning of the period | $ | 9.43 | | $ | 9.97 |
| | | | | | |
| Income from Investment Operations | | | | | |
| Net investment income | | 0.32 | | | 0.15 |
| Net realized and unrealized loss on investments | (0.79) | | (0.54) |
| Total loss from investment operations | (0.47) | | (0.39) |
| | | | | | |
| Distributions | | | | | |
| Dividends from net investment income | (0.29) | | (0.11) |
| Dividends from net realized gain on investments | (0.00) | | (0.03) |
| Tax return of capital | (0.00) | | (0.01) |
| Total distributions | (0.29) | | (0.15) |
| Paid-in capital from redemption fees | | 0.00(2) | | | 0.00(2) |
| Net asset value - end of period | $ | 8.67 | | $ | 9.43 |
| Total return | (5.08)%(3) | | (3.89)%(3) |
| | | | | | |
| Ratios/Supplemental Data | | | | | |
| Net assets, end of period (in thousands) | $ | 1,155 | | $ | 1,430 |
| Ratio of expenses to average net assets | | 0.75%(4) | | | 0.70%(4) |
| Ratio of expenses to average net assets without fee waivers | | 2.54%(4) | | | 7.26%(4) |
| Ratio of net investment income to average net assets | | 7.10%(4) | | | 7.34%(4) |
| | | | | |
| Ratio of net investment income to average net assets | | | | | |
| without fee waivers | | 5.31%(4) | | | 0.78%(4) |
| Portfolio turnover rate | 16.71% | | 20.87%(5) |
(1) Unaudited.
(2) Less than $0.005 per share.
(3) Total return not annualized for periods less than one full year.
(4) Annualized.
(5) Portfolio turnover rate is calculated at the Fund level and represents the year ended December 31, 2007.
See Notes to Financial Statements.
| 1-800-392-CORE (2673) ■ www.westcore.com | 173 |
| Westcore Plus Bond Fund - Institutional Class |
| Selected data for a share of beneficial interest outstanding throughout the period indicated. |
| | | | For the Period |
| | | | September 28, 2007 |
| | Six Months Ended | | (inception) to |
| | June 30, 2008(1) | | December 31, 2007 |
| Net asset value - beginning of the period | $ | 10.55 | | $ | 10.45 |
| | | | | | |
| Income from Investment Operations | | | | | |
| Net investment income | | 0.27 | | | 0.13 |
| Net realized and unrealized gain/(loss) on investments | | (0.25) | | | 0.11 |
| Total income from investment operations | | 0.02 | | | 0.24 |
| | | | | | |
| Distributions | | | | | |
| Dividends from net investment income | | (0.26) | | | (0.14) |
| Total distributions | | (0.26) | | | (0.14) |
| Paid-in capital from redemption fees | | 0.00(2) | | | 0.00(2) |
| Net asset value - end of period | $ | 10.31 | | $ | 10.55 |
| Total return | | 0.28%(3) | | | 2.27%(3) |
| | | | | | |
| Ratios/Supplemental Data | | | | | |
| Net assets, end of period (in thousands) | $ | 71,757 | | $ | 35,516 |
| Ratio of expenses to average net assets | | 0.46%(4) | | | 0.44%(4) |
| Ratio of expenses to average net assets without fee waivers | | 0.74%(4) | | | 1.30%(4) |
| Ratio of net investment income to average net assets | | 5.13%(4) | | | 5.13%(4) |
| Ratio of net investment income to average net assets | | | | | |
| without fee waivers | | 4.85%(4) | | | 4.28%(4) |
| Portfolio turnover rate | | 9.56% | | | 47.69%(5) |
(1) Unaudited.
(2) Less than $0.005 per share.
(3) Total return not annualized for periods less than one full year.
(4) Annualized.
(5) Portfolio turnover rate is calculated at the Fund level and represents the year ended December 31, 2007.
See Notes to Financial Statements.
| 174 | Semi-Annual Report June 30, 2008 (Unaudited) | |

1. Significant Accounting Policies
Westcore Trust (the “Trust”) is registered under the Investment Company Act of 1940, as amended, as an open-ended management investment company. Interests in the Westcore MIDCO Growth, Westcore Growth, Westcore Select, Westcore International Frontier, Westcore Blue Chip, Westcore Mid-Cap Value, Westcore Small-Cap Opportunity, Westcore Small-Cap Value, Westcore Micro-Cap Opportunity, Westcore Flexible Income, Westcore Plus Bond and Westcore Colorado Tax-Exempt Funds (the “Funds”) are represented by separate classes of beneficial interest of the Trust, which is organized as a Massachusetts business trust.
The Westcore MIDCO Growth, Westcore Growth, Westcore Select, Westcore International Frontier, Westcore Blue Chip, Westcore Mid-Cap Value, Westcore Small Cap Opportunity, Westcore Small-Cap Value, Westcore Micro-Cap Opportunity, Westcore Flexible Income, Westcore Plus Bond and Westcore Colorado Tax Exempt Funds offer Retail Class shares.
The Westcore MIDCO Growth, Westcore Growth, Westcore Blue Chip, Westcore Small Cap Opportunity, Westcore Small-Cap Value, Westcore Flexible Income and Westcore Plus Bond offer Institutional Class shares.
All classes of shares have identical rights to earnings, assets and voting privileges, except for class specific expenses and exclusive rights to vote on matters affecting only individual classes.
The following is a summary of significant accounting policies consistently followed by each Fund in the preparation of its financial statements. The policies are in conformity with accounting principles generally accepted in the United States of America for investment companies.
Use of Estimates – The preparation of financial statements in accordance with accounting principles generally accepted in the United States of America requires management to make estimates and assumptions that affect the reported amounts and disclosures in the financial statements. The actual results could differ from those estimates.
Investment Valuation – All securities of the Funds are valued as of the close of regular trading on the New York Stock Exchange (“NYSE”), currently 4:00 p.m. (Eastern Time), on each day that the NYSE is open, subject to provisions in the prospectus and/or Statement of Additional Information regarding pricing at other times in case of an emergency and optional pricing of the Funds in the event that the NYSE does not open for business because of an emergency.
| 1-800-392-CORE (2673) ■ www.westcore.com | 175 |
Securities that are traded on a recognized domestic stock exchange are generally valued at the last sales price as of the valuation time on the principal stock exchange on which they are traded. Securities that are principally traded on the National Association of Securities Dealers Automated Quotation (“NASDAQ”) exchange are generally valued at the NASDAQ Official Closing Price (“NOCP”). Unlisted securities that are traded on the domestic over-the-counter market for which last sales prices are available, are generally valued at the last sales price as of the valuation time. In the absence of sales and NOCP, such securities are valued at the mean of the bid and asked prices.
Securities that are traded on a foreign stock exchange (and that are not listed on a recognized domestic stock exchange or traded on the NASDAQ exchange or the domestic over-the-counter market) are generally valued at the official closing price on the principal stock exchange on which they are traded. In the event that closing prices are not available for such foreign securities, such securities are generally valued at the last sales price occurring prior to the closing of its principal exchange. Exchange rates as of the close of regular trading on the NYSE are used to convert foreign security values into U.S. dollars. Forward foreign currency exchange contracts are valued on a daily basis based on the closing prices of the foreign currency rates as of the close of regular trading on the NYSE.
Fixed-income obligations, excluding municipal securities, having a remaining maturity of greater than 60 days, for which there are no readily available market quotations or sales information are valued at the mean between the evaluated bid and ask prices formulated by an independent pricing service. Municipal securities having a remaining maturity of greater than 60 days, for which there are no readily available market quotations or sales information are valued at the evaluated bid price formulated by an independent pricing service.
Securities having a remaining maturity of 60 days or less are valued at amortized cost which approximates market value.
When market quotations are not readily available or when events occur that make established valuation methods unreliable, securities of the Fund may be valued in good faith by or under the direction of the Board of Trustees. Factors which may be considered when determining the value of a security include (a) the fundamental data relating to the investment; (b) an evaluation of the forces which influence the market in which the security is sold, including the liquidity and depth of the market; (c) the market value at date of purchase; (d) information as to any transactions or offers with respect to the security or comparable securities; and (e) any other relevant matters. As of June 30, 2008, securities which have been valued in good faith, by or under the direction of the Board of Trustees, represented 4.65% and 2.87% of the net assets of Westcore Flexible Income and Westcore Plus Bond Funds, respectively.
| 176 | Semi-Annual Report June 30, 2008 (Unaudited) | |
Foreign Securities – All of the Funds, except the Westcore Colorado Tax-Exempt Fund, may invest at least a portion of their assets in foreign securities. As of June 30, 2008, all Funds were primarily invested in U.S. based issuers except Westcore International Frontier Fund. In the event that a Fund executes a foreign security transaction, the Fund will generally enter into a forward foreign currency contract to settle the foreign security transaction. Foreign securities may carry more risk than U.S. securities, such as political, market and currency risks.
The accounting records of the Funds are maintained in U.S. dollars. Prices of securities denominated in foreign currencies are translated into U.S. dollars at the closing rates of exchange at period end. Amounts related to the purchase and sale of foreign securities and investment income are translated at the rates of exchange prevailing on the respective dates of such transactions.
The effect of changes in foreign currency exchange rates on investments is separately identified from the fluctuations arising from changes in market values of securities held and reported with all other foreign currency gains and losses in the Funds’ Statements of Operations.
Federal Income Taxes – It is the Funds’ policy to continue to comply with the provisions of the Internal Revenue Code applicable to regulated investment companies and to distribute all of their taxable income to shareholders. Therefore, no federal income tax provision is required. At December 31, 2007, each Fund had available for federal income tax purposes unused capital loss carryforwards as follows:
| | | Westcore Plus | |
| Expiring | | Bond Fund | |
| 2013 | | $ | (130,618) | |
| 2014 | | | (248,374) | |
| Total | | $ | (378,992) | |
Net capital loss carryforwards utilized during the year ended December 31, 2007, were $2,941,781 for Westcore International Frontier Fund, $466,886 for Westcore Select Fund, $18,958 for Westcore Flexible Income Fund, $753,692 for Westcore Plus Bond Fund and $10,088 for Westcore Colorado Tax-Exempt Fund.
The Westcore Mid-Cap Value Fund, the Westcore Small-Cap Opportunity Fund, the Westcore Small-Cap Value Fund, the Westcore Plus Bond Fund, the Westcore Select Fund, and the Westcore International Frontier Fund elect to defer to its fiscal year ending December 31, 2008, approximately $224,810, $737,136, $172,216, $796,865, $187,205, $99,460 of capital losses recognized during the period from November 1, 2007 to December 31, 2007, respectively. Additionally, Westcore International Frontier Fund elects to defer to its fiscal year ending December 31, 2008, approximately $102 of foreign currency losses recognized during the period from November 1, 2007 to December 31, 2007.
| 1-800-392-CORE (2673) ■ www.westcore.com | 177 |
Classification of Distributions to Shareholders – Net investment income (loss) and net realized gain (loss) may differ for financial statement and tax purposes. The character of distributions made during the year from net investment income or net realized gains may differ from its ultimate characterization for federal income tax purposes. Also, due to the timing of dividend distributions, the fiscal year in which amounts are distributed may differ from the fiscal year in which the income or realized gain was recorded by the Funds. Net assets were unaffected by the reclassifications.
For the year ended December 31, 2007, each Fund recorded the following reclassifications to the accounts listed below:
| | | | Increase (Decrease) | | Increase (Decrease) |
| | | | (Over)/Undistributed Net | | Accumulated Net |
| | Paid-In-Capital | | Investment Income | | Realized Gain/(Loss) |
| Westcore MIDCO Growth Fund | $ | 0 | | $ | 1,088,420 | | $ | (1,088,420) |
| Westcore Growth Fund | | 1 | | | 149,441 | | | (149,442) |
| Westcore Select Fund | | 1 | | | 119,576 | | | (119,577) |
| Westcore International Frontier Fund | | 0 | | | (6,349) | | | 6,349 |
| Westcore Blue Chip Fund | | (1,189) | | | 54,537 | | | (53,348) |
| Westcore Mid-Cap Value Fund | | (14) | | | 16,901 | | | (16,887) |
| Westcore Small-Cap Opportunity Fund | | (129,422) | | | 129,662 | | | (240) |
| Westcore Small-Cap Value Fund | | 0 | | | (25,226) | | | 25,226 |
| Westcore Flexible Income Fund | | (31,288) | | | (1,358,232) | | | 1,389,520 |
| Westcore Plus Bond Fund | | (97,204) | | | 95,073 | | | 2,131 |
| Westcore Colorado Tax-Exempt Fund | | (5,085) | | | 5,085 | | | 0 |
The reclassifications were primarily as a result of the differing book/tax treatment of net operating losses and certain investments.
| 178 | Semi-Annual Report June 30, 2008 (Unaudited) | |
The tax character of the distributions paid during the year and the tax component of net assets were reported at the Funds’ year ended December 31, 2007.
| Westcore MIDCO Growth Fund |
| | Year Ended | | Period Ended | | Year Ended |
| | December 31, 2007 | | December 31, 2006 | | May 31, 2006 |
| Retail Class | | | | | | | | |
| Distributions paid from: | | | | | | | | |
| Ordinary Income | $ | 9,344,889 | | $ | 4,299,723 | | $ | 0 |
| Long-Term Capital Gain | | 19,358,259 | | | 24,013,746 | | | 424,049 |
| Total | $ | 28,703,148 | | $ | 28,313,469 | | $ | 424,049 |
| | | Year Ended | | | Period Ended | | | Year Ended |
| | December 31, 2007 | | December 31, 2006 | | May 31, 2006 |
| Institutional Class | | | | | | | | |
| Distributions paid from: | | | | | | | | |
| Ordinary Income | $ | 663,432 | | $ | 0 | | $ | 0 |
| Long-Term Capital Gain | | 1,374,290 | | | 0 | | | 0 |
| Total | $ | 2,037,722 | | $ | 0 | | $ | 0 |
| | | | | | | | | |
| Westcore Growth Fund |
| | | Year Ended | | | Period Ended | | | Year Ended |
| | December 31, 2007 | | December 31, 2006 | | May 31, 2006 |
| Retail Class | | | | | | | | |
| Distributions paid from: | | | | | | | | |
| Ordinary Income | $ | 2,459,864 | | $ | 0 | | $ | 56,298 |
| Long-Term Capital Gain | | 13,346,645 | | | 121,873 | | | 1,094,193 |
| Total | $ | 15,806,509 | | $ | 121,873 | | $ | 1,150,491 |
| | | Year Ended | | | Period Ended | | | Year Ended |
| | December 31, 2007 | | December 31, 2006 | | May 31, 2006 |
| Institutional Class | | | | | | | | |
| Distributions paid from: | | | | | | | | |
| Ordinary Income | $ | 26,968 | | $ | 0 | | $ | 0 |
| Long-Term Capital Gain | | 146,282 | | | 0 | | | 0 |
| Total | $ | 173,250 | | $ | 0 | | $ | 0 |
| | | | | | | | | |
| Westcore Select Fund |
| | | Year Ended | | | Period Ended | | | Year Ended |
| | December 31, 2007 | | December 31, 2006 | | May 31, 2006 |
| Retail Class | | | | | | | | |
| Distributions paid from: | | | | | | | | |
| Ordinary Income | $ | 2,663,061 | | $ | 0 | | $ | 0 |
| Long-Term Capital Gain | | 859,166 | | | 0 | | | 0 |
| Total | $ | 3,522,227 | | $ | 0 | | $ | 0 |
| 1-800-392-CORE (2673) ■ www.westcore.com | 179 |
| Westcore International Frontier Fund |
| | Year Ended | | Period Ended | | Year Ended |
| | December 31, 2007 | | December 31, 2006 | | May 31, 2006 |
| Retail Class | | | | | | | | |
| Distributions paid from: | | | | | | | | |
| Ordinary Income | $ | 554,632 | | $ | 306,597 | | $ | 64,646 |
| Long-Term Capital Gain | | 544,992 | | | 0 | | | 0 |
| Total | $ | 1,099,624 | | $ | 306,597 | | $ | 64,646 |
| | | | | | | | | |
| Westcore Blue Chip Fund |
| | | Year Ended | | | Period Ended | | | Year Ended |
| | December 31, 2007 | | December 31, 2006 | | May 31, 2006 |
| Retail Class | | | | | | | | |
| Distributions paid from: | | | | | | | | |
| Ordinary Income | $ | 467,394 | | $ | 413,567 | | $ | 300,005 |
| Long-Term Capital Gain | | 3,278,050 | | | 3,233,139 | | | 4,500,076 |
| Total | $ | 3,745,444 | | $ | 3,646,706 | | $ | 4,800,081 |
| | | | | | | | | |
| | | Year Ended | | | Period Ended | | | Year Ended |
| | December 31, 2007 | | December 31, 2006 | | May 31, 2006 |
| Institutional Class | | | | | | | | |
| Distributions paid from: | | | | | | | | |
| Ordinary Income | $ | 60,632 | | $ | 0 | | $ | 0 |
| Long-Term Capital Gain | | 397,018 | | | 0 | | | 0 |
| Total | $ | 457,650 | | $ | 0 | | $ | 0 |
| | | | | | | | | |
| Westcore Mid-Cap Value Fund |
| | | Year Ended | | | Period Ended | | | Year Ended |
| | December 31, 2007 | | December 31, 2006 | | May 31, 2006 |
| Retail Class | | | | | | | | |
| Distributions paid from: | | | | | | | | |
| Ordinary Income | $ | 293,959 | | $ | 400,024 | | $ | 634,195 |
| Long-Term Capital Gain | | 915,507 | | | 1,100,587 | | | 2,411,755 |
| Total | $ | 1,209,466 | | $ | 1,500,611 | | $ | 3,045,950 |
| | | | | | | | | |
| Westcore Small-Cap Opportunity Fund |
| | | Year Ended | | | Period Ended | | | Year Ended |
| | December 31, 2007 | | December 31, 2006 | | May 31, 2006 |
| Retail Class | | | | | | | | |
| Distributions paid from: | | | | | | | | |
| Ordinary Income | $ | 0 | | $ | 302,757 | | $ | 50,000 |
| Long-Term Capital Gain | | 552,722 | | | 1,699,996 | | | 2,490,489 |
| Total | $ | 552,722 | | $ | 2,002,753 | | $ | 2,540,489 |
| 180 | Semi-Annual Report June 30, 2008 (Unaudited) | |
| Westcore Small-Cap Opportunity Fund (continued) |
| | Year Ended | | Period Ended | | Year Ended |
| | December 31, 2007 | | December 31, 2006 | | May 31, 2006 |
| Institutional Class | | | | | | | | |
| Distributions paid from: | | | | | | | | |
| Long-Term Capital Gain | $ | 61,826 | | $ | 0 | | $ | 0 |
| Total | $ | 61,826 | | $ | 0 | | $ | 0 |
| | | | | | | | | |
| Westcore Small-Cap Value Fund |
| | | Year Ended | | | Period Ended | | | Year Ended |
| | December 31, 2007 | | December 31, 2006 | | May 31, 2006 |
| Retail Class: | | | | | | | | |
| Distributions paid from: | $ | 1,635,428 | | $ | 419,901 | | $ | 418,865 |
| Long-Term Capital Gain | | 966,723 | | | 17,789 | | | 0 |
| Total | $ | 2,602,151 | | $ | 437,690 | | $ | 418,865 |
| | | | | | | | | |
| | | Year Ended | | | Period Ended | | | Year Ended |
| | December 31, 2007 | | December 31, 2006 | | May 31, 2006 |
| Instiutional Class | | | | | | | | |
| Distributions paid from: | | | | | | | | |
| Ordinary Income | $ | 54,478 | | $ | 0 | | $ | 0 |
| Long-Term Capital Gain | | 30,518 | | | 0 | | | 0 |
| Total | $ | 84,996 | | $ | 0 | | $ | 0 |
| | | | | | | | | |
| Westcore Flexible Income Fund |
| | | Year Ended | | | Period Ended | | | Year Ended |
| | December 31, 2007 | | December 31, 2006 | | May 31, 2006 |
| Retail Class | | | | | | | | |
| Distributions paid from: | | | | | | | | |
| Ordinary Income | $ | 15,508,836 | | $ | 8,331,028 | | $ | 11,898,362 |
| Long-Term Capital Gain | | 741,846 | | | 0 | | | 0 |
| Paid In Capital | | 203,533 | | | 0 | | | 0 |
| Total | $ | 16,454,215 | | $ | 8,331,028 | | $ | 11,898,362 |
| | | | | | | | | |
| | | Year Ended | | | Period Ended | | | Year Ended |
| | December 31, 2007 | | December 31, 2006 | | May 31, 2006 |
| Institutional Class | | | | | | | | |
| Distributions paid from: | | | | | | | | |
| Ordinary Income | $ | 19,228 | | $ | 0 | | $ | 0 |
| Long-Term Capital Gain | | 5,046 | | | 0 | | | 0 |
| Paid In Capital | | 276 | | | 0 | | | 0 |
| Total | $ | 24,550 | | $ | 0 | | $ | 0 |
| 1-800-392-CORE (2673) ■ www.westcore.com | 181 |
| Westcore Plus-Bond Fund |
| | Year Ended | | Period Ended | | Year Ended |
| | December 31, 2007 | | December 31, 2006 | | May 31, 2006 |
| Retail Class | | | | | | | | |
| Distributions paid from: | | | | | | | | |
| Ordinary Income | $ | 50,629,968 | | $ | 18,313,453 | | $ | 19,687,611 |
| Long-Term Capital Gain | | 0 | | | 0 | | | 31,163 |
| Total | $ | 50,629,968 | | $ | 18,313,453 | | $ | 19,718,774 |
| | | | | | | | | |
| | | Year Ended | | | Period Ended | | | Year Ended |
| | December 31, 2007 | | December 31, 2006 | | May 31, 2006 |
| Institutional Class | | | | | | | | |
| Distributions paid from: | | | | | | | | |
| Ordinary Income | $ | 320,418 | | $ | 0 | | $ | 0 |
| Total | $ | 320,418 | | $ | 0 | | $ | 0 |
| | | | | | | | | |
| Westcore ColoradoTax-Exempt Fund |
| | | Year Ended | | | Period Ended | | | Year Ended |
| | December 31, 2007 | | December 31, 2006 | | May 31, 2006 |
| Retail Class | | | | | | | | |
| Distributions paid from: | | | | | | | | |
| Ordinary Income | $ | 7,800 | | $ | 2,724 | | $ | 0 |
| Tax-Exempt Income | | 2,203,445 | | | 1,251,222 | | | 2,195,840 |
| Total | $ | 2,211,245 | | $ | 1,253,946 | | $ | 2,195,840 |
As of December 31, 2007, the components of distributable earnings on a tax basis were as follows:
| | Westcore | | Westcore |
| | MIDCO | | Growth |
| | Growth Fund | | Fund |
| (Over)/Undistributed net investment income | $ | 351,196 | | $ | 2,951,199 |
| Accumulated net realized gain/(loss) on investments | | 5,630,138 | | | 7,114,174 |
| Net unrealized appreciation/depreciation on investments | | 30,487,246 | | | 79,433,527 |
| Effect of other timing differences | | (391,918) | | | (27,904) |
| Total | $ | 36,076,662 | | $ | 89,470,996 |
| | Westcore | | Westcore | | Westcore |
| | Select | | International | | Blue Chip |
| | Fund | | Frontier Fund | | Fund |
| (Over)/Undistributed net investment income | $ | 0 | | $ | 1,976 | | $ | 25,354 |
| Accumulated net realized gain/(loss) | | | | | | | | |
| on investments | | (187,434) | | | (99,460) | | | 49,758 |
| Net unrealized appreciation/(depreciation) | | | | | | | | |
| on investments | | 1,101,754 | | | 1,042,727 | | | 14,236,808 |
| Effect of other timing differences | | (7,677) | | | (7,032) | | | (41,422) |
| Total | $ | 906,643 | | $ | 938,211 | | $ | 14,270,498 |
| 182 | Semi-Annual Report June 30, 2008 (Unaudited) | |
| | Westcore | | Westcore | | Westcore |
| | Mid-Cap | | Small-Cap | | Small-Cap |
| | Value Fund | | Opportunity Fund | | Value Fund |
| (Over)/Undistributed net investment income | $ | 0 | | $ | 0 | | $ | 3,579 |
| Accumulated net realized gain/(loss) | | | | | | | | |
| on investments | | (167,739) | | | (736,083) | | | (172,216) |
| Net unrealized appreciation/(depreciation) | | | | | | | | |
| on investments | | 13,672,915 | | | 3,379,052 | | | (2,640,205) |
| Effect of other timing differences | | 28,534 | | | (35,046) | | | 30,846 |
| Total | $ | 13,533,710 | | $ | 2,607,923 | | $ | (2,777,996) |
| | | | | | | | | |
| | | Westcore | | | Westcore | | | Westcore |
| | | Flexible | | | Plus Bond | | | Colorado |
| | | Income Fund | | | Fund | | Tax-Exempt Fund |
| (Over)/Undistributed net investment income | $ | 0 | | $ | 0 | | $ | 0 |
| Accumulated net realized gain/(loss) | | | | | | | | |
| on investments | | 0 | | | (1,175,857) | | | 3,590 |
| Net unrealized appreciation/(depreciation) | | | | | | | | |
| on investments | | (16,562,746) | | | (436,653) | | | 602,137 |
| Effect of other timing differences | | (119,561) | | | (42,606) | | | (24,982) |
| Total | $ | (16,682,307) | | $ | (1,655,116) | | $ | 580,745 |
The effect of other timing differences primarily includes deferred Trustees’ compensation.
Distributions – Distributions of net investment income, if any, are generally made annually for the Westcore MIDCO Growth, Westcore Growth, Westcore Select, Westcore International Frontier, Westcore Blue Chip, Westcore Mid-Cap Value, Westcore Small-Cap Opportunity, Westcore Small-Cap Value and Westcore Micro-Cap Opportunity Funds and monthly for the Westcore Flexible Income, Westcore Plus Bond and Westcore Colorado Tax-Exempt Funds. Distributions of net realized capital gains, if any, are declared at least once each year for each of the Funds. Distributions to shareholders are recorded on the ex-dividend date.
Securities Lending – The Westcore Funds may loan securities to certain brokers who pay the Funds negotiated lenders’ fees. When earned, these fees, net of associated costs, are included in other income. The Funds receive U.S. Treasury obligations and/or cash as collateral against the loaned securities, in an amount at least equal to 102% of the market value of the loaned securities at the inception of each loan. This collateral must be maintained at not less than 100% of the market value of the loaned securities during the period of the loan. The risks to the Funds of securities lending are that the borrower may not provide additional collateral when required or return the securities when due. The Funds did not loan securities during the six month period ended June 30, 2008.
| 1-800-392-CORE (2673) ■ www.westcore.com | 183 |
Expenses: Expenses that are specific to a Fund or class of shares of a Fund are charged directly to that Fund or share class. Expenses that are common to all Funds generally are allocated among the Funds in proportion to their average daily net assets.
Expenses related to specific classes and the associated Fund level expenses, for the six months ended June 30, 2008, were as follows:
| Westcore MIDCO Growth Fund |
| | Retail Class | | Institutional Class | | Fund |
| Administrative fee | $ | - | | $ | 830 | | $ | 145,676 |
| Shareholder servicing reimbursements | | 38,418 | | | 0 | | | 0 |
| Transfer agent fees | | 16,364 | | | 63 | | | 12,857 |
| Legal fees | | 0 | | | 2,880 | | | 2,099 |
| Registration fees | | 3,434 | | | 1,013 | | | 0 |
| Other | | 1,275 | | | 1,229 | | | 1,749 |
| Westcore Growth Fund |
| | | Retail Class | | Institutional Class | | | Fund |
| Administrative fee | $ | - | | $ | 4,977 | | $ | 229,197 |
| Shareholder servicing reimbursements | | 109,745 | | | 0 | | | 0 |
| Transfer agent fees | | 10,247 | | | 45 | | | 9,590 |
| Fund accounting fees and expenses | | 0 | | | 3,732 | | | 45,237 |
| Legal fees | | 0 | | | 713 | | | 3,294 |
| Registration fees | | 10,799 | | | 1,013 | | | 0 |
| Other | | 1,275 | | | 1,229 | | | 2,409 |
| | | | | | | | | |
| Westcore Blue Chip Fund |
| | | Retail Class | | Institutional Class | | | Fund |
| Administrative fee | $ | - | | $ | 2,703 | | $ | 48,706 |
| Shareholder servicing reimbursements | | 5,699 | | | 0 | | | 0 |
| Transfer agent fees | | 4,011 | | | 55 | | | 7,786 |
| Fund accounting fees and expenses | | 0 | | | 1,458 | | | 17,595 |
| Legal fees | | 0 | | | 1,692 | | | 719 |
| Registration fees | | 4,747 | | | 432 | | | 0 |
| Other | | 1,275 | | | 1,229 | | | 906 |
| | | | | | | | | |
| Westcore Small-Cap Opportunity Fund |
| | | Retail Class | | Institutional Class | | | Fund |
| Administrative fee | $ | - | | $ | 4,972 | | $ | 23,414 |
| Shareholder servicing reimbursements | | 6,080 | | | 0 | | | 0 |
| Transfer agent fees | | 3,977 | | | 33 | | | 7,697 |
| Fund accounting fees and expenses | | 0 | | | 3,732 | | | 17,927 |
| Legal fees | | 0 | | | 585 | | | 351 |
| Registration fees | | 14,773 | | | 1,087 | | | 0 |
| Other | | 1,275 | | | 1,229 | | | 713 |
| 184 | Semi-Annual Report June 30, 2008 (Unaudited) | |
| Westcore Small-Cap Value Fund |
| | Retail Class | | Institutional Class | | Fund |
| Administrative fee | $ | - | | $ | 4,977 | | $ | 144,857 |
| Shareholder servicing reimbursements | | 54,148 | | | 0 | | | 0 |
| Transfer agent fees | | 1,933 | | | 296 | | | 7,014 |
| Fund accounting fees and expenses | | 0 | | | 3,730 | | | 30,501 |
| Legal fees | | 0 | | | 802 | | | 2,043 |
| Registration fees | | 11,298 | | | 891 | | | 0 |
| Other | | 1,275 | | | 1,229 | | | 4,022 |
| | | | | | | | | |
| Westcore Flexible Income Fund |
| | | Retail Class | | Institutional Class | | | Fund |
| Administrative fee | $ | - | | $ | 4,978 | | $ | 162,505 |
| Shareholder servicing reimbursements | | 71,897 | | | 0 | | | 0 |
| Transfer agent fees | | 14,171 | | | 22 | | | 10,279 |
| Fund accounting fees and expenses | | 0 | | | 3,732 | | | 40,262 |
| Legal fees | | 0 | | | 386 | | | 2,543 |
| Registration fees | | 6,937 | | | 1,013 | | | 0 |
| Other | | 1,275 | | | 1,229 | | | 37,534 |
| | | | | | | | | |
| Westcore Plus Bond Fund |
| | | Retail Class | | Institutional Class | | | Fund |
| Shareholder servicing reimbursements | $ | 391,602 | | $ | 0 | | $ | 0 |
| Transfer agent fees | | 97,230 | | | 699 | | | 41,057 |
| Legal fees | | 0 | | | 6,804 | | | 16,531 |
| Registration fees | | 13,652 | | | 1,013 | | | 0 |
| Other | | 1,275 | | | 1,251 | | | 12,331 |
| 1-800-392-CORE (2673) ■ www.westcore.com | 185 |
When-Issued Securities – Each Fund may purchase or sell securities on a “when issued” or “forward commitment” basis which involves a commitment by the Fund to purchase or sell particular securities with payment and delivery taking place at a future date. During this period, such securities do not earn interest, are subject to market fluctuation and may increase or decrease in value prior to their delivery. Each Fund maintains, in a segregated account with its custodian, liquid assets with a market value at least equal to the amount of its purchase commitments. The purchase of securities on a when-issued or forward commitment basis may increase the volatility of the Fund’s net asset value to the extent each Fund makes such purchases while remaining substantially fully invested. Settlements in the ordinary course of business, which may take substantially more than three business days for non-US securities, are not treated by the Funds as “when-issued” or “forward commitment” transactions.
Other – For financial reporting purposes, the Funds’ investment holdings include trades executed through the end of the last business day of the period. In addition, all shareholder transactions processed through the end of the last business day of the period are included in the beneficial interest transaction amounts. Dividend income is recorded on the ex-dividend date. Interest income, which includes amortization of premiums, accretion of discounts and income earned on money market funds, is accrued and recorded daily. Realized gains and losses from investment transactions and unrealized appreciation and depreciation of investments are reported on an identified cost basis.
The Funds recharacterize distributions received from Real Estate Investment Trusts (“REIT”) investments based on information provided by the REIT into the following categories: ordinary income, long-term capital gains, and return of capital. If information is not available on a timely basis from the REIT, the recharacterization will be based on available information which may include the previous year’s allocation. If new or additional information becomes available from the REIT at a later date, a recharacterization will be made in the following year. The Funds record as dividend income the amount recharacterized as ordinary income and as realized gain the amount recharacterized as capital in the Statement of Operations, and the amount recharacterized as a return of capital as a reduction to the cost of investments in the Statement of Assets and Liabilities and on the Portfolio of Investments. These recharacterizations are reflected in the accompanying financial statements.
| 186 | Semi-Annual Report June 30, 2008 (Unaudited) | |
2. Shares of Beneficial Interest
On June 30, 2008, there was an unlimited number of no par value shares of beneficial interest authorized for each Fund. Transactions in dollars and shares of beneficial interest were as follows:
| Westcore Equity Funds |
| Westcore MIDCO Growth Fund | | | | | |
| | Six Months Ended | | Year Ended |
| | June 30, 2008(1) | | December 31, 2007 |
| Dollars issued and redeemed: | | | | | |
| Retail Class: | | | | | |
| Shares sold | $ | 7,499,133 | | $ | 28,255,677 |
| Shares issued as reinvestment of dividends | | | | | |
| and distributions | | 0 | | | 26,074,045 |
| Total | | 7,499,133 | | | 54,329,722 |
| Shares redeemed | | (42,058,604) | | | (58,221,794) |
| Net decrease from beneficial interest transactions | $ | (34,559,471) | | $ | (3,892,072) |
| Institutional Class(2): | | | | | |
| Shares sold | $ | 29,623,475 | | $ | 13,274,342 |
| Shares issued as reinvestment of dividends | | | | | |
| and distributions | | 0 | | | 2,037,767 |
| Total | | 29,623,475 | | | 15,312,109 |
| Shares redeemed | | (1,201,359) | | | (121,596) |
| Net increase from beneficial interest transactions | $ | 28,422,116 | | $ | 15,190,513 |
| | | | | | |
| Shares issued and redeemed: | | | | | |
| Retail Class: | | | | | |
| Shares sold | | 1,168,851 | | | 3,601,496 |
| Common shares issued as reinvestment of dividends | | | | | |
| and distributions | | 0 | | | 3,746,271 |
| Total | | 1,168,851 | | | 7,347,767 |
| Shares redeemed | | (6,447,507) | | | (7,059,646) |
| Net increase/(decrease) in shares | | (5,278,656) | | | 288,121 |
| Institutional Class(2): | | | | | |
| Shares sold | | 4,500,164 | | | 1,517,668 |
| Common shares issued as reinvestment of dividends | | | | | |
| and distributions | | 0 | | | 292,363 |
| Total | | 4,500,164 | | | 1,810,031 |
| Shares redeemed | | (190,856) | | | (14,330) |
| Net increase in shares | | 4,309,308 | | | 1,795,701 |
(1) Unaudited
(2) The Fund began offering Institutional shares on September 28, 2007.
| 1-800-392-CORE (2673) ■ www.westcore.com | 187 |
| Westcore Growth Fund |
| | Six Months Ended | | Year Ended |
| | June 30, 2008(1) | | December 31, 2007 |
| | | | |
| Dollars issued and redeemed: | | | | | |
| Retail Class: | | | | | |
| Shares sold | $ | 46,162,007 | | $ | 86,689,911 |
| Shares issued as reinvestment of dividends | | | | | |
| and distributions | | 0 | | | 15,690,449 |
| Total | | 46,162,007 | | | 102,380,360 |
| Shares redeemed | | (59,807,392) | | | (122,604,697) |
| Net decrease from beneficial interest transactions | $ | (13,645,385) | | $ | (20,224,337) |
| Institutional Class(2): | | | | | |
| Shares sold | $ | 407,177 | | $ | 3,414,522 |
| Shares issued as reinvestment of dividends | | | | | |
| and distributions | | 0 | | | 173,233 |
| Total | | 407,177 | | | 3,587,755 |
| Shares redeemed | | (115,390) | | | (91,285) |
| Net increase from beneficial interest transactions | $ | 291,787 | | $ | 3,496,470 |
| | | | | | |
| Shares issued and redeemed: | | | | | |
| Retail Class: | | | | | |
| Shares sold | | 3,356,890 | | | 5,876,973 |
| Common shares issued as reinvestment of dividends | | | | | |
| and distributions | | 0 | | | 1,009,681 |
| Total | | 3,356,890 | | | 6,886,654 |
| Shares redeemed | | (4,350,138) | | | (8,078,805) |
| Net decrease in shares | | (993,248) | | | (1,192,151) |
| Institutional Class(2): | | | | | |
| Shares sold | | 29,885 | | | 207,651 |
| Common shares issued as reinvestment of dividends | | | | | |
| and distributions | | 0 | | | 11,141 |
| Total | | 29,885 | | | 218,792 |
| Shares redeemed | | (8,428) | | | (5,559) |
| Net increase in shares | | 21,457 | | | 213,233 |
| | | | | | |
| Westcore Select Fund |
| | | Six Months Ended | | | Year Ended |
| | | June 30, 2008 | | | December 31, 2007 |
| Shares issued and redeemed: | | | | | |
| Retail Class: | | | | | |
| Shares sold | | 690,698 | | | 1,227,359 |
| Common shares issued as reinvestment of dividends | | | | | |
| and distributions | | 0 | | | 195,808 |
| Total | | 690,698 | | | 1,423,167 |
| Shares redeemed | | (390,641) | | | (645,426) |
| Net increase in shares | | 300,057 | | | 777,741 |
(1) Unaudited
(2) The Fund began offering Institutional shares on September 28, 2007.
| 188 | Semi-Annual Report June 30, 2008 (Unaudited) | |
| Westcore International Frontier Fund |
| | Six Months Ended | | Year Ended |
| | June 30, 2008(1) | | December 31, 2007 |
| Shares issued and redeemed: | | | | | |
| Retail Class: | | | | | |
| Shares sold | $ | 170,320 | | $ | 727,238 |
| Common shares issued as reinvestment of dividends | | | | | |
| and distributions | | 0 | | | 58,831 |
| Total | | 170,320 | | | 786,069 |
| Shares redeemed | | (255,621) | | | (438,181) |
| Net increase/(decrease) in shares | | (85,301) | | | 347,888 |
| | | | | | |
| Westcore Blue Chip Fund |
| | | Six Months Ended | | | Year Ended |
| | | June 30, 2008 | | | December 31, 2007 |
| Dollars issued and redeemed: | | | | | |
| Retail Class: | | | | | |
| Shares sold | $ | 671,905 | | $ | 4,711,320 |
| Shares issued as reinvestment of dividends | | | | | |
| and distributions | | 0 | | | 3,581,770 |
| Total | | 671,905 | | | 8,293,090 |
| Shares redeemed | | (24,739,113) | | | (20,456,006) |
| Net decrease from beneficial interest transactions | $ | (24,067,208) | | $ | (12,162,916) |
| Institutional Class(2): | | | | | |
| Shares sold | $ | 22,123,322 | | $ | 7,065,619 |
| Shares issued as reinvestment of dividends | | | | | |
| and distributions | | 0 | | | 457,659 |
| Total | | 22,123,322 | | | 7,523,278 |
| Shares redeemed | | (686,994) | | | (102,839) |
| Net increase from beneficial interest transactions | $ | 21,436,328 | | $ | 7,420,439 |
| Shares issued and redeemed: | | | | | |
| Retail Class: | | | | | |
| Shares sold | | 52,875 | | | 333,802 |
| Common shares issued as reinvestment of dividends | | | | | |
| and distributions | | 0 | | | 269,712 |
| Total | | 52,875 | | | 603,514 |
| Shares redeemed | | (1,941,220) | | | (1,394,690) |
| Net decrease in shares | | (1,888,345) | | | (791,176) |
| Institutional Class(2): | | | | | |
| Shares sold | | 1,737,088 | | | 466,743 |
| Common shares issued as reinvestment of dividends | | | | | |
| and distributions | | 0 | | | 34,462 |
| Total | | 1,737,088 | | | 501,205 |
| Shares redeemed | | (54,247) | | | (7,015) |
| Net increase in shares | | 1,682,841 | | | 494,190 |
(1) Unaudited
(2) The Fund began offering Institutional shares on September 28, 2007.
| 1-800-392-CORE (2673) ■ www.westcore.com | 189 |
| Westcore Mid-Cap Value Fund |
| | Six Months Ended | | Year Ended |
| | June 30, 2008(1) | | December 31, 2007 |
| Shares issued and redeemed: | | | | | |
| Retail Class: | | | | | |
| Shares sold | $ | 446,435 | | $ | 1,996,924 |
| Common shares issued as reinvestment of dividends | | | | | |
| and distributions | | 0 | | | 49,731 |
| Total | | 446,435 | | | 2,046,655 |
| Shares redeemed | | (848,728) | | | (1,418,497) |
| Net increase/(decrease) in shares | | (402,293) | | | 628,158 |
| | | | | | |
| Westcore Small-Cap Opportunity Fund |
| | | Six Months Ended | | | Year Ended |
| | | June 30, 2008 | | | December 31, 2007 |
| Dollars issued and redeemed: | | | | | |
| Retail Class: | | | | | |
| Shares sold | $ | 1,666,286 | | $ | 22,520,826 |
| Shares issued as reinvestment of dividends | | | | | |
| and distributions | | 0 | | | 545,386 |
| Total | | 1,666,286 | | | 23,066,212 |
| Shares redeemed | | (7,420,214) | | | (16,426,938) |
| Net increase/(decrease) from beneficial interest transactions | $ | (5,753,928) | | $ | 6,639,274 |
| Institutional Class(2): | | | | | |
| Shares sold | $ | 555,468 | | $ | 3,565,559 |
| Shares issued as reinvestment of dividends | | | | | |
| and distributions | | 0 | | | 61,826 |
| Total | | 555,468 | | | 3,627,385 |
| Shares redeemed | | (107,294) | | | (41,157) |
| Net increase from beneficial interest transactions | $ | 448,174 | | $ | 3,586,228 |
| Shares issued and redeemed: | | | | | |
| Retail Class: | | | | | |
| Shares sold | | 52,611 | | | 575,924 |
| Common shares issued as reinvestment of dividends | | | | | |
| and distributions | | 0 | | | 15,772 |
| Total | | 52,611 | | | 591,696 |
| Shares redeemed | | (231,946) | | | (425,369) |
| Net increase/(decrease) in shares | | (179,335) | | | 166,327 |
| Institutional Class(2): | | | | | |
| Shares sold | | 17,560 | | | 92,150 |
| Common shares issued as reinvestment of dividends | | | | | |
| and distributions | | 0 | | | 1,788 |
| Total | | 17,560 | | | 93,938 |
| Shares redeemed | | (3,439) | | | (1,122) |
| Net increase in shares | | 14,121 | | | 92,816 |
(1) Unaudited
(2) The Fund began offering Institutional shares on September 28, 2007.
| 190 | Semi-Annual Report June 30, 2008 (Unaudited) | |
| Westcore Small-Cap Value Fund |
| | Six Months Ended | | Year Ended |
| | June 30, 2008(1) | | December 31, 2007 |
| Dollars issued and redeemed: | | | | | |
| Retail Class: | | | | | |
| Shares sold | $ | 64,080,704 | | $ | 142,557,966 |
| Shares issued as reinvestment of dividends | | | | | |
| and distributions | | 0 | | | 2,541,647 |
| Total | | 64,080,704 | | | 145,099,613 |
| Shares redeemed | | (35,693,318) | | | (29,956,314) |
| Net increase from beneficial interest transactions | $ | 28,387,386 | | $ | 115,143,299 |
| Institutional Class(2): | | | | | |
| Shares sold | $ | 3,826,838 | | $ | 6,502,514 |
| Shares issued as reinvestment of dividends | | | | | |
| and distributions | | 0 | | | 61,448 |
| Total | | 3,826,838 | | | 6,563,962 |
| Shares redeemed | | (596,321) | | | (155,110) |
| Net increase from beneficial interest transactions | $ | 3,230,517 | | $ | 6,408,852 |
| Shares issued and redeemed: | | | | | |
| Retail Class: | | | | | |
| Shares sold | | 5,614,096 | | | 10,907,998 |
| Common shares issued as reinvestment of dividends | | | | | |
| and distributions | | 0 | | | 208,332 |
| Total | | 5,614,096 | | | 11,116,330 |
| Shares redeemed | | (3,275,521) | | | (2,301,217) |
| Net increase in shares | | 2,338,575 | | | 8,815,113 |
| Institutional Class(2): | | | | | |
| Shares sold | | 336,755 | | | 508,968 |
| Common shares issued as reinvestment of dividends | | | | | |
| and distributions | | 0 | | | 5,037 |
| Total | | 336,755 | | | 514,005 |
| Shares redeemed | | (52,616) | | | (12,296) |
| Net increase in shares | | 284,139 | | | 501,709 |
| | | | | | |
| Westcore Micro-Cap Opportunity Fund |
| | | | | | Six Months Ended |
| | | | | | June 30, 2008(2) |
| Shares issued and redeemed: | | | | | |
| Retail Class: | | | | | |
| Shares sold | | | | | 49,035 |
| Net increase in shares | | | | | 49,035 |
(1) Unaudited
(2) The Fund began offering Institutional shares on September 28, 2007.
| 1-800-392-CORE (2673) ■ www.westcore.com | 191 |
| Westcore Bond Funds |
| Westcore Flexible Income Fund |
| | Six Months Ended | | Year Ended |
| | June 30, 2008(1) | | December 31, 2007 |
| Dollars issued and redeemed: | | | | | |
| Retail Class: | | | | | |
| Shares sold | $ | 18,866,644 | | $ | 102,175,446 |
| Shares issued as reinvestment of dividends | | | | | |
| and distributions | | 5,465,423 | | | 15,834,077 |
| Total | | 24,332,067 | | | 118,009,523 |
| Shares redeemed | | (70,895,563) | | | (156,079,841) |
| Net decrease from beneficial interest transactions | $ | (46,563,496) | | $ | (38,070,318) |
| Institutional Class(2): | | | | | |
| Shares sold | $ | 97,683 | | $ | 1,713,028 |
| Shares issued as reinvestment of dividends | | | | | |
| and distributions | | 41,437 | | | 24,646 |
| Total | | 139,120 | | | 1,737,674 |
| Shares redeemed | | (304,798) | | | (205,105) |
| Net increase/(decrease) from beneficial interest transactions | $ | (165,678) | | $ | 1,532,569 |
| Shares issued and redeemed: | | | | | |
| Retail Class: | | | | | |
| Shares sold | | 2,076,076 | | | 9,847,619 |
| Common shares issued as reinvestment of dividends | | | | | |
| and distributions | | 605,338 | | | 1,558,518 |
| Total | | 2,681,414 | | | 11,406,137 |
| Shares redeemed | | (7,885,838) | | | (15,325,871) |
| Net decrease in shares | | (5,204,424) | | | (3,919,734) |
| Institutional Class(2): | | | | | |
| Shares sold | | 10,778 | | | 170,306 |
| Common shares issued as reinvestment of dividends | | | | | |
| and distributions | | 4,593 | | | 2,559 |
| Total | | 15,371 | | | 172,865 |
| Shares redeemed | | (33,694) | | | (21,214) |
| Net increase/(decrease) in shares | | (18,323) | | | 151,651 |
(1) Unaudited
(2) The Fund began offering Institutional shares on September 28, 2007.
| 192 | Semi-Annual Report June 30, 2008 (Unaudited) | |
| Westcore Plus Bond Fund |
| | Six Months Ended | | Year Ended |
| | June 30, 2008(1) | | December 31, 2007 |
| Dollars issued and redeemed: | | | | | |
| Retail Class: | | | | | |
| Shares sold | $ | 235,074,891 | | $ | 624,817,872 |
| Shares issued as reinvestment of dividends | | | | | |
| and distributions | | 23,809,036 | | | 43,049,382 |
| Total | | 258,883,927 | | | 667,867,254 |
| Shares redeemed | | (218,373,451) | | | (297,513,671) |
| Net increase from beneficial interest transactions | $ | 40,510,476 | | $ | 370,353,583 |
| Institutional Class(2): | | | | | |
| Shares sold | $ | 41,388,133 | | $ | 35,780,446 |
| Shares issued as reinvestment of dividends | | | | | |
| and distributions | | 893,218 | | | 70,089 |
| Total | | 42,281,351 | | | 35,850,535 |
| Shares redeemed | | (4,218,956) | | | (415,158) |
| Net increase from beneficial interest transactions | $ | 38,062,395 | | $ | 35,435,377 |
| Shares issued and redeemed: | | | | | |
| Retail Class: | | | | | |
| Shares sold | | 22,311,444 | | | 59,406,559 |
| Common shares issued as reinvestment of dividends | | | | | |
| and distributions | | 2,276,213 | | | 4,107,516 |
| Total | | 24,587,657 | | | 63,514,075 |
| Shares redeemed | | (20,749,720) | | | (28,345,201) |
| Net increase in shares | | 3,837,937 | | | 35,168,874 |
| Institutional Class(2): | | | | | |
| Shares sold | | 3,906,011 | | | 3,400,625 |
| Common shares issued as reinvestment of dividends | | | | | |
| and distributions | | 85,380 | | | 6,663 |
| Total | | 3,991,391 | | | 3,407,288 |
| Shares redeemed | | (402,258) | | | (39,432) |
| Net increase in shares | | 3,589,133 | | | 3,367,856 |
| | | | | | |
| Westcore Colorado Tax-Exempt Fund |
| | | Six Months Ended | | | Year Ended |
| | | June 30, 2008 | | | December 31, 2007 |
| | | | | | |
| Shares issued and redeemed: | | | | | |
| Retail Class: | | | | | |
| Shares sold | | 748,929 | | | 972,572 |
| Common shares issued as reinvestment of dividends | | | | | |
| and distributions | | 93,712 | | | 174,640 |
| Total | | 842,641 | | | 1,147,212 |
| Shares redeemed | | (487,263) | | | (971,672) |
| Net increase in shares | | 355,378 | | | 175,540 |
(1) Unaudited
(2) The Fund began offering Institutional shares on September 28, 2007.
| 1-800-392-CORE (2673) ■ www.westcore.com | 193 |
| 3. Unrealized Appreciation and Depreciation on Investments |
| (Tax Basis) | | | | | | | | |
| | | | | | | | | |
| Westcore Equity Funds |
| | Westcore MIDCO | | Westcore | | Westcore |
| | Growth Fund | | Growth Fund | | Select Fund |
| As of June 30, 2008 | | | | | | | | |
| Gross appreciation (excess of value over tax cost) | $ | 22,771,782 | | $ | 41,107,537 | | $ | 1,656,845 |
| Gross depreciation (excess of tax cost over value) | | (14,902,705) | | | (7,146,257) | | | (4,347,991) |
| Net unrealized appreciation/(depreciation) | $ | 7,869,077 | | $ | 33,961,280 | | $ | (2,691,146) |
| Cost of investment for income tax purposes | $ | 148,549,278 | | $ | 210,845,021 | | $ | 39,616,229 |
| | | | | | | | |
| | | | | | | | | |
| | | Westcore | | | | | | Westcore |
| | | International | | | Westcore | | | Mid-Cap |
| | | Frontier Fund | | Blue Chip Fund | | | Value Fund |
| | | | | | | | |
| As of June 30, 2008 | | | | | | | | |
| Gross appreciation (excess of value over tax cost) | $ | 2,731,908 | | $ | 13,234,089 | | $ | 13,813,433 |
| Gross depreciation (excess of tax cost over value) | | (7,606,379) | | | (3,370,942) | | | (8,544,996) |
| | | | | | | | |
| Net unrealized appreciation/(depreciation) | $ | (4,874,471) | | $ | 9,863,147 | | $ | 5,268,437 |
| Cost of investment for income tax purposes | $ | 40,539,930 | | $ | 43,215,349 | | $ | 77,809,425 |
| | | | | | | | |
| | | | | | | | | |
| | | Westcore | | | Westcore | | | Westcore |
| | | Small-Cap | | | Small-Cap | | | Micro-Cap |
| | Opportunity Fund | | | Value Fund | | Opportunity Fund |
| | | | | | | |
| As of June 30, 2008 | | | | | | | | |
| Gross appreciation (excess of value over tax cost) | $ | 4,061,214 | | $ | 12,147,848 | | $ | 1,241 |
| Gross depreciation (excess of tax cost over value) | | (2,855,688) | | | (30,940,368) | | | (24,775) |
| | | | | | | | |
| Net unrealized appreciation/(depreciation) | $ | 1,205,526 | | $ | (18,792,520) | | $ | (23,534) |
| Cost of investment for income tax purposes | $ | 23,039,198 | | $ | 201,626,064 | | $ | 554,914 |
| | | | | | | | |
| | | | | | | | | |
| Westcore Bond Funds |
| | | Westcore | | | | | | Westcore |
| | | Flexible | | | Westcore | | | Colorado |
| | | Income Fund | | Plus Bond Fund | | Tax-Exempt Fund |
| | | | | | | |
| As of June 30, 2008 | | | | | | | | |
| Gross appreciation (excess of value over tax cost) | $ | 3,290,331 | | $ | 12,198,959 | | $ | 839,386 |
| Gross depreciation (excess of tax cost over value) | | (26,068,841) | | | (37,057,231) | | | (1,125,431) |
| Net unrealized depreciation | $ | (22,778,510) | | $ | (24,858,272) | | $ | (286,045) |
| Cost of investment for income tax purposes | $ | 168,581,353 | | $ | 1,205,330,032 | | $ | 59,626,234 |
4. Investment Advisory Fees, Administrative Fees and Other Related Party Transactions
The Trust has entered into an advisory agreement with Denver Investment Advisors LLC (the “Advisor” or “DenverIA”) for all Funds. The advisory agreement has been approved by the Trust’s Board of Trustees.
Pursuant to its advisory agreement with the Trust, DenverIA is entitled to an investment advisory fee, computed daily and payable monthly of 0.65%, 0.65%, 0.65%, 1.20%, 0.65%, 0.75%, 1.00%, 1.00%, 1.00%, 0.45%, 0.45% and 0.50% of the average net assets for Westcore MIDCO Growth, Westcore Growth, Westcore Select, Westcore International Frontier, Westcore Blue Chip, Westcore Mid-Cap Value, Westcore Small-Cap Opportunity, Westcore Small-Cap Value, Westcore Micro-Cap Opportunity, Westcore Flexible Income, Westcore Plus Bond and Westcore Colorado Tax-Exempt Funds, respectively.
| 194 | Semi-Annual Report June 30, 2008 (Unaudited) | |
ALPS Fund Services, Inc. (“ALPS”) and DenverIA serve as the Funds’ co-administrators (“Co-Administrators”). ALPS and DenverIA are entitled to receive a total fee from each Fund for its administrative services computed daily and paid monthly. DenverIA and ALPS agreed to allocate the co-administration fee as shown in the chart below. ALPS’ is also entitled to a minimum Trust level fee of $357,250 per annum, but no more than the amount of the administration fees paid by the Trust.
| | ALPS | DenverIA | Total |
| First $750 million in average daily Net Assets of the Trust | 0.05% | 0.20% | 0.25% |
| Next $250 million in average daily Net Assets of the Trust | 0.04% | 0.16% | 0.20% |
| Net Assets greater than $1.0 billion in average daily Net Assets of the Trust | 0.025% | 0.10% | 0.125% |
The administrative fees are then allocated to each Fund based upon the Fund’s relative proportion of the Trust’s Net Assets.
In addition, ALPS is entitled to an Institutional Class minimum administration fee. The fee is charged directly to each Institutional Class based on the Class’ assets in accordance with the schedule below.
| Assets | Annual Fee |
| $0 - $9,999,999 | $10,000 |
| $10,000,000 - $19,999,999 | $7,500 |
| $20,000,000 - $29,999,999 | $5,000 |
| $30,000,000 - $39,999,999 | $2,500 |
| Over $40,000,000 | $0 |
The Trust has agreed to reimburse DenverIA for a portion of the payments it makes to certain third party intermediaries for providing recordkeeping and sub-accounting services to persons who own Fund Retail Class shares through omnibus accounts (“Omnibus Accounts”). The amount reimbursed by the Trust is intended to not exceed the cost that would be incurred by the Trust if the shares held in the Omnibus Accounts were serviced directly by the Fund’s transfer agent.
To determine the reimbursement amount, the Trust’s effective cost for servicing shares directly by the Fund’s transfer agent is calculated on a semi-annual basis as follows (“Effective Rate”): Trust Retail Class Transfer Agency Costs divided by the Retail Class Trust Assets serviced directly by the Fund’s Transfer Agent.
This Effective Rate is then multiplied by the Retail Class assets in the Omnibus Accounts to determine the reimbursement amount.
| 1-800-392-CORE (2673) ■ www.westcore.com | 195 |
The Co-Administrators and the Advisor have contractually agreed to waive fees or reimburse expenses with respect to the Micro-Cap Opportunity Fund until at least June 23, 2009 and for each of the other Funds until at least April 30, 2009 so that the Net Annual Fund Operating Expenses for the Retail Class shares of the Westcore MIDCO Growth, Westcore Growth, Westcore Select, Westcore International Frontier, Westcore Blue Chip, Westcore Mid-Cap Value, Westcore Small-Cap Opportunity, Westcore Small-Cap Value, Westcore Micro-Cap Opportunity, Westcore Flexible Income, Westcore Plus Bond and Westcore Colorado Tax-Exempt Funds will not exceed 1.15%, 1.15%, 1.15%, 1.50%, 1.15%, 1.25%, 1.30%, 1.30%, 1.30%, 0.85%, 0.55%, and 0.65%, respectively. Without such fee waivers, for the period January 1, 2008 to June 30, 2008 the Total Annualized Fund Operating Expenses of the Westcore Select, Westcore International Frontier, Westcore Small-Cap Opportunity, Westcore Small-Cap Value, Westcore Flexible Income, Westcore Plus Bond, and Westcore Colorado Tax-Exempt Funds would be 1.18%, 1.87%, 1.68%, 1.36%, 0.89%, 0.79% and 0.92%, respectively. Without such fee waivers, for the period June 23, 2008 to June 30, 2008 the Total Annualized Fund Operating Expenses of the Westcore Micro-Cap Opportunity Fund would be 533.32%.
The Co-Administrators and the Advisor have contractually agreed to waive fees or reimburse expenses with respect to Institutional Class shares until at least April 30, 2009. The Advisor will waive its investment advisory and/or administration fees and/or reimburse for all the ongoing class-specific expenses for the Institutional Class shares. Without such fee waivers, for the period January 1, 2008 to June 30, 2008, the Total Annualized Operating Expenses for the Institutional Class shares of the Westcore MIDCO Growth, Westcore Growth, Westcore Blue Chip, Westcore Small-Cap Opportunity, Westcore Small-Cap Value, Westcore Flexible Income and Westcore Plus Bond Funds would be 0.98%, 1.67%, 1.06%, 2.24%, 1.57%, 2.54%, 0.74%, respectively.
ALPS, pursuant to a Transfer Agency Agreement, serves as Transfer Agent for each of the Funds. As Transfer Agent, ALPS has, among other things, agreed to: (a) issue and redeem shares of the Funds; (b) make dividend and other distributions to shareholders of the Funds; (c) effect transfers of shares; (d) mail communications to shareholders of the Funds, including account statements, confirmations, and dividend and distribution notices; (e) facilitates the electronic delivery of shareholder statements and reports and (f) maintain shareholder accounts. Under the Transfer Agency Agreement, ALPS receives from the Trust an annual minimum fee per Fund, a fee based upon each shareholder account and is reimbursed for out-of-pocket expenses.
ALPS has also agreed, pursuant to a separate Bookkeeping and Pricing Agreement, to maintain the financial accounts and records of the Funds and to compute the net asset value and certain other financial information of the Funds. Under the Bookkeeping and Pricing Agreement, ALPS receives from the Trust a fee based on the accounts of each Fund, subject to minimum fees on both the Retail and the Institutional Classes, and is reimbursed for out-of-pocket expenses.
| 196 | Semi-Annual Report June 30, 2008 (Unaudited) | |
Certain officers of the Funds are also officers of DenverIA. All access persons of the Trust, as defined in the 1940 Act, and members, officers and employees of the Advisor, follow strict guidelines and policies on personal trading as outlined in the Trust’s and the Advisor’s respective Code of Ethics.
The Trustees have appointed a Chief Compliance Officer who is also the Treasurer of the Trust and an employee of the Advisor. The Trustees agreed to pay the portion of his compensation attributable for services rendered as the Trust’s Chief Compliance Officer.
The Trust has a Trustee Deferred Compensation Plan (the “Deferral Plan”) which allows the trustees to defer the receipt of all or a portion of trustees fees. Under the Deferral Plan, any compensation deferred results in an equal adjustment to the Investment for/Payable for Trustee Deferred Compensation Plan on the Statement of Assets and Liabilities, as though an equivalent amount had been invested in shares of one or more Westcore Funds selected by the trustee. The amount paid to the trustees under the Deferral Plan will be determined based upon the performance of the selected funds. Deferral of trustees’ fees under the Deferral Plan will not affect the net assets of the Fund.
Shareholders individually holding more than 5% of the retail class of the Westcore Fund’s outstanding shares as of June 30, 2008, constituted 28.06% of the Westcore Small-Cap Opportunity Fund; 6.60% of the Westcore Select Fund; 14.01% of the Westcore Blue Chip Fund, 6.21% of the Westcore Colorado Tax-Exempt Fund and 91.80% of the Westcore Micro-Cap Opportunity Fund. Included in the percentages above are holdings of DenverIA and/or DenverIA’s retirement savings plan representing 6.60% of the Westcore Select Fund and 50.98% of the Westcore Micro-Cap Opportunity Fund.
Shareholders individually holding more than 5% of the institutional class of the Westcore Fund’s outstanding shares as of June 30, 2008, constituted 89.46% of the Westcore MIDCO Growth Fund; 99.43% of the Westcore Growth Fund; 87.86% of the Westcore Small-Cap Opportunity Fund; 95.70% of the Westcore Blue Chip Fund; 33.66% of the Westcore Small-CapValue Fund; 99.92% of the Westcore Flexible Income Fund and 43.55% of the Westcore Plus Bond Fund. Included in the percentages above are holdings of DenverIA and/or DenverIA’s retirement savings plan representing 25.33% of the Westcore MIDCO Growth Fund; 93.09% of the Westcore Growth Fund; 54.63% of the Westcore Small-Cap Opportunity Fund; 22.46% of the Westcore Blue Chip Fund; 21.41% of the Westcore Small-Cap Value Fund; 99.92% of the Westcore Flexible Income Fund and 5.59% of the Westcore Plus Bond Fund.
| 1-800-392-CORE (2673) ■ www.westcore.com | 197 |
5. New Accounting Pronouncements
Effective January 2, 2007, the Westcore Trust adopted FASB Interpretation No. 48 (“FIN 48”) “Accounting for Uncertainty in Income Taxes,” which requires that the financial statement effects of a tax position taken or expected to be taken in a tax return be recognized in the financial statements when it is more likely than not, based on the technical merits, that the position will be sustained upon examination. Management has concluded that the Westcore Trust has taken no uncertain tax positions that require adjustment to the financial statements to comply with the provisions of FIN 48. The Westcore Trust files income tax returns in the U.S. Federal jurisdiction and the States of Colorado and Mississippi. For the years ended May 31, 2005 through May 31, 2006 and through December 31, 2007, the Westcore Trust’s Federal and Colorado returns are still open to examination by the appropriate taxing authority. In addition, for years ended May 31, 2005 through May 31, 2006 and through December 31, 2007, the Westcore Flexible Income Fund’s Mississippi returns are still open to examination by the appropriate taxing authority as well. However, to the best of our knowledge there are currently no Federal, Colorado, or Mississippi income tax returns under examination.
In March 2008, the FASB issued Statement of Financial Accounting Standards No. 161, “Disclosures about Derivative Instruments and Hedging Activities” (“SFAS 161”). SFAS 161 is effective for fiscal years and interim periods beginning after November 15, 2008. SFAS 161 requires enhanced disclosures about Funds’ derivative and hedging activities. Management of the Funds currently believes that SFAS 161 will have no impact on the Funds’ financial statements.
6. FAS 157 Measurements
The Funds adopted Financial Accounting Standards Board Statement of Financial Accounting Standards No. 157, Fair Value Measurements (“FAS 157”), effective January 1, 2008. FAS 157 defines fair value, establishes a three-tier hierarchy to measure fair value based on the extent of use of “observable inputs” as compared to “unobservable inputs” for disclosure purposes and requires additional disclosures about these valuations measurements. Inputs refer broadly to the assumptions that market participants would use in pricing a security. Observable inputs are inputs that reflect the assumptions market participants would use in pricing the security developed based on market data obtained from sources independent of the reporting entity. Unobservable inputs are inputs that reflect the reporting entity’s own assumptions about the assumptions market participants would use in pricing the security developed based on the best information available in the circumstances.
| 198 | Semi-Annual Report June 30, 2008 (Unaudited) | |
The three-tier hierarchy is summarized as follows:
1) Level 1 - quoted prices in active markets for identical securities
2) Level 2 - other significant observable inputs (including quoted prices for similar securities, interest rates, prepayments speeds, credit risk, etc.)
3) Level 3 - significant unobservable inputs (including the Fund’s own assumptions in determining the fair value of investments)
The following is a summary of the inputs used as of June 30, 2008 in valuing the Funds’ assets:
| | Westcore MIDCO Growth Fund | | Westcore Growth Fund |
| | | | | | Other Financial | | | | | | Other Financial |
| | | | | | Instruments* | | | | | | Instruments* |
| | | | | | - Unrealized | | | | | | - Unrealized |
| | | Investments in | | | Appreciation | | | Investments in | | | Appreciation |
| Valuation Inputs | | Securities at Value | | | (Depreciation) | | | Securities at Value | | | (Depreciation) |
| | | | | | | | | | | |
| Level 1 - Quoted | | | | | | | | | | | |
| Prices | $ | 156,418,354 | | $ | - | | $ | 244,806,301 | | $ | - |
| Level 2 - Other | | | | | | | | | | | |
| Significant | | | | | | | | | | | |
| Observable Inputs | $ | - | | $ | - | | $ | - | | $ | - |
| Level 3 - Significant | | | | | | | | | | | |
| Unobservable Inputs | $ | - | | $ | - | | $ | - | | $ | - |
| Total | $ | 156,418,354 | | $ | - | | $ | 244,806,301 | | $ | - |
| | | | | | | | | | | |
| | Westcore Select Fund | | Westcore International Frontier Fund |
| | | | | | Other Financial | | | | | | Other Financial |
| | | | | | Instruments* | | | | | | Instruments* |
| | | | | | - Unrealized | | | | | | - Unrealized |
| | | Investments in | | | Appreciation | | | Investments in | | | Appreciation |
| Valuation Inputs | | Securities at Value | | | (Depreciation) | | | Securities at Value | | | (Depreciation) |
| | | | | | | | | | | |
| Level 1 - Quoted | | | | | | | | | | | |
| Prices | $ | 36,925,083 | | $ | - | | $ | 35,665,459 | | $ | - |
| Level 2 - Other | | | | | | | | | | | |
| Significant | | | | | | | | | | | |
| Observable Inputs | $ | - | | $ | - | | $ | - | | $ | - |
| Level 3 - Significant | | | | | | | | | | | |
| Unobservable Inputs | $ | - | | $ | - | | $ | - | | $ | - |
| Total | $ | 36,925,083 | | $ | - | | $ | 35,665,459 | | $ | - |
| | | | | | | | | | | |
| 1-800-392-CORE (2673) ■ www.westcore.com | 199 |
| | Westcore Blue Chip Fund | | Westcore Mid-Cap Value Fund |
| | | | | | Other Financial | | | | | | Other Financial |
| | | | | | Instruments* | | | | | | Instruments* |
| | | | | | - Unrealized | | | | | | - Unrealized |
| | | Investments in | | | Appreciation | | | Investments in | | | Appreciation |
| Valuation Inputs | | Securities at Value | | | (Depreciation) | | | Securities at Value | | | (Depreciation) |
| | | | | | | | | | | |
| Level 1 - Quoted | | | | | | | | | | | |
| Prices | $ | 53,078,495 | | $ | - | | $ | 83,077,862 | | $ | - |
| Level 2 - Other Sig- | | | | | | | | | | | |
| nificant Observable | | | | | | | | | | | |
| Inputs | $ | - | | $ | - | | $ | - | | $ | - |
| Level 3 - Significant | | | | | | | | | | | |
| Unobservable Inputs | $ | - | | $ | - | | $ | - | | $ | - |
| Total | $ | 53,078,495 | | $ | - | | $ | 83,077,862 | | $ | - |
| | | | | | | | | | | |
| | Westcore Small-Cap Opportunity Fund | | Westcore Small-Cap Value Fund |
| | | | | | Other Financial | | | | | | Other Financial |
| | | | | | Instruments* | | | | | | Instruments* |
| | | | | | - Unrealized | | | | | | - Unrealized |
| | | Investments in | | | Appreciation | | | Investments in | | | Appreciation |
| Valuation Inputs | | Securities at Value | | | (Depreciation) | | | Securities at Value | | | (Depreciation) |
| | | | | | | | | | | |
| Level 1 - Quoted | | | | | | | | | | | |
| Prices | $ | 24,244,724 | | $ | - | | $ | 182,833,544 | | $ | - |
| Level 2 - Other Sig- | | | | | | | | | | | |
| nificant Observable | | | | | | | | | | | |
| Inputs | $ | - | | $ | - | | $ | - | | $ | - |
| Level 3 - Significant | | | | | | | | | | | |
| Unobservable Inputs | $ | - | | $ | - | | $ | - | | $ | - |
| Total | $ | 24,244,724 | | $ | - | | $ | 182,833,544 | | $ | - |
| | | | | | | | | | | |
| | Westcore Micro-Cap Opportunity Fund | | Westcore Flexible Income Fund |
| | | | | | Other Financial | | | | | | Other Financial |
| | | | | | Instruments* | | | | | | Instruments* |
| | | | | | - Unrealized | | | | | | - Unrealized |
| | | Investments in | | | Appreciation | | | Investments in | | | Appreciation |
| Valuation Inputs | | Securities at Value | | | (Depreciation) | | | Securities at Value | | | (Depreciation) |
| | | | | | | | | | | |
| Level 1 - Quoted | | | | | | | | | | | |
| Prices | $ | 531,380 | | $ | - | | $ | 37,038,937 | | $ | - |
| Level 2 - Other Sig- | | | | | | | | | | | |
| nificant Observable | | | | | | | | | | | |
| Inputs | $ | - | | $ | - | | $ | 101,470,125 | | $ | - |
| Level 3 - Significant | | | | | | | | | | | |
| Unobservable Inputs | $ | - | | $ | - | | $ | 7,293,781 | | $ | - |
| Total | $ | 531,380 | | $ | - | | $ | 145,802,843 | | $ | - |
| | | | | | | | | | | |
| 200 | Semi-Annual Report June 30, 2008 (Unaudited) | |
| | Westcore Plus Bond Fund | | Westcore Colorado Tax-Exempt Fund |
| | | | | | Other Financial | | | | | | Other Financial |
| | | | | | Instruments* | | | | | | Instruments* |
| | | | | | - Unrealized | | | | | | - Unrealized |
| | | Investments in | | | Appreciation | | | Investments in | | | Appreciation |
| Valuation Inputs | | Securities at Value | | | (Depreciation) | | | Securities at Value | | | (Depreciation) |
| | | | | | | | | | | |
| Level 1 - Quoted | | | | | | | | | | | |
| Prices | $ | 291,215,822 | | $ | - | | $ | 2,172,749 | | $ | - |
| Level 2 - Other Sig- | | | | | | | | | | | |
| nificant Observable | | | | | | | | | | | |
| Inputs | $ | 880,036,925 | | $ | - | | $ | 57,167,440 | | $ | - |
| Level 3 - Significant | | | | | | | | | | | |
| Unobservable Inputs | $ | 9,219,013 | | $ | - | | $ | - | | $ | - |
| Total | $ | 1,180,471,760 | | $ | - | | $ | 59,340,189 | | $ | - |
| | | | | | | | | | | |
| * Other financial instruments include futures, forwards and swap contracts. | | | |
All securities of the Funds, except for Westcore Flexible Income and Plus Bond Funds, were valued using either Level 1 or Level 2 inputs during the six months ended June 30, 2008. Thus a reconciliation of assets in which significant unobservable inputs (Level 3) were used is not applicable for these Funds.
The following is a reconciliation of assets in which significant unobservable inputs (Level 3) were used in determining fair value:
| | Westcore Flexible Income Fund | | Westcore Plus Bond Fund |
| | | | | |
| | | | | | Other | | | | | | Other | |
| | | | | | Financial | | | | | | Financial | |
| | Investments | | Instruments | OFI - Market | Investments | | Instruments | OFI - Market |
| | in Securities | | (OFI) | Value | in Securities | | (OFI) | Value |
| | | | | | | | | |
| Balance as of | | | | | | | | | | | | |
| 12/31/2007 | | $12,882,485 | | $ - | $ - | | $14,220,582 | | $ - | $ - |
| Realized gain (loss) | (1,841,711) | | - | - | (1,875,079) | | - | - |
| Change in | | | | | | | | | | | | |
| unrealized | | | | | | | | | | | | |
| appreciation/ | | | | | | | | | | | | |
| depreciation) | (2,504,012) | | - | - | (2,474,630) | | - | - |
| Net purchases (sales) | (1,345,003) | | - | - | (1,085,455) | | - | - |
| Transfers in and/or | | | | | | | | | | | | |
| out of Level 3 | | | $102,022 | | - | - | | | $433,595 | | - | - |
| Balance as of | | | | | | | | | | | | |
| 6/30/2008 | | $7,293,781 | | $ - | $ - | | $9,219,013 | | $ - | $ - |
| | | | | | | | | | |
The inputs or methodology used for valuing securities are not necessarily an indication of the risk associated with investing in those securities.
Because of the inherent uncertainties of valuation, the values reflected in the financial statements may differ from the value determined upon sale of those investments.
| 1-800-392-CORE (2673) ■ www.westcore.com | 201 |
7. Illiquid Restricted Securities
As of June 30, 2008, investments in securities included issues that are restricted. Restricted securities are often purchased in private placement transactions, are not registered under the Securities Act of 1933, may have contractual restrictions on resale, and may be valued in good faith under methods approved by the Board of Trustees. A restricted security may also be considered illiquid if it lacks a readily available market. The Funds intend to invest no more than 15% of their net assets (determined at the time of purchase and reviewed periodically) in illiquid securities. Certain restricted securities, eligible for resale to qualified institutional investors, are not subject to that limitation if the Advisor, under supervision of the Board of Trustees, determines that a liquid trading market exists. The aggregate value of illiquid restricted securities subject to this limitation as of June 30, 2008 for the Westcore Flexible Income and Westcore Plus Bond Funds was $7,952,472 and $30,454,301, respectively, which represents 5.44% and 2.56% of the Funds’ net assets, respectively, as detailed below.
| Illiquid Restricted Securities as of June 30, 2008 (Unaudited) |
| Flexible Income Fund | | | | | | | | | |
| | Principal | | Acquisition | | | | Market |
| Description | Amount | | Date | | Cost | | Value |
| | | | | | | |
| Allied Capital, 6.34%, 10/13/2012 | 1,000,000 | | 9/21/05 | | $ | 1,000,000 | | $ | 928,090 |
| Anthracite CDO, Ltd., Series 2004-1A, Class G, | 500,000 | | 3/16/04 | | | 500,000 | | | 85,000 |
| FRN, 2/24/2014 | | | | | | | | | |
| Crest Ltd. Exeter Street Solar 2004-1A, Class E1, | 434,393 | | 4/8/04 | | | 418,853 | | | 224,438 |
| FRN, 10/28/2014 | | | | | | | | | |
| Crest Ltd., Series 2003-1A, Class PS 8.50%, | 200,000 | | 4/22/03 | | | 131,787 | | | 82,536 |
| 8/28/2012 | | | | | | | | | |
| Crest Ltd., Series 2003-2A, Class E1, FRN, | 250,000 | | 12/18/03 | | | 250,000 | | | 139,572 |
| 12/28/2013 | | | | | | | | | |
| Crest Ltd., Series 2003-2A, Class PS, 6.00%, | 413,450 | | 12/18/03 | | | 260,096 | | | 138,469 |
| 12/28/2013 | | | | | | | | | |
| Crest Ltd., Series 2004-1A, Class PS, 7.667% | 1,064,633 | | 10/22/04 | | | 501,471 | | | 322,126 |
| 12/28/2013 | | | | | | | | | |
| Crest Ltd., Series 2004-1A, Class H2, 7.334%, | 300,000 | | 10/22/04 | | | 285,920 | | | 146,511 |
| 10/28/2014 | | | | | | | | | |
| Crest Ltd., Series 2004-1A, Fairfield Street Solar, | 1,087,500 | | 11/24/04 | | | 1,087,500 | | | 460,491 |
| Class F1, FRN, 12/28/2014 | | | | | | | | | |
| Emigrant Capital Trust II, FRN, 4/14/2034 | 500,000 | | 8/11/04 | | | 497,535 | | | 500,353 |
| Eszopiclone Royalty Sub LLC Series IV | 1,090,000 | | 7/29/05 | | | 1,055,799 | | 1,076,915 |
| 12.00%, 3/15/2014 | | | | | | | | | |
| First Republic Cap Trust II, Series B, 8.75% | 20,000 | | 1/30/04 | | | 530,000 | | | 503,750 |
| I-Preferred Term Securities I Ltd., Subordinate | 100,000 | | 12/4/02 | | | 100,000 | | | 33,612 |
| Income Notes, 22.00%, 12/4/2012 | | | | | | | | | |
| Invesco Navigator Fund, 8.00% | 2,000 | | 11/15/05 | | | 2,000,000 | | 1,164,260 |
| N-STAR Real Estate CDO Ltd., Series 2004-2A, | 500,000 | | 6/16/04 | | | 468,475 | | | 330,450 |
| Class C2B, 6.591%, 6/28/2014 | | | | | | | | | |
| Preferred Term Securities VI Ltd., Subordinate | 100,000 | | 6/26/02 | | | 100,000 | | | 37,119 |
| Income Notes, 24.907%, 7/3/2012 | | | | | | | | | |
| Preferred Term Securities X Ltd., Subordinate | 150,000 | | 6/16/03 | | | 150,000 | | | 94,183 |
| Income Notes, 19.00%, 7/3/2013 | | | | | | | | | |
| 202 | Semi-Annual Report June 30, 2008 (Unaudited) | |
| Flexible Income Fund (continued) |
| | Principal | | Acquisition | | | | | Market |
| Description | Amount | | Date | | | Cost | | Value |
| | | | | | | | |
| Preferred Term Securities XI Ltd., Subordinate | 150,000 | | 6/16/03 | | | | 150,000 | | | 90,888 |
| Income Notes, 19.00%, 10/3/2013 | | | | | | | | | | | |
| Preferred Term Securities XII Ltd., Subordinate | 250,000 | | 12/9/03 | | | | 256,462 | | | 132,537 |
| Income Notes, 19.00%, 12/24/2013: | 500,000 | | 1/7/05 | | | | 512,926 | | | 265,075 |
| Preferred Term Securities XIV Ltd., Subordinate | 500,000 | | 6/9/04 | | | | 500,000 | | | 263,615 |
| Income Notes, 17.50%, 6/17/2014 | | | | | | | | | | | |
| Regional Diversified Funding, Series 2004-1, | 500,000 | | 2/13/04 | | | | 480,949 | | | | 4,000 |
| 16.80%, 2/15/2014 | | | | | | | | | | | |
| Regional Diversified Funding, Series 2005-1, | 750,000 | | 4/12/05 | | | | 750,000 | | | 112,500 |
| 0.00%, 3/15/2015 | | | | | | | | | | | |
| River North CDO Ltd., Series 2005-1A, 12.50%, | 600,000 | | 12/22/04 | | $ | | 600,000 | $ | | | 6,000 |
| 2/6/2014 | | | | | | | | | | | |
| Soloso Bank Pref 2005, 12.50%, 10/15/2015 | 750,000 | | 8/3/05 | | | | 744,550 | | | 300,000 |
| TIAA Real Estate CDO Ltd., Series 2003-1A, | 250,000 | | 10/16/03 | | | | 250,000 | | | 133,840 |
| Class PS, 16.00%, 9/30/2013 | | | | | | | | | | | |
| Times Square Hotel Trust, 8.528%, 8/1/2026 | 91,174 | | 8/9/01 | | | | 89,203 | | | 102,022 |
| Tricadia, Series 2003-1, Class PS, 17.575%, | 250,000 | | 1/14/04 | | | | 240,570 | | | 75,000 |
| 12/15/2013 | | | | | | | | | | | |
| Tricadia, Series 2004-2A, Class C, FRN, | 485,577 | | 10/8/04 | | | | 479,808 | | | 199,120 |
| 12/15/2019 | | | | | | | | | | | |
| Total | | | | | $ | | 14,391,904 | $ | | 7,952,472 |
| Total Net Assets | | | | | | | | $ | 146,299,107 |
| Illiquid Restricted Securities as % of Total Net Assets | | | | | | | | | | 5.44% |
| Total Illiquid Securities as % of Total Net Assets | | | | | | | | | | | 6.31% |
| | | | | | | | | | | | |
| Westcore Plus Bond Fund | | | | | | | | | | | |
| | Principal | | Acquisition | | | | | | | Market |
| Description | Amount | | Date | | | | Cost | | | Value |
| | | | | | | | | | |
| Allied Capital, 6.34%, 10/13/2012 | 4,000,000 | | 9/21/05 | | $ | 4,000,000 | $ | | 3,712,360 |
| Anthracite CDO, Ltd., Series 2004-1A, Class G, | 500,000 | | 3/16/04 | | | | 500,000 | | | 85,000 |
| FRN, 2/24/2014 | | | | | | | | | | | |
| BMW US Capital, 5.73%,5/1/2015 | 12,000,000 | | 10/16/07 | | 12,000,000 | | 11,888,880 |
| Community Reinvestment Revenue Notes, | 1,250,000 | | 6/13/06 | | | 1,049,034 | | | 1,062,014 |
| 5.73%, 6/1/2031 | | | | | | | | | | | |
| Crest Ltd., Series 2003-1A, Class PS 8.50%, | 800,000 | | 4/22/03 | | | | 527,147 | | | 330,144 |
| 8/28/2012 | | | | | | | | | | | |
| Crest Ltd., Series 2003-2A, Class PS, 6.00%, | 620,174 | | 12/18/03 | | | | 390,143 | | | 207,702 |
| 12/28/2013 | | | | | | | | | | | |
| Crest Ltd., Series 2004-1A, Class H2, 7.334%, | 750,000 | | 10/22/04 | | | | 714,800 | | | 366,277 |
| 10/28/2014 | | | | | | | | | | | |
| Crest Ltd., Series 2004-1A, Fairfield Street Solar, | 1,000,000 | | 11/24/04 | | | 1,000,000 | | | 423,440 |
| Class F1, FRN, 12/28/2014 | | | | | | | | | | | |
| Emigrant Capital Trust II, FRN, 04/14/2034 | 850,000 | | 8/11/04 | | | | 845,809 | | | 850,601 |
| Eszopiclone Royalty Sub LLC Series IV | 1,090,000 | | 7/29/05 | | | 1,055,799 | | | 1,076,915 |
| 12.00%,3/15/2014 | | | | | | | | | | | |
| First Tennessee Bank, FRN | 1,500,000 | | 3/16/06 | | | 1,500,000 | | | 1,098,750 |
| I-Preferred Term Securities I Ltd., Subordinate | 150,000 | | 12/4/02 | | | | 150,000 | | | 50,418 |
| Income Notes, 22.00%, 12/4/2012 | | | | | | | | | | | |
| N-STAR Real Estate CDO Ltd., Series 2004-2A, | 600,000 | | 6/16/04 | | | | 562,170 | | | 396,540 |
| Class C2B, 6.591%, 6/28/2014 | | | | | | | | | | | |
| Preferred Term Securities VI Ltd., Subordinate | 250,000 | | 6/26/02 | | | | 250,000 | | | 92,797 |
| Income Notes, 24.907%, 7/3/2012 | | | | | | | | | | | |
| Preferred Term Securities X Ltd., Subordinate | 350,000 | | 6/16/03 | | | | 350,000 | | | 219,761 |
| Income Notes, 19.00%, 7/3/2013 | | | | | | | | | | | |
| 1-800-392-CORE (2673) ■ www.westcore.com | 203 |
| Westcore Plus Bond Fund | | | | | | | | | | |
| | Principal | | Acquisition | | | | Market |
| Description | Amount | | Date | | | Cost | Value |
| Preferred Term Securities XI Ltd., Subordinate | 350,000 | | 6/16/03 | | | | 350,000 | | 212,072 |
| Income Notes, 19.00%, 10/3/2013 | | | | | | | | | | |
| Preferred Term Securities X1 B-3 Ltd., 5.30%, 9/24/2008 | 500,000 | | 6/2/05 | | | | 502,906 | | 426,375 |
| Preferred Term Securities XII Ltd., Subordinate | 250,000 | | 12/9/03 | | | | 254,847 | | 132,537 |
| Income Notes, 19.00%, 12/24/2013: | 250,000 | | 1/7/05 | | | | 254,847 | | 132,538 |
| Preferred Term Securities XIII Ltd., Subordinate | 500,000 | | 3/9/04 | | | | 500,000 | | 264,575 |
| Income Notes, 18.00%, 3/24/2014 | | | | | | | | | | |
| Preferred Term Securities XIV Ltd., Subordinate | 500,000 | | 6/9/04 | | | | 500,000 | | 263,615 |
| Income Notes, 17.50%, 6/17/2014 | | | | | | | | | | |
| Regional Diversified Funding, Series 2004-1A, | 500,000 | | 2/13/04 | | | | $480,949 | | | $40,000 |
| 16.80%, 2/15/2014 | | | | | | | | | | |
| Regional Diversified Funding, Series 2005-1A, | 750,000 | | 4/12/05 | | | | 750,000 | | 112,500 |
| 0.00%, 3/15/2015 | | | | | | | | | | |
| River North CDO ltd., Series 2005-1A, 12.50%, | 800,000 | | 12/22/04 | | | | 800,000 | | | 8,000 |
| 2/6/2014 | | | | | | | | | | |
| Soloso Bank Pref 2005, 12.50%, 10/15/2015 | 750,000 | | 8/3/05 | | | | 744,544 | | 300,000 |
| Strats-Daimler Chrysler CPI Notes, FRN, 11/15/2013 | 1,750,000 | | 12/27/04 | | | 1,723,015 | | 1,731,818 |
| | 905,000 | | 11/16/05 | | | | 891,045 | | 895,597 |
| | 385,000 | | 11/23/05 | | | | 379,063 | | 381,000 |
| | 425,000 | | 12/15/05 | | | | 418,447 | | 420,584 |
| Strats-FHLB, FRN, 8/15/2019 | 1,500,000 | | 2/24/05 | | | 1,485,205 | | 1,340,865 |
| | 100,000 | | 12/15/05 | | | | 99,014 | | | 89,391 |
| | 50,000 | | 12/15/05 | | | | 49,507 | | | 44,695 |
| | 500,000 | | 12/28/05 | | | | 495,068 | | 446,955 |
| Sweetwater Investors LLC, 5.875%, 5/15/2014 | 517,332 | | 5/31/05 | | | | 486,387 | | 508,030 |
| TIAA Real Estate CDO Ltd., Series 2003-1A, | 250,000 | | 11/6/03 | | | | 250,000 | | 133,840 |
| Class PS, 16.00%, 9/30/2013 | | | | | | | | | | |
| Times Square Hotel Trust, 8.528%, 8/1/2026 | 387,491 | | 8/9/01 | | | | 379,113 | | 433,595 |
| Tricadia, Series 2003-1, Class PS, 17.575%, | 250,000 | | 1/14/04 | | | | 240,573 | | | 75,000 |
| 12/15/2013 | | | | | | | | | | |
| Tricadia, Series 2004-2A, Class C, FRN, | 485,577 | | 10/8/04 | | | | 479,808 | | 199,120 |
| 12/15/2019 | | | | | | | | | | |
| Total | | | | | | $37,409,240 | | $30,454,301 |
| Total Net Assets | | | | | | | | $1,189,704,098 |
| Illiquid Restricted Securities as % of Total Net Assets | | | | | | | | | | 2.56% |
| Total Illiquid Securities as % of Total Net Assets | | | | | | | | | | 2.83% |
| 204 | Semi-Annual Report June 30, 2008 (Unaudited) | |
8. Purchases and Sales of Investments
Investment transactions for the six months ended June 30, 2008, excluding temporary short-term investments, were as follows:
| | Cost of Investments | | Proceeds from |
| Fund | Purchased | | Investments Sold |
| Westcore MIDCO Growth Fund | $ | 108,128,008 | | $ | 118,922,278 |
| Westcore Growth Fund | | 250,627,494 | | | 269,516,980 |
| Westcore Select Fund | | 50,970,647 | | | 47,425,131 |
| Westcore International Frontier Fund | | 14,146,592 | | | 13,867,740 |
| Westcore Blue Chip Fund | | 5,729,262 | | | 7,939,160 |
| Westcore Mid-Cap Value Fund | | 13,640,704 | | | 22,066,454 |
| Westcore Small-Cap Opportunity Fund | | 5,046,669 | | | 10,146,441 |
| Westcore Small-Cap Value Fund | | 74,667,825 | | | 41,901,366 |
| Westcore Micro-Cap Opportunity Fund | | 464,298 | | | - |
| Westcore Flexible Income Fund | | 26,346,405 | | | 50,200,123 |
| Westcore Plus Bond Fund | | 158,284,814 | | | 108,269,502 |
| Westcore Colorado Tax-Exempt Fund | | 7,728,241 | | | 3,821,528 |
| 1-800-392-CORE (2673) ■ www.westcore.com | 205 |

Fund Portfolio Holdings
The Funds file a complete schedule of portfolio holdings with the Commission for the first and third quarters of each fiscal year on Form N-Q within 60 days after the end of the period. Copies of the Fund’s Forms N-Q are available without a charge, upon request, by contacting the Fund at 1-800-392-2673 and on the Commission’s website at http://www.sec.gov. You may also review and copy Form N-Q at the Commission’s Public Reference Room in Washington, D.C. For more information about the operation of the Public Reference Room, please call the Commission at 1-800-SEC-0330.
Trust Proxy Voting Policies & Procedures
Policies and procedures used in determining how to vote proxies relating to portfolio securities and a summary of proxies voted by the Funds for the twelve month period ended June 30, 2008 are available without a charge, upon request by contacting Westcore Funds at 1-800-392-2673 or on the Commission’s website at http://www.sec.gov.
| 206 | Semi-Annual Report June 30, 2008 (Unaudited) | |

| 1-800-392-CORE (2673) ■ www.westcore.com | 207 |
| 208 | Semi-Annual Report June 30, 2008 (Unaudited) | |

| 1290 Broadway |
| Suite 1100 |
| Denver, CO 80203 |
| 1-800-392-CORE (2673) |
| www.westcore.com |
| |
| |
| |
| Westcore Trustees and Officers: |
| Jack D. Henderson, Chairman |
| Mary K. Anstine, Trustee |
| Vernon L. Hendrickson, Trustee |
| James B. O’Boyle, Trustee |
| Rick A. Pederson, Trustee |
| Robert L. Stamp, Trustee |
| Janice M. Teague, Trustee |
| Todger Anderson, President |
| Jasper R. Frontz, Treasurer & Chief Compliance Officer |
| Patrick D. Buchanan, Asst. Treasurer |
| JoEllen L. Legg, Secretary |
A description of the policies and procedures that Westcore Funds uses to determine how to vote proxies relating to portfolio securities is available (i) without charge, upon request, by calling 1-800-392-2673; (ii) on the Westcore Funds website, www.westcore.com; and (iii) on the Securities and Exchange Commission website at www.sec.gov.
This report has been prepared for Westcore shareholders and may be distributed to others only if preceded or accompanied by a prospectus.
Funds distributed by ALPS Distributors, Inc.
WC120
Item 2. Code of Ethics.
Not applicable to semi-annual report.
Item 3. Audit Committee Financial Expert.
Not applicable to semi-annual report.
Item 4. Principal Accountant Fees and Services.
Not applicable to semi-annual report.
Item 5. Audit Committee of Listed Registrants.
Not applicable.
Item 6. Investments.
a) Schedule of Investments is included as part of the Report to Stockholders filed under Item 1 of this form.
b) Not applicable.
Item 7. Disclosure of Proxy Voting Policies and Procedures for Closed-End Management Investment Companies.
Not applicable.
Item 8. Portfolio Managers of Closed-End Management Investment Companies.
Not applicable.
Item 9. Purchases of Equity Securities by Closed-End Management Investment Company and Affiliated Purchasers.
Not applicable
Item 10. Submission of Matters to a Vote of Security Holders.
There have been no material changes to the procedures by which shareholders may recommend nominees to the registrant’s Board of Trustees.
Item 11. Controls and Procedures.
(a) The registrant’s principal executive officer and principal financial officer have concluded that the registrant’s disclosure controls and procedures (as defined in Rule 30a-3(c) under the Investment Company Act of 1940, as amended) (the “1940 Act” ) (17 CFR 270.30a-3(e)) are effective based on their evaluation of these controls and procedures required by Rule 30a-3(b) under the 1940 Act (17 CFR 270.30a-3(b)) and Rules 13a-15(b) or 15d-15(b) under the Securities Exchange Act of 1934 (17 CFR 240.13a-15(b) or 240.15d-15(b)) as of a date within 90 days of the filing date of this report.
(b) There was no change in the registrant's internal control over financial reporting (as defined in Rule 30a-3(d) under the 1940 Act (17 CFR 270.30a-3(d)) that occurred during the second fiscal quarter of the period covered by this report that has materially affected, or is reasonably likely to materially affect, the registrant's internal control over financial reporting.
Item 12. Exhibits.
(a)(1) Not applicable to semi-annual report.
(a)(2) The certifications required by Rule 30a-2(a) of the 1940 Act (17 CFR 270.30a-2(a)) and Section 302 of the Sarbanes-Oxley Act of 2002 are attached hereto as Ex99.Cert.
(a)(3) Not applicable.
(b) The certifications required by Rule 30a-2(b) of the 1940 Act (17 CFR 270.30a-2(b)) and Section 906 of the Sarbanes-Oxley Act of 2002 are attached hereto as Ex99.906Cert.
SIGNATURES
Pursuant to the requirements of the Securities Exchange Act of 1934 and the Investment Company Act of 1940, the registrant has duly caused this report to be signed on its behalf by the undersigned, thereunto duly authorized.
WESTCORE TRUST
By: /s/ Todger Anderson
Todger Anderson
President/Principal Executive Officer
Date: September 8, 2008
Pursuant to the requirements of the Securities Exchange Act of 1934 and the Investment Company Act of 1940, this report has been signed below by the following persons on behalf of the registrant and in the capacities and on the dates indicated.
By: /s/ Todger Anderson
Todger Anderson
President/Principal Executive Officer
Date: September 8, 2008
By: /s/ Jasper R. Frontz
Jasper R. Frontz
Treasurer/Principal Financial Officer
Date: September 8, 2008