UNITED STATES
SECURITIES AND EXCHANGE COMMISSION
Washington, D.C. 20549
FORM N-CSR
CERTIFIED SHAREHOLDER REPORT OF REGISTERED
MANAGEMENT INVESTMENT COMPANIES
Investment Company Act file number: 811-3373
Westcore Trust
(exact name of registrant as specified in charter)
1290 Broadway, Suite 1100, Denver, Colorado 80203
(Address of principal executive offices) (Zip code)
Paul F. Leone, Secretary
Westcore Trust
1290 Broadway, Suite 1100
Denver, Colorado 80203
(Name and address of agent for service)
Registrant’s telephone number, including area code: 303-623-2577
Date of fiscal year end: December 31
Date of reporting period: June 30, 2010
Item 1. Reports to Stockholders.

2010 SEMI-ANNUAL REPORT JUNE 30, 2010 WESTCORE EQUITY FUNDS WESTCORE GROWTH FUND WESTCORE MIDCO GROWTH FUND WESTCORE SELECT FUND WESTCORE BLUE CHIP FUND WESTCORE MID-CAP VALUE FUND WESTCORE SMALL-CAP OPPORTUNITY FUND WESTCORE SMALL-CAP VALUE FUND WESTCORE MICRO-CAP OPPORTUNITY FUND WESTCORE INTERNATIONAL FRONTIER FUND WESTCORE BOND FUNDS WESTCORE FLEXIBLE INCOME FUND WESTCORE PLUS BOND FUND WESTCORE COLORADO TAX-EXEMPT FUND Westcore Funds are managed by Denver Investments |


DEAR FELLOW SHAREHOLDERS:
The economic recovery still appears to be under way. However, every day seems to bring both good and bad news about the recovery making it easy to be confused. This is not unusual after such a severe economic recession and financial meltdown.
We believe it will take years for consumers and governments to rebuild their financial strength. Because of this, the rate of economic growth in the short term will most likely be modest. In our opinion, there is even a small probability of negative economic growth in 2011.
Yet, even in periods of slow or negative economic growth, meaningful economic change can occur. These changes may impact companies, stock and bonds. Our investment teams work hard to identify opportunities that such changes may present.
The Westcore Family of Funds offers you twelve options to meet a variety of investment objectives. Portfolio manager commentaries, performance, financial and holdings information for each of the Westcore Funds can be found in this report.
Fixed income funds have generally provided positive returns in the current environment. This has been the case for much of the past ten years, and we do not expect interest rates to rise materially in the near future. For fixed income alternatives in your portfolio, Westcore offers three bond funds with very different investment objectives; the Westcore Plus Bond Fund, the Westcore Flexible Income Fund and the Westcore Colorado Tax-Exempt Fund.
As is often the case in an economic recovery, stock markets are currently favoring smaller companies over larger companies. Westcore offers several equity funds focused on small and medium sized companies. We would like to draw your attention to the Westcore Small-Cap Value Fund, the Westcore Select Fund and the Westcore International Frontier Fund.
We think the U. S. economy will prove to be very competitive in the years ahead. American entrepreneurs have been very creative contributing importantly to our economic growth. We believe this will continue and that our economic challenges, which are many and real, will be solved by our abundance of intellectual capital.
Thank you for your confidence in the Westcore Funds.

CFA is a trademark owned by the CFA Institute.
The Shareholder Letter and the Manager Commentaries included in this shareholder report contain certain forward-looking statements about the factors that may affect the performance of the Funds in the future. These statements are based on Fund management’s predictions and expectations concerning certain future events and their expected impact on the Funds, such as performance of the economy as a whole and of specific industry sectors, changes in the levels of interest rates, the impact of developing world events, and other factors that may influence the future performance of the Funds. Management believes these forward-looking statements to be reasonable, although they are inherently uncertain and difficult to predict. Actual events may cause adjustments in portfolio management strategies from those currently expected to be employed.
The recent growth rate in the stock market has helped to produce short-term returns for some asset classes that are not typical and may not continue in the future. Ongoing market volatility may subject fund performance to substantial short-term changes.

Investing primarily in equity securities of large companies with growth potential.
Ross G. Moscatelli, CFA Portfolio Manager
Craig W. Juran, CFA Portfolio Manager
CFA is a trademark owned by the CFA Institute.

The chart above represents historical performance of a hypothetical investment of $10,000 in the Fund over the past 10 years (or for the life of the Fund if shorter). Performance calculations are as of the end of June each year. Past performance does not guarantee future results. This chart does not reflect the deduction of taxes that a shareholder would pay on Fund distributions or the redemption of Fund shares.
Lipper Index data provided by Lipper, Inc.
Please see pages 28 and 29 for index definitions.
| Average Annual Total Returns |
| | | | | | | | | | | | Since | | Inception | |
| | 6 Months | | 1 Year | | 3 Years | | 5 Years | | 10 Years | | Inception | | Date | |
| Retail Class (WTEIX) | -10.20% | | 14.18% | | -8.78% | | -0.81% | | -1.38% | | 7.42% | | 6/1/88 | |
| Institutional Class | | | | | | | | | | | | | | |
| (WILGX) | -10.11 | | 14.25 | | -8.69 | | -0.75 | | -1.35 | | 7.43 | | 9/28/07 | |
| Russell 1000® | | | | | | | | | | | | | | |
| Growth Index | -7.64 | | 13.62 | | -6.91 | | 0.38 | | -5.14 | | 8.24 | | | |
| Lipper Large-Cap | | | | | | | | | | | | | | |
| Growth Index | -8.68 | | 12.59 | | -7.49 | | -0.56 | | -5.39 | | 7.45 | | | |
Retail Class Annual Expense Ratio (per the current prospectus) — Gross: 1.06%, Net: 1.06%
Institutional Class Annual Expense Ratio (per the current prospectus) — Gross: 2.55%, Net: 0.94%
The performance data quoted represents past performance and does not guarantee future results. Performance information for the institutional class shares prior to their inception date is based on the performance of the retail class. Current performance may be lower or higher than the performance quoted. To obtain current performance as of the most recent month-end, please call 800.392.CORE (2673) or visit us online at www.westcore.com. Average annual total returns and yield figures reflect the reinvestment of dividends, capital gains distributions, all fee waivers and expense reimbursements. Without the fee waivers and expense reimbursements, total return and yield figures would have been lower. The performance data quoted does not reflect the deduction of the 2% redemption fee imposed if shares are redeemed or exchanged within 90 calendar days from their date of purchase. If imposed, the fee would reduce the performance quoted. Total return and yield figures represent past performance. Investment return and principal value will vary, and shares, when redeemed, may be worth more or less than their original cost.
Westcore fund shares are not insured by the FDIC, the Federal Reserve Board or any other agency and are subject to risk including the possible loss of principal.
The Advisor and Administrators have contractually agreed to waive the investment advisory and/or administration fees and/or to reimburse Fund level other expenses from April 30, 2010 until at least April 30, 2011, so that Net Annual Fund Operating Expenses as reported in the Fund’s Financial Highlights will be no more than 1.15% for the Fund’s Retail Class for such period. In addition, the Advisor has contractually agreed to waive the investment advisory and/or administration fees and/or to reimburse Fund level other expenses in the same proportion as for the Retail Class waivers/reimbursements plus reimbursing the Institutional class-specific other expenses until at least April 30, 2011. The Advisor and Administrators are not contractually bound to continue these waivers/reimbursements past April 30, 2011, however neither party is currently expecting to make any change in the waivers/reimbursements after April 30, 2011. However, you will be notified in writing if these waivers and/or reimbursements are discontinued or materially changed after April 30, 2011.
Craig W. Juran is a registered representative of ALPS Distributors, Inc.
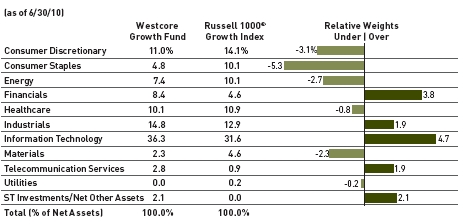
- Given the magnitude of the 2008-2009 recession, the pace of economic recovery in the first half of 2010 was somewhat disappointing. And, the period was anything but normal, with sovereign debt concerns, default risk from Portugal, Ireland, Italy, Greece, and Spain, the Euro under pressure, the Gulf oil spill, U.S. state and municipal budget deficits and debate of the U.S. Financial Reform Bill. This economic uncertainty combined with the “Flash Crash” on May 6 produced a big change in sentiment. The tide shifted towards more risk-averse behavior after the Dow fell 999 points in 30 minutes – producing one of the most volatile days in Wall Street history. Amidst this, the Westcore Growth Fund underperformed its benchmark the Russell 1000 Growth Index, for the six months ended June 30, 2010.
- The Fund’s holdings in the consumer discretionary and financials sectors were among the most detrimental relative to the benchmark. Additionally, the Fund’s underweight position in health care also detracted from performance relative to the benchmark. Companies in the financials sector faced significant uncertainty as completion of the Financial Reform Bill was delayed. From an individual holdings standpoint, the Fund’s largest detractors were technology related companies such as Google Inc., Microsoft Corp. and Visa Inc. We believe the pullback in their stock prices is temporary and market driven rather than company-specific or due to fundamental issues.
- At the sector level, the Fund’s strongest contributors relative to the benchmark were utilities, consumer staples and energy. The Fund’s lack of holdings in utilities was a positive as the sector did not perform well in the first half of the year. Although the Fund outperformed the benchmark in the energy sector, none of the Fund’s holdings in the sector were top performers. Fund holding Estee Lauder Cos. was a standout in the consumer staples sector. This manufacturer and marketer of skin and hair care products underwent a reorganization and management change in the second half of 2009. Investors appear encouraged by these changes. Apple Inc. was the Fund’s best performing stock having released two exciting products during the second quarter, the iPad and the iPhone 4G.
- Despite market uncertainty, we continue to focus on companies with dominant franchises, exciting new products, proprietary technology, unique distribution channels, and defensible business models that we believe will survive and thrive regardless of the economic environment. We expect continued volatility as investors rehash “ghosts” from the crash of 2008-2009. However, large-cap equities are trading at relatively low valuation levels that we have not seen since the recession of 1981-1982 and spring of 2009. We believe it won’t take much positive news for the markets to stabilize and/or advance. Meanwhile, we remain focused on driving long-term returns and we are seeing many compelling investment opportunities. Thank you for your continued investment in the Fund and your confidence in our team.
| PAGE 2 |
 |

| Stock Performance |
| (for the 6 months ended 6/30/10) | | |
| | Average | | Contribution |
| Top 5 Stocks | Weight | | to Return |
| Apple Inc. | 5.29% | | 0.69% |
| Las Vegas Sands Corp. | 1.44 | | 0.47 |
| Estee Lauder Cos. | 0.36 | | 0.17 |
| Union Pacific Corp. | 1.46 | | 0.10 |
| Cognizant Technology | | | |
| Solutions Corp. | 0.97 | | 0.09 |
| | | | |
| Bottom 5 Stocks | | | |
| Cisco Systems Inc. | 4.29% | | -0.44% |
| Hewlett-Packard Co. | 3.19 | | -0.47 |
| Visa Inc. | 2.54 | | -0.54 |
| Microsoft Corp. | 3.81 | | -0.95 |
| Google Inc. | 4.17 | | -1.25 |
Past performance does not guarantee future results. These stocks do not represent all of the securities purchased, sold or recommended by the Funds’ Adviser. To request a complete list of the contribution of each Fund holding to overall Fund performance during the period, please call 800.392.CORE (2673) or email invest@westcore.com.
Please see page 29 for a description of the methodology used to construct this chart.
| Top Ten Holdings |
| (as of 6/30/10) | |
Apple Inc. | 6.4% |
Cisco Systems Inc. | 4.1 |
Google Inc. | 3.9 |
PepsiCo Inc. | 3.5 |
Microsoft Corp. | 3.4 |
Visa Inc. | 3.1 |
Medco Health Solutions Inc. | 3.0 |
Hewlett-Packard Co. | 3.0 |
Occidental Petroleum Corp. | 2.6 |
EMC Corp. | 2.4 |
Total (% of Net Assets) | 35.4% |
Top ten holdings do not include any cash, cash equivalents or exchange traded fund investments and are subject to change. There are no guarantees that the Fund will continue to remain invested in any particular holding.
| Morningstar Ratings |
| | | |
| | | Number |
| | Morningstar | of Funds |
| | Rating™ | in Large Growth |
| | as of 6/30/10 | Category |
Overall | «««« | 1,545 |
3 Year | ««« | 1,545 |
5 Year | ««« | 1,298 |
10 Year | «««« | 739 |
Morningstar Ratings shown represent both the Retail and Institutional Classes. Morningstar proprietary ratings reflect historical risk-adjusted performance as of 6/30/10 and are subject to change every month.
Please see page 29 for more detail regarding Morningstar Ratings.
| Portfolio Characteristics |
| (as of 6/30/10) | | | | | |
| | Westcore | | Russell 1000® |
| | Growth Fund | | Growth Index |
| Weighted Average Market Capitalization ($ Bil) | $63.4 | | $68.4 |
| Price/Earnings (1 year trailing) | 20.9x | | 18.9x |
| EPS Growth (3 year historical) | 9.6% | | 7.0% |
| Beta | 1.1 | | 1.0 |
| Number of Holdings | 56 | | 631 |
| Portfolio Turnover Rate (6 month) | 33% | | – |
| | | | | | |
| Please see page 30 for definition of terms. | | | | | |
| | | | | |
| Sector Allocation |
 |
| Sector classifications presented herein are based on the sector categorization methodology of the Adviser to the Funds which may result in the sector designations for one Fund being different than another Fund’s sector designations. |
| |
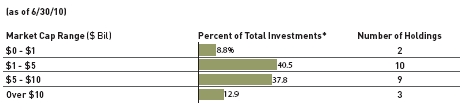
| Market Capitalization |
 *Total Investments for this chart excludes short-term investments, including money market mutual funds Market capitalization ranges were determined by the Adviser to the Fund and are for presentation purposes only. These market capitalization ranges do not necessarily correlate to the benchmark’s market capitalization ranges. |

Investing in a diversified portfolio of equity securities of primarily medium-sized companies with growth potential.
| William S. Chester, CFA Portfolio Manager | Brian C. Fitzsimons, CFA Portfolio Manager |
| Mitch S. Begun, CFA Portfolio Manager | Jeffrey J. Loehr, CFA Portfolio Manager |
| Adam C. Bliss Portfolio Manager | F. Wiley Reed, CFA Portfolio Manager |
CFA is a trademark owned by the CFA Institute. | |

The chart above represents historical performance of a hypothetical investment of $10,000 in the Fund over the past 10 years (or for the life of the Fund if shorter). Performance calculations are as of the end of June each year. Past performance does not guarantee future results. This chart does not reflect the deduction of taxes that a shareholder would pay on Fund distributions or the redemption of Fund shares.
Lipper Index data provided by Lipper, Inc.
Please see pages 28 and 29 for index definitions.
| Average Annual Total Returns |
| | | | | | | | | | | | Since | | Inception | |
| | 6 Months | | 1 Year | | 3 Years | | 5 Years | | 10 Years | | Inception | | Date | |
| Retail Class (WTMGX) | -1.92% | | 25.62% | | -7.22% | | 1.53% | | -0.07% | | 9.76% | | 8/1/86 | |
| Institutional Class | | | | | | | | | | | | | | |
| (WIMGX) | -1.92 | | 25.80 | | -7.11 | | 1.60 | | -0.03 | | 9.78 | | 9/28/07 | |
| Russell MidcapTM | | | | | | | | | | | | | | |
| Growth Index | -3.31 | | 21.30 | | -7.53 | | 1.37 | | -1.99 | | 9.03 | | | |
| Lipper Mid-Cap | | | | | | | | | | | | | | |
| Growth Index | -3.28 | | 21.13 | | -6.51 | | 2.85 | | -2.21 | | 8.52 | | | |
Retail Class Annual Expense Ratio (per the current prospectus) — Gross: 1.09%, Net: 1.09%
Institutional Class Annual Expense Ratio (per the current prospectus) — Gross: 1.04%, Net: 0.96%
The performance data quoted represents past performance and does not guarantee future results. Performance information for the institutional class shares prior to their inception date is based on the performance of the retail class. Current performance may be lower or higher than the performance quoted. To obtain current performance as of the most recent month-end, please call 800.392.CORE (2673) or visit us online at www.westcore.com. Average annual total returns and yield figures reflect the reinvestment of dividends, capital gains distributions, all fee waivers and expense reimbursements. Without the fee waivers and expense reimbursements, total return and yield figures would have been lower. The performance data quoted does not reflect the deduction of the 2% redemption fee imposed if shares are redeemed or exchanged within 90 calendar days from their date of purchase. If imposed, the fee would reduce the performance quoted. Total return and yield figures represent past performance. Investment return and principal value will vary, and shares, when redeemed, may be worth more or less than their original cost.
Westcore fund shares are not insured by the FDIC, the Federal Reserve Board or any other agency and are subject to risk including the possible loss of principal.
The Advisor and Administrators have contractually agreed to waive the investment advisory and/or administration fees and/or to reimburse Fund level other expenses from April 30, 2010 until at least April 30, 2011, so that Net Annual Fund Operating Expenses as reported in the Fund’s Financial Highlights will be no more than 1.15% for the Fund’s Retail Class for such period. In addition, the Advisor has contractually agreed to waive the investment advisory and/or administration fees and/or to reimburse Fund level other expenses in the same proportion as for the Retail Class waivers/reimbursements plus reimbursing the Institutional class-specific other expenses until at least April 30, 2011. The Advisor and Administrators are not contractually bound to continue these waivers/reimbursements past April 30, 2011, however neither party is currently expecting to make any change in the waivers/reimbursements after April 30, 2011. However, you will be notified in writing if these waivers and/or reimbursements are discontinued or materially changed after April 30, 2011.
- Equity markets were down slightly for the first six months of 2010 as questions over the trajectory of the economic recovery surfaced. Sovereign debt crises, growing budget deficits, a major oil spill in the Gulf of Mexico and an apparent economic soft patch all gave equity markets reason to pause after the strong gains of the last fifteen months.
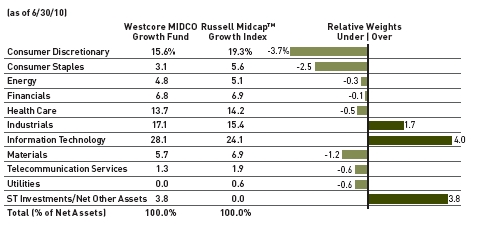
- The Westcore MIDCO Growth Fund’s outperformance versus its Russell Midcap Growth Index benchmark was most positively impacted by stocks in the information technology, industrials and consumer discretionary sectors.
- In the information technology sector, Akamai Technologies Inc. performed well as the company experienced increasing demand for video and applications delivered over the internet. Another strong performer in the information technology sector was Rovi Corp., which benefited from international pay TV deals for its proprietary TV guide business.
- Within the consumer discretionary sector, Netflix Inc. was the Fund’s best performer. The company’s prolific “Watch Instantly” streaming service drove strong margins and subscriber growth. Another consumer discretionary sector holding that contributed positively is off-price apparel retailer Ross Stores Inc. as cost-conscious consumers drove strong market share gains.
- The Fund’s relative performance was most negatively impacted by the financials, health care and energy sectors.
- Sluggish equity markets during the first half of 2010 led to weak performance in financial sector holding, T. Rowe Price Group Inc. We believe this pullback was market driven rather than specific to T. Rowe and therefore we maintained the Fund’s investment.
- The Fund’s underweight position in the health care sector detracted from performance, as increased clarity around U.S. healthcare legislative reform drove strong sector performance. Additionally, healthcare sector holding King Pharmaceuticals Inc. was the Fund’s worst performing holding as concerns arose over this pharmaceutical manufacturer’s existing product line. We are confident in management’s ability and see a delay in the development of this product line as temporary.
- Energy sector holding Cabot Oil & Gas Corp. suffered due to concern over regulatory and permit related issues in the Marcellus Shale and we opted to liquidate the position.
- As of June 30, 2010, the Fund was overweight the information technology and industrials sectors and its largest underweights were in the consumer staples and consumer discretionary sectors.
- Economic growth appears to be moderating from the lofty levels of the last few quarters. We are optimistic that the economy can continue to grow, albeit at a slower rate, whereby innovative companies can thrive and differentiate themselves from peers. We believe our in-depth research focus at the company level should help us identify good growth opportunities. As always, we thank you for your continued investment.
| PAGE 4 |
|

| Stock Performance |
| (for the 6 months ended 6/30/10) |
| | Average | | Contribution |
| Top 5 Stocks | Weight | | to Return |
| Netflix Inc. | 1.63% | | 1.14% |
| Akamai Technologies Inc. | 1.37 | | 0.70 |
| Rovi Corp. | 1.38 | | 0.46 |
| Dolby Laboratories Inc. | 1.93 | | 0.45 |
| Ross Stores Inc. | 1.68 | | 0.36 |
| | | | |
| Bottom 5 Stocks | | | |
| T. Rowe Price Group Inc. | 2.18% | | -0.34% |
| Tellabs Inc. | 0.28 | | -0.35 |
| Cabot Oil & Gas Corp. | 1.78 | | -0.45 |
| Global Payments Inc. | 0.69 | | -0.46 |
| King Pharmaceuticals Inc. | 1.32 | | -0.49 |
| | | | |
| Past performance does not guarantee future results. These stocks do not represent all of the securities purchased, sold or recommended by the Funds’ Adviser. To request a complete list of the contribution of each Fund holding to overall Fund performance during the period, please call 800.392.CORE (2673) or email invest@westcore.com. Please see page 29 for a description of the methodology used to construct this chart. |
Top Ten Holdings |
(as of 6/30/10) | |
TJX Companies Inc. | 2.2% |
Dolby Laboratories Inc. | 2.2 |
Waters Corp. | 2.1 |
Cooper Industries PLC | 2.1 |
Ingersoll-Rand PLC | 2.1 |
CR Bard Inc. | 2.1 |
AMERIGROUP Corp. | 2.0 |
Rovi Corp. | 2.0 |
T. Rowe Price Group Inc. | 2.0 |
Intuit Inc. | 2.0 |
Total (% of Net Assets) | 20.8% |
Top ten holdings do not include any cash, cash equivalents or exchange traded fund investments and are subject to change. There are no guarantees that the Fund will continue to remain invested in any particular holding.
|
| Morningstar Ratings |
| | | Number |
| | Morningstar | of Funds in |
| | Rating™ | Mid-Cap Growth |
| | as of 6/30/10 | Category |
Overall | ««« | 694 |
3 Year | ««« | 694 |
5 Year | ««« | 612 |
10 Year | ««« | 354 |
Morningstar Ratings shown represent both the Retail and Institutional Classes. Morningstar proprietary ratings reflect historical risk-adjusted performance as of 6/30/10 and are subject to change every month.Please see page 29 for more detail regarding Morningstar Ratings. |
| Portfolio Characteristics |
| (as of 6/30/10) | | | |
| | Westcore MIDCO | | Russell MidcapTM |
| | Growth Fund | | Growth Index |
| Weighted Average Market Capitalization ($ Bil) | $4.9 | | $6.0 |
| Price/Earnings (1 year trailing) | 20.2x | | 21.8x |
| EPS Growth (3 year historical) | 3.5% | | 4.7% |
| Beta | 0.98 | | 1.0 |
| Number of Holdings | 65 | | 497 |
| Portfolio Turnover Rate (6 month) | 51% | | — |
| | | | |
| Please see page 30 for definition of terms. |
| Sector Allocation |
 |
| Sector classifications presented herein are based on the sector categorization methodology of the Adviser to the Funds which may result in the sector designations for one Fund being different than another Fund’s sector designations. |
| Market Capitalization |
 |
| * Total Investments for this chart excludes short-term investments, including money market mutual funds. Market capitalization ranges were determined by the Adviser to the Fund and are for presentation purposes only. These market capitalization ranges do not necessarily correlate to the benchmark’s market capitalization ranges. |

Investing primarily in the common stock of a limited number of medium-sized companies selected for their growth potential.
| Fund Management |
| William S. Chester, CFA Portfolio Manager | Brian C. Fitzsimons, CFA Portfolio Manager |
| Mitch S. Begun, CFA Portfolio Manager | Jeffrey J. Loehr, CFA Portfolio Manager |
| Adam C. Bliss Portfolio Manager | F. Wiley Reed, CFA Portfolio Manager |
CFA is a trademark owned by the CFA Institute. | |
| | |
| Cumulative Returns |
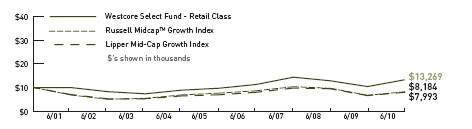
The chart above represents historical performance of a hypothetical investment of $10,000 in the Fund over the past 10 years (or for the life of the Fund if shorter). Performance calculations are as of the end of June each year. Past performance does not guarantee future results. This chart does not reflect the deduction of taxes that a shareholder would pay on Fund distributions or the redemption of Fund shares.
Lipper Index data provided by Lipper, Inc.
Please see pages 28 and 29 for index definitions.
| Average Annual Total Returns |
| | | | | | | | | | | | Since | Inception |
| | 6 Months | | 1 Year | | 3 Years | | 5 Years | | 10 Years | | Inception | Date |
| Retail Class (WTSLX) | -1.55% | | 27.43% | | -2.62% | | 6.43% | | 2.87% | | 12.11% | 10/1/99 |
| Russell MidcapTM | | | | | | | | | | | | |
| Growth Index | -3.31 | | 21.30 | | -7.53 | | 1.37 | | -1.99 | | 2.32 | |
| Lipper Mid-Cap | | | | | | | | | | | | |
| Growth Index | -3.28 | | 21.13 | | -6.51 | | 2.85 | | -2.21 | | 1.98 | |
Retail Class Annual Expense Ratio (per the current prospectus) — Gross: 1.17%, Net: 1.16%
The performance data quoted represents past performance and does not guarantee future results. Performance information for the institutional class shares prior to their inception date is based on the performance of the retail class. Current performance may be lower or higher than the performance quoted. To obtain current performance as of the most recent month-end, please call 800.392.CORE (2673) or visit us online at www.westcore.com. Average annual total returns and yield figures reflect the reinvestment of dividends, capital gains distributions, all fee waivers and expense reimbursements. Without the fee waivers and expense reimbursements, total return and yield figures would have been lower. The performance data quoted does not reflect the deduction of the 2% redemption fee imposed if shares are redeemed or exchanged within 90 calendar days from their date of purchase. If imposed, the fee would reduce the performance quoted. Total return and yield figures represent past performance. Investment return and principal value will vary, and shares, when redeemed, may be worth more or less than their original cost.
Westcore fund shares are not insured by the FDIC, the Federal Reserve Board or any other agency and are subject to risk including the possible loss of principal.
The Advisor and Administrators have contractually agreed to waive the investment advisory and/or administration fees and/or to reimburse Fund level other expenses from April 30, 2010 until at least April 30, 2011, so that Net Annual Fund Operating Expenses as reported in the Fund’s Financial Highlights will be no more than 1.15% for the Fund’s Retail Class for such period. The Advisor and Administrators are not contractually bound to continue these waivers/reimbursements past April 30, 2011, however neither party is currently expecting to make any change in the waivers/reimbursements after April 30, 2011. However, you will be notified in writing if these waivers and/or reimbursements are discontinued or materially changed after April 30, 2011.
Westcore Select Fund is a non-diversified fund and investing in non-diversified funds generally will be more volatile and a loss of principal could be greater than investing in more diversified funds.
Westcore Select Fund may participate in the initial public offering (“IPO”) market, and a significant portion of the Fund’s since inception return is attributable to its investments in IPOs, which in turn have had a magnified impact due to the Fund’s relatively small asset base. As the Fund’s assets continue to grow, it will be increasingly less likely to experience substantially similar performance by investing in IPOs.
- Equity markets were down slightly for the first six months of 2010 as questions over the trajectory of the economic recovery surfaced. Sovereign debt crises, growing budget deficits, a major oil spill in the Gulf of Mexico and an apparent economic soft patch all gave equity markets reason to pause after the strong gains of the last fifteen months.
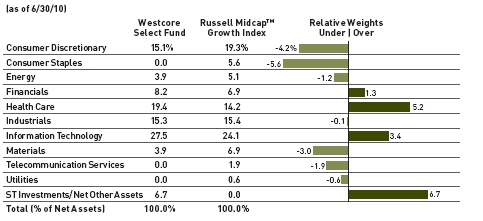
- The Westcore Select Fund’s outperformance versus its Russell Midcap Growth Index benchmark was most positively impacted by stocks in the information technology, industrials and consumer discretionary sectors.
- The Fund’s best performing stock in the period was information technology sector holding Akamai Technologies Inc. Akamai experienced increasing demand for video and applications delivered over the internet. Another strong performer within the information technology sector was Dolby Laboratories Inc., a developer of audio and video encoding technologies. Dolby continued to benefit from a cycle of businesses updating PCs and strong worldwide digital TV sales.
- Within the consumer discretionary sector, Fund holding Jos. A. Bank Clothiers Inc. produced strong results as this men’s apparel company experienced rapid new customer growth. Also in the consumer discretionary sector, off-price apparel retailer Ross Stores Inc. contributed positively to performance as cost-conscious consumers drove strong market share gains.
- The Fund’s relative performance was most negatively impacted by the health care, energy and consumer staples sectors.
- King Pharmaceuticals Inc. was the Fund’s worst performing holding as concerns arose over this pharmaceutical manufacturer’s existing product line and development of its new product portfolio. While we remain confident in management’s ability and see the delay in the development of this new product line as temporary, the concentrated style of the Fund led us to sell the position in favor of other opportunities.
- Energy sector holding Cabot Oil & Gas Corp. suffered due to concern over regulatory and permit related issues in the Marcellus Shale and we opted to liquidate the position.
- The Fund’s underweight position in the consumer staples sector detracted from performance given the sector’s strong relative performance during the period.
- As of June 30, 2010, the Fund was overweight the information technology, health care and financial sectors and was underweight the consumer staples, consumer discretionary and materials sectors. The Fund’s five largest stock positions were Rovi Corp., Bank of the Ozarks Inc., Shire PLC, Dolby Laboratories Inc., and Waters Corp.
- Economic growth appears to be moderating from the lofty levels of the last few quarters. We are optimistic that the economy can continue to grow, albeit at a slower rate, whereby innovative companies can thrive and differentiate themselves from peers. We believe our in-depth research focus at the company level should help us identify good growth opportunities. As always, we thank you for your continued investment.
| PAGE 6 |
|

| Stock Performance |
(for the 6 months ended 6/30/10) | | |
| | | | |
| | Average | | Contribution |
Top 5 Stocks | Weight | | to Return |
Akamai Technologies Inc. | 2.77% | | 1.40% |
Dolby Laboratories Inc. | 4.22 | | 1.12 |
Jos. A. Bank Clothiers Inc. | 3.99 | | 1.00 |
Ross Stores Inc. | 4.07 | | 0.96 |
WESCO International Inc. | 4.03 | | 0.81 |
| | | | |
Bottom 5 Stocks | | | |
Rockwood Holdings Inc. | 1.43% | | -0.75% |
Tellabs Inc. | 0.30 | | -0.87 |
Cabot Oil & Gas Corp. | 2.74 | | -1.00 |
Waddell & Reed Financial Inc. | 1.15 | | -1.11 |
King Pharmaceuticals Inc. | 3.21 | | -1.20 |
| | | | |
| Past performance does not guarantee future results. These stocks do not represent all of the securities purchased, sold or recommended by the Funds’ Adviser. To request a complete list of the contribution of each Fund holding to overall Fund performance during the period, please call 800.392.CORE (2673) or email invest@westcore.com. Please see page 29 for a description of the methodology used to construct this chart. |
| Top Ten Holdings |
(as of 6/30/10) | |
Rovi Corp. | 4.3% |
Bank of the Ozarks Inc. | 4.2 |
Dolby Laboratories Inc. | 4.1 |
Waters Corp. | 4.1 |
Intuit Inc. | 4.1 |
Jos. A. Bank Clothiers Inc. | 4.1 |
Cooper Industries PLC | 4.1 |
CR Bard Inc. | 4.0 |
Comerica Inc. | 4.0 |
VeriSign Inc. | 4.0 |
Total (% of Net Assets) | 41.0% |
Top ten holdings do not include any cash, cash equivalents or exchange traded fund investments and are subject to change. There are no guarantees that the Fund will continue to remain invested in any particular holding. |
| Morningstar Ratings |
| | | |
| | Number |
| | Morningstar | of Funds in |
| | Rating™ | Mid-Cap Growth |
| | as of 6/30/10 | Category |
| | |
Overall | ««««« | 694 |
3 Year | ««««« | 694 |
5 Year | ««««« | 612 |
10 Year | «««« | 354 |
Morningstar proprietary ratings reflect historical risk-adjusted performance as of 6/30/10 and are subject to change every month.Please see page 29 for more detail regarding Morningstar Ratings. |
| Portfolio Characteristics |
| (as of 6/30/10) | | | |
| | Westcore | | Russell MidcapTM |
| | Select Fund | | Growth Index |
| Weighted Average Market Capitalization ($ Bil) | $4.9 | | $6.0 |
| Price/Earnings (1 year trailing) | 19.5x | | 21.8x |
| EPS Growth (3 year historical) | 3.6% | | 4.7% |
| Beta | 0.8 | | 1.0 |
| Number of Holdings | 24 | | 497 |
| Portfolio Turnover Rate (6 month) | 105% | | — |
| | | | |
| Please see page 30 for definition of terms. |
| Sector Allocation |
 |
| Sector classifications presented herein are based on the sector categorization methodology of the Adviser to the Funds which may result in the sector designations for one Fund being different than another Fund’s sector designations. |
| Market Capitalization |
 |
| * Total Investments for this chart excludes short-term investments, including money market mutual funds. Market capitalization ranges were determined by the Adviser to the Fund and are for presentation purposes only. These market capitalization ranges do not necessarily correlate to the benchmark’s market capitalization ranges. |

Investing in large, well-established companies whose stocks appear to be undervalued.
| Fund Management |
| Kris B. Herrick, CFA Portfolio Manager | Troy Dayton, CFA Portfolio Manager |
| Derek R. Anguilm, CFA Portfolio Manager | Lisa Z. Ramirez, CFA Portfolio Manager |
| Mark M. Adelmann, CFA, CPA Portfolio Manager | |
CFA is a trademark owned by the CFA Institute. | |
| | |
| Cumulative Returns |

The chart above represents historical performance of a hypothetical investment of $10,000 in the Fund over the past 10 years (or for the life of the Fund if shorter). Performance calculations are as of the end of June each year. Past performance does not guarantee future results. This chart does not reflect the deduction of taxes that a shareholder would pay on Fund distributions or the redemption of Fund shares.
Lipper Index data provided by Lipper, Inc.
Please see pages 28 and 29 for index definitions.
| Average Annual Total Returns |
| | | | | | | | | | | | Since | | Inception |
| | 6 Months | | 1 Year | | 3 Years | | 5 Years | | 10 Years | | Inception | | Date |
| Retail Class (WTMVX) | -10.41% | | 7.09% | | -10.46% | | -1.67% | | 0.48% | | 7.66% | | 6/1/88 |
| Institutional Class | | | | | | | | | | | | | |
| (WIMVX) | -10.32 | | 7.27 | | -10.28 | | -1.55 | | 0.54 | | 7.69 | | 9/28/07 |
| S&P 500 Index | -6.65 | | 14.43 | | -9.81 | | -0.79 | | -1.59 | | 8.58 | | |
| Lipper Large-Cap | | | | | | | | | | | | | |
| Core Index | -7.65 | | 12.33 | | -9.56 | | -0.78 | | -2.17 | | 7.84 | | |
Retail Class Annual Expense Ratio (per the current prospectus) — Gross: 1.26%, Net: 1.15%
Institutional Class Annual Expense Ratio (per the current prospectus) — Gross: 1.14%, Net: 0.95%
The performance data quoted represents past performance and does not guarantee future results. Performance information for the institutional class shares prior to their inception date is based on the performance of the retail class. Current performance may be lower or higher than the performance quoted. To obtain current performance as of the most recent month-end, please call 800.392.CORE (2673) or visit us online at www.westcore.com. Average annual total returns and yield figures reflect the reinvestment of dividends, capital gains distributions, all fee waivers and expense reimbursements. Without the fee waivers and expense reimbursements, total return and yield figures would have been lower. The performance data quoted does not reflect the deduction of the 2% redemption fee imposed if shares are redeemed or exchanged within 90 calendar days from their date of purchase. If imposed, the fee would reduce the performance quoted. Total return and yield figures represent past performance. Investment return and principal value will vary, and shares, when redeemed, may be worth more or less than their original cost.
Westcore fund shares are not insured by the FDIC, the Federal Reserve Board or any other agency and are subject to risk including the possible loss of principal.
The Advisor and Administrators have contractually agreed to waive the investment advisory and/or administration fees and/or to reimburse Fund level other expenses from April 30, 2010 until at least April 30, 2011, so that Net Annual Fund Operating Expenses as reported in the Fund’s Financial Highlights will be no more than 1.15% for the Fund’s Retail Class for such period. In addition, the Advisor has contractually agreed to waive the investment advisory and/or administration fees and/or to reimburse Fund level other expenses in the same proportion as for the Retail Class waivers/reimbursements plus reimbursing the Institutional class-specific other expenses until at least April 30, 2011. The Advisor and Administrators are not contractually bound to continue these waivers/reimbursements past April 30, 2011, however neither party is currently expecting to make any change in the waivers/reimbursements after April 30, 2011. However, you will be notified in writing if these waivers and/or reimbursements are discontinued or materially changed after April 30, 2011.
Lisa Z. Ramirez is a registered representative of ALPS Distributors, Inc.
- The first half of 2010 proved challenging with many equity indexes suffering declines. The Westcore Blue Chip Fund’s results were disappointing for the period as it posted a negative return and lagged its S&P 500 Index benchmark. As economic indicators peaked and the recovery appeared to slow, the Fund’s significant exposure to economically sensitive companies led it to underperform. In response to our belief that a slow economic recovery and modest job growth through 2011 are likely, we shifted the portfolio somewhat towards less economically sensitive companies during the second quarter.
- The Fund’s weakest sectors relative to the benchmark in the first half of 2010 were technology, communications and capital goods. Communications sector holding Qualcomm Inc. struggled. This designer, manufacturer and marketer of digital wireless telecommunications did not grow as fast as we projected. We believe that the diffusion of 3G technology around the globe together with an improving economy over time should bring more predictability to Qualcomm’s business. Technology sector holding Symantec Corp. underperformed during the period. We believe investors are undervaluing this security software company. Management is, in our opinion, focused on creating shareholder value through measured growth, a focus on profits and cash flow, and share repurchases.
- The Fund’s strongest sectors relative to the benchmark were transportation, energy and consumer staples. However, the transportation and energy sectors did not produce any stocks that were among the Fund’s best performers. Within the consumer staples sector, Fund holding Campbell Soup Co. was a positive contributor. Merchandising improvements and increasing demand continued to drive improving results at the company. Evidence of economic and property value stability in the first quarter made SunTrust Banks Inc. one of the Fund’s best performing stocks in the first half of 2010. We believe SunTrust has an excellent banking franchise in the southeast. However, with conflicting evidence regarding the economic recovery, the position was sold subsequent to period end.
- Investors have become increasingly skeptical of the U.S. and global recovery as a number of economic indicators have flashed caution signals. Car and housing sales pulled back after the expiration of government stimulus programs. Job creation remains anemic and persistently high unemployment rates point to a consumer that cannot be expected to be the engine driving strong GDP growth. While we believe this may prove to be a typical correction from both a market and economic standpoint, we are monitoring the situation closely.
- As always, we thank our shareholders for their confidence in these volatile market conditions.
| PAGE 8 |
|

| Stock Performance |
(for the 6 months ended 6/30/10) |
| | | | |
| | Average | | Contribution |
Top 5 Stocks | Weight | | to Return |
Darden Restaurants Inc. | 1.37% | | 0.22% |
Altera Corp. | 1.95 | | 0.13 |
Campbell Soup Co. | 2.00 | | 0.12 |
SunTrust Banks Inc. | 1.47 | | 0.12 |
TJX Companies Inc. | 0.35 | | 0.12 |
| | | | |
Bottom 5 Stocks | | | |
Dell Inc. | 2.37% | | -0.46% |
Expedia Inc. | 2.14 | | -0.60 |
Symantec Corp. | 2.58 | | -0.61 |
Microsoft Corp. | 2.89 | | -0.79 |
Qualcomm Inc. | 2.73 | | -0.87 |
| | | | |
| Past performance does not guarantee future results. These stocks do not represent all of the securities purchased, sold or recommended by the Funds’ Adviser. To request a complete list of the contribution of each Fund holding to overall Fund performance during the period, please call 800.392.CORE (2673) or email invest@westcore.com. Please see page 29 for a description of the methodology used to construct this chart. |
| Top Ten Holdings |
(as of 6/30/10) | |
International Business Machines Corp. | 3.9% |
Occidental Petroleum Corp. | 3.4 |
Bank of America Corp. | 3.1 |
Microsoft Corp. | 3.0 |
Marathon Oil Corp. | 2.8 |
Amgen Inc. | 2.7 |
Colgate-Palmolive Co. | 2.7 |
International Paper Co. | 2.6 |
Norfolk Southern Corp. | 2.5 |
Zimmer Holdings Inc. | 2.5 |
Total (% of Net Assets) | 29.2% |
Top ten holdings do not include any cash, cash equivalents or exchange traded fund investments and are subject to change. There are no guarantees that the Fund will continue to remain invested in any particular holding. |
| Morningstar Ratings |
| | | Number |
| | Morningstar | of Funds in |
| | Rating™ | Large Blend |
| | as of 6/30/10 | Category |
Overall | ««« | 1,810 |
3 Year | ««« | 1,810 |
5 Year | ««« | 1,486 |
10 Year | «««« | 772 |
Morningstar Ratings shown represent both the Retail and Institutional Classes. Morningstar proprietary ratings reflect historical risk-adjusted performance as of 6/30/10 and are subject to change every month.Please see page 29 for more detail regarding Morningstar Ratings. |
| Portfolio Characteristics |
(as of 6/30/10) | | | |
| | Westcore | | S&P 500 |
| | Blue Chip Fund | | Index |
Weighted Average Market Capitalization ($ Bil) | $49.1 | | $72.8 |
Price/Cash Flow (1 year trailing) | 7.7x | | 9.4x |
Price/Book Value | 2.4x | | 2.7x |
Price/Earnings (1 year trailing) | 14.8x | | 17.0x |
Beta | 1.0 | | 1.0 |
Number of Holdings | 52 | | 500 |
Portfolio Turnover Rate (6 month) | 22% | | — |
Please see page 30 for definition of terms. | | | |
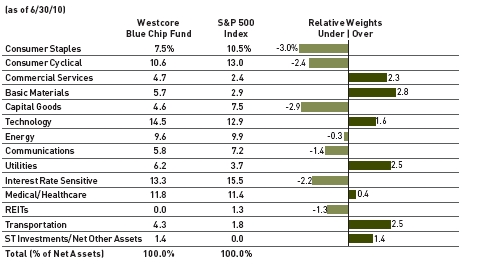
| Sector Allocation |
 |
| | | | | | | |
| Sector classifications presented herein are based on the sector categorization methodology of the Adviser to the Funds which may result in the sector designations for one Fund being different than another Fund’s sector designations. |
| Market Capitalization |
 |
| * Total Investments for this chart excludes short-term investments, including money market mutual funds. Market capitalization ranges were determined by the Adviser to the Fund and are for presentation purposes only. These market capitalization ranges do not necessarily correlate to the benchmark’s market capitalization ranges |

Investing in medium-sized companies whose stocks appear to be undervalued.
| Kris B. Herrick, CFA Portfolio Manager | Troy Dayton, CFA Portfolio Manager |
| Derek R. Anguilm, CFA Portfolio Manager | Lisa Z. Ramirez, CFA Portfolio Manager |
| Mark M. Adelmann, CFA, CPA Portfolio Manager | |
| | |
| CFA is a trademark owned by the CFA Institute. | |
| | |
| Cumulative Returns |

The chart above represents historical performance of a hypothetical investment of $10,000 in the Fund over the past 10 years (or for the life of the Fund if shorter). Performance calculations are as of the end of June each year. Past performance does not guarantee future results. This chart does not reflect the deduction of taxes that a shareholder would pay on Fund distributions or the redemption of Fund shares.
Lipper Index data provided by Lipper, Inc.
Please see pages 28 and 29 for index definitions.
| Average Annual Total Returns |
| | | | | | | | | | | | Since | Inception |
| | 6 Months | | 1 Year | | 3 Years | | 5 Years | | 10 Years | | Inception | Date |
| Retail Class | | | | | | | | | | | | |
| (WTMCX) | -2.49% | | 17.93% | | -11.92% | | -1.55% | | 4.33% | | 6.90% | 10/1/98 |
| Russell MidcapTM | | | | | | | | | | | | |
| Value Index | -0.88 | | 28.91 | | -9.44 | | 0.71 | | 7.55 | | 7.48 | |
| Lipper Mid-Cap | | | | | | | | | | | | |
| Value Index | -3.20 | | 23.19 | | -8.78 | | 0.76 | | 5.73 | | 7.20 | |
Retail Class Annual Expense Ratio (per the current prospectus) — Gross: 1.26%, Net: 1.25%
The performance data quoted represents past performance and does not guarantee future results. Performance information for the institutional class shares prior to their inception date is based on the performance of the retail class. Current performance may be lower or higher than the performance quoted. To obtain current performance as of the most recent month-end, please call 800.392.CORE (2673) or visit us online at www.westcore.com. Average annual total returns and yield figures reflect the reinvestment of dividends, capital gains distributions, all fee waivers and expense reimbursements. Without the fee waivers and expense reimbursements, total return and yield figures would have been lower. The performance data quoted does not reflect the deduction of the 2% redemption fee imposed if shares are redeemed or exchanged within 90 calendar days from their date of purchase. If imposed, the fee would reduce the performance quoted. Total return and yield figures represent past performance. Investment return and principal value will vary, and shares, when redeemed, may be worth more or less than their original cost.
Westcore fund shares are not insured by the FDIC, the Federal Reserve Board or any other agency and are subject to risk including the possible loss of principal.
The Advisor and Administrators have contractually agreed to waive the investment advisory and/or administration fees and/or to reimburse Fund level other expenses from April 30, 2010 until at least April 30, 2011, so that Net Annual Fund Operating Expenses as reported in the Fund’s Financial Highlights will be no more than 1.25% for the Fund’s Retail Class for such period. In addition, the Advisor has contractually agreed to waive the investment advisory and/or administration fees and/or to reimburse Fund level other expenses in the same proportion as for the Retail Class waivers/reimbursements plus reimbursing the Institutional class-specific other expenses until at least April 30, 2011. The Advisor and Administrators are not contractually bound to continue these waivers/reimbursements past April 30, 2011, however neither party is currently expecting to make any change in the waivers/reimbursements after April 30, 2011. However, you will be notified in writing if these waivers and/or reimbursements are discontinued or materially changed after April 30, 2011.
Lisa Z. Ramirez is a registered representative of ALPS Distributors, Inc.
- For the first half of 2010 we are disappointed to report that the Westcore Mid-Cap Value Fund’s return was negative and that the Fund underperformed its benchmark, the Russell Midcap Value Index. The first four months of 2010 were a continuation of the low quality, low share-price rally in place since the March 2009 market bottom. This rally came to an end in late April and early May as the market began rewarding what we believe are companies with higher-quality characteristics.
- The energy, commercial services and consumer cyclicals sectors were key contributors to the Fund’s performance relative to the benchmark in the period. Energy sector holding Forest Oil Corp. was the Fund’s top performer. In addition to its strong position in the Granite Wash Field as well as other prolific oil and gas fields in North America, Forest also managed costs better than its industry peers. Darden Restaurants Inc. was the Fund’s best performer in the consumer cyclicals sector. In this difficult economic environment, Darden has been more resilient than other restaurant operators. Its management team has effectively controlled labor and administrative costs, providing results that surpassed our expectations.
- The REITs, capital goods and utilities sectors were the Fund’s weakest contributors relative to the benchmark. The Fund’s underperformance in the REITs sector was primarily due to its underweight position. There were no significant individual underperformers within the Fund’s capital goods and utilities sector holdings. Dean Foods Co., a processor and distributor of dairy products was the Fund’s worst performing stock in the period. This consumer staples sector holding announced disappointing quarterly results driven by aggressive, competitive pricing and raw material cost volatility which led us to sell the position. Interest rate sensitive sector holding Invesco Ltd. struggled as investors became concerned that the second quarter market correction could become more severe and extended. Additionally, a significant portion of Invesco’s revenues generated by its investment operations in Europe were impacted by the weak Euro. While we believe Invesco is well managed and well positioned, we are monitoring the situation closely.
- The first half of 2010 was a rollercoaster ride for investors as the rally that began in March 2009 ended. Chaos reigned in the Euro market with Greece on the brink of default. In the U.S., car and housing sales declined after government stimulus programs expired, job creation remained anemic and persistently high unemployment rates pointed to a consumer that cannot be expected to be the engine driving strong GDP growth. While we believe this may prove to be a typical correction from both a market and economic standpoint, we are monitoring the situation closely. We believe that over the next year, companies with strong fundamentals will be rewarded by investors.
| PAGE 10 |
|

| Stock Performance |
| (for the 6 months ended 6/30/10) |
| | Average | | Contribution |
Top 5 Stocks | Weight | | to Return |
Zions Bancorporation | 1.16% | | 0.57% |
Tyson Foods Inc. | 2.28 | | 0.55 |
Darden Restaurants Inc. | 0.89 | | 0.43 |
Pactiv Corp. | 1.49 | | 0.35 |
Forest Oil Corp. | 1.72 | | 0.32 |
| | | | |
Bottom 5 Stocks | | | |
Harsco Corp. | 1.09% | | -0.31% |
International Paper Co. | 2.10 | | -0.37 |
Symantec Corp. | 1.74 | | -0.42 |
Invesco Ltd. | 1.64 | | -0.45 |
Dean Foods Co. | 1.13 | | -0.51 |
| | | | |
| Past performance does not guarantee future results. These stocks do not represent all of the securities purchased, sold or recommended by the Funds’ Adviser. To request a complete list of the contribution of each Fund holding to overall Fund performance during the period, please call 800.392.CORE (2673) or email invest@westcore.com Please see page 29 for a description of the methodology used to construct this chart. |
| Top Ten Holdings |
(as of 6/30/10) | |
Autoliv Inc. | 3.0% |
Reinsurance Group of America Inc. | 2.8 |
Quanta Services Inc. | 2.5 |
Comerica Inc. | 2.5 |
Altera Corp. | 2.4 |
Tyson Foods Inc. | 2.4 |
Crown Holdings Inc. | 2.4 |
Macy’s Inc. | 2.3 |
UGI Corp. | 2.3 |
PartnerRe Ltd. | 2.3 |
Total (% of Net Assets) | 24.9% |
Top ten holdings do not include any cash, cash equivalents or exchange traded fund investments and are subject to change. There are no guarantees that the Fund will continue to remain invested in any particular holding. |
| Morningstar Ratings |
| | | |
| | Number |
| | Morningstar | of Funds in |
| | Rating™ | Mid-Cap Blend |
| | as of 6/30/10 | Category |
| | |
Overall | «« | 364 |
3 Year | «« | 364 |
5 Year | «« | 307 |
10 Year | ««« | 161 |
| Morningstar proprietary ratings reflect historical risk-adjusted performance as of 6/30/10 and are subject to change every month. Please see page 29 for more detail regarding Morningstar Ratings. |
| Portfolio Characteristics |
(as of 6/30/10) | | | |
| | Westcore Mid-Cap | | Russell MidcapTM |
| | Value Fund | | Value Index |
Weighted Average Market Capitalization ($ Bil) | $4.9 | | $6.0 |
Price/Cash Flow (1 year trailing) | 7.1x | | 8.0x |
Price/Book Value | 1.7x | | 1.6x |
Price/Earnings (1 year trailing) | 16.4x | | 16.9x |
Beta | 0.9 | | 1.0 |
Number of Holdings | 58 | | 542 |
Portfolio Turnover Rate (6 month) | 18% | | — |
Please see page 30 for definition of terms. | | | |
| Sector Allocation |
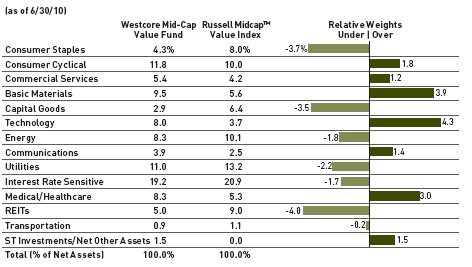 |
Sector classifications presented herein are based on the sector categorization methodology of the Adviser to the Funds which may result in the sector designations for one Fund being different than another Fund’s sector designations. |
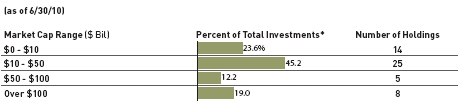
| Market Capitalization |
 |
| * Total Investments for this chart excludes short-term investments, including money market mutual funds. Market capitalization ranges were determined by the Adviser to the Fund and are for presentation purposes only. These market capitalization ranges do not necessarily correlate to the benchmark’s market capitalization ranges. |

Investing in small-company stocks that appear to be undervalued.
| | |
Kris B. Herrick, CFA Portfolio Manager
Derek R. Anguilm, CFA Portfolio Manager
Mark M. Adelmann, CFA, CPA Portfolio Manager | Troy Dayton, CFA Portfolio Manager
Lisa Z. Ramirez, CFA Portfolio Manager |
CFA is a trademark owned by the CFA Institute.
The chart above represents historical performance of a hypothetical investment of $10,000 in the Fund over the past 10 years (or for the life of the Fund if shorter). Performance calculations are as of the end of June each year. Past performance does not guarantee future results. This chart does not reflect the deduction of taxes that a shareholder would pay on Fund distributions or the redemption of Fund shares.
Lipper Index data provided by Lipper, Inc.
Please see pages 28 and 29 for index definitions.
| Average Annual Total Returns |
| | | | | | | | | | | | Since | | Inception |
| | 6 Months | | 1 Year | | 3 Years | | 5 Years | | 10 Years | | Inception | | Date |
| Retail Class (WTSCX) | -1.63% | | 20.38% | | -12.21% | | -0.26% | | 5.78% | | 7.50% | | 12/28/93 |
| Institutional Class | | | | | | | | | | | | | |
| (WISCX) | -1.62 | | 20.53 | | -12.08 | | -0.16 | | 5.83 | | 7.53 | | 9/28/07 |
| Russell 2000® Index | -1.95 | | 21.48 | | -8.60 | | 0.37 | | 3.00 | | 6.76 | | |
| Lipper Small-Cap | | | | | | | | | | | | | |
| Core Index | -2.09 | | 21.67 | | -7.59 | | 1.15 | | 4.16 | | 8.05 | | |
Retail Class Annual Expense Ratio (per the current prospectus) — Gross: 1.65%, Net: 1.31%
Institutional Class Annual Expense Ratio (per the current prospectus) — Gross: 2.77%, Net: 1.16%
The performance data quoted represents past performance and does not guarantee future results. Performance information for the institutional class shares prior to their inception date is based on the performance of the retail class. Current performance may be lower or higher than the performance quoted. To obtain current performance as of the most recent month-end, please call 800.392.CORE (2673) or visit us online at www.westcore.com. Average annual total returns and yield figures reflect the reinvestment of dividends, capital gains distributions, all fee waivers and expense reimbursements. Without the fee waivers and expense reimbursements, total return and yield figures would have been lower. The performance data quoted does not reflect the deduction of the 2% redemption fee imposed if shares are redeemed or exchanged within 90 calendar days from their date of purchase. If imposed, the fee would reduce the performance quoted. Total return and yield figures represent past performance. Investment return and principal value will vary, and shares, when redeemed, may be worth more or less than their original cost.
Westcore fund shares are not insured by the FDIC, the Federal Reserve Board or any other agency and are subject to risk including the possible loss of principal ..
The Advisor and Administrators have contractually agreed to waive the investment advisory and/or administration fees and/or to reimburse Fund level other expenses from April 30, 2010 until at least April 30, 2011, so that Net Annual Fund Operating Expenses as reported in the Fund’s Financial Highlights will be no more than 1.30% for the Fund’s Retail Class for such period. In addition, the Advisor has contractually agreed to waive the investment advisory and/or administration fees and/or to reimburse Fund level other expenses in the same proportion as for the Retail Class waivers/reimbursements plus reimbursing the Institutional class-specific other expenses until at least April 30, 2011. The Advisor and Administrators are not contractually bound to continue these waivers/reimbursements past April 30, 2011, however neither party is currently expecting to make any change in the waivers/reimbursements after April 30, 2011. However, you will be notified in writing if these waivers and/or reimbursements are discontinued or materially changed after April 30, 2011.
Investing in small-cap funds generally will be more volatile and loss of principal could be greater than investing in larger-cap funds.
Lisa Z. Ramirez is a registered representative of ALPS Distributors, Inc.
- The Westcore Small-Cap Opportunity Fund’s return for the first half of 2010 was negative, but it did outperform the benchmark Russell 2000 Index. The first four months of 2010 were a continuation of the low quality, low share-price rally in place since the March 2009 market bottom. This rally came to an end in late April and early May as the market began rewarding what we believe are companies with higher-quality characteristics.
- The Fund’s best performing sectors relative to the benchmark in the first six months of the year were medical/healthcare, technology and utilities. Lincare Holdings Inc. was the Fund’s leading medical/healthcare sector contributor. This in-home provider of oxygen and other respiratory therapy services saw solid share-price appreciation driven by better-than-expected quarterly results. The Fund’s underweight in the medical/healthcare sector also proved to be beneficial this quarter. Sybase Inc. was the Fund’s top performer in the technology sector. Sybase provides software and services for organizations to manage, analyze and mobilize information. During the period, SAP AG recognized the value that we saw in Sybase and acquired the company for a large premium.
- The interest rate sensitive, basic materials and capital good sectors were the most challenging relative to the benchmark in the period. Interest rate sensitive sector holding Piper Jaffray Cos. was the Fund’s poorest performer. Although Piper Jaffray reported solid fourth quarter results and outlined significant opportunities for 2010 and beyond, the stock remained under pressure as activity for brokers and investment banks failed to meet expectations. Despite the company’s strong balance sheet, we decided to move out of this position. Basic materials sector holding NewMarket Corp. is a holding company with two primary segments; petroleum additives and real estate development. NewMarket saw significant margin improvement in 2009 driven by price increases and recovering volumes. We anticipated continued margin improvement through the first half of the year, but the rapid rise in commodity prices offset price increases more quickly than we expected. We chose to sell the stock and realize the gain.
- The first half of 2010 was a rollercoaster ride for investors as the rally that began in March 2009 ended. Chaos reigned in the Euro market with Greece on the brink of default. In the U.S., car and housing sales declined after government stimulus programs expired, job creation remained anemic and persistently high unemployment rates pointed to a consumer that cannot be expected to be the engine driving strong GDP growth. While we believe this may prove to be a typical correction from both a market and economic standpoint, we are monitoring the situation closely. We believe that over the next year, companies with strong fundamentals will be rewarded by investors.
| PAGE 12 |
|

| Stock Performance |
| (for the 6 months ended 6/30/10) |
| | Average | | Contribution |
Top 5 Stocks | Weight | | to Return |
The Children’s Place | | | |
Retail Stores Inc. | 2.06% | | 0.58% |
Sybase Inc. | 1.28 | | 0.48 |
Lincare Holdings Inc. | 1.72 | | 0.48 |
Syniverse Holdings Inc. | 2.21 | | 0.31 |
STERIS Corp. | 1.73 | | 0.30 |
| | | |
Bottom 5 Stocks | | | |
Carrizo Oil & Gas Inc. | 0.74% | | -0.30% |
EMCOR Group Inc. | 2.04 | | -0.33 |
NewMarket Corp. | 0.71 | | -0.52 |
Cal Dive International Inc. | 2.26 | | -0.59 |
Piper Jaffray Cos. | 1.72 | | -0.72 |
Past performance does not guarantee future results. These stocks do not represent all of the securities purchased, sold or recommended by the Funds’ Adviser. To request a complete list of the contribution of each Fund holding to overall Fund performance during the period, please call 800.392.CORE (2673) or email invest@westcore.com.Please see page 29 for a description of the methodology used to construct this chart. |
| Top Ten Holdings |
(as of 6/30/10) | |
South Jersey Industries Inc. | 2.9% |
EnPro Industries Inc. | 2.6 |
Syniverse Holdings Inc. | 2.6 |
Waste Connections Inc. | 2.5 |
Cal Dive International Inc. | 2.3 |
Anworth Mortgage Asset Corp. | 2.1 |
Steiner Leisure Ltd. | 2.0 |
The Children’s Place Retail Stores Inc. | 2.0 |
EMCOR Group Inc. | 2.0 |
Bill Barrett Corp. | 1.9 |
Total (% of Net Assets) | 22.9% |
Top ten holdings do not include any cash, cash equivalents or exchange traded fund investments and are subject to change. There are no guarantees that the Fund will continue to remain invested in any particular holding. |
| Morningstar Ratings |
| | | Number |
| | Morningstar | of Funds in |
| | Rating™ | Small Blend |
| | as of 6/30/10 | Category |
Overall | ««« | 565 |
3 Year | «« | 565 |
5 Year | ««« | 479 |
10 Year | ««« | 251 |
Morningstar Ratings shown represent both the Retail and Institutional Classes. Morningstar proprietary ratings reflect historical risk-adjusted performance as of 6/30/10 and are subject to change every month.Please see page 29 for more detail regarding Morningstar Ratings. |
| Portfolio Characteristics |
(as of 6/30/10) | | | |
| | Westcore Small-Cap | | Russell 2000® |
| | Opportunity Fund | | Index |
Weighted Average Market Capitalization ($ Mil) | $1,144 | | $915 |
Price/Cash Flow (1 year trailing) | 7.9x | | 10.1x |
Price/Book Value | 1.8x | | 2.2x |
Price/Earnings (1 year trailing) | 20.3x | | 19.3x |
Beta | 1.0 | | 1.0 |
Number of Holdings | 67 | | 2,010 |
Portfolio Turnover Rate (6 month) | 20% | | — |
Please see page 30 for definition of terms. |
| Sector Allocation |
 |
Sector classifications presented herein are based on the sector categorization methodology of the Adviser to the Funds which may result in the sector designations for one Fund being different than another Fund’s sector designations. |
| Market Capitalization |
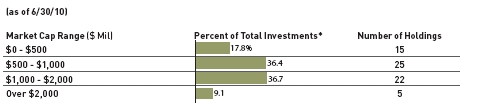 |
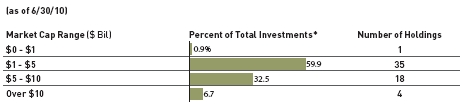
| * Total Investments for this chart reflects the value of such investments and excludes short-term investments, including money market mutual funds. Market capitalization ranges were determined by the Adviser to the Fund and are for presentation purposes only. These market capitalization ranges do not necessarily correlate to the benchmark’s market capitalization ranges. |

Investing primarily in small-cap, dividend paying stocks that appear to be undervalued.
| | |
| Kris B. Herrick, CFA Portfolio Manager | Troy Dayton, CFA Portfolio Manager |
| Derek R. Anguilm, CFA Portfolio Manager | Lisa Z. Ramirez, CFA Portfolio Manager |
| Mark M. Adelmann, CFA, CPA Portfolio Manager | |
| | |
| CFA is a trademark owned by the CFA Institute. | |
| | |
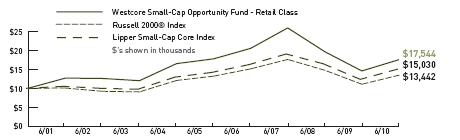
| Cumulative Returns |

The chart above represents historical performance of a hypothetical investment of $10,000 in the Fund over the past 10 years (or for the life of the Fund if shorter). Performance calculations are as of the end of June each year. Past performance does not guarantee future results. This chart does not reflect the deduction of taxes that a shareholder would pay on Fund distributions or the redemption of Fund shares.
Lipper Index data provided by Lipper, Inc.
Please see pages 28 and 29 for index definitions.
| Average Annual Total Returns |
| | | | | | | | | | Since | | Inception |
| | 6 Months | | 1 Year | | 3 Years | | 5 Years | 10 Years | Inception | | Date |
| Retail Class (WTSVX) | 2.10% | | 27.07% | | -9.75% | | 0.34% | N/A | 0.72% | | 12/13/04 |
| Institutional Class | | | | | | | | | | | |
| (WISVX) | 2.10 | | 27.16 | | -9.68 | | 0.38 | N/A | 0.76 | | 9/28/07 |
| Russell 2000® | | | | | | | | | | | |
| Value Index | -1.63 | | 25.07 | | -9.85 | | -0.51 | N/A | -0.04 | | |
| Lipper Small-Cap | | | | | | | | | | | |
| Value Index | -1.26 | | 25.50 | | -8.14 | | 0.90 | N/A | 1.65 | | |
Retail Class Annual Expense Ratio (per the current prospectus) — Gross: 1.38%, Net: 1.31%
Institutional Class Annual Expense Ratio (per the current prospectus) — Gross: 1.34%, Net: 1.21%
The performance data quoted represents past performance and does not guarantee future results. Performance information for the institutional class shares prior to their inception date is based on the performance of the retail class. Current performance may be lower or higher than the performance quoted. To obtain current performance as of the most recent month-end, please call 800.392.CORE (2673) or visit us online at www.westcore.com. Average annual total returns and yield figures reflect the reinvestment of dividends, capital gains distributions, all fee waivers and expense reimbursements. Without the fee waivers and expense reimbursements, total return and yield figures would have been lower. The performance data quoted does not reflect the deduction of the 2% redemption fee imposed if shares are redeemed or exchanged within 90 calendar days from their date of purchase. If imposed, the fee would reduce the performance quoted. Total return and yield figures represent past performance. Investment return and principal value will vary, and shares, when redeemed, may be worth more or less than their original cost.
Westcore fund shares are not insured by the FDIC, the Federal Reserve Board or any other agency and are subject to risk including the possible loss of principal.
The Advisor and Administrators have contractually agreed to waive the investment advisory and/or administration fees and/or to reimburse Fund level other expenses from April 30, 2010 until at least April 30, 2011, so that Net Annual Fund Operating Expenses as reported in the Fund’s Financial Highlights will be no more than 1.30% for the Fund’s Retail Class for such period. In addition, the Advisor has contractually agreed to waive the investment advisory and/or administration fees and/or to reimburse Fund level other expenses in the same proportion as for the Retail Class waivers/reimbursements plus reimbursing the Institutional class-specific other expenses until at least April 30, 2011. The Advisor and Administrators are not contractually bound to continue these waivers/reimbursements past April 30, 2011, however neither party is currently expecting to make any change in the waivers/ reimbursements after April 30, 2011. However, you will be notified in writing if these waivers and/or reimbursements are discontinued or materially changed after April 30, 2011.
Investing in small-cap funds generally will be more volatile and loss of principal could be greater than investing in larger-cap funds.
Lisa Z. Ramirez is a registered representative of ALPS Distributors, Inc.
- We are pleased that the Westcore Small-Cap Value Fund provided a positive return for the first half of the year and also outperformed its benchmark, the Russell 2000 Value Index. The first four months of 2010 continued the low quality, low share-price rally, in place since the March 2009 market bottom. This rally came to an end in late April and early May as the market began rewarding, what we believe, are companies with higher-quality characteristics.
- The three greatest contributors to the Fund’s performance relative to its benchmark were the interest rate sensitive, capital goods and energy sectors. American Equity Investment Life Holding Co. benefitted from the steep yield curve and investor interest in annuities. Capital goods sector holding Triumph Group Inc., a designer and manufacturer of aircraft components saw increased demand for its products. This along with its acquisition of Vought Aircraft Industries drove its stock price higher. Fund holding SM Energy Co., formerly St. Mary’s Land & Exploration Company, saw its stock price appreciate by focusing more on shale oil and gas development. Additionally, results in its Texas Eagle Ford Shale position appear to have caused investors to re-evaluate the company’s cash flow potential.
- The REITs, transportation and technology sectors were the Fund’s most disappointing relative to the benchmark. Within the REITs and technology sectors, no individual holdings significantly underperformed. The Fund’s underweight position in transportation coupled with weakness in trucking company Arkansas Best Corp. led to its sector underperformance.
- Arkansas Best’s share price declined after it was unable to attain a 15% wage reduction from union employees. Although we feel this is a setback in cost reduction, we believe freight conditions will improve. The Fund’s worst performing stock was energy sector holding EnergySolutions Inc. We believed that this nuclear services company would benefit from growth in disposal of low-level radioactive waste. However, after management disruptions and further research into the company’s growth opportunities, we decided to sell the position.
- The first half of 2010 was a rollercoaster ride for investors as the rally that began in March 2009 ended. Chaos reigned in the Euro market with Greece on the brink of default. In the U.S., car and housing sales declined after government stimulus programs expired, job creation remained anemic and persistently high unemployment rates pointed to a consumer that cannot be expected to be the engine driving strong GDP growth. While we believe this may prove to be a typical correction from both a market and economic standpoint, we are monitoring the situation closely. We believe that over the next year, companies with strong fundamentals will be rewarded by investors.
| PAGE 14 |
|

| Stock Performance |
| (for the 6 months ended 6/30/10) |
| | Average | | Contribution |
Top 5 Stocks | Weight | | to Return |
Triumph Group Inc. | 2.61% | | 0.69% |
American Equity Investment | | | |
Life Holding Co. | 1.79 | | 0.58 |
Adtran Inc. | 2.90 | | 0.57 |
SM Energy Co. | 2.26 | | 0.48 |
Foot Locker Inc. | 1.65 | | 0.38 |
| | | | |
Bottom 5 Stocks | | | |
Bob Evans Farms Inc. | 2.10% | | -0.25% |
Meridian Bioscience Inc. | 1.38 | | -0.28 |
Arkansas Best Corp. | 0.88 | | -0.28 |
Tupperware Brands Corp. | 2.73 | | -0.33 |
EnergySolutions Inc. | 0.76 | | -0.39 |
| | | | |
| Past performance does not guarantee future results. These stocks do not represent all of the securities purchased, sold or recommended by the Funds’ Adviser. To request a complete list of the contribution of each Fund holding to overall Fund performance during the period, please call 800.392.CORE (2673) or email invest@westcore.com. Please see page 29 for a description of the methodology used to construct this chart. |
| Top Ten Holdings |
(as of 6/30/10) | |
Adtran Inc. | 3.2% |
Belden Inc. | 3.0 |
Triumph Group Inc. | 2.9 |
Temple-Inland Inc. | 2.5 |
Tupperware Brands Corp. | 2.5 |
Owens & Minor Inc. | 2.5 |
South Jersey Industries Inc. | 2.4 |
MFA Financial Inc. | 2.2 |
Cash America International Inc. | 2.1 |
American Equity Investment Life | |
Holding Co. | 2.1 |
Total (% of Net Assets) | 25.4% |
Top ten holdings do not include any cash, cash equivalents or exchange traded fund investments and are subject to change. There are no guarantees that the Fund will continue to remain invested in any particular holding. |
| Morningstar Ratings |
| | | Number |
| | Morningstar | of Funds in |
| | Rating™ | Small Value |
| | as of 6/30/10 | Category |
Overall | ««« | 321 |
3 Year | ««« | 321 |
5 Year | ««« | 251 |
Morningstar Ratings shown represent both the Retail and Institutional Classes. Morningstar proprietary ratings reflect historical risk-adjusted performance as of 6/30/10 and are subject to change every month.Please see page 29 for more detail regarding Morningstar Ratings. |
| Portfolio Characteristics |
(as of 6/30/10) | | | |
| | Westcore Small-Cap | | Russell 2000® |
| | Value Fund | | Value Index |
Weighted Average Market Capitalization ($ Mil) | $1,311 | | $860 |
Price/Cash Flow (1 year trailing) | 8.4x | | 8.5x |
Price/Book Value | 2.0x | | 1.3x |
Price/Earnings (1 year trailing) | 19.3x | | 16.8x |
Beta | 1.0 | | 1.0 |
Number of Holdings | 66 | | 1,300 |
Portfolio Turnover Rate (6 month) | 18% | | — |
Please see page 30 for definition of terms. | | | |
| Sector Allocation |
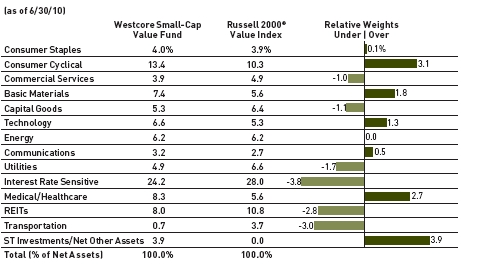 |
| Sector classifications presented herein are based on the sector categorization methodology of the Adviser to the Funds which may result in the sector designations for one Fund being different than another Fund’s sector designations. |
| Market Capitalization |
 |
* Total Investments for this chart reflects the value of such investments and excludes short-term investments, including money market mutual funds.Market capitalization ranges were determined by the Adviser to the Fund and are for presentation purposes only. These market capitalization ranges do not necessarily correlate to the benchmark’s market capitalization ranges. |

Investing primarily in micro-cap companies whose stocks appear to be undervalued.
Kris B. Herrick, CFA Portfolio Manager
Paul A . Kuppinger, CFA Portfolio Manager
Jon K. Tesseo Portfolio Manager
CFA is a trademark owned by the CFA Institute.
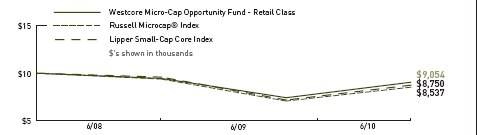
The chart above represents historical performance of a hypothetical investment of $10,000 in the Fund over the past 10 years (or for the life of the Fund if shorter). Performance calculations are as of the end of June each year. Past performance does not guarantee future results. This chart does not reflect the deduction of taxes that a shareholder would pay on Fund distributions or the redemption of Fund shares.
Lipper Index data provided by Lipper, Inc.
Please see pages 28 and 29 for index definitions.
| Average Annual Total Returns |
| | | | | | | | Since | Inception |
| | 6 Months | | 1 Year | 3 Years | 5 Years | 10 Years | Inception | Date |
| Retail Class (WTMIX) | 3.70% | | 21.76% | N/A | N/A | N/A | -4.80% | 6/23/08 |
| Russell | | | | | | | | |
| Microcap® Index | 0.12 | | 20.45 | N/A | N/A | N/A | -8.93 | |
| Lipper Small-Cap | | | | | | | | |
| Core Index | -2.09 | | 21.67 | N/A | N/A | N/A | -6.46 | |
Retail Class Annual Expense Ratio (per the current prospectus) — Gross: 7.97%, Net: 1.31%
The performance data quoted represents past performance and does not guarantee future results. Performance information for the institutional class shares prior to their inception date is based on the performance of the retail class. Current performance may be lower or higher than the performance quoted. To obtain current performance as of the most recent month-end, please call 800.392.CORE (2673) or visit us online at www.westcore.com. Average annual total returns and yield figures reflect the reinvestment of dividends, capital gains distributions, all fee waivers and expense reimbursements. Without the fee waivers and expense reimbursements, total return and yield figures would have been lower. The performance data quoted does not reflect the deduction of the 2% redemption fee imposed if shares are redeemed or exchanged within 90 calendar days from their date of purchase. If imposed, the fee would reduce the performance quoted. Total return and yield figures represent past performance. Investment return and principal value will vary, and shares, when redeemed, may be worth more or less than their original cost.
Westcore fund shares are not insured by the FDIC, the Federal Reserve Board or any other agency and are subject to risk including the possible loss of principal.
The Advisor and Administrators have contractually agreed to waive the investment advisory and/or administration fees and/or to reimburse Fund level other expenses from April 30, 2010 until at least April 30, 2011, so that Net Annual Fund Operating Expenses as reported in the Fund’s Financial Highlights will be no more than 1.30% for the Fund’s Retail Class for such period. In addition, the Advisor has contractually agreed to waive the investment advisory and/or administration fees and/or to reimburse Fund level other expenses in the same proportion as for the Retail Class waivers/reimbursements plus reimbursing the Institutional class-specific other expenses until at least April 30, 2011. The Advisor and Administrators are not contractually bound to continue these waivers/reimbursements past April 30, 2011, however neither party is currently expecting to make any change in the waivers/reimbursements after April 30, 2011. However, you will be notified in writing if these waivers and/or reimbursements are discontinued or materially changed after April 30, 2011.
Investing in small-cap funds generally will be more volatile and loss of principal could be greater than investing in larger-cap funds.
Jon K. Tesseo is a registered representative of ALPS Distributors, Inc.
- We are pleased to report that the Westcore Micro-Cap Opportunity Fund ended the first six months of 2010 with a positive return and also outperformed its benchmark, the Russell Microcap Index.
- The rally which began with low quality, low priced stocks in March 2009 persisted through the first four months of 2010, though the leadership shifted more toward the type of stocks our models focus on. However, as the euro-region debt crisis progressed into the latest financial pandemic, investors became more risk-averse. Although neither the Fund nor the benchmark had material exposure to Europe the “flight to quality” appeared to affect unrelated securities. Most if its impact was felt in June with the benchmark down 8.35% and the Fund off 7.14%.
- Despite losing some ground in the second quarter as the markets shifted, we believe our models worked well in the first half of the year with the Fund outperforming the benchmark in 10 of 13 sectors. The Fund’s best performing sectors relative to the benchmark were interest rate sensitive, medical/healthcare, and energy. The Fund’s worst performing sectors relative to the benchmark were REITS, transportation and consumer staples.
- Each year at the end of June, the Russell Indexes rebalance making the end of the second quarter interesting for portfolios structured on models, such as the Westcore Micro-Cap Opportunity Fund. To avoid any issues with Russell’s rebalance, we try to rebalance earlier in the month of June and that was our strategy this year. We believe our models are working well. Currently the Fund holds a significant position in high cash flow yield companies – the type of companies which have historically performed well over time. We believe the Fund is positioned to take advantage of a market rebound.
- We are optimistic about the potential for a strong second half of the year and thank you for your continued investment.
| PAGE 16 |
|

| Stock Performance |
| (for the 6 months ended 6/30/10) |
| | Average | | Contribution |
Top 5 Stocks | Weight | | to Return |
Cirrus Logic Inc. | 0.66% | | 0.72% |
Delcath Systems Inc. | 0.58 | | 0.49 |
Radian Group Inc. | 0.17 | | 0.46 |
Questcor Pharmaceuticals Inc. | 0.57 | | 0.43 |
NPS Pharmaceuticals Inc. | 0.60 | | 0.37 |
| | | | |
Bottom 5 Stocks | | | |
ModusLink Global | | | |
Solutions Inc. | 0.73% | | -0.25% |
AEP Industries Inc. | 0.69 | | -0.26 |
STEC Inc. | 0.24 | | -0.27 |
Cambrex Corp. | 0.35 | | -0.29 |
Great Atlantic & Pacific Tea Co. | 0.28 | | -0.34 |
| | | |
| Past performance does not guarantee future results. These stocks do not represent all of the securities purchased, sold or recommended by the Funds’ Adviser. To request a complete list of the contribution of each Fund holding to overall Fund performance during the period, please call 800.392.CORE (2673) or email invest@westcore.com. Please see page 29 for a description of the methodology used to construct this chart. |
| Top Ten Holdings | |
(as of 6/30/10) | |
Gulfport Energy Corp. | 0.9% |
Hypercom Corp. | 0.9 |
SonicWALL Inc. | 0.9 |
Bolt Technology Corp. | 0.9 |
Miller Industries Inc. | 0.9 |
State Bancorp Inc. | 0.9 |
Cirrus Logic Inc. | 0.9 |
Crosstex Energy Inc. | 0.9 |
Cambrex Corp. | 0.8 |
Neenah Paper Inc. | 0.8 |
Total (% of Net Assets) | 8.8% |
Top ten holdings do not include any cash, cash equivalents or exchange traded fund investments and are subject to change. There are no guarantees that the Fund will continue to remain invested in any particular holding. |
Morningstar does not yet rate this Fund as it is less than 3 years old.
| Portfolio Characteristics |
(as of 6/30/10) | | | |
| | Westcore Micro-Cap | | Russell |
| | Opportunity Fund | | Microcap® Index |
Weighted Average Market Capitalization ($ Mil) | $315 | | $244 |
Price/Cash Flow (1 year trailing) | 9.0x | | 9.2x |
Price/Book Value | 1.9x | | 1.9x |
Price/Earnings (1 year trailing) | 18.4x | | 18.9x |
Number of Holdings | 178 | | 1,630 |
Portfolio Turnover Rate (6 month) | 56% | | — |
| | | | |
| Please see page 30 for definition of terms. |
| Sector Allocation |
 |
Sector classifications presented herein are based on the sector categorization methodology of the Adviser to the Funds which may result in the sector designations for one Fund being different than another Fund’s sector designations. |
| Market Capitalization |
 |
* Total Investments for this chart reflects the value of such investments and excludes short-term investments, including money market mutual funds.Market capitalization ranges were determined by the Adviser to the Fund and are for presentation purposes only. These market capitalization ranges do not necessarily correlate to the benchmark’s market capitalization ranges. |

Investing in equity securities of international small-cap companies that are poised for growth.
John C. Fenley, CFA Portfolio Manager
Jeremy A. Duhon, CFA Portfolio Manager
CFA is a trademark owned by the CFA Institute.

The chart above represents historical performance of a hypothetical investment of $10,000 in the Fund over the past 10 years (or for the life of the Fund if shorter). Performance calculations are as of the end of June each year. Past performance does not guarantee future results. This chart does not reflect the deduction of taxes that a shareholder would pay on Fund distributions or the redemption of Fund shares.
Lipper Index data provided by Lipper, Inc.
Please see pages 28 and 29 for index definitions.
| Average Annual Total Returns |
| | | | | | | | | | | | Since | Inception |
| | 6 Months | | 1 Year | | 3 Years | | 5 Years | | 10 Years | | Inception | Date |
| Retail Class (WTIFX) | 1.37% | | 26.09% | | -7.77% | | 3.09% | | 0.46% | | 2.68% | 12/15/99 |
| MSCI EAFE | | | | | | | | | | | | |
| Small-Cap Index® | -7.10 | | 12.29 | | -13.08 | | 1.09 | | 5.01 | | 5.47 | |
| Lipper | | | | | | | | | | | | |
| International | | | | | | | | | | | | |
| Small-Cap Index | -6.40 | | 16.84 | | -12.03 | | 3.64 | | 4.91 | | 4.60 | |
Retail Class Annual Expense Ratio (per the current prospectus) — Gross: 2.02%, Net: 1.51%
The performance data quoted represents past performance and does not guarantee future results. Performance information for the institutional class shares prior to their inception date is based on the performance of the retail class. Current performance may be lower or higher than the performance quoted. To obtain current performance as of the most recent month-end, please call 800.392.CORE (2673) or visit us online at www.westcore.com. Average annual total returns and yield figures reflect the reinvestment of dividends, capital gains distributions, all fee waivers and expense reimbursements. Without the fee waivers and expense reimbursements, total return and yield figures would have been lower. The performance data quoted does not reflect the deduction of the 2% redemption fee imposed if shares are redeemed or exchanged within 90 calendar days from their date of purchase. If imposed, the fee would reduce the performance quoted. Total return and yield figures represent past performance. Investment return and principal value will vary, and shares, when redeemed, may be worth more or less than their original cost.
Westcore fund shares are not insured by the FDIC, the Federal Reserve Board or any other agency and are subject to risk including the possible loss of principal.
The Advisor and Administrators have contractually agreed to waive the investment advisory and/or administration fees and/or to reimburse Fund level other expenses from April 30, 2010 until at least April 30, 2011, so that Net Annual Fund Operating Expenses as reported in the Fund’s Financial Highlights will be no more than 1.50% for the Fund’s Retail Class for such period. In addition, the Advisor has contractually agreed to waive the investment advisory and/or administration fees and/or to reimburse Fund level other expenses in the same proportion as for the Retail Class waivers/reimbursements plus reimbursing the Institutional class-specific other expenses until at least April 30, 2011. The Advisor and Administrators are not contractually bound to continue these waivers/reimbursements past April 30, 2011, however neither party is currently expecting to make any change in the waivers/ reimbursements after April 30, 2011. However, you will be notified in writing if these waivers and/or reimbursements are discontinued or materially changed after April 30, 2011.
Investing in small-cap funds generally will be more volatile and loss of principal could be greater than investing in larger-cap funds.
Investing in foreign securities entails special risks, such as currency fluctuations and political uncertainties, which are described in more detail in the prospectus.
- The Westcore International Frontier Fund outpaced its benchmark, the MSCI EAFE Small-Cap Index, for the first half of 2010. Economic uncertainty amidst the deteriorating sovereign financial situation in Europe, slowing growth in China and moderating recovery expectations in the U.S. led markets to negative returns. Despite these factors, we believe sentiment is too focused on the near term. Focusing on operational performance of companies during declining markets rather than on falling stock prices is core to our process and has enabled us to invest in companies that we believe are more attractively priced.
- Strong contributors during the period included Simplex Technology Inc. and Aeon Delight Co. Ltd. Simplex is a software leader for the financial industry in Japan. This information technology sector company focuses on the growing area of user-friendly trading applications. We believe Simplex benefits from expertise in both IT and finance. It reported revenue and operating profit growth for its March fiscal year-end. Industrials sector holding Aeon Delight Co. Ltd. is a Japanese facilities management company. While the economic environment in Japan caused growth to slow, the market had priced in a dire future for Aeon. Our research indicated flat profits for the next several quarters, but that long-term growth prospects and competitive advantage remained intact. Aeon’s shares rallied after reporting roughly flat earnings for its year and first quarter.
- Detractors included Wirecard AG, a German-based Internet payment and processing service company. Despite strong operating performance, shares were impacted in the first half of 2010 by unsubstantiated statements about the company. Germany’s financial regulator, Bafin, has been investigating whether trading in Wirecard shares was manipulated. Our research leads us to believe Wirecard is on track to deliver strong results in 2010 and the rumor was unfounded. Another detractor, Athens-based METKA SA, builds power plants in Europe and the Middle East. Concerns that the sovereign debt crisis could force governments to cancel power projects led to a decline in its share price. Our research indicates that although governments might curtail infrastructure spending in certain sectors, the shortage of power in regions that METKA serves should allow it to continue running a valuable business.
- Once again, markets are bracing for a meltdown, as world headlines highlight slowing global growth and stretched government balance sheets. We characterize these periods as “stock picker” markets. We believe it is beneficial to pay attention to fundamentals, regardless of headlines. With portfolio holdings appearing to perform well operationally, we hope the success of these companies will not be overlooked for long and that share prices will respond.
- As always, we thank our shareholders for their confidence in these volatile markets.
| PAGE 18 |
|

| Stock Performance |
| (for the 6 months ended 6/30/10) |
| | Average | | Contribution |
Top 5 Stocks | Weight | | to Return |
Aeon Delight Co. Ltd. | 3.46% | | 1.65% |
Simplex Technology Inc. | 3.07 | | 1.46 |
Rightmove PLC | 3.53 | | 0.84 |
Prestige International Inc. | 2.99 | | 0.80 |
Diploma PLC | 4.00 | | 0.67 |
| | | |
Bottom 5 Stocks | | | |
METKA SA | 2.04% | | -0.50% |
Azimut Holding SpA | 1.34 | | -0.52 |
Mears Group PLC | 3.64 | | -0.78 |
Morgan Sindall Group PLC | 4.99 | | -0.90 |
Wirecard AG | 3.87 | | -1.48 |
Past performance does not guarantee future results. These stocks do not represent all of the securities purchased, sold or recommended by the Funds’ Adviser. To request a complete list of the contribution of each Fund holding to overall Fund performance during the period, please call 800.392.CORE (2673) or email invest@westcore.com.Please see page 29 for a description of the methodology used to construct this chart. |
| Top Ten Holdings |
(as of 6/30/10) |
Credit Corp. Group L td. [Australia] | 5.5% |
Cardno Ltd. [Australia] | 5.4 |
Pico Far East Holdings L td. [Hong Kong] | 5.2 |
Morgan Sindall Group PLC [United Kingdom] | 5.0 |
Wirecard AG [Germany] | 4.9 |
Prestige International Inc. [Japan] | 4.8 |
IG Group Holdings PLC [United Kingdom] | 4.8 |
Slater & Gordon Ltd. [Australia] | 4.7 |
Mears Group PLC [United Kingdom] | 3.9 |
Prosafe Production PLC [Norway] | 3.9 |
Total (% of Net Assets) | 48.1% |
| | |
| Top ten holdings do not include any cash, cash equivalents or exchange traded fund investments and are subject to change. There are no guarantees that the Fund will continue to remain invested in any particular holding. |
| Morningstar Ratings |
| | | |
| | Number of Funds |
| | Morningstar | in Foreign |
| | Rating™ | Small/Mid |
| | as of 6/30/10 | Growth Category |
| | |
Overall | ««« | 112 |
3 Year | «««« | 112 |
5 Year | ««« | 88 |
10 Year | «« | 40 |
| | | |
| Morningstar proprietary ratings reflect historical risk-adjusted performance as of 6/30/10 and are subject to change every month. Please see page 29 for more detail regarding Morningstar Ratings. |
| Portfolio Characteristics |
(as of 6/30/10) | Westcore International | | MSCI EAFE |
| | Frontier Fund | | Small-CapIndex® |
Weighted Average Market Capitalization ($ Mil) | $730 | | $1,302 |
Number of Countries Represented | 19 | | 28 |
Price/Earnings (1 year trailing) | 13.0x | | 22.3x |
Price/Book Value | 2.7x | | 2.0x |
Number of Holdings | 37 | | 2,288 |
Portfolio Turnover R ate (6 month) | 28% | | — |
Please see page 30 for definition of terms. | | | |
| Sector Allocation |
 |
| Sector classifications presented herein are based on the sector categorization methodology of the Adviser to the Funds which may result in the sector designations for one Fund being different than another Fund’s sector designations. |
| Regional Allocation |
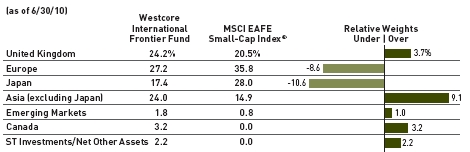 |
| Percentages are based on Total Net Assets Please see page 30 for definitions of terms. |
| Market Capitalization |
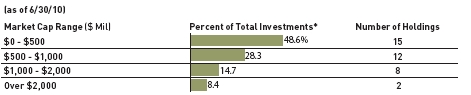 |
| * Total Investments for this chart reflects the value of such investments and excludes short-term investments, including money market mutual funds. Market capitalization ranges were determined by the Adviser to the Fund and are for presentation purposes only. These market capitalization ranges do not necessarily correlate to the benchmark’s market capitalization ranges. |

A fixed-income fund investing in a wide variety of income-producing securities, primarily bonds and to a lesser extent convertible bonds, and equity securities.
Mark R. McKissick, CFA Portfolio Manager
Troy A. Johnson, CFA Portfolio Manager
CFA is a trademark owned by the CFA Institute.

The chart above represents historical performance of a hypothetical investment of $10,000 in the Fund over the past 10 years (or for the life of the Fund if shorter). Performance calculations are as of the end of June each year. Past performance does not guarantee future results. This chart does not reflect the deduction of taxes that a shareholder would pay on Fund distributions or the redemption of Fund shares.
Lipper Index data provided by Lipper, Inc.
Please see pages 28 and 29 for index definitions.
| Average Annual Total Returns |
| | 6 | | 1 | | 3 | | 5 | | 10 | | Since | | 30-Day | | Incep. |
| | Months | | Year | | Years | | Years | | Years | | Incep. | | SEC Yield | | Date |
| Retail Class (WTLTX) | 4.91% | | 21.72% | | -1.33% | | 2.47% | | 5.89% | | 7.57% | | 6.95% | | 6/1/88 |
| Institutional Class (WILTX) | 5.00 | | 21.90 | | -1.24 | | 2.53 | | 5.92 | | 7.59 | | 7.08 | | 9/28/07 |
| Barclays Capital U.S. | | | | | | | | | | | | | | | |
| Corporate High Yield Ba Index | 4.96 | | 22.14 | | 8.33 | | 7.33 | | 8.06 | | 8.91 | | N/A | | |
| Westcore Flexible Income | | | | | | | | | | | | | | | |
| Fund Custom Index | 4.96 | | 22.14 | | 8.33 | | 7.33 | | 8.05 | | 9.02 | | N/A | | |
| Lipper High Current | | | | | | | | | | | | | | | |
| Yield Index | 3.78 | | 24.97 | | 2.96 | | 4.92 | | 4.72 | | 6.82 | | N/A | | |
Retail Class Annual Expense Ratio (per the current prospectus) — Gross: 0.93%, Net: 0.87%
Institutional Class Annual Expense Ratio (per the current prospectus) — Gross: 4.00%, Net: 0.74%
30-Day SEC Yield figures reflect all fee waivers and expense reimbursements. Without the absorption of these fee waivers and/or expense reimbursements, the figures would have been 6.89% for the retail class and 4.12% for the institutional class.
The performance data quoted represents past performance and does not guarantee future results. Performance information for the institutional class shares prior to their inception date is based on the performance of the retail class. Current performance may be lower or higher than the performance quoted. To obtain current performance as of the most recent month-end, please call 800.392.CORE (2673) or visit us online at www.westcore.com. Average annual total returns and yield figures reflect the reinvestment of dividends, capital gains distributions, all fee waivers and expense reimbursements. Without the fee waivers and expense reimbursements, total return and yield figures would have been lower. The performance data quoted does not reflect the deduction of the 2% redemption fee imposed if shares are redeemed or exchanged within 90 calendar days from their date of purchase. If imposed, the fee would reduce the performance quoted. Total return and yield figures represent past performance. Investment return and principal value will vary, and shares, when redeemed, may be worth more or less than their original cost.
Westcore fund shares are not insured by the FDIC, the Federal Reserve Board or any other agency and are subject to risk including the possible loss of principal.
The Advisor and Administrators have contractually agreed to waive the investment advisory and/or administration fees and/or to reimburse Fund level other expenses from April 30, 2010 until at least April 30, 2011, so that Net Annual Fund Operating Expenses as reported in the Fund’s Financial Highlights will be no more than 0.85% for the Fund’s Retail Class for such period. In addition, the Advisor has contractually agreed to waive the investment advisory and/or administration fees and/or to reimburse Fund level other expenses in the same proportion as for the Retail Class waivers/reimbursements plus reimbursing the Institutional class-specific other expenses until at least April 30, 2011. The Advisor and Administrators are not contractually bound to continue these waivers/reimbursements past April 30, 2011, however neither party is currently expecting to make any change in the waivers/reimbursements after April 30, 2011. However, you will be notified in writing if these waivers and/or reimbursements are discontinued or materially changed after April 30, 2011.
Westcore Flexible Income Fund may invest in high-yield/high-risk bonds which are subject to greater level of liquidity risk.
Mark R. McKissick is a registered representative of ALPS Distributors, Inc.
- The high yield market entered 2010 with positive momentum and continued inflows representing demand for higher yield by investors. The demand was met by increased issuance of high yield securities. This market strength continued through April driven by signs that the economy was recovering and that future default rates would continue to decline. However, during the latter half of the period concern shifted to the less than robust recovery and fallout from global financial problems promoting a flight to quality. The market experienced withdrawals, new issuance activity slowed, and high yield valuations declined.
- The Westcore Flexible Income Fund slightly underperformed the return of its benchmark, the Barclays Capital U.S. Corporate High Yield Ba Index for the first half of 2010. The Fund was adversely affected late in the period by our exposure to energy, particularly Anadarko, and fallout from the Gulf of Mexico situation. Our bias toward asset rich companies including some investment grade issues, worked against the Fund relative to the benchmark early in the period, but provided support and outsized relative returns later as economic concerns mounted and high yield valuations moved lower.
- Apart from a large energy allocation, the Fund also maintains an overweight in metals and mining and REITs. These core industry concentrations are illustrative of our focus on issuers with large tangible asset bases relative to their debt load. We feel that hard assets provide more flexibility in regards to dealing with re-financing issues and liquidity needs as they arise throughout a credit cycle.
- While short term technical conditions within the market can result in some volatility, we feel a slow extended recovery with limited growth potential can allow certain issuers to continue to reduce debt loads, either through the paying down of debt or by increasing profitability, and in doing so improve their credit profile. We believe current valuations already reflect a less than robust recovery and we are finding attractive opportunities as we enter the second half of the year.
| PAGE 20 |
|

| Top Ten Corporate Credit Exposure |
(as of 6/30/10) | |
Forest Oil Corp. | 4.1% |
Las Vegas Sands | 4.0 |
Valero Energy | 3.6 |
Tennessee Gas Pipeline | 3.5 |
Omega Healthcare | 3.3 |
Host Hotels | 3.3 |
Aramark Corp. | 3.2 |
Freeport-McMoRan Copper & Gold | 2.7 |
Teck Resources L td. | 2.6 |
Tuckahoe Credit Lease | 2.6 |
Total (% of Net Assets) | 32.9% |
| | |
| Percentages represent the Fund’s aggregate holdings in the same corporate issuer and its affiliates. Top Ten Corporate Credit Exposure are subject to change. There are no guarantees that the Fund will continue to remain invested in any particular security or issuer. |
| Morningstar Ratings |
| | | Number |
| | | of Funds in |
| | Morningstar | High Yield |
| | Rating™ | Bond |
| | as of 6/30/10 | Category |
Overall | «« | 500 |
3 Year | « | 500 |
5 Year | « | 428 |
10 Year | ««« | 280 |
| | | |
| Morningstar Ratings shown represent both the Retail and Institutional Classes. Morningstar proprietary ratings reflect historical risk-adjusted performance as of 6/30/10 and are subject to change every month. Please see page 29 for more detail regarding Morningstar Ratings. |
| Portfolio Characteristics |
(as of 6/30/10) | | | |
| | | | Barclays Capital U.S. |
| | Westcore Flexible | | Corporate High |
| | Income Fund | | Yield Ba Index |
Modified Duration | 4.7 years | | 4.9 years |
Effective Maturity | 6.5 years | | 7.9 years |
Number of Holdings | 100 | | 633 |
Portfolio Turnover R ate (6 month) | 18% | | — |
Please see page 30 for definitions of terms. | | | |
| Asset Allocation |
 |
| Percentages are based on Total Net Assets. |
| Ratings Allocation |
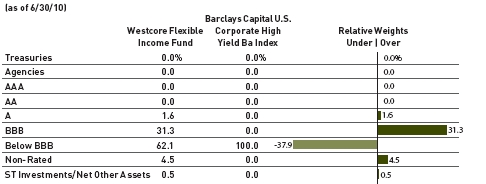 |
| Percentages are based on Total Investments. The ratings allocation reflects the Standard & Poor’s equivalent ratings category for the highest credit-quality rating assigned by either Standard & Poor’s or Moody’s. |
| Maturity Allocation |
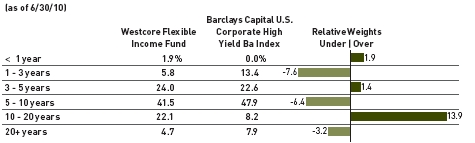 |
| Percentages are based on Total Investments. The Adviser to the Funds utilizes the expected maturity in presenting this information. |

A fixed-income fund focusing on investment quality bonds of varying maturities.
Mark R. McKissick, CFA Portfolio Manager
Lisa M. Snyder, CFA Portfolio Manager
CFA is a trademark owned by the CFA Institute.
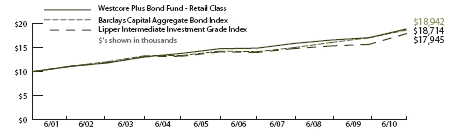
The chart above represents historical performance of a hypothetical investment of $10,000 in the Fund over the past 10 years (or for the life of the Fund if shorter). Performance calculations are as of the end of June each year. Past performance does not guarantee future results. This chart does not reflect the deduction of taxes that a shareholder would pay on Fund distributions or the redemption of Fund shares.
Lipper Index data provided by Lipper, Inc.
Please see pages 28 and 29 for index definitions.
| Average Annual Total Returns |
| | 6 | | 1 | | 3 | | 5 | | 10 | | Since | | 30-Day | | Incep. |
| | Months | | Year | | Years | | Years | | Years | | Incep. | | SEC Yield | | Date |
| Retail Class (WTIBX) | 5.33% | | 10.70% | | 5.98% | | 5.06% | | 6.60% | | 6.85% | | 3.62% | | 6/1/88 |
| Institutional Class (WIIBX) | 5.35 | | 10.82 | | 6.07 | | 5.12 | | 6.62 | | 6.86 | | 3.70 | | 9/28/07 |
| Barclays Capital Aggregate | | | | | | | | | | | | | | | |
| Bond Index | 5.33 | | 9.50 | | 7.55 | | 5.54 | | 6.47 | | 7.49 | | N/A | | |
| Lipper Intermediate | | | | | | | | | | | | | | | |
| Investment Grade Index | 6.05 | | 14.30 | | 6.53 | | 4.91 | | 6.02 | | 6.75 | | N/A | | |
Retail Class Annual Expense Ratio (per the current prospectus) — Gross: 0.82%, Net: 0.56%
Institutional Class Annual Expense Ratio (per the current prospectus) — Gross: 0.74%, Net: 0.45%
30-Day SEC Yield figures reflect all fee waivers and expense reimbursements. Without the absorption of these fee waivers and/or expense reimbursements, the figures would have been 3.41% for the retail class and 3.47% for the institutional class.
The performance data quoted represents past performance and does not guarantee future results. Performance information for the institutional class shares prior to their inception date is based on the performance of the retail class. Current performance may be lower or higher than the performance quoted. To obtain current performance as of the most recent month-end, please call 800.392.CORE (2673) or visit us online at www.westcore.com. Average annual total returns and yield figures reflect the reinvestment of dividends, capital gains distributions, all fee waivers and expense reimbursements. Without the fee waivers and expense reimbursements, total return and yield figures would have been lower. The performance data quoted does not reflect the deduction of the 2% redemption fee imposed if shares are redeemed or exchanged within 90 calendar days from their date of purchase. If imposed, the fee would reduce the performance quoted. Total return and yield figures represent past performance. Investment return and principal value will vary, and shares, when redeemed, may be worth more or less than their original cost.
Westcore fund shares are not insured by the FDIC, the Federal Reserve Board or any other agency and are subject to risk including the possible loss of principal.
The Advisor and Administrators have contractually agreed to waive the investment advisory and/or administration fees and/or to reimburse Fund level other expenses from April 30, 2010 until at least April 30, 2011, so that Net Annual Fund Operating Expenses as reported in the Fund’s Financial Highlights will be no more than 0.55% for the Fund’s Retail Class for such period. In addition, the Advisor has contractually agreed to waive the investment advisory and/or administration fees and/or to reimburse Fund level other expenses in the same proportion as for the Retail Class waivers/reimbursements plus reimbursing the Institutional class-specific other expenses until at least April 30, 2011. The Advisor and Administrators are not contractually bound to continue these waivers/reimbursements past April 30, 2011, however neither party is currently expecting to make any change in the waivers/reimbursements after April 30, 2011. However, you will be notified in writing if these waivers and/or reimbursements are discontinued or materially changed after April 30, 2011.
Westcore Plus Bond Fund may invest in high-yield/high-risk bonds which are subject to greater level of liquidity risk.
Mark R. McKissick is a registered representative of ALPS Distributors, Inc.
- The first half of 2010 is a tale of two quite different quarters. The first quarter saw a continuation of a dominant theme from 2009: corporate bond outperformance. Corporate bonds in the Barclays Capital Aggregate Index returned 2.30% through March 31 compared to the Treasury sector which returned only 1.12%. Within investment-grade corporate bonds, BBB-rated bonds were the best performers, returning 3.25% for the first quarter of 2010. During the second quarter, concerns about the Eurozone and the weakness of the economic recovery emerged, spurring Treasuries to outperform corporate bonds, with longer maturity Treasuries posting double-digit returns of 14.71%. In the second quarter, BBB-rated bonds were the weakest performing corporate sector, although still positive, as this sector of the Index posted a 3.16% return.
- The Westcore Plus Bond Fund’s performance over the first two quarters was similarly bifurcated. In the first quarter, the Fund benefitted from its overweight position in corporate bonds, specific holdings in REITs, consumer non-cyclical, energy, basic industries and utilities, and a weighting of approximately 10% in high-yield corporate securities. However, the Fund’s outperformance in the first quarter was offset by its underperformance in the second quarter, when an underweight in Treasuries was a meaningful source of its lagging (although still positive) returns. Thus, by June 30, the Fund’s year-to-date return was exactly even with the Barclays Capital Aggregate Index.
- At this time, we maintain the cautious macroeconomic outlook that we have had throughout this recovery period. Our interest rate exposure is roughly equal to that of the benchmark as we currently view rates as range-bound; inflation expectations remain muted and the looming uncertainties on Eurozone stability and the weakness of the recovery are a boost to Treasuries. We expect that in this environment the robust demand we have seen for high-quality corporate bonds will persist.
- We continue to find value in the income advantage of investment-grade corporate bonds and in higher quality, non-investment-grade issuers. Across the quality spectrum, we still believe that security selection will drive performance going forward and continue to search for issuers with improving credit fundamentals, sustainable competitive advantages, and attractive valuations given our long-term investment-oriented approach.
| PAGE 22 |
|

| Top Ten Corporate Credit Exposure |
| (as of 6/30/10) |
Crown Castle Towers | 1.8% |
Berkshire Hathaway | 1.4 |
Anheuser-Busch | 1.4 |
Duke Energy | 1.1 |
Kimco Realty | 1.0 |
Exxon Mobil | 1.0 |
WEA Finance/Westfield Capital | 1.0 |
GTP Towers LLC | 1.0 |
CBS Corp. | 1.0 |
Kraft Foods | 1.0 |
Total (% of Net Assets) | 11.7% |
Percentages represent the Fund’s aggregate holdings in the same corporate issuer and its affiliates. Top Ten Corporate Credit Exposure are subject to change. There are no guarantees that the Fund will continue to remain invested in any particular security or issuer. |
| Morningstar Ratings |
| | | Number |
| | | of Funds in |
| | Morningstar | Intermediate- |
| | Rating™ | Term Bond |
| | as of 6/30/10 | Category |
Overall | «««« | 1,011 |
3 Year | ««« | 1,011 |
5 Year | ««« | 880 |
10 Year | «««« | 515 |
| | | |
| Morningstar Ratings shown represent both the Retail and Institutional Classes. Morningstar proprietary ratings reflect historical risk-adjusted performance as of 6/30/10 and are subject to change every month. Please see page 29 for more detail regarding Morningstar Ratings. |
| Portfolio Characteristics |
(as of 6/30/10) | | | |
| | Westcore Plus | | Barclays Capital |
| | Bond Fund | | Aggregate Bond Index |
Modified Duration | 4.2 years | | 4.3 years |
Effective Maturity | 7.4 years | | 6.5 years |
Number of Holdings | 260 | | 8,211 |
Portfolio Turnover Rate (6 month) | 19% | | — |
Please see page 30 for definitions of terms. | | | |
| Asset Allocation |
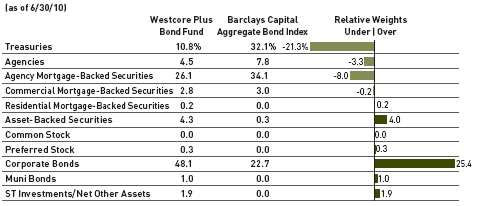 |
| Percentages are based on Total Net Assets. |
| Ratings Allocation |
 |
| Percentages are based on Total Investments. The ratings allocation reflects the Standard & Poor’s equivalent ratings category for the highest credit-quality rating assigned by either Standard & Poor’s or Moody’s. |
| Maturity Allocation |
 |
| Percentages are based on Total Investments. The Adviser to the Funds utilizes the expected maturity in presenting this information. |

A Colorado municipal bond fund focusing on federal and state tax-exempt income primarily through investments in investment-grade quality bonds of intermediate maturity.
Thomas B. Stevens, CFA Portfolio Manager
Kenneth A. Harris, CFA Portfolio Manager
CFA is a trademark owned by the CFA Institute.
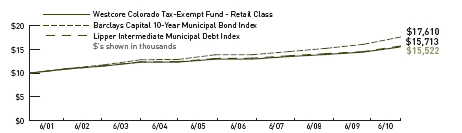
The chart above represents historical performance of a hypothetical investment of $10,000 in the Fund over the past 10 years (or for the life of the Fund if shorter). Performance calculations are as of the end of June each year. Past performance does not guarantee future results. This chart does not reflect the deduction of taxes that a shareholder would pay on Fund distributions or the redemption of Fund shares.
Lipper Index data provided by Lipper, Inc.
Please see pages 28 and 29 for index definitions.
| Average Annual Total Returns |
| | 6 | | 1 | | 3 | | 5 | | 10 | | Since | 30-Day | Incep. |
| | Months | | Year | | Years | | Years | | Years | | Incep. | SEC Yield | Date |
| Retail Class (WTCOX) | 2.52% | | 7.53% | | 4.78% | | 3.71% | | 4.49% | | 5.04% | 3.43% | 6/1/91 |
| Barclays Capital 10-Year | | | | | | | | | | | | | |
| Municipal Bond Index | 4.12 | | 9.58 | | 6.59 | | 4.91 | | 5.82 | | 6.35 | N/A | |
| Lipper Intermediate | | | | | | | | | | | | | |
| Municipal Debt Index | 2.67 | | 8.19 | | 4.78 | | 3.75 | | 4.62 | | 5.08 | N/A | |
Retail Class Annual Expense Ratio (per the current prospectus) — Gross: 0.91%, Net: 0.66%
30-Day SEC Yield figure reflects all fee waivers and expense reimbursements. Without the absorption of these fee waivers and/or expense reimbursements, the figure would have been 3.21%.
The performance data quoted represents past performance and does not guarantee future results. Performance information for the institutional class shares prior to their inception date is based on the performance of the retail class. Current performance may be lower or higher than the performance quoted. To obtain current performance as of the most recent month-end, please call 800.392.CORE (2673) or visit us online at www.westcore.com. Average annual total returns and yield figures reflect the reinvestment of dividends, capital gains distributions, all fee waivers and expense reimbursements. Without the fee waivers and expense reimbursements, total return and yield figures would have been lower. The performance data quoted does not reflect the deduction of the 2% redemption fee imposed if shares are redeemed or exchanged within 90 calendar days from their date of purchase. If imposed, the fee would reduce the performance quoted. Total return and yield figures represent past performance. Investment return and principal value will vary, and shares, when redeemed, may be worth more or less than their original cost.
Westcore fund shares are not insured by the FDIC, the Federal Reserve Board or any other agency and are subject to risk including the possible loss of principal.
The Advisor and Administrators have contractually agreed to waive the investment advisory and/or administration fees and/or to reimburse Fund level other expenses from April 30, 2010 until at least April 30, 2011, so that Net Annual Fund Operating Expenses as reported in the Fund’s Financial Highlights will be no more than 0.65% for the Fund’s Retail Class for such period. In addition, the Advisor has contractually agreed to waive the investment advisory and/or administration fees and/or to reimburse Fund level other expenses in the same proportion as for the Retail Class waivers/reimbursements plus reimbursing the Institutional class-specific other expenses until at least April 30, 2011. The Advisor and Administrators are not contractually bound to continue these waivers/reimbursements past April 30, 2011, however neither party is currently expecting to make any change in the waivers/ reimbursements after April 30, 2011. However, you will be notified in writing if these waivers and/or reimbursements are discontinued or materially changed after April 30, 2011.
Westcore Colorado Tax-Exempt Fund invests primarily in instruments issued by or on behalf of one state and generally will be more volatile and loss of principal could be greater due to state specific risk.
- Municipal bond yields declined over the first six months of 2010. As examples, the yield on a ten-year “AAA” general obligation bond fell from 3.08% at the beginning of the year to 2.67% by June 30, as reported by Municipal Market Data, and a twenty-year “AAA” obligation dipped from 3.77% to 3.70%. The yield curve steepened as short-to-intermediate yields declined more than did longer-dated maturities.
- Despite ongoing challenges of widening shortfalls in budget gaps by state and local municipalities and yields on ten-year top-rated municipal bonds at a record 9-year low, investor demand is increasing. Citigroup, Inc., State Street Corp. and U.S. Bancorp are among U.S. Banks whose municipal bond holdings have reached a 25-year high just as state budget deficits swell to $140 billion, according to a report by Bloomberg.
- The Westcore Colorado Tax-Exempt Fund’s performance for the first six months was held back partly by a relatively large commitment in cash equivalent securities and lower-yielding pre-refunded debt securities with short-term maturities. In addition, the modified duration of the Fund, at 5.0 years, was shorter than the benchmark’s 7.1 years. We have taken strides to extend the Fund’s maturity schedule. At year end, 2009, 20.1% of the portfolio was represented by issues 5 years or shorter. At June 30, that number was 8.8%.
- Colorado’s budget constraints continue to remain a challenge. The State barely scraped by with a balanced budget for the June 30, 2010 fiscal year. Colorado will begin the 2011 fiscal year on July 1 with up to a $72 million shortfall, prompting additional spending cuts. While the prognosis among state legislators is that the budget will be somewhat stable over the immediate term, the fiscal year 2011-2012 appears worrisome. That year is when the state could face up to a $1 billion shortfall as federal stimulus money and a multitude of one-time revenue sources become no longer available.
- Fund purchases over the past six months have concentrated on secondary pieces of higher quality general obligation and revenue bonds. Specific examples of recent additions included “AA” rated Eagle Garfield, Colorado School District 5.00% due 12/1/2026, “AA” Boulder County Open Space, Colorado 5.00% due 1/1/2024 and “AA” Platte River Power Authority Colorado 5.00% due 6/1/2027, among others.
- In our opinion, the Westcore Colorado Tax-Exempt Fund is structured at the present time to effectively combat the difficult economic and fiscal environment pressuring the state. The Fund continues to emphasize coupons of 5% or higher due to the incremental income. This is not a new theme, but rather encompasses our view that such securities possess the most attractive opportunities in either a rising or falling interest rate environment.
| PAGE 24 |
|

| Top Ten Holdings |
(as of 6/30/10) | % of Net Assets |
Eagle Garfield & Rout County SD Re-50J, | |
5.00%, 12/1/2026 | 2.3% |
Denver Health & Hospital Auth Rev, | |
6.00%, 12/1/2031 | 1.8 |
Jefferson County School District R-001, |
5.25%, 12/1/2024 | 1.5 |
Boulder County Open Space, | |
5.00%, 1/1/2024 | 1.5 |
Douglas County School District Re 1, | |
0.00%, 12/15/2015 | 1.5 |
Denver City & County School District #1, |
5.25%, 12/1/2025 | 1.4 |
Platte River Power Auth Power Rev, | |
5.00%, 6/1/2027, | 1.4 |
Brighton Water Activity Ent Rev, | |
5.00%, 12/1/2029, | 1.4 |
Denver City & County Water Commrs, | |
5.00%, 12/15/2029, | 1.3 |
Colorado Springs Utility Rev, | |
5.00%, 11/15/2027, | 1.3 |
Total (% of Net Assets) | 15.4% |
Top ten holdings do not include any cash, cash equivalents or exchange traded fund investments and are subject to change. There are no guarantees that the Fund will continue to remain invested in any particular holding. |
| Morningstar Ratings |
| | | Number |
| | | of Funds in |
| | Morningstar | Muni Single |
| | Rating™ | State Interm |
| | as of 6/30/10 | Category |
Overall | ««« | 240 |
3 Year | ««« | 240 |
5 Year | ««« | 233 |
10 Year | ««« | 189 |
Morningstar proprietary ratings reflect historical risk-adjusted performance as of 6/30/10 and are subject to change every month.Please see page 29 for more detail regarding Morningstar Ratings. |
| Portfolio Characteristics |
(as of 6/30/10) |
| | Westcore Colorado | | Barclays Capital 10-Year |
| | Tax-Exempt Fund | | Municipal Bond Index |
Modified Duration | 5.0 years | | 7.1 years |
Effective Maturity | 6.4 years | | 9.9 years |
Colorado Double Tax-Exempt Percentage | | | |
(excludes cash & cash equivalents) | 100.0 | | — |
Percentage of Holdings Subject to AMT | 0.0 | | — |
Number of Holdings | 177 | | — |
Portfolio Turnover Rate (6 month) | 1% | | — |
Please see page 30 for definition of terms. |
| Ratings Allocation |
 |
| Percentages are based on Total Investments. The ratings allocation reflects the Standard & Poor’s equivalent ratings category for the highest credit-quality rating assigned by either Standard & Poor’s or Moody’s. |
| Maturity Allocation |
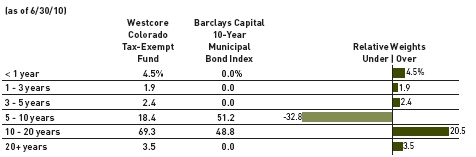 |
| Percentages are based on Total Investments. The Adviser to the Funds utilizes the expected maturity in presenting this information. |

Disclosure of Fund Expenses (Unaudited)
As a shareholder of a Fund, you incur two types of costs: (1) transaction costs (such as the 2% fee on redemption of Fund shares made within 90 days of purchase); and (2) ongoing costs, including management fees and other Fund expenses. The examples on the next page are intended to help you understand your ongoing costs (in dollars) of investing in a Fund and to compare these costs with the ongoing costs of investing in other mutual funds. The examples are based on an investment of $1,000 invested on January 1, 2010 and held until June 30, 2010.
Actual Expenses. The first line of the table on the next page provides information about actual account values and actual expenses. You may use the information in this line, together with the amount you invested, to estimate the expenses that you paid over the period. Simply divide your account value by $1,000 (for example, an $8,600 account value divided by $1,000 = 8.6), then multiply the result by the number in the first line under the heading “Expenses Paid During Period” to estimate the expenses you paid on your account during this period.
Hypothetical Example for Comparison Purposes. The second line of the table on the next page provides information about hypothetical account values and hypothetical expenses based on the Fund’s actual expense ratio and an assumed rate of return of 5% per year before expenses, which is not the Fund’s actual return. The hypothetical account values and expenses may not be used to estimate the actual ending account balance or expenses you paid for the period. You may use this information to compare the ongoing costs of investing in a Fund and other mutual funds. To do so, compare this 5% hypothetical example with the 5% hypothetical examples that appear in the shareholder reports of other funds.
Expenses shown in the table on the next page are meant to highlight ongoing Fund costs only and do not reflect transaction costs, such as redemption fees. Therefore, the second line of the table is useful in comparing ongoing costs only, and may not help you determine the relative total costs of owning different funds. In addition, if these transactional costs were included, your costs would have been higher.
Expenses Paid During Period
With respect to Expenses Paid During the Period, as shown in the table on the next page, expenses are equal to the Fund’s annualized expense ratio, as shown below, multiplied by the average account value over the period, multiplied by the number of days in the last six months of the fiscal half-year, 181/365 (to reflect the half-year period). The annualized expense ratios for the last six months were as follows:
Fund | Retail Class | | Institutional Class |
Westcore Growth Fund | 1.04% | | 0.93% | |
Westcore MIDCO Growth Fund | 1.03% | | 0.93% | |
Westcore Select Fund | 1.05% | | N/A | |
Westcore Blue Chip Fund | 1.15% | | 0.95% | |
Westcore Mid-Cap Value Fund | 1.22% | | N/A | |
Westcore Small-Cap Opportunity Fund | 1.30% | | 1.19% | |
Westcore Small-Cap Value Fund | 1.30% | | 1.22% | |
Westcore Micro-Cap Opportunity Fund | 1.30% | | N/A | |
Westcore International Frontier Fund | 1.50% | | N /A | |
Westcore Flexible Income Fund | 0.85% | | 0.75% | |
Westcore Plus Bond Fund | 0.55% | | 0.46% | |
Westcore Colorado Tax-Exempt Fund | 0.65% | | N/A | |
| PAGE 26 |
|
| | | | | | | Expenses Paid |
| | | Beginning Account | | Ending Account | | During the Period |
| Fund | | Value 1/1/10 | | Value 6/30/10 | | 1/1/10 to 6/30/10 |
| Westcore Growth Fund | | | | | |
| | | | | | | |
| Retail Class | Actual | $ | 1,000.00 | | $ | 898.00 | | $ | 4.91 |
| | Hypothetical (5% return before expenses) | $ | 1,000.00 | | $ | 1,019.62 | | $ | 5.22 |
| Institutional Class | Actual | $ | 1,000.00 | | $ | 898.90 | | $ | 4.40 |
| | Hypothetical (5% return before expenses) | $ | 1,000.00 | | $ | 1,020.16 | | $ | 4.68 |
| Westcore MIDCO Growth Fund | | | | | | | | |
| Retail Class | Actual | $ | 1,000.00 | | $ | 980.80 | | $ | 5.06 |
| | Hypothetical (5% return before expenses) | $ | 1,000.00 | | $ | 1,019.68 | | $ | 5.16 |
| Institutional Class | Actual | $ | 1,000.00 | | $ | 980.80 | | $ | 4.59 |
| | Hypothetical (5% return before expenses) | $ | 1,000.00 | | $ | 1,020.16 | | $ | 4.68 |
| Westcore Select Fund | | | | | | | | |
| Retail Class | Actual | $ | 1,000.00 | | $ | 984.50 | | $ | 5.19 |
| | Hypothetical (5% return before expenses) | $ | 1,000.00 | | $ | 1,019.56 | | $ | 5.28 |
| Westcore Blue Chip Fund | | | | | | | | |
| Retail Class | Actual | $ | 1,000.00 | | $ | 895.90 | | $ | 5.41 |
| | Hypothetical (5% return before expenses) | $ | 1,000.00 | | $ | 1,019.09 | | $ | 5.76 |
| Institutional Class | Actual | $ | 1,000.00 | | $ | 896.80 | | $ | 4.47 |
| | Hypothetical (5% return before expenses) | $ | 1,000.00 | | $ | 1,020.08 | | $ | 4.76 |
| Westcore Mid-Cap Value Fund | | | | | | | | |
| Retail Class | Actual | $ | 1,000.00 | | $ | 975.10 | | $ | 5.97 |
| | Hypothetical (5% return before expenses) | $ | 1,000.00 | | $ | 1,018.74 | | $ | 6.11 |
| Westcore Small-Cap Opportunity Fund | | | | | | | | |
| Retail Class | Actual | $ | 1,000.00 | | $ | 983.70 | | $ | 6.39 |
| | Hypothetical (5% return before expenses) | $ | 1,000.00 | | $ | 1,018.35 | | $ | 6.51 |
| Institutional Class | Actual | $ | 1,000.00 | | $ | 983.80 | | $ | 5.85 |
| | Hypothetical (5% return before expenses) | $ | 1,000.00 | | $ | 1,018.89 | | $ | 5.96 |
| Westcore Small-Cap Value Fund | | | | | | | | |
| Retail Class | Actual | $ | 1,000.00 | | $ | 1,021.00 | | $ | 6.51 |
| | Hypothetical (5% return before expenses) | $ | 1,000.00 | | $ | 1,018.35 | | $ | 6.51 |
| Institutional Class | Actual | $ | 1,000.00 | | $ | 1,021.00 | | $ | 6.11 |
| | Hypothetical (5% return before expenses) | $ | 1,000.00 | | $ | 1,018.74 | | $ | 6.11 |
| Westcore Micro-Cap Opportunity Fund | | | | | | | | |
| Retail Class | Actual | $ | 1,000.00 | | $ | 1,037.00 | | $ | 6.57 |
| | Hypothetical (5% return before expenses) | $ | 1,000.00 | | $ | 1,018.35 | | $ | 6.51 |
| Westcore International Frontier Fund | | | | | | | | |
| Retail Class | Actual | $ | 1,000.00 | | $ | 1,013.70 | | $ | 7.49 |
| | Hypothetical (5% return before expenses) | $ | 1,000.00 | | $ | 1,017.35 | | $ | 7.50 |
| Westcore Flexible Income Fund | | | | | | | | |
| Retail Class | Actual | $ | 1,000.00 | | $ | 1,049.10 | | $ | 4.37 |
| | Hypothetical (5% return before expenses) | $ | 1,000.00 | | $ | 1,020.53 | | $ | 4.31 |
| Institutional Class | Actual | $ | 1,000.00 | | $ | 1,050.00 | | $ | 3.80 |
| | Hypothetical (5% return before expenses) | $ | 1,000.00 | | $ | 1,021.08 | | $ | 3.75 |
| Westcore Plus Bond Fund | | | | | | | | |
| Retail Class | Actual | $ | 1,000.00 | | $ | 1,053.30 | | $ | 2.80 |
| | Hypothetical (5% return before expenses) | $ | 1,000.00 | | $ | 1,022.07 | | $ | 2.76 |
| Institutional Class | Actual | $ | 1,000.00 | | $ | 1,053.50 | | $ | 2.34 |
| | Hypothetical (5% return before expenses) | $ | 1,000.00 | | $ | 1,022.51 | | $ | 2.31 |
| Westcore Colorado Tax-Exempt Fund | | | | | | | | |
| Retail Class | Actual | $ | 1,000.00 | | $ | 1,025.20 | | $ | 3.26 |
| | Hypothetical (5% return before expenses) | $ | 1,000.00 | | $ | 1,021.57 | | $ | 3.26 |
|

|

| Index Definitions and Disclosures |
All indices are unmanaged and index performance figures include reinvestment of dividends but do not reflect any fees, expenses or taxes. Investors cannot invest directly in an index.
The S&P 500 Index is comprised of 500 common stocks chosen for market size, liquidity, and industry group representation. It is a market-value weighted index (stock price times number of shares outstanding), with each stock’s weight in the Index proportionate to its market value.
The Russell MidcapTM Growth Index measures the performance of those Russell Midcap companies with higher price-to-book ratios and higher forecasted growth values than the threshold determined by the Frank Russell Company. The Russell Midcap companies are comprised of the 800 smallest companies in the Russell 1000 Index. The Russell 1000 Index consists of the 1,000 largest U.S. Incorporated companies based on total market capitalization.
The Russell MidcapTM Value Index measures the performance of those Russell Midcap companies with lower price-to-book ratios and lower forecasted growth values. The stocks are also members of the Russell 1000 Value index.
The Russell 1000® Growth Index measures the performance of the largest 1,000 firms in the Russell 3000 Index, which represents approximately 98% of the investable U.S. equity market.
The Russell 2000® Index measures the performance of the smallest 2,000 companies in the Russell 3000 Index. The Russell 3000 Index consists of the 3,000 largest U.S. incorporated companies based on total market capitalization.
The Russell 2000® Value Index measures the performance of companies within the Russell 2000 Index having lower price-to-book ratios and lower forecasted growth values. The Russell 2000 Index includes the 2000 firms from the Russell 3000 Index with the smallest market capitalizations. The Russell 3000 Index represents 98% of the investable US equity market.
The Russell Microcap® Index measures the performance of the microcap segment of the U. S. equity market. It makes up less than 3% of the U.S. equity market. It includes 1,000 of the smallest securities in the Russell 2000 Index based on a combination of their market cap and current index membership and it includes the next 1,000 securities.
The MSCI EAFE Small-Cap Index® is a free float-adjusted market capitalization index that is designed to measure the performance of securities of small cap companies listed on the stock exchanges of 21 developed markets outside of North America with a full market capitalization range of US $200 million-$1.5 billion.
The Westcore Flexible Income Fund Custom Index is comprised of the Barclays Capital Long-Term Government/Corporate Bond Index from the Fund’s inception to 9/30/00 and the Barclays Capital U.S. Corporate High Yield Ba Index for the time period 10/1/00 to the most recent period end to reflect the change in the Fund’s investment strategy on 10/1/00. The Adviser believes that the Custom Index is the best benchmark measurement for historical performance over eight years.
The Barclays Capital U.S. Corporate High Yield Ba Index measures the performance of intermediate (1 to 10 year) U.S. high yield issues. It includes fixed-rate, noninvestment grade debt issues rated Ba1 or lower by Moody’s, rated BB+ or lower by S&P, rated below investment grade by Fitch Investor’s Service or if unrated previously held a high yield rating or have been associated with a high yield issuer, and must trade accordingly.
The Barclays Capital Aggregate Bond Index is a fixed income, market-value-weighted index generally representative of investment grade fixed-rate debt issues, including government, corporate, asset-backed, and mortgage-backed securities with maturities of at least one year.
The Barclays Capital 10-Year Municipal Bond Index includes investment grade (Moody’s Investor Services Aaa to Baa, Standard and Poor’s Corporation AAA to BBB) tax-exempt bonds with maturities between eight and twelve years.
The Municipal 20 Bond Buyer Index is comprised of yields of 20 general obligation municipal bonds published weekly by The Bond Buyer.
The Municipal 25 Bond Buyer Revenue Index is comprised of yields of 25 revenue bonds with 30-year maturities published weekly by The Bond Buyer.
The Lipper Large-Cap Growth Index is comprised of the 30 largest mutual funds in the Lipper Large-Cap Growth Funds classification.
The Lipper Mid-Cap Growth Index is comprised of the 30 largest mutual funds in the Lipper Mid-Cap Growth Funds classification.
The Lipper Large-Cap Core Index is comprised of the 30 largest mutual funds in the Lipper Large-Cap Core Funds classification.
| PAGE 28 |
|

The Lipper Mid-Cap Value Index is comprised of the 30 largest mutual funds in the Lipper Mid-Cap Value Funds classification.
The Lipper Small-Cap Core Index is comprised of the 30 largest mutual funds in the Lipper Small-Cap Core Funds classification.
The Lipper Small-Cap Value Index is comprised of the 30 largest mutual funds in the Lipper Small-Cap Value Funds classification.
The Lipper International Small-Cap Index is comprised of the 30 largest mutual funds in the Lipper International Small-Cap Funds classification.
The Lipper High Current Yield Index is comprised of the 30 largest mutual funds in the Lipper High Current Yield Funds classification.
The Lipper Intermediate Investment Grade Index is comprised of the 30 largest mutual funds in the Lipper Intermediate Investment Grade Debt Funds classification.
The Lipper Intermediate Municipal Debt Index is comprised of the 30 largest mutual funds in the Lipper Intermediate Municipal Debt Funds classification.
Russell Investments is the source and owner of the Russell Index data contained in this material and all trademarks and copyrights related thereto. Any further dissemination or redistribution is strictly prohibited. Russell Investments is not responsible for the formatting or configuration of this material or for any inaccuracy in Denver Investments’ presentation thereof.
Standard & Poor’s is the source and owner of the S&P Index data contained in this material and all trademarks and copyrights related thereto. Any further dissemination or redistribution is strictly prohibited. Standard & Poor’s is not responsible for the formatting or configuration of this material or for any inaccuracy in Denver Investments’ presentation thereof.
MSCI Barra is the source and owner of the MSCI Index data contained in this material and all trademarks and copyrights related thereto. Any further dissemination or redistribution is strictly prohibited. MSCI Barra is not responsible for the formatting or configuration of this material or for any inaccuracy in Denver Investments’ presentation thereof.
Barclays Capital is the source and owner of the Barclays Capital Index data contained in this material and all trademarks and copyrights related thereto. Any further dissemination or redistribution is strictly prohibited. Barclays Capital is not responsible for the formatting or configuration of this material or for any inaccuracy in Denver Investments’ presentation thereof.
Lipper, a Thomson Reuters Company is the source and owner of the Lipper Index data contained in this material and all trademarks and copyrights related thereto. Any further dissemination or redistribution is strictly prohibited. Lipper Inc. is not responsible for the formatting or configuration of this material or for any inaccuracy in Denver Investments’ presentation thereof.
| Top 5/Bottom 5 Stock Performance Calculation Methodology |
The Calculation methodology used to construct this chart took into account consistently the weighting of every holding in the Fund that contributed to the Fund’s performance during the Measurement Period, and the Chart reflects consistently the results of the Calculation. The Calculation determined the contribution of each Fund holding by calculating the weight (i.e., percentage of the Total Investments) of each holding multiplied by the rate of return for that holding during the first six months of 2010.
©2010 Morningstar, Inc. All Rights Reserved. The information contained herein is: (1) proprietary to Morningstar; (2) may not be copied or distributed; and (3) is not warranted to be accurate, complete or timely. Neither Morningstar nor its content providers are responsible for any damages or losses arising from any use of this information. Past performance is no guarantee of future results.
Morningstar proprietary ratings reflect historical risk-adjusted performance as of 6/30/10 and are subject to change every month. For each fund with at least a 3-year history, Morningstar calculates a rating based on a Morningstar Risk-Adjusted Return measure that accounts for variation in a fund’s monthly performance (including the effects of sales charges and redemption fees), placing more emphasis on downward variations and rewarding consistent performance. The top 10% of funds in each category receive a Morningstar RatingTM of 5 stars, the next 22.5% receive 4 stars, the next 35% receive 3 stars, the next 22.5% receive 2 stars and the bottom 10% receive 1 star. (Each share class is counted as a fraction of one fund within this scale and rated separately, which may cause slight variations in the distribution percentages.) The Overall Morningstar Rating for a fund is derived from a weighted average of the performance figures associated with its 3-, 5- and 10-year (if applicable) Morningstar Rating metrics. During periods on which ratings are based, service providers of the Fund waived fees. This waiver had a material impact on the funds’ average annual returns. In the absence of fee waivers, performance would have been reduced.
|
|
Duration – A generic description of the sensitivity of a bond’s price (as a percentage of initial price) to a change in yield.
EPS (Earnings per Share) Growth – Earnings per share is the portion of a company’s profit allocated to each outstanding share of common stock. EPS growth serves as an indicator of a company’s profitability.
Effective Maturity – A weighted average of the maturities of the bonds in a portfolio.
Emerging Markets – Westcore International Frontier Fund considers emerging market countries to be those countries that are neither U.S. nor developed countries.
Market Capitalization – The market capitalization represents the total value of a company or stock. It is calculated by multiplying the number of shares outstanding by the current price of one share.
Modified Duration – A duration measure in which it is assumed that yield changes do not change the expected cash flows.
Number of Holdings – The Number of Holdings presented excludes short-term investments including money market mutual funds.
Portfolio Turnover Rate – A percentage computed by taking the lesser of purchases or sales of portfolio securities (excluding short-term investments) for the period and dividing it by the monthly average of the market value of the portfolio securities during the period.
Price to Book Value (P/B) Ratio – The P/B ratio is used to compare a company’s book value to its current market price. This ratio compares the market’s valuation of a company to the value of that company as indicated on its financial statements. The higher the ratio, the higher the premium the market is willing to pay for the company above its hard assets.
Price to Cash (P/C) Flow Ratio – The P/C flow ratio is a measure of a firm’s stock price relative to its financial performance. For a fund, the P/C flow ratio is the weighted average of all stocks held in the fund. It represents the amount an investor is willing to pay for a dollar generated from a particular company’s operations.
Price to Earnings (P/E) Ratio – The P/E ratio is a stock’s per share price divided by its per share earnings over a 12-month period. For a fund, the P/E ratio is the weighted average of all stocks held in the fund. The higher the P/E ratio, the more the market is willing to pay for each dollar of annual earnings.
SEC Yield – The SEC Yield is a standardized method of computing return on investment that the U.S. Securities and Exchange Commission (SEC) requires mutual funds to use when advertising their yields. Its objective is to allow a confusion-free comparison of the performance of different funds.
Weighted Average – An average that takes into account the proportional relevance of each component, rather than treating each component equally.
| PAGE 30 |
|
Intentionally Left Blank

| STATEMENTS OF INVESTMENTS | | |
| | | |
| Westcore Growth Fund | 33 | |
| | | |
| Westcore MIDCO Growth Fund | 35 | |
| | | |
| Westcore Select Fund | 37 | |
| | | |
| Westcore Blue Chip Fund | 38 | |
| | | |
| Westcore Mid-Cap Value Fund | 40 | |
| | | |
| Westcore Small-Cap Opportunity Fund | 42 | |
| | | |
| Westcore Small-Cap Value Fund | 44 | |
| | | |
| Westcore Micro-Cap Opportunity Fund | 46 | |
| | | |
| Westcore International Frontier Fund | 49 | |
| | | |
| Westcore Flexible Income Fund | 51 | |
| | | |
| Westcore Plus Bond Fund | 55 | |
| | | |
| Westcore Colorado Tax-Exempt Fund | 61 | |
| | | |
| Common Abbreviations | 67 | |
| | | |
| STATEMENTS OF ASSETS AND LIABILITIES | 68 | |
| | | |
| STATEMENTS OF OPERATIONS | 70 | |
| | | |
| STATEMENTS OF CHANGES IN NET ASSETS | 72 | |
| | | |
| FINANCIAL HIGHLIGHTS | 76 | |
| | | |
| NOTES TO FINANCIAL STATEMENTS | 86 | |
| PAGE 32 |
|

WESTCORE GROWTH FUND AS OF JUNE 30, 2010
(UNAUDITED)
| | Shares | | Market Value | |
COMMON STOCKS | | | | 97.88% | |
Consumer Discretionary | | | | 10.98% | |
Hotels, Restaurants & Leisure | | | 2.29% | |
Las Vegas Sands Corp.** | 63,830 | | $ | 1,413,196 | |
Royal Caribbean Cruises | | | | | |
Ltd.** | 34,650 | | | 788,981 | |
| | | | | 2,202,177 | |
| | | | | | |
Internet & Catalog Retail | | | | 2.38% | |
Amazon.com Inc.** | 12,085 | | | 1,320,407 | |
priceline.com Inc.** | 5,530 | | | 976,266 | |
| | | | | 2,296,673 | |
| | | | | | |
Multiline Retail | | | | 3.48% | |
Nordstrom Inc. | 45,090 | | | 1,451,447 | |
Target Corp. | 38,680 | | | 1,901,896 | |
| | | | | 3,353,343 | |
| | | | | | |
Specialty Retail | | | | 1.57% | |
Home Depot Inc. | 53,830 | | | 1,511,008 | |
| | | | | | |
Textiles, Apparel & Luxury Goods | | | 1.26% | |
Coach Inc. | 33,100 | | | 1,209,805 | |
| | | | | | |
Total Consumer Discretionary | | | | |
(Cost $8,261,670) | | | | 10,573,006 | |
| | | | | | |
Consumer Staples | | | | 4.83% | |
Beverages | | | | 3.46% | |
PepsiCo Inc. | 54,662 | | | 3,331,649 | |
| | | | | | |
Food & Staples Retailing | | | | 1.37% | |
Costco Wholesale Corp. | 24,020 | | | 1,317,016 | |
| | | | | | |
Total Consumer Staples | | | | | |
(Cost $4,555,077) | | | | 4,648,665 | |
| | | | | | |
Energy | | | | 7.39% | |
Energy Equipment & Services | | | 2.10% | |
Schlumberger Ltd. | 36,560 | | | 2,023,231 | |
| | | | | | |
Oil, Gas & Consumable Fuels | | | 5.29% | |
EOG Resources Inc. | 14,626 | | | 1,438,760 | |
Occidental Petroleum | | | | | |
Corp. | 32,287 | | | 2,490,942 | |
Southwestern Energy | | | | | |
Co.** | 30,040 | | | 1,160,745 | |
| | | | | 5,090,447 | |
| | | | | | |
Total Energy | | | | | |
(Cost $7,385,106) | | | | 7,113,678 | |
| �� | Shares | | Market Value | |
Financials | | | 8.41% | |
Capital Markets | | | 1.79% | |
Goldman Sachs Group | | | | |
Inc. | 4,420 | $ | 580,213 | |
T. Rowe Price Group Inc. | 25,740 | | 1,142,599 | |
| | | | 1,722,812 | |
| | | | | |
Commercial Banks | | | 2.42% | |
PNC Financial Services | | | | |
Group Inc. | 20,000 | | 1,130,000 | |
Wells Fargo & Co. | 46,800 | | 1,198,080 | |
| | | | 2,328,080 | |
| | | | | |
Consumer Finance | | | 1.46% | |
American Express Co. | 35,400 | | 1,405,380 | |
| | | | | |
Diversified Financial Services | | 2.74% | |
Intercontinental Exchange | | | | |
Inc.** | 8,400 | | 949,452 | |
JPMorgan Chase & Co. | 46,180 | | 1,690,650 | |
| | | | 2,640,102 | |
| | | | | |
Total Financials | | | | |
(Cost $8,118,066) | | | 8,096,374 | |
| | | | | |
Healthcare | | | 10.08% | |
Biotechnology | | | 3.60% | |
Celgene Corp.** | 44,010 | | 2,236,588 | |
United Therapeutics | | | | |
Corp.** | 25,080 | | 1,224,155 | |
| | | | 3,460,743 | |
| | | | | |
Healthcare Equipment & Supplies | | 1.01% | |
Covidien PLC (Ireland) | 24,290 | | 975,972 | |
| | | | | |
Healthcare Providers & Services | | 3.04% | |
Medco Health Solutions | | | | |
Inc.** | 53,140 | | 2,926,951 | |
| | | | | |
Pharmaceuticals | | | 2.43% | |
Abbott Laboratories | 29,830 | | 1,395,447 | |
Teva Pharmaceutical | | | | |
Industries Ltd. - ADR | | | | |
(Israel) | 18,159 | | 944,087 | |
| | | | 2,339,534 | |
| | | | | |
Total Healthcare | | | | |
(Cost $9,003,033) | | | 9,703,200 | |
| | | | | |
Industrials | | | 14.78% | |
Aerospace & Defense | | | 3.75% | |
Precision Castparts Corp. | 13,319 | | 1,370,791 | |
United Technologies | | | | |
Corp. | 34,507 | | 2,239,849 | |
| | | | 3,610,640 | |
| | Shares | | Market Value | |
Air Freight & Logistics | | | 0.73% | |
FedEx Corp. | 9,960 | $ | 698,295 | |
| | | | | |
Electrical Equipment | | | 3.12% | |
AMETEK Inc. | 25,200 | | 1,011,780 | |
Cooper Industries PLC | 32,070 | | 1,411,080 | |
Emerson Electric Co. | 13,220 | | 577,582 | |
| | | | 3,000,442 | |
| | | | | |
Machinery | | | 5.43% | |
Caterpillar Inc. | 27,090 | | 1,627,296 | |
Danaher Corp. | 37,382 | | 1,387,620 | |
Illinois Tool Works Inc. | 32,840 | | 1,355,635 | |
Parker Hannifin Corp. | 15,510 | | 860,185 | |
| | | | 5,230,736 | |
| | | | | |
Road & Rail | | | 1.75% | |
Union Pacific Corp. | 24,310 | | 1,689,788 | |
| | | | | |
Total Industrials | | | | |
(Cost $12,739,675) | | | 14,229,901 | |
| | | | | |
Information Technology | | | 36.29% | |
Communications Equipment | | 4.06% | |
Cisco Systems Inc.** | 183,422 | | 3,908,723 | |
| | | | | |
Computers & Peripherals | | | 13.30% | |
Apple Inc.** | 24,337 | | 6,121,486 | |
EMC Corp.** | 126,640 | | 2,317,512 | |
Hewlett-Packard Co. | 67,471 | | 2,920,145 | |
NetApp Inc.** | 38,850 | | 1,449,494 | |
| | | | 12,808,637 | |
| | | | | |
Electronic Equipment Instruments | | | |
& Components | | | 1.10% | |
Agilent Technologies | | | | |
Inc.** | 37,150 | | 1,056,175 | |
| | | | | |
Internet Software & | | | | |
Services | | | 5.41% | |
Equinix Inc.** | 17,560 | | 1,426,223 | |
Google Inc. - Class A** | 8,506 | | 3,784,745 | |
| | | | 5,210,968 | |
| | | | | |
IT Services | | | 4.83% | |
Cognizant Technology | | | | |
Solutions Corp.** | 33,370 | | 1,670,502 | |
Visa Inc. | 42,047 | | 2,974,825 | |
| | | | 4,645,327 | |
| | | | | |
Semiconductors & Semiconductor | | | |
Equipment | | | 2.56% | |
Broadcom Corp. | 53,711 | | 1,770,852 | |
Marvell Technology | | | | |
Group Ltd. (Bermuda)** | 44,190 | | 696,434 | |
| | | | 2,467,286 | |
|
|
WESTCORE GROWTH FUND AS OF JUNE 30, 2010 (continued)
(UNAUDITED)
| | Shares | Market Value | |
| Software | | | 5.03% | |
| Microsoft Corp. | 142,670 | $ | 3,282,837 | |
| Oracle Corp. | 72,470 | | 1,555,206 | |
| | | | 4,838,043 | |
| | | | | |
| Total Information Technology | | | |
| (Cost $25,801,056) | | | 34,935,159 | |
| | | | | |
| Materials | | | 2.31% | |
| Chemicals | | | 1.02% | |
| Praxair Inc. | 12,870 | | 977,991 | |
| | | | | |
| Metals & Mining | | | 1.29% | |
| Allegheny Technologies | | | | |
| Inc. | 28,140 | | 1,243,507 | |
| | | | | |
| Total Materials | | | | |
| (Cost $2,176,506) | | | 2,221,498 | |
| | | | | |
| Telecommunication Services | | 2.81% | |
| Wireless Telecommunication | | | |
| Services | | | 2.81% | |
| Crown Castle | | | | |
| International Corp.** | 46,160 | | 1,719,922 | |
| Millicom International | | | | |
| Cellular S.A. | | | | |
| (Luxembourg) | 12,200 | | 989,054 | |
| | | | 2,708,976 | |
| | | | | |
| Total Telecommunication Services | | | |
| (Cost $2,544,156) | | | 2,708,976 | |
| | | | | |
| Total Common Stocks | | | | |
| (Cost $80,584,345) | | | 94,230,457 | |
| | | | | |
| MONEY MARKET MUTUAL FUNDS | | 2.62% | |
| Fidelity Institutional | | | | |
| Money Market | | | | |
| Government | | | | |
| Portfolio - Class I | | | | |
| (7 Day Yield 0.044%) | 2,520,765 | | 2,520,765 | |
| | | | | |
| Total Money Market Mutual Funds | | | |
| (Cost $2,520,765) | | | 2,520,765 | |
| | | | | |
| Total Investments | | | | |
| (Cost $83,105,110) | 100.50% | | 96,751,222 | |
| | | | | |
| Liabilities in Excess of | | | | |
| Other Assets | (0.50%) | | (485,546) | |
| | | | | |
| Net Assets | 100.00% | $ | 96,265,676 | |
| Westcore Growth Fund | | | | | |
| Country Breakdown as of June 30, 2010 | | | |
| (Unaudited) | | | | | |
| Country | Market Value | | % | |
| United States | $ | 93,145,675 | | 96.76% | |
| Luxembourg | | 989,054 | | 1.03% | |
| Ireland | | 975,972 | | 1.01% | |
| Israel | | 944,087 | | 0.98% | |
| Bermuda | | 696,434 | | 0.72% | |
| Total Investments | | 96,751,222 | | 100.50% | |
| Liabilities in Excess | | | | | |
| of Other Assets | | (485,546) | | (0.50%) | |
| Net Assets | $ | 96,265,676 | | 100.00% | |
| | | | | | |
| Please note the country classification is based on the company headquarters and is unaudited. All of the Fund’s investments are traded on U.S. exchanges. Sector and industry classifications presented herein are based on the sector and industry categorization methodology of the Adviser to the Funds which may result in the designations for one Fund being different from another. Sector and industry classifications are unaudited.**Non-income producing security. See Notes to Financial Statements. |
| PAGE 34 |
|
WESTCORE MIDCO GROWTH FUND AS OF JUNE 30, 2010
(UNAUDITED)
| | Shares | | Market Value | |
COMMON STOCKS | | | | 96.22% | |
Consumer Discretionary | | | | 15.58% | |
Hotels, Restaurants & Leisure | | | 1.26% | |
Darden Restaurants Inc. | 36,400 | | $ | 1,414,140 | |
| | | | | | |
Internet & Catalog Retail | | | | 1.06% | |
Netflix Inc.** | 11,000 | | | 1,195,150 | |
| | | | | | |
Specialty Retail | | | | 8.28% | |
American Eagle | | | | | |
Outfitters Inc. | 80,100 | | | 941,175 | |
J. Crew Group Inc.** | 43,600 | | | 1,604,916 | |
Ross Stores Inc. | 40,200 | | | 2,142,258 | |
Signet Jewelers Ltd. | | | | | |
( Bermuda)** | 76,300 | | | 2,098,250 | |
TJX Companies Inc. | 59,900 | | | 2,512,805 | |
| | | | | 9,299,404 | |
| | | | | | |
Textiles, Apparel & Luxury Goods | | | 4.98% | |
Phillips-Van Heusen | | | | | |
Corp. | 30,900 | | | 1,429,743 | |
Polo Ralph Lauren Corp. | 18,100 | | | 1,320,576 | |
VF Corp. | 15,800 | | | 1,124,644 | |
The Warnaco Group | | | | | |
Inc.** | 47,600 | | | 1,720,264 | |
| | | | | 5,595,227 | |
| | | | | | |
Total Consumer Discretionary | | | | |
(Cost $14,652,150) | | | | 17,503,921 | |
| | | | | | |
Consumer Staples | | | | 3.09% | |
Food & Staples Retailing | | | | 1.38% | |
BJ’s Wholesale Club | | | | | |
Inc.** | 41,900 | | | 1,550,719 | |
| | | | | | |
Personal Products | | | | 1.71% | |
Herbalife Ltd. (Cayman | | | | | |
Islands) | 41,700 | | | 1,920,285 | |
| | | | | | |
Total Consumer Staples | | | | | |
(Cost $2,836,045) | | | | 3,471,004 | |
| | | | | | |
Energy | | | | 4.83% | |
Energy Equipment & Services | | | | 1.57% | |
Dril-Quip Inc.** | 14,000 | | | 616,280 | |
Helmerich & Payne Inc. | 31,300 | | | 1,143,076 | |
| | | | | 1,759,356 | |
| | | | | | |
Oil, Gas & Consumable Fuels | | | 3.26% | |
Bill Barrett Corp.** | 59,400 | | | 1,827,738 | |
SM Energy Co. | 45,800 | | | 1,839,328 | |
| | | | | 3,667,066 | |
| | | | | | |
Total Energy | | | | | |
(Cost $5,896,385) | | | | 5,426,422 | |
| | Shares | | Market Value | |
Financials | | | | 6.85% | |
Capital Markets | | | | 3.13% | |
Eaton Vance Corp. | 45,400 | | $ | 1,253,494 | |
T. Rowe Price Group Inc. | 51,100 | | | 2,268,329 | |
| | | | | 3,521,823 | |
| | | | | | |
Commercial Banks | | | | 1.60% | |
Comerica Inc. | 48,700 | | | 1,793,621 | |
| | | | | | |
Thrifts & Mortgage Finance | | | | 2.12% | |
Hudson City Bancorp | | | | | |
Inc. | 111,800 | | | 1,368,432 | |
Washington Federal Inc. | 62,900 | | | 1,017,722 | |
| | | | | 2,386,154 | |
| | | | | | |
Total Financials | | | | | |
(Cost $7,317,321) | | | | 7,701,598 | |
| | | | | | |
Health Care | | | | 13.68% | |
Health Care Equipment & Supplies | | | 3.66% | |
C.R. Bard Inc. | 30,100 | | | 2,333,653 | |
Immucor Inc.** | 93,500 | | | 1,781,175 | |
| | | | | 4,114,828 | |
| | | | | | |
Health Care Providers & Services | | | 5.22% | |
AMERIGROUP Corp.** | 70,300 | | | 2,283,344 | |
DaVita Inc.** | 24,050 | | | 1,501,682 | |
Lincare Holdings Inc.** | 64,000 | | | 2,080,640 | |
| | | | | 5,865,666 | |
| | | | | | |
Life Sciences Tools & Services | | | 2.13% | |
Waters Corp.** | 36,900 | | | 2,387,430 | |
| | | | | | |
Pharmaceuticals | | | | 2.67% | |
King Pharmaceuticals | | | | | |
Inc.** | 78,000 | | | 592,020 | |
Shire Pharmaceuticals - | | | | | |
ADR (Ireland) | 39,300 | | | 2,412,234 | |
| | | | | 3,004,254 | |
| | | | | | |
Total Health Care | | | | | |
(Cost $13,255,137) | | | | 15,372,178 | |
| | | | | | |
Industrials | | | | 17.09% | |
Air Freight & Logistics | | | | 1.91% | |
Atlas Air Worldwide | | | | | |
Holdings Inc.** | 24,800 | | | 1,178,000 | |
UTi Worldwide Inc. | | | | | |
(Virgin Islands) | 77,900 | | | 964,402 | |
| | | | | 2,142,402 | |
| | | | | | |
| | | | | | |
Electrical Equipment | | | | 3.39% | |
Cooper Industries PLC | 54,200 | | | 2,384,800 | |
| | Shares | | Market Value | |
Rockwell Automation | | | | | |
Inc. | 29,100 | | $ | 1,428,519 | |
| | | | | 3,813,319 | |
| | | | | | |
Machinery | | | | 8.52% | |
Ingersoll-Rand PLC | | | | | |
(Ireland) | 68,500 | | | 2,362,565 | |
Lincoln Electric | | | | | |
Holdings Inc. | 23,700 | | | 1,208,463 | |
Parker Hannifin Corp. | 30,500 | | | 1,691,530 | |
Pentair Inc. | 52,700 | | | 1,696,940 | |
SPX Corp. | 20,900 | | | 1,103,729 | |
WABCO Holdings Inc.** | 47,800 | | | 1,504,744 | |
| | | | | 9,567,971 | |
| | | | | | |
Road & Rail | | | | 1.48% | |
Knight Transportation | | | | | |
Inc. | 82,100 | | | 1,661,704 | |
| | | | | | |
Trading Companies & Distributors | | | 1.79% | |
WESCO International | | | | | |
Inc.** | 59,800 | | | 2,013,466 | |
| | | | | | |
Total Industrials | | | | | |
(Cost $16,828,647) | | | | 19,198,862 | |
| | | | | | |
Information Technology | | | | 28.06% | |
Computers & Peripherals | | | | 2.87% | |
QLogic Corp.** | 67,800 | | | 1,126,836 | |
Teradata Corp.** | 68,800 | | | 2,097,024 | |
| | | | | 3,223,860 | |
| | | | | | |
Electronic Equipment Instruments | | | | |
& Components | | | | 2.15% | |
Dolby Laboratories Inc. - | | | | | |
Class A** | 38,600 | | | 2,419,834 | |
| | | | | | |
Internet Software & Services | | | | 4.28% | |
Akamai Technologies | | | | | |
Inc.** | 41,000 | | | 1,663,370 | |
Rackspace Hosting | | | | | |
Inc.** | 53,400 | | | 979,356 | |
VeriSign Inc.** | 81,500 | | | 2,163,825 | |
| | | | | 4,806,551 | |
| | | | | | |
IT Services | | | | 1.40% | |
Global Payments Inc. | 43,200 | | | 1,578,528 | |
| | | | | | |
Office Electronics | | | | 1.00% | |
Zebra Technologies | | | | | |
Corp. - Class A** | 44,300 | | | 1,123,891 | |
| | | | | | |
Semiconductors & Semiconductor | | | | |
Equipment | | | | 5.95% | |
Analog Devices Inc. | 55,500 | | | 1,546,230 | |
Novellus Systems Inc.** | 50,700 | | | 1,285,752 | |
|
|
WESTCORE MIDCO GROWTH FUND AS OF JUNE 30, 2010 (continued)
(UNAUDITED)
| | Shares | | Market Value | |
Silicon Laboratories | | | | | |
Inc.** | 52,500 | | $ | 2,129,400 | |
Xilinx Inc. | 68,200 | | | 1,722,732 | |
| | | | | 6,684,114 | |
| | | | | | |
Software | | | | 10.41% | |
ANSYS Inc.** | 44,500 | | | 1,805,365 | |
Check Point Software | | | | | |
Technologies Ltd. | | | | | |
(Israel)** | 44,300 | | | 1,305,964 | |
Citrix Systems Inc.** | 53,100 | | | 2,242,413 | |
Intuit Inc.** | 65,100 | | | 2,263,527 | |
Red Hat Inc.** | 62,500 | | | 1,808,750 | |
Rovi Corp.** | 59,900 | | | 2,270,809 | |
| | | | | 11,696,828 | |
| | | | | | |
Total Information Technology | | | | | |
(Cost $28,101,988) | | | | 31,533,606 | |
| | | | | | |
Materials | | | | 5.73% | |
Chemicals | | | | 4.18% | |
Celanese Corp. - Series A | 60,800 | | | 1,514,528 | |
FMC Corp. | 26,500 | | | 1,521,895 | |
Rockwood Holdings | | | | | |
Inc.** | 73,400 | | | 1,665,446 | |
| | | | | 4,701,869 | |
| | | | | | |
Metals & Mining | | | | 1.55% | |
Compass Minerals | | | | | |
International Inc. | 24,700 | | | 1,735,916 | |
| | | | | | |
Total Materials | | | | | |
(Cost $5,165,785) | | | | 6,437,785 | |
| | | | | | |
Telecommunication Services | | | | 1.31% | |
Diversified Telecommunication | | | | |
Services | | | | 1.31% | |
tw telecom Inc. - Class A** | 88,300 | | | 1,472,844 | |
| | | | | | |
Total Telecommunication Services | | | | |
(Cost $875,714) | | | | 1,472,844 | |
| | | | | | |
Total Common Stocks | | | | | |
| (Cost $94,929,172) | | | | 108,118,220 | |
| | | | | | |
MONEY MARKET MUTUAL FUNDS | | | 2.31% | |
Fidelity Institutional | | | | | |
Money Market | | | | | |
Government | | | | | |
Portfolio - Class I | | | | | |
(7 Day Yield 0.044%) | 2,602,371 | | | 2,602,371 | |
| | | | | | |
Total Money Market Mutual Funds | | | | |
(Cost $2,602,371) | | | | 2,602,371 | |
| | Shares | | Market Value | |
Total Investments | | | | | |
(Cost $97,531,543) | | 98.53% | $ | 110,720,591 | |
| | | | | | |
Other Assets in Excess | | | | | |
of Liabilities | | 1.47% | | 1,646,174 | |
| | | | | | |
Net Assets | | 100.00% | $ | 112,366,765 | |
| | | | | | |
Westcore MIDCO Growth Fund | | | |
Country Breakdown as of June 30, 2010 | | | |
(Unaudited) | | | | | |
Country | Market Value | | % | |
United States | $ | 99,656,891 | | 88.69% | |
Ireland | | 4,774,799 | | 4.25% | |
Bermuda | | 2,098,250 | | 1.86% | |
Cayman Islands | | 1,920,285 | | 1.71% | |
Israel | | 1,305,964 | | 1.16% | |
Virgin Islands | | 964,402 | | 0.86% | |
Total Investments | | 110,720,591 | | 98.53% | |
Other Assets in Excess | | | | | |
of Liabilities | | 1,646,174 | | 1.47% | |
Net Assets | $ | 112,366,765 | | 100.00% | |
| | | | | | |
Please note the country classification is based on the company headquarters and is unaudited. All of the Fund’s investments are traded on U.S. exchanges. Sector and industry classifications presented herein are based on the sector and industry categorization methodology of the Adviser to the Funds which may result in the designations for one Fund being different from another. Sector and industry classifications are unaudited. **Non-income producing security. See Notes to Financial Statements. |
| PAGE 36 |
|
WESTCORE SELECT FUND AS OF JUNE 30, 2010
(UNAUDITED)
| | Shares | | Market Value | |
COMMON STOCKS | | | | 93.30% | |
Consumer Discretionary | | | | 15.12% | |
Specialty Retail | | | | 11.83% | |
Jos. A. Bank Clothiers | | | | | |
Inc.** | 108,200 | | $ | 5,841,718 | |
Ross Stores Inc. | 108,169 | | | 5,764,326 | |
Signet Jewelers Ltd. | | | | | |
(Bermuda)** | 197,800 | | | 5,439,500 | |
| | | | | 17,045,544 | |
| | | | | | |
Textiles, Apparel & Luxury Goods | | | 3.29% | |
The Warnaco Group Inc.** | 131,400 | | | 4,748,796 | |
| | | | | | |
Total Consumer Discretionary | | | | |
(Cost $22,655,364) | | | | 21,794,340 | |
| | | | | | |
Energy | | | | 3.86% | |
Oil, Gas & Consumable Fuels | | | 3.86% | |
Bill Barrett Corp.** | 180,800 | | | 5,563,216 | |
| | | | | | |
Total Energy | | | | | |
(Cost $6,199,109) | | | | 5,563,216 | |
| | | | | | |
Financials | | | | 8.18% | |
Commercial Banks | | | | 8.18% | |
Bank of the Ozarks Inc. | 168,600 | | | 5,980,242 | |
Comerica Inc. | 157,600 | | | 5,804,408 | |
| | | | | 11,784,650 | |
| | | | | | |
Total Financials | | | | | |
(Cost $11,491,091) | | | | 11,784,650 | |
| | | | | | |
Health Care | | | | 19.43% | |
Health Care Equipment & Supplies | | | 7.79% | |
C.R. Bard Inc. | 75,000 | | | 5,814,750 | |
Immucor Inc.** | 284,400 | | | 5,417,820 | |
| | | | | 11,232,570 | |
| | | | | | |
Health Care Providers & Services | | | 3.40% | |
AMERIGROUP Corp.** | 150,700 | | | 4,894,736 | |
| | | | | | |
Life Sciences Tools & Services | | | 4.09% | |
Waters Corp.** | 91,000 | | | 5,887,700 | |
| | | | | | |
Pharmaceuticals | | | | 4.15% | |
Shire PLC (Ireland) | 97,400 | | | 5,978,412 | |
| | | | | | |
Total Health Care | | | | | |
(Cost $29,542,881) | | | | 27,993,418 | |
| | | | | | |
Industrials | | | | 15.29% | |
Electrical Equipment | | | | 4.05% | |
Cooper Industries PLC | 132,700 | | | 5,838,800 | |
| | Shares | Market Value | |
Machinery | | | 7.34% | |
Ingersoll-Rand PLC | | | | |
(Ireland) | 158,400 | $ | 5,463,216 | |
Parker Hannifin Corp. | 92,100 | | 5,107,866 | |
| | | | 10,571,082 | |
| | | | | |
Trading Companies & Distributors | | 3.90% | |
WESCO International | | | | |
Inc.** | 166,900 | | 5,619,523 | |
| | | | | |
Total Industrials | | | | |
(Cost $22,273,288) | | | 22,029,405 | |
| | | | | |
Information Technology | | | 27.50% | |
Computers & Peripherals | | | 3.86% | |
Teradata Corp.** | 182,400 | | 5,559,552 | |
| | | | | |
Electronic Equipment Instruments | | | |
& Components | | | 4.10% | |
Dolby Laboratories Inc. - | | | | |
Class A** | 94,300 | | 5,911,667 | |
| | | | | |
Internet Software & Services | | 4.02% | |
VeriSign Inc.** | 217,900 | | 5,785,245 | |
| | | | | |
Semiconductors & Semiconductor | | | |
Equipment | | | 3.61% | |
Silicon Laboratories Inc.** | 128,300 | | 5,203,848 | |
| | | | | |
Software | | | 11.91% | |
Citrix Systems Inc.** | 120,510 | | 5,089,137 | |
Intuit Inc.** | 168,500 | | 5,858,745 | |
Rovi Corp.** | 163,800 | | 6,209,658 | |
| | | | 17,157,540 | |
| | | | | |
Total Information Technology | | | |
(Cost $40,387,387) | | | 39,617,852 | |
| | | | | |
Materials | | | 3.92% | |
Chemicals | | | 3.92% | |
Rockwood Holdings Inc.** | 248,800 | | 5,645,272 | |
| | | | | |
Total Materials | | | | |
(Cost $6,801,087) | | | 5,645,272 | |
| | | | | |
Total Common Stocks | | | | |
(Cost $139,350,207) | | | 134,428,153 | |
| | | | | |
MONEY MARKET MUTUAL FUNDS | | 1.76% | |
Fidelity Institutional | | | | |
Money Market | | | | |
Government | | | | |
Portfolio - Class I | | | | |
(7 Day Yield 0.044%) | 2,531,774 | | 2,531,774 | |
| | Shares | | Market Value | |
Total Money Market Mutual Funds | | | |
(Cost $2,531,774) | | | | 2,531,774 | |
| | | | | | |
Total Investments | | | | | |
(Cost $141,881,981) | | 95.06% $ | | 136,959,927 | |
| | | | | | |
Other Assets in Excess | | | | | |
of Liabilities | | 4.94% | | 7,124,931 | |
| | | | | | |
Net Assets | | 100.00% | $ | 144,084,858 | |
| | | | | | |
Westcore Select Fund | | | | | |
Country Breakdown as of June 30, 2010 | |
(Unaudited) | | | | | |
Country | | Market Value | | % | |
United States | $ | 120,078,799 | | 83.34% | |
Ireland | | 11,441,628 | | 7.94% | |
Bermuda | | 5,439,500 | | 3.78% | |
Total Investments | | 136,959,927 | | 95.06% | |
Other Assets in Excess | | | | | |
of Liabilities | | 7,124,931 | | 4.94% | |
Net Assets | $ | 144,084,858 | | 100.00% | |
| | | | | | |
Please note the country classification is based on the company headquarters and is unaudited. All of the Fund’s investments are traded on U.S. exchanges. Sector and industry classifications presented herein are based on the sector and industry categorization methodology of the Adviser to the Funds which may result in the designations for one Fund being different from another. Sector and industry classifications are unaudited. ** Non-income producing security. See Notes to Financial Statements. |
|
|
WESTCORE BLUE CHIP FUND AS OF JUNE 30, 2010
(UNAUDITED)
| | Shares | | Market Value | |
COMMON STOCKS | | | | 98.75% | |
Basic Materials | | | | 5.72% | |
Chemicals | | | | 1.00% | |
Ecolab Inc. | 7,300 | | $ | 327,843 | |
| | | | | | |
Forestry & Paper | | | | 4.72% | |
Ball Corp. | 13,150 | | | 694,715 | |
International Paper Co. | 37,950 | | | 858,808 | |
| | | | | 1,553,523 | |
| | | | | | |
Total Basic Materials | | | | | |
(Cost $1,568,459) | | | | 1,881,366 | |
| | | | | | |
Capital Goods | | | | 4.61% | |
Aerospace & Defense | | | | 2.66% | |
General Dynamics Corp. | 6,900 | | | 404,064 | |
Raytheon Co. | 9,700 | | | 469,383 | |
| | | | | 873,447 | |
| | | | | | |
Industrial Products | | | | 1.95% | |
ITT Corp. | 14,300 | | | 642,356 | |
| | | | | | |
Total Capital Goods | | | | | |
(Cost $1,221,776) | | | | 1,515,803 | |
| | | | | | |
Commercial Services | | | | 4.73% | |
Business Products & Services | | | 2.23% | |
Quanta Services Inc.** | 35,500 | | | 733,075 | |
| | | | | | |
IT Services | | | | 1.33% | |
Computer Sciences Corp. | 9,700 | | | 438,925 | |
| | | | | | |
Transaction Processing | | | | 1.17% | |
The Western Union Co. | 25,700 | | | 383,187 | |
| | | | | | |
Total Commercial Services | | | | | |
(Cost $1,883,386) | | | | 1,555,187 | |
| | | | | | |
Communications | | | | 5.84% | |
Networking | | | | 1.87% | |
Cisco Systems Inc.** | 28,900 | | | 615,859 | |
| | | | | | |
Telecomm Equipment & Solutions | | | 3.97% | |
Qualcomm Inc. | 22,900 | | | 752,036 | |
Research In Motion Ltd. | | | | | |
(Canada)** | 11,200 | | | 551,712 | |
| | | | | 1,303,748 | |
| | | | | | |
Total Communications | | | | | |
(Cost $2,342,400) | | | | 1,919,607 | |
| | | | | | |
Consumer Cyclical | | | | 10.64% | |
Apparel & Footwear Manufacturing | | | 3.47% | |
Nike Inc. - Class B | 9,750 | | | 658,612 | |
| | Shares | | Market Value | |
VF Corp. | 6,800 | | $ | 484,024 | |
| | | | | 1,142,636 | |
| | | | | | |
Department Stores | | | | 2.29% | |
Macy’s Inc. | 42,000 | | | 751,800 | |
| | | | | | |
Other Consumer Services | | | | 1.53% | |
Expedia Inc. | 26,850 | | | 504,243 | |
| | | | | | |
Restaurants | | | | 1.09% | |
Darden Restaurants Inc. | 9,200 | | | 357,420 | |
| | | | | | |
Specialty Retail | | | | 2.26% | |
Best Buy Co. Inc. | 21,900 | | | 741,534 | |
| | | | | | |
Total Consumer Cyclical | | | | | |
(Cost $3,465,434) | | | | 3,497,633 | |
| | | | | | |
Consumer Staples | | | | 7.47% | |
Consumer Products | | | | 2.73% | |
Colgate-Palmolive Co. | 11,400 | | | 897,864 | |
| | | | | | |
Food & Agricultural Products | | | 4.74% | |
Campbell Soup Co. | 21,300 | | | 763,179 | |
Unilever N.V. | | | | | |
(Netherlands) | 29,100 | | | 795,012 | |
| | | | | 1,558,191 | |
| | | | | | |
Total Consumer Staples | | | | | |
(Cost $2,278,253) | | | | 2,456,055 | |
| | | | | | |
Energy | | | | 9.56% | |
Exploration & Production | | | | 3.40% | |
Occidental Petroleum | | | | | |
Corp. | 14,500 | | | 1,118,675 | |
| | | | | | |
Integrated Oils | | | | 4.21% | |
Exxon Mobil Corp. | 8,000 | | | 456,560 | |
Marathon Oil Corp. | 29,800 | | | 926,482 | |
| | | | | 1,383,042 | |
| | | | | | |
Oil Services | | | | 1.95% | |
Ensco PLC | | | | | |
(United Kingdom) | 8,400 | | | 329,952 | |
Noble Corp.** | | | | | |
(Switzerland) | 10,100 | | | 312,191 | |
| | | | | 642,143 | |
| | | | | | |
Total Energy | | | | | |
(Cost $2,428,142) | | | | 3,143,860 | |
| | | | | | |
Interest Rate Sensitive | | | | 13.30% | |
Money Center Banks | | | | 5.08% | |
Bank of America Corp. | 70,350 | | | 1,010,930 | |
| | Shares | | Market Value | |
JPMorgan Chase & Co. | 18,000 | $ | 658,980 | |
| | | | 1,669,910 | |
| | | | | |
Property Casualty Insurance | | | 3.16% | |
ACE Ltd. (Switzerland) | 12,100 | | 622,908 | |
Travelers Cos. Inc. | 8,450 | | 416,163 | |
| | | | 1,039,071 | |
| | | | | |
Regional Banks | | | 2.09% | |
Comerica Inc. | 10,100 | | 371,983 | |
SunTrust Banks Inc. | 13,600 | | 316,880 | |
| | | | 688,863 | |
| | | | | |
Securities & Asset Management | | 2.97% | |
The Bank of New York | | | | |
Mellon Corp. | 22,800 | | 562,932 | |
Goldman Sachs Group Inc. | 3,150 | | 413,500 | |
| | | | 976,432 | |
| | | | | |
Total Interest Rate Sensitive | | | | |
(Cost $4,199,204) | | | 4,374,276 | |
| | | | | |
Medical/Healthcare | | | 11.83% | |
Medical Technology | | | 2.52% | |
Zimmer Holdings Inc.** | 15,350 | | 829,667 | |
| | | | | |
Pharmaceuticals | | | 9.31% | |
Abbott Laboratories | 16,650 | | 778,887 | |
Amgen Inc.** | 17,100 | | 899,460 | |
Forest Laboratories Inc.** | 25,150 | | 689,865 | |
Pfizer Inc. | 48,594 | | 692,950 | |
| | | | 3,061,162 | |
| | | | | |
Total Medical/Healthcare | | | | |
(Cost $4,032,040) | | | 3,890,829 | |
| | | | | |
Technology | | | 14.53% | |
Computer Software | | | 5.44% | |
Microsoft Corp. | 42,900 | | 987,129 | |
Symantec Corp.** | 57,800 | | 802,264 | |
| | | | 1,789,393 | |
| | | | | |
PC’s & Servers | | | 6.10% | |
Dell Inc. ** | 60,900 | | 734,454 | |
International Business | | | | |
Machines Corp. | 10,300 | | 1,271,844 | |
| | | | 2,006,298 | |
| | | | | |
Semiconductors | | | 2.99% | |
Altera Corp. | 19,800 | | 491,238 | |
Intel Corp. | 25,300 | | 492,085 | |
| | | | 983,323 | |
| | | | | |
Total Technology | | | | |
(Cost $4,755,638) | | | 4,779,014 | |
| PAGE 38 |
|
WESTCORE BLUE CHIP FUND AS OF JUNE 30, 2010 (continued)
(UNAUDITED)
| | Shares | Market Value | |
Transportation | | | 4.32% | |
Railroads | | | 4.32% | |
Norfolk Southern Corp. | 15,650 | $ | 830,233 | |
Union Pacific Corp. | 8,500 | | 590,835 | |
| | | | 1,421,068 | |
| | | | | |
Total Transportation | | | | |
(Cost $1,079,016) | | | 1,421,068 | |
| | | | | |
Utilities | | | 6.20% | |
Independent Power | | | 2.21% | |
Exelon Corp. | 9,000 | | 341,730 | |
Public Service | | | | |
Enterprises Group Inc. | 12,300 | | 385,359 | |
| | | | 727,089 | |
| | | | | |
Integrated Gas & Electric | | | 1.02% | |
Dominion Resources | | | | |
Inc. | 8,600 | | 333,164 | |
| | | | | |
Regulated Electric | | | 2.97% | |
Edison International | 20,200 | | 640,744 | |
Entergy Corp. | 4,700 | | 336,614 | |
| | | | 977,358 | |
| | | | | |
Total Utilities | | | | |
(Cost $2,007,217) | | | 2,037,611 | |
| | | | | |
Total Common Stocks | | | | |
(Cost $31,260,965) | | | 32,472,309 | |
| | | | | |
MONEY MARKET MUTUAL FUNDS | | 1.14% | |
Fidelity Institutional | | | | |
Money Market | | | | |
Government | | | | |
Portfolio - Class I | | | | |
(7 Day Yield 0.044%) | 375,229 | | 375,229 | |
| | | | | |
Total Money Market Mutual Funds | | | |
(Cost $375,229) | | | 375,229 | |
| | | | | |
| | | | | |
Total Investments | | | | |
(Cost $31,636,194) | 99.89% | | 32,847,538 | |
| | | | | |
Other Assets in Excess of | | | | |
Liabilities | 0.11% | | 34,940 | |
| | | | | |
Net Assets | 100.00% | $ | 32,882,478 | |
Westcore Blue Chip Fund | | | | | |
Country Breakdown as of June 30, 2010 | | | |
(Unaudited) | | | | | |
Country | | Market Value | | % | |
United States | $ | 30,235,763 | | 91.95% | |
Switzerland | | 935,099 | | 2.84% | |
Netherlands | | 795,012 | | 2.42% | |
Canada | | 551,712 | | 1.68% | |
United Kingdom | | 329,952 | | 1.00% | |
Total Investments | | 32,847,538 | | 99.89% | |
Other Assets in Excess | | | | | |
of Liabilities | | 34,940 | | 0.11% | |
Net Assets | $ | 32,882,478 | | 100.00% | |
| | | | | | |
Please note the country classification is based on the company headquarters and is unaudited. All of the Fund’s investments are traded on U.S. exchanges. Sector and industry classifications presented herein are based on the sector and industry categorization methodology of the Adviser to the Funds which may result in the designations for one Fund being different from another. Sector and industry classifications are unaudited. **Non-income producing security. See Notes to Financial Statements. |
WESTCORE MID-CAP VALUE FUND AS OF JUNE 30, 2010
(UNAUDITED)
| | Shares | | Market Value | |
COMMON STOCKS | | | | 98.45% | |
Basic Materials | | | | 9.49% | |
Forestry & Paper | | | | 4.18% | |
International Paper Co. | 39,300 | | $ | 889,359 | |
Packaging Corp. of | | | | | |
America | 44,700 | | | 984,294 | |
| | | | | 1,873,653 | |
| | | | | | |
Other Materials (Rubber & Plastic) | | | 4.23% | |
Crown Holdings Inc.** | 42,650 | | | 1,067,956 | |
Owens-Illinois Inc. ** | 31,300 | | | 827,885 | |
| | | | | 1,895,841 | |
| | | | | | |
Steel | | | | 1.08% | |
Harsco Corp. | 20,500 | | | 481,750 | |
| | | | | | |
Total Basic Materials | | | | | |
(Cost $3,266,560) | | | | 4,251,244 | |
| | | | | | |
Capital Goods | | | | 2.88% | |
Electrical Equipment | | | | 1.73% | |
General Cable Corp.** | 29,100 | | | 775,515 | |
| | | | | | |
Industrial Products | | | | 1.15% | |
ITT Corp. | 11,400 | | | 512,088 | |
| | | | | | |
Total Capital Goods | | | | | |
(Cost $2,147,854) | | | | 1,287,603 | |
| | | | | | |
Commercial Services | | | | 5.35% | |
Business Products & Services | | | 3.60% | |
Quanta Services Inc.** | 54,175 | | | 1,118,714 | |
Xerox Corp. | 61,381 | | | 493,503 | |
| | | | | 1,612,217 | |
| | | | | | |
Environmental & Pollution Control | | | 1.75% | |
Waste Connections Inc.** | 22,490 | | | 784,676 | |
| | | | | | |
Total Commercial Services | | | | | |
(Cost $2,402,658) | | | | 2,396,893 | |
| | | | | | |
Communications | | | | 3.87% | |
Telecomm Equipment & Solutions | | | 3.87% | |
Adtran Inc. | 28,850 | | | 786,740 | |
CommScope Inc.** | 39,900 | | | 948,423 | |
| | | | | 1,735,163 | |
| | | | | | |
Total Communications | | | | | |
(Cost $1,755,539) | | | | 1,735,163 | |
| | | | | | |
Consumer Cyclical | | | | 11.80% | |
Clothing & Accessories | | | | 2.82% | |
Abercrombie & Fitch Co. | | | | | |
- Class A | 19,200 | | | 589,248 | |
| | Shares | | Market Value | |
Polo Ralph Lauren Corp. | 9,200 | | $ | 671,232 | |
| | | | | 1,260,480 | |
| | | | | | |
Department Stores | | | | 2.29% | |
Macy’s Inc. | 57,300 | | | 1,025,670 | |
| | | | | | |
Motor Vehicle Parts | | | | 3.03% | |
Autoliv Inc. (Sweden)** | 28,400 | | | 1,358,940 | |
| | | | | | |
Specialty Retail | | | | 3.66% | |
Signet Jewelers Ltd. | | | | | |
(Bermuda)** | 27,900 | | | 767,250 | |
Tiffany & Co. | 22,960 | | | 870,414 | |
| | | | | 1,637,664 | |
| | | | | | |
Total Consumer Cyclical | | | | | |
(Cost $5,085,300) | | | | 5,282,754 | |
| | | | | | |
Consumer Staples | | | | 4.35% | |
Food & Agricultural Products | | | 4.35% | |
The J.M. Smucker Co. | 14,400 | | | 867,168 | |
Tyson Foods Inc. - Class A | 65,950 | | | 1,080,920 | |
| | | | | 1,948,088 | |
| | | | | | |
Total Consumer Staples | | | | | |
(Cost $1,706,146) | | | | 1,948,088 | |
| | | | | | |
Energy | | | | 8.33% | |
Exploration & Production | | | | 3.79% | |
Forest Oil Corp. ** | 31,300 | | | 856,368 | |
SM Energy Co. | 21,000 | | | 843,360 | |
| | | | | 1,699,728 | |
| | | | | | |
Oil Services | | | | 2.77% | |
Ensco PLC - ADR | | | | | |
(United Kingdom) | 8,400 | | | 329,952 | |
Noble Corp.** | 10,100 | | | 312,191 | |
(Switzerland) | | | | | |
Tidewater Inc. | 15,400 | | | 596,288 | |
| | | | | 1,238,431 | |
| | | | | | |
Refining & Marketing | | | | 1.77% | |
Holly Corp. | 29,800 | | | 792,084 | |
| | | | | | |
Total Energy | | | | | |
(Cost $3,974,487) | | | | 3,730,243 | |
| | | | | | |
Interest Rate Sensitive | | | | 19.19% | |
Life & Health Insurance | | | | 4.60% | |
Reinsurance Group of | | | | | |
America Inc. | 27,841 | | | 1,272,612 | |
Unum Group | 36,300 | | | 787,710 | |
| | | | | 2,060,322 | |
| | Shares | | Market Value | |
Property Casualty Insurance | | | 4.94% | |
Alterra Capital Holdings | | | | |
Ltd. (Bermuda) | 25,400 | $ | 477,012 | |
Axis Capital Holdings Ltd. | | | | |
(Bermuda) | 24,500 | | 728,140 | |
PartnerRe Ltd. | | | | |
(Bermuda) | 14,340 | | 1,005,808 | |
| | | | 2,210,960 | |
| | | | | |
Regional Banks | | | 5.47% | |
Comerica Inc. | 30,100 | | 1,108,583 | |
SunTrust Banks Inc. | 37,200 | | 866,760 | |
Zions Bancorporation | 22,100 | | 476,697 | |
| | | | 2,452,040 | |
| | | | | |
Securities & Asset Management | | 2.11% | |
Affiliated Managers | | | | |
Group Inc.** | 6,550 | | 398,043 | |
Invesco Ltd. | 32,500 | | 546,975 | |
| | | | 945,018 | |
| | | | | |
Thrifts | | | 2.07% | |
Annaly Capital | | | | |
Management Inc. | 54,100 | | 927,815 | |
| | | | | |
Total Interest Rate Sensitive | | | | |
(Cost $7,739,342) | | | 8,596,155 | |
| | | | | |
Medical/Healthcare | | | 8.27% | |
Healthcare Services | | | 3.09% | |
Lincare Holdings Inc.** | 18,000 | | 585,180 | |
Omnicare Inc. | 33,700 | | 798,690 | |
| | | | 1,383,870 | |
| | | | | |
Medical Technology | | | 1.60% | |
Life Technologies Corp.** | 15,230 | | 719,617 | |
| | | | | |
Pharmaceuticals | | | 3.58% | |
Cephalon Inc.** | 13,100 | | 743,425 | |
Forest Laboratories Inc.** | 31,300 | | 858,559 | |
| | | | 1,601,984 | |
| | | | | |
Total Medical/Healthcare | | | | |
(Cost $3,358,725) | | | 3,705,471 | |
| | | | | |
Real Estate Investment | | | | |
Trusts (REITs) | | | 4.98% | |
Healthcare | | | 1.11% | |
Senior Housing | | | | |
Properties Trust | 24,700 | | 496,717 | |
| | | | | |
Office Properties | | | 3.87% | |
Alexandria Real Estate | | | | |
Equities Inc. | 9,500 | | 602,015 | |
Digital Realty Trust Inc. | 12,300 | | 709,464 | |
| PAGE 40 |
|
WESTCORE MID-CAP VALUE FUND AS OF JUNE 30, 2010 (continued)
(UNAUDITED)
| | Shares | Market Value | |
Mack-Cali Realty Corp. | 14,200 | $ | 422,166 | |
| | | | 1,733,645 | |
| | | | | |
Total Real Estate Investment Trusts (REITs) | |
(Cost $2,631,425) | | | 2,230,362 | |
| | | | | |
Technology | | | 8.05% | |
Computer Software | | | 3.43% | |
Symantec Corp.** | 51,800 | | 718,984 | |
Synopsys Inc.** | 39,100 | | 816,017 | |
| | | | 1,535,001 | |
| | | | | |
Electronic Equipment | | | 0.70% | |
Belden Inc. | 14,200 | | 312,400 | |
| | | | | |
Semiconductors | | | 2.44% | |
Altera Corp. | 44,080 | | 1,093,625 | |
| | | | | |
Technology Resellers | | | | |
& Distributors | | | 1.48% | |
Ingram Micro Inc. - | | | | |
Class A** | 43,650 | | 663,043 | |
| | | | | |
Total Technology | | | | |
(Cost $3,938,173) | | | 3,604,069 | |
| | | | | |
Transportation | | | 0.85% | |
Trucking, Shipping & Air Freight | | 0.85% | |
Diana Shipping Inc. | | | | |
(Greece)** | 33,900 | | 381,714 | |
| | | | | |
Total Transportation | | | | |
(Cost $764,030) | | | 381,714 | |
| | | | | |
Utilities | | | 11.04% | |
Gas Utilities | | | 2.26% | |
UGI Corp. | 39,855 | | 1,013,911 | |
| | | | | |
Independent Power | | | 1.54% | |
NRG Energy Inc.** | 32,500 | | 689,325 | |
| | | | | |
Integrated Gas & Electric | | | 3.15% | |
CenterPoint Energy Inc. | 71,035 | | 934,821 | |
NiSource Inc. | 32,700 | | 474,150 | |
| | | | 1,408,971 | |
| | | | | |
Regulated Electric | | | 4.09% | |
Edison International | 27,300 | | 865,956 | |
Westar Energy Inc. | 44,600 | | 963,806 | |
| | | | 1,829,762 | |
Total Utilities | | | | |
(Cost $5,053,149) | | | 4,941,969 | |
| | | | | |
Total Common Stocks | | | | |
(Cost $43,823,388) | | | 44,091,728 | |
| | Shares | | Market Value | |
MONEY MARKET MUTUAL FUNDS | | 1.63% | |
Fidelity Institutional | | | | | |
Money Market | | | | | |
Government | | | | | |
Portfolio - Class I | | | | | |
(7 Day Yield 0.044%) | | 731,575 | $ | 731,575 | |
| | | | | | |
Total Money Market Mutual Funds | | | |
(Cost $731,575) | | | | 731,575 | |
| | | | | | |
Total Investments | | | | | |
(Cost $44,554,963) | 100.08% | | 44,823,303 | |
| | | | | | |
Liabilities in Excess | | | | | |
of Other Assets | | (0.08%) | | (36,667) | |
| | | | | | |
Net Assets | 100.00% | $ | 44,786,636 | |
| | | | | | |
Westcore Mid-Cap Value Fund | | | |
Country Breakdown as of June 30, 2010 | |
(Unaudited) | | | | | |
Country | | Market Value | | % | |
United States | $ | 39,462,296 | | 88.11% | |
Bermuda | | 2,978,210 | | 6.65% | |
Sweden | | 1,358,940 | | 3.03% | |
Greece | | 381,714 | | 0.85% | |
United Kingdom | | 329,952 | | 0.74% | |
Switzerland | | 312,191 | | 0.70% | |
Total Investments | | 44,823,303 | | 100.08% | |
Liabilities in Excess | | | | | |
of Other Assets | | (36,667) | | (0.08%) | |
Net Assets | $ | 44,786,636 | | 100.00% | |
| | | | | | |
Please note the country classification is based on the company headquarters and is unaudited. All of the Fund’s investments are traded on U.S. exchanges. Sector and industry classifications presented herein are based on the sector and industry categorization methodology of the Adviser to the Funds which may result in the designations for one Fund being different from another. Sector and industry classifications are unaudited. ** Non-income producing security. See Notes to Financial Statements. |
|
|
WESTCORE SMALL-CAP OPPORTUNITY FUND AS OF JUNE 30, 2010
(UNAUDITED)
| | Shares | | Market Value | |
COMMON STOCKS | | | | 97.06% | |
Basic Materials | | | | 5.52% | |
Forestry & Paper | | | | 3.01% | |
KapStone Paper and | | | | | |
Packaging Corp.** | 41,600 | | $ | 463,424 | |
Rock-Tenn Co. - Class A | 13,500 | | | 670,545 | |
| | | | | 1,133,969 | |
| | | | | | |
Precious Metals | | | | 0.94% | |
Thompson Creek Metals | | | | | |
Co. Inc. (Canada)** | 41,000 | | | 355,880 | |
| | | | | | |
Specialty Chemicals | | | | 0.71% | |
OM Group Inc.** | 11,200 | | | 267,232 | |
| | | | | | |
Steel | | | | 0.86% | |
Schnitzer Steel | | | | | |
Industries Inc. | 8,250 | | | 323,400 | |
| | | | | | |
Total Basic Materials | | | | | |
(Cost $2,244,492) | | | | 2,080,481 | |
| | | | | | |
Capital Goods | | | | 7.04% | |
Electrical Equipment | | | | 1.01% | |
General Cable Corp.** | 14,295 | | | 380,962 | |
| | | | | | |
Engineering & Construction | | | | 2.01% | |
EMCOR Group Inc.** | 32,670 | | | 756,964 | |
| | | | | | |
Industrial Products | | | | 2.64% | |
EnPro Industries Inc.** | 35,300 | | | 993,695 | |
| | | | | | |
Machinery | | | | 1.38% | |
Columbus McKinnon | | | | | |
Corp.** | 37,170 | | | 519,265 | |
| | | | | | |
Total Capital Goods | | | | | |
(Cost $2,647,534) | | | | 2,650,886 | |
| | | | | | |
Commercial Services | | | | 5.20% | |
Business Products & Services | | | 0.80% | |
CRA International Inc.** | 15,900 | | | 299,397 | |
| | | | | | |
Distributors & Wholesalers | | | | 1.91% | |
Central Garden & Pet Co. | | | | | |
- Class A** | 80,300 | | | 720,291 | |
| | | | | | |
Environmental & Pollution Control | | | 2.49% | |
Waste Connections Inc.** | 26,910 | | | 938,890 | |
| | | | | | |
Total Commercial Services | | | | | |
(Cost $2,022,221) | | | | 1,958,578 | |
| | Shares | | Market Value | |
Communications | | | | 3.96% | |
Telecomm Equipment & Solutions | | | 3.96% | |
CommScope Inc.** | 21,440 | | $ | 509,629 | |
Syniverse Holdings Inc.** | 48,100 | | | 983,645 | |
| | | | | 1,493,274 | |
| | | | | | |
Total Communications | | | | | |
(Cost $1,405,551) | | | | 1,493,274 | |
| | | | | | |
Consumer Cyclical | | | | 15.52% | |
Apparel & Footwear Manufacturers | | | 1.30% | |
Wolverine World | | | | | |
Wide Inc. | 19,360 | | | 488,259 | |
| | | | | | |
Clothing & Accessories | | | | 8.89% | |
AnnTaylor Stores Corp.** | 20,900 | | | 340,043 | |
The Cato Corp. | 28,800 | | | 634,176 | |
The Children’s Place | | | | | |
Retail Stores Inc.** | 17,300 | | | 761,546 | |
The Finish Line Inc. - | | | | | |
Class A | 40,800 | | | 568,344 | |
Kenneth Cole | | | | | |
Productions Inc. - | | | | | |
Class A** | 27,500 | | | 302,775 | |
Perry Ellis | | | | | |
International Inc.** | 16,500 | | | 333,300 | |
Steven Madden Ltd.** | 12,975 | | | 408,972 | |
| | | | | 3,349,156 | |
| | | | | | |
Motor Vehicles | | | | 0.78% | |
Group 1 Automotive Inc.** | 12,500 | | | 294,125 | |
| | | | | | |
Recreation & Leisure | | | | 3.55% | |
JAKKS Pacific Inc.** | 39,700 | | | 570,886 | |
Steiner Leisure Ltd. | | | | | |
(Bahamas)** | 19,900 | | | 764,956 | |
| | | | | 1,335,842 | |
| | | | | | |
Restaurants | | | | 1.00% | |
CEC Entertainment Inc.** | 10,700 | | | 377,282 | |
| | | | | | |
Total Consumer Cyclical | | | | | |
(Cost $4,818,442) | | | | 5,844,664 | |
| | | | | | |
Consumer Staples | | | | 4.08% | |
Consumer Products | | | | 1.55% | |
Elizabeth Arden Inc.** | 40,310 | | | 585,301 | |
| | | | | | |
Food & Agricultural Products | | | 2.53% | |
The Andersons Inc. | 12,300 | | | 400,857 | |
Calavo Growers Inc. | 30,620 | | | 549,935 | |
| | | | | 950,792 | |
| | | | | | |
Total Consumer Staples | | | | | |
(Cost $1,677,282) | | | | 1,536,093 | |
| | Shares | | Market Value | |
Energy | | | 6.69% | |
Exploration & Production | | | 1.92% | |
Bill Barrett Corp.** | 23,500 | $ | 723,095 | |
| | | | | |
Oil Services | | | 4.77% | |
Cal Dive | | | | |
International Inc.** | 148,000 | | 865,800 | |
Oil States | | | | |
International Inc.** | 14,760 | | 584,201 | |
T-3 Energy Services Inc.** | 12,440 | | 347,076 | |
| | | | 1,797,077 | |
| | | | | |
Total Energy | | | | |
(Cost $2,705,930) | | | 2,520,172 | |
| | | | | |
Interest Rate Sensitive | | | 14.59% | |
Other Banks | | | 4.24% | |
Boston Private Financial | | | | |
Holdings Inc. | 73,450 | | 472,283 | |
First Midwest | | | | |
Bancorp Inc. | 50,500 | | 614,080 | |
PacWest Bancorp | 27,910 | | 511,032 | |
| | | | 1,597,395 | |
| | | | | |
Property Casualty Insurance | | 3.93% | |
Alterra Capital Holdings | | | | |
Ltd. (Bermuda) | 28,110 | | 527,906 | |
AMERISAFE Inc.** | 26,900 | | 472,095 | |
The Hanover Insurance | | | | |
Group Inc. | 11,000 | | 478,500 | |
| | | | 1,478,501 | |
| | | | | |
Securities & Asset Management | | 2.50% | |
Investment Technology | | | | |
Group Inc.** | 23,000 | | 369,380 | |
Piper Jaffray Cos.** | 17,785 | | 573,033 | |
| | | | 942,413 | |
| | | | | |
Specialty Finance | | | 1.83% | |
First Cash Financial | | | | |
Services Inc.** | 31,660 | | 690,188 | |
| | | | | |
Thrifts | | | 2.09% | |
Anworth Mortgage Asset | | | | |
Corp. | 110,800 | | 788,896 | |
| | | | | |
Total Interest Rate Sensitive | | | |
(Cost $5,375,891) | | | 5,497,393 | |
| | | | | |
Medical/Healthcare | | | 12.46% | |
Healthcare Services | | | 5.63% | |
Centene Corp.** | 30,350 | | 652,525 | |
Kendle | | | | |
International Inc.** | 13,200 | | 152,064 | |
LifePoint Hospitals Inc.** | 19,900 | | 624,860 | |
Lincare Holdings Inc.** | 21,250 | | 690,838 | |
| | | | 2,120,287 | |
| PAGE 42 |
|
WESTCORE SMALL-CAP OPPORTUNITY FUND AS OF JUNE 30, 2010 (continued)
(UNAUDITED)
| | Shares | | Market Value | |
Medical Products & Supplies | | | 3.31% | |
Orthofix International | | | | | |
N.V. (Netherlands)** | 21,450 | | $ | 687,472 | |
STERIS Corp. | 18,020 | | | 560,062 | |
| | | | | 1,247,534 | |
| | | | | | |
Medical Technology | | | | 1.76% | |
ZOLL Medical Corp.** | 24,400 | | | 661,240 | |
| | | | | | |
Pharmaceuticals | | | | 1.76% | |
Medicis Pharmaceutical | | | | | |
Corp. | 30,300 | | | 662,964 | |
| | | | | | |
Total Medical/Healthcare | | | | | |
(Cost $4,244,416) | | | | 4,692,025 | |
| | | | | | |
Real Estate Investment Trusts | | | | |
(REITs) | | | | 5.52% | |
Healthcare | | | | 1.55% | |
Cogdell Spencer Inc. | 86,500 | | | 584,740 | |
| | | | | | |
Multi-Family | | | | 1.09% | |
Associated Estates Realty | | | | | |
Corp. | 31,600 | | | 409,220 | |
| | | | | | |
Office Properties | | | | 1.32% | |
BioMed Realty Trust Inc. | 30,900 | | | 497,181 | |
| | | | | | |
Office Industrial | | | | 1.56% | |
PS Business Parks Inc. | 10,565 | | | 589,316 | |
| | | | | | |
Total Real Estate Investment Trusts (REITs) | |
(Cost $1,731,286) | | | | 2,080,457 | |
| | | | | | |
Technology | | | | 9.08% | |
Computer Software | | | | 3.46% | |
Manhattan | | | | | |
Associates Inc.** | 9,400 | | | 258,970 | |
Parametric | | | | | |
Technology Corp.** | 24,800 | | | 388,616 | |
Sybase Inc.** | 10,150 | | | 656,299 | |
| | | | | 1,303,885 | |
| | | | | | |
Electronic Equipment | | | | 3.28% | |
Belden Inc. | 32,850 | | | 722,700 | |
Rofin-Sinar | | | | | |
Technologies Inc.** | 24,550 | | | 511,131 | |
| | | | | 1,233,831 | |
| | | | | | |
Semiconductor Capital Equipment | | | 1.64% | |
Veeco Instruments Inc.** | 18,060 | | | 619,097 | |
| | | | | | |
Semiconductors | | | | 0.70% | |
Integrated Device | | | | | |
Technology Inc.** | 53,600 | | | 265,320 | |
| | Shares | Market Value | |
Total Technology | | | | |
(Cost $2,966,851) | | $ | 3,422,133 | |
| | | | | |
Transportation | | | 3.11% | |
Trucking, Shipping & Air Freight | | 3.11% | |
Marten Transport Ltd.** | 31,600 | | 656,648 | |
Tsakos Energy Navigation | | | | |
Ltd. (Greece) | 19,300 | | 273,481 | |
Ultrapetrol Bahamas Ltd. | | | | |
(Bahamas)** | 55,470 | | 241,294 | |
| | | | 1,171,423 | |
| | | | | |
Total Transportation | | | | |
(Cost $1,595,660) | | | 1,171,423 | |
| | | | | |
Utilities | | | 4.29% | |
Gas Utilities | | | 2.87% | |
South Jersey | | | | |
Industries Inc. | 25,120 | | 1,079,155 | |
| | | | | |
Regulated Electric | | | 1.42% | |
Westar Energy Inc. | 24,830 | | 536,576 | |
| | | | | |
Total Utilities | | | | |
(Cost $1,401,099) | | | 1,615,731 | |
| | | | | |
Total Common Stocks | | | | |
(Cost $34,836,655) | | | 36,563,310 | |
| | | | | |
MONEY MARKET MUTUAL FUNDS | | 2.38% | |
Fidelity Institutional | | | | |
Money Market | | | | |
Government | | | | |
Portfolio - Class I | | | | |
(7 Day Yield 0.044%) | 896,848 | | 896,848 | |
| | | | | |
Total Money Market Mutual Funds | | | |
(Cost $896,848) | | | 896,848 | |
| | | | | |
Total Investments | | | | |
(Cost $35,733,503) | 99.44% | | 37,460,158 | |
| | | | | |
Other Assets in Excess | | | | |
of Liabilities | 0.56% | | 209,733 | |
| | | | | |
Net Assets | 100.00% | $ | 37,669,891 | |
Westcore Small-Cap Opportunity Fund | | | |
Country Breakdown as of June 30, 2010 | | | |
(Unaudited) | | | | | |
Country | Market Value | | % | |
United States | $ | 34,609,169 | | 91.88% | |
Bahamas | | 1,006,250 | | 2.67% | |
Netherlands | | 687,472 | | 1.82% | |
Bermuda | | 527,906 | | 1.40% | |
Canada | | 355,880 | | 0.94% | |
Greece | | 273,481 | | 0.73% | |
Total Investments | | 37,460,158 | | 99.44% | |
Other Assets in Excess | | | | | |
of Liabilities | | 209,733 | | 0.56% | |
Net Assets | $ | 37,669,891 | | 100.00% | |
| | | | | | |
Please note the country classification is based on the company headquarters and is unaudited. All of the Fund’s investments are traded on U.S. exchanges. Sector and industry classifications presented herein are based on the sector and industry categorization methodology of the Adviser to the Funds which may result in the designations for one Fund being different from another. Sector and industry classifications are unaudited. ** Non-income producing security. See Notes to Financial Statements. |
WESTCORE SMALL-CAP VALUE FUND AS OF JUNE 30, 2010
(UNAUDITED)
| | Shares | | Market Value | |
COMMON STOCKS | | | | 96.11% | |
Basic Materials | | | | 7.44% | |
Chemicals | | | | 1.08% | |
Innophos Holdings Inc. | 111,000 | | $ | 2,894,880 | |
| | | | | | |
Forestry & Paper | | | | 2.50% | |
Temple-Inland Inc. | 323,500 | | | 6,686,745 | |
| | | | | | |
Specialty Chemicals | | | | 1.35% | |
Cabot Corp. | 149,100 | | | 3,594,801 | |
| | | | | | |
Steel | | | | 2.51% | |
Schnitzer Steel | | | | | |
Industries Inc. | 80,400 | | | 3,151,680 | |
Worthington | | | | | |
Industries Inc. | 275,300 | | | 3,540,358 | |
| | | | | 6,692,038 | |
| | | | | | |
Total Basic Materials | | | | | |
(Cost $17,860,648) | | | | 19,868,464 | |
| | | | | | |
Capital Goods | | | | 5.27% | |
Aerospace & Defense Suppliers | | | 2.90% | |
Triumph Group Inc. | 116,400 | | | 7,755,732 | |
| | | | | | |
Electrical Equipment | | | | 1.59% | |
Franklin Electric Co. Inc. | 147,182 | | | 4,241,785 | |
| | | | | | |
Industrial Products | | | | 0.78% | |
Lincoln Electric | | | | | |
Holdings Inc. | 40,630 | | | 2,071,724 | |
| | | | | | |
Total Capital Goods | | | | | |
(Cost $11,509,918) | | | | 14,069,241 | |
| | | | | | |
Commercial Services | | | | 3.85% | |
Business Products & Services | | | 3.85% | |
Brink’s Co. | 155,400 | | | 2,957,262 | |
CDI Corp. | 220,135 | | | 3,418,697 | |
Ennis Inc. | 259,410 | | | 3,893,744 | |
| | | | | 10,269,703 | |
| | | | | | |
Total Commercial Services | | | | | |
(Cost $12,721,052) | | | | 10,269,703 | |
| | | | | | |
Communications | | | | 3.24% | |
Telecomm Equipment & Solutions | | | 3.24% | |
Adtran Inc. | 317,450 | | | 8,656,861 | |
| | | | | | |
Total Communications | | | | | |
(Cost $6,674,503) | | | | 8,656,861 | |
| | Shares | | Market Value | |
Consumer Cyclical | | | | 13.38% | |
Clothing & Accessories | | | | 4.96% | |
Columbia Sportswear Co. | 95,100 | | $ | 4,438,317 | |
The Finish Line Inc. - | | | | | |
Class A | 190,800 | | | 2,657,844 | |
Foot Locker Inc. | 202,900 | | | 2,560,598 | |
Stage Stores Inc. | 335,560 | | | 3,583,781 | |
| | | | | 13,240,540 | |
| | | | | | |
Consumer Durables | | | | 2.41% | |
Knoll Inc. | 167,150 | | | 2,221,423 | |
The Toro Co. | 85,900 | | | 4,219,408 | |
| | | | | 6,440,831 | |
| | | | | | |
Hard Goods Retail | | | | 0.92% | |
Aaron’s Inc. | 144,165 | | | 2,460,897 | |
| | | | | | |
Motor Vehicle Parts | | | | 1.64% | |
Cooper Tire & Rubber Co. | 224,200 | | | 4,371,900 | |
| | | | | | |
Other Consumer Services | | | | 1.63% | |
Regis Corp. | 278,800 | | | 4,340,916 | |
| | | | | | |
Restaurants | | | | 1.82% | |
Bob Evans Farms Inc. | 197,855 | | | 4,871,190 | |
| | | | | | |
Total Consumer Cyclical | | | | | |
(Cost $31,789,457) | | | | 35,726,274 | |
| | | | | | |
Consumer Staples | | | | 3.98% | |
Food & Agriculture Products | | | 1.48% | |
Lancaster Colony Corp. | 74,240 | | | 3,961,446 | |
| | | | | | |
Home Products | | | | 2.50% | |
Tupperware Brands | | | | | |
Corp. | 167,150 | | | 6,660,928 | |
| | | | | | |
Total Consumer Staples | | | | | |
(Cost $7,875,772) | | | | 10,622,374 | |
| | | | | | |
Energy | | | | 6.17% | |
Alternative Energy | | | | 0.58% | |
EnergySolutions Inc. | 304,500 | | | 1,549,905 | |
| | | | | | |
Exploration & Production | | | | 1.80% | |
SM Energy Co. | 119,700 | | | 4,807,152 | |
| | | | | | |
Oil Services | | | | 2.22% | |
RPC Inc. | 241,100 | | | 3,291,015 | |
Tidewater Inc. | 67,900 | | | 2,629,088 | |
| | | | | 5,920,103 | |
| | Shares | | Market Value | |
Refining & Marketing | | | | 1.57% | |
Holly Corp. | 157,300 | | $ | 4,181,034 | |
| | | | | | |
Total Energy | | | | | |
(Cost $17,322,415) | | | | 16,458,194 | |
| | | | | | |
Interest Rate Sensitive | | | | 24.15% | |
Life & Health Insurance | | | | 4.51% | |
American Equity | | | | | |
Investment Life | | | | | |
Holding Co. | 535,350 | | | 5,524,812 | |
Protective Life Corp. | 129,700 | | | 2,774,283 | |
StanCorp Financial | | | | | |
Group Inc. | 92,000 | | | 3,729,680 | |
| | | | | 12,028,775 | |
| | | | | | |
Other Banks | | | | 9.58% | |
Bank of the Ozarks Inc. | 44,400 | | | 1,574,868 | |
Community Bank | | | | | |
System Inc. | 208,400 | | | 4,591,052 | |
Fulton Financial Corp. | 414,000 | | | 3,995,100 | |
Independent Bank Corp. | 41,370 | | | 1,021,012 | |
PacWest Bancorp | 171,355 | | | 3,137,510 | |
Westamerica Bancorp | 72,320 | | | 3,798,246 | |
Whitney Holding Corp. | 298,100 | | | 2,757,425 | |
Wintrust Financial Corp. | 140,800 | | | 4,694,272 | |
| | | | | 25,569,485 | |
| | | | | | |
Property Casualty Insurance | | | 3.88% | |
Alterra Capital Holdings | | | | | |
Ltd. (Bermuda) | 131,265 | | | 2,465,157 | |
Infinity Property & | | | | | |
Casualty Corp. | 27,300 | | | 1,260,714 | |
Platinum Underwriters | | | | | |
Holdings Ltd. | | | | | |
(Bermuda) | 121,775 | | | 4,419,215 | |
Safety Insurance | | | | | |
Group Inc. | 59,600 | | | 2,206,392 | |
| | | | | 10,351,478 | |
| | | | | | |
Specialty Finance | | | | 2.08% | |
Cash America | | | | | |
International Inc. | 162,360 | | | 5,564,077 | |
| | | | | | |
Thrifts & Mortgage REITs | | | | 4.10% | |
Astoria Financial Corp. | 374,700 | | | 5,155,872 | |
MFA Financial Inc. | 784,040 | | | 5,801,896 | |
| | | | | 10,957,768 | |
| | | | | | |
Total Interest Rate Sensitive | | | | |
(Cost $55,877,187) | | | | 64,471,583 | |
| | | | | | |
Medical/Healthcare | | | | 8.31% | |
Healthcare Services | | | | 2.46% | |
Owens & Minor Inc. | 231,165 | | | 6,560,463 | |
| PAGE 44 |
|
WESTCORE SMALL-CAP VALUE FUND AS OF JUNE 30, 2010 (continued)
(UNAUDITED)
| | Shares | | Market Value | |
Medical Products & Supplies | | | 4.48% | |
Cooper Cos. Inc. | 111,050 | | $ | 4,418,679 | |
Meridian Bioscience Inc. | 224,075 | | | 3,809,275 | |
STERIS Corp. | 120,550 | | | 3,746,694 | |
| | | | | 11,974,648 | |
| | | | | | |
Pharmaceuticals | | | | 1.37% | |
Biovail Corp. (Canada) | 189,700 | | | 3,649,828 | |
| | | | | | |
Total Medical/Healthcare | | | | | |
(Cost $19,690,073) | | | | 22,184,939 | |
| | | | | | |
Real Estate Investment Trusts (REITs) | 8.04% | |
Apartments | | | | 1.00% | |
American Campus | | | | | |
Communities Inc. | 98,300 | | | 2,682,607 | |
| | | | | | |
Manufactured Homes | | | | 1.38% | |
Equity Lifestyle | | | | | |
Properties Inc. | 76,100 | | | 3,670,303 | |
| | | | | | |
Office Properties | | | | 5.66% | |
Brandywine Realty Trust | 472,500 | | | 5,079,375 | |
First Potomac | | | | | |
Realty Trust | 249,700 | | | 3,588,189 | |
Government Properties | | | | | |
Income Trust | 140,000 | | | 3,572,800 | |
Mack-Cali Realty Corp. | 96,500 | | | 2,868,945 | |
| | | | | 15,109,309 | |
| | | | | | |
Total Real Estate Investment Trusts (REITs) | |
(Cost $20,355,247) | | | | 21,462,219 | |
| | | | | | |
Technology | | | | 6.65% | |
Computer Software | | | | 1.55% | |
Blackbaud Inc. | 189,645 | | | 4,128,572 | |
| | | | | | |
Electronic Equipment | | | | 5.10% | |
Belden Inc. | 360,000 | | | 7,920,000 | |
CTS Corp. | 304,300 | | | 2,811,732 | |
Park Electrochemical | | | | | |
Corp. | 117,843 | | | 2,876,547 | |
| | | | | 13,608,279 | |
| | | | | | |
Total Technology | | | | | |
(Cost $19,800,420) | | | | 17,736,851 | |
| | | | | | |
Transportation | | | | 0.71% | |
Trucking, Shipping & Air Freight | | | 0.71% | |
Arkansas Best Corp. | 91,700 | | | 1,902,775 | |
| | | | | | |
Total Transportation | | | | | |
(Cost $3,003,391) | | | | 1,902,775 | |
| | Shares | Market Value | |
Utilities | | | | 4.92% | |
Gas Utilities | | | | 3.91% | |
Northwest Natural | | | | | |
Gas Co. | | 94,460 | $ | 4,115,622 | |
South Jersey | | | | | |
Industries Inc. | | 147,475 | | 6,335,526 | |
| | | | | 10,451,148 | |
| | | | | | |
Regulated Electric | | | | 1.01% | |
UIL Holdings Corp. | | 107,500 | | 2,690,725 | |
| | | | | | |
Total Utilities | | | | | |
(Cost $12,658,841) | | | | 13,141,873 | |
| | | | | | |
Total Common Stocks | | | | | |
(Cost $237,138,924) | | | | 256,571,351 | |
| | | | | | |
MONEY MARKET MUTUAL FUNDS | | 4.38% | |
Fidelity Institutional | | | | | |
Money Market | | | | | |
Government | | | | | |
Portfolio - Class I | | | | | |
(7 Day Yield 0.044%) | 11,709,366 | | 11,709,366 | |
| | | | | | |
Total Money Market Mutual Funds | | | |
(Cost $11,709,366) | | | | 11,709,366 | |
| | | | | | |
Total Investments | | | | | |
(Cost $248,848,290) | | 100.49% | 268,280,717 | |
| | | | | | |
Liabilities in Excess | | | | | |
of Other Assets | | (0.49%) | | (1,317,778) | |
| | | | | | |
Net Assets | | 100.00% | $ | 266,962,939 | |
| | | | | | |
Westcore Small-Cap Value Fund | | | |
Country Breakdown as of June 30, 2010 | |
(Unaudited) | | | | | |
Country | | Market Value | % | |
United States | $ | 257,746,517 | 96.55% | |
Bermuda | | 6,884,372 | 2.58% | |
Canada | | 3,649,828 | 1.36% | |
Total Investments | | 268,280,717 | 100.49% | |
Liabilities in Excess | | | | | |
of Other Assets | | (1,317,778) | (0.49%) | |
Net Assets | $ | 266,962,939 | 100.00% | |
| | | | | | |
Please note the country classification is based on the company headquarters and is unaudited. All of the Fund’s investments are traded on U.S. exchanges. Sector and industry classifications presented herein are based on the sector and industry categorization methodology of the Adviser to the Funds which may result in the designations for one Fund being different from another. Sector and industry classifications are unaudited. See Notes to Financial Statements. |
|
|
WESTCORE MICRO-CAP OPPORTUNITY FUND AS OF JUNE 30, 2010
(UNAUDITED)
| | Shares | | Market Value | |
COMMON STOCKS | | | | 97.33% | |
Basic Materials | | | | 5.74% | |
Chemicals | | | | 1.18% | |
Innophos Holdings Inc. | 611 | | $ | 15,935 | |
KMG Chemicals Inc. | 616 | | | 8,846 | |
| | | | | 24,781 | |
| | | | | | |
Forestry & Paper | | | | 1.19% | |
Buckeye Technologies | | | | | |
Inc.** | 821 | | | 8,169 | |
Neenah Paper Inc. | 923 | | | 16,891 | |
| | | | | 25,060 | |
| | | | | | |
Other Materials (Rubber & Plastic) | | | 1.66% | |
A. Schulman Inc. | 478 | | | 9,063 | |
AEP Industries Inc.** | 650 | | | 15,522 | |
Innospec Inc.** | 1,103 | | | 10,346 | |
| | | | | 34,931 | |
| | | | | | |
Specialty Chemicals | | | | 1.11% | |
Aceto Corp. | 2,355 | | | 13,494 | |
Stepan Co. | 142 | | | 9,717 | |
| | | | | 23,211 | |
| | | | | | |
Steel | | | | 0.60% | |
Olympic Steel Inc. | 546 | | | 12,541 | |
| | | | | | |
Total Basic Materials | | | | | |
(Cost $124,138) | | | | 120,524 | |
| | | | | | |
Capital Goods | | | | 4.91% | |
Aerospace & Defense Suppliers | | | 1.61% | |
Hawk Corp. - Class A** | 464 | | | 11,809 | |
Herley Industries Inc.** | 700 | | | 9,982 | |
Ladish Co. Inc.** | 530 | | | 12,041 | |
| | | | | 33,832 | |
| | | | | | |
Electrical Equipment | | | | 1.18% | |
AAON Inc. | 465 | | | 10,839 | |
Houston Wire & Cable Co. | 1,278 | | | 13,866 | |
| | | | | 24,705 | |
| | | | | | |
Industrial Products | | | | 1.22% | |
Dynamic Materials Corp. | 765 | | | 12,271 | |
Stratasys Inc.** | 541 | | | 13,287 | |
| | | | | 25,558 | |
| | | | | | |
Transportation Equipment & Parts | | | 0.90% | |
Miller Industries Inc. | 1,410 | | | 18,993 | |
| | | | | | |
Total Capital Goods | | | | | |
(Cost $98,557) | | | | 103,088 | |
| | Shares | | Market Value | |
Commercial Services | | | | 8.15% | |
Business Products & Services | | | | 5.78% | |
Acacia Research Corp. | 1,042 | | $ | 14,828 | |
Advisory Board Co.** | 315 | | | 13,532 | |
Barrett Business | | | | | |
Services Inc. | 981 | | | 12,165 | |
Consolidated Graphics Inc.** | 210 | | | 9,081 | |
Electro Rent Corp. | 1,113 | | | 14,235 | |
Ennis Inc. | 585 | | | 8,781 | |
On Assignment Inc.** | 1,498 | | | 7,535 | |
Perficient Inc.** | 1,597 | | | 14,229 | |
Rewards Network Inc. | 681 | | | 9,309 | |
S1 Corp.** | 1,415 | | | 8,504 | |
VSE Corp. | 290 | | | 9,228 | |
| | | | | 121,427 | |
| | | | | | |
Educational Services | | | | 0.60% | |
Universal Technical | | | | | |
Institute Inc.** | 536 | | | 12,671 | |
| | | | | | |
IT Services | | | | 1.40% | |
iGate Corp. | 1,109 | | | 14,218 | |
Infospace Inc.** | 1,014 | | | 7,625 | |
Ness Technologies Inc. | | | | | |
(Israel)** | 1,739 | | | 7,495 | |
| | | | | 29,338 | |
| | | | | | |
Transaction Processing | | | | 0.37% | |
Cass Information | | | | | |
Systems Inc. | 225 | | | 7,706 | |
| | | | | | |
Total Commercial Services | | | | | |
(Cost $153,307) | | | | 171,142 | |
| | | | | | |
Communications | | | | 5.67% | |
Networking | | | | 0.94% | |
Hypercom Corp.** | 4,241 | | | 19,678 | |
| | | | | | |
Telecomm Equipment & Solutions | | | 2.96% | |
Anaren Inc.** | 495 | | | 7,395 | |
Novatel Wireless Inc.** | 2,288 | | | 13,133 | |
Oplink Communications | | | | | |
Inc.** | 850 | | | 12,181 | |
RADWARE Ltd. (Israel)** | 756 | | | 15,475 | |
Symmetricom Inc.** | 2,760 | | | 14,049 | |
| | | | | 62,233 | |
| | | | | | |
Telecomm Service Providers | | | | 1.77% | |
Atlantic Tele-Network | | | | | |
Inc. | 218 | | | 9,003 | |
RCN Corp.** | 840 | | | 12,441 | |
USA Mobility Inc. | 1,222 | | | 15,788 | |
| | | | | 37,232 | |
| | | | | | |
Total Communications | | | | | |
(Cost $97,226) | | | | 119,143 | |
| | Shares | | Market Value | |
Consumer Cyclical | | | | 13.41% | |
Apparel & Footwear Manufacturing | | | 1.77% | |
Culp Inc.** | 850 | | $ | 9,316 | |
Maidenform Brands Inc.** | 749 | | | 15,250 | |
Unifi Inc.** | 3,320 | | | 12,682 | |
| | | | | 37,248 | |
| | | | | | |
Consumer Durables | | | | 1.08% | |
Knoll Inc. | 778 | | | 10,340 | |
La-Z-Boy Inc.** | 730 | | | 5,424 | |
Smith & Wesson Holding | | | | | |
Corp.** | 1,691 | | | 6,916 | |
| | | | | 22,680 | |
| | | | | | |
Hard Goods Retail | | | | 0.64% | |
Haverty Furniture Cos. | | | | | |
Inc. | 1,088 | | | 13,371 | |
| | | | | | |
Homebuilders & Suppliers | | | | 1.67% | |
Beazer Homes USA Inc.** | 2,525 | | | 9,166 | |
Brookfield Homes Corp.** | 1,300 | | | 8,762 | |
Hovnanian Enterprises | | | | | |
Inc.** | 2,768 | | | 10,186 | |
Standard Pacific Corp.** | 2,063 | | | 6,870 | |
| | | | | 34,984 | |
| | | | | | |
Motor Vehicle Parts | | | | 0.84% | |
ATC Technology Corp.** | 621 | | | 10,011 | |
Standard Motor Products | | | | | |
Inc. | 959 | | | 7,739 | |
| | | | | 17,750 | |
| | | | | | |
Motor Vehicles | | | | 0.32% | |
America’s Car-Mart Inc.** | 295 | | | 6,676 | |
| | | | | | |
Other Consumer Services | | | | 1.58% | |
Pre-Paid Legal Services | | | | | |
Inc.** | 171 | | | 7,779 | |
Shutterfly Inc.** | 649 | | | 15,550 | |
Stamps.com Inc.** | 968 | | | 9,922 | |
| | | | | 33,251 | |
| | | | | | |
Publishing & Media | | | | 0.62% | |
Belo Corp.** | 1,237 | | | 7,038 | |
The E.W. Scripps Co.** | 797 | | | 5,938 | |
| | | | | 12,976 | |
| | | | | | |
Recreation & Leisure | | | | 1.64% | |
Rick’s Cabaret | | | | | |
International Inc.** | 889 | | | 7,014 | |
Sport Supply Group Inc. | 1,014 | | | 13,649 | |
Sturm, Ruger & Co. Inc. | 964 | | | 13,814 | |
| | | | | 34,477 | |
| PAGE 46 |
|
WESTCORE MICRO-CAP OPPORTUNITY FUND AS OF JUNE 30, 2010 (continued)
(UNAUDITED)
| | Shares | | Market Value | |
Restaurants | | | | 2.13% | |
AFC Enterprises Inc.** | 1,621 | | $ | 4,751 | |
Biglari Holdings Inc.** | 34 | | | 9,755 | |
California Pizza Kitchen | | | | | |
Inc.** | 889 | | | 13,468 | |
Luby’s Inc.** | 1,765 | | | 6,795 | |
| | | | | 44,769 | |
| | | | | | |
Specialty Retail | | | | 1.12% | |
Franklin Covey Co.** | 1,084 | | | 7,046 | |
MarineMax Inc.** | 846 | | | 5,871 | |
West Marine Inc.** | 976 | | | 10,619 | |
| | | | | 23,536 | |
| | | | | | |
Total Consumer Cyclical | | | | | |
(Cost $285,684) | | | | 281,718 | |
| | | | | | |
Consumer Staples | | | | 2.43% | |
Consumer Products | | | | 0.60% | |
Medifast Inc.** | 485 | | | 12,566 | |
| | | | | | |
Food & Agricultural Products | | | 0.78% | |
MGP Ingredients Inc.** | 2,488 | | | 16,496 | |
| | | | | | |
Grocery & Convenience | | | | 1.05% | |
Great Atlantic & Pacific | | | | | |
Tea Co.** | 2,519 | | | 9,824 | |
The Pantry Inc.** | 862 | | | 12,163 | |
| | | | | 21,987 | |
| | | | | | |
Total Consumer Staples | | | | | |
(Cost $58,098) | | | | 51,049 | |
| | | | | | |
Energy | | | | 5.21% | |
Coal | | | | 0.36% | |
Westmoreland Coal Co.** | 929 | | | 7,544 | |
| | | | | | |
Exploration & Production | | | | 2.02% | |
Gulfport Energy Corp.** | 1,667 | | | 19,770 | |
Panhandle Oil and Gas | | | | | |
Inc. | 325 | | | 8,590 | |
Vaalco Energy Inc.** | 2,540 | | | 14,224 | |
| | | | | 42,584 | |
| | | | | | |
Oil Services | | | | 1.98% | |
Bolt Technology Corp.** | 2,176 | | | 19,040 | |
Dawson Geophysical Co.** | 700 | | | 14,889 | |
PHI Inc.** | 545 | | | 7,679 | |
| | | | | 41,608 | |
| | | | | | |
Pipelines | | | | 0.85% | |
Crosstex Energy Inc.** | 2,777 | | | 17,801 | |
| | | | | | |
Total Energy | | | | | |
(Cost $110,312) | | | | 109,537 | |
| | Shares | | Market Value | |
Interest Rate Sensitive | | | | 20.75% | |
Life & Health Insurance | | | | 0.51% | |
American Equity | | | | | |
Investment Life | | | | | |
Holding Co. | 1,033 | | $ | 10,661 | |
| | | | | | |
Other Banks | | | | 10.21% | |
Boston Private Financial | | | | | |
Holdings Inc. | 1,723 | | | 11,079 | |
Center Financial Corp.** | 2,555 | | | 13,158 | |
Eagle Bancorp Inc.** | 784 | | | 9,236 | |
First Busey Corp. | 2,318 | | | 10,501 | |
First Financial Corp. | 423 | | | 10,918 | |
First Merchants Corp. | 1,807 | | | 15,323 | |
First Place Financial | | | | | |
Corp. | 2,160 | | | 6,480 | |
Heartland Financial USA | | | | | |
Inc. | 908 | | | 15,690 | |
Lakeland Bancorp Inc. | 1,222 | | | 10,411 | |
Nara Bancorp Inc.** | 1,146 | | | 9,661 | |
Republic Bancorp Inc. - | | | | | |
Class A | 433 | | | 9,699 | |
SCBT Financial Corp. | 477 | | | 16,800 | |
Sierra Bancorp | 813 | | | 9,349 | |
Simmons First National | | | | | |
Corp. - Class A | 435 | | | 11,423 | |
Southside Bancshares | | | | | |
Inc. | 635 | | | 12,462 | |
State Bancorp Inc. | 1,968 | | | 18,696 | |
Sun Bancorp Inc.** | 3,619 | | | 13,607 | |
Tompkins Financial Corp. | 264 | | | 9,966 | |
| | | | | 214,459 | |
| | | | | | |
Property Casualty Insurance | | | | 2.82% | |
American Physicians | | | | | |
Capital Inc. | 422 | | | 13,019 | |
American Safety | | | | | |
Insurance Holdings | | | | | |
Ltd. (Bermuda)** | 697 | | | 10,957 | |
AMERISAFE Inc.** | 633 | | | 11,109 | |
Hallmark Financial | | | | | |
Services Inc.** | 1,184 | | | 11,781 | |
NYMAGIC Inc. | 643 | | | 12,403 | |
| | | | | 59,269 | |
| | | | | | |
Regional Banks | | | | 0.38% | |
Centerstate Banks of | | | | | |
Florida Inc. | 798 | | | 8,052 | |
| | | | | | |
Securities & Asset Management | | | 2.82% | |
Diamond Hill Investment | | | | | |
Group Inc. | 161 | | | 9,127 | |
International Assets | | | | | |
Holding Corp.** | 441 | | | 7,056 | |
MVC Capital Inc. | 1,138 | | | 14,703 | |
Oppenheimer Holdings | | | | | |
Inc. | 362 | | | 8,670 | |
| | Shares | | Market Value | |
Rodman & Renshaw | | | | |
Capital Group Inc.** | 3,788 | $ | 10,834 | |
TradeStation Group Inc.** | 1,311 | | 8,849 | |
| | | | 59,239 | |
| | | | | |
Specialty Finance | | | 1.88% | |
Dollar Financial Corp.** | 443 | | 8,767 | |
MCG Capital Corp. | 2,423 | | 11,703 | |
Newcastle Investment | | | | |
Corp.** | 3,708 | | 9,937 | |
NorthStar Realty Finance | | | | |
Corp. | 3,410 | | 9,105 | |
| | | | 39,512 | |
| | | | | |
Thrifts | | | 2.13% | |
Columbia Banking | | | | |
System Inc. | 521 | | 9,513 | |
Dime Community | | | | |
Bancshares | 1,000 | | 12,330 | |
Flushing Financial Corp. | 994 | | 12,157 | |
Great Southern Bancorp | | | | |
Inc. | 524 | | 10,642 | |
| | | | 44,642 | |
| | | | | |
Total Interest Rate Sensitive | | | | |
(Cost $443,150) | | | 435,834 | |
| | | | | |
Medical/Healthcare | | | 14.19% | |
Healthcare Services | | | 3.72% | |
America Service Group | | | | |
Inc. | 782 | | 13,450 | |
American Dental | | | | |
Partners Inc.** | 1,186 | | 14,363 | |
American Physicians | | | | |
Service Group Inc. | 464 | | 11,345 | |
Assisted Living Concepts | | | | |
Inc. - Class A** | 246 | | 7,279 | |
Five Star Quality Care | | | | |
Inc.** | 3,035 | | 9,166 | |
Kendle International | | | | |
Inc.** | 1,243 | | 14,319 | |
National Healthcare | | | | |
Corp. | 240 | | 8,270 | |
| | | | 78,192 | |
| | | | | |
Medical Products & Supplies | | | 1.83% | |
Atrion Corp. | 70 | | 9,453 | |
Micrus Endovascular | | | | |
Corp.** | 686 | | 14,262 | |
Young Innovations Inc. | 518 | | 14,582 | |
| | | | 38,297 | |
| | | | | |
Medical Technology | | | 2.93% | |
Kensey Nash Corp.** | 465 | | 11,025 | |
NeurogesX Inc.** | 2,323 | | 15,401 | |
Quidel Corp.** | 882 | | 11,193 | |
Symmetry Medical Inc.** | 1,426 | | 15,030 | |
|
|
WESTCORE MICRO-CAP OPPORTUNITY FUND AS OF JUNE 30, 2010 (continued)
(UNAUDITED)
| | Shares | | Market Value | |
Synovis Life Technologies | | | | | |
Inc.** | 585 | | $ | 8,939 | |
| | | | | 61,588 | |
| | | | | | |
Pharmaceuticals | | | | 5.71% | |
Albany Molecular | | | | | |
Research Inc.** | 3,168 | | | 16,379 | |
Ardea Biosciences Inc.** | 513 | | | 10,547 | |
Cambrex Corp.** | 5,423 | | | 17,082 | |
Hi-Tech Pharmacal Co | | | | | |
Inc.** | 443 | | | 10,149 | |
Jazz Pharmaceuticals | | | | | |
Inc.** | 1,226 | | | 9,600 | |
NPS Pharmaceuticals | | | | | |
Inc.** | 1,585 | | | 10,207 | |
OraSure Technologies | | | | | |
Inc.** | 1,692 | | | 7,834 | |
Pain Therapeutics Inc.** | 1,304 | | | 7,250 | |
Pharmacyclics Inc.** | 1,260 | | | 8,392 | |
QLT Inc. (Canada)** | 2,270 | | | 13,053 | |
Questcor | | | | | |
Pharmaceuticals Inc.** | 924 | | | 9,434 | |
| | | | | 119,927 | |
| | | | | | |
Total Medical/Healthcare | | | | | |
(Cost $280,826) | | | | 298,004 | |
| | | | | | |
Real Estate Investment Trusts (REITs) | 1.87% | |
Apartments | | | | 0.77% | |
Sun Communities Inc. | 619 | | | 16,069 | |
| | | | | | |
Multi-Family | | | | 0.69% | |
Associated Estates Realty | | | | | |
Corp. | 1,126 | | | 14,582 | |
| | | | | | |
Retail Properties | | | | 0.41% | |
Ramco-Gershenson | | | | | |
Properties Trust | 851 | | | 8,595 | |
| | | | | | |
Total Real Estate Investment Trusts (REITs) | |
(Cost $37,420) | | | | 39,246 | |
| | | | | | |
Technology | | | | 14.54% | |
Computer Software | | | | 4.03% | |
DivX Inc.** | 1,934 | | | 14,814 | |
Manhattan Associates | | | | | |
Inc.** | 583 | | | 16,062 | |
ModusLink Global | | | | | |
Solutions Inc.** | 1,717 | | | 10,354 | |
PC-Tel Inc.** | 2,477 | | | 12,484 | |
SeaChange International | | | | | |
Inc.** | 1,417 | | | 11,662 | |
SonicWALL Inc.** | 1,634 | | | 19,199 | |
| | | | | 84,575 | |
| | Shares | | Market Value | |
Electronic Equipment | | | | 2.35% | |
CTS Corp. | 782 | | $ | 7,226 | |
Measurement | | | | | |
Specialties Inc.** | 887 | | | 12,152 | |
NVE Corp.** | 304 | | | 13,233 | |
Spectrum Control Inc.** | 1,205 | | | 16,846 | |
| | | | | 49,457 | |
| | | | | | |
Peripherals | | | | 0.32% | |
Xyratex Ltd. (Bermuda)** | 473 | | | 6,693 | |
| | | | | | |
Semiconductor Capital Equipment | | | 1.57% | |
Kulicke & Soffa | | | | | |
Industries Inc.** | 1,432 | | | 10,053 | |
Newport Corp.** | 1,166 | | | 10,564 | |
Photronics Inc.** | 2,757 | | | 12,461 | |
| | | | | 33,078 | |
| | | | | | |
Semiconductors | | | | 5.49% | |
Actel Corp.** | 732 | | | 9,384 | |
CEVA Inc.** | 1,213 | | | 15,284 | |
Cirrus Logic Inc.** | 1,177 | | | 18,608 | |
DSP Group Inc.** | 1,311 | | | 8,377 | |
Exar Corp.** | 1,156 | | | 8,011 | |
Integrated Silicon | | | | | |
Solution Inc.** | 940 | | | 7,088 | |
Lattice Semiconductor | | | | | |
Corp.** | 2,992 | | | 12,985 | |
Silicon Image Inc.** | 2,780 | | | 9,758 | |
SMART Modular | | | | | |
Technologies (WWH) | | | | | |
Inc.** | 1,790 | | | 10,472 | |
Volterra Semiconductor | | | | | |
Corp.** | 663 | | | 15,289 | |
| | | | | 115,256 | |
| | | | | | |
Technology Resellers & | | | | | |
Distributors | | | | 0.78% | |
Insight Enterprises Inc.** | 1,241 | | | 16,331 | |
| | | | | | |
Total Technology | | | | | |
(Cost $283,429) | | | | 305,390 | |
| | | | | | |
Utilities | | | | 0.46% | |
Regulated Electric | | | | 0.46% | |
Central Vermont Public | | | | | |
Service Corp. | 487 | | | 9,613 | |
| | | | | | |
Total Utilities | | | | | |
(Cost $10,318) | | | | 9,613 | |
| | | | | | |
Total Common Stocks | | | | | |
(Cost $1,982,465) | | | | 2,044,288 | |
| | Shares | | Market Value | |
MONEY MARKET MUTUAL FUNDS | | 2.34% | |
Fidelity Institutional | | | | | |
Money Market | | | | | |
Government | | | | | |
Portfolio - Class I | | | | | |
(7 Day Yield 0.044%) | | 49,069 | $ | 49,069 | |
| | | | | | |
Total Money Market Mutual Funds | | | |
(Cost $49,069) | | | | 49,069 | |
| | | | | | |
Total Investments | | | | | |
(Cost $2,031,534) | | 99.67% | | 2,093,357 | |
| | | | | | |
Other Assets in Excess of | | | | | |
Liabilities | | 0.33% | | 6,997 | |
| | | | | | |
Net Assets | 100.00% | $ | 2,100,354 | |
| | | | | | |
Westcore Micro-Cap Opportunity Fund | | | |
Country Breakdown as of June 30, 2010 | | | |
(Unaudited) | | | | | |
Country | Market Value | | % | |
United States | $ | 2,039,684 | | 97.11% | |
Israel | | 22,970 | | 1.10% | |
Bermuda | | 17,650 | | 0.84% | |
Canada | | 13,053 | | 0.62% | |
Total Investments | | 2,093,357 | | 99.67% | |
Other Assets in Excess of | | | | | |
Liabilities | | 6,997 | | 0.33% | |
Net Assets | $ | 2,100,354 | | 100.00% | |
| | | | | | |
Please note the country classification is based on the company headquarters and is unaudited. All of the Fund’s investments are traded on U.S. exchanges. Sector and industry classifications presented herein are based on the sector and industry categorization methodology of the Adviser to the Funds which may result in the designations for one Fund being different from another. Sector and industry classifications are unaudited. **Non-income producing security. See Notes to Financial Statements. |
| PAGE 48 |
|
WESTCORE INTERNATIONAL FRONTIER FUND AS OF JUNE 30, 2010
(UNAUDITED)
| | Shares | | Market Value | |
COMMON STOCKS | | | | 97.77% | |
Consumer Discretionary | | | | 20.62% | |
Diversified Consumer Services | | | 5.17% | |
Raffles Education Corp. | | | | | |
Ltd. (Singapore) | 831,860 | | $ | 168,239 | |
Slater & Gordon Ltd. | | | | | |
(Australia) | 1,250,973 | | | 1,611,101 | |
| | | | | 1,779,340 | |
| | | | | | |
Hotels, Restaurants & Leisure | | | 1.39% | |
Domino’s Pizza Group | | | | | |
Ltd. (United Kingdom) | 84,900 | | | 479,667 | |
| | | | | | |
Household Durables | | | | 1.44% | |
Maisons France Confort | | | | | |
(France) | 13,950 | | | 494,705 | |
| | | | | | |
Media | | | | 9.89% | |
CTS Eventim AG | | | | | |
(Germany) | 14,900 | | | 712,604 | |
Pico Far East Holdings | | | | | |
Ltd. (Hong Kong) | 9,749,700 | | | 1,774,300 | |
Rightmove PLC (United | | | | | |
Kingdom) | 97,700 | | | 916,465 | |
| | | | | 3,403,369 | |
| | | | | | |
Specialty Retail | | | | 2.73% | |
Bonjour Holdings Ltd. | | | | | |
(Hong Kong) | 814,000 | | | 230,227 | |
Point Inc. (Japan) | 12,900 | | | 707,552 | |
| | | | | 937,779 | |
| | | | | | |
Total Consumer Discretionary | | | | |
(Cost $6,046,160) | | | | 7,094,860 | |
| | | | | | |
Consumer Staples | | | | 3.03% | |
Food & Staples Retailing | | | | 1.39% | |
Eurocash S.A. (Poland) | 75,400 | | | 479,854 | |
| | | | | | |
Food Products | | | | 1.64% | |
Cranswick PLC | | | | | |
(United Kingdom) | 44,000 | | | 562,481 | |
| | | | | | |
Total Consumer Staples | | | | | |
(Cost $825,939) | | | | 1,042,335 | |
| | | | | | |
Energy | | | | 3.86% | |
Energy Equipment & Services | | | 3.86% | |
Prosafe Production PLC | | | | | |
(Norway)** | 659,420 | | | 1,329,571 | |
| | | | | | |
Total Energy | | | | | |
(Cost $2,237,173) | | | | 1,329,571 | |
| | Shares | | Market Value | |
Financials | | | | 10.99% | |
Capital Markets | | | | 3.06% | |
Azimut Holding S.p.A | | | | | |
(Italy) | 37,718 | | $ | 311,347 | |
London Capital Group | | | | | |
Holdings PLC | | | | | |
(United Kingdom) | 371,900 | | | 741,800 | |
| | | | | 1,053,147 | |
| | | | | | |
Diversified Financial Services | | | 4.76% | |
IG Group Holdings PLC | | | | | |
(United Kingdom) | 262,300 | | | 1,638,738 | |
| | | | | | |
Thrifts & Mortgage Finance | | | | 3.17% | |
Home Capital Group Inc. | | | | | |
(Canada) | 27,500 | | | 1,089,357 | |
| | | | | | |
Total Financials | | | | | |
(Cost $3,504,577) | | | | 3,781,242 | |
| | | | | | |
Healthcare | | | | 5.94% | |
Healthcare Equipment & Supplies | | | 4.12% | |
EPS Co. Ltd. (Japan) | 230 | | | 581,519 | |
Nakanishi Inc. (Japan) | 5,600 | | | 480,733 | |
Omega Pharma N.V. | | | | | |
(Belgium) | 8,100 | | | 353,974 | |
| | | | | 1,416,226 | |
| | | | | | |
Healthcare Providers & Services | | | 1.21% | |
Odontoprev S.A. (Brazil) | 12,100 | | | 418,305 | |
| | | | | | |
Pharmaceuticals | | | | 0.61% | |
China Medical System | | | | | |
Holdings Ltd. | | | | | |
(Cayman Islands) | 400,000 | | | 209,174 | |
| | | | | | |
Total Healthcare | | | | | |
(Cost $1,710,081) | | | | 2,043,705 | |
| | | | | | |
Industrials | | | | 44.52% | |
Commercial Services & Supplies | | | 17.82% | |
Aeon Delight Co. Ltd. | | | | | |
(Japan) | 63,200 | | | 1,230,189 | |
Credit Corp. Group Ltd. | | | | | |
(Australia) | 855,060 | | | 1,904,380 | |
Mears Group PLC | | | | | |
(United Kingdom) | 372,334 | | | 1,352,207 | |
Prestige International | | | | | |
Inc. (Japan) | 990 | | | 1,644,412 | |
| | | | | 6,131,188 | |
| | | | | | |
Construction & Engineering | | | | 11.63% | |
Cardno Ltd. (Australia) | 558,200 | | | 1,861,559 | |
| | Shares | Market Value | |
Maire Tecnimont S.p.A. | | | |
(Italy) | 137,000 $ | 435,078 | |
Morgan Sindall Group | | | |
PLC (United Kingdom) | 223,539 | 1,704,848 | |
| | | 4,001,485 | |
| | | | |
Machinery | | 6.65% | |
Andritz AG (Austria) | 21,100 | 1,176,970 | |
Duro Felguera S.A. | | | |
(Spain) | 63,000 | 615,178 | |
METKA SA (Greece) | 49,700 | 495,626 | |
| | | 2,287,774 | |
| | | | |
Professional Services | | 2.09% | |
SAI Global Ltd. (Australia) | 213,300 | 718,900 | |
| | | | |
Trading Companies & Distributors | 6.33% | |
Diploma PLC | | | |
(United Kingdom) | 269,850 | 919,256 | |
Indutrade AB (Sweden) | 58,600 | 1,258,046 | |
| | | 2,177,302 | |
| | | | |
Total Industrials | | | |
(Cost $13,505,948) | | 15,316,649 | |
| | | | |
Information Technology | | 8.81% | |
IT Services | | 5.83% | |
GMO Payment Gateway | | | |
Inc. (Japan) | 200 | 315,194 | |
Wirecard AG (Germany) | 198,806 | 1,691,052 | |
| | | 2,006,246 | |
| | | | |
Software | | 2.98% | |
Simplex Technology Inc. | | | |
(Japan) | 1,410 | 1,023,889 | |
| | | | |
Total Information Technology | | |
(Cost $2,477,503) | | 3,030,135 | |
| | | | |
Total Common Stocks | | | |
(Cost $30,307,381) | | 33,638,497 | |
| | | | |
MONEY MARKET MUTUAL FUNDS | 1.30% | |
Fidelity Institutional | | | |
Money Market | | | |
Government | | | |
Portfolio - Class I | | | |
(7 Day Yield 0.044%) | 445,766 | 445,766 | |
| | | | |
Total Money Market Mutual Funds | | |
(Cost $445,766) | | 445,766 | |
|
|
WESTCORE INTERNATIONAL FRONTIER FUND AS OF JUNE 30, 2010 (continued)
(UNAUDITED)
| | | | Market Value | |
Total Investments | | | | | |
(Cost $30,753,147) | 99.07% | $ | 34,084,263 | |
| | | | | | |
Other Assets in Excess | | | | | |
of Liabilities | | 0.93% | | 320,093 | |
| | | | | | |
Net Assets | 100.00% | $ | 34,404,356 | |
| | | | | | |
Westcore International Frontier Fund | | | |
Country Breakdown as of June 30, 2010 | | | |
(Unaudited) | | | | | |
Country | Market Value | | % | |
United Kingdom | $ | 8,315,462 | | 24.17% | |
Australia | | 6,095,940 | | 17.72% | |
Japan | | 5,983,488 | | 17.39% | |
Germany | | 2,403,656 | | 6.99% | |
Hong Kong | | 2,004,527 | | 5.83% | |
Norway | | 1,329,571 | | 3.86% | |
Sweden | | 1,258,046 | | 3.66% | |
Austria | | 1,176,970 | | 3.42% | |
Canada | | 1,089,357 | | 3.17% | |
Italy | | 746,425 | | 2.17% | |
Spain | | 615,178 | | 1.79% | |
Greece | | 495,626 | | 1.44% | |
France | | 494,705 | | 1.44% | |
Poland | | 479,854 | | 1.39% | |
United States | | 445,766 | | 1.29% | |
Brazil | | 418,305 | | 1.21% | |
Belgium | | 353,974 | | 1.03% | |
Cayman Islands | | 209,174 | | 0.61% | |
Singapore | | 168,239 | | 0.49% | |
Total Investments | 34,084,263 | | 99.07% | |
Other Assets in Excess | | | | | |
of Liabilities | | 320,093 | | 0.93% | |
Net Assets | $ | 34,404,356 | | 100.00% | |
| | | | | | |
Please note the country classification is based on the company headquarters and is unaudited. Sector and industry classifications presented herein are based on the sector and industry categorization methodology of the Adviser to the Funds which may result in the designations for one Fund being different from another. Sector and industry classifications are unaudited. ** Non-income producing security. See Notes to Financial Statements. |
| PAGE 50 |
|
WESTCORE FLEXIBLE INCOME FUND AS OF JUNE 30, 2010
(UNAUDITED)
| | Shares | Market Value | |
COMMON STOCKS | | | 0.27% | |
Consumer Staples | | | 0.27% | |
Food & Staples Retailing | | | 0.27% | |
Winn-Dixie Stores Inc.** | 19,942 | $ | 192,241 | |
| | | | | |
Total Consumer Staples | | | | |
(Cost $0) | | | 192,241 | |
| | | | | |
Total Common Stocks | | | | |
(Cost $0) | | | 192,241 | |
| | | | | |
CONVERTIBLE PREFERRED STOCKS | | 1.62% | |
Utilities & Energy | | | 1.62% | |
Energy-Non Utility | | | 1.62% | |
AES Trust III, | | | | |
6.750%, 10/15/2029 | 26,100 | | 1,131,435 | |
| | | | | |
Total Utilities & Energy | | | | |
(Cost $1,140,080) | | | 1,131,435 | |
| | | | | |
Total Convertible Preferred Stocks | | | |
(Cost $1,140,080) | | | 1,131,435 | |
| | | | | |
NONCONVERTIBLE PREFERRED STOCKS | 4.70% | |
Financial | | | 4.70% | |
Financial Services | | | 0.64% | |
First Republic Capital Trust II, | | | | |
Series B, 8.750%(1) | 20,000 | | 446,876 | |
| | | | | |
Government Sponsored Entity | | 0.02% | |
Federal Home Loan Mortgage Corp., | | | |
8.375%**(2) | 33,380 | | 11,349 | |
| | | | | |
Real Estate Investment Trusts (REITs) | 4.04% | |
Diversified | | | 1.76% | |
Cousins Properties Inc.: | | | | |
7.500% | 17,000 | | 365,330 | |
7.750% | 25,000 | | 568,000 | |
Digital Realty Trust Inc., | | | | |
8.500% | 11,800 | | 297,950 | |
| | | | 1,231,280 | |
| | | | | |
Hotels | | | 0.89% | |
Hospitality Properties Trust, | | | | |
Series B, 8.875% | 25,000 | | 625,750 | |
| | | | | |
Office Property | | | 0.19% | |
SL Green Realty Corp., | | | | |
Series C, 7.625% | 5,600 | | 132,944 | |
| | | | | |
Warehouse-Industrial | | | 1.20% | |
CenterPoint Properties Trust, | | | | |
5.377%(3)(4) | 1,500 | | 837,000 | |
| | Principal | | |
| | Amount | Market Value | |
Total Financial | | | | | |
(Cost $5,029,328) | | | $ | 3,285,199 | |
| | | | | | |
Total Nonconvertible Preferred Stocks | | |
(Cost $5,029,328) | | | | 3,285,199 | |
| | | | | | |
CORPORATE BONDS | | | | 83.63% | |
Financial | | | | 12.91% | |
Financial Services | | | | 0.24% | |
Emigrant Capital Trust II, | | | | | |
2.941%, 4/14/2034(1)(4) | $ | 500,000 | | 170,760 | |
| | | | | | |
Insurance | | | | 2.52% | |
Zurich Reinsurance Inc., | | | | | |
7.125%, 10/15/2023 | 1,700,000 | | 1,760,359 | |
| | | | | | |
Savings & Loans | | | | 1.21% | |
Washington Mutual Bank, | | | | | |
5.550%, 6/16/2010**(2) | 2,000,000 | | 850,000 | |
| | | | | | |
Real Estate Investment Trusts (REITs) | 8.94% | |
Healthcare | | | | 3.34% | |
Omega Healthcare Investors Inc., | | | |
7.000%, 1/15/2016 | 2,350,000 | | 2,332,375 | |
| | | | | | |
Hotels | | | | 3.30% | |
Host Marriott Corp., | | | | | |
Series Q, 6.750%, | | | | | |
6/1/2016 | 2,325,000 | | 2,310,469 | |
| | | | | | |
Shopping Centers | | | | 1.24% | |
Kimco Realty Corp., | | | | | |
6.875%, 10/1/2019 | | 775,000 | | 865,543 | |
| | | | | | |
Warehouse-Industrial | | | | 1.06% | |
ProLogis, | | | | | |
7.625%, 8/15/2014 | | 700,000 | | 743,812 | |
| | | | | | |
Total Financial | | | | | |
(Cost $9,693,442) | | | | 9,033,318 | |
| | | | | | |
Industrial | | | | 51.02% | |
Aerospace & Defense | | | | 2.13% | |
L-3 Communications Corp., | | | | |
5.875%, 1/15/2015 | 1,500,000 | | 1,488,750 | |
| | | | | | |
Airlines | | | | 0.27% | |
Atlas Air Inc., | | | | | |
Pass-Through | | | | | |
Certificates, | | | | | |
Series 1999-1, | | | | | |
Class A-1, 7.200%, | | | | | |
1/2/2019(5) | | 58,686 | | 55,165 | |
| | Principal | | | |
| | Amount | | Market Value | |
Continental Airlines Inc.: | | | | | | |
Pass-Through | | | | | | |
Certificates, | | | | | | |
Series 2000-1, | | | | | | |
Class C, 7.033%, | | | | | | |
6/15/2011(5) | $ | 15,415 | | $ | 15,376 | |
Pass-Through | | | | | | |
Certificates, | | | | | | |
Series 1997-1, | | | | | | |
Class B, 7.461%, | | | | | | |
4/1/2013(5) | | 11,416 | | | 11,188 | |
Pass-Through | | | | | | |
Certificates, | | | | | | |
Series 1999-1, | | | | | | |
Class B, 6.795%, | | | | | | |
8/2/2018(5) | | 120,151 | | | 110,539 | |
| | | | | | 192,268 | |
| | | | | | | |
Autos | | | | | 2.73% | |
Dana Corp., Escrow Units, | | | | | | |
1/15/2015**(2)(3) | 1,300,000 | | | – | |
Delphi Corp.: | | | | | | |
6.500%, 5/1/2009**(2)(3) | 1,375,000 | | | 34,375 | |
8.250%, 10/15/2033**(2)(3) | 1,015,000 | | | – | |
Goodyear Tire & Rubber Co.: | | | | | |
8.625%, 12/1/2011 | | 167,000 | | | 174,515 | |
8.750%, 8/15/2020 | 1,144,000 | | | 1,175,460 | |
Oshkosh Corp., | | | | | | |
8.250%, 3/1/2017 | | 500,000 | | | 522,500 | |
| | | | | | 1,906,850 | |
| | | | | | | |
Building Materials | | | | | 1.38% | |
USG Corp., | | | | | | |
9.750%, 8/1/2014(1) | | 925,000 | | | 966,625 | |
| | | | | | | |
Chemicals | | | | | 0.35% | |
Union Carbide Chemical & Plastics Co. Inc., | |
7.875%, 4/1/2023 | | 250,000 | | | 247,991 | |
| | | | | | | |
Healthcare | | | | | 3.32% | |
DaVita Inc., | | | | | | |
6.625%, 3/15/2013 | | 767,000 | | | 771,794 | |
HCA Inc., | | | | | | |
7.875%, 2/15/2020 | 1,500,000 | | | 1,550,625 | |
| | | | | | 2,322,419 | |
| | | | | | | |
Leisure | | | | | 11.75% | |
Fontainebleau Las Vegas Holdings LLC, | | |
10.250%, 6/15/2015**(1)(2) | 3,000,000 | | | 26,250 | |
Harrah’s Operating Co. Inc.: | | | | | |
10.000%, 12/15/2018 | 1,028,000 | | | 848,100 | |
10.000%, 12/15/2018 | | 336,000 | | | 277,200 | |
Las Vegas Sands Corp., | | | | | | |
6.375%, 2/15/2015 | 2,900,000 | | | 2,798,500 | |
MGM Mirage Resort Inc.: | | | | | | |
8.500%, 9/15/2010 | | 500,000 | | | 501,250 | |
10.375%, 5/15/2014 | | 250,000 | | | 273,125 | |
|
|
WESTCORE FLEXIBLE INCOME FUND AS OF JUNE 30, 2010 (continued)
(UNAUDITED)
| | Principal | | | |
| | Amount | | Market Value | |
Premier Ent. Biloxi, | | | | | | |
0.000%, 2/1/2012**(2)(3) | $ | 250,000 | | $ | – | |
Royal Caribbean Cruises Ltd. (Liberia), | | | | |
6.875%, 12/1/2013 | 1,000,000 | | | 977,500 | |
Seneca Gaming Corp., | | | | | | |
7.250%, 5/1/2012 | | 100,000 | | | 98,250 | |
Starwood Hotels & Resorts Worldwide Inc., | | |
7.150%, 12/1/2019 | 1,295,000 | | | 1,317,663 | |
Station Casinos Inc., | | | | | | |
6.875%, 3/1/2016**(2) | 1,950,000 | | | 11,212 | |
Times Square Hotel Trust, | | | | | | |
8.528%, 8/1/2026(1)(3) | | 84,720 | | | 87,312 | |
Vail Resorts Inc., | | | | | | |
6.750%, 2/15/2014 | 1,000,000 | | | 1,002,500 | |
| | | | | | 8,218,862 | |
| | | | | | | |
Metals & Mining | | | | | 7.83% | |
Allegheny Ludlum Corp., | | | | | | |
6.950%, 12/15/2025 | 1,580,000 | | | 1,517,868 | |
Freeport-McMoRan Copper & Gold Inc., | | |
8.375%, 4/1/2017 | 1,725,000 | | | 1,899,965 | |
Novelis Inc. (Canada), | | | | | | |
7.250%, 2/15/2015 | | 225,000 | | | 218,250 | |
Teck Resources Ltd. (Canada), | | | | |
10.750%, 5/15/2019 | 1,500,000 | | | 1,840,718 | |
| | | | | | 5,476,801 | |
| | | | | | | |
Other Industrial | | | | | 3.23% | |
Aramark Corp., | | | | | | |
8.500%, 2/1/2015 | 2,225,000 | | | 2,258,375 | |
| | | | | | | |
Packaging & Containers | | | | | 3.64% | |
Ball Corp., | | | | | | |
6.625%, 3/15/2018 | 1,500,000 | | | 1,507,500 | |
Crown Americas LLC / Crown | | | | | |
Americas Capital Corp. II, | | | | | |
7.625%, 5/15/2017(1) | 1,000,000 | | | 1,040,000 | |
| | | | | | 2,547,500 | |
| | | | | | | |
Paper & Forestry | | | | | 2.58% | |
Potlatch Corp., | | | | | | |
7.500%, 11/1/2019 | 1,000,000 | | | 1,012,500 | |
West Fraser Timber Co. Ltd. (Canada), | | | | |
5.200%, 10/15/2014(1) | | 850,000 | | | 792,625 | |
| | | | | | 1,805,125 | |
| | | | | | | |
Pharmaceuticals | | | | | 0.73% | |
Eszopiclone Royalty SUB LLC, | | | | | |
Series IV, 12.000%, | | | | | | |
3/15/2014(1)(3) | | 663,396 | | | 510,814 | |
| | | | | | | |
Retail | | | | | 4.70% | |
Amerigas Partners LP, | | | | | | |
7.250%, 5/20/2015 | 1,510,000 | | | 1,517,550 | |
Ltd. Brands Inc., | | | | | | |
7.000%, 5/1/2020 | | 750,000 | | | 759,375 | |
| | Principal | | | |
| | Amount | | Market Value | |
Macy’s Retail Holdings Inc., | | | | | |
5.900%, 12/1/2016 | $ | 1,000,000 | | $ | 1,007,500 | |
Winn-Dixie Stores Inc., | | | | | | |
Escrow Units**(2)(3) | 2,150,000 | | | – | |
| | | | | | 3,284,425 | |
| | | | | | | |
Telecom & Related | | | | | 2.60% | |
Tuckahoe Credit Lease Trust, | | | | | |
9.310%, 10/20/2025(1)(3) | 1,970,247 | | | 1,816,686 | |
| | | | | | | |
Transportation | | | | | 3.78% | |
Federal Express Corp. | | | | | | |
1997 Pass Through Trust, | | | | | |
Series 97-C, 7.650%, | | | | | | |
1/15/2014 | 1,110,534 | | | 1,110,534 | |
Kansas City Southern Railway, | | | | |
13.000%, 12/15/2013 | 1,273,000 | | | 1,533,965 | |
| | | | | | 2,644,499 | |
| | | | | | | |
Total Industrial | | | | | | |
(Cost $41,836,996) | | | | | 35,687,990 | |
| | | | | | | |
Utilities & Energy | | | | | 19.70% | |
Energy-Non Utility | | | | | 18.62% | |
Forest Oil Corp., | | | | | | |
7.250%, 6/15/2019 | 2,950,000 | | | 2,861,500 | |
Kerr-McGee Corp., | | | | | | |
6.950%, 7/1/2024 | 1,050,000 | | | 956,945 | |
Pride International Inc., | | | | | | |
7.375%, 7/15/2014 | 1,075,000 | | | 1,076,344 | |
Range Resources Corp., | | | | | | |
7.500%, 10/1/2017 | 1,575,000 | | | 1,596,656 | |
Southwestern Energy Co., | | | | | | |
7.500%, 2/1/2018 | 1,510,000 | | | 1,611,925 | |
Tennessee Gas Pipeline Co.: | | | | | |
7.500%, 4/1/2017 | | 400,000 | | | 458,797 | |
7.000%, 3/15/2027 | 1,850,000 | | | 1,962,473 | |
Valero Energy Corp., | | | | | | |
6.125%, 6/15/2017 | 2,350,000 | | | 2,500,642 | |
| | | | | | 13,025,282 | |
| | | | | | | |
Utilities | | | | | 1.08% | |
Calpine Corp. Escrow, | | | | | | |
8.750%, 7/15/2013(3) | | 200,000 | | | – | |
Indianapolis Power & Light Co., | | | | | | |
6.300%, 7/1/2013(1) | | 100,000 | | | 111,320 | |
WPD Holdings Inc. (United Kingdom), | | | | |
7.250%, 12/15/2017(1) | | 600,000 | | | 643,900 | |
| | | | | | 755,220 | |
| | | | | | | |
Total Utilities & Energy | | | | | | |
(Cost $13,511,836) | | | | | 13,780,502 | |
| | | | | | | |
Total Corporate Bonds | | | | | | |
(Cost $65,042,274) | | | | | 58,501,810 | |
| | Principal | | | |
| | Amount | | Market Value | |
ASSET-BACKED SECURITIES, COLLATERALIZED | |
DEBT OBLIGATIONS, COMMERCIAL MORTGAGE- | | | | |
BACKED SECURITIES, RESIDENTIAL MORTGAGE- | |
BACKED SECURITIES, & AGENCY MORTGAGE | |
BACKED SECURITIES | | | | | 7.86% | |
Asset-Backed Securities | | | | | 4.34% | |
Harley-Davidson Motorcycle Trust, | | | | |
Series 2007-1, Class C, | | | | | | |
5.540%, 4/15/2015 | $ | 1,850,000 | | $ | 1,921,118 | |
Vanderbilt Mortgage and Finance Inc.: | | | | |
Series 2002-B, Class | | | | | | |
B1, 5.850%, 4/7/2018 | | 90,983 | | | 88,778 | |
Series 1997-C, | | | | | | |
Class 2B3, | | | | | | |
1.501%, 8/7/2027(4) | | 1,282,077 | | | 1,028,558 | |
| | | | | | | |
Total Asset-Backed Securities | | | | |
(Cost $2,852,475) | | | | | 3,038,454 | |
| | | | | | | |
Collateralized Debt Obligations | | | 0.58% | |
Anthracite Ltd. (Cayman Islands), | | | | |
Series 2004-1A, Class G, | | | | | | |
3.297%, 2/24/2014(1)(3)(4)(5) | | 500,000 | | | 10,000 | |
Crest Ltd. Series 2003-1A (Cayman Islands), | |
Class PS, 5.100%, | | | | | | |
8/28/2012**(1)(3)(4)(5)(6) | | 200,000 | | | 10,000 | |
Crest Ltd. Series 2003-2A (Cayman Islands): | |
Class E1, 5.387%, | | | | | | |
12/28/2013(1)(3)(4)(5) | | 250,000 | | | 23,750 | |
Class PS, 6.000%, | | | | | | |
12/28/2013(1)(3)(5)(6) | | 413,450 | | | 24,807 | |
Crest Ltd. Series 2004-1A (Cayman Islands): | |
Class PS, 5.500%, | | | | | | |
12/28/2013(1)(3)(5)(6) | | 1,064,633 | | | 63,878 | |
Exeter Street Solar, | | | | | | |
Series , Class E1, | | | | | | |
4.287%, 10/28/2014(1)(3)(4)(5) | | 418,853 | | | 41,885 | |
Class H2, 7.334%, | | | | | | |
10/28/2014(1)(3)(5) | | 300,000 | | | 19,500 | |
Fairfield Street Solar, | | | | | | |
Series , Class F, | | | | | | |
5.403%, | | | | | | |
12/28/2014(1)(3)(4)(5) | | 1,087,500 | | | 65,250 | |
I-Preferred Term Securities I Ltd. | | | | |
(Cayman Islands), | | | | | | |
Subordinate | | | | | | |
Income Notes, 0.000%, | | | | | | |
12/4/2012**(1)(5)(6) | | 100,000 | | | 50 | |
N-Star Real Estate Ltd. (Cayman Islands), | | |
Series 2004-2A, | | | | | | |
Class C2B, 6.591%, | | | | | | |
6/28/2014(1)(3)(5) | | 500,000 | | | 126,605 | |
Preferred Term Securities VI Ltd. | | | | |
(Cayman Islands), | | | | | | |
Subordinate | | | | | | |
Income Notes, 0.000%, | | | | | | |
7/3/2012**(1)(5)(6) | | 100,000 | | | 50 | |
| PAGE 52 |
|
WESTCORE FLEXIBLE INCOME FUND AS OF JUNE 30, 2010 (continued)
(UNAUDITED)
| | Principal | | | |
| | Amount | | Market Value | |
Preferred Term Securities X Ltd. | | | | |
(Cayman Islands), | | | | | | |
Subordinate | | | | | | |
Income Notes, 0.000%, | | | | | | |
7/3/2013**(1)(5)(6) | $ | 150,000 | | $ | 15 | |
Preferred Term Securities XI Ltd. | | | | |
(Cayman Islands), | | | | | | |
Subordinate | | | | | | |
Income Notes, 0.000%, | | | | | | |
10/3/2013**(1)(5)(6) | | 150,000 | | | 45 | |
Preferred Term Securities XII Ltd. | | | | |
(Cayman Islands), | | | | | | |
Subordinate | | | | | | |
Income Notes, 0.000%, | | | | | | |
12/24/2013**(1)(5)(6) | | 750,000 | | | 225 | |
Preferred Term Securities XIV Ltd. | | | | |
(Cayman Islands), | | | | | | |
Subordinate | | | | | | |
Income Notes, 0.000%, | | | | | | |
6/17/2014**(1)(5)(6) | | 500,000 | | | 100 | |
Regional Diversified Funding | | | | | |
(Cayman Islands), | | | | | | |
Series 2004-1, 0.000%, | | | | | | |
2/15/2014**(1)(2)(3)(5)(6) | | 500,000 | | | 50 | |
Regional Diversified Funding | | | | | |
(Cayman Islands), | | | | | | |
Series 2005-1, 0.000%, | | | | | | |
3/15/2015**(1)(3)(5)(6) | | 750,000 | | | 75 | |
River North Ltd. | | | | | | |
(Cayman Islands), | | | | | | |
Series 2005-1A, Class | | | | | | |
SUB, 0.000%, | | | | | | |
2/6/2014**(1)(3)(5)(6) | | 600,000 | | | 60 | |
Soloso Bank Pref 2005 | | | | | | |
(Cayman Islands), | | | | | | |
0.000%, | | | | | | |
10/15/2015**(1)(3)(5)(6) | | 750,000 | | | 75 | |
TIAA Real Estate | | | | | | |
(Cayman Islands), | | | | | | |
Series 2003-1A, | | | | | | |
Class PS, 9.000%, | | | | | | |
9/30/2013(1)(3)(5)(6) | | 250,000 | | | 16,750 | |
Tricadia (Cayman Islands), | | | | | | |
Series 2003-1A, | | | | | | |
Class PS, 0.000%, | | | | | | |
12/15/2013**(1)(3)(5)(6) | | 250,000 | | | 25 | |
| | | | | | | |
Total Collateralized Debt Obligations | | | | |
(Cost $8,812,053) | | | | | 403,195 | |
| | | | | | | |
Commercial Mortgage-Backed Securities | 2.94% | |
Crown Castle Towers LLC, | | | | | | |
6.113%, 1/15/2020(1) | | 925,000 | | | 1,018,073 | |
GTP Towers Issuer LLC, | | | | | | |
8.112%, 2/15/2015(1) | 1,000,000 | | | 1,041,073 | |
| | | | | | | |
Total Commercial Mortgage-Backed Securities | |
(Cost $1,925,000) | | | | | 2,059,146 | |
| | | Shares | | Market Value | |
Total Asset-Backed Securities, Collateralized
Debt Obligations, Commercial Mortgage-Backed
Securities, Residential Mortgage-Backed
Securities, & Agency Mortgage Backed Securities |
(Cost $13,589,528) | | $ | | 5,500,795 | |
| | | | | | |
MONEY MARKET | | | | | |
MUTUAL FUNDS | | | | 0.49% | |
Fidelity Institutional | | | | | |
Money Market | | | | | |
Government | | | | | |
Portfolio - Class I | | | | | |
(7 Day Yield 0.044%) | | 344,380 | | 344,380 | |
| | | | | | |
Total Money Market Mutual Funds | | | |
(Cost $344,380) | | | | 344,380 | |
| | | | | | |
| | | | | | |
Total Investments | | | | | |
(Cost $85,145,590) | | 98.57% | | 68,955,860 | |
| | | | | | |
Other Assets in Excess | | | | | |
of Liabilities | | 1.43% | | 1,001,974 | |
| | | | | | |
Net Assets | 100.00% | $ | 69,957,834 | |
| | | | | | |
Westcore Flexible Income Fund | | | |
Country Breakdown as of June 30, 2010 | | | |
(Unaudited) | | | | | |
Country | Market Value | | % | |
United States | $ | 64,079,672 | | 91.60% | |
Canada | | 2,851,593 | | 4.07% | |
Liberia | | 977,500 | | 1.40% | |
United Kingdom | | 643,900 | | 0.92% | |
Cayman Islands | | 403,195 | | 0.58% | |
Total Investments | | 68,955,860 | | 98.57% | |
Other Assets in Excess | | | | | |
of Liabilities | | 1,001,974 | | 1.43% | |
Net Assets | $ | 69,957,834 | | 100.00% | |
| | | | | | |
Please note the country classification is based on the domicile of the issuer and is unaudited. Sector and industry classifications presented herein are based on the sector and industry categorization methodology of the Adviser to the Funds which may result in the designations for one Fund being different from another. Sector and industry classifications are unaudited. ** Non-income producing security. See Notes to Financial Statements. |
|
|
WESTCORE FLEXIBLE INCOME FUND AS OF JUNE 30, 2010 (continued)
(UNAUDITED)
(1) This security is restricted. The following table provides additional information regarding each security. Included in this list are certain securities exempt from registration under Rule 144A of the Securities Act of 1933, which may be resold in transactions, normally to qualified institutional buyers. Please note that the Adviser, under supervision of the Board of Trustees, has determined that certain 144A securities listed below have a liquid trading market. Such securities represent 8.07% of the Fund’s net assets as of June 30, 2010.
| | | | | | | | | | | | Market Value | |
| | | | | | | | | | | | as Percentage | |
Issuer Description | Coupon | | Maturity Date | | Acquisition Date | | Cost | | Market Value | | of Net Assets | |
Anthracite Ltd., Series 2004-1A, Class G | 3.297% | | 2/24/14 | | 3/16/04 | | $ | 500,000 | | $ | 10,000 | | 0.01% | |
Crest Ltd., Series 2003-1A, Class PS | 5.100% | | 8/28/12 | | 4/22/03 | | | 158,232 | | | 10,000 | | 0.01% | |
Crest Ltd., Series 2003-2A: | | | | | | | | | | | | | | |
Class E1 | 5.387% | | 12/28/13 | | 11/25/03 | | | 250,000 | | | 23,750 | | 0.03% | |
Class PS | 6.000% | | 12/28/13 | | 11/25/03 | | | 301,072 | | | 24,807 | | 0.04% | |
Crest Ltd. Series 2004-1A: | | | | | | | | | | | | | | |
Class H2 | 7.334% | | 10/28/14 | | 10/22/04 | | | 286,067 | | | 19,500 | | 0.03% | |
Class PS | 5.500% | | 12/28/13 | | 10/22/04 | | | 503,386 | | | 63,878 | | 0.09% | |
Exeter Street Solar, Class E1 | 4.287% | | 10/28/14 | | 4/08/04 | | | 418,853 | | | 41,885 | | 0.06% | |
Fairfield Street Solar, Class F | 5.403% | | 12/28/14 | | 11/24/04 | | | 1,087,500 | | | 65,250 | | 0.09% | |
Crown Americas LLC / Crown Americas Capital Corp. II | 7.625% | | 5/15/17 | | 1/28/10 | | | 1,031,050 | | | 1,040,000 | | 1.49% | |
Crown Castle Towers LLC | 6.113% | | 1/15/20 | | 1/8/10 | | | 925,000 | | | 1,018,073 | | 1.46% | |
Emigrant Capital Trust II | 2.941% | | 4/14/34 | | 8/11/04 | | | 497,615 | | | 170,760 | | 0.24% | |
Eszoplicone Royalty Sub LLC, Series IV | 12.000% | | 3/15/14 | | 7/29/05 | | | 663,396 | | | 510,814 | | 0.73% | |
First Republic Capital Trust II, Series B | 8.750% | | – | | 1/30/04 | | | 530,000 | | | 446,876 | | 0.64% | |
Fontainebleau Las Vegas Holdings LLC | 10.250% | | 6/15/15 | | 9/13/07 | | | 2,716,866 | | | 26,250 | | 0.04% | |
GTP Towers Issuer LLC | 8.112% | | 2/15/15 | | 2/11/10 | | | 1,000,000 | | | 1,041,073 | | 1.49% | |
Indianapolis Power & Light Co. | 6.300% | | 7/1/13 | | 7/30/03 | | | 99,964 | | | 111,320 | | 0.16% | |
I -Preferred Term Securities I Ltd. | – | | 12/4/12 | | 11/21/02 | | | 100,000 | | | 50 | | 0.00% | |
N-Star Real Estate Ltd., Series 2004-2A, Class C2B | 6.591% | | 6/28/14 | | 6/16/04 | | | 468,852 | | | 126,605 | | 0.18% | |
Preferred Term Securities VI Ltd. | – | | 7/3/12 | | 6/13/02 | | | 100,000 | | | 50 | | 0.00% | |
Preferred Term Securities X Ltd. | – | | 7/3/13 | | 6/16/03 | | | 150,000 | | | 15 | | 0.00% | |
Preferred Term Securities XI Ltd. | – | | 10/3/13 | | 9/9/03 | | | 150,000 | | | 45 | | 0.00% | |
Preferred Term Securities XII Ltd. | – | | 12/24/13 | | 12/9/03 - 1/7/05 | | | 762,678 | | | 225 | | 0.00% | |
Preferred Term Securities XIV Ltd. | – | | 6/17/14 | | 6/9/04 | | | 500,000 | | | 100 | | 0.00% | |
Regional Diversified Funding, Series 2004-1 | – | | 2/15/14 | | 2/13/04 | | | 487,064 | | | 50 | | 0.00% | |
Regional Diversified Funding, Series 2005-1 | – | | 3/15/15 | | 3/21/05 | | | 750,000 | | | 75 | | 0.00% | |
River North Ltd., Series 2005-1A, Class SUB | – | | 2/6/14 | | 12/22/04 | | | 600,000 | | | 60 | | 0.00% | |
Soloso Bank Pref 2005 | – | | 10/15/15 | | 8/3/05 | | | 744,806 | | | 75 | | 0.00% | |
TIAA Real Estate Ltd., Series 2003-1A, Class PS | 9.000% | | 9/30/13 | | 10/16/03 | | | 250,000 | | | 16,750 | | 0.02% | |
Times Square Hotel Trust | 8.528% | | 8/1/26 | | 8/3/01 | | | 84,720 | | | 87,312 | | 0.13% | |
Tricadia, Series 2003-1A, Class PS | – | | 12/15/13 | | 12/10/03 | | | 243,541 | | | 25 | | 0.00% | |
Tuckahoe Credit Lease Trust | 9.310% | | 10/20/25 | | 12/11/09 | | | 1,736,851 | | | 1,816,686 | | 2.60% | |
USG Corp. | 9.750% | | 8/1/14 | | 7/30/09 | | | 909,892 | | | 966,625 | | 1.38% | |
West Fraser Timber Co. Ltd. | 5.200% | | 10/15/14 | | 7/20/09 - 8/3/09 | | | 688,339 | | | 792,625 | | 1.13% | |
WPD Holdings Inc. | 7.250% | | 12/15/17 | | 10/15/03 - 6/21/04 | | | 576,559 | | | 643,900 | | 0.92% | |
| | | | | | | | $ | 20,272,303 | | $ | 9,075,509 | | 12.97% | |
(2) Income is not being accrued on this security due to the issuer’s default or expected default on interest payments.
(3) This security has been valued in good faith by or under the direction of the Board of Trustees. As of June 30, 2010 these securities represented 5.27% of the Fund’s net assets.
(4) The coupon rate shown on floating or adjustable rate securities represents the rate at period end.
(5) The expected maturity date listed herein differs from the legal maturity date due to call or put features or due to the expected schedule of principal payments. (6) his security represents a junior tranche whereby the holder is entitled T to all residual interest, if any, which can vary. The rate listed is the investment adviser’s estimated rate of residual interest as of the reporting date.
| PAGE 54 |
|
WESTCORE PLUS BOND FUND AS OF JUNE 30, 2010
(UNAUDITED)
| | Shares/Principal | | | |
| | Amount | | Market Value | |
NONCONVERTIBLE PREFERRED STOCKS | 0.27% | |
Financial | | | | | 0.21% | |
Financial Services | | | | | 0.06% | |
First Tennessee Bank, | | | | | | |
3.750%(1)(2) | | 1,500 | | $ | 907,500 | |
| | | | | | | |
Government Sponsored Entity | | | 0.00%* | |
Federal Home Loan Mortgage Corp., | | | | |
8.375%**(3) | | 166,620 | | | 56,651 | |
| | | | | | | |
Real Estate Investment Trusts | | | | |
(REITs) | | | | | 0.15% | |
Apartments | | | | | 0.01% | |
Cousins Properties Inc., | | | | | | |
7.500% | | 10,300 | | | 221,347 | |
| | | | | | | |
Warehouse-Industrial | | | | | 0.14% | |
CenterPoint Properties Trust, | | | | |
5.377%(1)(4) | | 3,900 | | 2,176,200 | |
| | | | | | | |
Total Financial | | | | | | |
(Cost $9,816,702) | | | | 3,361,698 | |
| | | | | | | |
Utilities & Energy | | | | | 0.06% | |
Utilities | | | | | 0.06% | |
Southern California Edison, | | | | | |
5.349% | | 9,400 | | | 942,644 | |
| | | | | | | |
Total Utilities & Energy | | | | | | |
(Cost $940,000) | | | | | 942,644 | |
| | | | | | | |
Total Nonconvertible Preferred Stocks | | |
| (Cost $10,756,702) | | | | | 4,304,342 | |
| | | | | | | |
CORPORATE BONDS | | | | | 48.09% | |
Financial | | | | | 10.34% | |
Financial Services | | | | | 4.09% | |
BB&T Corp.: | | | | | | |
3.375%, 9/25/2013 | $ | 8,625,000 | | 8,903,579 | |
6.850%, 4/30/2019 | | 4,150,000 | | 4,875,573 | |
Emigrant Capital Trust II, | | | | | | |
2.941%, 4/14/2034(1)(2) | | 850,000 | | | 290,292 | |
FIA Card Services NA, | | | | | | |
6.625%, 6/15/2012 | | 10,452,000 | | 11,143,369 | |
First Empire Capital Trust, | | | | | |
8.277%, 6/1/2027 | | 25,000 | | | 23,272 | |
FMR Corp., | | | | | | |
7.490%, 6/15/2019(2) | | 5,000,000 | | 5,975,720 | |
Manufacturers & Traders Trust Co., | | | | |
1.791%, 4/1/2013(1) | | 526,000 | | | 511,792 | |
PNC Funding Corp., | | | | | | |
4.250%, 9/15/2015 | | 14,595,000 | | 15,284,132 | |
Union Bank of California, | | | | | | |
5.950%, 5/11/2016 | | 3,000,000 | | 3,222,813 | |
| | Principal | | | |
| | Amount | | Market Value | |
Wachovia Corp., | | | | | |
5.750%, 2/1/2018 | $ | 14,000,000 | $ | 15,370,908 | |
| | | | | 65,601,450 | |
| | | | | | |
Insurance | | | | 0.71% | |
Berkshire Hathaway, | | | | | |
4.850%, 1/15/2015 | | 5,000,000 | | 5,499,250 | |
Fund American Companies Inc., | | | |
5.875%, 5/15/2013 | | 4,375,000 | | 4,587,971 | |
Prudential Financial, | | | | | |
Series MTNB, | | | | | |
4.350%, | | | | | |
5/12/2015 | | 1,091,476 | | 1,105,923 | |
Zurich Reinsurance, | | | | | |
7.125%, 10/15/2023 | | 200,000 | | 207,101 | |
| | | | | 11,400,245 | |
| | | | | | |
Savings & Loans | | | | 0.32% | |
Washington Mutual Bank: | | | | |
2.969%, | | | | | |
6/16/2010**(3) | | 5,000,000 | | 2,125,000 | |
5.550%, | | | | | |
6/16/2010**(3) | | 7,100,000 | | 3,017,500 | |
| | | | | 5,142,500 | |
| | | | | | |
Real Estate Investment Trusts | | | |
(REITs) | | | | 5.22% | |
Diversified | | | | 0.60% | |
National Retail Properties Inc., | | | |
6.250%, 6/15/2014 | | 975,000 | | 1,036,465 | |
Prime Property Funding, | | | | |
5.600%, 6/15/2011(2) | | 2,410,000 | | 2,446,116 | |
Vornado Realty LP, | | | | | |
4.750%, 12/1/2010 | | 2,101,000 | | 2,121,455 | |
Washington REIT, | | | | | |
5.250%, 1/15/2014 | | 3,850,000 | | 4,074,956 | |
| | | | | 9,678,992 | |
Healthcare | | | | 0.38% | |
Healthcare Realty Trust Inc.: | | | |
8.125%, 5/1/2011 | | 375,000 | | 391,958 | |
5.125%, 4/1/2014 | | 3,125,000 | | 3,251,207 | |
Nationwide Health, | | | | | |
6.000%, 5/20/2015 | | 2,000,000 | | 2,165,818 | |
Senior Housing Properties Trust, | | | |
8.625%, 1/15/2012 | | 325,000 | | 338,000 | |
| | | | | 6,146,983 | |
| | | | | | |
Hotels | | | | 0.19% | |
Host Marriott Corp., | | | | | |
Series Q, 6.750%, | | | | | |
6/1/2016 | | 3,075,000 | | 3,055,781 | |
| | | | | | |
Office Property | | | | 0.03% | |
Boston Properties LP, | | | | | |
5.000%, 6/1/2015 | | 375,000 | | 389,450 | |
| | Principal | | | |
| | Amount | | Market Value | |
Regional Malls | | | | 1.79% | |
Simon Property Group: | | | | | |
5.250%, 12/1/2016 | $ | 8,950,000 | $ | 9,549,068 | |
7.375%, 6/15/2018 | | 2,868,000 | | 3,298,960 | |
WEA Finance LLC / WT Finance | | | |
Property Ltd. (Australia), | | | | |
7.500%, 6/2/2014(2) | | 8,420,000 | | 9,553,534 | |
Westfield Capital (Australia), | | | |
5.700%, 10/1/2016(2) | | 6,000,000 | | 6,400,698 | |
| | | | | 28,802,260 | |
| | | | | | |
Shopping Centers | | | | 1.19% | |
Kimco Realty Corp.: | | | | | |
Series MTNC, | | | | | |
5.980%, 7/30/2012 | | 1,800,000 | | 1,893,382 | |
5.783%, 3/15/2016 | | 2,000,000 | | 2,144,400 | |
6.875%, 10/1/2019 | 11,160,000 | | 12,463,823 | |
Weingarten Realty Investors: | | | |
4.857%, 1/15/2014 | | 2,015,000 | | 2,060,970 | |
6.640%, 7/15/2026 | | 545,000 | | 517,796 | |
| | | | | 19,080,371 | |
| | | | | | |
Timber | | | | 0.16% | |
Plum Creek Timberland, | | | | | |
5.875%, 11/15/2015 | | 2,400,000 | | 2,635,200 | |
| | | | | | |
Warehouse-Industrial | | | | 0.88% | |
Prologis Trust: | | | | | |
7.625%, 8/15/2014 | 11,405,000 | | 12,118,827 | |
7.810%, 2/1/2015 | | 800,000 | | 849,646 | |
7.625%, 7/1/2017 | | 1,100,000 | | 1,150,580 | |
| | | | | 14,119,053 | |
| | | | | | |
Total Financial | | | | | |
(Cost $164,842,246) | | | | 166,052,285 | |
| | | | | | |
Industrial | | | | 25.88% | |
Aerospace & Defense | | | | 0.69% | |
L-3 Communications Corp.: | | | |
6.125%, 7/15/2013 | | 2,750,000 | | 2,784,375 | |
5.875%, 1/15/2015 | | 4,715,000 | | 4,679,637 | |
Series WI-B, | | | | | |
10/15/2019 | | 3,400,000 | | 3,556,295 | |
| | | | | 11,020,307 | |
| | | | | | |
Airlines | | | | 0.11% | |
Southwest Airlines Co. 2007-1 | | | |
Pass Through Trust, | | | | | |
Series 2007-1, | | | | | |
6.150%, 8/1/2022 | | 1,764,210 | | 1,817,136 | |
| | | | | | |
Autos | | | | 1.06% | |
American Honda Finance Corp., | | | |
5.125%, | | | | | |
12/15/2010(2) | | 3,600,000 | | 3,664,739 | |
|
|
WESTCORE PLUS BOND FUND AS OF JUNE 30, 2010 (continued)
(UNAUDITED)
| | Principal | | | |
| | Amount | | Market Value | |
BMW US Capital Inc., | | | | | | |
5.730%, 11/1/2015(2)(4) | $ | 12,000,000 | | $ | 13,253,400 | |
Dana Corp., Escrow Units, | | | | | |
1/15/2015**(3)(4) | | 1,600,000 | | | – | |
Delphi Corp., | | | | | | |
6.500%, 5/1/2009**(3)(4) | | 1,000,000 | | | 25,000 | |
| | | | | | 16,943,139 | |
| | | | | | | |
Cable & Media | | | | | 1.73% | |
AT&T Broadband Corp., | | | | | | |
8.375%, 3/15/2013 | | 1,085,000 | | | 1,257,507 | |
CBS Corp.: | | | | | | |
8.200%, 5/15/2014 | | 10,235,000 | | | 12,079,480 | |
8.875%, 5/15/2019 | | 2,800,000 | | | 3,530,702 | |
Cox Communications Inc., | | | | | |
7.250%, 11/15/2015 | | 3,000,000 | | | 3,531,795 | |
Cox Enterprises Inc., | | | | | | |
7.875%, 9/15/2010(2) | | 3,000,000 | | | 3,037,245 | |
Time Warner Inc., | | | | | | |
9.150%, 2/1/2023 | | 2,410,000 | | | 3,254,734 | |
The Walt Disney Co., | | | | | | |
4.700%, 12/1/2012 | | 1,000,000 | | | 1,085,423 | |
| | | | | | 27,776,886 | |
| | | | | | | |
Chemicals | | | | | 1.01% | |
Dow Chemical Co., | | | | | | |
6.125%, 2/1/2011 | | 350,000 | | | 356,797 | |
Potash Corp. of Saskatchewan Inc. (Canada): | |
6.500%, 5/15/2019 | | 7,625,000 | | | 8,981,693 | |
4.875%, 3/30/2020 | | 5,700,000 | | | 6,081,923 | |
PPG Industries Inc., | | | | | | |
6.875%, 2/15/2012 | | 688,000 | | | 741,819 | |
| | | | | | 16,162,232 | |
| | | | | | | |
Food & Beverages | | | | | 4.82% | |
Anheuser-Busch Companies Inc.: | | | | |
4.950%, 1/15/2014 | | 175,000 | | | 189,086 | |
5.050%, 10/15/2016 | | 8,030,000 | | | 8,648,759 | |
5.500%, 1/15/2018 | | 4,900,000 | | | 5,353,069 | |
Anheuser-Busch InBev Worldwide Inc., | | |
4.125%, 1/15/2015 | | 7,150,000 | | | 7,495,610 | |
Bottling Group LLC, | | | | | | |
6.950%, 3/15/2014 | | 10,000,000 | | | 11,813,330 | |
The Coca-Cola Co., | | | | | | |
5.350%, 11/15/2017 | | 13,000,000 | | | 14,898,910 | |
Diageo Finance BV (Netherlands), | | | | |
5.300%, 10/28/2015 | | 9,700,000 | | | 10,873,496 | |
Kraft Foods Inc.: | | | | | | |
4.125%, 2/9/2016 | | 3,265,000 | | | 3,452,153 | |
5.375%, 2/10/2020 | | 11,125,000 | | | 11,952,489 | |
PepsiCo Inc., | | | | | | |
5.000%, 6/1/2018 | | 2,440,000 | | | 2,709,298 | |
| | | | | | 77,386,200 | |
| | Principal | | | |
| | Amount | | Market Value | |
Healthcare | | | | 1.22% | |
Baxter FinCo BV (Netherlands), | | | |
4.750%, 10/15/2010 | $ | 1,175,000 | $ | 1,188,921 | |
HCA Inc., | | | | | |
7.875%, 2/15/2020 | | 6,950,000 | | 7,184,563 | |
Medco Health Solutions Inc., | | | |
6.125%, 3/15/2013 | 10,075,000 | | 11,161,075 | |
| | | | | 19,534,559 | |
| | | | | | |
Leisure | | | | 0.92% | |
Fontainebleau Las Vegas Holdings LLC, | | | |
10.250%, | | | | | |
6/15/2015**(2)(3) | | 8,220,000 | | 71,925 | |
Harrah’s Operating Co. Inc.: | | | |
10.000%, | | | | | |
12/15/2018 | | 2,846,000 | | 2,347,950 | |
10.000%, | | | | | |
12/15/2018 | | 933,000 | | 769,725 | |
MGM Mirage, | | | | | |
7.625%, 7/15/2013 | | 1,500,000 | | 1,320,000 | |
Starwood Hotels & Resorts Worldwide Inc.: | |
6.250%, 2/15/2013 | | 5,250,000 | | 5,473,125 | |
6.750%, 5/15/2018 | | 4,395,000 | | 4,416,975 | |
Station Casinos Inc., | | | | | |
6.875%, 3/1/2016**(3) | | 2,900,000 | | 16,675 | |
Times Square Hotel Trust, | | | | |
8.528%, 8/1/2026(2)(4) | | 360,059 | | 371,077 | |
| | | | | 14,787,452 | |
| | | | | | |
Metals & Mining | | | | 2.08% | |
BHP Billiton Finance USA Ltd. (Australia), | |
5.500%, 4/1/2014 | 10,600,000 | | 11,831,890 | |
Freeport-McMoRan Copper & Gold Inc., | | | |
8.375%, 4/1/2017 | | 6,700,000 | | 7,379,574 | |
Sweetwater Investors LLC, | | | | |
5.875%, 5/15/2014(2) | | 341,005 | | 321,268 | |
Teck Resources Ltd. (Canada), | | | |
10.750%, 5/15/2019 | 11,350,000 | | 13,928,096 | |
| | | | | 33,460,828 | |
| | | | | | |
Other Industrial | | | | 1.19% | |
Aramark Corp., | | | | | |
8.500%, 2/1/2015 | | 3,575,000 | | 3,628,625 | |
BAE Systems Holdings Inc., | | | |
4.750%, 8/15/2010(2) | | 1,775,000 | | 1,781,892 | |
Kennametal Inc., | | | | | |
7.200%, 6/15/2012 | | 7,880,000 | | 8,382,169 | |
Science Applications: | | | | | |
6.250%, 7/1/2012 | | 2,700,000 | | 2,953,614 | |
5.500%, 7/1/2033 | | 1,225,000 | | 1,155,671 | |
WM Wrigley Jr. Co., | | | | | |
4.650%, 7/15/2015 | | 1,125,000 | | 1,147,500 | |
| | | | | 19,049,471 | |
| | Principal | | | |
| | Amount | | Market Value | |
Packaging & Containers | | | | 1.10% | |
Ball Corp., | | | | | |
6.625%, 3/15/2018 | $ | 10,358,000 | $ | 10,409,790 | |
Crown Americas LLC / Crown | | | |
Americas Capital Corp., | | | | |
7.750%, 11/15/2015 | | 6,975,000 | | 7,271,438 | |
| | | | | 17,681,228 | |
| | | | | | |
Paper & Forestry | | | | 1.43% | |
Potlatch Corp., | | | | | |
7.500%, 11/1/2019 | | 14,621,000 | | 14,803,762 | |
West Fraser Timber Co. Ltd. (Canada), | | | |
5.200%, | | | | | |
10/15/2014(2) | | 8,825,000 | | 8,229,313 | |
| | | | | 23,033,075 | |
| | | | | | |
Pharmaceuticals | | | | 2.14% | |
Abbott Laboratories, | | | | | |
5.150%, 11/30/2012 | | 10,125,000 | | 11,144,152 | |
Eli Lilly & Co., | | | | | |
5.500%, 3/15/2027 | | 10,000,000 | | 10,928,640 | |
Eszopiclone Royalty SUB LLC, | | | |
Series IV, 12.000%, | | | | | |
3/15/2014(2)(4) | | 663,396 | | 510,814 | |
GlaxoSmithKline Capital Inc., | | | |
4.850%, 5/15/2013 | | 10,775,000 | | 11,791,406 | |
| | | | | 34,375,012 | |
| | | | | | |
Retail | | | | 1.86% | |
Amerigas Partners, | | | | | |
7.250%, 5/20/2015 | | 1,250,000 | | 1,256,250 | |
Costco Wholesale Corp., | | | | | |
5.500%, 3/15/2017 | | 2,800,000 | | 3,229,237 | |
Macy’s Retail Holdings Inc., | | | |
5.900%, 12/1/2016 | | 11,648,000 | | 11,735,360 | |
Tesco PLC (United Kingdom), | | | |
5.500%, | | | | | |
11/15/2017(2) | | 5,000,000 | | 5,569,770 | |
Wal-Mart Stores Inc., | | | | | |
5.800%, 2/15/2018 | | 6,900,000 | | 8,145,919 | |
| | | | | 29,936,536 | |
Technology | | | | 1.47% | |
Dell Inc., | | | | | |
3.375%, 6/15/2012 | | 1,200,000 | | 1,246,082 | |
International Business Machines Corp., | | | | | |
7.625%, 10/15/2018 | | 6,250,000 | | 8,054,088 | |
Oracle Corp., | | | | | |
3.750%, 7/8/2014 | | 13,345,000 | | 14,306,214 | |
| | | | | 23,606,384 | |
| | | | | | |
Telecom & Related | | | | 1.22% | |
American Tower Corp., | | | | | |
4.625%, 4/1/2015 | | 3,600,000 | | 3,750,419 | |
AT&T Inc., | | | | | |
6.700%, 11/15/2013 | | 9,590,000 | | 11,079,787 | |
| PAGE 56 |
|
WESTCORE PLUS BOND FUND AS OF JUNE 30, 2010 (continued)
(UNAUDITED)
| | Principal | | | |
| | Amount | | Market Value | |
Tuckahoe Credit Lease Trust, | | | |
9.310%, | | | | | |
10/20/2025(2)(4) | $ | 5,035,077 | $ | 4,642,643 | |
Verizon Global, | | | | | |
4.375%, 6/1/2013 | | 125,000 | | 134,422 | |
| | | | | 19,607,271 | |
| | | | | | |
Transportation | | | | 1.83% | |
Burlington Northern Santa Fe Corp.: | | | |
5.750%, 3/15/2018 | 11,525,000 | | 12,972,321 | |
4.575%, 1/15/2021 | | 1,241,665 | | 1,329,730 | |
CSX Transportation Inc., | | | | | |
9.750%, 6/15/2020 | | 1,250,000 | | 1,724,351 | |
Federal Express Corp. 1997 Pass Through Trust, | |
Series 1997-A, | | | | | |
7.500%, | | | | | |
1/15/2018(5) | | 643,299 | | 701,196 | |
Kansas City Southern Railway, | | | |
13.000%, | | | | | |
12/15/2013 | | 6,950,000 | | 8,374,750 | |
Union Pacific Corp., | | | | | |
5.750%, 11/15/2017 | | 3,800,000 | | 4,299,464 | |
| | | | | 29,401,812 | |
| | | | | | |
Total Industrial | | | | | |
(Cost $402,909,032) | | | | 415,579,528 | |
| | | | | | |
Utilities & Energy | | | | 11.87% | |
Energy-Non Utility | | | | 6.68% | |
BP Capital Markets PLC (United Kingdom), | |
3.625%, 5/8/2014 | 12,000,000 | | 10,279,200 | |
Burlington Resources Inc., | | | | |
6.875%, 2/15/2026 | | 1,000,000 | | 1,179,344 | |
Devon Energy Corp., | | | | | |
5.625%, 1/15/2014 | 12,430,000 | | 13,809,220 | |
Forest Oil Corp., | | | | | |
7.250%, 6/15/2019 | | 9,825,000 | | 9,530,250 | |
Kerr-McGee Corp., | | | | | |
6.950%, 7/1/2024 | | 4,500,000 | | 4,101,192 | |
Northern Border Partners LP, | | | |
7.100%, 3/15/2011 | | 1,000,000 | | 1,036,671 | |
Northern Natural Gas Co., | | | | |
5.375%, | | | | | |
10/31/2012(2) | | 350,000 | | 378,107 | |
Pride International Inc., | | | | | |
7.375%, 7/15/2014 | 10,430,000 | | 10,443,038 | |
Southwestern Energy Co., | | | | |
7.500%, 2/1/2018 | | 10,520,000 | | 11,230,100 | |
Tennessee Gas Pipeline Co.: | | | |
7.000%, 3/15/2027 | | 75,000 | | 79,560 | |
7.000%, 10/15/2028 | | 9,775,000 | | 10,396,963 | |
Transcontinental Gas Pipe Line, | | | |
6.400%, 4/15/2016 | | 5,725,000 | | 6,518,548 | |
Valero Energy Corp., | | | | | |
6.125%, 6/15/2017 | | 3,175,000 | | 3,378,527 | |
| | Principal | | | |
| | Amount | | Market Value | |
Weatherford International Ltd. (Switzerland), | |
5.150%, 3/15/2013 | $ | 8,485,000 | $ | 8,896,760 | |
XTO Energy Inc.: | | | | | |
4.625%, 6/15/2013 | 10,400,000 | | 11,223,576 | |
6.750%, 8/1/2037 | | 3,750,000 | | 4,854,788 | |
| | | | | 107,335,844 | |
| | | | | | |
Utilities | | | | 5.19% | |
Centerpoint Energy Inc., | | | | | |
Series B, 7.250%, | | | | | |
9/1/2010 | | 2,350,000 | | 2,368,960 | |
Commonwealth Edison Co., | | | | |
Series 104, 5.950%, | | | | | |
8/15/2016 | | 7,375,000 | | 8,443,505 | |
Consumers Energy Co.: | | | | | |
Series B, 6.875%, | | | | | |
3/1/2018 | | 1,564,000 | | 1,811,440 | |
5.650%, 4/15/2020 | | 1,440,000 | | 1,604,052 | |
Duke Energy Carolinas LLC: | | | |
5.300%, 10/1/2015 | 10,150,000 | | 11,504,325 | |
Series C, 7.000%, | | | | | |
11/15/2018 | | 4,285,000 | | 5,340,571 | |
FPL Group Capital Inc.: | | | | | |
5.625%, 9/1/2011 | | 3,175,000 | | 3,320,764 | |
6.350%, 10/1/2066(1) | | 3,900,000 | | 3,514,368 | |
Georgia Power Co., | | | | | |
Series 07-A, | | | | | |
5.650%, | | | | | |
3/1/2037 | | 850,000 | | 914,666 | |
Indianapolis Power & Light Co., | | | | | |
6.300%, 7/1/2013(2) | | 400,000 | | 445,280 | |
MidAmerican Energy Holdings Co., | | | |
5.875%, 10/1/2012 | | 200,000 | | 216,684 | |
Nevada Power Co.: | | | | | |
Series M, 5.950%, | | | | | |
3/15/2016 | | 9,287,000 | | 10,446,343 | |
Series R, 6.750%, | | | | | |
7/1/2037 | | 2,850,000 | | 3,306,476 | |
Oncor Electric Delivery Co. LLC, | | | |
7.000%, 9/1/2022 | 11,945,000 | | 14,447,107 | |
Pacific Gas & Electric, | | | | | |
4.800%, 3/1/2014 | | 700,000 | | 759,420 | |
PacifiCorp, | | | | | |
6.900%, 11/15/2011 | | 2,107,000 | | 2,268,647 | |
Public Service Co. of Oklahoma, | | | |
6.150%, 8/1/2016 | | 3,075,000 | | 3,470,417 | |
San Diego Gas & Electric Co., | | | |
6.000%, 6/1/2026 | | 3,550,000 | | 4,184,311 | |
Tenaska Alabama II Partners LP, | | | |
6.125%, 3/30/2023(2) | | 242,124 | | 255,995 | |
Tenaska Virginia Partners LP, | | | |
6.119%, 3/30/2024(2) | | 213,089 | | 219,804 | |
Westar Energy Inc., | | | | | |
5.100%, 7/15/2020 | | 3,265,000 | | 3,485,469 | |
| | | Principal | | | |
| | | Amount | | Market Value | |
| | | | | | | |
| WPD Holdings (United Kingdom), | | | | | | |
7.250%, | | | | | | |
12/15/2017(2) | $ | 875,000 | $ | 939,020 | |
| | | | | | 83,267,624 | |
| | | | | | | |
Total Utilities & Energy | | | | | | |
(Cost $181,985,423) | | | | | 190,603,468 | |
| | | | | | | |
Total Corporate Bonds | | | | | | |
(Cost $749,736,701) | | | | | 772,235,281 | |
| | | | | | | |
MUNICIPAL BONDS | | | | | 0.98% | |
Washington | | | | | 0.98% | |
Washington State Build America Bonds, | | | |
| 5.090%, 8/1/2033 | | 15,900,000 | | 15,820,341 | |
| | | | | | | |
Total Municipal Bonds | | | | | | |
(Cost $15,900,000) | | | | | 15,820,341 | |
| | | | | | | |
ASSET-BACKED SECURITIES, COLLATERALIZED | |
DEBT OBLIGATIONS, COMMERCIAL MORTGAGE- | |
BACKED SECURITIES, RESIDENTIAL MORTGAGE- | |
BACKED SECURITIES, & AGENCY MORTGAGE | |
BACKED SECURITIES | | | | | 33.41% | |
Asset-Backed | | | | | | |
Securities | | | | | 4.31% | |
CarMax Auto Owner Trust: | | | | | |
Series 2009-2, | | | | | | |
Class A3, 1.740%, | | | | | | |
4/15/2014 | 3,300,000 | | 3,330,901 | |
Series 2009-2, | | | | | | |
Class B, 4.650%, | | | | | | |
8/17/2015 | 6,000,000 | | 6,148,584 | |
CenterPoint Energy Transition Bond Co. LLC, | |
Series 2008-A, | | | | | | |
Class A1, 4.192%, | | | | | | |
2/1/2020 | 4,531,504 | | 4,894,591 | |
Detroit Edison Securitization Funding LLC, | |
Series 2001-1, | | | | | | |
Class A4, 6.190%, | | | | | | |
3/1/2011(5) | | 141,737 | | 145,148 | |
Harley-Davidson Motorcycle Trust: | | | |
Series 2007-1, | | | | | | |
Class B, 5.370%, | | | | | | |
1/15/2011(5) | 1,000,000 | | 1,037,042 | |
Series 2007-1, | | | | | | |
Class C, 5.540%, | | | | | | |
4/15/2015 | 3,500,000 | | 3,634,547 | |
Series 2009-3, | | | | | | |
Class A3, 1.740%, | | | | | | |
9/16/2013 | 10,225,000 | | 10,282,925 | |
Honda Auto Receivables Owner Trust, | | | |
Series 2010-1, | | | | | | |
Class A4, 1.980%, | | | | | | |
3/21/2013 | 5,025,000 | | 5,106,259 | |
Hyundai Auto Receivables Trust, | | | |
Series 2009-A, | | | | | | |
Class A4, 3.150%, | | | | | | |
3/15/2016 | 14,651,000 | | 15,302,984 | |
|
|
WESTCORE PLUS BOND FUND AS OF JUNE 30, 2010 (continued)
(UNAUDITED)
| | | Principal | | | |
| | | Amount | | Market Value | |
John Deere Owner Trust, | | | | | |
Series 2008-A, | | | | | |
Class A3, 4.400%, | | | | | |
4/15/2011(5) | $ | 3,176,024 | $ | 3,201,422 | |
Marriott Vacation Club Owner Trust, | | | |
Series 2006-2A, | | | | | |
Class A, 5.362%, | | | | | |
4/20/2014(2)(5) | | 251,916 | | 256,190 | |
Mercedes-Benz Auto Receivables Trust, | |
Series 2009-1, | | | | | |
Class A3, 1.670%, | | | | | |
1/15/2014 | | 4,125,000 | | 4,171,117 | |
USAA Auto Owner Trust, | | | | | |
Series 2009-2, | | | | | |
Class A4, 2.530%, | | | | | |
6/17/2013(5) | | 7,075,000 | | 7,280,090 | |
Vanderbilt Mortgage and Finance Inc.: | | | |
Series 1997-B, | | | | | |
Class 2B3, 2.001%, | | | | | |
7/7/2013(1) | | 2,906,030 | | 2,375,831 | |
Series 2002-B, | | | | | |
Class B1, 5.850%, | | | | | |
4/7/2018 | | 133,441 | | 130,209 | |
Series 1997-C, | | | | | |
Class 2B3, 1.501%, | | | | | |
8/7/2027(1) | | 2,452,614 | | 1,967,631 | |
| | | | | | |
Total Asset-Backed Securities | | | |
(Cost $67,130,449) | | | | 69,265,471 | |
| | | | | | |
Collateralized Debt Obligations | | 0.03% | |
Anthracite Ltd. (Cayman Islands), | | | |
Series 2004-1A, | | | | | |
Class G, 3.297%, | | | | | |
2/24/2014(1)(2)(4)(5) | | 500,000 | | 10,000 | |
Crest Ltd. Series 2003-1A (Cayman Islands), | |
Class PS, 5.100%, | | | | | |
8/28/2012**(2)(4)(5)(6) | | 800,000 | | 40,000 | |
Crest Ltd. Series 2003-2A (Cayman Islands), | |
Class PS, 6.000%, | | | | | |
12/28/2013(2)(4)(5)(6) | | 620,174 | | 37,210 | |
Crest Ltd. Series 2004-1A (Cayman Islands): | |
Class H2, 7.334%, | | | | | |
10/28/2014(2)(4)(5) | | 750,000 | | 48,750 | |
Fairfield Street Solar, | | | | | |
Class F, 5.403%, | | | | | |
12/28/2014(1)(2)(4)(5) | | 1,000,000 | | 60,000 | |
-Preferred I Term Securities I Ltd. | | | |
(Cayman Islands), | | | | | |
Subordinate Income | | | | | |
Notes, 0.000%, | | | | | |
12/4/2012**(2)(5)(6) | | 150,000 | | 75 | |
N-Star Real Estate Ltd. (Cayman Islands), | |
Series 2004-2A, | | | | | |
Class C2B, 6.591%, | | | | | |
6/28/2014(2)(4)(5) | | 600,000 | | 151,926 | |
| | Principal | | |
| | Amount | | Market Value |
Preferred Term Securities VI Ltd. | | |
(Cayman Islands), | | | | |
Subordinate Income | | | | |
Notes, 0.000%, | | | | |
7/3/2012**(2)(5)(6) | $ | 250,000 | $ | 125 |
Preferred Term Securities X Ltd. | | |
(Cayman Islands), | | | | |
Subordinate Income | | | | |
Notes, 0.000%, | | | | |
7/3/2013**(2)(5)(6) | | 350,000 | | 35 |
Preferred Term Securities XI B-3 Ltd. | | |
(Cayman Islands), | | | | |
Mezzanine Note, | | | | |
2.139%, | | | | |
9/24/2033(1)(2)(4) | | 500,000 | | 81,035 |
Preferred Term Securities XI Ltd. | | |
(Cayman Islands), | | | | |
Subordinate Income | | | | |
Notes, 0.000%, | | | | |
10/3/2013**(2)(5)(6) | | 350,000 | | 105 |
Preferred Term Securities XII Ltd. | | |
(Cayman Islands), | | | | |
Subordinate Income | | | | |
Notes, 0.000%, | | | | |
12/24/2013**(2)(5)(6) | | 500,000 | | 150 |
Preferred Term Securities XIII Ltd. | | |
(Cayman Islands), | | | | |
Subordinate Income | | | | |
Notes, 0.000%, | | | | |
3/24/2014**(2)(5)(6) | | 500,000 | | 150 |
Preferred Term Securities XIV Ltd. | | |
(Cayman Islands), | | | | |
Subordinate Income | | | | |
Notes, 0.000%, | | | | |
6/17/2014**(2)(5)(6) | | 500,000 | | 100 |
Regional Diversified Funding (Cayman Islands), |
Series 2004-1, | | | | |
0.000%, | | | | |
2/15/2014**(2)(3)(4)(5)(6) | | 500,000 | | 50 |
Regional Diversified Funding (Cayman Islands), |
Series 2005-1, | | | | |
0.000%, | | | | |
3/15/2015**(2)(4)(5)(6) | | 750,000 | | 75 |
River North Ltd. (Cayman Islands), | | |
Series 2005-1A, | | | | |
Class SUB, | | | | |
0.000%, | | | | |
2/6/2014**(2)(4)(5)(6) | | 800,000 | | 80 |
Soloso Bank Pref (Cayman Islands), | | |
0.000%, | | | | |
10/15/2015**(2)(4)(5)(6) | | 750,000 | | 75 |
TIAA Real Estate Ltd. (Cayman Islands), | | |
Series 2003-1A, | | | | |
Class PS, 9.000%, | | | | |
9/30/2013(2)(4)(5)(6) | | 250,000 | | 16,750 |
Tricadia (Cayman Islands), | | | |
Series 2003-1, | | | | |
Class PS, 0.000%, | | | | |
12/15/2013**(2)(4)(5)(6) | | 250,000 | | 25 |
| | Principal | | | |
| | Amount | | Market Value | |
Total Collateralized Debt Obligations | | |
(Cost $10,248,271) | | | | $ | 446,716 | |
| | | | | | | |
Commercial Mortgage-Backed Securities | 2.78% | |
Crown Castle Towers LLC: | | | | | |
5.495%, 1/15/2017(2)(5) | $ | 4,500,000 | | | 4,824,882 | |
6.113%, 1/15/2020(2)(5) | | 8,975,000 | | | 9,878,056 | |
Series 2006-1A, | | | | | | |
Class F, 6.650%, | | | | | | |
11/15/2036(2) | | 3,000,000 | | | 3,105,969 | |
Series 2006-1A, | | | | | | |
Class G, 6.795%, | | | | | | |
11/15/2036(2) | 10,363,000 | | | 10,728,596 | |
GTP Towers Issuer LLC, | | | | | | |
8.112%, | | | | | | |
2/15/2015(2)(5) | 15,000,000 | | | 15,616,095 | |
SBA Tower Trust, | | | | | | |
4.254%, 4/15/2015(2)(5) | | 550,000 | | | 577,651 | |
| | | | | | | |
Total Commercial Mortgage-Backed Securities | |
(Cost $42,698,522) | | | | | 44,731,249 | |
| | | | | | | |
Residential Mortgage-Backed Securities | 0.19% | |
Banc of America Funding Corp.: | | | | |
Series 2005-4, | | | | | | |
Class 1A4, 5.500%, | | | | | | |
8/1/2035 | | 500,000 | | | 315,583 | |
Series 2005-4, | | | | | | |
Class 2A4, 5.500%, | | | | | | |
8/1/2035 | | 1,000,000 | | | 646,976 | |
Banc of America Mortgage Securities Inc.: | | |
Series 2005-2, | | | | | | |
Class 1A12, 5.500%, | | | | | | |
3/25/2035 | | 309,627 | | | 266,528 | |
Series 2005-8, | | | | | | |
Class A14, 5.500%, | | | | | | |
9/25/2035 | | 1,000,000 | | | 739,356 | |
Bank of America Alternative Loan Trust, | | |
Series 2005-4, | | | | | | |
Class CB9, 5.500%, | | | | | | |
5/25/2035 | | 833,000 | | | 565,740 | |
Bear Stearns Co., | | | | | | |
Series 2003-7, | | | | | | |
Class 4A, 4.924%, 1 | | | | | | |
0/25/2033(1) | | 123,842 | | | 126,967 | |
Countrywide Home Loan Mortgage | | | | |
Pass Through Trust, | | | | | | |
Series 2004-2, | | | | | | |
Class 3A1, 5.480%, | | | | | | |
11/25/2014(1)(5) | | 181,391 | | | 182,731 | |
Provident Funding Mortgage Loan Trust, | | |
Series 2004-1, | | | | | | |
Class 1A1, 2.830%, | | | | | | |
4/25/2034(1) | | 103,699 | | | 102,097 | |
WAMU Mortgage Pass-Through Certificates, | | |
Series 2003-AR3, | | | | | | |
Class B1, 2.629%, | | | | | | |
4/25/2033(1) | | 44,185 | | | 23,442 | |
| PAGE 58 |
|
WESTCORE PLUS BOND FUND AS OF JUNE 30, 2010 (continued)
(UNAUDITED)
| | Principal | | | |
| | Amount | | Market Value | |
Wells Fargo Mortgage Backed Securities Trust, | |
Series 2004-E, | | | | | |
Class A1, 4.857%, | | | | | |
11/25/2039(1) | $ | 168,285 | $ | 169,985 | |
| | | | | | |
Total Residential Mortgage-Backed Securities | |
(Cost $4,251,585) | | | | 3,139,405 | |
| | | | | | |
| | | | | | |
Agency Mortgage-Backed Securities | | 26.10% | |
FHLMC: | | | | | |
Gold Pool #G00336, | | | | | |
6.000%, 10/1/2024 | | 137,529 | | 149,954 | |
Pool #781804, | | | | | |
5.054%, 7/1/2034(1) | | 1,564,249 | | 1,672,626 | |
Pool #781811, | | | | | |
5.131%, 7/1/2034(1) | | 686,098 | | 733,828 | |
Pool #781958, | | | | | |
5.077%, 9/1/2034(1) | | 1,891,823 | | 2,020,613 | |
Gold Pool #G08061, | | | | | |
5.500%, 6/1/2035 | | 1,007,629 | | 1,084,682 | |
Gold Pool #G08079, | | | | | |
5.000%, 9/1/2035 | 16,762,788 | | 17,771,875 | |
Gold Pool #G01960, | | | | | |
5.000%, 12/1/2035 | | 5,335,374 | | 5,656,552 | |
Gold Pool #A41748, | | | | | |
5.000%, 1/1/2036 | | 6,609,748 | | 7,007,641 | |
Gold Pool #A42128, | | | | | |
5.500%, 1/1/2036 | | 8,344,193 | | 8,982,265 | |
Gold Pool #G02064, | | | | | |
5.000%, 2/1/2036 | | 8,148,423 | | 8,638,942 | |
Gold Pool #G05200, | | | | | |
5.000%, 5/1/2036 | 21,486,656 | | 22,780,109 | |
Gold Pool #G02252, | | | | | |
5.500%, 7/1/2036 | 20,238,248 | | 21,754,214 | |
Gold Pool #G02386, | | | | | |
6.000%, 11/1/2036 | 14,413,050 | | 15,675,099 | |
Pool #1G1317, | | | | | |
5.965%, 11/1/2036(1) | 11,655,367 | | 12,585,139 | |
Gold Pool #G03189, | | | | | |
6.500%, 9/1/2037 | 22,453,629 | | 24,658,306 | |
FNMA: | | | | | |
Pool #995749, | | | | | |
4.000%, 5/25/2024 | 28,905,430 | | 30,115,267 | |
Pool #AC8938, | | | | | |
4.500%, 1/1/2025 | 29,575,420 | | 31,269,944 | |
Pool #932361, | | | | | |
4.000%, 1/1/2025 | 28,911,758 | | 30,121,860 | |
Pool #AD4268, | | | | | |
4.500%, 3/1/2025 | 17,762,451 | | 18,771,820 | |
Pool #779610, | | | | | |
4.952%, 6/1/2034(1) | | 285,567 | | 302,497 | |
Pool #725705, | | | | | |
5.000%, 8/1/2034 | | 2,265,738 | | 2,411,402 | |
Pool #809893, | | | | | |
5.059%, 3/1/2035(1) | | 1,117,773 | | 1,176,930 | |
Pool #809894, | | | | | |
4.852%, 3/1/2035(1) | | 1,250,894 | | 1,313,295 | |
Pool #255706, | | | | | |
5.500%, 5/1/2035 | 11,782,537 | | 12,678,010 | |
| | Principal | | | |
| | Amount | | Market Value | |
Pool #735897, | | | | | | |
5.500%, 10/1/2035 | $ | 6,571,088 | | $ | 7,070,491 | |
Pool #836496, | | | | | | |
5.000%, 10/1/2035 | | 10,200,014 | | | 10,828,376 | |
Pool #850582, | | | | | | |
5.500%, 1/1/2036 | | 3,340,849 | | | 3,594,754 | |
Pool #845471, | | | | | | |
5.000%, 5/1/2036 | | 1,173,050 | | | 1,237,432 | |
Pool #888016, | | | | | | |
5.500%, 5/1/2036 | | 13,347,443 | | | 14,361,849 | |
Pool #190377, | | | | | | |
5.000%, 11/1/2036 | | 12,882,202 | | | 13,675,797 | |
Pool #256526, | | | | | | |
6.000%, 12/1/2036 | | 16,229,301 | | | 17,510,913 | |
Pool #888405, | | | | | | |
5.000%, 12/1/2036 | | 3,038,579 | | | 3,225,767 | |
Pool #907772, | | | | | | |
6.000%, 12/1/2036 | | 6,006,862 | | | 6,481,218 | |
Pool #910881, | | | | | | |
5.000%, 2/1/2037 | | 11,159,263 | | | 11,771,739 | |
Pool #889108, | | | | | | |
6.000%, 2/1/2038 | | 13,902,621 | | | 15,106,936 | |
Pool #257161, | | | | | | |
5.500%, 4/1/2038 | | 30,961,211 | | | 33,278,657 | |
GNMA, | | | | | | |
Pool #550656, | | | | | | |
5.000%, 9/15/2035 | | 1,576,350 | | | 1,689,454 | |
| | | | | | | |
Total Agency Mortgage-Backed Securities | |
(Cost $396,735,652) | | | | | 419,166,253 | |
| | | | | | | |
Total Asset-Backed Securities, Collateralized | |
Debt Obligations, Commercial Mortgage-Backed | |
Securities, Residential Mortgage-Backed | |
Securities, & Agency Mortgage Backed Securities | |
(Cost $521,064,479) | | | | | 536,749,094 | |
| | | | | | | |
U.S. GOVERNMENT & AGENCY | | | | |
OBLIGATIONS | | | | | 4.48% | |
FDIC Guaranteed: | | | | | | |
The Goldman Sachs Group Inc., | | | | |
3.250%, 6/15/2012 | | 3,090,000 | | | 3,237,770 | |
FHLMC, | | | | | | |
4.750%, 11/17/2015 | | 60,825,000 | | | 68,610,600 | |
FNMA, | | | | | | |
8.200%, 3/10/2016 | | 55,000 | | | 71,288 | |
| | | | | | | |
Total U.S. Government & Agency Obligations | |
(Cost $66,148,291) | | | | | 71,919,658 | |
| | | | | | | |
U.S. TREASURY BONDS & NOTES | | | 10.81% | |
4.500%, 2/28/2011 | | 26,000,000 | | | 26,730,236 | |
1.375%, 4/15/2012 | | 13,000,000 | | | 13,199,576 | |
2.625%, 7/31/2014 | | 37,750,000 | | | 39,463,510 | |
3.625%, 8/15/2019 | | 27,625,000 | | | 29,241,505 | |
6.000%, 2/15/2026 | | 13,000,000 | | | 16,765,944 | |
5.500%, 8/15/2028 | | 14,000,000 | | | 17,329,382 | |
| | Shares/ Principal | | | |
| | | Amount | | Market Value | |
4.375%, 2/15/2038 | $ | 13,500,000 | $ | 14,632,731 | |
4.375%, 11/15/2039 | | 15,000,000 | | 16,237,500 | |
| | | | | | | |
Total U.S. Treasury Bonds & Notes | | | |
(Cost $166,356,620) | | | | | 173,600,384 | |
| | | | | | | |
MONEY MARKET MUTUAL FUNDS | | 1.08% | |
Fidelity Institutional | | | | | | |
Money Market | | | | | | |
Government | | | | | | |
Portfolio - Class I | | | | | | |
(7 Day Yield 0.044%) | | 17,339,021 | | 17,339,021 | |
| | | | | | | |
Total Money Market Mutual Funds | | | |
(Cost $17,339,021) | | | | | 17,339,021 | |
| | | | | | | |
Total Investments | | | | | | |
(Cost $1,547,301,814) | | | 99.12% | | 1,591,968,121 | |
Other Assets in | | | | | | |
Excess of Liabilities | | | 0.88% | | 14,118,125 | |
| | | | | | | |
Net Assets | | | 100.00% | $ | 1,606,086,246 | |
| | | | | | | |
Westcore Plus Bond Fund | | | | | |
Country Breakdown as of June 30, 2010 | | | |
(Unaudited) | | | | | | |
Country | | | Market Value | | % | |
United States | | $ | 1,488,767,091 | | 92.69% | |
Canada | | | 37,221,025 | | 2.32% | |
Australia | | | 27,786,122 | | 1.73% | |
United Kingdom | | | 16,787,990 | | 1.05% | |
Netherlands | | | 12,062,417 | | 0.75% | |
Switzerland | | | 8,896,760 | | 0.55% | |
Cayman Islands | | | 446,716 | | 0.03% | |
Total Investments | | | 1,591,968,121 | | 99.12% | |
Other Assets in | | | | | | |
Excess of Liabilities | | | 14,118,125 | | 0.88% | |
Net Assets | | $ | 1,606,086,246 | | 100.00% | |
| | | | | | | |
Please note the country classification is based on the domicile of the issuer and is unaudited. Sector and industry classifications presented herein are based on the sector and industry categorization methodology of the Adviser to the Funds which may result in the designations for one Fund being different from another. Sector and industry classifications are unaudited. * Less than 0.005%. ** Non-income producing security. See Notes to Financial Statements. |
|
|
WESTCORE PLUS BOND FUND AS OF JUNE 30, 2010 (continued)
(UNAUDITED)
(1) The coupon rate shown on floating or adjustable rate securities represents the rate at period end.
(2) This security is restricted. The following table provides additional information regarding each security. Included in this list are certain securities exempt from registration under Rule 144A of the Securities Act of 1933, which may be resold in transactions, normally to qualified institutional buyers. Please note that the Adviser, under supervision of the Board of Trustees, has determined that certain 144A securities listed below have a liquid trading market. Such securities represent 5.85% of the Fund’s net assets as of June 30, 2010.
| | | | | | | | | | | | Market Value | |
| | | | | | | | | | | | as Percentage | |
| Issuer Description | Coupon | | Maturity Date | | Acquisition Date | | Cost | | Market Value | | of Net Assets | |
| American Honda Finance Corp. | 5.125% | | 12/15/10 | | 12/12/05 | | $ | 3,599,466 | | $ | 3,664,739 | | 0.23% | |
| Anthracite Ltd., Series 2004-1A, Class G | 3.297% | | 2/24/14 | | 3/16/04 | | | 500,000 | | | 10,000 | | 0.00% | |
| BAE Systems Holdings Inc. | 4.750% | | 8/15/10 | | 7/20/05 - 12/15/05 | | | 1,774,513 | | | 1,781,892 | | 0.11% | |
| BMW US Capital Inc. | 5.730% | | 11/1/15 | | 10/16/07 | | | 12,000,000 | | | 13,253,400 | | 0.83% | |
| Cox Enterprises Inc. | 7.875% | | 9/15/10 | | 8/19/04 - 8/2/05 | | | 3,013,762 | | | 3,037,245 | | 0.19% | |
| Crest Ltd., Series 2003-1A, Class PS | 5.100% | | 8/28/12 | | 4/22/03 | | | 634,327 | | | 40,000 | | 0.00% | |
| Crest Ltd., Series 2003-2A, Class PS | 6.000% | | 12/28/13 | | 11/25/03 | | | 451,606 | | | 37,210 | | 0.00% | |
| Crest Ltd. Series 2004-1A: | | | | | | | | | | | | | | |
| Class H2 | 7.334% | | 10/28/14 | | 10/22/04 | | | 715,167 | | | 48,750 | | 0.00% | |
| Fairfield Street Solar, Class F | 5.403% | | 12/28/14 | | 11/24/04 | | | 1,000,000 | | | 60,000 | | 0.00% | |
| Crown Castle Towers LLC | 5.495% | | 1/15/17 | | 1/8/10 | | | 4,500,000 | | | 4,824,882 | | 0.30% | |
| Crown Castle Towers LLC | 6.113% | | 1/15/20 | | 1/8/10 | | | 8,975,000 | | | 9,878,056 | | 0.62% | |
| Crown Castle Towers LLC: | | | | | | | | | | | | | | |
| Series 2006-1A, Class F | 6.650% | | 11/15/36 | | 10/19/09 | | | 3,053,853 | | | 3,105,969 | | 0.19% | |
| Series 2006-1A, Class G | 6.795% | | 11/15/36 | | 10/22/09 | | | 10,619,670 | | | 10,728,596 | | 0.67% | |
| Emigrant Capital Trust II | 2.941% | | 4/14/34 | | 8/11/04 | | | 845,943 | | | 290,292 | | 0.02% | |
| Eszoplicone Royalty SUB LLC, Series IV | 12.000% | | 3/15/14 | | 7/29/05 | | | 663,396 | | | 510,814 | | 0.03% | |
| First Tennessee Bank | 3.750% | | - | | 3/16/05 | | | 1,500,000 | | | 907,500 | | 0.06% | |
| FMR Corp. | 7.490% | | 6/1519 | | 3/6/07 | | | 5,723,400 | | | 5,975,720 | | 0.37% | |
| Fontainebleau Las Vegas Holdings LLC | 10.250% | | 6/15/15 | | 9/12/07 - 11/8/07 | | | 7,481,749 | | | 71,925 | | 0.00% | |
| GTP Towers Issuer LLC | 8.112% | | 2/15/15 | | 2/11/10 | | | 15,000,000 | | | 15,616,095 | | 0.97% | |
| Indianapolis Power & Light Co. | 6.300% | | 7/1/13 | | 7/30/03 - 2/6/06 | | | 401,406 | | | 445,280 | | 0.03% | |
| I-Preferred Term Securities I Ltd. | – | | 12/4/12 | | 11/21/02 | | | 150,000 | | | 75 | | 0.00% | |
| Marriott Vacation Club Owner Trust, Series 2006-2A, Class A | 5.362% | | 4/20/14 | | 10/31/06 | | | 251,913 | | | 256,190 | | 0.02% | |
| Northern Natural Gas Co. | 5.375% | | 10/31/12 | | 10/9/02 | | | 349,847 | | | 378,107 | | 0.02% | |
| N-Star Real Estate Ltd, Series 2004-2A, Class C2B | 6.591% | | 6/28/14 | | 6/16/04 | | | 562,623 | | | 151,926 | | 0.01% | |
| Preferred Term Securities VI Ltd. | – | | 7/3/12 | | 6/13/02 | | | 250,000 | | | 125 | | 0.00% | |
| Preferred Term Securities X Ltd. | – | | 7/3/13 | | 6/16/03 | | | 350,000 | | | 35 | | 0.00% | |
| Preferred Term Securities XI B-3 Ltd. | 2.139% | | 9/24/33 | | 6/2/05 | | | 502,794 | | | 81,035 | | 0.01% | |
| Preferred Term Securities XI Ltd. | – | | 10/3/13 | | 9/9/03 | | | 350,000 | | | 105 | | 0.00% | |
| Preferred Term Securities XII Ltd. | – | | 12/24/13 | | 12/9/03 - 1/7/05 | | | 506,339 | | | 150 | | 0.00% | |
| Preferred Term Securities XIII Ltd. | – | | 3/24/14 | | 3/9/04 | | | 500,000 | | | 150 | | 0.00% | |
| Preferred Term Securities XIV Ltd. | – | | 6/17/14 | | 6/9/04 | | | 500,000 | | | 100 | | 0.00% | |
| Prime Property Funding | 5.600% | | 6/15/11 | | 11/2/05 - 12/15/05 | | | 2,415,152 | | | 2,446,116 | | 0.15% | |
| Regional Diversified Funding, Series 2004-1 | – | | 2/15/14 | | 2/13/04 | | | 487,069 | | | 50 | | 0.00% | |
| Regional Diversified Funding, Series 2005-1 | – | | 3/15/15 | | 3/21/05 | | | 750,000 | | | 75 | | 0.00% | |
| River North Ltd, Series 2005-1A, Class SUB | – | | 2/6/14 | | 12/22/04 | | | 800,000 | | | 80 | | 0.00% | |
| SBA Towers Trust | 4.254% | | 11/15/36 | | 10/30/06 - 11/1/06 | | | 550,000 | | | 577,651 | | 0.04% | |
| Soloso Bank Pref | – | | 10/15/15 | | 8/3/05 | | | 744,802 | | | 75 | | 0.00% | |
| Sweetwater Investors LLC | 5.875% | | 5/15/14 | | 5/31/05 - 12/15/05 | | | 342,121 | | | 321,268 | | 0.02% | |
| Tenaska Alabama II Partners LP | 6.125% | | 3/30/23 | | 10/9/03 - 11/9/05 | | | 244,427 | | | 255,995 | | 0.02% | |
| Tenaska Virginia Partners LP | 6.119% | | 3/30/24 | | 4/29/04 - 1/19/05 | | | 212,967 | | | 219,804 | | 0.01% | |
| Tesco PLC | 5.500% | | 11/15/17 | | 10/29/07 | | | 4,983,419 | | | 5,569,770 | | 0.35% | |
| TIAA Real Estate Ltd., Series 2003-1A, Class PS | 9.000% | | 9/30/13 | | 10/16/03 | | | 250,000 | | | 16,750 | | 0.00% | |
| Times Square Hotel Trust | 8.528% | | 8/1/26 | | 8/3/01 | | | 360,059 | | | 371,077 | | 0.02% | |
| Tricadia, Series 2003-1A, Class PS | – | | 12/15/13 | | 12/10/03 | | | 243,543 | | | 25 | | 0.00% | |
| Tuckahoe Credit Lease Trust | 9.310% | | 10/20/25 | | 12/11/09 | | | 4,438,619 | | | 4,642,643 | | 0.29% | |
| WEA Finance LLC / WT Finance Aust Property Ltd. | 7.500% | | 6/2/14 | | 5/26/09 | | | 8,350,020 | | | 9,553,534 | | 0.59% | |
| Westfield Capital | 5.700% | | 10/1/16 | | 9/21/06 | | | 5,990,585 | | | 6,400,698 | | 0.40% | |
| West Fraser Timber Co. Ltd. | 5.200% | | 10/15/14 | | 6/12/06 - 7/20/09 | | | 7,886,889 | | | 8,229,313 | | 0.51% | |
| WPD Holdings | 7.250% | | 12/15/17 | | 10/15/03 - 6/30/06 | | | 858,306 | | | 939,020 | | 0.06% | |
| | | | | | | | $ | 127,158,923 | | $ | 114,700,307 | | 7.14% | |
(3) Income is not being accrued on this security due to the issuer’s default or expected default on interest payments.
(4) This security has been valued in good faith by or under the direction of the Board of Trustees. As of June 30, 2010 these securities represented 1.33% of the Fund’s net assets.
(5) The expected maturity date listed herein differs from the legal maturity date due to call or put features or due to the expected schedule of principal payments.
(6) This security represents a junior tranche whereby the holder is entitled to all residual interest, if any, which can vary. The rate listed is the investment adviser’s estimated rate of residual interest as of the reporting date.
| PAGE 60 |
|
WESTCORE COLORADO TAX-EXEMPT FUND AS OF JUNE 30, 2010
(UNAUDITED)
| | Principal | |
| | Amount | Market Value |
CERTIFICATES OF PARTICIPATION | | 14.62% |
Adams 12 Five Star | | | | |
Schools, | | | | |
Certificate of | | | | |
Participation, | | | | |
4.500%, 12/1/2027, | | | | |
Optional 12/1/2018 | | | | |
@ 100.00 | $ | 600,000 | $ | 602,478 |
Adams County, | | | | |
Certificate of | | | | |
Participation, | | | | |
5.000%, 12/1/2025, | | | | |
Optional 12/1/2018 | | | | |
@ 100.00 | | 1,200,000 | | 1,271,688 |
Auraria Higher | | | | |
Education | | | | |
Center, Certificate | | | | |
of Participation, | | | | |
6.000%, 5/1/2024, | | | | |
Optional 5/1/2019 | | | | |
@ 100.00 | | 499,000 | | 544,704 |
City of Aurora, | | | | |
Certificate of | | | | |
Participation, | | | | |
5.000%, 12/1/2026, | | | | |
Optional 12/1/2019 | | | | |
@ 100.00 | | 1,000,000 | | 1,064,780 |
City of Thornton, | | | | |
Certificate of | | | | |
Participation, | | | | |
4.000%, 12/1/2022, | | | | |
AMBAC | | 250,000 | | 245,670 |
Colorado State | | | | |
Higher Education, | | | | |
�� Cons. Lease Pur., | | | | |
Certificates of | | | | |
Participation: | | | | |
5.250%, 11/1/2023, | | | | |
Optional 11/1/2018 | | | | |
@ 100.00 | | 1,000,000 | | 1,105,550 |
5.000%, 11/1/2025 | | 1,000,000 | | 1,081,400 |
Colorado State, | | | | |
Certificate of | | | | |
Participation, | | | | |
University of | | | | |
Colorado at | | | | |
Denver | | | | |
Health Sciences | | | | |
Center Fitzsimons | | | | |
Academic, | | | | |
5.000%, 11/1/2018, | | | | |
Optional 11/1/2015 | | | | |
@ 100.00, | | | | |
NATL-RE | | 700,000 | | 749,126 |
Denver City & County, | | | | |
Certificate of | | | | |
Participation, | | | | |
Denver Botanic | | | | |
Gardens, | | | | |
5.250%, 12/1/2024, | | | | |
Optional 12/1/2018 | | | | |
@ 100.00 | | 625,000 | | 684,000 |
| | Principal | |
| | Amount | Market Value |
Douglas & Elbert | | | | |
Counties School | | | | |
District No. Re- | | | | |
1, Certificate of | | | | |
Participation, | | | | |
5.000%, 1/15/2025, | | | | |
Optional 1/15/2019 | | | | |
@ 100.00 | $ | 1,000,000 | $ | 1,055,350 |
Eagle County, | | | | |
Certificate of | | | | |
Participation, | | | | |
Justice Center | | | | |
Project, | | | | |
5.250%, 12/1/2023, | | | | |
Optional 12/1/2018 | | | | |
@ 100.00 | | 500,000 | | 553,230 |
El Paso County, | | | | |
Certificates of | | | | |
Participation, | | | | |
Detention Facility | | | | |
Project: | | | | |
5.375%, 12/1/2019, | | | | |
Optional 12/1/2012 | | | | |
@ 100.00, AMBAC | | 500,000 | | 523,525 |
5.375%, 12/1/2020, | | | | |
Optional 12/1/2012 | | | | |
@ 100.00, AMBAC | | 1,000,000 | | 1,044,220 |
Fort Collins, Certificates | | | | |
of Participation: | | | | |
5.000%, 6/1/2012 | | 1,000,000 | | 1,076,180 |
5.375%, 6/1/2023, | | | | |
Optional 6/1/2014 | | | | |
@ 100.00, AMBAC | | 1,000,000 | | 1,062,180 |
Garfield County Public | | | | |
Library District, | | | | |
Certificate of | | | | |
Participation, | | | | |
5.000%, 12/1/2024, | | | | |
Optional 12/1/2019 | | | | |
@ 100.00 | | 675,000 | | 689,189 |
Northern Colorado | | | | |
Water | | | | |
Conservancy | | | | |
District, Certificate | | | | |
of Participation, | | | | |
5.625%, 10/1/2018, | | | | |
Optional 10/1/2012 | | | | |
@ 100.00, | | | | |
NATL-RE | | 510,000 | | 538,830 |
Pueblo Co., Certificate | | | | |
of Participation, | | | | |
Police Complex | | | | |
Project, | | | | |
5.500%, 8/15/2018, | | | | |
Assured Guaranty | | 500,000 | | 558,080 |
Regional Transportation | | | | |
District, | | | | |
Certificates of | | | | |
Participation: | | | | |
4.500%, 6/1/2019, | | | | |
Optional 6/1/2015 | | | | |
@ 100.00, AMBAC | | 620,000 | | 634,489 |
| | | Principal | | |
| | | Amount | | Market Value |
5.000%, 12/1/2022, | | | | |
Optional 12/1/2017 | | | | |
@ 100.00, AMBAC | $ | 1,000,000 | $ | 1,060,860 |
5.000%, 11/1/2024, | | | | |
Prerefunded | | | | |
11/1/2013 @ 100.00 | | 1,000,000 | | 1,133,420 |
University of Colorado, | | | | |
Certificate of | | | | |
Participation, | | | | |
5.000%, 6/1/2023, | | | | |
Prerefunded | | | | |
6/1/2013 @ 100.00 | | 150,000 | | 167,169 |
| | | | | |
Total Certificates of Participation | |
(Cost $16,971,406) | | | | |
| | | | | |
GENERAL OBLIGATION BONDS | 32.72% |
County-City-Special District- | |
School District | | | | 32.72% |
Adams & Arapahoe Counties Joint | |
School District 28J: | | | | |
5.350%, 12/1/2015, | | | | |
Escrowed to | | | | |
Maturity | | 260,000 | | 309,228 |
6.250%, 12/1/2026, | | | | |
Optional 12/1/2018 | | | | |
@ 100.00 | | 1,250,000 | | 1,457,713 |
Adams 12 Five Star Schools, | | | |
zero coupon, | | | | |
12/15/2024, | | | | |
Optional | | | | |
12/15/2016 @ | | | | |
67.784, FGIC | | 2,385,000 | | 1,236,909 |
Adams County School District 12, | |
Series A, | | | | |
5.000%, | | | | |
12/15/2020, | | | | |
Prerefunded | | | | |
12/15/2011 @ | | | | |
100.00, NATL-RE | | 500,000 | | 532,655 |
Arapahoe County School District 5, | |
5.000%, | | | | |
12/15/2026, | | | | |
Optional | | | | |
12/15/2018 @ | | | | |
100.00 | | 1,000,000 | | 1,096,540 |
Arapahoe County School District | |
No. 6 Littleton, | | | | |
5.250%, 12/1/2021, | | | | |
Optional 12/1/2012 | | | | |
@ 100.00, NATL- | | | | |
RE FGIC | | 500,000 | | 540,745 |
Arapahoe Park & Recreation | |
District, | | | | |
5.250%, 12/1/2022, | | | | |
Optional 12/1/2012 | | | | |
@ 100.00, NATL- | | | | |
RE FGIC | | 750,000 | | 769,515 |
|
|
WESTCORE COLORADO TAX-EXEMPT FUND AS OF JUNE 30, 2010 (continued)
(UNAUDITED)
| | Principal | | | |
| | Amount | | Market Value | |
Basalt Colorado Sanitation District, | | | | |
5.000%, 12/1/2018, | | | | | | |
Optional 12/1/2011 | | | | | | |
@ 100.00, AMBAC | $ | 125,000 | | $ | 128,946 | |
Boulder County Open Space Capital | | | | |
Improvement Tr Fd, | | | | | | |
5.400%, 8/15/2015, | | | | | | |
Prerefunded | | | | | | |
8/15/2010 @ 100.00 | | 500,000 | | | 502,760 | |
Boulder Valley School District | | | | |
No Re-2, | | | | | | |
4.500%, 12/1/2025, | | | | | | |
Optional 6/1/2019 | | | | | | |
@ 100.00 | | 775,000 | | | 817,423 | |
Cherry Creek North Business | | | | |
Improvement District No. 1. | | | | | |
5.000%, 12/1/2028, | | | | | | |
Optional 12/1/2019 | | | | | | |
@ 100.00 | | 875,000 | | | 906,167 | |
City & County of Denver Board Water | | | | |
Commissioners, | | | | | | |
5.500%, 10/1/2011 | | 250,000 | | | 265,575 | |
City & County of Denver Justice | | | | |
System, | | | | | | |
5.000%, 8/1/2025, | | | | | | |
Optional 8/1/2018 | | | | | | |
@ 100.00 | | 750,000 | | | 826,260 | |
City & County of Denver, School | | | | |
District No. 1, Series A, | | | | | |
5.500%, 12/1/2022, | | | | | | |
FGIC | | 500,000 | | | 605,520 | |
Clear Creek County School District | | | | |
Re-1, | | | | | | |
4.300%, 12/1/2013, | | | | | | |
Optional 12/1/2012 | | | | | | |
@ 100.00, FSA | | 125,000 | | | 133,320 | |
Denver City & County School District | | | | |
No. 1: | | | | | | |
5.000%, 12/1/2018 | | 1,000,000 | | | 1,168,580 | |
5.250%, 12/1/2025, | | | | | | |
Optional 6/1/2019 | | | | | | |
@ 100.00 | | 1,500,000 | | | 1,689,480 | |
Denver West Metropolitan District: | | | | |
4.050%, 12/1/2013 | | 500,000 | | | 516,360 | |
4.250%, 12/1/2016, | | | | | | |
Optional 12/1/2015 | | | | | | |
@ 100.00 | | 140,000 | | | 133,122 | |
Douglas & Elbert Counties School | | | | |
District Re-1: | | | | | | |
zero coupon, | | | | | | |
12/15/2015 | | 2,000,000 | | | 1,733,060 | |
5.250%, | | | | | | |
12/15/2016, | | | | | | |
Prerefunded | | | | | | |
12/15/2011 @ | | | | | | |
100.00, NATL-RE | | 500,000 | | | 534,450 | |
5.250%, | | | | | | |
12/15/2017, | | | | | | |
Prerefunded | | | | | | |
12/15/2011 @ | | | | | | |
100.00, NATL-RE | | 1,000,000 | | | 1,068,900 | |
| | Principal | | |
| | Amount | | Market Value |
5.000%, | | | | | |
12/15/2023, | | | | | |
Optional | | | | | |
12/15/2017 @ | | | | | |
100.00 | $ | 1,250,000 | | $ | 1,375,325 |
Eagle Bend, Metropolitan District 2, | | | |
4.500%, 12/1/2025, | | | | | |
Optional 12/1/2015 | | | | | |
@ 100.00, RADIAN | | 400,000 | | | 385,336 |
Eagle, Garfield & Routt Counties | | | |
School District Re-50J, | | | | |
5.000%, 12/1/2026, | | | | | |
Optional 12/1/2016 | | | | | |
@ 100.00, FSA | | 2,500,000 | | | 2,697,000 |
Eagle-Vail Metropolitan District, | | | |
5.000%, 12/1/2029, | | | | | |
Optional 12/1/2019 | | | | | |
@ 100.00 | | 400,000 | | | 419,560 |
El Paso County School District 12, | | | |
5.000%, 9/15/2013, | | | | | |
Optional 9/15/2012 | | | | | |
@ 100.00 | | 1,000,000 | | | 1,088,310 |
El Paso County School District 2: | | | |
5.250%, 12/1/2012, | | | | | |
Optional 12/1/2010 | | | | | |
@ 100.00, NATL- | | | | | |
RE | | 250,000 | | | 254,687 |
5.000%, 12/1/2023, | | | | | |
Optional 12/1/2012 | | | | | |
@ 100.00, NATL- | | | | | |
RE | | 250,000 | | | 260,320 |
El Paso County School District | | | |
No. 20, | | | | | |
zero coupon, | | | | | |
12/15/2013, AGM | | 500,000 | | | 470,575 |
Evergreen Park & Recreation | | | |
District, | | | | | |
5.250%, 12/1/2017, | | | | | |
Prerefunded | | | | | |
12/1/2010 @ | | | | | |
100.00, AMBAC | | 115,000 | | | 117,299 |
Garfield County, Garfield School | | | |
District Re-2: | | | | | |
4.750%, 12/1/2025, | | | | | |
Optional 12/1/2016 | | | | | |
@ 100.00, AGM | | 1,000,000 | | | 1,052,350 |
5.000%, 12/1/2027, | | | | | |
Optional 12/1/2016 | | | | | |
@ 100.00, AGM | | 250,000 | | | 265,585 |
Garfield, Pitkin & Eagle Counties | | | |
Roaring Fork School District | | | |
Re-1, | | | | | |
5.000%, | | | | | |
12/15/2020, | | | | | |
Optional | | | | | |
12/15/2014 @ | | | | | |
100.00, AGM | | 500,000 | | | 538,265 |
Gunnison Watershed School District | | | |
No. Re 1J: | | | | | |
5.250%, 12/1/2024, | | | | | |
Optional 12/1/2018 | | | | | |
@ 100.00 | | 1,000,000 | | | 1,121,000 |
| | Principal | |
| | Amount | Market Value |
5.000%, 12/1/2028, | | | | |
Optional 12/1/2018 | | | | |
@ 100.00, Assured | | | | |
Guaranty | $ | 1,200,000 | $ | 1,297,332 |
Jefferson County School District | | |
R-1: | | | | |
5.250%, | | | | |
12/15/2024 | | 1,500,000 | | 1,793,670 |
5.000%, | | | | |
12/15/2024, | | | | |
Optional | | | | |
12/15/2014 @ | | | | |
100.00, AGM | | 1,000,000 | | 1,160,580 |
5.250%, | | | | |
12/15/2025, | | | | |
Optional | | | | |
12/15/2016 @ | | | | |
100.00, AGM | | 500,000 | | 547,945 |
La Plata County School District 9-R: | | |
5.250%, 11/1/2020, | | | | |
Prerefunded | | | | |
11/1/2012 @ | | | | |
100.00, NATL-RE | | 125,000 | | 138,214 |
5.125%, 11/1/2023, | | | | |
Optional 11/1/2013 | | | | |
@ 100.00, NATL- | | | | |
RE | | 100,000 | | 106,499 |
Larimer County, Poudre School | | |
District R-1, | | | | |
6.000%, | | | | |
12/15/2017, | | | | |
Prerefunded | | | | |
12/15/2010 @ | | | | |
100.00, FGIC | | 1,000,000 | | 1,025,000 |
Lincoln Park, Metropolitan District, | | |
5.625%, 12/1/2020, | | | | |
Optional 12/1/2017 | | | | |
@ 100.00 | | 250,000 | | 252,925 |
Mesa County Valley School District | | |
51 Grand Junction: | | | | |
5.000%, 12/1/2021, | | | | |
Optional 12/1/2014 | | | | |
@ 100.00, NATL- | | | | |
RE | | 525,000 | | 570,927 |
5.000%, 12/1/2022, | | | | |
Optional 12/1/2013 | | | | |
@ 100.00, NATL- | | | | |
RE | | 300,000 | | 324,822 |
5.000%, 12/1/2024, | | | | |
Optional 12/1/2014 | | | | |
@ 100.00, NATL- | | | | |
RE | | 1,000,000 | | 1,072,070 |
Moffat County School District No. | | |
Re-1 Craig, | | | | |
5.250%, 12/1/2026, | | | | |
Optional 12/1/2017 | | | | |
@ 100.00, AGM | | 1,030,000 | | 1,124,853 |
Pitkin County Open Space | | | | |
Acquisition, | | | | |
5.250%, 12/1/2018, | | | | |
Prerefunded | | | | |
12/1/2010 @ | | | | |
100.00, AMBAC | | 340,000 | | 346,797 |
| PAGE 62 |
|
WESTCORE COLORADO TAX-EXEMPT FUND AS OF JUNE 30, 2010 (continued)
(UNAUDITED)
| | Principal | | |
| | Amount | Market Value | |
Pitkin County School District No. | | | |
001, Aspen: | | | | | |
5.000%, 12/1/2020, | | | | | |
Prerefunded | | | | | |
12/1/2011 @ | | | | | |
100.00, FGIC | $ | 150,000 | $ | 159,533 | |
5.375%, 12/1/2026, | | | | | |
Optional 12/1/2019 | | | | | |
@ 100.00 | | 225,000 | | 254,691 | |
Pueblo County School District 60, | | | |
5.000%, | | | | | |
12/15/2022 | | 500,000 | | 582,815 | |
Pueblo County School District 70, | | | |
5.000%, 12/1/2015, | | | | | |
Optional 12/1/2011 | | | | | |
@ 100.00, | | | | | |
NATL-RE | | 165,000 | | 171,484 | |
Rio Blanco County School District | | | |
No. Re-1 Meeker, | | | | | |
5.250%, 12/1/2022, | | | | | |
Optional 12/1/2018 | | | | | |
@ 100.00 | | 575,000 | | 648,134 | |
Summit County, Summit County | | | |
School District Re-1, | | | | | |
5.000%, 12/1/2023, | | | | | |
Optional 12/1/2014, | | | | | |
NATL-RE FGIC | | 200,000 | | 213,736 | |
Weld & Adams County School | | | |
District Re-3, | | | | | |
5.000%, | | | | | |
12/15/2021, | | | | | |
Prerefunded | | | | | |
12/15/2014 @ | | | | | |
100.00, AGM | | 200,000 | | 232,116 | |
| | | | | | |
Total General Obligation Bonds | | | |
(Cost $37,478,099) | | | | 39,042,983 | |
| | | | | | |
REVENUE BONDS | | | | 47.69% | |
Airports | | | | 2.20% | |
City & County of Denver Airport | | | |
Series A Revenue: | | | | | |
5.000%, | | | | | |
11/15/2018, | | | | | |
Optional | | | | | |
11/15/2015 @ | | | | | |
100.00, XLCA | | 1,000,000 | | 1,085,390 | |
5.250%, | | | | | |
11/15/2028, | | | | | |
Optional | | | | | |
11/15/2019 @ | | | | | |
100.00 | | 1,000,000 | | 1,051,250 | |
Walker Field CO Public Airport | | | |
Authority, | | | | | |
5.000%, 12/1/2022, | | | | | |
Optional 12/1/2017 | | 500,000 | | 490,920 | |
| | | | | 2,627,560 | |
| | Principal | |
| | Amount | Market Value |
General | | | | 3.52% |
Boulder County Open Space Capital | | |
Improvement Tr Fd, | | | | |
5.000%, | | | | |
12/15/2025, | | | | |
Optional | | | | |
12/15/2018 @ | | | | |
100.00 | $ | 1,000,000 | $ | 1,088,200 |
Boulder County Open Space Capital | | |
Improvement Tr Fd Series A, | | | | |
5.000%, 1/1/2024, | | | | |
Optional | | | | |
01/01/2015 @ | | | | |
100.00, AGM | | 1,645,000 | | 1,734,735 |
Park Meadows Business | | | | |
Improvement District Sinking | | |
Fund, | | | | |
5.000%, 12/1/2017, | | | | |
Average Life | | | | |
9/1/2014 | | 250,000 | | 244,695 |
Regional Transportation District, | | |
Colorado Sales Tax Revenue | | |
Series A, | | | | |
5.000%, 11/1/2027, | | | | |
Optional | | | | |
11/01/2016 @ | | | | |
100.00, AMBAC | | 500,000 | | 533,690 |
Town of Castle Rock Co., Sales and | | |
Use Tax Revenue, | | | | |
6.000%, 6/1/2023, | | | | |
Optional 6/1/2018 | | | | |
@ 100.00, Assured | | | | |
Guaranty | | 500,000 | | 596,290 |
| | | | | 4,197,610 |
| | | | | |
Higher Education | | | | 8.43% |
City of Colorado Springs, Revenue | | |
Refunding Bonds, The | | | |
Colorado College Project, | | |
4.375%, 6/1/2026, | | | | |
Optional 6/1/2015 | | | | |
@ 100.00 | | 500,000 | | 505,810 |
Colorado Educational & | | |
Cultural Facilities Authority: | | |
5.000%, 9/1/2025, | | | | |
Optional | | | | |
09/01/2020 @ | | | | |
100.00 | | 1,105,000 | | 1,175,521 |
Pikes Peak College, | | | | |
5.000%, 12/1/2021, | | | | |
Optional 12/1/2011 | | | | |
@ 100.00, AMBAC | | 150,000 | | 152,288 |
Regis University, | | | | |
5.000%, 6/1/2020, | | | | |
Optional 6/1/2011 | | | | |
@ 100.00, AMBAC | | 200,000 | | 202,654 |
University of Denver: | | | | |
5.000%, 3/1/2018, | | | | |
Optional 9/1/2015 | | | | |
@ 100.00, | | | | |
NATL-RE | | 500,000 | | 537,745 |
| | | Principal | |
| | | Amount | Market Value |
5.000%, 3/1/2021, | | | | |
Optional 9/1/2015 | | | | |
@ 100.00, MBIA-RE | | | | |
FGIC | $ | 300,000 | $ | 314,970 |
Colorado School of Mines Auxiliary | | |
Facility Revenue Enterprise: | | |
5.250%, 12/1/2020, | | | | |
Optional 12/1/2012 | | | | |
@ 100.00, AMBAC | | 85,000 | | 87,821 |
5.250%, 12/1/2020, | | | | |
Prerefunded | | | | |
12/1/2012 @ | | | | |
100.00, AMBAC | | 420,000 | | 465,986 |
Colorado State Board of Governors, | | |
5.250%, 3/1/2024, | | | | |
Optional 3/1/2017, | | | | |
NATL-RE | | 500,000 | | 544,695 |
Colorado State Board of Governors | | |
University - Enterprise | | | | |
Revenue Bonds, | | | | |
5.000%, 12/1/2020, | | | | |
Prerefunded | | | | |
12/1/2015 @ | | | | |
100.00, XLCA | | 500,000 | | 584,260 |
Colorado State College Board of | | |
Trustees, Auxiliary Facilities | | |
System - Enterprise | | | | |
Revenue Bonds, | | | | |
5.000%, 5/15/2022, | | | | |
Optional | | | | |
5/15/2013, MBIA | | 660,000 | | 686,677 |
Fort Lewis College Board, | | | | |
4.625%, 10/1/2026, | | | | |
Optional | | | | |
10/17/2017 @ | | | | |
100.00, NATL-RE | | 500,000 | | 505,950 |
Mesa State College, Auxiliary Facility | | |
Enterprise Revenue, | | | | |
5.700%, 5/15/2026, | | | | |
Optional | | | | |
11/15/2017 @ | | | | |
100.00 | | 250,000 | | 306,660 |
University of Colorado Enterprise | | |
Systems Revenue Series A: | | |
5.100%, 6/1/2016, | | | | |
Prerefunded | | | | |
6/1/2011 @ 100.00 | | 150,000 | | 156,431 |
5.375%, 6/1/2026, | | | | |
Prerefunded | | | | |
6/1/2011 @ 100.00 | | 325,000 | | 339,735 |
University of Colorado Enterprise | | |
Systems Revenue Series B: | | |
5.000%, 6/1/2024, | | | | |
Prerefunded | | | | |
6/1/2013 @ 100.00, | | | | |
FGIC | | 150,000 | | 167,856 |
5.000%, 6/1/2026, | | | | |
Optional 6/1/2015 | | | | |
@ 100.00, NATL- | | | | |
RE | | 750,000 | | 792,982 |
|
|
WESTCORE COLORADO TAX-EXEMPT FUND AS OF JUNE 30, 2010 (continued)
(UNAUDITED)
| | Principal | |
| | Amount | Market Value |
University of Northern Colorado | | |
Auxiliary Facilities: | | | | |
5.000%, 6/1/2016, | | | | |
Optional 6/1/2011 | | | | |
@ 100.00, AMBAC | $ | 500,000 | $ | 509,545 |
5.000%, 6/1/2023, | | | | |
Optional 6/1/2011 | | | | |
@ 100.00, AMBAC | | 250,000 | | 252,385 |
Western State College, | | | | |
5.000%, 5/15/2034, | | | | |
Optional 5/15/2019 | | | | |
@ 100.00 | | 500,000 | | 512,560 |
Western State College Series A, | | |
5.000%, 5/15/2024, | | | | |
Optional | | | | |
05/15/2020 @ | | | | |
100.00 | | 1,160,000 | | 1,256,628 |
| | | | | 10,059,159 |
| | | | | |
Medical | | | | 13.07% |
Aspen Valley Hospital District, | | |
5.000%, | | | | |
10/15/2021, | | | | |
Optional | | | | |
10/15/2016 @ | | | | |
100.00 | | 600,000 | | 568,710 |
Aurora Colorado Hospital Revenue, | | |
Children’s Hospital, | | | | |
5.000%, 12/1/2022, | | | | |
Optional 12/1/2018 | | | | |
@ 100.00, AGM | | 1,000,000 | | 1,071,470 |
Colorado Health Facilities Authority | | |
Revenue, Adventist Sunbelt: | | |
5.125%, | | | | |
11/15/2020, | | | | |
Prerefunded | | | | |
11/15/2016 @ | | | | |
100.00 | | 345,000 | | 404,564 |
5.250%, | | | | |
11/15/2027, | | | | |
Optional | | | | |
11/15/2016 @ | | | | |
100.00(1) | | 1,000,000 | | 1,019,410 |
Colorado Health Facilities Authority | | |
Revenue, Catholic Health | | |
Initiatives: | | | | |
5.250%, 9/1/2021, | | | | |
Prerefunded | | | | |
9/1/2011 @ 100.00 | | 500,000 | | 527,320 |
5.250%, 7/1/2024, | | | | |
Optional 7/1/2019 | | | | |
@ 100.00 | | 1,000,000 | | 1,070,190 |
5.500%, 3/1/2032, | | | | |
Escrowed to | | | | |
maturity, Callable | | | | |
3/1/2012 @ 100.00 | | 500,000 | | 523,040 |
Colorado Health Facilities Authority | | |
Revenue, Covenant Retirement | | |
Communities Inc., | | | | |
5.250%, 12/1/2025, | | | | |
Optional 12/1/2015 | | | | |
@ 100.00 | | 500,000 | | 480,575 |
| | Principal | | | |
| | Amount | | Market Value | |
Colorado Health Facilities Authority | | | | |
Revenue, Evangelical | | | | | |
Lutheran: | | | | | | |
5.250%, 6/1/2020, | | | | | | |
Optional 6/1/2016 | | | | | | |
@ 100.00 | $ | 500,000 | | $ | 514,530 | |
5.250%, 6/1/2023, | | | | | | |
Optional 6/1/2016 | | | | | | |
@100.00 | | 400,000 | | | 407,080 | |
Colorado Health Facilities Authority | | | | |
Revenue, Park View Medical | | | | |
Center: | | | | | | |
5.000%, 9/1/2010 | | 205,000 | | | 205,711 | |
5.000%, 9/1/2011 | | 210,000 | | | 214,549 | |
5.000%, 9/1/2020, | | | | | | |
Optional 9/15/2015 | | | | | | |
@ 100.00 | | 450,000 | | | 458,352 | |
5.000%, 9/1/2025, | | | | | | |
Optional 9/1/2017 | | | | | | |
@ 100.00 | | 450,000 | | | 448,551 | |
Colorado Health Facilities Authority | | | | |
Revenue, Vail Valley Medical | | | | |
Center, | | | | | | |
5.000%, 1/15/2020, | | | | | | |
Optional 1/15/2015 | | | | | | |
@ 100.00 | | 940,000 | | | 962,898 | |
Colorado Health Facilities Authority | | | | |
Revenue, Valley View Hospital | | | | |
Association, | | | | | | |
5.000%, 5/15/2027, | | | | | | |
Optional 5/15/2017 | | | | | | |
@ 100.00 | | 250,000 | | | 243,320 | |
Colorado Health Facilities Authority | | | | |
Revenue, Yampa Valley Medical | | | | |
Center, | | | | | | |
5.000%, 9/15/2022, | | | | | | |
Optional 9/15/2017 | | | | | | |
@ 100.00 | | 850,000 | | | 833,978 | |
Colorado Health Facilities Authority, | | | | |
Poudre Valley Health, Series A, | | | | |
5.000%, 3/1/2025, | | | | | | |
Optional 3/1/2015 | | | | | | |
@ 100.00 | | 1,000,000 | | | 1,006,120 | |
Denver Health & Hospital Authority: | | | | |
5.000%, 12/1/2018, | | | | | | |
Optional 12/1/2016 | | 500,000 | | | 505,435 | |
5.000%, 12/1/2020, | | | | | | |
Optional 12/1/2016 | | 500,000 | | | 495,975 | |
6.000%, 12/1/2031, | | | | | | |
Prerefunded | | | | | | |
12/1/2011 @ 100.00 | | 2,000,000 | | | 2,152,100 | |
University of Colorado Hospital | | | | |
Authority: | | | | | | |
5.250%, | | | | | | |
11/15/2022, | | | | | | |
Callable upon | | | | | | |
30 days notice @ | | | | | | |
100.00, AMBAC | | 1,000,000 | | | 1,000,320 | |
| | Principal | | |
| | Amount | Market Value | |
5.600%, | | | | | |
11/15/2031, | | | | | |
Prerefunded | | | | | |
11/15/2011 | | | | | |
@100.00 | $ | 445,000 | $ | 475,683 | |
| | | | | 15,589,881 | |
| | | | | | |
Other | | | | 0.17% | |
Boulder County, (Atmospheric | | | |
Research), | | | | | |
5.000%, 9/1/2022, | | | | | |
Optional 9/1/2011 | | | | | |
@ 100.00, NATL- | | | | | |
RE | | 200,000 | | 203,260 | |
| | | | | | |
Special Tax | | | | 6.89% | |
Aurora Colorado Golf Course | | | | |
Enterprise: | | | | | |
4.125%, 12/1/2013 | | 110,000 | | 111,023 | |
4.250%, 12/1/2014 | | 125,000 | | 125,045 | |
4.375%, 12/1/2015 | | 125,000 | | 122,843 | |
Broomfield Sales & Use Tax, | | | | |
5.200%, 12/1/2017, | | | | | |
Optional 12/1/2012 | | | | | |
@ 100.00, AMBAC | | 500,000 | | 528,760 | |
Colorado Educational & Cultural | | | |
Facilities Authority: | | | | | |
Academy Charter | | | | | |
School: | | | | | |
5.000%, | | | | | |
12/15/2015, | | | | | |
Mandatory Sinking | | | | | |
Fund 12/15/2013 @ | | | | | |
100.00 | | 390,000 | | 412,409 | |
5.000%, | | | | | |
12/15/2021, | | | | | |
Optional | | | | | |
12/15/2015 @ | | | | | |
100.00, MORAL | | | | | |
OBLG | | 180,000 | | 185,589 | |
4.625%, | | | | | |
12/15/2028, | | | | | |
Optional | | | | | |
12/15/2015 @ | | | | | |
100.00, MORAL | | | | | |
OBLG | | 250,000 | | 241,120 | |
Ave Maria School, | | | | | |
6.000%, 12/1/2016, | | | | | |
RADIAN, | | | | | |
Prerefunded | | | | | |
12/1/2010 @ 100.00 | | 125,000 | | 127,618 | |
Bromley East Charter School, | | | |
5.125%, 9/15/2025, | | | | | |
Optional 9/15/2015 | | | | | |
@ 100.00, XLCA | | 500,000 | | 510,810 | |
Kent Denver School: | | | | | |
5.000%, 10/1/2019 | | 115,000 | | 125,004 | |
5.000%, 10/1/2030, | | | | | |
Optional 10/1/2019 | | | | | |
@ 100.00 | | 500,000 | | 505,495 | |
| PAGE 64 |
|
WESTCORE COLORADO TAX-EXEMPT FUND AS OF JUNE 30, 2010 (continued)
(UNAUDITED)
| | Principal | | |
| | Amount | Market Value | |
Denver City & County Golf | | | | | |
Enterprise: | | | | | |
5.500%, 9/1/2012, | | | | | |
Mandatory Sinking | | | | | |
Fund 9/1/2010 @ | | | | | |
100.00 | $ | 250,000 | $ | 255,242 | |
4.600%, 9/1/2015 | | 185,000 | | 186,424 | |
5.000%, 9/1/2018, | | | | | |
Optional 9/1/2016 | | | | | |
@ 100.00 | | 350,000 | | 351,264 | |
5.000%, 9/1/2019, | | | | | |
Optional 9/1/2016 | | | | | |
@ 100.00 | | 500,000 | | 498,875 | |
Grand Junction Leasing Authority | | | |
Capital Improvement: | | | | |
5.000%, 6/15/2020, | | | | | |
Optional 6/15/2016 | | | | | |
@ 100.00, NATL- | | | | | |
RE | | 390,000 | | 424,620 | |
5.000%, 6/15/2023, | | | | | |
Optional 6/15/2016 | | | | | |
@ 100.00, NATL- | | | | | |
RE | | 390,000 | | 419,398 | |
Greeley, Weld County Sales & Use Tax, | | | |
5.150%, 10/1/2015, | | | | | |
Prerefunded | | | | | |
10/1/2010 @ | | | | | |
100.00, NATL-RE | | 500,000 | | 505,740 | |
Longmont, Boulder County Sales & | | | |
Use Tax, | | | | | |
5.500%, | | | | | |
11/15/2015, | | | | | |
Prerefunded | | | | | |
11/15/2010 @ | | | | | |
100.00 | | 300,000 | | 305,604 | |
Northwest Parkway Public Highway | | | |
Authority Revenue, | | | | | |
zero coupon, | | | | | |
6/15/2025, | | | | | |
convertible | | | | | |
to 5.80% until | | | | | |
6/15/2025, AGM, | | | | | |
Prerefunded | | | | | |
6/15/2016 @ 100.00 | | 960,000 | | 1,088,784 | |
Superior Open Space Sales & Use Tax: | | | |
4.625%, 6/1/2015 | | 100,000 | | 104,110 | |
4.750%, 6/1/2017, | | | | | |
Optional 6/1/2016 | | | | | |
@ 100.00 | | 325,000 | | 334,591 | |
Thornton, Adams County Sales & | | | |
Use Tax, Open Space & Parks, | | | |
5.250%, 9/1/2016, | | | | | |
Optional 9/1/2011 | | | | | |
@ 100.00, AGM | | 500,000 | | 521,280 | |
Westminster Sales & Use Tax, | | | |
5.000%, 12/1/2014, | | | | | |
Optional 12/1/2011 | | | | | |
@ 100.00 | | 220,000 | | 230,237 | |
| | | | | 8,221,885 | |
| | Principal | |
| | Amount | Market Value |
Utility | | | | 13.41% |
Arapahoe County Water & | | | |
Wastewater Authority Revenue, | | |
4.250%, 12/1/2025, | | | | |
Optional 12/1/2016 | | | | |
@ 100.00, AGM | $ | 450,000 | $ | 461,142 |
Arkansas River Power Authority, | | |
5.875%, 10/1/2026, | | | | |
SF 10/1/2022, | | | | |
XLCA | 1,000,000 | | 1,047,950 |
Boulder County Water & Sewer, | | |
5.300%, 12/1/2012, | | | | |
Prerefunded | | | | |
12/1/2010 @ 100.00 | | 125,000 | | 127,524 |
Brighton Colorado Water Activity | | |
Enterprise, | | | | |
5.000%, 12/1/2029, | | | | |
Optional 12/1/2019 | | | | |
@ 100.00 | 1,515,000 | | 1,613,142 |
Broomfield Water Activity | | | | |
Enterprise: | | | | |
5.500%, 12/1/2018, | | | | |
Optional 12/1/2010 | | | | |
@ 101.00, NATL- | | | | |
RE | | 500,000 | | 512,365 |
4.750%, 12/1/2022, | | | | |
Optional 12/1/2012 | | | | |
@ 100.00, NATL- | | | | |
RE | | 125,000 | | 126,722 |
Colorado Springs Colorado Utilities | | |
Revenue, | | | | |
5.000%, | | | | |
11/15/2027, | | | | |
Optional | | | | |
11/15/2019 @ | | | | |
100.00 | 1,500,000 | | 1,549,065 |
Colorado Water Resources & | | | |
Power Development Authority, | | |
Drinking Water, | | | | |
5.000%, 9/1/2017, | | | | |
Optional 9/1/2012 | | | | |
@ 100.00 | | 500,000 | | 530,025 |
Colorado Water Resources & Power | | |
Development Authority, Parker | | |
Water & Sanitation District, | | |
5.000%, 9/1/2026, | | | | |
Optional 9/1/2014 | | | | |
@ 100.00, | | | | |
NATL-RE | | 500,000 | | 500,710 |
Colorado Water Resources & Power | | |
Development Authority, Small | | |
Water Resources: | | | | |
5.700%, 11/1/2015, | | | | |
Optional 11/1/2010 | | | | |
@ 100.00, FGIC | | 265,000 | | 267,708 |
5.700%, 11/1/2015, | | | | |
Prerefunded | | | | |
11/1/2010 @ | | | | |
100.00, FGIC | | 235,000 | | 238,948 |
| | Principal | |
| | Amount | Market Value |
5.800%, 11/1/2020, | | | | |
Optional 11/1/2010 | | | | |
@ 100.00, | | | | |
NATL-RE FGIC | $ | 800,000 | $ | 806,776 |
Colorado Water Resources & Power | | |
Development Authority, Waste | | |
Water Revolving Fund, | | | |
5.500%, 9/1/2019 | | 500,000 | | 602,045 |
Denver City & County Board of Water | | |
Commissioners, | | | | |
5.000%, | | | | |
12/15/2029, | | | | |
Optional | | | | |
12/15/2017 @ | | | | |
100.00, AGM | 1,500,000 | | 1,597,680 |
Eagle River Water & Sanitation | | |
District, | | | | |
5.000%, 12/1/2029, | | | | |
Optional 12/1/2019 | | | | |
@ 100.00, Assured | | | | |
Guaranty | | 450,000 | | 473,067 |
Fort Collins Colorado Waste Water | | |
Utility Enterprise: | | | | |
5.000%, 12/1/2026, | | | | |
Optional 12/1/2018 | | | | |
@ 100.00 | 1,000,000 | | 1,093,870 |
5.000%, 12/1/2027, | | | | |
Optional 12/1/2018 | | | | |
@ 100.00 | | 465,000 | | 505,850 |
Fort Collins, Larimer County | | | |
Colorado Stormwater Utilities, | | |
4.875%, 12/1/2020, | | | | |
Optional 12/1/2012 | | | | |
@ 100.00, AMBAC | | 250,000 | | 258,490 |
Golden Colorado Water & Waste | | |
Treatment, | | | | |
4.950%, | | | | |
11/15/2022, | | | | |
Optional | | | | |
11/15/2013 @ | | | | |
100.00, AGM | | 150,000 | | 157,850 |
Greeley Colorado Water Revenue, | | |
4.200%, 8/1/2024, | | | | |
Optional 8/1/2016 | | | | |
@ 100.00, NATL-RE | 1,200,000 | | 1,217,964 |
Platte River Power Authority, | | | |
5.000%, 6/1/2027, | | | | |
Optional 6/1/2019 | | | | |
@ 100.00 | 1,500,000 | | 1,630,110 |
Pueblo County Pollution Control | | |
Public Service of Colorado | | |
Project, | | | | |
5.100%, 1/1/2019, | | | | |
Optional 1/1/2011 | | | | |
@ 100.00, AMBAC | | 150,000 | | 150,756 |
Thornton Colorado Water | | | | |
Enterprise, | | | | |
5.000%, 12/1/2021, | | | | |
Optional 12/1/2014 | | | | |
@ 100.00, MBIA | | 500,000 | | |
| | | | | 16,006,004 |
|
|
WESTCORE COLORADO TAX-EXEMPT FUND AS OF JUNE 30, 2010 (continued)
(UNAUDITED)
| | Shares/Principal | | |
| | Amount | | Market Value |
Total Revenue Bonds | | | | | |
(Cost $55,858,637) | | | | $ | 56,905,359 |
| | | | | | |
| | | | | | |
MONEY MARKET MUTUAL FUNDS | | | 4.37% |
Fidelity Institutional | | | | | |
Money Market Tax | | | | | |
Exempt - Class I (7 | | | | | |
Day Yield 0.116%) | | 5,216,397 | | | 5,216,397 |
| | | | | | |
Total Money Market Mutual Funds | | | |
(Cost $5,216,397) | | | | | 5,216,397 |
| | | | | | |
Total Investments | | | | | |
(Cost $115,524,539) | | 99.40% | | 118,610,857 |
| | | | | | |
Other Assets in Excess | | | | | |
of Liabilities | | 0.60% | | | 712,811 |
| | | | | | |
Net Assets | | 100.00% | | $ | 119,323,668 |
| | | | | | |
Westcore Colorado Tax-Exempt Fund | | | |
Country Breakdown as of June 30, 2010 | |
(Unaudited) | | | | | |
Country | | Market Value | | | % |
United States | $ | 118,610,857 | | | 99.40% |
Total Investments | | 118,610,857 | | | 99.40% |
Other Assets in Excess | | | | | |
of Liabilities | | 712,811 | | | 0.60% |
Net Assets | $ | 119,323,668 | | | 100.00% |
| | | | | |
Please note the country classification is based on the domicile of the issuer. Investment classifications presented herein are based on the sector and industry categorization methodology of the Adviser to the Funds which may result in the designations for one Fund being different from another. Investment classifications are unaudited. (1) The coupon rate shown on floating or adjustable rate securities represents the rate at period end. See Notes to Financial Statements. |
| PAGE 66 |
|
| COMMON ABBREVIATIONS |
| AB | Aktiebolag is the Swedish equivalent of the term corporation. |
| ADR | American Depositary Receipt |
| AG | Aktiengesellschaft is a German term that refers to a corporation that is limited by shares, i.e., owned by shareholders. |
| AGM | Assured Guaranty Municipal |
| AMBAC | Ambac Financial Group Inc. |
| BV | Besloten Vennootschap is a Dutch private limited liability company. |
| FDIC | Federal Deposit Insurance Corp. |
| FGIC | Financial Guaranty Insurance Co. |
| FHLMC | Federal Home Loan Mortgage Corp. |
| FNMA | Federal National Mortgage Association |
| FSA | Farm Service Agency |
| GNMA | Government National Mortgage Association |
| LLC | Limited Liability Company |
| LP | Limited Partnership |
| Ltd. | Limited |
| MBIA | MBIA Inc. delivers credit enhancement for the obligations of debt such as municipal bonds. The purchase of municipal bond insurance is |
| | used to improve or enhance the credit rating of a borrower’s debt financing. |
| MORAL OBLG | Charter School Moral Obligation Program. Moral Obligation bonds are revenue-backed, state issued municipal bonds, whose principal and |
| | interest is backed by the moral, but not legal, obligation of a state government. |
| MTN | Medium Term Note followed by applicable series |
| NA | National Association |
| NATL-RE | Third party insurer for municipal debt securities. |
| N.V. | Naamloze Vennootschap is the Dutch term for a public limited liability corporation. |
| PLC | Public Limited Co. |
| RADIAN | Radian Group Inc. |
| REIT | Real Estate Investment Trust |
| S.A. | Generally designates corporations in various countries, mostly those employing the civil law. This translates literally in all languages |
| | mentioned as anonymous company. |
| SBA | Small Business Administration |
| SF | Sinking Fund |
| S.p.A. | Società Per Azioni is an Italian shared company. |
| SUB | Subordinated Income Note |
| XLCA | XL Capital Assurance Inc. delivers credit enhancement for the obligations of debt such as municipal bonds |
|
|

WESTCORE EQUITY FUNDS AS OF JUNE 30, 2010 (UNAUDITED)
| | Westcore | | Westcore | | Westcore | | Westcore | | Westcore | | Westcore |
| | Growth | | MIDCO | | Select | | Blue Chip | | Mid-Cap | | Small-Cap |
| | Fund | | Growth Fund | | Fund | | Fund | | Value Fund | | Opportunity Fund |
Assets | | | | | | | | | | | | | | | | | | | | | | | |
Investments at value (cost - see below) | $ | 96,751,222 | | $ | 110,720,591 | | $ | 136,959,927 | | $ | 32,847,538 | | $ | 44,823,303 | | $ | 37,460,158 |
Cash and cash equivalents | | | 0 | | | | 0 | | | | 0 | | | | 0 | | | | 0 | | | | 0 |
Foreign cash at value (cost - see below) | | | 0 | | | | 0 | | | | 0 | | | | 0 | | | | 0 | | | | 0 |
Receivable for investment securities sold | | 1,033,865 | | | 2,226,669 | | | 6,608,202 | | | 658,155 | | | | 0 | | | 229,913 |
Dividends and interest receivable | | 66,519 | | | 47,676 | | | 38,957 | | | 27,854 | | | 106,264 | | | 36,140 |
Receivable for fund shares subscribed | | 37,239 | | | 8,129 | | | 635,948 | | | 53,225 | | | | 9,979 | | | 11,291 |
Investment for trustee deferred | | | | | | | | | | | | | | | | | | | | | | | |
compensation plan | | 24,961 | | | 345,776 | | | | 7,787 | | | 39,511 | | | | 4,403 | | | 34,794 |
Receivable due from advisor | | | 0 | | | | 0 | | | | 0 | | | | 0 | | | | 0 | | | | 0 |
Prepaid and other assets | | 20,373 | | | 18,944 | | | 14,842 | | | 13,672 | | | | 8,729 | | | 16,295 |
Total Assets | | 97,934,179 | | | 113,367,785 | | | 144,265,663 | | | 33,639,955 | | | 44,952,678 | | | 37,788,591 |
| | | | | | | | | | | | | | | | | | | | | | | |
Liabilities | | | | | | | | | | | | | | | | | | | | | | | |
Payable for investment | | | | | | | | | | | | | | | | | | | | | | | |
securities purchased | | 1,024,473 | | | 479,493 | | | | 0 | | | 675,040 | | | 101,984 | | | 25,475 |
Payable for fund shares redeemed | | 515,455 | | | 56,955 | | | 40,004 | | | 5,017 | | | | 0 | | | | 6,292 |
Payable for investment advisory fee | | 52,178 | | | 62,455 | | | 77,797 | | | 11,110 | | | 29,239 | | | 23,657 |
Payable for administration fee | | 15,125 | | | 16,863 | | | 20,166 | | | 5,106 | | | | 6,569 | | | | 6,108 |
Payable for shareholder servicing | | 5,808 | | | 3,162 | | | | 7,647 | | | | 452 | | | | 2,141 | | | | 1,287 |
Payable for trustee deferred | | | | | | | | | | | | | | | | | | | | | | | |
compensation plan | | 24,961 | | | 345,776 | | | | 7,787 | | | 39,511 | | | | 4,403 | | | 34,794 |
Payable for chief compliance officer fee | | | 513 | | | | 678 | | | | 602 | | | | 198 | | | | 295 | | | | 258 |
Other payables | | 29,990 | | | 35,638 | | | 26,802 | | | 21,043 | | | 21,411 | | | 20,829 |
Total Liabilities | | 1,668,503 | | | 1,001,020 | | | 180,805 | | | 757,477 | | | 166,042 | | | 118,700 |
Net Assets | $ | 96,265,676 | | $ | 112,366,765 | | $ | 144,084,858 | | $ | 32,882,478 | | $ | 44,786,636 | | $ | 37,669,891 |
| | | | | | | | | | | | | | | | | | | | | | | |
Net Assets Consist of: | | | | | | | | | | | | | | | | | | | | | | | |
Paid-in capital | $ | 119,775,210 | | $ | 122,017,968 | | $ | 150,212,813 | | $ | 34,088,790 | | $ | 59,515,881 | | $ | 38,989,807 |
(Over)/Undistributed net | | | | | | | | | | | | | | | | | | | | | | | |
investment income | | (98,909) | | | (508,789) | | | (256,941) | | | 67,650 | | | 103,743 | | | (22,809) |
Accumulated net realized loss on | | | | | | | | | | | | | | | | | | | | | | | |
investments and foreign | | | | | | | | | | | | | | | | | | | | | | | |
currency transactions | | (37,056,737) | | | (22,331,462) | | | (948,960) | | | (2,485,306) | | | (15,101,328) | | | (3,023,762) |
Net unrealized appreciation/ | | | | | | | | | | | | | | | | | | | | | | | |
(depreciation) on investments and | | | | | | | | | | | | | | | | | | | | | | | |
translation of assets and liabilities | | | | | | | | | | | | | | | | | | | | | | | |
denominated in foreign currencies | | 13,646,112 | | | 13,189,048 | | | (4,922,054) | | | 1,211,344 | | | 268,340 | | | 1,726,655 |
Net Assets | $ | 96,265,676 | | $ | 112,366,765 | | $ | 144,084,858 | | $ | 32,882,478 | | $ | 44,786,636 | | $ | 37,669,891 |
| | | | | | | | | | | | | | | | | | | | | | | |
Net Assets: | | | | | | | | | | | | | | | | | | | | | | | |
Retail Class | $ | 93,501,100 | | $ | 79,969,591 | | $ | 144,084,858 | | $ | 14,228,710 | | $ | 44,786,636 | | $ | 34,619,481 |
Institutional Class | | 2,764,576 | | | 32,397,174 | | | | N/A | | | 18,653,768 | | | | N/A | | | 3,050,410 |
Shares of Beneficial Interest Outstanding: | | | | | | | | | | | | | | | | | | | | | | | |
Retail Class | | 9,568,720 | | | 15,669,871 | | | 9,068,493 | | | 1,476,048 | | | 3,007,122 | | | 1,244,592 |
Institutional Class | | 282,658 | | | 6,323,634 | | | | N/A | | | 1,933,690 | | | | N/A | | | 109,123 |
Net Asset Value and Redemption Price | | | | | | | | | | | | | | | | | | | | | | | |
Per Share (Net Assets Per | | | | | | | | | | | | | | | | | | | | | | | |
Share Outstanding) | | | | | | | | | | | | | | | | | | | | | | | |
Retail Class | $ | | 9.77 | | $ | | 5.10 | | $ | | 15.89 | | $ | | 9.64 | | $ | | 14.89 | | $ | | 27.82 |
Institutional Class | | | 9.78 | | | | 5.12 | | | | N /A | | | | 9.65 | | | | N /A | | | | 27.95 |
| | | | | | | | | | | | | | | | | | | | | | | | |
Cost of Investments | $ | 83,105,110 | | $ | 97,531,543 | | $ | 141,881,981 | | $ | 31,636,194 | | $ | 44,554,963 | | $ | 35,733,503 |
Cost of Foreign Currency Held | $ | | 0 | | $ | | 0 | | $ | | 0 | | $ | | 0 | | $ | | 0 | | $ | | 0 |
| | | | | | | | | | | | | | | | | | | | | | | |
See Notes to Financial Statements. |
| PAGE 68 |
|
AS OF JUNE 30, 2010 (UNAUDITED)
| | WESTCORE EQUITY FUNDS | | WESTCORE BOND FUNDS |
| | | Westcore | | Westcore | | Westcore | | Westcore | | Westcore | | Westcore |
| | | Small-Cap | | Micro-Cap | | International | | Flexible | | Plus Bond | | Colorado |
| | | Value Fund | | Opportunity Fund | | Frontier Fund | | Income Fund | | Fund | | Tax-Exempt Fund |
Assets | | | | | | | | | | | | | | | | | | |
Investments at value (cost - see below) | $ | 268,280,717 | | $ | 2,093,357 | | $ | 34,084,263 | | $ | 68,955,860 | | $ | 1,591,968,121 | | $ | 118,610,857 |
Cash and cash equivalents | | 0 | | | 0 | | | 0 | | | | 2 | | | 40,602,074 | | | 0 |
Foreign cash at value (cost - see below) | | 0 | | | 0 | | | 117,069 | | | | 0 | | | 0 | | | 0 |
Receivable for investment securities sold | | 1,605,951 | | | 0 | | | 653,114 | | | 8,864 | | | 44,382 | | | 0 |
Dividends and interest receivable | | 343,416 | | | 1,250 | | | 41,775 | | | 1,061,811 | | | 15,144,388 | | | 767,816 |
Receivable for fund shares subscribed | | 174,032 | | | 0 | | | 61,947 | | | 17,450 | | | 1,123,088 | | | 29,566 |
Investment for trustee deferred | | | | | | | | | | | | | | | | | | |
compensation plan | | 1,290 | | | 0 | | | 6,925 | | | 23,256 | | | 54,006 | | | 25,258 |
Receivable due from advisor | | 0 | | | 5,346 | | | 0 | | | | 0 | | | 0 | | | 0 |
Prepaid and other assets | | 20,213 | | | 15,459 | | | 10,410 | | | 26,059 | | | 57,424 | | | 4,223 |
Total Assets | | 270,425,619 | | | 2,115,412 | | | 34,975,503 | | | 70,093,302 | | | 1,648,993,483 | | | 119,437,720 |
| | | | | | | | | | | | | | | | | | | |
Liabilities | | | | | | | | | | | | | | | | | | |
Payable for investment | | | | | | | | | | | | | | | | | | |
securities purchased | | 3,013,336 | | | 0 | | | 475,144 | | | | 0 | | | 40,600,961 | | | 0 |
Payable for fund shares redeemed | | 134,940 | | | 0 | | | 39,269 | | | 41,671 | | | 1,410,145 | | | 1,601 |
Payable for investment advisory fee | | 211,789 | | | 0 | | | 22,496 | | | 19,057 | | | 315,193 | | | 27,488 |
Payable for administration fee | | 38,097 | | | 893 | | | 4,499 | | | 10,284 | | | 206,424 | | | 15,209 |
Payable for shareholder servicing | | 11,179 | | | 85 | | | 1,709 | | | 3,095 | | | 71,155 | | | 6,057 |
Payable for trustee deferred | | | | | | | | | | | | | | | | | | |
compensation plan | | 1,290 | | | 0 | | | 6,925 | | | 23,256 | | | 54,006 | | | 25,258 |
Payable for chief compliance officer fee | | 1,566 | | | 6 | | | 153 | | | 417 | | | 8,483 | | | 726 |
Other payables | | 50,483 | | | 14,074 | | | 20,952 | | | 37,688 | | | 240,870 | | | 37,713 |
Total Liabilities | | 3,462,680 | | | 15,058 | | | 571,147 | | | 135,468 | | | 42,907,237 | | | 114,052 |
Net Assets | $ | 266,962,939 | | $ | 2,100,354 | | $ | 34,404,356 | | $ | 69,957,834 | | $ | 1,606,086,246 | | $ | 119,323,668 |
| | | | | | | | | | | | | | | | | | | |
Net Assets Consist of: | | | | | | | | | | | | | | | | | | |
Paid-in capital | $ | 304,448,048 | | $ | 2,310,268 | | $ | 40,877,280 | | $ | 118,679,708 | | $ | 1,570,530,885 | | $ | 116,298,199 |
(Over)/Undistributed net | | | | | | | | | | | | | | | | | | |
investment income | | 1,458,790 | | | (1,518) | | | 303,756 | | | (191,884) | | | (7,340) | | | (16,077) |
Accumulated net realized loss | | | | | | | | | | | | | | | | | | |
on investments and foreign | | | | | | | | | | | | | | | | | | |
currency transactions | | (58,376,326) | | | (270,219) | | | (10,108,231) | | | (32,340,260) | | | (9,103,606) | | | (44,772) |
Net unrealized appreciation/ | | | | | | | | | | | | | | | | | | |
(depreciation) on investments and | | | | | | | | | | | | | | | | | | |
translation of assets and liabilities | | | | | | | | | | | | | | | | | | |
denominated in foreign currencies | | 19,432,427 | | | 61,823 | | | 3,331,551 | | | (16,189,730) | | | 44,666,307 | | | 3,086,318 |
Net Assets | $ | 266,962,939 | | $ | 2,100,354 | | $ | 34,404,356 | | $ | 69,957,834 | | $ | 1,606,086,246 | | $ | 119,323,668 |
| | | | | | | | | | | | | | | | | | | |
Net Assets: | | | | | | | | | | | | | | | | | | |
Retail Class | $ | 196,830,702 | | $ | 2,100,354 | | $ | 34,404,356 | | $ | 68,679,903 | | $ | 1,416,686,879 | | $ | 119,323,668 |
Institutional Class | | 70,132,237 | | | N/A | | | N/A | | | 1,277,931 | | | 189,399,367 | | | N/A |
Shares of Beneficial Interest Outstanding: | | | | | | | | | | | | | | | | | | |
Retail Class | | 20,261,465 | | | 233,922 | | | 2,907,337 | | | 8,486,887 | | | 131,817,584 | | | 10,587,503 |
Institutional Class | | 7,221,877 | | | N/A | | | N/A | | | 158,561 | | | 17,638,701 | | | N/A |
Net Asset Value and Redemption Price | | | | | | | | | | | | | | | | | | |
Per Share (Net Assets Per | | | | | | | | | | | | | | | | | | |
Share Outstanding) | | | | | | | | | | | | | | | | | | |
Retail Class | $ | 9.71 | | $ | 8.98 | | $ | 11.83 | | $ | 8.09 | | $ | 10.75 | | $ | 11.27 |
Institutional Class | | 9.71 | | | N/A | | | N/A | | | 8.06 | | | 10.74 | | | N/A |
| | | | | | | | | | | | | | | | | | | |
Cost of Investments | $ | 248,848,290 | | $ | 2,031,534 | | $ | 30,753,147 | | $ | 85,145,590 | | $ | 1,547,301,814 | | $ | 115,524,539 |
Cost of Foreign Currency Held | $ | 0 | | $ | 0 | | $ | 113,616 | | $ | | 0 | | $ | 0 | | $ | 0 |
See Notes to Financial Statements.
|
|
|

WESTCORE EQUITY FUNDS FOR THE SIX MONTHS ENDED JUNE 30, 2010 (UNAUDITED)
| | Westcore | | Westcore | | Westcore | | Westcore | | Westcore | | Westcore |
| | Growth | | MIDCO | | Select | | Blue Chip | | Mid-Cap | | Small-Cap |
| | Fund | | Growth Fund | | Fund | | Fund | | Value Fund | | Opportunity Fund |
Investment Income | | | | | | | | | | | | | | | | | |
Dividends, net of foreign taxes* | $ | 532,517 | | $ | 458,612 | | $ | 281,112 | | $ | 279,702 | | $ | 399,304 | | $ | 214,664 |
Interest | | 661 | | | 595 | | | 1,232 | | | 99 | | | 91 | | | 319 |
Other Income | | 0 | | | 0 | | | 0 | | | 0 | | | 0 | | | 0 |
Total Income | | 533,178 | | | 459,207 | | | 282,344 | | | 279,801 | | | 399,395 | | | 214,983 |
| | | | | | | | | | | | | | | | | | |
Expenses | | | | | | | | | | | | | | | | | |
Investment advisory fee | | 373,624 | | | 397,397 | | | 327,193 | | | 120,583 | | | 186,284 | | | 192,532 |
Administrative fee | | 102,863 | | | 105,293 | | | 85,483 | | | 34,062 | | | 42,279 | | | 37,718 |
Shareholder servicing reimbursement - | | | | | | | | | | | | | | | | | |
Retail Class | | 41,821 | | | 20,117 | | | 33,038 | | | 3,122 | | | 13,975 | | | 7,583 |
Transfer agent fees | | 14,755 | | | 23,567 | | | 18,302 | | | 11,890 | | | 11,135 | | | 11,607 |
Fund accounting fees and expenses | | 22,538 | | | 19,990 | | | 17,905 | | | 17,723 | | | 17,228 | | | 21,270 |
Legal fees | | 2,112 | | | 2,465 | | | 1,952 | | | 762 | | | 1,003 | | | 843 |
Printing fees | | 11,566 | | | 8,405 | | | 6,890 | | | 2,513 | | | 3,538 | | | 2,861 |
Registration fees | | 15,944 | | | 14,669 | | | 11,953 | | | 9,176 | | | 8,783 | | | 13,726 |
Audit and tax preparation fees | | 8,666 | | | 8,668 | | | 7,158 | | | 7,128 | | | 7,125 | | | 6,412 |
Custodian fees | | 3,408 | | | 6,515 | | | 7,244 | | | 1,626 | | | 2,789 | | | 3,727 |
Insurance | | 2,437 | | | 2,241 | | | 1,117 | | | 702 | | | 907 | | | 634 |
Trustee fees and expenses | | 5,956 | | | 6,905 | | | 5,623 | | | 2,012 | | | 2,799 | | | 2,370 |
Chief compliance officer fee | | 1,870 | | | 2,273 | | | 1,973 | | | 654 | | | 927 | | | 806 |
Other | | 7,730 | | | 4,391 | | | 5,103 | | | 4,327 | | | 3,425 | | | 5,006 |
Total expenses before waivers | | 615,290 | | | 622,896 | | | 530,934 | | | 216,280 | | | 302,197 | | | 307,095 |
Expenses waived by: | | | | | | | | | | | | | | | | | |
Investment advisor | | | | | | | | | | | | | | | | | |
Retail Class | | 0 | | | 0 | | | 0 | | | (7,684) | | | 0 | | | (37,455) |
Institutional Class | | (17,466) | | | (9,486) | | | N/A | | | (15,938) | | | N/A | | | (19,919) |
Administrator | | | | | | | | | | | | | | | | | |
Retail Class | | 0 | | | 0 | | | 0 | | | (340) | | | 0 | | | (1,153) |
Institutional Class | | 0 | | | 0 | | | N/A | | | 0 | | | N/A | | | 0 |
Net Expenses | | 597,824 | | | 613,410 | | | 530,934 | | | 192,318 | | | 302,197 | | | 248,568 |
Net Investment Income/(Loss) | | (64,646) | | | (154,203) | | | (248,590) | | | 87,483 | | | 97,198 | | | (33,585) |
| | | | | | | | | | | | | | | | | | |
Realized and Unrealized Gain/(Loss): | | | | | | | | | | | | | | | | | |
Net realized gain on investments | | 8,312,192 | | | 11,442,118 | | | 4,039,437 | | | 769,325 | | | 1,488,480 | | | 570,079 |
Net change in unrealized appreciation/ | | | | | | | | | | | | | | | | | |
(depreciation) on investments | | (18,531,974) | | | (13,155,090) | | | (12,609,180) | | | (4,671,058) | | | (2,595,779) | | | (1,200,834) |
Net Realized And Unrealized Loss | | (10,219,782) | | | (1,712,972) | | | (8,569,743) | | | (3,901,733) | | | (1,107,299) | | | (630,755) |
Net Decrease In Net Assets Resulting | | | | | | | | | | | | | | | | | |
From Operations | $ | (10,284,428) | | $ | (1,867,175) | | $ | (8,818,333) | | $ | (3,814,250) | | $ | (1,010,101) | | $ | (664,340) |
| | | | | | | | | | | | | | | | | | |
* Foreign tax withholdings | $ | 882 | | $ | 0 | | $ | 0 | | $ | 5,361 | | $ | 0 | | $ | 0 |
| | | | | | | | | | | | | | | | | | |
See Notes to Financial Statements. |
| PAGE 70 |
|
FOR THE SIX MONTHS ENDED JUNE 30, 2010 (UNAUDITED)
| | WESTCORE EQUITY FUNDS | | WESTCORE BOND FUNDS |
| | | Westcore | | Westcore | | | Westcore | | | Westcore | | | | Westcore | | Westcore |
| | | Small-Cap | | Micro-Cap | | | International | | | Flexible | | | | Plus Bond | | Colorado |
| | | Value Fund | | Opportunity Fund | | | Frontier Fund | | | Income Fund | | | | Fund | | Tax-Exempt Fund |
Investment Income | | | | | | | | | | | | | | | | | | |
Dividends, net of foreign taxes* | $ | 2,943,017 | | $ | 8,812 | | $ | 524,606 | | $ | 270,909 | | $ | 313,738 | | $ | 0 |
Interest | | 2,472 | | | 16 | | | 235 | | | 2,534,390 | | | 36,000,586 | | | 2,372,467 |
Other Income | | 0 | | | 0 | | | 0 | | | 104,036 | | | 182,240 | | | 0 |
Total Income | | 2,945,489 | | | 8,828 | | | 524,841 | | | 2,909,335 | | | 36,496,564 | | | 2,372,467 |
| | | | | | | | | | | | | | | | | | | |
Expenses | | | | | | | | | | | | | | | | | | |
Investment advisory fee | | 1,345,368 | | | 9,421 | | | 200,047 | | | 163,563 | | | 3,416,090 | | | 278,453 |
Administrative fee | | 228,882 | | | 6,562 | | | 28,366 | | | 66,847 | | | 1,291,947 | | | 94,778 |
Shareholder servicing reimbursement - | | | | | | | | | | | | | | | | | | |
Retail Class | | 69,217 | | | 480 | | | 9,879 | | | 22,388 | | | 457,274 | | | 36,001 |
Transfer agent fees | | 11,841 | | | 8,144 | | | 10,206 | | | 15,159 | | | 108,487 | | | 10,079 |
Fund accounting fees and expenses | | 38,154 | | | 23,463 | | | 24,824 | | | 24,712 | | | 174,389 | | | 31,051 |
Legal fees | | 5,550 | | | 41 | | | 695 | | | 1,426 | | | 28,334 | | | 2,130 |
Printing fees | | 19,114 | | | 215 | | | 2,188 | | | 5,113 | | | 104,443 | | | 8,002 |
Registration fees | | 19,142 | | | 8,711 | | | 8,939 | | | 16,597 | | | 41,689 | | | 2,306 |
Audit and tax preparation fees | | 8,651 | | | 5,144 | | | 7,126 | | | 10,694 | | | 13,969 | | | 9,169 |
Custodian fees | | 8,095 | | | 41 | | | 5,678 | | | 4,162 | | | 48,869 | | | 3,790 |
Insurance | | 4,409 | | | 33 | | | 621 | | | 1,401 | | | 26,799 | | | 1,880 |
Trustee fees and expenses | | 15,331 | | | 103 | | | 1,828 | | | 3,984 | | | 83,300 | | | 6,616 |
Chief compliance officer fee | | 5,160 | | | 32 | | | 603 | | | 1,314 | | | 27,707 | | | 2,244 |
Other | | 21,512 | | | 3,242 | | | 3,350 | | | 2,229 | | | 39,023 | | | 6,303 |
Total expenses before waivers | | 1,800,426 | | | 65,632 | | | 304,350 | | | 339,589 | | | 5,862,320 | | | 492,802 |
Expenses waived by: | | | | | | | | | | | | | | | | | | |
Investment advisor | | | | | | | | | | | | | | | | | | |
Retail Class | | (50,975) | | | (51,756)(a) | | | (52,864) | | | (10,453) | | | (1,473,633) | | | (124,029) |
Institutional Class | | (27,146) | | | N/A | | | N/A | | | (16,781) | | | (193,295) | | | N/A |
Administrator | | | | | | | | | | | | | | | | | | |
Retail Class | | (1,649) | | | (1,589) | | | (1,378) | | | (619) | | | (87,433) | | | (6,783) |
Institutional Class | | 0 | | | N/A | | | N/A | | | | 0 | | | 0 | | | N/A |
Net Expenses | | 1,720,656 | | | 12,287 | | | 250,108 | | | 311,736 | | | 4,107,959 | | | 361,990 |
Net Investment Income/(Loss) | | 1,224,833 | | | (3,459) | | | 274,733 | | | 2,597,599 | | | 32,388,605 | | | 2,010,477 |
| | | | | | | | | | | | | | | | | | | |
Realized and Unrealized Gain/(Loss): | | | | | | | | | | | | | | | | | | |
Net realized gain/(loss) on investments | | 6,820,609 | | | 136,003 | | | 2,345,351 | | | (881,574) | | | (2,518,994) | | | 13,139 |
Net realized loss on foreign | | | | | | | | | | | | | | | | | | |
currency transactions | | 0 | | | 0 | | | (193,441) | | | | 0 | | | 0 | | | 0 |
Net change in unrealized appreciation/ | | | | | | | | | | | | | | | | | | |
(depreciation) on investments | | (4,574,728) | | | (111,043) | | | (382,294) | | | 1,833,605 | | | 49,151,119 | | | 780,139 |
Net change in unrealized appreciation/ | | | | | | | | | | | | | | | | | | |
(depreciation) on translation of | | | | | | | | | | | | | | | | | | |
assets and liabilities denominated | | | | | | | | | | | | | | | | | | |
in foreign currencies | | 0 | | | 0 | | | (1,691,076) | | | | 0 | | | 0 | | | 0 |
Net Realized And Unrealized Gain | | 2,245,881 | | | 24,960 | | | 78,540 | | | 952,031 | | | 46,632,125 | | | 793,278 |
Net Increase In Net Assets | | | | | | | | | | | | | | | | | | |
Resulting From Operations | $ | 3,470,714 | | $ | 21,501 | | $ | 353,273 | | $ | 3,549,630 | | $ | 79,020,730 | | $ | 2,803,755 |
| | | | | | | | | | | | | | | | | | | |
* Foreign tax withholdings | $ | 5,144 | | $ | 0 | | $ | 39,301 | | $ | | 0 | | $ | 0 | | $ | 0 |
| | | | | | | | | | | | | | | | | | | |
(a) Includes $42,335 which represents a reimbursement of operating expenses by the Investment Advisor. |
| | | | | | | | | | | | | | | | | | | |
See Notes to Financial Statements. |
|
|

| | Westcore Growth Fund | | Westcore MIDCO Growth Fund | | Westcore Select Fund |
| | | Six Months Ended | | | | | Six Months Ended | | | | | Six Months Ended | | | |
| | | June 30, 2010 | | Year Ended | | June 30, 2010 | | Year Ended | | June 30, 2010 | | Year Ended |
| | | (Unaudited) | | December 31, 2009 | | (Unaudited) | | December 31, 2009 | | (Unaudited) | | December 31, 2009 |
Increase/(Decrease) in Net Assets from: | | | | | | | | | | | | | | | | | |
| | | | | | | | | | | | | | | | | | |
Operations: | | | | | | | | | | | | | | | | | |
Net investment (loss) | $ | (64,646) | | $ | (60,662) | | $ | (154,203) | | $ | (173,732) | | $ | (248,590) | | $ | (123,724) |
Net realized gain/(loss) | | 8,312,192 | | | (4,924,071) | | | 11,442,118 | | | 1,929,341 | | | 4,039,437 | | | 7,298,621 |
Change in unrealized net appreciation or depreciation | | (18,531,974) | | | 45,496,139 | | | (13,155,090) | | | 38,728,604 | | | (12,609,180) | | | 8,719,781 |
Net increase/(decrease) in net assets | | | | | | | | | | | | | | | | | |
resulting from operations | | (10,284,428) | | | 40,511,406 | | | (1,867,175) | | | 40,484,213 | | | (8,818,333) | | | 15,894,678 |
| | | | | | | | | | | | | | | | | | |
Distributions to Shareholders (Note 1): | | | | | | | | | | | | | | | | | |
From net investment income | | | | | | | | | | | | | | | | | |
Retail Class | | 0 | | | (49,492) | | | 0 | | | 0 | | | 0 | | | 0 |
Institutional Class | | 0 | | | (6,323) | | | 0 | | | 0 | | | N/A | | | N/A |
From net realized capital gains | | | | | | | | | | | | | | | | | |
Retail Class | | 0 | | | 0 | | | 0 | | | 0 | | | 0 | | | 0 |
Institutional Class | | 0 | | | 0 | | | 0 | | | 0 | | | N/A | | | N/A |
From paid in capital | | | | | | | | | | | | | | | | | |
Retail Class | | 0 | | | 0 | | | 0 | | | 0 | | | 0 | | | 0 |
Institutional Class | | 0 | | | 0 | | | 0 | | | 0 | | | N/A | | | N/A |
Decrease in net assets from distributions | | | | | | | | | | | | | | | | | |
to shareholders | | 0 | | | (55,815) | | | 0 | | | 0 | | | 0 | | | 0 |
| | | | | | | | | | | | | | | | | | |
Beneficial Interest Transactions (Note 2): | | | | | | | | | | | | | | | | | |
Shares sold | | | | | | | | | | | | | | | | | |
Retail Class | | 12,505,555 | | | 8,593,753 | | | 2,880,800 | | | 9,101,131 | | | 96,915,989 | | | 37,806,833 |
Institutional Class | | 725,759 | | | 474,280 | | | 735,752 | | | 3,182,337 | | | N/A | | | N/A |
Shares issued in reinvestment of distributions | | | | | | | | | | | | | | | | | |
Retail Class | | 0 | | | 48,901 | | | 0 | | | 0 | | | 0 | | | 0 |
Institutional Class | | 0 | | | 6,323 | | | 0 | | | 0 | | | N/A | | | N/A |
Cost of Shares Redeemed | | | | | | | | | | | | | | | | | |
Retail Class | | (29,504,436) | | | (61,040,326) | | | (7,163,546) | | | (17,402,732) | | | (11,229,038) | | | (14,737,524) |
Institutional Class | | (252,063) | | | (445,131) | | | (1,927,089) | | | (4,038,221) | | | N/A | | | N/A |
Net increase/(decrease) resulting from | | | | | | | | | | | | | | | | | |
beneficial interest transactions | | (16,525,185) | | | (52,362,200) | | | (5,474,083) | | | (9,157,485) | | | 85,686,951 | | | 23,069,309 |
Redemption Fees | | 210 | | | 10,209 | | | 930 | | | 2,786 | | | 16,841 | | | 12,493 |
Net Increase/(Decrease) In Net Assets | | (26,809,403) | | | (11,896,400) | | | (7,340,328) | | | 31,329,514 | | | 76,885,459 | | | 38,976,480 |
| | | | | | | | | | | | | | | | | | |
Net Assets: | | | | | | | | | | | | | | | | | |
Beginning of year | | 123,075,079 | | | 134,971,479 | | | 119,707,093 | | | 88,377,579 | | | 67,199,399 | | | 28,222,919 |
End of year or period* | $ | 96,265,676 | | $ | 123,075,079 | | $ | 112,366,765 | | $ | 119,707,093 | | $ | 144,084,858 | | $ | 67,199,399 |
| | | | | | | | | | | | | | | | | | |
*Including overdistributed net investment | | | | | | | | | | | | | | | | | |
income of: | $ | (98,909) | | $ | (34,263) | | $ | (508,789) | | $ | (354,586) | | $ | (256,941) | | $ | (8,351) |
| | | | | | | | | | | | | | | | | | |
See Notes to Financial Statements. |
| PAGE 72 |
|
| | Westcore Blue Chip Fund | | Westcore Mid-Cap Value Fund | | Westcore Small-Cap Opportunity Fund |
| | Six Months Ended | | | | | Six Months Ended | | | | | Six Months Ended | | | |
| | June 30, 2010 | | Year Ended | | June 30, 2010 | | Year Ended | | June 30, 2010 | | Year Ended |
| | (Unaudited) | | December 31, 2009 | | (Unaudited) | | December 31, 2009 | | (Unaudited) | | December 31, 2009 |
Increase/(Decrease) in Net Assets from: | | | | | | | | | | | | | | | | | |
| | | | | | | | | | | | | | | | | | |
Operations: | | | | | | | | | | | | | | | | | |
Net investment income/(loss) | $ | 87,483 | | $ | 223,446 | | $ | 97,198 | | $ | 342,244 | | $ | (33,585) | | $ | 41,421 |
Net realized gain/(loss) | | 769,325 | | | (1,577,816) | | | 1,488,480 | | | (3,250,766) | | | 570,079 | | | (1,515,789) |
Change in unrealized net appreciation or depreciation | | (4,671,058) | | | 10,912,033 | | | (2,595,779) | | | 15,564,766 | | | (1,200,834) | | | 8,902,360 |
Net increase/(decrease) in net assets | | | | | | | | | | | | | | | | | |
resulting from operations | | (3,814,250) | | | 9,557,663 | | | (1,010,101) | | | 12,656,244 | | | (664,340) | | | 7,427,992 |
| | | | | | | | | | | | | | | | | | |
Distributions to Shareholders (Note 1): | | | | | | | | | | | | | | | | | |
From net investment income | | | | | | | | | | | | | | | | | |
Retail Class | | 0 | | | (70,396) | | | 0 | | | (327,999) | | | 0 | | | 0 |
Institutional Class | | 0 | | | (129,604) | | | N/A | | | N/A | | | 0 | | | 0 |
From net realized capital gains | | | | | | | | | | | | | | | | | |
Retail Class | | 0 | | | 0 | | | 0 | | | 0 | | | 0 | | | 0 |
Institutional Class | | 0 | | | 0 | | | N/A | | | N/A | | | 0 | | | 0 |
From paid in capital | | | | | | | | | | | | | | | | | |
Retail Class | | 0 | | | 0 | | | 0 | | | 0 | | | 0 | | | 0 |
Institutional Class | | 0 | | | 0 | | | N/A | | | N/A | | | 0 | | | 0 |
Decrease in net assets from distributions | | | | | | | | | | | | | | | | | |
to shareholders | | 0 | | | (200,000) | | | 0 | | | (327,999) | | | 0 | | | 0 |
| | | | | | | | | | | | | | | | | | |
Beneficial Interest Transactions (Note 2): | | | | | | | | | | | | | | | | | |
Shares sold | | | | | | | | | | | | | | | | | |
Retail Class | | 378,303 | | | 893,575 | | | 3,846,816 | | | 9,049,301 | | | 6,147,589 | | | 13,259,822 |
Institutional Class | | 202,530 | | | 374,940 | | | N/A | | | N/A | | | 184,862 | | | 340,084 |
Shares issued in reinvestment of distributions | | | | | | | | | | | | | | | | | |
Retail Class | | 0 | | | 61,177 | | | 0 | | | 281,297 | | | 0 | | | 0 |
Institutional Class | | 0 | | | 120,926 | | | N/A | | | N/A | | | 0 | | | 0 |
Cost of Shares Redeemed | | | | | | | | | | | | | | | | | |
Retail Class | | (1,128,696) | | | (5,164,852) | | | (6,622,624) | | | (13,801,819) | | | (3,298,294) | | | (3,610,486) |
Institutional Class | | (973,025) | | | (2,017,304) | | | N/A | | | N/A | | | (253,295) | | | (226,379) |
Net increase/(decrease) resulting from | | | | | | | | | | | | | | | | | |
beneficial interest transactions | | (1,520,888) | | | (5,731,538) | | | (2,775,808) | | | (4,471,221) | | | 2,780,862 | | | 9,763,041 |
Redemption Fees | | 103 | | | 293 | | | 53 | | | 1,470 | | | 893 | | | 8,776 |
Net Increase/(Decrease) In Net Assets | | (5,335,035) | | | 3,626,418 | | | (3,785,856) | | | 7,858,494 | | | 2,117,415 | | | 17,199,809 |
| | | | | | | | | | | | | | | | | | |
Net Assets: | | | | | | | | | | | | | | | | | |
Beginning of year | | 38,217,513 | | | 34,591,095 | | | 48,572,492 | | | 40,713,998 | | | 35,552,476 | | | 18,352,667 |
End of year or period* | $ | 32,882,478 | | $ | 38,217,513 | | $ | 44,786,636 | | $ | 48,572,492 | | $ | 37,669,891 | | $ | 35,552,476 |
| | | | | | | | | | | | | | | | | | |
*Including (over)/undistributed net investment | | | | | | | | | | | | | | | | | |
income of: | $ | 67,650 | | $ | (19,833) | | $ | 103,743 | | $ | 6,545 | | $ | (22,809) | | $ | 10,776 |
| | | | | | | | | | | | | | | | | | |
See Notes to Financial Statements. |
|
|
| | Westcore Small-Cap Value Fund | | Westcore Micro-Cap Opportunity Fund | | Westcore International Frontier Fund |
| | | Six Months Ended | | | | | Six Months Ended | | | | | Six Months Ended | | | |
| | | June 30, 2010 | | Year Ended | | June 30, 2010 | | Year Ended | | June 30, 2010 | | Year Ended |
| | | (Unaudited) | | December 31, 2009 | | (Unaudited) | | December 31, 2009 | | (Unaudited) | | December 31, 2009 |
Increase/(Decrease) in Net Assets from: | | | | | | | | | | | | | | | | | |
| | | | | | | | | | | | | | | | | | |
Operations: | | | | | | | | | | | | | | | | | |
Net investment income/(loss) | $ | 1,224,833 | | $ | 2,802,539 | | $ | (3,459) | | $ | 3,602 | | $ | 274,733 | | $ | 418,049 |
Net realized gain/(loss) | | 6,820,609 | | | (41,174,848) | | | 136,003 | | | (216,470) | | | 2,151,910 | | | (5,387,665) |
Change in unrealized net appreciation or depreciation | | (4,574,728) | | | 85,456,065 | | | (111,043) | | | 387,555 | | | (2,073,370) | | | 16,965,593 |
Net increase in net assets | | | | | | | | | | | | | | | | | |
resulting from operations | | 3,470,714 | | | 47,083,756 | | | 21,501 | | | 174,687 | | | 353,273 | | | 11,995,977 |
| | | | | | | | | | | | | | | | | | |
Distributions to Shareholders (Note 1): | | | | | | | | | | | | | | | | | |
From net investment income | | | | | | | | | | | | | | | | | |
Retail Class | | 0 | | | (1,993,752) | | | 0 | | | (6,600) | | | 0 | | | (365,000) |
Institutional Class | | 0 | | | (576,246) | | | N/A | | | N/A | | | N/A | | | N/A |
From net realized capital gains | | | | | | | | | | | | | | | | | |
Retail Class | | 0 | | | 0 | | | 0 | | | 0 | | | 0 | | | 0 |
Institutional Class | | 0 | | | 0 | | | N/A | | | N/A | | | N/A | | | N/A |
From paid in capital | | | | | | | | | | | | | | | | | |
Retail Class | | 0 | | | 0 | | | 0 | | | 0 | | | 0 | | | 0 |
Institutional Class | | 0 | | | 0 | | | N/A | | | N/A | | | N/A | | | N/A |
Decrease in net assets from distributions | | | | | | | | | | | | | | | | | |
to shareholders | | 0 | | | (2,569,998) | | | 0 | | | (6,600) | | | 0 | | | (365,000) |
| | | | | | | | | | | | | | | | | | |
Beneficial Interest Transactions (Note 2): | | | | | | | | | | | | | | | | | |
Shares sold | | | | | | | | | | | | | | | | | |
Retail Class | | 35,630,221 | | | 78,394,493 | | | 708,634 | | | 1,325,689 | | | 6,214,170 | | | 6,126,911 |
Institutional Class | | 26,365,029 | | | 31,762,269 | | | N/A | | | N/A | | | N/A | | | N/A |
Shares issued in reinvestment of distributions | | | | | | | | | | | | | | | | | |
Retail Class | | 0 | | | 1,644,043 | | | 0 | | | 6,512 | | | 0 | | | 304,408 |
Institutional Class | | 0 | | | 533,584 | | | N/A | | | N/A | | | N/A | | | N/A |
Cost of Shares Redeemed | | | | | | | | | | | | | | | | | |
Retail Class | | (34,473,572) | | | (72,844,070) | | | (553,562) | | | (681,139) | | | (4,521,606) | | | (3,989,040) |
Institutional Class | | (8,497,493) | | | (8,514,207) | | | N/A | | | N/A | | | N/A | | | N/A |
Net increase resulting from | | | | | | | | | | | | | | | | | |
beneficial interest transactions | | 19,024,185 | | | 30,976,112 | | | 155,072 | | | 651,062 | | | 1,692,564 | | | 2,442,279 |
Redemption Fees | | 10,734 | | | 147,991 | | | 0 | | | 631 | | | 2,141 | | | 803 |
Net Increase In Net Assets | | 22,505,633 | | | 75,637,861 | | | 176,573 | | | 819,780 | | | 2,047,978 | | | 14,074,059 |
| | | | | | | | | | | | | | | | | | |
Net Assets: | | | | | | | | | | | | | | | | | |
Beginning of year or period | | 244,457,306 | | | 168,819,445 | | | 1,923,781 | | | 1,104,001 | | | 32,356,378 | | | 18,282,319 |
End of year or period* | $ | 266,962,939 | | $ | 244,457,306 | | $ | 2,100,354 | | $ | 1,923,781 | | $ | 34,404,356 | | $ | 32,356,378 |
| | | | | | | | | | | | | | | | | | |
*Including (over)/undistributed net investment | | | | | | | | | | | | | | | | | |
income of: | $ | 1,458,790 | | $ | 233,957 | | $ | (1,518) | | $ | 1,941 | | $ | 303,756 | | $ | 29,023 |
| | | | | | | | | | | | | | | | | | |
See Notes to Financial Statements. |
| PAGE 74 |
|
| | Westcore Flexible Income Fund | | Westcore Plus Bond Fund | | Westcore Colorado Tax-Exempt Fund |
| | | Six Months Ended | | | | | | Six Months Ended | | | | | Six Months Ended | | |
| | | June 30, 2010 | | Year Ended | | | June 30, 2010 | | Year Ended | | June 30, 2010 | | Year Ended |
| | | (Unaudited) | | December 31, 2009 | | | (Unaudited) | | December 31, 2009 | | (Unaudited) | | December 31, 2009 |
Increase/(Decrease) in Net Assets from: | | | | | | | | | | | | | | | | | | |
| | | | | | | | | | | | | | | | | | | |
Operations: | | | | | | | | | | | | | | | | | | |
Net investment income | $ | 2,597,599 | | $ | 5,047,312 | | $ | 32,388,605 | | $ | 56,426,582 | | $ | | 2,010,477 | | $ | 3,096,475 |
Net realized gain/(loss) | | (881,574) | | | (5,157,372) | | | (2,518,994) | | | 1,286,110 | | | | 13,139 | | | 33,109 |
Change in unrealized net appreciation or depreciation | | 1,833,605 | | | 23,393,268 | | | 49,151,119 | | | 71,091,866 | | | | 780,139 | | | 4,852,874 |
Net increase in net assets | | | | | | | | | | | | | | | | | | |
resulting from operations | | 3,549,630 | | | 23,283,208 | | | 79,020,730 | | | 128,804,558 | | | | 2,803,755 | | | 7,982,458 |
| | | | | | | | | | | | | | | | | | | |
Distributions to Shareholders (Note 1): | | | | | | | | | | | | | | | | | | |
From net investment income | | | | | | | | | | | | | | | | | | |
Retail Class | | (2,455,522) | | | (4,923,185) | | | (28,577,525) | | | (52,089,178) | | | | (2,014,639) | | | (3,085,601) |
Institutional Class | | (46,148) | | | (76,818) | | | (3,552,824) | | | (4,147,536) | | | | N/A | | | N/A |
From net realized capital gains | | | | | | | | | | | | | | | | | | |
Retail Class | | 0 | | | 0 | | | 0 | | | 0 | | | | 0 | | | 0 |
Institutional Class | | 0 | | | 0 | | | 0 | | | 0 | | | | N/A | | | N/A |
From paid in capital | | | | | | | | | | | | | | | | | | |
Retail Class | | 0 | | | 0 | | | 0 | | | 0 | | | | 0 | | | 0 |
Institutional Class | | 0 | | | 0 | | | 0 | | | 0 | | | | N/A | | | N/A |
Decrease in net assets from distributions | | | | | | | | | | | | | | | | | | |
to shareholders | | (2,501,670) | | | (5,000,003) | | | (32,130,349) | | | (56,236,714) | | | | (2,014,639) | | | (3,085,601) |
| | | | | | | | | | | | | | | | | | | |
Beneficial Interest Transactions (Note 2): | | | | | | | | | | | | | | | | | | |
Shares sold | | | | | | | | | | | | | | | | | | |
Retail Class | | 6,304,823 | | | 7,951,642 | | | 221,007,316 | | | 555,374,038 | | | | 18,554,755 | | | 53,387,527 |
Institutional Class | | 548,982 | | | 944,953 | | | 71,617,624 | | | 73,627,607 | | | | N/A | | | N/A |
Shares issued in reinvestment of distributions | | | | | | | | | | | | | | | | | | |
Retail Class | | 2,329,351 | | | 4,650,471 | | | 27,205,882 | | | 48,191,832 | | | | 1,816,197 | | | 2,801,724 |
Institutional Class | | 46,148 | | | 76,693 | | | 2,935,744 | | | 2,870,232 | | | | N/A | | | N/A |
Cost of Shares Redeemed | | | | | | | | | | | | | | | | | | |
Retail Class | | (13,775,603) | | | (22,868,902) | | | (200,411,493) | | | (413,761,270) | | | | (7,733,417) | | | (22,413,127) |
Institutional Class | | (565,656) | | | (821,227) | | | (21,665,850) | | | (14,896,112) | | | | N/A | | | N/A |
Net increase/(decrease) resulting from | | | | | | | | | | | | | | | | | | |
beneficial interest transactions | | (5,111,955) | | | (10,066,370) | | | 100,689,223 | | | 251,406,327 | | | | 12,637,535 | | | 33,776,124 |
Redemption Fees | | 4,972 | | | 9,341 | | | 32,522 | | | 230,775 | | | | 5,600 | | | 12,357 |
Net Increase/(Decrease) In Net Assets | | (4,059,023) | | | 8,226,176 | | | 147,612,126 | | | 324,204,946 | | | | 13,432,251 | | | 38,685,338 |
| | | | | | | | | | | | | | | | | | | |
Net Assets: | | | | | | | | | | | | | | | | | | |
Beginning of year or period | | 74,016,857 | | | 65,790,681 | | | 1,458,474,120 | | | 1,134,269,174 | | | 105,891,417 | | | 67,206,079 |
End of year or period* | $ | 69,957,834 | | $ | 74,016,857 | | $ | 1,606,086,246 | | $ | 1,458,474,120 | | | $ | 119,323,668 | | $ | 105,891,417 |
| | | | | | | | | | | | | | | | | | | |
*Including overdistributed net investment | | | | | | | | | | | | | | | | | | |
income of: | $ | (191,884) | | $ | (287,813) | | $ | (7,340) | | $ | (265,596) | | | $ | (16,077) | | $ | (11,915) |
| | | | | | | | | | | | | | | | | | | |
See Notes to Financial Statements. |
|
|

Selected data for a share of beneficial interest outstanding throughout the period indicated. |
| |
| | | | Income from Investment Operations | | Distributions |
| | | | | | | | | | | | | | | | |
| | | | Net | | | | Net Realized And | | | Total Income/ | | | | | | |
| | | | Asset Value | | Net | | Unrealized Gain/ | | | (Loss) from | | | | Dividends From Net | | |
| | | | Beginning of the | | Investment | | (Loss) on | | | Investment | | Dividends from Net | | Realized Gain on | | Total |
| | Year or Period Ended | | Period | | Income/(Loss) | | Investments | | | Operations | | Investment Income | | Investments | | Distributions |
| | WESTCORE GROWTH FUND |
| | Retail Class |
| | 06/30/10 | | $ | 10.88 | | $ | (0.01) | | $ | (1.10) | | $ | (1.11) | | $ | (0.00) | | $ | (0.00) | | $ | (0.00) | |
| | 12/31/09 | | | 7.80 | | | (0.01) | | | 3.09 | | | 3.08 | | | (0.00) | (b) | | (0.00) | | | (0.00) | (b) |
| | 12/31/08 | | | 15.45 | | | 0.00 | (b) | | (7.02) | | | (7.02) | | | (0.00) | | | (0.63) | | | (0.63) | |
| | 12/31/07 | | | 13.31 | | | (0.01) | | | 3.01 | | | 3.00 | | | (0.00) | | | (0.86) | | | (0.86) | |
| | 12/31/06 (a) | | | 12.58 | | | (0.00) | (b) | | 0.74 | | | 0.74 | | | (0.00) | | | (0.01) | | | (0.01) | |
| | 05/31/06 | | | 11.74 | | | (0.03) | | | 0.93 | | | 0.90 | | | (0.00) | (b) | | (0.06) | | | (0.06) | |
| | 05/31/05 | | | 11.01 | | | 0.01 | | | 0.94 | | | 0.95 | | | (0.01) | | | (0.21) | | | (0.22) | |
| | Institutional Class |
| | 06/30/10 | | | 10.88 | | | (0.00) | | | (1.10) | | | (1.10) | | | (0.00) | | | (0.00) | | | (0.00) | |
| | 12/31/09 | | | 7.81 | | | (0.00) | (b) | | 3.10 | | | 3.10 | | | (0.03) | | | (0.00) | | | (0.03) | |
| | 12/31/08 | | | 15.45 | | | 0.01 | | | (7.02) | | | (7.01) | | | (0.00) | | | (0.63) | | | (0.63) | |
| | 12/31/07 (f) | | | 15.96 | | | (0.00) | (b) | | 0.35 | | | 0.35 | | | (0.00) | | | (0.86) | | | (0.86) | |
| | WESTCORE MIDCO GROWTH FUND |
| | Retail Class |
| | 06/30/10 | | | 5.20 | | | (0.01) | | | (0.09) | | | (0.10) | | | (0.00) | | | (0.00) | | | (0.00) | |
| | 12/31/09 | | | 3.55 | | | (0.01) | | | 1.66 | | | 1.65 | | | (0.00) | | | (0.00) | | | (0.00) | |
| | 12/31/08 | | | 6.94 | | | (0.04) | | | (3.09) | | | (3.13) | | | (0.00) | | | (0.26) | | | (0.26) | |
| | 12/31/07 | | | 7.45 | | | (0.04) | | | 0.89 | | | 0.85 | | | (0.00) | | | (1.36) | | | (1.36) | |
| | 12/31/06 (a) | | | 7.99 | | | (0.00) | (b) | | 0.78 | | | 0.78 | | | (0.00) | | | (1.32) | | | (1.32) | |
| | 05/31/06 | | | 7.03 | | | (0.03) | | | 1.01 | | | 0.98 | | | (0.00) | | | (0.02) | | | (0.02) | |
| | 05/31/05 | | | 6.79 | | | (0.04) | | | 0.28 | | | 0.24 | | | (0.00) | | | (0.00) | | | (0.00) | |
| | Institutional Class |
| | 06/30/10 | | | 5.22 | | | (0.00) | (b) | | (0.10) | | | (0.10) | | | (0.00) | | | (0.00) | | | (0.00) | |
| | 12/31/09 | | | 3.56 | | | (0.00) | (b) | | 1.66 | | | 1.66 | | | (0.00) | | | (0.00) | | | (0.00) | |
| | 12/31/08 | | | 6.95 | | | (0.04) | | | (3.09) | | | (3.13) | | | (0.00) | | | (0.26) | | | (0.26) | |
| | 12/31/07 (f) | | | 8.55 | | | (0.01) | | | (0.23) | | | (0.24) | | | (0.00) | | | (1.36) | | | (1.36) | |
| | | | | | | | | | | | | | | | | | | | | | | | |
| (a) | Effective December 31, 2006, the Westcore Funds changed their fiscal year end from May 31 to December 31. |
| (b) | Less than $0.005 per share. |
| (c) | Total return and portfolio turnover rate are not annualized for periods less than one full year. |
| (d) | Annualized. |
| PAGE 76 |
|

| | | | | | | Ratios/Supplemental Data |
| | | | | | | | | | | | | | | Ratio of Net | | |
| | | | | | | | | | | | | | | Investment | | |
| | | | | | | | | | | Ratio of Expenses | | Ratio of Net | | Income/(Loss) | | |
| | Paid-in | | | | | Net Assets, | | Ratio of Expenses | | to Average Net | | Investment Income/ | | to Average Net | | |
| | Capital from | Net Asset Value | | | | End of Period | | to Average Net | | Assets Without | | (Loss) to | | Assets Without | | Portfolio |
| | Redemption Fees | End of Period | | Total Return | | (in Thousands) | | Assets | | Fee Waivers | | Average Net Assets | | Fee Waivers | | Turnover Rate |
| |
| |
| | $ | 0.00 (b) | $ | 9.77 | | (10.20%) | (c) | $ | 93,501 | | 1.04% | (d) | 1.04% | (d) | (0.12%) | (d) | (0.12%) | (d) | 33% | (c) |
| | | 0.00 (b) | | 10.88 | | 39.54% | | | 120,456 | | 1.06% | | 1.06% | | (0.05%) | | (0.05%) | | 83% | |
| | | 0.00 (b) | | 7.80 | | (45.33%) | | | 133,174 | | 1.03% | | 1.03% | | 0.02% | | 0.02% | | 183% | |
| | | 0.00 (b) | | 15.45 | | 22.48% | | | 299,659 | | 1.05% | | 1.05% | | (0.05%) | | (0.05%) | | 127% | |
| | | 0.00 (b) | | 13.31 | | 5.85% | (c) | | 274,035 | | 1.11% | (d) | 1.11% | (d) | (0.16%) | (d) | (0.16%) | (d) | 87% | |
| | | 0.00 (b) | | 12.58 | | 7.67% | | | 255,343 | | 1.08% | | 1.08% | | (0.24%) | | (0.24%) | | 111% | |
| | | 0.00 (b) | | 11.74 | | 8.61% | | | 179,698 | | 1.13% | | 1.13% | | 0.13% | | 0.13% | | 113% | |
| |
| | | 0.00 (b) | | 9.78 | | (10.11%) | (c) | | 2,765 | | 0.93% | (d) | 2.14% | (d) | (0.00%) | (c)(d) | (1.21%) | (d) | 33% | (c) |
| | | 0.00 (b) | | 10.88 | | 39.64% | | | 2,619 | | 0.94% | | 2.55% | | 0.05% | | (1.56%) | | 83% | |
| | | 0.00 (b) | | 7.81 | | (45.26%) | | | 1,797 | | 0.92% | | 1.90% | | 0.13% | | (0.85%) | | 183% | |
| | | 0.00 (b) | | 15.45 | | 2.14% | (c) | | 3,294 | | 0.98% | (d) | 4.64% | (d) | (0.01%) | (d) | (3.68%) | (d) | 127% | (e) |
| |
| |
| | | 0.00 (b) | | 5.10 | | (1.92%) | (c) | | 79,970 | | 1.03% | (d) | 1.03% | (d) | (0.28%) | (d) | (0.28%) | (d) | 51% | (c) |
| | | 0.00 (b) | | 5.20 | | 46.48% | | | 85,559 | | 1.08% | | 1.08% | | (0.20%) | | (0.20%) | | 121% | |
| | | 0.00 (b) | | 3.55 | | (44.92%) | | | 64,515 | | 1.03% | | 1.03% | | (0.48%) | | (0.48%) | | 142% | |
| | | 0.00 (b) | | 6.94 | | 11.37% | | | 173,481 | | 1.03% | | 1.03% | | (0.56%) | | (0.56%) | | 116% | |
| | | 0.00 (b) | | 7.45 | | 9.63% | (c) | | 184,097 | | 1.08% | (d) | 1.08% | (d) | (0.37%) | (d) | (0.37%) | (d) | 76% | |
| | | 0.00 (b) | | 7.99 | | 13.90% | | | 193,647 | | 1.09% | | 1.09% | | (0.34%) | | (0.34%) | | 127% | |
| | | 0.00 (b) | | 7.03 | | 3.53% | | | 183,085 | | 1.11% | | 1.11% | | (0.62%) | | (0.62%) | | 84% | |
| |
| | | 0.00 (b) | | 5.12 | | (1.92%) | (c) | | 32,397 | | 0.93% | (d) | 0.99% | (d) | (0.18%) | (d) | (0.24%) | (d) | 51% | (c) |
| | | 0.00 (b) | | 5.22 | | 46.63% | | | 34,148 | | 0.95% | | 1.03% | | (0.08%) | | (0.15%) | | 121% | |
| | | 0.00 (b) | | 3.56 | | (44.86%) | | | 23,863 | | 0.93% | | 0.97% | | (0.36%) | | (0.40%) | | 142% | |
| | | 0.00 (b) | | 6.95 | | (2.84%) | (c) | | 12,477 | | 0.98% | (d) | 2.08% | (d) | (0.47%) | (d) | (1.58%) | (d) | 116% | (e) |
| | | | | | | | | | | | | | | | | | | | | |
| | | | | | | | | | | | | | | | | | | | | |
| | | | | | | | | | | | | | | | | | | | | |
| | | | | | | | | | | | | | | | | | | | | |
| | | | | | | | | | | | | | | | | | | | | |
(e) | Portfolio turnover rate is calculated at the Fund level and represents the year ended December 31, 2007. |
(f) | Period from September 28, 2007 (inception date) through December 31, 2007. |
See Notes to Financial Statements.
|
|
|
Selected data for a share of beneficial interest outstanding throughout the period indicated. |
|
| | | | Income from Investment Operations | | Distributions |
| | | | | | | | | | | | | | | |
| | | | Net | | | | Net Realized And | | | Total Income/ | | | | | |
| | | | Asset Value | | Net | | Unrealized Gain/ | | | (Loss) from | | | | Dividends From Net | |
| | | | Beginning of the | | Investment | | (Loss) on | | | Investment | | Dividends from Net | | Realized Gain on | Total |
| | Year or Period Ended | | Period | | Income/(Loss) | | Investments | | | Operations | | Investment Income | | Investments | Distributions |
| | WESTCORE SELECT FUND |
| | Retail Class |
| | 06/30/10 | | $ | 16.14 | | $ | (0.03) | | $ | (0.22) | | $ | (0.25) | | $ | (0.00) | | $ | (0.00) | | $ | (0.00) |
| | 12/31/09 | | | 11.44 | | | (0.03) | | | 4.73 | | | 4.70 | | | (0.00) | | | (0.00) | | | (0.00) |
| | 12/31/08 | | | 17.43 | | | (0.09) | | | (5.91) | | | (6.00) | | | (0.00) | | | (0.00) | (b) | | (0.00) |
| | 12/31/07 | | | 16.66 | | | (0.05) | | | 2.59 | | | 2.54 | | | (0.00) | | | (1.78) | | | (1.78) |
| | 12/31/06 (a) | | | 15.04 | | | 0.01 | | | 1.61 | | | 1.62 | | | (0.00) | | | (0.00) | | | (0.00) |
| | 05/31/06 | | | 12.23 | | | (0.07) | | | 2.88 | | | 2.81 | | | (0.00) | | | (0.00) | | | (0.00) |
| | 05/31/05 | | | 11.46 | | | (0.08) | | | 0.85 | | | 0.77 | | | (0.00) | | | (0.00) | | | (0.00) |
| | WESTCORE BLUE CHIP FUND |
| | Retail Class |
| | 06/30/10 | | | 10.76 | | | 0.02 | | | (1.14) | | | (1.12) | | | (0.00) | | | (0.00) | | | (0.00) |
| | 12/31/09 | | | 8.32 | | | 0.06 | | | 2.43 | | | 2.49 | | | (0.05) | | | (0.00) | | | (0.05) |
| | 12/31/08 | | | 13.18 | | | 0.07 | | | (4.85) | | | (4.78) | | | (0.07) | | | (0.01) | | | (0.08) |
| | 12/31/07 | | | 13.73 | | | 0.08 | | | 0.35 | | | 0.43 | | | (0.09) | | | (0.89) | | | (0.98) |
| | 12/31/06 (a) | | | 13.24 | | | 0.04 | | | 1.24 | | | 1.28 | | | (0.08) | | | (0.71) | | | (0.79) |
| | 05/31/06 | | | 13.02 | | | 0.06 | | | 1.24 | | | 1.30 | | | (0.07) | | | (1.01) | | | (1.08) |
| | 05/31/05 | | | 11.62 | | | 0.06 | | | 1.34 | | | 1.40 | | | (0.00) | | | (0.00) | | | (0.00) |
| | Institutional Class |
| | 06/30/10 | | | 10.76 | | | 0.03 | | | (1.14) | | | (1.11) | | | (0.00) | | | (0.00) | | | (0.00) |
| | 12/31/09 | | | 8.32 | | | 0.07 | | | 2.43 | | | 2.50 | | | (0.06) | | | (0.00) | | | (0.06) |
| | 12/31/08 | | | 13.18 | | | 0.13 | | | (4.89) | | | (4.76) | | | (0.09) | | | (0.01) | | | (0.10) |
| | 12/31/07 (f) | | | 14.88 | | | 0.02 | | | (0.73) | | | (0.71) | | | (0.10) | | | (0.89) | | | (0.99) |
| | WESTCORE MID–CAP VALUE FUND |
| | Retail Class |
| | 06/30/10 | | | 15.27 | | | 0.03 | | | (0.41) | | | (0.38) | | | (0.00) | | | (0.00) | | | (0.00) |
| | 12/31/09 | | | 11.65 | | | 0.11 | | | 3.61 | | | 3.72 | | | (0.10) | | | (0.00) | | | (0.10) |
| | 12/31/08 | | | 20.57 | | | 0.16 | | | (8.89) | | | (8.73) | | | (0.17) | | | (0.02) | | | (0.19) |
| | 12/31/07 | | | 20.48 | | | 0.03 | | | 0.31 | | | 0.34 | | | (0.02) | | | (0.23) | | | (0.25) |
| | 12/31/06 (a) | | | 18.96 | | | 0.06 | | | 1.82 | | | 1.88 | | | (0.10) | | | (0.26) | | | (0.36) |
| | 05/31/06 | | | 17.54 | | | 0.06 | | | 2.63 | | | 2.69 | | | (0.04) | | | (1.23) | | | (1.27) |
| | 05/31/05 | | | 15.28 | | | 0.03 | | | 3.00 | | | 3.03 | | | (0.00) | | | (0.77) | | | (0.77) |
| | | | | | | | | | | | | | | | | | | | | | | |
| | | | | | | | | | | | | | | | | | | | | | | |
| | | | | | | | | | | | | | | | | | | | | | | |
| | | | | | | | | | | | | | | | | | | | | | | |
| (a) | Effective December 31, 2006, the Westcore Funds changed their fiscal year end from May 31 to December 31. |
| (b) | Less than $0.005 per share. |
| (c) | Total return and portfolio turnover rate are not annualized for periods less than one full year. |
| (d) | Annualized. |
| PAGE 78 |
|
| | | Ratios/Supplemental Data |
| | Paid-in
Capital from Redemption Fees | | Net Asset Value
End of Period | | Total Return | | Net Assets,
End of Period
(in Thousands) | | Ratio of Expenses
to Average Net
Assets | Ratio of Expenses
to Average Net
Assets Without
Fee Waivers | Ratio of Net
Investment Income/
(Loss) to
Average Net Assets | Ratio of Net
Investment
Income/(Loss)
to Average Net
Assets Without
Fee Waivers | Portfolio
Turnover Rate |
| |
| |
| | $ 0.00 | (b) | | $ 15.89 | | (1.55%) | (c) | | $ 144,085 | | 1.05% | (d) | 1.05% | (d) | (0.49%) | (d) | (0.49%) | (d) | 105% | (c) |
| | | 0.00 | (b) | | 16.14 | | 41.08% | | | 67,199 | | 1.15% | (d) | 1.16% | | (0.30%) | | (0.31%) | | 217% | |
| | | 0.01 | | | 11.44 | | (34.35%) | | | 28,233 | | 1.15% | | 1.21% | | (0.66%) | | (0.72%) | | 237% | |
| | | 0.01 | | | 17.43 | | 15.25% | | | 37,579 | | 1.15% | | 1.27% | | (0.40%) | | (0.53%) | | 168% | |
| | | 0.00 | (b) | | 16.66 | | 10.77% | (c) | | 22,963 | | 1.15% | (d) | 1.53% | (d) | (0.11%) | (d) | (0.50%) | (d) | 65% | |
| | | 0.00 | (b) | | 15.04 | | 22.98% | | | 9,499 | | 1.15% | | 1.75% | | (0.45%) | | (1.05%) | | 148% | |
| | | 0.00 | (b) | | 12.23 | | 6.72% | | | 9,179 | | 1.15% | | 1.83% | | (0.72%) | | (1.40%) | | 107% | |
| |
| |
| | | 0.00 | (b) | | 9.64 | | (10.41%) | (c) | | 14,229 | | 1.15% | (d) | 1.25% | (d) | 0.36% | (d) | 0.26% | (d) | 22% | (c) |
| | | 0.00 | (b) | | 10.76 | | 29.87% | | | 16,632 | | 1.15% | | 1.26% | | 0.53% | | 0.41% | | 21% | |
| | | 0.00 | (b) | | 8.32 | | (36.24%) | | | 16,490 | | 1.13% | | 1.13% | | 0.45% | | 0.45% | | 27% | |
| | | 0.00 | (b) | | 13.18 | | 3.13% | | | 53,321 | | 1.05% | | 1.05% | | 0.49% | | 0.49% | | 42% | |
| | | 0.00 | (b) | | 13.73 | | 9.65% | (c) | | 66,402 | | 1.09% | (d) | 1.09% | (d) | 0.49% | (d) | 0.49% | (d) | 28% | |
| | | 0.00 | (b) | | 13.24 | | 10.09% | | | 63,775 | | 1.11% | | 1.11% | | 0.43% | | 0.43% | | 50% | |
| | | 0.00 | (b) | | 13.02 | | 12.05% | | | 63,118 | | 1.15% | | 1.26% | | 0.57% | | 0.46% | | 58% | |
| |
| | | 0.00 | (b) | | 9.65 | | (10.32%) | (c) | | 18,654 | | 0.95% | (d) | 1.10% | (d) | 0.56% | (d) | 0.41% | (d) | 22% | (c) |
| | | 0.00 | (b) | | 10.76 | | 30.10% | | | 21,585 | | 0.95% | | 1.14% | | 0.72% | | 0.53% | | 21% | |
| | | 0.00 | | | 8.32 | | (36.09%) | | | 18,101 | | 0.98% | | 1.03% | | 0.68% | | 0.63% | | 27% | |
| | | 0.00 | | | 13.18 | | (4.78%) | (c) | | 6,515 | | 0.98% | (d) | 1.85% | (d) | 0.61% | (d) | (0.25%) | (d) | 42% | (e) |
| |
| |
| | | 0.00 | (b) | | 14.89 | | (2.49%) | (c) | | 44,787 | | 1.22% | (d) | 1.22% | (d) | 0.39% | (d) | 0.39% | (d) | 18% | (c) |
| | | 0.00 | (b) | | 15.27 | | 31.95% | | | 48,572 | | 1.25% | | 1.26% | | 0.77% | | 0.77% | | 27% | |
| | | 0.00 | (b) | | 11.65 | | (42.38%) | | | 40,714 | | 1.19% | | 1.19% | | 0.74% | | 0.74% | | 35% | |
| | | 0.00 | (b) | | 20.57 | | 1.66% | | | 100,863 | | 1.17% | | 1.17% | | 0.12% | | 0.12% | | 40% | |
| | | 0.00 | (b) | | 20.48 | | 9.90% | (c) | | 87,571 | | 1.23% | (d) | 1.23% | (d) | 0.64% | (d) | 0.64% | (d) | 33% | |
| | | 0.00 | (b) | | 18.96 | | 15.44% | | | 71,040 | | 1.25% | | 1.26% | | 0.49% | | 0.48% | | 49% | |
| | | 0.00 | (b) | | 17.54 | | 20.02% | | | 30,733 | | 1.25% | | 1.45% | | 0.26% | | 0.07% | | 63% | |
| | | | | | | | | | | | | | | | | | | | | | |
| | | | | | | | | | | | | | | | | | | | | | |
| | | | | | | | | | | | | | | | | | | | | | |
| | | | | | | | | | | | | | | | | | | | | | |
(e) | Portfolio turnover rate is calculated at the Fund level and represents the year ended December 31, 2007. |
(f) | Period from September 28, 2007 (inception date) through December 31, 2007. |
See Notes to Financial Statements.
|
|
|
Selected data for a share of beneficial interest outstanding throughout the period indicated. |
| | | | |
| | | Income from Investment Operations | | Distributions |
| | | | | | | | | | | | | |
| | | Net | | | Net Realized And | | | Total Income/ | | | | | |
| | | Asset Value | | Net | Unrealized Gain/ | | | (Loss) from | | | | Dividends From Net | |
| | | Beginning of the | | Investment | (Loss) on | | | Investment | | Dividends from Net | | Realized Gain on | Total |
Year or Period Ended | | Period | | Income/(Loss) | Investments | | | Operations | | Investment Income | | Investments | Distributions |
WESTCORE SMALL-CAP OPPORTUNITY FUND | | | | | | | | | | | | | | | |
Retail Class | | | | | | | | | | | | | | | | | | | | | |
06/30/10 | | $ | 28.28 | | $ | (0.02) | | $ | (0.44) | | $ | (0.46) | | $ | (0.00) | | $ | (0.00) | | $ | (0.00) |
12/31/09 | | | 22.01 | | | 0.06 | | | 6.20 | | | 6.26 | | | (0.00) | | | (0.00) | | | (0.00) |
12/31/08 | | | 34.34 | | | (0.03) | | | (12.41) | | | (12.44) | | | (0.00) | | | (0.00) | (b) | | (0.00) |
12/31/07 | | | 36.22 | | | (0.15) | | | (1.05) | | | (1.20) | | | (0.00) | | | (0.68) | | | (0.68) |
12/31/06 (a) | | | 36.24 | | | 0.01 | | | 3.23 | | | 3.24 | | | (0.00) | | | (3.26) | | | (3.26) |
05/31/06 | | | 34.96 | | | (0.12) | | | 6.48 | | | 6.36 | | | (0.00) | | | (5.08) | | | (5.08) |
05/31/05 | | | 32.71 | | | (0.30) | | | 3.74 | | | 3.44 | | | (0.00) | | | (1.19) | | | (1.19) |
Institutional Class | | | | | | | | | | | | | | | | | | | | | |
06/30/10 | | | 28.41 | | | (0.01) | | | (0.45) | | | (0.46) | | | (0.00) | | | (0.00) | | | (0.00) |
12/31/09 | | | 22.07 | | | 0.05 | | | 6.28 | | | 6.33 | | | (0.00) | | | (0.00) | | | (0.00) |
12/31/08 | | | 34.36 | | | 0.03 | | | (12.41) | | | (12.38) | | | (0.00) | | | (0.00) | (b) | | (0.00) |
12/31/07 (f) | | | 38.40 | | | (0.00) | (b) | | (3.36) | | | (3.36) | | | (0.00) | | | (0.68) | | | (0.68) |
WESTCORE SMALL–CAP VALUE FUND | | | | | | | | | | | | | | | | | | |
Retail Class | | | | | | | | | | | | | | | | | | | | | |
06/30/10 | | | 9.51 | | | 0.04 | | | 0.16 | | | 0.20 | | | (0.00) | | | (0.00) | | | (0.00) |
12/31/09 | | | 7.87 | | | 0.11 | | | 1.62 | | | 1.62 | | | (0.10) | | | (0.00) | | | (0.10) |
12/31/08 | | | 12.06 | | | 0.13 | | | (4.20) | | | (4.07) | | | (0.13) | | | (0.00) | | | (0.13) |
12/31/07 | | | 12.69 | | | 0.12 | | | (0.54) | | | (0.42) | | | (0.12) | | | (0.09) | | | (0.21) |
12/31/06 (a) | | | 11.10 | | | 0.06 | | | 1.62 | | | 1.68 | | | (0.09) | | | (0.00) | | | (0.09) |
05/31/06 | | | 9.80 | | | 0.14 | | | 1.34 | | | 1.48 | | | (0.11) | | | (0.07) | | | (0.18) |
05/31/05 | | | 10.00 | | | 0.03 | | | (0.23) | | | (0.20) | | | (0.00) | | | (0.00) | | | (0.00) |
Institutional Class | | | | | | | | | | | | | | | | | | | | | |
06/30/10 | | | 9.51 | | | 0.06 | | | 0.14 | | | 0.20 | | | (0.00) | | | (0.00) | | | (0.00) |
12/31/09 | | | 7.87 | | | 0.13 | | | 1.62 | | | 1.75 | | | (0.11) | | | (0.00) | | | (0.11) |
12/31/08 | | | 12.06 | | | 0.14 | | | (4.19) | | | (4.05) | | | (0.14) | | | (0.00) | | | (0.14) |
12/31/07 (f) | | | 13.42 | | | 0.05 | | | (1.20) | | | (1.15) | | | (0.12) | | | (0.09) | | | (0.21) |
| | | | | | | | | | | | | | | | | | | | | | |
| | | | | | | | | | | | | | | | | | | | | | |
(a) | Effective December 31, 2006, the Westcore Funds changed their fiscal year end from May 31 to December 31. |
(b) | Less than $0.005 per share. |
(c) | Total return and portfolio turnover rate are not annualized for periods less than one full year. |
(d) | Annualized. |
| PAGE 80 |
|
| | | | | | Ratios/Supplemental Data |
| | | | | | | | | | | | | | | Ratio of Net | | |
| | | | | | | | | | | | | | | Investment | | |
| | | | | | | | | | | Ratio of Expenses | | Ratio of Net | | Income/(Loss) | | |
Paid-in | | | | | | Net Assets, | | Ratio of Expenses | | to Average Net | | Investment Income/ | | to Average Net | | |
Capital from | Net Asset Value | | | | | End of Period | | to Average Net | | Assets Without | | (Loss) to | | Assets Without | | Portfolio |
Redemption Fees | End of Period | | Total Return | | | (in Thousands) | | Assets | | Fee Waivers | | Average Net Assets | | Fee Waivers | | Turnover Rate |
| |
| |
$ | 0.00 | (b) | $ | 27.82 | | (1.63%) | (c) | $ | 34,619 | | 1.30% | (d) | 1.52% | (d) | (0.18%) | (d) | (0.40%) | (d) | 20% | (c) |
| | 0.01 | | | 28.28 | | 28.49% | | | 32,380 | | 1.30% | | 1.64% | | 0.15% | | (0.19%) | | 24% | |
| | 0.11 | | | 22.01 | | (35.90%) | | | 16,027 | | 1.30% | | 1.70% | | (0.08%) | | (0.48%) | | 57% | |
| | 0.00 | (b) | | 34.34 | | (3.33%) | | | 28,482 | | 1.30% | | 1.58% | | (0.42%) | | (0.70%) | | 71% | |
| | 0.00 | (b) | | 36.22 | | 8.86% | (c) | | 24,015 | | 1.30% | (d) | 1.73% | (d) | (0.27%) | (d) | (0.72%) | (d) | 32% | |
| | 0.00 | (b) | | 36.24 | | 19.04% | | | 20,473 | | 1.30% | | 1.77% | | (0.34%) | | (0.81%) | | 75% | |
| | 0.00 | (b) | | 34.96 | | 10.33% | | | 18,394 | | 1.30% | | 1.69% | | (0.55%) | | (0.94%) | | 70% | |
| |
| | 0.00 | (b) | | 27.95 | | (1.62%) | (c) | | 3,050 | | 1.19% | (d) | 2.43% | (d) | (0.09%) | (d) | (1.33%) | (d) | 20% | (c) |
| | 0.01 | | | 28.41 | | 28.73% | | | 3,172 | | 1.15% | | 2.76% | | 0.25% | | (1.36%) | | 24% | |
| | 0.09 | | | 22.07 | | (35.76%) | | | 2,326 | | 1.08% | | 2.38% | | 0.18% | | (1.13%) | | 57% | |
| | (0.00) | (b) | | 34.36 | | (8.76%) | | | 3,189 | | 1.22% | (d) | 6.09% | (d) | (0.09%) | (d) | (4.95%) | | 71% | (e) |
| |
| |
| | 0.00 | (b) | | 9.71 | | 2.10% | (c) | | 196,831 | | 1.30% | (d) | 1.35% | (d) | 0.88% | (d) | 0.83% | (d) | 18% | (c) |
| | 0.01 | | | 9.51 | | 22.08% | | | 192,180 | | 1.30% | | 1.37% | | 1.38% | | 1.31% | | 33% | |
| | 0.01 | | | 7.87 | | (33.57%) | | | 148,135 | | 1.30% | | 1.38% | | 1.51% | | 1.44% | | 45% | |
| | 0.00 | (b) | | 12.06 | | (3.38%) | | | 161,792 | | 1.30% | | 1.38% | | 1.25% | | 1.16% | | 35% | |
| | 0.00 | (b) | | 12.69 | | 15.19% | (c) | | 58,343 | | 1.30% | (d) | 1.53% | (d) | 1.24% | (d) | 1.01% | (d) | 19% | |
| | 0.00 | (b) | | 11.10 | | 15.22% | | | 37,797 | | 1.30% | | 1.61% | | 1.47% | | 1.16% | | 43% | |
| | 0.00 | (b) | | 9.80 | | (2.00%) | (c) | | 16,032 | | 1.30% | (d) | 2.94% | (d) | 1.33% | (d) | (0.31%) | (d) | 27% | |
| |
| | 0.00 | (b) | | 9.71 | | 2.10% | (c) | | 70,132 | | 1.22% | (d) | 1.30% | (d) | 0.99% | (d) | 0.91% | (d) | 18% | (c) |
| | 0.00 | (b) | | 9.51 | | 22.16% | | | 52,278 | | 1.20% | | 1.33% | | 1.53% | | 1.39% | | 33% | |
| | 0.00 | (b) | | 7.87 | | (33.51%) | | | 20,684 | | 1.21% | | 1.51% | | 1.80% | | 1.49% | | 45% | |
| | 0.00 | (b) | | 12.06 | | (8.58%) | (c) | | 6,051 | | 1.20% | (d) | 4.50% | (d) | 1.76% | (d) | (1.55%) | (d) | 35% | (e) |
(e) | Portfolio turnover rate is calculated at the Fund level and represents the year ended December 31, 2007. |
(f) | Period from September 28, 2007 (inception date) through December 31, 2007. |
See Notes to Financial Statements.
|
|
|
Selected data for a share of beneficial interest outstanding throughout the period indicated. |
| |
| | | | Income from Investment Operations | | Distributions |
| | | | | | | | | | | | | | | | | | |
| | | | Net | | | | Net Realized And | | | Total Income/ | | | | Dividends From | | | | |
| | | | Asset Value | | Net | | Unrealized Gain/ | | | (Loss) from | | Dividends from | | Net Realized | | Tax | | |
| | | | Beginning of the | | Investment | | (Loss) on | | | Investment | | Net Investment | | Gain on | | Return of | | Total |
| | Year or Period Ended | | Period | | Income/(Loss) | | Investments | | | Operations | | Income | | Investments | | Capital | | Distributions |
| | WESTCORE MICRO–CAP OPPORTUNITY FUND | | | | | | | | | | | | | | | | | | |
| | Retail Class | | | | | | | | | | | | | | | | | | | | | | | | |
| | 06/30/10 | | $ | 8.66 | | $ | (0.02) | | $ | 0.34 | | $ | 0.32 | | $ | (0.00) | | $ | (0.00) | | $ | (0.00) | | $ | (0.00) |
| | 12/31/09 | | | 7.53 | | | 0.02 | | | 1.14 | | | 1.16 | | | (0.03) | | | (0.00) | | | (0.00) | | | (0.03) |
| | 12/31/08 | | | 10.00 | | | 0.04 | | | (2.49) | | | (2.45) | | | (0.03) | | | (0.00) | | | (0.00) | | | (0.03) |
| | WESTCORE INTERNATIONAL FRONTIER FUND | | | | | | | | | | | | | | | | | | |
| | Retail Class | | | | | | | | | | | | | | | | | | | | | | | | |
| | 06/30/10 | | | 11.67 | | | 0.09 | | | 0.07 | | | 0.16 | | | (0.00) | | | (0.00) | | | (0.00) | | | (0.00) |
| | 12/31/09 | | | 7.19 | | | 0.15 | | | 4.46 | | | 4.61 | | | (0.13) | | | (0.00) | | | (0.00) | | | (0.13) |
| | 12/31/08 | | | 14.41 | | | 0.18 | | | (7.23) | | | (7.05) | | | (0.17) | | | (0.00) | | | (0.00) | | | (0.17) |
| | 12/31/07 | | | 14.39 | | | 0.06 | | | 0.36 | | | 0.42 | | | (0.09) | | | (0.31) | | | (0.00) | | | (0.40) |
| | 12/31/06(a) | | | 13.40 | | | 0.04 | | | 1.07 | | | 1.11 | | | (0.12) | | | (0.00) | | | (0.00) | | | (0.12) |
| | 05/31/06 | | | 10.43 | | | 0.11 | | | 2.89 | | | 3.00 | | | (0.00) | | | (0.03) | | | (0.00) | | | (0.03) |
| | 05/31/05 | | | 9.97 | | | 0.03 | | | 0.44 | | | 0.47 | | | (0.01) | | | (0.00) | | | (0.00) | | | (0.01) |
| | WESTCORE FLEXIBLE INCOME FUND | | | | | | | | | | | | | | | | | | | | | |
| | Retail Class | | | | | | | | | | | | | | | | | | | | | | | | |
| | 06/30/10 | | | 7.98 | | | 0.29 | | | 0.10 | | | 0.39 | | | (0.28) | | | (0.00) | | | (0.00) | | | (0.28) |
| | 12/31/09 | | | 6.12 | | | 0.51 | | | 1.86 | | | 2.37 | | | (0.51) | | | (0.00) | | | (0.00) | | | (0.51) |
| | 12/31/08 | | | 9.44 | | | 0.56 | | | (3.26) | | | (2.70) | | | (0.62) | | | (0.00) | | | (0.01) | | | (0.61) |
| | 12/31/07 | | | 10.41 | | | 0.66 | | | (0.99) | | | (0.33) | | | (0.60) | | | (0.03) | | | (0.01) | | | (0.64) |
| | 12/31/06(a) | | | 9.86 | | | 0.39 | | | 0.56 | | | 0.95 | | | (0.40) | | | (0.00) | | | (0.00) | | | (0.40) |
| | 05/31/06 | | | 9.97 | | | 0.74 | | | (0.17) | | | 0.57 | | | (0.68) | | | (0.00) | | | (0.00) | | | (0.68) |
| | 05/31/05 | | | 9.76 | | | 0.71 | | | 0.17 | | | 0.88 | | | (0.67) | | | (0.00) | | | (0.00) | | | (0.67) |
| | Institutional Class | | | | | | | | | | | | | | | | | | | | | | | | |
| | 06/30/10 | | | 7.96 | | | 0.29 | | | 0.11 | | | 0.40 | | | (0.30) | | | (0.00) | | | (0.00) | | | (0.30) |
| | 12/31/09 | | | 6.11 | | | 0.52 | | | 1.85 | | | 2.37 | | | (0.52) | | | (0.00) | | | (0.00) | | | (0.52) |
| | 12/31/08 | | | 9.43 | | | 0.58 | | | (3.27) | | | (2.69) | | | (0.63) | | | (0.00) | | | (0.01) | | | (0.62) |
| | 12/31/07(f) | | | 9.97 | | | 0.15 | | | (0.54) | | | (0.39) | | | (0.11) | | | (0.03) | | | (0.01) | | | (0.15) |
| | | | | | | | | | | | | | | | | | | | | | | | | | |
(a) | Effective December 31, 2006, the Westcore Funds changed their fiscal year end from May 31 to December 31. |
(b) | Less than $0.005 per share. |
(c) | Total return and portfolio turnover rate are not annualized for periods less than one full year. |
(d) | Annualized. |
| PAGE 82 |
|
| | | Ratios/Supplemental Data |
| | | | | | | | | | | | | | Ratio of Net | | |
| | | | | | | | | | | | | | Investment | | |
| | | | | | | | | | Ratio of Expenses | | Ratio of Net | | Income/(Loss) | | |
Paid-in | | | | | Net Assets, | | Ratio of Expenses | | to Average Net | | Investment Income/ | | to Average Net | | |
Capital from | Net Asset Value | | | | End of Period | | to Average Net | | Assets Without | | (Loss) to | | Assets Without | | Portfolio |
Redemption Fees | End of Period | | Total Return | | (in Thousands) | | Assets | | Fee Waivers | | Average Net Assets | | Fee Waivers | | Turnover Rate |
| | | | | | | | | | | | | | | | | | | | | |
| | | | | | | | | | | | | | | | | | | | | |
$ | 0.00 | | $ | 8.98 | | 3.70% | (c) | $ | 2,100 | | 1.30% | (d) | 6.97% | (d) | (0.37%) | (d) | (6.03%) | (d) | 56% | (c) |
| | 0.00 | (b) | | 8.66 | | 15.40% | | | 1,924 | | 1.30% | | 7.96% | | 0.27% | | (6.39%) | | 130% | |
| | 0.01 | | | 7.53 | | (24.33%) | (c) | | 1,104 | | 1.30% | | 18.13% | | 1.06% | | (15.77%) | | 60% | |
| | | | | | | | | | | | | | | | | | | | | |
| | | | | | | | | | | | | | | | | | | | | |
| | 0.00 | (b) | | 11.83 | | 1.37% | (c) | | 34,404 | | 1.50% | (d) | 1.83% | (d) | 1.65% | (d) | 1.32% | (d) | 28% | (c) |
| | 0.00 | (b) | | 11.67 | | 64.17% | | | 32,356 | | 1.50% | | 2.01% | | 1.68% | | 1.17% | | 65% | |
| | 0.00 | (b) | | 7.19 | | (48.86%) | | | 18,282 | | 1.50% | | 1.98% | | 1.47% | | 0.99% | | 70% | |
| | 0.00 | (b) | | 14.41 | | 2.94% | | | 40,680 | | 1.50% | | 1.87% | | 0.40% | | 0.03% | | 78% | |
| | 0.00 | (b) | | 14.39 | | 8.33% | (c) | | 35,629 | | 1.50% | (d) | 2.26% | (d) | 0.33% | (d) | (0.43%) | (d) | 93% | |
| | 0.00 | (b) | | 13.40 | | 28.78% | | | 36,517 | | 1.50% | | 1.98% | | 1.12% | | 0.64% | | 38% | |
| | 0.00 | (b) | | 10.43 | | 4.73% | | | 21,397 | | 1.50% | | 2.12% | | 0.31% | | (0.31%) | | 52% | |
| | | | | | | | | | | | | | | | | | | | | |
| | | | | | | | | | | | | | | | | | | | | |
| | 0.00 | (b) | | 8.09 | | 4.91% | (c) | | 68,680 | | 0.85% | (d) | 0.89% | (d) | 7.14% | (d) | 7.11% | (d) | 18% | (c) |
| | 0.00 | (b) | | 7.98 | | 40.09% | | | 72,783 | | 0.85% | | 0.91% | | 7.21% | | 7.15% | | 30% | |
| | 0.00 | (b) | | 6.12 | | (29.97%) | | | 65,043 | | 0.85% | | 0.92% | | 6.91% | | 6.83% | | 21% | |
| | 0.00 | (b) | | 9.44 | | (3.45%) | | | 207,038 | | 0.85% | | 0.92% | | 6.30% | | 6.23% | | 21% | |
| | 0.00 | (b) | | 10.41 | | 9.80% | (c) | | 269,243 | | 0.85% | (d) | 0.96% | (d) | 7.34% | (d) | 7.23% | (d) | 15% | |
| | 0.00 | (b) | | 9.86 | | 5.94% | | | 171,116 | | 0.85% | | 0.93% | | 7.44% | | 7.36% | | 25% | |
| | 0.00 | (b) | | 9.97 | | 9.15% | | | 163,158 | | 0.85% | | 0.97% | | 7.12% | | 7.00% | | 22% | |
| | | | | | | | | | | | | | | | | | | | | |
| | 0.00 | (b) | | 8.06 | | 5.00% | (c) | | 1,278 | | 0.75% | | 3.42% | (d) | 7.27% | (d) | 4.60% | (d) | 18% | (c) |
| | 0.00 | (b) | | 7.96 | | 40.30% | | | 1,234 | | 0.72% | | 3.98% | | 7.26% | | 4.00% | | 30% | |
| | 0.00 | (b) | | 6.11 | | (29.89%) | | | 748 | | 0.74% | | 3.21% | | 7.12% | | 4.65% | | 21% | |
| | 0.00 | (b) | | 9.43 | | (3.89%) | (c) | | 1,430 | | 0.70% | (d) | 7.26% | (d) | 7.34% | (d) | 0.78% | (d) | 21% | (e) |
| | | | | | | | | | | | | | | | | | | | | |
(e) | Portfolio turnover rate is calculated at the Fund level and represents the year ended December 31, 2007. |
(f) | Period from September 28, 2007 (inception date) through December 31, 2007. |
See Notes to Financial Statements. |
|
|
Selected data for a share of beneficial interest outstanding throughout the period indicated. |
|
| | | | Income from Investment Operations | | | | Distributions | | |
| | | | | | | | | | | | | | | | | |
| | | | Net | | | | Net Realized And | | | Total Income/ | | | | Dividends From | | | |
| | | | Asset Value | | Net | | Unrealized Gain/ | | | (Loss) from | | Dividends from | | Net Realized | Tax | | |
| | | | Beginning of the | | Investment | | (Loss) on | | | Investment | | Net Investment | | Gain on | Return of | | Total |
| | Year or Period Ended | | Period | | Income/(Loss) | | Investments | | | Operations | | Income | | Investments | Capital | | Distributions |
| | WESTCORE PLUS BOND FUND | | | | | | | | | | | | | | | | | | | | |
| | Retail Class | | | | | | | | | | | | | | | | | | | | | | | |
| | 06/30/10 | | $ | 10.42 | | $ | 0.22 | | $ | 0.33 | | $ | 0.55 | | $ | (0.22) | | $ | (0.00) | | $ | (0.00) | | (0.22) |
| | 12/31/09 | | | 9.85 | | | 0.44 | | | 0.57 | | | 1.01 | | | (0.44) | | | (0.00) | | | (0.00) | | (0.44) |
| | 12/31/08 | | | 10.55 | | | 0.51 | | | (0.70) | | | (0.19) | | | (0.51) | | | (0.00) | | | (0.00) | | (0.51) |
| | 12/31/07 | | | 10.54 | | | 0.55 | | | 0.01 | | | 0.56 | | | (0.55) | | | (0.00) | | | (0.00) | | (0.55) |
| | 12/31/06(a) | | | 10.28 | | | 0.33 | | | 0.25 | | | 0.58 | | | (0.32) | | | (0.00) | | | (0.00) | | (0.32) |
| | 05/31/06 | | | 10.70 | | | 0.57 | | | (0.41) | | | 0.16 | | | (0.58) | | | (0.00) | (b) | | (0.00) | | (0.58) |
| | 05/31/05 | | | 10.62 | | | 0.59 | | | 0.14 | | | 0.73 | | | (0.58) | | | (0.07) | | | (0.00) | | (0.65) |
| | Institutional Class | | | | | | | | | | | | | | | | | | | | | | | |
| | 06/30/10 | | | 10.42 | | | 0.23 | | | 0.32 | | | 0.55 | | | (0.23) | | | (0.00) | | | (0.00) | | (0.23) |
| | 12/31/09 | | | 9.85 | | | 0.45 | | | 0.57 | | | 1.02 | | | (0.45) | | | (0.00) | | | (0.00) | | (0.45) |
| | 12/31/08 | | | 10.55 | | | 0.52 | | | (0.70) | | | (0.18) | | | (0.52) | | | (0.00) | | | (0.00) | | (0.52) |
| | 12/31/07(f) | | | 10.45 | | | 0.13 | | | 0.11 | | | 0.24 | | | (0.14) | | | (0.00) | | | (0.00) | | (0.14) |
| | WESTCORE COLORADO TAX–EXEMPT FUND | | | | | | | | | | | | | | | | | | |
| | 06/30/10 | | | 11.19 | | | 0.20 | | | 0.08 | | | 0.28 | | | (0.20) | | | (0.00) | | | (0.00) | | (0.20) |
| | 12/31/09 | | | 10.48 | | | 0.40 | | | 0.71 | | | 1.11 | | | (0.40) | | | (0.00) | | | (0.00) | | (0.40) |
| | 12/31/08 | | | 11.04 | | | 0.42 | | | (0.56) | | | (0.14) | | | (0.42) | | | (0.00) | | | (0.00) | | (0.42) |
| | 12/31/07 | | | 11.16 | | | 0.43 | | | (0.12) | | | 0.31 | | | (0.43) | | | (0.00) | | | (0.00) | | (0.43) |
| | 12/31/06(a) | | | 11.00 | | | 0.25 | | | 0.16 | | | 0.41 | | | (0.25) | | | (0.00) | | | (0.00) | | (0.25) |
| | 05/31/06 | | | 11.32 | | | 0.42 | | | (0.32) | | | 0.10 | | | (0.42) | | | (0.00) | | | (0.00) | | (0.42) |
| | 05/31/05 | | | 11.23 | | | 0.41 | | | 0.10 | | | 0.51 | | | (0.42) | | | (0.00) | | | (0.00) | | (0.42) |
| | | | | | | | | | | | | | | | | | | | | | | | | |
(a) | Effective December 31, 2006, the Westcore Funds changed their fiscal year end from May 31 to December 31. |
(b) | Less than $0.005 per share. |
(c) | Total return and portfolio turnover rate are not annualized for periods less than one full year. |
(d) | Annualized. |
| PAGE 84 |
|
| | | Ratios/Supplemental Data |
| | | | | | | | | | | Ratio of Net | |
| | | | | | | | | | | Investment | |
| | | | | | | | | Ratio of Expenses | Ratio of Net | Income/(Loss) | |
Paid–in | | | | | Net Assets, | | Ratio of Expenses | to Average Net | Investment Income/ | to Average Net | |
Capital from | Net Asset Value | | | | End of Period | | to Average Net | Assets Without | (Loss) to | Assets Without | Portfolio |
Redemption Fees | End of Period | | Total Return | | (in Thousands) | | Assets | Fee Waivers | Average Net Assets | Fee Waivers | Turnover Rate |
| |
| |
$ | 0.00 (b) | $ | 10.75 | | 5.33% | | $ | 1,416,687 | | 0.55% | (d) | 0.78% | (d) | 4.26% | (d) | 4.03% | (d) | 19% | (c) |
| | 0.00 (b) | | 10.42 | | 10.42% | | | 1,326,659 | | 0.55% | | 0.81% | | 4.32% | | 4.05% | | 36% | |
| | 0.00 (b) | | 9.85 | | (1.86%) | | | 1,069,006 | | 0.55% | | 0.81% | | 4.98% | | 4.72% | | 54% | |
| | 0.00 (b) | | 10.55 | | 5.42% | | | 1,102,647 | | 0.55% | | 0.82% | | 5.21% | | 4.94% | | 48% | |
| | 0.00 (b) | | 10.54 | | 5.75% | (c) | | 731,616 | | 0.55% | (d) | 0.86% | (d) | 5.49% | (d) | 5.17% | (d) | 11% | |
| | 0.00 (b) | | 10.28 | | 1.48% | | | 460,509 | | 0.55% | | 0.89% | | 5.58% | | 5.24% | | 32% | |
| | 0.00 (b) | | 10.70 | | 6.97% | | | 226,609 | | 0.55% | | 1.00% | | 5.61% | | 5.16% | | 31% | |
| |
| | 0.00 (b) | | 10.74 | | 5.35% | | | 189,399 | | 0.46% | (d) | 0.71% | (d) | 4.34% | (d) | 4.10% | (d) | 19% | (c) |
| | 0.00 (b) | | 10.42 | | 10.56% | | | 131,815 | | 0.44% | | 0.73% | | 4.40% | | 4.11% | | 36% | |
| | 0.00 (b) | | 9.85 | | (1.77%) | | | 65,263 | | 0.46% | | 0.73% | | 5.09% | | 4.82% | | 54% | |
| | 0.00 (b) | | 10.55 | | 2.27% | (c) | | 35,516 | | 0.44% | (d) | 1.30% | (d) | 5.13% | (d) | 4.28% | (d) | 48% | (e) |
| |
| | 0.00 (b) | | 11.27 | | 2.52% | | | 119,324 | | 0.65% | (d) | 0.88% | (d) | 3.61% | (d) | 3.38% | (d) | 1% | (c) |
| | 0.00 (b) | | 11.19 | | 10.71% | | | 105,891 | | 0.65% | | 0.90% | | 3.67% | | 3.42% | | 8% | |
| | 0.00 (b) | | 10.48 | | (1.34%) | | | 67,206 | | 0.65% | | 0.91% | | 3.85% | | 3.59% | | 16% | |
| | 0.00 (b) | | 11.04 | | 2.84% | | | 57,204 | | 0.65% | | 0.95% | | 3.84% | | 3.54% | | 14% | |
| | 0.00 (b) | | 11.16 | | 3.77% | (c) | | 55,895 | | 0.65% | (d) | 0.98% | (d) | 3.87% | (d) | 3.53% | (d) | 8% | |
| | 0.00 (b) | | 11.00 | | 0.93% | | | 55,529 | | 0.65% | | 0.98% | | 3.77% | | 3.44% | | 22% | |
| | 0.00 (b) | | 11.32 | | 4.55% | | | 59,346 | | 0.65% | | 1.07% | | 3.68% | | 3.26% | | 33% | |
| | | | | | | | | | | | | | | | | | | | |
| | | | | | | | | | | | | | | | | | | | |
(e) | Portfolio turnover rate is calculated at the Fund level and represents the year ended December 31, 2007. |
(f) | Period from September 28, 2007 (inception date) through December 31, 2007. |
See Notes to Financial Statements |

1. ORGANIZATION
Westcore Trust (the “Trust”) is registered under the Investment Company Act of 1940, as amended, as an open-end management investment company. Interests in the Westcore Growth, Westcore MIDCO Growth, Westcore Select, Westcore Blue Chip, Westcore Mid-Cap Value, Westcore Small-Cap Opportunity, Westcore Small-Cap Value, Westcore Micro-Cap Opportunity, Westcore International Frontier, Westcore Flexible Income, Westcore Plus Bond and Westcore Colorado Tax-Exempt Funds (the “Funds”) are represented by separate classes of beneficial interest of the Trust, which is organized as a Massachusetts business trust.
The Westcore Growth, Westcore MIDCO Growth, Westcore Select, Westcore Blue Chip, Westcore Mid-Cap Value, Westcore Small-Cap Opportunity, Westcore Small-Cap Value, Westcore Micro-Cap Opportunity, Westcore International Frontier, Westcore Flexible Income, Westcore Plus Bond and Westcore Colorado Tax-Exempt Funds offer Retail Class shares.
The Westcore Growth, Westcore MIDCO Growth, Westcore Blue Chip, Westcore Small-Cap Opportunity, Westcore Small-Cap Value, Westcore Flexible Income and Westcore Plus Bond Funds offer Institutional Class shares.
All classes of shares have identical rights to earnings, assets and voting privileges, except for class specific expenses and exclusive rights to vote on matters solely affecting such class.
2. SIGNIFICANT ACCOUNTING POLICIES
The following is a summary of significant accounting policies consistently followed by each Fund in the preparation of its financial statements. The policies are in conformity with accounting principles generally accepted in the United States of America for investment companies.
Use of Estimates – The preparation of financial statements in accordance with accounting principles generally accepted in the United States of America requires management to make estimates and assumptions that affect the reported amounts and disclosures in the financial statements. The actual results could differ from those estimates.
Investment Valuation – All securities of the Funds are valued as of the close of regular trading on the New York Stock Exchange (“NYSE”), currently 4:00 p.m. (Eastern Time), on each day that the NYSE is open, subject to provisions in the prospectus and/or Statement of Additional Information regarding pricing at other times in case of an emergency and optional pricing of the Funds in the event that the NYSE does not open for business because of an emergency.
Securities that are traded on a recognized domestic stock exchange are generally valued at the last sales price as of the valuation time on the principal stock exchange on which they are traded. Securities that are principally traded on the National Association of Securities Dealers Automated Quotation (“NASDAQ”) exchange are generally valued at the NASDAQ Official Closing Price (“NOCP”). Unlisted securities that are traded on the domestic over-the-counter market for which last sales prices are available, are generally valued at the last sales price as of the valuation time. In the absence of sales and NOCP, such securities are valued at the mean of the bid and asked prices. Exchange-traded interest rate futures are valued at the settlement price determined by the relevant exchange.
Securities that are traded on a foreign stock exchange (and that are not listed on a recognized domestic stock exchange or traded on the NASDAQ exchange or the domestic over-the-counter market) are generally valued at the official closing price on the principal stock exchange on which they are traded. In the event that closing prices are not available for such foreign securities, such securities are generally valued at the last sales price occurring prior to the closing of its principal exchange. Exchange rates as of the close of regular trading on the NYSE are used to convert foreign security values into U.S. dollars. Forward foreign currency exchange contracts are valued on a daily basis based on the closing prices of the foreign currency rates as of the close of regular trading on the NYSE.
Redeemable securities issued by open-end registered investment companies are valued at the investment company’s applicable net asset value.
Fixed-income obligations, excluding municipal securities, having a remaining maturity of greater than 60 days, for which there are no readily available market quotations or sales information are valued at the mean between the evaluated bid and ask prices formulated by an independent pricing service. Municipal securities having a remaining maturity of greater than 60 days, for which there are no readily available market quotations or sales information are valued at the evaluated bid price formulated by an independent pricing service.
Securities having a remaining maturity of 60 days or less are valued at amortized cost which approximates market value.
When market quotations are not readily available or when events occur that make established valuation methods unreliable, securities of the Fund may be valued in good faith by or under the direction of the Board of Trustees. Factors which may be considered when determining the value of a security include (a) the fundamental data relating to the investment; (b) an evaluation of the forces which influence the market in which the security is sold, including the liquidity and depth of the market; (c) the market value at date of purchase; (d) information as to any transactions or offers with respect to the security or comparable securities; and (e) any other relevant matters.
| PAGE 86 |
|
Foreign Securities – All of the Funds, except the Westcore Colorado Tax-Exempt Fund, may invest at least a portion of their assets in foreign securities. As of June 30, 2010, all Funds were primarily invested in U.S. based issuers, as determined by the location of their headquarters, except Westcore International Frontier Fund. In the event that a Fund executes a foreign security transaction, the Fund will generally enter into a foreign currency contract to settle the foreign security transaction. Foreign securities may carry more risk than U.S. securities, such as political, market and currency risks. The accounting records of the Funds are maintained in U.S. dollars. Prices of securities denominated in foreign currencies are translated into U.S. dollars at the closing rates of exchange at period end. Amounts related to the purchase and sale of foreign securities and investment income are translated at the rates of exchange prevailing on the respective dates of such transactions.
The effect of changes in foreign currency exchange rates on investments is separately identified from the fluctuations arising from changes in market values of securities held and reported with all other foreign currency gains and losses in the Funds’ Statements of Operations.
Federal Income Taxes –No provision for income taxes is included in the accompanying financial statements, as the Funds intend to distribute to shareholders all taxable investment income and realized gains and otherwise comply with Subchapter M of the Internal Revenue Code applicable to regulated investment companies.
The Funds evaluate tax positions taken (or expected to be taken) in the course of preparing the Funds’ tax returns to determine whether these positions meet a “more-likely-than- not” standard that, based on the technical merits, have a more than fifty percent likelihood of being sustained by a taxing authority upon examination. A tax position that meets the “more-likely-than-not” recognition threshold is measured to determine the amount of benefit to recognize in the financial statements.
Management of the Funds analyzes all open tax years, as defined by the Statute of Limitations, for all major jurisdictions, including federal tax authorities and certain state tax authorities. As of and during the fiscal year ended December 31, 2009, the Funds did not have a liability for any unrecognized tax benefits. The Funds file income tax returns in the U.S. federal jurisdiction and Colorado. For the years ended December 31, 2006 through December 31, 2009 for the federal jurisdiction and for the years ended December 31, 2005 through December 31, 2009, for Colorado, the Funds’ returns are still open to examination by the appropriate taxing authority. In addition, for the years ended May 31, 2006 through December 31, 2009, the Westcore Flexible Income Fund’s Mississippi returns are still open to examination by the appropriate taxing authority as well.
At December 31, 2009, each Fund had available for federal income tax purposes unused capital loss carryforwards as follows:
| | Expiring |
| | 2013 | 2014 | 2015 | 2016 | | 2017 | | Total |
| Westcore Growth Fund | $ | – | – | – | $ | (17,393,501) | | $ | (25,964,731) | | $ | (43,358,232) |
| Westcore MIDCO Growth Fund | | – | – | – | | (20,966,318) | | | (10,147,429) | | | (31,113,747) |
| Westcore Select Fund | | – | – | – | | (4,988,397) | | | – | | | (4,988,397) |
| Westcore Blue Chip Fund | | – | – | – | | (866,270) | | | (2,245,149) | | | (3,111,419) |
| Westcore Mid-Cap Value Fund | | – | – | – | | (8,929,534) | | | (7,328,000) | | | (16,257,534) |
| Westcore Small-Cap Opportunity Fund | | – | – | – | | (1,123,689) | | | (1,919,462) | | | (3,043,151) |
| Westcore Small-Cap Value Fund | | – | – | – | | (10,495,432) | | | (47,910,746) | | | (58,406,178) |
| Westcore Micro-Cap Opportunity Fund | | – | – | – | | (9,575) | | | (330,946) | | | (340,521) |
| Westcore International Frontier Fund | | – | – | – | | (3,157,045) | | | (8,018,392) | | | (11,175,437) |
| Westcore Flexible Income Fund | | (18,958) | (340,539) | (775,600) | | (20,255,986) | | | (9,408,999) | | | (30,800,082) |
| Westcore Plus Bond Fund | | (130,618) | (1,089,201) | – | | (5,231,790) | | | (1,145,250) | | | (7,596,859) |
| Westcore Colorado Tax-Exempt Fund | | – | – | – | | (35,227) | | | (22,684) | | | (57,911) |
The Westcore MIDCO Growth, Westcore Small-Cap Opportunity, Westcore Small-Cap Value, Westcore Micro-Cap Opportunity, Westcore Flexible Income and Westcore Plus Bond elect to defer to their fiscal year ending December 31, 2010, approximately $853,188, $210,577, $2,388,205, $31,430, $1,047,479, $60,257 of capital losses recognized during the period from November 1, 2009 to December 31, 2009, respectively. Additionally, Westcore International Frontier Fund elected to defer to its fiscal year ending December 31, 2010, approximately $8,375 of foreign currency losses recognized during the period from November 1, 2009 to December 31, 2009.
Classification of Distributions to Shareholders – Net investment income (loss) and net realized gain (loss) may differ for financial statement and tax purposes. The character of distributions made during the year from net investment income or net realized gains may differ from its ultimate characterization for federal income tax purposes. Also, due to the timing of dividend distributions, the fiscal year in which amounts are distributed may differ from the fiscal year in which the income or realized gain was recorded by the Funds. Net assets were unaffected by the reclassifications.
|
|
For the year ended December 31, 2009, each Fund recorded the following reclassifications to the accounts listed below: |
| | | | | | | | | |
| | | Increase/(Decrease) | Increase/(Decrease) |
| | | Accumulated Net | Accumulated Net |
| | Paid-in Capital | Investment Income | Gain/(Loss) |
Westcore Growth Fund | $ | (61,636) | | $ | 61,636 | | $ | 0 |
Westcore MIDCO Growth Fund | | (199,154) | | | 218,309 | | | (19,155) |
Westcore Select Fund | | (106,373) | | | 123,950 | | | (17,577) |
Westcore Blue Chip Fund | | 0 | | | 0 | | | 0 |
Westcore Mid-Cap Value Fund | | 0 | | | 0 | | | 0 |
Westcore Small-Cap Opportunity Fund | | 0 | | | 0 | | | 0 |
Westcore Small-Cap Value Fund | | 1 | | | 0 | | | (1) |
Westcore Micro-Cap Opportunity Fund | | (10) | | | 4,587 | | | (4,577) |
Westcore International Frontier Fund | | 0 | | | (14,948) | | | 14,948 |
Westcore Flexible Income Fund | | (1,189,461) | | | (66,812) | | | 1,256,273 |
Westcore Plus Bond Fund | | 665,581 | | | (190,089) | | | (475,492) |
Westcore Colorado Tax-Exempt Fund | | 0 | | | 0 | | | 0 |
The reclassifications were primarily as a result of the differing book/tax treatment of net operating losses and certain investments.
The tax character of the distributions paid during the year and the tax component of net assets were reported at the Funds’ year ended December 31, 2009.
| | Year Ended | | Year Ended |
| | December 31, 2009 | | December 31, 2008 |
| Westcore Growth Fund | | | | | |
| Ordinary Income | $ | 55,805 | | $ | 2,951,199 |
| Long-Term Capital Gain | | 0 | | | 7,114,174 |
| Total | $ | 55,805 | | $ | 10,065,373 |
| | | | | | |
| Westcore MIDCO Growth Fund | | | | | |
| Ordinary Income | $ | 0 | | $ | 371,890 |
| Long-Term Capital Gain | | 0 | | | 5,630,138 |
| Total | $ | 0 | | $ | 6,002,028 |
| | | | | | |
| Westcore Select Fund | | | | | |
| Ordinary Income | $ | 0 | | $ | 7,553 |
| Long-Term Capital Gain | | 0 | | | 0 |
| Total | $ | 0 | | $ | 7,553 |
| | | | | | |
| Westcore Blue Chip Fund | | | | | |
| Ordinary Income | $ | 200,000 | | $ | 307,736 |
| Long-Term Capital Gain | | 0 | | | 49,758 |
| Paid-in Capital | | 0 | | | 16,048 |
| Total | $ | 200,000 | | $ | 373,542 |
| PAGE 88 |
|
| | Year Ended | | Year Ended |
| | December 31, 2009 | | December 31, 2008 |
| Westcore Mid-Cap Value Fund | | | | | |
| Ordinary Income | $ | 327,999 | | $ | 595,101 |
| Long-Term Capital Gain | | 0 | | | 57,071 |
| Paid-in Capital | | 0 | | | 9,028 |
| Total | $ | 327,999 | | $ | 661,200 |
| | | | | | |
| Westcore Small-Cap Opportunity Fund | | | | | |
| Ordinary Income | $ | 0 | | $ | 0 |
| Long-Term Capital Gain | | 0 | | | 1,053 |
| Total | $ | 0 | | $ | 1,053 |
| | | | | | |
| Westcore Small-Cap Value Fund | | | | | |
| Ordinary Income | $ | 2,569,998 | | $ | 2,720,638 |
| Long-Term Capital Gain | | 0 | | | 0 |
| Paid-in Capital | | 0 | | | 54,127 |
| Total | $ | 2,569,998 | | $ | 2,774,765 |
| | | | | | |
| Westcore Micro-Cap Opportunity Fund | | | | | |
| Ordinary Income | $ | 6,600 | | $ | 4,905 (a) |
| Long-Term Capital Gain | | 0 | | | 0 (a) |
| Total | $ | 6,600 | | $ | 4,905 (a) |
| | | | | | |
| Westcore International Frontier Fund | | | | | |
| Ordinary Income | $ | 365,000 | | $ | 398,817 |
| Long-Term Capital Gain | | 0 | | | 0 |
| Paid-in Capital | | 0 | | | 35,894 |
| Total | $ | 365,000 | | $ | 434,711 |
| | | | | | |
| Westcore Flexible Income Fund | | | | | |
| Ordinary Income | $ | 5,000,003 | | $ | 10,402,288 |
| Long-Term Capital Gain | | 0 | | | 0 |
| Paid-in Capital | | 0 | | | 133,750 |
| Total | $ | 5,000,003 | | $ | 10,536,038 |
| | | | | | |
| Westcore Plus Bond Fund | | | | | |
| Ordinary Income | $ | 56,236,714 | | $ | 58,161,774 |
| Long-Term Capital Gain | | 0 | | | 0 |
| Total | $ | 56,236,714 | | $ | 58,161,774 |
| | | | | | |
| Westcore Colorado Tax-Exempt Fund | | | | | |
| Ordinary Income | $ | 2,380 | | $ | 2,724 |
| Tax-Exempt Income | | 3,083,221 | | | 2,342,991 |
| Total | $ | 3,085,601 | | $ | 2,345,715 |
| | | | | | |
| (a) Period from June 23, 2008 (since inception) through December 31, 2008. |
|
|
| As of December 31, 2009, the components of distributable earnings on a tax basis were as follows: |
| | | | | | | | | | | | | | |
| | Westcore | | | Westcore MIDCO | | Westcore | | | Westcore Blue |
| | Growth Fund | | | Growth Fund | | Select Fund | | | Chip Fund |
| (Over)/Undistributed net investment income | $ | 0 | | $ | 0 | | $ | 0 | | $ | 19,385 |
Accumulated net realized gain/(loss)
on investments | | | | | | | | | | | | | |
| | (43,358,232) | | | (31,966,935) | | | (4,988,397) | | | (3,111,419) |
Net unrealized appreciation/(depreciation)
on investments | | | | | | | | | | | | | |
| | 30,167,389 | | | 24,537,493 | | | 7,687,126 | | | 5,739,190 |
| Effect of other timing differences | | (34,263) | | | (354,586) | | | (8,351) | | | (39,218) |
| Total | $ | (13,225,106) | | $ | (7,784,028) | | $ | 2,690,378 | | $ | 2,607,938 |
| | | | | | | | | | | | | | |
| | | | | | | Westcore | | | Westcore | | | Westcore |
| | | Westcore Mid-Cap | | | Small-Cap | | | Small-Cap | | | Micro-Cap |
| | | Value Fund | | | Opportunity Fund | | | Value Fund | | | Opportunity Fund |
| (Over)/Undistributed net investment income | $ | 14,536 | | $ | 42,702 | | $ | 244,058 | | $ | 1,974 |
Accumulated net realized gain/(loss)
on investments | | | | | | | | | | | | | |
| | (16,257,534) | | | (3,253,728) | | | (60,794,383) | | | (371,951) |
Net unrealized appreciation/(depreciation)
on investments | | | | | | | | | | | | | |
| | 2,531,845 | | | 2,587,376 | | | 19,604,603 | | | 138,595 |
| Effect of other timing differences | | (7,991) | | | (31,926) | | | (10,101) | | | (33) |
| Total | $ | (13,719,144) | | $ | (655,576) | | $ | (40,955,823) | | $ | (231,415) |
| | | | | | | | | | | | | | |
| | | | | | | | | | | | | | Westcore |
| | Westcore International | | | Westcore Flexible | | | Westcore | | | Colorado Tax-Exempt |
| | | Frontier Fund | | | Income Fund | | | Plus Bond Fund | | | Fund |
| (Over)/Undistributed net investment income | $ | 39,322 | | $ | 9,968 | | $ | 38,193 | | $ | 11,290 |
Accumulated net realized gain/(loss)
on investments | | | | | | | | | | | | | |
| | (11,175,437) | | | (31,847,561) | | | (7,657,116) | | | (57,911) |
Net unrealized appreciation/(depreciation)
on investments | | | | | | | | | | | | | |
| | 4,320,217 | | | (17,634,460) | | | (3,407,624) | | | 2,307,860 |
| Effect of other timing differences | | (10,299) | | | (297,781) | | | (308,473) | | | (24,886) |
| Total | $ | (6,826,197) | | $ | (49,769,834) | | $ | (11,335,020) | | $ | 2,236,353 |
The effect of other timing differences primarily includes deferred Trustees’ compensation.
The Funds recharacterize distributions received from Real Estate Investment Trusts (“REITs”) investments based on information provided by the REIT into the following categories: ordinary income, long-term capital gains, and return of capital. If information is not available on a timely basis from the REIT, the recharacterization will be based on available information which may include the previous year’s allocation. If new or additional information becomes available from the REIT at a later date, a recharacterization will be made in the following year. The Funds record as dividend income the amount recharacterized as ordinary income and as realized gain the amount recharacterized as capital in the Statement of Operations, and the amount recharacterized as a return of capital as a reduction to the cost of investments in the Statement of Assets and Liabilities and on the Statement of Investments. These recharacterizations are reflected in the accompanying financial statements.
Distributions – Distributions of net investment income, if any, are generally made annually for the Westcore Growth, Westcore MIDCO Growth, Westcore Select, Westcore Blue Chip, Westcore Mid-Cap Value, Westcore Small-Cap Opportunity, Westcore Small-Cap Value, Westcore Micro-Cap Opportunity and Westcore International Frontier Funds and monthly for the Westcore Flexible Income, Westcore Plus Bond and Westcore Colorado Tax-Exempt Funds. Distributions of net realized capital gains, if any, are declared at least once each year for each of the Funds. Distributions to shareholders are recorded on the ex-dividend date.
Securities Lending – The Westcore Funds may loan securities to certain brokers who pay the Funds negotiated lenders’ fees. When earned, these fees, net of associated costs, are included in other income. The Funds receive U.S. Treasury obligations and/or cash as collateral against the loaned securities, in an amount at least equal to 102% of the market value of the loaned securities at the inception of each loan. This collateral must be maintained at not less than 100% of the market value of the loaned securities during the period of the loan. The risks to the Funds of securities lending are that the borrower may not provide additional collateral when required or return the securities when due. The Funds did not loan securities during the six months ended June 30, 2010.
Expenses – Expenses that are specific to a Fund or class of shares of a Fund are charged directly to that Fund or share class. Expenses that are common to all Funds generally are allocated among the Funds in proportion to their average daily net assets.
| PAGE 90 |
|
| Expenses related to specific classes and the associated Fund level expenses, for the six months ended June 30, 2010, were as follows: |
| | |
| Westcore Growth Fund | | | | | | | | |
| | Retail Class | | Institutional Class | | Fund |
| | Specific Expenses | | Specific Expenses | | Level Expenses |
| Administrative fee | $ | 0 | | $ | 4,959 | | $ | 97,904 |
| Shareholder servicing reimbursement | | 41,821 | | | 0 | | | 0 |
| Transfer agent fees | | 6,132 | | | 44 | | | 8,579 |
| Fund accounting fees and expenses | | 0 | | | 3,720 | | | 18,818 |
| Registration fees | | 8,694 | | | 7,250 | | | 0 |
| Other | | 1,398 | | | 1,398 | | | 4,934 |
| | | | | | | | | |
| Westcore MIDCO Growth Fund | | | | | | | | |
| | Retail Class | | Institutional Class | | Fund |
| | Specific Expenses | | Specific Expenses | | Level Expenses |
| Administrative fee | $ | 0 | | $ | 1,240 | | $ | 104,053 |
| Shareholder servicing reimbursement | | 20,117 | | | 0 | | | 0 |
| Transfer agent fees | | 13,205 | | | 85 | | | 10,277 |
| Fund accounting fees and expenses | | 0 | | | 0 | | | 19,990 |
| Registration fees | | 7,341 | | | 7,328 | | | 0 |
| Other | | 1,398 | | | 831 | | | 2,162 |
| | | | | | | | | |
| Westcore Blue Chip Fund | | | | | | | | |
| | Retail Class | | Institutional Class | | Fund |
| | Specific Expenses | | Specific Expenses | | Level Expenses |
| Administrative fee | $ | 0 | | $ | 2,479 | | $ | 31,583 |
| Shareholder servicing reimbursement | | 3,122 | | | 0 | | | 0 |
| Transfer agent fees | | 3,313 | | | 50 | | | 8,527 |
| Fund accounting fees and expenses | | 0 | | | 1,240 | | | 16,483 |
| Registration fees | | 8,313 | | | 863 | | | 0 |
| Other | | 1,398 | | | 831 | | | 2,098 |
| | | | | | | | | |
| Westcore Small-Cap Opportunity Fund | | | | | | | | |
| | Retail Class | | Institutional Class | | Fund |
| | Specific Expenses | | Specific Expenses | | Level Expenses |
| Administrative fee | $ | 0 | | $ | 4,959 | | $ | 32,759 |
| Shareholder servicing reimbursement | | 7,583 | | | 0 | | | 0 |
| Transfer agent fees | | 3,077 | | | 31 | | | 8,499 |
| Fund accounting fees and expenses | | 0 | | | 3,720 | | | 17,550 |
| Registration fees | | 6,842 | | | 6,884 | | | 0 |
| Other | | 1,398 | | | 831 | | | 2,777 |
| | | | | | | | | |
| Westcore Small-Cap Value Fund | | | | | | | | |
| | Retail Class | | Institutional Class | | Fund |
| | Specific Expenses | | Specific Expenses | | Level Expenses |
| Administrative fee | $ | 0 | | $ | 0 | | $ | 228,882 |
| Shareholder servicing reimbursement | | 69,217 | | | 0 | | | 0 |
| Transfer agent fees | | 2,922 | | | 546 | | | 8,373 |
| Fund accounting fees and expenses | | 0 | | | 0 | | | 38,154 |
| Registration fees | | 11,859 | | | 7,283 | | | 0 |
| Other | | 1,398 | | | 831 | | | 19,283 |
| | | | | | | | | |
|
|
| Westcore Flexible Income Fund | | | | | | | | |
| | Retail Class | | Institutional Class | | Fund |
| | Specific Expenses | | Specific Expenses | | Level Expenses |
| Administrative fee | $ | 0 | | $ | 4,959 | | $ | 61,888 |
| Shareholder servicing reimbursement | | 22,388 | | | 0 | | | 0 |
| Transfer agent fees | | 6,424 | | | 14 | | | 8,721 |
| Fund accounting fees and expenses | | 0 | | | 3,720 | | | 20,992 |
| Registration fees | | 9,546 | | | 7,051 | | | 0 |
| Other | | 1,398 | | | 831 | | | 0 |
| | | | | | | | | |
| Westcore Plus Bond Fund | | | | | | | | |
| | Retail Class | | Institutional Class | | Fund |
| | Specific Expenses | | Specific Expenses | | Level Expenses |
| Administrative fee | $ | 0 | | $ | 0 | | $ | 1,291,947 |
| Shareholder servicing reimbursement | | 457,274 | | | 0 | | | 0 |
| Transfer agent fees | | 87,643 | | | 1,088 | | | 19,756 |
| Fund accounting fees and expenses | | 0 | | | 0 | | | 174,389 |
| Registration fees | | 33,186 | | | 8,503 | | | 0 |
| Other | | 1,398 | | | 1,398 | | | 36,227 |
When-Issued Securities – Each Fund may purchase or sell securities on a “when-issued” or “forward commitment” basis which involves a commitment by the Fund to purchase or sell particular securities with payment and delivery taking place at a future date. During this period, such securities do not earn interest, are subject to market fluctuation and may increase or decrease in value prior to their delivery. Each Fund maintains, in a segregated account with its custodian, liquid assets with a market value at least equal to the amount of its purchase commitments. The purchase of securities on a when-issued or forward commitment basis may increase the volatility of the Fund’s net asset value to the extent each Fund makes such purchases while remaining substantially fully invested. Settlements in the ordinary course of business, which may take substantially more than three business days for non-US securities, are not treated by the Funds as “when-issued” or “forward commitment” transactions.
Other – For financial reporting purposes, the Funds’ investment holdings include trades executed through the end of the last business day of the period. In addition, all shareholder transactions processed through the end of the last business day of the period are included in the beneficial interest transaction amounts. Dividend income is recorded on the ex-dividend date. Interest income, which includes amortization of premiums, accretion of discounts and income earned on money market funds, is accrued and recorded daily. Realized gains and losses from investment transactions and unrealized appreciation and depreciation of investments are reported on an identified cost basis.
| PAGE 92 |
|
3. SHARES OF BENEFICIAL INTEREST
On June 30, 2010, there was an unlimited number of no par value shares of beneficial interest authorized for each Fund. Transactions in shares of beneficial interest were as follows:
| Westcore Equity Funds | | | | | | | |
| | Westcore Growth Fund | | Westcore MIDCO Growth Fund |
| | Six Months Ended | | Year Ended | | Six Months Ended | | Year Ended |
| | June 30, 2010 | | December 31, 2009 | | June 30, 2010 | | December 31, 2009 |
Shares issued and redeemed: | | | | | | | |
| Shares sold | | | | | | | |
| Retail Class | 1,144,803 | | 974,991 | | 531,847 | | 2,319,742 |
| Institutional Class | 65,174 | | 57,404 | | 132,797 | | 773,740 |
| Shares issued in reinvestment of distributions | | | | | | | |
| Retail Class | 0 | | 4,466 | | 0 | | 0 |
| Institutional Class | 0 | | 577 | | 0 | | 0 |
| Shares redeemed | | | | | | | |
| Retail Class | (2,651,807) | | (6,979,430) | | (1,306,097) | | (4,031,172) |
| Institutional Class | (23,262) | | (47,427) | | (350,036) | | (933,968) |
| Net decrease in shares | (1,465,092) | | (5,989,419) | | (991,489) | | (1,871,658) |
| | | | | | | | |
| | Westcore Select Fund | | Westcore Blue Chip Fund |
| | Six Months Ended | | Year Ended | | Six Months Ended | | Year Ended |
| | June 30, 2010 | | December 31, 2009 | | June 30, 2010 | | December 31, 2009 |
| Shares issued and redeemed: | | | | | | | |
| Shares sold | | | | | | | |
| Retail Class | 5,571,674 | | 2,814,042 | | 36,243 | | 98,128 |
| Institutional Class | N/A | | N/A | | 18,804 | | 41,024 |
| Shares issued in reinvestment of distributions | | | | | | | |
| Retail Class | 0 | | 0 | | 0 | | 5,623 |
| Institutional Class | N/A | | N/A | | 0 | | 11,125 |
| Shares redeemed | | | | | | | |
| Retail Class | (667,820) | | (1,116,051) | | (105,722) | | (540,148) |
| Institutional Class | N/A | | N/A | | (91,522) | | (221,728) |
| Net increase/(decrease) in shares | 4,903,854 | | 1,697,991 | | (142,197) | | (605,976) |
|
|
| | Westcore Mid-Cap Value Fund | | Westcore Small-Cap Opportunity Fund |
| | Six Months Ended | | Year Ended | | Six Months Ended | | Year Ended |
| | June 30, 2010 | | December 31, 2009 | | June 30, 2010 | | December 31, 2009 |
| Shares issued and redeemed: | | | | | | | |
| Shares sold | | | | | | | |
| Retail Class | 244,283 | | 698,029 | | 207,613 | | 571,325 |
| Institutional Class | N/A | | N/A | | 6,178 | | 14,930 |
| Shares issued in reinvestment of distributions | | | | | | | |
| Retail Class | 0 | | 18,172 | | 0 | | 0 |
| Institutional Class | N/A | | N/A | | 0 | | 0 |
| Shares redeemed | | | | | | | |
| Retail Class | (418,902) | | (1,030,702) | | (107,869) | | (154,603) |
| Institutional Class | N/A | | N/A | | (8,726) | | (8,625) |
| Net increase/(decrease) in shares | (174,619) | | (314,501) | | 97,196 | | 423,027 |
| | | | | | | | |
| | Westcore Small-Cap Value Fund | | Westcore Micro-Cap Opportunity Fund |
| | Six Months Ended | | Year Ended | | Six Months Ended | | Year Ended |
| | June 30, 2010 | | December 31, 2009 | | June 30, 2010 | | December 31, 2009 |
| Shares issued and redeemed: | | | | | | | |
| Shares sold | | | | | | | |
| Retail Class | 3,441,188 | | 10,417,416 | | 72,460 | | 161,170 |
| Institutional Class | 2,567,799 | | 3,921,472 | | N/A | | N/A |
| Shares issued in reinvestment of distributions | | | | | | | |
| Retail Class | 0 | | 169,664 | | 0 | | 748 |
| Institutional Class | 0 | | 55,122 | | N/A | | N/A |
| Shares redeemed | | | | | | | |
| Retail Class | (3,379,985) | | (9,200,562) | | (60,696) | | (86,467) |
| Institutional Class | (845,422) | | (1,106,635) | | N/A | | N/A |
| Net increase in shares | 1,783,580 | | 4,256,477 | | 11,764 | | 75,451 |
| | | | | | | | |
| | | | | | | | |
| | Westcore International Frontier Fund | | Westcore Flexible Income Fund |
| | Six Months Ended | | Year Ended | | Six Months Ended | | Year Ended |
| | June 30, 2010 | | December 31, 2009 | | June 30, 2010 | | December 31, 2009 |
| Shares issued and redeemed: | | | | | | | |
| Shares sold | | | | | | | |
| Retail Class | 515,998 | | 621,056 | | 773,446 | | 1,137,478 |
| Institutional Class | N/A | | N/A | | 67,415 | | 134,284 |
| Shares issued in reinvestment of distributions | | | | | | | |
| Retail Class | 0 | | 26,401 | | 286,080 | | 665,101 |
| Institutional Class | N/A | | N/A | | 5,683 | | 10,845 |
| Shares redeemed | | | | | | | |
| Retail Class | (380,990) | | (418,890) | | (1,687,672) | | (3,308,883) |
| Institutional Class | N/A | | N/A | | (69,496) | | (112,478) |
| Net increase/(decrease) in shares | 135,008 | | 228,567 | | (624,544) | | (1,473,653) |
| PAGE 94 |
|
| | Westcore Plus Bond Fund | | Westcore Colorado Tax-Exempt Fund |
| | Six Months Ended | | Year Ended | | Six Months Ended | | Year Ended |
| | June 30, 2010 | | December 31, 2009 | | June 30, 2010 | | December 31, 2009 |
| Shares issued and redeemed: | | | | | | | |
| Shares sold | | | | | | | |
| Retail Class | 20,848,776 | | 54,728,578 | | 1,650,664 | | 4,837,708 |
| Institutional Class | 6,744,168 | | 7,197,541 | | N/A | | N/A |
| Shares issued in reinvestment of distributions | | | | | | | |
| Retail Class | 2,564,977 | | 4,730,726 | | 161,636 | | 254,637 |
| Institutional Class | 276,684 | | 279,584 | | N/A | | N/A |
| Shares redeemed | | | | | | | |
| Retail Class | (18,907,564) | | (40,673,010) | | (687,293) | | (2,045,622) |
| Institutional Class | (2,034,269) | | (1,450,910) | | N/A | | N/A |
| Net increase in shares | 9,492,772 | | 24,812,509 | | 1,125,007 | | 3,046,723 |
4. UNREALIZED APPRECIATION AND DEPRECIATION ON INVESTMENTS (TAX BASIS)
Westcore Equity Funds
| | | | | | | | Westcore |
| | Westcore | | Westcore MIDCO | Westcore | Westcore Blue | | Mid-Cap Value |
| | Growth Fund | | Growth Fund | Select Fund | Chip Fund | | Fund |
| As of June 30, 2010 | | | | | | | | | | |
| Gross appreciation (excess of value over tax cost) | $ | 16,466,375 | | $ | 16,978,002 | $ | 4,883,694 | $ | 4,193,571 | $ | 4,987,639 |
| Gross depreciation (excess of tax cost over value) | | (3,847,761) | | | (4,309,289) | | (9,885,975) | | (3,071,869) | | (4,964,500) |
| Net unrealized appreciation/(depreciation) | $ | 12,618,614 | | $ | 12,668,713 | $ | (5,002,281) | $ | 1,121,702 | $ | 23,139 |
| Cost of investment for income tax purposes | $ | 84,132,608 | | $ | 98,051,878 | $ | 141,962,208 | $ | 31,725,836 | $ | 44,800,164 |
| | | Westcore | | | Westcore | | Westcore | | Westcore |
| | | Small-Cap | | | Small-Cap | | Micro-Cap | | International |
| | | Opportunity Fund | | | Value Fund | Opportunity Fund | | Frontier Fund |
| As of June 30, 2010 | | | | | | | | | | | | | |
| Gross appreciation (excess of value over tax cost) | $ | 5,424,758 | | | $ | 35,375,109 | $ | 214,643 | $ | | 5,633,750 |
| Gross depreciation (excess of tax cost over value) | | (3,934,540) | | | | (19,237,919) | | (180,676) | | | (3,166,061) |
| Net unrealized appreciation/(depreciation) | $ | 1,490,218 | | | $ | 16,137,190 | $ | 33,967 | $ | | 2,467,689 |
| Cost of investment for income tax purposes | $ | 35,969,940 | | | $ | 252,143,527 | $ | 2,059,390 | $ | | 31,616,574 |
| Westcore Bond Funds | | | | | | | | |
| | | Westcore | | | | | | |
| | | Flexible | | | Westcore | | | Westcore Colorado |
| | | Income Fund | | | Plus Bond Fund | | | Tax-Exempt Fund |
| As of June 30, 2010 | | | | | | | | | |
| Gross appreciation (excess of value over tax cost) | $ | 3,451,272 | | $ | | 88,499,931 | | $ | | 3,537,413 |
| Gross depreciation (excess of tax cost over value) | | (19,083,837) | | | | (42,279,187) | | | | (449,325) |
| Net unrealized appreciation/(depreciation) | $ | (15,632,565) | | $ | | 46,220,744 | | $ | | 3,088,088 |
| Cost of investment for income tax purposes | $ | 84,588,425 | | $ | | 1,545,747,377 | | $ | | 115,522,769 |
5. INVESTMENT ADVISORY FEES, ADMINISTRATIVE FEES AND OTHER RELATED PARTY TRANSACTIONS
The Trust has entered into an advisory agreement with Denver Investment Advisors LLC (the “Advisor” or “Denver Investments”) for all Funds. The advisory agreement has been approved by the Trust’s Board of Trustees.
Pursuant to its advisory agreement with the Trust, Denver Investments is entitled to an investment advisory fee, computed daily and payable monthly of 0.65%, 0.65%, 0.65%, 0.65%, 0.75%, 1.00%, 1.00%, 1.00%, 1.20%, 0.45%, 0.45% and 0.50% of the average net assets for Westcore Growth, Westcore MIDCO Growth, Westcore Select, Westcore Blue Chip, Westcore Mid-Cap Value, Westcore Small-Cap Opportunity, Westcore Small-Cap Value, Westcore Micro-Cap Opportunity, Westcore International Frontier, Westcore Flexible Income, Westcore Plus Bond and Westcore Colorado Tax-Exempt Funds, respectively.
ALPS Fund Services, Inc. (“ALPS”) and Denver Investments serve as the Funds’ co-administrators (“Co-Administrators”). ALPS and Denver Investments are entitled to receive a total fee from each Fund for its administrative services computed daily and paid monthly. Denver Investments and ALPS agreed to allocate the co-administration fee as shown in the chart below. ALPS is also entitled to a minimum Trust level fee of $357,250 per annum, but no more than the amount of the administration fees paid by the Trust.
| | ALPS | Denver
Investments | Total |
First $750 million in average daily Net Assets of the Trust | 0.05% | 0.20% | 0.25% |
Next $250 million in average daily Net Assets of the Trust | 0.04% | 0.16% | 0.20% |
Net Assets greater than $1.0 billion in average daily Net
Assets of the Trust | 0.025% | 0.10% | 0.125% |
The administrative fees are then allocated to each Fund based upon the Fund’s relative proportion of the Trust’s Net Assets.
In addition, ALPS is entitled to an Institutional Class minimum administration fee. The fee is charged directly to each Institutional Class based on the Class’ assets in accordance with the schedule below.
| Assets | | Annual Fee |
| $0 - $9,999,999 | | $ | 10,000 |
| $10,000,000 - $19,999,999 | | $ | 7,500 |
| $20,000,000 - $29,999,999 | | $ | 5,000 |
| $30,000,000 - $39,999,999 | | $ | 2,500 |
| Over $40,000,000 | | $ | 0 |
In addition, ALPS is entitled to a minimum administration fee for Westcore Micro-Cap Opportunity Fund. The fee is charged directly to the Fund based on the Fund’s net assets in accordance with the schedule below.
| Assets | | Annual Fee |
| $0 - $9,999,999 | | $ | 10,000 |
| $10,000,000 - $19,999,999 | | $ | 7,500 |
| $20,000,000 - $29,999,999 | | $ | 5,000 |
| Over $30,000,000 | | $ | 0 |
| PAGE 96 |
|
The Trust has agreed to reimburse Denver Investments for a portion of the payments it makes to certain third party intermediaries for providing recordkeeping and sub-accounting services to persons who own Fund Retail Class shares through omnibus accounts (“Omnibus Accounts”). The amount reimbursed by the Trust is intended to not exceed the cost that would be incurred by the Trust if the shares held in the Omnibus Accounts were serviced directly by the Fund’s transfer agent.
To determine the reimbursement amount, the Trust’s effective cost for servicing shares directly by the Fund’s transfer agent is calculated on a semi-annual basis as follows (“Effective Rate”):
Trust Retail Class Transfer Agency Costs divided by the Retail Class Trust Assets serviced directly by the Fund’s Transfer Agent.
This Effective Rate is then multiplied by the Retail Class assets in the Omnibus Accounts to determine the reimbursement amount.
The Co-Administrators and the Advisor have contractually agreed to waive fees or reimburse expenses for each of the Funds until at least April 29, 2011 so that the Net Annual Fund Operating Expenses for the Retail Class shares of the Westcore Growth, Westcore MIDCO Growth, Westcore Select, Westcore Blue Chip, Westcore Mid-Cap Value, Westcore Small-Cap Opportunity, Westcore Small-Cap Value, Westcore Micro-Cap Opportunity, Westcore International Frontier, Westcore Flexible Income, Westcore Plus Bond and Westcore Colorado Tax-Exempt Funds will not exceed 1.15%, 1.15%, 1.15%, 1.15%, 1.25%, 1.30%, 1.30%, 1.30%, 1.50%, 0.85%, 0.55%, and 0.65%, respectively. Without such fee waivers, for the six months ended June 30, 2010, the Total Annualized Fund Operating Expenses of the Westcore Blue Chip, Westcore Small-Cap Opportunity, Westcore Small-Cap Value, Westcore Micro-Cap Opportunity, Westcore International Frontier, Westcore Flexible Income, Westcore Plus Bond, and Westcore Colorado Tax-Exempt Funds would be 1.25%, 1.52%, 1.35%, 6.97%, 1.83%, 0.89%, 0.78% and 0.88%, respectively.
The Co-Administrators and the Advisor have contractually agreed to waive fees or reimburse expenses with respect to Institutional Class shares until at least April 29, 2011. The Advisor will waive its investment advisory and/or administration fees and/or reimburse for all the ongoing class-specific expenses for the Institutional Class shares. Without such fee waivers, for the six months ended June 30, 2010, the Total Annualized Operating Expenses for the Institutional Class shares of the Westcore Growth, Westcore MIDCO Growth, Westcore Blue Chip, Westcore Small-Cap Opportunity, Westcore Small-Cap Value, Westcore Flexible Income and Westcore Plus Bond Funds would be 2.14%, 0.99%, 1.10%, 2.43%, 1.30%, 3.42% and 0.71%, respectively.
ALPS, pursuant to a Transfer Agency Agreement, serves as Transfer Agent for each of the Funds. As Transfer Agent, ALPS has, among other things, agreed to: (a) issue and redeem shares of the Funds; (b) make dividend and other distributions to shareholders of the Funds; (c) effect transfers of shares; (d) mail communications to shareholders of the Funds, including account statements, confirmations, and dividend and distribution notices; (e) facilitate the electronic delivery of shareholder statements and reports and (f) maintain shareholder accounts. Under the Transfer Agency Agreement, ALPS receives from the Trust an annual minimum fee per Fund, a fee based upon each shareholder account and is reimbursed for out-of-pocket expenses.
ALPS has also agreed, pursuant to a separate Bookkeeping and Pricing Agreement, to maintain the financial accounts and records of the Funds and to compute the net asset value and certain other financial information of the Funds. Under the Bookkeeping and Pricing Agreement, ALPS receives from the Trust a fee based on the assets of each Fund, subject to minimum fees on both the Retail and the Institutional Classes, and is reimbursed for out-of-pocket expenses.
Certain officers of the Funds are also officers of Denver Investments. All access persons of the Trust, as defined in the 1940 Act, and members, officers and employees of the Advisor, follow strict guidelines and policies on personal trading as outlined in the Trust’s and the Advisor’s respective Code of Ethics.
The Trustees have appointed a Chief Compliance Officer who is also the Treasurer of the Trust and an employee of the Advisor. The Trustees agreed to have the Funds pay the portion of his compensation attributable for services rendered as the Trust’s Chief Compliance Officer.
The Trust has a Trustee Deferred Compensation Plan (the “Deferral Plan”) which allows the trustees to defer the receipt of all or a portion of trustees fees. Under the Deferral Plan, any compensation deferred results in an equal adjustment to the Investment for/Payable for Trustee Deferred Compensation Plan on the Statement of Assets and Liabilities, as though an equivalent amount had been invested in shares of one or more Westcore Funds selected by the trustee. The amount paid to the trustees under the Deferral Plan will be determined based upon the performance of the selected funds. Deferral of trustees’ fees under the Deferral Plan will not affect the net assets of the Fund.
Shareholders individually holding more than 5% of the retail class of the Westcore Fund’s outstanding shares as of June 30, 2010, constituted 17.34% of the Westcore Small-Cap Opportunity Fund, 35.08% of the Westcore Micro-Cap Opportunity Fund and 5.66% of the Westcore International Frontier Fund. Included in the percentages above are holdings of Denver Investments and/or Denver Investments’ retirement savings plan representing 29.42% of the Westcore Micro-Cap Opportunity Fund and 5.66% of the Westcore International Frontier Fund.
Shareholders individually holding more than 5% of the institutional class of the Westcore Fund’s outstanding shares as of June 30, 2010, constituted 94.58% of the Westcore Growth Fund; 78.75% of the Westcore MIDCO Growth Fund; 95.34% of the Westcore Blue Chip Fund; 84.96% of the Westcore Small-Cap Opportunity Fund and 99.92% of the Westcore Flexible Income Fund. Included in the percentages above are holdings of Denver Investments and/or Denver Investments’ retirement savings plan representing 83.19% of the Westcore Growth Fund; 22.04% of the Westcore MIDCO Growth Fund; 23.37% of the Westcore Blue Chip Fund; 52.39% of the Westcore Small-Cap Opportunity Fund and 99.92% of the Westcore Flexible Income Fund.
6. NEW ACCOUNTING PRONOUNCEMENTS
In January 2010, the Financial Accounting Standards Board issued Accounting Standards Updated No. 2010-06, “Improving Disclosures About Fair Value Measurements” (“ASU”). The ASU requires enhanced disclosures about (1) transfers into and out of Levels 1 and 2 and (2) purchases, sales, issuances, and settlements on a gross basis relating to Level 3 measurements. The first disclosure is effective for the first reporting period (including interim periods) beginning after December 15, 2009, and such disclosures are reflected in footnote #7, Fair Value Measurements. The second disclosure is effective for fiscal years beginning after December 15, 2010, and for interim periods within those fiscal years. Management is currently evaluating the impact the adoption of this will have on the Funds’ financial statement disclosures.
7. FAIR VALUE MEASUREMENTS
A three-tier hierarchy has been established for fair value measurement based on the extent of use of “observable inputs” as compared to “unobservable inputs” for disclosure purposes and requires additional disclosures about these valuations measurements. Inputs refer broadly to the assumptions that market participants would use in pricing a security. Observable inputs are inputs that reflect the assumptions market participants would use in pricing the security developed based on market data obtained from sources independent of the reporting entity. Unobservable inputs are inputs that reflect the reporting entity’s own assumptions about the assumptions market participants would use in pricing the security developed based on the best information available in the circumstances
The three-tier hierarchy is summarized as follows:
| 1) Level 1 - | quoted and unadjusted prices in active markets for identical securities |
| 2) Level 2 - | other significant observable inputs (including quoted prices for similar securities, interest rates, prepayments speeds, credit risk, etc.) |
| 3) Level 3 - | significant unobservable inputs (including the Fund’s own assumptions in determining the fair value of investments) |
The following is a summary of the inputs used as of June 30, 2010 in valuing the Funds’ assets:
| Westcore Growth Fund | | | | | | | | | | | |
| Investments in Securities | Level 1 – Quoted and | | Level 2 – Other Significant | | Level 3 – Significant | | |
| at Value | Unadjusted Prices | | Observable Inputs | | Unobservable Inputs | | Total |
| Common Stocks | $ | 94,230,457 | | $ | – | | $ | – | | $ | 94,230,457 |
| Money Market Mutual Funds | | 2,520,765 | | | – | | | – | | | 2,520,765 |
| Total | $ | 96,751,222 | | $ | – | | $ | – | | $ | 96,751,222 |
| | | | | | | | | | | | |
| Westcore MIDCO Growth Fund | | | | | | | | | | |
| Investments in Securities | | Level 1 – Quoted and | | Level 2 – Other Significant | | | Level 3 – Significant | | | |
| at Value | | Unadjusted Prices | | | Observable Inputs | | | Unobservable Inputs | | | Total |
| Common Stocks | $ | 108,118,220 | | $ | – | | $ | – | | $ | 108,118,220 |
| Money Market Mutual Funds | | 2,602,371 | | | – | | | – | | | 2,602,371 |
| Total | $ | 110,720,591 | | $ | – | | $ | – | | $ | 110,720,591 |
| | | | | | | | | | | | |
| Westcore Select Fund | | | | | | | | | | | |
| Investments in Securities | | Level 1 – Quoted and | | Level 2 – Other Significant | | | Level 3 – Significant | | | |
| at Value | | Unadjusted Prices | | | Observable Inputs | | | Unobservable Inputs | | | Total |
| Common Stocks | $ | 134,428,153 | | $ | – | | $ | – | | $ | 134,428,153 |
| Money Market Mutual Funds | | 2,531,774 | | | – | | | – | | | 2,531,774 |
| Total | $ | 136,959,927 | | $ | – | | $ | – | | $ | 136,959,927 |
| | | | | | | | | | | | |
| Westcore Blue Chip Fund | | | | | | | | | | | |
| Investments in Securities | | Level 1 – Quoted and | | Level 2 – Other Significant | | | Level 3 – Significant | | | |
| at Value | | Unadjusted Prices | | | Observable Inputs | | | Unobservable Inputs | | | Total |
| Common Stocks | $ | 32,472,309 | | $ | – | | $ | – | | $ | 32,472,309 |
| Money Market Mutual Funds | | 375,229 | | | – | | | – | | | 375,229 |
| Total | $ | 32,847,538 | | $ | – | | $ | – | | $ | 32,847,538 |
| | | | | | | | | | | | |
| Westcore Mid-Cap Value Fund | | | | | | | | | | |
| Investments in Securities | | Level 1 – Quoted and | | Level 2 – Other Significant | | | Level 3 – Significant | | | |
| at Value | | Unadjusted Prices | | | Observable Inputs | | | Unobservable Inputs | | | Total |
| Common Stocks | $ | 44,091,728 | | $ | – | | $ | – | | $ | 44,091,728 |
| Money Market Mutual Funds | | 731,575 | | | – | | | – | | | 731,575 |
| Total | $ | 44,823,303 | | $ | – | | $ | – | | $ | 44,823,303 |
| PAGE 98 |
|
| Westcore Small-Cap Opportunity Fund | | | | | | | | | |
| Investments in Securities | Level 1 – Quoted and | | Level 2 – Other Significant | | Level 3 – Significant | | |
| at Value | Unadjusted Prices | | Observable Inputs | | Unobservable Inputs | | Total |
| Common Stocks | $ | 36,563,310 | | $ | – | | $ | – | | $ | 36,563,310 |
| Money Market Mutual Funds | | 896,848 | | | – | | | – | | | 896,848 |
| Total | $ | 37,460,158 | | $ | – | | $ | – | | $ | 37,460,158 |
Westcore Small-Cap Value Fund | | | | | | | | | | |
| Investments in Securities | | Level 1 – Quoted and | | Level 2 – Other Significant | | | Level 3 – Significant | | | |
| at Value | | Unadjusted Prices | | Observable Inputs | | | Unobservable Inputs | | | Total |
| Common Stocks | $ | 256,571,351 | | $ | – | | $ | – | | $ | 256,571,351 |
| Money Market Mutual Funds | | 11,709,366 | | | – | | | – | | | 11,709,366 |
| Total | $ | 268,280,717 | | $ | – | | $ | – | | $ | 268,280,717 |
Westcore Micro-Cap Opportunity Fund | | | | | | | | | |
| Investments in Securities | | Level 1 – Quoted and | | Level 2 – Other Significant | | | Level 3 – Significant | | | |
| at Value | | Unadjusted Prices | | Observable Inputs | | | Unobservable Inputs | | | Total |
| Common Stocks | $ | 2,044,288 | | $ | – | | $ | – | | $ | 2,044,288 |
| Money Market Mutual Funds | | 49,069 | | | – | | | – | | | 49,069 |
| Total | $ | 2,093,357 | | $ | – | | $ | – | | $ | 2,093,357 |
Westcore International Frontier Fund | | | | | | | | | |
| Investments in Securities | | Level 1 – Quoted and | | Level 2 – Other Significant | | | Level 3 – Significant | | | |
| at Value | | Unadjusted Prices | | Observable Inputs | | | Unobservable Inputs | | | Total |
| Common Stocks | $ | 6,677,035 | | $ | 26,961,462 | | $ | – | | $ | 33,638,497 |
| Money Market Mutual Funds | | 445,766 | | | – | | | – | | | 445,766 |
| Total | $ | 7,122,801 | | $ | 26,961,462 | | $ | – | | $ | 34,084,263 |
Westcore Flexible Income Fund | | | | | | | | | | |
| Investments in Securities | | Level 1 – Quoted and | | Level 2 – Other Significant | | | Level 3 – Significant | | | |
| at Value | | Unadjusted Prices | | Observable Inputs | | | Unobservable Inputs | | | Total |
| Common Stocks | $ | 192,241 | | $ | – | | $ | – | | $ | 192,241 |
| Convertible Preferred Stocks | | 1,131,435 | | | – | | | – | | | 1,131,435 |
| Nonconvertible Preferred Stocks | | 2,001,323 | | | 446,876 | | | 837,000 | | | 3,285,199 |
| Corporate Bonds | | – | | | 56,086,998 | | | 2,414,812 | | | 58,501,810 |
Asset-Backed Securities,
Collateralized Obligations
& Commercial Mortgage-
Backed Securities | | | | | | | | | | | |
| | | | | | | | | | | |
| | – | | | 4,056,527 | | | 1,444,268 | | | 5,500,795 |
| Money Market Mutual Funds | | 344,380 | | | – | | | – | | | 344,380 |
| Total | $ | 3,669,379 | | $ | 60,590,401 | | $ | 4,696,080 | | $ | 68,955,860 |
|
|
| Westcore Plus Bond Fund | | | | | | | | | | | |
| Investments in Securities | Level 1 – Quoted and | | Level 2 – Other Significant | | Level 3 – Significant | | |
| at Value | Unadjusted Prices | | Observable Inputs | | Unobservable Inputs | | Total |
| Nonconvertible Preferred Stocks | $ | 277,998 | | $ | 1,850,144 | | $ | 2,176,200 | | $ | 4,304,342 |
| Corporate Bonds | | – | | | 753,457,347 | | | 18,777,934 | | | 772,235,281 |
| Municipal Bond | | – | | | 15,820,341 | | | – | | | 15,820,341 |
Asset-Backed Securities, Col-
lateralized Debt Obligations,
Commercial Mortgage-Backed
Securities, Residential Mortgage-
Backed Securities, & Agency
Mortgage-Backed Securities | | | | | | | | | | | |
| | | | | | | | | | | |
| | | | | | | | | | | |
| | | | | | | | | | | |
| | – | | | 520,686,283 | | | 16,062,811 | | | 536,749,094 |
U.S. Government &
Agency Obligations | | | | | | | | | | | |
| | – | | | 71,919,658 | | | – | | | 71,919,658 |
| U.S. Treasury Bonds & Notes | | 173,600,384 | | | – | | | – | | | 173,600,384 |
| Money Market Mutual Funds | | 17,339,021 | | | – | | | – | | | 17,339,021 |
| Total | $ | 191,217,403 | | $ | 1,363,733,773 | | $ | 37,016,945 | | $ | 1,591,968,121 |
| | | | | | | | | | | | |
| Westcore Colorado Tax-Exempt Fund | | | | | | | | | |
| Investments in Securities | | Level 1 – Quoted and | | Level 2 – Other Significant | | | Level 3 – Significant | | | |
| at Value | | Unadjusted Prices | | | Observable Inputs | | | Unobservable Inputs | | | Total |
| Municipal Bonds | $ | – | | $ | 113,394,460 | | $ | – | | $ | 113,394,460 |
| Money Market Mutual Funds | | 5,216,397 | | | – | | | – | | | 5,216,397 |
| Total | $ | 5,216,397 | | $ | 113,394,460 | | $ | – | | $ | 118,610,857 |
There were no transfers into or out of Levels 1 and 2 during the period except in Westcore International Frontier Fund.
Westcore International Frontier Fund utilizes a fair value evaluation service with respect to international securities with an earlier market closing than the Fund’s net asset value computation cutoff. As such, international securities can transfer between Level 1 and Level 2 based on triggers being met without disclosure detailing the transfers into and out of Level 1 and Level 2.
All securities of the Funds, except for Westcore Flexible Income and Plus Bond Funds, were valued using either Level 1 or Level 2 inputs during the six months ended June 30, 2010. Thus a reconciliation of assets in which significant unobservable inputs (Level 3) were used is not applicable for these Funds.
The following is a reconciliation of assets in which significant unobservable inputs (Level 3) were used in determining fair value:
| Westcore Flexible Income Fund | | | | | | | | | | | | | | | |
| | | | | | Change in unrealized | | | | | | |
| | Balance as of | | | | appreciation/ | | Net purchases/ | | Transfers in and/or | | Balance as of |
| Investments in Securities | December 31, 2009 | | Realized gain* | | (depreciation)* | | (sales) | | out of Level 3 | | June 30, 2010 |
Nonconvertible
Preferred Stocks | | | | | | | | | | | | | | | | | |
| $ | 801,000 | | $ | - | | $ | 36,000 | | $ | - | | $ | – | | $ | 837,000 |
| Corporate Bonds | | 3,217,065 | | | 3,379 | | | 29,315 | | | (834,945) | | | – | | | 2,414,814 |
Asset-Backed Securities,
Collateralized Obligations
& Commercial Mortgage-
Backed Securities | | | | | | | | | | | | | | | | | |
| | | | | | | | | | | | | | | | | |
| | 474,599 | | | - | | | (51,613) | | | 1,021,280 | | | – | | | 1,444,266 |
| Total | $ | 4,492,664 | | $ | 3,379 | | $ | 13,702 | | $ | 186,335 | | $ | – | | $ | 4,696,080 |
| PAGE 100 |
|
| Westcore Plus Bond Fund | | | | | | | | | | | | | | | |
| | | | | Change in unrealized | | | | | | |
| | Balance as of | | | appreciation/ | | Net purchases/ | | Transfers in and/or | | Balance as of |
| Investments in Securities | December 31, 2009 | | Realized gain* | (depreciation)* | | (sales) | | out of Level 3 | | June 30, 2010 |
Nonconvertible
Preferred Stocks | | | | | | | | | | | | | | | | |
| $ | 2,082,600 | | $ | - | $ | 93,600 | | $ | - | | $ | – | | $ | 2,176,200 |
| Corporate Bonds | | 21,022,358 | | | 8,678 | | 742,366 | | | (2,995,467) | | | – | | | 18,777,935 |
Asset-Backed Securities,
Collateralized Debt
Obligations, Commercial
Mortgage-Backed Securities,
Residential Mortgage-
Backed Securities, & Agency
Mortgage-Backed Securities | | | | | | | | | | | | | | | | |
| | | | | | | | | | | | | | | | |
| | | | | | | | | | | | | | | | |
| | | | | | | | | | | | | | | | |
| | 514,762 | | | - | | 498,018 | | | 15,050,030 | | | – | | | 16,062,810 |
| Total | $ | 23,619,720 | | $ | 8,678 | $ | 1,333,984 | | $ | 12,054,563 | | $ | – | | $ | 37,016,945 |
* Net realized gain/(loss) and net unrealized appreciation/(depreciation) are included in the related amounts in the statement of operations.For fair value measurements using significant other observable inputs (Level 2), the Funds generally utilize an independent pricing service which utilizes evaluated pricing models that vary by asset class and incorporate available trade, bid and other market information, and for structured securities also incorporate cash flow and, when available, loan performance data. The independent pricing service’s evaluated pricing models apply available market information through processes such as benchmark curves, benchmarking of similar securities, and sector groupings. For certain securities, the independent pricing service uses model processes, such as the Option Adjusted Spread (benchmark driven) model, to assess interest rate impact and develop prepayment scenarios. With respect to trades and bids, the independent pricing service reviews the lot size to determine whether the information is representative of an orderly trading market. If the independent pricing service determines that trade or bid information is not consistent with other information available, the trade or bid will not be reflected in the evaluated price.
In the event the independent pricing service is unable to provide an evaluated price for a security or Denver Investments believes the price provided is not reliable, securities of the Funds may be valued in good faith as described in Footnote 2 of the Financial Statements. These fair value measurements typically utilize significant unobservable inputs (Level 3). In these instances, Denver Investments typically seeks to find an alternative independent source, such as a broker/dealer that is reasonably knowledgeable of the security to provide a price quote, typically by developing “indicative” pricing models similar to the models used by the independent pricing service described above. In addition, Denver Investments personnel may develop their own pricing estimates using similar techniques and modeling as described above.
The inputs or methodology used for valuing securities are not necessarily an indication of the risk associated with investing in those securities.
Because of the inherent uncertainties of valuation, the values reflected in the financial statements may differ from the value determined upon sale of those investments.
8. FOREIGN CURRENCY EXCHANGE CONTRACTS
The Westcore International Frontier Fund buys and sells securities denominated in currencies other than the U.S. dollar and it is the Fund’s standard practice to purchase or sell foreign currencies on a “spot” or cash basis at the prevailing rate in the foreign currency exchange market or enter into forward foreign currency exchange contracts to settle the transaction in the proper currency.
When entering into a spot or forward foreign currency contract, the Fund agrees to receive or deliver a fixed quantity of foreign currency for an agreed-upon price on an agreed future date. These contracts are valued at each portfolio valuation, and the Fund’s net equity therein, representing unrealized gain or loss on the contracts as measured by the difference between the spot or forward foreign exchange rates at the dates of entry into the contracts and the spot or forward rates at the reporting date, is included in the statement of assets and liabilities. Realized and unrealized gains and losses are included in the statement of operations. These instruments involve market risk and credit risk in excess of the amount recognized in the statement of assets and liabilities. Risks arise from the possible inability of counterparties to meet the terms of their contracts and from movement in currency exchange rates.
As of June 30, 2010, the Fund had the following spot/forward foreign currency contracts included on the statement of assets and liabilities:
| Contracts Sold | Settlement Date | Unrealized Gain/Loss |
| 86,284 Euro vs. 106,104 US Dollars | July 1, 2010 | $ | 591 |
| 121,421 British Pound Sterling vs. 183,174 US Dollars | July 1, 2010 | | 1,760 |
| 14,331,310 Japanese Yen vs. 160,467 US Dollars | July 1, 2010 | | (1,624) |
| 122,804 Euro vs. 149,723 US Dollars | July 2, 2010 | | (449) |
| 5,065,226 Japanese Yen vs. 57,221 US Dollars | July 2, 2010 | | (68) |
| | | | |
| | | | |
Contracts Sold | Settlement Date | Unrealized Gain/Loss |
| 68,048 US Dollars vs. 45,107 British Pound Sterling | July 1, 2010 | $ | (654) |
| 249,787 US Dollars vs. 165,935 British Pound Sterling | July 2, 2010 | | (1,863) |
| 49,993 US Dollars vs. 389,177 Hong Kong Dollar | July 2, 2010 | | (15) |
9. PURCHASES AND SALES OF INVESTMENTS
Investment transactions for the six months ended June 30, 2010 excluding temporary short-term investments, were as follows:
| Fund | Cost of Investments | | Proceeds from |
| | Purchased | | Investments Sold |
| Westcore Growth Fund | $ | 36,045,483 | | $ | 53,896,938 |
| Westcore MIDCO Growth Fund | | 60,333,424 | | | 67,932,200 |
| Westcore Select Fund | | 180,627,694 | | | 102,765,724 |
| Westcore Blue Chip Fund | | 7,798,537 | | | 9,247,762 |
| Westcore Mid-Cap Value Fund | | 8,600,327 | | | 11,530,167 |
| Westcore Small-Cap Opportunity Fund | | 10,105,902 | | | 7,530,533 |
| Westcore Small-Cap Value Fund | | 58,365,325 | | | 45,852,673 |
| Westcore Micro-Cap Opportunity Fund | | 1,173,015 | | | 1,016,589 |
| Westcore International Frontier Fund | | 12,142,317 | | | 8,966,548 |
| Westcore Flexible Income Fund | | 12,558,163 | | | 14,981,998 |
| Westcore Plus Bond Fund | | 410,123,462 | | | 287,054,154 |
| Westcore Colorado Tax-Exempt Fund | | 15,867,623 | | | 726,250 |
10. SUBSEQUENT EVENTS
Management has evaluated whether any events or transactions occurred subsequent to June 30, 2010 through the issuance date of the Funds’ financial statements, and determined that there were no other material events or transactions that would require recognition or disclosure in the Funds’ financial statements.
| PAGE 102 |
|

| PAGE 104 |
|
Westcore Trustees and Officers:
Jack D. Henderson, Chairman
Mary K. Anstine, Trustee
John A. DeTore, Trustee
Rick A. Pederson, Trustee
Robert L. Stamp, Trustee
Janice M. Teague, Trustee
Douglas M. Sparks, Trustee
James A. Smith, Trustee
Todger Anderson, President
Jasper R. Frontz, Treasurer & Chief Compliance Officer
Patrick D. Buchanan, Asst. Treasurer
Paul F. Leone, Secretary


A description of the policies and procedures that Westcore Funds uses to determine how to vote proxies relating to portfolio securities is available (i) without charge, upon request, by calling 800.392.CORE; (ii) on the Westcore Funds website, www.westcore.com; and (iii) on the Securities and Exchange Commission website at www.sec.gov.
This report has been prepared for Westcore shareholders and may be distributed to others only if preceded or accompanied by a prospectus.
Westcore Funds are distributed by ALPS Distributors, Inc.
Item 2. Code of Ethics.
Not applicable to semi-annual report.
Item 3. Audit Committee Financial Expert.
Not applicable to semi-annual report.
Item 4. Principal Accountant Fees and Services.
Not applicable to semi-annual report.
Item 5. Audit Committee of Listed Registrants.
Not applicable.
Item 6. Investments.
a) Schedule of Investments in securities of unaffiliated issuers as of the close of the reporting period is included as part of the Reports to Stockholders filed under Item 1 of this Form N-CSR.
b) Not applicable.
Item 7. Disclosure of Proxy Voting Policies and Procedures for Closed-End Management Investment Companies.
Not applicable.
Item 8. Portfolio Managers of Closed-End Management Investment Companies.
Not applicable.
Item 9. Purchases of Equity Securities by Closed-End Management Investment Company and Affiliated Purchasers.
Not applicable.
Item 10. Submission of Matters to a Vote of Security Holders.
There have been no material changes to the procedures by which shareholders may recommend nominees to the registrant’s Board of Trustees, where these changes were implemented after the registrant last provided disclosure in response to the requirements of item 407 (c)(2)(iv) of Regulation S-K or this Item.
Item 11. Controls and Procedures.
(a) The registrant’s principal executive officer and principal financial officer have concluded that the registrant’s disclosure controls and procedures (as defined in Rule 30a-3(c) under the Investment Company Act of 1940, as amended) (the “1940 Act”) (17 CFR 270.30a-3(e)) are effective based on their evaluation of these controls and procedures required by Rule 30a-3(b) under the 1940 Act (17 CFR 270.30a-3(b)) and Rules 13a-15(b) or 15d-15(b) under the Securities Exchange Act of 1934 (17 CFR 240.13a-15(b) or 240.15d-15(b)) as of a date within 90 days of the filing date of this report.
(b) There was no change in the registrant’s internal control over financial reporting (as defined in Rule 30a-3(d) under the 1940 Act (17 CFR 270.30a-3(d)) that occurred during the second fiscal quarter of the period covered by this report that has materially affected, or is reasonably likely to materially affect, the registrant's internal control over financial reporting.
Item 12. Exhibits.
(a)(1) Not applicable to semi-annual report.
(a)(2) The certifications required by Rule 30a-2(a) of the 1940 Act (17 CFR 270.30a-2(a)) and Section 302 of the Sarbanes-Oxley Act of 2002 are attached hereto as Ex99.Cert.
(a)(3) Not applicable.
(b) The certifications required by Rule 30a-2(b) of the 1940 Act (17 CFR 270.30a-2(b)) and Section 906 of the Sarbanes-Oxley Act of 2002 are attached hereto as Ex99.906Cert.
SIGNATURES
Pursuant to the requirements of the Securities Exchange Act of 1934 and the Investment Company Act of 1940, the registrant has duly caused this report to be signed on its behalf by the undersigned, thereunto duly authorized.
WESTCORE TRUST
By: /s/ Todger Anderson
Todger Anderson
President/Principal Executive Officer
Date: September 3, 2010
Pursuant to the requirements of the Securities Exchange Act of 1934 and the Investment Company Act of 1940, this report has been signed below by the following persons on behalf of the registrant and in the capacities and on the dates indicated.
By: /s/ Todger Anderson
Todger Anderson
President/Principal Executive Officer
Date: September 3, 2010
By: /s/ Jasper R. Frontz
Jasper R. Frontz
Treasurer/Principal Financial Officer
Date: September 3, 2010