UNITED STATES
SECURITIES AND EXCHANGE COMMISSION
Washington, D.C. 20549
FORM N-CSR
CERTIFIED SHAREHOLDER REPORT OF REGISTERED
MANAGEMENT INVESTMENT COMPANIES
Investment Company Act file number: 811-3373
Westcore Trust
(exact name of registrant as specified in charter)
1290 Broadway, Suite 1100, Denver, Colorado 80203
(Address of principal executive offices) (Zip code)
David T. Buhler, Secretary
Westcore Trust
1290 Broadway, Suite 1100, Denver, Colorado 80203
(Name and address of agent for service)
Registrant’s telephone number, including area code: 303-623-2577
Date of fiscal year end: December 31
Date of reporting period: June 30, 2012
Item 1. Reports to Stockholders.

|
2012 SEMI-ANNUAL REPORT
|
| | | |
| | | |
JUNE 30, 2012 | TICKER SYMBOLS |
| |
|
| | Retail | Institutional |
Fund | Class | Class |
|
WESTCORE EQUITY FUNDS | | |
Westcore Growth Fund | WTEIX | WILGX |
Westcore MIDCO Growth Fund | WTMGX | WIMGX |
Westcore Select Fund | WTSLX | – |
Westcore Blue Chip Fund | WTMVX | WIMVX |
Westcore Mid-Cap Value Fund | WTMCX | – |
Westcore Small-Cap Opportunity Fund | WTSCX | WISCX |
Westcore Small-Cap Value Fund | WTSVX | WISVX |
Westcore Micro-Cap Opportunity Fund | WTMIX | – |
Westcore International Small-Cap Fund | WTIFX | – |
| | | |
WESTCORE BOND FUNDS | | |
Westcore Flexible Income Fund | WTLTX | WILTX |
Westcore Plus Bond Fund | WTIBX | WIIBX |
Westcore Colorado Tax-Exempt Fund | WTCOX | – |
| | | |
| | | |
| | | |
| | | |
| | | |
| | | |
| | | |
| | | |
Westcore Funds are managed by Denver Investments. |
| | |
The mountain logo together with “Westcore Funds Denver Investments” |
is a registered service mark of Denver Investments. |
| |
| |
| |


INTENTIONALLY LEFT BLANK

DEAR FELLOW SHAREHOLDER:
Today’s investment environment is at worst unsettling and at best frustrating. Slow economic growth, the looming possibility of a recession, developed countries (including our own) awash in debt, Europe struggling to rescue the Euro and China’s slowing growth, are all causes for concern. And the list of problems is unfortunately much longer. However, it is helpful to remember that the late 1970s and early 1980s presented an equally bleak outlook. Yet the stock and bond markets rallied strongly in the 1980s and 1990s as the economic problems were solved.
We believe the most likely economic scenario for the next several years is slow growth with minimal inflation. Today’s economic challenges will, in our opinion, be solved by modifications to government budgets, taxes and regulations, in much the same way as the economic problems of the late 1970s and early 1980s were solved. Given this scenario, we believe that the stock market will likely provide higher returns than the bond market over the next several years.
We continue to stress the importance of a well thought out, long-term investment plan. In our experience, changing your investment plan because of every new economic development is not a good idea. Put simply, be diversified and be patient.
As many of the following commentaries from our portfolio management teams illustrate, the first six months of 2012 provided a roller coaster ride for investors. For equities, the first quarter was one of the strongest in history; only to be followed by a dramatic pullback in the second quarter. The fixed income markets saw interest rates rise in the first quarter only to fall to near historic lows by the end of June. Despite this volatility, most indices ended the first half with gains. Most of the Westcore Funds participated in these gains with varying levels of success relative to their benchmarks.
We would like to let you know that the Westcore Board will go through an important transition at the end of 2012. Jack Henderson, Chairman of the Board since the fund family’s inception in 1982, will retire on December 31.
The Westcore family of mutual funds was one of the first bank-sponsored fund families in the country. Jack has steered the funds through a number of critical transitions over the 30-year period and always focused on shareholders’ best interests.
 The Board has elected Mary Anstine to become the new chair effective January 1, 2013. Mary has been a member of the Board since 2006. She has an extensive background in mutual fund operations and investments, allowing her to continue Jack’s excellent leadership.
Please review the comments and details about each of the funds on the following pages. We thank you for your confidence in our investment teams.
| CFA is a trademark owned by the CFA Institute. |
| |
| The Shareholder Letter and the Manager Commentaries included in this shareholder report contain certain forward-looking statements about the factors that may affect the performance of the Funds in the future. These statements are based on Fund management’s predictions and expectations concerning certain future events and their expected impact on the Funds, such as performance of the economy as a whole and of specific industry sectors, changes in the levels of interest rates, the impact of developing world events, and other factors that may influence the future performance of the Funds. Management believes these forward-looking statements to be reasonable, although they are inherently uncertain and difficult to predict. Actual events may cause adjustments in portfolio management strategies from those currently expected to be employed. |
PAGE 1 |
 |

Investing primarily in equity securities of large companies with growth potential.
Ross G. Moscatelli, CFA Portfolio Manager
Craig W. Juran, CFA Portfolio Manager
CFA is a trademark owned by the CFA Institute.

The chart above represents historical performance of a hypothetical investment of $10,000 in the Fund over the past 10 years (or for the life of the Fund if shorter). Performance calculations are as of the end of June each year. Past performance does not guarantee future results. This chart does not reflect the deduction of taxes that a shareholder would pay on Fund distributions or the redemption of Fund shares.
Lipper Index data provided by Lipper, Inc.
Please see pages 28 and 29 for index definitions.
Average Annual Total Returns |
| | | | | | | Since | Inception |
| | 6 Months | 1 Year | 3 Years | 5 Years | 10 Years | Inception | Date |
Retail Class (WTEIX) | 11.00% | 2.83% | 17.36% | 1.45% | 5.29% | 8.33% | 6/1/1988 |
|
|
|
|
|
|
|
|
Institutional Class | | | | | | | |
(WILGX) | 11.04 | 2.97 | 17.48 | 1.56 | 5.34 | 8.36 | 9/28/2007 |
|
|
|
|
|
|
|
|
Russell 1000® | | | | | | | |
Growth Index | 10.09 | 5.77 | 17.50 | 2.87 | 6.03 | 9.14 | |
|
|
|
|
|
|
|
|
Lipper Large-Cap | | | | | | | |
Growth Index | 9.75 | 1.26 | 14.79 | 1.24 | 4.42 | 8.13 | |
Retail Class Annual Expense Ratio (per the current prospectus) — Gross: 1.06%, Net: 1.06%
Institutional Class Annual Expense Ratio (per the current prospectus) — Gross: 1.26%, Net: 0.89%
The performance data quoted represents past performance and does not guarantee future results. Performance information for the institutional class shares prior to their inception date is based on the performance of the retail class. Current performance may be lower or higher than the performance quoted. To obtain current performance as of the most recent month-end, please call 800.392.CORE (2673) or visit us online at www.westcore.com. Average annual total returns and yield figures reflect the reinvestment of dividends, capital gains distributions, all fee waivers and expense reimbursements. Without the fee waivers and expense reimbursements, total return and yield figures would have been lower. Total return and yield figures represent past performance. Investment return and principal value will vary, and shares, when redeemed, may be worth more or less than their original cost. Westcore fund shares are not insured by the FDIC, the Federal Reserve Board or any other agency and are subject to investment risk.
Denver Investments (the “Adviser”) has contractually agreed to waive the investment advisory and/or administration fees and/or to reimburse Fund level other expenses from April 30, 2012 until at least April 30, 2013, so that the ratio of expenses to average net assets as reported in the Fund’s Financial Highlights will be no more than 1.15% for the Fund’s Retail Class for such period. In addition, the Adviser has contractually agreed to waive the investment advisory and/or administration fees and/or to reimburse Fund level other expenses for the Institutional Class in the same proportion as the Retail Class waivers/reimbursements as well as reimburse the Institutional class-specific other expenses until at least April 30, 2013.
Craig W. Juran is a registered representative of ALPS Distributors, Inc.
- It is often said that you have to put the past behind you. That, however, can be very difficult for investors, especially with memories of the 2008 market collapse still fresh. Dramatic pullbacks in equity markets during the spring and summer for each of the past three years have made it even more difficult to put the past to rest. Then, like clockwork, as we headed into the spring of 2012, equity markets experienced yet another bout of macro-related uncertainty as the European region struggled over how to combat a sovereign debt crisis with coordinated monetary and fiscal policies. Despite all of the uncertainty and negative sentiment, most equity indices were very resilient and remained in positive territory for the first half of 2012.
- For the first six months of the year, the Westcore Growth Fund outperformed its benchmark, the Russell 1000® Growth Index. The Fund’s holdings in the consumer staples, consumer discretionary and industrials sectors produced its best returns relative to its benchmark. Holdings in the health care, financials and materials sectors produced the Fund’s weakest results relative to the benchmark.
- Among the Fund’s best performing holdings were Apple Inc., Whole Foods Market, Inc., and Alexion Pharmaceuticals Inc. Apple delivered strong results as an attractive valuation and a strong product pipeline increased investor interest. Apple’s products have shown strong market share gains as it improved consumers’ mobile media experience with products such as the iPhone 4, iPad 3, and Macbook Air. Consumer staples sector holding Whole Foods produced strong returns as consumers increasingly chose organic and healthier products. Health care sector holding Alexion Pharmaceuticals develops treatments for ultra-rare diseases. The company performed well in the period as it continued to execute its global expansion strategy with Soliris, its flagship drug.
- Holdings that produced the Fund’s weakest results in the period include Triumph Group Inc., Cabot Oil & Gas Corp. and Google Inc. Industrials sector holding Triumph Group derives a significant portion of its revenue from the manufacture, repair and overhaul of commercial airplanes. The global economic slowdown caused investors to ratchet down growth forecasts for airline travel and aircraft repair which negatively impacted Triumph’s stock price. Energy sector holding Cabot Oil & Gas struggled as a warm winter, particularly on the East Coast, caused natural gas prices to decline. Fund holding Google also hurt performance during the period as investors grew concerned regarding Google’s ability to monetize mobile search versus desktop search. Although the number of searches on mobile devices is much higher than desktops, the profitability of each search is currently lower.
- Uncertainty and volatility will, in our view, remain high in equity markets as investors deal with current fiscal and economic problems. Additionally, the U.S. presidential election in the fall and persistent turmoil in Washington D.C. will likely continue to impact equity markets. However, it appears that many of these uncertainties and problems are beginning to be discounted by the markets. For investors with longer time horizons, we believe the current investment environment is intriguing as expectations are low and confidence in equities is weak.
| PAGE 2 |
 |

Stock Performance |
(for the year ended 6/30/12) | | |
| | Average | Contribution |
5 Highest | Weight | to Return |
|
|
|
Apple Inc. | 9.73% | 3.39% |
|
|
|
Equinix Inc. | 1.28 | 0.82 |
|
|
|
Whole Foods Market Inc. | 2.00 | 0.69 |
|
|
|
Alexion Pharmaceuticals Inc. | 1.71 | 0.59 |
|
|
|
TransDigm Group Inc. | 1.68 | 0.57 |
| | | |
5 Lowest | | |
|
|
|
Triumph Group Inc. | 0.62% | -0.17% |
|
|
|
EMC Corp. | 0.79 | -0.19 |
|
|
|
Cabot Oil & Gas Corp. | 0.12 | -0.22 |
|
|
|
F5 Networks Inc. | 1.20 | -0.32 |
|
|
|
Google Inc. | 3.26 | -0.47 |
| | | |
Past performance does not guarantee future results. These stocks do not represent all of the securities purchased, sold or recommended by the Funds’ Adviser. To request a complete list of the contribution of each Fund holding to overall Fund performance during the period, please call 800.392.CORE (2673) or email invest@westcore.com. |
| | | |
Please see page 29 for a description of the methodology used to construct this chart. |
| | | |
Top Ten Holdings |
(as of 6/30/12) | | |
Apple Inc. | | 10.2% |
|
|
|
Microsoft Corp. | | 3.5 |
|
|
|
Home Depot Inc. | | 2.3 |
|
|
|
Alexion Pharmaceuticals Inc. | | 2.3 |
|
|
|
Whole Foods Market Inc. | | 2.2 |
|
|
|
Alliance Data Systems Corp. | | 2.2 |
|
|
|
QUALCOMM Inc. | | 2.2 |
|
|
|
Google Inc. | | 2.1 |
|
|
|
Philip Morris International Inc. | | 2.0 |
|
|
|
Exxon Mobil Corp. | | 1.8 |
|
|
|
Total (% of Net Assets) | | 30.8% |
| | |
Top ten holdings do not include any cash, cash equivalents or exchange traded fund investments and are subject to change. There are no guarantees that the Fund will continue to remain invested in any particular holding. |
Morningstar Ratings |
| | | Number |
| | Morningstar | of Funds |
| | Rating™ | in Large Growth |
| | as of 6/30/12 | Category |
Overall | ««« | 1,510 |
|
|
|
3 Year | «««« | 1,510 |
|
|
|
5 Year | ««« | 1,297 |
|
|
|
10 Year | ««« | 855 |
| | |
Morningstar Ratings shown represent the Retail Class. Morningstar proprietary ratings reflect historical risk-adjusted performance as of 6/30/12 and are subject to change every month. |
| |
Please see page 29 for more detail regarding Morningstar Ratings. |
Portfolio Characteristics |
| (as of 6/30/12) | | |
| | Westcore | Russell 1000® |
| | Growth Fund | Growth Index |
| Weighted Average Market Capitalization ($ Bil) | $106.5 | $106.4 |
|
|
|
| Price/Earnings (1 year trailing) | 19.5x | 17.8x |
|
|
|
| EPS Growth (3 year historical) | 24.5% | 19.5% |
|
|
|
| Beta | 1.1 | 1.0 |
|
|
|
| Number of Holdings | 61 | 572 |
|
|
|
| Portfolio Turnover Rate | 83% | — |
| | | |
| Please see page 30 for definition of terms. |
| |
Sector Allocation |

Sector classifications presented herein are based on the sector categorization methodology of the Adviser to the Funds which may result in the sector designations for one Fund being different than another Fund’s sector designations.
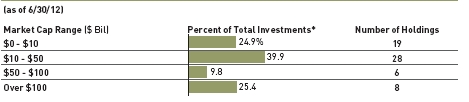
* Total Investments for this chart excludes short-term investments, including money market mutual funds.
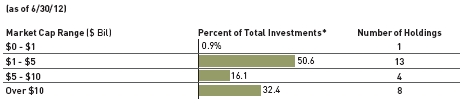
Market capitalization ranges were determined by the Adviser to the Fund and are for presentation purposes only. These market capitalization ranges do not necessarily correlate to the benchmark’s market capitalization ranges.
PAGE 3 |
|

Investing in a diversified portfolio of equity securities of primarily medium-sized companies with growth potential.
Fund Management |
| William S. Chester, CFA Portfolio Manager | Brian C. Fitzsimons, CFA Portfolio Manager |
| Mitch S. Begun, CFA Portfolio Manager | Jeffrey J. Loehr, CFA Portfolio Manager |
| Adam C. Bliss Portfolio Manager | F. Wiley Reed, CFA Portfolio Manager |
| CFA is a trademark owned by the CFA Institute. | |
| | |
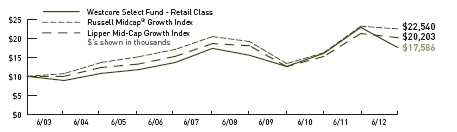
Cumulative Returns |

The chart above represents historical performance of a hypothetical investment of $10,000 in the Fund over the past 10 years (or for the life of the Fund if shorter). Performance calculations are as of the end of June each year. Past performance does not guarantee future results. This chart does not reflect the deduction of taxes that a shareholder would pay on Fund distributions or the redemption of Fund shares.
Lipper Index data provided by Lipper, Inc.
Please see pages 28 and 29 for index definitions.
Average Annual Total Returns
| | | | | | | Since | Inception |
| | 6 Months | 1 Year | 3 Years | 5 Years | 10 Years | Inception | Date |
| Retail Class (WTMGX) | -0.34% | -14.81% | 15.54% | -0.39% | 6.05% | 9.84% | 8/1/1986 |
|
|
|
|
|
|
|
|
| Institutional Class | | | | | | | |
| (WIMGX) | -0.17 | -14.61 | 15.69 | -0.27 | 6.11 | 9.87 | 9/28/2007 |
|
|
|
|
|
|
|
|
| Russell Midcap® | | | | | | | |
| Growth Index | 8.10 | -2.99 | 19.01 | 1.90 | 8.47 | 9.69 | |
|
|
|
|
|
|
|
|
| Lipper Mid-Cap | | | | | | | |
| Growth Index | 7.72 | -5.16 | 17.09 | 1.61 | 7.29 | 9.02 | |
Retail Class Annual Expense Ratio (per the current prospectus) — Gross: 1.02%, Net: 1.02%
Institutional Class Annual Expense Ratio (per the current prospectus) — Gross: 0.92%, Net: 0.88%
The performance data quoted represents past performance and does not guarantee future results. Performance information for the institutional class shares prior to their inception date is based on the performance of the retail class. Current performance may be lower or higher than the performance quoted. To obtain current performance as of the most recent month-end, please call 800.392.CORE (2673) or visit us online at www.westcore.com. Average annual total returns and yield figures reflect the reinvestment of dividends, capital gains distributions, all fee waivers and expense reimbursements. Without the fee waivers and expense reimbursements, total return and yield figures would have been lower. Total return and yield figures represent past performance. Investment return and principal value will vary, and shares, when redeemed, may be worth more or less than their original cost. Westcore fund shares are not insured by the FDIC, the Federal Reserve Board or any other agency and are subject to investment risk.
Denver Investments (the “Adviser”) has contractually agreed to waive the investment advisory and/or administration fees and/or to reimburse Fund level other expenses from April 30, 2012 until at least April 30, 2013, so that the ratio of expenses to average net assets as reported in the Fund’s Financial Highlights will be no more than 1.15% for the Fund’s Retail Class for such period. In addition, the Adviser has contractually agreed to waive the investment advisory and/or administration fees and/or to reimburse Fund level other expenses for the Institutional Class in the same proportion as the Retail Class waivers/reimbursements as well as reimburse the Institutional class-specific other expenses until at least April 30, 2013.
- In the first half of 2012, the Westcore MIDCO Growth Fund underperformed its benchmark the Russell Midcap® Growth Index.
- This period of underperformance has been both disappointing and unusual in magnitude. Just twelve months ago, the picture was very different. Exiting June 30, 2011, the Fund had outperformed its benchmark for the 1-, 3-, 5-, and 10-year periods. The last twelve months have been a setback to the Fund’s long-term returns, but we are reminded that our disciplines have served us well over time. Our approach to investing remains the same – we use in-depth fundamental research designed to find growth companies that we believe will prosper over time.
- In the first half of 2012, the Fund’s most significant underperformance relative to the benchmark came from stock selection in three sectors: consumer discretionary, information technology, and energy. Zynga Inc., a social media gaming provider, was the Fund’s largest detractor in the information technology sector. During the second quarter investors became increasingly skeptical of its growth opportunities. Specialty mattresses manufacturer, Tempur-Pedic International Inc., was the Fund’s worst performing consumer discretionary stock, as an unprecedented level of competitor promotions caused a significant reduction in its earnings forecast. Within the energy sector, SM Energy Company is a liquids-focused exploration and production company. Its exposure to natural gas liquids (NGLs) proved unfavorable as an increase in NGL production created pricing pressure. We believe that this dynamic is likely to continue, and we exited the position.
- The financials and utilities sectors were the only positive contributors to the Fund’s performance. The Fund’s lack of exposure to the utilities sector proved beneficial as the sector underperformed. Within the financials sector our stock selection was good, but none of these holdings were among the Fund’s top five contributors. Although the health care and information technology sectors provided disappointing results relative to the benchmark, both produced top-performers. The Fund’s best performing stock in the first half was health care company Onyx Pharmaceuticals Inc. It received a favorable recommendation from the U.S. Food and Drug Administration’s Oncologic Drugs Advisory Committee for its novel drug to treat Multiple Myeloma. The Fund’s second largest contributor was LinkedIn Corp., a technology company that continued to execute on its strategy of disrupting the recruiting industry with innovative ways to link professionals.
- As of June 30, the Fund’s primary overweight positions were in the health care and information technology sectors, and its primary underweight positions were in the consumer discretionary and industrials sectors.
- Sluggish economic growth and sovereign credit concerns emanating out of Europe have created some significant headwinds for equities. However, we see signs for optimism as global inflation has begun to moderate bringing with it central bank easing. Here at home, the data increasingly indicates an improvement in the housing market, which we believe should be particularly good for the U.S. economy. As the macro-economic and political clouds begin to part, we are confident that the environment for growth companies that meet our quality criteria will improve.
| PAGE 4 |
|

Stock Performance |
(for the year ended 6/30/12) | | |
| | Average | Contribution |
5 Highest | Weight | to Return |
|
|
|
Onyx Pharmaceuticals Inc. | 1.65% | 1.26% |
|
|
|
LinkedIn Corp. | 2.10 | 1.05 |
|
|
|
Amylin Pharmaceuticals Inc. | 0.52 | 0.75 |
|
|
|
Citrix Systems Inc. | 2.34 | 0.70 |
|
|
|
HCA Holdings Inc. | 1.16 | 0.51 |
| | | |
5 Lowest | | |
|
Pioneer Natural | | |
Resources Co. | 1.56% | -0.56% |
|
|
|
Ryder System Inc. | 1.81 | -0.56 |
|
|
|
SM Energy Company | 1.60 | -0.66 |
|
|
|
Zynga Inc. | 1.51 | -1.01 |
|
|
|
Tempur-Pedic | | |
International Inc. | 0.54 | -1.29 |
| | | |
Past performance does not guarantee future results. These stocks do not represent all of the securities purchased, sold or recommended by the Funds’ Adviser. To request a complete list of the contribution of each Fund holding to overall Fund performance during the period, please call 800.392.CORE (2673) or email invest@westcore.com. |
| | | |
Please see page 29 for a description of the methodology used to construct this chart. |
| |
Top Ten Holdings |
(as of 6/30/12) | | |
Onyx Pharmaceuticals Inc. | | 3.3% |
|
|
Citrix Systems Inc. | | 2.8 |
|
|
FMC Corp. | | 2.4 |
|
|
DR Horton Inc. | | 2.4 |
|
|
Pioneer Natural Resources Co. | | 2.3 |
|
|
Agilent Technologies Inc. | | 2.3 |
|
|
BE Aerospace Inc. | | 2.3 |
|
|
St. Jude Medical Inc. | | 2.2 |
|
|
Vertex Pharmaceuticals Inc. | | 2.2 |
|
|
Red Hat Inc. | | 2.2 |
|
|
Total (% of Net Assets) | | 24.4% |
| | | |
Top ten holdings do not include any cash, cash equivalents or exchange traded fund investments and are subject to change. There are no guarantees that the Fund will continue to remain invested in any particular holding. |
Morningstar Ratings |
| | | Number |
| | Morningstar | of Funds in |
| | Rating™ | Mid-Cap Growth |
| | as of 6/30/12 | Category |
| Overall | «« | 678 |
|
|
|
| 3 Year | «« | 678 |
|
|
|
| 5 Year | «« | 598 |
|
|
|
| 10 Year | «« | 430 |
| |
| Morningstar Ratings shown represent the Retail Class. Morningstar proprietary ratings reflect historical risk-adjusted performance as of 6/30/12 and are subject to change every month. |
| | |
| Please see page 29 for more detail regarding Morningstar Ratings. |
Portfolio Characteristics |
| (as of 6/30/12) | | |
| | Westcore MIDCO | Russell Midcap® |
| | Growth Fund | Growth Index |
| Weighted Average Market Capitalization ($ Bil) | $6.6 | $8.6 |
|
|
|
|
|
| Price/Earnings (1 year trailing) | 17.0x | 20.4x |
|
|
|
| EPS Growth (3 year historical) | 20.1% | 15.8% |
|
|
|
| Beta | 1.1 | 1.0 |
|
|
|
| Number of Holdings | 56 | 459 |
|
|
|
| Portfolio Turnover Rate | 53% | — |
| | | |
| Please see page 30 for definition of terms. |
| | | | | |
Sector Allocation |
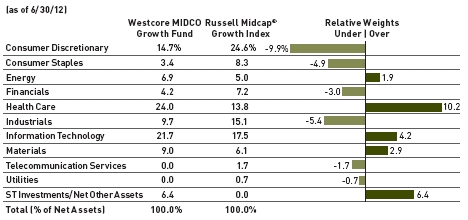
Sector classifications presented herein are based on the sector categorization methodology of the Adviser to the Funds which may result in the sector designations for one Fund being different than another Fund’s sector designations.
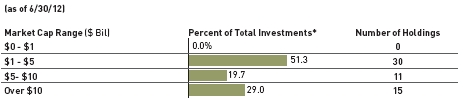
* Total Investments for this chart excludes short-term investments, including money market mutual funds.
Market capitalization ranges were determined by the Adviser to the Fund and are for presentation purposes only. These market capitalization ranges do not necessarily correlate to the benchmark’s market capitalization ranges.
PAGE 5 |
|

Investing primarily in the common stock of a limited number of medium-sized companies selected for their growth potential.
Fund Management |
| William S. Chester, CFA Portfolio Manager | Brian C. Fitzsimons, CFA Portfolio Manager |
| Mitch S. Begun, CFA Portfolio Manager | Jeffrey J. Loehr, CFA Portfolio Manager |
| Adam C. Bliss Portfolio Manager | F. Wiley Reed, CFA Portfolio Manager |
| | |
| CFA is a trademark owned by the CFA Institute. | |
| | |
Cumulative Returns |
The chart above represents historical performance of a hypothetical investment of $10,000 in the Fund over the past 10 years (or for the life of the Fund if shorter). Performance calculations are as of the end of June each year. Past performance does not guarantee future results. This chart does not reflect the deduction of taxes that a shareholder would pay on Fund distributions or the redemption of Fund shares.
Lipper Index data provided by Lipper, Inc.
Please see pages 28 and 29 for index definitions.
Average Annual Total Returns
| | | | | | | Since | Inception |
| | 6 Months | 1 Year | 3 Years | 5 Years | 10 Years | Inception | Date |
| Retail Class (WTSLX) | -7.64% | -23.30% | 11.73% | 0.22% | 5.81% | 10.90% | 10/1/1999 |
|
|
|
|
|
|
|
|
| Russell Midcap® | | | | | | | |
| Growth Index | 8.10 | -2.99 | 19.01 | 1.90 | 8.47 | 4.62 | |
|
|
|
|
|
|
|
| Lipper Mid-Cap | | | | | | | |
| Growth Index | 7.72 | -5.16 | 17.09 | 1.61 | 7.29 | 3.94 | |
Retail Class Annual Expense Ratio (per the current prospectus) — Gross: 1.02%, Net: 1.02%
The performance data quoted represents past performance and does not guarantee future results. Performance information for the institutional class shares prior to their inception date is based on the performance of the retail class. Current performance may be lower or higher than the performance quoted. To obtain current performance as of the most recent month-end, please call 800.392.CORE (2673) or visit us online at www.westcore.com. Average annual total returns and yield figures reflect the reinvestment of dividends, capital gains distributions, all fee waivers and expense reimbursements. Without the fee waivers and expense reimbursements, total return and yield figures would have been lower. Total return and yield figures represent past performance. Investment return and principal value will vary, and shares, when redeemed, may be worth more or less than their original cost. Westcore fund shares are not insured by the FDIC, the Federal Reserve Board or any other agency and are subject to investment risk.
Denver Investments (the “Adviser”) has contractually agreed to waive the investment advisory and/or administration fees and/or to reimburse Fund level other expenses from April 30, 2012 until at least April 30, 2013, so that the ratio of expenses to average net assets as reported in the Fund’s Financial Highlights will be no more than 1.15% for the Fund’s Retail Class for such period.
Westcore Select Fund is a non-diversified fund and investing in non-diversified funds generally will be more volatile and a loss of principal could be greater than investing in more diversified funds.
Wescore Select Fund may participate in the Initial Public Offering (IPO) market and a significant portion of the Fund’s since inception return has been attributable to its investments in IPOs. There is no guarantee that as the Fund’s assets grow it will continue to experience substantially similar performance by investing in IPOs.
- In the first half of 2012, the Westcore Select Fund underperformed its benchmark the Russell Midcap® Growth Index.
- This period of underperformance has been both disappointing and unusual in magnitude. Just twelve months ago, the picture was very different. Exiting June 30, 2011, the Fund had outperformed its benchmark for the 3-, 5-, and 10-year periods and slightly underperformed for the 1-year. The last twelve months have been a setback to the Fund’s long-term returns, but we are reminded that our disciplines have served us well over time. Our approach to investing remains the same – we use in-depth fundamental research designed to find growth companies that we believe will prosper over time.
- In the first half of 2012, the Fund’s most significant underperformance relative to the benchmark came from stock selection in three sectors: consumer discretionary, information technology, and health care. The Fund’s largest individual detractor was information technology holding Zynga Inc., a leading provider of social media gaming. Investors developed an increasingly skeptical view of its growth opportunities during the second quarter. Take-Two Interactive Software Inc. was another large detractor in the information technology sector. The stock of this video game manufacturer came under pressure due to delays in the launch of the next version in the company’s popular “Grand Theft Auto” game series. Consumer discretionary sector holding Tempur-Pedic International Inc., a manufacturer of specialty mattresses, also detracted meaningfully from the Fund’s performance. An unprecedented level of competitor promotions caused a significant reduction in its earnings forecast.
The financials sector was the only positive contributing sector to the Fund’s performance in the first half of 2012. Although the health care and information technology sectors provided disappointing results relative to the benchmark, both produced top-performing stocks in the first half of the year. The Fund’s best performing stock in the quarter was health care sector holding Onyx Pharmaceuticals Inc. It received a favorable recommendation from the U.S. Food and Drug Administration’s Oncologic Drugs Advisory Committee for its novel drug to treat Multiple Myeloma. The Fund’s second largest contributor was LinkedIn Corp., a technology company that continued to execute on its strategy of disrupting the recruiting industry with innovative ways to linking professionals.
- As of the end of the first half of 2012, the Fund’s primary overweight positions were in the information technology and health care sectors, and its primary underweight positions were in the consumer discretionary and consumer staples sectors.
- Sluggish economic growth and sovereign credit concerns emanating out of Europe have created some significant headwinds for equities. However, we see signs for optimism as global inflation has begun to moderate bringing with it central bank easing. Here at home, the data increasingly indicates an improvement in the housing market, which we believe should be particularly good for the U.S. economy. As the macro-economic and political clouds begin to part, we are confident that the environment for growth companies that meet our quality criteria will improve.
| PAGE 6 |
|

Stock Performance |
| (for the year ended 6/30/12) | | |
| | Average | Contribution |
| 5 Highest | Weight | to Return |
|
|
|
| Onyx Pharmaceuticals Inc. | 1.87% | 2.41% |
|
|
|
| LinkedIn Corp. | 3.65 | 1.81 |
|
|
|
| Citrix Systems Inc. | 5.09 | 1.40 |
|
|
|
| Zions Bancorporation | 4.29 | 0.60 |
|
|
|
| St. Jude Medical Inc. | 4.11 | 0.56 |
| | | |
| 5 Lowest | | |
|
| SanDisk Corp. | 2.34% | -0.98% |
|
|
|
| Ryder System Inc. | 3.81 | -1.21 |
|
|
|
| Take-Two Interactive | | |
| Software Inc. | 4.10 | -1.24 |
|
|
|
| Tempur-Pedic | | |
| International Inc. | 0.31 | -1.73 |
|
|
|
| Zynga Inc. | 1.78 | -1.96 |
| | | |
| Past performance does not guarantee future results. These stocks do not represent all of the securities purchased, sold or recommended by the Funds’ Adviser. To request a complete list of the contribution of each Fund holding to overall Fund performance during the period, please call 800.392.CORE (2673) or email invest@westcore.com. |
| | | |
| Please see page 29 for a description of the methodology used to construct this chart. |
| |
| | | |
Top Ten Holdings |
| | | |
| (as of 6/30/12) | | |
| Onyx Pharmaceuticals Inc. | | 6.3% |
|
|
| Citrix Systems Inc. | | 5.3 |
|
|
| Zions Bancorporation | | 4.8 |
|
|
| BE Aerospace Inc. | | 4.7 |
|
|
| DR Horton Inc. | | 4.7 |
|
|
| LinkedIn Corp. | | 4.5 |
|
|
| Agilent Technologies Inc. | | 4.2 |
|
|
| Avago Technologies Ltd. | | 4.1 |
|
|
| Starwood Hotels & Resorts Worldwide Inc. | 4.0 |
|
|
| WESCO International Inc. | | 4.0 |
|
|
| Total (% of Net Assets) | | 46.6% |
| | | |
| Top ten holdings do not include any cash, cash equivalents or exchange traded fund investments and are subject to change. There are no guarantees that the Fund will continue to remain invested in any particular holding. |
Morningstar Ratings |
| | | Number |
| | Morningstar | of Funds in |
| | Rating™ | Mid-Cap Growth |
| | as of 6/30/12 | Category |
| Overall | «« | 678 |
|
|
|
| 3 Year | « | 678 |
|
|
|
| 5 Year | ««« | 598 |
|
|
|
| 10 Year | «« | 430 |
| | | |
| Morningstar proprietary ratings reflect historical risk-adjusted performance as of 6/30/12 and are subject to change every month. |
| |
| Please see page 29 for more detail regarding Morningstar Ratings. |
Portfolio Characteristics |
| (as of 6/30/12) | | |
| | Westcore | Russell Midcap® |
| | Select Fund | Growth Index |
| Weighted Average Market Capitalization ($ Bil) | $6.7 | $8.6 |
|
|
|
|
|
| Price/Earnings (1 year trailing) | 18.0x | 20.4x |
|
|
|
| EPS Growth (3 year historical) | 20.2% | 15.8% |
|
|
|
| Beta | 1.2 | 1.0 |
|
|
|
| Number of Holdings | 26 | 459 |
|
|
|
| Portfolio Turnover Rate | 91% | — |
| | | |
| Please see page 30 for definition of terms. |
| | | |
Sector Allocation |

Sector classifications presented herein are based on the sector categorization methodology of the Adviser to the Funds which may result in the sector designations for one Fund being different than another Fund’s sector designations.
* Total Investments for this chart excludes short-term investments, including money market mutual funds.
Market capitalization ranges were determined by the Adviser to the Fund and are for presentation purposes only. These market capitalization ranges do not necessarily correlate to the benchmark’s market capitalization ranges.
PAGE 7 |
|

Investing in large, well-established companies whose stocks appear to be undervalued.
Fund Management |
| Kris B. Herrick, CFA Portfolio Manager | Troy Dayton, CFA Portfolio Manager |
| Derek R. Anguilm, CFA Portfolio Manager | Lisa Z. Ramirez, CFA Portfolio Manager |
| Mark M. Adelmann, CFA, CPA Portfolio Manager | |
| | |
| CFA is a trademark owned by the CFA Institute. |
| | |
Cumulative Returns |

The chart above represents historical performance of a hypothetical investment of $10,000 in the Fund over the past 10 years (or for the life of the Fund if shorter). Performance calculations are as of the end of June each year. Past performance does not guarantee future results. This chart does not reflect the deduction of taxes that a shareholder would pay on Fund distributions or the redemption of Fund shares.
Lipper Index data provided by Lipper, Inc.
Please see pages 28 and 29 for index definitions.
Average Annual Total Returns |
| | | | | | | Since | Inception |
| | 6 Months | 1 Year | 3 Years | 5 Years | 10 Years | Inception | Date |
| Retail Class (WTMVX) | 6.70% | 3.72% | 11.74% | -1.33% | 4.16% | 8.19% | 6/1/1988 |
|
|
|
|
|
|
|
|
| Institutional Class | | | | | | | |
| (WIMVX) | 6.72 | 3.93 | 11.84 | -1.19 | 4.24 | 8.22 | 9/28/2007 |
|
|
|
|
|
|
|
|
| S&P 500® Index | 9.49 | 5.45 | 16.40 | 0.22 | 5.33 | 9.28 | |
|
|
|
|
|
|
|
| Lipper Large-Cap | | | | | | | |
| Core Index | 8.04 | 2.65 | 14.05 | -0.47 | 4.32 | 8.41 | |
Retail Class Annual Expense Ratio (per the current prospectus) — Gross: 1.12%, Net: 1.12%
Institutional Class Annual Expense Ratio (per the current prospectus) — Gross: 0.96%, Net: 0.94%
The performance data quoted represents past performance and does not guarantee future results. Performance information for the institutional class shares prior to their inception date is based on the performance of the retail class. Current performance may be lower or higher than the performance quoted. To obtain current performance as of the most recent month-end, please call 800.392.CORE (2673) or visit us online at www.westcore.com. Average annual total returns and yield figures reflect the reinvestment of dividends, capital gains distributions, all fee waivers and expense reimbursements Without the fee waivers and expense reimbursements, total return and yield figures would have been lower. Total return and yield figures represent past performance. Investment return and principal value will vary, and shares, when redeemed, may be worth more or less than their original cost. Westcore fund shares are not insured by the FDIC, the Federal Reserve Board or any other agency and are subject to investment risk.
Denver Investments (the “Adviser”) has contractually agreed to waive the investment advisory and/or administration fees and/or to reimburse Fund level other expenses from April 30, 2012 until at least April 30, 2013, so that the ratio of expenses to average net assets as reported in the Fund’s Financial Highlights will be no more than 1.15% for the Fund’s Retail Class for such period. In addition, the Adviser has contractually agreed to waive the investment advisory and/or administration fees and/or to reimburse Fund level other expenses for the Institutional Class in the same proportion as the Retail Class waivers/reimbursements as well as reimburse the Institutional class-specific other expenses until at least April 30, 2013.
Lisa Z. Ramirez is a registered representative of ALPS Distributors, Inc.
- The Westcore Blue Chip Fund underperformed its benchmark, the S&P 500® Index, for the first six months of 2012.
- The stock market has been volatile year-to-date, with alternating periods of “risk on” and “risk off”. The first quarter was one of the strongest first quarters in history, led by low-quality, higher-risk (defined by beta and high long-term growth expectation) stocks. Economic strength was positively impacted by the mild winter and spring. Optimism faded in the second quarter as job creation dropped and Europe remained in financial and political turmoil. Returns were negative across the capitalization spectrum, and stocks with better fundamentals generally outperformed. Even with the second quarter shift to stocks with better fundamentals, at midyear the market leaders are lower quality, higher beta, less liquid stocks.
- During the first half of 2012, the portfolio’s most positive contributions were in the energy, medical/ healthcare and communications sectors. Although not in a top contributing sector, Wal-Mart Stores Inc. was a top performing stock. It continued to execute on our thesis of improving fundamentals. The market has taken notice of these improving fundamentals and a stable business model in an unstable global economy. Within transportation, Union Pacific Corp., a railroad operator, was the top contributor. The company reported results that beat market expectations driven by stronger revenues and lower costs. The company increased its prices and we believe solid fundamentals should lead to strong free cash generation. In medical/ healthcare, while no individual names stood out, stock selection contributed to the relative outperformance.
- The sectors that detracted most from performance during the first half were technology, interest rate sensitive, and consumer cyclicals. Dell Inc. (computers, servers and related services) was one of the biggest detractors in technology. We believe the cash flow stream at Dell is mispriced and the company should unlock this through its non-computing business. The market seems laser-focused on Dell’s inability to achieve its stated goal for growth in the computing segment while ignoring growth in overall cash flows. Prudential Financial Inc. (global life insurance, annuity and asset management) contributed to underperformance in the interest rate sensitive sector. We believe that Prudential is meaningfully undervalued considering its current returns and improved international opportunities. It seems to us that Prudential compares favorably to banks in terms of credit and near-term interest rate risk.
- Looking forward, we remain cautious about economic growth and corporate profits over the second half of the year. It appears that companies are unlikely to start hiring any time soon given the slow economic growth and numerous uncertainties. While consumers have been able to deleverage to some extent, we believe they will be unable to carry the economy as in the past. Back-to-school shopping will be an important time for retailers and the economy as a whole. It seems to us that China’s agreements with its trading partners to settle trades outside of the U.S. dollar, the extraordinary value of derivatives and the impact of sanctions against Iran are some risks to the portfolio that deserve monitoring. We continue to believe that our fundamental research will position the Fund well over the long term.
| PAGE 8 |
|

Stock Performance |
| (for the year ended 6/30/12) | | |
| | Average | Contribution |
| 5 Highest | Weight | to Return |
|
|
|
| Wal-Mart Stores Inc. | 3.58% | 0.68% |
|
|
|
| Microsoft Corp. | 3.68 | 0.62 |
|
|
|
| Union Pacific Corp. | 3.26 | 0.45 |
|
|
|
| SunTrust Banks Inc. | 1.26 | 0.42 |
|
|
|
| Mattel Inc. | 1.91 | 0.41 |
| | | |
| 5 Lowest | | |
|
| Symantec Corp. | 2.13% | -0.14% |
|
|
|
| Marathon Oil Corp. | 1.76 | -0.18 |
|
|
|
| Occidental Petroleum | | |
| Corp. | 3.06 | -0.18 |
|
|
|
| Dell Inc. | 1.52 | -0.22 |
|
|
|
| Prudential Financial Inc. | 0.89 | -0.28 |
| | | |
| Past performance does not guarantee future results. These stocks do not represent all of the securities purchased, sold or recommended by the Funds’ Adviser. To request a complete list of the contribution of each Fund holding to overall Fund performance during the period, please call 800.392.CORE (2673) or email invest@westcore.com. |
| |
| Please see page 29 for a description of the methodology used to construct this chart. |
| | | |
Top Ten Holdings |
| | | |
| (as of 6/30/12) | | |
| | | |
| Wal-Mart Stores Inc. | | 4.1% |
|
|
| Microsoft Corp. | | 3.8 |
|
|
| International Business Machines Corp. | 3.7 |
|
|
| Union Pacific Corp. | | 3.6 |
|
|
| ACE Ltd. | | 3.2 |
|
|
| Pfizer Inc. | | 3.0 |
|
|
| Occidental Petroleum Corp. | | 2.9 |
|
|
| Abbott Laboratories | | 2.8 |
|
|
| Amgen Inc. | | 2.8 |
|
|
|
| Unilever N.V. | | 2.6 |
|
|
| Total (% of Net Assets) | | 32.5% |
| | | |
| Top ten holdings do not include any cash, cash equivalents or exchange traded fund investments and are subject to change. There are no guarantees that the Fund will continue to remain invested in any particular holding. |
Morningstar Ratings |
| | | Number |
| | Morningstar | of Funds in |
| | Rating™ | Large Blend |
| | as of 6/30/12 | Category |
| Overall | ««« | 1,539 |
|
|
|
| 3 Year | «« | 1,539 |
|
|
|
| 5 Year | ««« | 1,346 |
|
|
|
| 10 Year | ««« | 838 |
| |
| Morningstar Ratings shown represent the Retail Class. Morningstar proprietary ratings reflect historical risk-adjusted performance as of 6/30/12 and are subject to change every month. |
| | |
| Please see page 29 for more detail regarding Morningstar Ratings. |
Portfolio Characteristics |
| (as of 6/30/12) | | |
| | Westcore | S&P 500® |
| | Blue Chip Fund | Index |
| Weighted Average Market Capitalization ($ Bil) | $66.1 | $108.1 |
|
|
|
| Price/Cash Flow (1 year trailing) | 10.1x | 10.8x |
|
|
|
| Price/Book Value | 2.6x | 3.0x |
|
|
|
| Price/Earnings (1 year trailing) | 12.6x | 14.5x |
|
|
|
| Beta | 1.0 | 1.0 |
|
|
|
| Number of Holdings | 51 | 500 |
|
|
|
| Portfolio Turnover Rate | 6% | — |
| | | |
| Please see page 30 for definition of terms. |
| | | |
Sector Allocation |
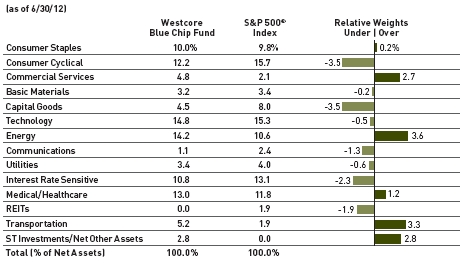
Sector classifications presented herein are based on the sector categorization methodology of the Adviser to the Funds which may result in the sector designations for one Fund being different than another Fund’s sector designations.
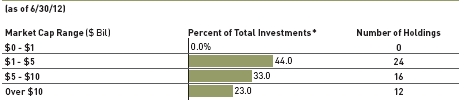
* Total Investments for this chart excludes short-term investments, including money market mutual funds.
Market capitalization ranges were determined by the Adviser to the Fund and are for presentation purposes only. These market capitalization ranges do not necessarily correlate to the benchmark’s market capitalization ranges.
PAGE 9 |
|

Investing in medium-sized companies whose stocks appear to be undervalued.
Fund Management |
| | |
| Kris B. Herrick, CFA Portfolio Manager | Troy Dayton, CFA Portfolio Manager |
| Derek R. Anguilm, CFA Portfolio Manager | Lisa Z. Ramirez, CFA Portfolio Manager |
| Mark M. Adelmann, CFA, CPA Portfolio Manager | |
| CFA is a trademark owned by the CFA Institute. | |
| | |
Cumulative Returns |

The chart above represents historical performance of a hypothetical investment of $10,000 in the Fund over the past 10 years (or for the life of the Fund if shorter). Performance calculations are as of the end of June each year. Past performance does not guarantee future results. This chart does not reflect the deduction of taxes that a shareholder would pay on Fund distributions or the redemption of Fund shares.
Lipper Index data provided by Lipper, Inc.
Please see pages 28 and 29 for index definitions.
Average Annual Total Returns
| | | | | | | Since | Inception |
| | 6 Months | 1 Year | 3 Years | 5 Years | 10 Years | Inception | Date |
| Retail Class | | | | | | | |
| (WTMCX) | 3.54% | -4.15% | 14.59% | -2.71% | 6.14% | 7.76% | 10/1/1998 |
|
|
|
|
|
|
|
|
| Russell Midcap® | | | | | | | |
| Value Index | 7.78 | -0.37 | 19.92 | -0.13 | 8.17 | 8.63 | |
|
|
|
|
|
|
|
| Lipper Mid-Cap | | | | | | | |
| Value Index | 7.33 | -3.42 | 16.64 | -0.45 | 7.19 | 8.08 | |
Retail Class Annual Expense Ratio (per the current prospectus) — Gross: 1.22%, Net: 1.22%
The performance data quoted represents past performance and does not guarantee future results. Performance information for the institutional class shares prior to their inception date is based on the performance of the retail class. Current performance may be lower or higher than the performance quoted. To obtain current performance as of the most recent month-end, please call 800.392.CORE (2673) or visit us online at www.westcore.com. Average annual total returns and yield figures reflect the reinvestment of dividends, capital gains distributions, all fee waivers and expense reimbursements. Without the fee waivers and expense reimbursements, total return and yield figures would have been lower. Total return and yield figures represent past performance. Investment return and principal value will vary, and shares, when redeemed, may be worth more or less than their original cost. Westcore fund shares are not insured by the FDIC, the Federal Reserve Board or any other agency and are subject to investment risk.
Denver Investments (the “Adviser”) has contractually agreed to waive the investment advisory and/or administration fees and/or to reimburse Fund level other expenses from April 30, 2012 until at least April 30, 2013, so that the ratio of expenses to average net assets as reported in the Fund’s Financial Highlights will be no more than 1.25% for the Fund’s Retail Class for such period.
Lisa Z. Ramirez is a registered representative of ALPS Distributors, Inc.
- The Westcore Mid-Cap Value Fund underperformed its benchmark, the Russell Midcap® Value Index, during the first six months of 2012.
- The stock market has been volatile year-to-date, with alternating periods of “risk on” and “risk off”. The first quarter was one of the strongest first quarters in history, led by low-quality, higher-risk (defined by beta and high long-term growth expectation) stocks. Economic strength was positively impacted by the mild winter and spring. Optimism faded in the second quarter as job creation dropped and Europe remained in financial and political turmoil. Returns were negative across the capitalization spectrum, and stocks with better fundamentals generally outperformed. Even with the second quarter shift to stocks with better fundamentals, at midyear the market leaders are lower quality, higher beta, less liquid stocks.
- The most significant sector contributions relative to the benchmark came from energy, utilities and transportation. Energy holding HollyFrontier Corp. was the best performing stock in the portfolio during the period. It benefitted from lower raw material costs relative to competitors. Furthermore, the merger between Holly and Frontier Oil allowed it future access to low-cost crude oil in Utah and Canada. Within the utilities and transportation sectors, no individual stocks were standouts. Outside of the three sectors noted above, PartnerRe Ltd., a global reinsurer in the interest rate sensitive sector, performed well following a difficult 2011. The company benefitted from improvements in insurance rates, a more normal catastrophe loss environment and evidence of strong reserves. We believe that the valuation and fundamental backdrop remain compelling for PartnerRe.
- The sectors that detracted most from performance relative to the benchmark were consumer cyclicals, REITs and consumer staples. Fund performance in consumer cyclicals suffered due to a pullback in J.C. Penney Company Inc. Expectations were ahead of execution and investors were disappointed. The company is involved in a turnaround of price, product and positioning in the apparel market. We believe it is too early to judge the results as the majority of changes have yet to happen. Although Fund holding Forest Oil Corp. was not in the poorer performing sectors above, it was another weak performer. Low natural gas prices negatively impacted its cash flows. Furthermore, it experienced disappointing results in its Texas acreage. Finally, when the board decided to replace the management team, we sold the stock. No individual stocks were standouts within the REITs and consumer staples sectors.
- Looking forward, we remain cautious about economic growth and corporate profits over the second half of the year. It appears that companies are unlikely to start hiring any time soon given the slow economic growth and numerous uncertainties. While consumers have been able to deleverage to some extent, we believe they will be unable to carry the economy as in the past. Back-to-school shopping will be an important time for retailers and the economy as a whole. It seems to us that China’s agreements with its trading partners to settle trades outside of the U.S. dollar, the extraordinary value of derivatives and the impact of sanctions against Iran are some risks to the portfolio that deserve monitoring. We continue to believe that our fundamental research will position the Fund well over the long term.
| PAGE 10 |
|

Stock Performance |
| (for the year ended 6/30/12) | | |
| | Average | Contribution |
5 Highest | Weight | to Return |
|
|
|
| HollyFrontier Corp. | 2.21% | 0.95% |
|
|
|
| Allied World Assurance Co. | 2.19 | 0.53 |
|
|
|
| PartnerRe Ltd. | 2.68 | 0.50 |
|
|
|
| SunTrust Banks Inc. | 1.41 | 0.45 |
|
|
|
| Avago Technologies Ltd. | 1.94 | 0.41 |
| | | |
| 5 Lowest | | |
|
| Parametric Technology Corp. | 0.54% | -0.22% |
|
|
|
| Omnicare Inc. | 2.31 | -0.23 |
|
|
|
| SM Energy Company | 0.88 | -0.26 |
|
|
|
| Forest Oil Corp. | 0.80 | -0.37 |
|
|
|
| J.C. Penney Company Inc. | 1.66 | -0.59 |
| | | |
| Past performance does not guarantee future results. These stocks do not represent all of the securities purchased, sold or recommended by the Funds’ Adviser. To request a complete list of the contribution of each Fund holding to overall Fund performance during the period, please call 800.392.CORE (2673) or email invest@westcore.com. |
| | | |
| Please see page 29 for a description of the methodology used to construct this chart. |
| | | |
Top Ten Holdings |
| (as of 6/30/12) | | |
| DISH Network Corp. | | 3.3% |
|
|
|
| AXIS Capital Holdings Ltd. | | 3.1 |
|
|
|
| Quanta Services Inc. | | 3.0 |
|
|
|
| HollyFrontier Corp. | | 2.7 |
|
|
| Westar Energy Inc. | | 2.6 |
|
|
| Reinsurance Group of America Inc. | 2.5 |
|
|
| Crown Holdings Inc. | | 2.4 |
|
|
| American Water Works Co. Inc. | | 2.4 |
|
|
| Activision Blizzard Inc. | | 2.4 |
|
|
| Forest Laboratories Inc. | | 2.4 |
|
|
|
| Total (% of Net Assets) | | 26.8% |
| | | |
| Top ten holdings do not include any cash, cash equivalents or exchange traded fund investments and are subject to change. There are no guarantees that the Fund will continue to remain invested in any particular holding. |
Morningstar Ratings |
| | | Number |
| | Morningstar | of Funds in |
| | Rating™ | Mid-Cap Value |
| | as of 6/30/12 | Category |
| Overall | «« | 336 |
|
|
| 3 Year | ««« | 336 |
|
|
| 5 Year | «« | 296 |
|
|
| 10 Year | «« | 149 |
| | | |
| Morningstar proprietary ratings reflect historical risk-adjusted performance as of 6/30/12 and are subject to change every month. |
| | | |
| Please see page 29 for more detail regarding Morningstar Ratings. |
Portfolio Characteristics |
| (as of 6/30/12) | | |
| | Westcore Mid-Cap | Russell Midcap® |
| | Value Fund | Value Index |
| Weighted Average Market Capitalization ($ Bil) | $6.4 | $7.7 |
|
|
|
|
|
| Price/Cash Flow (1 year trailing) | 11.0x | 10.4x |
|
|
|
| Price/Book Value | 1.8x | 1.7x |
|
|
|
| Price/Earnings (1 year trailing) | 13.4x | 13.9x |
|
|
|
| Beta | 0.9 | 1.0 |
|
|
|
| Number of Holdings | 52 | 560 |
|
| Portfolio Turnover Rate | 10% | — |
| | | | |
| Please see page 30 for definition of terms. | | | | |
| | | | | |
Sector Allocation |

Sector classifications presented herein are based on the sector categorization methodology of the Adviser to the Funds which may result in the sector designations for one Fund being different than another Fund’s sector designations.
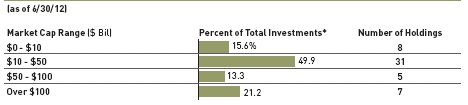
* Total Investments for this chart excludes short-term investments, including money market mutual funds.
Market capitalization ranges were determined by the Adviser to the Fund and are for presentation purposes only. These market capitalization ranges do not necessarily correlate to the benchmark’s market capitalization ranges.
PAGE 11 |
|

Investing in small-company stocks that appear to be undervalued.
Fund Management |
| | |
| Kris B. Herrick, CFA Portfolio Manager | Troy Dayton, CFA Portfolio Manager |
| Derek R. Anguilm, CFA Portfolio Manager | Lisa Z. Ramirez, CFA Portfolio Manager |
| Mark M. Adelmann, CFA, CPA Portfolio Manager | |
| CFA is a trademark owned by the CFA Institute. | |
| | |
Cumulative Returns |

The chart above represents historical performance of a hypothetical investment of $10,000 in the Fund over the past 10 years (or for the life of the Fund if shorter). Performance calculations are as of the end of June each year. Past performance does not guarantee future results. This chart does not reflect the deduction of taxes that a shareholder would pay on Fund distributions or the redemption of Fund shares.
Lipper Index data provided by Lipper, Inc.
Please see pages 28 and 29 for index definitions.
Average Annual Total Returns
| | | | | | | Since | Inception |
| | 6 Months | 1 Year | 3 Years | 5 Years | 10 Years | Inception | Date |
| Retail Class (WTSCX) | 4.61% | -4.42% | 14.09% | -3.55% | 5.56% | 7.88% | 12/28/1993 |
|
|
|
|
|
|
|
|
| Institutional Class | | | | | | | |
| (WISCX) | 4.68 | -4.32 | 14.22 | -3.42 | 5.64 | 7.92 | 9/28/2007 |
|
|
|
|
|
|
|
|
| Russell 2000® Index | 8.53 | -2.08 | 17.80 | 0.54 | 7.00 | 7.72 | |
|
|
|
|
|
|
|
| Lipper Small-Cap | | | | | | | |
| Core Index | 6.24 | -3.75 | 16.87 | 0.70 | 7.05 | 8.74 | |
Retail Class Annual Expense Ratio (per the current prospectus) — Gross: 1.45%, Net: 1.31%
Institutional Class Annual Expense Ratio (per the current prospectus) — Gross: 1.80%, Net: 1.20%
The performance data quoted represents past performance and does not guarantee future results. Performance information for the institutional class shares prior to their inception date is based on the performance of the retail class. Current performance may be lower or higher than the performance quoted. To obtain current performance as of the most recent month-end, please call 800.392.CORE (2673) or visit us online at www.westcore.com. Average annual total returns and yield figures reflect the reinvestment of dividends, capital gains distributions, all fee waivers and expense reimbursements. Without the fee waivers and expense reimbursements, total return and yield figures would have been lower. Total return and yield figures represent past performance. Investment return and principal value will vary, and shares, when redeemed, may be worth more or less than their original cost. Westcore fund shares are not insured by the FDIC, the Federal Reserve Board or any other agency and are subject to investment risk.
Denver Investments (the “Adviser”) has contractually agreed to waive the investment advisory and/or administration fees and/or to reimburse Fund level other expenses from April 30, 2012 until at least April 30, 2013, so that the ratio of expenses to average net assets as reported in the Fund’s Financial Highlights will be no more than 1.30% for the Fund’s Retail Class for such period. In addition, the Adviser has contractually agreed to waive the investment advisory and/or administration fees and/or to reimburse Fund level other expenses for the Institutional Class in the same proportion as the Retail Class waivers/reimbursements as well as reimburse the Institutional class-specific other expenses until at least April 30, 2013.
Investing in small-cap funds generally will be more volatile and loss of principal could be greater than investing in larger-cap funds.
Lisa Z. Ramirez is a registered representative of ALPS Distributors, Inc.
- The Westcore Small-Cap Opportunity Fund underperformed its benchmark the Russell 2000® Index, during the first six months of 2012.
- The stock market has been volatile year-to-date, with alternating periods of “risk on” and “risk off”. The first quarter was one of the strongest first quarters in history, led by low-quality, higher-risk (defined by beta and high long-term growth expectation) stocks. Economic strength was positively impacted by the mild winter and spring. Optimism faded in the second quarter as job creation dropped and Europe remained in financial and political turmoil. Returns were negative across the capitalization spectrum, and stocks with better fundamentals generally outperformed. Even with the second quarter shift to stocks with better fundamentals, at midyear the market leaders are lower quality, higher beta, less liquid stocks.
- The strongest contributing sectors year-to-date were commercial services, transportation and medical/healthcare. Within medical/healthcare, Zoll Medical Corp. was a top performer. The company benefited from stronger-than-anticipated demand in the hospital and pre-hospital markets. During the period, Asahi Kasei Corporation, a Japanese diversified chemical manufacturer completed its acquisition of Zoll Medical. Commercial services holding, Central Garden & Pet Co., a garden and pet care supplier, was a top contributor. We continue to see consumers spend on home and garden products, which should benefit company sales. At the same time, management has embarked on cost-cutting initiatives that should lead to increased profits.
- The sectors that provided the least contribution to relative performance were interest rate sensitive, capital goods and basic materials. Capital goods holding, Twin Disc Inc., a designer, manufacturer and seller of power transmission equipment struggled. The first half of 2012 saw an unexpected decrease in oil and gas drilling which negatively impacted transmission sales. With this element of our thesis violated, we sold the stock. Outside of the three sectors mentioned above, the first half was also a difficult period for energy holding, Newpark Resources Inc. Land drilling in North America slowed due to a decline in gas-directed rig count. This is not being fully offset by drilling for oil. At the same time that activity has slowed, costs for a key raw material, barite, a weighting agent in drilling mud, have increased. We are confident in Newpark’s competitive position, as drilling activity returns to more normal levels and costs for barite stabilize.
- Looking forward, we remain cautious about economic growth and corporate profits over the second half of the year. It appears that companies are unlikely to start hiring any time soon given the slow economic growth and numerous uncertainties. While consumers have been able to deleverage to some extent, we believe they will be unable to carry the economy as in the past. Back-to-school shopping will be an important time for retailers and the economy as a whole. It seems to us that China’s agreements with its trading partners to settle trades outside of the U.S. dollar, the extraordinary value of derivatives and the impact of sanctions against Iran are some risks to the portfolio that deserve monitoring. We continue to believe that our fundamental research will position the Fund well over the long term. As always, your continued confidence is appreciated.
| PAGE 12 |
|

Stock Performance |
| (for the year ended 6/30/12) | | |
| | Average | Contribution |
5 Highest | Weight | to Return |
|
|
|
| Zoll Medical Corp. | 1.64% | 1.07% |
|
|
|
| Standard Microsystems Corp. | 2.40 | 0.87 |
|
|
|
| GeoResources Inc. | 2.83 | 0.61 |
|
|
|
| Cott Corp. | 2.06 | 0.61 |
|
|
|
| Central Garden & Pet Co. | 2.04 | 0.59 |
| | | |
| 5 Lowest | | |
|
| Take-Two Interactive | | |
| Software Inc. | 1.92% | -0.55% |
|
|
|
| Keynote Systems Inc. | 1.82 | -0.56 |
|
|
|
| Twin Disc Inc. | 0.83 | -0.58 |
|
|
|
| Bill Barrett Corp. | 1.26 | -0.64 |
|
|
|
| Newpark Resources Inc. | 1.76 | -0.83 |
| | | |
| Past performance does not guarantee future results. These stocks do not represent all of the securities purchased, sold or recommended by the Funds’ Adviser. To request a complete list of the contribution of each Fund holding to overall Fund performance during the period, please call 800.392.CORE (2673) or email invest@westcore.com. |
| |
| Please see page 29 for a description of the methodology used to construct this chart. |
| | | |
Top Ten Holdings |
| (as of 6/30/12) | | |
| | | |
| GeoResources Inc. | | 3.1% |
|
|
|
| Standard Microsystems Corp. | | 3.1 |
|
|
| Schweitzer-Mauduit International Inc . | 2.7 |
|
|
| Medicis Pharmaceuticals Corp. | | 2.6 |
|
|
| Cott Corp. | | 2.5 |
|
|
| Myriad Genetics Inc. | | 2.5 |
|
|
| Elizabeth Arden Inc. | | 2.4 |
|
|
| Central Garden & Pet Co. | | 2.4 |
|
|
| Orthofix International N.V. | | 2.4 |
|
|
|
| U.S. Physical Therapy Inc. | | 2.4 |
|
|
| Total (% of Net Assets) | | 26.1% |
| | | |
| Top ten holdings do not include any cash, cash equivalents or exchange traded fund investments and are subject to change. There are no guarantees that the Fund will continue to remain invested in any particular holding. |
Morningstar Ratings |
| | | Number |
| | Morningstar | of Funds in |
| | Rating™ | Small Blend |
| | as of 6/30/12 | Category |
| Overall | «« | 598 |
|
|
| 3 Year | «« | 598 |
|
|
| 5 Year | «« | 518 |
|
|
| 10 Year | «« | 310 |
| | | |
| Morningstar Ratings shown represent the Retail Class. Morningstar proprietary ratings reflect historical risk-adjusted performance as of 6/30/12 and are subject to change every month. |
| | | |
| Please see page 29 for more detail regarding Morningstar Ratings. |
Portfolio Characteristics |
| (as of 6/30/12) | | | | |
| | Westcore Small-Cap | Russell 2000® |
| | Opportunity Fund | Index |
| Weighted Average Market Capitalization ($ Mil) | $1,077.0 | $1,187.0 |
|
|
|
|
|
| Price/Cash Flow (1 year trailing) | 9.6x | 11.9x |
|
|
| Price/Book Value | 1.9x | 2.4x |
|
|
| Price/Earnings (1 year trailing) | 14.9x | 16.4x |
|
|
| Beta | 0.9 | 1.0 |
|
|
| Number of Holdings | 59 | 2,002 |
|
|
| Portfolio Turnover Rate | 16% | — |
| | | | | |
| Please see page 30 for definition of terms. |
| | | | | |
Sector Allocation |
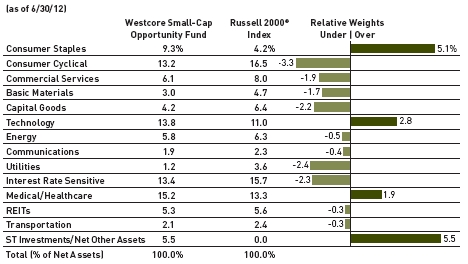
Sector classifications presented herein are based on the sector categorization methodology of the Adviser to the Funds which may result in the sector designations for one Fund being different than another Fund’s sector designations.
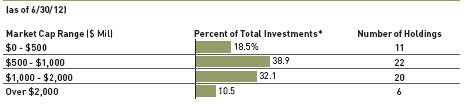
* Total Investments for this chart reflects the value of such investments and excludes short-term investments, including money market mutual funds.
Market capitalization ranges were determined by the Adviser to the Fund and are for presentation purposes only. These market capitalization ranges do not necessarily correlate to the benchmark’s market capitalization ranges.
PAGE 13 |
|

Investing primarily in small-cap, dividend paying stocks that appear to be undervalued.
Fund Management |
| | |
| Kris B. Herrick, CFA Portfolio Manager | Troy Dayton, CFA Portfolio Manager |
| Derek R. Anguilm, CFA Portfolio Manager | Lisa Z. Ramirez, CFA Portfolio Manager |
| Mark M. Adelmann, CFA, CPA Portfolio Manager | |
| CFA is a trademark owned by the CFA Institute. | |
| | |
Cumulative Returns |

The chart above represents historical performance of a hypothetical investment of $10,000 in the Fund over the past 10 years (or for the life of the Fund if shorter). Performance calculations are as of the end of June each year. Past performance does not guarantee future results. This chart does not reflect the deduction of taxes that a shareholder would pay on Fund distributions or the redemption of Fund shares.
Lipper Index data provided by Lipper, Inc.
Please see pages 28 and 29 for index definitions.
Average Annual Total Returns
| | | | | | | Since | Inception |
| | 6 Months | 1 Year | 3 Years | 5 Years | 10 Years | Inception | Date |
| Retail Class (WTSVX) | 5.84% | -0.24% | 18.59% | -0.71% | — | 4.22% | 12/13/2004 |
|
|
|
|
|
|
|
|
| Institutional Class | | | | | | | |
| (WISVX) | 5.85 | -0.23 | 18.66 | -0.65 | — | 4.26 | 9/28/2007 |
|
|
|
|
|
|
|
|
| Russell 2000® | | | | | | | |
| Value Index | 8.23 | -1.43 | 17.43 | -1.05 | — | 3.43 | |
|
|
|
|
|
|
|
| Lipper Small-Cap | | | | | | | |
| Value Index | 6.09 | -3.37 | 17.30 | -0.06 | — | 4.62 | |
Retail Class Annual Expense Ratio (per the current prospectus) — Gross: 1.38%, Net: 1.31%
Institutional Class Annual Expense Ratio (per the current prospectus) — Gross: 1.25%, Net: 1.17%
The performance data quoted represents past performance and does not guarantee future results. Performance information for the institutional class shares prior to their inception date is based on the performance of the retail class. Current performance may be lower or higher than the performance quoted. To obtain current performance as of the most recent month-end, please call 800.392.CORE (2673) or visit us online at www.westcore.com. Average annual total returns and yield figures reflect the reinvestment of dividends, capital gains distributions, all fee waivers and expense reimbursements. Without the fee waivers and expense reimbursements, total return and yield figures would have been lower. Total return and yield figures represent past performance. Investment return and principal value will vary, and shares, when redeemed, may be worth more or less than their original cost. Westcore fund shares are not insured by the FDIC, the Federal Reserve Board or any other agency and are subject to investment risk.
Denver Investments (the “Adviser”) has contractually agreed to waive the investment advisory and/or administration fees and/or to reimburse Fund level other expenses from April 30, 2012 until at least April 30, 2013, so that the ratio of expenses to average net assets as reported in the Fund’s Financial Highlights will be no more than 1.30% for the Fund’s Retail Class for such period. In addition, the Adviser has contractually agreed to waive the investment advisory and/or administration fees and/or to reimburse Fund level other expenses for the Institutional Class in the same proportion as the Retail Class waivers/reimbursements as well as reimburse the Institutional class-specific other expenses until at least April 30, 2013.
Investing in small-cap funds generally will be more volatile and loss of principal could be greater than investing in larger-cap funds.
Lisa Z. Ramirez is a registered representative of ALPS Distributors, Inc.
- The Westcore Small-Cap Value Fund underperformed its benchmark index, the Russell 2000® Value Index, during the first six months of 2012.
- The stock market has been volatile year-to-date, with alternating periods of “risk on” and “risk off”. The first quarter was one of the strongest first quarters in history, led by low-quality, higher-risk (defined by beta and high long-term growth expectation) stocks. Economic strength was positively impacted by the mild winter and spring. Optimism faded in the second quarter as job creation dropped and Europe remained in financial and political turmoil. Returns were negative across the capitalization spectrum, and stocks with better fundamentals generally outperformed. Even with the second quarter shift to stocks with better fundamentals, at midyear the market leaders are lower quality, higher beta, less liquid stocks.
- The most significant sector contributions relative to the benchmark for the period came from consumer cyclical, medical/healthcare and commercial services. Medical/healthcare holding West Pharmaceutical Services Inc., a provider of packaging solutions for the pharmaceutical and biotech industries, was the best performing stock in the portfolio. Greater orders for packing systems led to an increase in profits and cash flows. We believe future proprietary product launches should result in sizeable increases to revenues, profits, and free cash flow. Within commercial services MAXIMUS Inc. was a top performer. It is a provider of technology solutions to health and human services department for state and federal governments, as well several foreign governments. We foresee management continuing to improve the implementation of its business plan. Additionally, our analysis indicates improving demand from state governments for its technology solutions, as deadlines for healthcare-exchange implementation approach.
- The weakest contributions year-to-date relative to the benchmark were in the interest rate sensitive, communications and energy sectors. Interest rate sensitive holding, GATX Corp., a railcar leaser, finished 2011 very strongly, and we reduced the position early in the first quarter. We continue to believe that the fundamentals of its tank-car leasing business are strong and improving. Within energy, Bristow Group Inc., a leading provider of helicopter transportation services to the global offshore energy industry, was a meaningful detractor. Declining energy prices led the market to conclude that drilling activity will decline along with the deteriorating economics. We disagree and believe that Bristow is well positioned to take advantage of increased global drilling activity over the intermediate-term.
- Looking forward, we remain cautious about economic growth and corporate profits over the second half of the year. It appears that companies are unlikely to start hiring any time soon given the slow economic growth and numerous uncertainties. While consumers have been able to deleverage to some extent, we believe they will be unable to carry the economy as in the past. Back-to-school shopping will be an important time for retailers and the economy as a whole. It seems to us that China’s agreements with its trading partners to settle trades outside of the U.S. dollar, the extraordinary value of derivatives and the impact of sanctions against Iran are some risks to the portfolio that deserve monitoring. We continue to believe that our fundamental research will position the Fund well over the long term.
| PAGE 14 |
|

Stock Performance |
| (for the year ended 6/30/12) | | |
| | | |
| | Average | Contribution |
5 Highest | Weight | to Return |
|
|
|
| West Pharmaceutical | | |
| Services Inc. | 2.43% | 0.75% |
|
|
|
| Protective Life Corp. | 2.02 | 0.71 |
|
|
|
| MAXIMUS Inc. | 1.95 | 0.48 |
|
|
|
| Brandywine Realty Trust | 1.53 | 0.44 |
|
|
|
| Bob Evans Farms Inc. | 2.17 | 0.43 |
| | | |
| 5 Lowest | | |
|
| GATX Corp. | 1.30% | -0.14% |
|
|
|
| Brink's Co. | 1.62 | -0.23 |
|
|
|
| Bristow Group Inc. | 1.90 | -0.28 |
|
|
|
| Buckeye Technologies Inc. | 2.03 | -0.28 |
|
|
|
| Schnitzer Steel | | |
| Industries Inc. | 0.82 | -0.41 |
| | | |
| Past performance does not guarantee future results. These stocks do not represent all of the securities purchased, sold or recommended by the Funds’ Adviser. To request a complete list of the contribution of each Fund holding to overall Fund performance during the period, please call 800.392.CORE (2673) or email invest@westcore.com. |
| | | |
| Please see page 29 for a description of the methodology used to construct this chart. |
| | | |
Top Ten Holdings |
| | | |
| (as of 6/30/12) | | |
| West Pharmaceutical Services Inc. | 2.8% |
|
|
| Plantronics Inc. | | 2.8 |
|
|
| Endurance Specialty Holdings Ltd. | 2.4 |
|
|
| Schweitzer-Mauduit International Inc. | 2.4 |
|
|
| Bob Evans Farms Inc. | | 2.3 |
|
|
| MAXIMUS Inc. | | 2.3 |
|
|
| Medicis Pharmaceuticals Corp. | | 2.2 |
|
|
| Portland General Electric Co. | | 2.2 |
|
|
| Alterra Capital Holdings Ltd. | | 2.0 |
|
|
| Owens & Minor Inc. | | 2.0 |
|
|
| Total (% of Net Assets) | | 23.4% |
| | | |
| Top ten holdings do not include any cash, cash equivalents or exchange traded fund investments and are subject to change. There are no guarantees that the Fund will continue to remain invested in any particular holding. |
Morningstar Ratings |
| | | |
| | | Number |
| | Morningstar | of Funds in |
| | Rating™ | Small Value |
| | as of 6/30/12 | Category |
| | |
| Overall | ««« | 284 |
|
| 3 Year | «««« | 284 |
|
|
| 5 Year | ««« | 253 |
| |
| Morningstar Ratings shown represent the Retail Class. Morningstar proprietary ratings reflect historical risk-adjusted performance as of 6/30/12 and are subject to change every month. |
| | | |
| Please see page 29 for more detail regarding Morningstar Ratings. |
Portfolio Characteristics |
| (as of 6/30/12) | | | | | |
| | Westcore Small-Cap | | Russell 2000® |
| | Value Fund | | Value Index |
| Weighted Average Market Capitalization ($ Mil) | $1,542.0 | | $1,025.0 |
|
| Price/Cash Flow (1 year trailing) | 10.3x | | 10.0x |
|
| Price/Book Value | 2.0x | | 1.4x |
|
| Price/Earnings (1 year trailing) | 14.5x | | 13.7x |
|
| Beta | 0.8 | | 1.0 |
|
| Number of Holdings | 66 | | 1,419 |
|
| Portfolio Turnover Rate | 18% | | — |
| | | | |
| Please see page 30 for definition of terms. |
| |
Sector Allocation |

Sector classifications presented herein are based on the sector categorization methodology of the Adviser to the Funds which may result in the sector designations for one Fund being different than another Fund’s sector designations.
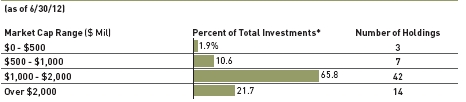
* Total Investments for this chart excludes short-term investments, including money market mutual funds.
Market capitalization ranges were determined by the Adviser to the Fund and are for presentation purposes only. These market capitalization ranges do not necessarily correlate to the benchmark’s market capitalization ranges.
PAGE 15 |
|

Investing primarily in micro-cap companies whose stocks appear to be undervalued.
Kris B. Herrick, CFA Portfolio Manager
Paul A. Kuppinger, CFA Portfolio Manager
Jon K. Tesseo Portfolio Manager
CFA is a trademark owned by the CFA Institute.
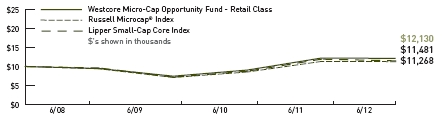
The chart above represents historical performance of a hypothetical investment of $10,000 in the Fund over the past 10 years (or for the life of the Fund if shorter). Performance calculations are as of the end of June each year. Past performance does not guarantee future results. This chart does not reflect the deduction of taxes that a shareholder would pay on Fund distributions or the redemption of Fund shares.
Lipper Index data provided by Lipper, Inc.
Please see pages 28 and 29 for index definitions.
Average Annual Total Returns |
| | | | | | | Since | Inception |
| | 6 Months | 1 Year | 3 Years | 5 Years | 10 Years | Inception | Date |
| Retail Class (WTMIX) | 7.89% | -0.82% | 17.72% | — | — | 4.92% | 6/23/2008 |
|
|
|
|
|
|
|
|
| Russell Microcap® | | | | | | | |
| Index | 13.01 | -0.54 | 16.71 | — | — | 2.22 | |
|
|
|
|
|
|
|
| Lipper Small-Cap | | | | | | | |
| Core Index | 6.24 | -3.75 | 16.87 | — | — | 3.51 | |
Retail Class Annual Expense Ratio (per the current prospectus) — Gross: 5.74%, Net: 1.31%
The performance data quoted represents past performance and does not guarantee future results. Performance information for the institutional class shares prior to their inception date is based on the performance of the retail class. Current performance may be lower or higher than the performance quoted. To obtain current performance as of the most recent month-end, please call 800.392.CORE (2673) or visit us online at www.westcore.com. Average annual total returns and yield figures reflect the reinvestment of dividends, capital gains distributions, all fee waivers and expense reimbursements. Without the fee waivers and expense reimbursements, total return and yield figures would have been lower. The performance data quoted does not reflect the deduction of the 2% redemption fee imposed if shares are redeemed or exchanged within 90 calendar days from their date of purchase. If imposed, the fee would reduce the performance quoted. Total return and yield figures represent past performance. Investment return and principal value will vary, and shares, when redeemed, may be worth more or less than their original cost. Westcore fund shares are not insured by the FDIC, the Federal Reserve Board or any other agency and are subject to investment risk.
Denver Investments (the “Adviser”) has contractually agreed to waive the investment advisory and/or administration fees and/or to reimburse Fund level other expenses from April 30, 2012 until at least April 30, 2013, so that the ratio of expenses to average net assets as reported in the Fund’s Financial Highlights will be no more than 1.30% for the Fund’s Retail Class for such period.
Investing in small-cap funds generally will be more volatile and loss of principal could be greater than investing in larger-cap funds.
Jon K. Tesseo is a registered representative of ALPS Distributors, Inc.
- The high market volatility we saw in 2011 continued through the first half of 2012 as investors oscillated between “risk on” and “risk off”. Macro fears centered on the impact that sovereign debt issues in the European region would have on the rest of the world’s markets.
- Despite these challenging conditions the Westcore Micro-Cap Opportunity Fund provided a positive return for the first half of the year. It did, however, underperform its benchmark, the Russell Microcap® Index, for the period. In fact, the Russell Microcap® Index led the broad market indices for the first six months of the year with its impressive 13.01% return.
- In the first six months of 2012, the Fund outperformed the benchmark in four sectors and underperformed in nine.
- The medical/healthcare sector was the largest drag to the Fund’s performance relative to the benchmark. While the Fund’s holdings were up in the sector, we held an underweight position versus the benchmark and that led to half of the Fund’s overall underperformance relative to the benchmark. Commercial services and technology were two of the Fund’s other underperforming sectors in the period.
- The Fund’s best performing sector relative to the benchmark was consumer cyclicals. The Fund was overweight the sector and the models worked well selecting stocks in the sector. Consumer staples and transportation were other sectors in which the Fund outperformed the benchmark in the period.
- Despite strong gains year-to-date, we believe micro-cap stocks remain inexpensive versus large-caps as evidenced by the fact that stocks within the Russell Microcap® Index are trading at a discount on a price to cash, price to earnings, price to book and price to sales basis.
| PAGE 16 |
|

Stock Performance |
| (for the year ended 6/30/12) | | |
| | Average | Contribution |
5 Highest | Weight | to Return |
|
|
|
| Cost Plus Inc. | 0.53% | 0.46% |
|
|
|
| Multimedia Games | | |
| Holding Co. Inc. | 0.66 | 0.42 |
|
|
|
| Susser Holdings Corp. | 0.78 | 0.41 |
|
|
|
| Town Sports International | | |
| Holdings Inc. | 0.33 | 0.38 |
|
|
|
| HealthStream Inc. | 0.54 | 0.35 |
| | | |
| 5 Lowest | | |
|
| Basic Energy Services Inc. | 0.37% | -0.22% |
|
|
|
| Olympic Steel Inc. | 0.71 | -0.24 |
|
|
|
| CEVA Inc. | 0.25 | -0.24 |
|
|
|
| Consolidated Graphics Inc. | 0.52 | -0.27 |
|
|
|
| ChinaCast Education Corp. | 0.58 | -0.81 |
| | | |
| Past performance does not guarantee future results. These stocks do not represent all of the securities purchased, sold or recommended by the Funds’ Adviser. To request a complete list of the contribution of each Fund holding to overall Fund performance during the period, please call 800.392.CORE (2673) or email invest@westcore.com. |
| | | |
| Please see page 29 for a description of the methodology used to construct this chart. |
| | | |
Top Ten Holdings |
| (as of 6/30/12) | | |
| Spectrum Pharmaceuticals Inc. | | 1.1% |
|
|
| Peoples Bancorp Inc. | | 1.0 |
|
|
| Neurocrine Biosciences Inc. | | 1.0 |
|
|
| Susser Holdings Corp. | | 0.9 |
|
|
| Sun Healthcare Group Inc. | | 0.9 |
|
|
| Wilshire Bancorp Inc. | | 0.9 |
|
| Lincoln Educational Services Corp. | 0.9 |
|
|
| Monotype Imaging Holdings Inc. | | 0.9 |
|
|
| First Community Bancshares Inc. | 0.9 |
|
|
| Preferred Bank | | 0.9 |
|
|
| Total (% of Net Assets) | | 9.4% |
| | | |
| Top ten holdings do not include any cash, cash equivalents or exchange traded fund investments and are subject to change. There are no guarantees that the Fund will continue to remain invested in any particular holding. |
Morningstar Ratings |
| | | | Number |
| | Morningstar | of Funds in |
| | Rating™ | Small Blend |
| | as of 6/30/12 | Category |
| Overall | ««« | 598 |
|
| 3 Year | ««« | 598 |
|
|
| Morningstar proprietary ratings reflect historical risk-adjusted performance as of 6/30/12 and are subject to change every month. |
| | | | |
| Please see page 29 for more detail regarding Morningstar Ratings. |
Portfolio Characteristics |
| (as of 6/30/12) | | | | | |
| | Westcore Micro-Cap | | Russell |
| | Opportunity Fund | | Microcap® Index |
| Weighted Average Market Capitalization ($ Mil) | $352.0 | | $290.0 |
|
|
|
|
|
| Price/Cash Flow (1 year trailing) | 9.7x | | 10.9x |
|
|
|
| Price/Book Value | 2.1x | | 2.1x |
|
|
|
| Price/Earnings (1 year trailing) | 12.7x | | 13.7x |
|
|
|
| Beta | 1.0 | | 1.0 |
|
|
|
| Number of Holdings | 178 | | 1,498 |
|
|
|
| Portfolio Turnover Rate | 78% | | — |
| | | | | | |
| Please see page 30 for definition of terms. | | | | | |
| |
Sector Allocation |
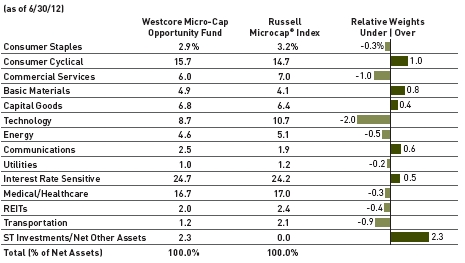
Sector classifications presented herein are based on the sector categorization methodology of the Adviser to the Funds which may result in the sector designations for one Fund being different than another Fund’s sector designations.
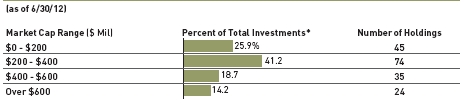
* Total Investments for this chart excludes short-term investments, including money market mutual funds.
Market capitalization ranges were determined by the Adviser to the Fund and are for presentation purposes only. These market capitalization ranges do not necessarily correlate to the benchmark’s market capitalization ranges.
PAGE 17 |
|

Investing in equity securities of international small-cap companies that are poised for growth.
John C. Fenley, CFA Portfolio Manager
Jeremy A. Duhon, CFA Portfolio Manager
CFA is a trademark owned by the CFA Institute.
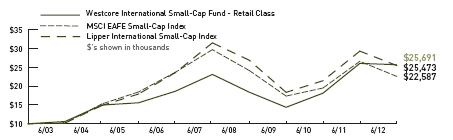
The chart above represents historical performance of a hypothetical investment of $10,000 in the Fund over the past 10 years (or for the life of the Fund if shorter). Performance calculations are as of the end of June each year. Past performance does not guarantee future results. This chart does not reflect the deduction of taxes that a shareholder would pay on Fund distributions or the redemption of Fund shares.
Lipper Index data provided by Lipper, Inc.
Please see pages 28 and 29 for index definitions.
Average Annual Total Returns |
| | | | | | | Since | Inception |
| | 6 Months | 1 Year | 3 Years | 5 Years | 10 Years | Inception | Date |
| Retail Class (WTIFX) | 12.71% | -1.31% | 21.35% | 2.14% | 9.90% | 5.13% | 12/15/99 |
|
|
|
|
|
|
|
|
| MSCI EAFE | | | | | | | |
| Small-Cap Index | 4.93 | -15.06 | 9.17 | -5.32 | 8.49 | 5.67 | |
|
|
|
|
|
|
|
| Lipper International | | | | | | | |
| Small-Cap Index | 6.26 | -13.03 | 11.56 | -4.15 | 9.80 | 5.29 | |
Retail Class Annual Expense Ratio (per the current prospectus) — Gross: 1.66%, Net: 1.51%
The performance data quoted represents past performance and does not guarantee future results. Performance information for the institutional class shares prior to their inception date is based on the performance of the retail class. Current performance may be lower or higher than the performance quoted. To obtain current performance as of the most recent month-end, please call 800.392.CORE (2673) or visit us online at www.westcore.com. Average annual total returns and yield figures reflect the reinvestment of dividends, capital gains distributions, all fee waivers and expense reimbursements. Without the fee waivers and expense reimbursements, total return and yield figures would have been lower. The performance data quoted does not reflect the deduction of the 2% redemption fee imposed if shares are redeemed or exchanged within 90 calendar days from their date of purchase. If imposed, the fee would reduce the performance quoted. Total return and yield figures represent past performance. Investment return and principal value will vary, and shares, when redeemed, may be worth more or less than their original cost. Westcore fund shares are not insured by the FDIC, the Federal Reserve Board or any other agency and are subject to investment risk.
Denver Investments (the “Adviser”) has contractually agreed to waive the investment advisory and/or administration fees and/or to reimburse Fund level other expenses from April 30, 2012 until at least April 30, 2013, so that the ratio of expenses to average net assets as reported in the Fund’s Financial Highlights will be no more than 1.50% for the Fund’s Retail Class for such period.
Investing in small-cap funds generally will be more volatile and loss of principal could be greater than investing in larger-cap funds.
Investing in foreign securities entails special risks, such as currency fluctuations and political uncertainties, which are described in more detail in the prospectus.
- The year began with investors acknowledging that the sell-off of 2011 was overdone. Hopes of fiscal resolution in Europe, signs of improving economic data coming from the U.S. and a pick-up in global growth contributed to solid first quarter market gains. Throughout the second quarter of 2012, investors refocused on the headline risks of the European sovereign debt crisis, a potential hard landing for China’s economy and “fiscal cliff” concerns in the U.S., leading most equity markets to end the quarter in negative territory.
- The Westcore International Small-Cap Fund was not immune to volatility in the markets, but it did outperform its benchmark, the MSCI EAFE Small-Cap Index through the first half and posted a positive return.
- Among the period’s strong performers was Hong Kong-based Pico Far East Holdings Ltd. Pico provides exhibition and event marketing services throughout Asia and the Middle East. The stock performed well over the second quarter after reporting solid revenue growth and improved operating leverage. Fund holding Cardno Ltd., an Australia-based engineering consultant with a global reach from emerging markets to developed markets, also moved higher on the back of solid growth. Cardno successfully navigated through choppy waters with an acquisition strategy that significantly diversified its business both geographically and by sector. Its U.S. environmental services business, for instance, continued to see strong demand.
- Fund holdings that lagged over the first half include Megastudy Co. Ltd. and newer holdings Gree Inc. and DeNA Co. Ltd. Megastudy, based in Korea, is a provider of high school and college entrance-exam preparatory materials and instruction. The Korean government recently imposed new regulations in an attempt to reduce household private-education spending, which took a toll on education companies such as Megastudy. We believe Megastudy’s leadership position and the competitive educational environment students face in Korea will help it prevail over the long term. Gree and DeNA are Japan-based social gaming companies. During the period, a type of game that was popular on both platforms was banned. Simply put, the government felt that the odds of winning in the game were not clear to consumers. Our analysis leads us to believe that the effect of the new regulations will not materially impact the earnings of these two companies over the long term. Currently, we believe there remains enough evidence of growth prospects through the launch of new games and international expansion to justify holding these positions.
- Despite the return of volatility to equity markets, we remain focused on our discipline of seeking consistently fast-growing, high-return, cash-generative companies that have strong balance sheets. This focus, coupled with our strict valuation discipline, has been a cornerstone of the Fund’s investment process for over five years, and we believe it will help us position the Fund well over time.
| PAGE 18 |
|

Stock Performance |
| (for the year ended 6/30/12) | | |
| | Average | Contribution |
5 Highest | Weight | to Return |
|
|
| Cardno Ltd. | 6.70% | 3.05% |
|
|
| Pico Far East Holdings Ltd. | 5.55 | 2.14 |
|
|
| Credit Corp. Group Ltd. | 6.67 | 2.10 |
|
|
| Diploma PLC | 3.01 | 1.18 |
|
|
| Xtep International | | |
| Holdings Ltd. | 5.33 | 0.96 |
| | | |
| 5 Lowest | | |
|
| Home Capital Group Inc. | 2.94% | -0.11% |
|
| DeNA Co. Ltd. | 2.37 | -0.22 |
|
|
| Gree Inc. | 1.20 | -0.26 |
|
|
| Ports Design Ltd. | 3.04 | -0.62 |
|
|
| Megastudy Co. Ltd. | 1.62 | -1.18 |
| | | |
| Past performance does not guarantee future results. These stocks do not represent all of the securities purchased, sold or recommended by the Funds’ Adviser. To request a complete list of the contribution of each Fund holding to overall Fund performance during the period, please call 800.392.CORE (2673) or email invest@westcore.com. |
| | | |
| Please see page 29 for a description of the methodology used to construct this chart. |
| |
Top Ten Holdings |
| (as of 6/30/12) | | |
| Cardno Ltd. [Australia] | | 5.9% |
|
|
| Credit Corp. Group Ltd. [Australia] | | 5.5 |
|
|
| Pico Far East Holdings Ltd. [Hong Kong] | | 5.0 |
|
|
| IG Group Holdings PLC [United Kingdom] | | 4.9 |
|
|
| Slater & Gordon Ltd. [Australia] | | 4.8 |
|
|
| Aeon Delight Co. Ltd. [Japan] | | 4.4 |
|
|
| Prestige International Inc. [Japan] | | 4.1 |
|
|
| Xtep International Holdings Ltd. [Hong Kong] 4.1 |
|
| Mears Group PLC [United Kingdom] | | 4.0 |
|
|
| Ports Design Ltd. [Hong Kong] | | 3.6 |
|
|
| Total (% of Net Assets) | | 46.3% |
| | | |
| Top ten holdings do not include any cash, cash equivalents or exchange traded fund investments and are subject to change. There are no guarantees that the Fund will continue to remain invested in any particular holding. |
Morningstar Ratings |
| | | Number of Funds |
| | Morningstar | in Foreign |
| | Rating™ | Small/Mid |
| | as of 6/30/12 | Growth Category |
| Overall | «««« | 96 |
|
|
| 3 Year | ««««« | 96 |
|
|
| 5 Year | ««««« | 88 |
|
|
| 10 Year | ««« | 53 |
| |
| Morningstar proprietary ratings reflect historical risk-adjusted performance as of 6/30/12 and are subject to change every month. |
| | | |
| Please see page 29 for more detail regarding Morningstar Ratings. |
Portfolio Characteristics |
| (as of 6/30/12) | | | | |
| | Westcore International | MSCI EAFE |
| | Small-Cap Fund | Small-CapIndex |
| Weighted Average Market Capitalization ($ Mil) | | $1,229.0 | | $1,455.0 |
|
|
|
|
|
| Number of Countries Represented | | 14 | | 22 |
|
|
|
| Price/Earnings (1 year trailing) | | 11.4x | | 10.6x |
|
|
| Price/Book Value | | 2.7x | | 1.8x |
|
| Number of Holdings | | 37 | | 2,270 |
|
| Portfolio Turnover Rate | | 8% | | — |
| | | | | |
| Please see page 30 for definition of terms. | | | | |
| | | | | |
Sector Allocation |

Sector classifications presented herein are based on the sector categorization methodology of the Adviser to the Funds which may result in the sector designations for one Fund being different than another Fund’s sector designations.
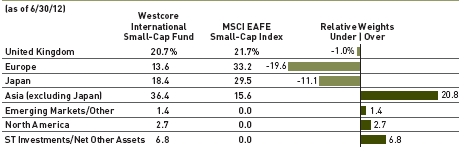
Percentages are based on Total Net Assets

* Total Investments for this chart excludes short-term investments, including money market mutual funds. Market capitalization ranges were determined by the Adviser to the Fund and are for presentation purposes only. These market capitalization ranges do not necessarily correlate to the benchmark’s market capitalization ranges.
PAGE 19 |
|

A fixed-income fund investing in a wide variety of income-producing securities, primarily bonds and to a lesser extent convertible bonds, and equity securities.
Mark R. McKissick, CFA Portfolio Manager
Troy A. Johnson, CFA Portfolio Manager
CFA is a trademark owned by the CFA Institute.
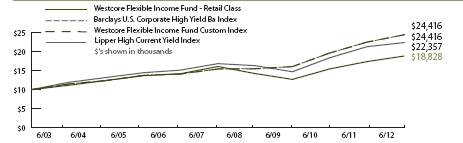
The chart above represents historical performance of a hypothetical investment of $10,000 in the Fund over the past 10 years (or for the life of the Fund if shorter). Performance calculations are as of the end of June each year. Past performance does not guarantee future results. This chart does not reflect the deduction of taxes that a shareholder would pay on Fund distributions or the redemption of Fund shares.
Lipper Index data provided by Lipper, Inc.
Please see pages 28 and 29 for index definitions.
Average Annual Total Returns
| | 6 | 1 | 3 | 5 | 10 | Since | 30-Day | Incep. |
| | Months | Year | Years | Years | Years | Incep. | SEC Yield | Date |
| Retail Class (WTLTX) | 4.95% | 8.43% | 14.06% | 3.21% | 6.53% | 7.81% | 5.22% | 6/1/1988 |
|
|
|
|
|
|
|
|
|
| Institutional Class (WILTX) | 5.09 | 8.60 | 14.17 | 3.30 | 6.58 | 7.83 | 5.40 | 9/28/2007 |
|
|
|
|
|
|
|
|
|
| Barclays U.S. Corporate | | | | | | | | |
| High Yield Ba Index | 6.81 | 8.63 | 15.01 | 9.62 | 9.32 | 9.13 | — | |
|
|
|
|
|
|
|
|
| Westcore Flexible Income Fund | | | | | | | | |
| Custom Index | 6.81 | 8.63 | 15.01 | 9.62 | 9.32 | 9.23 | — | |
|
|
|
|
|
|
|
|
| Lipper High Current | | | | | | | | |
| Yield Index | 6.91 | 5.09 | 15.02 | 5.85 | 8.38 | 7.11 | — | |
Retail Class Annual Expense Ratio (per the current prospectus) — Gross: 0.88%, Net: 0.86%
Institutional Class Annual Expense Ratio (per the current prospectus) — Gross: 1.87%, Net: 0.75%
30-Day SEC Yield figures reflect all fee waivers and expense reimbursements. Without the absorption of these fee waivers and/or expense reimbursements, the figures would have been 5.20% for the retail class and 4.80% for the institutional class.
The performance data quoted represents past performance and does not guarantee future results. Performance information for the institutional class shares prior to their inception date is based on the performance of the retail class. Current performance may be lower or higher than the performance quoted. To obtain current performance as of the most recent month-end, please call 800.392.CORE (2673) or visit us online at www.westcore.com. Average annual total returns and yield figures reflect the reinvestment of dividends, capital gains distributions, all fee waivers and expense reimbursements. Without the fee waivers and expense reimbursements, total return and yield figures would have been lower. The performance data quoted does not reflect the deduction of the 2% redemption fee imposed if shares are redeemed or exchanged within 90 calendar days from their date of purchase. If imposed, the fee would reduce the performance quoted. Total return and yield figures represent past performance. Investment return and principal value will vary, and shares, when redeemed, may be worth more or less than their original cost. Westcore fund shares are not insured by the FDIC, the Federal Reserve Board or any other agency and are subject to investment risk. Denver Investments (the “Adviser”) has contractually agreed to waive the investment advisory and/or administration fees and/or to reimburse Fund level other expenses from April 30, 2012 until at least April 30, 2013, so that the ratio of expenses to average net assets as reported in the Fund’s Financial Highlights will be no more than 0.85% for the Fund’s Retail Class for such period. In addition, the Adviser has contractually agreed to waive the investment advisory and/or administration fees and/or to reimburse Fund level other expenses for the Institutional Class in the same proportion as the Retail Class waivers/reimbursements as well as reimburse the Institutional class-specific other expenses until at least April 30, 2013.
Westcore Flexible Income Fund may invest in high-yield/high-risk bonds which are subject to greater levels of liquidity risk.
Mark R. McKissick is a registered representative of ALPS Distributors, Inc.
- Market appetite for yield continued through the first half of the year as investors’ comfort with high yield securities grew and returns for the asset class moved higher. The first quarter’s positive economic statistics, which signaled a self-sustaining growth outlook, later gave way to domestic growth concerns stemming from Europe and a slowing China. While this did cause some outflows and a slowing of new issue activity, it was not enough to derail the overall positive environment within high yield during the period. As the second quarter came to a close, the search for relative yield cautiously drew investors back to the asset class which continued to benefit from low default rates and a benign near-term credit outlook.
- The Westcore Flexible Income Fund’s return in the first half of 2012 fell short of the Barclays U.S. Corporate High Yield Ba Index’s return. The Fund’s underperformance versus its benchmark was attributable to its underweight positions in certain cyclical industries and in hybrid securities, which tend to perform well during credit rallies. Its overweight of energy-related issues also contributed to the underperformance, with that industry posting poor relative returns throughout the period.
- The Fund’s holdings in general continued to benefit from improving credit profiles and refinancing activity. Our focus on higher quality bonds within the high yield space was a positive contributor to the Fund’s performance during intermittent periods of weakness in the second quarter when concerns about domestic economic growth were resurrected.
- We believe the Fund is positioned to offer competitive yield with more limited downside risk and volatility versus more traditional high yield funds over the long term. Our process entails intensive credit analysis to evaluate yield versus risk through an entire business cycle which typically has resulted in an overweight of higher-rated high yield issues. Most importantly, we believe this strategy works over the long term for shareholders who want comparative yield potential versus other high yield funds, but who are a little more sensitive to volatility and capital preservation.
| PAGE 20 |
|

Top Ten Corporate Credit Exposure |
| (as of 6/30/12) | |
| Range Resources Corp. | 3.0% |
|
|
| HCA Inc. | 3.0 |
|
|
| Frontier Communication | 2.6 |
|
|
| Vail Resorts Inc. | 2.6 |
|
|
| Plains Exploration | 2.5 |
|
|
| Goodyear Tire & Rubber | 2.5 |
|
|
| Crown Americas | 2.4 |
|
|
| Limited Brands | 2.4 |
|
|
| BE Aerospace | 2.4 |
|
|
| Dupont Fabros Tech LP | 2.4 |
|
|
| Total (% of Net Assets) | 25.8% |
| |
| |
| Percentages represent the Fund’s aggregate holdings in the same corporate issuer and its affiliates. Top Ten Corporate Credit Exposure are subject to change. There are no guarantees that the Fund will continue to remain invested in any particular security or issuer. |
Morningstar Ratings |
| | | |
| | | Number of |
| | Morningstar | Funds in High |
| | Rating™ | Yield Bond |
| | as of 6/30/12 | Category |
| | | |
| Overall | «« | 512 |
|
|
| 3 Year | ««« | 512 |
|
|
| 5 Year | «« | 449 |
|
|
| 10 Year | « | 307 |
| |
| Morningstar Ratings shown represent the RetailClass. Morningstar proprietary ratings reflect historical risk-adjusted performance as of 6/30/12 and are subject to change every month. |
| |
| Please see page 29 for more detail regarding Morningstar Ratings. |
Portfolio Characteristics |
| (as of 6/30/12) | | |
| | Westcore Flexible | Barclays U.S. Corporate |
| | Income Fund | High Yield Ba Index |
| Modified Duration | 3.6 years | 4.5 years |
|
|
|
| Effective Maturity | 4.4 years | 7.4 years |
|
|
|
| Number of Holdings | 82 | 708 |
|
|
|
| Portfolio Turnover Rate | 23% | — |
| | | |
| Please see page 30 for definition of terms. | | |
| | | |
Asset Allocation |
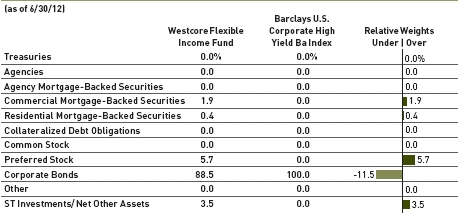
Percentages are based on Total Net Assets.

Percentages are based on Total Investments. The ratings allocation reflects the Standard & Poor’s equivalent ratings category for the highest credit-quality rating assigned by either Standard & Poor’s or Moody’s.
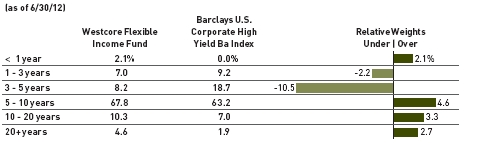
Percentages are based on Total Investments. The Adviser to the Funds utilizes the expected maturity in presenting this information.
PAGE 21 |
|

A fixed-income fund focusing on investment quality bonds of varying maturities.
Mark R. McKissick, CFA Portfolio Manager
Lisa M. Snyder, CFA Portfolio Manager
CFA is a trademark owned by the CFA Institute.
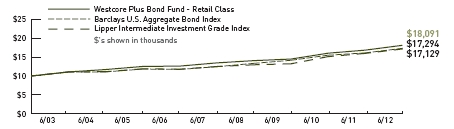
The chart above represents historical performance of a hypothetical investment of $10,000 in the Fund over the past 10 years (or for the life of the Fund if shorter). Performance calculations are as of the end of June each year. Past performance does not guarantee future results. This chart does not reflect the deduction of taxes that a shareholder would pay on Fund distributions or the redemption of Fund shares.
Lipper Index data provided by Lipper, Inc.
Please see pages 28 and 29 for index definitions.
Average Annual Total Returns
| | 6 | 1 | 3 | 5 | 10 | Since | 30-Day | Incep. |
| | Months | Year | Years | Years | Years | Incep. | SEC Yield | Date |
| Retail Class (WTIBX) | 3.18% | 7.55% | 7.73% | 6.10% | 6.11% | 6.80% | 2.73% | 6/1/1988 |
|
|
|
|
|
|
|
|
|
| Institutional Class (WIIBX) | 3.27 | 7.76 | 7.89 | 6.23 | 6.17 | 6.83 | 2.93 | 9/28/2007 |
|
|
|
|
|
|
|
|
|
| Barclays U.S. Aggregate | | | | | | | | |
| Bond Index | 2.37 | 7.47 | 6.93 | 6.79 | 5.63 | 7.33 | — | |
|
|
|
|
|
|
|
|
| Lipper Intermediate | | | | | | | | |
| Investment Grade Index | 4.13 | 7.31 | 9.02 | 6.51 | 5.53 | 6.70 | — | |
Retail Class Annual Expense Ratio (per the current prospectus) — Gross: 0.69%, Net: 0.55%
Institutional Class Annual Expense Ratio (per the current prospectus) — Gross: 0.55%, Net: 0.41%
30-Day SEC Yield figures reflect all fee waivers and expense reimbursements. Without the absorption of these fee waivers and/or expense reimbursements, the figures would have been 2.58% for the retail class and 2.78% for the institutional class.
The performance data quoted represents past performance and does not guarantee future results. Performance information for the institutional class shares prior to their inception date is based on the performance of the retail class. Current performance may be lower or higher than the performance quoted. To obtain current performance as of the most recent month-end, please call 800.392.CORE (2673) or visit us online at www.westcore.com. Average annual total returns and yield figures reflect the reinvestment of dividends, capital gains distributions, all fee waivers and expense reimbursements. Without the fee waivers and expense reimbursements, total return and yield figures would have been lower. Total return and yield figures represent past performance. Investment return and principal value will vary, and shares, when redeemed, may be worth more or less than their original cost. Westcore fund shares are not insured by the FDIC, the Federal Reserve Board or any other agency and are subject to investment risk.
Denver Investments (the “Adviser”) has contractually agreed to waive the investment advisory and/or administration fees and/or to reimburse Fund level other expenses from April 30, 2012 until at least April 30, 2013, so that the ratio of expenses to average net assets as reported in the Fund’s Financial Highlights will be no more than 0.55% for the Fund’s Retail Class for such period. In addition, the Adviser has contractually agreed to waive the investment advisory and/or administration fees and/or to reimburse Fund level other expenses for the Institutional Class in the same proportion as the Retail Class waivers/reimbursements as well as reimburse the Institutional class-specific other expenses until at least April 30, 2013.
Westcore Plus Bond Fund may invest in high-yield/high-risk bonds which are subject to greater levels of liquidity risk.
Mark R. McKissick is a registered representative of ALPS Distributors, Inc.
- After rising slightly during the first quarter of 2012, longer-term U.S. Treasury yields ended the first half of the year lower. The 10-year Treasury yield began the year at 1.88%, rose to 2.21% by the end of the first quarter but was back down to 1.65% by June 30, 2012. Some key economic indicators such as unemployment, auto sales, and gross domestic product (GDP) suggested a strengthening U.S. economy in the first quarter. However, little positive momentum was carried into the second quarter as data such as industrial production and lower commodity and energy prices indicated a potential slowdown in the U.S. and globally.
- Additionally, the European debt crisis continued to oscillate between optimism over German-led assistance and pessimism over debtor nations’ ability to make changes to their fiscal imbalances and their uncompetitive labor markets. With market sentiments swinging back to pessimism, capital flowed strongly into low-risk assets fueling the rally in U.S. Treasuries. The United States is not the only country seeing all-time lows in its interest rates. At quarter end, Switzerland’s ten-year yield was 0.64%, Japan’s was 0.84%, Great Britain’s was 1.73%, Sweden’s was 1.59%, and Canada’s was 1.74%.
- The Westcore Plus Bond Fund outperformed its benchmark, the Barclays U.S. Aggregate Bond Index, for the first six months of 2012. The Fund’s outperformance was driven by its corporate bond exposure, including its allocation to higher quality high-yield bonds, which provided additional income over its benchmark. In particular, holdings in the consumer cyclical, REIT, and utility industries contributed to outperformance. Detracting from the Fund’s performance were holdings in agency mortgage-backed securities, its underweight to certain financial issuers, and its lack of exposure to other non-Treasury government-related securities.
- Our economic outlook continues to see the global economy struggle to find sustainable growth in what is now the third year of recovery following the recession of 2008-09. We expect very modest private-sector loan growth, no strong recovery in the real estate market for several years, unemployment declining very slowly, and a deep recession in peripheral Europe. In spite of the money creation that is now a global phenomenon, we look for modest inflation as global competitive forces and excess capacity in labor and capital markets all work to keep a lid on consumer price increases.
- We continue to overweight corporate bonds in an environment of positive, but slow, economic growth, strong corporate profits, continued deleveraging by corporations and individuals, and contained inflation. We expect select higher quality non-investment grade issuers to also perform well in this environment and therefore we maintain a strategic allocation to high yield bonds. Portfolio durations are similar to the benchmark as we anticipate rates remaining relatively low for an extended period of time. In our view, government agency mortgage-backed securities also offer good value due to their very high credit quality and higher yields. While we do ultimately see inflation as the solution to global debt problems, we believe it is far enough in the future that fixed income investors will be rewarded for capturing the income available in today’s market.
| PAGE 22 |
|

Top Ten Corporate Credit Exposure |
| (as of 6/30/12) | |
| Pepsico | 1.3% |
|
|
| Crown Castle Towers LLC | 1.3 |
|
|
| Berkshire Hathaway | 1.2 |
|
|
| Wal-Mart Stores | 1.1 |
|
|
| Honda Auto Receivables | 1.1 |
|
|
| Anheuser Busch | 1.0 |
|
|
| City National Corp. | 1.0 |
|
|
| Potlatch Corp. | 1.0 |
|
|
| BP Capital Markets PLC | 1.0 |
|
|
| Washington REIT | 1.0 |
|
|
| Total (% of Net Assets) | 11.0% |
| |
| Percentages represent the Fund’s aggregate holdings in the same corporate issuer and its affiliates. Top Ten Corporate Credit Exposure are subject to change. There are no guarantees that the Fund will continue to remain invested in any particular security or issuer. |
Morningstar Ratings | |
| | | Number of |
| | | Funds in |
| | Morningstar | Intermediate- |
| | Rating™ | Term Bond |
| | as of 6/30/12 | Category |
| Overall | «««« | 1,015 |
|
|
|
| 3 Year | ««« | 1,015 |
|
|
|
| 5 Year | ««« | 880 |
|
|
|
| 10 Year | «««« | 606 |
| | | |
| Morningstar Ratings shown represent the Retail Class. Morningstar proprietary ratings reflect historical risk-adjusted performance as of 6/30/12 and are subject to change every month. |
| |
| Please see page 29 for more detail regarding Morningstar Ratings. |
Portfolio Characteristics |
| (as of 6/30/12) | | |
| | Westcore Plus | Barclays U.S. |
| | Bond Fund | Aggregate Bond Index |
| Modified Duration | 5.2 years | 5.1 years |
|
|
|
| Effective Maturity | 8.3 years | 7.1 years |
|
|
|
| Number of Holdings | 227 | 7,923 |
|
|
|
| Portfolio Turnover Rate | 17% | — |
| | | |
| Please see page 30 for definition of terms. |
| | | |
Asset Allocation |

Percentages are based on Total Net Assets.

Percentages are based on Total Investments. The ratings allocation reflects the Standard & Poor’s equivalent ratings category for the highest credit-quality rating assigned by either Standard & Poor’s or Moody’s.

Percentages are based on Total Investments. The Adviser to the Funds utilizes the expected maturity in presenting this information.
PAGE 23 |
|

A Colorado municipal bond fund focusing on federal and state tax-exempt income primarily through investments in investment-grade quality bonds of intermediate maturity.
Thomas B. Stevens, CFA Portfolio Manager
Kenneth A. Harris, CFA Portfolio Manager
CFA is a trademark owned by the CFA Institute.
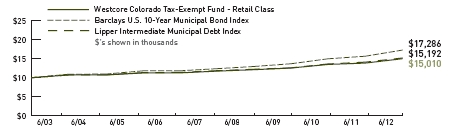
The chart above represents historical performance of a hypothetical investment of $10,000 in the Fund over the past 10 years (or for the life of the Fund if shorter). Performance calculations are as of the end of June each year. Past performance does not guarantee future results. This chart does not reflect the deduction of taxes that a shareholder would pay on Fund distributions or the redemption of Fund shares.
Lipper Index data provided by Lipper, Inc.
Please see pages 28 and 29 for index definitions.
Average Annual Total Returns
| | 6 | 1 | 3 | 5 | 10 | Since | 30-Day | Incep. |
| | Months | Year | Years | Years | Years | Incep. | SEC Yield | Date |
| Retail Class (WTCOX) | 2.82% | 8.29% | 6.11% | 5.03% | 4.14% | 5.08% | 2.73% | 6/1/1991 |
|
|
|
|
|
|
|
|
|
| Barclays U.S. 10-Year | | | | | | | | |
| Municipal Bond Index | 2.68 | 10.30 | 8.09 | 6.89 | 5.63 | 6.44 | — | |
|
|
|
|
|
|
|
|
| Lipper Intermediate | | | | | | | | |
| Municipal Debt Index | 2.68 | 7.68 | 6.45 | 5.10 | 4.27 | 5.13 | — | |
Retail Class Annual Expense Ratio (per the current prospectus) — Gross: 0.77%, Net: 0.66%
30-Day SEC Yield figure reflects all fee waivers and expense reimbursements. Without the absorption of these fee waivers and/or expense reimbursements, the figure would have been 2.62%.
The performance data quoted represents past performance and does not guarantee future results. Performance information for the institutional class shares prior to their inception date is based on the performance of the retail class. Current performance may be lower or higher than the performance quoted. To obtain current performance as of the most recent month-end, please call 800.392.CORE (2673) or visit us online at www.westcore.com. Average annual total returns and yield figures reflect the reinvestment of dividends, capital gains distributions, all fee waivers and expense reimbursements. Without the fee waivers and expense reimbursements, total return and yield figures would have been lower. Total return and yield figures represent past performance. Investment return and principal value will vary, and shares, when redeemed, may be worth more or less than their original cost. Westcore fund shares are not insured by the FDIC, the Federal Reserve Board or any other agency and are subject to investment risk.
Denver Investments (the “Adviser”) has contractually agreed to waive the investment advisory and/or administration fees and/or to reimburse Fund level other expenses from April 30, 2012 until at least April 30, 2013, so that the ratio of expenses to average net assets as reported in the Fund’s Financial Highlights will be no more than 0.65% for the Fund’s Retail Class for such period.
Westcore Colorado Tax-Exempt Fund invests primarily in instruments issued by or on behalf of one state and generally will be more volatile and loss of principal could be greater due to state specific risk.
- Continuing a trend which has been in place over the past year, municipal bond yields fell over the first half of 2012. Yields on “AAA” rated general obligation debt securities were near their lowest levels of the year as of June 30, 2012, as was evidenced by the 1.86% yield for a 10-year security. This compares to a 2.01% yield as of December 30, 2011 and 2.67% as of June 30, 2011, according to data provided by Thomson Reuters. The yield curve flattened over the past six months as the Federal Reserve maintained an accommodative posture against a backdrop of discouraging economic news at the same time investor demand for longer-maturity assets was pronounced, driving interest rates lower.
- The global economic struggle continues as China’s growth slowed for a sixth consecutive quarter and the peripheral European nations of Italy and Spain saw their debt ratings downgraded by Moody’s. Such difficult economic times are driving investors into more risk-averse assets, which has pushed U.S. Treasury and “AAA” municipal bond yields to record or near-record lows.
- Despite wide spread publicity surrounding bankruptcies among a few California cities, municipal defaults remain rare, and 2012’s default rate year-to-date is the lowest in three years. According to Barron’s, the number of defaults during the first six months was 42, or 38% below 2011 at this point of the year. There have been no defaults within the state of Colorado during the half-year ended June 30, 2012. The credit rating of the State remains Aa1 by Moody’s and AA by S&P, with a stable outlook by both.
- The Westcore Colorado Tax-Exempt Fund’s performance for the first half of 2012 trailed its benchmark, the Barclays U.S. 10-Year Municipal Bond Index. The Fund’s modified duration was purposely extended during the first half of the year, to 5.11 years compared to 4.64 years as of year-end 2011. This was shorter than the modified duration of the benchmark as of June 30, 2012, which was 6.08 years, and helps to explain the Fund’s relative underperformance. The Fund’s average maturity of 6.03 years on June 30 was also shorter than the 9.87 years reflected by the benchmark.
- The overall credit situation within municipalities is gradually improving, despite isolated situations such as Stockton, California. The Nelson Rockefeller Institute of Government reported recently that state tax collections have increased for nine consecutive quarters. This has helped every state adopt a budget on time for fiscal 2013. By comparison, in the past four years, states failed to enact budgets by their deadlines thirteen times. The State of Colorado was not among those thirteen.
- In the current environment, the Fund managers anticipate reducing the cash equivalent position and utilizing those proceeds into new Colorado issuance or secondary securities within the 10-20 year range with coupons of 4% or higher. Coupons in excess of 5% would be our preference but these are sometimes not readily available in the current interest rate environment. We intend to maintain the current overall credit quality of the Fund. In addition, should the opportunity present itself, the Fund managers would consider adding to an existing position currently held within the Fund.
| PAGE 24 |
|

Top Ten Holdings |
| (as of 6/30/12) | % of Net Assets |
| | |
| Denver City & County School District #1 |
| 5.25%, 12/1/2025 | 2.3% |
|
|
| Arapahoe County School District #1 | |
| 5.00%,12/1/2029 | 2.2 |
|
|
| Eagle Garfield & Rout County SD Re-50J |
| 5.00%, 12/1/2026 | 2.1 |
|
|
| Platte River Power Auth Power Rev | |
| 5.00%, 6/1/2027 | 1.7 |
|
|
| Jefferson County School District R-001 |
| 5.25%, 12/1/2024 | 1.5 |
|
|
| La Plata County School District R-9 | |
| 5.00%, 11/1/2022 | 1.4 |
|
|
| Boulder County Open Space | |
| 5.00%, 1/1/2024 | 1.4 |
|
|
| Garfield Pitkin & Eagle County School District Re-1 |
| 5.00%, 12/15/2023 | 1.4 |
|
|
| Roaring Fork School District Re-1 | |
|
|
| 5.00%, 12/15/2024 | 1.4 |
|
|
| Adams & Arapahoe Counties JT School District 28J |
|
| 5.00%, 12/1/2026 | 1.4 |
|
|
| Total (% of Net Assets) | 16.8% |
| | |
| Top ten holdings do not include any cash, cash equivalents or exchange traded fund investments and are subject to change. There are no guarantees that the Fund will continue to remain invested in any particular holding. |
Morningstar Ratings | |
| | | Number of |
| | | Funds in |
| | Morningstar | Muni Single |
| | Rating™ | State Interm |
| | as of 6/30/12 | Category |
| Overall | ««« | 211 |
|
|
|
| 3 Year | ««« | 211 |
|
|
|
| 5 Year | ««« | 205 |
|
|
|
| 10 Year | ««« | 170 |
| | | |
| Morningstar proprietary ratings reflect historical risk-adjusted performance as of 6/30/12 and are subject to change every month.. |
| | | |
| Please see page 29 for more detail regarding Morningstar Ratings. |
Portfolio Characteristics |
| (as of 6/30/12) | | |
| | Westcore Colorado | Barclays U.S. 10-Year |
| | Tax-Exempt Fund | Municipal Bond Index |
| Modified Duration | 5.1 years | 6.1 years |
|
|
|
| Effective Maturity | 6.1 years | 9.9 years |
|
|
|
| Colorado Double Tax-Exempt Percentage | | |
| (excludes cash & cash equivalents) | 100 | — |
|
|
|
| Percentage of Holdings Subject to AMT | 0 | — |
|
|
|
| Number of Holdings | 158 | — |
|
|
|
| Portfolio Turnover Rate | 3% | — |
| | | |
| Please see page 30 for definition of terms. |
| | | |
Ratings Allocation |

Percentages are based on Total Investments. The ratings allocation reflects the Standard & Poor’s equivalent ratings category for the highest credit-quality rating assigned by either Standard & Poor’s or Moody’s.
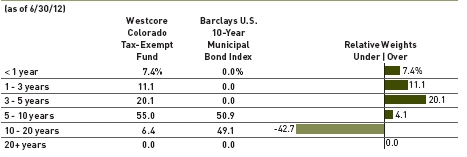
Percentages are based on Total Investments. The Adviser to the Funds utilizes the expected maturity in presenting this information.
PAGE 25 |
|

Disclosure of Fund Expenses (Unaudited)
As a shareholder of a Fund, you incur two types of costs: (1) transaction costs (such as the 2% fee on redemption of certain Fund shares made within 90 days of purchase); and (2) ongoing costs, including management fees and other Fund expenses. The examples on the next page are intended to help you understand your ongoing costs (in dollars) of investing in a Fund and to compare these costs with the ongoing costs of investing in other mutual funds. The examples are based on an investment of $1,000 invested on January 1, 2012 and held until June 30, 2012.
Actual Expenses. The first line of the table on the next page provides information about actual account values and actual expenses. You may use the information in this line, together with the amount you invested, to estimate the expenses that you paid over the period. Simply divide your account value by $1,000 (for example, an $8,600 account value divided by $1,000 = 8.6), then multiply the result by the number in the first line under the heading “Expenses Paid During Period” to estimate the expenses you paid on your account during this period.
Hypothetical Example for Comparison Purposes. The second line of the table on the next page provides information about hypothetical account values and hypothetical expenses based on the Fund’s actual expense ratio and an assumed rate of return of 5% per year before expenses, which is not the Fund’s actual return. The hypothetical account values and expenses may not be used to estimate the actual ending account balance or expenses you paid for the period. You may use this information to compare the ongoing costs of investing in a Fund and other mutual funds. To do so, compare this 5% hypothetical example with the 5% hypothetical examples that appear in the shareholder reports of other funds.
Expenses shown in the table on the next page are meant to highlight ongoing Fund costs only and do not reflect transaction costs, such as redemption fees. Therefore, the second line of the table is useful in comparing ongoing costs only, and may not help you determine the relative total costs of owning different funds. In addition, if these transactional costs were included, your costs would have been higher.
Expenses Paid During Period
With respect to Expenses Paid During the Period, as shown in the table on the next page, expenses are equal to the Fund’s annualized expense ratio, as shown below, multiplied by the average account value over the period, multiplied by the number of days in the last six months of the fiscal half-year, 182/366 (to reflect the half-year period). The annualized expense ratios for the last six months were as follows:
| Fund | Retail Class | Institutional Class |
|
|
|
| Westcore Growth Fund | 1.13% | 0.95% |
| Westcore MIDCO Growth Fund | 1.06% | 0.91% |
| Westcore Select Fund | 1.06% | N/A |
| Westcore Blue Chip Fund | 1.15% | 0.97% |
| Westcore Mid-Cap Value Fund | 1.25% | N/A |
| Westcore Small-Cap Opportunity Fund | 1.30% | 1.18% |
| Westcore Small-Cap Value Fund | 1.30% | 1.15% |
| Westcore Micro-Cap Opportunity Fund | 1.30% | N/A |
| Westcore International Small-Cap Fund | 1.50% | N/A |
| Westcore Flexible Income Fund | 0.85% | 0.71% |
| Westcore Plus Bond Fund | 0.55% | 0.40% |
| Westcore Colorado Tax-Exempt Fund | 0.65% | N/A |
| PAGE 26 |
|
| | | | | | | Expense Paid |
| | | Beginning Account | | Ending Account | | During the Period |
| | | Value | | Value | | 1/1/2012 to |
| Fund | | 1/1/2012 | | 6/30/2012 | | 6/30/2012 |
| | | | | | | |
| Westcore Growth Fund | | | | | |
| Retail Class | Actual | $ | 1,000.00 | | $ | 1,110.00 | | $ | 5.93 |
| | Hypothetical (5% return before expenses) | $ | 1,000.00 | | $ | 1,019.24 | | $ | 5.67 |
| Institutional Class | Actual | $ | 1,000.00 | | $ | 1,110.40 | | $ | 4.98 |
| | Hypothetical (5% return before expenses) | $ | 1,000.00 | | $ | 1,020.14 | | $ | 4.77 |
| Westcore MIDCO Growth Fund | | | | | | | | |
| Retail Class | Actual | $ | 1,000.00 | | $ | 996.60 | | $ | 5.26 |
| | Hypothetical (5% return before expenses) | $ | 1,000.00 | | $ | 1,019.59 | | $ | 5.32 |
| Institutional Class | Actual | $ | 1,000.00 | | $ | 998.30 | | $ | 4.52 |
| | Hypothetical (5% return before expenses) | $ | 1,000.00 | | $ | 1,020.34 | | $ | 4.57 |
| Westcore Select Fund | | | | | | | | |
| Retail Class | Actual | $ | 1,000.00 | | $ | 923.60 | | $ | 5.07 |
| | Hypothetical (5% return before expenses) | $ | 1,000.00 | | $ | 1,019.59 | | $ | 5.32 |
| Westcore Blue Chip Fund | | | | | | | | |
| Retail Class | Actual | $ | 1,000.00 | | $ | 1,067.00 | | $ | 5.91 |
| | Hypothetical (5% return before expenses) | $ | 1,000.00 | | $ | 1,019.14 | | $ | 5.77 |
| Institutional Class | Actual | $ | 1,000.00 | | $ | 1,067.20 | | $ | 4.99 |
| | Hypothetical (5% return before expenses) | $ | 1,000.00 | | $ | 1,020.04 | | $ | 4.87 |
| Westcore Mid-Cap Value Fund | | | | | | | | |
| Retail Class | Actual | $ | 1,000.00 | | $ | 1,035.40 | | $ | 6.33 |
| | Hypothetical (5% return before expenses) | $ | 1,000.00 | | $ | 1,018.65 | | $ | 6.27 |
| Westcore Small-Cap Opportunity Fund | | | | | | | | |
| Retail Class | Actual | $ | 1,000.00 | | $ | 1,046.10 | | $ | 6.61 |
| | Hypothetical (5% return before expenses) | $ | 1,000.00 | | $ | 1,018.40 | | $ | 6.52 |
| Institutional Class | Actual | $ | 1,000.00 | | $ | 1,046.80 | | $ | 6.01 |
| | Hypothetical (5% return before expenses) | $ | 1,000.00 | | $ | 1,019.00 | | $ | 5.92 |
| Westcore Small-Cap Value Fund | | | | | | | | |
| Retail Class | Actual | $ | 1,000.00 | | $ | 1,058.40 | | $ | 6.65 |
| | Hypothetical (5% return before expenses) | $ | 1,000.00 | | $ | 1,018.40 | | $ | 6.52 |
| Institutional Class | Actual | $ | 1,000.00 | | $ | 1,058.50 | | $ | 5.89 |
| | Hypothetical (5% return before expenses) | $ | 1,000.00 | | $ | 1,019.14 | | $ | 5.77 |
| Westcore Micro-Cap Opportunity Fund | | | | | | | | |
| Retail Class | Actual | $ | 1,000.00 | | $ | 1,078.90 | | $ | 6.72 |
| | Hypothetical (5% return before expenses) | $ | 1,000.00 | | $ | 1,018.40 | | $ | 6.52 |
| Westcore International Small-Cap Fund | | | | | | | | |
| Retail Class | Actual | $ | 1,000.00 | | $ | 1,127.10 | | $ | 7.93 |
| | Hypothetical (5% return before expenses) | $ | 1,000.00 | | $ | 1,017.40 | | $ | 7.52 |
| Westcore Flexible Income Fund | | | | | | | | |
| Retail Class | Actual | $ | 1,000.00 | | $ | 1,049.50 | | $ | 4.33 |
| | Hypothetical (5% return before expenses) | $ | 1,000.00 | | $ | 1,020.64 | | $ | 4.27 |
| Institutional Class | Actual | $ | 1,000.00 | | $ | 1,050.90 | | $ | 3.62 |
| | Hypothetical (5% return before expenses) | $ | 1,000.00 | | $ | 1,021.33 | | $ | 3.57 |
| Westcore Plus Bond Fund | | | | | | | | |
| Retail Class | Actual | $ | 1,000.00 | | $ | 1,031.80 | | $ | 2.78 |
| | Hypothetical (5% return before expenses) | $ | 1,000.00 | | $ | 1,022.13 | | $ | 2.77 |
| Institutional Class | Actual | $ | 1,000.00 | | $ | 1,032.70 | | $ | 2.02 |
| | Hypothetical (5% return before expenses) | $ | 1,000.00 | | $ | 1,022.87 | | $ | 2.01 |
| Westcore Colorado Tax-Exempt Fund | | | | | | | | |
| Retail Class | Actual | $ | 1,000.00 | | $ | 1,028.20 | | $ | 3.28 |
| | Hypothetical (5% return before expenses) | $ | 1,000.00 | | $ | 1,021.63 | | $ | 3.27 |
PAGE 27 |
|

Index Definitions and Disclosures
All indices are unmanaged and index performance figures include reinvestment of dividends but do not reflect any fees, expenses or taxes. Investors cannot invest directly in an index.
The S&P 500® Index is comprised of 500 common stocks chosen for market size, liquidity, and industry group representation. It is a market-value weighted index (stock price times number of shares outstanding), with each stock’s weight in the Index proportionate to its market value.
The Russell Midcap® Growth Index measures the performance of those Russell Midcap companies with higher price-to-book ratios and higher forecasted growth values than the threshold determined by the Frank Russell Company. The Russell Midcap companies are comprised of the 800 smallest companies in the Russell 1000 Index. The Russell 1000 Index consists of the 1,000 largest U.S. Incorporated companies based on total market capitalization.
The Russell Midcap® Value Index measures the performance of those Russell Midcap companies with lower price-to-book ratios and lower forecasted growth values. The stocks are also members of the Russell 1000 Value index.
The Russell 1000® Growth Index measures the performance of the largest 1,000 firms in the Russell 3000 Index, which represents approximately 98% of the investable U.S. equity market.
The Russell 2000® Index measures the performance of the smallest 2,000 companies in the Russell 3000 Index. The Russell 3000 Index consists of the 3,000 largest U.S. incorporated companies based on total market capitalization.
The Russell 2000® Value Index measures the performance of companies within the Russell 2000 Index having lower price-to-book ratios and lower forecasted growth values. The Russell 2000 Index includes the 2000 firms from the Russell 3000 Index with the smallest market capitalizations. The Russell 3000 Index represents 98% of the investable U.S. equity market.
The Russell Microcap® Index measures the performance of the microcap segment of the U.S. equity market. It makes up less than 3% of the U.S. equity market. It includes 1,000 of the smallest securities in the Russell 2000 Index based on a combination of their market cap and current index membership and it includes the next 1,000 securities.
The MSCI EAFE Small-Cap Index is an unmanaged market-capitalization-weighted index that represents the performance of smaller capitalization companies in developed stock markets outside of North America. The index targets all companies with market capitalization below that of the companies in the MSCI EAFE Index and up to 99% coverage of the free-float adjusted market capitalization in each market.
The Westcore Flexible Income Fund Custom Index is comprised of the Barclays U.S. Long-Term Government/Corporate Bond Index from the Fund’s inception to 9/30/00 and the Barclays U.S. Corporate High Yield Ba Index for the time period 10/1/00 to the most recent period end to reflect the change in the Fund’s investment strategy on 10/1/00. The Adviser believes that the Custom Index is the best benchmark measurement for historical performance over eight years.
The Barclays U.S. Corporate High Yield Ba Index measures the performance of intermediate (1 to 10 year) U.S. high yield issues. It includes fixed-rate, noninvestment grade debt issues rated Ba1 or lower by Moody’s, rated BB« or lower by S&P, rated below investment grade by Fitch Investor’s Service or if unrated previously held a high yield rating or have been associated with a high yield issuer, and must trade accordingly.
The Barclays U.S. Aggregate Bond Index is a fixed income, market-value-weighted index generally representative of investment grade fixed-rate debt issues, including government, corporate, asset-backed, and mortgage-backed securities with maturities of at least one year.
The Barclays U.S. 10-Year Municipal Bond Index includes investment grade (Moody’s Investor Services Aaa to Baa, Standard and Poor’s Corporation AAA to BBB) tax-exempt bonds with maturities between eight and twelve years.
The Municipal 20 Bond Buyer Index is comprised of yields of 20 general obligation municipal bonds published weekly by The Bond Buyer.
The Municipal 25 Bond Buyer Revenue Index is comprised of yields of 25 revenue bonds with 30-year maturities published weekly by The Bond Buyer.
The Lipper Large-Cap Growth Index is comprised of the 30 largest mutual funds in the Lipper Large-Cap Growth Funds classification.
The Lipper Mid-Cap Growth Index is comprised of the 30 largest mutual funds in the Lipper Mid-Cap Growth Funds classification.
| PAGE 28 |
|

The Lipper Large-Cap Core Index is comprised of the 30 largest mutual funds in the Lipper Large-Cap Core Funds classification.
The Lipper Mid-Cap Value Index is comprised of the 30 largest mutual funds in the Lipper Mid-Cap Value Funds classification.
The Lipper Small-Cap Core Index is comprised of the 30 largest mutual funds in the Lipper Small-Cap Core Funds classification.
The Lipper Small-Cap Value Index is comprised of the 30 largest mutual funds in the Lipper Small-Cap Value Funds classification.
The Lipper International Small-Cap Index is comprised of the 30 largest mutual funds in the Lipper International Small-Cap Funds classification.
The Lipper High Current Yield Index is comprised of the 30 largest mutual funds in the Lipper High Current Yield Funds classification.
The Lipper Intermediate Investment Grade Index is comprised of the 30 largest mutual funds in the Lipper Intermediate Investment Grade Debt Funds classification.
The Lipper Intermediate Municipal Debt Index is comprised of the 30 largest mutual funds in the Lipper Intermediate Municipal Debt Funds classification.
Russell Investments is the source and owner of the Russell Index data contained in this material and all trademarks and copyrights related thereto. Any further dissemination or redistribution is strictly prohibited. Russell Investments is not responsible for the formatting or configuration of this material or for any inaccuracy in Denver Investments’ presentation thereof.
Standard & Poor’s is the source and owner of the S&P Index data contained in this material and all trademarks and copyrights related thereto. Any further dissemination or redistribution is strictly prohibited. Standard & Poor’s is not responsible for the formatting or configuration of this material or for any inaccuracy in Denver Investments’ presentation thereof.
MSCI Barra is the source and owner of the MSCI Index data contained in this material and all trademarks and copyrights related thereto. Any further dissemination or redistribution is strictly prohibited. MSCI Barra is not responsible for the formatting or configuration of this material or for any inaccuracy in Denver Investments’ presentation thereof.
Barclays Capital is the source and owner of the Barclays Capital Index data contained in this material and all trademarks and copyrights related thereto. Any further dissemination or redistribution is strictly prohibited. Barclays Capital is not responsible for the formatting or configuration of this material or for any inaccuracy in Denver Investments’ presentation thereof.
Lipper Inc. is the source and owner of the Lipper Index data contained in this material and all trademarks and copyrights related thereto. Any further dissemination or redistribution is strictly prohibited. Lipper Inc. is not responsible for the formatting or configuration of this material or for any inaccuracy in Denver Investments’ presentation thereof.
Top 5/Bottom 5 Stock Performance Calculation Methodology
The Calculation methodology used to construct this chart took into account consistently the weighting of every holding in the Fund that contributed to the Fund’s performance during the Measurement Period, and the Chart reflects consistently the results of the Calculation. The Calculation determined the contribution of each Fund holding by calculating the weight (i.e., percentage of the Total Investments) of each holding multiplied by the rate of return for that holding during the first six months of 2012.
Morningstar Disclosures
©2012 Morningstar, Inc. All Rights Reserved. The information contained herein is: (1) proprietary to Morningstar; (2) may not be copied or distributed; and (3) is not warranted to be accurate, complete or timely. Neither Morningstar nor its content providers are responsible for any damages or losses arising from any use of this information. Past performance is no guarantee of future results.
Morningstar proprietary ratings reflect historical risk-adjusted performance as of 6/30/12 and are subject to change every month. For each fund with at least a 3-year history, Morningstar calculates a rating based on a Morningstar Risk-Adjusted Return measure that accounts for variation in a fund’s monthly performance (including the effects of sales charges and redemption fees), placing more emphasis on downward variations and rewarding consistent performance. The top 10% of funds in each category receive a Morningstar RatingTM of 5 stars, the next 22.5% receive 4 stars, the next 35% receive 3 stars, the next 22.5% receive 2 stars and the bottom 10% receive 1 star. (Each share class is counted as a fraction of one fund within this scale and rated separately, which may cause slight variations in the distribution percentages.) The Overall Morningstar Rating for a fund is derived from a weighted average of the performance figures associated with its 3-, 5- and 10-year (if applicable) Morningstar Rating metrics. During periods on which ratings are based, service providers of the Fund waived fees. This waiver had a material impact on the funds’ average annual returns. In the absence of fee waivers, performance would have been reduced.
PAGE 29 |
|
Definitions of Terms
Beta – A measure of a fund’s sensitivity to market movements. The beta of the market is 1.00 by definition. A beta above 1 is more volatile than the overall market, while a beta below 1 is less volatile.
Credit Quality Rating – A rating of an individual bond as determined by a nationally recognized statistical rating organization (NRSRO) such as Standard & Poor’s or Moody’s. Credit quality ratings range from highest, “AAA ” to lowest, “D”. For more information regarding rating methodologies for Standard & Poor’s, visit www.standardandpoors.com and for Moody’s, visit www.moodys.com.
Duration – A generic description of the sensitivity of a bond’s price (as a percentage of initial price) to a change in yield.
EPS (Earnings per Share) Growth – Earnings per share is the portion of a company’s profit allocated to each outstanding share of common stock. EPS growth serves as an indicator of a company’s profitability.
Effective Maturity – A weighted average of the maturities of the bonds in a portfolio.
Emerging Markets – Westcore International Small-Cap Fund considers emerging market countries to be those countries that are neither U.S. nor developed countries.
Market Capitalization – The market capitalization represents the total value of a company or stock. It is calculated by multiplying the number of shares outstanding by the current price of one share.
Modified Duration – A duration measure in which it is assumed that yield changes do not change the expected cash flows.
Number of Holdings – The Number of Holdings presented excludes short-term investments including money market mutual funds.
Portfolio Turnover Rate – A percentage computed by taking the lesser of purchases or sales of portfolio securities (excluding short-term investments) for the year and dividing it by the monthly average of the market value of the portfolio securities during the year.
Price to Book Value (P/B) Ratio – The P/B ratio is used to compare a company’s book value to its current market price. This ratio compares the market’s valuation of a company to the value of that company as indicated on its financial statements. The higher the ratio, the higher the premium the market is willing to pay for the company above its hard assets.
Price to Cash (P/C) Flow Ratio – The P/C flow ratio is a measure of a firm’s stock price relative to its financial performance. For a fund, the P/C flow ratio is the weighted average of all stocks held in the fund. It represents the amount an investor is willing to pay for a dollar generated from a particular company’s operations.
Price to Earnings (P/E) Ratio – The P/E ratio is a stock’s per share price divided by its per share earnings over a 12-month period. For a fund, the P/E ratio is the weighted average of all stocks held in the fund. The higher the P/E ratio, the more the market is willing to pay for each dollar of annual earnings.
Quantitative Easing – A monetary policy that the Federal Reserve, and other central banks, pursue to increase the supply of money and thereby expand liquidity in the hopes of fostering stronger growth.
REIT – A REIT is a real estate investment trust. REITs are securities that sell like a stock on a major exchange. REITs invest directly in real estate, either through properties or mortgages.
Return on Equity (ROE) – A measure of how well a company used reinvested earnings to generate additional earnings. It is used as a general indication of a company’s efficiency; in other words, how much profit is a company able to generate given the resources provided by its stockholders.
Risk On, Risk Off – A concept that describes market sentiment as either “risk on” or “risk off”. During a market sentiment of “risk on”, the market is optimistic and more willing to take on risk in exchange for possibly better returns. When market sentiment is “risk off”, the market is pessimistic and will favor investments with perceived lower risk.
SEC Yield – The SEC Yield is a standardized method of computing return on investment that the U.S. Securities and Exchange Commission (SEC) requires mutual funds to use when advertising their yields. Its objective is to allow a confusion-free comparison of the performance of different funds.
Weighted Average – An average that takes into account the proportional relevance of each component, rather than treating each component equally.
| PAGE 30 |
|

PAGE 31 |
|

WESTCORE GROWTH FUND AS OF JUNE 30, 2012
(UNAUDITED)
| | Shares | | Market Value |
| COMMON STOCKS | | | 96.00% |
| Consumer Discretionary | | | 16.43% |
| Hotels, Restaurants & Leisure | | | 2.96% |
| Chipotle Mexican | | | | |
| Grill Inc.** | 1,605 | | $ | 609,820 |
| Panera Bread Co. - | | | | |
| Class A** | 5,370 | | | 748,793 |
| Starwood Hotels & | | | | |
| Resorts Worldwide | | | | |
| Inc. | 10,560 | | | 560,102 |
| | | |
|
| | | | 1,918,715 |
| | | | | |
| Household Durables | | | | 1.04% |
| PulteGroup Inc.** | 63,100 | | | 675,170 |
| | | | | |
| Internet & Catalog Retail | | | | 3.05% |
| Amazon.com Inc.** | 4,900 | | 1,118,915 |
| Priceline.com Inc.** | 1,292 | | | 858,560 |
| | | |
|
| | | | 1,977,475 |
| | | | | |
| Media | | | | 2.31% |
| CBS Corp. - Class B | 19,874 | | | 651,470 |
| Comcast Corp. | 26,400 | | | 844,008 |
| | | |
|
| | | | 1,495,478 |
| | | | | |
| Specialty Retail | | | | 5.32% |
| AutoZone Inc.** | 2,280 | | | 837,147 |
| Home Depot Inc. | 28,238 | | 1,496,332 |
| TJX Companies Inc. | 25,876 | | 1,110,857 |
| | | |
|
| | | | 3,444,336 |
| | | | | |
| Textiles, Apparel & Luxury Goods | | | 1.75% |
| Lululemon Athletica Inc. | | | | |
| (Canada)** | 9,480 | | | 565,292 |
| VF Corp. | 4,255 | | | 567,830 |
| | | |
|
| | | | 1,133,122 |
| | | | | |
| Total Consumer Discretionary | | | |
| (Cost $8,817,824) | | | 10,644,296 |
| | | |
|
| | | | | |
| Consumer Staples | | | 5.88% |
| Beverages | | | | 1.63% |
| Monster Beverage Corp.** | 14,870 | | 1,058,744 |
| | | | | |
| Food & Staples Retailing | | | | 2.23% |
| Whole Foods Market Inc. | 15,118 | | 1,441,048 |
| | | | | |
| Tobacco | | | | 2.02% |
| Philip Morris | | | | |
| International Inc. | 15,025 | | 1,311,081 |
| | | | | |
| Total Consumer Staples | | | | |
| (Cost $3,082,217) | | | 3,810,873 |
| | | |
|
| | Shares | | Market Value |
| Energy | | | 4.94% |
| Energy Equipment & Services | | | 1.58% |
| Noble Corp.** | 12,965 | | $ | 421,751 |
| Oceaneering | | | | |
| International Inc. | 12,585 | | | 602,318 |
| | | |
|
| | | | 1,024,069 |
| | | | | |
| Oil, Gas & Consumable Fuels | | | 3.36% |
| EOG Resources Inc. | 10,945 | | | 986,254 |
| Exxon Mobil Corp. | 13,940 | | 1,192,846 |
| | | |
|
| | | | 2,179,100 |
| | | | | |
| Total Energy | | | | |
| (Cost $3,478,283) | | | 3,203,169 |
| | | |
|
| | | | | |
| Financials | | | 7.64% |
| Capital Markets | | | | 1.13% |
| Affiliated Managers | | | | |
| Group Inc.** | 6,725 | | | 736,051 |
| | | | | |
| Commercial Banks | | | | 3.00% |
| US Bancorp | 28,654 | | | 921,513 |
| Wells Fargo & Co. | 30,500 | | 1,019,920 |
| | | |
|
| | | | 1,941,433 |
| | | | | |
| Consumer Finance | | | | 0.75% |
| Capital One Financial | | | | |
| Corp. | 8,865 | | | 484,561 |
| | | | | |
| Insurance | | | | 1.27% |
| Brown & Brown Inc. | 30,100 | | | 820,827 |
| | | | | |
| Real Estate Investment Trusts (REITs) | | | 1.49% |
| American Tower Corp. - | | | | |
| Class A | 13,804 | | | 965,038 |
| | | | | |
| Total Financials | | | | |
| (Cost $4,254,341) | | | 4,947,910 |
| | | |
|
| | | | | |
| Health Care | | | 11.02% |
| Biotechnology | | | | 5.43% |
| Alexion Pharmaceuticals | | | | |
| Inc.** | 14,777 | | 1,467,356 |
| Biogen Idec Inc.** | 8,112 | | 1,171,211 |
| Gilead Sciences Inc.** | 17,100 | | | 876,888 |
| | | |
|
| | | | 3,515,455 |
| | | | | |
| Health Care Providers & Services | | | 1.74% |
| Express Scripts Holding | | | | |
| Co.** | 20,215 | | 1,128,603 |
| | | | | |
| Health Care Technology | | | | 1.26% |
| Cerner Corp.** | 9,888 | | | 817,342 |
| | Shares | | Market Value |
| Pharmaceuticals | | | | 2.59% |
| Allergan Inc. | 11,714 | | $ | 1,084,365 |
| Perrigo Co. | 5,050 | | | 595,547 |
| | | | |
|
| | | | | 1,679,912 |
| | | | | |
| Total Health Care | | | | |
| (Cost $6,140,698) | | | | 7,141,312 |
| | | | |
|
| | | | | |
| Industrials | | | 12.76% |
| Aerospace & Defense | | | | 4.29% |
| Honeywell International | | | | |
| Inc. | 15,165 | | | 846,814 |
| Precision Castparts Corp. | 4,774 | | | 785,275 |
| TransDigm Group Inc.** | 8,538 | | | 1,146,653 |
| | | | |
|
| | | | | 2,778,742 |
| | | | | |
| Electrical Equipment | | | | 1.56% |
| AMETEK Inc. | 20,251 | | | 1,010,727 |
| | | | | |
| Industrial Conglomerates | | | | 3.04% |
| Carlisle Cos. Inc. | 18,400 | | | 975,568 |
| Danaher Corp. | 19,135 | | | 996,551 |
| | | | |
|
| | | | | 1,972,119 |
| | | | | |
| Professional Services | | | | 1.37% |
| Verisk Analytics Inc. - | | | | |
| Class A** | 17,950 | | | 884,217 |
| | | | | |
| Road & Rail | | | | 2.50% |
| J.B. Hunt Transport | | | | |
| Services Inc. | 18,610 | | | 1,109,156 |
| Kansas City Southern | 7,355 | | | 511,614 |
| | | | |
|
| | | | | 1,620,770 |
| | | | | |
| Total Industrials | | | | |
| (Cost $6,478,356) | | | | 8,266,575 |
| | | | |
|
| | | | | |
| Information Technology | | | 30.78% |
| Communications Equipment | | | 2.96% |
| F5 Networks Inc.** | 5,255 | | | 523,188 |
| QUALCOMM Inc. | 25,096 | | | 1,397,345 |
| | | | |
|
| | | | | 1,920,533 |
| | | | | |
| Computers & Peripherals | | | | 10.95% |
| Apple Inc.** | 11,327 | | | 6,614,968 |
| EMC Corp.** | 18,700 | | | 479,281 |
| | | | |
|
| | | | | 7,094,249 |
| | | | | |
| Internet Software & Services | | | 6.89% |
| eBay Inc.** | 22,000 | | | 924,220 |
| Equinix Inc.** | 4,695 | | | 824,677 |
| Google Inc. - Class A** | 2,345 | | | 1,360,264 |
| IAC/InterActiveCorp. | 10,385 | | | 473,556 |
| LinkedIn Corp. - Class A** | 8,275 | | | 879,384 |
| | | | |
|
| | | | | 4,462,101 |
| PAGE 32 |
|
WESTCORE GROWTH FUND AS OF JUNE 30, 2012 (continued)
(UNAUDITED)
| | Shares | | Market Value |
| IT Services | | | | 5.05% |
| Accenture PLC - Class A | | | | |
| (Ireland) | 13,929 | | $ | 836,994 |
| Alliance Data Systems | | | | |
| Corp.** | 10,353 | | 1,397,655 |
| Teradata Corp.** | 14,430 | | 1,039,104 |
| | | |
|
| | | | 3,273,753 |
| | | | | |
| Semiconductors & Semiconductor | | | |
| Equipment | | | | 1.48% |
| Intel Corp. | 35,875 | | | 956,069 |
| | | | | |
| Software | | | | 3.45% |
| Microsoft Corp. | 73,100 | | 2,236,129 |
| | | | | |
| Total Information Technology | | | |
| (Cost $12,197,148) | | | 19,942,834 |
| | | |
|
| | | | | |
| Materials | | | | 4.25% |
| Chemicals | | | | 4.25% |
| Ashland Inc. | 14,100 | | | 977,271 |
| CF Industries Holdings | | | | |
| Inc. | 3,500 | | | 678,090 |
| FMC Corp. | 20,530 | | 1,097,944 |
| | | |
|
| | | | 2,753,305 |
| | | | | |
| Total Materials | | | | |
| (Cost $2,313,106) | | | 2,753,305 |
| | | |
|
| | | | | |
| Telecommunication Services | | | 2.30% |
| Diversified Telecommunication | | | |
| Services | | | | 0.51% |
| BCE Inc. (Canada) | 8,015 | | | 330,218 |
| | | | | |
| Wireless Telecommunication | | | |
| Services | | | | 1.79% |
| Crown Castle | | | | |
| International Corp.** | 19,800 | | 1,161,468 |
| | | | | |
| Total Telecommunication Services | | | |
| (Cost $1,418,164) | | | 1,491,686 |
| | | |
|
| | | | | |
| Total Common Stocks | | | | |
| (Cost $48,180,137) | | | 62,201,960 |
| | | |
|
| | | | | |
| MONEY MARKET MUTUAL FUNDS | | | 4.48% |
| Fidelity Institutional | | | | |
| Money Market | | | | |
| Government | | | | |
| Portfolio - Class I | | | | |
| (7 Day Yield 0.010%) | 2,905,628 | | 2,905,628 |
| | | |
|
| | | | | |
| Total Money Market Mutual Funds | | | |
| (Cost $2,905,628) | | | 2,905,628 |
| | | |
|
| | Market Value |
| Total Investments | | |
| (Cost $51,085,765) 100.48% | $ | 65,107,588 |
| | | |
| Liabilities in Excess of | | |
| Other Assets (0.48%) | | (313,442) |
| |
|
| | | |
| Net Assets 100.00% | $ | 64,794,146 |
| |
|
| | | |
| Sector and industry classifications presented herein are based on the sector and industry categorization methodology of the Adviser to the Funds which may result in the designations for one Fund being different from another. |
| |
| ** Non-income producing security. | | |
| | | |
| See Notes to Financial Statements. | | |
| | | |
| | | |
| | | |
| | | |
| | | |
| | | |
| | | |
| | | |
| | | |
| | | |
| | | |
| | | |
| | | |
| | | |
| | | |
| | | |
| | | |
| | | |
| | | |
| | | |
| | | |
| | | |
| | | |
PAGE 33 |
|
WESTCORE MIDCO GROWTH FUND AS OF JUNE 30, 2012
(UNAUDITED)
| | Shares | | Market Value |
| COMMON STOCKS | | | 93.62% |
| Consumer Discretionary | | | 14.74% |
| Hotels, Restaurants & Leisure | | | 2.01% |
| Starwood Hotels & | | | | |
| Resorts Worldwide | | | | |
| Inc. | 45,500 | | $ | 2,413,320 |
| | | | | |
| Household Durables | | | | 3.94% |
| DR Horton Inc. | 155,000 | | | 2,848,900 |
| Tempur-Pedic | | | | |
| International Inc.** | 81,000 | | | 1,894,590 |
| | | |
|
| | | | | 4,743,490 |
| | | | | |
| Internet & Catalog Retail | | | | 0.50% |
| TripAdvisor Inc.** | 13,500 | | | 603,315 |
| | | | | |
| Multiline Retail | | | | 1.64% |
| Nordstrom Inc. | 39,800 | | | 1,977,662 |
| | | | | |
| Specialty Retail | | | | 5.43% |
| Bed Bath & Beyond Inc.** | 19,300 | | | 1,192,740 |
| DSW Inc. - Class A | 26,600 | | | 1,447,040 |
| Express Inc.** | 94,144 | | | 1,710,596 |
| Ross Stores Inc. | 34,800 | | | 2,173,956 |
| | | |
|
| | | | | 6,524,332 |
| | | | | |
| Textiles, Apparel & Luxury Goods | | | 1.22% |
| Michael Kors Holdings Ltd. | | | | |
| (British Virgin Islands)** | 35,101 | | | 1,468,626 |
| | | | | |
| Total Consumer Discretionary | | | |
| (Cost $18,032,454) | | | 17,730,745 |
| | | |
|
| | | | | |
| Consumer Staples | | | 3.41% |
| Beverages | | | | 1.58% |
| Dr Pepper Snapple Group | | | | |
| Inc. | 43,400 | | | 1,898,750 |
| | | | | |
| Personal Products | | | | 1.83% |
| Herbalife Ltd. | | | | |
| (Cayman Islands) | 45,500 | | | 2,199,015 |
| | | | | |
| Total Consumer Staples | | | | |
| (Cost $4,342,544) | | | | 4,097,765 |
| | | |
|
| | | | | |
| Energy | | | 6.94% |
| Energy Equipment & Services | | | 1.62% |
| Oil States International | | | | |
| Inc.** | 29,500 | | | 1,952,900 |
| | Shares | | Market Value |
| Oil, Gas & Consumable Fuels | | | | 5.32% |
| Pioneer Natural | | | | |
| Resources Co. | 31,200 | | $ | 2,752,152 |
| Southwestern Energy Co.** | 40,600 | | | 1,296,358 |
| Whiting Petroleum Corp.** | 57,000 | | | 2,343,840 |
| | | |
|
| | | | | 6,392,350 |
| | | | | |
| Total Energy | | | | |
| (Cost $9,799,601) | | | | 8,345,250 |
| | | |
|
| | | | | |
| Financials | | | 4.16% |
| Commercial Banks | | | | 2.19% |
| Zions Bancorporation | 135,700 | | | 2,635,294 |
| | | | | |
| Thrifts & Mortgage Finance | | | | 1.97% |
| Ocwen Financial Corp.** | 125,900 | | | 2,364,402 |
| | | | | |
| Total Financials | | | | |
| (Cost $4,261,202) | | | | 4,999,696 |
| | | |
|
| | | | | |
| Health Care | | | 24.01% |
| Biotechnology | | | | 7.83% |
| Alkermes PLC** | 91,959 | | | 1,560,544 |
| Cubist Pharmaceuticals | | | | |
| Inc.** | 30,700 | | | 1,163,837 |
| Onyx Pharmaceuticals | | | | |
| Inc.** | 60,300 | | | 4,006,935 |
| Vertex Pharmaceuticals | | | | |
| Inc.** | 48,000 | | | 2,684,160 |
| | | |
|
| | | | | 9,415,476 |
| | | | | |
| Health Care Equipment & Supplies | | | 7.18% |
| Sirona Dental Systems | | | | |
| Inc.** | 46,300 | | | 2,083,963 |
| St. Jude Medical Inc. | 67,300 | | | 2,685,943 |
| Thoratec Corp.** | 66,800 | | | 2,243,144 |
| Varian Medical Systems | | | | |
| Inc.** | 26,600 | | | 1,616,482 |
| | | |
|
| | | | | 8,629,532 |
| | | | | |
| Health Care Providers & Services | | | 5.28% |
| DaVita Inc.** | 19,850 | | | 1,949,469 |
| HCA Holdings Inc. | 71,700 | | | 2,181,831 |
| MEDNAX Inc.** | 32,400 | | | 2,220,696 |
| | | |
|
| | | | | 6,351,996 |
| | | | | |
| Life Sciences, Tools & Services | | | 2.27% |
| Agilent Technologies Inc. | 69,700 | | | 2,735,028 |
| | | | | |
| Pharmaceuticals | | | | 1.45% |
| Endo Health Solutions Inc.** | 56,100 | | | 1,737,978 |
| | | | | |
| Total Health Care | | | | |
| (Cost $24,944,085) | | | 28,870,010 |
| | | |
|
| | Shares | | Market Value |
| Industrials | | | 9.66% |
| Aerospace & Defense | | | | 3.73% |
| BE Aerospace Inc.** | 61,900 | | $ | 2,702,554 |
| Spirit Aerosystems | | | | |
| Holdings Inc. - | | | | |
| Class A** | 75,000 | | | 1,787,250 |
| | | |
|
| | | | | 4,489,804 |
| | | | | |
| Machinery | | | | 1.36% |
| SPX Corp. | 25,000 | | | 1,633,000 |
| | | | | |
| Road & Rail | | | | 2.56% |
| Old Dominion Freight | | | | |
| Line Inc.** | 33,300 | | | 1,441,557 |
| Ryder System Inc. | 45,500 | | | 1,638,455 |
| | | |
|
| | | | | 3,080,012 |
| | | | | |
| Trading Companies & Distributors | | | 2.01% |
| WESCO International | | | | |
| Inc.** | 41,900 | | | 2,411,345 |
| | | | | |
| Total Industrials | | | | |
| (Cost $11,505,613) | | | 11,614,161 |
| | | |
|
| | | | | |
| Information Technology | | | 21.71% |
| Computers & Peripherals | | | | 1.05% |
| NetApp Inc.** | 39,800 | | | 1,266,436 |
| | | | | |
| Internet Software & Services | | | 1.96% |
| LinkedIn Corp. - Class A** | 22,190 | | | 2,358,131 |
| | | | | |
| Semiconductors & | | | | |
| Semiconductor Equipment | | | 8.09% |
| Altera Corp. | 25,800 | | | 873,072 |
| Atmel Corp.** | 225,500 | | | 1,510,850 |
| Avago Technologies Ltd. | | | | |
| (Singapore) | 62,700 | | | 2,250,930 |
| Cypress Semiconductor | | | | |
| Corp.** | 106,600 | | | 1,409,252 |
| Lam Research Corp.** | 63,100 | | | 2,381,394 |
| LSI Corp.** | 204,200 | | | 1,300,754 |
| | | |
|
| | | | | 9,726,252 |
| | | | | |
| Software | | | | 10.61% |
| Autodesk Inc.** | 70,100 | | | 2,452,799 |
| Citrix Systems Inc.** | 40,200 | | | 3,374,388 |
| Red Hat Inc.** | 46,700 | | | 2,637,616 |
| TIBCO Software Inc.** | 79,900 | | | 2,390,608 |
| Zynga Inc. - Class A** | 348,900 | | | 1,898,016 |
| | | |
|
| | | | 12,753,427 |
| | | | | |
| Total Information Technology | | | |
| (Cost $27,693,549) | | | 26,104,246 |
| | | |
|
| PAGE 34 |
|
WESTCORE MIDCO GROWTH FUND AS OF JUNE 30, 2012 (continued)
(UNAUDITED)
| | Shares | | Market Value |
| Materials | | | | 8.99% |
| Chemicals | | | | | 8.30% |
| Albemarle Corp. | 34,800 | | | $ | 2,075,472 |
| Cytec Industries Inc. | 23,400 | | | | 1,372,176 |
| FMC Corp. | 53,300 | | | | 2,850,484 |
| Rockwood Holdings Inc. | 43,000 | | | | 1,907,050 |
| Westlake Chemical Corp. | 34,000 | | | | 1,776,840 |
| | | | |
|
| | | | | | 9,982,022 |
| | | | | | |
| Metals & Mining | | | | | 0.69% |
| Walter Energy Inc. | 18,811 | | | | 830,694 |
| | | | | | |
| Total Materials | | | | | |
| (Cost $9,175,296) | | | | 10,812,716 |
| | | | |
|
| | | | | | |
| Total Common Stocks | | | | | |
| (Cost $109,754,344) | | | | 112,574,589 |
| | | | |
|
| | | | | | |
| MONEY MARKET MUTUAL FUNDS | | | | 5.29% |
| Fidelity Institutional | | | | | |
| Money Market | | | | | |
| Government | | | | | |
| Portfolio - Class I | | | | | |
| (7 Day Yield 0.010%) | 6,361,438 | | | | 6,361,438 |
| | | | |
|
| | | | | | |
| Total Money Market Mutual Funds | | | | |
| (Cost $6,361,438) | | | | | 6,361,438 |
| | | | |
|
| | | | | | |
| | | | | | |
| Total Investments | | | | | |
| (Cost $116,115,782) | 98.91% | | | 118,936,027 |
| | | | | | |
| Other Assets in | | | | | |
| Excess of Liabilities | 1.09% | | | | 1,312,572 |
| | | | |
|
| | | | | | |
| Net Assets | 100.00% | | $ | 120,248,599 |
| | | | |
|
| | | | | | |
| Sector and industry classifications presented herein are based on the sector and industry categorization methodology of the Adviser to the Funds which may result in the designations for one Fund being different from another. |
| |
| ** Non-income producing security. |
| |
| See Notes to Financial Statements. |
PAGE 35 |
|
WESTCORE SELECT FUND AS OF JUNE 30, 2012
(UNAUDITED)
| | Shares | | Market Value |
| COMMON STOCKS | | | 99.53% |
| Consumer Discretionary | | | 15.63% |
| Hotels, Restaurants & Leisure | | | 4.04% |
| Starwood Hotels & | | | | |
| Resorts Worldwide | | | | |
| Inc. | 373,000 | | $ | 19,783,920 |
| | | | | |
| Household Durables | | | | 4.68% |
| DR Horton Inc. | 1,248,800 | | | 22,952,944 |
| | | | | |
| Specialty Retail | | | | 6.91% |
| Bed Bath & Beyond Inc.** | 260,600 | | | 16,105,080 |
| Express Inc.** | 977,900 | | | 17,768,443 |
| | | |
|
| | | | | 33,873,523 |
| | | | | |
| Total Consumer Discretionary | | | |
| (Cost $79,795,624) | | | | 76,610,387 |
| | | |
|
| | | | | |
| Consumer Staples | | | 3.34% |
| Personal Products | | | | 3.34% |
| Herbalife Ltd. | | | | |
| (Cayman Islands) | 338,700 | | | 16,369,371 |
| | | | | |
| Total Consumer Staples | | | | |
| (Cost $20,652,344) | | | | 16,369,371 |
| | | |
|
| | | | | |
| Energy | | | 6.91% |
| Oil, Gas & Consumable Fuels | | | 6.91% |
| Pioneer Natural | | | | |
| Resources Co. | 194,900 | | | 17,192,129 |
| Whiting Petroleum Corp.** | 405,700 | | | 16,682,384 |
| | | |
|
| | | | | 33,874,513 |
| | | | | |
| Total Energy | | | | |
| (Cost $43,597,560) | | | | 33,874,513 |
| | | |
|
| | | | | |
| Financials | | | 4.78% |
| Commercial Banks | | | | 4.78% |
| Zions Bancorporation | 1,206,600 | | | 23,432,172 |
| | | | | |
| Total Financials | | | | |
| (Cost $20,543,622) | | | | 23,432,172 |
| | | |
|
| | | | | |
| Health Care | | | 21.67% |
| Biotechnology | | | | 10.23% |
| Onyx Pharmaceuticals | | | | |
| Inc.** | 467,700 | | | 31,078,665 |
| Vertex Pharmaceuticals | | | | |
| Inc.** | 340,500 | | | 19,040,760 |
| | | |
|
| | | | | 50,119,425 |
| | | | | |
| Health Care Equipment & Supplies | | | 7.23% |
| St. Jude Medical Inc. | 441,100 | | | 17,604,301 |
| Thoratec Corp.** | 531,600 | | | 17,851,128 |
| | | |
|
| | | | | 35,455,429 |
| | Shares | | Market Value |
| Life Sciences Tools & Services | | | 4.21% |
| Agilent Technologies Inc. | 525,300 | | $ | 20,612,772 |
| | | | | |
| Total Health Care | | | | |
| (Cost $98,191,020) | | | 106,187,626 |
| | | |
|
| | | | | |
| Industrials | | | 15.46% |
| Aerospace & Defense | | | | 8.20% |
| BE Aerospace Inc.** | 532,000 | | | 23,227,120 |
| Spirit Aerosystems | | | | |
| Holdings Inc. - | | | | |
| Class A** | 711,000 | | | 16,943,130 |
| | | |
|
| | | | | 40,170,250 |
| | | | | |
| Road & Rail | | | | 3.30% |
| Ryder System Inc. | 448,800 | | | 16,161,288 |
| | | | | |
| Trading Companies & Distributors | | | 3.96% |
| WESCO International | | | | |
| Inc.** | 337,400 | | | 19,417,370 |
| | | |
|
| | | | | |
| Total Industrials | | | | |
| (Cost $78,934,208) | | | | 75,748,908 |
| | | |
|
| | | | | |
| Information Technology | | | 24.00% |
| Internet Software & Services | | | 4.45% |
| LinkedIn Corp. - Class A** | 205,476 | | | 21,835,934 |
| | | | | |
| Semiconductors & Semiconductor | | | |
| Equipment | | | | 7.50% |
| Avago Technologies Ltd. | | | | |
| (Singapore) | 557,600 | | | 20,017,840 |
| Lam Research Corp.** | 443,100 | | | 16,722,594 |
| | | |
|
| | | | | 36,740,434 |
| | | | | |
| Software | | | | 12.05% |
| Citrix Systems Inc.** | 310,730 | | | 26,082,676 |
| Take-Two Interactive | | | | |
| Software Inc.** | 445,813 | | | 4,217,391 |
| TIBCO Software Inc.** | 369,900 | | | 11,067,408 |
| Zynga Inc. - Class A** | 3,251,115 | | | 17,686,066 |
| | | |
|
| | | | | 59,053,541 |
| | | | | |
| Total Information Technology | | | |
| (Cost $111,135,837) | | | 117,629,909 |
| | | |
|
| | | | | |
| Materials | | | 7.74% |
| Chemicals | | | | 7.74% |
| Albemarle Corp. | 322,000 | | | 19,204,080 |
| Rockwood Holdings Inc. | 421,600 | | | 18,697,960 |
| | | |
|
| | | | | 37,902,040 |
| | | | | |
| Total Materials | | | | |
| (Cost $39,185,688) | | | | 37,902,040 |
| | | |
|
| | Shares | | Market Value |
| Total Common Stocks | | | | |
| (Cost $492,035,903) | | | $ | 487,754,926 |
| | | |
|
|
| | | | | |
| MONEY MARKET MUTUAL FUNDS | | | 0.22% |
| Fidelity Institutional | | | | |
| Money Market | | | | |
| Government | | | | |
| Portfolio - Class I | | | | |
| (7 Day Yield 0.010%) | 1,063,887 | | | 1,063,887 |
| | | |
|
| | | | | |
| Total Money Market Mutual Funds | | | |
| (Cost $1,063,887) | | | | 1,063,887 |
| | | |
|
| | | | | |
| | | | | |
| Total Investments | | | | |
| (Cost $493,099,790) | 99.75% | | | 488,818,813 |
| | | | | |
| Other Assets in | | | | |
| Excess of Liabilities | 0.25% | | | 1,229,795 |
| | | |
|
| | | | | |
| Net Assets | 100.00% | | $ | 490,048,608 |
| | | |
|
| | | | | |
| Sector and industry classifications presented herein are based on the sector and industry categorization methodology of the Adviser to the Funds which may result in the designations for one Fund being different from another. |
| |
| ** Non-income producing security. |
| |
| See Notes to Financial Statements. |
| PAGE 36 |
|
WESTCORE BLUE CHIP FUND AS OF JUNE 30, 2012
(UNAUDITED)
| | Shares | | Market Value |
| COMMON STOCKS | | | 97.20% |
| Basic Materials | | | 3.21% |
| Forestry & Paper | | | | 3.21% |
| Ball Corp. | 34,680 | | $ | 1,423,614 |
| International Paper Co. | 25,450 | | | 735,759 |
| | | |
|
| | | | | 2,159,373 |
| | | | | |
| Total Basic Materials | | | | |
| (Cost $1,286,296) | | | | 2,159,373 |
| | | |
|
| | | | | |
| Capital Goods | | | 4.45% |
| Aerospace & Defense | | | | 2.96% |
| General Dynamics Corp. | 13,300 | | | 877,268 |
| Raytheon Co. | 19,700 | | | 1,114,823 |
| | | |
|
| | | | | 1,992,091 |
| | | | | |
| Industrial Products | | | | 1.49% |
| Xylem Inc. | 39,700 | | | 999,249 |
| | | | | |
| Total Capital Goods | | | | |
| (Cost $2,669,667) | | | | 2,991,340 |
| | | |
|
| | | | | |
| Commercial Services | | | 4.84% |
| Business Products & Services | | | 2.52% |
| Quanta Services Inc.** | 70,400 | | | 1,694,528 |
| | | | | |
| IT Services | | | | 0.70% |
| Accenture PLC - Class A | | | | |
| (Ireland) | 7,800 | | | 468,702 |
| | | | | |
| Transaction Processing | | | | 1.62% |
| The Western Union Co. | 64,900 | | | 1,092,916 |
| | | | | |
| Total Commercial Services | | | | |
| (Cost $2,905,429) | | | | 3,256,146 |
| | | |
|
| | | | | |
| Communications | | | 1.09% |
| Telecomm Equipment & Solutions | | | 1.09% |
| QUALCOMM Inc. | 13,200 | | | 734,976 |
| | | | | |
| Total Communications | | | | |
| (Cost $579,573) | | | | 734,976 |
| | | |
|
| | | | | |
| Consumer Cyclical | | | 12.23% |
| Cable, Satellite & Telecomm Services | | | 3.74% |
| DIRECTV - Class A** | 23,900 | | | 1,166,798 |
| DISH Network Corp. - | | | | |
| Class A | 47,300 | | | 1,350,415 |
| | | |
|
| | | | | 2,517,213 |
| | | | | |
| Department Stores | | | | 1.52% |
| Macy’s Inc. | 29,700 | | | 1,020,195 |
| | Shares | | Market Value |
| General Merchandise | | | | 4.09% |
| Wal-Mart Stores Inc. | 39,500 | | $ | 2,753,940 |
| | | | | |
| Recreation & Leisure | | | | 1.48% |
| Mattel Inc. | 30,700 | | | 995,908 |
| | | | | |
| Specialty Retail | | | | 1.40% |
| Lowe’s Cos. Inc. | 33,000 | | | 938,520 |
| | | | | |
| Total Consumer Cyclical | | | | |
| (Cost $6,656,956) | | | | 8,225,776 |
| | | |
|
| | | | | |
| Consumer Staples | | | 10.04% |
| Beverages: Non-Alcoholic | | | | 2.09% |
| Dr Pepper Snapple Group | | | | |
| Inc. | 32,200 | | | 1,408,750 |
| | | | | |
| Consumer Products | | | | 1.50% |
| Colgate-Palmolive Co. | 9,700 | | | 1,009,770 |
| | | | | |
| Food & Agricultural Products | | | 6.45% |
| Campbell Soup Co. | 33,100 | | | 1,104,878 |
| HJ Heinz Co. | 27,500 | | | 1,495,450 |
| Unilever N.V. | | | | |
| (Netherlands) | 52,000 | | | 1,734,200 |
| | | |
|
| | | | | 4,334,528 |
| | | | | |
| Total Consumer Staples | | | | |
| (Cost $5,956,282) | | | | 6,753,048 |
| | | |
|
| | | | | |
| Energy | | | 14.19% |
| Exploration & Production | | | | 4.41% |
| Marathon Oil Corp. | 40,600 | | | 1,038,142 |
| Occidental Petroleum | | | | |
| Corp. | 22,480 | | | 1,928,110 |
| | | |
|
| | | | | 2,966,252 |
| | | | | |
| Integrated Oils | | | | 1.87% |
| Exxon Mobil Corp. | 14,700 | | | 1,257,879 |
| | | | | |
| Oil Services | | | | 5.34% |
| Ensco PLC - ADR | | | | |
| (United Kingdom) | 25,100 | | | 1,178,947 |
| National Oilwell Varco | | | | |
| Inc. | 20,200 | | | 1,301,688 |
| Noble Corp. | | | | |
| (Switzerland)** | 34,100 | | | 1,109,273 |
| | | |
|
| | | | | 3,589,908 |
| | | | | |
| Refining & Marketing | | | | 2.57% |
| HollyFrontier Corp. | 23,100 | | | 818,433 |
| Marathon Petroleum | | | | |
| Corp. | 20,250 | | | 909,630 |
| | | |
|
| | | | | 1,728,063 |
| | Shares | | Market Value |
| Total Energy | | | | |
| (Cost $7,774,556) | | | $ | 9,542,102 |
| | | |
|
| | | | | |
| Interest Rate Sensitive | | | 10.78% |
| Insurance & Real Estate Brokers | | | 1.41% |
| AON PLC | 20,300 | | | 949,634 |
| | | | | |
| Life & Health Insurance | | | | 1.24% |
| Prudential Financial Inc. | 17,200 | | | 832,996 |
| | | | | |
| Property Casualty Insurance | | | 4.31% |
| ACE Ltd. (Switzerland) | 29,200 | | | 2,164,596 |
| The Chubb Corp. | 10,100 | | | 735,482 |
| | | |
|
| | | | | 2,900,078 |
| | | | | |
| Regional Banks | | | | 3.82% |
| PNC Financial Services | | | | |
| Group Inc. | 14,000 | | | 855,540 |
| SunTrust Banks Inc. | 30,700 | | | 743,861 |
| Wells Fargo & Co. | 28,900 | | | 966,416 |
| | | |
|
| | | | | 2,565,817 |
| | | | | |
| Total Interest Rate Sensitive | | | |
| (Cost $6,475,992) | | | | 7,248,525 |
| | | |
|
| | | | | |
| Medical/Healthcare | | | 12.95% |
| Healthcare Services | | | | 2.00% |
| AmerisourceBergen | | | | |
| Corp. | 34,200 | | | 1,345,770 |
| | | | | |
| Pharmaceuticals | | | | 10.95% |
| Abbott Laboratories | 29,650 | | | 1,911,536 |
| Amgen Inc. | 26,000 | | | 1,899,040 |
| Forest Laboratories Inc.** | 44,650 | | | 1,562,303 |
| Pfizer Inc. | 86,562 | | | 1,990,926 |
| | | |
|
| | | | | 7,363,805 |
| | | | | |
| Total Medical/Healthcare | | | | |
| (Cost $6,877,851) | | | | 8,709,575 |
| | | |
|
| | | | | |
| Technology | | | 14.80% |
| Computer Software | | | | 8.19% |
| Activision Blizzard Inc. | 141,800 | | | 1,700,182 |
| Microsoft Corp. | 82,500 | | | 2,523,675 |
| Symantec Corp.** | 87,700 | | | 1,281,297 |
| | | |
|
| | | | | 5,505,154 |
| | | | | |
| PC’s & Servers | | | | 4.90% |
| Dell Inc.** | 66,600 | | | 833,832 |
| International Business | | | | |
| Machines Corp. | 12,600 | | | 2,464,308 |
| | | |
|
| | | | | 3,298,140 |
PAGE 37 |
|
WESTCORE BLUE CHIP FUND AS OF JUNE 30, 2012 (continued)
(UNAUDITED)
| | Shares | Market Value |
| Semiconductors | | | 1.71% |
| Avago Technologies Ltd. | | | |
| (Singapore) | 32,100 | $ | 1,152,390 |
| | | | |
| Total Technology | | | |
| (Cost $8,411,653) | | | 9,955,684 |
| | | |
|
| | | | |
| Transportation | | 5.20% |
| Railroads | | | 5.20% |
| Norfolk Southern Corp. | 15,450 | | 1,108,847 |
| Union Pacific Corp. | 20,000 | | 2,386,200 |
| | | |
|
| | | | 3,495,047 |
| | | | |
| Total Transportation | | | |
| (Cost $2,021,482) | | | 3,495,047 |
| | | |
|
| | | | |
| Utilities | | 3.42% |
| Independent Power | | | 1.93% |
| Exelon Corp. | 15,800 | | 594,396 |
| Public Service | | | |
| Enterprises Group | | | |
| Inc. | 21,600 | | 702,000 |
| | | |
|
| | | | 1,296,396 |
| | | | |
| Regulated Electric | | | 1.49% |
| Edison International | 21,700 | | 1,002,540 |
| | | | |
| Total Utilities | | | |
| (Cost $1,962,943) | | | 2,298,936 |
| | | |
|
| | | | |
| Total Common Stocks | | | |
| (Cost $53,578,680) | | 65,370,528 |
| | | |
|
| | | |
| MONEY MARKET MUTUAL FUNDS | | 2.36% |
| Fidelity Institutional | | | |
| Money Market | | | |
| Government | | | |
| Portfolio - Class I | | | |
| (7 Day Yield 0.010%) | 1,591,479 | | 1,591,479 |
| | | | |
| Total Money Market Mutual Funds | | |
| (Cost $1,591,479) | | | 1,591,479 |
| | | |
|
| | | | |
| | | | |
| Total Investments | | | |
| (Cost $55,170,159) | 99.56% | 66,962,007 |
| | | | |
| Other Assets in | | | |
| Excess of Liabilities | 0.44% | | 293,912 |
| | | |
|
| | | | |
| Net Assets | 100.00% | $ | 67,255,919 |
| | | |
|
| | | | |
| Sector and industry classifications presented herein are based on the sector and industry categorization methodology of the Adviser to the Funds which may result in the designations for one Fund being different from another. |
| | | | |
| ** Non-income producing security. |
| | | | |
| See Notes to Financial Statements. |
| PAGE 38 |
|
WESTCORE MID-CAP VALUE FUND AS OF JUNE 30, 2012
(UNAUDITED)
| | Shares | | Market Value |
| COMMON STOCKS | | | 96.59% |
| Basic Materials | | | 6.73% |
| Forestry & Paper | | | | 2.61% |
| International Paper Co. | 19,500 | | $ | 563,745 |
| Packaging Corp. of | | | | |
| America | 16,500 | | | 465,960 |
| | | |
|
| | | | 1,029,705 |
| | | | | |
| Other Materials (Rubber & Plastic) | | | 3.54% |
| Crown Holdings Inc.** | 27,700 | | | 955,373 |
| Owens-Illinois Inc.** | 23,100 | | | 442,827 |
| | | |
|
| | | | 1,398,200 |
| | | | | |
| Precious Metals | | | | 0.58% |
| Hecla Mining Co. | 48,600 | | | 230,850 |
| | | | | |
| Total Basic Materials | | | | |
| (Cost $1,640,434) | | | 2,658,755 |
| | | |
|
| | | | | |
| Capital Goods | | | 4.50% |
| Electrical Equipment | | | | 1.91% |
| General Cable Corp.** | 29,000 | | | 752,260 |
| | | | | |
| Industrial Products | | | | 2.59% |
| Avery Dennison Corp. | 15,900 | | | 434,706 |
| Xylem Inc. | 23,400 | | | 588,978 |
| | | |
|
| | | | 1,023,684 |
| | | | | |
| Total Capital Goods | | | | |
| (Cost $2,426,689) | | | 1,775,944 |
| | | |
|
| | | | | |
| Commercial Services | | | 5.86% |
| Business Products & Services | | | 4.35% |
| Quanta Services Inc.** | 49,775 | | 1,198,084 |
| Xerox Corp. | 66,081 | | | 520,058 |
| | | |
|
| | | | 1,718,142 |
| | | | | |
| Environmental & Pollution Control | | | 1.51% |
| Waste Connections Inc. | 19,835 | | | 593,463 |
| | | | | |
| Total Commercial Services | | | | |
| (Cost $2,211,383) | | | 2,311,605 |
| | | |
|
| | | | | |
| Communications | | | 2.27% |
| Telecomm Equipment & Solutions | | | 2.27% |
| Plantronics Inc. | 26,800 | | | 895,120 |
| | | | | |
| Total Communications | | | | |
| (Cost $936,686) | | | | 895,120 |
| | | |
|
| | | | | |
| Consumer Cyclical | | | 7.70% |
| Cable, Satellite & Telecomm | | | | |
| Services | | | | 3.25% |
| DISH Network Corp. - | | | | |
| Class A | 44,950 | | 1,283,323 |
| | Shares | | Market Value |
| Department Stores | | | | 2.90% |
| J.C. Penney Co. Inc. | 20,550 | | $ | 479,020 |
| Macy’s Inc. | 19,400 | | | 666,390 |
| | | |
|
| | | | 1,145,410 |
| | | | | |
| Recreation & Leisure | | | | 1.55% |
| Mattel Inc. | 18,800 | | | 609,872 |
| | | | | |
| Total Consumer Cyclical | | | | |
| (Cost $2,535,747) | | | 3,038,605 |
| | | |
|
| | | | | |
| Consumer Staples | | | 5.84% |
| Beverages: Non-Alcoholic | | | | 2.18% |
| Dr Pepper Snapple Group | | | | |
| Inc. | 19,700 | | | 861,875 |
| | | | | |
| Food & Agricultural Products | | | 3.66% |
| The J.M. Smucker Co. | 7,450 | | | 562,624 |
| Tyson Foods Inc. - Class A | 46,750 | | | 880,302 |
| | | |
|
| | | | 1,442,926 |
| | | | | |
| Total Consumer Staples | | | | |
| (Cost $1,750,082) | | | 2,304,801 |
| | | |
|
| | | | | |
| Energy | | | 8.32% |
| Oil Services | | | | 5.62% |
| Ensco PLC - ADR | | | | |
| (United Kingdom) | 16,050 | | | 753,869 |
| Noble Corp. | | | | |
| (Switzerland)** | 20,750 | | | 674,997 |
| Tidewater Inc. | 17,000 | | | 788,120 |
| | | |
|
| | | | 2,216,986 |
| | | | | |
| Refining & Marketing | | | | 2.70% |
| HollyFrontier Corp. | 30,100 | | 1,066,443 |
| | | | | |
| Total Energy | | | | |
| (Cost $2,694,213) | | | 3,283,429 |
| | | |
|
| | | | | |
| Interest Rate Sensitive | | | 17.74% |
| Insurance & Real Estate Brokers | | | 2.14% |
| AON PLC | 18,050 | | | 844,379 |
| | | | | |
| Life & Health Insurance | | | | 4.68% |
| Reinsurance Group of | | | | |
| America Inc. | 18,791 | | | 999,869 |
| Unum Group | 44,250 | | | 846,503 |
| | | |
|
| | | | 1,846,372 |
| | | | | |
| Property Casualty Insurance | | | 8.49% |
| Allied World Assurance | | | | |
| Co. Holdings AG | | | | |
| (Switzerland) | 9,150 | | | 727,150 |
| Alterra Capital Holdings | | | | |
| Ltd. (Bermuda) | 21,650 | | | 505,528 |
| | Shares | | Market Value |
| AXIS Capital Holdings Ltd. | | | | |
| (Bermuda) | 37,850 | | $ | 1,232,017 |
| PartnerRe Ltd. (Bermuda) | 11,740 | | | 888,366 |
| | | |
|
| | | | | 3,353,061 |
| | | | | |
| Regional Banks | | | | 2.43% |
| Comerica Inc. | 13,550 | | | 416,120 |
| SunTrust Banks Inc. | 22,400 | | | 542,752 |
| | | |
|
| | | | | 958,872 |
| | | | | |
| Total Interest Rate Sensitive | | | | |
| (Cost $6,037,615) | | | | 7,002,684 |
| | | |
|
| | | | | |
| Medical/Healthcare | | | 8.23% |
| Healthcare Services | | | | 5.86% |
| AmerisourceBergen Corp. | 20,950 | | | 824,383 |
| Covance Inc.** | 12,350 | | | 590,948 |
| Omnicare Inc. | 28,750 | | | 897,862 |
| | | |
|
| | | | | 2,313,193 |
| | | | | |
| Pharmaceuticals | | | | 2.37% |
| Forest Laboratories Inc.** | 26,700 | | | 934,233 |
| | | | | |
| Total Medical/Healthcare | | | | |
| (Cost $3,015,814) | | | | 3,247,426 |
| | | |
|
| | | | | |
| Real Estate Investment Trusts | | | |
| (REITs) | | | | 8.12% |
| Diversified & Specialty | | | | 1.65% |
| Rayonier Inc. | 14,550 | | | 653,295 |
| | | | | |
| Healthcare | | | | 2.26% |
| Senior Housing | | | | |
| Properties Trust | 40,000 | | | 892,800 |
| | | | | |
| Multi-Family | | | | 1.43% |
| Home Properties Inc. | 9,200 | | | 564,512 |
| | | | | |
| Office Properties | | | | 2.78% |
| Alexandria Real Estate | | | | |
| Equities Inc. | 8,200 | | | 596,304 |
| Digital Realty Trust Inc. | 6,650 | | | 499,215 |
| | | |
|
| | | | | 1,095,519 |
| | | | | |
| Total Real Estate Investment Trusts (REITs) |
| (Cost $2,762,764) | | | | 3,206,126 |
| | | |
|
| | | | | |
| Technology | | | 9.19% |
| Computer Software | | | | 7.01% |
| Activision Blizzard Inc. | 78,150 | | | 937,019 |
| Parametric Technology | | | | |
| Corp.** | 28,000 | | | 586,880 |
| Symantec Corp.** | 44,150 | | | 645,031 |
| Synopsys Inc.** | 20,300 | | | 597,429 |
| | | |
|
| | | | | 2,766,359 |
PAGE 39 |
|
WESTCORE MID-CAP VALUE FUND AS OF JUNE 30, 2012 (continued)
(UNAUDITED)
| | Shares | | Market Value |
| Semiconductors | | | | | 2.18% |
| Avago Technologies Ltd. | | | | | |
| (Singapore) | 24,050 | | | $ | 863,395 |
| | | | | | |
| Total Technology | | | | | |
| (Cost $3,557,837) | | | | 3,629,754 |
| | | | |
|
| | | | | | |
| Utilities | | | | 12.09% |
| Gas Utilities | | | | | 1.89% |
| UGI Corp. | 25,405 | | | | 747,669 |
| | | | | | |
| Integrated Gas & Electric | | | | | 1.86% |
| CenterPoint Energy Inc. | 35,435 | | | | 732,442 |
| | | | | | |
| Regulated Electric | | | | | 5.96% |
| Edison International | 12,850 | | | | 593,670 |
| Great Plains Energy Inc. | 34,750 | | | | 743,998 |
| Westar Energy Inc. | 33,950 | | | 1,016,802 |
| | | | |
|
| | | | | 2,354,470 |
| | | | | | |
| Water Utilities | | | | | 2.38% |
| American Water Works | | | | | |
| Co. Inc. | 27,350 | | | | 937,558 |
| | | | | | |
| Total Utilities | | | | | |
| (Cost $3,615,301) | | | | 4,772,139 |
| | | | |
|
| | | | | | |
| Total Common Stocks | | | | | |
| (Cost $33,184,565) | | | | 38,126,388 |
| | | | |
|
| | | | | | |
| MONEY MARKET MUTUAL FUNDS | | | | 1.28% |
| Fidelity Institutional | | | | | |
| Money Market | | | | | |
| Government | | | | | |
| Portfolio - Class I | | | | | |
| (7 Day Yield 0.010%) | 505,293 | | | | 505,293 |
| | | | |
|
| | | | | | |
| Total Money Market Mutual Funds | | | | |
| (Cost $505,293) | | | | | 505,293 |
| | | | |
|
| | | | | | |
| | | | | | |
| Total Investments | | | | | |
| (Cost $33,689,858) | 97.87% | | | 38,631,681 |
| | | | | | |
| Other Assets in | | | | | |
| Excess of Liabilities | 2.13% | | | | 839,961 |
| | | | |
|
| | | | | | |
| Net Assets | 100.00% | | $ | 39,471,642 |
| | | | |
|
| | | | | |
| Sector and industry classifications presented herein are based on the sector and industry categorization methodology of the Adviser to the Funds which may result in the designations for one Fund being different from another. |
| | | | | |
| ** Non-income producing security. |
| |
| See Notes to Financial Statements. |
| |
| PAGE 40 |
|
WESTCORE SMALL-CAP OPPORTUNITY FUND AS OF JUNE 30, 2012
(UNAUDITED)
| | Shares | | Market Value |
| COMMON STOCKS | | | 94.65% |
| Basic Materials | | | 2.96% |
| Forestry & Paper | | | | 1.86% |
| KapStone Paper and | | | | |
| Packaging Corp.** | 55,100 | | $ | 873,335 |
| | | | | |
| Precious Metals | | | | 0.64% |
| Hecla Mining Co. | 63,700 | | | 302,575 |
| | | | | |
| Specialty Chemicals | | | | 0.46% |
| OM Group Inc.** | 11,400 | | | 216,600 |
| | | | | |
| Total Basic Materials | | | | |
| (Cost $1,387,178) | | | 1,392,510 |
| | | |
|
| | | | | |
| Capital Goods | | | 4.22% |
| Electrical Equipment | | | | 1.85% |
| General Cable Corp.** | 33,495 | | | 868,860 |
| | | | | |
| Engineering & Construction | | | | 1.24% |
| EMCOR Group Inc. | 20,970 | | | 583,386 |
| | | | | |
| Industrial Products | | | | 1.13% |
| EnPro Industries Inc.** | 14,300 | | | 534,391 |
| | | | | |
| Total Capital Goods | | | | |
| (Cost $1,440,705) | | | 1,986,637 |
| | | |
|
| | | | | |
| Commercial Services | | | 6.10% |
| Business Products & Services | | | 2.10% |
| CRA International Inc.** | 24,400 | | | 358,436 |
| Schawk Inc. | 49,700 | | | 631,190 |
| | | |
|
| | | | | 989,626 |
| | | | | |
| Distributors & Wholesalers | | | | 2.37% |
| Central Garden & Pet Co. - | | | | |
| Class A** | 102,300 | | 1,114,047 |
| | | | | |
| Educational Services | | | | 1.63% |
| Bridgepoint Education Inc.** | 35,200 | | | 767,360 |
| | | | | |
| Total Commercial Services | | | | |
| (Cost $3,028,155) | | | 2,871,033 |
| | | |
|
| | | | | |
| Communications | | | 1.93% |
| Telecomm Equipment & Solutions | | | 1.93% |
| Plantronics Inc. | 27,200 | | | 908,480 |
| | | | | |
| Total Communications | | | | |
| (Cost $894,187) | | | | 908,480 |
| | | |
|
| | | | | |
| Consumer Cyclical | | | 13.21% |
| Clothing & Accessories | | | | 6.41% |
| ANN Inc.** | 19,630 | | | 500,368 |
| | Shares | | Market Value |
| The Cato Corp. - Class A | 29,400 | | $ | 895,524 |
| The Childrens Place | | | | |
| Retail Stores Inc.** | 14,030 | | | 699,115 |
| Perry Ellis International | | | | |
| Inc.** | 44,400 | | | 921,300 |
| | | |
|
| | | | 3,016,307 |
| | | | | |
| Recreation & Leisure | | | | 3.96% |
| JAKKS Pacific Inc. | 57,600 | | | 922,176 |
| Steiner Leisure Ltd. | | | | |
| (Bahamas)** | 20,300 | | | 942,123 |
| | | |
|
| | | | 1,864,299 |
| | | | | |
| Restaurants | | | | 2.04% |
| CEC Entertainment Inc. | 26,400 | | | 960,168 |
| | | | | |
| Specialty Retail | | | | 0.80% |
| PEP Boys - Manny Moe | | | | |
| & Jack | 37,800 | | | 374,220 |
| | | | | |
| Total Consumer Cyclical | | | | |
| (Cost $4,747,196) | | | 6,214,994 |
| | | |
|
| | | | | |
| Consumer Staples | | | 9.32% |
| Consumer Products | | | | 2.42% |
| Elizabeth Arden Inc.** | 29,310 | | 1,137,521 |
| | | | | |
| Food & Agricultural Products | | | 4.19% |
| Calavo Growers Inc. | 30,920 | | | 790,934 |
| Cott Corp. (Canada)** | 144,200 | | 1,183,882 |
| | | |
|
| | | | 1,974,816 |
| | | | | |
| Tobacco | | | | 2.71% |
| Schweitzer-Mauduit | | | | |
| International Inc. | 18,700 | | 1,274,218 |
| | | | | |
| Total Consumer Staples | | | | |
| (Cost $3,060,894) | | | 4,386,555 |
| | | |
|
| | | | | |
| Energy | | | 5.80% |
| Exploration & Production | | | | 4.24% |
| Bill Barrett Corp.** | 24,000 | | | 514,080 |
| GeoResources Inc.** | 40,400 | | 1,479,044 |
| | | |
|
| | | | 1,993,124 |
| | | | | |
| Oil Services | | | | 1.56% |
| Newpark Resources Inc.** | 124,600 | | | 735,140 |
| | | | | |
| Total Energy | | | | |
| (Cost $2,849,820) | | | 2,728,264 |
| | | |
|
| | | | | |
| Interest Rate Sensitive | | | 13.43% |
| Life & Health Insurance | | | | 1.88% |
| National Financial | | | | |
| Partners Corp.** | 66,000 | | | 884,400 |
| | Shares | | Market Value |
| Other Banks | | | | 5.05% |
| Associated Banc-Corp. | 45,800 | | $ | 604,102 |
| Berkshire Hills Bancorp | | | | |
| Inc. | 23,000 | | | 506,000 |
| NBT Bancorp Inc. | 33,500 | | | 723,265 |
| PacWest Bancorp | 23,010 | | | 544,647 |
| | | |
|
| | | | 2,378,014 |
| | | | | |
| Property Casualty Insurance | | | | 6.50% |
| Allied World Assurance | | | | |
| Co. Holdings AG | | | | |
| (Switzerland) | 10,800 | | | 858,276 |
| Alterra Capital Holdings | | | | |
| Ltd. (Bermuda) | 39,510 | | | 922,558 |
| The Hanover Insurance | | | | |
| Group Inc. | 12,800 | | | 500,864 |
| Meadowbrook Insurance | | | | |
| Group Inc. | 88,082 | | | 774,241 |
| | | |
|
| | | | 3,055,939 |
| | | | | |
| Total Interest Rate Sensitive | | | | |
| (Cost $5,693,396) | | | 6,318,353 |
| | | |
|
| | | | | |
| Medical/Healthcare | | | 15.22% |
| Healthcare Services | | | | 6.53% |
| LifePoint Hospitals Inc.** | 25,900 | | 1,061,382 |
| PAREXEL International | | | | |
| Corp.** | 32,200 | | | 909,006 |
| U.S. Physical Therapy Inc. | 43,400 | | 1,103,662 |
| | | |
|
| | | | 3,074,050 |
| | | | | |
| Medical Products & Supplies | | | | 3.60% |
| Orthofix International | | | | |
| N.V. (Netherlands)** | 26,950 | | 1,111,688 |
| STERIS Corp. | 18,620 | | | 584,109 |
| | | |
|
| | | | 1,695,797 |
| | | | | |
| Pharmaceuticals | | | | 5.09% |
| Medicis Pharmaceutical | | | | |
| Corp. - Class A | 35,400 | | 1,208,910 |
| Myriad Genetics Inc.** | 49,800 | | 1,183,746 |
| | | |
|
| | | | 2,392,656 |
| | | | | |
| Total Medical/Healthcare | | | | |
| (Cost $5,657,333) | | | 7,162,503 |
| | | |
|
| | | | | |
| Real Estate Investment Trusts (REITs) | | | 5.33% |
| Hotels | | | | 1.10% |
| Chesapeake Lodging | | | | |
| Trust | 30,100 | | | 518,322 |
| | | | | |
| Multi-Family | | | | 1.38% |
| Associated Estates Realty | | | | |
| Corp. | 43,300 | | | 647,335 |
PAGE 41 |
|
WESTCORE SMALL-CAP OPPORTUNITY FUND AS OF JUNE 30, 2012 (continued)
(UNAUDITED)
| | Shares | | Market Value |
| Office Industrial | | | | 1.79% |
| PS Business Parks Inc. | 12,465 | | $ | 844,130 |
| | | | | |
| Retail Properties | | | | 1.06% |
| Retail Opportunity | | | | |
| Investments Corp. | 41,300 | | | 498,078 |
| | | | | |
| Total Real Estate Investment Trusts (REITs) | |
| (Cost $1,987,480) | | | 2,507,865 |
| | | |
|
| | | | | |
| Technology | | | | 13.81% |
| Computer Software | | | | 6.42% |
| Keynote Systems Inc. | 49,200 | | | 730,620 |
| Manhattan Associates | | | | |
| Inc.** | 10,400 | | | 475,384 |
| Net 1 UEPS Technologies | | | | |
| Inc. (South Africa)** | 60,100 | | | 503,037 |
| Parametric Technology | | | | |
| Corp.** | 32,900 | | | 689,584 |
| Take-Two Interactive | | | | |
| Software Inc.** | 65,900 | | | 623,414 |
| | | |
|
| | | | 3,022,039 |
| | | | | |
| Electronic Equipment | | | | 1.24% |
| Belden Inc. | 17,450 | | | 581,957 |
| | | | | |
| Semiconductor Cap Equipment | | | 1.23% |
| Amkor Technology Inc.** | 118,235 | | | 576,987 |
| | | | | |
| Semiconductors | | | | 4.92% |
| Cypress Semiconductor | | | | |
| Corp.** | 30,800 | | | 407,176 |
| Fairchild Semiconductor | | | | |
| International Inc. - | | | | |
| Class A** | 33,500 | | | 472,350 |
| Standard Microsystems | | | | |
| Corp.** | 38,990 | | 1,438,341 |
| | | |
|
| | | | 2,317,867 |
| | | | | |
| Total Technology | | | | |
| (Cost $6,403,640) | | | 6,498,850 |
| | | |
|
| | | | | |
| Transportation | | | | 2.11% |
| Trucking, Shipping & Air Freight | | | 2.11% |
| Marten Transport Ltd. | 46,600 | | | 990,716 |
| | | | | |
| Total Transportation | | | | |
| (Cost $947,500) | | | | 990,716 |
| | | |
|
| | | | | |
| Utilities | | | | 1.21% |
| Regulated Electric | | | | 1.21% |
| El Paso Electric Co. | 8,100 | | | 268,596 |
| UNS Energy Corp. | 7,800 | | | 299,598 |
| | | |
|
| | | | | 568,194 |
| | Shares | | Market Value |
| Total Utilities | | | | | |
| (Cost $531,715) | | | | $ | 568,194 |
| | | | |
|
|
| | | | | | |
| Total Common Stocks | | | | | |
| (Cost $38,629,199) | | | | 44,534,954 |
| | | | |
|
| | | | | | |
| MONEY MARKET MUTUAL FUNDS | | | | 3.63% |
| Fidelity Institutional | | | | | |
| Money Market | | | | | |
| Government | | | | | |
| Portfolio - Class I | | | | | |
| (7 Day Yield 0.010%) | 1,709,286 | | | 1,709,286 |
| | | | |
|
| | | | | | |
| Total Money Market Mutual Funds | | | | |
| (Cost $1,709,286) | | | | 1,709,286 |
| | | | |
|
| | | | | | |
| | | | | | |
| Total Investments | | | | | |
| (Cost $40,338,485) | 98.28% | | | 46,244,240 |
| | | | | | |
| Other Assets in | | | | | |
| Excess of Liabilities | 1.72% | | | | 808,564 |
| | | | |
|
| | | | | | |
| Net Assets | 100.00% | | $ | 47,052,804 |
| | | | |
|
| | | | | | |
| Sector and industry classifications presented herein are based on the sector and industry categorization methodology of the Adviser to the Funds which may result in the designations for one Fund being different from another. |
| | | |
| ** Non-income producing security. |
| |
| See Notes to Financial Statements. |
| |
| |
| |
| |
| |
| |
| PAGE 42 |
|
WESTCORE SMALL-CAP VALUE FUND AS OF JUNE 30, 2012 (
UNAUDITED)
| | Shares | | Market Value |
| COMMON STOCKS | | | | 95.62% |
| Basic Materials | | | | 5.76% |
| Chemicals | | | | 2.27% |
| Compass Minerals | | | | |
| International Inc. | 41,700 | | $ | 3,180,876 |
| Innophos Holdings Inc. | 69,300 | | | 3,912,678 |
| | | |
|
| | | | | 7,093,554 |
| | | | | |
| Forestry & Paper | | | | 1.76% |
| Buckeye Technologies Inc. | 192,900 | | | 5,495,721 |
| | | | | |
| Specialty Chemicals | | | | 1.73% |
| Cabot Corp. | 133,300 | | | 5,425,310 |
| | | | | |
| Total Basic Materials | | | | |
| (Cost $13,424,944) | | | 18,014,585 |
| | | |
|
| | | | | |
| Capital Goods | | | | 5.13% |
| Aerospace & Defense Suppliers | | | 2.93% |
| Alliant Techsystems Inc. | 66,400 | | | 3,357,848 |
| Cubic Corp. | 66,930 | | | 3,217,994 |
| Curtiss-Wright Corp. | 83,761 | | | 2,600,779 |
| | | |
|
| | | | | 9,176,621 |
| | | | | |
| Electrical Equipment | | | | 2.20% |
| Actuant Corp. - Class A | 111,900 | | | 3,039,204 |
| Franklin Electric Co. Inc. | 74,765 | | | 3,822,735 |
| | | |
|
| | | | | 6,861,939 |
| | | | | |
| Total Capital Goods | | | | |
| (Cost $15,282,053) | | | 16,038,560 |
| | | |
|
| | | | | |
| Commercial Services | | | | 4.40% |
| Business Products & Services | | | 4.40% |
| The Brink’s Co. | 204,200 | | | 4,733,356 |
| Ennis Inc. | 129,410 | | | 1,990,326 |
| MAXIMUS Inc. | 136,200 | | | 7,048,350 |
| | | |
|
| | | | 13,772,032 |
| | | | | |
| Total Commercial Services | | | | |
| (Cost $11,448,981) | | | 13,772,032 |
| | | |
|
| | | | | |
| Communications | | | | 2.76% |
| Telecomm Equipment & Solutions | | | 2.76% |
| Plantronics Inc. | 258,293 | | | 8,626,986 |
| | | | | |
| Total Communications | | | | |
| (Cost $8,723,078) | | | | 8,626,986 |
| | | |
|
| | | | | |
| Consumer Cyclical | | | | 13.42% |
| Apparel & Footwear Manufacturing | | | 1.42% |
| The Jones Apparel | | | | |
| Group Inc. | 464,100 | | | 4,436,796 |
| | Shares | | Market Value |
| Clothing & Accessories | | | | 3.38% |
| The Finish Line Inc. - | | | | |
| Class A | 275,400 | | $ | 5,758,614 |
| Stage Stores Inc. | 262,260 | | | 4,804,603 |
| | | |
|
| | | | 10,563,217 |
| | | | | |
| Consumer Durables | | | | 1.15% |
| The Toro Co. | 49,200 | | | 3,605,868 |
| | | | | |
| Department Stores | | | | 0.52% |
| Dillard’s Inc. - Class A | 25,392 | | | 1,616,963 |
| | | | | |
| Motor Vehicle Parts | | | | 1.55% |
| Cooper Tire & Rubber Co. | 277,300 | | | 4,863,842 |
| | | | | |
| Other Consumer Services | | | | 1.43% |
| Regis Corp. | 249,300 | | | 4,477,428 |
| | | | | |
| Restaurants | | | | 3.97% |
| Bob Evans Farms Inc. | 176,955 | | | 7,113,591 |
| CEC Entertainment Inc. | 146,100 | | | 5,313,657 |
| | | |
|
| | | | 12,427,248 |
| | | | | |
| Total Consumer Cyclical | | | | |
| (Cost $32,545,288) | | | 41,991,362 |
| | | |
|
| | | | | |
| Consumer Staples | | | | 6.04% |
| Food & Agricultural Products | | | 1.78% |
| Sensient Technologies | | | | |
| Corp. | 151,900 | | | 5,579,287 |
| | | | | |
| Grocery & Convenience | | | | 1.91% |
| Casey’s General Stores Inc. | 101,300 | | | 5,975,687 |
| | | | | |
| Tobacco | | | | 2.35% |
| Schweitzer-Mauduit | | | | |
| International Inc. | 107,800 | | | 7,345,492 |
| | | | | |
| Total Consumer Staples | | | | |
| (Cost $16,250,921) | | | 18,900,466 |
| | | |
|
| | | | | |
| Energy | | | | 4.62% |
| Exploration & Production | | | | 1.22% |
| Berry Petroleum Co. - | | | | |
| Class A | 96,400 | | | 3,823,224 |
| | | | | |
| Oil Services | | | | 3.40% |
| Bristow Group Inc. | 127,600 | | | 5,189,492 |
| Tidewater Inc. | 117,400 | | | 5,442,664 |
| | | |
|
| | | | 10,632,156 |
| | | | | |
| Total Energy | | | | |
| (Cost $15,228,539) | | | 14,455,380 |
| | | |
|
| | Shares | | Market Value |
| Interest Rate Sensitive | | | | 25.87% |
| Life & Health Insurance | | | | 4.63% |
| American Equity | | | | |
| Investment Life | | | | |
| Holding Co. | 478,850 | | $ | 5,272,138 |
| Protective Life Corp. | 161,860 | | | 4,760,303 |
| StanCorp Financial | | | | |
| Group Inc. | 119,300 | | | 4,433,188 |
| | | |
|
| | | | 14,465,629 |
| | | | | |
| Other Banks | | | | 8.92% |
| Bank of the Ozarks Inc. | 127,100 | | | 3,823,168 |
| Community Bank | | | | |
| System Inc. | 146,500 | | | 3,973,080 |
| Fulton Financial Corp. | 581,500 | | | 5,809,185 |
| Trustmark Corp. | 173,300 | | | 4,242,384 |
| Westamerica Bancorp | 132,720 | | | 6,263,057 |
| Wintrust Financial Corp. | 107,200 | | | 3,805,600 |
| | | |
|
| | | | 27,916,474 |
| | | | | |
| Property Casualty Insurance | | | 7.03% |
| Alterra Capital Holdings | | | | |
| Ltd. (Bermuda) | 273,465 | | | 6,385,407 |
| Aspen Insurance | | | | |
| Holdings Ltd. | | | | |
| (Bermuda) | 173,600 | | | 5,017,040 |
| Endurance Specialty | | | | |
| Holdings Ltd. | | | | |
| (Bermuda) | 192,900 | | | 7,391,928 |
| Kemper Corp. | 104,000 | | | 3,198,000 |
| | | |
|
| | | | 21,992,375 |
| | | | | |
| Specialty Finance | | | | 2.82% |
| Cash America | | | | |
| International Inc. | 122,260 | | | 5,384,330 |
| GATX Corp. | 89,445 | | | 3,443,633 |
| | | |
|
| | | | | 8,827,963 |
| | | | | |
| Thrifts | | | | 2.47% |
| Hatteras Financial Corp. | 138,400 | | | 3,958,240 |
| Webster Financial Corp. | 173,400 | | | 3,755,844 |
| | | |
|
| | | | | 7,714,084 |
| | | | | |
| Total Interest Rate Sensitive | | | |
| (Cost $68,879,305) | | | 80,916,525 |
| | | |
|
| | | | | |
| Medical/Healthcare | | | | 9.81% |
| Healthcare Services | | | | 2.02% |
| Owens & Minor Inc. | 206,765 | | | 6,333,212 |
| | | | | |
| Medical Products & Supplies | | | 5.57% |
| Meridian Bioscience Inc. | 256,375 | | | 5,245,432 |
| STERIS Corp. | 109,750 | | | 3,442,858 |
| West Pharmaceutical | | | | |
| Services Inc. | 173,000 | | | 8,734,770 |
| | | |
|
| | | | 17,423,060 |
PAGE 43 |
|
WESTCORE SMALL-CAP VALUE FUND AS OF JUNE 30, 2012 (continued)
(UNAUDITED)
| | Shares | | Market Value |
| Pharmaceuticals | | | | 2.22% |
| Medicis Pharmaceutical | | | | |
| Corp. - Class A | 203,400 | | $ | 6,946,110 |
| | | | | |
| Total Medical/Healthcare | | | | |
| (Cost $25,563,010) | | | 30,702,382 |
| | | |
|
| | | | | |
| Real Estate Investment Trusts | | | |
| (REITs) | | | | 8.18% |
| Diversified & Specialty | | | | 2.75% |
| CubeSmart | 343,296 | | | 4,006,264 |
| DuPont Fabros | | | | |
| Technology Inc. | 160,700 | | | 4,589,592 |
| | | |
|
| | | | | 8,595,856 |
| | | | | |
| Healthcare | | | | 1.57% |
| LTC Properties Inc. | 135,785 | | | 4,926,280 |
| | | | | |
| Multi-Family | | | | 1.07% |
| Equity Lifestyle | | | | |
| Properties Inc. | 48,500 | | | 3,345,045 |
| | | | | |
| Office Properties | | | | 2.79% |
| Brandywine Realty Trust | 422,600 | | | 5,214,884 |
| Government Properties | | | | |
| Income Trust | 155,400 | | | 3,515,148 |
| | | |
|
| | | | | 8,730,032 |
| | | | | |
| Total Real Estate Investment Trusts (REITs) |
| (Cost $21,778,268) | | | 25,597,213 |
| | | |
|
| | | | | |
| Technology | | | | 5.38% |
| Computer Software | | | | 1.20% |
| Blackbaud Inc. | 27,888 | | | 715,885 |
| Ebix Inc. | 151,600 | | | 3,024,420 |
| | | |
|
| | | | | 3,740,305 |
| | | | | |
| Electronic Equipment | | | | 3.20% |
| Belden Inc. | 117,016 | | | 3,902,484 |
| CTS Corp. | 277,300 | | | 2,612,166 |
| Park Electrochemical | | | | |
| Corp. | 135,365 | | | 3,503,246 |
| | | |
|
| | | | 10,017,896 |
| | | | | |
| Semiconductors | | | | 0.98% |
| Intersil Corp. | 289,300 | | | 3,081,045 |
| | | | | |
| Total Technology | | | | |
| (Cost $14,480,252) | | | 16,839,246 |
| | | |
|
| | | | | |
| Transportation | | | | 0.34% |
| Trucking, Shipping & Air Freight | | | 0.34% |
| Teekay Tankers Ltd. - | | | | |
| Class A (Bermuda) | 231,070 | | | 1,053,679 |
| | Shares | Market Value |
| Total Transportation | | | | |
| (Cost $2,723,435) | | | $ | 1,053,679 |
| | | |
|
|
| | | | | |
| Utilities | | | | 3.91% |
| Regulated Electric | | | | 3.91% |
| El Paso Electric Co. | 77,300 | | | 2,563,268 |
| Portland General | | | | |
| Electric Co. | 252,430 | | | 6,729,784 |
| UNS Energy Corp. | 76,294 | | | 2,930,452 |
| | | |
|
| | | | 12,223,504 |
| | | | | |
| Total Utilities | | | | |
| (Cost $11,066,595) | | | 12,223,504 |
| | | |
|
| | | | | |
| Total Common Stocks | | | | |
| (Cost $257,394,669) | | | 299,131,920 |
| | | |
|
| | | | | |
| MONEY MARKET MUTUAL FUNDS | | | 3.68% |
| Fidelity Institutional | | | | |
| Money Market | | | | |
| Government | | | | |
| Portfolio - Class I | | | | |
| (7 Day Yield 0.010%) | 11,511,705 | | 11,511,705 |
| | | |
|
| | | | | |
| Total Money Market Mutual Funds | | | |
| (Cost $11,511,705) | | | 11,511,705 |
| | | |
|
| | | | | |
| | | | | |
| Total Investments | | | | |
| (Cost $268,906,374) | 99.30% | | 310,643,625 |
| | | | | |
| Other Assets in | | | | |
| Excess of Liabilities | 0.70% | | | 2,190,327 |
| | | |
|
| | | | | |
| Net Assets | 100.00% | $ | 312,833,952 |
| | | |
|
| | | | | |
| Sector and industry classifications presented herein are based on the sector and industry categorization methodology of the Adviser to the Funds which may result in the designations for one Fund being different from another. |
| | | |
| See Notes to Financial Statements. |
| |
| |
| PAGE 44 |
|
WESTCORE MICRO-CAP OPPORTUNITY FUND AS OF JUNE 30, 2012
(UNAUDITED)
| | Shares | | Market Value |
| COMMON STOCKS | | | 97.75% |
| Basic Materials | | | | 4.88% |
| Chemicals | | | | 0.45% |
| Ferro Corp.** | 2,769 | | $ | 13,291 |
| | | | | |
| Forestry & Paper | | | | 1.37% |
| Mercer International | | | | |
| Inc.** | 1,367 | | | 7,805 |
| Neenah Paper Inc. | 526 | | | 14,039 |
| P.H. Glatfelter Co. | 1,124 | | | 18,400 |
| | | |
|
| | | | | 40,244 |
| | | | | |
| Non-Ferrous Metals | | | | 0.54% |
| Horsehead Holding | | | | |
| Corp.** | 1,586 | | | 15,797 |
| | | | | |
| Other Materials (Rubber & Plastic) | | | 1.31% |
| AEP Industries Inc.** | 377 | | | 16,419 |
| Myers Industries Inc. | 1,288 | | | 22,102 |
| | | |
|
| | | | | 38,521 |
| | | | | |
| Precious Metals | | | | 0.33% |
| Endeavour Silver Corp. | | | | |
| (Canada)** | 1,181 | | | 9,590 |
| | | | | |
| Steel | | | | 0.88% |
| Gibraltar Industries Inc.** | 994 | | | 10,318 |
| Olympic Steel Inc. | 958 | | | 15,730 |
| | | |
|
| | | | | 26,048 |
| | | | | |
| Total Basic Materials | | | | |
| (Cost $133,438) | | | 143,491 |
| | | |
|
| | | | | |
| Capital Goods | | | | 6.83% |
| Electrical Equipment | | | | 0.35% |
| LSI Industries Inc. | 1,445 | | | 10,289 |
| | | | | |
| Engineering & Construction | | | 1.30% |
| Argan Inc. | 1,496 | | | 20,914 |
| Primoris Services Corp. | 1,449 | | | 17,388 |
| | | |
|
| | | | | 38,302 |
| | | | | |
| Farm Equipment | | | | 0.52% |
| Alamo Group Inc. | 491 | | | 15,403 |
| | | | | |
| Industrial Products | | | | 3.60% |
| DXP Enterprises Inc.** | 537 | | | 22,280 |
| Hardinge Inc. | 2,405 | | | 21,885 |
| Lydall Inc.** | 1,494 | | | 20,199 |
| Material Sciences Corp.** | 2,919 | | | 23,936 |
| Standex International | | | | |
| Corp. | 410 | | | 17,454 |
| | | |
|
| | | | 105,754 |
| | Shares | | Market Value |
| Machinery | | | | 0.74% |
| Cascade Corp. | 461 | | $ | 21,690 |
| | | | | |
| Transportation Equipment & Parts | | | 0.32% |
| Miller Industries Inc. | 595 | | | 9,478 |
| | | | | |
| Total Capital Goods | | | | |
| (Cost $197,705) | | | 200,916 |
| | | |
|
| | | | | |
| Commercial Services | | | | 5.94% |
| Business Products & Services | | | 3.39% |
| Asta Funding Inc. | 2,271 | | | 21,279 |
| Barrett Business | | | | |
| Services Inc. | 934 | | | 19,745 |
| Consolidated Graphics Inc.** | 425 | | | 12,346 |
| Electro Rent Corp. | 982 | | | 15,938 |
| Marlin Business Services | | | | |
| Corp. | 1,225 | | | 20,078 |
| Taser International Inc.** | 1,954 | | | 10,239 |
| | | |
|
| | | | | 99,625 |
| | | | | |
| Educational Services | | | | 1.97% |
| Capella Education Co.** | 403 | | | 14,008 |
| Lincoln Educational | | | | |
| Services Corp. | 4,016 | | | 26,104 |
| The Providence Service | | | | |
| Corp.** | 1,306 | | | 17,905 |
| | | |
|
| | | | | 58,017 |
| | | | | |
| IT Services | | | | 0.58% |
| NCI Inc.** | 4,255 | | | 17,233 |
| | | | | |
| Total Commercial Services | | | | |
| (Cost $156,837) | | | 174,875 |
| | | |
|
| | | | | |
| Communications | | | | 2.52% |
| Networking | | | | 0.55% |
| Extreme Networks Inc.** | 4,710 | | | 16,202 |
| | | | | |
| Telecomm Equipment & Solutions | | | 1.97% |
| Communications | | | | |
| Systems Inc. | 975 | | | 10,891 |
| Globecomm Systems Inc.** | 1,004 | | | 10,181 |
| Ituran Location and | | | | |
| Control Ltd. (Israel) | 797 | | | 8,743 |
| Preformed Line Products Co. | 186 | | | 10,771 |
| Telular Corp. | 1,874 | | | 17,316 |
| | | |
|
| | | | | 57,902 |
| | | | | |
| Total Communications | | | | |
| (Cost $78,799) | | | | 74,104 |
| | | |
|
| | Shares | | Market Value |
| Consumer Cyclical | | | | 15.74% |
| Cable, Satellite & Telecomm Services | | | 2.92% |
| Fairpoint | | | | |
| Communications | | | | |
| Inc.** | 1,811 | | $ | 11,138 |
| HickoryTech Corp. | 1,688 | | | 18,754 |
| IDT Corp. - Class B | 1,578 | | | 15,480 |
| Premiere Global | | | | |
| Services Inc.** | 1,362 | | | 11,427 |
| SureWest | | | | |
| Communications Inc. | 557 | | | 11,736 |
| USA Mobility Inc. | 1,341 | | | 17,245 |
| | | | |
|
| | | | | 85,780 |
| | | | | |
| Clothing & Accessories | | | | 0.65% |
| Oxford Industries Inc. | 428 | | | 19,132 |
| | | | | |
| Homebuilders & Suppliers | | | | 1.14% |
| Cavco Industries Inc.** | 368 | | | 18,871 |
| US Home Systems Inc. | 1,443 | | | 14,646 |
| | | | |
|
| | | | | 33,517 |
| | | | | |
| Hotels & Gaming | | | | 1.19% |
| Ameristar Casinos Inc. | 921 | | | 16,366 |
| Multimedia Games | | | | |
| Holding Co. Inc.** | 1,328 | | | 18,592 |
| | | | |
|
| | | | | 34,958 |
| | | | | |
| Motor Vehicles | | | | 1.13% |
| America’s Car-Mart Inc.** | 461 | | | 17,910 |
| Lithia Motors Inc. | 663 | | | 15,282 |
| | | | |
|
| | | | | 33,192 |
| | | | | |
| Other Consumer Services | | | | 0.32% |
| Stamps.com Inc.** | 380 | | | 9,375 |
| | | | | |
| Publishing & Media | | | | 0.94% |
| Ballantyne Strong Inc.** | 2,337 | | | 13,952 |
| Spanish Broadcasting | | | | |
| System Inc.** | 3,388 | | | 13,755 |
| | | | |
|
| | | | | 27,707 |
| | | | | |
| Recreation & Leisure | | | | 3.55% |
| Arctic Cat Inc.** | 399 | | | 14,587 |
| LeapFrog Enterprises Inc.** | 2,385 | | | 24,470 |
| Rick’s Cabaret | | | | |
| International Inc.** | 1,917 | | | 16,620 |
| Shuffle Master Inc.** | 1,087 | | | 15,001 |
| Sturm Ruger & Co. Inc. | 425 | | | 17,064 |
| Viad Corp. | 843 | | | 16,860 |
| | | | |
|
| | | | 104,602 |
PAGE 45 |
|
WESTCORE MICRO-CAP OPPORTUNITY FUND AS OF JUNE 30, 2012 (continued)
(UNAUDITED)
| | Shares | | Market Value |
| Restaurants | | | | 2.87% |
| AFC Enterprises Inc.** | 897 | | $ | 20,757 |
| Benihana Inc. | 669 | | | 10,778 |
| Caribou Coffee Co. Inc.** | 861 | | | 11,115 |
| Fiesta Restaurant | | | | |
| Group Inc.** | 768 | | | 10,161 |
| Red Robin Gourmet | | | | |
| Burgers Inc.** | 354 | | | 10,800 |
| Ruth’s Hospitality | | | | |
| Group Inc.** | 3,149 | | | 20,783 |
| | | |
|
| | | | | 84,394 |
| | | | | |
| Specialty Retail | | | | 1.03% |
| Movado Group Inc. | 662 | | | 16,563 |
| Winmark Corp. | 237 | | | 13,877 |
| | | |
|
| | | | | 30,440 |
| | | | | |
| Total Consumer Cyclical | | | | |
| (Cost $392,848) | | | 463,097 |
| | | |
|
| | | | | |
| Consumer Staples | | | | 2.92% |
| Consumer Products | | | | 1.25% |
| Obagi Medical Products Inc.** | 985 | | | 15,041 |
| Prestige Brands | | | | |
| Holdings Inc.** | 1,383 | | | 21,865 |
| | | |
|
| | | | | 36,906 |
| | | | | |
| Grocery & Convenience | | | | 1.67% |
| The Pantry Inc.** | 1,519 | | | 22,329 |
| Susser Holdings Corp.** | 720 | | | 26,763 |
| | | |
|
| | | | | 49,092 |
| | | | | |
| Total Consumer Staples | | | | |
| (Cost $66,081) | | | | 85,998 |
| | | |
|
| | | | | |
| Energy | | | | 4.64% |
| Exploration & Production | | | | 1.35% |
| Abraxas Petroleum Corp.** | 3,727 | | | 11,889 |
| Panhandle Oil and Gas | | | | |
| Inc. - Class A | 504 | | | 15,190 |
| Vaalco Energy Inc.** | 1,466 | | | 12,652 |
| | | |
|
| | | | | 39,731 |
| | | | | |
| Oil Services | | | | 2.83% |
| Bolt Technology Corp. | 968 | | | 14,530 |
| Flotek Industries Inc.** | 895 | | | 8,359 |
| Gulf Island Fabrication Inc. | 389 | | | 10,974 |
| Mitcham Industries Inc.** | 537 | | | 9,113 |
| Natural Gas Services | | | | |
| Group Inc.** | 1,476 | | | 21,874 |
| Pioneer Drilling Co.** | 1,325 | | | 10,560 |
| TGC Industries Inc.** | 801 | | | 7,778 |
| | | |
|
| | | | | 83,188 |
| | Shares | | Market Value |
| Pipelines | | | | 0.46% |
| Crosstex Energy Inc. | 979 | | $ | 13,706 |
| | | | | |
| Total Energy | | | | |
| (Cost $117,342) | | | 136,625 |
| | | |
|
| | | | | |
| Interest Rate Sensitive | | | 24.71% |
| Life & Health Insurance | | | | 0.52% |
| Presidential Life Corp. | 1,554 | | | 15,276 |
| | | | | |
| Other Banks | | | 11.97% |
| Bank of Kentucky | | | | |
| Financial Corp. | 860 | | | 22,910 |
| Banner Corp. | 1,144 | | | 25,065 |
| BBCN Bancorp Inc.** | 1,798 | | | 19,580 |
| Cardinal Financial Corp. | 1,505 | | | 18,481 |
| First Community | | | | |
| Bancshares Inc. | 1,793 | | | 25,873 |
| First Merchants Corp. | 1,040 | | | 12,958 |
| Hanmi Financial Corp.** | 2,227 | | | 23,339 |
| Heartland Financial | | | | |
| USA Inc. | 823 | | | 19,752 |
| Peoples Bancorp Inc. | 1,339 | | | 29,431 |
| Pinnacle Financial | | | | |
| Partners Inc.** | 677 | | | 13,208 |
| Preferred Bank** | 1,914 | | | 25,571 |
| Provident New York | | | | |
| Bancorp | 2,806 | | | 21,298 |
| Republic Bancorp Inc. - | | | | |
| Class A | 901 | | | 20,047 |
| Southwest Bancorp Inc.** | 1,527 | | | 14,369 |
| Taylor Capital Group Inc.** | 761 | | | 12,473 |
| West Coast Bancorp** | 1,093 | | | 21,478 |
| Wilshire Bancorp Inc.** | 4,780 | | | 26,195 |
| | | |
|
| | | | 352,028 |
| | | | | |
| Property Casualty Insurance | | | 1.94% |
| American Safety | | | | |
| Insurance Holdings | | | | |
| Ltd. (Bermuda)** | 712 | | | 13,350 |
| Baldwin & Lyons Inc. - | | | | |
| Class B | 470 | | | 10,923 |
| Homeowners Choice Inc. | 660 | | | 11,616 |
| Stewart Information | | | | |
| Services Corp. | 1,388 | | | 21,305 |
| | | |
|
| | | | | 57,194 |
| | | | | |
| Regional Banks | | | | 1.43% |
| Centerstate Banks of | | | | |
| Florida Inc. | 2,416 | | | 17,274 |
| Horizon Bancorp | 938 | | | 24,670 |
| | | |
|
| | | | | 41,944 |
| | | | | |
| Securities & Asset Management | | | 2.23% |
| Capital Southwest Corp. | 125 | | | 12,855 |
| Epoch Holding Corp. | 502 | | | 11,436 |
| | Shares | | Market Value |
| Safeguard Scientifics Inc.** | 710 | | $ | 10,991 |
| SWS Group Inc.** | 3,141 | | | 16,741 |
| Virtus Investment | | | | |
| Partners Inc.** | 169 | | | 13,689 |
| | | |
|
| | | | | 65,712 |
| | | | | |
| Specialty Finance | | | | 4.06% |
| Federal Agricultural | | | | |
| Mortgage Corp. | 942 | | | 24,709 |
| MCG Capital Corp. | 5,248 | | | 24,141 |
| Medallion Financial Corp. | 1,988 | | | 21,113 |
| NewStar Financial Inc.** | 1,197 | | | 15,513 |
| Nicholas Financial Inc. | 1,327 | | | 17,012 |
| NorthStar Realty Finance | | | | |
| Corp. | 3,248 | | | 16,954 |
| | | |
|
| | | | 119,442 |
| | | | | |
| Thrifts | | | | 2.56% |
| BofI Holding Inc.** | 1,282 | | | 25,332 |
| First Financial Holdings | | | | |
| Inc. | 1,221 | | | 13,089 |
| Home Federal Bancorp Inc. | 2,020 | | | 21,210 |
| New York Mortgage Trust | | | | |
| Inc. | 2,225 | | | 15,709 |
| | | |
|
| | | | | 75,340 |
| | | | | |
| Total Interest Rate Sensitive | | | | |
| (Cost $653,409) | | | 726,936 |
| | | |
|
| | | | | |
| Medical/Health Care | | | 16.65% |
| Healthcare Services | | | | 3.76% |
| Capital Senior Living | | | | |
| Corp.** | 1,478 | | | 15,667 |
| CardioNet Inc.** | 5,887 | | | 11,951 |
| Five Star Quality Care Inc.** | 5,287 | | | 16,231 |
| Metropolitan Health | | | | |
| Networks Inc.** | 1,697 | | | 16,240 |
| Skilled Healthcare | | | | |
| Group Inc.** | 3,842 | | | 24,128 |
| Sun Healthcare Group Inc.** | 3,142 | | | 26,298 |
| | | |
|
| | | | 110,515 |
| | | | | |
| Medical Products & Supplies | | | | 3.16% |
| AMAG Pharmaceuticals | | | | |
| Inc.** | 1,549 | | | 23,855 |
| Anika Therapeutics Inc.** | 1,290 | | | 17,531 |
| Atrion Corp. | 86 | | | 17,628 |
| Staar Surgical Co.** | 1,315 | | | 10,218 |
| Trinity Biotech PLC - ADR | | | | |
| (Ireland) | 1,128 | | | 13,536 |
| Young Innovations Inc. | 298 | | | 10,278 |
| | | |
|
| | | | | 93,046 |
| PAGE 46 |
|
WESTCORE MICRO-CAP OPPORTUNITY FUND AS OF JUNE 30, 2012 (continued)
(UNAUDITED)
| | Shares | | Market Value |
| Medical Technology | | | | 1.12% |
| HealthStream Inc.** | 663 | | $ | 17,238 |
| Heska Corp. | 1,424 | | | 15,806 |
| | | |
|
| | | | | 33,044 |
| | | | | |
| Pharmaceuticals | | | | 8.61% |
| Acura Pharmaceuticals Inc.** | 3,282 | | | 10,305 |
| Affymax Inc.** | 613 | | | 7,895 |
| ArQule Inc.** | 1,586 | | | 9,405 |
| Array Biopharma Inc.** | 3,047 | | | 10,573 |
| BioCryst | | | | |
| Pharmaceuticals Inc.** | 3,137 | | | 12,485 |
| Cumberland | | | | |
| Pharmaceuticals Inc.** | 3,830 | | | 24,742 |
| Curis Inc.** | 2,435 | | | 13,149 |
| Depomed Inc.** | 2,937 | | | 16,712 |
| DUSA Pharmaceuticals | | | | |
| Inc.** | 1,745 | | | 9,109 |
| Genomic Health Inc.** | 417 | | | 13,928 |
| Hi-Tech Pharmacal Co. Inc.** | 386 | | | 12,506 |
| Neurocrine Biosciences | | | | |
| Inc.** | 3,540 | | | 28,001 |
| Optimer Pharmaceuticals | | | | |
| Inc.** | 810 | | | 12,571 |
| OraSure Technologies Inc.** | 1,529 | | | 17,186 |
| QLT Inc. (Canada)** | 1,298 | | | 9,891 |
| SciClone | | | | |
| Pharmaceuticals Inc.** | 1,955 | | | 13,705 |
| Spectrum | | | | |
| Pharmaceuticals Inc.** | 1,996 | | | 31,058 |
| | | |
|
| | | | 253,221 |
| | | | | |
| Total Medical/Healthcare | | | | |
| (Cost $434,294) | | | 489,826 |
| | | |
|
| | | | | |
| Real Estate Investment Trusts (REITs) | | | 1.97% |
| Diversified & Specialty | | | | 0.74% |
| Winthrop Realty Trust | 1,789 | | | 21,754 |
| | | | | |
| Multi-Family | | | | 0.63% |
| Associated Estates Realty | | | | |
| Corp. | 1,237 | | | 18,493 |
| | | | | |
| | | | | |
| | | | | |
| Retail Properties | | | | 0.60% |
| Agree Realty Corp. | 799 | | | 17,682 |
| | | | | |
| Total Real Estate Investment Trusts (REITs) | |
| (Cost $56,813) | | | | 57,929 |
| | | |
|
| | | | | |
| Technology | | | | 8.73% |
| Computer Software | | | | 2.92% |
| American Software Inc. | 1,357 | | | 10,788 |
| | Shares | | Market Value |
| ClickSoftware | | | | |
| Technologies Ltd. | | | | |
| (Israel) | 1,427 | | $ | 11,545 |
| Digimarc Corp. | 705 | | | 18,090 |
| Keynote Systems Inc. | 634 | | | 9,415 |
| Monotype Imaging | | | | |
| Holdings Inc.** | 1,547 | | | 25,943 |
| SeaChange International | | | | |
| Inc.** | 1,244 | | | 10,238 |
| | | |
|
| | | | | 86,019 |
| | | | | |
| Electronic Equipment | | | | 2.85% |
| CalAmp Corp.** | 3,304 | | | 24,218 |
| FARO Technologies Inc.** | 211 | | | 8,879 |
| Measurement Specialties | | | | |
| Inc.** | 462 | | | 15,020 |
| Mesa Laboratories Inc. | 247 | | | 11,483 |
| MTS Systems Corp. | 306 | | | 11,796 |
| Zygo Corp.** | 698 | | | 12,466 |
| | | |
|
| | | | | 83,862 |
| | | | | |
| Peripherals | | | | 0.75% |
| Xyratex Ltd. (Bermuda) | 1,964 | | | 22,213 |
| | | | | |
| Semiconductor Cap Equipment | | | 1.33% |
| Kopin Corp.** | 3,325 | | | 11,438 |
| Kulicke & Soffa | | | | |
| Industries Inc.** | 814 | | | 7,261 |
| Photronics Inc.** | 1,585 | | | 9,668 |
| Rudolph Technologies Inc.** | 1,225 | | | 10,682 |
| | | |
|
| | | | | 39,049 |
| | | | | |
| Semiconductors | | | | 0.88% |
| Integrated Silicon | | | | |
| Solution Inc.** | 1,323 | | | 13,349 |
| IXYS Corp.** | 1,115 | | | 12,455 |
| | | |
|
| | | | | 25,804 |
| | | | | |
| Total Technology | | | | |
| (Cost $258,424) | | | 256,947 |
| | | |
|
| | | | | |
| Transportation | | | | 1.21% |
| Airlines | | | | 0.57% |
| Hawaiian Holdings Inc.** | 2,590 | | | 16,861 |
| | | | | |
| | | | | |
| Trucking, Shipping & Air Freight | | | 0.64% |
| Saia Inc. | 852 | | | 18,650 |
| | | | | |
| Total Transportation | | | | |
| (Cost $28,681) | | | | 35,511 |
| | | |
|
| | | | | |
| Utilities | | | | 1.01% |
| Gas Utilities | | | | 0.56% |
| Chesapeake Utilities Corp. | 376 | | | 16,439 |
| | Shares | Market Value |
| Independent Power | | | | 0.45% |
| Genie Energy Ltd. - Class B | 1,701 | $ | | 13,217 |
| | | | | |
| Total Utilities | | | | |
| (Cost $28,284) | | | | 29,656 |
| | | |
|
| | | | | |
| Total Common Stocks | | | | |
| (Cost $2,602,955) | | | 2,875,911 |
| | | |
|
| | | | | |
| MONEY MARKET MUTUAL FUNDS | | 13.01% |
| Fidelity Institutional | | | | |
| Money Market | | | | |
| Government | | | | |
| Portfolio - Class I | | | | |
| (7 Day Yield 0.010%) | 382,978 | | 382,978 |
| | | |
|
| | | | | |
| Total Money Market Mutual Funds | | | |
| (Cost $382,978) | | | 382,978 |
| | | |
|
| | | | | |
| | | | | |
| Total Investments | | | | |
| (Cost $2,985,933) | 110.76% | | 3,258,889 |
| | | | | |
| Liabilities in Excess | | | | |
| of Other Assets | (10.76%) | | (316,689) |
| | | |
|
| | | | | |
| Net Assets | 100.00% | $ | 2,942,200 |
| | | |
|
| | | | | |
| Sector and industry classifications presented herein are based on the sector and industry categorization methodology of the Adviser to the Funds which may result in the designations for one Fund being different from another. |
| |
| ** Non-income producing security. |
| |
| See Notes to Financial Statements. |
PAGE 47 |
|
WESTCORE INTERNATIONAL SMALL-CAP FUND AS OF JUNE 30, 2012
(UNAUDITED)
| | Shares | | Market Value |
| COMMON STOCKS | | | | 93.21% |
| Consumer Discretionary | | | | 27.12% |
| Diversified Consumer Services | | | 7.62% |
| MegaStudy Co. Ltd. | | | | |
| (South Korea) | 85,100 | | $ | 5,795,433 |
| Slater & Gordon Ltd. | | | | |
| (Australia) | 5,230,743 | | | 9,904,277 |
| | | |
|
| | | | 15,699,710 |
| | | | | |
| Hotels, Restaurants & Leisure | | | 0.36% |
| Domino’s Pizza Group | | | | |
| Ltd. | | | | |
| (United Kingdom) | 93,500 | | | 753,406 |
| | | | | |
| Household Durables | | | | 0.87% |
| Maisons France Confort | | | | |
| (France) | 70,740 | | | 1,790,433 |
| | | | | |
| Media | | | | 7.39% |
| CTS Eventim AG | | | | |
| (Germany) | 131,800 | | | 3,961,339 |
| Pico Far East Holdings | | | | |
| Ltd. (Hong Kong) | 42,549,600 | | 10,365,979 |
| Rightmove PLC | | | | |
| (United Kingdom) | 36,100 | | | 900,083 |
| | | |
|
| | | | 15,227,401 |
| | | | | |
| Specialty Retail | | | | 6.80% |
| Bonjour Holdings Ltd. | | | | |
| (Hong Kong) | 46,296,600 | | | 6,683,749 |
| Ports Design Ltd. | | | | |
| (Hong Kong) | 7,064,106 | | | 7,330,036 |
| | | |
|
| | | | 14,013,785 |
| | | | | |
| Textiles, Apparel & Luxury Goods | | | 4.08% |
| Xtep International | | | | |
| Holdings Ltd. | | | | |
| (Hong Kong) | 24,176,300 | | | 8,414,080 |
| | | | | |
| Total Consumer Discretionary | | | |
| (Cost $60,031,059) | | | 55,898,815 |
| | | |
|
| | | | | |
| Consumer Staples | | | | 0.71% |
| Food & Staples Retailing | | | | 0.71% |
| Eurocash S.A. (Poland) | 118,800 | | | 1,461,979 |
| | | | | |
| Total Consumer Staples | | | | |
| (Cost $687,228) | | | | 1,461,979 |
| | | |
|
| | | | | |
| Financials | | | | 10.38% |
| Capital Markets | | | | 2.18% |
| Azimut Holding S.p.A. | | | | |
| (Italy) | 399,228 | | | 4,082,210 |
| Treasury Group Ltd. | | | | |
| (Australia) | 97,650 | | | 401,778 |
| | | |
|
| | | | | 4,483,988 |
| | Shares | | Market Value |
| Diversified Financial Services | | | 5.51% |
| IG Group Holdings PLC | | | | |
| (United Kingdom) | 1,340,050 | | $ | 10,052,841 |
| London Capital Group | | | | |
| Holdings PLC | | | | |
| (United Kingdom) | 1,139,826 | | | 1,294,222 |
| | | | |
|
| | | | | 11,347,063 |
| | | | | |
| Thrifts & Mortgage Finance | | | 2.69% |
| Home Capital Group Inc. | | | | |
| (Canada) | 125,100 | | | 5,551,535 |
| | | | | |
| Total Financials | | | | |
| (Cost $21,298,191) | | | | 21,382,586 |
| | | | |
|
| | | | | |
| Health Care | | | | 1.47% |
| Life Sciences Tools & Services | | | 0.78% |
| EPS Co. Ltd. (Japan) | 590 | | | 1,608,319 |
| | | | | |
| Pharmaceuticals | | | | 0.69% |
| China Medical System | | | | |
| Holdings Ltd. | | | | |
| (Cayman Islands) | 3,283,500 | | | 1,413,633 |
| | | | | |
| Total Health Care | | | | |
| (Cost $2,523,455) | | | | 3,021,952 |
| | | | |
|
| | | | | |
| Industrials | | | | 39.93% |
| Commercial Services & Supplies | | | 20.95% |
| Aeon Delight Co. Ltd. | | | | |
| (Japan) | 399,800 | | | 9,137,857 |
| Credit Corp. Group Ltd. | | | | |
| (Australia) | 1,909,771 | | | 11,317,422 |
| Mears Group PLC | | | | |
| (United Kingdom) | 1,981,700 | | | 8,193,588 |
| Mitie Group PLC | | | | |
| (United Kingdom) | 1,475,700 | | | 6,013,643 |
| Prestige International | | | | |
| Inc. (Japan) | 756,300 | | | 8,515,294 |
| | | | |
|
| | | | | 43,177,804 |
| | | | | |
| Construction & Engineering | | | 8.70% |
| Cardno Ltd. (Australia)* | 1,582,363 | | | 12,243,781 |
| Morgan Sindall Group | | | | |
| PLC | | | | |
| (United Kingdom) | 608,767 | | | 5,672,838 |
| | | | |
|
| | | | | 17,916,619 |
| | | | | |
| Machinery | | | | 3.53% |
| Andritz AG (Austria) | 113,860 | | | 5,838,531 |
| Duro Felguera S.A. | | | | |
| (Spain) | 103,600 | | | 569,000 |
| Metka S.A. (Greece) | 99,830 | | | 865,396 |
| | | | |
|
| | | | | 7,272,927 |
| | Shares | | Market Value |
| Professional Services | | | | | 3.87% |
| ITE Group PLC | | | | | |
| (United Kingdom) | 1,779,800 | | | $ | 5,390,884 |
| SAI Global Ltd. (Australia) | 529,574 | | | | 2,590,849 |
| | | | |
|
| | | | | | 7,981,733 |
| | | | | | |
| Trading Companies & Distributors | | | | 2.88% |
| Indutrade AB (Sweden) | 216,900 | | | | 5,941,865 |
| | | | | | |
| Total Industrials | | | | | |
| (Cost $64,923,488) | | | | 82,290,948 |
| | | | |
|
| | | | | | |
| Information Technology | | | | | 13.60% |
| Electronic Equipment & | | | | | |
| Components | | | | | 2.13% |
| Diploma PLC | | | | | |
| (United Kingdom) | 628,330 | | | | 4,383,972 |
| | | | | | |
| Internet Software & Services | | | | 8.14% |
| DeNA Co. Ltd. (Japan) | 252,700 | | | | 6,597,672 |
| Gree Inc. (Japan) | 298,800 | | | | 5,909,837 |
| SMS Co. Ltd. (Japan) | 2,100 | | | | 4,255,958 |
| | | | |
|
| | | | | 16,763,467 |
| | | | | | |
| IT Services | | | | | 2.41% |
| Wirecard AG (Germany)** | 256,906 | | | | 4,971,011 |
| | | | | | |
| Software | | | | | 0.92% |
| Simplex Holdings Inc. (Japan) | 5,532 | | | | 1,900,403 |
| | | | | | |
| Total Information Technology | | | | |
| (Cost $24,437,573) | | | | 28,018,853 |
| | | | |
|
| | | | | | |
| Total Common Stocks | | | | | |
| (Cost $173,900,994) | | | | 192,075,133 |
| | | | |
|
| | | | | | |
| MONEY MARKET MUTUAL FUNDS | | | | 6.82% |
| Fidelity Institutional | | | | | |
| Money Market | | | | | |
| Government | | | | | |
| Portfolio - Class I | | | | | |
| (7 Day Yield 0.010%) | 14,053,850 | | | 14,053,850 |
| | | | |
|
| | | | | | |
| Total Money Market Mutual Funds | | | | |
| (Cost $14,053,850) | | | | 14,053,850 |
| | | | |
|
| | | | | | |
| | | | | | |
| Total Investments | | | | | |
| (Cost $187,954,844) | 100.03% | | | 206,128,983 |
| | | | | | |
| Liabilities in Excess of | | | | | |
| Other Assets | (0.03%) | | | | (57,424) |
| | | | |
|
| | | | | | |
| Net Assets | 100.00% | | | $ | 206,071,559 |
| | | | |
|
| PAGE 48 |
|
WESTCORE INTERNATIONAL SMALL-CAP FUND AS OF JUNE 30, 2012 (continued)
(UNAUDITED)
| Westcore International Small-Cap Fund |
| Country Breakdown as of June 30, 2012 |
| (Unaudited) | | | | |
| Country | Market Value | | % |
| United Kingdom | $ | 42,655,477 | | 20.70% |
| Japan | | 37,925,340 | | 18.40% |
| Australia | | 36,458,107 | | 17.69% |
| Hong Kong | | 32,793,844 | | 15.92% |
| United States | | 14,053,850 | | 6.82% |
| Germany | | 8,932,350 | | 4.34% |
| Sweden | | 5,941,865 | | 2.88% |
| Austria | | 5,838,531 | | 2.83% |
| South Korea | | 5,795,433 | | 2.81% |
| Canada | | 5,551,535 | | 2.69% |
| Italy | | 4,082,210 | | 1.98% |
| France | | 1,790,433 | | 0.87% |
| Poland | | 1,461,979 | | 0.71% |
| Cayman Islands | | 1,413,633 | | 0.69% |
| Greece | | 865,396 | | 0.42% |
| Spain | | 569,000 | | 0.28% |
|
| Total Investments | 206,128,983 | | 100.03% |
| Liabilities in Excess of | | | | |
| Other Assets | | (57,424) | | (0.03%) |
|
| Net Assets | $ | 206,071,559 | | 100.00% |
|
| | | | | |
| Please note the country breakdown is based on the company headquarters. Sector and industry classifications presented herein are based on the sector and industry categorization methodology of the Adviser to the Funds which may result in the designations for one Fund being different from another. |
| | | |
| *All or a portion of the security is pledged as collateral on forward foreign currency contracts as of June 30, 2012. |
| | | | | |
| ** Non-income producing security. |
| |
| See Notes to Financial Statements. |
| Outstanding Forward Foreign Currency Contracts | | | | | | | | | |
| | | | | | | | | Unrealized |
| Contract | Contracted | Purchase/Sale | Expiration | Value On | | | | Appreciation/ |
| Description | Amount | Contract | Date | Settlement Date | | Current Value | | (Depreciation) |
|
|
|
|
|
|
| NZD | 1,839,558 | Purchase | 9/24/2012 | $ | 1,457,279 | | $ | 1,463,795 | | $ | | 6,516 |
| | | | | | | | | | | |
|
|
| | | | | | | | | | | $ | | 6,516 |
| | | | | | | | | | | |
|
| | | | | | | | | | | | | |
| AUD | 17,158,382 | Sale | 9/24/2012 | $ | 17,335,457 | | $ | 17,419,925 | | $ | (84,468) |
| CAD | 5,693,301 | Sale | 9/24/2012 | | 5,577,785 | | | 5,581,115 | | | (3,330) |
| CHF | 8,355,398 | Purchase | 9/24/2012 | | 8,846,840 | | | 8,823,431 | | | (23,409) |
| DKK | 21,853,564 | Purchase | 9/24/2012 | | 3,739,039 | | | 3,728,838 | | | (10,201) |
| EUR | 15,413,845 | Purchase | 9/24/2012 | 19,565,409 | | 19,522,975 | | | (42,434) |
| GBP | 995,394 | Purchase | 9/24/2012 | | 1,564,561 | | | 1,558,579 | | | (5,982) |
| HKD | 238,932,764 | Sale | 9/24/2012 | 30,790,305 | | 30,807,731 | | | (17,426) |
| ILS | 9,523,850 | Purchase | 9/24/2012 | | 2,469,750 | | | 2,428,168 | | | (41,582) |
| JPY | 1,867,762,910 | Purchase | 9/24/2012 | 23,678,056 | | 23,394,553 | | (283,503) |
| KRW | 6,637,800,000 | Sale | 9/24/2012 | | 5,719,973 | | | 5,762,363 | | | (42,390) |
| NOK | 30,021,029 | Purchase | 9/24/2012 | | 5,048,860 | | | 5,030,192 | | | (18,668) |
| PLN | 4,835,160 | Sale | 9/24/2012 | | 1,427,438 | | | 1,436,184 | | | (8,746) |
| SEK | 646,829 | Sale | 9/24/2012 | | 92,561 | | | 93,213 | | | | (652) |
| SGD | 7,071,875 | Purchase | 9/24/2012 | | 5,590,768 | | | 5,583,501 | | | (7,267) |
| | | | | | | | | | | |
|
| | | | | | | | | | | $ | | (590,058) |
| | | | | | | | | | | |
|
PAGE 49 |
|
WESTCORE FLEXIBLE INCOME FUND AS OF JUNE 30, 2012
(UNAUDITED)
| | Shares | Market Value |
| CONVERTIBLE PREFERRED STOCKS | | 1.38% |
| Utilities | | 1.38% |
| Utilities | | | | 1.38% |
| AES Trust III, | | | | |
| 6.750%, 10/15/2029 | | 26,100 | $ | 1,286,991 |
| | | | | |
| Total Utilities | | | | |
| (Cost $1,140,080) | | | 1,286,991 |
| | | |
|
| | | | | |
| Total Convertible Preferred Stocks | | |
| (Cost $1,140,080) | | | 1,286,991 |
| | | |
|
| | | | | |
| NONCONVERTIBLE PREFERRED STOCKS | 4.31% |
| Financials | | 4.31% |
| Real Estate Investment Trusts (REITs) | | 4.31% |
| Diversified (REITs) | | | | 2.23% |
| Cousins Properties Inc.: | | | | |
| 7.500% | | 17,000 | | 428,740 |
| 7.750% | | 25,000 | | 633,750 |
| National Retail Properties Inc., | | | |
| 6.625% | | 39,000 | 1,014,000 |
| | | |
|
| | | | 2,076,490 |
| | | | | |
| Storage (REITs) | | | | 1.11% |
| Public Storage: | | | | |
| 6.450% | | 6,900 | | 176,847 |
| 6.350% | | 31,000 | | 860,250 |
| | | | |
|
| | | | 1,037,097 |
| | | | | |
| Warehouse-Industrial (REITs) | | | 0.97% |
| CenterPoint Properties Trust, | | | |
| 5.377%(1)(2) | | 1,500 | | 900,000 |
| | | | | |
| Total Financials | | | | |
| (Cost $4,552,496) | | | 4,013,587 |
| | | |
|
| | | | | |
| Total Nonconvertible Preferred Stocks | | |
| (Cost $4,552,496) | | | 4,013,587 |
| | | |
|
| | | | | |
| | | Principal | | |
| | | Amount | Market Value |
| CORPORATE BONDS | 88.48% |
| Financials | 10.82% |
| Financial Services | | | | 0.25% |
| Emigrant Capital Trust II - 144A, | | |
| 3.049%, 4/14/2034(2)(3) | $ | 500,000 | | 226,691 |
| | | | | |
| Insurance | | | | 1.17% |
| Zurich Reinsurance Inc., | | | | |
| 7.125%, 10/15/2023 | 1,000,000 | 1,090,680 |
| | Principal | | |
| | Amount | | Market Value |
| Savings & Loans | | | | | 0.68% |
| Washington Mutual Bank, | | | | | |
| 5.550%, | | | | | |
| 6/16/2010**(4) | $ | 2,000,000 | | $ | 635,000 |
| | | | | | |
| Real Estate Investment Trusts (REITs) | | | 8.72% |
| Data Center (REITs) | | | | | 2.37% |
| DuPont Fabros Technology LP, | | | |
| 8.500%, 12/15/2017 | 2,000,000 | | 2,210,000 |
| | | | | | |
| Healthcare (REITs) | | | | | 2.30% |
| Omega Healthcare Investors Inc., | | | |
| 6.750%, 10/15/2022 | 2,000,000 | | 2,145,000 |
| | | | | | |
| Hotels (REITs) | | | | | 2.33% |
| Host Hotels & Resorts LP: | | | | | |
| 5.875%, 6/15/2019 | 1,500,000 | | 1,627,500 |
| 6.000%, 11/1/2020 | | 500,000 | | | 545,000 |
| | | | | |
|
| | | | | 2,172,500 |
| | | | | | |
| Timber (REITs) | | | | | 1.72% |
| Potlatch Corp., | | | | | |
| 7.500%, 11/1/2019 | 1,500,000 | | 1,597,500 |
| | | | | | |
| Total Financials | | | | | |
| (Cost $10,761,135) | | | | 10,077,371 |
| | | | |
|
| | | | | | |
| Industrials | | | 75.22% |
| Aerospace & Defense | | | | | 2.37% |
| BE Aerospace Inc.: | | | | | |
| 8.500%, 7/1/2018 | | 750,000 | | | 824,062 |
| 6.875%, 10/1/2020 | 1,250,000 | | 1,387,500 |
| | | |
|
| | | | | 2,211,562 |
| | | | | | |
| Airlines | | | | | 0.13% |
| Atlas Air Inc., | | | | | |
| Pass-Through | | | | | |
| Certificates, Series | | | | | |
| 1999-1, Class A-1, | | | | | |
| 7.200%, 1/2/2019(5) | | 46,900 | | | 46,900 |
| Continental Airlines Inc., | | | | | |
| Pass-Through | | | | | |
| Certificates, Series | | | | | |
| 1999-1, Class B, | | | | | |
| 6.795%, 8/2/2018(5) | | 70,450 | | | 69,746 |
| | | | | |
|
| | | | | | 116,646 |
| | | | | | |
| Auto Parts & Equipment | | | | | 0.58% |
| Tenneco Inc., | | | | | |
| 7.750%, 8/15/2018 | | 500,000 | | | 545,000 |
| | Principal | | |
| | Amount | | Market Value |
| Autos | | | | | 2.49% |
| DPH Holdings Corp.: | | | | | |
| 6.500%, 5/1/2009**(1)(4) | $ | 1,375,000 | | $ | 20,625 |
| 8.250%, | | | | | |
| 10/15/2033**(1)(4) | 1,015,000 | | | 0 |
| Goodyear Tire & Rubber Co., | | | | |
| 8.750%, 8/15/2020 | 2,144,000 | | 2,296,760 |
| | | |
|
| | | | | 2,317,385 |
| | | | | | |
| Broadcasting | | | | | 1.19% |
| Sinclair Television Group Inc. - 144A, | | | |
| 9.250%, 11/1/2017(3) | 1,000,000 | | 1,110,000 |
| | | | | | |
| Building Materials | | | | | 1.70% |
| USG Corp. - 144A, | | | | | |
| 8.375%, 10/15/2018(3) | 1,500,000 | | 1,582,500 |
| | | | | | |
| Cable & Media | | | | | 1.21% |
| Virgin Media Finance PLC (United Kingdom), | |
| 8.375%, 10/15/2019 | 1,000,000 | | 1,128,750 |
| | | | | | |
| Chemicals | | | | | 0.85% |
| Polymer Group Inc., | | | | | |
| 7.750%, 2/1/2019 | | 750,000 | | 795,938 |
| | | | | | |
| Commercial Services | | | | | 5.74% |
| Aramark Corp., | | | | | |
| 8.500%, 2/1/2015 | 1,500,000 | | 1,537,515 |
| Corrections Corp. of America, | | | |
| 7.750%, 6/1/2017 | 1,500,000 | | 1,631,250 |
| Iron Mountain Inc.: | | | | | |
| 7.750%, 10/1/2019 | | 500,000 | | 542,500 |
| 8.375%, 8/15/2021 | 1,500,000 | | 1,635,000 |
| | | |
|
| | | | | 5,346,265 |
| | | | | | |
| Consumer Products | | | | | 1.99% |
| Jarden Corp., | | | | | |
| 6.125%, 11/15/2022 | 1,750,000 | | 1,855,000 |
| | | | | | |
| Consumer Services | | | | | 2.04% |
| Service Corp. International: | | | | | |
| 6.750%, 4/1/2016 | | 500,000 | | 547,500 |
| 7.000%, 5/15/2019 | 1,250,000 | | 1,350,000 |
| | | |
|
| | | | | 1,897,500 |
| | | | | | |
| Energy-Non Utility | | | | 14.59% |
| Denbury Resources Inc., | | | | | |
| 6.375%, 8/15/2021 | 1,500,000 | | 1,567,500 |
| Forest Oil Corp., | | | | | |
| 7.250%, 6/15/2019 | 2,100,000 | | 1,937,250 |
| MarkWest Energy Partners LP / MarkWest Energy |
| Finance Corp., | | | | | |
| 6.750%, 11/1/2020 | 2,000,000 | | 2,135,000 |
| PAGE 50 |
|
WESTCORE FLEXIBLE INCOME FUND AS OF JUNE 30, 2012 (continued)
(UNAUDITED)
| | Principal | | |
| | Amount | | Market Value |
| Plains Exploration & Production Co.: | | | |
| 6.125%, 6/15/2019 | $ | 2,000,000 | | $ | 2,020,000 |
| 8.625%, 10/15/2019 | | 250,000 | | | 277,187 |
| Range Resources Corp.: | | | | | |
| 5.750%, 6/1/2021 | | 1,750,000 | | | 1,837,500 |
| 5.000%, 8/15/2022 | 1,000,000 | | | 988,750 |
| Southwestern Energy Co., | | | | | |
| 7.500%, 2/1/2018 | 1,410,000 | | | 1,694,338 |
| Tesoro Corp., | | | | | |
| 9.750%, 6/1/2019 | 1,000,000 | | | 1,135,000 |
| | | | |
|
| | | | | 13,592,525 |
| | | | | | |
| Healthcare | | | | | 6.86% |
| Community Health Systems Inc., | | | |
| 8.875%, 7/15/2015 | 1,983,000 | | | 2,037,533 |
| DaVita Inc., | | | | | |
| 6.625%, 11/1/2020 | 1,500,000 | | | 1,571,250 |
| HCA Inc., | | | | | |
| 7.875%, 2/15/2020 | 2,500,000 | | | 2,787,500 |
| | | | |
|
| | | | | | 6,396,283 |
| | | | | | |
| Leasing | | | | | 0.62% |
| Aviation Capital Group Corp. - 144A, | | | |
| 6.750%, 4/6/2021(3) | | 575,000 | | | 577,743 |
| | | | | | |
| Leisure | | | | | 10.12% |
| Harrah’s Operating Co. Inc.: | | | | |
| 10.000%, | | | | | |
| 12/15/2018 | | 336,000 | | | 224,280 |
| 10.000%, | | | | | |
| 12/15/2018 | 1,028,000 | | | 708,035 |
| MGM Mirage Resort Inc., | | | | | |
| 10.375%, 5/15/2014 | 1,500,000 | | | 1,698,750 |
| Penn National Gaming Inc. | | | | | |
| 8.750%, 8/15/2019 | 1,000,000 | | | 1,112,500 |
| Premier Ent. Biloxi, | | | | | |
| 0.000%, 2/1/2012**(1)(4) | | 250,000 | | | 0 |
| Royal Caribbean Cruises Ltd. (Liberia), | | | |
| 6.875%, 12/1/2013 | | 500,000 | | | 530,250 |
| Speedway Motorsports Inc.: | | | | |
| 8.750%, 6/1/2016 | 1,000,000 | | | 1,092,500 |
| 6.750%, 2/1/2019 | | 753,000 | | | 789,709 |
| Starwood Hotels & Resorts Worldwide Inc., |
| 7.150%, 12/1/2019 | | 760,000 | | | 897,411 |
| Vail Resorts Inc., | | | | | |
| 6.500%, 5/1/2019 | 2,250,000 | | | 2,373,750 |
| | | | |
|
| | | | | | 9,427,185 |
| | | | | | |
| Metals & Mining | | | | | 0.54% |
| FMG Resources August 2006 Pty Ltd. - 144A |
| (Australia), | | | | | |
| 6.875%, 2/1/2018(3) | | 500,000 | | | 506,875 |
| | Principal | | |
| | Amount | | Market Value |
| Other Industrials | | | | | 1.08% |
| Mueller Water Products Inc., | | | | |
| 8.750%, 9/1/2020 | $ | 902,000 | | $ | 1,005,730 |
| | | | | | |
| | | | | | |
| Packaging & Containers | | | | | 4.79% |
| Ball Corp., | | | | | |
| 5.750%, 5/15/2021 | 2,025,000 | | | 2,187,000 |
| Crown Americas LLC / Crown Americas Capital |
| Corp. III, | | | | | |
| 6.250%, 2/1/2021 | 2,075,000 | | | 2,277,312 |
| | | | |
|
| | | | | | 4,464,312 |
| | | | | | |
| Paper & Forestry | | | | | 0.96% |
| West Fraser Timber Co. Ltd. - 144A (Canada), |
| 5.200%, | | | | | |
| 10/15/2014(3) | | 850,000 | | | 894,625 |
| | | | | | |
| Pharmaceuticals | | | | | 0.21% |
| Eszopiclone Royalty SUB LLC - 144A, | | | |
| Series IV, 12.000%, | | | | | |
| 3/15/2014(1)(3) | | 199,226 | | | 199,226 |
| | | | | | |
| Retail | | | | | 5.75% |
| AmeriGas Finance LLC / AmeriGas Finance Corp., |
| 6.750%, 5/20/2020 | 2,000,000 | | | 2,045,000 |
| Ltd. Brands Inc.: | | | | | |
| 7.000%, 5/1/2020 | 1,250,000 | | | 1,393,750 |
| 6.625%, 4/1/2021 | | 750,000 | | | 823,125 |
| Sally Holdings LLC / Sally Capital Inc., | | | |
| 6.875%, 11/15/2019 | 1,000,000 | | | 1,092,500 |
| Winn-Dixie Stores Inc., | | | | | |
| Series Escrow | | | | | |
| Units**(1)(4) | 2,150,000 | | | 0 |
| | | | |
|
| | | | | | 5,354,375 |
| | | | | | |
| Technology | | | | | 2.65% |
| Amkor Technology Inc., | | | | | |
| 7.375%, 5/1/2018 | | 500,000 | | | 521,875 |
| Fidelity National Information Services Inc.: | |
| 7.625%, 7/15/2017 | 1,250,000 | | | 1,384,375 |
| 7.875%, 7/15/2020 | | 500,000 | | | 565,000 |
| | | | | |
|
| | | | | | 2,471,250 |
| | | | | | |
| Telecomm & Related | | | | | 4.77% |
| Frontier Communications Corp., | | | |
| 8.500%, 4/15/2020 | 2,250,000 | | | 2,396,250 |
| Tuckahoe Credit Lease Trust - 144A, | | | |
| 9.310%, | | | | | |
| 10/20/2025(1)(3) | 1,844,247 | | | 2,049,014 |
| | | | |
|
| | | | | | 4,445,264 |
| | Principal | |
| | Amount | Market Value |
| Textiles, Apparel & Luxury Goods | | 1.99% |
| Hanesbrands Inc., | | | | |
| 6.375%, 12/15/2020 | $ | 1,750,000 | $ | 1,850,625 |
| | | | | |
| Total Industrials | | | | |
| (Cost $69,477,512) | | | | 70,092,564 |
| | | | |
|
| | | | |
| | | | | |
| Utilities | | | | 2.44% |
| Utilities | | | | 2.44% |
| Calpine Corp Escrow, | | | | |
| 8.750%, | | | | |
| 7/15/2013**(1)(4) | | 200,000 | | 0 |
| Calpine Corp. - 144A, | | | | |
| 7.500%, 2/15/2021(3) | 2,000,000 | | 2,170,000 |
| Indianapolis Power & Light Co. - 144A, | | |
| 6.300%, 7/1/2013(3) | | 100,000 | | 105,328 |
| | | | |
|
| | | | | 2,275,328 |
| | | | | |
| Total Utilities | | | | |
| (Cost $2,152,745) | | | | 2,275,328 |
| | | | |
|
| | | | | |
| Total Corporate Bonds | | | | |
| (Cost $82,391,392) | | | | 82,445,263 |
| | | | |
|
| | | | |
| | | | | |
| COMMERCIAL MORTGAGE-BACKED |
| SECURITIES & RESIDENTIAL |
| MORTGAGE-BACKED SECURITIES | | 2.37% |
| Commercial Mortgage-Backed Securities | 1.94% |
| Adams Outdoor Advertising LP - 144A, | | |
| 10.756%, | | | | |
| 12/20/2017(3)(5) | | 700,000 | | 752,868 |
| GTP Towers Issuer LLC - 144A, | | |
| 8.112%, | | | | |
| 2/15/2015(3)(5) | 1,000,000 | | 1,052,436 |
| | | |
|
| | | | | 1,805,304 |
| | | | | |
| Total Commercial Mortgage-Backed Securities |
| (Cost $1,700,000) | | | | 1,805,304 |
| | | | |
|
| | | | | |
| Residential Mortgage-Backed Securities | 0.43% |
| Residential Funding Mortgage Securities II Inc., |
| Series 2002-HS2, | | | | |
| Class M1, 5.680%, | | | | |
| 1/25/2032 | | 404,125 | | 405,173 |
| | | | | |
| Total Residential Mortgage-Backed Securities |
| (Cost $405,254) | | | | 405,173 |
| | | | |
|
| | | | | |
| Total Commercial Mortgage-Backed Securities & |
| Residential Mortgage-Backed Securities | |
| (Cost $2,105,254) | | | | 2,210,477 |
| | | | |
|
PAGE 51 |
|
WESTCORE FLEXIBLE INCOME FUND AS OF JUNE 30, 2012 (continued)
(UNAUDITED)
| | Shares | | Market Value |
| MONEY MARKET MUTUAL FUNDS | | | 2.11% |
| Fidelity Institutional | | | | |
| Money Market | | | | |
| Government | | | | |
| Portfolio - Class I | | | | |
| (7 Day Yield 0.010%) | 1,971,856 | | $ | 1,971,856 |
| | | |
|
|
| | | | | |
| Total Money Market Mutual Funds | | | |
| (Cost $1,971,856) | | | | 1,971,856 |
| | | |
|
| | | | | |
| | | | | |
| Total Investments | | | | |
| (Cost $92,161,078) | 98.65% | | 91,928,174 |
| | | | | |
| Other Assets in | | | | |
| Excess of Liabilities | 1.35% | | | 1,254,561 |
| | | |
|
| | | | | |
| Net Assets | 100.00% | | $ | 93,182,735 |
| | | |
|
| | | | | |
| ** Non-income producing security. |
| |
| See Notes to Financial Statements. |
| PAGE 52 |
|
WESTCORE FLEXIBLE INCOME FUND AS OF JUNE 30, 2012 (continued)
(UNAUDITED)
(1)
| This security has been valued in good faith by management under the direction of the Board of Trustees. As of June 30, 2012 these securities represented 3.40% of the Fund’s net assets.
|
(2)
| The coupon rate shown on floating or adjustable rate securities represents the rate at period end.
|
(3)
| This security is restricted. The following table provides additional information regarding each security. Included in this list are certain securities exempt from registration under Rule 144A of the Securities Act of 1933, which may be resold in transactions, normally to qualified institutional buyers.
|
| | | | | | | | | | | | Market Value |
| | | | | | | | | | | | as Percentage |
| Issuer Description | Coupon | | Maturity Date | | Acquisition Date | | Cost | | Market Value | | of Net Assets |
|
| Adams Outdoor Advertising LP | 10.756% | | 12/20/2017 | | 12/3/2010 | | $ | 700,000 | | $ | 752,868 | | 0.81% |
| Aviation Capital Group Corp. | 6.750% | | 4/6/2021 | | 12/7/2011 | | | 548,661 | | | 577,743 | | 0.62%^ |
| Calpine Corp. | 7.500% | | 2/15/2021 | | 10/18/2010 - 2/2/2012 | | | 2,052,768 | | | 2,170,000 | | 2.33%^ |
| Emigrant Capital Trust II | 3.049% | | 4/14/2034 | | 8/11/2004 | | | 497,968 | | | 226,691 | | 0.25% |
| Eszoplicone Royalty SUB LLC, Series IV | 12.000% | | 3/15/2014 | | 7/29/2005 | | | 199,226 | | | 199,226 | | 0.21% |
| FMG Resources August 2006 Pty Ltd. | 6.875% | | 2/1/2018 | | 11/30/2011 | | | 467,571 | | | 506,875 | | 0.54%^ |
| GTP Towers Issuer LLC | 8.112% | | 2/15/2015 | | 2/11/2010 | | | 1,000,000 | | | 1,052,436 | | 1.13% |
| Indianapolis Power & Light Co. | 6.300% | | 7/1/2013 | | 7/30/2003 | | | 99,977 | | | 105,328 | | 0.11%^ |
| Sinclair Television Group Inc. | 9.250% | | 11/1/2017 | | 11/15/2011 - 11/17/2011 | | | 1,076,944 | | | 1,110,000 | | 1.19%^ |
| Tuckahoe Credit Lease Trust | 9.310% | | 10/20/2025 | | 12/11/2009 | | | 1,637,757 | | | 2,049,014 | | 2.20% |
| USG Corp. | 8.375% | | 10/15/2018 | | 11/9/2010 - 10/25/2011 | | | 1,452,266 | | | 1,582,500 | | 1.70%^ |
| West Fraser Timber Co. Ltd. | 5.200% | | 10/15/2014 | | 7/20/2009 - 8/3/2009 | | | 754,704 | | | 894,625 | | 0.96%^ |
| | | | | | | | |
|
| | | | | | | | $ | 10,487,842 | | $ | 11,227,306 | | 12.05% |
| | | | | | | | |
|
^ 144A securities with a liquid trading market as determined by the Adviser under the supervision of the Board of Trustees. Such securities represent 7.45% of the Fund’s net assets as of June 30, 2012.
|
(4)
| Income is not being accrued on this security due to the issuer’s default or expected default on interest payments.
|
(5)
| The expected maturity date listed herein differs from the legal maturity date due to call or put features or due to the expected schedule of principal payments.
|
PAGE 53 |
|
WESTCORE PLUS BOND FUND AS OF JUNE 30, 2012
(UNAUDITED)
| | Shares | | Market Value |
| NONCONVERTIBLE | | | |
| PREFERRED STOCKS | | | 0.26% |
| Financials | | | 0.21% |
| Financial Services | | | | | 0.06% |
| First Tennessee Bank - 144A, | | | |
| 3.750%(1)(2) | | 1,500 | | $ | 1,011,094 |
| | | | | | |
| Real Estate Investment Trusts (REITs) | | | 0.15% |
| Apartments (REITs) | | | | | 0.01% |
| Cousins Properties Inc., | | | | | |
| 7.500% | | 10,300 | | | 259,766 |
| | | | | | |
| Warehouse-Industrial (REITs) | | | 0.14% |
| CenterPoint Properties Trust, | | | |
| 5.120%(1)(3) | | 3,900 | | | 2,340,000 |
| | | | | | |
| Total Financials | | | | | |
| (Cost $5,591,577) | | | | | 3,610,860 |
| | | | | |
|
| | | | | | |
| Utilities | | | | | 0.05% |
| Utilities | | | | | 0.05% |
| Southern California Edison, | | | | |
| 5.349% | | 7,638 | | | 764,754 |
| | | | | | |
| Total Utilities | | | | | |
| (Cost $763,800) | | | | | 764,754 |
| | | | | |
|
| | | | | | |
| Total Nonconvertible Preferred Stocks | | | |
| (Cost $6,355,377) | | | | | 4,375,614 |
| | | | | |
|
| | | | | | |
| | | Principal | | | |
| | | Amount | | Market Value |
| CORPORATE BONDS | | | 47.54% |
| Financials | | | 14.32% |
| Financial Services | | | | | 6.74% |
| BB&T Corp.: | | | | | |
| 3.200%, 3/15/2016 | $ | 8,975,000 | | | 9,511,005 |
| 6.850%, 4/30/2019 | 4,150,000 | | | 5,243,994 |
| Capital One Financial Corp., | | | | |
| 4.750%, 7/15/2021 | 6,700,000 | | | 7,329,854 |
| City National Corp., | | | | | |
| 5.250%, 9/15/2020 | 16,475,000 | | 17,562,844 |
| Emigrant Capital Trust II - 144A, | | | |
| 3.049%, 4/14/2034(1)(2) | | 850,000 | | | 385,375 |
| First Empire Capital Trust, | | | | | |
| 8.277%, 6/1/2027 | | 25,000 | | | 25,563 |
| First Horizon National Corp., | | | | |
| 5.375%, 12/15/2015 | 12,525,000 | | 13,228,892 |
| FMR Corp. - 144A, | | | | | |
| 7.490%, 6/15/2019(2) | 5,000,000 | | | 6,057,245 |
| KeyCorp, | | | | | |
| 5.100%, 3/24/2021 | 7,525,000 | | | 8,413,642 |
| PNC Funding Corp., | | | | | |
| 4.250%, 9/15/2015 | 14,595,000 | | 15,875,259 |
| | Principal | | |
| | Amount | | Market Value |
| The Toronto-Dominion Bank (Canada), | | | |
| 2.500%, 7/14/2016 | $ | 12,000,000 | | $ | 12,449,808 |
| Union Bank of California, | | | | | |
| 5.950%, 5/11/2016 | | 3,100,000 | | | 3,467,626 |
| Wachovia Corp., | | | | | |
| 5.625%, 10/15/2016 | 14,250,000 | | | 16,084,915 |
| | | | |
|
| | | | | 115,636,022 |
| | | | | | |
| Insurance | | | | | 1.26% |
| Berkshire Hathaway, | | | | | |
| 4.850%, 1/15/2015 | | 5,000,000 | | | 5,505,190 |
| OneBeacon U.S. Holdings Inc., | | | |
| 5.875%, 5/15/2013 | | 4,858,000 | | | 4,997,959 |
| PartnerRe Finance B LLC, | | | | | |
| 5.500%, 6/1/2020 | | 9,700,000 | | | 10,256,217 |
| Prudential Financial, | | | | | |
| Series MTNB, | | | | | |
| 4.346%, 5/12/2015 | | 675,366 | | | 688,870 |
| Zurich Reinsurance Inc., | | | | | |
| 7.125%, 10/15/2023 | | 200,000 | | | 218,136 |
| | | | | |
|
| | | | | | 21,666,372 |
| | | | | | |
| Leasing | | | | | 0.34% |
| Aviation Capital Group Corp. - 144A, | | | |
| 6.750%, 4/6/2021(2) | | 5,725,000 | | | 5,752,314 |
| | | | | | |
| Savings & Loans | | | | | 0.22% |
| Washington Mutual Bank: | | | | | |
| 5.550%, | | | | | |
| 6/16/2010**(4) | | 7,100,000 | | | 2,254,250 |
| 2.969%, | | | | | |
| 6/16/2010**(4) | | 5,000,000 | | | 1,587,500 |
| | | | | |
|
| | | | | | 3,841,750 |
| | | | | | |
| Real Estate Investment Trusts (REITs) | | | 5.76% |
| Cell Tower (REITs) | | | | | 0.23% |
| American Tower Corp., | | | | | |
| 7.250%, 5/15/2019 | | 3,350,000 | | | 3,937,000 |
| | | | | | |
| Data Center (REITs) | | | | | 0.65% |
| DuPont Fabros Technology LP, | | | |
| 8.500%, 12/15/2017 | 10,075,000 | | | 11,132,875 |
| | | | | | |
| Diversified (REITs) | | | | | 1.04% |
| National Retail Properties Inc., | | | |
| 6.250%, 6/15/2014 | | 975,000 | | | 1,035,579 |
| Washington REIT: | | | | | |
| 5.250%, 1/15/2014 | | 2,000,000 | | | 2,074,716 |
| 4.950%, 10/1/2020 | 13,825,000 | | | 14,733,316 |
| | | | |
|
| | | | | | 17,843,611 |
| | | | | | |
| Healthcare (REITs) | | | | | 0.65% |
| Healthcare Realty Trust Inc., | | | | |
| 5.125%, 4/1/2014 | | 3,125,000 | | | 3,237,303 |
| | Principal | | |
| | Amount | | Market Value |
| Omega Healthcare Investors Inc., | | | |
| 6.750%, 10/15/2022 | $ | 7,430,000 | | $ | 7,968,675 |
| | | | |
|
|
| | | | | 11,205,978 |
| | | | | | |
| Hotels (REITs) | | | | | 0.49% |
| Host Hotels & Resorts LP: | | | | | |
| 5.875%, 6/15/2019 | 2,100,000 | | | 2,278,500 |
| 6.000%, 11/1/2020 | 5,575,000 | | | 6,076,750 |
| | | |
|
| | | | | | 8,355,250 |
| | | | | | |
| Industrials (REITs) | | | | | 0.52% |
| ProLogis LP: | | | | | |
| 7.625%, 8/15/2014 | 6,970,000 | | | 7,671,649 |
| 7.625%, 7/1/2017 | 1,100,000 | | | 1,295,806 |
| | | |
|
| | | | | | 8,967,455 |
| | | | | | |
| Regional Malls (REITs) | | | | | 0.77% |
| Simon Property Group LP: | | | | | |
| 6.100%, 5/1/2016 | 6,025,000 | | | 6,864,517 |
| 7.375%, 6/15/2018 | 2,868,000 | | | 3,548,906 |
| 10.350%, 4/1/2019 | 2,050,000 | | | 2,881,015 |
| | | |
|
| | | | | 13,294,438 |
| | | | | | |
| Shopping Centers (REITs) | | | | | 0.26% |
| Kimco Realty Corp., | | | | | |
| Series MTNC, | | | | | |
| 5.980%, 7/30/2012 | 1,800,000 | | | 1,806,214 |
| Weingarten Realty Investors: | | | | |
| 4.857%, 1/15/2014 | 2,015,000 | | | 2,067,543 |
| 6.640%, 7/15/2026 | | 545,000 | | | 606,009 |
| | | | |
|
| | | | | | 4,479,766 |
| | | | | | |
| Timber (REITs) | | | | | 1.15% |
| Plum Creek Timberland, | | | | | |
| 5.875%, 11/15/2015 | 2,400,000 | | | 2,661,614 |
| Potlatch Corp., | | | | | |
| 7.500%, 11/1/2019 | 15,996,000 | | 17,035,740 |
| | | |
|
| | | | | 19,697,354 |
| | | | | | |
| Total Financials | | | | | |
| (Cost $240,242,691) | | | | 245,810,185 |
| | | | |
|
| | | | | | |
| Industrials | | | 27.85% |
| Aerospace & Defense | | | | | 0.10% |
| BE Aerospace Inc., | | | | | |
| 6.875%, 10/1/2020 | 1,550,000 | | | 1,720,500 |
| | | | | | |
| Autos | | | | | 0.77% |
| BMW US Capital Inc. - 144A, | | | | |
| 5.730%, 11/1/2015(2)(3) | 12,000,000 | | 13,198,320 |
| DPH Holdings Corp., | | | | | |
| 6.500%, 5/1/2009**(3)(4) | 1,000,000 | | | 15,000 |
| | | |
|
| | | | | 13,213,320 |
| PAGE 54 |
|
WESTCORE PLUS BOND FUND AS OF JUNE 30, 2012 (continued)
(UNAUDITED)
| | Principal | | |
| | Amount | | Market Value |
| Broadcasting | | | | | 0.04% |
| Sinclair Television Group Inc. - 144A, | | | |
| 9.250%, 11/1/2017(2) | $ | 600,000 | | $ | 666,000 |
| | | | | | |
| Building Materials | | | | | 0.52% |
| USG Corp. - 144A, | | | | | |
| 8.375%, | | | | | |
| 10/15/2018(2) | 8,400,000 | | 8,862,000 |
| | | | | | |
| Cable & Media | | | | | 1.73% |
| CBS Corp., | | | | | |
| 8.875%, 5/15/2019 | 11,675,000 | | 15,468,196 |
| Time Warner Inc., | | | | | |
| 9.150%, 2/1/2023 | 2,410,000 | | 3,358,128 |
| Virgin Media/Secured Finance PLC | | | |
| (United Kingdom), | | | | | |
| 5.250%, 1/15/2021 | 9,735,000 | | 10,811,029 |
| | | |
|
| | | | | 29,637,353 |
| | | | | | |
| Chemicals | | | | | 0.56% |
| Potash Corp. of Saskatchewan Inc. (Canada), |
| 6.500%, 5/15/2019 | 7,625,000 | | 9,594,278 |
| | | | | | |
| Commercial Services | | | | | 0.47% |
| Iron Mountain Inc., | | | | | |
| 7.750%, 10/1/2019 | 7,425,000 | | 8,056,125 |
| | | | | | |
| Consumer Products | | | | | 0.31% |
| Jarden Corp., | | | | | |
| 6.125%, 11/15/2022 | 5,000,000 | | 5,300,000 |
| | | | | | |
| Energy-Non Utility | | | | | 6.00% |
| Apache Corp., | | | | | |
| 5.100%, 9/1/2040 | 5,550,000 | | 6,407,303 |
| BP Capital Markets PLC (United Kingdom), | |
| 3.625%, 5/8/2014 | 16,080,000 | | 16,864,495 |
| Burlington Resources Inc., | | | | | |
| 6.875%, 2/15/2026 | 1,000,000 | | 1,308,728 |
| Forest Oil Corp., | | | | | |
| 7.250%, 6/15/2019 | 12,460,000 | | 11,494,350 |
| Kerr-McGee Corp., | | | | | |
| 6.950%, 7/1/2024 | 4,500,000 | | 5,586,426 |
| Pride International Inc.: | | | | | |
| 8.500%, 6/15/2019 | 2,925,000 | | 3,784,663 |
| 6.875%, 8/15/2020 | 7,575,000 | | 9,315,258 |
| Range Resources Corp., | | | | | |
| 5.750%, 6/1/2021 | 11,225,000 | | 11,786,250 |
| Southwestern Energy Co., | | | | | |
| 7.500%, 2/1/2018 | 10,520,000 | | 12,641,442 |
| Tennessee Gas Pipeline Co.: | | | | |
| 7.000%, 3/15/2027 | | 75,000 | | | 94,441 |
| 7.000%, 10/15/2028 | 9,775,000 | | 12,299,266 |
| Transcontinental Gas Pipe Line, | | | |
| 6.400%, 4/15/2016 | 5,725,000 | | 6,617,505 |
| | Principal | | |
| | Amount | | Market Value |
| Valero Energy Corp., | | | | | |
| 6.125%, 6/15/2017 | $ | 4,000,000 | | $ | 4,663,112 |
| Weatherford International Ltd. (Switzerland), |
| 5.150%, 3/15/2013 | | 171,000 | | | 175,659 |
| | | | |
|
| | | | | 103,038,898 |
| | | | | | |
| Food & Beverages | | | | | 4.12% |
| Anheuser-Busch Companies Inc. (Belgium), |
| 5.050%, 10/15/2016 | 8,030,000 | | | 9,165,121 |
| Anheuser-Busch InBev Worldwide Inc. (Belgium), |
| 7.750%, 1/15/2019 | 6,350,000 | | | 8,402,574 |
| The Coca-Cola Co.: | | | | | |
| 3.625%, 3/15/2014 | 5,000,000 | | | 5,257,535 |
| 1.500%, 11/15/2015 | 6,000,000 | | | 6,136,176 |
| Diageo Finance BV (Netherlands), | | | |
| 5.300%, 10/28/2015 | 9,700,000 | | 10,946,207 |
| Kraft Foods Inc.: | | | | | |
| 4.125%, 2/9/2016 | 2,000,000 | | | 2,180,378 |
| 5.375%, 2/10/2020 | 4,125,000 | | | 4,892,238 |
| PepsiCo Inc.: | | | | | |
| 3.750%, 3/1/2014 | 6,500,000 | | | 6,821,737 |
| 2.500%, 5/10/2016 | 15,000,000 | | 15,767,940 |
| WM Wrigley Jr. Co., | | | | | |
| 4.650%, 7/15/2015 | 1,125,000 | | | 1,197,085 |
| | | |
|
| | | | | 70,766,991 |
| | | | | | |
| Healthcare | | | | | 0.97% |
| DaVita Inc., | | | | | |
| 6.625%, 11/1/2020 | 3,700,000 | | | 3,875,750 |
| HCA Inc., | | | | | |
| 7.875%, 2/15/2020 | 11,475,000 | | 12,794,625 |
| | | |
|
| | | | | 16,670,375 |
| | | | | | |
| Leisure | | | | | 1.18% |
| Harrah’s Operating Co. Inc.: | | | | |
| 10.000%, | | | | | |
| 12/15/2018 | | 933,000 | | | 622,778 |
| 10.000%, | | | | | |
| 12/15/2018 | 2,846,000 | | | 1,960,182 |
| MGM Mirage, | | | | | |
| 7.625%, 7/15/2013 | 1,500,000 | | | 1,545,000 |
| Starwood Hotels & Resorts Worldwide Inc., |
| 6.750%, 5/15/2018 | 9,170,000 | | 10,669,891 |
| Vail Resorts Inc., | | | | | |
| 6.500%, 5/1/2019 | 5,250,000 | | | 5,538,750 |
| | | |
|
| | | | | 20,336,601 |
| | | | | | |
| Machinery | | | | | 0.26% |
| Cummins Inc., | | | | | |
| 7.125%, 3/1/2028 | 3,301,000 | | | 4,463,150 |
| | | | | | |
| Metals & Mining | | | | | 1.17% |
| BHP Billiton Finance USA Ltd. (Australia): | |
| 5.500%, 4/1/2014 | 5,075,000 | | | 5,500,224 |
| 6.500%, 4/1/2019 | 5,025,000 | | | 6,409,197 |
| | Principal | | |
| | Amount | | Market Value |
| Sweetwater Investors LLC - 144A, | | | |
| 5.875%, 5/15/2014(2) | $ | 180,364 | | $ | 177,100 |
| Teck Resources Ltd. (Canada), | | | | |
| 10.750%, 5/15/2019 | 6,676,000 | | 8,037,998 |
| | | |
|
| | | | | 20,124,519 |
| | | | | | |
| Packaging & Containers | | | | | 1.33% |
| Ball Corp., | | | | | |
| 5.750%, 5/15/2021 | 15,000,000 | | 16,200,000 |
| Crown Americas LLC / Crown Americas Capital |
| Corp. III, | | | | | |
| 6.250%, 2/1/2021 | 6,000,000 | | 6,585,000 |
| | | |
|
| | | | | 22,785,000 |
| | | | | | |
| Paper & Forestry | | | | | 0.54% |
| West Fraser Timber Co. Ltd. - 144A (Canada), |
| 5.200%, | | | | | |
| 10/15/2014(2) | 8,825,000 | | 9,288,313 |
| | | | | | |
| Pharmaceuticals | | | | | 0.74% |
| Eszopiclone Royalty SUB LLC - 144A, | | | |
| Series IV, 12.000%, | | | | | |
| 3/15/2014(2)(3) | | 199,226 | | | 199,226 |
| GlaxoSmithKline Capital Inc. (United Kingdom), |
| 5.650%, 5/15/2018 | 10,350,000 | | 12,533,777 |
| | | |
|
| | | | | 12,733,003 |
| | | | | | |
| Retail | | | | | 2.84% |
| AmeriGas Finance LLC / AmeriGas Finance Corp., |
| 6.750%, 5/20/2020 | 7,975,000 | | 8,154,437 |
| Macy’s Retail Holdings Inc., | | | | |
| 7.450%, 7/15/2017 | 11,050,000 | | 13,475,376 |
| Sally Holdings LLC/Sally Capital Inc. | | | |
| 6.875%, 11/15/2019 | 7,690,000 | | 8,401,325 |
| Wal-Mart Stores Inc., | | | | | |
| 7.550%, 2/15/2030 | 12,400,000 | | 18,656,098 |
| | | |
|
| | | | | 48,687,236 |
| | | | | | |
| Technology | | | | | 0.56% |
| International Business Machines Corp., | | | |
| 2.000%, 1/5/2016 | 8,000,000 | | 8,270,008 |
| Science Applications International Corp., | | | |
| 5.500%, 7/1/2033 | 1,225,000 | | 1,292,072 |
| | | |
|
| | | | | 9,562,080 |
| | | | | | |
| Telecomm & Related | | | | | 2.09% |
| America Movil SAB de CV (Mexico), | | | |
| 5.000%, 10/16/2019 | 6,975,000 | | 7,954,925 |
| AT&T Inc., | | | | | |
| 5.625%, 6/15/2016 | 9,600,000 | | 11,128,685 |
| AT&T Mobility LLC, | | | | | |
| 7.125%, 12/15/2031 | 2,750,000 | | 3,656,031 |
| Frontier Communications Corp., | | | |
| 8.125%, 10/1/2018 | 7,450,000 | | 7,952,875 |
PAGE 55 |
|
WESTCORE PLUS BOND FUND AS OF JUNE 30, 2012 (continued)
(UNAUDITED)
| | Principal | | |
| | Amount | | Market Value |
| Tuckahoe Credit Lease Trust - 144A, | | | |
| 9.310%, 10/20/2025(2)(3) | $ | 4,713,076 | | $ | 5,236,369 |
| | | | |
|
|
| | | | | 35,928,885 |
| | | | | | |
| Textiles, Apparel & Luxury Goods | | | 0.33% |
| Hanesbrands Inc., | | | | | |
| 6.375%, 12/15/2020 | 5,400,000 | | | 5,710,500 |
| | | | | | |
| Transportation | | | | | 1.22% |
| Burlington Northern Santa Fe Corp.: | | | |
| 5.750%, 3/15/2018 | 7,175,000 | | | 8,545,403 |
| 4.575%, 1/15/2021 | | 981,807 | | | 1,062,079 |
| Burlington Northern Santa Fe LLC, | | | |
| 6.150%, 5/1/2037 | 4,325,000 | | | 5,330,632 |
| Canadian National Railway Co. (Canada), | |
| 6.800%, 7/15/2018 | 3,315,000 | | | 4,180,805 |
| CSX Transportation Inc., | | | | | |
| 9.750%, 6/15/2020 | 1,250,000 | | | 1,759,536 |
| | | |
|
| | | | | 20,878,455 |
| | | | | | |
| Total Industrials | | | | | |
| (Cost $447,028,021) | | | | 478,023,582 |
| | | | |
|
| | | | | | |
| Utilities | | | 5.37% |
| Utilities | | | | | 5.37% |
| Calpine Corp. - 144A, | | | | | |
| 7.500%, 2/15/2021(2) | 8,350,000 | | | 9,059,750 |
| Commonwealth Edison Co., | | | | | |
| Series 104, 5.950%, | | | | | |
| 8/15/2016 | 7,375,000 | | | 8,666,975 |
| Consumers Energy Co., | | | | | |
| Series B, 6.875%, | | | | | |
| 3/1/2018 | 1,564,000 | | | 1,928,659 |
| Duke Energy Carolinas LLC: | | | | |
| Series C, 7.000%, | | | | | |
| 11/15/2018 | 4,285,000 | | | 5,562,787 |
| 3.900%, 6/15/2021 | 4,275,000 | | | 4,779,249 |
| Georgia Power Co., | | | | | |
| Series 07-A, | | | | | |
| 5.650%, 3/1/2037 | | 850,000 | | | 1,034,667 |
| Indianapolis Power & Light Co. - 144A, | | | |
| 6.300%, 7/1/2013(2) | | 400,000 | | | 421,311 |
| MidAmerican Energy Holdings Co., | | | |
| 5.875%, 10/1/2012 | | 200,000 | | | 202,526 |
| Nevada Power Co.: | | | | | |
| Series M, 5.950%, | | | | | |
| 3/15/2016 | 9,287,000 | | 10,645,400 |
| Series R, 6.750%, | | | | | |
| 7/1/2037 | 2,850,000 | | | 3,873,566 |
| NextEra Energy Capital Corp.: | | | |
| 2.600%, 9/1/2015 | 3,200,000 | | | 3,290,672 |
| 6.350%, 10/1/2066(1) | 2,900,000 | | | 2,960,726 |
| | Principal | |
| | Amount | Market Value |
| Northern Natural Gas Co. - 144A, | | |
| 5.375%, | | | | |
| 10/31/2012(2) | $ | 350,000 | $ | 355,233 |
| Oncor Electric Delivery Co. LLC, | | |
| 7.000%, 9/1/2022 | 13,178,000 | 16,049,539 |
| Public Service Co. of Oklahoma, | | |
| 6.150%, 8/1/2016 | 3,075,000 | 3,547,397 |
| San Diego Gas & Electric Co., | | | |
| 6.000%, 6/1/2026 | 3,550,000 | 4,693,835 |
| Tenaska Alabama II Partners LP - 144A, | |
| 6.125%, 3/30/2023(2) | | 221,874 | | 231,728 |
| Tenaska Virginia Partners LP - 144A, | | |
| 6.119%, 3/30/2024(2) | | 197,498 | | 214,436 |
| Westar Energy Inc., | | | | |
| 8.625%, 12/1/2018 | 9,950,000 | 13,581,431 |
| WPD Holdings Inc. - 144A (United Kingdom), | |
| 7.250%, | | | | |
| 12/15/2017(2) | | 875,000 | 1,008,892 |
| | | |
|
| | | | 92,108,779 |
| | | | | |
| Total Utilities | | | | |
| (Cost $81,360,263) | | | 92,108,779 |
| | | |
|
| | | | | |
| Total Corporate Bonds | | | | |
| (Cost $768,630,975) | | | 815,942,546 |
| | | |
|
| | | | | |
| MUNICIPAL BONDS | | 0.40% |
| Washington | | 0.40% |
| Washington State Build America Bonds, | |
| 5.090%, 8/1/2033 | 5,900,000 | 6,934,093 |
| | | | | |
| Total Municipal Bonds | | | | |
| (Cost $5,900,000) | | | 6,934,093 |
| | | |
|
| | | | | |
| ASSET-BACKED SECURITIES, | | |
| COMMERCIAL MORTGAGE-BACKED | | |
| SECURITIES, RESIDENTIAL | | |
| MORTGAGE-BACKED SECURITIES | | |
| & AGENCY MORTGAGE-BACKED | | |
| SECURITIES | | 38.04% |
| Asset-Backed Securities | | 5.66% |
| Aircraft Lease Securitisation Ltd. - 144A, | |
| Series 2007-1A, | | | | |
| Class G3, 0.499%, | | | | |
| 5/10/2032(1)(2) | 8,807,785 | 8,279,318 |
| BMW Vehicle Owner Trust, | | | | |
| Series 2011-A, | | | | |
| Class A3, 0.760%, | | | | |
| 9/25/2014(5) | 4,500,000 | 4,510,724 |
| CarMax Auto Owner Trust: | | | | |
| Series 2009-2, | | | | |
| Class A3, 1.740%, | | | | |
| 4/15/2014 | | 819,007 | | 821,445 |
| Series 2009-2, | | | | |
| Class B, 4.650%, | | | | |
| 8/17/2015 | 6,000,000 | 6,309,978 |
| | Principal | | |
| | Amount | | Market Value |
| CenterPoint Energy Transition Bond Co. LLC, |
| Series 2008-A, | | | | | |
| Class A1, 4.192%, | | | | | |
| 2/1/2020 | $ | 3,335,034 | | $ | 3,589,587 |
| Honda Auto Receivables Owner Trust: | | | |
| Series 2010-1, | | | | | |
| Class A4, 1.980%, | | | | | |
| 3/21/2013(5) | 5,025,000 | | | 5,077,119 |
| Series 2010-3, | | | | | |
| Class A4, 0.940%, | | | | | |
| 11/21/2013(5) | 8,480,000 | | | 8,510,757 |
| Series 2012-2, | | | | | |
| Class A4, 0.910%, | | | | | |
| 6/15/2015(5) | 4,200,000 | | | 4,212,810 |
| Hyundai Auto Receivables Trust, | | | |
| Series 2009-A, | | | | | |
| Class A4, 3.150%, | | | | | |
| 3/15/2016 | 5,300,000 | | | 5,415,922 |
| John Deere Owner Trust: | | | | | |
| Series 2011-A, | | | | | |
| Class A3, 1.290%, | | | | | |
| 1/15/2016 | 3,325,000 | | | 3,349,136 |
| Series 2011-A, | | | | | |
| Class A4, 1.960%, | | | | | |
| 4/16/2018 | 5,528,000 | | | 5,668,522 |
| Marriott Vacation Club Owner Trust - 144A: | |
| Series 2006-2A, | | | | | |
| Class A, 5.362%, | | | | | |
| 4/20/2014(2)(5) | | 112,815 | | | 114,386 |
| Series 2010-1A, | | | | | |
| Class A, 3.540%, | | | | | |
| 12/20/2032(2) | 5,739,337 | | | 5,891,366 |
| Mercedes-Benz Auto Receivables Trust, | | | |
| Series 2009-1, | | | | | |
| Class A3, 1.670%, | | | | | |
| 1/15/2014 | | 996,608 | | | 1,000,443 |
| Toyota Auto Receivables Owner Trust: | | | |
| Series 2012-A, | | | | | |
| Class A3, 0.750%, | | | | | |
| 2/16/2016 | 10,000,000 | | 10,024,550 |
| Series 2012-A, | | | | | |
| Class A4, 0.990%, | | | | | |
| 8/15/2017 | 5,000,000 | | | 5,030,090 |
| Chase Issuance Trust, | | | | | |
| Series 2012-A3, | | | | | |
| Class A3, 0.790%, | | | | | |
| 6/15/2017 | 11,000,000 | | 11,012,441 |
| World Financial Network Credit Card Master Trust, |
| Series 2011-A, | | | | | |
| Class A, 1.680%, | | | | | |
| 8/15/2018 | 8,250,000 | | | 8,299,764 |
| | | | | | |
| Total Asset-Backed Securities | | | |
| (Cost $95,905,836) | | | | 97,118,358 |
| | | | |
|
| | | | | | |
| Commercial Mortgage-Backed Securities | 3.11% |
| Adams Outdoor Advertising LP - 144A: | | | |
| 5.438%, | | | | | |
| 12/20/2017(2)(5) | 7,924,434 | | | 8,417,674 |
| PAGE 56 |
|
WESTCORE PLUS BOND FUND AS OF JUNE 30, 2012 (continued)
(UNAUDITED)
| | Principal | | |
| | Amount | | Market Value |
| 10.756%, | | | | | |
| 12/20/2017(2)(5) | $ | 6,300,000 | | $ | 6,775,814 |
| Crown Castle Towers LLC - 144A: | | | |
| 5.495%, 1/15/2017(2)(5) | 4,500,000 | | | 5,001,592 |
| 6.113%, 1/15/2020(2)(5) | 8,975,000 | | 10,412,023 |
| 4.883%, 8/15/2020(2)(5) | | 5,900,000 | | | 6,420,905 |
| | | | | | |
| GTP Towers Issuer LLC - 144A, | | | |
| 8.112%, 2/15/2015(2)(5) | 15,000,000 | | 15,786,540 |
| SBA Tower Trust - 144A, | | | | | |
| 4.254%, 4/15/2015(2)(5) | | 550,000 | | | 576,534 |
| | | | | | |
| Total Commercial Mortgage-Backed Securities |
| (Cost $49,149,433) | | | | 53,391,082 |
| | | | |
|
| | | | | | |
| Residential Mortgage-Backed Securities | 0.92% |
| Banc of America Funding Corp.: | | | |
| Class 2A4, 5.500%, | | | | | |
| 8/1/2035 | | 836,591 | | | 740,133 |
| Series 2005-4, | | | | | |
| Class 1A4, 5.500%, | | | | | |
| 8/1/2035 | | 416,799 | | | 343,568 |
| Banc of America Mortgage Securities Inc.: | |
| Series 2003-G, | | | | | |
| Class 2A1, 2.831%, | | | | | |
| 8/25/2033(1) | 6,642,206 | | | 6,370,659 |
| Series 2005-2, | | | | | |
| Class 1A12, 5.500%, | | | | | |
| 3/25/2035 | | 288,426 | | | 278,701 |
| Series 2005-8, | | | | | |
| Class A14, 5.500%, | | | | | |
| 9/25/2035 | | 846,051 | | | 677,277 |
| Bank of America Alternative Loan Trust, | |
| Series 2005-4, | | | | | |
| Class CB9, 5.500%, | | | | | |
| 5/25/2035 | | 803,835 | | | 142,768 |
| Bear Stearns Co.: | | | | | |
| Series 2003-AC4, | | | | | |
| Class A, 5.500%, | | | | | |
| 9/25/2033 | 7,001,848 | | | 7,196,079 |
| Series 2003-7, | | | | | |
| Class 4A, 4.878%, | | | | | |
| 10/25/2033(1) | | 48,921 | | | 50,221 |
| WAMU Mortgage Pass-Through Certificates, |
| Series 2003-AR3, | | | | | |
| Class B1, 2.370%, | | | | | |
| 4/25/2033(1) | | 41,370 | | | 28,974 |
| | | | | | |
| Total Residential Mortgage-Backed Securities |
| (Cost $16,717,156) | | | | 15,828,380 |
| | | | |
|
| | | | | | |
| Agency Mortgage-Backed Securities | | | 28.35% |
| FGLMC: | | | | | |
| Pool #A92533, | | | | | |
| 4.500%, 6/1/2040 | 12,210,785 | | 13,067,518 |
| Pool #A97047, | | | | | |
| 4.500%, 2/1/2041 | 10,185,773 | | 10,916,337 |
| | Principal | | |
| | Amount | | Market Value |
| FHLMC: | | | | | |
| Pool #781958, | | | | | |
| 5.126%, 9/1/2034(1) | $ | 684,071 | | $ | 736,459 |
| Gold Pool #G08061, | | | | | |
| 5.500%, 6/1/2035 | | 534,517 | | | 584,547 |
| Gold Pool #G08079, | | | | | |
| 5.000%, 9/1/2035 | 8,752,883 | | 9,437,744 |
| Gold Pool #G01960, | | | | | |
| 5.000%, 12/1/2035 | 2,678,254 | | 2,887,811 |
| Gold Pool #A41748, | | | | | |
| 5.000%, 1/1/2036 | 3,679,362 | | 3,967,251 |
| Gold Pool #A42128, | | | | | |
| 5.500%, 1/1/2036 | 2,981,442 | | 3,260,502 |
| Gold Pool #G02064, | | | | | |
| 5.000%, 2/1/2036 | 4,050,171 | | 4,367,073 |
| Gold Pool #G05200, | | | | | |
| 5.000%, 5/1/2036 | 11,705,915 | | 12,621,833 |
| Gold Pool #G02252, | | | | | |
| 5.500%, 7/1/2036 | 9,473,070 | | 10,327,181 |
| Gold Pool #G02386, | | | | | |
| 6.000%, 11/1/2036 | 6,644,604 | | 7,305,736 |
| Pool #1G1317, | | | | | |
| 5.975%, 11/1/2036(1) | 3,089,609 | | 3,348,194 |
| Gold Pool #G03189, | | | | | |
| 6.500%, 9/1/2037 | 12,086,905 | | 13,573,740 |
| Pool #A86876, | | | | | |
| 5.000%, 6/1/2039 | 9,547,098 | | 10,265,755 |
| Gold Pool #A91161, | | | | | |
| 4.500%, 2/1/2040 | 11,159,752 | | 11,942,743 |
| Pool #A97620, | | | | | |
| 4.500%, 3/1/2041 | 22,922,076 | | 24,566,139 |
| Gold Pool #Q05168, | | | | | |
| 4.000%, 12/1/2041 | 29,232,675 | | 31,097,661 |
| Gold Pool #Q05601 | | | | | |
| 4.000%, 1/10/2042 | 18,211,112 | | 19,372,944 |
| Gold Pool #C03789, | | | | | |
| 4.000%, 3/1/2042 | 18,505,210 | | 19,685,805 |
| FNMA: | | | | | |
| Pool #995749, | | | | | |
| 4.000%, 5/25/2024 | 13,240,870 | | 14,094,112 |
| Pool #932361, | | | | | |
| 4.000%, 1/1/2025 | 14,633,518 | | 15,576,502 |
| Pool #AC8938, | | | | | |
| 4.500%, 1/1/2025 | 16,994,372 | | 18,235,522 |
| Pool #AD4268, | | | | | |
| 4.500%, 3/1/2025 | 10,226,723 | | 10,973,612 |
| Pool #725705, | | | | | |
| 5.000%, 8/1/2034 | 1,153,071 | | 1,252,462 |
| Pool #735288, | | | | | |
| 5.000%, 3/1/2035 | 6,357,501 | | 6,935,741 |
| Pool #255706, | | | | | |
| 5.500%, 5/1/2035 | 6,433,088 | | 7,057,336 |
| Pool #735897, | | | | | |
| 5.500%, 10/1/2035 | 4,172,326 | | 4,577,195 |
| Pool #836496, | | | | | |
| 5.000%, 10/1/2035 | 5,721,897 | | 6,210,295 |
| Pool #850582, | | | | | |
| 5.500%, 1/1/2036 | 1,932,665 | | 2,120,205 |
| | Principal | | |
| | Amount | | Market Value |
| Pool #745275, | | | | | |
5.000%, 2/1/2036 | $ | 7,353,606 | | $ | 7,999,415 |
Pool #845471, | | | | | |
5.000%, 5/1/2036 | 1,005,010 | | | 1,076,817 |
Pool #888016, | | | | | |
5.500%, 5/1/2036 | 7,643,284 | | | 8,384,965 |
Pool #190377, | | | | | |
5.000%, 11/1/2036 | 6,598,491 | | | 7,161,712 |
Pool #256526, | | | | | |
6.000%, 12/1/2036 | 8,978,244 | | | 9,823,868 |
Pool #888405, | | | | | |
5.000%, 12/1/2036 | 1,519,343 | | | 1,649,028 |
Pool #907772, | | | | | |
6.000%, 12/1/2036 | 3,496,398 | | | 3,825,710 |
Pool #910881, | | | | | |
5.000%, 2/1/2037 | 6,495,607 | | | 6,959,711 |
Pool #889108, | | | | | |
6.000%, 2/1/2038 | 6,738,602 | | | 7,426,984 |
Pool #257161, | | | | | |
5.500%, 4/1/2038 | 12,221,066 | | 13,338,218 |
Pool #889579, | | | | | |
6.000%, 5/1/2038 | 12,183,105 | | 13,433,835 |
Pool #995838, | | | | | |
5.500%, 5/1/2039 | 9,871,747 | | 10,774,143 |
Pool #AE0395, | | | | | |
4.500%, 10/1/2040 | 23,657,726 | | 25,394,724 |
Pool #AE0949, | | | | | |
4.000%, 2/1/2041 | 39,391,784 | | 42,015,710 |
Pool #AJ1407, | | | | | |
4.000%, 9/1/2041 | 18,650,168 | | 19,898,293 |
Pool # AJ4245, | | | | | |
4.000%, 11/1/2041 | 5,710,130 | | | 6,092,269 |
| GNMA, | | | | | |
| Pool #550656, | | | | | |
| 5.000%, 9/15/2035 | | 954,200 | | | 1,053,455 |
| | | | | | |
| Total Agency Mortgage-Backed Securities |
| (Cost $467,925,778) | | | | 486,674,812 |
| | | | |
|
| | | | | | |
| Total Asset-Backed Securities, Commercial |
| Mortgage-Backed Securities, Residential | |
| Mortgage-Backed Securities & Agency Mortgage |
| Backed Securities | | | | | |
| (Cost $629,698,203) | | | | 653,012,632 |
| | | | |
|
| | | | | | |
| U.S. GOVERNMENT & AGENCY | | | |
| OBLIGATIONS | | | | | 0.01% |
| FNMA, | | | | | |
| 8.200%, 3/10/2016 | | 55,000 | | | 69,870 |
| | | | | | |
| Total U.S. Government & Agency Obligations |
| (Cost $52,987) | | | | | 69,870 |
| | | | |
|
PAGE 57 |
|
WESTCORE PLUS BOND FUND AS OF JUNE 30, 2012 (continued)
(UNAUDITED)
| | | Principal | | |
| | | Amount | | Market Value |
| U.S. TREASURY BONDS & NOTES | | | 12.93% |
4.000%, 2/15/2014 | $ | 36,100,000 | | $ | 38,247,661 |
4.250%, 11/15/2014 | | 4,900,000 | | | 5,349,423 |
1.750%, 10/31/2018 | | 43,600,000 | | | 45,660,798 |
3.625%, 2/15/2020 | | 10,000,000 | | | 11,772,660 |
5.375%, 2/15/2031 | | 5,750,000 | | | 8,387,813 |
4.500%, 2/15/2036 | | 16,750,000 | | | 22,531,363 |
4.375%, 2/15/2038 | | 4,500,000 | | | 5,981,485 |
4.375%, 11/15/2039 | | 15,000,000 | | | 20,010,945 |
4.750%, 2/15/2041 | | 36,700,000 | | | 51,930,500 |
3.750%, 8/15/2041 | | 10,000,000 | | | 12,081,250 |
| | | | | | |
| Total U.S. Treasury Bonds & Notes | | | |
| (Cost $197,211,442) | | | | 221,953,898 |
| | | | |
|
| | | | | | |
| | | | | | |
| | | Shares | | | Market Value |
| MONEY MARKET MUTUAL FUNDS | | | 0.09% |
| Bank of New York Cash | | | | | |
Reserve | | | | | |
(7 Day Yield 0.050%) | | 1,500,798 | | | 1,500,798 |
| Fidelity Institutional | | | | | |
Money Market | | | | | |
Government | | | | | |
Portfolio - Class I | | | | | |
(7 Day Yield 0.010%) | | 54,874 | | | 54,874 |
| | | | |
|
| | | | | | |
| Total Money Market Mutual Funds | | | |
| (Cost $1,555,672) | | | | | 1,555,672 |
| | | | |
|
| | | | | | |
| | | | | | |
| Total Investments | | | | | |
| (Cost $1,609,404,656) | | 99.27% | | 1,703,844,325 |
| | | | | | |
| Other Assets in | | | | | |
| Excess of Liabilities | | 0.73% | | | 12,607,928 |
| | | | |
|
| | | | | | |
| Net Assets | | 100.00% | | $ | 1,716,452,253 |
| | | | |
|
| | | | | | |
| ** Non-income producing security. |
| |
| See Notes to Financial Statements. |
| PAGE 58 |
|
WESTCORE PLUS BOND FUND AS OF JUNE 30, 2012 (continued)
(UNAUDITED)
(1)
| The coupon rate shown on floating or adjustable rate securities represents the rate at period end.
|
(2)
| This security is restricted. The following table provides additional information regarding each security. Included in this list are certain securities exempt from registration under Rule 144A of the Securities Act of 1933, which may be resold in transactions, normally to qualified institutional buyers.
|
| | | | | | | | | | | | Market Value |
| | | | | | | | | | | | as Percentage |
| Issuer Description | Coupon | | Maturity Date | | Acquisition Date | | Cost | | Market Value | | of Net Assets |
|
| Adams Outdoor Advertising LP | 5.438% | | 12/20/2017 | | 12/3/2010 | | $ | 7,924,434 | | $ | 8,417,674 | | 0.49% |
| Adams Outdoor Advertising LP | 10.756% | | 12/20/2017 | | 12/3/2010 | | | 6,300,000 | | | 6,775,814 | | 0.40% |
| Aircraft Lease Securitisation Ltd., Series 2007-1A, Class G3 | 0.499 % | | 5/10/2032 | | 4/26/2012 | | | 8,302,678 | | | 8,279,318 | | 0.48%^ |
| Aviation Capital Group Corp. | 6.750% | | 4/6/2021 | | 12/7/2011 | | | 5,439,688 | | | 5,752,314 | | 0.34%^ |
| BMW US Capital Inc. | 5.730% | | 11/1/2015 | | 10/16/2007 | | | 12,000,000 | | | 13,198,320 | | 0.77% |
| Calpine Corp. | 7.500 % | | 2/15/2021 | | 10/18/2010-10/19/2010 | | | 8,365,000 | | | 9,059,750 | | 0.53%^ |
| Crown Castle Towers LLC | 5.495% | | 1/15/2017 | | 1/8/2010 | | | 4,500,000 | | | 5,001,592 | | 0.29%^ |
| Crown Castle Towers LLC | 6.113% | | 1/15/2020 | | 1/8/2010 | | | 8,975,000 | | | 10,412,023 | | 0.61%^ |
| Crown Castle Towers LLC | 4.883% | | 8/15/2020 | | 7/29/2010 | | | 5,900,000 | | | 6,420,905 | | 0.37%^ |
| Emigrant Capital Trust II | 3.049% | | 4/14/2034 | | 8/11/2004 | | | 845,809 | | | 385,375 | | 0.02% |
| Eszoplicone Royalty SUB LLC, Series IV | 12.000% | | 3/15/2014 | | 7/29/2005 | | | 199,226 | | | 199,226 | | 0.01% |
| First Tennessee Bank | 3.750 % | | – | | 3/16/2005 | | | 1,500,000 | | | 1,011,094 | | 0.06% |
| FMR Corp. | 7.490% | | 6/15/2019 | | 3/6/2007 | | | 5,915,050 | | | 6,057,245 | | 0.35%^ |
| GTP Towers Issuer LLC | 8.112% | | 2/15/2015 | | 2/11/2010 | | | 15,000,000 | | | 15,786,540 | | 0.92% |
| Indianapolis Power & Light Co. | 6.300 % | | 7/1/2013 | | 7/30/2003 - 2/6/2006 | | | 403,217 | | | 421,311 | | 0.02%^ |
| Marriott Vacation Club Owner Trust, Series 2006-2A, Class A | 5.362% | | 4/20/2014 | | 10/31/2006 | | | 112,815 | | | 114,386 | | 0.01%^ |
| Marriott Vacation Club Owner Trust, Series 2010-1A, Class A | 3.540% | | 12/20/2032 | | 11/5/2010 | | | 5,739,337 | | | 5,891,366 | | 0.34%^ |
| Northern Natural Gas Co. | 5.375% | | 10/31/2012 | | 10/9/2002 | | | 349,650 | | | 355,233 | | 0.02%^ |
| SBA Towers Trust | 4.254% | | 4/15/2015 | | 4/8/2010 | | | 550,000 | | | 576,534 | | 0.03%^ |
| Sinclair Television Group Inc. | 9.250% | | 11/1/2017 | | 11/17/2011 | | | 651,000 | | | 666,000 | | 0.04%^ |
| Sweetwater Investors LLC | 5.875% | | 5/15/2014 | | 5/31/2005 - 12/15/2005 | | | 182,417 | | | 177,100 | | 0.01% |
| Tenaska Alabama II Partners LP | 6.125 % | | 3/30/2023 | | 10/9/2003 - 1/19/2005 | | | 224,541 | | | 231,728 | | 0.01%^ |
| Tenaska Virginia Partners LP | 6.119% | | 3/30/2024 | | 4/29/2004 - 1/19/2005 | | | 197,404 | | | 214,436 | | 0.01%^ |
| Tuckahoe Credit Lease Trust | 9.310% | | 10/20/2025 | | 12/11/2009 | | | 4,147,283 | | | 5,236,369 | | 0.31% |
| USG Corp. | 8.375% | | 10/15/2018 | | 11/8/2010-11/9/2010 | | | 8,507,750 | | | 8,862,000 | | 0.52%^ |
| West Fraser Timber Co. Ltd. | 5.200% | | 10/15/2014 | | 6/12/2006 - 8/3/2009 | | | 7,587,068 | | | 9,288,313 | | 0.54%^ |
| WPD Holdings Inc. | 7.250% | | 12/15/2017 | | 10/15/2003 - 6/30/2006 | | | 851,170 | | | 1,008,892 | | 0.06%^ |
| | | | | | | | |
|
| | | | | | | | $ | 120,670,537 | | $ | 129,800,858 | | 7.56% |
| | | | | | | | |
|
^ 144A securities with a liquid trading market as determined by the Adviser under the supervision of the Board of Trustees. Such securities represent 4.57% of the Fund’s net assets as of June 30, 2012.
|
(3)
| This security has been valued in good faith by management under the direction of the Board of Trustees. As of June 30, 2012 these securities represented 1.22% of the Fund’s net assets.
|
(4)
| Income is not being accrued on this security due to the issuer’s default or expected default on interest payments.
|
(5)
| The expected maturity date listed herein differs from the legal maturity date due to call or put features or due to the expected schedule of principal payments.
|
(6)
| Step Bond. Coupon increases periodically based upon a predetermined schedule. Interest rate disclosed is that which is in effect at June 30, 2012.
|
PAGE 59 |
|
WESTCORE COLORADO TAX-EXEMPT FUND AS OF JUNE 30, 2012
(UNAUDITED)
| | Principal | |
| | Amount | Market Value |
| CERTIFICATES OF PARTICIPATION | | 12.67% |
| Auraria Higher Education | | | | |
| Center, | | | | |
| 6.000%, 5/1/2024, | | | | |
| Optional 5/1/2019 | | | | |
| @ 100.00 | $ | 499,000 | $ | 567,543 |
| City of Aurora: | | | | |
| 5.000%, 12/1/2026, | | | | |
| Optional 12/1/2019 | | | | |
| @ 100.00 | 1,000,000 | 1,121,320 |
| 5.000%, 12/1/2030, | | | | |
| Optional 12/1/2019 | | | | |
| @ 100.00 | | 675,000 | | 745,159 |
| Colorado State Higher | | | | |
| Education Capital | | | | |
| Construction Lease | | | | |
| Purchase Program: | | | | |
| 5.250%, 11/1/2023, | | | | |
| Optional 11/1/2018 | | | | |
| @ 100.00 | 1,000,000 | 1,151,650 |
| 5.000%, 11/1/2025 | 1,000,000 | 1,169,050 |
| Colorado State, | | | | |
| University of | | | | |
| Colorado at Denver | | | | |
| Health Sciences | | | | |
| Center Fitzsimons | | | | |
| Academic: | | | | |
| 5.000%, 11/1/2018, | | | | |
| Prerefunded | | | | |
| 11/1/2015 @ 100.00, | | | | |
| NATL-RE | | 700,000 | | 803,152 |
| Series A, | | | | |
| 4.500%, 11/1/2022, | | | | |
| Prerefunded | | | | |
| 11/1/2015 @ 100.00 | | 500,000 | | 577,180 |
| Denver City & County, | | | | |
| Denver Botanic | | | | |
| Gardens, | | | | |
| 5.250%, 12/1/2024, | | | | |
| Optional 12/1/2018 | | | | |
| @ 100.00 | | 625,000 | | 711,062 |
| Douglas & Elbert | | | | |
| Counties School | | | | |
| District No. Re-1, | | | | |
| 5.000%, 1/15/2025, | | | | |
| Optional 1/15/2019 | | | | |
| @ 100.00 | 1,000,000 | 1,110,870 |
| Eagle County, Justice | | | | |
| Center Project, | | | | |
| 5.250%, 12/1/2023, | | | | |
| Optional 12/1/2018 | | | | |
| @ 100.00 | | 500,000 | | 573,575 |
| El Paso County School | | | | |
| District No. 49 | | | | |
| Falcon, | | | | |
| 5.000%, 12/15/2028, | | | | |
| Optional | | | | |
| 12/15/17 @ 100.00 | | 800,000 | | 881,496 |
| | Principal | |
| | Amount | Market Value |
| Fort Collins Co., | | | | |
5.375%, 6/1/2023, | | | | |
Optional 6/1/2014 @ | | | | |
100.00, AMBAC | $ | 1,000,000 | $ | 1,071,920 |
| Garfield County Public | | | | |
Library District, | | | | |
5.000%, 12/1/2024, | | | | |
Optional 12/1/2019 | | | | |
@ 100.00 | | 675,000 | | 730,006 |
| Northern Colorado | | | | |
Water Conservancy | | | | |
District, | | | | |
5.625%, 10/1/2018, | | | | |
Optional 10/1/2012 | | | | |
@ 100.00, NATL-RE | | 510,000 | | 515,029 |
| Pueblo Co., Police | | | | |
Complex Project, | | | | |
5.500%, 8/15/2018, | | | | |
AGM | | 500,000 | | 599,865 |
| Regional Transportation | | | | |
District: | | | | |
4.500%, 6/1/2019, | | | | |
Optional 6/1/2015 @ | | | | |
100.00, AMBAC | | 620,000 | | 661,900 |
5.000%, 6/1/2020 | 1,200,000 | | 1,411,140 |
5.000%, 12/1/2022, | | | | |
Optional 12/1/2017 | | | | |
@ 100.00, AMBAC | 1,000,000 | | 1,119,210 |
| State of Colorado, | | | | |
Building Excellent | | | | |
Schools Today, | | | | |
5.000%, 3/15/2024, | | | | |
Optional 3/15/2021 | | | | |
@ 100.00 | 1,000,000 | | 1,161,990 |
| University of Colorado, | | | | |
5.000%, 6/1/2023, | | | | |
Prerefunded | | | | |
6/1/2013 @ 100.00 | | 150,000 | | 156,370 |
| | | | |
|
| | | | | |
| Total Certificates of Participation | | |
| (Cost $15,903,257) | | | 16,839,487 |
| | | |
|
| | | | | |
| GENERAL OBLIGATION BONDS | | 40.75% |
| County-City-Special | | | | |
District-School District | | | 40.75% |
| Adams & Arapahoe | | | | |
Counties Joint | | | | |
School District 28J: | | | | |
5.000%, 12/1/2026, | | | | |
Optional 12/1/2022 | | | | |
@ 100.00 | 1,500,000 | | 1,803,570 |
6.250%, 12/1/2026, | | | | |
Prerefunded | | | | |
12/1/2018 @ 100.00 | 1,250,000 | | 1,641,675 |
5.000%, 12/1/2028, | | | | |
Optional 12/1/2022 | | | | |
@ 100.00 | | 500,000 | | 593,225 |
| | Principal | |
| | Amount | Market Value |
| Adams 12 Five Star | | | | |
| Schools, | | | | |
| zero coupon, | | | | |
| 12/15/2024, | | | | |
| Optional 12/15/2016 | | | | |
| @ 67.784, FGIC | $ | 2,385,000 | $ | 1,451,463 |
| Arapahoe County School | | | | |
| District No. 1 | | | | |
| Englewood: | | | | |
| 5.000%, 12/1/2028, | | | | |
| Optional 12/1/2021 | | | | |
| @ 100.00 | | 975,000 | | 1,145,976 |
| 5.000%, 12/1/2029, | | | | |
| Optional 12/1/2021 | | | | |
| @ 100.00 | 2,440,000 | | 2,874,491 |
| Arapahoe County School | | | | |
| District No. 5 | | | | |
| Cherry Creek, | | | | |
| 5.000%, 12/15/2026, | | | | |
| Optional 12/15/2018 | | | | |
| @ 100.00 | 1,000,000 | | 1,187,190 |
| Arapahoe County School | | | | |
| District No. 6 | | | | |
| Littleton, | | | | |
| 5.250%, 12/1/2021, | | | | |
| Prerefunded | | | | |
| 12/1/2012 @ 100.00, | | | | |
| NATL-RE FGIC | | 500,000 | | 510,290 |
| Arapahoe Park & | | | | |
| Recreation District, | | | | |
| 5.250%, 12/1/2022, | | | | |
| Prerefunded | | | | |
| 12/1/2012 @ 100.00, | | | | |
| NATL-RE FGIC | | 750,000 | | 765,435 |
| Boulder Larimer & | | | | |
| Weld Counties St. | | | | |
| Vrain Valley School | | | | |
| District Re1J, | | | | |
| 5.000%, 12/15/2026, | | | | |
| Optional 12/15/2016 | | | | |
| @ 100.00 | 1,000,000 | | 1,131,510 |
| City & County of Denver | | | | |
| Justice System, | | | | |
| 5.000%, 8/1/2025, | | | | |
| Optional 8/1/2018 | | | | |
| @ 100.00 | | 750,000 | | 856,830 |
| Clear Creek County | | | | |
| School District | | | | |
| Re-1, | | | | |
| 4.300%, 12/1/2013, | | | | |
| Prerefunded | | | | |
| 12/1/2012 @ 100.00, | | | | |
| AGM | | 125,000 | | 127,093 |
| Denver City & County | | | | |
| School District | | | | |
| No. 1: | | | | |
| 5.000%, 12/1/2018 | 1,000,000 | | 1,215,710 |
| 5.250%, 12/1/2025, | | | | |
| Optional 6/1/2019 | | | | |
| @ 100.00 | 2,500,000 | | 3,025,175 |
| PAGE 60 |
|
WESTCORE COLORADO TAX-EXEMPT FUND AS OF JUNE 30, 2012 (continued)
(UNAUDITED)
| | Principal | |
| | Amount | Market Value |
| Series A, | | | | |
| 5.500%, 12/1/2022, | | | | |
| FGIC | $ | 500,000 | $ | 651,615 |
| Douglas & Elbert | | | | |
| Counties School | | | | |
| District Re-1: | | | | |
| 5.000%, 12/15/2017, | | | | |
| Optional 12/15/2014 | | | | |
| @ 100.00, AGM | 1,325,000 | 1,461,144 |
| 5.000%, 12/15/2023, | | | | |
| Prerefunded | | | | |
| 12/15/2017 @ 100.00 | 1,250,000 | 1,520,212 |
| Eagle, Garfield & Routt | | | | |
| Counties School | | | | |
| District Re-50J, | | | | |
| 5.000%, 12/1/2026, | | | | |
| Optional 12/1/2016 | | | | |
| @ 100.00, AGM | 2,500,000 | 2,837,325 |
| El Paso County School | | | | |
| District 2, | | | | |
| 5.000%, 12/1/2023, | | | | |
| Prerefunded | | | | |
| 12/1/2012 @ 100.00, | | | | |
| NATL-RE | | 250,000 | | 254,892 |
| El Paso County School | | | | |
| District No. 20: | | | | |
| zero coupon, | | | | |
| 12/15/2013, AGM | | 500,000 | | 489,955 |
| 4.000%, 12/15/2023, | | | | |
| Optional 12/15/2021 | | | | |
| @ 100.00 | | 500,000 | | 565,885 |
| Garfield County, Garfield | | | | |
| School District | | | | |
| Re-2: | | | | |
| 4.000%, 12/1/2024, | | | | |
| Optional 12/15/2022 | | | | |
| @ 100.00 | 1,000,000 | 1,123,990 |
| 5.000%, 12/1/2024, | | | | |
| Prerefunded | | | | |
| 12/1/2016 @ 100.00, | | | | |
| AGM | | 800,000 | | 948,976 |
| 4.750%, 12/1/2025, | | | | |
| Optional 12/1/2016 | | | | |
| @ 100.00, AGM | 1,000,000 | 1,086,320 |
| 5.000%, 12/1/2027, | | | | |
| Optional 12/1/2016 | | | | |
| @ 100.00, AGM | | 250,000 | | 277,790 |
| Garfield, Pitkin & Eagle | | | | |
| Counties Roaring | | | | |
| Fork School District | | | | |
| Re-1: | | | | |
| 5.000%, 12/15/2020, | | | | |
| Prerefunded | | | | |
| 12/15/2014 @ | | | | |
| 100.00, AGM | | 500,000 | | 555,375 |
| 5.000%, 12/15/2023, | | | | |
| Optional 12/15/2021 | | | | |
| @ 100.00 | 1,500,000 | 1,812,300 |
| | Principal | |
| | Amount | Market Value |
| 5.000%, 12/15/2024, | | | | |
| Optional 12/15/2021 | | | | |
| @ 100.00 | $ | 1,500,000 | $ | 1,809,495 |
| Grand County School | | | | |
| District No. 2 East | | | | |
| Grand, | | | | |
| 4.000%, 12/1/2023, | | | | |
| Optional 12/15/2021 | | | | |
| @ 100.00 | | 585,000 | | 672,405 |
| Gunnison Watershed | | | | |
| School District No. | | | | |
| Re 1J: | | | | |
| 5.250%, 12/1/2024, | | | | |
| Optional 12/1/2018 | | | | |
| @ 100.00 | 1,000,000 | | 1,199,120 |
| 5.000%, 12/1/2028, | | | | |
| Optional 12/1/2018 | | | | |
| @ 100.00, AGM | 1,200,000 | | 1,356,804 |
| Ignacio School District | | | | |
| 11JT: | | | | |
| 5.250%, 12/1/2024, | | | | |
| Optional 12/15/2021 | | | | |
| @ 100.00 | | 500,000 | | 610,845 |
| 5.000%, 12/1/2029, | | | | |
| Optional 12/15/2021 | | | | |
| @ 100.00 | 1,000,000 | | 1,155,720 |
| Jefferson County School | | | | |
| District R-1: | | | | |
| 5.250%, 12/15/2024 | 1,500,000 | | 1,923,975 |
| 5.250%, 12/15/2025, | | | | |
| Optional 12/15/2016 | | | | |
| @ 100.00, AGM | | 500,000 | | 566,265 |
| La Plata County School | | | | |
| District No. 9-R | | | | |
| Durango: | | | | |
| 5.250%, 11/1/2020, | | | | |
| Prerefunded | | | | |
| 11/1/2012 @ 100.00, | | | | |
| NATL-RE | | 125,000 | | 127,024 |
| 5.000%, 11/1/2022, | | | | |
| Optional 11/1/2021 | | | | |
| @ 100.00 | 1,500,000 | | 1,849,365 |
| 4.500%, 11/1/2023, | | | | |
| Optional 11/1/2021 | | | | |
| @ 100.00 | 1,000,000 | | 1,171,720 |
| 5.000%, 11/1/2024, | | | | |
| Optional 11/1/2021 | | | | |
| @ 100.00 | 1,000,000 | | 1,203,940 |
| Lincoln Park, | | | | |
| Metropolitan | | | | |
| District, | | | | |
| 5.625%, 12/1/2020, | | | | |
| Optional 12/1/2017 | | | | |
| @ 100.00 | | 250,000 | | 261,520 |
| Logan County School | | | | |
| District No Re-1 | | | | |
| Valley-Sterling: | | | | |
| 4.000%, 12/15/2022, | | | | |
| Optional 12/15/2021 | | | | |
| @ 100.00 | | 320,000 | | 371,242 |
| | Principal | |
| | Amount | Market Value |
| 4.000%, 12/15/2023, | | | | |
| Optional 12/15/2021 | | | | |
| @ 100.00 | $ | 440,000 | $ | 503,971 |
| 4.000%, 12/15/2024, | | | | |
| Optional 12/15/2021 | | | | |
| @ 100.00 | | 175,000 | | 198,060 |
| Mesa County Valley | | | | |
| School District 51 | | | | |
| Grand Junction: | | | | |
| 5.000%, 12/1/2021, | | | | |
| Prerefunded | | | | |
| 12/1/2014 @ 100.00, | | | | |
| NATL-RE | | 525,000 | | 582,220 |
| 5.000%, 12/1/2022, | | | | |
| Prerefunded | | | | |
| 12/1/2014 @ 100.00, | | | | |
| NATL-RE | | 300,000 | | 332,697 |
| 5.000%, 12/1/2024, | | | | |
| Prerefunded | | | | |
| 12/1/2014 @ 100.00, | | | | |
| NATL-RE | 1,000,000 | 1,108,990 |
| Moffat County School | | | | |
| District No. Re-1 | | | | |
| Craig, | | | | |
| 5.250%, 12/1/2026, | | | | |
| Optional 12/1/2017 | | | | |
| @ 100.00, AGM | 1,030,000 | 1,169,575 |
| Pitkin County School | | | | |
| District No. 001, | | | | |
| Aspen, | | | | |
| 5.375%, 12/1/2026, | | | | |
| Optional 12/1/2019 | | | | |
| @ 100.00 | | 225,000 | | 266,974 |
| Pueblo County School | | | | |
| District 60: | | | | |
| 5.000%, 12/15/2021 | | 750,000 | | 933,262 |
| 5.000%, 12/15/2022 | | 500,000 | | 626,285 |
| Rio Blanco County School | | | | |
| District No. Re-1 | | | | |
| Meeker, | | | | |
| 5.250%, 12/1/2022, | | | | |
| Optional 12/1/2018 | | | | |
| @ 100.00 | | 575,000 | | 675,107 |
| Summit County, Summit | | | | |
| County School | | | | |
| District Re-1: | | | | |
| 5.000%, 12/1/2023, | | | | |
| Prerefunded | | | | |
| 12/1/2014 @ 100.00, | | | | |
| NATL-RE-FGIC | | 200,000 | | 221,798 |
| 4.000%, 12/1/2024, | | | | |
| Optional 12/1/2021 | | | | |
| @ 100.00 | 1,020,000 | 1,135,750 |
| Weld & Adams Counties | | | | |
| School District RE- | | | | |
| 3J, Series A, | | | | |
| 5.000%, 12/15/2021, | | | | |
| Prerefunded | | | | |
| 12/15/2014 @ | | | | |
| 100.00, AGM | | 200,000 | | 222,150 |
PAGE 61 |
|
WESTCORE COLORADO TAX-EXEMPT FUND AS OF JUNE 30, 2012 (continued)
(UNAUDITED)
| | Principal | |
| | Amount | Market Value |
| Total General Obligation Bonds | | |
| (Cost $51,113,177) | | | $ | 54,171,691 |
| | | | |
|
| | | | | |
| REVENUE BONDS | | | | 42.67% |
| Airports | | | | 1.69% |
| City & County of Denver | | | | |
Airport Series A | | | | |
Revenue: | | | | |
5.000%, 11/15/2018, | | | | |
Optional 11/15/2015 | | | | |
@ 100.00, XLCA | $ | 1,000,000 | | 1,116,030 |
5.250%, 11/15/2028, | | | | |
Optional 11/15/2019 | | | | |
@ 100.00 | 1,000,000 | | 1,127,870 |
| | | |
|
| | | | | 2,243,900 |
| | | | | |
| General | | | | 4.50% |
| Boulder County Open | | | | |
Space Capital | | | | |
Improvement Trust | | | | |
Fund, | | | | |
5.000%, 12/15/2025, | | | | |
Optional 12/15/2018 | | | | |
@ 100.00 | 1,000,000 | | 1,144,100 |
Series A, 5.000%, | | | | |
1/1/2024, | | | | |
Prerefunded | | | | |
1/1/2015 @ 100.00, | | | | |
AGM | 1,645,000 | | 1,828,730 |
Series B, 5.250%, | | | | |
7/15/2024, Optional | | | | |
7/15/2021 @ 100.00 | 1,000,000 | | 1,218,300 |
| Grand Junction, | | | | |
5.000%, 3/1/2022, | | | | |
Optional 9/1/2021 | | | | |
@ 100.00 | | 500,000 | | 612,255 |
| Regional Transportation | | | | |
District, Colorado | | | | |
Sales Tax Revenue, | | | | |
Series A, | | | | |
5.000%, 11/1/2027, | | | | |
Optional 11/1/2016 | | | | |
@ 100.00, AMBAC | | 500,000 | | 568,915 |
| Town of Castle Rock | | | | |
Sales and Use Tax | | | | |
Revenue, | | | | |
6.000%, 6/1/2023, | | | | |
Optional 6/1/2018 @ | | | | |
100.00, AGM | | 500,000 | | 603,750 |
| | | | |
|
| | | | | 5,976,050 |
| | | | | |
| Higher Education | | | | 6.94% |
| Colorado Educational & | | | | |
Cultural Facilities | | | | |
Authority: | | | | |
University of Denver: | | | | |
5.000%, 3/1/2018, | | | | |
Optional 9/1/2015 @ | | | | |
100.00, NATL-RE | | 500,000 | | 546,280 |
| | Principal | |
| | Amount | Market Value |
| 5.000%, 3/1/2021, | | | | |
| Optional 9/1/2015 | | | | |
| @ 100.00, MBIA-RE | | | | |
| FGIC | $ | 300,000 | $ | 324,318 |
| |
| Colorado School of Mines | | | | |
| Auxiliary Facility | | | | |
| Revenue Enterprise, | | | | |
| 5.250%, 12/1/2020, | | | | |
| Prerefunded | | | | |
| 12/1/2012 @ 100.00, | | | | |
| AMBAC | | 420,000 | | 428,644 |
| 5.250%, 12/1/2020, | | | | |
| Optional 12/1/2012 | | | | |
| @ 100.00, AMBAC | | 85,000 | | 85,892 |
| Colorado State Board | | | | |
| of Governors | | | | |
| University - | | | | |
| Enterprise Revenue | | | | |
| Bonds: | | | | |
| 5.000%, 12/1/2020, | | | | |
| Prerefunded | | | | |
| 12/1/2015 @ 100.00, | | | | |
| XLCA | | 500,000 | | 573,500 |
| 5.250%, 3/1/2024, | | | | |
| Optional 3/1/2017 | | | | |
| @ 100.00 | | 75,000 | | 84,430 |
| 5.250%, 3/1/2024, | | | | |
| Prerefunded | | | | |
| 3/1/2017 @ 100.00 | | 425,000 | | 511,254 |
| 5.000%, 3/1/2029, | | | | |
| Optional 3/1/2022 | | | | |
| @ 100.00 | 1,500,000 | 1,738,905 |
| Colorado State | | | | |
| College Board of | | | | |
| Trustees, Auxiliary | | | | |
| Facilities System - | | | | |
| Enterprise Revenue | | | | |
| Bonds, | | | | |
| 5.000%, 5/15/2022, | | | | |
| Prerefunded | | | | |
| 5/15/2013 @ 100.00, | | | | |
| NATL-RE | | 660,000 | | 677,609 |
| Mesa State College, | | | | |
| Auxiliary Facility | | | | |
| Enterprise Revenue, | | | | |
| 5.700%, 5/15/2026, | | | | |
| Prerefunded | | | | |
| 11/15/2017 @ 100.00 | | 250,000 | | 313,707 |
| University of Colorado | | | | |
| Enterprise Systems | | | | |
| Revenue, | | | | |
| 5.000%, 6/1/2026, | | | | |
| Prerefunded | | | | |
| 6/1/2015 @ 100.00 | | 750,000 | | 845,603 |
| Series A-1, 5.000%, | | | | |
| 6/1/2028, Optional | | | | |
| 6/1/2022 @ 100.00 | 1,500,000 | 1,768,065 |
| 5.000%, 6/1/2029, | | | | |
| Optional 6/1/2022 | | | | |
| @ 100.00 | 1,000,000 | 1,172,140 |
| | Principal | |
| | Amount | Market Value |
| Series B, 5.000%, | | | | |
| 6/1/2024, | | | | |
| Prerefunded | | | | |
| 6/1/2013 @ 100.00, | | | | |
| FGIC | $ | 150,000 | $ | 156,441 |
| | | | |
|
| | | | 9,226,788 |
| | | | | |
| Medical | | | | 10.66% |
| Aspen Valley Hospital District, | | | |
| 5.000%, 10/15/2021, | | | | |
| Optional 10/15/2016 | | | | |
| @ 100.00 | | 600,000 | | 631,296 |
| Aurora Colorado Hospital | | | | |
| Revenue, Children’s | | | | |
| Hospital, | | | | |
| 5.000%, 12/1/2022, | | | | |
| Optional 12/1/2018 | | | | |
| @ 100.00, AGM | 1,000,000 | 1,101,220 |
| Colorado Health Facilities | | | | |
| Authority Revenue, | | | | |
| Adventist Sunbelt: | | | | |
| 5.125%, 11/15/2020, | | | | |
| Prerefunded | | | | |
| 11/15/2016 @ 100.00 | | 345,000 | | 410,947 |
| 5.250%, 11/15/2027, | | | | |
| Optional 11/15/2016 | | | | |
| @ 100.00(1) | 1,000,000 | 1,094,300 |
| Colorado Health Facilities | | | | |
| Authority Revenue, | | | | |
| Catholic Health | | | | |
| Initiatives: | | | | |
| 5.000%, 2/1/2023, | | | | |
| Optional 2/1/2021 | | | | |
| @ 100.00 | | 500,000 | | 587,890 |
| 5.250%, 7/1/2024, | | | | |
| Optional 7/1/2019 | | | | |
| @ 100.00 | 1,000,000 | 1,166,270 |
| 4.750%, 9/1/2025, | | | | |
| Optional 5/1/2018 | | | | |
| @ 100.00 | | 660,000 | | 723,103 |
| Colorado Health | | | | |
| Facilities Authority | | | | |
| Revenue, Covenant | | | | |
| Retirement | | | | |
| Communities Inc., | | | | |
| 5.250%, 12/1/2025, | | | | |
| Optional 12/1/2015 | | | | |
| @ 100.00 | | 500,000 | | 506,810 |
| Colorado Health Facilities | | | | |
| Authority Revenue, | | | | |
| Evangelical | | | | |
| Lutheran: | | | | |
| 5.250%, 6/1/2018, | | | | |
| Optional 6/1/2016 | | | | |
| @ 100.00 | | 750,000 | | 832,177 |
| 5.250%, 6/1/2020, | | | | |
| Optional 6/1/2016 | | | | |
| @ 100.00 | | 500,000 | | 550,850 |
| PAGE 62 |
|
WESTCORE COLORADO TAX-EXEMPT FUND AS OF JUNE 30, 2012 (continued)
(UNAUDITED)
| | Principal | |
| | Amount | Market Value |
| 5.250%, 6/1/2023, | | | | |
| Optional 6/1/2016 | | | | |
| @ 100.00 | $ | 400,000 | $ | 438,180 |
| Colorado Health Facilities | | | | |
| Authority Revenue, | | | | |
| Park View Medical | | | | |
| Center: | | | | |
| 5.000%, 9/1/2020, | | | | |
| Optional 9/15/2015 | | | | |
| @ 100.00 | | 450,000 | | 483,633 |
| 5.000%, 9/1/2025, | | | | |
| Optional 9/1/2017 | | | | |
| @ 100.00 | | 450,000 | | 474,183 |
| Colorado Health | | | | |
| Facilities Authority | | | | |
| Revenue, Sisters | | | | |
| Leavenworth, Series B, | | | |
| 5.000%, 1/1/2023, | | | | |
| Optional 1/1/2020 | | | | |
| @ 100.00 | 1,000,000 | 1,153,540 |
| Colorado Health Facilities | | | | |
| Authority Revenue, | | | | |
| Vail Valley Medical | | | | |
| Center: | | | | |
| 5.000%, 1/15/2020, | | | | |
| Prerefunded | | | | |
| 1/15/2015 @ 100.00 | | 700,000 | | 778,463 |
| 5.000%, 1/15/2020, | | | | |
| Optional 1/15/2015 | | | | |
| @ 100.00 | | 240,000 | | 254,001 |
| Colorado Health Facilities | | | | |
| Authority Revenue, | | | | |
| Valley View Hospital | | | | |
| Association, | | | | |
| 5.000%, 5/15/2027, | | | | |
| Optional 5/15/2017 | | | | |
| @ 100.00 | | 250,000 | | 259,590 |
| Colorado Health Facilities | | | | |
| Authority Revenue, | | | | |
| Yampa Valley | | | | |
| Medical Center, | | | | |
| 5.000%, 9/15/2022, | | | | |
| Optional 9/15/2017 | | | | |
| @ 100.00 | | 850,000 | | 890,273 |
| Colorado Health Facilities | | | | |
| Authority, Poudre | | | | |
| Valley Health, Series A, | | | |
| 5.000%, 3/1/2025, | | | | |
| Optional 3/1/2015 | | | | |
| @ 100.00 | | 700,000 | | 739,123 |
| Denver Health & Hospital | | | | |
| Authority: | | | | |
| 5.000%, 12/1/2018, | | | | |
| Optional 12/1/2016 | | | | |
| @ 100.00 | | 500,000 | | 555,580 |
| 5.000%, 12/1/2020, | | | | |
| Optional 12/1/2016 | | | | |
| @ 100.00 | | 500,000 | | 542,470 |
| | | | |
|
| | | | 14,173,899 |
| | Principal | | |
| | Amount | | Market Value |
| Special Tax | | | | | 5.55% |
| Aurora Colorado Golf | | | | | |
| Course Enterprise: | | | | | |
| 4.125%, 12/1/2013 | $ | 110,000 | | $ | 111,628 |
| 4.250%, 12/1/2014 | | 125,000 | | | 127,286 |
| 4.375%, 12/1/2015 | | 125,000 | | | 126,713 |
| Broomfield Sales | | | | | |
| & Use Tax, | | | | | |
| 5.200%, 12/1/2017, | | | | | |
| Optional 12/1/2012 | | | | | |
| @ 100.00, AMBAC | | 500,000 | | | 508,060 |
| Colorado Educational & | | | | | |
| Cultural Facilities | | | | | |
| Authority: | | | | | |
| Academy Charter School: | | | |
| 5.000%, 12/15/2015, | | | | | |
| Mandatory Sinking | | | | | |
| Fund 12/15/2013 @ | | | | | |
| 100.00 | | 390,000 | | | 426,028 |
| 5.000%, 12/15/2021, | | | | | |
| Optional 12/15/2015 | | | | | |
| @ 100.00, MORAL | | | | | |
| OBLG | | 180,000 | | | 186,262 |
| 4.625%, 12/15/2028, | | | | | |
| Optional 12/15/2015 | | | | | |
| @ 100.00, MORAL | | | | | |
| OBLG | | 250,000 | | | 251,283 |
| Bromley East | | | | | |
| Charter School, | | | | | |
| 5.125%, 9/15/2025, | | | | | |
| Optional 9/15/2015 | | | | | |
| @ 100.00, XLCA | | 500,000 | | | 517,440 |
| Cherry Creek | | | | | |
| Academy, | | | | | |
| 4.000%, 4/1/2022, | | | | | |
| Mandatory Sinking | | | | | |
| Fund 4/1/2016 @ | | | | | |
| 100.00 | | 250,000 | | | 254,230 |
| Kent Denver School, | | | | | |
| 5.000%, 10/1/2019 | | 115,000 | | | 131,550 |
| Denver City & County Golf | | | | | |
| Enterprise: | | | | | |
| 5.500%, 9/1/2012, | | | | | |
| Mandatory Sinking | | | | | |
| Fund 9/1/2010 @ | | | | | |
| 100.00 | | 90,000 | | | 90,515 |
| 4.600%, 9/1/2015 | | 185,000 | | | 190,296 |
| 5.000%, 9/1/2018, | | | | | |
| Optional 9/1/2016 | | | | | |
| @ 100.00 | | 350,000 | | | 360,689 |
| 5.000%, 9/1/2019, | | | | | |
| Optional 9/1/2016 | | | | | |
| @ 100.00 | | 500,000 | | | 512,970 |
| Grand Junction Leasing | | | | | |
| Authority Capital | | | | | |
| Improvement: | | | | | |
| 5.000%, 6/15/2020, | | | | | |
| Optional 6/15/2016 | | | | | |
| @ 100.00, NATL-RE | | 390,000 | | | 430,880 |
| | Principal | |
| | Amount | Market Value |
| 5.000%, 6/15/2023, | | | | |
| Optional 6/15/2016 | | | | |
| @ 100.00, NATL-RE | $ | 390,000 | $ | 429,019 |
| Northwest Parkway | | | | |
| Public Highway | | | | |
| Authority Revenue, | | | | |
| 5.800%, 6/15/2025, | | | | |
| Prerefunded | | | | |
| 6/15/2016 @ 100.00, | | | | |
| AGM | | 960,000 | 1,149,312 |
| Superior Open Space | | | | |
| Sales & Use Tax: | | | | |
| 4.625%, 6/1/2015 | | 100,000 | | 104,657 |
| 4.750%, 6/1/2017, | | | | |
| Optional 6/1/2016 | | | | |
| @ 100.00 | | 325,000 | | 343,961 |
| 5.000%, 6/1/2026, | | | | |
| Optional 6/1/2016 | | | | |
| @ 100.00 | 1,085,000 | 1,127,814 |
| | |
|
| | | | 7,380,593 |
| | | | | |
| Transportation | | | | 0.98% |
| Colorado Department of | | | | |
| Transportation: | | | | |
| 5.000%, 12/15/2016, | | | | |
| Prerefunded | | | | |
| 12/15/2014 @100.00, | | | | |
| NATL-RE FGIC | | 975,000 | 1,082,982 |
| 5.000%, 12/15/2016, | | | | |
| NATL-RE FGIC | | 205,000 | | 226,695 |
| | | |
|
| | | | 1,309,677 |
| | | | | |
| Utilities | | | | 12.35% |
| Brighton Colorado Water | | | | |
| Activity Enterprise, | | | | |
| 5.000%, 12/1/2029, | | | | |
| Optional 12/1/2019 | | | | |
| @ 100.00 | 1,515,000 | 1,722,373 |
| Colorado Springs | | | | |
| Colorado Utilities | | | | |
| Revenue, | | | | |
| 5.000%, 11/15/2027, | | | | |
| Optional 11/15/2021 | | | | |
| @ 100.00 | 1,000,000 | 1,181,840 |
| Colorado Water | | | | |
| Resources & Power | | | | |
| Development | | | | |
| Authority, | | | | |
| 5.000%, 9/1/2022, | | | | |
| Optional 9/1/2014 | | | | |
| @ 100.00 | | 650,000 | | 704,282 |
| Colorado Water | | | | |
| Resources & Power | | | | |
| Development | | | | |
| Authority, Drinking | | | | |
| Water, | | | | |
| 5.000%, 9/1/2017, | | | | |
| Optional 9/1/2012 | | | | |
| @ 100.00 | | 500,000 | | 503,330 |
PAGE 63 |
|
WESTCORE COLORADO TAX-EXEMPT FUND AS OF JUNE 30, 2012 (continued)
(UNAUDITED)
| | Principal | |
| | Amount | Market Value |
| Colorado Water | | | | |
| Resources & Power | | | | |
| Development | | | | |
| Authority, East | | | | |
| Cherry Creek Valley | | | | |
| Water & Sanitation | | | | |
| District, | | | | |
| 4.250%, 11/15/2025, | | | | |
| Optional 11/15/2015 | | | | |
| @ 100.00, NATL-RE | $ | 1,420,000 | $ | 1,466,647 |
| Colorado Water | | | | |
| Resources & Power | | | | |
| Development | | | | |
| Authority, Parker | | | | |
| Water & Sanitation | | | | |
| District, | | | | |
| 5.000%, 9/1/2026, | | | | |
| Optional 9/1/2014 @ | | | | |
| 100.00, NATL-RE | | 500,000 | | 512,800 |
| Colorado Water | | | | |
| Resources & Power | | | | |
| Development | | | | |
| Authority, | | | | |
| Steamboat Springs | | | | |
| Utility Enterprise | | | | |
| Project, | | | | |
| 5.000%, 8/1/2031, | | | | |
| Optional 8/1/2021 | | | | |
| @ 100.00 | | 625,000 | | 704,050 |
| Colorado Water | | | | |
| Resources & Power | | | | |
| Development | | | | |
| Authority, Waste | | | | |
| Water Revolving | | | | |
| Fund, | | | | |
| 5.500%, 9/1/2019 | | 500,000 | | 634,820 |
| Denver City & County | | | | |
| Board of Water | | | | |
| Commissioners, | | | | |
| 5.000%, 12/15/2029, | | | | |
| Optional 12/15/2017 | | | | |
| @ 100.00, AGM | 1,575,000 | | 1,775,954 |
| Fort Collins Colorado | | | | |
| Waste Water Utility | | | | |
| Enterprise: | | | | |
| 5.000%, 12/1/2026, | | | | |
| Optional 12/1/2018 | | | | |
| @ 100.00 | 1,000,000 | | 1,125,040 |
| 5.000%, 12/1/2027, | | | | |
| Optional 12/1/2018 | | | | |
| @ 100.00 | | 465,000 | | 522,274 |
| Fort Collins, Larimer | | | | |
| County Colorado | | | | |
| Stormwater Utilities, | | | | |
| 4.875%, 12/1/2020, | | | | |
| Prerefunded | | | | |
| 12/1/2012 @ 100.00, | | | | |
| AMBAC | | 250,000 | | 254,767 |
| | | Principal | | | |
| | | Amount/Shares | | | Market Value |
| Golden Colorado Water & | | | | | |
Waste Treatment, | | | | | |
4.950%, 11/15/2022, | | | | | |
Optional 11/15/2013 | | | | | |
@ 100.00, AGM | $ | 150,000 | | $ | 155,785 |
| Parker Co., Water & | | | | | |
Sanitation District | | | | | |
Enterprise Revenue, | | | | | |
5.000%, 11/1/2026, | | | | | |
Optional AGM | | | | | |
5/1/2022 @ 100.00 | | 400,000 | | | 470,584 |
| Platte River Power | | | | | |
Authority, Series HH: | | | | | |
5.000%, 6/1/2022, | | | | | |
Optional 6/1/2019 | | | | | |
@ 100.00 | | 485,000 | | | 574,279 |
5.000%, 6/1/2027, | | | | | |
Optional 6/1/2019 | | | | | |
@ 100.00 | 2,000,000 | | 2,283,920 |
5.000%, 6/1/2028, | | | | | |
Optional 6/1/2019 | | | | | |
@ 100.00 | 1,000,000 | | 1,136,570 |
| Pueblo County Pollution | | | | | |
Control Public | | | | | |
Service of Colorado | | | | | |
Project, | | | | | |
5.100%, 1/1/2019, | | | | | |
Optional anytime | | | | | |
upon 30 days notice | | | | | |
@ 100.00, AMBAC | | 150,000 | | | 150,170 |
| Thornton Colorado Water | | | | | |
Enterprise, | | | | | |
5.000%, 12/1/2021, | | | | | |
Optional 12/1/2014 | | | | | |
@ 100.00, NATL-RE | | 500,000 | | | 538,970 |
| | | | |
|
| | | | | 16,418,455 |
| | | | | | |
| Total Revenue Bonds | | | | | |
| (Cost $53,553,651) | | | | 56,729,362 |
| | | | |
|
| | | | | | |
| MONEY MARKET MUTUAL FUNDS | | | 3.36% |
| Fidelity Institutional | | | | | |
Money Market Tax | | | | | |
Exempt - Class I | | | | | |
(7 Day Yield 0.010%) | 4,473,837 | | 4,473,837 |
| | | |
|
| | | | | | |
| Total Money Market Mutual Funds | | | |
| (Cost $4,473,837) | | | | 4,473,837 |
| | | | |
|
| | | | | | |
| | | | | | |
| Total Investments | | | | | |
| (Cost $125,043,922) | | 99.45% | | 132,214,377 |
| | | | | | |
| Other Assets in | | | | | |
| Excess of Liabilities | | 0.55% | | | 726,927 |
| | | | |
|
| | | | | | |
| Net Assets | 100.00% | $ | 132,941,304 |
| | | |
|
| | | | |
| (1) The coupon rate shown on floating or adjustable rate securities represents the rate at period end. |
| | | | |
| See Notes to Financial Statements. |
| PAGE 64 |
|
| COMMON ABBREVIATIONS |
| |
| AB | Aktiebolag is the Swedish equivalent of the term corporation. |
| ADR | American Depositary Receipt |
| AG | Aktiengesellschaft is a German term that refers to a corporation that is limited by shares, i.e., owned by shareholders. |
| AGM | Assured Guaranty Municipal |
| AMBAC | Ambac Financial Group Inc. |
| BV | Besloten Vennootschap is a Dutch private limited liability company. |
| FGIC | Financial Guaranty Insurance Co. |
| FHLMC | Federal Home Loan Mortgage Corp. |
| FNMA | Federal National Mortgage Association |
| GNMA | Government National Mortgage Association |
| LLC | Limited Liability Company |
| LP | Limited Partnership |
| Ltd. | Limited |
| MBIA | MBIA Inc. delivers credit enhancement for the obligations of debt such as municipal bonds. The purchase of municipal bond insurance is used |
| | to improve or enhance the credit rating of a borrower’s debt financing. |
| MORAL OBLG | Charter School Moral Obligation Program. Moral Obligation bonds are revenue-backed, state issued municipal bonds, whose principal and |
| | interest is backed by the moral, but not legal, obligation of a state government. |
| NATL-RE | Third party insurer for municipal debt securities. |
| N.V. | Naamloze Vennootschap is the Dutch term for a public limited liability corporation. |
| PLC | Public Limited Co. |
| REIT | Real Estate Investment Trust |
| S.A. | Generally designates corporations in various countries, mostly those employing the civil law. This translates literally in all languages |
| | mentioned as anonymous company. |
| S.p.A. | Società Per Azioni is an Italian shared company. |
| XLCA | XL Capital Assurance Inc. delivers credit enhancement for the obligations of debt such as municipal bonds |
| | |
| | |
| CURRENCY ABBREVIATIONS |
| | |
| AUD | Australian Dollar |
| CAD | Canadian Dollar |
| CHF | Swiss Franc |
| DKK | Danish Krone |
| EUR | Euro Currency |
| GBP | British Pound |
| HKD | Hong Kong Dollar |
| ILS | Israeli Shekel |
| JPY | Japanese Yen |
| KRW | Korean Won |
| NOK | Norwegian Krone |
| NZD | New Zealand Dollar |
| PLN | Polish Zloty |
| SEK | Swedish Krona |
| SGD | Singapore Dollar |
PAGE 65 |
|

| WESTCORE FUNDS AS OF JUNE 30, 2012 (UNAUDITED) |
| |
| | Westcore | | Westcore | | Westcore | | Westcore | | Westcore | | Westcore |
| | Growth | | MIDCO | | Select | | Blue Chip | | Mid-Cap | | Small-Cap |
| | Fund | | Growth Fund | | Fund | | Fund | | Value Fund | | Opportunity Fund |
| | | | | | | | | | | | |
| Assets | | | | | | | | | | | | | | | | | |
| Investments at value (cost - see below) | $ | 65,107,588 | | $ | 118,936,027 | | $ | 488,818,813 | | $ | 66,962,007 | | $ | 38,631,681 | | $ | 46,244,240 |
| Foreign cash at value (cost - see below) | | 0 | | | 0 | | | 0 | | | 0 | | | 0 | | | 0 |
| Unrealized gain on forward foreign | | | | | | | | | | | | | | | | | |
| currency contracts | | 0 | | | 0 | | | 0 | | | 0 | | | 0 | | | 0 |
| Receivable for investment securities sold | | 1,165,933 | | | 5,236,920 | | | 4,783,046 | | | 2,509,073 | | | 2,591,164 | | | 850,431 |
| Dividends and interest receivable | | 37,583 | | | 80,607 | | | 356,446 | | | 84,286 | | | 62,578 | | | 26,005 |
| Receivable for fund shares subscribed | | 16,320 | | | 9,468 | | | 223,550 | | | 344 | | | 1,502 | | | 15,693 |
| Investment for trustee deferred compensation plan | | 24,961 | | | 345,776 | | | 7,787 | | | 39,511 | | | 4,403 | | | 34,794 |
| Receivable due from advisor | | 0 | | | 0 | | | 0 | | | 0 | | | 0 | | | 0 |
| Prepaid and other assets | | 18,775 | | | 20,790 | | | 34,235 | | | 13,393 | | | 9,636 | | | 18,981 |
| | |
| | |
| | |
| | |
| | |
| | |
|
| Total Assets | | 66,371,160 | | | 124,629,588 | | | 494,223,877 | | | 69,608,614 | | | 41,300,964 | | | 47,190,144 |
| | |
| | |
| | |
| | |
| | |
| | |
|
| | | | | | | | | | | | | | | | | | |
| Liabilities | | | | | | | | | | | | | | | | | |
| Payable for investment securities purchased | | 1,448,818 | | | 3,833,008 | | | 1,933,929 | | | 2,230,134 | | | 1,745,505 | | | 0 |
| Unrealized loss on forward foreign | | | | | | | | | | | | | | | | | |
| currency contracts | | 0 | | | 0 | | | 0 | | | 0 | | | 0 | | | 0 |
| Payable for fund shares redeemed | | 28,212 | | | 76,646 | | | 1,699,717 | | | 0 | | | 27,087 | | | 38,742 |
| Payable for investment advisory fee | | 32,199 | | | 64,024 | | | 259,444 | | | 32,934 | | | 23,926 | | | 30,631 |
| Payable for administration fee | | 7,185 | | | 13,472 | | | 55,881 | | | 7,480 | | | 4,416 | | | 5,253 |
| Payable for shareholder servicing reimbursement | | 7,238 | | | 7,201 | | | 58,275 | | | 2,765 | | | 4,574 | | | 4,341 |
| Payable for trustee deferred compensation plan | | 24,961 | | | 345,776 | | | 7,787 | | | 39,511 | | | 4,403 | | | 34,794 |
| Payable for chief compliance officer fee | | 177 | | | 388 | | | 2,094 | | | 178 | | | 106 | | | 120 |
| Other payables | | 28,224 | | | 40,474 | | | 158,142 | | | 39,693 | | | 19,305 | | | 23,459 |
| | |
| | |
| | |
| | |
| | |
| | |
|
| Total Liabilities | | 1,577,014 | | | 4,380,989 | | | 4,175,269 | | | 2,352,695 | | | 1,829,322 | | | 137,340 |
| | |
| | |
| | |
| | |
| | |
| | |
|
| Net Assets | $ | 64,794,146 | | $ | 120,248,599 | | $ | 490,048,608 | | $ | 67,255,919 | | $ | 39,471,642 | | $ | 47,052,804 |
| | |
| | |
| | |
| | |
| | |
| | |
|
| | | | | | | | | | | | | | | | | | |
| Net Assets Consist of: | | | | | | | | | | | | | | | | | |
| Paid-in capital | $ | 53,331,285 | | $ | 112,800,494 | | $ | 609,082,977 | | $ | 52,395,981 | | $ | 43,811,554 | | $ | 38,388,227 |
| (Over)/Undistributed net investment income | | (102,424) | | | (472,771) | | | (1,944,430) | | | 369,086 | | | 182,764 | | | (110,348) |
| Accumulated net realized gain/(loss) on investments | | | | | | | | | | | | | | | | | |
| and foreign currency transactions | | (2,456,538) | | | 5,100,631 | | | (112,808,962) | | | 2,699,004 | | | (9,464,499) | | | 2,869,170 |
| Net unrealized appreciation/(depreciation) | | | | | | | | | | | | | | | | | |
| on investments and translation of assets and | | | | | | | | | | | | | | | | | |
| liabilities denominated in foreign currencies | | 14,021,823 | | | 2,820,245 | | | (4,280,977) | | | 11,791,848 | | | 4,941,823 | | | 5,905,755 |
| | |
| | |
| | |
| | |
| | |
| | |
|
| Net Assets | $ | 64,794,146 | | $ | 120,248,599 | | $ | 490,048,608 | | $ | 67,255,919 | | $ | 39,471,642 | | $ | 47,052,804 |
| | |
| | |
| | |
| | |
| | |
| | |
|
| | | | | | | | | | | | | | | | | | |
| Net Assets: | | | | | | | | | | | | | | | | | |
| Retail Class | $ | 61,349,890 | | $ | 85,082,437 | | $ | 490,048,608 | | $ | 60,000,085 | | $ | 39,471,642 | | $ | 44,270,309 |
| Institutional Class | | 3,444,256 | | | 35,166,162 | | | N/A | | | 7,255,834 | | | N/A | | | 2,782,495 |
| Shares of Beneficial Interest Outstanding: | | | | | | | | | | | | | | | | | |
| Retail Class | | 4,435,943 | | | 14,474,451 | | | 28,361,556 | | | 4,894,913 | | | 2,105,730 | | | 1,309,946 |
| Institutional Class | | 248,134 | | | 5,939,476 | | | N/A | | | 593,072 | | | N/A | | | 81,866 |
| Net Asset Value and Redemption Price Per Share | | | | | | | | | | | | | | | | | |
| (Net Assets Per Share Outstanding): | | | | | | | | | | | | | | | | | |
| Retail Class | $ | 13.83 | | $ | 5.88 | | $ | 17.28 | | $ | 12.26 | | $ | 18.74 | | $ | 33.80 |
| Institutional Class | | 13.88 | | | 5.92 | | | N/A | | | 12.23 | | | N/A | | | 33.99 |
| | | | | | | | | | | | | | | | | | |
| Cost of Investments | $ | 51,085,765 | | $ | 116,115,782 | | $ | 493,099,790 | | $ | 55,170,159 | | $ | 33,689,858 | | $ | 40,338,485 |
| | |
| | |
| | |
| | |
| | |
| | |
|
| Cost of Foreign Currency Held | $ | 0 | | $ | 0 | | $ | 0 | | $ | 0 | | $ | 0 | | $ | 0 |
| | |
| | |
| | |
| | |
| | |
| | |
|
| See Notes to Financial Statements. |
| PAGE 66 |
|
| WESTCORE FUNDS AS OF JUNE 30, 2012 (UNAUDITED) |
| | | | | | | | | | | | | | | | | | |
| | Westcore | | Westcore | | Westcore | | Westcore | | Westcore | | Westcore |
| | Small-Cap | | Micro-Cap | | International | | Flexible | | Plus Bond | | Colorado |
| | Value Fund | | Opportunity Fund | | Small-Cap Fund | | Income Fund | | Fund | | Tax-Exempt Fund |
| | | | | | | | | | | | |
| Assets | | | | | | | | | | | | | | | | | |
| Investments at value (cost - see below) | $ | 310,643,625 | | $ | 3,258,889 | | $ | 206,128,983 | | $ | 91,928,174 | | $ | 1,703,844,325 | | $ | 132,214,377 |
| Foreign cash at value (cost - see below) | | 0 | | | 0 | | | 6,204 | | | 0 | | | 0 | | | 0 |
| Unrealized gain on forward foreign | | | | | | | | | | | | | | | | | |
| currency contracts | | 0 | | | 0 | | | 6,516 | | | 0 | | | 0 | | | 0 |
| Receivable for investment securities sold | | 3,207,169 | | | 0 | | | 0 | | | 0 | | | 0 | | | 0 |
| Dividends and interest receivable | | 422,372 | | | 2,298 | | | 631,396 | | | 1,313,562 | | | 14,897,336 | | | 793,129 |
| Receivable for fund shares subscribed | | 1,805,321 | | | 1,425 | | | 283,156 | | | 45,433 | | | 973,881 | | | 50,675 |
| Investment for trustee deferred compensation plan | | 1,290 | | | 0 | | | 6,925 | | | 23,256 | | | 54,006 | | | 25,258 |
| Receivable due from advisor | | 0 | | | 3,035 | | | 0 | | | 0 | | | 0 | | | 0 |
| Prepaid and other assets | | 26,571 | | | 18,121 | | | 18,631 | | | 26,108 | | | 52,067 | | | 3,492 |
| | |
| | |
| |
| | |
| | |
| | |
|
| Total Assets | | 316,106,348 | | | 3,283,768 | | | 207,081,811 | | | 93,336,533 | | | 1,719,821,615 | | | 133,086,931 |
| | |
| | |
| |
| | |
| | |
| | |
|
| | | | | | | | | | | | | | | | | | |
| Liabilities | | | | | | | | | | | | | | | | | |
| Payable for investment securities purchased | | 874,778 | | | 327,220 | | | 111,775 | | | 0 | | | 1,500,793 | | | 0 |
| Unrealized loss on forward foreign | | | | | | | | | | | | | | | | | |
| currency contracts | | 0 | | | 0 | | | 590,058 | | | 0 | | | 0 | | | 0 |
| Payable for fund shares redeemed | | 2,036,367 | | | 0 | | | 29,429 | | | 49,447 | | | 914,367 | | | 21,617 |
| Payable for investment advisory fee | | 224,284 | | | 0 | | | 177,194 | | | 31,696 | | | 277,631 | | | 40,224 |
| Payable for administration fee | | 34,523 | | | 288 | | | 22,622 | | | 10,633 | | | 196,882 | | | 15,027 |
| Payable for shareholder servicing reimbursement | | 26,462 | | | 282 | | | 25,208 | | | 10,042 | | | 187,695 | | | 14,705 |
| Payable for trustee deferred compensation plan | | 1,290 | | | 0 | | | 6,925 | | | 23,256 | | | 54,006 | | | 25,258 |
| Payable for chief compliance officer fee | | 817 | | | 7 | | | 301 | | | 208 | | | 3,558 | | | 242 |
| Other payables | | 73,875 | | | 13,771 | | | 46,740 | | | 28,516 | | | 234,430 | | | 28,554 |
| | |
| | |
| |
| | |
| | |
| | |
|
| Total Liabilities | | 3,272,396 | | | 341,568 | | | 1,010,252 | | | 153,798 | | | 3,369,362 | | | 145,627 |
| | |
| | |
| |
| | |
| | |
| | |
|
| Net Assets | $ | 312,833,952 | | $ | 2,942,200 | | $ | 206,071,559 | | $ | 93,182,735 | | $ | 1,716,452,253 | | $ | 132,941,304 |
| | |
| | |
| |
| | |
| | |
| | |
|
| | | | | | | | | | | | | | | | | | |
| Net Assets Consist of: | | | | | | | | | | | | | | | | | |
| Paid-in capital | $ | 274,711,318 | | $ | 2,566,404 | | $ | 197,095,026 | | $ | 136,071,813 | | $ | 1,620,741,068 | | $ | 126,847,928 |
| (Over)/Undistributed net investment income | | 1,408,607 | | | 1,313 | | | 2,370,127 | | | (368,269) | | | (261,865) | | | (13,931) |
| Accumulated net realized gain/(loss) on investments | | | | | | | | | | | | | | | | | |
| and foreign currency transactions | | (5,023,224) | | | 101,527 | | | (10,981,487) | | | (42,287,905) | | | 1,533,381 | | | (1,063,148) |
| Net unrealized appreciation/(depreciation) on | | | | | | | | | | | | | | | | | |
| investments and translation of assets and | | | | | | | | | | | | | | | | | |
| liabilities denominated in foreign currencies | | 41,737,251 | | | 272,956 | | | 17,587,893 | | | (232,904) | | | 94,439,669 | | | 7,170,455 |
| | |
| | |
| |
| | |
| | |
| | |
|
| Net Assets | $ | 312,833,952 | | $ | 2,942,200 | | $ 2 06,071,559 | | $ | 93,182,735 | | $ | 1,716,452,253 | | $ | 132,941,304 |
| | |
| | |
| |
| | |
| | |
| | |
|
| | | | | | | | | | | | | | | | | | |
| Net Assets: | | | | | | | | | | | | | | | | | |
| Retail Class | $ | 207,944,765 | | $ | 2,942,200 | | $ | 206,071,559 | | $ | 90,280,650 | | $ | 1,495,244,829 | | $ | 132,941,304 |
| Institutional Class | | 104,889,187 | | | N/A | | | N/A | | | 2,902,085 | | | 221,207,424 | | | N/A |
| Shares of Beneficial Interest Outstanding: | | | | | | | | | | | | | | | | | |
| Retail Class | | 16,628,580 | | | 244,604 | | | 12,563,119 | | | 10,346,046 | | | 133,683,381 | | | 11,378,769 |
| Institutional Class | | 8,399,730 | | | N/A | | | N/A | | | 337,521 | | | 20,001,151 | | | N/A |
| Net Asset Value and Redemption Price Per Share | | | | | | | | | | | | | | | | | |
| (Net Assets Per Share Outstanding): | | | | | | | | | | | | | | | | | |
| Retail Class | $ | 12.51 | | $ | 12.03 | | $ | 16.40 | | $ | 8.73 | | $ | 11.18 | | $ | 11.68 |
| Institutional Class | | 12.49 | | | N/A | | | N/A | | | 8.60 | | | 11.06 | | | N/A |
| | | | | | | | | | | | | | | | | | |
| Cost of Investments | $ | 268,906,374 | | $ | 2,985,933 | | $ | 187,954,844 | | $ | 92,161,078 | | $ | 1,609,404,656 | | $ | 125,043,922 |
| | |
| |
|
| |
|
| | |
| | |
| | |
|
| Cost of Foreign Currency Held | $ | 0 | | $ | 0 | | $ | 6,227 | | $ | 0 | | $ | 0 | | $ | 0 |
| | |
| |
|
| |
|
| | |
| | |
| | |
|
| See Notes to Financial Statements. |
PAGE 67 |
|

| WESTCORE FUNDS FOR THE SIX MONTHS ENDED JUNE 30, 2012 (UNAUDITED) |
| | | | | | | | | | | | | | | | | | |
| | Westcore | | Westcore | | Westcore | | Westcore | | Westcore | | Westcore |
| | Growth | | MIDCO | | Select | | Blue Chip | | Mid-Cap | | Small-Cap |
| | Fund | | Growth Fund | | Fund | | Fund | | Value Fund | | Opportunity Fund |
| | | | | | | | | | | | |
| Investment Income | | | | | | | | | | | | | | | | | |
| Dividends, net of foreign taxes* | $ | 309,643 | | $ | 505,522 | | $ | 1,400,627 | | $ | 742,808 | | $ | 449,108 | | $ | 228,388 |
| Interest | | 67 | | | 134 | | | 1,049 | | | 299 | | | 50 | | | 94 |
| Other Income | | 0 | | | 0 | | | 0 | | | 0 | | | 0 | | | 0 |
| | |
| | |
| | |
| | |
| | |
| | |
|
| Total Income | | 309,710 | | | 505,656 | | | 1,401,676 | | | 743,107 | | | 449,158 | | | 228,482 |
| | |
| | |
| | |
| | |
| | |
| | |
|
| | | | | | | | | | | | | | | | | | |
| Expenses | | | | | | | | | | | | | | | | | |
| Investment advisory fee | | 221,359 | | | 439,174 | | | 2,046,799 | | | 225,143 | | | 156,838 | | | 241,236 |
| Administrative fee | | 55,213 | | | 103,072 | | | 481,701 | | | 56,040 | | | 31,850 | | | 40,017 |
| Shareholder servicing reimbursement - | | | | | | | | | | | | | | | | | |
| Retail Class | | 43,799 | | | 49,037 | | | 441,299 | | | 17,098 | | | 29,030 | | | 26,291 |
| Transfer agent fees | | 13,008 | | | 23,957 | | | 75,891 | | | 56,277 | | | 9,575 | | | 12,286 |
| Fund accounting fees and expenses | | 15,251 | | | 16,753 | | | 48,142 | | | 14,477 | | | 12,130 | | | 15,672 |
| Legal fees | | 865 | | | 1,789 | | | 8,238 | | | 766 | | | 554 | | | 646 |
| Printing fees | | 5,953 | | | 10,362 | | | 84,868 | | | 9,809 | | | 3,492 | | | 3,166 |
| Registration fees | | 13,565 | | | 15,201 | | | 10,563 | | | 9,542 | | | 8,056 | | | 12,818 |
| Audit and tax preparation fees | | 8,908 | | | 8,907 | | | 7,719 | | | 5,889 | | | 7,245 | | | 7,421 |
| Custodian fees | | 4,240 | | | 8,636 | | | 23,699 | | | 3,136 | | | 1,822 | | | 2,777 |
| Insurance | | 851 | | | 1,748 | | | 9,349 | | | 947 | | | 538 | | | 584 |
| Trustee fees and expenses | | 3,150 | | | 6,422 | | | 31,230 | | | 3,194 | | | 1,911 | | | 2,213 |
| Chief compliance officer fee | | 926 | | | 1,889 | | | 9,203 | | | 942 | | | 572 | | | 652 |
| Other | | 3,889 | | | 5,809 | | | 47,957 | | | 7,685 | | | 2,809 | | | 4,132 |
| | |
| | |
| | |
| | |
| | |
| | |
|
| Total expenses before waivers | | 390,977 | | | 692,756 | | | 3,326,658 | | | 410,945 | | | 266,422 | | | 369,911 |
| Expenses waived by: | | | | | | | | | | | | | | | | | |
| Investment advisor | | | | | | | | | | | | | | | | | |
| Retail Class | | 0 | | | 0 | | | 0 | | | (11,698) | | | (4,637) | | | (41,893) |
| Institutional Class | | (12,711) | | | (7,515) | | | N/A | | | (7,466) | | | N/A | | | (15,293) |
| Administrator | | | | | | | | | | | | | | | | | |
| Retail Class | | 0 | | | 0 | | | 0 | | | (405) | | | (218) | | | (885) |
| Institutional Class | | 0 | | | 0 | | | N/A | | | 0 | | | N/A | | | 0 |
| | |
| | |
| | |
| | |
| | |
| | |
|
| Net Expenses | | 378,266 | | | 685,241 | | | 3,326,658 | | | 391,376 | | | 261,567 | | | 311,840 |
| | |
| | |
| | |
| | |
| | |
| | |
|
| Net Investment Income/(Loss) | | (68,556) | | | (179,585) | | | (1,924,982) | | | 351,731 | | | 187,591 | | | (83,358) |
| | |
| | |
| | |
| | |
| | |
| | |
|
| | | | | | | | | | | | | | | | | | |
| Realized and Unrealized Gain/(Loss): | | | | | | | | | | | | | | | | | |
| Net realized gain/(loss) on investments | | 8,377,971 | | | 5,407,367 | | | (31,661,433) | | | 2,530,399 | | | 1,895,555 | | | 2,611,642 |
| Net change in unrealized appreciation/ | | | | | | | | | | | | | | | | | |
| (depreciation) on investments | | (787,711) | | | (4,605,590) | | | (4,137,590) | | | 1,662,697 | | | (526,174) | | | (330,395) |
| | |
| | |
| | |
| | |
| | |
| | |
|
| Net Realized And Unrealized Gain/(Loss) | | 7,590,260 | | | 801,777 | | | (35,799,023) | | | 4,193,096 | | | 1,369,381 | | | 2,281,247 |
| | |
| | |
| | |
| | |
| | |
| | |
|
| Net Increase/(Decrease) In Net Assets Resulting | | | | | | | | | | | | | | | | | |
| From Operations | $ | 7,521,704 | | $ | 622,192 | | $ | (37,724,005) | | $ | 4,544,827 | | $ | 1,556,972 | | $ | 2,197,889 |
| | |
| | |
| | |
| | |
| | |
| | |
|
| | | | | | | | | | | | | | | | | | |
| * Foreign tax withholdings | $ | 2,354 | | $ | 2,087 | | $ | 0 | | $ | 4,909 | | $ | 0 | | $ | 0 |
| | |
| | |
| | |
| | |
| | |
| | |
|
See Notes to Financial Statements. |
| PAGE 68 |
|
| WESTCORE FUNDS FOR THE SIX MONTHS ENDED JUNE 30, 2012 (UNAUDITED) |
| | | | | | | | | | | | | | | | | | |
| | Westcore | | Westcore | | Westcore | | Westcore | | Westcore | | Westcore |
| | Small-Cap | | Micro-Cap | | International | | Flexible | | Plus Bond | | Colorado |
| | Value Fund | | Opportunity Fund | | Small-Cap Fund | | Income Fund | | Fund | | Tax-Exempt Fund |
| | | | | | | | | | | | |
| Investment Income | | | | | | | | | | | | | | | | | |
| Dividends, net of foreign taxes* | $ | 3,351,864 | | $ | 20,554 | | $ | 3,970,859 | | $ | 230,852 | | $ | 172,786 | | $ | 0 |
| Interest | | 654 | | | 7 | | | 0 | | | 2,851,731 | | | 35,009,468 | | | 2,406,031 |
| Other Income | | 0 | | | 0 | | | 9,185 | | | 108,905 | | | 655,550 | | | 0 |
| | |
| | |
| | |
| | |
| | |
| | |
|
| Total Income | | 3,352,518 | | | 20,561 | | | 3,980,044 | | | 3,191,488 | | | 35,837,804 | | | 2,406,031 |
| | |
| | |
| | |
| | |
| | |
| | |
|
| | | | | | | | | | | | | | | | | | |
| Expenses | | | | | | | | | | | | | | | | | |
| Investment advisory fee | | 1,538,843 | | | 14,144 | | | 1,021,231 | | | 216,957 | | | 3,448,192 | | | 290,676 |
| Administrative fee | | 234,028 | | | 5,465 | | | 128,711 | | | 76,626 | | | 1,259,437 | | | 94,799 |
| Shareholder servicing reimbursement - | | | | | | | | | | | | | | | | | |
| Retail Class | | 159,261 | | | 1,850 | | | 126,191 | | | 61,536 | | | 1,063,560 | | | 81,793 |
| Transfer agent fees | | 18,923 | | | 8,114 | | | 18,664 | | | 15,690 | | | 94,532 | | | 10,028 |
| Fund accounting fees and expenses | | 30,152 | | | 16,951 | | | 18,713 | | | 17,485 | | | 125,974 | | | 23,301 |
| Legal fees | | 4,100 | | | 42 | | | 2,351 | | | 1,303 | | | 22,228 | | | 1,685 |
| Printing fees | | 33,258 | | | 511 | | | 12,459 | | | 6,602 | | | 113,451 | | | 5,508 |
| Registration fees | | 13,741 | | | 8,268 | | | 14,545 | | | 14,165 | | | 23,081 | | | 1,849 |
| Audit and tax preparation fees | | 8,433 | | | 6,420 | | | 7,806 | | | 12,615 | | | 13,598 | | | 9,740 |
| Custodian fees | | 16,294 | | | 3,494 | | | 23,845 | | | 3,813 | | | 47,414 | | | 3,678 |
| Insurance | | 3,729 | | | 19 | | | 1,801 | | | 821 | | | 19,447 | | | 1,311 |
| Trustee fees and expenses | | 13,921 | | | 131 | | | 7,021 | | | 4,387 | | | 73,394 | | | 5,486 |
| Chief compliance officer fee | | 4,113 | | | 39 | | | 2,064 | | | 1,287 | | | 21,606 | | | 1,609 |
| Other | | 6,118 | | | 2,050 | | | 11,115 | | | 4,773 | | | 21,061 | | | 3,077 |
| | |
| | |
| | |
| | |
| | |
| | |
|
| Total expenses before waivers | | 2,084,914 | | | 67,498 | | | 1,396,517 | | | 438,060 | | | 6,346,975 | | | 534,540 |
| Expenses waived by: | | | | | | | | | | | | | | | | | |
| Investment advisor | | | | | | | | | | | | | | | | | |
| Retail Class | | (102,392) | | | (48,031) | | | (117,895) | | | (15,221) | | | (1,627,778) | | | (122,947) |
| Institutional Class | | (56,550) | | | N/A | | | N/A | | | (13,709) | | | (240,221) | | | N/A |
| Administrator | | | | | | | | | | | | | | | | | |
| Retail Class | | (2,120) | | | (1,032) | | | (2,085) | | | (804) | | | (69,201) | | | (5,496) |
| Institutional Class | | 0 | | | N/A | | | N/A | | | 0 | | | 0 | | | N/A |
| | |
| | |
| | |
| | |
| | |
| | |
|
| Net Expenses | | 1,923,852 | | | 18,435 | | | 1,276,537 | | | 408,326 | | | 4,409,775 | | | 406,097 |
| | |
| | |
| | |
| | |
| | |
| | |
|
| Net Investment Income | | 1,428,666 | | | 2,126 | | | 2,703,507 | | | 2,783,162 | | | 31,428,029 | | | 1,999,934 |
| | |
| | |
| | |
| | |
| | |
| | |
|
| | | | | | | | | | | | | | | | | | |
| Realized and Unrealized Gain/(Loss): | | | | | | | | | | | | | | | | | |
| Net realized gain/(loss) on investments | | 10,759,288 | | | 131,371 | | | 280,248 | | | (3,316,081) | | | 822,880 | | | (9,477) |
| Net realized loss on foreign | | | | | | | | | | | | | | | | | |
| currency transactions | | 0 | | | 0 | | | (2,337,842) | | | 0 | | | 0 | | | 0 |
| Net change in unrealized appreciation/ | | | | | | | | | | | | | | | | | |
| (depreciation) on investments | | 4,897,973 | | | 66,596 | | | 16,793,414 | | | 5,096,579 | | | 20,868,188 | | | 1,431,074 |
| Net change in unrealized depreciation on | | | | | | | | | | | | | | | | | |
| translation of assets and liabilities denominated | | | | | | | | | | | | | | | | | |
| in foreign currencies | | 0 | | | 0 | | | (736,029) | | | 0 | | | 0 | | | 0 |
| | |
| | |
| | |
| | |
| | |
| | |
|
| Net Realized And Unrealized Gain | | 15,657,261 | | | 197,967 | | | 13,999,791 | | | 1,780,498 | | | 21,691,068 | | | 1,421,597 |
| | |
| | |
| | |
| | |
| | |
| | |
|
| Net Increase In Net Assets Resulting | | | | | | | | | | | | | | | | | |
| From Operations | $ | 17,085,927 | | $ | 200,093 | | $ | 16,703,298 | | $ | 4,563,660 | | $ | 53,119,097 | | $ | 3,421,531 |
| | |
| | |
| | |
| | |
| | |
| | |
|
| | | | | | | | | | | | | | | | | | |
| * Foreign tax withholdings | $ | 0 | | $ | 376 | | $ | 260,454 | | $ | 0 | | $ | 0 | | $ | 0 |
| | |
| | |
| | |
| | |
| | |
| | |
|
| | | | | | | | | | | | | | | | | | |
See Notes to Financial Statements. |
PAGE 69 |
|

| | Westcore Growth Fund | | Westcore MIDCO Growth Fund | | Westcore Select Fund |
| | Six Months Ended | | | | Six Months Ended | | | | Six Months Ended | | |
| | June 30, 2012 | | Year Ended | | June 30, 2012 | | Year Ended | | June 30, 2012 | | Year Ended |
| | (Unaudited) | | December 31, 2011 | | (Unaudited) | | December 31, 2011 | | (Unaudited) | | December 31, 2011 |
| | | | | | | | | | | | | | | |
| Increase/(Decrease) in Net Assets from: | | | | | | | | | | | | | | | | | |
| Operations: | | | | | | | | | | | | | | | | | |
| Net investment loss | $ | (68,556) | | $ | (179,734) | | $ | (179,585) | | $ | (318,337) | | $ | (1,924,982) | | $ | (2,739,231) |
| Net realized gain/(loss) | | 8,377,971 | | | 18,413,891 | | | 5,407,367 | | | 19,868,579 | | | (31,661,433) | | | (80,970,008) |
| Change in unrealized net appreciation or (depreciation) | | (787,711) | | | (16,827,055) | | | (4,605,590) | | | (31,100,226) | | | (4,137,590) | | | (52,626,326) |
| | |
| | |
| | |
| | |
| | |
| | |
|
| Net increase/(decrease) in net assets resulting | | | | | | | | | | | | | | | | | |
| from operations | | 7,521,704 | | | 1,407,102 | | | 622,192 | | | (11,549,984) | | | (37,724,005) | | | (136,335,565) |
| | |
| | |
| | |
| | |
| | |
| | |
|
| | | | | | | | | | | | | | | | | | |
| Distributions to Shareholders (Note 2): | | | | | | | | | | | | | | | | | |
| From net investment income | | | | | | | | | | | | | | | | | |
| Retail Class | | 0 | | | 0 | | | 0 | | | 0 | | | 0 | | | (4,503,597) |
| Institutional Class | | 0 | | | 0 | | | 0 | | | 0 | | | N/A | | | N/A |
| From net realized capital gains | | | | | | | | | | | | | | | | | |
| Retail Class | | 0 | | | 0 | | | 0 | | | (5,891,648) | | | 0 | | | 0 |
| Institutional Class | | 0 | | | 0 | | | 0 | | | (2,315,777) | | | N/A | | | N/A |
| From paid-in capital | | | | | | | | | | | | | | | | | |
| Retail Class | | 0 | | | 0 | | | 0 | | | 0 | | | 0 | | | 0 |
| Institutional Class | | 0 | | | 0 | | | 0 | | | 0 | | | N/A | | | N/A |
| | |
| | |
| | |
| | |
| | |
| | |
|
| Decrease in net assets from distributions | | | | | | | | | | | | | | | | | |
| to shareholders | | 0 | | | 0 | | | 0 | | | (8,207,425) | | | 0 | | | (4,503,597) |
| | |
| | |
| | |
| | |
| | |
| | |
|
| | | | | | | | | | | | | | | | | | |
| Beneficial Interest Transactions (Note 3): | | | | | | | | | | | | | | | | | |
| Shares sold | | | | | | | | | | | | | | | | | |
| Retail Class | | 9,011,516 | | | 19,424,275 | | | 4,090,434 | | | 31,551,259 | | | 68,983,853 | | | 749,733,215 |
| Institutional Class | | 599,381 | | | 6,247,263 | | | 893,357 | | | 2,485,681 | | | N/A | | | N/A |
| Shares issued in reinvestment of distributions | | | | | | | | | | | | | | | | | |
| Retail Class | | 0 | | | 0 | | | 0 | | | 5,631,877 | | | 0 | | | 4,326,560 |
| Institutional Class | | 0 | | | 0 | | | 0 | | | 2,315,777 | | | N/A | | | N/A |
| Cost of shares redeemed | | | | | | | | | | | | | | | | | |
| Retail Class | | (13,299,951) | | | (70,157,197) | | | (16,398,346) | | | (30,000,928) | | | (222,434,871) | | | (324,510,682) |
| Institutional Class | | (6,990,805) | | | (945,897) | | | (4,117,074) | | | (3,285,283) | | | N/A | | | N/A |
| | |
| | |
| | |
| | |
| | |
| | |
|
| Net increase/(decrease) resulting from beneficial | | | | | | | | | | | | | | | | | |
| interest transactions | | (10,679,859) | | | (45,431,556) | | | (15,531,629) | | | 8,698,383 | | | (153,451,018) | | | 429,549,093 |
| | |
| | |
| | |
| | |
| | |
| | |
|
| Redemption Fees | | 4,046 | | | 7,982 | | | 602 | | | 25,155 | | | 23,356 | | | 316,754 |
| | |
| | |
| | |
| | |
| | |
| | |
|
| Net Increase/(Decrease) In Net Assets | | (3,154,109) | | | (44,016,472) | | | (14,908,835) | | | (11,033,871) | | | (191,151,667) | | | 289,026,685 |
| | |
| | |
| | |
| | |
| | |
| | |
|
| | | | | | | | | | | | | | | | | | |
| Net Assets: | | | | | | | | | | | | | | | | | |
| Beginning of year | | 67,948,255 | | | 111,964,727 | | | 135,157,434 | | | 146,191,305 | | | 681,200,275 | | | 392,173,590 |
| | |
| | |
| | |
| | |
| | |
| | |
|
| End of period* | $ | 64,794,146 | | $ | 67,948,255 | | $ | 120,248,599 | | $ | 135,157,434 | | $ | 490,048,608 | | $ | 681,200,275 |
| | |
| | |
| | |
| | |
| | |
| | |
|
| *Including overdistributed net investment income of: | $ | (102,424) | | $ | (33,868) | | $ | (472,771) | | $ | (293,186) | | $ | (1,944,430) | | $ | (19,448) |
| | |
| | |
| | |
| | |
| | |
| | |
|
See Notes to Financial Statements. |
| PAGE 70 |
|
| | Westcore Blue Chip Fund | | Westcore Mid-Cap Value Fund | | Westcore Small-Cap Opportunity Fund |
| | | | | | |
| | Six Months Ended | | | | Six Months Ended | | | | Six Months Ended | | |
| | June 30, 2012 | | Year Ended | | June 30, 2012 | | Year Ended | | June 30, 2012 | | Year Ended |
| | (Unaudited) | | December 31, 2011 | | (Unaudited) | | December 31, 2011 | | (Unaudited) | | December 31, 2011 |
| | | | | | | | | | | | | | | |
| Increase/(Decrease) in Net Assets from: | | | | | | | | | | | | | | | | | |
| Operations: | | | | | | | | | | | | | | | | | |
| Net investment income/(loss) | $ | 351,731 | | $ | 877,509 | | $ | 187,591 | | $ | 372,255 | | $ | (83,358) | | $ | (158,695) |
| Net realized gain | | 2,530,399 | | | 7,398,042 | | | 1,895,555 | | | 2,091,266 | | | 2,611,642 | | | 3,955,323 |
| Change in unrealized net appreciation or (depreciation) | | 1,662,697 | | | (5,436,635) | | | (526,174) | | | (2,310,994) | | | (330,395) | | | (5,724,320) |
| | |
| | |
| | |
| | |
| | |
| | |
|
| Net increase/(decrease) in net assets resulting | | | | | | | | | | | | | | | | | |
| from operations | | 4,544,827 | | | 2,838,916 | | | 1,556,972 | | | 152,527 | | | 2,197,889 | | | (1,927,692) |
| | |
| | |
| | |
| | |
| | |
| | |
|
| | | | | | | | | | | | | | | | | | |
| Distributions to Shareholders (Note 2): | | | | | | | | | | | | | | | | | |
| From net investment income | | | | | | | | | | | | | | | | | |
| Retail Class | | (22) | | | (760,025) | | | 0 | | | (368,999) | | | 0 | | | 0 |
| Institutional Class | | 0 | | | (153,076) | | | N/A | | | N/A | | | 0 | | | 0 |
| From net realized capital gains | | | | | | | | | | | | | | | | | |
| Retail Class | | (21) | | | (241,989) | | | 0 | | | 0 | | | 0 | | | (630,978) |
| Institutional Class | | 0 | | | (30,647) | | | N/A | | | N/A | | | 0 | | | (47,259) |
| From paid-in capital | | | | | | | | | | | | | | | | | |
| Retail Class | | 0 | | | 0 | | | 0 | | | 0 | | | 0 | | | 0 |
| Institutional Class | | 0 | | | 0 | | | N/A | | | N/A | | | 0 | | | 0 |
| | |
| | |
| | |
| | |
| | |
| | |
|
| Decrease in net assets from distributions | | | | | | | | | | | | | | | | | |
| to shareholders | | (43) | | | (1,185,737) | | | 0 | | | (368,999) | | | 0 | | | (678,237) |
| | |
| | |
| | |
| | |
| | |
| | |
|
| | | | | | | | | | | | | | | | | | |
| Beneficial Interest Transactions (Note 3): | | | | | | | | | | | | | | | | | |
| Shares sold | | | | | | | | | | | | | | | | | |
| Retail Class | | 963,969 | | | 980,177 | | | 1,974,797 | | | 6,346,699 | | | 4,071,859 | | | 9,939,698 |
| Institutional Class | | 144,334 | | | 288,298 | | | N/A | | | N/A | | | 59,039 | | | 163,381 |
| Shares issued in reinvestment of distributions | | | | | | | | | | | | | | | | | |
| Retail Class | | 45 | | | 764,528 | | | 0 | | | 357,023 | | | 0 | | | 220,089 |
| Institutional Class | | 0 | | | 159,696 | | | N/A | | | N/A | | | 0 | | | 47,259 |
| Cost of shares redeemed | | | | | | | | | | | | | | | | | |
| Retail Class | | (6,286,551) | | | (69,212,722) | | | (7,249,936) | | | (9,712,933) | | | (5,427,569) | | | (13,012,158) |
| Institutional Class | | (1,214,830) | | | (14,091,045) | | | N/A | | | N/A | | | (735,527) | | | (371,352) |
| Acquisition - Retail Class | | N/A | | | 113,157,517 | | | N/A | | | N/A | | | N/A | | | N/A |
| | |
| | |
| | |
| | |
| | |
| | |
|
| Net increase/(decrease) resulting from beneficial | | | | | | | | | | | | | | | | | |
| interest transactions | | (6,393,033) | | | 32,046,449 | | | (5,275,139) | | | (3,009,211) | | | (2,032,198) | | | (3,013,083) |
| | |
| | |
| | |
| | |
| | |
| | |
|
| Redemption Fees | | 22 | | | 127,727 | | | 153 | | | 2,347 | | | 551 | | | 520 |
| | |
| | |
| | |
| | |
| | |
| | |
|
| Net Increase/(Decrease) In Net Assets | | (1,848,227) | | | 33,827,355 | | | (3,718,014) | | | (3,223,336) | | | 166,242 | | | (5,618,492) |
| | |
| | |
| | |
| | |
| | |
| | |
|
| | | | | | | | | | | | | | | | | | |
| Net Assets: | | | | | | | | | | | | | | | | | |
| Beginning of year | | 69,104,146 | | | 35,276,791 | | | 43,189,656 | | | 46,412,992 | | | 46,886,562 | | | 52,505,054 |
| | |
| | |
| | |
| | |
| | |
| | |
|
| End of period* | $ | 67,255,919 | | $ | 69,104,146 | | $ | 39,471,642 | | $ | 43,189,656 | | $ | 47,052,804 | | $ | 46,886,562 |
| | |
| | |
| | |
| | |
| | |
| | |
|
| *Including (over)/undistributed net investment | | | | | | | | | | | | | | | | | |
| income of: | $ | 369,086 | | $ | 17,377 | | $ | 182,764 | | $ | (4,827) | | $ | (110,348) | | $ | (26,990) |
| | |
| | |
| | |
| | |
| | |
| | |
|
| See Notes to Financial Statements. |
PAGE 71 |
|
| | Westcore Small-Cap Value Fund | | Westcore Micro-Cap Opportunity Fund | | Westcore International Small-Cap Fund |
| | | | | | |
| | Six Months Ended | | | | | Six Months Ended | | | | | Six Months Ended | | | |
| | June 30, 2012 | | Year Ended | | June 30, 2012 | | Year Ended | | June 30, 2012 | | Year Ended |
| | (Unaudited) | | December 31, 2011 | | (Unaudited) | | December 31, 2011 | | (Unaudited) | | December 31, 2011 |
| | | | | | | | | | | | | | | |
| Increase/(Decrease) in Net Assets from: | | | | | | | | | | | | | | | | | |
| Operations: | | | | | | | | | | | | | | | | | |
| Net investment income/(loss) | $ | 1,428,666 | | $ | 2,748,938 | | $ | 2,126 | | $ | (2,374) | | $ | 2,703,507 | | $ | 2,087,923 |
| Net realized gain/(loss) | | 10,759,288 | | | 32,246,405 | | | 131,371 | | | 73,243 | | | (2,057,594) | | | 40,365 |
| Change in unrealized net appreciation or (depreciation) | | 4,897,973 | | | (38,131,332) | | | 66,596 | | | (156,720) | | | 16,057,385 | | | (14,413,726) |
| | |
| | |
| | |
| | |
| | |
| | |
|
| Net increase/(decrease) in net assets resulting | | | | | | | | | | | | | | | | | |
| from operations | | 17,085,927 | | | (3,135,989) | | | 200,093 | | | (85,851) | | | 16,703,298 | | | (12,285,438) |
| | |
| | |
| | |
| | |
| | |
| | |
|
| | | | | | | | | | | | | | | | | | |
| Distributions to Shareholders (Note 2): | | | | | | | | | | | | | | | | | |
| From net investment income | | | | | | | | | | | | | | | | | |
| Retail Class | | 0 | | | (1,885,679) | | | 0 | | | 0 | | | 0 | | | (2,200,004) |
| Institutional Class | | 0 | | | (1,004,321) | | | N/A | | | N/A | | | N/A | | | N/A |
| From net realized capital gains | | | | | | | | | | | | | | | | | |
| Retail Class | | 0 | | | 0 | | | 0 | | | 0 | | | 0 | | | 0 |
| Institutional Class | | 0 | | | 0 | | | N/A | | | N/A | | | N/A | | | N/A |
| From paid-in capital | | | | | | | | | | | | | | | | | |
| Retail Class | | 0 | | | 0 | | | 0 | | | 0 | | | 0 | | | 0 |
| Institutional Class | | 0 | | | 0 | | | N/A | | | N/A | | | N/A | | | N/A |
| | |
| | |
| | |
| | |
| | |
| | |
|
| Decrease in net assets from distributions | | | | | | | | | | | | | | | | | |
| to shareholders | | 0 | | | (2,890,000) | | | 0 | | | 0 | | | 0 | | | (2,200,004) |
| | |
| | |
| | |
| | |
| | |
| | |
|
| | | | | | | | | | | | | | | | | | |
| Beneficial Interest Transactions (Note 3): | | | | | | | | | | | | | | | | | |
| Shares sold | | | | | | | | | | | | | | | | | |
| Retail Class | | 29,744,897 | | | 49,872,763 | | | 1,773,254 | | | 616,074 | | | 86,527,181 | | | 136,056,940 |
| Institutional Class | | 14,728,862 | | | 31,310,278 | | | N/A | | | N/A | | | N/A | | | N/A |
| Shares issued in reinvestment of distributions | | | | | | | | | | | | | | | | | |
| Retail Class | | 0 | | | 1,309,356 | | | 0 | | | 0 | | | 0 | | | 2,056,851 |
| Institutional Class | | 0 | | | 906,945 | | | N/A | | | N/A | | | N/A | | | N/A |
| Cost of shares redeemed | | | | | | | | | | | | | | | | | |
| Retail Class | | (30,276,805) | | | (93,484,313) | | | (764,921) | | | (392,372) | | | (30,429,884) | | | (51,359,867) |
| Institutional Class | | (7,659,414) | | | (51,802,172) | | | N/A | | | N/A | | | N/A | | | N/A |
| | |
| | |
| | |
| | |
| | |
| | |
|
| Net increase/(decrease) resulting from beneficial | | | | | | | | | | | | | | | | | |
| interest transactions | | 6,537,540 | | | (61,887,143) | | | 1,008,333 | | | 223,702 | | | 56,097,297 | | | 86,753,924 |
| | |
| | |
| | |
| | |
| | |
| | |
|
| Redemption Fees | | 1,075 | | | 19,853 | | | 228 | | | 1,941 | | | 34,902 | | | 42,992 |
| | |
| | |
| | |
| | |
| | |
| | |
|
| Net Increase/(Decrease) In Net Assets | | 23,624,542 | | | (67,893,279) | | | 1,208,654 | | | 139,792 | | | 72,835,497 | | | 72,311,474 |
| | |
| | |
| | |
| | |
| | |
| | |
|
| | | | | | | | | | | | | | | | | | |
| Net Assets: | | | | | | | | | | | | | | | | | |
| Beginning of year | | 289,209,410 | | | 357,102,689 | | | 1,733,546 | | | 1,593,754 | | | 133,236,062 | | | 60,924,588 |
| | |
| | |
| | |
| | |
| | |
| | |
|
| End of period* | $ | 312,833,952 | | $ | 289,209,410 | | $ | 2,942,200 | | $ | 1,733,546 | | $ | 206,071,559 | | $ | 133,236,062 |
| | |
| | |
| | |
| | |
| | |
| | |
|
| *Including overdistributed net investment income of: | $ | 1,408,607 | | $ | (20,059) | | $ | 1,313 | | $ | (813) | | $ | 2,370,127 | | $ | (333,380) |
| | |
| | |
| | |
| | |
| | |
| | |
|
| See Notes to Financial Statements. |
| PAGE 72 |
|
| | Westcore Flexible Income Fund | | Westcore Plus Bond Fund | | Westcore Colorado Tax-Exempt Fund |
| | | | | | |
| | Six Months Ended | | | | | | Six Months Ended | | | | | Six Months Ended | | | |
| | June 30, 2012 | | Year Ended | | | June 30, 2012 | | | Year Ended | | June 30, 2012 | | Year Ended |
| | (Unaudited) | | December 31, 2011 | | | (Unaudited) | | | December 31, 2011 | | (Unaudited) | | December 31, 2011 |
| | | | | | | | | | | | | | | | |
| Increase in Net Assets from: | | | | | | | | | | | | | | | | | |
| Operations: | | | | | | | | | | | | | | | | | |
| Net investment income | $ | 2,783,162 | | $ | 4,245,580 | | $ | 31,428,029 | | $ | 61,978,180 | | $ | 1,999,934 | | $ | 3,716,973 |
| Net realized gain/(loss) | | (3,316,081) | | | (7,762,882) | | | 822,880 | | | 1,607,731 | | | (9,477) | | | (961,741) |
| Change in unrealized net appreciation or (depreciation) | | 5,096,579 | | | 8,925,277 | | | 20,868,188 | | | 49,562,532 | | | 1,431,074 | | | 5,823,128 |
| | |
| | |
| | |
| | |
| | |
| | |
|
| Net increase in net assets resulting | | | | | | | | | | | | | | | | | |
| from operations | | 4,563,660 | | | 5,407,975 | | | 53,119,097 | | | 113,148,443 | | | 3,421,531 | | | 8,578,360 |
| | |
| | |
| | |
| | |
| | |
| | |
|
| | | | | | | | | | | | | | | | | | |
| Distributions to Shareholders (Note 2): | | | | | | | | | | | | | | | | | |
| From net investment income | | | | | | | | | | | | | | | | | |
| �� Retail Class | | (2,821,606) | | | (4,044,106) | | | (27,294,385) | | | (53,488,522) | | | (1,995,611) | | | (3,719,074) |
| Institutional Class | | (69,789) | | | (105,044) | | | (4,082,716) | | | (10,139,677) | | | N/A | | | N/A |
| From net realized capital gains | | | | | | | | | | | | | | | | | |
| Retail Class | | 0 | | | 0 | | | 0 | | | (4,722,973) | | | 0 | | | 0 |
| Institutional Class | | 0 | | | 0 | | | 0 | | | (670,271) | | | N/A | | | N/A |
| From paid-in capital | | | | | | | | | | | | | | | | | |
| Retail Class | | 0 | | | 0 | | | 0 | | | 0 | | | 0 | | | 0 |
| Institutional Class | | 0 | | | 0 | | | 0 | | | 0 | | | N/A | | | N/A |
| | |
| | |
| | |
| | |
| | |
| | |
|
| Decrease in net assets from distributions | | | | | | | | | | | | | | | | | |
| to shareholders | | (2,891,395) | | | (4,149,150) | | | (31,377,101) | | | (69,021,443) | | | (1,995,611) | | | (3,719,074) |
| | |
| | |
| | |
| | |
| | |
| | |
|
| | | | | | | | | | | | | | | | | | |
| Beneficial Interest Transactions (Note 3): | | | | | | | | | | | | | | | | | |
| Shares sold | | | | | | | | | | | | | | | | | |
| Retail Class | | 18,327,987 | | | 38,618,862 | | | 204,202,678 | | | 384,569,833 | | | 23,221,358 | | | 26,106,710 |
| Institutional Class | | 1,229,122 | | | 1,782,533 | | | 37,475,610 | | | 59,415,788 | | | N/A | | | N/A |
| Shares issued in reinvestment of distributions | | | | | | | | | | | | | | | | | |
| Retail Class | | 2,702,872 | | | 3,830,946 | | | 26,179,934 | | | 55,668,327 | | | 1,824,831 | | | 3,366,982 |
| Institutional Class | | 69,789 | | | 105,044 | | | 3,693,398 | | | 9,737,865 | | | N/A | | | N/A |
| Cost of shares redeemed | | | | | | | | | | | | | | | | | |
| Retail Class | | (20,375,448) | | | (21,597,975) | | | (153,665,844) | | | (469,945,911) | | | (6,752,286) | | | (39,591,894) |
| Institutional Class | | (536,618) | | | (1,293,550) | | | (19,048,836) | | | (95,733,299) | | | N/A | | | N/A |
| | |
| | |
| | |
| | |
| | |
| | |
|
| Net increase/(decrease) resulting from beneficial | | | | | | | | | | | | | | | | | |
| interest transactions | | 1,417,704 | | | 21,445,860 | | | 98,836,940 | | | (56,287,397) | | | 18,293,903 | | | (10,118,202) |
| | |
| | |
| | |
| | |
| | |
| | |
|
| Redemption Fees | | 35,949 | | | 42,185 | | | 50,974 | | | 220,743 | | | 619 | | | 1,634 |
| | |
| | |
| | |
| | |
| | |
| | |
|
| Net Increase/(Decrease) In Net Assets | | 3,125,918 | | | 22,746,870 | | | 120,629,910 | | | (11,939,654) | | | 19,720,442 | | | (5,257,282) |
| | |
| | |
| | |
| | |
| | |
| | |
|
| | | | | | | | | | | | | | | | | | |
| Net Assets: | | | | | | | | | | | | | | | | | |
| Beginning of year | | 90,056,817 | | | 67,309,947 | | | 1,595,822,343 | | | 1,607,761,997 | | | 113,220,862 | | | 118,478,144 |
| | |
| | |
| | |
| | |
| | |
| | |
|
| End of period* | $ | 93,182,735 | | $ | 90,056,817 | | $ | 1,716,452,253 | | $ | 1,595,822,343 | | $ | 132,941,304 | | $ | 113,220,862 |
| | |
| | |
| | |
| | |
| | |
| | |
|
| *Including overdistributed net investment income of: | $ | (368,269) | | $ | (260,036) | | $ | (261,865) | | $ | (312,793) | | $ | (13,931) | | $ | (18,254) |
| | |
| | |
| | |
| | |
| | |
| | |
|
See Notes to Financial Statements. |
PAGE 73 |
|

Selected data for a share of beneficial interest outstanding throughout the period indicated.
| | | Income from Investment Operations | | Distributions |
| | | | | | | | | |
| | | | | | | | | | | | | | | |
| | | Net | | | | Net Realized And | | | Total Income/ | | | | | | | | | |
| | | Asset Value | | Net | | Unrealized Gain/ | | | (Loss) from | | | | | Dividends From Net | | | |
| | | Beginning of the | | Investment | | (Loss) on | | | Investment | | Dividends from Net | | Realized Gain on | | | Total |
| Year or Period Ended | | Period | | Income/(Loss) | | Investments | | | Operations | | Investment Income | | Investments | | | Distributions |
| WESTCORE GROWTH FUND |
| Retail Class |
| 06/30/12 (Unaudited) | | $ | 12.46 | | $ | (0.01)(f) | | $ | 1.38 | | $ | 1.37 | | $ | (0.00) | | $ | (0.00) | | $ | (0.00) |
|
| 12/31/11 | | | 12.54 | | | (0.03)(f) | | | (0.05) | | | (0.08) | | | (0.00) | | | (0.00) | | | (0.00) |
|
| 12/31/10 | | | 10.88 | | | (0.01) | | | 1.67 | | | 1.66 | | | (0.00) | | | (0.00) | | | (0.00) |
|
| 12/31/09 | | | 7.80 | | | (0.01) | | | 3.09 | | | 3.08 | | | (0.00) (a) | | | (0.00) | | | (0.00) (a) |
|
| 12/31/08 | | | 15.45 | | | 0.00 (a) | | | (7.02) | | | (7.02) | | | (0.00) | | | (0.63) | | | (0.63) |
|
| 12/31/07 | | | 13.31 | | | (0.01) | | | 3.01 | | | 3.00 | | | (0.00) | | | (0.86) | | | (0.86) |
|
| Institutional Class |
| 06/30/12 (Unaudited) | | | 12.50 | | | (0.01)(f) | | | 1.39 | | | 1.38 | | | (0.00) | | | (0.00) | | | (0.00) |
|
| 12/31/11 | | | 12.56 | | | 0.00 (a)(f) | | | (0.06) | | | (0.06) | | | (0.00) | | | (0.00) | | | (0.00) |
|
| 12/31/10 | | | 10.88 | | | 0.01 | | | 1.67 | | | 1.68 | | | (0.00) | | | (0.00) | | | (0.00) |
|
| 12/31/09 | | | 7.81 | | | (0.00) (a) | | | 3.10 | | | 3.10 | | | (0.03) | | | (0.00) | | | (0.03) |
|
| 12/31/08 | | | 15.45 | | | 0.01 | | | (7.02) | | | (7.01) | | | (0.00) | | | (0.63) | | | (0.63) |
|
| 12/31/07 (e) | | | 15.96 | | | (0.00) (a) | | | 0.35 | | | 0.35 | | | (0.00) | | | (0.86) | | | (0.86) |
|
| WESTCORE MIDCO GROWTH FUND |
| Retail Class |
| 06/30/12 (Unaudited) | | | 5.90 | | | (0.01)(f) | | | (0.01) | | | (0.02) | | | (0.00) | | | (0.00) | | | (0.00) |
|
| 12/31/11 | | | 6.77 | | | (0.02)(f) | | | (0.47) | | | (0.49) | | | (0.00) | | | (0.38) | | | (0.38) |
|
| 12/31/10 | | | 5.20 | | | (0.01) | | | 1.58 | | | 1.57 | | | (0.00) | | | (0.00) | | | (0.00) |
|
| 12/31/09 | | | 3.55 | | | (0.01) | | | 1.66 | | | 1.65 | | | (0.00) | | | (0.00) | | | (0.00) |
|
| 12/31/08 | | | 6.94 | | | (0.04) | | | (3.09) | | | (3.13) | | | (0.00) | | | (0.26) | | | (0.26) |
|
| 12/31/07 | | | 7.45 | | | (0.04) | | | 0.89 | | | 0.85 | | | (0.00) | | | (1.36) | | | (1.36) |
|
| Institutional Class |
| 06/30/12 (Unaudited) | | | 5.93 | | | (0.01)(f) | | | 0.00 | | | (0.01) | | | (0.00) | | | (0.00) | | | (0.00) |
|
| 12/31/11 | | | 6.80 | | | (0.01)(f) | | | (0.48) | | | (0.49) | | | (0.00) | | | (0.38) | | | (0.38) |
|
| 12/31/10 | | | 5.22 | | | 0.00 (a) | | | 1.58 | | | 1.58 | | | (0.00) | | | (0.00) | | | (0.00) |
|
| 12/31/09 | | | 3.56 | | | (0.00) (a) | | | 1.66 | | | 1.66 | | | (0.00) | | | (0.00) | | | (0.00) |
|
| 12/31/08 | | | 6.95 | | | (0.04) | | | (3.09) | | | (3.13) | | | (0.00) | | | (0.26) | | | (0.26) |
|
| 12/31/07 (e) | | | 8.55 | | | (0.01) | | | (0.23) | | | (0.24) | | | (0.00) | | | (1.36) | | | (1.36) |
|
| | | | | | | | | | | | | | | | | | | | | | |
| | | | | | | | | | | | | | | | | | | | | | |
| (a) Less than $0.005 and $(0.005) per share. |
| (b) Total return is not annualized for periods less than one full year. |
| (c) Annualized. |
| PAGE 74 |
|

| | | | Ratios/Supplemental Data |
| | | | | | | | | | | | | | | | | Ratio of Net | | |
| | | | | | | | | | | | | | | | | Investment | | |
| | | | | | | | | | | | | Ratio of Expenses | | Ratio of Net | | Income/(Loss) | | |
| | Paid-in | | | | | | Net Assets, | | Ratio of Expenses | | to Average Net | | Investment Income/ | | to Average Net | | |
| | Capital from | Net Asset Value | | | | End of Period | | to Average Net | | Assets Without | | (Loss) to | | Assets Without | | Portfolio |
| | Redemption Fees | End of Period | | Total Return | | (in Thousands) | | Assets | | Fee Waivers | | Average Net Assets | | Fee Waivers | | Turnover Rate |
| | | | | | | | | | | | | | | | | | | |
| | | | | | | | | | | | | | | | | | | |
| | 0.00 (a) | $ | 13.83 | | 11.00% (b) | | $ | 61,350 | | 1.13% (c) | | 1.13% (c) | | (0.22%) (c) | | (0.22%) (c) | | 83% (b) |
| |
|
| | 0.00 (a) | | 12.46 | | (0.64%) | | | 59,311 | | 1.11% | | 1.11% | | (0.22%) | | (0.22%) | | 130% |
| |
|
| | 0.00 (a) | | 12.54 | | 15.26% | | | 108,694 | | 1.08% | | 1.08% | | (0.07%) | | (0.07%) | | 99% |
| |
|
| | 0.00 (a) | | 10.88 | | 39.54% | | | 120,456 | | 1.06% | | 1.06% | | (0.05%) | | (0.05%) | | 83% |
| |
|
| | 0.00 (a) | | 7.80 | | (45.33%) | | | 133,174 | | 1.03% | | 1.03% | | 0.02% | | 0.02% | | 183% |
| |
|
| | 0.00 (a) | | 15.45 | | 22.48% | | | 299,659 | | 1.05% | | 1.05% | | (0.05%) | | (0.05%) | | 127% |
| |
|
| | | | | | | | | | | | | | | | | | | |
| | 0.00 (a) | | 13.88 | | 11.04% (b) | | | 3,444 | | 0.95% (c) | | 1.30% (c) | | (0.08%) (c) | | (0.43%) (c) | | 83% (b) |
| |
|
| | 0.00 (a) | | 12.50 | | (0.48%) | | | 8,637 | | 0.95% | | 1.70% | | 0.02% | | (0.73%) | | 130% |
| |
|
| | 0.00 (a) | | 12.56 | | 15.44% | | | 3,271 | | 0.94% | | 2.13% | | 0.08% | | (1.11%) | | 99% |
| |
|
| | 0.00 (a) | | 10.88 | | 39.64% | | | 2,619 | | 0.94% | | 2.55% | | 0.05% | | (1.56%) | | 83% |
| |
|
| | 0.00 (a) | | 7.81 | | (45.26%) | | | 1,797 | | 0.92% | | 1.90% | | 0.13% | | (0.85%) | | 183% |
| |
|
| | 0.00 (a) | | 15.45 | | 2.14% (b) | | | 3,294 | | 0.98% (c) | | 4.64% (c) | | (0.01%) (c) | | (3.68%) (c) | | 127% (d) |
| |
|
| | | | | | | | | | | | | | | | | | | |
| | | | | | | | | | | | | | | | | | | |
| | 0.00 (a) | | 5.88 | | (0.34%) (b) | | | 85,082 | | 1.06% (c) | | 1.06% (c) | | (0.31%) (c) | | (0.31%) (c) | | 53% (b) |
| |
|
| | 0.00 (a) | | 5.90 | | (7.20%) | | | 96,762 | | 1.06% | | 1.06% | | (0.25%) | | (0.25%) | | 113% |
| |
|
| | 0.00 (a) | | 6.77 | | 30.19% | | | 104,119 | | 1.05% | | 1.05% | | (0.19%) | | (0.19%) | | 98% |
| |
|
| | 0.00 (a) | | 5.20 | | 46.48% | | | 85,559 | | 1.08% | | 1.08% | | (0.20%) | | (0.20%) | | 121% |
| |
|
| | 0.00 (a) | | 3.55 | | (44.92%) | | | 64,515 | | 1.03% | | 1.03% | | (0.48%) | | (0.48%) | | 142% |
| |
|
| | 0.00 (a) | | 6.94 | | 11.37% | | | 173,481 | | 1.03% | | 1.03% | | (0.56%) | | (0.56%) | | 116% |
| |
|
| | | | | | | | | | | | | | | | | | | |
| | 0.00 (a) | | 5.92 | | (0.17%) (b) | | | 35,166 | | 0.91% (c) | | 0.95% (c) | | (0.16%) (c) | | (0.20%) (c) | | 53% (b) |
| |
|
| | 0.00 (a) | | 5.93 | | (7.17%) | | | 38,396 | | 0.92% | | 0.97% | | (0.11%) | | (0.16%) | | 113% |
| |
|
| | 0.00 (a) | | 6.80 | | 30.27% | | | 42,072 | | 0.93% | | 0.98% | | (0.07%) | | (0.12%) | | 98% |
| |
|
| | 0.00 (a) | | 5.22 | | 46.63% | | | 34,148 | | 0.95% | | 1.03% | | (0.08%) | | (0.15%) | | 121% |
| |
|
| | 0.00 (a) | | 3.56 | | (44.86%) | | | 23,863 | | 0.93% | | 0.97% | | (0.36%) | | (0.40%) | | 142% |
| |
|
| | 0.00 (a) | | 6.95 | | (2.84%) (b) | | | 12,477 | | 0.98% (c) | | 2.08% (c) | | (0.47%) (c) | | (1.58%) (c) | | 116% (d) |
| |
|
| | | | | | | | | | | | | | | | | | | |
| | | | | | | | | | | | | | | | | | | |
| | | | | | | | | | | | | | | | | | | |
| | | | | | | | | | | | | | | | | | | |
| | | | | | | | | | | | | | | | | | | |
| (d) | Portfolio turnover rate is calculated at the Fund level and represents the year ended December 31, 2007. |
| (e) | Period from September 28, 2007 (inception date) through December 31, 2007. |
| (f) | Calculated using the average shares method. |
| See Notes to Financial Statements. |
PAGE 75 |
|
Selected data for a share of beneficial interest outstanding throughout the period indicated.
| | | Income from Investment Operations | | Distributions |
| | | | | | | | | |
| | | | | | | | | | | | | | | |
| | | Net | | | | | Net Realized And | | | Total Income/ | | | | | | | | | |
| | | Asset Value | | Net | | Unrealized Gain/ | | | (Loss) from | | | | | Dividends From Net | | | |
| | | Beginning of the | | Investment | | (Loss) on | | | Investment | | Dividends from Net | | Realized Gain on | | | Total |
| Year or Period Ended | | Period | | Income/(Loss) | | Investments | | | Operations | | Investment Income | | Investments | | | Distributions |
| WESTCORE SELECT FUND |
| Retail Class |
| 06/30/12 (Unaudited) | | $ | 18.71 | | $ | (0.06)(f) | | $ | (1.37) | | $ | (1.43) | | $ | (0.00) | | $ | (0.00) | | $ | (0.00) |
|
| 12/31/11 | | | 21.07 | | | (0.08)(f) | | | (2.17) | | | (2.25) | | | (0.00) | | | (0.12) | | | (0.12) |
|
| 12/31/10 | | | 16.14 | | | (0.01) | | | 4.93 | | | 4.92 | | | (0.00) | | | (0.00) | | | (0.00) |
|
| 12/31/09 | | | 11.44 | | | (0.03) | | | 4.73 | | | 4.70 | | | (0.00) | | | (0.00) | | | (0.00) |
|
| 12/31/08 | | | 17.43 | | | (0.09) | | | (5.91) | | | (6.00) | | | (0.00) | | | (0.00) (a) | | | (0.00) (a) |
|
| 12/31/07 | | | 16.66 | | | (0.05) | | | 2.59 | | | 2.54 | | | (0.00) | | | (1.78) | | | (1.78) |
|
| WESTCORE BLUE CHIP FUND |
| Retail Class |
| 06/30/12 (Unaudited) | | | 11.49 | | | 0.06(f) | | | 0.71 | | | 0.77 | | | (0.00) | | | (0.00) | | | (0.00) |
|
| 12/31/11 | | | 11.12 | | | 0.13(f) | | | 0.43 | | | 0.56 | | | (0.16) | | | (0.05) | | | (0.21) |
|
| 12/31/10 | | | 10.76 | | | 0.07 | | | 0.36 | | | 0.43 | | | (0.07) | | | (0.00) | | | (0.07) |
|
| 12/31/09 | | | 8.32 | | | 0.06 | | | 2.43 | | | 2.49 | | | (0.05) | | | (0.00) | | | (0.05) |
|
| 12/31/08 | | | 13.18 | | | 0.07 | | | (4.85) | | | (4.78) | | | (0.07) | | | (0.01) | | | (0.08) |
|
| 12/31/07 | | | 13.73 | | | 0.08 | | | 0.35 | | | 0.43 | | | (0.09) | | | (0.89) | | | (0.98) |
|
| Institutional Class |
| 06/30/12 (Unaudited) | | | 11.46 | | | 0.07(f) | | | 0.70 | | | 0.77 | | | (0.00) | | | (0.00) | | | (0.00) |
|
| 12/31/11 | | | 11.10 | | | 0.13(f) | | | 0.46 | | | 0.59 | | | (0.19) | | | (0.05) | | | (0.24) |
|
| 12/31/10 | | | 10.76 | | | 0.09 | | | 0.35 | | | 0.44 | | | (0.10) | | | (0.00) | | | (0.10) |
|
| 12/31/09 | | | 8.32 | | | 0.07 | | | 2.43 | | | 2.50 | | | (0.06) | | | (0.00) | | | (0.06) |
|
| 12/31/08 | | | 13.18 | | | 0.13 | | | (4.89) | | | (4.76) | | | (0.09) | | | (0.01) | | | (0.10) |
|
| 12/31/07 (e) | | | 14.88 | | | 0.02 | | | (0.73) | | | (0.71) | | | (0.10) | | | (0.89) | | | (0.99) |
|
| WESTCORE MID–CAP VALUE FUND |
| Retail Class |
| 06/30/12 (Unaudited) | | | 18.10 | | | 0.08(f) | | | 0.56 | | | 0.64 | | | (0.00) | | | (0.00) | | | (0.00) |
|
| 12/31/11 | | | 18.26 | | | 0.15(f) | | | (0.15) | | | 0.00 | | | (0.16) | | | (0.00) | | | (0.16) |
|
| 12/31/10 | | | 15.27 | | | 0.08 | | | 3.00 | | | 3.08 | | | (0.09) | | | (0.00) | | | (0.09) |
|
| 12/31/09 | | | 11.65 | | | 0.11 | | | 3.61 | | | 3.72 | | | (0.10) | | | (0.00) | | | (0.10) |
|
| 12/31/08 | | | 20.57 | | | 0.16 | | | (8.89) | | | (8.73) | | | (0.17) | | | (0.02) | | | (0.19) |
|
| 12/31/07 | | | 20.48 | | | 0.03 | | | 0.31 | | | 0.34 | | | (0.02) | | | (0.23) | | | (0.25) |
|
| |
| |
| |
| (a) Less than $0.005 and $(0.005) per share. |
| (b) Total return is not annualized for periods less than one full year. |
| (c) Annualized. |
| PAGE 76 |
|
| | | | Ratios/Supplemental Data |
| | | | | | | | | | | | | | | Ratio of Net | | |
| | | | | | | | | | | | | | | Investment | | |
| | | | | | | | | | | Ratio of Expenses | | Ratio of Net | | Income/(Loss) | | |
| | Paid-in | | | | | Net Assets, | | Ratio of Expenses | | to Average Net | | Investment Income/ | | to Average Net | | |
| | Capital from | Net Asset Value | | | | End of Period | | to Average Net | | Assets Without | | (Loss) to | | Assets Without | | Portfolio |
| | Redemption Fees | End of Period | | Total Return | | (in Thousands) | | Assets | | Fee Waivers | | Average Net Assets | | Fee Waivers | | Turnover Rate |
| | | | | | | | | | | | | | | | | |
| | | | | | | | | | | | | | | | | |
| | 0.00 (a) | | 17.28 | | (7.64%) (b) | | | 490,049 | | 1.06% (c) | | 1.06% (c) | | (0.61%) (c) | | (0.61%) (c) | | 91% (b) |
| |
|
| | 0.01 | | 18.71 | | (10.61%) | | | 681,200 | | 1.05% | | 1.05% | | (0.39%) | | (0.39%) | | 155% |
| |
|
| | 0.01 | | 21.07 | | 30.55% | | | 392,174 | | 1.07% | | 1.07% | | (0.11%) | | (0.11%) | | 143% |
| |
|
| | 0.00 (a) | | 16.14 | | 41.08% | | | 67,199 | | 1.15% | | 1.16% | | (0.30%) | | (0.31%) | | 217% |
| |
|
| | 0.01 | | 11.44 | | (34.35%) | | | 28,233 | | 1.15% | | 1.21% | | (0.66%) | | (0.72%) | | 237% |
| |
|
| | 0.01 | | 17.43 | | 15.25% | | | 37,579 | | 1.15% | | 1.27% | | (0.40%) | | (0.53%) | | 168% |
| |
|
| | | | | | | | | | | | | | | | | | | |
| | | | | | | | | | | | | | | | | | | |
| | 0.00 (a) | | 12.26 | | 6.70% (b) | | | 60,000 | | 1.15% (c) | | 1.19% (c) | | 1.00% (c) | | 0.96% (c) | | 6% (b) |
| |
|
| | 0.02 | | 11.49 | | 5.19% | | | 61,295 | | 1.15% | | 1.30% | | 1.12% | | 0.97% | | 37% |
| |
|
| | 0.00 (a) | | 11.12 | | 3.99% | | | 14,610 | | 1.15% | | 1.28% | | 0.65% | | 0.52% | | 39% |
| |
|
| | 0.00 (a) | | 10.76 | | 29.87% | | | 16,632 | | 1.15% | | 1.26% | | 0.53% | | 0.41% | | 21% |
| |
|
| | 0.00 (a) | | 8.32 | | (36.24%) | | | 16,490 | | 1.13% | | 1.13% | | 0.45% | | 0.45% | | 27% |
| |
|
| | 0.00 (a) | | 13.18 | | 3.13% | | | 53,321 | | 1.05% | | 1.05% | | 0.49% | | 0.49% | | 42% |
| |
|
| | | | | | | | | | | | | | | | | | | |
| | 0.00 (a) | | 12.23 | | 6.72% (b) | | | 7,256 | | 0.97% (c) | | 1.16% (c) | | 1.17% (c) | | 0.98% (c) | | 6% (b) |
| |
|
| | 0.01 | | 11.46 | | 5.34% | | | 7,809 | | 1.00% | | 1.17% | | 1.11% | | 0.94% | | 37% |
| |
|
| | 0.00 (a) | | 11.10 | | 4.05% | | | 20,667 | | 1.05% | | 1.11% | | 0.76% | | 0.70% | | 39% |
| |
|
| | 0.00 (a) | | 10.76 | | 30.10% | | | 21,585 | | 0.95% | | 1.14% | | 0.72% | | 0.53% | | 21% |
| |
|
| | 0.00 | | 8.32 | | (36.09%) | | | 18,101 | | 0.98% | | 1.03% | | 0.68% | | 0.63% | | 27% |
| |
|
| | 0.00 | | 13.18 | | (4.78%) (b) | | | 6,515 | | 0.98% (c) | | 1.85% (c) | | 0.61% (c) | | (0.25%) (c) | | 42% (d) |
| |
|
| | | | | | | | | | | | | | | | | | | |
| | | | | | | | | | | | | | | | | | | |
| | 0.00 (a) | | 18.74 | | 3.54% (b) | | | 39,472 | | 1.25% (c) | | 1.27% (c) | | 0.90% (c) | | 0.87% (c) | | 10% (b) |
| |
|
| | 0.00 (a) | | 18.10 | | (0.02%) | | | 43,190 | | 1.25% | | 1.29% | | 0.82% | | 0.78% | | 32% |
| |
|
| | 0.00 (a) | | 18.26 | | 20.18% | | | 46,413 | | 1.25% | | 1.27% | | 0.43% | | 0.41% | | 33% |
| |
|
| | 0.00 (a) | | 15.27 | | 31.95% | | | 48,572 | | 1.25% | | 1.26% | | 0.77% | | 0.77% | | 27% |
| |
|
| | 0.00 (a) | | 11.65 | | (42.38%) | | | 40,714 | | 1.19% | | 1.19% | | 0.74% | | 0.74% | | 35% |
| |
|
| | 0.00 (a) | | 20.57 | | 1.66% | | | 100,863 | | 1.17% | | 1.17% | | 0.12% | | 0.12% | | 40% |
| |
|
| | | | | | | | | | | | | | | | | | | |
| | | | | | | | | | | | | | | | | | | |
| | | | | | | | | | | | | | | | | | | |
| (d) | Portfolio turnover rate is calculated at the Fund level and represents the year ended December 31, 2007. |
| (e) | Period from September 28, 2007 (inception date) through December 31, 2007. |
| (f) | Calculated using the average share method. |
| See Notes to Financial Statements |
PAGE 77 |
|
Selected data for a share of beneficial interest outstanding throughout the period indicated.
| |
| | | Income from Investment Operations | | Distributions |
| | | Net | | | | | Net Realized And | | Total Income/ | | | | | | | | |
| | | Asset Value | | Net | | Unrealized Gain/ | | (Loss) from | | | | | Dividends From Net | | |
| | | Beginning of the | | Investment | | (Loss) on | | Investment | | Dividends from Net | | Realized Gain on | | Total |
| | Year or Period Ended | Period | | Income/(Loss) | | Investments | | Operations | | Investment Income | | Investments | | Distributions |
| | WESTCORE SMALL-CAP OPPORTUNITY FUND |
| | Retail Class |
| | 06/30/12 (Unaudited) | $ | 32.31 | | $ | (0.06)(f) | | $ | 1.55 | $ | 1.49 | | $ | (0.00) | | $ | (0.00) | $ | (0.00) |
| |
|
| | 12/31/11 | | 34.13 | | | (0.11)(f) | | | (1.24) | | (1.35) | | | (0.00) | | | (0.47) | | (0.47) |
| |
|
| | 12/31/10 | | 28.28 | | | (0.08) | | | 5.94 | | 5.86 | | | (0.02) | | | (0.00) | | (0.02) |
| |
|
| | 12/31/09 | | 22.01 | | | 0.06 | | | 6.20 | | 6.26 | | | (0.00) | | | (0.00) | | (0.00) |
| |
|
| | 12/31/08 | | 34.34 | | | (0.03) | | | (12.41) | | (12.44) | | | (0.00) | | | (0.00) (a) | | (0.00) (a) |
| |
|
| | 12/31/07 | | 36.22 | | | (0.15) | | | (1.05) | | (1.20) | | | (0.00) | | | (0.68) | | (0.68) |
| |
|
| | Institutional Class |
| | 06/30/12 (Unaudited) | | 32.47 | | | (0.04)(f) | | | 1.56 | | 1.52 | | | (0.00) | | | (0.00) | | (0.00) |
| |
|
| | 12/31/11 | | 34.26 | | | (0.07) (f) | | | (1.25) | | (1.32) | | | (0.00) | | | (0.47) | | (0.47) |
| |
|
| | 12/31/10 | | 28.41 | | | 0.39 | | | 5.52 | | 5.91 | | | (0.07) | | | (0.00) | | (0.07) |
| |
|
| | 12/31/09 | | 22.07 | | | 0.05 | | | 6.28 | | 6.33 | | | (0.00) | | | (0.00) | | (0.00) |
| |
|
| | 12/31/08 | | 34.36 | | | 0.03 | | | (12.41) | | (12.38) | | | (0.00) | | | (0.00) (a) | | (0.00) |
| |
|
| | 12/31/07 (e) | | 38.40 | | | (0.00) (a) | | | (3.36) | | (3.36) | | | (0.00) | | | (0.68) | | (0.68) |
| |
|
| | WESTCORE SMALL–CAP VALUE FUND |
| | Retail Class |
| | 06/30/12 (Unaudited) | | 11.82 | | | 0.05(f) | | | 0.64 | | 0.69 | | | (0.00) | | | (0.00) | | (0.00) |
| |
|
| | 12/31/11 | | 11.97 | | | 0.09 (f) | | | (0.13) | | (0.04) | | | (0.11) | | | (0.00) | | (0.11) |
| |
|
| | 12/31/10 | | 9.51 | | | 0.11 | | | 2.46 | | 2.57 | | | (0.11) | | | (0.00) | | (0.11) |
| |
|
| | 12/31/09 | | 7.87 | | | 0.11 | | | 1.62 | | 1.73 | | | (0.10) | | | (0.00) | | (0.10) |
| |
|
| | 12/31/08 | | 12.06 | | | 0.13 | | | (4.20) | | (4.07) | | | (0.13) | | | (0.00) | | (0.13) |
| |
|
| | 12/31/07 | | 12.69 | | | 0.12 | | | (0.54) | | (0.42) | | | (0.12) | | | (0.09) | | (0.21) |
| |
|
| | Institutional Class |
| | 06/30/12 (Unaudited) | | 11.80 | | | 0.06(f) | | | 0.63 | | 0.69 | | | (0.00) | | | (0.00) | | (0.00) |
| |
|
| | 12/31/11 | | 11.97 | | | 0.11 (f) | | | (0.15) | | (0.04) | | | (0.13) | | | (0.00) | | (0.13) |
| |
|
| | 12/31/10 | | 9.51 | | | 0.11 | | | 2.47 | | 2.58 | | | (0.12) | | | (0.00) | | (0.12) |
| |
|
| | 12/31/09 | | 7.87 | | | 0.13 | | | 1.62 | | 1.75 | | | (0.11) | | | (0.00) | | (0.11) |
| |
|
| | 12/31/08 | | 12.06 | | | 0.14 | | | (4.19) | | (4.05) | | | (0.14) | | | (0.00) | | (0.14) |
| |
|
| | 12/31/07 (e) | | 13.42 | | | 0.05 | | | (1.20) | | (1.15) | | | (0.12) | | | (0.09) | | (0.21) |
| |
|
| | | | | | | | | | | | | | | | | | | | |
| | | | | | | | | | | | | | | | | | | | |
| | | | | | | | | | | | | | | | | | | | |
| | | | | | | | | | | | | | | | | | | | |
| (a) | Less than $0.005 and $(0.005) per share. |
| (b) | Total return is not annualized for periods less than one full year. |
| (c) | Annualized. |
| PAGE 78 |
|
| | | | Ratios/Supplemental Data |
| | | | | | | | | | | | | | | | | Ratio of Net | | |
| | | | | | | | | | | | | | | | | Investment | | |
| | | | | | | | | | | | | Ratio of Expenses | | Ratio of Net | | Income/(Loss) | | |
| | Paid-in | | | | | | | Net Assets, | | Ratio of Expenses | | to Average Net | | Investment Income/ | | to Average Net | | |
| | Capital from | Net Asset Value | | | | | End of Period | | to Average Net | | Assets Without | | (Loss) to | | Assets Without | | Portfolio |
| | Redemption Fees | End of Period | | Total Return | | (in Thousands) | | Assets | | Fee Waivers | | Average Net Assets | | Fee Waivers | | Turnover Rate |
| | | | | | | | | | | | | | | | | | | |
| | | | | | | | | | | | | | | | | | | |
| | 0.00 (a) | $ | 33.80 | | 4.61% (b) | | $ | 44,270 | | 1.30% (c) | | 1.49% (c) | | (0.35%) (c) | | (0.54%) (c) | | 16% (b) |
| |
|
| | 0.00 (a) | | 32.31 | | (3.95%) | | | 43,570 | | 1.30% | | 1.52% | | (0.32%) | | (0.54%) | | 51% |
| |
|
| | 0.01 | | 34.13 | | 20.77% | | | 48,857 | | 1.30% | | 1.52% | | (0.21%) | | (0.43%) | | 49% |
| |
|
| | 0.01 | | 28.28 | | 28.49% | | | 32,380 | | 1.30% | | 1.64% | | 0.15% | | (0.19%) | | 24% |
| |
|
| | 0.11 | | 22.01 | | (35.90%) | | | 16,027 | | 1.30% | | 1.70% | | (0.08%) | | (0.48%) | | 57% |
| |
|
| | 0.00 (a) | | 34.34 | | (3.33%) | | | 28,482 | | 1.30% | | 1.58% | | (0.42%) | | (0.70%) | | 71% |
| |
|
| | | | | | | | | | | | | | | | | | | |
| | 0.00 (a) | | 33.99 | | 4.68% (b) | | | 2,782 | | 1.18% (c) | | 2.10% (c) | | (0.25%) (c) | | (1.17%) (c) | | 16% (b) |
| |
|
| | 0.00 (a) | | 32.47 | | (3.85%) | | | 3,317 | | 1.19% | | 2.37% | | (0.21%) | | (1.39%) | | 51% |
| |
|
| | 0.01 | | 34.26 | | 20.84% | | | 3,648 | | 1.22% | | 2.39% | | (0.14%) | | (1.31%) | | 49% |
| |
|
| | 0.01 | | 28.41 | | 28.73% | | | 3,172 | | 1.15% | | 2.76% | | 0.25% | | (1.36%) | | 24% |
| |
|
| | 0.09 | | 22.07 | | (35.76%) | | | 2,326 | | 1.08% | | 2.38% | | 0.18% | | (1.13%) | | 57% |
| |
|
| | 0.00 (a) | | 34.36 | | (8.76%) (b) | | | 3,189 | | 1.22% (c) | | 6.09% (c) | | (0.09%) (c) | | (4.95%) (c) | | 71% (d) |
| |
|
| | | | | | | | | | | | | | | | | | | |
| | | | | | | | | | | | | | | | | | | |
| | 0.00 (a) | | 12.51 | | 5.84% (b) | | | 207,945 | | 1.30% (c) | | 1.40% (c) | | 0.88% (c) | | 0.77% (c) | | 18% (b) |
| |
|
| | 0.00 (a) | | 11.82 | | (0.31%) | | | 196,764 | | 1.30% | | 1.42% | | 0.77% | | 0.66% | | 40% |
| |
|
| | 0.00 (a) | | 11.97 | | 27.03% | | | 242,817 | | 1.30% | | 1.39% | | 1.03% | | 0.93% | | 39% |
| |
|
| | 0.01 | | 9.51 | | 22.08% | | | 192,180 | | 1.30% | | 1.37% | | 1.38% | | 1.31% | | 33% |
| |
|
| | 0.01 | | 7.87 | | (33.57%) | | | 148,135 | | 1.30% | | 1.38% | | 1.51% | | 1.44% | | 45% |
| |
|
| | 0.00 (a) | | 12.06 | | (3.38%) | | | 161,792 | | 1.30% | | 1.38% | | 1.25% | | 1.16% | | 35% |
| |
|
| | | | | | | | | | | | | | | | | | | |
| | 0.00 (a) | | 12.49 | | 5.85% (b) | | | 104,889 | | 1.15% (c) | | 1.26% (c) | | 1.04% (c) | | 0.93% (c) | | 18% (b) |
| |
|
| | 0.00 (a) | | 11.80 | | (0.31%) | | | 92,446 | | 1.16% | | 1.29% | | 0.92% | | 0.79% | | 40% |
| |
|
| | 0.00 (a) | | 11.97 | | 27.15% | | | 114,286 | | 1.18% | | 1.29% | | 1.17% | | 1.07% | | 39% |
| |
|
| | 0.00 (a) | | 9.51 | | 22.16% | | | 52,278 | | 1.20% | | 1.33% | | 1.53% | | 1.39% | | 33% |
| |
|
| | 0.00 (a) | | 7.87 | | (33.51%) | | | 20,684 | | 1.21% | | 1.51% | | 1.80% | | 1.49% | | 45% |
| |
|
| | 0.00 (a) | | 12.06 | | (8.58%) (b) | | | 6,051 | | 1.20% (c) | | 4.50% (c) | | 1.76% (c) | | (1.55%) (c) | | 35% (d) |
| |
|
| | | | | | | | | | | | | | | | | | | |
| | | | | | | | | | | | | | | | | | | |
| | | | | | | | | | | | | | | | | | | |
| | | | | | | | | | | | | | | | | | | |
| (d) | Portfolio turnover rate is calculated at the Fund level and represents the year ended December 31, 2007. |
| (e) | Period from September 28, 2007 (inception date) through December 31, 2007. |
| (f) | Calculated using the average shares method. |
| | |
| See Notes to Financial Statements. |
PAGE 79 |
|
Selected data for a share of beneficial interest outstanding throughout the period indicated.
| | | | Income from Investment Operations | | Distributions |
| | | | | | | | | | | | | | | | | | |
| | | | Net | | | | Net Realized And | | | Total Income/ | | | | | Dividends From | | | | | | |
| | | | Asset Value | | Net | | Unrealized Gain/ | | | (Loss) from | | Dividends from | | Net Realized | | Tax | | | |
| | | | Beginning of the | | Investment | | (Loss) on | | | Investment | | Net Investment | | Gain on | | Return of | | Total |
| | Year or Period Ended | | Period | | Income/(Loss) | | Investments | | | Operations | | Income | | Investments | | Capital | | Distributions |
| | | | | | | | | | | | | | | | | | | | | | |
| | WESTCORE MICRO–CAP OPPORTUNITY FUND |
| | Retail Class |
| | 06/30/12 (Unaudited) | | $ | 11.15 | | $ | 0.01(f) | | $ | 0.87 | | $ | 0.88 | | $ | (0.00) | | $ | (0.00) | | $ | (0.00) | | $ | (0.00) |
| |
|
| | 12/31/11 | | | 11.56 | | | (0.02)(f) | | | (0.40) | | | (0.42) | | | (0.00) | | | (0.00) | | | (0.00) | | | (0.00) |
| |
|
| | 12/31/10 | | | 8.66 | | | (0.03) | | | 2.93 | | | 2.90 | | | (0.00) | | | (0.00) | | | (0.00) | | | (0.00) |
| |
|
| | 12/31/09 | | | 7.53 | | | 0.02 | | | 1.14 | | | 1.16 | | | (0.03) | | | (0.00) | | | (0.00) | | | (0.03) |
| |
|
| | 12/31/08 | | | 10.00 | | | 0.04 | | | (2.49) | | | (2.45) | | | (0.03) | | | (0.00) | | | (0.00) | | | (0.03) |
| |
|
| | WESTCORE INTERNATIONAL SMALL-CAP FUND |
| | Retail Class |
| | 06/30/12 (Unaudited) | | | 14.55 | | | 0.26(f) | | | 1.59 | | | 1.85 | | | (0.00) | | | (0.00) | | | (0.00) | | | (0.00) |
| |
|
| | 12/31/11 | | | 15.70 | | | 0.29(f) | | | (1.21) | | | (0.92) | | | (0.24) | | | (0.00) | | | (0.00) | | | (0.24) |
| |
|
| | 12/31/10 | | | 11.67 | | | 0.11 | | | 4.00 | | | 4.11 | | | (0.08) | | | (0.00) | | | (0.00) | | | (0.08) |
| |
|
| | 12/31/09 | | | 7.19 | | | 0.15 | | | 4.46 | | | 4.61 | | | (0.13) | | | (0.00) | | | (0.00) | | | (0.13) |
| |
|
| | 12/31/08 | | | 14.41 | | | 0.18 | | | (7.23) | | | (7.05) | | | (0.17) | | | (0.00) | | | (0.00) | | | (0.17) |
| |
|
| | 12/31/07 | | | 14.39 | | | 0.06 | | | 0.36 | | | 0.42 | | | (0.09) | | | (0.31) | | | (0.00) | | | (0.40) |
| |
|
| | WESTCORE FLEXIBLE INCOME FUND |
| | Retail Class |
| | 06/30/12 (Unaudited) | | | 8.57 | | | 0.25(f) | | | 0.17 | | | 0.42 | | | (0.26) | | | (0.00) | | | (0.00) | | | (0.26) |
| |
|
| | 12/31/11 | | | 8.42 | | | 0.53(f) | | | 0.12 | | | 0.65 | | | (0.51) | | | (0.00) | | | (0.00) | | | (0.51) |
| |
|
| | 12/31/10 | | | 7.98 | | | 0.56 | | | 0.43 | | | 0.99 | | | (0.55) | | | (0.00) | | | (0.00) (a) | | | (0.55) |
| |
|
| | 12/31/09 | | | 6.12 | | | 0.51 | | | 1.86 | | | 2.37 | | | (0.51) | | | (0.00) | | | (0.00) | | | (0.51) |
| |
|
| | 12/31/08 | | | 9.44 | | | 0.56 | | | (3.26) | | | (2.70) | | | (0.62) | | | (0.00) | | | (0.01) | | | (0.61) |
| |
|
| | 12/31/07 | | | 10.41 | | | 0.66 | | | (0.99) | | | (0.33) | | | (0.60) | | | (0.03) | | | (0.01) | | | (0.64) |
| |
|
| | Institutional Class |
| | 06/30/12 (Unaudited) | | | 8.43 | | | 0.25(f) | | | 0.18 | | | 0.43 | | | (0.26) | | | (0.00) | | | (0.00) | | | (0.26) |
| |
|
| | 12/31/11 | | | 8.34 | | | 0.53(f) | | | 0.12 | | | 0.65 | | | (0.57) | | | (0.00) | | | (0.00) | | | (0.57) |
| |
|
| | 12/31/10 | | | 7.96 | | | 0.57 | | | 0.42 | | | 0.99 | | | (0.61) | | | (0.00) | | | (0.00) (a) | | | (0.61) |
| |
|
| | 12/31/09 | | | 6.11 | | | 0.52 | | | 1.85 | | | 2.37 | | | (0.52) | | | (0.00) | | | (0.00) | | | (0.52) |
| |
|
| | 12/31/08 | | | 9.43 | | | 0.58 | | | (3.27) | | | (2.69) | | | (0.63) | | | (0.00) | | | (0.01) | | | (0.62) |
| |
|
| | 12/31/07 (e) | | | 9.97 | | | 0.15 | | | (0.54) | | | (0.39) | | | (0.11) | | | (0.03) | | | (0.01) | | | (0.15) |
| |
|
| | | | | | | | | | | | | | | | | | | | | | | | | | |
| | | | | | | | | | | | | | | | | | | | | | | | | | |
| | | | | | | | | | | | | | | | | | | | | | | | | | |
| | | | | | | | | | | | | | | | | | | | | | | | | | |
| | | | | | | | | | | | | | | | | | | | | | | | | | |
| (a) | Less than $0.005 and $(0.005) per share. |
| (b) | Total return is not annualized for periods less than one full year. |
| (c) | Annualized. |
| PAGE 80 |
|
| | | Ratios/Supplemental Data |
| | | | | | | | | | | | | | | | | Ratio of Net | | |
| | | | | | | | | | | | | | | | | Investment | | |
| | | | | | | | | | | | | Ratio of Expenses | | Ratio of Net | | Income/(Loss) | | |
| Paid-in | | | | | | Net Assets, | | Ratio of Expenses | | to Average Net | | Investment Income/ | | to Average Net | | |
| Capital from | Net Asset Value | | | | End of Period | | to Average Net | | Assets Without | | (Loss) to | | Assets Without | | Portfolio |
| Redemption Fees | End of Period | | Total Return | | (in Thousands) | | Assets | | Fee Waivers | | Average Net Assets | | Fee Waivers | | Turnover Rate |
| | | | | | | | | | | | | | | | | | | |
| | | | | | | | | | | | | | | | | | | |
| $ | 0.00 (a) | $ | 12.03 | | 7.89% (b) | | $ | 2,942 | | 1.30% (c) | | 4.77% (c) | | 0.15% (c) | | (3.32%) (c) | | 78% (b) |
|
| | 0.01 | | 11.15 | | (3.55%) | | | 1,734 | | 1.30% | | 8.07% | | (0.14%) | | (6.91%) | | 88% |
|
| | 0.00 (a) | | 11.56 | | 33.49% | | | 1,594 | | 1.30% | | 6.96% | | (0.25%) | | (5.91%) | | 107% |
|
| | 0.00 (a) | | 8.66 | | 15.40% | | | 1,924 | | 1.30% | | 7.96% | | 0.27% | | (6.39%) | | 130% |
|
| | 0.01 | | 7.53 | | (24.33%) (b) | | | 1,104 | | 1.30% | | 18.13% | | 1.06% | | (15.77%) | | 60% |
|
| | | | | | | | | | | | | | | | | | | |
| | | | | | | | | | | | | | | | | | | |
| | 0.00 (a) | | 16.40 | | 12.71% (b) | | | 206,072 | | 1.50% (c) | | 1.64% (c) | | 3.18% (c) | | 3.04% (c) | | 8% (b) |
|
| | 0.01 | | 14.55 | | (5.75%) | | | 133,236 | | 1.50% | | 1.70% | | 1.82% | | 1.62% | | 27% |
|
| | 0.00 (a) | | 15.70 | | 35.25% | | | 60,925 | | 1.50% | | 1.84% | | 1.10% | | 0.77% | | 44% |
|
| | 0.00 (a) | | 11.67 | | 64.17% | | | 32,356 | | 1.50% | | 2.01% | | 1.68% | | 1.17% | | 65% |
|
| | 0.00 (a) | | 7.19 | | (48.86%) | | | 18,282 | | 1.50% | | 1.98% | | 1.47% | | 0.99% | | 70% |
|
| | 0.00 (a) | | 14.41 | | 2.94% | | | 40,680 | | 1.50% | | 1.87% | | 0.40% | | 0.03% | | 78% |
|
| | | | | | | | | | | | | | | | | | | |
| | | | | | | | | | | | | | | | | | | |
| | 0.00 (a) | | 8.73 | | 4.95% (b) | | | 90,281 | | 0.85% (c) | | 0.88% (c) | | 5.77% (c) | | 5.73% (c) | | 23% (b) |
|
| | 0.01 | | 8.57 | | 8.13% | | | 87,962 | | 0.85% | | 0.93% | | 6.24% | | 6.16% | | 45% |
|
| | 0.00 (a) | | 8.42 | | 12.71% | | | 65,829 | | 0.85% | | 0.93% | | 6.75% | | 6.67% | | 38% |
|
| | 0.00 (a) | | 7.98 | | 40.09% | | | 72,783 | | 0.85% | | 0.91% | | 7.21% | | 7.15% | | 30% |
|
| | 0.00 (a) | | 6.12 | | (29.97%) | | | 65,043 | | 0.85% | | 0.92% | | 6.91% | | 6.83% | | 21% |
|
| | 0.00 (a) | | 9.44 | | (3.45%) | | | 207,038 | | 0.85% | | 0.92% | | 6.30% | | 6.23% | | 21% |
|
| | | | | | | | | | | | | | | | | | | |
| | 0.00 (a) | | 8.60 | | 5.09% (b) | | | 2,902 | | 0.71% (c) | | 1.92% (c) | | 5.93% (c) | | 4.72% (c) | | 23% (b) |
|
| | 0.01 | | 8.43 | | 8.14% | | | 2,095 | | 0.74% | | 3.04% | | 6.35% | | 4.05% | | 45% |
|
| | 0.00 (a) | | 8.34 | | 12.79% | | | 1,481 | | 0.75% | | 3.24% | | 6.82% | | 4.32% | | 38% |
|
| | 0.00 (a) | | 7.96 | | 40.30% | | | 1,234 | | 0.72% | | 3.98% | | 7.26% | | 4.00% | | 30% |
|
| | 0.00 (a) | | 6.11 | | (29.89%) | | | 748 | | 0.74% | | 3.21% | | 7.12% | | 4.65% | | 21% |
|
| | 0.00 (b) | | 9.43 | | (3.89%) (b) | | | 1,430 | | 0.70% (c) | | 7.26% (c) | | 7.34% (c) | | 0.78% (c) | | 21% (d) |
|
| | | | | | | | | | | | | | | | | | | |
| | | | | | | | | | | | | | | | | | | |
| | | | | | | | | | | | | | | | | | | |
| | | | | | | | | | | | | | | | | | | |
| | | | | | | | | | | | | | | | | | | |
| (d) | Portfolio turnover rate is calculated at the Fund level and represents the year ended December 31, 2007. |
| (e) | Period from September 28, 2007 (inception date) through December 31, 2007. |
| (f) | Calculated using the average shares method. |
| | |
| See Notes to Financial Statements. |
PAGE 81 |
|
Selected data for a share of beneficial interest outstanding throughout the period indicated. |
| |
| | | Income from Investment Operations | | Distributions |
| | | | | | | | | | | | | | | | |
| | | | Net | | | | | Net Realized And | | Total Income/ | | | | Dividends From | | | | | | |
| | | | Asset Value | | Net | | Unrealized Gain/ | | (Loss) from | | Dividends from | Net Realized | | | Tax | | | |
| | | | Beginning of the | | Investment | | (Loss) on | | Investment | | Net Investment | Gain on | | | Return of | | Total |
| | Year or Period Ended | | Period | | Income/(Loss) | | Investments | | Operations | | Income | Investments | | | Capital | | Distributions |
| WESTCORE PLUS BOND FUND |
| Retail Class |
| | 06/30/12 (Unaudited) | | $ | 11.04 | | $ | 0.21(f) | | $ | 0.14 | $ | 0.35 | | $ | (0.21) | $ | (0.00) | | $ | (0.00) | | $ | (0.21) |
| |
|
| | 12/31/11 | | | 10.72 | | | 0.43(f) | | | 0.37 | | 0.80 | | | (0.44) | | (0.04) | | | (0.00) | | | (0.48) |
| |
|
| | 12/31/10 | | | 10.42 | | | 0.45 | | | 0.29 | | 0.74 | | | (0.44) | | (0.00) | | | (0.00) | | | (0.44) |
| |
|
| | 12/31/09 | | | 9.85 | | | 0.44 | | | 0.57 | | 1.01 | | | (0.44) | | (0.00) | | | (0.00) | | | (0.44) |
| |
|
| | 12/31/08 | | | 10.55 | | | 0.51 | | | (0.70) | | (0.19) | | | (0.51) | | (0.00) | | | (0.00) | | | (0.51) |
| |
|
| | 12/31/07 | | | 10.54 | | | 0.55 | | | 0.01 | | 0.56 | | | (0.55) | | (0.00) | | | (0.00) | | | (0.55) |
| |
|
| | Institutional Class |
| | 06/30/12 (Unaudited) | | | 10.92 | | | 0.21(f) | | | 0.14 | | 0.35 | | | (0.21) | | (0.00) | | | (0.00) | | | (0.21) |
| |
|
| | 12/31/11 | | | 10.68 | | | 0.45(f) | | | 0.37 | | 0.82 | | | (0.54) | | (0.04) | | | (0.00) | | | (0.58) |
| |
|
| | 12/31/10 | | | 10.42 | | | 0.47 | | | 0.28 | | 0.75 | | | (0.49) | | (0.00) | | | (0.00) | | | (0.49) |
| |
|
| | 12/31/09 | | | 9.85 | | | 0.45 | | | 0.57 | | 1.02 | | | (0.45) | | (0.00) | | | (0.00) | | | (0.45) |
| |
|
| | 12/31/08 | | | 10.55 | | | 0.52 | | | (0.70) | | (0.18) | | | (0.52) | | (0.00) | | | (0.00) | | | (0.52) |
| |
|
| | 12/31/07 (e) | | | 10.45 | | | 0.13 | | | 0.11 | | 0.24 | | | (0.14) | | (0.00) | | | (0.00) | | | (0.14) |
| |
|
| | WESTCORE COLORADO TAX–EXEMPT FUND |
| | 06/30/12 (Unaudited) | | | 11.54 | | | 0.19(f) | | | 0.13 | | 0.32 | | | (0.18) | | (0.00) | | | (0.00) | | | (0.18) |
| |
|
| | 12/31/11 | | | 10.99 | | | 0.40(f) | | | 0.56 | | 0.96 | | | (0.41) | | (0.00) | | | (0.00) | | | (0.41) |
| |
|
| | 12/31/10 | | | 11.19 | | | 0.40 | | | (0.20) | | 0.20 | | | (0.40) | | (0.00) | | | (0.00) | | | (0.40) |
| |
|
| | 12/31/09 | | | 10.48 | | | 0.40 | | | 0.71 | | 1.11 | | | (0.40) | | (0.00) | | | (0.00) | | | (0.40) |
| |
|
| | 12/31/08 | | | 11.04 | | | 0.42 | | | (0.56) | | (0.14) | | | (0.42) | | (0.00) | | | (0.00) | | | (0.42) |
| |
|
| | 12/31/07 | | | 11.16 | | | 0.43 | | | (0.12) | | 0.31 | | | (0.43) | | (0.00) | | | (0.00) | | | (0.43) |
| |
|
| | | | | | | | | | | | | | | | | | | | | | | | |
| | | | | | | | | | | | | | | | | | | | | | | | |
| | | | | | | | | | | | | | | | | | | | | | | | |
| | | | | | | | | | | | | | | | | | | | | | | | |
| | | | | | | | | | | | | | | | | | | | | | | | |
| | | | | | | | | | | | | | | | | | | | | | | | |
| | | | | | | | | | | | | | | | | | | | | | | | |
| | | | | | | | | | | | | | | | | | | | | | | | |
| | | | | | | | | | | | | | | | | | | | | | | | |
| (a) | Less than $0.005 and $(0.005) per share. | |
| (b) | Total return is not annualized for periods less than one full year. |
| (c) | Annualized. | |
| PAGE 82 |
|
| | | | | Ratios/Supplemental Data |
| | | | | | | | | Ratio of Net | |
| | | | | | | | | Investment | |
| | | | | | | Ratio of Expenses | Ratio of Net | Income/(Loss) | |
| Paid–in | | | | Net Assets, | Ratio of Expenses | to Average Net | Investment Income/ | to Average Net | |
| Capital from | Net Asset Value | | | End of Period | to Average Net | Assets Without | (Loss) to | Assets Without | Portfolio |
| Redemption Fees | End of Period | Total Return | | (in Thousands) | Assets | Fee Waivers | Average Net Assets | Fee Waivers | Turnover Rate |
| | | | | | | | | | | | | |
| | | | | | | | | | | | | |
| $ | 0.00 (a) | $ | 11.18 | 3.18% (b) | | $ | 1,495,245 | 0.55% (c) | 0.78% (c) | 3.77% (c) | 3.54% (c) | 17% (b) |
|
|
|
|
|
|
|
|
|
|
|
|
| | 0.00 (a) | | 11.04 | 7.55% | | | 1,399,473 | 0.55% | 0.83% | 3.98% | 3.70% | 42% |
|
|
|
|
|
|
|
|
|
| | 0.00 (a) | | 10.72 | 7.22% | | | 1,389,702 | 0.55% | 0.83% | 4.20% | 3.92% | 45% |
|
|
|
|
|
|
|
|
|
| | 0.00 (a)) | | 10.42 | 10.42% | | | 1,326,659 | 0.55% | 0.81% | 4.32% | 4.05% | 36% |
|
|
|
|
|
|
|
|
|
| | 0.00 (a) | | 9.85 | (1.86%) | | | 1,069,006 | 0.55% | 0.81% | 4.98% | 4.72% | 54% |
|
|
|
|
|
|
|
|
|
| | 0.00 (a) | | 10.55 | 5.42% | | | 1,102,647 | 0.55% | 0.82% | 5.21% | 4.94% | 48% |
|
|
|
|
|
|
|
|
|
| | | | | | | | | | | | | |
| | 0.00 (a) | | 11.06 | 3.27% (b) | | | 221,207 | 0.40% (c) | 0.63% (c) | 3.92% (c) | 3.69% (c) | 17% (b) |
|
|
|
|
|
|
|
|
|
| | 0.00 (a) | | 10.92 | 7.81% | | | 196,349 | 0.41% | 0.69% | 4.13% | 3.86% | 42% |
|
|
|
|
|
|
|
|
|
| | 0.00 (a) | | 10.68 | 7.25% | | | 218,060 | 0.43% | 0.70% | 4.31% | 4.04% | 45% |
|
|
|
|
|
|
|
|
|
| | 0.00 (a) | | 10.42 | 10.56% | | | 131,815 | 0.44% | 0.73% | 4.40% | 4.11% | 36% |
|
|
|
|
|
|
|
|
|
| | 0.00 (a) | | 9.85 | (1.77%) | | | 65,263 | 0.46% | 0.73% | 5.09% | 4.82% | 54% |
|
|
|
|
|
|
|
|
|
| | 0.00 (a) | | 10.55 | 2.27% (b) | | | 35,516 | 0.44% (c) | 1.30% (c) | 5.13% (c) | 4.28% (c) | 48% (d) |
|
|
|
|
|
|
|
|
|
| | | | | | | | | | | | | |
| | 0.00 (a) | | 11.68 | 2.82% (b) | | | 132,941 | 0.65% (c) | 0.86% (c) | 3.20% (c) | 3.00% (c) | 3% (b) |
|
|
|
|
|
|
|
|
|
| | 0.00 (a) | | 11.54 | 8.88% | | | 113,221 | 0.65% | 0.91% | 3.60% | 3.34% | 17% |
|
|
|
|
|
|
|
|
|
| | 0.00 (a) | | 10.99 | 1.77% | | | 118,478 | 0.65% | 0.91% | 3.56% | 3.30% | 6% |
|
|
|
|
|
|
|
|
|
| | 0.00 (a) | | 11.19 | 10.71% | | | 105,891 | 0.65% | 0.90% | 3.67% | 3.42% | 8% |
|
|
|
|
|
|
|
|
|
| | 0.00 (a) | | 10.48 | (1.34%) | | | 67,206 | 0.65% | 0.91% | 3.85% | 3.59% | 16% |
|
|
|
|
|
|
|
|
|
| | 0.00 (a) | | 11.04 | 2.84% | | | 57,204 | 0.65% | 0.95% | 3.84% | 3.54% | 14% |
|
|
|
|
|
|
|
|
|
| | | | | | | | | | | | | |
| | | | | | | | | | | | | |
| | | | | | | | | | | | | |
| | | | | | | | | | | | | |
| | | | | | | | | | | | | |
| | | | | | | | | | | | | |
| | | | | | | | | | | | | |
| (d) | Portfolio turnover rate is calculated at the Fund level and represents the year ended December 31, 2007. |
| (e) | Period from September 28, 2007 (inception date) through December 31, 2007. |
| (f) | Calculated using the average shares method. |
| | |
| See Notes to Financial Statements |
PAGE 83 |
|

1. ORGANIZATION
Westcore Trust (the “Trust”) is registered under the Investment Company Act of 1940, as amended, as an open-end management investment company. Interests in the Westcore Growth, Westcore MIDCO Growth, Westcore Select, Westcore Blue Chip, Westcore Mid-Cap Value, Westcore Small-Cap Opportunity, Westcore Small-Cap Value, Westcore Micro-Cap Opportunity, Westcore International Small-Cap, Westcore Flexible Income, Westcore Plus Bond and Westcore Colorado Tax-Exempt Funds (the “Funds”) are represented by separate classes of beneficial interest of the Trust, which is organized as a Massachusetts business trust. The Funds offer Retail Class shares. The Westcore Growth, Westcore MIDCO Growth, Westcore Blue Chip, Westcore Small-Cap Opportunity, Westcore Small-Cap Value, Westcore Flexible Income and Westcore Plus Bond Funds offer Institutional Class shares. All classes of shares have identical rights to earnings, assets and voting privileges, except for class specific expenses and exclusive rights to vote on matters solely affecting such class.
2. SIGNIFICANT ACCOUNTING POLICIES
The following is a summary of significant accounting policies consistently followed by each Fund in the preparation of its financial statements. The policies are in conformity with accounting principles generally accepted in the United States of America for investment companies.
Use of Estimates – The preparation of financial statements in accordance with accounting principles generally accepted in the United States of America requires management to make estimates and assumptions that affect the reported amounts and disclosures in the financial statements. The actual results could differ from those estimates.
Investment Valuation – All securities of the Funds are valued as of the close of regular trading on the New York Stock Exchange (“NYSE”), currently 4:00 p.m. (Eastern Time), on each day that the NYSE is open, subject to provisions in the prospectus and/or Statement of Additional Information regarding pricing at other times in case of an emergency and optional pricing of the Funds in the event that the NYSE does not open for business because of an emergency.
Securities that are traded on a recognized domestic stock exchange are generally valued at the last sales price as of the valuation time on the principal stock exchange on which they are traded. Securities that are principally traded on the National Association of Securities Dealers Automated Quotation (“NASDAQ”) exchange are generally valued at the NASDAQ Official Closing Price (“NOCP”). Unlisted securities that are traded on the domestic over-the-counter market for which last sales prices are available, are generally valued at the last sales price as of the valuation time. In the absence of sales and NOCP, such securities are valued at the mean of the bid and asked prices.
Securities that are traded on a foreign stock exchange (and that are not listed on a recognized domestic stock exchange or traded on the NASDAQ exchange or the domestic over-the-counter market) are generally valued at the official closing price on the principal stock exchange on which they are traded. In the event that closing prices are not available for such foreign securities, such securities are generally valued at the last sales price occurring prior to the closing of its principal exchange. Exchange rates as of the close of regular trading on the NYSE are used to convert foreign security values into U.S. dollars. Forward foreign currency exchange contracts are valued on a daily basis based on the closing prices of the foreign currency rates as of the close of regular trading on the NYSE.
Redeemable securities issued by open-end registered investment companies are valued at the investment company’s applicable net asset value.
Fixed-income obligations, excluding municipal securities, having a remaining maturity of greater than 60 days, are typically valued at the mean between the evaluated bid and ask prices formulated by an independent pricing service. Municipal securities having a remaining maturity of greater than 60 days, are typically valued at the evaluated bid price formulated by an independent pricing service.
Securities having a remaining maturity of 60 days or less are valued at amortized cost which approximates market value.
When market quotations are not readily available or when events occur that make established valuation methods unreliable, securities of the Fund may be valued in good faith by or under the direction of the Board of Trustees. Factors which may be considered when determining the value of a security include (a) the fundamental data relating to the investment; (b) an evaluation of the forces which influence the market in which the security is sold, including the liquidity and depth of the market; (c) the market value at date of purchase; (d) information as to any transactions or offers with respect to the security or comparable securities; and (e) any other relevant matters.
Market, Credit and Counterparty Risk – In the normal course of business, the Funds invest in securities and enter into transactions where risks exist due to fluctuations in the market (market risk) or failure of the issuer of a security to meet all its obligations (issuer credit risk). The value of securities held by the Funds may decline in response to certain events, including those directly involving the issuers whose securities are owned by the Funds; conditions affecting the general economy; overall market changes; local, regional, national or global political, social or economic instability; and currency and interest rate and price fluctuations. Similar to issuer credit risk, the Funds may be exposed to counterparty credit risk, or the risk that an entity with which the Funds have unsettled or open transactions may fail to or be unable to perform on its commitments. The Funds manage counterparty credit risk by entering into transactions only with counterparties that they believe have the financial resources to honor their obligations and by monitoring the financial stability of those counterparties.
Foreign Securities – All of the Funds, except the Westcore Colorado Tax-Exempt Fund, may invest at least a portion of their assets in foreign securities. As of June 30, 2012, all Funds were primarily invested in U.S. based issuers, as determined by the location of their headquarters, except Westcore International Small-Cap Fund. In the event that a Fund executes a foreign security transaction, the Fund will generally enter into a foreign currency contract to settle the foreign security transaction. Foreign securities may carry more risk than U.S. securities, such as political, market and currency risks. The accounting records of the Funds are maintained in U.S. dollars. Prices of securities denominated in foreign currencies are translated into U.S. dollars at the closing rates of exchange at period end. Amounts related to the purchase and sale of foreign securities and investment income are translated at the rates of exchange prevailing on the respective dates of such transactions.
| PAGE 84 |
|
The effect of changes in foreign currency exchange rates on investments is separately identified from the fluctuations arising from changes in market values of securities held and reported with all other foreign currency gains and losses in the Funds’ Statements of Operations.
Concentration of Risk – As of June 30, 2012, the Westcore International Small-Cap Fund invested a significant percentage of its assets in the United Kingdom, Japan, and Australia. Therefore, it may be more affected by economic developments and currency fluctuations in these countries.
Federal Income Taxes – No provision for income taxes is included in the accompanying financial statements, as the Funds intend to distribute to shareholders all taxable investment income and realized gains and otherwise comply with Subchapter M of the Internal Revenue Code applicable to regulated investment companies.
Management of the Funds has analyzed all open tax years, as defined by the Statute of Limitations, for all major jurisdictions, including federal tax authorities and certain state tax authorities and has concluded that no provision for income tax is required for uncertain tax positions. The Funds file income tax returns in the U.S. federal jurisdiction and Colorado. For the years ended December 31, 2008 through December 31, 2011 for the federal jurisdiction and for the years ended December 31, 2007 through December 31, 2011, for Colorado, the Funds’ returns are still open to examination by the appropriate taxing authority. In addition, for the years ended May 31, 2007 through December 31, 2011, the Westcore Flexible Income Fund’s Mississippi returns are still open to examination by the appropriate taxing authority as well.
Under the Regulated Investment Company Modernization Act of 2010 (“the Modernization Act”), net capital losses recognized in tax years beginning after December 22, 2010 may be carried forward indefinitely, and the character of the losses is retained as short-term and/or long-term. Under the law in effect prior to the Modernization Act, net capital losses were carried forward for eight years and treated as short-term. As a transition rule, the Modernization Act requires that post-enactment net capital losses be used before pre-enactment net capital losses. Additionally, post-enactment capital losses that are carried forward will retain their character as either short-term or long-term losses rather than being considered all short-term as under previous law.
At December 31, 2011, each Fund had available for federal income tax purposes unused pre-enactment capital loss carryforwards as follows:
| | Expiring |
| | | 2013 | | 2014 | | 2015 | | 2016 | | 2017 | | 2018 | | Total |
| Westcore Growth Fund | $ | | | – | | $ | | – | | $ | | – | | $ | | – | | $ | 9,989,640 | | $ | | – | | $ | 9,989,640 |
| Westcore MIDCO Growth Fund | | | | – | | | | – | | | | – | | | | – | | | – | | | | – | | | – |
| Westcore Select Fund | | | | – | | | | – | | | | – | | | | – | | | – | | | | – | | | – |
| Westcore Blue Chip Fund | | | | – | | | | – | | | | – | | | | – | | | – | | | | – | | | – |
| Westcore Mid-Cap Value Fund | | | | – | | | | – | | | | – | | | 3,787,970 | | | 7,328,000 | | | | – | | | 11,115,970 |
| Westcore Small-Cap | | | | | | | | | | | | | | | | | | | | | | | | | | |
| Opportunity Fund | | | | – | | | | – | | | | – | | | | – | | | – | | | | – | | | – |
| Westcore Small-Cap Value Fund | | | | – | | | | – | | | | – | | | | – | | | 12,627,608 | | | | – | | | 12,627,608 |
| Westcore Micro-Cap | | | | | | | | | | | | | | | | | | | | | | | | | | |
| Opportunity Fund | | | | – | | | | – | | | | – | | | | – | | | 9,862 | | | | – | | | 9,862 |
| Westcore International | | | | | | | | | | | | | | | | | | | | | | | | | | |
| Small-Cap Fund | | | | – | | | | – | | | | – | | | | – | | | 7,275,307 | | | | – | | | 7,275,307 |
| Westcore Flexible Income Fund | | | 18,958 | | | 340,539 | | | 775,600 | | | 20,255,986 | | | 9,408,999 | | | 1,064,911 | | | 31,864,993 |
| Westcore Plus Bond Fund | | | | – | | | | – | | | | – | | | | – | | | – | | | | – | | | – |
| Westcore Colorado | | | | | | | | | | | | | | | | | | | | | | | | | | |
| Tax-Exempt Fund | | | | – | | | | – | | | | – | | | 18,307 | | | 22,684 | | | | – | | | 40,991 |
| | | | | | | | | | | | | | | | | | | | | | | | | | | |
At December 31, 2011, the following Funds had available for tax purposes unused post-enactment capital loss carryforwards as follows:
| | | Short-Term | Long-Term |
| Westcore Select Fund | $ | 71,093,822 | $ | – |
| Westcore Flexible Income Fund | | – | 6,235,922 |
| Westcore Colorado Tax-Exempt Fund | | 550,467 | | 207,613 |
PAGE 85 |
|
| During the period ended December 31, 2011, each Fund had utilized capital loss carryforwards as follows: |
| | | | | | | | | | | |
| Westcore | | Westcore | | Westcore | | Westcore |
| Growth Fund | | MIDCO Growth Fund | | Blue Chip Fund | | Mid-Cap Value Fund |
| $ | 19,222,355 | | $ | 11,704,824 | | $ | 6,874,885 | | $ | 2,078,067 |
| | | | | | | | | | | |
| Westcore Small-Cap | | Westcore Small-Cap | | Westcore Micro-Cap | | Westcore International |
| Opportunity Fund | | | Value Fund | | Opportunity Fund | | Small-Cap Fund |
| $ | 2,606,792 | | $ | 32,794,634 | | $ | 76,076 | | $ | 979,774 |
The Westcore Growth Fund, Westcore MIDCO Growth Fund, Westcore Select Fund, Westcore Small-Cap Value Fund, Westcore Micro-Cap Opportunity Fund, Westcore Flexible Income, Westcore Plus Bond, and Westcore Colorado Tax-Exempt Fund elect to defer to their fiscal year ending December 31, 2012, approximately $601,198, $153,276, $5,335,046, $380,126, $13,491, $1,209,014, $547,833, and $254,600 of capital losses recognized during the period from November 1, 2011 to December 31, 2011, respectively. Additionally, Westcore International Small-Cap Fund elected to defer to its fiscal year ending December 31, 2012, approximately $732,292 of specified losses recognized during the period from November 1, 2011 to December 31, 2011.
Classification of Distributions to Shareholders – Net investment income (loss) and net realized gain (loss) may differ for financial statement and tax purposes. The character of distributions made during the year from net investment income or net realized gains may differ from its ultimate characterization for federal income tax purposes. Also, due to the timing of dividend distributions, the fiscal year in which amounts are distributed may differ from the fiscal year in which the income or realized gain was recorded by the Funds. Net assets were unaffected by the reclassifications. For the year ended December 31, 2011, each Fund recorded the following reclassifications to the accounts listed below:
| | | | | (Over)/Undistributed Net | | Accumulated Net Realized |
| | Paid-in Capital | | Investment Income | | Gain/(Loss) |
| Westcore Growth Fund | $ | (177,357) | | $ | 177,357 | | $ | 0 |
| Westcore MIDCO Growth Fund | | (250,623) | | | 314,546 | | | (63,923) |
| Westcore Select Fund | | (2,729,100) | | | 2,729,103 | | | (3) |
| Westcore Blue Chip Fund | | 4,667,006 | | | 86,009 | | | (4,753,015) |
| Westcore Mid-Cap Value Fund | | 46 | | | (46) | | | 0 |
| Westcore Small-Cap Opportunity Fund | | (157,686) | | | 157,686 | | | 0 |
| Westcore Small-Cap Value Fund | | (135,403) | | | 135,403 | | | 0 |
| Westcore Micro-Cap Opportunity Fund | | | 1 | | | 1,625 | | | (1,626) |
| Westcore International Small-Cap Fund | | | 0 | | | (29,831) | | | 29,831 |
| Westcore Flexible Income Fund | | 7,736 | | | (46,733) | | | 38,997 |
| Westcore Plus Bond Fund | | | 0 | | | 1,605,406 | | | (1,605,406) |
| Westcore Colorado Tax-Exempt Fund | | | 0 | | | 0 | | | 0 |
| The reclassifications were primarily as a result of the differing book/tax treatment of net operating losses and certain investments. |
| |
| The tax character of the distributions paid were as follows: |
| | | | | | | | | | |
| | | Year Ended | | | | | Year Ended |
| | | December 31, 2011 | | | | | December 31, 2010 |
| Westcore Growth Fund | | | | | | | | | |
| Ordinary Income | | $ | 0 | | | | | $ | 0 |
| Long-Term Capital Gain | | | 0 | | | | | | 0 |
|
| Total | | $ | 0 | | | | | $ | 0 |
|
| | | | | | | | | | |
| Westcore MIDCO Growth Fund | | | | | | | | | |
| Ordinary Income | | $ | 0 | | | | | $ | 0 |
| Long-Term Capital Gain | | | 8,207,425 | | | | | | 0 |
|
| Total | | $ | 8,207,425 | | | | | $ | 0 |
|
| PAGE 86 |
|
| | Year Ended | | Year Ended |
| | December 31, 2011 | | December 31, 2010 |
| Westcore Select Fund | | | | | |
| Ordinary Income | $ | 3,924,950 | | $ | 0 |
| Long-Term Capital Gain | | 578,650 | | | 0 |
|
| Total | $ | 4,503,600 | | $ | 0 |
|
| | | | | | |
| Westcore Blue Chip Fund | | | | | |
| Ordinary Income | $ | 913,101 | | $ | 270,003 |
| Long-Term Capital Gain | | 272,636 | | | 0 |
|
| Total | $ | 1,185,737 | | $ | 270,003 |
|
| | | | | | |
| Westcore Mid-Cap Value Fund | | | | | |
| Ordinary Income | $ | 368,999 | | $ | 234,999 |
| Long-Term Capital Gain | | 0 | | | 0 |
|
| Total | $ | 368,999 | | $ | 234,999 |
|
| | | | | | |
| Westcore Small-Cap Opportunity Fund | | | | | |
| Ordinary Income | $ | 0 | | $ | 42,702 |
| Long-Term Capital Gain | | 678,237 | | | 0 |
|
| Total | $ | 678,237 | | $ | 42,702 |
|
| | | | | | |
| Westcore Small-Cap Value Fund | | | | | |
| Ordinary Income | $ | 2,890,000 | | $ | 3,394,997 |
| Long-Term Capital Gain | | 0 | | | 0 |
|
| Total | $ | 2,890,000 | | $ | 3,394,997 |
|
| | | | | | |
| Westcore Micro-Cap Opportunity Fund | | | | | |
| Ordinary Income | $ | 0 | | $ | 0 |
| Long-Term Capital Gain | | 0 | | | 0 |
|
| Total | $ | 0 | | $ | 0 |
|
| | | | | | |
| Westcore International Small-Cap Fund | | | | | |
| Ordinary Income | $ | 2,200,004 | | $ | 315,002 |
| Long-Term Capital Gain | | 0 | | | 0 |
|
| Total | $ | 2,200,004 | | $ | 315,002 |
|
| | | | | | |
| Westcore Flexible Income Fund | | | | | |
| Ordinary Income | $ | 4,149,150 | | $ | 4,719,796 |
| Long-Term Capital Gain | | 0 | | | 0 |
| Return of Capital | | 0 | | | 7,737 |
|
| Total | $ | 4,149,150 | | $ | 4,727,533 |
|
| | | | | | |
| Westcore Plus Bond Fund | | | | | |
| Ordinary Income | $ | 63,981,542 | | $ | 66,455,229 |
| Long-Term Capital Gain | | 5,039,901 | | | 0 |
|
| Total | $ | 69,021,443 | | $ | 66,455,229 |
|
PAGE 87 |
|
| | Year Ended | | Year Ended |
| | December 31, 2011 | | December 31, 2010 |
| Westcore Colorado Tax-Exempt Fund | | | | | |
| Ordinary Income | $ | 14,864 | | $ | 6,884 |
| Tax-Exempt Income | | 3,704,210 | | | 4,197,387 |
|
| Total | $ | 3,719,074 | | $ | 4,204,271 |
|
As of December 31, 2011, the components of distributable earnings on a tax basis were as follows:
| | Westcore | | Westcore MIDCO | | Westcore | | Westcore Blue |
| | Growth Fund | | Growth Fund | | Select Fund | | Chip Fund |
| Undistributed net investment income | $ | 0 | | $ | 0 | | $ | 0 | | $ | 51,989 |
| Accumulated net realized gain/(loss) | | | | | | | | | | | |
| on investments | | (10,590,838) | | | 218,921 | | | (76,428,868) | | | 424,872 |
| Net unrealized appreciation/(depreciation) | | | | | | | | | | | |
| on investments | | 14,565,863 | | | 6,900,178 | | | (4,862,048) | | | 9,872,905 |
| Effect of other timing differences | | (33,868) | | | (293,186) | | | (19,448) | | | (34,612) |
|
| Total | $ | 3,941,157 | | $ | 6,825,913 | | $ | (81,310,364) | | $ | 10,315,154 |
|
| | | | | | | | | | | | |
| | | | | | Westcore | | | Westcore | | | Westcore |
| | Westcore Mid-Cap | | | Small-Cap | | | Small-Cap | | | Micro-Cap |
| | | Value Fund | | Opportunity Fund | | | Value Fund | | Opportunity Fund |
| Undistributed net investment income | $ | 4,228 | | $ | 0 | | $ | 0 | | $ | 4,121 |
| Accumulated net realized gain/(loss) | | | | | | | | | | | |
| on investments | | (11,115,970) | | | 436,646 | | | (13,007,734) | | | (23,353) |
| Net unrealized appreciation on investments | | 5,223,913 | | | 6,057,032 | | | 34,064,500 | | | 195,027 |
| Effect of other timing differences | | (9,055) | | | (26,990) | | | (20,059) | | | (92) |
|
| Total | $ | (5,896,884) | | $ | 6,466,688 | | $ | 21,036,707 | | $ | 175,703 |
|
| | | | | | | | | | | | |
| | | | | | | | | | | | Westcore |
| | Westcore International | | Westcore Flexible | | | Westcore | | Colorado Tax-Exempt |
| | Small-Cap Fund | | | Income Fund | | Plus Bond Fund | | | Fund |
| Undistributed net investment income | $ | 91,343 | | $ | 51,320 | | $ | 38,629 | | $ | 3,910 |
| Accumulated net realized (loss) on investments | | (7,275,307) | | | (39,309,929) | | | (547,833) | | | (1,053,671) |
| Net unrealized appreciation/(depreciation) | | | | | | | | | | | |
| on investments | | (121,467) | | | (4,991,378) | | | 74,835,282 | | | 5,741,167 |
| Effect of other timing differences | | (421,334) | | | (311,356) | | | (356,889) | | | (23,950) |
|
| Total | $ | (7,726,765) | | $ | (44,561,343) | | $ | 73,969,189 | | $ | 4,667,456 |
|
The effect of other timing differences is primarily related to deferred Trustees’ compensation.
The Funds recharacterize distributions received from Real Estate Investment Trust (“REIT”) investments based on information provided by the REIT into the following categories: ordinary income, long-term capital gains, and return of capital. If information is not available on a timely basis from the REIT , the recharacterization will be estimated based on available information which may include the previous year’s allocation. If new or additional information becomes available from the REIT at a later date, a recharacterization will be made in the following year.
Distributions – Distributions of net investment income, if any, are generally made annually for the Westcore Growth, Westcore MIDCO Growth, Westcore Select, Westcore Blue Chip, Westcore Mid-Cap Value, Westcore Small-Cap Opportunity, Westcore Small-Cap Value, Westcore Micro-Cap Opportunity and Westcore International Small-Cap Funds and monthly for the Westcore Flexible Income, Westcore Plus Bond and Westcore Colorado Tax-Exempt Funds. Distributions of net realized capital gains, if any, are declared at least once each year for each of the Funds. Distributions to shareholders are recorded on the ex-dividend date.
| PAGE 88 |
|
Redemption Fee – Westcore Micro-Cap Opportunity, Westcore International Small-Cap and Westcore Flexible Income impose a two percent (2%) redemption fee (the “Redemption Fee”) on Fund shares if such Fund shares are redeemed (including in connection with an exchange) within ninety (90) calendar days from their date of purchase. The Redemption Fees, which are reflected in the Statement of Changes in Net Assets, are intended to encourage long-term investment in the Funds and, to the extent that frequent trading persists, to offset brokerage commissions, market impact, transaction costs and other expenses associated with frequent trading. Prior to May 1, 2012, all of the Funds imposed such Redemption Fees.
Expenses – Expenses that are specific to a Fund or class of shares of a Fund are charged directly to that Fund or share class. Expenses that are common to all Funds generally are allocated among the Funds in proportion to their average daily net assets.
Expenses related to specific classes and the associated Fund level expenses, for the six months ended June 30, 2012, were as follows:
| Westcore Growth Fund |
| | Retail Class | | Institutional Class | | Fund |
| | Specific Expenses | | Specific Expenses | | Level Expenses |
| Administrative fee | $ | 0 | | $ | 3,306 | | $ | 51,907 |
| Shareholder servicing reimbursement | | 43,799 | | | 0 | | | 0 |
| Transfer agent fees | | 3,878 | | | 47 | | | 9,083 |
| Fund accounting fees and expenses | | 0 | | | 2,480 | | | 12,771 |
| Registration fees | | 7,026 | | | 6,539 | | | 0 |
| Other | | 812 | | | 359 | | | 2,718 |
| | | | | | | | | |
| Westcore MIDCO Growth Fund |
| | | Retail Class | | Institutional Class | | | Fund |
| | Specific Expenses | | Specific Expenses | | Level Expenses |
| Administrative fee | $ | 0 | | $ | 0 | | $ | 103,072 |
| Shareholder servicing reimbursement | | 49,037 | | | 0 | | | 0 |
| Transfer agent fees | | 12,786 | | | 118 | | | 11,053 |
| Fund accounting fees and expenses | | 0 | | | 0 | | | 16,753 |
| Registration fees | | 8,576 | | | 6,625 | | | 0 |
| Other | | 1,914 | | | 788 | | | 3,107 |
| | | | | | | | | |
| Westcore Blue Chip Fund |
| | | Retail Class | | Institutional Class | | | Fund |
| | Specific Expenses | | Specific Expenses | | Level Expenses |
| Administrative fee | $ | 0 | | $ | 3,306 | | $ | 52,734 |
| Shareholder servicing reimbursement | | 17,098 | | | 0 | | | 0 |
| Transfer agent fees | | 39,399 | | | 52 | | | 16,826 |
| Fund accounting fees and expenses | | 0 | | | 2,480 | | | 11,997 |
| Registration fees | | 8,544 | | | 998 | | | 0 |
| Other | | 2,061 | | | 673 | | | 4,951 |
| | | | | | | | | |
| Westcore Small-Cap Opportunity Fund |
| | | Retail Class | | Institutional Class | | | Fund |
| | Specific Expenses | | Specific Expenses | | Level Expenses |
| Administrative fee | $ | 0 | | $ | 3,306 | | $ | 36,711 |
| Shareholder servicing reimbursement | | 26,291 | | | 0 | | | 0 |
| Transfer agent fees | | 3,500 | | | 32 | | | 8,754 |
| Fund accounting fees and expenses | | 0 | | | 2,480 | | | 13,192 |
| Registration fees | | 6,439 | | | 6,379 | | | 0 |
| Other | | 1,542 | | | 772 | | | 1,818 |
PAGE 89 |
|
| Westcore Small-Cap Value Fund |
| | Retail Class | | Institutional Class | | Fund |
| | Specific Expenses | | Specific Expenses | | Level Expenses |
| Administrative fee | $ | 0 | | $ | 0 | | $ | 234,028 |
| Shareholder servicing reimbursement | | 159,261 | | | 0 | | | 0 |
| Transfer agent fees | | 4,376 | | | 4,597 | | | 9,950 |
| Fund accounting fees and expenses | | 0 | | | 0 | | | 30,152 |
| Registration fees | | 6,876 | | | 6,865 | | | 0 |
| Other | | 2,418 | | | 1,387 | | | 2,313 |
| | | | | | | | | |
| Westcore Flexible Income Fund |
| | Retail Class | | Institutional Class | | Fund |
| | Specific Expenses | | Specific Expenses | | Level Expenses |
| Administrative fee | $ | 0 | | $ | 3,306 | | $ | 73,320 |
| Shareholder servicing reimbursement | | 61,536 | | | 0 | | | 0 |
| Transfer agent fees | | 6,252 | | | 39 | | | 9,399 |
| Fund accounting fees and expenses | | 0 | | | 2,480 | | | 15,005 |
| Registration fees | | 7,147 | | | 7,018 | | | 0 |
| Other | | 2,166 | | | 771 | | | 1,836 |
| | | | | | | | | |
| Westcore Plus Bond Fund |
| | Retail Class | | Institutional Class | | Fund |
| | Specific Expenses | | Specific Expenses | | Level Expenses |
| Administrative fee | $ | 0 | | $ | 0 | | $ | 1,259,437 |
| Shareholder servicing reimbursement | | 1,063,560 | | | 0 | | | 0 |
| Transfer agent fees | | 69,666 | | | 1,381 | | | 23,485 |
| Fund accounting fees and expenses | | 0 | | | 0 | | | 125,974 |
| Registration fees | | 15,727 | | | 7,354 | | | 0 |
| Other | | 8,438 | | | 643 | | | 11,980 |
When-Issued Securities – Each Fund may purchase or sell securities on a “when issued” or “forward commitment” basis which involves a commitment by the Fund to purchase or sell particular securities with payment and delivery taking place at a future date. During this period, such securities do not earn interest, are subject to market fluctuation and may increase or decrease in value prior to their delivery. Each Fund maintains, in a segregated account with its custodian, liquid assets with a market value at least equal to the amount of its purchase commitments. The purchase of securities on a when-issued or forward commitment basis may increase the volatility of the Fund’s net asset value to the extent each Fund makes such purchases while remaining substantially fully invested. Settlements in the ordinary course of business, which may take substantially more than three business days for non-US securities, are not treated by the Funds as “when-issued” or “forward commitment” transactions.
Other – For financial reporting purposes, the Funds’ investment transactions and shareholder transactions are recorded on trade date. Dividend income is recorded on the ex-dividend date. Interest income, which includes amortization of premiums, accretion of discounts and income earned on money market funds, is accrued and recorded daily. Realized gains and losses from investment transactions and unrealized appreciation and depreciation of investments are reported on an identified cost basis. Other Income is primarily comprised of consent fees which are compensation for agreeing to changes in the terms to debt instruments.
| PAGE 90 |
|
3. SHARES OF BENEFICIAL INTEREST
On June 30, 2012, there was an unlimited number of no par value shares of beneficial interest authorized for each Fund. Transactions in shares of beneficial interest were as follows:
| | Westcore Growth Fund | | Westcore MIDCO Growth Fund |
| |
| |
|
| | Six Months Ended | | Year Ended | | Six Months Ended | | Year Ended |
| | June 30, 2012 | | December 31, 2011 | | June 30, 2012 | | December 31, 2011 |
| Shares issued and redeemed: | | | | | | | |
| Shares sold | | | | | | | |
| Retail Class | 657,741 | | 1,497,983 | | 645,322 | | 4,486,508 |
| Institutional Class | 42,464 | | 504,955 | | 141,198 | | 365,436 |
| Shares issued in reinvestment of distributions | | | | | | | |
| Retail Class | 0 | | 0 | | 0 | | 962,714 |
| Institutional Class | 0 | | 0 | | 0 | | 393,840 |
| Shares redeemed | | | | | | | |
| Retail Class | (983,160) | | (5,407,310) | | (2,581,782) | | (4,417,129) |
| Institutional Class | (485,427) | | (74,307) | | (671,893) | | (474,615) |
| |
| |
| |
| |
|
| Net increase/(decrease) resulting from | | | | | | | |
| share transactions | (768,382) | | (3,478,679) | | (2,467,155) | | 1,316,754 |
| |
| |
| |
| |
|
| | | | | | | | |
| | Westcore Select Fund | | Westcore Blue Chip Fund |
| |
| |
|
| | Six Months Ended | | Year Ended | | Six Months Ended | | Year Ended |
| | June 30, 2012 | | December 31, 2011 | | June 30, 2012 | | December 31, 2011 |
| Shares issued and redeemed: | | | | | | | |
| Shares sold | | | | | | | |
| Retail Class | 3,560,637 | | 34,267,036 | | 80,656 | | 84,537 |
| Institutional Class | N/A | | N/A | | 11,754 | | 25,109 |
| Shares issued in reinvestment of distributions | | | | | | | |
| Retail Class | 0 | | 232,611 | | 4 | | 66,904 |
| Institutional Class | N/A | | N/A | | 0 | | 14,034 |
| Shares redeemed | | | | | | | |
| Retail Class | (11,610,249) | | (16,697,082) | | (518,474) | | (5,930,025) |
| Institutional Class | N/A | | N/A | | (100,018) | | (1,219,035) |
| Acquisition (Note 10) - Retail Class | N/A | | N/A | | N/A | | 9,797,590 |
| |
| |
| |
| |
|
| Net increase/(decrease) resulting from | | | | | | | |
| share transactions | (8,049,612) | | 17,802,565 | | (526,078) | | 2,839,114 |
| |
| |
| |
| |
|
PAGE 91 |
|
| | Westcore Mid-Cap Value Fund | | Westcore Small-Cap Opportunity Fund |
| |
| |
|
| | Six Months Ended | | Year Ended | | Six Months Ended | | Year Ended |
| | June 30, 2012 | | December 31, 2011 | | June 30, 2012 | | December 31, 2011 |
| Shares issued and redeemed: | | | | | | | |
| Shares sold | | | | | | | |
| Retail Class | 104,415 | | 343,736 | | 119,336 | | 293,153 |
| Institutional Class | N/A | | N/A | | 1,676 | | 4,790 |
| Shares issued in reinvestment of distributions | | | | | | | |
| Retail Class | 0 | | 19,824 | | 0 | | 6,846 |
| Institutional Class | N/A | | N/A | | 0 | | 1,462 |
| Shares redeemed | | | | | | | |
| Retail Class | (385,036) | | (518,638) | | (158,047) | | (383,014) |
| Institutional Class | N/A | | N/A | | (21,946) | | (10,610) |
| |
| |
| |
| |
|
| Net decrease resulting from share transactions | (280,621) | | (155,078) | | (58,981) | | (87,373) |
| |
| |
| |
| |
|
| | | | | | | | |
| | Westcore Small-Cap Value Fund | | Westcore Micro-Cap Opportunity Fund |
| |
| |
|
| | Six Months Ended | | Year Ended | | Six Months Ended | | Year Ended |
| | June 30, 2012 | | December 31, 2011 | | June 30, 2012 | | December 31, 2011 |
| Shares issued and redeemed: | | | | | | | |
| Shares sold | | | | | | | |
| Retail Class | 2,427,765 | | 4,127,583 | | 151,682 | | 53,214 |
| Institutional Class | 1,185,011 | | 2,619,276 | | N/A | | N/A |
| Shares issued in reinvestment of distributions | | | | | | | |
| Retail Class | 0 | | 111,151 | | 0 | | 0 |
| Institutional Class | 0 | | 77,187 | | N/A | | N/A |
| Shares redeemed | | | | | | | |
| Retail Class | (2,439,279) | | (7,877,676) | | (62,554) | | (35,567) |
| Institutional Class | (620,775) | | (4,412,014) | | N/A | | N/A |
| |
| |
| |
| |
|
| Net increase/(decrease) resulting from | | | | | | | |
| share transactions | 552,722 | | (5,354,493) | | 89,128 | | 17,647 |
| |
| |
| |
| |
|
| | | | | | | | |
| | Westcore International Small-Cap Fund | | Westcore Flexible Income Fund |
| |
| |
|
| | Six Months Ended | | Year Ended | | Six Months Ended | | Year Ended |
| | June 30, 2012 | | December 31, 2011 | | June 30, 2012 | | December 31, 2011 |
| Shares issued and redeemed: | | | | | | | |
| Shares sold | | | | | | | |
| Retail Class | 5,261,721 | | 8,479,408 | | 2,109,147 | | 4,542,219 |
| Institutional Class | N/A | | N/A | | 143,444 | | 211,727 |
| Shares issued in reinvestment of distributions | | | | | | | |
| Retail Class | 0 | | 143,434 | | 310,518 | | 451,430 |
| Institutional Class | N/A | | N/A | | 8,144 | | 12,534 |
| Shares redeemed | | | | | | | |
| Retail Class | (1,857,183) | | (3,344,897) | | (2,343,038) | | (2,546,525) |
| Institutional Class | N/A | | N/A | | (62,448) | | (153,478) |
| |
| |
| |
| |
|
| Net increase resulting from share transactions | 3,404,538 | | 5,277,945 | | 165,767 | | 2,517,907 |
| |
| |
| |
| |
|
| PAGE 92 |
|
| | Westcore Plus Bond Fund | | Westcore Colorado Tax-Exempt Fund |
| |
| |
|
| | Six Months Ended | | Year Ended | | Six Months Ended | | Year Ended |
| | June 30, 2012 | | December 31, 2011 | | June 30, 2012 | | December 31, 2011 |
| Shares issued and redeemed: | | | | | | | |
| Shares sold | | | | | | | |
| Retail Class | 18,387,232 | | 35,314,517 | | 1,986,199 | | 2,320,503 |
| Institutional Class | 3,411,200 | | 5,483,227 | | N/A | | N/A |
| Shares issued in reinvestment of distributions | | | | | | | |
| Retail Class | 2,358,324 | | 5,118,092 | | 156,328 | | 300,777 |
| Institutional Class | 336,589 | | 900,490 | | N/A | | N/A |
| Shares redeemed | | | | | | | |
| Retail Class | (13,825,755) | | (43,353,055) | | (578,381) | | (3,589,700) |
| Institutional Class | (1,733,662) | | (8,808,833) | | N/A | | N/A |
| |
| |
| |
| |
|
| Net increase/(decrease) resulting from | | | | | | | |
| share transactions | 8,933,928 | | (5,345,562) | | 1,564,146 | | (968,420) |
| |
| |
| |
| |
|
4. COST AND UNREALIZED APPRECIATION AND DEPRECIATION ON INVESTMENTS ON A TAX BASIS
Westcore Equity Funds
| | | | | | | Westcore | | Westcore |
| | Westcore | | Westcore MIDCO | | Westcore | Blue | | Mid-Cap Value |
| | Growth Fund | | Growth Fund | | Select Fund | Chip Fund | | Fund |
| As of June 30, 2012 | | | | | | | | | | | | |
| | | | | | | | | | | | | |
| Gross appreciation (excess of value over tax cost) | $ | 14,835,234 | | $ | 12,381,187 | $ | 31,350,168 | $ | 12,686,061 | | $ | 6,426,780 |
| | |
| | |
| |
| |
| | |
|
| Gross depreciation (excess of tax cost over value) | | (840,769) | | | (10,285,288) | | (43,650,752) | | (1,124,688) | | | (1,664,185) |
| | |
| | |
| |
| |
| | |
|
| Net unrealized appreciation/(depreciation) | $ | 13,994,465 | | $ | 2,095,899 | $ | (12,300,584) | $ | 11,561,373 | | $ | 4,762,595 |
| | |
| | |
| |
| |
| | |
|
| Cost of investment for income tax purposes | $ | 51,113,123 | | $ | 116,840,128 | $ | 501,119,397 | $ | 55,400,634 | | $ | 33,869,086 |
| | |
| | |
| |
| |
| | |
|
| | | Westcore | | | | Westcore | | | Westcore | | Westcore |
| | | Small-Cap | | | | Small-Cap | | | Micro-Cap | | International |
| | Opportunity Fund | | | | Value Fund | | Opportunity Fund | | Small-Cap Fund |
| As of June 30, 2012 | | | | | | | | | | | | |
| | | | | | | | | | | | | |
| Gross appreciation (excess of value over tax cost) | $ | 8,451,048 | | | $ | 47,836,588 | | $ | 375,006 | | $ | 32,198,143 |
| | |
| | | |
| | |
| | |
|
| Gross depreciation (excess of tax cost over value) | | (2,718,051) | | | | (8,643,862) | | | (104,900) | | | (15,537,320) |
| | |
| | | |
| | |
| | |
|
| Net unrealized appreciation/(depreciation) | $ | 5,732,997 | | | $ | 39,192,726 | | $ | 270,106 | | $ | 16,660,823 |
| | |
| | | |
| | |
| | |
|
| Cost of investment for income tax purposes | $ | 40,511,243 | | | $ | 271,450,899 | | $ | 2,988,783 | | $ | 189,468,160 |
| | |
| | | |
| | |
| | |
|
| | | | | | | | | | | | | |
| Westcore Bond Funds |
| | | Westcore | | | | Westcore | | Westcore Colorado | | | |
| | Flexible Income Fund | | | | Plus Bond Fund | | Tax-Exempt Fund | | | |
| As of June 30, 2012 | | | | | | | | | | | | |
| | | | | | | | | | | | | |
| Gross appreciation (excess of value over tax cost) | $ | 4,979,691 | | | $ | 110,789,655 | | $ | 7,453,194 | | | |
| | |
| | | |
| | |
| | | |
| Gross depreciation (excess of tax cost over value) | | (4,856,325) | | | | (15,218,026) | | | (280,856) | | | |
| | |
| | | |
| | |
| | | |
| Net unrealized appreciation/(depreciation) | $ | 123,366 | | | $ | 95,571,629 | | $ | 7,172,338 | | | |
| | |
| | | |
| | |
| | | |
| Cost of investment for income tax purposes | $ | 91,804,808 | | | $ | 1,608,272,696 | | $ | 125,042,039 | | | |
| | |
| | | |
| | |
| | | |
PAGE 93 |
|
5. INVESTMENT ADVISORY FEES, ADMINISTRATIVE FEES AND OTHER RELATED PARTY TRANSACTIONS
The Trust has entered into an advisory agreement with Denver Investment Advisors LLC (the “Advisor” or “Denver Investments”) for all Funds. The advisory agreement has been approved by the Trust’s Board of Trustees.
Pursuant to its advisory agreement with the Trust, Denver Investments is entitled to an investment advisory fee, computed daily and payable monthly of 0.65%, 0.65%, 0.65%, 0.65%, 0.75%, 1.00%, 1.00%, 1.00%, 1.20%, 0.45%, 0.35% and 0.40% of the average net assets for Westcore Growth, Westcore MIDCO Growth, Westcore Select, Westcore Blue Chip, Westcore Mid-Cap Value, Westcore Small-Cap Opportunity, Westcore Small-Cap Value, Westcore Micro-Cap Opportunity, Westcore International Small-Cap, Westcore Flexible Income, Westcore Plus Bond and Westcore Colorado Tax-Exempt Funds, respectively. Prior to May 1, 2012 the investment advisory fee was 0.45% and 0.50% for the Westcore Plus Bond and Westcore Tax-Exempt Funds, respectively.
ALPS Fund Services, Inc. (“ALPS”) and Denver Investments serve as the Funds’ co-administrators (“Co-Administrators”). ALPS and Denver Investments are entitled to receive a total fee from each Fund for its administrative services computed daily and paid monthly. Denver Investments and ALPS revised the agreement with the Funds effective May 1, 2012 and agreed to allocate the co-administration fee as shown in the chart below. In addition, the Bookkeeping and Pricing services provided by ALPS were consolidated into the revised agreement and fee schedule below.
| | ALPS | | Denver Investments | | Total |
| First $3.5 billion in average daily Net Assets of the Trust | 0.04% | | 0.10% | | 0.14% |
| Net Assets greater than $3.5 billion in average daily Net Assets | | | | | |
| of the Trust | 0.025% | | 0.05% | | 0.075% |
| | | | | | |
| The administrative fees are then allocated to each Fund based upon the Fund’s relative proportion of the Trust’s Net Assets. |
| |
| The minimum Trust level fees, Institutional Class fees and Westcore Micro-Cap Opportunity Fund fees were all eliminated. |
| |
| Prior to May 1, 2012 the following fees applied. |
| | | | | | |
| | ALPS | | Denver Investments | | Total |
| First $750 million in average daily Net Assets of the Trust | 0.05% | | 0.20% | | 0.25% |
| Next $250 million in average daily Net Assets of the Trust | 0.04% | | 0.16% | | 0.20% |
| Net Assets greater than $1.0 billion in average daily Net | | | | | |
| Assets of the Trust | 0.025% | | 0.10% | | 0.125% |
The administrative fees are then allocated to each Fund based upon the Fund’s relative proportion of the Trust’s Net Assets. ALPS was also entitled to a minimum Trust level fee of $357,250 per annum, but no more than the amount of the administration fees paid by the Trust.
In addition, ALPS was entitled to an Institutional Class minimum administration fee up until 5/1/2012. The fee was charged directly to each Institutional Class based on the Class’ assets in accordance with the schedule below.
| Assets | Annual Fee |
| $0 - $9,999,999 | $ | 10,000 |
| $10,000,000 - $19,999,999 | $ | 7,500 |
| $20,000,000 - $29,999,999 | $ | 5,000 |
| $30,000,000 - $39,999,999 | $ | 2,500 |
| Over $40,000,000 | $ | 0 |
In addition, ALPS was entitled to a minimum administration fee for Westcore Micro-Cap Opportunity Fund up until 5/1/2012. The fee was charged directly to the Fund based on the Fund’s net assets in accordance with the schedule below.
| Assets | Annual Fee |
| $0 - $9,999,999 | $ | 10,000 |
| $10,000,000 - $19,999,999 | $ | 7,500 |
| $20,000,000 - $29,999,999 | $ | 5,000 |
| Over $30,000,000 | $ | 0 |
| PAGE 94 |
|
Each Fund has agreed to reimburse the Adviser for a portion of the payments it makes to certain Service Organizations for providing recordkeeping and sub-accounting services to persons who own Fund Retail Class shares through omnibus accounts (“Omnibus Accounts”). The amount reimbursed by the Trust is intended to not exceed the estimated cost that would be incurred by the Fund if the shares held in the Omnibus Accounts were serviced directly by the Fund’s transfer agent.
To determine the Periodic Reimbursement Amount, the Fund’s effective cost for servicing shares directly by the Fund’s transfer agent is calculated on a periodic basis but no later than quarterly as follows (“Effective Rate”):
Fund Retail Class Transfer Agency Costs divided by Fund Retail Class Assets serviced directly by the Fund’s Transfer Agent.
This Effective Rate is then multiplied by the Retail Class assets in the Omnibus Accounts as of the most recent practical date (typically quarter end) to calculate the Periodic Reimbursement Amount.
The Co-Administrators and the Advisor contractually agreed to waive fees or reimburse expenses for each of the Funds until April 29, 2012. Effective April 30, 2012 the Advisor contractually agreed that the Net Annual Fund Operating Expenses for the Retail Class shares of the Westcore Growth, Westcore MIDCO Growth, Westcore Select, Westcore Blue Chip, Westcore Mid-Cap Value, Westcore Small-Cap Opportunity, Westcore Small-Cap Value, Westcore Micro-Cap Opportunity, West-core International Small-Cap, Westcore Flexible Income, Westcore Plus Bond and Westcore Colorado Tax-Exempt Funds will not exceed 1.15%, 1.15%, 1.15%, 1.15%, 1.25%, 1.30%, 1.30%, 1.30%, 1.50%, 0.85%, 0.55%, and 0.65%, respectively until at least April 30, 2013. Without such fee waivers, for the six months ended June 30, 2012, the Total Annualized Fund Operating Expenses of the Westcore Blue Chip, Westcore Mid-Cap Value, Westcore Small-Cap Opportunity, Westcore Small-Cap Value, Westcore Micro-Cap Opportunity, Westcore International Small-Cap, Westcore Flexible Income, Westcore Plus Bond, and Westcore Colorado Tax-Exempt Funds would be 1.19%, 1.27%, 1.49%, 1.40%, 4.77%, 1.64%, 0.88%, 0.78% and 0.86% respectively.
Denver Investments as Advisor and Co-Administrator has contractually agreed to waive fees or reimburse expenses with respect to Institutional Class shares until at least April 30, 2013. Denver Investments will waive its investment advisory and/or administration fees and/or reimburse for all the ongoing class-specific expenses for the Institutional Class shares. Without such fee waivers, for the six months ended June 30, 2012, the Total Annualized Operating Expenses for the Institutional Class shares of the Westcore Growth, Westcore Midco Growth, Westcore Blue Chip, Westcore Small-Cap Opportunity, Westcore Small-Cap Value, Westcore Flexible Income and Westcore Plus Bond Funds would be 1.30%, 0.95%, 1.16%, 2.10%, 1.26%, 1.92% and 0.63%, respectively.
ALPS, pursuant to a Transfer Agency Agreement, serves as Transfer Agent for each of the Funds. As Transfer Agent, ALPS has, among other things, agreed to: (a) issue and redeem shares of the Funds; (b) make dividend and other distributions to shareholders of the Funds; (c) effect transfers of shares; (d) mail communications to shareholders of the Funds, including account statements, confirmations, and dividend and distribution notices; (e) facilitate the electronic delivery of shareholder statements and reports and (f) maintain shareholder accounts. Under the Transfer Agency Agreement, ALPS receives from the Trust an annual minimum fee per Fund, a fee based upon each shareholder account and is reimbursed for out-of-pocket expenses.
ALPS agreed, pursuant to a separate Bookkeeping and Pricing Agreement, to maintain the financial accounts and records of the Funds and to compute the net asset value and certain other financial information of the Funds. Under the Bookkeeping and Pricing Agreement, ALPS received from the Trust a fee based on the assets of each Fund, subject to minimum fees on both the Retail and the Institutional Classes, and is reimbursed for out-of pocket expenses. Effective May 1, 2012, these services were consolidated into the Administration Agreement.
Certain officers of the Funds are also officers of Denver Investments. All access persons of the Trust, as defined in the 1940 Act, and members, offi-cers and employees of the Advisor, follow strict guidelines and policies on personal trading as outlined in the Trust’s and the Advisor’s respective Code of Ethics.
The Trustees have appointed a Chief Compliance Officer who is also the Treasurer of the Trust and an employee of the Advisor. The Trustees agreed to have the Funds pay the portion of his compensation attributable for services rendered as the Trust’s Chief Compliance Officer.
The Trust has a Trustee Deferred Compensation Plan (the “Deferral Plan”) which allows the trustees to defer the receipt of all or a portion of trustees fees. Under the Deferral Plan, any compensation deferred results in an equal adjustment to the Investment for/Payable for Trustee Deferred Compensation Plan on the Statement of Assets and Liabilities, as though an equivalent amount had been invested in shares of one or more Westcore Funds selected by the trustee. The amount paid to the trustees under the Deferral Plan will be determined based upon the performance of the selected funds. Deferral of trustees’ fees under the Deferral Plan will not affect the net assets of the Fund.
6. NEW ACCOUNTING PRONOUNCEMENTS
In December 2011, the FASB issued ASU NO. 2011-11 “Disclosures about Offsetting Assets and Liabilities” to expand current disclosure requirements on the offsetting of certain assets and liabilities. The new disclosures will be required for investments and derivative financial instruments subject to master netting or similar agreements which are eligible for offset in the Statements of Assets and Liabilities and will require an entity to disclose both gross and net information about such investments and transactions in the financial statements. The guidance is effective for financial statements with fiscal years beginning on or after January 1, 2013, and interim periods within those fiscal years. Management is evaluating the impact of this guidance on the Funds’ financial statement disclosures.
PAGE 95 |
|
7. FAIR VALUE MEASUREMENTS
A three-tier hierarchy has been established to measure fair value based on the extent of use of “observable inputs” as compared to “unobservable inputs” for disclosure purposes and requires additional disclosures about these valuations measurements. Inputs refer broadly to the assumptions that market participants would use in pricing a security. Observable inputs are inputs that reflect the assumptions market participants would use in pricing the security developed based on market data obtained from sources independent of the reporting entity. Unobservable inputs are inputs that reflect the reporting entity’s own assumptions about the assumptions market participants would use in pricing the security developed based on the best information available in the circumstances.
The three-tier hierarchy is summarized as follows:
1) Level 1 – Quoted & Unadjusted Prices in active markets for identical investments
2) Level 2 – Other Significant Observable Inputs (including quoted prices for similar investments, interest rates, prepayment speeds, credit risk, etc.)
3) Level 3 – Significant Unobservable Inputs (including the Fund’s own assumptions in determining the fair value of investments). The following is a summary of the inputs used as of June 30, 2012 in valuing the Funds’ assets:
| Westcore Growth Fund |
| |
| Investments in Securities | Level 1–Quoted and | | Level 2–Other Significant | | Level 3–Significant | | |
| at Value* | Unadjusted Prices | | Observable Inputs | | Unobservable Inputs | | Total |
|
| Common Stocks | $ | 62,201,960 | | $ | – | | $ | – | | $ | 62,201,960 |
| Money Market Mutual Funds | | 2,905,628 | | | – | | | – | | | 2,905,628 |
|
| Total | $ | 65,107,588 | | $ | – | | $ | – | | $ | 65,107,588 |
|
| | | | | | | | | | | | |
| Westcore MIDCO Growth Fund |
| |
| Investments in Securities | Level 1–Quoted and | | Level 2–Other Significant | | Level 3–Significant | | | |
| at Value* | Unadjusted Prices | | Observable Inputs | | Unobservable Inputs | | | Total |
|
| Common Stocks | $ | 112,574,589 | | $ | – | | $ | – | | $ | 112,574,589 |
| Money Market Mutual Funds | | 6,361,438 | | | – | | | – | | | 6,361,438 |
|
| Total | $ | 118,936,027 | | $ | – | | $ | – | | $ | 118,936,027 |
|
| | | | | | | | | | | | |
| Westcore Select Fund |
| |
| Investments in Securities | Level 1–Quoted and | | Level 2–Other Significant | | Level 3–Significant | | | |
| at Value* | Unadjusted Prices | | Observable Inputs | | Unobservable Inputs | | | Total |
|
| Common Stocks | $ | 487,754,926 | | $ | – | | $ | – | | $ | 487,754,926 |
| Money Market Mutual Funds | | 1,063,887 | | | – | | | – | | | 1,063,887 |
|
| Total | $ | 488,818,813 | | $ | – | | $ | – | | $ | 488,818,813 |
|
| | | | | | | | | | | | |
| Westcore Blue Chip Fund |
| |
| Investments in Securities | Level 1–Quoted and | | Level 2–Other Significant | | Level 3–Significant | | | |
| at Value* | Unadjusted Prices | | Observable Inputs | | Unobservable Inputs | | | Total |
|
| Common Stocks | $ | 65,370,528 | | $ | – | | $ | – | | $ | 65,370,528 |
| Money Market Mutual Funds | | 1,591,479 | | | – | | | – | | | 1,591,479 |
|
| Total | $ | 66,962,007 | | $ | – | | $ | – | | $ | 66,962,007 |
|
| Westcore Mid-Cap Value Fund |
| |
| Investments in Securities | Level 1–Quoted and | | Level 2–Other Significant | | Level 3–Significant | | | |
| at Value* | Unadjusted Prices | | Observable Inputs | | Unobservable Inputs | | | Total |
|
| Common Stocks | $ | 38,126,388 | | $ | – | | $ | – | | $ | 38,126,388 |
| Money Market Mutual Funds | | 505,293 | | | – | | | – | | | 505,293 |
|
| Total | $ | 38,631,681 | | $ | – | | $ | – | | $ | 38,631,681 |
|
| | | | | | | | | | | | |
| Westcore Small-Cap Opportunity Fund |
| |
| Investments in Securities | Level 1–Quoted and | | Level 2–Other Significant | | Level 3–Significant | | | |
| at Value* | Unadjusted Prices | | Observable Inputs | | Unobservable Inputs | | | Total |
|
| Common Stocks | $ | 44,534,954 | | $ | – | | $ | – | | $ | 44,534,954 |
| Money Market Mutual Funds | | 1,709,286 | | | – | | | – | | | 1,709,286 |
|
| Total | $ | 46,244,240 | | $ | – | | $ | – | | $ | 46,244,240 |
|
| PAGE 96 |
|
| Westcore Small-Cap Value Fund |
| | | | | | | | | | | | |
| Investments in Securities | Level 1–Quoted and | | Level 2–Other Significant | | Level 3–Significant | | |
| at Value* | Unadjusted Prices | | Observable Inputs | | Unobservable Inputs | | Total |
|
| Common Stocks | $ | 299,131,920 | | $ | – | | $ | – | | $ | 299,131,920 |
| Money Market Mutual Funds | | 11,511,705 | | | – | | | – | | | 11,511,705 |
|
| Total | $ | 310,643,625 | | $ | – | | $ | – | | $ | 310,643,625 |
|
| | | | | | | | | | | | |
| Westcore Micro-Cap Opportunity Fund |
| | | | | | | | | | | |
| Investments in Securities | Level 1–Quoted and | | Level 2–Other Significant | | Level 3–Significant | | | |
| at Value* | Unadjusted Prices | | Observable Inputs | | Unobservable Inputs | | | Total |
|
| Common Stocks | $ | 2,875,911 | | $ | – | | $ | – | | $ | 2,875,911 |
| Money Market Mutual Funds | | 382,978 | | | – | | | – | | | 382,978 |
|
| Total | $ | 3,258,889 | | $ | – | | $ | – | | $ | 3,258,889 |
|
| | | | | | | | | | | | |
| Westcore International Small-Cap Fund |
| | | | | | | | | | |
| Investments in Securities | Level 1–Quoted and | | Level 2–Other Significant | | Level 3–Significant | | | |
| at Value* | Unadjusted Prices | | Observable Inputs | | Unobservable Inputs | | | Total |
|
| Common Stocks | $ | 192,075,133 | | $ | – | | $ | – | | $ | 192,075,133 |
| Money Market Mutual Funds | | 14,053,850 | | | – | | | – | | | 14,053,850 |
|
| Total | $ | 206,128,983 | | $ | – | | $ | – | | $ | 206,128,983 |
|
| Other Financial Instruments** |
|
| Assets: | | | | | | | | | | | |
|
| Forward Foreign | | | | | | | | | | | |
| Currency Contracts | $ | – | | $ | 6,516 | | $ | – | | $ | 6,516 |
| Liabilities: | | | | | | | | | | | |
| Forward Foreign | | | | | | | | | | | |
| Currency Contracts | | – | | | (590,058) | | | – | | | (590,058) |
|
| Total | $ | – | | $ | (583,542) | | $ | – | | $ | (583,542) |
|
| | | | | | | | | | | | |
| Westcore Flexible Income Fund |
| | | | | | | | | | | | |
| Investments in Securities | Level 1–Quoted and | | Level 2–Other Significant | | Level 3–Significant | | | |
| at Value* | Unadjusted Prices | | Observable Inputs | | Unobservable Inputs | | | Total |
|
| Convertible Preferred Stocks | $ | 1,286,991 | | $ | – | | $ | – | | $ | 1,286,991 |
| Nonconvertible Preferred Stocks | | 3,113,587 | | | | | | 900,000 | | | 4,013,587 |
| Corporate Bonds | | – | | | 80,176,398 | | | 2,268,865 | | | 82,445,263 |
| Commercial Mortgage-Backed | | | | | | | | | | | |
| Securities & Residential | | | | | | | | | | | |
| Mortgage Backed Securities | | – | | | 2,210,477 | | | – | | | 2,210,477 |
| Money Market Mutual Funds | | 1,971,856 | | | – | | | – | | | 1,971,856 |
|
| Total | $ | 6,372,434 | | $ | 82,386,875 | | $ | 3,168,865 | | $ | 91,928,174 |
|
| Westcore Plus Bond Fund |
| | | | | | | | | | | | |
| Investments in Securities | Level 1 – Quoted and | | Level 2 – Other Significant | | Level 3 – Significant | | | |
| at Value* | Unadjusted Prices | | Observable Inputs | | Unobservable Inputs | | | Total |
|
| Nonconvertible Preferred Stocks | $ | 2,035,614 | | $ | - | | $ | 2,340,000 | | $ | 4,375,614 |
| Corporate Bonds | | – | | | 797,293,631 | | | 18,648,915 | | | 815,942,546 |
| Municipal Bonds | | – | | | 6,934,093 | | | – | | | 6,934,093 |
| Asset-Backed Securities, | | | | | | | | | | | |
| Commercial Mortgage-Backed | | | | | | | | | | | |
| Securities, Residential Mortgage- | | | | | | | | | | | |
| Backed Securities & Agency | | | | | | | | | | | |
| Mortgage-Backed Securities | | – | | | 653,012,632 | | | – | | | 653,012,632 |
| U.S. Government & Agency | | | | | | | | | | | |
| Obligations | | – | | | 69,870 | | | – | | | 69,870 |
| U.S. Treasury Bonds & Notes | | – | | | 221,953,898 | | | – | | | 221,953,898 |
| Money Market Mutual Funds | | 1,555,672 | – | | | | | – | | | 1,555,672 |
|
| Total | $ | 3,591,286 | | $ | 1,679,264,124 | | $ | 20,988,915 | | $ | 1,703,844,325 |
|
PAGE 97 |
|
| Westcore Colorado Tax-Exempt Fund |
| |
| Investments in Securities | Level 1–Quoted and | | Level 2–Other Significant | Level 3–Significant | | |
| at Value* | Unadjusted Prices | | Observable Inputs | Unobservable Inputs | | Total |
|
| Municipal Bonds | $ | – | | $ | 127,740,540 | $ | – | | $ | 127,740,540 |
| Money Market Mutual Funds | | 4,473,837 | | | – | | – | | | 4,473,837 |
|
| Total | $ | 4,473,837 | | $ | 127,740,540 | $ | – | | $ | 132,214,377 |
|
* For detailed Industry descriptions, see the accompanying Statements of Investments.
** Other financial instruments are derivative instruments not reflected in the Statements of Investments.
There were no transfers between Levels 1 and 2 during the period. It is the Funds’ policy to recognize transfers into and out of all levels at the end of the reporting period.
Westcore International Small-Cap Fund utilizes a fair value evaluation service with respect to international securities with an earlier market closing than the Fund’s net asset value computation cutoff.
All securities of the Funds, except for Westcore Flexible Income and Plus Bond Funds, were valued using either Level 1 or Level 2 inputs during the six months ended June 30, 2012. Thus a reconciliation of assets in which significant unobservable inputs (Level 3) were used is not applicable for these Funds.
The following is a reconciliation of assets in which significant unobservable inputs (Level 3) were used in determining fair value:
| Westcore Flexible Income Fund |
| | | | | | | | | | | | | | | | | | | | | | | | | |
| | | | | | | | | | | | | | | | | Net change in |
| | | | | | | | | | | | | | | | | unrealized appreciation/ |
| | | | | | | | Change in | | | | | | | | | (depreciation) |
| | Balance as of | | Accrued | | | | unrealized | | | | Transfer in | | | | attributable to Level 3 |
| | December 31, | | discount/ | | Realized gain/ | | appreciation/ | | Sales | | and/or (out) of | | Balance as of | | investments still held at |
| Investments in Securities | 2011 | | premium | | (loss)* | | (depreciation)* | | proceeds | | Level 3 | | | June 30, 2012 | | June 30, 2012 |
|
| Nonconvertible | | | | | | | | | | | | | | | | | | | | | | | | |
| Preferred Stocks | $ | 883,125 | | $ | – | | $ | – | | $ | 16,875 | | $ | – | | $ | | – | | $ | 900,000 | | $ | 16,875 |
| Corporate Bonds | | 2,236,817 | | | 7,633 | | | 3,795 | | | 172,893 | | | (152,273) | | | | – | | | 2,268,865 | | | 172,893 |
| Commercial Mortgage- | | | | | | | | | | | | | | | | | | | | | | | | |
| Backed Securities & | | | | | | | | | | | | | | | | | | | | | | | | |
| Residential Mortgage | | | | | | | | | | | | | | | | | | | | | | | | |
| Backed Securities | | 126,077 | | | 7,035 | | | (3,592,370) | | | 3,700,199 | | | (240,941) | | | | – | | | – | | | – |
|
| Total | $ | 3,246,019 | | $ | 14,668 | | $ | (3,588,575) | | $ | 3,889,967 | | $ | (393,214) | | $ | | – | | $ | 3,168,865 | | $ | 189,768 |
|
| | | | | | | | | | | | | | | | | | | | | | | | | |
Westcore Plus Bond Fund |
| | | | | | | | | | | | | | | | | | | | | | | | | |
| | | | | | | | | | | | | | | | | | | | | | | | Net change in |
| | | | | | | | | | | | | | | | | | | | | | | | unrealized appreciation/ |
| | | | | | | | | | | Change in | | | | | | | | | | | | (depreciation) |
| | Balance as of | | Accrued | | | | | unrealized | | | | | Transfer in | | | | | attributable to level 3 |
| | December 31, | | Discount/ | | | Realized | | appreciation/ | | | Sales | | and/or (out) of | | Balance as of | | investments still held at |
| Investments in Securities | 2011 | | Premium | | | gain/(loss)* | | (depreciation)* | | | proceeds | | Level 3 | | June 30, 2012 | | June 30, 2012 |
|
| Nonconvertible | | | | | | | | | | | | | | | | | | | | | | | | |
| Preferred Stocks | $ | 2,296,125 | | $ | – | | $ | – | | $ | 43,875 | | $ | – | | $ | | – | | $ | 2,340,000 | | $ | 43,875 |
| Corporate Bonds | | 18,332,924 | | | 8,390 | | | 9,696 | | | 502,501 | | | (204,596) | | | | – | | | 18,648,915 | | | 502,501 |
| Asset-Backed Securities, | | | | | | | | | | | | | | | | | | | | | | | | |
| Commercial Mortgage- | | | | | | | | | | | | | | | | | | | | | | | | |
| Backed Securities, | | | | | | | | | | | | | | | | | | | | | | | | |
| Residential Mortgage- | | | | | | | | | | | | | | | | | | | | | | | | |
| Backed Securities & Agency | | | | | | | | | | | | | | | | | | | | | | | | |
| Mortgage-Backed Securities | | 264,111 | | | 11,229 | | | (5,102,868) | | | 5,214,783 | | | (387,255) | | | | – | | | – | | | – |
|
| Total | $ | 20,893,160 | | $ | 19,619 | | $ | (5,093,172) | | $ | 5,761,159 | | $ | (591,851) | | $ | | – | | $ | 20,988,915 | | $ | 546,376 |
|
* Net realized gain/(loss) and net unrealized appreciation/(depreciation) are included in the related amounts in the statement of operations. |
| PAGE 98 |
|
The inputs or methodologies used for valuing securities are not necessarily an indication of the risk associated with investing in those securities.
For fair value measurements using significant other observable inputs (Level 2), the Funds generally utilize an independent pricing service which utilizes evaluated pricing models that vary by asset class and incorporate available trade, bid and other market information, and for structured securities also incorporate cash flow and, when available, loan performance data. The independent pricing service’s evaluated pricing models apply available market information through processes such as benchmark curves, benchmarking of similar securities, and sector groupings. For certain securities, the independent pricing service uses model processes, such as the Option Adjusted Spread (benchmark driven) model, to assess interest rate impact and develop prepayment scenarios. With respect to trades and bids, the independent pricing service reviews the lot size to determine whether the information is representative of an orderly trading market. If the independent pricing service determines that trade or bid information is not consistent with other information available, the trade or bid will not be reflected in the evaluated price.
In the event the independent pricing service is unable to provide an evaluated price for a security or Denver Investments believes the price provided is not reliable, securities of the Funds may be valued in good faith as described above in Note 2. In these instances, at least one member of Denver Investments’ Management Committee and compliance department will typically seek input from the investment team of the Fund since they are typically the most knowledgeable of the relevant factors in valuing the securities. Denver Investments may seek to find an alternative independent source, such as a broker/dealer to provide a price quote, or by using evaluated pricing models similar to the techniques and models used by the independent pricing service. These fair value measurement techniques may utilize unobservable inputs (Level 3).
At least quarterly, Denver Investments receives a report on the pricing for all fair valued securities during the period along with any actual sales prices, broker quotes and/or pricing from the independent pricing service. Denver Investments uses this information to analyze changes in fair value measurements over the period and as a back test of pricing methods.
Then on at least a quarterly basis, Denver Investments presents the factors considered in determining the fair value measurements and presents that information to the Audit Committee which meets at least quarterly. The Audit Committee then will provide a recommendation to the Board for approval of the fair value measurements.
The table below provides additional information about the Level 3 Fair Value Measurements as of June 30, 2012:
| Westcore Flexible Income Fund |
| |
| Quantitative Information about | Fair Value | | | |
| Level 3 Fair Value Measurements | at 06/30/2012 | Valuation Technique | Unobservable Input | Level/Range |
|
| Nonconvertible Preferred Stocks | $ | 900,000 | Consensus Pricing** | Broker Quotes | N/A |
| Corporate Bonds | | | | | |
| | $ | 2,049,014 | Adjusted Spread Pricing* | Comparability Adjustment | 2.00% |
| | | | | Liquidity Adjustment | 1.50% |
| | | | | | |
| | $ | 219,851 | Consensus Pricing** | Broker Quotes | N/A |
|
| Total | $ | 3,168,865 | | | |
|
| | | | | | |
| Westcore Plus Bond Fund |
| |
| Quantitative Information about | | Fair Value | | | |
| Level 3 Fair Value Measurements | | at 06/30/2012 | Valuation Technique | Unobservable Input | Level/Range |
|
| Nonconvertible Preferred Stocks | $ | 2,340,000 | Consensus Pricing** | Broker Quotes | N/A |
| Corporate Bonds | | | | | |
| | $ | 5,236,369 | Adjusted Spread Pricing* | Comparability Adjustment | 2.00% |
| | | | | Liquidity Adjustment | 1.50% |
| | | | | | |
| | $ | 13,412,546 | Consensus Pricing** | Broker Quotes | N/A |
|
| Total | $ | 20,988,915 | | | |
|
| * We identify comparable security(ies) and obtain market observable spreads to Treasuries, and then adjust for appropriate comparability or liquidity adjustments. |
| |
| ** Denver Investments seeks up to 3 independent price quotes, but in certain cases only one may be available. We evaluate whether the source of the pricing was using valuation techniques in accordance in accordance with topic 820 by developing an internal reasonableness check. For those quotes that are considered reasonable, quantitative unobservable inputs are not developed by Denver Investments. |
PAGE 99 |
|
8. FOREIGN CURRENCY EXCHANGE CONTRACTS
The Westcore International Small-Cap Fund may purchase or sell foreign currencies on a “spot” or cash basis at the prevailing rate in the foreign currency exchange market to settle investment transactions in the proper currency. In addition, this Fund may purchase or sell forward currency contracts to adjust the portfolio’s exposure to different currencies consistent with the investment team’s targets, which consider the currency weightings within the Fund’s benchmark index.
When entering into a spot or forward foreign currency contract, the Fund agrees to receive or deliver a fixed quantity of foreign currency for an agreed upon price on an agreed future date. These contracts are valued at each portfolio valuation, and the Fund’s net equity therein, representing unrealized gain or loss on the contracts as measured by the difference between the spot or forward foreign exchange rates at the dates of entry into the contracts and the spot or forward rates at the reporting date, is included in the statement of assets and liabilities. Realized and unrealized gains and losses are included in the statement of operations. These instruments involve credit risk and market risk in excess of the amount recognized in the statement of assets and liabilities. Risks arise from the possible inability of counterparties to meet the terms of their contracts and from movement in currency exchange rates.
The number of forward foreign currency contracts held at June 30, 2012 is representative of activity during the six months ended June 30, 2012.
The effect of derivative instruments on the Statement of Assets and Liabilities as of June 30, 2012 is as follows:
| | | Asset Derivatives | | Liability Derivatives |
| |
|
| | Statement of Assets and | | | |
| Risk Exposure | Liabilities Location | Unrealized Appreciation | | Unrealized Depreciation |
| Westcore International Small-Cap Fund | | | | | | |
| Forward Foreign Currency Contracts | Net unrealized appreciation/(depreciation) | | | | | |
| | on investments and translation of assets and | | | | | |
| | liabilities denominated in foreign currencies | $ | 6,516 | | $ | 590,058 |
|
| Total | | $ | 6,516 | | $ | 590,058 |
|
| | | | | | | |
| The effect of derivative instruments on the Statement of Operations for the six months ended June 30, 2012 is as follows: |
| | | | | | | |
| Risk Exposure | Statement of Operations Location | | | | | |
| Westcore International Small-Cap Fund | | | | | | |
| Forward Foreign Currency Contracts | Net realized loss on foreign currency | | | | | |
| | transactions | $ | (2,036,065) | | | |
| | | | | | | |
| Forward Foreign Currency Contracts | Net change in unrealized depreciation of | | | | | |
| | assets and liabilities denominated in foreign | | | | | |
| | currencies | | (215,154) | | | |
|
| Total | | $ | (2,251,219) | | | |
|
| PAGE 100 |
|
| 9. PURCHASES AND SALES OF INVESTMENTS |
| | | | | | |
| Investment transactions for the six months ended June 30, 2012 excluding long-term U.S. government securities and short-term investments were as follows: |
| | | | | | |
| | Cost of Investments | | Proceeds from |
| Fund | Purchased | | Investments Sold |
| Westcore Growth Fund | $ | 55,929,929 | | $ | 67,671,188 |
| Westcore MIDCO Growth Fund | | 69,457,037 | | | 91,496,463 |
| Westcore Select Fund | | 546,088,171 | | | 670,306,382 |
| Westcore Blue Chip Fund | | 3,988,665 | | | 11,070,712 |
| Westcore Mid-Cap Value Fund | | 4,030,444 | | | 8,695,971 |
| Westcore Small-Cap Opportunity Fund | | 7,480,797 | | | 9,958,235 |
| Westcore Small-Cap Value Fund | | 61,617,986 | | | 54,649,420 |
| Westcore Micro-Cap Opportunity Fund | | 3,159,586 | | | 2,163,336 |
| Westcore International Small-Cap Fund | | 55,859,607 | | | 12,593,251 |
| Westcore Flexible Income Fund | | 24,230,060 | | | 20,897,792 |
| Westcore Plus Bond Fund | | 314,749,129 | | | 230,510,609 |
| Westcore Colorado Tax-Exempt Fund | | 27,458,584 | | | 4,045,995 |
| | | | | | |
| Purchases and sales of long-term U.S. Government securities for the six months ended June 30, 2012, were as follows: | | | |
| | | | | | |
| | Cost of Investments | | | Proceeds from |
| Fund | Purchased | | | Investments Sold |
| Westcore Plus Bond Fund | $ | 88,513,838 | | $ | 54,595,268 |
PAGE 101 |
|

| PAGE 102 |
|
| Westcore Trustees and Officers: |
| Jack D. Henderson, Chairman |
| Mary K. Anstine, Trustee |
| John A. DeTore, Trustee |
| Rick A. Pederson, Trustee |
| James A. Smith, Trustee |
| Douglas M. Sparks, Trustee |
| Janice M. Teague, Trustee |
| Todger Anderson, President |
| Jasper R. Frontz, Treasurer & Chief Compliance Officer |
| Patrick D. Buchanan, Asst. Treasurer |
| David T. Buhler, Secretary |

FOR MORE INFORMATION ABOUT WESTCORE FUNDS, PLEASE CONTACT:
Westcore Funds | 1290 Broadway, Suite 1100 | Denver, Colorado 80203
Individual Investors: 800.392.CORE | Financial Advisors: 800.734.WEST | www.westcore.com |
A description of the policies and procedures that Westcore Funds uses to determine how to vote proxies relating to portfolio securities is available (i) without charge, upon request, by calling 800.392.CORE; (ii) on the Westcore Funds website, www.westcore.com; and (iii) on the Securities and Exchange Commission website at www.sec.gov.
This report has been prepared for Westcore shareholders and may be distributed to others only if preceded or accompanied by a prospectus.
Westcore Funds are distributed by ALPS Distributors, Inc.
WC120
Item 2. Code of Ethics.
Not applicable to semi-annual report.
Item 3. Audit Committee Financial Expert.
Not applicable to semi-annual report.
Item 4. Principal Accountant Fees and Services.
Not applicable to semi-annual report.
Item 5. Audit Committee of Listed Registrants.
Not applicable.
Item 6. Investments.
a) Schedule of Investments in securities of unaffiliated issuers as of the close of the reporting period is included as part of the Reports to Stockholders filed under Item 1 of this form.
b) Not applicable.
Item 7. Disclosure of Proxy Voting Policies and Procedures for Closed-End Management Investment Companies.
Not applicable.
Item 8. Portfolio Managers of Closed-End Management Investment Companies.
Not applicable.
Item 9. Purchases of Equity Securities by Closed-End Management Investment Company and Affiliated Purchasers.
Not applicable.
Item 10. Submission of Matters to a Vote of Security Holders.
There have been no material changes to the procedures by which shareholders may recommend nominees to the registrant’s Board of Trustees.
Item 11. Controls and Procedures.
(a) The registrant’s principal executive officer and principal financial officer have concluded that the registrant’s disclosure controls and procedures (as defined in Rule 30a-3(c) under the Investment Company Act of 1940, as amended) (the “1940 Act”) (17 CFR 270.30a-3(e)) are effective based on their evaluation of these controls and procedures required by Rule 30a-3(b) under the 1940 Act (17 CFR 270.30a-3(b)) and Rules 13a-15(b) or 15d-15(b) under the Securities Exchange Act of 1934 (17 CFR 240.13a-15(b) or 240.15d-15(b)) as of a date within 90 days of the filing date of this report.
(b) There was no change in the registrant’s internal control over financial reporting (as defined in Rule 30a-3(d) under the 1940 Act (17 CFR 270.30a-3(d)) that occurred during the second fiscal quarter of the period covered by this report that has materially affected, or is reasonably likely to materially affect, the registrant's internal control over financial reporting.
Item 12. Exhibits.
(a)(1) Not applicable to semi-annual report.
(a)(2) The certifications required by Rule 30a-2(a) of the 1940 Act (17 CFR 270.30a-2(a)) and Section 302 of the Sarbanes-Oxley Act of 2002 are attached hereto as Ex99.Cert.
(a)(3) Not applicable.
(b) The certifications required by Rule 30a-2(b) of the 1940 Act (17 CFR 270.30a-2(b)) and Section 906 of the Sarbanes-Oxley Act of 2002 are attached hereto as Ex99.906Cert.
SIGNATURES
Pursuant to the requirements of the Securities Exchange Act of 1934 and the Investment Company Act of 1940, the registrant has duly caused this report to be signed on its behalf by the undersigned, thereunto duly authorized.
WESTCORE TRUST
By: | /s/ Todger Anderson | |
| Todger Anderson | |
| President/Principal Executive Officer | |
| | |
Date: | September 7, 2012 | |
Pursuant to the requirements of the Securities Exchange Act of 1934 and the Investment Company Act of 1940, this report has been signed below by the following persons on behalf of the registrant and in the capacities and on the dates indicated.
By: | /s/ Todger Anderson | |
| Todger Anderson | |
| President/Principal Executive Officer | |
| | |
Date: | September 7, 2012 | |
By: | /s/ Jasper R. Frontz | |
| Jasper R. Frontz | |
| Treasurer/Principal Financial Officer | |
| | |
Date: | September 7, 2012 | |