| SHAREHOLDER LETTER | (UNAUDITED) |
DEAR FELLOW SHAREHOLDERS
Global economic issues dominated the investment landscape in the first half of 2015. These issues included Greece’s continued struggle to avoid bankruptcy and new concerns over slowing growth in China. In spite of these worries, the S&P 500® Index and 10-year Treasury bond ended the first half of 2015 relatively unchanged.
Throughout early 2015, investors became increasingly concerned that Greece would declare bankruptcy and/or be removed from the European Union (EU). While this situation was not new, the larger issue of Europe’s reaction to a default by Greece and its potential “domino” effect on the rest of the continent moved to the forefront. Greek political unrest was also concerning as proposals for austerity programs were repeatedly turned down. In spite of the relatively insignificant size of Greece’s economy, Greece and the rest of the EU were at a standstill until a last-minute bailout deal (largely led by Germany) allowed Europe to return to normal. Investors then breathed a sigh of relief until China’s economic growth materially slowed.
While Greece’s economy is smaller than the economies of many U.S. cities, China’s economy is arguably the largest in the world. The Shanghai Composite Index, which tracks China’s primary stock market, dropped over 17% from June 12 to June 30. In our opinion this decline largely reflects two things, slowing economic growth and a rapidly increasing amount of non-performing loans coming to light, despite the government’s efforts to insulate the capital markets. The Chinese government attempted to intervene in the downturn, purchasing $145 billion in equities. As we’ve seen historically, government intervention rarely works in the long term and there appears to be little expectation that it will work in this circumstance. The slowing economic growth in China is a situation that will require close monitoring. The U.S. and global economies are more closely tied together than at any time it the past and a slowdown in China has the potential to depress U.S. economic growth.
Global volatility and slowing growth in China may affect the Federal Reserve’s willingness to raise the Fed Funds Rate this year. Slower economic growth in China has resulted in a strengthening U.S. dollar and is negatively impacting U.S. profit growth. With very little evident inflation and the potential for slowing earnings for U.S. companies, we believe there is less incentive for the Fed to raise rates. Fed watchers will have an interesting second half of 2015 determining how to balance the newly evolving contravening factors the Fed must weigh in order to determine its next move.
We will continue to monitor these events and the multitude of other factors that impact your investments in the Westcore Funds. Our portfolio managers and analysts are deeply dedicated to the success of your investments and we sincerely appreciate your confidence in us. Please let us know if you have any questions or require additional information.
| | | |
 |  | |
| Mary K. Anstine | John W. Zimmerman, CFA | |
| Chairman | President | |
John W. Zimmerman is a registered representative of ALPS Distributors, Inc.
CFA is a trademark owned by the CFA Institute.
The Shareholder Letter and the Manager Commentaries included in this shareholder report contain certain forward-looking statements about the factors that may affect the performance of the Funds in the future. These statements are based on Fund management’s predictions and expectations concerning certain future events and their expected impact on the Funds, such as performance of the economy as a whole and of specific industry sectors, changes in the levels of interest rates, the impact of developing world events, and other factors that may influence the future performance of the Funds. Management believes these forward-looking statements to be reasonable, although they are inherently uncertain and difficult to predict. Actual events may cause adjustments in portfolio management strategies from those currently expected to be employed.
| PAGE 1 |
| |
 | p: 800.392.CORE (2673) | www.westcore.com |
| WESTCORE GROWTH FUND (WTEIX, WILGX) | (UNAUDITED) |
Fund Strategy
Investing primarily in equity securities of large companies with growth potential.
Fund Management
Craig W. Juran, CFA Portfolio Manager
CFA is a trademark owned by CFA Institute.
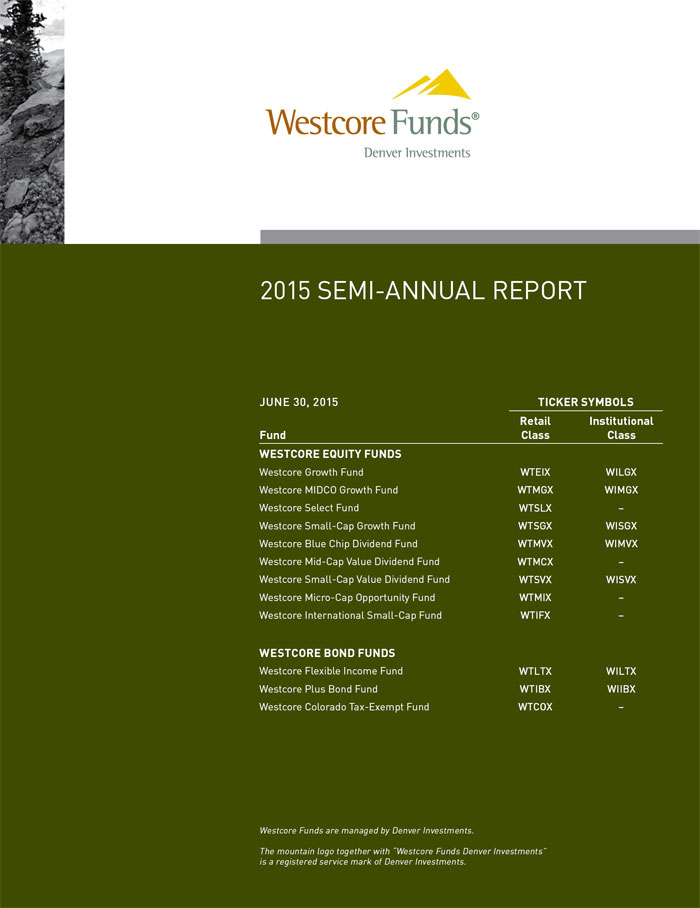
Cumulative Returns
The chart above represents historical performance of a hypothetical investment of $10,000 in the Fund over the past 10 years (or for the life of the Fund if shorter). Performance calculations are as of the end of June each year. Past performance does not guarantee future results. This chart does not reflect the deduction of taxes that a shareholder would pay on Fund distributions or the redemption of Fund shares.
Lipper Index data provided by Lipper, Inc.
Please see index definitions beginning on page 28.
Average Annual Total Returns
| | | | | | | | |
| | 6 Months | 1 Year | 3 Years | 5 Years | 10 Years | Since
Inception | Inception
Date |
| Retail Class (WTEIX) | 6.05% | 11.58% | 16.02% | 17.19% | 7.82% | 9.16% | 6/1/1988 |
| Institutional Class (WILGX) | 6.21 | 11.89 | 16.27 | 17.40 | 7.95 | 9.21 | 9/28/2007 |
Russell 1000® Growth Index | 3.96 | 10.56 | 17.99 | 18.59 | 9.11 | 10.08 | |
| Lipper Large-Cap Growth Index | 4.42 | 10.56 | 18.11 | 17.23 | 7.97 | 9.19 | |
Retail Class Annual Expense Ratio (per the current prospectus) — Gross: 1.11%, Net: 1.11%
Institutional Class Annual Expense Ratio (per the current prospectus) — Gross: 1.05%, Net: 0.91%
The performance data quoted represents past performance and does not guarantee future results. Performance information for the institutional class shares prior to their inception date is based on the performance of the retail class. Current performance may be lower or higher than the performance quoted. To obtain current performance as of the most recent month-end, please call 800.392.CORE (2673) or visit us online at www.westcore.com. Average annual total returns and yield figures reflect the reinvestment of dividends, capital gains distributions, all fee waivers and expense reimbursements. Without the fee waivers and expense reimbursements, total return and yield figures would have been lower. Total return and yield figures represent past performance. Investment return and principal value will vary, and shares, when redeemed, may be worth more or less than their original cost. Westcore fund shares are not insured by the FDIC, the Federal Reserve Board or any other agency and are subject to investment risk.
Denver Investments (the “Adviser”) has contractually agreed to waive certain investment advisory and/or administration fees and/or to reimburse other expenses from April 30, 2015 until at least April 30, 2016. The first waiver/reimbursement applies so that the ratio of expenses to average net assets, as reported in the Fund’s Financial Highlights, will be no more than 1.15% for the Fund’s Retail Class for such period. The second waiver/reimbursement applies so that Fund level Other Expenses for the Institutional Class will be in the same proportion as the Retail Class waivers/reimbursements. The third waiver/reimbursement applies so that the institutional class-specific Other Expenses are reimbursed. The Adviser has contractually agreed to waive/reimburse all of these class-specific Other Expenses, but only to the extent that the difference between the net Institutional Class and net Retail Class expense ratios, after applying the waiver/reimbursement, does not exceed 25 basis points. These agreements may not be terminated or modified prior to this date without the approval of the Board of Trustees.
Craig W. Juran is a registered representative of ALPS Distributors, Inc.
Manager Commentary
| | |
| ■ | Equity markets advanced in the first half of 2015, as a slow but improving U.S. economy was offset by turmoil in Europe associated with the potential exit of Greece from the European Union and continued troubles in emerging markets. As the U.S. economy continues to heal, we think the Federal Reserve is getting closer to normalizing its interest-rate policy, and we think this is a positive step. Although there may be some dislocations associated with a slight increase in interest rates, we believe the longer-term benefits will outweigh short-term volatility associated with a return to more normalized Fed policy. |
| | |
| ■ | For the first six months of 2015, the Westcore Growth Fund outperformed its benchmark, the Russell 1000® Growth Index. The Fund’s returns, relative to the benchmark, were enhanced by holdings in the information technology, health care and industrials sectors. Holdings in consumer discretionary, energy and materials sectors detracted from the Fund’s relative performance. |
| | |
| ■ | Among the Fund’s strongest contributors in the first half of 2015 were Apple Inc., Gilead Sciences, Inc. and Palo Alto Networks, Inc. Apple delivered strong performance as investors became more intrigued with the Apple watch and its potential implications. Although the watch is early in its adoption phase, it potentially might help consumers live healthier life styles, along with supporting the Apple ecosystem. Gilead Sciences, a biotechnology company, delivered strong performance driven by robust first quarter results. These strong results, along with positive commentary about its drug pipeline, drove the stock higher. Palo Alto Networks, an enterprise network security platform provider, delivered strong performance as cybersecurity remained one of the biggest concerns for most corporations. Its next-generation firewall solves many problems that traditional firewalls struggle with. We believe the company is well positioned and that network security is an attractive longer-term growth market. |
| | |
| ■ | Among the Fund’s biggest detractors in the first six months of 2015 were Chipotle Mexican Grill Inc., Goodyear Tire & Rubber Co and Alibaba Group Holding Ltd. Chipotle underperformed in the first half of 2015 after issuing earnings estimates that disappointed some investors. We believe that Chipotle remains one of the best-positioned restaurants to capture consumers’ increasing desire for healthier products and higher-quality foods. We anticipated that Goodyear Tire’s improving fundamentals would lead to accelerating earnings in 2015. In January, however, the company reduced its financial forecasts based on challenging winter weather in Europe and the impact of a stronger U.S. dollar. This uncertainty led us to exit the position. International e-commerce company Alibaba Group struggled as it faced pressure from Chinese government regulation that led to slower revenue growth. We believe the company has compelling longer-term growth opportunities and that some of the near-term headwinds should dissipate in the second half of 2015. |
| | |
| ■ | We continue to see positive data that suggests the U.S. economy is picking up steam. After a slow start to the year, in which the U.S. economy was hampered by severe winter weather, we are starting to see signs of acceleration driven by improved hiring, lower gasoline prices and a pick-up in housing activity. Although the equity markets will likely remain volatile, it is becoming evident to us that a synchronized global recovery may be gaining traction, which may help reduce the fears of deflation and restore confidence in global economies. |
| PAGE 2 |
| |
| 2015 Semi-Annual Report |
| WESTCORE GROWTH FUND (continued) | (UNAUDITED) |
Stock Performance
(for the year ended 6/30/15)
| | | | | |
| 5 Highest | Average
Weight | Contribution
to Return |
| Apple Inc. | 9.92 | % | 1.54 | % |
| Gilead Sciences Inc. | 4.32 | | 1.00 | |
| Walt Disney Co. | 3.79 | | 0.72 | |
| Palo Alto Networks Inc. | 1.65 | | 0.61 | |
| Amazon.com Inc. | 1.78 | | 0.60 | |
| | | | | |
| 5 Lowest | | | | |
| Chipotle Mexican Grill Inc. | 2.82 | % | -0.34 | % |
| Goodyear Tire & Rubber Co. | 0.29 | | -0.34 | |
| Alibaba Group Holding Ltd. | 0.45 | | -0.37 | |
| SanDisk Corp. | 0.15 | | -0.40 | |
| Microsoft Corp. | 0.62 | | -0.49 | |
Past performance does not guarantee future results. These stocks do not represent all of the securities purchased, sold or recommended by the Funds’ Adviser. To request a complete list of the contribution of each Fund holding to overall Fund performance during the period, please call 800.392.CORE (2673) or email invest@westcore.com.
Please see page 30 for a description of the methodology used to construct this chart.
Top Ten Holdings
(as of 6/30/15)
| | | |
| Apple Inc. | 9.5 | % |
| Gilead Sciences Inc. | 5.1 | |
| Facebook Inc. | 4.9 | |
| Home Depot Inc. | 3.7 | |
| Illumina Inc. | 3.6 | |
| Walt Disney Co. | 3.5 | |
| Visa Inc. | 3.2 | |
| Priceline Group Inc. | 3.2 | |
| Celgene Corp. | 2.9 | |
| Allergan PLC | 2.8 | |
| Total (% of Net Assets) | 42.4 | % |
Top ten holdings do not include any cash, cash equivalents or exchange traded fund investments and are subject to change. There are no guarantees that the Fund will continue to remain invested in any particular holding.
Portfolio Characteristics
(as of 6/30/15)
| | Westcore
Growth Fund | Russell 1000®
Growth Index |
| Weighted Average Market Capitalization ($ Bil) | $135.6 | $122.4 |
| Price/Earnings (1 year trailing) | 26.1x | 22.7x |
| EPS Growth (3 year historical) | 21.9% | 14.0% |
| Beta | 1.1 | 1.0 |
| Number of Holdings | 41 | 644 |
| Portfolio Turnover Rate (1 year trailing) | 104% | — |
Please see definition of terms beginning on page 30.
Sector Allocation
(as of 6/30/15)
| | | | | | | |
| | Westcore
Growth Fund | Russell 1000®
Growth Index | Relative Weights
Under | Over |
| Consumer Discretionary | 19.5 | % | 21.0 | % | -1.5 | % |
| Consumer Staples | 5.2 | | 10.5 | | -5.3 | |
| Energy | 4.4 | | 1.0 | | 3.4 | |
| Financials | 4.2 | | 5.4 | | -1.2 | |
| Health Care | 19.0 | | 18.3 | | 0.7 | |
| Industrials | 8.7 | | 11.1 | | -2.4 | |
| Information Technology | 33.7 | | 27.0 | | 6.7 | |
| Materials | 4.3 | | 3.9 | | 0.4 | |
| Telecommunication Services | 0.0 | | 1.8 | | -1.8 | |
| Utilities | 0.0 | | 0.0 | | 0.0 | |
| ST Investments/Net Other Assets | 1.0 | | 0.0 | | 1.0 | |
| Total (% of Net Assets) | 100.0 | % | 100.0 | % | | |
Sector classifications presented herein are based on the sector categorization methodology of the Adviser to the Funds which may result in the sector designations for one Fund being different than another Fund’s sector designations. For Fund compliance purposes, the Fund’s industry classifications refer to any one or more of the industry sub-classifications used by one or more widely recognized market indexes or ratings group indexes, and/or as defined by Fund management. This definition may not apply for purposes of this report, which may combine industry sub-classifications for reporting ease. Industries are shown as a percentage of net assets.
Market Capitalization
(as of 6/30/15)
Market Cap Range ($ Bil) | Percent of Total Equities | | Number of Holdings |
| $0 - $10 | 10.2 | % | | 6 |
| $10 - $50 | 38.3 | | | 20 |
| $50 - $100 | 13.0 | | | 5 |
| Over $100 | 38.5 | | | 10 |
Market capitalization ranges were determined by the Adviser to the Fund and are for presentation purposes only. These market capitalization ranges do not necessarily correlate to the benchmark’s market capitalization ranges.
| PAGE 3 |
| |
| p: 800.392.CORE (2673) | www.westcore.com |
| WESTCORE MIDCO GROWTH FUND (WTMGX, WIMGX) | (UNAUDITED) |
Fund Strategy
Investing in a diversified portfolio of equity securities of primarily medium-sized companies with growth potential.
Fund Management
| |
Mitch S. Begun, CFA Lead Portfolio Manager |
F. Wiley Reed, CFA Lead Portfolio Manager |
Adam C. Bliss Portfolio Manager |
Brian C. Fitzsimons, CFA Portfolio Manager |
Jeffrey J. Loehr, CFA Portfolio Manager |
CFA is a trademark owned by CFA Institute.
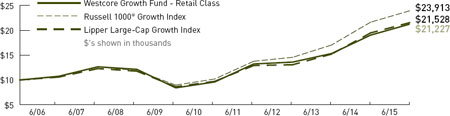
Cumulative Returns
The chart above represents historical performance of a hypothetical investment of $10,000 in the Fund over the past 10 years (or for the life of the Fund if shorter). Performance calculations are as of the end of June each year. Past performance does not guarantee future results. This chart does not reflect the deduction of taxes that a shareholder would pay on Fund distributions or the redemption of Fund shares.
Lipper Index data provided by Lipper, Inc.
Please see index definitions beginning on page 28.
Average Annual Total Returns
| | | | | | | | | | | | | | |
| | 6 Months | 1 Year | 3 Years | 5 Years | 10 Years | Since
Inception | Inception
Date |
| Retail Class (WTMGX) | 7.08 | % | 6.51 | % | 19.36 | % | 15.86 | % | 8.46 | % | 10.79 | % | 8/1/1986 |
| Institutional Class (WIMGX) | 7.12 | | 6.70 | | 19.59 | | 16.05 | | 8.59 | | 10.84 | | 9/28/2007 |
Russell Midcap® Growth Index | 4.18 | | 9.45 | | 19.24 | | 18.69 | | 9.69 | | 10.61 | | |
| Lipper Mid-Cap Growth Index | 5.54 | | 9.19 | | 17.84 | | 16.75 | | 9.58 | | 9.90 | | |
Retail Class Annual Expense Ratio (per the current prospectus) — Gross: 1.04%, Net: 1.04%
Institutional Class Annual Expense Ratio (per the current prospectus) — Gross: 0.99%, Net: 0.90%
The performance data quoted represents past performance and does not guarantee future results. Performance information for the institutional class shares prior to their inception date is based on the performance of the retail class. Current performance may be lower or higher than the performance quoted. To obtain current performance as of the most recent month-end, please call 800.392.CORE (2673) or visit us online at www.westcore.com. Average annual total returns and yield figures reflect the reinvestment of dividends, capital gains distributions, all fee waivers and expense reimbursements. Without the fee waivers and expense reimbursements, total return and yield figures would have been lower. Total return and yield figures represent past performance. Investment return and principal value will vary, and shares, when redeemed, may be worth more or less than their original cost. Westcore fund shares are not insured by the FDIC, the Federal Reserve Board or any other agency and are subject to investment risk.
Denver Investments (the “Adviser”) has contractually agreed to waive certain investment advisory and/or administration fees and/or to reimburse other expenses from April 30, 2015 until at least April 30, 2016. The first waiver/reimbursement applies so that the ratio of expenses to average net assets, as reported in the Fund’s Financial Highlights, will be no more than 1.15% for the Fund’s Retail Class for such period. The second waiver/reimbursement applies so that Fund level Other Expenses for the Institutional Class will be in the same proportion as the Retail Class waivers/reimbursements. The third waiver/reimbursement applies so that the institutional class-specific Other Expenses are reimbursed. The Adviser has contractually agreed to waive/reimburse all of these class-specific Other Expenses, but only to the extent that the difference between the net Institutional Class and net Retail Class expense ratios, after applying the waiver/reimbursement, does not exceed 25 basis points. These agreements may not be terminated or modified prior to this date without the approval of the Board of Trustees.
Investing in mid-cap funds generally will be more volatile and loss of principal could be greater than investing in large-cap funds.
Manager Commentary
| | |
| ■ | For the first half of 2015, the Westcore MIDCO Growth Fund outperformed its benchmark, the Russell Midcap® Growth Index. |
| | |
| ■ | Despite an eventful backdrop, including turbulence in the Eurozone due to the potential exit of Greece and rising anxiety in Asian markets, U.S. equity returns were fairly uneventful. Year-to-date returns for small-cap indexes were ahead of large-cap indexes with the Russell 2000® Index up 4.75% versus the Russell 1000® Index’s 1.71% gain, and the Russell Midcap® Index up 2.35%. More interesting to us is the discrepancy between the returns of growth stocks and value stocks thus far in 2015. The Russell Midcap® Growth Index ended the first half up 4.18% versus the Russell Midcap® Value index’s gain of just 0.41%. This trend was consistent across market capitalizations and is a continuation of a theme we have seen for the last ten years–companies that are growing faster are being rewarded due to their scarcity in a slowly growing economy. At this juncture, we expect this trend to continue as global growth concerns are at the forefront and the U.S. economy chugs along with decent growth. |
| | |
| ■ | The sectors that contributed most to the Fund’s performance relative to its benchmark in the period were information technology, consumer discretionary and financials. The Fund’s best-performing stock was consumer discretionary sector holding Netflix, Inc. The stock outperformed as the company invested well in original content and international expansion. Netflix’s largest growth opportunity, expansion into international markets, should be completed by the end of 2016. Tesla Motors Inc., also within the consumer discretionary sector, performed well as investors got more comfortable with the Model X electric car rollout and the company’s opportunities in new energy storage solutions. Demand for Tesla’s cars remains high and longer term, we believe Tesla’s expertise in battery management software and manufacturing solutions provides broader opportunities. Tableau Software Inc., an analytics software solutions provider, was also among the Fund’s top contributors. The stock was strong as demand for the company’s data visualization and analytics solutions remained healthy. Tableau is just starting its international push and we think it has a long runway for growth. |
| | |
| ■ | Two sectors detracted from the Fund’s performance relative to its benchmark in the first half of 2015, consumer staples and energy. The Fund’s worst-performing stock was consumer staples sector holding Keurig Green Mountain Inc. The maker of Keurig single-serve brewers and Green Mountain branded K-cups, struggled as its recently launched 2.0 brewing system underperformed expectations. We remain confident in the product’s potential and the company’s pipeline of innovation. Applied Materials Inc., a semiconductor equipment provider, was also a significant detractor in the period. The company was unable to overcome global regulatory scrutiny of its planned merger with Tokyo Electron Ltd. and slower-than-anticipated capital expenditure spending by semiconductor manufacturers. Wynn Resorts Ltd., a leading casino company, was also a drag on the Fund’s performance as the company cut its dividend and indicated more uncertainty regarding a gaming revenue recovery in Macau. We think the dividend cut was prudent in light of current circumstances and that Wynn will recover nicely once the market recovers. |
| | |
| ■ | As of the end of the first half of 2015, the Fund was overweighted primarily in the information technology and energy sectors, and underweighted primarily in the consumer discretionary and industrials sectors. |
| PAGE 4 |
| |
| 2015 Semi-Annual Report |
| WESTCORE MIDCO GROWTH FUND (continued) | (UNAUDITED) |
Stock Performance
(for the year ended 6/30/15)
| | | | | |
| 5 Highest | Average
Weight | Contribution
to Return |
| Netflix Inc. | 2.20 | % | 1.52 | % |
| Pharmacyclics Inc. | 0.33 | | 0.75 | |
| FireEye Inc. | 1.35 | | 0.69 | |
| Tableau Software Inc. | 1.86 | | 0.59 | |
| Tesla Motors Inc. | 2.26 | | 0.55 | |
| | | | | |
| 5 Lowest | | | | |
| Zulily Inc. | 0.55 | % | -0.34 | % |
| Applied Materials Inc. | 1.67 | | -0.41 | |
| United Continental Holdings Inc. | 2.02 | | -0.43 | |
| Wynn Resorts Ltd | 1.38 | | -0.50 | |
| Keurig Green Mountain Inc. | 1.56 | | -0.75 | |
Past performance does not guarantee future results. These stocks do not represent all of the securities purchased, sold or recommended by the Funds’ Adviser. To request a complete list of the contribution of each Fund holding to overall Fund performance during the period, please call 800.392.CORE (2673) or email invest@westcore.com.
Please see page 30 for a description of the methodology used to construct this chart.
Top Ten Holdings
(as of 6/30/15)
| Tesla Motors Inc. | 2.1 | % |
| Tableau Software Inc. | 2.0 | |
| Affiliated Managers Group Inc. | 2.0 | |
| BioMarin Pharmaceutical Inc. | 2.0 | |
| Under Armour Inc. | 2.0 | |
| Fiserv Inc. | 1.9 | |
| Restoration Hardware Holdings Inc. | 1.9 | |
| BorgWarner Inc. | 1.9 | |
| Tractor Supply Co. | 1.9 | |
| LinkedIn Corp. | 1.9 | |
| Total (% of Net Assets) | 19.6 | % |
Top ten holdings do not include any cash, cash equivalents or exchange traded fund investments and are subject to change. There are no guarantees that the Fund will continue to remain invested in any particular holding.
Portfolio Characteristics
(as of 6/30/15)
| | Westcore MIDCO
Growth Fund | Russell Midcap®
Growth Index |
| Weighted Average Market Capitalization ($ Bil) | $11.3 | $13.2 |
| Price/Earnings (1 year trailing) | 25.5x | 24.7x |
| EPS Growth (3 year historical) | 20.1% | 14.5% |
| Beta | 1.2 | 1.1 |
| Number of Holdings | 75 | 507 |
| Portfolio Turnover Rate (1 year trailing) | 62% | — |
Please see definition of terms beginning on page 30.
Sector Allocation
(as of 6/30/15)
| | | | | | | |
| | Westcore MIDCO
Growth Fund | Russell Midcap®
Growth Index | Relative Weights
Under | Over |
| Consumer Discretionary | 18.8 | % | 24.5 | % | -5.7 | % |
| Consumer Staples | 3.9 | | 7.4 | | -3.5 | |
| Energy | 4.5 | | 1.2 | | 3.3 | |
| Financials | 8.4 | | 11.1 | | -2.7 | |
| Health Care | 13.9 | | 14.4 | | -0.5 | |
| Industrials | 11.7 | | 15.6 | | -3.9 | |
| Information Technology | 28.0 | | 20.0 | | 8.0 | |
| Materials | 6.1 | | 5.3 | | 0.8 | |
| Telecommunication Services | 0.0 | | 0.4 | | -0.4 | |
| Utilities | 0.0 | | 0.1 | | -0.1 | |
| ST Investments/Net Other Assets | 4.7 | | 0.0 | | 4.7 | |
| Total (% of Net Assets) | 100.0 | % | 100.0 | % | | |
Sector classifications presented herein are based on the sector categorization methodology of the Adviser to the Funds which may result in the sector designations for one Fund being different than another Fund’s sector designations. For Fund compliance purposes, the Fund’s industry classifications refer to any one or more of the industry sub-classifications used by one or more widely recognized market indexes or ratings group indexes, and/or as defined by Fund management. This definition may not apply for purposes of this report, which may combine industry sub-classifications for reporting ease. Industries are shown as a percentage of net assets.
Market Capitalization
(as of 6/30/15)
| | | | | |
Market Cap Range ($ Bil) | Percent of Total Equities | | Number of Holdings |
| $0 - $1 | 0.0 | % | | 0 |
| $1 - $5 | 21.9 | | | 21 |
| $5 - $10 | 32.4 | | | 27 |
| Over $10 | 45.7 | | | 27 |
Market capitalization ranges were determined by the Adviser to the Fund and are for presentation purposes only. These market capitalization ranges do not necessarily correlate to the benchmark’s market capitalization ranges.
| |
| PAGE 5 |
| |
| p: 800.392.CORE (2673) | www.westcore.com |
| WESTCORE SELECT FUND (WTSLX) | (UNAUDITED) |
Fund Strategy
Investing primarily in the common stock of a limited number of medium-sized companies selected for their growth potential.
Fund Management
| |
Mitch S. Begun, CFA Lead Portfolio Manager |
F. Wiley Reed, CFA Lead Portfolio Manager |
Adam C. Bliss Portfolio Manager |
Brian C. Fitzsimons, CFA Portfolio Manager |
Jeffrey J. Loehr, CFA Portfolio Manager |
CFA is a trademark owned by CFA Institute.
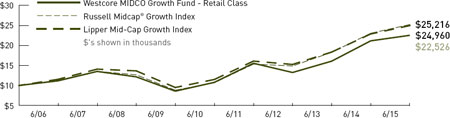
Cumulative Returns
The chart above represents historical performance of a hypothetical investment of $10,000 in the Fund over the past 10 years (or for the life of the Fund if shorter). Performance calculations are as of the end of June each year. Past performance does not guarantee future results. This chart does not reflect the deduction of taxes that a shareholder would pay on Fund distributions or the redemption of Fund shares.
Lipper Index data provided by Lipper, Inc.
Please see index definitions beginning on page 28.
Average Annual Total Returns
| | | | | | | | | | | | | | |
| | 6 Months | 1 Year | 3 Years | 5 Years | 10 Years | Since
Inception | Inception
Date |
| Retail Class (WTSLX) | 3.36 | % | 5.06 | % | 14.82 | % | 10.63 | % | 8.51 | % | 11.64 | % | 10/1/1999 |
Russell Midcap® Growth Index | 4.18 | | 9.45 | | 19.24 | | 18.69 | | 9.69 | | 7.22 | | |
| Lipper Mid-Cap Growth Index | 5.54 | | 9.19 | | 17.84 | | 16.75 | | 9.58 | | 6.45 | | |
Retail Class Annual Expense Ratio (per the current prospectus) — Gross: 1.10%, Net: 1.10%
The performance data quoted represents past performance and does not guarantee future results. Performance information for the institutional class shares prior to their inception date is based on the performance of the retail class. Current performance may be lower or higher than the performance quoted. To obtain current performance as of the most recent month-end, please call 800.392.CORE (2673) or visit us online at www.westcore.com. Average annual total returns and yield figures reflect the reinvestment of dividends, capital gains distributions, all fee waivers and expense reimbursements. Without the fee waivers and expense reimbursements, total return and yield figures would have been lower. Total return and yield figures represent past performance. Investment return and principal value will vary, and shares, when redeemed, may be worth more or less than their original cost. Westcore fund shares are not insured by the FDIC, the Federal Reserve Board or any other agency and are subject to investment risk.
Denver Investments (the “Adviser”) has contractually agreed to waive certain investment advisory and/or administration fees and/or to reimburse other expenses from April 30, 2015 until at least April 30, 2016. The waiver/reimbursement applies so that the ratio of expenses to average net assets, as reported in the Fund’s financial statements, will be no more than 1.15% for the Fund’s Retail Class for such period. Please see the Fund’s Prospectus for more information. This agreement may not be terminated or modified prior to this date without the approval of the Board of Trustees. Without the fee waivers and expense reimbursements, total return figures would have been lower.
Investing in mid-cap funds generally will be more volatile and loss of principal could be greater than investing in large-cap funds.
Manager Commentary
| | |
| ■ | For the first half of 2015, the Westcore Select Fund underperformed its benchmark, the Russell Midcap® Growth Index. |
| | |
| ■ | Despite an eventful backdrop, including turbulence in the Eurozone due to the potential exit of Greece and rising anxiety in Asian markets, U.S. equity returns were fairly uneventful. Year-to-date returns for small-cap indexes were ahead of large-cap indexes with the Russell 2000® Index up 4.75% versus the Russell 1000® Index’s 1.71% gain, and the Russell Midcap® Index up 2.35%. More interesting to us is the discrepancy between the returns of growth stocks and value stocks thus far in 2015. The Russell Midcap® Growth Index ended the first half up 4.18% versus the Russell Midcap® Value index’s gain of just 0.41%. This trend was consistent across market capitalizations and is a continuation of a theme we have seen for the last ten years–companies that are growing faster are being rewarded due to their scarcity in a slowly growing economy. At this juncture, we expect this trend to continue as global growth concerns are at the forefront and the U.S. economy chugs along with decent growth. |
| | |
| ■ | The three sectors that contributed most to the Fund’s performance relative to its benchmark in the period were consumer discretionary, information technology and financials. The Fund’s best-performing stock was consumer discretionary sector holding Netflix, Inc. The stock outperformed as the company invested well in original content and international expansion. Netflix’s largest growth opportunity, expansion into international markets, should be completed by the end of 2016. Tesla Motors Inc., also within the consumer discretionary sector, performed well as investors got more comfortable with the Model X electric car rollout and the company’s opportunities in new energy storage solutions. Demand for Tesla’s cars remains high and longer term, we believe Tesla’s expertise in battery management software and manufacturing solutions provides broader opportunities. Tableau Software Inc., an analytics software solutions provider, was also among the Fund’s top contributors. The stock was strong as demand for the company’s data visualization and analytics solutions remained healthy. Tableau is just starting its international push and we think it has a long runway for growth. |
| | |
| ■ | The three sectors that detracted most to the Fund’s performance relative to its benchmark in the period were consumer staples, industrials and materials. The Fund’s worst-performing stock was Wynn Resorts Ltd., a leading casino company. The stock struggled as the company cut its dividend and indicated more uncertainty regarding a gaming revenue recovery in Macau. We think the dividend cut was prudent in light of current circumstances and that Wynn will recover nicely once the market recovers. Applied Materials Inc., a semiconductor equipment provider, was also a significant detractor in the period. The company was unable to overcome global regulatory scrutiny of its planned merger with Tokyo Electron Ltd. and slower-than-anticipated capital expenditure spending by semiconductor manufacturers. Deckers Outdoor Corp., owner of the Ugg footwear brand, struggled as holiday sales and spring preorders for its flagship Ugg brand slowed sizably. We exited the position in the first quarter. |
| | |
| ■ | As of the end of the first half of 2015, the Fund was overweighted primarily in the information technology and energy sectors, and underweighted primarily in the consumer discretionary and consumer staples sectors. |
| PAGE 6 |
| |
| 2015 Semi-Annual Report |
| WESTCORE SELECT FUND (continued) | (UNAUDITED) |
Stock Performance
(for the year ended 6/30/15)
| | | | | |
| 5 Highest | Average
Weight | Contribution
to Return |
| Netflix Inc. | 2.86 | % | 1.92 | % |
| FireEye Inc. | 2.87 | | 1.49 | |
| Tesla Motors Inc. | 3.42 | | 0.87 | |
| Tableau Software Inc. | 2.68 | | 0.79 | |
| Lululemon Athletica Inc. | 2.15 | | 0.58 | |
| | | | | |
| 5 Lowest | | | | |
| Melco Crown Entertainment Ltd. | 1.68 | % | -0.41 | % |
| Deckers Outdoor Corp. | 0.75 | | -0.59 | |
| Applied Materials Inc. | 3.31 | | -0.81 | |
| United Continental Holdings Inc. | 3.80 | | -0.84 | |
| Wynn Resorts Ltd. | 2.55 | | -0.93 | |
Past performance does not guarantee future results. These stocks do not represent all of the securities purchased, sold or recommended by the Funds’ Adviser. To request a complete list of the contribution of each Fund holding to overall Fund performance during the period, please call 800.392.CORE (2673) or email invest@westcore.com.
Please see page 30 for a description of the methodology used to construct this chart.
Top Ten Holdings
(as of 6/30/15)
| Affiliated Managers Group Inc. | 4.5 | % |
| Tesla Motors Inc. | 3.9 | |
| Amphenol Corp. | 3.6 | |
| BorgWarner Inc. | 3.5 | |
| United Continental Holdings Inc. | 3.5 | |
| ServiceNow Inc. | 3.5 | |
| SVB Financial Group | 3.4 | |
| LinkedIn Corp. | 3.3 | |
| Under Armour Inc. | 3.2 | |
| Team Health Holdings Inc. | 3.2 | |
| Total (% of Net Assets) | 35.6 | % |
Top ten holdings do not include any cash, cash equivalents or exchange traded fund investments and are subject to change. There are no guarantees that the Fund will continue to remain invested in any particular holding.
Portfolio Characteristics
(as of 6/30/15)
| | | |
| | Westcore
Select Fund | Russell Midcap®
Growth Index |
| Weighted Average Market Capitalization ($ Bil) | $12.6 | $13.2 |
| Price/Earnings (1 year trailing) | 24.5x | 24.7x |
| EPS Growth (3 year historical) | 20.1% | 14.5% |
| Beta | 1.1 | 1.1 |
| Number of Holdings | 34 | 507 |
| Portfolio Turnover Rate (1 year trailing) | 65% | — |
Please see definition of terms beginning on page 30.
Sector Allocation
(as of 6/30/15)
| | | | | | | |
| | Westcore
Select Fund | Russell Midcap®
Growth Index | Relative Weights
Under | Over |
| Consumer Discretionary | 19.2 | % | 24.5 | % | -5.3 | % |
| Consumer Staples | 2.7 | | 7.4 | | -4.7 | |
| Energy | 4.0 | | 1.2 | | 2.8 | |
| Financials | 7.9 | | 11.1 | | -3.2 | |
| Health Care | 16.3 | | 14.4 | | 1.9 | |
| Industrials | 13.7 | | 15.6 | | -1.9 | |
| Information Technology | 26.2 | | 20.0 | | 6.2 | |
| Materials | 5.9 | | 5.3 | | 0.6 | |
| Telecommunication Services | 0.0 | | 0.4 | | -0.4 | |
| Utilities | 0.0 | | 0.1 | | -0.1 | |
| ST Investments/Net Other Assets | 4.1 | | 0.0 | | 4.1 | |
| Total (% of Net Assets) | 100.0 | % | 100.0 | % | | |
Sector classifications presented herein are based on the sector categorization methodology of the Adviser to the Funds which may result in the sector designations for one Fund being different than another Fund’s sector designations. For Fund compliance purposes, the Fund’s industry classifications refer to any one or more of the industry sub-classifications used by one or more widely recognized market indexes or ratings group indexes, and/or as defined by Fund management. This definition may not apply for purposes of this report, which may combine industry sub-classifications for reporting ease. Industries are shown as a percentage of net assets.
Market Capitalization
(as of 6/30/15)
| | | | | |
Market Cap Range ($ Bil) | Percent of Total Equities | | Number of Holdings |
| $0 - $1 | 0.0 | % | | 0 |
| $1 - $5 | 21.2 | | | 8 |
| $5 - $10 | 31.7 | | | 12 |
| Over $10 | 47.1 | | | 14 |
Market capitalization ranges were determined by the Adviser to the Fund and are for presentation purposes only. These market capitalization ranges do not necessarily correlate to the benchmark’s market capitalization ranges.
| |
| PAGE 7 |
| |
| p: 800.392.CORE (2673) | www.westcore.com |
| WESTCORE SMALL-CAP GROWTH FUND (WTSGX, WISGX) | (UNAUDITED) |
Fund Strategy
Investing in a diversified portfolio of equity securities of primarily small-sized companies with growth potential.
Fund Management
Mitch S. Begun, CFA Lead Portfolio Manager |
F. Wiley Reed, CFA Lead Portfolio Manager |
Adam C. Bliss Portfolio Manager |
Brian C. Fitzsimons, CFA Portfolio Manager |
Jeffrey J. Loehr, CFA Portfolio Manager |
CFA is a trademark owned by CFA Institute.
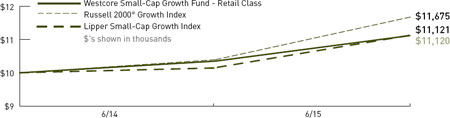
Cumulative Returns
The chart above represents historical performance of a hypothetical investment of $10,000 in the Fund over the past 10 years (or for the life of the Fund if shorter). Performance calculations are as of the end of June each year. Past performance does not guarantee future results. This chart does not reflect the deduction of taxes that a shareholder would pay on Fund distributions or the redemption of Fund shares.
Lipper Index data provided by Lipper, Inc.
Please see index definitions beginning on page 28.
Average Annual Total Returns
| | | | | | | | | | | | | | |
| | 6 Months | 1 Year | 3 Years | 5 Years | 10 Years | Since
Inception | Inception
Date |
| Retail Class (WTSGX) | 5.70 | % | 7.44 | % | — | | — | | — | | 7.20 | % | 12/20/2013 |
| Institutional Class (WISGX) | 6.06 | | 8.11 | | — | | — | | — | | 7.71 | | 12/20/2013 |
Russell 2000® Growth Index | 8.74 | | 12.34 | | — | | — | | — | | 10.70 | | |
| Lipper Small-Cap Growth Index | 7.54 | | 9.63 | | — | | — | | — | | 7.22 | | |
Retail Class Annual Expense Ratio (per the current prospectus) — Gross: 5.18%, Net: 1.30%
Institutional Class Annual Expense Ratio (per the current prospectus) — Gross: 3.61%, Net: 1.05%
The performance data quoted represents past performance and does not guarantee future results. Performance information for the institutional class shares prior to their inception date is based on the performance of the retail class. Current performance may be lower or higher than the performance quoted. To obtain current performance as of the most recent month-end, please call 800.392.CORE (2673) or visit us online at www.westcore.com. Average annual total returns and yield figures reflect the reinvestment of dividends, capital gains distributions, all fee waivers and expense reimbursements. Without the fee waivers and expense reimbursements, total return and yield figures would have been lower. The performance data quoted does not reflect the deduction of the 2% redemption fee imposed if shares are redeemed or exchanged within 90 calendar days from their date of purchase. If imposed, the fee would reduce the performance quoted. Total return and yield figures represent past performance. Investment return and principal value will vary, and shares, when redeemed, may be worth more or less than their original cost. Westcore fund shares are not insured by the FDIC, the Federal Reserve Board or any other agency and are subject to investment risk.
Denver Investments (the “Adviser”) has contractually agreed to waive certain investment advisory and/or administration fees and/or to reimburse other expenses from April 30, 2015 until at least April 30, 2016. The first waiver/reimbursement applies so that the ratio of expenses to average net assets, as reported in the Fund’s Financial Highlights, will be no more than 1.30% for the Fund’s Retail Class for such period. The second waiver/reimbursement applies so that Fund level Other Expenses for the Institutional Class will be in the same proportion as the Retail Class waivers/reimbursements. The third waiver/reimbursement applies so that the institutional class-specific Other Expenses are reimbursed. The Adviser has contractually agreed to waive/reimburse all of these class-specific Other Expenses, but only to the extent that the difference between the net Institutional Class and net Retail Class expense ratios, after applying the waiver/reimbursement, does not exceed 25 basis points. These agreements may not be terminated or modified prior to this date without the approval of the Board of Trustees.
Investing in small-cap funds generally will be more volatile and loss of principal could be greater than investing in larger-cap funds.
Manager Commentary
| | |
| ■ | For the first half of 2015, the Westcore Small-Cap Growth Fund underperformed its benchmark, the Russell 2000® Growth Index. |
| | |
| ■ | Despite an eventful backdrop, including turbulence in the Eurozone due to the potential exit of Greece and rising anxiety in Asian markets, U.S. equity returns were fairly uneventful. Year-to-date returns for small-cap indexes were ahead of large-cap indexes with the Russell 2000® Index up 4.75% versus the Russell 1000® Index’s 1.71% gain, and the Russell Midcap® Index up 2.35%. More interesting to us is the discrepancy between the returns of growth stocks and value stocks thus far in 2015. The Russell 2000® Growth Index ended the first half up 8.74% versus the Russell 2000® Value index’s gain of just 0.76%. This trend was consistent across market capitalizations and is a continuation of a theme we have seen for the last ten years–companies that are growing faster are being rewarded due to their scarcity in a slowly growing economy. At this juncture, we expect this trend to continue as global growth concerns are at the forefront and the U.S. economy chugs along with decent growth. |
| | |
| ■ | The three sectors that contributed most to the Fund’s performance relative to its benchmark in the period were financials, information technology and materials. The Fund’s best-performing stock was Sage Therapeutics Inc. This biotechnology company outperformed as additional data emerged regarding its drug candidate for the treatment of nervous system disorders. We believe the company has an attractive drug pipeline that is undervalued. Security software provider FireEye Inc. outperformed following its acquisition of Mandiant last year. FireEye is the market leader in high-end advanced persistent threat (APT) solutions and demand remains strong for its security solutions. However, we exited the position as its market capitalization grew larger than our target universe. Globant SA, an information technology sector company, was also a top contributor in the period. This software solutions provider benefited as companies and consumers increasingly utilized applications via the cloud and on mobile devices. We have a favorable view of Globant’s growth prospects. |
| | |
| ■ | The three sectors that detracted most from the Fund’s performance relative to its benchmark in the period were consumer discretionary, health care and industrials. The Fund’s worst-performing stock was Vince Holding Corp. This high-end apparel and accessories brand in the consumer discretionary sector performed poorly as its wholesale business segment faced continued pressure from weak department store ordering patterns. We believe this slowdown will prove temporary and that Vince remains an exciting up-and-coming brand. Within the health care sector, both OvaScience Inc. and OraSure Technologies Inc. were significant drags on the Fund’s performance. OvaScience underperformed after reporting data on Augment, its treatment for improving in vitro-fertilization (IVF) pregnancy rates. Although this initial data was positive, investors clearly wanted a more robust clinical analysis. We believe Augment, along with other products in OvaScience’s pipeline, have an opportunity to penetrate what could be a huge market. OraSure underperformed after reporting weaker-than-expected fourth quarter 2014 results for its rapid hepatitis C test, OraQuick HCV. Given uncertainty regarding growth potential for this test, we exited the position. |
| | |
| ■ | As of the end of the first half of 2015, the Fund was overweighted in the financials and energy sectors, and underweighted primarily in the industrials and consumer discretionary sectors. |
| PAGE 8 |
| |
| 2015 Semi-Annual Report |
| WESTCORE SMALL-CAP GROWTH FUND (continued) | (UNAUDITED) |
Stock Performance
(for the year ended 6/30/15)
| | | | | |
| 5 Highest | Average
Weight | Contribution
to Return |
| Sage Therapeutics Inc. | 1.02 | % | 0.73 | % |
| FireEye Inc. | 1.03 | | 0.67 | |
| Globant SA | 0.76 | | 0.63 | |
| IMAX Corp. | 1.78 | | 0.57 | |
| Clovis Oncology Inc. | 1.13 | | 0.57 | |
| | | | | |
| 5 Lowest | | | | |
| Vera Bradley Inc. | 0.62 | % | -0.39 | % |
| OvaScience Inc. | 1.34 | | -0.47 | |
| Saia Inc. | 1.27 | | -0.50 | |
| OraSure Technologies Inc. | 0.59 | | -0.55 | |
| Vince Holding Corp. | 0.94 | | -0.73 | |
Past performance does not guarantee future results. These stocks do not represent all of the securities purchased, sold or recommended by the Funds’ Adviser. To request a complete list of the contribution of each Fund holding to overall Fund performance during the period, please call 800.392. CORE (2673) or email invest@westcore.com.
Please see page 30 for a description of the methodology used to construct this chart.
Top Ten Holdings
(as of 6/30/15)
| | | |
| Restoration Hardware Holdings Inc. | 2.2 | % |
| Virtusa Corp. | 2.1 | |
| Acadia Healthcare Co. Inc. | 2.1 | |
| Team Health Holdings Inc. | 2.0 | |
| Inphi Corp. | 2.0 | |
| PolyOne Corp. | 2.0 | |
| Vail Resorts Inc. | 1.9 | |
| Eagle Bancorp Inc. | 1.9 | |
| Evercore Partners Inc. | 1.9 | |
| Western Alliance Bancorp | 1.9 | |
| Total (% of Net Assets) | 20.0 | % |
Top ten holdings do not include any cash, cash equivalents or exchange traded fund investments and are subject to change. There are no guarantees that the Fund will continue to remain invested in any particular holding.
Portfolio Characteristics
(as of 6/30/15)
| | | |
| | Westcore Small-Cap
Growth Fund | Russell 2000®
Growth Index |
| Weighted Average Market Capitalization ($ Bil) | $2.4 | $2.1 |
| Price/Earnings (1 year trailing) | 31.5x | 19.6x |
| EPS Growth (3 year historical) | 29.0% | 11.3% |
| Beta | 1.2 | 1.3 |
| Number of Holdings | 89 | 1,163 |
| Portfolio Turnover Rate (1 year trailing) | 92% | — |
Please see definition of terms beginning on page 30.
Sector Allocation
(as of 6/30/15)
| | | | | | | |
| | Westcore Small-Cap
Growth Fund | Russell 2000®
Growth Index | Relative Weights
Under | Over |
| Consumer Discretionary | 15.4 | % | 18.3 | % | -2.9 | % |
| Consumer Staples | 2.9 | | 3.3 | | -0.4 | |
| Energy | 4.6 | | 1.5 | | 3.1 | |
| Financials | 10.6 | | 7.2 | | 3.4 | |
| Health Care | 28.2 | | 27.5 | | 0.7 | |
| Industrials | 9.2 | | 13.2 | | -4.0 | |
| Information Technology | 25.1 | | 23.9 | | 1.2 | |
| Materials | 2.0 | | 4.2 | | -2.2 | |
| Telecommunication Services | 0.8 | | 0.8 | | 0.0 | |
| Utilities | 0.0 | | 0.1 | | -0.1 | |
| ST Investments/Net Other Assets | 1.2 | | 0.0 | | 1.2 | |
| Total (% of Net Assets) | 100.0 | % | 100.0 | % | | |
Sector classifications presented herein are based on the sector categorization methodology of the Adviser to the Funds which may result in the sector designations for one Fund being different than another Fund’s sector designations. For Fund compliance purposes, the Fund’s industry classifications refer to any one or more of the industry sub-classifications used by one or more widely recognized market indexes or ratings group indexes, and/or as defined by Fund management. This definition may not apply for purposes of this report, which may combine industry sub-classifications for reporting ease. Industries are shown as a percentage of net assets.
Market Capitalization
(as of 6/30/15)
| | | | | |
Market Cap Range ($ Mil) | Percent of Total Equities | | Number of Holdings |
| $0 - $500 | 9.6 | % | | 12 |
| $500 - $1,000 | 12.8 | | | 12 |
| $1,000 - $2,000 | 24.8 | | | 23 |
| Over $2,000 | 52.8 | | | 42 |
Market capitalization ranges were determined by the Adviser to the Fund and are for presentation purposes only. These market capitalization ranges do not necessarily correlate to the benchmark’s market capitalization ranges.
| |
| PAGE 9 |
| |
| p: 800.392.CORE (2673) | www.westcore.com |
| WESTCORE BLUE CHIP DIVIDEND FUND (WTMVX, WIMVX) | (UNAUDITED) |
Fund Strategy
Investing in large, well-established, dividend-paying companies both in the United States and in developed foreign markets.
Fund Management
| |
Troy Dayton, CFA Portfolio Manager |
Mark M. Adelmann, CFA, CPA Portfolio Manager |
Derek R. Anguilm, CFA Portfolio Manager |
Paul A. Kuppinger, CFA Portfolio Manager |
Lisa Z. Ramirez, CFA Portfolio Manager |
Alex A. Ruehle, CFA Portfolio Manager |
| |
CFA is a trademark owned by CFA Institute.
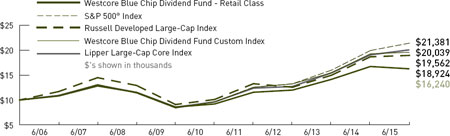
Cumulative Returns
The chart above represents historical performance of a hypothetical investment of $10,000 in the Fund over the past 10 years (or for the life of the Fund if shorter). Performance calculations are as of the end of June each year. Past performance does not guarantee future results. This chart does not reflect the deduction of taxes that a shareholder would pay on Fund distributions or the redemption of Fund shares.
Lipper Index data provided by Lipper, Inc.
Please see index definitions beginning on page 28.
Average Annual Total Returns
| | | | | | | | | | | | | | |
| | 6 Months | 1 Year | 3 Years | 5 Years | 10 Years | Since
Inception | Inception
Date |
| Retail Class (WTMVX) | -1.90 | % | -2.79 | % | 10.67 | % | 12.05 | % | 4.97 | % | 8.46 | % | 6/1/1988 |
| Institutional Class (WIMVX) | 1.86 | | -2.64 | | 10.91 | | 12.21 | | 5.11 | | 8.51 | | 9/28/2007 |
S&P 500® Index | 1.23 | | 7.42 | | 17.31 | | 17.34 | | 7.89 | | 10.15 | | |
| Russell Developed Large-Cap Index | 2.67 | | 1.50 | | 14.66 | | 13.38 | | 6.59 | | — | | |
| Westcore Blue Chip Dividend Fund Custom Index | 2.67 | | 1.50 | | 13.89 | | 15.28 | | 6.94 | | 9.97 | | |
| Lipper Large-Cap Core Index | 0.76 | | 5.25 | | 16.43 | | 15.82 | | 7.20 | | 9.27 | | |
Retail Class Annual Expense Ratio (per the current prospectus) — Gross: 1.14%, Net: 0.99%
Institutional Class Annual Expense Ratio (per the current prospectus) — Gross: 1.01%, Net: 0.82%
The performance data quoted represents past performance and does not guarantee future results. Performance information for the institutional class shares prior to their inception date is based on the performance of the retail class. Current performance may be lower or higher than the performance quoted. To obtain current performance as of the most recent month-end, please call 800.392.CORE (2673) or visit us online at www.westcore.com. Average annual total returns and yield figures reflect the reinvestment of dividends, capital gains distributions, all fee waivers and expense reimbursements. Without the fee waivers and expense reimbursements, total return and yield figures would have been lower. Total return and yield figures represent past performance. Investment return and principal value will vary, and shares, when redeemed, may be worth more or less than their original cost. Westcore fund shares are not insured by the FDIC, the Federal Reserve Board or any other agency and are subject to investment risk.
Denver Investments (the “Adviser”) has contractually agreed to waive certain investment advisory and/or administration fees and/or to reimburse other expenses from April 30, 2015 until at least April 30, 2016. The first waiver/reimbursement applies so that the ratio of expenses to average net assets, as reported in the Fund’s Financial Highlights, will be no more than 0.99% for the Fund’s Retail Class for such period. The second waiver/reimbursement applies so that Fund level Other Expenses for the Institutional Class will be in the same proportion as the Retail Class waivers/reimbursements. The third waiver/reimbursement applies so that the institutional class-specific Other Expenses are reimbursed. The Adviser has contractually agreed to waive/reimburse all of these class-specific Other Expenses, but only to the extent that the difference between the net Institutional Class and net Retail Class expense ratios, after applying the waiver/reimbursement, does not exceed 25 basis points. These agreements may not be terminated or modified prior to this date without the approval of the Board of Trustees.
Investments in foreign companies are subject to special risks, including currency fluctuations, social, economic, and political uncertainties, which could increase volatility.
Dividends are not guaranteed. A company’s future abilities to pay dividends may be limited and a company may cease paying dividends at any time.
Lisa Z. Ramirez is a registered representative of ALPS Distributors, Inc.
Manager Commentary
| | |
| ■ | The Westcore Blue Chip Dividend Fund underperformed its new benchmark, the Russell Developed Large-Cap Index and the S&P 500® Index, for the first half of 2015. Although weather-related issues caused a slow start to the year, the U.S. economy has since gained momentum with strong job creation, rising consumer confidence and early signs of wage gains. The strong U.S. dollar has had a negative impact on earnings, particularly for larger companies with more foreign currency exposure. Globally, China’s economy is decelerating and there are concerns that real estate and stock market speculation have reached the “bubble” stage. Russia is in recession due to economic sanctions and the precipitous decline in energy prices. Greece is the headline grabber as it stumbles toward default and possible exit from the European Union. These divergent economic paths have elevated market volatility. |
| | |
| ■ | In the first six months of 2015, the information technology, telecommunication services and materials sectors produced the Fund’s best returns relative to its benchmark. Apple Inc. was a significant contributor driven by stronger than expected quarterly results and anticipation of a successful launch of its iWatch. Apple’s revenues grew more quickly than expected, primarily driven by the success of its most recent iPhone release. We sold the position as its valuations relative to our dividend projections became less competitive. Luxury goods company LVMH Moet Hennessy Louis Vuitton SE outperformed as growth accelerated following a slowdown in 2014. The repositioning of the Louis Vuitton brand is working with nearly all divisions returning to profitability. Currency pressure created a tailwind and LMVH has managed well through the turbulent environment and we see potential for strong dividend growth ahead. |
| | |
| ■ | The Fund’s weakest sectors relative to its benchmark were utilities, industrials and consumer staples. Wal-Mart Stores Inc. was the Fund’s largest detractor in the period as sales growth was tepid and increased investments in labor and e-commerce resulted in profit margin pressure. We believe the company’s investments will result in improved sales and cash flow, and that the stock is significantly undervalued. Utility sector stocks have been pressured this year by rising interest rates and the expectation of further rate increases. Edison International was the Fund’s weakest utility holding in the period, due to a proposal by a consumer advocacy group to throw out the already-approved settlement on the San Onofre nuclear plant investigation. We have already factored the settlement into our valuation of the company, and don’t believe that reopening the case will lead to a worse outcome or a different assessment of the company’s value. It could, however, take longer to come to a similar conclusion and cause more volatility in the stock price. |
| | |
| ■ | As we look to the second half of 2015, we expect volatility to remain elevated. The Federal Reserve continues to keep investors guessing as to when it will increase short-term rates. Additionally, we believe the divergence of global economic growth will keep investor angst at high levels. However, it is difficult for us to envision an end to domestic economic improvement and positive market returns with the consumer gaining confidence, housing activity strengthening and interest rates at abnormally low levels. We believe well thought out stock selection will be even more important for the balance of the year as, broadly speaking, valuations appear stretched. |
| PAGE 10 |
| |
| 2015 Semi-Annual Report |
| WESTCORE BLUE CHIP DIVIDEND FUND (continued) | (UNAUDITED) |
Stock Performance
(for the year ended 6/30/15)
| | | | | |
| 5 Highest | Average
Weight | Contribution
to Return |
| Apple Inc. | 1.39 | % | 0.68 | % |
| LVMH Moet Hennessy Louis Vuitton SE | 1.23 | | 0.57 | |
| Pfizer Inc. | 3.54 | | 0.36 | |
| Sage Group PLC | 2.22 | | 0.33 | |
| Reckitt Benckiser Group plc | 1.15 | | 0.32 | |
| | | | | |
| 5 Lowest | | | | |
| QUALCOMM Inc. | 2.14 | % | -0.45 | % |
| Mattel Inc. | 3.14 | | -0.46 | |
| Edison International | 3.49 | | -0.47 | |
| Royal Dutch Shell PLC | 3.01 | | -0.50 | |
| Wal-Mart Stores Inc. | 3.43 | | -0.56 | |
Past performance does not guarantee future results. These stocks do not represent all of the securities purchased, sold or recommended by the Funds’ Adviser. To request a complete list of the contribution of each Fund holding to overall Fund performance during the period, please call 800.392.CORE (2673) or email invest@westcore.com.
Please see page 30 for a description of the methodology used to construct this chart.
Top Ten Holdings
(as of 6/30/15)
| | | |
| Kimberly-Clark Corp. | 3.5 | % |
| McDonald’s Corp. | 3.5 | |
| Novartis AG | 3.5 | |
| Sodexo | 3.5 | |
| Koninklijke DSM NV | 3.4 | |
| Target Corp. | 3.4 | |
| AbbVie Inc. | 3.4 | |
| Allianz SE | 3.4 | |
| British American Tobacco PLC | 3.4 | |
| Occidental Petroleum Corp. | 3.4 | |
| Total (% of Net Assets) | 34.4 | % |
Top ten holdings do not include any cash, cash equivalents or exchange traded fund investments and are subject to change. There are no guarantees that the Fund will continue to remain invested in any particular holding.
Notice Regarding Benchmark Change
Effective with the June 30, 2015 semi-annual report, the Westcore Board of Trustees has approved a benchmark change for the Westcore Blue Chip Dividend Fund from the S&P 500® Index to the Russell Developed Large-Cap Index. The new benchmark index reflects the global investment objective of the Fund. We will continue to present the S&P 500® Index for historical comparison purposes to the extent required.
Portfolio Characteristics
(as of 6/30/15)
| | | |
| | Westcore Blue Chip
Dividend Fund | Russell Developed
Large-Cap Index |
| Weighted Average Market Capitalization ($ Bil) | $88.2 | $87.6 |
| Price/Cash Flow (1 year trailing) | 12.9x | 14.0x |
| Price/Book Value | 4.0x | 3.2x |
| Price/Earnings (1 year trailing) | 17.4x | 18.8x |
| Beta | 0.8 | 1.0 |
| Number of Holdings | 30 | 2,426 |
| Portfolio Turnover Rate (1 year trailing) | 40% | — |
Please see definition of terms beginning on page 30.
Sector Allocation
(as of 6/30/15)
| | | | | | | |
| | Westcore Blue Chip
Dividend Fund | Russell Developed
Large-Cap Index | Relative Weights
Under | Over |
| Consumer Discretionary | 13.8 | % | 20.1 | % | -6.3 | % |
| Consumer Staples | 16.8 | | 10.3 | | 6.5 | |
| Energy | 9.9 | | 1.5 | | 8.4 | |
| Financials | 6.8 | | 20.2 | | -13.4 | |
| Health Care | 17.0 | | 4.5 | | 12.5 | |
| Industrials | 6.1 | | 19.0 | | -12.9 | |
| Information Technology | 16.6 | | 11.4 | | 5.2 | |
| Materials | 3.4 | | 5.7 | | -2.3 | |
| Telecommunication Services | 3.4 | | 4.9 | | -1.5 | |
| Utilities | 5.9 | | 2.4 | | 3.5 | |
| ST Investments/Net Other Assets | 0.3 | | 0.0 | | 0.3 | |
| Total (% of Net Assets) | 100.0 | % | 100.0 | % | | |
Sector classifications presented herein are based on the sector categorization methodology of the Adviser to the Funds which may result in the sector designations for one Fund being different than another Fund’s sector designations. For Fund compliance purposes, the Fund’s industry classifications refer to any one or more of the industry sub-classifications used by one or more widely recognized market indexes or ratings group indexes, and/or as defined by Fund management. This definition may not apply for purposes of this report, which may combine industry sub-classifications for reporting ease. Industries are shown as a percentage of net assets.
Market Capitalization
(as of 6/30/15)
| | | | | |
Market Cap Range ($ Bil) | Percent of Total Equities | | Number of Holdings |
| $0 - $10 | 19.2 | % | | 6 |
| $10 - $50 | 27.0 | | | 8 |
| $50 - $100 | 17.1 | | | 5 |
| Over $100 | 36.7 | | | 11 |
Market capitalization ranges were determined by the Adviser to the Fund and are for presentation purposes only. These market capitalization ranges do not necessarily correlate to the benchmark’s market capitalization ranges.
| |
| PAGE 11 |
| |
| p: 800.392.CORE (2673) | www.westcore.com |
| WESTCORE MID-CAP VALUE DIVIDEND FUND (WTMCX) | (UNAUDITED) |
Fund Strategy
Investing in medium-sized, dividend-paying companies whose stocks appear to be undervalued.
Fund Management
Troy Dayton, CFA Portfolio Manager |
Derek R. Anguilm, CFA Portfolio Manager |
Mark M. Adelmann, CFA, CPA Portfolio Manager |
Lisa Z. Ramirez, CFA Portfolio Manager |
CFA is a trademark owned by CFA Institute.
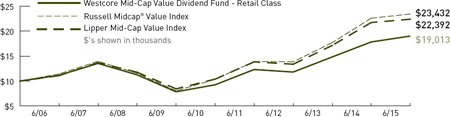
Cumulative Returns
The chart above represents historical performance of a hypothetical investment of $10,000 in the Fund over the past 10 years (or for the life of the Fund if shorter). Performance calculations are as of the end of June each year. Past performance does not guarantee future results. This chart does not reflect the deduction of taxes that a shareholder would pay on Fund distributions or the redemption of Fund shares.
Lipper Index data provided by Lipper, Inc.
Please see index definitions beginning on page 28.
Average Annual Total Returns
| | | | | | | | | | | | | | |
| | 6 Months | 1 Year | 3 Years | 5 Years | 10 Years | Since
Inception | Inception
Date |
| Retail Class (WTMCX) | 0.86 | % | 6.61 | % | 17.23 | % | 15.50 | % | 6.64 | % | 9.40 | % | 10/1/1998 |
Russell Midcap® Value Index | 0.41 | | 3.67 | | 19.13 | | 17.73 | | 8.89 | | 10.44 | | |
| Lipper Mid-Cap Value Index | 2.22 | | 3.05 | | 18.75 | | 16.62 | | 8.40 | | 9.91 | | |
Retail Class Annual Expense Ratio (per the current prospectus) — Gross: 1.19%, Net: 1.19%
The performance data quoted represents past performance and does not guarantee future results. Performance information for the institutional class shares prior to their inception date is based on the performance of the retail class. Current performance may be lower or higher than the performance quoted. To obtain current performance as of the most recent month-end, please call 800.392.CORE (2673) or visit us online at www.westcore.com. Average annual total returns and yield figures reflect the reinvestment of dividends, capital gains distributions, all fee waivers and expense reimbursements. Without the fee waivers and expense reimbursements, total return and yield figures would have been lower. Total return and yield figures represent past performance. Investment return and principal value will vary, and shares, when redeemed, may be worth more or less than their original cost. Westcore fund shares are not insured by the FDIC, the Federal Reserve Board or any other agency and are subject to investment risk.
Denver Investments (the “Adviser”) has contractually agreed to waive certain investment advisory and/or administration fees and/or to reimburse other expenses from April 30, 2015 until at least April 30, 2016. The waiver/reimbursement applies so that the ratio of expenses to average net assets, as reported in the Fund’s financial statements, will be no more than 1.25% for the Fund’s Retail Class for such period. Please see the Fund’s Prospectus for more information. This agreement may not be terminated or modified prior to this date without the approval of the Board of Trustees. Without the fee waivers and expense reimbursements, total return figures would have been lower.
Investing in mid-cap funds generally will be more volatile and loss of principal could be greater than investing in large-cap funds.
Dividends are not guaranteed. A company’s future abilities to pay dividends may be limited and a company may cease paying dividends at any time.
Lisa Z. Ramirez is a registered representative of ALPS Distributors, Inc.
Manager Commentary
| | |
| ■ | The Westcore Mid-Cap Value Dividend Fund outperformed its benchmark, the Russell Midcap® Value Index for the first half of 2015. Although weather-related issues caused a slow start to the year, the U.S. economy has since gained momentum with strong job creation, rising consumer confidence and early signs of wage gains. The strong U.S. dollar has had a negative impact on earnings, particularly for larger companies with more foreign currency exposure. Globally, China’s economy is decelerating and there are concerns that real estate and stock market speculation have reached the “bubble” stage. Russia is in recession due to economic sanctions and the precipitous decline in energy prices. Greece is the headline grabber as it stumbles toward default and possible exit from the European Union. These divergent economic paths have elevated market volatility. |
| | |
| ■ | The energy, utilities and interest rate sensitive sectors were the Fund’s top contributors, relative to its benchmark, in the first half of the year. Avago Technologies Ltd., which designs, develops and supplies analog, mixed-signal and optoelectronic products, outperformed as continued success in its wireless segment lifted results. The company sustained its leadership position as an Apple component supplier, hinted at the potential for increased component sales to Samsung and synergistically integrated Emulex Corp., which it acquired in May. Avago announced its intention to acquire Broadcom Corp., which was received positively. As the upcoming merger would place the company in the large cap space, we sold the Fund’s position. Cinemark Holdings Inc performed well in the first half of the year due to strong ticket and concession sales, as well as continued growth in international markets. We like this motion picture exhibition company’s long-term growth opportunity in Latin American markets as well as the consistent cash generation of the overall business. |
| | |
| ■ | The Fund’s weakest contributors, relative to its benchmark, in the first half of 2015 were the commercial services, transportation and capital goods sectors. Xerox Corp, a business process and document management solutions provider, detracted from performance. Xerox had a difficult second quarter as its financial results revealed weakness in its service segment revenue and in new business signings. Additionally, software implementation costs for the California Medicaid system, which Xerox manages, were higher than expected. While Xerox sentiment remains weak, we believe platform standardization, enhanced cost management, the realization of revenue from its New York Medicaid contract and better aligned sales markets are supportive of the stock near-term. Con-way Inc announced operating results that bested expectations, primarily supported by an improvement in freight operating margins. However, a growing industry truck fleet (increasing supply) is masking the improvements being made and adding volume pressures in the near-term. |
| |
| ■ | As we look to the second half of 2015, we expect volatility to remain elevated. The Federal Reserve continues to keep investors guessing as to when it will increase short-term rates. Additionally, we believe the divergence of global economic growth will keep investor angst at high levels. However, it is difficult for us to envision an end to domestic economic improvement and positive market returns with the consumer gaining confidence, housing activity strengthening and interest rates at abnormally low levels. We believe well thought out stock selection will be even more important for the balance of the year as, broadly speaking, valuations appear stretched. |
| PAGE 12 |
| |
| 2015 Semi-Annual Report |
| WESTCORE MID-CAP VALUE DIVIDEND FUND (continued) | (UNAUDITED) |
Stock Performance
(for the year ended 6/30/15)
| | | | | |
| 5 Highest | Average
Weight | Contribution
to Return |
| Omnicare Inc | 2.39 | % | 0.72 | % |
| Universal Health Services Inc | 2.74 | | 0.63 | |
| Avago Technologies Ltd. | 1.66 | | 0.62 | |
| AmerisourceBergen Corp | 3.09 | | 0.49 | |
| Cinemark Holdings Inc | 1.75 | | 0.40 | |
| | | | | |
| 5 Lowest | | | | |
| Scripps Networks Interactive Inc | 1.76 | % | -0.24 | % |
| Western Digital Corp | 0.59 | | -0.33 | |
| Con-way Inc | 1.78 | | -0.44 | |
| NetApp Inc | 1.81 | | -0.47 | |
| Xerox Corp | 2.01 | | -0.49 | |
Past performance does not guarantee future results. These stocks do not represent all of the securities purchased, sold or recommended by the Funds’ Adviser. To request a complete list of the contribution of each Fund holding to overall Fund performance during the period, please call 800.392.CORE (2673) or email invest@westcore.com.
Please see page 30 for a description of the methodology used to construct this chart.
Top Ten Holdings
(as of 6/30/15)
| | | |
| AmerisourceBergen Corp | 3.2 | % |
| Rock-Tenn Co | 3.0 | |
| UNUM Group | 2.6 | |
| Edison International | 2.5 | |
| Universal Health Services Inc | 2.3 | |
| Goodyear Tire & Rubber Co | 2.3 | |
| Validus Holdings Ltd | 2.3 | |
| WR Berkley Corp | 2.2 | |
| American Water Works Co Inc | 2.2 | |
| Tyson Foods Inc | 2.1 | |
| Total (% of Net Assets) | 24.7 | % |
Top ten holdings do not include any cash, cash equivalents or exchange traded fund investments and are subject to change. There are no guarantees that the Fund will continue to remain invested in any particular holding.
Portfolio Characteristics
(as of 6/30/15)
| | | |
| | Westcore Mid-Cap
Value Dividend Fund | Russell Midcap®
Value Index |
| Weighted Average Market Capitalization ($ Bil) | $10.4 | $11.1 |
| Price/Cash Flow (1 year trailing) | 10.8x | 12.4x |
| Price/Book Value | 2.5x | 2.1x |
| Price/Earnings (1 year trailing) | 15.7x | 17.9x |
| Beta | 1.1 | 1.2 |
| Number of Holdings | 61 | 554 |
| Portfolio Turnover Rate (1 year trailing) | 41% | — |
Please see definition of terms beginning on page 30.
Sector Allocation
(as of 6/30/15)
| | | | | | | |
| | Westcore
Mid-Cap Value
Dividend Fund | Russell Midcap®
Value Index | Relative Weights
Under | Over |
| Consumer Staples | 5.2 | % | 3.4 | % | 1.8 | % |
| Consumer Cyclical | 11.3 | | 8.9 | | 2.4 | |
| Commercial Services | 1.8 | | 4.9 | | -3.1 | |
| Basic Materials | 8.5 | | 7.0 | | 1.5 | |
| Capital Goods | 5.7 | | 5.6 | | 0.1 | |
| Technology | 10.0 | | 9.7 | | 0.3 | |
| Energy | 1.9 | | 10.2 | | -8.3 | |
| Utilities | 8.7 | | 10.9 | | -2.2 | |
| Interest Rate Sensitive | 22.4 | | 20.2 | | 2.2 | |
| Medical/Healthcare | 12.0 | | 6.2 | | 5.8 | |
| REITs | 9.6 | | 12.0 | | -2.4 | |
| Transportation | 1.7 | | 1.0 | | 0.7 | |
| ST Investments/Net Other Assets | 1.2 | | 0.0 | | 1.2 | |
| Total (% of Net Assets) | 100.0 | % | 100.0 | % | | |
Sector classifications presented herein are based on the sector categorization methodology of the Adviser to the Funds which may result in the sector designations for one Fund being different than another Fund’s sector designations. For Fund compliance purposes, the Fund’s industry classifications refer to any one or more of the industry sub-classifications used by one or more widely recognized market indexes or ratings group indexes, and/or as defined by Fund management. This definition may not apply for purposes of this report, which may combine industry sub-classifications for reporting ease. Industries are shown as a percentage of net assets.
Market Capitalization
(as of 6/30/15)
Market Cap Range ($ Bil) | Percent of Total Equities | | Number of Holdings |
| $0 - $1 | 0.0 | % | | 0 |
| $1 - $5 | 29.2 | | | 21 |
| $5 - $10 | 28.2 | | | 16 |
| Over $10 | 42.6 | | | 24 |
Market capitalization ranges were determined by the Adviser to the Fund and are for presentation purposes only. These market capitalization ranges do not necessarily correlate to the benchmark’s market capitalization ranges.
| |
| PAGE 13 |
| |
| p: 800.392.CORE (2673) | www.westcore.com |
| WESTCORE SMALL-CAP VALUE DIVIDEND FUND (WTSVX, WISVX) | (UNAUDITED) |
Fund Strategy
Investing primarily in small-cap, dividend paying stocks that appear to be undervalued.
Fund Management
Troy Dayton, CFA Portfolio Manager |
Derek R. Anguilm, CFA Portfolio Manager |
Mark M. Adelmann, CFA, CPA Portfolio Manager |
Lisa Z. Ramirez, CFA Portfolio Manager |
CFA is a trademark owned by CFA Institute.
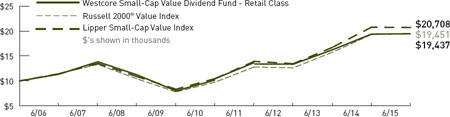
Cumulative Returns
The chart above represents historical performance of a hypothetical investment of $10,000 in the Fund over the past 10 years (or for the life of the Fund if shorter). Performance calculations are as of the end of June each year. Past performance does not guarantee future results. This chart does not reflect the deduction of taxes that a shareholder would pay on Fund distributions or the redemption of Fund shares.
Lipper Index data provided by Lipper, Inc.
Please see index definitions beginning on page 28.
Average Annual Total Returns
| | | | | | | | | | | | | | |
| | 6 Months | 1 Year | 3 Years | 5 Years | 10 Years | Since
Inception | Inception
Date |
| Retail Class (WTSVX) | -3.27 | % | 0.39 | % | 13.36 | % | 13.84 | % | 6.88 | % | 6.74 | % | 12/13/2004 |
| Institutional Class (WISVX) | -3.19 | | 0.56 | | 13.57 | | 14.00 | | 6.97 | | 6.83 | | 9/28/2007 |
Russell 2000® Value Index | 0.76 | | 0.78 | | 15.50 | | 14.81 | | 6.87 | | 6.83 | | |
| Lipper Small-Cap Value Index | 1.41 | | -0.22 | | 15.47 | | 14.64 | | 7.55 | | 7.59 | | |
Retail Class Annual Expense Ratio (per the current prospectus) — Gross: 1.40%, Net: 1.30%
Institutional Class Annual Expense Ratio (per the current prospectus) — Gross: 1.21%, Net: 1.11%
The performance data quoted represents past performance and does not guarantee future results. Performance information for the institutional class shares prior to their inception date is based on the performance of the retail class. Current performance may be lower or higher than the performance quoted. To obtain current performance as of the most recent month-end, please call 800.392.CORE (2673) or visit us online at www.westcore.com. Average annual total returns and yield figures reflect the reinvestment of dividends, capital gains distributions, all fee waivers and expense reimbursements. Without the fee waivers and expense reimbursements, total return and yield figures would have been lower. Total return and yield figures represent past performance. Investment return and principal value will vary, and shares, when redeemed, may be worth more or less than their original cost. Westcore fund shares are not insured by the FDIC, the Federal Reserve Board or any other agency and are subject to investment risk.
Denver Investments (the “Adviser”) has contractually agreed to waive certain investment advisory and/or administration fees and/or to reimburse other expenses from April 30, 2015 until at least April 30, 2016. The first waiver/reimbursement applies so that the ratio of expenses to average net assets, as reported in the Fund’s Financial Highlights, will be no more than 1.30% for the Fund’s Retail Class for such period. The second waiver/reimbursement applies so that Fund level Other Expenses for the Institutional Class will be in the same proportion as the Retail Class waivers/reimbursements. The third waiver/reimbursement applies so that the institutional class-specific Other Expenses are reimbursed. The Adviser has contractually agreed to waive/reimburse all of these class-specific Other Expenses, but only to the extent that the difference between the net Institutional Class and net Retail Class expense ratios, after applying the waiver/reimbursement, does not exceed 25 basis points. These agreements may not be terminated or modified prior to this date without the approval of the Board of Trustees.
Investing in small-cap funds generally will be more volatile and loss of principal could be greater than investing in larger-cap funds.
Dividends are not guaranteed. A company’s future abilities to pay dividends may be limited and a company may cease paying dividends at any time.
Lisa Z. Ramirez is a registered representative of ALPS Distributors, Inc.
Manager Commentary
| | |
| ■ | The Westcore Small-Cap Value Dividend Fund underperformed its benchmark, the Russell 2000® Value Index, for the first half of 2015. Although weather-related issues caused a slow start to the year, the U.S. economy has since gained momentum with strong job creation, rising consumer confidence and early signs of wage gains. The strong U.S. dollar has had a negative impact on earnings, particularly for larger companies with more foreign currency exposure. Globally, China’s economy is decelerating and there are concerns that real estate and stock market speculation have reached the “bubble” stage. Russia is in recession due to economic sanctions and the precipitous decline in energy prices. Greece is the headline grabber as it stumbles toward default and possible exit from the European Union. These divergent economic paths have elevated market volatility. |
| | |
| ■ | The technology, energy and commercial services sectors were the Fund’s top contributors, relative to its benchmark in the first half of the year. Software provider, NICE Systems Ltd, was the Fund’s strongest performer as it reported strength in its bank-focused financial crimes and compliance segment and solid growth in its customer interactions segment. NICE also indicated its intention to expand its market to include larger banks, which could significantly grow its opportunities. MAXIMUS Inc, an outsourcing provider of health and human services programs to government agencies, was among the Fund’s leading performers. The company reported solid quarterly results attributable to strong growth in its health services segment MAXIMUS also announced that the Australian department of employment awarded it further work. Additionally, a June Supreme Court ruling removed some market uncertainty as it upheld federal subsidies associated with the Affordable Care Act. |
| | |
| ■ | The Fund’s most disappointing sectors, relative to its benchmark, were consumer cyclicals, consumer staples and basic materials. FXCM Inc., a platform for foreign exchange traders, was the Fund’s most disappointing performer in the period. The Swiss franc rose significantly and nearly instantaneously following the Swiss National Bank’s January 15 announcement that it would no longer maintain a fixed exchange rate with the euro. This panic led many FXCM clients to incur losses that caused FXCM to fall below required capital levels. FXCM was forced to meet this requirement through a costly loan. We exited the position believing the company’s prospects were impaired. Dean Foods Co, a dairy products processor and distributor, was another underperformer. Although Dean Foods reported a strong first quarter, retail milk prices remained elevated, resulting in weaker consumption. More recently, retailers reduced milk prices and early signs are that this is boosting consumption. We are confident that stabilization in raw milk costs, cost reduction initiatives and improved retail milk prices should position Dean well. |
| | |
| ■ | As we look to the second half of 2015, we expect volatility to remain elevated. The Federal Reserve continues to keep investors guessing as to when it will increase short-term rates. Additionally, we believe the divergence of global economic growth will keep investor angst at high levels. However, it is difficult for us to envision an end to domestic economic improvement and positive market returns with the consumer gaining confidence, housing activity strengthening and interest rates at abnormally low levels. We believe well thought out stock selection will be even more important for the balance of the year as, broadly speaking, valuations appear stretched. |
| PAGE 14 |
| |
| 2015 Semi-Annual Report |
| WESTCORE SMALL-CAP VALUE DIVIDEND FUND (continued) | (UNAUDITED) |
Stock Performance
(for the year ended 6/30/15)
| | | | | |
| 5 Highest | Average
Weight | Contribution
to Return |
| NICE Systems Ltd | 2.50 | % | 0.61 | % |
| MAXIMUS Inc | 1.91 | | 0.40 | |
| Webster Financial Corp | 1.70 | | 0.37 | |
| Western Refining Inc. | 0.69 | | 0.34 | |
| Phibro Animal Health Corp | 1.37 | | 0.34 | |
| | | | | |
| 5 Lowest | | | | |
| Greif | 0.71 | % | -0.42 | % |
| KapStone Paper and Packaging Corp | 1.40 | | -0.47 | |
| Con-way Inc | 1.99 | | -0.48 | |
| Dean Foods Co | 3.75 | | -0.68 | |
| FXCM Inc. | 0.21 | | -1.91 | |
Past performance does not guarantee future results. These stocks do not represent all of the securities purchased, sold or recommended by the Funds’ Adviser. To request a complete list of the contribution of each Fund holding to overall Fund performance during the period, please call 800.392.CORE (2673) or email invest@westcore.com.
Please see page 30 for a description of the methodology used to construct this chart.
Top Ten Holdings
(as of 6/30/15)
| | | |
| Dean Foods Co | 3.5 | % |
| Greenhill & Co Inc | 2.6 | |
| Big Lots Inc | 2.2 | |
| Valley National Bancorp | 2.2 | |
| Cubic Corp | 2.2 | |
| NICE Systems Ltd | 2.2 | |
| West Pharmaceutical Services Inc. | 2.1 | |
| The Laclede Group Inc | 2.1 | |
| Steelcase Inc | 2.1 | |
| Abercrombie & Fitch Co | 2.1 | |
| Total (% of Net Assets) | 23.3 | % |
Top ten holdings do not include any cash, cash equivalents or exchange traded fund investments and are subject to change. There are no guarantees that the Fund will continue to remain invested in any particular holding.
Portfolio Characteristics
(as of 6/30/15)
| | | |
| | Westcore Small-Cap
Value Dividend Fund | Russell 2000®
Value Index |
| Weighted Average Market Capitalization ($ Mil) | $2,211.0 | $1,692.0 |
| Price/Cash Flow (1 year trailing) | 12.4x | 13.0x |
| Price/Book Value | 2.3x | 1.7x |
| Price/Earnings (1 year trailing) | 19.5x | 16.3x |
| Beta | 1.1 | 1.8 |
| Number of Holdings | 64 | 1,319 |
| Portfolio Turnover Rate (1 year trailing) | 56% | — |
Please see definition of terms beginning on page 30.
Sector Allocation
(as of 6/30/15)
| | | | | | | |
| | Westcore
Small-Cap Value
Dividend Fund | Russell 2000®
Value Index | Relative Weights
Under | Over |
| Consumer Staples | 6.9 | % | 3.1 | % | 3.8 | % |
| Consumer Cyclical | 14.8 | | 10.6 | | 4.2 | |
| Commercial Services | 4.9 | | 6.2 | | -1.3 | |
| Basic Materials | 3.9 | | 4.2 | | -0.3 | |
| Capital Goods | 6.8 | | 6.2 | | 0.6 | |
| Technology | 7.3 | | 9.3 | | -2.0 | |
| Energy | 2.6 | | 5.9 | | -3.3 | |
| Utilities | 6.1 | | 6.5 | | -0.4 | |
| Interest Rate Sensitive | 27.2 | | 29.9 | | -2.7 | |
| Medical/Healthcare | 5.0 | | 4.1 | | 0.9 | |
| REITs | 10.7 | | 11.8 | | -1.1 | |
| Transportation | 1.8 | | 2.2 | | -0.4 | |
| ST Investments/Net Other Assets | 2.0 | | 0.0 | | 2.0 | |
| Total (% of Net Assets) | 100.0 | % | 100.0 | % | | |
Sector classifications presented herein are based on the sector categorization methodology of the Adviser to the Funds which may result in the sector designations for one Fund being different than another Fund’s sector designations. For Fund compliance purposes, the Fund’s industry classifications refer to any one or more of the industry sub-classifications used by one or more widely recognized market indexes or ratings group indexes, and/or as defined by Fund management. This definition may not apply for purposes of this report, which may combine industry sub-classifications for reporting ease. Industries are shown as a percentage of net assets.
Market Capitalization
(as of 6/30/15)
| | | | | |
Market Cap Range ($ Mil) | Percent of Total Equities | | Number of Holdings |
| $0 - $500 | 0.0 | % | | 0 |
| $500 - $1,000 | 2.6 | | | 2 |
| $1,000 - $2,000 | 40.6 | | | 26 |
| Over $2,000 | 56.8 | | | 36 |
Market capitalization ranges were determined by the Adviser to the Fund and are for presentation purposes only. These market capitalization ranges do not necessarily correlate to the benchmark’s market capitalization ranges.
| |
| PAGE 15 |
| |
| p: 800.392.CORE (2673) | www.westcore.com |
| WESTCORE MICRO-CAP OPPORTUNITY FUND (WTMIX) | (UNAUDITED) |
Fund Strategy
Investing primarily in micro-cap companies whose stocks appear to be undervalued.
Fund Management
Paul A. Kuppinger, CFA Portfolio Manager
CFA is a trademark owned by CFA Institute.
Cumulative Returns
The chart above represents historical performance of a hypothetical investment of $10,000 in the Fund over the past 10 years (or for the life of the Fund if shorter). Performance calculations are as of the end of June each year. Past performance does not guarantee future results. This chart does not reflect the deduction of taxes that a shareholder would pay on Fund distributions or the redemption of Fund shares.
Lipper Index data provided by Lipper, Inc.
Please see index definitions beginning on page 28.
Average Annual Total Returns
| | | | | | | | | | | | | | |
| | 6 Months | 1 Year | 3 Years | 5 Years | 10 Years | Since
Inception | Inception
Date |
| Retail Class (WTMIX) | 1.56 | % | 4.20 | % | 17.70 | % | 16.91 | % | — | | 10.20 | % | 6/23/2008 |
Russell Micro-Cap® Index | 6.03 | | 8.21 | | 19.25 | | 17.48 | | — | | 9.18 | | |
| Lipper Small-Cap Core Index | 3.63 | | 3.89 | | 17.02 | | 16.02 | | — | | 9.10 | | |
Retail Class Annual Expense Ratio (per the current prospectus) — Gross: 1.69%, Net: 1.39%
The performance data quoted represents past performance and does not guarantee future results. Performance information for the institutional class shares prior to their inception date is based on the performance of the retail class. Current performance may be lower or higher than the performance quoted. To obtain current performance as of the most recent month-end, please call 800.392.CORE (2673) or visit us online at www.westcore.com. Average annual total returns and yield figures reflect the reinvestment of dividends, capital gains distributions, all fee waivers and expense reimbursements. Without the fee waivers and expense reimbursements, total return and yield figures would have been lower. The performance data quoted does not reflect the deduction of the 2% redemption fee imposed if shares are redeemed or exchanged within 90 calendar days from their date of purchase. If imposed, the fee would reduce the performance quoted. Total return and yield figures represent past performance. Investment return and principal value will vary, and shares, when redeemed, may be worth more or less than their original cost. Westcore fund shares are not insured by the FDIC, the Federal Reserve Board or any other agency and are subject to investment risk.
Denver Investments (the “Adviser”) has contractually agreed to waive certain investment advisory and/or administration fees and/or to reimburse other expenses from April 30, 2015 until at least April 30, 2016. The waiver/reimbursement applies so that the ratio of expenses to average net assets, as reported in the Fund’s financial statements, will be no more than 1.30% for the Fund’s Retail Class for such period. Please see the Fund’s Prospectus for more information. This agreement may not be terminated or modified prior to this date without the approval of the Board of Trustees. Without the fee waivers and expense reimbursements, total return figures would have been lower.
Investing in micro-cap funds generally will be more volatile and loss of principal could be greater than investing in larger-cap funds.
Manager Commentary
| | |
| ■ | Markets started off 2015 much like 2014. The Westcore Micro-Cap Opportunity Fund got off to a rocky start as it trailed its benchmark, the Russell Microcap® Index, by 2.6 percentage points at the end of the first quarter. For the first half of the year it underperformed its benchmark by 4.5 percentage points. |
| | |
| ■ | As these results imply, our models had mixed success for the first half of the year. Six of the 12 sectors in the Fund had positive absolute returns, while six had negative absolute returns. The capital goods, consumer staples and transportation sectors were the Fund’s best performers relative to the benchmark. The sectors that fared worst compared to the benchmark were technology, medical/healthcare and consumer cyclicals. |
| | |
| ■ | Much of the Fund’s lag in performance was caused by its overweighted position in the energy sector and its underweighted position in the medical/healthcare sector, specifically in biotechnology companies. The Fund’s performance in the technology sector also lagged the benchmark, as many of the more volatile stocks in the sector did quite well. |
| | |
| ■ | From a factor perspective, the second quarter was difficult. Valuation and dividend yield were not effective indicators of future performance. Company size was predictive as larger companies in the micro-cap space outperformed smaller companies. Other factors that were predictive included price momentum and return on equity (ROE). Also, higher-priced stocks outperformed lower-priced stocks, higher-beta stocks outperformed lower-beta stocks and stocks of non-dividend paying companies outperformed stocks of dividend paying companies. |
| | |
| ■ | Among the Fund’s best-performing holdings for the first half of the year were Anacor Pharmaceuticals Inc, a developer of small-molecule therapeutics derived from its boron chemistry platform. Repligen Corp., which develops and produces products used in biological drugs, was another strong performer. Also among the Fund’s top contributors was Cambrex Corp., another company that develops small molecule therapeutics. |
| | |
| ■ | The holdings that were the largest detractors included McClatchy Co., a news and information publisher; Dex Media Inc., a local marketing solutions provider; and pharmaceutical company Pernix Therapeutics Holdings Inc. A significant detractor to relative performance was bluebird bio, Inc. which the Fund did not hold. Its stock was up more than 70% for the first half of the year and provided a strong boost to the benchmark’s return. |
| | |
| ■ | A notable event at the end of the quarter was the Russell Index reconstitution. Each year, Russell rebalances its indexes in order to ensure that they accurately represent the market segments for which they are intended. The rebalance is important to the Fund because it can change the size of companies in the benchmark along with the sector and industry weightings. We then adjust our models to maintain our target ranges for tracking the benchmark. |
| | |
| ■ | At the time of the rebalance, the largest stock in the Russell Microcap Index had a market capitalization of just over $1 billion, compared to just under $900 million last year. The smallest company in the rebalanced benchmark has a market capitalization of about $30 million. With the rebalance, the benchmark sector weights shifted. Medical/healthcare decreased in weight by nearly 7%, while energy increased by about 3%. |
| PAGE 16 |
| |
| 2015 Semi-Annual Report |
| WESTCORE MICRO-CAP OPPORTUNITY FUND (continued) | (UNAUDITED) |
Stock Performance
(for the year ended 6/30/15)
| | | | | | |
| 5 Highest | | Average
Weight | Contribution
to Return |
| Anacor Pharmaceuticals Inc. | | 0.89 | % | 0.83 | % |
| Cambrex Corp. | | 0.84 | | 0.63 | |
| Repligen Corp. | | 0.90 | | 0.63 | |
| Heska Corp. | | 0.54 | | 0.36 | |
| Net 1 UEPS Technologies Inc | | 0.71 | | 0.35 | |
| | | | | | |
| 5 Lowest | | | | | |
| Pernix Therapeutics Holdings Inc. | | 0.20 | % | -0.23 | % |
| Infinity Pharmaceuticals Inc. | | 0.59 | | -0.24 | |
| LRAD Corp | | 0.55 | | -0.28 | |
| Dex Media Inc. | | 0.11 | | -0.43 | |
| McClatchy Co. | | 0.40 | | -0.50 | |
Past performance does not guarantee future results. These stocks do not represent all of the securities purchased, sold or recommended by the Funds’ Adviser. To request a complete list of the contribution of each Fund holding to overall Fund performance during the period, please call 800.392. CORE (2673) or email invest@westcore.com.
Please see page 30 for a description of the methodology used to construct this chart.
Top Ten Holdings
(as of 6/30/15)
| | | |
| SciClone Pharmaceuticals Inc | 1.0 | % |
| LHC Group Inc | 1.0 | |
| Flagstar Bancorp Inc | 0.9 | |
| Net 1 UEPS Technologies Inc | 0.9 | |
| First Community Bancshares Inc | 0.9 | |
| REX American Resources Corp. | 0.9 | |
| Denny’s Corp | 0.9 | |
| Atrion Corp | 0.9 | |
| Emergent Biosolutions Inc | 0.9 | |
| Spectrum Pharmaceuticals Inc | 0.9 | |
| Total (% of Net Assets) | 9.2 | % |
Top ten holdings do not include any cash, cash equivalents or exchange traded fund investments and are subject to change. There are no guarantees that the Fund will continue to remain invested in any particular holding.
Portfolio Characteristics
(as of 6/30/15)
| | | |
| | Westcore Micro-Cap
Opportunity Fund | Russell
Microcap® Index |
| Weighted Average Market Capitalization ($ Mil) | $522.0 | $479.0 |
| Price/Cash Flow (1 year trailing) | 13.4x | 15.6x |
| Price/Book Value | 2.3x | 2.6x |
| Price/Earnings (1 year trailing) | 16.7x | 9.9x |
| Beta | 1.3 | 1.2 |
| Number of Holdings | 184 | 1,682 |
| Portfolio Turnover Rate (1 year trailing) | 107% | — |
Please see definition of terms beginning on page 30.
Sector Allocation
(as of 6/30/15)
| | | | | | | | |
| | | Westcore Micro-Cap
Opportunity Fund | Russell
Microcap® Index | Relative Weights
Under | Over |
| Consumer Staples | | 5.6 | % | 2.8 | % | 2.8 | % |
| Consumer Cyclical | | 7.1 | | 13.7 | | -6.6 | |
| Commercial Services | | 6.8 | | 6.4 | | 0.4 | |
| Basic Materials | | 4.8 | | 2.6 | | 2.2 | |
| Capital Goods | | 2.6 | | 4.0 | | -1.4 | |
| Technology | | 14.3 | | 15.1 | | -0.8 | |
| Energy | | 4.7 | | 4.8 | | -0.1 | |
| Utilities | | 0.6 | | 1.1 | | -0.5 | |
| Interest Rate Sensitive | | 24.5 | | 23.6 | | 0.9 | |
| Medical/Healthcare | | 23.0 | | 20.9 | | 2.1 | |
| REITs | | 3.1 | | 3.2 | | -0.1 | |
| Transportation | | 1.1 | | 1.8 | | -0.7 | |
| ST Investments/Net Other Assets | | 1.8 | | 0.0 | | 1.8 | |
| Total (% of Net Assets) | | 100.0 | % | 100.0 | % | | |
Sector classifications presented herein are based on the sector categorization methodology of the Adviser to the Funds which may result in the sector designations for one Fund being different than another Fund’s sector designations. For Fund compliance purposes, the Fund’s industry classifications refer to any one or more of the industry sub-classifications used by one or more widely recognized market indexes or ratings group indexes, and/or as defined by Fund management. This definition may not apply for purposes of this report, which may combine industry sub-classifications for reporting ease. Industries are shown as a percentage of net assets.
Market Capitalization
(as of 6/30/15)
| | | | | |
Market Cap Range ($ Mil) | Percent of Total Equities | | Number of Holdings |
| $0 - $200 | 12.4 | % | | 26 |
| $200 - $400 | 26.7 | | | 51 |
| $400 - $600 | 26.8 | | | 50 |
| Over $600 | 34.1 | | | 57 |
Market capitalization ranges were determined by the Adviser to the Fund and are for presentation purposes only. These market capitalization ranges do not necessarily correlate to the benchmark’s market capitalization ranges.
| |
| PAGE 17 |
| |
| p: 800.392.CORE (2673) | www.westcore.com |
| WESTCORE INTERNATIONAL SMALL-CAP FUND (WTIFX) | (UNAUDITED) |
Fund Strategy
Investing in equity securities of international small-cap companies that are poised for growth.
Fund Management
John C. Fenley, CFA Portfolio Manager
Jeremy A. Duhon, CFA Portfolio Manager
CFA is a trademark owned by CFA Institute.
Cumulative Returns
The chart above represents historical performance of a hypothetical investment of $10,000 in the Fund over the past 10 years (or for the life of the Fund if shorter). Performance calculations are as of the end of June each year. Past performance does not guarantee future results. This chart does not reflect the deduction of taxes that a shareholder would pay on Fund distributions or the redemption of Fund shares.
Lipper Index data provided by Lipper, Inc.
Please see index definitions beginning on page 28.
Average Annual Total Returns
| | | | | | | | | | | | | | | |
| | | 6 Months | 1 Year | 3 Years | 5 Years | 10 Years | Since
Inception | Inception
Date |
| Retail Class (WTIFX) | | 3.53 | % | -12.97 | % | 4.43 | % | 10.05 | % | 6.51 | % | 4.99 | % | 12/15/1999 |
| MSCI EAFE Small-Cap Index | | 10.15 | | -0.77 | | 15.69 | | 12.40 | | 6.59 | | 7.25 | | |
| MSCI ACWI ex USA Small Cap Index* | | 8.32 | | -3.07 | �� | 12.32 | | 9.72 | | 7.39 | | 7.06 | | |
| Lipper International Small-Cap Index | | 9.22 | | -1.60 | | 14.81 | | 12.45 | | 7.96 | | 7.06 | | |
Retail Class Annual Expense Ratio (per the current prospectus) — Gross: 1.58%, Net: 1.50%
The performance data quoted represents past performance and does not guarantee future results. Performance information for the institutional class shares prior to their inception date is based on the performance of the retail class. Current performance may be lower or higher than the performance quoted. To obtain current performance as of the most recent month-end, please call 800.392.CORE (2673) or visit us online at www.westcore.com. Average annual total returns and yield figures reflect the reinvestment of dividends, capital gains distributions, all fee waivers and expense reimbursements. Without the fee waivers and expense reimbursements, total return and yield figures would have been lower. Total return and yield figures represent past performance. Investment return and principal value will vary, and shares, when redeemed, may be worth more or less than their original cost. Westcore fund shares are not insured by the FDIC, the Federal Reserve Board or any other agency and are subject to investment risk.
Denver Investments (the “Adviser”) has contractually agreed to waive certain investment advisory and/or administration fees and/or to reimburse other expenses from April 30, 2015 until at least April 30, 2016. The waiver/reimbursement applies so that the ratio of expenses to average net assets, as reported in the Fund’s financial statements, will be no more than 1.50% for the Fund’s Retail Class for such period. Please see the Fund’s Prospectus for more information. This agreement may not be terminated or modified prior to this date without the approval of the Board of Trustees. Without the fee waivers and expense reimbursements, total return figures would have been lower.
| * | MSCI Inc. launched the MSCI ACWI ex USA Small-Cap Index on June 1, 2007. Data prior to the launch date is back-tested data provided and derived by MSCI (i.e. calculations of how the index might have performed over that time period had the index existed). There may be material differences between back-tested performance and actual results. Past performance, whether actual or back-tested, is no indication or guarantee of future performance. MSCI Inc. is the source and owner of the MSCI ACWI ex USA Small-Cap Index data. |
Investing in small-cap funds generally will be more volatile and loss of principal could be greater than investing in larger-cap funds.
Investing in foreign securities entails special risks, such as currency fluctuations and political uncertainties, which are described in more detail in the prospectus.
Manager Commentary
| | |
| ■ | International markets trended modestly upward over the first six months of the year with a few pullback periods in January, March and June. Hopes for monetary easing-induced growth were tempered by uneven economic news and intermittent concerns over Greece. Small-cap stocks in most international markets showed strength relative to larger-cap stocks. Among the best performing small-cap markets in local terms were France, Spain and Japan. However, a weakening euro, relative to the U.S. dollar, dampened returns from the European markets for U.S.-based investors. June was an especially volatile month for Chinese markets. Of note is that the Fund’s exposure to China is through Hong Kong-listed companies, which exhibited far less volatility in June. |
| | |
| ■ | Over the period, the Westcore International Small-Cap Fund lagged its benchmark, the MSCI EAFE Small-Cap Index, and the broader MSCI ACWI ex USA Small-Cap Index. The Fund’s overweighted positions in Korea and South Africa were positive contributors. Holdings in Hong Kong, Italy and Norway also contributed to performance. The Fund’s overweighted position to and stock selection in Australia were primary detractors. Weightings in China and Canada had a negative impact as these holdings underperformed the benchmark as a whole. |
| | |
| ■ | The Fund’s top individual performers included Rightmove PLC, Azimut Holdings S.p.A. and PAX Global Technology Ltd. Rightmove operates the largest property listings website in the United Kingdom. It gained from strong growth in site traffic and average revenue per advertiser. Azimut is an Italy-based asset manager also specializing in the selling and distribution of its financial products. We believe a key source of Azimut’s competitive advantage derives from its robust distribution model. PAX Global, based in Hong Kong, is a leading provider of point of sales terminals designed to process a range of electronic payment types. Active in the global arena, PAX benefited from strong growth outside of its regional markets. |
| | |
| ■ | Slater & Gordon Ltd., Decmil Group Ltd. and Cardno Ltd. were among the Fund’s greatest individual detractors during the first half of the year. Slater & Gordon is a national law firm based in Australia. Skepticism around a Slater & Gordon acquisition impacted the stock. We remain positive on the company and its ambitions for global expansion. Decmil specializes in the construction of temporary facilities and infrastructure for mining and energy companies. Exposure to a weakened Australian resources sector weighed on the stock. We believe its business model will continue to benefit from high occupancy rates and new projects in the accommodation business and the success of the operational work Decmil provides in the liquefied natural gas space. Cardno operates as an infrastructure and environmental services company. Due to unanticipated slowing in some of its end markets we found Cardno’s quality and upside potential less attractive. Consequently, we exited the position. |
| | |
| ■ | Our investment discipline, which seeks to identify and invest in solid companies at compelling valuations, continues to encounter some headwinds. While we are not pleased with the performance we have delivered to our shareholders for the first half of this year, we are encouraged by the strong fundamentals of the Fund’s holdings and their attractive relative valuations. It is our conviction that the market will recognize the potential of these companies, close what we see as a valuation gap, and ideally deliver improving returns. |
| PAGE 18 |
| |
| 2015 Semi-Annual Report |
| WESTCORE INTERNATIONAL SMALL-CAP FUND (continued) | (UNAUDITED) |
Stock Performance
(for the year ended 6/30/15)
| | | | | |
| 5 Highest | Average
Weight | Contribution
to Return |
| Credit Corp Group Ltd. | 6.71 | % | 1.17 | % |
| Azimut Holding S.p.A. | 3.66 | | 1.16 | |
| Rightmove PLC | 3.10 | | 1.14 | |
| PAX Global Technology Ltd. | 3.58 | | 1.09 | |
| Pico Far East Holdings Ltd. | 3.06 | | 1.04 | |
| | | | | |
| 5 Lowest | | | | |
| Cardno Ltd. | 1.71 | % | -0.58 | % |
| CANCOM SE | 4.53 | | -0.64 | |
| Decmil Group Ltd. | 2.94 | | -0.80 | |
| REXLot Holdings Ltd. | 3.76 | | -1.00 | |
| Slater & Gordon Ltd. | 3.25 | | -1.34 | |
Past performance does not guarantee future results. These stocks do not represent all of the securities purchased, sold or recommended by the Funds’ Adviser. To request a complete list of the contribution of each Fund holding to overall Fund performance during the period, please call 800.392.CORE (2673) or email invest@westcore.com.
Please see page 30 for a description of the methodology used to construct this chart.
Top Ten Holdings
(as of 6/30/15)
| | | |
| Credit Corp Group Ltd. [Austalia] | 6.0 | % |
| PAX Global Technology Ltd. [Hong Kong] | 4.4 | |
| CANCOM SE [Germany] | 4.2 | |
| Magic Software Enterprises Ltd. [Israel] | 4.2 | |
| Rightmove PLC [United Kingdom] | 4.0 | |
| Admiral Group PLC [United Kingdom] | 3.9 | |
| Azimut Holding S.p.A. [Italy] | 3.9 | |
| Diploma PLC [United Kingdom] | 3.7 | |
| Woolworths Holdings Ltd. [South Africa] | 2.9 | |
| Webjet Ltd. [Austalia] | 2.8 | |
| Total (% of Net Assets) | 40.0 | % |
Top ten holdings do not include any cash, cash equivalents or exchange traded fund investments and are subject to change. There are no guarantees that the Fund will continue to remain invested in any particular holding.
Portfolio Characteristics
(as of 6/30/15)
| | | |
| | Westcore International
Small-Cap Fund | MSCI EAFE
Small-Cap Index |
| Weighted Average Market Capitalization ($ Mil) | $2,417.0 | $2,356.0 |
| Number of Countries Represented | 13 | 21 |
| Price/Earnings (1 year trailing) | 24.0x | 17.1x |
| Price/Book Value | 3.9x | 2.6x |
| Cash | 1.7% | 0.0% |
| Forward Currency Contracts | -0.2% | 0.0% |
| Number of Holdings | 40 | 2,162 |
| Portfolio Turnover Rate | 26% | — |
Please see definition of terms beginning on page 30.
Forward currency contracts are reported at their unrealized appreciation/(depreciation) at month-end, which represents the change in contract’s value from trade date.
Sector Allocation
(as of 6/30/15)
| | | Westcore
International
Small-Cap Fund | MSCI EAFE
Small-Cap Index | Relative Weights
Under | Over |
| Consumer Discretionary | | 34.3 | % | 17.5 | % | 16.8 | % |
| Consumer Staples | | 2.8 | | 6.2 | | -3.4 | |
| Energy | | 1.5 | | 2.5 | | -1.0 | |
| Financials | | 17.1 | | 22.7 | | -5.6 | |
| Health Care | | 4.1 | | 7.3 | | -3.2 | |
| Industrials | | 20.0 | | 22.4 | | -2.4 | |
| Information Technology | | 20.2 | | 9.6 | | 10.6 | |
| Materials | | 0.0 | | 8.5 | | -8.5 | |
| Telecom Services | | 0.0 | | 1.6 | | -1.6 | |
| Utilities | | 0.0 | | 1.7 | | -1.7 | |
| Total (% of Equities) | | 100.0 | % | 100.0 | % | | |
Sector classifications presented herein are based on the sector categorization methodology of the Adviser to the Funds which may result in the sector designations for one Fund being different than another Fund’s sector designations. For Fund compliance purposes, the Fund’s industry classifications refer to any one or more of the industry sub-classifications used by one or more widely recognized market indexes or ratings group indexes, and/or as defined by Fund management. This definition may not apply for purposes of this report, which may combine industry sub-classifications for reporting ease. Industries are shown as a percentage of net assets.
Regional Allocation
(as of 6/30/15)
| | | | | | | | |
| | | Westcore
International
Small-Cap Fund | MSCI EAFE
Small-Cap Index | Relative Weights
Under | Over |
| United Kingdom | | 22.3 | % | 22.1 | % | 0.2 | % |
| Europe | | 17.4 | | 35.9 | | -18.5 | |
| Japan | | 13.0 | | 30.2 | | -17.2 | |
| Asia (excluding Japan) | | 30.4 | | 11.8 | | 18.6 | |
| Emerging Markets/Other | | 12.8 | | 0.0 | | 12.8 | |
| North America | | 4.1 | | 0.0 | | 4.1 | |
Percentages are based on Total Equities.
Market Capitalization
(as of 6/30/15)
| | | | | |
Market Cap Range ($ Mil) | Percent of Total Equities | | Number of Holdings |
| $0 - $500 | 25.9 | % | | 9 |
| $500 - $1,000 | 18.0 | | | 8 |
| $1,000 - $2,000 | 11.6 | | | 4 |
| Over $2,000 | 44.5 | | | 19 |
Market capitalization ranges were determined by the Adviser to the Fund and are for presentation purposes only. These market capitalization ranges do not necessarily correlate to the benchmark’s market capitalization ranges.
| |
| PAGE 19 |
| |
| p: 800.392.CORE (2673) | www.westcore.com |
| WESTCORE FLEXIBLE INCOME FUND (WTLTX, WILTX) | (UNAUDITED) |
Fund Strategy
A fixed-income fund investing in a wide variety of income-producing securities, primarily bonds and to a lesser extent convertible bonds, and equity securities.
Fund Management
Troy A. Johnson, CFA Portfolio Manager
Mark R. McKissick, CFA Portfolio Manager
CFA is a trademark owned by CFA Institute.
Cumulative Returns
The chart above represents historical performance of a hypothetical investment of $10,000 in the Fund over the past 10 years (or for the life of the Fund if shorter). Performance calculations are as of the end of June each year. Past performance does not guarantee future results. This chart does not reflect the deduction of taxes that a shareholder would pay on Fund distributions or the redemption of Fund shares.
Lipper Index data provided by Lipper, Inc.
Please see index definitions beginning on page 28.
Average Annual Total Returns
| | | | | | | | | | | | | | | | | |
| | | 6 Months | 1 Year | 3 Years | 5 Years | 10 Years | Since
Incep. | 30-Day
SEC
Yield | Incep.
Date |
| Retail Class (WTLTX) | | 1.82 | % | 2.40 | % | 5.50 | % | 7.44 | % | 4.93 | % | 7.55 | % | 4.39 | % | 6/1/1988 |
| Institutional Class (WILTX) | | 1.95 | | 2.74 | | 5.69 | | 7.59 | | 5.03 | | 7.59 | | 4.36 | | 9/28/2007 |
| Barclays U.S. Corporate High Yield Ba Index | | 2.31 | | 1.84 | | 6.71 | | 8.64 | | 7.98 | | 8.86 | | — | | |
| Lipper High Current Yield Index | | 2.57 | | -0.39 | | 6.82 | | 8.21 | | 6.56 | | 7.07 | | — | | |
Retail Class Annual Expense Ratio (per the current prospectus) — Gross: 0.88%, Net: 0.85%
Institutional Class Annual Expense Ratio (per the current prospectus) — Gross: 1.04%, Net: 0.67%
30-Day SEC Yield figures reflect all fee waivers and expense reimbursements. Without the absorption of these fee waivers and/or expense reimbursements, the figures would have been 3.97% for the retail class and 3.96% for the institutional class.
The performance data quoted represents past performance and does not guarantee future results. Performance information for the institutional class shares prior to their inception date is based on the performance of the retail class. Current performance may be lower or higher than the performance quoted. To obtain current performance as of the most recent month-end, please call 800.392.CORE (2673) or visit us online at www.westcore.com. Average annual total returns and yield figures reflect the reinvestment of dividends, capital gains distributions, all fee waivers and expense reimbursements. Without the fee waivers and expense reimbursements, total return and yield figures would have been lower. The performance data quoted does not reflect the deduction of the 2% redemption fee imposed if shares are redeemed or exchanged within 90 calendar days from their date of purchase. If imposed, the fee would reduce the performance quoted. Total return and yield figures represent past performance. Investment return and principal value will vary, and shares, when redeemed, may be worth more or less than their original cost. Westcore fund shares are not insured by the FDIC, the Federal Reserve Board or any other agency and are subject to investment risk.
Denver Investments (the “Adviser”) has contractually agreed to waive certain investment advisory and/or administration fees and/or to reimburse other expenses from April 30, 2015 until at least April 30, 2016. The first waiver/reimbursement applies so that the ratio of expenses to average net assets, as reported in the Fund’s Financial Highlights, will be no more than 0.85% for the Fund’s Retail Class for such period. The second waiver/reimbursement applies so that Fund level Other Expenses for the Institutional Class will be in the same proportion as the Retail Class waivers/reimbursements. The third waiver/reimbursement applies so that the institutional class-specific Other Expenses are reimbursed. The Adviser has contractually agreed to waive/reimburse all of these class-specific Other Expenses, but only to the extent that the difference between the net Institutional Class and net Retail Class expense ratios, after applying the waiver/reimbursement, does not exceed 25 basis points. These agreements may not be terminated or modified prior to this date without the approval of the Board of Trustees.
Westcore Flexible Income Fund may invest in high-yield/high-risk bonds which are subject to greater levels of liquidity risk. Additionally, investing in bonds entails interest rate risk and credit risk.
Mark R. McKissick is a registered representative of ALPS Distributors, Inc.
Manager Commentary
| | |
| ■ | The U.S. economy appeared to gain a little momentum following an abnormally weak first quarter. The improvement caused investors to ponder the necessity, timing and scale of the next Federal Reserve rate hike cycle; however, as the first half of 2015 came to an end, global growth concerns again returned to the forefront of investors’ minds as a result of significant declines registered across the Chinese equity market and the evolving situation between Greece and the European Union. The high-yield market generally outperformed other fixed income categories as its relative yield advantage and shorter duration lessened the impact of a moderate rise in rates during the first half of the year. |
| | |
| ■ | The Westcore Flexible Income Fund’s return for the first six months of 2015 fell short of its benchmark, the Barclays U.S. Corporate High Yield Ba Index. A few holdings in the energy and metals and mining industries hindered the Fund’s performance in the period as those industries experienced a more limited recovery following last year’s sell-off. Weakness across global commodity markets at the end of the second quarter impacted these holdings as well. The Fund’s performance was also adversely impacted by an unfortunate court ruling related to one of its holdings. The relatively short duration of the Fund versus its benchmark was a positive contributor in the period. |
| | |
| ■ | We remain optimistic about the underlying credit fundamentals of higher-quality issuers within the high-yield market considering relatively healthy balance sheets in general, an overall low default rate and the limited amount of debt that needs to be refinanced over the next few years. Areas of concern that we are monitoring include the likelihood for levering events by specific companies, potentially rising correlation of high-yield returns to the Treasury market and weakening trends in covenant protection for bondholders. |
| | |
| ■ | We believe the Fund is positioned to offer competitive yield with more limited downside price volatility versus traditional high-yield investments. Our process entails intensive credit analysis by which we evaluate yield versus risk through business cycles, and it follows that a larger weighting of higher-rated, high-yield issues is a logical result. Most importantly, we believe this strategy works over the long term for shareholders who want comparative yield from a high-yield fund, but who are also more sensitive to volatility, and more focused on capital preservation. |
| PAGE 20 |
| |
| 2015 Semi-Annual Report |
| WESTCORE FLEXIBLE INCOME FUND (continued) | (UNAUDITED) |
Top Ten Corporate Credit Exposure
(as of 6/30/15)
| | | |
| Goodyear Tire & Rubber Co. | 3.0 | % |
| Range Resources Corp. | 3.0 | |
| Sabine Pass LNG LP | 2.8 | |
| Royal Caribbean Cruises Ltd. | 2.8 | |
| Frontier Communications Corp. | 2.8 | |
| MarkWest Energy Partners LP | 2.8 | |
| Potlatch Corp. | 2.6 | |
| Tuckahoe Credit Lease Trust | 2.6 | |
| Crown Americas LLC | 2.5 | |
| Omega Healthcare Investors Inc. | 2.4 | |
| Total (% of Net Assets) | 27.3 | % |
Percentages represent the Fund’s aggregate holdings in the same corporate issuer and its affiliates. Top Ten Corporate Credit Exposure are subject to change. There are no guarantees that the Fund will continue to remain invested in any particular security or issuer.
Portfolio Characteristics
(as of 6/30/15)
| | | |
| | Westcore Flexible | Barclays U.S. Corporate |
| | Income Fund | High Yield Ba Index |
| Effective Duration | 4.3 years | 4.9 years |
| Effective Maturity | 6.4 years | 7.0 years |
| Number of Holdings | 62 | 890 |
| Portfolio Turnover Rate (1 year trailing) | 52% | — |
Please see definition of terms beginning on page 30.
Asset Allocation
(as of 6/30/15)
| | | | | | | | |
| | | Westcore Flexible
Income Fund | Barclays U.S.
Corporate High
Yield Ba Index | Relative Weights
Under | Over |
| Corporate Bonds | | 88.4 | % | 100.0 | % | -11.6 | % |
| Residential Mortgage-Backed Securities | | 1.0 | | 0.0 | | 1.0 | |
| Commercial Mortgage-Backed Securities | | 2.6 | | 0.0 | | 2.6 | |
| Asset-Backed Securities | | 0.0 | | 0.0 | | 0.0 | |
| Preferred Stock | | 2.8 | | 0.0 | | 2.8 | |
| Common Stock | | 0.0 | | 0.0 | | 0.0 | |
| Other | | 2.8 | | 0.0 | | 2.8 | |
| ST Investments/Net Other Assets | | 2.4 | | 0.0 | | 2.4 | |
Percentages are based on Total Net Assets.
Ratings Allocation
(as of 6/30/15)
| | | | | | | | |
| | | Westcore Flexible
Income Fund | Barclays U.S.
Corporate High
Yield Ba Index | Relative Weights
Under | Over |
| Treasuries | | 0.0 | % | 0.0 | % | 0.0 | % |
| Agencies | | 0.0 | | 0.0 | | 0.0 | |
| AAA | | 0.0 | | 0.0 | | 0.0 | |
| AA | | 0.0 | | 0.0 | | 0.0 | |
| A | | 0.0 | | 0.0 | | 0.0 | |
| BBB | | 14.9 | | 0.0 | | 14.9 | |
| Below BBB | | 79.2 | | 100.0 | | -20.8 | |
| Non-Rated | | 4.7 | | 0.0 | | 4.7 | |
| ST Investments/Net Other Assets | | 1.2 | | 0.0 | | 1.2 | |
Percentages are based on Total Investments. The ratings allocation reflects the Standard & Poor’s equivalent ratings category for the highest credit-quality rating assigned by either Standard & Poor’s or Moody’s.
Maturity Distribution
(as of 6/30/15)
| | | | | | | | |
| | | Westcore Flexible
Income Fund | Barclays U.S.
Corporate High
Yield Ba Index | Relative Weights
Under | Over |
< 1 year | | 2.4 | % | 0.0 | % | 2.4 | % |
| 1 - 3 years | | 3.0 | | 13.1 | | -10.1 | |
| 3 - 5 years | | 14.6 | | 19.4 | | -4.8 | |
| 5 - 10 years | | 75.3 | | 58.5 | | 16.8 | |
| 10 - 20 years | | 4.0 | | 5.2 | | -1.2 | |
| 20+ years | | 0.7 | | 3.8 | | -3.1 | |
Percentages are based on Total Investments. The Adviser to the Funds utilizes the expected maturity in presenting this information.
| |
| PAGE 21 |
| |
| p: 800.392.CORE (2673) | www.westcore.com |
| WESTCORE PLUS BOND FUND (WTIBX, WIIBX) | (UNAUDITED) |
Fund Strategy
A fixed-income fund focusing on investment quality bonds of varying maturities.
Fund Management
Mark R. McKissick, CFA Portfolio Manager
Troy A. Johnson, CFA Portfolio Manager
CFA is a trademark owned by CFA Institute.
Cumulative Returns
The chart above represents historical performance of a hypothetical investment of $10,000 in the Fund over the past 10 years (or for the life of the Fund if shorter). Performance calculations are as of the end of June each year. Past performance does not guarantee future results. This chart does not reflect the deduction of taxes that a shareholder would pay on Fund distributions or the redemption of Fund shares.
Lipper Index data provided by Lipper, Inc.
The Lipper Intermediate Investment Grade Index is no longer calculated as of September 30, 2013. The Lipper Core Plus Bond Index is the Westcore Plus Bond Fund’s replacement peer group index.
Please see index definitions beginning on page 28.
Average Annual Total Returns
| | | | | | | | | | | | | | | | |
| | 6 Months | 1 Year | 3 Years | 5 Years | 10 Years | Since
Incep. | 30-Day
SEC
Yield | Incep.
Date |
| Retail Class (WTIBX) | 0.10 | % | 1.62 | % | 2.35 | % | 3.91 | % | 4.48 | % | 6.30 | % | 2.44 | % | 6/1/1988 |
| Institutional Class (WIIBX) | 0.24 | | 1.76 | | 2.50 | | 4.07 | | 4.59 | | 6.34 | | 2.56 | | 9/28/2007 |
| Barclays U.S. Aggregate Bond Index | -0.10 | | 1.86 | | 1.83 | | 3.35 | | 4.44 | | 6.71 | | — | | |
| Lipper Core Plus Bond Index* | 0.22 | | 1.33 | | 3.02 | | 4.50 | | 5.08 | | — | | — | | |
Retail Class Annual Expense Ratio (per the current prospectus) — Gross: 0.70%, Net: 0.55%
Institutional Class Annual Expense Ratio (per the current prospectus) — Gross: 0.55%, Net: 0.42%
30-Day SEC Yield figures reflect all fee waivers and expense reimbursements. Without the absorption of these fee waivers and/or expense reimbursements, the figures would have been 2.30% for the retail class and 2.43% for the institutional class.
The performance data quoted represents past performance and does not guarantee future results. Performance information for the institutional class shares prior to their inception date is based on the performance of the retail class. Current performance may be lower or higher than the performance quoted. To obtain current performance as of the most recent month-end, please call 800.392.CORE (2673) or visit us online at www.westcore.com. Average annual total returns and yield figures reflect the reinvestment of dividends, capital gains distributions, all fee waivers and expense reimbursements. Without the fee waivers and expense reimbursements, total return and yield figures would have been lower. Total return and yield figures represent past performance. Investment return and principal value will vary, and shares, when redeemed, may be worth more or less than their original cost. Westcore fund shares are not insured by the FDIC, the Federal Reserve Board or any other agency and are subject to investment risk.
Denver Investments (the “Adviser”) has contractually agreed to waive certain investment advisory and/or administration fees and/or to reimburse other expenses from April 30, 2015 until at least April 30, 2016. The first waiver/reimbursement applies so that the ratio of expenses to average net assets, as reported in the Fund’s Financial Highlights, will be no more than 0.55% for the Fund’s Retail Class for such period. The second waiver/reimbursement applies so that Fund level Other Expenses for the Institutional Class will be in the same proportion as the Retail Class waivers/reimbursements. The third waiver/reimbursement applies so that the institutional class-specific Other Expenses are reimbursed. The Adviser has contractually agreed to waive/reimburse all of these class-specific Other Expenses, but only to the extent that the difference between the net Institutional Class and net Retail Class expense ratios, after applying the waiver/reimbursement, does not exceed 25 basis points. These agreements may not be terminated or modified prior to this date without the approval of the Board of Trustees.
| * | A since inception calculation is not provided as the December 31, 1997 inception of the Lipper Core Plus Bond Index followed the June 1, 1988 inception of the Westcore Plus Bond Fund. |
Westcore Plus Bond Fund may invest in high-yield/high-risk bonds which are subject to greater levels of liquidity risk. Additionally, investing in bonds entails interest rate risk and credit risk.
Mark R. McKissick is a registered representative of ALPS Distributors, Inc.
Manager Commentary
| | |
| ■ | Thirty-year U.S. Treasury rates hit all-time historical lows at the end of January before rebounding as the year progressed. In the first half of 2015, interest rates were generally higher than they were at the beginning of the year, particularly for securities with maturities of longer than five years. Yields have been volatile, moving up and down, in spite of expectations that the Federal Reserve will raise short-term rates sometime in 2015. Fewer, smaller rate increases have been in our forecast, and Federal Reserve forecasts have become more consistent with our projections in that regard. Federal Reserve Chair Yellen is now emphasizing the trajectory of rate increases, rather than the timing of when they will begin, and has indicated that any moves will be data dependent. |
| | |
| ■ | We think it is wise to focus on the economy, as the Fed will follow. Though we do believe the Fed is uncomfortable with its current abnormally easy monetary policy, and that it would prefer to raise rates as soon as is practicable. |
| | |
| ■ | The U.S. economy looked stronger in the second quarter following the unusually weak first quarter. The unemployment rate declined to 5.3% in June. |
| | |
| ■ | The “Greek tragedy” and weak growth in China became more evident and this created concern that the global growth engine of the last decade could pull already anemic global growth rates even lower. Low inflation around the world is keeping interest rates tethered, and flight to the safety of U.S. assets created volatility as events unfolded. Evidence of market intervention by Chinese authorities may prove counter-productive beyond the attempted short-term fix. |
| | |
| ■ | The Westcore Plus Bond Fund outperformed its benchmark, the Barclays U.S. Aggregate Bond Index, in the first half of 2015 due to the additional income provided from non-Treasury holdings. Income from high-yield holdings contributed meaningfully, especially given the high-quality high-yield we focus on. The Fund’s overweighted position in non-Treasury securities detracted from its performance as yield spreads widened and bond prices decreased; however, our rigorous research process helped to mitigate this as the specific securities selected for the Fund outperformed those in the benchmark. |
| | |
| ■ | Our outlook is for interest rates to remain relatively low as the global economy still appears unable to support higher borrowing costs due to the headwinds mentioned above, a somewhat tepid recovery and still substantial levels of excess debt. We remain unconvinced that the U.S. economy will experience the underlying strength the Fed will need to be comfortable beyond more than a few small rate increases. |
| | |
| ■ | In our view, U.S. fixed income securities offer attractive yields versus those available elsewhere in today’s global marketplace. We believe the Fund is positioned to perform well in this slow-growth, low inflation environment that favors income over capital appreciation. As of June 30, the Fund had modestly underweighted duration versus its benchmark and was positioned for a higher income level versus the benchmark. We have maintained overweighted positions in corporate bonds, including exposure to select, high-quality taxable municipal bonds. Our goal is to provide outperformance over a range of interest rate scenarios. The market’s appetite for additional yield generally remains stable and our rigorous credit selection process is aimed at adding incremental relative return through selection of specific bonds that we believe should perform better than those in the benchmark. |
| PAGE 22 |
| |
| 2015 Semi-Annual Report |
| WESTCORE PLUS BOND FUND (continued) | (UNAUDITED) |
Top Ten Corporate Credit Exposure
(as of 6/30/15)
| | | |
| Range Resources Corp. | 1.5 | % |
| Crown Castle Towers LLC | 1.4 | |
| City National Corp. | 1.3 | |
| Potlatch Corp. | 1.2 | |
| Washington REIT | 1.1 | |
| Washington State | 1.1 | |
| General Electric | 1.1 | |
| Oncor Electric Delivery Co. LLC | 1.1 | |
| PepsiCo Inc. | 1.0 | |
| PNC Funding Corp. | 1.0 | |
| Total (% of Net Assets) | 11.8 | % |
Percentages represent the Fund’s aggregate holdings in the same corporate issuer and its affiliates. Top Ten Corporate Credit Exposure are subject to change. There are no guarantees that the Fund will continue to remain invested in any particular security or issuer.
Portfolio Characteristics
(as of 6/30/15)
| | Westcore Plus
Bond Fund | Barclays U.S.
Aggregate Bond Index |
| Effective Duration | 5.4 years | 5.6 years |
| Effective Maturity | 7.6 years | 7.9 years |
| Number of Holdings | 215 | 9,496 |
| Portfolio Turnover Rate (1 year trailing) | 57% | — |
Please see definition of terms beginning on page 30.
Asset Allocation
(as of 6/30/15)
| | | | | | | | |
| | | Westcore Plus
Bond Fund | Barclays U.S.
Aggregate Bond Index | Relative Weights
Under | Over |
| U.S. Treasuries | | 12.6 | % | 36.2 | % | -23.6 | % |
| U.S. Agencies | | 1.4 | | 3.2 | | -1.8 | |
| Other Government-Related | | 5.9 | | 6.1 | | -0.2 | |
| Corporate Bonds | | 45.5 | | 23.9 | | 21.6 | |
| Agency Mortgage-Backed Securities | | 23.5 | | 28.1 | | -4.6 | |
| Residential Mortgage-Backed Securities | | 3.1 | | 0.0 | | 3.1 | |
| Commercial Mortgage-Backed Securities | | 2.4 | | 1.9 | | 0.5 | |
| Asset-Backed Securities | | 3.5 | | 0.6 | | 2.9 | |
| Preferred Stock | | 0.9 | | 0.0 | | 0.9 | |
| Common Stock | | 0.0 | | 0.0 | | 0.0 | |
| Other | | 0.0 | | 0.0 | | 0.0 | |
| ST Investments/Net Other Assets | | 1.2 | | 0.0 | | 1.2 | |
Percentages are based on Total Net Assets.
Ratings Allocation
(as of 6/30/15)
| | | | | | | | |
| | | Westcore Plus
Bond Fund | Barclays U.S.
Aggregate Bond Index | Relative Weights
Under | Over |
| Treasuries | | 12.7 | % | 36.1 | % | -23.4 | % |
| Agencies | | 25.1 | | 31.3 | | -6.2 | |
| AAA | | 4.5 | | 5.3 | | -0.8 | |
| AA | | 9.3 | | 3.3 | | 6.0 | |
| A | | 20.8 | | 11.4 | | 9.4 | |
| BBB | | 17.1 | | 12.6 | | 4.5 | |
| Below BBB | | 9.6 | | 0.0 | | 9.6 | |
| Non-Rated | | 0.4 | | 0.0 | | 0.4 | |
| ST Investments/Net Other Assets | | 0.5 | | 0.0 | | 0.5 | |
Percentages are based on Total Investments. The ratings allocation reflects the Standard & Poor’s equivalent ratings category for the highest credit-quality rating assigned by either Standard & Poor’s or Moody’s.
Maturity Distribution
(as of 6/30/15)
| | | | | | | | |
| | | Westcore Plus
Bond Fund | Barclays U.S.
Aggregate Bond Index | Relative Weights
Under | Over |
< 1 year | | 8.1 | % | 0.0 | % | 8.1 | % |
| 1 - 3 years | | 11.9 | | 24.0 | | -12.1 | |
| 3 - 5 years | | 27.1 | | 24.7 | | 2.4 | |
| 5 - 10 years | | 35.4 | | 37.2 | | -1.8 | |
| 10 - 20 years | | 8.2 | | 3.3 | | 4.9 | |
| 20+ years | | 9.3 | | 10.8 | | -1.5 | |
Percentages are based on Total Investments. The Adviser to the Funds utilizes the expected maturity in presenting this information.
| |
| PAGE 23 |
| |
| p: 800.392.CORE (2673) | www.westcore.com |
| | |
| WESTCORE COLORADO TAX-EXEMPT FUND (WTCOX) | (UNAUDITED) |
Fund Strategy
A Colorado municipal bond fund focusing on federal and state tax-exempt income primarily through investments in investment-grade quality bonds of intermediate maturity.
Fund Management
Kenneth A. Harris, CFA Portfolio Manager
CFA is a trademark owned by CFA Institute.
Cumulative Returns
The chart above represents historical performance of a hypothetical investment of $10,000 in the Fund over the past 10 years (or for the life of the Fund if shorter). Performance calculations are as of the end of June each year. Past performance does not guarantee future results. This chart does not reflect the deduction of taxes that a shareholder would pay on Fund distributions or the redemption of Fund shares.
Lipper Index data provided by Lipper, Inc.
Please see index definitions beginning on page 28.
Average Annual Total Returns
| | | | | | | | | | | | | | | | | |
| | | 6 Months | 1 Year | 3 Years | 5 Years | 10 Years | Since
Incep. | 30-Day
SEC
Yield | Incep.
Date |
| Retail Class (WTCOX) | | 0.22 | % | 2.68 | % | 2.44 | % | 3.62 | % | 3.67 | % | 4.74 | % | 2.58 | % | 6/1/1991 |
| Barclays U.S. 10-Year Municipal Bond Index | | 0.11 | | 2.98 | | 3.11 | | 4.79 | | 4.85 | | 6.02 | | — | | |
| Lipper Intermediate Municipal Debt Index | | -0.06 | | 1.93 | | 2.30 | | 3.61 | | 3.68 | | 4.77 | | — | | |
Retail Class Annual Expense Ratio (per the current prospectus) — Gross: 0.77%, Net: 0.65%
30-Day SEC Yield figure reflects all fee waivers and expense reimbursements. Without the absorption of these fee waivers and/or expense reimbursements, the figure would have been 2.47%.
The performance data quoted represents past performance and does not guarantee future results. Performance information for the institutional class shares prior to their inception date is based on the performance of the retail class. Current performance may be lower or higher than the performance quoted. To obtain current performance as of the most recent month-end, please call 800.392.CORE (2673) or visit us online at www.westcore.com. Average annual total returns and yield figures reflect the reinvestment of dividends, capital gains distributions, all fee waivers and expense reimbursements. Without the fee waivers and expense reimbursements, total return and yield figures would have been lower. Total return and yield figures represent past performance. Investment return and principal value will vary, and shares, when redeemed, may be worth more or less than their original cost. Westcore fund shares are not insured by the FDIC, the Federal Reserve Board or any other agency and are subject to investment risk.
Denver Investments (the “Adviser”) has contractually agreed to waive certain investment advisory and/or administration fees and/or to reimburse other expenses from April 30, 2015 until at least April 30, 2016. The waiver/reimbursement applies so that the ratio of expenses to average net assets, as reported in the Fund’s financial statements, will be no more than 0.65% for the Fund’s Retail Class for such period. Please see the Fund’s Prospectus for more information. This agreement may not be terminated or modified prior to this date without the approval of the Board of Trustees. Without the fee waivers and expense reimbursements, total return figures would have been lower.
Westcore Colorado Tax-Exempt Fund invests primarily in instruments issued by or on behalf of one state and generally will be more volatile and loss of principal could be greater due to state specific risk.
Manager Commentary
| | |
| ■ | After initially falling, interest rates rose amidst volatility through the first half of the year, providing some validity to predictions of higher rates. Slowly rising rates are ultimately healthy for bond investors and, depending on the speed at which rates rise, can still produce positive returns for bonds. The Westcore Colorado Tax-Exempt Fund outperformed its benchmark, the Barclays U.S. 10-Year Municipal Bond Index, for the first half of the year. The outperformance can be attributed to the Fund having shorter duration and higher yield. |
| | |
| ■ | We have expressed concerns about Puerto Rico’s debt in previous commentaries. Investors seemed complacent despite the massive amount of debt this little island had issued, clear signs of credit deterioration and the enormous exposure of some single state funds. It appears our concern was warranted as on June 28, Governor Alejandro Garcia Padilla announced that the island was perilously close to a “death spiral” and “unable to pay its debts.” Following this, its bonds have sold off dramatically. We believe it is our job to sort through the mess and panic to see if there is value, especially since bonds issued by Puerto Rico are double tax exempt in all states. Our research uncovered that, even at 50 or 60 cents to the dollar, the situation is so bad that we don’t see value in the uninsured bonds. As we looked more closely into municipal debt insurers, we found that the largest, most stable insurer had, in our opinion, a very manageable level of exposure to bonds from Puerto Rico. These bonds are trading at distressed levels due the Puerto Rico name, but in the event of a default, the insurer must pay all principal and interest. Given this, we have taken a small position in insured bonds from Puerto Rico, which have a Standard & Poor’s rating of AA. |
| | |
| ■ | The U.S. economy looked stronger after the abnormally weak first quarter and the Federal Reserve postured to raise short-term interest rates during 2015. The unemployment rate fell to 5.3% in June, and there were solid increases in the number of employed workers as well as the number of people re-entering the labor market. This indicated underlying strength in the labor market, and the possibility that wages will begin rising more rapidly as the pool of available skilled labor becomes tighter. Additionally, lower oil prices have had a dramatic effect, reducing global inflation and future inflationary expectations. The Fed’s preferred measure of inflation, the Implicit Price Deflator for Personal Consumption Expenditures index (PCE), has not been above its proclaimed 2% target in over two and a half years while many major countries experience outright deflation. The Fed is facing a conundrum as raising rates in a low inflation, slow growth world could further exacerbate the already prevalent headwinds. Yet staying at a 0% target Fed Funds rate is considered “abnormal” policy. |
| | |
| ■ | The Fund’s effective duration as of June 30, 2015 was 5.25 and its average maturity was 8.56 years. This is longer duration and average maturity than year end. |
| | |
| ■ | At year end, no individual holdings within the Fund were subject to the Alternative Minimum Tax (AMT) and, except for cash equivalents, the Fund was invested 100% in securities exempt from Colorado state income taxes. |
| PAGE 24 |
| |
| 2015 Semi-Annual Report |
| WESTCORE COLORADO TAX-EXEMPT FUND (continued) | (UNAUDITED) |
Top Ten Holdings
| | | |
| (as of 6/30/15) | % of Net Assets |
| Cherry Creek School District #5 5.00%, 12/15/24 | 2.2 | % |
| Arapahoe County School District #1 5.00%, 12/1/29 | 1.6 | |
| Auraria Colorado Higher Education Center 4.00%, 4/1/29 | 1.6 | |
| Eagle, Garfield & Routt County School District Re-5OJ 5.00%, 12/1/26 | 1.5 | |
| El Paso County School District #49-REF 5.13%, 12/15/28 | 1.4 | |
| Denver City & County School District #1-B-REF 5.00%, 12/1/26 | 1.4 | |
| University of Colorado Hospital Authority A 5.00%, 11/15/36 | 1.3 | |
| El Paso County School District #49 COPS-A 5.13%, 12/15/28 | 1.2 | |
| Tallyns Reach Met District #3 4.00%, 12/1/21 | 1.2 | |
| Rangeview Library District 5.00%, 12/15/22 | 1.2 | |
| Total (% of Net Assets) | 14.6 | % |
Top ten holdings do not include any cash, cash equivalents or exchange traded fund investments and are subject to change. There are no guarantees that the Fund will continue to remain invested in any particular holding.
Portfolio Characteristics
(as of 6/30/15)
| | Westcore Colorado | Barclays U.S. 10-Year |
| | Tax-Exempt Fund | Municipal Bond Index |
| Effective Duration | 5.3 years | 5.8 years |
| Effective Maturity | 8.6 years | 9.9 years |
| Colorado Double Tax-Exempt Percentage (excludes cash & cash equivalents) | 100 | — |
| Percentage of Holdings Subject to AMT | 0 | — |
| Number of Holdings | 173 | — |
| Portfolio Turnover Rate (1 year trailing) | 20% | — |
Please see definition of terms beginning on page 30.
Ratings Allocation
(as of 6/30/15)
| | | | | | | | |
| | | Westcore
Colorado
Tax-Exempt
Fund | Barclays U.S.
10-Year
Municipal
Bond Index | Relative Weights
Under | Over |
| Treasuries | | 0.0 | % | 0.0 | % | 0.0 | % |
| Agencies | | 0.0 | | 0.0 | | 0.0 | |
| AAA | | 3.0 | | 14.4 | | -11.4 | |
| AA | | 61.9 | | 51.9 | | 10.0 | |
| A | | 13.8 | | 30.4 | | -16.6 | |
| BBB | | 10.9 | | 3.3 | | 7.6 | |
| Below BBB | | 1.6 | | 0.0 | | 1.6 | |
| Non-Rated | | 3.0 | | 0.0 | | 3.0 | |
| ST Investments/Net Other Assets | | 5.8 | | 0.0 | | 5.8 | |
Percentages are based on Total Investments. The ratings allocation reflects the Standard & Poor’s equivalent ratings category for the highest credit-quality rating assigned by either Standard & Poor’s or Moody’s.
Maturity Distribution
(as of 6/30/15)
| | | | | | | | |
| | | Westcore
Colorado
Tax-Exempt
Fund | Barclays U.S.
10-Year
Municipal
Bond Index | Relative Weights
Under | Over |
< 1 year | | 7.9 | % | 0.0 | % | 7.9 | % |
| 1 - 3 years | | 13.4 | | 0.0 | | 13.4 | |
| 3 - 5 years | | 11.8 | | 0.0 | | 11.8 | |
| 5 - 10 years | | 25.6 | | 51.0 | | -25.4 | |
| 10 - 20 years | | 40.2 | | 49.0 | | -8.8 | |
| 20+ years | | 1.1 | | 0.0 | | 1.1 | |
Percentages are based on Total Investments. The Adviser to the Funds utilizes the expected maturity in presenting this information.
| |
| PAGE 25 |
| |
| p: 800.392.CORE (2673) | www.westcore.com |
Disclosure of Fund Expenses
As a shareholder of a Fund, you incur two types of costs: (1) transaction costs (such as the 2% fee on redemption of certain Fund shares made within 90 days of purchase); and (2) ongoing costs, including management fees and other Fund expenses. The examples on the next page are intended to help you understand your ongoing costs (in dollars) of investing in a Fund and to compare these costs with the ongoing costs of investing in other mutual funds. The examples are based on an investment of $1,000 invested on January 1, 2015 and held until June 30, 2015.
Actual Expenses. The first line of the table on the next page provides information about actual account values and actual expenses. You may use the information in this line, together with the amount you invested, to estimate the expenses that you paid over the period. Simply divide your account value by $1,000 (for example, an $8,600 account value divided by $1,000 = 8.6), then multiply the result by the number in the first line under the heading “Expenses Paid During Period” to estimate the expenses you paid on your account during this period.
Hypothetical Example for Comparison Purposes. The second line of the table on the next page provides information about hypothetical account values and hypothetical expenses based on the Fund’s actual expense ratio and an assumed rate of return of 5% per year before expenses, which is not the Fund’s actual return. The hypothetical account values and expenses may not be used to estimate the actual ending account balance or expenses you paid for the period. You may use this information to compare the ongoing costs of investing in a Fund and other mutual funds. To do so, compare this 5% hypothetical example with the 5% hypothetical examples that appear in the shareholder reports of other funds.
Expenses shown in the table on the next page are meant to highlight ongoing Fund costs only and do not reflect transaction costs, such as redemption fees. Therefore, the second line of the table is useful in comparing ongoing costs only, and may not help you determine the relative total costs of owning different funds. In addition, if these transactional costs were included, your costs would have been higher.
Expenses Paid During Period
With respect to Expenses Paid During the Period, as shown in the table on the next page, expenses are equal to the Fund’s annualized expense ratio, as shown below, multiplied by the average account value over the period, multiplied by the number of days in the last six months of the fiscal half-year, 181/365 (to reflect the half-year period). The annualized expense ratios for the last six months were as follows:
| | | | | | |
| Fund | | Retail Class | Institutional Class |
| Westcore Growth Fund | | 1.15 | % | 0.95% | |
| Westcore MIDCO Growth Fund | | 1.02 | % | 0.89% | |
| Westcore Select Fund | | 1.09 | % | N/A | |
| Westcore Small-Cap Growth Fund | | 1.30 | % | 0.72% | |
| Westcore Blue Chip Dividend Fund | | 0.99 | % | 0.82% | |
| Westcore Mid-Cap Value Dividend Fund | | 1.18 | % | N/A | |
| Westcore Small-Cap Value Dividend Fund | | 1.30 | % | 1.13% | |
| Westcore Micro-Cap Opportunity Fund | | 1.30 | % | N/A | |
| Westcore International Small-Cap Fund | | 1.50 | % | N/A | |
| Westcore Flexible Income Fund | | 0.85 | % | 0.77% | |
| Westcore Plus Bond Fund | | 0.55 | % | 0.42% | |
| Westcore Colorado Tax-Exempt Fund | | 0.65 | % | N/A | |
| PAGE 26 |
| |
| 2015 Semi-Annual Report |
| FUND EXPENSES (continued) | (UNAUDITED) |
| Fund | | | | Beginning Account
Value
1/1/2015 | | Ending Account
Value
6/30/2015 | | Expense Paid
During the Period
1/1/2015 to
6/30/2015 | |
| Westcore Growth Fund | | | | | | | | | | | | |
| Retail Class | | Actual | | $ | 1,000.00 | | $ | 1,060.50 | | $ | 5.88 | |
| | | Hypothetical (5% return before expenses) | | $ | 1,000.00 | | $ | 1,019.09 | | $ | 5.76 | |
| Institutional Class | | Actual | | $ | 1,000.00 | | $ | 1,062.10 | | $ | 4.86 | |
| | | Hypothetical (5% return before expenses) | | $ | 1,000.00 | | $ | 1,020.08 | | $ | 4.76 | |
| Westcore MIDCO Growth Fund | | | | | | | | | | | | |
| Retail Class | | Actual | | $ | 1,000.00 | | $ | 1,070.80 | | $ | 5.24 | |
| | | Hypothetical (5% return before expenses) | | $ | 1,000.00 | | $ | 1,019.74 | | $ | 5.11 | |
| Institutional Class | | Actual | | $ | 1,000.00 | | $ | 1,071.20 | | $ | 4.57 | |
| | | Hypothetical (5% return before expenses) | | $ | 1,000.00 | | $ | 1,020.38 | | $ | 4.46 | |
| Westcore Select Fund | | | | | | | | | | | | |
| Retail Class | | Actual | | $ | 1,000.00 | | $ | 1,033.60 | | $ | 5.50 | |
| | | Hypothetical (5% return before expenses) | | $ | 1,000.00 | | $ | 1,019.39 | | $ | 5.46 | |
| Westcore Small-Cap Growth Fund | | | | | | | | | | | | |
| Retail Class | | Actual | | $ | 1,000.00 | | $ | 1,057.00 | | $ | 6.63 | |
| | | Hypothetical (5% return before expenses) | | $ | 1,000.00 | | $ | 1,018.35 | | $ | 6.51 | |
| Institutional Class | | Actual | | $ | 1,000.00 | | $ | 1,060.60 | | $ | 3.68 | |
| | | Hypothetical (5% return before expenses) | | $ | 1,000.00 | | $ | 1,021.22 | | $ | 3.61 | |
| Westcore Blue Chip Dividend Fund | | | | | | | | | | | | |
| Retail Class | | Actual | | $ | 1,000.00 | | $ | 981.00 | | $ | 4.86 | |
| | | Hypothetical (5% return before expenses) | | $ | 1,000.00 | | $ | 1,019.89 | | $ | 4.96 | |
| Institutional Class | | Actual | | $ | 1,000.00 | | $ | 981.40 | | $ | 4.03 | |
| | | Hypothetical (5% return before expenses) | | $ | 1,000.00 | | $ | 1,020.73 | | $ | 4.11 | |
| Westcore Mid-Cap Value Dividend Fund | | | | | | | | | | | | |
| Retail Class | | Actual | | $ | 1,000.00 | | $ | 1,008.60 | | $ | 5.88 | |
| | | Hypothetical (5% return before expenses) | | $ | 1,000.00 | | $ | 1,018.94 | | $ | 5.91 | |
| Westcore Small-Cap Value Dividend Fund | | | | | | | | | | | | |
| Retail Class | | Actual | | $ | 1,000.00 | | $ | 967.30 | | $ | 6.34 | |
| | | Hypothetical (5% return before expenses) | | $ | 1,000.00 | | $ | 1,018.35 | | $ | 6.51 | |
| Institutional Class | | Actual | | $ | 1,000.00 | | $ | 968.10 | | $ | 5.51 | |
| | | Hypothetical (5% return before expenses) | | $ | 1,000.00 | | $ | 1,019.19 | | $ | 5.66 | |
| Westcore Micro-Cap Opportunity Fund | | | | | | | | | | | | |
| Retail Class | | Actual | | $ | 1,000.00 | | $ | 1,015.60 | | $ | 6.50 | |
| | | Hypothetical (5% return before expenses) | | $ | 1,000.00 | | $ | 1,018.35 | | $ | 6.51 | |
| Westcore International Small-Cap Fund | | | | | | | | | | | | |
| Retail Class | | Actual | | $ | 1,000.00 | | $ | 1,035.30 | | $ | 7.57 | |
| | | Hypothetical (5% return before expenses) | | $ | 1,000.00 | | $ | 1,017.36 | | $ | 7.50 | |
| Westcore Flexible Income Fund | | | | | | | | | | | | |
| Retail Class | | Actual | | $ | 1,000.00 | | $ | 1,018.20 | | $ | 4.25 | |
| | | Hypothetical (5% return before expenses) | | $ | 1,000.00 | | $ | 1,020.58 | | $ | 4.26 | |
| Institutional Class | | Actual | | $ | 1,000.00 | | $ | 1,019.50 | | $ | 3.86 | |
| | | Hypothetical (5% return before expenses) | | $ | 1,000.00 | | $ | 1,020.98 | | $ | 3.86 | |
| Westcore Plus Bond Fund | | | | | | | | | | | | |
| Retail Class | | Actual | | $ | 1,000.00 | | $ | 1,001.00 | | $ | 2.73 | |
| | | Hypothetical (5% return before expenses) | | $ | 1,000.00 | | $ | 1,022.07 | | $ | 2.76 | |
| Institutional Class | | Actual | | $ | 1,000.00 | | $ | 1,002.40 | | $ | 2.09 | |
| | | Hypothetical (5% return before expenses) | | $ | 1,000.00 | | $ | 1,022.71 | | $ | 2.11 | |
| Westcore Colorado Tax-Exempt Fund | | | | | | | | | | | | |
| Retail Class | | Actual | | $ | 1,000.00 | | $ | 1,002.20 | | $ | 3.23 | |
| | | Hypothetical (5% return before expenses) | | $ | 1,000.00 | | $ | 1,021.57 | | $ | 3.26 | |
| PAGE 27 |
| |
| p: 800.392.CORE (2673) | www.westcore.com |
| IMPORTANT DISCLOSURES | (UNAUDITED) |
Index Definitions and Disclosures
All indices are unmanaged and index performance figures include reinvestment of dividends but do not reflect any fees, expenses or taxes. Investors cannot invest directly in an index.
The Barclays U.S. 10-Year Municipal Bond Index includes investment grade (Moody’s Investor Services Aaa to Baa, Standard and Poor’s Corporation AAA to BBB) tax-exempt bonds with maturities between eight and twelve years.
The Barclays U.S. Aggregate Bond Index is a fixed income, market-value-weighted index generally representative of investment grade fixed-rate debt issues, including government, corporate, asset-backed, and mortgage-backed securities with maturities of at least one year.
The Barclays U.S. Corporate High Yield Ba Index measures the performance of intermediate (1 to 10 year) U.S. high yield issues. It includes fixed-rate, noninvestment grade debt issues rated Ba1 or lower by Moody’s, rated BB+ or lower by S&P, rated below investment grade by Fitch Investor’s Service or if unrated previously held a high yield rating or have been associated with a high yield issuer, and must trade accordingly.
The Chicago Board Options Exchange Volatility Index (VIX) is a widely used measure of market risk which is intended to show the market’s expectation of 30-day volatility. It is constructed using the implied volatilities of a wide range of S&P 500® Index options.
The Conference Board’s Leading Economic Indicators Index® for the United States (LEI) is a composite of 10 key variables which, historically, have been useful in predicting future economic activity in the United States. It is calculated by the Conference Board, a research organization for businesses that provides information about management and the marketplace.
The Consumer Confidence Index (CCI) is a survey by the Conference Board (a research organization for businesses that provides information about management and the marketplace) that measures how optimistic or pessimistic consumers are with respect to the economy and the near future.
The Dow Jones Industrial Average is a price weighted average of 30 significant stocks traded on the New York Stock Exchange and the NASDAQ.
The Lipper Core Plus Bond Index tracks the performance of funds that invest at least 65% in domestic investment-grade debt issues (rated in the top four grades) with any remaining investment in non-benchmark sectors such as high-yield, global and emerging market debt. These funds maintain dollar-weighted average maturities of five to ten years.
The Lipper High Current Yield Index tracks the performance of funds that aim at high (relative) current yield from fixed income securities, have no quality or maturity restrictions, and tend to invest in lower-grade debt issues.
The Lipper Intermediate Municipal Debt Index tracks the performance of funds that invest in municipal debt issues with dollar-weighted average maturities of five to ten years.
The Lipper International Small-Cap Index tracks the performance of funds that, by portfolio practice, invest at least 75% of their equity assets in companies strictly outside of the U.S. with market capitalizations (on a three-year weighted basis) below Lipper’s international large-cap floor.
The Lipper Large-Cap Core Index tracks the performance of funds that, by portfolio practice, invest at least 75% of their equity assets in companies with market capitalizations (on a three-year weighted basis) above Lipper’s USDE large-cap floor.
The Lipper Large-Cap Growth Index tracks the performance of funds that, by portfolio practice, invest at least 75% of their equity assets in companies with market capitalizations (on a three-year weighted basis) above Lipper’s USDE large-cap floor.
The Lipper Mid-Cap Growth Index tracks the performance of funds that, by portfolio practice, invest at least 75% of their equity assets in companies with market capitalizations (on a three-year weighted basis) below Lipper’s USDE large-cap floor.
The Lipper Mid-Cap Value Index tracks the performance of funds that, by portfolio practice, invest at least 75% of their equity assets in companies with market capitalizations (on a three-year weighted basis) below Lipper’s USDE large-cap floor.
The Lipper Small-Cap Core Index tracks the performance of funds that, by portfolio practice, invest at least 75% of their equity assets in companies with market capitalizations (on a three-year weighted basis) below Lipper’s USDE small-cap ceiling.
| PAGE 28 |
| |
| 2015 Semi-Annual Report |
| IMPORTANT DISCLOSURES (continued) | (UNAUDITED) |
The Lipper Small-Cap Growth Index tracks the performance of funds that invest at least 75% of their equity assets in companies with market capitalization (on a three-year weighted basis) below Lipper’s USDE Small-cap ceiling.
The Lipper Small-Cap Value Index tracks the performance of funds that, by portfolio practice, invest at least 75% of their equity assets in companies with market capitalizations (on a three-year weighted basis) below Lipper’s USDE small-cap ceiling.
The MSCI ACWI Index captures large and mid cap representation across 23 Developed Market and 23 Emerging Market countries. With 2,470 constituents, the index covers approximately 85% of the global investable equity opportunity set.
The MSCI ACWI ex USA Small Cap Index captures small cap representation across 22 of 23 Developed Market countries (excluding the U.S.) and 23 Emerging Market countries. With 4,233 constituents, the index covers approximately 14% of the global equity opportunity set outside the U.S.
The MSCI EAFE Small-Cap Index is an unmanaged market-capitalization-weighted index that represents the performance of smaller capitalization companies in developed stock markets outside of North America. The index targets all companies with market capitalization below that of the companies in the MSCI EAFE Index and up to 99% coverage of the free-float adjusted market capitalization in each market.
The Russell 1000® Index measures the performance of the large-cap segment of the U.S. equity universe. It is a subset of the Russell 3000® Index and includes approximately 1000 of the largest securities based on a combination of their market cap and current index membership. The Russell 1000® Index represents approximately 92% of the U.S. market.
The Russell 1000® Growth Index measures the performance of the largest 1,000 firms in the Russell 3000® Index, which represents approximately 98% of the investable U.S. equity market.
The Russell 2000® Index measures the performance of the small-cap segment of the U.S. equity universe. The Russell 2000® Index is a subset of the Russell 3000® Index representing approximately 10% of the total market capitalization of that index. It includes approximately 2000 of the smallest securities based on a combination of their market cap and current index membership.
The Russell 2000® Growth Index measures the performance of the small-cap growth segment of the U.S. equity universe. It includes those Russell 2000® Index companies with higher price-to-value ratios and higher forecasted growth values.
The Russell 2000® Value Index measures the performance of companies within the Russell 2000® Index having lower price-to-book ratios and lower forecasted growth values. The Russell 2000® Index includes the 2000 firms from the Russell 3000® Index with the smallest market capitalizations. The Russell 3000® Index represents 98% of the investable U.S. equity market.
The Russell Developed Large-Cap Index is constructed to provide a comprehensive and unbiased barometer for the large-cap segment of the developed equity universe.
The Russell Microcap® Index measures the performance of the microcap segment of the U.S. equity market. It makes up less than 3% of the U.S. equity market. It includes 1,000 of the smallest securities in the Russell 2000® Index based on a combination of their market cap and current index membership and it includes the next 1,000 securities.
The Russell Midcap® Growth Index measures the performance of those Russell Midcap companies with higher price-to-book ratios and higher forecasted growth values than the threshold determined by the Frank Russell Company. The Russell Midcap companies are comprised of the 800 smallest companies in the Russell 1000® Index. The Russell 1000® Index consists of the 1,000 largest U.S. Incorporated companies based on total market capitalization.
The Russell Midcap® Value Index measures the performance of those Russell Midcap companies with lower price-to-book ratios and lower forecasted growth values. The stocks are also members of the Russell 1000® Value index.
The S&P 500® Index is comprised of 500 common stocks chosen for market size, liquidity, and industry group representation. It is a market-value weighted index (stock price times number of shares outstanding), with each stock’s weight in the Index proportionate to its market value.
The Shanghai Composite Index is a stock market index of all stocks that are traded at the Shanghai Stock Exchange.
| PAGE 29 |
| |
| p: 800.392.CORE (2673) | www.westcore.com |
| | |
| IMPORTANT DISCLOSURES (continued) | (UNAUDITED) |
The Westcore Blue Chip Dividend Fund Custom Index is comprised of the S&P 500® Index from the Fund’s inception to 4/30/2013 and the Russell Developed Large-Cap Index for the time period 5/1/2013 to the most recent period end to reflect the change in the Fund’s investment strategy on 4/30/2013. The Adviser believes that the Custom Index is the best benchmark measurement for periods prior to 4/30/2013.
Barclays Capital is the source and owner of the Barclays Capital Index data contained in this material and all trademarks and copyrights related thereto. Any further dissemination or redistribution is strictly prohibited. Barclays Capital is not responsible for the formatting or configuration of this material or for any inaccuracy in Denver Investments’ presentation thereof.
Lipper Inc. is the source and owner of the Lipper Index data contained in this material and all trademarks and copyrights related thereto. Any further dissemination or redistribution is strictly prohibited. Lipper Inc. is not responsible for the formatting or configuration of this material or for any inaccuracy in Denver Investments’ presentation thereof.
MSCI Barra is the source and owner of the MSCI Index data contained in this material and all trademarks and copyrights related thereto. Any further dissemination or redistribution is strictly prohibited. MSCI Barra is not responsible for the formatting or configuration of this material or for any inaccuracy in Denver Investments’ presentation thereof.
Russell Investments is the source and owner of the Russell Index data contained in this material and all trademarks and copyrights related thereto. Any further dissemination or redistribution is strictly prohibited. Russell Investments is not responsible for the formatting or configuration of this material or for any inaccuracy in Denver Investments’ presentation thereof.
Standard & Poor’s is the source and owner of the S&P Index data contained in this material and all trademarks and copyrights related thereto. Any further dissemination or redistribution is strictly prohibited. Standard & Poor’s is not responsible for the formatting or configuration of this material or for any inaccuracy in Denver Investments’ presentation thereof.
Top 5/Bottom 5 Stock Performance Calculation Methodology
The Calculation methodology used to construct this chart took into account consistently the weighting of every holding in the Fund that contributed to the Fund’s performance during the Measurement Period, and the Chart reflects consistently the results of the Calculation. The Calculation determined the contribution of each Fund holding by calculating the weight (i.e., percentage of the Total Investments) of each holding multiplied by the rate of return for that holding during the first six months of 2015.
Definition of Terms
Beta: A measure of a fund’s sensitivity to market movements. The beta of the market is 1.00 by definition. A beta above 1 is more volatile than the overall market, while a beta below 1 is less volatile.
Consumer Price Index (CPI): Measures changes in the price level of a market basket of consumer goods and services purchased by households.
Credit Quality Rating: A rating of an individual bond as determined by a nationally recognized statistical rating organization (NRSRO) such as Standard & Poor’s or Moody’s. Credit quality ratings range from highest, “AAA “ to lowest, “D”. For more information regarding rating methodologies for Standard & Poor’s, visit www.standardandpoors.com and for Moody’s, visit www.moodys.com.
Duration: A generic description of the sensitivity of a bond’s price (as a percentage of initial price) to a change in yield.
EPS (Earnings per Share) Growth: Earnings per share is the portion of a company’s profit allocated to each outstanding share of common stock. EPS growth serves as an indicator of a company’s profitability.
Effective Maturity: A weighted average of the maturities of the bonds in a portfolio.
Emerging Markets: Westcore International Small-Cap Fund considers emerging market countries to be those countries that are neither U.S. nor developed countries.
Federal Reserve (the Fed): The central banking system of the United States.
Free Cash Flow to Total Enterprise Value (FCF/TEV): A valuation metric used to compare the amount of cash a firm generates to the total value of the resources used to generate that cash.
Gross Domestic Product (GDP): The market value of all officially recognized goods and services produced within a country in a given period of time.
| PAGE 30 |
| |
| 2015 Semi-Annual Report |
| IMPORTANT DISCLOSURES (continued) | (UNAUDITED) |
Market Capitalization: The market capitalization represents the total value of a company or stock. It is calculated by multiplying the number of shares outstanding by the current price of one share.
Modified Duration: A duration measure in which it is assumed that yield changes do not change the expected cash flows.
Number of Holdings: The Number of Holdings presented excludes short-term investments including money market mutual funds.
Operating Cash Flow to Price (OCF/P): A valuation metric used to compare the amount of cash a firm generates per share from operations to the price of the stock.
Portfolio Turnover Rate: A percentage computed by taking the lesser of purchases or sales of portfolio securities (excluding short-term investments) for the year and dividing it by the monthly average of the market value of the portfolio securities during the year.
Price to Book Value (P/B) Ratio: The P/B ratio is used to compare a company’s book value to its current market price. This ratio compares the market’s valuation of a company to the value of that company as indicated on its financial statements. The higher the ratio, the higher the premium the market is willing to pay for the company above its hard assets.
Price to Cash (P/C) Flow Ratio: The P/C flow ratio is a measure of a firm’s stock price relative to its financial performance. For a fund, the P/C flow ratio is the weighted average of all stocks held in the fund. It represents the amount an investor is willing to pay for a dollar generated from a particular company’s operations.
Price to Earnings (P/E) Ratio: The P/E ratio is a stock’s per share price divided by its per share earnings over a 12-month period. For a fund, the P/E ratio is the weighted average of all stocks held in the fund. The higher the P/E ratio, the more the market is willing to pay for each dollar of annual earnings.
Quantitative Easing: A monetary policy that the Federal Reserve, and other central banks, pursue to increase the supply of money and thereby expand liquidity in the hopes of fostering stronger growth.
REIT: A REIT is a real estate investment trust. REITs are securities that sell like a stock on a major exchange. REITs invest directly in real estate, either through properties or mortgages.
Return on Equity (ROE): A measure of how well a company used reinvested earnings to generate additional earnings. It is used as a general indication of a company’s efficiency; in other words, how much profit is a company able to generate given the resources provided by its stockholders.
Risk On, Risk Off: A concept that describes market sentiment as either “risk on” or “risk off”. During a market sentiment of “risk on”, the market is optimistic and more willing to take on risk in exchange for possibly better returns. When market sentiment is “risk off”, the market is pessimistic and will favor investments with perceived lower risk.
SEC Yield: The SEC Yield is a standardized method of computing return on investment that the U.S. Securities and Exchange Commission (SEC) requires mutual funds to use when advertising their yields. Its objective is to allow a confusion-free comparison of the performance of different funds.
Weighted Average: An average that takes into account the proportional relevance of each component, rather than treating each component equally.
| |
| PAGE 31 |
| |
| p: 800.392.CORE (2673) | www.westcore.com |