UNITED STATES
SECURITIES AND EXCHANGE COMMISSION
Washington, D.C. 20549
FORM N-CSR
CERTIFIED SHAREHOLDER REPORT OF REGISTERED
MANAGEMENT INVESTMENT COMPANIES
Investment Company Act file number: 811-3373
Westcore Trust
(exact name of registrant as specified in charter)
1290 Broadway, Suite 1100, Denver, Colorado 80203
(Address of principal executive offices) (Zip code)
David T. Buhler, Secretary
Westcore Trust
1290 Broadway, Suite 1100, Denver, Colorado 80203
(Name and address of agent for service)
Registrant’s telephone number, including area code: 303-623-2577
Date of fiscal year end: December 31
Date of reporting period: June 30, 2014
Item 1. Reports to Stockholders.

| | |
| | |
| | |
2014 SEMI-ANNUAL REPORT |
| | | |
| | | |
JUNE 30, 2014 | |
| | |
| | Retail | Institutional |
Fund | Class | Class |
|
WESTCORE EQUITY FUNDS |
Westcore Growth Fund | WTEIX | WILGX |
Westcore MIDCO Growth Fund | WTMGX | WIMGX |
Westcore Select Fund | WTSLX | – |
Westcore Small-Cap Growth Fund | WTSGX | WISGX |
Westcore Blue Chip Dividend Fund | WTMVX | WIMVX |
Westcore Mid-Cap Value Dividend Fund | WTMCX | – |
Westcore Small-Cap Value Dividend Fund | WTSVX | WISVX |
Westcore Micro-Cap Opportunity Fund | WTMIX | – |
Westcore International Small-Cap Fund | WTIFX | – |
| | | |
WESTCORE BOND FUNDS |
Westcore Flexible Income Fund | WTLTX | WILTX |
Westcore Plus Bond Fund | WTIBX | WIIBX |
Westcore Colorado Tax-Exempt Fund | WTCOX | – |
| | | |
| | | |
| | | |
| | | |
| | | |
| | | |
| | | |
| | | |
Westcore Funds are managed by Denver Investments. |
| |
The mountain logo together with “Westcore Funds Denver Investments” is a registered service mark of Denver Investments. |
|


| SHAREHOLDER LETTER | 1 |
| | |
| FUND OVERVIEWS | |
| | |
| Westcore Growth Fund | 2 |
| | |
| Westcore MIDCO Growth Fund | 4 |
| | |
| Westcore Select Fund | 6 |
| | |
| Westcore Small-Cap Growth Fund | 8 |
| | |
| Westcore Blue Chip Dividend Fund | 10 |
| | |
| Westcore Mid-Cap Value Dividend Fund | 12 |
| | |
| Westcore Small-Cap Value Dividend Fund | 14 |
| | |
| Westcore Micro-Cap Opportunity Fund | 16 |
| | |
| Westcore International Small-Cap Fund | 18 |
| | |
| Westcore Flexible Income Fund | 20 |
| | |
| Westcore Plus Bond Fund | 22 |
| | |
| Westcore Colorado Tax-Exempt Fund | 24 |
| | |
| FUND EXPENSES | 26 |
| | |
| IMPORTANT DISCLOSURES | 28 |
| | |
| FINANCIAL STATEMENTS | 33 |
| | |
| Statements of Investments | 34 |
| | |
| Statements of Assets and Liabilities | 64 |
| | |
| Statements of Operations | 66 |
| | |
| Statements of Changes in Net Assets | 68 |
| | |
| Financial Highlights | 72 |
| | |
| Notes to Financial Statements | 82 |
INTENTIONALLY LEFT BLANK

DEAR FELLOW SHAREHOLDER:
Both stocks and bonds continued their rallies through the first half of 2014. The S&P 500® Index posted a 7.14% increase and 10-year Treasury note prices rallied due to a decrease in interest rates from a 3.04% yield at the beginning of the year to 2.53% on June 30.
The U.S. equity market shrugged off a significant downward revision of first quarter 2014 economic growth, primarily attributing the decrease to severe weather in the period. The equity market appeared to focus on positive leading economic indicators such as the ISM® Manufacturing report and on improving readings from the Conference Board’s Leading Economic Indicators Index®. Both the Dow Jones Industrial Average and the S&P 500® Index achieved record highs in the first half of 2014 as U.S. equities finished higher for the sixth consecutive quarter. While all areas of U.S. equities increased in the period, large-cap stocks took over market leadership. A rotation to large cap leadership is typical as a bull market extends.
The bond market also rallied in the first half of 2014, quickly adjusting to the tapering of quantitative easing by the Federal Reserve and indicating that bond investors expect inflationary pressures to remain muted throughout the economy. Interest rates, as reflected by the 10-year U.S. Treasury note, started the year at the high of 3.04% and fell by a full 0.6% to a multi-year low of 2.44% before ticking back up to 2.53% at the end of June. The Westcore fixed income funds performed well in this environment.
It is relatively unusual for the equity and bond markets to have moved in tandem for such an extended period. With the valuations of both asset classes at or near historically high levels, we believe expert fundamental analysis and diversification are the keys to success. Your Westcore investment teams place a very high priority on deep, proprietary fundamental research and portfolio construction. Also, the diversity of strategies offered by the Westcore Fund family allows you to have a broad variety of actively managed strategies in which to build your investment program.
We thank you for your continued confidence in the Westcore Funds family. Please let us know if you have any questions or comments.

Diversification does not eliminate risk.
John W. Zimmerman is a registered representative of ALPS Distributors, Inc.
CFA is a trademark owned by the CFA Institute.
The Shareholder Letter and the Manager Commentaries included in this shareholder report contain certain forward-looking statements about the factors that may affect the performance of the Funds in the future. These statements are based on Fund management’s predictions and expectations concerning certain future events and their expected impact on the Funds, such as performance of the economy as a whole and of specific industry sectors, changes in the levels of interest rates, the impact of developing world events, and other factors that may influence the future performance of the Funds. Management believes these forward-looking statements to be reasonable, although they are inherently uncertain and difficult to predict. Actual events may cause adjustments in portfolio management strategies from those currently expected to be employed.

Fund Strategy
Investing primarily in equity securities of large companies with growth potential.
Fund Management
Ross G. Moscatelli, CFA Portfolio Manager
Craig W. Juran, CFA Portfolio Manager
CFA is a trademark owned by CFA Institute.
Cumulative Returns
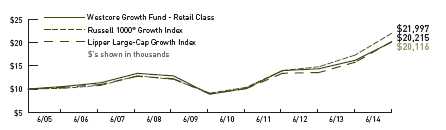
The chart above represents historical performance of a hypothetical investment of $10,000 in the Fund over the past 10 years (or for the life of the Fund if shorter). Performance calculations are as of the end of June each year. Past performance does not guarantee future results. This chart does not reflect the deduction of taxes that a shareholder would pay on Fund distributions or the redemption of Fund shares.
Lipper Index data provided by Lipper, Inc.
Please see pages 28 and 29 for index definitions.
Average Annual Total Returns
| | | | | | | | | | |
| | | | | | | | | | | | Since | Inception |
| | 6 Months | | 1 Year | | 3 Years | | 5 Years | | 10 Years | | Inception | Date |
| Retail Class (WTEIX) | 1.50% | | 24.16% | | 12.90% | | 17.73% | | 7.24% | | 9.07% | 6/1/1988 |
| Institutional Class | | | | | | | | | | | | |
| (WILGX) | 1.55 | | 24.38 | | 13.09 | | 17.90 | | 7.34 | | 9.11 | 9/28/2007 |
| Russell 1000® | | | | | | | | | | | | |
| Growth Index | 6.31 | | 26.92 | | 16.26 | | 19.24 | | 8.20 | | 10.06 | |
| Lipper Large-Cap | | | | | | | | | | | | |
| Growth Index | 4.21 | | 28.07 | | 14.70 | | 17.65 | | 7.29 | | 9.14 | |
Retail Class Annual Expense Ratio (per the current prospectus) — Gross: 1.09%, Net: 1.09%
Institutional Class Annual Expense Ratio (per the current prospectus) — Gross: 1.14%, Net: 0.89%
The performance data quoted represents past performance and does not guarantee future results. Performance information for the institutional class shares prior to their inception date is based on the performance of the retail class. Since inception performance figures for the index are from the inception of the retail class. Current performance may be lower or higher than the performance quoted. To obtain current performance as of the most recent month-end, please call 800.392. CORE (2673) or visit us online at www.westcore.com. Average annual total returns and yield figures reflect the reinvestment of dividends, capital gains distributions, all fee waivers and expense reimbursements. Without the fee waivers and expense reimbursements, total return and yield figures would have been lower. Total return and yield figures represent past performance. Investment return and principal value will vary, and shares, when redeemed, may be worth more or less than their original cost. Westcore fund shares are not insured by the FDIC, the Federal Reserve Board or any other agency and are subject to investment risk.
Denver Investments (the “Adviser”) has contractually agreed to waive the investment advisory and/or administration fees and/or to reimburse other expenses from April 30, 2014 until at least April 30, 2015, so that the ratio of expenses to average net assets as reported in the Fund’s Financial Highlights will be no more than 1.15% for the Fund’s Retail Class for such period. In addition, the Adviser has contractually agreed to waive the investment advisory and/or administration fees and/or to reimburse Fund level Other Expenses for the Institutional Class in the same proportion as the Retail Class waivers/reimbursements as well as reimburse the Institutional class-specific Other Expenses until at least April 30, 2015. This agreement may not be terminated or modified prior to this date except with the approval of the Board of Trustees.
Craig W. Juran is a registered representative of ALPS Distributors, Inc.
Investors rode a wave of optimism into 2014 as robust equity markets, an improving housing market and an expanding economy produced a confidence not seen in years. Economic growth came to a standstill in the first quarter, as one of the worst winters on record forced travel delays, stopped construction activity, shut down shopping malls and closed many schools. Additionally, conflict between Russia and Ukraine and a potential civil war in Iraq created uncertainty which led to fear and nervousness in the markets. As sentiment changed, many high growth and momentum stocks underperformed significantly as investors gravitated towards more predictable business models. Despite fluctuating sentiment in the first half of the year, markets advanced higher while digesting fear, volatility and nervousness which we believe is a sign of resilient markets.
For the first six months of 2014, the Westcore Growth Fund underperformed its benchmark, the Russell 1000® Growth Index. Reduced interest rates caused investors to seek dividend-yielding stocks with steady cash flows in favor of those with accelerating growth and earnings momentum. This negatively impacted the Fund’s return relative to the benchmark as we emphasize companies that are fast growing and have increasing earnings.
During the first six months of the year, the Fund’s performance compared to its benchmark was enhanced by holdings in the information technology and industrial sectors. The Fund’s strongest contributors were Apple Inc., EOG Resources Inc. and United Rentals Inc. After underperforming in 2013, Apple regained investors’ confidence delivering strong quarterly results in April. It also announced a massive increase in its buyback authorization, a 7-for-1 stock split and another dividend increase. Energy sector companies like EOG benefited from uncertainty in Ukraine and Iraq which supported oil prices. Investors also recognized EOG’s strong performance and substantial growth opportunities. United Rentals performed well as demand for commercial construction equipment accelerated and the pricing environment improved.
The Fund’s weakest sectors relative to the benchmark during the first six months of 2014 were health care, financials and energy. Fund holdings in Amazon.com Inc., Nu Skin Enterprises Inc., and NetSuite Inc. were its largest detractors. Shares of Amazon were sold off early in 2014 as investors questioned its valuation and pace of profit growth. We sold the Fund’s position in Amazon, but remain intrigued in its long-term prospects. NetSuite shares were sold off as investors rotated out of higher growth and earnings momentum companies into more defensive companies. A sell-off of Nu Skin ensued at the beginning of 2014 as the Chinese Government opened an investigation into Nu Skin’s business practices. As China was a major engine for Nu Skin’s growth, we opted to sell the Fund’s position amidst the uncertainty, but we continue to monitor the situation.
The fundamental backdrop for equity markets, in our opinion, remains positive. Central banks around the world are looking at ways to facilitate faster economic growth in order to alleviate significant unemployment/underemployment. Additionally, we believe interest rates should remain low (although with a bias to increase) for the foreseeable future as investors’ appetite for fixed income securities remains high due to the aging populations of most developed economies. Slow but improving economic growth, along with relatively low interest rates, should provide a backdrop for improving earnings growth in the second half of 2014.
| PAGE 2 |
 |

| Stock Performance |
| (for the six months ended 6/30/14) | | |
| | Average | | Contribution |
| 5 Highest | Weight | | to Return |
| Apple Inc. | 6.13% | | 1.07% |
| EOG Resources Inc. | 1.66 | | 0.64 |
| United Rentals Inc. | 1.84 | | 0.56 |
| Delta Air Lines Inc. | 1.59 | | 0.55 |
| NXP Semiconductors N.V. | 1.12 | | 0.47 |
| | | | |
| 5 Lowest | | | |
| Twitter Inc. | 0.17% | | -0.23% |
| Bristol-Myers Squibb Co. | 1.68 | | -0.25 |
| NetSuite Inc. | 0.18 | | -0.27 |
| Nu Skin Enterprises Inc. | 0.08 | | -0.35 |
| Amazon.com Inc. | 1.33 | | -0.49 |
| | | | |
| Past performance does not guarantee future results. These stocks do not represent all of the securities purchased, sold or recommended by the Funds’ Adviser. To request a complete list of the contribution of each Fund holding to overall Fund performance during the period, please call 800.392.CORE (2673) or email invest@westcore.com. |
| |
| Please see page 30 for a description of the methodology used to construct this chart. |
| | | | |
| | | | |
| Top Ten Holdings |
| (as of 6/30/14) | | | |
| Apple Inc. | | | 6.9% |
| Microsoft Corp. | | | 3.7 |
| Facebook Inc. | | | 3.3 |
| PPG Industries Inc. | | | 2.9 |
| Cummins Inc. | | | 2.8 |
| Gilead Sciences Inc. | | | 2.7 |
| Google Inc. Class A | | | 2.4 |
| Google Inc. Class C | | | 2.4 |
| Union Pacific Corp. | | | 2.3 |
| Fortinet Inc. | | | 2.3 |
| Total (% of Net Assets) | | | 31.7% |
| | | | |
| Top ten holdings do not include any cash, cash equivalents or exchange traded fund investments and are subject to change. There are no guarantees that the Fund will continue to remain invested in any particular holding. |
| | | | |
| Portfolio Characteristics |
| (as of 6/30/14) | | | |
| | Westcore | | Russell 1000® |
| | Growth Fund | | Growth Index |
| Weighted Average Market Capitalization ($ Bil) | $99.0 | | $102.2 |
| Price/Earnings (1 year trailing) | 21.2x | | 22.1x |
| EPS Growth (3 year historical) | 20.7% | | 14.8% |
| Beta | 1.1 | | 1.0 |
| Number of Holdings | 53 | | 672 |
| Portfolio Turnover Rate | 81% | | — |
| | | | |
| Please see page 30 for definition of terms. | | | |
| | | | |
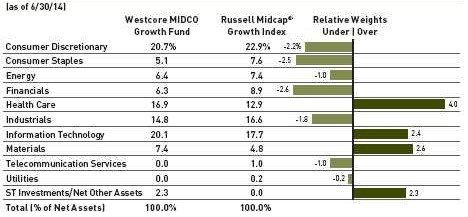
| Sector Allocation |
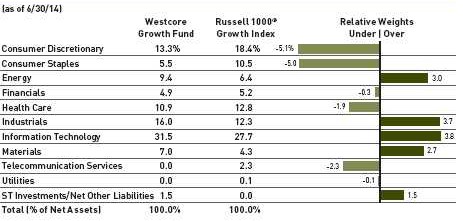
Sector classifications presented herein are based on the sector categorization methodology of the Adviser to the Funds. Sector designations for one Fund may be different than another Fund’s sector designations.
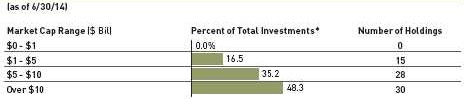
Market Capitalization
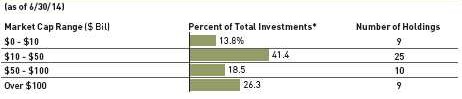
* Total Investments for this chart excludes short-term investments, including money market mutual funds.
Market capitalization ranges were determined by the Adviser to the Fund and are for presentation purposes only. These market capitalization ranges do not necessarily correlate to the benchmark’s market capitalization ranges.

| Fund Strategy |
| | |
| Investing in a diversified portfolio of equity securities of primarily medium-sized companies with |
| growth potential. | |
| | |
| Fund Management |
| | |
| Mitch S. Begun, CFA Lead Portfolio Manager | Brian C. Fitzsimons, CFA Portfolio Manager |
| F. Wiley Reed, CFA Lead Portfolio Manager | Jeffrey J. Loehr, CFA Portfolio Manager |
| Adam C. Bliss Portfolio Manager | |
| | |
| CFA is a trademark owned by CFA Institute. | |
| | |
| Cumulative Returns |
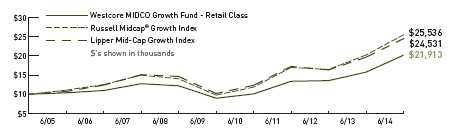
The chart above represents historical performance of a hypothetical investment of $10,000 in the Fund over the past 10 years (or for the life of the Fund if shorter). Performance calculations are as of the end of June each year. Past performance does not guarantee future results. This chart does not reflect the deduction of taxes that a shareholder would pay on Fund distributions or the redemption of Fund shares.
Lipper Index data provided by Lipper, Inc.
Please see pages 28 and 29 for index definitions.
| Average Annual Total Returns |
| | | | | | | | | | | | Since | Inception |
| | 6 Months | | 1 Year | | 3 Years | | 5 Years | | 10 Years | | Inception | Date |
| Retail Class (WTMGX) | 5.11% | | 31.60% | | 10.80% | | 19.75% | | 8.16% | | 10.95% | 8/1/1986 |
| Institutional Class | | | | | | | | | | | | |
| (WIMGX) | 5.34 | | 31.91 | | 11.03 | | 19.94 | | 8.27 | | 10.99 | 9/28/2007 |
| Russell Midcap® | | | | | | | | | | | | |
| Growth Index | 6.51 | | 26.04 | | 14.54 | | 21.16 | | 9.83 | | 10.69 | |
| Lipper Mid-Cap | | | | | | | | | | | | |
| Growth Index | 4.30 | | 24.62 | | 12.43 | | 19.19 | | 9.39 | | 9.93 | |
Retail Class Annual Expense Ratio (per the current prospectus) — Gross: 1.05%, Net: 1.05%
Institutional Class Annual Expense Ratio (per the current prospectus) — Gross: 0.95%, Net: 0.88%
The performance data quoted represents past performance and does not guarantee future results. Performance information for the institutional class shares prior to their inception date is based on the performance of the retail class. Since inception performance figures for the index are from the inception of the retail class. Current performance may be lower or higher than the performance quoted. To obtain current performance as of the most recent month-end, please call 800.392.CORE (2673) or visit us online at www.westcore.com. Average annual total returns and yield figures reflect the reinvestment of dividends, capital gains distributions, all fee waivers and expense reimbursements. Without the fee waivers and expense reimbursements, total return and yield figures would have been lower. Total return and yield figures represent past performance. Investment return and principal value will vary, and shares, when redeemed, may be worth more or less than their original cost. Westcore fund shares are not insured by the FDIC, the Federal Reserve Board or any other agency and are subject to investment risk.
Denver Investments (the “Adviser”) has contractually agreed to waive the investment advisory and/or administration fees and/or to reimburse other expenses from April 30, 2014 until at least April 30, 2015, so that the ratio of expenses to average net assets as reported in the Fund’s Financial Highlights will be no more than 1.15% for the Fund’s Retail Class for such period. In addition, the Adviser has contractually agreed to waive the investment advisory and/or administration fees and/or to reimburse Fund level Other Expenses for the Institutional Class in the same proportion as the Retail Class waivers/reimbursements as well as reimburse the Institutional class-specific Other Expenses until at least April 30, 2015. This agreement may not be terminated or modified prior to this date except with the approval of the Board of Trustees.
Investing in mid-cap funds generally will be more volatile and loss of principal could be greater than investing in large-cap funds.
For the first half of 2014, the Westcore MIDCO Growth Fund underperformed its benchmark, the Russell Midcap® Growth Index.
Equity markets finished the first half of the year comfortably positive, although the second quarter was characterized by a sharp sell-off of growth stocks in April, followed by a rebound throughout May and June. While we are disappointed in the Fund’s performance for the period, we are not surprised to see the Fund underperform in the period as higher growth stocks suffered disproportionately. The Fund consists of companies that we believe have disruptive technologies and services that often show higher growth characteristics. We feel very good about the Fund’s positioning going forward, given that valuations have corrected significantly in many of the higher growth areas of the market.
The three sectors that contributed most to the Fund’s performance relative to its benchmark in the period were consumer discretionary, materials and financials. The Fund’s best-performing stock in the period was FireEye Inc., within the information technology sector. FireEye is emerging as a strong player in the market for next-generation security solutions with a product line that includes systems for web, email and file security, as well as malware analysis. The company announced a large acquisition in the first quarter to help complement its existing advanced persistent threat (APT) capabilities. Keurig Green Mountain, Inc., the maker of the Keurig single-serve coffee system, was the Fund’s second-best performer in the period. The company reported strong K-cup sales momentum and major new license partner wins ahead of the upcoming Keurig 2.0 product launch in the fall of this year. Within the materials sector, U.S. Silica Holdings Inc., a company that provides frac sand largely used in oil and gas recovery, was the Fund’s strongest performer. Robust demand from customers drove frac sand pricing higher after a prolonged period of pressure. As of the end of the first half of 2014, we own positions in all three companies.
The three sectors that detracted most from the Fund’s performance relative to its benchmark in the period were energy, health care and industrials. The Fund’s worst-performing stock was Lululemon Athletica Inc., within the consumer discretionary sector. This high-end athletic apparel brand retailer underperformed in the period as sales trends remained weak despite management efforts to improve supply chain and overall product quality issues. We currently continue to hold the stock as we believe strong brand equity exists. We see positive product catalysts coming in the fall which, in our opinion, will reignite sales growth. Within the industrials sector, both DigitalGlobe Inc. and Kansas City Southern were significant detractors to the Fund’s performance in the period. DigitalGlobe, a provider of imaging satellites, reported disappointing first quarter results and a subpar outlook as demand from emerging markets was weak. Kansas City Southern, a railroad network company, experienced delayed growth opportunities that are taking longer to materialize than we expected. We exited our positions in both DigitalGlobe and Kansas City Southern in the period.
As of the end of the second quarter of 2014, the Fund was overweighted primarily in the health care and materials sectors, and underweighted primarily in the financials and consumer staples sectors.
| PAGE 4 |
|

| Stock Performance |
| (for the six months ended 6/30/14) | | |
| | Average | | Contribution |
| 5 Highest | Weight | | to Return |
| FireEye Inc. | 1.12% | | 0.78% |
| Keurig Green Mountain Inc. | 1.22 | | 0.73 |
| U.S. Silica Holdings Inc. | 1.26 | | 0.70 |
| Actavis PLC | 1.80 | | 0.52 |
| Pioneer Natural Resources Co. | 1.90 | | 0.51 |
| | | | |
| 5 Lowest | | | |
| DigitalGlobe Inc. | 0.82% | | -0.25% |
| Twitter Inc. | 1.06 | | -0.29 |
| PriceSmart Inc. | 0.89 | | -0.30 |
| Kansas City Southern | 0.20 | | -0.31 |
| Lululemon Athletica Inc. | 1.31 | | -0.57 |
| |
| Past performance does not guarantee future results. These stocks do not represent all of the securities purchased, sold or recommended by the Funds’ Adviser. To request a complete list of the contribution of each Fund holding to overall Fund performance during the period, please call 800.392.CORE (2673) or email invest@westcore.com. |
| |
| Please see page 30 for a description of the methodology used to construct this chart. |
| | | | |
| Top Ten Holdings |
| (as of 6/30/14) | | | |
| Mead Johnson Nutrition Co. | | | 2.2% |
| Perrigo Co. PLC | | | 2.1 |
| Actavis PLC | | | 2.1 |
| Ingersoll-Rand PLC | | | 2.0 |
| Varian Medical Systems Inc. | | | 2.0 |
| BorgWarner Inc. | | | 2.0 |
| Keurig Green Mountain, Inc. | | | 1.9 |
| Alexion Pharmaceuticals Inc. | | | 1.9 |
| United Continental Holdings, Inc. | | | 1.9 |
| Rockwood Holdings Inc. | | | 1.9 |
| Total (% of Net Assets) | | | 20.0% |
| |
| Top ten holdings do not include any cash, cash equivalents or exchange traded fund investments and are subject to change. There are no guarantees that the Fund will continue to remain invested in any particular holding. |
| Portfolio Characteristics |
| (as of 6/30/14) | | | |
| | Westcore MIDCO | | Russell Midcap® |
| | Growth Fund | | Growth Index |
| Weighted Average Market Capitalization ($ Bil) | $13.2 | | $12.6 |
| Price/Earnings (1 year trailing) | 28.1x | | 25.5x |
| EPS Growth (3 year historical) | 21.1% | | 16.3% |
| Beta | 1.2 | | 1.0 |
| Number of Holdings | 73 | | 544 |
| Portfolio Turnover Rate | 57% | | — |
| | | | |
| Please see page 30 for definition of terms. | | | |
| | | | |
| Sector Allocation |
Sector classifications presented herein are based on the sector categorization methodology of the Adviser to the Funds which may result in the sector designations for one Fund being different than another Fund’s sector designations.
*Total Investments for this chart excludes short-term investments, including money market mutual funds.
Market capitalization ranges were determined by the Adviser to the Fund and are for presentation purposes only. These market capitalization ranges do not necessarily correlate to the benchmark’s market capitalization ranges.

| Fund Strategy |
| Investing primarily in the common stock of a limited number of medium-sized companies selected for their growth potential. |
| | |
| Fund Management |
| | |
| Mitch S. Begun, CFA Lead Portfolio Manager | Brian C. Fitzsimons, CFA Portfolio Manager |
| F. Wiley Reed, CFA Lead Portfolio Manager | Jeffrey J. Loehr, CFA Portfolio Manager |
| Adam C. Bliss Portfolio Manager | |
| | |
| CFA is a trademark owned by CFA Institute. | |
| | |
| Cumulative Returns |
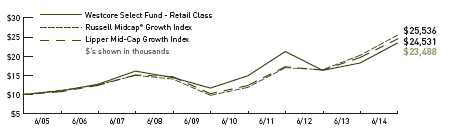
The chart above represents historical performance of a hypothetical investment of $10,000 in the Fund over the past 10 years (or for the life of the Fund if shorter). Performance calculations are as of the end of June each year. Past performance does not guarantee future results. This chart does not reflect the deduction of taxes that a shareholder would pay on Fund distributions or the redemption of Fund shares.
Lipper Index data provided by Lipper, Inc.
Please see pages 28 and 29 for index definitions.
| Average Annual Total Returns |
| | | | | | | | | | | | Since | Inception |
| | 6 Months | | 1 Year | | 3 Years | | 5 Years | | 10 Years | | Inception | Date |
| Retail Class (WTSLX) | 2.85% | | 28.68% | | 3.39% | | 14.99% | | 8.91% | | 12.10% | 10/1/1999 |
| Russell Midcap® | | | | | | | | | | | | |
| Growth Index | 6.51 | | 26.04 | | 14.54 | | 21.16 | | 9.83 | | 7.11 | |
| Lipper Mid-Cap | | | | | | | | | | | | |
| Growth Index | 4.30 | | 24.62 | | 12.43 | | 19.19 | | 9.39 | | 6.27 | |
Retail Class Annual Expense Ratio (per the current prospectus) — Gross: 1.08%, Net: 1.08%
The performance data quoted represents past performance and does not guarantee future results. Current performance may be lower or higher than the performance quoted. To obtain current performance as of the most recent month-end, please call 800.392.CORE (2673) or visit us online at www.westcore.com. Average annual total returns and yield figures reflect the reinvestment of dividends, capital gains distributions, all fee waivers and expense reimbursements. Without the fee waivers and expense reimbursements, total return and yield figures would have been lower. Total return and yield figures represent past performance. Investment return and principal value will vary, and shares, when redeemed, may be worth more or less than their original cost. Westcore fund shares are not insured by the FDIC, the Federal Reserve Board or any other agency and are subject to investment risk.
Denver Investments (the “Adviser”) has contractually agreed to waive the investment advisory and/or administration fees and/or to reimburse other expenses from April 30, 2014 until at least April 30, 2015, so that the ratio of expenses to average net assets as reported in the Fund’s Financial Highlights will be no more than 1.15% for the Fund’s Retail Class for such period. This agreement may not be terminated or modified prior to this date except with the approval of the Board of Trustees.
Investing in mid-cap funds generally will be more volatile and loss of principal could be greater than investing in large-cap funds.
Manager Commentary
For the first half of 2014, the Westcore Select Fund underperformed its benchmark, the Russell Midcap® Growth Index.
Equity markets finished the first half of the year comfortably positive, although the second quarter was characterized by a sharp sell-off of growth stocks in April, followed by a rebound throughout May and June. While we are disappointed in the Fund’s performance for the period, we are not surprised to see the Fund underperform in the period as higher growth stocks suffered disproportionately. The Fund consists of companies that we believe have disruptive technologies and services that often show higher growth characteristics. We feel very good about the Fund’s positioning going forward, given that valuations have corrected significantly in many of the higher growth areas of the market.
The three sectors that contributed most to the Fund’s performance relative to its benchmark in the first half of the year were consumer discretionary, consumer staples and financials. The Fund’s best-performing stock in the period was FireEye Inc., within the information technology sector. FireEye is emerging as a strong player in the market for next-generation security solutions with a product line that includes systems for web, email and file security, as well as malware analysis. The company announced a large acquisition in the first quarter to help complement its existing advanced persistent threat (APT) capabilities. Pioneer Natural Resources Co., an energy exploration and production company, was the Fund’s second-best performer in the period. It continued to have very good well results in the Permian Basin in West Texas and is managing costs well. In addition, Pioneer is looking to export some of its condensate (natural gas liquid) production in the Eagleford Shale in South Texas. Under Armour Inc., a branded athletic apparel and footwear company in the consumer discretionary sector, performed well in the period as accelerating sales and profits continued to indicate larger domestic and global distribution opportunities. As of the end of the first half of 2014, we own positions in all three companies.
The three sectors that detracted most from the Fund’s performance relative to its benchmark in the period were health care, industrials and materials. The Fund’s worst-performing stock was Lululemon Athletica Inc., within the consumer discretionary sector. This high-end athletic apparel brand retailer underperformed in the period as sales trends remained weak despite management efforts to improve supply chain and overall product quality issues. We currently continue to hold the stock as we believe strong brand equity exists. We see positive product catalysts coming in the fall which, in our opinion, will reignite sales growth. Within the industrials sector, both DigitalGlobe Inc. and Kansas City Southern were significant detractors to the Fund’s performance in the period. DigitalGlobe, a provider of imaging satellites, reported disappointing first quarter results and a subpar outlook as demand from emerging markets was weak. Kansas City Southern, a railroad network company, experienced delayed growth opportunities that are taking longer to materialize than we expected. We exited our positions in both DigitalGlobe and Kansas City Southern in the period.
As of the end of the first half of 2014, compared to the benchmark, the Fund was overweighted primarily in the information technology and health care sectors, and underweighted primarily in the financials and consumer discretionary sectors.
| PAGE 6 |
|

| Stock Performance |
| (for the six months ended 6/30/14) | | |
| | Average | | Contribution |
| 5 Highest | Weight | | to Return |
| FireEye Inc. | 1.57% | | 1.05% |
| Pioneer Natural Resources Co. | 3.35 | | 0.89 |
| Under Armour Inc. | 2.73 | | 0.81 |
| Pandora Media Inc. | 2.71 | | 0.72 |
| TripAdvisor Inc. | 2.67 | | 0.69 |
| | | | |
| 5 Lowest | | | |
| DigitalGlobe Inc. | 1.72% | | -0.49% |
| Clovis Oncology Inc. | 0.98 | | -0.53 |
| Fortune Brands Home & | | | |
| Security, Inc. | 1.82 | | -0.54 |
| Kansas City Southern | 0.40 | | -0.60 |
| Lululemon Athletica Inc. | 2.56 | | -1.09 |
| |
| Past performance does not guarantee future results. These stocks do not represent all of the securities purchased, sold or recommended by the Funds’ Adviser. To request a complete list of the contribution of each Fund holding to overall Fund performance during the period, please call 800.392.CORE (2673) or email invest@westcore.com. |
| |
| Please see page 30 for a description of the methodology used to construct this chart. |
| | | | |
| | | | |
| Top Ten Holdings |
| (as of 6/30/14) | | | |
| Mead Johnson Nutrition Co. | | | 4.3% |
| Affiliated Managers Group Inc. | | | 3.8 |
| Perrigo Co. PLC | | | 3.7 |
| Wynn Resorts, Ltd. | | | 3.6 |
| BorgWarner Inc. | | | 3.5 |
| Pandora Media Inc. | | | 3.5 |
| United Continental Holdings, Inc. | | | 3.4 |
| Ingersoll-Rand PLC | | | 3.3 |
| Amphenol Corp. | | | 3.3 |
| Rockwood Holdings Inc. | | | 3.3 |
| Total (% of Net Assets) | | | 35.7% |
| |
| Top ten holdings do not include any cash, cash equivalents or exchange traded fund investments and are subject to change. There are no guarantees that the Fund will continue to remain invested in any particular holding. |
| Portfolio Characteristics |
| (as of 6/30/14) | | | |
| | Westcore | | Russell Midcap® |
| | Select Fund | | Growth Index |
| Weighted Average Market Capitalization ($ Bil) | $13.6 | | $12.6 |
| Price/Earnings (1 year trailing) | 27.8x | | 25.5x |
| EPS Growth (3 year historical) | 25.2% | | 16.3% |
| Beta | 1.3 | | 1.0 |
| Number of Holdings | 32 | | 544 |
| Portfolio Turnover Rate | 76% | | — |
| | | | |
| Please see page 30 for definition of terms. | | | |
| | | | |
| Sector Allocation |

Sector classifications presented herein are based on the sector categorization methodology of the Adviser to the Funds which may result in the sector designations for one Fund being different than another Fund’s sector designations.
Market Capitalization

* Total Investments for this chart excludes short-term investments, including money market mutual funds.
Market capitalization ranges were determined by the Adviser to the Fund and are for presentation purposes only. These market capitalization ranges do not necessarily correlate to the benchmark’s market capitalization ranges.

| Fund Strategy |
| Investing in a diversified portfolio of equity securities of primarily small-sized companies with |
| growth potential. | |
| | |
| Fund Management |
| Mitch S. Begun, CFA Lead Portfolio Manager | Brian C. Fitzsimons, CFA Portfolio Manager |
| F. Wiley Reed, CFA Lead Portfolio Manager | Jeffrey J. Loehr, CFA Portfolio Manager |
| Adam C. Bliss Portfolio Manager | |
| | |
| CFA is a trademark owned by CFA Institute. | |
| | |
| Cumulative Returns |
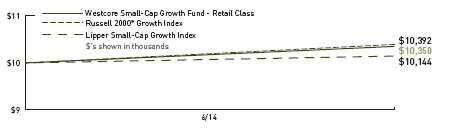
The chart above represents historical performance of a hypothetical investment of $10,000 in the Fund over the past 10 years (or for the life of the Fund if shorter). Performance calculations are as of the end of June each year. Past performance does not guarantee future results. This chart does not reflect the deduction of taxes that a shareholder would pay on Fund distributions or the redemption of Fund shares.
Lipper Index data provided by Lipper, Inc.
Please see pages 28 and 29 for index definitions.
| Average Annual Total Returns |
| | | | | | | | | | | | Since | Inception |
| | 6 Months | | 1 Year | | 3 Years | | 5 Years | | 10 Years | | Inception | Date |
| Retail Class (WTSGX) | 2.17% | | — | | — | | — | | — | | 3.50% | 12/20/2013 |
| Institutional Class | | | | | | | | | | | | |
| (WISGX) | 2.27 | | — | | — | | — | | — | | 3.60 | 12/20/2013 |
| Russell 2000® | | | | | | | | | | | | |
| Growth Index | 2.21 | | — | | — | | — | | — | | 3.92 | |
| Lipper Small-Cap | | | | | | | | | | | | |
| Growth Index | 0.04 | | — | | — | | — | | — | | 1.44 | |
Retail Class Annual Expense Ratio (per the current prospectus) — Gross: 3.26%, Net: 1.30%
Institutional Class Annual Expense Ratio (per the current prospectus) — Gross: 3.11%, Net: 1.15%
The performance data quoted represents past performance and does not guarantee future results. Performance information for the institutional class shares prior to their inception date is based on the performance of the retail class. Since inception performance figures for the index are from the inception of the retail class. Current performance may be lower or higher than the performance quoted. To obtain current performance as of the most recent month-end, please call 800.392.CORE (2673) or visit us online at www.westcore.com. Average annual total returns and yield figures reflect the reinvestment of dividends, capital gains distributions, all fee waivers and expense reimbursements. Without the fee waivers and expense reimbursements, total return and yield figures would have been lower. The performance data quoted does not reflect the deduction of the 2% redemption fee imposed if shares are redeemed or exchanged within 90 calendar days from their date of purchase. If imposed, the fee would reduce the performance quoted. Total return and yield figures represent past performance. Investment return and principal value will vary, and shares, when redeemed, may be worth more or less than their original cost. Westcore fund shares are not insured by the FDIC, the Federal Reserve Board or any other agency and are subject to investment risk.
Denver Investments (the “Adviser”) has contractually agreed to waive the investment advisory and/or administration fees and/or to reimburse other expenses from April 30, 2014 until at least April 30, 2015, so that the ratio of expenses to average net assets as reported in the Fund’s Financial Highlights will be no more than 1.30% for the Fund’s Retail Class for such period. In addition, the Adviser has contractually agreed to waive the investment advisory and/or administration fees and/or to reimburse Fund level Other Expenses for the Institutional Class in the same proportion as the Retail Class waivers/reimbursements as well as reimburse the Institutional class-specific Other Expenses until at least April 30, 2015. This agreement may not be terminated or modified prior to this date except with the approval of the Board of Trustees.
Investing in small-cap funds generally will be more volatile and loss of principal could be greater than investing in larger-cap funds. NEW FUND RISK: There can be no assurance that the Fund will grow to or maintain an economically viable size. There may be limited or no performance history for investors to evaluate.
Manager Commentary
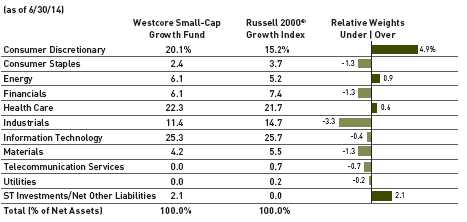
For the first half of 2014, the Westcore Small-Cap Growth Fund slightly underperformed its benchmark, the Russell 2000® Growth Index.
Equity markets finished the first half of the year comfortably positive, although the second quarter was characterized by a sharp sell-off of growth stocks in April, followed by a rebound throughout May and June. While we are disappointed that the Fund’s performance lagged the benchmark slightly for the period, we are not surprised as higher growth stocks suffered disproportionately. The Fund consists of companies that we believe have disruptive technologies and services that often show higher growth characteristics. We feel very good about the Fund’s positioning going forward, particularly given that valuations have corrected significantly in many of the higher growth areas of the market.
The three sectors that contributed most to the Fund’s performance relative to its benchmark in the first half of the year were health care, materials and industrials. The Fund’s best-performing stock in the period was biotechnology company InterMune, Inc., which announced successful clinical trial results for a drug to treat Idiopathic Pulmonary Fibrosis. Pacira Pharmaceuticals, Inc., also within the health care sector, was another significant contributor as it continued to show a strong sales trajectory for its post-surgical pain management drug Exparel®. Within the materials sector, U.S. Silica Holdings Inc., a company that provides frac sand largely used in oil and gas recovery, was the Fund’s strongest performer. Robust demand from customers drove frac sand pricing higher after a prolonged period of pressure. We continue to maintain positions in Pacira and U.S. Silica; however, we exited InterMune in the second quarter.
The three sectors that detracted most to the Fund’s performance relative to its benchmark in the period were consumer staples, financials and information technology. The Fund’s worst-performing stock was Natural Grocers by Vitamin Cottage Inc., within the consumer staples sector. This natural and organic retailer underperformed after reporting weaker-than-expected sales results in the second quarter, largely attributed to an increase in regional competitor new store openings. As of period-end we continued to hold the position as we believe its differentiated model within the natural and organic industry will gain market share in the long term. PriceSmart Inc., also within the consumer staples sector, was a drag on performance in the period. PriceSmart, an operator of warehouse clubs in Latin America and the Caribbean, reported weaker-than-expected sales results in the first half of the year, driven by regional cannibalization from the company’s own new store openings. We believe these impacts will be short-lived and remain excited about the company’s dominant market position and ultimate unit growth opportunity in new and existing regions. Imperva, Inc., a security software provider in the information technology sector, announced disappointing results in the second quarter as it suffered from execution issues and potential competitive threats. We exited the position in the period.
As of the end of the first half of 2014, compared to the benchmark, the Fund was overweighted primarily in the consumer discretionary and energy sectors, and underweighted primarily in the industrials and materials sectors.
| PAGE 8 |
|

| Stock Performance |
| (for the six months ended 6/30/14) | | |
| | Average | | Contribution |
| 5 Highest | Weight | | to Return |
| InterMune, Inc. | 0.56% | | 1.10% |
| FireEye Inc. | 0.60 | | 1.07 |
| Pacira Pharmaceuticals, Inc. | 1.62 | | 0.87 |
| U.S. Silica Holdings Inc. | 1.50 | | 0.83 |
| Exact Sciences Corp. | 1.50 | | 0.71 |
| | | | |
| 5 Lowest | | | |
| PriceSmart Inc. | 1.19% | | -0.37% |
| Imperva, Inc. | 0.76 | | -0.38 |
| Clovis Oncology Inc. | 1.02 | | -0.39 |
| Cornerstone Ondemand, Inc. | 0.85 | | -0.43 |
| Natural Grocers by Vitamin | | | |
| Cottage Inc. | 1.29 | | -0.93 |
| |
| Past performance does not guarantee future results. These stocks do not represent all of the securities purchased, sold or recommended by the Funds’ Adviser. To request a complete list of the contribution of each Fund holding to overall Fund performance during the period, please call 800.392.CORE (2673) or email invest@westcore.com. |
| | | | |
| Please see page 30 for a description of the methodology used to construct this chart. |
| | | | |
| | | | |
| Top Ten Holdings |
| (as of 6/30/14) | | | |
| IMAX Corp. | | | 2.2% |
| NCI Building Systems Inc. | | | 2.1 |
| Grand Canyon Education Inc. | | | 2.1 |
| Pacira Pharmaceuticals, Inc. | | | 2.1 |
| Lennox International Inc. | | | 2.1 |
| OraSure Technologies Inc. | | | 2.1 |
| Deckers Outdoor Corp. | | | 2.1 |
| PolyOne Corp. | | | 2.1 |
| InvenSense Inc. | | | 2.0 |
| Evercore Partners Inc. | | | 2.0 |
| Total (% of Net Assets) | | | 20.9% |
| |
| Top ten holdings do not include any cash, cash equivalents or exchange traded fund investments and are subject to change. There are no guarantees that the Fund will continue to remain invested in any particular holding. |
| Portfolio Characteristics |
| (as of 6/30/14) | | | |
| | Westcore Small-Cap | | Russell 2000® |
| | Growth Fund | | Growth Index |
| Weighted Average Market Capitalization ($ Bil) | $2.3 | | $1.9 |
| Price/Earnings (1 year trailing) | 28.5x | | 26.8x |
| EPS Growth (3 year historical) | 27.0% | | 16.0% |
| Beta | 1.0 | | 1.0 |
| Number of Holdings | 76 | | 1163 |
| Portfolio Turnover Rate | 81% | | — |
| | | | |
| Please see page 30 for definition of terms. |
| | | | |
| Sector Allocation |
Sector classifications presented herein are based on the sector categorization methodology of the Adviser to the Funds. Sector designations for one Fund may be different than another Fund’s sector designations.
Market Capitalization

* Total Investments for this chart excludes short-term investments, including money market mutual funds.
Market capitalization ranges were determined by the Adviser to the Fund and are for presentation purposes only. These market capitalization ranges do not necessarily correlate to the benchmark’s market capitalization ranges.

| Fund Strategy |
| Investing in large, well-established, dividend-paying companies both in the United States and in developed foreign markets. |
| | |
| Fund Management |
| Troy Dayton, CFA Portfolio Manager | Paul A. Kuppinger, CFA Portfolio Manager |
| Mark M. Adelmann, CFA, CPA Portfolio Manager | Lisa Z. Ramirez, CFA Portfolio Manager |
| Derek R. Anguilm, CFA Portfolio Manager | Alex A. Ruehle, CFA Portfolio Manager |
| | |
| CFA is a trademark owned by CFA Institute. |
| | |
| Cumulative Returns |

The chart above represents historical performance of a hypothetical investment of $10,000 in the Fund over the past 10 years (or for the life of the Fund if shorter). Performance calculations are as of the end of June each year. Past performance does not guarantee future results. This chart does not reflect the deduction of taxes that a shareholder would pay on Fund distributions or the redemption of Fund shares.
Lipper Index data provided by Lipper, Inc.
Please see pages 28 and 29 for index definitions.
| Average Annual Total Returns |
| | | | | | | | | | | | Since | | Inception |
| | 6 Months | | 1 Year | | 3 Years | | 5 Years | | 10 Years | | Inception | | Date |
| Retail Class (WTMVX) | 5.38% | | 18.23% | | 13.09% | | 14.24% | | 6.33% | | 8.92% | | 6/1/1988 |
| Institutional Class | | | | | | | | | | | | | |
| (WIMVX) | 5.49 | | 18.41 | | 13.35 | | 14.41 | | 6.45 | | 8.96 | | 9/28/2007 |
| S&P 500® Index | 7.14 | | 24.61 | | 16.59 | | 18.83 | | 7.78 | | 10.25 | | |
| Lipper Large-Cap | | | | | | | | | | | | | |
| Core Index | 6.58 | | 23.38 | | 15.47 | | 17.34 | | 7.16 | | 9.42 | | |
Retail Class Annual Expense Ratio (per the current prospectus) — Gross: 1.14%, Net: 0.99%
Institutional Class Annual Expense Ratio (per the current prospectus) — Gross: 0.98%, Net: 0.92%
The performance data quoted represents past performance and does not guarantee future results. Performance information for the institutional class shares prior to their inception date is based on the performance of the retail class. Since inception performance figures for the index are from the inception of the retail class. Current performance may be lower or higher than the performance quoted. To obtain current performance as of the most recent month-end, please call 800.392.CORE (2673) or visit us online at www.westcore.com. Average annual total returns and yield figures reflect the reinvestment of dividends, capital gains distributions, all fee waivers and expense reimbursements. Without the fee waivers and expense reimbursements, total return and yield figures would have been lower. Total return and yield figures represent past performance. Investment return and principal value will vary, and shares, when redeemed, may be worth more or less than their original cost. Westcore fund shares are not insured by the FDIC, the Federal Reserve Board or any other agency and are subject to investment risk.
Denver Investments (the “Adviser”) has contractually agreed to waive the investment advisory and/or administration fees and/or to reimburse other expenses from April 30, 2014 until at least April 30, 2015, so that the ratio of expenses to average net assets as reported in the Fund’s Financial Highlights will be no more than 0.99% for the Fund’s Retail Class for such period. In addition, the Adviser has contractually agreed to waive the investment advisory and/or administration fees and/or to reimburse Fund level Other Expenses for the Institutional Class in the same proportion as the Retail Class waivers/reimbursements as well as reimburse the Institutional class-specific Other Expenses until at least April 30, 2015. This agreement may not be terminated or modified prior to this date except with the approval of the Board of Trustees.
Investments in foreign companies are subject to special risks, including currency fluctuations, social, economic, and political uncertainties, which could increase volatility.
Dividends are not guaranteed. A company’s future abilities to pay dividends may be limited and a company may cease paying dividends at any time.
Lisa Z. Ramirez is a registered representative of ALPS Distributors, Inc.
Manager Commentary
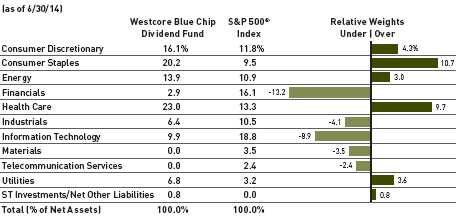
The Westcore Blue Chip Dividend Fund underperformed its benchmark the S&P 500® Index for the six months ended June 30, 2014. Generally, major stock market indices have, so far in 2014, produced single digit results with large-capitalization stocks outperforming smaller-capitalization stocks. Economic growth continues to be positive but below historical norms for this point in the economic cycle. The Federal Reserve continues tapering its quantitative easing program and expects interest rates to remain low well into 2015. Trading volatility as measured by the Chicago Board Options Exchange Volatility Index (VIX) is at eight year lows. Companies continue to borrow at a torrid pace and initial public offerings (IPO’s) have also increased. Investors’ appetite for higher returns remains strong as they seem to be willing to assume more risk to achieve greater returns.
General Dynamics Corp. continued to be an outstanding performer after a strong first quarter. The company reported strong earnings, driven by strength in the business jet segment and meaningful share buybacks. We continue to believe the business jet cycle is in its early stages of expansion, and the defense cycle has troughed. We believe the strong cash flow of the company should reward shareholders through dividend growth as well as continued share buybacks. Global oil exploration and production company, Royal Dutch Shell PLC had strong results as oil prices remained at elevated levels. Investors also seemed enthused since the company has reined in its capital expenditure program. We foresee Royal Dutch growing revenues in the low single digits over the next five years, while increasing its payout ratio.
Retail handbag and accessory company, Coach Inc., contributed to the Fund’s overall underperformance. While we believe Coach maintains a strong brand name, the consumer has been more price sensitive than originally anticipated as the company executes a turnaround strategy to regain market share. Coach has a strong balance sheet with no debt and we continue to assess whether these recent difficulties in terms of product repositioning may impair future dividend growth. American toy manufacturer Mattel Inc. underperformed through the first half of 2014. The company had a difficult holiday season due to weather and a cost-minded consumer. Mattel also had a disappointing second quarter after missing earnings expectations. Profit margins were pressured by the clearing of excess inventories. We expect improvement in the second half of the year as the new MEGA acquisition begins to contribute to the business. The dividend yield remains attractive and we believe it will continue to grow.
Our outlook on the equity markets remains positive going into the second half of 2014. Home sales rebounded in the second quarter and consumers seem to be shrugging off the effects of the long, cold spring. The Consumer Confidence Index® rose to its highest level since January 2008. In general, valuations are high, but not excessive. Interest rates remain low, and while bonds have had strong returns thus far in 2014, they generally appear less attractive than stocks. Geopolitical issues remain a wild card, and currently are worsening with what some believe is civil war in both the Ukraine and Iraq, and a potential debt default in Argentina. In this environment we believe company fundamentals and valuations will become increasingly relevant in driving returns.
| PAGE 10 |
|

| Stock Performance |
| (for the six months ended 6/30/14) | | |
| | Average | | Contribution |
| 5 Highest | Weight | | to Return |
| General Dynamics Corp. | 3.52% | | 0.77% |
| Total S.A. | 3.48 | | 0.67 |
| Royal Dutch Shell PLC | 3.42 | | 0.62 |
| Novartis AG | 3.53 | | 0.54 |
| British American Tobacco PLC | 3.44 | | 0.49 |
| | | | |
| 5 Lowest | | | |
| Accenture PLC | 3.32% | | -0.04% |
| Wal-Mart Stores Inc. | 3.31 | | -0.12 |
| Darden Restaurants Inc. | 2.95 | | -0.25 |
| Mattel Inc. | 3.19 | | -0.66 |
| Coach Inc. | 2.71 | | -1.34 |
| |
| Past performance does not guarantee future results. These stocks do not represent all of the securities purchased, sold or recommended by the Funds’ Adviser. To request a complete list of the contribution of each Fund holding to overall Fund performance during the period, please call 800.392.CORE (2673) or email invest@westcore.com. |
| | | | |
| Please see page 30 for a description of the methodology used to construct this chart. |
|
| | | | |
| | | | |
| Top Ten Holdings |
| (as of 6/30/14) | | | |
| Chevron Corp. | | | 3.6% |
| Royal Dutch Shell PLC | | | 3.6 |
| Kimberly-Clark Corp. | | | 3.6 |
| LVMH Moet Hennessy Louis Vuitton S.A. | | 3.6 |
| AbbVie Inc. | | | 3.5 |
| Microsoft Corp. | | | 3.5 |
| Canadian Utilities Ltd. | | | 3.5 |
| McDonald's Corp. | | | 3.5 |
| Sodexo | | | 3.5 |
| British American Tobacco PLC | | | 3.4 |
| Total (% of Net Assets) | | | 35.3% |
| | | | |
| Top ten holdings do not include any cash, cash equivalents or exchange traded fund investments and are subject to change. There are no guarantees that the Fund will continue to remain invested in any particular holding. |
| | | | |
| Portfolio Characteristics |
| (as of 6/30/14) | | | |
| | Westcore Blue Chip | | S&P 500® |
| | Dividend Fund | | Index |
| Weighted Average Market Capitalization ($ Bil) | $122.1 | | $118.2 |
| Price/Cash Flow (1 year trailing) | 11.8x | | 13.2x |
| Price/Book Value | 4.2x | | 3.5x |
| Price/Earnings (1 year trailing) | 17.0x | | 18.5x |
| Beta | 0.9 | | 1.0 |
| Number of Holdings | 30 | | 500 |
| Portfolio Turnover Rate | 5% | | — |
| | | | |
| Please see page 30 for definition of terms. |
| | | | |
| Sector Allocation |
Sector classifications presented herein are based on the sector categorization methodology of the Adviser to the Funds which may result in the sector designations for one Fund being different than another Fund’s sector designations.
Market Capitalization

* Total Investments for this chart excludes short-term investments, including money market mutual funds.
Market capitalization ranges were determined by the Adviser to the Fund and are for presentation purposes only. These market capitalization ranges do not necessarily correlate to the benchmark’s market capitalization ranges.

| Fund Strategy |
| | |
| Investing in medium-sized, dividend-paying companies whose stocks appear to be undervalued. |
| | |
| Fund Management |
| | |
| Troy Dayton, CFA Portfolio Manager | Mark M. Adelmann, CFA, CPA Portfolio Manager |
| Derek R. Anguilm, CFA Portfolio Manager | Lisa Z. Ramirez, CFA Portfolio Manager |
| | |
| CFA is a trademark owned by CFA Institute. | |
| | |
| Cumulative Returns |
The chart above represents historical performance of a hypothetical investment of $10,000 in the Fund over the past 10 years (or for the life of the Fund if shorter). Performance calculations are as of the end of June each year. Past performance does not guarantee future results. This chart does not reflect the deduction of taxes that a shareholder would pay on Fund distributions or the redemption of Fund shares.
Lipper Index data provided by Lipper, Inc.
Please see pages 28 and 29 for index definitions.
| Average Annual Total Returns |
| | | | | | | | | | | | Since | Inception |
| | 6 Months | | 1 Year | | 3 Years | | 5 Years | | 10 Years | | Inception | Date |
| Retail Class | | | | | | | | | | | | |
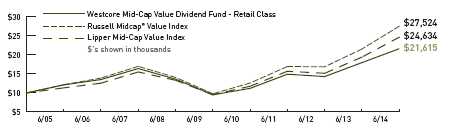
| (WTMCX) | 6.61% | | 20.30% | | 13.14% | | 17.85% | | 8.01% | | 9.58% | 10/1/1998 |
| Russell Midcap® | | | | | | | | | | | | |
| Value Index | 11.14 | | 27.76 | | 17.56 | | 22.97 | | 10.66 | | 10.89 | |
| Lipper Mid-Cap | | | | | | | | | | | | |
| Value Index | 8.08 | | 26.83 | | 16.21 | | 20.86 | | 9.44 | | 10.36 | |
Retail Class Annual Expense Ratio (per the current prospectus) — Gross: 1.24%, Net: 1.24%
The performance data quoted represents past performance and does not guarantee future results. Current performance may be lower or higher than the performance quoted. To obtain current performance as of the most recent month-end, please call 800.392.CORE (2673) or visit us online at www.westcore.com. Average annual total returns and yield figures reflect the reinvestment of dividends, capital gains distributions, all fee waivers and expense reimbursements. Without the fee waivers and expense reimbursements, total return and yield figures would have been lower. Total return and yield figures represent past performance. Investment return and principal value will vary, and shares, when redeemed, may be worth more or less than their original cost. Westcore fund shares are not insured by the FDIC, the Federal Reserve Board or any other agency and are subject to investment risk.
Denver Investments (the “Adviser”) has contractually agreed to waive the investment advisory and/or administration fees and/or to reimburse other expenses from April 30, 2014 until at least April 30, 2015, so that the ratio of expenses to average net assets as reported in the Fund’s Financial Highlights will be no more than 1.25% for the Fund’s Retail Class for such period. This agreement may not be terminated or modified prior to this date except with the approval of the Board of Trustees.
Investing in mid-cap funds generally will be more volatile and loss of principal could be greater than investing in large-cap funds.
Dividends are not guaranteed. A company’s future abilities to pay dividends may be limited and a company may cease paying dividends at any time.
Lisa Z. Ramirez is a registered representative of ALPS Distributors, Inc.
Manager Commentary
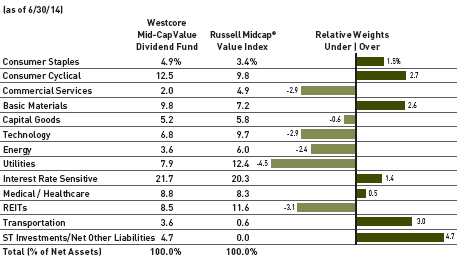
The Westcore Mid-Cap Value Dividend Fund underperformed its benchmark, the Russell Midcap® Value Index, for the first six months of 2014.
Generally major stock market indices have, so far in 2014, produced single digit results with large-capitalization stocks outperforming smaller-capitalization stocks. Economic growth continues to be positive but below historical norms for this point in the economic cycle. The Federal Reserve continues tapering its quantitative easing program and expects interest rates to remain low well into 2015. Trading volatility as measured by the Chicago Board Options Exchange Volatility Index (VIX) is at eight year lows. Companies continue to borrow at a torrid pace and initial public offerings (IPO’s) have also increased. Investors’ appetite for higher returns remains strong as they seem to be willing to assume more risk to achieve greater returns.
Over the past six months the sectors that contributed most to the Fund’s performance relative to the benchmark were medical/ healthcare, commercial services and capital goods. Questcor Pharmaceuticals Inc. was the Fund’s top-performing stock for the first half of this year. It was recently announced that global specialty pharmaceutical company, Mallinkrodt plc and Questcor had reached an agreement for Questcor to be acquired. Avago Technologies Ltd. reported strong wireless performance led by Samsung sales and greater exposure to the Chinese market. We remain confident about Avago and believe the market is still undervaluing its future cash flow stream. Tyson Foods Inc. is a manufacturer of poultry, beef, and pork. During the period it purchased Hillshire Farms. We believe the acquisition makes strategic sense and bolsters the company’s value-added strategy while providing benefits to both the chicken and pork businesses.
The energy, consumer cyclical and interest rate sensitive sectors were the Fund’s most challenging relative to the benchmark in the first half of the year. Within the energy sector, Ensco PLC was the Fund’s weakest performer for the year. We were surprised by the softness in demand for new rigs given high oil prices. A lack of clarity as to the length of this demand softness resulted in a decision to sell the stock during the second quarter. Within the consumer cyclical sector retail handbag and accessory company, Coach Inc., underperformed. While we believe Coach has a strong brand name, the consumer has been more price-sensitive. We sold the stock and await stabilization in its North American business. Concerns that property catastrophe pricing was softening weighed on insurance stocks and Fund holding, Endurance Specialty Holdings Ltd., was negatively impacted. Reported results have been generally in line with expectations and we believe management is successfully building the company into a broader, more globally relevant business.
Our outlook on the equity markets remains positive going into the second half of 2014. Home sales rebounded in the second quarter and consumers seem to be shrugging off the effects of the long, cold spring. The Consumer Confidence Index® rose to its highest level since January 2008. In general, valuations are high, but not excessive. Interest rates remain low, and while bonds have had strong returns thus far in 2014, they generally appear less attractive than stocks. Geopolitical issues remain a wild card, and currently are worsening with what some believe is civil war in both the Ukraine and Iraq, and a potential debt default in Argentina. In this environment we believe company fundamentals and valuations will become increasingly relevant in driving returns.
| PAGE 12 |
|

| Stock Performance |
| (for the six months ended 6/30/14) |
| |
| | Average | | Contribution |
| 5 Highest | Weight | | to Return |
| Questcor | | | |
| Pharmaceuticals Inc. | 2.84% | | 1.84% |
| Avago Technologies Ltd. | 1.74 | | 0.62 |
| Westar Energy Inc. | 2.24 | | 0.46 |
| Tyson Foods Inc. | 2.22 | | 0.43 |
| American Water | | | |
| Works Co. Inc. | 2.34 | | 0.42 |
| | | | |
| 5 Lowest | | | |
| West Pharmaceutical | | | |
| Services Inc. | 1.37% | | -0.24% |
| Whirlpool Corp. | 2.10 | | -0.25 |
| Ensco PLC | 0.68 | | -0.27 |
| Endurance Specialty | | | |
| Holdings Ltd. | 2.02 | | -0.27 |
| Coach Inc. | 1.81 | | -0.84 |
| |
| Past performance does not guarantee future results. These stocks do not represent all of the securities purchased, sold or recommended by the Funds’ Adviser. To request a complete list of the contribution of each Fund holding to overall Fund performance during the period, please call 800.392.CORE (2673) or email invest@westcore.com. |
| |
| Please see page 30 for a description of the methodology used to construct this chart. |
| | | | |
| | | | |
| Top Ten Holdings |
| (as of 6/30/14) | | | |
| Cinemark Holdings Inc. | | | 3.2% |
| Oshkosh Corp. | | | 2.8 |
| Avery Dennison Corp. | | | 2.7 |
| Reinsurance Group of America, Inc. | | 2.7 |
| Unum Group | | | 2.5 |
| American Water Works Co. Inc. | | | 2.4 |
| Omnicare Inc. | | | 2.4 |
| Universal Health Services Inc. | | | 2.4 |
| Westar Energy Inc. | | | 2.3 |
| NASDAQ OMX Group, Inc. | | | 2.3 |
| Total (% of Net Assets) | | | 25.7% |
| |
| Top ten holdings do not include any cash, cash equivalents or exchange traded fund investments and are subject to change. There are no guarantees that the Fund will continue to remain invested in any particular holding. |
| | | | |
| Portfolio Characteristics |
| (as of 6/30/14) | | | |
| | Westcore Mid-Cap | | Russell Midcap® |
| | Value Dividend Fund | | Value Index |
| Weighted Average Market Capitalization ($ Bil) | $8.9 | | $11.1 |
| Price/Cash Flow (1 year trailing) | 11.5x | | 13.0x |
| Price/Book Value | 2.6x | | 2.2x |
| Price/Earnings (1 year trailing) | 17.2x | | 18.4x |
| Beta | 0.84 | | 1.0 |
| Number of Holdings | 52 | | 561 |
| Portfolio Turnover Rate | 34% | | — |
| | | | |
| Please see page 30 for definition of terms. | | | |
| | | | |
| Sector Allocation |
Sector classifications presented herein are based on the sector categorization methodology of the Adviser to the Funds which may result in the sector designations for one Fund being different than another Fund’s sector designations.
Market Capitalization

* Total Investments for this chart excludes short-term investments, including money market mutual funds.
Market capitalization ranges were determined by the Adviser to the Fund and are for presentation purposes only. These market capitalization ranges do not necessarily correlate to the benchmark’s market capitalization ranges.

| Fund Strategy |
| Investing primarily in small-cap, dividend paying stocks that appear to be undervalued. |
| |
| Fund Management |
| Troy Dayton, CFA Portfolio Manager | Mark M. Adelmann, CFA, CPA Portfolio Manager |
| Derek R. Anguilm, CFA Portfolio Manager | Lisa Z. Ramirez, CFA Portfolio Manager |
| | |
| CFA is a trademark owned by CFA Institute. |
| | |
| Cumulative Returns |
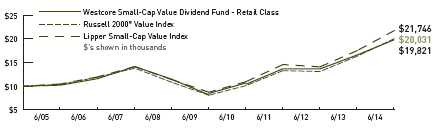
The chart above represents historical performance of a hypothetical investment of $10,000 in the Fund over the past 10 years (or for the life of the Fund if shorter). Performance calculations are as of the end of June each year. Past performance does not guarantee future results. This chart does not reflect the deduction of taxes that a shareholder would pay on Fund distributions or the redemption of Fund shares.
Lipper Index data provided by Lipper, Inc.
Please see pages 28 and 29 for index definitions.
| Average Annual Total Returns |
| | | | | | | | | | | | Since | Inception |
| | 6 Months | | 1 Year | | 3 Years | | 5 Years | | 10 Years | | Inception | Date |
| Retail Class (WTSVX) | 2.57% | | 19.43% | | 13.12% | | 19.34% | | — | | 7.43% | 12/13/2004 |
| Institutional Class | | | | | | | | | | | | |
| (WISVX) | 2.64 | | 19.64 | | 13.27 | | 19.47 | | — | | 7.51 | 9/28/2007 |
| Russell 2000® | | | | | | | | | | | | |
| Value Index | 4.20 | | 22.54 | | 14.65 | | 19.88 | | — | | 7.55 | |
| Lipper Small-Cap | | | | | | | | | | | | |
| Value Index | 4.74 | | 24.17 | | 14.25 | | 20.02 | | — | | 8.44 | |
Retail Class Annual Expense Ratio (per the current prospectus) — Gross: 1.39%, Net: 1.30%
Institutional Class Annual Expense Ratio (per the current prospectus) — Gross: 1.22%, Net: 1.12%
The performance data quoted represents past performance and does not guarantee future results. Performance information for the institutional class shares prior to their inception date is based on the performance of the retail class. Since inception performance figures for the index are from the inception of the retail class. Current performance may be lower or higher than the performance quoted. To obtain current performance as of the most recent month-end, please call 800.392.CORE (2673) or visit us online at www.westcore.com. Average annual total returns and yield figures reflect the reinvestment of dividends, capital gains distributions, all fee waivers and expense reimbursements. Without the fee waivers and expense reimbursements, total return and yield figures would have been lower. Total return and yield figures represent past performance. Investment return and principal value will vary, and shares, when redeemed, may be worth more or less than their original cost. Westcore fund shares are not insured by the FDIC, the Federal Reserve Board or any other agency and are subject to investment risk.
Denver Investments (the “Adviser”) contractually agreed to waive the investment advisory and/or administration fees and/or to reimburse other expenses from April 30, 2014 until at least April 30, 2015, so that the ratio of expenses to average net assets as reported in the Fund’s Financial Highlights will be no more than 1.30% for the Fund’s Retail Class for such period. In addition, the Adviser has contractually agreed to waive the investment advisory and/or administration fees and/or to reimburse Fund level Other Expenses for the Institutional Class in the same proportion as the Retail Class waivers/reimbursements as well as reimburse the Institutional class-specific Other Expenses until at least April 30, 2015. This agreement may not be terminated or modified prior to this date except with the approval of the Board of Trustees.
Investing in small-cap funds generally will be more volatile and loss of principal could be greater than investing in larger-cap funds.
Dividends are not guaranteed. A company’s future abilities to pay dividends may be limited and a company may cease paying dividends at any time.
Lisa Z. Ramirez is a registered representative of ALPS Distributors, Inc.
Manager Commentary
The Westcore Small-Cap Value Dividend Fund underperformed its benchmark, the Russell 2000® Value Index, for the six months ended June 30, 2014.
Generally major stock market indices have, so far in 2014, produced single digit results with large-capitalization stocks outperforming smaller-capitalization stocks. Economic growth continues to be positive but below historical norms for this point in the economic cycle. The Federal Reserve continues tapering its quantitative easing program and expects interest rates to remain low well into 2015. Trading volatility as measured by the Chicago Board Options Exchange Volatility Index (VIX) is at eight year lows. Companies continue to borrow at a torrid pace and initial public offerings (IPO’s) have also increased. Investors’ appetite for higher returns remains strong as they seem to be willing to assume more risk to achieve greater returns.
Mid-year contribution leaders relative to the benchmark were the medical/healthcare, basic materials and transportation sectors. Questcor Pharmaceuticals Inc. was the Fund’s top-performing stock in the first half of the year. It was recently announced that global specialty pharmaceutical company, Mallinkrodt plc and Questcor had reached an agreement for Questcor to be acquired. Within basic materials, Compass Minerals International Inc. reported better-than-expected earnings in the second quarter. The harsh winter depleted deicing salt inventories leading to higher contracted prices for the coming winter. These positive trends have driven earnings estimates higher for 2014 and 2015. Innophos Holdings Inc. reported better-than-expected sales and earnings due to a turnaround in the specialty phosphate business. We anticipate the company will increase prices which should allow for continued improvement in profits.
Sectors with the poorest performance relative to the benchmark were energy, consumer cyclical and capital goods. Consumer cyclical holding Pier 1 Imports Inc. underperformed, although second quarter sales were up. However, profits came under pressure due to a more promotional retail environment. Recent online sales growth was encouraging and we believe Pier 1 can continue to turn around. In April, Brink’s Co. announced that the devaluation of the Venezuelan bolivar eliminated its regional profitability for the remainder of its fiscal year. We believe Brink’s has reduced the risk of its Venezuela exposure and is focusing on improving North American profitability. Greenhill & Co. Inc. provides financial advice on mergers and acquisitions (M&A). Investors anticipated an increase in M&A activity for 2014 but Greenhill’s participation was lackluster. Recently however, Greenhill’s activity levels appear to have improved. We believe the fundamentals of the economy and financial markets support increased M&A activity and currently remain optimistic about Greenhill’s prospects.
Our outlook on the equity markets remains positive going into the second half of 2014. Home sales rebounded in the second quarter and consumers seem to be shrugging off the effects of the long, cold spring. The Consumer Confidence Index® rose to its highest level since January 2008. In general, valuations are high, but not excessive. Interest rates remain low, and while bonds have had strong returns thus far in 2014, they generally appear less attractive than stocks. Geopolitical issues remain a wild card, and currently are worsening with what some believe is civil war in both the Ukraine and Iraq, and a potential debt default in Argentina. In this environment we believe company fundamentals and valuations will become increasingly relevant in driving returns.
| PAGE 14 |
|

| Stock Performance |
| (for the six months ended 6/30/14) | | |
| | Average | | Contribution |
| 5 Highest | Weight | | to Return |
| Questcor | | | |
| Pharmaceuticals Inc. | 2.94% | | 1.90% |
| Comstock Resources Inc. | 1.50 | | 0.75 |
| Innophos Holdings Inc. | 2.30 | | 0.46 |
| Compass Minerals | | | |
| International Inc. | 2.20 | | 0.46 |
| Cash America | | | |
| International Inc. | 2.11 | | 0.44 |
| | | | |
| 5 Lowest | | | |
| Brink's Co. | 1.44% | | -0.34% |
| Greenhill & Co. Inc. | 2.36 | | -0.35 |
| Schweitzer-Mauduit | | | |
| International Inc. | 2.76 | | -0.42 |
| West Pharmaceutical | | | |
| Services Inc. | 2.66 | | -0.44 |
| Pier 1 Imports Inc. | 1.63 | | -0.64 |
| |
| Past performance does not guarantee future results. These stocks do not represent all of the securities purchased, sold or recommended by the Funds’ Adviser. To request a complete list of the contribution of each Fund holding to overall Fund performance during the period, please call 800.392.CORE (2673) or email invest@westcore.com. |
| |
| Please see page 30 for a description of the methodology used to construct this chart. |
| | | | |
| | | | |
| Top Ten Holdings |
| (as of 6/30/14) | | | |
| Dean Foods Co. | | | 3.3% |
| Greenhill & Co. Inc. | | | 3.1 |
| Brown Shoe Co. Inc. | | | 2.8 |
| Schweitzer-Mauduit International Inc. | | 2.8 |
| NICE Systems Ltd. | | | 2.6 |
| Innophos Holdings Inc. | | | 2.5 |
| Bristow Group Inc. | | | 2.4 |
| j2 Global Inc. | | | 2.4 |
| West Pharmaceutical Services Inc. | | 2.4 |
| Compass Minerals International Inc. | | 2.3 |
| Total (% of Net Assets) | | | 26.6% |
| |
|
| Top ten holdings do not include any cash, cash equivalents or exchange traded fund investments and are subject to change. There are no guarantees that the Fund will continue to remain invested in any particular holding. |
| Portfolio Characteristics |
| (as of 6/30/14) | | | |
| | Westcore Small-Cap | | Russell 2000® |
| | Value Dividend Fund | | Value Index |
| Weighted Average Market Capitalization ($ Mil) | $2,046 | | $1,647 |
| Price/Cash Flow (1 year trailing) | 11.8x | | 12.3x |
| Price/Book Value | 2.4x | | 1.8x |
| Price/Earnings (1 year trailing) | 19.1x | | 17.0x |
| Beta | 0.86 | | 1.0 |
| Number of Holdings | 57 | | 1,321 |
| Portfolio Turnover Rate | 31% | | — |
| | | | |
| Please see page 30 for definition of terms. |
| | | | |
| Sector Allocation |
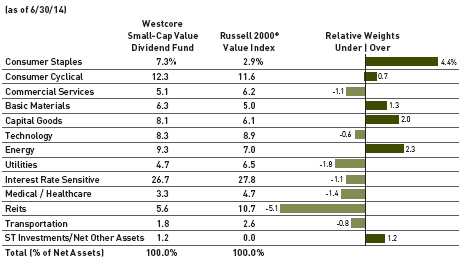
Sector classifications presented herein are based on the sector categorization methodology of the Adviser to the Funds which may result in the sector designations for one Fund being different than another Fund’s sector designations.
Market Capitalization
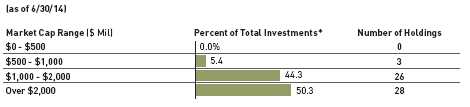
* Total Investments for this chart excludes short-term investments, including money market mutual funds.
Market capitalization ranges were determined by the Adviser to the Fund and are for presentation purposes only. These market capitalization ranges do not necessarily correlate to the benchmark’s market capitalization ranges.

| Fund Strategy |
| |
| Investing primarily in micro-cap companies whose stocks appear to be undervalued. |
| |
| Fund Management |
| |
| Jon K. Tesseo Portfolio Manager |
| Paul A. Kuppinger, CFA Portfolio Manager |
| |
| CFA is a trademark owned by CFA Institute. |
| |
| Cumulative Returns |

The chart above represents historical performance of a hypothetical investment of $10,000 in the Fund over the past 10 years (or for the life of the Fund if shorter). Performance calculations are as of the end of June each year. Past performance does not guarantee future results. This chart does not reflect the deduction of taxes that a shareholder would pay on Fund distributions or the redemption of Fund shares.
Lipper Index data provided by Lipper, Inc.
Please see pages 28 and 29 for index definitions.
| Average Annual Total Returns |
| | | | | | | | | | | | Since | Inception |
| | 6 Months | | 1 Year | | 3 Years | | 5 Years | | 10 Years | | Inception | Date |
| Retail Class (WTMIX) | -0.11% | | 25.24% | | 15.77% | | 20.61% | | — | | 11.23% | 6/23/2008 |
| Russell Microcap® Index | 1.56 | | 24.98 | | 15.94 | | 20.03 | | — | | 9.34 | |
| Lipper Small-Cap Core Index | 3.83 | | 23.49 | | 14.08 | | 19.75 | | — | | 9.99 | |
Retail Class Annual Expense Ratio (per the current prospectus) — Gross: 1.99%, Net: 1.34%
The performance data quoted represents past performance and does not guarantee future results. Current performance may be lower or higher than the performance quoted. To obtain current performance as of the most recent month-end, please call 800.392.CORE (2673) or visit us online at www.westcore.com. Average annual total returns and yield figures reflect the reinvestment of dividends, capital gains distributions, all fee waivers and expense reimbursements. Without the fee waivers and expense reimbursements, total return and yield figures would have been lower. The performance data quoted does not reflect the deduction of the 2% redemption fee imposed if shares are redeemed or exchanged within 90 calendar days from their date of purchase. If imposed, the fee would reduce the performance quoted. Total return and yield figures represent past performance. Investment return and principal value will vary, and shares, when redeemed, may be worth more or less than their original cost. Westcore fund shares are not insured by the FDIC, the Federal Reserve Board or any other agency and are subject to investment risk.
Denver Investments (the “Adviser”) has contractually agreed to waive the investment advisory and/or administration fees and/or to reimburse other expenses from April 30, 2014 until at least April 30, 2015, so that the ratio of expenses to average net assets as reported in the Fund’s Financial Highlights will be no more than 1.30% for the Fund’s Retail Class for such period. This agreement may not be terminated or modified prior to this date except with the approval of the Board of Trustees.
Investing in micro-cap funds generally will be more volatile and loss of principal could be greater than investing in larger-cap funds.
Jon K. Tesseo is a registered representative of ALPS Distributors, Inc.
Manager Commentary
Markets started off 2014 much like 2013. The Westcore Micro-Cap Opportunity Fund got off to a rocky start as it trailed its benchmark, the Russell Microcap® Index, by 3.8 percentage points at the end of January. The Fund ended the first quarter trailing the benchmark by 2.9 percentage points and for the first half of the year it underperformed by 1.7 percentage points.
As these results imply, our models had mixed success for the first half of the year. Seven of the 12 sectors in the Fund had positive absolute returns, while five had negative absolute returns. The capital goods, consumer staples and commercial services sectors were the Fund’s best performers relative to the benchmark. The sectors that fared worst compared to the benchmark were interest rate sensitive, medical/heathcare and consumer cyclicals.
During the second quarter the factors that we generally consider relevant began to perform closer to historical levels. Stocks that generated above-average free cash flow in relation to enterprise value generally outperformed more expensive stocks. On the whole, that was also true for companies that generated excess operating cash relative to their price. Stocks with higher returns on equity (ROE) outperformed those with lower ROEs. Growth factors fared worse as 9-month price momentum, forecasted growth rates and beta all underperformed. We had neutral to negative bets on these factors. This benefited the Fund’s performance towards the end of the semi-annual period and provides us with optimism as we head into the second half of the year.
The Fund’s best-performing holding for the first half of the year was Albany Molecular Research Inc., a service firm to the pharmaceutical industry that contracts drug manufacturing and development. Repligen Corp., which develops and produces products used in biological drugs, was another strong performer. Another top contributor was REX American Resources Corp., which produces ethanol and corn-based non-food grade corn oil.
The Fund’s worst-performing holding in the period was Barret Business Services Inc., a business management solutions company. QuinStreet, Inc., an online performance marketing company also underperformed, as did Zogenix Inc., a biotech firm engaged in the development of drugs for the central nervous system and novel pain treatments.
| PAGE 16 |
|

| Stock Performance |
| (for the six months ended 6/30/14) | | |
| | Average | | Contribution |
| 5 Highest | Weight | | to Return |
| Albany Molecular | | | |
| Research Inc. | 0.50% | | 0.47% |
| Repligen Corp. | 0.80 | | 0.44 |
| REX American | | | |
| Resources Corp. | 0.71 | | 0.37 |
| VSE Corp. | 0.81 | | 0.33 |
| Lydall Inc. | 0.67 | | 0.31 |
| | | | |
| 5 Lowest | | | |
| Overstock.com, Inc. | 0.30% | | -0.26% |
| Zogenix Inc. | 0.31 | | -0.26 |
| QuinStreet, Inc. | 0.55 | | -0.28 |
| Extreme Networks, Inc. | 0.48 | | -0.31 |
| Barrett Business | | | |
| Services Inc. | 0.49 | | -0.37 |
| |
| Past performance does not guarantee future results.These stocks do not represent all of the securities purchased, sold or recommended by the Funds’ Adviser. To request a complete list of the contribution of each Fund holding to overall Fund performance during the period, please call 800.392.CORE (2673) or email invest@westcore.com. |
| | | | |
| Please see page 30 for a description of the methodology used to construct this chart. |
| | | | |
| | | | |
| Top Ten Holdings |
| (as of 6/30/14) | | | |
| VSE Corp. | | | 0.9% |
| BankFinancial Corp. | | | 0.9 |
| ZAGG, Inc. | | | 0.9 |
| TechTarget, Inc. | | | 0.9 |
| First Financial Corp. | | | 0.9 |
| Methode Electronics Inc. | | | 0.8 |
| Agree Realty Corp. | | | 0.8 |
| Federal Agricultural Mortgage Corp. | | 0.8 |
| Great Southern Bancorp Inc. | | | 0.8 |
| Hawaiian Telcom Holdco Inc. | | | 0.8 |
| Total (% of Net Assets) | | | 8.5% |
| |
| Top ten holdings do not include any cash, cash equivalents or exchange traded fund investments and are subject to change. There are no guarantees that the Fund will continue to remain invested in any particular holding. |
| Portfolio Characteristics |
| (as of 6/30/14) | | | |
| | Westcore Micro-Cap | | Russell |
| | Opportunity Fund | | Microcap® Index |
| Weighted Average Market Capitalization ($ Mil) | $458 | | $447 |
| Price/Cash Flow (1 year trailing) | 12.6x | | 14.0x |
| Price/Book Value | 2.5x | | 2.6x |
| Price/Earnings (1 year trailing) | 12.4x | | 17.3x |
| Beta | 0.96 | | 1.0 |
| Number of Holdings | 187 | | 1,632 |
| Portfolio Turnover Rate | 43% | | — |
| | | | |
| Please see page 30 for definition of terms. |
| | | | |
| Sector Allocation |

Sector classifications presented herein are based on the sector categorization methodology of the Adviser to the Funds which may result in the sector designations for one Fund being different than another Fund’s sector designations.
Market Capitalization

* Total Investments for this chart excludes short-term investments, including money market mutual funds.
Market capitalization ranges were determined by the Adviser to the Fund and are for presentation purposes only. These market capitalization ranges do not necessarily correlate to the benchmark’s market capitalization ranges.

| Fund Strategy |
| Investing in equity securities of international small-cap companies that are poised for growth. |
| |
| Fund Management |
| |
| John C. Fenley, CFA Portfolio Manager |
| Jeremy A. Duhon, CFA Portfolio Manager |
| |
| CFA is a trademark owned by CFA Institute. |
| |
| Cumulative Returns |
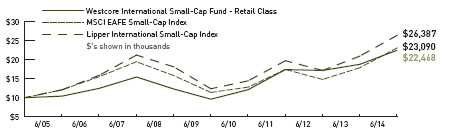
The chart above represents historical performance of a hypothetical investment of $10,000 in the Fund over the past 10 years (or for the life of the Fund if shorter). Performance calculations are as of the end of June each year. Past performance does not guarantee future results. This chart does not reflect the deduction of taxes that a shareholder would pay on Fund distributions or the redemption of Fund shares.
The MSCI ACWI ex USA Small Cap Index is not included in the chart because its inception date is June 1, 2007.
Lipper Index data provided by Lipper, Inc.
Please see pages 28 and 29 for index definitions.
Average Annual Total Returns
| | | | | | | | | | | | Since | Inception |
| | 6 Months | | 1 Year | | 3 Years | | 5 Years | | 10 Years | | Inception | Date |
| Retail Class (WTIFX) | -3.43% | | 19.63% | | 8.90% | | 18.52% | | 8.44% | | 6.36% | 12/15/1999 |
| MSCI EAFE | | | | | | | | | | | | |
| Small-Cap Index | 5.50 | | 29.08 | | 9.84 | | 15.21 | | 8.73 | | 7.93 | |
| MSCI ACWI ex USA | | | | | | | | | | | | |
| Small Cap Index* | 7.24 | | 26.09 | | 6.13 | | 14.70 | | — | | — | |
| Lipper International | | | | | | | | | | | | |
| Small-Cap Index | 4.97 | | 26.00 | | 10.17 | | 16.38 | | 10.19 | | 7.68 | |
Retail Class Annual Expense Ratio (per the current prospectus) — Gross: 1.63%, Net: 1.50%
The performance data quoted represents past performance and does not guarantee future results. Current performance may be lower or higher than the performance quoted. To obtain current performance as of the most recent month-end, please call 800.392.CORE (2673) or visit us online at www.westcore.com. Average annual total returns and yield figures reflect the reinvestment of dividends, capital gains distributions, all fee waivers and expense reimbursements. Without the fee waivers and expense reimbursements, total return and yield figures would have been lower. Total return and yield figures represent past performance. Investment return and principal value will vary, and shares, when redeemed, may be worth more or less than their original cost. Westcore fund shares are not insured by the FDIC, the Federal Reserve Board or any other agency and are subject to investment risk.
* Ten-year and since inception returns for the MSCI ACWI ex USA Small Cap Index are not included due to its June 1, 2007 inception.
Denver Investments (the “Adviser”) has contractually agreed to waive the investment advisory and/or administration fees and/or to reimburse other expenses from April 30, 2014 until at least April 30, 2015, so that the ratio of expenses to average net assets as reported in the Fund’s Financial Highlights will be no more than 1.50% for the Fund’s Retail Class for such period. This agreement may not be terminated or modified prior to this date except with the approval of the Board of Trustees.
Investing in small-cap funds generally will be more volatile and loss of principal could be greater than investing in larger-cap funds.
Investing in foreign securities entails special risks, such as currency fluctuations and political uncertainties, which are described in more detail in the prospectus.
Manager Commentary
Despite a sluggish start to the year and looming geopolitical news of struggles in Ukraine and Iraq, overall, international markets finished the first half of 2014 in positive territory with emerging markets leading. Global markets reacted favorably to stimulus measures implemented and suggested by the European Central Bank and the Federal Reserve Bank. In China, efforts to spur economic growth included lowering the reserve requirements for banks with sufficient loans to small- and mid-sized businesses and agriculture. For the first six months of 2014, the Westcore International Small-Cap Fund underperformed its benchmark, the MSCI EAFE Small-Cap Index. Also, please note that we are introducing an additional index, the MSCI ACWI ex USA Small Cap Index, which provides a broader comparison of the Fund’s investible universe because it includes emerging markets and Canada.
Contributors to the Fund’s performance in the first half of 2014 included U.K.-based Kentz Corp. Ltd. and Admiral Group plc. Kentz provides design, engineering and construction services primarily for the oil and gas sector. During the second quarter, SNC-Lavalin Group Inc. announced a cash acquisition of Kentz at a premium. This is a great example of a high-quality and undervalued company being recognized. Admiral Group is a financial services intermediary company which operates car insurance businesses in the United Kingdom and the United States. Regulations implemented in the United Kingdom in 2013 did not negatively impact Admiral’s profitability as much as originally anticipated, giving investors optimism in its strong operations. Another contributor to the Fund’s performance was PAX Global Technology Ltd., based in Hong Kong. PAX is the leading electronic funds transfer point of sales (POS) terminal provider in Asia and one of the most active globally. It is expanding into other markets and has seen an increase in sales volume in overseas markets.
Most of the Fund’s underperformance relative to its benchmark came from holdings in Hong Kong. Negative sentiment surrounding slowing growth in China as well as the Chinese government’s campaign to limit luxury gift giving and consumption significantly impacted share prices in the consumer discretionary sector. The Fund’s two largest detractors were Pico Far East Holdings Ltd. and Ports Design Ltd. Pico is a leader in exhibition and event marketing. Ports Design designs, manufactures and sells high-end apparel in mainland China. Year-to-date, its costs, amplified by store refurbishments, exceeded revenues. Although certain business segments may face pressure over the near term, we believe that overall Pico and Ports Design will perform well over the long term. Another headwind to the Fund’s performance came from Australian industrial companies that were negatively affected by fears of China slowing. Australia-based Decmil Group Ltd., which specializes in construction of temporary facilities and infrastructure for mining and energy companies, detracted from performance. With its diversification to natural gas extraction and significant cash on the balance sheet, we believe Decmil is positioned to succeed in the long term.
One of our beliefs is that success will not be overlooked for long. We focus on finding what we believe are high-quality, undervalued stocks. We keep a watchful eye on operating performance rather than short-term price movements, with the goal of rewarding our investors over the long term. Although it is disappointing to underperform in any time frame, we remain confident in our investment process.
| PAGE 18 |
|

| Stock Performance |
| (for the six months ended 6/30/14) | | |
| | Average | | Contribution |
| 5 Highest | Weight | | to Return |
| Kentz Corp. Ltd. | 2.07% | | 0.93% |
| Admiral Group plc | 3.33 | | 0.76 |
| PAX Global | | | |
| Technology Ltd. | 1.25 | | 0.58 |
| Home Capital Group Inc. | 3.08 | | 0.56 |
| TGS-NOPEC | | | |
| Geophysical Co. ASA | 3.08 | | 0.56 |
| | | | |
| 5 Lowest | | | |
| Bonjour Holdings Ltd. | 2.88% | | -0.57% |
| ITE Group PLC | 2.99 | | -0.65 |
| Decmil Group Ltd. | 2.56 | | -0.68 |
| Ports Design Ltd. | 2.95 | | -1.66 |
| Pico Far East Holdings Ltd. | 4.80 | | -1.81 |
| |
| Past performance does not guarantee future results. These stocks do not represent all of the securities purchased, sold or recommended by the Funds’ Adviser. To request a complete list of the contribution of each Fund holding to overall Fund performance during the period, please call 800.392.CORE (2673) or email invest@westcore.com. |
| |
| Please see page 30 for a description of the methodology used to construct this chart. |
| | | | |
| | | | |
| Top Ten Holdings |
| (as of 6/30/14) | | | |
| Credit Corp. Group Ltd. [Australia] | | 5.5% |
| Cardno Ltd. [Australia] | | | 4.1 |
| Pico Far East Holdings Ltd. [Hong Kong] | | 4.0 |
| REXLot Holdings Ltd. [Hong Kong] | | 3.7 |
| ITE Group PLC [United Kingdom] | | 3.7 |
| Admiral Group plc [United Kingdom] | | 3.4 |
| Mears Group PLC [United Kingdom] | | 3.2 |
| Prestige International Inc. [Japan] | | 3.1 |
| Slater & Gordon Ltd. [Australia] | | | 3.1 |
| Kentz Corp. Ltd. [United Kingdom] | | 3.0 |
| Total (% of Net Assets) | | | 36.8% |
| |
| Top ten holdings do not include any cash, cash equivalents or exchange traded fund investments and are subject to change. There are no guarantees that the Fund will continue to remain invested in any particular holding. |
| Portfolio Characteristics |
| (as of 6/30/14) | | | |
| | Westcore International | | MSCI EAFE |
| | Small-Cap Fund | | Small-CapIndex |
| Weighted Average Market Capitalization ($ Mil) | $2,243 | | $2,355 |
| Number of Countries Represented | 16 | | 21 |
| Price/Earnings (1 year trailing) | 19.7x | | 15.2x |
| Price/Book Value | 4.0x | | 2.3x |
| Number of Holdings | 41 | | 2,181 |
| Portfolio Turnover Rate | 30% | | — |
| | | | |
| Please see page 30 for definition of terms. |
| | | | |
| Sector Allocation |

Sector classifications presented herein are based on the sector categorization methodology of the Adviser to the Funds which may result in the sector designations for one Fund being different than another Fund’s sector designations.
Regional Allocation
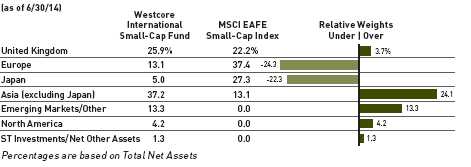

* Total Investments for this chart excludes short-term investments, including money market mutual funds.
Market capitalization ranges were determined by the Adviser to the Fund and are for presentation purposes only. These market capitalization ranges do not necessarily correlate to the benchmark’s market capitalization ranges.

| Fund Strategy |
| A fixed-income fund investing in a wide variety of income-producing securities, primarily bonds and to a lesser extent convertible bonds, and equity securities. |
| |
| Fund Management |
| Troy A. Johnson, CFA Portfolio Manager |
| Mark R. McKissick, CFA Portfolio Manager |
| |
| CFA is a trademark owned by CFA Institute. |
| |
| Cumulative Returns |
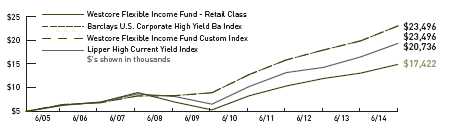
The chart above represents historical performance of a hypothetical investment of $10,000 in the Fund over the past 10 years (or for the life of the Fund if shorter). Performance calculations are as of the end of June each year. Past performance does not guarantee future results. This chart does not reflect the deduction of taxes that a shareholder would pay on Fund distributions or the redemption of Fund shares.
Lipper Index data provided by Lipper, Inc.
Please see pages 28 and 29 for index definitions.
| Average Annual Total Returns |
| | 6 | | 1 | | 3 | | 5 | | 10 | | Since | | 30-Day | Incep. |
| | Months | | Year | | Years | | Years | | Years | | Incep. | | SEC Yield | Date |
| Retail Class (WTLTX) | 4.41% | | 8.58% | | 7.53% | | 11.22% | | 5.71% | | 7.75% | | 4.24% | 6/1/1988 |
| Institutional Class (WILTX) | 4.40 | | 8.67 | | 7.66 | | 11.33 | | 5.78 | | 7.78 | | 4.59 | 9/28/2007 |
| Barclays U.S. Corporate | | | | | | | | | | | | | | |
| High Yield Ba Index | 5.85 | | 11.13 | | 9.03 | | 12.66 | | 8.90 | | 9.14 | | — | |
| Westcore Flexible Income | | | | | | | | | | | | | | |
| Fund Custom Index | 5.85 | | 11.13 | | 9.03 | | 12.66 | | 8.90 | | 9.23 | | — | |
| Lipper High Current | | | | | | | | | | | | | | |
| Yield Index | 5.27 | | 11.44 | | 8.74 | | 13.23 | | 7.57 | | 7.37 | | — | |
Retail Class Annual Expense Ratio (per the current prospectus) — Gross: 0.91%, Net: 0.85%
Institutional Class Annual Expense Ratio (per the current prospectus) — Gross: 1.11%, Net: 0.69%
30-Day SEC Yield figures reflect all fee waivers and expense reimbursements. Without the absorption of these fee waivers and/or expense reimbursements, the figures would have been 4.21% for the retail class and 4.07%for the institutional class.
The performance data quoted represents past performance and does not guarantee future results. Performance information for the institutional class shares prior to their inception date is based on the performance of the retail class. Since inception performance figures for the index are from the inception of the retail class. Current performance may be lower or higher than the performance quoted. To obtain current performance as of the most recent month-end, please call 800.392.CORE (2673) or visit us online at www.westcore.com. Average annual total returns and yield figures reflect the reinvestment of dividends, capital gains distributions, all fee waivers and expense reimbursements. Without the fee waivers and expense reimbursements, total return and yield figures would have been lower. The performance data quoted does not reflect the deduction of the 2% redemption fee imposed if shares are redeemed or exchanged within 90 calendar days from their date of purchase. If imposed, the fee would reduce the performance quoted. Total return and yield figures represent past performance. Investment return and principal value will vary, and shares, when redeemed, may be worth more or less than their original cost. Westcore fund shares are not insured by the FDIC, the Federal Reserve Board or any other agency and are subject to investment risk.
Denver Investments (the “Adviser”) has contractually agreed to waive the investment advisory and/or administration fees and/or to reimburse other expenses from April 30, 2014 until at least April 30, 2015, so that the ratio of expenses to average net assets as reported in the Fund’s Financial Highlights will be no more than 0.85% for the Fund’s Retail Class for such period. In addition, the Adviser has contractually agreed to waive the investment advisory and/or administration fees and/or to reimburse Fund level Other Expenses for the Institutional Class in the same proportion as the Retail Class waivers/reimbursements as well as reimburse the Institutional class-specific Other Expenses until at least April 30, 2015. This agreement may not be terminated or modified prior to this date except with the approval of the Board of Trustees.
Westcore Flexible Income Fund may invest in high-yield/high-risk bonds which are subject to greater levels of liquidity risk. Additionally, investing in bonds entails interest rate risk and credit risk.
Mark R. McKissick is a registered representative of ALPS Distributors, Inc.
Manager Commentary
The high-yield market continued to demonstrate strength through the first half of 2014 as credit spread levels compressed towards the minimum levels achieved after the financial crisis. This contributed to high-yield returns outpacing other fixed income segments during a period that offered a hospitable environment for bond investors. With the consensus suggesting that the weakness exhibited in the first quarter was weather related and the economy appearing to be gathering momentum, investors remained comfortable looking to the more speculative areas of the market to gain additional yield. Over the course of the last several months, domestic fixed income valuations in general have significantly benefited from the flight to quality brought about by geo-political events in Ukraine and Iraq, plus the relatively high yield offered versus foreign alternatives. The associated “carry trade”, along with the “easy-money” policy of the Fed, has resulted in high-yield valuations approaching the upper end of historically exhibited price levels and correspondingly nearing the lower end of recorded absolute yield levels.
The Westcore Flexible Income Fund underperformed its benchmark, the Barclays U.S. Corporate High Yield Ba Index, for the first six months of 2014. The Fund continued to be adversely affected, relative to the benchmark, during the period by its allocation to less economically sensitive high-yield corporate bonds and its lesser interest rate duration.
We remain optimistic regarding the underlying credit fundamentals of issuers within the high-yield market due to relatively healthy balance sheets in general, an overall low default rate and the limited amount of debt that needs to be refinanced over the next few years. Areas of concern that we are monitoring include the potential for levering events by specific companies, rising correlation of high-yield returns to the Treasury market and weakening trends in covenant protection for bondholders. We also recognize the more limited upside available in the marketplace today relative to historical averages given the overall low level of absolute yields offered.
We believe the Fund is positioned to offer competitive yield with more limited downside price volatility versus traditional high-yield investments. Our process entails intensive credit analysis by which we evaluate yield versus risk through business cycles, and it follows that a larger weighting of higher-rated, high-yield issues is a logical result. Most importantly, we believe this strategy works over the long term for shareholders who want comparative yield from a high-yield fund, but who are more sensitive to volatility and more focused on capital preservation.
| PAGE 20 |
|

| Top Ten Corporate Credit Exposure |
| (as of 6/30/14) | |
| Range Resources Corp. | 3.1% |
| Frontier Communications | 3.0 |
| Centerpoint Properties Trust | 2.9 |
| Goodyear Tire & Rubber Co. | 2.8 |
| Tuckahoe Credit Lease Trust | 2.8 |
| MarkWest Energy Partners LP | 2.7 |
| Royal Caribbean Cruises Ltd. | 2.7 |
| Potlatch Corp. | 2.5 |
| Calpine Corp. | 2.5 |
| Crown Americas LLC | 2.5 |
| Total (% of Net Assets) | 27.5% |
| |
| Percentages represent the Fund’s aggregate holdings in the same corporate issuer and its affiliates. Top Ten Corporate Credit Exposure are subject to change. There are no guarantees that the Fund will continue to remain invested in any particular security or issuer. |
| Portfolio Characteristics |
| (as of 6/30/14) | | | |
| | Westcore Flexible | | Barclays U.S. Corporate |
| | Income Fund | | High Yield Ba Index |
| Effective Duration | 3.6 years | | 4.8 years |
| Effective Maturity | 7.7 years | | 7.2 years |
| Number of Holdings | 64 | | 800 |
| Portfolio Turnover Rate | 9% | | — |
| | | | |
| Please see page 30 for definition of terms. |
| | | | |
| Asset Allocation |
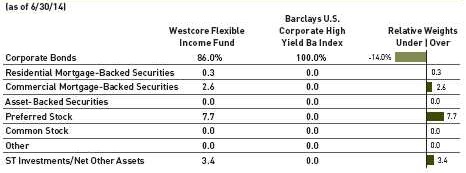
Percentages are based on Total Net Assets.
Ratings Allocation
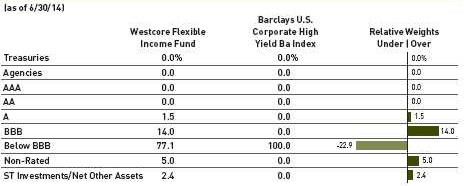
Percentages are based on Total Investments. The ratings allocation reflects the Standard & Poor’s equivalent ratings category for the highest credit-quality rating assigned by either Standard & Poor’s or Moody’s.
Maturity Distribution

Percentages are based on Total Investments. The Adviser to the Funds utilizes the expected maturity in presenting this information.

| Fund Strategy |
| A fixed-income fund focusing on investment quality bonds of varying maturities. |
| |
| Fund Management |
| Mark R. McKissick, CFA Portfolio Manager |
| Troy A. Johnson, CFA Portfolio Manager |
| CFA is a trademark owned by CFA Institute. |
| |
| Cumulative Returns |
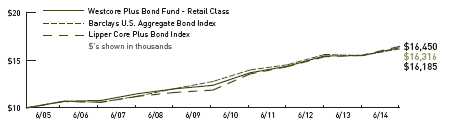
The chart above represents historical performance of a hypothetical investment of $10,000 in the Fund over the past 10 years (or for the life of the Fund if shorter). Performance calculations are as of the end of June each year. Past performance does not guarantee future results. This chart does not reflect the deduction of taxes that a shareholder would pay on Fund distributions or the redemption of Fund shares.
Lipper Index data provided by Lipper, Inc.
The Lipper Intermediate Investment Grade Index is no longer calculated as of September 30, 2013. The Lipper Core Plus Bond Index is the Westcore Plus Bond Fund’s replacement peer group index.
Please see pages 28 and 29 for index definitions.
| Average Annual Total Returns |
| | 6 | | 1 | | 3 | | 5 | | 10 | | Since | | 30-Day | Incep. |
| | Months | | Year | | Years | | Years | | Years | | Incep. | | SEC Yield | Date |
| Retail Class (WTIBX) | 4.31% | | 5.38% | | 4.31% | | 5.70% | | 5.02% | | 6.48% | | 2.44% | 6/1/1988 |
| Institutional Class (WIIBX) | 4.45 | | 5.60 | | 4.48 | | 5.86 | | 5.11 | | 6.52 | | 2.42 | 9/28/2007 |
| Barclays U.S. Aggregate | | | | | | | | | | | | | | |
| Bond Index | 3.93 | | 4.37 | | 3.66 | | 4.85 | | 4.93 | | 6.90 | | — | |
| Lipper Core Plus | | | | | | | | | | | | | | |
| Bond Index* | 3.83 | | 5.97 | | 4.94 | | 7.09 | | 5.71 | | — | | — | |
Retail Class Annual Expense Ratio (per the current prospectus) — Gross: 0.72%, Net: 0.55%
Institutional Class Annual Expense Ratio (per the current prospectus) — Gross: 0.55%, Net: 0.38%
30-Day SEC Yield figures reflect all fee waivers and expense reimbursements. Without the absorption of these fee waivers and/or expense reimbursements, the figures would have been 2.29% for the retail class and 2.29% for the institutional class.
The performance data quoted represents past performance and does not guarantee future results. Performance information for the institutional class shares prior to their inception date is based on the performance of the retail class. Since inception performance figures for the index are from the inception of the retail class. Current performance may be lower or higher than the performance quoted. To obtain current performance as of the most recent month-end, please call 800.392.CORE (2673) or visit us online at www. westcore.com. Average annual total returns and yield figures reflect the reinvestment of dividends, capital gains distributions, all fee waivers and expense reimbursements. Without the fee waivers and expense reimbursements, total return and yield figures would have been lower. Total return and yield figures represent past performance. Investment return and principal value will vary, and shares, when redeemed, may be worth more or less than their original cost. Westcore fund shares are not insured by the FDIC, the Federal Reserve Board or any other agency and are subject to investment risk.
Denver Investments (the “Adviser”) has contractually agreed to waive the investment advisory and/or administration fees and/or to reimburse other expenses from April 30, 2014 until at least April 30, 2015, so that the ratio of expenses to average net assets as reported in the Fund’s Financial Highlights will be no more than 0.55% for the Fund’s Retail Class for such period. In addition, the Adviser has contractually agreed to waive the investment advisory and/or administration fees and/or to reimburse Fund level Other Expenses for the Institutional Class in the same proportion as the Retail Class waivers/reimbursements as well as reimburse the Institutional class-specific Other Expenses until at least April 30, 2015.This agreement may not be terminated or modified prior to this date except with the approval of the Board of Trustees.
* A since inception calculation is not provided as the December 31, 1997 inception of the Lipper Core Plus Bond Index followed the June 1, 1988 inception of the Westcore Plus Bond Fund.
Westcore Plus Bond Fund may invest in high-yield/high-risk bonds which are subject to greater levels of liquidity risk. Additionally, investing in bonds entails interest rate risk and credit risk.
Mark R. McKissick is a registered representative of ALPS Distributors, Inc.
Manager Commentary
Yield declines are not confined to the United States, as the German 10-year bund (bond) is approaching its post-crisis low yield of 1.24%, and Greece’s 10-year note yield fell to 5.85%. The 2.53% approximate yield of the U.S. 10-year Treasury note looks reasonable against percolating global tension in Ukraine and the Middle East promoting a flight to safety and quality. U.S. markets remain in combination the largest, most liquid, transparent and legally sound in the world.
Economic growth worldwide remains weak, and easy monetary policies by developed country central banks promote a global carry trade pursuing any and all “safe” yield-bearing assets in what is perceived to be a prevailing low volatility period. Growth may rebound after winter weather related problems. U.S. unemployment has dropped to 6.3%* as monthly non-farm payrolls averaged above 200,000 for the last year; however, labor force participation remains low. Home sales have bounced higher in the spring selling season and bank lending has finally begun to accelerate somewhat. There have also been some nascent signs that inflation is picking up from the low levels of the last several years. Federal Reserve Chair Janet Yellen’s recent commentary suggests policy will likely remain accommodative for a considerable period after the end of asset purchases particularly if inflation remains below 2%. The Fed’s favorite inflation measure, the Core Personal Consumption Expenditures Deflator, reached 1.5% year-over-year in May.
The Westcore Plus Bond Fund slightly outperformed its benchmark, the Barclays U.S. Aggregate Bond Index, in the first half of 2014. Declining interest rates drove a positive absolute return, and the Fund’s overweighted position in non-treasury securities, particularly corporate bonds including some considered high-yield, provided additional income and price return as credit-yield spreads tightened. The specific corporate securities selected to be held in the Fund added relative return compared to the benchmark, with those rated BBB performing notably well. Specifically, bonds held in the utility, energy, REIT, and communications industries contributed significantly to returns, while the Fund’s underweighted positions in foreign sovereign debt, life insurance, and commercial mortgage-backed securities (CMBS) limited its return. The Fund’s underweighted position in mortgage-backed securities (MBS) detracted from relative returns as MBS outperformed Treasury securities, and the return of the MBS securities held by the Fund lagged those in the benchmark. The Fund was slightly short in interest rate exposure (duration), which was a small relative negative as interest rates declined.
We still see headwinds that should restrain output in the United States for the next several years including an uncompetitive corporate tax structure, demographic drag, regulatory policies that still inhibit bank lending, a political stalemate in Washington and constrained export markets. This environment may support relatively low interest rates.
We expect to position the Fund with modestly reduced interest rate exposure versus the benchmark considering the recovery trend in the economy and signs that inflation may increase a bit. We expect some volatility in interest rates. We have positioned the Fund with an overweighted position in corporate bonds with the intention of providing an income advantage over its benchmark as yield spreads are still meaningfully higher than historically tight levels; however, we recognize the trend of shareholder-friendly activities and/ or mergers and acquisitions which can result in increased leverage for companies.
*Source: Bureau of Labor Statistics. Data as of 6/30/2014.
| PAGE 22 |
|

| Top Ten Corporate Credit Exposure |
| (as of 6/30/14) | |
| Crown Castle Towers LLC | 1.5% |
| City National Corp. | 1.3 |
| Potlatch Corp. | 1.2 |
| Wal-Mart Stores Inc. | 1.2 |
| Washington REIT | 1.2 |
| Washington State | 1.2 |
| Oncor Electric Delivery Co. LLC | 1.2 |
| Range Resources Corp. | 1.1 |
| Tennessee Gas Pipeline | 1.1 |
| Wachovia Corp. | 1.1 |
| Total (% of Net Assets) | 12.1% |
| |
| Percentages represent the Fund’s aggregate holdings in the same corporate issuer and its affiliates. Top Ten Corporate Credit Exposure are subject to change. There are no guarantees that the Fund will continue to remain invested in any particular security or issuer. |
| Portfolio Characteristics |
| (as of 6/30/14) | | | |
| | Westcore Plus | | Barclays U.S. |
| | Bond Fund | | Aggregate Bond Index |
| Effective Duration | 5.3 years | | 5.6 years |
| Effective Maturity | 8.1 years | | 7.7 years |
| Number of Holdings | 212 | | 8,818 |
| Portfolio Turnover Rate | 32% | | — |
| |
| Please see page 30 for definition of terms. |
| | | | |
| Asset Allocation |
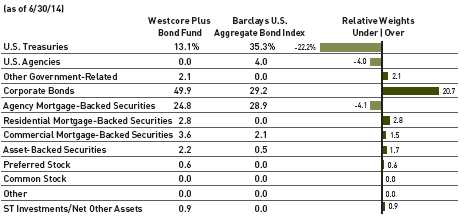
Percentages are based on Total Net Assets.
Ratings Allocation
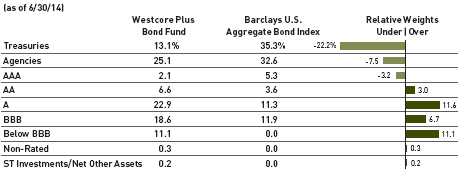
Percentages are based on Total Investments. The ratings allocation reflects the Standard & Poor’s equivalent ratings category for the highest credit-quality rating assigned by either Standard & Poor’s or Moody’s.
Maturity Distribution
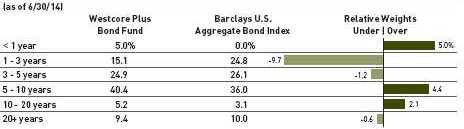
Percentages are based on Total Investments. The Adviser to the Funds utilizes the expected maturity in presenting this information.

| Fund Strategy |
| |
| A Colorado municipal bond fund focusing on federal and state tax-exempt income primarily through investments in investment-grade quality bonds of intermediate maturity. |
| |
| Fund Management |
| |
| Kenneth A. Harris, CFA Portfolio Manager |
| |
| CFA is a trademark owned by CFA Institute. |
| |
| Cumulative Returns |
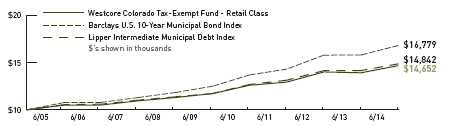
The chart above represents historical performance of a hypothetical investment of $10,000 in the Fund over the past 10 years (or for the life of the Fund if shorter). Performance calculations are as of the end of June each year. Past performance does not guarantee future results. This chart does not reflect the deduction of taxes that a shareholder would pay on Fund distributions or the redemption of Fund shares.
Lipper Index data provided by Lipper, Inc.
Please see pages 28 and 29 for index definitions.
| Average Annual Total Returns |
| | 6 | | 1 | | 3 | | 5 | | 10 | | Since | | 30-Day | Incep. |
| | Months | | Year | | Years | | Years | | Years | | Incep. | | SEC Yield | Date |
| Retail Class (WTCOX) | 4.65% | | 5.38% | | 4.27% | | 4.58% | | 3.89% | | 4.83% | | 2.67% | 6/1/1991 |
| Barclays U.S. 10-Year | | | | | | | | | | | | | | |
| Municipal Bond Index | 5.69 | | 6.34 | | 5.50 | | 6.10 | | 5.31 | | 6.16 | | — | |
| Lipper Intermediate | | | | | | | | | | | | | | |
| Municipal Debt Index | 4.30 | | 4.94 | | 4.19 | | 4.85 | | 4.03 | | 4.90 | | — | |
Retail Class Annual Expense Ratio (per the current prospectus) — Gross: 0.80%, Net: 0.65%
30-Day SEC Yield figure reflects all fee waivers and expense reimbursements. Without the absorption of these fee waivers and/or expense reimbursements, the figure would have been 2.55%.
The performance data quoted represents past performance and does not guarantee future results. Current performance may be lower or higher than the performance quoted. To obtain current performance as of the most recent month-end, please call 800.392.CORE (2673) or visit us online at www.westcore.com. Average annual total returns and yield figures reflect the reinvestment of dividends, capital gains distributions, all fee waivers and expense reimbursements. Without the fee waivers and expense reimbursements, total return and yield figures would have been lower. Total return and yield figures represent past performance. Investment return and principal value will vary, and shares, when redeemed, may be worth more or less than their original cost. Westcore fund shares are not insured by the FDIC, the Federal Reserve Board or any other agency and are subject to investment risk.
Denver Investments (the “Adviser”) has contractually agreed to waive the investment advisory and/or administration fees and/or to reimburse other expenses from April 30, 2014 until at least April 30, 2015, so that the ratio of expenses to average net assets as reported in the Fund’s Financial Highlights will be no more than 0.65% for the Fund’s Retail Class for such period. This agreement may not be terminated or modified prior to this date except with the approval of the Board of Trustees.
Westcore Colorado Tax-Exempt Fund invests primarily in instruments issued by or on behalf of one state and generally will be more volatile and loss of principal could be greater due to state specific risk.
Manager Commentary
Municipal performance was very strong for the first half of 2014. Robust demand, coupled with low supply and falling rates spurred a strong rally across the entire municipal market. If nothing else, the performance of the bond markets through the first half of the year shows the danger in consensus views, as nearly every market strategist predicted that rates would drift higher this year.
We remain very positive on the credit fundamentals of Colorado’s municipal market and believe it is one of the best places in the country to be investing. Real estate, job creation and GDP have all made stronger recoveries in Colorado than national averages. From June 2012 to May 2014, Zillow reports that home prices in Colorado and Denver to have increased 16% and 20% respectively. This is just one of many major tailwinds that will help increase revenues to local governments. We continue to focus on these tailwinds and work to decipher which sectors and individual credit names we believe will benefit the most.
The Westcore Colorado Tax-Exempt Fund underperformed its benchmark, the Barclays 10-Year Municipal Bond Index, for the six months ended June 30, 2014. This underperformance can largely be attributed to the Fund’s lower interest rate risk, expressed through duration.
The Fund’s modified duration as of June 30, 2014 was 4.33 years and its average maturity was 4.67 years. Both were less than at the previous quarter- and year-end. The benchmark’s modified duration and average maturity were 5.86 and 9.85, respectively.
As mentioned previously, at the end of last year, sentiment seemed to have overwhelmingly swung to the view that rates would move higher. Yet as yields have ground lower and volatility has hit generational lows, sentiment seems to have broadly swung the other direction. We have seen double digit price gains year-to-date in some of our longer bonds and decided it prudent to take some of those gains, raise liquidity and lessen our interest rate exposure.
Puerto Rico, which is a major issuer in the municipal market, appears to be at a breaking point and was super-downgraded to junk by Moody’s on July 1, 2014. Bonds issued by Puerto Rico are broadly held by many of the larger municipal fund managers and could pose a systemic risk to the market. The municipal market is notorious for throwing the baby out with the bathwater and if we are able to buy high-quality Colorado bonds for lower prices due to fiscal problems of a small island in the Caribbean, we certainly will consider the option. The Fund does not own any debt issued by Puerto Rico.
| PAGE 24 |
|

| Top Ten Holdings |
| (as of 6/30/14) | % of Net Assets |
| Grand County School District #2 | |
| 5.25%, 12/1/26 | 2.3% |
| Arapahoe County School District #1 | |
| 5.00%, 12/1/29 | 2.1 |
| Eagle, Garfield & Routt County School District Re-5OJ |
| 5.00%, 12/1/26 | 2.1 |
| El Paso County School District #49 | |
| 5.13%, 12/15/28 | 1.6 |
| Tallyns Reach Met District #3 | |
| 4.00%, 12/1/21 | 1.6 |
| Rangeview Library District | |
| 5.00%, 12/15/22 | 1.5 |
| Denver City & County Airport | |
| 5.00%, 11/15/25 | 1.5 |
| Regional Transportation District COP | |
| 5.00%, 6/1/18 | 1.4 |
| Castle Rock Sales & Use Tax Revenue | |
| 5.00%, 6/1/29 | 1.4 |
| Garfield Pitkin & Eagle County School District Re-1 |
| 5.00%, 12/15/23 | 1.3 |
| Total (% of Net Assets) | 16.8% |
| |
| Top ten holdings do not include any cash, cash equivalents or exchange traded fund investments and are subject to change. There are no guarantees that the Fund will continue to remain invested in any particular holding. |
| Portfolio Characteristics |
| (as of 6/30/14) | | | |
| | Westcore Colorado | | Barclays U.S. 10-Year |
| | Tax-Exempt Fund | | Municipal Bond Index |
| Modified Duration | 4.3 years | | 5.9 years |
| Effective Maturity | 4.7 years | | 9.9 years |
| Colorado Double Tax-Exempt Percentage (excludes | | | |
| cash & cash equivalents) | 100 | | — |
| Percentage of Holdings Subject to AMT | 0 | | — |
| Number of Holdings | 137 | | — |
| Portfolio Turnover Rate | 9% | | — |
| Please see page 30 for definition of terms. | | | |
| | | | |
| Ratings Allocation |
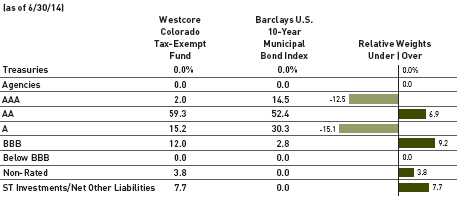
Percentages are based on Total Investments. The ratings allocation reflects the Standard & Poor’s equivalent ratings category for the highest credit-quality rating assigned by either Standard & Poor’s or Moody’s.
Maturity Distribution
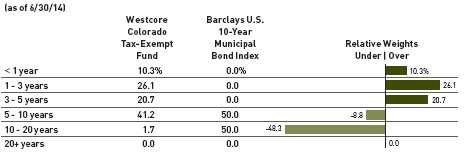
Percentages are based on Total Investments. The Adviser to the Funds utilizes the expected maturity in presenting this information.

Disclosure of Fund Expenses
As a shareholder of a Fund, you incur two types of costs: (1) transaction costs (such as the 2% fee on redemption of certain Fund shares made within 90 days of purchase); and (2) ongoing costs, including management fees and other Fund expenses. The examples on the next page are intended to help you understand your ongoing costs (in dollars) of investing in a Fund and to compare these costs with the ongoing costs of investing in other mutual funds. The examples are based on an investment of $1,000 invested on January 1, 2014 and held until June 30, 2014.
Actual Expenses. The first line of the table on the next page provides information about actual account values and actual expenses. You may use the information in this line, together with the amount you invested, to estimate the expenses that you paid over the period. Simply divide your account value by $1,000 (for example, an $8,600 account value divided by $1,000 = 8.6), then multiply the result by the number in the first line under the heading “Expenses Paid During Period” to estimate the expenses you paid on your account during this period.
Hypothetical Example for Comparison Purposes. The second line of the table on the next page provides information about hypothetical account values and hypothetical expenses based on the Fund’s actual expense ratio and an assumed rate of return of 5% per year before expenses, which is not the Fund’s actual return. The hypothetical account values and expenses may not be used to estimate the actual ending account balance or expenses you paid for the period. You may use this information to compare the ongoing costs of investing in a Fund and other mutual funds. To do so, compare this 5% hypothetical example with the 5% hypothetical examples that appear in the shareholder reports of other funds.
Expenses shown in the table on the next page are meant to highlight ongoing Fund costs only and do not reflect transaction costs, such as redemption fees. Therefore, the second line of the table is useful in comparing ongoing costs only, and may not help you determine the relative total costs of owning different funds. In addition, if these transactional costs were included, your costs would have been higher.
Expenses Paid During Period
With respect to Expenses Paid During the Period, as shown in the table on the next page, expenses are equal to the Fund’s annualized expense ratio, as shown below, multiplied by the average account value over the period, multiplied by the number of days in the last six months of the fiscal half-year, 181/365 (to reflect the half-year period). The annualized expense ratios for the last six months were as follows:
Fund | Retail Class | Institutional Class |
Westcore Growth Fund | 1.08% | | 0.90% | |
Westcore MIDCO Growth Fund | 1.03% | | 0.90% | |
Westcore Select Fund | 1.09% | | N/A | |
Westcore Small-Cap Growth Fund | 1.30% | | 0.83% | |
Westcore Blue Chip Dividend Fund | 0.99% | | 0.81% | |
Westcore Mid-Cap Value Dividend Fund | 1.20% | | N/A | |
Westcore Small-Cap Value Dividend Fund | 1.30% | | 1.12% | |
Westcore Micro-Cap Opportunity Fund | 1.30% | | N/A | |
Westcore International Small-Cap Fund | 1.50% | | N/A | |
Westcore Flexible Income Fund | 0.85% | | 0.67% | |
Westcore Plus Bond Fund | 0.55% | | 0.42% | |
Westcore Colorado Tax-Exempt Fund | 0.65% | | N/A | |
| PAGE 26 |
|

| | | | | | Expense Paid |
| | Beginning Account | Ending Account | During the Period |
| | Value | Value | 1/1/2014 to |
Fund | | 1/1/2014 | 6/30/2014 | 6/30/2014 |
| | | | | | | |
Westcore Growth Fund | | | | | | | |
Retail Class | Actual | $ | 1,000.00 | $ | 1,015.00 | $ | 5.40 |
| Hypothetical (5% return before expenses) | $ | 1,000.00 | $ | 1,019.44 | $ | 5.41 |
Institutional Class | Actual | $ | 1,000.00 | $ | 1,015.50 | $ | 4.50 |
| Hypothetical (5% return before expenses) | $ | 1,000.00 | $ | 1,020.33 | $ | 4.51 |
Westcore MIDCO Growth Fund | | | | | | | |
Retail Class | Actual | $ | 1,000.00 | $ | 1,051.10 | $ | 5.24 |
| Hypothetical (5% return before expenses) | $ | 1,000.00 | $ | 1,019.69 | $ | 5.16 |
Institutional Class | Actual | $ | 1,000.00 | $ | 1,053.40 | $ | 4.58 |
| Hypothetical (5% return before expenses) | $ | 1,000.00 | $ | 1,020.33 | $ | 4.51 |
Westcore Select Fund | | | | | | | |
Retail Class | Actual | $ | 1,000.00 | $ | 1,028.50 | $ | 5.48 |
| Hypothetical (5% return before expenses) | $ | 1,000.00 | $ | 1,019.39 | $ | 5.46 |
Westcore Small-Cap Growth Fund | | | | | | | |
Retail Class | Actual | $ | 1,000.00 | $ | 1,021.70 | $ | 6.52 |
| Hypothetical (5% return before expenses) | $ | 1,000.00 | $ | 1,018.35 | $ | 6.51 |
Institutional Class | Actual | $ | 1,000.00 | $ | 1,022.70 | $ | 4.16 |
| Hypothetical (5% return before expenses) | $ | 1,000.00 | $ | 1,020.68 | $ | 4.16 |
Westcore Blue Chip Dividend Fund | | | | | | | |
Retail Class | Actual | $ | 1,000.00 | $ | 1,053.80 | $ | 5.04 |
| Hypothetical (5% return before expenses) | $ | 1,000.00 | $ | 1,019.89 | $ | 4.96 |
Institutional Class | Actual | $ | 1,000.00 | $ | 1,054.90 | $ | 4.13 |
| Hypothetical (5% return before expenses) | $ | 1,000.00 | $ | 1,020.78 | $ | 4.06 |
Westcore Mid-Cap Value Dividend Fund | | | | | | | |
Retail Class | Actual | $ | 1,000.00 | $ | 1,066.10 | $ | 6.15 |
| Hypothetical (5% return before expenses) | $ | 1,000.00 | $ | 1,018.84 | $ | 6.01 |
Westcore Small-Cap Value Dividend Fund | | | | | | | |
Retail Class | Actual | $ | 1,000.00 | $ | 1,025.70 | $ | 6.53 |
| Hypothetical (5% return before expenses) | $ | 1,000.00 | $ | 1,018.35 | $ | 6.51 |
Institutional Class | Actual | $ | 1,000.00 | $ | 1,026.40 | $ | 5.63 |
| Hypothetical (5% return before expenses) | $ | 1,000.00 | $ | 1,019.24 | $ | 5.61 |
Westcore Micro-Cap Opportunity Fund | | | | | | | |
Retail Class | Actual | $ | 1,000.00 | $ | 998.90 | $ | 6.44 |
| Hypothetical (5% return before expenses) | $ | 1,000.00 | $ | 1,018.35 | $ | 6.51 |
Westcore International Small-Cap Fund | | | | | | | |
Retail Class | Actual | $ | 1,000.00 | $ | 965.70 | $ | 7.31 |
| Hypothetical (5% return before expenses) | $ | 1,000.00 | $ | 1,017.36 | $ | 7.50 |
Westcore Flexible Income Fund | | | | | | | |
Retail Class | Actual | $ | 1,000.00 | $ | 1,044.10 | $ | 4.31 |
| Hypothetical (5% return before expenses) | $ | 1,000.00 | $ | 1,020.58 | $ | 4.26 |
Institutional Class | Actual | $ | 1,000.00 | $ | 1,044.00 | $ | 3.40 |
| Hypothetical (5% return before expenses) | $ | 1,000.00 | $ | 1,021.47 | $ | 3.36 |
Westcore Plus Bond Fund | | | | | | | |
Retail Class | Actual | $ | 1,000.00 | $ | 1,043.10 | $ | 2.79 |
| Hypothetical (5% return before expenses) | $ | 1,000.00 | $ | 1,022.07 | $ | 2.76 |
Institutional Class | Actual | $ | 1,000.00 | $ | 1,044.50 | $ | 2.13 |
| Hypothetical (5% return before expenses) | $ | 1,000.00 | $ | 1,022.71 | $ | 2.11 |
Westcore Colorado Tax-Exempt Fund | | | | | | | |
Retail Class | Actual | $ | 1,000.00 | $ | 1,046.50 | $ | 3.30 |
| Hypothetical (5% return before expenses) | $ | 1,000.00 | $ | 1,021.57 | $ | 3.26 |
|

|

Index Definitions and Disclosures |
All indices are unmanaged and index performance figures include reinvestment of dividends but do not reflect any fees, expenses or taxes. Investors cannot invest directly in an index.
The Barclays U.S. 10-Year Municipal Bond Index includes investment grade (Moody’s Investor Services Aaa to Baa, Standard and Poor’s Corporation AAA to BBB) tax-exempt bonds with maturities between eight and twelve years.
The Barclays U.S. Aggregate Bond Index is a fixed income, market-value-weighted index generally representative of investment grade fixed- rate debt issues, including government, corporate, asset-backed, and mortgage-backed securities with maturities of at least one year.
The Barclays U.S. Corporate High Yield Ba Index measures the performance of intermediate (1 to 10 year) U.S. high yield issues. It includes fixed-rate, noninvestment grade debt issues rated Ba1 or lower by Moody’s, rated BB+ or lower by S&P, rated below investment grade by Fitch Investor’s Service or if unrated previously held a high yield rating or have been associated with a high yield issuer, and must trade accordingly.
The Chicago Board Options Exchange Volatility Index (VIX) is a widely used measure of market risk which is intended to show the market’s expectation of 30-day volatility. It is constructed using the implied volatilities of a wide range of S&P 500® Index options.
The Conference Board’s Leading Economic Indicators Index® for the United States (LEI) is a composite of 10 key variables which, historically, have been useful in predicting future economic activity in the United States. It is calculated by the Conference Board, a research organization for businesses that provides information about management and the marketplace.
The Consumer Confidence Index (CCI) is a survey by the Conference Board (a research organization for businesses that provides information about management and the marketplace) that measures how optimistic or pessimistic consumers are with respect to the economy and the near future.
The Dow Jones Industrial Average is a price weighted average of 30 significant stocks traded on the New York Stock Exchange and the NASDAQ.
The Lipper Core Plus Bond Index tracks the performance of funds that invest at least 65% in domestic investment-grade debt issues (rated in the top four grades) with any remaining investment in non-benchmark sectors such as high-yield, global and emerging market debt. These funds maintain dollar-weighted average maturities of five to ten years.
The Lipper High Current Yield Index tracks the performance of funds that aim at high (relative) current yield from fixed income securities, have no quality or maturity restrictions, and tend to invest in lower-grade debt issues.
The Lipper Intermediate Municipal Debt Index tracks the performance of funds that invest in municipal debt issues with dollar-weighted average maturities of five to ten years.
The Lipper International Small-Cap Index tracks the performance of funds that, by portfolio practice, invest at least 75% of their equity assets in companies strictly outside of the U.S. with market capitalizations (on a three-year weighted basis) below Lipper’s international large-cap floor.
The Lipper Large -Cap Core Index tracks the performance of funds that, by portfolio practice, invest at least 75% of their equity assets in companies with market capitalizations (on a three-year weighted basis) above Lipper’s USDE large-cap floor.
The Lipper Large-Cap Growth Index tracks the performance of funds that, by portfolio practice, invest at least 75% of their equity assets in companies with market capitalizations (on a three-year weighted basis) above Lipper’s USDE large-cap floor.
The Lipper Mid-Cap Growth Index tracks the performance of funds that, by portfolio practice, invest at least 75% of their equity assets in companies with market capitalizations (on a three-year weighted basis) below Lipper’s USDE large-cap floor.
The Lipper Mid -Cap Value Index tracks the performance of funds that, by portfolio practice, invest at least 75% of their equity assets in companies with market capitalizations (on a three-year weighted basis) below Lipper’s USDE large-cap floor.
The Lipper Small-Cap Core Index tracks the performance of funds that, by portfolio practice, invest at least 75% of their equity assets in companies with market capitalizations (on a three-year weighted basis) below Lipper’s USDE small-cap ceiling.
| PAGE 28 |
|

The Lipper Small-Cap Growth Index market capitalization (on a three-year tracks the performance of funds that invest at least 75% of their equity assets in companies with weighted basis) below Lipper’s USDE Small-cap ceiling.
The Lipper Small-Cap Value Index tracks the performance of funds that, by portfolio practice, invest at least 75% of their equity assets in companies with market capitalizations (on a three-year weighted basis) below Lipper’s USDE small-cap ceiling.
The MSCI ACWI ex USA Small Cap Index captures small cap representation across 22 of 23 Developed Market countries (excluding the U.S.) and 23 Emerging Market countries. With 4,233 constituents, the index covers approximately 14% of the global equity opportunity set outside the U.S.
The MSCI EAFE Small-Cap Index is an unmanaged market-capitalization-weighted index that represents the performance of smaller capitalization companies in developed stock markets outside of North America. The index targets all companies with market capitalization below that of the companies in the MSCI EAFE Index and up to 99% coverage of the free-float adjusted market capitalization in each market.
The Russell 1000® Growth Index measures the performance of the largest 1,000 firms in the Russell 3000 Index, which represents approximately 98% of the investable U.S. equity market.
The Russell 2000® Growth Index measures the performance of the small-cap growth segment of the U.S. equity universe. It includes those Russell 2000 Index companies with higher price-to-value ratios and higher forecasted growth values.
The Russell 2000® Value Index measures the performance of companies within the Russell 2000 Index having lower price-to-book ratios and lower forecasted growth values. The Russell 2000 Index includes the 2000 firms from the Russell 3000 Index with the smallest market capitalizations. The Russell 3000 Index represents 98% of the investable U.S. equity market.
The Russell Microcap® Index measures the performance of the microcap segment of the U.S. equity market. It makes up less than 3% of the U.S. equity market. It includes 1,000 of the smallest securities in the Russell 2000 Index based on a combination of their market cap and current index membership and it includes the next 1,000 securities.
The Russell Midcap® Growth Index measures the performance of those Russell Midcap companies with higher price-to-book ratios and higher forecasted growth values than the threshold determined by the Frank Russell Company. The Russell Midcap companies are comprised of the 800 smallest companies in the Russell 1000 Index. The Russell 1000 Index consists of the 1,000 largest U.S. Incorporated companies based on total market capitalization.
The Russell Midcap® Value Index measures the performance of those Russell Midcap companies with lower price-to-book ratios and lower forecasted growth values. The stocks are also members of the Russell 1000 Value index.
The S&P 500® Index is comprised of 500 common stocks chosen for market size, liquidity, and industry group representation. It is a market- value weighted index (stock price times number of shares outstanding), with each stock’s weight in the Index proportionate to its market value.
The Westcore Flexible Income Fund Custom Index is comprised of the Barclays U.S. Long-Term Government/Corporate Bond Index from the Fund’s inception to 9/30/00 and the Barclays U.S. Corporate High Yield Ba Index for the time period 10/1/00 to the most recent period end to reflect the change in the Fund’s investment strategy on 10/1/00. The Adviser believes that the Custom Index is the best benchmark measurement for since inception performance.
Barclays Capital is the source and owner of the Barclays Capital Index data contained in this material and all trademarks and copyrights related thereto. Any further dissemination or redistribution is strictly prohibited. Barclays Capital is not responsible for the formatting or configuration of this material or for any inaccuracy in Denver Investments’ presentation thereof.
Lipper Inc. is the source and owner of the Lipper Index data contained in this material and all trademarks and copyrights related thereto. Any further dissemination or redistribution is strictly prohibited. Lipper Inc. is not responsible for the formatting or configuration of this material or for any inaccuracy in Denver Investments’ presentation thereof.
MSCI Barra is the source and owner of the MSCI Index data contained in this material and all trademarks and copyrights related thereto. Any further dissemination or redistribution is strictly prohibited. MSCI Barra is not responsible for the formatting or configuration of this material or for any inaccuracy in Denver Investments’ presentation thereof.
Russell Investments is the source and owner of the Russell Index data contained in this material and all trademarks and copyrights related thereto. Any further dissemination or redistribution is strictly prohibited. Russell Investments is not responsible for the formatting or configuration of this material or for any inaccuracy in Denver Investments’ presentation thereof.
Standard & Poor’s is the source and owner of the S&P Index data contained in this material and all trademarks and copyrights related thereto. Any further dissemination or redistribution is strictly prohibited. Standard & Poor’s is not responsible for the formatting or configuration of this material or for any inaccuracy in Denver Investments’ presentation thereof.
| Top 5/Bottom 5 Stock Performance Calculation Methodology |
The Calculation methodology used to construct this chart took into account consistently the weighting of every holding in the Fund that contributed to the Fund’s performance during the Measurement Period, and the Chart reflects consistently the results of the Calculation. The Calculation determined the contribution of each Fund holding by calculating the weight (i.e., percentage of the Total Investments) of each holding multiplied by the rate of return for that holding during the first six months of 2014.
Beta – A measure of a fund’s sensitivity to market movements. The beta of the market is 1.00 by definition. A beta above 1 is more volatile than the overall market, while a beta below 1 is less volatile.
Consumer Price Index (CPI) - Measures changes in the price level of a market basket of consumer goods and services purchased by households.
Credit Quality Rating – A rating of an individual bond as determined by a nationally recognized statistical rating organization (NRSRO) such as Standard & Poor’s or Moody’s. Credit quality ratings range from highest, “AAA ” to lowest, “D”. For more information regarding rating methodologies for Standard & Poor’s, visit www.standardandpoors.com and for Moody’s, visit www.moodys.com.
Duration – A generic description of the sensitivity of a bond’s price (as a percentage of initial price) to a change in yield.
EPS (Earnings per Share) Growth – Earnings per share is the portion of a company’s profit allocated to each outstanding share of common stock. EPS growth serves as an indicator of a company’s profitability.
Effective Maturity – A weighted average of the maturities of the bonds in a portfolio.
Emerging Markets – Westcore International Small-Cap Fund considers emerging market countries to be those countries that are neither U.S. nor developed countries.
Federal Reserve (the Fed) – The central banking system of the United States.
Gross Domestic Product (GDP) – The market value of all officially recognized goods and services produced within a country in a given period of time.
ISM Manufacturing Report On Business® – A near-term economic barometer that is issued on the first business day of every month.
Market Capitalization – The market capitalization represents the total value of a company or stock. It is calculated by multiplying the number of shares outstanding by the current price of one share.
Modified Duration – A duration measure in which it is assumed that yield changes do not change the expected cash flows. Number of Holdings – The Number of Holdings presented excludes short-term investments including money market mutual funds.
Portfolio Turnover Rate – A percentage computed by taking the lesser of purchases or sales of portfolio securities (excluding short-term investments) for the year and dividing it by the monthly average of the market value of the portfolio securities during the year.
Price to Book Value (P/B) Ratio – The P/B ratio is used to compare a company’s book value to its current market price. This ratio compares the market’s valuation of a company to the value of that company as indicated on its financial statements. The higher the ratio, the higher the premium the market is willing to pay for the company above its hard assets.
Price to Cash (P/C) Flow Ratio – The P/C flow ratio is a measure of a firm’s stock price relative to its financial performance. For a fund, the P/C flow ratio is the weighted average of all stocks held in the fund. It represents the amount an investor is willing to pay for a dollar generated from a particular company’s operations.
Price to Earnings (P/E) Ratio – The P/E ratio is a stock’s per share price divided by its per share earnings over a 12-month period. For a fund, the P/E ratio is the weighted average of all stocks held in the fund. The higher the P/E ratio, the more the market is willing to pay for each dollar of annual earnings.
Quantitative Easing – A monetary policy that the Federal Reserve, and other central banks, pursue to increase the supply of money and thereby expand liquidity in the hopes of fostering stronger growth.
REIT – A REIT is a real estate investment trust. REITs are securities that sell like a stock on a major exchange. REITs invest directly in real estate, either through properties or mortgages.
| PAGE 30 |
|
Return on Equity (ROE) – A measure of how well a company used reinvested earnings to generate additional earnings. It is used as a general indication of a company’s efficiency; in other words, how much profit is a company able to generate given the resources provided by its stockholders.
Risk On, Risk Off – A concept that describes market sentiment as either “risk on” or “risk off”. During a market sentiment of “risk on”, the market is optimistic and more willing to take on risk in exchange for possibly better returns. When market sentiment is “risk off”, the market is pessimistic and will favor investments with perceived lower risk.
SEC Yield – The SEC Yield is a standardized method of computing return on investment that the U.S. Securities and Exchange Commission (SEC) requires mutual funds to use when advertising their yields. Its objective is to allow a confusion-free comparison of the performance of different funds.
Weighted Average – An average that takes into account the proportional relevance of each component, rather than treating each component equally.

| PAGE 32 |
|

STATEMENTS OF INVESTMENTS

WESTCORE GROWTH FUND AS OF JUNE 30, 2014
(UNAUDITED)
| Shares | Market Value |
COMMON STOCKS | | 98.52% |
Consumer Discretionary | | 13.33% |
Hotels, Restaurants & Leisure | | 3.05% |
Chipotle Mexican Grill Inc.** | 2,090 | $1,238,346 |
Las Vegas Sands Corp. | 9,440 | 719,517 |
| | 1,957,863 |
Household Durables | | 1.71% |
DR Horton Inc. | 44,650 | 1,097,497 |
Internet & Catalog Retail | | 1.74% |
Priceline Group Inc.** | 930 | 1,118,790 |
Media | | 3.71% |
CBS Corp. | 18,810 | 1,168,853 |
Walt Disney Co. | 14,170 | 1,214,936 |
| | 2,383,789 |
Multiline Retail | | 1.71% |
Macy’s Inc. | 18,920 | 1,097,738 |
Textiles, Apparel & Luxury Goods | | 1.41% |
Michael Kors Holdings Ltd. | | |
(Hong Kong)** | 10,250 | 908,663 |
Total Consumer Discretionary | | |
(Cost $6,919,624) | | 8,564,340 |
| | | |
Consumer Staples | | 5.53% |
Beverages | | 1.51% |
Constellation Brands Inc.** | 11,000 | 969,430 |
Food & Staples Retailing | | 1.38% |
CVS Caremark Corp. | 11,780 | 887,859 |
Food Products | | 2.64% |
Hain Celestial Group Inc.** | 8,990 | 797,773 |
Whitewave Foods Co.** | 27,650 | 895,030 |
| | 1,692,803 |
Total Consumer Staples | | |
(Cost $3,231,320) | | 3,550,092 |
| | | |
Energy | | 9.40% |
Energy Equipment & Services | | 3.38% |
Halliburton Co. | 18,900 | 1,342,089 |
Patterson-UTI Energy Inc. | 23,700 | 828,078 |
| | 2,170,167 |
Oil, Gas & Consumable Fuels | | 6.02% |
Anadarko Petroleum Corp. | 7,650 | 837,445 |
Cimarex Energy Co. | 5,700 | 817,722 |
EOG Resources Inc. | 12,620 | 1,474,773 |
| Shares | Market Value |
Range Resources Corp. | 8,450 | $734,728 |
| | 3,864,668 |
Total Energy | | |
(Cost $5,394,534) | | 6,034,835 |
| | | |
Financials | | 4.85% |
Capital Markets | | 1.15% |
Charles Schwab Corp. | 27,290 | 734,920 |
Commercial Banks | | 3.70% |
Banco Santander SA ADR | | |
(Spain) | 85,000 | 885,700 |
ICICI Bank Ltd. ADR (India) | 16,000 | 798,400 |
Regions Financial Corp. | 65,280 | 693,273 |
| | 2,377,373 |
Total Financials | | |
(Cost $3,090,834) | | 3,112,293 |
| | | |
Health Care | | 10.88% |
Biotechnology | | 4.80% |
Biogen Idec Inc.** | 4,262 | 1,343,851 |
Gilead Sciences Inc.** | 21,010 | 1,741,939 |
| | 3,085,790 |
Health Care Providers & Services | 3.37% |
McKesson Corp. | 6,790 | 1,264,366 |
Universal Health Services | | |
Inc. | 9,400 | 900,144 |
| | 2,164,510 |
Pharmaceuticals | | 2.71% |
Actavis PLC** | 4,800 | 1,070,640 |
Valeant Pharmaceuticals | | |
International Inc. | | |
(Canada)** | 5,300 | 668,436 |
| | 1,739,076 |
Total Health Care | | |
(Cost $4,930,364) | | 6,989,376 |
| | | |
Industrials | | 16.04% |
Aerospace & Defense | | 3.89% |
Boeing Co. | 9,850 | 1,253,215 |
Honeywell International Inc. | 13,420 | 1,247,389 |
| | 2,500,604 |
Airlines | | 1.41% |
Delta Air Lines Inc. | 23,370 | 904,886 |
Electrical Equipment | | 3.60% |
AMETEK Inc. | 17,236 | 901,098 |
Rockwell Automation Inc. | 11,280 | 1,411,805 |
| | 2,312,903 |
| Shares | Market Value |
Machinery | | 2.79% |
Cummins Inc. | 11,620 | $1,792,850 |
Road & Rail | | 2.33% |
Union Pacific Corp. | 15,020 | 1,498,245 |
Trading Companies & Distributors | 2.02% |
United Rentals Inc.** | 12,350 | 1,293,416 |
Total Industrials | | |
(Cost $7,838,962) | | 10,302,904 |
| | | |
Information Technology | | 31.45% |
Computers & Peripherals | | 6.87% |
Apple Inc. | 47,469 | 4,411,294 |
Electronic Equipment & Instruments | 1.69% |
Amphenol Corp. | 11,300 | 1,088,642 |
Internet Software & Services | | 9.58% |
Equinix Inc.** | 4,400 | 924,396 |
Facebook Inc. - Class A** | 31,750 | 2,136,458 |
Google Inc. - Class A** | 2,666 | 1,558,730 |
Google Inc. - Class C** | 2,666 | 1,533,696 |
| | 6,153,280 |
IT Services | | 3.00% |
Alliance Data Systems | | |
Corp.** | 3,800 | 1,068,750 |
Cognizant Technology | | |
Solutions Corp.** | 17,550 | 858,371 |
| | 1,927,121 |
Semiconductors & Semiconductor | |
Equipment | | 4.26% |
Microchip Technology Inc. | 19,050 | 929,830 |
NXP Semiconductor N.V. | | |
(Netherlands)** | 13,320 | 881,518 |
Skyworks Solutions Inc. | 19,650 | 922,764 |
| | 2,734,112 |
Software | | 6.05% |
Fortinet Inc.** | 59,490 | 1,494,984 |
Microsoft Corp. | 57,350 | 2,391,495 |
| | 3,886,479 |
Total Information Technology | | |
(Cost $12,930,010) | | 20,200,928 |
| | | |
Materials | | 7.04% |
Chemicals | | 4.48% |
Ecolab Inc. | 9,020 | 1,004,287 |
PPG Industries Inc. | 8,900 | 1,870,335 |
| | 2,874,622 |
| PAGE 34 |
|
WESTCORE GROWTH FUND AS OF JUNE 30, 2014 (continued)
(UNAUDITED)
| Shares | Market Value |
Construction Materials | | 1.33% |
Vulcan Materials Co. | 13,400 | $854,250 |
Metal & Mining | | 1.23% |
Rio Tinto PLC ADR (United | | |
Kingdom) | 14,600 | 792,488 |
Total Materials | | |
(Cost $4,238,210) | | 4,521,360 |
Total Common Stocks | | |
(Cost $48,573,858) | | 63,276,128 |
| | | |
MONEY MARKET MUTUAL FUNDS | 1.84% |
Fidelity Institutional Money | | |
Market Government | | |
Portfolio - Class I | | |
(7 Day Yield 0.010%) | 1,181,964 | 1,181,964 |
Total Money Market Mutual Funds | |
(Cost $1,181,964) | | 1,181,964 |
Total Investments | | |
(Cost $49,755,822) | 100.36% | 64,458,092 |
Liabilities in Excess of | | |
Other Assets | (0.36%) | (228,396) |
Net Assets | 100.00% | $64,229,696 |
Sector and industry classifications presented herein are based on the sector and industry categorization methodology of the Adviser to the Funds which may result in the designations for one Fund being different from another.
** Non-income producing security.
See Notes to Financial Statements.
|
|
| Shares | Market Value |
COMMON STOCKS | | 97.70% |
Consumer Discretionary | | 20.72% |
Auto Components | | 3.07% |
BorgWarner Inc. | 30,992 | $2,020,368 |
Delphi Automotive PLC | | |
(United Kingdom) | 16,027 | 1,101,696 |
| | 3,122,064 |
Automobiles | | 1.03% |
Tesla Motors Inc.** | 4,381 | 1,051,703 |
Hotels, Restaurants & Leisure | | 3.33% |
Dunkin’ Brands Group Inc. | 18,480 | 846,569 |
Melco Crown | | |
Entertainment Ltd. | | |
- ADR (China-Hong | | |
Kong) | 21,800 | 778,478 |
Wynn Resorts Ltd. | 8,451 | 1,754,089 |
| | 3,379,136 |
Household Durables | | 1.50% |
DR Horton Inc. | 61,925 | 1,522,116 |
Internet & Catalog Retail | | 2.83% |
NetFlix Inc.** | 3,320 | 1,462,792 |
TripAdvisor Inc.** | 9,073 | 985,872 |
zulily, Inc. - Class A** | 10,306 | 422,031 |
| | 2,870,695 |
Media | | 1.29% |
Lions Gate Entertainment | | |
Corp. | 45,784 | 1,308,507 |
Specialty Retail | | 0.77% |
Tractor Supply Co. | 13,004 | 785,442 |
Textiles Apparel & Luxury Goods | 6.90% |
Deckers Outdoor Corp.** | 20,553 | 1,774,341 |
Kate Spade & Co.** | 21,146 | 806,508 |
Lululemon Athletica Inc. | | |
(Canada)** | 32,841 | 1,329,404 |
Ralph Lauren Corp. | 10,747 | 1,726,935 |
Under Armour Inc. - Class | | |
A** | 23,010 | 1,368,865 |
| | 7,006,053 |
Total Consumer Discretionary | | |
(Cost $17,476,237) | | 21,045,716 |
| | | |
Consumer Staples | | 5.12% |
Food & Staples Retailing | | 2.89% |
Keurig Green Mountain, Inc. | 15,793 | 1,967,965 |
PriceSmart Inc. | 11,170 | 972,237 |
| | 2,940,202 |
| Shares | Market Value |
Food Products | | 2.23% |
Mead Johnson Nutrition Co. | 24,258 | $2,260,118 |
Total Consumer Staples | | |
(Cost $4,273,794) | | 5,200,320 |
| | | |
Energy | | 6.40% |
Oil, Gas & Consumable Fuels | | 6.40% |
Antero Resources Corp.** | 24,899 | 1,634,121 |
Gulfport Energy Corp.** | 14,897 | 935,532 |
Noble Energy Inc. | 15,880 | 1,230,065 |
Pioneer Natural | | |
Resources Co. | 7,839 | 1,801,480 |
Western Refining Inc. | 23,900 | 897,445 |
| | 6,498,643 |
Total Energy | | |
(Cost $4,936,055) | | 6,498,643 |
| | | |
Financials | | 6.32% |
Capital Markets | | 3.77% |
Affiliated Managers Group | | |
Inc.** | 8,904 | 1,828,882 |
LPL Financial Holdings | | |
Inc. | 23,156 | 1,151,780 |
SEI Investments Co. | 25,933 | 849,824 |
| | 3,830,486 |
Commercial Banks | | 2.55% |
First Republic Bank | 28,084 | 1,544,339 |
SVB Financial Group** | 8,939 | 1,042,466 |
| | 2,586,805 |
Total Financials | | |
(Cost $5,123,883) | | 6,417,291 |
| | | |
Health Care | | 16.92% |
Biotechnology | | 6.03% |
Alexion Pharmaceuticals | | |
Inc.** | 12,374 | 1,933,438 |
Alkermes PLC (Ireland)** | 26,279 | 1,322,622 |
Alnylam Pharmaceuticals | | |
Inc.** | 7,312 | 461,899 |
Medivation, Inc.** | 13,004 | 1,002,348 |
Regeneron | | |
Pharmaceuticals | | |
Inc.** | 4,990 | 1,409,525 |
| | 6,129,832 |
Health Care Equipment & Supplies | 4.63% |
Align Technology Inc.** | 17,750 | 994,710 |
Edwards Lifesciences | | |
Corp.** | 19,536 | 1,676,970 |
| Shares | Market Value |
Varian Medical Systems | | |
Inc.** | 24,511 | |
| | 4,709,525 |
Health Care Providers & Services | 1.57% |
Envision Healthcare | | |
Holdings, Inc.** | 44,350 | 1,592,609 |
Pharmaceuticals | | 4.69% |
Actavis PLC (Ireland)** | 9,331 | 2,081,279 |
Pacira Pharmaceuticals, | | |
Inc.** | 6,300 | 578,718 |
Perrigo Co. PLC | 14,413 | 2,100,839 |
| | 4,760,836 |
Total Health Care | | |
(Cost $14,509,725) | | 17,192,802 |
| | | |
Industrials | | 14.79% |
Aerospace & Defense | | 0.70% |
BE Aerospace Inc.** | 7,693 | 711,526 |
Airlines | | 1.90% |
United Continental | | |
Holdings, Inc.** | 46,887 | 1,925,649 |
Building Products | | 3.88% |
Allegion PLC (Ireland) | 23,638 | 1,339,802 |
Fortune Brands Home & | | |
Security, Inc. | 22,470 | 897,227 |
Lennox International Inc. | 18,993 | 1,701,203 |
| | 3,938,232 |
Electrical Equipment | | 2.41% |
Sensata Technologies | | |
Holding N.V. | | |
(Netherlands)** | 29,062 | 1,359,520 |
SolarCity Corp.** | 15,379 | 1,085,758 |
| | 2,445,278 |
Machinery | | 5.18% |
Ingersoll-Rand PLC | | |
(Ireland) | 32,696 | 2,043,827 |
Terex Corp. | 42,143 | 1,732,077 |
WABCO Holdings Inc.** | 13,950 | 1,490,139 |
| | 5,266,043 |
Road & Rail | | 0.72% |
Old Dominion Freight Line | | |
Inc.** | 11,550 | 735,504 |
Total Industrials | | |
(Cost $11,525,190) | | 15,022,232 |
| PAGE 36 |
|
WESTCORE MIDCO GROWTH FUND AS OF JUNE 30, 2014 (continued)
(UNAUDITED)
| Shares | Market Value |
Information Technology | | 20.08% |
Communications Equipment | | 1.04% |
Palo Alto Networks Inc.** | 12,617 | $1,057,935 |
Electric Equipment & Instruments | 2.86% |
Amphenol Corp. - Class A | 15,800 | 1,522,172 |
IPG Photonics Corp.** | 20,017 | 1,377,170 |
| | 2,899,342 |
Internet Software & Services | | 6.34% |
Akamai Technologies Inc.** | 23,600 | 1,441,016 |
LinkedIn Corp. - Class A** | 8,950 | 1,534,657 |
Pandora Media Inc.** | 58,088 | 1,713,596 |
Twitter Inc.** | 42,700 | 1,749,419 |
| | 6,438,688 |
IT Services | | 2.12% |
Fiserv Inc.** | 22,900 | 1,381,328 |
Jack Henry & Associates | | |
Inc. | 13,058 | 776,037 |
| | 2,157,365 |
Semiconductors & Semiconductor | |
Equipment | | 2.69% |
Applied Materials Inc. | 77,689 | 1,751,887 |
NXP Semiconductor N.V. | | |
(Netherlands)** | 14,823 | 980,986 |
| | 2,732,873 |
Software | | 5.03% |
Activision Blizzard Inc. | 68,050 | 1,517,515 |
FireEye Inc.** | 38,800 | 1,573,340 |
Splunk Inc.** | 21,915 | 1,212,557 |
Tableau Software Inc. - | | |
Class A** | 11,268 | 803,746 |
| | 5,107,158 |
Total Information Technology | | |
(Cost $17,198,012) | | 20,393,361 |
| | | |
Materials | | 7.35% |
Chemicals | | 5.23% |
Eastman Chemical Co. | 18,243 | 1,593,526 |
FMC Corp. | 25,613 | 1,823,389 |
Rockwood Holdings Inc. | 24,935 | 1,894,811 |
| | 5,311,726 |
Construction Materials | | 1.27% |
Eagle Materials Inc. | 13,700 | 1,291,636 |
Metal & Mining | | 0.85% |
US Silica Holdings Inc. | 15,569 | 863,146 |
| Shares | Market Value |
Total Materials | | |
(Cost $5,405,066) | | $7,466,508 |
Total Common Stocks | | |
(Cost $80,447,962) | | 99,236,873 |
| | |
MONEY MARKET MUTUAL FUNDS | 0.78% |
Fidelity Institutional Money | | |
Market Government | | |
Portfolio - Class I | | |
(7 Day Yield 0.010%) | 787,632 | 787,632 |
Total Money Market Mutual Funds | |
(Cost $787,632) | | 787,632 |
Total Investments | | |
(Cost $81,235,594) | 98.48% | 100,024,505 |
Other Assets in | | |
Excess of Liabilities | 1.52% | 1,546,447 |
Net Assets | 100.00% | $101,570,952 |
Sector and industry classifications presented herein are based on the sector and industry categorization methodology of the Adviser to the Funds which may result in the designations for one Fund being different from another.
** Non-income producing security.
See Notes to Financial Statements.
|
|
WESTCORE SELECT FUND AS OF JUNE 30, 2014
(UNAUDITED)
| Shares | Market Value |
COMMON STOCKS | | 98.77% |
Consumer Discretionary | | 20.46% |
Auto Components | | 3.52% |
BorgWarner Inc. | 55,766 | $3,635,385 |
Hotels Restaurants & Leisure | 3.64% |
Wynn Resorts Ltd. | 18,150 | 3,767,214 |
Household Durables | | 3.13% |
DR Horton Inc. | 131,903 | 3,242,176 |
Internet & Catalog Retail | | 2.13% |
TripAdvisor Inc.** | 20,310 | 2,206,885 |
Textiles Apparel & Luxury Goods | 8.04% |
Deckers Outdoor Corp.** | 30,900 | 2,667,597 |
Lululemon Athletica Inc. | | |
(Canada)** | 71,551 | 2,896,384 |
Under Armour Inc. - Class | | |
A** | 46,218 | 2,749,509 |
| | 8,313,490 |
Total Consumer Discretionary | |
(Cost $17,320,193) | | 21,165,150 |
| | | |
Consumer Staples | | 6.83% |
Food Products | | 6.83% |
Keurig Green Mountain, | | |
Inc. | 21,150 | 2,635,502 |
Mead Johnson Nutrition | | |
Co. | 47,538 | 4,429,115 |
| | 7,064,617 |
Total Consumer Staples | | |
(Cost $5,808,291) | | 7,064,617 |
| | | |
Energy | | 6.09% |
Oil, Gas & Consumable Fuels | 6.09% |
Antero Resources Corp.** | 45,969 | 3,016,945 |
Pioneer Natural | | |
Resources Co. | 14,306 | 3,287,662 |
| | 6,304,607 |
Total Energy | | |
(Cost $4,175,775) | | 6,304,607 |
| | | |
Financials | | 3.82% |
Capital Markets | | 3.82% |
Affiliated Managers Group | | |
Inc.** | 19,219 | 3,947,583 |
Total Financials | | |
(Cost $2,508,749) | | 3,947,583 |
| Shares | Market Value |
Health Care | | 16.07% |
Biotechnology | | 3.16% |
Regeneron | | |
Pharmaceuticals | | |
Inc.** | 11,547 | $3,261,681 |
Health Care Equipment & Supplies | 6.34% |
Edwards Lifesciences | | |
Corp.** | 37,407 | 3,211,017 |
Varian Medical Systems | | |
Inc.** | 40,263 | 3,347,466 |
| | 6,558,483 |
Health Care Providers & Services | 2.88% |
Team Health Holdings, | | |
Inc.** | 59,700 | 2,981,418 |
Pharmaceuticals | | 3.69% |
Perrigo Co. PLC | 26,206 | 3,819,786 |
Total Health Care | | |
(Cost $15,605,947) | | 16,621,368 |
| | | |
Industrials | | 15.74% |
Airlines | | 3.38% |
United Continental | | |
Holdings, Inc.** | 85,084 | 3,494,400 |
Electrical Equipment | | 3.08% |
Sensata Technologies | | |
Holding N.V. | | |
(Netherlands)** | 68,191 | 3,189,975 |
Machinery | | 9.28% |
Ingersoll-Rand PLC | | |
(Ireland) | 54,538 | 3,409,170 |
Terex Corp. | 76,366 | 3,138,643 |
WABCO Holdings Inc.** | 28,574 | 3,052,275 |
| | 9,600,088 |
Total Industrials | | |
(Cost $12,916,170) | | 16,284,463 |
| | | |
Information Technology | | 23.40% |
Electronic Equipment & Instruments | 5.72% |
Amphenol Corp. | 35,300 | 3,400,802 |
IPG Photonics Corp.** | 36,600 | 2,518,080 |
| | 5,918,882 |
Internet Software & Services | 8.96% |
LinkedIn Corp. - Class A** | 18,650 | 3,197,915 |
Pandora Media Inc.** | 121,290 | 3,578,055 |
Twitter Inc.** | 60,850 | 2,493,025 |
| | 9,268,995 |
| Shares | Market Value |
Semiconductors & Semiconductor | |
Equipment | | 3.04% |
Applied Materials Inc. | 139,700 | $3,150,235 |
Software | | 5.68% |
Activision Blizzard Inc. | 142,650 | 3,181,095 |
FireEye Inc.** | 66,450 | 2,694,548 |
| | 5,875,643 |
Total Information Technology | |
(Cost $22,435,701) | | 24,213,755 |
| | | |
Materials | | 6.36% |
Chemicals | | 6.36% |
FMC Corp. | 45,180 | 3,216,364 |
Rockwood Holdings Inc. | 44,324 | 3,368,181 |
| | 6,584,545 |
Total Materials | | |
(Cost $6,442,826) | | 6,584,545 |
Total Common Stocks | | |
(Cost $87,213,652) | | 102,186,088 |
| | | |
MONEY MARKET MUTUAL FUNDS | 1.53% |
Fidelity Institutional Money | | |
Market Government | | |
Portfolio - Class I | | |
(7 Day Yield 0.010%) | 1,582,524 | 1,582,524 |
Total Money Market Mutual Funds | |
(Cost $1,582,524) | | 1,582,524 |
Total Investments | | |
(Cost $88,796,176) | 100.30% | 103,768,612 |
Liabilities in Excess | | |
of Other Assets | (0.30%) | (310,228) |
Net Assets | 100.00% | $103,458,384 |
Sector and industry classifications presented herein are based on the sector and industry categorization methodology of the Adviser to the Funds which may result in the designations for one Fund being different from another.
** Non-income producing security.
See Notes to Financial Statements.
| PAGE 38 |
|
WESTCORE SMALL-CAP GROWTH FUND AS OF JUNE 30, 2014
(UNAUDITED)
| Shares | Market Value |
COMMON STOCKS | | 97.92% |
Consumer Discretionary | | 20.07% |
Diversified Consumer Services | | 2.12% |
Grand Canyon Education | | |
Inc.** | 1,481 | $68,082 |
Hotels Restaurants & Leisure | | 3.49% |
Del Frisco’s Restaurant | | |
Group, Inc.** | 1,778 | 49,002 |
Vail Resorts Inc. | 819 | 63,210 |
| | 112,212 |
Household Durables | | 3.25% |
iRobot Corp.** | 1,168 | 47,830 |
The Ryland Group, Inc. | 1,435 | 56,596 |
| | 104,426 |
Internet & Catalog Retail | | 0.86% |
HomeAway Inc.** | 797 | 27,752 |
Media | | 3.45% |
IMAX Corp. (Canada)** | 2,470 | 70,346 |
Lions Gate Entertainment | | |
Corp. | 1,419 | 40,555 |
| | 110,901 |
Specialty Retail | | 1.03% |
Five Below Inc.** | 451 | 18,000 |
Tilly’s, Inc. - Class A** | 1,887 | 15,171 |
| | 33,171 |
Textiles Apparel & Luxury Goods | | 5.87% |
Deckers Outdoor Corp.** | 762 | 65,782 |
Kate Spade & Co.** | 622 | 23,723 |
Tumi Holdings Inc.** | 1,633 | 32,872 |
Vera Bradley Inc.** | 642 | 14,041 |
Vince Holding Corp.** | 1,416 | 51,854 |
| | 188,272 |
Total Consumer Discretionary | | |
(Cost $634,352) | | 644,816 |
| | | |
Consumer Staples | | 2.37% |
Food & Staples Retailing | | 2.37% |
Natural Grocers by Vitamin | | |
Cottage Inc.** | 1,455 | 31,152 |
PriceSmart Inc. | 515 | 44,825 |
| | 75,977 |
Total Consumer Staples | | |
(Cost $111,014) | | 75,977 |
| Shares | Market Value |
Energy | | 6.13% |
Oil, Gas & Consumable Fuels | | 6.13% |
Diamondback Energy Inc.** | 331 | $29,393 |
Goodrich Petroleum Corp.** | 1,279 | 35,300 |
PDC Energy Inc.** | 789 | 49,825 |
Rice Energy, Inc.** | 1,728 | 52,618 |
Western Refining Inc. | 790 | 29,665 |
| | 196,801 |
Total Energy | | |
(Cost $162,969) | | 196,801 |
| | | |
Financials | | 6.15% |
Capital Markets | | 1.98% |
Evercore Partners Inc. - | | |
Class A | 1,103 | 63,577 |
Commercial Banks | | 2.73% |
Eagle Bancorp Inc.** | 1,361 | 45,934 |
Western Alliance Bancorp** | 1,759 | 41,864 |
| | 87,798 |
Diversified Financial Services | | 1.44% |
MarketAxess Holdings Inc. | 855 | 46,221 |
Total Financials | | |
(Cost $199,355) | | 197,596 |
| | | |
Health Care | | 22.30% |
Biotechnology | | 6.24% |
Acceleron Pharma, Inc.** | 892 | 30,301 |
Alnylam Pharmaceuticals | | |
Inc.** | 523 | 33,038 |
Clovis Oncology Inc.** | 517 | 21,409 |
Exact Sciences Corp.** | 3,013 | 51,312 |
NPS Pharmaceuticals Inc.** | 938 | 31,001 |
Synageva BioPharma Corp.** | 319 | 33,431 |
| | 200,492 |
Health Care Equipment & Supplies | 9.96% |
ABIOMED Inc.** | 1,712 | 43,040 |
Align Technology Inc.** | 440 | 24,658 |
AtriCure Inc.** | 2,625 | 48,247 |
Cardiovascular Systems | | |
Inc.** | 1,403 | 43,717 |
HeartWare International | | |
Inc.** | 435 | 38,498 |
Novadaq Technologies Inc. | | |
(Canada)** | 1,828 | 30,125 |
OraSure Technologies Inc.** | 7,650 | 65,866 |
Veracyte, Inc.** | 1,494 | 25,577 |
| | 319,728 |
Health Care Providers & Services | | 1.96% |
Team Health Holdings, Inc.** | 1,262 | 63,024 |
| Shares | Market Value |
Health Care Technology | | 0.54% |
Veeva Systems, Inc. - Class | | |
A** | 686 | $17,459 |
Pharmaceuticals | | 3.60% |
Alcobra Ltd. (Israel)** | 1,082 | 18,729 |
Pacira Pharmaceuticals, | | |
Inc.** | 733 | 67,334 |
Tetraphase Pharmaceuticals | | |
Inc.** | 2,202 | 29,705 |
| | 115,768 |
Total Health Care | | |
(Cost $671,125) | | 716,471 |
| | | |
Industrials | | 11.42% |
Air Freight & Logistics | | 1.18% |
HUB Group Inc. - Class A** | 751 | 37,850 |
Building Products | | 4.22% |
Lennox International Inc. | 751 | 67,267 |
NCI Building Systems Inc.** | 3,518 | 68,355 |
| | 135,622 |
Commercial Services & Supplies | | 1.17% |
Interface Inc. | 2,002 | 37,718 |
Machinery | | 2.50% |
Commercial Vehicle Group | | |
Inc.** | 3,922 | 39,377 |
Proto Labs Inc.** | 501 | 41,042 |
| | 80,419 |
Road & Rail | | 2.35% |
Heartland Express Inc. | 1,596 | 34,059 |
Saia Inc.** | 940 | 41,294 |
| | 75,353 |
Total Industrials | | |
(Cost $336,500) | | 366,962 |
| | | |
Information Technology | | 25.30% |
Electronic Equipment & Instruments | 5.55% |
InvenSense Inc.** | 2,830 | 64,213 |
IPG Photonics Corp.** | 766 | 52,701 |
Maxwell Technologies, Inc.** | 2,442 | 36,947 |
Methode Electronics Inc. | 636 | 24,302 |
| | 178,163 |
Internet Software & Services | | 3.12% |
Pandora Media Inc.** | 1,939 | 57,200 |
Shutterstock, Inc.** | 517 | 42,901 |
| | 100,101 |
|
|
WESTCORE SMALL-CAP GROWTH FUND AS OF JUNE 30, 2014 (continued)
(UNAUDITED)
| Shares | Market Value |
IT Services | | 2.74% |
Jack Henry & Associates | | |
Inc. | 746 | $44,335 |
Virtusa Corp.** | 1,218 | 43,604 |
| | 87,939 |
Semiconductors & Semi Equipment | 8.91% |
Applied Micro Circuits | | |
Corp.** | 3,278 | 35,435 |
Cavium, Inc.** | 456 | 22,645 |
Inphi Corp.** | 3,742 | 54,933 |
Monolithic Power Systems | | |
Inc. | 1,295 | 54,843 |
Nanometrics Inc.** | 1,452 | 26,499 |
Rambus Inc.** | 2,231 | 31,903 |
SunEdison Inc.** | 2,659 | 60,093 |
| | 286,351 |
Software | | 4.98% |
FireEye Inc.** | 1,285 | 52,106 |
Guidewire Software Inc.** | 656 | 26,673 |
Take-Two Interactive | | |
Software Inc.** | 1,219 | 27,111 |
The Ultimate Software | | |
Group Inc.** | 316 | 43,662 |
Varonis Systems Inc.** | 363 | 10,531 |
| | 160,083 |
Total Information Technology | |
(Cost $729,031) | | 812,637 |
| | | |
Materials | | 4.18% |
Chemicals | | 3.13% |
Flotek Industries Inc.** | 1,081 | 34,765 |
PolyOne Corp. | 1,561 | 65,781 |
| | 100,546 |
Metal & Mining | | 1.05% |
US Silica Holdings Inc. | 610 | 33,818 |
Total Materials | | |
(Cost $105,774) | | 134,364 |
Total Common Stocks | | |
(Cost $2,950,120) | | 3,145,624 |
| | |
MONEY MARKET MUTUAL FUNDS | 2.85% |
Fidelity Institutional Money | | |
Market Government | | |
Portfolio - Class I | | |
(7 Day Yield 0.010%) | 91,429 | 91,429 |
Total Money Market Mutual Funds | |
(Cost $91,429) | | 91,429 |
| Shares | Market Value |
Total Investments | | |
(Cost $3,041,549) | 100.77% | $3,237,053 |
Liabilities in Excess | | |
of Other Assets | (0.77%) | (24,838) |
Net Assets | 100.00% | $3,212,215 |
Sector and industry classifications presented herein are based on the sector and industry categorization methodology of the Adviser to the Funds which may result in the designations for one Fund being different from another.
** Non-income producing security.
See Notes to Financial Statements.
| PAGE 40 |
|
WESTCORE BLUE CHIP DIVIDEND FUND AS OF JUNE 30, 2014
(UNAUDITED)
| Shares | Market Value |
COMMON STOCKS | | 99.17% |
Consumer Discretionary | | 16.11% |
Hotels Restaurants & Leisure | | 6.93% |
McDonald’s Corp. | 20,260 | $2,040,992 |
Sodexo (France) | 18,892 | 2,031,996 |
| | 4,072,988 |
Leisure Equipment & Products | 3.37% |
Mattel Inc. | 50,810 | 1,980,066 |
Textiles Apparel & Luxury Goods | 5.81% |
Coach Inc. | 38,560 | 1,318,366 |
LVMH Moet Hennessy Louis | | |
Vuitton S.A. ADR | | |
(France) | 54,270 | 2,093,737 |
| | 3,412,103 |
Total Consumer Discretionary | | |
(Cost $9,105,904) | | 9,465,157 |
| | | |
Consumer Staples | | 20.23% |
Food & Staples Retailing | | 3.26% |
Wal-Mart Stores Inc. | 25,490 | 1,913,534 |
Food Products | | 6.61% |
General Mills Inc. | 36,980 | 1,942,929 |
Nestle SA ADR | | |
(Switzerland) | 25,020 | 1,943,304 |
| | 3,886,233 |
Household Products | | 6.92% |
Kimberly-Clark Corp. | 18,900 | 2,102,058 |
Reckitt Benckiser Group | | |
PLC ADR (United | | |
Kingdom) | 112,162 | 1,962,835 |
| | 4,064,893 |
Tobacco | | 3.44% |
British American Tobacco | | |
PLC ADR (United | | |
Kingdom) | 16,980 | 2,021,978 |
Total Consumer Staples | | |
(Cost $10,329,178) | | 11,886,638 |
| | | |
Energy | | 13.89% |
Oil Gas & Consumable Fuels | | 13.89% |
Chevron Corp. | 16,380 | 2,138,409 |
Occidental Petroleum Corp. | 18,990 | 1,948,944 |
Royal Dutch Shell PLC ADR | | |
(Netherlands) | 24,520 | 2,133,485 |
Total S.A. ADR (France) | 26,870 | 1,940,014 |
| | 8,160,852 |
Total Energy | | |
(Cost $5,983,643) | | 8,160,852 |
| Shares | Market Value |
Financials | | 2.93% |
Commercial Banks | | 2.93% |
US Bancorp | 39,740 | $1,721,537 |
Total Financials | | |
(Cost $1,498,516) | | 1,721,537 |
| | | |
Health Care | | 22.93% |
Health Care Equipment & Supplies | 2.79% |
Baxter International Inc. | 22,680 | 1,639,764 |
Health Care Providers & Services | 3.36% |
AmerisourceBergen Corp. | 27,140 | 1,971,992 |
Pharmaceuticals | | 16.78% |
AbbVie Inc. | 36,590 | 2,065,140 |
GlaxoSmithKline PLC ADR | | |
(United Kingdom) | 37,180 | 1,988,386 |
Novartis AG ADR | | |
(Switzerland) | 21,490 | 1,945,490 |
Pfizer Inc. | 64,602 | 1,917,387 |
Roche Holding AG ADR | | |
(Switzerland) | 52,060 | 1,941,838 |
| | 9,858,241 |
Total Health Care | | |
(Cost $9,845,476) | | 13,469,997 |
| | | |
Industrials | | 6.36% |
Aerospace & Defense | | 6.36% |
General Dynamics Corp. | 16,620 | 1,937,061 |
Raytheon Co. | 19,490 | 1,797,953 |
| | 3,735,014 |
Total Industrials | | |
(Cost $1,775,346) | | 3,735,014 |
| | | |
Information Technology | | 9.91% |
Computers & Peripherals | | 3.11% |
Apple Inc. | 19,670 | 1,827,933 |
IT Services | | 3.30% |
Accenture PLC - Class A | | |
(Ireland) | 23,990 | 1,939,352 |
Software | | 3.50% |
Microsoft Corp. | 49,320 | 2,056,644 |
Total Information Technology | |
(Cost $4,457,429) | | 5,823,929 |
| | | |
Utilities | | 6.81% |
Electric Utilities | | 3.31% |
Edison International | 33,500 | 1,946,685 |
| Shares | Market Value |
Multi-Utilities | | 3.50% |
Canadian Utilities Ltd. - | | |
Class A (Canada) | 54,760 | $2,052,762 |
Total Utilities | | |
(Cost $3,909,014) | | 3,999,447 |
Total Common Stocks | | |
(Cost $46,904,506) | | 58,262,571 |
| | |
MONEY MARKET MUTUAL FUNDS | 1.23% |
Fidelity Institutional Money | | |
Market Government | | |
Portfolio - Class I | | |
(7 Day Yield 0.010%) | 722,696 | 722,696 |
Total Money Market Mutual Funds | |
(Cost $722,696) | | 722,696 |
Total Investments | | |
(Cost $47,627,202) | 100.40% | 58,985,267 |
Liabilities in Excess | | |
of Other Assets | (0.40%) | (232,506) |
Net Assets | 100.00% | $58,752,761 |
Westcore Blue Chip Dividend Fund
Country Breakdown as of June 30, 2014
(Unaudited)
Country | Market Value | % |
United States | $34,990,090 | 59.56% |
France | 6,065,747 | 10.32% |
United Kingdom | 5,973,199 | 10.16% |
Switzerland | 5,830,632 | 9.93% |
Netherlands | 2,133,485 | 3.63% |
Canada | 2,052,762 | 3.50% |
Ireland | 1,939,352 | 3.30% |
Total Investments | 58,985,267 | 100.40% |
Liabilities in Excess | | |
of Other Assets | (232,506) | (0.40%) |
Net Assets | $58,752,761 | 100.00% |
Please note the country breakdown is based on the company headquarters.
Sector and industry classifications presented herein are based on the sector and industry categorization methodology of the Adviser to the Funds which may result in the designations for one Fund being different from another.
See Notes to Financial Statements.
WESTCORE MID-CAP VALUE DIVIDEND FUND AS OF JUNE 30, 2014
(UNAUDITED)
| Shares | Market Value |
COMMON STOCKS | | 95.34% |
Basic Materials | | 9.78% |
Chemicals | | 2.96% |
Compass Minerals | | |
International Inc. | 8,900 | $852,086 |
Eastman Chemical Co. | 9,400 | 821,090 |
| | 1,673,176 |
Forestry & Paper | | 6.82% |
Avery Dennison Corp. | 30,200 | 1,547,750 |
International Paper Co. | 23,700 | 1,196,139 |
Rock-Tenn Co. - Class A | 10,600 | 1,119,254 |
| | 3,863,143 |
Total Basic Materials | | |
(Cost $4,415,404) | | 5,536,319 |
| | | |
Capital Goods | | 5.24% |
Engineering & Construction | | 1.46% |
EMCOR Group Inc. | 18,600 | 828,258 |
Industrial Products | | 0.98% |
Parker Hannifin Corp. | 4,400 | 553,212 |
Transportation Equipment & Parts | 2.80% |
Oshkosh Corp. | 28,500 | 1,582,605 |
Total Capital Goods | | |
(Cost $2,924,041) | | 2,964,075 |
| | | |
Commercial Services | | 2.03% |
Business Products & Services | 2.03% |
Xerox Corp. | 92,481 | 1,150,464 |
Total Commercial Services | | |
(Cost $866,737) | | 1,150,464 |
| | | |
Consumer Cyclical | | 12.48% |
Apparel & Footwear Mfg | | 1.32% |
Coach Inc. | 21,900 | 748,761 |
Consumer Durables | | 1.89% |
Whirlpool Corp. | 7,700 | 1,071,994 |
Department Stores | | 2.09% |
Nordstrom Inc. | 17,400 | 1,181,982 |
Motor Vehicle Parts | | 1.96% |
Delphi Automotive PLC | | |
(United Kingdom) | 16,100 | 1,106,714 |
Publishing & Media | | 5.22% |
Cinemark Holdings Inc. | 50,500 | 1,785,680 |
| Shares | Market Value |
Scripps Networks | | |
Interactive Inc. - Class | | |
A | 14,400 | $1,168,416 |
| | 2,954,096 |
Total Consumer Cyclical | | |
(Cost $6,979,783) | | 7,063,547 |
| | | |
Consumer Staples | | 4.88% |
Beverages: Non-Alcoholic | | 1.13% |
Dr Pepper Snapple Group | | |
Inc. | 10,900 | 638,522 |
Food & Agricultural Products | 3.75% |
Ingredion, Inc. | 14,600 | 1,095,584 |
Tyson Foods Inc. - Class A | 27,350 | 1,026,719 |
| | 2,122,303 |
Total Consumer Staples | | |
(Cost $1,896,397) | | 2,760,825 |
| | | |
Energy | | 3.60% |
Oil Services | | 1.05% |
Tidewater Inc. | 10,646 | 597,773 |
Refining & Marketing | | 2.55% |
HollyFrontier Corp. | 12,300 | 537,387 |
Western Refining Inc. | 24,100 | 904,955 |
| | 1,442,342 |
Total Energy | | |
(Cost $1,401,743) | | 2,040,115 |
| | | |
Interest Rate Sensitive | | 21.67% |
Life & Health Insurance | | 5.15% |
Reinsurance Group of | | |
America Inc. | 19,191 | 1,514,170 |
Unum Group | 40,250 | 1,399,090 |
| | 2,913,260 |
Other Banks | | 3.13% |
BOK Financial Corp. | 12,300 | 819,180 |
First Citizens BancShares | | |
Inc. - Class A | 3,900 | 955,500 |
| | 1,774,680 |
Property Casualty Insurance | | 5.79% |
Endurance Specialty | | |
Holdings Ltd. | | |
(Bermuda) | 20,600 | 1,062,754 |
Validus Holdings Ltd. | | |
(Bermuda) | 28,800 | 1,101,312 |
WR Berkley Corp. | 24,100 | 1,116,071 |
| | 3,280,137 |
| Shares | Market Value |
Regional Banks | | 5.32% |
Fifth Third Bancorp | 39,200 | $836,920 |
M&T Bank Corp. | 9,100 | 1,128,855 |
Zions Bancorporation | 35,500 | 1,046,185 |
| | 3,011,960 |
Securities & Asset Management | 2.28% |
The NASDAQ OMX Group | | |
Inc. | 33,400 | 1,289,908 |
Total Interest Rate Sensitive | | |
(Cost $10,397,893) | | 12,269,945 |
| | | |
Medical/Healthcare | | 8.80% |
Healthcare Services | | 6.93% |
AmerisourceBergen Corp. | 16,750 | 1,217,055 |
Omnicare Inc. | 20,550 | 1,368,013 |
Universal Health Services | | |
Inc. - Class B | 14,000 | 1,340,640 |
| | 3,925,708 |
Medical Products & Supplies | | 0.87% |
West Pharmaceutical | | |
Services Inc. | 11,600 | 489,288 |
Pharmaceuticals | | 1.00% |
Questcor Pharmaceuticals | | |
Inc. | 6,100 | 564,189 |
Total Medical/Healthcare | | |
(Cost $2,722,223) | | 4,979,185 |
| | |
Real Estate Investment Trusts (REITs) | 8.50% |
Diversified & Specialty | | 2.11% |
Weyerhaeuser Co. | 36,000 | 1,191,240 |
Healthcare | | 1.74% |
Senior Housing Properties | | |
Trust | 40,600 | 986,174 |
Multi-Family | | 1.43% |
American Campus | | |
Communities Inc. | 21,200 | 810,688 |
Office | | 1.59% |
Alexandria Real Estate | | |
Equities Inc. | 11,600 | 900,624 |
Retail | | 1.63% |
Taubman Centers Inc. | 12,200 | 924,882 |
Total Real Estate Investment Trusts (REITs) |
(Cost $4,340,046) | | 4,813,608 |
| PAGE 42 |
|
WESTCORE MID-CAP VALUE DIVIDEND FUND AS OF JUNE 30, 2014 (continued)
(UNAUDITED)
| Shares | Market Value |
Technology | | 6.80% |
Computer Software | | 3.53% |
Activision Blizzard Inc. | 41,250 | $919,875 |
CA Inc. | 37,500 | 1,077,750 |
| | 1,997,625 |
Networking | | 1.48% |
Plantronics Inc. | 17,500 | 840,875 |
Semiconductors | | 1.79% |
Avago Technologies Ltd. | | |
(Singapore) | 14,050 | 1,012,584 |
Total Technology | | |
(Cost $2,546,776) | | 3,851,084 |
| | | |
Transportation | | 3.65% |
Airlines | | 1.51% |
Copa Holdings SA - Class A | | |
(Panama) | 6,000 | 855,420 |
Trucking, Shipping, Air Freight | 2.14% |
Con-way Inc. | 24,000 | 1,209,840 |
Total Transportation | | |
(Cost $1,855,053) | | 2,065,260 |
| | | |
Utilities | | 7.91% |
Independent Power | | 1.06% |
FirstEnergy Corp. | 17,300 | 600,656 |
Regulated Electric | | 4.41% |
Edison International | 20,200 | 1,173,822 |
Westar Energy Inc. | 34,650 | 1,323,284 |
| | 2,497,106 |
Water Utilities | | 2.44% |
American Water Works | | |
Co. Inc. | 27,950 | 1,382,127 |
Total Utilities | | |
(Cost $3,239,248) | | 4,479,889 |
Total Common Stocks | | |
(Cost $43,585,344) | | 53,974,316 |
| | | |
MONEY MARKET MUTUAL FUNDS | 6.15% |
Fidelity Institutional Money | | |
Market Government | | |
Portfolio - Class I | | |
(7 Day Yield 0.010%) | 3,481,892 | 3,481,892 |
Total Money Market Mutual Funds | |
(Cost $3,481,892) | | 3,481,892 |
| Shares | Market Value |
Total Investments | | |
(Cost $47,067,236) | 101.49% | $57,456,208 |
Liabilities in Excess | | |
of Other Assets | (1.49%) | |
Net Assets | 100.00% | $56,614,614 |
Sector and industry classifications presented herein are based on the sector and industry categorization methodology of the Adviser to the Funds which may result in the designations for one Fund being different from another.
See Notes to Financial Statements.
|
|
WESTCORE SMALL-CAP VALUE DIVIDEND FUND AS OF JUNE 30, 2014
(UNAUDITED)
| Shares | Market Value |
COMMON STOCKS | | 98.82% |
Basic Materials | | 6.31% |
Chemicals | | 4.83% |
Compass Minerals | | |
International Inc. | 88,375 | $8,461,023 |
Innophos Holdings Inc. | 156,849 | 9,029,797 |
| | 17,490,820 |
Forestry & Paper | | 1.48% |
Greif, Inc. - Class A | 97,900 | 5,341,424 |
Total Basic Materials | | |
(Cost $18,478,709) | | 22,832,244 |
| | | |
Capital Goods | | 8.12% |
Aerospace/Defense Suppliers | 3.79% |
Cubic Corp. | 167,288 | 7,445,989 |
Curtiss-Wright Corp. | 95,651 | 6,270,880 |
| | 13,716,869 |
Electrical Equipment | | 2.78% |
Actuant Corp. - Class A | 132,060 | 4,565,314 |
Watts Water Technologies | | |
Inc. - Class A | 88,790 | 5,481,007 |
| | 10,046,321 |
Industrial Products | | 1.55% |
Barnes Group Inc. | 145,010 | 5,588,685 |
Total Capital Goods | | |
(Cost $25,962,514) | | 29,351,875 |
| | | |
Commercial Services | | 5.12% |
Business Products & Services | 5.12% |
ABM Industries Inc. | 122,900 | 3,315,842 |
The Brink’s Co. | 159,360 | 4,497,140 |
G&K Services Inc. - Class | | |
A | 91,060 | 4,741,494 |
MAXIMUS Inc. | 138,850 | 5,973,327 |
| | 18,527,803 |
Total Commercial Services | | |
(Cost $15,638,150) | | 18,527,803 |
| | | |
Consumer Cyclical | | 12.27% |
Clothing & Accessories | | 8.05% |
Brown Shoe Co. Inc. | 352,760 | 10,092,464 |
The Cato Corp. - Class A | 213,940 | 6,610,746 |
The Finish Line Inc. - | | |
Class A | 220,980 | 6,571,945 |
Stage Stores Inc. | 311,880 | 5,829,037 |
| | 29,104,192 |
| Shares | Market Value |
Motor Vehicle Parts | | 1.27% |
Standard Motor Products | | |
Inc. | 102,490 | $4,578,228 |
Recreation & Leisure | | 1.32% |
Thor Industries Inc. | 84,210 | 4,789,023 |
Specality Retail | | 1.63% |
Pier 1 Imports Inc. | 382,330 | 5,891,705 |
Total Consumer Cyclical | | |
(Cost $35,819,779) | | 44,363,148 |
| | | |
Consumer Staples | | 7.28% |
Food & Agricultural Products | 3.29% |
Dean Foods Co. | 675,900 | 11,889,081 |
Grocery & Convenience | | 1.24% |
Casey’s General Stores | | |
Inc. | 63,780 | 4,483,096 |
Tobacco | | 2.75% |
Schweitzer-Mauduit | | |
International Inc. | 227,550 | 9,934,833 |
Total Consumer Staples | | |
(Cost $22,262,283) | | 26,307,010 |
| | | |
Energy | | 9.27% |
Exploration & Production | | 3.52% |
Comstock Resources Inc. | 200,220 | 5,774,345 |
Energy XXI Bermuda Ltd. | | |
(Bermuda) | 293,550 | 6,936,586 |
| | 12,710,931 |
Oil Services | | 3.58% |
Bristow Group Inc. | 106,980 | 8,624,728 |
Gulfmark Offshore Inc. - | | |
Class A | 95,650 | 4,321,467 |
| | 12,946,195 |
Refining & Marketing | | 2.17% |
Western Refining Inc. | 209,360 | 7,861,468 |
Total Energy | | |
(Cost $27,268,689) | | 33,518,594 |
| | | |
Interest Rate Sensitive | | 26.69% |
Life & Health Insurance | | 3.13% |
Primerica Inc. | 129,810 | 6,211,409 |
StanCorp Financial Group | | |
Inc. | 79,640 | 5,096,960 |
| | 11,308,369 |
| Shares | Market Value |
Other Banks | | 10.69% |
Bank of the Ozarks Inc. | 200,280 | $6,699,366 |
Community Bank System | | |
Inc. | 90,350 | 3,270,670 |
Hancock Holding Co. | 197,940 | 6,991,241 |
Susquehanna Bancshares | | |
Inc. | 502,900 | 5,310,624 |
Valley National Bancorp | 446,700 | 4,426,797 |
Westamerica Bancorp | 106,560 | 5,570,957 |
Wintrust Financial Corp. | 139,202 | 6,403,292 |
| | 38,672,947 |
Property Casualty Insurance | | 3.24% |
Endurance Specialty | | |
Holdings Ltd. | | |
(Bermuda) | 154,800 | 7,986,132 |
Montpelier Re Holdings | | |
Ltd. (Bermuda) | 116,710 | 3,728,884 |
| | 11,715,016 |
Securities & Asset Management | 4.98% |
FXCM Inc. - Class A | 448,420 | 6,708,363 |
Greenhill & Co. Inc | 229,800 | 11,317,650 |
| | 18,026,013 |
Specialty Finance | | 1.43% |
Cash America | | |
International Inc. | 116,437 | 5,173,296 |
Thrifts | | 3.22% |
Iberia Bank Corp. | 104,730 | 7,246,269 |
Webster Financial Corp. | 138,890 | 4,380,590 |
| | 11,626,859 |
Total Interest Rate Sensitive | | |
(Cost $77,251,731) | | 96,522,500 |
| | | |
Medical/Healthcare | | 3.34% |
Medical Products & Supplies | | 2.35% |
West Pharmaceutical | | |
Services Inc. | 201,582 | 8,502,729 |
Pharmaceuticals | | 0.99% |
Questcor Pharmaceuticals | | |
Inc. | 38,740 | 3,583,062 |
Total Medical/Healthcare | | |
(Cost $6,129,593) | | 12,085,791 |
| | |
Real Estate Investment Trusts | |
(REITs) | | 5.61% |
Diversified & Specialty Reits | | 1.51% |
DuPont Fabros Technology | | |
Inc. | 202,280 | 5,453,469 |
| PAGE 44 |
|
WESTCORE SMALL-CAP VALUE DIVIDEND FUND AS OF JUNE 30, 2014 (continued)
(UNAUDITED)
| Shares | Market Value |
Hotels | | 1.18% |
Chesapeake Lodging Trust | 141,610 | $4,280,870 |
Multi-Family | | 2.92% |
Education Realty Trust Inc. | 528,000 | 5,670,720 |
Post Properties Inc. | 91,079 | 4,869,084 |
| | 10,539,804 |
Total Real Estate Investment Trusts (REITs) |
(Cost $17,769,117) | | 20,274,143 |
| | | |
Technology | | 8.25% |
Computer Software | | 2.59% |
NICE Systems Ltd. ADR | | |
(Israel) | 229,820 | 9,378,954 |
Networking | | 4.46% |
j2 Global Inc. | 168,349 | 8,562,230 |
Plantronics Inc. | 157,153 | 7,551,202 |
| | 16,113,432 |
Semiconductors | | 1.20% |
Intersil Corp. - Class A | 290,393 | 4,341,375 |
Total Technology | | |
(Cost $24,343,739) | | 29,833,761 |
| | | |
Transportation | | 1.81% |
Trucking, Shipping, Air Freight | 1.81% |
Con-way Inc. | 129,800 | 6,543,218 |
Total Transportation | | |
(Cost $5,439,010) | | 6,543,218 |
| | | |
Utilities | | 4.75% |
Gas | | 1.27% |
WGL Holdings, Inc. | 106,700 | 4,598,770 |
Regulated Electric | | 3.48% |
El Paso Electric Co. | 120,640 | 4,850,934 |
Portland General Electric | | |
Co. | 222,970 | 7,730,370 |
| | 12,581,304 |
Total Utilities | | |
(Cost $13,741,566) | | 17,180,074 |
Total Common Stocks | | |
(Cost $290,104,880) | | 357,340,161 |
| Shares | Market Value |
MONEY MARKET MUTUAL FUNDS | 0.70% |
Fidelity Institutional Money | | |
Market Government | | |
Portfolio - Class I | | |
(7 Day Yield 0.010%) | 2,544,994 | |
Total Money Market Mutual Funds | |
(Cost $2,544,994) | | 2,544,994 |
Total Investments | | |
(Cost $292,649,874) | 99.52% | 359,885,155 |
Other Assets in Excess | | |
of Liabilities | 0.48% | 1,744,105 |
Net Assets | 100.00% | $361,629,260 |
Sector and industry classifications presented herein are based on the sector and industry categorization methodology of the Adviser to the Funds which may result in the designations for one Fund being different from another.
See Notes to Financial Statements.
|
|
WESTCORE MICRO-CAP OPPORTUNITY FUND AS OF JUNE 30, 2014
(UNAUDITED)
| Shares | Market Value |
COMMON STOCKS | | 97.70% |
Basic Materials | | 4.90% |
Forestry & Paper | | 1.16% |
Neenah Paper Inc. | 3,643 | $193,625 |
Xerium Technologies Inc.** | 15,259 | 213,016 |
| | 406,641 |
Non-Ferrous Metals | | 1.10% |
Horsehead Holding Corp.** | 10,983 | 200,550 |
Insteel Industries Inc. | 9,314 | 183,020 |
| | 383,570 |
Other Materials (Rubber & Plastic) | 1.06% |
AEP Industries Inc.** | 2,567 | 89,512 |
Myers Industries Inc. | 5,080 | 102,057 |
US Concrete Inc.** | 7,235 | 179,066 |
| | 370,635 |
Precious Metals | | 0.42% |
Fortuna Silver Mines, Inc. | | |
(Canada)** | 27,024 | 148,902 |
Specialty Chemicals | | 0.51% |
Aceto Corp. | 9,821 | 178,153 |
Steel | | 0.65% |
Handy & Harman Ltd.** | 8,476 | 226,902 |
| | | |
Total Basic Materials | | |
(Cost $1,453,942) | | 1,714,803 |
| | | |
Capital Goods | | 4.61% |
Aerospace/Defense Suppliers | 0.92% |
Aerovironment Inc.** | 4,360 | 138,648 |
Sparton Corp.** | 6,645 | 184,332 |
| | 322,980 |
Engineering & Construction | | 1.31% |
Argan Inc. | 7,637 | 284,784 |
Furmanite Corp.** | 14,846 | 172,807 |
| | 457,591 |
Farm Equipment | | 0.53% |
Alamo Group Inc. | 3,412 | 184,555 |
Industrial Products | | 1.85% |
Lydall Inc.** | 6,840 | 187,211 |
NN Inc. | 11,076 | 283,324 |
Northwest Pipe Co.** | 4,408 | 177,775 |
| | 648,310 |
Total Capital Goods | | |
(Cost $1,159,730) | | 1,613,436 |
| Shares | Market Value |
Commercial Services | | 6.40% |
Business Products & Services | 5.15% |
Asta Funding Inc.** | 24,918 | $205,573 |
Barrett Business Services | | |
Inc. | 2,613 | 122,811 |
CBIZ Inc.** | 30,385 | 274,377 |
CDI Corp. | 10,983 | 158,265 |
Electro Rent Corp. | 13,449 | 225,002 |
Intersections, Inc. | 43,308 | 213,075 |
Omnicell Inc.** | 4,020 | 115,414 |
TASER International Inc.** | 13,502 | 179,577 |
VSE Corp. | 4,379 | 307,931 |
| | 1,802,025 |
IT Services | | 1.25% |
ManTech International | | |
Corp. - Class A | 9,114 | 269,045 |
Support.com, Inc.** | 62,015 | 168,061 |
| | 437,106 |
Total Commercial Services | | |
(Cost $1,999,919) | | 2,239,131 |
| | | |
Consumer Cyclical | | 12.36% |
Apparel & Footwear Manufacturing | 0.60% |
Unifi Inc.** | 7,617 | 209,696 |
Consumer Durables | | 1.26% |
Skullcandy Inc.** | 19,325 | 140,106 |
ZAGG, Inc.** | 55,500 | 301,365 |
| | 441,471 |
Hard Goods Retail | | 0.54% |
Haverty Furniture Co. Inc. | 7,450 | 187,219 |
Homebuilders & Suppliers | | 0.58% |
Beazer Homes USA Inc.** | 3,215 | 67,451 |
PGT Inc.** | 15,891 | 134,597 |
| | 202,048 |
Motor Vehicle Parts | | 0.75% |
Stoneridge Inc.** | 16,505 | 176,933 |
US Auto Parts Network, | | |
Inc.** | 23,557 | 85,041 |
| | 261,974 |
Motor Vehicles | | 0.28% |
Autobytel Inc.** | 7,586 | 99,452 |
Publishing & Media | | 3.39% |
Courier Corp. | 11,509 | 171,714 |
Emmis Communications | | |
Corp.** | 49,086 | 146,767 |
| Shares | Market Value |
Entravision Communications | | |
Corp. - Class A | 39,154 | $243,538 |
Gray Television Inc.** | 16,262 | 213,520 |
Lee Enterprises Inc.** | 57,870 | 257,522 |
LIN Media LLC - Class A** | 5,629 | 153,390 |
| | 1,186,451 |
Recreation & Leisure | | 1.76% |
Carmike Cinemas Inc.** | 3,338 | 117,264 |
Rick’s Cabaret International | | |
Inc.** | 18,992 | 193,908 |
Smith & Wesson Holding | | |
Corp.** | 10,760 | 156,451 |
Winnebago Industries Inc.** | 5,838 | 147,001 |
| | 614,624 |
Restaurants | | 2.08% |
Denny’s Corp.** | 33,374 | 217,599 |
Kona Grill Inc.** | 7,518 | 145,924 |
Red Robin Gourmet | | |
Burgers Inc.** | 2,431 | 173,087 |
Ruth’s Hospitality Group | | |
Inc. | 15,519 | 191,660 |
| | 728,270 |
Specialty Retail | | 1.12% |
1-800-Flowers.com Inc. - | | |
Class A** | 25,897 | 150,202 |
CSS Industries Inc. | 4,859 | 128,132 |
Movado Group Inc. | 2,728 | 113,676 |
| | 392,010 |
Total Consumer Cyclical | | |
(Cost $3,693,034) | | 4,323,215 |
| | | |
Consumer Staples | | 3.25% |
Food & Agricultural Products | 1.27% |
Chiquita Brands | | |
International Inc.** | 10,778 | 116,941 |
John B Sanfilippo & Son | | |
Inc. | 6,947 | 183,887 |
SunOpta Inc. (Canada)** | 10,097 | 142,166 |
| | 442,994 |
Grocery & Convenience | | 0.80% |
Ingles Markets Inc. - Class | | |
A | 4,140 | 109,089 |
The Pantry Inc.** | 10,536 | 170,683 |
| | 279,772 |
Home Products | | 1.18% |
Libbey Inc.** | 10,205 | 271,862 |
Lifetime Brands Inc. | 9,021 | 141,810 |
| | 413,672 |
| PAGE 46 |
|
WESTCORE MICRO-CAP OPPORTUNITY FUND AS OF JUNE 30, 2014 (continued)
(UNAUDITED)
| Shares | Market Value |
Total Consumer Staples | | |
(Cost $972,923) | | $1,136,438 |
| | | |
Energy | | 5.53% |
Coal | | 1.02% |
Walter Energy Inc. | 24,979 | 136,136 |
Westmoreland Coal Co.** | 6,116 | 221,888 |
| | 358,024 |
Exploration & Production | | 0.99% |
Panhandle Oil and Gas Inc. | | |
- Class A | 2,716 | 152,177 |
Quicksilver Resources, | | |
Inc.** | 72,725 | 194,176 |
| | 346,353 |
Oil Services | | 2.82% |
Bolt Technology Corp. | 6,659 | 122,193 |
Dawson Geophysical Co. | 6,088 | 174,421 |
Natural Gas Services Group | | |
Inc.** | 7,519 | 248,578 |
North American Energy | | |
Partners Inc. (Canada) | 30,837 | 248,238 |
PHI Inc.** | 4,312 | 192,186 |
| | 985,616 |
Refining & Marketing | | 0.70% |
REX American Resources | | |
Corp.** | 3,355 | 245,955 |
Total Energy | | |
(Cost $1,408,933) | | 1,935,948 |
| | | |
Interest Rate Sensitive | | 21.66% |
Life & Health Insurance | | 0.66% |
National Western Life | | |
Insurance Co. - Class | | |
A | 919 | 229,208 |
Other Banks | | 10.31% |
American National | | |
Bankshares Inc. | 7,903 | 171,732 |
BankFinancial Corp. | 27,576 | 307,748 |
Banner Corp. | 5,816 | 230,488 |
Central Pacific Financial | | |
Corp. | 13,702 | 271,985 |
Enterprise Financial | | |
Services Corp. | 10,872 | 196,348 |
First Bancorp | 14,047 | 257,763 |
First Community | | |
Bancshares Inc. | 8,775 | 125,746 |
First Financial Corp. | 9,230 | 297,114 |
First Merchants Corp. | 11,417 | 241,355 |
Hanmi Financial Corp. | 11,227 | 236,665 |
Macatawa Bank Corp. | 43,566 | 220,880 |
| Shares | Market Value |
Peoples Bancorp Inc. | 5,385 | $142,433 |
Simmons First National | | |
Corp. - Class A | 6,641 | 261,589 |
Southside Bancshares Inc. | 1 | 29 |
Southwest Bancorp Inc. | 15,514 | 264,669 |
Trico Bancshares | 7,643 | 176,859 |
United Community Banks | | |
Inc. | 12,574 | 205,836 |
| | 3,609,239 |
Property Casualty Insurance | | 1.95% |
Baldwin & Lyons Inc. - | | |
Class B | 6,970 | 180,802 |
EMC Insurance Group Inc. - | | |
Class A | 3,716 | 114,378 |
HCI Group Inc. | 3,167 | 128,580 |
United Fire Group Inc. | 3,602 | 105,611 |
Universal Insurance | | |
Holdings Inc. | 11,686 | 151,567 |
| | 680,938 |
Regional Banks | | 0.84% |
Sterling Bancorp | 13,843 | 166,116 |
SY Bancorp Inc. | 4,309 | 128,839 |
| | 294,955 |
Securities & Asset Management | 1.16% |
Capital Southwest Corp. | 3,739 | 134,641 |
Oppenheimer Holdings Inc. | | |
- Class A | 6,825 | 163,732 |
Pzena Investment | | |
Management, Inc. - | | |
Class A | 9,779 | 109,134 |
| | 407,507 |
Specialty Finance | | 2.74% |
Federal Agricultural | | |
Mortgage Corp. - | | |
Class C | 9,328 | 289,914 |
Gladstone Capital Corp. | 18,957 | 190,707 |
Gladstone Investment Corp. | 35,557 | 263,122 |
Resource Capital Corp. | 38,209 | 215,117 |
| | 958,860 |
Thrifts | | 4.00% |
Arbor Realty Trust Inc. | 20,030 | 139,209 |
Dime Community | | |
Bancshares Inc. | 14,889 | 235,097 |
ESSA Bancorp Inc. | 13,533 | 150,622 |
First Defiance Financial | | |
Corp. | 8,299 | 238,181 |
Great Southern Bancorp | | |
Inc. | 8,924 | 286,014 |
New York Mortgage Trust | | |
Inc. | 29,035 | 226,764 |
| Shares | Market Value |
Westfield Financial Inc. | 16,604 | $123,866 |
| | 1,399,753 |
Total Interest Rate Sensitive | | |
(Cost $7,129,146) | | 7,580,460 |
| | | |
Medical/Healthcare | | 19.51% |
Healthcare Services | | 2.87% |
Addus HomeCare Corp.** | 6,219 | 139,803 |
Albany Molecular Research | | |
Inc.** | 7,311 | 147,098 |
Capital Senior Living Corp.** | 5,955 | 141,967 |
LHC Group Inc.** | 9,373 | 200,301 |
RadNet Inc.** | 22,624 | 149,997 |
Triple-S Management Corp. | | |
- Class B (Puerto | | |
Rico)** | 12,486 | 223,874 |
| | 1,003,040 |
Medical Products & Supplies | | 3.83% |
AMAG Pharmaceuticals | | |
Inc.** | 1,912 | 39,617 |
Anika Therapeutics Inc.** | 5,518 | 255,649 |
Atrion Corp. | 829 | 270,254 |
Chindex International Inc.** | 6,225 | 147,470 |
Icad, Inc.** | 32,701 | 209,613 |
Kewaunee Scientific Corp. | 9,615 | 169,224 |
Trinity Biotech PLC ADR | | |
(Ireland) | 5,006 | 115,288 |
Zeltiq Aesthetics Inc.** | 8,791 | 133,535 |
| | 1,340,650 |
Medical Technology | | 1.62% |
Affymetrix Inc.** | 28,041 | 249,845 |
Heska Corp.** | 13,733 | 147,630 |
Nordion Inc. (Canada)** | 13,511 | 169,698 |
| | 567,173 |
Pharmaceuticals | | 11.19% |
Agenus, Inc.** | 50,722 | 163,325 |
Alexza Pharmaceuticals | | |
Inc.** | 20,808 | 95,092 |
Anacor Pharmaceuticals, | | |
Inc.** | 10,553 | 187,105 |
ArQule Inc.** | 80,378 | 124,586 |
Array BioPharma Inc.** | 42,903 | 195,638 |
AVANIR Pharmaceuticals | | |
Inc. - Class A** | 20,987 | 118,367 |
Cambrex Corp.** | 11,199 | 231,819 |
Coronado Biosciences Inc.** | 60,332 | 103,771 |
CTI BioPharma Corp.** | 60,437 | 169,828 |
Exelixis Inc.** | 47,238 | 160,137 |
Galena Biopharma Inc.** | 39,326 | 120,338 |
Geron Corp.** | 69,020 | 221,554 |
Immunomedics Inc.** | 49,437 | 180,445 |
|
|
WESTCORE MICRO-CAP OPPORTUNITY FUND AS OF JUNE 30, 2014 (continued)
(UNAUDITED)
| Shares | Market Value |
Omeros Corp.** | 11,232 | $195,437 |
Orexigen Therapeutics Inc.** | 29,460 | 182,063 |
Pozen Inc. | 15,393 | 128,224 |
Repligen Corp.** | 11,851 | 270,084 |
SciClone Pharmaceuticals | | |
Inc.** | 45,772 | 240,761 |
SIGA Technologies Inc.** | 47,577 | 134,167 |
Spectrum Pharmaceuticals | | |
Inc.** | 26,100 | 212,193 |
TrovaGene Inc.** | 43,541 | 152,393 |
ZIOPHARM Oncology Inc.** | 48,281 | 194,572 |
Zogenix Inc.** | 66,917 | 134,503 |
| | 3,916,402 |
Total Medical/Healthcare | | |
(Cost $6,584,920) | | 6,827,265 |
| | |
Real Estate Investment Trusts (REITs) | 1.04% |
Diversified & Specialty Reits | | 0.21% |
Winthrop Realty Trust | 4,853 | 74,493 |
Retail | | 0.83% |
Agree Realty Corp. | 9,595 | 290,057 |
Total Real Estate Investment Trusts (REITs) |
(Cost $329,299) | | 364,550 |
| | | |
Technology | | 17.31% |
Cable/Satellite/Telecomm Services | 4.59% |
Alaska Communications | | |
Systems Group Inc.** | 155,993 | 280,788 |
Consolidated | | |
Communications | | |
Holdings Inc. | 5,247 | 116,693 |
Enventis Corp. | 11,655 | 184,615 |
FairPoint Communications | | |
Inc.** | 15,769 | 220,293 |
Hawaiian Telcom Holdco | | |
Inc.** | 9,957 | 284,870 |
IDT Corp. - Class B | 8,645 | 150,596 |
Inteliquent | 16,306 | 226,164 |
USA Mobility Inc. | 9,270 | 142,758 |
| | 1,606,777 |
Computer Software | | 3.87% |
EnerNOC Inc.** | 5,006 | 94,864 |
IntraLinks Holdings Inc.** | 20,798 | 184,894 |
Lionbridge Technologies | | |
Inc.** | 24,013 | 142,637 |
Marchex Inc. - Class B | 18,233 | 219,161 |
PDF Solutions Inc.** | 9,591 | 203,521 |
TechTarget, Inc.** | 33,839 | 298,460 |
Telenav Inc.** | 36,907 | 210,001 |
| | 1,353,538 |
| Shares | Market Value |
Electronic Equipment | | 4.23% |
Bel Fuse Inc. - Class B | 7,723 | $198,249 |
CalAmp Corp.** | 6,234 | 135,028 |
Checkpoint Systems Inc.** | 13,222 | 184,976 |
CTS Corp. | 13,314 | 248,972 |
Measurement Specialties | | |
Inc.** | 3,214 | 276,629 |
Mesa Laboratories Inc. | 1,710 | 143,572 |
Methode Electronics Inc. | 7,698 | 294,140 |
| | 1,481,566 |
Networking | | 3.02% |
AudioCodes Ltd. (Israel)** | 15,189 | 107,082 |
Clearfield Inc.** | 9,489 | 159,320 |
Ituran Location and Control | | |
Ltd. (Israel) | 11,369 | 277,063 |
Preformed Line Products | | |
Co. | 1,681 | 90,488 |
ShoreTel Inc.** | 34,024 | 221,837 |
Tessco Technologies, Inc. | 6,268 | 198,884 |
| | 1,054,674 |
Semiconductor Cap Equipment | | 1.25% |
Cascade Microtech Inc.** | 15,786 | 215,637 |
Ultra Clean Holdings Inc.** | 24,550 | 222,177 |
| | 437,814 |
Semiconductors | | 0.35% |
Silicon Image Inc.** | 24,451 | 123,233 |
Total Technology | | |
(Cost $5,373,063) | | 6,057,602 |
| | | |
Transportation | | 0.61% |
Airlines | | 0.29% |
Hawaiian Holdings Inc.** | 7,294 | 100,001 |
Trucking, Shipping, Air Freight | | 0.32% |
Global Ship Lease Inc. | | |
- Class A (Great | | |
Britain)** | 27,320 | 112,558 |
Total Transportation | | |
(Cost $189,064) | | 212,559 |
| | | |
Utilities | | 0.52% |
Gas Utilities | | 0.52% |
Chesapeake Utilities Corp. | 2,557 | 182,391 |
Total Utilities | | |
(Cost $135,899) | | 182,391 |
Total Common Stocks | | |
(Cost $30,429,872) | | 34,187,798 |
| Shares | Market Value |
MONEY MARKET MUTUAL FUNDS | 5.00% |
Fidelity Institutional Money | | |
Market Government | | |
Portfolio - Class I | | |
(7 Day Yield 0.010%) | 1,750,708 | |
Total Money Market Mutual Funds | |
(Cost $1,750,708) | | 1,750,708 |
Total Investments | | |
(Cost $32,180,580) | 102.70% | 35,938,506 |
Liabilities in Excess | | |
of Other Assets | (2.70%) | (945,907) |
Net Assets | 100.00% | $34,992,599 |
Sector and industry classifications presented herein are based on the sector and industry categorization methodology of the Adviser to the Funds which may result in the designations for one Fund being different from another.
** Non-income producing security.
See Notes to Financial Statements.
| PAGE 48 |
|
WESTCORE INTERNATIONAL SMALL-CAP FUND AS OF JUNE 30, 2014
(UNAUDITED)
| Shares | Market Value |
COMMON STOCKS | | 98.70% |
Consumer Discretionary | | 36.13% |
Diversified Consumer Services | 3.08% |
Slater & Gordon Ltd. | | |
(Australia) | 2,874,014 | $13,983,887 |
Hotels Restaurants & Leisure | 5.61% |
MTY Food Group Inc. | | |
(Canada) | 307,280 | 8,696,739 |
REXLot Holdings Ltd. | | |
(Hong Kong) | 142,989,954 | |
| | 25,485,661 |
Household Durables | | 2.08% |
Haier Electronics Group | | |
Co. Ltd. (Hong Kong) | 3,618,051 | 9,453,129 |
Internet & Catalog Retail | | 1.83% |
Webjet Ltd. (Australia) | 3,642,008 | 8,310,853 |
Media | | 9.05% |
CTS Eventim AG | | |
(Germany) | 148,245 | 4,231,367 |
ITE Group PLC (United | | |
Kingdom) | 4,089,611 | 16,580,450 |
Pico Far East Holdings | | |
Ltd. (Hong Kong)(1) | 78,291,271 | 18,182,840 |
Rightmove PLC (United | | |
Kingdom) | 57,673 | 2,116,151 |
| | 41,110,808 |
Multiline Retail | | 2.27% |
Woolworths Holdings Ltd. | | |
(South Africa) | 1,403,234 | 10,311,494 |
Specialty Retail | | 4.78% |
Bonjour Holdings Ltd. | | |
(Hong Kong) | 82,715,859 | 12,913,681 |
Teknosa Ic Ve Dis Ticaret | | |
AS (Turkey) | 1,606,703 | 8,797,203 |
| | 21,710,884 |
Textiles Apparel & Luxury Goods | 7.43% |
Burberry Group PLC | | |
(United Kingdom) | 415,052 | 10,533,990 |
Ports Design Ltd. (Hong | | |
Kong) | 22,443,439 | 10,135,223 |
Xtep International | | |
Holdings Ltd. (Hong | | |
Kong) | 31,042,373 | |
| | 33,766,416 |
Total Consumer Discretionary | |
(Cost $158,368,447) | | 164,133,132 |
| Shares | Market Value |
Consumer Staples | | 2.12% |
Food & Staples Retailing | | 2.12% |
Eurocash S.A. (Poland) | 92,192 | $1,220,666 |
Tsuruha Holdings Inc. | | |
(Japan) | 152,391 | 8,408,920 |
| | 9,629,586 |
Total Consumer Staples | | |
(Cost $6,811,247) | | 9,629,586 |
| | | |
Energy | | 2.09% |
Energy Equipment & Services | 2.09% |
TGS-NOPEC Geophysical | | |
Co. ASA (Norway) | 297,235 | 9,502,643 |
Total Energy | | |
(Cost $7,872,552) | | 9,502,643 |
| | | |
Financials | | 14.31% |
Capital Markets | | 6.91% |
Ashmore Group PLC | | |
(United Kingdom) | 1,237,750 | 7,837,615 |
Azimut Holding S.p.A. | | |
(Italy) | 480,371 | 12,379,272 |
CETIP SA - Mercados | | |
Organizados (Brazil) | 786,973 | 11,201,765 |
| | 31,418,652 |
Diversified Financial Services | 1.74% |
IG Group Holdings PLC | | |
(United Kingdom) | 786,431 | 7,907,109 |
Insurance | | 3.40% |
Admiral Group plc | | |
(United Kingdom) | 582,133 | 15,432,024 |
Thrifts & Mortgage Finance | | 2.26% |
Home Capital Group Inc. | | |
(Canada) | 229,003 | 10,264,949 |
Total Financials | | |
(Cost $40,983,835) | | 65,022,734 |
| | | |
Health Care | | 5.56% |
Health Care Technology | | 2.21% |
Advanced Computer | | |
Software Group PLC | | |
(United Kingdom) | 5,100,410 | 10,038,115 |
Pharmaceuticals | | 3.35% |
China Medical System | | |
Holdings Ltd. | | |
(China) | 8,719,285 | 10,676,354 |
Sino Biopharmaceutical | | |
Ltd. (Hong Kong) | 5,624,985 | 4,557,817 |
| | 15,234,171 |
| Shares | Market Value |
Total Health Care | | |
(Cost $19,056,235) | | $25,272,286 |
| | | |
Industrials | | 27.98% |
Commercial Services & Supplies | 11.75% |
Credit Corp. Group Ltd. | | |
(Australia)(1) | 3,024,321 | 24,810,554 |
Mears Group PLC (United | | |
Kingdom) | 1,797,307 | 14,302,912 |
Prestige International Inc. | | |
(Japan)(1) | 1,565,018 | |
| | 53,372,502 |
Construction & Engineering | 9.56% |
Cardno Ltd. (Australia) | 3,108,023 | 18,522,117 |
Decmil Group Ltd. | | |
(Australia) | 6,630,849 | 11,160,835 |
Kentz Corp. Ltd. (United | | |
Kingdom) | 867,114 | |
| | 43,424,525 |
Machinery | | 4.20% |
Andritz AG (Austria) | 190,882 | 11,031,322 |
Rotork PLC (United | | |
Kingdom) | 176,801 | 8,078,770 |
| | 19,110,092 |
Trading Companies & Distributors | 2.47% |
Diploma PLC (United | | |
Kingdom) | 1,022,694 | 11,218,970 |
Total Industrials | | |
(Cost $94,372,187) | | 127,126,089 |
| | | |
Information Technology | | 10.51% |
Electronic Equipment & Instruments | 1.59% |
PAX Global Technology | | |
Ltd. (Hong Kong)** | 10,992,129 | 7,218,974 |
IT Services | | 4.02% |
CANCOM SE (Germany) | 246,699 | 12,645,730 |
KGInicis Co. Ltd. (South | | |
Korea) | 506,596 | 5,632,739 |
| | 18,278,469 |
Software | | 4.90% |
Magic Software | | |
Enterprises Ltd. | | |
(Israel) | 1,297,415 | 9,717,639 |
Totvs S.A. (Brazil) | 727,417 | |
| | 22,244,553 |
Total Information Technology | |
(Cost $45,234,845) | | 47,741,996 |
|
|
WESTCORE INTERNATIONAL SMALL-CAP FUND AS OF JUNE 30, 2014 (continued)
(UNAUDITED)
| Shares | Market Value |
Total Common Stocks | | |
(Cost $372,699,348) | | $448,428,466 |
| | | |
MONEY MARKET MUTUAL FUNDS | 1.18% |
Bank of New York | | |
Cash Reserve | | |
(7 Day Yield 0.050%) | 7,680 | 7,680 |
Fidelity Institutional | | |
Money Market | | |
Government | | |
Portfolio - Class I | | |
(7 Day Yield 0.010%) | 5,341,202 | 5,341,202 |
Total Money Market Mutual Funds | |
(Cost $5,348,882) | | 5,348,882 |
Total Investments | | |
(Cost $378,048,230) | 99.88% | 453,777,348 |
Other Assets in Excess | | |
of Liabilities | 0.12% | 565,601 |
Net Assets | 100.00% | $454,342,949 |
Westcore International Small-Cap Fund
Country Breakdown as of June 30, 2014
(Unaudited)
Country | Market Value | % |
United Kingdom | $117,787,679 | 25.93% |
Hong Kong | 92,347,789 | 20.32% |
Australia | 76,788,246 | 16.91% |
Brazil | 23,728,679 | 5.23% |
Japan | 22,667,956 | 4.99% |
Canada | 18,961,688 | 4.17% |
Germany | 16,877,097 | 3.71% |
Italy | 12,379,272 | 2.72% |
Austria | 11,031,322 | 2.42% |
China | 10,676,354 | 2.35% |
South Africa | 10,311,494 | 2.27% |
Israel | 9,717,639 | 2.14% |
Norway | 9,502,643 | 2.09% |
Turkey | 8,797,203 | 1.94% |
South Korea | 5,632,739 | 1.24% |
United States | 5,348,882 | 1.18% |
Poland | 1,220,666 | 0.27% |
Total Investments | 453,777,348 | 99.88% |
Other Assets in Excess | | |
of Liabilities | 565,601 | 0.12% |
Net Assets | $454,342,949 | 100.00% |
Please note the country breakdown is based on the company headquarters.
Sector and industry classifications presented herein are based on the sector and industry categorization methodology of the Adviser to the Funds which may result in the designations for one Fund being different from another.
(1) Affiliated Security
** Non-income producing security.
See Notes to Financial Statements.
Outstanding Forward Foreign Currency Contracts | | | |
| | | | | | | Unrealized |
Contract | Contracted | Purchase/Sale | Expiration | Value On | Current | Appreciation/ |
Description | Amount | Contract | Date | Settlement Date | Value | (Depreciation) |
| CHF | 18,147,517 | Purchase | 9/22/2014 | $20,354,334 | $20,478,919 | $124,585 |
| DKK | 47,429,363 | Purchase | 9/22/2014 | 8,671,742 | 8,715,109 | 43,367 |
| EUR | 49,033,651 | Purchase | 9/22/2014 | 66,897,590 | 67,163,251 | 265,661 |
| ILS | 15,944,740 | Purchase | 9/22/2014 | 4,632,971 | 4,644,622 | 11,651 |
| JPY | 10,356,569,649 | Purchase | 9/22/2014 | 101,843,222 | 102,294,530 | 451,308 |
| NZD | 5,803,502 | Purchase | 9/22/2014 | 5,015,630 | 5,040,557 | 24,927 |
| SEK | 129,467,537 | Purchase | 9/22/2014 | 19,323,628 | 19,360,537 | 36,909 |
| SGD | 14,736,962 | Purchase | 9/22/2014 | 11,804,509 | 11,819,323 | 14,814 |
| | | | | | | $973,222 |
| AUD | 47,691,594 | Sale | 9/22/2014 | $44,599,509 | $44,699,024 | $(99,515) |
| BRL | 54,351,967 | Sale | 9/22/2014 | 23,695,164 | 24,008,466 | (313,302) |
| CAD | 22,006,861 | Sale | 9/22/2014 | 20,281,513 | 20,580,637 | (299,124) |
| GBP | 5,898,684 | Sale | 9/22/2014 | 10,046,881 | 10,087,866 | (40,985) |
| HKD | 740,503,342 | Sale | 9/22/2014 | 95,500,760 | 95,507,658 | (6,898) |
| KRW | 5,825,854,000 | Sale | 9/22/2014 | 5,691,033 | 5,738,062 | (47,029) |
| NOK | 22,532,718 | Sale | 9/22/2014 | 3,659,687 | 3,661,536 | (1,849) |
| PLN | 3,954,115 | Sale | 9/22/2014 | 1,294,233 | 1,295,189 | (956) |
| TRY | 17,914,738 | Sale | 9/22/2014 | 8,243,673 | 8,311,484 | (67,811) |
| ZAR | 109,171,605 | Sale | 9/22/2014 | 10,080,974 | 10,120,364 | (39,390) |
| | | | | | | $(916,859) |
| PAGE 50 |
|
WESTCORE FLEXIBLE INCOME FUND AS OF JUNE 30, 2014
(UNAUDITED)
| Shares | Market Value |
CONVERTIBLE PREFERRED STOCKS | 1.96% |
Utilities | | 1.96% |
Utilities | | 1.96% |
AES Trust III, | | |
6.750%, 10/15/2029 | 26,100 | $1,353,024 |
Total Utilities | | |
(Cost $1,140,080) | | 1,353,024 |
Total Convertible Preferred Stocks | |
(Cost $1,140,080) | | 1,353,024 |
| | |
NONCONVERTIBLE PREFERRED | |
STOCKS | | 5.75% |
Financials | | 5.75% |
Financial Services | | 1.06% |
ING Groep NV (Netherlands), | |
6.125% | 29,000 | 734,280 |
Real Estate Investment Trusts (REITs) | 4.69% |
Diversified (REITs) | | 1.06% |
National Retail Properties Inc., | |
6.625% | 29,000 | 732,540 |
Hotels (REITs) | | 0.70% |
Hersha Hospitality Trust, | | |
8.000% | 18,600 | 480,252 |
Warehouse-Industrial (REITs) | 2.93% |
CenterPoint Properties Trust, | |
5.377%(1)(2) | 3,015 | 2,018,543 |
Total Financials | | |
(Cost $4,232,379) | | 3,965,615 |
Total Nonconvertible Preferred Stocks | |
(Cost $4,232,379) | | 3,965,615 |
| Principal | |
| Amount | Market Value |
CORPORATE BONDS | | 85.97% |
Financials | | 9.73% |
Financial Services | | 2.30% |
Emigrant Capital Trust II - 144A, | |
2.549%, 4/14/2034(2)(3) | $500,000 | $345,000 |
General Motors Financial Co. Inc, | |
4.250%, 5/15/2023 | 425,000 | 425,531 |
Provident Funding Associates LP / PFG | |
Finance Corp., | | |
10.125%, 2/15/2019(3) | 750,000 | 816,563 |
| | 1,587,094 |
Insurance | | 1.74% |
Zurich Reinsurance Inc., | | |
7.125%, 10/15/2023 | 1,000,000 | 1,197,884 |
| | Principal | |
| | Amount | Market Value |
Savings & Loans | | 0.80% |
Washington Mutual Bank, | | |
5.550%, 6/16/2010**(4) | $2,000,000 | $553,750 |
Real Estate Investment Trusts (REITs) | 4.89% |
Healthcare (REITs) | | 2.36% |
Omega Healthcare Investors Inc., | |
6.750%, 10/15/2022 | 1,500,000 | 1,628,550 |
Timber (REITs) | | 2.53% |
Potlatch Corp., | | |
7.500%, 11/1/2019 | 1,500,000 | 1,745,625 |
Total Financials | | |
(Cost $7,345,102) | | 6,712,903 |
| | | |
Industrials | | 72.16% |
Aerospace & Defense | | 1.98% |
BE Aerospace Inc., | | |
6.875%, 10/1/2020 | 1,250,000 | 1,364,062 |
Airlines | | 1.63% |
American Airlines 2013-2 Class A | |
Pass Through Trust - 144A, | |
4.950%, 1/15/2023(3) | 970,400 | 1,050,458 |
Atlas Air Inc., | | |
Pass-Through | | |
Certificates, Series | | |
1999-1, Class A-1, | | |
7.200%, 1/2/2019(1) | 30,943 | 32,180 |
Continental Airlines Inc., | | |
Pass-Through | | |
Certificates, Series | | |
1999-1, Class B, | | |
6.795%, 8/2/2018 | 35,638 | 37,955 |
| | 1,120,593 |
Autos | | 4.48% |
General Motors Co. - 144A, | | |
4.875%, 10/2/2023(3) | 575,000 | 608,062 |
Goodyear Tire & Rubber Co., | | |
8.750%, 8/15/2020 | 1,644,000 | 1,956,360 |
Tenneco Inc., | | |
7.750%, 8/15/2018 | 500,000 | 522,500 |
| | 3,086,922 |
Building Materials | | 3.68% |
USG Corp. - 144A, | | |
8.375%, 10/15/2018(3) | 1,500,000 | 1,585,500 |
Vulcan Materials Co., | | |
7.000%, 6/15/2018 | 825,000 | 953,906 |
| | 2,539,406 |
| Principal | |
| Amount | Market Value |
Cable | | 1.79% |
Virgin Media/Secured Finance PLC | |
(United Kingdom), | | |
5.250%, 1/15/2021 | $1,160,000 | $1,232,500 |
Cable & Media | | 0.87% |
AMC Networks Inc., | | |
4.750%, 12/15/2022 | 600,000 | 603,000 |
Commercial Services | | 1.25% |
Iron Mountain Inc., | | |
8.375%, 8/15/2021 | 822,000 | 864,580 |
Consumer Products | | 1.93% |
Jarden Corp., | | |
6.125%, 11/15/2022 | 1,250,000 | 1,329,688 |
Consumer Services | | 0.78% |
Service Corp. International, | |
6.750%, 4/1/2016 | 500,000 | 541,250 |
Energy-Non Utility | | 16.62% |
Concho Resources, Inc., | | |
5.500%, 4/1/2023 | 825,000 | 891,000 |
Denbury Resources Inc., | | |
6.375%, 8/15/2021 | 1,500,000 | 1,616,250 |
Enterprise Products Operating LLC, | |
Series B, 7.034%, | | |
1/15/2068(2) | 750,000 | 856,729 |
MarkWest Energy Partners LP / MarkWest Energy |
Finance Corp.: | | |
6.750%, 11/1/2020 | 1,425,000 | 1,553,250 |
4.500%, 7/15/2023 | 325,000 | 333,125 |
Range Resources Corp.: | | |
5.750%, 6/1/2021 | 1,000,000 | 1,085,000 |
5.000%, 8/15/2022 | 1,000,000 | 1,065,000 |
Sabine Pass LNG LP, | | |
7.500%, 11/30/2016 | 1,000,000 | 1,110,000 |
Tesoro Corp., | | |
5.375%, 10/1/2022 | 1,500,000 | 1,578,750 |
Whiting Petroleum Corp., | | |
5.750%, 3/15/2021 | 1,250,000 | 1,371,875 |
| | 11,460,979 |
Healthcare | | 1.93% |
DaVita Inc., | | |
6.625%, 11/1/2020 | 1,250,000 | 1,334,375 |
Leasing | | 0.95% |
Aviation Capital Group Corp. - 144A, | |
6.750%, 4/6/2021(3) | 575,000 | 651,692 |
|
|
WESTCORE FLEXIBLE INCOME FUND AS OF JUNE 30, 2014 (continued)
(UNAUDITED)
| Principal | |
| Amount | Market Value |
Leisure | | 6.90% |
Royal Caribbean Cruises Ltd. (Liberia), | |
5.250%, 11/15/2022 | $1,750,000 | $1,846,250 |
Speedway Motorsports Inc., | | |
6.750%, 2/1/2019 | 1,253,000 | 1,334,445 |
Vail Resorts Inc., | | |
6.500%, 5/1/2019 | 1,500,000 | 1,579,688 |
| | 4,760,383 |
Metals & Mining | | 4.69% |
FMG Resources August 2006 Pty Ltd. - 144A |
(Australia), | | |
8.250%, 11/1/2019(3) | 1,500,000 | 1,638,750 |
Newmont Mining Corp., | | |
3.500%, 3/15/2022 | 500,000 | 482,643 |
Plains Exploration & Production Co., | |
6.125%, 6/15/2019 | 1,000,000 | 1,110,000 |
| | 3,231,393 |
Other Industrials | | 3.64% |
AmeriGas Finance LLC / AmeriGas Finance Corp., |
6.750%, 5/20/2020 | 1,500,000 | 1,635,000 |
Mueller Water Products Inc., | |
8.750%, 9/1/2020 | 784,000 | 875,140 |
| | 2,510,140 |
Packaging & Containers | | 4.43% |
Ball Corp., | | |
5.750%, 5/15/2021 | 1,275,000 | 1,362,656 |
Crown Americas LLC / Crown Americas | |
Capital Corp. III, | | |
6.250%, 2/1/2021 | 1,575,000 | 1,693,125 |
| | 3,055,781 |
Restaurants | | 1.18% |
Darden Restaurants Inc., | | |
4.500%, 10/15/2021 | 775,000 | 815,078 |
Retail | | 2.09% |
Limited Brands Inc., | | |
7.000%, 5/1/2020 | 1,250,000 | 1,442,188 |
Winn-Dixie Stores Inc., | | |
Series Escrow Units, | | |
4/1/2008**(1)(4)(5) | 2,150,000 | 0 |
| | 1,442,188 |
Technology | | 1.53% |
Amkor Technology Inc.: | | |
7.375%, 5/1/2018 | 500,000 | 520,000 |
6.625%, 6/1/2021 | 500,000 | 535,000 |
| | 1,055,000 |
| Principal | |
| Amount | Market Value |
Telecomm & Related | | 5.81% |
Frontier Communications Corp., | |
8.500%, 4/15/2020 | $1,750,000 | $2,073,750 |
Tuckahoe Credit Lease Trust - 144A, | |
9.310%, 10/20/2025(1)(3) | 1,691,684 | 1,933,426 |
| | 4,007,176 |
Textiles, Apparel & Luxury Goods | 1.97% |
Hanesbrands Inc., | | |
6.375%, 12/15/2020 | 1,250,000 | 1,357,812 |
Transportation | | 2.03% |
Gulfmark Offshore Inc., | | |
6.375%, 3/15/2022 | 1,340,000 | 1,400,300 |
Total Industrials | | |
(Cost $46,465,633) | | 49,764,298 |
| | | |
Utilities | | 4.08% |
Utilities | | 4.08% |
Calpine Corp Escrow, | | |
8.750%, 7/15/2013**(1)(4) | 200,000 | 0 |
Calpine Corp. - 144A, | | |
7.500%, 2/15/2021(3) | 1,562,000 | 1,696,722 |
NRG Energy Inc., | | |
7.875%, 5/15/2021 | 1,000,000 | 1,113,750 |
| | 2,810,472 |
Total Utilities | | |
(Cost $2,706,455) | | 2,810,472 |
Total Corporate Bonds | | |
(Cost $56,517,190) | | 59,287,673 |
| | |
COMMERCIAL MORTGAGE-BACKED | |
SECURITIES & RESIDENTIAL | |
MORTGAGE-BACKED SECURITIES | 2.90% |
Commercial Mortgage-Backed | |
Securities | | 2.60% |
Advertising | | 2.60% |
Adams Outdoor Advertising LP - 144A, | |
10.756%, 12/20/2017(3) | 700,000 | 772,060 |
GTP Towers Issuer LLC - 144A, | |
8.112%, 2/15/2015(3) | 1,000,000 | 1,021,342 |
| | 1,793,402 |
Total Commercial Mortgage-Backed Securities |
(Cost $1,700,000) | | 1,793,402 |
| Principal | |
| Amount | Market Value |
Residential Mortgage-Backed | |
Securities | | 0.30% |
| | 0.30% |
First Horizon Mortgage Pass-Through Trust |
2003-7, Series 2003-7, | | |
Class 1A5, 5.250%, | | |
9/25/2033 | $209,446 | $209,690 |
Total Residential Mortgage-Backed Securities |
(Cost $209,184) | | 209,690 |
| | | |
| Total Commercial Mortgage-Backed Securities & | | |
| Residential Mortgage-Backed Securities | | |
(Cost $1,909,184) | | 2,003,092 |
| | | |
| Shares | Market Value |
MONEY MARKET MUTUAL FUNDS | 2.33% |
Fidelity Institutional Money | | |
Market Government | | |
Portfolio - Class I | | |
(7 Day Yield 0.010%) | 1,604,581 | $1,604,581 |
Total Money Market Mutual Funds | |
(Cost $1,604,581) | | 1,604,581 |
Total Investments | | |
(Cost $65,403,414) | 98.91% | 68,213,985 |
Other Assets in Excess | | |
of Liabilities | 1.09% | 751,453 |
Net Assets | 100.00% | $68,965,438 |
** Non-income producing security.
See Notes to Financial Statements.
| PAGE 52 |
|
WESTCORE FLEXIBLE INCOME FUND AS OF JUNE 30, 2014 (continued)
(UNAUDITED)
| (1) | This security has been valued in good faith by management under the direction of the Board of Trustees. As of June 30, 2014 these securities represented 5.78% of the Fund’s net assets. |
| (2) | The coupon rate shown on floating or adjustable rate securities represents the rate at period end. |
| (3) | This security is restricted. The following table provides additional information regarding each security. Included in this list are certain securities exempt from registration under Rule 144A of the Securities Act of 1933, which may be resold in transactions, normally to qualified institutional buyers. |
Issuer Description | Coupon | Maturity Date | Acquisition Date(s) | | Cost | | Market Value | Market Value
as Percentage
of Net Assets |
Adams Outdoor Advertising LP | 10.756% | 12/20/17 | 12/3/10 | $ | 700,000 | $ | 772,060 | 1.12% |
American Airlines 2013-2 Class A Pass | | | | | | | | |
Through Trust | 4.950% | 1/15/23 | 7/24/2013 - 7/26/2013 | | 971,015 | | 1,050,458 | 1.52%^ |
Aviation Capital Group Corp. | 6.750% | 4/6/21 | 12/7/11 | | 553,250 | | 651,692 | 0.95%^ |
Calpine Corp. | 7.500% | 2/15/21 | 10/18/2010 - 2/2/2012 | | 1,595,579 | | 1,696,722 | 2.46%^ |
Emigrant Capital Trust II | 2.549% | 4/14/34 | 8/11/04 | | 498,137 | | 345,000 | 0.50% |
FMG Resources August 2006 Pty Ltd. | 8.250% | 11/1/19 | 10/18/2013 - 5/30/2014 | | 1,636,527 | | 1,638,750 | 2.38%^ |
General Motors Co. | 4.875% | 10/2/23 | 6/12/14 | | 606,147 | | 608,062 | 0.88%^ |
GTP Towers Issuer LLC | 8.112% | 2/15/15 | 2/11/10 | | 1,000,000 | | 1,021,342 | 1.48% |
Provident Funding Associates LP / PFG | | | | | | | | |
Finance Corp. | 10.125% | 2/15/19 | 5/20/14 | | 814,357 | | 816,563 | 1.18%^ |
Tuckahoe Credit Lease Trust | 9.310% | 10/20/25 | 12/11/09 | | 1,516,014 | | 1,933,426 | 2.80% |
USG Corp. | 8.375% | 10/15/18 | 11/9/2010 - 10/25/2011 | | 1,463,806 | | 1,585,500 | 2.30%^ |
| | | | $ | 11,354,832 | $ | 12,119,575 | 17.57% |
| ^ | 144A securities with a liquid trading market as determined by the Adviser under the supervision of the Board of Trustees. Such securities represent 11.67% of the Fund’s net assets as of June 30, 2014. |
| (4) | Income is not being accrued on this security due to the issuer’s default or expected default on interest payments. |
| (5) | Security in default on interest payments. The issuer defaulted on the maturity payment, pending the outcome of bankruptcy filing. |
| | |
WESTCORE PLUS BOND FUND AS OF JUNE 30, 2014
(UNAUDITED)
| Shares | Market Value |
NONCONVERTIBLE PREFERRED | |
STOCKS | | 0.59% |
Financials | | 0.53% |
Financial Services | | 0.35% |
First Tennessee Bank - 144A, | |
3.750%(1)(2) | 1,500 | $1,111,218 |
ING Groep NV (Netherlands), | |
6.125% | 161,818 | 4,097,232 |
| | 5,208,450 |
Real Estate Investment Trusts | |
(REITs) | | 0.18% |
Warehouse-Industrial (REITs) | 0.18% |
CenterPoint Properties Trust, | |
5.400%(1)(3) | 3,900 | 2,611,050 |
Total Financials | | |
(Cost $9,452,345) | | 7,819,500 |
| | | |
Utilities | | 0.06% |
Utilities | | 0.06% |
Southern California Edison, | |
5.070%(1) | 7,638 | 784,327 |
Total Utilities | | |
(Cost $763,800) | | 784,327 |
Total Nonconvertible Preferred Stocks | |
(Cost $10,216,145) | | 8,603,827 |
| Principal | |
| Amount | Market Value |
CORPORATE BONDS | | 49.88% |
Financials | | 17.77% |
Financial Services | | 10.78% |
American Express Credit Corp., | |
2.800%, 9/19/2016 | $13,800,000 | $14,375,405 |
Bank of America Corp., | | |
5.000%, 5/13/2021 | 5,950,000 | 6,648,268 |
BB&T Corp., | | |
6.850%, 4/30/2019 | 4,150,000 | 5,046,504 |
Capital One Financial Corp., | |
4.750%, 7/15/2021 | 6,700,000 | 7,461,703 |
Citigroup Inc., | | |
5.375%, 8/9/2020 | 5,475,000 | 6,281,216 |
City National Corp., | | |
5.250%, 9/15/2020 | 16,475,000 | 18,594,921 |
Emigrant Capital Trust II - 144A, | |
2.549%, 4/14/2034(1)(2) | 850,000 | 586,500 |
First Empire Capital Trust, | |
8.277%, 6/1/2027 | 25,000 | 25,416 |
First Horizon National Corp., | |
5.375%, 12/15/2015 | 12,525,000 | 13,253,654 |
| Principal | |
| Amount | Market Value |
FMR Corp. - 144A, | | |
7.490%, 6/15/2019(2) | $5,000,000 | $6,099,890 |
General Electric Capital Corp., | |
2.300%, 4/27/2017 | 13,950,000 | 14,416,097 |
General Motors Financial Co. Inc, | |
4.250%, 5/15/2023 | 3,200,000 | 3,204,000 |
JPMorgan Chase & Co., | | |
4.400%, 7/22/2020 | 7,150,000 | 7,821,428 |
PNC Funding Corp.: | | |
4.250%, 9/15/2015 | 6,845,000 | 7,148,617 |
4.375%, 8/11/2020 | 7,525,000 | 8,222,274 |
The Toronto-Dominion Bank (Canada): | |
2.500%, 7/14/2016 | 4,625,000 | 4,792,013 |
1.400%, 4/30/2018 | 7,825,000 | 7,766,172 |
Union Bank of California, | | |
5.950%, 5/11/2016 | 3,100,000 | 3,387,615 |
Validus Holdings Ltd. (Bermuda), | |
8.875%, 1/26/2040 | 5,175,000 | 7,448,854 |
Wachovia Corp., | | |
5.625%, 10/15/2016 | 14,250,000 | 15,710,611 |
| | 158,291,158 |
Insurance | | 1.15% |
Berkshire Hathaway Finance Corp., | |
1.600%, 5/15/2017 | 5,325,000 | 5,411,723 |
PartnerRe Finance B LLC, | |
5.500%, 6/1/2020 | 9,700,000 | 11,045,506 |
Prudential Financial, | | |
Series MTNB, | | |
4.346%, 5/12/2015(1) | 221,537 | 223,855 |
Zurich Reinsurance Inc., | | |
7.125%, 10/15/2023 | 200,000 | 239,577 |
| | 16,920,661 |
Savings & Loans | | 0.09% |
Washington Mutual Bank, | | |
2.969%, | | |
6/16/2010**(4) | 5,000,000 | 1,384,375 |
Real Estate Investment Trusts | |
(REITs) | | 5.75% |
Cell Tower (REITs) | | 0.28% |
American Tower Corp., | | |
5.900%, 11/1/2021 | 3,575,000 | 4,128,099 |
Diversified (REITs) | | 1.16% |
Washington REIT: | | |
4.950%, 10/1/2020 | 13,825,000 | 15,039,167 |
3.950%, 10/15/2022 | 2,025,000 | 2,032,150 |
| | 17,071,317 |
Healthcare (REITs) | | 1.56% |
Omega Healthcare Investors Inc., | |
6.750%, 10/15/2022 | 10,420,000 | 11,312,994 |
| Principal | |
| Amount | Market Value |
Ventas Realty LP / Ventas Capital Corp., |
4.750%, 6/1/2021 | $10,500,000 | |
| | 22,836,523 |
Hotels (REITs) | | 0.42% |
Host Hotels & Resorts LP, | |
6.000%, 11/1/2020 | 5,575,000 | 6,085,715 |
Regional Malls (REITs) | | 0.89% |
Simon Property Group LP: | |
7.375%, 6/15/2018 | 2,868,000 | 3,451,285 |
4.375%, 3/1/2021 | 8,775,000 | 9,657,634 |
| | 13,108,919 |
Shopping Centers (REITs) | 0.04% |
Weingarten Realty Investors, | |
6.640%, 7/15/2026 | 545,000 | 631,725 |
Timber (REITs) | | 1.40% |
Plum Creek Timberland, | | |
5.875%, 11/15/2015 | 2,400,000 | 2,548,737 |
Potlatch Corp., | | |
7.500%, 11/1/2019 | 15,521,000 | 18,062,564 |
| | 20,611,301 |
Total Financials | | |
(Cost $251,082,871) | | 261,069,793 |
| | | |
Industrials | | 26.36% |
Airlines | | 0.74% |
American Airlines 2013-2 Class A Pass Through |
Trust, | | |
4.950%, 1/15/2023(2) | 10,067,904 | 10,898,506 |
Autos | | 1.15% |
BMW US Capital Inc. - 144A, | |
5.730%, 5/1/2015(2)(3) | 12,000,000 | 12,488,400 |
General Motors Co. - 144A, | |
4.875%, 10/2/2023(2) | 4,200,000 | 4,441,500 |
| | 16,929,900 |
Cable & Media | | 1.44% |
AMC Networks Inc., | | |
4.750%, 12/15/2022 | 2,650,000 | 2,663,250 |
CBS Corp., | | |
8.875%, 5/15/2019 | 8,875,000 | 11,515,872 |
Time Warner Inc., | | |
9.150%, 2/1/2023 | 2,410,000 | 3,342,272 |
Virgin Media/Secured Finance PLC (United |
Kingdom), | | |
5.250%, 1/15/2021 | 3,460,000 | 3,676,250 |
| | 21,197,644 |
| PAGE 54 |
|
WESTCORE PLUS BOND FUND AS OF JUNE 30, 2014 (continued)
(UNAUDITED)
| Principal | |
| Amount | Market Value |
Chemicals | | 1.00% |
The Dow Chemical Co., | | |
8.550%, 5/15/2019 | $11,375,000 | $14,634,165 |
Energy-Non Utility | | 7.28% |
Anadarko Finance Co., | | |
Series B, 7.500%, | | |
5/1/2031 | 11,100,000 | 15,133,917 |
Burlington Resources Inc., | |
6.875%, 2/15/2026 | 1,000,000 | 1,228,480 |
Concho Resources, Inc., | | |
5.500%, 4/1/2023 | 3,800,000 | 4,104,000 |
Devon Energy Corp., | | |
3.250%, 5/15/2022 | 11,500,000 | 11,598,164 |
MarkWest Energy Partners LP / MarkWest Energy |
Finance Corp.: | | |
6.750%, 11/1/2020 | 6,820,000 | 7,433,800 |
4.500%, 7/15/2023 | 2,484,000 | 2,546,100 |
Range Resources Corp., | | |
5.750%, 6/1/2021 | 15,450,000 | 16,763,250 |
Sabine Pass LNG LP, | | �� |
7.500%, 11/30/2016 | 6,625,000 | 7,353,750 |
Southwestern Energy Co., | | |
7.500%, 2/1/2018 | 5,520,000 | 6,583,317 |
Tennessee Gas Pipeline Co.: | |
7.000%, 3/15/2027 | 75,000 | 94,831 |
7.000%, 10/15/2028 | 9,775,000 | 12,529,282 |
8.375%, 6/15/2032 | 2,600,000 | 3,648,102 |
Tesoro Corp., | | |
5.375%, 10/1/2022 | 3,790,000 | 3,988,975 |
Transcontinental Gas Pipe Line, | |
6.400%, 4/15/2016 | 5,725,000 | 6,259,721 |
Whiting Petroleum Corp., | | |
5.750%, 3/15/2021 | 7,000,000 | 7,682,500 |
| | 106,948,189 |
Food & Beverages | | 2.53% |
Anheuser-Busch InBev Worldwide Inc. (Belgium), |
7.750%, 1/15/2019 | 11,550,000 | 14,281,482 |
The Coca-Cola Co., | | |
1.500%, 11/15/2015 | 6,000,000 | 6,091,410 |
PepsiCo Inc., | | |
2.500%, 5/10/2016 | 15,000,000 | 15,529,755 |
WM Wrigley Jr. Co., | | |
4.650%, 7/15/2015 | 1,125,000 | 1,171,258 |
| | 37,073,905 |
Leisure | | 1.34% |
Royal Caribbean Cruises Ltd., | |
5.250%, 11/15/2022 | 8,425,000 | 8,888,375 |
Starwood Hotels & Resorts Worldwide Inc., |
6.750%, 5/15/2018 | 9,170,000 | 10,799,583 |
| | 19,687,958 |
| Principal | |
| Amount | Market Value |
Metals & Mining | | 0.70% |
BHP Billiton Finance USA Ltd. (Australia), |
6.500%, 4/1/2019 | $5,025,000 | $6,052,743 |
Newmont Mining Corp., | | |
3.500%, 3/15/2022 | 4,325,000 | 4,174,862 |
| | 10,227,605 |
Other Industrials | | 0.59% |
AmeriGas Finance LLC / AmeriGas Finance Corp., |
6.750%, 5/20/2020 | 7,975,000 | 8,692,750 |
Packaging & Containers | | 0.91% |
Ball Corp., | | |
5.750%, 5/15/2021 | 6,525,000 | 6,973,594 |
Crown Americas LLC / Crown Americas Capital |
Corp. III, | | |
6.250%, 2/1/2021 | 6,000,000 | 6,450,000 |
| | 13,423,594 |
Paper & Forestry | | 0.61% |
West Fraser Timber Co. Ltd. - 144A (Canada), |
5.200%, | | |
10/15/2014(2) | 8,825,000 | 8,945,329 |
Restaurants | | 0.81% |
Darden Restaurants Inc., | | |
4.500%, 10/15/2021 | 11,325,000 | 11,910,661 |
Retail | | 2.91% |
Costco Wholesale Corp., | | |
1.700%, 12/15/2019 | 13,975,000 | 13,778,539 |
Kohl’s Corp., | | |
3.250%, 2/1/2023 | 11,650,000 | 11,285,635 |
Wal-Mart Stores Inc., | | |
7.550%, 2/15/2030 | 12,400,000 | 17,662,845 |
| | 42,727,019 |
Telecomm & Related | | 3.03% |
America Movil SAB de CV (Mexico), | |
5.000%, 10/16/2019 | 6,975,000 | 7,870,590 |
AT&T, Inc.: | | |
2.375%, 11/27/2018 | 7,300,000 | 7,429,130 |
Series WI, 5.350%, | | |
9/1/2040 | 3,450,000 | 3,760,124 |
Frontier Communications Corp., | |
8.500%, 4/15/2020 | 7,400,000 | 8,769,000 |
Tuckahoe Credit Lease Trust - 144A, | |
9.310%, | | |
10/20/2025(2)(3) | 4,323,193 | 4,940,977 |
Verizon Communications, Inc., | |
5.150%, 9/15/2023 | 10,475,000 | 11,738,002 |
| | 44,507,823 |
| Principal | |
| Amount | Market Value |
Tobacco | | 0.52% |
Philip Morris International, Inc., | |
2.625%, 3/6/2023 | $7,825,000 | $7,609,061 |
Transportation | | 0.80% |
Burlington Northern Santa Fe Corp.: | |
5.750%, 3/15/2018 | 3,325,000 | 3,814,829 |
4.575%, 1/15/2021(3) | 740,526 | 801,620 |
6.150%, 5/1/2037 | 4,325,000 | 5,396,376 |
CSX Transportation Inc., | | |
9.750%, 6/15/2020 | 1,250,000 | 1,693,139 |
| | 11,705,964 |
Total Industrials | | |
(Cost $365,633,825) | | 387,120,073 |
| | | |
Utilities | | 5.75% |
Utilities | | 5.75% |
Calpine Corp. - 144A, | | |
7.500%, 2/15/2021(2) | 6,524,000 | 7,086,695 |
Commonwealth Edison Co., | |
Series 104, 5.950%, | | |
8/15/2016 | 7,375,000 | 8,142,981 |
Consumers Energy Co., | | |
Series B, 6.875%, | | |
3/1/2018 | 1,564,000 | 1,824,897 |
Duke Energy Carolinas LLC: | |
Series C, 7.000%, | | |
11/15/2018 | 4,285,000 | 5,197,444 |
3.900%, 6/15/2021 | 4,275,000 | 4,646,587 |
FPL Group Capital Inc.: | | |
2.600%, 9/1/2015 | 3,200,000 | 3,270,211 |
6.350%, 10/1/2066(1) | 2,900,000 | 2,861,596 |
Georgia Power Co., | | |
Series 07-A, | | |
5.650%, 3/1/2037 | 850,000 | 1,019,756 |
Nevada Power Co.: | | |
Series M, 5.950%, | | |
3/15/2016 | 3,287,000 | 3,572,479 |
Series R, 6.750%, | | |
7/1/2037 | 2,850,000 | 3,906,669 |
NRG Energy Inc., | | |
7.875%, 5/15/2021 | 3,675,000 | 4,093,031 |
Oncor Electric Delivery Co. LLC, | |
7.000%, 9/1/2022 | 13,178,000 | 16,859,999 |
Public Service Co. of Oklahoma, | |
6.150%, 8/1/2016 | 3,075,000 | 3,383,232 |
San Diego Gas & Electric Co., | |
6.000%, 6/1/2026 | 3,550,000 | 4,428,646 |
Tenaska Alabama II Partners LP - 144A, |
6.125%, 3/30/2023(2) | 194,430 | 217,260 |
Tenaska Virginia Partners LP - 144A, | |
6.119%, 3/30/2024(2) | 176,401 | 195,918 |
Westar Energy Inc., | | |
8.625%, 12/1/2018 | 9,950,000 | 12,756,328 |
|
|
WESTCORE PLUS BOND FUND AS OF JUNE 30, 2014 (continued)
(UNAUDITED)
| Principal | |
| Amount | Market Value |
WPD Holdings Inc - 144A (United Kingdom), |
7.250%, | | |
12/15/2017(2) | $875,000 | $1,009,020 |
| | 84,472,749 |
Total Utilities | | |
(Cost $75,430,248) | | 84,472,749 |
Total Corporate Bonds | | |
(Cost $692,146,944) | | 732,662,615 |
| | | |
MUNICIPAL BONDS | | 2.17% |
Washington | | 1.38% |
Washington State Build America Bonds: |
Series Fuel Sales | | |
Tax Revenue, | | |
5.090%, 8/1/2033 | 5,900,000 | 6,759,689 |
Series AD Valorem | | |
Property Tax, | | |
5.481%, 8/1/2039 | 8,400,000 | 10,243,380 |
Washington State Convention Center Public |
Facilities District, | | |
Series Hotel | | |
Occupancy Tax, | | |
6.790%, 7/1/2040 | 2,725,000 | 3,284,061 |
| | 20,287,130 |
| | | |
District Of Columbia | | 0.79% |
Metropolitan Washington Airports Authority Dulles |
Toll Road Revenue, | | |
7.462%, 10/1/2046 | 8,600,000 | 11,584,630 |
Total Municipal Bonds | | |
(Cost $30,705,480) | | 31,871,760 |
| | |
ASSET-BACKED SECURITIES, | |
COMMERCIAL MORTGAGE-BACKED | |
SECURITIES, RESIDENTIAL | |
MORTGAGE-BACKED SECURITIES | |
& AGENCY MORTGAGE-BACKED | |
SECURITIES | | 33.42% |
Asset-Backed Securities | | 2.19% |
Aircraft Lease Securitisation Ltd. - 144A, |
Series 2007-1A, | | |
Class G3, 0.412%, | | |
5/10/2032(1)(2) | 4,136,185 | 4,022,440 |
Centerpoint Energy Transition Bond Co. III LLC, |
Series 2008-A, | | |
Class A1, 4.192%, | | |
2/1/2020 | 1,954,277 | 2,033,913 |
Honda Auto Receivables Owner Trust, | |
Series 2012-2, | | |
Class A4, 0.910%, | | |
6/15/2015 | 4,200,000 | 4,221,550 |
| Principal | |
| Amount | Market Value |
Marriott Vacation Club Owner Trust - 144A, |
Series 2010-1A, | | |
Class A, 3.540%, | | |
10/20/2032(2) | $3,369,828 | $3,472,904 |
Toyota Auto Receivables Owner Trust: | |
Series 2012-A, | | |
Class A3, 0.750%, | | |
2/16/2016 | 5,092,840 | 5,101,259 |
Series 2012-A, | | |
Class A4, 0.990%, | | |
8/15/2017 | 5,000,000 | 5,028,770 |
World Financial Network Credit Card Master |
Trust, | | |
Series 2011-A, | | |
Class A, 1.680%, | | |
8/15/2018 | 8,250,000 | 8,274,832 |
Total Asset-Backed Securities | |
(Cost $31,786,885) | | 32,155,668 |
| | |
Commercial Mortgage-Backed | |
Securities | | 3.55% |
Adams Outdoor Advertising LP - 144A: | |
5.438%, | | |
12/20/2017(2) | 7,509,458 | 7,946,133 |
10.756%, | | |
12/20/2017(2) | 6,300,000 | 6,948,541 |
Crown Castle Towers LLC - 144A: | |
5.495%, 1/15/2017(2) | 4,500,000 | 4,859,005 |
6.113%, 1/15/2020(2) | 8,975,000 | 10,574,776 |
4.883%, 8/15/2020(2) | 5,900,000 | 6,524,586 |
GTP Towers Issuer LLC - 144A, | |
8.112%, 2/15/2015(2) | 15,000,000 | 15,320,130 |
Total Commercial Mortgage-Backed Securities |
(Cost $48,184,458) | | 52,173,171 |
| | |
Residential Mortgage-Backed | |
Securities | | 2.82% |
American Home Mortgage Investment Trust |
2004-4, | | |
Series 2004-4, | | |
Class 6A1, 5.500%, | | |
2/25/2045 | 5,381,574 | 5,665,732 |
Banc of America Funding Trust: | |
Class 2A4, 5.500%, | | |
8/1/2035 | 581,169 | 578,646 |
Series 2005-4, | | |
Class 1A4, 5.500%, | | |
8/1/2035 | 291,830 | 293,159 |
Banc of America Mortgage Securities Inc.: |
Series 2003-G, | | |
Class 2A1, 2.733%, | | |
8/25/2033(1) | 4,158,433 | 4,216,422 |
Series 2005-8, | | |
Class A14, 5.500%, | | |
9/25/2035 | 611,728 | 200,689 |
| Principal | |
| Amount | Market Value |
Banc of America Mortgage Trust, | |
Series 2003-E, | | |
Class 3A1, 2.622%, | | |
6/25/2033(1) | $3,221,786 | $3,244,267 |
Bear Stearns Co., | | |
Series 2003-AC4, | | |
Class A, 5.500%, | | |
9/25/2033(5) | 5,196,912 | 5,398,371 |
Countrywide Asset-Backed Certificates, |
Series 2005-1, | | |
Class AF6, 5.030%, | | |
7/25/2035(1) | 3,289,734 | 3,364,563 |
GSR Mortgage Loan Trust 2005-3F, | |
Series 2005-3F, | | |
Class 2A3, 6.000%, | | |
3/25/2035 | 3,326,264 | 3,457,595 |
RAMP Series Trust, | | |
Series 2006-EFC2, | | |
Class A3, 0.312%, | | |
12/25/2036(1) | 4,198,694 | 3,926,396 |
CHL Mortgage Pass-Through Trust 2004-HYB2, |
Series 2004-HYB2, | | |
Class 5A, 2.470%, | | |
7/20/2034 | 5,044,995 | 4,978,543 |
JP Morgan Mortgage Trust 2013-2 - 144A, |
Series 2013-2, | | |
Class A2, 3.500%, | | |
12/25/2030(2) | 6,063,916 | 6,115,896 |
| | 11,094,439 |
Total Residential Mortgage-Backed Securities |
(Cost $41,409,343) | | 41,440,279 |
| | |
Agency Mortgage-Backed | |
Securities | | 24.86% |
FHLMC: | | |
Pool #781958, | | |
5.042%, 9/1/2034(1) | 230,739 | 242,074 |
Gold Pool #G08061, | | |
5.500%, 6/1/2035 | 252,225 | 283,493 |
Gold Pool #G08079, | | |
5.000%, 9/1/2035 | 3,253,581 | 3,608,953 |
Gold Pool #G01960, | | |
5.000%, 12/1/2035 | 973,826 | 1,080,272 |
Gold Pool #A41748, | | |
5.000%, 1/1/2036 | 1,324,865 | 1,471,846 |
Gold Pool #A42128, | | |
5.500%, 1/1/2036 | 1,057,173 | 1,182,046 |
Gold Pool #G02064, | | |
5.000%, 2/1/2036 | 1,580,012 | 1,751,947 |
Gold Pool #G05200, | | |
5.000%, 5/1/2036 | 4,823,395 | 5,349,179 |
Gold Pool #G02252, | | |
5.500%, 7/1/2036 | 3,079,576 | 3,439,781 |
Gold Pool #G02386, | | |
6.000%, 11/1/2036 | 2,167,811 | 2,440,574 |
Pool #1G1317, | | |
5.921%, 11/1/2036(1) | 1,397,154 | 1,500,960 |
| PAGE 56 |
|
WESTCORE PLUS BOND FUND AS OF JUNE 30, 2014 (continued)
(UNAUDITED)
| Principal | |
| Amount | Market Value |
Gold Pool #G03189, | | |
6.500%, 9/1/2037 | $4,097,447 | $4,619,028 |
Pool #A86876, | | |
5.000%, 6/1/2039 | 3,995,222 | 4,420,662 |
Gold Pool #A91161, | | |
4.500%, 2/1/2040 | 5,754,703 | 6,230,053 |
Pool #A92533, | | |
4.500%, 6/1/2040 | 6,286,857 | 6,805,272 |
Pool #A93505, | | |
4.500%, 8/1/2040 | 8,298,031 | 8,986,095 |
Pool #A97047, | | |
4.500%, 2/1/2041 | 6,472,725 | 7,005,747 |
Pool #A97620, | | |
4.500%, 3/1/2041 | 11,750,833 | 12,721,452 |
Gold Pool #Q05168, | | |
4.000%, 12/1/2041 | 19,390,146 | 20,554,427 |
Gold Pool #Q05601, | | |
4.000%, 1/10/2042 | 11,418,347 | 12,103,961 |
Gold Pool #C03789, | | |
4.000%, 3/1/2042 | 10,078,142 | 10,683,284 |
FNMA: | | |
Pool #932361, | | |
4.000%, 1/1/2025 | 6,002,621 | 6,417,090 |
Pool #AC8938, | | |
4.500%, 1/1/2025 | 8,336,337 | 8,936,453 |
Pool #AD4268, | | |
4.500%, 3/1/2025 | 5,131,848 | 5,475,913 |
Pool #AL2840, | | |
2.500%, 11/1/2027 | 13,933,872 | 14,172,545 |
Pool #AB4853, | | |
3.000%, 4/1/2032 | 20,698,160 | 21,110,384 |
Pool #MA1201, | | |
3.500%, 10/1/2032 | 20,102,921 | 21,063,459 |
Pool #725705, | | |
5.000%, 8/1/2034 | 492,781 | 548,860 |
Pool #735288, | | |
5.000%, 3/1/2035 | 2,695,083 | 3,000,455 |
Pool #255706, | | |
5.500%, 5/1/2035 | 2,625,737 | 2,948,196 |
Pool #735897, | | |
5.500%, 10/1/2035 | 2,017,880 | 2,263,325 |
Pool #850582, | | |
5.500%, 1/1/2036 | 744,325 | 834,021 |
Pool #745275, | | |
5.000%, 2/1/2036 | 2,894,505 | 3,218,751 |
Pool #845471, | | |
5.000%, 5/1/2036 | 662,966 | 720,814 |
Pool #888016, | | |
5.500%, 5/1/2036 | 3,361,195 | 3,768,813 |
Pool #190377, | | |
5.000%, 11/1/2036 | 2,767,608 | 3,077,671 |
Pool #256526, | | |
6.000%, 12/1/2036 | 2,863,908 | 3,141,458 |
Pool #888405, | | |
5.000%, 12/1/2036 | 563,440 | 625,959 |
Pool #907772, | | |
6.000%, 12/1/2036 | 585,689 | 614,666 |
| Principal | |
| Amount | Market Value |
Pool #910881, | | |
5.000%, 2/1/2037 | $2,362,693 | $2,569,316 |
Pool #889108, | | |
6.000%, 2/1/2038 | 2,277,348 | 2,562,950 |
Pool #889579, | | |
6.000%, 5/1/2038 | 3,823,366 | 4,307,018 |
Pool #995373, | | |
4.500%, 2/1/2039 | 16,620,033 | 18,000,210 |
Pool #995838, | | |
5.500%, 5/1/2039 | 3,046,365 | 3,406,339 |
Pool #AE0395, | | |
4.500%, 10/1/2040 | 12,479,597 | 13,517,949 |
Pool #AE0949, | | |
4.000%, 2/1/2041 | 23,573,486 | 25,039,852 |
Pool #AJ1407, | | |
4.000%, 9/1/2041 | 9,843,196 | 10,456,949 |
Pool #AL0933, | | |
5.000%, 10/1/2041(6) | 3,291,432 | 3,660,317 |
Pool #AL2625, | | |
3.500%, 10/1/2042 | 14,256,996 | 14,686,644 |
Pool # MA1273, | | |
3.500%, 12/1/2042 | 14,209,699 | 14,637,922 |
Pool #AL4010, | | |
3.500%, 7/1/2043 | 21,677,151 | 22,358,681 |
Pool #MA1700, | | |
4.500%, 12/1/2043 | 7,849,878 | 8,501,756 |
GNMA, | | |
Pool #550656, | | |
5.000%, 9/15/2035 | 424,334 | 466,751 |
Ginnie Mae II pool, | | |
Pool #G24496, | | |
5.000%, 7/20/2039 | 2,307,918 | 2,563,916 |
Total Agency Mortgage-Backed Securities |
(Cost $357,685,878) | | 365,156,509 |
| | | |
| Total Asset-Backed Securities, Commercial | | |
| Mortgage-Backed Securities, Residential | | |
Mortgage-Backed Securities & Agency | | |
Mortgage-Backed Securities | | |
(Cost $479,066,564) | | 490,925,627 |
| | |
U.S. GOVERNMENT & AGENCY | |
OBLIGATIONS | | 0.00%(7) |
FNMA, | | |
8.200%, 3/10/2016 | 55,000 | 62,127 |
Total U.S. Government & Agency Obligations |
(Cost $53,982) | | 62,127 |
| | |
U.S. TREASURY BONDS & NOTES | 13.03% |
U.S. Treasury Bond: | | |
4.125%, 5/15/2015 | 14,750,000 | 15,265,380 |
2.750%, 2/15/2019 | 3,245,000 | 3,424,617 |
3.375%, 11/15/2019 | 5,975,000 | 6,492,447 |
2.625%, 8/15/2020 | 7,345,000 | 7,643,104 |
3.125%, 5/15/2021 | 1,055,000 | 1,126,130 |
| Principal | |
| Amount | Market Value |
2.000%, 11/15/2021 | $4,655,000 | $4,595,905 |
6.750%, 8/15/2026 | 1,350,000 | 1,920,164 |
5.000%, 5/15/2037 | 15,050,000 | 19,508,563 |
2.750%, 8/15/2042 | 3,500,000 | 3,124,023 |
2.625%, 4/30/2016 | 9,520,000 | 9,910,472 |
1.625%, 8/15/2022 | 930,000 | 882,701 |
5.375%, 2/15/2031 | 5,740,000 | 7,529,715 |
4.375%, 2/15/2038 | 12,025,000 | 14,334,173 |
4.375%, 11/15/2039 | 15,000,000 | 17,932,035 |
4.750%, 2/15/2041 | 22,850,000 | 28,983,808 |
U.S. Treasury Note: | | |
0.250%, 2/15/2015 | 5,340,000 | 5,346,152 |
1.250%, 10/31/2015 | 20,825,000 | 21,120,298 |
1.000%, 8/31/2016(8) | 22,020,000 | 22,247,951 |
| | 191,387,638 |
Total U.S. Treasury Bonds & Notes | |
(Cost $182,496,593) | | 191,387,638 |
| Shares | Market Value |
MONEY MARKET MUTUAL FUNDS | 0.41% |
Fidelity Institutional | | |
Money Market | | |
Government | | |
Portfolio - Class I | | |
(7 Day Yield 0.010%) | 5,948,241 | 5,948,241 |
Total Money Market Mutual Funds | |
(Cost $5,948,241) | | 5,948,241 |
Total Investments | | |
(Cost $1,400,633,949) | 99.50% | 1,461,461,835 |
Other Assets in Excess | | |
of Liabilities | 0.50% | 7,344,861 |
Net Assets | 100.00% | $1,468,806,696 |
** Non-income producing security.
See Notes to Financial Statements.
WESTCORE PLUS BOND FUND AS OF JUNE 30, 2014 (continued)
(UNAUDITED)
| (1) | The coupon rate shown on floating or adjustable rate securities represents the rate at period end. |
| (2) | This security is restricted. The following table provides additional information regarding each security. Included in this list are certain securities exempt from registration under Rule 144A of the Securities Act of 1933, which may be resold in transactions, normally to qualified institutional buyers. |
| Issuer Description | Coupon | Maturity Date | Acquisition Date(s) | | Cost | | Market Value | Market Value
as Percentage
of Net Assets |
| Adams Outdoor Advertising LP | 5.438% | 12/20/17 | 12/3/10 | $ | 4,509,458 | $ | 7,946,133 | 0.54% |
Adams Outdoor Advertising LP | 10.756% | 12/20/17 | 12/3/10 | | 6,300,000 | | 6,948,541 | 0.47% |
Aircraft Lease Securitisation Ltd., Series 2007-1A, Class G3 | 0.459% | 5/10/32 | 4/26/12 | | 3,922,691 | | 4,022,440 | 0.27%^ |
American Airlines 2013-2 Class A Pass Through Trust | 4.950% | 1/15/23 | 7/24/2013 - 1/28/2014 | | 10,314,707 | | 10,898,506 | 0.74%^ |
BMW US Capital Inc. | 5.730% | 11/1/15 | 10/16/07 | | 12,000,000 | | 12,488,400 | 0.85% |
Calpine Corp. | 7.500% | 2/15/21 | 10/18/2010 - 10/19/2010 | | 6,531,979 | | 7,086,695 | 0.48%^ |
Crown Castle Towers LLC | 5.495% | 1/15/17 | 1/8/10 | | 4,500,000 | | 4,859,005 | 0.33%^ |
Crown Castle Towers LLC | 6.113% | 1/15/20 | 1/8/10 | | 8,975,000 | | 10,574,776 | 0.72%^ |
Crown Castle Towers LLC | 4.883% | 8/15/20 | 7/29/10 | | 5,900,000 | | 6,524,586 | 0.44%^ |
Emigrant Capital Trust II | 2.549% | 4/14/34 | 8/11/04 | | 846,833 | | 586,500 | 0.04% |
First Tennessee Bank | 3.750% | – | 3/16/05 | | 1,500,000 | | 1,111,219 | 0.08% |
FMR Corp. | 7.490% | 6/15/19 | 3/6/07 | | 5,441,961 | | 6,099,890 | 0.42%^ |
General Motors Co. | 4.875% | 10/2/23 | 6/12/14 | | 4,427,529 | | 4,441,500 | 0.30%^ |
GTP Towers Issuer LLC | 8.112% | 2/15/15 | 2/11/10 | | 15,000,000 | | 15,320,130 | 1.04% |
JP Morgan Mortgage Trust 2013-2 | 3.500% | 12/25/30 | 6/10/13 | | 6,124,121 | | 6,115,896 | 0.42%^ |
Marriott Vacation Club Owner Trust, Series 2010-1A, Class A | 3.540% | 12/20/32 | 11/5/10 | | 3,369,481 | | 3,472,904 | 0.24%^ |
Tenaska Alabama II Partners LP | 6.125% | 3/30/23 | 10/9/2003 - 9/4/2009 | | 195,861 | | 217,260 | 0.01%^ |
Tenaska Virginia Partners LP | 6.119% | 3/30/24 | 4/29/2004 - 1/19/2005 | | 176,335 | | 195,918 | 0.01%^ |
Tuckahoe Credit Lease Trust | 9.310% | 10/20/25 | 12/11/09 | | 3,874,259 | | 4,940,977 | 0.34% |
West Fraser Timber Co. Ltd. | 5.200% | 10/15/14 | 6/12/2006 - 8/3/2009 | | 8,749,464 | | 8,945,329 | 0.61%^ |
WPD Holdings Inc (United Kingdom) | 7.250% | 12/15/17 | 10/15/2003 - 6/30/2006 | | 865,576 | | 1,009,020 | 0.07%^ |
| | | | $ | 113,525,255 | $ | 123,805,625 | 8.42% |
| ^ | 144A securities with a liquid trading market as determined by the Adviser under the supervision of the Board of Trustees. Such securities represent 5.06% of the Fund’s net assets as of June 30, 2014. |
| (3) | This security has been valued in good faith by management under the direction of the Board of Trustees. As of June 30, 2014 these securities represented 1.42% of the Fund’s net assets. |
| (4) | Income is not being accrued on this security due to the issuer’s default or expected default on interest payments. |
| (5) | Step bond. Coupon increases periodically based upon a predetermined schedule. Interest rate disclosed is that which is in effect at June 30, 2014. |
| (6) | When - Issued Security. |
| (7) | Less than 0.005% |
| (8) | This security is segregated to cover the purchase price of when-issued/forward commitment securities held as of June 30, 2014 (Note 2). |
| PAGE 58 |
|
WESTCORE COLORADO TAX-EXEMPT FUND AS OF JUNE 30, 2014
(UNAUDITED)
| Principal | |
| Amount | Market Value |
CERTIFICATES OF PARTICIPATION | 19.77% |
Auraria Higher Education Center, | |
6.000%, 5/1/2024, | | |
Optional 11/1/2019 @ | | |
100.00 | $499,000 | $561,450 |
City of Aurora: | | |
5.000%, 12/1/2026, | | |
Optional 12/1/2019 @ | | |
100.00 | 1,000,000 | 1,137,710 |
5.000%, 12/1/2030, | | |
Optional 12/1/2019 @ | | |
100.00 | 875,000 | 980,814 |
City of Westminster Co., | | |
4.000%, 12/1/2024, | | |
Optional 12/1/2023 @ | | |
100.00 | 1,215,000 | 1,297,498 |
| Colorado State Higher Education Capital | | |
Construction Lease Purchase Program: | | |
5.250%, 11/1/2023, | | |
Optional 11/1/2018 @ | | |
100.00 | 1,000,000 | 1,139,860 |
5.000%, 11/1/2025 | 1,000,000 | 1,172,980 |
| Colorado State, University of Colorado at | | |
Denver Health Sciences Center Fitzsimons | | |
Academic: | | |
5.000%, 11/1/2018, | | |
Prerefunded 11/01/15 | | |
@ 100.00, NATL-RE | 700,000 | 744,821 |
4.500%, 11/1/2022 | 550,000 | 624,250 |
Denver City & County, Denver Botanic Gardens, |
5.250%, 12/1/2024, | | |
Optional 12/1/2018 @ | | |
100.00 | 625,000 | 710,625 |
Douglas & Elbert Counties School District Re-1: |
5.000%, 1/15/2025, | | |
Optional 1/15/2019 @ | | |
100.00 | 1,000,000 | 1,115,600 |
5.000%, 1/15/2029, | | |
Optional 1/15/2023 @ | | |
100.00 | 705,000 | 791,264 |
Eagle County, Justice Center Project, | |
5.250%, 12/1/2023, | | |
Optional 12/1/2018 @ | | |
100.00 | 500,000 | 548,965 |
El Paso County School District No. 49 Falcon, |
5.000%, 12/15/2028, | | |
Optional 12/15/17 @ | | |
100.00 | 800,000 | 884,408 |
El Paso County School District No 49 Falcon, |
5.125%, 12/15/2028, | | |
Optional 12/15/2016 | | |
@ 100.00 | 2,000,000 | 2,164,180 |
Garfield County Public Library District, | |
5.000%, 12/1/2024, | | |
Optional 12/1/2019 @ | | |
100.00 | 675,000 | 722,439 |
| | Principal | |
| | Amount | Market Value |
Pueblo Co., Police Complex Project, | |
5.500%, 8/15/2018, | | |
AGM | $500,000 | $571,580 |
Regional Transportation District: | |
4.500%, 6/1/2019, | | |
Prerefunded 6/1/2015 | | |
@ 100.00, AMBAC | 620,000 | 644,428 |
5.000%, 6/1/2020 | 1,200,000 | 1,397,556 |
5.000%, 12/1/2022, | | |
Optional 12/1/2017 @ | | |
100.00, AMBAC | 1,000,000 | 1,115,240 |
Regional Transportation District, | |
5.000%, 6/1/2026, | | |
Optional 6/1/2023 @ | | |
100.00(1) | 1,500,000 | 1,699,155 |
Regional Transportation District, | |
5.000%, 6/1/2018 | 1,650,000 | 1,878,673 |
State of Colorado, Building Excellent Schools Today, |
5.000%, 3/15/2024, | | |
Optional 3/15/2021 @ | | |
100.00 | 1,000,000 | 1,142,040 |
Rangeview Library District, | | |
Series | | |
Lease(Renewal), | | |
5.000%, 12/15/2022, | | |
Optional 12/15/2018 | | |
@ 100.00, | 1,815,000 | 2,047,356 |
Town of Parker Co., | | |
Series | | |
Lease(Renewal), | | |
5.000%, 11/1/2030, | | |
Optional 11/15/2023 | | |
@100.00, | 1,150,000 | 1,295,970 |
Total Certificates of Participation | |
(Cost $25,524,581) | | $26,388,862 |
| | |
GENERAL OBLIGATION BONDS | 18.17% |
County-City-Special District-School | |
District | | 18.17% |
Adams 12 Five Star Schools, | |
zero coupon, | | |
12/15/2024, Optional | | |
12/15/2016 @ 67.784, | | |
FGIC | 2,385,000 | 1,535,988 |
Arapahoe County School District No. 1 Englewood: |
5.000%, 12/1/2028, | | |
Optional 12/1/2021 @ | | |
100.00 | 975,000 | 1,116,931 |
Series AD Valorem | | |
Property Tax, 5.000%, | | |
12/1/2029, Optional | | |
12/1/2021 @ 100.00, | 2,440,000 | 2,781,185 |
| | | |
| Boulder Larimer & Weld Counties St. Vrain Valley | Principal | Market Value |
School District Re-1J, | Amount | |
5.000%, 12/15/2026, | | |
Optional 12/15/2016 | | |
@ 100.00 | $1,000,000 | $1,101,180 |
| City & County of Denver Justice System, | | |
5.000%, 8/1/2025, | | |
Optional 8/1/2018 @ | | |
100.00 | 750,000 | 864,375 |
| Denver City & County School District No. 1, | | |
5.500%, 12/1/2022, | | |
FGIC | 500,000 | 623,015 |
| Douglas & Elbert Counties School District Re-1, | | |
zero coupon, | | |
12/15/2022 | 1,660,000 | 1,337,810 |
Eagle, Garfield & Routt Counties School District | | |
Re-50J, | | |
5.000%, 12/1/2026, | | |
Prefunded 12/01/16 | | |
@ 100.00, AGM | 2,500,000 | 2,773,750 |
| Garfield County, Garfield School District Re-2: | | |
5.000%, 12/1/2024, | | |
Prerefunded | | |
12/1/2016 @ 100.00, | | |
AGM | 800,000 | 887,600 |
4.750%, 12/1/2025, | | |
Optional 12/1/2016 @ | | |
100.00, AGM | 1,000,000 | 1,087,600 |
5.000%, 12/1/2027, | | |
Prerefunded | | |
12/1/2016 @ 100.00, | | |
AGM | 250,000 | 277,375 |
Garfield, Pitkin & Eagle Counties Roaring Fork | | |
School District Re-1: | | |
5.000%, 12/15/2023, | | |
Optional 12/15/2021 | | |
@ 100.00 | 1,500,000 | 1,772,445 |
5.000%, 12/15/2024, | | |
Optional 12/15/2021 | | |
@ 100.00 | 1,500,000 | 1,741,275 |
| Ignacio School District No. 11JT: | | |
5.250%, 12/1/2024, | | |
Optional 12/1/2021 @ | | |
100.00 | 500,000 | 590,260 |
5.000%, 12/1/2029, | | |
Optional 12/1/2021 @ | | |
100.00 | 1,000,000 | 1,129,160 |
| Jefferson County School District R-1, | | |
5.250%, 12/15/2025, | | |
Prerefunded | | |
12/15/2016 @ 100.00, | | |
AGM | 500,000 | 558,670 |
| La Plata County School District No. 9-R Durango: | | |
4.500%, 11/1/2023, | | |
Optional 11/1/2021 @ | | |
100.00 | 1,000,000 | 1,129,550 |
| | | |
|
|
WESTCORE COLORADO TAX-EXEMPT FUND AS OF JUNE 30, 2014 (continued)
(UNAUDITED)
| Principal | |
| Amount | Market Value |
5.000%, 11/1/2024, | | |
Optional 11/1/2021 @ | | |
100.00 | $1,000,000 | $1,162,050 |
Moffat County School District Re-1 Craig, |
5.250%, 12/1/2026, | | |
Optional 12/1/2017 @ | | |
100.00, AGM | 1,030,000 | 1,148,131 |
Rio Blanco County School District Re-1 Meeker, |
5.250%, 12/1/2022, | | |
Optional 12/1/2018 @ | | |
100.00 | 575,000 | 634,317 |
Total General Obligation Bonds | |
(Cost $23,516,313) | | $24,252,667 |
| | |
GENERAL OBLIGATION UNLTD | 6.52% |
Development | | 0.64% |
Central Platte Valley Metropolitan District, |
5.500%, 12/1/2029, | | |
Optional 12/1/2023 | | |
@100.00 | 750,000 | 851,332 |
Facilities | | 2.69% |
Clear Creek Metropolitan Recreation District, |
2.500%, 12/1/2017 | 1,430,000 | 1,497,325 |
Tallyns Reach Metropolitan District No 3, |
Series AD Valorem | | |
Property Tax, 4.000%, | | |
12/1/2021, Mandatory | | |
Sinking Fund, 2017- | | |
2021 @100.00, | 1,930,000 | 2,093,413 |
| | 3,590,738 |
General Obligation | | 0.88% |
South Suburban Park & Recreation District, |
5.000%, 12/15/2019 | 1,000,000 | 1,175,620 |
School District | | 2.31% |
Grand County School District No 2 East Grand, |
5.250%, 12/1/2026, | | |
Optional 12/1/2017 @ | | |
100.00 | 2,695,000 | 3,078,148 |
Total General Obligation Unltd | |
(Cost $8,518,618) | | $8,695,838 |
| | | |
REVENUE BONDS | | 45.75% |
Airports | | 3.11% |
City & County of Denver Airport Series A Revenue: |
5.000%, 11/15/2018, | | |
Optional 11/15/2015 | | |
@ 100.00, XLCA | 1,000,000 | 1,062,910 |
5.000%, 11/15/2025, | | |
Optional 11/15/2015 | | |
@ 100.00 | 1,840,000 | 1,951,578 |
| Principal | |
| Amount | Market Value |
5.250%, 11/15/2028, | | |
Optional 11/15/2019 | | |
@ 100.00 | $1,000,000 | |
| | 4,149,618 |
Education | | 0.39% |
Colorado Educational & Cultural Facilities |
Authority, | | |
Series Charter | | |
School Aid, 5.625%, | | |
1/15/2044, Mandatory | | |
Sinking Fund | | |
1/15/2015 @ 100.00, | 510,000 | 523,806 |
General | | 8.42% |
Boulder County Open Space Capital Improvement |
Trust Fund: | | |
Series B, 5.250%, | | |
7/15/2024, Optional | | |
7/15/2021 @ 100.00, | 1,000,000 | 1,175,650 |
5.000%, 12/15/2025, | | |
Optional 12/15/2018 | | |
@ 100.00 | 1,000,000 | 1,143,160 |
City & County of Denver Co., | |
5.250%, 9/1/2018 | 1,500,000 | 1,723,440 |
City of Commerce City Co.: | | |
5.000%, 8/1/2026, | | |
Optional 8/1/2024 | | |
@100.00 | 350,000 | 404,222 |
5.000%, 8/1/2028, | | |
Optional 8/1/2024 | | |
@100.00 | 600,000 | 680,772 |
Denver CO Convention, | | |
5.000%, 12/1/2035, | | |
Optional 11/1/2016 @ | | |
100.00 | 1,060,000 | 1,072,222 |
Denver Convention Center Hotel Authority, |
4.750%, 12/1/2035, | | |
Optional 11/1/2016 @ | | |
100.00 | 300,000 | 301,386 |
Grand Junction, | | |
5.000%, 3/1/2022, | | |
Optional 9/1/2021 @ | | |
100.00 | 500,000 | 582,905 |
Plaza Metropolitan District No 1, | |
5.000%, 12/1/2022 | 1,000,000 | 1,078,200 |
Regional Transportation District, Colorado Sales |
Tax Revenue, Series A, | | |
5.000%, 11/1/2027, | | |
Prerefunded | | |
11/1/2016 @ 100.00, | | |
AMBAC | 575,000 | 637,353 |
Town of Castle Rock Co., | | |
5.000%, 6/1/2029, | | |
Optional 6/1/2023 @ | | |
100.00 | 1,630,000 | 1,850,457 |
| Principal | |
| Amount | Market Value |
Town of Castle Rock Sales and Use Tax Revenue, |
6.000%, 6/1/2023, | | |
Optional 6/1/2018 @ | | |
100.00, AGM | $500,000 | $583,490 |
| | 11,233,257 |
Higher Education | | 4.69% |
Colorado Educational & Cultural Facilities |
Authority: | | |
4.000%, 3/1/2024, | | |
Optional 3/1/2023 @ | | |
100.00 | 500,000 | 543,440 |
4.000%, 3/1/2025, | | |
Optional 3/1/2023 @ | | |
100.00 | 500,000 | 538,270 |
University of Denver, | | |
5.000%, 3/1/2018, | | |
Optional 9/1/2015 @ | | |
100.00, NATL-RE | 500,000 | 525,595 |
Colorado Mesa University, | | |
5.125%, 5/15/2037, | | |
Optional 5/15/2017 @ | | |
100.00 | 25,000 | 25,870 |
Colorado School of Mines, | | |
5.000%, 12/1/2028, | | |
Optional 12/1/2022 @ | | |
100.00 | 350,000 | 400,008 |
Colorado State Board of Governors University - |
Enterprise Revenue Bonds: | |
5.000%, 12/1/2020, | | |
Prerefunded | | |
12/1/2015 @ 100.00, | | |
XLCA | 500,000 | 533,285 |
5.250%, 3/1/2024, | | |
Prerefunded 3/1/2017 | | |
@ 100.00 | 75,000 | 84,427 |
5.000%, 3/1/2026, | | |
Optional 3/1/2022 @ | | |
100.00 | 1,000,000 | 1,143,300 |
5.000%, 3/1/2029, | | |
Optional 3/1/2022 @ | | |
100.00 | 1,500,000 | 1,688,610 |
University of Colorado Enterprise Systems |
Revenue, | | |
5.000%, 6/1/2026, | | |
Prerefunded 6/1/2015 | | |
@ 100.00 | 750,000 | 782,962 |
| | 6,265,767 |
Medical | | 16.01% |
Aspen Valley Hospital District: | |
5.000%, 10/15/2021, | | |
Optional 10/15/2016 | | |
@ 100.00 | 600,000 | 618,354 |
5.000%, 10/15/2030, | | |
Optional 10/15/2022 | | |
@ 100.00 | 1,000,000 | 1,053,270 |
| PAGE 60 |
|
WESTCORE COLORADO TAX-EXEMPT FUND AS OF JUNE 30, 2014 (continued)
(UNAUDITED)
| Principal | |
| Amount | Market Value |
Aurora Colorado Hospital Revenue, Children’s |
Hospital, | | |
5.000%, 12/1/2022, | | |
Optional 6/1/2018 @ | | |
100.00, AGM | $1,000,000 | $1,109,920 |
Colorado Health Facilities Authority: | |
5.000%, 1/1/2017 | 1,105,000 | 1,173,886 |
5.000%, 2/1/2022 | 200,000 | 225,772 |
5.000%, 2/1/2023 | 520,000 | 588,047 |
Colorado Health Facilities Authority Revenue, |
Adventist Sunbelt: | | |
5.125%, 11/15/2020, | | |
Prerefunded | | |
11/15/2016 @ 100.00(2) | 345,000 | 384,051 |
5.250%, 11/15/2027, | | |
Optional 11/15/2016 | | |
@ 100.00(2) | 1,000,000 | 1,088,080 |
Colorado Health Facilities Authority Revenue, |
Catholic Health Initiatives: | |
5.000%, 2/1/2023, | | |
Optional 2/1/2021 @ | | |
100.00 | 500,000 | 566,940 |
5.250%, 7/1/2024, | | |
Optional 7/1/2019 @ | | |
100.00 | 1,000,000 | 1,124,860 |
4.750%, 9/1/2025, | | |
Optional 5/1/2018 @ | | |
100.00 | 660,000 | 701,448 |
Colorado Health Facilities Authority Revenue, |
Covenant Retirement Communities Inc., |
5.250%, 12/1/2025, | | |
Optional 12/1/2015 @ | | |
100.00 | 500,000 | 507,925 |
Colorado Health Facilities Authority Revenue, |
Craig Hospital Project, | | |
5.000%, 12/1/2024, | | |
Optional 12/1/2022 @ | | |
100.00 | 1,000,000 | 1,135,740 |
Colorado Health Facilities Authority Revenue, |
Evangelical Lutheran: | | |
5.250%, 6/1/2018, | | |
Optional 6/1/2016 @ | | |
100.00 | 750,000 | 791,985 |
5.250%, 6/1/2020, | | |
Optional 6/1/2016 @ | | |
100.00 | 500,000 | 525,110 |
5.250%, 6/1/2023, | | |
Optional 6/1/2016 @ | | |
100.00 | 400,000 | 416,356 |
Colorado Health Facilities Authority Revenue, |
Park View Medical Center: | |
5.000%, 9/1/2020, | | |
Optional 9/15/2015 @ | | |
100.00 | 450,000 | 464,719 |
5.000%, 9/1/2025, | | |
Optional 9/1/2017 @ | | |
100.00 | 450,000 | 474,426 |
| Principal | |
| Amount | Market Value |
Colorado Health Facilities Authority Revenue, |
Sisters Leavenworth, Series B, | |
5.000%, 1/1/2023, | | |
Optional 1/1/2020 @ | | |
100.00 | $1,000,000 | $1,143,050 |
Colorado Health Facilities Authority Revenue, Vail |
Valley Medical Center: | | |
5.000%, 1/15/2020, | | |
Prerefunded | | |
1/15/2015 @ 100.00 | 700,000 | 717,899 |
5.000%, 1/15/2020, | | |
Optional 1/15/2015 @ | | |
100.00 | 240,000 | 244,663 |
Colorado Health Facilities Authority Revenue, |
Valley View Hospital Association, | |
5.000%, 5/15/2027, | | |
Optional 5/15/2017 @ | | |
100.00 | 250,000 | 256,970 |
Colorado Health Facilities Authority Revenue, |
Yampa Valley Medical Center, | |
5.000%, 9/15/2022, | | |
Optional 9/15/2017 @ | | |
100.00 | 850,000 | 878,339 |
Colorado Health Facilities Authority, Poudre Valley |
Health, Series A, | | |
5.000%, 3/1/2025, | | |
Optional 3/1/2015 @ | | |
100.00 | 700,000 | 716,744 |
Denver Health & Hospital Authority: | |
Series Hlth, Hosp, | | |
Nurshome Rev., | | |
5.000%, 12/1/2017, | | |
Optional 11/1/2016 @ | | |
100.00, | 1,500,000 | 1,652,790 |
5.000%, 12/1/2018, | | |
Optional 12/1/2016 @ | | |
100.00 | 550,000 | 605,050 |
5.000%, 12/1/2020, | | |
Optional 12/1/2016 @ | | |
100.00 | 500,000 | 548,910 |
University of Colorado Hospital Authority: |
5.000%, 11/15/2023, | | |
Optional 11/15/2022 | | |
@ 100.00 | 450,000 | 521,919 |
5.000%, 11/15/2027, | | |
Optional 11/15/2022 | | |
@ 100.00 | 1,000,000 | 1,126,480 |
| | 21,363,703 |
Nursing Homes | | 0.63% |
Colorado Health Facilities Authority, | |
5.000%, 6/1/2022 | 750,000 | 843,120 |
Special Tax | | 4.82% |
Aurora Colorado Golf Course Enterprise: |
4.250%, 12/1/2014 | 125,000 | 125,369 |
4.375%, 12/1/2015 | 125,000 | 125,311 |
| Principal | |
| Amount | Market Value |
Colorado Educational & Cultural Facilities |
Authority: | | |
Academy Charter School: | |
5.000%, 12/15/2015, | | |
Mandatory Sinking | | |
Fund 12/15/2013 @ | | |
100.00 | $270,000 | $281,515 |
5.000%, 12/15/2021, | | |
Optional 12/15/2015 | | |
@ 100.00, Moral Oblg | 180,000 | 185,665 |
4.625%, 12/15/2028, | | |
Optional 12/15/2015 | | |
@ 100.00, Moral Oblg | 250,000 | 252,773 |
Bromley East Charter School, | |
5.125%, 9/15/2025, | | |
Optional 9/15/2015 @ | | |
100.00, XLCA | 500,000 | 513,665 |
Cherry Creek Academy, | |
4.000%, 4/1/2022, | | |
Mandatory Sinking | | |
Fund 4/1/2016 @ | | |
100.00 | 250,000 | 255,845 |
Kent Denver School, | | |
5.000%, 10/1/2019 | 115,000 | 125,612 |
Denver City & County Golf Enterprise: | |
4.600%, 9/1/2015 | 185,000 | 188,176 |
5.000%, 9/1/2018, | | |
Optional 9/1/2016 @ | | |
100.00 | 350,000 | 363,188 |
5.000%, 9/1/2019, | | |
Optional 9/1/2016 @ | | |
100.00 | 500,000 | 517,570 |
Grand Junction Leasing Authority Capital |
Improvement: | | |
5.000%, 6/15/2020, | | |
Optional 6/15/2016 @ | | |
100.00, NATL-RE | 390,000 | 418,240 |
5.000%, 6/15/2023, | | |
Optional 6/15/2016 @ | | |
100.00, NATL-RE | 390,000 | 417,148 |
Northwest Parkway Public Highway Authority |
Revenue, | | |
5.800%, 6/15/2025, | | |
Prerefunded | | |
6/15/2016 @ 100.00, | | |
AGM | 960,000 | 1,060,195 |
Superior Open Space Sales & Use Tax: | |
4.625%, 6/1/2015 | 100,000 | 102,247 |
4.750%, 6/1/2017, | | |
Optional 6/1/2016 @ | | |
100.00 | 325,000 | 348,589 |
5.000%, 6/1/2026, | | |
Optional 6/1/2016 @ | | |
100.00 | 1,085,000 | 1,158,606 |
| | 6,439,714 |
|
|
WESTCORE COLORADO TAX-EXEMPT FUND AS OF JUNE 30, 2014 (continued)
(UNAUDITED)
| Principal | |
| Amount | Market Value |
Transportation | | 0.16% |
State of Colorado Department of Transportation, |
5.000%, 12/15/2016, | | |
Prerefunded | | |
12/15/2014 @ 100.00, | | |
NATL-RE FGIC | $205,000 | $209,471 |
Utilities | | 5.85% |
Brighton Colorado Water Activity Enterprise, |
5.000%, 12/1/2029, | | |
Optional 12/1/2019 @ | | |
100.00 | 1,515,000 | 1,690,907 |
Colorado Springs Colorado Utilities Revenue, |
5.000%, 11/15/2027, | | |
Optional 11/15/2021 | | |
@ 100.00 | 1,000,000 | 1,148,360 |
Colorado Water Resources & Power Development |
Authority, | | |
5.000%, 9/1/2022, | | |
Prerefunded 9/1/2014 | | |
@ 100.00 | 5,000 | 5,039 |
| Colorado Water Resources & Power Development | | |
Authority, East Cherry Creek Valley Water & | | |
Sanitation District, | | |
4.250%, 11/15/2025, | | |
Optional 11/15/2015 | | |
@ 100.00, NATL-RE | 1,420,000 | 1,471,631 |
Denver City & County Board of Water |
Commissioners, | | |
5.000%, 12/15/2029, | | |
Optional 12/15/2017 | | |
@ 100.00, AGM | 1,575,000 | 1,767,008 |
Eagle River Water & Sanitation District, |
5.000%, 12/1/2027, | | |
Optional 12/1/2022 @ | | |
100.00 | 200,000 | 226,044 |
Fort Collins Colorado Waste Water Utility |
Enterprise, | | |
5.000%, 12/1/2027, | | |
Optional 12/1/2018 @ | | |
100.00 | 465,000 | 529,091 |
Parker Co., Water & Sanitation District Enterprise |
Revenue, | | |
5.000%, 11/1/2026, | | |
Optional 5/1/2022 @ | | |
100.00 | 400,000 | 461,764 |
Thornton Colorado Water Enterprise, |
5.000%, 12/1/2021, | | |
Prerefunded | | |
12/1/2014 @ 100.00, | | |
NATL-RE | 500,000 | 510,065 |
| | 7,809,909 |
| | Principal | Market |
| | Amount | Value |
| Water | | 1.67% |
| City & County of Broomfield Co., | | |
| Series Sewer | | |
| Revenue, 5.000%, | | |
| 12/1/2023, Optional | | |
| 12/1/2022 @ 100.00, | $1,285,000 | $1,496,562 |
| City of Aurora Co. Water Revenue, | | |
5.000%, 8/1/2020, | | |
Optional 8/1/2017 @ | | |
100.00 | 650,000 | 727,136 |
| | 2,223,698 |
Total Revenue Bonds | | |
(Cost $59,367,257) | | $61,062,063 |
| | | |
TAX ALLOCATION | | 2.06% |
Development | | 2.06% |
Denver Urban Renewal Authority: | |
5.000%, 12/1/2024, | | |
Optional 12/1/2022 @ | | |
100.00 | 500,000 | 572,240 |
5.000%, 12/1/2025, | | |
Optional 12/1/2022 @ | | |
100.00 | 1,000,000 | 1,134,160 |
Plaza Metropolitan District No 1, | |
4.000%, 12/1/2016 | 1,000,000 | 1,040,830 |
| | 2,747,230 |
Total Tax Allocation | | |
(Cost $2,741,398) | | $2,747,230 |
| Shares | Market Value |
MONEY MARKET MUTUAL FUNDS | 8.48% |
Bank of New York Cash | | |
Reserve (7 Day Yield | | |
0.050%)(3) | 1,691,835 | 1,691,835 |
Fidelity Institutional Money | | |
Market Tax Exempt | | |
- Class I (7 Day Yield | | |
0.010%) | 9,629,838 | 9,629,838 |
Total Money Market Mutual Funds | |
(Cost $11,321,673) | | 11,321,673 |
Total Investments | | |
(Cost $130,989,840) | 100.75% | 134,468,333 |
Liabilities in Excess of | | |
Other Assets | (0.75%) | $(997,530) |
Net Assets | 100.00% | $133,470,803 |
Investment classifications presented herein are based on the categorization methodology of the Adviser to the Funds which may result in the designations for one Fund being different form another. Investment classifications are unaudited.
| (1) | When - Issued Security. |
| (2) | The coupon rate shown on floating or adjustable rate securities represents the rate at period end. |
| (3) | This security is segregated to cover the purchase price of when-issued/forward commitment securities held as of June 30, 2014 (Note 2). |
See Notes to Financial Statements.
| PAGE 62 |
|
COMMON ABBREVIATIONS |
| | |
| ADR | American Depositary Receipt. |
| AG | Aktiengesellschaft is a German term that refers to a corporation that is limited by shares, i.e., owned by shareholders. |
| AGM | Assured Guaranty Municipal. |
| AMBAC | Ambac Financial Group Incorporated. |
| FGIC | Financial Guaranty Insurance Company. |
| FHLMC | Federal Home Loan Mortgage Corporation. |
| FNMA | Federal National Mortgage Association. |
| GNMA | Government National Mortgage Association. |
| LLC | Limited Liability Company. |
| LP | Limited Partnership. |
| Ltd. | Limited. |
| MBIA-RE | MBIA Inc. delivers credit enhancement for the obligations of debt such as municipal bonds. The purchase of municipal bond insurance is used to improve or enhance the credit rating of a borrower’s debt financing. |
| MTNB | Medium Term Notes Bond. |
| MTNC | Medium Term Notes Class C. |
| MORAL OBLG | Charter School Moral Obligation Program. Moral Obligation bonds are revenue-backed, state issued municipal bonds, whose principal and interest is backed by the moral, but not legal, obligation of a state government. |
| NA | National Association. |
| NATL- RE | Third party insurer for municipal debt securities. |
| N.V. | Naamloze Vennootschap is the Dutch term for a public limited liability corporation. |
| PLC | Public Limited Company. |
| Pty Ltd. | Proprieatry Limited Company. |
| REIT(s) | Real Estate Investment Trust. |
| SA | Generally designates corporations in various countries, mostly those employing the civil law. |
| SAB de CV | Sociedad Anonima Bursatil de Capital Variable is a Spanish Variable Capital Company. |
| SE | SE Regulation. A European Company which can operate on a Europe-wide basis and be governed by Community law directly applicable in all Member States. |
| S.p.A. | Società Per Azioni is an Italian shared company. |
| XLCA | XL Capital Assurance Inc. delivers credit enhancement for the obligations of debt such as municipal bonds. |
| | |
CURRENCY ABBREVIATIONS |
| | |
| AUD | Australian Dollar |
| BRL | Brazilian Dollar |
| CAD | Canadian Dollar |
| CHF | Swiss Franc |
| DKK | Danish Krone |
| EUR | Euro Currency |
| GBP | British Pound |
| HKD | Hong Kong Dollar |
| ILS | Israeli Shekel |
| JPY | Japanese Yen |
| KRW | South Korean Won |
| NOK | Norwegian Krone |
| NZD | New Zealand Dollar |
| PLN | Polish Zloty |
| SEK | Swedish Krona |
| SGD | Singapore Dollar |
| TRY | Turkish Lira |
| ZAR | South African Rand |
|
|

WESTCORE FUNDS AS OF JUNE 30, 2014 (UNAUDITED)
| Westcore Growth Fund | Westcore MIDCO Growth Fund | Westcore Select Fund | Westcore Small-Cap Growth Fund | Westcore Blue Chip Dividend Fund | Westcore Mid-Cap Value Dividend Fund |
|
|
Assets: | | | | | | | | | | | | |
Investments at value (cost - see below) | $ | 64,458,092 | $ | 100,024,505 | $ | 103,768,612 | $ | 3,237,053 | $ | 58,985,267 | $ | 57,456,208 |
Investments in affiliates at value (cost - see below) | | 0 | | 0 | | 0 | | 0 | | 0 | | 0 |
Unrealized gain on forward foreign currency contracts | | 0 | | 0 | | 0 | | 0 | | 0 | | 0 |
Receivable for investment securities sold | | 0 | | 1,234,716 | | 0 | | 16,083 | | 1,673,355 | | 0 |
Dividends and interest receivable | | 27,545 | | 41,975 | | 31,981 | | 1,113 | | 104,324 | | 54,816 |
Receivable for fund shares subscribed | | 27,935 | | 5,632,196 | | 18,796 | | 4,790 | | 4,400 | | 20,251 |
Investment for trustee deferred compensation plan | | 33,932 | | 65,945 | | 35,169 | | 0 | | 16,538 | | 12,716 |
Receivable due from advisor | | 0 | | 0 | | 0 | | 10,624 | | 0 | | 0 |
Deferred offering costs | | 0 | | 0 | | 0 | | 15,941 | | 0 | | 0 |
Prepaid and other assets | | 18,369 | | 18,210 | | 10,506 | | 8,916 | | 14,232 | | 8,193 |
Total Assets | | 64,565,873 | | 107,017,547 | | 103,865,064 | | 3,294,520 | | 60,798,116 | | 57,552,184 |
Liabilities: | | | | | | | | | | | | |
Payable for investment securities purchased | | 0 | | 0 | | 0 | | 16,269 | | 1,947,881 | | 853,630 |
Unrealized loss on forward foreign currency contracts | | 0 | | 0 | | 0 | | 0 | | 0 | | 0 |
Payable for fund shares redeemed | | 223,549 | | 5,273,371 | | 249,300 | | 59,822 | | 9,963 | | 1,281 |
Payable for investment advisory fee | | 35,356 | | 51,743 | | 55,116 | | 0 | | 21,878 | | 34,531 |
Payable for administration fee | | 7,835 | | 12,619 | | 12,545 | | 623 | | 7,396 | | 7,264 |
Payable for shareholder servicing reimbursements | | 7,498 | | 6,596 | | 12,210 | | 0 | | 3,110 | | 7,551 |
Payable for trustee deferred compensation plan | | 33,932 | | 65,945 | | 35,169 | | 0 | | 16,538 | | 12,716 |
Payable for transfer agent fee | | 2,085 | | 4,867 | | 8,831 | | 1,291 | | 12,712 | | 1,711 |
Payable for audit fee | | 11,839 | | 12,083 | | 10,670 | | 4,225 | | 12,132 | | 10,727 |
Payable for printing fee | | 4,614 | | 5,794 | | 9,326 | | 0 | | 5,774 | | 3,235 |
Payable for trustee fee | | 2,077 | | 2,874 | | 3,053 | | 16 | | 1,770 | | 1,360 |
Payable for custody fee | | 4,091 | | 6,845 | | 7,689 | | 0 | | 2,385 | | 2,067 |
Payable for chief compliance officer fee | | 227 | | 334 | | 350 | | 0 | | 202 | | 118 |
Other payables | | 3,074 | | 3,524 | | 2,421 | | 59 | | 3,614 | | 1,379 |
Total Liabilities | | 336,177 | | 5,446,595 | | 406,680 | | 82,305 | | 2,045,355 | | 937,570 |
Net Assets | $ | 64,229,696 | $ | 101,570,952 | $ | 103,458,384 | $ | 3,212,215 | $ | 58,752,761 | $ | 56,614,614 |
Net Assets Consist of: | | | | | | | | | | | | |
Paid-in capital | $ | 41,042,996 | $ | 68,593,449 | $ | 180,288,550 | $ | 3,131,656 | $ | 45,561,916 | $ | 42,659,057 |
Undistributed net investment income/(loss) | | (88,277) | | (513,005) | | (405,911) | | (9,837) | | 38,655 | | 273,544 |
Accumulated net realized gain/(loss) on | | | | | | | | | | | | |
investments, forward foreign currency contracts | | | | | | | | | | | | |
and foreign currency transactions | | 8,572,707 | | 14,701,597 | | (91,396,691) | | (105,108) | | 1,794,104 | | 3,293,041 |
Net unrealized appreciation/(depreciation) on | | | | | | | | | | | | |
investments, forward foreign currency contracts | | | | | | | | | | | | |
and translation of assets and liabilities | | | | | | | | | | | | |
denominated in foreign currencies | | 14,702,270 | | 18,788,911 | | 14,972,436 | | 195,504 | | 11,358,086 | | 10,388,972 |
Net Assets | $ | 64,229,696 | $ | 101,570,952 | $ | 103,458,384 | $ | 3,212,215 | $ | 58,752,761 | $ | 56,614,614 |
Net Assets: | | | | | | | | | | | | |
Retail Class | $ | 49,461,309 | $ | 80,399,635 | $ | 103,458,384 | $ | 504,917 | $ | 53,701,819 | $ | 56,614,614 |
Institutional Class | | 14,768,387 | | 21,171,317 | | N/A | | 2,707,298 | | 5,050,942 | | N/A |
Shares of Beneficial Interest Outstanding: | | | | | | | | | | | | |
Retail Class | | 3,049,837 | | 11,506,789 | | 4,155,555 | | 48,784 | | 4,723,482 | | 2,041,887 |
Institutional Class | | 903,040 | | 2,983,501 | | N/A | | 261,206 | | 446,712 | | N/A |
Net Asset Value and Redemption Price Per Share | | | | | | | | | | | | |
(Net Assets Per Share Outstanding): | | | | | | | | | | | | |
Retail Class | | 16.22 | | 6.99 | | 24.90 | | 10.35 | | 11.37 | | 27.73 |
Institutional Class | | 16.35 | | 7.10 | | N/A | | 10.36 | | 11.31 | | N/A |
Cost of Investments | $ | 49,755,822 | $ | 81,235,594 | $ | 88,796,176 | $ | 3,041,549 | $ | 47,627,202 | $ | 47,067,236 |
Cost of Affiliated Investments | $ | 0 | $ | 0 | $ | 0 | $ | 0 | $ | 0 | $ | 0 |
See Notes to Financial Statements.
| PAGE 64 |
|
WESTCORE FUNDS AS OF JUNE 30, 2014 (UNAUDITED)
| Westcore
Small-Cap Value Dividend Fund | Westcore Micro-Cap
Opportunity Fund | Westcore International Small-Cap Fund | Westcore Flexible Income Fund | Westcore Plus Bond Fund | Westcore Colorado
Tax-Exempt Fund |
|
|
Assets: | | | | | | | | | | | | |
Investments at value (cost - see below) | $ | 359,885,155 | $ | 35,938,506 | $ | 396,524,918 | $ | 68,213,985 | $ | 1,461,461,835 | $ | 134,468,333 |
Investments in affiliates at value (cost - see below) | | 0 | | 0 | | 57,252,430 | | 0 | | 0 | | 0 |
Unrealized gain on forward foreign currency contracts | | 0 | | 0 | | 973,222 | | 0 | | 0 | | 0 |
Receivable for investment securities sold | | 4,481,974 | | 73,352 | | 2,192,580 | | 0 | | 12,812,294 | | 0 |
Dividends and interest receivable | | 375,275 | | 42,105 | | 1,015,658 | | 853,225 | | 11,625,248 | | 811,418 |
Receivable for fund shares subscribed | | 125,564 | | 6,663 | | 139,968 | | 3,979 | | 1,125,031 | | 2,600 |
Investment for trustee deferred compensation plan | | 58,678 | | 1,312 | | 23,003 | | 31,112 | | 285,381 | | 22,682 |
Receivable due from advisor | | 0 | | 0 | | 0 | | 0 | | 0 | | 0 |
Deferred offering costs | | 0 | | 0 | | 0 | | 0 | | 0 | | 0 |
Prepaid and other assets | | 20,271 | | 15,814 | | 19,910 | | 17,162 | | 42,726 | | 3,625 |
Total Assets | | 364,946,917 | | 36,077,752 | | 458,141,689 | | 69,119,463 | 1,487,352,515 | | 135,308,658 |
Liabilities: | | | | | | | | | | | | |
Payable for investment securities purchased | | 1,178,962 | | 1,034,377 | | 1,441,906 | | 0 | | 16,327,014 | | 1,691,835 |
Unrealized loss on forward foreign currency contracts | | 0 | | 0 | | 916,859 | | 0 | | 0 | | 0 |
Payable for fund shares redeemed | | 1,677,172 | | 2,859 | | 697,129 | | 48,374 | | 1,079,656 | | 21,500 |
Payable for investment advisory fee | | 263,430 | | 20,461 | | 412,328 | | 22,338 | | 262,024 | | 30,420 |
Payable for administration fee | | 42,882 | | 6,888 | | 51,346 | | 9,399 | | 169,289 | | 18,866 |
Payable for shareholder servicing reimbursements | | 24,881 | | 4,906 | | 57,581 | | 7,737 | | 171,514 | | 16,415 |
Payable for trustee deferred compensation plan | | 58,678 | | 1,312 | | 23,003 | | 31,112 | | 285,381 | | 22,682 |
Payable for transfer agent fee | | 5,497 | | 1,665 | | 6,644 | | 2,562 | | 16,208 | | 1,720 |
Payable for audit fee | | 13,851 | | 10,191 | | 12,520 | | 20,706 | | 28,182 | | 18,112 |
Payable for printing fee | | 18,057 | | 351 | | 37,003 | | 3,857 | | 87,492 | | 6,495 |
Payable for trustee fee | | 6,812 | | 1,326 | | 12,462 | | 1,783 | | 39,492 | | 3,262 |
Payable for custody fee | | 14,582 | | 0 | | 102,517 | | 2,870 | | 52,616 | | 4,219 |
Payable for chief compliance officer fee | | 521 | | 0 | | 1,180 | | 168 | | 3,858 | | 287 |
Other payables | | 12,332 | | 817 | | 26,262 | | 3,119 | | 23,093 | | 2,042 |
Total Liabilities | | 3,317,657 | | 1,085,153 | | 3,798,740 | | 154,025 | | 18,545,819 | | 1,837,855 |
Net Assets | $ | 361,629,260 | $ | 34,992,599 | $ | 454,342,949 | $ | 68,965,438 | $ | 1,468,806,696 | $ | 133,470,803 |
Net Assets Consist of: | | | | | | | | | | | | |
Paid-in capital | $ | 259,812,107 | $ | 30,146,740 | $ | 367,330,430 | $ | 108,902,590 | $ | 1,403,608,441 | $ | 130,047,926 |
Undistributed net investment income/(loss) | | 1,876,606 | | (9,256) | | (2,149,323) | | 9,528 | | (1,377,843) | | (21,896) |
Accumulated net realized gain/(loss) on | | | | | | | | | | | | |
investments, forward foreign currency contracts | | | | | | | | | | | | |
and foreign currency transactions | | 32,705,266 | | 1,097,189 | | 13,369,663 | | (42,757,251) | | 5,748,211 | | (33,720) |
Net unrealized appreciation/(depreciation) on | | | | | | | | | | | | |
investments, forward foreign currency contracts | | | | | | | | | | | | |
and translation of assets and liabilities | | | | | | | | | | | | |
denominated in foreign currencies | | 67,235,281 | | 3,757,926 | | 75,792,179 | | 2,810,571 | | 60,827,887 | | 3,478,493 |
Net Assets | $ | 361,629,260 | $ | 34,992,599 | $ | 454,342,949 | $ | 68,965,438 | $ | 1,468,806,696 | $ | 133,470,803 |
Net Assets: | | | | | | | | | | | | |
Retail Class | $ | 153,800,836 | $ | 34,992,599 | $ | 454,342,949 | $ | 63,798,486 | $ | 1,287,584,994 | $ | 133,470,803 |
Institutional Class | | 207,828,424 | | N/A | | N/A | | 5,166,952 | | 181,221,702 | | N/A |
Shares of Beneficial Interest Outstanding: | | | | | | | | | | | | |
Retail Class | | 10,429,271 | | 1,980,475 | | 22,134,633 | | 7,092,428 | | 117,117,439 | | 11,593,617 |
Institutional Class | | 14,062,607 | | N/A | | N/A | | 582,246 | | 16,672,795 | | N/A |
Net Asset Value and Redemption Price Per Share | | | | | | | | | | | | |
(Net Assets Per Share Outstanding): | | | | | | | | | | | | |
Retail Class | | 14.75 | | 17.67 | | 20.53 | | 9.00 | | 10.99 | | 11.51 |
Institutional Class | | 14.78 | | N/A | | N/A | | 8.87 | | 10.87 | | N/A |
Cost of Investments | $ | 292,649,874 | $ | 32,180,580 | $ | 337,169,765 | $ | 65,403,414 | $ | 1,400,633,948 | $ | 130,989,840 |
Cost of Affiliated Investments | $ | 0 | $ | 0 | $ | 40,878,465 | $ | 0 | $ | 0 | $ | 0 |
See Notes to Financial Statements.

WESTCORE FUNDS FOR THE SIX MONTHS ENDED JUNE 30, 2014 (UNAUDITED)
| Westcore Growth Fund | Westcore MIDCO Growth Fund | Westcore Select Fund | Westcore Small-Cap Growth Fund | Westcore Blue Chip Dividend Fund | Westcore Mid-Cap Value Dividend Fund |
|
|
Investment Income: | | | | | | | | | | | | |
Dividends, net of foreign taxes* | $ | 340,275 | $ | 246,259 | $ | 215,343 | $ | 3,094 | $ | 1,013,007 | $ | 603,515 |
Dividends from affiliated securities | | 0 | | 0 | | 0 | | 0 | | 0 | | 0 |
Interest | | 0 | | 0 | | 0 | | 0 | | 0 | | 0 |
Total Income | | 340,275 | | 246,259 | | 215,343 | | 3,094 | | 1,013,007 | | 603,515 |
Expenses: | | | | | | | | | | | | |
Investment advisory fee | | 241,414 | | 322,422 | | 351,226 | | 14,561 | | 189,935 | | 199,767 |
Administrative fee | | 51,529 | | 68,793 | | 74,962 | | 2,018 | | 40,509 | | 36,920 |
Shareholder servicing reimbursement - | | | | | | | | | | | | |
Retail Class | | 49,794 | | 39,345 | | 75,847 | | 13 | | 16,819 | | 42,846 |
Transfer agent fees | | 10,475 | | 23,074 | | 36,479 | | 6,266 | | 45,173 | | 7,844 |
Independent pricing service fees | | 3,302 | | 3,261 | | 1,981 | | 1,731 | | 1,507 | | 2,269 |
Legal fees | | 1,015 | | 1,352 | | 1,480 | | 26 | | 794 | | 675 |
Printing fees | | 4,809 | | 5,502 | | 9,731 | | 1,569 | | 7,603 | | 3,256 |
Registration fees | | 15,365 | | 16,318 | | 9,849 | | 2,024 | | 10,908 | | 9,042 |
Audit and tax preparation fees | | 8,259 | | 8,559 | | 7,341 | | 4,236 | | 8,473 | | 7,218 |
Custodian fees | | 4,330 | | 9,797 | | 7,915 | | 344 | | 3,100 | | 2,038 |
Insurance | | 1,099 | | 1,546 | | 1,692 | | 0 | | 963 | | 738 |
Trustee fees and expenses | | 3,795 | | 5,025 | | 5,527 | | 111 | | 2,932 | | 2,526 |
Offering costs | | 0 | | 0 | | 0 | | 22,027 | | 0 | | 0 |
Chief compliance officer fee | | 1,218 | | 1,620 | | 1,778 | | 33 | | 950 | | 812 |
Other | | 2,690 | | 2,991 | | 3,468 | | 2,299 | | 2,621 | | 2,587 |
Total expenses before waivers | | 399,094 | | 509,605 | | 589,276 | | 57,258 | | 332,287 | | 318,538 |
Expenses waived by: | | | | | | | | | | | | |
Investment advisor | | | | | | | | | | | | |
Retail Class | | 0 | | 0 | | 0 | | (6,390) | | (42,729) | | 0 |
Institutional Class | | (7,680) | | (8,207) | | N/A | | (37,964) | | (5,485) | | N/A |
Net Expenses | | 391,414 | | 501,398 | | 589,276 | | 12,904 | | 284,073 | | 318,538 |
Net Investment Income/(Loss) | | (51,139) | | (255,139) | | (373,933) | | (9,810) | | 728,934 | | 284,977 |
Realized and Unrealized Gain/(Loss): | | | | | | | | | | | | |
Net realized gain/(loss) on investments | | 6,599,375 | | 11,784,359 | | 15,102,811 | | (105,108) | | 965,072 | | 5,271,444 |
Net realized gain/(loss) on investments in affiliates | | 0 | | 0 | | 0 | | 0 | | 0 | | 0 |
Net realized gain/(loss) on forward foreign currency | | | | | | | | | | | | |
contracts and foreign currency transactions | | 0 | | 0 | | 0 | | 0 | | 8,214 | | 0 |
Net change in unrealized appreciation/ | | | | | | | | | | | | |
(depreciation) on investments | | (5,730,134) | | (6,603,587) | | (11,950,037) | | 164,764 | | 1,427,071 | | (2,051,947) |
Net change in unrealized appreciation/ | | | | | | | | | | | | |
(depreciation) on investments in affiliates | | 0 | | 0 | | 0 | | 0 | | 0 | | 0 |
Net change in unrealized appreciation/ | | | | | | | | | | | | |
(depreciation) on forward foreign currency | | | | | | | | | | | | |
contracts and translation of assets and liabilities | | | | | | | | | | | | |
denominated in foreign currencies | | 0 | | 0 | | 0 | | 0 | | (26,709) | | 0 |
Net Realized And Unrealized Gain/(Loss) | | 869,241 | | 5,180,772 | | 3,152,774 | | 59,656 | | 2,373,648 | | 3,219,497 |
Net Increase/(Decrease) in Net Assets Resulting from Operations | $ | 818,102 | $ | 4,925,633 | $ | 2,778,841 | $ | 49,846 | $ | 3,102,582 | $ | 3,504,474 |
*Foreign tax withholdings | $ | 4,628 | $ | 1,514 | $ | 0 | $ | 11 | $ | 55,546 | $ | 369 |
See Notes to Financial Statements.
| PAGE 66 |
|
WESTCORE FUNDS FOR THE SIX MONTHS ENDED JUNE 30, 2014
(UNAUDITED)
| Westcore
Small-Cap Value Dividend Fund | Westcore Micro-Cap
Opportunity Fund | Westcore International Small-Cap Fund | Westcore Flexible Income Fund | Westcore Plus Bond Fund | Westcore Colorado
Tax-Exempt Fund |
|
|
Investment Income: | | | | | | | | | | | | |
Dividends, net of foreign taxes* | $ | 3,927,242 | $ | 204,496 | $ | 6,546,760 | $ | 198,204 | $ | 214,162 | $ | 406 |
Dividends from affiliated securities | | 0 | | 0 | | 1,191,853 | | 0 | | 0 | | 0 |
Interest | | 0 | | 0 | | 0 | | 1,789,081 | | 26,694,864 | | 2,246,192 |
Total Income | | 3,927,242 | | 204,496 | | 7,738,613 | | 1,987,285 | | 26,909,026 | | 2,246,598 |
Expenses | | | | | | | | | | | | |
Investment advisory fee | | 1,677,373 | | 163,604 | | 2,795,634 | | 149,871 | | 2,535,875 | | 248,428 |
Administrative fee | | 232,426 | | 22,675 | | 323,086 | | 46,172 | | 1,004,526 | | 86,073 |
Shareholder servicing reimbursement - | | | | | | | | | | | | |
Retail Class | | 134,211 | | 27,364 | | 351,312 | | 45,006 | | 981,461 | | 91,548 |
Transfer agent fees | | 21,696 | | 6,415 | | 31,327 | | 12,413 | | 73,282 | | 9,046 |
Independent pricing service fees | | 4,212 | | 7,365 | | 4,655 | | 4,575 | | 18,392 | | 10,912 |
Legal fees | | 3,985 | | 352 | | 6,087 | | 863 | | 18,969 | | 1,575 |
Printing fees | | 20,568 | | 1,700 | | 44,145 | | 4,574 | | 87,225 | | 5,306 |
Registration fees | | 17,136 | | 11,775 | | 13,767 | | 16,072 | | 24,819 | | 2,609 |
Audit and tax preparation fees | | 9,457 | | 6,673 | | 10,272 | | 10,239 | | 16,971 | | 9,582 |
Custodian fees | | 16,340 | | 1,064 | | 89,801 | | 2,596 | | 51,184 | | 4,101 |
Insurance | | 4,642 | | 298 | | 6,756 | | 909 | | 21,079 | | 1,727 |
Trustee fees and expenses | | 15,549 | | 2,098 | | 22,697 | | 3,225 | | 70,779 | | 5,882 |
Offering costs | | 0 | | 0 | | 0 | | 0 | | 0 | | 0 |
Chief compliance officer fee | | 4,778 | | 424 | | 7,313 | | 1,038 | | 22,786 | | 1,893 |
Other | | 5,482 | | 2,346 | | 9,463 | | 2,812 | | 19,654 | | 3,169 |
Total expenses before waivers | | 2,167,855 | | 254,153 | | 3,716,315 | | 300,365 | | 4,947,002 | | 481,851 |
Expenses waived by: | | | | | | | | | | | | |
Investment advisor | | | | | | | | | | | | |
Retail Class | | (67,427) | | (41,467) | | (221,772) | | (12,432) | | (965,009) | | (78,155) |
Institutional Class | | (81,789) | | N/A | | N/A | | (8,869) | | (138,895) | | N/A |
Net Expenses | | 2,018,639 | | 212,686 | | 3,494,543 | | 279,064 | | 3,843,098 | | 403,696 |
Net Investment Income/(Loss) | | 1,908,603 | | (8,190) | | 4,244,070 | | 1,708,221 | | 23,065,928 | | 1,842,902 |
Realized and Unrealized Gain/(Loss) | | | | | | | | | | | | |
Net realized gain/(loss) on investments | | 25,512,595 | | 795,137 | | 20,709,935 | | 176,243 | | 6,120,651 | | 488,677 |
Net realized gain/(loss) on investments in affiliates | | 0 | | 0 | | 456,810 | | 0 | | 0 | | 0 |
Net realized gain/(loss) on forward foreign currency | | | | | | | | | | | | |
contracts and foreign currency transactions | | 0 | | 0 | | (6,300,395) | | 0 | | 0 | | 0 |
Net change in unrealized appreciation/ | | | | | | | | | | | | |
(depreciation) on investments | | (18,242,646) | | (752,753) | | (35,929,478) | | 990,818 | | 33,485,043 | | 3,365,288 |
Net change in unrealized appreciation/ | | | | | | | | | | | | |
(depreciation) on investments in affiliates | | 0 | | 0 | | (12,729,537) | | 0 | | 0 | | 0 |
Net change in unrealized appreciation/ | | | | | | | | | | | | |
(depreciation) on forward foreign currency | | | | | | | | | | | | |
contracts and translation of assets and liabilities | | | | | | | | | | | | |
denominated in foreign currencies | | 0 | | 0 | | 12,546,005 | | 0 | | 0 | | 0 |
Net Realized And Unrealized Gain/(Loss) | | 7,269,949 | | 42,384 | | (21,246,660) | | 1,167,061 | | 39,605,694 | | 3,853,965 |
Net Increase/(Decrease) in Net Assets Resulting from Operations | $ | 9,178,552 | $ | 34,194 | $ | (17,002,590) | $ | 2,875,282 | $ | 62,671,622 | $ | 5,696,867 |
*Foreign tax withholdings | $ | 9,765 | $ | 1,819 | $ | 549,572 | $ | 1,665 | $ | 9,292 | $ | 0 |
See Notes to Financial Statements.
|
|

| | Westcore Growth Fund | | Westcore MIDCO Growth Fund | | Westcore Select Fund |
| Six Months Ended June 30, 2014 (Unaudited) | Year Ended December 31, 2013 | Six Months Ended June 30, 2014 (Unaudited) | Year Ended
December 31, 2013 | Six Months Ended June 30, 2014 (Unaudited) | Year Ended December 31, 2013 |
|
|
Increase/(Decrease) in Net Assets from: | | | | | | | | | | | | |
Operations: | | | | | | | | | | | | |
Net investment income/(loss) | $ | (51,139) | $ | (114,382) | $ | (255,139) | $ | (692,065) | $ | (373,933) | $ | (936,969) |
Net realized gain/(loss) | | 6,599,375 | | 14,425,593 | | 11,784,359 | | 27,223,548 | | 15,102,811 | | 38,185,109 |
Change in unrealized net appreciation/(depreciation) | | (5,730,134) | | 6,981,463 | | (6,603,587) | | 13,436,679 | | (11,950,037) | | 14,620,261 |
Net increase/(decrease) in net assets resulting | | | | | | | | | | | | |
from operations | | 818,102 | | 21,292,674 | | 4,925,633 | | 39,968,162 | | 2,778,841 | | 51,868,401 |
Distributions to Shareholders (Note 2): | | | | | | | | | | | | |
From net realized capital gains | | | | | | | | | | | | |
Retail Class | | 0 | | (10,155,932) | | 0 | | (20,609,371) | | 0 | | 0 |
Institutional Class | | 0 | | (1,344,047) | | 0 | | (3,640,592) | | N/A | | N/A |
Decrease in net assets from distributions to | | | | | | | | | | | | |
shareholders | | 0 | | (11,499,979) | | 0 | | (24,249,963) | | 0 | | 0 |
Beneficial Interest Transactions (Note 3): | | | | | | | | | | | | |
Shares sold | | | | | | | | | | | | |
Retail Class | | 2,742,653 | | 9,494,488 | | 4,712,523 | | 5,694,388 | | 7,972,733 | | 21,566,609 |
Institutional Class | | 6,009,151 | | 3,590,078 | | 6,014,953 | | 1,860,180 | | N/A | | N/A |
Shares issued in reinvestment of distributions | | | | | | | | | | | | |
Retail Class | | 0 | | 9,984,051 | | 0 | | 20,274,909 | | 0 | | 0 |
Institutional Class | | 0 | | 1,286,154 | | 0 | | 3,640,592 | | N/A | | N/A |
Cost of shares redeemed | | | | | | | | | | | | |
Retail Class | | (23,502,867) | | (25,405,267) | | (11,440,486) | | (26,849,406) | | (18,351,081) | | (140,880,592) |
Institutional Class | | (705,371) | | (952,137) | | (880,804) | | (29,802,096) | | N/A | | N/A |
Net increase/(decrease) resulting from beneficial | | | | | | | | | | | | |
interest transactions | | (15,456,434) | | (2,002,633) | | (1,593,814) | | (25,181,433) | | (10,378,348) | | (119,313,983) |
Redemption Fees | | 0 | | 0 | | 0 | | 0 | | 0 | | 0 |
Net Increase/(Decrease) in Net Assets | | (14,638,332) | | 7,790,062 | | 3,331,819 | | (9,463,234) | | (7,599,507) | | (67,445,582) |
Net Assets: | | | | | | | | | | | | |
Beginning of year | | 78,868,028 | | 71,077,966 | | 98,239,133 | | 107,702,367 | | 111,057,891 | | 178,503,473 |
End of period* | $ | 64,229,696 | $ | 78,868,028 | $ | 101,570,952 | $ | 98,239,133 | $ | 103,458,384 | $ | 111,057,891 |
*Including undistributed net investment | | | | | | | | | | | | |
income/(loss) of: | $ | (88,277) | $ | (37,138) | $ | (513,005) | $ | (257,866) | $ | (405,911) | $ | (31,978) |
See Notes to Financial Statements.
| PAGE 68 |
|
| | Westcore Small-Cap Growth Fund | | Westcore Blue Chip Dividend Fund | Westcore Mid-Cap Value Dividend Fund |
| Six Months Ended June 30, 2014 (Unaudited) | Period Ended December 31, 2013 (a) | Six Months Ended June 30, 2014 (Unaudited) | Year Ended December 31, 2013 (b) | Six Months Ended June 30, 2014 (Unaudited) | Year Ended December 31, 2013 (c) |
|
|
Increase/(Decrease) in Net Assets from: | | | | | | | | | | | | |
Operations: | | | | | | | | | | | | |
Net investment income/(loss) | $ | (9,810) | $ | (503) | $ | 728,934 | $ | 878,632 | $ | 284,977 | $ | 453,489 |
Net realized gain/(loss) | | (105,108) | | 0 | | 973,286 | | 16,892,711 | | 5,271,444 | | 6,250,787 |
Change in unrealized net appreciation/(depreciation) | | 164,764 | | 30,740 | | 1,400,362 | | (3,535,602) | | (2,051,947) | | 5,632,847 |
Net increase/(decrease) in net assets resulting | | | | | | | | | | | | |
from operations | | 49,846 | | 30,237 | | 3,102,582 | | 14,235,741 | | 3,504,474 | | 12,337,123 |
Distributions to Shareholders (Note 2): | | | | | | | | | | | | |
From net investment income | | | | | | | | | | | | |
Retail Class | | 0 | | 0 | | (590,031) | | (831,852) | | 0 | | (489,999) |
Institutional Class | | 0 | | 0 | | (67,212) | | (108,049) | | N/A | | N/A |
From net realized capital gains | | | | | | | | | | | | |
Retail Class | | 0 | | 0 | | 0 | | (14,808,480) | | 0 | | 0 |
Institutional Class | | 0 | | 0 | | 0 | | (1,668,526) | | N/A | | N/A |
Decrease in net assets from distributions to | | | | | | | | | | | | |
shareholders | | 0 | | 0 | | (657,243) | | (17,416,907) | | 0 | | (489,999) |
Beneficial Interest Transactions (Note 3): | | | | | | | | | | | | |
Shares sold | | | | | | | | | | | | |
Retail Class | | 467,870 | | 68,500 | | 1,160,709 | | 2,270,268 | | 3,511,594 | | 7,190,429 |
Institutional Class | | 516,108 | | 3,346,247 | | 807,933 | | 1,392,639 | | N/A | | N/A |
Shares issued in reinvestment of distributions | | | | | | | | | | | | |
Retail Class | | 0 | | 0 | | 494,741 | | 12,474,424 | | 0 | | 477,668 |
Institutional Class | | 0 | | 0 | | 67,212 | | 1,776,575 | | N/A | | N/A |
Cost of shares redeemed | | | | | | | | | | | | |
Retail Class | | (34,977) | | 0 | | (3,932,413) | | (13,302,105) | | (3,683,349) | | (6,573,997) |
Institutional Class | | (170,217) | | (1,061,399) | | (2,091,733) | | (3,456,462) | | N/A | | N/A |
Net increase/(decrease) resulting from beneficial | | | | | | | | | | | | |
interest transactions | | 778,784 | | 2,353,348 | | (3,493,551) | | 1,155,339 | | (171,755) | | 1,094,100 |
Redemption Fees | | 0 | | 0 | | 0 | | 0 | | 0 | | 0 |
Net Increase/(Decrease) in Net Assets | | 828,630 | | 2,383,585 | | (1,048,212) | | (2,025,827) | | 3,332,719 | | 12,941,224 |
Net Assets: | | | | | | | | | | | | |
Beginning of year | | 2,383,585 | | 0 | | 59,800,973 | | 61,826,800 | | 53,281,895 | | 40,340,671 |
End of period* | $ | 3,212,215 | $ | 2,383,585 | $ | 58,752,761 | $ | 59,800,973 | $ | 56,614,614 | $ | 53,281,895 |
*Including undistributed net investment | | | | | | | | | | | | |
income/(loss) of: | $ | (9,837) | $ | (27) | $ | 38,655 | $ | (33,036) | $ | 273,544 | $ | (11,433) |
| (a) | Commenced Operations on December 20, 2013. |
| (b) | Prior to April 30, 2013 known as the Westcore Blue Chip Fund. |
| (c) | Prior to April 30, 2013 known as the Westcore Mid-Cap Value Fund. |
See Notes to Financial Statements.
|
|
| | Westcore Small-Cap Value Dividend Fund | Westcore Micro-Cap Opportunity Fund | | Westcore International Small-Cap Fund |
| | Six Months Ended June 30, 2014 (Unaudited) | Year Ended December 31, 2013 (a) | Six Months Ended June 30, 2014 (Unaudited) | Year Ended
December 31, 2013 | Six Months Ended June 30, 2014 (Unaudited) | Year Ended December 31, 2013 |
| |
| |
Increase/(Decrease) in Net Assets from: | | | | | | | | | | | | |
Operations: | | | | | | | | | | | | |
Net investment income/(loss) | $ | 1,908,603 | $ | 2,591,189 | $ | (8,190) | $ | (752) | $ | 4,244,070 | $ | 7,729,842 |
Net realized gain/(loss) | | 25,512,595 | | 58,714,164 | | 795,137 | | 733,189 | | 14,866,350 | | 16,277,777 |
Change in unrealized net appreciation/(depreciation) | | (18,242,646) | | 36,092,828 | | (752,753) | | 4,080,465 | | (36,113,010) | | 62,639,930 |
Net increase/(decrease) in net assets resulting | | | | | | | | | | | | |
| from operations | | 9,178,552 | | 97,398,181 | | 34,194 | | 4,812,902 | | (17,002,590) | | 86,647,549 |
Distributions to Shareholders (Note 2): | | | | | | | | | | | | |
From net investment income | | | | | | | | | | | | |
| Retail Class | | 0 | | (1,387,093) | | 0 | | (15,005) | | 0 | | (14,400,034) |
| Institutional Class | | 0 | | (1,262,831) | | N/A | | N/A | | N/A | | N/A |
From net realized capital gains | | | | | | | | | | | | |
| Retail Class | | 0 | | (27,793,188) | | 0 | | (402,493) | | 0 | | 0 |
| Institutional Class | | 0 | | (23,579,052) | | N/A | | N/A | | N/A | | N/A |
Decrease in net assets from distributions to | | | | | | | | | | | | |
| shareholders | | 0 | | (54,022,164) | | 0 | | (417,498) | | 0 | | (14,400,034) |
Beneficial Interest Transactions (Note 3): | | | | | | | | | | | | |
Shares sold | | | | | | | | | | | | |
| Retail Class | | 10,850,627 | | 30,947,909 | | 17,463,539 | | 14,886,618 | | 50,236,418 | | 209,744,438 |
| Institutional Class | | 89,636,469 | | 45,217,713 | | N/A | | N/A | | N/A | | N/A |
Shares issued in reinvestment of distributions | | | | | | | | | | | | |
| Retail Class | | 0 | | 23,390,588 | | 0 | | 417,301 | | 0 | | 12,805,410 |
| Institutional Class | | 0 | | 23,196,017 | | N/A | | N/A | | N/A | | N/A |
Cost of shares redeemed | | | | | | | | | | | | |
| Retail Class | | (30,448,749) | | (116,839,160) | | (3,291,932) | | (1,899,328) | | (59,679,927) | | (141,857,785) |
| Institutional Class | | (34,782,839) | | (64,207,941) | | N/A | | N/A | | N/A | | N/A |
Acquisition (Note 9) | | | | | | | | | | | | |
| Retail Class | | 0 | | 15,711,827 | | N/A | | N/A | | N/A | | N/A |
| Institutional Class | | 0 | | 2,491,277 | | N/A | | N/A | | N/A | | N/A |
Net increase/(decrease) resulting from beneficial | | | | | | | | | | | | |
| interest transactions | | 35,255,508 | | (40,091,770) | | 14,171,607 | | 13,404,591 | | (9,443,509) | | 80,692,063 |
Redemption Fees | | 0 | | 0 | | 0 | | 368 | | 0 | | 24,103 |
Net Increase/(Decrease) in Net Assets | | 44,434,060 | | 3,284,247 | | 14,205,801 | | 17,800,363 | | (26,446,099) | | 152,963,681 |
Net Assets: | | | | | | | | | | | | |
Beginning of year | | 317,195,200 | | 313,910,953 | | 20,786,798 | | 2,986,435 | | 480,789,048 | | 327,825,367 |
End of period* | $ | 361,629,260 | $ | 317,195,200 | $ | 34,992,599 | $ | 20,786,798 | $ | 454,342,949 | $ | 480,789,048 |
*Including undistributed net investment | | | | | | | | | | | | |
| income/(loss) of: | $ | 1,876,606 | $ | (31,997) | $ | (9,256) | $ | (1,066) | $ | (2,149,323) | $ | (6,393,393) |
(a) | Prior to April 30, 2013 known as the Westcore Small-Cap Value Fund. |
See Notes to Financial Statements.
| PAGE 70 |
|
| | Westcore Flexible Income Fund | | Westcore Plus Bond Fund | Westcore Colorado Tax-Exempt Fund |
| Six Months Ended June 30, 2014 (Unaudited) | Year Ended December 31, 2013 | Six Months Ended June 30, 2014 (Unaudited) | Year Ended
December 31, 2013 | Six Months Ended June 30, 2014 (Unaudited) | Year Ended December 31, 2013 |
|
|
Increase/(Decrease) in Net Assets from: | | | | | | | | | | | | |
Operations: | | | | | | | | | | | | |
Net investment income/(loss) | $ | 1,708,221 | $ | 3,790,241 | $ | 23,065,928 | $ | 49,749,153 | $ | 1,842,902 | $ | 4,049,285 |
Net realized gain/(loss) | | 176,243 | | (1,547,805) | | 6,120,651 | | 5,292,582 | | 488,677 | | 503,149 |
Change in unrealized net appreciation/(depreciation) | | 990,818 | | 646,300 | | 33,485,043 | | (75,572,836) | | 3,365,288 | | (8,409,458) |
Net increase/(decrease) in net assets resulting | | | | | | | | | | | | |
from operations | | 2,875,282 | | 2,888,736 | | 62,671,622 | | (20,531,101) | | 5,696,867 | | (3,857,024) |
Distributions to Shareholders (Note 2): | | | | | | | | | | | | |
From net investment income | | | | | | | | | | | | |
Retail Class | | (1,511,058) | | (3,505,184) | | (20,501,796) | | (45,875,407) | | (1,837,897) | | (4,055,751) |
Institutional Class | | (113,149) | | (238,726) | | (3,711,461) | | (8,873,173) | | N/A | | N/A |
From net realized capital gains | | | | | | | | | | | | |
Retail Class | | 0 | | 0 | | 0 | | (1,690,631) | | 0 | | 0 |
Institutional Class | | 0 | | 0 | | 0 | | (319,182) | | N/A | | N/A |
Decrease in net assets from distributions to | | | | | | | | | | | | |
shareholders | | (1,624,207) | | (3,743,910) | | (24,213,257) | | (56,758,393) | | (1,837,897) | | (4,055,751) |
Beneficial Interest Transactions (Note 3): | | | | | | | | | | | | |
Shares sold | | | | | | | | | | | | |
Retail Class | | 5,130,058 | | 11,009,266 | | 179,486,451 | | 357,133,071 | | 18,063,493 | | 28,048,227 |
Institutional Class | | 1,420,762 | | 2,154,936 | | 22,150,852 | | 107,671,753 | | N/A | | N/A |
Shares issued in reinvestment of distributions | | | | | | | | | | | | |
Retail Class | | 1,417,546 | | 3,258,522 | | 19,913,845 | | 45,767,653 | | 1,666,287 | | 3,711,487 |
Institutional Class | | 113,146 | | 238,726 | | 3,646,039 | | 8,841,907 | | N/A | | N/A |
Cost of shares redeemed | | | | | | | | | | | | |
Retail Class | | (5,525,151) | | (26,076,678) | | (156,058,670) | | (583,723,522) | | (8,601,187) | | (52,183,746) |
Institutional Class | | (959,619) | | (4,311,815) | | (77,553,086) | | (119,152,472) | | N/A | | N/A |
Net increase/(decrease) resulting from beneficial | | | | | | | | | | | | |
interest transactions | | 1,596,742 | | (13,727,043) | | (8,414,569) | | (183,461,610) | | 11,128,593 | | (20,424,032) |
Redemption Fees | | 2,279 | | 23,663 | | 0 | | 0 | | 0 | | 0 |
Net Increase/(Decrease) in Net Assets | | 2,850,096 | | (14,558,554) | | 30,043,796 | | (260,751,104) | | 14,987,563 | | (28,336,807) |
Net Assets: | | | | | | | | | | | | |
Beginning of year | | 66,115,342 | | 80,673,896 | | 1,438,762,900 | | 1,699,514,004 | | 118,483,240 | | 146,820,047 |
End of period* | $ | 68,965,438 | $ | 66,115,342 | $ | 1,468,806,696 | $ | 1,438,762,900 | $ | 133,470,803 | $ | 118,483,240 |
*Including undistributed net investment | | | | | | | | | | | | |
income/(loss) of: | $ | 9,528 | $ | (74,486) | $ | (1,377,843) | $ | (230,514) | $ | (21,896) | $ | (26,901) |
See Notes to Financial Statements.

Selected data for a share of beneficial interest outstanding throughout the period indicated.
| | Income from Investment Operations | | | | Distributions | | |
| | Net Asset Value Beginning of the Period | | | | Net Realized And
Unrealized Gain/ (Loss) on Investments | | Total Income/ (Loss) from Investment Operations | | | Dividends From Net Realized Gain on Investments | | | | |
| | | Net Investment Income/(Loss) | | Dividends from
Net Investment Income | | Tax Return of Capital | | Total Distributions |
| | | | | |
Period Ended | | | | |
WESTCORE GROWTH FUND |
Retail Class | | | | | | | | | | | | | | | | |
06/30/14 (Unaudited) | $ 15.98 | | | $ (0.01) | (a) | | $ 0.25 | | | $ 0.24 | | | $(0.00) | | | $ (0.00) | | | $ (0.00) | | | $ (0.00) | |
12/31/13 | | 14.07 | | | (0.03) | (a) | | 4.62 | | | 4.59 | | | (0.00) | | | (2.68) | | | (0.00) | | | (2.68) | |
12/31/12 | | 12.46 | | | 0.05 | (a) | | 1.83 | | | 1.88 | | | (0.05) | | | (0.22) | | | (0.00) | | | (0.27) | |
12/31/11 | | 12.54 | | | (0.03) | (a) | | (0.05) | | | (0.08) | | | (0.00) | | | (0.00) | | | (0.00) | (d) | | (0.00) | |
12/31/10 | | 10.88 | | | (0.01) | | | 1.67 | | | 1.66 | | | (0.00) | | | (0.00) | | | (0.00) | (d) | | (0.00) | |
12/31/09 | | 7.80 | | | (0.01) | | | 3.09 | | �� | 3.08 | | | (0.00) | (d) | | (0.00) | | | (0.00) | (d) | | (0.00) | (d) |
Institutional Class | | | | | | | | | | | | | | | | | | | | | | | |
06/30/14 (Unaudited) | 16.10 | | | 0.00 | (a)(d) | | 0.25 | | | 0.25 | | | (0.00) | | | (0.00) | | | (0.00) | | | (0.00) | |
12/31/13 | | 14.14 | | | 0.01 | (a) | | 4.63 | | | 4.64 | | | (0.00) | | | (2.68) | | | (0.00) | | | (2.68) | |
12/31/12 | | 12.50 | | | 0.04 | (a) | | 1.88 | | | 1.92 | | | (0.06) | | | (0.22) | | | (0.00) | | | (0.28) | |
12/31/11 | | 12.56 | | | (0.00) | (a)(d) | | (0.06) | | | (0.06) | | | (0.00) | | | (0.00) | | | (0.00) | (d) | | (0.00) | |
12/31/10 | | 10.88 | | | 0.01 | | | 1.67 | | | 1.68 | | | (0.00) | | | (0.00) | | | (0.00) | (d) | | (0.00) | |
12/31/09 | | 7.81 | | | (0.00) | (d) | | 3.10 | | | 3.10 | | | (0.03) | | | (0.00) | | | (0.00) | (d) | | (0.03) | |
WESTCORE MIDCO GROWTH FUND | | | | | | | | | | | | | | | | | |
Retail Class | | | | | | | | | | | | | | | | | | | | | | | |
06/30/14 (Unaudited) | 6.65 | | | (0.02) | (a) | | 0.36 | | | 0.34 | | | (0.00) | | | (0.00) | | | (0.00) | | | (0.00) | |
12/31/13 | | 6.11 | | | (0.05) | (a) | | 2.75 | | | 2.70 | | | (0.00) | | | (2.16) | | | (0.00) | | | (2.16) | |
12/31/12 | | 5.90 | | | (0.01) | (a) | | 0.28 | | | 0.27 | | | (0.00) | | | (0.06) | | | (0.00) | | | (0.06) | |
12/31/11 | | 6.77 | | | (0.02) | (a) | | (0.47) | | | (0.49) | | | (0.00) | | | (0.38) | | | (0.00) | (d) | | (0.38) | |
12/31/10 | | 5.20 | | | (0.01) | | | 1.58 | | | 1.57 | | | (0.00) | | | (0.00) | | | (0.00) | (d) | | (0.00) | |
12/31/09 | | 3.55 | | | (0.01) | | | 1.66 | | | 1.65 | | | (0.00) | | | (0.00) | | | (0.00) | (d) | | (0.00) | |
Institutional Class | | | | | | | | | | | | | | | | | | | | | | | |
06/30/14 (Unaudited) | 6.74 | | | (0.01) | (a) | | 0.37 | | | 0.36 | | | (0.00) | | | (0.00) | | | (0.00) | | | (0.00) | |
12/31/13 | | 6.16 | | | (0.04) | (a) | | 2.78 | | | 2.74 | | | (0.00) | | | (2.16) | | | (0.00) | | | (2.16) | |
12/31/12 | | 5.93 | | | (0.00) | (a)(d) | | 0.29 | | | 0.29 | | | (0.00) | | | (0.06) | | | (0.00) | | | (0.06) | |
12/31/11 | | 6.80 | | | (0.01) | (a) | | (0.48) | | | (0.49) | | | (0.00) | | | (0.38) | | | (0.00) | (d) | | (0.38) | |
12/31/10 | | 5.22 | | | 0.00 | (d) | | 1.58 | | | 1.58 | | | (0.00) | | | (0.00) | | | (0.00) | (d) | | (0.00) | |
12/31/09 | | 3.56 | | | (0.00) | (d) | | 1.66 | | | 1.66 | | | (0.00) | | | (0.00) | | | (0.00) | (d) | | (0.00) | |
(a) Calculated using the average shares method.
(b) Total return and portfolio turnover are not annualized for period less than one full year.
(c) Annualized.
(d) Less than $0.005 and $(0.005) per share.
| PAGE 72 |
|

| | | | | Ratios/Supplemental Data |
Paid-in
Capital from
Redemption Fees | Net Asset Value
End of Period | Total Return | Net Assets,
End of Period
(in Thousands) | Ratio of Expenses
to Average Net
Assets | Ratio of Expenses
to Average Net
Assets Without
Fee Waivers | Ratio of Net
Investment
Income/(Loss) to
Average Net
Assets | Ratio of Net
Investment
Income/(Loss)
to Average Net
Assets Without
Fee Waivers | Portfolio
Turnover Rate |
| | | | | | | | | | | |
| | | | | | | | | | | |
| $ 0.00 | | $ 16.22 | | 1.50% | (b) | $ 49,461 | | 1.08% | (c) | 1.08% | (c) | (0.17%) | (c) | (0.17%) | (c) | 81% | (b) |
0.00 | | 15.98 | | 32.93% | | 69,632 | | 1.09% | | 1.09% | | (0.17%) | | (0.17%) | | 182% | |
0.00 | (d) | 14.07 | | 15.13% | | 66,514 | | 1.11% | | 1.11% | | 0.36% | | 0.36% | | 167% | |
0.00 | (d) | 12.46 | | (0.64%) | | 59,311 | | 1.11% | | 1.11% | | (0.22%) | | (0.22%) | | 130% | |
0.00 | (d) | 12.54 | | 15.26% | | 108,694 | | 1.08% | | 1.08% | | (0.07%) | | (0.07%) | | 99% | |
0.00 | (d) | 10.88 | | 39.54% | | 120,456 | | 1.06% | | 1.06% | | (0.05%) | | (0.05%) | | 83% | |
| | | | | | | | | | | | | | | | | | |
0.00 | | 16.35 | | 1.55% | (b) | 14,768 | | 0.90% | (c) | 1.03% | (c) | 0.06% | (c) | (0.07%) | (c) | 81% | (b) |
0.00 | | 16.10 | | 33.13% | | 9,236 | | 0.89% | | 1.14% | | 0.06% | | (0.20%) | | 182% | |
0.00 | (d) | 14.14 | | 15.37% | | 4,564 | | 0.92% | | 1.32% | | 0.31% | | (0.09%) | | 167% | |
0.00 | (d) | 12.50 | | (0.48%) | | 8,637 | | 0.95% | | 1.70% | | 0.02% | | (0.73%) | | 130% | |
0.00 | (d) | 12.56 | | 15.44% | | 3,271 | | 0.94% | | 2.13% | | 0.08% | | (1.11%) | | 99% | |
0.00 | (d) | 10.88 | | 39.64% | | 2,619 | | 0.94% | | 2.55% | | 0.05% | | (1.56%) | | 83% | |
| | | | | | | | | | | | | | | | | | |
| | | | | | | | | | | | | | | | | | |
0.00 | | 6.99 | | 5.11% | (b) | 80,400 | | 1.03% | (c) | 1.03% | (c) | (0.54%) | (c) | (0.54%) | (c) | 57% | (b) |
0.00 | | 6.65 | | 44.67% | | 83,008 | | 1.05% | | 1.05% | | (0.67%) | | (0.67%) | | 117% | |
0.00 | (d) | 6.11 | | 4.64% | | 74,221 | | 1.05% | | 1.05% | | (0.12%) | | (0.12%) | | 114% | |
0.00 | (d) | 5.90 | | (7.20%) | | 96,762 | | 1.06% | | 1.06% | | (0.25%) | | (0.25%) | | 113% | |
0.00 | (d) | 6.77 | | 30.19% | | 104,119 | | 1.05% | | 1.05% | | (0.19%) | | (0.19%) | | 98% | |
0.00 | (d) | 5.20 | | 46.48% | | 85,559 | | 1.08% | | 1.08% | | (0.20%) | | (0.20%) | | 121% | |
| | | | | | | | | | | | | | | | | | |
0.00 | | 7.10 | | 5.34% | (b) | 21,171 | | 0.90% | (c) | 1.00% | (c) | (0.40%) | (c) | (0.50%) | (c) | 57% | (b) |
0.00 | | 6.74 | | 44.94% | | 15,231 | | 0.88% | | 0.95% | | (0.53%) | | (0.60%) | | 117% | |
0.00 | (d) | 6.16 | | 4.96% | | 33,482 | | 0.87% | | 0.93% | | 0.06% | | 0.01% | | 114% | |
0.00 | (d) | 5.93 | | (7.17%) | | 38,396 | | 0.92% | | 0.97% | | (0.11%) | | (0.16%) | | 113% | |
0.00 | (d) | 6.80 | | 30.27% | | 42,072 | | 0.93% | | 0.98% | | (0.07%) | | (0.12%) | | 98% | |
0.00 | (d) | 5.22 | | 46.63% | | 34,148 | | 0.95% | | 1.03% | | (0.08%) | | (0.15%) | | 121% | |
See Notes to Financial Statements.
Selected data for a share of beneficial interest outstanding throughout the period indicated.
| | Income from Investment Operations | | | | Distributions | | |
| | Net Asset Value Beginning of the Period | | | | Net Realized And
Unrealized Gain/ (Loss) on Investments | | Total Income/ (Loss) from Investment Operations | | | Dividends From Net Realized Gain on Investments | | | | |
| | | Net Investment Income/(Loss) | | Dividends from
Net Investment Income | | | | |
| | | | | Tax Return of Capital | | Total Distributions |
Period Ended | | | | |
WESTCORE SELECT FUND | | | | | | | | | | | | |
Retail Class | | | | | | | | | | | | | | | | |
06/30/14 (Unaudited) | | $ 24.21 | | | $ (0.08) | (a) | | $ 0.77 | | | $ 0.69 | | | $ (0.00) | | | $ (0.00) | | | $ (0.00) | | | $ (0.00) | |
12/31/13 | | 16.60 | | | (0.14) | (a) | | 7.75 | | | 7.61 | | | (0.00) | | | (0.00) | | | (0.00) | | | (0.00) | |
12/31/12 | | 18.71 | | | (0.09) | (a) | | (2.02) | | | (2.11) | | | (0.00) | | | (0.00) | | | (0.00) | | | (0.00) | |
12/31/11 | | 21.07 | | | (0.08) | (a) | | (2.17) | | | (2.25) | | | (0.00) | | | (0.12) | | | (0.00) | (d) | | (0.12) | |
12/31/10 | | 16.14 | | | (0.01) | | | 4.93 | | | 4.92 | | | (0.00) | | | (0.00) | | | (0.00) | (d) | | (0.00) | |
12/31/09 | | 11.44 | | | (0.03) | | | 4.73 | | | 4.70 | | | (0.00) | | | (0.00) | | | (0.00) | (d) | | (0.00) | |
WESTCORE SMALL-CAP GROWTH FUND | | | | | | | | | | | | | | | | | | |
Retail Class | | | | | | | | | | | | | | | | | | | | | | | |
06/30/14 (Unaudited) | 10.13 | | | (0.05) | (a) | | 0.27 | | | 0.22 | | | (0.00) | | | (0.00) | | | (0.00) | | | (0.00) | |
12/31/13 (e) | 10.00 | | | (0.00) | (a)(d) | | 0.13 | | | 0.13 | | | (0.00) | | | (0.00) | | | (0.00) | | | (0.00) | |
Institutional Class | | | | | | | | | | | | | | | | | | | | | | | |
06/30/14 (Unaudited) | 10.13 | | | (0.03) | (a) | | 0.26 | | | 0.23 | | | (0.00) | | | (0.00) | | | (0.00) | | | (0.00) | |
12/31/13 (e) | 10.00 | | | (0.00) | (a)(d) | | 0.13 | | | 0.13 | | | (0.00) | | | (0.00) | | | (0.00) | | | (0.00) | |
WESTCORE BLUE CHIP DIVIDEND FUND | | | | | | | | | | | | | | | | | | |
Retail Class | | | | | | | | | | | | | | | | | | | | | | | |
06/30/14 (Unaudited) | 10.91 | | | 0.14 | (a) | | 0.44 | | | 0.58 | | | (0.12) | | | (0.00) | | | (0.00) | | | (0.12) | |
12/31/13 (g) | 12.00 | | | 0.18 | (a) | | 2.68 | | | 2.86 | | | (0.21) | | | (3.74) | | | (0.00) | | | (3.95) | |
12/31/12 | | 11.49 | | | 0.14 | (a) | | 1.40 | | | 1.54 | | | (0.16) | | | (0.87) | | | (0.00) | | | (1.03) | |
12/31/11 | | 11.12 | | | 0.13 | (a) | | 0.43 | | | 0.56 | | | (0.16) | | | (0.05) | | | (0.00) | | | (0.21) | |
12/31/10 | | 10.76 | | | 0.07 | | | 0.36 | | | 0.43 | | | (0.07) | | | (0.00) | | | (0.00) | | | (0.07) | |
12/31/09 | | 8.32 | | | 0.06 | | | 2.43 | | | 2.49 | | | (0.05) | | | (0.00) | | | (0.00) | | | (0.05) | |
Institutional Class | | | | | | | | | | | | | | | | | | | | | | | |
06/30/14 (Unaudited) | 10.85 | | | 0.15 | (a) | | 0.44 | | | 0.59 | | | (0.13) | | | (0.00) | | | (0.00) | | | (0.13) | |
12/31/13 (g) | 11.96 | | | 0.20 | (a) | | 2.67 | | | 2.87 | | | (0.24) | | | (3.74) | | | (0.00) | | | (3.98) | |
12/31/12 | | 11.46 | | | 0.17 | (a) | | 1.39 | | | 1.56 | | | (0.19) | | | (0.87) | | | (0.00) | | | (1.06) | |
12/31/11 | | 11.10 | | | 0.13 | (a) | | 0.46 | | | 0.59 | | | (0.19) | | | (0.05) | | | (0.00) | | | (0.24) | |
12/31/10 | | 10.76 | | | 0.09 | | | 0.35 | | | 0.44 | | | (0.10) | | | (0.00) | | | (0.00) | | | (0.10) | |
12/31/09 | | 8.32 | | | 0.07 | | | 2.43 | | | 2.50 | | | (0.06) | | | (0.00) | | | (0.00) | | | (0.06) | |
| (a) | Calculated using the average shares method. |
| (b) | Total return and portfolio turnover are not annualized for period less than one full year. |
| (c) | Annualized. |
| (d) | Less than $0.005 and $(0.005) per share. |
| (e) | Commenced Operation on December 20, 2013. |
| (f) | Ratios before fee waivers for startup periods may not be representative of long term operating results. |
| (g) | Prior to Aril 30, 2013 known as the Westcore Blue Chip Fund. |
| (h) | Contractual expense limitation changed from 1.15% to 0.99% effective September 1, 2013. |
| (i) | Net expense ratio is significantly less than expected rate in prospectus of 1.15% due to the higher asset levels in the institutional class compared to the retail class. If the retail class assets increase relative to the institutional class assets it is expected that the net expense ratio will be closer to the |
| PAGE 74 |
|
| | | | | | | | Ratios/Supplemental Data | | | | |
| | | | | | | | | | | Ratio of Net Investment Income/(Loss) to Average Net Assets Without Fee Waivers | | |
| | | | | | | | | | Ratio of Net Investment Income/(Loss) to Average Net Assets | | |
| | | | | | | | Ratio of Expenses to Average Net Assets Without Fee Waivers | | |
Paid-in
Capital from Redemption Fees | | | | Net Assets, End of Period (in Thousands) | Ratio of Expenses to Average Net Assets | Portfolio Turnover Rate |
Net Asset Value End of Period | | |
Total Return |
| | | | | | | | | |
| | | | | | | | | |
| $ 0.00 | | $ 24.90 | | | 2.85% | (b) | $ 103,458 | | | 1.09% | (c) | 1.09% | (c) | (0.69%) | (c) | (0.69%) | (c) | 76% | (b) |
| 0.00 | | 24.21 | | | 45.84% | | 111,058 | | | 1.08% | | 1.08% | | (0.70%) | | (0.70%) | | 106% | |
| 0.00 | (d) | 16.60 | | | (11.28%) | | 178,503 | | | 1.06% | | 1.06% | | (0.50%) | | (0.50%) | | 167% | |
| 0.01 | | 18.71 | | | (10.61%) | | 681,200 | | | 1.05% | | 1.05% | | (0.39%) | | (0.39%) | | 155% | |
| 0.01 | | 21.07 | | | 30.55% | | 392,174 | | | 1.07% | | 1.07% | | (0.11%) | | (0.11%) | | 143% | |
| 0.00 | (d) | 16.14 | | | 41.08% | | 67,199 | | | 1.15% | | 1.16% | | (0.30%) | | (0.31%) | | 217% | |
| | | | | | | | | | | | | | | | | | | | | |
| | | | | | | | | | | | | | | | | | | | | |
| 0.00 | | 10.35 | | | 2.17% | (b) | 505 | | | 1.30% | (c) | 5.33% | (c)(f) | (1.06%) | (c) | (5.09%) | (c)(f) | 81% | (b) |
| 0.00 | | 10.13 | | | 1.30% | (b) | 69 | | | 1.30% | (c) | 12.91% | (c)(f) | (0.98%) | (c) | (12.60%) | (c)(f) | 0% | (b) |
| | | | | | | | | | | | | | | | | | | | | |
| 0.00 | | 10.36 | | | 2.27% | (b) | 2,707 | | | 0.83% | (c)(i) | 3.76% | (c)(f) | (0.62%) | (c) | (3.55%) | (c)(f) | 81% | (b) |
| 0.00 | | 10.13 | | | 1.30% | (b) | 2,314 | | | 1.06% | (c) | 12.52% | (c)(f) | (0.75%) | (c) | (12.22%) | (c)(f) | 0% | (b) |
| | | | | | | | | | | | | | | | | | | | | |
| | | | | | | | | | | | | | | | | | | | | |
| 0.00 | | 11.37 | | | 5.38% | (b) | 53,702 | | | 0.99% | (c) | 1.15% | (c) | 2.48% | (c) | 2.32% | (c) | 5% | (b) |
| 0.00 | | 10.91 | | | 24.53% | | 53,780 | | | 1.10% | (h) | 1.14% | | 1.31% | | 1.27% | | 91% | |
| 0.00 | (d) | 12.00 | | | 13.39% | | 55,215 | | | 1.15% | | 1.17% | | 1.13% | | 1.11% | | 9% | |
| 0.02 | | 11.49 | | | 5.19% | | 61,295 | | | 1.15% | | 1.30% | | 1.12% | | 0.97% | | 37% | |
| 0.00 | (d) | 11.12 | | | 3.99% | | 14,610 | | | 1.15% | | 1.28% | | 0.65% | | 0.52% | | 39% | |
| 0.00 | (d) | 10.76 | | | 29.87% | | 16,632 | | | 1.15% | | 1.26% | | 0.53% | | 0.41% | | 21% | |
| | | | | | | | | | | | | | | | | | | | | |
| 0.00 | | 11.31 | | | 5.49% | (b) | 5,051 | | | 0.81% | (c) | 1.00% | (c) | 2.66% | (c) | 2.47% | (c) | 5% | (b) |
| 0.00 | | 10.85 | | | 24.72% | | 6,021 | | | 0.92% | | 0.98% | | 1.49% | | 1.43% | | 91% | |
| 0.00 | (d) | 11.96 | | | 13.66% | | 6,612 | | | 0.92% | | 1.06% | | 1.35% | | 1.21% | | 9% | |
| 0.01 | | 11.46 | | | 5.34% | | 7,809 | | | 1.00% | | 1.17% | | 1.11% | | 0.94% | | 37% | |
| 0.00 | (d) | 11.10 | | | 4.05% | | 20,667 | | | 1.05% | | 1.11% | | 0.76% | | 0.70% | | 39% | |
| 0.00 | (d) | 10.76 | | | 30.10% | | 21,585 | | | 0.95% | | 1.14% | | 0.72% | | 0.53% | | 21% | |
See Notes to Financial Statements.
Selected data for a share of beneficial interest outstanding throughout the period indicated.
| | Income from Investment Operations | | | | Distributions | | |
| | Net Asset Value Beginning of the Period | | | Net Realized And
Unrealized Gain/
(Loss) on
Investments | | Total Income/ (Loss) from Investment Operations | | | Dividends From Net Realized Gain on Investments | | | | |
| | | Net Investment Income/(Loss) | | Dividends from
Net Investment Income | | | | |
| | | | | Tax Return of Capital | | Total Distributions |
Period Ended | | | | |
WESTCORE MID–CAP VALUE DIVIDEND FUND | | | | | | | | | | |
Retail Class | | | | | | | | | | | | | | | |
06/30/14 (Unaudited) | $ 26.01 | | | $ 0.14 | (a) | | $ 1.58 | | | $ 1.72 | | | $ (0.00) | | $ (0.00) | | $ (0.00) | | $ (0.00) |
12/31/13 (d) | 20.11 | | | 0.23 | (a) | | 5.91 | | | 6.14 | | | (0.24) | | (0.00) | | (0.00) | | (0.24) |
12/31/12 | | 18.10 | | | 0.19 | (a) | | 2.05 | | | 2.24 | | | (0.23) | | (0.00) | | (0.00) | | (0.23) |
12/31/11 | | 18.26 | | | 0.15 | (a) | | (0.15) | | | (0.00) | | | (0.16) | | (0.00) | | (0.00) | | (0.16) |
12/31/10 | | 15.27 | | | 0.08 | | | 3.00 | | | 3.08 | | | (0.09) | | (0.00) | | (0.00) | | (0.09) |
12/31/09 | | 11.65 | | | 0.11 | | | 3.61 | | | 3.72 | | | (0.10) | | (0.00) | | (0.00) | | (0.10) |
WESTCORE SMALL–CAP VALUE DIVIDEND FUND | | | | | | | | | | | | |
Retail Class | | | | | | | | | | | | | | | | | | | |
06/30/14 (Unaudited) | 14.38 | | | 0.07 | (a) | | 0.30 | | | 0.37 | | | (0.00) | | (0.00) | | (0.00) | | (0.00) |
12/31/13 (f) | 12.65 | | | 0.11 | (a) | | 4.45 | | | 4.56 | | | (0.13) | | (2.70) | | (0.00) | | (2.83) |
12/31/12 | | 11.82 | | | 0.11 | (a) | | 1.03 | | | 1.14 | | | (0.13) | | (0.18) | | (0.00) | | (0.31) |
12/31/11 | | 11.97 | | | 0.09 | (a) | | (0.13) | | | (0.04) | | | (0.11) | | (0.00) | | (0.00) | | (0.11) |
12/31/10 | | 9.51 | | | 0.11 | | | 2.46 | | | 2.57 | | | (0.11) | | (0.00) | | (0.00) | | (0.11) |
12/31/09 | | 7.87 | | | 0.11 | | | 1.62 | | | 1.73 | | | (0.10) | | (0.00) | | (0.00) | | (0.10) |
Institutional Class | | | | | | | | | | | | | | | | | | | |
06/30/14 (Unaudited) | 14.40 | | | 0.09 | (a) | | 0.29 | | | 0.38 | | | (0.00) | | (0.00) | | (0.00) | | (0.00) |
12/31/13 | | 12.64 | | | 0.14 | (a) | | 4.46 | | | 4.60 | | | (0.14) | | (2.70) | | (0.00) | | (2.84) |
12/31/12 | | 11.80 | | | 0.13 | (a) | | 1.02 | | | 1.15 | | | (0.13) | | (0.18) | | (0.00) | | (0.31) |
12/31/11 | | 11.97 | | | 0.11 | (a) | | (0.15) | | | (0.04) | | | (0.13) | | (0.00) | | (0.00) | | (0.13) |
12/31/10 | | 9.51 | | | 0.11 | | | 2.47 | | | 2.58 | | | (0.12) | | (0.00) | | (0.00) | | (0.12) |
12/31/09 | | 7.87 | | | 0.13 | | | 1.62 | | | 1.75 | | | (0.11) | | (0.00) | | (0.00) | | (0.11) |
WESTCORE MICRO-CAP OPPORTUNITY FUND | | | | | | | | | | | | | |
Retail Class | | | | | | | | | | | | | | | | | | | |
06/30/14 (Unaudited) | 17.69 | | | (0.00) | (a) | | (0.02) | (g) | | (0.02) | | | (0.00) | | (0.00) | | (0.00) | | (0.00) |
12/31/13 | | 12.35 | | | (0.00) | (a)(b) | | 5.70 | | | 5.70 | | | (0.01) | | (0.35) | | (0.00) | | (0.36) |
12/31/12 | | 11.15 | | | 0.11 | (a) | | 1.62 | | | 1.73 | | | (0.14) | | (0.39) | | (0.00) | | (0.53) |
12/31/11 | | 11.56 | | | (0.02) | (a) | | (0.40) | | | (0.42) | | | (0.00) | | (0.00) | | (0.00) | | (0.00) |
12/31/10 | | 8.66 | | | (0.03) | | | 2.93 | | | 2.90 | | | (0.00) | | (0.00) | | (0.00) | | (0.00) |
12/31/09 | | 7.53 | | | 0.02 | | | 1.14 | | | 1.16 | | | (0.03) | | (0.00) | | (0.00) | | (0.03) |
| (a) | Calculated using the average shares method. |
| (b) | Total return and portfolio turnover are not annualized for period less than one full year. |
| (c) | Annualized. |
| (d) | Prior to April 30, 2013 known as Westcore Mid-Cap Value Fund. |
| (e) | Less than $0.005 and $(0.005) per share. |
| (f) | Prior to April 30, 2013 known as Westcore Small-Cap Value Fund. |
| (g) | The amount shown for a share outstanding throughout the period may not correlate with the Statement of Operations for the period due to the timing of sales and redemptions of Fund shares in relation to income earned and/or fluctuating market value of the investments of the Fund. |
| PAGE 76 |
|
| | | | | | | Ratios/Supplemental Data | | | |
| | | | | | | | | Ratio of Net
Investment
Income/(Loss)
to Average Net
Assets Without
Fee Waivers | | |
| | | | | | | | Ratio of Net
Investment
Income/(Loss) to
Average Net
Assets | | |
| | | | | | | Ratio of Expenses
to Average Net
Assets Without
Fee Waivers | | |
Paid-in Capital from
Redemption Fees | | | | Net Assets,
End of Period
(in Thousands) | Ratio of Expenses to Average Net Assets | Portfolio
Turnover Rate |
Net Asset Value End of Period | | |
Total Return |
| | | | | | | | | |
| | | | | | | | | |
| $ 0.00 | | | $ 27.73 | | 6.61% | (b) | | $ 56,615 | | 1.20% | (c) | 1.20% | (c) | 1.07% | (c) | 1.07% | (c) | 34% | (b) |
| 0.00 | | | 26.01 | | 30.57% | | | 53,282 | | 1.24% | | 1.24% | | 0.96% | | 0.96% | | 51% | |
| 0.00 | (e) | | 20.11 | | 12.39% | | | 40,341 | | 1.25% | | 1.26% | | 0.96% | | 0.96% | | 21% | |
| 0.00 | (e) | | 18.10 | | (0.02%) | | | 43,190 | | 1.25% | | 1.29% | | 0.82% | | 0.78% | | 32% | |
| 0.00 | (e) | | 18.26 | | 20.18% | | | 46,413 | | 1.25% | | 1.27% | | 0.43% | | 0.41% | | 33% | |
| 0.00 | (e) | | 15.27 | | 31.95% | | | 48,572 | | 1.25% | | 1.26% | | 0.77% | | 0.77% | | 27% | |
| | | | | | | | | | | | | | | | | | | | | |
| | | | | | | | | | | | | | | | | | | | | |
| 0.00 | | | 14.75 | | 2.57% | (b) | | 153,801 | | 1.30% | (c) | 1.39% | (c) | 0.99% | (c) | 0.90% | (c) | 31% | (b) |
| 0.00 | | | 14.38 | | 36.49% | | | 169,821 | | 1.30% | | 1.39% | | 0.76% | | 0.67% | | 53% | |
| 0.00 | (e) | | 12.65 | | 9.69% | | | 189,858 | | 1.30% | | 1.39% | | 0.87% | | 0.78% | | 35% | |
| 0.00 | (e) | | 11.82 | | (0.31%) | | | 196,764 | | 1.30% | | 1.42% | | 0.77% | | 0.66% | | 40% | |
| 0.00 | (e) | | 11.97 | | 27.03% | | | 242,817 | | 1.30% | | 1.39% | | 1.03% | | 0.93% | | 39% | |
| 0.01 | | | 9.51 | | 22.08% | | | 192,180 | | 1.30% | | 1.37% | | 1.38% | | 1.31% | | 33% | |
| | | | | | | | | | | | | | | | | | | | | |
| 0.00 | | | 14.78 | | 2.64% | (b) | | 207,828 | | 1.12% | (c) | 1.21% | (c) | 1.26% | (c) | 1.17% | (c) | 31% | (b) |
| 0.00 | | | 14.40 | | 36.86% | | | 147,374 | | 1.12% | | 1.23% | | 0.94% | | 0.83% | | 53% | |
| 0.00 | (e) | | 12.64 | | 9.78% | | | 124,052 | | 1.14% | | 1.24% | | 1.07% | | 0.96% | | 35% | |
| 0.00 | (e) | | 11.80 | | (0.31%) | | | 92,446 | | 1.16% | | 1.29% | | 0.92% | | 0.79% | | 40% | |
| 0.00 | (e) | | 11.97 | | 27.15% | | | 114,286 | | 1.18% | | 1.29% | | 1.17% | | 1.07% | | 39% | |
| 0.00 | (e) | | 9.51 | | 22.16% | | | 52,278 | | 1.20% | | 1.33% | | 1.53% | | 1.39% | | 33% | |
| | | | | | | | | | | | | | | | | | | | | |
| | | | | | | | | | | | | | | | | | | | | |
| 0.00 | | | 17.67 | | (0.11%) | (b) | | 34,993 | | 1.30% | (c) | 1.55% | (c) | (0.05%) | (c) | (0.30%) | (c) | 43% | (b) |
| 0.00 | (e) | | 17.69 | | 46.20% | | | 20,787 | | 1.30% | | 1.95% | | (0.01%) | | (0.66%) | | 52% | |
| 0.00 | (e) | | 12.35 | | 15.60% | | | 2,986 | | 1.30% | | 4.71% | | 0.94% | | (2.47%) | | 132% | |
| 0.01 | | | 11.15 | | (3.55%) | | | 1,734 | | 1.30% | | 8.07% | | (0.14%) | | (6.91%) | | 88% | |
| 0.00 | (e) | | 11.56 | | 33.49% | | | 1,594 | | 1.30% | | 6.96% | | (0.25%) | | (5.91%) | | 107% | |
| 0.00 | (e) | | 8.66 | | 15.40% | | | 1,924 | | 1.30% | | 7.96% | | 0.27% | | (6.39%) | | 130% | |
See Notes to Financial Statements.
Selected data for a share of beneficial interest outstanding throughout the period indicated.
| | Income from Investment Operations | | | | Distributions | | |
| | Net Asset Value Beginning of the Period | | | Net Realized And
Unrealized Gain/ (Loss) on Investments | | Total Income/ (Loss) from Investment Operations | | | Dividends From Net Realized Gain on Investments | | | | |
| | | Net Investment Income/(Loss) | | Dividends from
Net Investment Income | | | | |
| | | | | Tax Return of Capital | | Total Distributions |
Period Ended | | | | |
WESTCORE INTERNATIONAL SMALL-CAP FUND | | | | | | | | | | | |
Retail Class | | | | | | | | | | | | | | | |
06/30/14 (Unaudited) | $ 21.26 | | | $ 0.19 | (a) | | $ (0.92) | | | $ (0.73) | | | $ (0.00) | | | $ (0.00) | | | $ (0.00) | | | $ (0.00) | |
12/31/13 | | 17.94 | | | 0.35 | (a) | | 3.63 | | | 3.98 | | | (0.66) | | | (0.00) | | | (0.00) | | | (0.66) | |
12/31/12 | | 14.55 | | | 0.37 | (a) | | 3.24 | | | 3.61 | | | (0.22) | | | (0.00) | | | (0.00) | | | (0.22) | |
12/31/11 | | 15.70 | | | 0.29 | (a) | | (1.21) | | | (0.92) | | | (0.24) | | | (0.00) | | | (0.00) | | | (0.24) | |
12/31/10 | | 11.67 | | | 0.11 | | | 4.00 | | | 4.11 | | | (0.08) | | | (0.00) | | | (0.00) | | | (0.08) | |
12/31/09 | | 7.19 | | | 0.15 | | | 4.46 | | | 4.61 | | | (0.13) | | | (0.00) | | | (0.00) | | | (0.13) | |
WESTCORE FLEXIBLE INCOME FUND | | | | | | | | | | | | | | | | | | |
Retail Class | | | | | | | | | | | | | | | | | | | | | | | |
06/30/14 (Unaudited) | 8.83 | | | 0.23 | (a) | | 0.16 | | | 0.39 | | | (0.22) | | | (0.00) | | | (0.00) | | | (0.22) | |
12/31/13 | | 8.94 | | | 0.49 | (a) | | (0.12) | | | 0.37 | | | (0.48) | | | (0.00) | | | (0.00) | | | (0.48) | |
12/31/12 | | 8.57 | | | 0.50 | (a) | | 0.38 | | | 0.88 | | | (0.51) | | | (0.00) | | | (0.00) | | | (0.51) | |
12/31/11 | | 8.42 | | | 0.53 | (a) | | 0.12 | | | 0.65 | | | (0.51) | | | (0.00) | | | (0.00) | | | (0.51) | |
12/31/10 | | 7.98 | | | 0.56 | | | 0.43 | | | 0.99 | | | (0.55) | | | (0.00) | | | (0.00) | (d) | | (0.55) | |
12/31/09 | | 6.12 | | | 0.51 | | | 1.86 | | | 2.37 | | | (0.51) | | | (0.00) | | | (0.00) | | | (0.51) | |
Institutional Class | | | | | | | | | | | | | | | | | | | | | | | |
06/30/14 (Unaudited) | 8.71 | | | 0.23 | (a) | | 0.15 | | | 0.38 | | | (0.22) | | | (0.00) | | | (0.00) | | | (0.22) | |
12/31/13 | | 8.82 | | | 0.49 | (a) | | (0.11) | | | 0.38 | | | (0.49) | | | (0.00) | | | (0.00) | | | (0.49) | |
12/31/12 | | 8.43 | | | 0.50 | (a) | | 0.38 | | | 0.88 | | | (0.49) | | | (0.00) | | | (0.00) | | | (0.49) | |
12/31/11 | | 8.34 | | | 0.53 | (a) | | 0.12 | | | 0.65 | | | (0.57) | | | (0.00) | | | (0.00) | | | (0.57) | |
12/31/10 | | 7.96 | | | 0.57 | | | 0.42 | | | 0.99 | | | (0.61) | | | (0.00) | | | (0.00) | (d) | | (0.61) | |
12/31/09 | | 6.11 | | | 0.52 | | | 1.85 | | | 2.37 | | | (0.52) | | | (0.00) | | | (0.00) | | | (0.52) | |
(a) Calculated using the average shares method.
(b) Total return and portfolio turnover are not annualized for period less than one full year.
(c) Annualized.
(d) Less than $0.005 and $(0.005) per share.
| PAGE 78 |
|
| | | | | | | Ratios/Supplemental Data | | | |
| | | | | | | | | Ratio of Net
Investment
Income/(Loss)
to Average Net
Assets Without
Fee Waivers | | |
| | | | | | | | Ratio of Net
Investment
Income/(Loss) to
Average Net Assets | | |
| | | | | | | Ratio of Expenses
to Average Net
Assets Without
Fee Waivers | | |
Paid-in Capital from
Redemption Fees | | | | Net Assets,
End of Period
(in Thousands) | Ratio of Expenses to Average Net Assets | Portfolio
Turnover Rate |
Net Asset Value End of Period | | |
Total Return |
| | | | | | | | | | | | | | | | | | | | |
| | | | | | | | | | | | | | | | | | | | |
| $ 0.00 | | $ 20.53 | | (3.43%) | (b) | $ 454,343 | | | 1.50% | (c) | 1.60% | (c) | 1.82% | (c) | 1.72% | (c) | 30% | (b) |
| 0.00 | (d) | 21.26 | | 22.36% | | 480,789 | | | 1.50% | | 1.63% | | 1.82% | | 1.69% | | 57% | |
| 0.00 | (d) | 17.94 | | 24.84% | | 327,825 | | | 1.50% | | 1.65% | | 2.22% | | 2.07% | | 14% | |
| 0.01 | | 14.55 | | (5.75%) | | 133,236 | | | 1.50% | | 1.70% | | 1.82% | | 1.62% | | 27% | |
| 0.00 | (d) | 15.70 | | 35.25% | | 60,925 | | | 1.50% | | 1.84% | | 1.10% | | 0.77% | | 44% | |
| 0.00 | (d) | 11.67 | | 64.17% | | 32,356 | | | 1.50% | | 2.01% | | 1.68% | | 1.17% | | 65% | |
| | | | | | | | | | | | | | | | | | | | |
| | | | | | | | | | | | | | | | | | | | |
| 0.00 | (d) | 9.00 | | 4.41% | (b) | 63,798 | | | 0.85% | (c) | 0.89% | (c) | 5.12% | (c) | 5.08% | (c) | 9% | (b) |
| 0.00 | (d) | 8.83 | | 4.31% | | 61,608 | | | 0.85% | | 0.91% | | 5.49% | | 5.43% | | 15% | |
| 0.00 | (d) | 8.94 | | 10.49% | | 74,206 | | | 0.85% | | 0.90% | | 5.69% | | 5.65% | | 34% | |
| 0.01 | | 8.57 | | 8.13% | | 87,962 | | | 0.85% | | 0.93% | | 6.24% | | 6.16% | | 45% | |
| 0.00 | (d) | 8.42 | | 12.71% | | 65,829 | | | 0.85% | | 0.93% | | 6.75% | | 6.67% | | 38% | |
| 0.00 | (d) | 7.98 | | 40.09% | | 72,783 | | | 0.85% | | 0.91% | | 7.21% | | 7.15% | | 30% | |
| | | | | | | | | | | | | | | | | | | | |
| 0.00 | (d) | 8.87 | | 4.40% | (b) | 5,167 | | | 0.67% | (c) | 1.06% | (c) | 5.30% | (c) | 4.91% | (c) | 9% | (b) |
| 0.00 | (d) | 8.71 | | 4.45% | | 4,507 | | | 0.69% | | 1.11% | | 5.64% | | 5.22% | | 15% | |
| 0.00 | (d) | 8.82 | | 10.74% | | 6,468 | | | 0.71% | | 1.30% | | 5.76% | | 5.16% | | 34% | |
| 0.01 | | 8.43 | | 8.14% | | 2,095 | | | 0.74% | | 3.04% | | 6.35% | | 4.05% | | 45% | |
| 0.00 | (d) | 8.34 | | 12.79% | | 1,481 | | | 0.75% | | 3.24% | | 6.82% | | 4.32% | | 38% | |
| 0.00 | (d) | 7.96 | | 40.30% | | 1,234 | | | 0.72% | | 3.98% | | 7.26% | | 4.00% | | 30% | |
See Notes to Financial Statements.
Selected data for a share of beneficial interest outstanding throughout the period indicated.
| | Income from Investment Operations | | | | Distributions | | |
| | Net Asset Value Beginning of the Period | | | Net Realized And
Unrealized Gain/ (Loss) on Investments | | Total Income/ (Loss) from Investment Operations | | | Dividends From Net Realized Gain on Investments | | | | |
| | | Net Investment Income/(Loss) | | Dividends from
Net Investment Income | | | | |
| | | | | Tax Return of Capital | | Total Distributions |
Period Ended | | | | |
WESTCORE PLUS BOND FUND | | | | | | | | | | | |
Retail Class | | | | | | | | | | | | | | | |
06/30/14 (Unaudited) | $ 10.71 | | | $ 0.17 | (a) | | $ 0.29 | | | | $ 0.46 | | | $ (0.18) | | | $ (0.00) | | | $ (0.00) | | | $ (0.18) | |
12/31/13 | | 11.24 | | | 0.34 | (a) | | (0.48) | | | | (0.14) | | | (0.38) | | | (0.01) | | | (0.00) | | | (0.39) | |
12/31/12 | | 11.04 | | | 0.40 | (a) | | 0.21 | | | | 0.61 | | | (0.40) | | | (0.01) | | | (0.00) | | | (0.41) | |
12/31/11 | | 10.72 | | | 0.43 | (a) | | 0.37 | | | | 0.80 | | | (0.44) | | | (0.04) | | | (0.00) | | | (0.48) | |
12/31/10 | | 10.42 | | | 0.45 | | | 0.29 | | | | 0.74 | | | (0.44) | | | (0.00) | | | (0.00) | | | (0.44) | |
12/31/09 | | 9.85 | | | 0.44 | | | 0.57 | | | | 1.01 | | | (0.44) | | | (0.00) | | | (0.00) | | | (0.44) | |
Institutional Class | | | | | | | | | | | | | | | | | | | | | | | | |
06/30/14 (Unaudited) | 10.59 | | | 0.18 | (a) | | 0.29 | | | | 0.47 | | | (0.19) | | | (0.00) | | | (0.00) | | | (0.19) | |
12/31/13 | | 11.11 | | | 0.36 | (a) | | (0.48) | | | | (0.12) | | | (0.39) | | | (0.01) | | | (0.00) | | | (0.40) | |
12/31/12 | | 10.92 | | | 0.42 | (a) | | 0.20 | | | | 0.62 | | | (0.42) | | | (0.01) | | | (0.00) | | | (0.43) | |
12/31/11 | | 10.68 | | | 0.45 | (a) | | 0.37 | | | | 0.82 | | | (0.54) | | | (0.04) | | | (0.00) | | | (0.58) | |
12/31/10 | | 10.42 | | | 0.47 | | | 0.28 | | | | 0.75 | | | (0.49) | | | (0.00) | | | (0.00) | | | (0.49) | |
12/31/09 | | 9.85 | | | 0.45 | | | 0.57 | | | | 1.02 | | | (0.45) | | | (0.00) | | | (0.00) | | | (0.45) | |
WESTCORE COLORADO TAX–EXEMPT FUND | | | | | | | | | | | | | | | | |
06/30/14 (Unaudited) | 11.16 | | | 0.17 | (a) | | 0.35 | | | | 0.52 | | | (0.17) | | | (0.00) | | | (0.00) | | | (0.17) | |
12/31/13 | | 11.81 | | | 0.35 | (a) | | (0.65) | | | | (0.30) | | | (0.35) | | | (0.00) | | | (0.00) | | | (0.35) | |
12/31/12 | | 11.54 | | | 0.37 | (a) | | 0.27 | | | | 0.64 | | | (0.37) | | | (0.00) | | | (0.00) | | | (0.37) | |
12/31/11 | | 10.99 | | | 0.40 | (a) | | 0.56 | | | | 0.96 | | | (0.41) | | | (0.00) | | | (0.00) | | | (0.41) | |
12/31/10 | | 11.19 | | | 0.40 | | | (0.20) | | | | 0.20 | | | (0.40) | | | (0.00) | | | (0.00) | | | (0.40) | |
12/31/09 | | 10.48 | | | 0.40 | | | 0.71 | | | | 1.11 | | | (0.40) | | | (0.00) | | | (0.00) | | | (0.40) | |
(a) Calculated using the average shares method.
(b) Total return and portfolio turnover are not annualized for period less than one full year.
(c) Annualized.
(d) Less than $0.005 and $(0.005) per share.
| PAGE 80 |
|
| | | | | | | Ratios/Supplemental Data | | | |
| | | | | | | | | Ratio of Net
Investment
Income/(Loss)
to Average Net
Assets Without
Fee Waivers | | |
| | | | | | | | Ratio of Net
Investment
Income/(Loss) to
Average Net Assets | | |
| | | | | | | Ratio of Expenses
to Average Net
Assets Without
Fee Waivers | | |
Paid-in Capital from
Redemption Fees | | | | Net Assets,
End of Period
(in Thousands) | Ratio of Expenses to Average Net Assets | Portfolio
Turnover Rate |
Net Asset Value End of Period | | |
Total Return |
| | | | | | | | | |
| | | | | | | | | |
| $ 0.00 | | $ 10.99 | | 4.31% | (b) | $ 1,287,585 | | 0.55% | (c) | 0.71% | (c) | 3.16% | (c) | 3.00% | (c) | 32% | (b) |
| 0.00 | | 10.71 | | (1.23%) | | 1,211,518 | | 0.55% | | 0.72% | | 3.12% | | 2.95% | | 50% | |
| 0.00 | (d) | 11.24 | | 5.67% | | 1,457,800 | | 0.55% | | 0.75% | | 3.61% | | 3.41% | | 32% | |
| 0.00 | (d) | 11.04 | | 7.55% | | 1,399,473 | | 0.55% | | 0.83% | | 3.98% | | 3.70% | | 42% | |
| 0.00 | (d) | 10.72 | | 7.22% | | 1,389,702 | | 0.55% | | 0.83% | | 4.20% | | 3.92% | | 45% | |
| 0.00 | (d) | 10.42 | | 10.42% | | 1,326,659 | | 0.55% | | 0.81% | | 4.32% | | 4.05% | | 36% | |
| | | | | | | | | | | | | | | | | | | |
| 0.00 | | 10.87 | | 4.45% | (b) | 181,222 | | 0.42% | (c) | 0.55% | (c) | 3.29% | (c) | 3.16% | (c) | 32% | (b) |
| 0.00 | | 10.59 | | (1.05%) | | 227,245 | | 0.38% | | 0.55% | | 3.29% | | 3.12% | | 50% | |
| 0.00 | (d) | 11.11 | | 5.74% | | 241,714 | | 0.40% | | 0.59% | | 3.76% | | 3.57% | | 32% | |
| 0.00 | (d) | 10.92 | | 7.81% | | 196,349 | | 0.41% | | 0.69% | | 4.13% | | 3.86% | | 42% | |
| 0.00 | (d) | 10.68 | | 7.25% | | 218,060 | | 0.43% | | 0.70% | | 4.31% | | 4.04% | | 45% | |
| 0.00 | (d) | 10.42 | | 10.56% | | 131,815 | | 0.44% | | 0.73% | | 4.40% | | 4.11% | | 36% | |
| | | | | | | | | | | | | | | | | | | |
| 0.00 | | 11.51 | | 4.65% | (b) | 133,471 | | 0.65% | (c) | 0.78% | (c) | 2.97% | (c) | 2.84% | (c) | 9% | (b) |
| 0.00 | | 11.16 | | (2.56%) | | 118,483 | | 0.65% | | 0.80% | | 3.05% | | 2.90% | | 23% | |
| 0.00 | (d) | 11.81 | | 5.57% | | 146,820 | | 0.65% | | 0.81% | | 3.12% | | 2.96% | | 7% | |
| 0.00 | (d) | 11.54 | | 8.88% | | 113,221 | | 0.65% | | 0.91% | | 3.60% | | 3.34% | | 17% | |
| 0.00 | (d) | 10.99 | | 1.77% | | 118,478 | | 0.65% | | 0.91% | | 3.56% | | 3.30% | | 6% | |
| 0.00 | (d) | 11.19 | | 10.71% | | 105,891 | | 0.65% | | 0.90% | | 3.67% | | 3.42% | | 8% | |
See Notes to Financial Statements.

1. ORGANIZATION
Westcore Trust (the “Trust”) is registered under the Investment Company Act of 1940, as amended, as an open-end management investment company. Interests in the Westcore Growth Fund, Westcore MIDCO Growth Fund, Westcore Select Fund, Westcore Small-Cap Growth Fund, Westcore Blue Chip Dividend Fund, Westcore Mid-Cap Value Dividend Fund, Westcore Small-Cap Value Dividend Fund, Westcore Micro-Cap Opportunity Fund, Westcore International Small-Cap Fund, Westcore Flexible Income Fund, Westcore Plus Bond Fund and Westcore Colorado Tax-Exempt Funds (the “Funds”) are represented by separate classes of beneficial interest of the Trust, which is organized as a Massachusetts business trust. The Funds offer Retail Class shares. The Westcore Growth, Westcore MIDCO Growth, Westcore Small-Cap Growth, Westcore Blue Chip Dividend, Westcore Small-Cap Value Dividend, Westcore Flexible Income and Westcore Plus Bond Funds also offer Institutional Class shares. All classes of shares have identical rights to earnings, as-sets and voting privileges, except for class specific expenses and exclusive rights to vote on matters solely affecting such class.
2. SIGNIFICANT ACCOUNTING POLICIES
The following is a summary of significant accounting policies consistently followed by each Fund in the preparation of its financial statements. Each Fund is considered an investment company for financial reporting purposes, the following policies are in conformity with accounting principles generally accepted in the United States of America for investment companies.
Use of Estimates – The preparation of financial statements in accordance with accounting principles generally accepted in the United States of America requires management to make estimates and assumptions that affect the reported amounts and disclosures in the financial statements. The actual results could differ from those estimates.
Investment Valuation – All securities of the Funds are valued as of the close of regular trading on the New York Stock Exchange (“NYSE”), currently 4:00 p.m. (Eastern Time), on each day that the NYSE is open, subject to provisions in the prospectus and/or Statement of Additional Information regarding pricing at other times in case of an emergency and optional pricing of the Funds in the event that the NYSE does not open for business because of an emergency.
Securities that are traded on a recognized domestic stock exchange are generally valued at the last sales price as of the valuation time on the principal stock exchange on which they are traded. Securities that are principally traded on the National Association of Securities Dealers Automated Quotation (“NASDAQ”) exchange are generally valued at the NASDAQ Official Closing Price (“NOCP”). Unlisted securities that are traded on the domestic over-the-counter market for which last sales prices are available, are generally valued at the last sales price as of the valuation time. In the absence of sales and NOCP, such securities are valued at the mean of the bid and asked prices.
Securities that are traded on a foreign stock exchange (and that are not listed on a recognized domestic stock exchange or traded on the NASDAQ exchange or the domestic over-the-counter market) are generally valued at the official closing price on the principal stock exchange on which they are traded. In the event that closing prices are not available for such foreign securities, such securities are generally valued at the last sales price occurring prior to the closing of its principal exchange. Exchange rates as of the close of regular trading on the NYSE are used to convert foreign security values into U.S. dollars. Forward foreign currency exchange contracts are valued on a daily basis based on the closing prices of the foreign currency rates as of the close of regular trading on the NYSE.
Redeemable securities issued by open-end registered investment companies are valued at the investment company’s applicable net asset value.
Fixed-income obligations, excluding municipal securities, having a remaining maturity of greater than 60 days, are typically valued at the mean between the evaluated bid and ask prices formulated by an independent pricing service. Municipal securities having a remaining maturity of greater than 60 days, are typically valued at the evaluated bid price formulated by an independent pricing service.
Securities having a remaining maturity of 60 days or less are valued at amortized cost which approximates market value.
When market quotations are not readily available or when events occur that make established valuation methods unreliable, securities of the Fund may be valued in good faith by or under the direction of the Board of Trustees. Factors which may be considered when determining the value of a security include (a) the fundamental data relating to the investment; (b) an evaluation of the forces which influence the market in which the security is sold, including the liquidity and depth of the market; (c) the market value at date of purchase; (d) information as to any transactions or offers with respect to the security or comparable securities; and (e) any other relevant matters.
Market, Credit and Counterparty Risk – In the normal course of business, the Funds invest in securities and enter into transactions where risks exist due to fluctuations in the market (market risk) or failure of the issuer of a security to meet all its obligations (issuer credit risk). The value of securities held by the Funds may decline in response to certain events, including those directly involving the issuers whose securities are owned by the Funds; conditions affecting the general economy; overall market changes; local, regional, national or global political, social or economic instability; and currency and interest rate and price fluctuations. Similar to issuer credit risk, the Funds may be exposed to counterparty credit risk, or the risk that an entity with which the Funds have unsettled or open transactions may fail to or be unable to perform on its commitments. The Funds manage counterparty credit risk by entering into transactions only with counterparties that they believe have the financial resources to honor their obligations and by monitoring the financial stability of those counterparties.
Securities Traded on Foreign Exchanges – All of the Funds, except the Westcore Colorado Tax-Exempt Fund, may invest at least a portion of their assets in foreign securities. As of June 30, 2014, all Funds were primarily invested in securities traded on U.S. exchanges, except Westcore International Small-Cap Fund. In the event that a Fund executes a security transaction on a foreign exchange, the Fund will generally enter into a foreign currency contract to settle the foreign security transaction. Foreign securities may carry more risk than U.S. securities, such as political, market and currency risks. The accounting records of the Funds are maintained in U.S. dollars. Prices of securities denominated in foreign currencies are translated into U.S. dollars at the closing rates of exchange at period end. Amounts related to the purchase and sale of foreign securities and investment income are translated at the rates of exchange prevailing on the respective dates of such transactions.
| PAGE 82 |
|
The effect of changes in foreign currency exchange rates on investments is separately identified from the fluctuations arising from changes in market values of securities held and reported with all other foreign currency gains and losses in the Funds’ Statements of Operations.
Concentration of Risk – As of June 30, 2014, the Westcore International Small-Cap Fund invested a significant percentage of its assets in the United Kingdom, Hong Kong, and Australia. Therefore, it may be more affected by economic developments and currency fluctuations in these countries.
Federal Income Taxes – No provision for income taxes is included in the accompanying financial statements, as the Funds intend to distribute to shareholders all taxable investment income and realized gains and otherwise comply with Subchapter M of the Internal Revenue Code of 1986, as amended, applicable to regulated investment companies.
As of and during the six months ended June 30, 2014, the Funds did not have a liability for any unrecognized tax benefits. The Funds files U.S. federal, state, and local tax returns as required. Each Fund’s tax returns are subject to examination by the relevant tax authorities until expiration of the applicable statute of limitations which is generally three years after the filing of the tax return. Tax returns for open years have incorporated no uncertain tax positions that require a provision for income taxes.
Under the Regulated Investment Company Modernization Act of 2010 (the “Act”), net capital losses recognized in tax years beginning after December 22, 2010 may be carried forward indefinitely, and the character of the losses is retained as short-term and/or long-term. Under the law in effect prior to the Act, net capital losses were carried forward for eight years and treated as short-term. As a transition rule, the Act requires that post-enactment net capital losses be used before pre-enactment net capital losses.
At December 31, 2013, each Fund had available for federal income tax purposes unused pre-enactment capital loss carryforwards as follows:
| Expiring |
| | 2014 | | 2015 | | 2016 | 2017 | | 2018 | Total |
Westcore Mid-Cap Value | $ | – | $ | – | $ | – | $ 1,878,516 | $ | – | $ 1,878,516 |
Dividend Fund |
| | | | | | | | | |
Westcore Flexible Income Fund | | 340,539 | | 775,600 | | 20,255,986 | 9,408,999 | | 1,064,911 | 31,846,035 |
Westcore Colorado | | – | | – | | 18,307 | 22,684 | | – | 40,991 |
Tax-Exempt Fund | | | | |
| | | | | | | | | | |
At December 31, 2013, the following Funds had available for federal income tax purposes unused post-enactment capital loss carryforwards as follows:
| Short-Term | Long-Term |
Westcore Select Fund | $ 87,767,109 | $ 18,088,000 |
Westcore Flexible Income Fund | – | 11,614,998 |
Westcore Colorado Tax-Exempt Fund | 481,406 | – |
| | |
During the year ended December 31, 2013, the most recent year end, each Fund had utilized capital loss carryforwards as follows:
| Westcore Mid-Cap | Westcore International | Westcore Colorado |
Westcore Select Fund | Value Dividend Fund | Small-Cap Fund | Tax-Exempt Fund |
$ 31,313,807 | $ 6,063,232 | $ 8,611,033 | $ | 455,704 |
| | | | |
Westcore International Small-Cap Fund and Westcore Plus Bond Fund elect to defer to their fiscal year ending December 31, 2014, approximately $1,162,941 and $1,286,467 of capital losses recognized during the period from November 1, 2013 to December 31, 2013, respectively. Additionally, the Westcore Blue Chip Dividend Fund and Westcore International Small-Cap Fund elect to defer to their fiscal year ending December 31, 2014, approximately $515 and $1,028,845 of late year ordinary losses recognized during the period from November 1, 2013 to December 31, 2013.
Distributions – Distributions of net investment income, if any, are generally made annually for the Westcore Growth, Westcore MIDCO Growth, Westcore Select, Westcore Small-Cap Growth, Westcore Mid-Cap Value Dividend, Westcore Small-Cap Value Dividend, Westcore Micro-Cap Opportunity and Westcore International Small-Cap Funds; monthly for the Westcore Flexible Income, Westcore Plus Bond and Westcore Colorado Tax-Exempt Funds and quarterly for the Westcore Blue Chip Dividend Fund. Distributions of net realized capital gains, if any, are declared at least once each year for each of the Funds. Distributions to shareholders are recorded on the ex-dividend date. Net investment income (loss) and net realized gain (loss) may differ for financial statement and tax purposes. The character of distributions made during the year from net investment income or net realized gains may differ from its ultimate characterization for federal income tax purposes. Also, due to the timing of dividend distributions, the fiscal year in which amounts are distributed may differ from the fiscal year in which the income or realized gain was recorded by the Funds.
|
|
The tax character of the distributions paid in 2013 were as follows:
| Year Ended |
| December 31, 2013 |
Westcore Growth Fund | | |
Ordinary Income | $ | 5,799,996 |
Long-Term Capital Gain | | 5,699,983 |
Total | $ | 11,499,979 |
Westcore MIDCO Growth Fund | | |
Ordinary Income | $ | 12,453,954 |
Long-Term Capital Gain | | 11,796,009 |
Total | $ | 24,249,963 |
Westcore Select Fund | | |
Ordinary Income | $ | 0 |
Long-Term Capital Gain | | 0 |
Total | $ | 0 |
Westcore Small-Cap Growth Fund | | |
Ordinary Income | $ | 0 |
Long-Term Capital Gain | | 0 |
Total | $ | 0 |
Westcore Blue Chip Dividend Fund | | |
Ordinary Income | $ | 1,839,909 |
Long-Term Capital Gain | | 15,576,998 |
Total | $ | 17,416,907 |
Westcore Mid-Cap Value Dividend Fund | | |
Ordinary Income | $ | 489,999 |
Long-Term Capital Gain | | 0 |
Total | $ | 489,999 |
Westcore Small-Cap Value Dividend Fund | | |
Ordinary Income | $ | 11,731,944 |
Long-Term Capital Gain | | 42,290,220 |
Total | $ | 54,022,164 |
Westcore Micro-Cap Opportunity Fund | | |
Ordinary Income | $ | 147,500 |
Long-Term Capital Gain | | 269,998 |
Total | $ | 417,498 |
| PAGE 84 |
|
| Year Ended |
| December 31, 2013 |
Westcore International Small-Cap Fund | | |
Ordinary Income | $ | 14,400,034 |
Long-Term Capital Gain | | 0 |
Total | $ | 14,400,034 |
| | |
Westcore Flexible Income Fund | | |
Ordinary Income | $ | 3,743,910 |
Long-Term Capital Gain | | 0 |
Total | $ | 3,743,910 |
Westcore Plus Bond Fund | | |
Ordinary Income | $ | 54,686,173 |
Long-Term Capital Gain | | 2,072,220 |
Total | $ | 56,758,393 |
Westcore Colorado Tax-Exempt Fund | | |
Ordinary Income | $ | 12,791 |
Tax-Exempt Income | | 4,042,960 |
Total | $ | 4,055,751 |
Redemption Fee – The Westcore Small-Cap Growth, Westcore Micro-Cap Opportunity and Westcore Flexible Income Funds impose a two percent (2%) redemption fee (the “Redemption Fee”) on Fund shares if such Fund shares are redeemed (including in connection with an exchange) within ninety (90) calendar days from their date of purchase. Effective April 30, 2013, Westcore International Small-Cap discontinued imposing redemption fees. The Redemption Fees, which are reflected in the Statement of Changes in Net Assets, are intended to encourage long-term investment in the Funds and, to the extent that frequent trading persists, to offset brokerage commissions, market impact, transaction costs and other expenses associated with frequent trading.
Expenses – Expenses that are specific to a Fund or class of shares of a Fund are charged directly to that Fund or share class. Expenses that are common to all Funds generally are allocated among the Funds in proportion to their average daily net assets.
Expenses related to specific classes and the associated Fund level expenses, for the six months ended June 30, 2014, were as follows:
Westcore Growth Fund
| Retail Class | Institutional Class | | Fund |
| Specific Expenses | Specific Expenses | | Level Expenses |
Shareholder servicing reimbursement | $ | 49,794 | $ | – | $ | – |
Transfer agent fees | | 3,038 | | 68 | | 7,369 |
Registration fees | | 8,101 | | 7,264 | | – |
Other | | – | | 348 | | 2,342 |
| | | | | | |
Westcore MIDCO Growth Fund | | | | | | |
| | | | | |
| Retail Class | Institutional Class | | Fund |
| Specific Expenses | Specific Expenses | | Level Expenses |
Shareholder servicing reimbursement | $ | 39,345 | $ | – | $ | – |
Transfer agent fees | | 11,846 | | 87 | | 11,141 |
Registration fees | | 8,546 | | 7,772 | | – |
Other | | – | | 348 | | 2,643 |
| | | | | | |
Westcore Small-Cap Growth Fund
| Retail Class | Institutional Class | | Fund |
| Specific Expenses | Specific Expenses | | Level Expenses |
Shareholder servicing reimbursement | $ | 13 | $ | – | $ | – |
Transfer agent fees | | 69 | | 41 | | 6,156 |
Registration fees | | 1,699 | | 325 | | – |
Other | | 651 | | 355 | | 1,293 |
| | | | | | |
Westcore Blue Chip Dividend Fund | | | | | | |
| | | | | Fund |
| Retail Class | Institutional Class | |
| Specific Expenses | Specific Expenses | | Level Expenses |
Shareholder servicing reimbursement | $ | 16,819 | $ | – | $ | – |
Transfer agent fees | | 27,963 | | 36 | | 17,174 |
Registration fees | | 9,658 | | 1,250 | | – |
Other | | – | | 348 | | 2,273 |
| | | | | | |
Westcore Small-Cap Value Dividend Fund | | | | | | |
| | | | | Fund |
| Retail Class | Institutional Class | |
| Specific Expenses | Specific Expenses | | Level Expenses |
Shareholder servicing reimbursement | $ | 134,211 | $ | – | $ | – |
Transfer agent fees | | 7,044 | | 4,841 | | 9,811 |
Registration fees | | 8,156 | | 8,980 | | – |
Other | | – | | 348 | | 5,134 |
| | | | | | |
Westcore Flexible Income Fund | | | | | | |
| | | | | Fund |
| Retail Class | Institutional Class | |
| Specific Expenses | Specific Expenses | | Level Expenses |
Shareholder servicing reimbursement | $ | 45,006 | $ | – | $ | – |
Transfer agent fees | | 4,497 | | 99 | | 7,817 |
Registration fees | | 8,367 | | 7,705 | | – |
Other | | – | | 348 | | 2,464 |
| | | | | | |
Westcore Plus Bond Fund | | | | | | |
| | | | | Fund |
| Retail Class | Institutional Class | |
| Specific Expenses | Specific Expenses | | Level Expenses |
Shareholder servicing reimbursement | $ | 981,461 | $ | – | $ | – |
Transfer agent fees | | 49,697 | | 2,086 | | 21,499 |
Registration fees | | 15,280 | | 9,539 | | – |
Other | | – | | 348 | | 19,306 |
| | | | | | |
When-Issued/Forward Commitment Securities – Each Fund may purchase or sell securities on a “when issued” or “forward commitment” basis which involves a commitment by the Fund to purchase or sell particular securities with payment and delivery taking place at a future date. During this period, such securities do not earn interest, are subject to market fluctuation and may increase or decrease in value prior to their delivery. In accordance with SEC guidance, each Fund segregates liquid assets in an amount sufficient to satisfy the purchase price. The purchase of securities on a when-issued or forward commitment basis may increase the volatility of the Fund’s net asset value to the extent each Fund makes such purchases while remaining substantially fully invested. Settlements in the ordinary course of business, which may take substantially more than three business days for non-U.S. securities, are not treated by the Funds as “when-issued” or “forward commitment” transactions.
Offering Costs – The Westcore Small-Cap Growth Fund incurred offering costs, including fees for printing initial prospectuses, legal, and registration fees. These costs are being amortized over the first twelve months from the commencement date of the Fund, December 20, 2013. Amounts amortized in the six months ended June 30, 2014 are shown on the Fund’s Statement of Operations and amounts that remain to be amortized are shown on the Fund’s Statement of Assets and Liabilities.
| PAGE 86 |
|
Other – For financial reporting purposes, the Funds’ investment transactions and shareholder transactions are recorded on trade date. Dividend income is recorded on the ex-dividend date. Foreign dividend income is recorded on the ex-dividend date or as soon as practical after the Funds determine the existence of a dividend declaration after exercising reasonable due diligence. Interest income, which includes amortization of premiums, accretion of discounts and income earned on money market funds, is accrued and recorded daily. Realized gains and losses from investment transactions and unrealized appreciation and depreciation of investments are reported on an identified cost basis. Other income is primarily comprised of consent fees which are compensation for agreeing to changes in the terms of debt instruments.
3. SHARES OF BENEFICIAL INTEREST
On June 30, 2014, there was an unlimited number of no par value shares of beneficial interest authorized for each Fund. Transactions in shares of beneficial interest were as follows:
| Westcore Growth Fund | Westcore MIDCO Growth Fund |
| Six Months Ended | Year Ended | Six Months Ended | Year Ended |
| June 30, 2014 | December 31, 2013 | June 30, 2014 | December 31, 2013 |
Shares issued and redeemed: | | | | |
Shares sold | | | | |
Retail Class | 172,576 | 605,530 | 677,724 | 788,136 |
Institutional Class | 373,589 | 230,417 | 849,236 | 258,708 |
Shares issued in reinvestment of distributions | | | | |
Retail Class | 0 | 634,311 | 0 | 3,095,406 |
Institutional Class | 0 | 81,145 | 0 | 548,282 |
Shares redeemed | | | | |
Retail Class | (1,479,058) | (1,609,370) | (1,660,775) | (3,537,114) |
Institutional Class | (44,109) | (60,859) | (127,046) | (3,978,101) |
Net decrease resulting from share transactions
| (977,002) | (118,826) | (260,861) | (2,824,683) |
| Westcore Select Fund | Westcore Small-Cap Growth Fund |
| Six Months Ended | Year Ended | Six Months Ended | Period Ended |
| June 30, 2014 | December 31, 2013 | June 30, 2014 | December 31, 2013 |
Shares issued and redeemed: | | | | |
Shares sold | | | | |
Retail Class | 312,148 | 1,048,297 | 45,563 | 6,845 |
Institutional Class | N/A | N/A | 49,532 | 334,508 |
Shares issued in reinvestment of distributions | | | | |
Retail Class | 0 | 0 | 0 | 0 |
Institutional Class | N/A | N/A | N/A | 0 |
Shares redeemed | | | | |
Retail Class | (743,985) | (7,213,446) | (3,624) | 0 |
Institutional Class | N/A | N/A | (16,694) | (106,140) |
Net increase/(decrease) resulting from | | | | |
share transactions | (431,837) | (6,165,149) | 74,777 | 235,213 |
|
|
| Westcore Blue Chip Dividend Fund | Westcore Mid-Cap Value Dividend Fund |
| Six Months Ended | Year Ended | Six Months Ended | Year Ended |
| June 30, 2014 | December 31, 2013 | June 30, 2014 | December 31, 2013 |
Shares issued and redeemed: | | | | |
Shares sold | | | | |
Retail Class | 105,691 | 168,168 | 134,148 | 307,791 |
Institutional Class | 73,219 | 104,257 | N/A | N/A |
Shares issued in reinvestment of distributions | | | | |
Retail Class | 44,597 | 1,165,698 | 0 | 18,674 |
Institutional Class | 6,085 | 166,853 | N/A | N/A |
Shares redeemed | | | | |
Retail Class | (358,103) | (1,005,228) | (140,807) | (283,825) |
Institutional Class | (187,809) | (268,952) | N/A | N/A |
Net increase/(decrease) resulting from | | | | |
share transactions | (316,320) | 330,796 | (6,659) | 42,640 |
| Westcore Small-Cap Value Dividend Fund | Westcore Micro-Cap Opportunity Fund |
| Six Months Ended | Year Ended | Six Months Ended | Year Ended |
| June 30, 2014 | December 31, 2013 | June 30, 2014 | December 31, 2013 |
Shares issued and redeemed: | | | | |
Shares sold | | | | |
Retail Class | 771,495 | 2,107,536 | 998,064 | 1,029,208 |
Institutional Class | 6,262,238 | 2,952,328 | N/A | N/A |
Shares issued in reinvestment of distributions | | | | |
Retail Class | 0 | 1,655,385 | 0 | 23,983 |
Institutional Class | 0 | 1,640,454 | N/A | N/A |
Shares Redeemed | | | | |
Retail Class | (2,150,997) | (7,910,076) | (192,755) | (119,784) |
Institutional Class | (2,435,216) | (4,318,956) | N/A | N/A |
Merger Shares | | | | |
Retail Class | N/A | 942,663 | N/A | N/A |
Institutional Class | N/A | 149,255 | N/A | N/A |
Net increase/(decrease) resulting from | | | | |
share transactions | 2,447,520 | (2,781,411) | 805,309 | 933,407 |
| PAGE 88 |
|
| Westcore International Small-Cap Fund | Westcore Flexible Income Fund |
| Six Months Ended | Year Ended | Six Months Ended | Year Ended |
| June 30, 2014 | December 31, 2013 | June 30, 2014 | December 31, 2013 |
Shares issued and redeemed: | | | | |
Shares sold | | | | |
Retail Class | 2,417,646 | 11,213,137 | 572,726 | 1,239,863 |
Institutional Class | N/A | N/A | 160,608 | 246,326 |
Shares issued in reinvestment of distributions | | | | |
Retail Class | 0 | 632,679 | 158,426 | 367,676 |
Institutional Class | N/A | N/A | 12,822 | 27,328 |
Shares redeemed | | | | |
Retail Class | (2,902,381) | (7,496,563) | (617,637) | (2,931,256) |
Institutional Class | N/A | N/A | (108,739) | (489,615) |
Net increase/(decrease) resulting from | | | | |
share transactions | (484,735) | 4,349,253 | 178,206 | (1,539,678) |
| Westcore Plus Bond Fund | Westcore Colorado Tax-Exempt Fund |
| Six Months Ended | Year Ended | Six Months Ended | Year Ended |
| June 30, 2014 | December 31, 2013 | June 30, 2014 | December 31, 2013 |
Shares issued and redeemed: | | | | |
Shares sold | | | | |
Retail Class | 16,474,696 | 32,622,265 | 1,585,089 | 2,442,570 |
Institutional Class | 2,056,821 | 9,884,756 | N/A | N/A |
Shares issued in reinvestment of distributions | | | | |
Retail Class | 1,824,870 | 4,179,992 | 146,137 | 324,889 |
Institutional Class | 338,053 | 817,282 | N/A | N/A |
Shares redeemed | | | | |
Retail Class | (14,335,843) | (53,381,559) | (756,852) | (4,581,234) |
Institutional Class | (7,181,791) | (10,994,984) | N/A | N/A |
Net increase/(decrease) resulting from | | | | |
share transactions | (823,194) | (16,872,248) | 974,374 | (1,813,775) |
4. COST AND UNREALIZED APPRECIATION AND DEPRECIATION ON INVESTMENTS ON A TAX BASIS
Westcore Equity Funds
| | | | | | | | | Westcore |
| Westcore | Westcore MIDCO | | Westcore | Westcore Small-Cap | Blue Chip |
| Growth Fund | Growth Fund | | Select Fund | Growth Fund | Dividend Fund |
As of June 30, 2014 | | | | | | | | | | |
Gross appreciation (excess of value over tax cost) | $ | 14,880,956 | $ | 19,804,673 | $ | 16,602,209 | $ | 292,361 | $ | 12,013,887 |
Gross depreciation (excess of tax cost over value) | | (196,462) | | (1,291,226) | | (2,003,460) | | (115,661) | | (721,804) |
Net unrealized appreciation/(depreciation) | $ | 14,684,494 | $ | 18,513,447 | $ | 14,598,749 | $ | 176,700 | $ | 11,292,083 |
Cost of investment for income tax purposes | $ | 49,773,598 | $ | 81,511,058 | $ | 89,598,749 | $ | 3,060,353 | $ | 47,693,184 |
|
|
| | Westcore | Westcore | Westcore | Westcore |
| | Mid-Cap Value | Small-Cap Value | Micro-Cap | International |
| | Dividend Fund | Dividend Fund | Opportunity Fund | Small-Cap Fund |
As of June 30, 2014 | | | | | | | | |
Gross appreciation (excess of value over tax cost) | $ | 10,765,049 | $ | 72,725,493 | $ | 5,246,322 | $ | 107,697,530 |
Gross depreciation (excess of tax cost over value) | | (474,191) | | (6,809,924) | | (1,561,768) | | (32,370,056) |
Net unrealized appreciation/(depreciation) | $ | 10,290,858 | $ | 65,915,569 | $ | 3,684,554 | $ | 75,327,474 |
Cost of investment for income tax purposes | $ | 47,165,350 | $ | 293,969,586 | $ | 32,253,952 | $ | 378,449,874 |
Westcore Bond Funds
| Westcore | Westcore | Westcore Colorado |
| Flexible Income Fund | Plus Bond Fund | Tax-Exempt Fund |
As of June 30, 2014 | | | | | | |
Gross appreciation (excess of value over tax cost) | $ | 5,299,426 | $ | 70,362,011 | $ | 4,159,832 |
Gross depreciation (excess of tax cost over value) | | (2,122,271) | | (8,631,832) | | (681,339) |
Net unrealized appreciation/(depreciation) | $ | 3,177,155 | $ | 61,730,179 | $ | 3,478,493 |
Cost of investment for income tax purposes | $ | 65,036,830 | $ | 1,399,731,656 | $ | 130,989,840 |
5. INVESTMENT ADVISORY FEES, ADMINISTRATIVE FEES AND OTHER RELATED PARTY TRANSACTIONS
The Trust has entered into an advisory agreement with Denver Investment Advisors LLC (the “Adviser” or “Denver Investments”) for all Funds. The advisory agreement has been approved by the Trust’s Board of Trustees.
Pursuant to its advisory agreement with the Trust, Denver Investments is entitled to an investment advisory fee, based on the average net assets of each Fund, computed daily and payable monthly as shown in the table below.
Westcore Growth Fund | 0.65% |
Westcore MIDCO Growth Fund | 0.65% |
Westcore Select Fund | 0.65% |
Westcore Small-Cap Growth Fund | 1.00% |
Westcore Blue Chip Dividend Fund | 0.65% |
Westcore Mid-Cap Value Dividend Fund | 0.75% |
Westcore Small-Cap Value Dividend Fund | 1.00% |
Westcore Micro-Cap Opportunity Fund | 1.00% |
Westcore International Small-Cap Fund | 1.20% |
Westcore Flexible Income Fund | 0.45% |
Westcore Plus Bond Fund | 0.35% |
Westcore Colorado Tax-Exempt Fund | 0.40% |
| |
ALPS Fund Services, Inc. (“ALPS”) and Denver Investments serve as the Funds’ co-administrators (“Co-Administrators”). ALPS and Denver Investments are entitled to receive a total fee from each Fund for its administrative services computed daily and paid monthly.
| ALPS | Denver Investments | Total |
First $3.5 billion in average daily Net Assets of the Trust | 0.036%* | 0.10% | 0.136% |
Net Assets greater than $3.5 billion in average daily Net Assets | | | |
of the Trust | 0.025% | 0.05% | 0.075% |
| | | |
* Prior to May 1, 2014, 0.04%.
| PAGE 90 |
|
The administrative fees are then allocated to each Fund based upon the Fund’s relative proportion of the Trust’s Net Assets.
Each Fund has agreed to reimburse the Adviser for a portion of the payments it makes to certain Service Organizations for providing recordkeeping and sub-accounting services to persons who own Fund Retail Class shares through omnibus accounts (“Omnibus Accounts”). The amount reimbursed by the Fund, presented on the Statements of Operations as Shareholder servicing reimbursement - Retail Class, is intended to not exceed the estimated cost that would be incurred by the Fund if the shares held in the Omnibus Accounts were serviced directly by the Fund’s transfer agent.
To determine the Periodic Reimbursement Amount, the Fund’s effective cost for servicing shares directly by the Fund’s transfer agent is calculated on a periodic basis but no later than quarterly as follows (“Effective Rate”):
Fund Retail Class Transfer Agency Costs divided by Fund Retail Class Assets serviced directly by the Fund’s Transfer Agent.
This Effective Rate is then multiplied by the Retail Class assets in the Omnibus Accounts as of the most recent practical date (typically quarter end) to calculate the Periodic Reimbursement Amount.
Denver Investments as Adviser and Co-Administrator has contractually agreed, until at least April 30, 2015, that the Net Annual Fund Operating Expenses for the Retail Class shares of the Funds will not exceed the amounts shown in the table below.
Westcore Growth Fund | 1.15% |
Westcore MIDCO Growth Fund | 1.15% |
Westcore Select Fund | 1.15% |
Westcore Small-Cap Growth Fund | 1.30% |
Westcore Blue Chip Dividend Fund | 0.99% |
Westcore Mid-Cap Value Dividend Fund | 1.25% |
Westcore Small-Cap Value Dividend Fund | 1.30% |
Westcore Micro-Cap Opportunity Fund | 1.30% |
Westcore International Small-Cap Fund | 1.50% |
Westcore Flexible Income Fund | 0.85% |
Westcore Plus Bond Fund | 0.55% |
Westcore Colorado Tax-Exempt Fund | 0.65% |
| |
Without such fee waivers, for the six months ended ended June 30, 2014, the Total Annualized Fund Operating Expenses for the Retail Class shares of the Funds are as follows:
Westcore Small-Cap Growth Fund | 5.33% |
Westcore Blue Chip Dividend Fund | 1.15% |
Westcore Small-Cap Value Dividend Fund | 1.39% |
Westcore Micro-Cap Opportunity Fund | 1.55% |
Westcore International Small-Cap Fund | 1.60% |
Westcore Flexible Income Fund | 0.89% |
Westcore Plus Bond Fund | 0.71% |
Westcore Colorado Tax-Exempt Fund | 0.78% |
| |
Denver Investments has contractually agreed to waive the investment advisory and/or administration fees and/or to reimburse Fund level Other expenses for the Institutional Class in the same proportion as the Retail Class waivers/reimbursements as well as reimburse the Institutional class-specific Other expenses until at least April 30, 2015. Without such fee waivers, for the six months ended June 30, 2014, the Total Annualized Operating Expenses for the Institutional Class shares of the Funds are shown in the table below.
Westcore Growth Fund | 1.03% |
Westcore MIDCO Growth Fund | 1.00% |
Westcore Small-Cap Growth Fund | 3.76% |
Westcore Blue Chip Dividend Fund | 1.00% |
Westcore Small-Cap Value Dividend Fund | 1.21% |
Westcore Flexible Income Fund | 1.06% |
Westcore Plus Bond Fund | 0.55% |
| |
ALPS, pursuant to a Transfer Agency Agreement, serves as Transfer Agent for each of the Funds. As Transfer Agent, ALPS has, among other things, agreed to: (a) issue and redeem shares of the Funds; (b) make dividend and other distributions to shareholders of the Funds; (c) effect transfers of shares; (d) mail communications to shareholders of the Funds, including account statements, confirmations, and dividend and distribution notices; (e) facilitate the electronic delivery of shareholder statements and reports and (f) maintain shareholder accounts. Under the Transfer Agency Agreement, ALPS receives from the Trust an annual minimum fee per Fund, a fee based upon each shareholder account and is reimbursed for out-of-pocket expenses.
Certain officers of the Funds are also officers of Denver Investments. All access persons of the Trust, as defined in the 1940 Act, and members, officers and employees of the Adviser, follow strict guidelines and policies on personal trading as outlined in the Trust’s and the Adviser’s respective Code of Ethics.
The Trustees have appointed a Chief Compliance Officer who is also the Treasurer of the Trust and a partner of the Adviser. The Trustees agreed to have the Funds pay the portion of his compensation attributable for services rendered as the Trust’s Chief Compliance Officer.
The Trust has a Trustee Deferred Compensation Plan (the “Deferral Plan”) which allows the Trustees to defer the receipt of all or a portion of Trustees fees. Under the Deferral Plan, any compensation deferred results in an equal adjustment to the Investment for/Payable for Trustee Deferred Compensation Plan on the Statement of Assets and Liabilities, as though an equivalent amount had been invested in shares of one or more Westcore Funds selected by the Trustee. The amount paid to the Trustees under the Deferral Plan will be determined based upon the performance of the selected funds. Deferral of Trustees’ fees under the Deferral Plan will not affect the net assets of the Fund.
Where a Fund owns 5% or more of the outstanding voting securities, either directly or indirectly, of a particular issuer, the 1940 Act deems such an issuer to be an “affiliate” of the Fund. As of June 30, 2014, Westcore International Small-Cap Fund owned 5% or more of the outstanding voting securities of the issuers identified in the table below and therefore those issuers would be deemed to be affiliates of that Fund for purposes of the 1940 Act.
| Share Balance at | | | Share Balance at | Market Value at | | | Realized |
Security Name | December 31, 2013 | Purchases | Sales | June 30, 2014 | June 30, 2014 | | Dividends | Gains/(Losses) |
Credit Corp. Group Ltd. | | | | | | | | | | |
(Australia) | 3,024,321 | – | – | 3,024,321 | $ | 24,810,554 | $ | 541,382 | $ | – |
Pico Far East Holdings | | | | | | | | | | |
Ltd. (Hong Kong) | 80,832,879 | – | (2,541,608) | 78,291,271 | | 18,182,840 | | 571,558 | | (206,385) |
Prestige International | | | | | | | | | | |
Inc. (Japan) | 1,923,022 | – | (358,004) | 1,565,018 | | 14,259,036 | | 78,913 | | 663,195 |
| | | | | $ | 57,252,430 | $ | 1,191,853 | $ | 456,810 |
6. FAIR VALUE MEASUREMENTS
A three-tier hierarchy has been established to measure fair value based on the extent of use of “observable inputs” as compared to “unobservable inputs” for disclosure purposes and requires additional disclosures about these valuations measurements. Inputs refer broadly to the assumptions that market participants would use in pricing a security. Observable inputs are inputs that reflect the assumptions market participants would use in pricing the security developed based on market data obtained from sources independent of the reporting entity. Unobservable inputs are inputs that reflect the reporting entity’s own assumptions about the assumptions market participants would use in pricing the security developed based on the best information available in the circumstances.
| PAGE 92 |
|
The three-tier hierarchy is summarized as follows:
1) Level 1 – Quoted & Unadjusted Prices in active markets for identical investments
2) Level 2 – Other Significant Observable Inputs (including quoted prices for similar investments, interest rates, prepayment speeds, credit risk, etc.)
3) Level 3 – Significant Unobservable Inputs (including the Fund’s own assumptions in determining the fair value of investments).
The following is a summary of the inputs used as of June 30, 2014 in valuing the Funds’ assets:
Westcore Growth Fund
Investments in Securities | Level 1 - Quoted and | Level 2 - Other Significant | Level 3 - Significant | |
at Value* | Unadjusted Prices | Observable Inputs | Unobservable Inputs | Total |
Common Stocks | $ | 63,276,128 | $ | – | $ | – | $ | 63,276,128 |
Money Market Mutual Funds | | 1,181,964 | | – | | – | | 1,181,964 |
Total | $ | 64,458,092 | $ | – | $ | – | $ | 64,458,092 |
Westcore MIDCO Growth Fund
Investments in Securities | Level 1 - Quoted and | Level 2 - Other Significant | Level 3 - Significant | |
at Value* | Unadjusted Prices | Observable Inputs | Unobservable Inputs | Total |
Common Stocks | $ | 99,236,873 | $ | – | $ | – | $ | 99,236,873 |
Money Market Mutual Funds | | 787,632 | | – | | – | | 787,632 |
Total | $ | 100,024,505 | $ | – | $ | – | $ | 100,024,505 |
Westcore Select Fund | | | | | | | | |
| | | | | |
Investments in Securities | Level 1 - Quoted and | Level 2 - Other Significant | Level 3 - Significant | | |
at Value* | Unadjusted Prices | Observable Inputs | Unobservable Inputs | | Total |
Common Stocks | $ | 102,186,088 | $ | – | $ | – | $ | 102,186,088 |
Money Market Mutual Funds | | 1,582,524 | | – | | – | | 1,582,524 |
Total | $ | 103,768,612 | $ | – | $ | – | $ | 103,768,612 |
Westcore Small-Cap Growth Fund | | | | | | | |
| | | | | |
Investments in Securities | Level 1 - Quoted and | Level 2 - Other Significant | Level 3 - Significant | | |
at Value* | Unadjusted Prices | Observable Inputs | Unobservable Inputs | | Total |
Common Stocks | $ | 3,145,624 | $ | – | $ | – | $ | 3,145,624 |
Money Market Mutual Funds | | 91,429 | | – | | – | | 91,429 |
Total | $ | 3,237,053 | $ | – | $ | – | $ | 3,237,053 |
Westcore Blue Chip Dividend Fund | | | | | | | |
| | | | | |
Investments in Securities | Level 1 - Quoted and | Level 2 - Other Significant | Level 3 - Significant | | |
at Value* | Unadjusted Prices | Observable Inputs | Unobservable Inputs | | Total |
Common Stocks | $ | 58,262,571 | $ | – | $ | – | $ | 58,262,571 |
Money Market Mutual Funds | | 722,696 | | – | | – | | 722,696 |
Total | $ | 58,985,267 | $ | – | $ | – | $ | 58,985,267 |
Westcore Mid-Cap Value Dividend Fund | | | | | | |
| | | | | |
Investments in Securities | Level 1 - Quoted and | Level 2 - Other Significant | Level 3 - Significant | | |
at Value* | Unadjusted Prices | Observable Inputs | Unobservable Inputs | | Total |
Common Stocks | $ | 53,974,316 | $ | – | $ | – | $ | 53,974,316 |
Money Market Mutual Funds | | 3,481,892 | | – | | – | | 3,481,892 |
Total | $ | 57,456,208 | $ | – | $ | – | $ | 57,456,208 |
|
|
Westcore Small-Cap Value Dividend Fund
Investments in Securities | Level 1 - Quoted and | Level 2 - Other Significant | Level 3 - Significant | |
at Value* | Unadjusted Prices | Observable Inputs | Unobservable Inputs | Total |
Common Stocks | $ | 357,340,161 | $ | – | $ | – | $ | 357,340,161 |
Money Market Mutual Funds | | 2,544,994 | | – | | – | | 2,544,994 |
Total | $ | 359,885,155 | $ | – | $ | – | $ | 359,885,155 |
Westcore Micro-Cap Opportunity Fund
Investments in Securities | Level 1 - Quoted and | Level 2 - Other Significant | Level 3 - Significant | |
at Value* | Unadjusted Prices | Observable Inputs | Unobservable Inputs | Total |
Common Stocks | $ | 34,187,798 | $ | – | $ | – | $ | 34,187,798 |
Money Market Mutual Funds | | 1,750,708 | | – | | – | | 1,750,708 |
Total | $ | 35,938,506 | $ | – | $ | – | $ | 35,938,506 |
Westcore International Small-Cap Fund
Investments in Securities | Level 1 - Quoted and | Level 2 - Other Significant | Level 3 - Significant | |
at Value* | Unadjusted Prices | Observable Inputs | Unobservable Inputs | Total |
Common Stocks | $ | 448,428,466 | $ | – | $ | – | $ | 448,428,466 |
Money Market Mutual Funds | | 5,348,882 | | – | | – | | 5,348,882 |
Total | $ | 453,777,348 | $ | – | $ | – | $ | 453,777,348 |
Other Financial Instruments** | | | | | | | | |
Assets: | | | | | | | | |
Forward Foreign | | | | | | | | |
Currency Contracts | $ | – | $ | 973,222 | $ | – | $ | 973,222 |
Liabilities: | | | | | | | | |
Forward Foreign | | | | | | | | |
Currency Contracts | | – | | (916,859) | | – | | (916,859) |
Total | $ | – | $ | 56,363 | $ | – | $ | 56,363 |
Westcore Flexible Income Fund
Investments in Securities | Level 1 – Quoted and | Level 2 – Other Significant | Level 3 – Significant | |
at Value* | Unadjusted Prices | Observable Inputs | Unobservable Inputs | Total |
Convertible Preferred Stocks | $ | 1,353,024 | $ | – | $ | – | $ | 1,353,024 |
Nonconvertible Preferred Stocks | | 1,947,072 | | – | | 2,018,543 | | 3,965,615 |
Corporate Bonds | | – | | 57,322,067 | | 1,965,606 | | 59,287,673 |
Commercial Mortgage-Backed | | | | | | | | |
Securities & Residential | | | | | | | | |
Mortgage-Backed Securities | | – | | 2,003,092 | | – | | 2,003,092 |
Money Market Mutual Funds | | 1,604,581 | | – | | – | | 1,604,581 |
Total | $ | 4,904,677 | $ | 59,325,159 | $ | 3,984,149 | $ | 68,213,985 |
| PAGE 94 |
|
Westcore Plus Bond Fund
Investments in Securities | Level 1 – Quoted and | Level 2 – Other Significant | Level 3 – Significant | |
at Value* | Unadjusted Prices | Observable Inputs | Unobservable Inputs | | Total |
Nonconvertible Preferred Stocks | $ | 5,992,777 | $ | – | $ | 2,611,050 | $ | 8,603,827 |
Corporate Bonds | | – | | 714,431,618 | | 18,230,997 | | 732,662,615 |
Municipal Bonds | | – | | 31,871,760 | | – | | 31,871,760 |
Asset-Backed Securities, | | | | | | | | |
Commercial Mortgage- | | | | | | | | |
Backed Securities, | | | | | | | | |
Residential Mortgage-Backed | | | | | | | | |
Securities, & Agency | | | | | | | | |
Mortgage-Backed Securities | | – | | 490,925,627 | | – | | 490,925,627 |
U.S. Government & | | | | | | | | |
Agency Obligations | | – | | 62,127 | | – | | 62,127 |
U.S. Treasury Bonds & Notes | | – | | 191,387,638 | | – | | 191,387,638 |
Money Market Mutual Funds | | 5,948,241 | | – | | – | | 5,948,241 |
Total | $ | 11,941,018 | $ | 1,428,678,770 | $ | 20,842,047 | $ | 1,461,461,835 |
Westcore Colorado Tax-Exempt Fund
Investments in Securities | Level 1 – Quoted and | Level 2 – Other Significant | Level 3 – Significant | |
at Value* | | Unadjusted Prices | | Observable Inputs | Unobservable Inputs | | Total |
Municipal Bonds | $ | – | $ | 123,146,660 | $ | – | $ | 123,146,660 |
Money Market Mutual Funds | | 11,321,673 | | – | | – | | 11,321,673 |
Total | $ | 11,321,673 | $ | 123,146,660 | $ | – | $ | 134,468,333 |
* For detailed Industry descriptions, see the accompanying Statements of Investments.
** Other financial instruments are derivative instruments not reflected in the Statements of Investments.
It is the Funds’ policy to recognize transfers into and out of all levels at the end of the reporting period. There were no transfers between Levels 1 and 2 during the six months ended June 30, 2014.
All securities of the Funds, except for Westcore Flexible Income and Plus Bond Funds, were valued using either Level 1 or Level 2 inputs during the six months ended June 30, 2014. Thus a reconciliation of assets in which significant unobservable inputs (Level 3) were used is not applicable for these Funds.
The following is a reconciliation of assets in which significant unobservable inputs (Level 3) were used in determining fair value:
Westcore Flexible Income Fund
| | | | | | | | | | | | | Net change in unrealized |
| | | | | | | | | | | | | appreciation/(depreciation) |
| | | | | | | | Change in | | | | | included in the Statements |
| | Balance as of | | Accrued | | | | Unrealized | | | | | of Operations attributable to |
Investments in | December 31, | | discount/ | | Realized | Appreciation/ | | Sales | | Balance as of | Level 3 investments held at |
Securities | | 2013 | | premium | | Gain/(Loss)* | (Depreciation) | | Proceeds | June 30, 2014 | June 30, 2014 |
Nonconvertible | | | | | | | | | | | | | | |
Preferred Stocks | $ | 1,880,606 | $ | – | $ | – | $ | 137,937 | $ | – | $ | 2,018,543 | $ | 137,937 |
Corporate Bonds | | 1,952,784 | | 3,757 | | 4,309 | | 49,592 | | (44,836) | | 1,965,606 | | 49,592 |
Total | $ | 3,833,390 | $ | 3,757 | $ | 4,309 | $ | 187,529 | $ | (44,836) | $ | 3,984,149 | $ | 187,529 |
Westcore Plus Bond Fund
| | | | | | | | | | | | | Net change in unrealized |
| | | | | | | | | | | | | appreciation/(depreciation) |
| | | | | | | Change in | | | | | included in the Statements |
| Balance as of | | Accrued | | | Unrealized | | | | | of Operations attributable to |
Investments in | December 31, | | discount/ | | Realized | Appreciation/ | | Sales | | Balance as of | Level 3 investments held at |
Securities | 2013 | | premium | | Gain/(Loss)* | Depreciation)* | | Proceeds | | June 30, 2014 | June 30, 2014 |
Nonconvertible | | | | | | | | | | | | | | |
Preferred Stocks | $ | 2,432,625 | $ | – | $ | – | $ | 178,425 | $ | – | $ | 2,611,050 | $ | 178,425 |
Corporate Bonds | | 18,548,734 | | 9,428 | | 10,619 | | (122,340) | | (215,444) | | 18,230,997 | | (122,340) |
Total | $ | 20,981,359 | $ | 9,428 | $ | 10,619 | $ | 56,085 | $ | (215,444) | $ | 20,842,047 | $ | 56,085 |
* Net realized gain/(loss) and net unrealized appreciation/(depreciation) are included in the related amounts in the Statement of Operations.
The inputs or methodologies used for valuing securities are not necessarily an indication of the risk associated with investing in those securities.
For fair value measurements using significant other observable inputs (Level 2), the Funds generally utilize an independent pricing service which utilizes evaluated pricing models that vary by asset class and incorporate available trade, bid and other market information, and for structured securities also incorporate cash flow and, when available, loan performance data. The independent pricing service’s evaluated pricing models apply available market information through processes such as benchmark curves, benchmarking of similar securities, and sector groupings. For certain securities, the independent pricing service uses model processes, such as the Option Adjusted Spread (benchmark driven) model, to assess interest rate impact and develop prepayment scenarios. With respect to trades and bids, the independent pricing service reviews the lot size to determine whether the information is representative of an orderly trading market. If the independent pricing service determines that trade or bid information is not consistent with other information available, the trade or bid will not be reflected in the evaluated price.
In the event the independent pricing service is unable to provide an evaluated price for a security or Denver Investments believes the price provided is not reliable, securities of the Funds may be valued in good faith as described above in Note 2. In these instances, the compliance department will typically seek input from the investment team of the Fund since they are typically the most knowledgeable of the relevant factors in valuing the securities. Denver Investments may seek to find an alternative independent source, such as a broker/dealer to provide a price quote, or by using evaluated pricing models similar to the techniques and models used by the independent pricing service. These fair value measurement techniques may utilize unobservable inputs (Level 3).
At least quarterly, Denver Investments receives a report on the pricing for all fair valued securities during the period along with any actual sales prices, broker quotes and/or pricing from the independent pricing service. Denver Investments uses this information to analyze changes in fair value measurements over the period and as a back test of pricing methods.
Then on at least a quarterly basis, Denver Investments presents the factors considered in determining the fair value measurements and presents that information to the Audit Committee which meets at least quarterly. The Audit Committee then will provide a recommendation to the Board for approval of the fair value measurements.
The table below provides additional information about the Level 3 Fair Value Measurements as of June 30, 2014:
Westcore Flexible Income Fund | | | | | |
Quantitative Information about | | Fair Value | | | |
Level 3 Fair Value Measurements | | at 6/30/2014 | Valuation Technique | Unobservable Input | Level/Range |
Nonconvertible Preferred Stocks | $ | 2,018,543 | Consensus Pricing** | Broker Quotes | N/A |
Corporate Bonds | | 1,933,426 | Adjusted Spread Pricing* | Comparability Adjustment | 1.425% |
| |
| | | | Liquidity Adjustment | 0.40% |
| | 32,180 | Consensus Pricing** | Broker Quotes | N/A |
Total | $ | 3,984,149 | | | |
| PAGE 96 |
|
Westcore Plus Bond Fund | | | | | |
| | | | | | |
Quantitative Information about | | Fair Value | | | |
Level 3 Fair Value Measurements | | at 6/30/2014 | Valuation Technique | Unobservable Input | Level/Range |
Nonconvertible Preferred Stocks | $ | 2,611,050 | Consensus Pricing** | Broker Quotes | N/A |
Corporate Bonds | | 4,940,977 | Adjusted Spread Pricing* | Comparability Adjustment | 1.425% |
| |
| | | | Liquidity Adjustment | 0.40% |
| | 13,290,020 | Consensus Pricing** | Broker Quotes | N/A |
Total | $ | 20,842,047 | | | |
* Denver Investments identifies comparable security(ies) and obtains market observable spreads to Treasuries, and then adjusts for appropriate comparability or liquidity adjustments.
** Denver Investments seeks up to three independent price quotes, but in certain cases only one may be available. Denver Investments evaluates whether the source of the pricing uses valuation techniques in accordance with ASC topic 820 by developing an internal reasonableness check. For those quotes that are considered reasonable, quantitative unobservable inputs are not developed by Denver Investments.
7. FOREIGN CURRENCY EXCHANGE CONTRACTS
The Westcore International Small-Cap Fund may purchase or sell foreign currencies on a “spot” or cash basis at the prevailing rate in the foreign currency exchange market to settle investment transactions in the proper currency. In addition, this Fund may purchase or sell forward currency contracts to adjust the portfolio’s exposure to different currencies consistent with the investment team’s targets, which consider the currency weightings within the Fund’s benchmark index.
When entering into a spot or forward foreign currency contract, the Fund agrees to receive or deliver a fixed quantity of foreign currency for an agreed upon price on an agreed future date. These contracts are valued at each portfolio valuation, and the Fund’s net equity therein, representing unrealized gain or loss on the contracts as measured by the difference between the spot or forward foreign exchange rates at the dates of entry into the contracts and the spot or forward rates at the reporting date, is included in the Statement of Assets and Liabilities. Realized and unrealized gains and losses are included in the Statement of Operations. These instruments involve credit risk and market risk in excess of the amount recognized in the Statement of Assets and Liabilities. Risks arise from the possible inability of counterparties to meet the terms of their contracts and from movement in currency exchange rates.
The Fund must segregate assets determined to be liquid in accordance with procedures established by the Board of Trustees, or otherwise cover its position in a permissible manner.
The forward foreign currency contracts held at June 30, 2014 as disclosed at the end of the Statement of Investments is representative of activity during the six months ended June 30, 2014.
The effect of derivative instruments on the Statement of Assets and Liabilities as of June 30, 2014 is as follows:
| | Asset Derivatives | Liability Derivatives |
| Statement of Assets and | | | | |
Risk Exposure | Liabilities Location | Unrealized Appreciation | Unrealized Depreciation |
Westcore International Small-Cap Fund | | | | | |
Forward Foreign Currency Contracts | | | | | |
(Foreign Exchange Rate Risk) | Unrealized gain on forward currency contracts | $ | 973,222 | $ | 916,859 |
Total | | $ | 973,222 | $ | 916,859 |
The effect of derivative instruments on the Statement of Operations for the six months ended June 30, 2014 is as follows:
Risk Exposure | Statement of Operations Location | | |
Westcore International Small-Cap Fund | | | |
Forward Foreign Currency Contracts | | | |
(Foreign Exchange Rate Risk) | Net realized loss on forward foreign currency contracts and foreign currency transactions | $ | (3,864,437) |
Forward Foreign Currency Contracts | Net change in unrealized appreciation on forward foreign currency contracts and | | |
(Foreign Exchange Rate Risk) | translation of assets and liabilities denominated in foreign currencies | | 589,969 |
Total | | $ | (3,274,468) |
8. PURCHASES AND SALES OF INVESTMENTS
Investment transactions for the six months ended June 30, 2014 excluding long-term U.S. government securities and short-term investments were as follows:
| | Cost of Investments | | Proceeds from |
Fund | | Purchased | | Investments Sold |
Westcore Growth Fund | $ | 59,102,202 | | $ | 75,068,500 | |
Westcore MIDCO Growth Fund | | 54,535,955 | | | 57,109,473 | |
Westcore Select Fund | | 79,585,258 | | | 89,709,634 | |
Westcore Small-Cap Growth Fund | | 2,982,173 | | | 2,209,237 | |
Westcore Blue Chip Dividend Fund | | 2,671,310 | | | 6,668,076 | |
Westcore Mid-Cap Value Dividend Fund | | 17,747,679 | | | 18,646,369 | |
Westcore Small-Cap Value Dividend Fund | | 140,907,515 | | | 104,563,245 | |
Westcore Micro-Cap Opportunity Fund | | 26,975,722 | | | 13,366,173 | |
Westcore International Small-Cap Fund | | 140,145,937 | | | 142,380,534 | |
Westcore Flexible Income Fund | | 8,800,882 | | | 5,760,699 | |
Westcore Plus Bond Fund | | 180,500,918 | | | 159,652,802 | |
Westcore Colorado Tax-Exempt Fund | | 15,305,382 | | | 10,216,268 | |
| | | | |
Purchases and sales of long-term U.S. Government securities for the six months ended June 30, 2014, were as follows:
| | Cost of Investments | | Proceeds from |
Fund | | Purchased | | Investments Sold |
Westcore Plus Bond Fund | $ | 275,933,896 | $ | 306,140,248 |
| | | | |
9. REORGANIZATION
On September 9, 2013, the Westcore Board of Trustees approved a form of Agreement and Plan of Reorganization for the Westcore Small-Cap Opportunity Fund (the “Acquired Fund”) with and into the Westcore Small-Cap Value Dividend Fund (the “Acquiring Fund”).
As of the close of business on November 14, 2013, assets of the Acquired Fund were acquired by the Acquiring Fund in exchange for shares of the Acquiring Fund and the assumption by the Acquiring Fund of the liabilities of the Acquired Fund. Upon the closing of the reorganization, the Acquiring Fund issued 1,091,918 shares in exchange for net assets of the Acquired Fund valued at $18,203,104.
| PAGE 98 |
|

Westcore Trustees and Officers:
Mary K. Anstine, Chairman
John A. DeTore, Trustee
Rick A. Pederson, Trustee
James A. Smith, Trustee
Douglas M. Sparks, Trustee
Janice M. Teague, Trustee
John W. Zimmerman, President
Jasper R. Frontz, Treasurer & Chief Compliance Officer
Jill A. Kerschen, Asst. Treasurer
David T. Buhler, Secretary

FOR MORE INFORMATION ABOUT WESTCORE FUNDS, PLEASE CONTACT:
Westcore Funds | 1290 Broadway, Suite 1100 | Denver, Colorado 80203
Individual Investors: 800.392.CORE | Financial Advisors: 800.734.WEST | www.westcore.com
|
A description of the policies and procedures that Westcore Funds uses to determine how to vote proxies relating to portfolio securities and information regarding how each Fund voted proxies relating to portfolio securities during the most recent 12-month period ended June 30 is available (i) without charge, upon request, by calling toll-free 800.392.CORE; (ii) on the Westcore Funds website, www.westcore.com; and (iii) on the Securities and Exchange Commission website at www.sec.gov.
Each Fund files a complete schedule of portfolio holdings with the Securities and Exchange Commission (“SEC”) for the first and third quarters of each fiscal year on Form N-Q within 60 days after the period end. Copies of the Westcore Funds Form N-Q are available without a charge, upon request, by contacting Westcore Funds toll-free at 800.392.CORE and on the SEC’s website at http://www.sec.gov. You may also review and copy the Form N-Q at the SEC’s Public Reference Room in Washington, D.C. For more information about the operation of the Public Reference Room, please call the SEC at 1-800-SEC-0330.
This report has been prepared for Westcore shareholders and may be distributed to others only if preceded or accompanied by a prospectus. Westcore Funds are distributed by ALPS Distributors, Inc.
WC120
Item 2. Code of Ethics.
Not applicable to semi-annual report.
Item 3. Audit Committee Financial Expert.
Not applicable to semi-annual report.
Item 4. Principal Accountant Fees and Services.
Not applicable to semi-annual report.
Item 5. Audit Committee of Listed Registrants.
Not applicable.
Item 6. Investments.
a) Schedule of Investments in securities of unaffiliated issuers as of the close of the reporting period is included as part of the Reports to Stockholders filed under Item 1 of this form.
b) Not applicable.
Item 7. Disclosure of Proxy Voting Policies and Procedures for Closed-End Management Investment Companies.
Not applicable.
Item 8. Portfolio Managers of Closed-End Management Investment Companies.
Not applicable.
Item 9. Purchases of Equity Securities by Closed-End Management Investment Company and Affiliated Purchasers.
Not applicable.
Item 10. Submission of Matters to a Vote of Security Holders.
There have been no material changes to the procedures by which shareholders may recommend nominees to the registrant’s Board of Trustees.
Item 11. Controls and Procedures.
| | (a) | The registrant’s principal executive officer and principal financial officer have concluded that the registrant’s disclosure controls and procedures (as defined in Rule 30a-3(c) under the Investment Company Act of 1940, as amended) (the “1940 Act”) (17 CFR 270.30a-3(e)) are effective based on their evaluation of these controls and procedures required by Rule 30a-3(b) under the 1940 Act (17 CFR 270.30a-3(b)) and Rules 13a-15(b) or 15d-15(b) under the Securities Exchange Act of 1934 (17 CFR 240.13a-15(b) or 240.15d-15(b)) as of a date within 90 days of the filing date of this report. |
| | | |
| | (b) | There was no change in the registrant’s internal control over financial reporting (as defined in Rule 30a-3(d) under the 1940 Act (17 CFR 270.30a-3(d)) that occurred during the second fiscal quarter of the period covered by this report that has materially affected, or is reasonably likely to materially affect, the registrant's internal control over financial reporting. |
Item 12. Exhibits.
| | (a)(1) | Not applicable to semi-annual report. |
| | | |
| | (a)(2) | The certifications required by Rule 30a-2(a) of the 1940 Act (17 CFR 270.30a-2(a)) and Section 302 of the Sarbanes-Oxley Act of 2002 are attached hereto as EX-99.CERT. |
| | | |
| | (a)(3) | Not applicable. |
| | | |
| | (b) | The certifications required by Rule 30a-2(b) of the 1940 Act (17 CFR 270.30a-2(b)) and Section 906 of the Sarbanes-Oxley Act of 2002 are attached hereto as EX-99.906CERT. |
SIGNATURES
Pursuant to the requirements of the Securities Exchange Act of 1934 and the Investment Company Act of 1940, the registrant has duly caused this report to be signed on its behalf by the undersigned, thereunto duly authorized.
WESTCORE TRUST
By: | /s/ John W. Zimmerman | |
| John W. Zimmerman | |
| President/Principal Executive Officer | |
| | |
Date: | September 5, 2014 | |
Pursuant to the requirements of the Securities Exchange Act of 1934 and the Investment Company Act of 1940, this report has been signed below by the following persons on behalf of the registrant and in the capacities and on the dates indicated.
By: | /s/ John W. Zimmerman | |
| John W. Zimmerman | |
| President/Principal Executive Officer | |
| | |
Date: | September 5, 2014 | |
By: | /s/ Jasper R. Frontz | |
| Jasper R. Frontz | |
| Treasurer/Principal Financial Officer | |
| | |
Date: | September 5, 2014 | |