UNITED STATES
SECURITIES AND EXCHANGE COMMISSION
Washington, D.C. 20549
FORM N-CSR
CERTIFIED SHAREHOLDER REPORT OF REGISTERED
MANAGEMENT INVESTMENT COMPANIES
Investment Company Act file number: 811-3373
Westcore Trust
(exact name of registrant as specified in charter)
1290 Broadway, Suite 1100, Denver, Colorado 80203
(Address of principal executive offices) (Zip code)
David T. Buhler, Secretary
Westcore Trust
1290 Broadway, Suite 1100, Denver, Colorado 80203
(Name and address of agent for service)
Registrant’s telephone number, including area code: 303-623-2577
Date of fiscal year end: December 31
Date of reporting period: June 30, 2013
Item 1. Reports to Stockholders.

INTENTIONALLY LEFT BLANK
DEAR FELLOW SHAREHOLDER:
The first six months of 2013 were very rewarding to equity investors. The S&P 500® Index provided a 13.82% total return. The upward momentum has continued into the third quarter with the Index up nearly 20% for the year through the end of July.
We want to share three thoughts about the equity market. First, the year is not over. Second, the stock market and the economy seldom move in sync. Third, there have been 14 years in the last 40 years when the S&P 500® provided a total return of greater than 20%.
The first six months were not as kind to bond investors. The Barclays U.S. Aggregate Bond Index had a negative total return of -2.44%. This did not surprise investors because bond yields were at historic lows at the beginning of the year.
As you know, many views about the economy, stocks and bonds are expressed daily in the media. In our observation, it’s worth noting that the slow economic recovery from the Great Recession of 2008-09 continues and that we currently see no economic crisis building on the horizon. Additionally, stocks appear to be fairly-valued based on historical data and bonds appear to be expensive.
At the moment, bonds are presenting a dilemma to many investors because of their low yields and high valuations. While each investor’s situation is different, it may be helpful to keep in mind that stocks are typically more volatile than bonds. Therefore, if stability in your portfolio is important to you, bonds should likely remain a part of your investment selection. And, it is useful to remember that having a diversified portfolio will normally mean that all of your investments won’t be delivering high returns at the same time.
In the following pages of this report, you will find a brief commentary on each Westcore fund provided by the portfolio management team. You can also review the individual holdings of each fund.
As we let you know this spring, the Westcore Blue Chip Dividend Fund has made important changes to its investment objective and strategy. The Fund is now investing in a more focused portfolio of large companies, but has expanded its investment universe to include companies around the globe. Additionally, the Fund’s emphasis is on finding companies that the investment team believes will grow their dividends at an above-average rate. More details are available in the Fund’s commentary.
Thank you for being a part of the Westcore family of investors.

CFA is a trademark owned by the CFA Institute.
Diversification does not ensure a profit or guarantee against loss.
The Shareholder Letter and the Manager Commentaries included in this shareholder report contain certain forward-looking statements about the factors that may affect the performance of the Funds in the future. These statements are based on Fund management’s predictions and expectations concerning certain future events and their expected impact on the Funds, such as performance of the economy as a whole and of specific industry sectors, changes in the levels of interest rates, the impact of developing world events, and other factors that may influence the future performance of the Funds. Management believes these forward-looking statements to be reasonable, although they are inherently uncertain and difficult to predict. Actual events may cause adjustments in portfolio management strategies from those currently expected to be employed.
PAGE 1 |

|
Investing primarily in equity securities of large companies with growth potential.
Ross G. Moscatelli, CFA Portfolio Manager Craig W. Juran, CFA Portfolio Manager
CFA is a trademark owned by the CFA Institute.
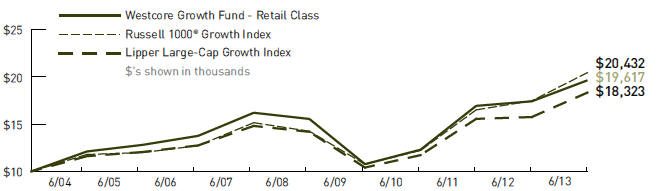
The chart above represents historical performance of a hypothetical investment of $10,000 in the Fund over the past 10 years (or for the life of the Fund if shorter). Performance calculations are as of the end of June each year. Past performance does not guarantee future results. This chart does not reflect the deduction of taxes that a shareholder would pay on Fund distributions or the redemption of Fund shares.
Lipper Index data provided by Lipper, Inc. Please see pages 28 and 29 for index definitions.
| Average Annual Total Returns | | | | | | | | | |
| | | | | | | | | | | | Since | Inception |
| | 6 Months | | 1 Year | | 3 Years | | 5 Years | | 10 Years | | Inception | Date |
| Retail Class (WTEIX) | 8.67% | | 12.72% | | 16.85% | | 4.77% | | 6.97% | | 8.51% | 6/1/1988 |
| Institutional Class | | | | | | | | | | | | |
| (WILGX) | 8.70 | | 12.93 | | 17.03 | | 4.91 | | 7.05 | | 8.54 | 9/28/2007 |
| Russell 1000® | | | | | | | | | | | | |
| Growth Index | 11.80 | | 17.07 | | 18.68 | | 7.47 | | 7.40 | | 9.44 | |
| Lipper Large-Cap | | | | | | | | | | | | |
| Growth Index | 10.18 | | 16.38 | | 16.06 | | 5.26 | | 6.24 | | 8.44 | |
Retail Class Annual Expense Ratio (per the current prospectus) — Gross: 1.11%, Net: 1.11%
Institutional Class Annual Expense Ratio (per the current prospectus) — Gross: 1.32%, Net: 0.92%
The performance data quoted represents past performance and does not guarantee future results. Performance information for the institutional class shares prior to their inception date is based on the performance of the retail class. Current performance may be lower or higher than the performance quoted. To obtain current performance as of the most recent month-end, please call 800.392.CORE (2673) or visit us online at www.westcore.com. Average annual total returns and yield figures reflect the reinvestment of dividends, capital gains distributions, all fee waivers and expense reimbursements. Without the fee waivers and expense reimbursements, total return and yield figures would have been lower. Total return and yield figures represent past performance. Investment return and principal value will vary, and shares, when redeemed, may be worth more or less than their original cost. Westcore fund shares are not insured by the FDIC, the Federal Reserve Board or any other agency and are subject to investment risk.
Denver Investments (the “Adviser”) has contractually agreed to waive the investment advisory and/or administration fees and/or to reimburse Fund level other expenses from April 30, 2013 until at least April 30, 2014, so that the ratio of expenses to average net assets as reported in the Fund’s Financial Highlights will be no more than 1.15% for the Fund’s Retail Class for such period. In addition, the Adviser has contractually agreed to waive the investment advisory and/or administration fees and/or to reimburse Fund level Other Expenses for the Institutional Class in the same proportion as the Retail Class waivers/reimbursements as well as reimburse the Institutional class-specific Other Expenses until at least April 30, 2014. This agreement may not be terminated or modified prior to this date except with the approval of the Board of Trustees.
Craig W. Juran is a registered representative of ALPS Distributors, Inc.
- During the first six months of the year, U.S. equity markets delivered strong returns fueled by low interest rates, an improving housing market, better employment trends, and the belief that the U.S. economy was finally starting to heal from the recession which started more than five years ago. Although equity markets experienced increased volatility during the second quarter, the biggest dislocations happened in the fixed income markets as the Federal Reserve signaled a potential end to Quantitative Easing (QE) causing investors to consider the possibility of higher interest rates. The prospect of QE reduction along with slower macroeconomic data from China and emerging markets ignited a new round of fear-induced selling in equity markets in the second quarter. This caused a short but powerful 6% correction in May and June, with international markets (especially emerging markets) experiencing a more significant correction. As fear subsided, however, equity markets recovered and continued to march ahead.
- Against this backdrop, the Westcore Growth Fund lagged its benchmark, the Russell 1000® Growth Index. Most of the underperformance was associated with more defensive-type equities outperforming traditional growth companies within the large-cap space.
- Holdings in financials, health care and energy produced the strongest returns relative to the benchmark during the first half of 2013. The Fund’s strongest individual performers were Gilead Sciences Inc., Google Inc. and Biogen Idec Inc. Gilead is a dominant player in the market for HIV therapies and we believe its recent acquisition of Pharmasset Inc. positions Gilead to introduce the first all-oral drug regimen for hepatitis C in 2014. Google’s prospects continued to improve as investors became more excited about its new products, such as Google Glass, a wearable computer with an optical head-mounted display, and accelerating revenue opportunities in mobile search advertising. Biogen Idec, which specializes in drugs for neurological disorders and cancer, continued to receive positive data associated with its drug for treating multiple sclerosis.
- The Fund’s weakest sectors relative to the benchmark were consumer staples, materials and information technology. From a company standpoint, the Fund’s largest detractors during the first six months were Apple Inc., Aruba Networks Inc., and Onyx Pharmaceuticals Inc. Although Apple announced a $60 billion stock buyback program, investors remained concerned about its lack of new products and slowing iPhone sales. Aruba Networks provides access management, network infrastructure and mobility application solutions for mobile enterprise networks. It delivered poor results in the first quarter and lowered future expectations, as a slowing global economy dampened demand for enterprise spending. This led investors to question the long-term growth associated with its end markets. Health care sector holding Onyx Pharmaceuticals experienced weakness in the period and we exited the position.
- With the U.S. economy improving, the housing market healing, commodity prices declining, low interest and inflation rates persisting, and central banks around the world adding liquidity as a way to promote growth, we are encouraged by the longer-term prospects for equities. As the economic impact of the U.S. federal sequester (automatic budget cuts which started in 2013) and higher taxes start to fade, we believe there is a strong possibility that the economy will pick up steam in the second half of the year, potentially driving corporate profits higher. Although the road may be bumpy at times, in our opinion, the fundamental backdrop for large-cap growth companies remains compelling.
PAGE 2 |

|
| Stock Performance | | | | |
(for the year ended 6/30/13) | | | | |
| | Average | | Contribution | |
5 Highest | Weight | | to Return | |
Gilead Sciences Inc. | 2.50% | | 0.90% | |
Google Inc. | 4.09 | | 0.89 | |
Biogen Idec Inc. | 1.92 | | 0.79 | |
Home Depot Inc. | 2.89 | | 0.70 | |
LinkedIn Corp. | 1.34 | | 0.68 | |
| | | | | |
5 Lowest | | | | |
Brookdale Senior Living Inc. | 0.46% | | -0.12% | |
VMware Inc. | 0.19 | | -0.16 | |
Onyx Pharmaceuticals Inc. | 0.50 | | -0.20 | |
Aruba Networks Inc. | 0.58 | | -0.50 | |
Apple Inc. | 6.16 | | -1.90 | |
Past performance does not guarantee future results. These stocks do not represent all of the securities purchased, sold or recommended by the Funds’ Adviser. To request a complete list of the contribution of each Fund holding to overall Fund performance during the period, please call 800.392.CORE (2673) or email invest@westcore.com.
Please see page 29 for a description of the methodology used to construct this chart.
| Top Ten Holdings | | |
(as of 6/30/13) | | |
Apple Inc. | 4.7% | |
Google Inc. | 4.5 | |
Microsoft Corp. | 4.3 | |
Visa Inc. | 3.3 | |
Home Depot Inc. | 3.2 | |
Amazon.com Inc. | 2.4 | |
Honeywell International Inc. | 2.3 | |
Costco Wholesale Corp. | 2.3 | |
Starbucks Corp. | 2.2 | |
Express Scripts Holding Co. | 2.2 | |
Total (% of Net Assets) | 31.4% | |
Top ten holdings do not include any cash, cash equivalents or exchange traded fund investments and are subject to change. There are no guarantees that the Fund will continue to remain invested in any particular holding.
| Morningstar Ratings | | |
| | | Number | |
| | Morningstar | of Funds | |
| | Rating™ | in Large Growth | |
| | as of 6/30/13 | Category | |
Overall | ««« | 1,488 | |
3 Year | ««« | 1,488 | |
5 Year | ««« | 1,308 | |
10 Year | ««« | 863 | |
Morningstar Ratings shown represent the Retail Class. Morningstar proprietary ratings reflect historical risk-adjusted performance as of 6/30/13 and are subject to change every month.
Please see page 29 for more detail regarding Morningstar Ratings.
| Portfolio Characteristics | | | | | | |
(as of 6/30/13) | | | | | | |
| | Westcore | | Russell 1000® | |
| | Growth Fund | | Growth Index | |
Weighted Average Market Capitalization ($ Bil) | $84.3 | | $90.0 | |
Price/Earnings (1 year trailing) | 20.9x | | 19.0x | |
EPS Growth (3 year historical) | 23.0% | | 19.5% | |
Beta | 1.1 | | 1.0 | |
Number of Holdings | 57 | | 575 | |
Portfolio Turnover Rate | 174% | | — | |
| | | | | | |
Please see page 30 for definition of terms. | | | | | | |
| | | | | | | |
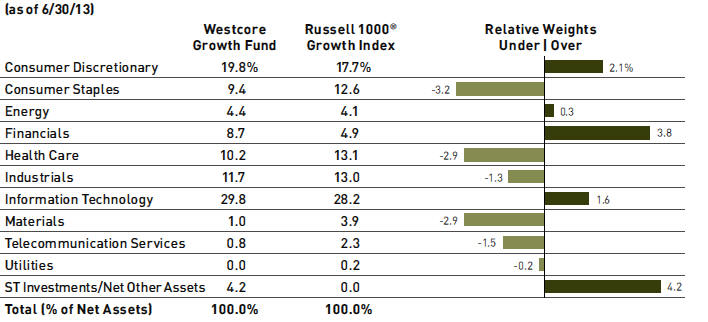
Sector classifications presented herein are based on the sector categorization methodology of the Adviser to the Funds which may result in the sector designations for one Fund being different than another Fund’s sector designations.
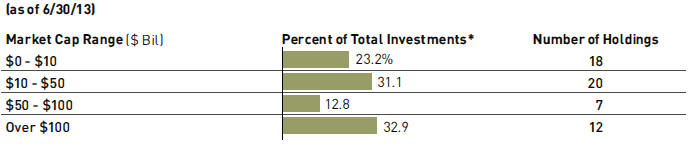
*Total Investments for this chart excludes short-term investments, including money market mutual funds.
Market capitalization ranges were determined by the Adviser to the Fund and are for presentation purposes only. These market capitalization ranges do not necessarily correlate to the benchmark’s market capitalization ranges.
| | PAGE 3 |
|
Investing in a diversified portfolio of equity securities of primarily medium-sized companies with growth potential.
| | |
Mitch S. Begun, CFA Lead Portfolio Manager Portfolio Manager
F. Wiley Reed, CFA Lead Portfolio Manager
Adam C. Bliss Portfolio Manager | Brian C. Fitzsimons, CFA
Jeffrey J. Loehr, CFA Portfolio Manager |
CFA is a trademark owned by the CFA Institute.

The chart above represents historical performance of a hypothetical investment of $10,000 in the Fund over the past 10 years (or for the life of the Fund if shorter). Performance calculations are as of the end of June each year. Past performance does not guarantee future results. This chart does not reflect the deduction of taxes that a shareholder would pay on Fund distributions or the redemption of Fund shares.
Lipper Index data provided by Lipper, Inc.
Please see pages 28 and 29 for index definitions.
| Average Annual Total Returns | | | | | | | | | |
| | | | | | | | | | | | Since | Inception |
| | 6 Months | | 1 Year | | 3 Years | | 5 Years | | 10 Years | | Inception | Date |
Retail Class (WTMGX) | 15.55% | | 21.32% | | 14.20% | | 5.73% | | 7.14% | | 10.25% | 8/1/1986 |
Institutional Class | | | | | | | | | | | | |
(WIMGX) | 15.75 | | 21.69 | | 14.42 | | 5.89 | | 7.24 | | 10.28 | 9/28/2007 |
Russell Midcap® | | | | | | | | | | | | |
Growth Index | 14.70 | | 22.88 | | 19.53 | | 7.61 | | 9.94 | | 10.15 | |
Lipper Mid-Cap | | | | | | | | | | | | |
Growth Index | 14.26 | | 20.24 | | 16.81 | | 6.09 | | 9.26 | | 9.42 | |
Retail Class Annual Expense Ratio (per the current prospectus) — Gross: 1.06%, Net: 1.06%
Institutional Class Annual Expense Ratio (per the current prospectus) — Gross: 0.94%, Net: 0.88%
The performance data quoted represents past performance and does not guarantee future results. Performance information for the institutional class shares prior to their inception date is based on the performance of the retail class. Current performance may be lower or higher than the performance quoted. To obtain current performance as of the most recent month-end, please call 800.392.CORE (2673) or visit us online at www.westcore.com. Average annual total returns and yield figures reflect the reinvestment of dividends, capital gains distributions, all fee waivers and expense reimbursements. Without the fee waivers and expense reimbursements, total return and yield figures would have been lower. Total return and yield figures represent past performance. Investment return and principal value will vary, and shares, when redeemed, may be worth more or less than their original cost. Westcore fund shares are not insured by the FDIC, the Federal Reserve Board or any other agency and are subject to investment risk.
Denver Investments (the “Adviser”) has contractually agreed to waive the investment advisory and/or administration fees and/or to reimburse Fund level other expenses from April 30, 2013 until at least April 30, 2014, so that the ratio of expenses to average net assets as reported in the Fund’s Financial Highlights will be no more than 1.15% for the Fund’s Retail Class for such period. In addition, the Adviser has contractually agreed to waive the investment advisory and/or administration fees and/or to reimburse Fund level Other Expenses for the Institutional Class in the same proportion as the Retail Class waivers/reimbursements as well as reimburse the Institutional class-specific Other Expenses until at least April 30, 2014. This agreement may not be terminated or modified prior to this date except with the approval of the Board of Trustees.
- In the first half of 2013, the Westcore MIDCO Growth Fund outperformed its benchmark, the Russell Midcap® Growth Index.
- Domestic small- and mid-cap equities surged to all-time highs in the first half of 2013. While equity markets rose, the threat of the Fed tapering its Quantitative Easing strategy sparked a sharp rise in interest rates in the second quarter. Taking a step back, we view interest rates going higher as primarily a sign that the U.S. economy is improving. Strong demand for housing and autos along with benign inflation continued to provide a solid backdrop for equities.
- The three sectors that contributed most to the Fund’s performance relative to its benchmark in the first half of 2013 were information technology, materials and consumer discretionary. The Fund’s best performing stock was consumer discretionary sector holding Netflix Inc. The company has evolved into the industry leader for streaming video content as new original content, along with exclusive content, helped retain existing customers and attract new subscribers. Within information technology, both LinkedIn Corp. and Splunk Inc. were top contributors. LinkedIn, the world’s largest online professional network, continued to monetize its unique asset through product innovation and solid execution. Splunk’s software solutions, which collect and index data at a massive scale, have become increasingly embedded in enterprise decision-making and analytic processes. The Fund’s underweighted position, along with stock selection drove outperformance in the materials sector.
- Just two sectors detracted from the Fund’s performance relative to its benchmark in the first half of 2013—consumer staples and health care. The Fund’s worst performing stock was information technology sector holding Aruba Networks Inc. Aruba, a leader in enterprise Wi-Fi solutions, saw increased competition in the second quarter and gave a disappointing growth outlook. We exited the position in the period. Also within information technology, Akamai Technologies Inc. was a notable underperformer. This Internet content delivery network provider lowered its revenue growth forecast due to reduced demand for media solutions. We sold the stock on concerns about longer-term pricing pressure for its solutions. Thoratec Corp., a leading provider of healthcare equipment for heart failure patients, was also a drag on the portfolio. Its results were disappointing in the face of intense competition and we exited the position. The Fund’s underperformance in the consumer staples sector was driven primarily by its underweighted position in the sector.
- As of the end of the first half of 2013, the Fund was overweighted primarily in the information technology and consumer discretionary sectors, and underweighted primarily in the materials, financials and consumer staples sectors.
- From our vantage point, the slowing global growth environment remains the biggest concern. Tensions are rising in many emerging markets and China has seen material weakness in its economy. It is becoming increasingly clear to us that the U.S. economy is decoupling from the emerging markets with steady growth and has the potential for acceleration in the second half of 2013. We believe the United States is in the middle innings of a multi-year business up-cycle. While decoupling is a word that most investors do not believe can exist in this global economy, in our opinion, the data suggest otherwise at this point, so stay tuned. We are optimistic about growth prospects for the United States and have positioned the Fund accordingly.
| PAGE 4 | |
|
| WESTCORE MIDCO GROWTH FUND (WTMGX (continued) |
| |
(for the year ended 6/30/13)
| | Average | | Contribution | |
5 Highest | Weight | | to Return | |
Netflix Inc. | 1.84% | | 1.73% | |
LinkedIn Corp. | 2.51 | | 1.17 | |
Splunk Inc. | 2.08 | | 0.97 | |
Pandora Media Inc. | 1.15 | | 0.70 | |
ServiceNow Inc. | 1.63 | | 0.64 | |
| | | | | |
5 Lowest | | | | |
TIBCO Software Inc. | 0.81% | | -0.25% | |
Thoratec Corp. | 1.37 | | -0.29 | |
Akamai Technologies Inc. | 0.92 | | -0.31 | |
Rackspace Hosting Inc. | 0.58 | | -0.45 | |
Aruba Networks Inc. | 0.46 | | -0.47 | |
Past performance does not guarantee future results. These stocks do not represent all of the securities purchased, sold or recommended by the Funds’ Adviser. To request a complete list of the contribution of each Fund holding to overall Fund performance during the period, please call 800.392.CORE (2673) or email invest@westcore.com.
Please see page 29 for a description of the methodology used to construct this chart.
| | | |
(as of 6/30/13) | | |
LinkedIn Corp. | 2.5% | |
Splunk Inc. | 2.4 | |
Discovery Communications Inc. | 2.3 | |
Sirius XM Radio Inc. | 2.2 | |
ServiceNow Inc. | 2.2 | |
Ralph Lauren Corp. | 2.1 | |
Workday Inc. | 2.1 | |
Netflix Inc. | 2.1 | |
Ingersoll-Rand PLC | 2.1 | |
Pandora Media Inc. | 2.1 | |
Total (% of Net Assets) | 22.1% | |
Top ten holdings do not include any cash, cash equivalents or exchange traded fund investments and are subject to change. There are no guarantees that the Fund will continue to remain invested in any particular holding.
| | | Number | |
| | Morningstar | of Funds in | |
| | Rating™ | Mid-Cap Growth | |
| | as of 6/30/13 | Category | |
Overall | «« | 637 | |
3 Year | «« | 637 | |
5 Year | ««« | 563 | |
10 Year | «« | 417 | |
Morningstar Ratings shown represent the Retail Class. Morningstar proprietary ratings reflect historical risk-adjusted performance as of 6/30/13 and are subject to change every month.
Please see page 29 for more detail regarding Morningstar Ratings.
Portfolio Characteristics |
(as of 6/30/13)
| | Westcore MIDCO | | Russell Midcap® | |
| | Growth Fund | | Growth Index | |
Weighted Average Market Capitalization ($ Bil) | $8.7 | | $10.5 | |
Price/Earnings (1 year trailing) | 25.3x | | 21.3x | |
EPS Growth (3 year historical) | 22.2% | | 20.4% | |
Beta | 1.2 | | 1.0 | |
Number of Holdings | 68 | | 460 | |
Portfolio Turnover Rate | 123% | | — | |
Please see page 30 for definition of terms.

Sector classifications presented herein are based on the sector categorization methodology of the Adviser to the Funds which may result in the sector designations for one Fund being different than another Fund’s sector designations.

*Total Investments for this chart excludes short-term investments, including money market mutual funds.
Market capitalization ranges were determined by the Adviser to the Fund and are for presentation purposes only. These market capitalization ranges do not necessarily correlate to the benchmark’s market capitalization ranges.
PAGE 5 |
|
Investing primarily in the common stock of a limited number of medium-sized companies selected for their growth potential.
| | |
Mitch S. Begun, CFA Lead Portfolio Manager Portfolio Manager
F. Wiley Reed, CFA Lead Portfolio Manager
Adam C. Bliss Portfolio Manager | Brian C. Fitzsimons, CFA
Jeffrey J. Loehr, CFA Portfolio Manager |
CFA is a trademark owned by the CFA Institute.
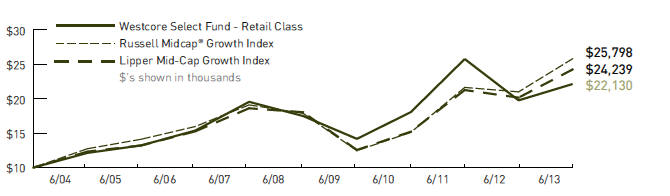
The chart above represents historical performance of a hypothetical investment of $10,000 in the Fund over the past 10 years (or for the life of the Fund if shorter). Performance calculations are as of the end of June each year. Past performance does not guarantee future results. This chart does not reflect the deduction of taxes that a shareholder would pay on Fund distributions or the redemption of Fund shares.
Lipper Index data provided by Lipper, Inc.
Please see pages 28 and 29 for index definitions.
| Average Annual Total Returns |
| | | | | | | | | | | | | |
| | | | | | | | | | | | Since | Inception |
| | 6 Months | | 1 Year | | 3 Years | | 5 Years | | 10 Years | | Inception | Date |
Retail Class (WTSLX) | 16.57% | | 11.98% | | 7.02% | | 4.82% | | 8.27% | | 10.98% | 10/1/1999 |
Russell Midcap® | | | | | | | | | | | | |
Growth Index | 14.70 | | 22.88 | | 19.53 | | 7.61 | | 9.94 | | 5.85 | |
Lipper Mid-Cap | | | | | | | | | | | | |
Growth Index | 14.26 | | 20.24 | | 16.81 | | 6.09 | | 9.26 | | 5.04 | |
Retail Class Annual Expense Ratio (per the current prospectus) — Gross: 1.07%, Net: 1.07%
The performance data quoted represents past performance and does not guarantee future results. Performance information for the institutional class shares prior to their inception date is based on the performance of the retail class. Current performance may be lower or higher than the performance quoted. To obtain current performance as of the most recent month-end, please call 800.392.CORE (2673) or visit us online at www.westcore.com. Average annual total returns and yield figures reflect the reinvestment of dividends, capital gains distributions, all fee waivers and expense reimbursements. Without the fee waivers and expense reimbursements, total return and yield figures would have been lower. Total return and yield figures represent past performance. Investment return and principal value will vary, and shares, when redeemed, may be worth more or less than their original cost. Westcore fund shares are not insured by the FDIC, the Federal Reserve Board or any other agency and are subject to investment risk.
Denver Investments (the “Adviser”) has contractually agreed to waive the investment advisory and/or administration fees and/or to reimburse Fund level other expenses from April 30, 2013 until at least April 30, 2014, so that the ratio of expenses to average net assets as reported in the Fund’s Financial Highlights will be no more than 1.15% for the Fund’s Retail Class for such period. This agreement may not be terminated or modified prior to this date except with the approval of the Board of Trustees.
Westcore Select Fund is a non-diversified fund and investing in non-diversified funds generally will be more volatile and a loss of principal could be greater than investing in more diversified funds.
- In the first half of 2013, the Westcore Select Fund outperformed its benchmark, the Russell Midcap® Growth Index.
- Domestic small- and mid-cap equities surged to all-time highs in the first half of 2013. While equity markets rose, the threat of the Fed tapering its Quantitative Easing strategy sparked a sharp rise in interest rates in the second quarter. Taking a step back, we view interest rates going higher as primarily a sign that the U.S. economy is improving. Strong demand for housing and autos along with benign inflation continued to provide a solid backdrop for equities.
- The sectors that contributed most to the Fund’s performance relative to its benchmark in the first half of 2013 were information technology, materials and industrials. Within information technology, both LinkedIn Corp. and Splunk Inc. were top contributors. LinkedIn, the world’s largest online professional network, continued to monetize its unique asset through product innovation and solid execution. Splunk’s software solutions, which collect and index data at a massive scale, have become increasingly embedded in enterprise decision-making and analytic processes. Industrials sector holding, Kansas City Southern, performed well as investors came to appreciate this rail operator’s accelerating growth profile. We believe its rail network is positioned to benefit from two long-term trends: the “near-shoring” of manufacturing to Mexico and increasing U.S. oil production. Rockwood Holdings Inc. was the Fund’s best performer in the materials sector. This diversified chemical company saw strength in its lithium segment and announced the divestiture of its ceramic business for attractive terms.
- The sectors that detracted most from performance relative to the benchmark were health care, consumer staples and consumer discretionary. The Fund’s worst performing stock was information technology sector holding Aruba Networks Inc. Aruba, a leader in enterprise Wi-Fi solutions, saw increased competition in the second quarter and gave a disappointing growth outlook. We exited the position. Also within information technology, Akamai Technologies Inc. was a notable underperformer. This Internet content delivery network provider lowered its revenue growth forecast due to reduced demand media solutions. We sold the stock on concerns about longer-term pricing pressure for its solutions. Thoratec Corp., a leading provider of healthcare equipment for heart failure patients, was also a drag on performance. Disappointing results in the face of intense competition led us to exit the position. The Fund’s underperformance in the consumer staples sector was driven primarily by its underweighted position while stock selection led to underperformance in the consumer discretionary sector.
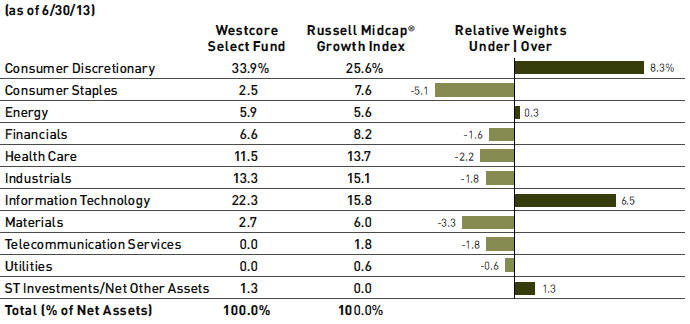
- As of the end of the first half of 2013, the Fund was overweighted primarily in the information technology and consumer discretionary sectors, and underweighted primarily in the consumer staples and materials sectors.
- From our vantage point, the slowing global growth environment remains the biggest concern. Tensions are rising in many emerging markets and China has seen material weakness in its economy. It is becoming increasingly clear to us that the U.S. economy is decoupling from the emerging markets with steady growth and has the potential for acceleration in the second half of 2013. We believe the United States is in the middle innings of a multi-year business up-cycle. While decoupling is a word that most investors do not believe can exist in this global economy, in our opinion, the data suggest otherwise at this point, so stay tuned. We are optimistic about growth prospects for the United States and have positioned the Fund accordingly.
PAGE 6 |
|
| WESTCORE SELECT FUND (continued) |
| |
(for the year ended 6/30/13)
| | Average | | Contribution | |
5 Highest | Weight | | to Return | |
LinkedIn Corp. | 4.48% | | 2.11% | |
Splunk Inc. | 3.68 | | 1.75 | |
Kansas City Southern | 3.90 | | 1.25 | |
Express Inc. | 3.17 | | 1.15 | |
Rockwood Holdings Inc. | 1.96 | | 1.02 | |
| | | | | |
5 Lowest | | | | |
Palo Alto Networks Inc. | 2.08% | | -0.20% | |
TIBCO Software Inc. | 1.50 | | -0.33 | |
Akamai Technologies Inc. | 1.55 | | -0.52 | |
Thoratec Corp. | 2.90 | | -0.62 | |
Aruba Networks Inc. | 0.67 | | -0.70 | |
Past performance does not guarantee future results. These stocks do not represent all of the securities purchased, sold or recommended by the Funds’ Adviser. To request a complete list of the contribution of each Fund holding to overall Fund performance during the period, please call 800.392.CORE (2673) or email invest@westcore.com.
Please see page 29 for a description of the methodology used to construct this chart.
| | | |
(as of 6/30/13) | | |
LinkedIn Corp. | 4.4% | |
Splunk Inc. | 4.3 | |
WABCO Holdings Inc. | 3.7 | |
BorgWarner Inc. | 3.7 | |
ServiceNow Inc. | 3.6 | |
Ralph Lauren Corp. | 3.6 | |
Michael Kors Holdings Ltd. | 3.6 | |
Pandora Media Inc. | 3.5 | |
Gartner Inc. | 3.4 | |
SVB Financial Group | 3.4 | |
Total (% of Net Assets) | 37.2% | |
Top ten holdings do not include any cash, cash equivalents or exchange traded fund investments and are subject to change. There are no guarantees that the Fund will continue to remain invested in any particular holding.
| | | Number | |
| | Morningstar | of Funds in | |
| | Rating™ | Mid-Cap Growth | |
| | as of 6/30/13 | Category | |
Overall | «« | 637 | |
3 Year | « | 637 | |
5 Year | «« | 563 | |
10 Year | ««« | 417 | |
Morningstar proprietary ratings reflect historical risk-adjusted performance as of 6/30/13 and are subject to change every month.
Please see page 29 for more detail regarding Morningstar Ratings.
Portfolio Characteristics |
(as of 6/30/13)
| | Westcore | | Russell Midcap® | |
| | Select Fund | | Growth Index | |
Weighted Average Market Capitalization ($ Bil) | $9.5 | | $10.5 | |
Price/Earnings (1 year trailing) | 24.4x | | 21.3x | |
EPS Growth (3 year historical) | 30.6% | | 20.4% | |
Beta | 1.2 | | 1.0 | |
Number of Holdings | 32 | | 460 | |
Portfolio Turnover Rate | 125% | | — | |
Please see page 30 for definition of terms.
Sector classifications presented herein are based on the sector categorization methodology of the Adviser to the Funds which may result in the sector designations for one Fund being different than another Fund’s sector designations.
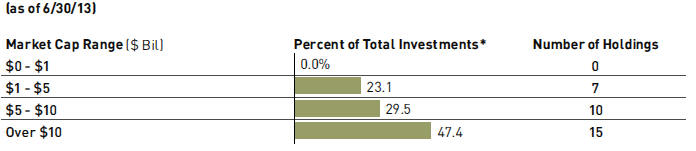
*Total Investments for this chart excludes short-term investments, including money market mutual funds.
Market capitalization ranges were determined by the Adviser to the Fund and are for presentation purposes only. These market capitalization ranges do not necessarily correlate to the benchmark’s market capitalization ranges.
PAGE 7 |
|
Investing in large, well-established, dividend-paying companies both in the United States and in developed foreign markets.
| | |
Troy Dayton, CFA Portfolio Manager Portfolio Manager
Derek R. Anguilm, CFA Portfolio Manager Manager | Mark M. Adelmann, CFA, CPA
Lisa Z. Ramirez, CFA Portfolio |
CFA is a trademark owned by the CFA Institute.

The chart above represents historical performance of a hypothetical investment of $10,000 in the Fund over the past 10 years (or for the life of the Fund if shorter). Performance calculations are as of the end of June each year. Past performance does not guarantee future results. This chart does not reflect the deduction of taxes that a shareholder would pay on Fund distributions or the redemption of Fund shares.
Lipper Index data provided by Lipper, Inc.
Please see pages 28 and 29 for index definitions.
| Average Annual Total Returns |
| | | | | | | | | | | | Since | | Inception | |
| | 6 Months | | 1 Year | | 3 Years | | 5 Years | | 10 Years | | Inception | | Date | |
Retail Class (WTMVX) | 11.00% | | 17.96% | | 15.40% | | 4.19% | | 6.51% | | 8.56% | | 6/1/1988 | |
Institutional Class | | | | | | | | | | | | | | |
(WIMVX) | 11.21 | | 18.34 | | 15.57 | | 4.37 | | 6.61 | | 8.60 | | 9/28/2007 | |
S&P 500® Index | 13.82 | | 20.60 | | 18.45 | | 7.01 | | 7.30 | | 9.71 | | | |
Lipper Large-Cap | | | | | | | | | | | | | | |
Core Index | 13.87 | | 21.55 | | 17.09 | | 6.03 | | 6.48 | | 8.90 | | | |
Retail Class Annual Expense Ratio (per the current prospectus) — Gross: 1.17%, Net: 1.15%
Institutional Class Annual Expense Ratio (per the current prospectus) — Gross: 1.06%, Net: 0.92%
The performance data quoted represents past performance and does not guarantee future results. Performance information for the institutional class shares prior to their inception date is based on the performance of the retail class. Current performance may be lower or higher than the performance quoted. To obtain current performance as of the most recent month-end, please call 800.392.CORE (2673) or visit us online at www.westcore.com. Average annual total returns and yield figures reflect the reinvestment of dividends, capital gains distributions, all fee waivers and expense reimbursements. Without the fee waivers and expense reimbursements, total return and yield figures would have been lower. Total return and yield figures represent past performance. Investment return and principal value will vary, and shares, when redeemed, may be worth more or less than their original cost. Westcore fund shares are not insured by the FDIC, the Federal Reserve Board or any other agency and are subject to investment risk.
As of April 30, 2013, the Westcore Blue Chip Dividend Fund’s objective changed to long-term capital appreciation primarily through investments in large, well-established dividend paying companies.
Denver Investments (the “Adviser”) has contractually agreed to waive the investment advisory and/or administration fees and/or to reimburse Fund level other expenses from April 30, 2013 until at least April 30, 2014, so that the ratio of expenses to average net assets as reported in the Fund’s Financial Highlights will be no more than 1.15% for the Fund’s Retail Class for such period. In addition, the Adviser has contractually agreed to waive the investment advisory and/or administration fees and/or to reimburse Fund level Other Expenses for the Institutional Class in the same proportion as the Retail Class waivers/reimbursements as well as reimburse the Institutional class-specific Other Expenses until at least April 30, 2014. This agreement may not be terminated or modified prior to this date except with the approval of the Board of Trustees.
Lisa Z. Ramirez is a registered representative of ALPS Distributors, Inc.
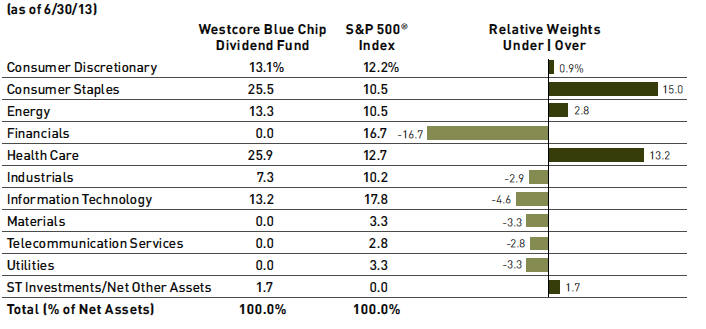
- Late in the second quarter we began to transition the Westcore Blue Chip Dividend Fund to a more focused portfolio of companies that, in our view, offer the opportunity of a growing dividend payment. We believe that coupling competitive advantage and quality considerations with a global perspective is the best starting point to find dividend-paying companies that, we believe, can weather economic cycles.
- The Westcore Blue Chip Dividend Fund underperformed its benchmark the S&P 500® Index in the first half of 2013. While we seek to outperform both the U.S. and global large-cap benchmarks over longer periods of time, the portfolio’s more concentrated focus and exposure to global companies may result in more volatility versus the benchmark in shorter timeframes. Our primary focus is on companies’ expected dividend yield and growth over a rolling 5-year timeframe.
- An illustration of this is British American Tobacco PLC (“BTI”). Had an investor purchased the stock in 2002 at a dividend yield of approximately 5%, by the end of 2012 the investor would be receiving a nearly 32% yield on initial investment (assuming dividend reinvestment). The equity value of the investment also compounded at over 21% per year. Of course, over that decade-long period the company’s stock price fluctuated, both outperforming and underperforming broad market indexes. This period was no exception, as BTI’s share price detracted from overall Fund performance. Our focus remains on the cash generating power of the company that we expect should benefit Fund shareholders in the form of cash dividends. While we cannot guarantee that companies held in the portfolio will perform as strongly as BTI, we think that it serves as an excellent reminder of the power of a dividend growth approach.
- The stocks in the portfolio currently generate a trailing one-year return on equity more than 3% above the average of those in the benchmark and on average do so without the use of higher debt. Additionally, we believe the portfolio is invested in companies at attractive valuations relative to the benchmark.
- During the first half of 2013 Microsoft Corp. was the portfolio’s top performer relative to the benchmark based on rate of return. It has grown its dividend at a five-year compound annual growth rate of 14.3% as a result of growing free cash flow and reducing shares outstanding. While the demand for technology-based goods is volatile quarter-to-quarter, long-term operating results and outlook remain steady, and we believe Microsoft should continue growing its dividend above 10% per year. Ball Corp.’s results disappointed as revenue growth slowed and earnings missed expectations. While Ball has grown its dividend, current yield remains low. Our belief that the company has a diminished ability to increase its payout in the near term led us to sell the stock.
- With the current worry over prospective returns in the bond market and uncertainty created by the possibility of Federal Reserve action, we believe that now is a great time to consider an investment in the Westcore Blue Chip Dividend Fund. We seek to build a portfolio of companies with strong and growing dividends and look forward to discussing the results of our efforts through these letters.
PAGE 8 |
|
| WESTCORE BLUE CHIP DIVIDEND FUND (continued) |
| |
(for the year ended 6/30/13)
| | Average | | Contribution | |
5 Highest | Weight | | to Return | |
Microsoft Corp. | 3.47% | | 0.97% | |
AmerisourceBergen Corp. | 2.76 | | 0.70 | |
H.J. Heinz Co. | 1.83 | | 0.66 | |
Activision Blizzard Inc. | 1.03 | | 0.61 | |
Campbell Soup Co. | 1.32 | | 0.59 | |
| | | | | |
5 Lowest | | | | |
Coca-Cola Co. | 1.06% | | -0.14% | |
Ball Corp. | 2.64 | | -0.19 | |
LVMH Moet Hennessy | | | | |
Louis Vuitton SA | 1.12 | | -0.23 | |
British American | | | | |
Tobacco PLC | 1.11 | | -0.24 | |
Nestle S.A. | 1.06 | | -0.25 | |
Past performance does not guarantee future results. These stocks do not represent all of the securities purchased, sold or recommended by the Funds’ Adviser. To request a complete list of the contribution of each Fund holding to overall Fund performance during the period, please call 800.392.CORE (2673) or email invest@westcore.com.
Please see page 29 for a description of the methodology used to construct this chart.
| | | |
(as of 6/30/13) | | |
Raytheon Co. | 3.7% | |
General Dynamics Corp. | 3.6 | |
Microsoft Corp. | 3.6 | |
AmerisourceBergen Corp. | 3.5 | |
Occidental Petroleum Corp. | 3.5 | |
Mattel Inc. | 3.4 | |
Darden Restaurants Inc. | 3.4 | |
Roche Holding AG | 3.3 | |
Chevron Corp. | 3.3 | |
Total SA | 3.3 | |
Total (% of Net Assets) | 34.6% | |
Top ten holdings do not include any cash, cash equivalents or exchange traded fund investments and are subject to change. There are no guarantees that the Fund will continue to remain invested in any particular holding.
| | | Number | |
| | Morningstar | of Funds in | |
| | Rating™ | Large Blend | |
| | as of 6/30/13 | Category | |
Overall | ««« | 1,381 | |
3 Year | ««« | 1,381 | |
5 Year | «« | 1,254 | |
10 Year | ««« | 774 | |
Morningstar Ratings shown represent the Retail Class. Morningstar proprietary ratings reflect historical risk-adjusted performance as of 6/30/13 and are subject to change every month.
Please see page 29 for more detail regarding Morningstar Ratings.
Portfolio Characteristics |
(as of 6/30/13)
| | Westcore Blue Chip | | S&P 500® | |
| | Dividend Fund | | Index | |
Weighted Average Market Capitalization ($ Bil) | $99.1 | | $102.7 | |
Price/Cash Flow (1 year trailing) | 10.9x | | 11.9x | |
Price/Book Value | 3.1x | | 2.7x | |
Price/Earnings (1 year trailing) | 14.9x | | 16.7x | |
Beta | 0.9 | | 1.0 | |
Number of Holdings | 30 | | 500 | |
Portfolio Turnover Rate | 78% | | — | |
Please see page 30 for definition of terms.
Sector classifications presented herein are based on the sector categorization methodology of the Adviser to the Funds which may result in the sector designations for one Fund being different than another Fund’s sector designations.

*Total Investments for this chart excludes short-term investments, including money market mutual funds.
Market capitalization ranges were determined by the Adviser to the Fund and are for presentation purposes only. These market capitalization ranges do not necessarily correlate to the benchmark’s market capitalization ranges.
PAGE 9 |
|
Investing in medium-sized, dividend-paying companies whose stocks appear to be undervalued.
| | |
Troy Dayton, CFA Portfolio Manager Portfolio Manager
Derek R. Anguilm, CFA Portfolio Manager | Mark M. Adelmann, CFA, CPA
Lisa Z. Ramirez, CFA Portfolio Manager |
CFA is a trademark owned by the CFA Institute.

The chart above represents historical performance of a hypothetical investment of $10,000 in the Fund over the past 10 years (or for the life of the Fund if shorter). Performance calculations are as of the end of June each year. Past performance does not guarantee future results. This chart does not reflect the deduction of taxes that a shareholder would pay on Fund distributions or the redemption of Fund shares.
Lipper Index data provided by Lipper, Inc. Please see pages 28 and 29 for index definitions.
| Average Annual Total Returns |
| | | | | | | | | | | | Since | Inception |
| | 6 Months | | 1 Year | | 3 Years | | 5 Years | | 10 Years | | Inception | Date |
Retail Class | | | | | | | | | | | | |
(WTMCX) | 15.71% | | 25.61% | | 17.02% | | 5.68% | | 8.77% | | 8.89% | 10/1/1998 |
Russell Midcap® | | | | | | | | | | | | |
Value Index | 16.10 | | 27.65 | | 19.53 | | 8.87 | | 10.92 | | 9.83 | |
Lipper Mid-Cap | | | | | | | | | | | | |
Value Index | 16.22 | | 28.11 | | 18.17 | | 7.81 | | 9.83 | | 9.33 | |
Retail Class Annual Expense Ratio (per the current prospectus) — Gross: 1.27%, Net: 1.26%
The performance data quoted represents past performance and does not guarantee future results. Performance information for the institutional class shares prior to their inception date is based on the performance of the retail class. Current performance may be lower or higher than the performance quoted. To obtain current performance as of the most recent month-end, please call 800.392.CORE (2673) or visit us online at www.westcore.com. Average annual total returns and yield figures reflect the reinvestment of dividends, capital gains distributions, all fee waivers and expense reimbursements. Without the fee waivers and expense reimbursements, total return and yield figures would have been lower. Total return and yield figures represent past performance. Investment return and principal value will vary, and shares, when redeemed, may be worth more or less than their original cost. Westcore fund shares are not insured by the FDIC, the Federal Reserve Board or any other agency and are subject to investment risk.
Denver Investments (the “Adviser”) has contractually agreed to waive the investment advisory and/or administration fees and/or to reimburse Fund level other expenses from April 30, 2013 until at least April 30, 2014, so that the ratio of expenses to average net assets as reported in the Fund’s Financial Highlights will be no more than 1.25% for the Fund’s Retail Class for such period. This agreement may not be terminated or modified prior to this date except with the approval of the Board of Trustees.
Lisa Z. Ramirez is a registered representative of ALPS Distributors, Inc.
- The Westcore Mid-Cap Value Dividend Fund underperformed its benchmark the Russell Midcap® Value Index for the first half of 2013.
- The Federal Reserve attempted to provide clarity as to when it would begin to taper its quantitative easing programs. In so doing, the Fed is attempting to orchestrate a gradual movement of interest rates toward levels that more fairly reflect the current economic environment. History suggests this is a very difficult thing to accomplish. The stock market may also be recalibrating as investors feel less certain they will be protected by Federal Reserve actions.
- The strongest contributors to the Fund’s relative performance thus far in 2013 were the medical/ healthcare, energy and interest rate sensitive sectors. During the first quarter, supply disruptions at Questcor Pharmaceuticals, Inc. were tied to SKU changes required by Medicaid. This soft spot was short-lived as investors were encouraged by prescription trends that have regained strength and surpassed prior levels. Furthermore, investors seemed enthusiastic when Questcor announced the acquisition of a product that will provide it with international exposure while eliminating a potential long-term competing product. The outperformance in energy was partly due to the portfolio’s underweighted position in this sector and partly to strong performance within oil services. Disability insurer and group benefits provider, Unum Group, was the leader within the interest rate sensitive sector and the Fund’s top performer for the first six months. Investors rewarded the company’s stable-to- modestly improving operating results. Job growth was also an important factor in Unum’s strong performance as was the rising interest rate environment. We believe these two factors will continue to benefit the company’s results going forward.
- Relative returns were dampened by results in the technology, consumer cyclical and commercial services sectors. After a strong 2012 and first quarter 2013, investors were not satisfied that Dillard’s Inc. reported a quarter that was in-line with, but not as strong as previous quarters. Dillard’s, a Fund holding in the consumer cyclical sector, is a turnaround story that has historically been successful. We still see ample opportunity for sales growth and margin improvement as the company continues to close underperforming stores and introduces higher-end, unique vendor products. Silver producer, Hecla Mining Co. underperformed in the first half of the year as silver prices were under severe pressure. After Hecla announced the acquisition of Aurizon Mines, we elected to sell the position as we believe the price paid was excessive and were alarmed by the impact on the balance sheet.
- Most investors would agree Federal Reserve quantitative easing drove interest rates down to artificially low, unsustainable levels in an effort to stimulate stock prices, housing activity and associated home prices, and consumer net worth and by association, consumer confidence. While slower than expected, improvements in these areas now bring the capital markets to a critical juncture. Investors may for the first time in years be seeing negative total returns from their bond portfolios this quarter. The mantra that rewarded investors the past four to five years has been “don’t fight the Fed.” This particularly rewarded investors in lower-quality, less-liquid bonds and stocks with weaker fundamentals. It will be interesting to see what “don’t fight the Fed” will mean for the markets as they cautiously change direction. We believe the Fund’s focus on high- quality; dividend paying companies is well positioned for this environment.
PAGE 10 |
|
| WESTCORE MID-CAP VALUE DIVIDEND FUND (continued) |
| |
(for the year ended 6/30/13)
| | Average | | Contribution | |
5 Highest | Weight | | to Return | |
Unum Group | 2.19% | | 0.91% | |
AXIS Capital Holdings Ltd. | 2.22 | | 0.79 | |
Questcor Pharmaceuticals Inc. | 1.19 | | 0.74 | |
Tyson Foods Inc. | 2.47 | | 0.73 | |
Omnicare Inc. | 2.37 | | 0.71 | |
| | | | | |
5 Lowest | | | | |
Alexandria Real Estate | | | | |
Equities Inc. | 1.30% | | -0.03% | |
Silgan Holdings Inc. | 0.68 | | -0.03 | |
Dillard's Inc. | 2.00 | | -0.06 | |
Ball Corp. | 1.99 | | -0.12 | |
Hecla Mining Co. | 0.65 | | -0.64 | |
Past performance does not guarantee future results. These stocks do not represent all of the securities purchased, sold or recommended by the Funds’ Adviser. To request a complete list of the contribution of each Fund holding to overall Fund performance during the period, please call 800.392.CORE (2673) or email invest@westcore.com.
Please see page 29 for a description of the methodology used to construct this chart.
| | | |
(as of 6/30/13) | | |
Questcor Pharmaceuticals Inc. | 2.9% | |
Reinsurance Group of America Inc. | 2.8 | |
Tyson Foods Inc. | 2.6 | |
Plantronics Inc. | 2.6 | |
American Water Works Co. Inc. | 2.5 | |
Westar Energy Inc. | 2.4 | |
The NASDAQ OMX Group Inc. | 2.3 | |
Quest Diagnostics Inc. | 2.2 | |
UGI Corp. | 2.2 | |
Home Properties Inc. | 2.1 | |
Total (% of Net Assets) | 24.6% | |
Top ten holdings do not include any cash, cash equivalents or exchange traded fund investments and are subject to change. There are no guarantees that the Fund will continue to remain invested in any particular holding.
| | | | |
| | | Number | |
| | Morningstar | of Funds in | |
| | Rating™ | Mid-Cap Value | |
| | as of 6/30/13 | Category | |
Overall | ««« | 369 | |
3 Year | ««« | 369 | |
5 Year | «« | 312 | |
10 Year | ««« | 176 | |
Morningstar proprietary ratings reflect historical risk-adjusted performance as of 6/30/13 and are subject to change every month.
Please see page 29 for more detail regarding Morningstar Ratings.
| Portfolio Characteristics | | | | | | |
(as of 6/30/13)
| | Westcore Mid-Cap | | Russell Midcap® | |
| | Value Dividend Fund | | Value Index | |
Weighted Average Market Capitalization ($ Bil) | $7.4 | | $9.8 | |
Price/Cash Flow (1 year trailing) | 9.5x | | 11.9x | |
Price/Book Value | 2.3x | | 2.0x | |
Price/Earnings (1 year trailing) | 14.5x | | 15.5x | |
Beta | 0.9 | | 1.0 | |
Number of Holdings | 55 | | 563 | |
Portfolio Turnover Rate | 42% | | — | |
Please see page 30 for definition of terms.
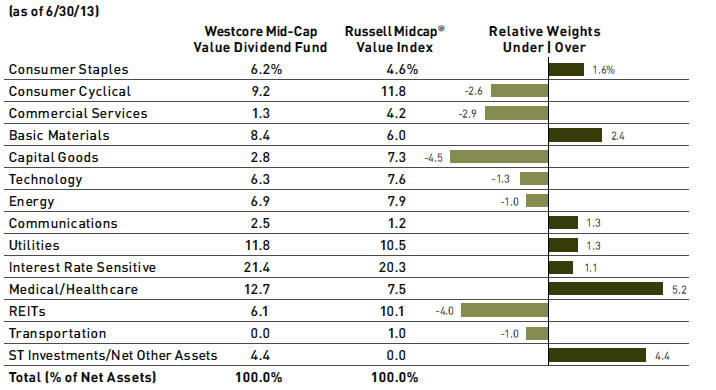
Sector classifications presented herein are based on the sector categorization methodology of the Adviser to the Funds which may result in the sector designations for one Fund being different than another Fund’s sector designations.
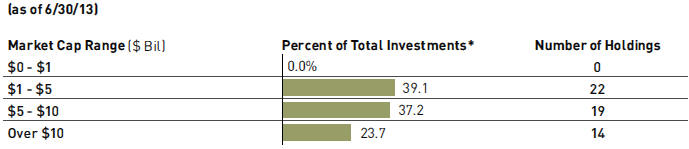
*Total Investments for this chart excludes short-term investments, including money market mutual funds.
Market capitalization ranges were determined by the Adviser to the Fund and are for presentation purposes only. These market capitalization ranges do not necessarily correlate to the benchmark’s market capitalization ranges.
PAGE 11 |
|
Investing in small-company stocks that appear to be undervalued.
| | |
Troy Dayton, CFA Portfolio Manager Portfolio Manager
Derek R. Anguilm, CFA Portfolio Manager | Mark M. Adelmann, CFA, CPA
Lisa Z. Ramirez, CFA Portfolio Manager |
CFA is a trademark owned by the CFA Institute.
The chart above represents historical performance of a hypothetical investment of $10,000 in the Fund over the past 10 years (or for the life of the Fund if shorter). Performance calculations are as of the end of June each year. Past performance does not guarantee future results. This chart does not reflect the deduction of taxes that a shareholder would pay on Fund distributions or the redemption of Fund shares.
Lipper Index data provided by Lipper, Inc.
Please see pages 28 and 29 for index definitions.
| Average Annual Total Returns |
| | | | | | | | | | | | Since | | Inception | |
| | 6 Months | | 1 Year | | 3 Years | | 5 Years | | 10 Years | | Inception | | Date | |
Retail Class (WTSCX) | 14.69% | | 17.33% | | 13.12% | | 5.25% | | 7.78% | | 8.35% | | 12/28/1993 | |
Institutional Class | | | | | | | | | | | | | | |
(WISCX) | 14.75 | | 17.48 | | 13.25 | | 5.39 | | 7.87 | | 8.39 | | 9/28/2007 | |
Russell 2000® Index | 15.86 | | 24.21 | | 18.67 | | 8.77 | | 9.53 | | 8.51 | | | |
Lipper Small-Cap | | | | | | | | | | | | | | |
Core Index | 14.45 | | 24.89 | | 17.90 | | 8.38 | | 9.72 | | 9.51 | | | |
Retail Class Annual Expense Ratio (per the current prospectus) — Gross: 1.51%, Net: 1.31%
Institutional Class Annual Expense Ratio (per the current prospectus) — Gross: 2.08%, Net: 1.19%
The performance data quoted represents past performance and does not guarantee future results. Performance information for the institutional class shares prior to their inception date is based on the performance of the retail class. Current performance may be lower or higher than the performance quoted. To obtain current performance as of the most recent month-end, please call 800.392.CORE (2673) or visit us online at www.westcore.com. Average annual total returns and yield figures reflect the reinvestment of dividends, capital gains distributions, all fee waivers and expense reimbursements. Without the fee waivers and expense reimbursements, total return and yield figures would have been lower. Total return and yield figures represent past performance. Investment return and principal value will vary, and shares, when redeemed, may be worth more or less than their original cost. Westcore fund shares are not insured by the FDIC, the Federal Reserve Board or any other agency and are subject to investment risk.
Denver Investments (the “Adviser”) contractually agreed to waive the investment advisory and/or administration fees and/or to reimburse Fund level other expenses from April 30, 2013 until at least April 30, 2014, so that the ratio of expenses to average net assets as reported in the Fund’s Financial Highlights will be no more than 1.30% for the Fund’s Retail Class for such period. In addition, the Adviser has contractually agreed to waive the investment advisory and/or administration fees and/or to reimburse Fund level Other Expenses for the Institutional Class in the same proportion as the Retail Class waivers/reimbursements as well as reimburse the Institutional class-specific Other Expenses until at least April 30, 2014. This agreement may not be terminated or modified prior to this date except with the approval of the Board of Trustees.
Investing in small-cap funds generally will be more volatile and loss of principal could be greater than investing in larger-cap funds.
Lisa Z. Ramirez is a registered representative of ALPS Distributors, Inc.
- Despite second quarter outperformance, the Westcore Small-Cap Opportunity Fund underperformed its benchmark the Russell 2000® Index for the first half of 2013.
- The Federal Reserve attempted to provide clarity as to when it would begin to taper its quantitative easing programs. In so doing, the Fed is attempting to orchestrate a gradual movement of interest rates toward levels that more fairly reflect the current economic environment. History suggests this is a very difficult thing to accomplish. The stock market may also be recalibrating as investors feel less certain they will be protected by Federal Reserve actions.
- In mid-2013, the best contributors to relative performance were the interest rate sensitive, energy and basic materials sectors. Independent financial services distribution company, National Financial Partners Corp., was the standout performer in the interest rate sensitive sector. During the period Madison Dearborn Partners LLC, a private equity firm, offered to buy the company validating our opinion that National Financial was undervalued. We sold the stock and re-deployed the proceeds. KapStone Paper & Packaging Corp. was the standout in basic materials. KapStone’s recently announced acquisition of Longview Fibre and Packaging, Inc. increases its containerboard exposure and adds to its Kraft Paper business. Additionally, the acquisition will bring wallpaper to the company’s mix of products.
- Weak first half relative contributors were the commercial services, medical/healthcare and consumer cyclical sectors. Commercial services holding, Central Garden & Pet Co. has experienced disappointing revisions recently with uncharacteristically cooler weather impacting demand for its garden products. Further, increased inventory and higher marketing costs have impaired near-term cash flows. The new CEO indicated the company will embark on further cost cutting measures with a balanced approach focusing on greater profitability, sales growth and strong customer service. Medical/ healthcare holding, Orthofix International N.V., had a disappointing quarter as its stimulation business, one of its higher-margin units, has continued to be weak. Furthermore, every business unit outside of biologics has seemingly become impaired. With a lack of clarity on business improvement, we sold the stock.
- Most investors would agree Federal Reserve quantitative easing drove interest rates down to artificially low, unsustainable levels in an effort to stimulate stock prices, housing activity and associated home prices, and consumer net worth and by association, consumer confidence. While slower than expected, improvements in these areas now bring the capital markets to a critical juncture. Investors may for the first time in years be seeing negative total returns from their bond portfolios this quarter. The mantra that rewarded investors the past four to five years has been “don’t fight the Fed.” This particularly rewarded investors in lower-quality, less-liquid bonds and stocks with weaker fundamentals. It will be interesting to see what “don’t fight the Fed” will mean for the markets as they cautiously change direction. We believe the Fund’s focus on high-quality, cash flow driven companies allows it to be well positioned for this environment.
PAGE 12 |
|
| WESTCORE SMALL-CAP OPPORTUNITY FUND (continued) |
| |
(for the year ended 6/30/13)
| | Average | | Contribution | |
5 Highest | Weight | | to Return | |
KapStone Paper & | | | | |
Packaging Corp. | 1.96% | | 1.23% | |
PAREXEL International Corp. | 1.82 | | 1.17 | |
Monotype Imaging Holdings Inc. | 2.10 | | 1.14 | |
National Financial | | | | |
Partners Corp. | 1.63 | | 0.92 | |
Schweitzer-Mauduit | | | | |
International Inc. | 3.09 | | 0.87 | |
| | | | | |
5 Lowest | | | | |
Schawk Inc. | 0.57% | | -0.22% | |
Tetra Tech Inc. | 0.92 | | -0.50 | |
Hecla Mining Co. | 0.60 | | -0.59 | |
Orthofix International N.V. | 1.71 | | -0.63 | |
Central Garden & Pet Co. | 1.75 | | -0.76 | |
Past performance does not guarantee future results. These stocks do not represent all of the securities purchased, sold or recommended by the Funds’ Adviser. To request a complete list of the contribution of each Fund holding to overall Fund performance during the period, please call 800.392.CORE (2673) or email invest@westcore.com.
Please see page 29 for a description of the methodology used to construct this chart.
| | | |
(as of 6/30/13) | | |
Schweitzer-Mauduit International Inc. | 3.7% | |
U.S. Physical Therapy Inc. | 2.7 | |
Express Inc. | 2.5 | |
PharMerica Corp. | 2.5 | |
Horace Mann Educators Corp. | 2.5 | |
LifePoint Hospitals Inc. | 2.5 | |
Plantronics Inc. | 2.3 | |
AmTrust Financial Services Inc. | 2.3 | |
Marten Transport Ltd. | 2.2 | |
West Pharmaceutical Services Inc. | 2.1 | |
Total (% of Net Assets) | 25.3% | |
Top ten holdings do not include any cash, cash equivalents or exchange traded fund investments and are subject to change. There are no guarantees that the Fund will continue to remain invested in any particular holding.
| | | | |
| | | Number | |
| | Morningstar | of Funds in | |
| | Rating™ | Small Blend | |
| | as of 6/30/13 | Category | |
Overall | «« | 621 | |
3 Year | « | 621 | |
5 Year | «« | 548 | |
10 Year | «« | 339 | |
Morningstar Ratings shown represent the Retail Class. Morningstar proprietary ratings reflect historical risk-adjusted performance as of 6/30/13 and are subject to change every month.
Please see page 29 for more detail regarding Morningstar Ratings.
| Portfolio Characteristics | | | | | | |
(as of 6/30/13)
| | Westcore Small-Cap | | Russell 2000® | |
| | Opportunity Fund | | Index | |
Weighted Average Market Capitalization ($ Mil) | | $1,394.0 | | | $1,587.0 | |
Price/Cash Flow (1 year trailing) | | 10.9x | | | 13.3x | |
Price/Book Value | | 2.1x | | | 2.3x | |
Price/Earnings (1 year trailing) | | 17.9x | | | 18.4x | |
Beta | | 0.9 | | | 1.0 | |
Number of Holdings | | 60 | | | 1,934 | |
Portfolio Turnover Rate | | 60% | | | — | |
Please see page 30 for definition of terms.

Sector classifications presented herein are based on the sector categorization methodology of the Adviser to the Funds which may result in the sector designations for one Fund being different than another Fund’s sector designations.

*Total Investments for this chart excludes short-term investments, including money market mutual funds.
Market capitalization ranges were determined by the Adviser to the Fund and are for presentation purposes only. These market capitalization ranges do not necessarily correlate to the benchmark’s market capitalization ranges.
PAGE 13 |
|
Investing primarily in small-cap, dividend paying stocks that appear to be undervalued.
| | |
Troy Dayton, CFA Portfolio Manager Portfolio Manager
Derek R. Anguilm, CFA Portfolio Manager | Mark M. Adelmann, CFA, CPA
Lisa Z. Ramirez, CFA Portfolio Manager |
CFA is a trademark owned by the CFA Institute.
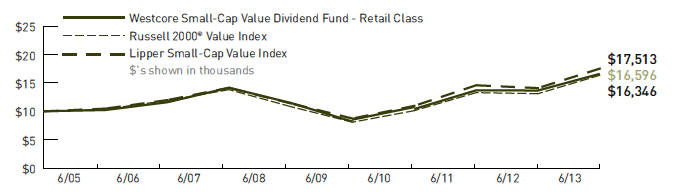
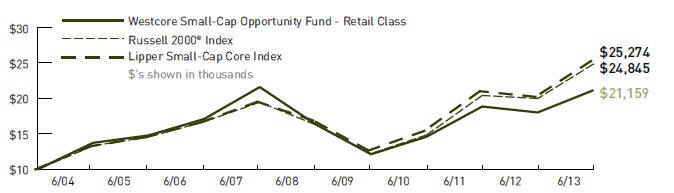
The chart above represents historical performance of a hypothetical investment of $10,000 in the Fund over the past 10 years (or for the life of the Fund if shorter). Performance calculations are as of the end of June each year. Past performance does not guarantee future results. This chart does not reflect the deduction of taxes that a shareholder would pay on Fund distributions or the redemption of Fund shares.
Lipper Index data provided by Lipper, Inc.
Please see pages 28 and 29 for index definitions.
| Average Annual Total Returns |
| | | | | | | | | | | | Since | Inception |
| | 6 Months | | 1 Year | | 3 Years | | 5 Years | | 10 Years | | Inception | Date |
Retail Class (WTSVX) | 17.23% | | 21.50% | | 16.83% | | 7.66% | | — | | 6.11% | 12/13/2004 |
Institutional Class | | | | | | | | | | | | |
(WISVX) | 17.41 | | 21.76 | | 16.96 | | 7.77 | | — | | 6.17 | 9/28/2007 |
Russell 2000® | | | | | | | | | | | | |
Value Index | 14.39 | | 24.77 | | 17.33 | | 8.59 | | — | | 5.72 | |
Lipper Small-Cap | | | | | | | | | | | | |
Value Index | 14.09 | | 24.29 | | 16.92 | | 8.98 | | — | | 6.74 | |
Retail Class Annual Expense Ratio (per the current prospectus) — Gross: 1.40%, Net: 1.31%
Institutional Class Annual Expense Ratio (per the current prospectus) — Gross: 1.25%, Net: 1.15%
The performance data quoted represents past performance and does not guarantee future results. Performance information for the institutional class shares prior to their inception date is based on the performance of the retail class. Current performance may be lower or higher than the performance quoted. To obtain current performance as of the most recent month-end, please call 800.392.CORE (2673) or visit us online at www.westcore.com. Average annual total returns and yield figures reflect the reinvestment of dividends, capital gains distributions, all fee waivers and expense reimbursements. Without the fee waivers and expense reimbursements, total return and yield figures would have been lower. Total return and yield figures represent past performance. Investment return and principal value will vary, and shares, when redeemed, may be worth more or less than their original cost. Westcore fund shares are not insured by the FDIC, the Federal Reserve Board or any other agency and are subject to investment risk.
Denver Investments (the “Adviser”) contractually agreed to waive the investment advisory and/or administration fees and/or to reimburse Fund level other expenses from April 30, 2013 until at least April 30, 2014, so that the ratio of expenses to average net assets as reported in the Fund’s Financial Highlights will be no more than 1.30% for the Fund’s Retail Class for such period. In addition, the Adviser has contractually agreed to waive the investment advisory and/or administration fees and/or to reimburse Fund level Other Expenses for the Institutional Class in the same proportion as the Retail Class waivers/reimbursements as well as reimburse the Institutional class-specific Other Expenses until at least April 30, 2014. This agreement may not be terminated or modified prior to this date except with the approval of the Board of Trustees.
Investing in small-cap funds generally will be more volatile and loss of principal could be greater than investing in larger-cap funds.
Lisa Z. Ramirez is a registered representative of ALPS Distributors, Inc.
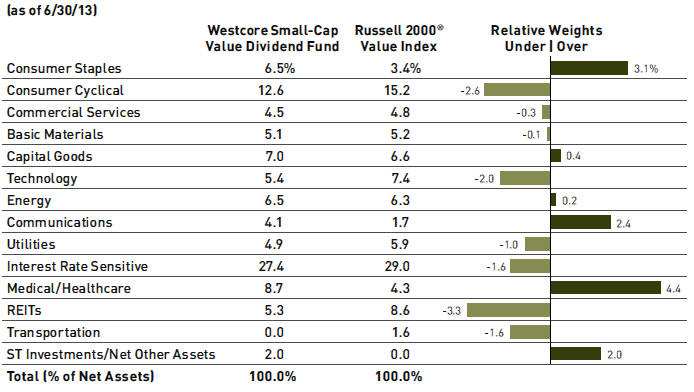
- The Westcore Small-Cap Value Dividend Fund outperformed its benchmark, the Russell 2000 Value® Index, for the first half of 2013.
- The Federal Reserve attempted to provide clarity as to when it would begin to taper its quantitative easing programs. In so doing, the Fed is attempting to orchestrate a gradual movement of interest rates toward levels that more fairly reflect the current economic environment. History suggests this is a very difficult thing to accomplish. The stock market may also be recalibrating as investors feel less certain they will be protected by Federal Reserve actions.
- The interest rate sensitive, medical/healthcare and energy sectors were the most significant contributors to relative performance in the first six months of the year. Endurance Specialty Holdings, Ltd., a worldwide insurance underwriter of personal and commercial property, was the strongest performer within the interest rate sensitive holdings. The stock benefitted from investors growing comfortable with the idea of a more “normal” year for crop insurance. If realized, this could result in significant earnings improvement versus 2012. We continue to like its mix of insurance and reinsurance lines, as well as its meaningful scale in the crop insurance area. Within medical/healthcare, supply disruptions at Questcor Pharmaceuticals, Inc. were tied to SKU changes required by Medicaid. This soft spot was short-lived as investors were encouraged by prescription trends that have regained strength and surpassed prior levels. Furthermore, investors seemed enthusiastic when Questcor announced the acquisition of a product that will provide it with international exposure, while eliminating a potential long-term competing product. Questcor ended the first half as the Fund’s best performer.
- The sectors that produced the most disappointing relative contributions were consumer cyclical, commercial services and technology. The Brink’s Company, within the commercial services sector, was among the Fund’s weakest holdings. While results for the second quarter were better than expected largely due to solid performance in Venezuela and the Asia Pacific region, investors continue to focus on concerns in the North America market. Management continues to shed unprofitable business units in order to improve operating margins. We see the potential for future improvements in cash flow and profits for Brink’s. In technology, semiconductor holding, Intersil Corp., had disappointing results. Investors are looking for more clarity from the new CEO and yet-to-be-named CFO as to their goals and time table for achievement. We continue to believe the semiconductor industry is experiencing a favorable upswing in demand.
- Most investors would agree Federal Reserve quantitative easing drove interest rates down to artificially low, unsustainable levels in an effort to stimulate stock prices, housing activity and associated home prices, and consumer net worth and by association, consumer confidence. While slower than expected, improvements in these areas now bring the capital markets to a critical juncture. Investors may for the first time in years be seeing negative total returns from their bond portfolios this quarter. The mantra that rewarded investors the past four to five years has been “don’t fight the Fed.” This particularly rewarded investors in lower-quality, less-liquid bonds and stocks with weaker fundamentals. It will be interesting to see what “don’t fight the Fed” will mean for the markets as they cautiously change direction. We believe the Fund’s focus on high-quality, dividend paying companies is well positioned for this environment.
PAGE 14 |
|
| WESTCORE SMALL-CAP VALUE DIVIDEND FUND (continued) |
| |
(for the year ended 6/30/13)
| | Average | | Contribution | |
5 Highest | Weight | | to Return | |
| | | | | |
Questcor Pharmaceuticals Inc. | 1.55% | | 0.99% | |
West Pharmaceutical | | | | |
Services Inc. | 3.49 | | 0.95 | |
Schweitzer-Mauduit | | | | |
International Inc. | 2.85 | | 0.76 | |
Endurance Specialty | | | | |
Holdings Ltd. | 2.56 | | 0.75 | |
Plantronics Inc. | 3.13 | | 0.62 | |
| | | | | |
5 Lowest | | | | |
Intersil Corp. | 1.27% | | -0.03% | |
Brady Corp. | 0.39 | | -0.06 | |
Cabot Corp. | 0.43 | | -0.14 | |
The Brink's Co. | 2.04 | | -0.22 | |
Hecla Mining Co. | 0.29 | | -0.28 | |
Past performance does not guarantee future results. These stocks do not represent all of the securities purchased, sold or recommended by the Funds’ Adviser. To request a complete list of the contribution of each Fund holding to overall Fund performance during the period, please call 800.392.CORE (2673) or email invest@westcore.com.
Please see page 29 for a description of the methodology used to construct this chart.
(as of 6/30/13)
West Pharmaceutical Services Inc. | 3.7% | |
Schweitzer-Mauduit International Inc. | 3.2 | |
Plantronics Inc. | 3.0 | |
Questcor Pharmaceuticals Inc. | 2.8 | |
MAXIMUS Inc. | 2.7 | |
Endurance Specialty Holdings Ltd. | 2.7 | |
Tidewater Inc. | 2.3 | |
Buckeye Technologies Inc. | 2.2 | |
Portland General Electric Co. | 2.1 | |
Compass Minerals International Inc. | 2.0 | |
Total (% of Net Assets) | 26.7% | |
Top ten holdings do not include any cash, cash equivalents or exchange traded fund investments and are subject to change. There are no guarantees that the Fund will continue to remain invested in any particular holding.
| | | | |
| | | Number | |
| | Morningstar | of Funds in | |
| | Rating™ | Small Value | |
| | as of 6/30/13 | Category | |
Overall | ««« | 295 | |
3 Year | ««« | 295 | |
5 Year | ««« | 254 | |
Morningstar Ratings shown represent the Retail Class. Morningstar proprietary ratings reflect historical risk-adjusted performance as of 6/30/13 and are subject to change every month.
Please see page 29 for more detail regarding Morningstar Ratings.
| Portfolio Characteristics | | | | | | |
(as of 6/30/13)
| | Westcore Small-Cap | | Russell 2000® | |
| | Value Dividend Fund | | Value Index | |
Weighted Average Market Capitalization ($ Mil) | | $1,892.0 | | | $1,367.0 | |
Price/Cash Flow (1 year trailing) | | 11.9x | | | 11.4x | |
Price/Book Value | | 2.1x | | | 1.7x | |
Price/Earnings (1 year trailing) | | 17.6x | | | 15.8x | |
Beta | | 0.9 | | | 1.0 | |
Number of Holdings | | 64 | | | 1,392 | |
Portfolio Turnover Rate | | 36% | | | — | |
Please see page 30 for definition of terms.
Sector classifications presented herein are based on the sector categorization methodology of the Adviser to the Funds which may result in the sector designations for one Fund being different than another Fund’s sector designations.

*Total Investments for this chart excludes short-term investments, including money market mutual funds.
Market capitalization ranges were determined by the Adviser to the Fund and are for presentation purposes only. These market capitalization ranges do not necessarily correlate to the benchmark’s market capitalization ranges.
PAGE 15 |
|
Investing primarily in micro-cap companies whose stocks appear to be undervalued.
Jon K. Tesseo Portfolio Manager
Paul A. Kuppinger, CFA Portfolio Manager
CFA is a trademark owned by the CFA Institute.
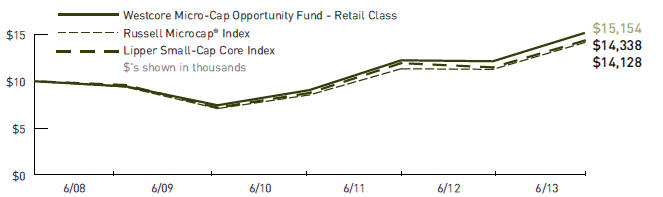
The chart above represents historical performance of a hypothetical investment of $10,000 in the Fund over the past 10 years (or for the life of the Fund if shorter). Performance calculations are as of the end of June each year. Past performance does not guarantee future results. This chart does not reflect the deduction of taxes that a shareholder would pay on Fund distributions or the redemption of Fund shares.
Lipper Index data provided by Lipper, Inc.
Please see pages 28 and 29 for index definitions.
| Average Annual Total Returns |
| | | | | | | | | | | | Since | Inception |
| | 6 Months | | 1 Year | | 3 Years | | 5 Years | | 10 Years | | Inception | Date |
Retail Class (WTMIX) | 16.60% | | 24.93% | | 18.73% | | 9.91% | | — | | 8.63% | 6/23/2008 |
Russell Microcap® Index | 18.32 | | 25.38 | | 18.28 | | 8.53 | | — | | 6.46 | |
Lipper Small-Cap Core Index | 14.45 | | 24.89 | | 17.90 | | 8.38 | | — | | 7.47 | |
Retail Class Annual Expense Ratio (per the current prospectus) — Gross: 4.72%, Net: 1.31%
The performance data quoted represents past performance and does not guarantee future results. Performance information for the institutional class shares prior to their inception date is based on the performance of the retail class. Current performance may be lower or higher than the performance quoted. To obtain current performance as of the most recent month-end, please call 800.392.CORE (2673) or visit us online at www.westcore.com. Average annual total returns and yield figures reflect the reinvestment of dividends, capital gains distributions, all fee waivers and expense reimbursements. Without the fee waivers and expense reimbursements, total return and yield figures would have been lower. The performance data quoted does not reflect the deduction of the 2% redemption fee imposed if shares are redeemed or exchanged within 90 calendar days from their date of purchase. If imposed, the fee would reduce the performance quoted. Total return and yield figures represent past performance. Investment return and principal value will vary, and shares, when redeemed, may be worth more or less than their original cost. Westcore fund shares are not insured by the FDIC, the Federal Reserve Board or any other agency and are subject to investment risk.
Denver Investments (the “Adviser”) has contractually agreed to waive the investment advisory and/or administration fees and/or to reimburse Fund level other expenses from April 30, 2013 until at least April 30, 2014, so that the ratio of expenses to average net assets as reported in the Fund’s Financial Highlights will be no more than 1.30% for the Fund’s Retail Class for such period. This agreement may not be terminated or modified prior to this date except with the approval of the Board of Trustees.
Investing in micro-cap funds generally will be more volatile and loss of principal could be greater than investing in larger-cap funds.
Jon K. Tesseo is a registered representative of ALPS Distributors, Inc.
- For first half of 2013 the Westcore Micro-Cap Opportunity Fund underperformed its benchmark, the Russell Microcap® Index. Although all sectors in both the Fund and the benchmark produced positive performance for the period, the Fund’s performance relative to the benchmark was mixed. It outperformed in six sectors, underperformed in six sectors and performed in-line with the benchmark in one sector.
- On the factor front, the first quarter and the second quarter were nearly opposite. In the first quarter, the models we use to help manage and select stocks for the Fund did not do well. Growth stocks and non-dividend paying companies did well, and beta and price momentum were predictive in the first quarter. In the second quarter things reversed and our models provided better results. Price momentum continued to be predictive, valuation and return on equity also were predictive factors, and dividend-paying companies did well.
- The Fund’s best-performing sectors relative to the benchmark were consumer cyclicals, consumer staples and basic materials. While the Fund was overweighted in both the consumer cyclicals and consumer staples sectors, our model-based stock selection drove performance. In the basic materials sector, the benchmark did not perform terribly well and our models did a good job of selecting stocks, resulting in Fund outperformance in that sector.
- The medical/healthcare, interest rate sensitive and commercial services sectors were the Fund’s worst performers relative to the benchmark. The Fund was underweighted in the medical/ healthcare sector for much of the first half of the year and the sector did well. Additionally, the models did not do a good job of selecting names in the sector. The Fund was underweighted in the interest rate sensitive sector, which helped relative performance, but was not enough to offset the models’ stock selection in the sector.
- Interestingly, both the Fund’s best and worst performing companies in the first half of 2013 were pharmaceutical companies. Obagi Medical Products Inc. was the Fund’s top performing stock. Obagi, which develops prescription skin care products, was acquired in a deal that was completed in April. Affymax Inc. was the Fund’s worst performer as its only drug was pulled from use due to safety concerns.
- Consumer cyclicals sector holding IDT Corp. was the Fund’s best performing stock. This telecommunication services company’s primary business segment sells international phone cards under multiple brand names. A second segment offers phone service to over 55,000 primarily residential customers. Another top performer in the first half of the year was transportation sector holding Saia Inc. Saia is a multi-regional, less-than-truckload shipping company headquartered in Georgia.
- Another medical/healthcare sector holding, Spectrum Pharmaceuticals Inc. was also a drag on performance. Spectrum focuses on oncology and hematology drugs. Interest rate sensitive sector holding Consumer Portfolio Services Inc. was among the Fund’s worst performers in the period. The company specializes in providing financing for the purchase of new and used cars and trucks by retail customers. It serves as a source of funds for consumers who might not qualify for loans through more conventional sources.
- We believe the Fund is well-positioned going into the second half of the year as our proprietary models continue to search for quality micro- cap companies.
PAGE 16 |
|
| WESTCORE MICRO-CAP OPPORTUNITY FUND (continued) |
| |
(for the year ended 6/30/13)
| | Average | | Contribution | |
5 Highest | Weight | | to Return | |
IDT Corp. | 1.03% | | 0.53% | |
Stoneridge Inc. | 0.75 | | 0.35 | |
VSE Corp. | 0.62 | | 0.32 | |
Gray Television Inc. | 0.66 | | 0.29 | |
Obagi Medical Products Inc. | 0.45 | | 0.28 | |
| | | | | |
5 Lowest | | | | |
CDI Corp. | 0.69% | | -0.15% | |
Access National Corp. | 0.32 | | -0.16 | |
Endeavour Silver Corp. | 0.23 | | -0.16 | |
Lionbridge Technologies Inc. | 0.38 | | -0.19 | |
Consumer Portfolio | | | | |
Services Inc. | 0.65 | | -0.35 | |
Past performance does not guarantee future results. These stocks do not represent all of the securities purchased, sold or recommended by the Funds’ Adviser. To request a complete list of the contribution of each Fund holding to overall Fund performance during the period, please call 800.392.CORE (2673) or email invest@westcore.com.
Please see page 29 for a description of the methodology used to construct this chart.
| | | |
(as of 6/30/13) | | |
Hawaiian Holdings Inc. | 0.9% | |
Neutral Tandem Inc. | 0.9 | |
Sparton Corp. | 0.9 | |
National Western Life Insurance Co. | 0.9 | |
Endocyte Inc. | 0.9 | |
Ituran Location and Control Ltd. | 0.9 | |
Enterprise Financial Services Corp. | 0.9 | |
Central Pacific Financial Corp. | 0.9 | |
Kona Grill Inc. | 0.9 | |
Rick's Cabaret International Inc. | 0.9 | |
Total (% of Net Assets) | 9.0% | |
Top ten holdings do not include any cash, cash equivalents or exchange traded fund investments and are subject to change. There are no guarantees that the Fund will continue to remain invested in any particular holding.
| | | | |
| | | Number | |
| | Morningstar | of Funds in | |
| | Rating™ | Small Blend | |
| | as of 6/30/13 | Category | |
Overall | «««« | 621 | |
3 Year | ««« | 621 | |
5 Year | «««« | 548 | |
Morningstar proprietary ratings reflect historical risk-adjusted performance as of 6/30/13 and are subject to change every month.
Please see page 29 for more detail regarding Morningstar Ratings.
| Portfolio Characteristics | | | | | | |
(as of 6/30/13)
| | Westcore Micro-Cap | | Russell | |
| | Opportunity Fund | | Microcap® Index | |
Weighted Average Market Capitalization ($ Mil) | $364.0 | | $482.0 | |
Price/Cash Flow (1 year trailing) | 10.0x | | 12.7x | |
Price/Book Value | 1.9x | | 2.0x | |
Price/Earnings (1 year trailing) | 13.3x | | 15.5x | |
Beta | 0.9 | | 1.0 | |
Number of Holdings | 177 | | 1,414 | |
Portfolio Turnover Rate | 93% | | — | |
| | | | | | | |
Please see page 30 for definition of terms. | | | | | | |
| | | | | | | |
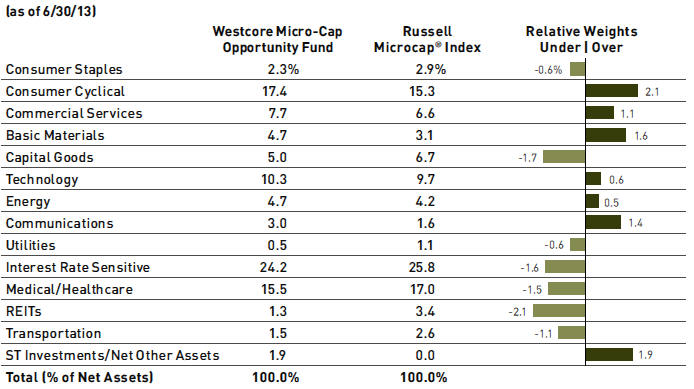
Sector classifications presented herein are based on the sector categorization methodology of the Adviser to the Funds which may result in the sector designations for one Fund being different than another Fund’s sector designations.

*Total Investments for this chart excludes short-term investments, including money market mutual funds.
Market capitalization ranges were determined by the Adviser to the Fund and are for presentation purposes only. These market capitalization ranges do not necessarily correlate to the benchmark’s market capitalization ranges.
PAGE 17 |
|
Investing in equity securities of international small-cap companies that are poised for growth.
John C. Fenley, CFA Portfolio Manager
Jeremy A. Duhon, CFA Portfolio Manager
CFA is a trademark owned by the CFA Institute.
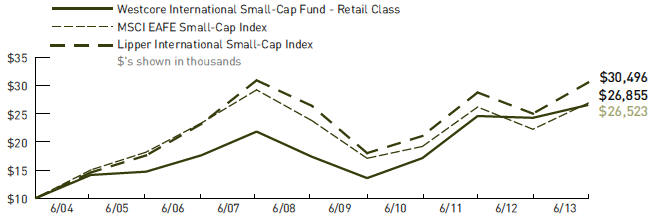
The chart above represents historical performance of a hypothetical investment of $10,000 in the Fund over the past 10 years (or for the life of the Fund if shorter). Performance calculations are as of the end of June each year. Past performance does not guarantee future results. This chart does not reflect the deduction of taxes that a shareholder would pay on Fund distributions or the redemption of Fund shares.
Lipper Index data provided by Lipper, Inc.
Please see pages 28 and 29 for index definitions.
| Average Annual Total Returns |
| | | | | | | | | | | | Since | Inception |
| | 6 Months | | 1 Year | | 3 Years | | 5 Years | | 10 Years | | Inception | Date |
Retail Class (WTIFX) | -1.23% | | 9.40% | | 15.74% | | 8.86% | | 10.25% | | 5.44% | 12/15/1999 |
MSCI EAFE | | | | | | | | | | | | |
Small-Cap Index | 5.69 | | 20.88 | | 11.88 | | 2.48 | | 10.38 | | 6.63 | |
Lipper International | | | | | | | | | | | | |
Small-Cap Index | 6.52 | | 22.04 | | 13.19 | | 2.95 | | 11.79 | | 6.44 | |
Retail Class Annual Expense Ratio (per the current prospectus) — Gross: 1.66%, Net: 1.51%
The performance data quoted represents past performance and does not guarantee future results. Performance information for the institutional class shares prior to their inception date is based on the performance of the retail class. Current performance may be lower or higher than the performance quoted. To obtain current performance as of the most recent month-end, please call 800.392.CORE (2673) or visit us online at www.westcore.com. Average annual total returns and yield figures reflect the reinvestment of dividends, capital gains distributions, all fee waivers and expense reimbursements. Without the fee waivers and expense reimbursements, total return and yield figures would have been lower. The performance data quoted does not reflect the deduction of the 2% redemption fee imposed if shares are redeemed or exchanged within 90 calendar days from their date of purchase. If imposed, the fee would reduce the performance quoted. Total return and yield figures represent past performance. Investment return and principal value will vary, and shares, when redeemed, may be worth more or less than their original cost. Westcore fund shares are not insured by the FDIC, the Federal Reserve Board or any other agency and are subject to investment risk.
Denver Investments (the “Adviser”) has contractually agreed to waive the investment advisory and/or administration fees and/or to reimburse Fund level other expenses from April 30, 2013 until at least April 30, 2014, so that the ratio of expenses to average net assets as reported in the Fund’s Financial Highlights will be no more than 1.50% for the Fund’s Retail Class for such period. This agreement may not be terminated or modified prior to this date except with the approval of the Board of Trustees. Investing in small-cap funds generally will be more volatile and loss of principal could be greater than investing in larger-cap funds.
Investing in foreign securities entails special risks, such as currency fluctuations and political uncertainties, which are described in more detail in the prospectus.
- Global markets were mixed during the first half of the year. U.S. markets took center stage as signs of improvement in the United States overshadowed the continued malaise in international markets. This environment favored U.S. and European stocks while those in Australia, China and emerging markets struggled. Most Asian markets finished the first half in negative territory with Japan’s Nikkei 225 Stock Average the only market in the region to post healthy gains. Japan’s performance was mainly attributable to the continued weakness of the Japanese yen due to economic stimulus policies implemented earlier this year known as “Abenomics”. These policies particularly helped Japan’s large-cap export companies while its small-cap companies continued to trail. Against this backdrop, the Westcore International Small-Cap Fund trailed its benchmark, the MSCI EAFE Small-Cap Index, for the six months ended June 30, 2013.
- The bulk of the Fund’s underperformance relative to its benchmark stemmed from holdings in Japan and Australia. The strength of the Japanese market combined with the Fund’s underweight position there accounted for almost half of the underperformance. Additionally, one of the Fund’s Japanese holdings, DeNA Company Ltd., which we have discussed in past commentaries, continued to struggle. DeNA, a social mobile gaming company, has been largely traded based on “buzz” in the industry. We focus on company operations, rather than industry buzz, and we currently believe in DeNA’s long-term prospects as its earnings have been up strongly. Most of the concerns surrounding DeNA have been based on one of its competitors, GungHo Online Entertainment Inc., whose stock surged as a result of its creation of one wildly popular game. The Fund’s holdings in Australia also detracted significantly from performance in the first half of 2013. China’s slowing economy impacted commodities in Australia which in turn led to Australian stocks being sold indiscriminately. Cardno Ltd., an environmental engineering firm with half of its business outside of Australia, along with Decmil Group Ltd., a construction company, are both examples of companies that have been sold off due to economic concerns related to commodities and mining in Australia. We currently believe these are both stable businesses with strong operations.
- One of the top contributors to the Fund’s performance in the first half of the year was Hong Kong-based Bonjour Holdings Ltd., a cosmetics retailer and wholesaler. Despite weaker retail sentiment, Bonjour’s sales performance has remained on track and the company plans to expand its retail network by three to five stores in Hong Kong this year. United Kingdom-based IG Group Holdings PLC, which provides derivative trading services, was another top contributor. IG Group benefited from increased market volatility surrounding the Cyprus “bail-in”, the fall in gold prices and movements in the yen. Another contributor was Pico Far East Holdings Ltd., a Hong-Kong-based exhibition and event marketing services provider. Pico continued to lead in the space in China and other Asian markets. Its underlying growth has been solid and it has attracted investors with its expansion into new markets.
- Despite slowing growth in China and related economies such as Australia, we remain cautiously optimistic. In general, company operations appear strong and valuations are compelling. We continue to focus on investing in companies that we believe are fast-growing, cash generative businesses with sound balance sheets. This focus, coupled with our strict valuation process, has been the cornerstone of the Fund’s investment process.
PAGE 18 |
|
| WESTCORE INTERNATIONAL SMALL-CAP FUND (continued) |
| |
(for the year ended 6/30/13)
| | Average | | Contribution | |
5 Highest | Weight | | to Return | |
ICAP PLC | 2.24% | | 0.57% | |
Bonjour Holdings Ltd. | 2.83 | | 0.53 | |
IG Group Holdings PLC | 5.18 | | 0.45 | |
Azimut Holding S.p.A. | 3.18 | | 0.44 | |
Prestige International Inc. | 2.39 | | 0.44 | |
| | | | | |
5 Lowest | | | | |
Andritz AG | 2.64% | | -0.66% | |
Decmil Group Ltd. | 2.05 | | -0.82 | |
Ports Design Ltd. | 4.29 | | -0.96 | |
DeNA Co. Ltd. | 4.69 | | -1.50 | |
Cardno Ltd. | 5.99 | | -2.37 | |
Past performance does not guarantee future results. These stocks do not represent all of the securities purchased, sold or recommended by the Funds’ Adviser. To request a complete list of the contribution of each Fund holding to overall Fund performance during the period, please call 800.392.CORE (2673) or email invest@westcore.com.
Please see page 29 for a description of the methodology used to construct this chart.
| | | |
(as of 6/30/13) | | |
Credit Corp Group Ltd. [Australia] | 6.9% | |
Pico Far East Holdings Ltd. [Hong Kong] | 6.8 | |
Cardno Ltd. [Australia] | 5.3 | |
DeNA Co. Ltd. [Japan] | 4.3 | |
Tsuruha Holdings Inc. [Japan] | 4.0 | |
Ports Design Ltd. [Hong Kong] | 4.0 | |
IG Group Holdings PLC [United Kingdom] | 3.9 | |
ITE Group PLC [United Kingdom] | 3.9 | |
Bonjour Holdings Ltd. [Hong Kong] | 3.8 | |
Ashmore Group PLC [United Kingdom] | 3.8 | |
Total (% of Net Assets) | 46.7% | |
Top ten holdings do not include any cash, cash equivalents or exchange traded fund investments and are subject to change. There are no guarantees that the Fund will continue to remain invested in any particular holding.
| | | | |
| | | Number of Funds | |
| | Morningstar | in Foreign | |
| | Rating™ | Small/Mid | |
| | as of 6/30/13 | Growth Category | |
Overall | ««« | 111 | |
3 Year | «««« | 111 | |
5 Year | ««««« | 88 | |
10 Year | «« | 58 | |
Morningstar proprietary ratings reflect historical risk-adjusted performance as of 6/30/13 and are subject to change every month.
Please see page 29 for more detail regarding Morningstar Ratings.
| Portfolio Characteristics | | | | | | |
(as of 6/30/13)
| | Westcore International | | MSCI EAFE | |
| | Small-Cap Fund | | Small-Cap Index | |
Weighted Average Market Capitalization ($ Mil) | | $1,662.0 | | | $1,839.0 | |
Number of Countries Represented | | 11 | | | 22 | |
Price/Earnings (1 year trailing) | | 12.0x | | | 12.1x | |
Price/Book Value | | 2.7x | | | 1.9x | |
Number of Holdings | | 37 | | | 2,156 | |
Portfolio Turnover Rate | | 45% | | | — | |
Please see page 30 for definition of terms.

Sector classifications presented herein are based on the sector categorization methodology of the Adviser to the Funds which may result in the sector designations for one Fund being different than another Fund’s sector designations.
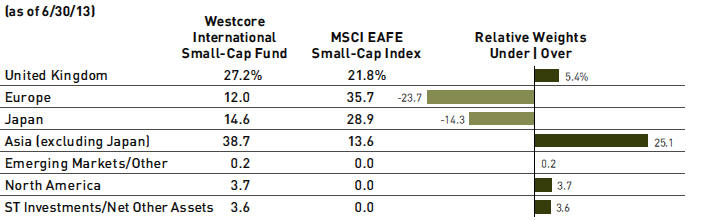
Percentages are based on Total Net Assets

PAGE 19 |
|
A fixed-income fund investing in a wide variety of income-producing securities, primarily bonds and to a lesser extent convertible bonds, and equity securities.
Mark R. McKissick, CFA Portfolio Manager
Troy A. Johnson, CFA Portfolio Manager
CFA is a trademark owned by the CFA Institute.
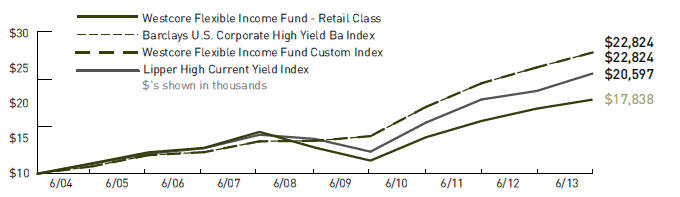
The chart above represents historical performance of a hypothetical investment of $10,000 in the Fund over the past 10 years (or for the life of the Fund if shorter). Performance calculations are as of the end of June each year. Past performance does not guarantee future results. This chart does not reflect the deduction of taxes that a shareholder would pay on Fund distributions or the redemption of Fund shares.
Lipper Index data provided by Lipper, Inc. Please see pages 28 and 29 for index definitions.
| Average Annual Total Returns |
| | 6 | | 1 | | 3 | | 5 | | 10 | | Since | | 30-Day | Incep. |
| | Months | | Year | | Years | | Years | | Years | | Incep. | | SEC Yield | Date |
Retail Class (WTLTX) | 0.31% | | 5.60% | | 8.79% | | 6.94% | | 5.96% | | 7.72% | | 4.47% | 6/1/1988 |
Institutional Class (WILTX) | 0.35 | | 5.74 | | 8.89 | | 7.03 | | 6.02 | | 7.74 | | 4.62 | 9/28/2007 |
Barclays U.S. Corporate | | | | | | | | | | | | | | |
High Yield Ba Index | 0.06 | | 7.36 | | 10.16 | | 11.10 | | 8.58 | | 9.06 | | — | |
Westcore Flexible Income | | | | | | | | | | | | | | |
Fund Custom Index | 0.06 | | 7.36 | | 10.16 | | 11.10 | | 8.58 | | 9.16 | | — | |
Lipper High Current | | | | | | | | | | | | | | |
Yield Index | 1.68 | | 9.78 | | 10.16 | | 8.53 | | 7.49 | | 7.21 | | — | |
Retail Class Annual Expense Ratio (per the current prospectus) — Gross: 0.91%, Net: 0.86%
Institutional Class Annual Expense Ratio (per the current prospectus) — Gross: 1.31%, Net: 0.72%
30-Day SEC Yield figures reflect all fee waivers and expense reimbursements. Without the absorption of these fee waivers and/or expense reimbursements, the figures would have been 4.40% for the retail class and 4.16% for the institutional class.
The performance data quoted represents past performance and does not guarantee future results. Performance information for the institutional class shares prior to their inception date is based on the performance of the retail class. Current performance may be lower or higher than the performance quoted. To obtain current performance as of the most recent month-end, please call 800.392.CORE (2673) or visit us online at www.westcore.com. Average annual total returns and yield figures reflect the reinvestment of dividends, capital gains distributions, all fee waivers and expense reimbursements. Without the fee waivers and expense reimbursements, total return and yield figures would have been lower. The performance data quoted does not reflect the deduction of the 2% redemption fee imposed if shares are redeemed or exchanged within 90 calendar days from their date of purchase. If imposed, the fee would reduce the performance quoted. Total return and yield figures represent past performance. Investment return and principal value will vary, and shares, when redeemed, may be worth more or less than their original cost. Westcore fund shares are not insured by the FDIC, the Federal Reserve Board or any other agency and are subject to investment risk. Denver Investments (the “Adviser”) has contractually agreed to waive the investment advisory and/or administration fees and/or to reimburse Fund level other expenses from April 30, 2013 until at least April 30, 2014, so that the ratio of expenses to average net assets as reported in the Fund’s Financial Highlights will be no more than 0.85% for the Fund’s Retail Class for such period. In addition, the Adviser has contractually agreed to waive the investment advisory and/or administration fees and/or to reimburse Fund level Other Expenses for the Institutional Class in the same proportion as the Retail Class waivers/reimbursements as well as reimburse the Institutional class-specific Other Expenses until at least April 30, 2014. This agreement may not be terminated or modified prior to this date except with the approval of the Board of Trustees.
Westcore Flexible Income Fund may invest in high-yield/high-risk bonds which are subject to greater levels of liquidity risk. Additionally, investing in bonds entails interest rate risk and credit risk.
Mark R. McKissick is a registered representative of ALPS Distributors, Inc.
- The high-yield market exhibited volatility exiting the first half of the year as capital flows displayed investor uneasiness with the increasing potential for the Federal Reserve to move to a less accommodative policy. Our view is that while we are inevitably moving closer to a reduction in monetary stimulus, the economy has not yet exhibited the strength necessary to overcome the inertia caused by deleveraging. When the slow growth we’ve experienced is placed into the context of current global economic uncertainty, relatively benign inflationary pressure, and an environment conducive to surprise exogenous events, perhaps the probability of meaningful and imminently higher rates from recent levels is more limited than may otherwise be perceived.
- The high-yield asset class has provided positive returns year-to-date and superior relative performance to other fixed income asset classes in general. The high-yield market currently remains susceptible to negative capital flows and is likely to continue to exhibit volatility under such circumstances. While outflows would impact valuations, we are presently optimistic regarding the underlying fundamentals of the high-yield market due to relatively healthy balance sheets in general, an overall low default rate and the limited amount of debt that needs to be refinanced over the next few years. Areas of increasing concern that we are monitoring include the potential for levering events by specific companies, rising correlation of high-yield returns to the Treasury market and weakening trends in covenant protection for bondholders.
- The Westcore Flexible Income Fund outperformed its benchmark, the Barclays U.S. Corporate High Yield Ba Index, in the first six months of 2013. Our focus on underlying asset support and the resulting underweight of financials detracted from the Fund’s performance relative to its benchmark through the first six months of the year. However, the Fund’s shorter duration, avoidance of financial hybrid securities and focus on less economically sensitive issues aided performance, specifically during the most recent quarter of volatility. Consistent with the benchmark and across fixed income markets, the Fund did exhibit increased correlation with the Treasury market move during the latter half of the period, which negatively impacted performance.
- We believe the Fund is positioned to offer competitive yield with more limited downside price volatility versus traditional high-yield funds, and the most recent period appears to support that profile. Our process entails intensive credit analysis to evaluate yield versus risk through an entire business cycle, and the overweight of higher-rated, high-yield issues is a logical result. Most importantly, we believe this strategy works over the long-term for investors who want comparative yield from a high-yield fund, but who are a little more sensitive to volatility and are more focused on capital preservation.
PAGE 20 |
|
| WESTCORE FLEXIBLE INCOME FUND (continued) |
| |
| Top Ten Corporate Credit Exposure |
(as of 6/30/13)
Range Resources Corp. | 3.0% | |
Tuckahoe Credit Lease Trust | 2.9 | |
Frontier Communications | 2.9 | |
Goodyear Tire & Rubber Co. | 2.9 | |
Calpine Corp. | 2.8 | |
Centerpoint Properties Trust | 2.8 | |
Potlatch Corp. | 2.6 | |
Crown Americas LLC | 2.5 | |
USG Corp. | 2.4 | |
Ball Corp. | 2.4 | |
Total (% of Net Assets) | 27.2% | |
Percentages represent the Fund’s aggregate holdings in the same corporate issuer and its affiliates. Top Ten Corporate Credit Exposure are subject to change. There are no guarantees that the Fund will continue to remain invested in any particular security or issuer.
| | | | |
| | | Number of | |
| | Morningstar | Funds in High | |
| | Rating™ | Yield Bond | |
| | as of 6/30/13 | Category | |
Overall | «« | 525 | |
3 Year | ««« | 525 | |
5 Year | «« | 467 | |
10 Year | « | 326 | |
Morningstar Ratings shown represent the Retail Class. Morningstar proprietary ratings reflect historical risk-adjusted performance as of 6/30/13 and are subject to change every month.
Please see page 29 for more detail regarding Morningstar Ratings.
| Portfolio Characteristics | | | | | | |
(as of 6/30/13)
| | Westcore Flexible | | Barclays U.S. Corporate | |
| | Income Fund | | High Yield Ba Index | |
Effective Duration | 4.7 years | | 5.0 years | |
Effective Maturity | 8.6 years | | 7.3 years | |
Number of Holdings | 66 | | 697 | |
Portfolio Turnover Rate | 15% | | — | |
Please see page 30 for definition of terms.

Percentages are based on Total Net Assets.

Percentages are based on Total Investments. The ratings allocation reflects the Standard & Poor’s equivalent ratings category for the highest credit-quality rating assigned by either Standard & Poor’s or Moody’s.

Percentages are based on Total Investments. The Adviser to the Funds utilizes the expected maturity in presenting this information.
PAGE 21 |
|
A fixed-income fund focusing on investment quality bonds of varying maturities.
Mark R. McKissick, CFA Portfolio Manager
Lisa M. Snyder, CFA Portfolio Manager
CFA is a trademark owned by the CFA Institute.

The chart above represents historical performance of a hypothetical investment of $10,000 in the Fund over the past 10 years (or for the life of the Fund if shorter). Performance calculations are as of the end of June each year. Past performance does not guarantee future results. This chart does not reflect the deduction of taxes that a shareholder would pay on Fund distributions or the redemption of Fund shares.
Lipper Index data provided by Lipper, Inc. Please see pages 28 and 29 for index definitions.
| Average Annual Total Returns |
| | 6 | | 1 | | 3 | | 5 | | 10 | | Since | | 30-Day | Incep. |
| | Months | | Year | | Years | | Years | | Years | | Incep. | | SEC Yield | Date |
Retail Class (WTIBX) | -2.23% | | 0.13% | | 4.19% | | 5.21% | | 5.05% | | 6.53% | | 2.38% | 6/1/1988 |
Institutional Class (WIIBX) | -2.13 | | 0.22 | | 4.34 | | 5.32 | | 5.12 | | 6.56 | | 2.57 | 9/28/2007 |
Barclays U.S. Aggregate | | | | | | | | | | | | | | |
Bond Index | -2.44 | | -0.69 | | 3.51 | | 5.19 | | 4.52 | | 7.00 | | — | |
Lipper Intermediate | | | | | | | | | | | | | | |
Investment Grade Index | -2.50 | | 0.95 | | 4.60 | | 5.95 | | 4.56 | | 6.46 | | — | |
Retail Class Annual Expense Ratio (per the current prospectus) — Gross: 0.75%, Net: 0.55%
Institutional Class Annual Expense Ratio (per the current prospectus) — Gross: 0.59%, Net: 0.40%
30-Day SEC Yield figures reflect all fee waivers and expense reimbursements. Without the absorption of these fee waivers and/or expense reimbursements, the figures would have been 2.20% for the retail class and 2.39% for the institutional class.
The performance data quoted represents past performance and does not guarantee future results. Performance information for the institutional class shares prior to their inception date is based on the performance of the retail class. Current performance may be lower or higher than the performance quoted. To obtain current performance as of the most recent month-end, please call 800.392.CORE (2673) or visit us online at www.westcore.com. Average annual total returns and yield figures reflect the reinvestment of dividends, capital gains distributions, all fee waivers and expense reimbursements. Without the fee waivers and expense reimbursements, total return and yield figures would have been lower. Total return and yield figures represent past performance. Investment return and principal value will vary, and shares, when redeemed, may be worth more or less than their original cost. Westcore fund shares are not insured by the FDIC, the Federal Reserve Board or any other agency and are subject to investment risk.
Denver Investments (the “Adviser”) has contractually agreed to waive the investment advisory and/or administration fees and/or to reimburse Fund level other expenses from April 30, 2013 until at least April 30, 2014, so that the ratio of expenses to average net assets as reported in the Fund’s Financial Highlights will be no more than 0.55% for the Fund’s Retail Class for such period. In addition, the Adviser has contractually agreed to waive the investment advisory and/or administration fees and/or to reimburse Fund level Other Expenses for the Institutional Class in the same proportion as the Retail Class waivers/reimbursements as well as reimburse the Institutional class-specific Other Expenses until at least April 30, 2014. This agreement may not be terminated or modified prior to this date except with the approval of the Board of Trustees.
Westcore Plus Bond Fund may invest in high-yield/high-risk bonds which are subject to greater levels of liquidity risk. Additionally, investing in bonds entails interest rate risk and credit risk.
Mark R. McKissick is a registered representative of ALPS Distributors, Inc.
- Interest rates turned higher in the first half of the year with reports that the global economy had stabilized at slow but steady growth, along with declining unemployment here in the United States. The market was further disrupted by recent comments from Chairman Bernanke that the Federal Reserve may begin to slow or even cease its exceptional monetary accommodation within the next 3 to 12 months. The Fed’s data-dependent withdrawal will be based on its current forecast of accelerating growth and modest inflation, should they come to fruition. We continue to be skeptical of the Fed’s optimism for a sustained, accelerating recovery in light of limited inflation, declining inflation expectations, and continuing sluggishness in the global economy.
- The U.S. bond market provided negative returns to investors as Treasury rates rose for all but the shortest maturities. Against this backdrop, the Westcore Plus Bond Fund outperformed its benchmark, the Barclays U.S. Aggregate Bond Index, for the first half of 2013. The Fund’s interest rate positioning did not materially affect relative performance as its exposure was similar to the benchmark’s. The Fund’s overweighted allocation to non-Treasuries continued to provide additional income relative to the benchmark in a low interest rate environment; however the additional yield was not enough to offset the negative price return due to higher Treasury rates and widening credit spreads. Within the Fund’s corporate holdings, the allocation to high-yield securities, primarily “BB” rated, was beneficial as high-yield corporate bonds outperformed investment-grade corporate bonds. The Fund’s modest underweighted position in mortgage-backed securities (MBS) was also beneficial, as MBS underperformed due to rising market interest rates and speculation of slowing Federal Reserve purchases.
- Despite recent signs of modest strength, our economic outlook continues to foresee slow global growth as we move through the fourth year of recovery following the Great Recession of 2008-09. With growth this low, as well as the unsolved and growing global imbalances of debt and deficits, we believe it wouldn’t take much of a shock to push growth back into recession. This condition seems likely to keep our economy in a cycle of short and shallow recoveries followed by periods of weakness until we truly begin correcting imbalances and return to a path of sustainable prosperity. We also see a return of the various factors that have abated recently, but which likely will limit the rise in rates. These include ongoing problems in Europe and Japan, and emerging issues in China and other developing markets.
- We are likely to continue positioning the Fund with modestly reduced interest rate exposure given the risk-reward trade-off that limits large price gains from bonds. Our current intent is to maintain the Fund’s overweight position in corporate bonds, including higher-quality, high-yield issues, in an environment of healthy corporate profits and strong balance sheets. The goal of this positioning is to provide an income advantage over the Fund’s benchmark. While we are concerned about the recent rise in rates, we are not convinced the market is headed to significantly higher interest rates. With inflation declining, unemployment high, and very slow economic growth, we do not believe a sustained rise in rates is warranted or supportable by the market for more than a short time.
PAGE 22 |
|
| WESTCORE PLUS BOND FUND (continued) |
| |
| Top Ten Corporate Credit Exposure |
(as of 6/30/13)
Crown Castle Towers LLC | 1.4% | |
PepsiCo Inc. | 1.4 | |
Potlatch Corp. | 1.2 | |
City National Corp. | 1.2 | |
Wal-Mart Stores Inc. | 1.1 | |
Anheuser Busch Co. | 1.1 | |
Darden Restaurants Inc. | 1.1 | |
Kohl's Corp. | 1.1 | |
Oncor Electric Delivery Co. LLC | 1.1 | |
Washington REIT | 1.1 | |
Total (% of Net Assets) | 11.8% | |
Percentages represent the Fund’s aggregate holdings in the same corporate issuer and its affiliates. Top Ten Corporate Credit Exposure are subject to change. There are no guarantees that the Fund will continue to remain invested in any particular security or issuer.
| | | | |
| | | Number of | |
| | | Funds in | |
| | Morningstar | Intermediate- | |
| | Rating™ | Term Bond | |
| | as of 6/30/13 | Category | |
Overall | «««« | 1,005 | |
3 Year | ««« | 1,005 | |
5 Year | ««« | 873 | |
10 Year | «««« | 616 | |
Morningstar Ratings shown represent the Retail Class. Morningstar proprietary ratings reflect historical risk-adjusted performance as of 6/30/13 and are subject to change every month.
Please see page 29 for more detail regarding Morningstar Ratings.
| Portfolio Characteristics | | | | | | |
(as of 6/30/13)
| | Westcore Plus | | Barclays U.S. | |
| | Bond Fund | | Aggregate Bond Index | |
Effective Duration | 5.5 years | | 5.5 years | |
Effective Maturity | 7.8 years | | 7.5 years | |
Number of Holdings | 227 | | 8,395 | |
Portfolio Turnover Rate | 34% | | — | |
Please see page 30 for definition of terms.
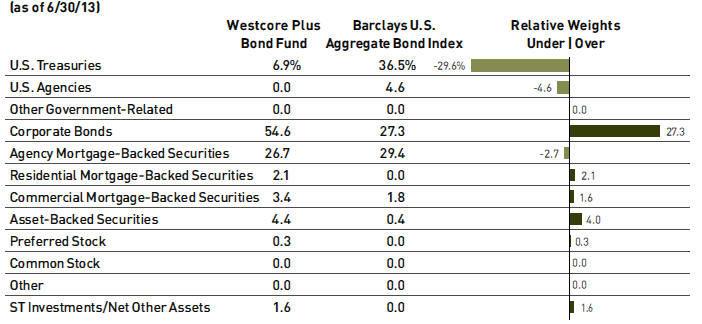
Percentages are based on Total Net Assets.
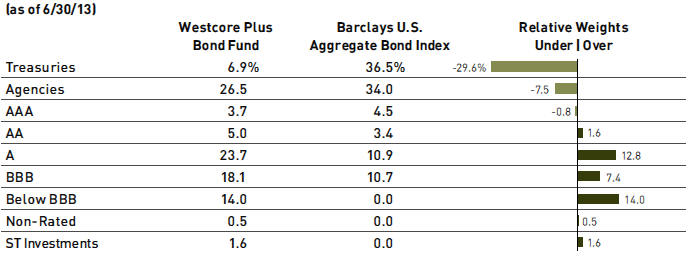
Percentages are based on Total Investments. The ratings allocation reflects the Standard & Poor’s equivalent ratings category for the highest credit-quality rating assigned by either Standard & Poor’s or Moody’s.

PAGE 23 |
|
A Colorado municipal bond fund focusing on federal and state tax-exempt income primarily through investments in investment-grade quality bonds of intermediate maturity.
Kenneth A. Harris, CFA Portfolio Manager
CFA is a trademark owned by the CFA Institute.

The chart above represents historical performance of a hypothetical investment of $10,000 in the Fund over the past 10 years (or for the life of the Fund if shorter). Performance calculations are as of the end of June each year. Past performance does not guarantee future results. This chart does not reflect the deduction of taxes that a shareholder would pay on Fund distributions or the redemption of Fund shares.
Lipper Index data provided by Lipper, Inc. Please see pages 28 and 29 for index definitions.
| Average Annual Total Returns |
| | 6 | | 1 | | 3 | | 5 | | 10 | | Since | | 30-Day | Incep. |
| | Months | | Year | | Years | | Years | | Years | | Incep. | | SEC Yield | Date |
Retail Class (WTCOX) | -3.23% | | -0.64% | | 3.36% | | 4.24% | | 3.35% | | 4.81% | | 2.80% | 6/1/1991 |
Barclays U.S. 10-Year | | | | | | | | | | | | | | |
Municipal Bond Index | -2.77 | | 0.09 | | 4.88 | | 5.94 | | 4.71 | | 6.15 | | — | |
Lipper Intermediate | | | | | | | | | | | | | | |
Municipal Debt Index | -2.33 | | 0.10 | | 3.73 | | 4.46 | | 3.56 | | 4.90 | | — | |
Retail Class Annual Expense Ratio (per the current prospectus) — Gross: 0.82%, Net: 0.66%
30-Day SEC Yield figure reflects all fee waivers and expense reimbursements. Without the absorption of these fee waivers and/or expense reimbursements, the figure would have been 2.64%.
The performance data quoted represents past performance and does not guarantee future results. Performance information for the institutional class shares prior to their inception date is based on the performance of the retail class. Current performance may be lower or higher than the performance quoted. To obtain current performance as of the most recent month-end, please call 800.392.CORE (2673) or visit us online at www.westcore.com. Average annual total returns and yield figures reflect the reinvestment of dividends, capital gains distributions, all fee waivers and expense reimbursements. Without the fee waivers and expense reimbursements, total return and yield figures would have been lower. Total return and yield figures represent past performance. Investment return and principal value will vary, and shares, when redeemed, may be worth more or less than their original cost. Westcore fund shares are not insured by the FDIC, the Federal Reserve Board or any other agency and are subject to investment risk.
Denver Investments (the “Adviser”) has contractually agreed to waive the investment advisory and/or administration fees and/or to reimburse Fund level other expenses from April 30, 2013 until at least April 30, 2014, so that the ratio of expenses to average net assets as reported in the Fund’s Financial Highlights will be no more than 0.65% for the Fund’s Retail Class for such period. This agreement may not be terminated or modified prior to this date except with the approval of the Board of Trustees.
Westcore Colorado Tax-Exempt Fund invests primarily in instruments issued by or on behalf of one state and generally will be more volatile and loss of principal could be greater due to state specific risk.
- The Westcore Colorado Tax-Exempt Fund underperformed its benchmark, the Barclays U.S. 10-Year Municipal Bond Index for the six months ended June 30, 2013. The Fund’s underperformance in recent periods has been due to the relative underperformance of high-quality intermediate maturity issues. Shorter maturities, as well as lower-quality issues, held up better in the rising rate environment.
- While we are concerned with the recent rise in rates, we don’t believe we are headed to continually higher and higher interest rates. With inflation declining, unemployment high, and very slow economic growth, we do not believe a sustained rise in rates is warranted or supportable by the market.
- The Fund’s modified duration as of June 30, 2013 was 5.3 years and its average maturity was 6.3 years. Both were slightly less than at the previous year-end of December 31, 2012. As of June 30 no individual holdings within the Fund were subject to the Alternative Minimum Tax (AMT). Except for the 2.0% cash equivalent position, the Fund was entirely invested in tax-exempt securities of issuers domiciled within the state of Colorado.
- Interest rates turned higher in the first half of the year with reports that the global economy was stabilizing with slow, but steady, growth. The market was further disrupted by Federal Reserve Chairman Ben Bernanke’s recent comments that the Fed may at some point within the next 6 to 12 months begin to slow or even stop its exceptional monetary accommodation. Its withdrawal would be based on its current forecast of accelerating growth and modest inflation coming to fruition. We continue to be skeptical of its optimism for a sustained recovery in light of the continuing struggles and imbalances in the global economy.
- The Colorado municipal bond market has been relatively unaffected by the continued isolated instances of well-publicized credit issues coming from Detroit and California, as well as the pension reform issues that have hurt the state of Illinois. Colorado municipalities have done well in managing their debts with reduced expenses and some increased revenues as the local economy continues to recover from the latest recession. We remain positive on the underlying credit worthiness of the majority of Colorado issuers.
- We anticipate keeping the Fund’s cash equivalent position to a minimum and utilizing excess funds for purchases of new Colorado issuance or secondary securities within the 10-20 year range with coupons of 5% or higher. We intend to maintain the current credit quality of the underlying holdings within the Fund.
PAGE 24 |
|
| WESTCORE COLORADO TAX-EXEMPT FUND (continued) |
| |
| | | |
| (as of 6/30/13) | % of Net Assets | |
| Denver City & County School District #1 | |
| 5.25%, 12/1/2025 | 2.3% | |
| Eagle Garfield & Rout County SD Re-50J | |
| 5.00%,12/1/2026 | 2.2 | |
| Arapahoe County School District #1 | | |
| 5.00%, 12/1/2029 | 2.1 | |
| Platte River Power Auth Power Rev | | |
| 5.00%, 6/1/2027 | 1.7 | |
| Colorado Springs Utilities Revenue | | |
| 4.00%, 11/15/2030 | 1.6 | |
| Jefferson County School District R-001 | | |
| 5.25%, 12/1/2024 | 1.4 | |
| Castle Rock Sales & Use Tax Revenue | | |
| 5.00%, 6/1/2029 | 1.4 | |
| Denver City & County Excose Tax Revenue | |
| 5.25%, 9/1/2018 | 1.3 | |
| Garfield Pitkin & Eagle County School District Re-1 | |
| 5.00%, 12/15/2023 | 1.3 | |
| Roaring Fork School District Re-1 | | |
| 5.00%, 12/15/2024 | 1.3 | |
| Total (% of Net Assets) | 16.6% | |
Top ten holdings do not include any cash, cash equivalents or exchange traded fund investments and are subject to change. There are no guarantees that the Fund will continue to remain invested in any particular holding.
| | | | |
| | | Number of | |
| | | Funds in | |
| | Morningstar | Muni Single | |
| | Rating™ | State Interm | |
| | as of 6/30/13 | Category | |
Overall | ««« | 219 | |
3 Year | ««« | 219 | |
5 Year | ««« | 216 | |
10 Year | ««« | 201 | |
Morningstar proprietary ratings reflect historical risk-adjusted performance as of 6/30/13 and are subject to change every month.
Please see page 29 for more detail regarding Morningstar Ratings.
| Portfolio Characteristics | | | | | | |
| | | | | |
(as of 6/30/13) | | | | |
| | Westcore Colorado | | Barclays U.S. 10-Year | |
| | Tax-Exempt Fund | | Municipal Bond Index | |
Effective Duration | 5.2 years | | 5.9 years | |
Effective Maturity | 6.3 years | | 9.9 years | |
Colorado Double Tax-Exempt Percentage | | | | |
(excludes cash & cash equivalents) | 100 | | — | |
Percentage of Holdings Subject to AMT | 0 | | — | |
Number of Holdings | 152 | | — | |
Portfolio Turnover Rate | 22 | % | — | |
| | | | | |
Please see page 30 for definition of terms. | | | | |
| | | | | |

Percentages are based on Total Investments. The ratings allocation reflects the Standard & Poor’s equivalent ratings category for the highest credit-quality rating assigned by either Standard & Poor’s or Moody’s.
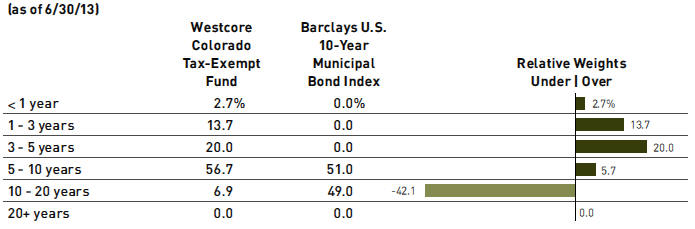
Percentages are based on Total Investments. The Adviser to the Funds utilizes the expected maturity in presenting this information.
PAGE 25 |
|
Disclosure of Fund Expenses (Unaudited)
As a shareholder of a Fund, you incur two types of costs: (1) transaction costs (such as the 2% fee on redemption of certain Fund shares made within 90 days of purchase); and (2) ongoing costs, including management fees and other Fund expenses. The examples on the next page are intended to help you understand your ongoing costs (in dollars) of investing in a Fund and to compare these costs with the ongoing costs of investing in other mutual funds. The examples are based on an investment of $1,000 invested on January 1, 2013 and held until June 30, 2013.
Actual Expenses. The first line of the table on the next page provides information about actual account values and actual expenses. You may use the information in this line, together with the amount you invested, to estimate the expenses that you paid over the period. Simply divide your account value by $1,000 (for example, an $8,600 account value divided by $1,000 = 8.6), then multiply the result by the number in the first line under the heading “Expenses Paid During Period” to estimate the expenses you paid on your account during this period.
Hypothetical Example for Comparison Purposes. The second line of the table on the next page provides information about hypothetical account values and hypothetical expenses based on the Fund’s actual expense ratio and an assumed rate of return of 5% per year before expenses, which is not the Fund’s actual return. The hypothetical account values and expenses may not be used to estimate the actual ending account balance or expenses you paid for the period. You may use this information to compare the ongoing costs of investing in a Fund and other mutual funds. To do so, compare this 5% hypothetical example with the 5% hypothetical examples that appear in the shareholder reports of other funds.
Expenses shown in the table on the next page are meant to highlight ongoing Fund costs only and do not reflect transaction costs, such as redemption fees. Therefore, the second line of the table is useful in comparing ongoing costs only, and may not help you determine the relative total costs of owning different funds. In addition, if these transactional costs were included, your costs would have been higher.
Expenses Paid During Period
With respect to Expenses Paid During the Period, as shown in the table on the next page, expenses are equal to the Fund’s annualized expense ratio, as shown below, multiplied by the average account value over the period, multiplied by the number of days in the last six months of the fiscal half-year, 181/365 (to reflect the half-year period). The annualized expense ratios for the last six months were as follows:
Fund | Retail Class | Institutional Class |
Westcore Growth Fund | 1.10 | % | 0.89 | % |
Westcore MIDCO Growth Fund | 1.05 | % | 0.88 | % |
Westcore Select Fund | 1.09 | % | N/A | |
Westcore Blue Chip Dividend Fund | 1.13 | % | 0.92 | % |
Westcore Mid-Cap Value Dividend Fund | 1.23 | % | N/A | |
Westcore Small-Cap Opportunity Fund | 1.30 | % | 1.15 | % |
Westcore Small-Cap Value Dividend Fund | 1.30 | % | 1.12 | % |
Westcore Micro-Cap Opportunity Fund | 1.30 | % | N/A | |
Westcore International Small-Cap Fund | 1.50 | % | N/A | |
Westcore Flexible Income Fund | 0.85 | % | 0.69 | % |
Westcore Plus Bond Fund | 0.55 | % | 0.38 | % |
Westcore Colorado Tax-Exempt Fund | 0.65 | % | N/A | |
PAGE 26 |
|
| FUND EXPENSES (continued) |
| |
| | | | | | | Expense Paid | |
| | | Beginning Account | | Ending Account | | During the Period | |
| | | Value | | Value | | 1/1/2013 to | |
Fund | | 1/1/2013 | | 6/30/2013 | | 6/30/2013 (1) | |
Westcore Growth Fund | | | | | | | |
Retail Class | Actual | 1,000.00 | | 1,086.70 | | 5.69 | |
| | Hypothetical (5% return before expenses) | $ | 1,000.00 | | $ | 1,019.34 | | $ | 5.51 | |
Institutional Class | Actual | $ | 1,000.00 | | $ | 1,087.00 | | $ | 4.61 | |
| | Hypothetical (5% return before expenses) | $ | 1,000.00 | | $ | 1,020.38 | | $ | 4.46 | |
Westcore MIDCO Growth Fund | | | | | | | | | | |
Retail Class | Actual | $ | 1,000.00 | | $ | 1,155.50 | | $ | 5.61 | |
| | Hypothetical (5% return before expenses) | $ | 1,000.00 | | $ | 1,019.59 | | $ | 5.26 | |
Institutional Class | Actual | $ | 1,000.00 | | $ | 1,157.50 | | $ | 4.71 | |
| | Hypothetical (5% return before expenses) | $ | 1,000.00 | | $ | 1,020.43 | | $ | 4.41 | |
Westcore Select Fund | | | | | | | | | | |
Retail Class | Actual | $ | 1,000.00 | | $ | 1,165.70 | | $ | 5.85 | |
| | Hypothetical (5% return before expenses) | $ | 1,000.00 | | $ | 1,019.39 | | $ | 5.46 | |
Westcore Blue Chip Dividend Fund | | | | | | | | | | |
Retail Class | Actual | $ | 1,000.00 | | $ | 1,110.00 | | $ | 5.91 | |
| | Hypothetical (5% return before expenses) | $ | 1,000.00 | | $ | 1,019.19 | | $ | 5.66 | |
Institutional Class | Actual | $ | 1,000.00 | | $ | 1,111.20 | | $ | 4.82 | |
| | Hypothetical (5% return before expenses) | $ | 1,000.00 | | $ | 1,020.23 | | $ | 4.61 | |
Westcore Mid-Cap Value Dividend Fund | | | | | | | | | | |
Retail Class | Actual | $ | 1,000.00 | | $ | 1,157.10 | | $ | 6.58 | |
| | Hypothetical (5% return before expenses) | $ | 1,000.00 | | $ | 1,018.70 | | $ | 6.16 | |
Westcore Small-Cap Opportunity Fund | | | | | | | | | | |
Retail Class | Actual | $ | 1,000.00 | | $ | 1,146.90 | | $ | 6.92 | |
| | Hypothetical (5% return before expenses) | $ | 1,000.00 | | $ | 1,018.35 | | $ | 6.51 | |
Institutional Class | Actual | $ | 1,000.00 | | $ | 1,147.90 | | $ | 6.12 | |
| | Hypothetical (5% return before expenses) | $ | 1,000.00 | | $ | 1,019.09 | | $ | 5.76 | |
Westcore Small-Cap Value Dividend Fund | | | | | | | | | | |
Retail Class | Actual | $ | 1,000.00 | | $ | 1,172.30 | | $ | 7.00 | |
| | Hypothetical (5% return before expenses) | $ | 1,000.00 | | $ | 1,018.35 | | $ | 6.51 | |
Institutional Class | Actual | $ | 1,000.00 | | $ | 1,174.10 | | $ | 6.04 | |
| | Hypothetical (5% return before expenses) | $ | 1,000.00 | | $ | 1,019.24 | | $ | 5.61 | |
Westcore Micro-Cap Opportunity Fund | | | | | | | | | | |
Retail Class | Actual | $ | 1,000.00 | | $ | 1,166.00 | | $ | 6.98 | |
| | Hypothetical (5% return before expenses) | $ | 1,000.00 | | $ | 1,018.35 | | $ | 6.51 | |
Westcore International Small-Cap Fund | | | | | | | | | | |
Retail Class | Actual | $ | 1,000.00 | | $ | 987.70 | | $ | 7.39 | |
| | Hypothetical (5% return before expenses) | $ | 1,000.00 | | $ | 1,017.36 | | $ | 7.50 | |
Westcore Flexible Income Fund | | | | | | | | | | |
Retail Class | Actual | $ | 1,000.00 | | $ | 1,003.10 | | $ | 4.22 | |
| | Hypothetical (5% return before expenses) | $ | 1,000.00 | | $ | 1,020.58 | | $ | 4.26 | |
Institutional Class | Actual | $ | 1,000.00 | | $ | 1,003.50 | | $ | 3.43 | |
| | Hypothetical (5% return before expenses) | $ | 1,000.00 | | $ | 1,021.37 | | $ | 3.46 | |
Westcore Plus Bond Fund | | | | | | | | | | |
Retail Class | Actual | $ | 1,000.00 | | $ | 977.70 | | $ | 2.70 | |
| | Hypothetical (5% return before expenses) | $ | 1,000.00 | | $ | 1,022.07 | | $ | 2.76 | |
Institutional Class | Actual | $ | 1,000.00 | | $ | 978.70 | | $ | 1.86 | |
| | Hypothetical (5% return before expenses) | $ | 1,000.00 | | $ | 1,022.91 | | $ | 1.91 | |
Westcore Colorado Tax-Exempt Fund | | | | | | | | | | |
Retail Class | Actual | $ | 1,000.00 | | $ | 967.70 | | $ | 3.17 | |
| | Hypothetical (5% return before expenses) | $ | 1,000.00 | | $ | 1,021.57 | | $ | 3.26 | |
PAGE 27 |
|
| Index Definitions and Disclosures |
All indices are unmanaged and index performance figures include reinvestment of dividends but do not reflect any fees, expenses or taxes. Investors cannot invest directly in an index.
The S&P 500® Index is comprised of 500 common stocks chosen for market size, liquidity, and industry group representation. It is a market-value weighted index (stock price times number of shares outstanding), with each stock’s weight in the Index proportionate to its market value.
The Russell Midcap® Growth Index measures the performance of those Russell Midcap companies with higher price-to-book ratios and higher forecasted growth values than the threshold determined by the Frank Russell Company. The Russell Midcap companies are comprised of the 800 smallest companies in the Russell 1000 Index. The Russell 1000 Index consists of the 1,000 largest U.S. Incorporated companies based on total market capitalization.
The Russell Midcap® Value Index measures the performance of those Russell Midcap companies with lower price-to-book ratios and lower forecasted growth values. The stocks are also members of the Russell 1000 Value index.
The Russell 1000® Growth Index measures the performance of the largest 1,000 firms in the Russell 3000 Index, which represents approximately 98% of the investable U.S. equity market.
The Russell 2000® Index measures the performance of the smallest 2,000 companies in the Russell 3000 Index. The Russell 3000 Index consists of the 3,000 largest U.S. incorporated companies based on total market capitalization.
The Russell 2000® Value Index measures the performance of companies within the Russell 2000 Index having lower price-to-book ratios and lower forecasted growth values. The Russell 2000 Index includes the 2000 firms from the Russell 3000 Index with the smallest market capitalizations. The Russell 3000 Index represents 98% of the investable U.S. equity market.
The Russell Microcap® Index measures the performance of the microcap segment of the U.S. equity market. It makes up less than 3% of the U.S. equity market. It includes 1,000 of the smallest securities in the Russell 2000 Index based on a combination of their market cap and current index membership and it includes the next 1,000 securities.
The MSCI EAFE Small-Cap Index is an unmanaged market-capitalization-weighted index that represents the performance of smaller capitalization companies in developed stock markets outside of North America. The index targets all companies with market capitalization below that of the companies in the MSCI EAFE Index and up to 99% coverage of the free-float adjusted market capitalization in each market.
The Westcore Flexible Income Fund Custom Index is comprised of the Barclays U.S. Long-Term Government/Corporate Bond Index from the Fund’s inception to 9/30/00 and the Barclays U.S. Corporate High Yield Ba Index for the time period 10/1/00 to the most recent period end to reflect the change in the Fund’s investment strategy on 10/1/00. The Adviser believes that the Custom Index is the best benchmark measurement for historical performance over eight years.
The Barclays U.S. Corporate High Yield Ba Index measures the performance of intermediate (1 to 10 year) U.S. high yield issues. It includes fixed-rate, noninvestment grade debt issues rated Ba1 or lower by Moody’s, rated BB+ or lower by S&P, rated below investment grade by Fitch Investor’s Service or if unrated previously held a high yield rating or have been associated with a high yield issuer, and must trade accordingly.
The Barclays U.S. Aggregate Bond Index is a fixed income, market-value-weighted index generally representative of investment grade fixed-rate debt issues, including government, corporate, asset-backed, and mortgage-backed securities with maturities of at least one year.
The Barclays U.S. 10-Year Municipal Bond Index includes investment grade (Moody’s Investor Services Aaa to Baa, Standard and Poor’s Corporation AAA to BBB) tax-exempt bonds with maturities between eight and twelve years.
The Municipal 20 Bond Buyer Index is comprised of yields of 20 general obligation municipal bonds published weekly by The Bond Buyer.
The Municipal 25 Bond Buyer Revenue Index is comprised of yields of 25 revenue bonds with 30-year maturities published weekly by The Bond Buyer.
The Lipper Large-Cap Growth Index is comprised of the 30 largest mutual funds in the Lipper Large-Cap Growth Funds classification.
The Lipper Mid-Cap Growth Index is comprised of the 30 largest mutual funds in the Lipper Mid-Cap Growth Funds classification.
| PAGE 28 | |
|
| IMPORTANT DISCLOSURES (continued) |
| |
The Lipper Large-Cap Core Index is comprised of the 30 largest mutual funds in the Lipper Large-Cap Core Funds classification.
The Lipper Mid-Cap Value Index is comprised of the 30 largest mutual funds in the Lipper Mid-Cap Value Funds classification.
The Lipper Small-Cap Core Index is comprised of the 30 largest mutual funds in the Lipper Small-Cap Core Funds classification.
The Lipper Small-Cap Value Index is comprised of the 30 largest mutual funds in the Lipper Small-Cap Value Funds classification.
The Lipper International Small-Cap Index is comprised of the 30 largest mutual funds in the Lipper International Small-Cap Funds classification.
The Lipper High Current Yield Index is comprised of the 30 largest mutual funds in the Lipper High Current Yield Funds classification.
The Lipper Intermediate Investment Grade Index is comprised of the 30 largest mutual funds in the Lipper Intermediate Investment Grade Debt Funds classification.
The Lipper Intermediate Municipal Debt Index is comprised of the 30 largest mutual funds in the Lipper Intermediate Municipal Debt Funds classification.
Russell Investments is the source and owner of the Russell Index data contained in this material and all trademarks and copyrights related thereto. Any further dissemination or redistribution is strictly prohibited. Russell Investments is not responsible for the formatting or configuration of this material or for any inaccuracy in Denver Investments’ presentation thereof.
Standard & Poor’s is the source and owner of the S&P Index data contained in this material and all trademarks and copyrights related thereto. Any further dissemination or redistribution is strictly prohibited. Standard & Poor’s is not responsible for the formatting or configuration of this material or for any inaccuracy in Denver Investments’ presentation thereof.
MSCI Barra is the source and owner of the MSCI Index data contained in this material and all trademarks and copyrights related thereto. Any further dissemination or redistribution is strictly prohibited. MSCI Barra is not responsible for the formatting or configuration of this material or for any inaccuracy in Denver Investments’ presentation thereof.
Barclays Capital is the source and owner of the Barclays Capital Index data contained in this material and all trademarks and copyrights related thereto. Any further dissemination or redistribution is strictly prohibited. Barclays Capital is not responsible for the formatting or configuration of this material or for any inaccuracy in Denver Investments’ presentation thereof.
Lipper Inc. is the source and owner of the Lipper Index data contained in this material and all trademarks and copyrights related thereto. Any further dissemination or redistribution is strictly prohibited. Lipper Inc. is not responsible for the formatting or configuration of this material or for any inaccuracy in Denver Investments’ presentation thereof.
| Top 5/Bottom 5 Stock Performance Calculation Methodology |
The Calculation methodology used to construct this chart took into account consistently the weighting of every holding in the Fund that contributed to the Fund’s performance during the Measurement Period, and the Chart reflects consistently the results of the Calculation. The Calculation determined the contribution of each Fund holding by calculating the weight (i.e., percentage of the Total Investments) of each holding multiplied by the rate of return for that holding during the first six months of 2013.
©2013 Morningstar, Inc. All Rights Reserved. The information contained herein is: (1) proprietary to Morningstar; (2) may not be copied or distributed; and (3) is not warranted to be accurate, complete or timely. Neither Morningstar nor its content providers are responsible for any damages or losses arising from any use of this information. Past performance is no guarantee of future results.
Morningstar proprietary ratings reflect historical risk-adjusted performance as of 6/30/13 and are subject to change every month. For each fund with at least a 3-year history, Morningstar calculates a rating based on a Morningstar Risk-Adjusted Return measure that accounts for variation in a fund’s monthly performance (including the effects of sales charges and redemption fees), placing more emphasis on downward variations and rewarding consistent performance. The top 10% of funds in each category receive a Morningstar RatingTM of 5 stars, the next 22.5% receive 4 stars, the next 35% receive 3 stars, the next 22.5% receive 2 stars and the bottom 10% receive 1 star. (Each share class is counted as a fraction of one fund within this scale and rated separately, which may cause slight variations in the distribution percentages.) The Overall Morningstar Rating for a fund is derived from a weighted average of the performance figures associated with its 3-, 5- and 10-year (if applicable) Morningstar Rating metrics. During periods on which ratings are based, service providers of the Fund waived fees. This waiver had a material impact on the funds’ average annual returns. In the absence of fee waivers, performance would have been reduced.
PAGE 29 |
|
| IMPORTANT DISCLOSURES (continued) |
| |
Beta – A measure of a fund’s sensitivity to market movements. The beta of the market is 1.00 by definition. A beta above 1 is more volatile than the overall market, while a beta below 1 is less volatile.
Credit Quality Rating – A rating of an individual bond as determined by a nationally recognized statistical rating organization (NRSRO) such as Standard & Poor’s or Moody’s. Credit quality ratings range from highest, “AAA ” to lowest, “D”. For more information regarding rating methodologies for Standard & Poor’s, visit www.standardandpoors.com and for Moody’s, visit www.moodys.com.
Duration – A generic description of the sensitivity of a bond’s price (as a percentage of initial price) to a change in yield.
EPS (Earnings per Share) Growth – Earnings per share is the portion of a company’s profit allocated to each outstanding share of common stock. EPS growth serves as an indicator of a company’s profitability.
Effective Maturity – A weighted average of the maturities of the bonds in a portfolio.
Emerging Markets – Westcore International Small-Cap Fund considers emerging market countries to be those countries that are neither U.S. nor developed countries.
Market Capitalization – The market capitalization represents the total value of a company or stock. It is calculated by multiplying the number of shares outstanding by the current price of one share.
Modified Duration – A duration measure in which it is assumed that yield changes do not change the expected cash flows.
Number of Holdings – The Number of Holdings presented excludes short-term investments including money market mutual funds.
Portfolio Turnover Rate – A percentage computed by taking the lesser of purchases or sales of portfolio securities (excluding short-term investments) for the year and dividing it by the monthly average of the market value of the portfolio securities during the year.
Price to Book Value (P/B) Ratio – The P/B ratio is used to compare a company’s book value to its current market price. This ratio compares the market’s valuation of a company to the value of that company as indicated on its financial statements. The higher the ratio, the higher the premium the market is willing to pay for the company above its hard assets.
Price to Cash (P/C) Flow Ratio – The P/C flow ratio is a measure of a firm’s stock price relative to its financial performance. For a fund, the P/C flow ratio is the weighted average of all stocks held in the fund. It represents the amount an investor is willing to pay for a dollar generated from a particular company’s operations.
Price to Earnings (P/E) Ratio – The P/E ratio is a stock’s per share price divided by its per share earnings over a 12-month period. For a fund, the P/E ratio is the weighted average of all stocks held in the fund. The higher the P/E ratio, the more the market is willing to pay for each dollar of annual earnings.
Quantitative Easing – A monetary policy that the Federal Reserve, and other central banks, pursue to increase the supply of money and thereby expand liquidity in the hopes of fostering stronger growth.
REIT – A REIT is a real estate investment trust. REITs are securities that sell like a stock on a major exchange. REITs invest directly in real estate, either through properties or mortgages.
Return on Equity (ROE) – A measure of how well a company used reinvested earnings to generate additional earnings. It is used as a general indication of a company’s efficiency; in other words, how much profit is a company able to generate given the resources provided by its stockholders.
Risk On, Risk Off – A concept that describes market sentiment as either “risk on” or “risk off”. During a market sentiment of “risk on”, the market is optimistic and more willing to take on risk in exchange for possibly better returns. When market sentiment is “risk off”, the market is pessimistic and will favor investments with perceived lower risk.
SEC Yield – The SEC Yield is a standardized method of computing return on investment that the U.S. Securities and Exchange Commission (SEC) requires mutual funds to use when advertising their yields. Its objective is to allow a confusion-free comparison of the performance of different funds.
Weighted Average – An average that takes into account the proportional relevance of each component, rather than treating each component equally.
PAGE 30 |
|
| FINANCIAL STATEMENTS TABLE OF CONTENTS |
| |
| STATEMENTS OF INVESTMENTS | | |
| | | |
| Westcore Growth Fund | 32 | |
| | | |
| Westcore MIDCO Growth Fund | 34 | |
| | | |
| Westcore Select Fund | 36 | |
| | | |
| Westcore Blue Chip Dividend Fund | 37 | |
| | | |
| Westcore Mid-Cap Value Dividend Fund | 38 | |
| | | |
| Westcore Small-Cap Opportunity Fund | 40 | |
| | | |
| Westcore Small-Cap Value Dividend Fund | 42 | |
| | | |
| Westcore Micro-Cap Opportunity Fund | 44 | |
| | | |
| Westcore International Small-Cap Fund | 47 | |
| | | |
| Westcore Flexible Income Fund | 49 | |
| | | |
| Westcore Plus Bond Fund | 52 | |
| | | |
| Westcore Colorado Tax-Exempt Fund | 58 | |
| | | |
| Common Abbreviations | 63 | |
| | | |
| STATEMENTS OF ASSETS AND LIABILITIES | 64 | |
| | | |
| STATEMENTS OF OPERATIONS | 66 | |
| | | |
| STATEMENTS OF CHANGES IN NET ASSETS | 68 | |
| | | |
| FINANCIAL HIGHLIGHTS | 72 | |
| | | |
| NOTES TO FINANCIAL STATEMENTS | 82 | |
PAGE 31 |
|
| STATEMENTS OF INVESTMENTS |
| |
| |
| | Shares | Market Value |
COMMON STOCKS | | 95.66% |
Consumer Discretionary | | 19.78% |
Automobiles | | 1.41% |
Toyota Motor Corp. - ADR | | |
(Japan) | 8,350 | $1,007,511 |
Hotels, Restaurants & Leisure | | 5.20% |
Las Vegas Sands Corp. | 22,220 | 1,176,105 |
Panera Bread Co. - | | |
Class A** | 5,300 | 985,482 |
Starbucks Corp. | 23,600 | 1,545,564 |
| | 3,707,151 |
Household Durables | | 2.05% |
PulteGroup Inc.** | 29,350 | 556,769 |
Whirlpool Corp. | 7,900 | 903,444 |
| | 1,460,213 |
Internet & Catalog Retail | | 4.34% |
Amazon.com Inc.** | 6,200 | 1,721,678 |
Priceline.com Inc.** | 1,660 | 1,373,036 |
| | 3,094,714 |
Media | | 2.04% |
Walt Disney Co. | 23,050 | 1,455,607 |
Specialty Retail | | 3.18% |
Home Depot Inc. | 29,238 | 2,265,068 |
Textiles, Apparel & Luxury Goods | 1.56% |
Michael Kors Holdings | | |
Ltd. (British Virgin | | |
Islands)** | 17,950 | 1,113,259 |
Total Consumer Discretionary | | |
(Cost $11,524,319) | | 14,103,523 |
Consumer Staples | | 9.32% |
Food & Staples Retailing | | 4.92% |
Costco Wholesale Corp. | 14,550 | 1,608,794 |
CVS Caremark Corp. | 15,000 | 857,700 |
Whole Foods Market Inc. | 20,300 | 1,045,044 |
| | 3,511,538 |
Food Products | | 2.95% |
Green Mountain Coffee | | |
Roasters, Inc.** | 13,600 | 1,020,816 |
Hain Celestial Group Inc.** | 16,700 | 1,084,999 |
| | 2,105,815 |
Personal Products | | 1.45% |
The Estee Lauder Cos. Inc. - | | |
Class A | 15,700 | 1,032,589 |
Total Consumer Staples | | |
(Cost $6,372,179) | | 6,649,942 |
| | Shares | Market Value |
Energy | | 4.39% |
Energy Equipment & Services | | 1.41% |
Cameron International | | |
Corp.** | 16,450 | $1,006,082 |
Oil, Gas & Consumable Fuels | | 2.98% |
Cabot Oil & Gas Corp. | 17,900 | 1,271,258 |
EOG Resources Inc. | 6,500 | 855,920 |
| | 2,127,178 |
Total Energy | | |
(Cost $2,821,828) | | 3,133,260 |
| | | |
Financials | | 8.71% |
Capital Markets | | 3.03% |
Affiliated Managers Group | | |
Inc.** | 6,775 | 1,110,693 |
Goldman Sachs Group Inc. | 6,950 | 1,051,188 |
| | 2,161,881 |
Commercial Banks | | 0.75% |
SunTrust Banks Inc. | 17,000 | 536,690 |
Diversified Financial Services | | 2.28% |
Citigroup Inc. | 11,300 | 542,061 |
JPMorgan Chase & Co. | 20,500 | 1,082,195 |
| | 1,624,256 |
Insurance | | 2.65% |
American International | | |
Group Inc.** | 19,800 | 885,060 |
Berkshire Hathaway Inc. | | |
Class B** | 8,950 | 1,001,684 |
| | 1,886,744 |
Total Financials | | |
(Cost $5,109,067) | | 6,209,571 |
| | | |
Health Care | | 10.16% |
Biotechnology | | 3.86% |
Biogen Idec Inc.** | 5,762 | 1,239,982 |
Gilead Sciences Inc.** | 29,600 | 1,515,816 |
| | 2,755,798 |
Health Care Providers & Services | 4.88% |
Express Scripts Holding | | |
Co.** | 25,000 | 1,542,250 |
Omnicare Inc. | 18,600 | 887,406 |
Universal Health Services | | |
Inc. - Class B | 15,700 | 1,051,272 |
| | 3,480,928 |
Pharmaceuticals | | 1.42% |
Endo Health Solutions Inc.** | 27,500 | 1,011,725 |
Total Health Care | | |
(Cost $5,738,864) | | 7,248,451 |
| Shares | Market Value |
Industrials | | 11.72% |
Aerospace & Defense | | 4.80% |
Honeywell International | | |
Inc. | 20,950 | $1,662,173 |
TransDigm Group Inc. | 4,300 | 674,111 |
Triumph Group Inc. | 13,750 | 1,088,313 |
| | 3,424,597 |
Airlines | | 1.46% |
Delta Air Lines Inc.** | 55,800 | 1,044,018 |
Electrical Equipment | | 2.87% |
AMETEK Inc. | 24,127 | 1,020,551 |
Eaton Corp. PLC (Ireland) | 15,600 | 1,026,636 |
| | 2,047,187 |
Industrial Conglomerates | | 0.97% |
Carlisle Cos. Inc. | 11,050 | 688,525 |
Road & Rail | | 1.62% |
J.B. Hunt Transport | | |
Services Inc. | 16,000 | 1,155,840 |
Total Industrials | | |
(Cost $7,137,136) | | 8,360,167 |
| | | |
Information Technology | | 29.76% |
Computers & Peripherals | | 6.19% |
Apple Inc. | 8,457 | 3,349,648 |
SanDisk Corp.** | 17,400 | 1,063,140 |
| | 4,412,788 |
Internet Software & Services | 5.68% |
Google Inc. - Class A** | 3,636 | 3,201,025 |
LinkedIn Corp. - Class A** | 4,775 | 851,383 |
| | 4,052,408 |
IT Services | | 5.28% |
Accenture PLC - Class A | | |
(Ireland) | 19,300 | 1,388,828 |
Visa Inc. - Class A | 13,000 | 2,375,750 |
| | 3,764,578 |
Semiconductors & Semiconductor | |
Equipment | | 4.29% |
Intel Corp. | 56,000 | 1,356,320 |
Lam Research Corp.** | 12,300 | 545,382 |
Microchip Technology Inc. | 16,900 | 629,525 |
ON Semiconductor Corp.** | 65,700 | 530,856 |
| | 3,062,083 |
Software | | 8.32% |
Microsoft Corp. | 88,700 | 3,062,811 |
NetSuite Inc.** | 11,750 | 1,077,945 |
Splunk Inc.** | 25,500 | 1,182,180 |
Workday Inc. - Class A** | 9,500 | 608,855 |
| | 5,931,791 |
PAGE 32 |
|
| STATEMENTS OF INVESTMENTS |
| |
WESTCORE GROWTH FUND AS OF JUNE 30, 2013 (continued)
(UNAUDITED)
| Shares | Market Value |
Total Information Technology | |
(Cost $15,794,190) | | $21,223,648 |
| | | |
Materials | | 0.98% |
Construction Materials | | 0.98% |
Martin Marietta Materials | | |
Inc. | 7,100 | 698,782 |
Total Materials | | |
(Cost $712,189) | | 698,782 |
| | |
Telecommunications Services | 0.84% |
Wireless Telecommunications Services | 0.84% |
T-Mobile US Inc. | 24,100 | 597,921 |
Total Telecommunications Services | |
(Cost $588,079) | | 597,921 |
Total Common Stocks | | |
(Cost $55,797,851) | | 68,225,265 |
| | |
MONEY MARKET MUTUAL FUNDS | 4.97% |
Fidelity Institutional Money | | |
Market Government | | |
Portfolio - Class I | | |
(7 Day Yield 0.000%)(1) | 3,545,944 | 3,545,944 |
Total Money Market Mutual Funds | |
(Cost $3,545,944) | | 3,545,944 |
Total Investments | | |
(Cost $59,343,795) | 100.63% | 71,771,209 |
Liabilities in Excess of | | |
Other Assets | (0.63%) | (451,368) |
Net Assets | 100.00% | $71,319,841 |
Sector and industry classifications presented herein are based on the sector and industry categorization methodology of the Adviser to the Funds which may result in the designations for one Fund being different from another.
** Non-income producing security.
(1) Less than 0.0005%.
See Notes to Financial Statements.
PAGE 33 |
|
| STATEMENTS OF INVESTMENTS |
| |
WESTCORE MIDCO GROWTH FUND AS OF JUNE 30, 2013
(UNAUDITED)
| Shares | Market Value |
COMMON STOCKS | | 97.81% |
Consumer Discretionary | | 30.24% |
Auto Components | | 3.79% |
BorgWarner Inc.** | 23,450 | $2,020,217 |
Delphi Automotive PLC | | |
(Jersey) | 39,440 | 1,999,214 |
| | 4,019,431 |
Hotels, Restaurants & Leisure | 5.71% |
Chipotle Mexican Grill Inc.** | 5,790 | 2,109,587 |
Dunkin’ Brands Group Inc. | 26,520 | 1,135,586 |
Panera Bread Co. - | | |
Class A** | 5,470 | 1,017,092 |
Wynn Resorts Ltd. | 14,040 | 1,797,120 |
| | 6,059,385 |
Household Durables | | 1.40% |
DR Horton Inc. | 69,930 | 1,488,110 |
Internet & Catalog Retail | | 2.09% |
Netflix Inc.** | 10,520 | 2,220,667 |
Media | | 4.47% |
Discovery Communications | | |
Inc. - Class A** | 30,930 | 2,388,105 |
Sirius XM Radio Inc. | 705,160 | 2,362,286 |
| | 4,750,391 |
Specialty Retail | | 6.35% |
CarMax Inc.** | 36,820 | 1,699,611 |
DSW Inc. - Class A | 18,860 | 1,385,644 |
Express Inc.** | 87,750 | 1,840,118 |
Tractor Supply Co. | 9,280 | 1,091,421 |
Urban Outfitters, Inc.** | 18,190 | 731,602 |
| | 6,748,396 |
Textiles Apparel & Luxury Goods | 6.43% |
Carter’s Inc. | 12,130 | 898,469 |
Michael Kors Holdings | | |
Ltd. (British Virgin | | |
Islands)** | 33,891 | 2,101,920 |
Ralph Lauren Corp. | 12,950 | 2,249,933 |
Under Armour Inc. - | | |
Class A** | 26,520 | 1,583,509 |
| | 6,833,831 |
Total Consumer Discretionary | |
(Cost $25,188,544) | | 32,120,211 |
| | | |
Consumer Staples | | 5.01% |
Food & Staples Retailing | | 3.43% |
Fresh Market Inc.** | 16,760 | 833,307 |
Pricesmart Inc. | 14,580 | 1,277,645 |
Whole Foods Market Inc. | 29,700 | 1,528,956 |
| | 3,639,908 |
| Shares | Market Value |
Food Products | | 1.58% |
Mead Johnson Nutrition | | |
Co. | 21,230 | $1,682,053 |
| | | |
Total Consumer Staples | | |
(Cost $5,425,552) | | 5,321,961 |
| | | |
Energy | | 6.93% |
Energy Equipment & Services | 3.71% |
Cameron International | | |
Corp.** | 21,410 | 1,309,435 |
Core Laboratories NV | | |
(Netherlands) | 4,930 | 747,684 |
Oceaneering International | | |
Inc. | 26,110 | 1,885,142 |
| | 3,942,261 |
Oil, Gas & Consumable Fuels | | 3.22% |
Noble Energy Inc. | 22,890 | 1,374,316 |
Pioneer Natural | | |
Resources Co. | 14,160 | 2,049,660 |
| | 3,423,976 |
Total Energy | | |
(Cost $5,825,009) | | 7,366,237 |
| | | |
Financials | | 4.99% |
Capital Markets | | 1.97% |
Affiliated Managers Group | | |
Inc.** | 12,780 | 2,095,153 |
Commercial Banks | | 1.09% |
SVB Financial Group** | 13,900 | 1,158,148 |
Real Estate Management & | | |
Development | | 1.93% |
CBRE Group Inc. - | | |
Class A** | 32,350 | 755,696 |
Realogy Holdings Corp.** | 26,960 | 1,295,159 |
| | 2,050,855 |
Total Financials | | |
(Cost $4,604,063) | | 5,304,156 |
| | | |
Health Care | | 11.18% |
Biotechnology | | 7.55% |
Alkermes PLC (Ireland)** | 55,880 | 1,602,638 |
Cubist Pharmaceuticals | | |
Inc.** | 32,350 | 1,562,505 |
Onyx Pharmaceuticals | | |
Inc.** | 16,360 | 1,420,375 |
Pharmacyclics Inc.** | 19,270 | 1,531,387 |
Regeneron | | |
Pharmaceuticals Inc.** | 8,450 | 1,900,236 |
| | 8,017,141 |
| Shares | Market Value |
Health Care Equipment & Supplies | 2.63% |
Align Technology Inc.** | 45,550 | $1,687,172 |
Sirona Dental Systems | | |
Inc.** | 16,742 | 1,102,963 |
| | 2,790,135 |
Life Sciences Tools & Services | 1.00% |
Bruker Corp.** | 66,200 | 1,069,130 |
| | | |
Total Health Care | | |
(Cost $9,817,762) | | 11,876,406 |
| | | |
Industrials | | 13.22% |
Building Products | | 1.65% |
Lennox International Inc. | 27,180 | 1,754,197 |
Electrical Equipment | | 4.25% |
Acuity Brands Inc. | 17,600 | 1,329,152 |
Rockwell Automation Inc. | 16,530 | 1,374,304 |
Sensata Technologies | | |
Holding N.V. | | |
(Netherlands)** | 51,760 | 1,806,424 |
| | 4,509,880 |
Machinery | | 3.85% |
Ingersoll-Rand PLC | | |
(Ireland) | 39,370 | 2,185,823 |
WABCO Holdings Inc.** | 25,460 | 1,901,607 |
| | 4,087,430 |
Road & Rail | | 2.38% |
J.B. Hunt Transport | | |
Services Inc. | 11,540 | 833,650 |
Kansas City Southern | 16,000 | 1,695,360 |
| | 2,529,010 |
Trading Companies & Distributors | 1.09% |
United Rentals Inc.** | 23,300 | 1,162,903 |
| | | |
Total Industrials | | |
(Cost $11,476,510) | | 14,043,420 |
| | | |
Information Technology | | 23.49% |
Communications Equipment | | 0.75% |
Ciena Corp.** | 41,100 | 798,162 |
| | | |
Internet Software & Services | 5.29% |
LinkedIn Corp. - Class A** | 14,930 | 2,662,019 |
Pandora Media Inc.** | 118,770 | 2,185,368 |
Zillow Inc. - Class A** | 13,680 | 770,184 |
| | 5,617,571 |
IT Services | | 2.57% |
Gartner Inc.** | 32,470 | 1,850,465 |
Jack Henry & Associates | | |
Inc. | 18,560 | 874,733 |
| | 2,725,198 |
PAGE 34 |
|
| STATEMENTS OF INVESTMENTS |
| |
WESTCORE MIDCO GROWTH FUND AS OF JUNE 30, 2013 (continued)
(UNAUDITED)
| Shares | Market Value |
Semiconductors & Semiconductor | |
Equipment | | 3.43% |
Advanced Micro Devices | | |
Inc.** | 257,050 | $1,048,764 |
ARM Holdings PLC - ADR | | |
(United Kingdom) | 31,940 | 1,155,589 |
Lam Research Corp.** | 32,500 | 1,441,050 |
| | 3,645,403 |
| | | |
Software | | 11.45% |
Guidewire Software, Inc.** | 13,450 | 565,572 |
Informatica Corp.** | 33,970 | 1,188,271 |
NetSuite Inc. (Canada)** | 12,300 | 1,128,402 |
QLIK Technologies Inc.** | 47,580 | 1,345,087 |
ServiceNow Inc.** | 57,450 | 2,320,405 |
Splunk Inc.** | 55,130 | 2,555,827 |
Tableau Software Inc. - | | |
Class A** | 15,000 | 831,300 |
Workday Inc. - Class A** | 34,740 | 2,226,487 |
| | 12,161,351 |
Total Information Technology | |
(Cost $20,633,960) | | 24,947,685 |
| | | |
Materials | | 2.75% |
Chemicals | | 2.75% |
FMC Corp. | 31,110 | 1,899,577 |
Rockwood Holdings Inc. | 15,940 | 1,020,638 |
| | 2,920,215 |
Total Materials | | |
(Cost $1,240,546) | | 2,920,215 |
Total Common Stocks | | |
(Cost $84,211,946) | | 103,900,291 |
| | |
MONEY MARKET MUTUAL FUNDS | 1.95% |
Bank of New York | | |
Cash Reserve | | |
(7 Day Yield 0.050%) | 212,028 | 212,028 |
Fidelity Institutional Money | | |
Market Government | | |
Portfolio - Class I | | |
(7 Day Yield 0.010%) | 1,861,654 | 1,861,654 |
Total Money Market Mutual Funds | |
(Cost $2,073,682) | | 2,073,682 |
Total Investments | | |
(Cost $86,285,628) | 99.76% | 105,973,973 |
Other Assets in | | |
Excess of Liabilities | 0.24% | 256,971 |
Net Assets | 100.00% | $106,230,944 |
Sector and industry classifications presented herein are based on the sector and industry categorization methodology of the Adviser to the Funds which may result in the designations for one Fund being different from another.
** Non-income producing security.
See Notes to Financial Statements.
PAGE 35 |
|
| Shares | Market Value |
COMMON STOCKS | | 99.80% |
Consumer Discretionary | | 34.25% |
Auto Components | | 3.66% |
BorgWarner Inc.** | 50,840 | $4,379,866 |
| | |
Hotels Restaurants & Leisure | 5.46% |
Chipotle Mexican Grill | | |
Inc.** | 8,550 | 3,115,192 |
Wynn Resorts Ltd. | 26,740 | 3,422,720 |
| | 6,537,912 |
Household Durables | | 0.50% |
DR Horton Inc. | 28,050 | 596,904 |
Internet & Catalog Retail | | 2.39% |
Netflix Inc.** | 13,580 | 2,866,602 |
Media | | 6.33% |
Discovery Communications | | |
Inc. - Class A** | 49,060 | 3,787,922 |
Sirius XM Radio Inc. | 1,130,156 | 3,786,023 |
| | 7,573,945 |
Specialty Retail | | 5.47% |
CarMax Inc.** | 82,940 | 3,828,511 |
Express Inc.** | 129,330 | 2,712,050 |
| | 6,540,561 |
Textiles Apparel & Luxury Goods | 10.44% |
Michael Kors Holdings | | |
Ltd. (British Virgin | | |
Islands)** | 68,660 | 4,258,293 |
Ralph Lauren Corp. | 25,000 | 4,343,500 |
Under Armour Inc. - | | |
Class A** | 65,140 | 3,889,510 |
| | 12,491,303 |
Total Consumer Discretionary | |
(Cost $36,183,564) | | 40,987,093 |
| | | |
Consumer Staples | | 2.48% |
Food Products | | 2.48% |
Mead Johnson Nutrition | | |
Co. | 37,450 | 2,967,163 |
Total Consumer Staples | | |
(Cost $3,083,521) | | 2,967,163 |
| | | |
Energy | | 5.99% |
Energy Equipment & Services | 2.64% |
Oceaneering International | | |
Inc. | 43,730 | 3,157,306 |
Oil, Gas & Consumable Fuels | 3.35% |
Pioneer Natural Resources | | |
Co. | 27,670 | 4,005,233 |
Total Energy | | |
(Cost $4,679,376) | | 7,162,539 |
| Shares | Market Value |
Financials | | 6.69% |
Capital Markets | | 3.28% |
Affiliated Managers Group | | |
Inc.** | 23,910 | $3,919,805 |
Commercial Banks | | 3.41% |
SVB Financial Group** | 49,000 | 4,082,680 |
Total Financials | | |
(Cost $6,818,310) | | 8,002,485 |
| | | |
Health Care | | 11.58% |
Biotechnology | | 8.38% |
Cubist Pharmaceuticals | | |
Inc.** | 65,140 | 3,146,262 |
Pharmacyclics Inc.** | 45,120 | 3,585,687 |
Regeneron | | |
Pharmaceuticals, | | |
Inc.** | 14,640 | 3,292,243 |
| | 10,024,192 |
Health Care Equipment & Supplies | 3.20% |
Align Technology Inc.** | 103,450 | 3,831,788 |
Total Health Care | | |
(Cost $13,637,490) | | 13,855,980 |
| | | |
Industrials | | 13.44% |
Electrical Equipment | | 3.25% |
Sensata Technologies | | |
Holding N.V. | | |
(Netherlands)** | 111,520 | 3,892,048 |
Machinery | | 6.95% |
Ingersoll-Rand PLC | | |
(Ireland) | 70,467 | 3,912,328 |
WABCO Holdings Inc.** | 58,890 | 4,398,494 |
| | 8,310,822 |
Road & Rail | | 3.24% |
Kansas City Southern | 36,590 | 3,877,076 |
Total Industrials | | |
(Cost $13,575,217) | | 16,079,946 |
| | | |
Information Technology | | 22.60% |
Internet Software & Services | 7.90% |
LinkedIn Corp. - Class A** | 29,460 | 5,252,718 |
Pandora Media Inc.** | 228,350 | 4,201,640 |
| | 9,454,358 |
IT Services | | 3.44% |
Gartner Inc.** | 72,229 | 4,116,331 |
Software | | 11.26% |
ServiceNow Inc.** | 107,920 | 4,358,889 |
Splunk Inc.** | 111,494 | 5,168,862 |
Workday Inc. - Class A** | 61,570 | 3,946,021 |
| | 13,473,772 |
| Shares | Market Value |
Total Information Technology | |
(Cost $20,098,287) | | $27,044,461 |
| | | |
Materials | | 2.77% |
Chemicals | | 2.77% |
FMC Corp. | 54,390 | 3,321,053 |
Total Materials | | |
(Cost $3,351,554) | | 3,321,053 |
Total Common Stocks | | |
(Cost $101,427,319) | | 119,420,720 |
Total Investments | | |
(Cost $101,427,319) | 99.80% | 119,420,720 |
Other Assets in Excess | | |
of Liabilities | 0.20% | 243,054 |
Net Assets | 100.00% | $119,663,774 |
Sector and industry classifications presented herein are based on the sector and industry categorization methodology of the Adviser to the Funds which may result in the designations for one Fund being different from another.
** Non-income producing security.
See Notes to Financial Statements.
PAGE 36 |
|
| STATEMENTS OF INVESTMENTS |
| |
WESTCORE BLUE CHIP DIVIDEND FUND AS OF JUNE 30, 2013
(UNAUDITED)
| | Shares | Market Value |
COMMON STOCKS | | 98.38% |
Consumer Discretionary | | 13.13% |
Hotels Restaurants & Leisure | | 6.52% |
Darden Restaurants Inc. | 44,000 | $2,221,120 |
McDonald’s Corp. | 20,900 | 2,069,100 |
| | 4,290,220 |
Leisure Equipment & Products | 3.43% |
Mattel Inc. | 49,900 | 2,260,969 |
Textiles Apparel & Luxury Goods | 3.18% |
LVMH Moet Hennessy | | |
Louis Vuitton SA ADR | | |
(France) | 64,600 | 2,094,397 |
Total Consumer Discretionary | | |
(Cost $8,229,143) | | 8,645,586 |
| | | |
Consumer Staples | | 25.49% |
Beverages | | 3.24% |
Dr Pepper Snapple Group | | |
Inc. | 46,500 | 2,135,745 |
Food & Staples Retailing | | 3.24% |
Wal-Mart Stores Inc. | 28,600 | 2,130,414 |
Food Products | | 9.42% |
General Mills Inc. | 42,800 | 2,077,084 |
Nestle SA ADR | | |
(Switzerland) | 31,200 | 2,052,336 |
Unilever N.V. (Netherlands) | 52,800 | 2,075,568 |
| | 6,204,988 |
Household Products | | 6.45% |
Kimberly-Clark Corp. | 21,400 | 2,078,796 |
Reckitt Benckiser Group | | |
PLC ADR (United | | |
Kingdom) | 152,000 | 2,168,280 |
| | 4,247,076 |
Tobacco | | 3.14% |
British American Tobacco | | |
PLC ADR (United | | |
Kingdom) | 20,100 | 2,069,094 |
Total Consumer Staples | | |
(Cost $16,162,118) | | 16,787,317 |
| | | |
Energy | | 13.33% |
Oil Gas & Consumable Fuels | | 13.33% |
Chevron Corp. | 18,500 | 2,189,290 |
Occidental Petroleum Corp. | 25,480 | 2,273,580 |
Royal Dutch Shell PLC ADR | | |
(Netherlands) | 32,100 | 2,127,267 |
Total SA ADR (France) | 44,900 | 2,186,630 |
| | 8,776,767 |
| Shares | Market Value |
Total Energy | | |
(Cost $8,199,839) | | $8,776,767 |
| | | |
Health Care | | 25.90% |
Health Care Provider & Services | 6.66% |
AmerisourceBergen Corp. | 41,400 | 2,311,362 |
Quest Diagnostics Inc. | 34,200 | 2,073,546 |
| | 4,384,908 |
Pharmaceuticals | | 19.24% |
AbbVie Inc. | 49,450 | 2,044,263 |
GlaxoSmithKline PLC ADR | | |
(United Kingdom) | 42,700 | 2,133,719 |
Novartis AG ADR | | |
(Switzerland) | 30,300 | 2,142,513 |
Pfizer Inc. | 73,462 | 2,057,671 |
Roche Holding AG ADR | 35,500 | 2,196,207 |
Sanofi ADR (France) | 40,800 | 2,101,608 |
| | 12,675,981 |
Total Health Care | | |
(Cost $15,574,095) | | 17,060,889 |
| | | |
Industrials | | 7.33% |
Aerospace & Defense | | 7.33% |
General Dynamics Corp. | 30,600 | 2,396,898 |
Raytheon Co. | 36,800 | 2,433,216 |
| | 4,830,114 |
Total Industrials | | |
(Cost $3,861,279) | | 4,830,114 |
| | | |
Information Technology | | 13.20% |
IT Services | | 6.49% |
Accenture PLC - Class A | | |
(Ireland) | 29,400 | 2,115,624 |
International Business | | |
Machines Corp. | 11,300 | 2,159,543 |
| | 4,275,167 |
Software | | 6.71% |
Microsoft Corp. | 68,700 | 2,372,211 |
Symantec Corp. | 91,000 | 2,044,770 |
| | 4,416,981 |
Total Information Technology | |
(Cost $6,756,044) | | 8,692,148 |
Total Common Stocks | | |
(Cost $58,782,518) | | 64,792,821 |
| Shares | Market Value |
MONEY MARKET MUTUAL FUNDS | 4.59% |
Fidelity Institutional Money | | |
Market Government | | |
Portfolio - Class I | | |
(7 Day Yield 0.000%)(1) | 3,024,732 | $3,024,732 |
Total Money Market Mutual Funds | | |
(Cost $3,024,732) | 3,024,732 |
Total Investments | | |
(Cost $61,807,250) | 102.97% | 67,817,553 |
Liabilities in Excess of | | |
Other Assets | (2.97%) | (1,958,474) |
Net Assets | 100.00% | $65,859,079 |
Westcore Blue Chip Dividend Fund | |
Country Breakdown as of June 30, 2013 | |
(Unaudited) | | |
Country | Market Value | % |
United States | $44,550,517 | 67.65% |
France | 6,382,635 | 9.69% |
United Kingdom | 6,371,093 | 9.67% |
Netherlands | 4,202,835 | 6.38% |
Switzerland | 4,194,849 | 6.37% |
Ireland | 2,115,624 | 3.21% |
Total Investments | 67,817,553 | 102.97% |
Liabilities in Excess of | | |
Other Assets | (1,958,474) | (2.97%) |
Net Assets | $65,859,079 | 100.00% |
Please note the country breakdown is based on the company headquarters.
Sector and industry classifications presented herein are based on the sector and industry categorization methodology of the Adviser to the Funds which may result in the designations for one Fund being different from another.
(1) Less than 0.0005%.
See Notes to Financial Statements.
PAGE 37 |
|
| STATEMENTS OF INVESTMENTS |
| |
WESTCORE MID-CAP VALUE DIVIDEND FUND AS OF JUNE 30, 2013
(UNAUDITED)
| Shares | Market Value |
COMMON STOCKS | | 96.03% |
Basic Materials | | 8.40% |
Chemicals | | 1.60% |
Compass Minerals | | |
International Inc. | 8,900 | $752,317 |
Forestry & Paper | | 6.80% |
Ball Corp. | 20,800 | 864,032 |
International Paper Co. | 12,500 | 553,875 |
Rock-Tenn Co. - Class A | 8,500 | 848,980 |
Silgan Holdings Inc. | 19,700 | 925,112 |
| | 3,191,999 |
Total Basic Materials | | |
(Cost $3,307,217) | | 3,944,316 |
| | | |
Capital Goods | | 2.85% |
Industrial Products | | 2.85% |
Avery Dennison Corp. | 16,200 | 692,712 |
Xylem Inc. | 23,900 | 643,866 |
| | 1,336,578 |
Total Capital Goods | | |
(Cost $1,334,137) | | 1,336,578 |
| | | |
Commercial Services | | 1.30% |
Business Products & Services | 1.30% |
Xerox Corp. | 67,381 | 611,146 |
Total Commercial Services | | |
(Cost $595,384) | | 611,146 |
Communications | | 2.56% |
Telecomm Equipment & Solutions | 2.56% |
Plantronics Inc. | 27,300 | 1,199,016 |
Total Communications | | |
(Cost $962,098) | | 1,199,016 |
| | | |
Consumer Cyclical | | 9.20% |
Department Stores | | 3.94% |
Dillard’s Inc. - Class A | 11,000 | 901,670 |
Macy’s Inc. | 19,700 | 945,600 |
| | 1,847,270 |
Recreation & Leisure | | 3.21% |
Mattel Inc. | 19,200 | 869,952 |
Thor Industries Inc. | 12,900 | 634,422 |
| | 1,504,374 |
Restaurants | | 2.05% |
Darden Restaurants Inc. | 19,100 | 964,168 |
Total Consumer Cyclical | | |
(Cost $3,046,258) | | 4,315,812 |
| |
| | Shares | Market Value |
Consumer Staples | | 6.22% |
Beverages: Non-Alcoholic | | 1.96% |
Dr Pepper Snapple Group | | |
Inc. | 20,000 | $918,600 |
Food & Agricultural Products | | 4.26% |
The J.M. Smucker Co. | 7,550 | 778,783 |
Tyson Foods Inc. - Class A | 47,650 | 1,223,652 |
| | 2,002,435 |
Total Consumer Staples | | |
(Cost $1,823,502) | | 2,921,035 |
| | | |
Energy | | 6.94% |
Oil Services | | 5.82% |
Ensco PLC - Class A (United | | |
Kingdom) | 16,350 | 950,262 |
Noble Corp. (Switzerland) | 21,150 | 794,817 |
Tidewater Inc. | 17,300 | 985,581 |
| | 2,730,660 |
Refining & Marketing | | 1.12% |
HollyFrontier Corp. | 12,300 | 526,194 |
Total Energy | | |
(Cost $2,449,209) | | 3,256,854 |
| | | |
Interest Rate Sensitive | | 21.46% |
Insurance/Real Estate Brokers | | 1.62% |
AON PLC | 11,850 | 762,547 |
Life & Health Insurance | | 4.90% |
Reinsurance Group of | | |
America Inc. | 19,191 | 1,326,290 |
Unum Group | 33,150 | 973,616 |
| | 2,299,906 |
Other Banks | | 1.60% |
First Citizens BancShares | | |
Inc. - Class A | 3,900 | 748,995 |
Property Casualty Insurance | | 8.29% |
Allied World Assurance | | |
Co. Holdings AG | | |
(Switzerland) | 6,350 | 581,089 |
AmTrust Financial Services | | |
Inc. | 20,800 | 742,560 |
AXIS Capital Holdings Ltd. | | |
(Bermuda) | 10,950 | 501,291 |
Endurance Specialty | | |
Holdings Ltd. | | |
(Bermuda) | 9,600 | 493,920 |
PartnerRe Ltd. (Bermuda) | 7,752 | 702,021 |
Validus Holdings Ltd. | | |
(Bermuda) | 24,100 | 870,492 |
| | 3,891,373 |
| Shares | Market Value |
Regional Banks | | 2.72% |
Comerica Inc. | 13,850 | $551,645 |
SunTrust Banks Inc. | 22,900 | 722,953 |
| | 1,274,598 |
Securities & Asset Management | 2.33% |
The NASDAQ OMX Group | | |
Inc. | 33,400 | 1,095,186 |
Total Interest Rate Sensitive | | |
(Cost $7,746,343) | | 10,072,605 |
| | | |
Medical/Healthcare | | 12.74% |
Healthcare Services | | 8.26% |
AmerisourceBergen Corp. | 16,750 | 935,152 |
Omnicare Inc. | 20,550 | 980,441 |
Quest Diagnostics Inc. | 16,900 | 1,024,647 |
Universal Health Services | | |
Inc. - Class B | 14,000 | 937,440 |
| | 3,877,680 |
Medical Products & Supplies | | 1.63% |
West Pharmaceutical | | |
Services Inc. | 10,900 | 765,834 |
Pharmaceuticals | | 2.85% |
Questcor Pharmaceuticals | | |
Inc. | 29,400 | 1,336,524 |
Total Medical/Healthcare | | |
(Cost $4,773,297) | | 5,980,038 |
| | | |
Real Estate Investment Trusts (REITs) | 6.17% |
Diversified & Specialty | | 1.03% |
Rayonier Inc. | 8,750 | 484,662 |
Healthcare | | 1.00% |
Senior Housing Properties | | |
Trust | 18,100 | 469,333 |
Multi-Family | | 2.13% |
Home Properties Inc. | 15,300 | 1,000,161 |
Office Properties | | 2.01% |
Alexandria Real Estate | | |
Equities Inc. | 8,400 | 552,048 |
Mack-Cali Realty Corp. | 16,000 | 391,840 |
| | 943,888 |
Total Real Estate Investment Trusts (REITs) |
(Cost $2,533,752) | | 2,898,044 |
Technology | | 6.36% |
Computer Software | | 4.41% |
Activision Blizzard Inc. | 41,250 | 588,225 |
CA Inc. | 26,800 | 767,284 |
Symantec Corp. | 31,850 | 715,670 |
| | 2,071,179 |
PAGE 38 |
|
| STATEMENTS OF INVESTMENTS |
| |
WESTCORE MID-CAP VALUE DIVIDEND FUND AS OF JUNE 30, 2013 (continued)
(UNAUDITED)
| Shares | | Market Value |
Semiconductors | | 1.95% |
Avago Technologies Ltd. | | | |
(Singapore) | 24,450 | $913,941 |
Total Technology | | | |
(Cost $2,580,774) | | 2,985,120 |
| | | |
Utilities | | | 11.83% |
Gas Utilities | | 2.16% |
UGI Corp. | 25,905 | 1,013,145 |
Integrated Gas & Electric | | 1.81% |
CenterPoint Energy Inc. | 36,135 | 848,811 |
Regulated Electric | | 5.41% |
Edison International | 13,150 | 633,304 |
Great Plains Energy Inc. | 35,450 | 799,043 |
Westar Energy Inc. | 34,650 | 1,107,414 |
| | | 2,539,761 |
Water Utilities | | 2.45% |
American Water Works | | | |
Co. Inc. | 27,950 | 1,152,378 |
Total Utilities | | | |
(Cost $3,775,292) | | 5,554,095 |
Total Common Stocks | | | |
(Cost $34,927,263) | | 45,074,659 |
| | | |
MONEY MARKET MUTUAL FUNDS | | 5.35% |
Fidelity Institutional Money | | | |
Market Government | | | |
Portfolio - Class I | | | |
(7 Day Yield 0.000%)(1) | 2,514,386 | 2,514,386 |
Total Money Market Mutual Funds | | |
(Cost $2,514,386) | | 2,514,386 |
Total Investments | | | |
(Cost $37,441,649) | 101.38% | 47,589,045 |
Liabilities in Excess of | | | |
Other Assets | (1.38%) | (649,507) |
Net Assets | 100.00% | | $46,939,538 |
Sector and industry classifications presented herein are based on the sector and industry categorization methodology of the Adviser to the Funds which may result in the designations for one Fund being different from another.
(1) Less than 0.0005%.
See Notes to Financial Statements.
PAGE 39 |
|
| STATEMENTS OF INVESTMENTS |
| |
WESTCORE SMALL-CAP OPPORTUNITY FUND AS OF JUNE 30, 2013
(UNAUDITED)
| Shares | Market Value |
COMMON STOCKS | | 99.62% |
Basic Materials | | 3.14% |
Forestry & Paper | | 2.09% |
KapStone Paper and | | |
Packaging Corp. | 10,230 | $411,041 |
| | |
Other Materials (Rubber & Plastic) | 1.05% |
Raven Industries Inc. | 6,900 | 206,862 |
| | |
Total Basic Materials | | |
(Cost $298,575) | | 617,903 |
| | |
Capital Goods | | 5.09% |
Engineering & Construction | | 1.68% |
EMCOR Group Inc. | 8,150 | 331,297 |
| | |
Industrial Products | | 3.41% |
Dynamic Materials Corp. | 17,400 | 287,274 |
EnPro Industries Inc.** | 7,580 | 384,761 |
| | 672,035 |
| | |
Total Capital Goods | | |
(Cost $557,727) | | 1,003,332 |
| | | |
Commercial Services | | 3.03% |
Distributors & Wholesalers | | 1.37% |
Central Garden & Pet Co. - | | |
Class A** | 39,310 | 271,239 |
| | |
Environmental & Polluion Control | 1.66% |
Tetra Tech Inc.** | 13,900 | 326,789 |
| | |
Total Commercial Services | | |
(Cost $799,183) | | 598,028 |
| | |
Communications | | 2.32% |
Telecomm Equipment & Solutions | 2.32% |
Plantronics Inc. | 10,430 | 458,086 |
| | |
Total Communications | | |
(Cost $310,361) | | 458,086 |
| | | |
Consumer Cyclical | | 21.44% |
Apparel & Footwear Mfg | | 3.59% |
G-III Apparel Group Ltd.** | 7,200 | 346,464 |
Iconix Brand Group Inc.** | 12,300 | 361,743 |
| | 708,207 |
| |
| | |
Clothing & Accessories | | 9.36% |
ANN Inc.** | 11,920 | 395,744 |
Cato Corp. - Class A | 11,360 | 283,545 |
The Childrens Place Retail | | |
Stores Inc.** | 5,857 | 320,964 |
Express Inc.** | 23,760 | 498,247 |
| Shares | Market Value |
Perry Ellis International | | |
Inc. | 17,070 | $346,692 |
| | 1,845,192 |
General Merchandise | | 1.97% |
|
Big Lots Inc.** | 12,300 | 387,819 |
| | |
Recreation & Leisure | | 4.49% |
Steiner Leisure Ltd. | | |
(Bahamas)** | 7,810 | 412,837 |
Thor Industries, Inc. | 3,700 | 181,966 |
WMS Industries Inc.** | 11,400 | 290,814 |
| | 885,617 |
Restaurants | | 2.03% |
|
CEC Entertainment Inc. | 9,720 | 398,909 |
Total Consumer Cyclical | | |
| |
(Cost $3,022,620) | | 4,225,744 |
| | | |
Consumer Staples | | 7.32% |
Consumer Products | | 1.78% |
Elizabeth Arden Inc.** | 7,800 | 351,546 |
Food & Agricultural Products | 0.88% |
Cott Corp. (Canada) | 22,100 | 172,601 |
Grocery & Convenience | | 1.01% |
|
Casey’s General Stores Inc. | 3,300 | 198,528 |
| | |
Tobacco | | 3.65% |
Schweitzer-Mauduit | | |
International Inc. | 14,440 | 720,267 |
Total Consumer Staples | | |
| |
(Cost $812,702) | | 1,442,942 |
| | | |
Energy | | 3.90% |
Exploration & Production | | 1.08% |
Berry Petroleum Co. - | | |
Class A | 5,000 | 211,600 |
| | |
Oil Services | | 2.82% |
Gulfmark Offshore Inc. | | |
Class A | 5,940 | 267,835 |
Hornbeck Offshore Services | |
Inc.** | 5,390 | 288,365 |
| | | 556,200 |
Total Energy | | |
(Cost $594,518) | | 767,800 |
| | |
| | |
| | |
| | |
| Shares | Market Value |
Interest Rate Sensitive | | 19.51% |
Life & Health Insurance | | 3.41% |
American Equity Investment | | |
Life Holding Co. | 23,000 | $361,100 |
StanCorp Financial Group | | |
Inc. | 6,300 | 311,283 |
| | 672,383 |
Other Banks | | 7.99% |
First Citizens BancShares | | |
Inc. Class A | 1,700 | 326,485 |
NBT Bancorp Inc. | 18,880 | 399,689 |
PacWest Bancorp | 8,560 | 262,364 |
Southside Bancshares Inc. | 15,045 | 359,275 |
Wintrust Financial Corp. | 5,900 | 225,852 |
| | 1,573,665 |
Property Casualty Insurance | | 4.74% |
AmTrust Financial Services | | |
Inc. | 12,400 | 442,680 |
Horace Mann Educators | | |
Corp. | 20,150 | 491,257 |
| | 933,937 |
Specialty Finance | | 1.87% |
Cash America International | | |
Inc. | 8,120 | 369,135 |
Thrifts | | 1.50% |
Iberiabank Corp. | 5,500 | 294,855 |
Total Interest Rate Sensitive | | |
(Cost $3,370,074) | | 3,843,975 |
| | | |
Medical/Healthcare | | 12.78% |
Healthcare Services | | 7.70% |
LifePoint Hospitals Inc.** | 10,050 | 490,842 |
PharMerica Corp.** | 35,590 | 493,278 |
U.S. Physical Therapy Inc. | 19,280 | 532,899 |
| | 1,517,019 |
Medical Products & Supplies | | 2.10% |
West Pharmaceutical | | |
Services Inc. | 5,900 | 414,534 |
Pharmaceuticals | | 2.98% |
Impax Laboratories Inc.** | 11,690 | 233,215 |
Myriad Genetics Inc.** | 13,140 | 353,072 |
| | 586,287 |
Total Medical/Healthcare | | |
(Cost $2,160,978) | | 2,517,840 |
PAGE 40 |
|
| STATEMENTS OF INVESTMENTS |
| |
WESTCORE SMALL-CAP OPPORTUNITY FUND AS OF JUNE 30, 2013 (continued)
(UNAUDITED)
| Shares | Market Value |
Real Estate Investment Trusts (REITs) | 3.83% |
Hotels | | 0.87% |
Chesapeake Lodging Trust | 8,220 | $170,894 |
| | |
Multi-Family | | 1.84% |
Associated Estates Realty | | |
Corp. | 22,620 | 363,729 |
Retail | | 1.12% |
|
Retail Opportunity | | |
Investments Corp. | 15,900 | 221,010 |
| | |
Total Real Estate Investment Trusts (REITs) |
(Cost $523,871) | | 755,633 |
| | |
Technology | | 12.85% |
Computer Software | | 6.81% |
Keynote Systems Inc. | 18,820 | 371,883 |
Monotype Imaging Holdings | | |
Inc. | 12,700 | 322,707 |
NICE Systems Ltd. ADR | | |
(Israel) | 9,600 | 354,144 |
PTC Inc.** | 11,970 | 293,624 |
| | 1,342,358 |
Electronic Equipment | | 0.49% |
MTS Systems Corp. | 1,700 | 96,220 |
Semiconductors | | 3.52% |
Cypress Semiconductor | | |
Corp. | 19,280 | 206,875 |
Fairchild Semiconductor | | |
International Inc.** | 19,630 | 270,894 |
Microsemi Corp.** | 9,500 | 216,125 |
| | 693,894 |
Technology Resellers & Distributors | 2.03% |
SYNNEX Corp.** | 5,200 | 219,856 |
Tech Data Corp.** | 3,800 | 178,942 |
| | 398,798 |
Total Technology | | |
(Cost $2,234,014) | | 2,531,270 |
| | | |
Transportation | | 2.17% |
Trucking, Shipping, Air Freight | 2.17% |
Marten Transport Ltd. | 27,270 | 427,321 |
Total Transportation | | |
(Cost $341,679) | | 427,321 |
| Shares | Market Value |
Utilities | | 2.24% |
Regulated Electric | | 2.24% |
El Paso Electric Co. | 5,900 | $208,329 |
UNS Energy Corp. | 5,200 | 232,596 |
| | 440,925 |
| | |
Total Utilities | | |
(Cost $370,017) | | 440,925 |
| | |
Total Common Stocks | | |
(Cost $15,396,319) | | 19,630,799 |
| | | |
MONEY MARKET MUTUAL FUNDS | 1.04% |
Fidelity Institutional Money | |
Market Government | | |
Portfolio - Class I | | |
(7 Day Yield 0.000%)(1) | 205,367 | 205,367 |
Total Money Market Mutual Funds | |
|
(Cost $205,367) | | 205,367 |
| | |
| | |
Total Investments | | |
(Cost $15,601,686) | 100.66% | 19,836,166 |
Liabilities in Excess of | | |
Other Assets | (0.66%) | (130,616) |
Net Assets | 100.00% | $19,705,550 |
| | |
Sector and industry classifications presented herein are based on the sector and industry |
categorization methodology of the Adviser to the |
Funds which may result in the designations for |
one Fund being different from another. | |
** Non-income producing security. | |
(1) Less than 0.0005%. | | |
| | |
See Notes to Financial Statements. | |
| | |
| | |
| | |
| | |
| | |
| | |
| | |
| | |
PAGE 41 |
|
| STATEMENTS OF INVESTMENTS |
| |
WESTCORE SMALL-CAP VALUE DIVIDEND FUND AS OF JUNE 30, 2013
(UNAUDITED)
| Shares | Market Value |
COMMON STOCKS | | 98.16% |
Basic Materials | | 5.11% |
Chemicals | | 2.88% |
Compass Minerals | | |
International Inc. | 70,430 | $5,953,448 |
Innophos Holdings Inc. | 53,500 | 2,523,595 |
| | 8,477,043 |
Forestry & Paper | | 2.23% |
Buckeye Technologies Inc. | 177,899 | 6,589,379 |
Total Basic Materials | | |
(Cost $11,307,787) | | 15,066,422 |
| | | |
Capital Goods | | 7.06% |
Aerospace/Defense | | 1.75% |
Huntington Ingalls | | |
Industries Inc. | 91,300 | 5,156,624 |
Aerospace/Defense Suppliers | 2.08% |
Cubic Corp. | 76,878 | 3,697,832 |
Curtiss-Wright Corp. | 65,761 | 2,437,102 |
| | 6,134,934 |
Electrical Equipment | | 1.99% |
Actuant Corp. - Class A | 178,100 | 5,871,957 |
Industrial Products | | 1.24% |
Brady Corp. - Class A | 118,700 | 3,647,651 |
Total Capital Goods | | |
(Cost $18,917,570) | | 20,811,166 |
| | | |
Commercial Services | | 4.47% |
Business Products & Services | 4.47% |
The Brink’s Co. | 204,900 | 5,226,999 |
MAXIMUS Inc. | 106,900 | 7,961,912 |
| | 13,188,911 |
Total Commercial Services | | |
(Cost $8,608,424) | | 13,188,911 |
| | | |
Communications | | 4.07% |
Telecomm Equipment & Solutions | 4.07% |
j2 Global Inc. | 72,713 | 3,091,030 |
Plantronics Inc. | 202,793 | 8,906,668 |
| | 11,997,698 |
Total Communications | | |
(Cost $9,614,236) | | 11,997,698 |
| | | |
Consumer Cyclical | | 12.58% |
Clothing & Accessories | | 5.41% |
Brown Shoe Co. Inc. | 260,700 | 5,612,871 |
| Shares | Market Value |
The Cato Corp. - Class A | 118,000 | $2,945,280 |
The Finish Line Inc. - | | |
Class A | 216,200 | 4,726,132 |
Stage Stores Inc. | 113,160 | 2,659,260 |
| | 15,943,543 |
Consumer Durables | | 1.17% |
The Toro Co. | 76,100 | 3,455,701 |
Other Consumer Services | | 0.17% |
Regis Corp. | 31,400 | 515,588 |
Recreation & Leisure | | 0.89% |
Thor Industries Inc. | 53,392 | 2,625,819 |
Restaurants | | 4.94% |
Bob Evans Farms Inc. | 122,111 | 5,736,775 |
CEC Entertainment Inc. | 84,600 | 3,471,984 |
Texas Roadhouse Inc. | 213,765 | 5,348,400 |
| | 14,557,159 |
Total Consumer Cyclical | | |
(Cost $24,852,702) | | 37,097,810 |
| | | |
Consumer Staples | | 6.48% |
Food & Agricultural Products | 1.64% |
Sensient Technologies | | |
Corp. | 119,300 | 4,828,071 |
Grocery & Convenience | | 1.64% |
Casey’s General Stores | | |
Inc. | 80,200 | 4,824,832 |
Tobacco | | 3.20% |
Schweitzer-Mauduit | | |
International Inc. | 189,300 | 9,442,284 |
Total Consumer Staples | | |
(Cost $13,080,357) | | 19,095,187 |
| | | |
Energy | | 6.48% |
Exploration & Production | | 1.60% |
Berry Petroleum Co. - | | |
Class A | 111,400 | 4,714,448 |
Oil Services | | 4.88% |
Bristow Group Inc. | 64,600 | 4,219,672 |
Gulfmark Offshore Inc. | | |
Class A | 75,600 | 3,408,804 |
Tidewater Inc. | 118,701 | 6,762,396 |
| | 14,390,872 |
Total Energy | | |
(Cost $15,008,913) | | 19,105,320 |
| Shares | Market Value |
Interest Rate Sensitive | | 27.47% |
Life & Health Insurance | | 6.84% |
American Equity | | |
Investment Life | | |
Holding Co. | 376,150 | $5,905,555 |
Primerica Inc. | 126,900 | 4,751,136 |
Protective Life Corp. | 126,960 | 4,876,533 |
StanCorp Financial Group | | |
Inc. | 93,600 | 4,624,776 |
| | 20,158,000 |
Other Banks | | 8.37% |
Bank of the Ozarks Inc. | 98,000 | 4,246,340 |
Community Bank System | | |
Inc. | 113,000 | 3,486,050 |
FirstMerit Corp. | 104,600 | 2,095,138 |
Fulton Financial Corp. | 303,000 | 3,478,440 |
Trustmark Corp. | 133,600 | 3,283,888 |
Westamerica Bancorp | 104,220 | 4,761,812 |
Wintrust Financial Corp. | 87,212 | 3,338,475 |
| | 24,690,143 |
Property Casualty Insurance | | 5.51% |
Aspen Insurance Holdings | | |
Ltd. (Bermuda) | 135,900 | 5,040,531 |
Endurance Specialty | | |
Holdings Ltd. | | |
(Bermuda) | 151,600 | 7,799,820 |
Montpelier Re Holdings | | |
Ltd. (Bermuda) | 135,900 | 3,398,859 |
| | 16,239,210 |
Specialty Finance | | 1.83% |
Cash America | | |
International Inc. | 118,460 | 5,385,192 |
Thrifts | | 4.92% |
Hatteras Financial Corp. | 109,200 | 2,690,688 |
Iberia Bank Corp. | 82,300 | 4,412,103 |
Washington Federal Inc. | 207,900 | 3,925,152 |
Webster Financial Corp. | 135,900 | 3,489,912 |
| | 14,517,855 |
Total Interest Rate Sensitive | | |
(Cost $59,416,297) | | 80,990,400 |
| | | |
Medical/Healthcare | | 8.75% |
Healthcare Services | | 1.36% |
Owens & Minor Inc. | 118,976 | 4,024,958 |
Medical Products & Supplies | | 4.57% |
Meridian Bioscience Inc. | 124,175 | 2,669,763 |
West Pharmaceutical | | |
Services Inc. | 153,700 | 10,798,962 |
| | 13,468,725 |
PAGE 42 |
|
| STATEMENTS OF INVESTMENTS |
| |
WESTCORE SMALL-CAP VALUE DIVIDEND FUND AS OF JUNE 30, 2013 (continued)
(UNAUDITED)
| Shares | Market Value |
Pharmaceuticals | | 2.82% |
Questcor Pharmaceuticals | | |
Inc. | 182,600 | $8,300,996 |
Total Medical/Healthcare | | |
(Cost $16,923,932) | | 25,794,679 |
| | | |
Real Estate Investment Trusts (REITs) | 5.27% |
Diversified & Specialty | | 2.46% |
CubeSmart | 218,200 | 3,486,836 |
DuPont Fabros Technology | | |
Inc. | 156,000 | 3,767,400 |
| | 7,254,236 |
Office Properties | | 2.81% |
Brandywine Realty Trust | 332,000 | 4,488,640 |
Government Properties | | |
Income Trust | 151,100 | 3,810,742 |
| | 8,299,382 |
Total Real Estate Investment Trusts (REITs) |
(Cost $13,306,678) | | 15,553,618 |
| | | |
Technology | | 5.46% |
Computer Software | | 2.92% |
Blackbaud Inc. | 130,888 | 4,263,022 |
NICE Systems Ltd. ADR | | |
(Israel) | 118,000 | 4,353,020 |
| | 8,616,042 |
Electronic Equipment | | 0.73% |
Belden Inc. | 43,016 | 2,147,789 |
Semiconductors | | 1.81% |
Cypress Semiconductor | | |
Corp. | 190,443 | 2,043,453 |
Intersil Corp. - Class A | 422,333 | 3,302,644 |
| | 5,346,097 |
Total Technology | | |
(Cost $14,334,757) | | 16,109,928 |
| | | |
Utilities | | 4.96% |
Regulated Electric | | 4.96% |
El Paso Electric Co. | 118,000 | 4,166,580 |
Portland General Electric | | |
Co. | 198,230 | 6,063,856 |
UNS Energy Corp. | 98,000 | 4,383,540 |
| | 14,613,976 |
Total Utilities | | |
(Cost $12,052,622) | | 14,613,976 |
Total Common Stocks | | |
(Cost $217,424,275) | | 289,425,115 |
| Shares | | Market Value |
MONEY MARKET MUTUAL FUNDS | 1.69% |
Fidelity Institutional Money | | | |
Market Government | | | |
Portfolio - Class I | | | |
(7 Day Yield 0.000%)(1) | 4,987,532 | $4,987,532 |
Total Money Market Mutual Funds | | |
(Cost $4,987,532) | | 4,987,532 |
Total Investments | | | |
(Cost $222,411,807) | 99.85% | 294,412,647 |
Other Assets in | | | |
Excess of Liabilities | 0.15% | 445,808 |
Net Assets | 100.00% | | $294,858,455 |
Sector and industry classifications presented herein are based on the sector and industry categorization methodology of the Adviser to the Funds which may result in the designations for one Fund being different from another.
(1) Less than 0.0005%.
See Notes to Financial Statements.
PAGE 43 |
|
| STATEMENTS OF INVESTMENTS |
| |
WESTCORE MICRO-CAP OPPORTUNITY FUND AS OF JUNE 30, 2013
(UNAUDITED)
| | Shares | Market Value |
COMMON STOCKS | | 98.04% |
Basic Materials | | 4.65% |
Forestry & Paper | | 1.09% |
Neenah Paper Inc. | 1,863 | $59,187 |
Xerium Technologies Inc.** | 7,814 | 79,547 |
| | 138,734 |
Non-Ferrous Metals | | 0.56% |
Horsehead Holding Corp.** | 5,614 | 71,915 |
Other Materials (Rubber & Plastic) | 2.22% |
AEP Industries Inc.** | 1,329 | 98,865 |
Intertape Polymer Group | | |
Inc. (Canada) | 3,527 | 43,382 |
Myers Industries Inc. | 2,628 | 39,446 |
US Concrete Inc.** | 6,152 | 101,016 |
| | 282,709 |
Steel | | 0.78% |
Handy & Harman Ltd.** | 5,575 | 99,681 |
Total Basic Materials | | |
(Cost $523,109) | | 593,039 |
| | | |
Capital Goods | | 4.99% |
Aerospace / Defense Suppliers | | 0.88% |
Sparton Corp.** | 6,525 | 112,491 |
Engineering & Construction | | 1.08% |
Argan Inc. | 3,912 | 61,027 |
Michael Baker Corp. | 2,846 | 77,155 |
| | 138,182 |
Farm Equipment | | 0.56% |
Alamo Group Inc. | 1,739 | 70,986 |
Industrial Products | | 2.47% |
Hardinge Inc. | 4,649 | 68,712 |
LB Foster Co. - Class A | 1,030 | 44,465 |
Lydall Inc.** | 5,283 | 77,132 |
Northwest Pipe Co.** | 1,685 | 47,012 |
Standex International Corp. | 1,456 | 76,804 |
| | 314,125 |
Total Capital Goods | | |
(Cost $595,084) | | 635,784 |
| | | |
Commercial Services | | 7.74% |
Business Products & Services | | 5.55% |
Asta Funding Inc. | 8,041 | 69,555 |
Barrett Business | | |
Services Inc. | 1,877 | 97,998 |
CBIZ Inc.** | 7,895 | 52,975 |
CDI Corp. | 5,614 | 79,494 |
Electro Rent Corp. | 3,470 | 58,261 |
| Shares | Market Value |
Gentiva Health Services | | |
Inc.** | 4,323 | $43,057 |
ICG Group Inc.** | 9,376 | 106,886 |
Omnicell Inc.** | 2,063 | 42,395 |
TASER International Inc.** | 6,915 | 58,916 |
VSE Corp. | 2,399 | 98,527 |
| | 708,064 |
Educational Services | | 0.47% |
Capella Education Co.** | 1,431 | 59,601 |
Environmental / Pollution Control | 0.69% |
Ceco Environmental Corp. | 7,116 | 87,527 |
IT Services | | 1.03% |
ManTech International | | |
Corp. - Class A | 3,588 | 93,719 |
NCI Inc. - Class A** | 9,094 | 37,649 |
| | 131,368 |
Total Commercial Services | | |
(Cost $922,717) | | 986,560 |
| | | |
Communications | | 3.03% |
Networking | | 0.45% |
Extreme Networks Inc.** | 16,679 | 57,542 |
Telecomm Equipment & Solutions | 2.58% |
Anaren Inc.** | 3,674 | 84,282 |
Globecomm Systems Inc.** | 3,552 | 44,897 |
Ituran Location and Control | | |
Ltd. (Israel) | 6,513 | 109,875 |
Preformed Line Products | | |
Co. | 659 | 43,698 |
Symmetricom Inc.** | 10,276 | 46,139 |
| | 328,891 |
Total Communications | | |
(Cost $380,166) | | 386,433 |
| | | |
Consumer Cyclical | | 17.44% |
Apparel & Footwear Manufacturing | 0.87% |
Maidenform Brands Inc.** | 1,772 | 30,709 |
Unifi Inc.** | 3,899 | 80,592 |
| | 111,301 |
Cable/Satellite/Telecomm Services | 4.14% |
Consolidated | | |
Communications | | |
Holdings Inc. | 2,717 | 47,303 |
FairPoint Communications | | |
Inc.** | 11,361 | 94,864 |
HickoryTech Corp. | 5,972 | 63,483 |
IDT Corp. - Class B | 4,448 | 83,133 |
Inteliquent | 20,359 | 117,064 |
| Shares | Market Value |
Premiere Global Services | | |
Inc.** | 4,818 | $58,153 |
USA Mobility Inc. | 4,740 | 64,322 |
| | 528,322 |
Department Stores | | 0.30% |
The Bon-Ton Stores Inc. | 2,109 | 38,067 |
Hard Goods Retail | | 0.25% |
Haverty Furniture Co. Inc. | 1,354 | 31,155 |
Homebuilders & Suppliers | | 0.29% |
Beazer Homes USA Inc.** | 2,106 | 36,901 |
Motor Vehicle Parts | | 1.03% |
Modine Manufacturing Co.** | 3,067 | 33,369 |
Stoneridge Inc.** | 8,436 | 98,195 |
| | 131,564 |
Motor Vehicles | | 0.35% |
America’s Car-Mart Inc.** | 1,034 | 44,710 |
Publishing & Media | | 2.65% |
Courier Corp. | 5,893 | 84,152 |
Entravision | | |
Communications | | |
Corp. - Class A | 10,011 | 61,568 |
Gray Television Inc.** | 13,521 | 97,351 |
LIN TV Corp. - Class A** | 6,153 | 94,141 |
| | 337,212 |
Recreation & Leisure | | 3.15% |
Rick’s Cabaret International | | |
Inc.** | 12,492 | 107,806 |
Smith & Wesson Holding | | |
Corp.** | 5,493 | 54,820 |
Steinway Musical | | |
Instruments Inc.** | 2,848 | 86,665 |
Town Sports International | | |
Holdings Inc. | 3,970 | 42,757 |
Viad Corp. | 1,912 | 46,882 |
Winnebago Industries Inc.** | 2,993 | 62,823 |
| | 401,753 |
Restaurants | | 2.90% |
Denny’s Corp.** | 17,148 | 96,372 |
Kona Grill Inc.** | 9,202 | 107,847 |
Red Robin Gourmet | | |
Burgers Inc.** | 1,256 | 69,306 |
Ruth’s Hospitality Group | | |
Inc. | 7,951 | 95,969 |
| | 369,494 |
Specialty Retail | | 1.51% |
1-800-Flowers.com Inc. - | | |
Class A** | 13,283 | 82,222 |
PAGE 44 |
|
| STATEMENTS OF INVESTMENTS |
| |
WESTCORE MICRO-CAP OPPORTUNITY FUND AS OF JUNE 30, 2013 (continued)
(UNAUDITED)
| Shares | Market Value |
CSS Industries Inc. | 2,508 | $62,524 |
Movado Group Inc. | 1,415 | 47,870 |
| | 192,616 |
| | |
Total Consumer Cyclical | | |
| |
(Cost $1,878,619) | | 2,223,095 |
| | |
Consumer Staples | | 2.26% |
Food & Agricultural Products | 1.75% |
Chiquita Brands | | |
International Inc.** | 5,505 | 60,115 |
John B Sanfilippo & Son | | |
Inc. | 3,584 | 72,253 |
Seneca Foods Corp. - | | |
Class A** | 2,960 | 90,813 |
| | 223,181 |
| |
| | |
Grocery & Convenience | | 0.51% |
The Pantry Inc.** | 5,375 | 65,467 |
Total Consumer Staples | | |
| |
(Cost $292,922) | | 288,648 |
| | |
Energy | | 4.67% |
Alternative Energy | | 0.67% |
EnerNOC Inc.** | 2,588 | 34,317 |
Green Plains Renewable | | |
Energy Inc.** | 3,837 | 51,109 |
| | 85,426 |
| |
Coal | | 0.28% |
|
Westmoreland Coal Co.** | 3,139 | 35,251 |
| | |
Exploration & Production | | 0.40% |
Panhandle Oil and Gas Inc. - | | |
Class A | 1,787 | 50,929 |
| | |
Oil Services | | 2.77% |
Basic Energy Services Inc.** | 2,739 | 33,115 |
Bolt Technology Corp. | 3,428 | 58,550 |
Dawson Geophysical Co.** | 1,319 | 48,618 |
Natural Gas Services Group | | |
Inc.** | 3,847 | 90,366 |
PHI Inc.** | 2,218 | 76,077 |
TGC Industries Inc. | 5,677 | 46,665 |
| | | 353,391 |
| | |
Refining & Marketing | | 0.55% |
|
REX American Resources | | |
Corp.** | 2,450 | 70,487 |
| | | |
Total Energy | | |
(Cost $531,880) | | 595,484 |
| | |
| Shares | Market Value |
Interest Rate Sensitive | | 24.21% |
Life & Health Insurance | | 0.88% |
National Western Life | | |
Insurance Co. - | | |
Class A | 590 | $112,012 |
| | |
Other Banks | | 9.75% |
American National | | |
Bankshares Inc. | 4,051 | 94,145 |
Ameris Bancorp** | 3,235 | 54,510 |
Banner Corp. | 2,980 | 100,694 |
Capital City Bank Group | | |
Inc.** | 3,801 | 43,826 |
Central Pacific Financial | |
Corp.** | 6,069 | 109,242 |
Enterprise Financial | | |
Services Corp. | 6,852 | 109,358 |
First Community | | |
Bancshares Inc. | 4,517 | 70,827 |
First Merchants Corp. | 3,674 | 63,009 |
Hanmi Financial Corp.** | 5,744 | 101,496 |
Heartland Financial USA | | |
Inc. | 1,895 | 52,094 |
Peoples Bancorp Inc. | 3,542 | 74,665 |
Provident New York | | |
Bancorp | 7,097 | 66,286 |
Southwest Bancorp Inc.** | 3,641 | 48,061 |
Trico Bancshares | 3,913 | 83,464 |
United Community Banks | | |
Inc.** | 6,420 | 79,736 |
Wilshire Bancorp Inc. | 13,798 | 91,343 |
| | 1,242,756 |
| | |
Property Casualty Insurance | | 2.87% |
American Safety Insurance | | |
Holdings Ltd. | | |
(Bermuda)** | 2,708 | 78,396 |
Baldwin & Lyons Inc. - | | |
Class B | 1,760 | 42,733 |
Homeowners Choice Inc. | 1,607 | 49,367 |
Stewart Information | | |
Services Corp. | 3,600 | 94,284 |
United Fire Group Inc. | 1,840 | 45,687 |
Universal Insurance | | |
Holdings Inc. | 7,909 | 55,996 |
| | 366,463 |
| |
| | |
Regional Banks | | 1.00% |
Centerstate Banks of | | |
Florida Inc. | 7,125 | 61,845 |
Horizon Bancorp | 3,239 | 66,108 |
| | 127,953 |
| |
Securities & Asset Management | 0.52% |
Capital Southwest Corp. | 479 | 66,021 |
| Shares | Market Value |
Specialty Finance | | 4.12% |
Arbor Realty Trust Inc. | 14,630 | $91,876 |
Consumer Portfolio | | |
Services Inc.** | 9,058 | 66,486 |
Federal Agricultural | | |
Mortgage Corp. - | | |
Class C | 2,392 | 69,081 |
MCG Capital Corp. | 19,311 | 100,610 |
Medallion Financial Corp. | 4,489 | 62,442 |
NewStar Financial Inc.** | 4,333 | 57,716 |
Resource Capital Corp. | 12,555 | 77,213 |
| | 525,424 |
Thrifts | | 5.07% |
Dime Community | | |
Bancshares Inc. | 3,967 | 60,774 |
ESSA Bancorp Inc. | 8,901 | 97,555 |
First Defiance Financial | | |
Corp. | 4,264 | 96,153 |
First Financial Holdings Inc. | 4,322 | 91,670 |
Home Federal Bancorp Inc. | 5,088 | 64,821 |
New York Mortgage Trust | | |
Inc. | 14,915 | 100,975 |
Provident Financial | | |
Holdings Inc. | 4,727 | 75,065 |
Westfield Financial Inc. | 8,489 | 59,423 |
| | 646,436 |
Total Interest Rate Sensitive | | |
(Cost $2,913,065) | | 3,087,065 |
| | | |
Medical/Healthcare | | 15.49% |
Healthcare Services | | 3.56% |
Addus HomeCare Corp.** | 5,216 | 102,964 |
Albany Molecular Research | | |
Inc.** | 8,779 | 104,207 |
Capital Senior Living Corp.** | 3,054 | 72,991 |
Five Star Quality Care Inc.** | 14,237 | 79,869 |
LHC Group Inc.** | 4,795 | 93,886 |
| | 453,917 |
Medical Products & Supplies | | 3.38% |
AMAG Pharmaceuticals | | |
Inc.** | 3,994 | 88,866 |
Atrion Corp. | 290 | 63,426 |
Kewaunee Scientific Corp. | 6,325 | 80,011 |
Medical Action Industries | | |
Inc.** | 13,284 | 102,287 |
Rochester Medical Corp.** | 3,605 | 53,102 |
Trinity Biotech PLC ADR | | |
(Ireland) | 2,588 | 43,608 |
| | 431,300 |
PAGE 45 |
|
| STATEMENTS OF INVESTMENTS |
| |
WESTCORE MICRO-CAP OPPORTUNITY FUND AS OF JUNE 30, 2013 (continued)
(UNAUDITED)
| Shares | Market Value |
Medical Technology | | 1.16% |
BioDelivery Sciences | | |
International Inc.** | 16,198 | $65,764 |
Cynosure Inc. - Class A** | 3,135 | 81,447 |
| | 147,211 |
Pharmaceuticals | | 7.39% |
Array BioPharma Inc.** | 10,788 | 48,978 |
Astex Pharmaceuticals** | 11,112 | 45,670 |
Cambrex Corp.** | 5,679 | 79,336 |
Curis Inc.** | 16,709 | 53,302 |
Emergent Biosolutions | | |
Inc.** | 4,775 | 68,855 |
Endocyte Inc.** | 8,413 | 110,463 |
Hi-Tech Pharmacal Co. Inc. | 1,371 | 45,517 |
Lannett Co. Inc** | 6,695 | 79,737 |
Nanosphere Inc.** | 15,915 | 48,859 |
Pozen Inc.** | 9,726 | 48,727 |
SciClone Pharmaceuticals | | |
Inc.** | 14,627 | 72,550 |
SIGA Technologies Inc.** | 15,254 | 43,321 |
Spectrum Pharmaceuticals | | |
Inc. | 9,884 | 73,735 |
TrovaGene Inc.** | 9,832 | 68,726 |
XenoPort Inc.** | 10,969 | 54,297 |
| | 942,073 |
Total Medical/Healthcare | | |
(Cost $1,972,119) | | 1,974,501 |
| | | |
Real Estate Investment Trusts (REITs) | 1.29% |
Diversified & Specialty | | 0.62% |
Winthrop Realty Trust | 6,587 | 79,242 |
Retail Properties | | 0.67% |
Agree Realty Corp. | 2,896 | 85,490 |
Total Real Estate Investment Trusts (REITs) |
(Cost $157,415) | | 164,732 |
| | | |
Technology | | 10.24% |
Business Machines | | 0.75% |
Silicon Graphics | | |
International Corp.** | 7,162 | 95,828 |
Computer Software | | 3.91% |
Avid Technology Inc.** | 5,254 | 30,894 |
IntraLinks Holdings Inc.** | 10,644 | 77,275 |
PDF Solutions Inc.** | 5,491 | 101,199 |
RealNetworks Inc.** | 7,372 | 55,732 |
REIS Inc.** | 4,479 | 82,817 |
SeaChange International | | |
Inc.** | 4,402 | 51,547 |
Telenav Inc.** | 18,911 | 98,905 |
| | 498,369 |
| Shares | Market Value |
Electronic Equipment | | 3.09% |
CalAmp Corp.** | 5,963 | $87,060 |
Checkpoint Systems Inc.** | 6,767 | 96,024 |
Measurement Specialties | | |
Inc.** | 1,634 | 76,030 |
Mesa Laboratories Inc. | 871 | 47,147 |
Methode Electronics Inc. | 5,152 | 87,635 |
| | 393,896 |
Semiconductor Cap Equipment | 1.21% |
FormFactor Inc.** | 9,202 | 62,113 |
Kopin Corp.** | 11,772 | 43,674 |
Rudolph Technologies Inc.** | 4,338 | 48,586 |
| | 154,373 |
Semiconductors | | 1.28% |
IXYS Corp. | 3,948 | 43,665 |
Sigma Designs Inc.** | 9,190 | 46,410 |
Silicon Image Inc.** | 12,552 | 73,429 |
| | 163,504 |
Total Technology | | |
(Cost $1,194,189) | | 1,305,970 |
| | | |
Transportation | | 1.49% |
Airlines | | 0.92% |
Hawaiian Holdings Inc.** | 19,216 | 117,410 |
Trucking, Shipping, Air Freight | 0.57% |
Saia Inc.** | 2,432 | 72,887 |
Total Transportation | | |
(Cost $154,408) | | 190,297 |
Utilities | | 0.54% |
Gas Utilities | | 0.54% |
Chesapeake Utilities Corp. | 1,323 | 68,121 |
Total Utilities | | |
(Cost $63,226) | | 68,121 |
Total Common Stocks | | |
(Cost $11,578,919) | | 12,499,729 |
| | | |
MONEY MARKET MUTUAL FUNDS | 1.94% |
Fidelity Institutional Money | | |
Market Government | | |
Portfolio - Class I | | |
(7 Day Yield 0.000%)(1) | 246,836 | 246,836 |
Total Money Market Mutual Funds | |
(Cost $246,836) | | 246,836 |
| Shares | | Market Value |
Total Investments | | | |
(Cost $11,825,755) | 99.98% | $12,746,565 |
Other Assets in | | | |
Excess of Liabilities | 0.02% | 2,810 |
Net Assets | 100.00% | | $12,749,375 |
Sector and industry classifications presented herein are based on the sector and industry categorization methodology of the Adviser to the Funds which may result in the designations for one Fund being different from another.
** Non-income producing security.
(1) Less than 0.0005%.
See Notes to Financial Statements.
PAGE 46 |
|
| STATEMENTS OF INVESTMENTS |
| |
WESTCORE INTERNATIONAL SMALL-CAP FUND AS OF JUNE 30, 2013
(UNAUDITED)
| Shares | Market Value |
COMMON STOCKS | | 96.31% |
Consumer Discretionary | | 24.68% |
Diversified Consumer Services | 2.66% |
Slater & Gordon Ltd. | | |
(Australia) | 4,183,110 | $10,635,382 |
Internet & Catalog Retail | | 3.26% |
Webjet Ltd. (Australia) | 3,205,114 | 13,044,052 |
Media | | 8.70% |
CTS Eventim AG | | |
(Germany) | 188,264 | 7,589,275 |
Pico Far East Holdings | | |
Ltd. (Hong Kong) | 80,105,564 | 27,163,006 |
| | 34,752,281 |
Specialty Retail | | 3.78% |
Bonjour Holdings Ltd. | | |
(Hong Kong) | 82,532,064 | 15,110,208 |
Textiles Apparel & Luxury Goods | 6.28% |
Ports Design Ltd. (Hong | | |
Kong) | 24,479,657 | 15,970,380 |
Xtep International | | |
Holdings Ltd. (Hong | | |
Kong) | 21,812,036 | 9,111,725 |
| | 25,082,105 |
Total Consumer Discretionary | |
(Cost $89,244,393) | | 98,624,028 |
| | | |
Consumer Staples | | 4.19% |
Food & Staples Retailing | | 4.19% |
Eurocash S.A. (Poland) | 40,199 | 710,170 |
Tsuruha Holdings Inc. | | |
(Japan) | 169,469 | 16,044,705 |
| | 16,754,875 |
Total Consumer Staples | | |
(Cost $14,327,443) | | 16,754,875 |
| | | |
Financials | | 20.27% |
Capital Markets | | 9.33% |
Ashmore Group PLC | | |
(United Kingdom) | 2,876,639 | 15,037,733 |
Azimut Holding S.p.A. | | |
(Italy) | 648,484 | 11,808,881 |
ICAP PLC (United | | |
Kingdom) | 1,888,400 | 10,440,369 |
| | 37,286,983 |
Diversified Financial Services | 3.89% |
IG Group Holdings PLC | | |
(United Kingdom) | 1,762,545 | 15,548,398 |
| Shares | Market Value |
Insurance | | 3.40% |
Admiral Group PLC | | |
(United Kingdom) | 673,587 | $13,595,090 |
Thrifts & Mortgage Finance | | 3.65% |
Home Capital Group Inc. | | |
(Canada) | 276,521 | 14,600,372 |
Total Financials | | |
(Cost $73,035,182) | | 81,030,843 |
| | | |
Health Care | | 4.13% |
Health Care Providers & Services | 1.29% |
Synergy Health PLC | | |
(United Kingdom) | 301,360 | 5,170,257 |
Life Sciences Tools & Services | 1.59% |
EPS Co. Ltd. (Japan) | 5,704 | 6,349,280 |
Pharmaceuticals | | 1.25% |
China Medical System | | |
Holdings Ltd. | | |
(Cayman Islands) | 5,598,676 | 4,995,177 |
Total Health Care | | |
(Cost $14,380,548) | | 16,514,714 |
| | | |
Industrials | | 33.41% |
Commercial Services & Supplies | 16.13% |
AEON Delight Co. Ltd. | | |
(Japan) | 260,767 | 4,729,984 |
Credit Corp Group Ltd. | | |
(Australia) | 3,203,863 | 27,542,972 |
Mears Group PLC (United | | |
Kingdom) | 1,958,162 | 11,518,512 |
Mitie Group PLC (United | | |
Kingdom) | 1,418,229 | 5,420,712 |
Prestige International Inc. | | |
(Japan) | 807,890 | 10,483,509 |
Serco Group PLC (United | | |
Kingdom) | 511,120 | 4,792,625 |
| | 64,488,314 |
Construction & Engineering | 7.27% |
Cardno Ltd. (Australia) | 4,456,929 | 21,114,193 |
Decmil Group Ltd. | | |
(Australia) | 4,882,743 | 7,948,641 |
| | 29,062,834 |
Machinery | | 3.67% |
Andritz AG (Austria) | 253,268 | 12,997,021 |
Duro Felguera S.A. (Spain) | 257,639 | 1,660,002 |
| | 14,657,023 |
Professional Services | | 4.22% |
ITE Group PLC (United | | |
Kingdom) | 3,403,583 | 15,436,948 |
| Shares | Market Value |
SAI Global Ltd. (Australia) | 435,678 | $1,446,376 |
| | 16,883,324 |
Trading Companies & Distributors | 2.12% |
Indutrade AB (Sweden) | 273,168 | 8,452,358 |
Total Industrials | | |
(Cost $121,300,366) | | 133,543,853 |
| | | |
Information Technology | | 9.63% |
Electronic Equipment & Instruments | 2.90% |
Diploma PLC | | |
(United Kingdom) | 1,362,482 | 11,615,124 |
Internet Software & Services | 4.90% |
DeNA Co. Ltd. (Japan) | 878,594 | 17,256,514 |
SMS Co. Ltd. (Japan) | 183,385 | 2,327,906 |
| | 19,584,420 |
IT Services | | 1.65% |
GMO Payment Gateway | | |
Inc. (Japan) | 42,868 | 915,019 |
Wirecard AG (Germany) | 208,224 | 5,667,305 |
| | 6,582,324 |
Software | | 0.18% |
Magic Software | | |
Enterprises Ltd. | | |
(Israel) | 132,489 | 714,116 |
Total Information Technology | |
(Cost $38,518,968) | | 38,495,984 |
Total Common Stocks | | |
(Cost $350,806,900) | | 384,964,297 |
| | | |
MONEY MARKET MUTUAL FUNDS | 5.87% |
Fidelity Institutional | | |
Money Market | | |
Government | | |
Portfolio - Class I | | |
(7 Day Yield 0.000%)(1) | 23,449,658 | 23,449,658 |
Total Money Market Mutual Funds | |
(Cost $23,449,658) | | 23,449,658 |
Total Investments | | |
(Cost $374,256,558) | 102.18% | 408,413,955 |
Liabilities in Excess of | | |
Other Assets | (2.18%) | (8,708,299) |
Net Assets | 100.00% | $399,705,656 |
PAGE 47 |
|
| STATEMENTS OF INVESTMENTS |
| |
WESTCORE INTERNATIONAL SMALL-CAP FUND AS OF JUNE 30, 2013 (continued)
(UNAUDITED)
Westcore International Small-Cap Fund
Country Breakdown as of June 30, 2013
(Unaudited)
Country | Market Value | % |
United Kingdom | $108,575,768 | 27.15% |
Australia | 81,731,616 | 20.44% |
Hong Kong | 67,355,319 | 16.86% |
Japan | 58,106,917 | 14.53% |
United States | 23,449,658 | 5.87% |
Canada | 14,600,372 | 3.65% |
Germany | 13,256,580 | 3.32% |
Austria | 12,997,021 | 3.25% |
Italy | 11,808,881 | 2.96% |
Sweden | 8,452,358 | 2.12% |
Cayman Islands | 4,995,177 | 1.25% |
Spain | 1,660,002 | 0.42% |
Israel | 714,116 | 0.18% |
Poland | 710,170 | 0.18% |
Total Investments | 408,413,955 | 102.18% |
Liabilities in Excess of | | |
Other Assets | (8,708,299) | (2.18%) |
Net Assets | $399,705,656 | 100.00% |
Please note the country breakdown is based on the company headquarters.
Sector and industry classifications presented herein are based on the sector and industry categorization methodology of the Adviser to the Funds which may result in the designations for one Fund being different from another.
(1) Less than 0.0005%.
See Notes to Financial Statements.
Outstanding Forward Foreign Currency Contracts
Contract | Contracted | Purchase/Sale | Expiration | Value On | | | Unrealized | |
| | Appreciation/ | |
Description | Amount | Contract | Date | Settlement Date | Current Value | | (Depreciation) | |
AUD | 55,867,311 | Sale | 09/25/2013 | $52,880,868 | $50,758,066 | $2,122,802 | | |
CAD | 15,073,160 | Sale | 09/25/2013 | 14,748,631 | 14,300,721 | 447,910 | | |
GBP | 12,607,660 | Sale | 09/25/2013 | 19,721,028 | 19,164,202 | 556,826 | | |
HKD | 446,810,389 | Sale | 09/25/2013 | 57,645,315 | 57,628,188 | 17,127 | | |
KRW | 3,701,533,051 | Sale | 09/25/2013 | 3,259,572 | 3,228,272 | 31,300 | | |
PLN | 2,315,462 | Sale | 09/25/2013 | 724,803 | 693,003 | 31,800 | | |
| | | | | | | $3,207,765 | | |
CHF | 14,770,168 | Purchase | 09/25/2013 | $16,068,853 | $15,649,870 | | $(418,983) | | |
DKK | 48,674,034 | Purchase | 09/25/2013 | 8,751,489 | 8,502,709 | (248,780) | | |
EUR | 36,241,334 | Purchase | 09/25/2013 | 48,628,151 | 47,192,705 | (1,435,446) | | |
ILS | 16,704,298 | Purchase | 09/25/2013 | 4,639,030 | 4,582,902 | (56,128) | | |
JPY | 4,950,284,086 | Purchase | 09/25/2013 | 52,102,495 | 49,934,027 | (2,168,468) | | |
NOK | 56,597,170 | Purchase | 09/25/2013 | 9,855,584 | 9,287,286 | (568,298) | | |
NZD | 3,982,654 | Purchase | 09/25/2013 | 3,184,805 | 3,066,631 | (118,174) | | |
SEK | 32,125,289 | Purchase | 09/25/2013 | 5,013,181 | 4,780,828 | (232,353) | | |
SGD | 14,893,916 | Purchase | 09/25/2013 | 11,869,781 | 11,752,733 | (117,048) | | |
| | | | | | | $(5,363,678) | | |
PAGE 48 |
|
| STATEMENTS OF INVESTMENTS |
| |
WESTCORE FLEXIBLE INCOME FUND AS OF JUNE 30, 2013
(UNAUDITED)
|
| |
| | | |
| | Shares | Market Value |
CONVERTIBLE PREFERRED STOCKS | | 1.96% |
Utilities | | 1.96% |
Utilities | | 1.96% |
AES Trust III, | | |
6.750%, 10/15/2029 | 26,100 | $1,313,352 |
Total Utilities | | |
(Cost $1,140,080) | | 1,313,352 |
Total Convertible Preferred Stocks | |
(Cost $1,140,080) | | 1,313,352 |
| | | |
NONCONVERTIBLE PREFERRED | |
STOCKS | | 6.06% |
Financials | | 6.06% |
Real Estate Investment Trusts (REITs) | 6.06% |
Diversified (REITs) | | 1.27% |
Cousins Properties Inc., | | |
7.500% | 4,594 | 116,320 |
National Retail Properties Inc., | |
6.625% | 29,000 | 736,310 |
| | 852,630 |
Hotels (REITs) | | 0.71% |
Hersha Hospitality Trust, | | |
8.000% | 18,600 | 477,183 |
Storage (REITs) | | 1.33% |
Public Storage, | | |
6.350% | 35,150 | 898,083 |
Warehouse-Industrial (REITs) | 2.75% |
CenterPoint Properties Trust, | |
5.377%(1)(2) | 3,015 | 1,846,687 |
| | | |
Total Financials | | |
(Cost $4,552,346) | | 4,074,583 |
Total Nonconvertible Preferred Stocks | |
(Cost $4,552,346) | | 4,074,583 |
| Principal | |
| Amount | Market Value |
CORPORATE BONDS | | 87.36% |
Financials | | 9.61% |
Financial Services | | 0.49% |
Emigrant Capital Trust II - 144A, | |
2.720%, 4/14/2034(2)(3) | $500,000 | 327,671 |
Insurance | | 1.68% |
Zurich Reinsurance Inc., | | |
7.125%, 10/15/2023 | 1,000,000 | 1,129,525 |
| Principal | |
| | Amount | Market Value |
| |
Savings & Loans | | | 0.91% |
Washington Mutual Bank, | | | |
5.550%, 6/16/2010**(4) | $2,000,000 | $615,000 |
Real Estate Investment Trusts (REITs) | 6.53% |
Data Center (REITs) | | | 0.79% |
DuPont Fabros Technology LP, | | |
8.500%, 12/15/2017 | 500,000 | 530,000 |
Healthcare (REITs) | | | 2.39% |
Omega Healthcare Investors Inc., | | |
6.750%, 10/15/2022 | 1,500,000 | 1,605,000 |
Hotels (REITs) | | | 0.80% |
Host Hotels & Resorts LP, | | | |
5.875%, 6/15/2019 | 500,000 | 537,744 |
Timber (REITs) | | | 2.55% |
Potlatch Corp., | | | |
7.500%, 11/1/2019 | 1,500,000 | 1,717,500 |
Total Financials | | | |
(Cost $7,118,030) | | | 6,462,440 |
| | | | |
Industrials | | | 73.32% |
Aerospace & Defense | | | 2.02% |
BE Aerospace Inc., | | | |
6.875%, 10/1/2020 | 1,250,000 | 1,356,250 |
Airlines | | | 0.14% |
Atlas Air Inc., | | | |
Pass-Through | | | |
Certificates, Series | | | |
1999-1, Class A-1, | | | |
7.200%, 1/2/2019(5) | 39,747 | 40,542 |
Continental Airlines Inc., | | | |
Pass-Through | | | |
Certificates, Series | | | |
1999-1, Class B, | | | |
6.795%, 8/2/2018(5) | 50,914 | 52,569 |
| | | 93,111 |
Autos | | | 3.66% |
Goodyear Tire & Rubber Co., | | | |
8.750%, 8/15/2020 | 1,644,000 | 1,923,480 |
Tenneco Inc., | | | |
7.750%, 8/15/2018 | 500,000 | 537,500 |
| | | 2,460,980 |
Broadcasting | | | 1.98% |
Entravision Communications Corp., | | |
8.750%, 8/1/2017 | 500,000 | 534,375 |
Sinclair Television Group Inc. - 144A, | | |
9.250%, 11/1/2017(3) | 750,000 | 796,875 |
| | | 1,331,250 |
| | Principal | |
| | Amount | Market Value |
| |
Building Materials | | | 3.77% |
USG Corp. - 144A, | | | |
8.375%, 10/15/2018(3) | $1,500,000 | $1,631,250 |
Vulcan Materials Co., | | | |
7.000%, 6/15/2018 | 825,000 | 899,250 |
| | | 2,530,500 |
Cable | | | 1.49% |
Virgin Media/Secured Finance PLC | | |
(United Kingdom), | | | |
5.250%, 1/15/2021 | 1,000,000 | 1,001,170 |
Chemicals | | | 1.16% |
Polymer Group Inc., | | | |
7.750%, 2/1/2019 | 750,000 | 783,750 |
Commercial Services | | | 2.38% |
Iron Mountain Inc., | | | |
8.375%, 8/15/2021 | 1,500,000 | 1,603,125 |
Consumer Products | | | 1.96% |
Jarden Corp., | | | |
6.125%, 11/15/2022 | 1,250,000 | 1,317,188 |
Consumer Services | | | 1.99% |
Service Corp. International: | | | |
6.750%, 4/1/2016 | 500,000 | 539,375 |
7.000%, 5/15/2019 | 750,000 | 796,875 |
| | | 1,336,250 |
Energy-Non Utility | | | 13.42% |
Denbury Resources Inc., | | | |
6.375%, 8/15/2021 | 1,500,000 | 1,582,500 |
Enterprise Products Operating LLC, | | |
Series B, 7.034%, | | | |
1/15/2068(2) | 750,000 | 842,700 |
Forest Oil Corp., | | | |
7.250%, 6/15/2019 | 1,500,000 | 1,417,500 |
MarkWest Energy Partners LP / MarkWest Energy |
Finance Corp., | | | |
6.750%, 11/1/2020 | 1,500,000 | 1,590,000 |
Range Resources Corp.: | | | |
5.750%, 6/1/2021 | 1,000,000 | 1,035,000 |
5.000%, 8/15/2022 | 1,000,000 | 982,500 |
Tesoro Corp.: | | | |
9.750%, 6/1/2019 | 500,000 | 555,000 |
5.375%, 10/1/2022 | 1,000,000 | 1,017,500 |
| | | 9,022,700 |
Healthcare | | | 3.59% |
DaVita Inc., | | | |
6.625%, 11/1/2020 | 1,250,000 | 1,331,250 |
HCA Inc., | | | |
7.875%, 2/15/2020 | 1,000,000 | 1,079,375 |
| | | 2,410,625 |
PAGE 49 |
|
| STATEMENTS OF INVESTMENTS |
| |
WESTCORE FLEXIBLE INCOME FUND AS OF JUNE 30, 2013 (continued)
(UNAUDITED)
| Principal | |
| Amount | Market Value |
Leasing | | 0.90% |
Aviation Capital Group Corp. - 144A, | |
6.750%, 4/6/2021(3) | $575,000 | $606,208 |
Leisure | | 7.28% |
|
Penn National Gaming Inc., | | |
8.750%, 8/15/2019 | 950,000 | 1,045,000 |
Royal Caribbean Cruises Ltd. (Liberia), | |
5.250%, 11/15/2022 | 1,500,000 | 1,477,500 |
Speedway Motorsports Inc., | | |
6.750%, 2/1/2019 | 753,000 | 790,650 |
Vail Resorts Inc., | | |
6.500%, 5/1/2019 | 1,500,000 | 1,578,750 |
| | 4,891,900 |
Metals & Mining | | 3.10% |
FMG Resources August 2006 Pty Ltd. - 144A |
(Australia), | | |
6.875%, 2/1/2018(3) | 500,000 | 495,625 |
Plains Exploration & Production Co., | |
6.125%, 6/15/2019 | 1,500,000 | 1,591,616 |
| | 2,087,241 |
Other Industrials | | 3.60% |
|
AmeriGas Finance LLC / AmeriGas Finance Corp., |
6.750%, 5/20/2020 | 1,500,000 | 1,560,000 |
Mueller Water Products Inc., | |
8.750%, 9/1/2020 | 784,000 | 858,480 |
| | 2,418,480 |
Packaging & Containers | | 4.89% |
|
Ball Corp., | | |
5.750%, 5/15/2021 | 1,525,000 | 1,612,687 |
Crown Americas LLC / Crown Americas Capital |
Corp. III, | | |
6.250%, 2/1/2021 | 1,575,000 | 1,677,375 |
| | 3,290,062 |
| | |
Paper & Forestry | | 1.33% |
West Fraser Timber Co. Ltd. - 144A (Canada), |
5.200%, 10/15/2014(3) | 850,000 | 894,625 |
| | |
Retail | | 3.68% |
Limited Brands Inc., | | |
7.000%, 5/1/2020 | 1,250,000 | 1,393,750 |
Sally Holdings LLC / Sally Capital Inc., | |
6.875%, 11/15/2019 | 1,000,000 | 1,077,500 |
Winn-Dixie Stores Inc., | | |
Series Escrow Units, | | |
4/1/2099**(1)(4) | 2,150,000 | 0 |
| | 2,471,250 |
Technology | | 0.78% |
Amkor Technology Inc., | | |
7.375%, 5/1/2018 | 500,000 | 522,500 |
| Principal | |
| Amount | Market Value |
Telecomm & Related | | 5.82% |
Frontier Communications Corp., | |
8.500%, 4/15/2020 | $1,750,000 | $1,938,125 |
Tuckahoe Credit Lease Trust - 144A, | |
9.310%, 10/20/2025(1)(3) | 1,771,549 | 1,976,606 |
| | 3,914,731 |
| | |
Textiles, Apparel & Luxury Goods | 2.39% |
Hanesbrands Inc., | | |
6.375%, 12/15/2020 | 1,500,000 | 1,606,875 |
Transportation | | 1.99% |
|
Gulfmark Offshore Inc., | | |
6.375%, 3/15/2022 | 1,340,000 | 1,336,650 |
Total Industrials | | |
(Cost $47,209,176) | | 49,287,421 |
| | |
Utilities | | 4.43% |
Utilities | | 4.43% |
Calpine Corp Escrow, | | |
8.750%, 7/15/2013**(1)(4) | 200,000 | 0 |
Calpine Corp. - 144A, | | |
7.500%, 2/15/2021(3) | 1,774,000 | 1,902,615 |
NRG Energy Inc., | | |
7.875%, 5/15/2021 | 1,000,000 | 1,072,500 |
| | 2,975,115 |
| | |
Total Utilities | | |
(Cost $2,940,269) | | 2,975,115 |
| | |
Total Corporate Bonds | | |
(Cost $57,267,475) | | 58,724,976 |
| | |
COMMERCIAL MORTGAGE-BACKED | |
SECURITIES & RESIDENTIAL | |
MORTGAGE-BACKED SECURITIES | 2.94% |
Commercial Mortgage-Backed | |
Securities | | 2.71% |
Advertising | | 2.71% |
Adams Outdoor Advertising LP - 144A, | |
10.756%, 12/20/2017(3)(5) | 700,000 | 781,437 |
GTP Towers Issuer LLC - 144A, | |
8.112%, 2/15/2015(3)(5) | 1,000,000 | 1,038,609 |
| | 1,820,046 |
| | |
Total Commercial Mortgage-Backed Securities |
(Cost $1,700,000) | | 1,820,046 |
| | |
| | |
| | |
| | |
| | |
| | |
| Principal | |
| Amount | Market Value |
Residential Mortgage-Backed | |
Securities | | 0.23% |
| | 0.23% |
Home Equity Loan Trust 2002-HS2, | |
Series 2002-HS2, | | |
Class M1, 6.180%, | | |
1/25/2032(6) | $153,320 | $154,751 |
| | | |
Total Residential Mortgage-Backed Securities |
(Cost $153,737) | | 154,751 |
| | | |
| Total Commercial Mortgage-Backed Securities & | | |
| Residential Mortgage-Backed Securities | | |
| (Cost $1,853,737) | | 1,974,797 |
| | |
| Shares | Market Value |
MONEY MARKET MUTUAL FUNDS | 0.67% |
Fidelity Institutional Money | | |
Market Government | | |
Portfolio - Class I | | |
(7 Day Yield 0.000%)(7) | 450,148 | $450,148 |
Total Money Market Mutual Funds | |
(Cost $450,148) | | 450,148 |
Total Investments | | |
(Cost $65,263,786) | 98.99% | 66,537,856 |
Other Assets in | | |
Excess of Liabilities | 1.01% | 679,814 |
Net Assets | 100.00% | $67,217,670 |
** Non-income producing security.
See Notes to Financial Statements.
PAGE 50 |
|
| STATEMENTS OF INVESTMENTS |
| |
WESTCORE FLEXIBLE INCOME FUND AS OF JUNE 30, 2013 (continued)
(UNAUDITED)
| (1) | This security has been valued in good faith by management under the direction of the Board of Trustees. As of June 30, 2013 these securities represented 5.69% of the Fund’s net assets. |
| (2) | The coupon rate shown on floating or adjustable rate securities represents the rate at period end. |
| (3) | This security is restricted. The following table provides additional information regarding each security. Included in this list are certain securities exempt from registration under Rule 144A of the Securities Act of 1933, which may be resold in transactions, normally to qualified institutional buyers. |
| | | | | | | | Market Value |
| | | | | | | | as Percentage |
Issuer Description | Coupon | Maturity Date | Acquisition Date | | Cost | | Market Value | of Net Assets |
Adams Outdoor Advertising LP | 10.756% | 12/20/2017 | 12/3/2010 | $ | 700,000 | $ | 781,437 | 1.16% |
Aviation Capital Group Corp. | 6.750% | 4/6/2021 | 12/7/2011 | | 550,871 | | 606,208 | 0.90%^ |
Calpine Corp. | 7.500% | 2/15/2021 | 10/18/2010 - 2/2/2012 | | 1,816,614 | | 1,902,615 | 2.83%^ |
Emigrant Capital Trust II | 2.720% | 4/14/2034 | 8/11/2004 | | 498,055 | | 327,671 | 0.49% |
FMG Resources August 2006 Pty Ltd. | 6.875% | 2/1/2018 | 11/30/2011 | | 472,329 | | 495,625 | 0.74%^ |
GTP Towers Issuer LLC | 8.112% | 2/15/2015 | 2/11/2010 | | 1,000,000 | | 1,038,609 | 1.55% |
Sinclair Television Group Inc. | 9.250% | 11/1/2017 | 11/15/2011 - 11/17/2011 | | 798,303 | | 796,875 | 1.19%^ |
Tuckahoe Credit Lease Trust | 9.310% | 10/20/2025 | 12/11/2009 | | 1,580,001 | | 1,976,606 | 2.94% |
USG Corp. | 8.375% | 10/15/2018 | 11/9/2010 - 10/25/2011 | | 1,457,700 | | 1,631,250 | 2.43%^ |
West Fraser Timber Co. Ltd. | 5.200% | 10/15/2014 | 7/20/2009 - 8/3/2009 | | 793,539 | | 894,625 | 1.33%^ |
| | | | $ | 9,667,412 | $ | 10,451,521 | 15.56% |
| ^ | 144A securities with a liquid trading market as determined by the Adviser under the supervision of the Board of Trustees. Such securities represent 9.42% of the Fund’s net assets as of June 30, 2013. |
| | |
| (4) | Income is not being accrued on this security due to the issuer’s default or expected default on interest payments. |
| (5) | The expected maturity date listed herein differs from the legal maturity date due to call or put features or due to the expected schedule of principal payments. |
| (6) | Step bond. Coupon increases periodically based upon a predetermined schedule. Interest rate disclosed is that which is in effect at June 30, 2013. |
| (7) | Less than 0.0005%. |
PAGE 51 |
|
| STATEMENTS OF INVESTMENTS |
| |
WESTCORE PLUS BOND FUND AS OF JUNE 30, 2013
(UNAUDITED)
| Shares | Market Value |
NONCONVERTIBLE PREFERRED | |
STOCKS | | | 0.28% |
Financials | | | 0.23% |
Financial Services | | | 0.07% |
First Tennessee Bank - 144A, | |
3.750%(1)(2) | 1,500 | | $1,159,219 |
Real Estate Investment Trusts | |
(REITs) | | | 0.16% |
Apartments (REITs) | | | 0.01% |
Cousins Properties Inc., | | | |
7.500% | 2,700 | | 68,364 |
Warehouse-Industrial (REITs) | 0.15% |
CenterPoint Properties Trust, | |
5.377%(1)(3) | 3,900 | | 2,388,750 |
Total Financials | | | |
(Cost $5,401,577) | | | 3,616,333 |
| | | | |
Utilities | | | 0.05% |
Utilities | | | 0.05% |
Southern California Edison, | |
5.349%(1) | 7,638 | | 776,451 |
Total Utilities | | | |
(Cost $763,800) | | | 776,451 |
Total Nonconvertible Preferred Stocks | | |
(Cost $6,165,377) | | | 4,392,784 |
| Principal | | |
| Amount | | Market Value |
CORPORATE BONDS | | | 53.37% |
Financials | | | 16.32% |
Financial Services | | | 8.85% |
Bank of America Corp., | | | |
5.000%, 5/13/2021 | $5,950,000 | | 6,351,524 |
BB&T Corp.: | | | |
3.200%, 3/15/2016 | 8,975,000 | | 9,411,616 |
6.850%, 4/30/2019 | 4,150,000 | | 5,045,881 |
Capital One Financial Corp., | |
4.750%, 7/15/2021 | 6,700,000 | | 7,074,932 |
Citigroup Inc., | | | |
5.375%, 8/9/2020 | 5,475,000 | | 6,060,584 |
City National Corp., | | | |
5.250%, 9/15/2020 | 16,475,000 | | 17,873,958 |
Emigrant Capital Trust II - 144A, | |
2.720%, 4/14/2034(1) | | | |
(2) | 850,000 | | 557,041 |
First Empire Capital Trust, | |
8.277%, 6/1/2027 | 25,000 | | 25,312 |
First Horizon National Corp., | |
5.375%, 12/15/2015 | 12,525,000 | | 13,538,999 |
| Principal | |
| Amount | Market Value |
FMR Corp. - 144A, | | |
7.490%, 6/15/2019(2) | $5,000,000 | $6,041,900 |
Ford Motor Credit Co. LLC, | |
8.125%, 1/15/2020 | 8,775,000 | 10,598,936 |
JPMorgan Chase & Co., | | |
4.400%, 7/22/2020 | 7,150,000 | 7,484,899 |
PNC Funding Corp.: | | |
4.250%, 9/15/2015 | 6,845,000 | 7,281,082 |
5.125%, 2/8/2020 | 7,250,000 | 7,973,992 |
The Toronto-Dominion Bank (Canada): | |
2.500%, 7/14/2016 | 4,625,000 | 4,797,142 |
1.400%, 4/30/2018 | 7,825,000 | 7,600,861 |
Union Bank of California, | | |
5.950%, 5/11/2016 | 3,100,000 | 3,476,287 |
Wachovia Corp., | | |
5.625%, 10/15/2016 | 14,250,000 | 16,026,092 |
| | 137,221,038 |
Insurance | | 1.07% |
Berkshire Hathaway Finance Corp., | |
1.600%, 5/15/2017 | 5,325,000 | 5,305,915 |
PartnerRe Finance B LLC, | |
5.500%, 6/1/2020 | 9,700,000 | 10,687,072 |
Prudential Financial, | | |
Series MTNB, | | |
4.346%, 5/12/2015(1) | 453,373 | 463,817 |
Zurich Reinsurance Inc., | | |
7.125%, 10/15/2023 | 200,000 | 225,905 |
| | 16,682,709 |
Leasing | | 0.39% |
Aviation Capital Group Corp. - 144A, | |
6.750%, 4/6/2021(2) | 5,725,000 | 6,035,724 |
Savings & Loans | | 0.24% |
Washington Mutual Bank: | | |
5.550%, | | |
6/16/2010**(4) | 7,100,000 | 2,183,250 |
2.969%, | | |
6/16/2010**(4) | 5,000,000 | 1,537,500 |
| | 3,720,750 |
Real Estate Investment Trusts (REITs) | 5.77% |
Cell Tower (REITs) | | 0.26% |
American Tower Corp., | | |
7.250%, 5/15/2019 | 3,350,000 | 4,023,454 |
Diversified (REITs) | | 1.11% |
National Retail Properties Inc., | |
5.500%, 7/15/2021 | 825,000 | 893,862 |
Washington REIT: | | |
4.950%, 10/1/2020 | 13,825,000 | 14,369,083 |
3.950%, 10/15/2022 | 2,025,000 | 1,932,143 |
| | 17,195,088 |
| Principal | |
| Amount | Market Value |
Healthcare (REITs) | | 1.71% |
Omega Healthcare Investors Inc., | |
6.750%, 10/15/2022 $10,420,000 | $11,149,400 |
Ventas Realty LP / Ventas Capital Corp., |
4.750%, 6/1/2021 | 14,625,000 | 15,381,566 |
| | 26,530,966 |
Hotels (REITs) | | 0.39% |
Host Hotels & Resorts LP, | |
6.000%, 11/1/2020 | 5,575,000 | 6,008,796 |
Industrials (REITs) | | 0.08% |
ProLogis LP, | | |
7.625%, 7/1/2017 | 1,100,000 | 1,240,410 |
Regional Malls (REITs) | | 0.83% |
Simon Property Group LP: | |
7.375%, 6/15/2018 | 2,868,000 | 3,471,097 |
10.350%, 4/1/2019 | 2,050,000 | 2,841,298 |
5.650%, 2/1/2020 | 5,775,000 | 6,604,423 |
| | 12,916,818 |
Shopping Centers (REITs) | | 0.04% |
Weingarten Realty Investors, | |
6.640%, 7/15/2026 | 545,000 | 618,002 |
Timber (REITs) | | 1.35% |
Plum Creek Timberland, | | |
5.875%, 11/15/2015 | 2,400,000 | 2,634,746 |
Potlatch Corp., | | |
7.500%, 11/1/2019 | 15,996,000 | 18,315,420 |
| | 20,950,166 |
Total Financials | | |
(Cost $252,805,839) | | 253,143,921 |
| | | |
Industrials | | 31.55% |
Aerospace & Defense | | 0.11% |
BE Aerospace Inc., | | |
6.875%, 10/1/2020 | 1,550,000 | 1,681,750 |
Autos | | 0.84% |
BMW US Capital Inc. - 144A, | |
5.730%, 11/1/2015(2)(3) | 12,000,000 | 12,946,200 |
Building Materials | | 0.75% |
USG Corp. - 144A, | | |
8.375%, | | |
10/15/2018(2) | 8,400,000 | 9,135,000 |
Vulcan Materials Co., | | |
7.000%, 6/15/2018 | 2,328,000 | 2,537,520 |
| | 11,672,520 |
PAGE 52 |
|
| STATEMENTS OF INVESTMENTS |
| |
WESTCORE PLUS BOND FUND AS OF JUNE 30, 2013 (continued)
(UNAUDITED)
| Principal | |
| Amount | Market Value |
Cable & Media | | 1.87% |
CBS Corp., | | |
8.875%, 5/15/2019 $11,675,000 | $15,058,076 |
Time Warner Inc., | | |
9.150%, 2/1/2023 | 2,410,000 | 3,276,164 |
Virgin Media/Secured Finance PLC | |
(United Kingdom), | | |
5.250%, 1/15/2021 | 9,735,000 | 9,746,390 |
WPP Finance 2010 (United Kingdom), | |
3.625%, 9/7/2022 | 1,000,000 | 944,800 |
| | 29,025,430 |
Chemicals | | 0.66% |
The Dow Chemical Co., | | |
8.550%, 5/15/2019 | 2,700,000 | 3,447,624 |
Potash Corp. of Saskatchewan Inc. (Canada), |
6.500%, 5/15/2019 | 5,625,000 | 6,744,904 |
| | 10,192,528 |
Commercial Services | | 0.52% |
Iron Mountain Inc., | | |
7.750%, 10/1/2019 | 7,425,000 | 8,019,000 |
Consumer Products | | 0.34% |
Jarden Corp., | | |
6.125%, 11/15/2022 | 5,000,000 | 5,268,750 |
Energy-Non Utility | | 7.79% |
Apache Corp., | | |
5.100%, 9/1/2040 | 5,550,000 | 5,611,006 |
Burlington Resources Inc., | |
6.875%, 2/15/2026 | 1,000,000 | 1,182,004 |
Devon Energy Corp., | | |
6.300%, 1/15/2019 | 14,050,000 | 16,291,958 |
Forest Oil Corp., | | |
7.250%, 6/15/2019 | 12,460,000 | 11,774,700 |
Kerr-McGee Corp., | | |
6.950%, 7/1/2024 | 4,500,000 | 5,387,031 |
MarkWest Energy Partners LP / MarkWest Energy |
Finance Corp., | | |
6.750%, 11/1/2020 | 6,820,000 | 7,229,200 |
Pride International Inc.: | | |
8.500%, 6/15/2019 | 2,925,000 | 3,723,107 |
6.875%, 8/15/2020 | 7,575,000 | 8,999,198 |
Range Resources Corp., | | |
5.750%, 6/1/2021 | 15,450,000 | 15,990,750 |
Southwestern Energy Co., | | |
7.500%, 2/1/2018 | 10,520,000 | 12,482,948 |
Tennessee Gas Pipeline Co.: | |
7.000%, 3/15/2027 | 75,000 | 91,492 |
7.000%, 10/15/2028 | 9,775,000 | 11,911,551 |
8.375%, 6/15/2032 | 2,600,000 | 3,493,368 |
Tesoro Corp., | | |
5.375%, 10/1/2022 | 10,005,000 | 10,180,088 |
| Principal | |
| Amount | Market Value |
Transcontinental Gas Pipe Line, | |
6.400%, 4/15/2016 | $5,725,000 | $6,499,432 |
| | 120,847,833 |
Food & Beverages | | 3.27% |
Anheuser-Busch Companies Inc. (Belgium), |
5.050%, 10/15/2016 | 8,030,000 | 9,015,450 |
Anheuser-Busch InBev Worldwide Inc. (Belgium), |
7.750%, 1/15/2019 | 6,350,000 | 8,037,931 |
The Coca-Cola Co., | | |
1.500%, 11/15/2015 | 6,000,000 | 6,123,372 |
Diageo Finance BV (Netherlands), | |
5.300%, 10/28/2015 | 4,700,000 | 5,174,338 |
PepsiCo Inc.: | | |
3.750%, 3/1/2014 | 5,500,000 | 5,615,093 |
2.500%, 5/10/2016 | 15,000,000 | 15,616,215 |
WM Wrigley Jr. Co., | | |
4.650%, 7/15/2015 | 1,125,000 | 1,187,262 |
| | 50,769,661 |
Healthcare | | 0.25% |
DaVita Inc., | | |
6.625%, 11/1/2020 | 3,700,000 | 3,940,500 |
Leisure | | 1.69% |
MGM Mirage, | | |
7.625%, 7/15/2013 | 1,500,000 | 1,500,937 |
Royal Caribbean Cruises Ltd., | |
5.250%, 11/15/2022 | 8,425,000 | 8,298,625 |
Starwood Hotels & Resorts Worldwide Inc., |
6.750%, 5/15/2018 | 9,170,000 | 10,849,935 |
Vail Resorts Inc., | | |
6.500%, 5/1/2019 | 5,250,000 | 5,525,625 |
| | 26,175,122 |
Machinery | | 0.26% |
Cummins Inc., | | |
7.125%, 3/1/2028 | 3,301,000 | 4,062,217 |
Metals & Mining | | 0.63% |
BHP Billiton Finance USA Ltd. (Australia), |
6.500%, 4/1/2019 | 5,025,000 | 6,020,905 |
Newmont Mining Corp., | | |
3.500%, 3/15/2022 | 4,325,000 | 3,705,777 |
Sweetwater Investors LLC - 144A, | |
5.875%, 5/15/2014(2) | 92,792 | 92,147 |
| | 9,818,829 |
Other Industrials | | 0.54% |
AmeriGas Finance LLC / AmeriGas Finance Corp., |
6.750%, 5/20/2020 | 7,975,000 | 8,294,000 |
Packaging & Containers | | 0.75% |
Ball Corp., | | |
5.750%, 5/15/2021 | 5,000,000 | 5,287,500 |
| Principal | | |
| Amount | | Market Value |
Crown Americas LLC / Crown Americas Capital |
Corp. III, | | | |
6.250%, 2/1/2021 | $6,000,000 | | $6,390,000 |
| | | 11,677,500 |
Paper & Forestry | | | 0.60% |
West Fraser Timber Co. Ltd. - 144A (Canada), |
5.200%, | | | |
10/15/2014(2) | 8,825,000 | | 9,288,313 |
Pharmaceuticals | | | 0.77% |
GlaxoSmithKline Capital Inc. (United Kingdom), |
5.650%, 5/15/2018 | 10,350,000 | | 12,011,962 |
Restaurants | | | 1.07% |
Darden Restaurants Inc., | | | |
4.500%, 10/15/2021 | 16,500,000 | | 16,657,410 |
Retail | | | 4.32% |
Costco Wholesale Corp., | | | |
1.700%, 12/15/2019 | 13,975,000 | | 13,470,097 |
Kohl’s Corp., | | | |
4.000%, 11/1/2021 | 16,425,000 | | 16,458,146 |
Limited Brands Inc., | | | |
7.000%, 5/1/2020 | 5,875,000 | | 6,550,625 |
Sally Holdings LLC / Sally Capital Inc., | |
6.875%, 11/15/2019 | 12,435,000 | | 13,398,713 |
Wal-Mart Stores Inc., | | | |
7.550%, 2/15/2030 | 12,400,000 | | 17,068,116 |
| | | 66,945,697 |
Technology | | | 0.61% |
International Business Machines Corp., | |
2.000%, 1/5/2016 | 8,000,000 | | 8,210,576 |
Science Applications International Corp., |
5.500%, 7/1/2033 | 1,225,000 | | 1,186,773 |
| | | 9,397,349 |
Telecomm & Related | | | 2.26% |
America Movil SAB de CV (Mexico), | |
5.000%, 10/16/2019 | 6,975,000 | | 7,586,707 |
AT&T Inc., | | | |
5.625%, 6/15/2016 | 9,600,000 | | 10,745,962 |
AT&T Inc. - 144A, | | | |
4.300%, 12/15/2042(2) | 3,999,000 | | 3,500,249 |
Frontier Communications Corp., | |
8.500%, 4/15/2020 | 7,400,000 | | 8,195,500 |
Tuckahoe Credit Lease Trust - 144A, | |
9.310%, 10/20/2025(2)(3) | 4,527,292 | | 5,051,326 |
| | | 35,079,744 |
Textiles, Apparel & Luxury Goods | 0.37% |
Hanesbrands Inc., | | | |
6.375%, 12/15/2020 | 5,400,000 | | 5,784,750 |
PAGE 53 |
|
| STATEMENTS OF INVESTMENTS |
| |
WESTCORE PLUS BOND FUND AS OF JUNE 30, 2013 (continued)
(UNAUDITED)
| Principal | |
| Amount | Market Value |
Transportation | | 1.28% |
Burlington Northern Santa Fe Corp.: | |
5.750%, 3/15/2018 | $3,325,000 | $3,819,387 |
4.575%, 1/15/2021(3) | 853,078 | 912,793 |
6.150%, 5/1/2037 | 4,325,000 | 5,042,816 |
Burlington Northern Santa Fe LLC, | |
3.000%, 3/15/2023 | 4,600,000 | 4,389,867 |
Canadian National Railway Co. (Canada), |
6.800%, 7/15/2018 | 3,315,000 | 3,992,868 |
CSX Transportation Inc., | | |
9.750%, 6/15/2020 | 1,250,000 | 1,719,799 |
| | 19,877,530 |
Total Industrials | | |
(Cost $474,084,241) | | 489,434,595 |
Utilities | | 5.50% |
Utilities | | 5.50% |
Calpine Corp. - 144A, | | |
7.500%, 2/15/2021(2) | 7,444,000 | 7,983,690 |
Commonwealth Edison Co., | |
Series 104, 5.950%, | | |
8/15/2016 | 7,375,000 | 8,400,877 |
Consumers Energy Co., | | |
Series B, 6.875%, | | |
3/1/2018 | 1,564,000 | 1,879,559 |
Duke Energy Carolinas LLC: | |
Series C, 7.000%, | | |
11/15/2018 | 4,285,000 | 5,309,359 |
3.900%, 6/15/2021 | 4,275,000 | 4,541,970 |
Georgia Power Co., | | |
Series 07-A, | | |
5.650%, 3/1/2037 | 850,000 | 945,679 |
Nevada Power Co.: | | |
Series M, 5.950%, | | |
3/15/2016 | 3,287,000 | 3,661,919 |
Series R, 6.750%, | | |
7/1/2037 | 2,850,000 | 3,658,573 |
NextEra Energy Capital Corp.: | |
2.600%, 9/1/2015 | 3,200,000 | 3,297,117 |
6.350%, 10/1/2066(1) | 2,900,000 | 3,003,689 |
NRG Energy Inc., | | |
8.500%, 6/15/2019 | 3,807,000 | 4,087,766 |
Oncor Electric Delivery Co. LLC, | |
7.000%, 9/1/2022 | 13,178,000 | 16,378,449 |
Public Service Co. of Oklahoma, | |
6.150%, 8/1/2016 | 3,075,000 | 3,466,340 |
San Diego Gas & Electric Co., | |
6.000%, 6/1/2026 | 3,550,000 | 4,373,479 |
Tenaska Alabama II Partners LP - 144A, |
6.125%, 3/30/2023(2) | 208,744 | 222,217 |
Tenaska Virginia Partners LP - 144A, | |
6.119%, 3/30/2024(2) | 187,386 | 202,232 |
Westar Energy Inc., | | |
8.625%, 12/1/2018 | 9,950,000 | 12,959,815 |
| Principal | |
| Amount | Market Value |
WPD Holdings Inc - 144A (United Kingdom), |
7.250%, | | |
12/15/2017(2) | $875,000 | $1,003,438 |
| | 85,376,168 |
Total Utilities | | |
(Cost $77,132,335) | | 85,376,168 |
Total Corporate Bonds | | |
(Cost $804,022,415) | | 827,954,684 |
| | | |
MUNICIPAL BONDS | | 1.02% |
Washington | | 1.02% |
Washington State Build America Bonds: |
5.090%, 8/1/2033 | 5,900,000 | 6,393,004 |
5.481%, 8/1/2039 | 8,400,000 | 9,388,512 |
| | 15,781,516 |
Total Municipal Bonds | | |
(Cost $16,230,726) | | 15,781,516 |
| | | |
ASSET-BACKED SECURITIES, | |
COMMERCIAL MORTGAGE- | |
BACKED SECURITIES, | | |
RESIDENTIAL MORTGAGE-BACKED | |
SECURITIES & AGENCY MORTGAGE- | |
BACKED SECURITIES | | 36.36% |
Asset-Backed Securities | | 4.33% |
Aircraft Lease Securitisation Ltd. - 144A, |
Series 2007-1A, | | |
Class G3, 0.459%, | | |
5/10/2032(1)(2)(3) | 6,495,201 | 6,186,679 |
BMW Vehicle Owner Trust, | |
Series 2011-A, | | |
Class A3, 0.760%, | | |
9/25/2014(5) | 3,144,651 | 3,148,692 |
CarMax Auto Owner Trust, | | |
Series 2009-2, | | |
Class B, 4.650%, | | |
8/17/2015 | 6,000,000 | 6,126,870 |
Centerpoint Energy Transition Bond Co. III LLC, |
Series 2008-A, | | |
Class A1, 4.192%, | | |
2/1/2020 | 2,665,332 | 2,816,158 |
Honda Auto Receivables Owner Trust: | |
Series 2010-3, | | |
Class A4, 0.940%, | | |
11/21/2013(5) | 7,537,727 | 7,548,416 |
Series 2012-2, | | |
Class A4, 0.910%, | | |
6/15/2015(5) | 4,200,000 | 4,210,357 |
Hyundai Auto Receivables Trust, | |
Series 2009-A, | | |
Class A4, 3.150%, | | |
3/15/2016 | 2,208,057 | 2,225,613 |
| Principal | |
| Amount | Market Value |
John Deere Owner Trust: | | |
Series 2011-A, | | |
Class A3, 1.290%, | | |
1/15/2016 | $1,418,854 | $1,422,841 |
Series 2011-A, | | |
Class A4, 1.960%, | | |
4/16/2018 | 5,528,000 | 5,591,666 |
Marriott Vacation Club Owner Trust - 144A, |
Series 2010-1A, | | |
Class A, 3.540%, | | |
12/20/2032(2) | 4,374,271 | 4,497,923 |
Toyota Auto Receivables Owner Trust: | |
Series 2012-A, | | |
Class A3, 0.750%, | | |
2/16/2016 | 10,000,000 | 10,016,450 |
Series 2012-A, | | |
Class A4, 0.990%, | | |
8/15/2017 | 5,000,000 | 5,014,675 |
World Financial Network Credit Card Master |
Trust, | | |
Series 2011-A, | | |
Class A, 1.680%, | | |
8/15/2018 | 8,250,000 | 8,341,641 |
Total Asset-Backed Securities | |
(Cost $66,462,993) | | 67,147,981 |
| | | |
Commercial Mortgage-Backed | |
Securities | | 3.42% |
Adams Outdoor Advertising LP - 144A: | |
5.438%, | | |
12/20/2017(2)(5) | 7,748,867 | 8,259,874 |
10.756%, | | |
12/20/2017(2)(5) | 6,300,000 | 7,032,929 |
Crown Castle Towers LLC - 144A: | |
5.495%, 1/15/2017(2)(5) | 4,500,000 | 4,947,962 |
6.113%, 1/15/2020(2)(5) | 8,975,000 | 10,308,497 |
4.883%, 8/15/2020(2)(5) | 5,900,000 | 6,351,220 |
GTP Towers Issuer LLC - 144A, | |
8.112%, 2/15/2015(2)(5) | 15,000,000 | 15,579,135 |
SBA Tower Trust - 144A, | | |
4.254%, 4/15/2015(2)(5) | 550,000 | 570,151 |
Total Commercial Mortgage-Backed Securities |
(Cost $48,973,867) | | 53,049,768 |
| | | |
Residential Mortgage-Backed | |
Securities | | 2.16% |
Banc of America Funding Trust: | |
Class 2A4, 5.500%, | | |
8/1/2035 | 705,608 | 685,331 |
Series 2005-4, | | |
Class 1A4, 5.500%, | | |
8/1/2035 | 339,338 | 332,818 |
PAGE 54 |
|
| STATEMENTS OF INVESTMENTS |
| |
WESTCORE PLUS BOND FUND AS OF JUNE 30, 2013 (continued)
(UNAUDITED)
| Principal | |
| Amount | Market Value |
Banc of America Mortgage Securities Inc.: |
Series 2003-G, | | |
Class 2A1, 3.108%, | | |
8/25/2033(1) | $5,171,082 | $5,134,404 |
Series 2005- | | |
2, Class 1A12, | | |
5.500%, 3/25/2035 | 220,151 | 217,157 |
Series 2005-8, | | |
Class A14, 5.500%, | | |
9/25/2035 | 725,709 | 440,860 |
Banc of America Mortgage Trust, | |
Series 2003-E, | | |
Class 3A1, 2.890%, | | |
6/25/2033(1) | 3,918,174 | 3,887,216 |
Bank of America Alternative Loan Trust, |
Series 2005-4, | | |
Class CB9, 5.500%, | | |
5/25/2035 | 762,102 | 92,005 |
Bear Stearns Co.: | | |
Series 2003-AC4, | | |
Class A, 5.500%, | | |
9/25/2033(6) | 6,104,692 | 6,249,721 |
Series 2003-7, | | |
Class 4A, 4.819%, | | |
10/25/2033(1) | 28,141 | 28,345 |
Countrywide Asset-Backed Certificates, |
Series 2005-1, | | |
Class AF6, 5.030%, | | |
7/25/2035(1) | 5,132,841 | 5,278,998 |
RAMP Series Trust, | | |
Series 2006-EFC2, | | |
Class A3, 0.353%, | | |
12/25/2036(1) | 5,068,075 | 4,613,317 |
JP Morgan Mortgage Trust 2013-2, | |
Series 2013-2 - 144A | | |
Class A2, 3.500%, | | |
12/25/2030(2) | 6,669,276 | 6,537,025 |
Total Residential Mortgage-Backed Securities |
(Cost $34,594,721) | | 33,497,197 |
| | | |
Agency Mortgage-Backed | |
Securities | | 26.45% |
FHLMC: | | |
Pool #781958, | | |
5.137%, 9/1/2034(1) | 411,638 | 436,947 |
Gold Pool #G08061, | | |
5.500%, 6/1/2035 | 346,740 | 374,658 |
Gold Pool #G08079, | | |
5.000%, 9/1/2035 | 4,805,763 | 5,146,866 |
Gold Pool #G01960, | | |
5.000%, 12/1/2035 | 1,427,953 | 1,528,468 |
Gold Pool #A41748, | | |
5.000%, 1/1/2036 | 2,226,506 | 2,386,369 |
Gold Pool #A42128, | | |
5.500%, 1/1/2036 | 1,643,497 | 1,772,508 |
Gold Pool #G02064, | | |
5.000%, 2/1/2036 | 2,306,554 | 2,469,735 |
| Principal | |
| Amount | Market Value |
Gold Pool #G05200, | | |
5.000%, 5/1/2036 | $6,947,654 | $7,430,738 |
Gold Pool #G02252, | | |
5.500%, 7/1/2036 | 5,067,916 | 5,476,578 |
Gold Pool #G02386, | | |
6.000%, 11/1/2036 | 3,699,319 | 4,015,411 |
Pool #1G1317, | | |
5.900%, 11/1/2036(1) | 1,890,874 | 2,002,462 |
Gold Pool #G03189, | | |
6.500%, 9/1/2037 | 6,988,307 | 7,710,213 |
Pool #A86876, | | |
5.000%, 6/1/2039 | 6,604,847 | 7,076,526 |
Gold Pool #A91161, | | |
4.500%, 2/1/2040 | 7,123,181 | 7,506,729 |
Pool #A92533, | | |
4.500%, 6/1/2040 | 7,808,099 | 8,228,526 |
Pool #A93505, | | |
4.500%, 8/1/2040 | 10,340,590 | 10,897,379 |
Pool #A97047, | | |
4.500%, 2/1/2041 | 7,936,764 | 8,380,524 |
Pool #A97620, | | |
4.500%, 3/1/2041 | 14,406,052 | 15,211,523 |
Gold Pool #Q05168, | | |
4.000%, 12/1/2041 | 22,451,947 | 23,403,775 |
Gold Pool #Q05601, | | |
4.000%, 1/10/2042 | 13,359,873 | 13,927,106 |
Gold Pool #C03789, | | |
4.000%, 3/1/2042 | 12,093,373 | 12,613,545 |
FNMA: | | |
Pool #932361, | | |
4.000%, 1/1/2025 | 8,406,009 | 8,896,668 |
Pool #AC8938, | | |
4.500%, 1/1/2025 | 10,964,351 | 11,640,731 |
Pool #AD4268, | | |
4.500%, 3/1/2025 | 6,684,884 | 7,097,127 |
Pool #AL2840, | | |
2.500%, 11/1/2027 | 15,878,551 | 15,975,887 |
Pool #AB4853, | | |
3.000%, 4/1/2032 | 23,115,833 | 23,354,851 |
Pool #MA1201, | | |
3.500%, 10/1/2032 | 22,826,880 | 23,510,545 |
Pool #725705, | | |
5.000%, 8/1/2034 | 678,205 | 733,911 |
Pool #735288, | | |
5.000%, 3/1/2035 | 3,758,847 | 4,065,381 |
Pool #255706, | | |
5.500%, 5/1/2035 | 3,871,080 | 4,205,530 |
Pool #735897, | | |
5.500%, 10/1/2035 | 2,796,338 | 3,050,092 |
Pool #836496, | | |
5.000%, 10/1/2035 | 3,417,552 | 3,679,911 |
Pool #850582, | | |
5.500%, 1/1/2036 | 961,369 | 1,044,461 |
Pool #745275, | | |
5.000%, 2/1/2036 | 4,179,280 | 4,511,215 |
Pool #845471, | | |
5.000%, 5/1/2036 | 663,810 | 705,302 |
| Principal | |
| Amount | Market Value |
Pool #888016, | | |
5.500%, 5/1/2036 | $4,786,278 | $5,220,608 |
Pool #190377, | | |
5.000%, 11/1/2036 | 3,703,136 | 3,987,418 |
Pool #256526, | | |
6.000%, 12/1/2036 | 4,450,892 | 4,655,727 |
Pool #888405, | | |
5.000%, 12/1/2036 | 832,825 | 896,526 |
Pool #907772, | | |
6.000%, 12/1/2036 | 1,700,362 | 1,754,469 |
Pool #910881, | | |
5.000%, 2/1/2037 | 2,995,193 | 3,183,300 |
Pool #889108, | | |
6.000%, 2/1/2038 | 3,696,056 | 4,015,063 |
Pool #889579, | | |
6.000%, 5/1/2038 | 6,510,560 | 7,083,248 |
Pool #995838, | | |
5.500%, 5/1/2039 | 4,979,462 | 5,409,673 |
Pool #AE0395, | | |
4.500%, 10/1/2040 | 15,936,597 | 16,967,551 |
Pool #AE0949, | | |
4.000%, 2/1/2041 | 27,499,338 | 28,794,227 |
Pool #AJ1407, | | |
4.000%, 9/1/2041 | 11,793,513 | 12,302,946 |
Pool #AL2625, | | |
3.500%, 10/1/2042 | 15,448,397 | 15,710,835 |
Pool # MA1273, | | |
3.500%, 12/1/2042 | 15,365,579 | 15,616,806 |
Pool # AL3028, | | |
3.500%, 1/1/2043 | 23,227,771 | 23,607,545 |
GNMA, | | |
Pool #550656, | | |
5.000%, 9/15/2035 | 572,399 | 622,926 |
Total Agency Mortgage-Backed Securities |
(Cost $409,284,355) | | 410,297,066 |
| | | |
| | | |
| Total Asset-Backed Securities, Commercial | | |
| Mortgage-Backed Securities, Residential | | |
| Mortgage-Backed Securities & Agency | | |
| Mortgage-Backed Securities | | |
(Cost $559,315,936) | | 563,992,012 |
| | | |
U.S. GOVERNMENT & AGENCY | |
OBLIGATIONS | | 0.01% |
FNMA, | | |
8.200%, 3/10/2016 | 55,000 | 65,948 |
Total U.S. Government & Agency Obligations |
(Cost $53,461) | | 65,948 |
| | | |
U.S. TREASURY BONDS & NOTES | 6.85% |
4.000%, 2/15/2014 | 2,500,000 | 2,560,155 |
4.250%, 11/15/2014 | 400,000 | 422,031 |
4.000%, 2/15/2015 | 8,050,000 | 8,532,372 |
2.625%, 4/30/2016 | 13,650,000 | 14,413,554 |
PAGE 55 |
|
| STATEMENTS OF INVESTMENTS |
| |
WESTCORE PLUS BOND FUND AS OF JUNE 30, 2013 (continued)
(UNAUDITED)
| Principal | |
| Amount | Market Value |
5.375%, 2/15/2031 | $3,350,000 | $4,364,420 |
4.500%, 2/15/2036 | 15,250,000 | 18,179,662 |
4.375%, 2/15/2038 | 4,500,000 | 5,275,548 |
4.375%, 11/15/2039 | 15,000,000 | 17,610,930 |
4.750%, 2/15/2041 | 24,700,000 | 30,732,210 |
3.750%, 8/15/2041 | 4,000,000 | 4,229,064 |
| | 106,319,946 |
Total U.S. Treasury Bonds & Notes | |
(Cost $98,421,087) | | 106,319,946 |
| Shares | Market Value |
MONEY MARKET MUTUAL FUNDS | 0.22% |
Bank of New York Cash | | |
Reserve | | |
(7 Day Yield 0.050%) | 3,326,101 | 3,326,101 |
Total Money Market Mutual Funds | |
(Cost $3,326,101) | | 3,326,101 |
Total Investments | | |
(Cost $1,487,535,103) | 98.11% | 1,521,832,991 |
Other Assets in Excess | | |
of Liabilities | 1.89% | 29,325,626 |
Net Assets | 100.00% | $1,551,158,617 |
** Non-income producing security.
See Notes to Financial Statements.
PAGE 56 |
|
| STATEMENTS OF INVESTMENTS |
| |
WESTCORE PLUS BOND FUND AS OF JUNE 30, 2013 (continued)
(UNAUDITED)
| (1) | The coupon rate shown on floating or adjustable rate securities represents the rate at period end. |
| (2) | This security is restricted. The following table provides additional information regarding each security. Included in this list are certain securities exempt from registration under Rule 144A of the Securities Act of 1933, which may be resold in transactions, normally to qualified institutional buyers. |
| | |
| | | | | | | | Market Value |
| | | | | | | | as Percentage |
Issuer Description | Coupon | Maturity Date | Acquisition Date | Cost | | Market Value | of Net Assets |
Adams Outdoor Advertising LP | 5.438% | 12/20/2017 | 12/3/2010 $ | 7,748,867 | $ | 8,259,874 | 0.53% |
Adams Outdoor Advertising LP | 10.756% | 12/20/2017 | 12/3/2010 | | 6,300,000 | | 7,032,929 | 0.45% |
Aircraft Lease Securitisation Ltd., Series 2007-1A, Class G3 | 0.459% | 5/10/2032 | 4/26/2012 | | 6,495,201 | | 6,186,679 | 0.40%^ |
AT&T Inc. | 4.300% | 12/15/2042 | 4/10/2012 | | 3,566,309 | | 3,500,249 | 0.23%^ |
Aviation Capital Group Corp. | 6.750% | 4/6/2021 | 12/7/2011 | | 5,474,625 | | 6,035,724 | 0.39%^ |
BMW US Capital Inc. | 5.730% | 11/1/2015 | 10/16/2007 | | 12,000,000 | | 12,946,200 | 0.83% |
Calpine Corp. | 7.500% | 2/15/2021 | 10/18/2010 - 10/19/2010 | | 7,454,368 | | 7,983,690 | 0.51%^ |
Crown Castle Towers LLC | 5.495% | 1/15/2017 | 1/8/2010 | | 4,500,000 | | 4,947,962 | 0.32%^ |
Crown Castle Towers LLC | 6.113% | 1/15/2020 | 1/8/2010 | | 8,975,000 | | 10,308,497 | 0.66%^ |
Crown Castle Towers LLC | 4.883% | 8/15/2020 | 7/29/2010 | | 5,900,000 | | 6,351,220 | 0.41%^ |
Emigrant Capital Trust II | 2.720% | 4/14/2034 | 8/11/2004 | | 846,694 | | 557,041 | 0.04% |
First Tennessee Bank | 3.750% | – | 3/16/2005 | | 1,500,000 | | 1,159,219 | 0.07% |
FMR Corp. | 7.490% | 6/15/2019 | 3/6/2007 | | 5,518,073 | | 6,041,900 | 0.39%^ |
GTP Towers Issuer LLC | 8.112% | 2/15/2015 | 2/11/2010 | | 15,000,000 | | 15,579,135 | 1.00% |
JP Morgan Mortgage Trust 2013-2 | 3.500% | 5/25/2043 | 6/13/2013 | | 6,669,276 | | 6,537,025 | 0.42%^ |
Marriott Vacation Club Owner Trust, Series 2010-1A, Class A | 3.540% | 12/20/2032 | 11/5/2010 | | 4,373,815 | | 4,497,923 | 0.29%^ |
SBA Towers Trust | 4.254% | 4/15/2015 | 4/8/2010 | | 550,000 | | 570,151 | 0.04%^ |
Sweetwater Investors LLC | 5.875% | 5/15/2014 | 5/31/2005 - 12/15/2005 | | 92,909 | | 92,147 | 0.01% |
Tenaska Alabama II Partners LP | 6.125% | 3/30/2023 | 10/9/2003 - 9/4/2009 | | 210,412 | | 222,217 | 0.01%^ |
Tenaska Virginia Partners LP | 6.119% | 3/30/2024 | 4/29/2004 - 1/19/2005 | | 187,314 | | 202,232 | 0.01%^ |
Tuckahoe Credit Lease Trust | 9.310% | 10/20/2025 | 12/11/2009 | | 4,037,780 | | 5,051,326 | 0.33% |
USG Corp. | 8.375% | 10/15/2018 | 11/8/2010 - 11/9/2010 | | 8,478,707 | | 9,135,000 | 0.59%^ |
West Fraser Timber Co. Ltd. | 5.200% | 10/15/2014 | 6/12/2006 - 8/3/2009 | | 8,502,556 | | 9,288,313 | 0.60%^ |
WPD Holdings Inc (United Kingdom) | 7.250% | 12/15/2017 | 10/15/2003 - 6/30/2006 | | 863,465 | | 1,003,438 | 0.06%^ |
| | | | $ | 125,245,371 | $ | 133,490,091 | 8.61% |
| ^ | 144A securities with a liquid trading market as determined by the Adviser under the supervision of the Board of Trustees. Such securities represent 5.33% of the Fund’s net assets as of June 30, 2013. |
| | |
| (3) | This security has been valued in good faith by management under the direction of the Board of Trustees. As of June 30, 2013 these securities represented 1.77% of the Fund’s net assets. |
| (4) | Income is not being accrued on this security due to the issuer’s default or expected default on interest payments. |
| (5) | The expected maturity date listed herein differs from the legal maturity date due to call or put features or due to the expected schedule of principal payments. |
| (6) | Step bond. Coupon increases periodically based upon a predetermined schedule. Interest rate disclosed is that which is in effect at June 30, 2013. |
| | |
PAGE 57 |
|
| STATEMENTS OF INVESTMENTS |
| |
WESTCORE COLORADO TAX-EXEMPT FUND AS OF JUNE 30, 2013
(UNAUDITED)
| Principal | |
| Amount | Market Value |
CERTIFICATE PARTICIPATION | 0.33% |
Education | | 0.33% |
Denver City & County School District No 1, |
4.000%, 12/15/2019 | $400,000 | $438,028 |
Total Certificate Participation | |
(Cost $456,794) | | $438,028 |
CERTIFICATES OF PARTICIPATION | 16.04% |
Auraria Higher | | |
Education Center, | | |
6.000%, 5/1/2024, | | |
Optional 11/1/2019 | | |
@ 100.00 | 499,000 | 548,131 |
City of Aurora: | | |
5.000%, 12/1/2026, | | |
Optional 12/1/2019 | | |
@ 100.00 | 1,000,000 | 1,095,670 |
5.000%, 12/1/2030, | | |
Optional 12/1/2019 | | |
@ 100.00 | 875,000 | 937,300 |
City of Westminster Co.: | | |
4.000%, 12/1/2023 | 425,000 | 450,253 |
4.000%, 12/1/2024, | | |
Optional 12/1/2023 | | |
@ 100.00 | 1,215,000 | 1,261,134 |
4.000%, 12/1/2025, | | |
Optional 12/1/2023 | | |
@ 100.00 | 500,000 | 511,110 |
Colorado State Higher | | |
Education Capital | | |
Construction Lease | | |
Purchase Program: | | |
5.250%, 11/1/2023, | | |
Optional 11/1/2018 | | |
@ 100.00 | 1,000,000 | 1,124,650 |
5.000%, 11/1/2025 | 1,000,000 | 1,102,670 |
Colorado State, | | |
University of | | |
Colorado at Denver | | |
Health Sciences | | |
Center Fitzsimons | | |
Academic: | | |
5.000%, 11/1/2018, | | |
Prerefunded | | |
11/1/2015 @ 100.00, | | |
NATL-RE | 700,000 | 771,946 |
4.500%, 11/1/2022 | 550,000 | 606,782 |
Denver City & County, | | |
Denver Botanic | | |
Gardens, | | |
5.250%, 12/1/2024, | | |
Optional 12/1/2018 | | |
@ 100.00 | 625,000 | 686,225 |
| Principal | |
| Amount | Market Value |
Douglas & Elbert | | |
Counties School | | |
District Re-1: | | |
5.000%, 1/15/2025, | | |
Optional 1/15/2019 | | |
@ 100.00 | $1,000,000 | $1,070,180 |
5.000%, 1/15/2029, | | |
Optional 1/15/2023 | | |
@ 100.00 | 705,000 | 763,325 |
Eagle County, Justice | | |
Center Project, | | |
5.250%, 12/1/2023, | | |
Optional 12/1/2018 | | |
@ 100.00 | 500,000 | 551,325 |
El Paso County School D | | |
istrict No. 49 Falcon, | | |
5.000%, 12/15/2028, | | |
Optional 12/15/17 | | |
@ 100.00 | 800,000 | 846,000 |
Garfield County Public | | |
Library District, | | |
5.000%, 12/1/2024, | | |
Optional 12/1/2019 | | |
@ 100.00 | 675,000 | 714,379 |
Pueblo Co., Police | | |
Complex Project, | | |
5.500%, 8/15/2018, | | |
AGM | 500,000 | 579,160 |
Regional Transportation | | |
District: | | |
4.500%, 6/1/2019, | | |
Prerefunded | | |
6/1/2015 @ 100.00, | | |
AMBAC | 620,000 | 667,108 |
5.000%, 6/1/2020 | 1,200,000 | 1,372,920 |
5.000%, 12/1/2022, | | |
Optional 12/1/2017 | | |
@ 100.00, AMBAC | 1,000,000 | 1,079,460 |
State of Colorado | | |
Higher Education, | | |
4.000%, 11/1/2027, | | |
Optional 11/1/2023 | | |
@ 100.00 | 1,200,000 | 1,214,148 |
State of Colorado, | | |
Building Excellent | | |
Schools Today: | | |
5.000%, 3/15/2024, | | |
Optional 3/15/2021 | | |
@ 100.00 | 1,000,000 | 1,124,840 |
4.000%, 3/15/2025, | | |
Optional 3/15/2022 | | |
@ 100.00 | 1,000,000 | 1,034,140 |
4.000%, 3/15/2027, | | |
Optional 3/15/2022 | | |
@ 100.00 | 1,000,000 | 1,010,220 |
Total Certificates of Participation | |
(Cost $21,172,604) | | $21,123,076 |
| Principal | |
| Amount | Market Value |
GENERAL OBLIGATION BONDS | 30.57% |
County-City-Special | | |
District-School District | 30.57% |
Adams & Arapahoe | | |
Counties Joint | | |
School District | | |
No. 28J, | | |
6.250%, 12/1/2026, | | |
Prerefunded | | |
12/1/2018 @ 100.00 | $1,250,000 | $1,553,050 |
Adams 12 Five Star | | |
Schools, | | |
zero coupon, | | |
12/15/2024, Optional | | |
12/15/2016 @ 67.784, | | |
FGIC | 2,385,000 | 1,490,434 |
Arapahoe County | | |
School District | | |
No. 1 Englewood: | | |
5.000%, 12/1/2028, | | |
Optional 12/1/2021 | | |
@ 100.00 | 975,000 | 1,089,016 |
5.000%, 12/1/2029, | | |
Optional 12/1/2021 | | |
@ 100.00 | 2,440,000 | 2,704,618 |
Arapahoe County | | |
School District | | |
No. 5 Cherry Creek, | | |
5.000%, 12/15/2026, | | |
Optional 12/15/2018 | | |
@ 100.00 | 1,000,000 | 1,116,900 |
Boulder Larimer & | | |
Weld Counties | | |
St. Vrain Valley | | |
School District Re-1J, | | |
5.000%, 12/15/2026, | | |
Optional 12/15/2016 | | |
@ 100.00 | 1,000,000 | 1,084,550 |
City & County of Denver | | |
Justice System, | | |
5.000%, 8/1/2025, | | |
Optional 8/1/2018 | | |
@ 100.00 | 750,000 | 831,697 |
Denver City & County | | |
School District No. 1: | | |
5.500%, 12/1/2022, | | |
FGIC | 500,000 | 612,855 |
5.250%, 12/1/2025, | | |
Optional 6/1/2019 | | |
@ 100.00 | 2,680,000 | 3,052,574 |
4.000%, 12/1/2028, | | |
Optional 12/1/2021 | | |
@ 100.00 | 650,000 | 666,809 |
Douglas & Elbert | | |
Counties School | | |
District Re-1: | | |
5.000%, 12/15/2017, | | |
Optional 12/15/2014 | | |
@ 100.00, AGM | 1,325,000 | 1,401,890 |
PAGE 58 |
|
| STATEMENTS OF INVESTMENTS |
| |
WESTCORE COLORADO TAX-EXEMPT FUND AS OF JUNE 30, 2013 (continued)
(UNAUDITED)
| Principal | |
| Amount | Market Value |
zero coupon, | | |
12/15/2022 | $1,660,000 | $1,266,929 |
5.000%, 12/15/2023, | | |
Prerefunded | | |
12/15/2017 @ 100.00 | 1,250,000 | 1,454,037 |
5.000%, 12/15/2026, | | |
Prerefunded | | |
12/15/2017 @ 100.00 | 325,000 | 378,050 |
Eagle, Garfield & Routt | | |
Counties School | | |
District Re-50J, | | |
5.000%, 12/1/2026, | | |
Optional 12/1/2016 | | |
@ 100.00, AGM | 2,500,000 | 2,844,450 |
El Paso County School | | |
District No. 20, | | |
zero coupon, | | |
12/15/2013, AGM | 500,000 | 497,535 |
Garfield County, | | |
Garfield School | | |
District Re-2: | | |
5.000%, 12/1/2024, | | |
Prerefunded | | |
12/1/2016 @ 100.00, | | |
AGM | 800,000 | 908,776 |
4.750%, 12/1/2025, | | |
Optional 12/1/2016 | | |
@ 100.00, AGM | 1,000,000 | 1,058,310 |
5.000%, 12/1/2027, | | |
Prerefunded | | |
12/1/2016 @ 100.00, | | |
AGM | 250,000 | 283,992 |
Garfield, Pitkin & Eagle | | |
Counties Roaring | | |
Fork School District | | |
Re-1: | | |
5.000%, 12/15/2023, | | |
Optional 12/15/2021 | | |
@ 100.00 | 1,500,000 | 1,711,620 |
5.000%, 12/15/2024, | | |
Optional 12/15/2021 | | |
@ 100.00 | 1,500,000 | 1,721,220 |
Gunnison Watershed | | |
School District Re-1J, | | |
5.250%, 12/1/2024, | | |
Optional 12/1/2018 | | |
@ 100.00 | 1,000,000 | 1,135,100 |
Ignacio School District | | |
No. 11JT: | | |
5.250%, 12/1/2024, | | |
Optional 12/15/2021 | | |
@ 100.00 | 500,000 | 584,690 |
5.000%, 12/1/2029, | | |
Optional 12/15/2021 | | |
@ 100.00 | 1,000,000 | 1,100,790 |
Jefferson County School | | |
District R-1: | | |
5.250%, 12/15/2024 | 1,500,000 | 1,815,270 |
| Principal | |
| Amount | Market Value |
5.250%, 12/15/2025, | | |
Prerefunded | | |
12/15/2016 @ 100.00, | | |
AGM | $500,000 | $573,905 |
La Plata County | | |
School District | | |
No. 9-R Durango: | | |
4.500%, 11/1/2023, | | |
Optional 11/1/2021 | | |
@ 100.00 | 1,000,000 | 1,116,020 |
5.000%, 11/1/2024, | | |
Optional 11/1/2021 | | |
@ 100.00 | 1,000,000 | 1,149,550 |
Larimer County | | |
School District | | |
No R-1 Poudre, | | |
4.000%, 12/15/2025, | | |
Optional 12/15/2022 | | |
@ 100.00 | 1,000,000 | 1,057,250 |
Moffat County | | |
School District | | |
Re-1 Craig, | | |
5.250%, 12/1/2026, | | |
Optional 12/1/2017 | | |
@ 100.00, AGM | 1,030,000 | 1,112,668 |
Pitkin County | | |
School District | | |
No. 001, Aspen, | | |
5.375%, 12/1/2026, | | |
Optional 12/1/2019 | | |
@ 100.00 | 225,000 | 257,643 |
Pueblo County | | |
School District | | |
No. 60, | | |
5.000%, 12/15/2021 | 750,000 | 882,638 |
Rio Blanco County | | |
School District | | |
Re-1 Meeker, | | |
5.250%, 12/1/2022, | | |
Optional 12/1/2018 | | |
@ 100.00 | 575,000 | 638,860 |
Summit County, | | |
Summit County School | | |
District Re-1, | | |
4.000%, 12/1/2024, | | |
Optional 12/1/2021 | | |
@ 100.00 | 1,020,000 | 1,090,604 |
Total General Obligation Bonds | |
(Cost $39,228,070) | | $40,244,300 |
| | | |
REVENUE BONDS | | 49.23% |
Airports | | 1.66% |
City & County of Denver | | |
Airport Series A | | |
Revenue: | | |
5.000%, 11/15/2018, | | |
Optional 11/15/2015 | | |
@ 100.00, XLCA | 1,000,000 | 1,088,150 |
| Principal | |
| Amount | Market Value |
5.250%, 11/15/2028, | | |
Optional 11/15/2019 | | |
@ 100.00 | $1,000,000 | $1,094,880 |
| | 2,183,030 |
General | | 7.61% |
Boulder County | | |
Open Space Capital | | |
Improvement Trust | | |
Fund: | | |
Series B, 5.250%, | | |
7/15/2024, Optional | | |
7/15/2021 @ 100.00, | 1,000,000 | 1,166,540 |
5.000%, 12/15/2025, | | |
Optional 12/15/2018 | | |
@ 100.00 | 1,000,000 | 1,103,020 |
City & County of | | |
Denver Co., | | |
5.250%, 9/1/2018 | 1,500,000 | 1,745,085 |
Denver CO Convention, | | |
5.000%, 12/1/2035, | | |
Optional 11/1/2016 | | |
@ 100.00 | 1,060,000 | 1,074,840 |
Denver Convention | | |
Center Hotel | | |
Authority, | | |
4.750%, 12/1/2035, | | |
Optional 11/1/2016 | | |
@ 100.00 | 300,000 | 298,350 |
Grand Junction, | | |
5.000%, 3/1/2022, | | |
Optional 9/1/2021 | | |
@ 100.00 | 500,000 | 581,325 |
Plaza Metropolitan | | |
District No 1, | | |
5.000%, 12/1/2022 | 1,000,000 | 1,041,880 |
Regional Transportation | | |
District, Colorado | | |
Sales Tax Revenue, | | |
Series A, | | |
5.000%, 11/1/2027, | | |
Prerefunded | | |
11/1/2016 @ 100.00, | | |
AMBAC | 575,000 | 652,717 |
Town of Castle Rock Co., | | |
5.000%, 6/1/2029, | | |
Optional 6/1/2023 | | |
@ 100.00 | 1,630,000 | 1,783,187 |
Town of Castle Rock | | |
Sales and Use | | |
Tax Revenue, | | |
6.000%, 6/1/2023, | | |
Optional 6/1/2018 | | |
@ 100.00, AGM | 500,000 | 571,200 |
| | 10,018,144 |
PAGE 59 |
|
| STATEMENTS OF INVESTMENTS |
| |
WESTCORE COLORADO TAX-EXEMPT FUND AS OF JUNE 30, 2013 (continued)
(UNAUDITED)
| Principal | |
| Amount | Market Value |
Higher Education | | 7.58% |
Colorado Educational & | | |
Cultural Facilities | | |
Authority: | | |
4.000%, 3/1/2024, | | |
Optional 3/1/2023 | | |
@ 100.00 | $500,000 | $521,995 |
4.000%, 3/1/2025, | | |
Optional 3/1/2023 | | |
@ 100.00 | 500,000 | 516,590 |
University of Denver: | | |
5.000%, 3/1/2018, | | |
Optional 9/1/2015 | | |
@ 100.00, NATL-RE | 500,000 | 528,720 |
5.000%, 3/1/2021, | | |
Optional 9/1/2015 | | |
@ 100.00, MBIA-RE | | |
FGIC | 300,000 | 315,027 |
Colorado Mesa University, | | |
5.125%, 5/15/2037, | | |
Optional 5/15/2017 | | |
@ 100.00 | 25,000 | 25,699 |
Colorado School of Mines, | | |
5.000%, 12/1/2028, | | |
Optional 12/1/2022 | | |
@ 100.00 | 350,000 | 387,632 |
Colorado State Board of | | |
Governors University - | | |
Enterprise Revenue | | |
Bonds: | | |
5.000%, 12/1/2020, | | |
Prerefunded | | |
12/1/2015 @ 100.00, | | |
XLCA | 500,000 | 551,945 |
5.250%, 3/1/2024, | | |
Prerefunded | | |
3/1/2017 @ 100.00 | 75,000 | 86,255 |
5.250%, 3/1/2024, | | |
Prerefunded | | |
3/1/2017 @ 100.00 | 425,000 | 488,775 |
5.000%, 3/1/2026, | | |
Optional 3/1/2022 | | |
@ 100.00 | 1,000,000 | 1,108,830 |
5.000%, 3/1/2029, | | |
| |
Optional 3/1/2022 |
@ 100.00 | 1,500,000 | 1,614,495 |
Mesa State College, | | |
Auxiliary Facility | | |
Enterprise Revenue, | | |
5.700%, 5/15/2026, | | |
Prerefunded | | |
11/15/2017 @ 100.00 | 250,000 | 298,305 |
University of Colorado | | |
Enterprise Systems | | |
Revenue: | | |
5.000%, 6/1/2026, | | |
Prerefunded | | |
6/1/2015 @ 100.00 | 750,000 | 813,360 |
| Principal | |
| Amount | Market Value |
Series A-1, 5.000%, | | |
6/1/2028, Optional | | |
6/1/2022 @ 100.00, | $1,500,000 | $1,642,065 |
Series A-1, 5.000%, | | |
6/1/2029, Optional | | |
6/1/2022 @ 100.00, | 1,000,000 | 1,086,020 |
| | 9,985,713 |
| | |
Medical | | 14.20% |
Aspen Valley Hospital District: | |
5.000%, 10/15/2021, | | |
Optional 10/15/2016 | | |
@ 100.00 | 600,000 | 617,508 |
5.000%, 10/15/2030, | | |
Optional 10/15/2022 | | |
@ 100.00 | 1,000,000 | 1,025,320 |
Aurora Colorado | | |
Hospital Revenue, | | |
Children’s Hospital, | | |
5.000%, 12/1/2022, | | |
Optional 6/1/2018 | | |
@ 100.00, AGM | 1,000,000 | 1,090,200 |
Colorado Health | | |
Facilities Authority, | | |
5.000%, 1/1/2017 | 1,105,000 | 1,178,560 |
Colorado Health Facilities | | |
Authority Revenue, | | |
Adventist Sunbelt: | | |
5.125%, 11/15/2020, | | |
Prerefunded | | |
11/15/2016 @ 100.00 | 345,000 | 393,597 |
5.250%, 11/15/2027, | | |
Optional 11/15/2016 | | |
@ 100.00(1) | 1,000,000 | 1,085,540 |
Colorado Health | | |
Facilities Authority | | |
Revenue, Catholic | | |
Health Initiatives: | | |
5.000%, 2/1/2023, | | |
Optional 2/1/2021 | | |
@ 100.00 | 500,000 | 557,985 |
5.250%, 7/1/2024, | | |
Optional 7/1/2019 | | |
@ 100.00 | 1,000,000 | 1,122,020 |
4.750%, 9/1/2025, | | |
Optional 5/1/2018 | | |
@ 100.00 | 660,000 | 698,432 |
Colorado Health | | |
Facilities Authority | | |
Revenue, Covenant | | |
Retirement | | |
Communities Inc., | | |
5.250%, 12/1/2025, | | |
Optional 12/1/2015 | | |
@ 100.00 | 500,000 | 503,910 |
| | |
| | |
| | |
| Principal | |
| Amount | Market Value |
Colorado Health | | |
Facilities Authority | | |
Revenue, Craig | | |
Hospital Project, | | |
5.000%, 12/1/2024, | | |
Optional 12/1/2022 | | |
@ 100.00 | $1,000,000 | $1,080,190 |
Colorado Health | | |
Facilities Authority | | |
Revenue, Evangelical | | |
Lutheran: | | |
5.250%, 6/1/2018, | | |
Optional 6/1/2016 | | |
@ 100.00 | 750,000 | 802,095 |
5.250%, 6/1/2020, | | |
Optional 6/1/2016 | | |
@ 100.00 | 500,000 | 533,715 |
5.250%, 6/1/2023, | | |
Optional 6/1/2016 | | |
@ 100.00 | 400,000 | 423,752 |
Colorado Health | | |
Facilities Authority | | |
Revenue, Park View | | |
Medical Center: | | |
5.000%, 9/1/2020, | | |
Optional 9/15/2015 | | |
@ 100.00 | 450,000 | 475,069 |
5.000%, 9/1/2025, | | |
Optional 9/1/2017 | | |
@ 100.00 | 450,000 | 476,982 |
Colorado Health | | |
Facilities Authority | | |
Revenue, Sisters | | |
Leavenworth, Series B, | | |
5.000%, 1/1/2023, | | |
Optional 1/1/2020 | | |
@ 100.00 | 1,000,000 | 1,096,200 |
Colorado Health | | |
Facilities Authority | | |
Revenue, Vail Valley | | |
Medical Center: | | |
5.000%, 1/15/2020, | | |
Prerefunded | | |
1/15/2015 @ 100.00 | 700,000 | 747,495 |
5.000%, 1/15/2020, | | |
Optional 1/15/2015 | | |
@ 100.00 | 240,000 | 246,665 |
Colorado Health | | |
Facilities Authority | | |
Revenue, Valley View | | |
Hospital Association, | | |
5.000%, 5/15/2027, | | |
Optional 5/15/2017 | | |
@ 100.00 | 250,000 | 254,022 |
| | | |
PAGE 60 |
|
| STATEMENTS OF INVESTMENTS |
| |
WESTCORE COLORADO TAX-EXEMPT FUND AS OF JUNE 30, 2013 (continued)
(UNAUDITED)
| Principal | |
| Amount | Market Value |
Colorado Health | | |
Facilities Authority | | |
Revenue, Yampa | | |
Valley Medical Center, | | |
5.000%, 9/15/2022, | | |
Optional 9/15/2017 | | |
@ 100.00 | $850,000 | $870,621 |
Colorado Health | | |
Facilities Authority, | | |
Poudre Valley Health, | | |
Series A, | | |
5.000%, 3/1/2025, | | |
Optional 3/1/2015 | | |
@ 100.00 | 700,000 | 718,137 |
Denver Health & | | |
Hospital Authority: | | |
5.000%, 12/1/2018, | | |
Optional 12/1/2016 | | |
@ 100.00 | 550,000 | 590,205 |
5.000%, 12/1/2020, | | |
Optional 12/1/2016 | | |
@ 100.00 | 500,000 | 527,030 |
University of Colorado | | |
Hospital Authority: | | |
5.000%, 11/15/2023, | | |
Optional 11/15/2022 | | |
@ 100.00 | 450,000 | 496,683 |
5.000%, 11/15/2027, | | |
Optional 11/15/2022 | | |
@ 100.00 | 1,000,000 | 1,078,250 |
| | 18,690,183 |
Multi-Family Housing | | 0.24% |
Colorado Housing & | | |
Finance Authority, | | |
3.900%, 10/1/2032, | | |
Mandatory Sinking | | |
Fund, 2023 - 2032 | | |
@ 100.00, Optional | | |
10/1/2022 @ 100.00 | 335,000 | 320,525 |
Special Tax | | 5.01% |
Aurora Colorado Golf | | |
Course Enterprise: | | |
4.125%, 12/1/2013 | 110,000 | 110,403 |
4.250%, 12/1/2014 | 125,000 | 126,005 |
4.375%, 12/1/2015 | 125,000 | 125,097 |
Colorado Educational & | | |
Cultural Facilities Authority: | |
Academy Charter School: | |
5.000%, 12/15/2015, | | |
Mandatory Sinking | | |
Fund 12/15/2013 | | |
@ 100.00 | 390,000 | 413,697 |
5.000%, 12/15/2021, | | |
Optional 12/15/2015 | | |
@ 100.00, MORAL | | |
OBLG | 180,000 | 186,154 |
| Principal | |
| Amount | Market Value |
4.625%, 12/15/2028, | | |
Optional 12/15/2015 | | |
@ 100.00, MORAL | | |
OBLG | $250,000 | $247,950 |
Bromley East | | |
Charter School, | | |
5.125%, 9/15/2025, | | |
Optional 9/15/2015 | | |
@ 100.00, XLCA | 500,000 | 506,965 |
Cherry Creek Academy, | |
4.000%, 4/1/2022, | | |
Mandatory Sinking | | |
Fund 4/1/2016 | | |
@ 100.00 | 250,000 | 242,087 |
Kent Denver School, | | |
5.000%, 10/1/2019 | 115,000 | 126,285 |
Denver City & County | | |
Golf Enterprise: | | |
4.600%, 9/1/2015 | 185,000 | 187,157 |
5.000%, 9/1/2018, | | |
Optional 9/1/2016 | | |
@ 100.00 | 350,000 | 353,756 |
5.000%, 9/1/2019, | | |
Optional 9/1/2016 | | |
@ 100.00 | 500,000 | 504,635 |
Grand Junction | | |
Leasing Authority | | |
Capital Improvement: | | |
5.000%, 6/15/2020, | | |
Optional 6/15/2016 | | |
@ 100.00, NATL-RE | 390,000 | 415,838 |
5.000%, 6/15/2023, | | |
Optional 6/15/2016 | | |
@ 100.00, NATL-RE | 390,000 | 411,633 |
Northwest Parkway | | |
Public Highway | | |
Authority Revenue, | | |
5.800%, 6/15/2025, | | |
Prerefunded | | |
6/15/2016 @ 100.00, | | |
AGM | 960,000 | 1,094,515 |
Superior Open Space | | |
Sales & Use Tax: | | |
4.625%, 6/1/2015 | 100,000 | 103,997 |
4.750%, 6/1/2017, | | |
Optional 6/1/2016 | | |
@ 100.00 | 325,000 | 339,716 |
5.000%, 6/1/2026, | | |
Optional 6/1/2016 | | |
@ 100.00 | 1,085,000 | 1,097,239 |
| | 6,593,129 |
Transportation | | 0.17% |
Colorado Department | | |
of Transportation, | | |
5.000%, 12/15/2016, | | |
Prerefunded | | |
12/15/2014 @ 100.00, | | |
NATL-RE FGIC | 205,000 | 218,930 |
| Principal | |
| Amount | Market Value |
Utilities | | 12.21% |
Brighton Colorado Water | | |
Activity Enterprise, | | |
5.000%, 12/1/2029, | | |
Optional 12/1/2019 | | |
@ 100.00 | $1,515,000 | $1,599,870 |
City of Colorado | | |
Springs Co. Utilities | | |
System Revenue, | | |
4.000%, 11/15/2030, | | |
Optional 11/15/2022 | | |
@ 100.00 | 2,125,000 | 2,114,375 |
Colorado Springs Colorado | | |
Utilities Revenue, | | |
5.000%, 11/15/2027, | | |
Optional 11/15/2021 | | |
@ 100.00 | 1,000,000 | 1,122,590 |
Colorado Water | | |
Resources & Power | | |
Development Authority, | |
5.000%, 9/1/2022, | | |
Prerefunded | | |
9/1/2014 @ 100.00 | 5,000 | 5,279 |
Colorado Water | | |
Resources & Power | | |
Development Authority, | |
East Cherry Creek | | |
Valley Water & | | |
Sanitation District, | | |
4.250%, 11/15/2025, | | |
Optional 11/15/2015 | | |
@ 100.00, NATL-RE | 1,420,000 | 1,468,777 |
Colorado Water | | |
Resources & Power | | |
Development Authority, | |
Steamboat Springs | | |
Utility Enterprise | | |
Project, | | |
5.000%, 8/1/2031, | | |
Optional 8/1/2021 | | |
@ 100.00 | 625,000 | 667,763 |
Colorado Water | | |
Resources & Power | | |
Development Authority, | |
Waste Water | | |
Revolving Fund, | | |
5.500%, 9/1/2019 | 500,000 | 606,770 |
Denver City & County | | |
Board of Water | | |
Commissioners, | | |
5.000%, 12/15/2029, | | |
Optional 12/15/2017 | | |
@ 100.00, AGM | 1,575,000 | 1,691,692 |
Eagle River Water & | | |
Sanitation District, | | |
5.000%, 12/1/2027, | | |
Optional 12/1/2022 | | |
@ 100.00 | 200,000 | 219,498 |
PAGE 61 |
|
| STATEMENTS OF INVESTMENTS |
| |
WESTCORE COLORADO TAX-EXEMPT FUND AS OF JUNE 30, 2013 (continued)
(UNAUDITED)
| Principal | |
| Amount | Market Value |
Fort Collins | | |
Colorado Waste Water | | |
Utility Enterprise: | | |
5.000%, 12/1/2026, | | |
Optional 12/1/2018 | | |
@ 100.00 | $1,000,000 | $1,076,910 |
5.000%, 12/1/2027, | | |
Optional 12/1/2018 | | |
@ 100.00 | 465,000 | 497,680 |
Golden Colorado Water & | | |
Waste Treatment, | | |
4.950%, 11/15/2022, | | |
Optional 11/15/2013 | | |
@ 100.00, AGM | 150,000 | 151,266 |
Parker Co., Water & | | |
Sanitation District | | |
Enterprise Revenue, | | |
5.000%, 11/1/2026, | | |
Optional 5/1/2022 | | |
@ 100.00 | 400,000 | 445,852 |
Platte River Power | | |
Authority, Series HH: | | |
5.000%, 6/1/2022, | | |
Optional 6/1/2019 | | |
@ 100.00 | 485,000 | 548,103 |
5.000%, 6/1/2027, | | |
Optional 6/1/2019 | | |
@ 100.00 | 2,000,000 | 2,219,720 |
5.000%, 6/1/2028, | | |
Optional 6/1/2019 | | |
@ 100.00 | 1,000,000 | 1,105,290 |
Thornton Colorado | | |
Water Enterprise, | | |
5.000%, 12/1/2021, | | |
Prerefunded | | |
12/1/2014 @ 100.00, | | |
NATL-RE | 500,000 | 533,435 |
| | 16,074,870 |
Water | | 0.55% |
City of Aurora Co. | | |
Water Revenue, | | |
5.000%, 8/1/2020, | | |
Optional 8/1/2017 | | |
@ 100.00 | 650,000 | 727,337 |
Total Revenue Bonds | | |
(Cost $64,406,779) | | $64,811,861 |
| | | |
TAX ALLOCATION | | 1.24% |
Development | | 1.24% |
Denver Urban | | |
Renewal Authority: | | |
5.000%, 12/1/2024, | | |
Optional 12/1/2022 | | |
@ 100.00 | 500,000 | 548,745 |
| Principal | |
| Amount | Market Value |
5.000%, 12/1/2025, | | |
Optional 12/1/2022 | | |
@ 100.00 | $1,000,000 | $1,086,740 |
| | 1,635,485 |
Total Tax Allocation | | |
(Cost $1,729,288) | | $1,635,485 |
| | | |
MONEY MARKET MUTUAL FUNDS | 2.15% |
Fidelity Institutional | | |
Money Market Tax | | |
Exempt - Class I | | |
(7 Day Yield 0.010%) | 2,826,173 | 2,826,173 |
Total Money Market Mutual Funds | |
(Cost $2,826,173) | | 2,826,173 |
Total Investments | | |
(Cost $129,819,708) | 99.56% | 131,078,923 |
Other Assets in | | |
Excess of Liabilities | 0.44% | 583,425 |
Net Assets | 100.00% | $131,662,348 |
Investment classifications presented herein are based on the categorization methodology of the Adviser to the Funds which may result in the designations for one Fund being different form another. Investment classifications are unaudited.
(1) The coupon rate shown on floating or adjustable rate securities represents the rate at period end.
See Notes to Financial Statements.
PAGE 62 |
|
| STATEMENTS OF INVESTMENTS |
| |
COMMON ABBREVIATIONS
AB | Aktiebolag is the Swedish equivalent of the term corporation. |
| | |
ADR | American Depositary Receipt. |
| | |
AG | Aktiengesellschaft is a German term that refers to a corporation that is limited by shares, i.e., owned by shareholders. |
| | |
AGM | Assured Guaranty Municipal. |
| | |
AMBAC | Ambac Financial Group Inc. |
| | |
BV | Besloten Vennootschap is a Dutch private limited liability company. |
| | |
FGIC | Financial Guaranty Insurance Co. |
| | |
FHLMC | Federal Home Loan Mortgage Corp. |
| | |
FNMA | Federal National Mortgage Association. |
| | |
GNMA | Government National Mortgage Association. |
| | |
LLC | Limited Liability Company. |
| | |
LP | Limited Partnership. |
| | |
Ltd. | Limited. |
| | |
MBIA-RE | MBIA Inc. delivers credit enhancement for the obligations of debt such as municipal bonds. The purchase of municipal bond insurance is used to improve or enhance the credit rating of a borrower’s debt financing. |
| | |
MTNB | Medium Term Notes Bond. |
| | |
MORAL OBLG | Charter School Moral Obligation Program. Moral Obligation bonds are revenue-backed, state issued municipal bonds, whose principal and interest is backed by the moral, but not legal, obligation of a state government. |
| | |
Pty Ltd. | Proprietary Limited Company. |
| | |
NA | National Association. |
| | |
NATL-RE | Third party insurer for municipal debt securities. |
| | |
N.V. | Naamloze Vennootschap is the Dutch term for a public limited liability corporation. |
| | |
PLC | Public Limited Co. |
| | |
REIT(s) | Real Estate Investment Trust. |
| | |
S.A. | Generally designates corporations in various countries, mostly those employing the civil law. This translates literally in all languages mentioned as anonymous company. |
| | |
SAB de CV | Sociedad Anonima Bursatil de Capital Variable is a Spanish Variable Capital Company. |
| | |
S.p.A. | Società Per Azioni is an Italian shared company. |
| | |
XLCA | XL Capital Assurance Inc. delivers credit enhancement for the obligations of debt such as municipal bonds. |
| | |
CURRENCY ABBREVIATIONS |
| | |
AUD | Australian Dollar |
| | |
CAD | Canadian Dollar |
| | |
CHF | Swiss Franc |
| | |
DKK | Danish Krone |
| | |
EUR | Euro Currency |
| | |
GBP | British Pound |
| | |
HKD | Hong Kong Dollar |
| | |
ILS | Israeli Shekel |
| | |
JPY | Japanese Yen |
| | |
KRW | South Korean Won |
| | |
NOK | Norwegian Krone |
| | |
NZD | New Zealand Dollar |
| | |
PLN | Polish Zloty |
| | |
SEK | Swedish Krona |
| | |
SGD | Singapore Dollar |
PAGE 63 |
|
WESTCORE FUNDS AS OF JUNE 30, 2013
(UNAUDITED)
| | Westcore | | Westcore | | Westcore | | Westcore | | Westcore | | Westcore |
| | Growth | | MIDCO Growth | | Select | | Blue Chip | | Mid-Cap Value | | Small-Cap |
| | Fund | | Fund | | Fund | | Dividend Fund | | Dividend Fund | | Opportunity Fund |
Assets | | | | | | | | | | | | |
Investments at value (cost - see below) | $ | 71,771,209 | $ | 105,973,973 | $ | 119,420,720 | $ | 67,817,553 | $ | 47,589,045 | $ | 19,836,166 |
Investments in affiliates at value (cost - see below) | | 0 | | 0 | | 0 | | 0 | | 0 | | 0 |
Cash and cash equivalents | | 0 | | 0 | | 0 | | 0 | | 0 | | 0 |
Unrealized gain on forward foreign currency contracts | | 0 | | 0 | | 0 | | 0 | | 0 | | 0 |
Foreign cash at value (cost - see below) | | 0 | | 0 | | 0 | | 0 | | 0 | | 0 |
Receivable for investment securities sold | | 0 | | 1,792,712 | | 1,632,484 | | 8,478,242 | | 0 | | 0 |
Dividends and interest receivable | | 2,242 | | 30,591 | | 38,491 | | 101,751 | | 67,076 | | 12,513 |
Receivable for fund shares subscribed | | 231,288 | | 12,322 | | 43,735 | | 2,865 | | 6,534 | | 1,013 |
Investment for trustee deferred compensation plan | | 29,511 | | 59,762 | | 28,524 | | 14,193 | | 10,733 | | 9,259 |
Prepaid and other assets | | 17,531 | | 18,242 | | 12,579 | | 14,757 | | 8,657 | | 16,439 |
Total Assets | | 72,051,781 | | 107,887,602 | | 121,176,533 | | 76,429,361 | | 47,682,045 | | 19,875,390 |
Liabilities | | | | | | | | | | | | |
Payable for investment securities purchased | | 588,079 | | 1,440,388 | | 0 | | 10,423,765 | | 422,797 | | 118,014 |
Unrealized loss on forward foreign currency contracts | | 0 | | 0 | | 0 | | 0 | | 0 | | 0 |
Payable for fund shares redeemed | | 26,075 | | 38,126 | | 1,267,206 | | 47,651 | | 247,942 | | 2,511 |
Payable for investment advisory fee | | 37,312 | | 55,530 | | 67,235 | | 35,292 | | 28,760 | | 9,495 |
Payable for administration fee | | 9,270 | | 13,574 | | 15,141 | | 8,494 | | 6,215 | | 3,815 |
Payable for shareholder servicing reimbursements | | 9,750 | | 7,237 | | 16,447 | | 3,274 | | 6,864 | | 2,106 |
Payable for trustee deferred compensation plan | | 29,511 | | 59,762 | | 28,524 | | 14,193 | | 10,733 | | 9,259 |
Payable for transfer agent fee | | 3,441 | | 6,770 | | 15,737 | | 13,251 | | 2,530 | | 3,402 |
Payable for audit fee | | 11,309 | | 10,678 | | 9,668 | | 11,188 | | 9,728 | | 10,298 |
Payable for printing fee | | 4,914 | | 7,841 | | 24,747 | | 2,288 | | 1,330 | | 1,703 |
Payable for trustee fee | | 1,705 | | 2,678 | | 3,643 | | 1,704 | | 1,245 | | 1,494 |
Payable for custody fee | | 4,631 | | 7,622 | | 18,703 | | 3,050 | | 2,006 | | 2,226 |
Payable for chief compliance officer fee | | 440 | | 760 | | 2,269 | | 414 | | 232 | | 287 |
Overdraft due to shares redeemed | | 0 | | 0 | | 35,877 | | 0 | | 0 | | 0 |
Other payables | | 5,503 | | 5,692 | | 7,562 | | 5,718 | | 2,125 | | 5,230 |
Total Liabilities | | 731,940 | | 1,656,658 | | 1,512,759 | | 10,570,282 | | 742,507 | | 169,840 |
Net Assets | $ | 71,319,841 | $ | 106,230,944 | $ | 119,663,774 | $ | 65,859,079 | $ | 46,939,538 | $ | 19,705,550 |
Net Assets Consist of: | | | | | | | | | | | | |
Paid-in capital | $ | 52,501,329 | $ | 77,684,941 | $ | 226,895,362 | $ | 45,201,834 | $ | 42,065,097 | $ | 13,204,885 |
(Over)/Undistributed net investment income | | (59,588) | | (567,558) | | (557,693) | | 402,168 | | 226,126 | | (43,628) |
Accumulated net realized gain/(loss) on investments | | | | | | | | | | | | |
and foreign currency transactions | | 6,450,686 | | 9,425,216 | | (124,667,296) | | 14,244,774 | | (5,499,081) | | 2,309,813 |
Net unrealized appreciation/(depreciation) | | | | | | | | | | | | |
on investments and translation of assets | | | | | | | | | | | | |
denominated in foreign currencies | | 12,427,414 | | 19,688,345 | | 17,993,401 | | 6,010,303 | | 10,147,396 | | 4,234,480 |
Net Assets | $ | 71,319,841 | $ | 106,230,944 | $ | 119,663,774 | $ | 65,859,079 | $ | 46,939,538 | $ | 19,705,550 |
Net Assets: | | | | | | | | | | | | |
Retail Class | $ | 65,709,454 | $ | 78,361,342 | $ | 119,663,774 | $ | 58,819,088 | $ | 46,939,538 | $ | 17,305,729 |
Institutional Class | | 5,610,387 | | 27,869,602 | | N/A | | 7,039,991 | | N/A | | 2,399,821 |
Shares of Beneficial Interest Outstanding: | | | | | | | | | | | | |
Retail Class | | 4,297,713 | | 11,092,735 | | 6,184,445 | | 4,415,484 | | 2,017,421 | | 558,275 |
Institutional Class | | 364,993 | | 3,908,958 | | N/A | | 529,738 | | N/A | | 76,730 |
Net Asset Value and Redemption Price Per Share | | | | | | | | | | | | |
(Net Assets Per Share Outstanding): | | | | | | | | | | | | |
Retail Class | | 15.29 | | 7.06 | | 19.35 | | 13.32 | | 23.27 | | 31.00 |
Institutional Class | | 15.37 | | 7.13 | | N/A | | 13.29 | | N/A | | 31.28 |
Cost of Investments | $ | 59,343,795 | $ | 86,285,628 | $ | 101,427,319 | $ | 61,807,250 | $ | 37,441,649 | $ | 15,601,686 |
Cost of Affiliated Investments | | 0 | | 0 | | 0 | | 0 | | 0 | | 0 |
Cost of Foreign Currency Held | $ | 0 | $ | 0 | $ | 0 | $ | 0 | $ | 0 | $ | 0 |
See Notes to Financial Statements.
PAGE 64 |
|
| STATEMENTS OF ASSETS AND LIABILITIES |
| |
WESTCORE FUNDS AS OF JUNE 30, 2013
(UNAUDITED)
| | Westcore | | Westcore | | Westcore | | Westcore | | Westcore | | Westcore |
| | Small-Cap Value | | Micro-Cap | | International | | Flexible | | Plus Bond | | Colorado |
| | Dividend Fund | | Opportunity Fund | | Small-Cap Fund | | Income Fund | | Fund | | Tax-Exempt Fund |
Assets | | | | | | | | | | | | |
Investments at value (cost - see below) | $ | 294,412,647 | $ | 12,746,565 | $ | 343,224,468 | $ | 66,537,856 | $ | 1,521,832,991 | $ | 131,078,923 |
Investments in affiliates at value (cost - see below) | | 0 | | 0 | | 65,189,487 | | 0 | | 0 | | 0 |
Cash and cash equivalents | | 0 | | 0 | | 0 | | 0 | | 132,234 | | 0 |
Unrealized gain on forward foreign currency contracts | | 0 | | 0 | | 3,207,765 | | 0 | | 0 | | 0 |
Foreign cash at value (cost - see below) | | 0 | | 0 | | 407,778 | | 0 | | 0 | | 0 |
Receivable for investment securities sold | | 4,103,565 | | 0 | | 0 | | 569,625 | | 23,364,985 | | 0 |
Dividends and interest receivable | | 334,936 | | 13,839 | | 938,089 | | 874,027 | | 13,220,664 | | 886,239 |
Receivable for fund shares subscribed | | 179,251 | | 2,675 | | 225,358 | | 394,600 | | 1,564,781 | | 35,000 |
Investment for trustee deferred compensation plan | | 38,243 | | 938 | | 15,082 | | 27,106 | | 231,960 | | 18,569 |
Prepaid and other assets | | 23,235 | | 16,169 | | 21,737 | | 18,847 | | 52,023 | | 4,147 |
Total Assets | | 299,091,877 | | 12,780,186 | | 413,229,764 | | 68,422,061 | 1,560,399,638 | | 132,022,878 |
Liabilities | | | | | | | | | | | | |
Payable for investment securities purchased | | 3,250,298 | | 0 | | 7,151,109 | | 899,296 | | 2,538,102 | | 136,400 |
Unrealized loss on forward foreign currency contracts | | 0 | | 0 | | 5,363,678 | | 0 | | 0 | | 0 |
Payable for fund shares redeemed | | 591,603 | | 0 | | 435,994 | | 195,704 | | 5,555,788 | | 101,249 |
Payable for investment advisory fee | | 221,600 | | 4,371 | | 356,442 | | 20,234 | | 227,525 | | 27,587 |
Payable for administration fee | | 36,171 | | 4,604 | | 47,751 | | 10,340 | | 191,985 | | 21,434 |
Payable for shareholder servicing reimbursements | | 25,505 | | 1,597 | | 56,889 | | 8,703 | | 193,635 | | 19,034 |
Payable for trustee deferred compensation plan | | 38,243 | | 938 | | 15,082 | | 27,106 | | 231,960 | | 18,569 |
Payable for transfer agent fee | | 5,664 | | 2,419 | | 12,194 | | 4,664 | | 24,119 | | 2,827 |
Payable for audit fee | | 10,814 | | 9,314 | | 9,991 | | 17,304 | | 23,016 | | 13,942 |
Payable for printing fee | | 23,686 | | 206 | | 3,140 | | 10,012 | | 112,740 | | 8,095 |
Payable for trustee fee | | 8,637 | | 63 | | 8,747 | | 876 | | 52,943 | | 2,356 |
Payable for custody fee | | 12,091 | | 5,068 | | 59,396 | | 3,814 | | 62,951 | | 4,796 |
Payable for chief compliance officer fee | | 1,980 | | 0 | | 853 | | 624 | | 10,879 | | 837 |
Other payables | | 7,130 | | 2,231 | | 2,842 | | 5,714 | | 15,378 | | 3,404 |
Total Liabilities | | 4,233,422 | | 30,811 | | 13,524,108 | | 1,204,391 | | 9,241,021 | | 360,530 |
Net Assets | $ | 294,858,455 | $ | 12,749,375 | $ | 399,705,656 | $ | 67,217,670 | $ | 1,551,158,617 | $ | 131,662,348 |
Net Assets Consist of: | | | | | | | | | | | | |
Paid-in capital | $ | 202,052,158 | $ | 11,406,606 | $ | 374,897,864 | $ | 109,262,188 | $ | 1,512,158,541 | $ | 130,885,465 |
(Over)/Undistributed net investment income | | 1,371,247 | | (2,320) | | 1,822,263 | | (57,232) | | (3,424,880) | | (17,468) |
Accumulated net realized gain/(loss) on investments | | | | | | | | | | | | |
and foreign currency transactions | | 19,434,210 | | 424,279 | | (9,003,206) | | (43,261,356) | | 8,127,068 | | (464,864) |
Net unrealized appreciation/(depreciation) on | | | | | | | | | | | | |
investments and translation of assets and | | | | | | | | | | | | |
liabilities denominated in foreign currencies | | 72,000,840 | | 920,810 | | 31,988,735 | | 1,274,070 | | 34,297,888 | | 1,259,215 |
Net Assets | $ | 294,858,455 | $ | 12,749,375 | $ | 399,705,656 | $ | 67,217,670 | $ | 1,551,158,617 | $ | 131,662,348 |
Net Assets: | | | | | | | | | | | | |
Retail Class | $ | 167,775,706 | $ | 12,749,375 | $ | 399,705,656 | $ | 63,407,728 | $ | 1,305,770,158 | $ | 131,662,348 |
Institutional Class | | 127,082,749 | | N/A | | N/A | | 3,809,942 | | 245,388,459 | | N/A |
Shares of Beneficial Interest Outstanding: | | | | | | | | | | | | |
Retail Class | | 11,310,054 | | 885,372 | | 22,552,592 | | 7,274,433 | | 120,944,063 | | 11,689,635 |
Institutional Class | | 8,561,535 | | N/A | | N/A | | 443,107 | | 22,978,034 | | N/A |
Net Asset Value and Redemption Price Per Share | | | | | | | | | | | | |
(Net Assets Per Share Outstanding): | | | | | | | | | | | | |
Retail Class | | 14.83 | | 14.40 | | 17.72 | | 8.72 | | 10.80 | | 11.26 |
Institutional Class | | 14.84 | | N/A | | N/A | | 8.60 | | 10.68 | | N/A |
Cost of Investments | $ | 222,411,807 | $ | 11,825,755 | $ | 330,733,998 | $ | 65,263,786 | $ | 1,487,535,103 | $ | 129,819,708 |
Cost of Affiliated Investments | | 0 | | 0 | | 43,522,560 | | 0 | | 0 | | 0 |
Cost of Foreign Currency Held | $ | 0 | $ | 0 | $ | 407,770 | $ | 0 | $ | 0 | $ | 0 |
See Notes to Financial Statements.
PAGE 65 |
|
WESTCORE FUNDS FOR THE SIX MONTHS ENDED JUNE 30, 2013
(UNAUDITED)
| Westcore | | Westcore | | Westcore | | Westcore | | Westcore | | Westcore | |
| Growth | | MIDCO Growth | | Select | | Blue Chip | | Mid-Cap Value | | Small-Cap | |
| Fund | | Fund | | Fund | | Dividend Fund | | Dividend Fund | | Opportunity Fund | |
Investment Income | | | | | | | | | | | | | |
Dividends, net of foreign taxes* | $ | 377,761 | $ | 235,835 | $ | 276,429 | $ | 745,715 | $ | 509,650 | $ | 103,352 | |
Dividends from affiliated securities | | 0 | | 0 | | 0 | | 0 | | 0 | | 0 | |
Interest | | 0 | | 0 | | 0 | | 0 | | 0 | | 0 | |
Other Income | | 0 | | 0 | | 0 | | 0 | | 0 | | 0 | |
Total Income | | 377,761 | | 235,835 | | 276,429 | | 745,715 | | 509,650 | | 103,352 | |
Expenses | | | | | | | | | | | | | |
Investment advisory fee | | 241,846 | | 354,074 | | 480,595 | | 212,872 | | 165,994 | | 96,059 | |
Administrative fee | | 52,090 | | 76,262 | | 103,513 | | 45,849 | | 30,986 | | 13,448 | |
Shareholder servicing reimbursement - | | | | | | | | | | | | | |
Retail Class | | 60,575 | | 43,563 | | 116,032 | | 19,465 | | 38,894 | | 12,534 | |
Transfer agent fees | | 10,386 | | 22,258 | | 52,068 | | 48,884 | | 7,279 | | 9,902 | |
Independent pricing service fees | | 2,277 | | 2,991 | | 1,579 | | 1,918 | | 2,020 | | 3,284 | |
Legal fees | | 1,028 | | 1,254 | | 2,105 | | 687 | | 664 | | 285 | |
Printing fees | | 5,850 | | 11,139 | | 0 | | 6,635 | | 3,858 | | 1,975 | |
Registration fees | | 16,486 | | 16,193 | | 11,958 | | 11,010 | | 9,631 | | 15,628 | |
Audit and tax preparation fees | | 8,889 | | 8,258 | | 7,247 | | 8,768 | | 7,308 | | 7,878 | |
Custodian fees | | 4,139 | | 7,382 | | 15,439 | | 2,447 | | 1,519 | | 2,387 | |
Insurance | | 948 | | 1,422 | | 2,177 | | 861 | | 535 | | 222 | |
Trustee fees and expenses | | 3,064 | | 4,552 | | 5,579 | | 2,813 | | 1,707 | | 0 | |
Chief compliance officer fee | | 1,043 | | 1,483 | | 1,173 | | 896 | | 577 | | 304 | |
Other | | 2,837 | | 2,990 | | 6,532 | | 2,990 | | 2,354 | | 2,521 | |
Total expenses before waivers | | 411,458 | | 553,821 | | 805,997 | | 366,095 | | 273,326 | | 166,427 | |
Expenses waived by: | | | | | | | | | | | | | |
Investment advisor | | | | | | | | | | | | | |
Retail Class | | 0 | | 0 | | 0 | | (6) | | 0 | | (31,706) | |
Institutional Class | | (8,943) | | (8,676) | | N/A | | (1,752) | | N/A | | (11,614) | |
Net Expenses | | 402,515 | | 545,145 | | 805,997 | | 364,337 | | 273,326 | | 123,107 | |
Net Investment Income/(Loss) | | (24,754) | | (309,310) | | (529,568) | | 381,378 | | 236,324 | | (19,755) | |
Realized and Unrealized Gain/(Loss): | | | | | | | | | | | | | |
Net realized gain/(loss) on investments | | 7,290,890 | | 8,789,116 | | 20,017,315 | | 13,832,218 | | 2,730,109 | | 2,283,456 | |
Net realized gain/(loss) on affiliated investments | | 0 | | 0 | | 0 | | 0 | | 0 | | 0 | |
Net realized gain/(loss) on foreign currency transactions | | 0 | | 0 | | 0 | | 0 | | 0 | | 0 | |
Net change in unrealized appreciation/ | | | | | | | | | | | | | |
(depreciation) on investments | | (1,023,527) | | 7,732,526 | | 5,691,189 | | (7,483,023) | | 3,339,324 | | 360,483 | |
Net change in unrealized appreciation/ | | | | | | | | | | | | | |
(depreciation) on translation of assets and | | | | | | | | | | | | | |
liabilities denominated in foreign currencies | | 0 | | 0 | | 0 | | 0 | | 0 | | 0 | |
Net Realized And Unrealized Gain | | 6,267,363 | | 16,521,642 | | 25,708,504 | | 6,349,195 | | 6,069,433 | | 2,643,939 | |
Net Increase in Net Assets Resulting
from Operations | $ | 6,242,609 | $ | 16,212,332 | $ | 25,178,936 | $ | 6,730,573 | $ | 6,305,757 | $ | 2,624,184 | |
|
*Foreign tax withholdings | $ | 3,804 | $ | 358 | $ | 0 | $ | 10,410 | $ | 0 | $ | 540 | |
See Notes to Financial Statements.
PAGE 66 |
|
WESTCORE FUNDS FOR THE SIX MONTHS ENDED JUNE 30, 2013
(UNAUDITED)
| | Westcore | | Westcore | | Westcore | | Westcore | | Westcore | | Westcore | |
| | Small-Cap Value | | Micro-Cap | | International | | Flexible | | Plus Bond | | Colorado | |
| | Dividend Fund | | Opportunity Fund | | Small-Cap Fund | | Income Fund | | Fund | | Tax-Exempt Fund | |
Investment Income | | | | | | | | | | | | | |
Dividends, net of foreign taxes* | $ | 3,272,940 | $ | 52,995 | $ | 6,722,729 | $ | 204,076 | $ | 166,141 | $ | 0 | |
Dividends from affiliated securities | | 0 | | 0 | | 1,146,070 | | 0 | | 0 | | 0 | |
Interest | | 0 | | 0 | | 0 | | 2,069,000 | | 30,114,277 | | 2,614,001 | |
Other Income | | 0 | | 0 | | 0 | | 13,326 | | 0 | | 0 | |
Total Income | | 3,272,940 | | 52,995 | | 7,868,799 | | 2,286,402 | | 30,280,418 | | 2,614,001 | |
Expenses | | | | | | | | | | | | | |
Investment advisory fee | | 1,565,579 | | 41,896 | | 2,449,039 | | 161,293 | | 2,924,305 | | 288,032 | |
Administrative fee | | 219,181 | | 5,866 | | 285,721 | | 50,180 | | 1,169,722 | | 100,811 | |
Shareholder servicing reimbursement - | | | | | | | | | | | | | |
Retail Class | | 164,729 | | 6,359 | | 347,079 | | 54,978 | | 1,214,818 | | 117,694 | |
Transfer agent fees | | 18,559 | | 6,256 | | 38,457 | | 13,375 | | 98,862 | | 8,509 | |
Independent pricing service fees | | 3,664 | | 7,459 | | 4,210 | | 5,592 | | 19,144 | | 13,145 | |
Legal fees | | 3,554 | | 144 | | 3,942 | | 858 | | 18,641 | | 2,130 | |
Printing fees | | 25,706 | | 355 | | 30,134 | | 6,660 | | 121,561 | | 9,660 | |
Registration fees | | 18,852 | | 10,062 | | 21,684 | | 16,786 | | 32,249 | | 2,353 | |
Audit and tax preparation fees | | 8,394 | | 6,894 | | 7,571 | | 12,784 | | 18,496 | | 11,522 | |
Custodian fees | | 10,048 | | 5,547 | | 50,539 | | 3,229 | | 55,332 | | 4,207 | |
Insurance | | 4,141 | | 32 | | 3,721 | | 1,344 | | 24,042 | | 1,991 | |
Trustee fees and expenses | | 14,511 | | 215 | | 17,054 | | 2,932 | | 81,667 | | 5,736 | |
Chief compliance officer fee | | 4,534 | | 59 | | 5,197 | | 1,103 | | 24,303 | | 2,112 | |
Other | | 4,731 | | 1,946 | | 4,971 | | 3,090 | | 15,348 | | 3,218 | |
Total expenses before waivers | | 2,066,183 | | 93,090 | | 3,269,319 | | 334,204 | | 5,818,490 | | 571,120 | |
Expenses waived by: | | | | | | | | | | | | | |
Investment advisor | | | | | | | | | | | | | |
Retail Class | | (81,267) | | (38,625) | | (208,021) | | (23,522) | | (1,224,507) | | (103,068) | |
Institutional Class | | (66,898) | | N/A | | N/A | | (9,380) | | (219,423) | | N/A | |
Net Expenses | | 1,918,018 | | 54,465 | | 3,061,298 | | 301,302 | | 4,374,560 | | 468,052 | |
Net Investment Income/(Loss) | | 1,354,922 | | (1,470) | | 4,807,501 | | 1,985,100 | | 25,905,858 | | 2,145,949 | |
Realized and Unrealized Gain/(Loss): | | | | | | | | | | | | | |
Net realized gain/(loss) on investments | | 21,891,153 | | 437,382 | | 3,086,784 | | (1,776,938) | | 6,909,035 | | 560,682 | |
Net realized gain/(loss) on affiliated investments | | 0 | | 0 | | (26,867) | | 0 | | 0 | | 0 | |
Net realized gain/(loss) on foreign currency transactions | | 0 | | 0 | | 2,449,304 | | 0 | | 0 | | 0 | |
Net change in unrealized appreciation/ | | | | | | | | | | | | | |
(depreciation) on investments | | 27,744,487 | | 490,596 | | (15,285,261) | | 100,617 | | (68,617,792) | | (7,263,448) | |
Net change in unrealized appreciation/ | | | | | | | | | | | | | |
(depreciation) on translation of assets and | | | | | | | | | | | | | |
liabilities denominated in foreign currencies | | 0 | | 0 | | (1,991,263) | | 0 | | 0 | | 0 | |
Net Realized And Unrealized Gain/(Loss) | | 49,635,640 | | 927,978 | | (11,767,303) | | (1,676,321) | | (61,708,757) | | (6,702,766) | |
Net Increase/(Decrease) in Net Assets Resulting
from Operations | $ | 50,990,562 | $ | 926,508 | $ | (6,959,802) | $ | 308,779 | $ | (35,802,899) | $ | (4,556,817) | |
|
*Foreign tax withholdings | $ | 4,202 | $ | 481 | $ | 623,067 | $ | 0 | $ | 0 | $ | 0 | |
See Notes to Financial Statements.
PAGE 67 |
|
| | Westcore Growth Fund | | Westcore MIDCO Growth Fund | | Westcore Select Fund |
| | Six Months Ended | | | Six Months Ended | | | Six Months Ended | | |
| | June 30, 2013 | | Year Ended | | June 30, 2013 | | Year Ended | | June 30, 2013 | | Year Ended |
| | (Unaudited) | | December 31, 2012 | | (Unaudited) | | December 31, 2012 | | (Unaudited) | | December 31, 2012 |
Increase/(Decrease) in Net Assets from: | | | | | | | | | | | | |
Operations: | | | | | | | | | | | | |
Net investment income/(loss) | $ | (24,754) | $ | 243,098 | $ | (309,310) | $ | (85,068) | $ | (529,568) | $ | (2,309,265) |
Net realized gain/(loss) | | 7,290,890 | | 11,100,245 | | 8,789,116 | | 2,042,823 | | 20,017,315 | | (63,537,082) |
Change in unrealized net appreciation/(depreciation) | | (1,023,527) | | (1,358,593) | | 7,732,526 | | 4,529,984 | | 5,691,189 | | 12,445,599 |
Net increase/(decrease) in net assets resulting | | | | | | | | | | | | |
from operations | | 6,242,609 | | 9,984,750 | | 16,212,332 | | 6,487,739 | | 25,178,936 | | (53,400,748) |
Distributions to Shareholders (Note 2): | | | | | | | | | | | | |
From net investment income | | | | | | | | | | | | |
Retail Class | | 0 | | (232,436) | | 0 | | 0 | | 0 | | 0 |
Institutional Class | | 0 | | (17,566) | | 0 | | 0 | | N/A | | N/A |
From net realized capital gains | | | | | | | | | | | | |
Retail Class | | 0 | | (1,029,689) | | 0 | | (760,840) | | 0 | | 0 |
Institutional Class | | 0 | | (70,313) | | 0 | | (339,147) | | N/A | | N/A |
Decrease in net assets from distributions | | | | | | | | | | | | |
to shareholders | | 0 | | (1,350,004) | | 0 | | (1,099,987) | | 0 | | 0 |
Beneficial Interest Transactions (Note 3): | | | | | | | | | | | | |
Shares sold | | | | | | | | | | | | |
Retail Class | | 5,118,377 | | 19,056,400 | | 2,919,167 | | 6,090,254 | | 9,290,691 | | 86,638,341 |
Institutional Class | | 1,148,366 | | 2,414,976 | | 771,165 | | 1,304,843 | | N/A | | N/A |
Shares issued in reinvestment of distributions | | | | | | | | | | | | |
Retail Class | | 0 | | 1,234,215 | | 0 | | 749,043 | | 0 | | 0 |
Institutional Class | | 0 | | 80,896 | | 0 | | 339,147 | | N/A | | N/A |
Cost of shares redeemed | | | | | | | | | | | | |
Retail Class | | (11,765,254) | | (20,480,651) | | (10,013,322) | | (33,350,636) | | (93,309,326) | | (535,966,630) |
Institutional Class | | (502,223) | | (7,814,917) | | (11,360,765) | | (7,976,072) | | N/A | | N/A |
Net decrease resulting from beneficial | | | | | | | | | | | | |
interest transactions | | (6,000,734) | | (5,509,081) | | (17,683,755) | | (32,843,421) | | (84,018,635) | | (449,328,289) |
Redemption Fees | | 0 | | 4,046 | | 0 | | 602 | | 0 | | 32,235 |
Net Increase/(Decrease) in Net Assets | | 241,875 | | 3,129,711 | | (1,471,423) | | (27,455,067) | | (58,839,699) | | (502,696,802) |
Net Assets: | | | | | | | | | | | | |
Beginning of year | | 71,077,966 | | 67,948,255 | | 107,702,367 | | 135,157,434 | | 178,503,473 | | 681,200,275 |
End of period* | $ | 71,319,841 | $ | 71,077,966 | $ | 106,230,944 | $ | 107,702,367 | $ | 119,663,774 | $ | 178,503,473 |
*Including underdistributed net investment income of: | $ | (59,588) | $ | (34,834) | $ | (567,558) | $ | (258,248) | $ | (557,693) | $ | (28,125) |
See Notes to Financial Statements.
PAGE 68 |
|
| STATEMENTS OF CHANGES IN NET ASSETS |
| |
| | Westcore Blue Chip Dividend Fund | Westcore Mid-Cap Value Dividend Fund | Westcore Small-Cap Opportunity Fund |
| Six Months Ended | | | Six Months Ended | | | Six Months Ended | | |
| | June 30, 2013(a) | | Year Ended | | June 30, 2013(b) | | Year Ended | | June 30, 2013 | | Year Ended |
| | (Unaudited) | December 31, 2012 | | (Unaudited) | December 31, 2012 | | (Unaudited) | December 31, 2012 |
Increase/(Decrease) in Net Assets from: | | | | | | | | | | | | |
Operations: | | | | | | | | | | | | |
Net investment income/(loss) | $ | 381,378 | $ | 788,435 | $ | 236,324 | $ | 396,503 | $ | (19,755) | $ | (56,526) |
Net realized gain | | 13,832,218 | | 4,477,951 | | 2,730,109 | | 3,130,864 | | 2,283,456 | | 6,158,423 |
Change in unrealized net appreciation/(depreciation) | | (7,483,023) | | 3,364,175 | | 3,339,324 | | 1,340,075 | | 360,483 | | (2,362,153) |
Net increase in net assets resulting from operations | | 6,730,573 | | 8,630,561 | | 6,305,757 | | 4,867,442 | | 2,624,184 | | 3,739,744 |
Distributions to Shareholders (Note 2): | | | | | | | | | | | | |
From net investment income | | | | | | | | | | | | |
Retail Class | | 0 | | (687,084) | | 0 | | (458,000) | | 0 | | 0 |
Institutional Class | | 0 | | (97,938) | | N/A | | N/A | | 0 | | 0 |
From net realized capital gains | | | | | | | | | | | | |
Retail Class | | 0 | | (3,795,064) | | 0 | | 0 | | 0 | | (3,627,116) |
Institutional Class | | 0 | | (438,957) | | N/A | | N/A | | 0 | | (474,886) |
Decrease in net assets from distributions | | | | | | | | | | | | |
to shareholders | | 0 | | (5,019,043) | | 0 | | (458,000) | | 0 | | (4,102,002) |
Beneficial Interest Transactions (Note 3): | | | | | | | | | | | | |
Shares sold | | | | | | | | | | | | |
Retail Class | | 1,064,216 | | 1,158,398 | | 3,974,195 | | 3,488,915 | | 1,430,970 | | 6,851,167 |
Institutional Class | | 1,046,854 | | 397,306 | | N/A | | N/A | | 62,615 | | 148,857 |
Shares issued in reinvestment of distributions | | | | | | | | | | | | |
Retail Class | | 0 | | 3,432,166 | | 0 | | 442,928 | | 0 | | 3,055,722 |
Institutional Class | | 0 | | 536,895 | | N/A | | N/A | | 0 | | 474,886 |
Cost of shares redeemed | | | | | | | | | | | | |
Retail Class | | (3,507,098) | | (13,850,826) | | (3,681,085) | | (11,190,423) | | (2,543,227) | | (37,279,064) |
Institutional Class | | (1,302,266) | | (2,562,825) | | N/A | | N/A | | (200,326) | | (1,445,090) |
Net increase/(decrease) resulting from beneficial | | | | | | | | | | | | |
interest transactions | | (2,698,294) | | (10,888,886) | | 293,110 | | (7,258,580) | | (1,249,968) | | (28,193,522) |
Redemption Fees | | 0 | | 22 | | 0 | | 153 | | 0 | | 552 |
Net Increase/(Decrease) in Net Assets | | 4,032,279 | | (7,277,346) | | 6,598,867 | | (2,848,985) | | 1,374,216 | | (28,555,228) |
Net Assets: | | | | | | | | | | | | |
Beginning of year | | 61,826,800 | | 69,104,146 | | 40,340,671 | | 43,189,656 | | 18,331,334 | | 46,886,562 |
End of period* | $ | 65,859,079 | $ | 61,826,800 | $ | 46,939,538 | $ | 40,340,671 | $ | 19,705,550 | $ | 18,331,334 |
*Including (over)/undistributed net investment income of: | $ | 402,168 | $ | 20,790 | $ | 226,126 | $ | (10,198) | $ | (43,628) | $ | (23,873) |
(a) Prior to April 30, 2013 known as the Westcore Blue Chip Fund.
(b) Prior to April 30, 2013 known as the Westcore Mid-Cap Value Fund.
See Notes to Financial Statements.
PAGE 69 |
|
| STATEMENTS OF CHANGES IN NET ASSETS |
| |
| | Westcore Small-Cap Value Dividend Fund | Westcore Micro-Cap Opportunity Fund | | Westcore International Small-Cap Fund |
| | Six Months Ended | | | Six Months Ended | | | Six Months Ended | | |
| | | June 30, 2013(a) | | Year Ended | | June 30, 2013 | | Year Ended | | June 30, 2013 | | Year Ended |
| | | (Unaudited) | | December 31, 2012 | | (Unaudited) | | December 31, 2012 | | (Unaudited) | | December 31, 2012 |
Increase/(Decrease) in Net Assets from: | | | | | | | | | | | | |
Operations: | | | | | | | | | | | | |
Net investment income/(loss) | $ | 1,354,922 | $ | 2,918,436 | $ | (1,470) | $ | 25,571 | $ | 4,807,501 | $ | 4,679,190 |
Net realized gain/(loss) | | 21,891,153 | | 18,043,495 | | 437,382 | | 115,659 | | 5,509,221 | | (8,919,574) |
Change in unrealized net appreciation/(depreciation) | | 27,744,487 | | 7,417,075 | | 490,596 | | 223,854 | | (17,276,524) | | 47,734,751 |
Net increase/(decrease) in net assets resulting | | | | | | | | | | | | |
| from operations | | 50,990,562 | | 28,379,006 | | 926,508 | | 365,084 | | (6,959,802) | | 43,494,367 |
Distributions to Shareholders (Note 2): | | | | | | | | | | | | |
From net investment income | | | | | | | | | | | | |
| Retail Class | | 0 | | (1,895,995) | | 0 | | (33,000) | | 0 | | (4,000,006) |
| Institutional Class | | 0 | | (1,204,005) | | N/A | | N/A | | N/A | | N/A |
From net realized capital gains | | | | | | | | | | | | |
| Retail Class | | 0 | | (2,740,533) | | 0 | | (91,526) | | 0 | | 0 |
| Institutional Class | | 0 | | (1,759,445) | | N/A | | N/A | | N/A | | N/A |
Decrease in net assets from distributions | | | | | | | | | | | | |
| to shareholders | | 0 | | (7,599,978) | | 0 | | (124,526) | | 0 | | (4,000,006) |
Beneficial Interest Transactions (Note 3): | | | | | | | | | | | | |
Shares sold | | | | | | | | | | | | |
| Retail Class | | 15,719,484 | | 45,516,132 | | 9,271,942 | | 2,372,162 | | 156,658,184 | | 220,971,841 |
| Institutional Class | | 14,864,125 | | 42,188,048 | | N/A | | N/A | | N/A | | N/A |
Shares issued in reinvestment of distributions | | | | | | | | | | | | |
| Retail Class | | 0 | | 3,243,868 | | 0 | | 122,819 | | 0 | | 3,765,442 |
| Institutional Class | | 0 | | 2,663,220 | | N/A | | N/A | | N/A | | N/A |
Cost of shares redeemed | | | | | | | | | | | | |
| Retail Class | | (69,967,675) | | (70,158,455) | | (435,615) | | (1,482,878) | | (77,850,678) | | (69,703,244) |
| Institutional Class | | (32,658,994) | | (19,531,373) | | N/A | | N/A | | N/A | | N/A |
Net increase/(decrease) resulting from beneficial | | | | | | | | | | | | |
| interest transactions | | (72,043,060) | | 3,921,440 | | 8,836,327 | | 1,012,103 | | 78,807,506 | | 155,034,039 |
Redemption Fees | | 0 | | 1,075 | | 105 | | 228 | | 32,585 | | 60,905 |
Net Increase/(Decrease) in Net Assets | | (19,052,498) | | 24,701,543 | | 9,762,940 | | 1,252,889 | | 71,880,289 | | 194,589,305 |
Net Assets: | | | | | | | | | | | | |
Beginning of year | | 313,910,953 | | 289,209,410 | | 2,986,435 | | 1,733,546 | | 327,825,367 | | 133,236,062 |
End of period* | $ | 294,858,455 | $ | 313,910,953 | $ | 12,749,375 | $ | 2,986,435 | $ | 399,705,656 | $ | 327,825,367 |
*Including (over)/undistributed net investment income of: | $ | 1,371,247 | $ | 16,325 | $ | (2,320) | $ | (850) | $ | 1,822,263 | $ | (2,985,238) |
(a) | Prior to April 30, 2013 known as Westcore Small-Cap Fund. | | | | | | | | | | |
See Notes to Financial Statements. | | | | | | | | | | | | |
PAGE 70 |
|
| STATEMENTS OF CHANGES IN NET ASSETS |
| |
| | Westcore Flexible Income Fund | | Westcore Plus Bond Fund | Westcore Colorado Tax-Exempt Fund |
| Six Months Ended | | | Six Months Ended | | | Six Months Ended | | |
| | June 30, 2013 | | Year Ended | | June 30, 2013 | | Year Ended | | June 30, 2013 | | Year Ended |
| | (Unaudited) | December 31, 2012 | | (Unaudited) | December 31, 2012 | | (Unaudited) | December 31, 2012 |
Increase/(Decrease) in Net Assets from: | | | | | | | | | | | | |
Operations: | | | | | | | | | | | | |
Net investment income | $ | 1,985,100 | $ | 5,450,006 | $ | 25,905,858 | $ | 61,661,049 | $ | 2,145,949 | $ | 4,135,161 |
Net realized gain/(loss) | | (1,776,938) | | (2,535,581) | | 6,909,035 | | 2,283,329 | | 560,682 | | 28,125 |
Change in unrealized net appreciation/(depreciation) | | 100,617 | | 6,502,936 | | (68,617,792) | | 29,344,199 | | (7,263,448) | | 2,783,282 |
Net increase/(decrease) in net assets resulting | | | | | | | | | | | | |
from operations | | 308,779 | | 9,417,361 | | (35,802,899) | | 93,288,577 | | (4,556,817) | | 6,946,568 |
Distributions to Shareholders (Note 2): | | | | | | | | | | | | |
From net investment income | | | | | | | | | | | | |
Retail Class | | (1,883,084) | | (5,228,008) | | (24,538,310) | | (53,215,419) | | (2,142,982) | | (4,137,342) |
Institutional Class | | (118,202) | | (221,064) | | (4,688,099) | | (8,315,060) | | N/A | | N/A |
From net realized capital gains | | | | | | | | | | | | |
Retail Class | | 0 | | 0 | | 0 | | (1,630,298) | | 0 | | 0 |
Institutional Class | | 0 | | 0 | | 0 | | (269,723) | | N/A | | N/A |
Decrease in net assets from distributions | | | | | | | | | | | | |
to shareholders | | (2,001,286) | | (5,449,072) | | (29,226,409) | | (63,430,500) | | (2,142,982) | | (4,137,342) |
Beneficial Interest Transactions (Note 3): | | | | | | | | | | | | |
Shares sold | | | | | | | | | | | | |
Retail Class | | 5,366,826 | | 26,706,780 | | 148,476,409 | | 357,709,979 | | 14,992,808 | | 42,151,593 |
Institutional Class | | 866,449 | | 5,258,201 | | 65,281,582 | | 70,995,499 | | N/A | | N/A |
Shares issued in reinvestment of distributions | | | | | | | | | | | | |
Retail Class | | 1,749,122 | | 4,987,531 | | 23,525,788 | | 52,567,700 | | 1,965,669 | | 3,788,089 |
Institutional Class | | 118,202 | | 221,064 | | 4,377,889 | | 7,779,335 | | N/A | | N/A |
Cost of shares redeemed | | | | | | | | | | | | |
Retail Class | | (16,320,804) | | (49,321,441) | | (268,978,994) | | (378,159,270) | | (25,416,377) | | (15,150,342) |
Institutional Class | | (3,550,587) | | (1,250,763) | | (56,008,962) | | (37,109,716) | | N/A | | N/A |
Net increase/(decrease) resulting from beneficial | | | | | | | | | | | | |
interest transactions | | (11,770,792) | | (13,398,628) | | (83,326,288) | | 73,783,527 | | (8,457,900) | | 30,789,340 |
Redemption Fees | | 7,073 | | 47,418 | | 209 | | 50,057 | | 0 | | 619 |
Net Increase/(Decrease) in Net Assets | | (13,456,226) | | (9,382,921) | | (148,355,387) | | 103,691,661 | | (15,157,699) | | 33,599,185 |
Net Assets: | | | | | | | | | | | | |
Beginning of year | | 80,673,896 | | 90,056,817 | | 1,699,514,004 | | 1,595,822,343 | | 146,820,047 | | 113,220,862 |
End of period* | $ | 67,217,670 | $ | 80,673,896 | $ | 1,551,158,617 | $1,699,514,004 | $ | 131,662,348 | $ | 146,820,047 |
*Including underdistributed net investment income of: | $ | (57,232) | $ | (41,046) | $ | (3,424,880) | $ | (104,329) | $ | (17,468) | $ | (20,435) |
See Notes to Financial Statements.
PAGE 71 |
|
Selected data for a share of beneficial interest outstanding throughout the period indicated.
| | Income from Investment Operations | | | Distributions | | |
| | | | | | | | | | | | | | |
| | Net | | | | Net Realized And | | Total Income/ | | | | | | |
| | Asset Value | | Net | Unrealized Gain/ | | (Loss) from | | | Dividends From Net | | |
| | Beginning of | | Investment | | (Loss) on | | Investment | | Dividends from Net | | Realized Gain on | | Total |
Period Ended | the Period | | Income/(Loss) | | Investments | | Operations | | Investment Income | | Investments | | Distributions |
WESTCORE GROWTH FUND | | | | | | | | | | | | | |
Retail Class | | | | | | | | | | | | | | |
06/30/13 (Unaudited) $ | 14.07 | $ | (0.01)(a) | $ | 1.23 | $ | 1.22 | $ | (0.00) | $ | (0.00) | $ | (0.00) |
12/31/12 | | 12.46 | | 0.05(a) | | 1.83 | | 1.88 | | (0.05) | | (0.22) | | (0.27) |
12/31/11 | | 12.54 | | (0.03)(a) | | (0.05) | | (0.08) | | (0.00) | | (0.00) | | (0.00) |
12/31/10 | | 10.88 | | (0.01) | | 1.67 | | 1.66 | | (0.00) | | (0.00) | | (0.00) |
12/31/09 | | 7.80 | | (0.01) | | 3.09 | | 3.08 | | (0.00)(d) | | (0.00) | | (0.00)(d) |
12/31/08 | | 15.45 | | 0.00(d) | | (7.02) | | (7.02) | | (0.00) | | (0.63) | | (0.63) |
Institutional Class | | | | | | | | | | | | | | |
06/30/13 (Unaudited) | 14.14 | | 0.01(a) | | 1.22 | | 1.23 | | (0.00) | | (0.00) | | (0.00) |
12/31/12 | | 12.50 | | 0.04(a) | | 1.88 | | 1.92 | | (0.06) | | (0.22) | | (0.28) |
12/31/11 | | 12.56 | | 0.00(a)(d) | | (0.06) | | (0.06) | | (0.00) | | (0.00) | | (0.00) |
12/31/10 | | 10.88 | | 0.01 | | 1.67 | | 1.68 | | (0.00) | | (0.00) | | (0.00) |
12/31/09 | | 7.81 | | (0.00)(d) | | 3.10 | | 3.10 | | (0.03) | | (0.00) | | (0.03) |
12/31/08 | | 15.45 | | 0.01 | | (7.02) | | (7.01) | | (0.00) | | (0.63) | | (0.63) |
WESTCORE MIDCO GROWTH FUND | | | | | | | | | | | | | |
Retail Class | | | | | | | | | | | | | | |
06/30/13 (Unaudited) | 6.11 | | (0.02)(a) | | 0.97 | | 0.95 | | (0.00) | | (0.00) | | (0.00) |
12/31/12 | | 5.90 | | (0.01)(a) | | 0.28 | | 0.27 | | (0.00) | | (0.06) | | (0.06) |
12/31/11 | | 6.77 | | (0.02)(a) | | (0.47) | | (0.49) | | (0.00) | | (0.38) | | (0.38) |
12/31/10 | | 5.20 | | (0.01) | | 1.58 | | 1.57 | | (0.00) | | (0.00) | | (0.00) |
12/31/09 | | 3.55 | | (0.01) | | 1.66 | | 1.65 | | (0.00) | | (0.00) | | (0.00) |
12/31/08 | | 6.94 | | (0.04) | | (3.09) | | (3.13) | | (0.00) | | (0.26) | | (0.26) |
Institutional Class | | | | | | | | | | | | | | |
06/30/13 (Unaudited) | 6.16 | | (0.02)(a) | | 0.99 | | 0.97 | | (0.00) | | (0.00) | | (0.00) |
12/31/12 | | 5.93 | | 0.00(a)(d) | | 0.29 | | 0.29 | | (0.00) | | (0.06) | | (0.06) |
12/31/11 | | 6.80 | | (0.01)(a) | | (0.48) | | (0.49) | | (0.00) | | (0.38) | | (0.38) |
12/31/10 | | 5.22 | | 0.00(d) | | 1.58 | | 1.58 | | (0.00) | | (0.00) | | (0.00) |
12/31/09 | | 3.56 | | (0.00)(d) | | 1.66 | | 1.66 | | (0.00) | | (0.00) | | (0.00) |
12/31/08 | | 6.95 | | (0.04) | | (3.09) | | (3.13) | | (0.00) | | (0.26) | | (0.26) |
(a) Calculated using the average shares method.
(b) Total return and portfolio turnover are not annualized for period less than one full year.
(c) Annualized.
(d) Less than $0.005 and $(0.005) per share.
PAGE 72 |
|
| | | | | Ratios/Supplemental Data | | |
| | | | | | | | |
| | | | | | | Ratio of Net | |
| | | | | | Ratio of Net | Investment | |
| | | | | Ratio of Expenses | Investment | Income/(Loss) | |
Paid-in | | | Net Assets, | Ratio of Expenses | to Average Net | Income/(Loss) to | to Average Net | Portfolio |
Capital from | Net Asset Value | | End of Period | to Average Net | Assets Without | Average Net | Assets Without |
Redemption Fees | End of Period | Total Return | (in Thousands) | Assets | Fee Waivers | Assets | Fee Waivers | Turnover Rate |
| | | | | | | | | |
| | | | | | | | | |
$ 0.00 | $ 15.29 | 8.67%(b) | $ 65,709 | 1.10% (c) | 1.10% (c) | (0.08%) (c) | (0.08%) (c) | 88%(b) |
0.00 (d) | 14.07 | 15.13% | 66,514 | 1.11% | 1.11% | 0.36% | 0.36% | 167% |
0.00 (d) | 12.46 | (0.64%) | 59,311 | 1.11% | 1.11% | (0.22%) | (0.22%) | 130% |
0.00 (d) | 12.54 | 15.26% | 108,694 | 1.08% | 1.08% | (0.07%) | (0.07%) | 99% |
0.00 (d) | 10.88 | 39.54% | 120,456 | 1.06% | 1.06% | (0.05%) | (0.05%) | 83% |
0.00 (d) | 7.80 | (45.33%) | 133,174 | 1.03% | 1.03% | 0.02% | 0.02% | 183% |
| | | | | | | | | |
0.00 | 15.37 | 8.70%(b) | 5,610 | 0.89% (c) | 1.25% (c) | 0.13% (c) | (0.23%) (c) | 88%(b) |
0.00 (d) | 14.14 | 15.37% | 4,564 | 0.92% | 1.32% | 0.31% | (0.09%) | 167% |
0.00 (d) | 12.50 | (0.48%) | 8,637 | 0.95% | 1.70% | 0.02% | (0.73%) | 130% |
0.00 (d) | 12.56 | 15.44% | 3,271 | 0.94% | 2.13% | 0.08% | (1.11%) | 99% |
0.00 (d) | 10.88 | 39.64% | 2,619 | 0.94% | 2.55% | 0.05% | (1.56%) | 83% |
0.00 (d) | 7.81 | (45.26%) | 1,797 | 0.92% | 1.90% | 0.13% | (0.85%) | 183% |
| | | | | | | | | |
| | | | | | | | | |
0.00 | 7.06 | 15.55%(b) | 78,361 | 1.05% (c) | 1.05% (c) | (0.61%) (c) | (0.61%) (c) | 60%(b) |
0.00 (d) | 6.11 | 4.64% | 74,221 | 1.05% | 1.05% | (0.12%) | (0.12%) | 114% |
0.00 (d) | 5.90 | (7.20%) | 96,762 | 1.06% | 1.06% | (0.25%) | (0.25%) | 113% |
0.00 (d) | 6.77 | 30.19% | 104,119 | 1.05% | 1.05% | (0.19%) | (0.19%) | 98% |
0.00 (d) | 5.20 | 46.48% | 85,559 | 1.08% | 1.08% | (0.20%) | (0.20%) | 121% |
0.00 (d) | 3.55 | (44.92%) | 64,515 | 1.03% | 1.03% | (0.48%) | (0.48%) | 142% |
| | | | | | | | | |
0.00 | 7.13 | 15.75%(b) | 27,870 | 0.88% (c) | 0.94% (c) | (0.46%) (c) | (0.52%) (c) | 60%(b) |
0.00 (d) | 6.16 | 4.96% | 33,482 | 0.87% | 0.93% | 0.06% | 0.01% | 114% |
0.00 (d) | 5.93 | (7.17%) | 38,396 | 0.92% | 0.97% | (0.11%) | (0.16%) | 113% |
0.00 (d) | 6.80 | 30.27% | 42,072 | 0.93% | 0.98% | (0.07%) | (0.12%) | 98% |
0.00 (d) | 5.22 | 46.63% | 34,148 | 0.95% | 1.03% | (0.08%) | (0.15%) | 121% |
0.00 (d) | 3.56 | (44.86%) | 23,863 | 0.93% | 0.97% | (0.36%) | (0.40%) | 142% |
See Notes to Financial Statements.
PAGE 73 |
|
Selected data for a share of beneficial interest outstanding throughout the period indicated.
| | | Income from Investment Operations | | | Distributions | | |
| | | | | | | | | | | | | | |
| | | Net | | | Net Realized And | | Total Income/ | | | | | | |
| | | Asset Value | | Net | Unrealized Gain/ | | (Loss) from | | | Dividends From Net | | |
| | | Beginning of | | Investment | | (Loss) on | | Investment | | Dividends from Net | | Realized Gain on | | Total |
| Period Ended | the Period | | Income/(Loss) | | Investments | | Operations | | Investment Income | | Investments | | Distributions |
WESTCORE SELECT FUND | | | | | | | | | | | | |
Retail Class | | | | | | | | | | | | | |
| 06/30/13 (Unaudited) $ | 16.60 | $ | (0.07) (a) | $ | 2.82 | $ | 2.75 | $ | (0.00) | $ | (0.00) | $ | (0.00) |
| 12/31/12 | | 18.71 | | (0.09) (a) | | (2.02) | | (2.11) | | (0.00) | | (0.00) | | (0.00) |
| 12/31/11 | | 21.07 | | (0.08) (a) | | (2.17) | | (2.25) | | (0.00) | | (0.12) | | (0.12) |
| 12/31/10 | | 16.14 | | (0.01) | | 4.93 | | 4.92 | | (0.00) | | (0.00) | | (0.00) |
| 12/31/09 | | 11.44 | | (0.03) | | 4.73 | | 4.70 | | (0.00) | | (0.00) | | (0.00) |
| 12/31/08 | | 17.43 | | (0.09) | | (5.91) | | (6.00) | | (0.00) | | (0.00) (d) | | (0.00) (d) |
WESTCORE BLUE CHIP DIVIDEND FUND | | | | | | | | | | | | |
Retail Class | | | | | | | | | | | | | |
| 06/30/13 (Unaudited) (e) | 12.00 | | 0.07 (a) | | 1.25 | | 1.32 | | (0.00) | | (0.00) | | (0.00) |
| 12/31/12 | | 11.49 | | 0.14 (a) | | 1.40 | | 1.54 | | (0.16) | | (0.87) | | (1.03) |
| 12/31/11 | | 11.12 | | 0.13 (a) | | 0.43 | | 0.56 | | (0.16) | | (0.05) | | (0.21) |
| 12/31/10 | | 10.76 | | 0.07 | | 0.36 | | 0.43 | | (0.07) | | (0.00) | | (0.07) |
| 12/31/09 | | 8.32 | | 0.06 | | 2.43 | | 2.49 | | (0.05) | | (0.00) | | (0.05) |
| 12/31/08 | | 13.18 | | 0.07 | | (4.85) | | (4.78) | | (0.07) | | (0.01) | | (0.08) |
Institutional Class | | | | | | | | | | | | | |
| 06/30/13 (Unaudited) | 11.96 | | 0.09 (a) | | 1.24 | | 1.33 | | (0.00) | | (0.00) | | (0.00) |
| 12/31/12 | | 11.46 | | 0.17 (a) | | 1.39 | | 1.56 | | (0.19) | | (0.87) | | (1.06) |
| 12/31/11 | | 11.10 | | 0.13 (a) | | 0.46 | | 0.59 | | (0.19) | | (0.05) | | (0.24) |
| 12/31/10 | | 10.76 | | 0.09 | | 0.35 | | 0.44 | | (0.10) | | (0.00) | | (0.10) |
| 12/31/09 | | 8.32 | | 0.07 | | 2.43 | | 2.50 | | (0.06) | | (0.00) | | (0.06) |
| 12/31/08 | | 13.18 | | 0.13 | | (4.89) | | (4.76) | | (0.09) | | (0.01) | | (0.10) |
WESTCORE MID–CAP VALUE DIVIDEND FUND | | | | | | | | | | |
Retail Class | | | | | | | | | | | | | |
| 06/30/13 (Unaudited) (f) | 20.11 | | 0.12 (a) | | 3.04 | | 3.16 | | (0.00) | | (0.00) | | (0.00) |
| 12/31/12 | | 18.10 | | 0.19 (a) | | 2.05 | | 2.24 | | (0.23) | | (0.00) | | (0.23) |
| 12/31/11 | | 18.26 | | 0.15 (a) | | (0.15) | | 0.00 | | (0.16) | | (0.00) | | (0.16) |
| 12/31/10 | | 15.27 | | 0.08 | | 3.00 | | 3.08 | | (0.09) | | (0.00) | | (0.09) |
| 12/31/09 | | 11.65 | | 0.11 | | 3.61 | | 3.72 | | (0.10) | | (0.00) | | (0.10) |
| 12/31/08 | | 20.57 | | 0.16 | | (8.89) | | (8.73) | | (0.17) | | (0.02) | | (0.19) |
(a) | Calculated using the average shares method. | | | | | | | | | | |
(b) | Total return and portfolio turnover are not annualized for period less than one full year. | | | | | | |
(c) | Annualized. | | | | | | | | | | | | | |
(d) | Less than $0.005 and $(0.005) per share. | | | | | | | | | | |
(e) | Prior to April 30, 2013 known as the Westcore Blue Chip Fund. | | | | | | | | |
(f) | Prior to April 30, 2013 known as the Westcore Mid-Cap Value Fund. | | | | | | | | |
PAGE 74 |
|
| | | | | | | Ratios/Supplemental Data | | | |
| | | | | | | | | | | |
| | | | | | | | | Ratio of Net | | |
| | | | | | | | Ratio of Net | Investment | | |
| | | | | | | Ratio of Expenses | Investment | Income/(Loss) | | |
| Paid-in | | | | Net Assets, | Ratio of Expenses | to Average Net | Income/(Loss) to | to Average Net | Portfolio | |
| Capital from | Net Asset Value | | | End of Period | to Average Net | Assets Without | Average Net | Assets Without | |
Redemption Fees | End of Period | Total Return | (in Thousands) | Assets | Fee Waivers | Assets | Fee Waivers | Turnover Rate | |
| | | | | | | | | | | |
| | | | | | | | | | | |
| $ 0.00 | $ 19.35 | 16.57%(b) | $ 119,664 | 1.09% (c) | 1.09% (c) | (0.72%) (c) | (0.72%) (c) | | 58%(b) | |
| 0.00 (d) | 16.60 | (11.28%) | 178,503 | 1.06% | 1.06% | (0.50%) | (0.50%) | 167% | |
| 0.01 | 18.71 | (10.61%) | 681,200 | 1.05% | 1.05% | (0.39%) | (0.39%) | 155% | |
| 0.01 | 21.07 | 30.55% | | 392,174 | 1.07% | 1.07% | (0.11%) | (0.11%) | 143% | |
| 0.00 (d) | 16.14 | 41.08% | | 67,199 | 1.15% | 1.16% | (0.30%) | (0.31%) | 217% | |
| 0.01 | 11.44 | (34.35%) | 28,233 | 1.15% | 1.21% | (0.66%) | (0.72%) | 237% | |
| | | | | | | | | | | |
| | | | | | | | | | | |
| 0.00 | 13.32 | 11.00%(b) | 58,819 | 1.13% (c) | 1.13% (c) | 1.14% (c) | 1.14% (c) | 76%(b) | |
| 0.00 (d) | 12.00 | 13.39% | | 55,215 | 1.15% | 1.17% | 1.13% | 1.11% | 9% | |
| 0.02 | 11.49 | 5.19% | | 61,295 | 1.15% | 1.30% | 1.12% | 0.97% | 37% | |
| 0.00 (d) | 11.12 | 3.99% | | 14,610 | 1.15% | 1.28% | 0.65% | 0.52% | 39% | |
| 0.00 (d) | 10.76 | 29.87% | | 16,632 | 1.15% | 1.26% | 0.53% | 0.41% | 21% | |
| 0.00 (d) | 8.32 | (36.24%) | 16,490 | 1.13% | 1.13% | 0.45% | 0.45% | 27% | |
| | | | | | | | | | | |
| 0.00 | 13.29 | 11.12%(b) | 7,040 | 0.92% (c) | 0.97% (c) | 1.35% (c) | 1.30% (c) | 76%(b) | |
| 0.00 (d) | 11.96 | 13.66% | | 6,612 | 0.92% | 1.06% | 1.35% | 1.21% | 9% | |
| 0.01 | 11.46 | 5.34% | | 7,809 | 1.00% | 1.17% | 1.11% | 0.94% | 37% | |
| 0.00 (d) | 11.10 | 4.05% | | 20,667 | 1.05% | 1.11% | 0.76% | 0.70% | 39% | |
| 0.00 (d) | 10.76 | 30.10% | | 21,585 | 0.95% | 1.14% | 0.72% | 0.53% | 21% | |
| 0.00 | 8.32 | (36.09%) | 18,101 | 0.98% | 1.03% | 0.68% | 0.63% | 27% | |
| | | | | | | | | | | |
| | | | | | | | | | | | |
| 0.00 (d) | 23.27 | 15.71%(b) | 46,940 | 1.23% (c) | 1.23% (c) | 1.07% (c) | 1.07% (c) | 30%(b) | |
| 0.00 (d) | 20.11 | 12.39% | | 40,341 | 1.25% | 1.26% | 0.96% | 0.96% | 21% | |
| 0.00 (d) | 18.10 | (0.02%) | 43,190 | 1.25% | 1.29% | 0.82% | 0.78% | 32% | |
| 0.00 (d) | 18.26 | 20.18% | | 46,413 | 1.25% | 1.27% | 0.43% | 0.41% | 33% | |
| 0.00 (d) | 15.27 | 31.95% | | 48,572 | 1.25% | 1.26% | 0.77% | 0.77% | 27% | |
| 0.00 (d) | 11.65 | (42.38%) | 40,714 | 1.19% | 1.19% | 0.74% | 0.74% | 35% | |
See Notes to Financial Statements.
PAGE 75 |
|
Selected data for a share of beneficial interest outstanding throughout the period indicated.
| Income from Investment Operations | | | Distributions | | |
| | | | | | | | | | | | |
| Net | | | Net Realized And | | Total Income/ | | | | | | |
| Asset Value | | Net | Unrealized Gain/ | | (Loss) from | | | Dividends From Net | | |
| Beginning of | | Investment | | (Loss) on | | Investment | | Dividends from Net | | Realized Gain on | | Total |
Period Ended | the Period | | Income/(Loss) | | Investments | | Operations | | Investment Income | | Investments | | Distributions |
WESTCORE SMALL-CAP OPPORTUNITY FUND | | | | | | | | | | |
Retail Class | | | | | | | | | | | | | |
06/30/13 (Unaudited) | $ 27.03 | $ | (0.03) (a) | $ | 4.00 | $ | 3.97 | $ | (0.00) | $ | (0.00) | $ | (0.00) |
12/31/12 | 32.31 | | (0.05) (a) | | 2.23 | | 2.18 | | (0.00) | | (7.46) | | (7.46) |
12/31/11 | 34.13 | | (0.11) (a) | | (1.24) | | (1.35) | | (0.00) | | (0.47) | | (0.47) |
12/31/10 | 28.28 | | (0.08) | | 5.94 | | 5.86 | | (0.02) | | (0.00) | | (0.02) |
12/31/09 | 22.01 | | 0.06 | | 6.20 | | 6.26 | | (0.00) | | (0.00) | | (0.00) |
12/31/08 | 34.34 | | (0.03) | | (12.41) | | (12.44) | | (0.00) | | (0.00) (d) | | (0.00) (d) |
Institutional Class | | | | | | | | | | | | | |
06/30/13 (Unaudited) | 27.25 | | (0.01) (a) | | 4.04 | | 4.03 | | (0.00) | | (0.00) | | (0.00) |
12/31/12 | 32.47 | | 0.05 (a) | | 2.19 | | 2.24 | | (0.00) | | (7.46) | | (7.46) |
12/31/11 | 34.26 | | (0.07) (a) | | (1.25) | | (1.32) | | (0.00) | | (0.47) | | (0.47) |
12/31/10 | 28.41 | | 0.39 | | 5.52 | | 5.91 | | (0.07) | | (0.00) | | (0.07) |
12/31/09 | 22.07 | | 0.05 | | 6.28 | | 6.33 | | (0.00) | | (0.00) | | (0.00) |
12/31/08 | 34.36 | | 0.03 | | (12.41) | | (12.38) | | (0.00) | | (0.00) (d) | | (0.00) |
WESTCORE SMALL–CAP VALUE DIVIDEND FUND | | | | | | | | | | |
Retail Class | | | | | | | | | | | | | |
06/30/13 (Unaudited) (e) | 12.65 | | 0.05 (a) | | 2.13 | | 2.18 | | (0.00) | | (0.00) | | (0.00) |
12/31/12 | 11.82 | | 0.11 (a) | | 1.03 | | 1.14 | | (0.13) | | (0.18) | | (0.31) |
12/31/11 | 11.97 | | 0.09 (a) | | (0.13) | | (0.04) | | (0.11) | | (0.00) | | (0.11) |
12/31/10 | 9.51 | | 0.11 | | 2.46 | | 2.57 | | (0.11) | | (0.00) | | (0.11) |
12/31/09 | 7.87 | | 0.11 | | 1.62 | | 1.73 | | (0.10) | | (0.00) | | (0.10) |
12/31/08 | 12.06 | | 0.13 | | (4.20) | | (4.07) | | (0.13) | | (0.00) | | (0.13) |
Institutional Class | �� | | | | | | | | | | | | |
06/30/13 (Unaudited) | 12.64 | | 0.07 (a) | | 2.13 | | 2.20 | | (0.00) | | (0.00) | | (0.00) |
12/31/12 | 11.80 | | 0.13 (a) | | 1.02 | | 1.15 | | (0.13) | | (0.18) | | (0.31) |
12/31/11 | 11.97 | | 0.11 (a) | | (0.15) | | (0.04) | | (0.13) | | (0.00) | | (0.13) |
12/31/10 | 9.51 | | 0.11 | | 2.47 | | 2.58 | | (0.12) | | (0.00) | | (0.12) |
12/31/09 | 7.87 | | 0.13 | | 1.62 | | 1.75 | | (0.11) | | (0.00) | | (0.11) |
12/31/08 | 12.06 | | 0.14 | | (4.19) | | (4.05) | | (0.14) | | (0.00) | | (0.14) |
(a) Calculated using the average shares method.
(b) Total return and portfolio turnover are not annualized for period less than one full year.
(c) Annualized.
(d) Less than $0.005 and $(0.005) per share.
(e) Prior to April 30, 2013 known as the Westcore Small-Cap Fund.
PAGE 76 |
|
| | | | | Ratios/Supplemental Data | | | |
| | | | | | | | | |
| | | | | | | Ratio of Net | | |
| | | | | | Ratio of Net | Investment | | |
| | | | | Ratio of Expenses | Investment | Income/(Loss) | | |
Paid-in | | | Net Assets, | Ratio of Expenses | to Average Net | Income/(Loss) to | to Average Net | Portfolio | |
Capital from | Net Asset Value | | End of Period | to Average Net | Assets Without | Average Net | Assets Without | |
Redemption Fees | End of Period | Total Return | (in Thousands) | Assets | Fee Waivers | Assets | Fee Waivers | Turnover Rate | |
| | | | | | | | | | |
| | | | | | | | | | |
$ 0.00 | $ 31.00 | 14.69%(b) | $ 17,306 | 1.30% (c) | 1.68% (c) | (0.22%) (c) | (0.60%) (c) | 40% (b) | |
0.00 (d) | 27.03 | 7.02% | 16,118 | 1.30% | 1.50% | (0.16%) | (0.36%) | 40% | |
0.00 (d) | 32.31 | (3.95%) | 43,570 | 1.30% | 1.52% | (0.32%) | (0.54%) | 51% | |
0.01 | 34.13 | 20.77% | 48,857 | 1.30% | 1.52% | (0.21%) | (0.43%) | 49% | |
0.01 | 28.28 | 28.49% | 32,380 | 1.30% | 1.64% | 0.15% | (0.19%) | 24% | |
0.11 | 22.01 | (35.90%) | 16,027 | 1.30% | 1.70% | (0.08%) | (0.48%) | 57% | |
| | | | | | | | | | |
0.00 | 31.28 | 14.79%(b) | 2,400 | 1.15% (c) | 2.14% (c) | (0.07%) (c) | (1.06%) (c) | 40% (b) | |
0.00 (d) | 27.25 | 7.17% | 2,214 | 1.18% | 2.07% | 0.14% | (0.76%) | 40% | |
0.00 (d) | 32.47 | (3.85%) | 3,317 | 1.19% | 2.37% | (0.21%) | (1.39%) | 51% | |
0.01 | 34.26 | 20.84% | 3,648 | 1.22% | 2.39% | (0.14%) | (1.31%) | 49% | |
0.01 | 28.41 | 28.73% | 3,172 | 1.15% | 2.76% | 0.25% | (1.36%) | 24% | |
0.09 | 22.07 | (35.76%) | 2,326 | 1.08% | 2.38% | 0.18% | (1.13%) | 57% | |
| | | | | | | | | | |
| | | | | | | | | | |
0.00 (d) | 14.83 | 17.23%(b) | 167,776 | 1.30% (c) | 1.39% (c) | 0.80% (c) | 0.71% (c) | 21% (b) | |
0.00 (d) | 12.65 | 9.69% | 189,858 | 1.30% | 1.39% | 0.87% | 0.78% | 35% | |
0.00 (d) | 11.82 | (0.31%) | 196,764 | 1.30% | 1.42% | 0.77% | 0.66% | 40% | |
0.00 (d) | 11.97 | 27.03% | 242,817 | 1.30% | 1.39% | 1.03% | 0.93% | 39% | |
0.01 | 9.51 | 22.08% | 192,180 | 1.30% | 1.37% | 1.38% | 1.31% | 33% | |
0.01 | 7.87 | (33.57%) | 148,135 | 1.30% | 1.38% | 1.51% | 1.44% | 45% | |
| | | | | | | | | | |
0.00 (d) | 14.84 | 17.41%(b) | 127,083 | 1.12% (c) | 1.22% (c) | 0.96% (c) | 0.86% (c) | 21% (b) | |
0.00 (d) | 12.64 | 9.78% | 124,052 | 1.14% | 1.24% | 1.07% | 0.96% | 35% | |
0.00 (d) | 11.80 | (0.31%) | 92,446 | 1.16% | 1.29% | 0.92% | 0.79% | 40% | |
0.00 (d) | 11.97 | 27.15% | 114,286 | 1.18% | 1.29% | 1.17% | 1.07% | 39% | |
0.00 (d) | 9.51 | 22.16% | 52,278 | 1.20% | 1.33% | 1.53% | 1.39% | 33% | |
0.00 (d) | 7.87 | (33.51%) | 20,684 | 1.21% | 1.51% | 1.80% | 1.49% | 45% | |
See Notes to Financial Statements.
PAGE 77 |
|
Selected data for a share of beneficial interest outstanding throughout the period indicated.
| Income from Investment Operations | | | Distributions | | |
| | | | | | | | | | | | |
| Net | | | Net Realized And | | Total Income/ | | | | Dividends From | | |
| Asset Value | | Net | Unrealized Gain/ | | (Loss) from | | Dividends from | | Net Realized | | |
| Beginning of | | Investment | | (Loss) on | | Investment | | Net Investment | | Gain on | | Total |
Year or Period Ended | the Period | | Income/(Loss) | | Investments | | Operations | | Income | | Investments | | Distributions |
| | | | | | | | | | | | |
WESTCORE MICRO-CAP OPPORTUNITY FUND | | | | | | | | | | | | |
Retail Class | | | | | | | | | | | | | |
06/30/13 (Unaudited) | $ 12.35 | | $ (0.00) (a)(d) | | $ 2.05 | | $ 2.05 | | $ (0.00) | $ | (0.00) | $ | (0.00) |
12/31/12 | 11.15 | | 0.11 (a) | | 1.62 | | 1.73 | | (0.14) | | (0.39) | | (0.53) |
12/31/11 | 11.56 | | (0.02) (a) | | (0.40) | | (0.42) | | (0.00) | | (0.00) | | (0.00) |
12/31/10 | 8.66 | | (0.03) | | 2.93 | | 2.90 | | (0.00) | | (0.00) | | (0.00) |
12/31/09 | 7.53 | | 0.02 | | 1.14 | | 1.16 | | (0.03) | | (0.00) | | (0.03) |
12/31/08 (e) | 10.00 | | 0.04 | | (2.49) | | (2.45) | | (0.03) | | (0.00) | | (0.03) |
WESTCORE INTERNATIONAL SMALL-CAP FUND | | | | | | | | | | | |
Retail Class | | | | | | | | | | | | | |
06/30/13 (Unaudited) | 17.94 | | 0.21 (a) | | (0.43) | | (0.22) | | (0.00) | | (0.00) | | (0.00) |
12/31/12 | 14.55 | | 0.37 (a) | | 3.24 | | 3.61 | | (0.22) | | (0.00) | | (0.22) |
12/31/11 | 15.70 | | 0.29 (a) | | (1.21) | | (0.92) | | (0.24) | | (0.00) | | (0.24) |
12/31/10 | 11.67 | | 0.11 | | 4.00 | | 4.11 | | (0.08) | | (0.00) | | (0.08) |
12/31/09 | 7.19 | | 0.15 | | 4.46 | | 4.61 | | (0.13) | | (0.00) | | (0.13) |
12/31/08 | 14.41 | | 0.18 | | (7.23) | | (7.05) | | (0.17) | | (0.00) | | (0.17) |
WESTCORE FLEXIBLE INCOME FUND | | | | | | | | | | | | |
Retail Class | | | | | | | | | | | | | |
06/30/13 (Unaudited) | 8.94 | | 0.25 (a) | | (0.22) | | 0.03 | | (0.25) | | (0.00) | | (0.25) |
12/31/12 | 8.57 | | 0.50 (a) | | 0.38 | | 0.88 | | (0.51) | | (0.00) | | (0.51) |
12/31/11 | 8.42 | | 0.53 (a) | | 0.12 | | 0.65 | | (0.51) | | (0.00) | | (0.51) |
12/31/10 | 7.98 | | 0.56 | | 0.43 | | 0.99 | | (0.55) | | (0.00) (d) | | (0.55) |
12/31/09 | 6.12 | | 0.51 | | 1.86 | | 2.37 | | (0.51) | | (0.00) | | (0.51) |
12/31/08 | 9.44 | | 0.56 | | (3.26) | | (2.70) | | (0.62) | | (0.00) | | (0.61) |
Institutional Class | | | | | | | | | | | | | |
06/30/13 (Unaudited) | 8.82 | | 0.25 (a) | | (0.22) | | 0.03 | | (0.25) | | (0.00) | | (0.25) |
12/31/12 | 8.43 | | 0.50 (a) | | 0.38 | | 0.88 | | (0.49) | | (0.00) | | (0.49) |
12/31/11 | 8.34 | | 0.53 (a) | | 0.12 | | 0.65 | | (0.57) | | (0.00) | | (0.57) |
12/31/10 | 7.96 | | 0.57 | | 0.42 | | 0.99 | | (0.61) | | (0.00) (d) | | (0.61) |
12/31/09 | 6.11 | | 0.52 | | 1.85 | | 2.37 | | (0.52) | | (0.00) | | (0.52) |
12/31/08 | 9.43 | | 0.58 | | (3.27) | | (2.69) | | (0.63) | | (0.00) | | (0.62) |
(a) Calculated using the average shares method.
(b) Total return and portfolio turnover are not annualized for period less than one full year.
(c) Annualized.
(d) Less than $0.005 and $(0.005) per share.
(e) Period from June 23, 2008 (inception date) through December 31, 2008.
PAGE 78 |
|
| | | | | | Ratios/Supplemental Data | | | | |
| | | | | | | | | | | | |
| | | | | | | | | Ratio of Net | | | |
| | | | | | | | Ratio of Net | Investment | | | |
| | | | | | Ratio of Expenses | Investment | Income/(Loss) | | | |
| Paid-in | | | Net Assets, | Ratio of Expenses | to Average Net | Income/(Loss) to | to Average Net | Portfolio | |
| Capital from | Net Asset Value | | End of Period | to Average Net | Assets Without | Average Net | Assets Without | |
Redemption Fees | End of Period | Total Return | (in Thousands) | Assets | Fee Waivers | Assets | Fee Waivers | Turnover Rate | |
| | | | | | | | | | | | |
| | | | | | | | | | | | | |
$ | 0.00 (d) | $ 14.40 | 16.60%(b) | $ 12,749 | 1.30% (c) | 2.22%(c) | | (0.04%) (c) | (0.96%) (c) | 47%(b) | | |
| 0.00 (d) | 12.35 | 15.60% | 2,986 | 1.30% | 4.71% | | 0.94% | (2.47%) | 132% | | |
| 0.01 | 11.15 | (3.55%) | 1,734 | 1.30% | 8.07% | | (0.14%) | (6.91%) | 88% | | |
| 0.00 (d) | 11.56 | 33.49% | 1,594 | 1.30% | 6.96% | | (0.25%) | (5.91%) | 107% | | |
| 0.00 (d) | 8.66 | 15.40% | 1,924 | 1.30% | 7.96% | | 0.27% | (6.39%) | 130% | | |
| | | | | | | | | | | | | |
| | | | | | | | | | | | | |
| 0.01 | 7.53 | (24.33%) (b) | 1,104 | 1.30% | 18.13% | | 1.06% | (15.77%) | 60%(b) | | |
| 0.00 (d) | 17.72 | (1.23%) (b) | 399,706 | 1.50% (c) | 1.60%(c) | | 2.36% (c) | 2.26% (c) | 33%(b) | | |
| 0.00 (d) | 17.94 | 24.84% | 327,825 | 1.50% | 1.65% | | 2.22% | 2.07% | 14% | | |
| 0.01 | 14.55 | (5.75%) | 133,236 | 1.50% | 1.70% | | 1.82% | 1.62% | 27% | | |
| 0.00 (d) | 15.70 | 35.25% | 60,925 | 1.50% | 1.84% | | 1.10% | 0.77% | 44% | | |
| 0.00 (d) | 11.67 | 64.17% | 32,356 | 1.50% | 2.01% | | 1.68% | 1.17% | 65% | | |
| 0.00 (d) | 7.19 | (48.86%) | 18,282 | 1.50% | 1.98% | | 1.47% | 0.99% | 70% | | |
| | | | | | | | | | | | | |
| | | | | | | | | | | | | |
| 0.00 (d) | 8.72 | 0.31%(b) | 63,408 | 0.85% (c) | 0.92%(c) | | 5.53% (c) | 5.46% (c) | 8%(b) | | |
| 0.00 (d) | 8.94 | 10.49% | 74,206 | 0.85% | 0.90% | | 5.69% | 5.65% | 34% | | |
| 0.01 | 8.57 | 8.13% | 87,962 | 0.85% | 0.93% | | 6.24% | 6.16% | 45% | | |
| 0.00 (d) | 8.42 | 12.71% | 65,829 | 0.85% | 0.93% | | 6.75% | 6.67% | 38% | | |
| 0.00 (d) | 7.98 | 40.09% | 72,783 | 0.85% | 0.91% | | 7.21% | 7.15% | 30% | | |
| 0.00 (d) | 6.12 | (29.97%) | 65,043 | 0.85% | 0.92% | | 6.91% | 6.83% | 21% | | |
| | | | | | | | | | | | | |
| 0.00 (d) | 8.60 | 0.35%(b) | 3,810 | 0.69% (c) | 1.14%(c) | | 5.67% (c) | 5.22% (c) | 8%(b) | | |
| 0.00 (d) | 8.82 | 10.74% | 6,468 | 0.71% | 1.30% | | 5.76% | 5.16% | 34% | | |
| 0.01 | 8.43 | 8.14% | 2,095 | 0.74% | 3.04% | | 6.35% | 4.05% | 45% | | |
| 0.00 (d) | 8.34 | 12.79% | 1,481 | 0.75% | 3.24% | | 6.82% | 4.32% | 38% | | |
| 0.00 (d) | 7.96 | 40.30% | 1,234 | 0.72% | 3.98% | | 7.26% | 4.00% | 30% | | |
| 0.00 (d) | 6.11 | (29.89%) | 748 | 0.74% | 3.21% | | 7.12% | 4.65% | 21% | | |
See Notes to Financial Statements.
PAGE 79 |
|
Selected data for a share of beneficial interest outstanding throughout the period indicated.
| | | Income from Investment Operations | | | Distributions | | |
| | | | | | | | | | | | | | |
| | | Net | | | Net Realized And | | Total Income/ | | | | Dividends From | | |
| | | Asset Value | | Net | Unrealized Gain/ | | (Loss) from | | Dividends from | | Net Realized | | |
| | | Beginning of | | Investment | | (Loss) on | | Investment | | Net Investment | | Gain on | | Total |
Period Ended | | the Period | | Income/(Loss) | | Investments | | Operations | | Income | | Investments | | Distributions |
WESTCORE PLUS BOND FUND | | | | | | | | | | | | | | |
Retail Class | | | | | | | | | | | | | | |
06/30/13 (Unaudited) | $ | 11.24 | $ | 0.17 (a) | $ | (0.42) | $ | (0.25) | $ | (0.19) | $ | (0.00) | $ | (0.19) |
12/31/12 | | | 11.04 | | 0.40 (a) | | 0.21 | | 0.61 | | (0.40) | | (0.01) | | (0.41) |
12/31/11 | | | 10.72 | | 0.43 (a) | | 0.37 | | 0.80 | | (0.44) | | (0.04) | | (0.48) |
12/31/10 | | | 10.42 | | 0.45 | | 0.29 | | 0.74 | | (0.44) | | (0.00) | | (0.44) |
12/31/09 | | | 9.85 | | 0.44 | | 0.57 | | 1.01 | | (0.44) | | (0.00) | | (0.44) |
12/31/08 | | | 10.55 | | 0.51 | | (0.70) | | (0.19) | | (0.51) | | (0.00) | | (0.51) |
Institutional Class | | | | | | | | | | | | | | |
06/30/13 (Unaudited) | | 11.11 | | 0.18 (a) | | (0.41) | | (0.23) | | (0.20) | | (0.00) | | (0.20) |
12/31/12 | | | 10.92 | | 0.42 (a) | | 0.20 | | 0.62 | | (0.42) | | (0.01) | | (0.43) |
12/31/11 | | | 10.68 | | 0.45 (a) | | 0.37 | | 0.82 | | (0.54) | | (0.04) | | (0.58) |
12/31/10 | | | 10.42 | | 0.47 | | 0.28 | | 0.75 | | (0.49) | | (0.00) | | (0.49) |
12/31/09 | | | 9.85 | | 0.45 | | 0.57 | | 1.02 | | (0.45) | | (0.00) | | (0.45) |
12/31/08 | | | 10.55 | | 0.52 | | (0.70) | | (0.18) | | (0.52) | | (0.00) | | (0.52) |
WESTCORE COLORADO TAX–EXEMPT FUND | | | | | | | | | | | | |
06/30/13 (Unaudited) | | 11.81 | | 0.17 (a) | | (0.55) | | (0.38) | | (0.17) | | (0.00) | | (0.17) |
12/31/12 | | | 11.54 | | 0.37 (a) | | 0.27 | | 0.64 | | (0.37) | | (0.00) | | (0.37) |
12/31/11 | | | 10.99 | | 0.40 (a) | | 0.56 | | 0.96 | | (0.41) | | (0.00) | | (0.41) |
12/31/10 | | | 11.19 | | 0.40 | | (0.20) | | 0.20 | | (0.40) | | (0.00) | | (0.40) |
12/31/09 | | | 10.48 | | 0.40 | | 0.71 | | 1.11 | | (0.40) | | (0.00) | | (0.40) |
12/31/08 | | | 11.04 | | 0.42 | | (0.56) | | (0.14) | | (0.42) | | (0.00) | | (0.42) |
(a) Calculated using the average shares method.
(b) Total return and portfolio turnover are not annualized for period less than one full year.
(c) Annualized.
(d) Less than $0.005 and $(0.005) per share.
PAGE 80 |
|
| | | | | | | | | | | |
| | | | | | Ratios/Supplemental Data | | | | |
| | | | | | | | | | | |
| | | | | | | | Ratio of Net | | | |
| | | | | | | Ratio of Net | Investment | | | |
| | | | | | Ratio of Expenses | Investment | Income/(Loss) | | | |
Paid–in | | | Net Assets, | Ratio of Expenses | to Average Net | Income/(Loss) to | to Average Net | Portfolio | |
Capital from | Net Asset Value | | End of Period | to Average Net | Assets Without | Average Net | Assets Without | |
Redemption Fees | End of Period | Total Return | (in Thousands) | Assets | Fee Waivers | Assets | Fee Waivers | Turnover Rate | |
| | | | | | | | | | | | |
| | | | | | | | | | | | |
| $ 0.00 (d) | $ 10.80 | (2.23%) (b) | $ 1,305,770 | 0.55% (c) | 0.72% (c) | 3.07% (c) | 3.24% (c) | 21% (b) | | |
| 0.00 (d) | 11.24 | 5.67% | 1,457,800 | 0.55% | 0.75% | 3.61% | 3.41% | 32% | | |
| 0.00 (d) | 11.04 | 7.55% | 1,399,473 | 0.55% | 0.83% | 3.98% | 3.70% | 42% | | |
| 0.00 (d) | 10.72 | 7.22% | 1,389,702 | 0.55% | 0.83% | 4.20% | 3.92% | 45% | | |
| 0.00 (d) | 10.42 | 10.42% | 1,326,659 | 0.55% | 0.81% | 4.32% | 4.05% | 36% | | |
| 0.00 (d) | 9.85 | (1.86%) | 1,069,006 | 0.55% | 0.81% | 4.98% | 4.72% | 54% | | |
| | | | | | | | | | | |
| 0.00 (d) | 10.68 | (2.13%) (b) | 245,388 | 0.38% (c) | 0.55% (c) | 3.25% (c) | 3.42% (c) | 21% (b) | | |
| 0.00 (d) | 11.11 | 5.74% | 241,714 | 0.40% | 0.59% | 3.76% | 3.57% | 32% | | |
| 0.00 (d) | 10.92 | 7.81% | 196,349 | 0.41% | 0.69% | 4.13% | 3.86% | 42% | | |
| 0.00 (d) | 10.68 | 7.25% | 218,060 | 0.43% | 0.70% | 4.31% | 4.04% | 45% | | |
| 0.00 (d) | 10.42 | 10.56% | 131,815 | 0.44% | 0.73% | 4.40% | 4.11% | 36% | | |
| 0.00 (d) | 9.85 | (1.77%) | 65,263 | 0.46% | 0.73% | 5.09% | 4.82% | 54% | | |
| | | | | | | | | | | |
| 0.00 (d) | 11.26 | (3.23%) (b) | 131,662 | 0.65% (c) | 0.79% (c) | 2.84% (c) | 2.98% (c) | 13% (b) | | |
| 0.00 (d) | 11.81 | 5.57% | 146,820 | 0.65% | 0.81% | 3.12% | 2.96% | 7% | | |
| 0.00 (d) | 11.54 | 8.88% | 113,221 | 0.65% | 0.91% | 3.60% | 3.34% | 17% | | |
| 0.00 (d) | 10.99 | 1.77% | 118,478 | 0.65% | 0.91% | 3.56% | 3.30% | 6% | | |
| 0.00 (d) | 11.19 | 10.71% | 105,891 | 0.65% | 0.90% | 3.67% | 3.42% | 8% | | |
| 0.00 (d) | 10.48 | (1.34%) | 67,206 | 0.65% | 0.91% | 3.85% | 3.59% | 16% | | |
See Notes to Financial Statements.
PAGE 81 |
|
1. ORGANIZATION
Westcore Trust (the “Trust”) is registered under the Investment Company Act of 1940, as amended, as an open-end management investment company. Interests in the Westcore Growth Fund, Westcore MIDCO Growth Fund, Westcore Select Fund, Westcore Blue Chip Dividend Fund, (Prior to April 30, 2013 known as the Westcore Blue Chip Fund), Westcore Mid-Cap Value Dividend Fund, (Prior to April 30, 2013 known as the Westcore Mid-Cap Value Fund), Westcore Small-Cap Opportunity Fund, Westcore Small-Cap Value Dividend Fund, (Prior to April 30, 2013 known as the Westcore Small-Cap Value Fund), Westcore Micro-Cap Opportunity Fund, Westcore International Small-Cap Fund, Westcore Flexible Income Fund, Westcore Plus Bond Fund and Westcore Colorado Tax-Exempt Funds (the “Funds”) are represented by separate classes of beneficial interest of the Trust, which is organized as a Massachusetts business trust. The Funds offer Retail Class shares. The Westcore Growth, Westcore MIDCO Growth, Westcore Blue Chip Dividend, Westcore Small-Cap Opportunity, Westcore Small-Cap Value Dividend, Westcore Flexible Income and Westcore Plus Bond Funds offer Institutional Class shares. All classes of shares have identical rights to earnings, assets and voting privileges, except for class specific expenses and exclusive rights to vote on matters solely affecting such class.
2. SIGNIFICANT ACCOUNTING POLICIES
The following is a summary of significant accounting policies consistently followed by each Fund in the preparation of its financial statements. The policies are in conformity with accounting principles generally accepted in the United States of America for investment companies.
Use of Estimates – The preparation of financial statements in accordance with accounting principles generally accepted in the United States of America requires management to make estimates and assumptions that affect the reported amounts and disclosures in the financial statements. The actual results could differ from those estimates.
Investment Valuation – All securities of the Funds are valued as of the close of regular trading on the New York Stock Exchange (“NYSE”), currently 4:00 p.m. (Eastern Time), on each day that the NYSE is open, subject to provisions in the prospectus and/or Statement of Additional Information regarding pricing at other times in case of an emergency and optional pricing of the Funds in the event that the NYSE does not open for business because of an emergency.
Securities that are traded on a recognized domestic stock exchange are generally valued at the last sales price as of the valuation time on the principal stock exchange on which they are traded. Securities that are principally traded on the National Association of Securities Dealers Automated Quotation (“NASDAQ”) exchange are generally valued at the NASDAQ Official Closing Price (“NOCP”). Unlisted securities that are traded on the domestic over-the-counter market for which last sales prices are available, are generally valued at the last sales price as of the valuation time. In the absence of sales and NOCP, such securities are valued at the mean of the bid and asked prices.
Securities that are traded on a foreign stock exchange (and that are not listed on a recognized domestic stock exchange or traded on the NASDAQ exchange or the domestic over-the-counter market) are generally valued at the official closing price on the principal stock exchange on which they are traded. In the event that closing prices are not available for such foreign securities, such securities are generally valued at the last sales price occurring prior to the closing of its principal exchange. Exchange rates as of the close of regular trading on the NYSE are used to convert foreign security values into U.S. dollars. Forward foreign currency exchange contracts are valued on a daily basis based on the closing prices of the foreign currency rates as of the close of regular trading on the NYSE.
Redeemable securities issued by open-end registered investment companies are valued at the investment company’s applicable net asset value.
Fixed-income obligations, excluding municipal securities, having a remaining maturity of greater than 60 days, are typically valued at the mean between the evaluated bid and ask prices formulated by an independent pricing service. Municipal securities having a remaining maturity of greater than 60 days, are typically valued at the evaluated bid price formulated by an independent pricing service.
Securities having a remaining maturity of 60 days or less are valued at amortized cost which approximates market value.
When market quotations are not readily available or when events occur that make established valuation methods unreliable, securities of the Fund may be valued in good faith by or under the direction of the Board of Trustees. Factors which may be considered when determining the value of a security include (a) the fundamental data relating to the investment; (b) an evaluation of the forces which influence the market in which the security is sold, including the liquidity and depth of the market; (c) the market value at date of purchase; (d) information as to any transactions or offers with respect to the security or comparable securities; and (e) any other relevant matters.
Market, Credit and Counterparty Risk – In the normal course of business, the Funds invest in securities and enter into transactions where risks exist due to fluctuations in the market (market risk) or failure of the issuer of a security to meet all its obligations (issuer credit risk). The value of securities held by the Funds may decline in response to certain events, including those directly involving the issuers whose securities are owned by the Funds; conditions affecting the general economy; overall market changes; local, regional, national or global political, social or economic instability; and currency and interest rate and price fluctuations. Similar to issuer credit risk, the Funds may be exposed to counterparty credit risk, or the risk that an entity with which the Funds have unsettled or open transactions may fail to or be unable to perform on its commitments. The Funds manage counterparty credit risk by entering into transactions only with counterparties that they believe have the financial resources to honor their obligations and by monitoring the financial stability of those counterparties.
PAGE 82 |
|
| NOTES TO FINANCIAL STATEMENTS |
| |
Foreign Securities – All of the Funds, except the Westcore Colorado Tax-Exempt Fund, may invest at least a portion of their assets in foreign securities. As of June 30, 2013, all Funds were primarily invested in U.S. based issuers, as determined by the location of their headquarters, except Westcore International Small-Cap Fund. In the event that a Fund executes a foreign security transaction, the Fund will generally enter into a foreign currency contract to settle the foreign security transaction. Foreign securities may carry more risk than U.S. securities, such as political, market and currency risks. The accounting records of the Funds are maintained in U.S. dollars. Prices of securities denominated in foreign currencies are translated into U.S. dollars at the closing rates of exchange at period end. Amounts related to the purchase and sale of foreign securities and investment income are translated at the rates of exchange prevailing on the respective dates of such transactions.
The effect of changes in foreign currency exchange rates on investments is separately identified from the fluctuations arising from changes in market values of securities held and reported with all other foreign currency gains and losses in the Funds’ Statements of Operations.
Concentration of Risk – As of June 30, 2013, the Westcore International Small-Cap Fund invested a significant percentage of its assets in the United Kingdom, Australia, and Hong Kong. Therefore, it may be more affected by economic developments and currency fluctuations in these countries.
Federal Income Taxes – No provision for income taxes is included in the accompanying financial statements, as the Funds intend to distribute to shareholders all taxable investment income and realized gains and otherwise comply with Subchapter M of the Internal Revenue Code applicable to regulated investment companies.
As of and during the six months ended June 30, 2013, the fund did not have a liability for any unrecognized tax benefits. Management of the Funds has analyzed all open tax years, as defined by the Statute of Limitations, for all major jurisdictions, including federal tax authorities and certain state tax authorities and has concluded that no provision for income tax is required for uncertain tax positions. The Funds file income tax returns in the U.S. federal jurisdiction and Colorado. For the years ended December 31, 2009 through December 31, 2012 for the federal jurisdiction and for the years ended December 31, 2008 through December 31, 2012, for Colorado, the Funds’ returns are still open to examination by the appropriate taxing authority. In addition, for the years ended December 31, 2008, the Westcore Flexible Income Fund’s Mississippi returns are still open to examination by the appropriate taxing authority as well.
At December 31, 2012, each Fund had available for federal income tax purposes unused pre-enactment capital loss carryforwards as follows:
| | | | Expiring | | | | | |
| | 2013 | | 2014 | | 2015 | | 2016 | 2017 | | 2018 | Total |
Westcore Mid-Cap Value | $ | – | $ | – | $ | – | $ | 613,748 | $ 7,328,000 | $ | – | $ 7,941,748 |
Dividend Fund |
| | | | | | | | | | | |
Westcore International | | – | | – | | – | | – | 7,275,307 | | – | 7,725,307 |
Small-Cap Fund |
| | | | | | |
Westcore Flexible Income Fund | | 18,958 | | 340,539 | | 775,600 | | 20,255,986 | 9,408,999 | | 1,064,911 | 31,864,993 |
Westcore Colorado | | – | | – | | – | | 18,307 | 22,684 | | – | 40,991 |
Tax-Exempt Fund |
| | | | | | | | | | | |
| | | | | | | | | | | | |
At December 31, 2012, the following Funds had available for tax purposes unused post-enactment capital loss carryforwards as follows:
| Short-Term | Long-Term |
Westcore Select Fund | $ 110,053,685 | $ 27,115,231 |
Westcore International Small-Cap Fund | – | 1,335,726 |
Westcore Flexible Income Fund | – | 10,066,606 |
Westcore Colorado Tax-Exempt Fund | 550,467 | 386,643 |
| | |
PAGE 83 |
|
| NOTES TO FINANCIAL STATEMENTS |
| |
During the year ended December 31, 2012, each Fund had utilized capital loss carryforwards as follows:
Westcore | Westcore Mid-Cap | Westcore Small-Cap | Westcore Micro-Cap |
Growth Fund | Value Dividend Fund | Value Dividend Fund | Opportunity Fund |
$ 9,989,640 | $ 3,174,222 | $ 12,627,608 | $9,736 |
| | | | |
The Westcore Growth Fund, Westcore Select Fund, Westcore Mid-Cap Value Dividend Fund, Westcore Small-Cap Value Dividend Fund, Westcore Micro-Cap Opportunity Fund, Westcore International Small-Cap Fund and Westcore Colorado Tax-Exempt Fund elect to defer to their fiscal year ending December 31, 2013, approximately $822,285, $3,865,236, $120,342, $300,527, $11,116, $4,158,841, and $47,445 of capital losses recognized during the period from November 1, 2012 to December 31, 2012, respectively. Additionally, the Westcore International Small-Cap Fund elected to defer to its fiscal year ending December 31, 2013, approximately $1,466,101 of specified losses recognized during the period from November 1, 2012 to December 31, 2012.
Classification of Distributions to Shareholders – Net investment income (loss) and net realized gain (loss) may differ for financial statement and tax purposes. The character of distributions made during the year from net investment income or net realized gains may differ from its ultimate characterization for federal income tax purposes. Also, due to the timing of dividend distributions, the fiscal year in which amounts are distributed may differ from the fiscal year in which the income or realized gain was recorded by the Funds. Net assets were unaffected by the reclassifications. For the year ended December 31, 2012, the Funds most recent year end, each Fund recorded the following reclassifications to the accounts listed below:
| | | (Over)/Undistributed Net | Accumulated Net Realized |
| | Paid-in Capital | Investment Income | | Gain/(Loss) |
Westcore Growth Fund | $ | 0 | $ | 5,938 | $ | (5,938) |
Westcore MIDCO Growth Fund | | (120,006) | | 120,006 | | 0 |
Westcore Select Fund | | (2,300,588) | | 2,300,588 | | 0 |
Westcore Blue Chip Dividend Fund | | 0 | | 0 | | 0 |
Westcore Mid-Cap Value Dividend Fund | | (56,126) | | 56,126 | | 0 |
Westcore Small-Cap Opportunity Fund | | 2,227,949 | | 59,643 | | (2,287,592) |
Westcore Small-Cap Value Dividend Fund | | 0 | | 217,948 | | (217,948) |
Westcore Micro-Cap Opportunity Fund | | 0 | | 7,392 | | (7,392) |
Westcore International Small-Cap Fund | | 2 | | (3,331,042) | | 3,331,040 |
Westcore Flexible Income Fund | | (241,043) | | 218,056 | | 22,987 |
Westcore Plus Bond Fund | | (202,118) | | 77,894 | | 124,224 |
Westcore Colorado Tax-Exempt Fund | | 0 | | 0 | | 0 |
| | | | | | |
The reclassifications were primarily as a result of the differing book/tax treatment of net operating losses and certain investments.
The tax character of the distributions paid were as follows:
| | Year Ended | | Year Ended |
| December 31, 2012 | December 31, 2011 |
Westcore Growth Fund | | | | |
Ordinary Income | $ | 244,064 | $ | 0 |
Long-Term Capital Gain | | 1,105,940 | | 0 |
Total | $ | 1,350,004 | $ | 0 |
Westcore MIDCO Growth Fund | | | | |
Ordinary Income | $ | 0 | $ | 0 |
Long-Term Capital Gain | | 1,099,987 | | 8,207,425 |
Total | $ | 1,099,987 | $ | 8,207,425 |
PAGE 84 |
|
| NOTES TO FINANCIAL STATEMENTS |
| |
| | Year Ended | | Year Ended |
| December 31, 2012 | December 31, 2011 |
Westcore Select Fund | | | | |
Ordinary Income | $ | 0 | $ | 3,924,950 |
Long-Term Capital Gain | | 0 | | 578,650 |
Total | $ | 0 | $ | 4,503,600 |
Westcore Blue Chip Dividend Fund | | | | |
Ordinary Income | $ | 1,019,023 | $ | 913,101 |
Long-Term Capital Gain | | 4,000,020 | | 272,636 |
Total | $ | 5,019,043 | $ | 1,185,737 |
Westcore Mid-Cap Value Dividend Fund | | | | |
Ordinary Income | $ | 458,000 | $ | 368,999 |
Long-Term Capital Gain | | 0 | | 0 |
Total | $ | 458,000 | $ | 368,999 |
Westcore Small-Cap Opportunity Fund* | | | | |
Ordinary Income | $ | 102,000 | $ | 0 |
Long-Term Capital Gain | | 4,000,002 | | 678,237 |
Total | $ | 4,102,002 | $ | 678,237 |
Westcore Small-Cap Value Dividend Fund | | | | |
Ordinary Income | $ | 2,882,052 | $ | 2,890,000 |
Long-Term Capital Gain | | 4,717,926 | | 0 |
Total | $ | 7,599,978 | $ | 2,890,000 |
Westcore Micro-Cap Opportunity Fund | | | | |
Ordinary Income | $ | 30,164 | $ | 0 |
Long-Term Capital Gain | | 94,362 | | 0 |
Total | $ | 124,526 | $ | 0 |
Westcore International Small-Cap Fund | | | | |
Ordinary Income | $ | 4,000,006 | $ | 2,200,004 |
Long-Term Capital Gain | | 0 | | 0 |
Total | $ | 4,000,006 | $ | 2,200,004 |
Westcore Flexible Income Fund | | | | |
Ordinary Income | $ | 5,449,072 | $ | 4,149,150 |
Long-Term Capital Gain | | 0 | | 0 |
Total | $ | 5,449,072 | $ | 4,149,150 |
Westcore Plus Bond Fund | | | | |
Ordinary Income | $ | 61,771,153 | $ | 63,981,542 |
Long-Term Capital Gain | | 1,659,347 | | 5,039,901 |
Total | $ | 63,430,500 | $ | 69,021,443 |
* In addition to the long-term capital gain distribution paid, the Westcore Small-Cap Opportunity Fund designates $2,217,747 of earnings and profits distributed to shareholders on redemptions as long-term capital gain distribution.
PAGE 85 |
|
| NOTES TO FINANCIAL STATEMENTS |
| |
| | Year Ended | | Year Ended |
| December 31, 2012 | December 31, 2011 |
Westcore Colorado Tax-Exempt Fund | | | | |
Ordinary Income | $ | 15,545 | $ | 14,864 |
Tax-Exempt Income | | 4,121,797 | | 3,704,210 |
Total | $ | 4,137,342 | $ | 3,719,074 |
As of December 31, 2012, the Funds most recent year end, the components of distributable earnings on a tax basis were as follows:
| | Westcore | Westcore MIDCO | | Westcore | Westcore Blue | |
| Growth Fund | Growth Fund | | Select Fund | Chip Dividend Fund | |
Undistributed net investment income | $ | 0 | $ | 0 | $ | 0 | $ | 120,680 | |
Accumulated net realized gain/(loss) | | | | | | | | | |
on investments | | 34,096 | | 761,516 | | (141,034,152) | | 563,734 | |
Net unrealized appreciation on investments | | 13,398,926 | | 11,830,403 | | 8,651,753 | | 13,273,698 | |
Effect of other timing differences | | (857,119) | | (258,248) | | (28,125) | | (31,440) | |
Total | $ | 12,575,903 | $ | 12,333,671 | $ | (132,410,524) | $ | 13,926,672 | |
| | | | | | | | Westcore | |
| | | | Westcore | | Westcore | | |
| Westcore Mid-Cap | | Small-Cap | | Small-Cap | | Micro-Cap | |
| Value Dividend Fund | Opportunity Fund | Value Dividend Fund | Opportunity Fund | |
Undistributed net investment income | $ | 0 | $ | 0 | $ | 0 | $ | 0 | |
Accumulated net realized gain/(loss) | | | | | | | | | |
on investments | | (8,062,090) | | 75,715 | | 35,426 | | 2,260 | |
Net unrealized appreciation on investments | | 6,640,972 | | 3,824,639 | | 42,064,511 | | 425,967 | |
Effect of other timing differences | | (10,198) | | (23,873) | | (284,202) | | (11,966) | |
Total | $ | (1,431,316) | $ | 3,876,481 | $ | 41,815,735 | $ | 416,261 | |
| | | | | | | | Westcore | |
| | | | | | | | |
| Westcore International | Westcore Flexible | Westcore | Colorado Tax-Exempt | |
| Small-Cap Fund | Income Fund | Plus Bond Fund | | Fund | |
Undistributed net investment income | $ | 247,200 | $ | 23,009 | $ | 87,786 | $ | 4,501 | |
Accumulated net realized loss on investments | | (12,769,874) | | (41,931,599) | | 0 | | (1,025,546) | |
Net unrealized appreciation on investments | | 45,605,980 | | 1,620,634 | | 104,139,630 | | 8,522,663 | |
Effect of other timing differences | | (1,315,712) | | (64,055) | | (198,032) | | (24,936) | |
Total | $ | 31,767,594 | $ | (40,352,011) | $ | 104,029,384 | $ | 7,476,682 | |
The effect of other timing differences is primarily related to deferred Trustees’ compensation.
The Funds recharacterize distributions received from Real Estate Investment Trust (“REIT”) investments based on information provided by the REIT into the following categories: ordinary income, long-term capital gains, and return of capital. If information is not available on a timely basis from the REIT , the recharacterization will be estimated based on available information which may include the previous year’s allocation. If new or additional information becomes available from the REIT at a later date, a recharacterization will be made in the following year.
Distributions – Distributions of net investment income, if any, are generally made annually for the Westcore Growth, Westcore MIDCO Growth, Westcore Select, Westcore Blue Chip Dividend, Westcore Mid-Cap Value Dividend, Westcore Small-Cap Opportunity, Westcore Small-Cap Value Dividend, Westcore Micro-Cap Opportunity and Westcore International Small-Cap Funds and monthly for the Westcore Flexible Income, Westcore Plus Bond and Westcore Colorado Tax-Exempt Funds. Distributions of net realized capital gains, if any, are declared at least once each year for each of the Funds. Distributions to shareholders are recorded on the ex-dividend date.
Redemption Fee – Westcore Micro-Cap Opportunity and Westcore Flexible Income impose a two percent (2%) redemption fee (the “Redemption Fee”) on Fund shares if such Fund shares are redeemed (including in connection with an exchange) within ninety (90) calendar days from their date of purchase. The Redemption Fees, which are reflected in the Statement of Changes in Net Assets, are intended to encourage long-term investment in the Funds and, to the extent that frequent trading persists, to offset brokerage commissions, market impact, transaction costs and other expenses associated with frequent trading. Prior to May 1, 2012, all of the Funds imposed such Redemption Fees. Effective April 30, 2013, Westcore International Small-Cap discontinued imposing redemption fees.
PAGE 86 |
|
| NOTES TO FINANCIAL STATEMENTS |
| |
Expenses – Expenses that are specific to a Fund or class of shares of a Fund are charged directly to that Fund or share class. Expenses that are common to all Funds generally are allocated among the Funds in proportion to their average daily net assets.
Expenses related to specific classes and the associated Fund level expenses, for the six months ended June 30, 2013, were as follows:
Westcore Growth Fund
| Retail Class | Institutional Class | Fund |
| Specific Expenses | Specific Expenses | Level Expenses |
Shareholder servicing reimbursement | $ | 60,575 | $ | 0 | $ | 0 |
Transfer agent fees | | 3,366 | | 57 | | 6,963 |
Registration fees | | 8,254 | | 8,232 | | 0 |
Other | | 0 | | 654 | | 2,183 |
| | | | | | |
Westcore MIDCO Growth Fund | | | | | | |
| | | | | |
| Retail Class | Institutional Class | Fund |
| Specific Expenses | Specific Expenses | Level Expenses |
Shareholder servicing reimbursement | $ | 43,563 | $ | 0 | $ | 0 |
Transfer agent fees | | 12,336 | | 91 | | 9,831 |
Registration fees | | 8,193 | | 8,000 | | 0 |
Other | | 0 | | 584 | | 2,406 |
| | | | | | |
Westcore Blue Chip Dividend Fund | | | | | | |
| | | | | |
| Retail Class | Institutional Class | Fund |
| Specific Expenses | Specific Expenses | Level Expenses |
Shareholder servicing reimbursement | $ | 19,465 | $ | 0 | $ | 0 |
Transfer agent fees | | 33,875 | | 36 | | 14,973 |
Registration fees | | 9,895 | | 1,115 | | 0 |
Other | | 0 | | 601 | | 2,389 |
| | | | | | |
Westcore Small-Cap Opportunity Fund | | | | | | |
| | | | | |
| Retail Class | Institutional Class | Fund |
| Specific Expenses | Specific Expenses | Level Expenses |
Shareholder servicing reimbursement | $ | 12,534 | $ | 0 | $ | 0 |
Transfer agent fees | | 3,162 | | 25 | | 6,715 |
Registration fees | | 7,780 | | 7,848 | | 0 |
Other | | 0 | | 805 | | 1,716 |
| | | | | | |
Westcore Small-Cap Value Dividend Fund | | | | | | |
| | | | | |
| Retail Class | Institutional Class | Fund |
| Specific Expenses | Specific Expenses | Level Expenses |
Shareholder servicing reimbursement | $ | 164,729 | $ | 0 | $ | 0 |
Transfer agent fees | | 5,049 | | 4,850 | | 8,660 |
Registration fees | | 8,501 | | 10,351 | | 0 |
Other | | 0 | | 584 | | 4,147 |
| | | | | | |
PAGE 87 |
|
| NOTES TO FINANCIAL STATEMENTS |
| |
Westcore Flexible Income Fund
| Retail Class | Institutional Class | | Fund |
| Specific Expenses | Specific Expenses | | Level Expenses |
Shareholder servicing reimbursement | $ | 54,978 | $ | 0 | $ | 0 |
Transfer agent fees | | 5,293 | | 44 | | 8,038 |
Registration fees | | 8,599 | | 8,187 | | 0 |
Other | | 0 | | 602 | | 2,488 |
| | | | | | |
Westcore Plus Bond Fund
| Retail Class | Institutional Class | | Fund |
| Specific Expenses | Specific Expenses | | Level Expenses |
Shareholder servicing reimbursement | $ | 1,214,818 | $ | 0 | $ | 0 |
Transfer agent fees | | 71,023 | | 1,668 | | 26,171 |
Registration fees | | 21,565 | | 10,684 | | 0 |
Other | | 0 | | 654 | | 14,694 |
| | | | | | |
When-Issued Securities – Each Fund may purchase or sell securities on a “when issued” or “forward commitment” basis which involves a commitment by the Fund to purchase or sell particular securities with payment and delivery taking place at a future date. During this period, such securities do not earn interest, are subject to market fluctuation and may increase or decrease in value prior to their delivery. In accordance with SEC guidance, each Fund segregates liquid assets in an amount sufficient to satisfy the purchase price, pursuant to procedures established by the Board of Trustees, or otherwise cover its position in a permissible manner. The purchase of securities on a when-issued or forward commit-ment basis may increase the volatility of the Fund’s net asset value to the extent each Fund makes such purchases while remaining substantially fully invested. Settlements in the ordinary course of business, which may take substantially more than three business days for non-US securities, are not treated by the Funds as “when-issued” or “forward commitment” transactions. At June 30, 2013, the Funds held no when-issued securi-ties.
Other – For financial reporting purposes, the Funds’ investment transactions and shareholder transactions are recorded on trade date. Dividend income is recorded on the ex-dividend date. Foreign dividend income is recorded on the ex-dividend date or as soon as practical after the Funds de-termine the existence of a dividend declaration after exercising reasonable due diligence. Interest income, which includes amortization of premiums, accretion of discounts and income earned on money market funds, is accrued and recorded daily. Realized gains and losses from investment transac-tions and unrealized appreciation and depreciation of investments are reported on an identified cost basis. Other Income is primarily comprised of consent fees which are compensation for agreeing to changes in the terms of debt instruments.
PAGE 88 |
|
| NOTES TO FINANCIAL STATEMENTS |
| |
3. SHARES OF BENEFICIAL INTEREST
On June 30, 2013, there was an unlimited number of no par value shares of beneficial interest authorized for each Fund. Transactions in shares of beneficial interest were as follows:
| Westcore Growth Fund | Westcore MIDCO Growth Fund |
| Period Ended | Year Ended | Period Ended | Year Ended |
| June 30, 2013 | December 31, 2012 | June 30, 2013 | December 31, 2012 |
Shares issued and redeemed: | | | | |
Shares sold | | | | |
Retail Class | 343,233 | 1,365,107 | 435,585 | 977,641 |
Institutional Class | 75,452 | 168,597 | 112,463 | 209,758 |
Shares issued in reinvestment of distributions | | | | |
Retail Class | – | 88,474 | – | 124,219 |
Institutional Class | – | 5,774 | – | 55,781 |
Shares redeemed | | | | |
Retail Class | (771,368) | (1,489,095) | (1,486,262) | (5,369,359) |
Institutional Class | (33,316) | (542,611) | (1,635,927) | (1,303,288) |
Net decrease resulting from share transactions | (385,999) | (35,514) | (2,574,141) | (4,267,499) |
| Westcore Select Fund | Westcore Blue Chip Dividend Fund |
| Period Ended | Year Ended | Period Ended | Year Ended |
| June 30, 2013 | December 31, 2012 | June 30, 2013 | December 31, 2012 |
Shares issued and redeemed: | | | | |
Shares sold | | | | |
Retail Class | 505,617 | 4,612,402 | 80,663 | 95,811 |
Institutional Class | – | – | 78,452 | 31,450 |
Shares issued in reinvestment of distributions | | | | |
Retail Class | – | – | 0 | 287,211 |
Institutional Class | – | – | – | 45,079 |
Shares redeemed | | | | |
Retail Class | (5,073,713) | (30,271,029) | (267,838) | (1,113,090) |
Institutional Class | – | – | (101,773) | (204,806) |
Net decrease resulting from share transactions | (4,568,096) | (25,658,627) | (210,496) | (858,345) |
PAGE 89 |
|
| NOTES TO FINANCIAL STATEMENTS |
| |
| Westcore Mid-Cap Value Dividend Fund | Westcore Small-Cap Opportunity Fund |
| Period Ended | Year Ended | Period Ended | Year Ended |
| June 30, 2013 | December 31, 2012 | June 30, 2013 | December 31, 2012 |
Shares issued and redeemed: | | | | |
Shares sold | | | | |
Retail Class | 177,569 | 181,802 | 49,276 | 202,079 |
Institutional Class | – | – | 2,155 | 4,248 |
Shares issued in reinvestment of distributions | | | | |
Retail Class | – | 22,191 | – | 114,447 |
Institutional Class | – | – | – | 17,641 |
Shares redeemed | | | | |
Retail Class | (166,054) | (584,438) | (87,390) | (1,068,794) |
Institutional Class | – | – | (6,663) | (42,787) |
Net increase/(decrease) resulting from | | | | |
share transactions | 11,515 | (380,445) | (42,622) | (752,268) |
| Westcore Small-Cap Value Dividend Fund | Westcore Micro-Cap Opportunity Fund |
| Period Ended | Year Ended | Period Ended | Year Ended |
| June 30, 2013 | December 31, 2012 | June 30, 2013 | December 31, 2012 |
Shares issued and redeemed: | | | | |
Shares sold | | | | |
Retail Class | 1,141,141 | 3,680,222 | 675,478 | 199,360 |
Institutional Class | 1,064,193 | 3,329,943 | – | – |
Shares issued in reinvestment of distributions | | | | |
Retail Class | – | 258,682 | – | 10,076 |
Institutional Class | – | 212,548 | – | – |
Shares redeemed | | | | |
Retail Class | (4,844,352) | (5,565,733) | (31,865) | (123,153) |
Institutional Class | (2,315,162) | (1,565,481) | – | – |
Net increase/(decrease) resulting from | | | | |
share transactions | (4,954,180) | 350,181 | 643,613 | 86,283 |
| Westcore International Small-Cap Fund | Westcore Flexible Income Fund |
| Period Ended | Year Ended | Period Ended | Year Ended |
| June 30, 2013 | December 31, 2012 | June 30, 2013 | December 31, 2012 |
Shares issued and redeemed: | | | | |
Shares sold | | | | |
Retail Class | 8,523,711 | 13,062,552 | 597,915 | 3,050,589 |
Institutional Class | – | – | 97,886 | 603,385 |
Shares issued in reinvestment of distributions | | | | |
Retail Class | – | 211,423 | 195,848 | 568,106 |
Institutional Class | – | – | 13,415 | 25,410 |
Shares redeemed | | | | |
Retail Class | (4,241,234) | (4,162,441) | (1,821,960) | (5,585,484) |
Institutional Class | – | – | (401,710) | (143,660) |
Net increase/(decrease) resulting from | | | | |
share transactions | 4,282,477 | 9,111,534 | (1,318,606) | (1,481,654) |
PAGE 90 |
|
| Westcore Plus Bond Fund | Westcore Colorado Tax-Exempt Fund |
| Period Ended | Year Ended | Period Ended | Year Ended |
| June 30, 2013 | December 31, 2012 | June 30, 2013 | December 31, 2012 |
Shares issued and redeemed: | | | | |
Shares sold | | | | |
Retail Class | 13,306,119 | 31,986,034 | 1,274,451 | 3,583,879 |
Institutional Class | 5,906,045 | 6,414,270 | – | – |
Shares issued in reinvestment of distributions | | | | |
Retail Class | 2,117,544 | 4,697,791 | 168,337 | 322,265 |
Institutional Class | 398,702 | 702,912 | – | – |
Shares redeemed | | | | |
Retail Class | (24,212,618) | (33,714,387) | (2,186,171) | (1,287,749) |
Institutional Class | (5,079,371) | (3,351,548) | – | – |
Net increase/(decrease) resulting from | | | | |
share transactions | (7,563,579) | 2,969,438 | (743,383) | 2,618,395 |
4. COST AND UNREALIZED APPRECIATION AND DEPRECIATION ON INVESTMENTS ON A TAX BASIS
Westcore Equity Funds
| | | | | | | | | | | | | | Westcore | |
| Westcore | | Westcore MIDCO | | Westcore | | Westcore Blue | Mid-Cap Value | |
| Growth Fund | | Growth Fund | | Select Fund | | Chip Dividend Fund | Dividend Fund | |
As of June 30, 2013 | | | | | | | | | | | | | | | | |
Gross appreciation (excess of value over tax cost) | $ | 12,971,355 | | $ | 20,369,104 | | $ | 17,187,104 | | $ | 7,242,210 | $ | 10,270,890 | |
Gross depreciation (excess of tax cost over value) | | (574,014) | | | (740,357) | | | (439,995) | | | (1,329,663) | | (234,057) | |
Net unrealized appreciation | $ | 12,397,341 | | $ | 19,628,747 | | $ | 16,747,109 | | $ | 5,912,547 | $ | 10,036,833 | |
Cost of investment for income tax purposes | $ | 59,373,868 | | $ | 86,345,226 | | $ | 102,673,611 | | $ | 61,905,006 | $ | 37,552,212 | |
| | | | | | | | | | |
| Westcore | | Westcore | | Westcore | Westcore | |
| Small-Cap | | Small-Cap Value | | Micro-Cap | International | |
| Opportunity Fund | | Dividend Fund | | Opportunity Fund | Small-Cap Fund | |
As of June 30, 2013 | | | | | | | | | | | | | |
Gross appreciation (excess of value over tax cost) | $ | 4,602,087 | | $ | 72,495,109 | | $ | 1,286,544 | $ | 69,391,086 | |
Gross depreciation (excess of tax cost over value) | | (402,274) | | | (2,433,250) | | | (370,165) | | | (38,386,353) | |
Net unrealized appreciation | $ | 4,199,813 | | $ | 70,061,859 | | $ | 916,379 | $ | 33,004,733 | |
Cost of investment for income tax purposes | $ | 15,636,353 | | $ | 224,350,788 | | $ | 11,830,186 | $ 375,409,222 | |
Westcore Bond Funds | | | | | | | | | | | | | | | | | |
| | | | | | | |
| | | | | | | |
| | Westcore | | Westcore | | Westcore Colorado | | | |
| | Flexible Income Fund | | Plus Bond Fund | | Tax-Exempt Fund | | | |
As of June 30, 2013 | | | | | | | | | | | | | |
Gross appreciation (excess of value over tax cost) | $ | 4,244,444 | | $ | 65,499,750 | | $ | 4,151,598 | | | | |
Gross depreciation (excess of tax cost over value) | | (2,523,569) | | | (30,330,941) | | | (2,892,383) | | | | |
Net unrealized appreciation | $ | 1,720,875 | | $ | 35,168,809 | | $ | 1,259,215 | | | | |
Cost of investment for income tax purposes | $ | 64,816,981 | | $ | 1,486,664,182 | | $ | 129,819,708 | | | | |
PAGE 91 |
|
| NOTES TO FINANCIAL STATEMENTS |
| |
5. INVESTMENT ADVISORY FEES, ADMINISTRATIVE FEES AND OTHER RELATED PARTY TRANSACTIONS
The Trust has entered into an advisory agreement with Denver Investment Advisors LLC (the “Adviser” or “Denver Investments”) for all Funds. The advisory agreement has been approved by the Trust’s Board of Trustees.
Pursuant to its advisory agreement with the Trust, Denver Investments is entitled to an investment advisory fee, computed daily and payable monthly of 0.65%, 0.65%, 0.65%, 0.65%, 0.75%, 1.00%, 1.00%, 1.00%, 1.20%, 0.45%, 0.35% and 0.40% of the average net assets for Westcore Growth, Westcore MIDCO Growth, Westcore Select, Westcore Blue Chip Dividend, Westcore Mid-Cap Value Dividend, Westcore Small-Cap Opportunity, Westcore Small-Cap Value Dividend, Westcore Micro-Cap Opportunity, Westcore International Small-Cap, Westcore Flexible Income, Westcore Plus Bond and Westcore Colorado Tax-Exempt Funds, respectively. Prior to May 1, 2012 the investment advisory fee was 0.45% and 0.50% for the Westcore Plus Bond and Westcore Colorado Tax-Exempt Funds, respectively.
ALPS Fund Services, Inc. (“ALPS”) and Denver Investments serve as the Funds’ co-administrators (“Co-Administrators”). ALPS and Denver Investments are entitled to receive a total fee from each Fund for its administrative services computed daily and paid monthly. Denver Investments and ALPS revised the agreement with the Funds effective May 1, 2012 and agreed to allocate the co-administration fee as shown in the chart below. In addition, the Bookkeeping and Pricing services provided by ALPS were consolidated into the revised agreement and fee schedule below.
| ALPS | Denver Investments | Total |
First $3.5 billion in average daily Net Assets of the Trust | 0.04% | 0.10% | 0.14% |
Net Assets greater than $3.5 billion in average daily Net Assets | | | |
of the Trust | 0.025% | 0.05% | 0.075% |
| | | |
The administrative fees are then allocated to each Fund based upon the Fund’s relative proportion of the Trust’s Net Assets.
The minimum Trust level fees, Institutional Class fees and Westcore Micro-Cap Opportunity Fund fees were all eliminated.
Prior to May 1, 2012 the following fees applied.
| ALPS | Denver Investments | Total |
First $750 million in average daily Net Assets of the Trust | 0.05% | 0.20% | 0.25% |
Next $250 million in average daily Net Assets of the Trust | 0.04% | 0.16% | 0.20% |
Net Assets greater than $1.0 billion in average daily Net | | | |
Assets of the Trust | 0.025% | 0.10% | 0.125% |
| | | |
The administrative fees are then allocated to each Fund based upon the Fund’s relative proportion of the Trust’s Net Assets. ALPS was also entitled to a minimum Trust level fee of $357,250 per annum, but no more than the amount of the administration fees paid by the Trust.
In addition, ALPS was entitled to an Institutional Class minimum administration fee up until May 1, 2012. The fee was charged directly to each Institutional Class based on the Class’ assets in accordance with the schedule below.
Assets | Annual Fee |
$0 - $9,999,999 | $10,000 |
$10,000,000 - $19,999,999 | $7,500 |
$20,000,000 - $29,999,999 | $5,000 |
$30,000,000 - $39,999,999 | $2,500 |
Over $40,000,000 | $0 |
| |
In addition, ALPS was entitled to a minimum administration fee for the Funds up until May 1, 2012. The fee was charged directly to the Funds based on the Funds’ net assets in accordance with the schedule below.
Assets | Annual Fee |
$0 - $9,999,999 | | $10,000 |
$10,000,000 - $19,999,999 | | $7,500 |
$20,000,000 - $29,999,999 | | $5,000 |
Over $30,000,000 | | $0 |
| | |
PAGE 92 |
|
Each Fund has agreed to reimburse the Adviser for a portion of the payments it makes to certain Service Organizations for providing recordkeeping and sub-accounting services to persons who own Fund Retail Class shares through omnibus accounts (“Omnibus Accounts”). The amount reimbursed by the Fund is intended to not exceed the estimated cost that would be incurred by the Fund if the shares held in the Omnibus Accounts were serviced directly by the Fund’s transfer agent.
To determine the Periodic Reimbursement Amount, the Fund’s effective cost for servicing shares directly by the Fund’s transfer agent is calculated on a periodic basis but no later than quarterly as follows (“Effective Rate”):
Fund Retail Class Transfer Agency Costs divided by Fund Retail Class Assets serviced directly by the Fund’s Transfer Agent.
This Effective Rate is then multiplied by the Retail Class assets in the Omnibus Accounts as of the most recent practical date (typically quarter end) to calculate the Periodic Reimbursement Amount.
Denver Investments as Adviser and Co-Administrator has contractually agreed that the Net Annual Fund Operating Expenses for the Retail Class shares of the Westcore Growth, Westcore MIDCO Growth, Westcore Select, Westcore Blue Chip Dividend, Westcore Mid-Cap Value Dividend, Westcore Small-Cap Opportunity, Westcore Small-Cap Value Dividend, Westcore Micro-Cap Opportunity, Westcore International Small-Cap, Westcore Flexible Income, Westcore Plus Bond and Westcore Colorado Tax-Exempt Funds will not exceed 1.15%, 1.15%, 1.15%, 1.15%, 1.25%, 1.30%, 1.30%, 1.30%, 1.50%, 0.85%, 0.55%, and 0.65%, respectively until at least April 30, 2014. Without such fee waivers, for the six months ended June 30, 2013, the Total Annualized Fund Operating Expenses of the Westcore Blue Chip Dividend, Westcore Small-Cap Opportunity, Westcore Small-Cap Value Dividend, Westcore Micro-Cap Opportunity, Westcore International Small-Cap, Westcore Flexible Income, Westcore Plus Bond, and Westcore Colorado Tax-Exempt Funds would be 1.13%, 1.68%, 1.39%, 2.22%, 1.60%, 0.92%, 0.72%, and 0.79%, respectively.
Denver Investments as Adviser and Co-Administrator has contractually agreed to waive fees or reimburse expenses with respect to Institutional Class shares until at least April 30, 2014. Denver Investments will waive its investment advisory and/or administration fees and/or reimburse for all the ongoing class-specific expenses for the Institutional Class shares. Without such fee waivers, for the six months ended June 30, 2013, the Total Annualized Operating Expenses for the Institutional Class shares of the Westcore Growth, Westcore MIDCO Growth, Westcore Blue Chip Dividend, Westcore Small-Cap Opportunity, Westcore Small-Cap Value Dividend, Westcore Flexible Income and Westcore Plus Bond Funds would be 1.25%, 0.94%, 0.97%, 2.14%, 1.22%, 1.14% and 0.55%, respectively.
ALPS, pursuant to a Transfer Agency Agreement, serves as Transfer Agent for each of the Funds. As Transfer Agent, ALPS has, among other things, agreed to: (a) issue and redeem shares of the Funds; (b) make dividend and other distributions to shareholders of the Funds; (c) effect transfers of shares;
(d) mail communications to shareholders of the Funds, including account statements, confirmations, and dividend and distribution notices; (e) facilitate the electronic delivery of shareholder statements and reports and (f) maintain shareholder accounts. Under the Transfer Agency Agreement, ALPS receives from the Trust an annual minimum fee per Fund, a fee based upon each shareholder account and is reimbursed for out-of-pocket expenses.
Certain officers of the Funds are also officers of Denver Investments. All access persons of the Trust, as defined in the 1940 Act, and members, officers and employees of the Adviser, follow strict guidelines and policies on personal trading as outlined in the Trust’s and the Adviser’s respective Code of Ethics.
The Trustees have appointed a Chief Compliance Officer who is also the Treasurer of the Trust and an employee of the Adviser. The Trustees agreed to have the Funds pay the portion of his compensation attributable for services rendered as the Trust’s Chief Compliance Officer.
The Trust has a Trustee Deferred Compensation Plan (the “Deferral Plan”) which allows the Trustees to defer the receipt of all or a portion of Trustees fees. Under the Deferral Plan, any compensation deferred results in an equal adjustment to the Investment for/Payable for Trustee Deferred Compensation Plan on the Statement of Assets and Liabilities, as though an equivalent amount had been invested in shares of one or more Westcore Funds selected by the Trustee. The amount paid to the Trustees under the Deferral Plan will be determined based upon the performance of the selected funds. Deferral of Trustees’ fees under the Deferral Plan will not affect the net assets of the Fund.
Where a Fund owns 5% or more of the outstanding voting securities, either directly or indirectly, of a particular issuer, the 1940 Act deems such an issuer to be an “affiliate” of the Fund. As of June 30, 2013, Westcore International Small-Cap Fund owned 5% or more of the outstanding voting securities of the issuers identified in the table below and therefore those issuers would be deemed to be affiliates of that Fund for purposes of the 1940 Act.
| Share | | | Share | | | | | | |
| Balance at | | | Balance at | Market Value at | | | | | |
Security Name | January 1, 2013 | Purchases | Sales | June 30, 2013 | June 30, 2013 | | Dividends | Realized Loss | |
Credit Corp. Group Ltd. | | | | | | | | | | | |
(Australia) | 2,133,771 | 1,116,721 | 46,629 | 3,203,863 | $ | 27,542,972 | $ | 530,424 | $ | (26,867) | |
Pico Far East Holdings | | | – | | | | | | | – | |
Ltd. (Hong Kong) | 56,825,200 | 23,280,364 | 80,105,564 | | 27,163,006 | | 556,120 | | |
Prestige International | | – | – | | | | | | | – | |
Inc. (Japan) | 807,890 | 807,890 | | 10,483,509 | | 59,526 | | |
Total | 59,766,861 | 24,397,085 | 46,629 | 84,117,317 | $ | 65,189,487 | $ | 1,146,070 | $ | (26,867) | |
PAGE 93 |
|
| NOTES TO FINANCIAL STATEMENTS |
| |
6. FAIR VALUE MEASUREMENTS
A three-tier hierarchy has been established to measure fair value based on the extent of use of “observable inputs” as compared to “unobservable inputs” for disclosure purposes and requires additional disclosures about these valuations measurements. Inputs refer broadly to the assumptions that market participants would use in pricing a security. Observable inputs are inputs that reflect the assumptions market participants would use in pricing the security developed based on market data obtained from sources independent of the reporting entity. Unobservable inputs are inputs that reflect the reporting entity’s own assumptions about the assumptions market participants would use in pricing the security developed based on the best information available in the circumstances.
The three-tier hierarchy is summarized as follows:
1) Level 1 – Quoted & Unadjusted Prices in active markets for identical investments
2) Level 2 – Other Significant Observable Inputs (including quoted prices for similar investments, interest rates, prepayment speeds, credit risk, etc.)
3) Level 3 – Significant Unobservable Inputs (including the Fund’s own assumptions in determining the fair value of investments).
The following is a summary of the inputs used as of June 30, 2013 in valuing the Funds’ assets:
Westcore Growth Fund
Investments in Securities | Level 1 – Quoted and | Level 2 – Other Significant | Level 3 – Significant | |
at Value* | Unadjusted Prices | Observable Inputs | Unobservable Inputs | Total |
Common Stocks | $ | 68,225,265 | $ | – | $ | – | $ | 68,225,265 |
Money Market Mutual Funds | | 3,545,944 | | – | | – | | 3,545,944 |
Total | $ | 71,771,209 | $ | – | $ | – | $ | 71,771,209 |
Westcore MIDCO Growth Fund
Investments in Securities | Level 1 – Quoted and | Level 2 – Other Significant | Level 3 – Significant | |
at Value* | Unadjusted Prices | Observable Inputs | Unobservable Inputs | Total |
Common Stocks | $ | 103,900,291 | $ | – | $ | – | $ | 103,900,291 |
Money Market Mutual Funds | | 2,073,682 | | – | | – | | 2,073,682 |
Total | $ | 105,973,973 | $ | – | $ | – | $ | 105,973,973 |
Westcore Select Fund
Investments in Securities | Level 1 – Quoted and | Level 2 – Other Significant | Level 3 – Significant | | |
at Value* | Unadjusted Prices | Observable Inputs | Unobservable Inputs | | Total |
Common Stocks | $ | 119,420,720 | $ | – | $ | – | $ | 119,420,720 |
Total | $ | 119,420,720 | $ | – | $ | – | $ | 119,420,720 |
Westcore Blue Chip Dividend Fund
Investments in Securities | Level 1 – Quoted and | Level 2 – Other Significant | Level 3 – Significant | | |
at Value* | Unadjusted Prices | Observable Inputs | Unobservable Inputs | | Total |
Common Stocks | $ | 64,792,821 | $ | – | $ | – | $ | 64,792,821 |
Money Market Mutual Funds | | 3,024,732 | | – | | – | | 3,024,732 |
Total | $ | 67,817,553 | $ | – | $ | – | $ | 67,817,553 |
Westcore Mid-Cap Value Dividend Fund
Investments in Securities | Level 1 – Quoted and | Level 2 ��� Other Significant | Level 3 – Significant | | |
at Value* | Unadjusted Prices | Observable Inputs | Unobservable Inputs | | Total |
Common Stocks | $ | 45,074,659 | $ | – | $ | – | $ | 45,074,659 |
Money Market Mutual Funds | | 2,514,386 | | – | | – | | 2,514,386 |
Total | $ | 47,589,045 | $ | – | $ | – | $ | 47,589,045 |
PAGE 94 |
|
| NOTES TO FINANCIAL STATEMENTS |
Westcore Small-Cap Opportunity Fund
Investments in Securities | Level 1 – Quoted and | Level 2 – Other Significant | Level 3 – Significant | | |
at Value* | Unadjusted Prices | Observable Inputs | Unobservable Inputs | | Total |
Common Stocks | $ | 19,630,799 | $ | – | $ | – | $ | 19,630,799 |
Money Market Mutual Funds | | 205,367 | | – | | – | | 205,367 |
Total | $ | 19,836,166 | $ | – | $ | – | $ | 19,836,166 |
Westcore Small-Cap Value Dividend Fund
Investments in Securities | Level 1 – Quoted and | Level 2 – Other Significant | Level 3 – Significant | | |
at Value* | Unadjusted Prices | Observable Inputs | Unobservable Inputs | | Total |
Common Stocks | $ | 289,425,115 | $ | – | $ | – | $ | 289,425,115 |
Money Market Mutual Funds | | 4,987,532 | | – | | – | | 4,987,532 |
Total | $ | 294,412,647 | $ | – | $ | – | $ | 294,412,647 |
Westcore Micro-Cap Opportunity Fund
Investments in Securities | Level 1 – Quoted and | Level 2 – Other Significant | Level 3 – Significant | | |
at Value* | Unadjusted Prices | Observable Inputs | Unobservable Inputs | | Total |
Common Stocks | $ | 12,499,729 | $ | – | $ | – | $ | 12,499,729 |
Money Market Mutual Funds | | 246,836 | | – | | – | | 246,836 |
Total | $ | 12,746,565 | $ | – | $ | – | $ | 12,746,565 |
Westcore International Small-Cap Fund
Investments in Securities | Level 1 – Quoted and | Level 2 – Other Significant | Level 3 – Significant | | |
at Value* | Unadjusted Prices | Observable Inputs | Unobservable Inputs | | Total |
Common Stocks | $ | 384,964,297 | $ | – | $ | – | $ | 384,964,297 |
Money Market Mutual Funds | | 23,449,658 | | – | | – | | 23,449,658 |
Total | $ | 408,413,955 | $ | – | $ | – | $ | 408,413,955 |
Other Financial Instruments** | | | | | | | |
Assets: | | | | | | | | |
Forward Foreign | | | | | | | | |
Currency Contracts | $ | – | $ | 3,207,765 | $ | – | $ | 3,207,765 |
Liabilities: | | | | | | | | |
Forward Foreign | | | | | | | | |
Currency Contracts | | – | | (5,363,678) | | – | | (5,363,678) |
Total | $ | – | $ | (2,155,913) | $ | – | $ | (2,155,913) |
Westcore Flexible Income Fund | | | | | | | |
| | | | |
Investments in Securities | Level 1 – Quoted and | Level 2 – Other Significant | Level 3 – Significant | | |
at Value* | Unadjusted Prices | Observable Inputs | Unobservable Inputs | | Total |
Convertible Preferred Stocks | $ | 1,313,352 | $ | – | $ | – | $ | 1,313,352 |
Nonconvertible Preferred Stocks | | 2,227,896 | | – | | 1,846,687 | | 4,074,583 |
Corporate Bonds | | – | | 56,748,370 | | 1,976,606 | | 58,724,976 |
Money Market Mutual Funds | | 450,148 | | – | | – | | 450,148 |
Commercial Mortgage-Backed | | | | | | | | |
Securities & Residential | | | | | | | | |
Mortgage-Backed Securities | | – | | 1,974,797 | | – | | 1,974,797 |
Total | $ | 3,991,396 | $ | 58,723,167 | $ | 3,823,293 | $ | 66,537,856 |
PAGE 95 |
|
| NOTES TO FINANCIAL STATEMENTS |
| |
Westcore Plus Bond Fund
Investments in Securities | Level 1 – Quoted and | Level 2 – Other Significant | Level 3 – Significant | | |
at Value* | Unadjusted Prices | Observable Inputs | Unobservable Inputs | | Total |
Nonconvertible Preferred Stocks | $ | 844,815 | $ | 1,159,219 | $ | 2,388,750 | $ | 4,392,784 |
Corporate Bonds | | – | | 809,044,365 | | 18,910,319 | | 827,954,684 |
Municipal Bonds | | – | | 15,781,516 | | – | | 15,781,516 |
Asset-Backed Securities, Col- | | | | | | | | |
lateralized Debt Obligations, | | | | | | | | |
Commercial Mortgage- | | | | | | | | |
Backed Securities, Residential | | | | | | | | |
Mortgage-Backed Securities, | | | | | | | | |
& Agency Mortgage-Backed | | | | | | | | |
Securities | | – | | 557,805,333 | | 6,186,679 | | 563,992,012 |
U.S. Government & Agency | | | | | | | | |
Obligations | | – | | 65,948 | | – | | 65,948 |
U.S. Treasury Bonds & Notes | | 106,319,946 | | – | | – | | 106,319,946 |
Money Market Mutual Funds | | 3,326,101 | | – | | – | | 3,326,101 |
Total | $ | 110,490,862 | $ | 1,383,856,381 | $ | 27,485,748 | $ | 1,521,832,991 |
Westcore Colorado Tax-Exempt Fund
Investments in Securities | Level 1 – Quoted and | Level 2 – Other Significant | Level 3 – Significant | | |
at Value* | Unadjusted Prices | Observable Inputs | Unobservable Inputs | | Total |
Municipal Bonds | $ | – | $ | 128,252,750 | $ | – | $ | 128,252,750 |
Money Market Mutual Funds | | 2,826,173 | | – | | – | | 2,826,173 |
Total | $ | 2,826,173 | $ | 128,252,750 | $ | – | $ | 131,078,923 |
* For detailed Industry descriptions, see the accompanying Statements of Investments.
** Other financial instruments are derivative instruments not reflected in the Statements of Investments.
It is the Funds’ policy to recognize transfers into and out of all levels at the end of the reporting period. The Westcore International Small-Cap Fund utilizes a fair value evaluation service with respect to international securities with an earlier market closing than the Fund’s net asset value computation cutoff. When events trigger the use of the fair value evaluation service on a reporting period date, it results in certain securities transferring from a Level 1 to a Level 2 classification. The transfer amount disclosed in the table below represents the value of the securities as of June 30, 2013 transferred in/(out) of Level 1 and Level 2 during the reporting period that were also held as of December 31, 2012.
| | Level 1 - Quoted and Unadjusted Prices | | Level 2 - Other Significant Observable Inputs |
| | Transfers In | Transfers (Out) | | Transfers In | | | Transfers (Out) |
Westcore International Small-Cap Fund - | | | | | | | | |
Common Stocks | $ | 296,403,218 | $ | – | $ | – | $ | 296,403,218 |
Total | $ | 296,403,218 | $ | – | $ | – | $ | 296,403,218 |
All securities of the Funds, except for Westcore Flexible Income and Plus Bond Funds, were valued using either Level 1 or Level 2 inputs during the six months ended June 30, 2013. Thus a reconciliation of assets in which significant unobservable inputs (Level 3) were used is not applicable for these Funds.
The following is a reconciliation of assets in which significant unobservable inputs (Level 3) were used in determining fair value:
Westcore Flexible Income Fund
| | | | | | | | | | | | Net change in unrealized |
| | | | | | | Change in | | | | | appreciation/ (depreciation) included |
| Balance as of | | Accrued | | | unrealized | | | | | in the Statement of Operations |
| December 31, | | discount/ | Realized | appreciation/ | | Sales | Balance as of | attributable to level 3 investments |
Investments in Securities | | 2012 | | premium | gain/(loss)* | (depreciation)* | | proceeds | June 30, 2013 | held at June 30, 2013 |
Corporate Bonds | $ | 2,130,488 | $ | 4,758 | $(1,702,174) | $ | 1,672,082 | $ | (128,548) | $ | 1,976,606 | $ | (49,437) |
Nonconvertible | | | | | | | | | | | | | |
Preferred Stocks | | 1,688,400 | | – | – | | 158,287 | | – | | 1,846,687 | | 158,287 |
Total | $ | 3,818,888 | $ | 4,758 | $(1,702,174) | $ | 1,830,367 | $ | (128,548) | $ | 3,823,293 | $ | 108,851 |
PAGE 96 |
|
| NOTES TO FINANCIAL STATEMENTS |
| |
Westcore Plus Bond Fund
| | | | | | | | | | | | | | Net change in unrealized |
| | | | | | | | | | | | | | appreciation/ (depreciation) |
| | | | | | Change in | | | | | | | included in the Statement of |
| Balance as of | Accrued | | | unrealized | | | | | | | Operations attributable to |
| December 31, | discount/ | Realized | appreciation/ | | Sales | Transfer into | Balance as of | level 3 investments held |
Investments in Securities | 2012 | premium | gain/(loss)* | (depreciation)* | | proceeds | Level 3 | June 30, 2013 | at June 30, 2013 |
Corporate Bonds | $ | 19,606,306 | $ | 8,809 | $ | (610,477) | $ | 214,821 | $ | (309,140) | $ | – | $ | 18,910,319 | $ | (148,769) |
Nonconvertible | | | | | | | | | | | | | | | | |
Preferred Stocks | | 2,184,000 | | – | | – | | 204,750 | | – | | – | | 2,388,750 | | 204,750 |
Asset-Backed Securities, | | | | | | | | | | | | | | | | |
Collateralized | | | | | | | | | | | | | | | | |
Debt Obligations, | | | | | | | | | | | | | | | | |
Commercial Mortgage- | | | | | | | | | | | | | | | | |
Backed Securities, | | | | | | | | | | | | | | | | |
Residential Mortgage- | | | | | | | | | | | | | | | | |
Backed Securities & | | | | | | | | | | | | | | | | |
Agency Mortgage- | | | | | | | | | | | | | | | | |
Backed Securities | | – | | – | | – | | – | | – | | 6,186,679 | | 6,186,679 | | (74,178) |
Total | $ | 21,790,306 | $ | 8,809 | $ | (610,477) | $ | 419,571 | $ | (309,140) | $ | 6,186,679 | $ | 27,485,748 | $ | (18,197) |
* Net realized gain/(loss) and net unrealized appreciation/(depreciation) are included in the related amounts in the Statement of Operations.
The inputs or methodologies used for valuing securities are not necessarily an indication of the risk associated with investing in those securities.
For fair value measurements using significant other observable inputs (Level 2), the Funds generally utilize an independent pricing service which utilizes evaluated pricing models that vary by asset class and incorporate available trade, bid and other market information, and for structured securities also incorporate cash flow and, when available, loan performance data. The independent pricing service’s evaluated pricing models apply available market information through processes such as benchmark curves, benchmarking of similar securities, and sector groupings. For certain securities, the independent pricing service uses model processes, such as the Option Adjusted Spread (benchmark driven) model, to assess interest rate impact and develop prepayment scenarios. With respect to trades and bids, the independent pricing service reviews the lot size to determine whether the information is representative of an orderly trading market. If the independent pricing service determines that trade or bid information is not consistent with other information available, the trade or bid will not be reflected in the evaluated price.
In the event the independent pricing service is unable to provide an evaluated price for a security or Denver Investments believes the price provided is not reliable, securities of the Funds may be valued in good faith as described above in Note 2. In these instances, the compliance department will typically seek input from the investment team of the Fund since they are typically the most knowledgeable of the relevant factors in valuing the securities. Denver Investments may seek to find an alternative independent source, such as a broker/dealer to provide a price quote, or by using evaluated pricing models similar to the techniques and models used by the independent pricing service. These fair value measurement techniques may utilize unobservable inputs (Level 3). The Westcore Plus Bond Fund transferred one security from Level 2 to Level 3 because of a decrease in observable market activity and information.
At least quarterly, Denver Investments receives a report on the pricing for all fair valued securities during the period along with any actual sales prices, broker quotes and/or pricing from the independent pricing service. Denver Investments uses this information to analyze changes in fair value measurements over the period and as a back test of pricing methods.
Then on at least a quarterly basis, Denver Investments presents the factors considered in determining the fair value measurements and presents that information to the Audit Committee which meets at least quarterly. The Audit Committee then will provide a recommendation to the Board for approval of the fair value measurements.
PAGE 97 |
|
| NOTES TO FINANCIAL STATEMENTS |
| |
The table below provides additional information about the Level 3 Fair Value Measurements as of June 30, 2013:
Westcore Flexible Income Fund | | | | | | |
Quantitative Information about | | Fair Value | | | | |
Level 3 Fair Value Measurements | | at 6/30/2013 | Valuation Technique | Unobservable Input | Level/Range | |
Nonconvertible Preferred Stocks | $ | 1,846,687 | Consensus Pricing** | Broker Quotes | N/A | |
Corporate Bonds | | 1,976,606 | Adjusted Spread Pricing* | Comparability Adjustment | 1.71% | |
| | |
| | | | Liquidity Adjustment | 0.85% | |
| | 0 | Consensus Pricing** | Broker Quotes | N/A | |
Total | $ | 3,823,293 | | | | |
| | | | | | |
Westcore Plus Bond Fund | | | | | | |
Quantitative Information about | | Fair Value | | | | |
Level 3 Fair Value Measurements | | at 6/30/2013 | Valuation Technique | Unobservable Input | Level/Range | |
Nonconvertible Preferred Stocks | $ | 2,388,750 | Consensus Pricing** | Broker Quotes | N/A | |
Corporate Bonds | | 25,096,998 | Adjusted Spread Pricing* | Comparability Adjustment | 1.71% | |
| | |
| | | | Liquidity Adjustment | 0.85% | |
| | 0 | Consensus Pricing** | Broker Quotes | N/A | |
Total | $ | 27,485,748 | | | | |
| * | Denver Investments identifies comparable security(ies) and obtains market observable spreads to Treasuries, and then adjusts for appropriate comparability or liquidity adjustments. |
| | |
| ** | Denver Investments seeks up to three independent price quotes, but in certain cases only one may be available. Denver Investments evaluates whether the source of the pricing uses valuation techniques in accordance with ASC topic 820 by developing an internal reasonableness check. For those quotes that are considered reasonable, quantitative unobservable inputs are not developed by Denver Investments. |
7. FOREIGN CURRENCY EXCHANGE CONTRACTS
The Westcore International Small-Cap Fund may purchase or sell foreign currencies on a “spot” or cash basis at the prevailing rate in the foreign currency exchange market to settle investment transactions in the proper currency. In addition, this Fund may purchase or sell forward currency contracts to adjust the portfolio’s exposure to different currencies consistent with the investment team’s targets, which consider the currency weightings within the Fund’s benchmark index.
When entering into a spot or forward foreign currency contract, the Fund agrees to receive or deliver a fixed quantity of foreign currency for an agreed upon price on an agreed future date. These contracts are valued at each portfolio valuation, and the Fund’s net equity therein, representing unrealized gain or loss on the contracts as measured by the difference between the spot or forward foreign exchange rates at the dates of entry into the contracts and the spot or forward rates at the reporting date, is included in the statement of assets and liabilities. Realized and unrealized gains and losses are included in the statement of operations. These instruments involve credit risk and market risk in excess of the amount recognized in the statement of assets and liabilities. Risks arise from the possible inability of counterparties to meet the terms of their contracts and from movement in currency exchange rates.
The Fund must segregate assets determined to be liquid in accordance with procedures established by the Board of Trustees, or otherwise cover its position in a permissible manner.
The number of forward foreign currency contracts held at June 30, 2013 as disclosed at the end of the Statement of Investments is representative of activity during the six months ended June 30, 2013.
The effect of derivative instruments on the Statement of Assets and Liabilities as of June 30, 2013 is as follows:
| | Asset Derivatives | Liability Derivatives |
| Statement of Assets and | | | | |
Risk Exposure | Liabilities Location | Unrealized Appreciation | Unrealized Depreciation |
Westcore International Small-Cap Fund | | | | | |
Forward Foreign Currency Contracts | Unrealized gain (loss) on forward currency contracts | $ | 3,207,765 | $ | (5,363,678) |
Total | | $ | 3,207,765 | $ | (5,363,678) |
PAGE 98 |
|
| NOTES TO FINANCIAL STATEMENTS |
| |
The effect of derivative instruments on the Statement of Operations for the six months ended June 30, 2013 is as follows:
Risk Exposure | Statement of Operations Location | | |
Westcore International Small-Cap Fund | | | |
Forward Foreign Currency Contracts | Net realized gain on foreign currency transactions | $ | 2,652,947 |
| Net change in unrealized depreciation on translation of | | |
Forward Foreign Currency Contracts | assets and liabilities denominated in foreign currencies | | (1,980,480) |
Total | | $ | 672,467 |
8. PURCHASES AND SALES OF INVESTMENTS
Investment transactions for the six months ended June 30, 2013 excluding long-term U.S. government securities and short-term investments were as follows:
| | Cost of Investments | | Proceeds from |
Fund | | Purchased | | Investments Sold |
Westcore Growth Fund | $ | 63,695,259 | $ | 71,153,226 |
Westcore MIDCO Growth Fund | | 63,196,864 | | 81,042,834 |
Westcore Select Fund | | 83,130,480 | | 162,911,041 |
Westcore Blue Chip Dividend Fund | | 48,070,713 | | 51,160,442 |
Westcore Mid-Cap Value Dividend Fund | | 12,628,809 | | 12,558,812 |
Westcore Small-Cap Opportunity Fund | | 7,598,099 | | 8,434,608 |
Westcore Small-Cap Value Dividend Fund | | 64,382,741 | | 127,916,492 |
Westcore Micro-Cap Opportunity Fund | | 12,398,479 | | 3,736,308 |
Westcore International Small-Cap Fund | | 205,154,435 | | 127,041,817 |
Westcore Flexible Income Fund | | 5,586,921 | | 15,663,792 |
Westcore Plus Bond Fund | | 352,904,878 | | 448,356,188 |
Westcore Colorado Tax-Exempt Fund | | 18,326,771 | | 24,606,365 |
| | | | |
Purchases and sales of long-term U.S. government securities for the six months ended June 30, 2013, were as follows:
| | Cost of Investments | | Proceeds from |
Fund | | Purchased | | Investments Sold |
Westcore Plus Bond Fund | $ | 51,423,494 | $ | 147,721,762 |
| | | | |
PAGE 99 |
|
Westcore Trustees and Officers:
Mary K. Anstine, Chairman
John A. DeTore, Trustee
Rick A. Pederson, Truste
James A. Smith, Trustee
Douglas M. Sparks, Trustee
Janice M. Teague, Trustee
Todger Anderson, President
Jasper R. Frontz, Treasurer & Chief Compliance Officer
John H. Moore, Asst. Treasurer
David T. Buhler, Secretary
Item 2. | Code of Ethics. |
| |
| Not applicable to semi-annual report. |
| |
Item 3. | Audit Committee Financial Expert. |
| |
| Not applicable to semi-annual report. |
| |
Item 4. | Principal Accountant Fees and Services. |
| |
| Not applicable to semi-annual report. |
| |
Item 5. | Audit Committee of Listed Registrants. |
| |
| Not applicable. |
| |
Item 6. | Investments. |
| |
| a) | Schedule of Investments in securities of unaffiliated issuers as of the close of the reporting period is included as part of the Reports to Stockholders filed under Item 1 of this form. |
| | |
| b) | Not applicable. |
| |
Item 7. | Disclosure of Proxy Voting Policies and Procedures for Closed-End Management Investment Companies. |
| |
| Not applicable. |
| |
Item 8. | Portfolio Managers of Closed-End Management Investment Companies. |
| |
| Not applicable. |
| |
Item 9. | Purchases of Equity Securities by Closed-End Management Investment Company and Affiliated Purchasers. |
| |
| Not applicable. |
| |
Item 10. | Submission of Matters to a Vote of Security Holders. |
| |
| There have been no material changes to the procedures by which shareholders may recommend nominees to the registrant’s Board of Trustees. |
Item 11. | Controls and Procedures. |
| | |
| (a) | The registrant’s principal executive officer and principal financial officer have concluded that the registrant’s disclosure controls and procedures (as defined in Rule 30a-3(c) under the Investment Company Act of 1940, as amended) (the “1940 Act”) (17 CFR 270.30a-3(e)) are effective based on their evaluation of these controls and procedures required by Rule 30a-3(b) under the 1940 Act (17 CFR 270.30a-3(b)) and Rules 13a-15(b) or 15d-15(b) under the Securities Exchange Act of 1934 (17 CFR 240.13a-15(b) or 240.15d-15(b)) as of a date within 90 days of the filing date of this report. |
| | |
| (b) | There was no change in the registrant’s internal control over financial reporting (as defined in Rule 30a-3(d) under the 1940 Act (17 CFR 270.30a-3(d)) that occurred during the second fiscal quarter of the period covered by this report that has materially affected, or is reasonably likely to materially affect, the registrant's internal control over financial reporting. |
| | |
Item 12. | Exhibits. | |
| | |
| (a)(1) | Not applicable to semi-annual report. |
| | |
| (a)(2) | The certifications required by Rule 30a-2(a) of the 1940 Act (17 CFR 270.30a-2(a)) and Section 302 of the Sarbanes-Oxley Act of 2002 are attached hereto as EX-99.CERT. |
| | |
| (a)(3) | Not applicable. |
| | |
| (b) | The certifications required by Rule 30a-2(b) of the 1940 Act (17 CFR 270.30a-2(b)) and Section 906 of the Sarbanes-Oxley Act of 2002 are attached hereto as EX-99.906CERT. |
SIGNATURES
Pursuant to the requirements of the Securities Exchange Act of 1934 and the Investment Company Act of 1940, the registrant has duly caused this report to be signed on its behalf by the undersigned, thereunto duly authorized.
WESTCORE TRUST
By: | /s/ Todger Anderson | |
| Todger Anderson | |
| President/Principal Executive Officer | |
| | |
Date: | September 6, 2013 | |
Pursuant to the requirements of the Securities Exchange Act of 1934 and the Investment Company Act of 1940, this report has been signed below by the following persons on behalf of the registrant and in the capacities and on the dates indicated.
By: | /s/ Todger Anderson | |
| Todger Anderson | |
| President/Principal Executive Officer | |
| | |
Date: | September 6, 2013 | |
By: | /s/ Jasper R. Frontz | |
| Jasper R. Frontz | |
| Treasurer/Principal Financial Officer | |
| | |
Date: | September 6, 2013 | |