UNITED STATES
SECURITIES AND EXCHANGE COMMISSION
Washington, D.C. 20549
FORM N-CSR
CERTIFIED SHAREHOLDER REPORT OF REGISTERED
MANAGEMENT INVESTMENT COMPANIES
Investment Company Act file number: 811-3373
Westcore Trust
(exact name of registrant as specified in charter)
1290 Broadway, Suite 1100, Denver, Colorado 80203
(Address of principal executive offices) (Zip code)
Richard C. Noyes, Secretary
Westcore Trust
1290 Broadway, Suite 1100, Denver, Colorado 80203
(Name and address of agent for service)
Registrant’s telephone number, including area code: 303-623-2577
| Date of fiscal year end: | December 31 |
| Date of reporting period: | January 1, 2017 – June 30, 2017 |
| Item 1. | Reports to Stockholders. |
Table of Contents
| SHAREHOLDER LETTER | 1 |
| FUND OVERVIEWS | |
| Westcore Small‐Cap Growth Fund | 2 |
| Westcore Small‐Cap Growth Fund II | 4 |
| Westcore Mid‐Cap Value Dividend Fund | 6 |
| Westcore Mid‐Cap Value Dividend Fund II | 8 |
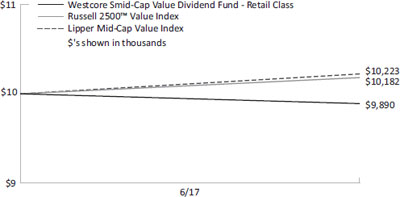
| Westcore Smid‐Cap Value Dividend Fund | 10 |
| Westcore Small‐Cap Value Dividend Fund | 12 |
| Westcore Global Large‐Cap Dividend Fund | 14 |
| Westcore Large‐Cap Dividend Fund | 16 |
| Westcore Micro‐Cap Opportunity Fund | 18 |
| Westcore International Small‐Cap Fund | 20 |
| Westcore Flexible Income Fund | 22 |
| Westcore Plus Bond Fund | 24 |
| Westcore Municipal Opportunities Fund | 26 |
| Westcore Colorado Tax‐Exempt Fund | 28 |
| FUND EXPENSES | 30 |
| IMPORTANT DISCLOSURES | 34 |
| FINANCIAL STATEMENTS | 39 |
| Statements of Investments | 39 |
| Statements of Assets and Liabilities | 86 |
| Statements of Operations | 89 |
| Statements of Changes in Net Assets | 92 |
| Financial Highlights | 97 |
| Notes to Financial Statements | 123 |
Semi-Annual Report | June 30, 2017 |  | |
Intentionally Left Blank
| Westcore Funds | Shareholder Letter |
June 30, 2017 (Unaudited)
Dear Fellow Shareholders,
Equity markets showed strength across the board in the first six months of 2017. The S&P 500® Index and the Dow Jones Industrial Average each rose more than 9%, the Nasdaq Composite Index gained 14.07%, and international stocks, as represented by the MSCI ACWI Index, gained 11.48%. Various factors contributed to the strong first half, including improving economies, strengthening corporate earnings, and low volatility in the U.S., European, and Asian stock markets.
Many sectors performed well on the domestic front. The health care, industrials, and financials sectors produced positive returns. Financial stocks in the S&P 500® Index have led all sectors since the Presidential election. Another positive sector was information technology, which fueled the Nasdaq. On the downside, energy and telecommunication services posted negative returns for both the second quarter and year‐to‐date. In the first half, stocks of larger companies performed better than stocks of smaller companies, and growth outperformed value.
U.S. bond yields declined even as the Federal Reserve increased the short‐term federal‐funds target rate two times this year. The second increase, which occurred in June, pushed the rate up another 0.25% and marked the fourth rate hike since the end of 2015. These rate increases reflect the Fed’s apparent view that economic growth will continue and inflation is likely to rise. However, skepticism remains in the markets. U.S. inflation measures dropped from 1.8% in February to 1.4% in June, both of which are short of the Federal Reserve’s desired goal of 2%. Weaker measures of inflation, such as these, can cause bond yields to decline, and when that occurs, bond prices rise. Given this environment in the first half of the year, U.S. bonds generally produced stable to slightly positive returns.
The municipal bond market saw yields decrease during the second quarter. The 10‐year AAA rated municipal bond yield fell from 2.25% to 1.96%.
As noted above, international markets performed well in the first six months of the year. Investors focused on signs of global economic recovery while keeping a watchful eye on the intentions signaled by central banks. Increased demand strengthened foreign currencies and as they grew stronger, the U.S. dollar weakened.
For more information on the first half of the year and how your Westcore Funds performed, please see the following pages. In addition, the Westcore Fund family is very proud of recent awards received by our value and fixed income funds. To learn more about these awards, please visit our website at www.westcore.com.
As we navigate these ever‐changing markets, you, our shareholders, are our priority.
Thank you for investing in the Westcore Funds.
| | |
Mary K. Anstine
Chairman | Janice M. Teague
President | |
The views of the author and information discussed in the shareholder letter and the manager commentaries are as of the date of publication, are subject to change, and may not reflect the writer’s current views. The views expressed represent an assessment of market conditions at a specific point in time, are opinions only and should not be relied upon as investment advice regarding a particular investment or markets in general. Such information does not constitute a recommendation to buy or sell specific securities or investment vehicles. It should not be assumed that any investment will be profitable or will equal the performance of the fund or any securities or any sectors mentioned in this letter or the manager commentaries. The subject matter contained in this letter and the manager commentaries has been derived from several sources believed to be reliable and accurate at the time of compilation. Neither Denver Investments, Westcore Funds, nor any Westcore Fund accept any liability for losses either direct or consequential caused by the use of this information. Diversification cannot guarantee gain or prevent losses.
Semi-Annual Report | June 30, 2017 | | 1 |
| Westcore Small-Cap Growth Fund | Fund Overview |
June 30, 2017 (Unaudited)
Fund Strategy
Investing in a diversified portfolio of equity securities of primarily small-sized companies with growth potential.
Fund Management
Brian C. Fitzsimons, CFA Portfolio Manager
Mitch S. Begun, CFA Portfolio Manager
Adam C. Bliss Portfolio Manager
CFA is a trademark owned by CFA Institute.
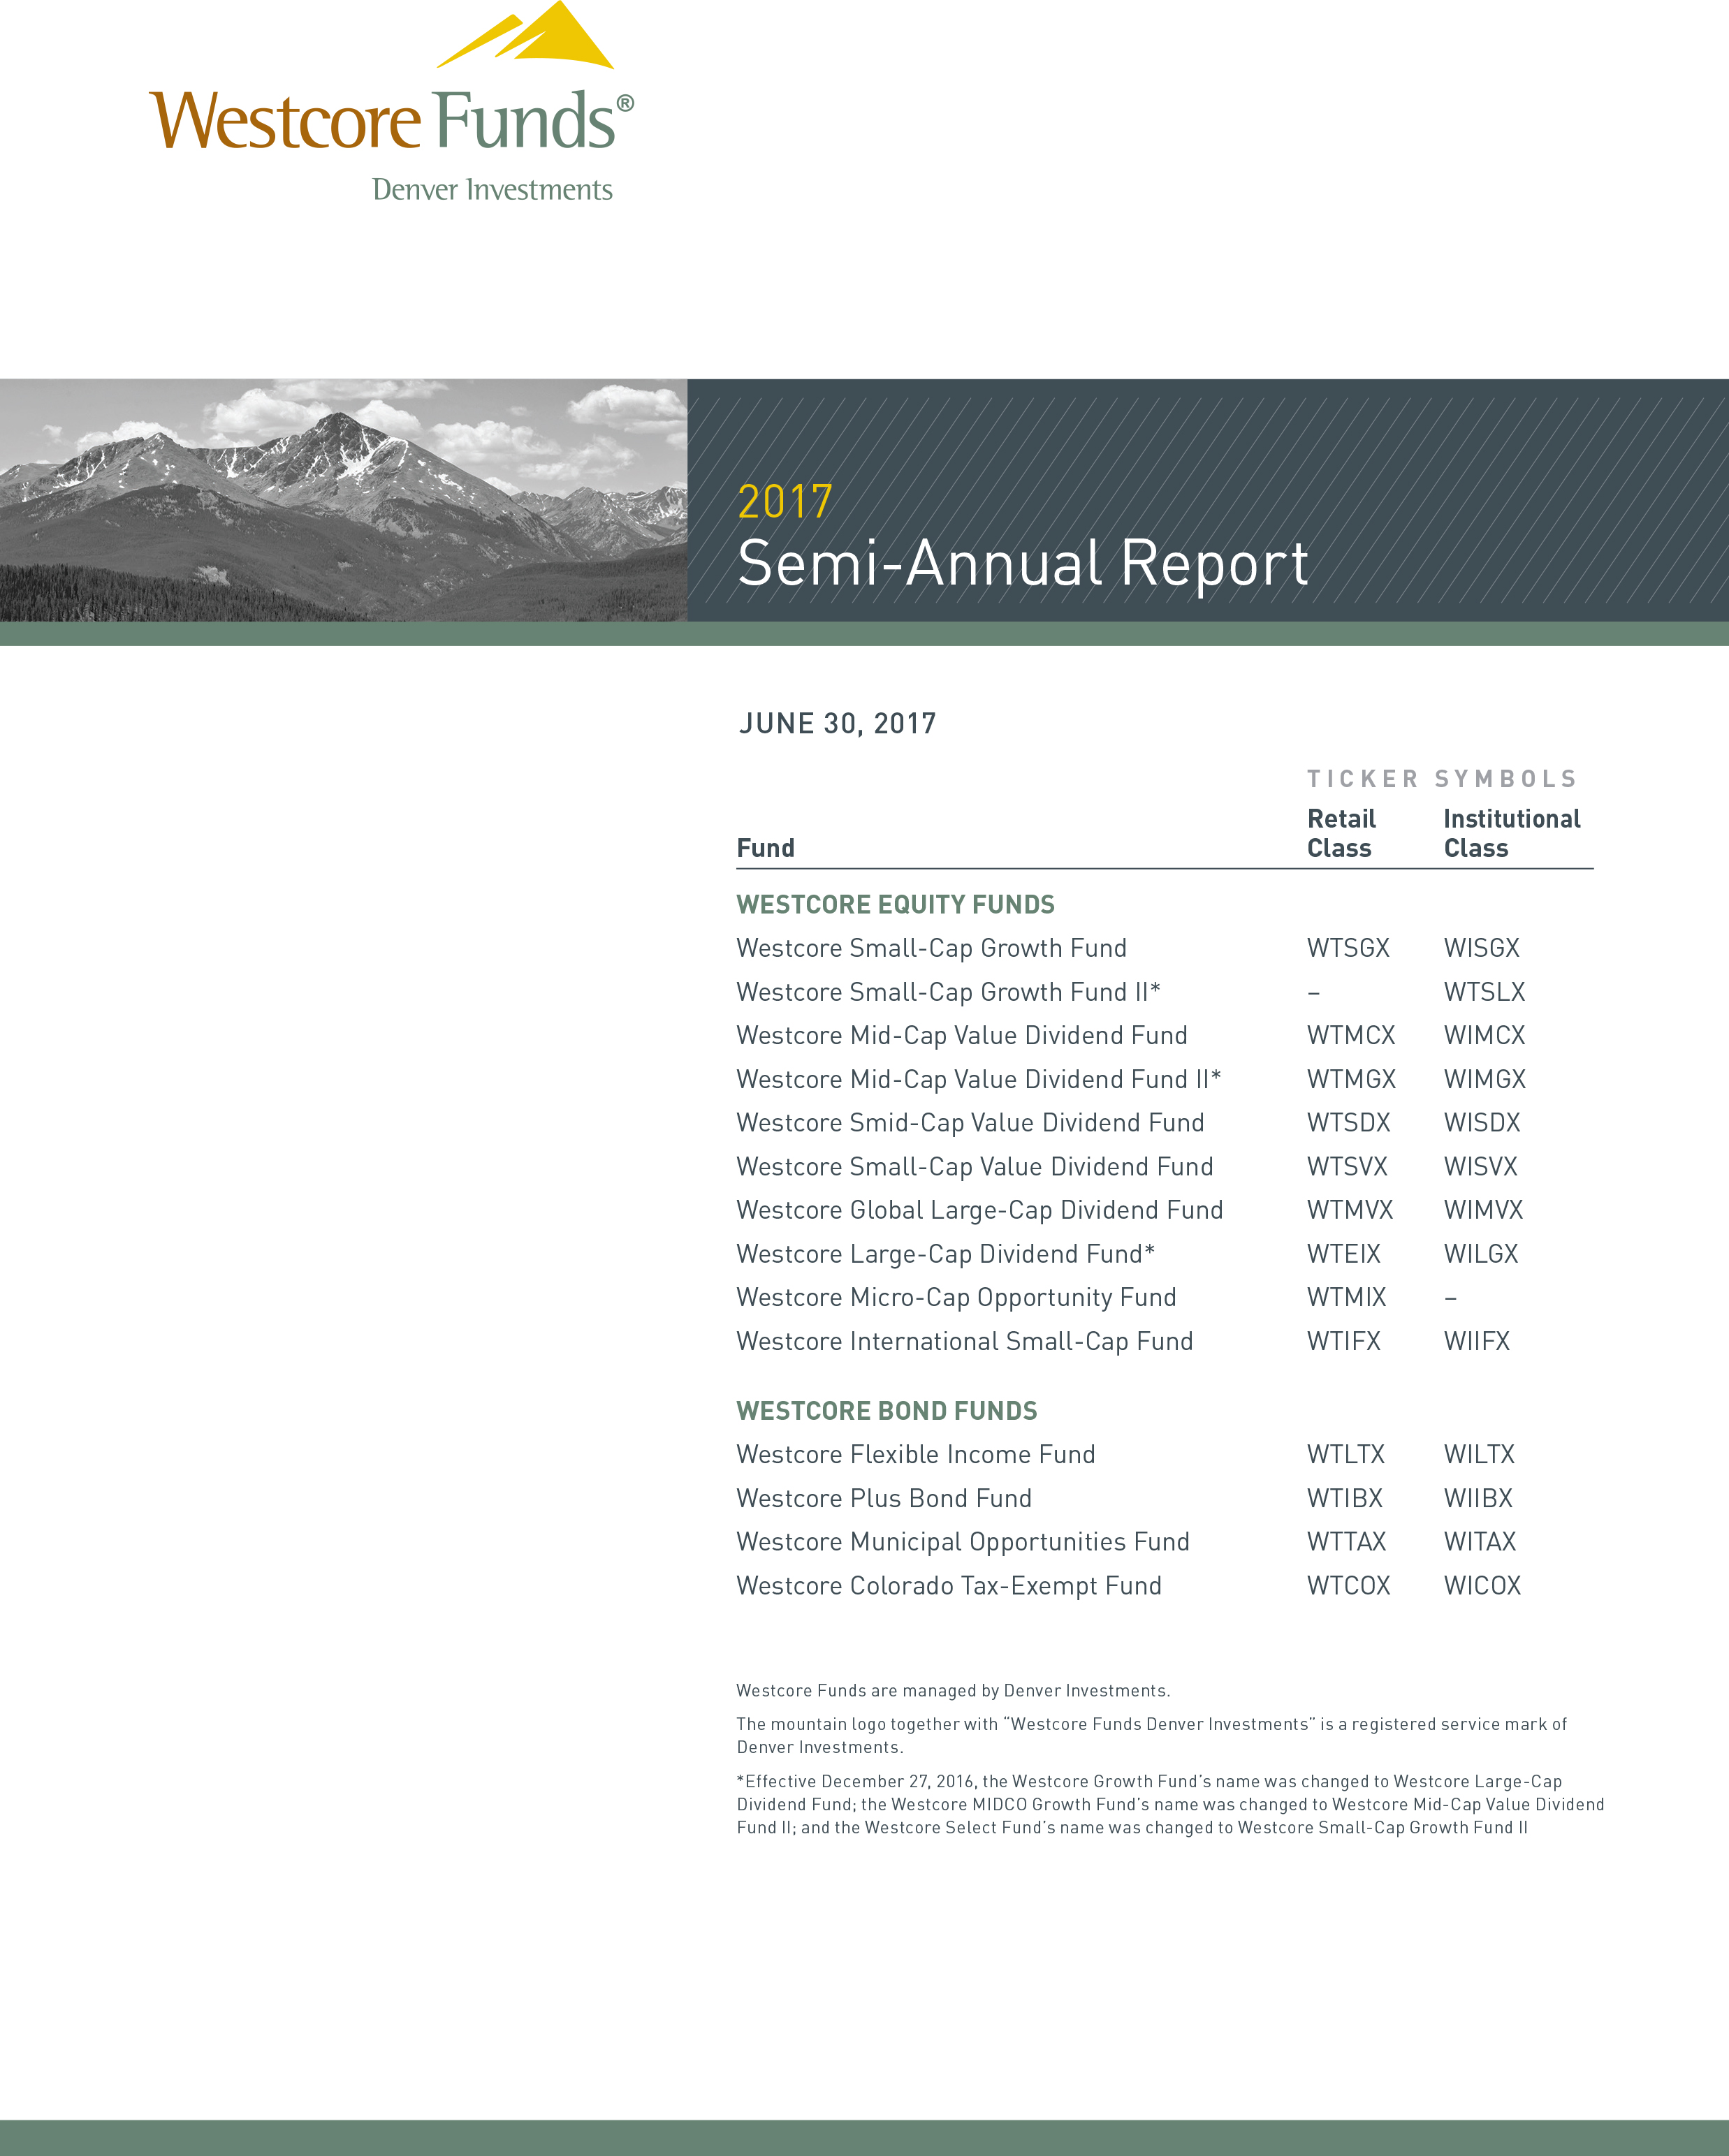
Cumulative Returns
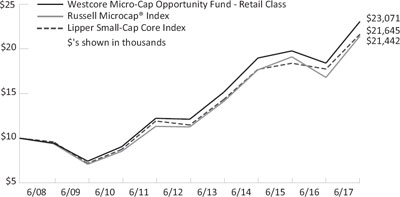
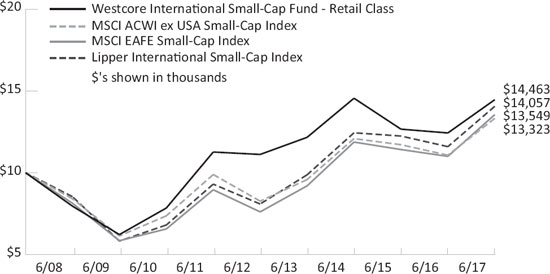
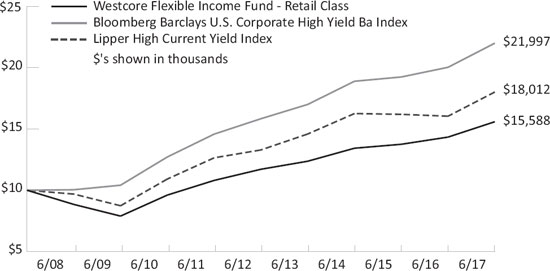
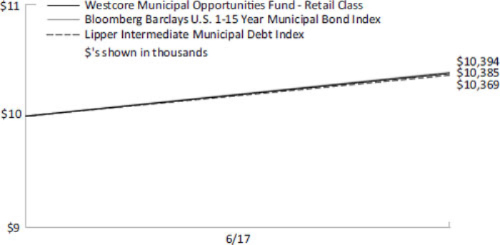
The chart above represents historical performance of a hypothetical investment of $10,000 in the Fund over the past 10 years (or for the life of the Fund if shorter). Performance calculations are as of the end of June each year. Past performance does not guarantee future results. This chart does not reflect the deduction of taxes that a shareholder would pay on Fund distributions or the redemption of Fund shares.
Lipper Index data provided by Lipper, Inc.
Please see index definitions beginning on page 34.
Average Annual Total Returns
| | 6 Months | 1 Year | 3 Years | 5 Years | 10 Years | Since Inception | Inception Date |
| Retail Class (WTSGX) | 15.89% | 29.44% | 6.86% | – | – | 6.85% | 12/20/2013 |
| Institutional Class (WISGX) | 15.88 | 29.64 | 7.25 | – | – | 7.21 | 12/20/2013 |
Russell 2000® Growth Index | 9.97 | 24.40 | 7.64 | – | – | 7.62 | |
| Lipper Small-Cap Growth Index | 10.98 | 20.55 | 6.56 | – | – | 5.97 | |
Retail Class Annual Expense Ratio (per the current prospectus) — Gross: 5.93%, Net: 1.24% Institutional Class Annual Expense Ratio (per the current prospectus) — Gross: 2.63%, Net: 0.99%
Sector Allocation(as of 6/30/17)
| Information Technology | 24.0% |
| Health Care | 19.4 |
| Consumer Discretionary | 18.6 |
| Industrials | 13.3 |
| Financials | 8.9 |
| Energy | 4.0 |
| Materials | 2.8 |
| Consumer Staples | 2.5 |
| Real Estate | 1.9 |
| Telecommunication Services | 1.8 |
Sector classifications presented herein are based on the sector categorization methodology of the Adviser to the Funds which may result in the sector designations for one Fund being different than another Fund’s sector designations. For Fund compliance purposes, the Fund’s industry classifications refer to any one or more of the industry sub-classifications used by one or more widely recognized market indexes or ratings group indexes, and/or as defined by Fund management. This definition may not apply for purposes of this report, which may combine industry sub-classifications for reporting ease. Industries are shown as a percentage of net assets.
The sector allocation table above does not include any cash or cash equivalents.
Top Ten Holdings (as of 6/30/17)
| Advisory Board Co. | 2.7% |
| Monolithic Power Systems, Inc. | 2.6 |
| Evercore Partners, Inc. | 2.3 |
| EPAM Systems, Inc. | 2.2 |
| Envestnet, Inc. | 2.1 |
| Acadia Healthcare Co., Inc. | 2.1 |
| Live Nation Entertainment, Inc. | 2.0 |
| PolyOne Corp. | 2.0 |
| Vail Resorts, Inc. | 2.0 |
| Globant SA | 1.9 |
| Total (% of Net Assets) | 21.8% |
Top ten holdings do not include any cash, cash equivalents or exchange traded fund investments. Holdings are subject to change and may not reflect the current or future position of the Fund.
Performance data quoted represents past performance and does not guarantee future results. Current performance may be lower or higher than the performance quoted. To obtain current performance as of the most recent month-end, visit www.westcore.com. Average annual total returns reflect the reinvestment of dividends, capital gains distributions, all fee waivers and expense reimbursements. Without the fee waivers and expense reimbursements, total return figures would have been lower. Investment return and principal value will vary, and shares, when redeemed, may be worth more or less than their original cost. Westcore fund shares are not insured by the FDIC, the Federal Reserve Board or any other agency and are subject to investment risk.
Denver Investments (the “Adviser”) has contractually agreed to waive certain investment advisory and/or administration fees and/or to reimburse other expenses from April 30, 2017 until at least April 30, 2018. The first waiver/reimbursement applies so that the ratio of expenses to average net assets, as reported in the Fund’s Financial Highlights, will be no more than 1.24% for the Fund’s Retail Class for such period. The second waiver/ reimbursement applies so that Fund level Other Expenses for the Institutional Class will be in the same proportion as the Retail Class waivers/ reimbursements. The third waiver/reimbursement applies so that the institutional class-specific Other Expenses are reimbursed. The Adviser has contractually agreed to waive/ reimburse all of these class-specific Other Expenses, but only to the extent that the difference between the net Institutional Class and net Retail Class expense ratios, after applying the waiver/reimbursement, does not exceed 25 basis points. These agreements may not be terminated or modified by the Adviser prior to April 30, 2018 without the approval of the Board of Trustees.
Investing in small-cap funds generally will be more volatile and loss of principal could be greater than investing in larger-cap funds.
| 2 | | www.westcore.com |
| Westcore Small-Cap Growth Fund | Fund Overview |
June 30, 2017 (Unaudited)
Manager Commentary
Market Overview
For the first six months of 2017, the Russell 2000® Growth Index returned 9.97%, while the Russell 2000® Value Index returned 0.54%. Looking back, the last twelve months have been quite a stylistic roller coaster and, interestingly, after the Russell 2000® Value Index’s post-election rally in the fourth quarter of 2016, followed by the Russell 2000® Growth Index’s rally in 2017, the two indexes have performed nearly identically for the last twelve months, returning approximately 25% each. Taking a step back, this has been a remarkable bull market for equities.
Fund Performance
For the first half of 2017, the Westcore Small-Cap Growth Fund outperformed its benchmark, returning 15.89% (retail class) compared to the Russell 2000® Growth Index’s 9.97% return for the same period.
Contributors to Return
The three sectors that contributed most to the Fund’s performance relative to its benchmark in the first half of 2017 were information technology, health care, and industrials. The Fund’s best-performing stock in the period was Advisory Board Co., which provides performance improvement software and solutions to the health care and higher education industries. The stock outperformed largely based on speculation that the company would be acquired. Regardless of whether a transaction comes to fruition in the near term, we believe in the company’s long-term growth opportunities and its competitive positioning. Also outperforming in the first half of the year was Intersect ENT, Inc., a medical device company focused on therapies for patients suffering from chronic sinusitis. The stock outperformed during the first half as near-term reimbursement concerns abated. As the market for chronic sinusitis therapies continues to expand, we are excited about the potential for Intersect’s currently available and pipeline products. Another top contributor was LendingTree, Inc., the premier lead-generation company for the lending industry. LendingTree continued to gain market share in the industry and expand its product set.
Detractors from Return
The three sectors that detracted most from the Fund’s performance relative to its benchmark in the first half of 2017 were energy,
telecommunication services, and real estate. The Fund’s worst-performing stock in the period was PDC Energy, Inc., an exploration and production company focused on operations in the Niobrara Formation and Permian Basin. Regulatory concerns in Colorado drove the stock’s underperformance. We believe, however, that the issues will prove transitory and have limited impact on the company’s long-term growth prospects. PDC has, in our opinion, continued to execute well and grow production. IMAX Corp., a leader in film technologies, was also a significant drag on the Fund’s performance in the first half of 2017. Despite a strong growth rate for new IMAX installations, the company suffered as global box office sales for films have been consistently weak. We believe the growth opportunity for IMAX screens remains robust, especially in China. Recent cost reductions and stock buyback authorization should, in our opinion, help support the stock at its current valuation. Microsemi Corp., a provider of semiconductors to the aerospace and defense, communications, data center, and industrial markets, was also weak in the first half of the year. In particular, concerns regarding optical equipment spending in China hampered the stock. In our opinion, Microsemi remains attractive due to its robust growth profile, tailwinds across nearly all segments of its business, and significant cash-flow generation.
Outlook and Positioning
As of the end of the first half of 2017, the Fund was overweighted in the consumer discretionary and financials sectors and underweighted primarily in the health care and industrials sectors.
The current economic recovery remains one of the longest on record, now sitting at 96 months. We still believe that we are in the later innings of an economic cycle. Despite this, the economy has continued to chug along at a relatively low-growth rate and we believe this favors strong growth companies that are less dependent on economic growth or cyclical trends. However, in our opinion, valuations have become increasingly difficult to justify in some of the higher-growth areas of the market. As a result, we have been actively executing our risk management disciplines by trimming or exiting positions in some of the more expensive areas of the market as they achieve our price targets.
Stock Performance (for the six months ended 6/30/17)
| 5 Highest | Average Weight | Contribution to Return |
| Advisory Board Co. | 2.35% | 1.03% |
| Take-Two Interactive Software, Inc. | 1.46 | 0.99 |
| Intersect ENT, Inc. | 0.98 | 0.96 |
| RingCentral, Inc. | 1.37 | 0.84 |
| LendingTree, Inc. | 1.38 | 0.81 |
| 5 Lowest | Average Weight | Contribution to Return |
| Microsemi Corp. | 1.99% | -0.26% |
| RSP Permian, Inc. | 0.97 | -0.32 |
| IMAX Corp. | 1.57 | -0.47 |
| National CineMedia, Inc. | 0.89 | -0.54 |
| PDC Energy, Inc. | 1.35 | -0.69 |
Past performance does not guarantee future results. These stocks do not represent all of the securities purchased, sold or recommended by the Fund’s Adviser. To request a complete list of the contribution of each Fund holding to overall Fund performance during the period, please call 800.392.CORE (2673) or email invest@westcore.com.
Please see page 36 for a description of the methodology used to construct this chart.
Semi-Annual Report | June 30, 2017 | | 3 |
| Westcore Small-Cap Growth Fund II | Fund Overview |
June 30, 2017 (Unaudited)
Fund Strategy
Investing in a diversified portfolio of equity securities of primarily small-sized companies with growth potential.
Fund Management
Brian C. Fitzsimons, CFA Portfolio Manager
Mitch S. Begun, CFA Portfolio Manager
Adam C. Bliss Portfolio Manager
CFA is a trademark owned by CFA Institute.
Cumulative Returns
The chart above represents historical performance of a hypothetical investment of $10,000 in the Fund over the past 10 years (or for the life of the Fund if shorter). Performance calculations are as of the end of June each year. Past performance does not guarantee future results. This chart does not reflect the deduction of taxes that a shareholder would pay on Fund distributions or the redemption of Fund shares.
Lipper Index data provided by Lipper, Inc.
Please see index definitions beginning on page 34.
Average Annual Total Returns
| | 6 Months | 1 Year | 3 Years | 5 Years | 10 Years | Since Inception | Inception Date |
| Institutional Class (WTSLX)* | 21.29% | 17.67% | -0.62% | 7.18% | 3.64% | 9.84% | 10/1/1999 |
Russell 2000® Growth Index | 9.97 | 24.40 | 7.64 | 13.98 | 7.82 | 6.47 | |
| Westcore Small-Cap Growth II Custom Index | 9.97 | 15.55 | 7.37 | 13.90 | 7.73 | 7.15 | |
Russell Midcap® Growth Index | 11.40 | 17.05 | 7.83 | 14.19 | 7.87 | 7.23 | |
| Lipper Small-Cap Growth Index | 10.98 | 20.55 | 6.56 | 12.48 | 6.46 | 6.79 | |
Institutional Class Annual Expense Ratio (per the current prospectus) — Gross: 1.24%, Net: 1.15%
Sector Allocation(as of 6/30/17)
| Information Technology | 23.1% |
| Health Care | 18.7 |
| Consumer Discretionary | 17.9 |
| Industrials | 12.8 |
| Financials | 8.5 |
| Energy | 3.9 |
| Materials | 2.7 |
| Consumer Staples | 2.4 |
| Real Estate | 1.8 |
| Telecommunication Services | 1.7 |
Sector classifications presented herein are based on the sector categorization methodology of the Adviser to the Funds which may result in the sector designations for one Fund being different than another Fund’s sector designations. For Fund compliance purposes, the Fund’s industry classifications refer to any one or more of the industry sub-classifications used by one or more widely recognized market indexes or ratings group indexes, and/or as defined by Fund management. This definition may not apply for purposes of this report, which may combine industry sub-classifications for reporting ease. Industries are shown as a percentage of net assets.
The sector allocation table above does not include any cash or cash equivalents.
Top Ten Holdings (as of 6/30/17)
| Advisory Board Co. | 2.8% |
| Monolithic Power Systems, Inc. | 2.6 |
| Evercore Partners, Inc. | 2.3 |
| EPAM Systems, Inc. | 2.2 |
| Envestnet, Inc. | 2.1 |
| Acadia Healthcare Co., Inc. | 2.1 |
| Live Nation Entertainment, Inc. | 2.0 |
| Vail Resorts, Inc. | 2.0 |
| PolyOne Corp. | 2.0 |
| Globant SA | 1.9 |
| Total (% of Net Assets) | 21.9% |
Top ten holdings do not include any cash, cash equivalents or exchange traded fund investments. Holdings are subject to change and may not reflect the current or future position of the Fund.
| * | Effective December 27, 2016 the Retail Class was designated Institutional Class. |
Effective December 27, 2016, the Westcore Select Fund was renamed the Westcore Small-Cap Growth Fund II and was repositioned to focus on small growth companies.
Performance data quoted represents past performance and does not guarantee future results. Current performance may be lower or higher than the performance quoted. To obtain current performance as of the most recent month-end, visit www.westcore.com. Average annual total returns reflect the reinvestment of dividends, capital gains distributions, all fee waivers and expense reimbursements. Without the fee waivers and expense reimbursements, total return figures would have been lower. Investment return and principal value will vary, and shares, when redeemed, may be worth more or less than their original cost. Westcore fund shares are not insured by the FDIC, the Federal Reserve Board or any other agency and are subject to investment risk.
Denver Investments (the “Adviser”) has contractually agreed to waive the investment advisory and/or administration fees and/or to reimburse other expenses from April 30, 2017 until at least April 30, 2018, so that the ratio of expenses to average net assets as reported in the Fund’s Financial Highlights will be no more than 1.15% for the Fund’s Institutional Class (formerly known as the Retail Class prior to December 27, 2016) for such period. This agreement may not be terminated or modified by the Adviser prior to April 30, 2018 without the approval of the Board of Trustees.
Investing in small-cap funds generally will be more volatile and loss of principal could be greater than investing in large-cap funds.
| 4 | | www.westcore.com |
| Westcore Small-Cap Growth Fund II | Fund Overview |
June 30, 2017 (Unaudited)
Manager Commentary
Market Overview
For the first six months of 2017, the Russell 2000® Growth Index returned 9.97%, while the Russell 2000® Value Index returned 0.54%. Looking back, the last twelve months have been quite a stylistic roller coaster and, interestingly, after the Russell 2000® Value Index’s post-election rally in the fourth quarter of 2016, followed by the Russell 2000® Growth Index’s rally in 2017, the two indexes have performed nearly identically for the last twelve months, returning approximately 25% each. Taking a step back, this has been a remarkable bull market for equities.
Fund Performance
For the first half of 2017, the Westcore Small-Cap Growth Fund II outperformed its benchmark, returning 21.29% compared to the Russell 2000® Growth Index’s 9.97% return over the same period. At the end of the period, the Westcore Small-Cap Growth Fund II received a settlement payment from a stock that was held in the Fund several years ago, prior to its change in investment strategy on December 27, 2016. This payment added 4.96% to the Fund’s return for the first six months of 2017.
Contributors to Return
The three sectors that contributed most to the Fund’s performance relative to its benchmark in the first half of 2017 were information technology, health care, and industrials. The Fund’s best-performing stock in the period was Advisory Board Co., which provides performance improvement software and solutions to the health care and higher education industries. The stock outperformed largely based on speculation that the company would be acquired. Regardless of whether a transaction comes to fruition in the near term, we believe in the company’s long-term growth opportunities and its competitive positioning. Also outperforming in the first half of the year was Intersect ENT, Inc., a medical device company focused on therapies for patients suffering from chronic sinusitis. The stock outperformed during the first half as near-term reimbursement concerns abated. As the market for chronic sinusitis therapies continues to expand, we are excited about the potential for Intersect’s currently available and pipeline products. Another top contributor was LendingTree, Inc., the premier lead-generation company for the lending industry. LendingTree continued to gain market share in the industry and expand its product set.
Detractors from Return
The three sectors that detracted most from the Fund’s performance relative to its benchmark in the first half of 2017 were energy, telecommunication services, and real estate. The Fund’s worst-performing stock in the period was PDC Energy, Inc., an exploration and production company focused on operations in the Niobrara Formation and Permian Basin. Regulatory concerns in Colorado drove the stock’s underperformance, however, we believe the issues will prove transitory and have limited impact on the company’s long-term growth prospects. PDC has, in our opinion, continued to execute well and grow production. IMAX Corp., a leader in film technologies, was also a significant drag on the Fund’s performance in the first half of 2017. Despite a strong growth rate for new IMAX installations, the company suffered as global box office sales for films have been consistently weak. We believe the growth opportunity for IMAX screens remains robust, especially in China. Recent cost reductions and stock buyback authorization should, in our opinion, help support the stock at its current valuation. Microsemi Corp., a provider of semiconductors to the aerospace and defense, communications, data center, and industrial markets, was also weak in the first half of the year. In particular, concerns regarding optical equipment spending in China hampered the stock. In our opinion, Microsemi remains attractive due to its robust growth profile, tailwinds across nearly all segments of its business, and significant cash-flow generation.
Outlook and Positioning
As of the end of the first half of 2017, the Fund was overweighted in the consumer discretionary and energy sectors and underweighted primarily in the health care and industrials sectors.
The current economic recovery remains one of the longest on record, now sitting at 96 months. We still believe that we are in the later innings of an economic cycle. Despite this, the economy has continued to chug along at a relatively low-growth rate and we believe this favors strong growth companies that are less dependent on economic growth or cyclical trends. However, in our opinion, valuations have become increasingly difficult to justify in some of the higher-growth areas of the market. As a result, we have been actively executing our risk management disciplines by trimming or exiting positions in some of the more expensive areas of the market as they achieve our price targets.
Stock Performance (for the six months ended 6/30/17)
| 5 Highest | Average Weight | Contribution to Return |
| Advisory Board Co. | 2.38% | 1.05% |
| Take-Two Interactive Software, Inc. | 1.47 | 1.01 |
| Intersect ENT, Inc. | 0.99 | 0.96 |
| RingCentral, Inc. | 1.38 | 0.85 |
| LendingTree, Inc. | 1.39 | 0.81 |
| 5 Lowest | Average Weight | Contribution to Return |
| Microsemi Corp. | 2.01% | -0.26% |
| RSP Permian, Inc. | 0.97 | -0.32 |
| IMAX Corp. | 1.59 | -0.48 |
| National CineMedia, Inc. | 0.90 | -0.54 |
| PDC Energy, Inc. | 1.35 | -0.69 |
Past performance does not guarantee future results. These stocks do not represent all of the securities purchased, sold or recommended by the Fund’s Adviser. To request a complete list of the contribution of each Fund holding to overall Fund performance during the period, please call 800.392.CORE (2673) or email invest@westcore.com.
Please see page 36 for a description of the methodology used to construct this chart.
Semi-Annual Report | June 30, 2017 | | 5 |
| Westcore Mid-Cap Value Dividend Fund | Fund Overview |
June 30, 2017 (Unaudited)
Fund Strategy
Investing in medium-sized, dividend-paying companies whose stocks appear to be undervalued.
Fund Management
Derek R. Anguilm, CFA Portfolio Manager | Mark M. Adelmann, CFA, CPA Portfolio Manager |
Troy Dayton, CFA Portfolio Manager | Lisa Z. Ramirez, CFA Portfolio Manager |
| CFA is a trademark owned by CFA Institute. | Alex A. Ruehle, CFA Portfolio Manager |
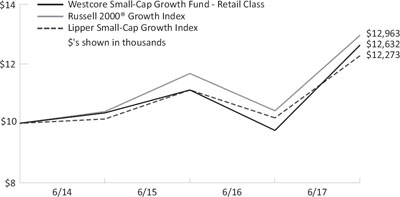
The chart above represents historical performance of a hypothetical investment of $10,000 in the Fund over the past 10 years (or for the life of the Fund if shorter). Performance calculations are as of the end of June each year. Past performance does not guarantee future results. This chart does not reflect the deduction of taxes that a shareholder would pay on Fund distributions or the redemption of Fund shares.
Lipper Index data provided by Lipper, Inc.
Please see index definitions beginning on page 34.
Average Annual Total Returns
| | 6 Months | 1 Year | 3 Years | 5 Years | 10 Years | Since Inception | Inception Date |
| Retail Class (WTMCX) | 0.95% | 13.88% | 8.87% | 14.29% | 5.45% | 9.46% | 10/1/1998 |
| Institutional Class (WIMCX) | 1.08 | 14.14 | 8.98 | 14.36 | 5.48 | 9.48 | 4/29/2016 |
Russell Midcap® Value Index | 5.18 | 15.93 | 7.46 | 15.14 | 7.23 | 10.32 | |
| Lipper Mid-Cap Value Index | 3.15 | 15.90 | 5.37 | 13.71 | 6.39 | 9.59 | |
Retail Class Annual Expense Ratio (per the current prospectus) — Gross: 1.19%, Net: 1.16%
Institutional Class Annual Expense Ratio (per the current prospectus) — Gross: 1.06%, Net: 0.91%
Sector Allocation(as of 6/30/17)
| Interest Rate Sensitive | 20.4% |
| Consumer | 15.5 |
| REITs | 12.7 |
| Capital Goods | 12.0 |
| Medical / Healthcare | 8.9 |
| Utilities | 8.8 |
| Technology | 8.3 |
| Energy | 7.8 |
| Basic Materials | 5.7 |
Sector classifications presented herein are based on the sector categorization methodology of the Adviser to the Funds which may result in the sector designations for one Fund being different than another Fund’s sector designations. For Fund compliance purposes, the Fund’s industry classifications refer to any one or more of the industry sub-classifications used by one or more widely recognized market indexes or ratings group indexes, and/or as defined by Fund management. This definition may not apply for purposes of this report, which may combine industry sub-classifications for reporting ease. Industries are shown as a percentage of net assets.
The sector allocation table above does not include any cash or cash equivalents.
Top Ten Holdings (as of 6/30/17)
| Ingredion, Inc. | 2.7% |
| Tyson Foods, Inc. | 2.6 |
| AmTrust Financial Services, Inc. | 2.6 |
| Public Service Enterprise Group, Inc. | 2.5 |
| Realogy Holdings Corp. | 2.5 |
| Xcel Energy, Inc. | 2.3 |
| Spire, Inc. | 2.2 |
| AmerisourceBergen Corp. | 2.2 |
| Uniti Group, Inc. | 2.1 |
| Range Resources Corp. | 2.0 |
| Total (% of Net Assets) | 23.6% |
Top ten holdings do not include any cash, cash equivalents or exchange traded fund investments. Holdings are subject to change and may not reflect the current or future position of the Fund.
Performance data quoted represents past performance and does not guarantee future results. Performance information for the institutional class shares prior to their inception is based on the performance of the retail class. Current performance may be lower or higher than the performance quoted. To obtain current performance as of the most recent month-end, visit www.westcore.com. Average annual total returns reflect the reinvestment of dividends, capital gains distributions, all fee waivers and expense reimbursements. Without the fee waivers and expense reimbursements, total return figures would have been lower. Investment return and principal value will vary, and shares, when redeemed, may be worth more or less than their original cost. Westcore fund shares are not insured by the FDIC, the Federal Reserve Board or any other agency and are subject to investment risk.
Denver Investments (the “Adviser”) has contractually agreed to waive the investment advisory and/or administration fees and/or to reimburse other expenses from April 30, 2017 until at least April 30, 2018, so that the ratio of expenses to average net assets as reported in the Fund’s Financial Highlights will be no more than 1.15% for the Fund’s Retail Class for such period. The second waiver/reimbursement applies so that Fund level Other Expenses for the Institutional Class will be in the same proportion as the Retail Class waivers/reimbursements. The third waiver/reimbursement applies so that the institutional class-specific Other Expenses are reimbursed. The Adviser has contractually agreed to waive/reimburse all of these class-specific Other Expenses, but only to the extent that the difference between the net Institutional Class and net Retail Class expense ratios, after applying the waiver/ reimbursement, does not exceed 25 basis points. This agreement may not be terminated or modified by the Adviser prior to April 30, 2018 without the approval of the Board of Trustees.
Investing in mid-cap funds generally will be more volatile and loss of principal could be greater than investing in large-cap funds.
Dividends are not guaranteed. A company’s future abilities to pay dividends may be limited and a company may cease paying dividends at any time.
Lisa Z. Ramirez is a registered representative of ALPS Distributors, Inc.
6 | | www.westcore.com |
| Westcore Mid-Cap Value Dividend Fund | Fund Overview |
June 30, 2017 (Unaudited)
Manager Commentary
Market Overview
U.S. equity markets experienced a strong start to the year, driven by expectations of accelerated economic growth, but value stocks took a pause in the second quarter as reality did not meet those lofty near-term expectations. Excitement around the pro-business policies of the new administration took a back seat following the failure to pass the American Health Care Act of 2017 and the announced investigation into ties between President Trump’s campaign and Russian officials. These issues drove market fears that the new administration would be unable to implement policy changes. At the same time, the outlook for inflation dimmed and other economic indicators began to signal the potential for a slowdown, despite the Federal Reserve’s apparent optimism as it raised rates for the fourth time since December 2015. As a result of a more subdued outlook for U.S. economic growth, growth stocks (which have historically been less economically sensitive than value stocks) outperformed value stocks year-to-date. Additionally, investors shifted assets to larger capitalization companies and to more defensive sectors, such as health care and utilities, and away from more cyclical sectors, such as energy and basic materials.
Fund Performance
The Westcore Mid-Cap Value Dividend Fund returned 0.95% (retail class) for the six months ended June 30, 2017, underperforming its benchmark, the Russell Midcap® Value Index, which returned 5.18% for the same period. The Fund was positioned more heavily in the smaller capitalization portion of the mid-cap universe where we have found more value over the past few years. As investors’ preferences shifted toward larger capitalization companies, this created a headwind for the Fund. However, the primary driver of underperformance year-to-date was stock selection.
Contributors to Return
The sectors that contributed most to the Fund’s performance relative to its benchmark were medical/healthcare and REITs. The Fund’s individual top performers were led by CyrusOne, Inc., a provider of mission-critical data center facilities. As it logged one of its strongest leasing quarters on record, the company announced solid financial results, which included increased full-year guidance for earnings estimates. Lam Research Corp. was also among the Fund’s strongest contributors. This semiconductor equipment company, benefited from robust demand for its 3D NAND flash storage technology, which helped drive strong financial results. Grifols SA, is a pharmaceutical company that primarily provides plasma-based therapeutics. The company reported continued improvement in the financial
performance of its bioscience division and improving margins following a period of significant capacity expansion investment. Pharmaceutical distribution company AmerisourceBergen Corp. was a solid contributor due to better-than-expected industry pricing dynamics. PVH Corp., a designer and marketer of branded dress shirts, produced strong financial results despite the backdrop of a difficult retail environment. The company revised guidance for earnings estimates up given the strength of its global brands and corresponding business momentum.
Detractors from Return
The Fund’s weakest sectors relative to its benchmark were interest rate sensitive, consumer, and technology. AmTrust Financial Services, Inc., a provider of insurance services primarily to small businesses, was the Fund’s largest individual detractor. During the second quarter, the Wall Street Journal published a story involving alleged accounting issues at AmTrust in 2013 and 2014. Although this information had been revealed previously, investors reacted anew and the stock underperformed. Noble Energy, Inc., an oil and gas exploration and production company, succumbed to market uncertainty about oil prices. This was coupled with a competitor incident in Colorado that heightened sensitivity to regulatory risk. Another energy holding, oil and gas producer SM Energy Co., also faced continued pressure from the uncertain oil price environment. We believe the market is overly penalizing the company and we are optimistic given its recent Permian Basin asset purchase. Foot Locker, Inc., a global retailer of athletic shoes and apparel, was the Fund’s largest detractor in the consumer sector. The retail environment continued to be challenging and Foot Locker was no exception. After missing quarterly financial estimates, news that Nike had decided to go direct through Amazon further pressured Footlocker’s shares. Avnet, Inc. was the Fund’s weakest performer in the technology sector. This electronics and components distributor posted sales shortfalls that were caused by consolidation of its suppliers. Additionally, increased costs associated with implementation of its process management software system contributed to the company’s disappointing financial results.
Outlook and Positioning
Looking ahead, we are excited about the opportunities that market and sector volatility may produce. As political, economic and market uncertainty continue, we will remain focused on finding dividend-paying stocks that we believe have sound fundamentals and are currently mispriced by the markets.
Stock Performance (for the six months ended 6/30/17)
| 5 Highest | Average Weight | Contribution to Return |
| CyrusOne, Inc. | 2.28% | 0.60% |
| Lam Research Corp. | 1.43 | 0.59 |
| Grifols SA | 1.67 | 0.44 |
| AmerisourceBergen Corp. | 1.93 | 0.39 |
| PVH Corp. | 1.44 | 0.37 |
| 5 Lowest | Average Weight | Contribution to Return |
| Avnet, Inc. | 1.88% | -0.35% |
| Foot Locker, Inc. | 1.30 | -0.41 |
| SM Energy Co. | 0.82 | -0.53 |
| Noble Energy, Inc. | 2.05 | -0.57 |
| AmTrust Financial Services, Inc. | 2.04 | -1.06 |
Past performance does not guarantee future results. These stocks do not represent all of the securities purchased, sold or recommended by the Fund’s Adviser. To request a complete list of the contribution of each Fund holding to overall Fund performance during the period, please call 800.392.CORE (2673) or email invest@westcore.com.
Please see page 36 for a description of the methodology used to construct this chart.
Semi-Annual Report | June 30, 2017 | | 7 |
| Westcore Mid-Cap Value Dividend Fund II | Fund Overview |
June 30, 2017 (Unaudited)
Fund Strategy
Investing in medium-sized, dividend-paying companies whose stocks appear to be undervalued.
| Fund Management | |
Derek R. Anguilm, CFA Portfolio Manager Troy Dayton, CFA Portfolio Manager CFA is a trademark owned by CFA Institute. | Mark M. Adelmann, CFA, CPA Portfolio Manager Lisa Z. Ramirez, CFA Portfolio Manager Alex A. Ruehle, CFA Portfolio Manager |
| |
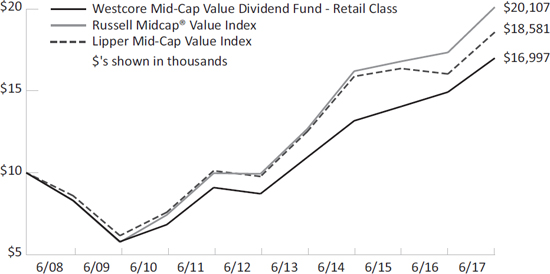
Cumulative Returns
The chart above represents historical performance of a hypothetical investment of $10,000 in the Fund over the past 10 years (or for the life of the Fund if shorter). Performance calculations are as of the end of June each year. Past performance does not guarantee future results. This chart does not reflect the deduction of taxes that a shareholder would pay on Fund distributions or the redemption of Fund shares. Lipper Index data provided by Lipper, Inc.
Please see index definitions beginning on page 34.
Average Annual Total Returns
| | 6 Months | 1 Year | 3 Years | 5 Years | 10 Years | Since Inception | Inception Date |
| Retail Class | | | | | | | |
| (WTMGX) | 1.12% | 1.16% | -3.63% | 7.40% | 3.43% | 9.44% | 8/1/1986 |
| Institutional Class | | | | | | | |
| (WIMGX) | 1.09 | 1.35 | -3.44 | 7.61 | 3.60 | 9.50 | 9/28/2007 |
Russell Midcap® | | | | | | | |
| Value Index | 5.18 | 15.93 | 7.46 | 15.14 | 7.23 | 11.83 | |
| Westcore Mid-Cap | | | | | | | |
| Value Dividend | | | | | | | |
| II Custom Index | 5.18 | 10.51 | 5.78 | 12.89 | 7.26 | 10.19 | |
Russell Midcap® | | | | | | | |
| Growth Index | 11.40 | 17.05 | 7.83 | 14.19 | 7.87 | 10.40 | |
| Lipper Mid-Cap | | | | | | | |
| Value Index | 3.15 | 15.90 | 5.37 | 13.71 | 6.39 | 10.46 | |
Retail Class Annual Expense Ratio (per the current prospectus) — Gross: 1.12%, Net: 1.12%
Institutional Class Annual Expense Ratio (per the current prospectus) — Gross: 1.08%, Net: 0.93%
Sector Allocation (as of 6/30/17)
| Interest Rate Sensitive | 19.9% |
| Consumer | 15.1 |
| REITs | 12.4 |
| Capital Goods | 11.6 |
| Medical / Healthcare | 8.6 |
| Utilities | 8.5 |
| Technology | 8.0 |
| Energy | 7.6 |
| Basic Materials | 5.5 |
Sector classifications presented herein are based on the sector categorization methodology of the Adviser to the Funds which may result in the sector designations for one Fund being different than another Fund’s sector designations. For Fund compliance purposes, the Fund’s industry classifications refer to any one or more of the industry sub-classifications used by one or more widely recognized market indexes or ratings group indexes, and/or as defined by Fund management. This definition may not apply for purposes of this report, which may combine industry sub-classifications for reporting ease. Industries are shown as a percentage of net assets.
The sector allocation table above does not include any cash or cash equivalents.
Top Ten Holdings (as of 6/30/17)
| Ingredion, Inc. | 2.6% |
| Tyson Foods, Inc. | 2.6 |
| AmTrust Financial Services, Inc. | 2.5 |
| Public Service Enterprise Group, Inc. | 2.5 |
| Realogy Holdings Corp. | 2.4 |
| Xcel Energy, Inc. | 2.2 |
| Uniti Group, Inc. | 2.1 |
| AmerisourceBergen Corp. | 2.1 |
| Spire, Inc. | 2.1 |
| Range Resources Corp. | 2.0 |
| Total (% of Net Assets) | 23.1% |
Top ten holdings do not include any cash, cash equivalents or exchange traded fund investments. Holdings are subject to change and may not reflect the current or future position of the Fund.
Effective December 27, 2016, the Westcore MIDCO Growth Fund was renamed the Westcore Mid-Cap Value Dividend Fund II and was repositioned to focus on medium-sized dividend-paying companies whose stocks appear undervalued.
Performance data quoted represents past performance and does not guarantee future results. Performance information for the institutional class shares prior to their inception is based on the performance of the retail class. Current performance may be lower or higher than the performance quoted. To obtain current performance as of the most recent month-end, visit www.westcore.com. Average annual total returns reflect the reinvestment of dividends, capital gains distributions, all fee waivers and expense reimbursements. Without the fee waivers and expense reimbursements, total return figures would have been lower. Investment return and principal value will vary, and shares, when redeemed, may be worth more or less than their original cost. Westcore fund shares are not insured by the FDIC, the Federal Reserve Board or any other agency and are subject to investment risk.
Denver Investments (the “Adviser”) has contractually agreed to waive certain investment advisory and/or administration fees and/or to reimburse other expenses from April 30, 2017 until at least April 30, 2018. The first waiver/reimbursement applies so that the ratio of expenses to average net assets, as reported in the Fund’s Financial Highlights, will be no more than 1.15% for the Fund’s Retail Class for such period. The second waiver/reimbursement applies so that Fund level Other Expenses for the Institutional Class will be in the same proportion as the Retail Class waivers/reimbursements. The third waiver/reimbursement applies so that the institutional class-specific Other Expenses are reimbursed. The Adviser has contractually agreed to waive/ reimburse all of these class-specific Other Expenses, but only to the extent that the difference between the net Institutional Class and net Retail Class expense ratios, after applying the waiver/reimbursement, does not exceed 25 basis points. These agreements may not be terminated or modified by the Adviser prior to April 30, 2018 without the approval of the Board of Trustees.
Investing in mid-cap funds generally will be more volatile and loss of principal could be greater than investing in large-cap funds.
Dividends are not guaranteed. A company’s future abilities to pay dividends may be limited and a company may cease paying dividends at any time.
Lisa Z. Ramirez is a registered representative of ALPS Distributors, Inc.
| 8 | | www.westcore.com |
| Westcore Mid-Cap Value Dividend Fund II | Fund Overview |
June 30, 2017 (Unaudited)
Manager Commentary
Market Overview
U.S. equity markets experienced a strong start to the year, driven by expectations of accelerated economic growth, but value stocks took a pause in the second quarter as reality did not meet those lofty near-term expectations. Excitement around the pro-business policies of the new administration took a back seat following the failure to pass the American Health Care Act of 2017 and the announced investigation into ties between President Trump’s campaign and Russian officials. These issues drove market fears that the new administration would be unable to implement policy changes. At the same time, the outlook for inflation dimmed and other economic indicators began to signal the potential for a slowdown, despite the Federal Reserve’s apparent optimism as it raised rates for the fourth time since December 2015. As a result of a more subdued outlook for U.S. economic growth, growth stocks (which have historically been less economically sensitive than value stocks) outperformed value stocks year-to-date. Additionally, investors shifted assets to larger capitalization companies and to more defensive sectors, such as health care and utilities, and away from more cyclical sectors, such as energy and basic materials.
Fund Performance
The Westcore Mid-Cap Value Dividend Fund II returned 1.12% (retail class) for the six months ended June 30, 2017, underperforming its benchmark, the Russell Midcap® Value Index, which returned 5.18% over the same period. The Fund was positioned more heavily in the smaller capitalization portion of the mid-cap universe where we have found more value over the past few years. As investors’ preference shifted toward larger capitalization companies, this created a headwind for the Fund. However, the primary driver of underperformance year-to-date was stock selection.
Contributors to Return
The sectors that contributed most to the Fund’s performance relative to its benchmark were medical/healthcare and REITs. The Fund’s individual top performers were led by CyrusOne, Inc., a provider of mission-critical data center facilities. As it logged one of its strongest leasing quarters on record, the company announced solid financial results, which included increased full-year guidance for earnings estimates. Lam Research Corp. was also among the Fund’s strongest contributors. This semiconductor equipment company, benefited from robust demand for its 3D NAND flash storage technology, which helped drive strong financial results. Grifols SA, is a pharmaceutical company that primarily provides plasma-based therapeutics. The company reported continued improvement in the financial
performance of its bioscience division and improving margins following a period of significant capacity expansion investment. Pharmaceutical distribution company AmerisourceBergen Corp. was a solid contributor due to better-than-expected industry pricing dynamics. PVH Corp., a designer and marketer of branded dress shirts, produced strong financial results despite the backdrop of a difficult retail environment. The company revised guidance for earnings estimates up given the strength of its global brands and corresponding business momentum.
Detractors from Return
The Fund’s weakest sectors relative to its benchmark were interest rate sensitive, consumer, and technology. AmTrust Financial Services, Inc., a provider of insurance services primarily to small businesses, was the Fund’s largest individual detractor. During the second quarter, the Wall Street Journal published a story involving alleged accounting issues at AmTrust in 2013 and 2014. Although this information had been revealed previously, investors reacted anew and the stock underperformed. Noble Energy, Inc., an oil and gas exploration and production company, succumbed to market uncertainty about oil prices. This was coupled with a competitor incident in Colorado that heightened sensitivity to regulatory risk. Another energy holding, oil and gas producer SM Energy Co., also faced continued pressure from the uncertain oil price environment. We believe the market is overly penalizing the company and we are optimistic given its recent Permian Basin asset purchase. Foot Locker, Inc., a global retailer of athletic shoes and apparel, was the Fund’s largest detractor in the consumer sector. The retail environment continued to be challenging and Foot Locker was no exception. After missing quarterly financial estimates, news that Nike had decided to go direct through Amazon further pressured Footlocker’s shares. Avnet, Inc. was the Fund’s weakest performer in the technology sector. This electronics and components distributor posted sales shortfalls that were caused by consolidation of its suppliers. Additionally, increased costs associated with implementation of its process management software system contributed to the company’s disappointing financial results.
Outlook and Positioning
Looking ahead, we are excited about the opportunities that market and sector volatility may produce. As political, economic and market uncertainty continue, we will remain focused on finding dividend-paying stocks that we believe have sound fundamentals and are currently mispriced by the markets.
Stock Performance (for the six months ended 6/30/17)
| 5 Highest | Average Weight | Contribution to Return |
| CyrusOne, Inc. | 2.29% | 0.60% |
| Lam Research Corp. | 1.44 | 0.60 |
| Grifols SA | 1.67 | 0.45 |
| AmerisourceBergen Corp. | 1.93 | 0.38 |
| PVH Corp. | 1.44 | 0.37 |
| 5 Lowest | Average Weight | Contribution to Return |
| Avnet, Inc. | 1.89% | -0.36% |
| Foot Locker, Inc. | 1.30 | -0.40 |
| SM Energy Co. | 0.82 | -0.53 |
| Noble Energy, Inc. | 2.06 | -0.57 |
| AmTrust Financial Services, Inc. | 2.04 | -1.07 |
Past performance does not guarantee future results. These stocks do not represent all of the securities purchased, sold or recommended by the Fund’s Adviser. To request a complete list of the contribution of each Fund holding to overall Fund performance during the period, please call 800.392.CORE (2673) or email invest@westcore.com.
Please see page 36 for a description of the methodology used to construct this chart.
Semi Annual Report | June 30, 2017 | | 9 |
| Westcore Smid-Cap Value Dividend Fund | Fund Overview |
June 30, 2017 (Unaudited)
Fund Strategy
Investing in small- and medium-sized, dividend-paying companies whose stocks appear to be undervalued.
| Fund Management | |
Derek R. Anguilm, CFA Portfolio Manager | Mark M. Adelmann, CFA, CPA Portfolio Manager |
Troy Dayton, CFA Portfolio Manager | Lisa Z. Ramirez, CFA Portfolio Manager |
| Alex A. Ruehle, CFA Portfolio Manager |
CFA is a trademark owned by CFA Institute.
Cumulative Returns
The chart above represents historical performance of a hypothetical investment of $10,000 in the Fund over the past 10 years (or for the life of the Fund if shorter). Performance calculations are as of the end of June each year. Past performance does not guarantee future results. This chart does not reflect the deduction of taxes that a shareholder would pay on Fund distributions or the redemption of Fund shares.
Lipper Index data provided by Lipper, Inc.
Please see index definitions beginning on page 34.
Average Annual Total Returns
| | 6 Months | 1 Year | 3 Years | 5 Years | 10 Years | Since Inception | Inception Date |
| Retail Class (WTSDX) | -0.70% | — | — | — | — | -1.40% | 12/16/2016 |
| Institutional Class (WISDX) | -0.60 | — | — | — | — | -1.30 | 12/16/2016 |
| Russell 2500™ Value Index | 1.95 | — | — | — | — | 1.82 | |
| Lipper Mid-Cap Value Index | 3.15 | — | — | — | — | 2.23 | |
Retail Class Annual Expense Ratio (per the current prospectus) — Gross: 42.04%, Net: 1.22%
Institutional Class Annual Expense Ratio (per the current prospectus) — Gross: 34.19%, Net: 1.09%
Sector Allocation (as of 6/30/17)
| Interest Rate Sensitive | 27.1% |
| Consumer | 13.2 |
| Capital Goods | 12.7 |
| REITs | 12.1 |
| Technology | 8.8 |
| Medical / Healthcare | 8.3 |
| Basic Materials | 6.0 |
| Energy | 5.9 |
| Utilities | 4.7 |
Sector classifications presented herein are based on the sector categorization methodology of the Adviser to the Funds which may result in the sector designations for one Fund being different than another Fund’s sector designations. For Fund compliance purposes, the Fund’s industry classifications refer to any one or more of the industry sub-classifications used by one or more widely recognized market indexes or ratings group indexes, and/or as defined by Fund management. This definition may not apply for purposes of this report, which may combine industry sub-classifications for reporting ease. Industries are shown as a percentage of net assets.
The sector allocation table above does not include any cash or cash equivalents.
Top Ten Holdings (as of 6/30/17) | |
| Phibro Animal Health Corp. | 2.4% |
| TiVo Corp. | 2.3 |
| Spire, Inc. | 2.2 |
| Realogy Holdings Corp. | 2.1 |
| Enerplus Corp. | 2.1 |
| Ingredion, Inc. | 2.1 |
| Greenbrier Cos., Inc. | 2.0 |
| AmTrust Financial Services, Inc. | 2.0 |
| Fifth Third Bancorp | 1.9 |
| Radian Group, Inc. | 1.9 |
| Total (% of Net Assets) | 20.9% |
Top ten holdings do not include any cash, cash equivalents or exchange traded fund investments. Holdings are subject to change and may not reflect the current or future position of the Fund.
NEW FUND RISK: There can be no assurance that the Fund will grow to or maintain an economically viable size. There may be limited or no performance history for investors to evaluate.
Performance data quoted represents past performance and does not guarantee future results. Current performance may be lower or higher than the performance quoted. To obtain current performance as of the most recent month-end, visit www.westcore.com. Average annual total returns reflect the reinvestment of dividends, capital gains distributions, all fee waivers and expense reimbursements. Without the fee waivers and expense reimbursements, total return figures would have been lower. Investment return and principal value will vary, and shares, when redeemed, may be worth more or less than their original cost. Westcore fund shares are not insured by the FDIC, the Federal Reserve Board or any other agency and are subject to investment risk.
Denver Investments (the “Adviser”) has contractually agreed to waive certain investment advisory and/or administration fees and/or to reimburse other expenses until at least April 30, 2018, so that the ratio of expenses to average net assets as reported in the Fund’s Financial Highlights will be no more than 1.20% for the Fund’s Retail Class for such period. Subsequent to any such waivers or reimbursements with respect to the Fund’s Retail Class, the Adviser will waive or reimburse Fund level Other Expenses for the Institutional Class in the same proportion as the Retail Class waivers/ reimbursements and also waive or reimburse Institutional class-specific Other Expenses, but only to the extent that the difference between the net Institutional Class and net Retail Class expense ratios does not exceed 25 basis points, after applying the waiver/reimbursement. These agreements may not be terminated or modified by the Adviser prior to April 30, 2018 without the approval of the Board of Trustees.
Investing in small- and mid-cap funds generally will be more volatile and loss of principal could be greater than investing in large-cap funds.
Dividends are not guaranteed. A company’s future abilities to pay dividends may be limited and a company may cease paying dividends at any time.
Lisa Z. Ramirez is a registered representative of ALPS Distributors, Inc.
| 10 | | www.westcore.com |
| Westcore Smid-Cap Value Dividend Fund | Fund Overview |
June 30, 2017 (Unaudited)
Manager Commentary
Market Overview
U.S. equity markets experienced a strong start to the year, driven by expectations of accelerated economic growth, but value stocks took a pause in the second quarter as reality did not meet those lofty near-term expectations. Excitement around the pro-business policies of the new administration took a back seat following the failure to pass the American Health Care Act of 2017 and the announced investigation into ties between President Trump’s campaign and Russian officials. These issues drove market fears that the new administration would be unable to implement policy changes. At the same time, the outlook for inflation dimmed and other economic indicators began to signal the potential for a slowdown, despite the Federal Reserve’s apparent optimism as it raised rates for the fourth time since December 2015. As a result of a more subdued outlook for U.S. economic growth, growth stocks (which have historically been less economically sensitive than value stocks) outperformed value stocks year-to-date. Additionally, investors shifted assets to larger capitalization companies and to more defensive sectors, such as health care and utilities, and away from more cyclical sectors, such as energy and basic materials.
Fund Performance
The Westcore Smid-Cap Value Dividend Fund returned -0.70% (retail class) for the six months ended June 30, 2017, underperforming its benchmark, the Russell 2500TM Value Index, which returned 1.95% over the same period.
Contributors to Return
The sectors that contributed most to the Fund’s performance relative to its benchmark were energy, REITs, and medical/healthcare. The Fund’s individual top performers were led by CyrusOne, Inc., a provider of mission-critical data center facilities. The company logged one of its strongest leasing quarters on record and announced solid financial results, which included increased full-year guidance for earnings estimates. Animal health and mineral nutrition company Phibro Animal Health Corp. posted better-than-expected results, driven by strong performance in its nutritional products and vaccines business units. GEO Group, Inc., a developer, owner, and operator of prisons and post-release services, was another strong contributor. Its solid performance was driven by a favorable outlook for Federal use of private prisons and by solid financial results. Realogy Holdings Corp.
is a residential real estate and brokerage company. It posted strong financial results due to recent improvements in technology solutions and talent retention, which resulted in share price appreciation. Lam Research Corp. was also among the Fund’s strongest performers. This semiconductor equipment company benefited from robust demand for its 3D NAND flash storage technology, which helped drive strong financial results.
Detractors from Return
The Fund’s weakest sectors relative to its benchmark were consumer, interest rate sensitive, and technology. AmTrust Financial Services, Inc., a provider of insurance services primarily to small businesses, was the Fund’s largest individual detractor. During the second quarter, the Wall Street Journal published a story involving alleged accounting issues at AmTrust in 2013 and 2014. Although this information had been revealed previously, investors reacted anew and the stock underperformed. Oil and gas producer SM Energy Co. continued to face pressure from the uncertain oil price environment. We believe the market is overly penalizing the company and are optimistic given its recent Permian Basin asset purchase. Specialty fashion retailer Cato Corp. was another detractor. It experienced share price weakness as the company continued its effort to fix past merchandising missteps against the backdrop of a difficult retail environment. Dairy processor and distributor Dean Foods Co. also detracted from performance. Its financial results missed consensus expectations and concerns around potential competitive industry pricing with new retail grocery entrants into the U.S. market pressured the stock. AMC Entertainment Holdings, Inc., an owner and operator of movie theaters, was another drag on the Fund’s performance. Difficult box office sales and ongoing negotiations around Premium Video on Demand (PVOD) pricing led to its underperformance.
Outlook and Positioning
Looking ahead, we are excited about the opportunities that market and sector volatility may produce. As political, economic and market uncertainty continue, we will remain focused on finding dividend-paying stocks that we believe have sound fundamentals and are currently mispriced by the markets.
Stock Performance (for the six months ended 6/30/17)
| 5 Highest | Average Weight | Contribution to Return |
| CyrusOne, Inc. | 2.28% | 0.57% |
| Phibro Animal Health Corp. | 1.95 | 0.53 |
| GEO Group, Inc. | 1.46 | 0.49 |
| Realogy Holdings Corp. | 2.00 | 0.47 |
| Lam Research Corp. | 1.11 | 0.42 |
| 5 Lowest | Average Weight | Contribution to Return |
| AMC Entertainment Holdings, Inc. | 1.13% | -0.40% |
| Dean Foods Co. | 2.11 | -0.49 |
| Cato Corp. | 1.03 | -0.50 |
| SM Energy Co. | 1.54 | -1.07 |
| AmTrust Financial Services, Inc. | 1.93 | -1.12 |
Past performance does not guarantee future results. These stocks do not represent all of the securities purchased, sold or recommended by the Fund’s Adviser. To request a complete list of the contribution of each Fund holding to overall Fund performance during the period, please call 800.392.CORE (2673) or email invest@westcore.com.
Please see page 36 for a description of the methodology used to construct this chart.
Semi-Annual Report | June 30, 2017 | | 11 |
| Westcore Small-Cap Value Dividend Fund | Fund Overview |
June 30, 2017 (Unaudited)
Fund Strategy
Investing primarily in small, dividend-paying companies whose stocks appear to be undervalued.
Fund Management
Derek R. Anguilm, CFA Portfolio Manager Troy Dayton, CFA Portfolio Manager | Mark M. Adelmann, CFA, CPA Portfolio Manager Lisa Z. Ramirez, CFA Portfolio Manager Alex A. Ruehle, CFA Portfolio Manager |
CFA is a trademark owned by CFA Institute.
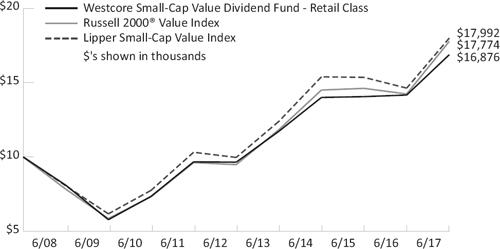
Cumulative Returns
The chart above represents historical performance of a hypothetical investment of $10,000 in the Fund over the past 10 years (or for the life of the Fund if shorter). Performance calculations are as of the end of June each year. Past performance does not guarantee future results. This chart does not reflect the deduction of taxes that a shareholder would pay on Fund distributions or the redemption of Fund shares.
Lipper Index data provided by Lipper, Inc.
Please see index definitions beginning on page 34.
Average Annual Total Returns
| | 6 Months | 1 Year | 3 Years | 5 Years | 10 Years | Since Inception | Inception Date |
| Retail Class (WTSVX) | -2.56% | 19.15% | 6.42% | 11.83% | 5.37% | 7.19% | 12/13/2004 |
| Institutional Class (WISVX) | -2.47 | 19.29 | 6.61 | 12.04 | 5.51 | 7.30 | 9/28/2007 |
Russell 2000® Value Index | 0.54 | 24.86 | 7.02 | 13.39 | 5.92 | 7.34 | |
| Lipper Small-Cap Value Index | 0.79 | 22.99 | 5.35 | 12.53 | 6.05 | 7.59 | |
Retail Class Annual Expense Ratio (per the current prospectus) — Gross: 1.46%, Net: 1.31%
Institutional Class Annual Expense Ratio (per the current prospectus) — Gross: 1.25%, Net: 1.09%
Sector Allocation (as of 6/30/17)
| Interest Rate Sensitive | 28.8% |
| Technology | 13.5 |
| Consumer | 13.2 |
| Capital Goods | 12.5 |
| REITs | 10.2 |
| Medical / Healthcare | 6.7 |
| Utilities | 4.7 |
| Energy | 4.2 |
| Basic Materials | 4.1 |
Sector classifications presented herein are based on the sector categorization methodology of the Adviser to the Funds which may result in the sector designations for one Fund being different than another Fund’s sector designations. For Fund compliance purposes, the Fund’s industry classifications refer to any one or more of the industry sub-classifications used by one or more widely recognized market indexes or ratings group indexes, and/or as defined by Fund management. This definition may not apply for purposes of this report, which may combine industry sub-classifications for reporting ease. Industries are shown as a percentage of net assets.
The sector allocation table above does not include any cash or cash equivalents.
Top Ten Holdings (as of 6/30/17)
| Enerplus Corp. | 2.8% |
| Dean Foods Co. | 2.8 |
| TiVo Corp. | 2.6 |
| AmTrust Financial Services, Inc. | 2.5 |
| CBL & Associates Properties, Inc. | 2.5 |
| Spire, Inc. | 2.4 |
| Sinclair Broadcast Group, Inc. | 2.4 |
| Radian Group, Inc. | 2.2 |
| Realogy Holdings Corp. | 2.2 |
| Umpqua Holdings Corp. | 2.1 |
| Total (% of Net Assets) | 24.5% |
Top ten holdings do not include any cash, cash equivalents or exchange traded fund investments. Holdings are subject to change and may not reflect the current or future position of the Fund.
Performance data quoted represents past performance and does not guarantee future results. Performance information for the institutional class shares prior to their inception is based on the performance of the retail class. Current performance may be lower or higher than the performance quoted. To obtain current performance as of the most recent month-end, visit www.westcore.com. Average annual total returns reflect the reinvestment of dividends, capital gains distributions, all fee waivers and expense reimbursements. Without the fee waivers and expense reimbursements, total return figures would have been lower. Investment return and principal value will vary, and shares, when redeemed, may be worth more or less than their original cost. Westcore fund shares are not insured by the FDIC, the Federal Reserve Board or any other agency and are subject to investment risk.
Denver Investments (the “Adviser”) has contractually agreed to waive certain investment advisory and/or administration fees and/or to reimburse other expenses from April 30, 2017 until at least April 30, 2018. The first waiver/reimbursement applies so that the ratio of expenses to average net assets, as reported in the Fund’s Financial Highlights, will be no more than 1.30% for the Fund’s Retail Class for such period. The second waiver/ reimbursement applies so that Fund level Other Expenses for the Institutional Class will be in the same proportion as the Retail Class waivers/ reimbursements. The third waiver/reimbursement applies so that the institutional class-specific Other Expenses are reimbursed. The Adviser has contractually agreed to waive/ reimburse all of these class-specific Other Expenses, but only to the extent that the difference between the net Institutional Class and net Retail Class expense ratios, after applying the waiver/reimbursement, does not exceed 25 basis points. These agreements may not be terminated or modified by the Adviser prior to April 30, 2018 without the approval of the Board of Trustees.
Investing in small-cap funds generally will be more volatile and loss of principal could be greater than investing in larger-cap funds.
Dividends are not guaranteed. A company’s future abilities to pay dividends may be limited and a company may cease paying dividends at any time.
Lisa Z. Ramirez is a registered representative of ALPS Distributors, Inc.
| 12 | | www.westcore.com |
| Westcore Small-Cap Value Dividend Fund | Fund Overview |
June 30, 2017 (Unaudited)
Manager Commentary
Market Overview
U.S. equity markets experienced a strong start to the year, driven by expectations of accelerated economic growth, but value stocks took a pause in the second quarter as reality did not meet those lofty near-term expectations. Excitement around the pro-business policies of the new administration took a back seat following the failure to pass the American Health Care Act of 2017 and the announced investigation into ties between President Trump’s campaign and Russian officials. These issues drove market fears that the new administration would be unable to implement policy changes. At the same time, the outlook for inflation dimmed and other economic indicators began to signal the potential for a slowdown, despite the Federal Reserve’s apparent optimism as it raised rates for the fourth time since December 2015. As a result of a more subdued outlook for U.S. economic growth, growth stocks (which have historically been less economically sensitive than value stocks) outperformed value stocks year-to-date. Additionally, investors shifted assets to larger capitalization companies and to more defensive sectors, such as health care and utilities, and away from more cyclical sectors, such as energy and basic materials.
Fund Performance
The Westcore Small-Cap Value Dividend Fund returned -2.56% (retail class) for the six months ended June 30, 2017, underperforming its benchmark, the Russell 2000® Value Index, which returned 0.54% for the same period.
Contributors to Return
The sectors that contributed most to the Fund’s performance relative to its benchmark were REITs, energy, and utilities. The Fund’s individual top performers were led by REIT sector holdings CyrusOne, Inc. and GEO Group, Inc. CyrusOne is a provider of mission-critical data center facilities. The company logged one of its strongest leasing quarters on record and announced solid financial results, which included increased full-year guidance for earnings estimates. GEO Group is a developer, owner, and operator of prisons and post-release services. Its strong performance was driven by a favorable outlook for Federal use of private prisons and by solid financial results. National food supplier AdvancePierre Foods Holdings, Inc. is a producer of ready-to-eat sandwiches, sandwich components, and other entrees and snacks. The company’s strong return and cash-flow improvement potential caught the attention of Tyson Foods, Inc. and in the second quarter
it was announced that Tyson would acquire AdvancePierre. Animal health and mineral nutrition company Phibro Animal Health Corp. posted better-than-expected results, driven by strong performance in its nutritional products and vaccines business units. Realogy Holdings Corp. is a residential real estate and brokerage company. It posted strong financial results due to recent improvements in technology solutions and talent retention, which resulted in share price appreciation.
Detractors from Return
The Fund’s weakest sectors relative to its benchmark were capital goods, interest rate sensitive, and consumer. From an individual stock perspective, SM Energy Co. detracted most from the Fund’s performance. This oil and gas producer continued to face pressure from the uncertain oil price environment. We believe the market is overly penalizing the company and are optimistic given its recent Permian Basin asset purchase. The Fund’s largest detractor within the interest rate sensitive sector was AmTrust Financial Services, Inc., a provider of insurance services primarily to small businesses. During the second quarter, the Wall Street Journal published a story involving alleged accounting issues at AmTrust in 2013 and 2014. Although this information had been revealed previously, investors reacted anew and the stock underperformed. Dairy processor and distributor Dean Foods Co. also detracted from performance. Its financial results missed consensus expectations and concerns around potential competitive industry pricing with new retail grocery entrants into the U.S. market pressured the stock. Engineering and construction company Chicago Bridge & Iron Co. was another drag on performance. A continuation of project cost overruns resulted in disappointing quarterly results. This, coupled with a dearth of new project awards, led to share price weakness. AMC Entertainment Holdings, Inc., an owner and operator of movie theaters, was another detractor in the period. Difficult box office sales and ongoing negotiations around Premium Video on Demand (PVOD) pricing led to its underperformance.
Outlook and Positioning
Looking ahead, we are excited about the opportunities that market and sector volatility may produce. As political, economic, and market uncertainty continue, we will remain focused on finding dividend-paying stocks that we believe have sound fundamentals and are currently mispriced by the markets.
Stock Performance (for the six months ended 6/30/17)
| 5 Highest | Average Weight | Contribution to Return |
| CyrusOne, Inc. | 2.44% | 0.64% |
| GEO Group, Inc | 1.99 | 0.55 |
| AdvancePierre Foods Holdings, Inc. | 0.91 | 0.49 |
| Phibro Animal Health Corp. | 1.71 | 0.46 |
| Realogy Holdings Corp. | 1.81 | 0.43 |
| 5 Lowest | Average Weight | Contribution to Return |
| AMC Entertainment Holdings, Inc. | 1.64% | -0.60% |
| Chicago Bridge & Iron Co. NV | 1.15 | -0.71 |
| Dean Foods Co. | 3.23 | -0.75 |
| AmTrust Financial Services, Inc. | 2.12 | -1.16 |
| SM Energy Co. | 1.61 | -1.18 |
Past performance does not guarantee future results. These stocks do not represent all of the securities purchased, sold or recommended by the Fund’s Adviser. To request a complete list of the contribution of each Fund holding to overall Fund performance during the period, please call 800.392.CORE (2673) or email invest@westcore.com.
Please see page 36 for a description of the methodology used to construct this chart.
Semi-Annual Report | June 30, 2017 | | 13 |
| Westcore Global Large-Cap Dividend Fund | Fund Overview |
June 30, 2017 (Unaudited)
Fund Strategy
Investing in large, well-established, dividend-paying companies both in the United States and in developed foreign markets.
Fund Management
Derek R. Anguilm, CFA Portfolio Manager Troy Dayton, CFA Portfolio Manager Mark M. Adelmann, CFA, CPA Portfolio Manager CFA is a trademark owned by CFA Institute. | Paul A. Kuppinger, CFA Portfolio Manager Lisa Z. Ramirez, CFA Portfolio Manager Alex A. Ruehle, CFA Portfolio Manager |
Cumulative Returns
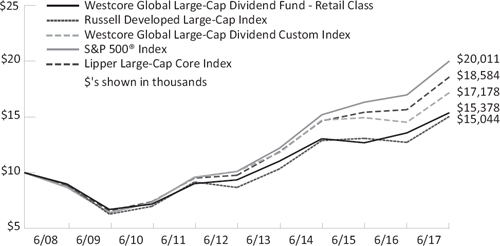
The chart above represents historical performance of a hypothetical investment of $10,000 in the Fund over the past 10 years (or for the life of the Fund if shorter). Performance calculations are as of the end of June each year. Past performance does not guarantee future results. This chart does not reflect the deduction of taxes that a shareholder would pay on Fund distributions or the redemption of Fund shares.
Lipper Index data provided by Lipper, Inc.
Please see index definitions beginning on page 34.
Average Annual Total Returns
| | 6 Months | 1 Year | 3 Years | 5 Years | 10 Years | Since Inception | Inception Date |
| Retail Class (WTMVX) | 10.16% | 13.34% | 5.63% | 10.45% | 4.40% | 8.57% | 6/1/1988 |
| Institutional Class (WIMVX) | 10.39 | 13.57 | 5.81 | 10.67 | 4.57 | 8.63 | 9/28/2007 |
| Russell Developed Large-Cap Index | 10.63 | 18.28 | 5.30 | 11.64 | 4.17 | — | |
| Westcore Global Large-Cap Dividend Custom Index | 10.63 | 18.28 | 5.30 | 11.19 | 5.55 | 9.77 | |
S&P 500® Index | 9.34 | 17.90 | 9.61 | 14.63 | 7.18 | 10.35 | |
| Lipper Large-Cap Core Index | 8.90 | 18.73 | 8.25 | 13.73 | 6.40 | 9.30 | |
Retail Class Annual Expense Ratio (per the current prospectus) — Gross: 1.23%, Net: 1.00%
Institutional Class Annual Expense Ratio (per the current prospectus) — Gross: 1.23%, Net: 0.82%
Sector Allocation (as of 6/30/17)
| Consumer Discretionary | 15.1% |
| Consumer Staples | 13.6 |
| Health Care | 13.5 |
| Financials | 12.9 |
| Information Technology | 12.3 |
| Industrials | 10.7 |
| Energy | 9.2 |
| Utilities | 3.3 |
| Materials | 3.2 |
| Telecommunication Services | 2.2 |
Sector classifications presented herein are based on the sector categorization methodology of the Adviser to the Funds which may result in the sector designations for one Fund being different than another Fund’s sector designations. For Fund compliance purposes, the Fund’s industry classifications refer to any one or more of the industry sub-classifications used by one or more widely recognized market indexes or ratings group indexes, and/or as defined by Fund management. This definition may not apply for purposes of this report, which may combine industry sub-classifications for reporting ease. Industries are shown as a percentage of net assets.
The sector allocation table above does not include any cash or cash equivalents.
Top Ten Holdings (as of 6/30/17)
| CSX Corp. | 4.4% |
| Apple, Inc. | 3.8 |
| Bayer AG | 3.8 |
| Nestle SA | 3.6 |
| British American Tobacco PLC | 3.6 |
| McDonald's Corp. | 3.6 |
| US Bancorp | 3.5 |
| Novartis AG | 3.4 |
| Broadridge Financial Solutions Inc. | 3.4 |
| Whitbread PLC | 3.4 |
| Total (% of Net Assets) | 36.4% |
Top ten holdings do not include any cash, cash equivalents or exchange traded fund investments. Holdings are subject to change and may not reflect the current or future position of the Fund.
Performance data quoted represents past performance and does not guarantee future results. Performance information for the institutional class shares prior to their inception is based on the performance of the retail class. Current performance may be lower or higher than the performance quoted. To obtain current performance as of the most recent month-end, visit www.westcore.com. Average annual total returns reflect the reinvestment of dividends, capital gains distributions, all fee waivers and expense reimbursements. Without the fee waivers and expense reimbursements, total return figures would have been lower. Investment return and principal value will vary, and shares, when redeemed, may be worth more or less than their original cost. Westcore fund shares are not insured by the FDIC, the Federal Reserve Board or any other agency and are subject to investment risk.
Denver Investments (the “Adviser”) has contractually agreed to waive certain investment advisory and/or administration fees and/or to reimburse other expenses from April 30, 2017 until at least April 30, 2018. The first waiver/reimbursement applies so that the ratio of expenses to average net assets, as reported in the Fund’s Financial Highlights, will be no more than 0.99% for the Fund’s Retail Class for such period. The second waiver/reimbursement applies so that Fund level Other Expenses for the Institutional Class will be in the same proportion as the Retail Class waivers/reimbursements. The third waiver/reimbursement applies so that the institutional class-specific Other Expenses are reimbursed. The Adviser has contractually agreed to waive/ reimburse all of these class-specific Other Expenses, but only to the extent that the difference between the net Institutional Class and net Retail Class expense ratios, after applying the waiver/reimbursement, does not exceed 25 basis points. These agreements may not be terminated or modified by the Adviser prior to April 30, 2018 without the approval of the Board of Trustees.
Investments in foreign companies are subject to special risks, including currency fluctuations, social, economic, and political uncertainties, which could increase volatility.
Dividends are not guaranteed. A company’s future abilities to pay dividends may be limited and a company may cease paying dividends at any time.
Lisa Z. Ramirez is a registered representative of ALPS Distributors, Inc.
| 14 | | www.westcore.com |
| Westcore Global Large-Cap Dividend Fund | Fund Overview |
June 30, 2017 (Unaudited)
Manager Commentary
Market Overview
U.S. equity markets experienced a strong start to the year, driven by expectations of accelerated economic growth, while other global markets played catch-up in the second quarter. In the United States, excitement around the pro-business policies of the new administration took a backseat following the failure to pass the American Health Care Act of 2017 and the announced investigation into ties between President Trump’s campaign and Russian officials. These issues drove market fears that the new administration would be unable to implement policy changes. At the same time, European markets began to see greater policy certainty through the arrival of long-anticipated election results in France and the United Kingdom.
Fund Performance
The Westcore Global Large-Cap Dividend Fund returned 10.16% (retail class) for the six months ended June 30, 2017, underperforming its benchmark, the Russell Developed Large-Cap Index, which returned 10.63% for the same period.
Contributors to Return
The sectors that contributed most to the Fund’s performance relative to the benchmark were consumer staples, industrials, and health care. The Fund’s top performers were led by CSX Corp., a provider of rail-based transportation services in the United States and Canada. The company generated strong network and customer performance metrics and management raised its outlook on productivity objectives. Mobile device and personal computer manufacturer Apple, Inc. posted solid financial results supported by robust demand for iPhone 7 models and strength in its services business. This, coupled with growing excitement around the iPhone 8 launch, led to the stock’s outperformance. Global health and nutrition manufacturer Bayer AG contributed to performance as the company announced strong results that were driven by each of its business segments. McDonald’s Corp., a global fast food retailer, posted solid financial results that highlighted market share gains in key markets and underscored its global footprint. Also among the Fund’s top contributors was global
tobacco company, British American Tobacco PLC. The company posted steady sales and earnings results, coupled with the announced acquisition of Reynolds American Inc., which should provide plenty of opportunities for synergy.
Detractors from Return
The Fund’s weakest sectors relative to the benchmark were information technology, consumer discretionary and telecommunication services. The Fund’s largest detractor was Brambles, Ltd. a global provider of pallet and other container solutions for companies to transport goods. Performance was weighed down by pricing pressure and higher costs resulting from network inefficiencies. Mattel, Inc., a manufacturer and marketer of a broad variety of toy products, was another significant detractor. After two consecutive quarters of weak results driven by too much inventory, new management updated forward earnings expectations and reduced its dividend payout to fund growth initiatives. Digital telecommunications company QUALCOMM, Inc. was negatively impacted by legal issues with two large customers. Although risk remains as QUALCOMM navigates remaining litigation with one customer, we believe the company retains a defendable intellectual property portfolio, with a durable royalty base. BT Group PLC, a British telecommunications provider, weighed on performance as increased pension liabilities created by a change in accounting methodology and a decrease in its dividend growth outlook pressured the share price. Exploration and production company Occidental Petroleum Corp. was another headwind to performance in the period. The outlook for oil prices remained uncertain as a recent recovery of supply output from Africa and unrelenting growth of supply from U.S. shale undermined OPEC-orchestrated output reductions.
Outlook and Positioning
Looking ahead, we are excited about the opportunities that market and sector volatility may produce. As political, economic, and market uncertainty continue, we will remain focused on finding dividend-paying stocks that we believe have sound fundamentals and are currently mispriced by the markets.
Stock Performance (for the six months ended 6/30/17)
| 5 Highest | Average Weight | Contribution to Return |
| CSX Corp. | 4.09% | 1.75% |
| Apple, Inc. | 3.88 | 0.92 |
| Bayer AG | 3.64 | 0.88 |
| McDonald's Corp. | 3.30 | 0.84 |
| British American Tobacco PLC | 3.63 | 0.83 |
| 5 Lowest | Average Weight | Contribution to Return |
| Occidental Petroleum Corp. | 2.85% | -0.42% |
| BT Group PLC | 2.49 | -0.48 |
| QUALCOMM, Inc. | 2.81 | -0.50 |
| Mattel, Inc. | 2.42 | -0.54 |
| Brambles, Ltd. | 2.91 | -0.56 |
Past performance does not guarantee future results. These stocks do not represent all of the securities purchased, sold or recommended by the Fund’s Adviser. To request a complete list of the contribution of each Fund holding to overall Fund performance during the period, please call 800.392.CORE (2673) or email invest@westcore.com.
Please see page 36 for a description of the methodology used to construct this chart.
Semi-Annual Report | June 30, 2017 | | 15 |
| Westcore Large-Cap Dividend Fund | Fund Overview |
| | June 30, 2017 (Unaudited) |
Fund Strategy
Investing in large, well-established, dividend-paying domestic companies.
Fund Management
Derek R. Anguilm, CFA Portfolio Manager | Paul A. Kuppinger, CFA Portfolio Manager |
Troy Dayton, CFA Portfolio Manager | Lisa Z. Ramirez, CFA Portfolio Manager |
Mark M. Adelmann, CFA, CPA Portfolio Manager | Alex A. Ruehle, CFA Portfolio Manager |
| | |
| CFA is a trademark owned by CFA Institute. | |
Cumulative Returns
The chart above represents historical performance of a hypothetical investment of $10,000 in the Fund over the past 10 years (or for the life of the Fund if shorter). Performance calculations are as of the end of June each year. Past performance does not guarantee future results. This chart does not reflect the deduction of taxes that a shareholder would pay on Fund distributions or the redemption of Fund shares.
Lipper Index data provided by Lipper, Inc.
Please see index definitions beginning on page 34.
Average Annual Total Returns
| | 6 Months | 1 Year | 3 Years | 5 Years | 10 Years | Since Inception | Inception Date |
| Retail Class (WTEIX) | 5.90% | 9.78% | 5.04% | 10.16% | 5.71% | 8.65% | 6/1/1988 |
| Institutional Class (WILGX) | 6.01 | 10.07 | 5.30 | 10.40 | 5.89 | 8.71 | 9/28/2007 |
Russell 1000® Index | 9.27 | 18.03 | 9.26 | 14.67 | 7.29 | 10.47 | |
| Westcore Large-Cap Dividend Custom Index | 9.27 | 15.43 | 9.55 | 14.33 | 8.45 | 10.00 | |
Russell 1000® Growth Index | 13.99 | 20.42 | 11.11 | 15.30 | 8.91 | 10.16 | |
| Lipper Large-Cap Growth Index | 8.90 | 18.73 | 8.25 | 13.73 | 6.40 | 9.30 | |
Retail Class Annual Expense Ratio (per the current prospectus) — Gross: 1.30%, Net: 0.89%
Institutional Class Annual Expense Ratio (per the current prospectus) — Gross: 1.49%, Net: 0.67%
Sector Allocation (as of 6/30/17) | |
| | |
| Information Technology | 18.5% |
| Consumer Discretionary | 17.8 |
| Consumer Staples | 16.1 |
| Health Care | 15.9 |
| Financials | 8.3 |
| Industrials | 8.0 |
| Utilities | 7.7 |
| Materials | 3.9 |
| Energy | 3.3 |
Sector classifications presented herein are based on the sector categorization methodology of the Adviser to the Funds which may result in the sector designations for one Fund being different than another Fund’s sector designations. For Fund compliance purposes, the Fund’s industry classifications refer to any one or more of the industry sub-classifications used by one or more widely recognized market indexes or ratings group indexes, and/or as defined by Fund management. This definition may not apply for purposes of this report, which may combine industry sub-classifications for reporting ease. Industries are shown as a percentage of net assets.
The sector allocation table above does not include any cash or cash equivalents.
Top Ten Holdings (as of 6/30/17) | |
| | |
| CSX Corp. | 4.4% |
| Wal-Mart Stores Inc. | 4.4 |
| Chubb Ltd. | 4.4 |
| Nestle SA | 4.2 |
| Cardinal Health Inc. | 4.2 |
| Pfizer, Inc. | 4.0 |
| Yum! Brands, Inc. | 4.0 |
| Kimberly-Clark Corp. | 4.0 |
| US Bancorp | 4.0 |
| Broadridge Financial Solutions Inc. | 3.9 |
| Total (% of Net Assets) | 41.4% |
Top ten holdings do not include any cash, cash equivalents or exchange traded fund investments. Holdings are subject to change and may not reflect the current or future position of the Fund.
Effective December 27, 2016, the Westcore Growth Fund was renamed the Westcore Large-Cap Dividend Fund and was repositioned to focus on large, dividend-paying companies.
Performance data quoted represents past performance and does not guarantee future results. Performance information for the institutional class shares prior to their inception is based on the performance of the retail class. Current performance may be lower or higher than the performance quoted. To obtain current performance as of the most recent month-end, visit www.westcore.com. Average annual total returns reflect the reinvestment of dividends, capital gains distributions, all fee waivers and expense reimbursements. Without the fee waivers and expense reimbursements, total return figures would have been lower. Investment return and principal value will vary, and shares, when redeemed, may be worth more or less than their original cost. Westcore fund shares are not insured by the FDIC, the Federal Reserve Board or any other agency and are subject to investment risk.
Denver Investments (the “Adviser”) has contractually agreed to waive certain investment advisory and/or administration fees and/or to reimburse other expenses from April 30, 2017 until at least April 30, 2018. The first waiver/reimbursement applies so that the ratio of expenses to average net assets, as reported in the Fund’s Financial Highlights, will be no more than 0.89% for the Fund’s Retail Class for such period. The second waiver/reimbursement applies so that Fund level Other Expenses for the Institutional Class will be in the same proportion as the Retail Class waivers/reimbursements. The third waiver/reimbursement applies so that the institutional class-specific Other Expenses are reimbursed. The Adviser has contractually agreed to waive/ reimburse all of these class-specific Other Expenses, but only to the extent that the difference between the net Institutional Class and net Retail Class expense ratios, after applying the waiver/reimbursement, does not exceed 25 basis points. These agreements may not be terminated or modified by the Adviser prior to April 30, 2018 without the approval of the Board of Trustees.
Dividends are not guaranteed. A company’s future abilities to pay dividends may be limited and a company may cease paying dividends at any time.
Lisa Z. Ramirez is a registered representative of ALPS Distributors, Inc.
| 16 | | www.westcore.com |
| Westcore Large-Cap Dividend Fund | Fund Overview |
| | June 30, 2017 (Unaudited) |
Manager Commentary
Market Overview
U.S. equity markets experienced a strong start to the year, driven by expectations of accelerated economic growth, but value stocks took a pause in the second quarter as reality did not meet those lofty near-term expectations. Excitement around the pro-business policies of the new administration took a back seat following the failure to pass the American Health Care Act of 2017, and the announced investigation into ties between President Trump’s campaign and Russian officials. These issues drove market fears that the new administration would be unable to implement policy changes. At the same time, the outlook for inflation dimmed and other economic indicators began to signal the potential for a slowdown, despite the Federal Reserve’s apparent optimism as it raised rates for the fourth time since December 2015. As a result of a more subdued outlook for U.S. economic growth, growth stocks (which have historically been less economically sensitive than value stocks) outperformed value stocks. Additionally, investors shifted assets to larger capitalization companies and to more defensive sectors, such as health care and utilities, and away from more cyclical sectors, such as energy and basic materials.
Fund Performance
The Westcore Large-Cap Dividend Fund returned 5.90% (retail class) for the six months ended June 30, 2017, underperforming its benchmark, the Russell 1000® Index, which returned 9.27% over the same period.
Contributors to Return
The sectors that contributed most to the Fund’s performance relative to its benchmark were industrials, energy, and telecommunications services. The Fund’s top performers were led by CSX Corp., a provider of rail-based transportation services in the United States and Canada. The company generated strong network and customer performance metrics and management raised its outlook on productivity objectives. McDonald’s Corp., a global fast food retailer, posted solid financial results that highlighted market share gains in key markets and underscored its strong global footprint. Mobile device and personal computer manufacturer Apple, Inc. posted solid financial results supported by robust demand for iPhone 7 models and strength in its services business. This, coupled with growing excitement around the iPhone 8 launch, led to the stock’s outperformance. Global consumer goods company Nestle SA was another strong performer
in the period. The company announced slightly better-than-expected financial results under the leadership of a new CEO. These results were driven by improved growth, and the continued recovery in Asia and Europe. Global biopharmaceutical company AbbVie, Inc. added to the Fund’s performance with solid financial results that exhibited continued strong growth from its lead product, Humira.
Detractors from Return
The Fund’s weakest sectors relative to its benchmark were consumer discretionary, information technology, and health care. The Fund’s three largest detractors in the period were consumer discretionary sector holdings Target Corp., Mattel, Inc., and Ralph Lauren Corp. Target, owner and operator Target stores, is in the early stages of a transformation strategy that requires significant investment across all areas of the business. This had a downward effect on earnings. Mattel, a manufacturer and marketer of a broad variety of toy products, reported two consecutive quarters of weak results attributable to too much inventory. New management updated forward earnings expectations and reduced its dividend payout to fund growth initiatives. Ralph Lauren, a designer, marketer, and distributor of premium lifestyle products, also detracted from performance in the period. The surprise departure of its CEO, Stefan Larsson, who was the architect behind recent turnaround plans presented by the company led to share price weakness. Digital telecommunications company QUALCOMM, Inc. was negatively impacted by legal issues with two large customers. Although risk remains as QUALCOMM navigates remaining litigation with one customer, we believe the company retains a defendable intellectual property portfolio, with a durable royalty base. Exploration and production company, Occidental Petroleum Corp. was another headwind to performance in the period. The outlook for oil prices remained uncertain as a recent recovery of supply output from Africa and unrelenting growth of supply from U.S. shale undermining OPEC-orchestrated output reductions.
Outlook and Positioning
Looking ahead, we are excited about the opportunities that market and sector volatility may produce. As political, economic, and market uncertainty continue, we will remain focused on finding dividend-paying stocks that we believe have sound fundamentals and are currently mispriced by the markets.
Stock Performance (for the six months ended 6/30/17)
| 5 Highest | Average Weight | Contribution to Return |
| CSX Corp. | 4.17% | 1.85% |
| McDonald's Corp. | 3.94 | 1.01 |
| Apple, Inc. | 4.00 | 0.97 |
| Nestle SA | 3.82 | 0.86 |
| AbbVie, Inc. | 3.78 | 0.67 |
| 5 Lowest | Average Weight | Contribution to Return |
| Occidental Petroleum Corp. | 3.27% | -0.52% |
| QUALCOMM, Inc. | 3.18 | -0.53 |
| Ralph Lauren Corp. | 3.15 | -0.65 |
| Mattel, Inc. | 3.10 | -0.90 |
| Target Corp. | 2.96 | -0.95 |
Past performance does not guarantee future results. These stocks do not represent all of the securities purchased, sold or recommended by the Fund’s Adviser. To request a complete list of the contribution of each Fund holding to overall Fund performance during the period, please call 800.392.CORE (2673) or email invest@westcore.com.
Please see page 36 for a description of the methodology used to construct this chart.
Semi-Annual Report | June 30, 2017 | | 17 |
| Westcore Micro-Cap Opportunity Fund | Fund Overview |
| | June 30, 2017 (Unaudited) |
Fund Strategy
Investing primarily in micro-cap companies whose stocks appear to be undervalued.
Fund Management
Paul A. Kuppinger, CFA Portfolio Manager
CFA is a trademark owned by CFA Institute.
Cumulative Returns
The chart above represents historical performance of a hypothetical investment of $10,000 in the Fund over the past 10 years (or for the life of the Fund if shorter). Performance calculations are as of the end of June each year. Past performance does not guarantee future results. This chart does not reflect the deduction of taxes that a shareholder would pay on Fund distributions or the redemption of Fund shares.
Lipper Index data provided by Lipper, Inc.
Please see index definitions beginning on page 34.
Average Annual Total Returns
| | 6 Months | 1 Year | 3 Years | 5 Years | 10 Years | Since Inception | Inception Date |
| Retail Class (WTMIX) | 0.11% | 25.33% | 6.73% | 13.72% | — | 9.71% | 6/23/2008 |
Russell Microcap® Index | 4.23 | 27.60 | 6.69 | 13.73 | — | 8.95 | |
| Lipper Small-Cap Core Index | 3.90 | 21.96 | 6.93 | 13.52 | — | 9.02 | |
Retail Class Annual Expense Ratio (per the current prospectus) — Gross: 2.09%, Net: 1.30%
Sector Allocation (as of 6/30/17) | |
| | |
| Financials | 24.1% |
| Health Care | 22.9 |
| Information Technology | 13.3 |
| Consumer Discretionary | 10.7 |
| Industrials | 10.2 |
| Energy | 4.8 |
| Materials | 3.2 |
| Consumer Staples | 2.9 |
| Real Estate | 2.1 |
| Utilities | 1.1 |
| Telecommunication Services | 0.9 |
Sector classifications presented herein are based on the sector categorization methodology of the Adviser to the Funds which may result in the sector designations for one Fund being different than another Fund’s sector designations. For Fund compliance purposes, the Fund’s industry classifications refer to any one or more of the industry sub-classifications used by one or more widely recognized market indexes or ratings group indexes, and/or as defined by Fund management. This definition may not apply for purposes of this report, which may combine industry sub-classifications for reporting ease. Industries are shown as a percentage of net assets.
The sector allocation table above does not include any cash or cash equivalents.
Top Ten Holdings (as of 6/30/17) | |
| | |
| Renewable Energy Group, Inc. | 1.0% |
| Phibro Animal Health Corp. | 1.0 |
| Lantheus Holdings, Inc. | 1.0 |
| Bassett Furniture Industries, Inc. | 1.0 |
| Repligen Corp. | 1.0 |
| Resource Capital Corp. | 1.0 |
| Schnitzer Steel Industries, Inc. | 0.9 |
| Neff Corp. | 0.9 |
| Exactech, Inc. | 0.9 |
| LHC Group, Inc. | 0.9 |
| Total (% of Net Assets) | 9.7% |
Top ten holdings do not include any cash, cash equivalents or exchange traded fund investments. Holdings are subject to change and may not reflect the current or future position of the Fund.
Performance data quoted represents past performance and does not guarantee future results. Current performance may be lower or higher than the performance quoted. To obtain current performance as of the most recent month-end, visit www.westcore.com. Average annual total returns reflect the reinvestment of dividends, capital gains distributions, all fee waivers and expense reimbursements. Without the fee waivers and expense reimbursements, total return figures would have been lower. Investment return and principal value will vary, and shares, when redeemed, may be worth more or less than their original cost. Westcore fund shares are not insured by the FDIC, the Federal Reserve Board or any other agency and are subject to investment risk.
Denver Investments (the “Adviser”) has contractually agreed to waive the investment advisory and/or administration fees and/or to reimburse other expenses from April 30, 2017 until at least April 30, 2018, so that the ratio of expenses to average net assets as reported in the Fund’s Financial Highlights will be no more than 1.30% for the Fund’s Retail Class for such period. This agreement may not be terminated or modified by the Adviser prior to April 30, 2018 without the approval of the Board of Trustees.
Investing in micro-cap funds generally will be more volatile and loss of principal could be greater than investing in larger-cap funds.
| 18 | | www.westcore.com |
| Westcore Micro-Cap Opportunity Fund | Fund Overview |
| | June 30, 2017 (Unaudited) |
Manager Commentary
Market Overview
Micro-cap stocks got off to a rocky start in 2017 as the post-election euphoria that drove performance at the end of 2016 wavered a bit. For the first three months of 2017, the Russell Microcap® Index returned a meager 0.38%. In the second quarter, however, micro-cap stocks rebounded with the Russell Microcap® Index returning 3.83% for the three months ended June 30. In the first half of the year, stocks that we view as expensive generally outperformed, while companies with high cash flow to price and other positive valuation metrics underperformed. Stocks with high return on equity also underperformed. From a trading standpoint, stocks with higher volatility and higher historical trading volume outperformed less-volatile and less-liquid stocks. Additionally, companies that have historically grown revenues, or are forecasted to do so over the next two years, outperformed slower-growth companies.
Fund Performance
The Westcore Micro-Cap Opportunity Fund returned 0.11% for the first half of the year, underperforming the 4.23% return over the same period of its benchmark, the Russell Microcap® Index. The models used to help manage and select stocks for the Fund provided mixed results for the first six months of 2017. On an absolute basis only 3 of the 11 sectors in the Fund provided positive returns for the period. The Fund outperformed the benchmark in 4 out of 11 sectors.
Contributors to Return
The Fund’s best-performing sectors relative to the benchmark were energy, health care, and materials. Pennsylvania-based OraSure Technologies, Inc. was the Fund’s top contributor in the period. This medical device company landed a major new customer, Helix, which allowed the firm to gain additional traction in its DNA Genotek, Inc. business. Also among the Fund’s best-performing holdings was Fortress Biotech, Inc., a biopharmaceutical company dedicated to creating a portfolio of novel pharmaceutical and biotechnology products. The company reported better-than-expected annual results for 2016. MiMedx Group, Inc., a biopharmaceutical company that
delivers innovative bioactive healing products for tissue regeneration, was another strong performer. The company reported better-than-expected results for the first quarter.
Detractors from Return
The Fund’s weakest sectors relative to the benchmark were information technology, financials, and telecommunications services. The Fund’s largest individual detractor in the first half of 2017 was Bristow Group, Inc. Bristow is a provider of industrial aviation services, including helicopter transportation, search and rescue, and aircraft support services, primarily to the offshore oil and gas industry. The company reported disappointing earnings for its fiscal fourth quarter and, with oil prices down and the offshore market showing few signs of near-term recovery, management forecast little improvement for fiscal year 2018. Another holding impacted by low oil prices was Atwood Oceanics, Inc. This offshore drilling contractor headquartered in Houston, Texas struggled in the first half of the year as offshore drillers continued to be hampered by low oil prices. DHI Group, Inc., a leading provider of data, insights, and employment connections to specialized professional communities also underperformed during the first half of the year. The stock struggled after the company announced that it had concluded its exploration of alternative ownership options and would continue to operate independently.
Outlook and Positioning
Despite the uncertainty around the timing of pro-growth policy changes proposed by the new administration, stock market volatility remains at extremely low levels. Additionally, we see continued signs of optimism for small companies. Non-residential fixed investment spending increased by 11% in the second quarter of 2017. This suggests that increased optimism among CEOs and CFOs is translating into actual activity. U.S. consumer confidence also remains high. While it certainly does not appear to be a low-risk environment for stocks, particularly as valuations have increased in recent years, we are still finding some micro-cap stocks that we believe are reasonably priced.
Stock Performance (for the six months ended 6/30/17)
| 5 Highest | Average Weight | Contribution to Return |
| OraSure Technologies, Inc. | 0.99% | 0.72% |
| Extreme Networks, Inc. | 0.59 | 0.42 |
| Fortress Biotech, Inc. | 0.66 | 0.40 |
| MiMedx Group, Inc. | 0.68 | 0.40 |
| LHC Group, Inc. | 0.84 | 0.36 |
| 5 Lowest | Average Weight | Contribution to Return |
| Zumiez Inc. | 0.39% | -0.23% |
| Atwood Oceanics, Inc. | 0.48 | -0.24 |
| Libbey, Inc. | 0.29 | -0.24 |
| DHI Group, Inc. | 0.39 | -0.32 |
| Bristow Group, Inc. | 0.46 | -0.39 |
Past performance does not guarantee future results. These stocks do not represent all of the securities purchased, sold or recommended by the Fund’s Adviser. To request a complete list of the contribution of each Fund holding to overall Fund performance during the period, please call 800.392.CORE (2673) or email invest@westcore.com.
Please see page 36 for a description of the methodology used to construct this chart.
Semi-Annual Report | June 30, 2017 | | 19 |
| Westcore International Small-Cap Fund | Fund Overview |
June 30, 2017 (Unaudited)
Fund Strategy
Investing in the stocks of small international companies that we believe are poised for growth.
Fund Management
John C. Fenley, CFA Portfolio Manager
Jeremy A. Duhon, CFA Portfolio Manager
CFA is a trademark owned by CFA Institute.
Cumulative Returns
The chart above represents historical performance of a hypothetical investment of $10,000 in the Fund over the past 10 years (or for the life of the Fund if shorter). Performance calculations are as of the end of June each year. Past performance does not guarantee future results. This chart does not reflect the deduction of taxes that a shareholder would pay on Fund distributions or the redemption of Fund shares.
Lipper Index data provided by Lipper, Inc.
Please see index definitions beginning on page 34.
Average Annual Total Returns
| | 6 Months | 1 Year | 3 Years | 5 Years | 10 Years | Since Inception | Inception Date |
| Retail Class (WTIFX) | 15.19% | 16.35% | -0.20% | 5.40% | 3.76% | 5.21% | 12/15/1999 |
| Institutional Class (WIIFX) | 15.28 | 16.56 | -0.12 | 5.45 | 3.78 | 5.22 | 4/29/2016 |
| MSCI ACWI ex USA Small-Cap Index | 15.56 | 20.32 | 3.31 | 10.02 | 2.91 | 7.08 | |
| MSCI EAFE Small-Cap Index | 16.72 | 23.18 | 5.60 | 12.94 | 3.41 | 7.77 | |
| Lipper International Small-Cap Index | 17.73 | 21.24 | 4.16 | 11.68 | 3.46 | 7.42 | |
Retail Class Annual Expense Ratio (per the current prospectus) — Gross: 1.77%, Net: 1.50%
Institutional Class Annual Expense Ratio (per the current prospectus) — Gross: 1.65%, Net: 1.25%
Sector Allocation(as of 6/30/17)
| Information Technology | 38.0% |
| Consumer Discretionary | 25.5 |
| Health Care | 10.5 |
| Financials | 10.4 |
| Industrials | 7.8 |
| Real Estate | 3.3 |
| Consumer Staples | 3.1 |
Sector classifications presented herein are based on the sector categorization methodology of the Adviser to the Funds which may result in the sector designations for one Fund being different than another Fund’s sector designations. For Fund compliance purposes, the Fund’s industry classifications refer to any one or more of the industry sub-classifications used by one or more widely recognized market indexes or ratings group indexes, and/or as defined by Fund management. This definition may not apply for purposes of this report, which may combine industry sub-classifications for reporting ease. Industries are shown as a percentage of net assets.
The sector allocation table above does not include any cash or cash equivalents.
Top Ten Holdings (as of 6/30/17)
| Corporate Travel Management, Ltd. | 4.4% |
| Constellation Software, Inc. | 3.7 |
| Webjet, Ltd. | 3.6 |
| CTS Eventim AG & Co. KGaA | 3.4 |
| SMS Co. Ltd. | 3.3 |
| Japan Property Management Center Co., Ltd. | 3.3 |
| Boyd Group Income Fund | 3.2 |
| Azimut Holding S.p.A. | 3.2 |
| Credit Corp. Group, Ltd. | 3.1 |
| Tsuruha Holdings, Inc. | 3.1 |
| Total (% of Net Assets) | 34.2% |
Top ten holdings do not include any cash, cash equivalents or exchange traded fund investments. Holdings are subject to change and may not reflect the current or future position of the Fund.
Performance data quoted represents past performance and does not guarantee future results. Performance information for the institutional class shares prior to their inception is based on the performance of the retail class. Current performance may be lower or higher than the performance quoted. To obtain current performance as of the most recent month-end, visit www.westcore.com. Average annual total returns reflect the reinvestment of dividends, capital gains distributions, all fee waivers and expense reimbursements. Without the fee waivers and expense reimbursements, total return figures would have been lower. Investment return and principal value will vary, and shares, when redeemed, may be worth more or less than their original cost. Westcore fund shares are not insured by the FDIC, the Federal Reserve Board or any other agency and are subject to investment risk.
Denver Investments (the “Adviser”) has contractually agreed to waive the investment advisory and/or administration fees and/or to reimburse other expenses from April 30, 2017 until at least April 30, 2018, so that the ratio of expenses to average net assets as reported in the Fund’s Financial Highlights will be no more than 1.50% for the Fund’s Retail Class for such period. The second waiver/reimbursement applies so that Fund level Other Expenses for the Institutional Class will be in the same proportion as the Retail Class waivers/reimbursements. The third waiver/reimbursement applies so that the institutional class-specific Other Expenses are reimbursed. The Adviser has contractually agreed to waive/reimburse all of these class-specific Other Expenses, but only to the extent that the difference between the net Institutional Class and net Retail Class expense ratios, after applying the waiver/ reimbursement, does not exceed 25 basis points. This agreement may not be terminated or modified by the Adviser prior to April 30, 2018 without the approval of the Board of Trustees.
The Adviser has also agreed to voluntarily waive a portion of the investment advisory and/or administration fees and/or reimburse additional Trust expenses commencing April 29, 2016 so that the ratio of expenses to average net assets of the Westcore International Small-Cap Fund (the “Fund”) Retail Class of the Trust as reported in the Funds Financial Highlights do not exceed 1.44%. The second and third sentences of footnote (2) above otherwise remain in full force and effect. The Adviser may discontinue this voluntary waiver at any time upon notice to the Trust.
Investing in small-cap funds generally will be more volatile and loss of principal could be greater than investing in larger-cap funds.
Investing in foreign securities entails special risks, such as currency fluctuations and political uncertainties, which are described in more detail in the prospectus.
| 20 | | www.westcore.com |
| Westcore International Small-Cap Fund | Fund Overview |
June 30, 2017 (Unaudited)
Manager Commentary
Market Overview
Global equity markets, both developed and emerging, were generally strong in the first half of 2017. Despite headwinds created by geopolitical uncertainty in specific regions, earnings growth appeared to be leading stocks higher. Interestingly, volatility remained low, even as the risk of media coverage having an adverse impact on markets was highlighted on an almost daily basis. Generally, stocks were exceptionally strong at the beginning of the second quarter but were showing weakness by quarter-end. This may be an indication that global geopolitical headlines are beginning to factor into investors’ appetite for global equities.
Fund Performance
The Westcore International Small-Cap Fund participated in the favorable global equity environment and returned 15.19% (retail class) for the first half of the year. This, however, underperformed its benchmark, the MSCI ACWI ex USA Index, which was up 15.56% over the same period. From a geographic perspective, companies in Japan and Sweden were the strongest contributors to the Fund’s performance for the half, while stocks in the United Kingdom and Israel were its most significant detractors.
Contributors to Return
At the company level, Arcland Service Holdings Co., Ltd. and Qualicorp SA were among the Fund’s largest contributors relative to its benchmark. Arcland is a Japan-based operator of mostly fast casual deep-fried tonkatsu (pork cutlet) restaurants. Profits have been growing at a double-digit rate as it offers quality meals at a reasonable price through its low-cost operating structure. Using state-of-the-art deep fryers, Arcland can produce consistent quality tonkatsu at a fast rate with fewer employees than its competitors. We anticipate that store openings, same-store sales growth, and new restaurant formats should continue to drive growth. Brazil-based Qualicorp, an intermediary between health and dental insurers and companies offering these benefits to employees, was another contributor to performance. It benefited from being one of the first companies to serve the affinity market, which are companies or organizations
that have common interests and have partnered to create a larger consumer base. This has given Qualicorp scale that can benefit its clients when negotiating with insurers. We believe that the company will continue to prosper from the growing affinity market.
Detractors from Return
Stocks that detracted from the Fund’s performance for the period include Sapiens International Corp. and Utilitywise PLC. Sapiens, headquartered in Israel, is a global provider of software solutions for the insurance industry. In addition to software development, Sapiens has distinguished itself from major competitors by also managing the delivery and implementation of its software. During the half, Sapiens trimmed its guidance for 2017 earnings estimates following the loss of a major client. We have spoken to management about this client loss and have conducted additional research. The company’s business model remains intact and we believe demand for its software and services should continue to grow over the medium to long term. Utilitywise is a United Kingdom-based consultant to businesses regarding energy and water consumption. It focuses on helping small and medium-sizes enterprise businesses procure better utility rates as its negotiating power with the utility companies is often stronger than these companies could get on their own. Recently, shares have been under pressure due to management changes and the prospect of weakening consumption by some clients. The management changes, along with deteriorating working capital, led us to exit the position.
Outlook and Positioning
Despite the negative news from a couple of detractors, we are quite optimistic about the Fund’s positioning based on the number of holdings that have grown revenue and earnings over the past quarter. In our experience, companies rarely grow consistently quarter after quarter or year after year. We monitor the revenue and earnings evolution of all of the Fund’s holdings and are encouraged that the majority are experiencing meaningful growth in both areas. Our hope is that the Fund’s holdings will continue to post operational strength, which we expect will translate into performance success.
Stock Performance (for the six months ended 6/30/17)
| 5 Highest | Average Weight | Contribution to Return |
| Cellavision AB | 2.39% | 1.82% |
| Arcland Service Holdings Co., Ltd. | 3.31 | 1.35 |
| Corporate Travel Management, Ltd. | 3.82 | 1.20 |
| CTS Eventim AG & Co. KGaA | 2.95 | 1.14 |
| Qualicorp SA | 2.28 | 1.01 |
| 5 Lowest | Average Weight | Contribution to Return |
| 3P Learning Ltd. | 0.51% | -0.19% |
| Domino's Pizza Group PLC | 2.82 | -0.39 |
| Kakaku.com, Inc. | 2.09 | -0.57 |
| Utilitywise PLC | 0.82 | -0.59 |
| Sapiens International Corp. NV | 2.94 | -0.74 |
Past performance does not guarantee future results. These stocks do not represent all of the securities purchased, sold or recommended by the Fund’s Adviser. To request a complete list of the contribution of each Fund holding to overall Fund performance during the period, please call 800.392.CORE (2673) or email invest@westcore.com.
Please see page 36 for a description of the methodology used to construct this chart.
Semi-Annual Report | June 30, 2017 | | 21 |
| Westcore Flexible Income Fund | Fund Overview |
June 30, 2017 (Unaudited)
Fund Strategy
A fixed-income fund investing in a wide variety of income-producing securities, primarily bonds and to a lesser extent convertible bonds, and equity securities.
Fund Management
Troy A. Johnson, CFA Portfolio Manager
Gregory M. Shea, CFA Portfolio Manager
CFA is a trademark owned by CFA Institute.
Cumulative Returns
The chart above represents historical performance of a hypothetical investment of $10,000 in the Fund over the past 10 years (or for the life of the Fund if shorter). Performance calculations are as of the end of June each year. Past performance does not guarantee future results. This chart does not reflect the deduction of taxes that a shareholder would pay on Fund distributions or the redemption of Fund shares.
Lipper Index data provided by Lipper, Inc.
Please see index definitions beginning on page 34.
Average Annual Total Returns
| | 6 Months | 1 Year | 3 Years | 5 Years | 10 Years | Since Inception | 30-Day SEC Yield | Inception Date |
| Retail Class (WTLTX) | 4.09% | 8.75% | 5.10% | 5.89% | 4.54% | 7.48% | 3.87% | 6/1/1988 |
| Institutional Class (WILTX) | 4.19 | 9.15 | 5.36 | 6.09 | 4.69 | 7.53 | 4.04 | 9/28/2007 |
| Bloomberg Barclays U.S. Corporate High Yield Ba Index | 4.79 | 9.83 | 5.21 | 6.80 | 8.20 | 8.72 | — | |
| Lipper High Current Yield Index | 4.72 | 12.30 | 3.48 | 6.28 | 6.06 | 6.96 | — | |
Retail Class Annual Expense Ratio (per the current prospectus) — Gross: 0.96%, Net: 0.86%
Institutional Class Annual Expense Ratio (per the current prospectus) — Gross: 0.85%, Net: 0.64%
Asset Allocation (as of 6/30/17)
| Corporate Bonds | 89.7% |
| Commercial Mortgage-Backed Securities | 3.7 |
| Money Market Mutual Funds | 3.2 |
| Preferred Stocks | 1.7 |
| Residential Mortgage-Backed Securities | 0.9 |
| Exchange Traded Funds | 0.8 |
Percentages are based on Total Net Assets.
Top Ten Corporate Credit Exposure (as of 6/30/17)
| Goodyear Tire & Rubber Co. | 2.8% |
| Range Resources Corp. | 2.6 |
| FMG RES AUG | 2.5 |
| MPLX LP | 2.5 |
| Potlatch Corp. | 2.1 |
| Concho Resources Inc | 2.1 |
| CCO Holdings LLC | 2.1 |
| Tuckahoe Credit Lease Trust | 2.0 |
| United Rental | 2.0 |
| Tesoro Corp. | 2.0 |
| Total (% of Net Assets) | 22.6% |
Percentages represent the Fund’s aggregate holdings in the same corporate issuer and its affiliates. Holdings are subject to change and may not reflect the current or future position of the Fund.
30-Day SEC Yield figures reflect all fee waivers and expense reimbursements. Without the absorption of these fee waivers and/or expense reimbursements, the figures would have been 3.74% for the retail class and 3.94% for the institutional class.
Performance data quoted represents past performance and does not guarantee future results. Performance information for the institutional class shares prior to their inception is based on the performance of the retail class. Current performance may be lower or higher than the performance quoted. To obtain current performance as of the most recent month-end, visit www.westcore.com. Average annual total returns reflect the reinvestment of dividends, capital gains distributions, all fee waivers and expense reimbursements. Without the fee waivers and expense reimbursements, total return figures would have been lower. Investment return and principal value will vary, and shares, when redeemed, may be worth more or less than their original cost. Westcore fund shares are not insured by the FDIC, the Federal Reserve Board or any other agency and are subject to investment risk.
Denver Investments (the “Adviser”) has contractually agreed to waive certain investment advisory and/or administration fees and/or to reimburse other expenses from April 30, 2017 until at least April 30, 2018. The first waiver/reimbursement applies so that the ratio of expenses to average net assets, as reported in the Fund’s Financial Highlights, will be no more than 0.85% for the Fund’s Retail Class for such period. The second waiver/reimbursement applies so that Fund level Other Expenses for the Institutional Class will be in the same proportion as the Retail Class waivers/reimbursements. The third waiver/reimbursement applies so that the institutional class-specific Other Expenses are reimbursed. The Adviser has contractually agreed to waive/ reimburse all of these class-specific Other Expenses, but only to the extent that the difference between the net Institutional Class and net Retail Class expense ratios, after applying the waiver/reimbursement, does not exceed 25 basis points. These agreements may not be terminated or modified by the Adviser prior to April 30, 2018 without the approval of the Board of Trustees.
Westcore Flexible Income Fund may invest in high-yield/high-risk bonds which are subject to greater levels of liquidity risk. Additionally, investing in bonds entails interest rate risk and credit risk.
Gregory M. Shea is a registered representative of ALPS Distributors, Inc.
| 22 | | www.westcore.com |
| Westcore Flexible Income Fund | Fund Overview |
June 30, 2017 (Unaudited)
Manager Commentary
Market Overview
The rally in higher risk securities that began in the fourth quarter of 2016 continued in the first six months of 2017. The stock market, as measured by the Russell 3000® Index, generated a solid return of 8.93%. The Federal Reserve increased the Fed Funds rate twice in the first half of the year. The first was a 0.25% increase in March and was followed by another widely anticipated 0.25% increase in June. The interest rate market was seemingly less bullish than the Federal Reserve and equity investors. This was evidenced by the yield curve continuing to flatten as short-term rates (i.e. the Fed Funds rate) moved higher and long-term rates moved lower. For example, the 10-year U.S. Treasury was down from 2.44% on December 31, 2016, to 2.30% on June 30, 2017. Oil prices, which continued to be a barometer of the high-yield market, fell another 14.3% during the first half of 2017. The trailing twelve-month high-yield default rate continued to move lower from 6.90% at December 31, 2016, to 4.43% as of June 30, 2017, indicative of improving issuer fundamentals and a supportive market for new high-yield issues. Against this backdrop, the Bloomberg Barclays U.S. Corporate High Yield Index posted positive returns in five of the first six months of the year and outperformed investment grade corporate bonds. At the sector level, health care and financials outperformed. Underperforming sectors included retail, which had a particularly challenging first quarter in which high-yield retailer bonds fell 1.27%, and energy, which fell 1.16% in the second quarter. From a quality perspective, risk was in vogue as the Bloomberg Barclays U.S. Corporate High Yield Caa Index posted a 6.59% return for the first half, while the Bloomberg Barclays U.S. Corporate High Yield Ba Index was up 4.79%.
Fund Performance
The Westcore Flexible Income Fund’s 4.09% (retail class) return for the first half lagged the 4.79% return recorded by its benchmark, the Bloomberg Barclays U.S. Corporate High Yield Ba Index, over the same period. The Fund benefited as several of its holdings received upgrades from high-yield credit ratings to investment-grade credit
ratings in the first half. Unfortunately, these benefits were more than offset by the Fund’s shorter duration and its energy sector positions, which ultimately led to its underperformance.
Outlook and Positioning
High-yield credit spreads (the additional yield over Treasuries offered by high-yield bonds) continued to tighten during the first half of 2017 and again approached the post-2008 lows established in mid-2014. Issuer fundamentals showed improvement when first quarter results were finalized, but overall leverage levels in the high-yield market currently remain elevated. In our view, we’ve passed the peak in balance sheet improvement for high-yield securities, except for a few commodity sectors and one-off situations. Increased political uncertainty has had a mild positive impact on bond markets as corporate America has started to take a “wait and see” approach while awaiting details regarding tax reform, regulatory reform, etc. We believe the key drivers of market valuations will likely be (1) the speed with which the Federal Reserve normalizes policy, (2) global investor appetite for fixed income assets, (3) results out of Washington D.C, and (4) the pace at which corporate America re-leverages balance sheets. We generally expect moderate outcomes on each of these fronts, but believe we have positioned the Fund appropriately if dislocations occur and the situation warrants.
We position the Fund with a longer-term investment orientation and an emphasis on higher-quality high-yield bonds. The goal of which is reducing the Fund’s volatility while providing solid risk-adjusted returns over time. Our process entails intensive credit analysis by which we evaluate yield versus risk through business cycles, and it follows that a larger weighting of higher-rated, high-yield issues is a logical result. Most importantly, we believe this strategy is suitable over the long term for shareholders who want comparative yield from a high-yield fund, but who are also more sensitive to volatility and more focused on capital preservation.
Semi-Annual Report | June 30, 2017 | | 23 |
| Westcore Plus Bond Fund | Fund Overview |
June 30, 2017 (Unaudited)
Fund Strategy
A fixed-income fund focusing on investment quality bonds of varying maturities.
Fund Management
Kenneth A. Harris, CFA Portfolio Manager
Troy A. Johnson, CFA Portfolio Manager
CFA is a trademark owned by CFA Institute.
Cumulative Returns
The chart above represents historical performance of a hypothetical investment of $10,000 in the Fund over the past 10 years (or for the life of the Fund if shorter). Performance calculations are as of the end of June each year. Past performance does not guarantee future results. This chart does not reflect the deduction of taxes that a shareholder would pay on Fund distributions or the redemption of Fund shares.
Lipper Index data provided by Lipper, Inc.
Please see index definitions beginning on page 34.
Average Annual Total Returns
| | 6 Months | 1 Year | 3 Years | 5 Years | 10 Years | Since Inception | 30-Day SEC Yield | Inception Date |
| Retail Class (WTIBX) | 3.04% | 1.13% | 2.79% | 2.76% | 4.42% | 6.10% | 2.84% | 6/1/1988 |
| Institutional Class (WIIBX) | 3.05 | 1.29 | 2.93 | 2.91 | 4.55 | 6.14 | 2.99 | 9/28/2007 |
| Bloomberg Barclays U.S. Aggregate Bond Index | 2.27 | -0.31 | 2.48 | 2.21 | 4.48 | 6.43 | — | |
| Lipper Core Plus Bond Index* | 3.06 | 2.04 | 2.62 | 3.12 | 5.18 | — | — | |
Retail Class Annual Expense Ratio (per the current prospectus) — Gross: 0.78%, Net: 0.55%
Institutional Class Annual Expense Ratio (per the current prospectus) — Gross: 0.56%, Net: 0.38%
Asset Allocation (as of 6/30/17) |
| Corporate Bonds | 38.0% |
| Mortgage-Backed Securities Passthrough | 25.5 |
| U.S. Treasury Bonds & Notes | 11.2 |
| Municipal Bonds | 9.4 |
| Asset Backed Securities | 6.4 |
| Commercial Mortgage-Backed Securities | 3.7 |
| Money Market Mutual Funds | 2.0 |
| Residential Mortgage-Backed Securities | 1.8 |
| Collateralized Loan Obligations | 1.5 |
| Preferred Stocks | 0.8 |
Percentages are based on Total Net Assets.
| Top Ten Corporate Credit Exposure | |
| (as of 6/30/17) | |
| San Diego Airport | 2.0% |
| Washington State | 1.7 |
| Washington REIT | 1.4 |
| Crown Castle Towers LLC | 1.3 |
| AMXCA | 1.3 |
| General Electric | 1.3 |
| North Texas Tollway Authority | 1.3 |
| San Francisco City and County CA Public Utilities | 1.2 |
| Pacific Gas & Electric | 1.2 |
| JP Morgan Chase & Co. | 1.2 |
| Total (% of Net Assets) | 13.8% |
Percentages represent the Fund’s aggregate holdings in the same corporate issuer and its affiliates. Holdings are subject to change and may not reflect the current or future position of the Fund.
30-Day SEC Yield figures reflect all fee waivers and expense reimbursements. Without the absorption of these fee waivers and/or expense reimbursements, the figures would have been 2.63% for the retail class and 2.84% for the institutional class.
Performance data quoted represents past performance and does not guarantee future results. Performance information for the institutional class shares prior to their inception is based on the performance of the retail class. Current performance may be lower or higher than the performance quoted. To obtain current performance as of the most recent month-end, visit www.westcore.com. Average annual total returns reflect the reinvestment of dividends, capital gains distributions, all fee waivers and expense reimbursements. Without the fee waivers and expense reimbursements, total return figures would have been lower. Investment return and principal value will vary, and shares, when redeemed, may be worth more or less than their original cost. Westcore fund shares are not insured by the FDIC, the Federal Reserve Board or any other agency and are subject to investment risk.
Denver Investments (the “Adviser”) has contractually agreed to waive certain investment advisory and/or administration fees and/or to reimburse other expenses from April 30, 2017 until at least April 30, 2018. The first waiver/reimbursement applies so that the ratio of expenses to average net assets, as reported in the Fund’s Financial Highlights, will be no more than 0.55% for the Fund’s Retail Class for such period. The second waiver/reimbursement applies so that Fund level Other Expenses for the Institutional Class will be in the same proportion as the Retail Class waivers/reimbursements. The third waiver/reimbursement applies so that the institutional class-specific Other Expenses are reimbursed. The Adviser has contractually agreed to waive/ reimburse all of these class-specific Other Expenses, but only to the extent that the difference between the net Institutional Class and net Retail Class expense ratios, after applying the waiver/reimbursement, does not exceed 25 basis points. These agreements may not be terminated or modified by the Adviser prior to April 30, 2018 without the approval of the Board of Trustees.
| * | A since inception calculation is not provided as the December 31, 1997 inception of the Lipper Core Plus Bond Index followed the June 1, 1988 inception of the Westcore Plus Bond Fund. |
Westcore Plus Bond Fund may invest in high-yield/high risk bonds which are subject togreater levels of liquidity risk. Additionally, investing in bonds entails interest rate risk and credit risk.
| 24 | | www.westcore.com |
| Westcore Plus Bond Fund | Fund Overview |
June 30, 2017 (Unaudited)
Manager Commentary
Market Overview
While the Federal Reserve was busy raising short-term interest rates in both March and June of this year, the market was equally busy lowering long-term interest rates. The result was a much flatter yield curve and a new emerging bond market conundrum. While we are not yet close to the dreaded inverted yield curve, which would signal an impending recession, it is quite remarkable that long-term rates continued to fall during the initial stages of a Federal Reserve rate-hiking cycle. The Federal Reserve appeared focused on a strengthening economy and the likelihood of rising inflation. Markets, however, remained skeptical as hopes faded that the new administration would produce imminent and meaningful tax reform or the anticipated fiscal stimulus from infrastructure spending. Meanwhile, stocks continued to reach new all-time highs and corporate bonds performed very well as investors embraced additional risk in anticipation of better returns and higher income levels. To us, it is a bit of a conundrum that optimism has led stocks to all-time highs and tighter spreads for high-yield corporate bonds (spreads are the additional yield over Treasuries offered by bonds) while, at the same time, the interest rate market seems to be forecasting slowing growth and continued low inflation. Investors seem more and more comfortable accepting the longevity of the current low-rate environment, with its minimal volatility that rewards risk takers of all forms. Perhaps we really are in the Goldilocks days where all indicators are “just right” and there is nothing to worry about.
Fund Performance
The Westcore Plus Bond Fund’s return of 3.04% (retail class) for the first six months of 2017, outperformed its benchmark, the Bloomberg Barclays U.S. Aggregate Bond Index, which generated 2.27% for the same period. The excess return was a result of the enhanced income-oriented positioning of the Fund relative to the benchmark. The Fund continued to benefit from its overweighted exposure to corporate and taxable municipal bonds through the accompanying yield advantage, as well as the spread tightening throughout the first half of the year. The strong relative performance of the Fund’s high-yield holdings, while limited in allocation, also augmented performance.
Outlook and Positioning
The prevailing economic outlook is for modest, but positive growth, and slowly rising inflation. At June 30, unemployment remained at cycle lows even as the labor force increased, with displaced workers
slowly returning to the workforce. The lack of strong wage increases remains a mystery as a scarcity of skilled workers in specific industries becomes more pronounced and unfilled positions accumulate. The Federal Reserve appears to believe that tight labor markets will imminently lead to rising real wages and then quickly into rising inflation as those cost pressures are pushed through to consumers. This strength in the U.S. economy is also evident in European, Asian and emerging markets, in what many are calling a synchronized global expansion. The appearance of tranquility and calm pervading the markets has us on high alert for the inflection point that would alter this outlook. Much will depend on the actions of central banks as they reduce their support of financial conditions through the unwinding of the unprecedented quantitative easing and bond buying of recent years. U.S. fixed income securities continue to look attractive versus those available elsewhere in today’s global marketplace, particularly the significantly lower and even negative rates offered in European and Japanese bond markets.
We believe the Fund is positioned to perform well over time and within the volatile environments that often arise across financial markets. The Fund is constructed with overweighted positions in shorter maturity “spread” sectors and a duration that is slightly shorter than the benchmark. This positioning is intended to capture higher income levels, while also being slightly more protective if we do see modest interest rate increases. We are also cognizant that a fall in interest rates is plausible if the pendulum of economic data swings back to the weaker side, a flight to quality is caused by another global crisis, or there is a sudden decline in stock prices. Recognizing that we are late in an already extended positive credit cycle, we have positioned the Fund with overweighted positions in carefully selected income-producing securities, including mortgage-backed securities as well as corporate and municipal bonds. These tactics are designed to enable performance over multiple interest rate and economic scenarios. We have increased our focus on quality and liquidity in an effort to mitigate negative credit events and market dislocations that could adversely impact portfolios. We believe our rigorous credit selection process is particularly valuable at this point in the credit cycle when it is critically important to assess valuations, as well as differentiate creditworthiness and long-term stability of each of our holdings. While we are concerned about the volatility and the recent spike in short-term rates, we are not convinced the market is quickly headed to significantly higher long-term interest rates.
Semi-Annual Report | June 30, 2017 | | 25 |
| Westcore Municipal Opportunities Fund | Fund Overview |
June 30, 2017 (Unaudited) Fund Strategy
A fixed income fund focusing primarily on investment-grade quality bonds of intermediate maturity which provide income exempt from federal taxation.
Fund Management
Kenneth A. Harris, CFA Portfolio Manager
Nicholas J. Foley Portfolio Manager
CFA is a trademark owned by CFA Institute.
Cumulative Returns
The chart above represents historical performance of a hypothetical investment of $10,000 in the Fund over the past 10 years (or for the life of the Fund if shorter). Performance calculations are as of the end of June each year. Past performance does not guarantee future results. This chart does not reflect the deduction of taxes that a shareholder would pay on Fund distributions or the redemption of Fund shares.
Lipper Index data provided by Lipper, Inc.
Please see index definitions beginning on page 34.
Average Annual Total Returns
| | 6 Months | 1 Year | 3 Years | 5 Years | 10 Years | Since Inception | 30-Day SEC Yield | Inception Date |
| Retail Class (WTTAX) | 4.91% | — | — | — | — | 6.49% | 2.70% | 12/16/2016 |
| Institutional Class (WITAX) | 5.06 | — | — | — | — | 6.64 | 2.96 | 12/16/2016 |
| Bloomberg Barclays U.S. 1-15 Year Municipal Bond Index | 3.21 | — | — | — | — | 3.94 | — | |
| Lipper Intermediate Municipal Debt Index | 3.01 | — | — | — | — | 3.69 | — | |
Retail Class Annual Expense Ratio (per the current prospectus) — Gross: 19.19%, Net: 0.73%
Institutional Class Annual Expense Ratio (per the current prospectus) — Gross: 19.56%, Net: 0.69%
Asset Allocation (as of 6/30/17)
| General Obligation | 22.7% |
| Transportation | 14.9 |
| General | 14.5 |
| Development | 11.4 |
| Nursing Homes | 10.0 |
| Higher Education | 5.1 |
| Short-Term Investments/Net Other Assets | 4.8 |
| Housing | 4.3 |
| Build America Bonds | 3.8 |
| Education | 3.1 |
| Airport | 2.5 |
| Medical | 2.2 |
| Facilities | 0.7 |
Percentages are based on Total Net Assets.
| Top Ten Corporate Credit Exposure |
| (as of 6/30/17) | |
| City of Coralville | 6.9% |
| Colorado Health Facilities Authority | 6.5 |
| Desert Hot Redevelopment | 5.9 |
| Pima CO Development | 5.8 |
| Papio | 5.4 |
| Commonwealth of Puerto Rico | 5.1 |
| High Plains | 4.7 |
| Baltimore Convention | 4.6 |
| CO High Performance | 4.4 |
| MD Econ Development | 4.3 |
| Total (% of Net Assets) | 53.5% |
Percentages represent the Fund’s aggregate holdings in the same corporate issuer and its affiliates. Holdings are subject to change and may not reflect the current or future position of the Fund.
NEW FUND RISK: There can be no assurance that the Fund will grow to or maintain an economically viable size. There may be limited or no performance history for investors to evaluate.
30-Day SEC Yield figures reflect all fee waivers and expense reimbursements. Without the absorption of these fee waivers and/or expense reimbursements, the figures would have been 0.85% for the retail class and 0.94% for the institutional class.
Performance data quoted represents past performance and does not guarantee future results. Current performance may be lower or higher than the performance quoted. To obtain current performance as of the most recent month-end, visit www.westcore.com. Average annual total returns reflect the reinvestment of dividends, capital gains distributions, all fee waivers and expense reimbursements. Without the fee waivers and expense reimbursements, total return figures would have been lower. Investment return and principal value will vary, and shares, when redeemed, may be worth more or less than their original cost. Westcore fund shares are not insured by the FDIC, the Federal Reserve Board or any other agency and are subject to investment risk.
Denver Investments (the “Adviser”) has contractually agreed to waive certain investment advisory and/or administration fees and/or to reimburse other expenses until at least April 30, 2018, so that the ratio of expenses to average net assets as reported in the Fund’s Financial Highlights will be no more than 0.65% for the Fund’s Retail Class for such period. Subsequent to any such waivers or reimbursements with respect to the Fund’s Retail Class, the Adviser will waive or reimburse Fund level Other Expenses for the Institutional Class in the same proportion as the Retail Class waivers/reimbursements and also waive or reimburse Institutional class-specific Other Expenses, but only to the extent that the difference between the net Institutional Class and net Retail Class expense ratios does not exceed 25 basis points, after applying the waiver/reimbursement. These agreements may not be terminated or modified by the Adviser prior to April 30, 2018 without the approval of the Board of Trustees.
Municipal bond fund income may be subject to state and local income taxes and the alternative minimum tax. Capital gains, if any, will be subject to capital gains tax.
Investments in municipal bonds are subject to interest rate risk, or the risk that the bonds will decline in value because of changes in market interest rates.
| 26 | | www.westcore.com |
| Westcore Municipal Opportunities Fund | Fund Overview |
June 30, 2017 (Unaudited)
Manager Commentary
Market Overview
Apart from a couple of starts and stops, the 10-year AAA municipal rate moved steadily lower over the first half of the year. Perhaps the most startling takeaway from the last six months was the disappearance of volatility within the municipal markets. One likely reason for the relative calm was a lack of supply of municipal bonds as issuance of new bonds has not kept up with the quantity of maturing and called bonds. Additionally, it is becoming apparent that many of the large initiatives that were anticipated after the November elections will come to fruition only slowly and in more diluted forms, if at all. This lack of political initiatives also supported lower volatility.
Rates and Ratios: The 10-year AAA rated municipal bond yield fell to 1.96% as of June 30, 2017. The low for the first half of the year was 1.82% and would likely have finished there if not for a bit of a selloff in the final days of June.
Municipal Bond Fund Flows: Flows into the municipal market were strong as political initiatives were delayed and performance was positive. Thomson Reuters Lipper reported inflows of $5.3 billion into municipal bond funds for the year-to-date through June 30. This represents an increase of approximately 0.78% in total assets in municipal bond funds in the United States.
Municipal Credit Events: Illinois’ credit rating was downgraded to within one notch of “junk” bond status by Moody’s Investors Service and S&P Global Ratings. We could be entering uncharted waters. If Illinois’ credit rating is further downgraded, it would be the first instance in which the credit of a U.S. state was junk rated. Currently
states, unlike nearly all other municipal entities, do not have the ability to enter bankruptcy. Illinois, however, may be the first to challenge this, as the state certainly appears to be in need of relief.
Connecticut’s credit rating was also downgraded by multiple credit agencies in the quarter. This may come as a surprise to many as the state has one of the highest earnings per capita in the United States. It is another example of how years and years of underfunding pensions and other long-term liabilities can stack up.
Fund Performance
The Westcore Municipal Opportunities Fund returned 4.91% (retail class) for the first half of the year. This compares to a return of 3.21% by its benchmark, the Bloomberg Barclays U.S. 1-15 Year Municipal Bond Index, over the same period.
Outlook and Positioning
Credit Positioning: Our outlook for municipal bonds remains positive as slow, steady growth since the 2008 recession has made its way into municipal revenues. We remain more bullish on revenue bonds and issuers who have limited exposure to long-term liabilities.
Duration: The Fund’s effective duration as of June 30, 2017 was 6.5 years and its average maturity was 13.5 years. This is a longer effective duration and maturity than the benchmark had as of June 30, 2017.
As of June 30, 2017, no individual holdings within the Fund were taxable to those shareholders subject to the Alternative Minimum Tax (AMT).
Semi-Annual Report | June 30, 2017 | | 27 |
| Westcore Colorado Tax-Exempt Fund | Fund Overview |
June 30, 2017 (Unaudited)
Fund Strategy
A Colorado municipal bond fund focused on investment-grade quality bonds of intermediate maturity that provide federal and state tax-exempt income.
Fund Management
Kenneth A. Harris, CFA Portfolio Manager
Nicholas J. Foley Portfolio Manager
CFA is a trademark owned by CFA Institute.
Cumulative Returns
The chart above represents historical performance of a hypothetical investment of $10,000 in the Fund over the past 10 years (or for the life of the Fund if shorter). Performance calculations are as of the end of June each year. Past performance does not guarantee future results. This chart does not reflect the deduction of taxes that a shareholder would pay on Fund distributions or the redemption of Fund shares.
Lipper Index data provided by Lipper, Inc.
Please see index definitions beginning on page 34.
Average Annual Total Returns
| | 6 Months | 1 Year | 3 Years | 5 Years | 10 Years | Since Inception | 30-Day SEC Yield | Inception Date |
| Retail Class (WTCOX) | 3.06% | -0.67% | 2.82% | 2.62% | 3.82% | 4.60% | 2.76% | 6/1/1991 |
| Institutional Class WICOX) | 3.20 | -0.53 | 2.87 | 2.65 | 3.83 | 4.61 | 2.92 | 4/29/2016 |
| Bloomberg Barclays U.S. 10-Year Municipal Bond Index | 4.18 | -0.41 | 3.56 | 3.40 | 5.13 | 5.85 | — | |
| Lipper Intermediate Municipal Debt Index | 3.01 | -0.61 | 2.48 | 2.49 | 3.79 | 4.63 | — | |
Retail Class Annual Expense Ratio (per the current prospectus) — Gross: 0.85%, Net: 0.66%
Institutional Class Annual Expense Ratio (per the current prospectus) — Gross: 0.69%, Net: 0.50%
Asset Allocation (as of 6/30/17)
| General | 20.1% |
| Medical | 17.3 |
| Development | 12.7 |
| Education | 11.8 |
| General Obligation | 9.4 |
| Transportation | 4.3 |
| Build America Bonds | 4.1 |
| Short-Term Investments/Net Other Assets | 3.9 |
| Higher Education | 3.8 |
| Airport | 3.1 |
| Multifamily Hsg | 2.5 |
| School District | 2.5 |
| Facilities | 1.8 |
| Water | 1.3 |
| Power | 0.8 |
| Nursing Homes | 0.7 |
Percentages are based on Total Net Assets.
Top Ten Credit Exposure (as of 6/30/17) |
| Colorado Education & Cultural Facilities Authority | 24.1% |
| Colorado Health Facilities Authority | 13.0 |
| University of Colorado Hospital Authority | 6.4 |
| Colorado High Performance | 3.5 |
| City & County of Denver Co Airport System Revenue | 2.6 |
| Aurora Cops | 2.4 |
| Denver Convention Center Hotel Authority | 2.4 |
| Central Platte Valley Metropolitan District | 2.4 |
| Regional Transportation District | 2.2 |
| Colorado Housing & Finance Authority | 1.9 |
| Total (% of Net Assets) | 60.9% |
Top ten holdings do not include any cash, cash equivalents or exchange traded fund investments. Holdings are subject to change and may not reflect the current or future position of the Fund.
30-Day SEC Yield figures reflect all fee waivers and expense reimbursements. Without the absorption of these fee waivers and/or expense reimbursements, the figures would have been 2.59% for the retail class and 2.79% for the institutional class.
Performance data quoted represents past performance and does not guarantee future results. Performance information for the institutional class shares prior to their inception is based on the performance of the retail class. Current performance may be lower or higher than the performance quoted. To obtain current performance as of the most recent month-end, visit www.westcore.com. Average annual total returns reflect the reinvestment of dividends, capital gains distributions, all fee waivers and expense reimbursements. Without the fee waivers and expense reimbursements, total return figures would have been lower. Investment return and principal value will vary, and shares, when redeemed, may be worth more or less than their original cost. Westcore fund shares are not insured by the FDIC, the Federal Reserve Board or any other agency and are subject to investment risk.
Denver Investments (the “Adviser”) has contractually agreed to waive the investment advisory and/or administration fees and/or to reimburse other expenses from April 30, 2017 until at least April 30, 2018, so that the ratio of expenses to average net assets as reported in the Fund’s Financial Highlights will be no more than 0.65% for the Fund’s Retail Class for such period. The second waiver/reimbursement applies so that Fund level Other Expenses for the Institutional Class will be in the same proportion as the Retail Class waivers/reimbursements. The third waiver/reimbursement applies so that the institutional class-specific Other Expenses are reimbursed. The Adviser has contractually agreed to waive/reimburse all of these class-specific Other Expenses, but only to the extent that the difference between the net Institutional Class and net Retail Class expense ratios, after applying the waiver/reimbursement, does not exceed 25 basis points. This agreement may not be terminated or modified by the Adviser prior to April 30, 2018 without the approval of the Board of Trustees.
Westcore Colorado Tax-Exempt Fund invests primarily in instruments issued by or on behalf of one state and generally will be more volatile and loss of principal could be greater due to state specific risk.
| 28 | | www.westcore.com |
| Westcore Colorado Tax-Exempt Fund | Fund Overview |
June 30, 2017 (Unaudited)
Manager Commentary
Market Overview
Apart from a couple of starts and stops, the 10-year AAA municipal rate moved steadily lower over the first half of the year. Perhaps the most startling takeaway from the last six months was the disappearance of volatility within the municipal markets. One likely reason for the relative calm was a lack of supply of municipal bonds as issuance of new bonds has not kept up with the quantity of maturing and called bonds. Additionally, it is becoming apparent that many of the large initiatives that were anticipated after the November elections will come to fruition only slowly and in more diluted forms, if at all. This lack of political initiatives also supported lower volatility.
Rates and Ratios: The 10-year AAA rated municipal bond yield fell to 1.96% as of June 30, 2017. The low for the first half of the year was 1.82% and would likely have finished there if not for a bit of a selloff in the final days of June.
Municipal Bond Fund Flows: Flows into the municipal market were strong as political initiatives were delayed and performance was positive. Thomson Reuters Lipper reported inflows of $5.3 billion into municipal bond funds for the year-to-date through June 30. This represents an increase of approximately 0.78% in total assets in municipal bond funds in the United States.
Colorado Issuance: Through the second quarter of 2017, issuance of new Colorado municipal bonds totaled approximately $1.6 billion across 59 offerings. The largest of which was a $188 million offering for further development and expansion of the Centerra Metropolitan
District between Greely and Loveland. The second largest offering was by the Colorado Highway Performance Transportation Authority. This $162 million issuance will finance the building of managed lanes along C-470 where it connects with I-25. As many of us living in metro Denver can attest, this is an area of major congestion, so we will be interested to see the project develop.
Fund Performance
The Westcore Colorado Tax-Exempt Fund returned 3.06% (retail class) for the six months ended June 30, 2017. This compares to a return of 4.18% by its benchmark, the Bloomberg Barclays U.S. 10-Year Municipal Bond Index for the same period.
Outlook & Positioning
Credit Positioning: Our outlook for municipal bonds remains positive as slow, steady growth since the 2008 recession has made its way into municipal revenues. We remain more bullish on revenue bonds and issuers who have limited exposure to long-term liabilities.
Duration: The Fund’s effective duration as of June 30, 2017 was 5.7 years and its average maturity was 11.4 years. This is a shorter effective duration and maturity than the benchmark as of June 30, 2017.
As of June 30, 2017, no individual holdings within the Fund were taxable to those shareholders subject to the Alternative Minimum Tax (AMT).
Semi-Annual Report | June 30, 2017 | | 29 |
| Westcore Funds | Fund Expenses |
June 30, 2017 (Unaudited)
Disclosure of Fund Expenses
As a shareholder of a Fund, you may incur two types of costs: (1) transaction costs; and (2) ongoing costs, including management fees and other Fund expenses. The examples on the next page are intended to help you understand your ongoing costs (in dollars) of investing in a Fund and to compare these costs with the ongoing costs of investing in other mutual funds. The examples are based on an investment of $1,000 invested on January 1, 2017 and held until June 30, 2017.
Actual Expenses. The first line of the table on the next page provides information about actual account values and actual expenses. You may use the information in this line, together with the amount you invested, to estimate the expenses that you paid over the period. Simply divide your account value by $1,000 (for example, an $8,600 account value divided by $1,000 = 8.6), then multiply the result by the number in the first line under the heading “Expenses Paid During Period” to estimate the expenses you paid on your account during this period.
Hypothetical Example for Comparison Purposes. The second line of the table on the next page provides information about hypothetical account values and hypothetical expenses based on the Fund’s actual expense ratio and an assumed rate of return of 5% per year before expenses, which is not the Fund’s actual return. The hypothetical account values and expenses may not be used to estimate the actual ending account balance or expenses you paid for the period. You may use this information to compare the ongoing costs of investing in a Fund and other mutual funds. To do so, compare this 5% hypothetical example with the 5% hypothetical examples that appear in the shareholder reports of other funds.
Expenses shown in the table on the next page are meant to highlight ongoing Fund costs only and do not reflect transaction costs, such as redemption fees. Therefore, the second line of the table is useful in comparing ongoing costs only, and may not help you determine the relative total costs of owning different funds. In addition, if these transactional costs were included, your costs would have been higher.
| 30 | | www.westcore.com |
| Westcore Funds | Fund Expenses |
June 30, 2017 (Unaudited)
| | Beginning Account Value January 1, 2017 | Ending Account Value June 30, 2017 | Expense Ratio(a) | Expenses Paid During period January 1, 2017 - June 30, 2017(b) |
| Westcore Small-Cap Growth Fund | | | | | |
| Retail | | | | | |
| Actual | $1,000.00 | $1,158.90 | 1.27 | %(c) | $6.80 |
| Hypothetical (5% return before expenses) | $1,000.00 | $1,018.50 | 1.27 | %(c) | $6.36 |
| Institutional | | | | | |
| Actual | $1,000.00 | $1,159.90 | 1.23 | % | $6.59 |
| Hypothetical (5% return before expenses) | $1,000.00 | $1,018.70 | 1.23 | % | $6.16 |
| | | | | | |
| Westcore Small-Cap Growth Fund II | | | | | |
| Institutional | | | | | |
| Actual | $1,000.00 | $1,213.40 | 1.08 | % | $5.93 |
| Hypothetical (5% return before expenses) | $1,000.00 | $1,019.44 | 1.08 | % | $5.41 |
| | | | | | |
| Westcore Mid-Cap Value Dividend Fund | | | | | |
| Retail | | | | | |
| Actual | $1,000.00 | $1,009.50 | 1.19 | %(d) | $5.93 |
| Hypothetical (5% return before expenses) | $1,000.00 | $1,018.89 | 1.19 | %(d) | $5.96 |
| Institutional | | | | | |
| Actual | $1,000.00 | $1,010.80 | 1.00 | % | $4.99 |
| Hypothetical (5% return before expenses) | $1,000.00 | $1,019.84 | 1.00 | % | $5.01 |
| | | | | | |
| Westcore Mid-Cap Value Dividend Fund II | | | | | |
| Retail | | | | | |
| Actual | $1,000.00 | $1,015.60 | 1.15 | % | $5.75 |
| Hypothetical (5% return before expenses) | $1,000.00 | $1,019.09 | 1.15 | % | $5.76 |
| Institutional | | | | | |
| Actual | $1,000.00 | $1,013.00 | 1.10 | % | $5.49 |
| Hypothetical (5% return before expenses) | $1,000.00 | $1,019.34 | 1.10 | % | $5.51 |
| | | | | | |
| Westcore Smid-Cap Value Dividend Fund | | | | | |
| Retail | | | | | |
| Actual | $1,000.00 | $993.00 | 1.20 | % | $5.93 |
| Hypothetical (5% return before expenses) | $1,000.00 | $1,018.84 | 1.20 | % | $6.01 |
| Institutional | | | | | |
| Actual | $1,000.00 | $994.00 | 0.95 | % | $4.70 |
| Hypothetical (5% return before expenses) | $1,000.00 | $1,020.08 | 0.95 | % | $4.76 |
| | | | | | |
| Westcore Small-Cap Value Dividend Fund | | | | | |
| Retail | | | | | |
| Actual | $1,000.00 | $974.40 | 1.30 | % | $6.36 |
| Hypothetical (5% return before expenses) | $1,000.00 | $1,018.35 | 1.30 | % | $6.51 |
| Institutional | | | | | |
| Actual | $1,000.00 | $975.30 | 1.11 | % | $5.44 |
| Hypothetical (5% return before expenses) | $1,000.00 | $1,019.29 | 1.11 | % | $5.56 |
| | | | | | |
| Westcore Global Large-Cap Dividend Fund | | | | | |
| Retail | | | | | |
| Actual | $1,000.00 | $1,101.60 | 0.99 | % | $5.16 |
| Hypothetical (5% return before expenses) | $1,000.00 | $1,019.89 | 0.99 | % | $4.96 |
| Institutional | | | | | |
| Actual | $1,000.00 | $1,103.90 | 0.90 | % | $4.69 |
| Hypothetical (5% return before expenses) | $1,000.00 | $1,020.33 | 0.90 | % | $4.51 |
Semi-Annual Report | June 30, 2017 | | 31 |
| Westcore Funds | Fund Expenses |
June 30, 2017 (Unaudited)
| | Beginning Account Value January 1, 2017 | Ending Account Value June 30, 2017 | Expense Ratio(a) | Expenses Paid During period January 1, 2017 - June 30, 2017(b) |
| Westcore Large-Cap Dividend Fund | | | | | |
| Retail | | | | | |
| Actual | $1,000.00 | $1,059.00 | 1.06 | %(e) | $5.41 |
| Hypothetical (5% return before expenses) | $1,000.00 | $1,019.54 | 1.06 | %(e) | $5.31 |
| Institutional | | | | | |
| Actual | $1,000.00 | $1,058.50 | 0.97 | % | $4.95 |
| Hypothetical (5% return before expenses) | $1,000.00 | $1,019.98 | 0.97 | % | $4.86 |
| | | | | | |
| Westcore Micro-Cap Opportunity Fund | | | | | |
| Retail | | | | | |
| Actual | $1,000.00 | $1,001.10 | 1.30 | % | $6.45 |
| Hypothetical (5% return before expenses) | $1,000.00 | $1,018.35 | 1.30 | % | $6.51 |
| | | | | | |
| Westcore International Small-Cap Fund | | | | | |
| Retail | | | | | |
| Actual | $1,000.00 | $1,151.90 | 1.44 | % | $7.68 |
| Hypothetical (5% return before expenses) | $1,000.00 | $1,017.65 | 1.44 | % | $7.20 |
| Institutional | | | | | |
| Actual | $1,000.00 | $1,152.80 | 1.29 | % | $6.89 |
| Hypothetical (5% return before expenses) | $1,000.00 | $1,018.40 | 1.29 | % | $6.46 |
| | | | | | |
| Westcore Flexible Income Fund | | | | | |
| Retail | | | | | |
| Actual | $1,000.00 | $1,040.90 | 0.85 | % | $4.30 |
| Hypothetical (5% return before expenses) | $1,000.00 | $1,020.58 | 0.85 | % | $4.26 |
| Institutional | | | | | |
| Actual | $1,000.00 | $1,041.90 | 0.68 | % | $3.44 |
| Hypothetical (5% return before expenses) | $1,000.00 | $1,021.42 | 0.68 | % | $3.41 |
| | | | | | |
| Westcore Plus Bond Fund | | | | | |
| Retail | | | | | |
| Actual | $1,000.00 | $1,030.40 | 0.55 | % | $2.77 |
| Hypothetical (5% return before expenses) | $1,000.00 | $1,022.07 | 0.55 | % | $2.76 |
| Institutional | | | | | |
| Actual | $1,000.00 | $1,030.50 | 0.40 | % | $2.01 |
| Hypothetical (5% return before expenses) | $1,000.00 | $1,022.81 | 0.40 | % | $2.01 |
| | | | | | |
| Westcore Municipal Opportunities Fund | | | | | |
| Retail | | | | | |
| Actual | $1,000.00 | $1,049.10 | 0.65 | % | $3.30 |
| Hypothetical (5% return before expenses) | $1,000.00 | $1,021.57 | 0.65 | % | $3.26 |
| Institutional | | | | | |
| Actual | $1,000.00 | $1,050.60 | 0.40 | % | $2.03 |
| Hypothetical (5% return before expenses) | $1,000.00 | $1,022.81 | 0.40 | % | $2.01 |
| | | | | | |
| Westcore Colorado Tax-Exempt Fund | | | | | |
| Retail | | | | | |
| Actual | $1,000.00 | $1,030.60 | 0.65 | % | $3.27 |
| Hypothetical (5% return before expenses) | $1,000.00 | $1,021.57 | 0.65 | % | $3.26 |
| Institutional | | | | | |
| Actual | $1,000.00 | $1,031.10 | 0.49 | % | $2.47 |
| Hypothetical (5% return before expenses) | $1,000.00 | $1,022.36 | 0.49 | % | $2.46 |
| 32 | | www.westcore.com |
| Westcore Funds | Fund Expenses |
June 30, 2017 (Unaudited)
(a) | The Fund's expense ratios have been annualized based on the Fund's most recent fiscal half-year expenses. |
(b) | Expenses are equal to the Fund's annualized expense ratio multiplied by the average account value over the period, multiplied by the number of days in the most recent fiscal half-year 181/365 (to reflect the half-year period). |
(c) | Contractual expense limitation change from 1.30% to 1.24% effective April 30, 2017. |
(d) | Contractual expense limitation change from 1.25% to 1.15% effective April 30, 2017. |
(e) | Contractual expense limitation change from 1.15% to 0.89% effective April 30, 2017. |
Semi-Annual Report | June 30, 2017 | | 33 |
| Westcore Funds | Important Disclosures |
June 30, 2017 (Unaudited)
INDEX DEFINITIONS AND DISCLOSURES
All indices are unmanaged and index performance figures include reinvestment of dividends but do not reflect any fees, expenses or taxes. Investors cannot invest directly in an index.
The Bloomberg Barclays U.S. 10-Year Municipal Bond Index includes investment grade (Moody’s Investor Services Aaa to Baa, Standard and Poor’s Corporation AAA to BBB) tax-exempt bonds with maturities between eight and twelve years.
The Bloomberg Barclays U.S. 1-15 Year Municipal Bond Index measures the performance of investment grade (Moody’s Investor Services Aaa to Baa, Standard and Poor’s Corporation AAA to BBB) general obligation and revenue bonds with maturities ranging from 1 to 17 years. It is a broad index that is representative of the tax-exempt bond market.
The Bloomberg Barclays U.S. Aggregate Bond Index is a fixed income, market-value-weighted index generally representative of investment grade fixed-rate debt issues, including government, corporate, asset-backed, and mortgage-backed securities with maturities of at least one year.
The Bloomberg Barclays U.S. Corporate High Yield Ba Index measures the performance of intermediate (1 to 10 year) U.S. high yield issues. It includes fixed-rate, noninvestment grade debt issues rated Ba1 or lower by Moody’s, rated BB+ or lower by S&P, rated below investment grade by Fitch Investor’s Service or if unrated previously held a high yield rating or have been associated with a high yield issuer, and must trade accordingly.
The Bloomberg Barclays U.S. Corporate High Yield Index measures the performance of the high-yield, fixed-rate corporate bond market. Securities are classified as high yield if the middle rating of Moody’s, Fitch and S&P is Ba1/BB+/BB+ or below.
The Dow Jones Industrial Average is a price-weighted average of 30 significant stocks traded on the New York Stock Exchange and the NASDAQ.
The Lipper Core Plus Bond Index tracks the performance of funds that invest at least 65% in domestic investment-grade debt issues (rated in the top four grades) with any remaining investment in non-benchmark sectors such as high-yield, global and emerging market debt. These funds maintain dollar-weighted average maturities of five to ten years.
The Lipper High Current Yield Index tracks the performance of funds that aim at high (relative) current yield from fixed income securities, have no quality or maturity restrictions, and tend to invest in lower-grade debt issues.
The Lipper Intermediate Municipal Debt Index tracks the performance of funds that invest in municipal debt issues with dollar-weighted average maturities of five to ten years.
The Lipper International Small-Cap Index tracks the performance of funds that, by portfolio practice, invest at least 75% of their equity assets in companies strictly outside of the U.S. with market capitalizations (on a three-year weighted basis) below Lipper’s international large-cap floor.
The Lipper Large-Cap Core Index tracks the performance of funds that, by portfolio practice, invest at least 75% of their equity assets in companies with market capitalizations (on a three-year weighted basis) above Lipper’s USDE large-cap floor.
The Lipper Large-Cap Growth Index tracks the performance of funds that, by portfolio practice, invest at least 75% of their equity assets in companies with market capitalizations (on a three-year weighted basis) above Lipper’s USDE large-cap floor.
The Lipper Mid-Cap Growth Index tracks the performance of funds that, by portfolio practice, invest at least 75% of their equity assets in companies with market capitalizations (on a three-year weighted basis) below Lipper’s USDE large-cap floor.
The Lipper Mid-Cap Value Index tracks the performance of funds that, by portfolio practice, invest at least 75% of their equity assets in companies with market capitalizations (on a three-year weighted basis) below Lipper’s USDE large-cap floor.
The Lipper Small-Cap Core Index tracks the performance of funds that, by portfolio practice, invest at least 75% of their equity assets in companies with market capitalizations (on a three-year weighted basis) below Lipper’s USDE small-cap ceiling.
The Lipper Small-Cap Growth Index tracks the performance of funds that invest at least 75% of their equity assets in companies with market capitalization (on a three-year weighted basis) below Lipper’s USDE Small-cap ceiling.
| 34 | | www.westcore.com |
| Westcore Funds | Important Disclosures |
June 30, 2017 (Unaudited)
The Lipper Small-Cap Value Index tracks the performance of funds that, by portfolio practice, invest at least 75% of their equity assets in companies with market capitalizations (on a three-year weighted basis) below Lipper’s USDE small-cap ceiling.
The MSCI ACWI Index captures large and mid cap representation across 23 Developed Market and 23 Emerging Market countries. With 2,470 constituents, the index covers approximately 85% of the global investable equity opportunity set.
The MSCI ACWI ex USA Small Cap Index captures small cap representation across 22 of 23 Developed Market countries (excluding the U.S.) and 23 Emerging Market countries. With 4,233 constituents, the index covers approximately 14% of the global equity opportunity set outside the U.S. MSCI Inc. launched the MSCI ACWI ex USA Small Cap Index on June 1, 2007. Data prior to the launch date is back-tested data provided and derived by MSCI (i.e. calculations of how the index might have performed over that time period had the index existed). There may be material differences between back-tested performance and actual results. Past performance, whether actual or back-tested, is no indication or guarantee of
future performance.
The MSCI EAFE Small-Cap Index is an unmanaged market-capitalization-weighted index that represents the performance of smaller capitalization companies in developed stock markets outside of North America. The index targets all companies with market capitalization below that of the companies in the MSCI EAFE Index and up to 99% coverage of the free-float adjusted market capitalization in each market.
The NASDAQ Composite Index measures all NASDAQ domestic and international based common type stocks listed on The NASDAQ Stock Market.
The Russell 1000® Index measures the performance of the large-cap segment of the U.S. equity universe. It is a subset of the Russell 3000® Index and includes approximately 1000 of the largest securities based on a combination of their market cap and current index membership. The Russell 1000® Index represents approximately 92% of the U.S. market.
The Russell 1000® Growth Index measures the performance of the largest 1,000 firms in the Russell 3000® Index, which represents approximately 98% of the investable U.S. equity market.
The Russell 2000® Index measures the performance of the small-cap segment of the U.S. equity universe. The Russell 2000® Index is a subset of the Russell 3000® Index representing approximately 10% of the total market capitalization of that index. It includes approximately 2000 of the smallest securities based on a combination of their market cap and current index membership.
The Russell 2000® Growth Index measures the performance of the small-cap growth segment of the U.S. equity universe. It includes those Russell 2000® Index companies with higher price-to-value ratios and higher forecasted growth values.
The Russell 2000® Value Index measures the performance of companies within the Russell 2000® Index having lower price-to-book ratios and lower forecasted growth values. The Russell 2000® Index includes the 2000 firms from the Russell 3000® Index with the smallest market capitalizations. The Russell 3000® Index represents 98% of the investable U.S. equity market.
The Russell 2500TM Value Index measures the performance of the small- to mid-cap segment of the U.S. equity universe. It includes those Russell 2500TM Index companies with lower price-to-book ratios and lower forecasted growth values.
The Russell 3000® Index measures the performance of the 3,000 largest U.S. stocks.
The Russell Developed Large-Cap Index is constructed to provide a comprehensive and unbiased barometer for the large-cap segment of the developed equity universe.
The Russell Microcap® Index measures the performance of the microcap segment of the U.S. equity market. It makes up less than 3% of the U.S. equity market. It includes 1,000 of the smallest securities in the Russell 2000® Index based on a combination of their market cap and current index membership and it includes the next 1,000 securities.
The Russell Midcap® Growth Index measures the performance of those Russell Midcap companies with higher price-to-book ratios and higher forecasted growth values than the threshold determined by the Frank Russell Company. The Russell Midcap companies are comprised of the 800 smallest companies in the Russell 1000® Index. The Russell 1000® Index consists of the 1,000 largest U.S. Incorporated companies based on total market capitalization.
The Russell Midcap® Value Index measures the performance of those Russell Midcap companies with lower price-to-book ratios and lower forecasted growth values. The stocks are also members of the Russell 1000® Value index.
Semi-Annual Report | June 30, 2017 | | 35 |
| Westcore Funds | Important Disclosures |
June 30, 2017 (Unaudited)
The S&P 500® Index is comprised of 500 common stocks chosen for market size, liquidity, and industry group representation. It is a market-value weighted index (stock price times number of shares outstanding), with each stock’s weight in the Index proportionate to its market value.
The Westcore Small-Cap Growth Fund II Custom Index is comprised of Russell Midcap® Growth Index from the Fund’s inception to 12/31/2016 and the Russell 2000® Growth Index for the time period 1/1/2017 to the most recent period end to reflect the change in the Fund’s investment strategy on 12/27/2016. The Adviser believes that the Custom Index is the best benchmark measurement for periods prior to 12/31/2016.
The Westcore Mid-Cap Value Dividend Fund II Custom Index is comprised of Russell Midcap® Growth Index from the Fund’s inception to 12/31/2016 and the Russell Midcap® Value Index for the time period 1/1/2017 to the most recent period end to reflect the change in the Fund’s investment strategy on 12/27/2016. The Adviser believes that the Custom Index is the best benchmark measurement for periods prior to 12/31/2016.
The Westcore Global Large-Cap Dividend Fund Custom Index is comprised of the S&P 500® Index from the Fund’s inception to 4/30/2013 and the Russell Developed Large-Cap Index for the time period 5/1/2013 to the most recent period end to reflect the change in the Fund’s investment strategy on 4/30/2013. The Adviser believes that the Custom Index is the best benchmark measurement for periods prior to 4/30/2013.
The Westcore Large-Cap Dividend Fund Custom Index is comprised of the Russell 1000® Growth Index from the Fund’s inception to 12/31/2016 and the Russell 1000® Index for the time period 1/1/2017 to the most recent period end to reflect the change in the Fund’s investment strategy on 12/27/2016. The Adviser believes that the Custom Index is the best benchmark measurement for periods prior to 12/31/2016.
Bloomberg Barclays U.S. is the source and owner of the Barclays Capital Index data contained in this material and all trademarks and copyrights related thereto. Any further dissemination or redistribution is strictly prohibited. Barclays Capital is not responsible for the formatting or configuration of this material or for any inaccuracy in Denver Investments’ presentation thereof.
Lipper Inc. is the source and owner of the Lipper Index data contained in this material and all trademarks and copyrights related thereto. Any further dissemination or redistribution is strictly prohibited. Lipper Inc. is not responsible for the formatting or configuration of this material or for any inaccuracy in Denver Investments’ presentation thereof.
MSCI Inc. is the source and owner of the MSCI Index data contained in this material and all trademarks and copyrights related thereto. Any further dissemination or redistribution is strictly prohibited. MSCI Barra is not responsible for the formatting or configuration of this material or for any inaccuracy in Denver Investments’ presentation thereof.
Russell Investments is the source and owner of the Russell Index data contained in this material and all trademarks and copyrights related thereto. Any further dissemination or redistribution is strictly prohibited. Russell Investments is not responsible for the formatting or configuration of this material or for any inaccuracy in Denver Investments’ presentation thereof.
Standard & Poor’s is the source and owner of the S&P Index data contained in this material and all trademarks and copyrights related thereto. Any further dissemination or redistribution is strictly prohibited. Standard & Poor’s is not responsible for the formatting or configuration of this material or for any inaccuracy in Denver Investments’ presentation thereof.
TOP 5/BOTTOM 5 STOCK PERFORMANCE CALCULATION METHODOLOGY
The Calculation methodology used to construct this chart took into account consistently the weighting of every holding in the Fund that contributed to the Fund’s performance during the Measurement Period, and the Chart reflects consistently the results of the Calculation. The Calculation determined the contribution of each Fund holding by calculating the weight (i.e., percentage of the Total Investments) of each holding multiplied by the rate of return for that holding during the first six months of 2017.
DEFINITION OF TERMS
Beta: A measure of a fund’s sensitivity to market movements. The beta of the market is 1.00 by definition. A beta above 1 is more volatile than the overall market, while a beta below 1 is less volatile.
Bond Rating Categories:
| • | AAA: An obligation rated “AAA” has the highest rating assigned by Standard & Poor’s. The obligor’s capacity to meet its financial commitment on the obligation is extremely strong. |
| 36 | | www.westcore.com |
| Westcore Funds | Important Disclosures |
June 30, 2017 (Unaudited)
| • | AA+: An obligation rated “AA+” differs from the highest rated obligations only in small degree. The obligor’s capacity to meet its financial commitment on the obligation is very strong. |
| • | AA: An obligation rated “AA” differs from the highest rated obligations only in small degree. The obligor’s capacity to meet its financial commitment on the obligation is very strong. |
| • | A: An obligation rated “A” is somewhat more susceptible to the adverse effects of changes in circumstances and economic conditions than obligations in higher-rated categories. However, the obligor’s capacity to meet its financial commitment on the obligation is still strong. |
| • | BBB: An obligation rated “BBB” exhibits adequate protection parameters. However, adverse economic conditions or changing circumstances are more likely to lead to a weakened capacity of the obligor to meet its financial commitment on the obligation. |
| • | Below BBB: Obligations rated “BB,” “B,” “CCC,” “CC” and “C” are regarded as having significant speculative characteristics. “BB” indicates the least degree of speculation and “C” the highest. While such obligations will likely have some quality and protective characteristics, these may be outweighed by large uncertainties or major exposures to adverse conditions. Bonds rated “BB” or below are commonly referred to as “junk” bonds. |
| • | Non-Rated: These bonds are not rated. |
Credit Quality Rating: A rating of an individual bond as determined by a nationally recognized statistical rating organization (NRSRO) such as Standard & Poor’s or Moody’s. Credit quality ratings range from highest, “AAA ” to lowest, “D”. For more information regarding rating methodologies for Standard & Poor’s, visit www.standardandpoors.com and for Moody’s, visit www.moodys.com.
Duration: A generic description of the sensitivity of a bond’s price (as a percentage of initial price) to a change in yield.
EPS (Earnings per Share) Growth: Earnings per share is the portion of a company’s profit allocated to each outstanding share of common stock. EPS growth serves as an indicator of a company’s profitability.
Effective Maturity: A weighted average of the maturities of the bonds in a portfolio.
Emerging Markets: Westcore International Small-Cap Fund considers emerging market countries to be those countries that are neither U.S. nor developed countries.
Federal Reserve (the Fed): The central banking system of the United States.
Free Cash Flow to Total Enterprise Value (FCF/TEV): A valuation metric used to compare the amount of cash a firm generates to the total value of the resources used to generate that cash.
Gross Domestic Product (GDP): The market value of all officially recognized goods and services produced within a country in a given period of time. Market Capitalization: The market capitalization represents the total value of a company or stock. It is calculated by multiplying the number of shares outstanding by the current price of one share.
Modified Duration: A duration measure in which it is assumed that yield changes do not change the expected cash flows.
Number of Holdings: The Number of Holdings presented excludes short-term investments including money market mutual funds.
OPEC: Is the Organization of the Petroleum Exporting Countries.
Operating Cash Flow to Price (OCF/P): A valuation metric used to compare the amount of cash a firm generates per share from operations to the price of the stock.
Portfolio Turnover Rate: A percentage computed by taking the lesser of purchases or sales of portfolio securities (excluding short-term investments) for the year and dividing it by the monthly average of the market value of the portfolio securities during the year.
Price to Book Value (P/B) Ratio: The P/B ratio is used to compare a company’s book value to its current market price. This ratio compares the market’s valuation of a company to the value of that company as indicated on its financial statements. The higher the ratio, the higher the premium the market is willing to pay for the company above its hard assets.
Price to Cash (P/C) Flow Ratio: The P/C flow ratio is a measure of a firm’s stock price relative to its financial performance. For a fund, the P/C flow ratio is the weighted average of all stocks held in the fund. It represents the amount an investor is willing to pay for a dollar generated from a particular company’s operations.
Semi-Annual Report | June 30, 2017 | | 37 |
| Westcore Funds | Important Disclosures |
June 30, 2017 (Unaudited)
Price to Earnings (P/E) Ratio: The P/E ratio is a stock’s per share price divided by its per share earnings over a 12-month period. For a fund, the P/E ratio is the weighted average of all stocks held in the fund. The higher the P/E ratio, the more the market is willing to pay for each dollar of
annual earnings.
REIT: A REIT is a real estate investment trust. REITs are securities that sell like a stock on a major exchange. REITs invest directly in real estate, either through properties or mortgages.
Return on Equity (ROE): A measure of how well a company used reinvested earnings to generate additional earnings. It is used as a general indication of a company’s efficiency; in other words, how much profit is a company able to generate given the resources provided by its stockholders.
Risk-Adjusted Return: Is a measure of return that incorporates the value of risk involved in the return of an investment. It is intended to help investors compare the returns of investments with varying levels of risk. Risk-adjusted return can be applied to individual securities, mutual funds and portfolios.
Risk On, Risk Off: A concept that describes market sentiment as either “risk on” or “risk off”. During a market sentiment of “risk on”, the market is optimistic and more willing to take on risk in exchange for possibly better returns. When market sentiment is “risk off”, the market is pessimistic and will favor investments with perceived lower risk.
SEC Yield: The SEC Yield is a standardized method of computing return on investment that the U.S. Securities and Exchange Commission (SEC) requires mutual funds to use when advertising their yields. Its objective is to allow a confusion-free comparison of the performance of different funds.
Tax-Adjusted Return: Is the return on an investment after taxes.
Weighted Average: An average that takes into account the proportional relevance of each component, rather than treating each component equally.
| 38 | | www.westcore.com |
| Westcore Small-Cap Growth Fund | Statement of Investments |
June 30, 2017 (Unaudited)
| | | Shares | | | Value | |
| Common Stocks (97.06%) | |
| Consumer Discretionary (18.60%) | |
| Diversified Consumer Services (2.54%) | | | | | | |
Bright Horizons Family Solutions, Inc.** | | | 1,035 | | | $ | 79,912 | |
Grand Canyon Education, Inc.** | | | 661 | | | | 51,829 | |
| | | | | | | | 131,741 | |
| Hotels Restaurants & Leisure (5.24%) | | | | | | | | |
| Jack in the Box, Inc. | | | 660 | | | | 65,010 | |
| Sonic Corp. | | | 1,925 | | | | 50,993 | |
| Vail Resorts, Inc. | | | 498 | | | | 101,010 | |
| Wingstop, Inc. | | | 1,760 | | | | 54,384 | |
| | | | | | | | 271,397 | |
| Internet & Direct Marketing Retail (1.12%) | | | | | |
Duluth Holdings, Inc. - Class B** | | | 1,015 | | | | 18,483 | |
| Nutrisystem, Inc. | | | 760 | | | | 39,558 | |
| | | | | | | | 58,041 | |
| Leisure Products (0.81%) | | | | | | | | |
| Callaway Golf Co. | | | 3,265 | | | | 41,727 | |
| | | | | | | | | |
| Media (5.67%) | | | | | | | | |
IMAX Corp. (Canada)** | | | 2,825 | | | | 62,150 | |
Lions Gate Entertainment Corp. -
Class B** | | | 1,827 | | | | 48,014 | |
Lions Gate Entertainment Corp. -
Class A** | | | 1,782 | | | | 50,288 | |
Live Nation Entertainment, Inc.** | | | 2,930 | | | | 102,110 | |
| National CineMedia, Inc. | | | 4,215 | | | | 31,275 | |
| | | | | | | | 293,837 | |
| Multiline Retail (0.70%) | | | | | | | | |
| Big Lots, Inc. | | | 755 | | | | 36,467 | |
| | | | | | | | | |
| Specialty Retail (2.52%) | | | | | | | | |
Burlington Stores, Inc.** | | | 745 | | | | 68,533 | |
Party City Holdco, Inc.** | | | 3,950 | | | | 61,817 | |
| | | | | | | | 130,350 | |
| Total Consumer Discretionary | | | | | | | 963,560 | |
| | | | | | | | | |
| Consumer Staples (2.51%) | |
| Beverages (1.31%) | | | | | | | | |
| MGP Ingredients, Inc. | | | 1,330 | | | | 68,056 | |
| | | | | | | | | |
| Food & Staples Retailing (1.20%) | | | | | | | | |
| PriceSmart, Inc. | | | 707 | | | | 61,933 | |
| | | | | | | | | |
| Total Consumer Staples | | | | | | | 129,989 | |
| | | | | | | | | |
| Energy (4.04%) | |
| Energy Equipment & Services (1.22%) | | | | | | | | |
| US Silica Holdings, Inc. | | | 1,785 | | | | 63,350 | |
| | | | | | | | | |
| Oil Gas & Consumable Fuels (2.82%) | | | | | | | | |
PDC Energy, Inc.** | | | 1,605 | | | | 69,191 | |
| | | Shares | | | Value | |
| Oil Gas & Consumable Fuels (continued) | | | | | | |
RSP Permian, Inc.** | | | 1,330 | | | $ | 42,919 | |
SRC Energy, Inc.** | | | 5,026 | | | | 33,825 | |
| | | | | | | | 145,935 | |
| Total Energy | | | | | | | 209,285 | |
| | | | | | | | | |
| Financials (8.87%) | |
| Banks (3.32%) | | | | | | | | |
| Bank of the Ozarks, Inc. | | | 1,583 | | | | 74,195 | |
Eagle Bancorp, Inc.** | | | 1,540 | | | | 97,482 | |
| | | | | | | | 171,677 | |
| Capital Markets (3.47%) | | | | | | | | |
| Evercore Partners, Inc. - Class A | | | 1,676 | | | | 118,158 | |
| MarketAxess Holdings, Inc. | | | 306 | | | | 61,537 | |
| | | | | | | | 179,695 | |
| Insurance (0.87%) | | | | | | | | |
| AMERISAFE, Inc. | | | 795 | | | | 45,275 | |
| | | | | | | | | |
| Thrift & Mortgage Finance (1.21%) | | | | | | | | |
LendingTree, Inc.** | | | 365 | | | | 62,853 | |
| | | | | | | | | |
| Total Financials | | | | | | | 459,500 | |
| | | | | | | | | |
| Health Care (19.38%) | |
| Biotechnology (3.66%) | | | | | | | | |
Ironwood Pharmaceuticals, Inc.** | | | 2,365 | | | | 44,651 | |
Prothena Corp. PLC (Ireland)** | | | 805 | | | | 43,566 | |
Sage Therapeutics, Inc.** | | | 473 | | | | 37,670 | |
Veracyte, Inc.** | | | 7,633 | | | | 63,583 | |
| | | | | | | | 189,470 | |
| Health Care Equipment & Supplies (5.79%) | | | | | |
Glaukos Corp.** | | | 2,110 | | | | 87,501 | |
Globus Medical, Inc. - Class A** | | | 2,040 | | | | 67,626 | |
K2M Group Holdings, Inc.** | | | 2,605 | | | | 63,458 | |
Nevro Corp.** | | | 1,095 | | | | 81,501 | |
| | | | | | | | 300,086 | |
| Health Care Providers & Services (5.17%) | | | | | |
Acadia Healthcare Co., Inc.** | | | 2,172 | | | | 107,254 | |
Amedisys, Inc.** | | | 900 | | | | 56,529 | |
HealthEquity, Inc.** | | | 1,230 | | | | 61,291 | |
LHC Group, Inc.** | | | 625 | | | | 42,431 | |
| | | | | | | | 267,505 | |
| Health Care Technology (1.66%) | | | | | | | | |
Medidata Solutions, Inc.** | | | 1,100 | | | | 86,020 | |
| | | | | | | | | |
| Pharmaceuticals (3.10%) | | | | | | | | |
Catalent, Inc.** | | | 1,785 | | | | 62,653 | |
Intersect ENT, Inc.** | | | 2,250 | | | | 62,888 | |
Pacira Pharmaceuticals, Inc.** | | | 735 | | | | 35,060 | |
| | | | | | | | 160,601 | |
| Total Health Care | | | | | | | 1,003,682 | |
See Notes to Financial Statements.
Semi-Annual Report | June 30, 2017 | | 39 |
| Westcore Small-Cap Growth Fund | Statement of Investments |
| | June 30, 2017 (Unaudited) |
| | | Shares | | | Value | |
| Industrials (13.29%) | |
| Aerospace & Defense (2.54%) | | | | | | |
Aerovironment, Inc.** | | | 935 | | | $ | 35,717 | |
| Hexcel Corp. | | | 1,810 | | | | 95,550 | |
| | | | | | | | 131,267 | |
| Commercial Services & Supplies (0.93%) | | | | | | | | |
| Ritchie Bros Auctioneers, Inc. (Canada) | | | 1,678 | | | | 48,226 | |
| | | | | | | | | |
| Construction & Engineering (1.03%) | | | | | | | | |
| Valmont Industries, Inc. | | | 355 | | | | 53,108 | |
| | | | | | | | | |
| Electrical Equipment (1.56%) | | | | | | | | |
Generac Holdings, Inc.** | | | 2,235 | | | | 80,751 | |
| | | | | | | | | |
| Machinery (1.65%) | | | | | | | | |
Proto Labs, Inc.** | | | 1,270 | | | | 85,407 | |
| | | | | | | | | |
| Professional Services (4.43%) | | | | | | | | |
Advisory Board Co.** | | | 2,756 | | | | 141,934 | |
Huron Consulting Group, Inc.** | | | 2,028 | | | | 87,610 | |
| | | | | | | | 229,544 | |
| Road & Rail (1.15%) | | | | | | | | |
Saia, Inc.** | | | 1,165 | | | | 59,764 | |
| | | | | | | | | |
| Total Industrials | | | | | | | 688,067 | |
| | | | | | | | | |
| Information Technology (24.00%) | |
| Internet Software & Services (4.35%) | | | | | | | | |
2U, Inc.** | | | 965 | | | | 45,278 | |
Envestnet, Inc.** | | | 2,780 | | | | 110,088 | |
GoDaddy, Inc. - Class A** | | | 1,645 | | | | 69,781 | |
| | | | | | | | 225,147 | |
| IT Services (2.20%) | | | | | | | | |
EPAM Systems, Inc.** | | | 1,355 | | | | 113,942 | |
| | | | | | | | | |
| Semiconductors & Semiconductor (7.80%) | | | | | |
Inphi Corp.** | | | 1,388 | | | | 47,608 | |
MACOM Technology Solutions Holdings, Inc.** | | | 910 | | | | 50,751 | |
Microsemi Corp.** | | | 1,980 | | | | 92,664 | |
| Monolithic Power Systems, Inc. | | | 1,410 | | | | 135,924 | |
Silicon Laboratories, Inc.** | | | 1,130 | | | | 77,235 | |
| | | | | | | | 404,182 | |
| Software (9.65%) | | | | | | | | |
Everbridge, Inc.** | | | 1,910 | | | | 46,527 | |
Fortinet, Inc.** | | | 1,690 | | | | 63,274 | |
Globant SA (Luxembourg)** | | | 2,288 | | | | 99,391 | |
Guidewire Software, Inc.** | | | 687 | | | | 47,204 | |
RingCentral, Inc. - Class A** | | | 1,764 | | | | 64,474 | |
Tyler Technologies, Inc.** | | | 525 | | | | 92,227 | |
| | | Shares | | | Value | |
| Software (continued) | | | | | | |
Zendesk, Inc.** | | | 3,127 | | | $ | 86,868 | |
| | | | | | | | 499,965 | |
| Total Information Technology | | | | | | | 1,243,236 | |
| | | | | | | | | |
| Materials (2.75%) | |
| Chemicals (2.75%) | | | | | | | | |
Flotek Industries, Inc.** | | | 4,630 | | | | 41,392 | |
| PolyOne Corp. | | | 2,608 | | | | 101,034 | |
| | | | | | | | 142,426 | |
| Total Materials | | | | | | | 142,426 | |
| | | | | | | | | |
| Real Estate (1.85%) | |
| Equity Real Estate Investment (1.85%) | | | | | | | | |
| QTS Realty Trust, Inc. - Class A | | | 1,834 | | | | 95,973 | |
| | | | | | | | | |
| Total Real Estate | | | | | | | 95,973 | |
| | | | | | | | | |
| Telecommunication Services (1.77%) | |
| Diversified Telecommunication (1.77%) | | | | | | | | |
| Cogent Communications Holdings, Inc. | | | 2,285 | | | | 91,629 | |
| | | | | | | | | |
| Total Telecommunication Services | | | | | | | 91,629 | |
| | | | | | | | | |
| Total Common Stocks (Cost $4,087,873) | | | | 5,027,347 | |
| | | | | | | | | |
| | | Shares | | | Value | |
| Money Market Mutual Funds (3.00%) | |
| Goldman Sachs Financial Square - Government Fund, (7 Day Yield 0.834%) | | | 155,226 | | | | 155,226 | |
| Total Money Market Mutual Funds (Cost $155,226) | | | | 155,226 | |
| | | | | | |
| Total Investments (100.06%) (Cost $4,243,099) | | | $ | 5,182,573 | |
| | | | | | | | | |
| Liabilities Less Other Assets (-0.06%) | | | | (2,850 | ) |
| | | | | | | | | |
| Net Assets (100.00%) | | | $ | 5,179,723 | |
See Notes to Financial Statements.
| 40 | | www.westcore.com |
| Westcore Small-Cap Growth Fund | Statement of Investments |
June 30, 2017 (Unaudited)
Sector and industry classifications presented herein are based on the sector and industry categorization methodology of the Adviser to the Funds which may result in the designations for one Fund being different from another. For Fund compliance purposes, the Fund’s industry classifications refer to any one or more of the industry sub-classifications used by one or more widely recognized market indexes or ratings group indexes, and/or as defined by Fund management. This definition may not apply for purposes of this report, which may combine industry sub-classifications for reporting ease. Industries are shown as a percentage of net assets.
** | Non-income producing security. |
See Notes to Financial Statements.
Semi-Annual Report | June 30, 2017 | | 41 |
| Westcore Small-Cap Growth Fund II | Statement of Investments |
June 30, 2017 (Unaudited)
| | | Shares | | | Value | |
| Common Stocks (93.53%) | |
| Consumer Discretionary (17.92%) | |
| Diversified Consumer Services (2.44%) | | | | | | |
Bright Horizons Family Solutions, Inc.** | | | 7,320 | | | $ | 565,177 | |
Grand Canyon Education, Inc.** | | | 4,665 | | | | 365,783 | |
| | | | | | | | 930,960 | |
| Hotels Restaurants & Leisure (5.05%) | | | | | | | | |
| Jack in the Box, Inc. | | | 4,665 | | | | 459,502 | |
| Sonic Corp. | | | 13,620 | | | | 360,794 | |
| Vail Resorts, Inc. | | | 3,530 | | | | 715,990 | |
| Wingstop, Inc. | | | 12,485 | | | | 385,787 | |
| | | | | | | | 1,922,073 | |
| Internet & Direct Marketing Retail (1.08%) | | | | | |
Duluth Holdings, Inc. - Class B** | | | 7,175 | | | | 130,657 | |
| Nutrisystem, Inc. | | | 5,395 | | | | 280,810 | |
| | | | | | | | 411,467 | |
| Leisure Products (0.77%) | | | | | | | | |
| Callaway Golf Co. | | | 23,130 | | | | 295,601 | |
| | | | | | | | | |
| Media (5.47%) | | | | | | | | |
IMAX Corp. (Canada)** | | | 20,010 | | | | 440,220 | |
Lions Gate Entertainment Corp. -
Class B** | | | 12,952 | | | | 340,378 | |
Lions Gate Entertainment Corp. -
Class A** | | | 12,630 | | | | 356,419 | |
Live Nation Entertainment, Inc.** | | | 20,768 | | | | 723,765 | |
| National CineMedia, Inc. | | | 29,870 | | | | 221,635 | |
| | | | | | | | 2,082,417 | |
| Multiline Retail (0.68%) | | | | | | | | |
| Big Lots, Inc. | | | 5,340 | | | | 257,922 | |
| | | | | | | | | |
| Specialty Retail (2.43%) | | | | | | | | |
Burlington Stores, Inc.** | | | 5,280 | | | | 485,707 | |
Party City Holdco, Inc.** | | | 28,000 | | | | 438,200 | |
| | | | | | | | 923,907 | |
| Total Consumer Discretionary | | | | | | | 6,824,347 | |
| | | | | | | | | |
| Consumer Staples (2.42%) | |
| Beverages (1.27%) | | | | | | | | |
| MGP Ingredients, Inc. | | | 9,420 | | | | 482,022 | |
| | | | | | | | | |
| Food & Staples Retailing (1.15%) | | | | | | | | |
| PriceSmart, Inc. | | | 4,995 | | | | 437,562 | |
| | | | | | | | | |
| Total Consumer Staples | | | | | | | 919,584 | |
| | | | | | | | | |
| Energy (3.89%) | |
| Energy Equipment & Services (1.18%) | | | | | | | | |
| US Silica Holdings, Inc. | | | 12,630 | | | | 448,239 | |
| | | | | | | | | |
| Oil Gas & Consumable Fuels (2.71%) | | | | | | | | |
PDC Energy, Inc.** | | | 11,375 | | | | 490,376 | |
| | | Shares | | | Value | |
| Oil Gas & Consumable Fuels (continued) | | | | | | | | |
RSP Permian, Inc.** | | | 9,420 | | | $ | 303,983 | |
SRC Energy, Inc.** | | | 35,615 | | | | 239,689 | |
| | | | | | | | 1,034,048 | |
| Total Energy | | | | | | | 1,482,287 | |
| | | | | | | | | |
| Financials (8.54%) | |
| Banks (3.19%) | | | | | | | | |
| Bank of the Ozarks, Inc. | | | 11,203 | | | | 525,085 | |
Eagle Bancorp, Inc.** | | | 10,910 | | | | 690,603 | |
| | | | | | | | 1,215,688 | |
| Capital Markets (3.33%) | | | | | | | | |
| Evercore Partners, Inc. - Class A | | | 11,810 | | | | 832,605 | |
| MarketAxess Holdings, Inc. | | | 2,160 | | | | 434,376 | |
| | | | | | | | 1,266,981 | |
| Insurance (0.84%) | | | | | | | | |
| AMERISAFE, Inc. | | | 5,630 | | | | 320,628 | |
| | | | | | | | | |
| Thrifts & Mortgage Finance (1.18%) | | | | | | | | |
LendingTree, Inc.** | | | 2,595 | | | | 446,859 | |
| | | | | | | | | |
| Total Financials | | | | | | | 3,250,156 | |
| | | | | | | | | |
| Health Care (18.68%) | |
| Biotechnology (3.53%) | | | | | | | | |
Ironwood Pharmaceuticals, Inc.** | | | 16,770 | | | | 316,617 | |
Prothena Corp. PLC (Ireland)** | | | 5,690 | | | | 307,943 | |
Sage Therapeutics, Inc.** | | | 3,355 | | | | 267,192 | |
Veracyte, Inc.** | | | 54,075 | | | | 450,445 | |
| | | | | | | | 1,342,197 | |
| Health Care Equipment & Supplies (5.58%) | | | | | |
Glaukos Corp.** | | | 14,965 | | | | 620,599 | |
Globus Medical, Inc. - Class A** | | | 14,465 | | | | 479,515 | |
K2M Group Holdings, Inc.** | | | 18,465 | | | | 449,807 | |
Nevro Corp.** | | | 7,740 | | | | 576,088 | |
| | | | | | | | 2,126,009 | |
| Health Care Providers & Services (4.98%) | | | | | |
Acadia Healthcare Co., Inc.** | | | 15,400 | | | | 760,452 | |
Amedisys, Inc.** | | | 6,390 | | | | 401,356 | |
HealthEquity, Inc.** | | | 8,720 | | | | 434,518 | |
LHC Group, Inc.** | | | 4,435 | | | | 301,092 | |
| | | | | | | | 1,897,418 | |
| Health Care Technology (1.60%) | | | | | | | | |
Medidata Solutions, Inc.** | | | 7,790 | | | | 609,178 | |
| | | | | | | | | |
| Pharmaceuticals (2.99%) | | | | | | | | |
Catalent, Inc.** | | | 12,660 | | | | 444,366 | |
Intersect ENT, Inc.** | | | 15,925 | | | | 445,104 | |
Pacira Pharmaceuticals, Inc.** | | | 5,220 | | | | 248,994 | |
| | | | | | | | 1,138,464 | |
| Total Health Care | | | | | | | 7,113,266 | |
See Notes to Financial Statements.
| 42 | | www.westcore.com |
| Westcore Small-Cap Growth Fund II | Statement of Investments |
June 30, 2017 (Unaudited)
| | | Shares | | | Value | |
| Industrials (12.81%) | |
| Aerospace & Defense (2.45%) | | | | | | | | |
Aerovironment, Inc.** | | | 6,620 | | | $ | 252,884 | |
| Hexcel Corp. | | | 12,835 | | | | 677,560 | |
| | | | | | | | 930,444 | |
| Commercial Services & Supplies (0.90%) | | | | | | | | |
| Ritchie Bros Auctioneers, Inc. (Canada) | | | 11,900 | | | | 342,006 | |
| | | | | | | | | |
| Construction & Engineering (0.99%) | | | | | | | | |
| Valmont Industries, Inc. | | | 2,510 | | | | 375,496 | |
| | | | | | | | | |
| Electrical Equipment (1.50%) | | | | | | | | |
Generac Holdings, Inc.** | | | 15,840 | | | | 572,299 | |
| | | | | | | | | |
| Machinery (1.59%) | | | | | | | | |
Proto Labs, Inc.** | | | 9,015 | | | | 606,259 | |
| | | | | | | | | |
| Professional Services (4.27%) | | | | | | | | |
Advisory Board Co.** | | | 19,515 | | | | 1,005,022 | |
Huron Consulting Group, Inc.** | | | 14,380 | | | | 621,216 | |
| | | | | | | | 1,626,238 | |
| Road & Rail (1.11%) | | | | | | | | |
Saia, Inc.** | | | 8,255 | | | | 423,482 | |
| | | | | | | | | |
| Total Industrials | | | | | | | 4,876,224 | |
| | | | | | | | | |
| Information Technology (23.12%) | |
| Internet Software & Services (4.19%) | | | | | | | | |
2U, Inc.** | | | 6,825 | | | | 320,229 | |
Envestnet, Inc.** | | | 19,690 | | | | 779,724 | |
GoDaddy, Inc. - Class A** | | | 11,665 | | | | 494,829 | |
| | | | | | | | 1,594,782 | |
| IT Services (2.12%) | | | | | | | | |
EPAM Systems, Inc.** | | | 9,595 | | | | 806,844 | |
| | | | | | | | | |
| Semiconductors & Semiconductor (7.52%) | | | | | |
Inphi Corp.** | | | 9,830 | | | | 337,169 | |
MACOM Technology Solutions Holdings, Inc.** | | | 6,445 | | | | 359,438 | |
Microsemi Corp.** | | | 14,030 | | | | 656,604 | |
| Monolithic Power Systems, Inc. | | | 9,975 | | | | 961,590 | |
Silicon Laboratories, Inc.** | | | 8,020 | | | | 548,167 | |
| | | | | | | | 2,862,968 | |
| Software (9.29%) | | | | | | | | |
Everbridge, Inc.** | | | 13,535 | | | | 329,712 | |
Fortinet, Inc.** | | | 11,960 | | | | 447,782 | |
Globant SA (Luxembourg)** | | | 16,215 | | | | 704,380 | |
Guidewire Software, Inc.** | | | 4,871 | | | | 334,686 | |
RingCentral, Inc. - Class A** | | | 12,485 | | | | 456,327 | |
Tyler Technologies, Inc.** | | | 3,703 | | | | 650,506 | |
| | | Shares | | | Value | |
| Software (continued) | | | | | | | | |
Zendesk, Inc.** | | | 22,170 | | | $ | 615,883 | |
| | | | | | | | 3,539,276 | |
| Total Information Technology | | | | | | | 8,803,870 | |
| | | | | | | | | |
| Materials (2.65%) | |
| Chemicals (2.65%) | | | | | | | | |
Flotek Industries, Inc.** | | | 32,815 | | | | 293,366 | |
| PolyOne Corp. | | | 18,465 | | | | 715,334 | |
| | | | | | | | 1,008,700 | |
| Total Materials | | | | | | | 1,008,700 | |
| | | | | | | | | |
| Real Estate (1.79%) | |
| Equity Real Estate Investment Trusts (REITs) (1.79%) | | | | | |
| QTS Realty Trust, Inc. - Class A | | | 13,010 | | | | 680,813 | |
| | | | | | | | | |
| Total Real Estate | | | | | | | 680,813 | |
| | | | | | | | | |
| Telecommunication Services (1.71%) | |
| Diversified Telecommunication (1.71%) | | | | | | | | |
| Cogent Communications Holdings, Inc. | | | 16,190 | | | | 649,219 | |
| | | | | | | | | |
| Total Telecommunication Services | | | | | | | 649,219 | |
| |
| Total Common Stocks (Cost $32,832,981) | | | | 35,608,466 | |
| | | Shares | | | Value | |
| Money Market Mutual Funds (6.94%) | |
Goldman Sachs Financial Square - Government Fund,
(7 Day Yield 0.834%) | | | 2,643,776 | | | | 2,643,776 | |
| |
| Total Money Market Mutual Funds (Cost $2,643,776) | | | | 2,643,776 | |
| | | | | |
| Total Investments (100.47%) (Cost $35,476,757) | | | $ | 38,252,242 | |
| | | | | | | | | |
| Liabilities Less Other Assets (-0.47%) | | | | (178,245 | ) |
| | | | | | | | | |
| Net Assets (100.00%) | | | $ | 38,073,997 | |
See Notes to Financial Statements.
Semi-Annual Report | June 30, 2017 | | 43 |
| Westcore Small-Cap Growth Fund II | Statement of Investments |
June 30, 2017 (Unaudited)
Sector and industry classifications presented herein are based on the sector and industry categorization methodology of the Adviser to the Funds which may result in the designations for one Fund being different from another. For Fund compliance purposes, the Fund’s industry classifications refer to any one or more of the industry sub-classifications used by one or more widely recognized market indexes or ratings group indexes, and/or as defined by Fund management. This definition may not apply for purposes of this report, which may combine industry sub-classifications for reporting ease. Industries are shown as a percentage of net assets.
| ** | Non-income producing security. |
See Notes to Financial Statements.
| 44 | | www.westcore.com |
| Westcore Mid-Cap Value Dividend Fund | Statement of Investments |
| | June 30, 2017 (Unaudited) |
| | | Shares | | | Value | |
| Common Stocks (99.92%) | |
| Basic Materials (5.65%) | |
| Chemicals (2.03%) | | | | | | |
| Compass Minerals International, Inc. | | | 12,830 | | | $ | 837,799 | |
| Eastman Chemical Co. | | | 10,300 | | | | 865,097 | |
| | | | | | | | 1,702,896 | |
| Forestry & Paper (1.50%) | | | | | | | | |
| WestRock Co. | | | 22,132 | | | | 1,253,999 | |
| | | | | | | | | |
| Other Materials (Rubber & Plastic) (1.14%) | | | | | |
| Westlake Chemical Corp. | | | 14,450 | | | | 956,734 | |
| | | | | | | | | |
| Specialty Chemicals (0.98%) | | | | | | | | |
| Mosaic Co. | | | 35,960 | | | | 820,967 | |
| | | | | | | | | |
| Total Basic Materials | | | | | | | 4,734,596 | |
| | | | | | | | | |
| Capital Goods (12.02%) | |
| Aerospace / Defense Suppliers (1.10%) | | | | | | | | |
| CAE, Inc. (Canada) | | | 53,445 | | | | 921,392 | |
| | | | | | | | | |
| Agricultural Products (5.30%) | | | | | | | | |
| Ingredion, Inc. | | | 19,000 | | | | 2,264,990 | |
| Tyson Foods, Inc. - Class A | | | 34,790 | | | | 2,178,898 | |
| | | | | | | | 4,443,888 | |
| Environmental / Pollution Control (1.65%) | | | | | | | | |
| Republic Services, Inc. | | | 21,650 | | | | 1,379,754 | |
| | | | | | | | | |
| Farm Equipment (1.75%) | | | | | | | | |
| AGCO Corp. | | | 21,797 | | | | 1,468,900 | |
| | | | | | | | | |
| Railroads (1.24%) | | | | | | | | |
| Kansas City Southern | | | 9,950 | | | | 1,041,267 | |
| | | | | | | | | |
| Transportation Equipment & Parts (0.98%) | | | | | |
| Oshkosh Corp. | | | 11,850 | | | | 816,228 | |
| | | | | | | | | |
| Total Capital Goods | | | | | | | 10,071,429 | |
| | | | | | | | | |
| Consumer (15.45%) | |
| Apparel & Footware Manufacturing (1.07%) | | | | | |
| Carter's, Inc. | | | 10,100 | | | | 898,395 | |
| | | | | | | | | |
| Beverages: Non-Alcoholic (0.98%) | | | | | | | | |
| Dr Pepper Snapple Group, Inc. | | | 9,033 | | | | 822,997 | |
| | | | | | | | | |
| Clothing & Accessories (2.78%) | | | | | | | | |
| Foot Locker, Inc. | | | 23,150 | | | | 1,140,832 | |
| | | Shares | | | Value | |
| Clothing & Accessories (continued) | | | | | | | | |
| PVH Corp. | | | 10,409 | | | $ | 1,191,830 | |
| | | | | | | | 2,332,662 | |
| Consumer Durables (1.35%) | | | | | | | | |
| Whirlpool Corp. | | | 5,883 | | | | 1,127,300 | |
| | | | | | | | | |
| Consumer Products (1.24%) | | | | | | | | |
| Estee Lauder Cos., Inc. - Class A | | | 10,829 | | | | 1,039,367 | |
| | | | | | | | | |
| Food Products (1.64%) | | | | | | | | |
| Lamb Weston Holdings, Inc. | | | 31,225 | | | | 1,375,149 | |
| | | | | | | | | |
| General Merchandise (1.55%) | | | | | | | | |
| Dollar General Corp. | | | 17,985 | | | | 1,296,539 | |
| | | | | | | | | |
| Motor Vehicle Parts (1.29%) | | | | | | | | |
| Goodyear Tire & Rubber Co. | | | 31,005 | | | | 1,083,935 | |
| | | | | | | | | |
| Publishing & Media (1.44%) | | | | | | | | |
| Sinclair Broadcast Group, Inc. - Class A | | | 36,600 | | | | 1,204,140 | |
| | | | | | | | | |
| Recreation & Leisure (1.14%) | | | | | | | | |
| Mattel, Inc. | | | 44,203 | | | | 951,691 | |
| | | | | | | | | |
| Specialty Retail (0.97%) | | | | | | | | |
| Dick's Sporting Goods, Inc. | | | 20,494 | | | | 816,276 | |
| | | | | | | | | |
| Total Consumer | | | | | | | 12,948,451 | |
| | | | | | | | | |
| Energy (7.79%) | |
| Exploration & Production (6.48%) | | | | | | | | |
| EQT Corp. | | | 23,050 | | | | 1,350,499 | |
| Noble Energy, Inc. | | | 52,700 | | | | 1,491,410 | |
| Range Resources Corp. | | | 72,975 | | | | 1,690,831 | |
| SM Energy Co. | | | 54,200 | | | | 895,926 | |
| | | | | | | | 5,428,666 | |
| Refining & Marketing (1.31%) | | | | | | | | |
| Marathon Petroleum Corp. | | | 21,000 | | | | 1,098,930 | |
| | | | | | | | | |
| Total Energy | | | | | | | 6,527,596 | |
| | | | | | | | | |
| Interest Rate Sensitive (20.36%) | |
| Insurance / Real Estate Brokers (2.48%) | | | | | | | | |
| Realogy Holdings Corp. | | | 64,050 | | | | 2,078,423 | |
| | | | | | | | | |
| Integrated Financial Services (1.81%) | | | | | | | | |
| Voya Financial, Inc. | | | 41,165 | | | | 1,518,577 | |
| | | | | | | | | |
| Life & Health Insurance (1.72%) | | | | | | | | |
| UNUM Group | | | 30,995 | | | | 1,445,297 | |
| | | | | | | | | |
| Other Banks (2.90%) | | | | | | | | |
| BOK Financial Corp. | | | 14,085 | | | | 1,184,971 | |
See Notes to Financial Statements.
Semi-Annual Report | June 30, 2017 | | 45 |
| Westcore Mid-Cap Value Dividend Fund | Statement of Investments |
| | June 30, 2017 (Unaudited) |
| | | Shares | | | Value | |
| Other Banks (continued) | | | | | | | | |
| FNB Corp. | | | 87,820 | | | $ | 1,243,531 | |
| | | | | | | | 2,428,502 | |
| Property Casualty Insurance (5.65%) | | | | | | | | |
| AmTrust Financial Services, Inc. | | | 142,406 | | | | 2,156,027 | |
| Radian Group, Inc. | | | 74,700 | | | | 1,221,345 | |
| Validus Holdings, Ltd. (Bermuda) | | | 26,145 | | | | 1,358,755 | |
| | | | | | | | 4,736,127 | |
| Regional Banks (4.58%) | | | | | | | | |
| Fifth Third Bancorp | | | 45,700 | | | | 1,186,372 | |
| Investors Bancorp, Inc. | | | 121,385 | | | | 1,621,704 | |
| KeyCorp | | | 54,950 | | | | 1,029,763 | |
| | | | | | | | 3,837,839 | |
| Specialty Finance (1.22%) | | | | | | | | |
| Navient Corp. | | | 61,400 | | | | 1,022,310 | |
| | | | | | | | | |
| Total Interest Rate Sensitive | | | | | | | 17,067,075 | |
| | | | | | | | | |
| Medical / Healthcare (8.85%) | |
| Healthcare Services (3.46%) | | | | | | | | |
| AmerisourceBergen Corp. | | | 19,105 | | | | 1,805,996 | |
| Cardinal Health, Inc. | | | 14,085 | | | | 1,097,503 | |
| | | | | | | | 2,903,499 | |
| Medical Products & Supplies (1.06%) | | | | | | | | |
| DENTSPLY SIRONA, Inc. | | | 13,750 | | | | 891,550 | |
| | | | | | | | | |
| Medical Technology (1.28%) | | | | | | | | |
| PerkinElmer, Inc. | | | 15,700 | | | | 1,069,798 | |
| | | | | | | | | |
| Pharmaceuticals (3.05%) | | | | | | | | |
| Grifols SA ADR (Spain) | | | 76,650 | | | | 1,619,614 | |
| Perrigo Co. PLC (Ireland) | | | 12,400 | | | | 936,448 | |
| | | | | | | | 2,556,062 | |
| Total Medical / Healthcare | | | | | | | 7,420,909 | |
| | | | | | | | | |
| REITs (12.73%) | |
| Diversified And Specialty REITs (3.59%) | | | | | | | | |
| CyrusOne, Inc. | | | 22,010 | | | | 1,227,057 | |
| Uniti Group, Inc. | | | 70,950 | | | | 1,783,683 | |
| | | | | | | | 3,010,740 | |
| Hotel & Resort REITs (1.12%) | | | | | | | | |
| Park Hotels & Resorts, Inc. | | | 34,700 | | | | 935,512 | |
| | | | | | | | | |
| Multi Family REITs (3.41%) | | | | | | | | |
| Equity Residential | | | 20,000 | | | | 1,316,600 | |
| Mid-America Apartment Communities, Inc. | | | 14,590 | | | | 1,537,494 | |
| | | | | | | | 2,854,094 | |
| Office REITs (1.46%) | | | | | | | | |
| Gramercy Property Trust | | | 41,250 | | | | 1,225,538 | |
| | | | | | | | | |
| Retail REITs (3.15%) | | | | | | | | |
Retail Properties of America, Inc. -
Class A | | | 91,250 | | | | 1,114,163 | |
| | | Shares | | | Value | |
| Retail REITs (continued) | | | | | | | | |
| Tanger Factory Outlet Centers, Inc. | | | 58,845 | | | $ | 1,528,793 | |
| | | | | | | | 2,642,956 | |
| Total REITs | | | | | | | 10,668,840 | |
| | | | | | | | | |
| Technology (8.25%) | |
| Cable/Satellite/Telecommunication Services (1.63%) | | | | | |
| TELUS Corp. (Canada) | | | 39,650 | | | | 1,368,718 | |
| | | | | | | | | |
| Computer Software (1.60%) | | | | | | | | |
| Dolby Laboratories, Inc. - Class A | | | 27,450 | | | | 1,343,952 | |
| | | | | | | | | |
| IT Services (3.24%) | | | | | | | | |
| Amdocs, Ltd. | | | 22,190 | | | | 1,430,368 | |
| CSRA, Inc. | | | 40,323 | | | | 1,280,255 | |
| | | | | | | | 2,710,623 | |
| Technology Resellers / Distributors (1.78%) | | | | | |
| Avnet, Inc. | | | 38,450 | | | | 1,494,936 | |
| | | | | | | | | |
| Total Technology | | | | | | | 6,918,229 | |
| | | | | | | | | |
| Utilities (8.82%) | |
| Gas Utilities (2.17%) | | | | | | | | |
| Spire, Inc. | | | 26,000 | | | | 1,813,500 | |
| | | | | | | | | |
| Independent Power (2.53%) | | | | | | | | |
| Public Service Enterprise Group, Inc. | | | 49,300 | | | | 2,120,393 | |
| | | | | | | | | |
| Integrated Gas & Electric (2.25%) | | | | | | | | |
| Xcel Energy, Inc. | | | 41,165 | | | | 1,888,650 | |
| | | | | | | | | |
| Regulated Electric (1.87%) | | | | | | | | |
| Edison International | | | 20,049 | | | | 1,567,632 | |
| | | | | | | | | |
| Total Utilities | | | | | | | 7,390,175 | |
| | | | | | | | | |
| Total Common Stocks (Cost $77,004,567) | | | | 83,747,300 | |
| | | Shares | | | Value | |
| Money Market Mutual Funds (0.49%) | |
Goldman Sachs Financial Square - Government Fund,
(7 Day Yield 0.834%) | | | 413,817 | | | | 413,816 | |
| | |
| Total Money Market Mutual Funds (Cost $413,816) | | | | 413,816 | |
See Notes to Financial Statements.
| 46 | | www.westcore.com |
| Westcore Mid-Cap Value Dividend Fund | Statement of Investments |
| | June 30, 2017 (Unaudited) |
| | | Shares | | | Value | |
Short Term Investments (0.00%)(a) | |
Bank of New York Cash Reserve,
(7 Day Yield 0.007%) | | | 720 | | | $ | 720 | |
| | | | | | | | | |
| Total Short Term Investments (Cost $720) | | | | 720 | |
| | |
| Total Investments (100.41%) (Cost $77,419,103) | | | $ | 84,161,836 | |
| | | | | | | | | |
| Liabilities Less Other Assets (-0.41%) | | | | (343,429 | ) |
| | | | | | | | | |
| Net Assets (100.00%) | | | $ | 83,818,407 | |
Sector and industry classifications presented herein are based on the sector and industry categorization methodology of the Adviser to the Funds which may result in the designations for one Fund being different from another. For Fund compliance purposes, the Fund’s industry classifications refer to any one or more of the industry sub-classifications used by one or more widely recognized market indexes or ratings group indexes, and/or as defined by Fund management. This definition may not apply for purposes of this report, which may combine industry sub-classifications for reporting ease. Industries are shown as a percentage of net assets.
See Notes to Financial Statements.
Semi-Annual Report | June 30, 2017 | | 47 |
| Westcore Mid-Cap Value Dividend Fund II | Statement of Investments |
June 30, 2017 (Unaudited)
| | | Shares | | | Value | |
| Common Stocks (97.14%) | | | | | | |
| Basic Materials (5.51%) | | | | | | |
| Chemicals (1.98%) | | | | | | |
| Compass Minerals International, Inc. | | | 4,930 | | | $ | 321,929 | |
| Eastman Chemical Co. | | | 3,920 | | | | 329,241 | |
| | | | | | | | 651,170 | |
| Forestry & Paper (1.47%) | | | | | | | | |
| WestRock Co. | | | 8,503 | | | | 481,780 | |
| | | | | | | | | |
| Other Materials (Rubber & Plastic) (1.10%) | | | | | |
| Westlake Chemical Corp. | | | 5,460 | | | | 361,507 | |
| | | | | | | | | |
| Specialty Chemicals (0.96%) | | | | | | | | |
| Mosaic Co. | | | 13,815 | | | | 315,396 | |
| | | | | | | | | |
| Total Basic Materials | | | | | | | 1,809,853 | |
| | | | | | | | | |
| Capital Goods (11.63%) | | | | | | | | |
| Aerospace / Defense Suppliers (1.07%) | | | | | | | | |
| CAE, Inc. (Canada) | | | 20,360 | | | | 351,006 | |
| | | | | | | | | |
| Agricultural Products (5.15%) | | | | | | | | |
| Ingredion, Inc. | | | 7,160 | | | | 853,544 | |
| Tyson Foods, Inc. - Class A | | | 13,365 | | | | 837,050 | |
| | | | | | | | 1,690,594 | |
| Environmental / Pollution Control (1.58%) | | | | | |
| Republic Services, Inc. | | | 8,140 | | | | 518,762 | |
| | | | | | | | | |
| Farm Equipment (1.70%) | | | | | | | | |
| AGCO Corp. | | | 8,270 | | | | 557,315 | |
| | | | | | | | | |
| Railroads (1.19%) | | | | | | | | |
| Kansas City Southern | | | 3,750 | | | | 392,438 | |
| | | | | | | | | |
| Transportation Equipment & Parts (0.94%) | | | | | |
| Oshkosh Corp. | | | 4,480 | | | | 308,582 | |
| | | | | | | | | |
| Total Capital Goods | | | | | | | 3,818,697 | |
| | | | | | | | | |
| Consumer (15.06%) | | | | | | | | |
| Apparel & Footwear Manufacturer (1.04%) | | | | | |
| Carter's, Inc. | | | 3,850 | | | | 342,458 | |
| | | | | | | | | |
| Beverages: Non-Alcoholic (0.95%) | | | | | | | | |
| Dr Pepper Snapple Group, Inc. | | | 3,435 | | | | 312,963 | |
| | | | | | | | | |
| Clothing & Accessories (2.73%) | | | | | | | | |
| Foot Locker, Inc. | | | 8,895 | | | | 438,346 | |
| | | Shares | | | Value | |
| Clothing & Accessories (continued) | | | | | | |
| PVH Corp. | | | 3,999 | | | $ | 457,885 | |
| | | | | | | | 896,231 | |
| Consumer Durables (1.30%) | | | | | | | | |
| Whirlpool Corp. | | | 2,226 | | | | 426,546 | |
| | | | | | | | | |
| Consumer Products (1.19%) | | | | | | | | |
| Estee Lauder Cos., Inc. - Class A | | | 4,078 | | | | 391,406 | |
| | | | | | | | | |
| Food Products (1.61%) | | | | | | | | |
| Lamb Weston Holdings, Inc. | | | 11,995 | | | | 528,260 | |
| | | | | | | | | |
| General Merchandise (1.52%) | | | | | | | | |
| Dollar General Corp. | | | 6,910 | | | | 498,142 | |
| | | | | | | | | |
| Motor Vehicle Parts (1.25%) | | | | | | | | |
| Goodyear Tire & Rubber Co. | | | 11,686 | | | | 408,543 | |
| | | | | | | | | |
| Publishing & Media (1.42%) | | | | | | | | |
| Sinclair Broadcast Group, Inc. - Class A | | | 14,200 | | | | 467,180 | |
| | | | | | | | | |
| Recreation & Leisure (1.10%) | | | | | | | | |
| Mattel, Inc. | | | 16,816 | | | | 362,048 | |
| | | | | | | | | |
| Specialty Retail (0.95%) | | | | | | | | |
| Dick's Sporting Goods, Inc. | | | 7,776 | | | | 309,718 | |
| | | | | | | | | |
| Total Consumer | | | | | | | 4,943,495 | |
| | | | | | | | | |
| Energy (7.56%) | | | | | | | | |
| Exploration & Production (6.29%) | | | | | | | | |
| EQT Corp. | | | 8,720 | | | | 510,905 | |
| Noble Energy, Inc. | | | 19,990 | | | | 565,717 | |
| Range Resources Corp. | | | 28,035 | | | | 649,571 | |
| SM Energy Co. | | | 20,572 | | | | 340,055 | |
| | | | | | | | 2,066,248 | |
| Refining & Marketing (1.27%) | | | | | | | | |
| Marathon Petroleum Corp. | | | 7,950 | | | | 416,023 | |
| | | | | | | | | |
| Total Energy | | | | | | | 2,482,271 | |
| | | | | | | | | |
| Interest Rate Sensitive (19.87%) | | | | | | | | |
| Insurance / Real Estate Brokers (2.43%) | | | | | | | | |
| Realogy Holdings Corp. | | | 24,605 | | | | 798,432 | |
| | | | | | | | | |
| Integrated Financial Services (1.78%) | | | | | | | | |
| Voya Financial, Inc. | | | 15,815 | | | | 583,415 | |
| | | | | | | | | |
| Life & Health Insurance (1.67%) | | | | | | | | |
| Unum Group | | | 11,741 | | | | 547,483 | |
| | | | | | | | | |
| Other Banks (2.83%) | | | | | | | | |
| BOK Financial Corp. | | | 5,360 | | | | 450,937 | |
| See Notes to Financial Statements. | |
| 48 | | www.westcore.com |
| Westcore Mid-Cap Value Dividend Fund II | Statement of Investments |
June 30, 2017 (Unaudited)
| | | Shares | | | Value | |
| Other Banks (continued) | | | | | | |
| FNB Corp. | | | 33,740 | | | $ | 477,758 | |
| | | | | | | | 928,695 | |
| Property Casualty Insurance (5.52%) | | | | | | | | |
| AmTrust Financial Services, Inc. | | | 54,740 | | | | 828,764 | |
| Radian Group, Inc. | | | 28,700 | | | | 469,245 | |
| Validus Holdings, Ltd. (Bermuda) | | | 9,870 | | | | 512,944 | |
| | | | | | | | 1,810,953 | |
| Regional Banks (4.46%) | | | | | | | | |
| Fifth Third Bancorp | | | 17,350 | | | | 450,406 | |
| Investors Bancorp, Inc. | | | 46,633 | | | | 623,017 | |
| KeyCorp | | | 20,890 | | | | 391,479 | |
| | | | | | | | 1,464,902 | |
| Specialty Finance (1.18%) | | | | | | | | |
| Navient Corp. | | | 23,300 | | | | 387,945 | |
| | | | | | | | | |
| Total Interest Rate Sensitive | | | | | | | 6,521,825 | |
| | | | | | | | | |
| Medical / Healthcare (8.56%) | | | | | | | | |
| Healthcare Services (3.35%) | | | | | | | | |
| AmerisourceBergen Corp. | | | 7,240 | | | | 684,398 | |
| Cardinal Health, Inc. | | | 5,310 | | | | 413,755 | |
| | | | | | | | 1,098,153 | |
| Medical Products & Supplies (1.03%) | | | | | | | | |
| DENTSPLY SIRONA, Inc. | | | 5,225 | | | | 338,789 | |
| | | | | | | | | |
| Medical Technology (1.23%) | | | | | | | | |
| PerkinElmer, Inc. | | | 5,950 | | | | 405,433 | |
| | | | | | | | | |
| Pharmaceuticals (2.95%) | | | | | | | | |
| Grifols SA ADR (Spain) | | | 29,020 | | | | 613,192 | |
| Perrigo Co. PLC (Ireland) | | | 4,690 | | | | 354,189 | |
| | | | | | | | 967,381 | |
| Total Medical / Healthcare | | | | | | | 2,809,756 | |
| | | | | | | | | |
| REITs (12.44%) | | | | | | | | |
| Diversified & Specialty REITs (3.54%) | | | | | | | | |
| CyrusOne, Inc. | | | 8,540 | | | | 476,105 | |
| Uniti Group, Inc. | | | 27,260 | | | | 685,316 | |
| | | | | | | | 1,161,421 | |
| Hotel & Resort REITs (1.08%) | | | | | | | | |
| Park Hotels & Resorts, Inc. | | | 13,100 | | | | 353,176 | |
| | | | | | | | | |
| Multi Family-REITs (3.34%) | | | | | | | | |
| Equity Residential | | | 7,685 | | | | 505,904 | |
| Mid-America Apartment Communities, Inc. | | | 5,606 | | | | 590,760 | |
| | | | | | | | 1,096,664 | |
| Office REITs (1.43%) | | | | | | | | |
| Gramercy Property Trust | | | 15,863 | | | | 471,290 | |
| | | | | | | | | |
| Retail REITs (3.05%) | | | | | | | | |
Retail Properties of America, Inc. -
Class A | | | 33,880 | | | | 413,675 | |
| | | Shares | | | Value | |
| Retail REITs (continued) | | | | | | |
| Tanger Factory Outlet Centers, Inc. | | | 22,610 | | | $ | 587,408 | |
| | | | | | | | 1,001,083 | |
| Total REITs | | | | | | | 4,083,634 | |
| | | | | | | | | |
| Technology (8.01%) | | | | | | | | |
| Cable / Satellite / Telecommunication Services (1.58%) | | | | | |
| TELUS Corp. (Canada) | | | 14,990 | | | | 517,455 | |
| | | | | | | | | |
| Computer Software (1.55%) | | | | | | | | |
| Dolby Laboratories, Inc. - Class A | | | 10,380 | | | | 508,205 | |
| | | | | | | | | |
| IT Services (3.16%) | | | | | | | | |
| Amdocs, Ltd. | | | 8,455 | | | | 545,009 | |
| CSRA, Inc. | | | 15,492 | | | | 491,871 | |
| | | | | | | | 1,036,880 | |
| Technology Resellers / Distributors (1.72%) | | | | | |
| Avnet, Inc. | | | 14,530 | | | | 564,926 | |
| | | | | | | | | |
| Total Technology | | | | | | | 2,627,466 | |
| | | | | | | | | |
| Utilities (8.50%) | | | | | | | | |
| Gas Utilities (2.08%) | | | | | | | | |
| Spire, Inc. | | | 9,800 | | | | 683,550 | |
| | | | | | | | | |
| Independent Power (2.45%) | | | | | | | | |
| Public Service Enterprise Group, Inc. | | | 18,680 | | | | 803,427 | |
| | | | | | | | | |
| Integrated Gas and Electric (2.17%) | | | | | | | | |
| Xcel Energy, Inc. | | | 15,520 | | | | 712,058 | |
| | | | | | | | | |
| Regulated Electric (1.80%) | | | | | | | | |
| Edison International | | | 7,550 | | | | 590,334 | |
| | | | | | | | | |
| Total Utilities | | | | | | | 2,789,369 | |
| | | | | | | | | |
| Total Common Stocks | | | | | | | | |
| (Cost $32,339,808) | | | | | | | 31,886,366 | |
| Money Market Mutual Funds (2.67%) | | Shares | | | Value | |
| | | | | | | |
Goldman Sachs Financial Square - Government Fund,
(7 Day Yield 0.834%) | | | 875,254 | | | | 875,254 | |
| Total Money Market Mutual Funds (Cost $875,254) | | | | 875,254 | |
See Notes to Financial Statements.
Semi-Annual Report | June 30, 2017 | | 49 |
| Westcore Mid-Cap Value Dividend Fund II | Statement of Investments |
June 30, 2017 (Unaudited)
| | | Shares | | | Value | |
Short Term Investments (0.00%)(a) | | | | | | |
Bank of New York Cash Reserve,
(7 Day Yield 0.007%) | | | 274 | | | $ | 274 | |
| | | | | | | | | |
| Total Short Term Investments (Cost $274) | | | | 274 | |
| | | | | | | | | |
| Total Investments (99.81%) (Cost $33,215,336) | | | $ | 32,761,894 | |
| | | | | | | | | |
| Other Assets Less Liabilities (0.19%) | | | | | | | 62,135 | |
| | | | | | | | | |
| Net Assets (100.00%) | | | | | | $ | 32,824,029 | |
| Sector and industry classifications presented herein are based on the sector and industry categorization methodology of the Adviser to the Funds which may result in the designations for one Fund being different from another. For Fund compliance purposes, the Fund’s industry classifications refer to any one or more of the industry sub-classifications used by one or more widely recognized market indexes or ratings group indexes, and/or as defined by Fund management. This definition may not apply for purposes of this report, which may combine industry sub-classifications for reporting ease. Industries are shown as a percentage of net assets. |
See Notes to Financial Statements.
| 50 | | www.westcore.com |
| Westcore Smid-Cap Value Dividend Fund | Statement of Investments |
June 30, 2017 (Unaudited)
| | | Shares | | | Value | |
| Common Stocks (98.83%) | |
| Basic Materials (6.00%) | |
| Chemicals (2.60%) | | | | | | |
| Compass Minerals International, Inc. | | | 130 | | | $ | 8,489 | |
| Eastman Chemical Co. | | | 108 | | | | 9,071 | |
| | | | | | | | 17,560 | |
| Forestry & Paper (1.04%) | | | | | | | | |
| WestRock Co. | | | 124 | | | | 7,026 | |
| | | | | | | | | |
| Other Materials (Rubber & Plastic) (1.07%) | | | | | |
| Westlake Chemical Corp. | | | 109 | | | | 7,217 | |
| | | | | | | | | |
| Specialty Chemicals (1.29%) | | | | | | | | |
| Mosaic Co. | | | 381 | | | | 8,698 | |
| | | | | | | | | |
| Total Basic Materials | | | | | | | 40,501 | |
| | | | | | | | | |
| Capital Goods (12.65%) | |
| Agricultural Products (5.46%) | | | | | | | | |
| Dean Foods Co. | | | 752 | | | | 12,784 | |
| Ingredion, Inc. | | | 116 | | | | 13,829 | |
| Tyson Foods, Inc. - Class A | | | 164 | | | | 10,271 | |
| | | | | | | | 36,884 | |
| Farm Equipment (1.75%) | | | | | | | | |
| AGCO Corp. | | | 175 | | | | 11,793 | |
| | | | | | | | | |
| Industrial Products (2.37%) | | | | | | | | |
| Global Brass & Copper Holdings, Inc. | | | 201 | | | | 6,140 | |
| Regal Beloit Corp. | | | 121 | | | | 9,868 | |
| | | | | | | | 16,008 | |
| Transportation Equipment & Parts (3.07%) | | | | | |
| Greenbrier Cos., Inc. | | | 294 | | | | 13,597 | |
| Oshkosh Corp. | | | 104 | | | | 7,164 | |
| | | | | | | | 20,761 | |
| Total Capital Goods | | | | | | | 85,446 | |
| | | | | | | | | |
| Consumer (13.23%) | |
| Clothing & Accessories (3.30%) | | | | | | | | |
| Caleres, Inc. | | | 294 | | | | 8,168 | |
| Cato Corp. - Class A | | | 361 | | | | 6,350 | |
| Foot Locker, Inc. | | | 158 | | | | 7,786 | |
| | | | | | | | 22,304 | |
| Food Products (1.23%) | | | | | | | | |
| Lamb Weston Holdings, Inc. | | | 188 | | | | 8,279 | |
| | | | | | | | | |
| General Merchandise (1.47%) | | | | | | | | |
| Big Lots, Inc. | | | 206 | | | | 9,950 | |
| | | | | | | | | |
| Motor Vehicle Parts (1.00%) | | | | | | | | |
| Goodyear Tire & Rubber Co. | | | 193 | | | | 6,747 | |
| | Shares | | Value | |
| Publishing & Media (2.92%) | | | | | | |
| AMC Entertainment Holdings, Inc. - Class A | | | 296 | | | $ | 6,734 | |
| Sinclair Broadcast Group, Inc. - Class A | | | 394 | | | | 12,963 | |
| | | | | | | | 19,697 | |
| Recreation & Leisure (1.24%) | | | | | | | | |
| Mattel, Inc. | | | 389 | | | | 8,375 | |
| | | | | | | | | |
| Restaurants (1.26%) | | | | | | | | |
| Bloomin' Brands, Inc. | | | 401 | | | | 8,513 | |
| | | | | | | | | |
| Specialty Retail (0.81%) | | | | | | | | |
| Dick's Sporting Goods, Inc. | | | 138 | | | | 5,497 | |
| | | | | | | | | |
| Total Consumer | | | | | | | 89,362 | |
| | | | | | | | | |
| Energy (5.93%) | |
| Exploration & Production (5.93%) | | | | | | | | |
| Enerplus Corp. (Canada) | | | 1,706 | | | | 13,853 | |
| EQT Corp. | | | 113 | | | | 6,620 | |
| Range Resources Corp. | | | 446 | | | | 10,334 | |
| SM Energy Co. | | | 560 | | | | 9,257 | |
| | | | | | | | 40,064 | |
| Total Energy | | | | | | | 40,064 | |
| | | | | | | | | |
| Interest Rate Sensitive (27.11%) | |
| Insurance / Real Estate Brokers (2.11%) | | | | | | | | |
| Realogy Holdings Corp. | | | 440 | | | | 14,278 | |
| | | | | | | | | |
| Integrated Financial Services (1.46%) | | | | | | | | |
| Voya Financial, Inc. | | | 268 | | | | 9,886 | |
| | | | | | | | | |
| Life & Health Insurance (1.40%) | | | | | | | | |
| Unum Group | | | 203 | | | | 9,466 | |
| | | | | | | | | |
| Other Banks (6.41%) | | | | | | | | |
| BOK Financial Corp. | | | 128 | | | | 10,768 | |
| FNB Corp. | | | 830 | | | | 11,753 | |
| Glacier Bancorp, Inc. | | | 285 | | | | 10,434 | |
| Independent Bank Corp. | | | 155 | | | | 10,331 | |
| | | | | | | | 43,286 | |
| Property Casualty Insurance (5.00%) | | | | | | | | |
| AmTrust Financial Services, Inc. | | | 871 | | | | 13,187 | |
| Radian Group, Inc. | | | 793 | | | | 12,965 | |
| Validus Holdings, Ltd. (Bermuda) | | | 146 | | | | 7,588 | |
| | | | | | | | 33,740 | |
| Regional Banks (6.53%) | | | | | | | | |
| Fifth Third Bancorp | | | 504 | | | | 13,084 | |
| First Horizon National Corp. | | | 474 | | | | 8,257 | |
| Investors Bancorp, Inc. | | | 745 | | | | 9,953 | |
| KeyCorp | | | 685 | | | | 12,837 | |
| | | | | | | | 44,131 | |
See Notes to Financial Statements.
Semi-Annual Report | June 30, 2017 | | 51 |
| Westcore Smid-Cap Value Dividend Fund | Statement of Investments |
June 30, 2017 (Unaudited)
| | | Shares | | | Value | |
| Securities & Asset Management (1.84%) | | | | | | |
| Artisan Partners Asset Management, Inc. - Class A | | | 404 | | | $ | 12,403 | |
| | | | | | | | | |
| Specialty Finance (1.18%) | | | | | | | | |
| Navient Corp. | | | 478 | | | | 7,959 | |
| | | | | | | | | |
| Thrifts (1.18%) | | | | | | | | |
| IBERIABANK Corp. | | | 98 | | | | 7,987 | |
| | | | | | | | | |
| Total Interest Rate Sensitive | | | | | | | 183,136 | |
| | | | | | | | | |
| Medical / Healthcare (8.34%) | |
| Healthcare Services (3.59%) | | | | | | | | |
| Aceto Corp. | | | 449 | | | | 6,937 | |
| AmerisourceBergen Corp. | | | 106 | | | | 10,020 | |
| Ensign Group, Inc. | | | 335 | | | | 7,293 | |
| | | | | | | | 24,250 | |
| Pharmaceuticals (4.75%) | | | | | | | | |
| Grifols SA ADR (Spain) | | | 327 | | | | 6,910 | |
| Perrigo Co. PLC (Ireland) | | | 118 | | | | 8,911 | |
| Phibro Animal Health Corp. - Class A | | | 440 | | | | 16,302 | |
| | | | | | | | 32,123 | |
| Total Medical / Healthcare | | | | | | | 56,373 | |
| | | | | | | | | |
| REITs (12.08%) | |
| Diversified & Specialty REITs (4.48%) | | | | | | | | |
| CyrusOne, Inc. | | | 195 | | | | 10,871 | |
| GEO Group, Inc. | | | 280 | | | | 8,280 | |
| Uniti Group, Inc. | | | 443 | | | | 11,137 | |
| | | | | | | | 30,288 | |
| Multi-Family REITs (1.51%) | | | | | | | | |
| Mid-America Apartment Communities, Inc. | | | 97 | | | | 10,222 | |
| | | | | | | | | |
| Office REITs (2.74%) | | | | | | | | |
| Gramercy Property Trust | | | 283 | | | | 8,408 | |
| Lexington Realty Trust | | | 1,017 | | | | 10,078 | |
| | | | | | | | 18,486 | |
| Retail REITs (3.35%) | | | | | | | | |
| CBL & Associates Properties, Inc. | | | 1,457 | | | | 12,283 | |
| Tanger Factory Outlet Centers, Inc. | | | 397 | | | | 10,314 | |
| | | | | | | | 22,597 | |
| Total REITs | | | | | | | 81,593 | |
| | | | | | | | | |
| Technology (8.83%) | |
| Computer Software (2.27%) | | | | | | | | |
| TiVo Corp. | | | 822 | | | | 15,330 | |
| | | | | | | | | |
| Electronic Equipment (1.39%) | | | | | | | | |
| MTS Systems Corp. | | | 182 | | | | 9,428 | |
| | | | | | | | | |
| IT Services (3.52%) | | | | | | | | |
| Amdocs, Ltd. | | | 117 | | | | 7,542 | |
| | Shares | | Value | |
| IT Services (continued) | | | | | | |
| CSRA, Inc. | | | 225 | | | $ | 7,143 | |
| EVERTEC, Inc. (Puerto Rico) | | | 526 | | | | 9,100 | |
| | | | | | | | 23,785 | |
| Technology Resellers & Distributors (1.65%) | | | | | |
| Avnet, Inc. | | | 286 | | | | 11,120 | |
| | | | | | | | | |
| Total Technology | | | | | | | 59,663 | |
| | | | | | | | | |
| Utilities (4.66%) | |
| Gas Utilities (2.20%) | | | | | | | | |
| Spire, Inc. | | | 213 | | | | 14,857 | |
| | | | | | | | | |
| Independent Power (0.99%) | | | | | | | | |
| Public Service Enterprise Group, Inc. | | | 155 | | | | 6,666 | |
| | | | | | | | | |
| Integrated Gas and Electric (1.47%) | | | | | | | | |
| NorthWestern Corp. | | | 163 | | | | 9,946 | |
| | | | | | | | | |
| Total Utilities | | | | | | | 31,469 | |
| | | | | | | | | |
| Total Common Stocks | |
| (Cost $682,436) | | | | | | | 667,607 | |
| | | Shares | | | Value | |
| Money Market Mutual Funds (0.86%) | |
Goldman Sachs Financial Square - Government Fund,
(7 Day Yield 0.834%) | | | 5,781 | | | | 5,781 | |
| Total Money Market Mutual Funds | |
| (Cost $5,781) | | | | | | | 5,781 | |
| | |
| Total Investments (99.69%) | | | | | |
| (Cost $688,217) | | | | | | $ | 673,388 | |
| | | | | | | | | |
| Other Assets Less Liabilities (0.31%) | | | | 2,094 | |
| | | | | | | | | |
| Net Assets (100.00%) | | | $ | 675,482 | |
| | |
Sector and industry classifications presented herein are based on the sector and industry categorization methodology of the Adviser to the Funds which may result in the designations for one Fund being different from another. For Fund compliance purposes, the Fund’s industry classifications refer to any one or more of the industry sub-classifications used by one or more widely recognized market indexes or ratings group indexes, and/or as defined by Fund management. This definition may not apply for purposes of this report, which may combine industry sub-classifications for reporting ease. Industries are shown as a percentage of net assets.
See Notes to Financial Statements.
| 52 | | www.westcore.com |
| Westcore Small-Cap Value Dividend Fund | Statement of Investments |
June 30, 2017 (Unaudited)
| | | Shares | | | Value | |
| Common Stocks (97.88%) | |
| Basic Materials (4.10%) | |
| Chemicals (1.26%) | | | | | | |
| Compass Minerals International, Inc. | | | 39,200 | | | $ | 2,559,760 | |
| | | | | | | | | |
| Forestry & Paper (1.24%) | | | | | | | | |
| PH Glatfelter Co. | | | 129,480 | | | | 2,530,039 | |
| | | | | | | | | |
| Non-Ferrous Metals (1.13%) | | | | | | | | |
| Materion Corp. | | | 61,550 | | | | 2,301,970 | |
| | | | | | | | | |
| Specialty Chemicals (0.47%) | | | | | | | | |
| Minerals Technologies, Inc. | | | 13,086 | | | | 957,895 | |
| | | | | | | | | |
| Total Basic Materials | | | | | | | 8,349,664 | |
| | | | | | | | | |
| Capital Goods (12.52%) | |
| Agricultural Products (2.80%) | | | | | | | | |
| Dean Foods Co. | | | 335,025 | | | | 5,695,425 | |
| | | | | | | | | |
| Electrical Equipment (1.10%) | | | | | | | | |
Watts Water Technologies, Inc. -
Class A | | | 35,460 | | | | 2,241,072 | |
| | | | | | | | | |
| Engineering & Construction (1.61%) | | | | | | | | |
| Tetra Tech, Inc. | | | 71,714 | | | | 3,280,916 | |
| | | | | | | | | |
| Industrial Products (5.08%) | | | | | | | | |
| Global Brass & Copper Holdings, Inc. | | | 75,130 | | | | 2,295,221 | |
| ITT, Inc. | | | 52,000 | | | | 2,089,360 | |
| Regal Beloit Corp. | | | 43,346 | | | | 3,534,866 | |
| The Timken Co. | | | 52,650 | | | | 2,435,063 | |
| | | | | | | | 10,354,510 | |
| Transportation Equipment & Parts (1.93%) | | | | | |
| Greenbrier Cos., Inc. | | | 85,100 | | | | 3,935,875 | |
| | | | | | | | | |
| Total Capital Goods | | | | | | | 25,507,798 | |
| | | | | | | | | |
| Consumer (13.19%) | |
| Clothing & Accessories (2.26%) | | | | | | | | |
| Caleres, Inc. | | | 92,690 | | | | 2,574,928 | |
| Cato Corp. - Class A | | | 115,320 | | | | 2,028,479 | |
| | | | | | | | 4,603,407 | |
| Food Products (0.98%) | | | | | | | | |
| Flowers Foods, Inc. | | | 115,560 | | | | 2,000,343 | |
| | | | | | | | | |
| General Merchandise (1.53%) | | | | | | | | |
| Big Lots, Inc. | | | 64,500 | | | | 3,115,350 | |
| | Shares | | Value | |
| Publishing & Media (5.47%) | | | | | | |
| AMC Entertainment Holdings, Inc. - Class A | | | 184,420 | | | $ | 4,195,555 | |
| Graham Holdings Co. - Class B | | | 3,525 | | | | 2,113,766 | |
| Sinclair Broadcast Group, Inc. - Class A | | | 146,955 | | | | 4,834,820 | |
| | | | | | | | 11,144,141 | |
| Restaurants (1.79%) | | | | | | | | |
| Bloomin' Brands, Inc. | | | 172,405 | | | | 3,660,158 | |
| | | | | | | | | |
| Specialty Retail (1.16%) | | | | | | | | |
| Big 5 Sporting Goods Corp. | | | 180,954 | | | | 2,361,450 | |
| | | | | | | | | |
| Total Consumer | | | | | | | 26,884,849 | |
| | | | | | | | | |
| Energy (4.17%) | |
| Exploration & Production (4.17%) | | | | | | | | |
| Enerplus Corp. (Canada) | | | 712,585 | | | | 5,786,190 | |
| SM Energy Co. | | | 163,930 | | | | 2,709,763 | |
| | | | | | | | 8,495,953 | |
| Total Energy | | | | | | | 8,495,953 | |
| | | | | | | | | |
| Interest Rate Sensitive (28.79%) | |
| Insurance / Real Estate Brokers (2.16%) | | | | | | | | |
| Realogy Holdings Corp. | | | 135,400 | | | | 4,393,730 | |
| | | | | | | | | |
| Life & Health Insurance (1.24%) | | | | | | | | |
| CNO Financial Group, Inc. | | | 120,615 | | | | 2,518,441 | |
| | | | | | | | | |
| Other Banks (13.88%) | | | | | | | | |
| First Midwest Bancorp, Inc. | | | 85,980 | | | | 2,004,194 | |
| FNB Corp. | | | 222,740 | | | | 3,153,998 | |
| Glacier Bancorp, Inc. | | | 83,620 | | | | 3,061,328 | |
| Hancock Holding Co. | | | 47,335 | | | | 2,319,415 | |
| Independent Bank Corp. | | | 45,970 | | | | 3,063,901 | |
| Umpqua Holdings Corp. | | | 229,050 | | | | 4,205,358 | |
| United Community Banks, Inc. | | | 74,300 | | | | 2,065,540 | |
| Valley National Bancorp | | | 260,355 | | | | 3,074,793 | |
| Westamerica Bancorporation | | | 35,426 | | | | 1,985,273 | |
| Wintrust Financial Corp. | | | 43,862 | | | | 3,352,811 | |
| | | | | | | | 28,286,611 | |
| Property Casualty Insurance (4.73%) | | | | | | | | |
| AmTrust Financial Services, Inc. | | | 341,335 | | | | 5,167,812 | |
| Radian Group, Inc. | | | 273,811 | | | | 4,476,810 | |
| | | | | | | | 9,644,622 | |
| Regional Banks (2.15%) | | | | | | | | |
| First Horizon National Corp. | | | 112,975 | | | | 1,968,025 | |
| Great Western Bancorp, Inc. | | | 59,210 | | | | 2,416,360 | |
| | | | | | | | 4,384,385 | |
| Securities & Asset Management (1.74%) | | | | | | | | |
| Artisan Partners Asset Management, Inc. - Class A | | | 115,500 | | | | 3,545,850 | |
See Notes to Financial Statements.
Semi-Annual Report | June 30, 2017 | | 53 |
| Westcore Small-Cap Value Dividend Fund | Statement of Investments |
June 30, 2017 (Unaudited)
| | Shares | | Value | |
| Thrifts (2.89%) | | | | | | | | |
| IBERIABANK Corp. | | | 35,695 | | | $ | 2,909,142 | |
| Northwest Bancshares, Inc. | | | 190,765 | | | | 2,977,842 | |
| | | | | | | | 5,886,984 | |
| Total Interest Rate Sensitive | | | | | | | 58,660,623 | |
| | | | | | | | | |
| Medical / Healthcare (6.70%) | |
| Healthcare Services (3.03%) | | | | | | | | |
| Aceto Corp. | | | 145,600 | | | | 2,249,520 | |
| Ensign Group, Inc. | | | 180,080 | | | | 3,920,342 | |
| | | | | | | | 6,169,862 | |
| Medical Technology (1.62%) | | | | | | | | |
| Bio-Techne Corp. | | | 28,135 | | | | 3,305,862 | |
| | | | | | | | | |
| Pharmaceuticals (2.05%) | | | | | | | | |
| Phibro Animal Health Corp. - Class A | | | 112,624 | | | | 4,172,719 | |
| | | | | | | | | |
| Total Medical / Healthcare | | | | | | | 13,648,443 | |
| | | | | | | | | |
| REITs (10.19%) | |
| Diversified & Specialty REITs (3.47%) | | | | | | | | |
| CyrusOne, Inc. | | | 52,890 | | | | 2,948,617 | |
| GEO Group, Inc. | | | 139,279 | | | | 4,118,480 | |
| | | | | | | | 7,067,097 | |
| Multi-Family REITs (1.29%) | | | | | | | | |
| Education Realty Trust, Inc. | | | 67,973 | | | | 2,633,954 | |
| | | | | | | | | |
| Office REITs (2.91%) | | | | | | | | |
| Gramercy Property Trust | | | 101,059 | | | | 3,002,463 | |
| Lexington Realty Trust | | | 295,220 | | | | 2,925,630 | |
| | | | | | | | 5,928,093 | |
| Retail REITs (2.52%) | | | | | | | | |
| CBL & Associates Properties, Inc. | | | 610,290 | | | | 5,144,745 | |
| | | | | | | | | |
| Total REITs | | | | | | | 20,773,889 | |
| | | | | | | | | |
| Technology (13.48%) | |
| Computer Software (4.38%) | | | | | | | | |
| Monotype Imaging Holdings, Inc. | | | 77,610 | | | | 1,420,263 | |
| Progress Software Corp. | | | 71,200 | | | | 2,199,368 | |
| TiVo Corp. | | | 284,620 | | | | 5,308,163 | |
| | | | | | | | 8,927,794 | |
| Electronic Equipment (3.20%) | | | | | | | | |
| Methode Electronics, Inc. | | | 62,432 | | | | 2,572,199 | |
| MTS Systems Corp. | | | 76,165 | | | | 3,945,347 | |
| | | | | | | | 6,517,546 | |
| IT Services (4.76%) | | | | | | | | |
| Convergys Corp. | | | 121,500 | | | | 2,889,270 | |
| EVERTEC, Inc. (Puerto Rico) | | | 208,175 | | | | 3,601,427 | |
| ManTech International Corp. - Class A | | | 77,252 | | | | 3,196,688 | |
| | | | | | | | 9,687,385 | |
| | Shares | | Value | |
| Semiconductors (0.43%) | | | | | | | | |
| Silicon Motion Technology Corp. ADR (Taiwan) | | | 18,156 | | | $ | 875,664 | |
| | | | | | | | | |
| Telecommunication Equipment & Solutions (0.71%) | | | | | |
| Plantronics, Inc. | | | 27,688 | | | | 1,448,359 | |
| | | | | | | | | |
| Total Technology | | | | | | | 27,456,748 | |
| | | | | | | | | |
| Utilities (4.74%) | |
| Gas Utilities (2.42%) | | | | | | | | |
| Spire, Inc. | | | 70,615 | | | | 4,925,396 | |
| | | | | | | | | |
| Integrated Gas and Electric (1.35%) | | | | | | | | |
| NorthWestern Corp. | | | 44,890 | | | | 2,739,188 | |
| | | | | | | | | |
| Regulated Electric (0.97%) | | | | | | | | |
| Portland General Electric Co. | | | 43,445 | | | | 1,985,002 | |
| | | | | | | | | |
| Total Utilities | | | | | | | 9,649,586 | |
| | | | | | | | | |
| Total Common Stocks | |
| (Cost $179,489,741) | | | | | | | 199,427,553 | |
| | Shares | | Value | |
| Money Market Mutual Funds (2.66%) | |
Goldman Sachs Financial Square - Government Fund,
(7 Day Yield 0.834%) | | | 5,423,562 | | | | 5,423,562 | |
| Total Money Market Mutual Funds | |
| (Cost $5,423,562) | | | | | | | 5,423,562 | |
| | |
| Total Investments (100.54%) | | | | | |
| (Cost $184,913,303) | | | | | | $ | 204,851,115 | |
| | | | | | | | | |
| Liabilities Less Other Assets (-0.54%) | | | | (1,108,672 | ) |
| | | | | | | | | |
| Net Assets (100.00%) | | | $ | 203,742,443 | |
Sector and industry classifications presented herein are based on the sector and industry categorization methodology of the Adviser to the Funds which may result in the designations for one Fund being different from another. For Fund compliance purposes, the Fund’s industry classifications refer to any one or more of the industry sub-classifications used by one or more widely recognized market indexes or ratings group indexes, and/or as defined by Fund management. This definition may not apply for purposes of this report, which may combine industry sub-classifications for reporting ease. Industries are shown as a percentage of net assets.
See Notes to Financial Statements.
| 54 | | www.westcore.com |
Westcore Global Large-Cap Dividend Fund | Statement of Investments |
June 30, 2017 (Unaudited)
| | | Shares | | | Value | |
| Common Stocks (96.04%) | | | | | | |
| Consumer Discretionary (15.09%) | | | | | | |
| Automobiles (2.98%) | | | | | | |
| Toyota Motor Corp. (Japan) | | | 30,300 | | | $ | 1,587,534 | |
| | | | | | | | | |
| Hotels Restaurants & Leisure (6.94%) | | | | | | | | |
| McDonald's Corp. | | | 12,435 | | | | 1,904,545 | |
| Whitbread PLC (United Kingdom) | | | 34,748 | | | | 1,795,367 | |
| | | | | | | | 3,699,912 | |
| Leisure Products (1.99%) | | | | | | | | |
| Mattel, Inc. | | | 49,240 | | | | 1,060,137 | |
| | | | | | | | | |
| Specialty Retail (3.18%) | | | | | | | | |
| Lowe's Cos, Inc. | | | 21,900 | | | | 1,697,907 | |
| | | | | | | | | |
| Total Consumer Discretionary | | | | | | | 8,045,490 | |
| | | | | | | | | |
| Consumer Staples (13.57%) | | | | | | | | |
| Food & Staples Retailing (3.31%) | | | | | | | | |
| Wal-Mart Stores, Inc. | | | 23,327 | | | | 1,765,387 | |
| | | | | | | | | |
| Food Products (3.62%) | | | | | | | | |
| Nestle SA ADR (Switzerland) | | | 22,145 | | | | 1,931,044 | |
| | | | | | | | | |
| Household Products (3.03%) | | | | | | | | |
| Kimberly Clark Corp. | | | 12,514 | | | | 1,615,683 | |
| | | | | | | | | |
| Tobacco (3.61%) | | | | | | | | |
| British American Tobacco PLC ADR (United Kingdom) | | | 28,030 | | | | 1,921,176 | |
| | | | | | | | | |
| Total Consumer Staples | | | | | | | 7,233,290 | |
| | | | | | | | | |
| Energy (9.16%) | | | | | | | | |
| Oil Gas & Consumable Fuels (9.16%) | | | | | | | | |
| Koninklijke Vopak N.V. (Netherlands) | | | 36,073 | | | | 1,672,753 | |
| Occidental Petroleum Corp. | | | 28,583 | | | | 1,711,264 | |
TOTAL SA ADR (France) | | | 30,202 | | | | 1,497,717 | |
| | | | | | | | 4,881,734 | |
| Total Energy | | | | | | | 4,881,734 | |
| | | | | | | | | |
| Financials (12.87%) | | | | | | | | |
| Banks (3.48%) | | �� | | | | | | |
| US Bancorp | | | 35,806 | | | | 1,859,048 | |
| | | | | | | | | |
| Insurance (9.39%) | | | | | | | | |
| Chubb, Ltd. (Switzerland) | | | 11,800 | | | | 1,715,484 | |
| Helvetia Holding AG (Switzerland) | | | 2,949 | | | | 1,686,856 | |
Power Financial Corp. (Canada) | | | 62,500 | | | | 1,603,466 | |
| | | | | | | | 5,005,806 | |
| Total Financials | | | | | | | 6,864,854 | |
| | | Shares | | | Value | |
| Health Care (13.53%) | | | | | | |
| Biotechnology (3.29%) | | | | | | |
| AbbVie, Inc. | | | 24,189 | | | $ | 1,753,945 | |
| | | | | | | | | |
| Pharmaceuticals (10.24%) | | | | | | | | |
| Bayer AG (Germany) | | | 15,500 | | | | 2,004,018 | |
| Novartis AG ADR (Switzerland) | | | 21,910 | | | | 1,828,828 | |
| Roche Holding AG (Switzerland) | | | 6,400 | | | | 1,629,867 | |
| | | | | | | | 5,462,713 | |
| Total Health Care | | | | | | | 7,216,658 | |
| | | | | | | | | |
| Industrials (10.72%) | | | | | | | | |
Commercial Services & Supplies (3.08%) | | | | | | | | |
| Brambles, Ltd. (Australia) | | | 219,389 | | | | 1,640,696 | |
| | | | | | | | | |
Professional Services (3.25%) | | | | | | | | |
Adecco Group AG (Switzerland) | | | 22,800 | | | | 1,733,361 | |
| | | | | | | | | |
| Road & Rail (4.39%) | | | | | | | | |
| CSX Corp. | | | 42,900 | | | | 2,340,624 | |
| | | | | | | | | |
| Total Industrials | | | | | | | 5,714,681 | |
| | | | | | | | | |
| Information Technology (12.32%) | | | | | | | | |
| IT Services (3.38%) | | | | | | | | |
| Broadridge Financial Solutions, Inc. | | | 23,900 | | | | 1,805,884 | |
| | | | | | | | | |
Semiconductors & Semiconductor (2.57%) | | | | | |
QUALCOMM, Inc. | | | 24,837 | | | | 1,371,499 | |
| | | | | | | | | |
| Software (2.56%) | | | | | | | | |
| Sage Group PLC (United Kingdom) | | | 152,152 | | | | 1,363,413 | |
| | | | | | | | | |
| Technology Hardware Storage & Peripherals (3.81%) | | | | | |
| Apple, Inc. | | | 14,100 | | | | 2,030,682 | |
| | | | | | | | | |
| Total Information Technology | | | | | | | 6,571,478 | |
| | | | | | | | | |
| Materials (3.21%) | | | | | | | | |
Chemicals (3.21%) | | | | | | | | |
| Koninklijke DSM N.V. (Netherlands) | | | 23,559 | | | | 1,712,421 | |
| | | | | | | | | |
| Total Materials | | | | | | | 1,712,421 | |
| | | | | | | | | |
| Telecommunication Services (2.24%) | | | | | | | | |
Diversified Telecommunication Services (2.24%) | | | | | |
BT Group PLC (United Kingdom) | | | 311,500 | | | | 1,195,840 | |
| | | | | | | | | |
| Total Telecommunication Services | | | | | | | 1,195,840 | |
See Notes to Financial Statements.
Semi-Annual Report | June 30, 2017 | | 55 |
Westcore Global Large-Cap Dividend Fund | Statement of Investments |
June 30, 2017 (Unaudited)
| | | Shares | | | Value | |
| Utilities (3.33%) | | | | | | |
| Multi Utilities (3.33%) | | | | | | |
| | | | | | | |
| Canadian Utilities, Ltd. Class A (Canada) | | | 55,235 | | | $ | 1,774,863 | |
| | | | | | | | | |
| Total Utilities | | | | | | | 1,774,863 | |
| | | | | | | | | |
| Total Common Stocks (Cost $42,985,739) | | | | 51,211,309 | |
| | | Shares | | | Value | |
| Money Market Mutual Funds (3.75%) | | | | | | |
| Goldman Sachs Financial Square - Government Fund, (7 Day Yield 0.834%) | | | 2,001,614 | | | | 2,001,614 | |
| | | | | | | | | |
| Total Money Market Mutual Funds (Cost $2,001,614) | | | | 2,001,614 | |
| | | | | | | | | |
| Total Investments (99.79%) (Cost $44,987,353) | | | $ | 53,212,923 | |
| | | | | | | | | |
| Other Assets Less Liabilities (0.21%) | | | | | | | 112,179 | |
| | | | | | | | | |
| Net Assets (100.00%) | | | | | | $ | 53,325,102 | |
Sector and industry classifications presented herein are based on the sector and industry categorization methodology of the Adviser to the Funds which may result in the designations for one Fund being different from another. For Fund compliance purposes, the Fund’s industry classifications refer to any one or more of the industry sub- classifications used by one or more widely recognized market indexes or ratings group indexes, and/or as defined by Fund management. This definition may not apply for purposes of this report, which may combine industry sub-classifications for reporting ease. Industries are shown as a percentage of net assets.
Country Breakdown as of June 30, 2017 (Unaudited) | |
| Country | | Market Value | | | % | |
| United States | | $ | 22,918,219 | | | | 42.96 | % |
Switzerland | | | 10,525,440 | | | | 19.73 | % |
| United Kingdom | | | 6,275,796 | | | | 11.78 | % |
| Netherlands | | | 3,385,174 | | | | 6.35 | % |
| Canada | | | 3,378,329 | | | | 6.34 | % |
| Germany | | | 2,004,018 | | | | 3.76 | % |
| Australia | | | 1,640,696 | | | | 3.08 | % |
| Japan | | | 1,587,534 | | | | 2.98 | % |
| France | | | 1,497,717 | | | | 2.81 | % |
| Total Investments | | | 53,212,923 | | | | 99.79 | % |
| Other Assets in Excess of Liabilities | | | 112,179 | | | | 0.21 | % |
| Net Assets | | $ | 53,325,102 | | | | 100.00 | % |
The country breakdown is based on the company headquarters.
See Notes to Financial Statements.
| 56 | | www.westcore.com |
Westcore Large-Cap Dividend Fund | Statement of Investments |
June 30, 2017 (Unaudited)
| | | Shares | | | Value | |
| Common Stocks (99.46%) | | | | | | |
| Consumer Discretionary (17.79%) | | | | | | |
| Hotels Restaurants & Leisure (7.90%) | | | | | | |
| McDonald's Corp. | | | 2,825 | | | $ | 432,677 | |
Yum! Brands, Inc. | | | 6,071 | | | | 447,797 | |
| | | | | | | | 880,474 | |
Multiline Retail (2.85%) | | | | | | | | |
| Target Corp. | | | 6,074 | | | | 317,610 | |
| | | | | | | | | |
Specialty Retail (3.85%) | | | | | | | | |
| Lowe's Cos., Inc. | | | 5,525 | | | | 428,353 | |
| | | | | | | | | |
| Textiles Apparel & Luxury Goods (3.19%) | | | | | | | | |
| Ralph Lauren Corp. | | | 4,809 | | | | 354,904 | |
| | | | | | | | | |
| Total Consumer Discretionary | | | | | | | 1,981,341 | |
| | | | | | | | | |
| Consumer Staples (16.06%) | | | | | | | | |
Food & Staples Retailing (4.36%) | | | | | | | | |
| Wal Mart, Stores Inc. | | | 6,412 | | | | 485,260 | |
| | | | | | | | | |
| Food Products (7.72%) | | | | | | | | |
General Mills, Inc. | | | 7,088 | | | | 392,675 | |
| Nestle SA ADR (Switzerland) | | | 5,365 | | | | 467,828 | |
| | | | | | | | 860,503 | |
| Household Products (3.98%) | | | | | | | | |
| Kimberly-Clark Corp. | | | 3,430 | | | | 442,848 | |
| | | | | | | | | |
| Total Consumer Staples | | | | | | | 1,788,611 | |
| | | | | | | | | |
| Energy (3.30%) | | | | | | | | |
| Oil Gas & Consumable Fuels (3.30%) | | | | | | | | |
| Occidental Petroleum Corp. | | | 6,144 | | | | 367,841 | |
| | | | | | | | | |
| Total Energy | | | | | | | 367,841 | |
| | | | | | | | | |
| Financials (8.33%) | | | | | | | | |
| Banks (3.97%) | | | | | | | | |
| US Bancorp | | | 8,523 | | | | 442,514 | |
| | | | | | | | | |
| Insurance (4.36%) | | | | | | | | |
| Chubb, Ltd. (Switzerland) | | | 3,337 | | | | 485,133 | |
| | | | | | | | | |
| Total Financials | | | | | | | 927,647 | |
| | | | | | | | | |
| Health Care (15.89%) | | | | | | | | |
| Biotechnology (7.70%) | | | | | | | | |
AbbVie, Inc. | | | 5,952 | | | | 431,580 | |
Gilead Sciences, Inc. | | | 6,012 | | | | 425,529 | |
| | | | | | | | 857,109 | |
| Health Care Providers & Services (4.15%) | | | | | | | | |
Cardinal Health, Inc. | | | 5,939 | | | | 462,767 | |
| | | Shares | | | Value | |
| Pharmaceuticals (4.04%) | | | | | | |
| Pfizer, Inc. | | | 13,400 | | | $ | 450,106 | |
| | | | | | | | | |
| Total Health Care | | | | | | | 1,769,982 | |
| | | | | | | | | |
| Industrials (8.01%) | | | | | | | | |
| Aerospace & Defense (3.65%) | | | | | | | | |
| L-3 Communications Holdings, Inc. | | | 2,435 | | | | 406,840 | |
| | | | | | | | | |
| Road & Rail (4.36%) | | | | | | | | |
| CSX Corp. | | | 8,904 | | | | 485,802 | |
| | | | | | | | | |
| Total Industrials | | | | | | | 892,642 | |
| | | | | | | | | |
| Information Technology (18.49%) | | | | | | | | |
| IT Services (7.59%) | | | | | | | | |
| Broadridge Financial Solutions, Inc. | | | 5,805 | | | | 438,626 | |
| International Business Machines Corp. | | | 2,644 | | | | 406,726 | |
| | | | | | | | 845,352 | |
Semiconductors & Semiconductor (7.00%) | | | | | |
| QUALCOMM, Inc. | | | 6,689 | | | | 369,367 | |
| Xilinx, Inc. | | | 6,382 | | | | 410,490 | |
| | | | | | | | 779,857 | |
| Technology Hardware Storage & | | | | | | | | |
| Peripherals (3.90%) | | | | | | | | |
| Apple, Inc. | | | 3,016 | | | | 434,364 | |
| | | | | | | | | |
| Total Information Technology | | | | | | | 2,059,573 | |
| | | | | | | | | |
| Materials (3.88%) | | | | | | | | |
Chemicals (3.88%) | | | | | | | | |
Eastman Chemical Co. | | | 5,141 | | | | 431,793 | |
| | | | | | | | | |
| Total Materials | | | | | | | 431,793 | |
| | | | | | | | | |
| Utilities (7.71%) | | | | | | | | |
| Electric Utilities (3.93%) | | | | | | | | |
| Edison International | | | 5,591 | | | | 437,161 | |
| | | | | | | | | |
| Independent Power and Renewable | | | | | | | | |
| Electricity Producers (3.78%) | | | | | | | | |
| AES Corp. | | | 37,938 | | | | 421,491 | |
| | | | | | | | | |
| Total Utilities | | | | | | | 858,652 | |
| | | | | | | | | |
| Total Common Stocks | | | | | | | | |
| (Cost $10,313,638) | | | | | | | 11,078,082 | |
See Notes to Financial Statements.
Semi-Annual Report | June 30, 2017 | | 57 |
Westcore Large-Cap Dividend Fund | Statement of Investments |
June 30, 2017 (Unaudited)
| | | Shares | | | Value | |
| Money Market Mutual Funds (0.34%) | | | | | | |
| Goldman Sachs Financial Square - | | | | | | |
| Government Fund, | | | | | | |
| (7 Day Yield 0.834%) | | | 38,418 | | | $ | 38,418 | |
| | | | | | | | | |
| Total Money Market Mutual Funds | | | | | | | | |
| (Cost $38,418) | | | | | | | 38,418 | |
| | | | | | | | | |
| Total Investments (99.80%) | | | | | | | | |
| (Cost $10,352,056) | | | | | | $ | 11,116,500 | |
| | | | | | | | | |
| Other Assets Less Liabilities (0.20%) | | | | | | | 22,290 | |
| | | | | | | | | |
| Net Assets (100.00%) | | | | | | $ | 11,138,790 | |
Sector and industry classifications presented herein are based on the sector and industry categorization methodology of the Adviser to the Funds which may result in the designations for one Fund being different from another. For Fund compliance purposes, the Fund’s industry classifications refer to any one or more of the industry sub- classifications used by one or more widely recognized market indexes or ratings group indexes, and/or as defined by Fund management. This definition may not apply for purposes of this report, which may combine industry sub-classifications for reporting ease. Industries are shown as a percentage of net assets.
See Notes to Financial Statements.
| 58 | | www.westcore.com |
| Westcore Micro-Cap Opportunity Fund | Statement of Investments |
June 30, 2017 (Unaudited)
| | | Shares | | | Value | |
| Common Stocks (96.23%) | |
| Consumer Discretionary (10.71%) | |
| Auto Components (0.34%) | | | | | | |
| Tower International, Inc. | | | 2,073 | | | $ | 46,539 | |
| | | | | | | | | |
| Diversified Consumer Services (1.51%) | | | | | | | | |
| American Public Education, Inc.** | | | 4,062 | | | | 96,066 | |
| Capella Education Co. | | | 1,255 | | | | 107,428 | |
| | | | | | | | 203,494 | |
| Hotels Restaurants & Leisure (0.37%) | | | | | | | | |
| Drive Shack, Inc. | | | 15,900 | | | | 50,085 | |
| | | | | | | | | |
| Household Durables (3.66%) | | | | | | | | |
| Bassett Furniture Industries, Inc. | | | 3,596 | | | | 136,468 | |
| Libbey, Inc. | | | 11,808 | | | | 95,173 | |
| Lifetime Brands, Inc. | | | 5,056 | | | | 91,767 | |
| M/I Homes, Inc.** | | | 2,384 | | | | 68,063 | |
| NACCO Industries, Inc. - Class A | | | 1,464 | | | | 103,724 | |
| | | | | | | | 495,195 | |
| Leisure Products (0.54%) | | | | | | | | |
| American Outdoor Brands Corp.** | | | 3,278 | | | | 72,641 | |
| | | | | | | | | |
| Media (0.50%) | | | | | | | | |
| tronc, Inc.** | | | 5,242 | | | | 67,569 | |
| | | | | | | | | |
| Specialty Retail (2.32%) | | | | | | | | |
| Big 5 Sporting Goods Corp. | | | 6,880 | | | | 89,784 | |
| Francesca's Holdings Corp.** | | | 7,387 | | | | 80,814 | |
| Haverty Furniture Cos., Inc. | | | 2,540 | | | | 63,754 | |
| Kirkland's, Inc.** | | | 7,663 | | | | 78,775 | |
| | | | | | | | 313,127 | |
| Textiles Apparel & Luxury Goods (1.47%) | | | | | | | | |
| Unifi, Inc.** | | | 3,170 | | | | 97,636 | |
| Vera Bradley, Inc.** | | | 10,378 | | | | 101,497 | |
| | | | | | | | 199,133 | |
| Total Consumer Discretionary | | | | | | | 1,447,783 | |
| | | | | | | | | |
| Consumer Staples (2.93%) | |
| Food & Staples Retailing (1.60%) | | | | | | | | |
| Ingles Markets, Inc. - Class A | | | 3,191 | | | | 106,260 | |
| SpartanNash Co. | | | 4,234 | | | | 109,915 | |
| | | | | | | | 216,175 | |
| Food Products (0.64%) | | | | | | | | |
| John B Sanfilippo & Son, Inc. | | | 1,377 | | | | 86,902 | |
| | | | | | | | | |
| Personal Products (0.69%) | | | | | | | | |
| Medifast, Inc. | | | 2,255 | | | | 93,515 | |
| | | | | | | | | |
| Total Consumer Staples | | | | | | | 396,592 | |
| | | | | | | | | |
| Energy (4.82%) | |
| Energy Equipment & Services (1.04%) | | | | | | | | |
| Bristow Group, Inc. | | | 11,102 | | | | 84,930 | |
| | | Shares | | | Value | |
| Energy Equipment & Services (continued) | | | | | | |
| Unit Corp.** | | | 2,986 | | | $ | 55,928 | |
| | | | | | | | 140,858 | |
| Oil Gas & Consumable Fuels (3.78%) | | | | | | | | |
| Evolution Petroleum Corp. | | | 5,860 | | | | 47,466 | |
| Green Plains Renewable Energy, Inc. | | | 4,486 | | | | 92,187 | |
| Pacific Ethanol, Inc.** | | | 13,923 | | | | 87,019 | |
| Panhandle Oil and Gas, Inc. - Class A | | | 2,259 | | | | 52,183 | |
| Renewable Energy Group, Inc.** | | | 10,833 | | | | 140,287 | |
| REX American Resources Corp.** | | | 943 | | | | 91,056 | |
| | | | | | | | 510,198 | |
| Total Energy | | | | | | | 651,056 | |
| | | | | | | | | |
| Financials (24.11%) | |
| Banks (13.06%) | | | | | | | | |
| American National Bankshares, Inc. | | | 2,811 | | | | 103,866 | |
| Arrow Financial Corp. | | | 3,027 | | | | 95,805 | |
| Bancorp, Inc.** | | | 15,255 | | | | 115,633 | |
| Central Pacific Financial Corp. | | | 3,659 | | | | 115,149 | |
| CoBiz Financial, Inc. | | | 5,700 | | | | 99,180 | |
| ConnectOne Bancorp, Inc. | | | 5,103 | | | | 115,073 | |
| Farmers Capital Bank Corp. | | | 2,669 | | | | 102,890 | |
| First Business Financial Services, Inc. | | | 4,082 | | | | 94,213 | |
First Interstate BancSystem, Inc. -
Class A | | | 2,776 | | | | 103,267 | |
| Horizon Bancorp | | | 4,423 | | | | 116,546 | |
| Independent Bank Corp. | | | 4,494 | | | | 97,745 | |
| Lakeland Bancorp, Inc. | | | 6,184 | | | | 116,568 | |
| Macatawa Bank Corp. | | | 9,421 | | | | 89,876 | |
| OFG Bancorp (Puerto Rico) | | | 7,703 | | | | 77,030 | |
| Republic Bancorp, Inc. - Class A | | | 3,261 | | | | 116,418 | |
| Sandy Spring Bancorp, Inc. | | | 2,396 | | | | 97,421 | |
| West Bancorporation, Inc. | | | 4,622 | | | | 109,310 | |
| | | | | | | | 1,765,990 | |
| Capital Markets (2.00%) | | | | | | | | |
| Diamond Hill Investment Group, Inc. | | | 587 | | | | 117,048 | |
| Greenhill & Co., Inc | | | 5,704 | | | | 114,650 | |
| Westwood Holdings Group, Inc. | | | 680 | | | | 38,549 | |
| | | | | | | | 270,247 | |
| Insurance (3.43%) | | | | | | | | |
| EMC Insurance Group, Inc. | | | 2,323 | | | | 64,533 | |
| HCI Group, Inc. | | | 1,316 | | | | 61,826 | |
| Heritage Insurance Holdings, Inc. | | | 6,873 | | | | 89,487 | |
| National Western Life Group, Inc. - Class A | | | 286 | | | | 91,411 | |
| United Fire Group, Inc. | | | 1,503 | | | | 66,222 | |
| Universal Insurance Holdings, Inc. | | | 3,607 | | | | 90,896 | |
| | | | | | | | 464,375 | |
| Mortgage Real Estate Investment Trust (REITs) (0.95%) | | | | | |
| Resource Capital Corp. | | | 12,622 | | | | 128,366 | |
| | | | | | | | | |
| Thrifts & Mortgage Finance (4.67%) | | | | | | | | |
| BankFinancial Corp. | | | 7,575 | | | | 113,019 | |
| Charter Financial Corp. | | | 5,243 | | | | 94,374 | |
See Notes to Financial Statements.
Semi-Annual Report | June 30, 2017 | | 59 |
| Westcore Micro-Cap Opportunity Fund | Statement of Investments |
June 30, 2017 (Unaudited)
| | | Shares | | | Value | |
| Thrifts & Mortgage Finance (continued) | | | | | | |
| Flagstar Bancorp, Inc.** | | | 3,123 | | | $ | 96,251 | |
| TrustCo Bank Corp. | | | 12,907 | | | | 100,029 | |
| United Financial Bancorp, Inc. | | | 6,802 | | | | 113,525 | |
| Waterstone Financial, Inc. | | | 6,069 | | | | 114,401 | |
| | | | | | | | 631,599 | |
| Total Financials | | | | | | | 3,260,577 | |
| | | | | | | | | |
| Health Care (22.94%) | |
| Biotechnology (8.44%) | | | | | | | | |
| AMAG Pharmaceuticals, Inc.** | | | 3,688 | | | | 67,859 | |
| BioSpecifics Technologies Corp.** | | | 2,004 | | | | 99,218 | |
| Cytokinetics, Inc.** | | | 7,868 | | | | 95,203 | |
| Emergent BioSolutions, Inc.** | | | 2,694 | | | | 91,354 | |
| Fortress Biotech, Inc.** | | | 25,106 | | | | 119,253 | |
| Genomic Health, Inc.** | | | 1,526 | | | | 49,671 | |
| MiMedx Group, Inc.** | | | 8,124 | | | | 121,616 | |
| Natera, Inc.** | | | 7,279 | | | | 79,050 | |
| Repligen Corp.** | | | 3,245 | | | | 134,473 | |
| Spectrum Pharmaceuticals, Inc.** | | | 16,340 | | | | 121,733 | |
| Veracyte, Inc.** | | | 11,215 | | | | 93,421 | |
| Xencor, Inc.** | | | 3,245 | | | | 68,502 | |
| | | | | | | | 1,141,353 | |
| Health Care Equipment & Supplies (3.98%) | | | | | |
| Anika Therapeutics, Inc.** | | | 2,297 | | | | 113,334 | |
| Exactech, Inc.** | | | 4,153 | | | | 123,759 | |
| Lantheus Holdings, Inc.** | | | 7,863 | | | | 138,782 | |
| Meridian Bioscience, Inc. | | | 3,126 | | | | 49,235 | |
| OraSure Technologies, Inc.** | | | 6,579 | | | | 113,554 | |
| | | | | | | | 538,664 | |
| Health Care Providers & Services (3.95%) | | | | | |
| Aceto Corp. | | | 2,459 | | | | 37,992 | |
| Addus HomeCare Corp.** | | | 2,587 | | | | 96,236 | |
| Civitas Solutions, Inc.** | | | 6,126 | | | | 107,205 | |
| Ensign Group, Inc. | | | 4,255 | | | | 92,631 | |
| LHC Group, Inc.** | | | 1,804 | | | | 122,474 | |
| RadNet, Inc.** | | | 9,990 | | | | 77,422 | |
| | | | | | | | 533,960 | |
| Health Care Technology (1.52%) | | | | | | | | |
| Computer Programs & Systems, Inc. | | | 3,469 | | | | 113,783 | |
| Quality Systems, Inc.** | | | 5,299 | | | | 91,196 | |
| | | | | | | | 204,979 | |
| Life Sciences Tools & Services (0.46%) | | | | | | | | |
| Enzo Biochem, Inc.** | | | 5,695 | | | | 62,873 | |
| | | | | | | | | |
| Pharmaceuticals (4.59%) | | | | | | | | |
| ANI Pharmaceuticals Inc.** | | | 2,075 | | | | 97,110 | |
| Lannett Co., Inc.** | | | 4,707 | | | | 96,023 | |
| Phibro Animal Health Corp. - Class A | | | 3,766 | | | | 139,530 | |
| SciClone Pharmaceuticals, Inc.** | | | 9,963 | | | | 109,593 | |
Sucampo Pharmaceuticals, Inc. -
Class A** | | | 8,996 | | | | 94,458 | |
| | | Shares | | | Value | |
| Pharmaceuticals (continued) | | | | | | |
| Teligent, Inc.** | | | 9,201 | | | $ | 84,189 | |
| | | | | | | | 620,903 | |
| Total Health Care | | | | | | | 3,102,732 | |
| | | | | | | | | |
| Industrials (10.19%) | |
| Aerospace & Defense (0.90%) | | | | | | | | |
| National Presto Industries, Inc. | | | 605 | | | | 66,853 | |
| Vectrus, Inc.** | | | 1,713 | | | | 55,364 | |
| | | | | | | | 122,217 | |
| Building Products (0.83%) | | | | | | | | |
| Continental Building Products, Inc.** | | | 4,812 | | | | 112,120 | |
| | | | | | | | | |
| Commercial Services & Supplies (1.76%) | | | | | | | | |
| McGrath RentCorp | | | 3,340 | | | | 115,664 | |
| SP Plus Corp.** | | | 1,843 | | | | 56,304 | |
| Viad Corp. | | | 1,397 | | | | 66,008 | |
| | | | | | | | 237,976 | |
| Electrical Equipment (0.90%) | | | | | | | | |
| Allied Motion Technologies, Inc. | | | 4,483 | | | | 122,027 | |
| | | | | | | | | |
| Machinery (1.78%) | | | | | | | | |
| Blue Bird Corp.** | | | 3,074 | | | | 52,258 | |
| Chart Industries, Inc.** | | | 2,404 | | | | 83,491 | |
| Greenbrier Cos., Inc. | | | 2,272 | | | | 105,080 | |
| | | | | | | | 240,829 | |
| Professional Services (1.70%) | | | | | | | | |
| ICF International, Inc.** | | | 2,462 | | | | 115,960 | |
| RPX Corp.** | | | 8,181 | | | | 114,125 | |
| | | | | | | | 230,085 | |
| Road & Rail (0.87%) | | | | | | | | |
| Roadrunner Transportation Systems, Inc.** | | | 16,164 | | | | 117,512 | |
| | | | | | | | | |
| Trading Companies & Distributors (1.45%) | | | | | |
| H&E Equipment Services, Inc. | | | 3,505 | | | | 71,537 | |
| Neff Corp. - Class A** | | | 6,540 | | | | 124,260 | |
| | | | | | | | 195,797 | |
| Total Industrials | | | | | | | 1,378,563 | |
| | | | | | | | | |
| Information Technology (13.27%) | |
| Communications Equipment (1.23%) | | | | | | | | |
| ADTRAN, Inc. | | | 3,045 | | | | 62,879 | |
| Ituran Location and Control, Ltd. (Israel) | | | 3,309 | | | | 103,572 | |
| | | | | | | | 166,451 | |
| Electronic Equipment Instruments & Components (3.92%) | |
| Bel Fuse, Inc. - Class B | | | 3,212 | | | | 79,336 | |
| Daktronics, Inc. | | | 10,870 | | | | 104,678 | |
| Insight Enterprises, Inc.** | | | 2,020 | | | | 80,780 | |
| Kimball Electronics, Inc.** | | | 4,561 | | | | 82,326 | |
| Methode Electronics, Inc. | | | 2,138 | | | | 88,086 | |
See Notes to Financial Statements.
| 60 | | www.westcore.com |
| Westcore Micro-Cap Opportunity Fund | Statement of Investments |
June 30, 2017 (Unaudited)
| | | Shares | | | Value | |
| Electronic Equipment Instruments & Components (continued) | | | | |
| Park Electrochemical Corp. | | | 5,155 | | | $ | 94,955 | |
| | | | | | | | 530,161 | |
| Internet Software & Services (1.79%) | | | | | | | | |
| DHI Group, Inc.** | | | 39,500 | | | | 112,575 | |
| LivePerson, Inc.** | | | 4,024 | | | | 44,264 | |
| Reis, Inc. | | | 4,015 | | | | 85,319 | |
| | | | | | | | 242,158 | |
| IT Services (3.34%) | | | | | | | | |
| Hackett Group, Inc. | | | 3,370 | | | | 52,235 | |
| ManTech International Corp. - Class A | | | 2,547 | | | | 105,395 | |
| NCI, Inc. - Class A** | | | 3,306 | | | | 69,757 | |
| Net 1 UEPS Technologies, Inc. (South Africa)** | | | 7,754 | | | | 76,454 | |
| Perficient, Inc.** | | | 3,613 | | | | 67,346 | |
| Unisys Corp.** | | | 6,257 | | | | 80,090 | |
| | | | | | | | 451,277 | |
| Semiconductors & Equipment (1.38%) | | | | | | | | |
| IXYS Corp. | | | 6,939 | | | | 114,147 | |
| Photronics, Inc.** | | | 7,763 | | | | 72,972 | |
| | | | | | | | 187,119 | |
| Software (1.61%) | | | | | | | | |
| American Software, Inc. - Class A | | | 3,207 | | | | 33,000 | |
| Monotype Imaging Holdings, Inc. | | | 2,867 | | | | 52,466 | |
| Rubicon Project, Inc.** | | | 14,187 | | | | 72,921 | |
| VASCO Data Security International, Inc.** | | | 4,091 | | | | 58,706 | |
| | | | | | | | 217,093 | |
| Total Information Technology | | | | | | | 1,794,259 | |
| | | | | | | | | |
| Materials (3.21%) | |
| Chemicals (0.84%) | | | | | | | | |
| Core Molding Technologies, Inc.** | | | 5,284 | | | | 114,187 | |
| | | | | | | | | |
| Construction Materials (0.67%) | | | | | | | | |
| United States Lime & Minerals, Inc. | | | 1,152 | | | | 90,398 | |
| | | | | | | | | |
| Metals & Mining (0.93%) | | | | | | | | |
| Schnitzer Steel Industries, Inc. - Class A | | | 5,002 | | | | 126,050 | |
| | | | | | | | | |
| Paper & Forest Products (0.77%) | | | | | | | | |
| PH Glatfelter Co. | | | 5,322 | | | | 103,992 | |
| | | | | | | | | |
| Total Materials | | | | | | | 434,627 | |
| | | | | | | | | |
| Real Estate (2.06%) | |
| Equity Real Estate Investment Trust (REITs) (2.06%) | | | | | |
| Ashford Hospitality Prime, Inc. | | | 3,401 | | | | 34,996 | |
| Ashford Hospitality Trust, Inc. | | | 12,439 | | | | 75,629 | |
| CorEnergy Infrastructure Trust, Inc. | | | 3,155 | | | | 105,977 | |
| | | Shares | | | Value | |
| Equity Real Estate Investment Trust (REITs) (continued) | | | | |
| Hersha Hospitality Trust | | | 3,361 | | | $ | 62,212 | |
| | | | | | | | 278,814 | |
| Total Real Estate | | | | | | | 278,814 | |
| | | | | | | | | |
| Telecommunication Services (0.88%) | |
| Diversified Telecommunication Services (0.88%) | | | | | |
| FairPoint Communications, Inc** | | | 7,586 | | | | 118,721 | |
| | | | | | | | | |
| Total Telecommunication Services | | | | | | | 118,721 | |
| | | | | | | | | |
| Utilities (1.11%) | |
| Multi-Utilities (0.41%) | | | | | | | | |
| Unitil Corp. | | | 1,147 | | | | 55,411 | |
| | | | | | | | | |
| Water Utilities (0.70%) | | | | | | | | |
| SJW Group | | | 1,920 | | | | 94,426 | |
| | | | | | | | | |
| Total Utilities | | | | | | | 149,837 | |
| | | | | | | | | |
| Total Common Stocks | |
| (Cost $10,895,573) | | | | | | | 13,013,561 | |
| | | | | | | | | |
| Rights and Warrants (0.03%) | |
| Health Care (0.03%) | |
| Pharmaceuticals (0.03%) | |
| Valeant Pharmaceuticals International, Inc.(a) | | | 22,951 | | | | 4,361 | |
| | | | | | | | | |
| Total Rights and Warrants | |
| (Cost $–) | | | | | | | 4,361 | |
| | | Shares | | | Value | |
| Money Market Mutual Funds (5.14%) | |
Goldman Sachs Financial Square - Government Fund,
(7 Day Yield 0.834%) | | | 694,419 | | | | 694,419 | |
| |
| Total Money Market Mutual Funds (Cost $694,419) | | | | 694,419 | |
| | |
| Total Investments (101.40%) (Cost $11,589,992) | | | $ | 13,712,341 | |
| | | | | | | | | |
| Liabilities Less Other Assets (-1.40%) | | | | (189,425 | ) |
| | | | | | | | | |
| Net Assets (100.00%) | | | $ | 13,522,916 | |
See Notes to Financial Statements.
Semi-Annual Report | June 30, 2017 | | 61 |
| Westcore Micro-Cap Opportunity Fund | Statement of Investments |
June 30, 2017 (Unaudited)
Sector and industry classifications presented herein are based on the sector and industry categorization methodology of the Adviser to the Funds which may result in the designations for one Fund being different from another. For Fund compliance purposes, the Fund’s industry classifications refer to any one or more of the industry sub-classifications used by one or more widely recognized market indexes or ratings group indexes, and/or as defined by Fund management. This definition may not apply for purposes of this report, which may combine industry sub-classifications for reporting ease. Industries are shown as a percentage of net assets.
** | Non-income producing security. |
(a) | This security has been valued in good faith by or under the direction of the Board of Trustees. As of June 30, 2017 these securities represented 0.03% of the Fund's net assets. |
See Notes to Financial Statements.
| 62 | | www.westcore.com |
| Westcore International Small-Cap Fund | Statement of Investments |
June 30, 2017 (Unaudited)
| | | Shares | | | Value | |
| Common Stocks (98.55%) | |
| Consumer Discretionary (25.49%) | |
| Diversified Consumer Services (4.10%) | | | | | | |
| G8 Education, Ltd. (Australia) | | | 638,096 | | | $ | 1,770,491 | |
| IBJ, Inc. (Japan) | | | 183,825 | | | | 1,217,601 | |
| | | | | | | | 2,988,092 | |
| Hotels Restaurants & Leisure (12.04%) | | | | | | | | |
| Arcland Service Holdings Co., Ltd. (Japan) | | | 112,608 | | | | 2,007,371 | |
| Corporate Travel Management, Ltd. (Australia) | | | 181,097 | | | | 3,193,046 | |
| Domino's Pizza Group PLC (United Kingdom) | | | 466,695 | | | | 1,786,463 | |
| MTY Food Group, Inc. (Canada) | | | 49,839 | | | | 1,781,721 | |
| | | | | | | | 8,768,601 | |
| Internet & Direct Marketing Retail (3.56%) | | | | | |
| Webjet, Ltd. (Australia) | | | 272,909 | | | | 2,590,510 | |
| | | | | | | | | |
| Media (3.35%) | | | | | | | | |
| CTS Eventim AG & Co. KGaA (Germany) | | | 55,145 | | | | 2,438,737 | |
| | | | | | | | | |
| Specialty Retail (2.44%) | | | | | | | | |
| Vertu Motors PLC (United Kingdom) | | | 2,811,600 | | | | 1,776,055 | |
| | | | | | | | | |
| Total Consumer Discretionary | | | | | | | 18,561,995 | |
| | | | | | | | | |
| Consumer Staples (3.13%) | |
| Food & Staples Retailing (3.13%) | | | | | | | | |
| Tsuruha Holdings, Inc. (Japan) | | | 21,480 | | | | 2,278,341 | |
| | | | | | | | | |
| Total Consumer Staples | | | | | | | 2,278,341 | |
| | | | | | | | | |
| Financials (10.37%) | |
| Capital Markets (5.19%) | | | | | | | | |
| Azimut Holding S.p.A. (Italy) | | | 115,550 | | | | 2,316,171 | |
M&A Capital Partners Co., Ltd. (Japan)** | | | 31,700 | | | | 1,462,751 | |
| | | | | | | | 3,778,922 | |
| Consumer Finance (3.14%) | | | | | | | | |
| Credit Corp. Group, Ltd. (Australia) | | | 168,159 | | | | 2,288,965 | |
| | | | | | | | | |
| Thrifts & Mortgage Finance (2.04%) | | | | | | | | |
| Mortgage Advice Bureau Holdings, Ltd. (United Kingdom) | | | 281,400 | | | | 1,484,364 | |
| | | | | | | | | |
| Total Financials | | | | | | | 7,552,251 | |
| | | | | | | | | |
| Health Care (10.53%) | |
| Health Care Equipment & Supplies (2.20%) | | | | | |
| Cellavision AB (Sweden) | | | 88,686 | | | | 1,600,089 | |
| | | Shares | | | Value | |
| Health Care Providers & Services (2.97%) | | | | | |
| Qualicorp SA (Brazil) | | | 248,500 | | | $ | 2,164,033 | |
| | | | | | | | | |
| Life Science Tools & Services (2.28%) | | | | | | | | |
| Eurofins Scientific SE (Luxembourg) | | | 2,950 | | | | 1,661,593 | |
| | | | | | | | | |
| Pharmaceuticals (3.08%) | | | | | | | | |
| China Medical System Holdings, Ltd. (China) | | | 1,296,265 | | | | 2,241,395 | |
| | | | | | | | | |
| Total Health Care | | | | | | | 7,667,110 | |
| | | | | | | | | |
| Industrials (7.79%) | |
| Commercial Services & Supplies (3.22%) | | | | | | | | |
| Boyd Group Income Fund (Canada) | | | 31,639 | | | | 2,345,844 | |
| | | | | | | | | |
| Professional Services (2.53%) | | | | | | | | |
| Nihon M&A Center, Inc. (Japan) | | | 50,379 | | | | 1,840,922 | |
| | | | | | | | | |
| Trading Companies & Distributors (2.04%) | | | | | |
| Diploma PLC (United Kingdom) | | | 103,345 | | | | 1,487,349 | |
| | | | | | | | | |
| Total Industrials | | | | | | | 5,674,115 | |
| | | | | | | | | |
| Information Technology (37.97%) | |
| Electronic Equipment Instruments & Components (5.80%) | | | | | |
| Ingenico Group SA (France) | | | 24,740 | | | | 2,246,134 | |
| PAX Global Technology, Ltd. (Hong Kong) | | | 3,081,492 | | | | 1,977,378 | |
| | | | | | | | 4,223,512 | |
| Internet Software & Services (11.04%) | | | | | | | | |
| iomart Group PLC (United Kingdom) | | | 449,634 | | | | 1,794,944 | |
Just Eat PLC (United Kingdom)** | | | 197,100 | | | | 1,681,470 | |
| Rightmove PLC (United Kingdom) | | | 38,799 | | | | 2,147,686 | |
| SMS Co., Ltd. (Japan) | | | 79,687 | | | | 2,415,938 | |
| | | | | | | | 8,040,038 | |
| IT Services (6.37%) | | | | | | | | |
| Econocom Group SA (Belgium) | | | 222,446 | | | | 1,860,024 | |
| Keywords Studios PLC (Ireland) | | | 173,140 | | | | 1,683,404 | |
| Softcat PLC (United Kingdom) | | | 213,600 | | | | 1,096,956 | |
| | | | | | | | 4,640,384 | |
| Software (14.76%) | | | | | | | | |
| Constellation Software, Inc. (Canada) | | | 5,140 | | | | 2,688,948 | |
Descartes Systems Group, Inc. (Canada)** | | | 59,400 | | | | 1,445,149 | |
| Linx SA (Brazil) | | | 269,250 | | | | 1,414,154 | |
Logo Yazilim Sanayi Ve Ticaret AS (Turkey)** | | | 95,500 | | | | 1,601,415 | |
| Magic Software Enterprises, Ltd. (Israel) | | | 225,966 | | | | 1,796,430 | |
See Notes to Financial Statements.
Semi-Annual Report | June 30, 2017 | | 63 |
| Westcore International Small-Cap Fund | Statement of Investments |
June 30, 2017 (Unaudited)
| | | Shares | | | Value | |
| Software (continued) | | | | | | | | |
Sapiens International Corp. NV (Israel)** | | | 161,130 | | | $ | 1,803,045 | |
| | | | | | | | 10,749,141 | |
| Total Information Technology | | | | | | | 27,653,075 | |
| | | | | | | | | |
| Real Estate (3.27%) | |
| Real Estate Management & Development (3.27%) | | | | | |
| Japan Property Management Center Co., Ltd. (Japan) | | | 193,501 | | | | 2,384,462 | |
| | | | | | | | | |
| Total Real Estate | | | | | | | 2,384,462 | |
| | | | | | | | | |
| Total Common Stocks (Cost $47,322,360) | | | | 71,771,349 | |
| | | Shares | | | Value | |
| Money Market Mutual Funds (1.06%) | |
Goldman Sachs Financial Square - Government Fund,
(7 Day Yield 0.834%) | | | 773,232 | | | | 773,232 | |
| Total Money Market Mutual Funds (Cost $773,232) | | | | 773,232 | |
| | |
| Total Investments (99.61%) (Cost $48,095,592) | | | $ | 72,544,581 | |
| | | | | | | | | |
| Other Assets Less Liabilities (0.39%) | | | | 284,416 | |
| | | | | | | | | |
| Net Assets (100.00%) | | | $ | 72,828,997 | |
Country Breakdown as of June 30, 2017 (Unaudited)
| Country | | Market Value | | | % | |
| Japan | | $ | 13,607,386 | | | | 18.69 | % |
| United Kingdom | | | 13,255,287 | | | | 18.20 | % |
| Australia | | | 9,843,012 | | | | 13.51 | % |
| Canada | | | 8,261,662 | | | | 11.34 | % |
| Israel | | | 3,599,475 | | | | 4.95 | % |
| Brazil | | | 3,578,187 | | | | 4.91 | % |
| Germany | | | 2,438,737 | | | | 3.35 | % |
| Italy | | | 2,316,171 | | | | 3.18 | % |
| France | | | 2,246,134 | | | | 3.08 | % |
| China | | | 2,241,395 | | | | 3.08 | % |
| Hong Kong | | | 1,977,378 | | | | 2.72 | % |
| Belgium | | | 1,860,024 | | | | 2.55 | % |
| Ireland | | | 1,683,404 | | | | 2.31 | % |
| Luxembourg | | | 1,661,593 | | | | 2.28 | % |
| Turkey | | | 1,601,415 | | | | 2.20 | % |
| Sweden | | | 1,600,089 | | | | 2.20 | % |
| United States | | | 773,232 | | | | 1.06 | % |
| Total Investments | | | 72,544,581 | | | | 99.61 | % |
| Other Assets in Excess of Liabilities | | | 284,416 | | | | 0.39 | % |
| Net Assets | | $ | 72,828,997 | | | | 100.00 | % |
The country breakdown is based on the company headquarters.
Sector and industry classifications presented herein are based on the sector and industry categorization methodology of the Adviser to the Funds which may result in the designations for one Fund being different from another. For Fund compliance purposes, the Fund’s industry classifications refer to any one or more of the industry sub-classifications used by one or more widely recognized market indexes or ratings group indexes, and/or as defined by Fund management. This definition may not apply for purposes of this report, which may combine industry sub-classifications for reporting ease. Industries are shown as a percentage of net assets.
| ** | Non-income producing security. |
See Notes to Financial Statements.
| 64 | | www.westcore.com |
| Westcore International Small-Cap Fund | Statement of Investments |
June 30, 2017 (Unaudited)
OUTSTANDING FORWARD FOREIGN CURRENCY CONTRACTS (a)
Contract Description | | Contracted Amount | | Purchase/Sale Contract | | Expiration Date | | Value On Settlement Date | | | Current Value | | | Unrealized Appreciation/ (Depreciation) | |
| BRL | | | 10,070,611 | | Sale | | 09/20/2017 | | $ | 3,005,175 | | | $ | 2,991,726 | | | $ | 13,449 | |
| CHF | | | 2,424,212 | | Purchase | | 09/20/2017 | | | 2,504,760 | | | | 2,540,852 | | | | 36,092 | |
| CZK | | | 513,638 | | Purchase | | 09/20/2017 | | | 22,127 | | | | 22,575 | | | | 448 | |
| DKK | | | 5,915,677 | | Purchase | | 09/20/2017 | | | 895,202 | | | | 912,666 | | | | 17,464 | |
| EUR | | | 2,654,601 | | Purchase | | 09/20/2017 | | | 2,989,186 | | | | 3,044,512 | | | | 55,326 | |
| HKD | | | 2,046,899 | | Sale | | 09/20/2017 | | | 262,869 | | | | 262,738 | | | | 131 | |
| HUF | | | 6,027,606 | | Purchase | | 09/20/2017 | | | 22,025 | | | | 22,364 | | | | 339 | |
| ILS | | | 2,053,506 | | Purchase | | 09/20/2017 | | | 584,330 | | | | 590,510 | | | | 6,180 | |
| NOK | | | 6,920,767 | | Purchase | | 09/20/2017 | | | 818,704 | | | | 830,236 | | | | 11,532 | |
| NZD | | | 787,168 | | Purchase | | 09/20/2017 | | | 570,685 | | | | 576,012 | | | | 5,327 | |
| PEN | | | 47,677 | | Purchase | | 09/20/2017 | | | 14,567 | | | | 14,571 | | | | 4 | |
| PLN | | | 718,755 | | Purchase | | 09/20/2017 | | | 191,061 | | | | 193,895 | | | | 2,834 | |
| QAR | | | 319,788 | | Purchase | | 09/20/2017 | | | 86,744 | | | | 87,244 | | | | 500 | |
| SEK | | | 8,878,475 | | Purchase | | 09/20/2017 | | | 1,026,544 | | | | 1,058,568 | | | | 32,024 | |
| SGD | | | 1,095,955 | | Purchase | | 09/20/2017 | | | 793,277 | | | | 797,020 | | | | 3,743 | |
| | | | | | | | | | | | | | | | | | $ | 185,393 | |
| | | | | | | | | | | | | | | | | | | | |
| AED | | | 320,477 | | Purchase | | 09/20/2017 | | $ | 87,272 | | | $ | 87,220 | | | $ | (52 | ) |
| AUD | | | 8,925,372 | | Sale | | 09/20/2017 | | | 6,790,610 | | | | 6,853,299 | | | | (62,689 | ) |
| CAD | | | 4,535,376 | | Sale | | 09/20/2017 | | | 3,432,477 | | | | 3,501,708 | | | | (69,231 | ) |
| CLP | | | 116,101,737 | | Purchase | | 09/20/2017 | | | 174,526 | | | | 174,501 | | | | (25 | ) |
| COP | | | 171,760,523 | | Purchase | | 09/20/2017 | | | 57,469 | | | | 55,783 | | | | (1,686 | ) |
| GBP | | | 3,812,715 | | Sale | | 09/20/2017 | | | 4,898,166 | | | | 4,977,933 | | | | (79,767 | ) |
| IDR | | | 5,216,685,854 | | Purchase | | 09/20/2017 | | | 387,851 | | | | 387,756 | | | | (95 | ) |
| INR | | | 143,841,347 | | Purchase | | 09/20/2017 | | | 2,207,689 | | | | 2,202,897 | | | | (4,792 | ) |
| JPY | | | 216,436,625 | | Purchase | | 09/20/2017 | | | 1,964,736 | | | | 1,930,903 | | | | (33,833 | ) |
| KRW | | | 3,007,738,880 | | Purchase | | 09/20/2017 | | | 2,657,213 | | | | 2,631,832 | | | | (25,381 | ) |
| MXN | | | 8,566,890 | | Purchase | | 09/20/2017 | | | 470,968 | | | | 466,238 | | | | (4,730 | ) |
| MYR | | | 2,234,126 | | Purchase | | 09/20/2017 | | | 521,052 | | | | 518,748 | | | | (2,304 | ) |
| PHP | | | 8,662,716 | | Purchase | | 09/20/2017 | | | 173,527 | | | | 171,015 | | | | (2,512 | ) |
| RUB | | | 4,201,941 | | Purchase | | 09/20/2017 | | | 71,433 | | | | 70,089 | | | | (1,344 | ) |
| THB | | | 20,257,227 | | Purchase | | 09/20/2017 | | | 597,036 | | | | 596,351 | | | | (685 | ) |
| TRY | | | 4,956,670 | | Sale | | 09/20/2017 | | | 1,375,586 | | | | 1,377,668 | | | | (2,082 | ) |
| TWD | | | 83,745,720 | | Purchase | | 09/20/2017 | | | 2,762,799 | | | | 2,760,804 | | | | (1,995 | ) |
| ZAR | | | 11,138,802 | | Purchase | | 09/20/2017 | | | 854,834 | | | | 840,262 | | | | (14,572 | ) |
| | | | | | | | | | | | | | | | | | $ | (307,775 | ) |
| (a) | As of June 30, 2017 BNY Mellon is the counter party for all Forward Foreign Currency Contracts. |
See Notes to Financial Statements.
Semi-Annual Report | June 30, 2017 | | 65 |
| Westcore Flexible Income Fund | Statement of Investments |
June 30, 2017 (Unaudited)
| | | Shares | | | Value | |
| Preferred Stocks (1.68%) | |
| Financial Institutions (1.68%) | |
| Banking (1.68%) | | | | | | |
| ING Group NV (Netherlands), 6.13% | | | 29,000 | | | $ | 751,390 | |
| Royal Bank of Scotland Group PLC (United Kingdom), 6.60% | | | 21,800 | | | | 564,402 | |
| | | | | | | | 1,315,792 | |
| Total Financial Institutions | | | | | | | 1,315,792 | |
| | | | | | | | | |
| Total Preferred Stocks (Cost $1,285,548) | | | | 1,315,792 | |
| | | | | | | | | |
| Exchange Traded Funds (0.81%) | |
SPDR® Barclays High Yield Bond ETF | | | 17,000 | | | | 632,400 | |
| | | | | | | | | |
| Total Exchange Traded Funds (Cost $588,710) | | | | 632,400 | |
| | | Principal Amount | | | Value | |
| Corporate Bonds (89.65%) | |
| Financial Institutions (4.00%) | |
| Banking (1.05%) | |
| Emigrant Capital Trust II - 144A: | | | | | | | | |
3.78%, 04/14/34(a)(b) | | $ | 500,000 | | | $ | 368,750 | |
| Washington Mutual Bank: | | | | | | | | |
5.55%, 06/16/10(c) | | | 2,000,000 | | | | 453,750 | |
| | | | | | | | 822,500 | |
| Finance Companies (1.77%) | |
| Aircastle, Ltd.: | | | | | | | | |
| 5.00%, 04/01/23 | | | 650,000 | | | | 695,500 | |
| Provident Funding Associates LP / PFG Finance Corp. - 144A: | | | | | | | | |
6.38%, 06/15/25(a) | | | 675,000 | | | | 693,563 | |
| | | | | | | | 1,389,063 | |
| Real Estate Investment Trusts (REITs) (1.18%) | |
| CBL & Associates LP: | | | | | | | | |
| 4.60%, 10/15/24 | | | 1,000,000 | | | | 921,884 | |
| | | | | | | | | |
| Total Financial Institutions | | | | | | | 3,133,447 | |
| | | | | | | | | |
| Industrial (83.88%) | |
| Basic Industry (10.77%) | |
| CF Industries, Inc.: | | | | | | | | |
| 3.45%, 06/01/23 | | | 750,000 | | | | 710,625 | |
| 5.38%, 03/15/44 | | | 500,000 | | | | 449,375 | |
| Compass Minerals International, Inc. - 144A: | | | | | | | | |
4.88%, 07/15/24(a) | | | 1,400,000 | | | | 1,386,000 | |
| FMG Resources August 2006 Pty, Ltd. - 144A (Australia): | | | | | | | | |
4.75%, 05/15/22(a) | | | 750,000 | | | | 754,688 | |
9.75%, 03/01/22(a) | | | 1,075,000 | | | | 1,229,531 | |
| | | Principal Amount | | | Value | |
| Basic Industry (continued) | |
| Potlatch Corp.: | | | | | | | | |
| 7.50%, 11/01/19 | | $ | 1,500,000 | | | $ | 1,650,000 | |
| Teck Resources, Ltd. - 144A (Canada): | | | | | | | | |
8.50%, 06/01/24(a) | | | 1,000,000 | | | | 1,157,500 | |
| West Fraser Timber Co., Ltd. - 144A (Canada): | | | | | | | | |
4.35%, 10/15/24(a) | | | 1,150,000 | | | | 1,112,544 | |
| | | | | | | | 8,450,263 | |
| Capital Goods (11.25%) | |
| Ball Corp.: | | | | | | | | |
| 5.25%, 07/01/25 | | | 700,000 | | | | 775,250 | |
| CNH Industrial N.V. (United Kingdom): | | | | | | | | |
| 4.50%, 08/15/23 | | | 1,250,000 | | | | 1,331,250 | |
| Huntington Ingalls Industries, Inc. - 144A: | | | | | | | | |
5.00%, 11/15/25(a) | | | 1,000,000 | | | | 1,076,250 | |
| James Hardie International Finance - 144A (Ireland): | | | | | | | | |
5.88%, 02/15/23(a) | | | 1,450,000 | | | | 1,526,125 | |
| Masco Corp.: | | | | | | | | |
| 6.50%, 08/15/32 | | | 366,000 | | | | 448,944 | |
| Moog, Inc. - 144A: | | | | | | | | |
5.25%, 12/01/22(a) | | | 750,000 | | | | 783,750 | |
| Orbital ATK, Inc.: | | | | | | | | |
| 5.50%, 10/01/23 | | | 500,000 | | | | 528,750 | |
| Oshkosh Corp.: | | | | | | | | |
| 5.38%, 03/01/25 | | | 750,000 | | | | 791,250 | |
| United Rentals North America, Inc.: | | | | | | | | |
| 4.63%, 07/15/23 | | | 1,500,000 | | | | 1,563,000 | |
| | | | | | | | 8,824,569 | |
| Communications (14.63%) | |
| AMC Networks, Inc.: | | | | | | | | |
| 4.75%, 12/15/22 | | | 975,000 | | | | 1,008,442 | |
| CCO Holdings LLC / CCO Holdings Capital Corp. - 144A: | | | | | | | | |
5.88%, 04/01/24(a) | | | 1,500,000 | | | | 1,605,000 | |
| DISH DBS Corp.: | | | | | | | | |
| 5.88%, 07/15/22 | | | 1,250,000 | | | | 1,346,875 | |
| Lamar Media Corp.: | | | | | | | | |
| 5.00%, 05/01/23 | | | 1,250,000 | | | | 1,306,250 | |
| Lions Gate Entertainment Corp. - 144A: | | | | | | | | |
5.88%, 11/01/24(a) | | | 1,000,000 | | | | 1,057,500 | |
| Nexstar Broadcasting, Inc. - 144A: | | | | | | | | |
5.63%, 08/01/24(a) | | | 1,000,000 | | | | 1,015,000 | |
| Nielsen Co. Luxembourg SARL - 144A (Luxembourg): | | | | | | | | |
5.00%, 02/01/25(a) | | | 500,000 | | | | 513,750 | |
| Sirius XM Radio, Inc. - 144A: | | | | | | | | |
4.63%, 05/15/23(a) | | | 1,000,000 | | | | 1,031,250 | |
See Notes to Financial Statements.
| 66 | | www.westcore.com |
| Westcore Flexible Income Fund | Statement of Investments |
June 30, 2017 (Unaudited)
| | | Principal Amount | | | Value | |
| Communications (continued) | |
| T-Mobile USA, Inc.: | | | | | | | | |
| 6.50%, 01/15/24 | | $ | 1,250,000 | | | $ | 1,346,875 | |
| Virgin Media Secured Finance PLC (United Kingdom): | | | | | | | | |
| 5.25%, 01/15/21 | | | 1,160,000 | | | | 1,245,550 | |
| | | | | | | | 11,476,492 | |
| Consumer Cyclical (18.82%) | |
| Allison Transmission, Inc. - 144A: | | | | | | | | |
5.00%, 10/01/24(a) | | | 1,375,000 | | | | 1,412,812 | |
| Cinemark USA, Inc.: | | | | | | | | |
| 4.88%, 06/01/23 | | | 1,250,000 | | | | 1,283,200 | |
| CoreCivic, Inc.: | | | | | | | | |
| 4.13%, 04/01/20 | | | 750,000 | | | | 774,375 | |
| DriveTime Automotive Group, Inc. / Bridgecrest Acceptance Corp. - 144A: | | | | | | | | |
8.00%, 06/01/21(a) | | | 750,000 | | | | 755,625 | |
| General Motors Co.: | | | | | | | | |
| 4.88%, 10/02/23 | | | 575,000 | | | | 616,960 | |
| General Motors Financial Co., Inc.: | | | | | | | | |
| 4.25%, 05/15/23 | | | 425,000 | | | | 445,320 | |
| Goodyear Tire & Rubber Co.: | | | | | | | | |
| 4.88%, 03/15/27 | | | 250,000 | | | | 254,375 | |
| 8.75%, 08/15/20 | | | 1,644,000 | | | | 1,939,920 | |
| Hanesbrands, Inc. - 144A: | | | | | | | | |
4.63%, 05/15/24(a) | | | 1,000,000 | | | | 1,020,000 | |
| L Brands, Inc.: | | | | | | | | |
| 5.63%, 02/15/22 | | | 500,000 | | | | 537,500 | |
| Meritor, Inc.: | | | | | | | | |
| 6.25%, 02/15/24 | | | 1,250,000 | | | | 1,309,375 | |
| MGM Growth Properties Operating Partnership LP / MGP Finance Co.-Issuer, Inc.: | | | | | | | | |
| 5.63%, 05/01/24 | | | 750,000 | | | | 821,250 | |
| Royal Caribbean Cruises, Ltd.: | | | | | | | | |
| 7.50%, 10/15/27 | | | 1,050,000 | | | | 1,374,219 | |
| Speedway Motorsports, Inc.: | | | | | | | | |
| 5.13%, 02/01/23 | | | 1,425,000 | | | | 1,453,500 | |
| Tenneco, Inc.: | | | | | | | | |
| 5.00%, 07/15/26 | | | 750,000 | | | | 760,313 | |
| | | | | | | | 14,758,744 | |
| Consumer Non-Cyclical (6.65%) | |
| Aramark Services, Inc. - 144A: | | | | | | | | |
5.00%, 04/01/25(a) | | | 750,000 | | | | 794,062 | |
| Hill-Rom Holdings, Inc. - 144A: | | | | | | | | |
5.00%, 02/15/25(a) | | | 500,000 | | | | 512,500 | |
| Quintiles IMS, Inc. - 144A: | | | | | | | | |
4.88%, 05/15/23(a) | | | 1,500,000 | | | | 1,543,125 | |
| Tesco PLC - 144A (United Kingdom): | | | | | | | | |
6.15%, 11/15/37(a) | | | 1,265,000 | | | | 1,331,815 | |
| Vista Outdoor, Inc.: | | | | | | | | |
| 5.88%, 10/01/23 | | | 1,000,000 | | | | 1,032,500 | |
| | | Principal Amount | | | Value | |
| Consumer Non-Cyclical (continued) | |
| Winn-Dixie Stores, Inc.: | | | | | | | | |
Series Escrow Units, 04/01/08(c)(d) | | $ | 2,150,000 | | | | 0 | |
| | | | | | | | 5,214,002 | |
| Energy - Independent (9.77%) | |
| Concho Resources, Inc.: | | | | | | | | |
| 5.50%, 04/01/23 | | | 1,575,000 | | | | 1,626,187 | |
| Diamondback Energy, Inc. - 144A: | | | | | | | | |
4.75%, 11/01/24(a) | | | 1,500,000 | | | | 1,500,000 | |
| Kerr-McGee Corp.: | | | | | | | | |
| 6.95%, 07/01/24 | | | 250,000 | | | | 293,631 | |
| Range Resources Corp.: | | | | | | | | |
| 4.88%, 05/15/25 | | | 2,100,000 | | | | 2,005,500 | |
| RSP Permian, Inc. - 144A: | | | | | | | | |
5.25%, 01/15/25(a) | | | 400,000 | | | | 402,500 | |
| 6.63%, 10/01/22 | | | 400,000 | | | | 417,000 | |
| Whiting Petroleum Corp.: | | | | | | | | |
| 5.75%, 03/15/21 | | | 1,500,000 | | | | 1,417,500 | |
| | | | | | | | 7,662,318 | |
| Energy - Midstream (6.07%) | |
| AmeriGas Partners LP / AmeriGas Finance Corp.: | | | | | | | | |
| 5.63%, 05/20/24 | | | 1,500,000 | | | | 1,556,250 | |
| Boardwalk Pipelines LP: | | | | | | | | |
| 3.38%, 02/01/23 | | | 1,250,000 | | | | 1,241,503 | |
| MPLX LP: | | | | | | | | |
| 4.88%, 06/01/25 | | | 1,850,000 | | | | 1,965,040 | |
| | | | | | | | 4,762,793 | |
| Energy - Oil Field Services (0.39%) | |
| Gulfmark Offshore, Inc.: | | | | | | | | |
6.38%, 03/15/22(c) | | | 1,000,000 | | | | 305,000 | |
| | | | | | | | | |
| Energy - Refining (1.99%) | |
| Tesoro Corp.: | | | | | | | | |
| 5.38%, 10/01/22 | | | 1,500,000 | | | | 1,560,000 | |
| | | | | | | | | |
| Technology (3.53%) | |
| Amkor Technology, Inc.: | | | | | | | | |
| 6.63%, 06/01/21 | | | 1,250,000 | | | | 1,275,000 | |
| Iron Mountain, Inc.: | | | | | | | | |
| 6.00%, 08/15/23 | | | 1,400,000 | | | | 1,494,500 | |
| | | | | | | | 2,769,500 | |
| Transportation (0.01%) | |
| Continental Airlines, Inc.: | | | | | | | | |
| Pass-Through Certificates, Series 1999-1B, Class B, 6.80%, 08/02/18 | | | 3,627 | | | | 3,754 | |
| | | | | | | | | |
| Total Industrial | | | | | | | 65,787,435 | |
See Notes to Financial Statements.
Semi-Annual Report | June 30, 2017 | | 67 |
| Westcore Flexible Income Fund | Statement of Investments |
June 30, 2017 (Unaudited)
| | | Principal Amount | | | Value | |
| Utility (1.77%) | |
| Electric (1.77%) | |
| Calpine Corp Escrow: | | | | | | | | |
8.75%, 12/29/49(c)(d) | | $ | 200,000 | | | | 0 | |
| NRG Energy, Inc.: | | | | | | | | |
| 7.88%, 05/15/21 | | | 1,340,000 | | | | 1,390,250 | |
| | | | | | | | 1,390,250 | |
| Total Utility | | | | | | | 1,390,250 | |
| | | | | | | | | |
| Total Corporate Bonds (Cost $70,569,055) | | | | 70,311,132 | |
| | | | | | | | | |
| Commercial Mortgage-Backed Securities (3.67%) | |
| InSite Issuer LLC - 144A | | | | | | | | |
| Series 2016-1A, Class C, | | | | | | | | |
6.41%, 11/15/23(a) | | | 250,000 | | | | 258,470 | |
| Tuckahoe Credit Lease Trust - 144A | | | | | | | | |
9.31%, 10/20/25(a)(d) | | | 1,402,115 | | | $ | 1,585,792 | |
| VB-S1 Issuer LLC - 144A | | | | | | | | |
| Series 2016-1A, Class F, | | | | | | | | |
6.90%, 06/15/21(a) | | | 1,000,000 | | | | 1,037,625 | |
| | | | | | | | | |
| Total Commercial Mortgage-Backed Securities (Cost $2,548,488) | | | | | 2,881,887 | |
| | | | | | | | | |
| Residential Mortgage-Backed Securities (0.86%) | |
| Citigroup Mortgage Loan Trust, Inc. | | | | | | | | |
| Series 2003-UST1, Class A1, | | | | | | | | |
| 5.50%, 12/25/18 | | | 292,941 | | | | 294,042 | |
| | | | | | | | | |
| Countrywide Asset-Backed Certificates - 144A Series 2005-SD2, Class M3, | | | | | | | | |
5.50%, 08/25/35(a)(e) | | | 382,805 | | | | 379,157 | |
| | | | | | | | | |
| Total Residential Mortgage-Backed Securities (Cost $675,630) | | | | | 673,199 | |
| | | Shares | | | Value | |
| Money Market Mutual Funds (3.20%) | |
Goldman Sachs Financial Square - Government Fund,
(7 Day Yield 0.834%) | | | 2,513,647 | | | | 2,513,647 | |
| Total Money Market Mutual Funds (Cost $2,513,647) | | | | 2,513,647 | |
| Total Investments (99.87%) (Cost $78,181,078) | | | $ | 78,328,057 | |
| | | | | | | | | |
| Other Assets Less Liabilities (0.13%) | | | | 105,442 | |
| | | | | | | | | |
| Net Assets (100.00%) | | | $ | 78,433,499 | |
| (a) | This security is restricted. See the table on the following page for additional information regarding each security. Included in the table are certain securities exempt from registration under Rule 144A of the Securities Act of 1933, which may be resold in transactions, normally to qualified institutional buyers. |
| (b) | The coupon rate shown on floating or adjustable rate securities represents the rate at period end. |
| (c) | Income is not being accrued on this security due to the issuer’s default or expected default on interest payments. Security deemed to be illiquid under procedures approved by the Fund's Board of Trustees. |
| (d) | This security has been valued in good faith by or under the direction of the Board of Trustees. As of June 30, 2017 these securities represented 2.02% of the Fund's net assets. |
| (e) | Step bond. Coupon increases periodically based upon a predetermined schedule. Interest rate disclosed is that which is in effect at June 30, 2017. |
See Notes to Financial Statements.
| 68 | | www.westcore.com |
| Westcore Flexible Income Fund | Statement of Investments |
June 30, 2017 (Unaudited)
| Restricted Securities | | | | | | | | | | | | | | | |
| Issuer Description | | Coupon | | Maturity Date | | Acquisition Date(s) | | Cost | | | Value | | | Value as Percentage of Net Assets | |
| Allison Transmission, Inc. - 144A | | | 5.000 | % | 10/01/2024 | | 9/14/2016 - 5/1/2017 | | $ | 1,395,845 | | | $ | 1,412,812 | | | | 1.80 | %^ |
| Aramark Services, Inc. - 144A | | | 5.000 | % | 04/01/2025 | | 3/9/2017 | | | 750,000 | | | | 794,062 | | | | 1.01 | %^ |
| CCO Holdings LLC / CCO Holdings Capital Corp. - 144A | | | 5.875 | % | 04/01/2024 | | 6/10/2016 - 8/5/2016 | | | 1,575,410 | | | | 1,605,000 | | | | 2.05 | %^ |
| Compass Minerals International, Inc. - 144A | | | 4.875 | % | 07/15/2024 | | 10/23/2014 - 3/18/2015 | | | 1,388,444 | | | | 1,386,000 | | | | 1.77 | %^ |
| Countrywide Asset-Backed Certificates - 144A | | | 5.500 | % | 08/25/2035 | | 9/23/2016 | | | 382,104 | | | | 379,157 | | | | 0.48 | % |
| Diamondback Energy, Inc. - 144A | | | 4.750 | % | 11/01/2024 | | 10/20/2016 | | | 1,500,000 | | | | 1,500,000 | | | | 1.91 | %^ |
| DriveTime Automotive Group, Inc. / Bridgecrest Acceptance Corp. - 144A | | | 8.000 | % | 06/01/2021 | | 3/10/2016 - 5/26/2016 | | | 682,911 | | | | 755,625 | | | | 0.96 | %^ |
| Emigrant Capital Trust II - 144A | | | 3.783 | % | 04/14/2034 | | 8/11/2004 | | | 498,311 | | | | 368,750 | | | | 0.47 | % |
| FMG Resources August 2006 Pty, Ltd. - 144A | | | 4.750 | % | 05/15/2022 | | 6/15/2017 | | | 751,741 | | | | 754,688 | | | | 0.96 | %^ |
| FMG Resources August 2006 Pty, Ltd. - 144A | | | 9.750 | % | 03/01/2022 | | 12/21/2016 - 4/18/2017 | | | 1,231,051 | | | | 1,229,531 | | | | 1.57 | %^ |
| Hanesbrands, Inc. - 144A | | | 4.625 | % | 05/15/2024 | | 5/3/2016 | | | 1,000,000 | | | | 1,020,000 | | | | 1.30 | %^ |
| Hill-Rom Holdings, Inc. - 144A | | | 5.000 | % | 02/15/2025 | | 2/9/2017 | | | 500,000 | | | | 512,500 | | | | 0.65 | %^ |
| Huntington Ingalls Industries, Inc. - 144A | | | 5.000 | % | 11/15/2025 | | 11/2/2015 - 10/7/2016 | | | 1,028,542 | | | | 1,076,250 | | | | 1.37 | %^ |
| InSite Issuer LLC - 144A | | | 6.414 | % | 11/15/2023 | | 10/25/2016 - 10/28/2016 | | | 250,651 | | | | 258,470 | | | | 0.33 | % |
| James Hardie International Finance - 144A | | | 5.875 | % | 02/15/2023 | | 10/6/2015 - 3/3/2017 | | | 1,479,866 | | | | 1,526,125 | | | | 1.95 | %^ |
| Lions Gate Entertainment Corp. - 144A | | | 5.875 | % | 11/01/2024 | | 10/13/2016 | | | 1,002,912 | | | | 1,057,500 | | | | 1.35 | %^ |
| Moog, Inc. - 144A | | | 5.250 | % | 12/01/2022 | | 3/20/2017 - 4/19/2017 | | | 768,645 | | | | 783,750 | | | | 1.00 | %^ |
| Nexstar Broadcasting, Inc. - 144A | | | 5.625 | % | 08/01/2024 | | 7/13/2016 - 7/14/2016 | | | 1,008,764 | | | | 1,015,000 | | | | 1.29 | %^ |
| Nielsen Co. Luxembourg SARL - 144A | | | 5.000 | % | 02/01/2025 | | 6/7/2017 | | | 513,671 | | | | 513,750 | | | | 0.65 | %^ |
| Provident Funding Associates LP / PFG Finance Corp. - 144A | | | 6.375 | % | 06/15/2025 | | 11/5/2014 - 5/24/2017 | | | 675,000 | | | | 693,563 | | | | 0.88 | %^ |
| Quintiles IMS, Inc. - 144A | | | 4.875 | % | 05/15/2023 | | 10/20/2016 - 2/8/2017 | | | 1,531,935 | | | | 1,543,125 | | | | 1.97 | %^ |
| RSP Permian, Inc. - 144A | | | 5.250 | % | 01/15/2025 | | 6/28/2017 | | | 400,000 | | | | 402,500 | | | | 0.52 | %^ |
| Sirius XM Radio, Inc. - 144A | | | 4.625 | % | 05/15/2023 | | 9/15/2016 - 11/29/2016 | | | 1,000,172 | | | | 1,031,250 | | | | 1.31 | %^ |
| Teck Resources, Ltd. - 144A | | | 8.500 | % | 06/01/2024 | | 12/11/2009 - 5/25/2017 | | | 1,157,180 | | | | 1,157,500 | | | | 1.47 | %^ |
| Tesco PLC - 144A | | | 6.150 | % | 11/15/2037 | | 10/7/2014 - 6/27/2017 | | | 1,315,283 | | | | 1,331,815 | | | | 1.70 | %^ |
| Tuckahoe Credit Lease Trust - 144A | | | 9.310 | % | 10/20/2025 | | 12/11/2009 | | | 1,279,389 | | | | 1,585,792 | | | | 2.02 | % |
| VB-S1 Issuer LLC - 144A | | | 6.901 | % | 06/15/2021 | | 6/8/2016 - 12/2/2016 | | | 1,018,448 | | | | 1,037,625 | | | | 1.32 | % |
| West Fraser Timber Co., Ltd. - 144A | | | 4.350 | % | 10/15/2024 | | 6/14/2016 - 12/2/2016 | | | 1,086,308 | | | | 1,112,544 | | | | 1.42 | % |
| | | | | | | | | | $ | 27,172,583 | | | $ | 27,844,684 | | | | 35.48 | % |
^ | 144A securities with a liquid trading market as determined by the Advisor under the supervision of the Board of Trustees. Such securities represent 29.44% of the Fund's net assets as of June 30, 2017. |
See Notes to Financial Statements.
Semi-Annual Report | June 30, 2017 | | 69 |
| Westcore Plus Bond Fund | Statement of Investments |
June 30, 2017 (Unaudited)
| | | Shares | | | Value | |
| Preferred Stocks (0.75%) | |
| Financial Institutions (0.75%) | |
| Banking (0.75%) | | | | | | |
| First Tennessee Bank NA - 144A, 3.75%(a)(b) | | | 1,500 | | | $ | 1,152,844 | |
| ING Group NV (Netherlands), 6.13% | | | 161,818 | | | | 4,192,704 | |
| Royal Bank of Scotland Group PLC (United Kingdom), 6.60% | | | 146,000 | | | | 3,779,940 | |
| | | | | | | | 9,125,488 | |
| Total Financial Institutions | | | | | | | 9,125,488 | |
| | | | | | | | | |
| Total Preferred Stocks | |
| (Cost $9,289,428) | | | | | | | 9,125,488 | |
| | | | | | | | | |
| | | Principal Amount | | | Value | |
| Corporate Bonds (37.98%) | |
| Financial Institutions (14.15%) | |
| Banking (6.08%) | |
| Bank of America Corp.: | | | | | | | | |
| 5.00%, 05/13/21 | | $ | 5,950,000 | | | $ | 6,497,358 | |
| BB&T Corp.: | | | | | | | | |
| 6.85%, 04/30/19 | | | 4,150,000 | | | | 4,503,929 | |
| Citigroup, Inc.: | | | | | | | | |
| 2.75%, 04/25/22 | | | 9,625,000 | | | | 9,636,223 | |
| Emigrant Capital Trust II - 144A: | | | | | | | | |
| 3.78%, 04/14/34(a)(b) | | | 850,000 | | | | 626,875 | |
| First Tennessee Bank NA: | | | | | | | | |
| 2.95%, 12/01/19 | | | 10,975,000 | | | | 11,101,454 | |
| JPMorgan Chase & Co.: | | | | | | | | |
| 4.40%, 07/22/20 | | | 13,300,000 | | | | 14,168,543 | |
| PNC Financial Services Group, Inc.: | | | | | | | | |
| 4.38%, 08/11/20 | | | 6,300,000 | | | | 6,707,950 | |
| RBC USA Holdco Corp.: | | | | | | | | |
| 5.25%, 09/15/20 | | | 1,900,000 | | | | 2,067,508 | |
| UBS AG: | | | | | | | | |
| Series GMTN, 2.38%, 08/14/19 | | | 12,075,000 | | | | 12,189,181 | |
| Wells Fargo & Co.: | | | | | | | | |
| 3.00%, 10/23/26 | | | 6,550,000 | | | | 6,386,479 | |
| | | | | | | | 73,885,500 | |
| Broker/Asset Managers/Exchanges (1.45%) | |
| CBOE Holdings, Inc.: | | | | | | | | |
| 3.65%, 01/12/27 | | | 11,900,000 | | | | 12,027,116 | |
| FMR LLC - 144A: | | | | | | | | |
| 7.49%, 06/15/19(a) | | | 5,000,000 | | | | 5,512,625 | |
| | | | | | | | 17,539,741 | |
| Finance Companies (2.53%) | |
| Aircastle, Ltd.: | | | | | | | | |
| 5.00%, 04/01/23 | | | 4,900,000 | | | | 5,243,000 | |
| General Electric Co.: | | | | | | | | |
| Series D, 5.00%, Perpetual Maturity(b) | | | 14,596,000 | | | | 15,510,439 | |
| | | Principal Amount | | | Value | |
| Finance Companies (continued) | |
| International Lease Finance Corp.: | | | | | | | | |
| 5.88%, 08/15/22 | | $ | 6,200,000 | | | $ | 7,014,271 | |
| Provident Funding Associates LP / PFG Finance Corp. - 144A: | | | | | | | | |
| 6.38%, 06/15/25(a) | | | 2,825,000 | | | | 2,902,688 | |
| | | | | | | | 30,670,398 | |
| Insurance (1.74%) | |
| Massachusetts Mutual Life Insurance Co. - 144A: | | | | | | | | |
| 8.88%, 06/01/39(a) | | | 1,414,000 | | | | 2,323,636 | |
| Northwestern Mutual Life Insurance Co. - 144A: | | | | | | | | |
| 6.06%, 03/30/40(a) | | | 6,025,000 | | | | 7,862,812 | |
| PartnerRe Finance B LLC: | | | | | | | | |
| 5.50%, 06/01/20 | | | 3,200,000 | | | | 3,480,304 | |
| Validus Holdings, Ltd. (Bermuda): | | | | | | | | |
| 8.88%, 01/26/40 | | | 5,175,000 | | | | 7,515,212 | |
| | | | | | | | 21,181,964 | |
| Real Estate Investment Trust (REITs) (2.35%) | |
| Ventas Realty LP / Ventas Capital Corp.: | | | | | | | | |
| 4.75%, 06/01/21 | | | 10,500,000 | | | | 11,240,744 | |
| Washington Real Estate Investment Trust: | | | | | | | | |
| 3.95%, 10/15/22 | | | 2,025,000 | | | | 2,058,898 | |
| 4.95%, 10/01/20 | | | 13,825,000 | | | | 14,598,827 | |
| Weingarten Realty Investors: | | | | | | | | |
| 6.64%, 07/15/26 | | | 545,000 | | | | 633,476 | |
| | | | | | | | 28,531,945 | |
| Total Financial Institutions | | | | | | | 171,809,548 | |
| | | | | | | | | |
| Industrial (19.99%) | |
| Basic Industry (2.81%) | |
| CF Industries, Inc. - 144A: | | | | | | | | |
| 4.50%, 12/01/26(a) | | | 4,325,000 | | | | 4,455,726 | |
| FMG Resources August 2006 Pty, Ltd. - 144A (Australia): | | | | | | | | |
| 9.75%, 03/01/22(a) | | | 7,725,000 | | | | 8,835,469 | |
| Potlatch Corp.: | | | | | | | | |
| 7.50%, 11/01/19 | | | 9,571,000 | | | | 10,528,100 | |
| West Fraser Timber Co., Ltd. - 144A (Canada): | | | | | | | | |
| 4.35%, 10/15/24(a) | | | 10,675,000 | | | | 10,327,315 | |
| | | | | | | | 34,146,610 | |
| Capital Goods (2.08%) | |
| Airbus Group Finance BV - 144A (Netherlands): | | | | | | | | |
| 2.70%, 04/17/23(a) | | | 1,950,000 | | | | 1,962,172 | |
| Boeing Co.: | | | | | | | | |
| 1.88%, 06/15/23 | | | 3,075,000 | | | | 2,960,739 | |
| CNH Industrial NV (United Kingdom): | | | | | | | | |
| 4.50%, 08/15/23 | | | 3,275,000 | | | | 3,487,875 | |
See Notes to Financial Statements.
| 70 | | www.westcore.com |
| Westcore Plus Bond Fund | Statement of Investments |
June 30, 2017 (Unaudited)
| | | Principal Amount | | | Value | |
| Capital Goods (continued) | |
| Hexcel Corp.: | | | | | | | | |
| 4.70%, 08/15/25 | | $ | 3,781,000 | | | $ | 4,077,869 | |
| Masco Corp.: | | | | | | | | |
| 4.45%, 04/01/25 | | | 3,875,000 | | | | 4,158,263 | |
| United Rentals North America, Inc.: | | | | | | | | |
| 4.63%, 07/15/23 | | | 6,850,000 | | | | 7,137,700 | |
| 7.63%, 04/15/22 | | | 1,358,000 | | | | 1,422,505 | |
| | | | | | | | 25,207,123 | |
| Communications (4.01%) | |
| America Movil SAB de CV (Mexico): | | | | | | | | |
| 5.00%, 10/16/19 | | | 6,975,000 | | | | 7,450,186 | |
| American Tower Corp.: | | | | | | | | |
| 5.90%, 11/01/21 | | | 3,575,000 | | | | 4,031,284 | |
| AT&T, Inc.: | | | | | | | | |
| 4.45%, 04/01/24 | | | 2,150,000 | | | | 2,266,659 | |
| 4.55%, 03/09/49 | | | 3,577,000 | | | | 3,379,793 | |
| Series WI, 5.35%, 09/01/40 | | | 344,000 | | | | 365,920 | |
| Cox Communications, Inc. - 144A: | | | | | | | | |
| 9.38%, 01/15/19(a) | | | 2,500,000 | | | | 2,754,670 | |
| Historic TW, Inc.: | | | | | | | | |
| 9.15%, 02/01/23 | | | 2,410,000 | | | | 3,094,515 | |
| Lions Gate Entertainment Corp. - 144A: | | | | | | | | |
| 5.88%, 11/01/24(a) | | | 4,700,000 | | | | 4,970,250 | |
| Nexstar Broadcasting, Inc. - 144A: | | | | | | | | |
| 5.63%, 08/01/24(a) | | | 6,750,000 | | | | 6,851,250 | |
| Verizon Communications, Inc.: | | | | | | | | |
| 5.15%, 09/15/23 | | | 12,200,000 | | | | 13,567,900 | |
| | | | | | | | 48,732,427 | |
| Consumer Cyclical (2.09%) | |
| DriveTime Automotive Group, Inc. / Bridgecrest Acceptance Corp. - 144A: | | | | | | | | |
| 8.00%, 06/01/21(a) | | | 7,720,000 | | | | 7,777,900 | |
| General Motors Co.: | | | | | | | | |
| 4.88%, 10/02/23 | | | 4,200,000 | | | | 4,506,491 | |
| General Motors Financial Co., Inc.: | | | | | | | | |
| 4.25%, 05/15/23 | | | 3,200,000 | | | | 3,352,995 | |
| Royal Caribbean Cruises, Ltd.: | | | | | | | | |
| 5.25%, 11/15/22 | | | 4,200,000 | | | | 4,674,264 | |
| 7.50%, 10/15/27 | | | 3,850,000 | | | | 5,038,803 | |
| | | | | | | | 25,350,453 | |
| Consumer Non-Cyclical (4.07%) | |
| Anheuser-Busch InBev Finance, Inc.: | | | | | | | | |
| 3.65%, 02/01/26 | | | 12,300,000 | | | | 12,696,220 | |
| Fomento Economico Mexicano SAB de CV (Mexico): | | | | | | | | |
| 2.88%, 05/10/23 | | | 6,700,000 | | | | 6,685,605 | |
| Mead Johnson Nutrition Co.: | | | | | | | | |
| 4.13%, 11/15/25 | | | 12,100,000 | | | | 13,061,430 | |
| | | Principal Amount | | | Value | |
| Consumer Non-Cyclical (continued) | |
| Tesco PLC - 144A (United Kingdom): | | | | | | | | |
| 6.15%, 11/15/37(a) | | $ | 11,425,000 | | | $ | 12,028,445 | |
| WhiteWave Foods Co.: | | | | | | | | |
| 5.38%, 10/01/22 | | | 4,400,000 | | | | 4,968,282 | |
| | | | | | | | 49,439,982 | |
| Energy - Independent (2.23%) | |
| Anadarko Finance Co.: | | | | | | | | |
| Series B, 7.50%, 05/01/31 | | | 5,050,000 | | | | 6,325,873 | |
| Apache Corp.: | | | | | | | | |
| 3.25%, 04/15/22 | | | 1,450,000 | | | | 1,472,524 | |
| Burlington Resources, Inc.: | | | | | | | | |
| 6.88%, 02/15/26 | | | 1,000,000 | | | | 1,203,030 | |
| Concho Resources, Inc.: | | | | | | | | |
| 5.50%, 04/01/23 | | | 7,050,000 | | | | 7,279,125 | |
| Devon Energy Corp.: | | | | | | | | |
| 3.25%, 05/15/22 | | | 4,750,000 | | | | 4,725,490 | |
| Range Resources Corp.: | | | | | | | | |
| 4.88%, 05/15/25 | | | 6,400,000 | | | | 6,112,000 | |
| | | | | | | | 27,118,042 | |
| Energy - Midstream (1.40%) | |
| Boardwalk Pipelines LP: | | | | | | | | |
| 3.38%, 02/01/23 | | | 3,925,000 | | | | 3,898,318 | |
| MPLX LP: | | | | | | | | |
| 4.88%, 06/01/25 | | | 6,700,000 | | | | 7,116,632 | |
| Tennessee Gas Pipeline Co. LLC: | | | | | | | | |
| 8.38%, 06/15/32 | | | 4,775,000 | | | | 5,954,831 | |
| | | | | | | | 16,969,781 | |
| Energy - Refining (0.48%) | |
| Tesoro Corp.: | | | | | | | | |
| 4.25%, 10/01/17 | | | 5,875,000 | | | | 5,893,359 | |
| | | | | | | | | |
| Transportation (0.82%) | |
| American Airlines 2013-2 Class A Pass Through Trust: | | | | | | | | |
| 4.95%, 01/15/23 | | | 7,897,207 | | | | 8,440,140 | |
| CSX Transportation, Inc.: | | | | | | | | |
| 9.75%, 06/15/20 | | | 1,250,000 | | | | 1,507,965 | |
| | | | | | | | 9,948,105 | |
| Total Industrial | | | | | | | 242,805,882 | |
| | | | | | | | | |
| Utility (3.84%) | |
| Electric (3.84%) | |
| Consumers Energy Co.: | | | | | | | | |
| Series B, 6.88%, 03/01/18 | | | 1,564,000 | | | | 1,619,115 | |
| Duke Energy Carolinas LLC: | | | | | | | | |
| 3.90%, 06/15/21 | | | 4,275,000 | | | | 4,540,576 | |
| Series C, 7.00%, 11/15/18 | | | 4,285,000 | | | | 4,590,362 | |
| Nevada Power Co.: | | | | | | | | |
| Series R, 6.75%, 07/01/37 | | | 2,850,000 | | | | 3,858,492 | |
| Oncor Electric Delivery Co. LLC: | | | | | | | | |
| 4.10%, 06/01/22 | | | 4,730,000 | | | | 5,040,609 | |
| 7.00%, 09/01/22 | | | 5,800,000 | | | | 6,989,035 | |
See Notes to Financial Statements.
Semi-Annual Report | June 30, 2017 | | 71 |
| Westcore Plus Bond Fund | Statement of Investments |
June 30, 2017 (Unaudited)
| | | Principal Amount | | | Value | |
| Electric (continued) | |
| Pacific Gas & Electric Co.: | | | | | | | | |
| 5.63%, 11/30/17 | | $ | 14,225,000 | | | $ | 14,459,471 | |
| PPL UK Distribution Holdings, Ltd. / Western Power Distribution, Ltd. - 144A (United Kingdom): | | | | | | | | |
| 7.25%, 12/15/17(a) | | | 875,000 | | | | 894,412 | |
| San Diego Gas & Electric Co.: | | | | | | | | |
| 6.00%, 06/01/26 | | | 3,550,000 | | | | 4,292,277 | |
| Tenaska Alabama II Partners LP - 144A: | | | | | | | | |
| 6.13%, 03/30/23(a) | | | 141,440 | | | | 149,176 | |
| Tenaska Virginia Partners LP - 144A: | | | | | | | | |
| 6.12%, 03/30/24(a) | | | 133,848 | | | | 147,318 | |
| | | | | | | | 46,580,843 | |
| Total Utility | | | | | | | 46,580,843 | |
| | | | | | | | | |
| Total Corporate Bonds | |
| (Cost $444,277,652) | | | | | | | 461,196,273 | |
| | | | | | | | | |
| | | Principal Amount | | | Value | |
| Municipal Bonds (9.39%) | |
| California (3.34%) | |
| City of San Francisco CA Public Utilities Commission Water Revenue: | | | | | | | | |
| 6.00%, 11/01/40(c) | | $ | 11,750,000 | | | $ | 14,777,857 | |
| San Diego County Regional Airport Authority: | | | | | | | | |
| 5.59%, 07/01/43(c) | | | 9,135,000 | | | | 10,155,197 | |
| 6.63%, 07/01/40(c) | | | 8,430,000 | | | | 9,420,356 | |
| University of California: | | | | | | | | |
| 6.27%, 05/15/31(c) | | | 5,875,000 | | | | 6,264,278 | |
| | | | | | | | | |
| Total California | | | | | | | 40,617,688 | |
| | | | | | | | | |
| District Of Columbia (1.03%) | |
| Metropolitan Washington Airports Authority Dulles Toll Road Revenue: | | | | | | | | |
| 7.46%, 10/01/46(c) | | | 8,600,000 | | | | 12,520,310 | |
| | | | | | | | | |
| Total District Of Columbia | | | | | | | 12,520,310 | |
| | | | | | | | | |
| Texas (2.35%) | |
| Dallas Independent School District: | | | | | | | | |
| 6.45%, 02/15/35(c) | | | 8,700,000 | | | | 9,954,627 | |
| | | Principal Amount | | | Value | |
| Texas (continued) | |
| North Texas Tollway Authority: | | | | | | | | |
| 8.41%, 02/01/30(c) | | $ | 4,350,000 | | | $ | 5,677,533 | |
| 8.91%, 02/01/30(c) | | | 8,350,000 | | | | 9,565,676 | |
| University of Texas System: | | | | | | | | |
| 6.28%, 08/15/41(c) | | | 3,026,000 | | | | 3,286,206 | |
| | | | | | | | | |
| Total Texas | | | | | | | 28,484,042 | |
| | | | | | | | | |
| Washington (2.67%) | |
| Port of Seattle WA: | | | | | | | | |
| 7.00%, 05/01/36(c) | | | 10,520,000 | | | | 11,451,441 | |
| State of Washington: | | | | | | | | |
| Series AD VALOREM PROPERTY TAX, 5.48%, 08/01/39(c) | | | 8,400,000 | | | | 10,526,628 | |
| Washington State Convention Center Public Facilities District: | | | | | | | | |
| Series HOTEL OCCUPANCY TAX, 6.79%, 07/01/40(c) | | | 8,125,000 | | | | 10,491,650 | |
| | | | | | | | | |
| Total Washington | | | | | | | 32,469,719 | |
| | | | | | | | | |
| Total Municipal Bonds | |
| (Cost $114,100,990) | | | | | | | 114,091,759 | |
| | | | | | | | | |
| Asset Backed Securities (6.44%) | |
| American Express Credit Account Master Trust | | | | | | | | |
| Series 2017-1, Class A, | | | | | | | | |
| 1.93%, 02/18/20 | | | 15,550,000 | | | | 15,592,248 | |
| Capital One Multi-Asset Execution Trust | | | | | | | | |
| Series 2017-A1, Class A1, | | | | | | | | |
| 2.00%, 03/16/20 | | | 10,325,000 | | | | 10,372,743 | |
| Chase Issuance Trust | | | | | | | | |
| Series 2015-A2, Class A2, | | | | | | | | |
| 1.59%, 02/18/20 | | | 12,225,000 | | | | 12,237,068 | |
| Drive Auto Receivables Trust 2016-B - 144A | | | | | | | | |
| Series 2016-BA, Class B, | | | | | | | | |
| 2.56%, 04/15/18(a) | | | 4,200,000 | | | | 4,214,239 | |
| Drive Auto Receivables Trust 2017-A - 144A | | | | | | | | |
| Series 2017-AA, Class B, | | | | | | | | |
| 2.51%, 01/15/21(a) | | | 3,600,000 | | | | 3,614,557 | |
| Honda Auto Receivables Owner Trust | | | | | | | | |
| Series 2017-1, Class A2, | | | | | | | | |
| 1.42%, 08/21/18 | | | 3,900,000 | | | | 3,899,932 | |
See Notes to Financial Statements.
| 72 | | www.westcore.com |
| Westcore Plus Bond Fund | Statement of Investments |
June 30, 2017 (Unaudited)
| | | Principal Amount | | | Value | |
| Asset Backed Securities (continued) | |
| Marriott Vacation Club Owner Trust - 144A | | | | | | | | |
| Series 2010-1A, Class A, | | | | | | | | |
| 3.54%, 10/20/32(a) | | $ | 1,196,938 | | | $ | 1,203,921 | |
| NextGear Floorplan Master Owner Trust - 144A | | | | | | | | |
| Series 2015-2A, Class A, | | | | | | | | |
| 2.38%, 10/15/18(a) | | | 7,905,000 | | | | 7,943,387 | |
| Santander Drive Auto Receivables Trust | | | | | | | | |
| Series 2016-2, Class B, | | | | | | | | |
| 2.08%, 02/16/21 | | | 10,450,000 | | | | 10,473,866 | |
| Sierra Receivables Funding Co. LLC - 144A | | | | | | | | |
| Series 2017-1A, Class A, | | | | | | | | |
| 2.91%, 07/20/24(a) | | | 3,618,093 | | | | 3,652,233 | |
| Toyota Auto Receivables Owner Trust | | | | | | | | |
| Series 2017-A, Class A3, | | | | | | | | |
| 1.73%, 02/16/21 | | | 5,000,000 | | | | 5,007,583 | |
| | | | | | | | | |
| Total Asset Backed Securities | |
| (Cost $77,967,706) | | | | | | | 78,211,777 | |
| | | | | | | | | |
| Collateralized Loan Obligations (1.53%) | |
| Madison Park Funding XIV, Ltd. - 144A | | | | | | | | |
| Series 2017-14A, Class A1R, | | | | | | | | |
| 2.28%, 07/20/26(a)(b) | | | 6,000,000 | | | | 6,014,010 | |
| Seneca Park CLO, Ltd. 2014-1 - 144A | | | | | | | | |
| Series 2017-1A, Class AR, | | | | | | | | |
| 2.28%, 07/17/26(a)(b) | | | 12,500,000 | | | | 12,524,413 | |
| | | | | | | | | |
| Total Collateralized Loan Obligations | |
| (Cost $18,510,462) | | | | | | | 18,538,423 | |
| | | | | | | | | |
| Commercial Mortgage-Backed Securities (3.65%) | |
| Crown Castle Towers LLC - 144A | | | | | | | | |
| | | | | | | | | |
| 4.88%, 08/15/20(a) | | | 5,900,000 | | | | 6,300,054 | |
| | | | | | | | | |
| 6.11%, 01/15/20(a) | | | 8,975,000 | | | | 9,654,880 | |
| Freddie Mac Multifamily Structured Pass Through Certificates | | | | | | | | |
| Series 2013-K031, Class A2, | | | | | | | | |
| 3.30%, 04/25/23 | | | 3,000,000 | | | | 3,148,036 | |
| GTP Acquisition Partners I LLC - 144A | | | | | | | | |
| | | | | | | | | |
| 3.48%, 06/16/25(a) | | | 10,800,000 | | | | 11,028,852 | |
| | | Principal Amount | | | Value | |
| Commercial Mortgage-Backed Securities (continued) | |
| InSite Issuer LLC - 144A | | | | | | | | |
| Series 2016-1A, Class C, | | | | | | | | |
| 6.41%, 11/15/23(a) | | $ | 2,250,000 | | | $ | 2,326,231 | |
| Tuckahoe Credit Lease Trust - 144A | | | | | | | | |
| 9.31%, 10/20/25(a)(d) | | | 3,583,184 | | | $ | 4,052,581 | |
| VB-S1 Issuer LLC - 144A | | | | | | | | |
| Series 2016-1A, Class F, | | | | | | | | |
| 6.90%, 06/15/21(a) | | | 7,500,000 | | | | 7,782,186 | |
| | | | | | | | | |
| Total Commercial Mortgage-Backed Securities | |
| (Cost $41,944,724) | | | | | | | 44,292,820 | |
| | | | | | | | | |
| Mortgage-Backed Securities Passthrough (25.52%) | |
| Fannie Mae Pool | | | | | | | | |
| Pool #889579, | | | | | | | | |
| 6.00%, 05/01/38 | | | 1,465,363 | | | | 1,657,020 | |
| Pool #889108, | | | | | | | | |
| 6.00%, 02/01/38 | | | 915,253 | | | | 1,038,003 | |
| Pool #907772, | | | | | | | | |
| 6.00%, 12/01/36 | | | 197,025 | | | | 206,425 | |
| Pool #995373, Series 2009, | | | | | | | | |
| 4.50%, 02/01/39 | | | 7,706,694 | | | | 8,305,306 | |
| Pool #910881, | | | | | | | | |
| 5.00%, 02/01/37 | | | 420,266 | | | | 433,153 | |
| Pool #888405, | | | | | | | | |
| 5.00%, 12/01/36 | | | 244,068 | | | | 268,118 | |
| Pool #BC2663, Series 2016, | | | | | | | | |
| 3.50%, 02/01/46 | | | 8,752,230 | | | | 8,994,753 | |
| Pool #850582, | | | | | | | | |
| 5.50%, 01/01/36 | | | 365,521 | | | | 409,112 | |
| Pool #BC1873, Series 2016, | | | | | | | | |
| 2.50%, 06/01/31 | | | 4,085,278 | | | | 4,113,786 | |
| Pool #888016, | | | | | | | | |
| 5.50%, 05/01/36 | | | 1,589,572 | | | | 1,770,717 | |
| Pool #BC6086, Series 2016, | | | | | | | | |
| 2.50%, 06/01/31 | | | 5,831,545 | | | | 5,870,568 | |
| Pool #MA2354, Series 2015, | | | | | | | | |
| 3.50%, 08/01/35 | | | 13,190,281 | | | | 13,735,590 | |
| Pool #MA2145, Series 2014, | | | | | | | | |
| 4.00%, 01/01/45 | | | 13,638,815 | | | | 14,356,347 | |
| Pool #AD4268, | | | | | | | | |
| 4.50%, 03/01/25 | | | 2,249,086 | | | | 2,368,340 | |
| Pool #AE0949, | | | | | | | | |
| 4.00%, 02/01/41 | | | 3,731,662 | | | | 3,942,700 | |
| Pool #AE0395, | | | | | | | | |
| 4.50%, 10/01/40 | | | 5,705,897 | | | | 6,171,757 | |
| Pool #MA2005, Series 2014, | | | | | | | | |
| 4.50%, 08/01/44 | | | 1,154,840 | | | | 1,241,098 | |
| Pool #AB4853, | | | | | | | | |
| 3.00%, 04/01/32 | | | 12,746,556 | | | | 13,036,440 | |
| Pool #995838, | | | | | | | | |
| 5.50%, 05/01/39 | | | 1,177,046 | | | | 1,314,103 | |
See Notes to Financial Statements.
Semi-Annual Report | June 30, 2017 | | 73 |
| Westcore Plus Bond Fund | Statement of Investments |
June 30, 2017 (Unaudited)
| | | Principal Amount | | | Value | |
| Mortgage-Backed Securities Passthrough (continued) | |
| Pool #AC8938, | | | | | | | | |
| 4.50%, 01/01/25 | | $ | 3,575,159 | | | $ | 3,784,883 | |
| Pool #MA1917, Series 2014, | | | | | | | | |
| 4.50%, 06/01/44 | | | 841,575 | | | | 904,479 | |
| Pool #MA1700, Series 2013, | | | | | | | | |
| 4.50%, 12/01/43 | | | 3,973,893 | | | | 4,282,291 | |
| Pool #AL9242, Series 2016, | | | | | | | | |
| 3.00%, 08/01/43 | | | 11,658,420 | | | | 11,708,954 | |
| Pool #AL7911, Series 2015, | | | | | | | | |
| 3.50%, 12/01/45 | | | 10,106,778 | | | | 10,428,346 | |
| Pool #AS5823, Series 2015, | | | | | | | | |
| 3.50%, 09/01/45 | | | 15,896,543 | | | | 16,337,035 | |
| Pool #AS7367, Series 2016, | | | | | | | | |
| 3.00%, 06/01/41 | | | 11,886,939 | | | | 11,942,208 | |
| Pool #AS6548, Series 2016, | | | | | | | | |
| 2.50%, 01/01/31 | | | 10,005,878 | | | | 10,077,478 | |
| Pool #AL5315, Series 2014, | | | | | | | | |
| 4.00%, 06/01/42 | | | 2,829,230 | | | | 2,998,000 | |
| Pool #256526, | | | | | | | | |
| 6.00%, 12/01/36 | | | 668,485 | | | | 701,669 | |
| Pool #190377, | | | | | | | | |
| 5.00%, 11/01/36 | | | 1,210,950 | | | | 1,330,016 | |
| Pool #255706, | | | | | | | | |
| 5.50%, 05/01/35 | | | 1,225,224 | | | | 1,360,919 | |
| Pool #AL3287, Series 2013, | | | | | | | | |
| 4.50%, 09/01/41 | | | 3,975,889 | | | | 4,301,452 | |
| Pool #AL0933, Series 2011, | | | | | | | | |
| 5.00%, 10/01/41 | | | 1,480,989 | | | | 1,619,345 | |
| Pool #735288, | | | | | | | | |
| 5.00%, 03/01/35 | | | 1,258,651 | | | | 1,382,281 | |
| Pool #725705, | | | | | | | | |
| 5.00%, 08/01/34 | | | 235,801 | | | | 258,228 | |
| Pool #735897, | | | | | | | | |
| 5.50%, 10/01/35 | | | 948,105 | | | | 1,056,293 | |
| Pool #845471, | | | | | | | | |
| 5.00%, 05/01/36 | | | 135,510 | | | | 141,985 | |
| Pool #745275, | | | | | | | | |
| 5.00%, 02/01/36 | | | 1,274,688 | | | | 1,399,993 | |
| Pool #AY3374, Series 2015, | | | | | | | | |
| 3.50%, 04/01/45 | | | 15,562,126 | | | | 16,057,425 | |
| Pool #AS7887, Series 2016, | | | | | | | | |
| 3.00%, 09/01/41 | | | 12,173,523 | | | | 12,230,124 | |
| Pool #AS7732, Series 2016, | | | | | | | | |
| 3.00%, 08/01/41 | | | 11,920,532 | | | | 11,975,958 | |
| Pool #AS8327, Series 2016, | | | | | | | | |
| 4.00%, 11/01/46 | | | 4,706,018 | | | | 4,951,357 | |
| Pool #AX2530, Series 2014, | | | | | | | | |
| 4.00%, 11/01/44 | | | 8,425,542 | | | | 8,878,494 | |
| Pool #AU1628, Series 2013, | | | | | | | | |
| 3.00%, 07/01/43 | | | 3,474,429 | | | | 3,488,972 | |
| Freddie Mac Gold Pool | | | | | | | | |
| Gold Pool #A92533, | | | | | | | | |
| 4.50%, 06/01/40 | | | 2,576,320 | | | | 2,772,807 | |
| | | Principal Amount | | | Value | |
| Mortgage-Backed Securities Passthrough (continued) | |
| Gold Pool #A93505, | | | | | | | | |
| 4.50%, 08/01/40 | | $ | 3,606,100 | | | $ | 3,884,951 | |
| Gold Pool #A91161, | | | | | | | | |
| 4.50%, 02/01/40 | | | 2,540,794 | | | | 2,731,635 | |
| Gold Pool #G08607, Series 2014, | | | | | | | | |
| 4.50%, 09/01/44 | | | 2,436,456 | | | | 2,609,616 | |
| Gold Pool #C03789, | | | | | | | | |
| 4.00%, 03/01/42 | | | 5,129,610 | | | | 5,418,510 | |
| Gold Pool #Q05168, | | | | | | | | |
| 4.00%, 12/01/41 | | | 10,937,282 | | | | 11,553,064 | |
| Gold Pool #G67700, Series 2016-, | | | | | | | | |
| 3.50%, 08/01/46 | | | 9,108,022 | | | | 9,414,945 | |
| Gold Pool #Q05601, | | | | | | | | |
| 4.00%, 01/01/42 | | | 6,286,582 | | | | 6,640,590 | |
| Gold Pool #A97047, | | | | | | | | |
| 4.50%, 02/01/41 | | | 3,126,474 | | | | 3,368,259 | |
| Gold Pool #A97620, | | | | | | | | |
| 4.50%, 03/01/41 | | | 5,597,198 | | | | 6,030,494 | |
| Gold Pool #G08079, | | | | | | | | |
| 5.00%, 09/01/35 | | | 1,254,639 | | | | 1,370,262 | |
| Gold Pool #G02064, | | | | | | | | |
| 5.00%, 02/01/36 | | | 649,621 | | | | 708,402 | |
| Gold Pool #G02252, | | | | | | | | |
| 5.50%, 07/01/36 | | | 1,160,479 | | | | 1,296,794 | |
| Gold Pool #G01960, | | | | | | | | |
| 5.00%, 12/01/35 | | | 416,903 | | | | 454,697 | |
| Gold Pool #A41748, | | | | | | | | |
| 5.00%, 01/01/36 | | | 558,035 | | | | 610,493 | |
| Gold Pool #A42128, | | | | | | | | |
| 5.50%, 01/01/36 | | | 489,369 | | | | 543,627 | |
| Gold Pool #G07961, Series 2015, | | | | | | | | |
| 3.50%, 03/01/45 | | | 10,816,657 | | | | 11,160,811 | |
| Gold Pool #G08061, | | | | | | | | |
| 5.50%, 06/01/35 | | | 115,050 | | | | 128,109 | |
| Gold Pool #G05200, | | | | | | | | |
| 5.00%, 05/01/36 | | | 2,115,541 | | | | 2,306,778 | |
| Gold Pool #G02386, | | | | | | | | |
| 6.00%, 11/01/36 | | | 786,656 | | | | 888,132 | |
| Gold Pool #G03189, | | | | | | | | |
| 6.50%, 09/01/37 | | | 1,537,300 | | | | 1,767,045 | |
| Freddie Mac Non Gold Pool | | | | | | | | |
| Pool #781958, | | | | | | | | |
| 2.56%, 09/01/34(b) | | | 106,345 | | | | 112,113 | |
| Ginnie Mae I Pool | | | | | | | | |
| Pool #550656, | | | | | | | | |
| 5.00%, 09/15/35 | | | 209,570 | | | | 228,673 | |
See Notes to Financial Statements.
| 74 | | www.westcore.com |
| Westcore Plus Bond Fund | Statement of Investments |
June 30, 2017 (Unaudited)
| | | Principal Amount | | | Value | |
| Mortgage-Backed Securities Passthrough (continued) | |
| Ginnie Mae II Pool | | | | | | | | |
| Pool #G24496, | | | | | | | | |
| 5.00%, 07/20/39 | | $ | 994,778 | | | $ | 1,087,857 | |
| | | | | | | | | |
| Total Mortgage-Backed Securities Passthrough | |
| (Cost $309,884,709) | | | | | | | 309,920,185 | |
| | | | | | | | | |
| Residential Mortgage-Backed Securities (1.82%) | |
| American Home Mortgage Investment Trust | | | | | | | | |
| Series 2004-4, Class 6A1, | | | | | | | | |
| 6.00%, 02/25/45(e) | | | 3,560,932 | | | | 3,616,812 | |
| Banc of America Funding Trust | | | | | | | | |
| Series 2005-4, Class 1A4, | | | | | | | | |
| 5.50%, 08/25/35 | | | 113,823 | | | | 113,923 | |
| Class 2A4, | | | | | | | | |
| 5.50%, 08/25/35 | | | 229,138 | | | | 227,740 | |
| Banc of America Mortgage Securities Inc. | | | | | | | | |
| Series 2005-8, Class A14, | | | | | | | | |
| 5.50%, 09/25/35 | | | 28,648 | | | | 1,757 | |
| Bear Stearns Co Asset Backed Securities Trust | | | | | | | | |
| Series 2003-AC4, Class A, | | | | | | | | |
| 5.50%, 09/25/33(e) | | | 5,430,596 | | | | 5,486,543 | |
| CHL Mortgage Pass-Through Trust | | | | | | | | |
| Series 2004-HYB2, Class 5A, | | | | | | | | |
| 3.49%, 07/20/34(b) | | | 2,508,980 | | | | 2,512,723 | |
| CWABS Asset-Backed Certificates Trust | | | | | | | | |
| Series 2005-1, Class AF6, | | | | | | | | |
| 5.03%, 07/25/35(b) | | | 507,855 | | | | 519,702 | |
| GSR Mortgage Loan Trust | | | | | | | | |
| Series 2005-3F, Class 2A3, | | | | | | | | |
| 6.00%, 03/25/35 | | | 1,234,254 | | | | 1,267,146 | |
| MASTR Alternative Loan Trust | | | | | | | | |
| Series 2005-3, Class 3A1, | | | | | | | | |
| 6.50%, 04/25/35 | | | 3,644,231 | | | | 3,852,587 | |
| PHHMC Trust | | | | | | | | |
| Series 2007-2, Class A2, | | | | | | | | |
| 5.75%, 05/18/37(b) | | | 1,516,761 | | | | 1,561,196 | |
| Renaissance Home Equity Loan Trust | | | | | | | | |
| Series 2005-2, Class AF6, | | | | | | | | |
| 4.78%, 08/25/35(e) | | | 2,894,462 | | | | 2,974,938 | |
| | | | | | | | | |
| Total Residential Mortgage-Backed Securities | |
| (Cost $22,194,962) | | | | | | | 22,135,067 | |
| | | Principal Amount | | | Value | |
| U.S. Treasury Bonds & Notes (11.15%) | |
| United States Treasury Note/Bond | | | | | | | | |
| 2.88%, 05/15/43 | | $ | 31,600,000 | | | $ | 31,951,803 | |
| 3.00%, 05/15/42 | | | 3,275,000 | | | | 3,396,659 | |
| 2.38%, 05/15/27 | | | 29,000,000 | | | | 29,191,458 | |
| 2.50%, 02/15/45 | | | 13,375,000 | | | | 12,505,103 | |
| 4.38%, 11/15/39 | | | 15,000,000 | | | | 19,143,750 | |
| 4.38%, 02/15/38 | | | 1,050,000 | | | | 1,339,693 | |
| 3.13%, 11/15/41 | | | 6,300,000 | | | | 6,680,709 | |
| 4.75%, 02/15/41 | | | 14,350,000 | | | | 19,345,881 | |
| | | | | | | | 123,555,056 | |
| United States Treasury Inflation Indexed Bonds | | | | | | | | |
| 0.38%, 07/15/25 | | | 11,959,832 | | | | 11,874,439 | |
| | | | | | | | | |
| Total U.S. Treasury Bonds & Notes | |
| (Cost $125,860,524) | | | | | | | 135,429,495 | |
| | | | | | | | | |
| | | Shares | | | Value | |
| Money Market Mutual Funds (2.04%) | |
Goldman Sachs Financial Square - Government Fund,
(7 Day Yield 0.834%) | | | 24,738,098 | | | | 24,738,098 | |
| Total Money Market Mutual Funds | |
| (Cost $24,738,098) | | | | | | | 24,738,098 | |
| | |
| Total Investments (100.27%) | | | | | |
| (Cost $1,188,769,255) | | | | | | $ | 1,217,679,385 | |
| | | | | | | | | |
| Liabilities Less Other Assets (-0.27%) | | | | (3,275,747 | ) |
| | | | | | | | | |
| Net Assets (100.00%) | | | $ | 1,214,403,638 | |
(a) | This security is restricted. See the table on the following page for additional information regarding each security. Included in the table are certain securities exempt from registration under Rule 144A of the Securities Act of 1933, which may be resold in transactions, normally to qualified institutional buyers. |
(b) | The coupon rate shown on floating or adjustable rate securities represents the rate at period end. |
(c) | Security can be called and redeemed at the option of the issuer prior to the stated maturity date which is included in the Statement of Investments. |
(d) | This security has been valued in good faith by or under the direction of the Board of Trustees. As of June 30, 2017 these securities represented 0.33% of the Fund's net assets. |
(e) | Step bond. Coupon increases periodically based upon a predetermined schedule. Interest rate disclosed is that which is in effect at June 30, 2017. |
See Notes to Financial Statements.
Semi-Annual Report | June 30, 2017 | | 75 |
| Westcore Plus Bond Fund | Statement of Investments |
June 30, 2017 (Unaudited)
| Restricted Securities | | | | | | | | | | | | | | | |
| Issuer Description | | Coupon | | Maturity Date | | Acquisition Date(s) | | Cost | | | Value | | | Value as Percentage of Net Assets | |
| Airbus Group Finance BV - 144A | | | 2.700 | % | 04/17/2023 | | 8/16/2016 - 6/13/2017 | | $ | 1,986,188 | | | $ | 1,962,172 | | | | 0.16 | %^ |
| CF Industries, Inc. - 144A | | | 4.500 | % | 12/01/2026 | | 11/10/2016 | | | 4,299,696 | | | | 4,455,726 | | | | 0.36 | %^ |
| Cox Communications, Inc. - 144A | | | 9.375 | % | 01/15/2019 | | 5/27/2015 - 5/29/2015 | | | 2,758,874 | | | | 2,754,670 | | | | 0.23 | %^ |
| Crown Castle Towers LLC - 144A | | | 6.113 | % | 01/15/2020 | | 1/8/2010 | | | 8,975,000 | | | | 9,654,880 | | | | 0.80 | %^ |
| Crown Castle Towers LLC - 144A | | | 4.883 | % | 08/15/2020 | | 7/29/2010 | | | 5,900,000 | | | | 6,300,054 | | | | 0.52 | %^ |
| Drive Auto Receivables Trust 2016-B - 144A | | | 2.560 | % | 04/15/2018 | | 5/18/2016 | | | 4,199,891 | | | | 4,214,239 | | | | 0.35 | %^ |
| Drive Auto Receivables Trust 2017-A - 144A | | | 2.510 | % | 01/15/2021 | | 1/24/2017 | | | 3,599,869 | | | | 3,614,557 | | | | 0.30 | %^ |
| DriveTime Automotive Group, Inc. / Bridgecrest Acceptance Corp. - 144A | | | 8.000 | % | 06/01/2021 | | 4/20/2016 - 5/26/2016 | | | 7,170,083 | | | | 7,777,900 | | | | 0.64 | %^ |
| Emigrant Capital Trust II - 144A | | | 3.783 | % | 04/14/2034 | | 8/11/2004 | | | 847,129 | | | | 626,875 | | | | 0.05 | % |
| First Tennessee Bank NA - 144A | | | 3.750 | % | | | 3/16/2005 | | | 1,500,000 | | | | 1,152,844 | | | | 0.09 | % |
| FMG Resources August 2006 Pty, Ltd. - 144A | | | 9.750 | % | 03/01/2022 | | 12/22/2016 - 4/18/2017 | | | 8,859,671 | | | | 8,835,469 | | | | 0.73 | %^ |
| FMR LLC - 144A | | | 7.490 | % | 06/15/2019 | | 3/6/2007 | | | 5,188,212 | | | | 5,512,625 | | | | 0.46 | %^ |
| GTP Acquisition Partners I LLC - 144A | | | 3.482 | % | 06/16/2025 | | 5/20/2015 - 5/27/2015 | | | 10,820,972 | | | | 11,028,852 | | | | 0.91 | %^ |
| InSite Issuer LLC - 144A | | | 6.414 | % | 11/15/2023 | | 10/25/2016 - 10/28/2016 | | | 2,255,862 | | | | 2,326,231 | | | | 0.19 | % |
| Lions Gate Entertainment Corp. - 144A | | | 5.875 | % | 11/01/2024 | | 10/13/2016 - 11/3/2016 | | | 4,712,275 | | | | 4,970,250 | | | | 0.41 | %^ |
| Madison Park Funding XIV, Ltd. - 144A | | | 2.276 | % | 07/20/2026 | | 4/13/2017 | | | 6,000,000 | | | | 6,014,010 | | | | 0.50 | %^ |
| Marriott Vacation Club Owner Trust - 144A | | | 3.540 | % | 10/20/2032 | | 11/5/2010 | | | 1,196,826 | | | | 1,203,921 | | | | 0.10 | % |
| Massachusetts Mutual Life Insurance Co. - 144A | | | 8.875 | % | 06/01/2039 | | 3/23/2015 | | | 2,292,519 | | | | 2,323,636 | | | | 0.19 | %^ |
| Nexstar Broadcasting, Inc. - 144A | | | 5.625 | % | 08/01/2024 | | 7/13/2016 - 7/14/2016 | | | 6,809,087 | | | | 6,851,250 | | | | 0.56 | %^ |
| NextGear Floorplan Master Owner Trust - 144A | | | 2.380 | % | 10/15/2018 | | 10/23/2015 | | | 7,904,524 | | | | 7,943,387 | | | | 0.65 | %^ |
| Northwestern Mutual Life Insurance Co. - 144A | | | 6.063 | % | 03/30/2040 | | 7/16/2015 - 8/10/2015 | | | 7,159,208 | | | | 7,862,812 | | | | 0.65 | %^ |
| PPL UK Distribution Holdings, Ltd. / Western Power Distribution, Ltd. - 144A | | | 7.250 | % | 12/15/2017 | | 10/15/2003 - 6/30/2006 | | | 873,533 | | | | 894,412 | | | | 0.08 | %^ |
| Provident Funding Associates LP / PFG Finance Corp. - 144A | | | 6.375 | % | 06/15/2025 | | 11/4/2014 - 5/24/2017 | | | 2,825,000 | | | | 2,902,688 | | | | 0.24 | %^ |
| Seneca Park CLO, Ltd. 2014-1 - 144A | | | 2.278 | % | 07/17/2026 | | 5/2/2017 | | | 12,510,462 | | | | 12,524,413 | | | | 1.03 | %^ |
| Sierra Receivables Funding Co. LLC - 144A | | | 2.910 | % | 07/20/2024 | | 3/13/2017 | | | 3,617,850 | | | | 3,652,233 | | | | 0.30 | %^ |
| Tenaska Alabama II Partners LP - 144A | | | 6.125 | % | 03/30/2023 | | 10/9/2003 - 9/4/2009 | | | 142,181 | | | | 149,176 | | | | 0.01 | %^ |
| Tenaska Virginia Partners LP - 144A | | | 6.119 | % | 03/30/2024 | | 4/29/2004 - 6/26/2014 | | | 133,808 | | | | 147,318 | | | | 0.01 | %^ |
| Tesco PLC - 144A | | | 6.150 | % | 11/15/2037 | | 10/7/2014 - 10/16/2014 | | | 12,121,516 | | | | 12,028,445 | | | | 0.99 | %^ |
| Tuckahoe Credit Lease Trust - 144A | | | 9.310 | % | 10/20/2025 | | 12/11/2009 | | | 3,269,549 | | | | 4,052,581 | | | | 0.33 | % |
| VB-S1 Issuer LLC - 144A | | | 6.901 | % | 06/15/2021 | | 6/8/2016 - 10/26/2016 | | | 7,560,851 | | | | 7,782,186 | | | | 0.64 | % |
| West Fraser Timber Co., Ltd. - 144A | | | 4.350 | % | 10/15/2024 | | 10/7/2014 | | | 10,675,000 | | | | 10,327,315 | | | | 0.85 | % |
| | | | | | | | | | $ | 158,165,636 | | | $ | 161,847,127 | | | | 13.33 | % |
^ | 144A securities with a liquid trading market as determined by the Advisor under the supervision of the Board of Trustees. Such securities represent 11.08% of the Fund's net assets as of June 30, 2017. |
See Notes to Financial Statements.
| 76 | | www.westcore.com |
| Westcore Municipal Opportunities Fund | Statement of Investments |
June 30, 2017 (Unaudited)
| | | Principal Amount | | | Value | |
| Municipal Bonds (95.22%) | | | | | | |
| Certificate Participation (0.44%) | | | | | | |
| Build America Bonds (0.44%) | | | | | | |
| San Joaquin Regional Rail Commission: | | | | | | |
7.64%, 05/01/30(a) | | $ | 20,000 | | | $ | 21,707 | |
| | | | | | | | | |
| Total Certificate Participation | | | | | | | 21,707 | |
| | | | | | | | | |
| General Obligation Ltd (7.09%) | | | | | | | | |
| General Obligation (7.09%) | | | | | | | | |
| City of North Las Vegas NV: | | | | | | | | |
4.25%, 10/01/33 NATL(a)(b) | | | 50,000 | | | | 50,016 | |
| Dallas County Hospital District: | | | | | | | | |
5.00%, 08/15/27(a) | | | 30,000 | | | | 34,658 | |
| Papio‐Missouri River Natural Resource District: | | | | | | | | |
4.00%, 12/15/31(a) | | | 250,000 | | | | 265,532 | |
| | | | | | | | 350,206 | |
| Total General Obligation Ltd | | | | | | | 350,206 | |
| | | | | | | | | |
| General Obligation Unltd (15.69%) | | | | | | | | |
| Development (2.33%) | | | | | | | | |
| Eagle Bend Metropolitan District No 2: | | | | | | | | |
5.00%, 12/01/37 BAM(a)(b) | | | 100,000 | | | | 114,952 | |
| | | | | | | | | |
| General Obligation (13.36%) | | | | | | | | |
| Commonwealth of Puerto Rico (Puerto Rico): | | | | | | | | |
5.25%, 07/01/24 AGM(a)(b) | | | 150,000 | | | | 159,473 | |
5.38%, 07/01/25 AGM(a)(b) | | | 85,000 | | | | 90,273 | |
| High Plains Metropolitan District: | | | | | | | | |
5.00%, 12/01/29 NATL(a)(b) | | | 200,000 | | | | 232,983 | |
| Vista Ridge Metropolitan District: | | | | | | | | |
5.00%, 12/01/28 BAM(a)(b) | | | 150,000 | | | | 177,248 | |
| | | | | | | | 659,977 | |
| Total General Obligation Unltd | | | | | | | 774,929 | |
| | | | | | | | | |
| Government Related (1.74%) | | | | | | | | |
| Local Authority (1.74%) | | | | | | | | |
| North Texas Tollway Authority: | | | | | | | | |
8.91%, 02/01/30(a) | | | 75,000 | | | | 85,919 | |
| | | | | | | | | |
| Total Government Related | | | | | | | 85,919 | |
| | | | | | | | | |
| Revenue Bonds (57.60%) | | | | | | | | |
| Airport (2.46%) | | | | | | | | |
| Chicago O'Hare International Airport: | | | | | | | | |
5.63%, 01/01/35(a) | | | 25,000 | | | | 28,073 | |
| County of Clark Department of Aviation: | | | | | | | | |
5.00%, 07/01/28(a) | | | 55,000 | | | | 63,877 | |
| | | Principal Amount | | | Value | |
| Airport (continued) | | | | | | |
| Dallas/Fort Worth International | | | | | | |
| Airport: | | | | | | |
5.25%, 11/01/32(a) | | $ | 25,000 | | | $ | 29,524 | |
| | | | | | | | 121,474 | |
| Build America Bonds (3.38%) | | | | | | | | |
| Arapahoe County Water & Wastewater Authority: | | | | | | | | |
6.68%, 12/01/39(a) | | | 30,000 | | | | 32,565 | |
University of Colorado: | | | | | | | | |
6.26%, 06/01/36(a) | | | 125,000 | | | | 134,464 | |
| | | | | | | | 167,029 | |
| Development (5.31%) | | | | | | | | |
| Brooklyn Arena Local Development Corp.: | | | | | | | | |
| 5.00%, 07/15/25 | | | 30,000 | | | | 35,759 | |
| City of Baltimore MD: | | | | | | | | |
5.00%, 09/01/34(a) | | | 200,000 | | | | 226,720 | |
| | | | | | | | 262,479 | |
| Education (3.14%) | | | | | | | | |
| Colorado Educational & Cultural Facilities Authority: | | | | | | | | |
| 4.00%, 06/15/20 | | | 15,000 | | | | 15,343 | |
| New Hope Cultural Education Facilities Finance Corp.: | | | | | | | | |
| 5.00%, 08/15/19 | | | 140,000 | | | | 139,781 | |
| | | | | | | | 155,124 | |
| Facilities (0.66%) | | | | | | | | |
| City of Irving TX: | | | | | | | | |
7.25%, 08/15/53(a) | | | 30,000 | | | | 32,430 | |
| | | | | | | | | |
| General (8.63%) | | | | | | | | |
| City of Coralville IA: | | | | | | | | |
5.00%, 05/01/33(a) | | | 250,000 | | | | 272,767 | |
| Mississippi State University | | | | | | | | |
| Educational Building Corp.: | | | | | | | | |
4.25%, 08/01/30(a) | | | 25,000 | | | | 27,116 | |
| Tennessee Energy Acquisition Corp.: | | | | | | | | |
5.25%, 09/01/26(a) | | | 105,000 | | | | 126,204 | |
| | | | | | | | 426,087 | |
| General Obligation (2.24%) | | | | | | | | |
| City of Coralville IA: | | | | | | | | |
4.00%, 05/01/27(a) | | | 65,000 | | | | 66,805 | |
| Fairburn Development Authority: | | | | | | | | |
4.75%, 07/01/33 AGM(a)(b) | | | 40,000 | | | | 43,760 | |
| | | | | | | | 110,565 | |
| Higher Education (5.05%) | | | | | | | | |
| County of Douglas NE: | | | | | | | | |
5.88%, 07/01/40(a) | | | 15,000 | | | | 16,806 | |
| Miami‐Dade County Educational Facilities Authority: | | | | | | | | |
5.00%, 04/01/33(a) | | | 15,000 | | | | 17,191 | |
See Notes to Financial Statements.
Semi-Annual Report | June 30, 2017 | | 77 |
| Westcore Municipal Opportunities Fund | Statement of Investments |
June 30, 2017 (Unaudited)
| | | Principal Amount | | | Value | |
| Higher Education (continued) | | | | | | |
| Washington Higher Education | | | | | | |
| Facilities Authority: | | | | | | |
5.00%, 10/01/27(a) | | $ | 35,000 | | | $ | 39,240 | |
5.25%, 04/01/43(a) | | | 120,000 | | | | 135,950 | |
| Washington State University: | | | | | | | | |
5.00%, 04/01/39(a) | | | 10,000 | | | | 11,322 | |
| Wisconsin Health & Educational Facilities Authority: | | | | | | | | |
5.00%, 10/01/30(a) | | | 25,000 | | | | 28,710 | |
| | | | | | | | 249,219 | |
| Housing (4.30%) | | | | | | | | |
| Maryland Economic Development | | | | | | | | |
| Corp.: | | | | | | | | |
5.00%, 07/01/37(a) | | | 200,000 | | | | 212,370 | |
| | | | | | | | | |
| Medical (2.24%) | | | | | | | | |
| Colorado Health Facilities Authority: | | | | | | | | |
4.63%, 09/01/39(a) | | | 30,000 | | | | 30,034 | |
| 5.00%, 01/01/20 | | | 15,000 | | | | 15,943 | |
| 5.00%, 01/01/22 | | | 30,000 | | | | 32,805 | |
5.00%, 01/01/25(a) | | | 30,000 | | | | 31,904 | |
| | | | | | | | 110,686 | |
| Nursing Homes (6.99%) | | | | | | | | |
| Colorado Health Facilities Authority: | | | | | | | | |
5.00%, 12/01/33(a) | | | 35,000 | | | | 36,894 | |
5.00%, 12/01/42(a) | | | 90,000 | | | | 93,886 | |
| 5.00%, 05/15/19 | | | 75,000 | | | | 79,266 | |
| Industrial Development Authority of the County of Pima: | | | | | | | | |
| 5.00%, 12/15/19 | | | 125,000 | | | | 135,355 | |
| | | | | | | | 345,401 | |
| Transportation (13.20% | | | | | | | | |
| Central Texas Turnpike System: | | | | | | | | |
5.00%, 08/15/28(a) | | | 95,000 | | | | 108,648 | |
5.00%, 08/15/30(a) | | | 25,000 | | | | 28,281 | |
5.00%, 08/15/31(a) | | | 25,000 | | | | 28,162 | |
| Colorado High Performance Transportation Enterprise: | | | | | | | | |
5.00%, 12/31/56(a) | | | 200,000 | | | | 217,955 | |
| Metropolitan Washington Airports Authority: | | | | | | | | |
6.50%, 10/01/41 AGC(a)(b) | | | 80,000 | | | | 103,335 | |
| North Texas Tollway Authority: | | | | | | | | |
6.20%, 01/01/42 AGC(a)(b) | | | 20,000 | | | | 24,977 | |
| Regional Transportation District: | | | | | | | | |
6.00%, 01/15/26(a) | | | 20,000 | | | | 22,181 | |
| Texas Private Activity Bond Surface Transportation Corp.: | | | | | | | | |
7.00%, 06/30/40(a) | | | 105,000 | | | | 118,760 | |
| | | | | | | | 652,299 | |
| Total Revenue Bonds | | | | | | | 2,845,163 | |
| | | Principal Amount | | | Value | |
| Revenue Notes (3.03%) | | | | | | |
| Nursing Homes (3.03%) | | | | | | |
Industrial Development Authority of the County of Pima: | | | | | | |
| 2.15%, 12/15/17 | | $ | 150,000 | | | $ | 149,864 | |
| | | | | | | | | |
| Total Revenue Notes | | | | | | | 149,864 | |
| | | | | | | | | |
| Special Assessment (3.74%) | | | | | | | | |
| Development (3.74%) | | | | | | | | |
| Village Community Development | | | | | | | | |
| District No 5: | | | | | | | | |
| 3.13%, 05/01/22 | | | 180,000 | | | | 184,909 | |
| | | | | | | | | |
| Total Special Assessment | | | | | | | 184,909 | |
| | | | | | | | | |
| Tax Allocation (5.89%) | | | | | | | | |
| General (5.89%) | | | | | | | | |
| Desert Hot Springs Redevelopment | | | | | | | | |
| Agency Successor Agency: | | | | | | | | |
5.00%, 09/01/32 BAM(a)(b) | | | 250,000 | | | | 290,858 | |
| | | | | | | | | |
| Total Tax Allocation | | | | | | | 290,858 | |
| | | | | | | | | |
| Total Municipal Bonds | | | | | | | | |
| (Cost $4,655,271) | | | | | | | 4,703,555 | |
| | | Shares | | | Value | |
| Money Market Mutual Funds (4.71%) | | | | | | |
| Goldman Sachs Financial Square ‐ | | | | | | |
| Government Fund, | | | | | | |
| (7 Day Yield 0.834%) | | | 232,401 | | | | 232,401 | |
| Total Money Market Mutual Funds (Cost $232,401) | | | | 232,401 | |
| | | | | | | | | |
| Total Investments (99.93%) (Cost $4,887,672) | | | $ | 4,935,956 | |
| | | | | | | | | |
| Other Assets Less Liabilities (0.07%) | | | | | | | 3,371 | |
| | | | | | | | | |
| Net Assets (100.00%) | | | | | | $ | 4,939,327 | |
See Notes to Financial Statements.
| 78 | | www.westcore.com |
| Westcore Municipal Opportunities Fund | Statement of Investments |
June 30, 2017 (Unaudited)
Sector and industry classifications presented herein are based on the sector and industry categorization methodology of the Adviser to the Funds which may result in the designations for one Fund being different from another. For Fund compliance purposes, the Fund’s industry classifications refer to any one or more of the industry sub-classifications used by one or more widely recognized market indexes or ratings group indexes, and/or as defined by Fund management. This definition may not apply for purposes of this report, which may combine industry sub-classifications for reporting ease. Industries are shown as a percentage of net assets.
(a) | Security can be called and redeemed at the option of the issuer prior to the stated maturity date which is included in the Statement of Investments. |
(b) | This security is insured. In the event of a default by the bond issuer, the insurer, as noted in the security description, guarantees scheduled principal and interest payments will be made when due. |
See Notes to Financial Statements.
Semi-Annual Report | June 30, 2017 | | 79 |
| Westcore Colorado Tax-Exempt Fund | Statement of Investments |
June 30, 2017 (Unaudited)
| | | Principal Amount | | | Value | |
| Municipal Bonds (96.11%) | |
| Certificate Participation (17.46%) | |
| Build America Bonds (0.22%) | |
| State of Colorado: | | | | | | |
| 4.99%, 03/15/19 | | $ | 500,000 | | | $ | 526,460 | |
| | | | | | | | | |
| Education (3.21%) | |
| Adams 12 Five Star Schools: | | | | | | | | |
| 2.00%, 12/15/17 | | | 500,000 | | | | 502,395 | |
| 2.00%, 12/15/18 | | | 200,000 | | | | 202,682 | |
| 3.00%, 12/15/20 | | | 1,830,000 | | | | 1,928,033 | |
| Douglas County School District No Re-1 Douglas & Elbert Counties: | | | | | | | | |
| 4.00%, 01/15/28(a) | | | 1,675,000 | | | | 1,855,967 | |
| 5.00%, 01/15/25(a)(b) | | | 1,000,000 | | | | 1,059,440 | |
| El Paso County School District No 49 Falcon: | | | | | | | | |
| 3.00%, 12/15/18 | | | 300,000 | | | | 307,521 | |
| Pueblo County School District No 70: | | | | | | | | |
| 1.50%, 01/15/18 | | | 175,000 | | | | 175,310 | |
| 1.88%, 01/15/19 | | | 180,000 | | | | 181,366 | |
| 2.10%, 01/15/20 | | | 215,000 | | | | 218,560 | |
| 2.38%, 01/15/21(a) | | | 270,000 | | | | 274,955 | |
| State of Colorado: | | | | | | | | |
| 5.00%, 03/15/24(a) | | | 1,000,000 | | | | 1,122,150 | |
| | | | | | | | 7,828,379 | |
| General (14.03%) | |
| Aspen Public Facilities Authority: | | | | | | | | |
| 5.88%, 09/01/32 AGM(a)(c) | | | 880,000 | | | | 882,050 | |
| Auraria Higher Education Center: | | | | | | | | |
| 6.00%, 05/01/24(a) | | | 499,000 | | | | 548,666 | |
| City & County of Broomfield CO: | | | | | | | | |
| 4.00%, 12/01/17 | | | 655,000 | | | | 663,115 | |
| City & County of Denver CO: | | | | | | | | |
| 5.25%, 12/01/24(a) | | | 625,000 | | | | 661,631 | |
| City of Aurora CO: | | | | | | | | |
| 5.00%, 12/01/30(a) | | | 875,000 | | | | 948,947 | |
| 5.00%, 12/01/34(a) | | | 450,000 | | | | 524,052 | |
| 5.00%, 12/01/35(a) | | | 615,000 | | | | 714,015 | |
| 5.00%, 12/01/42(a) | | | 3,235,000 | | | | 3,718,697 | |
| City of Glendale CO: | | | | | | | | |
| 5.00%, 12/01/25 AGM(c) | | | 2,000,000 | | | | 2,386,720 | |
| City of Longmont CO: | | | | | | | | |
| 5.00%, 12/01/28(a) | | | 1,500,000 | | | | 1,768,170 | |
| City of Pueblo CO: | | | | | | | | |
| 5.50%, 08/15/18 AGC(c) | | | 500,000 | | | | 524,845 | |
| Colorado Higher Education: | | | | | | | | |
| 5.25%, 11/01/23(a)(b) | | | 1,280,000 | | | | 1,350,758 | |
| County of Eagle CO: | | | | | | | | |
| 5.00%, 12/01/25 | | | 250,000 | | | | 303,858 | |
| 5.00%, 12/01/27(a) | | | 495,000 | | | | 587,842 | |
| 5.25%, 12/01/23(a)(b) | | | 500,000 | | | | 529,305 | |
| | | Principal Amount | | | Value | |
| General (continued) | |
| County of El Paso CO: | | | | | | |
| 2.00%, 12/01/20 AGM(c) | | $ | 1,615,000 | | | $ | 1,649,787 | |
| County of Pueblo CO: | | | | | | | | |
| 5.00%, 09/15/19 AGM(c) | | | 750,000 | | | | 809,925 | |
| Rangeview Library District: | | | | | | | | |
| 5.00%, 12/15/22 AGC(a)(b)(c) | | | 1,815,000 | | | | 1,917,838 | |
| Regional Transportation District: | | | | | | | | |
| 5.00%, 12/01/22 AMBAC(a)(c) | | | 1,000,000 | | | | 1,016,400 | |
| 5.00%, 06/01/20 | | | 1,200,000 | | | | 1,323,168 | |
| 5.00%, 06/01/28(a) | | | 2,000,000 | | | | 2,337,740 | |
| State of Colorado Department of Transportation: | | | | | | | | |
| 5.00%, 06/15/41(a) | | | 2,680,000 | | | | 2,836,030 | |
| Town of Breckenridge CO: | | | | | | | | |
| 5.00%, 12/01/35(a) | | | 2,425,000 | | | | 2,837,056 | |
| Town of Erie CO: | | | | | | | | |
| 5.00%, 11/01/27(a) | | | 1,735,000 | | | | 2,069,473 | |
| Town of Parker CO: | | | | | | | | |
| 5.00%, 11/01/30(a) | | | 1,150,000 | | | | 1,347,858 | |
| | | | | | | | 34,257,946 | |
| Total Certificate Participation | | | | | | | 42,612,785 | |
| | | | | | | | | |
| General Obligation Ltd (4.69%) | |
| Development (3.21%) | |
| Cherry Creek Corporate Center Metropolitan District: | | | | | | | | |
| 5.00%, 06/01/37(a) | | | 1,070,000 | | | | 1,072,129 | |
| Cornerstar Metropolitan District: | | | | | | | | |
| 3.50%, 12/01/21 | | | 500,000 | | | | 507,640 | |
| 4.50%, 12/01/27(a) | | | 500,000 | | | | 521,665 | |
| 5.13%, 12/01/37(a) | | | 1,000,000 | | | | 1,039,030 | |
| Sierra Ridge Metropolitan District No 2: | | | | | | | | |
| 5.50%, 12/01/46(a) | | | 1,000,000 | | | | 1,026,210 | |
| Southglenn Metropolitan District: | | | | | | | | |
| 3.00%, 12/01/21 | | | 1,960,000 | | | | 1,950,357 | |
| Tallyns Reach Metropolitan District No 3: | | | | | | | | |
| 6.75%, 11/01/38(a) | | | 1,720,000 | | | | 1,722,718 | |
| | | | | | | | 7,839,749 | |
| General Obligation (1.48%) | |
| Eaton Area Park & Recreation District: | | | | | | | | |
| 5.50%, 12/01/30(a) | | | 470,000 | | | | 512,267 | |
| Fossil Ridge Metropolitan District No 3: | | | | | | | | |
| 5.00%, 12/01/44(a) | | | 1,000,000 | | | | 1,028,280 | |
| 5.00%, 12/01/36(a) | | | 2,000,000 | | | | 2,079,740 | |
| | | | | | | | 3,620,287 | |
| Total General Obligation Ltd | | | | | | | 11,460,036 | |
See Notes to Financial Statements.
80 | | www.westcore.com |
| Westcore Colorado Tax-Exempt Fund | Statement of Investments |
June 30, 2017 (Unaudited)
| | | Principal Amount | | | Value | |
| General Obligation Unltd (18.19%) | |
| Development (6.43%) | |
| Beacon Point Metropolitan District: | | | | | | |
| 5.00%, 12/01/30 AGM(a)(c) | | $ | 1,000,000 | | | $ | 1,134,830 | |
| Breckenridge Mountain Metropolitan District: | | | | | | | | |
| 3.00%, 12/01/36 AGM(a)(c) | | | 250,000 | | | | 228,292 | |
| Central Platte Valley Metropolitan District: | | | | | | | | |
| 5.00%, 12/01/43(a) | | | 3,500,000 | | | | 3,712,100 | |
| 5.50%, 12/01/29(a) | | | 750,000 | | | | 848,205 | |
| 6.00%, 12/01/38(a) | | | 1,000,000 | | | | 1,167,840 | |
| Copperleaf Metropolitan District No 2: | | | | | | | | |
| 5.75%, 12/01/45(a) | | | 2,000,000 | | | | 2,085,660 | |
| Eagle Bend Metropolitan District No 2: | | | | | | | | |
| 5.00%, 12/01/37 BAM(a)(c) | | | 1,800,000 | | | | 2,069,136 | |
| North Range Metropolitan District No 1: | | | | | | | | |
| 5.00%, 12/01/38(a) | | | 3,000,000 | | | | 3,308,970 | |
| Wheatlands Metropolitan District: | | | | | | | | |
| 5.00%, 12/01/30 BAM(a)(c) | | | 1,000,000 | | | | 1,139,580 | |
| | | | | | | | 15,694,613 | |
| Facilities (1.43%) | |
| Clear Creek Metropolitan Recreation District: | | | | | | | | |
| 2.50%, 12/01/17 | | | 1,430,000 | | | | 1,433,575 | |
| Tallyns Reach Metropolitan District No 3: | | | | | | | | |
| 4.00%, 12/01/21 | | | 1,930,000 | | | | 2,052,439 | |
| | | | | | | | 3,486,014 | |
| General Obligation (7.87%) | |
| Anthem West Metropolitan District: | | | | | | | | |
| 5.00%, 12/01/35 BAM(a)(c) | | | 1,165,000 | | | | 1,305,639 | |
| City of Sheridan CO: | | | | | | | | |
| 5.00%, 12/01/34(a) | | | 1,425,000 | | | | 1,621,635 | |
| 5.00%, 12/01/36(a) | | | 1,575,000 | | | | 1,784,869 | |
| Commonwealth of Puerto Rico (Puerto Rico): | | | | | | | | |
| 5.25%, 07/01/20 AGM(c) | | | 1,635,000 | | | | 1,751,412 | |
| 5.25%, 07/01/24 AGM(a)(c) | | | 1,850,000 | | | | 1,966,828 | |
| 5.38%, 07/01/25 AGM(a)(c) | | | 1,400,000 | | | | 1,486,842 | |
| 5.50%, 07/01/17 AGM(c) | | | 1,285,000 | | | | 1,285,000 | |
| 5.50%, 07/01/18 AGM(c) | | | 735,000 | | | | 758,314 | |
| 5.50%, 07/01/19 AGM(c) | | | 1,260,000 | | | | 1,335,814 | |
| High Plains Metropolitan District: | | | | | | | | |
| 4.00%, 12/01/47 NATL(a)(c) | | | 2,425,000 | | | | 2,433,124 | |
| 5.00%, 12/01/35 NATL(a)(c) | | | 500,000 | | | | 575,265 | |
| Vista Ridge Metropolitan District: | | | | | | | | |
| 5.00%, 12/01/27 BAM(a)(c) | | | 485,000 | | | | 577,519 | |
| 5.00%, 12/01/28 BAM(a)(c) | | | 750,000 | | | | 886,237 | |
| 5.00%, 12/01/31 BAM(a)(c) | | | 1,250,000 | | | | 1,450,138 | |
| | | | | | | | 19,218,636 | |
| | | Principal Amount | | | Value | |
| School District (2.46%) | |
| Arapahoe County School District No 1 Englewood: | | | | | | |
| 5.00%, 12/01/29(a)(b) | | $ | 2,440,000 | | | $ | 2,820,542 | |
| Boulder Larimer & Weld Counties St Vrain Valley School District Re1J: | | | | | | | | |
| 4.00%, 12/15/17 | | | 1,400,000 | | | | 1,419,208 | |
| Douglas County School District No Re-1 Douglas & Elbert Counties: | | | | | | | | |
| zero coupon, 12/15/22 | | | 1,660,000 | | | | 1,500,906 | |
| Routt-Rio Blanco Counties School District Re-3 South Routt/CO: | | | | | | | | |
| 1.50%, 12/01/17 | | | 255,000 | | | | 255,653 | |
| | | | | | | | 5,996,309 | |
| Total General Obligation Unltd | | | | | | | 44,395,572 | |
| | | | | | | | | |
| Revenue Bonds (51.43%) | |
| Airport (3.09%) | |
| City & County of Denver CO Airport System Revenue: | | | | | | | | |
| 1.34%, 11/15/31(a)(d) | | | 5,135,000 | | | | 5,155,335 | |
| 5.25%, 11/15/28(a) | | | 1,000,000 | | | | 1,085,100 | |
| Grand Junction Regional Airport Authority: | | | | | | | | |
| 5.00%, 12/01/31 NATL(a)(c) | | | 1,155,000 | | | | 1,304,607 | |
| | | | | | | | 7,545,042 | |
| Build America Bonds (3.86%) | |
| University of Colorado: | | | | | | | | |
| 6.26%, 06/01/36(a) | | | 8,770,000 | | | | 9,433,977 | |
| | | | | | | | | |
| Development (2.37%) | |
| Denver Convention Center Hotel Authority: | | | | | | | | |
| 5.00%, 12/01/27(a) | | | 2,000,000 | | | | 2,361,480 | |
| 5.00%, 12/01/31(a) | | | 1,500,000 | | | | 1,722,960 | |
| 5.00%, 12/01/32(a) | | | 500,000 | | | | 571,260 | |
| 5.00%, 12/01/33(a) | | | 500,000 | | | | 568,650 | |
| 5.00%, 12/01/34(a) | | | 500,000 | | | | 566,920 | |
| | | | | | | | 5,791,270 | |
See Notes to Financial Statements.
Semi-Annual Report | June 30, 2017 | | 81 |
| Westcore Colorado Tax-Exempt Fund | Statement of Investments |
June 30, 2017 (Unaudited)
| | | Principal Amount | | | Value | |
| Education (8.63%) | |
| Colorado Educational & Cultural Facilities Authority: | | | | | | |
| 4.00%, 04/01/22 | | $ | 160,000 | | | $ | 166,077 | |
| 4.13%, 07/01/26(a) | | | 630,000 | | | | 642,247 | |
| 5.00%, 10/01/19 | | | 115,000 | | | | 124,772 | |
| 5.00%, 05/01/35(a) | | | 3,145,000 | | | | 3,369,364 | |
| 5.00%, 05/15/29(a) | | | 2,600,000 | | | | 3,032,588 | |
| 5.00%, 11/01/30(a) | | | 500,000 | | | | 565,035 | |
| 5.00%, 07/01/36(a) | | | 1,000,000 | | | | 1,075,570 | |
| 5.00%, 12/15/31(a) | | | 715,000 | | | | 829,893 | |
| 5.00%, 08/01/36(a) | | | 805,000 | | | | 905,448 | |
| 5.00%, 06/01/36(a) | | | 1,580,000 | | | | 1,751,351 | |
| 5.00%, 08/15/30(a) | | | 750,000 | | | | 819,735 | |
| 5.00%, 11/15/24 | | | 435,000 | | | | 492,968 | |
| 5.00%, 11/15/31(a) | | | 1,000,000 | | | | 1,115,060 | |
| 5.00%, 07/01/36(a) | | | 1,000,000 | | | | 1,018,110 | |
| 5.00%, 09/01/36(a) | | | 1,000,000 | | | | 1,000,680 | |
| 5.00%, 12/01/31(a) | | | 1,500,000 | | | | 1,680,870 | |
| 5.00%, 09/01/46(a) | | | 500,000 | | | | 498,445 | |
| 5.00%, 10/01/32(a) | | | 1,340,000 | | | | 1,462,074 | |
| 5.63%, 01/15/44(a) | | | 490,000 | | | | 522,002 | |
| | | | | | | | 21,072,289 | |
| Facilities (0.35%) | |
| City & County of Denver CO Golf Revenue: | | | | | | | | |
| 5.00%, 09/01/18(a) | | | 350,000 | | | | 350,889 | |
| 5.00%, 09/01/19(a) | | | 500,000 | | | | 501,220 | |
| | | | | | | | 852,109 | |
| General (2.45%) | |
| City & County of Denver CO: | | | | | | | | |
| 5.25%, 09/01/18 AGM(b)(c) | | | 1,500,000 | | | | 1,572,870 | |
| City of Commerce City CO: | | | | | | | | |
| 5.00%, 08/01/28 AGM(a)(c) | | | 600,000 | | | | 698,328 | |
| County of Boulder CO: | | | | | | | | |
| 5.00%, 12/15/25(a)(b) | | | 1,000,000 | | | | 1,056,660 | |
| Hyland Hills Park & Recreation District: | | | | | | | | |
| 1.20%, 12/15/17 | | | 100,000 | | | | 99,747 | |
| 1.45%, 12/15/18 | | | 150,000 | | | | 148,828 | |
| 1.70%, 12/15/19 | | | 425,000 | | | | 418,106 | |
| 2.00%, 12/15/21 | | | 250,000 | | | | 251,060 | |
| 2.00%, 12/15/22 | | | 300,000 | | | | 298,158 | |
| 2.00%, 12/15/20 | | | 150,000 | | | | 147,164 | |
| 2.15%, 12/15/21 | | | 135,000 | | | | 131,356 | |
| 3.00%, 12/15/23 | | | 200,000 | | | | 208,702 | |
| 5.00%, 12/15/24 | | | 275,000 | | | | 322,435 | |
| Puerto Rico Municipal Finance Agency (Puerto Rico): | | | | | | | | |
| 5.00%, 08/01/17 AGM(a)(c) | | | 105,000 | | | | 105,251 | |
| Town of Castle Rock CO: | | | | | | | | |
| 6.00%, 06/01/23 AGC(a)(b)(c) | | | 500,000 | | | | 522,590 | |
| | | | | | | | 5,981,255 | |
| | | Principal Amount | | | Value | |
| Higher Education (3.78%) | |
| Auraria Higher Education Center: | | | | | | |
| 4.00%, 04/01/29 AGM(a)(c) | | $ | 2,500,000 | | | $ | 2,669,575 | |
| Colorado Educational & Cultural Facilities Authority: | | | | | | | | |
| 4.00%, 03/01/30(a) | | | 1,000,000 | | | | 1,093,770 | |
| 4.00%, 03/01/33(a) | | | 1,125,000 | | | | 1,206,934 | |
| 5.00%, 10/01/36(a) | | | 1,500,000 | | | | 1,706,640 | |
| 5.00%, 10/01/34(a) | | | 1,975,000 | | | | 2,209,274 | |
| University of Colorado: | | | | | | | | |
| 4.00%, 06/01/32(a) | | | 300,000 | | | | 330,123 | |
| | | | | | | | 9,216,316 | |
| Medical (17.30%) | |
| Aspen Valley Hospital District: | | | | | | | | |
| 5.00%, 10/15/30(a) | | | 1,650,000 | | | | 1,788,022 | |
| City of Aurora CO: | | | | | | | | |
| 5.00%, 12/01/22 AGM(a)(b)(c) | | | 1,000,000 | | | | 1,036,220 | |
| Colorado Health Facilities Authority: | | | | | | | | |
| 1.88%, 07/01/39(d) | | | 1,575,000 | | | | 1,573,378 | |
| 4.00%, 05/15/29(a) | | | 1,695,000 | | | | 1,835,549 | |
| 5.00%, 01/15/28(a) | | | 1,150,000 | | | | 1,362,715 | |
| 5.00%, 05/15/30(a) | | | 500,000 | | | | 571,030 | |
| 5.00%, 05/15/40(a) | | | 1,000,000 | | | | 1,113,130 | |
| 5.00%, 05/15/25 | | | 1,000,000 | | | | 1,204,230 | |
| 5.00%, 12/01/27(a) | | | 1,000,000 | | | | 1,200,180 | |
| 5.00%, 12/01/29(a) | | | 1,010,000 | | | | 1,187,477 | |
| 5.00%, 09/15/22(a) | | | 850,000 | | | | 855,032 | |
| 5.00%, 09/01/25(a) | | | 450,000 | | | | 452,813 | |
| 5.00%, 12/01/19 | | | 300,000 | | | | 321,738 | |
| 5.00%, 12/01/21 | | | 875,000 | | | | 985,871 | |
| 5.00%, 12/01/24(a) | | | 1,000,000 | | | | 1,140,240 | |
| 5.00%, 02/01/22 | | | 200,000 | | | | 220,732 | |
| 5.00%, 02/01/23 | | | 520,000 | | | | 578,890 | |
| 5.00%, 07/01/21(a) | | | 5,000,000 | | | | 5,300,700 | |
| 5.00%, 01/01/23(a) | | | 1,000,000 | | | | 1,086,890 | |
| 5.00%, 10/01/17 | | | 1,045,000 | | | | 1,054,687 | |
| 5.00%, 02/01/23(a) | | | 500,000 | | | | 544,925 | |
| 5.00%, 01/01/18 | | | 1,630,000 | | | | 1,653,130 | |
| 5.00%, 09/01/29(a) | | | 1,000,000 | | | | 1,162,500 | |
| 5.00%, 10/01/32(a) | | | 500,000 | | | | 547,845 | |
| 5.25%, 07/01/24(a) | | | 1,000,000 | | | | 1,060,560 | |
| 5.25%, 02/01/31(a) | | | 1,500,000 | | | | 1,588,875 | |
| 6.25%, 10/01/33(a) | | | 1,250,000 | | | | 1,317,025 | |
| Denver Health & Hospital Authority: | | | | | | | | |
| 1.91%, 12/01/33(a)(d) | | | 1,585,000 | | | | 1,406,577 | |
| 5.00%, 12/01/18(a) | | | 550,000 | | | | 551,826 | |
| 5.00%, 12/01/39(a) | | | 1,500,000 | | | | 1,584,375 | |
| University of Colorado Hospital Authority: | | | | | | | | |
| 4.00%, 11/15/47(a)(d) | | | 3,000,000 | | | | 3,162,840 | |
| 5.00%, 11/15/36(a) | | | 2,470,000 | | | | 2,773,835 | |
| | | | | | | | 42,223,837 | |
See Notes to Financial Statements.
82 | | www.westcore.com |
| Westcore Colorado Tax-Exempt Fund | Statement of Investments |
June 30, 2017 (Unaudited)
| | | Principal Amount | | | Value | |
| Multifamily Housing (2.51%) | |
| Colorado Housing & Finance Authority: | | | | | | |
| 1.05%, 08/01/18 FHA | | $ | 1,500,000 | | | $ | 1,501,200 | |
| 2.20%, 11/01/18 FHA | | | 4,565,000 | | | | 4,626,491 | |
| | | | | | | | 6,127,691 | |
| Nursing Homes (0.74%) | |
| Colorado Health Facilities Authority: | | | | | | | | |
| 4.00%, 01/01/21 | | | 255,000 | | | | 266,564 | |
| 4.00%, 01/01/22 | | | 265,000 | | | | 277,407 | |
| 5.00%, 06/01/22 | | | 750,000 | | | | 847,823 | |
5.25%, 06/01/23(a) | | | 55,000 | | | | 55,107 | |
5.25%, 06/01/18(a) | | | 220,000 | | | | 220,596 | |
5.25%, 06/01/20(a) | | | 145,000 | | | | 145,347 | |
| | | | | | | | 1,812,844 | |
| Power (0.79%) | |
| Colorado Water Resources & Power Development Authority: | | | | | | | | |
5.65%, 09/01/30 AGM(a)(c) | | | 1,745,000 | | | | 1,928,487 | |
| | | | | | | | | |
| Transportation (4.27%) | |
| Colorado High Performance Transportation Enterprise: | | | | | | | | |
5.00%, 12/31/47(a) | | | 1,600,000 | | | | 1,767,936 | |
5.00%, 12/31/51(a) | | | 2,500,000 | | | | 2,741,625 | |
5.00%, 12/31/56(a) | | | 3,800,000 | | | | 4,141,164 | |
| E-470 Public Highway Authority: | | | | | | | | |
1.87%, 09/01/39(a)(d) | | | 1,000,000 | | | | 1,008,330 | |
| Regional Transportation District: | | | | | | | | |
6.00%, 01/15/34(a) | | | 700,000 | | | | 773,962 | |
| | | | | | | | 10,433,017 | |
| Water (1.29%) | |
| City & County of Broomfield CO: | | | | | | | | |
5.00%, 12/01/23(a) | | | 1,285,000 | | | | 1,482,890 | |
| City of Brighton CO Water Activity Revenue: | | | | | | | | |
5.00%, 12/01/29 AGC(a)(b)(c) | | | 1,515,000 | | | | 1,652,819 | |
| | | | | | | | 3,135,709 | |
| Total Revenue Bonds | | | | | | | 125,553,843 | |
| | | | | | | | | |
| Tax Allocation (4.34%) | |
| Development (0.70%) | |
| Denver Urban Renewal Authority: | | | | | | | | |
5.00%, 12/01/24(a) | | | 500,000 | | | | 577,555 | |
5.00%, 12/01/25(a) | | | 1,000,000 | | | | 1,141,880 | |
| | | | | | | | 1,719,435 | |
| General (3.64%) | |
| Centerra Metropolitan District No 1: | | | | | | | | |
| 5.00%, 12/01/20 | | | 750,000 | | | | 804,187 | |
| Fountain Urban Renewal Authority: | | | | | | | | |
4.50%, 11/01/29(a) | | | 1,945,000 | | | | 1,958,323 | |
| Park Creek Metropolitan District: | | | | | | | | |
5.00%, 12/01/26(a) | | | 730,000 | | | | 831,894 | |
5.00%, 12/01/27(a) | | | 620,000 | | | | 702,125 | |
| | | Principal Amount | | | Value | |
| General (continued) | |
| Plaza Metropolitan District No 1: | | | | | | |
| 5.00%, 12/01/22 | | $ | 1,000,000 | | | $ | 1,095,910 | |
| Thornton Development Authority: | | | | | | | | |
| 5.00%, 12/01/23 | | | 300,000 | | | | 350,490 | |
| 5.00%, 12/01/24 | | | 440,000 | | | | 521,418 | |
5.00%, 12/01/25(a) | | | 325,000 | | | | 385,382 | |
5.00%, 12/01/26(a) | | | 425,000 | | | | 502,371 | |
5.00%, 12/01/30(a) | | | 500,000 | | | | 581,055 | |
5.00%, 12/01/31(a) | | | 1,000,000 | | | | 1,154,820 | |
| | | | | | | | 8,887,975 | |
| Total Tax Allocation | | | | | | | 10,607,410 | |
| | | | | | | | | |
| Total Municipal Bonds (Cost $232,641,042) | | | | 234,629,646 | |
| | | Shares | | | Value | |
| Money Market Mutual Funds (3.28%) | |
| Goldman Sachs Financial Square - Government Fund, (7 Day Yield 0.834%) | | | 7,995,739 | | | | 7,995,739 | |
| | | | | | | | | |
| Total Money Market Mutual Funds (Cost $7,995,739) | | | | 7,995,739 | |
| | |
| Total Investments (99.39%) (Cost $240,636,781) | | | $ | 242,625,385 | |
| | | | | | | | | |
| Other Assets Less Liabilities (0.61%) | | | | 1,495,792 | |
| | | | | | | | | |
| Net Assets (100.00%) | | | $ | 244,121,177 | |
Investment classifications presented herein are based on the categorization methodology of the Adviser to the Funds which may result in the designations for one Fund being different form another. Investment classifications are unaudited. For Fund compliance purposes, the Fund’s industry classifications refer to any one or more of the industry sub-classifications used by one or more widely recognized market indexes or ratings group indexes, and/or as defined by Fund management. This definition may not apply for purposes of this report, which may combine industry sub-classifications for reporting ease. Industries are shown as a percentage of net assets.
(a) | Security can be called and redeemed at the option of the issuer prior to the stated maturity date which is included in the Statement of Investments. |
(b) | This security is prerefunded in advance of the next call date. |
| See Notes to Financial Statements. | |
Semi-Annual Report | June 30, 2017 | | 83 |
| Westcore Colorado Tax-Exempt Fund | Statement of Investments |
June 30, 2017 (Unaudited)
(c) | This security is insured. In the event of a default by the bond issuer, the insurer, as noted in the security description, guarantees scheduled principal and interest payments will be made when due. |
(d) | The coupon rate shown on floating or adjustable rate securities represents the rate at period end. |
| See Notes to Financial Statements. | |
| 84 | | www.westcore.com |
| Westcore Funds | Statement of Investments |
June 30, 2017 (Unaudited)
| COMMON ABBREVIATIONS |
| ADR | American Depositary Receipt. |
| AG | Aktiengesellschaft is a German term that refers to a corporation that is limited by shares, i.e., owned by shareholders. |
| AGC | Assured Guaranty Corporation |
| AGM | Assured Guaranty Municipal. |
| AMBAC | AmbacAssurance Corporation. |
| BAM | Build America Mutual |
| LLC | Limited Liability Company. |
| LP | Limited Partnership. |
| Ltd. | Limited. |
| MORAL OBLG | Charter School Moral Obligation Program. Moral Obligation bonds are revenue-backed, state issued municipal bonds, whose principal and interest is backed by the moral, but not legal, obligation of a state government. |
| NATL | National Public Finance Guarantee Corporation |
| NATL FGIC | National Public Finance Guarantee Corporation / Financial Guaranty Insurance Company |
| N.V. | Naamloze Vennootschap is the Dutch term for a public limited liability corporation. |
| PLC | Public Limited Company. |
| REIT(s) | Real Estate Investment Trust. |
| SA | Generally designates corporations in various countries, mostly those employing the civil law. This translates literally in all languages mentioned as anonymous company. |
| SE | SE Regulation. A European Company which can operate on a Europe-wide basis and be governed by Community law directly applicable in all Member States. |
| S.p.A. | Società Per Azioni is an Italian shared company. |
| XLCA | XL Capital Assurance Inc. |
| CURRENCY ABBREVIATIONS |
| AED | United Arab Emirates Dirham |
| AUD | Australian Dollar |
| BRL | Brazilian Dollar |
| CAD | Canadian Dollar |
| CHF | Swiss Franc |
| CLP | Chilean Peso |
| COP | Colombian Peso |
| CZK | Czech Republic Koruna |
| DKK | Danish Krone |
| EUR | Euro Currency |
| GBP | British Pound |
| HKD | Hong Kong Dollar |
| HUK | Hungarian Forint |
| IDR | Indonesian Rupiah |
| ILS | Israeli Shekel |
| INR | Indian Rupee |
| JPY | Japanese Yen |
| KRW | South Korean Won |
| MXN | Mexican Peso |
| MYR | Malaysian Ringgit |
| NOK | Norwegian Krone |
| NZD | New Zealand Dollar |
| PEN | Peruvian Sol |
| PHP | Philippine Peso |
| PLN | Polish Zloty |
| QAR | Qatari Rial |
| RUB | Russian Ruble |
| SEK | Swedish Krona |
| SGD | Singapore Dollar |
| THB | Thai Baht |
| TRY | Turkish Lira |
| TWD | New Taiwan Dollar |
| ZAR | South African Rand |
| See Notes to Financial Statements. | |
Semi-Annual Report | June 30, 2017 | | 85 |
| Westcore Funds | Statements of Assets and Liabilities |
| | June 30, 2017 (Unaudited) |
| | | Westcore Small-Cap Growth Fund | | | Westcore Small-Cap Growth Fund II | | | Westcore Mid-Cap Value Dividend Fund | | | Westcore Mid-Cap Value Dividend Fund II | | | Westcore Smid-Cap Value Dividend Fund | |
| Assets | | | | | | | | | | | | | | | |
| Investments, at cost | | $ | 4,243,099 | | | $ | 35,476,757 | | | $ | 77,419,103 | | | $ | 33,215,336 | | | $ | 688,217 | |
| Investments, at value | | | 5,182,573 | | | | 38,252,242 | | | | 84,161,836 | | | | 32,761,894 | | | | 673,388 | |
| Foreign currency, at value (Cost $–, $–, $2,802,$1,068 and $–, respectively) | | | – | | | | – | | | | 2,802 | | | | 1,068 | | | | – | |
| Receivables: | | | | | | | | | | | | | | | | | | | | |
| Fund shares subscribed | | | 4,484 | | | | 409 | | | | 17,686 | | | | 150 | | | | – | |
| Dividends and interest | | | 2,401 | | | | 16,391 | | | | 238,498 | | | | 90,351 | | | | 1,821 | |
| Due from Adviser | | | 2,207 | | | | – | | | | – | | | | – | | | | 6,606 | |
| Prepaid and other assets | | | 12,374 | | | | 8,864 | | | | 15,105 | | | | 15,234 | | | | 9,197 | |
| Total assets | | | 5,204,039 | | | | 38,277,906 | | | | 84,435,927 | | | | 32,868,697 | | | | 691,012 | |
| | | | | | | | | | | | | | | | | | | | | |
| Liabilities | | | | | | | | | | | | | | | | | | | | |
| Payables: | | | | | | | | | | | | | | | | | | | | |
| Investment securities purchased | | | – | | | | – | | | | 2,795 | | | | 1,065 | | | | – | |
| Fund shares redeemed | | | – | | | | 159,853 | | | | 527,594 | | | | – | | | | – | |
| Investment advisory fee | | | – | | | | 19,631 | | | | 45,326 | | | | 13,430 | | | | – | |
| Administration fee | | | 4,497 | | | | 6,559 | | | | 12,297 | | | | 6,610 | | | | 2,546 | |
| Shareholder servicing reimbursements | | | 89 | | | | – | | | | 8,227 | | | | 1,504 | | | | 34 | |
| Transfer agent fee | | | 1,746 | | | | 3,576 | | | | 718 | | | | 6,129 | | | | 2,071 | |
| Audit fee | | | 10,295 | | | | 10,933 | | | | 12,231 | | | | 11,738 | | | | 8,698 | |
| Printing fee | | | 1,500 | | | | 393 | | | | 4,332 | | | | 512 | | | | 42 | |
| Trustee fee | | | 98 | | | | 1,348 | | | | 2,598 | | | | 1,209 | | | | 16 | |
| Custody fee | | | 4,469 | | | | 1,206 | | | | 379 | | | | 1,754 | | | | 2,113 | |
| Chief compliance officer fee | | | 3 | | | | 227 | | | | 162 | | | | 284 | | | | 10 | |
| Other liabilities | | | 1,619 | | | | 183 | | | | 861 | | | | 433 | | | | – | |
| Total liabilities | | | 24,316 | | | | 203,909 | | | | 617,520 | | | | 44,668 | | | | 15,530 | |
| Net Assets | | $ | 5,179,723 | | | $ | 38,073,997 | | | $ | 83,818,407 | | | $ | 32,824,029 | | | $ | 675,482 | |
| | | | | | | | | | | | | | | | | | | | | |
| Net Assets Consists of | | | | | | | | | | | | | | | | | | | | |
| Paid‐in capital | | $ | 3,974,391 | | | $ | 118,758,909 | | | $ | 66,871,645 | | | $ | 33,057,049 | | | $ | 678,522 | |
| Accumulated net investment income/(loss) | | | (16,277 | ) | | | (140,150 | ) | | | 699,366 | | | | (16,207 | ) | | | 5,296 | |
| Accumulated net realized gain/(loss) | | | 282,135 | | | | (83,320,247 | ) | | | 9,504,146 | | | | 236,434 | | | | 6,493 | |
| Net unrealized appreciation/(depreciation) | | | 939,474 | | | | 2,775,485 | | | | 6,743,250 | | | | (453,247 | ) | | | (14,829 | ) |
| Net Assets | | $ | 5,179,723 | | | $ | 38,073,997 | | | $ | 83,818,407 | | | $ | 32,824,029 | | | $ | 675,482 | |
| | | | | | | | | | | | | | | | | | | | | |
| Net Assets | | | | | | | | | | | | | | | | | | | | |
| Retail | | | 862,772 | | | | N/A | | | | 49,034,734 | | | | 31,081,256 | | | | 428,771 | |
| Institutional | | | 4,316,951 | | | | 38,073,997 | | | | 34,783,673 | | | | 1,742,773 | | | | 246,711 | |
| Shares of Beneficial Interest Outstanding | | | | | | | | | | | | | | | | | | | | |
| Retail | | | 68,343 | | | | N/A | | | | 1,768,983 | | | | 6,833,611 | | | | 43,474 | |
| Institutional | | | 338,095 | | | | 1,557,436 | | | | 1,237,632 | | | | 372,882 | | | | 25,000 | |
| Net Asset Value and Redemption Price Per Share (Net Assets Per Share Outstanding) | | | | | | | | | | | | | | | | | | | | |
| Retail | | $ | 12.62 | | | $ | N/A | | | $ | 27.72 | | | $ | 4.55 | | | $ | 9.86 | |
| Institutional | | $ | 12.77 | | | $ | 24.45 | | | $ | 28.11 | | | $ | 4.67 | | | $ | 9.87 | |
| See Notes to Financial Statements. | |
| 86 | | www.westcore.com |
| Westcore Funds | Statements of Assets and Liabilities |
| | June 30, 2017 (Unaudited) |
| | | Westcore Small-Cap Value Dividend Fund | | | Westcore Global Large-Cap Dividend Fund | | | Westcore Large-Cap Dividend Fund | | | Westcore Micro-Cap Opportunity Fund | | | Westcore International Small-Cap Fund | |
| Assets | | | | | | | | | | | | | | | |
| Investments, at cost | | $ | 184,913,303 | | | $ | 44,987,353 | | | $ | 10,352,056 | | | $ | 11,589,992 | | | $ | 48,095,592 | |
| Investments, at value | | | 204,851,115 | | | | 53,212,923 | | | | 11,116,500 | | | | 13,712,341 | | | | 72,544,581 | |
| Unrealized gain on forward foreign currency contracts | | | – | | | | – | | | | – | | | | – | | | | 185,393 | |
| Foreign currency, at value (Cost $–, $29,792, $ –,$– and $–, respectively) | | | – | | | | 29,792 | | | | – | | | | – | | | | – | |
| Receivables: | | | | | | | | | | | | | | | | | | | | |
| Investment securities sold | | | 567,144 | | | | 1,154 | | | | – | | | | 2,939,910 | | | | 151,619 | |
| Fund shares subscribed | | | 39,615 | | | | 12,848 | | | | – | | | | 3,510 | | | | 156,798 | |
| Dividends and interest | | | 601,778 | | | | 149,234 | | | | 25,475 | | | | 14,192 | | | | 326,017 | |
| Due from Adviser | | | – | | | | – | | | | 2,271 | | | | – | | | | – | |
| Prepaid and other assets | | | 15,125 | | | | 13,107 | | | | 15,837 | | | | 13,307 | | | | 22,809 | |
| Total assets | | | 206,074,777 | | | | 53,419,058 | | | | 11,160,083 | | | | 16,683,260 | | | | 73,387,217 | |
| | | | | | | | | | | | | | | | | | | | | |
| Liabilities | | | | | | | | | | | | | | | | | | | | |
| Unrealized loss on forward foreign currency contracts | | | – | | | | – | | | | – | | | | – | | | | 307,775 | |
| Payables: | | | | | | | | | | | | | | | | | | | | |
| Investment securities purchased | | | 1,769,392 | | | | – | | | | – | | | | 3,126,210 | | | | 123,007 | |
| Fund shares redeemed | | | 332,217 | | | | 10,869 | | | | 208 | | | | 2,186 | | | | 9,583 | |
| Investment advisory fee | | | 142,356 | | | | 19,891 | | | | – | | | | 4,139 | | | | 55,162 | |
| Administration fee | | | 26,943 | | | | 8,250 | | | | 3,188 | | | | 7,962 | | | | 12,826 | |
| Shareholder servicing reimbursements | | | 12,651 | | | | 4,572 | | | | 1,226 | | | | 2,324 | | | | 6,980 | |
| Transfer agent fee | | | 5,467 | | | | 9,305 | | | | 2,274 | | | | 1,695 | | | | 5,643 | |
| Audit fee | | | 13,014 | | | | 12,191 | | | | 11,815 | | | | 10,311 | | | | 14,047 | |
| Printing fee | | | 14,034 | | | | 4,341 | | | | 15 | | | | 2,512 | | | | 7,108 | |
| Trustee fee | | | 7,160 | | | | 1,636 | | | | 716 | | | | 304 | | | | 2,165 | |
| Custody fee | | | 4,090 | | | | 3,686 | | | | 1,578 | | | | 1,908 | | | | 10,078 | |
| Chief compliance officer fee | | | 851 | | | | 160 | | | | 225 | | | | 28 | | | | 318 | |
| Due to custodian | | | – | | | | 17,625 | | | | – | | | | – | | | | – | |
| Other liabilities | | | 4,159 | | | | 1,430 | | | | 48 | | | | 765 | | | | 3,528 | |
| Total liabilities | | | 2,332,334 | | | | 93,956 | | | | 21,293 | | | | 3,160,344 | | | | 558,220 | |
| Net Assets | | $ | 203,742,443 | | | $ | 53,325,102 | | | $ | 11,138,790 | | | $ | 13,522,916 | | | $ | 72,828,997 | |
| | | | | | | | | | | | | | | | | | | | | |
| Net Assets Consists of | | | | | | | | | | | | | | | | | | | | |
| Paid‐in capital | | $ | 154,375,051 | | | $ | 42,972,338 | | | $ | 8,718,984 | | | $ | 9,060,023 | | | $ | 60,705,447 | |
| Accumulated net investment income/(loss) | | | 1,725,365 | | | | 7,886 | | | | (15,121 | ) | | | 732 | | | | (1,646,117 | ) |
| Accumulated net realized gain/(loss) | | | 27,704,145 | | | | 2,118,888 | | | | 1,670,483 | | | | 2,339,812 | | | | (10,523,931 | ) |
| Net unrealized appreciation/(depreciation) | | | 19,937,882 | | | | 8,225,990 | | | | 764,444 | | | | 2,122,349 | | | | 24,293,598 | |
| Net Assets | | $ | 203,742,443 | | | $ | 53,325,102 | | | $ | 11,138,790 | | | $ | 13,522,916 | | | $ | 72,828,997 | |
| | | | | | | | | | | | | | | | | | | | | |
| Net Assets | | | | | | | | | | | | | | | | | | | | |
| Retail | | | 74,572,806 | | | | 49,072,877 | | | | 10,613,816 | | | | 13,522,916 | | | | 46,594,542 | |
| Institutional | | | 129,169,637 | | | | 4,252,225 | | | | 524,974 | | | | N/A | | | | 26,234,455 | |
| Shares of Beneficial Interest Outstanding | | | | | | | | | | | | | | | | | | | | |
| Retail | | | 6,113,049 | | | | 4,597,003 | | | | 1,584,438 | | | | 713,279 | | | | 2,682,820 | |
| Institutional | | | 10,567,764 | | | | 401,225 | | | | 75,778 | | | | N/A | | | | 1,454,847 | |
| Net Asset Value and Redemption Price Per Share (Net Assets Per Share Outstanding) | | | | | | | | | | | | | | | | | | | | |
| Retail | | $ | 12.20 | | | $ | 10.67 | | | $ | 6.70 | | | $ | 18.96 | | | $ | 17.37 | |
| Institutional | | $ | 12.22 | | | $ | 10.60 | | | $ | 6.93 | | | $ | N/A | | | $ | 18.03 | |
| See Notes to Financial Statements. | |
Semi-Annual Report | June 30, 2017 | | 87 |
| Westcore Funds | Statements of Assets and Liabilities |
| | June 30, 2017 (Unaudited) |
| | | Westcore Flexible Income Fund | | | Westcore Plus Bond Fund | | | Westcore Municipal Opportunities Fund | | | Westcore Colorado Tax- Exempt Fund | |
| Assets | | | | | | | | | | | | |
| Investments, at cost | | $ | 78,181,078 | | | $ | 1,188,769,255 | | | $ | 4,887,672 | | | $ | 240,636,781 | |
| Investments, at value | | | 78,328,057 | | | | 1,217,679,385 | | | | 4,935,956 | | | | 242,625,385 | |
| Receivables: | | | | | | | | | | | | | | | | |
| Investment securities sold | | | 1,009 | | | | 1,716,262 | | | | 143 | | | | 3,291 | |
| Fund shares subscribed | | | 58,915 | | | | 286,439 | | | | – | | | | 30,325 | |
| Dividends and interest | | | 948,545 | | | | 9,267,642 | | | | 38,276 | | | | 1,791,457 | |
| Due from Adviser | | | – | | | | – | | | | 6,028 | | | | – | |
| Prepaid and other assets | | | 17,130 | | | | 37,418 | | | | 38,615 | | | | 9,956 | |
| Total assets | | | 79,353,656 | | | | 1,228,987,146 | | | | 5,019,018 | | | | 244,460,414 | |
| | | | | | | | | | | | | | | | | |
| Liabilities | | | | | | | | | | | | | | | | |
| Payables: | | | | | | | | | | | | | | | | |
| Investment securities purchased | | | 816,000 | | | | 12,801,206 | | | | 59,835 | | | | – | |
| Fund shares redeemed | | | 30,412 | | | | 1,097,574 | | | | – | | | | 169,922 | |
| Investment advisory fee | | | 21,077 | | | | 148,284 | | | | – | | | | 47,669 | |
| Administration fee | | | 15,507 | | | | 156,917 | | | | 4,648 | | | | 45,081 | |
| Shareholder servicing reimbursements | | | 9,696 | | | | 178,869 | | | | 98 | | | | 33,038 | |
| Transfer agent fee | | | 3,386 | | | | 12,269 | | | | 1,930 | | | | 1,406 | |
| Audit fee | | | 13,930 | | | | 22,248 | | | | 11,517 | | | | 14,570 | |
| Printing fee | | | 4,174 | | | | 76,279 | | | | 124 | | | | 11,155 | |
| Trustee fee | | | 2,896 | | | | 46,664 | | | | 87 | | | | 9,275 | |
| Custody fee | | | 1,412 | | | | 23,957 | | | | 1,443 | | | | 3,000 | |
| Chief compliance officer fee | | | 364 | | | | 7,182 | | | | 9 | | | | 1,168 | |
| Other Liabilities | | | 1,303 | | | | 12,059 | | | | – | | | | 2,953 | |
| Total liabilities | | | 920,157 | | | | 14,583,508 | | | | 79,691 | | | | 339,237 | |
| Net Assets | | $ | 78,433,499 | | | $ | 1,214,403,638 | | | $ | 4,939,327 | | | $ | 244,121,177 | |
| | | | | | | | | | | | | | | | | |
| Net Assets Consists of | | | | | | | | | | | | | | | | |
| Paid‐in capital | | $ | 96,233,911 | | | $ | 1,185,255,645 | | | $ | 4,858,278 | | | $ | 242,330,194 | |
| Accumulated net investment income/(loss) | | | 94,152 | | | | (1,311,756 | ) | | | 695 | | | | (1,874 | ) |
| Accumulated net realized gain/(loss) | | | (18,041,543 | ) | | | 1,549,619 | | | | 32,070 | | | | (195,747 | ) |
| Net unrealized appreciation/(depreciation) | | | 146,979 | | | | 28,910,130 | | | | 48,284 | | | | 1,988,604 | |
| Net Assets | | $ | 78,433,499 | | | $ | 1,214,403,638 | | | $ | 4,939,327 | | | $ | 244,121,177 | |
| | | | | | | | | | | | | | | | | |
| Net Assets | | | | | | | | | | | | | | | | |
| Retail | | | 59,673,480 | | | | 1,024,468,035 | | | | 1,353,864 | | | | 202,577,234 | |
| Institutional | | | 18,760,019 | | | | 189,935,603 | | | | 3,585,463 | | | | 41,543,943 | |
| Shares of Beneficial Interest Outstanding | | | | | | | | | | | | | | | | |
| Retail | | | 6,612,385 | | | | 95,543,141 | | | | 128,899 | | | | 17,593,374 | |
| Institutional | | | 2,105,648 | | | | 17,896,364 | | | | 341,175 | | | | 3,601,762 | |
| Net Asset Value and Redemption Price Per Share (Net Assets Per Share Outstanding) | | | | | | | | | | | | | | | | |
| Retail | | $ | 9.02 | | | $ | 10.72 | | | $ | 10.50 | | | $ | 11.51 | |
| Institutional | | $ | 8.91 | | | $ | 10.61 | | | $ | 10.51 | | | $ | 11.53 | |
| See Notes to Financial Statements. | |
| 88 | | www.westcore.com |
| Westcore Funds | Statements of Operations |
| | For the Six Months Ended June 30, 2017 (Unaudited) |
| | | Westcore
Small-Cap Growth Fund | | | Westcore
Small-Cap Growth Fund II | | | Westcore
Mid-Cap Value Dividend Fund | | | Westcore
Mid-Cap Value Dividend Fund II | | | Westcore
Smid-Cap Value Dividend Fund | |
| Investment Income | | | | | | | | | | | | | | | |
| Dividends | | $ | 12,369 | | | $ | 92,537 | | | $ | 1,090,643 | | | $ | 434,754 | | | $ | 7,589 | |
| Foreign taxes withheld | | | (75 | ) | | | (575 | ) | | | (7,831 | ) | | | (3,058 | ) | | | (24 | ) |
| Total income | | | 12,294 | | | | 91,962 | | | | 1,082,812 | | | | 431,696 | | | | 7,565 | |
| | | | | | | | | | | | | | | | | | | | | |
| Expenses | | | | | | | | | | | | | | | | | | | | |
| Investment advisory fee | | | 23,831 | | | | 117,873 | | | | 305,277 | | | | 112,333 | | | | 2,035 | |
| Administrative fee | | | 3,217 | | | | 24,481 | | | | 57,587 | | | | 23,331 | | | | 343 | |
| Shareholder servicing reimbursement - Retail Class | | | 519 | | | | – | | | | 48,845 | | | | 9,802 | | | | 248 | |
| Transfer agent fees | | | 7,820 | | | | 14,057 | | | | 9,277 | | | | 22,584 | | | | 6,730 | |
| Registration fees | | | 14,372 | | | | 7,855 | | | | 16,663 | | | | 14,416 | | | | 3,552 | |
| Audit and tax preparation fees | | | 7,647 | | | | 8,291 | | | | 9,649 | | | | 9,095 | | | | 5,630 | |
| Legal fees | | | 88 | | | | 750 | | | | 1,563 | | | | 783 | | | | 185 | |
| Independent pricing service fees | | | 3,607 | | | | 2,189 | | | | 2,915 | | | | 2,502 | | | | 2,387 | |
| Trustee fees and expenses | | | 289 | | | | 2,739 | | | | 6,262 | | | | 2,548 | | | | 49 | |
| Insurance expense | | | 81 | | | | 775 | | | | 1,423 | | | | 871 | | | | – | |
| Custodian fees | | | 4,597 | | | | 5,572 | | | | 5,624 | | | | 6,030 | | | | 4,846 | |
| Printing fees | | | 958 | | | | 6,760 | | | | 3,344 | | | | 3,700 | | | | – | |
| Chief compliance officer fee | | | 143 | | | | 1,271 | | | | 2,741 | | | | 1,237 | | | | 14 | |
| Offering costs | | | – | | | | – | | | | 4,882 | | | | – | | | | 12,530 | |
| Other | | | 3,415 | | | | 3,177 | | | | 4,420 | | | | 4,031 | | | | 2,519 | |
| Total expenses before waivers/reimbursements | | | 70,584 | | | | 195,790 | | | | 480,472 | | | | 213,263 | | | | 41,068 | |
| Expenses waived/reimbursed by investment advisor | | | | | | | | | | | | | | | | | | | | |
| Retail | | | (7,245 | ) | | | – | | | | – | | | | (14,402 | ) | | | (18,724 | ) |
| Institutional | | | (33,916 | ) | | | – | | | | (4,926 | ) | | | (726 | ) | | | (19,592 | ) |
| Net expenses | | | 29,423 | | | | 195,790 | | | | 475,546 | | | | 198,135 | | | | 2,752 | |
| Net Investment Income/(Loss) | | | (17,129 | ) | | | (103,828 | ) | | | 607,266 | | | | 233,561 | | | | 4,813 | |
| | | | | | �� | | | | | | | | | | | | | | | |
| Realized and Unrealized Gain/(Loss) | | | | | | | | | | | | | | | | | | | | |
| Net realized gain/(loss) on: | | | | | | | | | | | | | | | | | | | | |
| Investments | | | 475,053 | | | | 3,955,727 | | | | 6,568,574 | | | | 870,176 | | | | 6,508 | |
| Foreign currency | | | – | | | | – | | | | 73 | | | | 65 | | | | – | |
| | | | 475,053 | | | | 3,955,727 | | | | 6,568,647 | | | | 870,241 | | | | 6,508 | |
| Change in unrealized net appreciation/(depreciation) on: | | | | | | | | | | | | | | | | | | | | |
| Investments | | | 235,493 | | | | 3,219,394 | | | | (6,515,039 | ) | | | (616,803 | ) | | | (11,893 | ) |
| Translation of assets and liabilities denoted in foreign currencies | | | – | | | | – | | | | 599 | | | | 195 | | | | – | |
| | | | 235,493 | | | | 3,219,394 | | | | (6,514,440 | ) | | | (616,608 | ) | | | (11,893 | ) |
| Net realized and unrealized gain/(loss) | | | 710,546 | | | | 7,175,121 | | | | 54,207 | | | | 253,633 | | | | (5,385 | ) |
| Net Increase/(Decrease) in Net Assets Resulting From Operations | | $ | 693,417 | | | $ | 7,071,293 | | | $ | 661,473 | | | $ | 487,194 | | | $ | (572 | ) |
| See Notes to Financial Statements. | |
Semi-Annual Report | June 30, 2017 | | 89 |
| Westcore Funds | Statements of Operations |
| | For the Six Months Ended June 30, 2017 (Unaudited) |
| | | Westcore
Small-Cap Value Dividend Fund | | | Westcore
Global Large-Cap Dividend Fund | | | Westcore
Large-Cap Dividend Fund | | | Westcore
Micro-Cap Opportunity Fund | | | Westcore
International Small-Cap Fund | |
| Investment Income | | | | | | | | | | | | | | | |
| Dividends | | $ | 2,680,890 | | | $ | 929,309 | | | $ | 179,863 | | | $ | 86,127 | | | $ | 765,916 | |
| Foreign taxes withheld | | | (5,502 | ) | | | (70,518 | ) | | | (2,297 | ) | | | (622 | ) | | | (114,463 | ) |
| Total income | | | 2,675,388 | | | | 858,791 | | | | 177,566 | | | | 85,505 | | | | 651,453 | |
| | | | | | | | | | | | | | | | | | | | | |
| Expenses | | | | | | | | | | | | | | | | | | | | |
| Investment advisory fee | | | 1,032,016 | | | | 163,491 | | | | 39,066 | | | | 64,520 | | | | 423,095 | |
| Administrative fee | | | 139,322 | | | | 33,959 | | | | 8,114 | | | | 8,710 | | | | 47,597 | |
| Shareholder servicing reimbursement - Retail Class | | | 82,784 | | | | 25,388 | | | | 8,160 | | | | 13,724 | | | | 42,708 | |
| Transfer agent fees | | | 23,270 | | | | 33,709 | | | | 10,171 | | | | 7,703 | | | | 20,594 | |
| Registration fees | | | 17,193 | | | | 11,731 | | | | 13,858 | | | | 8,645 | | | | 11,733 | |
| Audit and tax preparation fees | | | 10,511 | | | | 9,566 | | | | 9,156 | | | | 7,673 | | | | 11,411 | |
| Legal fees | | | 4,125 | | | | 946 | | | | 312 | | | | 252 | | | | 1,406 | |
| Independent pricing service fees | | | 3,951 | | | | 2,148 | | | | 1,778 | | | | 6,176 | | | | 4,386 | |
| Trustee fees and expenses | | | 15,837 | | | | 3,648 | | | | 1,099 | | | | 840 | | | | 4,818 | |
| Insurance expense | | | 3,797 | | | | 921 | | | | 485 | | | | 215 | | | | 1,430 | |
| Custodian fees | | | 13,828 | | | | 7,339 | | | | 4,569 | | | | 1,737 | | | | 13,608 | |
| Printing fees | | | 7,845 | | | | 3,485 | | | | 1,737 | | | | 1,662 | | | | 5,238 | |
| Chief compliance officer fee | | | 7,174 | | | | 1,634 | | | | 496 | | | | 419 | | | | 2,324 | |
| Offering costs | | | – | | | | – | | | | – | | | | – | | | | 4,882 | |
| Other | | | 6,358 | | | | 4,215 | | | | 3,666 | | | | 2,806 | | | | 5,945 | |
| Total expenses before waivers/reimbursements | | | 1,368,011 | | | | 302,180 | | | | 102,667 | | | | 125,082 | | | | 601,175 | |
| Expenses waived/reimbursed by investment advisor | | | | | | | | | | | | | | | | | | | | |
| Retail | | | (61,060 | ) | | | (50,856 | ) | | | (37,367 | ) | | | (41,197 | ) | | | (73,119 | ) |
| Institutional | | | (83,083 | ) | | | (3,926 | ) | | | (1,696 | ) | | | N/A | | | | (37,992 | ) |
| Net expenses | | | 1,223,868 | | | | 247,398 | | | | 63,604 | | | | 83,885 | | | | 490,064 | |
| Net Investment Income/(Loss) | | | 1,451,520 | | | | 611,393 | | | | 113,962 | | | | 1,620 | | | | 161,389 | |
| | | | | | | | | | | | | | | | | | | | | |
| Realized and Unrealized Gain/(Loss) | | | | | | | | | | | | | | | | | | | | |
| Net realized gain/(loss) on: | | | | | | | | | | | | | | | | | | | | |
| Investments | | | 16,213,217 | | | | 654,426 | | | | 134,755 | | | | 2,339,716 | | | | 2,118,836 | |
| Foreign currency | | | 40 | | | | (1,176 | ) | | | – | | | | – | | | | (21,661 | ) |
| Forward foreign currency contracts | | | – | | | | – | | | | – | | | | – | | | | 399,017 | |
| | | | 16,213,257 | | | | 653,250 | | | | 134,755 | | | | 2,339,716 | | | | 2,496,192 | |
| Change in unrealized net appreciation/(depreciation) on: | | | | | | | | | | | | | | | | | | | | |
| Investments | | | (23,032,939 | ) | | | 3,632,179 | | | | 443,592 | | | | (2,332,071 | ) | | | 7,541,184 | |
| Forward foreign currency contracts | | | – | | | | – | | | | – | | | | – | | | | (145,727 | ) |
| Translation of assets and liabilities denoted in foreign currencies | | | 70 | | | | 4,105 | | | | – | | | | – | | | | 17,148 | |
| | | | (23,032,869 | ) | | | 3,636,284 | | | | 443,592 | | | | (2,332,071 | ) | | | 7,412,605 | |
| Net realized and unrealized gain/(loss) | | | (6,819,612 | ) | | | 4,289,534 | | | | 578,347 | | | | 7,645 | | | | 9,908,797 | |
| Net Increase/(Decrease) in Net Assets Resulting From Operations | | $ | (5,368,092 | ) | | $ | 4,900,927 | | | $ | 692,309 | | | $ | 9,265 | | | $ | 10,070,186 | |
| See Notes to Financial Statements. | |
| 90 | | www.westcore.com |
| Westcore Funds | Statements of Operations |
| | For the Six Months Ended June 30, 2017 (Unaudited) |
| | | Westcore Flexible Income Fund | | | Westcore Plus Bond Fund | | | Westcore Municipal Opportunities Fund | | | Westcore Colorado Tax-Exempt Fund | |
| Investment Income | | | | | | | | | | | | |
| Dividends | | $ | 74,135 | | | $ | 305,973 | | | $ | 650 | | | $ | 30,756 | |
| Interest | | | 2,094,703 | | | | 22,589,360 | | | | 39,541 | | | | 3,953,982 | |
| Total income | | | 2,168,838 | | | | 22,895,333 | | | | 40,191 | | | | 3,984,738 | |
| | | | | | | | | | | | | | | | | |
| Expenses | | | | | | | | | | | | | | | | |
| Investment advisory fee | | | 173,857 | | | | 2,078,364 | | | | 4,616 | | | | 469,686 | |
| Administrative fee | | | 52,157 | | | | 801,655 | | | | 1,554 | | | | 158,519 | |
| Shareholder servicing reimbursement - Retail Class | | | 57,161 | | | | 1,090,099 | | | | 764 | | | | 197,877 | |
| Transfer agent fees | | | 13,700 | | | | 41,765 | | | | 6,612 | | | | 10,497 | |
| Registration fees | | | 15,290 | | | | 23,825 | | | | 4,159 | | | | 4,590 | |
| Audit and tax preparation fees | | | 11,310 | | | | 19,727 | | | | 7,974 | | | | 11,961 | |
| Legal fees | | | 1,480 | | | | 24,734 | | | | 223 | | | | 4,617 | |
| Independent pricing service fees | | | 7,113 | | | | 21,599 | | | | 3,985 | | | | 19,340 | |
| Trustee fees and expenses | | | 5,957 | | | | 90,802 | | | | 166 | | | | 18,163 | |
| Insurance expense | | | 1,548 | | | | 25,975 | | | | – | | | | 4,844 | |
| Custodian fees | | | 5,068 | | | | 46,280 | | | | 2,447 | | | | 9,056 | |
| Printing fees | | | 4,965 | | | | 57,029 | | | | 14 | | | | 6,189 | |
| Chief compliance officer fee | | | 2,614 | | | | 41,223 | | | | 36 | | | | 7,954 | |
| Offering costs | | | – | | | | – | | | | 12,538 | | | | 1,857 | |
| Other | | | 4,607 | | | | 23,492 | | | | 2,560 | | | | 6,936 | |
| Total expenses before waivers/reimbursements | | | 356,827 | | | | 4,386,569 | | | | 47,648 | | | | 932,086 | |
| Expenses waived/reimbursed by investment advisor | | | | | | | | | | | | | | | | |
| Retail | | | (35,200 | ) | | | (1,116,730 | ) | | | (18,520 | ) | | | (171,214 | ) |
| Institutional | | | (8,808 | ) | | | (119,935 | ) | | | (23,367 | ) | | | (23,993 | ) |
| Net expenses | | | 312,819 | | | | 3,149,904 | | | | 5,761 | | | | 736,879 | |
| Net Investment Income/(Loss) | | | 1,856,019 | | | | 19,745,429 | | | | 34,430 | | | | 3,247,859 | |
| | | | | | | | | | | | | | | | | |
| Realized and Unrealized Gain/(Loss) | | | | | | | | | | | | | | | | |
| Net realized gain/(loss) on: | | | | | | | | | | | | | | | | |
| Investments | | | 555,374 | | | | 1,663,405 | | | | 32,070 | | | | 534,068 | |
| | | | 555,374 | | | | 1,663,405 | | | | 32,070 | | | | 534,068 | |
| Change in unrealized net appreciation/(depreciation) on: | | | | | | | | | | | | | | | | |
| Investments | | | 744,604 | | | | 14,394,441 | | | | 37,683 | | | | 3,494,549 | |
| | | | 744,604 | | | | 14,394,441 | | | | 37,683 | | | | 3,494,549 | |
| Net realized and unrealized gain/(loss) | | | 1,299,978 | | | | 16,057,846 | | | | 69,753 | | | | 4,028,617 | |
| Net Increase/(Decrease) in Net Assets Resulting From Operations | | $ | 3,155,997 | | | $ | 35,803,275 | | | $ | 104,183 | | | $ | 7,276,476 | |
| See Notes to Financial Statements. | |
Semi-Annual Report | June 30, 2017 | | 91 |
| Westcore Funds | Statements of Changes in Net Assets |
| | Westcore Small-Cap Growth Fund | | | Westcore Small-Cap Growth Fund II(a) | | | Westcore Mid-Cap Value Dividend Fund | |
| | | Six Months Ended
June 30, 2017
(Unaudited) | | | Year Ended
December 31, 2016 | | | Six Months Ended
June 30, 2017
(Unaudited) | | | Year Ended
December 31, 2016 | | | Six Months Ended
June 30, 2017
(Unaudited) | | | Year Ended
December 31, 2016 | |
| Operations | |
| Net investment income/(loss) | | $ | (17,129 | ) | | $ | (34,513 | ) | | $ | (103,828 | ) | | $ | (193,441 | ) | | $ | 607,266 | | | $ | 682,873 | |
| Net realized gain/(loss) | | | 475,053 | | | | (73,972 | ) | | | 3,955,727 | | | | (6,870,344 | ) | | | 6,568,647 | | | | 4,854,819 | |
| Change in unrealized net appreciation/(depreciation) | | | 235,493 | | | | 389,284 | | | | 3,219,394 | | | | 1,620,335 | | | | (6,514,440 | ) | | | 8,303,334 | |
| Net increase/(decrease) in net assets resulting from operations | | | 693,417 | | | | 280,799 | | | | 7,071,293 | | | | (5,443,430 | ) | | | 661,473 | | | | 13,841,026 | |
| | | | | | | | | | | | | | | | | | | | | | | | | |
| Distributions to Shareholders (Note 2) | | | | | | | | | | | | | | | | | | | | | | | | |
| From net investment income | | | | | | | | | | | | | | | | | | | | | | | | |
| Retail | | | – | | | | – | | | | N/A | | | | N/A | | | | – | | | | (613,443 | ) |
| Institutional | | | – | | | | – | | | | – | | | | – | | | | – | | | | (136,683 | )(b) |
| From net realized gains | | | | | | | | | | | | | | | | | | | | | | | | |
| Retail | | | – | | | | – | | | | N/A | | | | N/A | | | | – | | | | (1,432,308 | ) |
| Institutional | | | – | | | | – | | | | – | | | | – | | | | – | | | | (1,201,077 | )(b) |
| Decrease in net assets from distributions to shareholders | | | – | | | | – | | | | – | | | | – | | | | – | | | | (3,383,511 | ) |
| | | | | | | | | | | | | | | | | | | | | | | | | |
| Beneficial Interest Transactions (Note 3) | |
| Shares sold | | | | | | | | | | | | | | | | | | | | | | | | |
| Retail | | | 20,244 | | | | 219,775 | | | | N/A | | | | N/A | | | | 15,869,907 | | | | 27,536,668 | |
| Institutional | | | 364,122 | | | | 1,423,810 | | | | 2,040,999 | | | | 1,247,021 | | | | 1,927,367 | | | | 35,794,394 | (b) |
| Shares issued in reinvestment of distributions | | | | | | | | | | | | | | | | | | | | | | | | |
| Retail | | | – | | | | – | | | | N/A | | | | N/A | | | | – | | | | 1,977,573 | |
| Institutional | | | – | | | | – | | | | – | | | | – | | | | – | | | | 1,337,760 | (b) |
| Cost of shares redeemed | | | | | | | | | | | | | | | | | | | | | | | | |
| Retail | | | (19,525 | ) | | | (27,657 | ) | | | N/A | | | | N/A | | | | (11,146,427 | ) | | | (46,954,046 | ) |
| Institutional | | | (141,243 | ) | | | (4,146,248 | ) | | | (5,955,057 | ) | | | (19,391,204 | ) | | | (3,869,434 | ) | | | (1,516,354 | )(b) |
| Net increase/(decrease) resulting from beneficial interest transactions | | | 223,598 | | | | (2,530,320 | ) | | | (3,914,058 | ) | | | (18,144,183 | ) | | | 2,781,413 | | | | 18,175,995 | |
| Redemption Fees | | | – | | | | 1,977 | | | | – | | | | – | | | | – | | | | – | |
| Total net increase/(decrease) in net assets | | | 917,015 | | | | (2,247,544 | ) | | | 3,157,235 | | | | (23,587,613 | ) | | | 3,442,886 | | | | 28,633,510 | |
| | | | | | | | | | | | | | | | | | | | | | | | | |
| Net Assets | | | | | | | | | | | | | | | | | | | | | | | | |
| Beginning of period | | | 4,262,708 | | | | 6,510,252 | | | | 34,916,762 | | | | 58,504,375 | | | | 80,375,521 | | | | 51,742,011 | |
| End of period* | | $ | 5,179,723 | | | $ | 4,262,708 | | | $ | 38,073,997 | | | $ | 34,916,762 | | | $ | 83,818,407 | | | $ | 80,375,521 | |
| | | | | | | | | | | | | | | | | | | | | | | | | |
| *Accumulated net investment income/(loss) | | $ | (16,277 | ) | | $ | 852 | | | $ | (140,150 | ) | | $ | (36,322 | ) | | $ | 699,366 | | | $ | 92,100 | |
(a) | Prior to December 27, 2016 known as the Westcore Select Fund - Retail Class. |
(b) | The Fund added an institutional share class on April 29, 2016. |
See Notes to Financial Statements.
| 92 | | wwww.westcore.com |
| Westcore Funds | Statements of Changes in Net Assets |
| | | Westcore Mid-Cap Value Dividend Fund II(a) | | | Westcore Smid-Cap Value Dividend Fund(b) | | | Westcore Small-Cap Value Dividend Fund | |
| | | Six Months Ended
June 30, 2017
(Unaudited) | | | Year Ended
December 31, 2016 | | | Six Months Ended
June 30, 2017
(Unaudited) | | | Period Ended December 31, 2016 | | | Six Months Ended
June 30, 2017
(Unaudited) | | | Year Ended
December 31, 2016 | |
| Operations | |
| Net investment income/(loss) | | $ | 233,561 | | | $ | (234,044 | ) | | $ | 4,813 | | | $ | 465 | | | $ | 1,451,520 | | | $ | 2,156,748 | |
| Net realized gain/(loss) | | | 870,241 | | | | 456,744 | | | | 6,508 | | | | (15 | ) | | | 16,213,257 | | | | 20,103,819 | |
| Change in unrealized net appreciation/(depreciation) | | | (616,608 | ) | | | (4,439,249 | ) | | | (11,893 | ) | | | (2,936 | ) | | | (23,032,869 | ) | | | 29,286,310 | |
| Net increase/(decrease) in net assets resulting from operations | | | 487,194 | | | | (4,216,549 | ) | | | (572 | ) | | | (2,486 | ) | | | (5,368,092 | ) | | | 51,546,877 | |
| | | | | | | | | | | | | | | | | | | | | | | | | |
| Distributions to Shareholders (Note 2) | | | | | | | | | | | | | | | | | | | | | | | | |
| From net investment income | | | | | | | | | | | | | | | | | | | | | | | | |
| Retail | | | – | | | | (13,996 | ) | | | – | | | | – | | | | – | | | | (1,224,558 | ) |
| Institutional | | | – | | | | (1,156 | ) | | | – | | | | – | | | | – | | | | (2,025,232 | ) |
| From net realized gains | | | | | | | | | | | | | | | | | | | | | | | | |
| Retail | | | – | | | | – | | | | – | | | | – | | | | – | | | | (6,333,468 | ) |
| Institutional | | | – | | | | – | | | | – | | | | – | | | | – | | | | (8,962,910 | ) |
| Decrease in net assets from distributions to shareholders | | | – | | | | (15,152 | ) | | | – | | | | – | | | | – | | | | (18,546,168 | ) |
| | | | | | | | | | | | | | | | | | | | | | | | | |
| Beneficial Interest Transactions (Note 3) | |
| Shares sold | | | | | | | | | | | | | | | | | | | | | | | | |
| Retail | | | 1,898,550 | | | | 2,118,108 | | | | 308,520 | | | | 120,010 | | | | 5,764,065 | | | | 24,784,341 | |
| Institutional | | | 1,674 | | | | 1,467,835 | | | | – | | | | 250,010 | | | | 21,687,426 | | | | 44,803,603 | |
| Shares issued in reinvestment of distributions | | | | | | | | | | | | | | | | | | | | | | | | |
| Retail | | | – | | | | 13,685 | | | | – | | | | – | | | | – | | | | 5,757,955 | |
| Institutional | | | – | | | | 1,156 | | | | – | | | | – | | | | – | | | | 10,446,807 | |
| Cost of shares redeemed | | | | | | | | | | | | | | | | | | | | | | | | |
| Retail | | | (5,347,749 | ) | | | (28,426,035 | ) | | | – | | | | – | | | | (15,477,939 | ) | | | (36,226,778 | ) |
| Institutional | | | (7,093 | ) | | | (16,944,897 | ) | | | – | | | | – | | | | (19,478,632 | ) | | | (50,406,292 | ) |
| Net increase/(decrease) resulting from beneficial interest transactions | | | (3,454,618 | ) | | | (41,770,148 | ) | | | 308,520 | | | | 370,020 | | | | (7,505,080 | ) | | | (840,364 | ) |
| Total net increase/(decrease) in net assets | | | (2,967,424 | ) | | | (46,001,849 | ) | | | 307,948 | | | | 367,534 | | | | (12,873,172 | ) | | | 32,160,345 | |
| | | | | | | | | | | | | | | | | | | | | | | | | |
| Net Assets | | | | | | | | | | | | | | | | | | | | | | | | |
| Beginning of period | | | 35,791,453 | | | | 81,793,302 | | | | 367,534 | | | | – | | | | 216,615,615 | | | | 184,455,270 | |
| End of period* | | $ | 32,824,029 | | | $ | 35,791,453 | | | $ | 675,482 | | | $ | 367,534 | | | $ | 203,742,443 | | | $ | 216,615,615 | |
| | | | | | | | | | | | | | | | | | | | | | | | | |
| *Accumulated net investment income/(loss) | | $ | (16,207 | ) | | $ | (249,768 | ) | | $ | 5,296 | | | $ | 483 | | | $ | 1,725,365 | | | $ | 273,845 | |
(a) | Prior to December 27, 2016 known as the Westcore MIDCO Growth Fund. |
(b) | Commenced operations on December 19, 2016. |
| See Notes to Financial Statements. | |
| Semi-Annual Report | June 30, 2017 | | 93 |
| Westcore Funds | Statements of Changes in Net Assets |
| | | Westcore Global Large-Cap Dividend Fund(a) | | | Westcore Large-Cap Dividend Fund(b) | | | Westcore Micro-Cap Opportunity Fund | |
| | | Six Months Ended
June 30, 2017
(Unaudited) | | | Year Ended
December 31, 2016 | | | Six Months Ended
June 30, 2017
(Unaudited) | | | Year Ended
December 31, 2016 | | | Six Months Ended
June 30, 2017
(Unaudited) | | | Year Ended
December 31, 2016 | |
| Operations | |
| Net investment income/(loss) | | $ | 611,393 | | | $ | 783,310 | | | $ | 113,962 | | | $ | 42,211 | | | $ | 1,620 | | | $ | 45,563 | |
| Net realized gain/(loss) | | | 653,250 | | | | 1,507,936 | | | | 134,755 | | | | 5,072,246 | | | | 2,339,716 | | | | 178,621 | |
| Change in unrealized net appreciation/(depreciation) | | | 3,636,284 | | | | 1,167,374 | | | | 443,592 | | | | (5,408,631 | ) | | | (2,332,071 | ) | | | 1,879,897 | |
| Net increase/(decrease) in net assets resulting from operations | | | 4,900,927 | | | | 3,458,620 | | | | 692,309 | | | | (294,174 | ) | | | 9,265 | | | | 2,104,081 | |
| | | | | | | | | | | | | | | | | | | | | | | | | |
| Distributions to Shareholders (Note 2) | | | | | | | | | | | | | | | | | | | | | | | | |
| From net investment income | | | | | | | | | | | | | | | | | | | | | | | | |
| Retail | | | (513,461 | ) | | | (734,945 | ) | | | (92,612 | ) | | | – | | | | – | | | | (44,312 | ) |
| Institutional | | | (46,012 | ) | | | (68,202 | ) | | | (5,135 | ) | | | – | | | | N/A | | | | N/A | |
| From net realized gains | | | | | | | | | | | | | | | | | | | | | | | | |
| Retail | | | – | | | | (1,268,496 | ) | | | – | | | | (3,723,393 | ) | | | – | | | | (403,967 | ) |
| Institutional | | | – | | | | (95,772 | ) | | | – | | | | (773,092 | ) | | | N/A | | | | N/A | |
| Decrease in net assets from distributions to shareholders | | | (559,473 | ) | | | (2,167,415 | ) | | | (97,747 | ) | | | (4,496,485 | ) | | | – | | | | (448,279 | ) |
| | | | | | | | | | | | | | | | | | | | | | | | | |
| Beneficial Interest Transactions (Note 3) | |
| Shares sold | | | | | | | | | | | | | | | | | | | | | | | | |
| Retail | | | 3,260,584 | | | | 9,128,468 | | | | 240,603 | | | | 1,100,614 | | | | 1,614,724 | | | | 2,341,447 | |
| Institutional | | | 1,249,774 | | | | 884,366 | | | | 18,848 | | | | 342,085 | | | | N/A | | | | N/A | |
| Shares issued in reinvestment of distributions | | | | | | | | | | | | | | | | | | | | | | | | |
| Retail | | | 467,989 | | | | 1,794,855 | | | | 91,555 | | | | 3,680,147 | | | | – | | | | 448,124 | |
| Institutional | | | 45,541 | | | | 162,654 | | | | 5,135 | | | | 773,092 | | | | N/A | | | | N/A | |
| Cost of shares redeemed | | | | | | | | | | | | | | | | | | | | | | | | |
| Retail | | | (2,958,317 | ) | | | (5,425,825 | ) | | | (2,347,092 | ) | | | (13,748,298 | ) | | | (1,412,544 | ) | | | (11,924,376 | ) |
| Institutional | | | (844,723 | ) | | | (1,077,539 | ) | | | (71,414 | ) | | | (4,709,139 | ) | | | N/A | | | | N/A | |
| Net increase/(decrease) resulting from beneficial interest transactions | | | 1,220,848 | | | | 5,466,979 | | | | (2,062,365 | ) | | | (12,561,499 | ) | | | 202,180 | | | | (9,134,805 | ) |
| Redemption Fees | | | – | | | | – | | | | – | | | | – | | | | – | | | | 4,455 | |
| Total net increase/(decrease) in net assets | | | 5,562,302 | | | | 6,758,184 | | | | (1,467,803 | ) | | | (17,352,158 | ) | | | 211,445 | | | | (7,474,548 | ) |
| | | | | | | | | | | | | | | | | | | | | | | | | |
| Net Assets | | | | | | | | | | | | | | | | | | | | | | | | |
| Beginning of period | | | 47,762,800 | | | | 41,004,616 | | | | 12,606,593 | | | | 29,958,751 | | | | 13,311,471 | | | | 20,786,019 | |
| End of period* | | $ | 53,325,102 | | | $ | 47,762,800 | | | $ | 11,138,790 | | | $ | 12,606,593 | | | $ | 13,522,916 | | | $ | 13,311,471 | |
| | | | | | | | | | | | | | | | | | | | | | | | | |
| *Accumulated net investment income/(loss) | | $ | 7,886 | | | $ | (44,034 | ) | | $ | (15,121 | ) | | $ | (31,336 | ) | | $ | 732 | | | $ | (888 | ) |
(a) | Prior to April 29, 2016 known as the Westcore Blue Chip Dividend Fund. |
(b) | Prior to December 27, 2016 known as the Westcore Growth Fund. |
See Notes to Financial Statements.
| 94 | | wwww.westcore.com |
| Westcore Funds | Statements of Changes in Net Assets |
| | | Westcore International Small-Cap Fund | | | Westcore Flexible Income Fund | | | Westcore Plus Bond Fund | |
| | | Six Months Ended
June 30, 2017 (Unaudited) | | | Year Ended
December 31, 2016 | | | Six Months Ended
June 30, 2017
(Unaudited) | | | Year Ended
December 31, 2016 | | | Six Months Ended
June 30, 2017
(Unaudited) | | | Year Ended
December 31, 2016 | |
| Operations | |
| Net investment income/(loss) | | $ | 161,389 | | | $ | 440,526 | | | $ | 1,856,019 | | | $ | 3,173,030 | | | $ | 19,745,429 | | | $ | 40,288,624 | |
| Net realized gain/(loss) | | | 2,496,192 | | | | (4,228,697 | ) | | | 555,374 | | | | 353,696 | | | | 1,663,405 | | | | 3,933,255 | |
| Change in unrealized net appreciation/(depreciation) | | | 7,412,605 | | | | 4,288,688 | | | | 744,604 | | | | 4,256,608 | | | | 14,394,441 | | | | 8,858,255 | |
| Net increase/(decrease) in net assets resulting from operations | | | 10,070,186 | | | | 500,517 | | | | 3,155,997 | | | | 7,783,334 | | | | 35,803,275 | | | | 53,080,134 | |
| | | | | | | | | | | | | | | | | | | | | | | | | |
| Distributions to Shareholders (Note 2) | | | | | | | | | | | | | | | | | | | | | | | | |
| From net investment income | | | | | | | | | | | | | | | | | | | | | | | | |
| Retail | | | – | | | | (2,394,450 | ) | | | (1,314,480 | ) | | | (2,468,840 | ) | | | (18,383,680 | ) | | | (40,035,547 | ) |
| Institutional | | | – | | | | (283,367 | )(a) | | | (428,814 | ) | | | (695,466 | ) | | | (2,814,968 | ) | | | (3,885,093 | ) |
| From net realized gains | | | | | | | | | | | | | | | | | | | | | | | | |
| Retail | | | – | | | | – | | | | – | | | | – | | | | – | | | | (301,101 | ) |
| Institutional | | | – | | | | – | (a) | | | – | | | | – | | | | – | | | | (29,219 | ) |
| Decrease in net assets from distributions to shareholders | | | – | | | | (2,677,817 | ) | | | (1,743,294 | ) | | | (3,164,306 | ) | | | (21,198,648 | ) | | | (44,250,960 | ) |
| | | | | | | | | | | | | | | | | | | | | | | | | |
| Beneficial Interest Transactions (Note 3) | |
| Shares sold | | | | | | | | | | | | | | | | | | | | | | | | |
| Retail | | | 2,572,616 | | | | 11,306,610 | | | | 8,737,710 | | | | 22,497,041 | | | | 107,950,822 | | | | 241,684,616 | |
| Institutional | | | 4,391,657 | | | | 21,928,969 | (a) | | | 4,711,272 | | | | 10,182,996 | | | | 87,185,810 | | | | 64,856,773 | |
| Shares issued in reinvestment of distributions | | | | | | | | | | | | | | | | | | | | | | | | |
| Retail | | | – | | | | 2,321,253 | | | | 1,259,869 | | | | 2,345,925 | | | | 18,045,106 | | | | 39,418,686 | |
| Institutional | | | – | | | | 283,367 | (a) | | | 418,885 | | | | 685,606 | | | | 2,630,978 | | | | 3,647,587 | |
| Cost of shares redeemed | | | | | | | | | | | | | | | | | | | | | | | | |
| Retail | | | (12,453,939 | ) | | | (62,490,978 | ) | | | (8,388,661 | ) | | | (18,195,608 | ) | | | (180,678,410 | ) | | | (533,005,393 | ) |
| Institutional | | | (1,856,131 | ) | | | (1,290,670 | )(a) | | | (5,203,909 | ) | | | (4,824,784 | ) | | | (23,755,288 | ) | | | (54,771,744 | ) |
| Net increase/(decrease) resulting from beneficial interest transactions | | | (7,345,797 | ) | | | (27,941,449 | ) | | | 1,535,166 | | | | 12,691,176 | | | | 11,379,018 | | | | (238,169,475 | ) |
| Redemption Fees | | | – | | | | – | | | | – | | | | 15,224 | | | | – | | | | – | |
| Total net increase/(decrease) in net assets | | | 2,724,389 | | | | (30,118,749 | ) | | | 2,947,869 | | | | 17,325,428 | | | | 25,983,645 | | | | (229,340,301 | ) |
| | | | | | | | | | | | | | | | | | | | | | | | | |
| Net Assets | | | | | | | | | | | | | | | | | | | | | | | | |
| Beginning of period | | | 70,104,608 | | | | 100,223,357 | | | | 75,485,630 | | | | 58,160,202 | | | | 1,188,419,993 | | | | 1,417,760,294 | |
| End of period* | | $ | 72,828,997 | | | $ | 70,104,608 | | | $ | 78,433,499 | | | $ | 75,485,630 | | | $ | 1,214,403,638 | | | $ | 1,188,419,993 | |
| | | | | | | | | | | | | | | | | | | | | | | | | |
| *Accumulated net investment income/(loss) | | $ | (1,646,117 | ) | | $ | (1,807,506 | ) | | $ | 94,152 | | | $ | (18,573 | ) | | $ | (1,311,756 | ) | | $ | 141,463 | |
(a) | The Fund added an institutional share class on April 29, 2016. |
See Notes to Financial Statements.
| Semi-Annual Report | June 30, 2017 | | 95 |
| Westcore Funds | Statements of Changes in Net Assets |
| | | Westcore Municipal Opportunities Fund(a) | | | Westcore Colorado Tax-Exempt Fund | |
| | | Six Months Ended
June 30, 2017
(Unaudited) | | | Period Ended December 31, 2016 | | | Six Months Ended
June 30, 2017
(Unaudited) | | | Year Ended
December 31, 2016 | |
| Operations | |
| Net investment income/(loss) | | $ | 34,430 | | | $ | 286 | | | $ | 3,247,859 | | | $ | 5,784,471 | |
| Net realized gain/(loss) | | | 32,070 | | | | – | | | | 534,068 | | | | (132,085 | ) |
| Change in unrealized net appreciation/(depreciation) | | | 37,683 | | | | 10,601 | | | | 3,494,549 | | | | (6,859,779 | ) |
| Net increase/(decrease) in net assets resulting from operations | | | 104,183 | | | | 10,887 | | | | 7,276,476 | | | | (1,207,393 | ) |
| | | | | | | | | | | | | | | | | |
| Distributions to Shareholders (Note 2) | | | | | | | | | | | | | | | | |
| From net investment income | | | | | | | | | | | | | | | | |
| Retail | | | (12,658 | ) | | | – | | | | (2,726,148 | ) | | | (5,513,282 | ) |
| Institutional | | | (21,378 | ) | | | – | | | | (490,908 | ) | | | (336,259 | )(b) |
| From net realized gains | | | | | | | | | | | | | | | | |
| Retail | | | – | | | | – | | | | – | | | | (440,343 | ) |
| Institutional | | | – | | | | – | | | | – | | | | (69,011 | )(b) |
| Decrease in net assets from distributions to shareholders | | | (34,036 | ) | | | – | | | | (3,217,056 | ) | | | (6,358,895 | ) |
| | | | | | | | | | | | | | | | | |
| Beneficial Interest Transactions (Note 3) | |
| Shares sold | | | | | | | | | | | | | | | | |
| Retail | | | 914,305 | | | | 400,022 | | | | 24,429,069 | | | | 73,060,040 | |
| Institutional | | | 3,183,994 | | | | 350,010 | | | | 17,145,957 | | | | 35,576,527 | (b) |
| Shares issued in reinvestment of distributions | | | | | | | | | | | | | | | | |
| Retail | | | 11,929 | | | | – | | | | 2,482,748 | | | | 5,495,420 | |
| Institutional | | | 21,378 | | | | – | | | | 472,359 | | | | 395,641 | (b) |
| Cost of shares redeemed | | | | | | | | | | | | | | | | |
| Retail | | | (7,245 | ) | | | – | | | | (24,041,044 | ) | | | (69,121,941 | ) |
| Institutional | | | (16,100 | ) | | | – | | | | (6,221,665 | ) | | | (4,965,168 | )(b) |
| Net increase resulting from beneficial interest transactions | | | 4,108,261 | | | | 750,032 | | | | 14,267,424 | | | | 40,440,519 | |
| Total net increase in net assets | | | 4,178,408 | | | | 760,919 | | | | 18,326,844 | | | | 32,874,231 | |
| | | | | | | | | | | | | | | | | |
| Net Assets | | | | | | | | | | | | | | | | |
| Beginning of period | | | 760,919 | | | | – | | | | 225,794,333 | | | | 192,920,102 | |
| End of period* | | $ | 4,939,327 | | | $ | 760,919 | | | $ | 244,121,177 | | | $ | 225,794,333 | |
| | | | | | | | | | | | | | | | | |
| *Accumulated net investment income/(loss) | | $ | 695 | | | $ | 301 | | | $ | (1,874 | ) | | $ | (32,677 | ) |
(a) | Commenced operations on December 19, 2016. |
(b) | The Fund added an institutional share class on April 29, 2016. |
See Notes to Financial Statements.
| 96 | | wwww.westcore.com |
| Westcore Small-Cap Growth Funds | Financial Highlights |
For a Share Outstanding Throughout the Periods Presented
| Retail | | Six Months Ended
June 30, 2017
(Unaudited) | | | Year Ended
December 31, 2016 | | | Year Ended
December 31, 2015 | | | Year Ended
December 31, 2014 | | | For the Period Ended December 31, 2013 (a) | |
| Net asset value, beginning of period | | $ | 10.89 | | | $ | 10.01 | | | $ | 10.52 | | | $ | 10.13 | | | $ | 10.00 | |
| Income/(loss) from investment operations: | | | | | | | | | | | | | | | | | | | | |
Net investment income/(loss)(b) | | | (0.05 | ) | | | (0.09 | ) | | | (0.11 | ) | | | (0.10 | ) | | | (0.00 | )(c) |
| Net realized and unrealized gains/(losses) on investments | | | 1.78 | | | | 0.97 | | | | (0.39 | ) | | | 0.49 | | | | 0.13 | |
| Total from investment operations | | | 1.73 | | | | 0.88 | | | | (0.50 | ) | | | 0.39 | | | | 0.13 | |
| | | | | | | | | | | | | | | | | | | | | |
| Less dividends and distributions: | | | | | | | | | | | | | | | | | | | | |
| Distributions from net realized gains | | | – | | | | – | | | | (0.01 | ) | | | – | | | | – | |
| Total distributions | | | – | | | | – | | | | (0.01 | ) | | | – | | | | – | |
| | | | | | | | | | | | | | | | | | | | | |
| Paid-in capital from redemption fees | | | – | | | | – | | | | – | | | | 0.00 | (c) | | | – | |
| Net asset value, end of period | | $ | 12.62 | | | $ | 10.89 | | | $ | 10.01 | | | $ | 10.52 | | | $ | 10.13 | |
| | | | | | | | | | | | | | | | | | | | | |
| Total Return | | | 15.89 | %(d) | | | 8.79 | % | | | (4.77 | )% | | | 3.85 | % | | | 1.30 | %(d) |
| | | | | | | | | | | | | | | | | | | | | |
| Ratios and Supplemental Data | | | | | | | | | | | | | | | | | | | | |
| Net assets, end of period (in 000s) | | $ | 863 | | | $ | 744 | | | $ | 499 | | | $ | 599 | | | $ | 69 | |
| | | | | | | | | | | | | | | | | | | | | |
| Ratio of expenses to average net assets | | | | | | | | | | | | | | | | | | | | |
| With fee waivers/reimbursements | | | 1.27 | %(e)(f) | | | 1.30 | % | | | 1.30 | % | | | 1.30 | % | | | 1.30 | %(e) |
| Without fee waivers/reimbursements | | | 3.06 | %(e) | | | 5.93 | % | | | 4.96 | %(g) | | | 5.18 | %(g) | | | 12.91 | %(e)(g) |
| Ratio of net investment income/(loss) to average net assets | | | | | | | | | | | | | | | | | | | | |
| With fee waivers/reimbursements | | | (0.76 | )%(e) | | | (0.87 | )% | | | (1.03 | )% | | | (1.01 | )% | | | (0.98 | )%(e) |
| Without fee waivers/reimbursements | | | (2.55 | )%(e) | | | (5.50 | )% | | | (4.69 | )% | | | (4.89 | )%(g) | | | (12.60 | )%(e)(g) |
| Portfolio turnover rate | | | 37 | %(d) | | | 81 | % | | | 69 | % | | | 89 | % | | | 0 | %(d) |
| (a) | Commenced operations on December 20, 2013. |
| (b) | Calculated using the average shares method. |
| (c) | Less than $0.005 and $(0.005) per share. |
| (d) | Total return and portfolio turnover are not annualized for periods less than one full year. |
| (f) | Contractual expense limitation change from 1.30% to 1.24% effective April 30, 2017. |
(g) | Ratios before fee waivers for start up periods may not be representative of long-term operating results. |
See Notes to Financial Statements.
| Semi-Annual Report | June 30, 2017 | | 97 |
| Westcore Small-Cap Growth Funds | Financial Highlights |
For a Share Outstanding Throughout the Periods Presented
| Institutional | | Six Months Ended
June 30, 2017
(Unaudited) | | | Year Ended
December 31, 2016 | | | Year Ended
December 31, 2015 | | | Year Ended
December 31, 2014 | | | For the Period Ended December 31, 2013 (a) | |
| Net asset value, beginning of period | | $ | 11.01 | | | $ | 10.09 | | | $ | 10.56 | | | $ | 10.13 | | | $ | 10.00 | |
| Income/(loss) from investment operations: | | | | | | | | | | | | | | | | | | | | |
Net investment income/(loss)(b) | | | (0.04 | ) | | | (0.06 | ) | | | (0.07 | ) | | | (0.04 | ) | | | (0.00 | )(c) |
| Net realized and unrealized gains/(losses) on investments | | | 1.80 | | | | 0.98 | | | | (0.39 | ) | | | 0.47 | | | | 0.13 | |
| Total from investment operations | | | 1.76 | | | | 0.92 | | | | (0.46 | ) | | | 0.43 | | | | 0.13 | |
| | | | | | | | | | | | | | | | | | | | | |
| Less dividends and distributions: | | | | | | | | | | | | | | | | | | | | |
| Distributions from net realized gains | | | – | | | | – | | | | (0.01 | ) | | | – | | | | – | |
| Total distributions | | | – | | | | – | | | | (0.01 | ) | | | – | | | | – | |
| | | | | | | | | | | | | | | | | | | | | |
| Paid-in capital from redemption fees | | | – | | | | 0.00 | (c) | | | – | | | | 0.00 | (c) | | | – | |
| Net asset value, end of period | | $ | 12.77 | | | $ | 11.01 | | | $ | 10.09 | | | $ | 10.56 | | | $ | 10.13 | |
| | | | | | | | | | | | | | | | | | | | | |
| Total Return | | | 15.99 | %(d) | | | 9.12 | % | | | (4.37 | )% | | | 4.24 | % | | | 1.30 | %(d) |
| | | | | | | | | | | | | | | | | | | | | |
| Ratios and Supplemental Data | | | | | | | | | | | | | | | | | | | | |
| Net assets, end of period (in 000s) | | $ | 4,317 | | | $ | 3,519 | | | $ | 6,011 | | | $ | 8,063 | | | $ | 2,314 | |
| | | | | | | | | | | | | | | | | | | | | |
| Ratio of expenses to average net assets | | | | | | | | | | | | | | | | | | | | |
| With fee waivers/reimbursements | | | 1.23 | %(e) | | | 1.05 | %(f) | | | 0.88 | %(f) | | | 0.76 | %(f) | | | 1.06 | %(e) |
| Without fee waivers/reimbursements | | | 2.94 | %(e) | | | 2.63 | % | | | 2.21 | %(g) | | | 3.61 | %(g) | | | 12.52 | %(e)(g) |
| Ratio of net investment income/(loss) to average net assets | | | | | | | | | | | | | | | | | | | | |
| With fee waivers/reimbursements | | | (0.71 | )%(e) | | | (0.65 | )% | | | (0.61 | )% | | | (0.44 | )% | | | (0.75 | )%(e) |
| Without fee waivers/reimbursements | | | (2.42 | )%(e) | | | (2.22 | )% | | | (1.94 | )% | | | (3.29 | )%(g) | | | (12.22 | )%(e)(g) |
| Portfolio turnover rate | | | 37 | %(d) | | | 81 | % | | | 69 | % | | | 89 | % | | | 0 | %(d) |
| (a) | Commenced operations on December 20, 2013. |
| (b) | Calculated using the average shares method. |
| (c) | Less than $0.005 and $(0.005) per share. |
| (d) | Total return and portfolio turnover are not annualized for periods less than one full year. |
| (f) | Net expense ratio is significantly less than expected rate in prospectus, effective for that period, of 1.15% due to the higher asset levels in the institutional class compared to the retail class. If the retail class assets increase relative to the institutional class assets it is expected that the net expense ratio will be closer to the 1.15% expected rate. |
(g) | Ratios before fee waivers for start up periods may not be representative of long term operating results. |
See Notes to Financial Statements.
| 98 | | wwww.westcore.com |
| Westcore Small-Cap Growth Funds II | Financial Highlights |
For a Share Outstanding Throughout the Periods Presented
| Institutional | | Six Months Ended
June 30, 2017
(Unaudited) | | | Year Ended
December 31, 2016 (a) | | | Year Ended
December 31, 2015 | | | Year Ended
December 31, 2014 | | | Year Ended
December 31, 2013 | | | Year Ended
December 31, 2012 | |
| Net asset value, beginning of period | | $ | 20.15 | | | $ | 22.32 | | | $ | 25.31 | | | $ | 24.21 | | | $ | 16.60 | | | $ | 18.71 | |
| Income/(loss) from investment operations: | | | | | | | | | | | | | | | | | | | | | | | | |
Net investment income/(loss)(b) | | | (0.06 | ) | | | (0.09 | ) | | | (0.19 | ) | | | (0.17 | ) | | | (0.14 | ) | | | (0.09 | ) |
| Net realized and unrealized gains/(losses) on investments | | | 4.36 | | | | (2.08 | ) | | | (2.80 | ) | | | 1.27 | | | | 7.75 | | | | (2.02 | ) |
| Total from investment operations | | | 4.30 | | | | (2.17 | ) | | | (2.99 | ) | | | 1.10 | | | | 7.61 | | | | (2.11 | ) |
| | | | | | | | | | | | | | | | | | | | | | | | | |
| Paid-in capital from redemption fees | | | – | | | | – | | | | – | | | | – | | | | – | | | | 0.00 | (c) |
| Net asset value, end of period | | $ | 24.45 | | | $ | 20.15 | | | $ | 22.32 | | | $ | 25.31 | | | $ | 24.21 | | | $ | 16.60 | |
| | | | | | | | | | | | | | | | | | | | | | | | | |
| Total Return | | | 21.34 | %(d) | | | (9.72 | )% | | | (11.81 | )% | | | 4.54 | % | | | 45.84 | % | | | (11.28 | )% |
| | | | | | | | | | | | | | | | | | | | | | | | | |
| Ratios and Supplemental Data | | | | | | | | | | | | | | | | | | | | | | | | |
| Net assets, end of period (in 000s) | | $ | 38,074 | | | $ | 34,917 | | | $ | 58,504 | | | $ | 90,747 | | | $ | 111,058 | | | $ | 178,503 | |
| | | | | | | | | | | | | | | | | | | | | | | | | |
| Ratio of expenses to average net assets | | | | | | | | | | | | | | | | | | | | | | | | |
| With fee waivers/reimbursements | | | 1.08 | %(e) | | | 1.15 | % | | | 1.09 | % | | | 1.09 | % | | | 1.08 | % | | | 1.06 | % |
| Without fee waivers/reimbursements | | | 1.08 | %(e) | | | 1.24 | % | | | 1.09 | % | | | 1.09 | % | | | 1.08 | % | | | 1.06 | % |
| Ratio of net investment income/(loss) to average net assets | | | | | | | | | | | | | | | | | | | | | | | | |
| With fee waivers/reimbursements | | | (0.57 | )%(e) | | | (0.43 | )% | | | (0.76 | )% | | | (0.68 | )% | | | (0.70 | )% | | | (0.50 | )% |
| Without fee waivers/reimbursements | | | (0.57 | )%(e) | | | (0.52 | )% | | | (0.76 | )% | | | (0.68 | )% | | | (0.70 | )% | | | (0.50 | )% |
| Portfolio turnover rate | | | 33 | %(d) | | | 182 | % | | | 67 | % | | | 115 | % | | | 106 | % | | | 167 | % |
| (a) | Prior to December 27, 2016 known as the Westcore Select Fund - Retail Class. |
| (b) | Calculated using the average shares method. |
| (c) | Less than $0.005 and $(0.005) per share. |
| (d) | Total return and portfolio turnover are not annualized for periods less than one full year. |
See Notes to Financial Statements.
| Semi-Annual Report | June 30, 2017 | | 99 |
| Westcore Mid-Cap Value Dividend Fund | Financial Highlights |
For a Share Outstanding Throughout the Periods Presented
Retail | | Six Months Ended
June 30, 2017
(Unaudited) | | | Year Ended
December 31, 2016 | | | Year Ended
December 31, 2015 | | | Year Ended
December 31, 2014 | | | Year Ended
December 31, 2013 (a) | | | Year Ended
December 31, 2012 | |
| Net asset value, beginning of period | | $ | 27.46 | | | $ | 23.47 | | | $ | 26.87 | | | $ | 26.01 | | | $ | 20.11 | | | $ | 18.10 | |
| Income/(loss) from investment operations: | | | | | | | | | | | | | | | | | | | | | | | | |
Net investment income/(loss)(b) | | | 0.19 | | | | 0.24 | | | | 0.26 | | | | 0.26 | | | | 0.23 | | | | 0.19 | |
| Net realized and unrealized gains/(losses) on investments | | | 0.07 | | | | 5.11 | | | | (0.68 | ) | | | 2.98 | | | | 5.91 | | | | 2.05 | |
| Total from investment operations | | | 0.26 | | | | 5.35 | | | | (0.42 | ) | | | 3.24 | | | | 6.14 | | | | 2.24 | |
| | | | | | | | | | | | | | | | | | | | | | | | | |
| Less dividends and distributions: | | | | | | | | | | | | | | | | | | | | | | | | |
| Dividends from net investment income | | | – | | | | (0.41 | ) | | | (0.23 | ) | | | (0.30 | ) | | | (0.24 | ) | | | (0.23 | ) |
| Distributions from net realized gains | | | – | | | | (0.95 | ) | | | (2.75 | ) | | | (2.08 | ) | | | – | | | | – | |
| Total distributions | | | – | | | | (1.36 | ) | | | (2.98 | ) | | | (2.38 | ) | | | (0.24 | ) | | | (0.23 | ) |
| | | | | | | | | | | | | | | | | | | | | | | | | |
| Paid-in capital from redemption fees | | | – | | | | – | | | | – | | | | – | | | | – | | | | 0.00 | (c) |
| Net asset value, end of period | | $ | 27.72 | | | $ | 27.46 | | | $ | 23.47 | | | $ | 26.87 | | | $ | 26.01 | | | $ | 20.11 | |
| | | | | | | | | | | | | | | | | | | | | | | | | |
| Total Return | | | 0.95 | %(d) | | | 22.76 | % | | | (1.50 | )% | | | 12.69 | % | | | 30.57 | % | | | 12.39 | % |
| | | | | | | | | | | | | | | | | | | | | | | | | |
| Ratios and Supplemental Data | | | | | | | | | | | | | | | | | | | | | | | | |
| Net assets, end of period (in 000s) | | $ | 49,035 | | | $ | 44,021 | | | $ | 51,742 | | | $ | 58,402 | | | $ | 53,282 | | | $ | 40,341 | |
| | | | | | | | | | | | | | | | | | | | | | | | | |
| Ratio of expenses to average net assets | | | | | | | | | | | | | | | | | | | | | | | | |
| With fee waivers/reimbursements | | | 1.19 | %(e)(f) | | | 1.25 | % | | | 1.20 | % | | | 1.19 | % | | | 1.24 | % | | | 1.25 | % |
| Without fee waivers/reimbursements | | | 1.19 | %(e) | | | 1.28 | % | | | 1.20 | % | | | 1.19 | % | | | 1.24 | % | | | 1.26 | % |
| Ratio of net investment income/(loss) to average net assets | | | | | | | | | | | | | | | | | | | | | | | | |
| With fee waivers/reimbursements | | | 1.36 | %(e) | | | 0.97 | % | | | 0.96 | % | | | 0.95 | % | | | 0.96 | % | | | 0.96 | % |
| Without fee waivers/reimbursements | | | 1.36 | %(e) | | | 0.94 | % | | | 0.96 | % | | | 0.95 | % | | | 0.96 | % | | | 0.96 | % |
| Portfolio turnover rate | | | 40 | %(d) | | | 78 | % | | | 62 | % | | | 51 | % | | | 51 | % | | | 21 | % |
| | | | | | | | | | | | | | | | | | | | | | | | | |
| (a) | Prior to April 30, 2013 known as the Westcore Mid-Cap Value Fund. |
| (b) | Calculated using the average shares method. |
| (c) | Less than $0.005 and $(0.005) per share. |
| (d) | Total return and portfolio turnover are not annualized for periods less than one full year. |
| (f) | Contractual expense limitation change from 1.25% to 1.15% effective April 30, 2017. |
See Notes to Financial Statements.
| 100 | | wwww.westcore.com |
| Westcore Mid-Cap Value Dividend Fund | Financial Highlights |
For a Share Outstanding Throughout the Periods Presented
| Institutional | | Six Months Ended
June 30, 2017
(Unaudited) | | | For the Period Ended December 31, 2016 (a) | |
| Net asset value, beginning of period | | $ | 27.81 | | | $ | 24.89 | |
| Income/(loss) from investment operations: | | | | | | | | |
| Net investment income/(loss)(b) | | | 0.21 | | | | 0.31 | |
| Net realized and unrealized gains/(losses) on investments | | | 0.09 | | | | 3.67 | |
| Total from investment operations | | | 0.30 | | | | 3.98 | |
| | | | | | | | | |
| Less dividends and distributions: | | | | | | | | |
| Dividends from net investment income | | | – | | | | (0.11 | ) |
| Distributions from net realized gains | | | – | | | | (0.95 | ) |
| Total distributions | | | – | | | | (1.06 | ) |
| Net asset value, end of period | | $ | 28.11 | | | $ | 27.81 | |
| | | | | | | | | |
| Total Return | | | 1.08 | %(c) | | | 15.96 | %(c) |
| | | | | | | | | |
| Ratios and Supplemental Data | | | | | | | | |
| Net assets, end of period (in 000s) | | $ | 34,784 | | | $ | 36,355 | |
| | | | | | | | | |
| Ratio of expenses to average net assets | | | | | | | | |
| With fee waivers/reimbursements | | | 1.00 | %(d) | | | 1.00 | %(d) |
| Without fee waivers/reimbursements | | | 1.03 | %(d) | | | 1.15 | %(d) |
| Ratio of net investment income/(loss) to average net assets | | | | | | | | |
| With fee waivers/reimbursements | | | 1.52 | %(d) | | | 1.67 | %(d) |
| Without fee waivers/reimbursements | | | 1.49 | %(d) | | | 1.52 | %(d) |
| Portfolio turnover rate | | | 40 | %(c) | | | 78 | %(c)(e) |
| (a) | The Fund added an institutional share class on April 29, 2016. |
| (b) | Calculated using the average shares method. |
| (c) | Total return and portfolio turnover are not annualized for periods less than one full year. |
| (e) | Porfolio turnover rate is calculated at the fund level and represents the year ended December 31, 2016. |
See Notes to Financial Statements.
| Semi-Annual Report | June 30, 2017 | | 101 |
| Westcore Mid-Cap Value Dividend Fund II | Financial Highlights |
For a Share Outstanding Throughout the Periods Presented
| Retail | | Six Months Ended
June 30, 2017 (Unaudited) | | | Year Ended
December 31, 2016 (a) | | | Year Ended
December 31, 2015 | | | Year Ended
December 31, 2014 | | | Year Ended
December 31, 2013 | | | Year Ended
December 31, 2012 | |
| Net asset value, beginning of period | | $ | 4.48 | | | $ | 4.78 | | | $ | 5.37 | | | $ | 6.65 | | | $ | 6.11 | | | $ | 5.90 | |
| Income/(loss) from investment operations: | | | | | | | | | | | | | | | | | | | | | | | | |
Net investment income/(loss)(b) | | | 0.03 | | | | (0.02 | ) | | | (0.03 | ) | | | (0.04 | ) | | | (0.05 | ) | | | (0.01 | ) |
| Net realized and unrealized gains/(losses) on investments | | | 0.04 | | | | (0.28 | ) | | | (0.25 | ) | | | 0.32 | | | | 2.75 | | | | 0.28 | |
| Total from investment operations | | | 0.07 | | | | (0.30 | ) | | | (0.28 | ) | | | 0.28 | | | | 2.70 | | | | 0.27 | |
| | | | | | | | | | | | | | | | | | | | | | | | | |
| Less dividends and distributions: | | | | | | | | | | | | | | | | | | | | | | | | |
| Dividends from net investment income | | | – | | | | (0.00 | )(c) | | | – | | | | – | | | | – | | | | – | |
| Distributions from net realized gains | | | – | | | | – | | | | (0.31 | ) | | | (1.56 | ) | | | (2.16 | ) | | | (0.06 | ) |
| Total distributions | | | – | | | | – | | | | (0.31 | ) | | | (1.56 | ) | | | (2.16 | ) | | | (0.06 | ) |
| | | | | | | | | | | | | | | | | | | | | | | | | |
| Paid-in capital from redemption fees | | | – | | | | – | | | | – | | | | – | | | | – | | | | 0.00 | (c) |
| Net asset value, end of period | | $ | 4.55 | | | $ | 4.48 | | | $ | 4.78 | | | $ | 5.37 | | | $ | 6.65 | | | $ | 6.11 | |
| | | | | | | | | | | | | | | | | | | | | | | | | |
| Total Return | | | 1.56 | %(d) | | | (6.24 | )% | | | (5.08 | )% | | | 4.56 | % | | | 44.67 | % | | | 4.64 | % |
| | | | | | | | | | | | | | | | | | | | | | | | | |
| Ratios and Supplemental Data | | | | | | | | | | | | | | | | | | | | | | | | |
| Net assets, end of period (in 000s) | | $ | 31,081 | | | $ | 34,069 | | | $ | 63,675 | | | $ | 74,747 | | | $ | 83,008 | | | $ | 74,221 | |
| | | | | | | | | | | | | | | | | | | | | | | | | |
| Ratio of expenses to average net assets | | | | | | | | | | | | | | | | | | | | | | | | |
| With fee waivers/reimbursements | | | 1.15 | %(e) | | | 1.12 | % | | | 1.03 | % | | | 1.03 | % | | | 1.05 | % | | | 1.05 | % |
| Without fee waivers/reimbursements | | | 1.24 | %(e) | | | 1.12 | % | | | 1.03 | % | | | 1.03 | % | | | 1.05 | % | | | 1.05 | % |
| Ratio of net investment income/(loss) to average net assets | | | | | | | | | | | | | | | | | | | | | | | | |
| With fee waivers/reimbursements | | | 1.35 | %(e) | | | (0.42 | )% | | | (0.56 | )% | | | (0.61 | )% | | | (0.67 | )% | | | (0.12 | )% |
| Without fee waivers/reimbursements | | | 1.26 | %(e) | | | (0.43 | )% | | | (0.56 | )% | | | (0.61 | )% | | | (0.67 | )% | | | (0.12 | )% |
| Portfolio turnover rate | | | 42 | %(d) | | | 158 | % | | | 61 | % | | | 88 | % | | | 117 | % | | | 114 | % |
| (a) | Prior to December 27, 2016 known as the Westcore MIDCO Growth Fund |
| (b) | Calculated using the average shares method. |
| (c) | Less than $0.005 and $(0.005) per share. |
| (d) | Total return and portfolio turnover are not annualized for periods less than one full year. |
See Notes to Financial Statements.
| 102 | | www.westcore.com |
| Westcore Mid-Cap Value Dividend Fund II | Financial Highlights |
For a Share Outstanding Throughout the Periods Presented
| Institutional | | Six Months Ended
June 30, 2017
(Unaudited) | | | Year Ended
December 31, 2016 (a) | | | Year Ended
December 31, 2015 | | | Year Ended
December 31, 2014 | | | Year Ended
December 31, 2013 | | | Year Ended
December 31, 2012 | |
| Net asset value, beginning of period | | $ | 4.61 | | | $ | 4.89 | | | $ | 5.48 | | | $ | 6.74 | | | $ | 6.16 | | | $ | 5.93 | |
| Income/(loss) from investment operations: | | | | | | | | | | | | | | | | | | | | | | | | |
Net investment income/(loss)(b) | | | 0.03 | | | | (0.01 | ) | | | (0.02 | ) | | | (0.03 | ) | | | (0.04 | ) | | | 0.00 | (c) |
| Net realized and unrealized gains/(losses) on investments | | | 0.03 | | | | (0.27 | ) | | | (0.26 | ) | | | 0.33 | | | | 2.78 | | | | 0.29 | |
| Total from investment operations | | | 0.06 | | | | (0.28 | ) | | | (0.28 | ) | | | 0.30 | | | | 2.74 | | | | 0.29 | |
| | | | | | | | | | | | | | | | | | | | | | | | | |
| Less dividends and distributions: | | | | | | | | | | | | | | | | | | | | | | | | |
| Dividends from net investment income | | | – | | | | (0.00 | )(c) | | | – | | | | – | | | | – | | | | – | |
| Distributions from net realized gains | | | – | | | | – | | | | (0.31 | ) | | | (1.56 | ) | | | (2.16 | ) | | | (0.06 | ) |
| Total distributions | | | – | | | | – | | | | (0.31 | ) | | | (1.56 | ) | | | (2.16 | ) | | | (0.06 | ) |
| | | | | | | | | | | | | | | | | | | | | | | | | |
| Paid-in capital from redemption fees | | | – | | | | – | | | | – | | | | – | | | | – | | | | 0.00 | (c) |
| Net asset value, end of period | | $ | 4.67 | | | $ | 4.61 | | | $ | 4.89 | | | $ | 5.48 | | | $ | 6.74 | | | $ | 6.16 | |
| | | | | | | | | | | | | | | | | | | | | | | | | |
| Total Return | | | 1.30 | %(d) | | | (5.69 | )% | | | (4.98 | )% | | | 4.79 | % | | | 44.94 | % | | | 4.96 | % |
| | | | | | | | | | | | | | | | | | | | | | | | | |
| Ratios and Supplemental Data | | | | | | | | | | | | | | | | | | | | | | | | |
| Net assets, end of period (in 000s) | | $ | 1,743 | | | $ | 1,723 | | | $ | 18,119 | | | $ | 20,238 | | | $ | 15,231 | | | $ | 33,482 | |
| | | | | | | | | | | | | | | | | | | | | | | | | |
| Ratio of expenses to average net assets | | | | | | | | | | | | | | | | | | | | | | | | |
| With fee waivers/reimbursements | | | 1.10 | %(e) | | | 0.93 | % | | | 0.89 | % | | | 0.89 | % | | | 0.88 | % | | | 0.87 | % |
| Without fee waivers/reimbursements | | | 1.18 | %(e) | | | 1.08 | % | | | 0.97 | % | | | 0.98 | % | | | 0.95 | % | | | 0.93 | % |
| Ratio of net investment income/(loss) to average net assets | | | | | | | | | | | | | | | | | | | | | | | | |
| With fee waivers/reimbursements | | | 1.41 | %(e) | | | (0.28 | )% | | | (0.43 | )% | | | (0.46 | )% | | | (0.53 | )% | | | 0.06 | % |
| Without fee waivers/reimbursements | | | 1.33 | %(e) | | | (0.43 | )% | | | (0.51 | )% | | | (0.55 | )% | | | (0.60 | )% | | | 0.01 | % |
| Portfolio turnover rate | | | 42 | %(d) | | | 158 | % | | | 61 | % | | | 88 | % | | | 117 | % | | | 114 | % |
| (a) | Prior to December 27, 2016 known as the Westcore MIDCO Growth Fund |
| (b) | Calculated using the average shares method. |
| (c) | Less than $0.005 and $(0.005) per share. |
| (d) | Total return and portfolio turnover are not annualized for periods less than one full year. |
See Notes to Financial Statements.
Semi-Annual Report | June 30, 2017 | | 103 |
| Westcore Smid-Cap Value Dividend Fund | Financial Highlights |
For a Share Outstanding Throughout the Periods Presented
| Retail | | Six Months Ended
June 30, 2017 (Unaudited) | | | For the Period Ended December 31, 2016(a) | |
| Net asset value, beginning of period | | $ | 9.93 | | | $ | 10.00 | |
| Income/(loss) from investment operations: | | | | | | | | |
Net investment income/(loss)(b) | | | 0.09 | | | | 0.01 | |
| Net realized and unrealized gains/(losses) on investments | | | (0.16 | ) | | | (0.08 | ) |
| Total from investment operations | | | (0.07 | ) | | | (0.07 | ) |
| Net asset value, end of period | | $ | 9.86 | | | $ | 9.93 | |
| | | | | | | | | |
| Total Return | | | (0.70 | )%(c) | | | (0.70 | )%(c) |
| | | | | | | | | |
| Ratios and Supplemental Data | | | | | | | | |
| Net assets, end of period (in 000s) | | $ | 429 | | | $ | 119 | |
| | | | | | | | | |
| Ratio of expenses to average net assets | | | | | | | | |
| With fee waivers/reimbursements | | | 1.20 | %(d) | | | 1.20 | %(d) |
| Without fee waivers/reimbursements | | | 15.32 | %(d)(e) | | | 42.02 | %(d)(f) |
| Ratio of net investment income/(loss) to average net assets | | | | | | | | |
| With fee waivers/reimbursements | | | 1.91 | %(d) | | | 3.44 | %(d) |
| Without fee waivers/reimbursements | | | (12.21 | )%(d)(e) | | | (37.38 | )%(d)(f) |
| Portfolio turnover rate | | | 58 | %(c) | | | 2 | %(c) |
| (a) | Commenced operations on December 19, 2016. |
| (b) | Calculated using the average shares method. |
| (c) | Total return and portfolio turnover are not annualized for periods less than one full year. |
| (e) | Ratios before fee waivers for start up periods may not be representative of long term operating results. |
(f) | Ratios before fee waivers for start up periods may not be representative of long term operating results. For the purpose of the ratio, audit and tax preparation fees have not been annualized. |
See Notes to Financial Statements.
| 104 | | www.westcore.com |
| Westcore Smid-Cap Value Dividend Fund | Financial Highlights |
For a Share Outstanding Throughout the Periods Presented
| Institutional | | Six Months Ended
June 30, 2017 (Unaudited) | | | For the Period Ended December 31, 2016(a) | |
| Net asset value, beginning of period | | $ | 9.93 | | | $ | 10.00 | |
| Income/(loss) from investment operations: | | | | | | | | |
Net investment income/(loss)(b) | | | 0.09 | | | | 0.01 | |
| Net realized and unrealized gains/(losses) on investments | | | (0.15 | ) | | | (0.08 | ) |
| Total from investment operations | | | (0.06 | ) | | | (0.07 | ) |
| Net asset value, end of period | | $ | 9.87 | | | $ | 9.93 | |
| | | | | | | | | |
| Total Return | | | (0.60 | )%(c) | | | (0.70 | )%(c) |
| | | | | | | | | |
| Ratios and Supplemental Data | | | | | | | | |
| Net assets, end of period (in 000s) | | $ | 247 | | | $ | 248 | |
| | | | | | | | | |
| Ratio of expenses to average net assets | | | | | | | | |
| With fee waivers/reimbursements | | | 0.95 | %(d) | | | 1.07 | %(d) |
| Without fee waivers/reimbursements | | | 16.92 | %(d)(e) | | | 34.17 | %(d)(f) |
| Ratio of net investment income/(loss) to average net assets | | | | | | | | |
| With fee waivers/reimbursements | | | 1.86 | %(d) | | | 3.59 | %(d) |
| Without fee waivers/reimbursements | | | (14.11 | )%(d)(e) | | | (29.51 | )%(d)(f) |
| Portfolio turnover rate | | | 58 | %(c) | | | 2 | %(c) |
| (a) | Commenced operations on December 19, 2016. |
(b) | Calculated using the average shares method. |
| (c) | Total return and portfolio turnover are not annualized for periods less than one full year. |
| (e) | Ratios before fee waivers for start up periods may not be representative of long term operating results. |
| (f) | Ratios before fee waivers for start up periods may not be representative of long term operating results. For the purpose of the ratio, audit and tax preparation fees have not been annualized. |
See Notes to Financial Statements.
Semi-Annual Report | June 30, 2017 | | 105 |
| Westcore Small-Cap Value Dividend Fund | Financial Highlights |
For a Share Outstanding Throughout the Periods Presented
| Retail | | Six Months Ended June 30, 2017 (Unaudited) | | | Year Ended December 31, 2016 | | | Year Ended December 31, 2015 | | | Year Ended December 31, 2014 | | | Year Ended December 31, 2013(a) | | | Year Ended December 31, 2012 | |
| Net asset value, beginning of period | | $ | 12.52 | | | $ | 10.52 | | | $ | 13.45 | | | $ | 14.38 | | | $ | 12.65 | | | $ | 11.82 | |
| Income/(loss) from investment operations: | | | | | | | | | | | | | | | | | | | | | | | | |
Net investment income/(loss)(b) | | | 0.08 | | | | 0.11 | | | | 0.13 | | | | 0.14 | | | | 0.11 | | | | 0.11 | |
| Net realized and unrealized gains/(losses) on investments | | | (0.40 | ) | | | 3.02 | | | | (1.22 | ) | | | 0.75 | | | | 4.45 | | | | 1.03 | |
| Total from investment operations | | | (0.32 | ) | | | 3.13 | | | | (1.08 | ) | | | 0.89 | | | | 4.56 | | | | 1.14 | |
| | | | | | | | | | | | | | | | | | | | | | | | | |
| Less dividends and distributions: | | | | | | | | | | | | | | | | | | | | | | | | |
| Dividends from net investment income | | | – | | | | (0.18 | ) | | | (0.10 | ) | | | (0.15 | ) | | | (0.13 | ) | | | (0.13 | ) |
| Distributions from net realized gains | | | – | | | | (0.95 | ) | | | (1.75 | ) | | | (1.67 | ) | | | (2.70 | ) | | | (0.18 | ) |
| Total distributions | | | – | | | | (1.13 | ) | | | (1.85 | ) | | | (1.82 | ) | | | (2.83 | ) | | | (0.31 | ) |
| | | | | | | | | | | | | | | | | | | | | | | | | |
| Paid-in capital from redemption fees | | | – | | | | – | | | | – | | | | 0.00 | (c) | | | – | | | | 0.00 | (c) |
| Net asset value, end of period | | $ | 12.20 | | | $ | 12.52 | | | $ | 10.52 | | | $ | 13.45 | | | $ | 14.38 | | | $ | 12.65 | |
| | | | | | | | | | | | | | | | | | | | | | | | | |
| Total Return | | | (2.56 | )%(d) | | | 29.72 | % | | | (8.13 | )% | | | 6.46 | % | | | 36.49 | % | | | 9.69 | % |
| | | | | | | | | | | | | | | | | | | | | | | | | |
| Ratios and Supplemental Data | | | | | | | | | | | | | | | | | | | | | | | | |
| Net assets, end of period (in 000s) | | $ | 74,573 | | | $ | 86,518 | | | $ | 79,038 | | | $ | 141,445 | | | $ | 169,821 | | | $ | 189,858 | |
| | | | | | | | | | | | | | | | | | | | | | | | | |
| Ratio of expenses to average net assets | | | | | | | | | | | | | | | | | | | | | | | | |
| With fee waivers/reimbursements | | | 1.30 | %(e) | | | 1.30 | % | | | 1.30 | % | | | 1.30 | % | | | 1.30 | % | | | 1.30 | % |
| Without fee waivers/reimbursements | | | 1.45 | %(e) | | | 1.45 | % | | | 1.39 | % | | | 1.40 | % | | | 1.39 | % | | | 1.39 | % |
| Ratio of net investment income/(loss) to average net assets | | | | | | | | | | | | | | | | | | | | | | | | |
| With fee waivers/reimbursements | | | 1.26 | %(e) | | | 0.99 | % | | | 0.99 | % | | | 0.97 | % | | | 0.76 | % | | | 0.87 | % |
| Without fee waivers/reimbursements | | | 1.11 | %(e) | | | 0.84 | % | | | 0.90 | % | | | 0.87 | % | | | 0.67 | % | | | 0.78 | % |
| Portfolio turnover rate | | | 45 | %(d) | | | 96 | % | | | 74 | % | | | 70 | % | | | 53 | % | | | 35 | % |
| (a) | Prior to April 30, 2013 known as the Westcore Small-Cap Value Fund. |
| (b) | Calculated using the average shares method. |
| (c) | Less than $0.005 and $(0.005) per share. |
| (d) | Total return and portfolio turnover are not annualized for periods less than one full year. |
See Notes to Financial Statements.
| 106 | | www.westcore.com |
| Westcore Small-Cap Value Dividend Fund | Financial Highlights |
For a Share Outstanding Throughout the Periods Presented
| Institutional | | Six Months Ended June 30, 2017 (Unaudited) | | | Year Ended December 31, 2016 | | | Year Ended December 31, 2015 | | | Year Ended December 31, 2014 | | | Year Ended December 31, 2013(a) | | | Year Ended December 31, 2012 | |
| Net asset value, beginning of period | | $ | 12.53 | | | $ | 10.53 | | | $ | 13.47 | | | $ | 14.40 | | | $ | 12.64 | | | $ | 11.80 | |
| Income/(loss) from investment operations: | | | | | | | | | | | | | | | | | | | | | | | | |
Net investment income/(loss)(b) | | | 0.09 | | | | 0.14 | | | | 0.15 | | | | 0.17 | | | | 0.14 | | | | 0.13 | |
| Net realized and unrealized gains/(losses) on investments | | | (0.40 | ) | | | 3.02 | | | | (1.21 | ) | | | 0.74 | | | | 4.46 | | | | 1.02 | |
| Total from investment operations | | | (0.31 | ) | | | 3.16 | | | | (1.06 | ) | | | 0.91 | | | | 4.60 | | | | 1.15 | |
| | | | | | | | | | | | | | | | | | | | | | | | | |
| Less dividends and distributions: | | | | | | | | | | | | | | | | | | | | | | | | |
| Dividends from net investment income | | | – | | | | (0.21 | ) | | | (0.13 | ) | | | (0.17 | ) | | | (0.14 | ) | | | (0.13 | ) |
| Distributions from net realized gains | | | – | | | | (0.95 | ) | | | (1.75 | ) | | | (1.67 | ) | | | (2.70 | ) | | | (0.18 | ) |
| Total distributions | | | – | | | | (1.16 | ) | | | (1.88 | ) | | | (1.84 | ) | | | (2.84 | ) | | | (0.31 | ) |
| | | | | | | | | | | | | | | | | | | | | | | | | |
| Paid-in capital from redemption fees | | | – | | | | – | | | | – | | | | 0.00 | (c) | | | – | | | | 0.00 | (c) |
| Net asset value, end of period | | $ | 12.22 | | | $ | 12.53 | | | $ | 10.53 | | | $ | 13.47 | | | $ | 14.40 | | | $ | 12.64 | |
| | | | | | | | | | | | | | | | | | | | | | | | | |
| Total Return | | | (2.47 | )%(d) | | | 29.98 | % | | | (7.98 | )% | | | 6.62 | % | | | 36.86 | % | | | 9.78 | % |
| | | | | | | | | | | | | | | | | | | | | | | | | |
| Ratios and Supplemental Data | | | | | | | | | | | | | | | | | | | | | | | | |
| Net assets, end of period (in 000s) | | $ | 129,170 | | | $ | 130,098 | | | $ | 105,418 | | | $ | 190,166 | | | $ | 147,374 | | | $ | 124,052 | |
| | | | | | | | | | | | | | | | | | | | | | | | | |
| Ratio of expenses to average net assets | | | | | | | | | | | | | | | | | | | | | | | | |
| With fee waivers/reimbursements | | | 1.11 | %(e) | | | 1.08 | % | | | 1.13 | % | | | 1.11 | % | | | 1.12 | % | | | 1.14 | % |
| Without fee waivers/reimbursements | | | 1.24 | %(e) | | | 1.24 | % | | | 1.22 | % | | | 1.21 | % | | | 1.22 | % | | | 1.24 | % |
| Ratio of net investment income/(loss) to average net assets | | | | | | | | | | | | | | | | | | | | | | | | |
| With fee waivers/reimbursements | | | 1.50 | %(e) | | | 1.24 | % | | | 1.15 | % | | | 1.20 | % | | | 0.94 | % | | | 1.07 | % |
| Without fee waivers/reimbursements | | | 1.37 | %(e) | | | 1.08 | % | | | 1.06 | % | | | 1.10 | % | | | 0.84 | % | | | 0.96 | % |
| Portfolio turnover rate | | | 45 | %(d) | | | 96 | % | | | 74 | % | | | 70 | % | | | 53 | % | | | 35 | % |
| (a) | Prior to April 30, 2013 known as the Westcore Small-Cap Value Fund. |
| (b) | Calculated using the average shares method. |
| (c) | Less than $0.005 and $(0.005) per share. |
| (d) | Total return and portfolio turnover are not annualized for periods less than one full year. |
See Notes to Financial Statements.
Semi-Annual Report | June 30, 2017 | | 107 |
| Westcore Global Large-Cap Dividend Fund | Financial Highlights |
For a Share Outstanding Throughout the Periods Presented
| Retail | | Six Months Ended June 30, 2017 (Unaudited) | | | Year Ended December 31, 2016 (a) | | | Year Ended December 31, 2015 | | | Year Ended December 31, 2014 | | | Year Ended December 31, 2013 (b) | | | Year Ended December 31, 2012 | |
| Net asset value, beginning of period | | $ | 9.79 | | | $ | 9.45 | | | $ | 10.57 | | | $ | 10.91 | | | $ | 12.00 | | | $ | 11.49 | |
| Income/(loss) from investment operations: | | | | | | | | | | | | | | | | | | | | | | | | |
Net investment income/(loss)(c) | | | 0.12 | | | | 0.17 | | | | 0.23 | | | | 0.19 | | | | 0.18 | | | | 0.14 | |
| Net realized and unrealized gains/(losses) on investments | | | 0.87 | | | | 0.63 | | | | (0.30 | ) | | | 0.28 | | | | 2.68 | | | | 1.40 | |
| Total from investment operations | | | 0.99 | | | | 0.80 | | | | (0.07 | ) | | | 0.47 | | | | 2.86 | | | | 1.54 | |
| | | | | | | | | | | | | | | | | | | | | | | | | |
| Less dividends and distributions: | | | | | | | | | | | | | | | | | | | | | | | | |
| Dividends from net investment income | | | (0.11 | ) | | | (0.18 | ) | | | (0.23 | ) | | | (0.19 | ) | | | (0.21 | ) | | | (0.16 | ) |
| Distributions from net realized gains | | | – | | | | (0.28 | ) | | | (0.82 | ) | | | (0.62 | ) | | | (3.74 | ) | | | (0.87 | ) |
| Total distributions | | | (0.11 | ) | | | (0.46 | ) | | | (1.05 | ) | | | (0.81 | ) | | | (3.95 | ) | | | (1.03 | ) |
| | | | | | | | | | | | | | | | | | | | | | | | | |
| Paid-in capital from redemption fees | | | – | | | | – | | | | – | | | | – | | | | – | | | | 0.00 | (d) |
| Net asset value, end of period | | $ | 10.67 | | | $ | 9.79 | | | $ | 9.45 | | | $ | 10.57 | | | $ | 10.91 | | | $ | 12.00 | |
| | | | | | | | | | | | | | | | | | | | | | | | | |
| Total Return | | | 10.16 | %(e) | | | 8.58 | % | | | (0.56 | )% | | | 4.43 | % | | | 24.53 | % | | | 13.39 | % |
| | | | | | | | | | | | | | | | | | | | | | | | | |
| Ratios and Supplemental Data | | | | | | | | | | | | | | | | | | | | | | | | |
| Net assets, end of period (in 000s) | | $ | 49,073 | | | $ | 44,296 | | | $ | 37,613 | | | $ | 46,432 | | | $ | 53,780 | | | $ | 55,215 | |
| | | | | | | | | | | | | | | | | | | | | | | | | |
| Ratio of expenses to average net assets | | | | | | | | | | | | | | | | | | | | | | | | |
| With fee waivers/reimbursements | | | 0.99 | %(f) | | | 0.99 | % | | | 0.99 | % | | | 0.99 | % | | | 1.10 | %(g) | | | 1.15 | % |
| Without fee waivers/reimbursements | | | 1.21 | %(f) | | | 1.22 | % | | | 1.17 | % | | | 1.14 | % | | | 1.14 | % | | | 1.17 | % |
| Ratio of net investment income/(loss) to average net assets | | | | | | | | | | | | | | | | | | | | | | | | |
| With fee waivers/reimbursements | | | 2.42 | %(f) | | | 1.79 | % | | | 2.19 | % | | | 1.67 | % | | | 1.31 | % | | | 1.13 | % |
| Without fee waivers/reimbursements | | | 2.20 | %(f) | | | 1.56 | % | | | 2.01 | % | | | 1.52 | % | | | 1.27 | % | | | 1.11 | % |
| Portfolio turnover rate | | | 7 | %(e) | | | 61 | % | | | 65 | % | | | 18 | % | | | 91 | % | | | 9 | % |
| (a) | Prior to April 29, 2016 known as the Westcore Blue Chip Dividend Fund. |
| (b) | Prior to April 30, 2013 known as the Westcore Blue Chip Fund. |
| (c) | Calculated using the average shares method. |
| (d) | Less than $0.005 and $(0.005) per share. |
| (e) | Total return and portfolio turnover are not annualized for periods less than one full year. |
| (g) | Contractual expense limitation change from 1.15% to 0.99% effective September 1, 2013. |
See Notes to Financial Statements.
| 108 | | www.westcore.com |
| Westcore Global Large-Cap Dividend Fund | Financial Highlights |
For a Share Outstanding Throughout the Periods Presented
| Institutional | | Six Months Ended June 30, 2017 (Unaudited) | | | Year Ended December 31, 2016 (a) | | | Year Ended December 31, 2015 | | | Year Ended December 31, 2014 | | | Year Ended December 31, 2013 (b) | | | Year Ended December 31, 2012 | |
| Net asset value, beginning of period | | $ | 9.71 | | | $ | 9.39 | | | $ | 10.51 | | | $ | 10.85 | | | $ | 11.96 | | | $ | 11.46 | |
| Income/(loss) from investment operations: | | | | | | | | | | | | | | | | | | | | | | | | |
Net investment income/(loss)(c) | | | 0.13 | | | | 0.20 | | | | 0.25 | | | | 0.21 | | | | 0.20 | | | | 0.17 | |
| Net realized and unrealized gains/(losses) on investments | | | 0.88 | | | | 0.60 | | | | (0.30 | ) | | | 0.28 | | | | 2.67 | | | | 1.39 | |
| Total from investment operations | | | 1.01 | | | | 0.80 | | | | (0.05 | ) | | | 0.49 | | | | 2.87 | | | | 1.56 | |
| | | | | | | | | | | | | | | | | | | | | | | | | |
| Less dividends and distributions: | | | | | | | | | | | | | | | | | | | | | | | | |
| Dividends from net investment income | | | (0.12 | ) | | | (0.20 | ) | | | (0.25 | ) | | | (0.21 | ) | | | (0.24 | ) | | | (0.19 | ) |
| Distributions from net realized gains | | | – | | | | (0.28 | ) | | | (0.82 | ) | | | (0.62 | ) | | | (3.74 | ) | | | (0.87 | ) |
| Total distributions | | | (0.12 | ) | | | (0.48 | ) | | | (1.07 | ) | | | (0.83 | ) | | | (3.98 | ) | | | (1.06 | ) |
| | | | | | | | | | | | | | | | | | | | | | | | | |
| Paid-in capital from redemption fees | | | – | | | | – | | | | – | | | | – | | | | – | | | | 0.00 | (d) |
| Net asset value, end of period | | $ | 10.60 | | | $ | 9.71 | | | $ | 9.39 | | | $ | 10.51 | | | $ | 10.85 | | | $ | 11.96 | |
| | | | | | | | | | | | | | | | | | | | | | | | | |
| Total Return | | | 10.39 | %(e) | | | 8.63 | % | | | (0.42 | )% | | | 4.66 | % | | | 24.72 | % | | | 13.66 | % |
| | | | | | | | | | | | | | | | | | | | | | | | | |
| Ratios and Supplemental Data | | | | | | | | | | | | | | | | | | | | | | | | |
| Net assets, end of period (in 000s) | | $ | 4,252 | | | $ | 3,466 | | | $ | 3,391 | | | $ | 4,746 | | | $ | 6,021 | | | $ | 6,612 | |
| | | | | | | | | | | | | | | | | | | | | | | | | |
| Ratio of expenses to average net assets | | | | | | | | | | | | | | | | | | | | | | | | |
| With fee waivers/reimbursements | | | 0.90 | %(f) | | | 0.81 | % | | | 0.82 | % | | | 0.82 | % | | | 0.92 | % | | | 0.92 | % |
| Without fee waivers/reimbursements | | | 1.10 | %(f) | | | 1.21 | % | | | 1.05 | % | | | 1.01 | % | | | 0.98 | % | | | 1.06 | % |
| Ratio of net investment income/(loss) to average net assets | | | | | | | | | | | | | | | | | | | | | | | | |
| With fee waivers/reimbursements | | | 2.54 | %(f) | | | 2.01 | % | | | 2.38 | % | | | 1.88 | % | | | 1.49 | % | | | 1.35 | % |
| Without fee waivers/reimbursements | | | 2.34 | %(f) | | | 1.61 | % | | | 2.15 | % | | | 1.69 | % | | | 1.43 | % | | | 1.21 | % |
| Portfolio turnover rate | | | 7 | %(e) | | | 61 | % | | | 65 | % | | | 18 | % | | | 91 | % | | | 9 | % |
(a) | Prior to April 29, 2016 known as the Westcore Blue Chip Dividend Fund. |
(b) | Prior to April 30, 2013 known as the Westcore Blue Chip Fund. |
(c) | Calculated using the average shares method. |
(d) | Less than $0.005 and $(0.005) per share. |
(e) | Total return and portfolio turnover are not annualized for periods less than one full year. |
See Notes to Financial Statements.
Semi-Annual Report | June 30, 2017 | | 109 |
| Westcore Large-Cap Dividend Fund | Financial Highlights |
For a Share Outstanding Throughout the Periods Presented
| Retail | | Six Months Ended June 30, 2017 (Unaudited) | | | Year Ended December 31, 2016 (a) | | | Year Ended December 31, 2015 | | | Year Ended December 31, 2014 | | | Year Ended December 31, 2013 | | | Year Ended December 31, 2012 | |
| Net asset value, beginning of period | | $ | 6.38 | | | $ | 8.96 | | | $ | 12.72 | | | $ | 15.98 | | | $ | 14.07 | | | $ | 12.46 | |
| Income/(loss) from investment operations: | | | | | | | | | | | | | | | | | | | | | | | | |
Net investment income/(loss)(b) | | | 0.06 | | | | 0.01 | | | | (0.04 | ) | | | (0.03 | ) | | | (0.03 | ) | | | 0.05 | |
| Net realized and unrealized gains/(losses) on investments | | | 0.32 | | | | (0.01 | ) | | | 0.60 | | | | 1.04 | | | | 4.62 | | | | 1.83 | |
| Total from investment operations | | | 0.38 | | | | – | | | | 0.56 | | | | 1.01 | | | | 4.59 | | | | 1.88 | |
| | | | | | | | | | | | | | | | | | | | | | | | | |
| Less dividends and distributions: | | | | | | | | | | | | | | | | | | | | | | | | |
| Dividends from net investment income | | | (0.06 | ) | | | – | | | | – | | | | – | | | | – | | | | (0.05 | ) |
| Distributions from net realized gains | | | – | | | | (2.58 | ) | | | (4.32 | ) | | | (4.27 | ) | | | (2.68 | ) | | | (0.22 | ) |
| Total distributions | | | (0.06 | ) | | | (2.58 | ) | | | (4.32 | ) | | | (4.27 | ) | | | (2.68 | ) | | | (0.27 | ) |
| | | | | | | | | | | | | | | | | | | | | | | | | |
| Paid-in capital from redemption fees | | | – | | | | – | | | | – | | | | – | | | | – | | | | 0.00 | (c) |
| Net asset value, end of period | | $ | 6.70 | | | $ | 6.38 | | | $ | 8.96 | | | $ | 12.72 | | | $ | 15.98 | | | $ | 14.07 | |
| | | | | | | | | | | | | | | | | | | | | | | | | |
| Total Return | | | 5.90 | %(d) | | | (0.38 | )% | | | 4.43 | % | | | 6.79 | % | | | 32.93 | % | | | 15.13 | % |
| | | | | | | | | | | | | | | | | | | | | | | | | |
| Ratios and Supplemental Data | | | | | | | | | | | | | | | | | | | | | | | | |
| Net assets, end of period (in 000s) | | $ | 10,614 | | | $ | 12,061 | | | $ | 24,942 | | | $ | 33,954 | | | $ | 69,632 | | | $ | 66,514 | |
| | | | | | | | | | | | | | | | | | | | | | | | | |
| Ratio of expenses to average net assets | | | | | | | | | | | | | | | | | | | | | | | | |
| With fee waivers/reimbursements | | | 1.06 | %(e)(f) | | | 1.15 | % | | | 1.15 | % | | | 1.11 | % | | | 1.09 | % | | | 1.11 | % |
| Without fee waivers/reimbursements | | | 1.71 | %(e) | | | 1.30 | % | | | 1.17 | % | | | 1.11 | % | | | 1.09 | % | | | 1.11 | % |
| Ratio of net investment income/(loss) to average net assets | | | | | | | | | | | | | | | | | | | | | | | | |
| With fee waivers/reimbursements | | | 1.90 | %(e) | | | 0.14 | % | | | (0.34 | )% | | | (0.21 | )% | | | (0.17 | )% | | | 0.36 | % |
| Without fee waivers/reimbursements | | | 1.25 | %(e) | | | (0.01 | )% | | | (0.36 | )% | | | (0.21 | )% | | | (0.17 | )% | | | 0.36 | % |
| Portfolio turnover rate | | | 0 | %(d) | | | 112 | % | | | 96 | % | | | 144 | % | | | 182 | % | | | 167 | % |
(a) | Prior to December 27, 2016 known as the Westcore Growth Fund |
(b) | Calculated using the average shares method. |
(c) | Less than $0.005 and $(0.005) per share. |
(d) | Total return and portfolio turnover are not annualized for periods less than one full year. |
(f) | Contractual expense limitation change from 1.15% to 0.89% effective April 30, 2017. |
See Notes to Financial Statements.
| 110 | | www.westcore.com |
| Westcore Large-Cap Dividend Fund | Financial Highlights |
For a Share Outstanding Throughout the Periods Presented
| Institutional | | Six Months Ended June 30, 2017 (Unaudited) | | | Year Ended December 31, 2016 (a) | | | Year Ended December 31, 2015 | | | Year Ended December 31, 2014 | | | Year Ended December 31, 2013 | | | Year Ended December 31, 2012 | |
| Net asset value, beginning of period | | $ | 6.61 | | | $ | 9.16 | | | $ | 12.88 | | | $ | 16.10 | | | $ | 14.14 | | | $ | 12.50 | |
| Income/(loss) from investment operations: | | | | | | | | | | | | | | | | | | | | | | | | |
Net investment income/(loss)(b) | | | 0.07 | | | | 0.03 | | | | (0.02 | ) | | | 0.00 | (c) | | | 0.01 | | | | 0.04 | |
| Net realized and unrealized gains/(losses) on investments | | | 0.32 | | | | (0.00 | )(c) | | | 0.62 | | | | 1.05 | | | | 4.63 | | | | 1.88 | |
| Total from investment operations | | | 0.39 | | | | 0.03 | | | | 0.60 | | | | 1.05 | | | | 4.64 | | | | 1.92 | |
| | | | | | | | | | | | | | | | | | | | | | | | | |
| Less dividends and distributions: | | | | | | | | | | | | | | | | | | | | | | | | |
| Dividends from net investment income | | | (0.07 | ) | | | – | | | | – | | | | – | | | | – | | | | (0.06 | ) |
| Distributions from net realized gains | | | – | | | | (2.58 | ) | | | (4.32 | ) | | | (4.27 | ) | | | (2.68 | ) | | | (0.22 | ) |
| Total distributions | | | (0.07 | ) | | | (2.58 | ) | | | (4.32 | ) | | | (4.27 | ) | | | (2.68 | ) | | | (0.28 | ) |
| | | | | | | | | | | | | | | | | | | | | | | | | |
| Paid-in capital from redemption fees | | | – | | | | – | | | | – | | | | – | | | | – | | | | 0.00 | (c) |
| Net asset value, end of period | | $ | 6.93 | | | $ | 6.61 | | | $ | 9.16 | | | $ | 12.88 | | | $ | 16.10 | | | $ | 14.14 | |
| | | | | | | | | | | | | | | | | | | | | | | | | |
| Total Return | | | 5.85 | %(d) | | | 0.01 | % | | | 4.68 | % | | | 6.98 | % | | | 33.13 | % | | | 15.37 | % |
| | | | | | | | | | | | | | | | | | | | | | | | | |
| Ratios and Supplemental Data | | | | | | | | | | | | | | | | | | | | | | | | |
| Net assets, end of period (in 000s) | | $ | 525 | | | $ | 546 | | | $ | 5,016 | | | $ | 6,970 | | | $ | 9,236 | | | $ | 4,564 | |
| | | | | | | | | | | | | | | | | | | | | | | | | |
| Ratio of expenses to average net assets | | | | | | | | | | | | | | | | | | | | | | | | |
| With fee waivers/reimbursements | | | 0.97 | %(e) | | | 0.91 | % | | | 0.95 | % | | | 0.91 | % | | | 0.89 | % | | | 0.92 | % |
| Without fee waivers/reimbursements | | | 1.57 | %(e) | | | 1.49 | % | | | 1.28 | % | | | 1.05 | % | | | 1.15 | % | | | 1.32 | % |
| Ratio of net investment income/(loss) to average net assets | | | | | | | | | | | | | | | | | | | | | | | | |
| With fee waivers/reimbursements | | | 1.88 | %(e) | | | 0.37 | % | | | (0.15 | )% | | | 0.00 | % | | | 0.06 | % | | | 0.31 | % |
| Without fee waivers/reimbursements | | | 1.28 | %(e) | | | (0.21 | )% | | | (0.48 | )% | | | (0.14 | )% | | | (0.20 | )% | | | (0.09 | )% |
| Portfolio turnover rate | | | 0 | %(d) | | | 112 | % | | | 96 | % | | | 144 | % | | | 182 | % | | | 167 | % |
(a) | Prior to December 27, 2016 known as the Westcore Growth Fund |
(b) | Calculated using the average shares method. |
(c) | Less than $0.005 and $(0.005) per share. |
(d) | Total return and portfolio turnover are not annualized for periods less than one full year. |
See Notes to Financial Statements.
Semi-Annual Report | June 30, 2017 | | 111 |
| Westcore Micro-Cap Opportunity Fund | Financial Highlights |
For a Share Outstanding Throughout the Periods Presented
| Retail | | Six Months Ended June 30, 2017 (Unaudited) | | | Year Ended December 31, 2016 | | | Year Ended December 31, 2015 | | | Year Ended December 31, 2014 | | | Year Ended December 31, 2013 | | | Year Ended December 31, 2012 | |
| Net asset value, beginning of period | | $ | 18.94 | | | $ | 15.74 | | | $ | 17.96 | | | $ | 17.69 | | | $ | 12.35 | | | $ | 11.15 | |
| Income/(loss) from investment operations: | | | | | | | | | | | | | | | | | | | | | | | | |
Net investment income/(loss)(a) | | | 0.00 | (b) | | | 0.05 | | | | (0.01 | ) | | | (0.01 | ) | | | (0.00 | )(b) | | | 0.11 | |
| Net realized and unrealized gains/(losses) on investments | | | 0.02 | | | | 3.80 | | | | (0.88 | ) | | | 0.44 | | | | 5.70 | | | | 1.62 | |
| Total from investment operations | | | 0.02 | | | | 3.85 | | | | (0.89 | ) | | | 0.43 | | | | 5.70 | | | | 1.73 | |
| | | | | | | | | | | | | | | | | | | | | | | | | |
| Less dividends and distributions: | | | | | | | | | | | | | | | | | | | | | | | | |
| Dividends from net investment income | | | – | | | | (0.06 | ) | | | – | | | | – | | | | (0.01 | ) | | | (0.14 | ) |
| Distributions from net realized gains | | | – | | | | (0.59 | ) | | | (1.33 | ) | | | (0.16 | ) | | | (0.35 | ) | | | (0.39 | ) |
| Total distributions | | | – | | | | (0.65 | ) | | | (1.33 | ) | | | (0.16 | ) | | | (0.36 | ) | | | (0.53 | ) |
| | | | | | | | | | | | | | | | | | | | | | | | | |
| Paid-in capital from redemption fees | | | – | | | | 0.00 | (b) | | | 0.00 | (b) | | | 0.00 | (b) | | | – | | | | 0.00 | (b) |
| Net asset value, end of period | | $ | 18.96 | | | $ | 18.94 | | | $ | 15.74 | | | $ | 17.96 | | | $ | 17.69 | | | $ | 12.35 | |
| | | | | | | | | | | | | | | | | | | | | | | | | |
| Total Return | | | 0.11 | %(c) | | | 24.49 | % | | | (4.92 | )% | | | 2.49 | % | | | 46.20 | % | | | 15.60 | % |
| | | | | | | | | | | | | | | | | | | | | | | | | |
| Ratios and Supplemental Data | | | | | | | | | | | | | | | | | | | | | | | | |
| Net assets, end of period (in 000s) | | $ | 13,523 | | | $ | 13,311 | | | $ | 20,786 | | | $ | 37,206 | | | $ | 20,787 | | | $ | 2,986 | |
| | | | | | | | | | | | | | | | | | | | | | | | | |
| Ratio of expenses to average net assets | | | | | | | | | | | | | | | | | | | | | | | | |
| With fee waivers/reimbursements | | | 1.30 | %(d) | | | 1.30 | % | | | 1.30 | % | | | 1.30 | % | | | 1.30 | % | | | 1.30 | % |
| Without fee waivers/reimbursements | | | 1.94 | %(d) | | | 2.09 | % | | | 1.66 | % | | | 1.60 | % | | | 1.95 | % | | | 4.71 | % |
| Ratio of net investment income/(loss) to average net assets | | | | | | | | | | | | | | | | | | | | | | | | |
| With fee waivers/reimbursements | | | 0.03 | %(d) | | | 0.33 | % | | | 0.06 | % | | | (0.05 | )% | | | (0.01 | )% | | | 0.94 | % |
| Without fee waivers/reimbursements | | | (0.61 | )%(d) | | | (0.46 | )% | | | (0.42 | )% | | | (0.35 | )% | | | (0.66 | )% | | | (2.47 | )% |
| Portfolio turnover rate | | | 53 | %(c) | | | 43 | % | | | 105 | % | | | 72 | % | | | 52 | % | | | 132 | % |
(a) | Calculated using the average shares method. |
(b) | Less than $0.005 and $(0.005) per share. |
(c) | Total return and portfolio turnover are not annualized for periods less than one full year. |
See Notes to Financial Statements.
| 112 | | www.westcore.com |
| Westcore International Small-Cap Fund | Financial Highlights |
For a Share Outstanding Throughout the Periods Presented
| Retail | | Six Months Ended June 30, 2017 (Unaudited) | | | Year Ended December 31, 2016 | | | Year Ended December 31, 2015 | | | Year Ended December 31, 2014 | | | Year Ended December 31, 2013 | | | Year Ended December 31, 2012 | |
| Net asset value, beginning of period | | $ | 15.08 | | | $ | 15.59 | | | $ | 16.71 | | | $ | 21.26 | | | $ | 17.94 | | | $ | 14.55 | |
| Income/(loss) from investment operations: | | | | | | | | | | | | | | | | | | | | | | | | |
Net investment income/(loss)(a) | | | 0.03 | | | | 0.08 | | | | 0.23 | | | | 0.33 | | | | 0.35 | | | | 0.37 | |
| Net realized and unrealized gains/(losses) on investments | | | 2.26 | | | | 0.15 | | | | (0.09 | ) | | | (4.34 | ) | | | 3.63 | | | | 3.24 | |
| Total from investment operations | | | 2.29 | | | | 0.23 | | | | 0.14 | | | | (4.01 | ) | | | 3.98 | | | | 3.61 | |
| | | | | | | | | | | | | | | | | | | | | | | | | |
| Less dividends and distributions: | | | | | | | | | | | | | | | | | | | | | | | | |
| Dividends from net investment income | | | – | | | | (0.74 | ) | | | (0.79 | ) | | | (0.01 | ) | | | (0.66 | ) | | | (0.22 | ) |
| Distributions from net realized gains | | | – | | | | – | | | | (0.47 | ) | | | (0.53 | ) | | | – | | | | – | |
| Total distributions | | | – | | | | (0.74 | ) | | | (1.26 | ) | | | (0.54 | ) | | | (0.66 | ) | | | (0.22 | ) |
| | | | | | | | | | | | | | | | | | | | | | | | | |
| Paid-in capital from redemption fees | | | – | | | | – | | | | – | | | | – | | | | 0.00 | (b) | | | 0.00 | (b) |
| Net asset value, end of period | | $ | 17.37 | | | $ | 15.08 | | | $ | 15.59 | | | $ | 16.71 | | | $ | 21.26 | | | $ | 17.94 | |
| | | | | | | | | | | | | | | | | | | | | | | | | |
| Total Return | | | 15.19 | %(c) | | | 1.60 | % | | | 1.05 | % | | | (18.82 | )% | | | 22.36 | % | | | 24.84 | % |
| | | | | | | | | | | | | | | | | | | | | | | | | |
| Ratios and Supplemental Data | | | | | | | | | | | | | | | | | | | | | | | | |
| Net assets, end of period (in 000s) | | $ | 46,595 | | | $ | 49,746 | | | $ | 100,223 | | | $ | 294,657 | | | $ | 480,789 | | | $ | 327,825 | |
| | | | | | | | | | | | | | | | | | | | | | | | | |
| Ratio of expenses to average net assets | | | | | | | | | | | | | | | | | | | | | | | | |
| With fee waivers/reimbursements | | | 1.44 | %(d) | | | 1.46 | %(e) | | | 1.50 | % | | | 1.50 | % | | | 1.50 | % | | | 1.50 | % |
| Without fee waivers/reimbursements | | | 1.75 | %(d) | | | 1.77 | % | | | 1.62 | % | | | 1.58 | % | | | 1.63 | % | | | 1.65 | % |
| Ratio of net investment income/(loss) to average net assets | | | | | | | | | | | | | | | | | | | | | | | | |
| With fee waivers/reimbursements | | | 0.39 | %(d) | | | 0.51 | % | | | 1.35 | % | | | 1.65 | % | | | 1.82 | % | | | 2.22 | % |
| Without fee waivers/reimbursements | | | 0.08 | %(d) | | | 0.20 | % | | | 1.23 | % | | | 1.57 | % | | | 1.69 | % | | | 2.07 | % |
| Portfolio turnover rate | | | 19 | %(c) | | | 44 | % | | | 44 | % | | | 40 | % | | | 57 | % | | | 14 | % |
(a) | Calculated using the average shares method. |
(b) | Less than $0.005 and $(0.005) per share. |
(c) | Total return and portfolio turnover are not annualized for periods less than one full year. |
(e) | Contractual expense limitation change from 1.50% to 1.44% effective April 29, 2016. |
See Notes to Financial Statements.
Semi-Annual Report | June 30, 2017 | | 113 |
| Westcore International Small-Cap Fund | Financial Highlights |
| | For a Share Outstanding Throughout the Periods Presented |
| Institutional | | Six Months Ended
June 30, 2017
(Unaudited) | | | For the Period Ended December 31, 2016 (a) | |
| Net asset value, beginning of period | | $ | 15.64 | | | $ | 15.76 | |
| Income/(loss) from investment operations: | | | | | | | | |
| Net investment income/(loss)(b) | | | 0.05 | | | | 0.11 | |
| Net realized and unrealized gains/(losses) on investments | | | 2.34 | | | | (0.01 | ) |
| Total from investment operations | | | 2.39 | | | | 0.10 | |
| | | | | | | | | |
| Less dividends and distributions: | | | | | | | | |
| Dividends from net investment income | | | – | | | | (0.22 | ) |
| Total distributions | | | – | | | | (0.22 | ) |
| Net asset value, end of period | | $ | 18.03 | | | $ | 15.64 | |
| | | | | | | | | |
| Total Return | | | 15.28 | %(c) | | | 0.66 | %(c) |
| | | | | | | | | |
| Ratios and Supplemental Data | | | | | | | | |
| Net assets, end of period (in 000s) | | $ | 26,234 | | | $ | 20,358 | |
| | | | | | | | | |
| Ratio of expenses to average net assets | | | | | | | | |
| With fee waivers/reimbursements | | | 1.29 | %(d) | | | 1.19 | %(d) |
| Without fee waivers/reimbursements | | | 1.61 | %(d) | | | 1.65 | %(d) |
| Ratio of net investment income/(loss) to average net assets | | | | | | | | |
| With fee waivers/reimbursements | | | 0.60 | %(d) | | | 1.06 | %(d) |
| Without fee waivers/reimbursements | | | 0.28 | %(d) | | | 0.60 | %(d) |
| Portfolio turnover rate | | | 19 | %(c) | | | 44 | %(c)(e) |
(a) | The Fund added an institutional share class on April 29, 2016. |
(b) | Calculated using the average shares method. |
(c) | Total return and portfolio turnover are not annualized for periods less than one full year. |
(e) | Porfolio turnover rate is calculated at the fund level and represents the year ended December 31, 2016. |
| See Notes to Financial Statements. | | |
| 114 | | www.westcore.com |
| Westcore Flexible Income Fund | Financial Highlights |
| | For a Share Outstanding Throughout the Periods Presented |
| Retail | | Six Months Ended
June 30, 2017
(Unaudited) | | | Year Ended
December 31, 2016 | | | Year Ended
December 31, 2015 | | | Year Ended
December 31, 2014 | | | Year Ended
December 31, 2013 | | | Year Ended
December 31, 2012 | |
| Net asset value, beginning of period | | $ | 8.86 | | | $ | 8.23 | | | $ | 8.80 | | | $ | 8.83 | | | $ | 8.94 | | | $ | 8.57 | |
| Income/(loss) from investment operations: | | | | | | | | | | | | | | | | | | | | | | | | |
Net investment income/(loss)(a) | | | 0.21 | | | | 0.40 | | | | 0.42 | | | | 0.46 | | | | 0.49 | | | | 0.50 | |
| Net realized and unrealized gains/(losses) on investments | | | 0.15 | | | | 0.63 | | | | (0.55 | ) | | | (0.02 | ) | | | (0.12 | ) | | | 0.38 | |
| Total from investment operations | | | 0.36 | | | | 1.03 | | | | (0.13 | ) | | | 0.44 | | | | 0.37 | | | | 0.88 | |
| | | | | | | | | | | | | | | | | | | | | | | | | |
| Less dividends and distributions: | | | | | | | | | | | | | | | | | | | | | | | | |
| Dividends from net investment income | | | (0.20 | ) | | | (0.40 | ) | | | (0.44 | ) | | | (0.47 | ) | | | (0.48 | ) | | | (0.51 | ) |
| Return of capital | | | – | | | | – | | | | (0.00 | ) (b) | | | – | | | | – | | | | – | |
| Total distributions | | | (0.20 | ) | | | (0.40 | ) | | | (0.44 | ) | | | (0.47 | ) | | | (0.48 | ) | | | (0.51 | ) |
| | | | | | | | | | | | | | | | | | | | | | | | | |
| Paid-in capital from redemption fees | | | – | | | | 0.00 | (b) | | | 0.00 | (b) | | | 0.00 | (b) | | | 0.00 | (b) | | | 0.00 | (b) |
| Net asset value, end of period | | $ | 9.02 | | | $ | 8.86 | | | $ | 8.23 | | | $ | 8.80 | | | $ | 8.83 | | | $ | 8.94 | |
| | | | | | | | | | | | | | | | | | | | | | | | | |
| Total Return | | | 4.09 | %(c) | | | 12.75 | % | | | (1.64 | )% | | | 5.01 | % | | | 4.31 | % | | | 10.49 | % |
| | | | | | | | | | | | | | | | | | | | | | | | | |
| Ratios and Supplemental Data | | | | | | | | | | | | | | | | | | | | | | | | |
| Net assets, end of period (in 000s) | | $ | 59,673 | | | $ | 56,997 | | | $ | 46,725 | | | $ | 59,734 | | | $ | 61,608 | | | $ | 74,206 | |
| | | | | | | | | | | | | | | | | | | | | | | | | |
| Ratio of expenses to average net assets | | | | | | | | | | | | | | | | | | | | | | | | |
| With fee waivers/reimbursements | | | 0.85 | %(d) | | | 0.85 | % | | | 0.85 | % | | | 0.85 | % | | | 0.85 | % | | | 0.85 | % |
| Without fee waivers/reimbursements | | | 0.97 | %(d) | | | 0.95 | % | | | 0.98 | % | | | 0.88 | % | | | 0.91 | % | | | 0.90 | % |
| Ratio of net investment income/(loss) to average net assets | | | | | | | | | | | | | | | | | | | | | | | | |
| With fee waivers/reimbursements | | | 4.76 | %(d) | | | 4.63 | % | | | 4.86 | % | | | 5.16 | % | | | 5.49 | % | | | 5.69 | % |
| Without fee waivers/reimbursements | | | 4.64 | %(d) | | | 4.53 | % | | | 4.73 | % | | | 5.13 | % | | | 5.43 | % | | | 5.65 | % |
| Portfolio turnover rate | | | 20 | %(c) | | | 47 | % | | | 37 | % | | | 37 | % | | | 15 | % | | | 34 | % |
(a) | Calculated using the average shares method. |
(b) | Less than $0.005 and $(0.005) per share. |
(c) | Total return and portfolio turnover are not annualized for periods less than one full year. |
| See Notes to Financial Statements. | |
Semi-Annual Report | June 30, 2017 | | 115 |
| Westcore Flexible Income Fund | Financial Highlights |
| | For a Share Outstanding Throughout the Periods Presented |
| Institutional | | Six Months Ended
June 30, 2017
(Unaudited) | | | Year Ended
December 31, 2016 | | | Year Ended
December 31, 2015 | | | Year Ended
December 31, 2014 | | | Year Ended
December 31, 2013 | | | Year Ended
December 31, 2012 | |
| Net asset value, beginning of period | | $ | 8.75 | | | $ | 8.12 | | | $ | 8.68 | | | $ | 8.71 | | | $ | 8.82 | | | $ | 8.43 | |
| Income/(loss) from investment operations: | | | | | | | | | | | | | | | | | | | | | | | | |
Net investment income/(loss)(a) | | | 0.22 | | | | 0.41 | | | | 0.43 | | | | 0.47 | | | | 0.49 | | | | 0.50 | |
| Net realized and unrealized gains/(losses) on investments | | | 0.14 | | | | 0.62 | | | | (0.55 | ) | | | (0.02 | ) | | | (0.11 | ) | | | 0.38 | |
| Total from investment operations | | | 0.36 | | | | 1.03 | | | | (0.12 | ) | | | 0.45 | | | | 0.38 | | | | 0.88 | |
| | | | | | | | | | | | | | | | | | | | | | | | | |
| Less dividends and distributions: | | | | | | | | | | | | | | | | | | | | | | | | |
| Dividends from net investment income | | | (0.20 | ) | | | (0.41 | ) | | | (0.44 | ) | | | (0.48 | ) | | | (0.49 | ) | | | (0.49 | ) |
| Return of capital | | | – | | | | – | | | | (0.00 | ) (b) | | | – | | | | – | | | | – | |
| Total distributions | | | (0.20 | ) | | | (0.41 | ) | | | (0.44 | ) | | | (0.48 | ) | | | (0.49 | ) | | | (0.49 | ) |
| | | | | | | | | | | | | | | | | | | | | | | | | |
| Paid-in capital from redemption fees | | | – | | | | 0.01 | | | | 0.00 | (b) | | | 0.00 | (b) | | | 0.00 | (b) | | | 0.00 | (b) |
| Net asset value, end of period | | $ | 8.91 | | | $ | 8.75 | | | $ | 8.12 | | | $ | 8.68 | | | $ | 8.71 | | | $ | 8.82 | |
| | | | | | | | | | | | | | | | | | | | | | | | | |
| Total Return | | | 4.19 | %(c) | | | 13.10 | % | | | (1.51 | )% | | | 5.21 | % | | | 4.45 | % | | | 10.74 | % |
| | | | | | | | | | | | | | | | | | | | | | | | | |
| Ratios and Supplemental Data | | | | | | | | | | | | | | | | | | | | | | | | |
| Net assets, end of period (in 000s) | | $ | 18,760 | | | $ | 18,488 | | | $ | 11,435 | | | $ | 5,135 | | | $ | 4,507 | | | $ | 6,468 | |
| | | | | | | | | | | | | | | | | | | | | | | | | |
| Ratio of expenses to average net assets | | | | | | | | | | | | | | | | | | | | | | | | |
| With fee waivers/reimbursements | | | 0.68 | %(d) | | | 0.63 | % | | | 0.72 | % | | | 0.67 | % | | | 0.69 | % | | | 0.71 | % |
| Without fee waivers/reimbursements | | | 0.78 | %(d) | | | 0.84 | % | | | 1.03 | % | | | 1.04 | % | | | 1.11 | % | | | 1.30 | % |
| Ratio of net investment income/(loss) to average net assets | | | | | | | | | | | | | | | | | | | | | | | | |
| With fee waivers/reimbursements | | | 4.92 | %(d) | | | 4.85 | % | | | 5.06 | % | | | 5.36 | % | | | 5.64 | % | | | 5.76 | % |
| Without fee waivers/reimbursements | | | 4.82 | %(d) | | | 4.64 | % | | | 4.75 | % | | | 4.99 | % | | | 5.22 | % | | | 5.16 | % |
| Portfolio turnover rate | | | 20 | %(c) | | | 47 | % | | | 37 | % | | | 37 | % | | | 15 | % | | | 34 | % |
(a) | Calculated using the average shares method. |
(b) | Less than $0.005 and $(0.005) per share. |
(c) | Total return and portfolio turnover are not annualized for periods less than one full year. |
| See Notes to Financial Statements. | | |
| 116 | | www.westcore.com |
| Westcore Plus Bond Fund | Financial Highlights |
| | For a Share Outstanding Throughout the Periods Presented |
| Retail | | Six Months Ended
June 30, 2017
(Unaudited) | | | Year Ended
December 31, 2016 | | | Year Ended
December 31, 2015 | | | Year Ended
December 31, 2014 | | | Year Ended
December 31, 2013 | | | Year Ended
December 31, 2012 | |
| Net asset value, beginning of period | | $ | 10.59 | | | $ | 10.55 | | | $ | 10.92 | | | $ | 10.71 | | | $ | 11.24 | | | $ | 11.04 | |
| Income/(loss) from investment operations: | | | | | | | | | | | | | | | | | | | | | | | | |
Net investment income/(loss)(a) | | | 0.17 | | | | 0.33 | | | | 0.31 | | | | 0.34 | | | | 0.34 | | | | 0.40 | |
| Net realized and unrealized gains/(losses) on investments | | | 0.15 | | | | 0.07 | | | | (0.31 | ) | | | 0.28 | | | | (0.48 | ) | | | 0.21 | |
| Total from investment operations | | | 0.32 | | | | 0.40 | | | | – | | | | 0.62 | | | | (0.14 | ) | | | 0.61 | |
| | | | | | | | | | | | | | | | | | | | | | | | | |
| Less dividends and distributions: | | | | | | | | | | | | | | | | | | | | | | | | |
| Dividends from net investment income | | | (0.19 | ) | | | (0.36 | ) | | | (0.34 | ) | | | (0.35 | ) | | | (0.38 | ) | | | (0.40 | ) |
| Distributions from net realized gains | | | – | | | | (0.00 | )(b) | | | (0.03 | ) | | | (0.06 | ) | | | (0.01 | ) | | | (0.01 | ) |
| Total distributions | | | (0.19 | ) | | | (0.36 | ) | | | (0.37 | ) | | | (0.41 | ) | | | (0.39 | ) | | | (0.41 | ) |
| | | | | | | | | | | | | | | | | | | | | | | | | |
| Paid-in capital from redemption fees | | | – | | | | – | | | | – | | | | – | | | | – | | | | 0.00 | (b) |
| Net asset value, end of period | | $ | 10.72 | | | $ | 10.59 | | | $ | 10.55 | | | $ | 10.92 | | | $ | 10.71 | | | $ | 11.24 | |
| | | | | | | | | | | | | | | | | | | | | | | | | |
| Total Return | | | 3.04 | %(c) | | | 3.82 | % | | | 0.01 | % | | | 5.90 | % | | | (1.23 | )% | | | 5.67 | % |
| | | | | | | | | | | | | | | | | | | | | | | | | |
Ratios and Supplemental Data | | | | | | | | | | | | | | | | | | | | | | | | |
| Net assets, end of period (in 000s) | | $ | 1,024,468 | | | $ | 1,066,591 | | | $ | 1,309,659 | | | $ | 1,354,837 | | | $ | 1,211,518 | | | $ | 1,457,800 | |
| | | | | | | | | | | | | | | | | | | | | | | | | |
| Ratio of expenses to average net assets | | | | | | | | | | | | | | | | | | | | | | | | |
| With fee waivers/reimbursements | | | 0.55 | %(d) | | | 0.55 | % | | | 0.55 | % | | | 0.55 | % | | | 0.55 | % | | | 0.55 | % |
| Without fee waivers/reimbursements | | | 0.77 | %(d) | | | 0.78 | % | | | 0.70 | % | | | 0.70 | % | | | 0.72 | % | | | 0.75 | % |
| Ratio of net investment income/(loss) to average net assets | | | | | | | | | | | | | | | | | | | | | | | | |
| With fee waivers/reimbursements | | | 3.30 | %(d) | | | 3.03 | % | | | 2.87 | % | | | 3.08 | % | | | 3.12 | % | | | 3.61 | % |
| Without fee waivers/reimbursements | | | 3.08 | %(d) | | | 2.80 | % | | | 2.72 | % | | | 2.93 | % | | | 2.95 | % | | | 3.41 | % |
| Portfolio turnover rate | | | 16 | %(c) | | | 52 | % | | | 51 | % | | | 62 | % | | | 50 | % | | | 32 | % |
(a) | Calculated using the average shares method. |
(b) | Less than $0.005 and $(0.005) per share. |
(c) | Total return and portfolio turnover are not annualized for periods less than one full year. |
| See Notes to Financial Statements. | |
Semi-Annual Report | June 30, 2017 | | 117 |
| Westcore Plus Bond Fund | Financial Highlights |
For a Share Outstanding Throughout the Periods Presented | Institutional | | Six Months Ended
June 30, 2017
(Unaudited) | | | Year Ended
December 31, 2016 | | | Year Ended
December 31, 2015 | | | Year Ended
December 31, 2014 | | | Year Ended
December 31, 2013 | | | Year Ended
December 31, 2012 | |
| Net asset value, beginning of period | | $ | 10.48 | | | $ | 10.43 | | | $ | 10.79 | | | $ | 10.59 | | | $ | 11.11 | | | $ | 10.92 | |
| Income/(loss) from investment operations: | | | | | | | | | | | | | | | | | | | | | | | | |
Net investment income/(loss)(a) | | | 0.18 | | | | 0.34 | | | | 0.32 | | | | 0.35 | | | | 0.36 | | | | 0.42 | |
| Net realized and unrealized gains/(losses) on investments | | | 0.14 | | | | 0.08 | | | | (0.29 | ) | | | 0.28 | | | | (0.48 | ) | | | 0.20 | |
| Total from investment operations | | | 0.32 | | | | 0.42 | | | | 0.03 | | | | 0.63 | | | | (0.12 | ) | | | 0.62 | |
| | | | | | | | | | | | | | | | | | | | | | | | | |
| Less dividends and distributions: | | | | | | | | | | | | | | | | | | | | | | | | |
| Dividends from net investment income | | | (0.19 | ) | | | (0.37 | ) | | | (0.36 | ) | | | (0.37 | ) | | | (0.39 | ) | | | (0.42 | ) |
| Distributions from net realized gains | | | – | | | | (0.00 | )(b) | | | (0.03 | ) | | | (0.06 | ) | | | (0.01 | ) | | | (0.01 | ) |
| Total distributions | | | (0.19 | ) | | | (0.37 | ) | | | (0.39 | ) | | | (0.43 | ) | | | (0.40 | ) | | | (0.43 | ) |
| | | | | | | | | | | | | | | | | | | | | | | | | |
| Paid-in capital from redemption fees | | | – | | | | – | | | | – | | | | – | | | | – | | | | 0.00 | (b) |
| Net asset value, end of period | | $ | 10.61 | | | $ | 10.48 | | | $ | 10.43 | | | $ | 10.79 | | | $ | 10.59 | | | $ | 11.11 | |
| | | | | | | | | | | | | | | | | | | | | | | | | |
| Total Return | | | 3.05 | %(c) | | | 4.01 | % | | | 0.23 | % | | | 6.02 | % | | | (1.05 | )% | | | 5.74 | % |
| | | | | | | | | | | | | | | | | | | | | | | | | |
| Ratios and Supplemental Data | | | | | | | | | | | | | | | | | | | | | | | | |
| Net assets, end of period (in 000s) | | $ | 189,936 | | | $ | 121,829 | | | $ | 108,101 | | | $ | 151,986 | | | $ | 227,245 | | | $ | 241,714 | |
| | | | | | | | | | | | | | | | | | | | | | | | | |
| Ratio of expenses to average net assets | | | | | | | | | | | | | | | | | | | | | | | | |
| With fee waivers/reimbursements | | | 0.40 | %(d) | | | 0.38 | % | | | 0.42 | % | | | 0.42 | % | | | 0.38 | % | | | 0.40 | % |
| Without fee waivers/reimbursements | | | 0.56 | %(d) | | | 0.56 | % | | | 0.55 | % | | | 0.55 | % | | | 0.55 | % | | | 0.59 | % |
| Ratio of net investment income/(loss) to average net assets | | | | | | | | | | | | | | | | | | | | | | | | |
| With fee waivers/reimbursements | | | 3.48 | %(d) | | | 3.20 | % | | | 2.99 | % | | | 3.22 | % | | | 3.29 | % | | | 3.76 | % |
| Without fee waivers/reimbursements | | | 3.32 | %(d) | | | 3.02 | % | | | 2.86 | % | | | 3.09 | % | | | 3.12 | % | | | 3.57 | % |
| Portfolio turnover rate | | | 16 | %(c) | | | 52 | % | | | 51 | % | | | 62 | % | | | 50 | % | | | 32 | % |
(a) | Calculated using the average shares method. |
(b) | Less than $0.005 and $(0.005) per share. |
(c) | Total return and portfolio turnover are not annualized for periods less than one full year. |
See Notes to Financial Statements.
| 118 | | www.westcore.com |
| Westcore Municipal Opportunities Fund | Financial Highlights |
For a Share Outstanding Throughout the Periods Presented
| Retail | | Six Months Ended
June 30, 2017 (Unaudited) | | | For the Period Ended December 31, 2016(a) | |
| Net asset value, beginning of period | | $ | 10.15 | | | $ | 10.00 | |
| Income/(loss) from investment operations: | | | | | | | | |
Net investment income/(loss)(b) | | | 0.15 | | | | 0.00 | (c) |
| Net realized and unrealized gains/(losses) on investments | | | 0.35 | | | | 0.15 | |
| Total from investment operations | | | 0.50 | | | | 0.15 | |
| | | | | | | | | |
| Less dividends and distributions: | | | | | | | | |
| Dividends from net investment income | | | (0.15 | ) | | | – | |
| Total distributions | | | (0.15 | ) | | | – | |
| Net asset value, end of period | | $ | 10.50 | | | $ | 10.15 | |
| | | | | | | | | |
| Total Return | | | 4.91 | %(d) | | | 1.50 | %(d) |
| | | | | | | | | |
| Ratios and Supplemental Data | | | | | | | | |
| Net assets, end of period (in 000s) | | $ | 1,354 | | | $ | 406 | |
| | | | | | | | | |
| Ratio of expenses to average net assets | | | | | | | | |
| With fee waivers/reimbursements | | | 0.65 | %(e) | | | 0.65 | %(e) |
| Without fee waivers/reimbursements | | | 4.86 | %(e)(f) | | | 19.11 | %(e)(g) |
| Ratio of net investment income/(loss) to average net assets | | | | | | | | |
| With fee waivers/reimbursements | | | 2.88 | %(e) | | | 1.05 | %(e) |
| Without fee waivers/reimbursements | | | (1.33 | )%(e)(f) | | | (17.41 | )%(e)(g) |
| Portfolio turnover rate | | | 178 | %(d) | | | 0 | %(d) |
(a) | Commenced operations on December 19, 2016. (b) Calculated using the average shares method. |
(c) | Less than $0.005 and $(0.005) per share. |
(d) | Total return and portfolio turnover are not annualized for periods less than one full year. |
(f) | Ratios before fee waivers for start up periods may not be representative of long term operating results. |
(g) | Ratios before fee waivers for start up periods may not be representative of long term operating results. For the purpose of the ratio, audit and tax preparation fees have not been annualized. |
See Notes to Financial Statements.
Semi-Annual Report | June 30, 2017 | | 119 |
| Westcore Municipal Opportunities Fund | Financial Highlights |
For a Share Outstanding Throughout the Periods Presented
| Institutional | | Six Months Ended
June 30, 2017 (Unaudited) | | | For the Period Ended December 31, 2016(a) | |
| Net asset value, beginning of period | | $ | 10.15 | | | $ | 10.00 | |
| Income/(loss) from investment operations: | | | | | | | | |
Net investment income/(loss)(b) | | | 0.16 | | | | 0.00 | (c) |
| Net realized and unrealized gains/(losses) on investments | | | 0.35 | | | | 0.15 | |
| Total from investment operations | | | 0.51 | | | | 0.15 | |
| | | | | | | | | |
| Less dividends and distributions: | | | | | | | | |
| Dividends from net investment income | | | (0.15 | ) | | | – | |
| Total distributions | | | (0.15 | ) | | | – | |
| Net asset value, end of period | | $ | 10.51 | | | $ | 10.15 | |
| | | | | | | | | |
| Total Return | | | 5.06 | %(d) | | | 1.50 | %(d) |
| | | | | | | | | |
| Ratios and Supplemental Data | | | | | | | | |
| Net assets, end of period (in 000s) | | $ | 3,585 | | | $ | 355 | |
| | | | | | | | | |
| Ratio of expenses to average net assets | | | | | | | | |
| With fee waivers/reimbursements | | | 0.40 | %(e) | | | 0.61 | %(e) |
| Without fee waivers/reimbursements | | | 3.62 | %(e)(f) | | | 19.48 | %(e)(g) |
| Ratio of net investment income/(loss) to average net assets | | | | | | | | |
| With fee waivers/reimbursements | | | 3.00 | %(e) | | | 1.08 | %(e) |
| Without fee waivers/reimbursements | | | (0.22 | )%(e)(f) | | | (17.79 | )%(e)(g) |
| Portfolio turnover rate | | | 178 | %(d) | | | 0 | %(d) |
(a) | Commenced operations on December 19, 2016. (b) Calculated using the average shares method. |
(c) | Less than $0.005 and $(0.005) per share. |
(d) | Total return and portfolio turnover are not annualized for periods less than one full year. |
(f) | Ratios before fee waivers for start up periods may not be representative of long term operating results. |
(g) | Ratios before fee waivers for start up periods may not be representative of long term operating results. For the purpose of the ratio, audit and tax preparation fees have not been annualized. |
See Notes to Financial Statements.
| 120 | | www.westcore.com |
| Westcore Colorado Tax-Exempt Fund | Financial Highlights |
For a Share Outstanding Throughout the Periods Presented
| Retail | | Six Months Ended
June 30, 2017
(Unaudited) | | | Year Ended
December 31, 2016 | | | Year Ended
December 31, 2015 | | | Year Ended
December 31, 2014 | | | Year Ended
December 31, 2013 | | | Year Ended
December 31, 2012 | |
| Net asset value, beginning of period | | $ | 11.32 | | | $ | 11.66 | | | $ | 11.63 | | | $ | 11.16 | | | $ | 11.81 | | | $ | 11.54 | |
| Income/(loss) from investment operations: | | | | | | | | | | | | | | | | | | | | | | | | |
Net investment income/(loss)(a) | | | 0.16 | | | | 0.31 | | | | 0.32 | | | | 0.33 | | | | 0.35 | | | | 0.37 | |
| Net realized and unrealized gains/(losses) on investments | | | 0.18 | | | | (0.31 | ) | | | 0.02 | | | | 0.47 | | | | (0.65 | ) | | | 0.27 | |
| Total from investment operations | | | 0.34 | | | | – | | | | 0.34 | | | | 0.80 | | | | (0.30 | ) | | | 0.64 | |
| | | | | | | | | | | | | | | | | | | | | | | | | |
| Less dividends and distributions: | | | | | | | | | | | | | | | | | | | | | | | | |
| Dividends from net investment income | | | (0.15 | ) | | | (0.31 | ) | | | (0.31 | ) | | | (0.33 | ) | | | (0.35 | ) | | | (0.37 | ) |
| Distributions from net realized gains | | | – | | | | (0.03 | ) | | | – | | | | – | | | | – | | | | – | |
| Total distributions | | | (0.15 | ) | | | (0.34 | ) | | | (0.31 | ) | | | (0.33 | ) | | | (0.35 | ) | | | (0.37 | ) |
| | | | | | | | | | | | | | | | | | | | | | | | | |
| Paid-in capital from redemption fees | | | – | | | | – | | | | – | | | | – | | | | – | | | | 0.00 | (b) |
| Net asset value, end of period | | $ | 11.51 | | | $ | 11.32 | | | $ | 11.66 | | | $ | 11.63 | | | $ | 11.16 | | | $ | 11.81 | |
| | | | | | | | | | | | | | | | | | | | | | | | | |
| Total Return | | | 3.06 | %(c) | | | (0.07 | )% | | | 3.02 | % | | | 7.23 | % | | | (2.56 | )% | | | 5.57 | % |
| | | | | | | | | | | | | | | | | | | | | | | | | |
| Ratios and Supplemental Data | | | | | | | | | | | | | | | | | | | | | | | | |
| Net assets, end of period (in 000s) | | $ | 202,577 | | | $ | 196,237 | | | $ | 192,920 | | | $ | 158,972 | | | $ | 118,483 | | | $ | 146,820 | |
| | | | | | | | | | | | | | | | | | | | | | | | | |
| Ratio of expenses to average net assets | | | | | | | | | | | | | | | | | | | | | | | | |
| With fee waivers/reimbursements | | | 0.65 | %(d) | | | 0.65 | % | | | 0.65 | % | | | 0.65 | % | | | 0.65 | % | | | 0.65 | % |
| Without fee waivers/reimbursements | | | 0.82 | %(d) | | | 0.84 | % | | | 0.77 | % | | | 0.77 | % | | | 0.80 | % | | | 0.81 | % |
| Ratio of net investment income/(loss) to average net assets | | | | | | | | | | | | | | | | | | | | | | | | |
| With fee waivers/reimbursements | | | 2.74 | %(d) | | | 2.62 | % | | | 2.73 | % | | | 2.87 | % | | | 3.05 | % | | | 3.12 | % |
| Without fee waivers/reimbursements | | | 2.57 | %(d) | | | 2.43 | % | | | 2.61 | % | | | 2.75 | % | | | 2.90 | % | | | 2.96 | % |
| Portfolio turnover rate | | | 24 | %(c) | | | 47 | % | | | 30 | % | | | 13 | % | | | 23 | % | | | 7 | % |
(a) | Calculated using the average shares method. |
(b) | Less than $0.005 and $(0.005) per share. |
(c) | Total return and portfolio turnover are not annualized for periods less than one full year. |
See Notes to Financial Statements.
Semi-Annual Report | June 30, 2017 | | 121 |
| Westcore Colorado Tax-Exempt Fund | Financial Highlights |
For a Share Outstanding Throughout the Periods Presented
| Institutional | | Six Months Ended
June 30, 2017
(Unaudited) | | | For the Period Ended December 31, 2016 (a) | |
| Net asset value, beginning of period | | $ | 11.34 | | | $ | 11.79 | |
| Income/(loss) from investment operations: | | | | | | | | |
Net investment income/(loss)(b) | | | 0.17 | | | | 0.22 | |
| Net realized and unrealized gains/(losses) on investments | | | 0.18 | | | | (0.44 | ) |
| Total from investment operations | | | 0.35 | | | | (0.22 | ) |
| | | | | | | | | |
| Less dividends and distributions: | | | | | | | | |
| Dividends from net investment income | | | (0.16 | ) | | | (0.20 | ) |
| Distributions from net realized gains | | | – | | | | (0.03 | ) |
| Total distributions | | | (0.16 | ) | | | (0.23 | ) |
| Net asset value, end of period | | $ | 11.53 | | | $ | 11.34 | |
| | | | | | | | | |
| Total Return | | | 3.11 | %(c) | | | (1.93 | )%(c) |
| | | | | | | | | |
| Ratios and Supplemental Data | | | | | | | | |
| Net assets, end of period (in 000s) | | $ | 41,544 | | | $ | 29,557 | |
| | | | | | | | | |
| Ratio of expenses to average net assets | | | | | | | | |
| With fee waivers/reimbursements | | | 0.49 | %(d) | | | 0.49 | %(d) |
| Without fee waivers/reimbursements | | | 0.63 | %(d) | | | 0.68 | %(d) |
| Ratio of net investment income/(loss) to average net assets | | | | | | | | |
| With fee waivers/reimbursements | | | 2.90 | %(d) | | | 2.81 | %(d) |
| Without fee waivers/reimbursements | | | 2.76 | %(d) | | | 2.62 | %(d) |
| Portfolio turnover rate | | | 24 | %(c) | | | 47 | %(c)(e) |
| (a) | The Fund added an institutional share class on April 29, 2016. |
| (b) | Calculated using the average shares method. |
| (c) | Total return and portfolio turnover are not annualized for periods less than one full year. |
| (e) | Porfolio turnover rate is calculated at the fund level and represents the year ended December 31, 2016. |
See Notes to Financial Statements.
| 122 | | www.westcore.com |
| Westcore Funds | Notes to Financial Statements |
June 30, 2017 (Unaudited)
1. ORGANIZATION
Westcore Trust (the “Trust”) is registered under the Investment Company Act of 1940, as amended, as an open-end management investment company. Interests in the Westcore Small-Cap Growth Fund, Westcore Small-Cap Growth Fund II, , Westcore Mid-Cap Value Dividend Fund, Westcore Mid-Cap Value Dividend Fund II, Westcore Smid-Cap Value Dividend Fund, Westcore Small-Cap Value Dividend Fund, Westcore Global Large-Cap Dividend Fund, Westcore Large-Cap Dividend Fund, Westcore Micro-Cap Opportunity Fund, Westcore International Small-Cap Fund, Westcore Flexible Income Fund, Westcore Plus Bond Fund, Westcore Municipal Opportunities Fund and Westcore Colorado Tax-Exempt Fund (the “Funds”) are represented by separate classes of beneficial interest of the Trust, which is organized as a Massachusetts business trust. All of the Funds offer Retail Class shares except Westcore Small-Cap Growth Fund II. All of the Funds also offer Institutional Class shares except Westcore Micro-Cap Opportunity Fund. All classes of shares have identical rights to earnings, assets and voting privileges, except for class specific expenses and exclusive rights to vote on matters solely affecting such class.
2. SIGNIFICANT ACCOUNTING POLICIES
The following is a summary of significant accounting policies consistently followed by each Fund in the preparation of its financial statements. Each Fund is considered an investment company for financial reporting purposes, the following policies are in conformity with accounting principles generally accepted in the United States of America for investment companies.
Use of Estimates – The preparation of financial statements in accordance with accounting principles generally accepted in the United States of America requires management to make estimates and assumptions that affect the reported amounts and disclosures in the financial statements. The actual results could differ from those estimates.
Investment Valuation – All securities of the Funds are valued as of the close of regular trading on the New York Stock Exchange (“NYSE”), currently 4:00 p.m. (Eastern Time), on each day that the NYSE is open, subject to provisions in the prospectus and/or Statement of Additional Information regarding pricing at other times in case of an emergency and optional pricing of the Funds in the event that the NYSE does not open for business because of an emergency.
Securities that are traded on a recognized domestic stock exchange are generally valued at the last sales price as of the valuation time on the principal stock exchange on which they are traded. Securities that are principally traded on the National Association of Securities Dealers Automated Quotation (“NASDAQ”) exchange are generally valued at the NASDAQ Official Closing Price (“NOCP”). Unlisted securities that are traded on the domestic over-the-counter market for which last sales prices are available, are generally valued at the last sales price as of the valuation time. In the absence of sales and NOCP, such securities are valued at the mean of the bid and asked prices.
Securities that are traded on a foreign stock exchange (and that are not listed on a recognized domestic stock exchange or traded on the NASDAQ exchange or the domestic over the counter market) are generally valued at the official closing price on the principal stock exchange on which they are traded. When an event occurs subsequent to the close of the foreign exchange and the close of the NYSE that was likely to have changed such value, the fair value of those securities are determined in good faith in accordance with procedures established by and under the general supervision of the Board of Trustees. The Funds will use a fair valuation model provided by an independent pricing service, which is intended to reflect fair value when a security’s value is believed to have been materially affected by an valuation event that has occurred between the close of the exchange or market on which the security is traded and the close of the regular trading day on the NYSE. In the event that closing prices are not available for such foreign securities, such securities are generally valued at the last sales price occurring prior to the closing of its principal exchange.
Forward foreign currency contracts have a fair value determined by an automated system that estimates rates on the basis of the current day foreign currency exchange rates and forward foreign currency exchange rates supplied by a pricing vendor. Foreign currency exchange rates and foreign currency exchange forward rates may generally be obtained at the close of the NYSE.
Redeemable securities issued by open-end registered investment companies are valued at the investment company’s applicable net asset value.
Fixed-income obligations, excluding municipal securities, having a remaining maturity of greater than 60 days, are typically valued at the mean between the evaluated bid and ask prices formulated by an independent pricing service. Municipal securities having a remaining maturity of greater than 60 days, are typically valued at the evaluated bid price formulated by an independent pricing service.
Semi-Annual Report | June 30, 2017 | | 123 |
| Westcore Funds | Notes to Financial Statements |
June 30, 2017 (Unaudited)
When market quotations are not readily available or when events occur that make established valuation methods unreliable, securities of the Fund may be valued in good faith by or under the direction of the Board of Trustees. Factors which may be considered when determining the value of a security include (a) the fundamental data relating to the investment; (b) an evaluation of the forces which influence the market in which the security is sold, including the liquidity and depth of the market; (c) the market value at date of purchase; (d) information as to any transactions or offers with respect to the security or comparable securities; and (e) any other relevant matters.
Market, Credit and Counterparty Risk – In the normal course of business, the Funds invest in securities and enter into transactions where risks exist due to fluctuations in the market (market risk) or failure of the issuer of a security to meet all its obligations (issuer credit risk). The value of securities held by the Funds may decline in response to certain events, including those directly involving the issuers whose securities are owned by the Funds; conditions affecting the general economy; overall market changes; local, regional, national or global political, social or economic instability; and currency and interest rate and price fluctuations. Similar to issuer credit risk, the Funds may be exposed to counterparty credit risk, or the risk that an entity with which the Funds have unsettled or open transactions may fail to or be unable to perform on its commitments. The Funds manage counterparty credit risk by entering into transactions only with counterparties that they believe have the financial resources to honor their obligations and by monitoring the financial stability of those counterparties.
Securities Traded on Foreign Exchanges – All of the Funds, except the Westcore Colorado Tax-Exempt Fund, may invest at least a portion of their assets in foreign securities. As of June 30, 2017, all Funds were primarily invested in securities traded on U.S. exchanges, except Westcore International Small-Cap Fund and Westcore Global Large-Cap Dividend Fund. In the event that a Fund executes a security transaction on a foreign exchange, the Fund will generally enter into a foreign currency contract to settle the foreign security transaction. Foreign securities may carry more risk than U.S. securities, such as political, market and currency risks. The accounting records of the Funds are maintained in U.S. dollars. Prices of securities denominated in foreign currencies are translated into U.S. dollars at the closing rates of exchange at period end. Amounts related to the purchase and sale of foreign securities and investment income are translated at the rates of exchange prevailing on the respective dates of such transactions.
The portion of realized and unrealized gains or losses on investments due to fluctuations in foreign currency exchange rates is not separately disclosed and is included in realized and unrealized gains or losses on investments, when applicable.
Country Risk – As of June 30, 2017, the Westcore Global Large-Cap Dividend Fund invested a significant percentage of its assets in Switzerland and the United Kingdom and the Westcore International Small-Cap Fund invested a significant percentage of its assets in Japan, the United Kingdom, Australia, and Canada. Therefore, they may be more affected by economic developments and currency fluctuations in these countries.
Sector Concentration Risk – The Funds may concentrate investments in companies that are in a single sector or related sector. Concentrating investments in a single sector may make the Fund more susceptible to adverse economic, business, regulatory or other developments affecting that sector. If an economic downturn occurs in a sector in which the Fund’s investments are concentrated, the Fund may perform poorly during
that period.
Federal Income Taxes – No provision for income taxes is included in the accompanying financial statements, as the Funds intend to distribute to shareholders all taxable investment income and realized gains and otherwise comply with Subchapter M of the Internal Revenue Code of 1986, as amended, applicable to regulated investment companies.
As of and during the six months ended June 30, 2017, the Funds did not have a liability for any unrecognized tax benefits. The Funds file U.S. federal, state, and local tax returns as required. Each Fund’s tax returns are subject to examination by the relevant tax authorities until expiration of the applicable statute of limitations which is generally three years after the filing of the tax return. Tax returns for open years have incorporated no uncertain tax positions that require a provision for income taxes.
Redemption Fee – Effective September 15, 2016, the Funds no longer impose a redemption fee. Prior to September 15, 2016, the Westcore Small-Cap Growth, Westcore Micro-Cap Opportunity and Westcore Flexible Income Funds imposed a two percent (2%) redemption fee (the “Redemption Fee”) on Fund shares if such Fund shares are redeemed (including in connection with an exchange) within ninety (90) calendar days from their date of purchase. The Redemption Fees, which are reflected in the Statement of Changes in Net Assets, were intended to encourage long-term investment in the Funds and, to the extent that frequent trading persists, to offset brokerage commissions, market impact, transaction costs and other expenses associated with frequent trading.
| 124 | | www.westcore.com |
| Westcore Funds | Notes to Financial Statements |
June 30, 2017 (Unaudited)
Offering Costs – The Westcore Mid-Cap Value Dividend Fund-Institutional Class, Westcore International Small-Cap Fund-Institutional Class and Westcore Colorado Tax-Exempt Fund-Institutional Class incurred offering costs which are being amortized over the first twelve months from the commencement date of the Institutional share class, April 29, 2016. The Westcore Smid-Cap Value Dividend and Westcore Municipal Opportunities Funds incurred offering costs which are being amortized over the first twelve months from the commencement date of the Funds, December 19, 2016. Offering costs include fees for preparing and printing initial prospectuses, legal and registration fees. Amounts amortized in the six months ended June 30, 2017 are shown on the Funds’ Statement of Operations.
When-Issued/Forward Commitment Securities – Each Fund may purchase or sell securities on a “when issued” or “forward commitment” basis which involves a commitment by the Fund to purchase or sell particular securities with payment and delivery taking place at a future date. During this period, such securities do not earn interest, are subject to market fluctuation and may increase or decrease in value prior to their delivery. In accordance with SEC guidance, each Fund segregates liquid assets in an amount sufficient to satisfy the purchase price. The purchase of securities on a when-issued or forward commitment basis may increase the volatility of the Fund’s net asset value to the extent each Fund makes such purchases while remaining substantially fully invested. Settlements in the ordinary course of business, which may take substantially more than three business days for non-U.S. securities, are not treated by the Funds as “when-issued” or “forward commitment” transactions. As of June 30, 2017, none of the Funds held when-issued or forward commitment securities.
Other – For financial reporting purposes, the Funds’ investment transactions and shareholder transactions are recorded on trade date. Dividend income is recorded on the ex-dividend date. Foreign dividend income is recorded on the ex-dividend date or as soon as practical after the Funds determine the existence of a dividend declaration after exercising reasonable due diligence. Interest income, which includes amortization of premiums, accretion of discounts and income earned on money market funds, is accrued and recorded daily. Realized gains and losses from investment transactions and unrealized appreciation and depreciation of investments are reported on an identified cost basis.
3. SHARES OF BENEFICIAL INTEREST
On June 30, 2017, there was an unlimited number of no par value shares of beneficial interest authorized for each Fund. Transactions in shares of beneficial interest were as follows:
| | | For the Six Months Ended June 30, 2017 | | | For the Year Ended December 31, 2016 | |
| Westcore Small-Cap Growth Fund | | | | | | |
| Retail | |
| Shares Sold | | | 1,704 | | | | 21,131 | |
| Shares Issued in Reinvestment of Distributions | | | – | | | | – | |
| Total | | | 1,704 | | | | 21,131 | |
| Less Shares Redeemed | | | (1,660 | ) | | | (2,722 | ) |
| Net Increase | | | 44 | | | | 18,409 | |
| Institutional | |
| Shares Sold | | | 30,518 | | | | 155,051 | |
| Shares Issued in Reinvestment of Distributions | | | – | | | | – | |
| Total | | | 30,518 | | | | 155,051 | |
| Less Shares Redeemed | | | (11,897 | ) | | | (431,382 | ) |
| Net Increase/(Decrease) | | | 18,621 | | | | (276,331 | ) |
| Westcore Small-Cap Growth Fund II | | | | | | | | |
| Institutional | |
| Shares Sold | | | 93,543 | | | | 61,242 | |
| Shares Issued in Reinvestment of Distributions | | | – | | | | – | |
| Total | | | 93,543 | | | | 61,242 | |
| Less Shares Redeemed | | | (269,309 | ) | | | (948,987 | ) |
| Net Decrease | | | (175,766 | ) | | | (887,745 | ) |
Semi-Annual Report | June 30, 2017 | | 125 |
| Westcore Funds | Notes to Financial Statements |
June 30, 2017 (Unaudited)
| | | For the Period Ended June 30, 2017 | | | For the Year Ended December 31, 2016 | |
| Westcore Mid-Cap Value Dividend Fund | | | | | | |
| Retail | |
| Shares Sold | | | 569,530 | | | | 1,082,142 | |
| Shares Issued in Reinvestment of Distributions | | | – | | | | 71,781 | |
| Total | | | 569,530 | | | | 1,153,923 | |
| Less Shares Redeemed | | | (403,929 | ) | | | (1,754,745 | ) |
| Net Increase/(Decrease) | | | 165,601 | | | | (600,822 | ) |
| Institutional | |
| Shares Sold | | | 68,287 | | | | 1,314,600 | |
| Shares Issued in Reinvestment of Distributions | | | – | | | | 47,931 | |
| Total | | | 68,287 | | | | 1,362,531 | |
| Less Shares Redeemed | | | (137,896 | ) | | | (55,290 | ) |
| Net Increase/(Decrease) | | | (69,609 | ) | | | 1,307,241 | |
| Westcore Mid-Cap Value Dividend Fund II | | | | | | | | |
| Retail | |
| Shares Sold | | | 416,418 | | | | 503,752 | |
| Shares Issued in Reinvestment of Distributions | | | – | | | | 3,001 | |
| Total | | | 416,418 | | | | 506,753 | |
| Less Shares Redeemed | | | (1,181,983 | ) | | | (6,229,591 | ) |
| Net Decrease | | | (765,565 | ) | | | (5,722,838 | ) |
| Institutional | |
| Shares Sold | | | 357 | | | | 336,642 | |
| Shares Issued in Reinvestment of Distributions | | | – | | | | 248 | |
| Total | | | 357 | | | | 336,890 | |
| Less Shares Redeemed | | | (1,522 | ) | | | (3,664,982 | ) |
| Net Decrease | | | (1,165 | ) | | | (3,328,092 | ) |
| Westcore Smid-Cap Value Dividend Fund | | | | | | | | |
| Retail | |
| Shares Sold | | | 31,473 | | | | 12,001 | |
| Shares Issued in Reinvestment of Distributions | | | – | | | | – | |
| Total | | | 31,473 | | | | 12,001 | |
| Less Shares Redeemed | | | – | | | | – | |
| Net Increase | | | 31,473 | | | | 12,001 | |
| Institutional | |
| Shares Sold | | | – | | | | 25,001 | |
| Shares Issued in Reinvestment of Distributions | | | – | | | | – | |
| Total | | | – | | | | 25,001 | |
| Less Shares Redeemed | | | (1 | ) | | | – | |
| Net Increase/(Decrease) | | | (1 | ) | | | 25,001 | |
| Westcore Small-Cap Value Dividend Fund | | | | | | | | |
| Retail | |
| Shares Sold | | | 468,264 | | | | 2,285,219 | |
| Shares Issued in Reinvestment of Distributions | | | – | | | | 458,801 | |
| Total | | | 468,264 | | | | 2,744,020 | |
| Less Shares Redeemed | | | (1,268,253 | ) | | | (3,345,039 | ) |
| Net Decrease | | | (799,989 | ) | | | (601,019 | ) |
| Institutional | |
| Shares Sold | | | 1,774,984 | | | | 4,086,728 | |
| Shares Issued in Reinvestment of Distributions | | | – | | | | 831,752 | |
| Total | | | 1,774,984 | | | | 4,918,480 | |
| Less Shares Redeemed | | | (1,591,198 | ) | | | (4,545,471 | ) |
| Net Increase | | | 183,786 | | | | 373,009 | |
| 126 | | www.westcore.com |
| Westcore Funds | Notes to Financial Statements |
June 30, 2017 (Unaudited)
| | | For the Period Ended June 30, 2017 | | | For the Year Ended December 31, 2016 | |
| Westcore Global Large-Cap Dividend Fund | | | | | | |
| Retail | |
| Shares Sold | | | 313,780 | | | | 914,369 | |
| Shares Issued in Reinvestment of Distributions | | | 44,469 | | | | 183,233 | |
| Total | | | 358,249 | | | | 1,097,602 | |
| Less Shares Redeemed | | | (288,091 | ) | | | (550,383 | ) |
| Net Increase | | | 70,158 | | | | 547,219 | |
| Institutional | |
| Shares Sold | | | 121,670 | | | | 90,085 | |
| Shares Issued in Reinvestment of Distributions | | | 4,359 | | | | 16,732 | |
| Total | | | 126,029 | | | | 106,817 | |
| Less Shares Redeemed | | | (81,634 | ) | | | (111,238 | ) |
| Net Increase/(Decrease) | | | 44,395 | | | | (4,421 | ) |
| Westcore Large-Cap Dividend Fund | | | | | | | | |
| Retail | |
| Shares Sold | | | 36,855 | | | | 129,226 | |
| Shares Issued in Reinvestment of Distributions | | | 13,709 | | | | 569,682 | |
| Total | | | 50,564 | | | | 698,908 | |
| Less Shares Redeemed | | | (356,103 | ) | | | (1,593,654 | ) |
| Net Decrease | | | (305,539 | ) | | | (894,746 | ) |
| Institutional | |
| Shares Sold | | | 2,796 | | | | 39,560 | |
| Shares Issued in Reinvestment of Distributions | | | 744 | | | | 115,732 | |
| Total | | | 3,540 | | | | 155,292 | |
| Less Shares Redeemed | | | (10,353 | ) | | | (620,564 | ) |
| Net Decrease | | | (6,813 | ) | | | (465,272 | ) |
| Westcore Micro-Cap Opportunity Fund | | | | | | | | |
| Retail | |
| Shares Sold | | | 87,627 | | | | 147,345 | |
| Shares Issued in Reinvestment of Distributions | | | – | | | | 23,635 | |
| Total | | | 87,627 | | | | 170,980 | |
| Less Shares Redeemed | | | (77,063 | ) | | | (788,705 | ) |
| Net Increase/(Decrease) | | | 10,564 | | | | (617,725 | ) |
| Westcore International Small-Cap Fund | | | | | | | | |
| Retail | |
| Shares Sold | | | 158,625 | | | | 734,530 | |
| Shares Issued in Reinvestment of Distributions | | | – | | | | 157,266 | |
| Total | | | 158,625 | | | | 891,796 | |
| Less Shares Redeemed | | | (774,915 | ) | | | (4,022,039 | ) |
| Net Decrease | | | (616,290 | ) | | | (3,130,243 | ) |
| Institutional | |
| Shares Sold | | | 263,447 | | | | 1,362,878 | |
| Shares Issued in Reinvestment of Distributions | | | – | | | | 18,509 | |
| Total | | | 263,447 | | | | 1,381,387 | |
| Less Shares Redeemed | | | (109,975 | ) | | | (80,012 | ) |
| Net Increase | | | 153,472 | | | | 1,301,375 | |
Semi-Annual Report | June 30, 2017 | | 127 |
| Westcore Funds | Notes to Financial Statements |
June 30, 2017 (Unaudited)
| | | For the Period Ended June 30, 2017 | | | For the Year Ended December 31, 2016 | |
| Westcore Flexible Income Fund | | | | | | |
| Retail | |
| Shares Sold | | | 973,248 | | | | 2,579,355 | |
| Shares Issued in Reinvestment of Distributions | | | 140,396 | | | | 271,729 | |
| Total | | | 1,113,644 | | | | 2,851,084 | |
| Less Shares Redeemed | | | (933,827 | ) | | | (2,094,879 | ) |
| Net Increase | | | 179,817 | | | | 756,205 | |
| Institutional | |
| Shares Sold | | | 529,829 | | | | 1,182,044 | |
| Shares Issued in Reinvestment of Distributions | | | 47,279 | | | | 80,357 | |
| Total | | | 577,108 | | | | 1,262,401 | |
| Less Shares Redeemed | | | (584,994 | ) | | | (556,940 | ) |
| Net Increase/(Decrease) | | | (7,886 | ) | | | 705,461 | |
| Westcore Plus Bond Fund | | | | | | | | |
| Retail | |
| Shares Sold | | | 10,124,141 | | | | 22,332,747 | |
| Shares Issued in Reinvestment of Distributions | | | 1,692,158 | | | | 3,655,334 | |
| Total | | | 11,816,299 | | | | 25,988,081 | |
| Less Shares Redeemed | | | (16,958,758 | ) | | | (49,430,872 | ) |
| Net Decrease | | | (5,142,459 | ) | | | (23,442,791 | ) |
| Institutional | |
| Shares Sold | | | 8,272,142 | | | | 6,059,595 | |
| Shares Issued in Reinvestment of Distributions | | | 249,083 | | | | 342,491 | |
| Total | | | 8,521,225 | | | | 6,402,086 | |
| Less Shares Redeemed | | | (2,253,390 | ) | | | (5,141,784 | ) |
| Net Increase | | | 6,267,835 | | | | 1,260,302 | |
| Westcore Municipal Opportunities Fund | | | | | | | | |
| Retail | |
| Shares Sold | | | 88,439 | | | | 40,002 | |
| Shares Issued in Reinvestment of Distributions | | | 1,149 | | | | – | |
| Total | | | 89,588 | | | | 40,002 | |
| Less Shares Redeemed | | | (691 | ) | | | – | |
| Net Increase | | | 88,897 | | | | 40,002 | |
| Institutional | |
| Shares Sold | | | 305,649 | | | | 35,001 | |
| Shares Issued in Reinvestment of Distributions | | | 2,049 | | | | – | |
| Total | | | 307,698 | | | | 35,001 | |
| Less Shares Redeemed | | | (1,524 | ) | | | – | |
| Net Increase | | | 306,174 | | | | 35,001 | |
| Westcore Colorado Tax-Exempt Fund | | | | | | | | |
| Retail | |
| Shares Sold | | | 2,140,366 | | | | 6,213,627 | |
| Shares Issued in Reinvestment of Distributions | | | 217,145 | | | | 470,523 | |
| Total | | | 2,357,511 | | | | 6,684,150 | |
| Less Shares Redeemed | | | (2,102,351 | ) | | | (5,896,515 | ) |
| Net Increase | | | 255,160 | | | | 787,635 | |
| Institutional | |
| Shares Sold | | | 1,496,769 | | | | 3,010,621 | |
| Shares Issued in Reinvestment of Distributions | | | 41,214 | | | | 34,293 | |
| Total | | | 1,537,983 | | | | 3,044,914 | |
| Less Shares Redeemed | | | (543,773 | ) | | | (437,362 | ) |
| Net Increase | | | 994,210 | | | | 2,607,552 | |
| 128 | | www.westcore.com |
| Westcore Funds | Notes to Financial Statements |
| | June 30, 2017 (Unaudited) |
4. TAX BASIS DISTRIBUTIONS AND TAX BASIS INFORMATION
Under the Regulated Investment Company Modernization Act of 2010 (the “Act”), net capital losses recognized in tax years beginning after December 22, 2010 may be carried forward indefinitely, and the character of the losses is retained as short-term and/or long-term. Under the law in effect prior to the Act, net capital losses were carried forward for eight years and treated as short-term. As a transition rule, the Act requires that post-enactment net capital losses be used before pre-enactment net capital losses.
At December 31, 2016, the following Funds had available for federal income tax purposes unused pre-enactment capital loss carryforwards as follows:
| Fund | | Expiring in 2017 | | | Expiring in 2018 | |
| Westcore Flexible Income Fund | | $ | 9,408,999 | | | $ | 1,064,911 | |
Capital loss carryovers used during the year ended December 31, 2016 for Westcore Flexible Income Fund and Westcore Colorado Tax-Exempt Fund were $354,715 and $72,751, respectively.
At December 31, 2016, the following Funds had available for federal income tax purposes unused post-enactment capital loss carryforwards as follows:
| Fund | | Short-Term | | | Long-Term | |
| Westcore Small-Cap Growth Fund | | $ | 153,024 | | | $ | – | |
| Westcore Small-Cap Growth Fund II | | | 81,600,418 | | | | 5,399,441 | |
| Westcore Mid-Cap Value Dividend Fund II | | | 633,807 | | | | – | |
| Westcore International Small-Cap Fund | | | – | | | | 11,976,236 | |
| Westcore Flexible Income Fund | | | – | | | | 8,042,669 | |
The following Funds elect to defer to their fiscal year ending December 31, 2017, capital losses recognized during the period from November 1, 2016 to December 31, 2016 in the amounts of:
| Fund | | Capital Losses Recognized | |
| Westcore Small-Cap Growth Fund II | | $ | 236,305 | |
| Westcore International Small-Cap Fund | | | 34,433 | |
| Westcore Flexible Income Fund | | | 30,292 | |
| Westcore Colorado Tax-Exempt Fund | | | 729,815 | |
The following Funds elect to defer to their fiscal year ending December 31, 2017, late year ordinary losses recognized during the period from
November 1, 2016 to December 31, 2016 in the amounts of:
| Fund | | Ordinary Losses Recognized | |
| Westcore Mid-Cap Value Dividend Fund | | $ | 57 | |
| Westcore Global Large-Cap Dividend Fund | | | 11,277 | |
| Westcore International Small-Cap Fund | | | 594,556 | |
Semi-Annual Report | June 30, 2017 | | 129 |
| Westcore Funds | Notes to Financial Statements |
| June 30, 2017 (Unaudited) |
Distributions – Distributions of net investment income, if any, are generally made annually for the Westcore Small-Cap Growth, Westcore Small-Cap Growth II, Westcore Mid-Cap Value Dividend, Westcore Mid-Cap Value Dividend II, Westcore Smid-Cap Value Dividend, Westcore Small-Cap Value Dividend, Westcore Micro-Cap Opportunity and Westcore International Small-Cap Funds; monthly for the Westcore Flexible Income, Westcore Plus Bond, Westcore Municipal Opportunities and Westcore Colorado Tax-Exempt Funds and quarterly for the Westcore Large-Cap Dividend and Westcore Global Large-Cap Dividend Funds. Distributions of net realized capital gains, if any, are declared at least once each year for each of the Funds. Distributions to shareholders are recorded on the ex-dividend date.
The tax character of the distributions paid in 2016 were as follows:
| Fund | | Ordinary Income | | | Long-Term Capital Gains | | | Tax-Exempt Income | |
| Westcore Mid-Cap Value Dividend Fund | | $ | 1,355,480 | | | $ | 2,028,031 | | | | – | |
| Westcore Mid-Cap Value Dividend Fund II | | | 15,152 | | | | – | | | | – | |
| Westcore Small-Cap Value Dividend Fund | | | 3,249,790 | | | | 15,296,378 | | | | – | |
| Westcore Global Large-Cap Dividend Fund | | | 803,147 | | | | 1,364,268 | | | | – | |
| Westcore Large-Cap Dividend Fund | | | 135,826 | | | | 4,360,659 | | | | – | |
| Westcore Micro-Cap Opportunity Fund | | | 44,312 | | | | 403,967 | | | | – | |
| Westcore International Small-Cap Fund | | | 2,677,817 | | | | – | | | | – | |
| Westcore Flexible Income Fund | | | 3,164,306 | | | | – | | | | – | |
| Westcore Plus Bond Fund | | | 43,920,640 | | | | 330,320 | | | | – | |
| Westcore Colorado Tax-Exempt Fund | | | 334,063 | | | | 509,266 | | | | 5,515,566 | |
For the year ended 2016 Westcore Small-Cap Growth Fund and Westcore Small-Cap Growth Fund II had no distributions. For the year ended 2016 both Westcore Smid-Cap Value Fund and Westcore Municipal Opportunities Fund had no distributions.
As of June 30, 2017, net unrealized appreciation/depreciation of investments based on federal tax cost were as follows:
| Fund | | Gross Appreciation (excess of value over tax cost) | | | Gross Depreciation (excess of tax cost over value) | | | Net Unrealized Appreciation/ (Depreciation) | | | Cost of Investments for Income Tax Purposes | |
| Westcore Small-Cap Growth Fund | | $ | 1,059,606 | | | $ | (151,305 | ) | | $ | 908,301 | | | $ | 4,274,272 | |
| Westcore Small-Cap Growth Fund II | | | 4,302,407 | | | | (1,596,218 | ) | | | 2,706,189 | | | | 35,546,053 | |
| Westcore Mid-Cap Value Dividend Fund | | | 10,880,524 | | | | (4,138,163 | ) | | | 6,742,361 | | | | 77,419,475 | |
| Westcore Mid-Cap Value Dividend Fund II | | | 1,636,360 | | | | (2,123,785 | ) | | | (487,425 | ) | | | 33,249,319 | |
| Westcore Smid-Cap Value Dividend Fund | | | 24,509 | | | | (42,111 | ) | | | (17,602 | ) | | | 690,990 | |
| Westcore Small-Cap Value Dividend Fund | | | 29,831,776 | | | | (10,855,364 | ) | | | 18,976,412 | | | | 185,874,703 | |
| Westcore Global Large-Cap Dividend Fund | | | 9,114,413 | | | | (916,400 | ) | | | 8,198,013 | | | | 45,014,910 | |
| Westcore Large-Cap Dividend Fund | | | 1,261,683 | | | | (497,987 | ) | | | 763,696 | | | | 10,352,804 | |
| Westcore Micro-Cap Opportunity Fund | | | 2,403,864 | | | | (285,332 | ) | | | 2,118,532 | | | | 11,593,809 | |
| Westcore International Small-Cap Fund | | | 25,138,279 | | | | (917,447 | ) | | | 24,220,832 | | | | 48,323,749 | |
| Westcore Flexible Income Fund | | | 2,681,129 | | | | (2,584,195 | ) | | | 96,934 | | | | 78,231,123 | |
| Westcore Plus Bond Fund | | | 37,434,486 | | | | (8,972,231 | ) | | | 28,462,255 | | | | 1,189,217,130 | |
| Westcore Municipal Opportunities Fund | | | 54,511 | | | | (6,227 | ) | | | 48,284 | | | | 4,887,672 | |
| Westcore Colorado Tax-Exempt Fund | | | 3,613,598 | | | | (1,624,994 | ) | | | 1,988,604 | | | | 240,636,781 | |
5. INVESTMENT ADVISORY FEES, ADMINISTRATIVE FEES AND OTHER RELATED PARTY TRANSACTIONS
The Trust has entered into an advisory agreement with Denver Investment Advisors LLC (the “Adviser” or “Denver Investments”) for all Funds. The advisory agreement has been approved by the Trust’s Board of Trustees.
| 130 | | www.westcore.com |
| Westcore Funds | Notes to Financial Statements |
| June 30, 2017 (Unaudited) |
Pursuant to its advisory agreement with the Trust, Denver Investments is entitled to an investment advisory fee, based on the average net assets of each Fund, computed daily and payable monthly as shown in the table below.
| Westcore Small-Cap Growth Fund | 1.00% |
| Westcore Small-Cap Growth Fund II | 0.65% |
| Westcore Mid-Cap Value Dividend Fund | 0.65%* |
| Westcore Mid-Cap Value Dividend Fund II | 0.65% |
| Westcore Smid-Cap Value Dividend Fund | 0.80% |
| Westcore Small-Cap Value Dividend Fund | 1.00% |
| Westcore Global Large-Cap Dividend Fund | 0.65% |
| Westcore Large-Cap Dividend Fund | 0.65% |
| Westcore Micro-Cap Opportunity Fund | 1.00% |
| Westcore International Small-Cap Fund | 1.20% |
| Westcore Flexible Income Fund | 0.45% |
| Westcore Plus Bond Fund | 0.35% |
| Westcore Municipal Opportunities Fund | 0.40% |
| Westcore Colorado Tax-Exempt Fund | 0.40% |
* | Prior to April 30, 2017, the advisory fee was 0.75%. |
ALPS Fund Services, Inc. (“ALPS”) and Denver Investments serve as the Funds’ co-administrators (“Co-Administrators”). ALPS and Denver Investments are entitled to receive a total fee from each Fund for its administrative services computed daily and paid monthly based on the average daily net assets of the Trust. Denver Investments receives 0.10% on the first $3.5 billion in average daily net assets of the Trust and 0.05% for net assets greater than $3.5 billion. The administrative fees are allocated to each Fund based upon the Fund’s relative proportion of the Trust’s Net Assets and are disclosed in the Statement of Operations.
Each Fund has agreed to reimburse the Adviser for a portion of the payments it makes to certain Service Organizations for providing recordkeeping and sub-accounting services to persons who own Fund Retail Class shares through omnibus accounts (“Omnibus Accounts”). The amount reimbursed by the Fund, presented on the Statements of Operations as Shareholder servicing reimbursement - Retail Class, is intended to not exceed the estimated cost that would be incurred by the Fund if the shares held in the Omnibus Accounts were serviced directly by the Fund’s transfer agent.
To determine the Periodic Reimbursement Amount, each Fund’s effective cost for servicing shares directly by the Fund’s transfer agent is calculated on a periodic basis but no later than quarterly as follows (“Effective Rate”):
Fund Retail Class Transfer Agency Costs divided by Fund Retail Class Assets serviced directly by the Fund’s Transfer Agent.
This Effective Rate is then multiplied by the Retail Class assets in the Omnibus Accounts as of the most recent practical date (typically quarter end) to calculate the Periodic Reimbursement Amount.
Denver Investments as Adviser and Co-Administrator has contractually agreed, during the period ended June 30, 2017 and until at least April 30, 2018, that the Net Annual Fund Operating Expenses for the following shares of the Funds will not exceed the amounts shown in the table below.
| Westcore Small-Cap Growth Fund – Retail Class | 1.24%* |
| Westcore Small-Cap Growth Fund II – Institutional Class | 1.15% |
| Westcore Mid-Cap Value Dividend Fund – Retail Class | 1.15%* |
| Westcore Mid-Cap Value Dividend Fund II – Retail Class | 1.15% |
| Westcore Smid-Cap Value Dividend Fund – Retail Class | 1.20% |
| Westcore Small-Cap Value Dividend Fund – Retail Class | 1.30% |
| Westcore Global Large-Cap Dividend Fund – Retail Class | 0.99% |
| Westcore Large-Cap Dividend Fund – Retail Class | 0.89%* |
| Westcore Micro-Cap Opportunity Fund – Retail Class | 1.30% |
| Westcore International Small-Cap Fund – Retail Class | 1.50%** |
| Westcore Flexible Income Fund – Retail Class | 0.85% |
| Westcore Plus Bond Fund – Retail Class | 0.55% |
| Westcore Municipal Opportunities Fund – Retail Class | 0.65% |
| Westcore Colorado Tax-Exempt Fund – Retail Class | 0.65% |
Semi-Annual Report | June 30, 2017 | | 131 |
| Westcore Funds | Notes to Financial Statements |
| June 30, 2017 (Unaudited) |
* | Prior to April 30, 2017, the expense caps for Westcore Small-Cap Growth Fund Retail Class, Westcore Large-Cap Dividend Fund Retail Class and Westcore Mid-Cap Value Dividend Fund Retail Class were 1.30%, 1.15% and 1.25%, respectively. |
| ** | The Adviser has also agreed to voluntarily waive a portion of the investment advisory and/or administration fees and/or reimburse additional Trust expenses so that the ratio of expenses to average net assets of the Westcore International Small-Cap Fund (the “Fund”) Retail Class of the Trust as reported in the Funds’ Financial Highlights do not exceed 1.44%. The Adviser may discontinue this voluntary waiver at any time upon notice to the Trust. |
Denver Investments has contractually agreed to waive certain investment advisory and/or administration fees and/or to reimburse other expenses from April 30, 2017 until at least April 30, 2018. Adviser reimbursements are paid monthly in arrears. The first waiver/reimbursement applies so that the ratio of expenses to average net assets, as reported in the Fund’s Financial Highlights, will be no more than the amount reported in the table above, for the Fund’s Retail Class for such period. The second waiver/reimbursement applies so that Fund level Other Expenses for the Institutional Class will be in the same proportion as the Retail Class waivers/reimbursements. The third waiver/reimbursement applies so that the institutional class-specific Other Expenses are reimbursed. The Adviser has contractually agreed to waive/reimburse all of these class-specific Other Expenses, but only to the extent that the difference between the net Institutional Class and net Retail Class expense ratios after applying the waiver/reimbursement does not exceed 25 basis points. Without such fee waivers, for the six months ended June 30, 2017, the Total Annualized Operating Expenses for the Institutional Class shares of the Funds are as follows:
| Westcore Small-Cap Growth Fund | 2.94% |
| Westcore Mid-Cap Value Dividend Fund | 1.03% |
| Westcore Mid-Cap Value Dividend Fund II | 1.18% |
| Westcore Smid-Cap Value Dividend Fund | 16.92% |
| Westcore Small-Cap Value Dividend Fund | 1.24% |
| Westcore Global Large-Cap Dividend Fund | 1.10% |
| Westcore Large-Cap Dividend Fund | 1.57% |
| Westcore International Small-Cap Fund | 1.61% |
| Westcore Flexible Income Fund | 0.78% |
| Westcore Plus Bond Fund | 0.56% |
| Westcore Municipal Opportunities Fund | 3.62% |
| Westcore Colorado Tax-Exempt Fund | 0.63% |
ALPS, pursuant to a Transfer Agency Agreement, serves as Transfer Agent for each of the Funds. As Transfer Agent, ALPS has, among other things, agreed to: (a) issue and redeem shares of the Funds; (b) make dividend and other distributions to shareholders of the Funds; (c) effect transfers of shares; (d) mail communications to shareholders of the Funds, including account statements, confirmations, and dividend and distribution notices; (e) facilitate the electronic delivery of shareholder statements and reports and (f) maintain shareholder accounts. Under the Transfer Agency Agreement, ALPS receives from the Trust an annual minimum fee per Fund, a fee based upon each shareholder account and is reimbursed for out-of-pocket expenses.
An officer of the Funds is also an officer of Denver Investments. All access persons of the Trust, as defined in the 1940 Act, and members, officers and employees of the Adviser, follow strict guidelines and policies on personal trading as outlined in the Trust’s and the Adviser’s respective Code of Ethics.
The Trustees have appointed a Chief Compliance Officer who is also the Treasurer of the Trust and a partner of the Adviser. The Trustees agreed to have the Funds pay the portion of his compensation attributable for services rendered as the Trust’s Chief Compliance Officer. The Trustees have also appointed a President of the Trust who is also a Trustee. In addition to Trustee compensation, the President receives a fee per each regularly scheduled Board meeting.
The Trust has a Trustee Deferred Compensation Plan (the “Deferral Plan”) which allows the Trustees to defer the receipt of all or a portion of Trustees fees. Under the Deferral Plan, Trustee fees are paid and invested directly into shares of the Funds elected by the Trustees in the Deferral Plan. There is no future liability related to the balance in the Deferral Plan as such amounts are paid directly out of the respective capital accounts of the elected Funds. The amount paid to the Trustees under the Deferral Plan will be determined based upon the performance of the elected funds. The balance in the Deferral Plan as of June 30, 2017 is $587,665.
| 132 | | www.westcore.com |
| Westcore Funds | Notes to Financial Statements |
June 30, 2017 (Unaudited)
6. FAIR VALUE MEASUREMENTS
A three-tier hierarchy has been established to measure fair value based on the extent of use of “observable inputs” as compared to “unobservable inputs” for disclosure purposes and requires additional disclosures about these valuation measurements. Inputs refer broadly to the assumptions that market participants would use in pricing a security. Observable inputs are inputs that reflect the assumptions market participants would use in pricing the security developed based on market data obtained from sources independent of the reporting entity. Unobservable inputs are inputs that reflect the reporting entity’s own assumptions about the assumptions market participants would use in pricing the security developed based on the best information available in the circumstances.
The three-tier hierarchy is summarized as follows:
| 1) | Level 1 – Quoted & Unadjusted Prices in active markets for identical investments |
| 2) | Level 2 – Other Significant Observable Inputs (including quoted prices for similar investments, interest rates, prepayment speeds, credit risk, etc.) |
| 3) | Level 3 – Significant Unobservable Inputs (including the Fund’s own assumptions in determining the fair value of investments). |
The following is a summary of the inputs used as of June 30, 2017 in valuing the Funds’ assets:
| Westcore Small-Cap Growth Fund | |
| Investments in Securities at Value* | | Level 1 - Quoted and Unadjusted Prices | | | Level 2 - Other Significant Observable Inputs | | | Level 3 - Significant Unobservable Inputs | | | Total | |
| Common Stocks | | $ | 5,027,347 | | | $ | – | | | $ | – | | | $ | 5,027,347 | |
| Money Market Mutual Funds | | | 155,226 | | | | – | | | | – | | | | 155,226 | |
| Total | | $ | 5,182,573 | | | $ | – | | | $ | – | | | $ | 5,182,573 | |
| Westcore Small-Cap Growth Fund II | |
| Investments in Securities at Value* | | Level 1 - Quoted and Unadjusted Prices | | | Level 2 - Other Significant Observable Inputs | | | Level 3 - Significant Unobservable Inputs | | | Total | |
| Common Stocks | | $ | 35,608,466 | | | $ | – | | | $ | – | | | $ | 35,608,466 | |
| Money Market Mutual Funds | | | 2,643,776 | | | | – | | | | – | | | | 2,643,776 | |
| Total | | $ | 38,252,242 | | | $ | – | | | $ | – | | | $ | 38,252,242 | |
| Westcore Mid-Cap Value Dividend Fund | |
| Investments in Securities at Value* | | Level 1 - Quoted and Unadjusted Prices | | | Level 2 - Other Significant Observable Inputs | | | Level 3 - Significant Unobservable Inputs | | | Total | |
| Common Stocks | | $ | 83,747,300 | | | $ | – | | | $ | – | | | $ | 83,747,300 | |
| Money Market Mutual Funds | | | 413,816 | | | | – | | | | – | | | | 413,816 | |
| Short Term Investments | | | – | | | | 720 | | | | – | | | | 720 | |
| Total | | $ | 84,161,116 | | | $ | 720 | | | $ | – | | | $ | 84,161,836 | |
| Westcore Mid-Cap Value Dividend Fund II | |
| Investments in Securities at Value* | | Level 1 - Quoted and Unadjusted Prices | | | Level 2 - Other Significant Observable Inputs | | | Level 3 - Significant Unobservable Inputs | | | Total | |
| Common Stocks | | $ | 31,886,366 | | | $ | – | | | $ | – | | | $ | 31,886,366 | |
| Money Market Mutual Funds | | | 875,254 | | | | – | | | | – | | | | 875,254 | |
| Short Term Investments | | | – | | | | 274 | | | | – | | | | 274 | |
| Total | | $ | 32,761,620 | | | $ | 274 | | | $ | – | | | $ | 32,761,894 | |
Semi-Annual Report | June 30, 2017 | | 133 |
| Westcore Funds | Notes to Financial Statements |
June 30, 2017 (Unaudited)
| Westcore Smid-Cap Value Dividend Fund | |
| Investments in Securities at Value* | | Level 1 - Quoted and Unadjusted Prices | | | Level 2 - Other Significant Observable Inputs | | | Level 3 - Significant Unobservable Inputs | | | Total | |
| Common Stocks | | $ | 667,607 | | | $ | – | | | $ | – | | | $ | 667,607 | |
| Money Market Mutual Funds | | | 5,781 | | | | – | | | | – | | | | 5,781 | |
| Total | | $ | 673,388 | | | $ | – | | | $ | – | | | $ | 673,388 | |
| Westcore Small-Cap Value Dividend Fund | |
| Investments in Securities at Value* | | Level 1 - Quoted and Unadjusted Prices | | | Level 2 - Other Significant Observable Inputs | | | Level 3 - Significant Unobservable Inputs | | | Total | |
| Common Stocks | | $ | 199,427,553 | | | $ | – | | | $ | – | | | $ | 199,427,553 | |
| Money Market Mutual Funds | | | 5,423,562 | | | | – | | | | – | | | | 5,423,562 | |
| Total | | $ | 204,851,115 | | | $ | – | | | $ | – | | | $ | 204,851,115 | |
| Westcore Global Large-Cap Dividend Fund | |
| Investments in Securities at Value* | | Level 1 - Quoted and Unadjusted Prices | | | Level 2 - Other Significant Observable Inputs | | | Level 3 - Significant Unobservable Inputs | | | Total | |
| Common Stocks | | $ | 51,211,309 | | | $ | – | | | $ | – | | | $ | 51,211,309 | |
| Money Market Mutual Funds | | | 2,001,614 | | | | – | | | | – | | | | 2,001,614 | |
| Total | | $ | 53,212,923 | | | $ | – | | | $ | – | | | $ | 53,212,923 | |
| Westcore Large-Cap Dividend Fund | |
| Investments in Securities at Value* | | Level 1 - Quoted and Unadjusted Prices | | | Level 2 - Other Significant Observable Inputs | | | Level 3 - Significant Unobservable Inputs | | | Total | |
| Common Stocks | | $ | 11,078,082 | | | $ | – | | | $ | – | | | $ | 11,078,082 | |
| Money Market Mutual Funds | | | 38,418 | | | | – | | | | – | | | | 38,418 | |
| Total | | $ | 11,116,500 | | | $ | – | | | $ | – | | | $ | 11,116,500 | |
| Westcore Micro-Cap Opportunity Fund | |
| Investments in Securities at Value* | | Level 1 - Quoted and Unadjusted Prices | | | Level 2 - Other Significant Observable Inputs | | | Level 3 - Significant Unobservable Inputs | | | Total | |
| Common Stocks | | $ | 13,013,561 | | | $ | – | | | $ | – | | | $ | 13,013,561 | |
| Rights and Warrants | | | – | | | | – | | | | 4,361 | | | | 4,361 | |
| Money Market Mutual Funds | | | 694,419 | | | | – | | | | – | | | | 694,419 | |
| Total | | $ | 13,707,980 | | | $ | – | | | $ | 4,361 | | | $ | 13,712,341 | |
| Westcore International Small-Cap Fund | |
| Investments in Securities at Value* | | Level 1 - Quoted and Unadjusted Prices | | | Level 2 - Other Significant Observable Inputs | | | Level 3 - Significant Unobservable Inputs | | | Total | |
| Common Stocks | | $ | 71,771,349 | | | $ | – | | | $ | – | | | $ | 71,771,349 | |
| Money Market Mutual Funds | | | 773,232 | | | | – | | | | – | | | | 773,232 | |
| Total | | $ | 72,544,581 | | | $ | – | | | $ | – | | | $ | 72,544,581 | |
| Other Financial Instruments** | | | | | | | | | | | | | | | | |
| Assets | | | | | | | | | | | | | | | | |
| Forward Foreign Currency Contracts | | $ | – | | | $ | 185,393 | | | $ | – | | | $ | 185,393 | |
| Liabilities | | | | | | | | | | | | | | | | |
| Forward Foreign Currency Contracts | | | – | | | | (307,775 | ) | | | – | | | | (307,775 | ) |
| Total | | $ | – | | | $ | (122,382 | ) | | $ | – | | | $ | (122,382 | ) |
| 134 | | www.westcore.com |
| Westcore Funds | Notes to Financial Statements |
June 30, 2017 (Unaudited)
| Westcore Flexible Income Fund | |
| Investments in Securities at Value* | | Level 1 - Quoted and Unadjusted Prices | | | Level 2 - Other Significant Observable Inputs | | | Level 3 - Significant Unobservable Inputs | | | Total | |
| Preferred Stock | | $ | 1,315,792 | | | $ | – | | | $ | – | | | $ | 1,315,792 | |
| Exchange Traded Funds | | | 632,400 | | | | – | | | | – | | | | 632,400 | |
| Corporate Bonds | | | – | | | | 70,311,132 | | | | – | | | | 70,311,132 | |
| Commercial Mortgage-Backed Securities | | | – | | | | 1,296,095 | | | | 1,585,792 | | | | 2,881,887 | |
| Residential Mortgage-Backed Securities | | | – | | | | 673,199 | | | | – | | | | 673,199 | |
| Money Market Mutual Funds | | | 2,513,647 | | | | – | | | | – | | | | 2,513,647 | |
| Total | | $ | 4,461,839 | | | $ | 72,280,426 | | | $ | 1,585,792 | | | $ | 78,328,057 | |
| Westcore Plus Bond Fund | |
| Investments in Securities at Value* | | Level 1 - Quoted and Unadjusted Prices | | | Level 2 - Other Significant Observable Inputs | | | Level 3 - Significant Unobservable Inputs | | | Total | |
| Preferred Stock | | | | | | | | | | | | |
| Financial Institutions | | $ | 7,972,644 | | | $ | 1,152,844 | | | $ | – | | | $ | 9,125,488 | |
| Corporate Bonds | | | – | | | | 461,196,273 | | | | – | | | | 461,196,273 | |
| Municipal Bonds | | | – | | | | 114,091,759 | | | | – | | | | 114,091,759 | |
| Asset Backed Securities | | | – | | | | 78,211,777 | | | | – | | | | 78,211,777 | |
| Collateralized Loan Obligations | | | – | | | | 18,538,423 | | | | – | | | | 18,538,423 | |
| Commercial Mortgage-Backed Securities | | | – | | | | 40,240,239 | | | | 4,052,581 | | | | 44,292,820 | |
| Mortgage-Backed Securities Passthrough | | | – | | | | 309,920,185 | | | | – | | | | 309,920,185 | |
| Residential Mortgage-Backed Securities | | | – | | | | 22,135,067 | | | | – | | | | 22,135,067 | |
| U.S. Treasury Bonds & Notes | | | – | | | | 135,429,495 | | | | – | | | | 135,429,495 | |
| Money Market Mutual Funds | | | 24,738,098 | | | | – | | | | – | | | | 24,738,098 | |
| Total | | $ | 32,710,742 | | | $ | 1,180,916,062 | | | $ | 4,052,581 | | | $ | 1,217,679,385 | |
| Westcore Municipal Opportunities Fund | |
| Investments in Securities at Value* | | Level 1 - Quoted and Unadjusted Prices | | | Level 2 - Other Significant Observable Inputs | | | Level 3 - Significant Unobservable Inputs | | | Total | |
| Municipal Bonds | | $ | – | | | $ | 4,703,555 | | | $ | – | | | $ | 4,703,555 | |
| Money Market Mutual Funds | | | 232,401 | | | | – | | | | – | | | | 232,401 | |
| Total | | $ | 232,401 | | | $ | 4,703,555 | | | $ | – | | | $ | 4,935,956 | |
| Westcore Colorado Tax-Exempt Fund | |
| Investments in Securities at Value* | | Level 1 - Quoted and Unadjusted Prices | | | Level 2 - Other Significant Observable Inputs | | | Level 3 - Significant Unobservable Inputs | | | Total | |
| Municipal Bonds | | $ | – | | | $ | 234,629,646 | | | $ | – | | | $ | 234,629,646 | |
| Money Market Mutual Funds | | | 7,995,739 | | | | – | | | | – | | | | 7,995,739 | |
| Total | | $ | 7,995,739 | | | $ | 234,629,646 | | | $ | – | | | $ | 242,625,385 | |
| * | For detailed Industry descriptions, see the accompanying Statements of Investments. |
| ** | Other financial instruments are derivative instruments not reflected in the Statements of Investments. |
It is the Funds’ policy to recognize transfers into and out of all levels at the end of the reporting period.
The Westcore International Small-Cap Fund utilizes a fair value evaluation service with respect to international securities with an earlier market closing than the Fund’s net asset value computation cutoff. When events trigger the use of the fair value evaluation service on a reporting period date, it results in certain securities transferring from a Level 1 to a Level 2 classification. When the trigger is not met at a period end, it could result
Semi-Annual Report | June 30, 2017 | | 135 |
| Westcore Funds | Notes to Financial Statements |
June 30, 2017 (Unaudited)
in securities transferring from a Level 2 to a Level 1 classification. The transfer amount disclosed in the table below represents the value of the securities as of June 30, 2017 transferred in/(out) of Level 1 and Level 2 during the reporting period that were also held as of December 31, 2016.
The Westcore International Small-Cap Fund had the following transfers in/(out) of Level 1 and Level 2 at June 30, 2017:
| | | Level 1- Quoted and Unadjusted Prices | | | Level 2- Other Significant Observable Inputs | |
| | | Transfers In | | | Transfers (Out) | | | Transfers In | | | Transfers (Out) | |
| Common Stock | | $ | 3,578,187 | | | $ | – | | | $ | – | | | $ | (3,578,187 | ) |
| Total | | $ | 3,578,187 | | | $ | – | | | $ | – | | | $ | (3,578,187 | ) |
There were no significant Level 3 securities held in any of the Funds, except Westcore Flexible Income and Westcore Plus Bond Funds, as of June 30, 2017.
The following is a reconciliation of assets in which significant unobservable inputs (Level 3) were used in determining fair value:
| Westcore Flexible Income Fund | |
| Investments in Securities | | Balance as of December 31, 2016 | | | Accrued discount/premium | | | Return of Capital | | | Realized Gain/(Loss)* | | | Change in Unrealized Appreciation/ (Depreciation) | | | Purchases | | | Paydowns | | | Transfer into Level 3 | | | Transfer out of Level 3 | | | Balance as of June 30, 2017 | | | Net change in unrealized appreciation/ (depreciation) included in the Statements of Operations attributable to Level 3 investments held at June 30, 2017 | |
| Commercial Mortgage-Backed Securities | | $ | 1,603,359 | | | $ | 9,344 | | | $ | – | | | $ | – | | | $ | 27,447 | | | $ | – | | | $ | (54,358 | ) | | $ | – | | | $ | – | | | $ | 1,585,792 | | | $ | 27,447 | |
Total | | $ | 1,603,359 | | | $ | 9,344 | | | $ | – | | | $ | – | | | $ | 27,447 | | | $ | – | | | $ | (54,358 | ) | | $ | – | | | $ | – | | | $ | 1,585,792 | | | $ | 27,447 | |
Westcore Plus Bond Fund | |
| Investments in Securities | | Balance as of December 31, 2016 | | | Accrued discount/premium | | | Return of Capital | | | Realized Gain/(Loss)* | | | Change in Unrealized Appreciation/ (Depreciation) | | | Purchases | | | Paydowns | | | Transfer into Level 3 | | | Transfer out of Level 3 | | | Balance as of June 30, 2017 | | | Net change in unrealized appreciation/ (depreciation) included in the Statements of Operations attributable to Level 3 investments held at June 30, 2017 | |
| Commercial Mortgage-Backed Securities | | $ | 4,097,474 | | | $ | 23,879 | | | $ | – | | | $ | (16,675 | ) | | $ | 70,144 | | | $ | – | | | $ | (122,241 | ) | | $ | – | | | $ | – | | | $ | 4,052,581 | | | $ | 70,144 | |
Total | | $ | 4,097,474 | | | $ | 23,879 | | | $ | – | | | $ | (16,675 | ) | | $ | 70,144 | | | $ | – | | | $ | (122,241 | ) | | $ | – | | | $ | – | | | $ | 4,052,581 | | | $ | 70,144 | |
| * | Net realized gain/(loss) and net unrealized appreciation/(depreciation) are included in the related amounts in the Statement of Operations. |
The inputs or methodologies used for valuing securities are not necessarily an indication of the risk associated with investing in those securities.
For fair value measurements using significant other observable inputs (Level 2), the Funds generally utilize an independent pricing service which utilizes evaluated pricing models that vary by asset class and incorporate available trade, bid and other market information, and for structured securities also incorporate cash flow and, when available, loan performance data. The independent pricing service’s evaluated pricing models apply available market information through processes such as benchmark curves, benchmarking of similar securities, and sector groupings. For certain securities, the independent pricing service uses model processes, such as the Option Adjusted Spread (benchmark driven) model, to assess interest rate impact and develop prepayment scenarios. With respect to trades and bids, the independent pricing service reviews the lot size to determine
| 136 | | www.westcore.com |
| Westcore Funds | Notes to Financial Statements |
June 30, 2017 (Unaudited)
whether the information is representative of an orderly trading market. If the independent pricing service determines that trade or bid information is not consistent with other information available, the trade or bid will not be reflected in the evaluated price.
Corporate bonds, Municipal bonds, U.S. Government & Agency Obligations, and U.S. Treasury bonds & Notes are valued using market models that consider trade data, quotations from dealers and active market makers, relevant yield curve and spread data, creditworthiness, trade data or market information on comparable securities, and other relevant security specific information. Mortgage-related and asset-backed securities are valued based on models that consider trade data, prepayment and default projections, benchmark yield and spread data and estimated cash flows of each tranche of the issuer. Forward foreign currency contracts are normally valued on the basis of quotes obtained from brokers and dealers or independent pricing services.
In the event the independent pricing service is unable to provide an evaluated price for a security or Denver Investments believes the price provided is not reliable, securities of the Funds may be valued in good faith as described above in Note 2. In these instances, the compliance department will typically seek input from the investment team of the Fund since they are typically the most knowledgeable of the relevant factors in valuing the securities. Denver Investments may seek to find an alternative independent source, such as a broker/dealer to provide a price quote, or by using evaluated pricing models similar to the techniques and models used by the independent pricing service. These fair value measurement techniques may utilize unobservable inputs (Level 3).
At least quarterly, Denver Investments receives a report on the pricing for all fair valued securities during the period along with any actual sales prices, broker quotes and/or pricing from the independent pricing service. Denver Investments uses this information to analyze changes in fair value measurements over the period and as a back test of pricing methods.
Then on at least a quarterly basis, Denver Investments presents the factors considered in determining the fair value measurements and presents that information to the Audit Committee of the Board of Trustees which meets at least quarterly. The Audit Committee of the Board of Trustees then will provide a recommendation to the Board of Trustees for approval of the fair value measurements.
The table below provides additional information about the Level 3 Fair Value Measurements as of June 30, 2017:
| Westcore Flexible Income Fund | | | | | | |
| | | | | | | |
Quantitative Information about
Level 3 Fair Value Measurements | | Fair Value
at 6/30/2017 | | Valuation Technique | Unobservable Input(a) | | Range | |
| Commercial Mortgage-Backed Security | | $ | 1,585,792 | | Adjusted Spread Pricing* | Comparability Adjustment Liquidity Adjustment | | | 0.80 1.00 | % % |
| Total | | $ | 1,585,792 | | | | | | | |
| Westcore Plus Bond Fund | | | | | | |
| | | | | | | |
Quantitative Information about
Level 3 Fair Value Measurements | | Fair Value
at 6/30/2017 | | Valuation Technique | Unobservable Input(a) | | Range | |
| Commercial Mortgage-Backed Security | | $ | 4,052,581 | | Adjusted Spread Pricing* | Comparability Adjustment Liquidity Adjustment | | | 0.80 1.00 | % % |
| Total | | $ | 4,052,581 | | | | | | | |
| * | Denver Investments identifies comparable security(ies) and obtains market observable spreads to Treasuries, and then adjusts for appropriate comparability or liquidity adjustments. |
| (a) | A change to the unobservable input may result in a significant change to the value of the investment as follows: |
| Unobservable Input | Impact to Value if Input Increases | Impact to Value if Input Decreases |
| Comparability Adjustment | Decrease | Increase |
| Liquidity Adjustment | Decrease | Increase |
Semi-Annual Report | June 30, 2017 | | 137 |
| Westcore Funds | Notes to Financial Statements |
June 30, 2017 (Unaudited)
7. FORWARD FOREIGN CURRENCY EXCHANGE CONTRACTS
The Westcore International Small-Cap Fund may purchase or sell foreign currencies on a “spot” or cash basis at the prevailing rate in the foreign currency exchange market to settle investment transactions in the proper currency. In addition, this Fund may purchase or sell forward currency contracts to adjust the portfolio’s exposure to different currencies consistent with the investment team’s targets, which consider the currency weightings within the Fund’s benchmark index.
When entering into a spot or forward foreign currency contract, the Fund agrees to receive or deliver a fixed quantity of foreign currency for an agreed upon price on an agreed future date. These contracts are valued at each portfolio valuation, and the Fund’s net equity therein, representing unrealized gain or loss on the contracts as measured by the difference between the contractual rates at the dates of entry into the contracts and the spot or forward rates at the reporting date, is included in the Statement of Assets and Liabilities. Realized gains and losses and change in unrealized appreciation and depreciation are included in the Statement of Operations. These instruments involve credit risk and market risk in excess of the amount recognized in the Statement of Assets and Liabilities. Risks arise from the possible inability of counterparties to meet the terms of their contracts and from movement in currency exchange rates.
The Fund must segregate assets determined to be liquid in accordance with procedures established by the Board of Trustees, or otherwise cover its position in a permissible manner.
During the six months ended June 30, 2017, the Fund had average forward foreign currency contract values to buy and sell of $26,365,583 and $21,878,292, respectively.
The effect of derivative instruments on the Statement of Assets and Liabilities as of June 30, 2017 is as follows:
| Westcore International Small-Cap Fund | Asset Derivatives | | Liability Derivatives | |
| Risk Exposure | Statements of Assets and Liabilities Location | | Fair Value | | Statements of Assets and Liabilities Location | | Fair Value | |
| Forward Foreign Currency Contracts (Foreign Exchange Rate Risk) | Unrealized gain on forward foreign currency contracts | | $ | 185,393 | | Unrealized loss on forward foreign currency contracts | | $ | 307,775 | |
| Total | | | $ | 185,393 | | | | $ | 307,775 | |
The effect of derivative instruments on the Statement of Operations for the six months ended June 30, 2017 is as follows:
Westcore International Small-Cap Fund
Risk Exposure | Statements of Operations Location | | Realized
Gain/(Loss) on
Derivatives
Recognized
in Income | | | Change in
Unrealized Appreciation/
(Depreciation)
on Derivatives
Recognized
in Income | |
| Forward Foreign Currency Contracts (Foreign Exchange Rate Risk) | Net realized gain/(loss) on forward foreign currency contracts/ Change in unrealized net appreciation/(depreciation) on forward foreign currency contracts | | $ | 399,017 | | | $ | (145,727 | ) |
| Total | | | $ | 399,017 | | | $ | (145,727 | ) |
| 138 | | www.westcore.com |
| Westcore Funds | Notes to Financial Statements |
June 30, 2017 (Unaudited)
8. PURCHASES AND SALES OF INVESTMENTS
Investment transactions for the six months ended June 30, 2017 excluding long-term U.S. government securities and short-term investments were as follows:
| Fund | | Purchases of Securities | | | Proceeds from Sales of Securities | |
| Westcore Small-Cap Growth Fund | | $ | 1,794,493 | | | $ | 1,722,394 | |
| Westcore Small-Cap Growth Fund II | | | 11,604,275 | | | | 15,230,915 | |
| Westcore Mid-Cap Value Dividend Fund | | | 40,019,356 | | | | 32,971,835 | |
| Westcore Mid-Cap Value Dividend Fund II | | | 14,329,401 | | | | 17,332,465 | |
| Westcore Smid-Cap Value Dividend Fund | | | 609,282 | | | | 296,019 | |
| Westcore Small-Cap Value Dividend Fund | | | 90,943,479 | | | | 93,168,723 | |
| Westcore Global Large-Cap Dividend Fund | | | 4,409,434 | | | | 3,390,964 | |
| Westcore Large-Cap Dividend Fund | | | – | | | | 3,249,662 | |
| Westcore Micro-Cap Opportunity Fund | | | 6,665,247 | | | | 6,760,937 | |
| Westcore International Small-Cap Fund | | | 13,530,086 | | | | 21,476,917 | |
| Westcore Flexible Income Fund | | | 16,596,005 | | | | 15,223,200 | |
| Westcore Plus Bond Fund | | | 193,739,860 | | | | 185,428,040 | |
| Westcore Municipal Opportunities Fund | | | 8,015,177 | | | | 4,104,220 | |
| Westcore Colorado Tax-Exempt Fund | | | 71,601,083 | | | | 53,092,651 | |
Purchases and sales of long-term U.S. Government securities for the six months ended June 30, 2017, were as follows:
| Fund | Purchases of Long Term U.S. Government Obligations | | Proceeds from Sales of Long Term U.S. Government Obligations | |
| Westcore Plus Bond Fund | | $ | 63,792,577 | | | $ | 37,447,703 | |
9. SEC REGULATIONS
On October 13, 2016, the SEC amended Regulation S-X, which will require standardized, enhanced disclosure about derivatives in investment company financial statements, as well as other amendments. The compliance date for the amendments to Regulation S-X is August 1, 2017. Management is currently evaluating the impact to the financial statements and disclosures.
Semi-Annual Report | June 30, 2017 | | 139 |
Not applicable to semi-annual report.
| Item 3. | Audit Committee Financial Expert. |
Not applicable to semi-annual report.
| Item 4. | Principal Accountant Fees and Services. |
Not applicable to semi-annual report.
| Item 5. | Audit Committee of Listed Registrants. |
Not applicable.
| a) | Schedule of Investments in securities of unaffiliated issuers as of the close of the reporting period is included as part of the Reports to Stockholders filed under Item 1 of this form. |
| Item 7. | Disclosure of Proxy Voting Policies and Procedures for Closed-End Management Investment Companies. |
Not applicable.
| Item 8. | Portfolio Managers of Closed-End Management Investment Companies. |
Not applicable.
| Item 9. | Purchases of Equity Securities by Closed-End Management Investment Company and Affiliated Purchasers. |
Not applicable.
| Item 10. | Submission of Matters to a Vote of Security Holders. |
There have been no material changes to the procedures by which shareholders may recommend nominees to the registrant’s Board of Trustees.
| Item 11. | Controls and Procedures. |
| (a) | The registrant’s principal executive officer and principal financial officer have concluded that the registrant’s disclosure controls and procedures (as defined in Rule 30a-3(c) under the Investment Company Act of 1940, as amended) (the “1940 Act”) (17 CFR 270.30a-3(e)) are effective based on their evaluation of these controls and procedures required by Rule 30a-3(b) under the 1940 Act (17 CFR 270.30a-3(b)) and Rules 13a-15(b) or 15d-15(b) under the Securities Exchange Act of 1934 (17 CFR 240.13a-15(b) or 240.15d-15(b)) as of a date within 90 days of the filing date of this report. |
| (b) | There was no change in the registrant’s internal control over financial reporting (as defined in Rule 30a-3(d) under the 1940 Act (17 CFR 270.30a-3(d)) that occurred during the second fiscal quarter of the period covered by this report that has materially affected, or is reasonably likely to materially affect, the registrant’s internal control over financial reporting. |
| (a)(1) | Not applicable to semi-annual report. |
| (a)(2) | The certifications required by Rule 30a-2(a) of the 1940 Act (17 CFR 270.30a-2(a)) and Section 302 of the Sarbanes-Oxley Act of 2002 are attached hereto as EX-99.CERT. |
| (b) | The certifications required by Rule 30a-2(b) of the 1940 Act (17 CFR 270.30a-2(b)) and Section 906 of the Sarbanes-Oxley Act of 2002 are attached hereto as EX-99.906CERT. |
SIGNATURES
Pursuant to the requirements of the Securities Exchange Act of 1934 and the Investment Company Act of 1940, the registrant has duly caused this report to be signed on its behalf by the undersigned, thereunto duly authorized.
WESTCORE TRUST
| By: | /s/ Janice M. Teague | |
| | Janice M. Teague | |
| | President/Principal Executive Officer | |
| | | |
| Date: | September 8, 2017 | |
Pursuant to the requirements of the Securities Exchange Act of 1934 and the Investment Company Act of 1940, this report has been signed below by the following persons on behalf of the registrant and in the capacities and on the dates indicated.
| By: | /s/ Janice M. Teague | |
| | Janice M. Teague | |
| | President/Principal Executive Officer | |
| | | |
| Date: | September 8, 2017 | |
| By: | /s/ Jasper R. Frontz | |
| | Jasper R. Frontz | |
| | Treasurer/Principal Financial Officer | |
| | | |
| Date: | September 8, 2017 | |