| | OMB APPROVAL |
| | OMB Number: 3235-0570 Expires: July 31, 2022 Estimated average burden hours per response: 20.6 |
UNITED STATES
SECURITIES AND EXCHANGE COMMISSION
Washington, D.C. 20549
FORM N-CSR
CERTIFIED SHAREHOLDER REPORT OF REGISTERED
MANAGEMENT INVESTMENT COMPANIES
| Investment Company Act file number | 811-3373 | |
| SEGALL BRYANT & HAMILL TRUST |
| (Exact name of registrant as specified in charter) |
| 225 Pictoria Drive, Suite 450 Cincinnati, Ohio | 45246 |
| (Address of principal executive offices) | (Zip code) |
Derek W. Smith, Secretary |
| Segall Bryant & Hamill Trust, 225 Pictoria Drive, Suite 450 Cincinnati, Ohio 45246 |
| (Name and address of agent for service) |
| Registrant's telephone number, including area code: | (513) 869-4262 | |
| Date of fiscal year end: | December 31 | |
| | | |
| Date of reporting period: | June 30, 2020 | |
Form N-CSR is to be used by management investment companies to file reports with the Commission not later than 10 days after the transmission to stockholders of any report that is required to be transmitted to stockholders under Rule 30e-1 under the Investment Company Act of 1940 (17 CFR 270.30e-1). The Commission may use the information provided on Form N-CSR in its regulatory, disclosure review, inspection, and policymaking roles.
A registrant is required to disclose the information specified by Form N-CSR, and the Commission will make this information public. A registrant is not required to respond to the collection of information contained in Form N-CSR unless the Form displays a currently valid Office of Management and Budget ("OMB") control number. Please direct comments concerning the accuracy of the information collection burden estimate and any suggestions for reducing the burden to the Secretary, Securities and Exchange Commission, 450 Fifth Street, NW, Washington, DC 20549-0609. The OMB has reviewed this collection of information under the clearance requirements of 44 U.S.C. § 3507.
| Item 1. | Reports to Stockholders. |

Segall Bryant & Hamill Small Cap Value Fund
(Ticker Symbol: Retail - SBRVX; Institutional - SBHVX)
Segall Bryant & Hamill Small Cap Value Dividend Fund
(Ticker Symbol: Retail - WTSVX; Institutional - WISVX)
Segall Bryant & Hamill Small Cap Growth Fund
(Ticker Symbol: Retail - WTSGX; Institutional - WISGX)
Segall Bryant & Hamill Small Cap Core Fund
(Ticker Symbol: Retail - SBHCX; Institutional - SBASX)
Segall Bryant & Hamill Mid Cap Value Dividend Fund
(Ticker Symbol: Retail - WTMCX; Institutional - WIMCX)
Segall Bryant & Hamill All Cap Fund
(Ticker Symbol: Retail - SBRAX; Institutional - SBHAX)
Segall Bryant & Hamill Emerging Markets Fund
(Ticker Symbol: Retail - SBHEX; Institutional - SBEMX)
Segall Bryant & Hamill International Small Cap Fund
(Ticker Symbol: Retail - SBHSX; Institutional - SBSIX)
Segall Bryant & Hamill Fundamental International Small Cap Fund
(Ticker Symbol: Retail - WTIFX; Institutional - WIIFX)
Segall Bryant & Hamill Global Large Cap Fund
(Ticker Symbol: Retail - WTMVX; Institutional - WIMVX)
Segall Bryant & Hamill Workplace Equality Fund
(Ticker Symbol: Retail - WEQRX; Institutional - WEQIX)
Segall Bryant & Hamill Short Term Plus Fund
(Ticker Symbol: Retail - SBHPX; Institutional - SBAPX)
Segall Bryant & Hamill Plus Bond Fund
(Ticker Symbol: Retail - WTIBX; Institutional - WIIBX)
Segall Bryant & Hamill Quality High Yield Fund
(Ticker Symbol: Retail - WTLTX; Institutional - WILTX)
Segall Bryant & Hamill Municipal Opportunities Fund
(Ticker Symbol: Retail - WTTAX; Institutional - WITAX)
Segall Bryant & Hamill Colorado Tax Free Fund
(Ticker Symbol: Retail - WTCOX; Institutional - WICOX)
SEMI-ANNUAL REPORT
June 30, 2020
Beginning on January 1, 2021, as permitted by regulations adopted by the U.S. Securities and Exchange Commission, paper copies of the Funds’ annual and semi-annual shareholder reports will no longer be sent by mail, unless you specifically request paper copies of the reports from your financial intermediary (such as a broker-dealer or bank). Instead, the reports will be made available on the Funds’ website (www.sbhfunds.com), and you will be notified by mail each time a report is posted and provided with a website link to access the report.
If you already elected to receive shareholder reports electronically, you will not be affected by this change and you need not take any action. You may elect to receive shareholder reports and other communications from a Fund electronically anytime by contacting your financial intermediary.
You may elect to receive all future reports in paper free of charge. You can contact your financial intermediary to request that you continue to receive paper copies of your shareholder reports. Your election to receive reports in paper will apply to all funds held in your account with your financial intermediary.
| | |
Shareholder Letter | 1 |
Fund Overviews | |
Segall Bryant & Hamill Small Cap Value Fund | 2 |
Segall Bryant & Hamill Small Cap Value Dividend Fund | 4 |
Segall Bryant & Hamill Small Cap Growth Fund | 6 |
Segall Bryant & Hamill Small Cap Core Fund | 8 |
Segall Bryant & Hamill Mid Cap Value Dividend Fund | 10 |
Segall Bryant & Hamill All Cap Fund | 12 |
Segall Bryant & Hamill Emerging Markets Fund | 14 |
Segall Bryant & Hamill International Small Cap Fund | 16 |
Segall Bryant & Hamill Fundamental International Small Cap Fund | 18 |
Segall Bryant & Hamill Global Large Cap Fund | 20 |
Segall Bryant & Hamill Workplace Equality Fund | 22 |
Segall Bryant & Hamill Short Term Plus Fund | 24 |
Segall Bryant & Hamill Plus Bond Fund | 26 |
Segall Bryant & Hamill Quality High Yield Fund | 28 |
Segall Bryant & Hamill Municipal Opportunities Fund | 30 |
Segall Bryant & Hamill Colorado Tax Free Fund | 32 |
Fund Expenses | 34 |
Important Disclosures | 38 |
FINANCIAL STATEMENTS | 41 |
Statements of Investments | 41 |
Statements of Assets and Liabilities | 101 |
Statements of Operations | 105 |
Statements of Changes in Net Assets | 109 |
Financial Highlights | 115 |
Notes to Financial Statements | 147 |
Change in Independent Auditor | 164 |
Liquidity Risk Management Program | 165 |
Semi-Annual Report | June 30, 2020 |  | |
Intentionally Left Blank
Segall Bryant & Hamill Funds | Shareholder Letter |
| | June 30, 2020 (Unaudited) |
Dear Fellow Shareholders,
It is hard to overstate what a wild ride the first half of 2020 has been for both the economy and the financial markets. There is no precedent in modern times for the disruption and dislocation that has swept the globe in the wake of the COVID-19 pandemic. In a matter of months, patterns of daily life for individuals, families, schools, businesses, and society at large changed dramatically, impacting the lives of almost every person on the planet. Even saying that the U.S. economy fell into a recession—declining at an annual rate of 5.0% in the first quarter and 32.9% in the second quarter and ending the longest running expansion in the country’s history—does not begin to capture the economic pain and turmoil caused by the pandemic. Nor does saying that the unemployment rate rose as high as 14.7% in April before starting to improve in May and June or that the stock market hit a bull market high and a bear market low—all in the same month—before beginning to recover in the second quarter.
Despite these significant challenges, we are pleased to report that throughout the first half of the year, most of the funds in our trust helped protect our shareholders’ capital in the first quarter while allowing them to participate strongly in the dramatic market recovery in the second quarter. Our funds with a value-oriented investment approach continued to struggle as the strong momentum in growth stocks continued unabated through both of the first two quarters. The return gap between growth and value has widened even further during this period. Overall though, we are pleased with the performance of the SBH funds during this dramatic period. This performance is consistent with what we have told our fund shareholders over the years. Our investment process is designed to help our funds weather market “storms” better than their benchmarks through our disciplined approach to investing: our focus on bottom-up research; our focus on the investment merits of each stock or bond that we buy or continue to hold (or sell); and our emphasis on understanding the risks and potential upside of every holding. Yet, it is one thing to have a well-defined philosophy and approach, but another thing altogether to maintain that discipline in the face of such unprecedented circumstances.
As we begin the second half of the year, we have been asked (and ask ourselves), what do we think a recovery will look like? We tell clients that to form an opinion about an economic upturn or prospects for either the stock market or the bond market, we need to have some notion of when herd immunity will be achieved. Herd immunity, which is a way of saying that a sufficiently large proportion of the population is not susceptible to a virus, is thought to be achieved around 60% of the population. It can be acquired in one of three ways: (1) someone is naturally immune to the virus, (2) one contracts the disease and recovers, building antibodies into the process, or (3) a person is vaccinated, which also creates antibodies to allow the body to fight an invader. Knowing when a safe and effective vaccine is broadly available, therefore, is the key, and while we can hope, this is not an event given to economic or financial analysis.
What we can do, however, is to maintain our discipline and intensify our research efforts, as opportunities often arise in market dislocations of this magnitude. We will seek to identify stocks and bonds that may have risen too high or have been sold down so low as to be attractive under the worst of cases. Our analysts and portfolio managers are energized by this opportunity. For all the accolades placed on passive strategies over the last 10 years, it is times like these when accomplished active management can create real value for investors.

| 
|
Mary K. Anstine
Chairman | Philip L. Hildebrandt, CFA
President |
The views of the author and information discussed in the shareholder letter and the manager commentaries are as of the date of publication, are subject to change, and may not reflect the writer’s current views. The views expressed represent an assessment of market conditions at a specific point in time, are opinions only and should not be relied upon as investment advice regarding a particular investment or markets in general. Such information does not constitute a recommendation to buy or sell specific securities or investment vehicles. It should not be assumed that any investment will be profitable or will equal the performance of the fund or any securities or any sectors mentioned in this letter or the manager commentaries. The subject matter contained in this letter and the manager commentaries has been derived from several sources believed to be reliable and accurate at the time of compilation. Neither Segall Bryant & Hamill, Segall Bryant & Hamill Funds, nor any Segall Bryant & Hamill Fund accept any liability for losses either direct or consequential caused by the use of this information. Diversification cannot guarantee gain or prevent losses.
Semi-Annual Report | June 30, 2020 |  | 1 |
Segall Bryant & Hamill Small Cap Value Fund | Fund Overview |
| | June 30, 2020 (Unaudited) |
Fund Strategy
Investing primarily in equity securities of small-capitalization companies.
Fund Management
Mark T. Dickherber, CFA, CPA Portfolio Manager |
Shaun P. Nicholson Portfolio Manager |
CFA is a trademark owned by CFA Institute.
Cumulative Returns

The chart above represents historical performance of a hypothetical investment of $10,000 in the Fund over the past 10 years (or for the life of the Fund if shorter). Performance calculations are as of the end of June each year. Past performance does not guarantee future results. This chart does not reflect the deduction of taxes that a shareholder would pay on Fund distributions or the redemption of Fund shares.
Please see index definitions beginning on page 38.
Average Annual Total Returns
| | 6 Months | 1 Year | 3 Years | 5 Years | 10 Years | Since
Inception | Inception
Date |
Retail Class (SBRVX) | (18.49)% | (12.60)% | 2.01% | 3.56% | — | 5.36% | 12/9/19 |
Institutional Class (SBHVX) | (18.49)% | (12.54)% | 2.13% | 3.69% | — | 5.51% | 7/31/13 |
Russell 2000® Value Index | (23.50)% | (17.48)% | (4.35)% | 1.26% | — | 3.10% | |
Retail Class Annual Expense Ratio (per the current prospectus) — Gross: 1.24%, Net: 1.14%
Institutional Class Annual Expense Ratio (per the current prospectus) – Gross: 1.10%, Net: 0.99%
Sector Allocation (as of 6/30/20)
Information Technology | 17.4% |
Industrials | 17.0% |
Financials | 13.2% |
Health Care | 11.1% |
Materials | 7.3% |
Real Estate | 7.1% |
Consumer Staples | 7.0% |
Consumer Discretionary | 4.8% |
Utilities | 3.8% |
Energy | 3.3% |
Sector classifications presented are based on the Global Industry Classification Standard (GICS) methodology.
Sector weights may not sum to 100% due to rounding.
The sector allocation table above does not include any cash or cash equivalents.
Top Ten Holdings (as of 6/30/20)
Regal Beloit Corp. | 5.3% |
Equity Commonwealth | 4.8% |
NCR Corp. | 4.7% |
Hain Celestial Group, Inc. (The) | 4.4% |
Orthofix Medical, Inc. | 4.2% |
Progress Software Corp. | 3.8% |
FARO Technologies, Inc. | 3.2% |
Magellan Health, Inc. | 2.6% |
SPX Corp. | 2.5% |
TreeHouse Foods, Inc. | 2.1% |
Top ten holdings do not include any cash, cash equivalents or exchange traded fund investments. Holdings are subject to change and may not reflect the current or future position of the Fund.
Performance data quoted represents past performance and does not guarantee future results. Performance information for the Retail Class shares prior to their inception is based on the performance of the Institutional Class. Current performance may be lower or higher than the performance quoted. To obtain current performance as of the most recent month-end, visit www.sbhfunds.com. Average annual total returns reflect the reinvestment of dividends, capital gains distributions, all fee waivers and expense reimbursements. Without the fee waivers and expense reimbursements, total return figures would have been lower. Investment return and principal value will vary, and shares, when redeemed, may be worth more or less than their original cost. Segall Bryant & Hamill fund shares are not insured by the FDIC, the Federal Reserve Board or any other agency and are subject to investment risk.
Until at least December 31, 2021, Segall Bryant & Hamill, LLC (the “Adviser”) has contractually agreed to waive the investment advisory and/or administration fees and/or to reimburse other expenses, so that the ratio of expenses to average net assets as reported in the Fund’s Financial Highlights will be no more than 1.14% and 0.99% to the Fund’s Retail Class and Institutional Class, respectively, for such period. This agreement may not be terminated or modified by the Adviser prior to December 31, 2021, without the approval of the Board of Trustees.
Investing in small-cap funds generally will be more volatile and loss of principal could be greater than investing in larger-cap funds.
2 |  | www.sbhfunds.com | www.sbhfunds.com
|
Segall Bryant & Hamill Small Cap Value Fund | Fund Overview |
| | June 30, 2020 (Unaudited) |
Manager Commentary
Market Overview and Fund Performance
During the last six months, COVID-19 upended the markets. While the global economy continues to rebound, uncertainty and volatility remain a constant. For the 6-month period ending June 30, 2020, the Segall Bryant & Hamill Small Cap Value Fund (the “Fund”) returned -18.49% (Retail Class) versus -23.50% for the Russell 2000® Value Index.
Contributors to Return
During the period, Consumer Staples, Industrials, and Financials were the largest contributors to relative performance. Hain Celestial (HAIN) was a top contributor given improved results and tailwinds from stay-at-home benefits alongside the material changes the new team has made in order to improve returns and capital allocation. Papa John’s International (PZZA) was also a top contributor during the period. The company benefited from the new management team focusing on materially better new product offerings and improved efficiencies alongside the benefit of stay-at-home behaviors due to the virus.
Detractors from Return
From a sector perspective, Information Technology, Energy, and Consumer Discretionary detracted from relative performance. Within Information Technology, NCR Corporation (NCR) was a top detractor as investors seemed concerned the overall exposure to restaurants and retail, though small, could be a larger risk if the economy shuts down again. Within Health Care, the largest detractor was Orthofix Medical (OFIX). This was due to the risk of elective surgeries continuing to be postponed or stopped if hospitals have to deal with COVID-19 patients. Over the long term, we remain very optimistic in OFIX under its new leadership team.
Outlook and Positioning
What a year it has been. It has been by far the most challenging investing environment of our careers, including 2008’s tumultuous environment. After preserving capital in the first quarter of 2020, we were able to keep up with the markets sufficiently all things considered in the second quarter, despite a strong rally from the March lows with high volatility interspersed. We believe that the second half of 2020 will likely be equally volatile as vaccine hopes and monetary exuberance are balanced with the risks of elections, fiscal support, and more insolvencies than the limited number we have witnessed thus far. Managing the volatility via our Return on Invested Capital (ROIC) approach, coupled with risk mitigation, is what we do in all environments in an attempt to be on the right side of expectations.
We think the remainder of the year is likely to prove at least as challenging, if not more so, as the first six months. In fact, we think much of the decade is going to be ever more volatile and in need of prudent risk managers balancing scenarios and return opportunities versus a simple “stocks just go up” approach due to the zombie-filled landscape (“zombie” companies are those with low or negative ROIC, significant debt, and/or requiring bailouts). Our hope is that capitalism is allowed to thrive, and bad capital allocators are punished if historical decisions have been too risky and return destructive. We are very grateful for your trust in us to navigate these difficult times; we know trusting in active management has been no easy task the last decade.
Stock Performance (for the six months ended 6/30/20)
5 Highest | Average
Weight | Contribution
to Return | | 5 Lowest | Average
Weight | Contribution
to Return |
Hain Celestial Group, Inc. | 4.76% | 1.50% | | IBERIABANK Corp. | 1.00% | -1.11% |
Papa John’s International, Inc. | 1.15 | 0.50 | | Orthofix Medical, Inc. | 4.33 | -1.22 |
Progress Software Corp. | 3.46 | 0.44 | | Jack in the Box Inc. | 2.08 | -1.33 |
Astec Industries, Inc. | 1.32 | 0.43 | | WPX Energy, Inc. | 1.46 | -1.58 |
Chembio Diagnostics, Inc. | 0.33 | 0.38 | | NCR Corp. | 4.47 | -2.60 |
Past performance does not guarantee future results. These stocks do not represent all of the securities purchased, sold or recommended by the Fund’s Adviser. To request a complete list of the contribution of each Fund holding to overall Fund performance during the period, please call (800) 392-2673.
Please see page 39 for a description of the methodology used to construct this table.
Semi-Annual Report | June 30, 2020 |  | 3 |
Segall Bryant & Hamill Small Cap Value Dividend Fund | Fund Overview |
| | June 30, 2020 (Unaudited) |
Fund Strategy
Investing primarily in small, dividend-paying companies whose stocks appear to be undervalued.
Fund Management
Ralph M. Segall, CFA, CIC Portfolio Manager |
CFA is a trademark owned by CFA Institute.
Cumulative Returns

The chart above represents historical performance of a hypothetical investment of $10,000 in the Fund over the past 10 years (or for the life of the Fund if shorter). Performance calculations are as of the end of June each year. Past performance does not guarantee future results. This chart does not reflect the deduction of taxes that a shareholder would pay on Fund distributions or the redemption of Fund shares.
Please see index definitions beginning on page 38.
Average Annual Total Returns
| | 6 Months | 1 Year | 3 Years | 5 Years | 10 Years | Since
Inception | Inception
Date |
Retail Class (WTSVX) | (25.36)% | (23.83)% | (9.29)% | (2.17)% | 5.53% | 3.79% | 12/13/04 |
Institutional Class (WISVX) | (25.36)% | (23.72)% | (9.15)% | (2.01)% | 5.69% | 3.91% | 9/28/07 |
Russell 2000® Value Index | (23.50)% | (17.48)% | (4.35)% | 1.26% | 7.82% | 4.99% | |
Retail Class Annual Expense Ratio (per the current prospectus) — Gross: 1.33%, Net: 1.14%
Institutional Class Annual Expense Ratio (per the current prospectus) — Gross: 1.17%, Net: 0.99%
Sector Allocation (as of 6/30/20)
Financials | 24.3% |
Industrials | 13.7% |
Real Estate | 12.4% |
Information Technology | 11.6% |
Utilities | 8.1% |
Materials | 7.3% |
Consumer Discretionary | 6.7% |
Health Care | 5.1% |
Energy | 3.7% |
Consumer Staples | 3.2% |
Sector classifications presented are based on the Global Industry Classification Standard (GICS) methodology.
Sector weights may not sum to 100% due to rounding.
The sector allocation table above does not include any cash or cash equivalents.
Top Ten Holdings (as of 6/30/20)
InterDigital, Inc. | 2.7% |
Crane Co. | 2.6% |
Black Hills Corp. | 2.5% |
STAG Industrial, Inc. | 2.5% |
Physicians Realty Trust | 2.4% |
Atlantica Sustainable Infrastructure PLC | 2.4% |
EVERTEC, Inc. | 2.2% |
TTEC Holdings, Inc. | 2.2% |
EnerSys | 2.2% |
Ensign Group, Inc. (The) | 2.1% |
Top ten holdings do not include any cash, cash equivalents or exchange traded fund investments. Holdings are subject to change and may not reflect the current or future position of the Fund.
Performance data quoted represents past performance and does not guarantee future results. Performance information for the Institutional Class shares prior to their inception is based on the performance of the Retail Class. Current performance may be lower or higher than the performance quoted. To obtain current performance as of the most recent month-end, visit www.sbhfunds.com. Average annual total returns reflect the reinvestment of dividends, capital gains distributions, all fee waivers and expense reimbursements. Without the fee waivers and expense reimbursements, total return figures would have been lower. Investment return and principal value will vary, and shares, when redeemed, may be worth more or less than their original cost. Segall Bryant & Hamill fund shares are not insured by the FDIC, the Federal Reserve Board or any other agency and are subject to investment risk.
From May 1, 2020 until at least April 30, 2021, Segall Bryant & Hamill, LLC (the “Adviser”) has contractually agreed to waive the investment advisory and/or administration fees and/or to reimburse other expenses, so that the ratio of expenses to average net assets as reported in the Fund’s Financial Highlights will be no more than 1.14% and 0.99% to the Fund’s Retail Class and Institutional Class, respectively, for such period. This agreement may not be terminated or modified by the Adviser prior to April 30, 2021 without the approval of the Board of Trustees.
Investing in small-cap funds generally will be more volatile and loss of principal could be greater than investing in larger-cap funds.
Dividends are not guaranteed. A company’s future abilities to pay dividends may be limited and a company may cease paying dividends at any time.
4 |  | www.sbhfunds.com | www.sbhfunds.com
|
Segall Bryant & Hamill Small Cap Value Dividend Fund | Fund Overview |
| | June 30, 2020 (Unaudited) |
Manager Commentary
Market Overview and Fund Performance
To say that 2020 has been an unimaginable year would be a gross understatement. The first quarter was one of the worst quarters on record, ending the longest bull market in history. The violent sell-off was a consequence of the COVID-19 virus becoming a global pandemic, resulting in the near shutdown of the domestic (and global) economy. In the second quarter, we witnessed a dramatic recovery in the markets, despite the fact that we are still in the midst of the pandemic and it is likely we will see adverse economic impacts well into the future.
The Segall Bryant & Hamill Small Cap Value Dividend Fund (the “Fund”) contracted -25.36% (Retail Class) for the year-to-date period through June 30, 2020, trailing the -23.50% return of the Russell 2000® Value Index. Dividend-paying stocks, which have historically offered downside protection during market turmoil, underperformed due to the real or perceived cash flow impact on many businesses.
Contributors to Return
Sectors that contributed most to relative performance year-to-date were Information Technology (driven by selection), Real Estate (driven by allocation), and Utilities (driven by selection).
Information Technology holding, TTEC Holdings, Inc. (TTEC), was another top performer related to their ability to implement at-home and other virtual technologies necessary to maintain client business continuity related to work from home. QTS Realty Trust (QTS), a data center REIT, was another top contributor year to date. With healthy trends, solid backlog, and ample funding available for growth, we remain constructive on the stock.
Detractors from Return
Sectors that detracted the most from the Fund’s performance year-to-date were Energy (driven by allocation), Consumer Discretionary (driven by selection), and Consumer Staples (driven by allocation).
On an individual stock basis, Energy holding Enerplus Corporation (ERF), an oil and gas exploration and production (E&P) company, underperformed its peers. Solvency of many E&P energy companies began to be questioned. Financials holding Redwood Trust, Inc. (RWT), an originator and distributor of high quality, non-standard mortgages, was another top detractor. While we expected the quality of their underwriting and relatively conservative balance sheet management to support them through the economic slowdown, significant and rapid disruptions in the fixed income funding markets resulted in the sudden and unexpected forced selling of assets and we exited the position.
As was announced on July 23, 2020, the Fund’s Board of Trustees voted to merge the Segall Bryant & Hamill Small Cap Value Dividend Fund into the Segall Bryant & Hamill Small Cap Value Fund on or about September 25, 2020. Please see the Manager Commentary for the Segall Bryant & Hamill Small Cap Value Fund in this report for details about that fund. Please see the supplement to the Fund’s prospectus for complete details.
Stock Performance (for the six months ended 6/30/20)
5 Highest | Average
Weight | Contribution
to Return | | 5 Lowest | Average
Weight | Contribution
to Return |
Pan American Silver Corp. | 0.69% | 1.04% | | OUTFRONT Media Inc. | 1.69% | -1.31% |
TTEC Holdings, Inc. | 2.15 | 0.71 | | Allegiant Travel Co. | 0.86 | -1.33 |
NIC Inc. | 0.31 | 0.55 | | Enerplus Corp. | 1.29 | -1.79 |
QTS Realty Trust, Inc. | 2.18 | 0.49 | | PBF Energy, Inc. | 0.71 | -1.96 |
Brooks Automation, Inc. | 0.56 | 0.43 | | Redwood Trust, Inc. | 1.09 | -2.79 |
Past performance does not guarantee future results. These stocks do not represent all of the securities purchased, sold or recommended by the Fund’s Adviser. To request a complete list of the contribution of each Fund holding to overall Fund performance during the period, please call (800) 392-2673.
Please see page 39 for a description of the methodology used to construct this table.
Semi-Annual Report | June 30, 2020 |  | 5 |
Segall Bryant & Hamill Small Cap Growth Fund | Fund Overview |
| | June 30, 2020 (Unaudited) |
Fund Strategy
Investing in a diversified portfolio of equity securities of primarily small-sized companies with growth potential.
Fund Management
Brian C. Fitzsimons, CFA Portfolio Manager |
Mitch S. Begun, CFA Portfolio Manager |
CFA is a trademark owned by CFA Institute.
Cumulative Returns
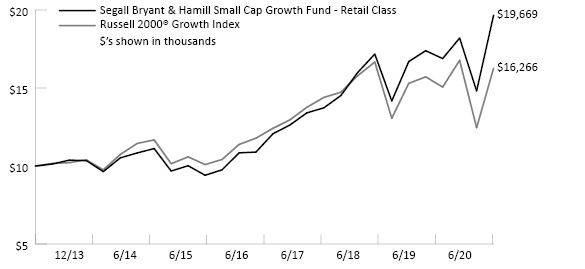
The chart above represents historical performance of a hypothetical investment of $10,000 in the Fund over the past 10 years (or for the life of the Fund if shorter). Performance calculations are as of the end of June each year. Past performance does not guarantee future results. This chart does not reflect the deduction of taxes that a shareholder would pay on Fund distributions or the redemption of Fund shares.
Please see index definitions beginning on page 38.
Average Annual Total Returns
| | 6 Months | 1 Year | 3 Years | 5 Years | 10 Years | Since
Inception | Inception
Date |
Retail Class (WTSGX) | 8.05% | 13.08% | 15.91% | 12.08% | — | 10.92% | 12/20/13 |
Institutional Class (WISGX) | 8.10% | 13.29% | 16.11% | 12.30% | — | 11.21% | 12/20/13 |
Russell 2000® Growth Index | (3.06)% | 3.48% | 7.86% | 6.86% | — | 7.74% | |
Retail Class Annual Expense Ratio (per the current prospectus) — Total: 1.12%
Institutional Class Annual Expense Ratio (per the current prospectus) — Total: 0.98%
Sector Allocation (as of 6/30/20)
Health Care | 25.1% |
Information Technology | 21.6% |
Industrials | 17.5% |
Consumer Discretionary | 12.2% |
Financials | 10.6% |
Real Estate | 3.5% |
Materials | 3.1% |
Communication Services | 2.4% |
Consumer Staples | 0.5% |
Sector classifications presented are based on the Global Industry Classification Standard (GICS) methodology.
Sector weights may not sum to 100% due to rounding.
The sector allocation table above does not include any cash or cash equivalents.
Top Ten Holdings (as of 6/30/20)
Goosehead Insurance, Inc. | 2.9% |
Globant S.A. | 2.7% |
Amedisys, Inc. | 2.4% |
Generac Holdings, Inc. | 2.3% |
Bright Horizons Family Solutions, Inc. | 2.2% |
Envestnet, Inc. | 2.0% |
QTS Realty Trust, Inc. | 2.0% |
Inphi Corp. | 2.0% |
Churchill Downs, Inc. | 2.0% |
Silicon Laboratories, Inc. | 1.8% |
Top ten holdings do not include any cash, cash equivalents or exchange traded fund investments. Holdings are subject to change and may not reflect the current or future position of the Fund.
Performance data quoted represents past performance and does not guarantee future results. Current performance may be lower or higher than the performance quoted. To obtain current performance as of the most recent month-end, visit www.sbhfunds.com. Average annual total returns reflect the reinvestment of dividends, capital gains distributions, all fee waivers and expense reimbursements. Without the fee waivers and expense reimbursements, total return figures would have been lower. Investment return and principal value will vary, and shares, when redeemed, may be worth more or less than their original cost. Segall Bryant & Hamill fund shares are not insured by the FDIC, the Federal Reserve Board or any other agency and are subject to investment risk.
From May 1, 2020 until at least April 30, 2021, Segall Bryant & Hamill, LLC (the “Adviser”) has contractually agreed to waive the investment advisory and/or administration fees and/or to reimburse other expenses, so that the ratio of expenses to average net assets as reported in the Fund’s Financial Highlights will be no more than 1.14% and 0.99% for the Fund’s Retail Class and Institutional Class, respectively, for such period. This agreement may not be terminated or modified by the Adviser prior to April 30, 2021 without the approval of the Board of Trustees.
Investing in small-cap funds generally will be more volatile and loss of principal could be greater than investing in larger-cap funds.
6 |  | www.sbhfunds.com | www.sbhfunds.com
|
Segall Bryant & Hamill Small Cap Growth Fund | Fund Overview |
| | June 30, 2020 (Unaudited) |
Manager Commentary
Market Overview and Fund Performance
The longest economic expansion on record came to a sudden, tragic halt with the spread of the COVID-19 virus in the first quarter of 2020. As the global economy hit the stop button, market participants rushed to safety causing a significant headwind to small cap equities with the Russell 2000® Growth Index falling approximately 40% in less than one month’s time. However, the second quarter saw a dramatic snapback rally that left the Russell 2000 Growth Index down just 3.06% year-to-date. Despite the economy entering a severe recession, market participants looked optimistically to the future. While the prospect of vaccination or treatment innovations likely has created some tailwind, the equity markets certainly were emboldened by the Federal Reserve’s supportive actions.
For the first half of 2020, the Segall Bryant & Hamill Small Cap Growth Fund (the “Fund”) returned 8.05% (Retail Class) versus -3.06% for the Russell 2000® Growth Index, outperforming in both quarters.
Contributors to Return
The three sectors that contributed most to the Fund’s performance relative to its benchmark in the period were Information Technology, Industrials, and Consumer Discretionary, primarily driven by selection. Teladoc Health, Inc. (TDOC), a leader in virtual health care delivery, was the portfolio’s best performing stock. The COVID-19 pandemic is driving awareness of the benefits of virtual care that has accelerated demand across its customer base. Everbridge, Inc. (EVBG), a provider of critical events management software, also significantly outperformed in the first half of 2020 as the company saw robust interest in its broad suite of public and employee safety solutions. Independent insurance agency Goosehead Insurance, Inc. (GSHD) was also a top contributor given the company delivered peer leading growth in premiums written as its unique business model of separating sales and service continues to drive market share gains.
Detractors from Return
The three sectors that detracted most from the Fund’s performance relative to its benchmark in the period were Materials, Health Care, and Energy. Selection was negative in both Materials and Energy, however, the portfolio’s underweight allocation in Health Care hurt the portfolio given the strength in the sector. The portfolio’s worst-performing stock in the period was Hexcel Corp. (HXL), a carbon fiber provider to the aerospace and defense markets. Key customers have cut production plans given the sharp slowdown in travel demand and potential credit issues with certain airlines. Despite near-term headwinds, we believe the long-term growth outlook for the company remains robust given its strong competitive positioning. Another significant detractor was OneSpaWorld Holdings Ltd. (OSW), a leading provider of wellness services onboard cruise ships. Cruise cancellations have put extreme pressure on the company, and we exited the position during the period given we would expect a long road ahead for a recovery. Huron Consulting (HURN), a global consultancy firm that collaborates with clients to drive strategic growth, ignite innovation and navigate constant change, was also an underperformer as its two primary end markets, hospitals and education, were severely disrupted due to COVID-19. We believe the company remains well positioned to generate strong results as the pandemic disruption subsides.
Outlook and Positioning
As of the end of the first half of 2020, the Fund’s portfolio was overweight primarily in the Financials and Industrials sectors and underweight primarily in the Health Care and Consumer Staples sectors. The resilience of the fundamentals at the majority of the Fund’s portfolio companies during the first half of the year has been impressive given the backdrop. We believe that the pandemic has accelerated many of the trends that were already in place, in effect, making the stronger companies even better competitively positioned to grow in the future. Our focus on high quality, fundamentally stable growth companies has been rewarded, not just in protecting in the downside of the first quarter drawdown but also in the recovery rally of the second quarter.
Stock Performance (for the six months ended 6/30/20)
5 Highest | Average
Weight | Contribution
to Return | | 5 Lowest | Average
Weight | Contribution
to Return |
Teladoc Health, Inc. | 1.26% | 1.86% | | Meridian Bancorp Inc. | 0.59% | -0.82% |
Live Nation Entertainment, Inc. | 0.45 | 1.33 | | OneSpaWorld Holdings Ltd. | 0.21 | -0.85 |
Everbridge, Inc. | 1.58 | 1.25 | | Ingevity Corp. | 1.26 | -0.88 |
Goosehead Insurance, Inc. | 2.35 | 1.23 | | Huron Consulting Group Inc. | 1.51 | -0.92 |
Ollie’s Bargain Outlet Holdings Inc. | 1.66 | 1.10 | | Hexcel Corp. | 1.52 | -1.28 |
Past performance does not guarantee future results. These stocks do not represent all of the securities purchased, sold or recommended by the Fund’s Adviser. To request a complete list of the contribution of each Fund holding to overall Fund performance during the period, please call (800) 392-2673.
Please see page 39 for a description of the methodology used to construct this table.
Semi-Annual Report | June 30, 2020 |  | 7 |
Segall Bryant & Hamill Small Cap Core Fund | Fund Overview |
| | June 30, 2020 (Unaudited) |
Fund Strategy
Investing primarily in equity securities of small-capitalization companies.
Fund Management
Jeffrey C. Paulis, CFA, CPA Portfolio Manager |
Mark T. Dickherber, CFA, CPA Portfolio Manager |
CFA is a trademark owned by CFA Institute.
Cumulative Returns
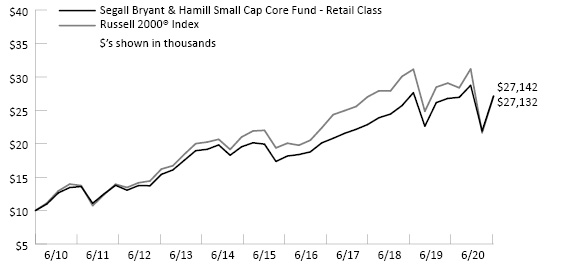
The chart above represents historical performance of a hypothetical investment of $10,000 in the Fund over the past 10 years (or for the life of the Fund if shorter). Performance calculations are as of the end of June each year. Past performance does not guarantee future results. This chart does not reflect the deduction of taxes that a shareholder would pay on Fund distributions or the redemption of Fund shares.
Please see index definitions beginning on page 38.
Average Annual Total Returns*
| | 6 Months | 1 Year | 3 Years | 5 Years | 10 Years | Since
Inception | Inception
Date |
Retail Class (SBHCX) | (5.60)% | 1.32% | 6.99% | 6.36% | 10.50% | 8.00% | 12/31/19 |
Institutional Class (SBASX) | (5.50)% | 1.50% | 7.16% | 6.52% | 10.67% | 8.16% | 12/15/03 |
Russell 2000® Index | (12.98)% | (6.63)% | 2.01% | 4.29% | 10.50% | 7.37% | |
Retail Class Annual Expense Ratio (per the current prospectus) — Gross: 1.41%, Net: 1.14%
Institutional Class Annual Expense Ratio (per the current prospectus) — Gross: 1.31%, Net: 0.99%
Sector Allocation (as of 6/30/20)
Information Technology | 23.4% |
Industrials | 21.2% |
Health Care | 15.1% |
Consumer Discretionary | 11.1% |
Financials | 6.5% |
Materials | 5.5% |
Consumer Staples | 5.2% |
Real Estate | 3.7% |
Energy | 1.6% |
Sector classifications presented are based on the Global Industry Classification Standard (GICS) methodology.
Sector weights may not sum to 100% due to rounding.
The sector allocation table above does not include any cash or cash equivalents.
Top Ten Holdings (as of 6/30/20)
Hain Celestial Group, Inc. (The) | 3.6% |
Five9, Inc. | 2.7% |
Equity Commonwealth | 2.3% |
Entegris, Inc. | 2.0% |
BlackLine, Inc. | 2.0% |
Model N, Inc. | 2.0% |
Pegasystems, Inc. | 2.0% |
Horizon Therapeutics PLC | 2.0% |
Bio-Rad Laboratories, Inc. | 1.8% |
Casella Waste Systems, Inc. | 1.7% |
Top ten holdings do not include any cash, cash equivalents or exchange traded fund investments. Holdings are subject to change and may not reflect the current or future position of the Fund.
* The quoted performance of the Fund reflects the past performance of Lower Wacker Small Cap Investment Fund, LLC (the “Partnership”), an unregistered limited partnership managed by the portfolio managers of the Fund. The Partnership was organized into the Institutional Class shares on December 31, 2019, the date the Fund commenced operations. The Fund has been managed in the same style since the Partnership’s inception on December 15, 2003. The Fund’s annual returns and long-term performance reflect the actual fees and expenses that were charge when the Fund was a limited partnership. From its inception on December 15, 2003 through December 31, 2019, the Partnership was not subject to certain investment restrictions, diversification requirements and other restrictions of the Investment Company Act of 1940, as amended or Subchapter M of the Internal Revenue Code of 1986, as amended, which, if they had been applicable, might have adversely affected the Fund’s performance.
Performance data quoted represents past performance and does not guarantee future results. Current performance may be lower or higher than the performance quoted. To obtain current performance as of the most recent month-end, visit www.sbhfunds.com. Average annual total returns reflect the reinvestment of dividends, capital gains distributions, all fee waivers and expense reimbursements. Without the fee waivers and expense reimbursements, total return figures would have been lower. Investment return and principal value will vary, and shares, when redeemed, may be worth more or less than their original cost. Segall Bryant & Hamill fund shares are not insured by the FDIC, the Federal Reserve Board or any other agency and are subject to investment risk.
Until at least April 30, 2021, Segall Bryant & Hamill, LLC (the “Adviser”) has contractually agreed to waive the investment advisory and/or administration fees and/or to reimburse other expenses, so that the ratio of expenses to average net assets as reported in the Fund’s Financial Highlights will be no more than 1.14% and 0.99% to the Fund’s Retail Class and Institutional Class, respectively, for such period. This agreement may not be terminated or modified by the Adviser prior to the termination date without the approval of the Board of Trustees.
Investing in small-cap funds generally will be more volatile and loss of principal could be greater than investing in larger-cap funds.
8 |  | www.sbhfunds.com | www.sbhfunds.com
|
Segall Bryant & Hamill Small Cap Core Fund | Fund Overview |
| | June 30, 2020 (Unaudited) |
Manager Commentary
Market Overview and Fund Performance
The Segall Bryant & Hamill Small Cap Core Fund (the “Fund”) decreased 5.60% (Retail Class) for the year-to-date period ending June 30, 2020, compared to a 12.98% decrease for the Russell 2000® Index. Saying the first half of 2020 was extraordinary is an understatement as the team navigated both a bear and bull market. The global pandemic and subsequent lockdown drove significant market declines which were quickly reversed due to unprecedent global fiscal and monetary stimulus. We are heartened by our ability to outperform through such extreme market changes and excited by the companies the market volatility provided a chance to add to the Fund.
Contributors to Return
Five9, Inc. (FIVN), a provider of cloud-based contact center communications as a service (CCaaS), was the top contributor to the Fund’s performance during the six-month period ended June 30, 2020. COVID-19 driven disruption and reduction to in-person interactions, elevated the importance of contact centers for servicing customers across industries. FIVN’s leadership position in the cloud-based market drove strong near-term results and positions it well to benefit short and long term. Horizon Therapeutics Company (HZNP), a biopharmaceutical company focused on orphan drugs for rare and rheumatic conditions, was also a large contributor to performance. HZNP benefited from the successful rollout of two drugs, Krystexxa (gout) and Tepezza (Thyroid Eye Disease), that are driving substantial growth for the company.
Detractors from Return
Harsco Corporation (HSC), a provider of environmental and clean earth solutions, was one of the largest detractors. HSC reported lackluster performance during the period driven by execution issues in their Rail segment and a shortfall in their Environmental segment. Further, after a period of significant balance sheet deleveraging, the company levered up to buy an underperforming asset. Given the confluence of negative factors against a backdrop of a deteriorating economic environment, we chose to exit the position. OneSpaWorld Holdings Ltd. (OSW) was another top detractor. OSW operates spa and related services on cruise ships. Given the short- and medium-term change in outlook for the cruise industry following the COVID-19 outbreak, we chose to exit the position.
Outlook and Positioning
The first half of 2020 saw a bear market, followed by a bull market, unprecedented unemployment increases, massive global monetary and fiscal stimulus and interest rates approaching zero percent globally. Following an initial sharp decline, global stock markets rebounded as worst-case scenarios envisioned in March & April are proving overly dour and economic data has improved considerably. Despite this rebound, we believe the fundamental outlook remains uncertain and businesses globally remain cautious. While a vaccine could accelerate the recovery, we believe it is likely the U.S. economy experiences a bumpy road on its return to (“the new”) normal over the next few years. Further, the impact of COVID will permanently change business and consumer behavior with broad implications from travel and retail to demand for industrial goods and commercial real estate, which likely results in sustained slower economic growth.
Importantly for the investors in the Fund, we believe that the team’s approach of focusing on companies operating in niche markets with defendable competitive advantages is becoming an even more important weapon, similar to after the 2008/2009. We favor companies that target smaller overall markets where they can achieve high market share and operate in a less competitively intense environment which results in higher and more stable ROIC profiles.
Combining these characteristics with strong management teams and attractive reward-to-risk ratios are the key pillars of our investment philosophy and have been for nearly two decades. We believe they are critically important across market cycles, but in the wake of COVID-19 and the uncertainty of what lies ahead, we are certain that our philosophical approach is becoming an even more important factor to drive future equity returns and relative performance.
Thank you for your continued interest and support.
Stock Performance (for the six months ended 6/30/20)
5 Highest | Average
Weight | Contribution
to Return | | 5 Lowest | Average
Weight | Contribution
to Return |
Five9, Inc. | 3.15% | 2.24% | | World Fuel Services Corp. | 1.12% | -0.68% |
Hain Celestial Group, Inc. | 3.16 | 0.98 | | Ameris Bancorp | 1.05 | -0.79 |
Horizon Therapeutics Public Ltd. Co. | 1.57 | 0.96 | | Harsco Corp. | 0.39 | -0.96 |
Lattice Semiconductor Corp. | 0.66 | 0.82 | | OneSpaWorld Holdings Ltd. | 0.38 | -1.01 |
BlackLine, Inc. | 2.04 | 0.80 | | Allegiant Travel Co. | 1.23 | -1.21 |
Past performance does not guarantee future results. These stocks do not represent all of the securities purchased, sold or recommended by the Fund’s Adviser. To request a complete list of the contribution of each Fund holding to overall Fund performance during the period, please call (800) 392-2673.
Please see page 39 for a description of the methodology used to construct this table.
Semi-Annual Report | June 30, 2020 |  | 9 |
Segall Bryant & Hamill Mid Cap Value Dividend Fund | Fund Overview |
| | June 30, 2020 (Unaudited) |
Fund Strategy
Investing in medium-sized, dividend-paying companies whose stocks appear to be undervalued.
Fund Management
Ralph M. Segall, CFA, CIC Portfolio Manager |
CFA is a trademark owned by CFA Institute.
Cumulative Returns
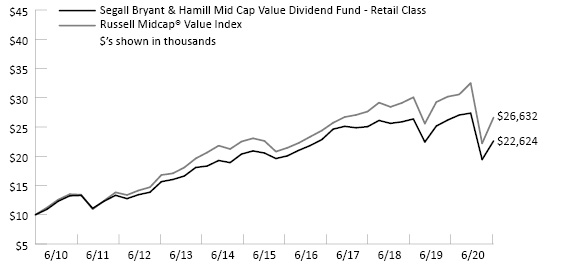
The chart above represents historical performance of a hypothetical investment of $10,000 in the Fund over the past 10 years (or for the life of the Fund if shorter). Performance calculations are as of the end of June each year. Past performance does not guarantee future results. This chart does not reflect the deduction of taxes that a shareholder would pay on Fund distributions or the redemption of Fund shares.
Please see index definitions beginning on page 38.
Average Annual Total Returns
| | 6 Months | 1 Year | 3 Years | 5 Years | 10 Years | Since
Inception | Inception
Date |
Retail Class (WTMCX) | (17.37)% | (13.65)% | (3.11)% | 1.94% | 8.51% | 7.64% | 10/1/98 |
Institutional Class (WIMCX) | (17.43)% | (13.69)% | (3.00)% | 2.07% | 8.58% | 7.67% | 4/29/16 |
Russell Midcap® Value Index | (18.09)% | (11.81)% | (0.54)% | 3.32% | 10.29% | 8.88% | |
Retail Class Annual Expense Ratio (per the current prospectus) — Gross: 1.08%, Net: 0.99%
Institutional Class Annual Expense Ratio (per the current prospectus) — Gross: 0.98%, Net: 0.84%
Sector Allocation (as of 6/30/20)
Industrials | 15.4% |
Real Estate | 13.1% |
Information Technology | 13.0% |
Financials | 12.9% |
Utilities | 12.2% |
Consumer Discretionary | 8.8% |
Health Care | 6.8% |
Materials | 5.4% |
Consumer Staples | 4.5% |
Energy | 3.7% |
Communication Services | 2.4% |
Sector classifications presented are based on the Global Industry Classification Standard (GICS) methodology.
Sector weights may not sum to 100% due to rounding.
The sector allocation table above does not include any cash or cash equivalents.
Top Ten Holdings (as of 6/30/20)
Americold Realty Trust | 3.5% |
InterDigital, Inc. | 2.5% |
CyrusOne, Inc. | 2.5% |
Republic Services, Inc. | 2.5% |
Sun Communities, Inc. | 2.5% |
TELUS Corp. | 2.4% |
Kansas City Southern | 2.4% |
Vistra Energy Corp. | 2.3% |
Grifols S.A. ADR | 2.2% |
Aaron’s, Inc. | 2.2% |
Top ten holdings do not include any cash, cash equivalents or exchange traded fund investments. Holdings are subject to change and may not reflect the current or future position of the Fund.
Performance data quoted represents past performance and does not guarantee future results. Performance information for the Institutional Class shares prior to their inception is based on the performance of the Retail Class. Current performance may be lower or higher than the performance quoted. To obtain current performance as of the most recent month-end, visit www.sbhfunds.com. Average annual total returns reflect the reinvestment of dividends, capital gains distributions, all fee waivers and expense reimbursements. Without the fee waivers and expense reimbursements, total return figures would have been lower. Investment return and principal value will vary, and shares, when redeemed, may be worth more or less than their original cost. Segall Bryant & Hamill fund shares are not insured by the FDIC, the Federal Reserve Board or any other agency and are subject to investment risk.
From May 1, 2020 until at least April 30, 2021, Segall Bryant & Hamill, LLC (the “Adviser”) has contractually agreed to waive the investment advisory and/or administration fees and/or to reimburse other expenses, so that the ratio of expenses to average net assets as reported in the Fund’s Financial Highlights will be no more than 0.99% and 0.84% for the Fund’s Retail Class and Institutional Class, respectively, for such period. This agreement may not be terminated or modified by the Adviser prior to April 30, 2021 without the approval of the Board of Trustees.
Investing in mid-cap funds generally will be more volatile and loss of principal could be greater than investing in large-cap funds.
Dividends are not guaranteed. A company’s future abilities to pay dividends may be limited and a company may cease paying dividends at any time.
10 |  | www.sbhfunds.com | www.sbhfunds.com
|
Segall Bryant & Hamill Mid Cap Value Dividend Fund | Fund Overview |
| | June 30, 2020 (Unaudited) |
Manager Commentary
Market Overview and Fund Performance
To say that 2020 has been an unimaginable year would be a gross understatement. The first quarter was one of the worst quarters on record, ending the longest bull market in history. The violent sell-off was a consequence of the COVID-19 virus becoming a global pandemic, resulting in the near shutdown of the domestic (and global) economy. In the second quarter, we witnessed a dramatic recovery in the markets, despite the fact that we are still in the midst of the pandemic and it is likely we will see adverse economic impacts well into the future.
The Segall Bryant & Hamill Mid Cap Value Dividend Fund (the “Fund”) contracted -17.37% (Retail Class) for the year-to-date period through June 30, 2020, ahead of the -18.09% return of the Russell Midcap® Value Index. Dividend-paying stocks, which have historically offered downside protection during market turmoil, underperformed due to the real or perceived cash flow impact on many businesses.
Contributors to Return
Sectors that contributed most to the Fund’s relative performance year-to-date were Real Estate (driven by selection), Information Technology (driven by allocation), and Materials (driven by selection). Materials holding Newmont Corporation (NEM), a global gold producer, outperformed Materials and the markets during this period, mostly in sympathy with higher gold prices. The case for precious metals is supported by aggressive monetary and fiscal policies across the world combined with high debt loads and impaired global real GDP. Americold Realty Trust (COLD), a cold storage real estate investment trust (REIT), was also a top contributor. COVID-19 shelter in place recommendations have driven a surge in grocery demand as consumers shift to eating at home, driving increased activity at the company’s temperature-controlled storage facilities. In addition, COLD maintained its 2020 guidance and reported no delays in its development pipeline.
Detractors from Return
Sectors that detracted the most from performance year-to-date were Consumer Staples (driven by allocation), Industrials (driven by selection), and Financials (driven by allocation). Energy holding Enerplus Corporation (ERF), an oil and gas exploration and production (E&P) company, was another detractor to performance this year as oil prices collapsed from $66 per barrel at the beginning of the year to nearly $23 at the end of the first quarter. Solvency of many E&P energy companies began to be questioned. Industrial holding CAE Inc. (CAE), a global leader in modeling, simulation, and training for the commercial aerospace industry was another detractor. The stock underperformed as the aerospace industry was negatively impacted by the economic slowdown.
As was announced on July 23, 2020, the Fund’s Board of Trustees voted to liquidate the Segall Bryant & Hamill Mid Cap Value Dividend Fund on or about September 17, 2020. Please see the supplement to the Fund’s prospectus for complete details.
Stock Performance (for the six months ended 6/30/20)
5 Highest | Average
Weight | Contribution
to Return | | 5 Lowest | Average
Weight | Contribution
to Return |
Newmont Corp. | 2.19% | 1.17% | | Axis Capital Holdings Ltd. | 2.19% | -1.03% |
Americold Realty Trust | 2.62 | 0.65 | | MDU Resources Group Inc. | 1.27 | -1.08 |
CyrusOne, Inc. | 2.10 | 0.61 | | Enerplus Corp. | 1.33 | -1.27 |
Knight-Swift Transportation Holdings Inc. | 0.62 | 0.36 | | CAE Inc. | 1.83 | -1.59 |
Citrix Systems, Inc. | 0.60 | 0.34 | | OUTFRONT Media Inc. | 1.09 | -1.85 |
Past performance does not guarantee future results. These stocks do not represent all of the securities purchased, sold or recommended by the Fund’s Adviser. To request a complete list of the contribution of each Fund holding to overall Fund performance during the period, please call (800) 392-2673.
Please see page 39 for a description of the methodology used to construct this table.
Semi-Annual Report | June 30, 2020 |  | 11 |
Segall Bryant & Hamill All Cap Fund | Fund Overview |
| | June 30, 2020 (Unaudited) |
Fund Strategy
Investing primarily in equity securities of any size, including small- and mid-capitalization companies.
Fund Management
Ralph M. Segall, CFA, CIC Portfolio Manager |
Suresh Rajagopal, CFA Portfolio Manager |
CFA is a trademark owned by CFA Institute.
Cumulative Returns
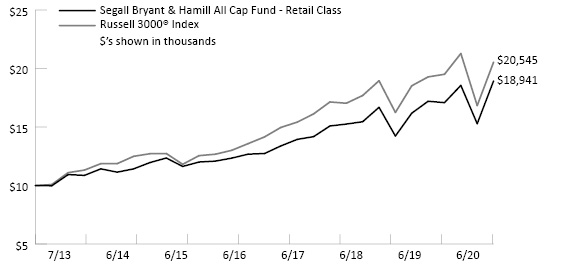
The chart above represents historical performance of a hypothetical investment of $10,000 in the Fund over the past 10 years (or for the life of the Fund if shorter). Performance calculations are as of the end of June each year. Past performance does not guarantee future results. This chart does not reflect the deduction of taxes that a shareholder would pay on Fund distributions or the redemption of Fund shares.
Please see index definitions beginning on page 38.
Average Annual Total Returns
| | 6 Months | 1 Year | 3 Years | 5 Years | 10 Years | Since
Inception | Inception
Date |
Retail Class (SBRAX) | 2.06% | 10.10% | 10.75% | 8.93% | — | 9.68% | 12/9/19 |
Institutional Class (SBHAX) | 2.12% | 10.24% | 10.91% | 9.08% | — | 9.84% | 7/31/13 |
Russell 3000® Index | (3.48)% | 6.53% | 10.04% | 10.03% | — | 10.97% | |
Retail Class Annual Expense Ratio (per the current prospectus) — Gross: 1.16%, Net: 0.99%
Institutional Class Annual Expense Ratio (per the current prospectus) — Gross: 1.03%, Net: 0.84%
Sector Allocation (as of 6/30/20)
Information Technology | 23.4% |
Health Care | 19.7% |
Consumer Discretionary | 13.0% |
Financials | 12.5% |
Industrials | 9.2% |
Materials | 6.1% |
Consumer Staples | 6.0% |
Communication Services | 5.8% |
Energy | 0.9% |
Sector classifications presented are based on the Global Industry Classification Standard (GICS) methodology.
Sector weights may not sum to 100% due to rounding.
The sector allocation table above does not include any cash or cash equivalents.
Top Ten Holdings (as of 6/30/20)
Microsoft Corp. | 5.0% |
Amazon.com, Inc. | 4.6% |
Alphabet, Inc. | 2.9% |
Visa, Inc. - Class A | 2.8% |
Marvell Technology Group, Ltd. | 2.7% |
Adobe, Inc. | 2.2% |
ServiceNow, Inc. | 2.2% |
FMC Corp. | 2.1% |
UnitedHealth Group, Inc. | 2.1% |
Danaher Corp. | 2.1% |
Top ten holdings do not include any cash, cash equivalents or exchange traded fund investments. Holdings are subject to change and may not reflect the current or future position of the Fund.
Performance data quoted represents past performance and does not guarantee future results. Performance information for the Retail Class shares prior to their inception is based on the performance of the Institutional Class. Current performance may be lower or higher than the performance quoted. To obtain current performance as of the most recent month-end, visit www.sbhfunds.com. Average annual total returns reflect the reinvestment of dividends, capital gains distributions, all fee waivers and expense reimbursements. Without the fee waivers and expense reimbursements, total return figures would have been lower. Investment return and principal value will vary, and shares, when redeemed, may be worth more or less than their original cost. Segall Bryant & Hamill fund shares are not insured by the FDIC, the Federal Reserve Board or any other agency and are subject to investment risk.
Until at least December 31, 2021, Segall Bryant & Hamill, LLC (the “Adviser”) has contractually agreed to waive the investment advisory and/or administration fees and/or to reimburse other expenses, so that the ratio of expenses to average net assets as reported in the Fund’s Financial Highlights will be no more than 0.99% and 0.84% to the Fund’s Retail Class and Institutional Class, respectively, for such period. This agreement may not be terminated or modified by the Adviser prior to December 31, 2021, without the approval of the Board of Trustees.
12 |  | www.sbhfunds.com | www.sbhfunds.com
|
Segall Bryant & Hamill All Cap Fund | Fund Overview |
| | June 30, 2020 (Unaudited) |
Manager Commentary
Fund Performance
For the year-to-date period, the Segall Bryant & Hamill All Cap Fund (the “Fund”) returned 2.06% (Retail Class) compared to a return of -3.48% for the Russell 3000® Index. For the year-to-date period, security selection contributed +425 bps to relative performance and sector allocation contributed +169 bps. Cash had a positive +64 bps total effect on the relative return.
As a reminder, the investment team’s strategy is to participate in all markets by investing in companies that maintain high Return on Invested Capital (ROIC), generate quality financial metrics (e.g., free cash flow growth, consistent earnings growth and margin expansion) and are operated by strong management teams.
Contributors to Return
At the sector level, the Fund’s best-performing areas were Health Care (+199 bps), Financials (+101 bps) and Energy (+73 bps). The outperformance in the Utilities sector was primarily related to allocation as it was a lagging group in the index, and this sector was significantly underweighted in the Fund. At the individual holding level, several names stood out in terms of their positive contributions to performance for the quarter:
● | Marvell Technology Group (MRVL) – Company benefited from significant outperformance in cloud data center applications and 5G infrastructure buildouts. |
● | Amazon.com (AMZN) – Profited from increased consumer adoption of e-commerce, accelerated by COVID-19, as well as continued Amazon Web Services growth. |
● | Catalent (CTLT) – Organization experiencing resilient demand for biologics capabilities in addition to new tailwinds from vaccine production opportunities. |
Detractors from Return
Consumer Discretionary (-22 bps), Communication Services (-21 bps), and Information Technology (-3 bps) were the largest detractors on a sector level for the year-to-date period. In terms of individual securities, several names detracted from performance:
● | JPMorgan Chase (JPM) – Economic pressures resulting from COVID-19 created concern around loan losses for financial services organizations. |
● | Reinsurance Group of America, Incorporated (RGA) – Concerns of rising claims due to COVID-19 created concern around the insured portfolio. |
● | Parker-Hannifin Corporation (PH) – Exposure to the aerospace and industrial sectors impacted by COVID-19. |
Outlook and Positioning
The market sharply recovered in the second quarter of 2020, as evidenced by the +20.5% return produced by the S&P 500® Index and +22.0% performance generated by the Russell 3000 benchmark. A confluence of factors contributed to the positive inflection higher in equities as governments, corporations, and consumers sought to navigate through unprecedented economic conditions caused by COVID-19. Timely and aggressive stimulus, both fiscal and monetary, can be given significant recognition for helping to maintain functional capital markets and broader economic sentiment. By significantly expanding its balance sheet and repairing bond market operations, the Federal Reserve (and central banks around the globe) played a crucial role toward ensuring companies were able to access liquidity. Available credit was viewed as necessary for bridging what will likely be a challenging year on cash flows and bottom lines (S&P earnings are forecasted to contract by -22.2% in 2020 per FactSet consensus). Similarly, enhanced unemployment benefits and stimulus checks helped to somewhat blunt the financial strain and confidence erosion from a consumer perspective.
While the pandemic still wages material disruption on daily life throughout the world, slowing infection rates during the second quarter, and optimism around prospective coronavirus treatments helped to provide visibility toward the reopening of commercial and social activity. The easing of lockdown restriction conditions allowed some corporations to offer up supportive demand commentary as the year progressed, relative to low investor expectations. This dynamic fueled a rally in cyclical corners of the market (crude futures appreciated +91.8%) all the while investors continued to favor mega cap technology companies in the period (NASDAQ-100 returned +30.3%) which provided helpful support at the index level. To be sure, the operating environment moving forward is far from clear. Escalating infection trends, social unrest, election rhetoric, and geopolitical tensions are just a few of the variables that the market will monitor in the back half of the calendar year against the context of valuation multiples, which stand elevated to historical averages. We believe that by focusing our bottom-up research process on ROIC-oriented companies that meet our quality standards, the All Cap Fund is well positioned to weather evolving external macro conditions.
Stock Performance (for the six months ended 6/30/20)
5 Highest | Average
Weight | Contribution
to Return | | 5 Lowest | Average
Weight | Contribution
to Return |
Amazon.com, Inc. | 3.79% | 1.92% | | Parker-Hannifin Corp. | 0.76% | -0.69% |
Microsoft Corp. | 4.56 | 1.41 | | V.F. Corp. | 1.36 | -0.85 |
Marvell Technology Group Ltd. | 2.48 | 1.30 | | Microchip Technology Inc. | 0.78 | -0.94 |
Catalent Inc. | 1.85 | 0.98 | | Reinsurance Group of America, Inc. | 1.49 | -1.07 |
Monolithic Power Systems, Inc. | 0.90 | 0.82 | | JPMorgan Chase & Co. | 2.40 | -1.15 |
Past performance does not guarantee future results. These stocks do not represent all of the securities purchased, sold or recommended by the Fund’s Adviser. To request a complete list of the contribution of each Fund holding to overall Fund performance during the period, please call (800) 392-2673.
Please see page 39 for a description of the methodology used to construct this table.
Semi-Annual Report | June 30, 2020 |  | 13 |
Segall Bryant & Hamill Emerging Markets Fund | Fund Overview |
| | June 30, 2020 (Unaudited) |
Fund Strategy
Investing primarily in equity securities of companies tied economically to emerging markets countries.
Fund Management
Scott E. Decatur, Ph.D. Portfolio Manager |
Nicholas C. Fedako, CFA Portfolio Manager |
CFA is a trademark owned by CFA Institute.
Cumulative Returns

The chart above represents historical performance of a hypothetical investment of $10,000 in the Fund over the past 10 years (or for the life of the Fund if shorter). Performance calculations are as of the end of June each year. Past performance does not guarantee future results. This chart does not reflect the deduction of taxes that a shareholder would pay on Fund distributions or the redemption of Fund shares.
Please see index definitions beginning on page 38.
Average Annual Total Returns
| | 6 Months | 1 Year | 3 Years | 5 Years | 10 Years | Since
Inception | Inception
Date |
Retail Class* (SBHEX) | (13.73)% | (9.32)% | (1.09)% | 1.28% | — | (0.02)% | 6/30/14 |
Institutional Class** (SBEMX) | (13.69)% | (9.18)% | (0.91)% | 1.49% | — | 0.17% | 6/30/11 |
MSCI Emerging Markets Index | (9.78)% | (3.39)% | 1.90% | 2.86% | — | 0.85% | |
Retail Class Annual Expense Ratio (per the current prospectus) — Gross: 2.56%, Net:1.38%
Institutional Class Annual Expense Ratio (per the current prospectus) — Gross: 2.41%, Net: 1.23%
Sector Allocation (as of 6/30/20)
Information Technology | 29.0% |
Financials | 19.3% |
Consumer Discretionary | 11.3% |
Materials | 7.1% |
Consumer Staples | 6.8% |
Communication Services | 6.5% |
Energy | 5.5% |
Industrials | 4.6% |
Health Care | 3.9% |
Real Estate | 2.9% |
Utilities | 2.4% |
Sector classifications presented are based on the Global Industry Classification Standard (GICS) methodology.
Sector weights may not sum to 100% due to rounding.
The sector allocation table above does not include any cash or cash equivalents.
Top Ten Holdings (as of 6/30/20)
Alibaba Group Holding, Ltd. ADR | 6.3% |
Tencent Holdings, Ltd. | 5.6% |
Samsung Electronics Co., Ltd. | 4.9% |
Taiwan Semiconductor Manufacturing Co., Ltd. ADR | 3.5% |
China Mobile, Ltd. | 1.7% |
Naspers, Ltd. | 1.4% |
Muthoot Finance, Ltd. | 1.3% |
Vipshop Holdings, Ltd. ADR | 1.1% |
Surgutneftegas PJSC | 1.1% |
Riyad Bank | 1.0% |
Top ten holdings do not include any cash, cash equivalents or exchange traded fund investments. Holdings are subject to change and may not reflect the current or future position of the Fund.
Performance data quoted represents past performance and does not guarantee future results. Performance information for the Retail Class shares prior to their inception is based on the performance of the Institutional Class. Current performance may be lower or higher than the performance quoted. To obtain current performance as of the most recent month-end, visit www.sbhfunds.com. Average annual total returns reflect the reinvestment of dividends, capital gains distributions, all fee waivers and expense reimbursements. Without the fee waivers and expense reimbursements, total return figures would have been lower. Investment return and principal value will vary, and shares, when redeemed, may be worth more or less than their original cost. Segall Bryant & Hamill fund shares are not insured by the FDIC, the Federal Reserve Board or any other agency and are subject to investment risk.
From December 9, 2019 until at least December 31, 2021, Segall Bryant & Hamill, LLC (the “Adviser”) has contractually agreed to waive the investment advisory and/or administration fees and/or to reimburse other expenses, so that the ratio of expenses to average net assets as reported in the Fund’s Financial Highlights will be no more than 1.38% and 1.23% to the Fund’s Retail Class and Institutional Class, respectively, for such period. This agreement may not be terminated or modified by the Adviser prior to December 31, 2021, without the approval of the Board of Trustees.
Investing in foreign companies are subject to special risks, including currency fluctuations, social, economic, and political uncertainties, which could increase volatility.
14 |  | www.sbhfunds.com | www.sbhfunds.com
|
Segall Bryant & Hamill Emerging Markets Fund | Fund Overview |
| | June 30, 2020 (Unaudited) |
Manager Commentary
Market Overview and Fund Performance
The first half of 2020 was marked by dramatic moves in global stock markets as many countries initially struggled to deal with the onset and spread of the novel coronavirus. After falling over 31% at one point, the MSCI Emerging Markets Index rallied to pare its year-to-date loss to 9.78% as governments took steps to contain the virus and central bankers provided stimulus to bolster their faltering economies. Regional performance varied as the best performer, Asia, ended the first half of the year down just 3.5% as its countries moved quickly to address the spreading virus with China actually advancing 3.5% over the same period. At the other extreme, Latin America is down 35.2% through the first half of the year due in large part to its largest constituent, Brazil, being down 38.9% with many critical of the country’s coronavirus response. The Europe, Middle East and Africa (“EMEA”) region ended 21.4% lower as strength in the Middle Eastern countries was offset by Europe. Health Care (+25.8%) is the top-performing EMEA sector this first half of the year on investor hopes for the discovery of an effective coronavirus vaccine. The worst performer was Energy -26.1% as the sector suffered a price war between Saudi Arabia and Russia along with reduced demand due to the pandemic.
The Segall Bryant & Hamill Emerging Markets Fund (the “Fund”) rebounded along with the broader market to pare its year-to-date losses at -13.73% (Retail Class), but still trailed the MSCI Emerging Markets Index return of -9.78% for the same period. The ongoing outperformance of expensively valued stocks, as measured by the MSCI Emerging Markets Growth Index (-1.5%), versus undervalued stocks, as measured by the MSCI Emerging Markets Value Index (-18.0%), remained a headwind for our Fund. The 16.5% shortfall of the value versus growth indices for half of a year is the largest on record, eclipsing the previous worst of 15.3% which occurred in the second half of 1999. Negative security selection in Asia (where value lagged growth by 18.7%) was the main driver of this period’s relative performance, mainly due to the underperformance of the Fund’s holdings in China. Selection was flat in EMEA and modestly negative in Latin America. At the sector level, positive stock selection in Financials, Utilities, and Real Estate was more than offset by negative selection in Communication Services, Consumer Discretionary, and Health Care. The performance of our investment team’s model components was mixed as profitability and momentum finished higher while valuation continued to suffer from investor preferences for expensive growth stocks.
Outlook and Positioning
While the direction of the market has been volatile over the last six months, investor preferences for expensive growth companies has been constant. The Fund has been able to defend against this growth deluge to a certain extent but has not been immune to the massive headwind. Some of the most acute underperformance versus the market this year has come from segments where we focus the Fund’s investments, specifically higher quality companies trading at reasonable valuations. It is important to note that expensive growth companies are not performing any better fundamentally than they normally have, in fact they are performing worse while value companies have in fact closed some of the growth gap over the past 3 years or so. The relative valuations of high quality, attractively priced companies started the year in very advantageous positioning and has gotten much more so with the continual price outperformance of the expensive growth companies. Comparisons to internal dislocations reached during the Dot-Com (TMT bubble) of 1999/2000 are certainly warranted now. It can be uncomfortable, for both investment managers and their clients, to maintain a value tilt, but with valuations where they currently stand, we believe the odds of a reversal soon have greatly increased. We retain our focus and remain confident in our prospects going forward.
Stock Performance (for the six months ended 6/30/20)
5 Highest | Average
Weight | Contribution
to Return | | 5 Lowest | Average
Weight | Contribution
to Return |
Tencent Holdings, Ltd. | 4.52 | 1.62 | | Banco do Brasil S.A. | 0.58 | -0.55 |
Alibaba Group Holding, Ltd. | 5.69 | 0.38 | | Itausa - Investimentos Itau S.A. | 0.69 | -0.51 |
Vipshop Holdings, Ltd. | 0.84 | 0.35 | | PT Media Nusantara Citra Tbk | 0.55 | -0.39 |
Muthoot Finance, Ltd. | 0.95 | 0.28 | | Petroleo Brasileiro S.A. | 0.45 | -0.36 |
Sinotruk Hong Kong, Ltd. | 0.76 | 0.24 | | Absa Group, Ltd. | 0.33 | -0.35 |
Past performance does not guarantee future results. These stocks do not represent all of the securities purchased, sold or recommended by the Fund’s Adviser. To request a complete list of the contribution of each Fund holding to overall Fund performance during the period, please call (800) 392-2673.
Please see page 39 for a description of the methodology used to construct this table.
Semi-Annual Report | June 30, 2020 |  | 15 |
Segall Bryant & Hamill International Small Cap Fund | Fund Overview |
| | June 30, 2020 (Unaudited) |
Fund Strategy
Investing primarily in equity securities of small capitalization companies located outside of the United States, including those in emerging markets.
Fund Management
Scott E. Decatur, Ph.D. Portfolio Manager |
Nicholas C. Fedako, CFA Portfolio Manager |
CFA is a trademark owned by CFA Institute.
Cumulative Returns
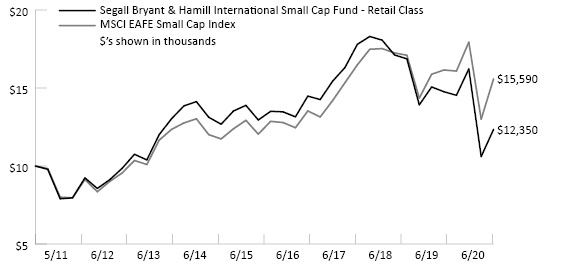
The chart above represents historical performance of a hypothetical investment of $10,000 in the Fund over the past 10 years (or for the life of the Fund if shorter). Performance calculations are as of the end of June each year. Past performance does not guarantee future results. This chart does not reflect the deduction of taxes that a shareholder would pay on Fund distributions or the redemption of Fund shares.
Please see index definitions beginning on page 38.
Average Annual Total Returns
| | 6 Months | 1 Year | 3 Years | 5 Years | 10 Years | Since
Inception | Inception
Date |
Retail Class* (SBHSX) | (23.88)% | (16.34)% | (8.87)% | (2.32)% | — | 2.35% | 6/30/14 |
Institutional Class** (SBSIX) | (23.78)% | (16.18)% | (8.64)% | (2.09)% | — | 2.59% | 5/31/11 |
MSCI EAFE Small Cap Index | (13.11)% | (3.52)% | 0.53% | 3.81% | — | 5.01% | |
Retail Class Annual Expense Ratio (per the current prospectus) — Gross: 1.41%, Net: 1.18%
Institutional Class Annual Expense Ratio (per the current prospectus) — Gross: 1.26%, Net: 1.03%
Sector Allocation (as of 6/30/20)
Industrials | 21.3% |
Consumer Discretionary | 13.5% |
Real Estate | 12.0% |
Information Technology | 10.9% |
Financials | 10.4% |
Materials | 8.0% |
Health Care | 7.6% |
Consumer Staples | 6.4% |
Communication Services | 3.5% |
Utilities | 2.5% |
Energy | 2.0% |
Sector classifications presented are based on the Global Industry Classification Standard (GICS) methodology.
Sector weights may not sum to 100% due to rounding.
The sector allocation table above does not include any cash or cash equivalents.
Top Ten Holdings (as of 6/30/20)
Sunrise Communications Group A.G. | 1.1% |
Haseko Corp. | 1.1% |
Computacenter PLC | 1.1% |
Signify N.V. | 1.0% |
TP ICAP PLC | 1.0% |
Ferrexpo PLC | 1.0% |
Anima Holding S.p.A. | 0.9% |
Galenica A.G. | 0.9% |
Loomis A.B. | 0.9% |
Getinge A.B. | 0.9% |
Top ten holdings do not include any cash, cash equivalents or exchange traded fund investments. Holdings are subject to change and may not reflect the current or future position of the Fund.
Performance data quoted represents past performance and does not guarantee future results. Performance information for the Retail Class shares prior to their inception is based on the performance of the Institutional Class. Current performance may be lower or higher than the performance quoted. To obtain current performance as of the most recent month-end, visit www.sbhfunds.com. Average annual total returns reflect the reinvestment of dividends, capital gains distributions, all fee waivers and expense reimbursements. Without the fee waivers and expense reimbursements, total return figures would have been lower. Investment return and principal value will vary, and shares, when redeemed, may be worth more or less than their original cost. Segall Bryant & Hamill fund shares are not insured by the FDIC, the Federal Reserve Board or any other agency and are subject to investment risk.
From December 9, 2019 until at least December 31, 2021, Segall Bryant & Hamill, LLC (the “Adviser”) has contractually agreed to waive the investment advisory and/or administration fees and/or to reimburse other expenses, so that the ratio of expenses to average net assets as reported in the Fund’s Financial Highlights will be no more than 1.18% and 1.03% to the Fund’s Retail Class and Institutional Class, respectively, for such period. This agreement may not be terminated or modified by the Adviser prior to December 31, 2021, without the approval of the Board of Trustees.
Investing in foreign companies are subject to special risks, including currency fluctuations, social, economic, and political uncertainties, which could increase volatility.
16 |  | www.sbhfunds.com | www.sbhfunds.com
|
Segall Bryant & Hamill International Small Cap Fund | Fund Overview |
| | June 30, 2020 (Unaudited) |
Manager Commentary
Market Overview and Fund Performance
The first half of 2020 was marked by dramatic moves in global stock markets as countries initially struggled to deal with the onset of the novel coronavirus. After falling over 38% at one point, the MSCI EAFE Small Cap Index rallied to pare its year-to-date loss to 13.11% as governments took steps to contain the virus and central bankers provided stimulus to bolster their faltering economies. At the region level, the Far East (-8.7%), Europe (-9.8%), and Japan (-10.0%) ended the first half of the year in a tight range despite varying individual country performances within regions. The U.K. (-27.2%) was the worst-performing benchmark region as many criticized the urgency of the country’s coronavirus response. Health Care (+4.1%), was the only sector to be up for the year on investor hopes of the discovery of an effective coronavirus vaccine. The worst-performing sector this year was Energy (-45.0%) which was hurt by a price war between Saudi Arabia and Russia and a coronavirus-driven demand shock.
The Segall Bryant & Hamill International Small Cap Fund (Retail Class) returned-23.88% versus a -13.11% return for the MSCI EAFE Small Cap Index. The ongoing outperformance of expensively valued stocks, as measured by the MSCI EAFE Small Cap Growth Index (-5.9%), versus undervalued stocks, as measured by the MSCI EAFE Small Cap Value Index (-20.5%), remained a strong headwind for the Fund. The 14.6% shortfall of the Value versus Growth indices is the largest first-half margin on record and second largest half year only behind the latter half of 1999 when Value underperformed growth by 22.4%. Value lagged Growth in every benchmark region, driving the Fund’s negative security selection in each. Selection was mixed at the sector level as the Fund’s stocks in Utilities and Energy outperformed their group’s overall returns but lagged in the remaining sectors. The profitability and momentum components of our investment team’s model performed well this year but could not offset the negative impact of the larger valuation component.
Outlook and Positioning
One dimension that remained constant during the volatile first half of 2020 is investor preference for expensive growth stocks over all others. This market disruption intensified a trend that has been ongoing for the past 3 years, investors overpaying for growth. Just as some fixed income investors “reach for yield” regardless of price or risk, we are seeing equity investors “reach for growth” in which they pay higher and higher multiples for less excess growth, simply because overall growth rates are lower. Investors’ frenzied preference for expensive Growth stocks has driven relative valuation ratios to levels that some believed would not have been seen again. Growth stocks are now at extremely high valuation ratios, with forecasted growth significantly down from long-term trends. Value stocks are the inverse, trading at distressed multiples, despite suffering less erosion of their expected future growth. Fundamental conditions in the market are not much different than normal – companies on average are performing as their long-term trends would suggest, with the only extraordinary aspect being the ever-expanding multiples of a small subset of the market, resulting in a value opportunity that is very rarely seen. It can be difficult for both investors and clients to maintain their focus and resolve during such periods of extreme turmoil, but we remain resolute in our approach. We do not know of the exact timing of the reversal, but we feel confident that this bubble, like all bubbles, will pop, and we and our investors will be well-positioned to capitalize.
Stock Performance (for the six months ended 6/30/20)
5 Highest | Average
Weight | Contribution
to Return | | 5 Lowest | Average
Weight | Contribution
to Return |
Hornbach Holding A.G. & Co. KGaA | 0.17 | 0.21 | | Go-Ahead Group PLC | 0.77 | -0.77 |
Gerresheimer A.G. | 0.74 | 0.20 | | ams A.G. | 0.33 | -0.75 |
Ferrexpo PLC | 0.66 | 0.19 | | Invincible Investment Corp. | 0.75 | -0.69 |
Scandinavian Tobacco Group A/S | 0.63 | 0.17 | | Vistry Group PLC | 0.72 | -0.65 |
Daiwabo Holdings Co., Ltd. | 0.57 | 0.16 | | NewRiver REIT PLC | 0.41 | -0.64 |
Past performance does not guarantee future results. These stocks do not represent all of the securities purchased, sold or recommended by the Fund’s Adviser. To request a complete list of the contribution of each Fund holding to overall Fund performance during the period, please call (800) 392-2673.
Please see page 39 for a description of the methodology used to construct this table.
Semi-Annual Report | June 30, 2020 |  | 17 |
Segall Bryant & Hamill
Fundamental International Small Cap Fund | Fund Overview |
| | June 30, 2020 (Unaudited) |
Fund Strategy
Investing in the stocks of small international companies that we believe are poised for growth.
Fund Management
John C. Fenley, CFA Portfolio Manager |
CFA is a trademark owned by CFA Institute.
Cumulative Returns

The chart above represents historical performance of a hypothetical investment of $10,000 in the Fund over the past 10 years (or for the life of the Fund if shorter). Performance calculations are as of the end of June each year. Past performance does not guarantee future results. This chart does not reflect the deduction of taxes that a shareholder would pay on Fund distributions or the redemption of Fund shares.
Please see index definitions beginning on page 38.
Average Annual Total Returns
| | 6 Months | 1 Year | 3 Years | 5 Years | 10 Years | Since
Inception | Inception
Date |
Retail Class (WTIFX) | (7.23)% | 0.30% | 5.84% | 6.25% | 8.13% | 5.30% | 12/15/99 |
Institutional Class (WIIFX) | (7.19)% | 0.45% | 6.00% | 6.40% | 8.21% | 5.33% | 4/29/16 |
MSCI ACWI ex USA Small Cap Index | (12.80)% | (4.34)% | (0.17)% | 2.50% | 6.05% | 5.99% | |
Retail Class Annual Expense Ratio (per the current prospectus) — Gross: 1.85%, Net: 1.25%
Institutional Class Annual Expense Ratio (per the current prospectus) — Gross: 1.72%, Net: 1.10%
Sector Allocation (as of 6/30/20)
Information Technology | 36.5% |
Industrials | 15.7% |
Consumer Discretionary | 13.7% |
Communication Services | 12.5% |
Financials | 8.1% |
Health Care | 3.8% |
Consumer Staples | 2.6% |
Sector classifications presented are based on the Global Industry Classification Standard (GICS) methodology.
Sector weights may not sum to 100% due to rounding.
The sector allocation table above does not include any cash or cash equivalents.
Top Ten Holdings (as of 6/30/20)
Appen, Ltd. | 5.1% |
Constellation Software, Inc. | 4.8% |
Fortnox A.B. | 4.6% |
Keywords Studios PLC | 4.5% |
GB Group PLC | 3.9% |
Clipper Logistics PLC | 3.6% |
SMS Co., Ltd. | 3.2% |
MIPS A.B. | 3.2% |
Webjet, Ltd. | 3.1% |
Fu Shou Yuan International Group, Ltd. | 2.8% |
Top ten holdings do not include any cash, cash equivalents or exchange traded fund investments. Holdings are subject to change and may not reflect the current or future position of the Fund.
Performance data quoted represents past performance and does not guarantee future results. Performance information for the Institutional Class shares prior to their inception is based on the performance of the Retail Class. Current performance may be lower or higher than the performance quoted. To obtain current performance as of the most recent month-end, visit www.sbhfunds.com. Average annual total returns reflect the reinvestment of dividends, capital gains distributions, all fee waivers and expense reimbursements. Without the fee waivers and expense reimbursements, total return figures would have been lower. Investment return and principal value will vary, and shares, when redeemed, may be worth more or less than their original cost. Segall Bryant & Hamill fund shares are not insured by the FDIC, the Federal Reserve Board or any other agency and are subject to investment risk.
From May 1, 2020 until at least April 30, 2021, Segall Bryant & Hamill, LLC (the “Adviser”) has contractually agreed to waive the investment advisory and/or administration fees and/or to reimburse other expenses, so that the ratio of expenses to average net assets as reported in the Fund’s Financial Highlights will be no more than 1.25% and 1.10% for the Fund’s Retail Class and Institutional Class, respectively, for such period. This agreement may not be terminated or modified by the Adviser prior to April 30, 2021 without the approval of the Board of Trustees.
Investing in small-cap funds generally will be more volatile and loss of principal could be greater than investing in larger-cap funds.
Investing in foreign securities entails special risks, such as currency fluctuations and political uncertainties, which are described in more detail in the prospectus.
18 |  | www.sbhfunds.com | www.sbhfunds.com
|
Segall Bryant & Hamill
Fundamental International Small Cap Fund | Fund Overview |
| | June 30, 2020 (Unaudited) |
Manager Commentary
Market Overview and Fund Performance
If ever one doubted that the market behaves in the short run like a voting machine, the first half of 2020 supplied proof in abundance. Thirty-three days was all it took for U.S. equities to collapse from peak to trough. Similar wipeouts took place across every major market. But while a V-shaped recovery remains to be seen in the global economy, one certainly took place in equity markets. The S&P 500® Index’s dramatic rebound, which ended the first half barely below the index’s all-time high, was joined by double-digit recoveries in equity prices in almost every major market. Economic data in the U.S. improved in May, China regained its footing, and the pandemic appeared to be largely tamed in most of the developed world.
Amidst this turbulence, the Segall Bryant & Hamill Fundamental International Small Cap Fund (the “Fund”) returned -7.23% (Retail Class) for the six-month period ending June 30, 2020, above the -12.80% return of the MSCI ACWI ex USA Small Cap Index.
Contributors to Return
On a sector level, both allocation and selection in Information Technology contributed to returns. Stock selection in the Industrials sector was also a significant contributor. On an individual stock basis, Appen (APX AU), an Australia-based company that provides training data and artificial intelligence solutions for natural language processing, was a top contributor. Serving customers in the technology industry such as Amazon, Microsoft, and Facebook in their efforts to optimize speech recognition, translation, and other language-related domains, Appen has been relatively insulated from COVID-19 and continues to grow at a rapid clip. MIPS AB (MIPS SE), a Sweden-based market leader in helmet safety solutions, was also a top contributor. MIPS posted double-digit growth during 2019, driven by its products gaining adoption as a market standard. Although MIPS’ customers have significant manufacturing ties to China that were temporarily disrupted due to COVID-19, manufacturing has largely resumed, and we believe the company has a more than sufficient cash balance to weather any near-term impacts.
Detractors from Return
The Communication Services and Consumer Discretionary sectors detracted from relative returns. In terms of individual stocks, Webjet Limited (WEB AU), an Australian online travel agency, was a top detractor. Although Webjet reported strong results for the first half of the year, it has borne the brunt of a steep decline in travel along with the rest of the travel industry. These circumstances left Webjet requiring new capital to meet operating liabilities and expenses. This capital is presumed to be enough to support Webjet in the near term, providing enough runway until travel recovers. Vision Inc. (9416 JP), a Japanese provider of mobile WiFi routers, also detracted from performance. Demand for mobile WiFi routers is dependent on travel, with Vision serving both business and leisure travelers. With the shutdown of travel to and from Japan, Vision’s revenue and operating income saw substantial declines in the first quarter. However, the company was still profitable during this worst-case scenario and enjoys a very strong balance sheet.
Outlook and Positioning
Today’s sanguine markets mask considerable underlying uncertainty, including the risk of a second viral wave before a vaccine is discovered. The U.S. is not immune to this, nor to domestic civic tension compounded by a looming election. Globally, the pandemic has been better contained in the developed world outside the U.S. but continues to ravage through less well-equipped countries. Investors will watch economic indicators intently, but we may still be in the early stages of a historic time. Since the onset of COVID-19, we have significantly downsized the Fund’s exposure to the most heavily affected businesses while shoring up the Fund’s presence in those with greater robustness. We do expect COVID-19 to accelerate existing technological trends and continue to see compelling opportunity in the information technology sector, which represents our largest sector allocation. While informed by broader macroeconomic developments, our process will continue to emphasize a commitment to bottom-up fundamental analysis in order to find the best opportunities, sectors and geographies. Looking forward, we are confident that our focus on holdings supported by strong fundamentals, such as high cash generation and low indebtedness, will position the Fund well.
Stock Performance (for the six months ended 6/30/20)
5 Highest | Average
Weight | Contribution
to Return | | 5 Lowest | Average
Weight | Contribution
to Return |
MIPS A.B. | 4.22% | 2.51% | | ZIGExN Co., Ltd. | 2.05% | -1.08% |
Appen, Ltd. | 4.13 | 2.75 | | MTY Food Group, Inc. | 1.24 | -1.58 |
Fortnox A.B. | 4.64 | 2.22 | | Momo, Inc. | 2.54 | -1.50 |
SwedenCare A.B. | 3.07 | 0.98 | | Vision, Inc. | 1.99 | -1.88 |
4Imprint Group PLC | 0.96 | 0.75 | | Webjet, Ltd. | 4.42 | -5.25 |
Past performance does not guarantee future results. These stocks do not represent all of the securities purchased, sold or recommended by the Fund’s Adviser. To request a complete list of the contribution of each Fund holding to overall Fund performance during the period, please call (800) 392-2673.
Please see page 39 for a description of the methodology used to construct this table.
Semi-Annual Report | June 30, 2020 |  | 19 |
Segall Bryant & Hamill Global Large Cap Fund | Fund Overview |
| | June 30, 2020 (Unaudited) |
Fund Strategy
Investing in large, well-established, dividend-paying companies both in the United States and in developed foreign markets.
Fund Management
Suresh Rajagopal, CFA Portfolio Manager | Ralph M. Segall, CFA, CIC Portfolio Manager |
CFA is a trademark owned by CFA Institute.
Cumulative Returns
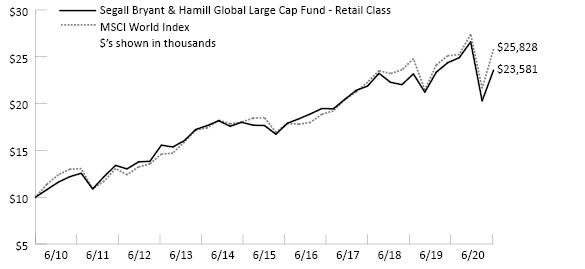
The chart above represents historical performance of a hypothetical investment of $10,000 in the Fund over the past 10 years (or for the life of the Fund if shorter). Performance calculations are as of the end of June each year. Past performance does not guarantee future results. This chart does not reflect the deduction of taxes that a shareholder would pay on Fund distributions or the redemption of Fund shares.
Please see index definitions beginning on page 38.
Average Annual Total Returns
| | 6 Months | 1 Year | 3 Years | 5 Years | 10 Years | Since
Inception | Inception
Date |
Retail Class (WTMVX) | (11.35)% | (3.27)% | 3.26% | 5.95% | 8.96% | 8.06% | 6/1/88 |
Institutional Class (WIMVX) | (11.38)% | (3.27)% | 3.36% | 6.09% | 9.11% | 8.13% | 9/28/07 |
MSCI World Index | (5.77)% | 2.84% | 6.70% | 6.90% | 9.95% | 6.98% | |
Retail Class Annual Expense Ratio (per the current prospectus) — Gross: 1.22%, Net: 0.89%
Institutional Class Annual Expense Ratio (per the current prospectus) — Gross: 1.12%, Net: 0.74%
Sector Allocation (as of 6/30/20)
Information Technology | 17.1% |
Health Care | 16.6% |
Consumer Staples | 14.8% |
Consumer Discretionary | 9.3% |
Financials | 9.0% |
Industrials | 9.0% |
Communication Services | 6.3% |
Energy | 5.9% |
Utilities | 5.6% |
Materials | 3.0% |
Sector classifications presented are based on the Global Industry Classification Standard (GICS) methodology.
Sector weights may not sum to 100% due to rounding.
The sector allocation table above does not include any cash or cash equivalents.
Top Ten Holdings (as of 6/30/20)
Chubb, Ltd. | 3.9% |
Broadridge Financial Solutions, Inc. | 3.9% |
Atos S.E. | 3.9% |
Bayer A.G. | 3.7% |
AbbVie, Inc. | 3.7% |
Broadcom, Inc. | 3.6% |
RELX PLC | 3.5% |
Danone S.A. | 3.4% |
Starbucks Corp. | 3.4% |
Verizon Communications, Inc. | 3.3% |
Top ten holdings do not include any cash, cash equivalents or exchange traded fund investments. Holdings are subject to change and may not reflect the current or future position of the Fund.
Performance data quoted represents past performance and does not guarantee future results. Performance information for the Institutional Class shares prior to their inception is based on the performance of the Retail Class. Current performance may be lower or higher than the performance quoted. To obtain current performance as of the most recent month-end, visit www.sbhfunds.com. Average annual total returns reflect the reinvestment of dividends, capital gains distributions, all fee waivers and expense reimbursements. Without the fee waivers and expense reimbursements, total return figures would have been lower. Investment return and principal value will vary, and shares, when redeemed, may be worth more or less than their original cost. Segall Bryant & Hamill fund shares are not insured by the FDIC, the Federal Reserve Board or any other agency and are subject to investment risk.
From May 1, 2020 until at least April 30, 2021, Segall Bryant & Hamill, LLC (the “Adviser”) has contractually agreed to waive the investment advisory and/or administration fees and/or to reimburse other expenses, so that the ratio of expenses to average net assets as reported in the Fund’s Financial Highlights will be no more than 0.89% and 0.74% for the Fund’s Retail Class and Institutional Class, respectively, for such period. This agreement may not be terminated or modified by the Adviser prior to April 30, 2021 without the approval of the Board of Trustees.
Investments in foreign companies are subject to special risks, including currency fluctuations, social, economic, and political uncertainties, which could increase volatility.
Dividends are not guaranteed. A company’s future abilities to pay dividends may be limited and a company may cease paying dividends at any time.
20 |  | www.sbhfunds.com | www.sbhfunds.com
|
Segall Bryant & Hamill Global Large Cap Fund | Fund Overview |
| | June 30, 2020 (Unaudited) |
Manager Commentary
Market Overview and Fund Performance
In the first half of 2020, we saw a dramatic synchronized recovery in global indices although the economic impacts of the global COVID-19 pandemic continued to intensify. While many of the companies exposed directly to the pandemic’s economic impact came under financial stress, decisive actions by the Federal Reserve, European Central Bank and others beginning in March sparked knee-jerk buying from market participants when memories of comparatively small interventions during the previous cycle supported asset prices and eventually spurred economic growth. Throughout the period, monetary actions were supplemented with fiscal actions like direct transfer payments.
While economically sensitive stocks rallied midway through the second quarter on the prospects of ending lockdowns, the key theme in leadership was around the convergence of an unprecedented contraction in real gross product in combination with (again) unprecedented global money supply expansion. These dynamics brought market trends already in process to an extreme, such as most asset classes inflecting sharply upward, precious metals markets recognizing government endorsement of a liberal use of money supply expansion, and an extreme investor preference for long duration growth assets as discount rates dropped and long-dated technology adoption theses were pulled forward by the social dynamics of lockdowns.
In the year-to-date period ending June 30, 2020, the Segall Bryant & Hamill Global Large Cap Fund (the “Fund”) returned -11.35% (Retail Class) versus -5.77% for the MSCI World Index benchmark.
Contributors to Returns
The top contributing sectors to Fund performance during the six-month period ending June 30, 2020, on a relative basis were Materials, Industrials, and Real Estate. Materials holding Newmont Corp. (NEM-US), a U.S.-based global gold miner, outperformed in sympathy with gold prices driven higher by aggressive monetary policies and macroeconomic uncertainty. Consumer Discretionary name Lowe’s Companies (LOW-US) was also a top contributor as quarantines motivated U.S. consumers to focus on home improvement projects, driving a sharp recovery in a stock oversold during the first quarter.
Detractors from Returns
Sectors that detracted most from relative performance were Information Technology, Consumer Discretionary, and Financials. The Fund does not participate in momentum-oriented, non-dividend paying technology names that have come to comprise significant weightings in the benchmark. This underexposure derives from our forecast of limited dividend income generation from these companies over our investment time horizon.
Consumer Discretionary holding Valeo SA (FR-PAR), a French provider of automotive technologies to global OEMs, was a top detractor. As COVID-19 spread to Europe and the US, the demand outlook plunged for end market auto sales and new car production that would consume Valeo’s high voltage electrification and advanced driver assistance technologies. Energy holding Marathon Petroleum Corp. (MPC-US), a U.S. refining and midstream operator, was also a top detractor although it recovered from first quarter fears around oil and refined product consumption as gasoline demand recovered more quickly than the market expected.
Outlook and Positioning
The second quarter of 2020 brought one of the most aggressive pro-growth market preferences in history. However, we know that in a world with double-digit U.S. unemployment and continuing global pandemic spread, our high cash flow-yielding and defensive investment style lends itself to participation with less volatility. Nonetheless, we reduced our weighting in names that bounced on the anticipation of the early reopening of global economies or are dependent on higher interest rate expectations.
With the pandemic’s first and second waves continuing to spread globally, we expect volatility around prospects for reopening over the next quarter. We weigh this against the increasing willingness of policymakers to expand fiscal deficits to fight economic weakness. Looking beyond a quarter or two, we are increasingly optimistic about the prospects for a functioning – although different – economy not far in the future.
As was announced on July 23, 2020, Suresh Rajagopal and Ralph M. Segall, members of Segall Bryant & Hamill’s All Cap investment team, assumed responsibility for the management of the Segall Bryant & Hamill Global Large Cap Fund. On that date it was also announced that the Board of Trustees of Segall Bryant & Hamill Trust approved a change to the name of the Fund. Effective September 22, 2020, the Fund will change its name to “Segall Bryant & Hamill Global All Cap Fund.” Please see the supplement to the Fund’s prospectus for details regarding the Fund’s Principal Investment Strategies effective September 22, 2020.
Stock Performance (for the six months ended 6/30/20)
5 Highest | Average
Weight | Contribution
to Return | | 5 Lowest | Average
Weight | Contribution
to Return |
Newmont Mining Corp. | 3.28% | 1.58% | | Power Corp. of Canada | 2.15% | -1.41% |
Lowe’s Cos., Inc. | 3.38 | 0.66 | | Marathon Petroleum Corp. | 2.61 | -1.42 |
Roche Holdings A.G. | 3.43 | 0.31 | | U.S. Bancorp | 3.10 | -1.49 |
Rockwell Automation, Inc. | 3.38 | 0.47 | | Valeo S.A. | 2.01 | -1.61 |
Atos S.E. | 3.23 | 0.40 | | Helvetia Holding A.G. | 2.49 | -2.08 |
Past performance does not guarantee future results. These stocks do not represent all of the securities purchased, sold or recommended by the Fund’s Adviser. To request a complete list of the contribution of each Fund holding to overall Fund performance during the period, please call (800) 392-2673.
Please see page 39 for a description of the methodology used to construct this table.
Semi-Annual Report | June 30, 2020 |  | 21 |
Segall Bryant & Hamill Workplace Equality Fund | Fund Overview |
| | June 30, 2020 (Unaudited) |
Fund Strategy
Investing in large, well-established, dividend-paying domestic companies.
Fund Management
Suresh Rajagopal, CFA Portfolio Manager | John N. Roberts, Esq. Portfolio Manager |
William J. Barritt, CFA Portfolio Manager | |
CFA is a trademark owned by CFA Institute.
Cumulative Returns
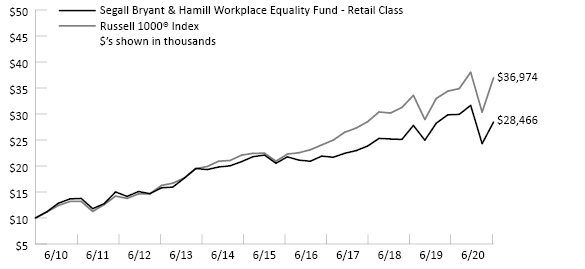
The chart above represents historical performance of a hypothetical investment of $10,000 in the Fund over the past 10 years (or for the life of the Fund if shorter). Performance calculations are as of the end of June each year. Past performance does not guarantee future results. This chart does not reflect the deduction of taxes that a shareholder would pay on Fund distributions or the redemption of Fund shares.
Please see index definitions beginning on page 38.
Average Annual Total Returns
| | 6 Months | 1 Year | 3 Years | 5 Years | 10 Years | Since
Inception | Inception
Date |
Retail Class (WEQRX) | (10.12)% | (4.62)% | 7.42% | 5.19% | 11.03% | 8.53% | 6/1/88 |
Institutional Class (WEQIX) | (10.11)% | (4.45)% | 7.65% | 5.41% | 11.25% | 8.61% | 9/28/07 |
Russell 1000® Index | (2.81)% | 7.48% | 10.64% | 10.47% | 13.97% | 10.44% | |
Retail Class Annual Expense Ratio (per the current prospectus) — Gross: 1.57%, Net: 0.89%
Institutional Class Annual Expense Ratio (per the current prospectus) — Gross: 1.41%, Net: 0.74%
Sector Allocation (as of 6/30/20)
Information Technology | 21.2% |
Health Care | 15.2% |
Financials | 12.5% |
Industrials | 11.0% |
Consumer Discretionary | 10.5% |
Consumer Staples | 7.5% |
Communication Services | 5.4% |
Utilities | 5.1% |
Energy | 4.1% |
Materials | 2.5% |
Real Estate | 1.6% |
Sector classifications presented are based on the Global Industry Classification Standard (GICS) methodology.
Sector weights may not sum to 100% due to rounding.
The sector allocation table above does not include any cash or cash equivalents.
Top Ten Holdings (as of 6/30/20)
NVIDIA Corp. | 3.7% |
Target Corp. | 3.0% |
General Mills, Inc. | 2.9% |
American Electric Power Co., Inc. | 2.9% |
Amgen, Inc. | 2.9% |
AbbVie, Inc. | 2.9% |
Oracle Corp. | 2.8% |
CSX Corp. | 2.7% |
Rockwell Automation, Inc. | 2.7% |
Becton, Dickinson and Co. | 2.6% |
Top ten holdings do not include any cash, cash equivalents or exchange traded fund investments. Holdings are subject to change and may not reflect the current or future position of the Fund.
Performance data quoted represents past performance and does not guarantee future results. Performance information for the Institutional Class shares prior to their inception is based on the performance of the Retail Class. Current performance may be lower or higher than the performance quoted. To obtain current performance as of the most recent month-end, visit www.sbhfunds.com. Average annual total returns reflect the reinvestment of dividends, capital gains distributions, all fee waivers and expense reimbursements. Without the fee waivers and expense reimbursements, total return figures would have been lower. Investment return and principal value will vary, and shares, when redeemed, may be worth more or less than their original cost. Segall Bryant & Hamill fund shares are not insured by the FDIC, the Federal Reserve Board or any other agency and are subject to investment risk.
From May 1, 2020 until at least April 30, 2021, Segall Bryant & Hamill, LLC (the “Adviser”) has contractually agreed to waive the investment advisory and/or administration fees and/or to reimburse other expenses, so that the ratio of expenses to average net assets as reported in the Fund’s Financial Highlights will be no more than 0.89% and 0.74% for the Fund’s Retail Class and Institutional Class, respectively, for such period. This agreement may not be terminated or modified by the Adviser prior to April 30, 2021 without the approval of the Board of Trustees.
Dividends are not guaranteed. A company’s future abilities to pay dividends may be limited and a company may cease paying dividends at any time.
22 |  | www.sbhfunds.com | www.sbhfunds.com
|
Segall Bryant & Hamill Workplace Equality Fund | Fund Overview |
| | June 30, 2020 (Unaudited) |
Manager Commentary
Market Overview and Fund Performance
In the first half of 2020, we saw a dramatic synchronized recovery in global indices although the economic impacts of the global COVID-19 pandemic continued to intensify. While many of the companies exposed directly to the pandemic’s economic impact came under financial stress, decisive actions by the Federal Reserve, European Central Bank and others beginning in March sparked knee-jerk buying from market participants when memories of comparatively small interventions during the previous cycle supported asset prices and eventually spurred economic growth. Throughout the period monetary actions were supplemented with fiscal actions like direct transfer payments.
While economically sensitive stocks rallied midway through the second quarter on the prospects of ending lockdowns, the key theme in leadership was around the convergence of an unprecedented contraction in real gross product in combination with (again) unprecedented global money supply expansion. These dynamics brought market trends already in process to an extreme, such as most asset classes inflecting sharply upward, precious metals markets recognizing government endorsement of a liberal use of money supply expansion, and an extreme investor preference for long duration growth assets as discount rates dropped and long-dated technology adoption theses were pulled forward by the social dynamics of lockdowns.
In the year-to-date period ending June 30, 2020, the Segall Bryant & Hamill Workplace Equality Fund (the “Fund”) (Retail Class) returned -10.12% versus -2.81% for the Russell 1000® Index.
Contributors to Returns
Consumer Staples, Industrials, and Health Care holdings outperformed on a relative basis year-to-date with strong stock selection dominating the performance contribution. Technology holding NVIDIA Corporation (NVDA) outperformed after reporting positive first quarter earnings and issuing an upbeat outlook driven by strength in gaming during the shutdown and consistent growth in data center sales. Gilead Sciences, Inc. (GILD) was also a top contributor, however we trimmed the Fund’s holdings of the biopharmaceutical company as investors bid shares higher on optimism over the effectiveness of their antiviral compound Remdesivir against COVID-19, resulting in less future upside potential, in our opinion.
Detractors from Returns
Consumer Discretionary, Information Technology, and Communication Services detracted from relative results during the period. Marathon Petroleum (MPC-US), a U.S. oil refining, midstream and gas station giant, underperformed markets in the first quarter. Quarantines addressing the SARS-COV-2 outbreak decimated gasoline demand, forcing the company to cut utilization of its refineries. The market recognized that stay-at-home measures mean fewer visits to its convenience stores and worsening prospects for crude run through its pipeline system. While the magnitude of the demand impact is dramatic, we believe that should the quarantine persist through the summer, the company’s now roughly 10% dividend yield remains covered by strong cash flow for the year. Restaurant owner/operator Brinker International, Inc. (EAT) was also a top detractor. The company nearly doubled in value off extremely depressed levels. We subsequently sold our remaining shares invested in the company when the company no longer met our investment criteria.
Outlook and Positioning
The second quarter of 2020 brought one of the most aggressive pro-growth market preferences in history. However, we know that in a world with double-digit U.S. unemployment and continuing global pandemic spread, our high cash flow-yielding and defensive investment style historically lends itself to participation with less volatility. Nonetheless, we reduced our weighting in names that bounced on the anticipation of the early reopening of global economies or are dependent on higher interest rate expectations.
With the pandemic’s first and second waves continuing to spread globally, we expect volatility around prospects for reopening over the next quarter. We weigh this against the increasing willingness of policymakers to expand fiscal deficits to fight economic weakness. Looking beyond a quarter or two, we are increasingly optimistic about the prospects for a functioning – although different – economy not far in the future.
As was announced on July 23, 2020, Suresh Rajagopal and William J. Barritt, who are members of Segall Bryant & Hamill’s All Cap investment team, joined John N. Roberts in managing the Segall Bryant & Hamill Workplace Equality Fund. On the same date, updates to the Fund’s Principal Investment Strategies were also announced. Please see the supplement to the Fund’s prospectus for complete details.
Stock Performance (for the six months ended 6/30/20)
5 Highest | Average
Weight | Contribution
to Return | | 5 Lowest | Average
Weight | Contribution
to Return |
NVIDIA Corp. | 3.33% | 1.70% | | Marathon Petroleum Corp. | 1.77% | -1.00% |
Gilead Sciences, Inc. | 2.59 | 0.58 | | Ralph Lauren Corp. | 2.04 | -1.11 |
General Mills, Inc. | 2.84 | 0.44 | | Brinker International, Inc. | 1.50 | -1.16 |
Microsoft Corp. | 0.76 | 0.37 | | U.S. Bancorp | 2.45 | -1.23 |
Oracle Corp. | 2.77 | 0.33 | | Jones Lang LaSalle Inc. | 1.96 | -1.27 |
Past performance does not guarantee future results. These stocks do not represent all of the securities purchased, sold or recommended by the Fund’s Adviser. To request a complete list of the contribution of each Fund holding to overall Fund performance during the period, please call (800) 392-2673.
Please see page 39 for a description of the methodology used to construct this table.
Semi-Annual Report | June 30, 2020 |  | 23 |
Segall Bryant & Hamill Short Term Plus Fund | Fund Overview |
| | June 30, 2020 (Unaudited) |
Fund Strategy
A fixed-income fund focusing primarily on investment quality bonds of short maturities.
Fund Management
James D. Dadura, CFA Portfolio Manager |
Gregory C. Hosbein, CFA Portfolio Manager |
CFA is a trademark owned by CFA Institute.
Cumulative Returns
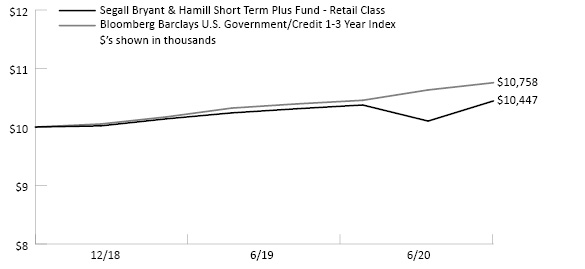
The chart above represents historical performance of a hypothetical investment of $10,000 in the Fund over the past 10 years (or for the life of the Fund if shorter). Performance calculations are as of the end of June each year. Past performance does not guarantee future results. This chart does not reflect the deduction of taxes that a shareholder would pay on Fund distributions or the redemption of Fund shares.
Please see index definitions beginning on page 38.
Average Annual Total Returns
| | 6 Months | 1 Year | 3 Years | 5 Years | 10 Years | Since
Inception | 30-Day
SEC Yield | Inception
Date |
Retail Class (SBHPX) | 0.67% | 1.99% | — | — | — | 2.87% | 1.19% | 12/14/18 |
Institutional Class (SBAPX) | 0.78% | 2.13% | — | — | — | 2.98% | 1.27% | 12/14/18 |
Bloomberg Barclays U.S. Government/Credit 1-3 Year Index | 2.88% | 4.20% | — | — | — | 4.85% | | |
Retail Class Annual Expense Ratio (per the current prospectus) — Gross: 4.13%, Net: 0.49%
Institutional Class Annual Expense Ratio (per the current prospectus) — Gross: 3.68%, Net: 0.40%
Asset Allocation (as of 6/30/20)
Industrial | 72.6% |
Utility | 14.3% |
Municipal Bonds | 5.1% |
U.S. Treasury Bonds & Notes | 3.2% |
Finance | 2.9% |
Asset Backed Securities | 0.4% |
Sector weights may not sum to 100% due to rounding.
The sector allocation table above does not include any cash or cash equivalents.
Top Ten Corporate Holdings
(as of 6/30/20)
Time Warner Cable, Inc. | 2.5% |
T-Mobile USA, Inc. | 2.1% |
Dominion Energy, Inc. | 2.0% |
Analog Devices, Inc. | 2.0% |
WEC Energy Group, Inc. | 1.9% |
Best Buy Co., Inc. | 1.9% |
Georgia Power Co. | 1.9% |
Mondelēz International, Inc. | 1.9% |
Xylem, Inc. | 1.9% |
Allergan, Inc. | 1.9% |
Percentages represent the Fund’s aggregate holdings in the same corporate issuer and its affiliates. Holdings are subject to change and may not reflect the current or future position of the Fund.
30-Day SEC Yield figures reflect all fee waivers and expense reimbursements. Without the absorption of these fee waivers and/or expense reimbursements, the figures would have been 1.17% for the Retail Class and 1.05% for the Institutional Class.
Performance data quoted represents past performance and does not guarantee future results. Current performance may be lower or higher than the performance quoted. To obtain current performance as of the most recent month-end, visit www.sbhfunds.com. Average annual total returns reflect the reinvestment of dividends, capital gains distributions, all fee waivers and expense reimbursements. Without the fee waivers and expense reimbursements, total return figures would have been lower. Investment return and principal value will vary, and shares, when redeemed, may be worth more or less than their original cost. Segall Bryant & Hamill fund shares are not insured by the FDIC, the Federal Reserve Board or any other agency and are subject to investment risk.
From May 1, 2020 until at least April 30, 2021, Segall Bryant & Hamill, LLC (the “Adviser”) has contractually agreed to waive the investment advisory and/or administration fees and/or to reimburse other expenses, so that the ratio of expenses to average net assets as reported in the Fund’s Financial Highlights will be no more than 0.49% and 0.40% for the Fund’s Retail Class and Institutional Class, respectively, for such period. This agreement may not be terminated or modified by the Adviser prior to April 30, 2021 without the approval of the Board of Trustees.
New Fund Risk: The Segall Bryant & Hamill Short Term Plus Fund was launched effective December 14, 2018. There can be no assurance that the Fund will grow to or maintain an economically viable size. There may be limited or no performance history for investors to evaluate.
Fixed Income Risks: Fixed income funds are subject to additional risk in that they may invest in high-yield/high-risk bonds and may be subject to greater levels of liquidity risk. Additionally, investing in bonds entails interest rate risk and credit risk.
24 |  | www.sbhfunds.com | www.sbhfunds.com
|
Segall Bryant & Hamill Short Term Plus Fund | Fund Overview |
| | June 30, 2020 (Unaudited) |
Manager Commentary
Market Overview
In the fixed income markets, the first half of 2020 was defined by two distinct quarters. The first quarter was dominated by COVID-19 fears, which led the Federal Reserve (Fed) to unleash a massive stimulus effort designed to bolster markets. Buying a mix of Treasuries, mortgage-backed securities, agency securities, corporate bonds and bond ETFs, the Fed, under Chairman Jay Powell, has increased the size of its balance sheet in 2020 from approximately $4 trillion to more than $7 trillion. At the current pace of asset purchases, the Fed’s balance sheet will have grown more in less than one year than it did over the six-year expansionary period (2008-2014) under Chairman Ben Bernanke. Given the liquidity provided by the Fed’s purchases, risk assets performed very well in the second quarter. Investment grade and high yield corporate bonds generated their highest quarterly returns since 2009, erasing most of their losses from the first quarter.
Fund Performance
The Segall Bryant & Hamill Short Term Plus Fund (the “Fund”) returned 0.67% (retail class) for the first half of 2020 compared to a return of 2.88% for its benchmark, the Bloomberg Barclays 1-3 Year U.S. Government/Credit Index. The most significant drivers of Fund performance relative to the benchmark during this period were duration and sector selection. The duration of the Fund averaged 1.18 years over this period vs. 1.92 years for the benchmark. This hurt relative returns as 1- to 3-year Treasury yields declined over 1.4% in the first half of the year. The Fund’s average allocation to the high yield corporate sector averaged 10.38% during this period vs. 0% for the benchmark. This hurt relative returns as 0 to 3-year high yield bonds returned -6.56% in the first half of the year.
Outlook and Positioning
The remainder of 2020 will be heavily influenced by the trajectory of COVID-19 and the impact it has on the reopening of cities and countries. While spreads on corporate bonds – both investment grade and high yield – made a strong recovery throughout the second quarter, they remain wide to where they began 2020. Following the record amount of new bonds issued in the first half of 2020, many corporate bond issuers have pushed out debt maturities and enhanced balance sheet liquidity, so we expect to remain overweight on corporate credit. The Fed has pledged its support to markets via low rates and continued quantitative easing, which will boost most fixed income markets. However, even with the Fed’s explicit support, the U.S. economy remains wobbly, as evidenced by various factors such as elevated unemployment and rising defaults in high yield. As November approaches, there will be increased focus on the U.S. elections. In short, we can say with conviction that uncertainty is quite high. Against this backdrop, we intend to maintain our bias toward securities that meet our standards for high quality, and to put a premium on safety and liquidity.
Semi-Annual Report | June 30, 2020 |  | 25 |
Segall Bryant & Hamill Plus Bond Fund | Fund Overview |
| | June 30, 2020 (Unaudited) |
Fund Strategy
A fixed-income fund focusing on investment quality bonds of varying maturities.
Fund Management
Troy A. Johnson, CFA Portfolio Manager | Darren G. Hewitson, CFA Portfolio Manager |
Kenneth A. Harris, CFA Portfolio Manager | Gregory M. Shea, CFA Portfolio Manager |
CFA is a trademark owned by CFA Institute.
Cumulative Returns

The chart above represents historical performance of a hypothetical investment of $10,000 in the Fund over the past 10 years (or for the life of the Fund if shorter). Performance calculations are as of the end of June each year. Past performance does not guarantee future results. This chart does not reflect the deduction of taxes that a shareholder would pay on Fund distributions or the redemption of Fund shares.
Please see index definitions beginning on page 38.
Average Annual Total Returns
| | 6 Months | 1 Year | 3 Years | 5 Years | 10 Years | Since
Inception | 30-Day
SEC Yield | Inception
Date |
Retail Class (WTIBX) | 5.48% | 7.97% | 5.20% | 4.47% | 4.19% | 6.01% | 2.16% | 6/1/88 |
Institutional Class (WIIBX) | 5.53% | 8.03% | 5.36% | 4.62% | 4.34% | 6.07% | 2.30% | 9/28/07 |
Bloomberg Barclays U.S. Aggregate Bond Index | 6.14% | 8.74% | 5.32% | 4.30% | 3.82% | 6.33% | | |
Retail Class Annual Expense Ratio (per the current prospectus) — Gross: 0.73%, Net: 0.55%
Institutional Class Annual Expense Ratio (per the current prospectus) — Gross: 0.55%, Net: 0.40%
Asset Allocation (as of 6/30/20)
Industrial | 32.0% |
Mortgage-Backed Securities Passthrough | 23.7% |
U.S. Treasury Bonds & Notes | 13.5% |
Finance | 11.7% |
Municipal Bonds | 9.8% |
Utility | 3.2% |
Asset Backed Securities | 3.0% |
Residential Mortgage-Backed Securities | 0.6% |
Percentages are based on Total Net Assets.
Top Ten Corporate Holdings
(as of 6/30/20)
Capital One Financial Corp. | 1.2% |
Oncor Electric Delivery Co. LLC | 1.1% |
Cboe Global Markets, Inc. | 1.1% |
Moody’s Corp. | 1.0% |
Harley-Davidson Financial Services, Inc. | 0.9% |
Comcast Corp. | 0.8% |
Roper Technologies, Inc. | 0.8% |
Boardwalk Pipelines LP | 0.8% |
Fiserv, Inc. | 0.8% |
Wells Fargo & Co. | 0.8% |
Percentages represent the Fund’s aggregate holdings in the same corporate issuer and its affiliates. Holdings are subject to change and may not reflect the current or future position of the Fund.
30-Day SEC Yield figures reflect all fee waivers and expense reimbursements. Without the absorption of these fee waivers and/or expense reimbursements, the figures would have been 2.08% for the Retail Class and 2.26% for the Institutional Class.
Performance data quoted represents past performance and does not guarantee future results. Performance information for the Institutional Class shares prior to their inception is based on the performance of the Retail Class. Current performance may be lower or higher than the performance quoted. To obtain current performance as of the most recent month-end, visit www.sbhfunds.com. Average annual total returns reflect the reinvestment of dividends, capital gains distributions, all fee waivers and expense reimbursements. Without the fee waivers and expense reimbursements, total return figures would have been lower. Investment return and principal value will vary, and shares, when redeemed, may be worth more or less than their original cost. Segall Bryant & Hamill fund shares are not insured by the FDIC, the Federal Reserve Board or any other agency and are subject to investment risk.
From May 1, 2020 until at least April 30, 2021, Segall Bryant & Hamill, LLC (the “Adviser”) has contractually agreed to waive the investment advisory and/or administration fees and/or to reimburse other expenses, so that the ratio of expenses to average net assets as reported in the Fund’s Financial Highlights will be no more than 0.55% and 0.40% for the Fund’s Retail Class and Institutional Class, respectively, for such period. This agreement may not be terminated or modified by the Adviser prior to April 30, 2021 without the approval of the Board of Trustees.
Segall Bryant & Hamill Plus Bond Fund may invest in high-yield/high-risk bonds which are subject to greater levels of liquidity risk. Additionally, investing in bonds entails interest rate risk and credit risk.
26 |  | www.sbhfunds.com | www.sbhfunds.com
|
Segall Bryant & Hamill Plus Bond Fund | Fund Overview |
| | June 30, 2020 (Unaudited) |
Manager Commentary
Market Overview
In the fixed income markets, the first half of 2020 was defined by two distinct quarters. The first quarter was dominated by COVID-19 fears, which led the Federal Reserve (Fed) to unleash a massive stimulus effort designed to bolster markets. Buying a mix of Treasuries, mortgage-backed securities, agency securities, corporate bonds and bond ETFs, the Fed, under Chairman Jay Powell, has increased the size of its balance sheet in 2020 from approximately $4 trillion to over $7 trillion. At the current pace of asset purchases, the Fed’s balance sheet will have grown more in less than one year than it did over the six-year expansionary period (2008-2014) under Chairman Ben Bernanke. Given the liquidity provided by the Fed’s purchases, risk assets performed very well in the second quarter. Investment grade and high yield corporate bonds generated their highest quarterly returns since 2009, erasing most of their losses from the first quarter.
Fund Performance
The Segall Bryant & Hamill Plus Bond Fund (the “Fund”) returned 5.48% (retail class) for the first half of 2020 compared to a 6.14% return posted by its benchmark, the Bloomberg Barclays U.S. Aggregate Bond Index. Security selection had a positive effect on Fund returns relative to the benchmark during this period. Treasury holdings in the Fund outperformed those in the benchmark significantly while the Fund’s mortgage-backed securities outperformed comparable bonds in the benchmark and taxable municipals outperformed the benchmark’s government-related securities. Corporate bonds held in the Fund underperformed primarily due to the allocation to high yield. Sector selection had a negative impact on relative performance during the first half of the year. The Fund was overweight corporate securities compared to the benchmark and underweight U.S. Treasury securities. This hurt relative returns as corporate bonds returned 5.02% vs 8.71% for Treasuries.
Outlook and Positioning
The remainder of 2020 will be heavily influenced by the trajectory of COVID-19 and the impact it has on the re-opening of cities and countries. While spreads on corporate bonds – both investment grade and high yield – made a strong recovery throughout the second quarter, they remain wide to where they began 2020. Following the record amount of new bonds issued in the first half of 2020, many corporate bond issuers have pushed out debt maturities and enhanced balance sheet liquidity, so we expect to remain overweight on corporate credit. The Fed has pledged its support to markets via low rates and continued quantitative easing, which will boost most fixed income markets. However, even with the Fed’s explicit support, the U.S. economy remains wobbly, as evidenced by various factors such as elevated unemployment and rising defaults in high yield. And, as November approaches, there will be increased focus on the U.S. elections. In short, we can say with conviction that uncertainty is quite high. Against this backdrop, we intend to maintain our bias toward securities that meet our standards for high quality and to put a premium on safety and liquidity when investing.
Semi-Annual Report | June 30, 2020 |  | 27 |
Segall Bryant & Hamill Quality High Yield Fund | Fund Overview |
| | June 30, 2020 (Unaudited) |
Fund Strategy
A fixed-income fund investing in a wide variety of income-producing securities, primarily bonds and to a lesser extent convertible bonds, and equity securities.
Fund Management
Troy A. Johnson, CFA Portfolio Manager |
Gregory M. Shea, CFA Portfolio Manager |
CFA is a trademark owned by CFA Institute.
Cumulative Returns
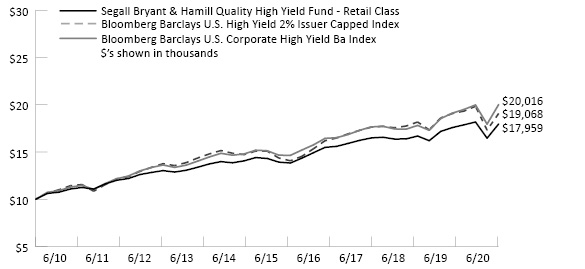
The chart above represents historical performance of a hypothetical investment of $10,000 in the Fund over the past 10 years (or for the life of the Fund if shorter). Performance calculations are as of the end of June each year. Past performance does not guarantee future results. This chart does not reflect the deduction of taxes that a shareholder would pay on Fund distributions or the redemption of Fund shares.
Please see index definitions beginning on page 38.
Average Annual Total Returns
| | 6 Months | 1 Year | 3 Years | 5 Years | 10 Years | Since
Inception | 30-Day
SEC Yield | Inception
Date |
Retail Class (WTLTX) | (1.17)% | 2.14% | 3.43% | 4.64% | 6.03% | 7.09% | 4.33% | 6/1/88 |
Institutional Class (WILTX) | (1.00)% | 2.41% | 3.60% | 4.83% | 6.20% | 7.15% | 4.47% | 9/28/07 |
Bloomberg Barclays U.S. High Yield 2% Issuer Capped Index | (3.83)% | 0.00% | 3.32% | 4.79% | 6.67% | N/A | | |
Bloomberg Barclays U.S. Corporate High Yield Ba Index | 0.21% | 4.75% | 4.98% | 5.75% | 7.19% | 8.37% | | |
Retail Class Annual Expense Ratio (per the current prospectus) — Gross: 0.98%, Net: 0.85%
Institutional Class Annual Expense Ratio (per the current prospectus) — Gross: 0.83%, Net: 0.70%
Asset Allocation (as of 6/30/20)
Industrial | 87.1% |
Finance | 8.3% |
Utility | 1.8% |
Asset Backed Securities | 1.4% |
Percentages are based on Total Net Assets.
Top Ten Holdings
(as of 6/30/20)
PDC Energy, Inc. | 2.6% |
United Rentals North America, Inc. | 2.5% |
Provident Funding Associates LP/PFG Finance Corp. | 2.4% |
AmeriGas Partners LP/AmeriGas Financial Corp. | 2.4% |
MGM Growth Properties Operating Partnership LP | 2.3% |
Teck Resources, Ltd. | 2.3% |
Lamar Media Corp. | 2.3% |
Range Resources Corp. | 2.3% |
MPT Operating Partnership LP/MPT Finance Corp. | 2.3% |
FMG Resources August 2006 Pty., Ltd. | 2.3% |
Percentages represent the Fund’s aggregate holdings in the same corporate issuer and its affiliates. Holdings are subject to change and may not reflect the current or future position of the Fund.
30-Day SEC Yield figures reflect all fee waivers and expense reimbursements. Without the absorption of these fee waivers and/or expense reimbursements, the figures would have been 4.34% for the Retail Class and 4.47% for the Institutional Class.
Performance data quoted represents past performance and does not guarantee future results. Performance information for the Institutional Class shares prior to their inception is based on the performance of the Retail Class. Current performance may be lower or higher than the performance quoted. To obtain current performance as of the most recent month-end, visit www.sbhfunds.com. Average annual total returns reflect the reinvestment of dividends, capital gains distributions, all fee waivers and expense reimbursements. Without the fee waivers and expense reimbursements, total return figures would have been lower. Investment return and principal value will vary, and shares, when redeemed, may be worth more or less than their original cost. Segall Bryant & Hamill fund shares are not insured by the FDIC, the Federal Reserve Board or any other agency and are subject to investment risk.
From May 1, 2020 until at least April 30, 2021, Segall Bryant & Hamill, LLC (the “Adviser”) has contractually agreed to waive the investment advisory and/or administration fees and/or to reimburse other expenses, so that the ratio of expenses to average net assets as reported in the Fund’s Financial Highlights will be no more than 0.85% and 0.70% for the Fund’s Retail Class and Institutional Class, respectively, for such period. This agreement may not be terminated or modified by the Adviser prior to April 30, 2021 without the approval of the Board of Trustees.
Segall Bryant & Hamill Quality High Yield Fund may invest in high-yield/high-risk bonds which are subject to greater levels of liquidity risk. Additionally, investing in bonds entail interest rate risk and credit risk.
28 |  | www.sbhfunds.com | www.sbhfunds.com
|
Segall Bryant & Hamill Quality High Yield Fund | Fund Overview |
| | June 30, 2020 (Unaudited) |
Manager Commentary
Market Overview
In the fixed income markets, the first half of 2020 was defined by two distinct quarters. The first quarter was dominated by COVID-19 fears, which led the Federal Reserve (Fed) to unleash a massive stimulus effort designed to bolster markets. Buying a mix of Treasuries, mortgage-backed securities, agency securities, corporate bonds and bond ETFs, the Fed, under Chairman Jay Powell, has increased the size of its balance sheet in 2020 from approximately $4 trillion to more than $7 trillion. At the current pace of asset purchases, the Fed’s balance sheet will have grown more in less than one year than it did over the six-year expansionary period (2008-2014) under Chairman Ben Bernanke. Given the liquidity provided by the Fed’s purchases, risk assets performed very well in the second quarter. High yield corporate bonds generated their highest quarterly returns since 2009, erasing most of their losses from the first quarter. Despite the Fed’s intervention, the high yield default rate now sits at 6.9%, its highest mark since 2010. During the ’08-’09 financial crisis, the default rate peaked at 14.4% in October 2009.
Fund Performance
The Segall Bryant & Hamill Quality High Yield Fund (the “Fund”) returned -1.17% (retail class) for the first half of 2020 compared to a -3.83% return posted by its benchmark, the Bloomberg Barclays U.S. High Yield 2% Issuer Capped Index. The Fund’s quality bias drove relative returns versus the index during this period of volatile spreads and increasing defaults. Positive contributors to the Fund’s performance relative to the benchmark included an overweight of BBBs and BBs and positive security selection in the Energy, Financial and Consumer Cyclical industries. Detractors from relative performance came from security selection in the asset-backed securities and Theater/Entertainment industries.
Outlook and Positioning
The remainder of 2020 will be heavily influenced by the trajectory of COVID-19 and the impact it has on the reopening of cities and countries. While spreads on high yield bonds made a strong recovery throughout the second quarter, they remain wide to where they began 2020. Following the record amount of new bonds issued in the first half of 2020, many high yield bond issuers have pushed out debt maturities and enhanced balance sheet liquidity. The Fed has pledged its support to markets via low rates and continued quantitative easing, which will boost most fixed income markets. However, even with the Fed’s explicit support, the U.S. economy remains wobbly, as evidenced by various factors such as elevated unemployment and rising defaults in high yield. As November approaches, there will be increased focus on the U.S. elections. In short, we can say with conviction that uncertainty is quite high. Against this backdrop, we intend to maintain our bias toward securities that meet our standards for high quality, and to put a premium on safety and liquidity.
Semi-Annual Report | June 30, 2020 |  | 29 |
Segall Bryant & Hamill Municipal Opportunities Fund | Fund Overview |
| | June 30, 2020 (Unaudited) |
Fund Strategy
A fixed income fund focusing primarily on investment-grade quality bonds of intermediate maturity which provide income exempt from federal taxation.
Fund Management
Kenneth A. Harris, CFA Portfolio Manager |
Nicholas J. Foley Portfolio Manager |
CFA is a trademark owned by CFA Institute.
Cumulative Returns
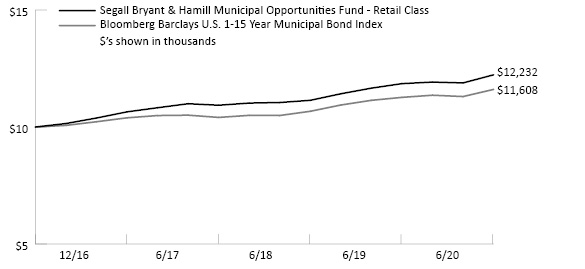
The chart above represents historical performance of a hypothetical investment of $10,000 in the Fund over the past 10 years (or for the life of the Fund if shorter). Performance calculations are as of the end of June each year. Past performance does not guarantee future results. This chart does not reflect the deduction of taxes that a shareholder would pay on Fund distributions or the redemption of Fund shares.
Please see index definitions beginning on page 38.
Average Annual Total Returns
| | 6 Months | 1 Year | 3 Years | 5 Years | 10 Years | Since
Inception | 30-Day
SEC Yield | Inception
Date |
Retail Class (WTTAX) | 2.60% | 4.88% | 4.73% | — | — | 5.86% | 1.93% | 12/16/16 |
Institutional Class (WITAX) | 2.69% | 5.16% | 4.89% | — | — | 6.05% | 2.08% | 12/16/16 |
Bloomberg Barclays U.S. 1-15 Year Municipal Bond Index | 2.18% | 4.18% | 3.75% | — | — | 4.31% | | |
Retail Class Annual Expense Ratio (per the current prospectus) — Gross: 0.89%, Net: 0.65%
Institutional Class Annual Expense Ratio (per the current prospectus) — Gross: 0.71%, Net: 0.50%
Asset Allocation (as of 6/30/20)
Revenue | 67.1% |
General Obligation | 17.8% |
Industrial | 2.3% |
Certificate Participation | 1.3% |
Local Authority | 1.1% |
Percentages are based on Total Net Assets.
Top Ten Holdings
(as of 6/30/20)
Foothill Eastern Transportation Corridor Agency Toll Road | 8.0% |
Virginia Small Business Financing Authority | 5.9% |
Central Platte Valley Metropolitan District | 5.3% |
Texas Transportation commission Central Texas Turnpike System | 4.8% |
Mid-Bay Bridge Authority | 3.9% |
Lower Colorado River Authority Texas Transmission Contract Revenue | 2.8% |
Hesperia California Community Redevelopment Agency Successor | 2.8% |
Colorado High Performance Transportation Enterprise | 2.6% |
Washington Higher Education Facilities Authority | 2.5% |
Wayne County Airport Authority | 2.2% |
Percentages represent the Fund’s aggregate holdings in the same corporate issuer and its affiliates. Holdings are subject to change and may not reflect the current or future position of the Fund.
30-Day SEC Yield figures reflect all fee waivers and expense reimbursements. Without the absorption of these fee waivers and/or expense reimbursements, the figures would have been 1.92% for the Retail Class and 2.04% for the Institutional Class.
Performance data quoted represents past performance and does not guarantee future results. Current performance may be lower or higher than the performance quoted. To obtain current performance as of the most recent month-end, visit www.sbhfunds.com. Average annual total returns reflect the reinvestment of dividends, capital gains distributions, all fee waivers and expense reimbursements. Without the fee waivers and expense reimbursements, total return figures would have been lower. Investment return and principal value will vary, and shares, when redeemed, may be worth more or less than their original cost. Segall Bryant & Hamill fund shares are not insured by the FDIC, the Federal Reserve Board or any other agency and are subject to investment risk.
From May 1, 2020 until at least April 30, 2021, Segall Bryant & Hamill, LLC (the “Adviser”) has contractually agreed to waive the investment advisory and/or administration fees and/or to reimburse other expenses, so that the ratio of expenses to average net assets as reported in the Fund’s Financial Highlights will be no more than 0.65% and 0.50% for the Fund’s Retail Class and Institutional Class, respectively, for such period. This agreement may not be terminated or modified by the Adviser prior to April 30, 2021 without the approval of the Board of Trustees.
Municipal bond fund income may be subject to state and local income taxes and the alternative minimum tax. Capital gains, if any, will be subject to capital gains tax. Investments in municipal bonds are subject to interest rate risk, or the risk that the bonds will decline in value because of changes in market interest rates.
30 |  | www.sbhfunds.com | www.sbhfunds.com
|
Segall Bryant & Hamill Municipal Opportunities Fund | Fund Overview |
| | June 30, 2020 (Unaudited) |
Manager Commentary
Market Overview
In the fixed income markets, the first half of 2020 was defined by two distinct quarters. The first quarter was dominated by COVID-19 fears, which led the Federal Reserve (Fed) to unleash a massive stimulus effort designed to bolster markets. Buying a mix of Treasuries, mortgage-backed securities, agency securities, corporate bonds and bond ETFs, the Fed, under Chairman Jay Powell, has increased the size of its balance sheet in 2020 from approximately $4 trillion to more than $7 trillion. At the current pace of asset purchases, the Fed’s balance sheet will have grown more in less than one year than it did over the six-year expansionary period (2008-2014) under Chairman Ben Bernanke. Given the liquidity provided by the Fed’s purchases, risk assets performed very well in the second quarter.
Municipal bonds staged an impressive rally during the second quarter with the combination of rates falling and spread tightening. While this strong performance was certainly a respite from the chaos in the municipal markets during the first quarter, it also brought to the forefront several new concerns, namely low rates and a rocky credit environment.
Fund Performance
The Segall Bryant & Hamill Municipal Opportunities Fund (the “Fund”) returned 2.60% (retail class) for the first half of 2020, compared to the 2.18% return posted by its benchmark, the Bloomberg Barclays U.S. Municipal Bond 1-15 Year Index. While we viewed the sell-off during the first quarter with some concern, we used it as an opportunity to reposition the Fund by extending duration and taking new or larger positions in some of our favorite credit names. Our larger concern in March as municipal ratios hit all-time highs was a concern that wasn’t top of mind with many investors—zero rates. At that time, we felt we might be moving too quickly as the sell-off could have persisted much longer had it not been for the record-setting fiscal and monetary interventions. However, the market snapped back faster than investors had anticipated and the steps we took to reposition the Fund benefited overall Fund performance for the second quarter. In particular, the Fund’s performance relative to its benchmark was largely driven by our extension in credit duration, which had a strong rally during the quarter. We believe that our income advantage and credit selection will drive performance going forward.
Outlook & Positioning
The remainder of 2020 will be heavily influenced by the trajectory of COVID-19 and the impact it has on the reopening of cities and countries. The Fed has pledged its support to markets via low rates and continued quantitative easing which should boost most all fixed income markets. However, even with the Fed’s explicit support, the U.S. economy remains wobbly, as evidenced by various factors such as elevated unemployment and rising defaults in high yield. As November approaches, there will be increased focus on the U.S. elections. In short, we can say with conviction that uncertainty is quite high. Against this backdrop, we intend to maintain our bias toward securities that meet our standards for high quality, and to put a premium on safety and liquidity when investing.
Thank you for your interest and support.
Semi-Annual Report | June 30, 2020 |  | 31 |
Segall Bryant & Hamill Colorado Tax Free Fund | Fund Overview |
| | June 30, 2020 (Unaudited) |
Fund Strategy
A Colorado municipal bond fund focused on investment-grade quality bonds of intermediate maturity that provide federal and state tax-exempt income.
Fund Management
Kenneth A. Harris, CFA Portfolio Manager |
Nicholas J. Foley Portfolio Manager |
CFA is a trademark owned by CFA Institute.
Cumulative Returns

The chart above represents historical performance of a hypothetical investment of $10,000 in the Fund over the past 10 years (or for the life of the Fund if shorter). Performance calculations are as of the end of June each year. Past performance does not guarantee future results. This chart does not reflect the deduction of taxes that a shareholder would pay on Fund distributions or the redemption of Fund shares.
Please see index definitions beginning on page 38.
Average Annual Total Returns
| | 6 Months | 1 Year | 3 Years | 5 Years | 10 Years | Since
Inception | 30-Day
SEC Yield | Inception
Date |
Retail Class (WTCOX) | 1.85% | 3.87% | 3.71% | 3.38% | 3.50% | 4.51% | 1.74% | 6/1/91 |
Institutional Class (WICOX) | 1.91% | 3.98% | 3.85% | 3.50% | 3.56% | 4.53% | 1.89% | 4/29/16 |
Bloomberg Barclays U.S. 1-15 Year Municipal Bond Index | 2.18% | 4.18% | 3.75% | 3.42% | 3.59% | N/A | | |
Bloomberg Barclays U.S. 10-Year Municipal Bond Index | 2.47% | 4.74% | 4.37% | 4.16% | 4.47% | 5.70% | | |
Retail Class Annual Expense Ratio (per the current prospectus) — Gross: 0.72%, Net: 0.65%
Institutional Class Annual Expense Ratio (per the current prospectus) — Gross: 0.56%, Net: 0.50%
Asset Allocation (as of 6/30/20)
Revenue | 56.2% |
General Obligation | 18.7% |
Certificate Participation | 18.7% |
Local Authority | 3.6% |
Prerefunded | 0.4% |
Percentages are based on Total Net Assets.
Top Ten Holdings
(as of 6/30/20)
Colorado Educational & Cultural Facilities Authority | 5.5% |
Colorado Health Facilities Authority | 4.1% |
Regional Transportation District Colorado | 4.0% |
City & County of Denver Colorado | 4.0% |
Denver City & County School District No. 1 COP | 3.7% |
Berthoud Colorado COP | 3.6% |
Park Creek Metropolitan District | 3.6% |
Colorado School of Mines | 3.3% |
City & County of Denver Colorado | 3.2% |
Central Platte Valley Metropolitan District | 3.0% |
Percentages represent the Fund’s aggregate holdings in the same corporate issuer and its affiliates. Holdings are subject to change and may not reflect the current or future position of the Fund.
30-Day SEC Yield figures reflect all fee waivers and expense reimbursements. Without the absorption of these fee waivers and/or expense reimbursements, the figures would have been 1.72% for the Retail Class and 1.85% for the Institutional Class.
Performance data quoted represents past performance and does not guarantee future results. Performance information for the Institutional Class shares prior to their inception is based on the performance of the Retail Class. Current performance may be lower or higher than the performance quoted. To obtain current performance as of the most recent month-end, visit www.sbhfunds.com. Average annual total returns reflect the reinvestment of dividends, capital gains distributions, all fee waivers and expense reimbursements. Without the fee waivers and expense reimbursements, total return figures would have been lower. Investment return and principal value will vary, and shares, when redeemed, may be worth more or less than their original cost. Segall Bryant & Hamill fund shares are not insured by the FDIC, the Federal Reserve Board or any other agency and are subject to investment risk.
From May 1, 2020 until at least April 30, 2021, Segall Bryant & Hamill, LLC (the “Adviser”) has contractually agreed to waive the investment advisory and/or administration fees and/or to reimburse other expenses, so that the ratio of expenses to average net assets as reported in the Fund’s Financial Highlights will be no more than 0.65% and 0.50% for the Fund’s Retail Class and Institutional Class, respectively, for such period. This agreement may not be terminated or modified by the Adviser prior to April 30, 2021 without the approval of the Board of Trustees.
Segall Bryant & Hamill Colorado Tax Free Fund invests primarily in instruments issued by or on behalf of one state and generally will be more volatile and loss of principal could be greater due to state specific risk.
32 |  | www.sbhfunds.com | www.sbhfunds.com
|
Segall Bryant & Hamill Colorado Tax Free Fund | Fund Overview |
| | June 30, 2020 (Unaudited) |
Manager Commentary
Market Overview
In the fixed income markets, the first half of 2020 was defined by two distinct quarters. The first quarter was dominated by COVID-19 fears, which led the Federal Reserve (Fed) to unleash a massive stimulus effort designed to bolster markets. Buying a mix of Treasuries, mortgage-backed securities, agency securities, corporate bonds and bond ETFs, the Fed, under Chairman Jay Powell, has increased the size of its balance sheet in 2020 from around $4 trillion to over $7 trillion. At the current pace of asset purchases, the Fed’s balance sheet will have grown more in less than one year than it did over the six-year expansionary period (2008-2014) under Chairman Ben Bernanke. Given the liquidity provided by the Fed’s purchases, risk assets performed very well in the second quarter.
Municipal bonds staged an impressive rally with the combination of rates falling and tightening of credit spreads. While the strong positive performance was certainly a respite from the pure chaos of the first quarter, it also brought to the forefront plenty of new concerns, namely low rates and a rocky credit environment.
Performance
The Segall Bryant & Hamill Colorado Tax Free Fund (the “Fund”) returned 1.85% (retail class) for the first half of 2020. This compares to the 2.18% return posted by its benchmark, the Bloomberg Barclays 1-15 Year Municipal Bond Index. The main driver of the Fund’s underperformance versus the benchmark was a rotation out of high-quality beta and into more spread and yield positions, as evidenced by the bulk of performance coming from price gains rather than income. We remain confident in the positioning moves we made in the Fund during the first half of 2020, as they were driven by our view that a strong income advantage will drive performance going forward.
Outlook and Positioning
The remainder of 2020 will be heavily influenced by the trajectory of COVID-19 and the impact it has on the re-opening of cities and countries. The Fed has pledged its support to markets via low rates and continued quantitative easing, which will boost most all fixed income markets. However, even with the Fed’s explicit support, the U.S. economy remains wobbly, as evidenced by various factors such as elevated unemployment and rising defaults in high yield. As November approaches, there will be increased focus on the U.S. elections. In short, we can say with conviction that uncertainty is quite high. Against this backdrop, we intend to maintain our bias toward securities we consider high quality, and to put a premium on safety and liquidity when investing.
Semi-Annual Report | June 30, 2020 |  | 33 |
Segall Bryant & Hamill Funds | Fund Expenses |
| | June 30, 2020 (Unaudited) |
Disclosure of Fund Expenses
As a shareholder of a Fund, you may incur two types of costs: (1) transaction costs; and (2) ongoing costs, including management fees and other Fund expenses. The examples on the next page are intended to help you understand your ongoing costs (in dollars) of investing in a Fund and to compare these costs with the ongoing costs of investing in other mutual funds. The examples are based on an investment of $1,000 invested on January 1, 2020 and held until June 30, 2020.
Actual Expenses. The first line of the table on the next page provides information about actual account values and actual expenses. You may use the information in this line, together with the amount you invested, to estimate the expenses that you paid over the period. Simply divide your account value by $1,000 (for example, an $8,600 account value divided by $1,000 = 8.6), then multiply the result by the number in the first line under the heading “Expenses Paid During Period” to estimate the expenses you paid on your account during this period.
Hypothetical Example for Comparison Purposes. The second line of the table on the next page provides information about hypothetical account values and hypothetical expenses based on the Fund’s actual expense ratio and an assumed rate of return of 5% per year before expenses, which is not the Fund’s actual return. The hypothetical account values and expenses may not be used to estimate the actual ending account balance or expenses you paid for the period. You may use this information to compare the ongoing costs of investing in a Fund and other mutual funds. To do so, compare this 5% hypothetical example with the 5% hypothetical examples that appear in the shareholder reports of other funds.
Expenses shown in the table on the next page are meant to highlight ongoing Fund costs only and do not reflect transaction costs. Therefore, the second line of the table is useful in comparing ongoing costs only and may not help you determine the relative total costs of owning different funds. In addition, if these transactional costs were included, your costs would have been higher.
34 |  | www.sbhfunds.com | www.sbhfunds.com
|
Segall Bryant & Hamill Funds | Fund Expenses |
| | June 30, 2020 (Unaudited) |
| Beginning Account
Value
January 1, 2020 | Ending Account
Value
June 30, 2020 | Expense
Ratio(a) | Expenses Paid
During Period(b) |
Segall Bryant & Hamill Small Cap Value Fund | | | | |
Retail | | | | |
Based on Actual Fund Return | $ 1,000.00 | $ 815.10 | 1.05% | $ 4.74 |
Based on Hypothetical 5% Return (before expenses) | $ 1,000.00 | $ 1,019.64 | 1.05% | $ 5.27 |
Institutional | | | | |
Based on Actual Fund Return | $ 1,000.00 | $ 815.10 | 0.99% | $ 4.47 |
Based on Hypothetical 5% Return (before expenses) | $ 1,000.00 | $ 1,019.94 | 0.99% | $ 4.97 |
| | | | |
Segall Bryant & Hamill Small Cap Value Dividend Fund | | | | |
Retail | | | | |
Based on Actual Fund Return | $ 1,000.00 | $ 746.40 | 1.14% | $ 4.95 |
Based on Hypothetical 5% Return (before expenses) | $ 1,000.00 | $ 1,019.19 | 1.14% | $ 5.72 |
Institutional | | | | |
Based on Actual Fund Return | $ 1,000.00 | $ 746.40 | 0.99% | $ 4.30 |
Based on Hypothetical 5% Return (before expenses) | $ 1,000.00 | $ 1,019.94 | 0.99% | $ 4.97 |
| | | | | |
Segall Bryant & Hamill Small Cap Growth Fund | | | | |
Retail | | | | |
Based on Actual Fund Return | $ 1,000.00 | $ 1,080.50 | 1.13% | $ 5.85 |
Based on Hypothetical 5% Return (before expenses) | $ 1,000.00 | $ 1,019.24 | 1.13% | $ 5.67 |
Institutional | | | | |
Based on Actual Fund Return | $ 1,000.00 | $ 1,081.00 | 0.99% | $ 5.12 |
Based on Hypothetical 5% Return (before expenses) | $ 1,000.00 | $ 1,019.94 | 0.99% | $ 4.97 |
| | | | | |
Segall Bryant & Hamill Small Cap Core Fund | | | | |
Retail | | | | |
Based on Actual Fund Return | $ 1,000.00 | $ 944.00 | 1.14% | $ 5.51 |
Based on Hypothetical 5% Return (before expenses) | $ 1,000.00 | $ 1,019.19 | 1.14% | $ 5.72 |
Institutional | | | | |
Based on Actual Fund Return | $ 1,000.00 | $ 945.00 | 0.99% | $ 4.79 |
Based on Hypothetical 5% Return (before expenses) | $ 1,000.00 | $ 1,019.94 | 0.99% | $ 4.97 |
| | | | | |
Segall Bryant & Hamill Mid Cap Value Dividend Fund | | | | |
Retail | | | | |
Based on Actual Fund Return | $ 1,000.00 | $ 826.30 | 0.99% | $ 4.50 |
Based on Hypothetical 5% Return (before expenses) | $ 1,000.00 | $ 1,019.94 | 0.99% | $ 4.97 |
Institutional | | | | |
Based on Actual Fund Return | $ 1,000.00 | $ 825.70 | 0.84% | $ 3.81 |
Based on Hypothetical 5% Return (before expenses) | $ 1,000.00 | $ 1,020.69 | 0.84% | $ 4.22 |
| | | | | |
Segall Bryant & Hamill All Cap Fund | | | | |
Retail | | | | |
Based on Actual Fund Return | $ 1,000.00 | $ 1,020.60 | 0.96% | $ 4.82 |
Based on Hypothetical 5% Return (before expenses) | $ 1,000.00 | $ 1,020.09 | 0.96% | $ 4.82 |
Institutional | | | | |
Based on Actual Fund Return | $ 1,000.00 | $ 1,021.20 | 0.84% | $ 4.22 |
Based on Hypothetical 5% Return (before expenses) | $ 1,000.00 | $ 1,020.69 | 0.84% | $ 4.22 |
| | | | |
Semi-Annual Report | June 30, 2020 |  | 35 |
Segall Bryant & Hamill Funds | Fund Expenses |
| | June 30, 2020 (Unaudited) |
| Beginning Account
Value
January 1, 2020 | Ending Account
Value
June 30, 2020 | Expense
Ratio(a) | Expenses Paid
During Period(b) |
Segall Bryant & Hamill Emerging Markets Fund | | | | |
Retail | | | | |
Based on Actual Fund Return | $ 1,000.00 | $ 862.70 | 1.38% | $ 6.39 |
Based on Hypothetical 5% Return (before expenses) | $ 1,000.00 | $ 1,018.00 | 1.38% | $ 6.92 |
Institutional | | | | |
Based on Actual Fund Return | $ 1,000.00 | $ 863.10 | 1.23% | $ 5.70 |
Based on Hypothetical 5% Return (before expenses) | $ 1,000.00 | $ 1,018.75 | 1.23% | $ 6.17 |
| | | | | |
Segall Bryant & Hamill International Small Cap Fund | | | | |
Retail | | | | |
Based on Actual Fund Return | $ 1,000.00 | $ 761.20 | 1.18% | $ 5.17 |
Based on Hypothetical 5% Return (before expenses) | $ 1,000.00 | $ 1,019.00 | 1.18% | $ 5.92 |
Institutional | | | | |
Based on Actual Fund Return | $ 1,000.00 | $ 762.20 | 1.03% | $ 4.51 |
Based on Hypothetical 5% Return (before expenses) | $ 1,000.00 | $ 1,019.74 | 1.03% | $ 5.17 |
| | | | | |
Segall Bryant & Hamill Fundamental International Small Cap Fund | | | |
Retail | | | | |
Based on Actual Fund Return | $ 1,000.00 | $ 927.70 | 1.25% | $ 5.99 |
Based on Hypothetical 5% Return (before expenses) | $ 1,000.00 | $ 1,018.65 | 1.25% | $ 6.27 |
Institutional | | | | |
Based on Actual Fund Return | $ 1,000.00 | $ 928.10 | 1.10% | $ 5.27 |
Based on Hypothetical 5% Return (before expenses) | $ 1,000.00 | $ 1,019.39 | 1.10% | $ 5.52 |
| | | | |
Segall Bryant & Hamill Global Large Cap Fund | | | | |
Retail | | | | |
Based on Actual Fund Return | $ 1,000.00 | $ 886.50 | 0.89% | $ 4.17 |
Based on Hypothetical 5% Return (before expenses) | $ 1,000.00 | $ 1,020.44 | 0.89% | $ 4.47 |
Institutional | | | | |
Based on Actual Fund Return | $ 1,000.00 | $ 886.20 | 0.74% | $ 3.47 |
Based on Hypothetical 5% Return (before expenses) | $ 1,000.00 | $ 1,021.18 | 0.74% | $ 3.72 |
| | | | | |
Segall Bryant & Hamill Workplace Equality Fund | | | | |
Retail | | | | |
Based on Actual Fund Return | $ 1,000.00 | $ 898.80 | 0.89% | $ 4.20 |
Based on Hypothetical 5% Return (before expenses) | $ 1,000.00 | $ 1,020.44 | 0.89% | $ 4.47 |
Institutional | | | | |
Based on Actual Fund Return | $ 1,000.00 | $ 898.90 | 0.74% | $ 3.49 |
Based on Hypothetical 5% Return (before expenses) | $ 1,000.00 | $ 1,021.18 | 0.74% | $ 3.72 |
| | | | | |
Segall Bryant & Hamill Short Term Plus Fund | | | | |
Retail | | | | |
Based on Actual Fund Return | $ 1,000.00 | $ 1,006.70 | 0.49% | $ 2.44 |
Based on Hypothetical 5% Return (before expenses) | $ 1,000.00 | $ 1,022.43 | 0.49% | $ 2.46 |
Institutional | | | | |
Based on Actual Fund Return | $ 1,000.00 | $ 1,007.80 | 0.40% | $ 2.00 |
Based on Hypothetical 5% Return (before expenses) | $ 1,000.00 | $ 1,022.87 | 0.40% | $ 2.01 |
| | | | | |
Segall Bryant & Hamill Plus Bond Fund | | | | |
Retail | | | | |
Based on Actual Fund Return | $ 1,000.00 | $ 1,054.80 | 0.55% | $ 2.81 |
Based on Hypothetical 5% Return (before expenses) | $ 1,000.00 | $ 1,022.13 | 0.55% | $ 2.77 |
Institutional | | | | |
Based on Actual Fund Return | $ 1,000.00 | $ 1,055.30 | 0.40% | $ 2.04 |
Based on Hypothetical 5% Return (before expenses) | $ 1,000.00 | $ 1,022.87 | 0.40% | $ 2.01 |
| | | | |
36 |  | www.sbhfunds.com | www.sbhfunds.com
|
Segall Bryant & Hamill Funds | Fund Expenses |
| | June 30, 2020 (Unaudited) |
| Beginning Account
Value
January 1, 2020 | Ending Account
Value
June 30, 2020 | Expense
Ratio(a) | Expenses Paid
During Period(b) |
Segall Bryant & Hamill Quality High Yield Fund | | | | |
Retail | | | | |
Based on Actual Fund Return | $ 1,000.00 | $ 988.30 | 0.85% | $ 4.20 |
Based on Hypothetical 5% Return (before expenses) | $ 1,000.00 | $ 1,020.64 | 0.85% | $ 4.27 |
Institutional | | | | |
Based on Actual Fund Return | $ 1,000.00 | $ 990.00 | 0.70% | $ 3.46 |
Based on Hypothetical 5% Return (before expenses) | $ 1,000.00 | $ 1,021.38 | 0.70% | $ 3.52 |
| | | | | |
Segall Bryant & Hamill Municipal Opportunities Fund | | | | |
Retail | | | | |
Based on Actual Fund Return | $ 1,000.00 | $ 1,026.00 | 0.65% | $ 3.27 |
Based on Hypothetical 5% Return (before expenses) | $ 1,000.00 | $ 1,021.63 | 0.65% | $ 3.27 |
Institutional | | | | |
Based on Actual Fund Return | $ 1,000.00 | $ 1,026.90 | 0.50% | $ 2.52 |
Based on Hypothetical 5% Return (before expenses) | $ 1,000.00 | $ 1,022.38 | 0.50% | $ 2.51 |
| | | | | |
Segall Bryant & Hamill Colorado Tax Free Fund | | | | |
Retail | | | | |
Based on Actual Fund Return | $ 1,000.00 | $ 1,018.50 | 0.65% | $ 3.26 |
Based on Hypothetical 5% Return (before expenses) | $ 1,000.00 | $ 1,021.63 | 0.65% | $ 3.27 |
Institutional | | | | |
Based on Actual Fund Return | $ 1,000.00 | $ 1,019.10 | 0.50% | $ 2.51 |
Based on Hypothetical 5% Return (before expenses) | $ 1,000.00 | $ 1,022.38 | 0.50% | $ 2.51 |
(a) | Annualized, based on each Fund’s most recent one-half year expenses. |
(b) | Expenses are equal to each Fund’s annualized net expense ratio multiplied by the average account value over the period, muliplied by 182/366 (to reflect the one-half year period). |
Semi-Annual Report | June 30, 2020 |  | 37 |
Segall Bryant & Hamill Funds | Important Disclosures |
| | June 30, 2020 (Unaudited) |
INDEX DEFINITIONS AND DISCLOSURES
All indices are unmanaged and index performance figures include reinvestment of dividends but do not reflect any fees, expenses or taxes. Investors cannot invest directly in an index.
The Bloomberg Barclays U.S. 10-Year Municipal Bond Index includes investment grade (Moody’s Investor Services Aaa to Baa, Standard and Poor’s Corporation AAA to BBB) tax-exempt bonds with maturities between eight and twelve years.
The Bloomberg Barclays U.S. 1-15 Year Municipal Bond Index measures the performance of investment grade (Moody’s Investor Services Aaa to Baa, Standard and Poor’s Corporation AAA to BBB) general obligation and revenue bonds with maturities ranging from 1 to 17 years. It is a broad index that is representative of the tax-exempt bond market.
The Bloomberg Barclays U.S. Aggregate Bond Index is a fixed income, market-value-weighted index generally representative of investment grade fixed-rate debt issues, including government, corporate, asset-backed, and mortgage-backed securities with maturities of at least one year.
The Bloomberg Barclays U.S. Corporate High Yield Ba Index measures the performance of intermediate (1 to 10 year) U.S. high yield issues. It includes fixed-rate, noninvestment grade debt issues rated Ba1 or lower by Moody’s, rated BB+ or lower by S&P, rated below investment grade by Fitch Investor’s Service or if unrated previously held a high yield rating or have been associated with a high yield issuer, and must trade accordingly.
The Bloomberg Barclays U.S. High Yield 2% Issuer Capped Index is an unmanaged index that is comprised of predominantly US High Yield Corporate Bonds and a broad cross section of leveraged loans syndicated in the United States, including dollar-denominated loans to overseas issuers. The weighting of index constituents is limited to a maximum 2%.
The Bloomberg Barclays U.S. Government/Credit 1-3 Year Index includes medium and larger issues of U.S. government, investment-grade corporate and investment-grade international dollar-denominated bonds that have maturities of between one and three years.
The MSCI ACWI ex USA Small Cap Index captures small cap representation across 22 of 23 Developed Market countries (excluding the U.S.) and 23 Emerging Market countries. With 4,233 constituents, the index covers approximately 14% of the global equity opportunity set outside the U.S. MSCI Inc. launched the MSCI ACWI ex USA Small Cap Index on June 1, 2007. Data prior to the launch date is back-tested data provided and derived by MSCI (i.e. calculations of how the index might have performed over that time period had the index existed). There may be material differences between back-tested performance and actual results. Past performance, whether actual or back-tested, is no indication or guarantee of future performance.
The MSCI EAFE Small Cap Index measures small cap representation across Developed Markets countries around the world, excluding the US and Canada. It is maintained by MSCI Barra, a provider of investment decision support tools; the EAFE acronym stands for Europe, Australasia and the Far East.
The MSCI Emerging Markets Index measures equity market performance of emerging markets, which consists of the following 23 emerging market indexes: Brazil, Chile, China, Colombia, Czech Republic, Egypt, Greece, Hungary, India, Indonesia, Korea, Malaysia, Mexico, Peru, Philippines, Poland, Qatar, Russia, South Africa, Taiwan, Thailand, Turkey and United Arab Emirates.
The MSCI World Index captures large and mid cap representation across 23 Developed Markets countries. With 1,632 constituents, the index covers approximately 85% of the free float-adjusted market capitalization in each country.
The Russell 1000® Index measures the performance of the large-cap segment of the U.S. equity universe. It is a subset of the Russell 3000® Index and includes approximately 1000 of the largest securities based on a combination of their market cap and current index membership. The Russell 1000® Index represents approximately 92% of the U.S. market.
The Russell 2000® Index measures the performance of the small-cap segment of the U.S. equity universe. The Russell 2000® Index is a subset of the Russell 3000® Index representing approximately 10% of the total market capitalization of that index. It includes approximately 2000 of the smallest securities based on a combination of their market cap and current index membership.
The Russell 2000® Growth Index measures the performance of the small-cap growth segment of the U.S. equity universe. It includes those Russell 2000® Index companies with higher price-to-value ratios and higher forecasted growth values.
The Russell 2000® Value Index measures the performance of companies within the Russell 2000® Index having lower price-to-book ratios and lower forecasted growth values. The Russell 2000® Index includes the 2000 firms from the Russell 3000® Index with the smallest market capitalizations. The Russell 3000® Index represents 98% of the investable U.S. equity market.
The Russell 3000® Index measures the performance of the 3,000 largest U.S. stocks.
38 |  | www.sbhfunds.com | www.sbhfunds.com
|
Segall Bryant & Hamill Funds | Important Disclosures |
| | June 30, 2020 (Unaudited) |
The Russell Midcap® Value Index measures the performance of those Russell Midcap companies with lower price-to-book ratios and lower forecasted growth values. The stocks are also members of the Russell 1000® Value index.
Bloomberg Barclays U.S. is the source and owner of the Barclays Capital Index data contained in this material and all trademarks and copyrights related thereto. Any further dissemination or redistribution is strictly prohibited. Barclays Capital is not responsible for the formatting or configuration of this material or for any inaccuracy in Segall Bryant & Hamill’s presentation thereof.
MSCI Inc. is the source and owner of the MSCI Index data contained in this material and all trademarks and copyrights related thereto. Any further dissemination or redistribution is strictly prohibited. MSCI Barra is not responsible for the formatting or configuration of this material or for any inaccuracy in Segall Bryant & Hamill’s presentation thereof.
FTSE Russell is the source and owner of the Russell Index data contained in this material and all trademarks and copyrights related thereto. Any further dissemination or redistribution is strictly prohibited. Russell Investments is not responsible for the formatting or configuration of this material or for any inaccuracy in Segall Bryant & Hamill’s presentation thereof.
TOP 5/BOTTOM 5 STOCK PERFORMANCE CALCULATION METHODOLOGY
The calculation methodology used to construct this table took into account consistently the weighting of every holding in the Fund that contributed to the Fund’s performance during the measurement period, and the table reflects consistently the results of the calculation. The calculation determined the contribution of each Fund holding by calculating the weight (i.e., percentage of the total investments) of each holding multiplied by the rate of return for that holding during the period ended June 30, 2020.
DEFINITION OF TERMS
Beta: A measure of a fund’s sensitivity to market movements. The beta of the market is 1.00 by definition. A beta above 1 is more volatile than the overall market, while a beta below 1 is less volatile.
Bond Rating Categories:
● | AAA: An obligation rated “AAA” has the highest rating assigned by Standard & Poor’s. The obligor’s capacity to meet its financial commitment on the obligation is extremely strong. |
● | AA+: An obligation rated “AA+” differs from the highest rated obligations only in small degree. The obligor’s capacity to meet its financial commitment on the obligation is very strong. |
● | AA: An obligation rated “AA” differs from the highest rated obligations only in small degree. The obligor’s capacity to meet its financial commitment on the obligation is very strong. |
● | A: An obligation rated “A” is somewhat more susceptible to the adverse effects of changes in circumstances and economic conditions than obligations in higher-rated categories. However, the obligor’s capacity to meet its financial commitment on the obligation is still strong. |
● | BBB: An obligation rated “BBB” exhibits adequate protection parameters. However, adverse economic conditions or changing circumstances are more likely to lead to a weakened capacity of the obligor to meet its financial commitment on the obligation. |
● | Below BBB: Obligations rated “BB,” “B,” “CCC,” “CC” and “C” are regarded as having significant speculative characteristics. “BB” indicates the least degree of speculation and “C” the highest. While such obligations will likely have some quality and protective characteristics, these may be outweighed by large uncertainties or major exposures to adverse conditions. Bonds rated “BB” or below are commonly referred to as “junk” bonds. |
● | Non-Rated: These bonds are not rated. |
Credit Quality Rating: A rating of an individual bond as determined by a nationally recognized statistical rating organization (NRSRO) such as Standard & Poor’s or Moody’s. Credit quality ratings range from highest, “AAA ” to lowest, “D”. For more information regarding rating methodologies for Standard & Poor’s, visit www.standardandpoors.com and for Moody’s, visit www.moodys.com.
Credit Spread: The difference in yield between two bonds of similar maturity, but different credit quality.
Duration: A generic description of the sensitivity of a bond’s price (as a percentage of initial price) to a change in yield.
EPS (Earnings per Share) Growth: Earnings per share is the portion of a company’s profit allocated to each outstanding share of common stock. EPS growth serves as an indicator of a company’s profitability.
Effective Maturity: A weighted average of the maturities of the bonds in a portfolio.
Semi-Annual Report | June 30, 2020 |  | 39 |
Segall Bryant & Hamill Funds | Important Disclosures |
| | June 30, 2020 (Unaudited) |
Emerging Markets: Segall Bryant & Hamill Funds consider emerging market countries to be those countries that are neither U.S. nor developed countries.
Federal Reserve (Fed): The central banking system of the United States.
Free Cash Flow to Total Enterprise Value (FCF/TEV): A valuation metric used to compare the amount of cash a firm generates to the total value of the resources used to generate that cash.
Gross Domestic Product (GDP): The market value of all officially recognized goods and services produced within a country in a given period of time.
Market Capitalization: The market capitalization represents the total value of a company or stock. It is calculated by multiplying the number of shares outstanding by the current price of one share.
Modified Duration: A duration measure in which it is assumed that yield changes do not change the expected cash flows.
Number of Holdings: The Number of Holdings presented excludes short-term investments including money market mutual funds.
OPEC: Is the Organization of the Petroleum Exporting Countries.
Operating Cash Flow to Price (OCF/P): A valuation metric used to compare the amount of cash a firm generates per share from operations to the price of the stock.
Portfolio Turnover Rate: A percentage computed by taking the lesser of purchases or sales of portfolio securities (excluding short-term investments) for the year and dividing it by the monthly average of the market value of the portfolio securities during the year.
Price to Book Value (P/B) Ratio: The P/B ratio is used to compare a company’s book value to its current market price. This ratio compares the market’s valuation of a company to the value of that company as indicated on its financial statements. The higher the ratio, the higher the premium the market is willing to pay for the company above its hard assets.
Price to Cash (P/C) Flow Ratio: The P/C flow ratio is a measure of a firm’s stock price relative to its financial performance. For a fund, the P/C flow ratio is the weighted average of all stocks held in the fund. It represents the amount an investor is willing to pay for a dollar generated from a particular company’s operations.
Price to Earnings (P/E) Ratio: The P/E ratio is a stock’s per share price divided by its per share earnings over a 12-month period. For a fund, the P/E ratio is the weighted average of all stocks held in the fund. The higher the P/E ratio, the more the market is willing to pay for each dollar of annual earnings.
REIT: A REIT is a real estate investment trust. REITs are securities that sell like a stock on a major exchange. REITs invest directly in real estate, either through properties or mortgages.
Return on Equity (ROE): A measure of how well a company used reinvested earnings to generate additional earnings. It is used as a general indication of a company’s efficiency; in other words, how much profit is a company able to generate given the resources provided by its stockholders.
Risk-Adjusted Return: Is a measure of return that incorporates the value of risk involved in the return of an investment. It is intended to help investors compare the returns of investments with varying levels of risk. Risk-adjusted return can be applied to individual securities, mutual funds and portfolios.
Risk On, Risk Off: A concept that describes market sentiment as either “risk on” or “risk off”. During a market sentiment of “risk on”, the market is optimistic and more willing to take on risk in exchange for possibly better returns. When market sentiment is “risk off”, the market is pessimistic and will favor investments with perceived lower risk.
SEC Yield: The SEC Yield is a standardized method of computing return on investment that the U.S. Securities and Exchange Commission (SEC) requires mutual funds to use when advertising their yields. Its objective is to allow a confusion-free comparison of the performance of different funds.
40 |  | www.sbhfunds.com | www.sbhfunds.com
|
Segall Bryant & Hamill Small Cap Value Fund | Statement of Investments |
| | June 30, 2020 (Unaudited) |
| | Shares | | | Value | |
COMMON STOCKS — 92.0% |
Consumer Discretionary — 4.8% |
Consumer Durables & Apparel — 1.4% |
Gildan Activewear, Inc. (Canada) | | | 74,651 | | | $ | 1,156,344 | |
Under Armour, Inc. - Class A (a) | | | 205,834 | | | | 2,004,823 | |
| | | | | | | | 3,161,167 | |
Consumer Services — 2.0% |
Jack in the Box, Inc. | | | 26,376 | | | | 1,954,198 | |
Papa John’s International, Inc. | | | 32,043 | | | | 2,544,535 | |
Red Lion Hotels Corp. (a) | | | 28,395 | | | | 66,160 | |
| | | | | | | | 4,564,893 | |
Retailing — 1.4% |
Core-Mark Holding Co., Inc. | | | 79,497 | | | | 1,983,848 | |
Quotient Technology, Inc. (a) | | | 184,005 | | | | 1,346,916 | |
| | | | | | | | 3,330,764 | |
Consumer Staples — 7.0% |
Food, Beverage & Tobacco — 7.0% |
Hain Celestial Group, Inc. (The) (a) | | | 317,776 | | | | 10,013,122 | |
Pilgrim’s Pride Corp. (a) | | | 78,359 | | | | 1,323,484 | |
TreeHouse Foods, Inc. (a) | | | 108,864 | | | | 4,768,243 | |
| | | | | | | | 16,104,849 | |
Energy — 3.3% |
Energy — 3.3% |
Helmerich & Payne, Inc. | | | 68,774 | | | | 1,341,781 | |
NexTier Oilfield Solutions, Inc. (a) | | | 235,008 | | | | 575,769 | |
Parsley Energy, Inc. - Class A | | | 124,676 | | | | 1,331,540 | |
PDC Energy, Inc. (a) | | | 136,080 | | | | 1,692,835 | |
WPX Energy, Inc. (a) | | | 396,205 | | | | 2,527,788 | |
| | | | | | | | 7,469,713 | |
Financials — 13.2% |
Banks — 13.2% |
Community Bank System, Inc. | | | 44,987 | | | | 2,565,159 | |
Enterprise Financial Services Corp. | | | 71,643 | | | | 2,229,530 | |
First Busey Corp. | | | 106,905 | | | | 1,993,778 | |
Glacier Bancorp, Inc. | | | 30,084 | | | | 1,061,664 | |
Investors Bancorp, Inc. | | | 239,626 | | | | 2,036,821 | |
Lakeland Financial Corp. | | | 73,742 | | | | 3,435,640 | |
National Bank Holdings Corp. - Class A | | | 133,211 | | | | 3,596,697 | |
Renasant Corp. | | | 102,357 | | | | 2,548,689 | |
Seacoast Banking Corp. of Florida (a) | | | 161,057 | | | | 3,285,563 | |
Umpqua Holdings Corp. | | | 290,140 | | | | 3,087,090 | |
United Community Banks, Inc. | | | 135,240 | | | | 2,721,029 | |
WesBanco, Inc. | | | 83,542 | | | | 1,696,738 | |
| | | | | | | | 30,258,398 | |
Health Care — 11.1% |
Healthcare Equipment & Services — 10.6% |
AngioDynamics, Inc. (a) | | | 65,276 | | | | 663,857 | |
Chembio Diagnostics, Inc. (a) | | | 105,296 | | | | 342,212 | |
ICU Medical, Inc. (a) | | | 17,631 | | | | 3,249,570 | |
Magellan Health, Inc. (a) | | | 82,487 | | | | 6,019,901 | |
MEDNAX, Inc. (a) | | | 250,610 | | | | 4,285,431 | |
Orthofix Medical, Inc. (a) | | | 303,153 | | | | 9,700,896 | |
| | | | | | | | 24,261,867 | |
| | Shares | | | Value | |
Pharmaceuticals, Biotechnology & Life Sciences — 0.5% |
Alkermes PLC (Ireland) (a) | | | 60,239 | | | $ | 1,168,938 | |
| |
Industrials — 17.0% |
Capital Goods — 16.5% |
AAR Corp. | | | 23,718 | | | | 490,251 | |
Astec Industries, Inc. | | | 67,095 | | | | 3,107,169 | |
AZZ, Inc. | | | 63,947 | | | | 2,194,661 | |
CIRCOR International, Inc. (a) | | | 83,187 | | | | 2,119,605 | |
Columbus McKinnon Corp. | | | 91,233 | | | | 3,051,744 | |
EnerSys | | | 40,369 | | | | 2,598,956 | |
Manitowoc Co., Inc. (The) (a) | | | 140,417 | | | | 1,527,737 | |
Quanex Building Products Corp. | | | 165,954 | | | | 2,303,442 | |
Regal Beloit Corp. | | | 140,207 | | | | 12,242,875 | |
SPX Corp. (a) | | | 139,963 | | | | 5,759,477 | |
Sterling Construction Co., Inc. (a) | | | 221,925 | | | | 2,323,555 | |
| | | | | | | | 37,719,472 | |
Commercial & Professional Services — 0.5% |
Huron Consulting Group, Inc. (a) | | | 27,496 | | | | 1,216,698 | |
| |
Information Technology — 17.4% |
Software & Services — 7.0% |
CommVault Systems, Inc. (a) | | | 63,597 | | | | 2,461,204 | |
Conduent, Inc. (a) | | | 231,090 | | | | 552,305 | |
CSG Systems International, Inc. | | | 45,197 | | | | 1,870,704 | |
FireEye, Inc. (a) | | | 197,788 | | | | 2,408,069 | |
Progress Software Corp. | | | 225,563 | | | | 8,740,566 | |
| | | | | | | | 16,032,848 | |
Technology Hardware & Equipment — 10.4% |
Belden, Inc. | | | 59,959 | | | | 1,951,665 | |
FARO Technologies, Inc. (a) | | | 135,100 | | | | 7,241,360 | |
FLIR Systems, Inc. | | | 53,960 | | | | 2,189,157 | |
NCR Corp. (a) | | | 627,539 | | | | 10,868,976 | |
Sierra Wireless, Inc. (Canada) (a) | | | 166,444 | | | | 1,494,667 | |
| | | | | | | | 23,745,825 | |
Materials — 7.3% |
Materials — 7.3% |
Coeur Mining, Inc. (a) | | | 114,951 | | | | 583,951 | |
Compass Minerals International, Inc. | | | 86,265 | | | | 4,205,419 | |
Ferro Corp. (a) | | | 164,905 | | | | 1,968,966 | |
P.H. Glatfelter Co. | | | 291,049 | | | | 4,671,336 | |
Schnitzer Steel Industries, Inc. - Class A | | | 125,851 | | | | 2,220,011 | |
Silgan Holdings, Inc. | | | 94,871 | | | | 3,072,872 | |
| | | | | | | | 16,722,555 | |
Real Estate — 7.1% |
Real Estate — 7.1% |
Columbia Property Trust, Inc. | | | 45,197 | | | | 593,889 | |
Cousins Properties, Inc. | | | 35,122 | | | | 1,047,689 | |
Empire State Realty Trust, Inc. - Class A | | | 174,280 | | | | 1,219,960 | |
Equity Commonwealth | | | 338,274 | | | | 10,892,423 | |
Physicians Realty Trust | | | 139,858 | | | | 2,450,312 | |
| | | | | | | | 16,204,273 | |
See Notes to Financial Statements.
Semi-Annual Report | June 30, 2020 |  | 41 |
Segall Bryant & Hamill Small Cap Value Fund | Statement of Investments |
| | June 30, 2020 (Unaudited) |
| | Shares | | | Value | |
Utilities — 3.8% |
Utilities — 3.8% |
ALLETE, Inc. | | | 45,082 | | | $ | 2,461,928 | |
California Water Service Group | | | 43,517 | | | | 2,075,761 | |
New Jersey Resources Corp. | | | 64,577 | | | | 2,108,439 | |
PNM Resources, Inc. | | | 52,616 | | | | 2,022,559 | |
| | | | | | | | 8,668,687 | |
Investments at Value — 92.0% (Cost $210,357,502) | | $ | 210,630,947 | |
| |
Other Assets in Excess of Liabilities — 8.0% | | | 18,427,418 | |
| |
Net Assets — 100.0% | | $ | 229,058,365 | |
(a) | Non-income producing security. |
Sector and industry classifications presented herein are based on the sector and industry categorization methodology of the Adviser to the Funds. For Fund compliance purposes, the Fund’s industry classifications refer to any one or more of the industry sub-classifications used by one or more widely recognized market indexes or ratings group indexes, and/or as defined by Fund management. This definition may not apply for purposes of this report, which may combine industry sub-classifications for reporting ease. Industries are shown as a percentage of net assets.
See Notes to Financial Statements.
42 |  | www.sbhfunds.com | www.sbhfunds.com
|
Segall Bryant & Hamill Small Cap Value Dividend Fund | Statement of Investments |
| | June 30, 2020 (Unaudited) |
| | Shares | | | Value | |
COMMON STOCKS — 96.1% |
Consumer Discretionary — 6.7% |
Consumer Durables & Apparel — 2.4% |
Callaway Golf Co. | | | 24,430 | | | $ | 427,769 | |
M.D.C. Holdings, Inc. | | | 9,920 | | | | 354,144 | |
Wolverine World Wide, Inc. | | | 25,290 | | | | 602,155 | |
| | | | | | | | 1,384,068 | |
Consumer Services — 0.9% |
Graham Holdings Co. - Class B | | | 1,566 | | | | 536,622 | |
| |
Retailing — 3.4% |
Aaron’s, Inc. | | | 22,684 | | | | 1,029,854 | |
Winmark Corp. | | | 5,560 | | | | 952,094 | |
| | | | | | | | 1,981,948 | |
Consumer Staples — 3.2% |
Food & Staples Retailing — 0.5% |
Natural Grocers by Vitamin Cottage, Inc. | | | 19,460 | | | | 289,565 | |
| |
Food, Beverage & Tobacco — 2.7% |
Fresh Del Monte Produce, Inc. (Cayman Islands) | | | 23,940 | | | | 589,403 | |
John B. Sanfilippo & Son, Inc. | | | 11,790 | | | | 1,006,040 | |
| | | | | | | | 1,595,443 | |
Energy — 3.7% |
Energy — 3.7% |
CVR Energy, Inc. | | | 47,270 | | | | 950,600 | |
Enerplus Corp. (Canada) | | | 150,081 | | | | 424,729 | |
Scorpio Tankers, Inc. | | | 26,360 | | | | 337,671 | |
Solaris Oilfield Infrastructure, Inc. - Class A | | | 59,273 | | | | 439,806 | |
| | | | | | | | 2,152,806 | |
Financials — 24.3% |
Banks — 15.8% |
Atlantic Union Bancshares Corp. | | | 39,208 | | | | 908,057 | |
F.N.B. Corp. | | | 59,976 | | | | 449,820 | |
First Interstate BancSystem, Inc. - Class A | | | 27,268 | | | | 844,217 | |
Glacier Bancorp, Inc. | | | 24,895 | | | | 878,545 | |
Independent Bank Corp. | | | 14,702 | | | | 986,357 | |
Independent Bank Group, Inc. | | | 17,570 | | | | 711,936 | |
Lakeland Financial Corp. | | | 16,815 | | | | 783,411 | |
OceanFirst Financial Corp. | | | 24,794 | | | | 437,118 | |
Radian Group, Inc. | | | 60,350 | | | | 936,029 | |
Sandy Spring Bancorp, Inc. | | | 23,684 | | | | 586,890 | |
Umpqua Holdings Corp. | | | 33,478 | | | | 356,206 | |
Washington Federal, Inc. | | | 22,577 | | | | 605,967 | |
Wintrust Financial Corp. | | | 17,023 | | | | 742,543 | |
| | | | | | | | 9,227,096 | |
Diversified Financials — 3.0% |
FirstCash, Inc. | | | 9,550 | | | | 644,434 | |
Houlihan Lokey, Inc. | | | 10,260 | | | | 570,866 | |
SLM Corp. | | | 74,549 | | | | 524,080 | |
| | | | | | | | 1,739,380 | |
| | Shares | | | Value | |
Insurance — 5.5% |
Argo Group International Holdings, Ltd. (Bermuda) | | | 13,687 | | | $ | 476,718 | |
Axis Capital Holdings, Ltd. (Bermuda) | | | 29,954 | | | | 1,214,934 | |
Hanover Insurance Group, Inc. (The) | | | 8,498 | | | | 861,102 | |
Horace Mann Educators Corp. | | | 18,001 | | | | 661,177 | |
| | | | | | | | 3,213,931 | |
Health Care — 5.1% |
Healthcare Equipment & Services — 4.1% |
Ensign Group, Inc. (The) | | | 29,535 | | | | 1,236,040 | |
LeMaitre Vascular, Inc. | | | 33,370 | | | | 880,968 | |
U.S. Physical Therapy, Inc. | | | 3,410 | | | | 276,278 | |
| | | | | | | | 2,393,286 | |
Pharmaceuticals, Biotechnology & Life Sciences — 1.0% |
Phibro Animal Health Corp. - Class A | | | 21,805 | | | | 572,817 | |
| |
Industrials — 13.7% |
Capital Goods — 8.5% |
AAR Corp. | | | 13,620 | | | | 281,525 | |
BWX Technologies, Inc. | | | 7,460 | | | | 422,534 | |
Crane Co. | | | 25,667 | | | | 1,526,160 | |
Encore Wire Corp. | | | 12,530 | | | | 611,715 | |
EnerSys | | | 19,726 | | | | 1,269,960 | |
Mueller Water Products, Inc. - Class A | | | 92,247 | | | | 869,889 | |
| | | | | | | | 4,981,783 | |
Commercial & Professional Services — 3.4% |
Barrett Business Services, Inc. | | | 20,241 | | | | 1,075,405 | |
ICF International, Inc. | | | 13,970 | | | | 905,675 | |
| | | | | | | | 1,981,080 | |
Transportation — 1.8% |
Forward Air Corp. | | | 20,650 | | | | 1,028,783 | |
| |
Information Technology — 11.6% |
Semiconductors & Semiconductor Equipment — 1.5% |
Brooks Automation, Inc. | | | 20,330 | | | | 899,399 | |
| |
Software & Services — 6.4% |
EVERTEC, Inc. | | | 46,350 | | | | 1,302,435 | |
MAXIMUS, Inc. | | �� | 15,719 | | | | 1,107,404 | |
TTEC Holdings, Inc. | | | 27,699 | | | | 1,289,665 | |
| | | | | | | | 3,699,504 | |
Technology Hardware & Equipment — 3.7% |
Benchmark Electronics, Inc. | | | 28,100 | | | | 606,960 | |
InterDigital, Inc. | | | 27,504 | | | | 1,557,552 | |
| | | | | | | | 2,164,512 | |
Materials — 7.3% |
Materials — 7.3% |
Graphic Packaging Holding Co. | | | 58,471 | | | | 818,009 | |
Huntsman Corp. | | | 31,883 | | | | 572,938 | |
Louisiana-Pacific Corp. | | | 36,110 | | | | 926,222 | |
Pan American Silver Corp. (Canada) | | | 32,660 | | | | 992,537 | |
Silgan Holdings, Inc. | | | 28,930 | | | | 937,043 | |
| | | | | | | | 4,246,749 | |
See Notes to Financial Statements.
Semi-Annual Report | June 30, 2020 |  | 43 |
Segall Bryant & Hamill Small Cap Value Dividend Fund | Statement of Investments |
| | June 30, 2020 (Unaudited) |
| | Shares | | | Value | |
Real Estate — 12.4% |
Real Estate — 12.4% |
Agree Realty Corp. | | | 3,780 | | | $ | 248,384 | |
Investors Real Estate Trust | | | 11,355 | | | | 800,414 | |
National Storage Affiliates Trust | | | 14,540 | | | | 416,716 | |
Outfront Media, Inc. | | | 37,955 | | | | 537,822 | |
Physicians Realty Trust | | | 80,676 | | | | 1,413,443 | |
QTS Realty Trust, Inc. - Class A | | | 19,249 | | | | 1,233,668 | |
Rayonier, Inc. | | | 12,240 | | | | 303,430 | |
Rexford Industrial Realty, Inc. | | | 19,885 | | | | 823,836 | |
STAG Industrial, Inc. | | | 49,365 | | | | 1,447,382 | |
| | | | | | | | 7,225,095 | |
Utilities — 8.1% |
Utilities — 8.1% |
ALLETE, Inc. | | | 22,336 | | | | 1,219,769 | |
Atlantica Sustainable Infrastructure PLC (United Kingdom) | | | 48,506 | | | | 1,411,525 | |
Black Hills Corp. | | | 25,890 | | | | 1,466,927 | |
PNM Resources, Inc. | | | 15,250 | | | | 586,210 | |
| | | | | | | | 4,684,431 | |
Investments at Value — 96.1% (Cost $58,275,747) | | $ | 55,998,298 | |
| |
Other Assets in Excess of Liabilities — 3.9% | | | 2,260,583 | |
| |
Net Assets — 100.0% | | $ | 58,258,881 | |
Sector and industry classifications presented herein are based on the sector and industry categorization methodology of the Adviser to the Funds. For Fund compliance purposes, the Fund’s industry classifications refer to any one or more of the industry sub-classifications used by one or more widely recognized market indexes or ratings group indexes, and/or as defined by Fund management. This definition may not apply for purposes of this report, which may combine industry sub-classifications for reporting ease. Industries are shown as a percentage of net assets.
See Notes to Financial Statements.
44 |  | www.sbhfunds.com | www.sbhfunds.com
|
Segall Bryant & Hamill Small Cap Growth Fund | Statement of Investments |
| | June 30, 2020 (Unaudited) |
| | Shares | | | Value | |
COMMON STOCKS — 96.5% |
Communication Services — 2.4% |
Media & Entertainment — 1.3% |
Eventbrite, Inc. - Class A (a) | | | 33,148 | | | $ | 284,078 | |
New York Times Co. (The) - Class A | | | 17,617 | | | | 740,443 | |
| | | | | | | | 1,024,521 | |
Telecommunication Services — 1.1% |
Cogent Communications Holdings, Inc. | | | 10,785 | | | | 834,327 | |
| |
Consumer Discretionary — 12.2% |
Automobiles & Components — 1.7% |
Fox Factory Holding Corp. (a) | | | 15,345 | | | | 1,267,650 | |
| |
Consumer Durables & Apparel — 0.7% |
Callaway Golf Co. | | | 29,865 | | | | 522,936 | |
| |
Consumer Services — 6.8% |
Bright Horizons Family Solutions, Inc. (a) | | | 14,108 | | | | 1,653,458 | |
Churchill Downs, Inc. | | | 11,286 | | | | 1,502,731 | |
Shake Shack, Inc. - Class A (a) | | | 15,385 | | | | 815,097 | |
Vail Resorts, Inc. | | | 3,072 | | | | 559,565 | |
Wingstop, Inc. | | | 4,890 | | | | 679,563 | |
| | | | | | | | 5,210,414 | |
Retailing — 3.0% |
Ollie’s Bargain Outlet Holdings, Inc. (a) | | | 12,224 | | | | 1,193,674 | |
Revolve Group, Inc. (a) | | | 20,455 | | | | 303,961 | |
RH (a) | | | 3,282 | | | | 816,890 | |
| | | | | | | | 2,314,525 | |
Consumer Staples — 0.5% |
Food, Beverage & Tobacco — 0.5% |
Simply Good Foods Co. (The) (a) | | | 19,800 | | | | 367,884 | |
| |
Financials — 10.6% |
Banks — 1.2% |
Bank OZK | | | 14,245 | | | | 334,330 | |
Eagle Bancorp, Inc. | | | 18,183 | | | | 595,494 | |
| | | | | | | | 929,824 | |
Diversified Financials — 4.2% |
Evercore, Inc. - Class A | | | 7,066 | | | | 416,329 | |
Focus Financial Partners, Inc. - Class A (a) | | | 19,533 | | | | 645,566 | |
Hamilton Lane, Inc. - Class A | | | 12,798 | | | | 862,201 | |
Houlihan Lokey, Inc. | | | 12,182 | | | | 677,806 | |
LendingTree, Inc. (a) | | | 2,037 | | | | 589,773 | |
| | | | | | | | 3,191,675 | |
Insurance — 5.2% |
AMERISAFE, Inc. | | | 7,597 | | | | 464,632 | |
Goosehead Insurance, Inc. - Class A (a) | | | 29,283 | | | | 2,200,910 | |
Trupanion, Inc. (a) | | | 30,553 | | | | 1,304,308 | |
| | | | | | | | 3,969,850 | |
Health Care — 25.1% |
Healthcare Equipment & Services — 13.5% |
Addus HomeCare Corp. (a) | | | 14,102 | | | | 1,305,281 | |
Amedisys, Inc. (a) | | | 9,128 | | | | 1,812,273 | |
BioTelemetry, Inc. (a) | | | 12,693 | | | | 573,597 | |
| | Shares | | | Value | |
Healthcare Equipment & Services (continued) |
Cardiovascular Systems, Inc. (a) | | | 22,667 | | | $ | 715,144 | |
CONMED Corp. | | | 10,320 | | | | 742,937 | |
Globus Medical, Inc. - Class A (a) | | | 27,084 | | | | 1,292,178 | |
Inspire Medical Systems, Inc. (a) | | | 10,179 | | | | 885,776 | |
Integra LifeSciences Holdings Corp. (a) | | | 13,713 | | | | 644,374 | |
LivaNova PLC (United Kingdom) (a) | | | 9,322 | | | | 448,668 | |
Omnicell, Inc. (a) | | | 14,617 | | | | 1,032,252 | |
Silk Road Medical, Inc. (a) | | | 21,617 | | | | 905,536 | |
| | | | | | | | 10,358,016 | |
Pharmaceuticals, Biotechnology & Life Sciences — 11.6% |
Adaptive Biotechnologies Corp. (a) | | | 23,000 | | | | 1,112,740 | |
Amicus Therapeutics, Inc. (a) | | | 45,041 | | | | 679,218 | |
Blueprint Medicines Corp. (a) | | | 9,750 | | | | 760,500 | |
Catalent, Inc. (a) | | | 11,308 | | | | 828,876 | |
Fate Therapeutics, Inc. (a) | | | 17,120 | | | | 587,387 | |
Natera, Inc. (a) | | | 25,350 | | | | 1,263,951 | |
Pacira BioSciences, Inc. (a) | | | 12,823 | | | | 672,823 | |
PRA Health Sciences, Inc. (a) | | | 8,150 | | | | 792,914 | |
Turning Point Therapeutics, Inc. (a) | | | 11,979 | | | | 773,724 | |
Twist Bioscience Corp. (a) | | | 15,608 | | | | 707,043 | |
Xencor, Inc. (a) | | | 21,080 | | | | 682,781 | |
| | | | | | | | 8,861,957 | |
Industrials — 17.5% |
Capital Goods — 11.0% |
AeroVironment, Inc. (a) | | | 8,279 | | | | 659,257 | |
Generac Holdings, Inc. (a) | | | 14,407 | | | | 1,756,645 | |
Hexcel Corp. | | | 24,740 | | | | 1,118,743 | |
John Bean Technologies Corp. | | | 8,263 | | | | 710,783 | |
Mercury Systems, Inc. (a) | | | 12,823 | | | | 1,008,657 | |
Proto Labs, Inc. (a) | | | 8,004 | | | | 900,210 | |
TPI Composites, Inc. (a) | | | 36,786 | | | | 859,689 | |
Trex Co., Inc. (a) | | | 10,769 | | | | 1,400,724 | |
| | | | | | | | 8,414,708 | |
Commercial & Professional Services — 5.5% |
ASGN, Inc. (a) | | | 11,642 | | | | 776,289 | |
Huron Consulting Group, Inc. (a) | | | 19,121 | | | | 846,104 | |
Ritchie Bros. Auctioneers, Inc. (Canada) | | | 28,176 | | | | 1,150,990 | |
Tetra Tech, Inc. | | | 7,036 | | | | 556,688 | |
Upwork, Inc. (a) | | | 64,433 | | | | 930,412 | |
| | | | | | | | 4,260,483 | |
Transportation — 1.0% |
Saia, Inc. (a) | | | 6,945 | | | | 772,145 | |
| |
Information Technology — 21.6% |
Semiconductors & Semiconductor Equipment — 9.1% |
Entegris, Inc. | | | 22,549 | | | | 1,331,518 | |
Inphi Corp. (a) | | | 13,097 | | | | 1,538,898 | |
Monolithic Power Systems, Inc. | | | 4,177 | | | | 989,949 | |
Onto Innovation, Inc. (a) | | | 24,723 | | | | 841,571 | |
Power Integrations, Inc. | | | 7,293 | | | | 861,522 | |
Silicon Laboratories, Inc. (a) | | | 13,971 | | | | 1,400,872 | |
| | | | | | | | 6,964,330 | |
Software & Services — 11.3% |
Anaplan, Inc. (a) | | | 12,984 | | | | 588,305 | |
See Notes to Financial Statements.
Semi-Annual Report | June 30, 2020 |  | 45 |
Segall Bryant & Hamill Small Cap Growth Fund | Statement of Investments |
| | June 30, 2020 (Unaudited) |
| | Shares | | | Value | |
Software & Services (continued) |
Endava PLC (United Kingdom) (a) | | | 18,490 | | | $ | 893,067 | |
Envestnet, Inc. (a) | | | 21,206 | | | | 1,559,489 | |
Everbridge, Inc. (a) | | | 5,255 | | | | 727,082 | |
Globant S.A. (Luxembourg) (a) | | | 13,696 | | | | 2,052,346 | |
MAXIMUS, Inc. | | | 17,536 | | | | 1,235,411 | |
RealPage, Inc. (a) | | | 9,823 | | | | 638,593 | |
Zendesk, Inc. (a) | | | 11,497 | | | | 1,017,829 | |
| | | | | | | | 8,712,122 | |
Technology Hardware & Equipment — 1.2% |
Novanta, Inc. (Canada) (a) | | | 8,554 | | | | 913,311 | |
| |
Materials — 3.1% |
Materials — 3.1% |
Ingevity Corp. (a) | | | 15,935 | | | | 837,703 | |
Innospec, Inc. | | | 7,600 | | | | 587,100 | |
Livent Corp. (a) | | | 50,077 | | | | 308,474 | |
PolyOne Corp. | | | 24,206 | | | | 634,924 | |
| | | | | | | | 2,368,201 | |
Real Estate — 3.5% |
Real Estate — 3.5% |
Americold Realty Trust | | | 22,120 | | | | 802,956 | |
QTS Realty Trust, Inc. - Class A | | | 24,069 | | | | 1,542,582 | |
Terreno Realty Corp. | | | 6,524 | | | | 343,424 | |
| | | | | | | | 2,688,962 | |
Investments at Value — 96.5% (Cost $56,421,111) | | $ | 73,947,841 | |
| |
Other Assets in Excess of Liabilities — 3.5% | | | 2,694,352 | |
| |
Net Assets — 100.0% | | $ | 76,642,193 | |
(a) | Non-income producing security. |
Sector and industry classifications presented herein are based on the sector and industry categorization methodology of the Adviser to the Funds. For Fund compliance purposes, the Fund’s industry classifications refer to any one or more of the industry sub-classifications used by one or more widely recognized market indexes or ratings group indexes, and/or as defined by Fund management. This definition may not apply for purposes of this report, which may combine industry sub-classifications for reporting ease. Industries are shown as a percentage of net assets.
See Notes to Financial Statements.
46 |  | www.sbhfunds.com | www.sbhfunds.com
|
Segall Bryant & Hamill Small Cap Core Fund | Statement of Investments |
| | June 30, 2020 (Unaudited) |
| | Shares | | | Value | |
COMMON STOCKS — 93.3% |
Consumer Discretionary — 11.1% |
Automobiles & Components — 3.2% |
Dorman Products, Inc. (a) | | | 7,079 | | | $ | 474,788 | |
Fox Factory Holding Corp. (a) | | | 7,139 | | | | 589,753 | |
Stoneridge, Inc. (a) | | | 7,436 | | | | 153,628 | |
| | | | | | | | 1,218,169 | |
Consumer Durables & Apparel — 2.8% |
Columbia Sportswear Co. | | | 2,369 | | | | 190,894 | |
Steven Madden, Ltd. | | | 6,017 | | | | 148,560 | |
Universal Electronics, Inc. (a) | | | 9,750 | | | | 456,495 | |
Wolverine World Wide, Inc. | | | 11,135 | | | | 265,124 | |
| | | | | | | | 1,061,073 | |
Consumer Services — 2.9% |
Choice Hotels International, Inc. | | | 3,443 | | | | 271,653 | |
Churchill Downs, Inc. | | | 2,593 | | | | 345,258 | |
Jack in the Box, Inc. | | | 3,229 | | | | 239,237 | |
Texas Roadhouse, Inc. | | | 4,687 | | | | 246,395 | |
| | | | | | | | 1,102,543 | |
Retailing — 2.2% |
Children’s Place, Inc. (The) | | | 5,286 | | | | 197,802 | |
Core-Mark Holding Co., Inc. | | | 12,575 | | | | 313,809 | |
Five Below, Inc. (a) | | | 2,807 | | | | 300,097 | |
| | | | | | | | 811,708 | |
Consumer Staples — 5.2% |
Food, Beverage & Tobacco — 5.2% |
Hain Celestial Group, Inc. (The) (a) | | | 43,654 | | | | 1,375,538 | |
Lancaster Colony Corp. | | | 2,082 | | | | 322,689 | |
TreeHouse Foods, Inc. (a) | | | 6,168 | | | | 270,158 | |
| | | | | | | | 1,968,385 | |
Energy — 1.6% |
Energy — 1.6% |
PDC Energy, Inc. (a) | | | 8,277 | | | | 102,966 | |
World Fuel Services Corp. | | | 11,158 | | | | 287,430 | |
WPX Energy, Inc. (a) | | | 34,641 | | | | 221,010 | |
| | | | | | | | 611,406 | |
Financials — 6.5% |
Banks — 6.5% |
Ameris Bancorp | | | 15,593 | | | | 367,839 | |
Glacier Bancorp, Inc. | | | 11,871 | | | | 418,927 | |
IBERIABANK Corp. | | | 3,596 | | | | 163,762 | |
Lakeland Financial Corp. | | | 11,036 | | | | 514,167 | |
Seacoast Banking Corp. of Florida (a) | | | 18,823 | | | | 383,989 | |
South State Corp. | | | 6,495 | | | | 309,552 | |
United Bankshares, Inc. | | | 10,792 | | | | 298,507 | |
| | | | | | | | 2,456,743 | |
Health Care — 15.1% |
Healthcare Equipment & Services — 9.3% |
Amedisys, Inc. (a) | | | 2,697 | | | | 535,462 | |
AngioDynamics, Inc. (a) | | | 12,703 | | | | 129,190 | |
Encompass Health Corp. | | | 7,281 | | | | 450,912 | |
Globus Medical, Inc. - Class A (a) | | | 8,972 | | | | 428,054 | |
Haemonetics Corp. (a) | | | 3,554 | | | | 318,296 | |
Insulet Corp. (a) | | | 3,067 | | | | 595,795 | |
Integra LifeSciences Holdings Corp. (a) | | | 7,750 | | | | 364,173 | |
| | Shares | | | Value | |
Healthcare Equipment & Services (continued) |
NuVasive, Inc. (a) | | | 4,189 | | | $ | 233,160 | |
Orthofix Medical, Inc. (a) | | | 14,466 | | | | 462,912 | |
| | | | | | | | 3,517,954 | |
Pharmaceuticals, Biotechnology & Life Sciences — 5.8% |
Bio-Rad Laboratories, Inc. - Class A (a) | | | 1,496 | | | | 675,429 | |
Bio-Techne Corp. | | | 1,503 | | | | 396,897 | |
Horizon Therapeutics PLC (a) | | | 13,442 | | | | 747,106 | |
NeoGenomics, Inc. (a) | | | 13,017 | | | | 403,267 | |
| | | | | | | | 2,222,699 | |
Industrials — 21.2% |
Capital Goods — 15.7% |
Armstrong World Industries, Inc. | | | 5,364 | | | | 418,177 | |
BWX Technologies, Inc. | | | 11,552 | | | | 654,305 | |
Carlisle Cos., Inc. | | | 4,916 | | | | 588,298 | |
Columbus McKinnon Corp. | | | 9,758 | | | | 326,405 | |
EnerSys | | | 9,273 | | | | 596,996 | |
Granite Construction, Inc. | | | 5,544 | | | | 106,112 | |
IDEX Corp. | | | 1,884 | | | | 297,747 | |
ITT, Inc. | | | 8,880 | | | | 521,611 | |
MSC Industrial Direct Co., Inc. - Class A | | | 6,445 | | | | 469,261 | |
RBC Bearings, Inc. (a) | | | 1,176 | | | | 157,631 | |
Regal Beloit Corp. | | | 4,968 | | | | 433,806 | |
Rexnord Corp. | | | 15,546 | | | | 453,166 | |
SPX Corp. (a) | | | 12,631 | | | | 519,766 | |
UFP Industries, Inc. | | | 8,536 | | | | 422,617 | |
| | | | | | | | 5,965,898 | |
Commercial & Professional Services — 3.2% |
Casella Waste Systems, Inc. - Class A (a) | | | 12,622 | | | | 657,859 | |
Healthcare Services Group, Inc. | | | 10,137 | | | | 247,951 | |
Tetra Tech, Inc. | | | 3,688 | | | | 291,794 | |
| | | | | | | | 1,197,604 | |
Transportation — 2.3% |
Allegiant Travel Co. | | | 2,892 | | | | 315,835 | |
Forward Air Corp. | | | 4,842 | | | | 241,229 | |
Hub Group, Inc. - Class A (a) | | | 6,620 | | | | 316,833 | |
| | | | | | | | 873,897 | |
Information Technology — 23.4% |
Semiconductors & Semiconductor Equipment — 4.8% |
Advanced Energy Industries, Inc. (a) | | | 8,328 | | | | 564,555 | |
Entegris, Inc. | | | 13,086 | | | | 772,728 | |
Lattice Semiconductor Corp. (a) | | | 17,822 | | | | 505,967 | |
| | | | | | | | 1,843,250 | |
Software & Services — 15.7% |
Anaplan, Inc. (a) | | | 5,801 | | | | 262,843 | |
BlackLine, Inc. (a) | | | 9,269 | | | | 768,493 | |
Everbridge, Inc. (a) | | | 2,490 | | | | 344,516 | |
Five9, Inc. (a) | | | 9,150 | | | | 1,012,631 | |
Model N, Inc. (a) | | | 22,066 | | | | 767,014 | |
New Relic, Inc. (a) | | | 3,945 | | | | 271,811 | |
Pegasystems, Inc. | | | 7,401 | | | | 748,759 | |
Proofpoint, Inc. (a) | | | 4,722 | | | | 524,709 | |
RealPage, Inc. (a) | | | 9,116 | | | | 592,631 | |
WNS Holdings, Ltd. ADR (Jersey) (a) | | | 6,991 | | | | 384,365 | |
Workiva, Inc. (a) | | | 4,970 | | | | 265,845 | |
| | | | | | | | 5,943,617 | |
See Notes to Financial Statements.
Semi-Annual Report | June 30, 2020 |  | 47 |
Segall Bryant & Hamill Small Cap Core Fund | Statement of Investments |
| | June 30, 2020 (Unaudited) |
| | Shares | | | Value | |
Technology Hardware & Equipment — 2.9% |
Coherent, Inc. (a) | | | 2,055 | | | $ | 269,164 | |
FARO Technologies, Inc. (a) | | | 3,567 | | | | 191,191 | |
Pure Storage, Inc. - Class A (a) | | | 36,835 | | | | 638,351 | |
| | | | | | | | 1,098,706 | |
Materials — 5.5% |
Materials — 5.5% |
Berry Global Group, Inc. (a) | | | 10,191 | | | | 451,665 | |
Compass Minerals International, Inc. | | | 7,760 | | | | 378,300 | |
Ferro Corp. (a) | | | 17,511 | | | | 209,082 | |
Ingevity Corp. (a) | | | 4,530 | | | | 238,142 | |
Quaker Chemical Corp. | | | 2,751 | | | | 510,723 | |
Silgan Holdings, Inc. | | | 9,459 | | | | 306,377 | |
| | | | | | | | 2,094,289 | |
Real Estate — 3.7% |
Real Estate — 3.7% |
Americold Realty Trust | | | 14,032 | | | | 509,361 | |
Equity Commonwealth | | | 27,228 | | | | 876,742 | |
| | | | | | | | 1,386,103 | �� |
Investments at Value — 93.3% (Cost $29,007,549) | | $ | 35,374,044 | |
| |
Other Assets in Excess of Liabilities — 6.7% | | | 2,527,795 | |
| |
Net Assets — 100.0% | | $ | 37,901,839 | |
(a) | Non-income producing security. |
Sector and industry classifications presented herein are based on the sector and industry categorization methodology of the Adviser to the Funds. For Fund compliance purposes, the Fund’s industry classifications refer to any one or more of the industry sub-classifications used by one or more widely recognized market indexes or ratings group indexes, and/or as defined by Fund management. This definition may not apply for purposes of this report, which may combine industry sub-classifications for reporting ease. Industries are shown as a percentage of net assets.
See Notes to Financial Statements.
48 |  | www.sbhfunds.com | www.sbhfunds.com
|
Segall Bryant & Hamill Mid Cap Value Dividend Fund | Statement of Investments |
| | June 30, 2020 (Unaudited) |
| | Shares | | | Value | |
COMMON STOCKS — 98.2% |
Communication Services — 2.4% |
Telecommunication Services — 2.4% |
TELUS Corp. (Canada) | | | 39,859 | | | $ | 668,435 | |
| |
Consumer Discretionary — 8.8% |
Consumer Durables & Apparel — 5.3% |
D.R. Horton, Inc. | | | 7,214 | | | | 400,016 | |
Garmin, Ltd. (Switzerland) | | | 4,713 | | | | 459,518 | |
Hasbro, Inc. | | | 5,756 | | | | 431,412 | |
VF Corp. | | | 2,270 | | | | 138,334 | |
| | | | | | | | 1,429,280 | |
Retailing — 3.5% |
Aaron’s, Inc. | | | 13,106 | | | | 595,012 | |
Ross Stores, Inc. | | | 4,306 | | | | 367,044 | |
| | | | | | | | 962,056 | |
Consumer Staples — 4.5% |
Food, Beverage & Tobacco — 3.0% |
Constellation Brands, Inc. - Class A | | | 768 | | | | 134,362 | |
Lamb Weston Holdings, Inc. | | | 6,692 | | | | 427,819 | |
Tyson Foods, Inc. - Class A | | | 4,216 | | | | 251,737 | |
| | | | | | | | 813,918 | |
Household & Personal Products — 1.5% |
Church & Dwight Co., Inc. | | | 5,433 | | | | 419,971 | |
| |
Energy — 3.7% |
Energy — 3.7% |
Diamondback Energy, Inc. | | | 5,149 | | | | 215,331 | |
Enerplus Corp. (Canada) | | | 115,121 | | | | 325,792 | |
Valero Energy Corp. | | | 7,968 | | | | 468,678 | |
| | | | | | | | 1,009,801 | |
Financials — 12.9% |
Banks — 5.0% |
BOK Financial Corp. | | | 6,754 | | | | 381,196 | |
Investors Bancorp, Inc. | | | 42,244 | | | | 359,074 | |
M&T Bank Corp. | | | 2,117 | | | | 220,104 | |
People’s United Financial, Inc. | | | 33,516 | | | | 387,780 | |
| | | | | | | | 1,348,154 | |
Diversified Financial Services — 1.0% |
Voya Financial, Inc. | | | 5,830 | | | | 271,970 | |
| |
Insurance — 6.9% |
Allstate Corp. (The) | | | 5,345 | | | | 518,412 | |
Axis Capital Holdings, Ltd. (Bermuda) | | | 13,491 | | | | 547,195 | |
Berkley (W.R.) Corp. | | | 4,903 | | | | 280,893 | |
Hartford Financial Services Group, Inc. (The) | | | 14,079 | | | | 542,745 | |
| | | | | | | | 1,889,245 | |
Health Care — 6.8% |
Healthcare Equipment & Services — 4.6% |
AmerisourceBergen Corp. | | | 2,667 | | | | 268,754 | |
Cerner Corp. | | | 6,556 | | | | 449,414 | |
Quest Diagnostics, Inc. | | | 4,588 | | | | 522,848 | |
| | | | | | | | 1,241,016 | |
| | Shares | | | Value | |
Pharmaceuticals, Biotechnology & Life Sciences — 2.2% |
Grifols S.A. ADR (Spain) | | | 33,337 | | | $ | 608,067 | |
| |
Industrials — 15.4% |
Capital Goods — 7.9% |
BWX Technologies, Inc. | | | 4,790 | | | | 271,306 | |
CAE, Inc. (Canada) | | | 15,686 | | | | 253,957 | |
Crane Co. | | | 9,720 | | | | 577,951 | |
ITT, Inc. | | | 4,720 | | | | 277,253 | |
Oshkosh Corp. | | | 6,744 | | | | 483,005 | |
Snap-on, Inc. | | | 2,032 | | | | 281,452 | |
| | | | | | | | 2,144,924 | |
Commercial & Professional Services — 2.5% |
Republic Services, Inc. | | | 8,260 | | | | 677,733 | |
| |
Transportation — 5.0% |
Kansas City Southern | | | 4,405 | | | | 657,622 | |
Knight-Swift Transportation Holdings, Inc. | | | 9,137 | | | | 381,104 | |
Landstar System, Inc. | | | 3,041 | | | | 341,535 | |
| | | | | | | | 1,380,261 | |
Information Technology — 13.0% |
Semiconductors & Semiconductor Equipment — 2.7% |
MKS Instruments, Inc. | | | 2,335 | | | | 264,416 | |
NXP Semiconductors N.V. (Netherlands) | | | 4,055 | | | | 462,432 | |
| | | | | | | | 726,848 | |
Software & Services — 6.8% |
Citrix Systems, Inc. | | | 857 | | | | 126,759 | |
Cognizant Technology Solutions Corp. - Class A | | | 2,273 | | | | 129,152 | |
EVERTEC, Inc. | | | 11,714 | | | | 329,163 | |
Genpact, Ltd. (Bermuda) | | | 14,038 | | | | 512,668 | |
MAXIMUS, Inc. | | | 7,634 | | | | 537,815 | |
Pegasystems, Inc. | | | 2,103 | | | | 212,761 | |
| | | | | | | | 1,848,318 | |
Technology Hardware & Equipment — 3.5% |
Dolby Laboratories, Inc. - Class A | | | 4,127 | | | | 271,845 | |
InterDigital, Inc. | | | 12,165 | | | | 688,904 | |
| | | | | | | | 960,749 | |
Materials — 5.4% |
Materials — 5.4% |
Graphic Packaging Holding Co. | | | 24,262 | | | | 339,425 | |
Huntsman Corp. | | | 15,233 | | | | 273,737 | |
Pan American Silver Corp. (Canada) | | | 14,390 | | | | 437,312 | |
Steel Dynamics, Inc. | | | 16,673 | | | | 434,999 | |
| | | | | | | | 1,485,473 | |
Real Estate — 13.1% |
Real Estate — 13.1% |
Americold Realty Trust | | | 26,436 | | | | 959,627 | |
CyrusOne, Inc. | | | 9,412 | | | | 684,723 | |
Invitation Homes, Inc. | | | 18,043 | | | | 496,724 | |
Physicians Realty Trust | | | 15,418 | | | | 270,123 | |
Rexford Industrial Realty, Inc. | | | 8,224 | | | | 340,720 | |
See Notes to Financial Statements.
Semi-Annual Report | June 30, 2020 |  | 49 |
Segall Bryant & Hamill Mid Cap Value Dividend Fund | Statement of Investments |
| | June 30, 2020 (Unaudited) |
| | Shares | | | Value | |
Real Estate (continued) |
SBA Communications Corp. | | | 455 | | | $ | 135,554 | |
Sun Communities, Inc. | | | 4,990 | | | | 677,043 | |
| | | | | | | | 3,564,514 | |
Utilities — 12.2% |
Utilities — 12.2% |
ALLETE, Inc. | | | 6,234 | | | | 340,439 | |
Alliant Energy Corp. | | | 7,526 | | | | 360,044 | |
Atmos Energy Corp. | | | 2,396 | | | | 238,594 | |
Pinnacle West Capital Corp. | | | 6,679 | | | | 489,504 | |
Public Service Enterprise Group, Inc. | | | 10,108 | | | | 496,909 | |
UGI Corp. | | | 12,842 | | | | 408,376 | |
Vistra Energy Corp. | | | 33,554 | | | | 624,775 | |
Xcel Energy, Inc. | | | 6,137 | | | | 383,562 | |
| | | | | | | | 3,342,203 | |
Investments at Value — 98.2% (Cost $25,982,885) | | $ | 26,792,936 | |
| |
Other Assets in Excess of Liabilities — 1.8% | | | 495,533 | |
| |
Net Assets — 100.0% | | $ | 27,288,469 | |
Sector and industry classifications presented herein are based on the sector and industry categorization methodology of the Adviser to the Funds. For Fund compliance purposes, the Fund’s industry classifications refer to any one or more of the industry sub-classifications used by one or more widely recognized market indexes or ratings group indexes, and/or as defined by Fund management. This definition may not apply for purposes of this report, which may combine industry sub-classifications for reporting ease. Industries are shown as a percentage of net assets.
See Notes to Financial Statements.
50 |  | www.sbhfunds.com | www.sbhfunds.com
|
Segall Bryant & Hamill All Cap Fund | Statement of Investments |
| | June 30, 2020 (Unaudited) |
| | Shares | | | Value | |
COMMON STOCKS — 96.6% |
Communication Services — 5.8% |
Media & Entertainment — 5.8% |
Alphabet, Inc. - Class C (a) | | | 2,641 | | | $ | 3,733,344 | |
Cable One, Inc. | | | 1,389 | | | | 2,465,266 | |
Comcast Corp. - Class A | | | 34,414 | | | | 1,341,458 | |
| | | | | | | | 7,540,068 | |
Consumer Discretionary — 13.0% |
Consumer Durables & Apparel — 2.3% |
Hasbro, Inc. | | | 18,247 | | | | 1,367,613 | |
VF Corp. | | | 24,974 | | | | 1,521,915 | |
| | | | | | | | 2,889,528 | |
Retailing — 10.7% |
Amazon.com, Inc. (a) | | | 2,149 | | | | 5,928,704 | |
Home Depot, Inc. (The) | | | 7,367 | | | | 1,845,507 | |
Ollie’s Bargain Outlet Holdings, Inc. (a) | | | 18,165 | | | | 1,773,812 | |
O’Reilly Automotive, Inc. (a) | | | 5,090 | | | | 2,146,301 | |
TJX Cos., Inc. (The) | | | 42,045 | | | | 2,125,795 | |
| | | | | | | | 13,820,119 | |
Consumer Staples — 6.0% |
Food & Staples Retailing — 1.2% |
Costco Wholesale Corp. | | | 5,207 | | | | 1,578,815 | |
| |
Food, Beverage & Tobacco — 2.4% |
Lamb Weston Holdings, Inc. | | | 19,755 | | | | 1,262,937 | |
Mondelēz International, Inc. - Class A | | | 36,202 | | | | 1,851,008 | |
| | | | | | | | 3,113,945 | |
Household & Personal Products — 2.4% |
Clorox Co. (The) | | | 6,012 | | | | 1,318,852 | |
Estée Lauder Cos., Inc. (The) - Class A | | | 9,292 | | | | 1,753,215 | |
| | | | | | | | 3,072,067 | |
Energy — 0.9% |
Energy — 0.9% |
Noble Energy, Inc. | | | 123,557 | | | | 1,107,071 | |
| |
Financials — 12.5% |
Banks — 4.2% |
First Republic Bank | | | 16,780 | | | | 1,778,512 | |
JPMorgan Chase & Co. | | | 25,122 | | | | 2,362,975 | |
Signature Bank | | | 11,483 | | | | 1,227,763 | |
| | | | | | | | 5,369,250 | |
Diversified Financials — 4.4% |
Ares Management Corp. - Class A | | | 55,277 | | | | 2,194,497 | |
Berkshire Hathaway, Inc. - Class B (a) | | | 7,756 | | | | 1,384,523 | |
S&P Global, Inc. | | | 6,512 | | | | 2,145,574 | |
| | | | | | | | 5,724,594 | |
Insurance — 3.9% |
Aon PLC - Class A (Ireland) | | | 10,724 | | | | 2,065,442 | |
Globe Life, Inc. | | | 23,173 | | | | 1,720,132 | |
Reinsurance Group of America, Inc. | | | 14,935 | | | | 1,171,502 | |
| | | | | | | | 4,957,076 | |
| | Shares | | | Value | |
Health Care — 19.7% |
Healthcare Equipment & Services — 9.8% |
Abbott Laboratories | | | 19,636 | | | $ | 1,795,320 | |
Alcon, Inc. (Switzerland) (a) | | | 33,645 | | | | 1,928,531 | |
Baxter International, Inc. | | | 23,542 | | | | 2,026,966 | |
Danaher Corp. | | | 15,071 | | | | 2,665,005 | |
Hologic, Inc. (a) | | | 27,460 | | | | 1,565,220 | |
UnitedHealth Group, Inc. | | | 9,114 | | | | 2,688,174 | |
| | | | | | | | 12,669,216 | |
Pharmaceuticals, Biotechnology & Life Sciences — 9.9% |
Bio-Techne Corp. | | | 5,928 | | | | 1,565,407 | |
Catalent, Inc. (a) | | | 26,038 | | | | 1,908,585 | |
Charles River Laboratories International, Inc. (a) | | | 8,828 | | | | 1,539,162 | |
Mettler-Toledo International, Inc. (a) | | | 1,992 | | | | 1,604,656 | |
Novartis A.G. ADR (Switzerland) | | | 21,971 | | | | 1,918,947 | |
Thermo Fisher Scientific, Inc. | | | 5,414 | | | | 1,961,709 | |
Zoetis, Inc. | | | 16,006 | | | | 2,193,462 | |
| | | | | | | | 12,691,928 | |
Industrials — 9.2% |
Capital Goods — 4.9% |
L3Harris Technologies, Inc. | | | 8,382 | | | | 1,422,174 | |
Quanta Services, Inc. | | | 67,448 | | | | 2,645,985 | |
Roper Technologies, Inc. | | | 5,666 | | | | 2,199,881 | |
| | | | | | | | 6,268,040 | |
Commercial & Professional Services — 3.1% |
Cintas Corp. | | | 6,581 | | | | 1,752,915 | |
IHS Markit, Ltd. | | | 30,394 | | | | 2,294,747 | |
| | | | | | | | 4,047,662 | |
Transportation — 1.2% |
Kansas City Southern | | | 10,410 | | | | 1,554,109 | |
| |
Information Technology — 23.4% |
Semiconductors & Semiconductor Equipment — 5.7% |
Marvell Technology Group, Ltd. (Bermuda) | | | 100,568 | | | | 3,525,914 | |
Monolithic Power Systems, Inc. | | | 9,204 | | | | 2,181,348 | |
NXP Semiconductors N.V. (Netherlands) | | | 14,799 | | | | 1,687,678 | |
| | | | | | | | 7,394,940 | |
Software & Services — 13.7% |
Adobe, Inc. (a) | | | 6,641 | | | | 2,890,894 | |
Guidewire Software, Inc. (a) | | | 16,574 | | | | 1,837,228 | |
Microsoft Corp. | | | 31,568 | | | | 6,424,404 | |
ServiceNow, Inc. (a) | | | 7,085 | | | | 2,869,850 | |
Visa, Inc. - Class A | | | 18,545 | | | | 3,582,337 | |
| | | | | | | | 17,604,713 | |
Technology Hardware & Equipment — 4.0% |
Apple, Inc. | | | 7,205 | | | | 2,628,384 | |
Zebra Technologies Corp. - Class A (a) | | | 9,700 | | | | 2,482,715 | |
| | | | | | | | 5,111,099 | |
See Notes to Financial Statements.
Semi-Annual Report | June 30, 2020 |  | 51 |
Segall Bryant & Hamill All Cap Fund | Statement of Investments |
| | June 30, 2020 (Unaudited) |
| | Shares | | | Value | |
Materials — 6.1% |
Materials — 6.1% |
Avery Dennison Corp. | | | 15,617 | | | $ | 1,781,744 | |
FMC Corp. | | | 27,602 | | | | 2,749,711 | |
Franco-Nevada Corp. (Canada) | | | 14,459 | | | | 2,019,055 | |
Sherwin-Williams Co. (The) | | | 2,239 | | | | 1,293,806 | |
| | | | | | | | 7,844,316 | |
Investments at Value — 96.6% (Cost $88,305,929) | | $ | 124,358,556 | |
| |
Other Assets in Excess of Liabilities — 3.4% | | | 4,427,277 | |
| |
Net Assets — 100.0% | | $ | 128,785,833 | |
(a) | Non-income producing security. |
Sector and industry classifications presented herein are based on the sector and industry categorization methodology of the Adviser to the Funds. For Fund compliance purposes, the Fund’s industry classifications refer to any one or more of the industry sub-classifications used by one or more widely recognized market indexes or ratings group indexes, and/or as defined by Fund management. This definition may not apply for purposes of this report, which may combine industry sub-classifications for reporting ease. Industries are shown as a percentage of net assets.
See Notes to Financial Statements.
52 |  | www.sbhfunds.com | www.sbhfunds.com
|
Segall Bryant & Hamill Emerging Markets Fund | Statement of Investments |
| | June 30, 2020 (Unaudited) |
| | Shares | | | Value | |
COMMON STOCKS — 96.2% |
Communication Services — 6.3% |
Media & Entertainment — 1.2% |
BAIOO Family Interactive, Ltd. (China) | | | 382,000 | | | $ | 48,987 | |
Chinese Universe Publishing and Media Group Co., Ltd. - Class A (China) | | | 50,800 | | | | 85,029 | |
Jagran Prakashan, Ltd. (India) | | | 43,811 | | | | 22,946 | |
NetDragon Websoft Holdings, Ltd. (China) | | | 48,500 | | | | 136,765 | |
Sun TV Network, Ltd. (India) | | | 5,400 | | | | 28,971 | |
Zee Entertainment Enterprises, Ltd. (India) | | | 12,358 | | | | 28,055 | |
| | | | | | | | 350,753 | |
Telecommunication Services — 5.1% |
América Móvil S.A.B. de C.V. - Class L ADR (Mexico) | | | 6,500 | | | | 82,485 | |
APT Satellite Holdings, Ltd. (China) | | | 118,000 | | | | 30,542 | |
Bharti Infratel, Ltd. (India) | | | 14,092 | | | | 41,392 | |
China Mobile, Ltd. (China) | | | 72,000 | | | | 486,147 | |
China Telecom Corp., Ltd. (China) | | | 168,000 | | | | 47,191 | |
China Unicom Hong Kong, Ltd. (China) | | | 198,000 | | | | 107,731 | |
Etihad Etisalat Co. (Saudi Arabia) (a) | | | 1,966 | | | | 13,977 | |
Globe Telecom, Inc. (Philippines) | | | 2,825 | | | | 117,618 | |
Hellenic Telecommunications Organization S.A. (Greece) (a) | | | 4,121 | | | | 55,677 | |
KT Corp. ADR (South Korea) | | | 13,000 | | | | 126,620 | |
LG Uplus Corp. (South Korea) | | | 2,351 | | | | 24,088 | |
MTN Group, Ltd. (South Africa) | | | 24,148 | | | | 73,928 | |
SK Telecom Co., Ltd. ADR (South Korea) | | | 4,500 | | | | 86,940 | |
Telekom Malaysia Bhd (Malaysia) | | | 69,300 | | | | 67,288 | |
TIM Participacoes S.A. ADR (Brazil) | | | 5,000 | | | | 64,700 | |
Turk Telekomunikasyon A.S. (Turkey) | | | 19,484 | | | | 23,061 | |
Turkcell Iletisim Hizmetleri A.S. ADR (Turkey) | | | 4,100 | | | | 23,616 | |
| | | | | | | | 1,473,001 | |
Consumer Discretionary — 11.3% |
Automobiles & Components — 3.3% |
Chaowei Power Holdings, Ltd. (China) | | | 281,000 | | | | 125,757 | |
Geely Automobile Holdings, Ltd. (China) | | | 98,000 | | | | 155,698 | |
Grupo Industrial Saltillo S.A.B. de C.V. (Mexico) (a) | | | 16,071 | | | | 11,676 | |
Hyundai Mobis Co., Ltd. (South Korea) | | | 578 | | | | 93,022 | |
Iron Force Industrial Co., Ltd. (Taiwan) | | | 8,000 | | | | 25,430 | |
Kia Motors Corp. (South Korea) | | | 4,367 | | | | 118,315 | |
Nexen Tire Corp. (South Korea) | | | 2,393 | | | | 10,693 | |
Oriental Holdings Bhd (Malaysia) | | | 22,300 | | | | 29,455 | |
Qingling Motors Co., Ltd. - H Shares (China) | | | 264,000 | | | | 48,201 | |
S&T Motiv Co., Ltd. (South Korea) | | | 818 | | | | 26,135 | |
Somboon Advance Technology PCL (Thailand) | | | 97,100 | | | | 33,811 | |
Tianneng Power International, Ltd. (China) | | | 78,000 | | | | 133,769 | |
Tupy S.A. (Brazil) (a) | | | 20,000 | | | | 70,259 | |
Xingda International Holdings, Ltd. (China) | | | 407,000 | | | | 79,178 | |
| | | | | | | | 961,399 | |
| | Shares | | | Value | |
Consumer Durables & Apparel — 2.5% |
361 Degrees International, Ltd. (China) | | | 639,000 | | | $ | 82,958 | |
KPR Mill, Ltd. (India) | | | 5,862 | | | | 37,874 | |
Ruentex Industries, Ltd. (Taiwan) | | | 13,000 | | | | 31,350 | |
Saha-Union PCL (Thailand) | | | 22,400 | | | | 25,922 | |
Skyworth Digital Co., Ltd. (China) (a) | | | 382,000 | | | | 107,349 | |
TCL Electronics Holdings, Ltd. (China) (a) | | | 260,000 | | | | 127,978 | |
Texhong Textile Group, Ltd. (China) | | | 143,000 | | | | 115,034 | |
Vestel Beyaz Esya Sanayi ve Ticaret A.S. (Turkey) (a) | | | 23,667 | | | | 89,758 | |
Weiqiao Textile Co. - H Shares (China) | | | 237,795 | | | | 42,340 | |
Welspun India, Ltd. (India) | | | 172,687 | | | | 85,188 | |
| | | | | | | | 745,751 | |
Consumer Services — 0.8% |
Berjaya Sports Toto Bhd (Malaysia) | | | 45,500 | | | | 23,426 | |
Shenzhen Overseas Chinese Town Co., Ltd. - Class A (China) | | | 238,700 | | | | 205,663 | |
| | | | | | | | 229,089 | |
Media — 2.0% |
Astro Malaysia Holdings Bhd (Malaysia) | | | 145,100 | | | | 28,284 | |
DB Corp., Ltd. (India) | | | 6,711 | | | | 6,598 | |
KT Skylife Co., Ltd. (South Korea) | | | 6,704 | | | | 44,482 | |
Media Nusantara Citra Tbk P.T. (Indonesia) | | | 1,768,900 | | | | 111,189 | |
Naspers, Ltd. - N Shares (South Africa) | | | 2,209 | | | | 405,816 | |
| | | | | | | | 596,369 | |
Retailing — 2.7% |
China Harmony New Energy Auto Holding, Ltd. (China) | | | 207,500 | | | | 103,793 | |
Eeka Fashion Holdings, Ltd. (China) (a) | | | 17,000 | | | | 18,841 | |
GS Home Shopping, Inc. (South Korea) | | | 292 | | | | 26,717 | |
Hyundai Home Shopping Network Corp. (South Korea) | | | 344 | | | | 18,490 | |
MBM Resources Bhd (Malaysia) | | | 45,300 | | | | 34,507 | |
Meituan Dianping (China) (a) | | | 2,700 | | | | 60,335 | |
Mitra Pinasthika Mustika Tbk P.T. (Indonesia) | | | 236,300 | | | | 8,000 | |
PTG Energy PCL (Thailand) | | | 98,100 | | | | 51,949 | |
Shanghai Yuyuan Tourist Mart Group Co., Ltd. - Class A (China) | | | 15,200 | | | | 19,124 | |
Vipshop Holdings, Ltd. ADR (China) (a) | | | 16,400 | | | | 326,524 | |
Xinhua Winshare Publishing and Media Co., Ltd. (China) | | | 159,000 | | | | 108,105 | |
| | | | | | | | 776,385 | |
Consumer Staples — 6.8% |
Food & Staples Retailing — 0.3% |
Cosco Capital, Inc. (Philippines) | | | 634,600 | | | | 64,465 | |
Credito Real S.A.B. de C.V. Sofom ER (Mexico) | | | 19,600 | | | | 15,348 | |
| | | | | | | | 79,813 | |
Food, Beverage & Tobacco — 6.3% |
Astral Foods, Ltd. (South Africa) | | | 7,225 | | | | 60,975 | |
Balrampur Chini Mills, Ltd. (India) | | | 80,622 | | | | 143,931 | |
C.P. Pokphand Co., Ltd. (China) | | | 300,000 | | | | 26,034 | |
Charoen Pokphand Foods PCL (Thailand) | | | 52,900 | | | | 54,597 | |
See Notes to Financial Statements.
Semi-Annual Report | June 30, 2020 |  | 53 |
Segall Bryant & Hamill Emerging Markets Fund | Statement of Investments |
| | June 30, 2020 (Unaudited) |
| | Shares | | | Value | |
Food, Beverage & Tobacco (continued) |
Cia Pesquera Camanchaca S.A. (Chile) | | | 241,136 | | | $ | 16,049 | |
CJ CheilJedang Corp. (South Korea) | | | 109 | | | | 29,840 | |
Daesang Holdings Co., Ltd. (South Korea) | | | 3,702 | | | | 25,195 | |
Eastern Co. SAE (Egypt) | | | 46,919 | | | | 37,161 | |
Embotelladora Andina S.A. - Class B ADR (Chile) | | | 900 | | | | 13,698 | |
Fujian Sunner Development Co., Ltd. - Class A (China) | | | 16,900 | | | | 69,704 | |
Godfrey Phillips India, Ltd. (India) | | | 2,786 | | | | 37,664 | |
Hey Song Corp. (Taiwan) | | | 29,000 | | | | 32,562 | |
Indofood Sukses Makmur Tbk P.T. (Indonesia) (a) | | | 30,800 | | | | 13,956 | |
Industrias Bachoco S.A.B. de C.V. - Series B (Mexico) | | | 41,700 | | | | 121,688 | |
JBS S.A. (Brazil) | | | 39,800 | | | | 154,822 | |
Kaveri Seed Co., Ltd. (India) | | | 3,930 | | | | 29,970 | |
KT&G Corp. (South Korea) | | | 932 | | | | 61,024 | |
Marfrig Global Foods S.A. (Brazil) (a) | | | 7,500 | | | | 17,395 | |
Muyuan Foodstuff Co., Ltd. - Class A (China) | | | 12,920 | | | | 150,473 | |
New Hope Liuhe Co., Ltd. - Class A (China) | | | 27,400 | | | | 116,122 | |
Orion Holdings Corp. (South Korea) | | | 11,790 | | | | 131,352 | |
Sarawak Oil Palms Bhd (Malaysia) (a) | | | 43,700 | | | | 30,562 | |
Saudi Telecom Co. (Saudi Arabia) | | | 5,177 | | | | 137,165 | |
Thai Vegetable Oil PCL (Thailand) | | | 49,600 | | | | 42,324 | |
Thaifoods Group PCL (Thailand) | | | 597,804 | | | | 95,741 | |
Tingyi Holding Corp. (China) | | | 12,000 | | | | 18,693 | |
Tunas Baru Lampung Tbk P.T. (Indonesia) | | | 2,049,052 | | | | 79,098 | |
Wens Foodstuff Group Co., Ltd. - Class A (China) | | | 28,920 | | | | 89,573 | |
| | | | | | | | 1,837,368 | |
Household & Personal Products — 0.2% |
EIS Eczacibasi Ilac ve Sinai ve Finansal Yatirimlar Sanayi ve Ticaret A.S. (Turkey) | | | 33,087 | | | | 29,523 | |
Emami, Ltd. (India) | | | 5,202 | | | | 15,236 | |
Hengan International Group Co., Ltd. (China) | | | 1,500 | | | | 11,807 | |
| | | | | | | | 56,566 | |
Energy — 5.1% |
Energy — 5.1% |
Adaro Energy Tbk P.T. (Indonesia) | | | 411,600 | | | | 28,573 | |
Bashneft PJSC (Russia) (a) | | | 5,182 | | | | 134,252 | |
Bukit Asam Tbk P.T. (Indonesia) | | | 123,800 | | | | 17,457 | |
China Merchants Energy Shipping Co., Ltd. (China) | | | 21,100 | | | | 17,501 | |
China Shenhua Energy Co., Ltd. - H Shares (China) | | | 10,500 | | | | 16,296 | |
China Suntien Green Energy Corp., Ltd. - H Shares (China) (a) | | | 229,000 | | | | 52,698 | |
Coal India, Ltd. (India) | | | 85,931 | | | | 151,696 | |
Cosan S.A. (Brazil) | | | 4,400 | | | | 57,393 | |
| | Shares | | | Value | |
Energy (continued) |
COSCO SHIPPING Energy Transportation Co., Ltd. - Class A (China) (a) | | | 17,500 | | | $ | 16,149 | |
E1 Corp. (South Korea) | | | 299 | | | | 8,666 | |
Exxaro Resources, Ltd. (South Africa) | | | 10,669 | | | | 80,499 | |
Great Eastern Shipping Co., Ltd. (The) (India) | | | 5,739 | | | | 16,113 | |
Indian Oil Corp., Ltd. (India) | | | 35,040 | | | | 39,680 | |
Inner Mongolia Yitai Coal Co., Ltd. - Class B (China) | | | 23,200 | | | | 15,098 | |
Lubelski Wegiel Bogdanka S.A. (Poland) | | | 7,565 | | | | 42,465 | |
Medco Energi Internasional Tbk P.T. (Indonesia) (a) | | | 859,200 | | | | 27,192 | |
Oil & Natural Gas Corp., Ltd. (India) | | | 38,850 | | | | 42,155 | |
Oil India, Ltd. (India) | | | 11,662 | | | | 14,532 | |
Petronet LNG, Ltd. (India) | | | 22,080 | | | | 75,511 | |
Polski Koncern Naftowy ORLEN S.A. (Poland) | | | 4,343 | | | | 69,014 | |
PTT PCL (Thailand) | | | 57,700 | | | | 71,277 | |
Reliance Industries, Ltd. 144A (India) (b) | | | 439 | | | | 19,816 | |
Semirara Mining & Power Corp. (Philippines) | | | 72,800 | | | | 18,630 | |
Shaanxi Coal Industry Co., Ltd. - Class A (China) | | | 21,200 | | | | 21,736 | |
Sinopec Kantons Holdings, Ltd. (China) (a) | | | 76,000 | | | | 29,171 | |
SK Gas, Ltd. (South Korea) | | | 286 | | | | 17,745 | |
Surgutneftegas PJSC (Russia) | | | 542,100 | | | | 294,159 | |
United Tractors Tbk P.T. (Indonesia) | | | 21,900 | | | | 25,145 | |
Yanzhou Coal Mining Co., Ltd. - Class A (China) | | | 14,700 | | | | 18,304 | |
Yanzhou Coal Mining Co., Ltd. - H Shares (China) | | | 76,000 | | | | 57,238 | |
| | | | | | | | 1,496,161 | |
Financials — 18.7% |
Banks — 11.1% |
Agricultural Bank of China, Ltd. - H Shares (China) (a) | | | 706,000 | | | | 285,749 | |
Alinma Bank (Saudi Arabia) (a) | | | 13,738 | | | | 53,380 | |
AMMB Holdings Bhd (Malaysia) | | | 19,200 | | | | 13,986 | |
Banco Bradesco S.A. (Brazil) | | | 17,622 | | | | 61,452 | |
Banco de Chile ADR (Chile) | | | 800 | | | | 14,120 | |
Banco do Brasil S.A. (Brazil) | | | 23,200 | | | | 137,186 | |
Banestes S.A. Banco do Estado do Espirito Santo (Brazil) | | | 33,300 | | | | 36,932 | |
Bank CIMB Niaga Tbk P.T. (Indonesia) | | | 1,080,900 | | | | 53,999 | |
Bank of Ayudhya PCL (Thailand) | | | 15,113 | | | | 11,184 | |
Bank of Beijing Co., Ltd. - Class A (China) | | | 32,600 | | | | 22,653 | |
Bank of Chengdu Co., Ltd. (China) (a) | | | 16,400 | | | | 18,530 | |
Bank of Guiyang Co., Ltd. - Class A (China) | | | 27,700 | | | | 28,143 | |
Bank of Zhengzhou Co., Ltd. - H Shares (China) | | | 51,700 | | | | 12,184 | |
See Notes to Financial Statements.
54 |  | www.sbhfunds.com | www.sbhfunds.com
|
Segall Bryant & Hamill Emerging Markets Fund | Statement of Investments |
| | June 30, 2020 (Unaudited) |
| | Shares | | | Value | |
Banks (continued) |
Bank Pembangunan Daerah Jawa Timur Tbk P.T. (Indonesia) | | | 1,492,700 | | | $ | 51,630 | |
China CITIC Bank Corp., Ltd. - H Shares (China) | | | 611,000 | | | | 267,745 | |
China Construction Bank Corp. - H Shares (China) | | | 186,000 | | | | 151,289 | |
China Everbright Bank Co., Ltd. (China) | | | 44,500 | | | | 22,597 | |
China Everbright Bank Co., Ltd. - H Shares (China) | | | 390,000 | | | | 147,262 | |
China Minsheng Banking Corp., Ltd. - Class A (China) (a) | | | 210,232 | | | | 169,064 | |
China Minsheng Banking Corp., Ltd. - H Shares (China) (a) | | | 108,500 | | | | 74,687 | |
Commercial Bank of Qatar (Qatar) | | | 175,707 | | | | 183,500 | |
Dubai Islamic Bank PJSC (United Arab Emirates) | | | 47,689 | | | | 49,768 | |
Emirates NBD Bank PJSC (United Arab Emirates) | | | 18,629 | | | | 45,383 | |
EnTie Commercial Bank Co., Ltd. (Taiwan) | | | 71,000 | | | | 34,513 | |
Faisal Islamic Bank of Egypt (Egypt) | | | 24,143 | | | | 15,555 | |
Hana Financial Group, Inc. (South Korea) | | | 4,703 | | | | 107,236 | |
Huishang Bank Corporation, Ltd. (China) (a) | | | 127,000 | | | | 44,078 | |
Intercorp Financial Services, Inc. (Peru) | | | 1,834 | | | | 48,491 | |
JB Financial Group Co., Ltd. (South Korea) | | | 13,180 | | | | 52,401 | |
KB Financial Group, Inc. ADR (South Korea) | | | 4,700 | | | | 130,754 | |
Krung Thai Bank PCL (Thailand) | | | 90,400 | | | | 30,239 | |
LIC Housing Finance, Ltd. (India) | | | 2,804 | | | | 9,863 | |
Malaysia Building Society Bhd (Malaysia) (a) | | | 430,500 | | | | 62,618 | |
National Commercial Bank (Saudi Arabia) | | | 4,425 | | | | 44,132 | |
Riyad Bank (Saudi Arabia) | | | 66,604 | | | | 300,335 | |
Sberbank of Russia PJSC (Russia) | | | 37,720 | | | | 107,834 | |
Shinhan Financial Group Co., Ltd. ADR (South Korea) | | | 600 | | | | 14,436 | |
SinoPac Financial Holdings Co., Ltd. (Taiwan) | | | 572,000 | | | | 212,006 | |
Thanachart Capital PCL (Thailand) | | | 78,100 | | | | 90,488 | |
Turkiye Sinai Kalkinma Bankasi A.S. (Turkey) (a) | | | 82,598 | | | | 15,547 | |
| | | | | | | | 3,232,949 | |
Diversified Financials — 4.5% |
Adira Dinamika Multi Finance Tbk P.T. (Indonesia) | | | 123,700 | | | | 61,822 | |
Banco Invex S.A. (Mexico) | | | 42,400 | | | | 31,209 | |
China Cinda Asset Management Co., Ltd. (China) (a) | | | 75,000 | | | | 14,794 | |
Corporacion Financiera Colombiana S.A. (Colombia) (a) | | | 14,940 | | | | 110,446 | |
Credito Real S.A.B. de C.V. Sofom ER (Mexico) (a) | | | 52,000 | | | | 27,033 | |
| | Shares | | | Value | |
Diversified Financials (continued) |
Fubon Financial Holdings Co., Ltd. (Taiwan) (a) | | | 46,000 | | | $ | 68,867 | |
GF Securities Co. (China) | | | 49,600 | | | | 53,420 | |
Hyundai Motor Securities Co., Ltd. (South Korea) | | | 1,416 | | | | 9,881 | |
Jih Sun Financial Holding Co., Ltd. (Taiwan) | | | 101,712 | | | | 33,398 | |
KRUK S.A. (Poland) | | | 794 | | | | 21,777 | |
Manappuram Finance, Ltd. (India) | | | 22,829 | | | | 45,895 | |
Meritz Financial Group, Inc. (South Korea) | | | 1,702 | | | | 13,364 | |
Muthoot Finance, Ltd. (India) | | | 25,861 | | | | 372,120 | |
OSK Holdings Bhd (Malaysia) | | | 241,800 | | | | 45,585 | |
Power Finance Corp., Ltd. (India) | | | 57,087 | | | | 63,558 | |
REC, Ltd. (India) | | | 128,352 | | | | 184,154 | |
Reinet Investments SCA (South Africa) | | | 6,325 | | | | 110,974 | |
Tata Investment Corp., Ltd. (India) | | | 4,663 | | | | 47,661 | |
| | | | | | | | 1,315,958 | |
Insurance — 3.1% |
Allianz Malaysia Bhd (Malaysia) | | | 4,300 | | | | 14,191 | |
Bangkok Life Assurance PCL (Thailand) | | | 28,229 | | | | 14,263 | |
Cathay Financial Holding Co., Ltd. (Taiwan) | | | 53,000 | | | | 75,598 | |
China Life Insurance Co., Ltd. (Taiwan) (a) | | | 34,000 | | | | 25,329 | |
Momentum Metropolitan Holdings, Ltd. (South Africa) | | | 23,945 | | | | 24,359 | |
New China Life Insurance Co., Ltd. - H Shares (China) | | | 45,300 | | | | 152,766 | |
Old Mutual, Ltd. (South Africa) | | | 74,483 | | | | 51,894 | |
Origin Property PCL (Thailand) | | | 69,600 | | | | 12,375 | |
People’s Insurance Co. Group of China (The) - H Shares (China) | | | 570,000 | | | | 167,152 | |
PICC Property & Casualty Co., Ltd. - H Shares (China) | | | 158,000 | | | | 131,308 | |
Ping An Insurance Group Co. of China, Ltd. - H Shares (China) | | | 4,500 | | | | 44,860 | |
Powszechny Zaklad Ubezpieczen S.A. (Poland) | | | 10,346 | | | | 76,140 | |
Shin Kong Financial Holding Co., Ltd. (Taiwan) | | | 108,000 | | | | 31,724 | |
Shinkong Insurance Co., Ltd. (Taiwan) | | | 66,000 | | | | 80,323 | |
| | | | | | | | 902,282 | |
Health Care — 3.9% |
Healthcare Equipment & Services — 0.9% |
Celltrion, Inc. (South Korea) (a) | | | 197 | | | | 50,551 | |
China National Medicines Corp., Ltd. (China) | | | 8,500 | | | | 48,904 | |
Qualicorp Consultoria e Corretora de Seguros S.A. (Brazil) | | | 29,700 | | | | 158,415 | |
Sinopharm Group Co., Ltd. - H Shares (China) | | | 4,400 | | | | 11,312 | |
| | | | | | | | 269,182 | |
Pharmaceuticals, Biotechnology & Life Sciences — 3.0% |
Caplin Point Laboratories, Ltd. (India) (a) | | | 14,224 | | | | 58,738 | |
See Notes to Financial Statements.
Semi-Annual Report | June 30, 2020 |  | 55 |
Segall Bryant & Hamill Emerging Markets Fund | Statement of Investments |
| | June 30, 2020 (Unaudited) |
| | Shares | | | Value | |
Pharmaceuticals, Biotechnology & Life Sciences (continued) |
Celltrion Healthcare Co., Ltd. (South Korea) (a) | | | 216 | | | $ | 19,634 | |
China Medical System Holdings, Ltd. (China) | | | 194,000 | | | | 229,426 | |
Chongkundang Holdings Corp. (South Korea) | | | 911 | | | | 91,689 | |
Chongqing Zhifei Biological Products Co., Ltd. - Class A (China) (a) | | | 2,200 | | | | 31,138 | |
CSPC Pharmaceutical Group, Ltd. (China) | | | 43,200 | | | | 81,816 | |
Granules India, Ltd. (India) | | | 64,930 | | | | 173,871 | |
Richter Gedeon Nyrt (Hungary) | | | 631 | | | | 13,087 | |
Shandong Xinhua Pharmaceutical Co., Ltd. (China) (a) | | | 238,000 | | | | 129,123 | |
Zhejiang NHU Co., Ltd. (China) | | | 10,400 | | | | 42,995 | |
| | | | | | | | 871,517 | |
Industrials — 4.6% |
Capital Goods — 4.1% |
Acter Group Corp., Ltd. (Taiwan) (a) | | | 2,000 | | | | 14,285 | |
Balmer Lawrie & Co., Ltd. (India) | | | 9,234 | | | | 13,416 | |
Bharat Electronics, Ltd. (India) | | | 48,630 | | | | 57,196 | |
BOC Aviation, Ltd. (China) | | | 4,300 | | | | 27,681 | |
Chicony Power Technology Co., Ltd. (Taiwan) | | | 13,000 | | | | 29,879 | |
China Aircraft Leasing Group Holdings, Ltd. (China) | | | 24,000 | | | | 19,566 | |
China Lesso Group Holdings, Ltd. (China) | | | 69,000 | | | | 90,568 | |
China Machinery Engineering Co. - H Shares (China) (a) | | | 52,000 | | | | 13,762 | |
China Railway Construction Corp., Ltd. - H Shares (China) | | | 30,500 | | | | 24,159 | |
China Railway Group, Ltd. - H Shares (China) | | | 56,000 | | | | 28,907 | |
Chongqing Machinery & Electric Co., Ltd. - H Shares (China) | | | 178,000 | | | | 9,238 | |
Concord New Energy Group, Ltd. (China) | | | 1,160,000 | | | | 48,765 | |
Daelim Industrial Co., Ltd. (South Korea) | | | 1,345 | | | | 92,762 | |
DMCI Holdings, Inc. (Philippines) | | | 168,800 | | | | 13,972 | |
Dogan Sirketler Grubu Holdings A.S. (Turkey) | | | 85,251 | | | | 26,125 | |
Engineers India, Ltd. (India) | | | 11,607 | | | | 11,588 | |
Fosun International, Ltd. (China) | | | 10,000 | | | | 12,816 | |
GS Engineering & Construction Corp. (South Korea) | | | 658 | | | | 13,583 | |
Gunkul Engineering PCL (Thailand) | | | 336,000 | | | | 28,417 | |
Hyundai Development Co. (South Korea) | | | 1,973 | | | | 13,987 | |
iMarketKorea, Inc. (South Korea) | | | 3,616 | | | | 26,282 | |
Iochpe-Maxion S.A. (Brazil) | | | 13,500 | | | | 33,570 | |
IRB Infrastructure Developers, Ltd. (India) (a) | | | 17,955 | | | | 21,133 | |
Kumho Industrial Co., Ltd. (South Korea) | | | 2,081 | | | | 11,626 | |
| | Shares | | | Value | |
Capital Goods (continued) |
LG Corp. (South Korea) | | | 249 | | | $ | 14,899 | |
Lonking Holdings, Ltd. (China) | | | 50,000 | | | | 15,230 | |
MMC Corp. Bhd (Malaysia) | | | 136,600 | | | | 23,489 | |
Sany Heavy Industry Co., Ltd. - Class A (China) | | | 13,800 | | | | 36,854 | |
Shanghai Industrial Holdings, Ltd. (China) | | | 8,000 | | | | 12,357 | |
Sinotruk Hong Kong, Ltd. (China) | | | 108,000 | | | | 281,852 | |
UEM Edgenta Bhd (Malaysia) | | | 29,700 | | | | 13,481 | |
Walsin Lihwa Corp. (Taiwan) | | | 104,000 | | | | 51,736 | |
Weichai Power Co., Ltd. - Class A (China) | | | 11,200 | | | | 21,829 | |
Zhengzhou Coal Mining Machinery Group Co., Ltd. - H Shares (China) | | | 71,200 | | | | 30,839 | |
| | | | | | | | 1,185,849 | |
Commercial & Professional Services — 0.1% |
China Everbright International, Ltd. (China) | | | 57,000 | | | | 30,243 | |
KEPCO Plant Service & Engine Co., Ltd. (South Korea) | | | 586 | | | | 14,270 | |
| | | | | | | | 44,513 | |
Transportation — 0.4% |
Allcargo Logistics, Ltd. (India) | | | 12,541 | | | | 13,099 | |
COSCO SHIPPING Energy Transportation Co., Ltd. - H Shares (China) (a) | | | 66,000 | | | | 29,560 | |
Hyundai Glovis Co., Ltd. (South Korea) | | | 283 | | | | 24,123 | |
Lingkaran Trans Kota Holdings Bhd (Malaysia) | | | 14,900 | | | | 14,655 | |
Shipping Corp. of India, Ltd. (India) (a) | | | 20,091 | | | | 15,159 | |
Wisdom Marine Lines Co., Ltd. (Taiwan) (a) | | | 17,000 | | | | 14,393 | |
| | | | | | | | 110,989 | |
Information Technology — 27.1% |
Semiconductors & Semiconductor Equipment — 5.5% |
Chipbond Technology Corp. (Taiwan) (a) | | | 18,000 | | | | 39,610 | |
ChipMOS Technologies, Inc. (Taiwan) | | | 15,000 | | | | 17,323 | |
Elan Microelectronics Corp. (Taiwan) | | | 5,000 | | | | 20,596 | |
GlobalWafers Co., Ltd. (Taiwan) (a) | | | 8,000 | | | | 110,487 | |
King Yuan Electronics Co., Ltd. (Taiwan) (a) | | | 22,000 | | | | 25,834 | |
LONGi Green Energy Technology Co., Ltd. - Class A (China) | | | 3,100 | | | | 17,954 | |
Powertech Technology, Inc. (Taiwan) | | | 41,000 | | | | 150,072 | |
Sino-American Silicon Products, Inc. (Taiwan) (a) | | | 6,000 | | | | 19,511 | |
SK Hynix, Inc. (South Korea) | | | 1,732 | | | | 123,985 | |
Taiwan Semiconductor Manufacturing Co., Ltd. ADR (Taiwan) | | | 17,900 | | | | 1,016,183 | |
Topco Scientific Co., Ltd. (Taiwan) (a) | | | 5,000 | | | | 18,629 | |
United Microelectronics Corp. (Taiwan) | | | 84,000 | | | | 45,538 | |
| | | | | | | | 1,605,722 | |
Software & Services — 13.2% |
Alibaba Group Holding, Ltd. ADR (China) (a) | | | 8,500 | | | | 1,833,450 | |
China Literature, Ltd. (China) (a) | | | 24 | | | | 163 | |
See Notes to Financial Statements.
56 |  | www.sbhfunds.com | www.sbhfunds.com
|
Segall Bryant & Hamill Emerging Markets Fund | Statement of Investments |
| | June 30, 2020 (Unaudited) |
| | Shares | | | Value | |
Software & Services (continued) |
HCL Technologies, Ltd. (India) | | | 34,192 | | | $ | 252,158 | |
International Games System Co., Ltd. (Taiwan) | | | 3,000 | | | | 75,268 | |
KGInicis Co., Ltd. (South Korea) | | | 755 | | | | 13,862 | |
Sonata Software, Ltd. (India) | | | 3,627 | | | | 11,435 | |
Tencent Holdings, Ltd. (China) | | | 25,600 | | | | 1,640,390 | |
| | | | | | | | 3,826,726 | |
Technology Hardware & Equipment — 8.4% |
BYD Electronic International Co., Ltd. (China) (a) | | | 55,500 | | | | 128,216 | |
Catcher Technology Co., Ltd. (Taiwan) | | | 6,000 | | | | 45,593 | |
Chicony Electronics Co., Ltd. (Taiwan) | | | 11,000 | | | | 31,972 | |
Cowell Fashion Co., Ltd. (South Korea) | | | 7,878 | | | | 36,100 | |
Elite Material Co., Ltd. (Taiwan) | | | 4,000 | | | | 21,829 | |
FLEXium Interconnect, Inc. (Taiwan) (a) | | | 6,000 | | | | 25,025 | |
Hon Hai Precision Industry Co., Ltd. (Taiwan) | | | 72,000 | | | | 211,982 | |
Inventec Corp. (Taiwan) | | | 35,000 | | | | 29,962 | |
Kingboard Laminates Holdings, Ltd. (China) | | | 14,500 | | | | 14,654 | |
LG Innotek Co., Ltd. (South Korea) | | | 137 | | | | 20,144 | |
Lite-On Technology Corp. (Taiwan) | | | 22,000 | | | | 34,737 | |
Micro-Star International Co., Ltd. (Taiwan) | | | 8,000 | | | | 29,368 | |
Mitac Holdings Corp. (Taiwan) | | | 21,850 | | | | 24,211 | |
Nanjing Panda Electronics Co., Ltd. - H Shares (China) | | | 184,000 | | | | 118,363 | |
PAX Global Technology, Ltd. (China) | | | 268,000 | | | | 117,398 | |
Pegatron Corp. (Taiwan) | | | 36,000 | | | | 78,736 | |
Redington India, Ltd. (India) | | | 14,224 | | | | 16,547 | |
Samsung Electronics Co., Ltd. (South Korea) | | | 19,503 | | | | 865,604 | |
SFA Engineering Corp. (South Korea) | | | 1,042 | | | | 28,583 | |
Spigen Korea Co., Ltd. (South Korea) | | | 576 | | | | 30,101 | |
Taiwan PCB Techvest Co., Ltd. (Taiwan) | | | 16,000 | | | | 19,089 | |
Trigiant Group, Ltd. (China) (a) | | | 656,000 | | | | 99,906 | |
Tripod Technology Corp. (Taiwan) | | | 12,000 | | | | 53,835 | |
Walsin Technology Corp. (Taiwan) | | | 7,000 | | | | 42,897 | |
Wistron Corp. (Taiwan) | | | 203,000 | | | | 248,496 | |
Zhen Ding Technology Holdings, Ltd. (Taiwan) | | | 19,000 | | | | 83,609 | |
| | | | | | | | 2,456,957 | |
Materials — 7.1% |
Materials — 7.1% |
Anglo American Platinum, Ltd. (South Africa) | | | 337 | | | | 24,517 | |
AngloGold Ashanti, Ltd. ADR (South Africa) | | | 4,000 | | | | 117,960 | |
Anhui Conch Cement Co., Ltd. - Class A (China) | | | 8,300 | | | | 62,508 | |
Anhui Conch Cement Co., Ltd. - H Shares (China) | | | 13,500 | | | | 91,478 | |
Asia Cement Corp. (Taiwan) | | | 96,000 | | | | 142,767 | |
Asia Paper Manufacturing Co., Ltd. (South Korea) | | | 571 | | | | 14,336 | |
| | Shares | | | Value | |
Materials (continued) |
Chambal Fertilisers and Chemicals, Ltd. (India) | | | 9,449 | | | $ | 17,788 | |
Chia Hsin Cement Corp. (Taiwan) | | | 31,000 | | | | 18,675 | |
China Lumena New Materials Corp. (China) (a) (c) | | | 1,700 | | | | 0 | |
China Metal Recycling Holdings, Ltd. (China) (a) (c) | | | 6,000 | | | | 0 | |
China National Building Material Co., Ltd. - H Shares (China) | | | 84,000 | | | | 90,098 | |
China Resources Cement Holdings, Ltd. (China) | | | 28,000 | | | | 34,533 | |
Eastern Polymer Group PCL (Thailand) (a) | | | 118,400 | | | | 18,468 | |
Empresa Siderurgica del Peru S.A.A. (Peru) | | | 67,009 | | | | 15,322 | |
GHCL, Ltd. (India) | | | 14,964 | | | | 27,276 | |
Gold Fields, Ltd. ADR (South Africa) | | | 6,900 | | | | 64,860 | |
Grupa Kety S.A. (Poland) (a) | | | 197 | | | | 21,836 | |
Grupo Mexico S.A.B de C.V. - Series B (Mexico) | | | 30,300 | | | | 70,428 | |
Hanil Holdings Co., Ltd. (South Korea) | | | 405 | | | | 15,568 | |
Hansol Paper Co., Ltd. (South Korea) | | | 1,068 | | | | 12,532 | |
Hyosung Corp. (South Korea) | | | 425 | | | | 22,389 | |
Impala Platinum Holdings, Ltd. (South Africa) | | | 8,642 | | | | 58,178 | |
Jindal Saw, Ltd. (India) | | | 15,518 | | | | 12,005 | |
Korea Zinc Co., Ltd. (South Korea) | | | 67 | | | | 18,822 | |
Kukdo Chemical Co., Ltd. (South Korea) | | | 499 | | | | 14,321 | |
LOTTE Fine Chemical Co., Ltd. (South Korea) | | | 423 | | | | 12,241 | |
MMC Norilsk Nickel PJSC (Russia) | | | 548 | | | | 144,454 | |
Nickel Asia Corp. (Philippines) | | | 503,000 | | | | 18,475 | |
Nizhnekamskneftekhim PJSC (Russia) | | | 26,725 | | | | 37,300 | |
NMDC, Ltd. (India) | | | 48,687 | | | | 52,678 | |
Saudi Industrial Investment Group (Saudi Arabia) | | | 26,293 | | | | 142,195 | |
Shinkong Synthetic Fibers Corp. (Taiwan) | | | 49,000 | | | | 18,782 | |
Sibanye-Stillwater, Ltd. ADR (South Africa) (a) | | | 5,100 | | | | 44,115 | |
SK Discovery Co., Ltd. (South Korea) | | | 785 | | | | 25,836 | |
Sociedad Minera Cerro Verde S.A.A. (Peru) (a) | | | 2,013 | | | | 37,240 | |
Soulbrain Co., Ltd. (South Korea) | | | 246 | | | | 19,707 | |
Taiwan Cement Corp. (Taiwan) | | | 117,235 | | | | 171,048 | |
Tipco Asphalt PCL (Thailand) | | | 28,500 | | | | 23,229 | |
Vale S.A. ADR (Brazil) | | | 22,474 | | | | 231,707 | |
Vinythai PCL (Thailand) | | | 24,000 | | | | 17,303 | |
West China Cement, Ltd. (China) | | | 166,000 | | | | 30,428 | |
Xiwang Special Steel Co., Ltd. (China) | | | 96,000 | | | | 6,009 | |
YFY, Inc. (Taiwan) | | | 86,000 | | | | 40,550 | |
Young Poong Corp. (South Korea) | | | 38 | | | | 14,720 | |
| | | | | | | | 2,074,682 | |
See Notes to Financial Statements.
Semi-Annual Report | June 30, 2020 |  | 57 |
Segall Bryant & Hamill Emerging Markets Fund | Statement of Investments |
| | June 30, 2020 (Unaudited) |
| | Shares | | | Value | |
Real Estate — 2.9% |
Real Estate — 2.9% |
Banco Actinver S.A. (Mexico) | | | 69,600 | | | $ | 55,257 | |
Beijing Urban Construction Design & Development Group Co., Ltd. (China) (a) | | | 81,000 | | | | 18,976 | |
China Aoyuan Group, Ltd. (China) | | | 130,000 | | | | 158,887 | |
China Fortune Land Development Co., Ltd. - Class A (China) | | | 3,800 | | | | 12,352 | |
China Overseas Grand Oceans Group, Ltd. (China) | | | 22,000 | | | | 12,538 | |
Country Garden Holdings Co., Ltd. (China) | | | 89,000 | | | | 110,386 | |
Delta Property Fund, Ltd. (South Africa) | | | 267,778 | | | | 6,120 | |
Develia S.A. (Poland) | | | 27,225 | | | | 13,397 | |
Dongwon Development Co., Ltd. (South Korea) | | | 3,882 | | | | 10,683 | |
Farglory Land Development Co., Ltd. (Taiwan) | | | 13,000 | | | | 20,968 | |
Gemdale Corp. - Class A (China) | | | 9,600 | | | | 18,690 | |
Greenland Holdings Corp., Ltd. - Class A (China) | | | 16,300 | | | | 14,310 | |
Jaya Real Property Tbk P.T. (Indonesia) (a) | | | 322,300 | | | | 9,107 | |
Jinke Property Group Co., Ltd. - Class A (China) (a) | | | 16,900 | | | | 19,587 | |
Kaisa Group Holdings, Ltd. (China) (a) | | | 40,000 | | | | 15,229 | |
KWG Group Holdings, Ltd. (China) (a) | | | 37,000 | | | | 62,156 | |
L.P.N. Development PCL (Thailand) | | | 72,500 | | | | 10,564 | |
Logan Property Holdings Co., Ltd. (China) | | | 40,000 | | | | 71,464 | |
Matrix Concepts Holdings Bhd (Malaysia) | | | 99,375 | | | | 42,031 | |
Noble Development PCL (Thailand) | | | 19,700 | | | | 7,028 | |
Poly Developments and Holdings Group Co., Ltd. - Class A (China) | | | 9,000 | | | | 18,892 | |
RiseSun Real Estate Development Co., Ltd. - Class A (China) | | | 13,300 | | | | 15,312 | |
SA Corporate Real Estate, Ltd. (South Africa) | | | 112,674 | | | | 8,308 | |
Seazen Group, Ltd. (China) (a) | | | 46,000 | | | | 39,943 | |
SK D&D Co., Ltd. (South Korea) | | | 718 | | | | 16,167 | |
Supalai PCL (Thailand) | | | 23,200 | | | | 12,656 | |
Times China Holdings, Ltd. (China) | | | 28,000 | | | | 52,211 | |
| | | | | | | | 853,219 | |
Utilities — 2.2% |
Utilities — 2.2% |
AES Gener S.A. (Chile) | | | 87,831 | | | | 12,618 | |
Athens Water Supply & Sewage Co. S.A. (Greece) | | | 1,916 | | | | 15,007 | |
Canvest Environmental Protection Group Co., Ltd. (China) | | | 30,000 | | | | 13,194 | |
Centrais Eletricas Brasileiras S.A. (Brazil) | | | 3,300 | | | | 18,815 | |
| | Shares | | | Value | |
Utilities (continued) |
China Longyuan Power Group Corp., Ltd. - H Shares (China) | | | 30,000 | | | $ | 16,914 | |
China Resources Power Holdings Co., Ltd. (China) | | | 54,000 | | | | 63,698 | |
China Water Affairs Group, Ltd. (China) | | | 118,000 | | | | 85,358 | |
Cia de Saneamento de Minas Gerais S.A. (Brazil) | | | 1,400 | | | | 14,994 | |
Enel Americas S.A. ADR (Chile) | | | 10,021 | | | | 75,258 | |
Enel Chile S.A. ADR (Chile) | | | 7 | | | | 26 | |
Engie Energia Chile S.A. (Chile) | | | 10,046 | | | | 13,441 | |
Federal Grid Co. Unified Energy System PJSC (Russia) | | | 6,680,000 | | | | 17,602 | |
First Gen Corp. (Philippines) | | | 56,300 | | | | 27,839 | |
First Philippine Holdings Corp. (Philippines) | | | 11,370 | | | | 13,990 | |
Infraestructura Energetica Nova S.A.B. de C.V. (Mexico) | | | 5,500 | | | | 15,818 | |
Inter RAO UES PJSC (Russia) | | | 646,000 | | | | 44,264 | |
Lopez Holdings Corp. (Philippines) (a) | | | 184,000 | | | | 10,136 | |
Malakoff Corp. Bhd (Malaysia) | | | 68,200 | | | | 14,544 | |
Mega First Corp. Bhd (Malaysia) (a) | | | 14,800 | | | | 21,814 | |
NTPC, Ltd. (India) | | | 29,570 | | | | 37,594 | |
OGK-2 PJSC (Russia) (a) | | | 2,185,000 | | | | 24,334 | |
Power Grid Corp. of India, Ltd. (India) | | | 17,631 | | | | 40,865 | |
SJVN, Ltd. (India) | | | 49,022 | | | | 14,149 | |
Yunnan Water Investment Co., Ltd. - H Shares (China) | | | 184,877 | | | | 32,537 | |
| | | | | | | | 644,809 | |
| | | | | | | | | |
Total Common Stocks (Cost $25,825,446) | | $ | 28,043,761 | |
| |
PREFERRED STOCKS — 3.1% |
Communication Services — 0.2% |
Telecommunication Services — 0.2% |
Telefonica Brasil S.A. ADR (Brazil) | | | 4,900 | | | $ | 43,414 | |
| |
Consumer Discretionary — 0.0% (d) |
Retailing — 0.0% (d) |
Lojas Americanas S.A. (Brazil) | | | 2,400 | | | | 14,205 | |
| |
Energy — 0.4% |
Energy — 0.4% |
Petroleo Brasileiro S.A. ADR (Brazil) | | | 8,000 | | | | 63,760 | |
Surgutneftegas PJSC (Russia) | | | 27,700 | | | | 13,662 | |
Transeft PJSC (Russia) | | | 17 | | | | 32,090 | |
| | | | | | | | 109,512 | |
Financials — 0.6% |
Banks — 0.6% |
Itausa - Investimentos Itau S.A. (Brazil) | | | 97,800 | | | | 172,503 | |
| |
Information Technology — 1.9% |
Technology Hardware & Equipment — 1.9% |
Samsung Electronics Co., Ltd. (South Korea) | | | 13,920 | | | | 543,659 | |
| |
See Notes to Financial Statements.
58 |  | www.sbhfunds.com | www.sbhfunds.com
|
Segall Bryant & Hamill Emerging Markets Fund | Statement of Investments |
| | June 30, 2020 (Unaudited) |
| | Shares | | | Value | |
Utilities — 0.2% |
Utilities — 0.2% |
Centrais Eletricas Brasileiras S.A. (Brazil) (a) | | | 2,800 | | | $ | 16,536 | |
Cia de Saneamento do Parana (Brazil) | | | 23,700 | | | | 27,375 | |
Cia Paranaense de Energia (Brazil) | | | 2,000 | | | | 22,373 | |
| | | | | | | | 66,284 | |
| | | | | | | | | |
Total Preferred Stocks (Cost $862,720) | | | 903,825 | |
| |
Investments at Value — 99.3% (Cost $26,688,166) | | $ | 28,947,586 | |
| |
Other Assets in Excess of Liabilities — 0.7% | | | 192,719 | |
| |
Net Assets — 100.0% | | $ | 29,140,305 | |
(a) | Non-income producing security. |
(b) | Security was purchased in a transaction exempt from registration in compliance with Rule 144A of the Securities Act of 1933. This security may be resold in transactions exempt from registration, normally to qualified institutional buyers. These securities are restricted. See the table below for additional information regarding each restricted security. |
(c) | Level 3 securities fair value under procedures established by the Board of Trustees, represents 0.0% of net assets. The total value of these securities is $0. |
(d) | Percentage rounds to less than 0.1%. |
Sector, industry and country classifications presented herein are based on the categorization methodology of the Adviser to the Funds. For Fund compliance purposes, the Fund’s classifications refer to any one or more of the classifications used by one or more widely recognized market indexes, and/or as defined by Fund management. This definition may not apply for purposes of this report, which may combine industry sub-classifications for reporting ease.
Country Breakdown
Country | | Value | | | % of Net
Assets | |
China | | $ | 11,785,039 | | | | 40.4 | % |
Taiwan | | | 3,694,575 | | | | 12.7 | % |
South Korea | | | 3,410,162 | | | | 11.7 | % |
India | | | 2,407,273 | | | | 8.3 | % |
Brazil | | | 1,417,806 | | | | 4.9 | % |
South Africa | | | 1,132,503 | | | | 3.9 | % |
Russia | | | 849,951 | | | | 2.9 | % |
Saudi Arabia | | | 691,184 | | | | 2.4 | % |
Thailand | | | 651,835 | | | | 2.2 | % |
Indonesia | | | 487,168 | | | | 1.7 | % |
Malaysia | | | 479,916 | | | | 1.6 | % |
Mexico | | | 430,942 | | | | 1.5 | % |
Philippines | | | 285,125 | | | | 1.0 | % |
Poland | | | 244,629 | | | | 0.8 | % |
Turkey | | | 207,630 | | | | 0.7 | % |
Qatar | | | 183,500 | | | | 0.6 | % |
Chile | | | 145,210 | | | | 0.5 | % |
Colombia | | | 110,446 | | | | 0.4 | % |
Peru | | | 101,053 | | | | 0.4 | % |
United Arab Emirates | | | 95,151 | | | | 0.3 | % |
Greece | | | 70,684 | | | | 0.2 | % |
Egypt | | | 52,716 | | | | 0.2 | % |
Hungary | | | 13,087 | | | | 0.0 | %(a) |
Total Investments | | $ | 28,947,586 | | | | 99.3 | % |
Other Assets in Excess of Liabilities | | | 192,719 | | | | 0.7 | % |
Net Assets | | $ | 29,140,305 | | | | 100.0 | % |
(a) | Percentage rounds to less than 0.1%. |
Restricted Securities
Issuer Description | Acquisition Date | | Cost | | | Value | | | Value as a
Percentage of
Net Assets | |
Reliance Industries, Ltd., 144A (India) | 04/29/20 | | $ | 16,736 | | | $ | 19,816 | | | | 0.07 | % |
See Notes to Financial Statements.
Semi-Annual Report | June 30, 2020 |  | 59 |
Segall Bryant & Hamill International Small Cap Fund | Statement of Investments |
| | June 30, 2020 (Unaudited) |
| | Shares | | | Value | |
COMMON STOCKS — 97.6% |
Communication Services — 3.5% |
Media & Entertainment — 0.6% |
DIP Corp. (Japan) | | | 15,400 | | | $ | 312,816 | |
Eutelsat Communications S.A. (France) | | | 70,585 | | | | 653,064 | |
| | | | | | | | 965,880 | |
Telecommunication Services — 2.9% |
Airtel Africa PLC (United Kingdom) (a) | | | 780,510 | | | | 606,196 | |
ARTERIA Networks Corp. (Japan) (a) | | | 24,600 | | | | 437,245 | |
Bezeq The Israeli Telecommunication Corp., Ltd. (Israel) (a) | | | 877,546 | | | | 796,330 | |
CITIC Telecom International Holdings, Ltd. (Hong Kong) | | | 2,168,000 | | | | 690,696 | |
Orange Belgium S.A. (Belgium) | | | 42,472 | | | | 693,067 | |
SpeedCast International, Ltd. (Australia) (a) (b) | | | 55,059 | | | | 25,613 | |
Sunrise Communications Group A.G. (Switzerland) (a) | | | 22,236 | | | | 1,977,779 | |
| | | | | | | | 5,226,926 | |
Consumer Discretionary — 13.5% |
Automobiles & Components — 2.8% |
Aisan Industry Co., Ltd. (Japan) | | | 22,717 | | | | 111,616 | |
CIE Automotive S.A. (Spain) | | | 30,333 | | | | 534,121 | |
Daikyonishikawa Corp. (Japan) | | | 78,664 | | | | 353,893 | |
Eagle Industry Co., Ltd. (Japan) | | | 24,500 | | | | 164,532 | |
Exedy Corp. (Japan) | | | 28,606 | | | | 427,027 | |
Faurecia S.E. (France) (a) | | | 8,623 | | | | 338,852 | |
G-Tekt Corp. (Japan) | | | 26,700 | | | | 259,075 | |
Kasai Kogyo Co., Ltd. (Japan) | | | 47,831 | | | | 202,510 | |
Piaggio & C. S.p.A. (Italy) | | | 351,069 | | | | 851,102 | |
Tokai Rika Co., Ltd. (Japan) | | | 26,800 | | | | 389,936 | |
Topre Corp. (Japan) | | | 37,300 | | | | 418,098 | |
Toyota Boshoku Corp. (Japan) | | | 38,200 | | | | 515,118 | |
Xinyi Glass Holdings, Ltd. (Hong Kong) | | | 352,000 | | | | 434,410 | |
| | | | | | | | 5,000,290 | |
Consumer Durables & Apparel — 4.4% |
Bellway PLC (United Kingdom) | | | 15,390 | | | | 484,719 | |
Cleanup Corp. (Japan) | | | 15,900 | | | | 84,569 | |
Crystal International Group, Ltd. (Hong Kong) | | | 401,500 | | | | 87,588 | |
Haseko Corp. (Japan) | | | 156,100 | | | | 1,970,925 | |
Pacific Textiles Holdings, Ltd. (Hong Kong) | | | 1,572,000 | | | | 761,978 | |
Photo-Me International PLC (United Kingdom) | | | 91,917 | | | | 62,464 | |
Redrow PLC (United Kingdom) | | | 217,392 | | | | 1,159,349 | |
Sumitomo Forestry Co., Ltd. (Japan) | | | 58,500 | | | | 735,978 | |
Tamron Co., Ltd. (Japan) | | | 46,700 | | | | 807,792 | |
Token Corp. (Japan) | | | 6,800 | | | | 443,622 | |
Vistry Group PLC (United Kingdom) | | | 142,268 | | | | 1,253,118 | |
| | | | | | | | 7,852,102 | |
Consumer Services — 1.5% |
Betsson A.B. (Sweden) (a) | | | 142,356 | | | | 992,325 | |
Gamesys Group PLC (United Kingdom) (a) | | | 89,680 | | | | 951,589 | |
| | Shares | | | Value | |
Consumer Services (continued) |
LeoVegas A.B. (Sweden) (a) | | | 171,949 | | | $ | 772,173 | |
| | | | | | | | 2,716,087 | |
Media — 0.8% |
Cineworld Group PLC (United Kingdom) | | | 153,009 | | | | 114,862 | |
HT&E, Ltd. (Australia) | | | 100,829 | | | | 83,640 | |
Mediaset Espana Comunicacion S.A. (Spain) (a) | | | 301,518 | | | | 1,118,574 | |
Proto Corp. (Japan) | | | 13,500 | | | | 125,951 | |
| | | | | | | | 1,443,027 | |
Media & Entertainment — 0.3% |
SKY Perfect JSAT Holdings, Inc. (Japan) | | | 141,517 | | | | 526,051 | |
| |
Retailing — 3.7% |
Chow Sang Sang Holdings International, Ltd. (Hong Kong) | | | 313,000 | | | | 332,896 | |
Clas Ohlson A.B. - B Shares (Sweden) | | | 70,334 | | | | 788,150 | |
Delek Automotive Systems, Ltd. (Israel) | | | 45,087 | | | | 205,457 | |
Dixons Carphone PLC (United Kingdom) | | | 286,375 | | | | 318,270 | |
eDreams ODIGEO S.A. (Spain) (a) | | | 48,271 | | | | 134,343 | |
Hornbach Baumarkt A.G. (Germany) | | | 6,029 | | | | 194,403 | |
Hornbach Holding A.G. & Co. KGaA (Germany) | | | 17,167 | | | | 1,423,584 | |
JB Hi-Fi, Ltd. (Australia) | | | 25,167 | | | | 753,017 | |
N Brown Group PLC (United Kingdom) | | | 142,235 | | | | 61,962 | |
Super Retail Group, Ltd. (Australia) | | | 260,183 | | | | 1,463,944 | |
T-Gaia Corp. (Japan) | | | 23,032 | | | | 435,321 | |
XEBIO Holdings Co., Ltd. (Japan) | | | 55,900 | | | | 435,518 | |
| | | | | | | | 6,546,865 | |
Consumer Staples — 6.4% |
Food & Staples Retailing — 0.9% |
Axial Retailing, Inc. (Japan) | | | 9,799 | | | | 392,265 | |
Cawachi, Ltd. (Japan) | | | 20,500 | | | | 529,478 | |
Conviviality PLC (United Kingdom) (a) (b) | | | 284,313 | | | | 0 | |
Life Corp. (Japan) | | | 10,400 | | | | 334,217 | |
Qol Holdings Co., Ltd. (Japan) | | | 25,550 | | | | 268,576 | |
Sonae SGPS S.A. (Portugal) | | | 88,641 | | | | 64,130 | |
Valor Holdings Co., Ltd. (Japan) | | | 5,165 | | | | 101,002 | |
| | | | | | | | 1,689,668 | |
Food, Beverage & Tobacco — 5.3% |
Agrana Beteiligungs A.G. (Austria) | | | 6,430 | | | | 132,568 | |
Austevoll Seafood A.S.A. (Norway) | | | 12,541 | | | | 104,162 | |
Bumitama Agri, Ltd. (Singapore) | | | 91,042 | | | | 28,860 | |
Chubu Shiryo Co., Ltd. (Japan) (a) | | | 19,288 | | | | 292,329 | |
Feed One Co., Ltd. (Japan) | | | 131,846 | | | | 246,847 | |
Grieg Seafood A.S.A. (Norway) | | | 15,191 | | | | 156,177 | |
Japfa, Ltd. (Singapore) | | | 1,402,363 | | | | 693,628 | |
J-Oil Mills, Inc. (Japan) | | | 12,700 | | | | 469,416 | |
La Doria S.p.A. (Italy) | | | 8,456 | | | | 107,995 | |
Marudai Food Co., Ltd. (Japan) | | | 26,820 | | | | 472,919 | |
Megmilk Snow Brand Co., Ltd. (Japan) | | | 28,500 | | | | 663,811 | |
Nisshin Oillio Group, Ltd. (The) (Japan) | | | 16,386 | | | | 512,802 | |
Origin Enterprises PLC (Ireland) | | | 106,975 | | | | 324,567 | |
Premier Foods PLC (United Kingdom) (a) | | | 310,794 | | | | 267,933 | |
See Notes to Financial Statements.
60 |  | www.sbhfunds.com | www.sbhfunds.com
|
Segall Bryant & Hamill International Small Cap Fund | Statement of Investments |
| | June 30, 2020 (Unaudited) |
| | Shares | | | Value | |
Food, Beverage & Tobacco (continued) |
Prima Meat Packers, Ltd. (Japan) | | | 32,100 | | | $ | 862,082 | |
Scandinavian Tobacco Group A/S (Denmark) | | | 98,366 | | | | 1,452,382 | |
Starzen Co., Ltd. (Japan) | | | 7,703 | | | | 303,246 | |
Strauss Group, Ltd. (Israel) | | | 27,979 | | | | 775,519 | |
Tassal Group, Ltd. (Australia) | | | 367,454 | | | | 879,867 | |
Tate & Lyle PLC (United Kingdom) | | | 60,824 | | | | 502,807 | |
Vilmorin & Cie S.A. (France) | | | 2,164 | | | | 114,656 | |
| | | | | | | | 9,364,573 | |
Household & Personal Products — 0.2% |
Best World International, Ltd. (Singapore) (b) | | | 88,900 | | | | 73,743 | |
Ontex Group N.V. (Belgium) (a) | | | 16,540 | | | | 243,174 | |
| | | | | | | | 316,917 | |
Energy — 2.0% |
Energy — 2.0% |
Beach Energy, Ltd. (Australia) | | | 464,594 | | | | 496,359 | |
Diversified Gas & Oil PLC (United Kingdom) | | | 912,018 | | | | 1,081,379 | |
Euronav N.V. (Belgium) | | | 137,408 | | | | 1,109,620 | |
Oil Refineries, Ltd. (Israel) | | | 304,636 | | | | 56,863 | |
RAIZNEXT Corp. (Japan) | | | 26,780 | | | | 302,652 | |
Serica Energy PLC (United Kingdom) | | | 14,418 | | | | 19,587 | |
Torm PLC (Denmark) | | | 69,002 | | | | 476,256 | |
| | | | | | | | 3,542,716 | |
Financials — 10.4% |
Banks — 2.4% |
Akita Bank, Ltd. (The) (Japan) | | | 10,100 | | | | 136,069 | |
Bank of Saga, Ltd. (The) (Japan) | | | 12,100 | | | | 131,866 | |
BAWAG Group A.G. (Austria) (a) | | | 23,412 | | | | 810,263 | |
Miyazaki Bank, Ltd. (The) (Japan) | | | 7,500 | | | | 166,211 | |
Norwegian Finans Holding A.S.A. (Norway) (a) | | | 149,798 | | | | 1,034,110 | |
San ju San Financial Group, Inc. (Japan) | | | 15,965 | | | | 196,151 | |
Suruga Bank, Ltd. (Japan) | | | 240,000 | | | | 843,556 | |
Tokyo Kiraboshi Financial Group, Inc. (Japan) | | | 3,200 | | | | 32,789 | |
Towa Bank, Ltd. (The) (Japan) | | | 43,146 | | | | 279,951 | |
Valiant Holding A.G. (Switzerland) | | | 6,082 | | | | 567,512 | |
| | | | | | | | 4,198,478 | |
Diversified Financials — 6.3% |
1st Pacific Co. (Hong Kong) | | | 880,000 | | | | 168,837 | |
AIFUL Corp. (Japan) (a) | | | 242,700 | | | | 536,372 | |
Anima Holding S.p.A. (Italy) | | | 381,411 | | | | 1,647,764 | |
Banca Farmafactoring S.p.A. (Italy) (a) (c) | | | 52,708 | | | | 300,379 | |
Credit Saison Co., Ltd. (Japan) | | | 68,800 | | | | 790,507 | |
DWS Group GmbH & Co. KGaA (Germany) (a) | | | 17,782 | | | | 648,051 | |
Fuyo General Lease Co., Ltd. (Japan) | | | 10,400 | | | | 579,468 | |
Haitong International Securities Group, Ltd. (Hong Kong) | | | 903,000 | | | | 216,733 | |
Hitachi Capital Corp. (Japan) | | | 22,183 | | | | 491,047 | |
Ina Invest Holding A.G. (Switzerland) (a) | | | 1,813 | | | | 40,193 | |
| | Shares | | | Value | |
Diversified Financials (continued) |
International Personal Finance PLC (United Kingdom) | | | 195,061 | | | $ | 126,331 | |
IOOF Holdings, Ltd. (Australia) | | | 84,807 | | | | 291,420 | |
Man Group PLC (United Kingdom) | | | 244,590 | | | | 395,979 | |
Navigator Global Investments, Ltd. (Australia) | | | 221,374 | | | | 182,166 | |
Pendal Group, Ltd. (Australia) | | | 237,281 | | | | 992,763 | |
Plus500, Ltd. (United Kingdom) | | | 85,632 | | | | 1,396,697 | |
Resurs Holding A.B. (Sweden) | | | 58,918 | | | | 243,009 | |
Sun Hung Kai & Co., Ltd. (Hong Kong) | | | 1,072,000 | | | | 421,961 | |
TP ICAP PLC (United Kingdom) | | | 402,135 | | | | 1,746,516 | |
| | | | | | | | 11,216,193 | |
Insurance — 1.7% |
ASR Nederland N.V. (Netherlands) | | | 14,656 | | | | 451,016 | |
Helvetia Holding A.G. (Switzerland) | | | 14,263 | | | | 1,335,985 | |
Menora Mivtachim Holdings, Ltd. (Israel) | | | 7,806 | | | | 78,521 | |
Migdal Insurance and Financial Holdings, Ltd. (Israel) | | | 261,004 | | | | 136,146 | |
Phoenix Group Holdings PLC (United Kingdom) | | | 59,124 | | | | 472,449 | |
Unipol Gruppo S.p.A. (Italy) | | | 90,906 | | | | 355,193 | |
Vienna Insurance Group A.G. (Austria) (a) | | | 7,397 | | | | 165,893 | |
| | | | | | | | 2,995,203 | |
Health Care — 7.2% |
Healthcare Equipment & Services — 3.9% |
Australian Pharmaceutical Industries, Ltd. (Australia) | | | 1,244,900 | | | | 986,255 | |
Draegerwerk A.G. & Co. KGaA (Germany) (a) | | | 8,585 | | | | 576,502 | |
Galenica A.G. (Switzerland) | | | 22,788 | | | | 1,633,758 | |
Getinge A.B. - B Shares (Sweden) | | | 81,827 | | | | 1,524,566 | |
Humana A.B. (Sweden) (a) | | | 52,974 | | | | 269,953 | |
Mediclinic International PLC (United Kingdom) | | | 90,654 | | | | 297,804 | |
Metlifecare, Ltd. (New Zealand) (a) | | | 68,806 | | | | 230,573 | |
Spire Healthcare Group PLC (United Kingdom) (a) | | | 320,595 | | | | 339,174 | |
UDG Healthcare PLC (United Kingdom) (a) | | | 26,267 | | | | 233,461 | |
Virtus Health, Ltd. (Australia) | | | 162,658 | | | | 319,972 | |
Vital KSK Holdings, Inc. (Japan) | | | 65,900 | | | | 632,645 | |
| | | | | | | | 7,044,663 | |
Pharmaceuticals, Biotechnology & Life Sciences — 3.3% |
Clinigen Group PLC (United Kingdom) | | | 5,009 | | | | 50,200 | |
Fuso Pharmaceutical Industries, Ltd. (Japan) | | | 6,000 | | | | 139,519 | |
Gerresheimer A.G. (Germany) | | | 12,036 | | | | 1,112,532 | |
Hikma Pharmaceuticals PLC (United Kingdom) | | | 21,588 | | | | 592,389 | |
Kaken Pharmaceutical Co., Ltd. (Japan) | | | 24,900 | | | | 1,275,131 | |
KYORIN Holdings, Inc. (Japan) | | | 32,100 | | | | 657,372 | |
Pharma Mar S.A. (Spain) | | | 27,619 | | | | 238,644 | |
Recipharm A.B. (Sweden) | | | 47,668 | | | | 591,167 | |
Sawai Pharmaceutical Co., Ltd. (Japan) | | | 11,900 | | | | 611,627 | |
See Notes to Financial Statements.
Semi-Annual Report | June 30, 2020 |  | 61 |
Segall Bryant & Hamill International Small Cap Fund | Statement of Investments |
| | June 30, 2020 (Unaudited) |
| | Shares | | | Value | |
Pharmaceuticals, Biotechnology & Life Sciences (continued) |
Towa Pharmaceutical Co., Ltd. (Japan) | | | 29,473 | | | $ | 545,875 | |
| | | | | | | | 5,814,456 | |
Industrials — 21.3% |
Capital Goods — 15.9% |
Aida Engineering, Ltd. (Japan) (a) | | | 11,119 | | | | 75,237 | |
Ashtrom Group, Ltd. (Israel) | | | 12,632 | | | | 134,038 | |
Austal, Ltd. (Australia) | | | 492,252 | | | | 1,109,607 | |
Danieli & C. Officine Meccaniche S.p.A. (Italy) | | | 43,050 | | | | 352,904 | |
Fomento de Construcciones y Contratas S.A. (Spain) | | | 45,787 | | | | 433,258 | |
Hazama Ando Corp. (Japan) | | | 62,900 | | | | 364,855 | |
IMI PLC (United Kingdom) (a) | | | 78,262 | | | | 892,856 | |
Implenia A.G. (Switzerland) | | | 9,067 | | | | 337,123 | |
Inabata & Co., Ltd. (Japan) | | | 68,200 | | | | 826,615 | |
Inwido A.B. (Sweden) (a) | | | 156,759 | | | | 1,093,616 | |
Kanamoto Co., Ltd. (Japan) | | | 28,282 | | | | 619,477 | |
Kandenko Co., Ltd. (Japan) | | | 68,900 | | | | 585,623 | |
Keller Group PLC (United Kingdom) | | | 13,375 | | | | 105,071 | |
Koninklijke BAM Groep N.V. (Netherlands) (a) | | | 161,207 | | | | 292,697 | |
Kumagai Gumi Co., Ltd. (Japan) | | | 55,000 | | | | 1,320,929 | |
Kyudenko Corp. (Japan) | | | 21,700 | | | | 640,523 | |
Lindab International A.B. (Sweden) | | | 56,584 | | | | 666,865 | |
Maeda Corp. (Japan) | | | 78,900 | | | | 603,867 | |
Maeda Road Construction Co., Ltd. (Japan) (a) | | | 31,500 | | | | 594,044 | |
Morgan Sindall Group PLC (United Kingdom) | | | 19,350 | | | | 294,708 | |
Nichias Corp. (Japan) | | | 32,900 | | | | 687,570 | |
Nippo Corp. (Japan) (a) | | | 9,200 | | | | 232,369 | |
Nippon Koei Co., Ltd. (Japan) | | | 19,300 | | | | 539,960 | |
Nishimatsu Construction Co., Ltd. (Japan) | | | 40,797 | | | | 814,259 | |
NRW Holdings, Ltd. (Australia) | | | 792,527 | | | | 1,038,963 | |
Peab A.B. - Class B (Sweden) (a) | | | 151,135 | | | | 1,249,095 | |
Penta-Ocean Construction Co., Ltd. (Japan) | | | 154,400 | | | | 833,807 | |
PER Aarsleff Holdings A/S - Class B (Denmark) | | | 30,049 | | | | 1,082,768 | |
Rexel S.A. (France) | | | 128,649 | | | | 1,474,757 | |
Sanki Engineering Co., Ltd. (Japan) | | | 66,840 | | | | 766,185 | |
Sembcorp Industries, Ltd. (Singapore) | | | 137,200 | | | | 173,683 | |
Signify N.V. (Netherlands) (a) | | | 71,403 | | | | 1,836,132 | |
Sulzer A.G. (Switzerland) | | | 1,299 | | | | 104,177 | |
Takamatsu Construction Group Co., Ltd. (Japan) | | | 26,167 | | | | 585,989 | |
Takasago Thermal Engineering Co., Ltd. (Japan) | | | 21,200 | | | | 311,798 | |
Tekken Corp. (Japan) | | | 2,882 | | | | 55,330 | |
TOA Corp. (Japan) | | | 44,100 | | | | 640,155 | |
Toda Corp. (Japan) | | | 60,200 | | | | 389,426 | |
Toenec Corp. (Japan) | | | 5,007 | | | | 173,596 | |
Totetsu Kogyo Co., Ltd. (Japan) | | | 12,550 | | | | 316,806 | |
Toyo Construction Co., Ltd. (Japan) | | | 132,000 | | | | 492,492 | |
| | Shares | | | Value | |
Capital Goods (continued) |
Trelleborg A.B. (Sweden) (a) | | | 34,208 | | | $ | 501,816 | |
Ultra Electronics Holdings PLC (United Kingdom) (a) | | | 4,594 | | | | 113,288 | |
Uponor OYJ (Finland) | | | 83,418 | | | | 1,129,931 | |
Veidekke A.S.A. (Norway) (a) | | | 27,653 | | | | 335,794 | |
Yahagi Construction Co., Ltd. (Japan) | | | 18,200 | | | | 132,989 | |
Yuasa Trading Co., Ltd. (Japan) | | | 21,254 | | | | 574,544 | |
Zehnder Group A.G. (Switzerland) | | | 9,542 | | | | 375,701 | |
| | | | | | | | 28,307,293 | |
Commercial & Professional Services — 2.1% |
Aggreko PLC (United Kingdom) | | | 39,401 | | | | 216,681 | |
Babcock International Group PLC (United Kingdom) | | | 269,010 | | | | 1,030,975 | |
Derichebourg S.A. (France) | | | 155,972 | | | | 449,455 | |
Intertrust N.V. (Netherlands) | | | 17,437 | | | | 297,050 | |
Loomis A.B. (Sweden) (a) | | | 67,781 | | | | 1,618,959 | |
Societe BIC S.A. (France) | | | 1,964 | | | | 100,025 | |
Tanseisha Co., Ltd. (Japan) | | | 13,300 | | | | 92,936 | |
| | | | | | | | 3,806,081 | |
Transportation — 3.3% |
bpost S.A. (Belgium) | | | 184,926 | | | | 1,250,177 | |
Compania de Distribucion Integral Logista Holdings S.A. (Spain) | | | 7,669 | | | | 143,700 | |
CTT-Correios de Portugal S.A. (Portugal) (a) | | | 182,958 | | | | 433,803 | |
D/S Norden A/S (Denmark) | | | 71,622 | | | | 966,230 | |
Dart Group PLC (United Kingdom) | | | 56,056 | | | | 582,427 | |
Go-Ahead Group PLC (The) (United Kingdom) | | | 83,240 | | | | 863,458 | |
Nobina A.B. (Sweden) (a) | | | 26,375 | | | | 158,036 | |
Redde Northgate PLC (United Kingdom) | | | 437,762 | | | | 900,032 | |
Stagecoach Group PLC (United Kingdom) | | | 331,438 | | | | 245,515 | |
Tourism Holdings, Ltd. (New Zealand) (a) | | | 239,708 | | | | 308,766 | |
| | | | | | | | 5,852,144 | |
Information Technology — 10.9% |
Semiconductors & Semiconductor Equipment — 2.0% |
Dialog Semiconductor PLC (Germany) (a) | | | 20,161 | | | | 921,714 | |
Ferrotec Holdings Corp. (Japan) | | | 79,500 | | | | 482,248 | |
Siltronic A.G. (Germany) | | | 11,590 | | | | 1,188,719 | |
Tower Semiconductor, Ltd. (Israel) (a) | | | 46,807 | | | | 890,410 | |
| | | | | | | | 3,483,091 | |
Software & Services — 4.4% |
Atea ASA (Norway) (a) | | | 108,399 | | | | 1,049,220 | |
Avast PLC (United Kingdom) | | | 139,237 | | | | 910,020 | |
Bravura Solutions, Ltd. (Australia) | | | 71,942 | | | | 226,734 | |
Computacenter PLC (United Kingdom) | | | 93,338 | | | | 1,891,702 | |
DTS Corp. (Japan) | | | 24,927 | | | | 514,356 | |
Econocom Group S.A./N.V. (Belgium) | | | 167,699 | | | | 339,920 | |
Integrated Research, Ltd. (Australia) | | | 172,163 | | | | 459,543 | |
Micro Focus International PLC (United Kingdom) (a) | | | 16,029 | | | | 85,514 | |
Mitsubishi Research Institute, Inc. (Japan) | | | 15,500 | | | | 620,127 | |
See Notes to Financial Statements.
62 |  | www.sbhfunds.com | www.sbhfunds.com
|
Segall Bryant & Hamill International Small Cap Fund | Statement of Investments |
| | June 30, 2020 (Unaudited) |
| | Shares | | | Value | |
Software & Services (continued) |
Playtech PLC (United Kingdom) | | | 69,747 | | | $ | 243,693 | |
Sopra Steria Group (France) | | | 2,631 | | | | 325,545 | |
TietoEVRY OYJ (Finland) (a) | | | 45,870 | | | | 1,255,922 | |
| | | | | | | | 7,922,296 | |
Technology Hardware & Equipment — 4.5% |
ALSO Holding A.G. (Switzerland) (a) | | | 3,500 | | | | 859,739 | |
AT&S Austria Technologie & Systemtechnik A.G. (Austria) | | | 32,795 | | | | 592,182 | |
CONEXIO Corp. (Japan) | | | 35,561 | | | | 470,745 | |
Daiwabo Holdings Co., Ltd. (Japan) | | | 21,200 | | | | 1,391,325 | |
Dicker Data, Ltd. (Australia) | | | 86,308 | | | | 416,482 | |
Eizo Corp. (Japan) | | | 11,396 | | | | 428,243 | |
Hakuto Co., Ltd. (Japan) | | | 12,700 | | | | 116,144 | |
Hosiden Corp. (Japan) | | | 61,300 | | | | 539,066 | |
Kaga Electronics Co., Ltd. (Japan) | | | 29,400 | | | | 534,835 | |
Landis+Gyr Group A.G. (Switzerland) (a) | | | 4,772 | | | | 309,125 | |
Logitech International S.A. (Switzerland) | | | 3,862 | | | | 253,069 | |
MCJ Co., Ltd. (Japan) | | | 137,100 | | | | 1,095,603 | |
Quadient (France) | | | 5,225 | | | | 76,379 | |
Restar Holdings Corp. (Japan) | | | 29,300 | | | | 570,167 | |
Sanshin Electronics Co., Ltd. (Japan) | | | 12,800 | | | | 182,854 | |
VTech Holdings, Ltd. (Hong Kong) (a) | | | 29,438 | | | | 177,339 | |
| | | | | | | | 8,013,297 | |
Materials — 7.9% |
Materials — 7.9% |
Aichi Steel Corp. (Japan) | | | 18,500 | | | | 526,229 | |
Aperam S.A. (France) | | | 28,865 | | | | 809,372 | |
Asahi Holdings, Inc. (Japan) | | | 22,900 | | | | 609,612 | |
Bekaert S.A. (Belgium) | | | 5,918 | | | | 116,369 | |
Buzzi Unicem S.p.A. (Italy) | | | 41,147 | | | | 513,163 | |
Centamin PLC (United Kingdom) | | | 66,623 | | | | 152,076 | |
Dainichiseika Color & Chemicals Manufacturing Co., Ltd. (Japan) | | | 4,600 | | | | 99,833 | |
Ferrexpo PLC (United Kingdom) | | | 796,577 | | | | 1,710,708 | |
Fletcher Building, Ltd. (New Zealand) | | | 78,018 | | | | 187,887 | |
Godo Steel, Ltd. (Japan) | | | 20,150 | | | | 343,550 | |
Granges A.B. (Sweden) (a) | | | 60,146 | | | | 479,446 | |
Hexpol A.B. (Sweden) (a) | | | 15,289 | | | | 114,068 | |
Kureha Corp. (Japan) | | | 8,000 | | | | 351,730 | |
Miquel y Costas & Miquel S.A. (Spain) | | | 15,871 | | | | 227,814 | |
Mount Gibson Iron, Ltd. (Australia) | | | 1,729,456 | | | | 737,193 | |
Nippon Light Metal Holdings Co., Ltd. (Japan) | | | 12,400 | | | | 21,722 | |
Perenti Global, Ltd. (Australia) | | | 1,326,829 | | | | 1,077,309 | |
Rengo Co., Ltd. (Japan) | | | 147,800 | | | | 1,204,816 | |
St Barbara, Ltd. (Australia) | | | 506,153 | | | | 1,120,472 | |
Tenma Corp. (Japan) | | | 12,125 | | | | 187,015 | |
Tokuyama Corp. (Japan) | | | 56,000 | | | | 1,324,964 | |
Tokyo Steel Manufacturing Co., Ltd. (Japan) | | | 64,200 | | | | 369,716 | |
Ube Industries, Ltd. (Japan) | | | 5,727 | | | | 98,701 | |
Vetropack Holding A.G. (Switzerland) (a) | | | 15,672 | | | | 866,743 | |
Vicat S.A. (France) | | | 15,162 | | | | 465,986 | |
| | Shares | | | Value | |
Materials (continued) |
Westgold Resources, Ltd. (Australia) (a) | | | 183,911 | | | $ | 270,035 | |
| | | | | | | | 13,986,529 | |
Real Estate — 12.0% |
Real Estate — 12.0% |
Allreal Holding A.G. (Switzerland) | | | 2,030 | | | | 402,415 | |
Aventus Group (Australia) | | | 405,946 | | | | 589,626 | |
Capital & Regional PLC (United Kingdom) | | | 48,879 | | | | 51,480 | |
Charter Hall Long Wale REIT (Australia) | | | 295,310 | | | | 880,998 | |
Civitas Social Housing PLC REIT (United Kingdom) | | | 870,256 | | | | 1,183,382 | |
Corestate Capital Holding S.A. (Germany) (a) | | | 50,390 | | | | 1,024,808 | |
Deutsche EuroShop A.G. (Germany) (a) | | | 48,916 | | | | 691,415 | |
Dios Fastigheter A.B. (Sweden) | | | 134,331 | | | | 899,673 | |
Eagle Hospitality Trust (Singapore) (a) (b) | | | 1,204,600 | | | | 165,030 | |
Far East Consortium International, Ltd. (Hong Kong) (a) | | | 882,000 | | | | 289,159 | |
First Real Estate Investment Trust (Singapore) | | | 1,482,503 | | | | 744,057 | |
Investec Australia Property Fund (Australia) (c) | | | 423,431 | | | | 356,088 | |
Invincible Investment Corp. (Japan) | | | 2,745 | | | | 712,487 | |
Japan Hotel REIT Investment Corp. (Japan) | | | 2,909 | | | | 1,206,673 | |
Kenedix Retail REIT Corp. (Japan) | | | 139 | | | | 260,245 | |
Keppel Pacific Oak US REIT (Singapore) | | | 790,000 | | | | 559,288 | |
Kiwi Property Group, Ltd. (New Zealand) (a) | | | 185,910 | | | | 126,578 | |
Kungsleden A.B. (Sweden) | | | 12,853 | | | | 96,181 | |
Lar Espana Real Estate Socimi S.A. (Spain) | | | 68,801 | | | | 359,120 | |
Lippo Malls Indonesia Retail Trust (Singapore) | | | 2,028,629 | | | | 198,418 | |
Mercialys S.A. (France) | | | 132,096 | | | | 1,107,622 | |
MIRAI Corp. (Japan) | | | 3,028 | | | | 1,069,063 | |
NewRiver REIT PLC (United Kingdom) (c) | | | 912,817 | | | | 711,009 | |
Norstar Holdings, Inc. (Israel) | | | 15,515 | | | | 76,836 | |
Nyfosa A.B. (Sweden) (a) | | | 58,148 | | | | 399,024 | |
Raysum Co., Ltd. (Japan) | | | 32,300 | | | | 284,925 | |
Regional REIT, Ltd. (United Kingdom) | | | 462,205 | | | | 405,646 | |
Samty Residential Investment Corp. (Japan) | | | 213 | | | | 209,207 | |
Sasseur Real Estate Investment Trust (Singapore) | | | 1,072,600 | | | | 572,727 | |
Savills PLC (United Kingdom) | | | 119,429 | | | | 1,218,036 | |
Selvaag Bolig A.S.A. (Norway) | | | 104,709 | | | | 621,600 | |
Star Asia Investment Corp. (Japan) | | | 290 | | | | 256,549 | |
Summit Real Estate Holdings, Ltd. (Israel) | | | 18,697 | | | | 171,301 | |
Takara Leben Co., Ltd. (Japan) | | | 253,557 | | | | 850,192 | |
Takara Leben Real Estate Investment Trust Corp. (Japan) | | | 1,244 | | | | 1,032,022 | |
Wereldhave N.V. (Netherlands) | | | 13,285 | | | | 122,473 | |
Wihlborgs Fastigheter A.B. (Sweden) | | | 14,188 | | | | 233,349 | |
See Notes to Financial Statements.
Semi-Annual Report | June 30, 2020 |  | 63 |
Segall Bryant & Hamill International Small Cap Fund | Statement of Investments |
| | June 30, 2020 (Unaudited) |
| | Shares | | | Value | |
Real Estate (continued) |
Workspace Group PLC (United Kingdom) (a) | | | 34,035 | | | $ | 276,083 | |
Yanlord Land Group, Ltd. (Singapore) (a) | | | 1,056,474 | | | | 894,064 | |
| | | | | | | | 21,308,849 | |
Utilities — 2.5% |
Utilities — 2.5% |
ACEA S.p.A. (Italy) | | | 47,509 | | | | 913,668 | |
BKW A.G. (Switzerland) | | | 4,696 | | | | 421,603 | |
Contact Energy, Ltd. (New Zealand) | | | 28,567 | | | | 116,177 | |
Drax Group PLC (United Kingdom) | | | 420,203 | | | | 1,341,031 | |
Encavis A.G. (Germany) | | | 31,390 | | | | 457,439 | |
EVN A.G. (Austria) | | | 10,119 | | | | 171,057 | |
Genesis Energy, Ltd. (New Zealand) | | | 54,997 | | | | 108,093 | |
Hokuriku Electric Power Co. (Japan) | | | 13,700 | | | | 87,164 | |
Italgas S.p.A. (Italy) | | | 116,571 | | | | 678,535 | |
Nippon Gas Co., Ltd. (Japan) (a) | | | 2,500 | | | | 107,491 | |
Redes Energeticas Nacionais, SGPS, S.A. (Portugal) | | | 44,122 | | | | 120,422 | |
| | | | | | | | 4,522,680 | |
| | | | | | | | | |
Total Common Stocks (Cost $193,432,950) | | | 173,662,355 | |
| |
PREFERRED STOCKS — 0.5% |
Health Care — 0.4% |
Healthcare Equipment & Services — 0.4% |
Draegerwerk A.G. & Co. KGaA (Germany) | | | 7,979 | | | | 653,066 | |
| |
Materials — 0.1% |
Materials — 0.1% |
STO S.E. & Co. KGaA (Germany) | | | 2,339 | | | | 265,467 | |
| |
Total Preferred Stocks (Cost $709,365) | | | 918,533 | |
| |
RIGHTS — 0.0% (d) |
Consumer Discretionary — 0.0% (d) |
Consumer Services — 0.0% (d) |
Betsson A.B. | | | 142,356 | | | | 43,839 | |
| | | | | | | | | |
Retailing — 0.0% |
Super Retail Group, Ltd. (b) | | | 37,169 | | | | 0 | |
| | | | | | | | | |
Total Rights (Cost $15,948) | | | 43,839 | |
| |
Investments at Value — 98.1% (Cost $194,158,263) | | $ | 174,624,727 | |
| |
Other Assets in Excess of Liabilities — 1.9% | | | 3,337,885 | |
| |
Net Assets — 100.0% | | $ | 177,962,612 | |
(a) | Non-income producing security. |
(b) | Level 3 securities fair value under procedures established by the Board of Trustees, represents 0.1% of net assets. The total value of these securities is $264,386. |
(c) | Restricted security. See the table on the following page for additional information. |
(d) | Percentage rounds to less than 0.1%. |
Sector, industry and country classifications presented herein are based on the categorization methodology of the Adviser to the Funds. For Fund compliance purposes, the Fund’s classifications refer to any one or more of the classifications used by one or more widely recognized market indexes, and/or as defined by Fund management. This definition may not apply for purposes of this report, which may combine industry sub-classifications for reporting ease.
Country Breakdown
Country | | Value | | | % of Net
Assets | |
Japan | | $ | 54,386,391 | | | | 30.6 | % |
United Kingdom | | | 27,960,626 | | | | 15.7 | % |
Australia | | | 14,758,066 | | | | 8.3 | % |
Sweden | | | 12,735,310 | | | | 7.2 | % |
Switzerland | | | 9,484,922 | | | | 5.3 | % |
Germany | | | 9,157,700 | | | | 5.1 | % |
France | | | 5,915,713 | | | | 3.3 | % |
Italy | | | 5,720,703 | | | | 3.2 | % |
Singapore | | | 4,103,498 | | | | 2.3 | % |
Denmark | | | 3,977,636 | | | | 2.2 | % |
Belgium | | | 3,752,327 | | | | 2.1 | % |
Hong Kong | | | 3,581,597 | | | | 2.0 | % |
Israel | | | 3,321,421 | | | | 1.9 | % |
Norway | | | 3,301,063 | | | | 1.9 | % |
Spain | | | 3,189,574 | | | | 1.8 | % |
Netherlands | | | 2,999,368 | | | | 1.7 | % |
Finland | | | 2,385,853 | | | | 1.3 | % |
Austria | | | 1,871,963 | | | | 1.1 | % |
New Zealand | | | 1,078,074 | | | | 0.6 | % |
Portugal | | | 618,355 | | | | 0.3 | % |
Ireland | | | 324,567 | | | | 0.2 | % |
Total Investments | | $ | 174,624,727 | | | | 98.1 | % |
Other Assets in Excess of Liabilities | | | 3,337,885 | | | | 1.9 | % |
Net Assets | | $ | 177,962,612 | | | | 100.0 | % |
See Notes to Financial Statements.
64 |  | www.sbhfunds.com | www.sbhfunds.com
|
Segall Bryant & Hamill International Small Cap Fund | Statement of Investments |
| | June 30, 2020 (Unaudited) |
Restricted Securities
Issuer Description | Acquisition Date | | Cost | | | Value | | | Value as a
Percentage of
Net Assets | |
Banca Farmafactoring S.p.A. (Italy) | 04/23/20-05/19/20 | | $ | 286,698 | | | $ | 300,379 | | | | 0.17 | % |
Investec Austrailia Property Fund (Austrailia) | 06/12/20-06/15/20 | | | 338,338 | | | | 356,088 | | | | 0.20 | % |
NewRiver REIT PLC (United Kingdom) | 02/13/18-05/11/20 | | | 1,898,444 | | | | 711,009 | | | | 0.40 | % |
| | | | $ | 2,523,480 | | | $ | 1,367,476 | | | | 0.77 | % |
See Notes to Financial Statements.
Semi-Annual Report | June 30, 2020 |  | 65 |
Segall Bryant & Hamill
Fundamental International Small Cap Fund | Statement of Investments |
| | June 30, 2020 (Unaudited) |
| | Shares | | | Value | |
COMMON STOCKS — 92.9% |
Communication Services — 12.5% |
Media & Entertainment — 9.9% |
4Imprint Group PLC (United Kingdom) (a) | | | 32,100 | | | $ | 978,630 | |
JYP Entertainment Corp. (South Korea) | | | 31,140 | | | | 554,293 | |
LIFULL Co., Ltd. (Japan) | | | 147,200 | | | | 580,449 | |
MarkLines Co., Ltd. (Japan) | | | 36,411 | | | | 758,709 | |
ZIGExN Co., Ltd. (Japan) | | | 191,642 | | | | 602,742 | |
| | | | | | | | 3,474,823 | |
Telecommunication Services — 2.6% |
KINX, Inc. (South Korea) | | | 6,760 | | | | 335,291 | |
Vision, Inc. (Japan) (a) | | | 88,100 | | | | 555,595 | |
| | | | | | | | 890,886 | |
Consumer Discretionary — 13.7% |
Consumer Durables & Apparel — 3.2% |
MIPS A.B. (Sweden) | | | 31,774 | | | | 1,101,665 | |
| |
Consumer Services — 6.3% |
Arcland Service Holdings Co., Ltd. (Japan) | | | 20,808 | | | | 369,236 | |
Fu Shou Yuan International Group, Ltd. (China) | | | 1,076,847 | | | | 989,970 | |
Jumbo Interactive, Ltd. (Australia) | | | 58,100 | | | | 388,573 | |
MTY Food Group, Inc. (Canada) | | | 9,589 | | | | 171,921 | |
Yossix Co., Ltd. (Japan) | | | 15,515 | | | | 285,265 | |
| | | | | | | | 2,204,965 | |
Retailing — 4.2% |
Vertu Motors PLC (United Kingdom) | | | 1,312,518 | | | | 398,130 | |
Webjet, Ltd. (Australia) | | | 464,742 | | | | 1,086,636 | |
| | | | | | | | 1,484,766 | |
Consumer Staples — 2.6% |
Household & Personal Products — 2.6% |
Kitanotatsujin Corp. (Japan) | | | 191,800 | | | | 919,541 | |
| |
Financials — 8.1% |
Banks — 1.5% |
Mortgage Advice Bureau Holdings, Ltd. (United Kingdom) | | | 70,549 | | | | 527,118 | |
| |
Diversified Financials — 6.6% |
Azimut Holdings S.p.A. (Italy) | | | 35,077 | | | | 602,167 | |
M&A Capital Partners Co., Ltd. (Japan) (a) | | | 19,112 | | | | 710,428 | |
Sanne Group PLC (Jersey) | | | 76,465 | | | | 596,181 | |
Strike Co., Ltd. (Japan) (a) | | | 9,000 | | | | 404,237 | |
| | | | | | | | 2,313,013 | |
Health Care — 3.8% |
Pharmaceuticals, Biotechnology & Life Sciences — 3.8% |
Essex Bio-Technology, Ltd. (Hong Kong) | | | 565,000 | | | | 401,837 | |
SwedenCare A.B. (Sweden) | | | 74,470 | | | | 914,934 | |
| | | | | | | | 1,316,771 | |
| | Shares | | | Value | |
Industrials — 15.7% |
Capital Goods — 3.5% |
Diploma PLC (United Kingdom) | | | 27,980 | | | $ | 622,005 | |
IMCD N.V. (Netherlands) (a) | | | 6,640 | | | | 626,272 | |
| | | | | | | | 1,248,277 | |
Commercial & Professional Services — 12.2% |
Boyd Group Services, Inc. (Canada) | | | 6,415 | | | | 954,845 | |
Clipper Logistics PLC (United Kingdom) | | | 343,775 | | | | 1,250,224 | |
Nihon M&A Center, Inc. (Japan) | | | 20,530 | | | | 933,646 | |
SMS Co., Ltd. (Japan) | | | 50,190 | | | | 1,129,431 | |
| | | | | | | | 4,268,146 | |
Information Technology — 36.5% |
Software & Services — 35.7% |
Appen, Ltd. (Australia) | | | 75,610 | | | | 1,795,309 | |
Autohome, Inc. ADR (China) | | | 6,243 | | | | 471,346 | |
CANCOM S.E. (Germany) (a) | | | 18,030 | | | | 961,345 | |
Constellation Software, Inc. (Canada) | | | 1,474 | | | | 1,664,344 | |
Fortnox A.B. (Sweden) | | | 58,654 | | | | 1,604,873 | |
GB Group PLC (United Kingdom) | | | 165,420 | | | | 1,381,705 | |
Keywords Studios PLC (Ireland) | | | 70,689 | | | | 1,587,119 | |
LiveChat Software S.A. (Poland) | | | 23,500 | | | | 379,235 | |
Logo Yazilim Sanayi Ve Ticaret A.S. (Turkey) (a) | | | 35,970 | | | | 406,740 | |
Momo, Inc. ADR (China) | | | 39,400 | | | | 688,712 | |
PagSeguro Digital, Ltd. - Class A (Brazil) (a) | | | 20,540 | | | | 725,884 | |
Softcat PLC (United Kingdom) | | | 60,969 | | | | 824,601 | |
| | | | | | | | 12,491,213 | |
Technology Hardware & Equipment — 0.8% |
PAX Global Technology, Ltd. (Hong Kong) | | | 688,200 | | | | 301,467 | |
| |
Investments at Value — 92.9% (Cost $25,224,044) | | $ | 32,542,651 | |
| |
Other Assets in Excess of Liabilities — 7.1% | | | 2,471,255 | |
| |
Net Assets — 100.0% | | $ | 35,013,906 | |
(a) | Non-income producing security. |
Sector, industry and country classifications presented herein are based on the categorization methodology of the Adviser to the Funds. For Fund compliance purposes, the Fund’s classifications refer to any one or more of the classifications used by one or more widely recognized market indexes, and/or as defined by Fund management. This definition may not apply for purposes of this report, which may combine industry sub-classifications for reporting ease.
See Notes to Financial Statements.
66 |  | www.sbhfunds.com | www.sbhfunds.com
|
Segall Bryant & Hamill
Fundamental International Small Cap Fund | Statement of Investments |
| | June 30, 2020 (Unaudited) |
Country Breakdown
Country | | Value | | | % of Net
Assets | |
Japan | | $ | 7,249,279 | | | | 20.7 | % |
United Kingdom | | | 5,982,413 | | | | 17.1 | % |
Sweden | | | 3,621,472 | | | | 10.3 | % |
Australia | | | 3,270,518 | | | | 9.3 | % |
Canada | | | 2,791,110 | | | | 8.0 | % |
China | | | 2,150,028 | | | | 6.1 | % |
Ireland | | | 1,587,119 | | | | 4.5 | % |
Germany | | | 961,345 | | | | 2.8 | % |
South Korea | | | 889,584 | | | | 2.5 | % |
Brazil | | | 725,884 | | | | 2.1 | % |
Hong Kong | | | 703,304 | | | | 2.0 | % |
Netherlands | | | 626,272 | | | | 1.8 | % |
Italy | | | 602,167 | | | | 1.7 | % |
Jersey | | | 596,181 | | | | 1.7 | % |
Turkey | | | 406,740 | | | | 1.2 | % |
Poland | | | 379,235 | | | | 1.1 | % |
Total Investments | | $ | 32,542,651 | | | | 92.9 | % |
Other Assets in Excess of Liabilities | | | 2,471,255 | | | | 7.1 | % |
Net Assets | | $ | 35,013,906 | | | | 100.0 | % |
See Notes to Financial Statements.
Semi-Annual Report | June 30, 2020 |  | 67 |
Segall Bryant & Hamill
Fundamental International Small Cap Fund | Statement of Investments |
| | June 30, 2020 (Unaudited) |
SCHEDULE OF FORWARD FOREIGN CURRENCY CONTRACTS
| | | | | | | | | | | | | | | | | | | | | | | Asset
Derivatives | | | Liability
Derivatives | |
Counterparty | | Settlement
Date | | | Fund
Receiving | | | U.S. $ Value at
June 30, 2020 | | | Fund
Delivering | | | U.S. $ Value at
June 30, 2020 | | | Unrealized
Appreciation | | | Unrealized
Depreciation | |
BNY Mellon | | | 9/17/2020 | | | | AED | | | | 45,999 | | | | USD | | | | 46,020 | | | $ | — | | | $ | (21 | ) |
BNY Mellon | | | 9/17/2020 | | | | BRL | | | | 501,565 | | | | USD | | | | 548,588 | | | | — | | | | (47,023 | ) |
BNY Mellon | | | 9/17/2020 | | | | CHF | | | | 1,634,293 | | | | USD | | | | 1,611,091 | | | | 23,202 | | | | — | |
BNY Mellon | | | 9/17/2020 | | | | CLP | | | | 66,649 | | | | USD | | | | 71,407 | | | | — | | | | (4,758 | ) |
BNY Mellon | | | 9/17/2020 | | | | COP | | | | 13,817 | | | | USD | | | | 14,550 | | | | — | | | | (733 | ) |
BNY Mellon | | | 9/17/2020 | | | | CZK | | | | 7,554 | | | | USD | | | | 7,652 | | | | — | | | | (98 | ) |
BNY Mellon | | | 9/17/2020 | | | | DKK | | | | 590,500 | | | | USD | | | | 594,942 | | | | — | | | | (4,442 | ) |
BNY Mellon | | | 9/17/2020 | | | | EUR | | | | 3,730,389 | | | | USD | | | | 3,760,003 | | | | — | | | | (29,614 | ) |
BNY Mellon | | | 9/17/2020 | | | | HUF | | | | 9,893 | | | | USD | | | | 10,279 | | | | — | | | | (386 | ) |
BNY Mellon | | | 9/17/2020 | | | | IDR | | | | 102,563 | | | | USD | | | | 106,433 | | | | — | | | | (3,870 | ) |
BNY Mellon | | | 9/17/2020 | | | | ILS | | | | 464,972 | | | | USD | | | | 465,012 | | | | — | | | | (40 | ) |
BNY Mellon | | | 9/17/2020 | | | | INR | | | | 913,863 | | | | USD | | | | 920,432 | | | | — | | | | (6,569 | ) |
BNY Mellon | | | 9/17/2020 | | | | JPY | | | | 1,615,288 | | | | USD | | | | 1,590,946 | | | | 24,342 | | | | — | |
BNY Mellon | | | 9/17/2020 | | | | KRW | | | | 1,422,516 | | | | USD | | | | 1,418,431 | | | | 4,084 | | | | — | |
BNY Mellon | | | 9/17/2020 | | | | MXP | | | | 169,397 | | | | USD | | | | 179,780 | | | | — | | | | (10,383 | ) |
BNY Mellon | | | 9/17/2020 | | | | NOK | | | | 552,119 | | | | USD | | | | 572,793 | | | | — | | | | (20,674 | ) |
BNY Mellon | | | 9/17/2020 | | | | NZD | | | | 226,231 | | | | USD | | | | 227,967 | | | | — | | | | (1,736 | ) |
BNY Mellon | | | 9/17/2020 | | | | PHP | | | | 54,334 | | | | USD | | | | 54,519 | | | | — | | | | (185 | ) |
BNY Mellon | | | 9/17/2020 | | | | PLN | | | | 81,180 | | | | USD | | | | 81,987 | | | | — | | | | (807 | ) |
BNY Mellon | | | 9/17/2020 | | | | QAR | | | | 86,037 | | | | USD | | | | 86,113 | | | | — | | | | (76 | ) |
BNY Mellon | | | 9/17/2020 | | | | RUB | | | | 62,518 | | | | USD | | | | 64,933 | | | | — | | | | (2,415 | ) |
BNY Mellon | | | 9/17/2020 | | | | SAR | | | | 204,880 | | | | USD | | | | 204,906 | | | | — | | | | (26 | ) |
BNY Mellon | | | 9/17/2020 | | | | SGD | | | | 458,580 | | | | USD | | | | 459,222 | | | | — | | | | (642 | ) |
BNY Mellon | | | 9/17/2020 | | | | THB | | | | 319,241 | | | | USD | | | | 313,383 | | | | 5,858 | | | | — | |
BNY Mellon | | | 9/17/2020 | | | | TWD | | | | 1,924,956 | | | | USD | | | | 1,882,573 | | | | 42,383 | | | | — | |
BNY Mellon | | | 9/17/2020 | | | | USD | | | | 2,060,100 | | | | SEK | | | | 2,027,058 | | | | 33,042 | | | | — | |
BNY Mellon | | | 9/17/2020 | | | | USD | | | | 307,212 | | | | HKD | | | | 307,594 | | | | — | | | | (382 | ) |
BNY Mellon | | | 9/17/2020 | | | | USD | | | | 4,202,827 | | | | GBP | | | | 4,094,833 | | | | 107,993 | | | | — | |
BNY Mellon | | | 9/17/2020 | | | | USD | | | | 1,630,177 | | | | AUD | | | | 1,612,628 | | | | 17,548 | | | | — | |
BNY Mellon | | | 9/17/2020 | | | | USD | | | | 217,131 | | | | CAD | | | | 214,407 | | | | 2,724 | | | | — | |
BNY Mellon | | | 9/17/2020 | | | | ZAR | | | | 233,179 | | | | USD | | | | 239,768 | | | | — | | | | (6,589 | ) |
Total | | | | | | | | | | | | | | | | | | | | | | $ | 261,176 | | | $ | (141,469 | ) |
See Notes to Financial Statements.
68 |  | www.sbhfunds.com | www.sbhfunds.com
|
Segall Bryant & Hamill Global Large Cap Fund | Statement of Investments |
| | June 30, 2020 (Unaudited) |
| | Shares | | | Value | |
COMMON STOCKS — 96.6% |
Communication Services — 6.3% |
Telecommunication Services — 6.3% |
KDDI Corp. (Japan) | | | 38,100 | | | $ | 1,136,774 | |
Verizon Communications, Inc. | | | 23,430 | | | | 1,291,696 | |
| | | | | | | | 2,428,470 | |
Consumer Discretionary — 9.3% |
Automobiles & Components — 2.6% |
Toyota Motor Corp. (Japan) | | | 16,200 | | | | 1,018,703 | |
| |
Consumer Services — 3.4% |
Starbucks Corp. | | | 17,700 | | | | 1,302,543 | |
| |
Retailing — 3.3% |
Lowe’s Cos., Inc. | | | 9,330 | | | | 1,260,670 | |
| |
Consumer Staples — 14.8% |
Food & Staples Retailing — 5.5% |
Koninklijke Ahold Delhaize N.V. (Netherlands) | | | 42,930 | | | | 1,170,248 | |
Walmart, Inc. | | | 8,107 | | | | 971,057 | |
| | | | | | | | 2,141,305 | |
Food, Beverage & Tobacco — 6.3% |
Asahi Group Holdings, Ltd. (Japan) | | | 31,200 | | | | 1,095,794 | |
Danone S.A. (France) (a) | | | 18,980 | | | | 1,317,723 | |
| | | | | | | | 2,413,517 | |
Household & Personal Products — 3.0% |
Kimberly-Clark Corp. | | | 8,244 | | | | 1,165,289 | |
| |
Energy — 5.9% |
Energy — 5.9% |
Chevron Corp. | | | 13,910 | | | | 1,241,189 | |
Marathon Petroleum Corp. | | | 27,710 | | | | 1,035,800 | |
| | | | | | | | 2,276,989 | |
Financials — 9.0% |
Banks — 2.9% |
U.S. Bancorp | | | 30,206 | | | | 1,112,185 | |
| |
Diversified Financials — 2.2% |
Charles Schwab Corp. (The) | | | 25,400 | | | | 856,996 | |
| |
Insurance — 3.9% |
Chubb, Ltd. (Switzerland) | | | 11,800 | | | | 1,494,116 | |
| |
Health Care — 16.6% |
Pharmaceuticals, Biotechnology & Life Sciences — 16.6% |
AbbVie, Inc. | | | 14,374 | | | | 1,411,239 | |
Bayer A.G. (Germany) | | | 19,540 | | | | 1,448,660 | |
Merck & Co., Inc. | | | 14,390 | | | | 1,112,779 | |
Novartis A.G. ADR (Switzerland) | | | 14,210 | | | | 1,241,102 | |
Roche Holdings A.G. (Switzerland) | | | 3,510 | | | | 1,216,012 | |
| | | | | | | | 6,429,792 | |
| | Shares | | | Value | |
Industrials — 9.0% |
Capital Goods — 5.5% |
Lockheed Martin Corp. | | | 2,960 | | | $ | 1,080,163 | |
Rockwell Automation, Inc. | | | 4,890 | | | | 1,041,570 | |
| | | | | | | | 2,121,733 | |
Commercial & Professional Services — 3.5% |
RELX PLC (United Kingdom) | | | 59,000 | | | | 1,365,579 | |
| |
Information Technology — 17.1% |
Semiconductors & Semiconductor Equipment — 6.1% |
Broadcom, Inc. | | | 4,380 | | | | 1,382,372 | |
Intel Corp. | | | 16,240 | | | | 971,639 | |
| | | | | | | | 2,354,011 | |
Software & Services — 11.0% |
Atos S.E. (France) (a) | | | 17,380 | | | | 1,490,336 | |
Broadridge Financial Solutions, Inc. | | | 11,840 | | | | 1,494,090 | |
Sage Group PLC (The) (United Kingdom) | | | 150,972 | | | | 1,253,189 | |
| | | | | | | | 4,237,615 | |
Materials — 3.0% |
Materials — 3.0% |
Newmont Mining Corp. | | | 19,080 | | | | 1,177,999 | |
| |
Utilities — 5.6% |
Utilities — 5.6% |
American Electric Power Co., Inc. | | | 15,470 | | | | 1,232,031 | |
Enel S.p.A. (Italy) | | | 108,920 | | | | 942,175 | |
| | | | | | | | 2,174,206 | |
Investments at Value — 96.6% (Cost $33,157,266) | | $ | 37,331,718 | |
| |
Other Assets in excess of Liabilities — 3.4% | | | 1,307,062 | |
| |
Net Assets — 100.0% | | $ | 38,638,780 | |
(a) | Non-income producing security. |
Sector, industry and country classifications presented herein are based on the categorization methodology of the Adviser to the Funds. For Fund compliance purposes, the Fund’s classifications refer to any one or more of the classifications used by one or more widely recognized market indexes, and/or as defined by Fund management. This definition may not apply for purposes of this report, which may combine industry sub-classifications for reporting ease.
See Notes to Financial Statements.
Semi-Annual Report | June 30, 2020 |  | 69 |
Segall Bryant & Hamill Global Large Cap Fund | Statement of Investments |
| | June 30, 2020 (Unaudited) |
Country Breakdown
Country | | Value | | | % of Net
Assets | |
United States | | $ | 21,141,307 | | | | 54.7 | % |
Switzerland | | | 3,951,230 | | | | 10.2 | % |
Japan | | | 3,251,271 | | | | 8.4 | % |
France | | | 2,808,059 | | | | 7.3 | % |
United Kingdom | | | 2,618,768 | | | | 6.8 | % |
Germany | | | 1,448,660 | | | | 3.8 | % |
Netherlands | | | 1,170,248 | | | | 3.0 | % |
Italy | | | 942,175 | | | | 2.4 | % |
Total Investments | | $ | 37,331,718 | | | | 96.6 | % |
Other Assets in Excess of Liabilities | | | 1,307,062 | | | | 3.4 | % |
Net Assets | | $ | 38,638,780 | | | | 100.0 | % |
See Notes to Financial Statements.
70 |  | www.sbhfunds.com | www.sbhfunds.com
|
Segall Bryant & Hamill Workplace Equality Fund | Statement of Investments |
| | June 30, 2020 (Unaudited) |
| | Shares | | | Value | |
COMMON STOCKS — 96.6% |
Communication Services — 5.4% |
Media & Entertainment — 1.6% |
Interpublic Group of Cos., Inc. (The) | | | 15,510 | | | $ | 266,152 | |
| |
Telecommunication Services — 3.8% |
AT&T, Inc. | | | 8,950 | | | | 270,558 | |
Verizon Communications, Inc. | | | 6,030 | | | | 332,434 | |
| | | | | | | | 602,992 | |
Consumer Discretionary — 10.5% |
Consumer Durables & Apparel — 1.7% |
Ralph Lauren Corp. | | | 3,750 | | | | 271,950 | |
| |
Consumer Services — 4.5% |
Starbucks Corp. | | | 4,120 | | | | 303,191 | |
Yum! Brands, Inc. | | | 4,718 | | | | 410,041 | |
| | | | | | | | 713,232 | |
Retailing — 4.3% |
Ross Stores, Inc. | | | 2,440 | | | | 207,986 | |
Target Corp. | | | 4,013 | | | | 481,279 | |
| | | | | | | | 689,265 | |
Consumer Staples — 7.5% |
Food & Staples Retailing — 2.3% |
Walmart, Inc. | | | 3,117 | | | | 373,354 | |
| |
Food, Beverage & Tobacco — 2.9% |
General Mills, Inc. | | | 7,570 | | | | 466,691 | |
| |
Household & Personal Products — 2.3% |
Kimberly-Clark Corp. | | | 2,572 | | | | 363,552 | |
| |
Energy — 4.1% |
Energy — 4.1% |
Chevron Corp. | | | 4,110 | | | | 366,735 | |
Marathon Petroleum Corp. | | | 7,530 | | | | 281,472 | |
| | | | | | | | 648,207 | |
Financials — 12.5% |
Banks — 3.8% |
M&T Bank Corp. | | | 2,430 | | | | 252,647 | |
U.S. Bancorp | | | 9,575 | | | | 352,551 | |
| | | | | | | | 605,198 | |
Diversified Financials — 3.2% |
Nasdaq, Inc. | | | 2,090 | | | | 249,692 | |
T. Rowe Price Group, Inc. | | | 2,130 | | | | 263,055 | |
| | | | | | | | 512,747 | |
Insurance — 5.5% |
Chubb, Ltd. (Switzerland) | | | 2,335 | | | | 295,658 | |
Principal Financial Group, Inc. | | | 7,150 | | | | 297,011 | |
Prudential Financial, Inc. | | | 4,770 | | | | 290,493 | |
| | | | | | | | 883,162 | |
| | Shares | | | Value | |
Health Care — 15.2% |
Healthcare Equipment & Services — 7.3% |
Becton, Dickinson and Co. | | | 1,770 | | | $ | 423,508 | |
Cardinal Health, Inc. | | | 7,525 | | | | 392,730 | |
Cerner Corp. | | | 5,270 | | | | 361,258 | |
| | | | | | | | 1,177,496 | |
Pharmaceuticals, Biotechnology & Life Sciences — 7.9% |
AbbVie, Inc. | | | 4,656 | | | | 457,126 | |
Amgen, Inc. | | | 1,950 | | | | 459,927 | |
Gilead Sciences, Inc. | | | 4,453 | | | | 342,614 | |
| | | | | | | | 1,259,667 | |
Industrials — 11.0% |
Capital Goods — 6.6% |
L3Harris Technologies, Inc. | | | 1,797 | | | | 304,897 | |
Lockheed Martin Corp. | | | 891 | | | | 325,144 | |
Rockwell Automation, Inc. | | | 2,040 | | | | 434,520 | |
| | | | | | | | 1,064,561 | |
Commercial & Professional Services — 1.7% |
ManpowerGroup, Inc. | | | 3,840 | | | | 264,000 | |
| |
Transportation — 2.7% |
CSX Corp. | | | 6,300 | | | | 439,362 | |
| |
Information Technology — 21.2% |
Semiconductors & Semiconductor Equipment — 6.0% |
NVIDIA Corp. | | | 1,555 | | | | 590,760 | |
Texas Instruments, Inc. | | | 2,950 | | | | 374,562 | |
| | | | | | | | 965,322 | |
Software & Services — 13.6% |
Accenture PLC - Class A (Ireland) | | | 1,930 | | | | 414,410 | |
Automatic Data Processing, Inc. | | | 2,180 | | | | 324,580 | |
Broadridge Financial Solutions, Inc. | | | 2,698 | | | | 340,461 | |
International Business Machines Corp. | | | 3,300 | | | | 398,541 | |
Microsoft Corp. | | | 1,285 | | | | 261,510 | |
Oracle Corp. | | | 8,050 | | | | 444,923 | |
| | | | | | | | 2,184,425 | |
Technology Hardware & Equipment — 1.6% |
NetApp, Inc. | | | 5,665 | | | | 251,356 | |
| |
Materials — 2.5% |
Materials — 2.5% |
Eastman Chemical Co. | | | 5,816 | | | | 405,026 | |
| |
Real Estate — 1.6% |
Real Estate — 1.6% |
Jones Lang LaSalle, Inc. | | | 2,535 | | | | 262,271 | |
| |
See Notes to Financial Statements.
Semi-Annual Report | June 30, 2020 |  | 71 |
Segall Bryant & Hamill Workplace Equality Fund | Statement of Investments |
| | June 30, 2020 (Unaudited) |
| | Shares | | | Value | |
Utilities — 5.1% |
Utilities — 5.1% |
American Electric Power Co., Inc. | | | 5,810 | | | $ | 462,708 | |
Exelon Corp. | | | 9,540 | | | | 346,207 | |
| | | | | | | | 808,915 | |
Investments at Value — 96.6% (Cost $14,953,724) | | $ | 15,478,903 | |
| |
Other Assets in Excess of Liabilities — 3.4% | | | 543,843 | |
| |
Net Assets — 100.0% | | $ | 16,022,746 | |
Sector and industry classifications presented herein are based on the sector and industry categorization methodology of the Adviser to the Funds. For Fund compliance purposes, the Fund’s industry classifications refer to any one or more of the industry sub-classifications used by one or more widely recognized market indexes or ratings group indexes, and/or as defined by Fund management. This definition may not apply for purposes of this report, which may combine industry sub-classifications for reporting ease. Industries are shown as a percentage of net assets.
See Notes to Financial Statements.
72 |  | www.sbhfunds.com | www.sbhfunds.com
|
Segall Bryant & Hamill Short Term Plus Fund | Statement of Investments |
| | June 30, 2020 (Unaudited) |
| | Coupon | | | Maturity | | | Par Value | | | Value | |
CORPORATE BONDS — 89.8% |
Finance — 2.9% |
Noncaptive Diversified Financial Companies — 1.8% |
Caterpillar Financial Services Corp., Series J | | | 0.950 | % | | | 05/13/22 | | | $ | 200,000 | | | $ | 202,573 | |
| |
Real Estate Investment Trusts — 1.1% |
Ventas Realty, L.P. | | | 3.250 | % | | | 08/15/22 | | | | 130,000 | | | | 133,063 | |
| |
Industrial — 72.6% |
Automobile Manufacturing — 4.9% |
General Motors Financial Co., Inc. | | | 4.200 | % | | | 11/06/21 | | | | 215,000 | | | | 220,493 | |
Goodyear Tire & Rubber Co. | | | 8.750 | % | | | 08/15/20 | | | | 135,000 | | | | 135,783 | |
Paccar Financial Corp., Series P | | | 0.800 | % | | | 06/08/23 | | | | 205,000 | | | | 205,785 | |
| | | | | | | | | | | | | | | | 562,061 | |
Beverage / Bottling — 3.6% |
Anheuser-Busch InBev S.A./N.V. | | | 2.625 | % | | | 01/17/23 | | | | 210,000 | | | | 220,455 | |
Brown Forman Corp. | | | 2.250 | % | | | 01/15/23 | | | | 106,000 | | | | 108,467 | |
Keurig Dr. Pepper, Inc. | | | 4.057 | % | | | 05/25/23 | | | | 80,000 | | | | 87,185 | |
| | | | | | | | | | | | | | | | 416,107 | |
Building Products — 3.4% |
Masco Corp. | | | 3.500 | % | | | 04/01/21 | | | | 210,000 | | | | 212,895 | |
Stanley Black & Decker, Inc. | | | 2.900 | % | | | 11/01/22 | | | | 170,000 | | | | 179,289 | |
| | | | | | | | | | | | | | | | 392,184 | |
Chemicals — 0.5% |
DowDuPont, Inc. | | | 3.766 | % | | | 11/15/20 | | | | 54,000 | | | | 54,615 | |
| |
Construction Machinery — 2.5% |
CNH Industrial Capital LLC | | | 4.875 | % | | | 04/01/21 | | | | 176,000 | | | | 180,575 | |
John Deere Capital Corp., Series G (3MO LIBOR + 24) (a) | | | 1.883 | % | | | 03/12/21 | | | | 105,000 | | | | 105,053 | |
| | | | | | | | | | | | | | | | 285,628 | |
Diversified Manufacturing — 6.2% |
Amphenol Corp. | | | 3.125 | % | | | 09/15/21 | | | | 181,000 | | | | 185,423 | |
Cooper US, Inc. | | | 3.875 | % | | | 12/15/20 | | | | 111,000 | | | | 111,749 | |
Roper Technologies, Inc. | | | 3.000 | % | | | 12/15/20 | | | | 195,000 | | | | 196,764 | |
Xylem, Inc. | | | 4.875 | % | | | 10/01/21 | | | | 210,000 | | | | 221,033 | |
| | | | | | | | | | | | | | | | 714,969 | |
Electronics — 7.0% |
Analog Devices, Inc. | | | 2.875 | % | | | 06/01/23 | | | | 215,000 | | | | 225,137 | |
Apple, Inc. | | | 0.750 | % | | | 05/11/23 | | | | 150,000 | | | | 151,580 | |
Corning, Inc. | | | 2.900 | % | | | 05/15/22 | | | | 200,000 | | | | 207,076 | |
Diamond 1 Finance Corp., 144A (b) | | | 5.450 | % | | | 06/15/23 | | | | 200,000 | | | | 218,762 | |
| | | | | | | | | | | | | | | | 802,555 | |
Food Processors — 1.9% |
Mondelēz International, Inc. | | | 2.125 | % | | | 04/13/23 | | | | 215,000 | | | | 222,683 | |
| |
Healthcare Facilities / Supplies — 2.7% |
CVS Health Corp. | | | 2.800 | % | | | 07/20/20 | | | | 150,000 | | | | 150,135 | |
HCA, Inc. | | | 4.750 | % | | | 05/01/23 | | | | 150,000 | | | | 162,761 | |
| | | | | | | | | | | | | | | | 312,896 | |
Independent Energy — 4.9% |
Apache Corp. | | | 3.625 | % | | | 02/01/21 | | | | 191,000 | | | | 189,110 | |
Occidental Petroleum Corp. | | | 4.850 | % | | | 03/15/21 | | | | 189,000 | | | | 187,583 | |
PDC Energy, Inc., CV | | | 1.125 | % | | | 09/15/21 | | | | 205,000 | | | | 187,776 | |
| | | | | | | | | | | | | | | | 564,469 | |
See Notes to Financial Statements.
Semi-Annual Report | June 30, 2020 |  | 73 |
Segall Bryant & Hamill Short Term Plus Fund | Statement of Investments |
| | June 30, 2020 (Unaudited) |
| | Coupon | | | Maturity | | | Par Value | | | Value | |
Information / Data Technology — 1.8% |
Paypal Holdings, Inc. | | | 1.350 | % | | | 05/11/23 | | | $ | 200,000 | | | $ | 204,160 | |
| |
Leisure / Entertainment — 1.3% |
Royal Caribbean Cruises, Ltd. | | | 2.650 | % | | | 11/28/20 | | | | 151,000 | | | | 146,499 | |
| |
Media - Cable — 2.5% |
Time Warner Cable, Inc. | | | 4.125 | % | | | 02/15/21 | | | | 75,000 | | | | 75,860 | |
Time Warner Cable, Inc. | | | 4.000 | % | | | 09/01/21 | | | | 200,000 | | | | 205,326 | |
| | | | | | | | | | | | | | | | 281,186 | |
Media - Non-Cable — 3.6% |
21st Century Fox America, Inc. | | | 4.500 | % | | | 02/15/21 | | | | 193,000 | | | | 197,634 | |
Omnicom GP/Omnicom Capital | | | 3.625 | % | | | 05/01/22 | | | | 205,000 | | | | 216,206 | |
| | | | | | | | | | | | | | | | 413,840 | |
Metals / Mining — 1.1% |
Teck Resources, Ltd. | | | 4.750 | % | | | 01/15/22 | | | | 124,000 | | | | 128,960 | |
| | | | | | | | | | | | | | | | | |
Midstream Energy — 3.8% |
Gulf South Pipeline Co., LP | | | 4.000 | % | | | 06/15/22 | | | | 210,000 | | | | 214,705 | |
Williams Partners, LP | | | 4.500 | % | | | 11/15/23 | | | | 200,000 | | | | 219,037 | |
| | | | | | | | | | | | | | | | 433,742 | |
Packaging — 1.9% |
Ball Corp. | | | 4.000 | % | | | 11/15/23 | | | | 213,000 | | | | 220,455 | |
| |
Pharmaceuticals — 1.9% |
Allergan, Inc. | | | 3.375 | % | | | 09/15/20 | | | | 220,000 | | | | 220,945 | |
| |
Railroads — 1.8% |
Canadian Pacific Rail Road Co. | | | 9.450 | % | | | 08/01/21 | | | | 190,000 | | | | 206,856 | |
| |
Retail Stores — 1.9% |
Best Buy Co., Inc. | | | 5.500 | % | | | 03/15/21 | | | | 219,000 | | | | 223,781 | |
| |
Services — 3.3% |
Expedia Group, Inc. | | | 5.950 | % | | | 08/15/20 | | | | 163,000 | | | | 163,479 | |
QVC, Inc. | | | 4.375 | % | | | 03/15/23 | | | | 210,000 | | | | 209,979 | |
| | | | | | | | | | | | | | | | 373,458 | |
Supermarkets — 0.2% |
Kroger Co. | | | 3.300 | % | | | 01/15/21 | | | | 24,000 | | | | 24,308 | |
| |
Transportation Services — 4.6% |
Continental Airlines, Inc., Series 2010-1, Class A | | | 4.750 | % | | | 07/12/22 | | | | 74,189 | | | | 73,112 | |
CSX Transportation, Inc. | | | 6.251 | % | | | 01/15/23 | | | | 67,811 | | | | 74,576 | |
Fedex Corp. | | | 3.400 | % | | | 01/14/22 | | | | 185,000 | | | | 192,420 | |
Hawaiian Airlines, Inc., Series 2013-1, Class B | | | 4.950 | % | | | 07/15/23 | | | | 50,911 | | | | 48,262 | |
U.S. Airways, Series 2013-1, Class B | | | 5.375 | % | | | 05/15/23 | | | | 165,613 | | | | 134,533 | |
| | | | | | | | | | | | | | | | 522,903 | |
Wireless Telecommunications — 3.6% |
Crown Castle International Corp. | | | 3.400 | % | | | 02/15/21 | | | | 170,000 | | | | 172,665 | |
T-Mobile USA, Inc. | | | 4.000 | % | | | 04/15/22 | | | | 230,000 | | | | 235,525 | |
| | | | | | | | | | | | | | | | 408,190 | |
Wireline Telecommunications — 1.7% |
Verizon Communications, Inc. | | | 5.150 | % | | | 09/15/23 | | | | 175,000 | | | | 199,190 | |
| |
See Notes to Financial Statements.
74 |  | www.sbhfunds.com | www.sbhfunds.com
|
Segall Bryant & Hamill Short Term Plus Fund | Statement of Investments |
| | June 30, 2020 (Unaudited) |
| | Coupon | | | Maturity | | | Par Value | | | Value | |
Utility — 14.3% |
Electric — 14.3% |
Ameren Corp. | | | 2.700 | % | | | 11/15/20 | | | $ | 41,000 | | | $ | 41,251 | |
Delmarva Power & Light Co. | | | 3.500 | % | | | 11/15/23 | | | | 185,000 | | | | 201,385 | |
Detroit Edison Co., Series 2012-A | | | 2.650 | % | | | 06/15/22 | | | | 100,000 | | | | 103,426 | |
Dominion Energy, Inc., Series A-1 (Yield of Treasury Note 2.125% 05/21 + 97) (c) | | | 2.715 | % | | | 08/15/21 | | | | 225,000 | | | | 229,950 | |
Duke Energy Carolinas LLC | | | 3.900 | % | | | 06/15/21 | | | | 210,000 | | | | 215,346 | |
Eversource Energy, Series I | | | 2.500 | % | | | 03/15/21 | | | | 198,000 | | | | 200,486 | |
Georgia Power Co., Series 2020-A | | | 2.100 | % | | | 07/30/23 | | | | 215,000 | | | | 223,720 | |
Oncor Electric Delivery Co. | | | 4.100 | % | | | 06/01/22 | | | | 85,000 | | | | 89,777 | |
Oncor Electric Delivery Co. | | | 7.000 | % | | | 09/01/22 | | | | 100,000 | | | | 113,118 | |
WEC Energy Group, Inc. | | | 3.100 | % | | | 03/08/22 | | | | 215,000 | | | | 223,859 | |
| | | | | | | | | | | | | | | | 1,642,318 | |
| |
Total Corporate Bonds (Cost $10,293,609) | | $ | 10,314,594 | |
| |
MUNICIPAL BONDS — 5.1% |
California — 1.4% |
San Diego California Public Facilities Financing Authority Senior Water Revenue Refunding Bonds, Series 2020-B | | | 1.231 | % | | | 08/01/22 | | | $ | 160,000 | | | $ | 161,499 | |
| |
Maryland — 0.7% |
Howard County, Maryland Refunding Consolidated Public Improvement Project and Refunding Bonds, Series 2020-C | | | 1.224 | % | | | 08/15/22 | | | | 75,000 | | | | 75,761 | |
State of Maryland, Series 2010-A | | | 4.200 | % | | | 03/01/21 | | | | 10,000 | | | | 10,220 | |
| | | | | | | | | | | | | | | | 85,981 | |
New Jersey — 1.1% |
New Jersey Economic Development Authority Water Facilities, Series 2020-C | | | 1.150 | % | | | 06/01/23 | | | | 125,000 | | | | 124,820 | |
| |
New York — 0.1% |
New York State Urban Development Corp., Series 2011-B | | | 2.790 | % | | | 03/15/21 | | | | 10,000 | | | | 10,155 | |
| |
Texas — 1.8% |
Fort Bend County Texas, Series 2020 | | | 5.000 | % | | | 03/01/23 | | | | 185,000 | | | | 205,698 | |
| |
Total Municipal Bonds (Cost $584,116) | | $ | 588,153 | |
| |
ASSET BACKED SECURITIES — 0.4% |
Honda Auto Receivables Owner Trust, Series 2017-2, Class A-3 | | | 1.680 | % | | | 08/16/21 | | | $ | 2,705 | | | $ | 2,713 | |
John Deere Owner Trust, Series 2017-B, Class A-3 | | | 1.820 | % | | | 10/15/21 | | | | 12,440 | | | | 12,463 | |
Toyota Auto Receivables Owner Trust, Series 2017-B, Class A-3 | | | 1.760 | % | | | 07/15/21 | | | | 12,808 | | | | 12,827 | |
Verizon Owner Trust, Series 2018-A, Class A-1A (a) | | | 3.230 | % | | | 04/20/23 | | | | 18,000 | | | | 18,396 | |
Total Asset Backed Securities (Cost $45,954) | | $ | 46,399 | |
| |
See Notes to Financial Statements.
Semi-Annual Report | June 30, 2020 |  | 75 |
Segall Bryant & Hamill Short Term Plus Fund | Statement of Investments |
| | June 30, 2020 (Unaudited) |
| | Coupon | | | Maturity | | | Par Value | | | Value | |
U.S. TREASURY BONDS & NOTES — 3.2% |
United States Treasury | | | 1.375 | % | | | 09/30/20 | | | $ | 145,000 | | | $ | 145,430 | |
United States Treasury | | | 2.250 | % | | | 04/15/22 | | | | 215,000 | | | | 222,987 | |
Total U.S. Treasury Bonds & Notes (Cost $362,300) | | $ | 368,417 | |
| |
Investments at Value — 98.5% (Cost $11,285,979) | | $ | 11,317,563 | |
| |
Other Assets in Excess of Liabilities — 1.5% | | | 168,073 | |
| |
Net Assets — 100.0% | | $ | 11,485,636 | |
(a) | Variable rate security. Interest rate resets periodically. The rate shown is the effective interest rate as of June 30, 2020. For securities based on a published reference rate and spread, the reference rate and spread (in basis points) are indicated parenthetically. Certain variable rate securities are not based on a published reference rate and spread but are determined by the issuer or agent and are based on current market conditions. These securities, therefore, do not indicate a reference rate and spread. |
(b) | Security was purchased in a transaction exempt from registration in compliance with Rule 144A of the Securities Act of 1933. This security may be resold in transactions exempt from registration, normally to qualified institutional buyers. These securities are restricted. See the table below for additional information regarding each restricted security. |
(c) | Step coupon. Rate shown is the coupon in effect as of June 30, 2020; reference rate and spread (in basis points) are indicated parenthetically. |
Sector and industry classifications presented herein are based on the sector and industry categorization methodology of the Adviser to the Funds. For Fund compliance purposes, the Fund’s industry classifications refer to any one or more of the industry sub-classifications used by one or more widely recognized market indexes or ratings group indexes, and/or as defined by Fund management. This definition may not apply for purposes of this report, which may combine industry sub-classifications for reporting ease. Industries are shown as a percentage of net assets.
Restricted Securities
Issuer Description | | Coupon | | | Maturity | | Acquisition Date | | Cost | | | Value | | | Value as a
Percentage of
Net Assets | |
Diamond 1 Finance Corp., 144A | | | 5.450% | | | | 06/15/23 | | 06/03/20 | | $ | 215,272 | | | $ | 218,762 | | | | 1.90 | % |
See Notes to Financial Statements.
76 |  | www.sbhfunds.com | www.sbhfunds.com
|
Segall Bryant & Hamill Plus Bond Fund | Statement of Investments |
| | June 30, 2020 (Unaudited) |
| | Coupon | | | Maturity | | | Par Value | | | Value | |
CORPORATE BONDS — 46.9% |
Finance — 11.7% |
Banking — 4.7% |
Bank of America Corp., Series N | | | 4.083 | % | | | 03/20/51 | | | $ | 3,000,000 | | | $ | 3,743,413 | |
BB&T Corp., Series G | | | 2.850 | % | | | 10/26/24 | | | | 3,676,000 | | | | 3,967,943 | |
Capital One Financial Corp. | | | 3.200 | % | | | 02/05/25 | | | | 11,640,000 | | | | 12,455,722 | |
JPMorgan Chase & Co. | | | 3.125 | % | | | 01/23/25 | | | | 7,285,000 | | | | 7,939,836 | |
Keycorp, Series I | | | 5.100 | % | | | 03/24/21 | | | | 5,000,000 | | | | 5,166,730 | |
PNC Bank NA | | | 2.700 | % | | | 11/01/22 | | | | 6,675,000 | | | | 6,983,284 | |
Wells Fargo & Co., Series Q | | | 2.406 | % | | | 10/30/25 | | | | 7,725,000 | | | | 8,041,711 | |
| | | | | | | | | | | | | | | | 48,298,639 | |
Broker/Asset Managers/Exchanges — 1.8% |
Cboe Global Markets, Inc. | | | 3.650 | % | | | 01/12/27 | | | | 9,800,000 | | | | 11,010,630 | |
FMR LLC, 144A (a) (b) | | | 5.350 | % | | | 11/15/21 | | | | 3,351,000 | | | | 3,539,832 | |
FMR LLC, 144A (a) (b) | | | 6.450 | % | | | 11/15/39 | | | | 2,575,000 | | | | 3,832,329 | |
| | | | | | | | | | | | | | | | 18,382,791 | |
Life Insurance — 1.4% |
Aviation Capital Group LLC, 144A (a) (b) | | | 3.875 | % | | | 05/01/23 | | | | 4,250,000 | | | | 4,043,408 | |
Massachusetts Mutual Life Insurance Co., 144A (a) (b) | | | 3.729 | % | | | 10/15/70 | | | | 2,279,000 | | | | 2,340,884 | |
Northwestern Mutual Life Insurance Co. (The), 144A (a) (b) | | | 3.850 | % | | | 09/30/47 | | | | 6,775,000 | | | | 7,743,744 | |
| | | | | | | | | | | | | | | | 14,128,036 | |
Mortgage Banking — 0.6% |
Provident Funding Associates LP/PFG Finance Corp., 144A (a) (b) | | | 6.375 | % | | | 06/15/25 | | | | 6,195,000 | | | | 5,792,325 | |
| |
Noncaptive Diversified Financial Companies — 0.4% |
Aircastle, Ltd. | | | 5.000 | % | | | 04/01/23 | | | | 3,000,000 | | | | 2,922,971 | |
GATX Corp. | | | 4.000 | % | | | 06/30/30 | | | | 1,575,000 | | | | 1,692,398 | |
| | | | | | | | | | | | | | | | 4,615,369 | |
Other Finance — 1.2% |
Moody’s Corp. | | | 4.875 | % | | | 02/15/24 | | | | 9,235,000 | | | | 10,435,895 | |
National Securities Clearing Corp., 144A (a) (b) | | | 1.500 | % | | | 04/23/25 | | | | 1,650,000 | | | | 1,687,563 | |
| | | | | | | | | | | | | | | | 12,123,458 | |
Real Estate Investment Trusts — 1.6% |
Federal Realty Investment Trust | | | 3.000 | % | | | 08/01/22 | | | | 2,020,000 | | | | 2,060,002 | |
MPT Operating Partnership LP/MPT Finance Corp. | | | 5.000 | % | | | 10/15/27 | | | | 6,175,000 | | | | 6,344,812 | |
Ventas Realty LP | | | 3.500 | % | | | 04/15/24 | | | | 3,000,000 | | | | 3,121,339 | |
Ventas Realty LP | | | 4.400 | % | | | 01/15/29 | | | | 2,955,000 | | | | 3,221,535 | |
Washington REIT | | | 3.950 | % | | | 10/15/22 | | | | 2,025,000 | | | | 2,066,548 | |
| | | | | | | | | | | | | | | | 16,814,236 | |
Industrial — 32.0% |
Aerospace / Defense — 0.9% |
Airbus Finance BV, 144A (a) (b) | | | 2.700 | % | | | 04/17/23 | | | | 1,860,000 | | | | 1,927,997 | |
Hexcel Corp. | | | 4.700 | % | | | 08/15/25 | | | | 3,041,000 | | | | 3,309,211 | |
Hexcel Corp. | | | 3.950 | % | | | 02/15/27 | | | | 335,000 | | | | 359,381 | |
Raytheon Co. (a) | | | 3.150 | % | | | 12/15/24 | | | | 3,696,000 | | | | 3,993,538 | |
| | | | | | | | | | | | | | | | 9,590,127 | |
Automobile Manufacturing — 1.6% |
General Motors Financial Co., Inc. | | | 3.950 | % | | | 04/13/24 | | | | 4,425,000 | | | | 4,577,671 | |
Goodyear Tire & Rubber Co. | | | 5.125 | % | | | 11/15/23 | | | | 2,000,000 | | | | 1,920,000 | |
Goodyear Tire & Rubber Co. | | | 9.500 | % | | | 05/31/25 | | | | 1,500,000 | | | | 1,606,875 | |
Harley-Davidson Financial Services, Inc., 144A (a) (b) | | | 4.050 | % | | | 02/04/22 | | | | 8,600,000 | | | | 8,864,426 | |
| | | | | | | | | | | | | | | | 16,968,972 | |
See Notes to Financial Statements.
Semi-Annual Report | June 30, 2020 |  | 77 |
Segall Bryant & Hamill Plus Bond Fund | Statement of Investments |
| | June 30, 2020 (Unaudited) |
| | Coupon | | | Maturity | | | Par Value | | | Value | |
Beverage / Bottling — 1.6% |
Anheuser-Busch Cos. LLC/Anheuser-Busch InBev Worldwide, Inc. | | | 4.900 | % | | | 02/01/46 | | | $ | 5,700,000 | | | $ | 6,971,848 | |
Fomento Economico Mexicano S.A.B. de C.V. | | | 2.875 | % | | | 05/10/23 | | | | 7,548,000 | | | | 7,830,197 | |
PepsiCo, Inc. | | | 3.875 | % | | | 03/19/60 | | | | 1,575,000 | | | | 2,005,272 | |
| | | | | | | | | | | | | | | | 16,807,317 | |
Building Products — 1.5% |
Allegion PLC | | | 3.500 | % | | | 10/01/29 | | | | 5,063,000 | | | | 5,307,373 | |
Allegion US Holding Co., Inc. | | | 3.550 | % | | | 10/01/27 | | | | 2,550,000 | | | | 2,669,608 | |
Masco Corp. | | | 6.500 | % | | | 08/15/32 | | | | 6,205,000 | | | | 7,538,044 | |
| | | | | | | | | | | | | | | | 15,515,025 | |
Construction Machinery — 1.4% |
CNH Industrial N.V. | | | 4.500 | % | | | 08/15/23 | | | | 3,275,000 | | | | 3,534,172 | |
Deere & Co. | | | 3.750 | % | | | 04/15/50 | | | | 1,590,000 | | | | 1,955,136 | |
John Deere Capital Corp. | | | 1.750 | % | | | 03/09/27 | | | | 2,045,000 | | | | 2,126,577 | |
United Rentals North America, Inc. | | | 6.500 | % | | | 12/15/26 | | | | 6,835,000 | | | | 7,176,750 | |
| | | | | | | | | | | | | | | | 14,792,635 | |
Consumer Products — 0.2% |
Vista Outdoor, Inc. | | | 5.875 | % | | | 10/01/23 | | | | 2,500,000 | | | | 2,443,750 | |
| |
Diversified Manufacturing — 0.8% |
Roper Technologies, Inc. | | | 3.650 | % | | | 09/15/23 | | | | 7,991,000 | | | | 8,687,178 | |
| |
Electronics — 0.8% |
Amkor Technology, Inc., 144A (a) (b) | | | 6.625 | % | | | 09/15/27 | | | | 2,203,000 | | | | 2,358,025 | |
Dell, Inc. | | | 7.100 | % | | | 04/15/28 | | | | 4,492,000 | | | | 5,289,330 | |
QORVO, Inc., 144A (a) (b) | | | 4.375 | % | | | 10/15/29 | | | | 775,000 | | | | 793,662 | |
| | | | | | | | | | | | | | | | 8,441,017 | |
Environmental — 0.1% |
Waste Management, Inc. | | | 3.200 | % | | | 06/15/26 | | | | 586,000 | | | | 600,445 | |
| |
Food Processors — 0.4% |
Kraft Heinz Food Co. | | | 4.625 | % | | | 01/30/29 | | | | 3,495,000 | | | | 3,766,867 | |
| |
Gaming — 0.5% |
MGM Growth Properties Operating Partnership LP/MGP Finance Co. | | | 5.625 | % | | | 05/01/24 | | | | 5,199,000 | | | | 5,407,324 | |
| |
Healthcare Facilities / Supplies — 0.5% |
Hologic, Inc., 144A (a) (b) | | | 4.625 | % | | | 02/01/28 | | | | 3,146,000 | | | | 3,263,975 | |
Teleflex, Inc. | | | 4.625 | % | | | 11/15/27 | | | | 1,390,000 | | | | 1,469,522 | |
Teleflex, Inc., 144A (a) (b) | | | 4.250 | % | | | 06/01/28 | | | | 350,000 | | | | 358,750 | |
| | | | | | | | | | | | | | | | 5,092,247 | |
Independent Energy — 2.2% |
Diamondback Energy, Inc. | | | 3.250 | % | | | 12/01/26 | | | | 6,790,000 | | | | 6,826,932 | |
Occidental Petroleum Corp. | | | 7.500 | % | | | 05/01/31 | | | | 6,085,000 | | | | 5,657,285 | |
PDC Energy, Inc., CV | | | 1.125 | % | | | 09/15/21 | | | | 6,025,000 | | | | 5,518,791 | |
Range Resources Corp. | | | 4.875 | % | | | 05/15/25 | | | | 6,400,000 | | | | 4,802,240 | |
| | | | | | | | | | | | | | | | 22,805,248 | |
Information / Data Technology — 0.8% |
Fiserv, Inc. | | | 3.200 | % | | | 07/01/26 | | | | 7,475,000 | | | | 8,273,404 | |
| | | | | | | | | | | | | | | | | |
Integrated Energy — 0.1% |
BP Capital Markets America, Inc. | | | 3.796 | % | | | 09/21/25 | | | | 748,000 | | | | 845,993 | |
| |
Lease / Rent — 0.7% |
SBA Tower Trust, Series 2016-1, 144A (a) (b) | | | 2.877 | % | | | 07/10/46 | | | | 6,805,000 | | | | 6,816,229 | |
| |
See Notes to Financial Statements.
78 |  | www.sbhfunds.com | www.sbhfunds.com
|
Segall Bryant & Hamill Plus Bond Fund | Statement of Investments |
| | June 30, 2020 (Unaudited) |
| | Coupon | | | Maturity | | | Par Value | | | Value | |
Media - Cable — 1.8% |
CCO Holdings LLC/CCO Holdings Capital Corp., 144A (a) (b) | | | 5.875 | % | | | 04/01/24 | | | $ | 6,000,000 | | | $ | 6,187,500 | |
Comcast Corp. | | | 2.350 | % | | | 01/15/27 | | | | 8,200,000 | | | | 8,761,603 | |
Sirius XM Radio, Inc., 144A (a) (b) | | | 5.375 | % | | | 07/15/26 | | | | 4,000,000 | | | | 4,130,960 | |
| | | | | | | | | | | | | | | | 19,080,063 | |
Media - Diversified — 0.3% |
Walt Disney Co. (The) | | | 4.625 | % | | | 03/23/40 | | | | 2,630,000 | | | | 3,286,208 | |
| |
Media - Non-Cable — 1.0% |
AMC Networks, Inc. | | | 4.750 | % | | | 12/15/22 | | | | 379,000 | | | | 378,053 | |
Lamar Media Corp., 144A (a) (b) | | | 3.750 | % | | | 02/15/28 | | | | 2,400,000 | | | | 2,262,720 | |
Netflix, Inc. | | | 4.875 | % | | | 04/15/28 | | | | 1,000,000 | | | | 1,069,270 | |
Netflix, Inc. | | | 6.375 | % | | | 05/15/29 | | | | 1,000,000 | | | | 1,165,000 | |
Netflix, Inc., 144A (a) (b) | | | 4.875 | % | | | 06/15/30 | | | | 350,000 | | | | 373,929 | |
Nexstar Broadcasting, Inc., 144A (a) (b) | | | 5.625 | % | | | 08/01/24 | | | | 5,250,000 | | | | 5,289,375 | |
| | | | | | | | | | | | | | | | 10,538,347 | |
Metals / Mining — 1.0% |
FMG Resources August 2006 Pty., Ltd., 144A (a) (b) | | | 4.750 | % | | | 05/15/22 | | | | 4,820,000 | | | | 4,912,881 | |
Teck Resources, Ltd. | | | 4.750 | % | | | 01/15/22 | | | | 4,950,000 | | | | 5,148,000 | |
Teck Resources, Ltd. | | | 3.750 | % | | | 02/01/23 | | | | 500,000 | | | | 516,875 | |
| | | | | | | | | | | | | | | | 10,577,756 | |
Midstream Energy — 3.9% |
AmeriGas Partners LP/AmeriGas Financial Corp. | | | 5.625 | % | | | 05/20/24 | | | | 5,932,000 | | | | 6,152,670 | |
Boardwalk Pipelines LP | | | 3.375 | % | | | 02/01/23 | | | | 5,305,000 | | | | 5,322,391 | |
Boardwalk Pipelines LP | | | 4.950 | % | | | 12/15/24 | | | | 3,015,000 | | | | 3,228,452 | |
Magellan Midstream Partners LP | | | 5.000 | % | | | 03/01/26 | | | | 6,125,000 | | | | 7,050,032 | |
MPLX LP | | | 4.875 | % | | | 06/01/25 | | | | 5,225,000 | | | | 5,829,665 | |
Tennessee Gas Pipeline Co. LLC | | | 8.375 | % | | | 06/15/32 | | | | 5,284,000 | | | | 7,020,124 | |
Valero Energy Partners LP | | | 4.375 | % | | | 12/15/26 | | | | 5,187,000 | | | | 5,888,225 | |
| | | | | | | | | | | | | | | | 40,491,559 | |
Oil Field Services — 0.1% |
Burlington Resources, Inc. | | | 6.875 | % | | | 02/15/26 | | | | 1,000,000 | | | | 1,193,887 | |
| |
Packaging — 1.4% |
Avery Dennison Corp. | | | 4.875 | % | | | 12/06/28 | | | | 5,775,000 | | | | 6,898,347 | |
Ball Corp. | | | 4.875 | % | | | 03/15/26 | | | | 4,500,000 | | | | 4,889,970 | |
Silgan Holdings, Inc. | | | 4.750 | % | | | 03/15/25 | | | | 779,000 | | | | 788,901 | |
Silgan Holdings, Inc., 144A (a) (b) | | | 4.125 | % | | | 02/01/28 | | | | 1,725,000 | | | | 1,709,906 | |
| | | | | | | | | | | | | | | | 14,287,124 | |
Paper & Forest Products — 0.7% |
Georiga-Pacific LLC, 144A (a) (b) | | | 5.400 | % | | | 11/01/20 | | | | 2,078,000 | | | | 2,111,097 | |
West Fraser Timber Co., Ltd., 144A (a) (b) | | | 4.350 | % | | | 10/15/24 | | | | 5,220,000 | | | | 5,292,284 | |
| | | | | | | | | | | | | | | | 7,403,381 | |
Railroads — 0.3% |
Kansas City Southern | | | 2.875 | % | | | 11/15/29 | | | | 3,293,000 | | | | 3,474,951 | |
| |
Restaurants — 0.9% |
McDonald’s Corp., Series MTN | | | 3.700 | % | | | 01/30/26 | | | | 1,921,000 | | | | 2,181,595 | |
Starbucks Corp., CV | | | 3.800 | % | | | 08/15/25 | | | | 4,000,000 | | | | 4,508,012 | |
Starbucks Corp. | | | 2.000 | % | | | 03/12/27 | | | | 2,000,000 | | | | 2,092,096 | |
| | | | | | | | | | | | | | | | 8,781,703 | |
Retail Stores — 1.3% |
AutoNation, Inc. | | | 4.750 | % | | | 06/01/30 | | | | 3,369,000 | | | | 3,649,945 | |
DriveTime Automotive Group, Inc./Bridgecrest Acceptance Corp., 144A (a) (b) | | | 8.000 | % | | | 06/01/21 | | | | 6,000,000 | | | | 5,685,000 | |
Hanesbrands, Inc., 144A (a) (b) | | | 4.625 | % | | | 05/15/24 | | | | 2,491,000 | | | | 2,478,545 | |
See Notes to Financial Statements.
Semi-Annual Report | June 30, 2020 |  | 79 |
Segall Bryant & Hamill Plus Bond Fund | Statement of Investments |
| | June 30, 2020 (Unaudited) |
| | Coupon | | | Maturity | | | Par Value | | | Value | |
Retail Stores (continued) |
Hanesbrands, Inc., 144A (a) (b) | | | 4.875 | % | | | 05/15/26 | | | $ | 2,000,000 | | | $ | 2,015,000 | |
| | | | | | | | | | | | | | | | 13,828,490 | |
Services — 1.0% |
QVC, Inc. | | | 4.850 | % | | | 04/01/24 | | | | 5,122,000 | | | | 5,155,805 | |
QVC, Inc. | | | 4.750 | % | | | 02/15/27 | | | | 2,085,000 | | | | 2,016,195 | |
Service Corp. International | | | 4.625 | % | | | 12/15/27 | | | | 483,000 | | | | 501,113 | |
Service Corp. International | | | 5.125 | % | | | 06/01/29 | | | | 2,700,000 | | | | 2,905,200 | |
| | | | | | | | | | | | | | | | 10,578,313 | |
Supermarkets — 0.7% |
Alimentation Couche-Tard, Inc., 144A (a) (b) | | | 3.550 | % | | | 07/26/27 | | | | 4,660,000 | | | | 5,000,066 | |
Tesco PLC, 144A (a) (b) | | | 6.150 | % | | | 11/15/37 | | | | 2,146,000 | | | | 2,707,551 | |
| | | | | | | | | | | | | | | | 7,707,617 | |
Transportation Services — 2.1% |
American Airlines, Inc., Series 2013-2, Class A (b) | | | 4.950 | % | | | 07/15/24 | | | | 7,520,741 | | | | 6,091,873 | |
FedEx Corp. | | | 3.900 | % | | | 02/01/35 | | | | 6,190,000 | | | | 6,687,898 | |
JB Hunt Transport Services, Inc. | | | 3.875 | % | | | 03/01/26 | | | | 5,925,000 | | | | 6,774,297 | |
United Parcel Service, Inc. | | | 5.200 | % | | | 04/01/40 | | | | 1,540,000 | | | | 2,125,527 | |
| | | | | | | | | | | | | | | | 21,679,595 | |
Wireless Telecommunications — 0.4% |
T-Mobile, Inc., 144A (a) (b) | | | 3.875 | % | | | 04/15/30 | | | | 3,600,000 | | | | 4,012,452 | |
| |
Wireline Telecommunications — 1.0% |
AT&T, Inc. | | | 3.500 | % | | | 06/01/41 | | | | 1,275,000 | | | | 1,338,982 | |
AT&T, Inc. | | | 5.150 | % | | | 11/15/46 | | | | 2,725,000 | | | | 3,426,658 | |
Verizon Communications, Inc. | | | 4.400 | % | | | 11/01/34 | | | | 4,625,000 | | | | 5,747,005 | |
| | | | | | | | | | | | | | | | 10,512,645 | |
Utility — 3.2% |
Electric — 3.2% |
Nevada Power Co. | | | 6.750 | % | | | 07/01/37 | | | | 2,850,000 | | | | 4,297,220 | |
NextEra Energy Capital Holdings, Inc., Series I | | | 2.403 | % | | | 09/01/21 | | | | 1,655,000 | | | | 1,692,423 | |
NV Energy, Inc. | | | 6.250 | % | | | 11/15/20 | | | | 2,881,000 | | | | 2,943,074 | |
Oncor Electric Delivery Co. LLC | | | 4.100 | % | | | 06/01/22 | | | | 4,730,000 | | | | 4,995,826 | |
Oncor Electric Delivery Co. LLC | | | 5.750 | % | | | 03/15/29 | | | | 4,725,000 | | | | 6,197,437 | |
Tenaska Alabama II Partners LP, 144A (a) (b) | | | 6.125 | % | | | 03/30/23 | | | | 82,739 | | | | 86,322 | |
Tenaska Virginia Partners LP, 144A (a) (b) | | | 6.119 | % | | | 03/30/24 | | | | 87,703 | | | | 91,858 | |
Virginia Electric & Power Co., Series A | | | 6.000 | % | | | 05/15/37 | | | | 5,581,000 | | | | 7,810,883 | |
Vistra Operations Co. LLC, 144A (a) (b) | | | 5.000 | % | | | 07/31/27 | | | | 4,699,000 | | | | 4,777,708 | |
| | | | | | | | | | | | | | | | 32,892,751 | |
| |
Total Corporate Bonds (Cost $465,735,836) | | $ | 487,335,474 | |
| |
MUNICIPAL BONDS — 9.8% |
California — 3.0% |
California Educational Facilities Authority, Series 2018-A | | | 4.842 | % | | | 10/01/48 | | | $ | 3,635,000 | | | $ | 3,991,848 | |
City of San Francisco, CA, Public Utilities Commission Water Revenue, Series 2010-B | | | 6.000 | % | | | 11/01/40 | | | | 7,750,000 | | | | 10,906,265 | |
Foothill Eastern Transportation Corridor Agency Toll Road, Series 2013-A | | | 5.750 | % | | | 01/15/46 | | | | 4,500,000 | | | | 4,997,430 | |
San Diego County Regional Airport Authority, Series 2010-C | | | 6.628 | % | | | 07/01/40 | | | | 8,430,000 | | | | 8,430,000 | |
San Diego County Regional Airport Authority, Series 2014-B | | | 5.594 | % | | | 07/01/43 | | | | 3,215,000 | | | | 3,369,545 | |
| | | | | | | | | | | | | | | | 31,695,088 | |
Colorado — 0.5% |
Denver Colorado Public Schools, Series 2013-B | | | 4.242 | % | | | 12/15/37 | | | | 3,900,000 | | | | 4,701,411 | |
| |
District of Columbia — 0.4% |
District of Columbia Income Tax, Series 2009-E | | | 5.591 | % | | | 12/01/34 | | | | 2,880,000 | | | | 3,823,574 | |
| |
See Notes to Financial Statements.
80 |  | www.sbhfunds.com | www.sbhfunds.com
|
Segall Bryant & Hamill Plus Bond Fund | Statement of Investments |
| | June 30, 2020 (Unaudited) |
| | Coupon | | | Maturity | | | Par Value | | | Value | |
Massachusetts — 1.0% |
Commonwealth of Massachusetts, Series 2019-D | | | 2.663 | % | | | 09/01/39 | | | $ | 9,440,000 | | | $ | 10,105,898 | |
| |
New York — 0.8% |
New York City Transitional Finance Authority, Series B SUB B-3 | | | 3.950 | % | | | 08/01/32 | | | | 7,665,000 | | | | 8,770,676 | |
| |
Texas — 1.7% |
Dallas Area Rapid Transit, Series 2010-B | | | 4.920 | % | | | 12/01/41 | | | | 6,110,000 | | | | 8,559,621 | |
Dallas Independent School District, Series 2010-C | | | 6.450 | % | | | 02/15/35 | | | | 4,600,000 | | | | 4,727,328 | |
Mission Economic Development Corporation Solid Waste Disposal, Series 2020-A (c) | | | 1.500 | % | | | 05/01/50 | | | | 700,000 | | | | 699,951 | |
Texas Transportation Commission Central Texas Turnpike System, Series 2020-B | | | 1.980 | % | | | 08/15/42 | | | | 4,025,000 | | | | 4,040,939 | |
| | | | | | | | | | | | | | | | 18,027,839 | |
Utah — 0.6% |
Utah Transit Authority Sales Tax Revenue, Series 2020 | | | 2.774 | % | | | 12/15/38 | | | | 5,925,000 | | | | 5,833,637 | |
| |
Virginia — 0.9% |
Virginia Small Business Financing Authority, Series 2017, 144A (a) (c) (d) | | | 3.000 | % | | | 07/01/50 | | | | 9,000,000 | | | | 8,977,590 | |
| |
Washington — 0.9% |
Port of Seattle Washington, Series 2017-B | | | 3.755 | % | | | 05/01/36 | | | | 1,925,000 | | | | 2,008,487 | |
State of Washington, Series 2010-D | | | 5.481 | % | | | 08/01/39 | | | | 5,275,000 | | | | 7,507,064 | |
| | | | | | | | | | | | | | | | 9,515,551 | |
| |
Total Municipal Bonds (Cost $94,493,715) | | $ | 101,451,264 | |
| |
ASSET BACKED SECURITIES — 3.0% |
Bear Stearns, Series 2003-AC4, Class A (e) | | | 5.500 | % | | | 09/25/33 | | | $ | 3,516,270 | | | $ | 3,600,631 | |
CWABS Asset-Backed Certificates Trust, Series 2005-1, Class AF-6 (c) | | | 5.030 | % | | | 07/25/35 | | | | 26,294 | | | | 26,687 | |
Deephaven Residential Mortgage Trust, Series 2017-3, Class A-3, 144A (a) (b) (c) | | | 2.813 | % | | | 10/25/47 | | | | 546,251 | | | | 550,934 | |
Deephaven Residential Mortgage Trust, Series 2018-1, Class A-3, 144A (a) (b) (c) | | | 3.202 | % | | | 01/25/58 | | | | 910,535 | | | | 919,058 | |
Deephaven Residential Mortgage Trust, Series 2018-2, Class A-1, 144A (a) (b) (c) | | | 3.479 | % | | | 04/25/58 | | | | 3,008,601 | | | | 3,060,712 | |
GTP Acquisition Partners I LLC, Series 2015-1-2, Class A 15-2, 144A (a) (b) | | | 3.482 | % | | | 06/16/25 | | | | 10,800,000 | | | | 11,312,115 | |
InSite Issuer, LLC, Series 2016-1, Class C, 144A (a) (b) | | | 6.414 | % | | | 11/15/46 | | | | 5,790,000 | | | | 5,751,788 | |
John Deere Owner Trust, Series 2018-B, Class A-3 | | | 3.080 | % | | | 11/15/22 | | | | 3,914,914 | | | | 3,977,572 | |
Renaissance Home Equity Loan Trust, Series 2005-2, Class A-F6 (e) | | | 3.780 | % | | | 08/25/35 | | | | 739,227 | | | | 773,307 | |
Sierra Timeshare Conduit Receivables Funding LLC, Series 2017-1, Class A, 144A (a) (b) | | | 2.910 | % | | | 03/20/34 | | | | 919,314 | | | | 913,135 | |
Total Asset Backed Securities (Cost $30,298,782) | | $ | 30,885,939 | |
| |
MORTGAGE-BACKED SECURITIES PASSTHROUGH — 23.7% |
Fannie Mae Pool — 18.3% |
Pool #AC8938 | | | 4.500 | % | | | 01/01/25 | | | $ | 1,481,938 | | | $ | 1,580,645 | |
Pool #AD4268 | | | 4.500 | % | | | 03/01/25 | | | | 990,112 | | | | 1,056,015 | |
Pool #MA3125 | | | 3.000 | % | | | 09/01/32 | | | | 10,930,713 | | | | 11,497,140 | |
Pool #725705 | | | 5.000 | % | | | 08/01/34 | | | | 130,725 | | | | 149,973 | |
Pool #MA3896 | | | 2.500 | % | | | 01/01/35 | | | | 9,745,463 | | | | 10,207,534 | |
Pool #735288 | | | 5.000 | % | | | 03/01/35 | | | | 707,818 | | | | 812,167 | |
Pool #MA4075 | | | 2.500 | % | | | 07/01/35 | | | | 7,120,000 | | | | 7,457,587 | |
Pool #MA2354, Series 2015 | | | 3.500 | % | | | 08/01/35 | | | | 7,715,654 | | | | 8,253,319 | |
Pool #735897 | | | 5.500 | % | | | 10/01/35 | | | | 503,959 | | | | 579,045 | |
Pool #745275 | | | 5.000 | % | | | 02/01/36 | | | | 701,901 | | | | 805,681 | |
Pool #888016 | | | 5.500 | % | | | 05/01/36 | | | | 862,236 | | | | 990,997 | |
Pool #190377 | | | 5.000 | % | | | 11/01/36 | | | | 670,463 | | | | 769,771 | |
Pool #888405 | | | 5.000 | % | | | 12/01/36 | | | | 139,030 | | | | 159,722 | |
Pool #256526 | | | 6.000 | % | | | 12/01/36 | | | | 314,612 | | | | 363,236 | |
Pool #910881 | | | 5.000 | % | | | 02/01/37 | | | | 136,731 | | | | 142,991 | |
See Notes to Financial Statements.
Semi-Annual Report | June 30, 2020 |  | 81 |
Segall Bryant & Hamill Plus Bond Fund | Statement of Investments |
| | June 30, 2020 (Unaudited) |
| | Coupon | | | Maturity | | | Par Value | | | Value | |
Fannie Mae Pool — 18.3% (continued) |
Pool #889108 | | | 6.000 | % | | | 02/01/38 | | | $ | 436,513 | | | $ | 498,482 | |
Pool #889579 | | | 6.000 | % | | | 05/01/38 | | | | 764,179 | | | | 891,863 | |
Pool #995838 | | | 5.500 | % | | | 05/01/39 | | | | 635,797 | | | | 730,030 | |
Pool #BM3090, Series 2017 | | | 3.500 | % | | | 02/01/41 | | | | 5,128,768 | | | | 5,543,996 | |
Pool #AS7367, Series 2016 | | | 3.000 | % | | | 06/01/41 | | | | 3,659,081 | | | | 3,911,628 | |
Pool #AS7732, Series 2016 | | | 3.000 | % | | | 08/01/41 | | | | 7,843,417 | | | | 8,399,693 | |
Pool #AS7887, Series 2016 | | | 3.000 | % | | | 09/01/41 | | | | 12,347,084 | | | | 13,054,330 | |
Pool #AL3287, Series 2013 | | | 4.500 | % | | | 09/01/41 | | | | 2,872,778 | | | | 3,197,307 | |
Pool #AL0933, Series 2011 | | | 5.000 | % | | | 10/01/41 | | | | 800,307 | | | | 919,684 | |
Pool #AL5315, Series 2014 | | | 4.000 | % | | | 06/01/42 | | | | 1,747,028 | | | | 1,917,962 | |
Pool #AU1628, Series 2013 | | | 3.000 | % | | | 07/01/43 | | | | 2,334,830 | | | | 2,501,448 | |
Pool #MA1700, Series 2013 | | | 4.500 | % | | | 12/01/43 | | | | 2,186,957 | | | | 2,434,132 | |
Pool #MA1917 | | | 4.500 | % | | | 06/01/44 | | | | 383,851 | | | | 424,991 | |
Pool #MA2005 | | | 4.500 | % | | | 08/01/44 | | | | 609,287 | | | | 672,342 | |
Pool #MA2145, Series 2014 | | | 4.000 | % | | | 01/01/45 | | | | 7,585,206 | | | | 8,239,296 | |
Pool #BM1909, Series 2017 | | | 4.000 | % | | | 02/01/45 | | | | 15,632,953 | | | | 17,522,288 | |
Pool #AY3374, Series 2015 | | | 3.500 | % | | | 04/01/45 | | | | 9,372,516 | | | | 10,186,795 | |
Pool #AS5823, Series 2015 | | | 3.500 | % | | | 09/01/45 | | | | 9,298,428 | | | | 9,956,689 | |
Pool #AL7911, Series 2015 | | | 3.500 | % | | | 12/01/45 | | | | 6,312,149 | | | | 6,860,602 | |
Pool #AS8461, Series 2016 | | | 3.500 | % | | | 12/01/46 | | | | 8,834,435 | | | | 9,391,179 | |
Pool #AS8784 | | | 3.000 | % | | | 02/01/47 | | | | 1,795,983 | | | | 1,898,927 | |
Pool #MA2956 | | | 3.000 | % | | | 04/01/47 | | | | 11,910,573 | | | | 12,608,474 | |
Pool #AS9663, Series 2017 | | | 4.000 | % | | | 05/01/47 | | | | 6,671,659 | | | | 7,140,519 | |
Pool #MA2863 | | | 3.000 | % | | | 12/01/47 | | | | 7,632,064 | | | | 8,073,650 | |
Pool #AL9242, Series 2016 | | | 3.000 | % | | | 10/25/49 | | | | 7,595,235 | | | | 8,134,586 | |
| | | | | | | | | | | | | | | | 189,936,716 | |
Freddie Mac Gold Pool — 4.6% |
Pool #G08061 | | | 5.500 | % | | | 06/01/35 | | | | 66,700 | | | | 76,567 | |
Pool #G08079 | | | 5.000 | % | | | 09/01/35 | | | | 644,188 | | | | 739,158 | |
Pool #G01960 | | | 5.000 | % | | | 12/01/35 | | | | 216,022 | | | | 247,905 | |
Pool #A41748 | | | 5.000 | % | | | 01/01/36 | | | | 180,318 | | | | 201,766 | |
Pool #A42128 | | | 5.500 | % | | | 01/01/36 | | | | 269,513 | | | | 308,798 | |
Pool #G02064 | | | 5.000 | % | | | 02/01/36 | | | | 362,390 | | | | 415,994 | |
Pool #G05200 | | | 5.000 | % | | | 05/01/36 | | | | 1,237,081 | | | | 1,419,434 | |
Pool #G02252 | | | 5.500 | % | | | 07/01/36 | | | | 640,747 | | | | 736,126 | |
Pool #G02386 | | | 6.000 | % | | | 11/01/36 | | | | 434,147 | | | | 505,892 | |
Pool #G03189 | | | 6.500 | % | | | 09/01/37 | | | | 800,886 | | | | 946,420 | |
Pool #G08607 | | | 4.500 | % | | | 09/01/44 | | | | 1,363,510 | | | | 1,509,217 | |
Pool #G07961, Series 2015 | | | 3.500 | % | | | 03/01/45 | | | | 6,553,613 | | | | 7,120,729 | |
Pool #G67700, Series 2016 | | | 3.500 | % | | | 08/01/46 | | | | 6,151,292 | | | | 6,718,532 | |
Pool #G08732 | | | 3.000 | % | | | 11/01/46 | | | | 8,626,328 | | | | 9,129,813 | |
Pool #G08737 | | | 3.000 | % | | | 12/01/46 | | | | 2,993,054 | | | | 3,162,729 | |
Pool #ZS4697 | | | 3.000 | % | | | 01/01/47 | | | | 4,605,578 | | | | 4,865,376 | |
Pool #G08747 | | | 3.000 | % | | | 02/01/47 | | | | 3,048,686 | | | | 3,223,925 | |
Pool #Q52216 | | | 3.500 | % | | | 11/01/47 | | | | 6,004,573 | | | | 6,363,693 | |
| | | | | | | | | | | | | | | | 47,692,074 | |
Freddie Mac Non-Gold Pool — 0.8% |
Pool #ZS-8069 | | | 3.000 | % | | | 05/01/33 | | | | 7,623,084 | | | | 8,021,225 | |
Pool #781958 (c) | | | 0.460 | % | | | 09/01/34 | | | | 55,730 | | | | 58,308 | |
| | | | | | | | | | | | | | | | 8,079,533 | |
Ginnie Mae I Pool — 0.0% (f) |
Pool #550656 | | | 5.000 | % | | | 09/15/35 | | | | 112,353 | | | | 127,904 | |
| | | | | | | | | | | | | | | | | |
See Notes to Financial Statements.
82 |  | www.sbhfunds.com | www.sbhfunds.com
|
Segall Bryant & Hamill Plus Bond Fund | Statement of Investments |
| | June 30, 2020 (Unaudited) |
| | Coupon | | | Maturity | | | Par Value | | | Value | |
Ginnie Mae II Pool — 0.0% (f) |
Pool #G24496 | | | 5.000 | % | | | 07/20/39 | | | $ | 534,894 | | | $ | 603,808 | |
| | | | | | | | | | | | | | | | | |
Total Mortgage-Backed Securities Passthrough (Cost $236,146,591) | | $ | 246,440,035 | |
| |
RESIDENTIAL MORTGAGE-BACKED SECURITIES — 0.6% |
Residential Mortgage-Backed Securities — 0.6% |
American Home Mortgage Investment Trust, Series 2004-4, Class VI-A-1 (e) | | | 6.000 | % | | | 02/25/45 | | | $ | 2,199,828 | | | $ | 2,286,811 | |
Banc of America Funding Trust, Series 2005-4, Class 1-A-4 | | | 5.500 | % | | | 08/25/35 | | | | 72,721 | | | | 74,931 | |
Banc of America Funding Trust, Series 2005-4, Class 2-A-4 | | | 5.500 | % | | | 08/25/35 | | | | 116,219 | | | | 118,257 | |
CHL Mortgage Pass-Through Trust, Series 2004-HYB2, Class 5-A (c) | | | 4.609 | % | | | 07/20/34 | | | | 1,016,530 | | | | 961,012 | |
GSR Mortgage Loan Trust, Series 2005-3F, Class 2A-3 | | | 6.000 | % | | | 03/25/35 | | | | 891,257 | | | �� | 824,869 | |
PHMC Trust, Series 2007-2, Class A-2 (c) | | | 5.447 | % | | | 05/18/37 | | | | 492,384 | | | | 497,576 | |
Sequoia Mortgage Trust, Series 2017-CH2, Class A-10, 144A (b) (c) | | | 4.000 | % | | | 12/25/47 | | | | 1,808,510 | | | | 1,833,493 | |
Total Residential Mortgage-Backed Securities (Cost $6,747,972) | | $ | 6,596,949 | |
| |
U.S. TREASURY BONDS & NOTES — 13.5% |
United States Treasury | | | 0.250 | % | | | 05/31/25 | | | $ | 235,000 | | | $ | 234,697 | |
United States Treasury | | | 2.250 | % | | | 11/15/25 | | | | 27,965,000 | | | | 30,810,657 | |
United States Treasury | | | 2.375 | % | | | 05/15/27 | | | | 3,725,000 | | | | 4,204,157 | |
United States Treasury | | | 2.625 | % | | | 02/15/29 | | | | 6,650,000 | | | | 7,791,930 | |
United States Treasury | | | 1.625 | % | | | 08/15/29 | | | | 5,000,000 | | | | 5,454,688 | |
United States Treasury | | | 3.750 | % | | | 08/15/41 | | | | 4,500,000 | | | | 6,628,711 | |
United States Treasury | | | 3.125 | % | | | 11/15/41 | | | | 16,425,000 | | | | 22,240,477 | |
United States Treasury | | | 2.875 | % | | | 05/15/43 | | | | 20,805,000 | | | | 27,173,280 | |
United States Treasury | | | 2.500 | % | | | 02/15/45 | | | | 25,675,000 | | | | 31,659,482 | |
United States Treasury | | | 3.000 | % | | | 02/15/49 | | | | 120,000 | | | | 165,577 | |
United States Treasury | | | 2.000 | % | | | 02/15/50 | | | | 3,750,000 | | | | 4,292,285 | |
Total U.S. Treasury Bonds & Notes (Cost $115,462,829) | | $ | 140,655,941 | |
| |
Investments at Value — 97.5% (Cost $948,885,725) | | $ | 1,013,365,602 | |
| |
Other Assets in Excess of Liabilities — 2.5% | | | 25,680,725 | |
| |
Net Assets — 100.0% | | $ | 1,039,046,327 | |
(a) | Security was purchased in a transaction exempt from registration in compliance with Rule 144A of the Securities Act of 1933. This security may be resold in transactions exempt from registration, normally to qualified institutional buyers. These securities represent $147,967,173 or 14.2% of net assets as of June 30, 2020. |
(b) | Restricted security. See the table on the following page for additional information. |
(c) | Variable rate security. Interest rate resets periodically. The rate shown is the effective interest rate as of June 30, 2020. For securities based on a published reference rate and spread, the reference rate and spread (in basis points) are indicated parenthetically. Certain variable rate securities are not based on a published reference rate and spread but are determined by the issuer or agent and are based on current market conditions. These securities, therefore, do not indicate a reference rate and spread. |
(d) | Security can be called and redeemed at the option of the issuer prior to the stated maturity date which is included in the Statement of Investments. |
(e) | Step coupon. Rate shown is the coupon in effect as of June 30, 2020. |
(f) | Percentage rounds to less than 0.1%. |
Sector and industry classifications presented herein are based on the sector and industry categorization methodology of the Adviser to the Funds. For Fund compliance purposes, the Fund’s industry classifications refer to any one or more of the industry sub-classifications used by one or more widely recognized market indexes or ratings group indexes, and/or as defined by Fund management. This definition may not apply for purposes of this report, which may combine industry sub-classifications for reporting ease. Industries are shown as a percentage of net assets.
See Notes to Financial Statements.
Semi-Annual Report | June 30, 2020 |  | 83 |
Segall Bryant & Hamill Plus Bond Fund | Statement of Investments |
| | June 30, 2020 (Unaudited) |
Restricted Securities
Issuer Description | | Coupon | | Maturity Date | Acquisition Date(s) | | Cost | | | Value | | | Value as a
Percentage of
Net Assets | |
Airbus Finance BV, 144A | | | 2.700 | % | 04/17/23 | 08/16/16-12/02/16 | | $ | 1,876,601 | | | $ | 1,927,997 | | | | 0.19 | % |
Alimentation Couche-Tard, Inc., 144A | | | 3.550 | % | 07/26/27 | 07/19/17-08/18/17 | | | 4,658,087 | | | | 5,000,066 | | | | 0.48 | % |
American Airlines, Inc., Series 2013-2, Class A | | | 4.950 | % | 07/15/24 | 07/24/13-08/15/19 | | | 7,664,391 | | | | 6,091,873 | | | | 0.59 | % |
Amkor Technology, Inc., 144A | | | 6.625 | % | 09/15/27 | 04/20/20-05/13/20 | | | 2,289,091 | | | | 2,358,025 | | | | 0.23 | % |
Aviation Capital Group LLC, 144A | | | 3.875 | % | 05/01/23 | 12/10/18 | | | 4,192,515 | | | | 4,043,408 | | | | 0.39 | % |
CCO Holdings LLC/CCO Holdings Capital Corp., 144A | | | 5.875 | % | 04/01/24 | 10/18/17 | | | 6,154,127 | | | | 6,187,500 | | | | 0.60 | % |
Deephaven Residential Mortgage Trust, Series 2017-3, Class A-3, 144A | | | 2.813 | % | 10/25/47 | 11/01/17-06/28/18 | | | 545,662 | | | | 550,934 | | | | 0.05 | % |
Deephaven Residential Mortgage Trust, Series 2018-1, Class A-3, 144A | | | 3.202 | % | 01/25/58 | 01/26/18 | | | 910,531 | | | | 919,058 | | | | 0.09 | % |
Deephaven Residential Mortgage Trust, Series 2018-2, Class A-1, 144A | | | 3.479 | % | 04/25/58 | 05/23/18-02/03/20 | | | 3,005,465 | | | | 3,060,712 | | | | 0.29 | % |
DriveTime Automotive Group, Inc./Bridgecrest Acceptance Corp., 144A | | | 8.000 | % | 06/01/21 | 04/20/16-05/26/16 | | | 5,880,325 | | | | 5,685,000 | | | | 0.55 | % |
FMG Resources August 2006 Pty., Ltd., 144A | | | 4.750 | % | 05/15/22 | 6/18/19-03/19/20 | | | 4,709,346 | | | | 4,912,881 | | | | 0.47 | % |
FMR LLC, 144A | | | 5.350 | % | 11/15/21 | 10/23/2019-04/13/20 | | | 3,489,315 | | | | 3,539,832 | | | | 0.34 | % |
FMR LLC, 144A | | | 6.450 | % | 11/15/39 | 03/27/19 | | | 3,322,355 | | | | 3,832,329 | | | | 0.37 | % |
Georiga-Pacific LLC, 144A | | | 5.400 | % | 11/01/20 | 10/30/19 | | | 2,101,113 | | | | 2,111,097 | | | | 0.20 | % |
GTP Acquisition Partners I LLC, Series 2015-1-2, Class A 15-2, 144A | | | 3.482 | % | 06/16/25 | 05/20/15-05/27/15 | | | 10,812,460 | | | | 11,312,115 | | | | 1.09 | % |
Hanesbrand, Inc., 144A | | | 4.625 | % | 05/15/24 | 03/18/20-06/02/20 | | | 2,374,080 | | | | 2,478,545 | | | | 0.24 | % |
Hanesbrand, Inc., 144A | | | 4.875 | % | 05/15/26 | 04/02/20-06/04/20 | | | 2,009,245 | | | | 2,015,000 | | | | 0.19 | % |
Harley-Davidson Financial Services, Inc., 144A | | | 4.050 | % | 02/04/22 | 01/31/19 | | | 8,596,286 | | | | 8,864,426 | | | | 0.85 | % |
Hologic, Inc., 144A | | | 4.625 | % | 02/01/28 | 04/01/20-04/08/20 | | | 3,134,831 | | | | 3,263,975 | | | | 0.31 | % |
InSite Issuer, LLC, Series 2016-1, Class C, 144A | | | 6.414 | % | 11/15/46 | 10/25/16-02/12/19 | | | 5,796,154 | | | | 5,751,788 | | | | 0.55 | % |
Lamar Media Corp., 144A | | | 3.750 | % | 02/15/28 | 4/16/2020 | | | 2,347,132 | | | | 2,262,720 | | | | 0.22 | % |
Massachusetts Mutual Life Insurance Co., 144A | | | 3.729 | % | 10/15/70 | 10/14/19 | | | 2,342,010 | | | | 2,340,884 | | | | 0.23 | % |
National Securities Clearing Corp., 144A | | | 1.500 | % | 04/23/25 | 04/16/20 | | | 1,646,868 | | | | 1,687,563 | | | | 0.16 | % |
Netflix, Inc., 144A | | | 4.875 | % | 06/15/30 | 04/21/20 | | | 365,662 | | | | 373,929 | | | | 0.04 | % |
Nexstar Broadcasting, Inc., 144A | | | 5.625 | % | 08/01/24 | 07/13/16 | | | 5,271,668 | | | | 5,289,375 | | | | 0.51 | % |
Northwestern Mutual Life Insurance Co. (The), 144A | | | 3.850 | % | 09/30/47 | 05/23/18-09/30/19 | | | 6,261,161 | | | | 7,743,744 | | | | 0.75 | % |
Provident Funding Associates LP/PFG Finance Corp., 144A | | | 6.375 | % | 06/15/25 | 05/24/17-03/24/20 | | | 5,742,501 | | | | 5,792,325 | | | | 0.56 | % |
QORVO, Inc., 144A | | | 4.375 | % | 10/15/29 | 6/16/20 | | | 800,121 | | | | 793,662 | | | | 0.08 | % |
SBA Tower Trust, Series 2016-1, 144A | | | 2.877 | % | 07/10/46 | 11/19/19-11/22/19 | | | 6,806,578 | | | | 6,816,229 | | | | 0.66 | % |
Sequoia Mortgage Trust, Series 2017-CH2, Class A-10, 144A | | | 4.000 | % | 12/25/47 | 11/07/17-09/19/18 | | | 1,846,795 | | | | 1,833,493 | | | | 0.18 | % |
Sierra Timeshare Conduit Receivables Funding LLC, Series 2017-1, Class A, 144A | | | 2.910 | % | 03/20/34 | 3/13/17-07/23/19 | | | 919,759 | | | | 913,135 | | | | 0.09 | % |
Silgan Holdings, Inc., 144A | | | 4.125 | % | 02/01/28 | 11/04/19 | | | 1,730,553 | | | | 1,709,906 | | | | 0.16 | % |
Sirius XM Radio, Inc., 144A | | | 5.375 | % | 07/15/26 | 03/30/20-06/02/20 | | | 4,102,163 | | | | 4,130,960 | | | | 0.40 | % |
Teleflex, Inc., 144A | | | 4.250 | % | 06/01/28 | 05/21/20 | | | 353,728 | | | | 358,750 | | | | 0.03 | % |
Tenaska Alabama II Partners LP, 144A | | | 6.125 | % | 03/30/23 | 10/09/03-09/04/09 | | | 82,964 | | | | 86,322 | | | | 0.01 | % |
Tenaska Virginia Partners LP, 144A | | | 6.119 | % | 03/30/24 | 04/29/04-06/26/14 | | | 87,688 | | | | 91,858 | | | | 0.01 | % |
Tesco PLC, 144A | | | 6.150 | % | 11/15/37 | 10/07/14 | | | 2,256,181 | | | | 2,707,551 | | | | 0.26 | % |
T-Mobile, Inc., 144A | | | 3.875 | % | 04/15/30 | 04/02/20 | | | 3,574,322 | | | | 4,012,452 | | | | 0.39 | % |
Vistra Operations Co., LLC, 144A | | | 5.000 | % | 07/31/27 | 06/17/19-07/24/19 | | | 4,752,245 | | | | 4,777,708 | | | | 0.46 | % |
West Fraser Timber Co., Ltd., 144A | | | 4.350 | % | 10/15/24 | 10/07/14 | | | 5,220,000 | | | | 5,292,284 | | | | 0.51 | % |
| | | | | | | | | $ | 140,029,079 | | | $ | 142,921,411 | | | | 13.78 | % |
See Notes to Financial Statements.
84 |  | www.sbhfunds.com | www.sbhfunds.com
|
Segall Bryant & Hamill Quality High Yield Fund | Statement of Investments |
| | June 30, 2020 (Unaudited) |
| | Coupon | | | Maturity | | | Par Value | | | Value | |
CORPORATE BONDS — 97.2% |
Finance — 8.3% |
Gaming — 2.4% |
MGM Growth Properties Operating Partnership LP | | | 4.500 | % | | | 01/15/28 | | | $ | 1,471,000 | | | $ | 1,432,430 | |
| |
Health Insurance — 1.2% |
Centene Corp., 144A (a) | | | 5.375 | % | | | 06/01/26 | | | | 725,000 | | | | 751,579 | |
| |
Mortgage Banking — 2.4% |
Provident Funding Associates LP/PFG Finance Corp., 144A (a) | | | 6.375 | % | | | 06/15/25 | | | | 1,576,000 | | | | 1,473,560 | |
| |
Real Estate Investment Trusts — 2.3% |
MPT Operating Partnership LP/MPT Finance Corp. | | | 5.000 | % | | | 10/15/27 | | | | 1,350,000 | | | | 1,387,125 | |
| |
Industrial — 87.1% |
Automobile Manufacturing — 3.6% |
General Motors Co. | | | 6.800 | % | | | 10/01/27 | | | | 850,000 | | | | 990,351 | |
Goodyear Tire & Rubber Co. | | | 9.500 | % | | | 05/31/25 | | | | 100,000 | | | | 107,125 | |
Goodyear Tire & Rubber Co. | | | 5.000 | % | | | 05/31/26 | | | | 470,000 | | | | 437,805 | |
Goodyear Tire & Rubber Co. | | | 4.875 | % | | | 03/15/27 | | | | 750,000 | | | | 687,000 | |
| | | | | | | | | | | | | | | | 2,222,281 | |
Building Products — 4.8% |
James Hardie International Finance DAC, 144A (a) | | | 4.750 | % | | | 01/15/25 | | | | 839,000 | | | | 853,683 | |
Masco Corp. | | | 6.500 | % | | | 08/15/32 | | | | 966,000 | | | | 1,173,529 | |
Summit Materials LLC | | | 6.125 | % | | | 07/15/23 | | | | 875,000 | | | | 871,106 | |
| | | | | | | | | | | | | | | | 2,898,318 | |
Chemicals — 4.3% |
Axalta Coating Systems LLC, 144A (a) | | | 4.750 | % | | | 06/15/27 | | | | 370,000 | | | | 371,924 | |
Compass Minerals International, Inc., 144A (a) | | | 4.875 | % | | | 07/15/24 | | | | 1,200,000 | | | | 1,203,000 | |
Olin Corp. | | | 5.125 | % | | | 09/15/27 | | | | 556,000 | | | | 519,860 | |
Olin Corp. | | | 5.000 | % | | | 02/01/30 | | | | 575,000 | | | | 508,875 | |
| | | | | | | | | | | | | | | | 2,603,659 | |
Construction Machinery — 3.2% |
H&E Equipment Services, Inc. | | | 5.625 | % | | | 09/01/25 | | | | 398,000 | | | | 401,896 | |
United Rentals North America, Inc. | | | 6.500 | % | | | 12/15/26 | | | | 1,450,000 | | | | 1,522,500 | |
| | | | | | | | | | | | | | | | 1,924,396 | |
Consumer Products — 2.0% |
Vista Outdoor, Inc. | | | 5.875 | % | | | 10/01/23 | | | | 1,250,000 | | | | 1,221,875 | |
| |
Diversified Manufacturing — 1.8% |
Wesco Distribution, Inc. | | | 5.375 | % | | | 06/15/24 | | | | 1,100,000 | | | | 1,094,731 | |
| |
Electronics — 4.5% |
Amkor Technology, Inc., 144A (a) | | | 6.625 | % | | | 09/15/27 | | | | 635,000 | | | | 679,685 | |
Dell, Inc. | | | 7.100 | % | | | 04/15/28 | | | | 655,000 | | | | 771,263 | |
EMC Corp. | | | 3.375 | % | | | 06/01/23 | | | | 515,000 | | | | 520,923 | |
QORVO, Inc., 144A (a) | | | 4.375 | % | | | 10/15/29 | | | | 750,000 | | | | 768,060 | |
| | | | | | | | | | | | | | | | 2,739,931 | |
Food Processors — 0.9% |
Kraft Heinz Foods Co. | | | 6.875 | % | | | 01/26/39 | | | | 466,000 | | | | 575,526 | |
| |
Healthcare Facilities / Supplies — 4.9% |
Hill-Rom Holdings, Inc., 144A (a) | | | 5.000 | % | | | 02/15/25 | | | | 500,000 | | | | 515,105 | |
Hologic, Inc., 144A (a) | | | 4.375 | % | | | 10/15/25 | | | | 1,000,000 | | | | 1,009,790 | |
Teleflex, Inc. | | | 4.875 | % | | | 06/01/26 | | | | 595,000 | | | | 613,981 | |
See Notes to Financial Statements.
Semi-Annual Report | June 30, 2020 |  | 85 |
Segall Bryant & Hamill Quality High Yield Fund | Statement of Investments |
| | June 30, 2020 (Unaudited) |
| | Coupon | | | Maturity | | | Par Value | | | Value | |
Healthcare Facilities / Supplies (continued) |
Teleflex, Inc. | | | 4.625 | % | | | 11/15/27 | | | $ | 825,000 | | | $ | 872,198 | |
| | | | | | | | | | | | | | | | 3,011,074 | |
Independent Energy — 9.4% |
Apache Corp. | | | 3.250 | % | | | 04/15/22 | | | | 515,000 | | | | 499,729 | |
Apache Corp. | | | 4.250 | % | | | 01/15/30 | | | | 325,000 | | | | 280,888 | |
Diamondback Energy, Inc. | | | 3.500 | % | | | 12/01/29 | | | | 911,000 | | | | 880,088 | |
Occidental Petroleum Corp. | | | 3.400 | % | | | 04/15/26 | | | | 1,000,000 | | | | 817,500 | |
Occidental Petroleum Corp. | | | 7.500 | % | | | 05/01/31 | | | | 296,000 | | | | 275,194 | |
PDC Energy, Inc., CV | | | 1.125 | % | | | 09/15/21 | | | | 1,442,000 | | | | 1,320,846 | |
PDC Energy, Inc. | | | 6.125 | % | | | 09/15/24 | | | | 290,000 | | | | 269,700 | |
Range Resources Corp. | | | 4.875 | % | | | 05/15/25 | | | | 1,850,000 | | | | 1,388,148 | |
| | | | | | | | | | | | | | | | 5,732,093 | |
Information / Data Technology — 1.1% |
CDK Global, Inc. | | | 5.000 | % | | | 10/15/24 | | | | 650,000 | | | | 689,000 | |
| | | | | | | | | | | | | | | | | |
Leisure / Entertainment — 4.1% |
Cedar Fair LP | | | 5.375 | % | | | 04/15/27 | | | | 292,000 | | | | 261,340 | |
Cedar Fair LP, 144A (a) | | | 5.250 | % | | | 07/15/29 | | | | 1,100,000 | | | | 994,532 | |
Royal Caribbean Cruises, Ltd. | | | 2.650 | % | | | 11/28/20 | | | | 1,267,000 | | | | 1,229,230 | |
| | | | | | | | | | | | | | | | 2,485,102 | |
Media — Cable — 1.7% |
DISH DBS Corp. | | | 5.875 | % | | | 07/15/22 | | | | 1,000,000 | | | | 1,016,800 | |
| |
Media — Non-Cable — 9.9% |
AMC Networks, Inc. | | | 4.750 | % | | | 12/15/22 | | | | 651,000 | | | | 649,372 | |
Lamar Media Corp. | | | 5.750 | % | | | 02/01/26 | | | | 183,000 | | | | 188,786 | |
Lamar Media Corp., 144A (a) | | | 3.750 | % | | | 02/15/28 | | | | 1,275,000 | | | | 1,202,070 | |
Netflix, Inc. | | | 5.875 | % | | | 11/15/28 | | | | 745,000 | | | | 847,289 | |
Netflix, Inc., 144A (a) | | | 4.875 | % | | | 06/15/30 | | | | 150,000 | | | | 160,256 | |
Nexstar Broadcasting, Inc., 144A (a) | | | 5.625 | % | | | 08/01/24 | | | | 250,000 | | | | 251,875 | |
Nexstar Broadcasting, Inc., 144A (a) | | | 5.625 | % | | | 07/15/27 | | | | 750,000 | | | | 750,045 | |
Nielsen Co. (Luxembourg) SARL (The), 144A (a) | | | 5.000 | % | | | 02/01/25 | | | | 750,000 | | | | 746,168 | |
Outfront Media Capital LLC | | | 5.625 | % | | | 02/15/24 | | | | 1,231,000 | | | | 1,234,077 | |
| | | | | | | | | | | | | | | | 6,029,938 | |
Metals / Mining — 4.6% |
FMG Resources August 2006 Pty., Ltd., 144A (a) | | | 4.750 | % | | | 05/15/22 | | | | 850,000 | | | | 866,380 | |
FMG Resources August 2006 Pty., Ltd., 144A (a) | | | 5.125 | % | | | 05/15/24 | | | | 500,000 | | | | 515,000 | |
Teck Resources, Ltd. | | | 4.750 | % | | | 01/15/22 | | | | 540,000 | | | | 561,600 | |
Teck Resources, Ltd. | | | 3.750 | % | | | 02/01/23 | | | | 831,000 | | | | 859,046 | |
| | | | | | | | | | | | | | | | 2,802,026 | |
Midstream Energy — 4.6% |
AmeriGas Partners LP/AmeriGas Financial Corp. | | | 5.625 | % | | | 05/20/24 | | | | 1,400,000 | | | | 1,452,080 | |
Tennessee Gas Pipeline Co. LLC | | | 8.375 | % | | | 06/15/32 | | | | 1,019,000 | | | | 1,353,805 | |
| | | | | | | | | | | | | | | | 2,805,885 | |
Packaging — 3.1% |
Berry Plastics Corp. | | | 5.125 | % | | | 07/15/23 | | | | 871,000 | | | | 875,991 | |
Silgan Holdings, Inc. | | | 4.750 | % | | | 03/15/25 | | | | 751,000 | | | | 760,545 | |
Silgan Holdings, Inc., 144A (a) | | | 4.125 | % | | | 02/01/28 | | | | 275,000 | | | | 272,594 | |
| | | | | | | | | | | | | | | | 1,909,130 | |
Paper & Forest Products — 1.0% |
West Fraser Timber Co., Ltd., 144A (a) | | | 4.350 | % | | | 10/15/24 | | | | 600,000 | | | | 608,308 | |
| |
Refining — 1.2% |
Tesoro Corp. | | | 5.375 | % | | | 10/01/22 | | | | 750,000 | | | | 744,314 | |
| |
See Notes to Financial Statements.
86 |  | www.sbhfunds.com | www.sbhfunds.com
|
Segall Bryant & Hamill Quality High Yield Fund | Statement of Investments |
| | June 30, 2020 (Unaudited) |
| | Coupon | | | Maturity | | | Par Value | | | Value | |
Restaurants — 1.9% |
Aramark Services, Inc. | | | 4.750 | % | | | 06/01/26 | | | $ | 1,200,000 | | | $ | 1,155,000 | |
| |
Retail Stores — 3.8% |
DriveTime Automotive Group, Inc./Bridgecrest Acceptance Corp., 144A (a) | | | 8.000 | % | | | 06/01/21 | | | | 1,125,000 | | | | 1,065,938 | |
Hanesbrands, Inc., 144A (a) | | | 4.625 | % | | | 05/15/24 | | | | 1,025,000 | | | | 1,019,875 | |
Hanesbrands, Inc., 144A (a) | | | 4.875 | % | | | 05/15/26 | | | | 250,000 | | | | 251,875 | |
| | | | | | | | | | | | | | | | 2,337,688 | |
Services — 2.8% |
QVC, Inc. | | | 4.850 | % | | | 04/01/24 | | | | 525,000 | | | | 528,465 | |
QVC, Inc. | | | 4.750 | % | | | 02/15/27 | | | | 680,000 | | | | 657,560 | |
Service Corp. International | | | 4.625 | % | | | 12/15/27 | | | | 501,000 | | | | 519,788 | |
| | | | | | | | | | | | | | | | 1,705,813 | |
Theater Entertainment — 1.0% |
Cinemark USA, Inc. | | | 4.875 | % | | | 06/01/23 | | | | 750,000 | | | | 633,750 | |
| |
Vehicle Parts — 4.1% |
Allison Transmission, Inc., 144A (a) | | | 5.000 | % | | | 10/01/24 | | | | 1,225,000 | | | | 1,221,937 | |
Meritor, Inc. | | | 6.250 | % | | | 02/15/24 | | | | 250,000 | | | | 251,875 | |
Meritor, Inc., 144A (a) | | | 6.250 | % | | | 06/01/25 | | | | 1,000,000 | | | | 1,010,000 | |
| | | | | | | | | | | | | | | | 2,483,812 | |
Wireless Telecommunications — 1.9% |
T-Mobile USA, Inc. | | | 6.500 | % | | | 01/15/24 | | | | 700,000 | | | | 715,190 | |
T-Mobile USA, Inc. | | | 4.750 | % | | | 02/01/28 | | | | 404,000 | | | | 426,636 | |
| | | | | | | | | | | | | | | | 1,141,826 | |
Wireline Telecommunications — 0.9% |
CenturyLink, Inc., Series W | | | 6.750 | % | | | 12/01/23 | | | | 510,000 | | | | 548,143 | |
| |
Utility — 1.8% |
Electric — 1.8% |
Vistra Operations Co. LLC, 144A (a) | | | 5.000 | % | | | 07/31/27 | | | | 1,100,000 | | | | 1,118,425 | |
| |
Total Corporate Bonds (Cost $59,681,494) | | $ | 59,283,538 | |
| |
ASSET BACKED SECURITIES — 1.4% |
InSite Issuer LLC, Series 2016-1, Class C, 144A (a) (Cost $849,739) | | | 6.414 | % | | | 11/15/46 | | | $ | 850,000 | | | $ | 844,390 | |
| |
Investments at Value — 98.6% (Cost $60,531,233) | | $ | 60,127,928 | |
| |
Other Assets in Excess of Liabilities — 1.4% | | | 884,532 | |
| |
Net Assets — 100.0% | | $ | 61,012,460 | |
(a) | Security was purchased in a transaction exempt from registration in compliance with Rule 144A of the Securities Act of 1933. This security may be resold in transactions exempt from registration, normally to qualified institutional buyers. These securities are restricted. See the table on the following page for additional information regarding each restricted security. |
Sector and industry classifications presented herein are based on the sector and industry categorization methodology of the Adviser to the Funds. For Fund compliance purposes, the Fund’s industry classifications refer to any one or more of the industry sub-classifications used by one or more widely recognized market indexes or ratings group indexes, and/or as defined by Fund management. This definition may not apply for purposes of this report, which may combine industry sub-classifications for reporting ease. Industries are shown as a percentage of net assets.
See Notes to Financial Statements.
Semi-Annual Report | June 30, 2020 |  | 87 |
Segall Bryant & Hamill Quality High Yield Fund | Statement of Investments |
| | June 30, 2020 (Unaudited) |
Restricted Securities
Issuer Description | | Coupon | | Maturity Date | Acquisition Date(s) | | Cost | | | Value | | | Value as a
Percentage of
Net Assets | |
Allison Transmission, Inc., 144A | | | 5.000 | % | 10/01/24 | 09/14/16-05/01/17 | | $ | 1,235,480 | | | $ | 1,221,937 | | | | 2.00 | % |
Amkor Technology, Inc., 144A | | | 6.625 | % | 09/15/27 | 03/21/19-04/21/20 | | | 635,045 | | | | 679,685 | | | | 1.11 | % |
Axalta Coating Systems LLC, 144A | | | 4.750 | % | 06/15/27 | 06/01/20-06/09/20 | | | 376,030 | | | | 371,924 | | | | 0.61 | % |
Cedar Fair LP, 144A | | | 5.250 | % | 07/15/29 | 07/16/19 | | | 1,170,257 | | | | 994,532 | | | | 1.63 | % |
Centene Corp., 144A | | | 5.375 | % | 06/01/26 | 05/09/18 | | | 725,000 | | | | 751,579 | | | | 1.23 | % |
Compass Minerals International, Inc., 144A | | | 4.875 | % | 07/15/24 | 10/23/14-03/18/15 | | | 1,192,668 | | | | 1,203,000 | | | | 1.97 | % |
DriveTime Automotive Group, Inc./Bridgecrest Acceptance Corp., 144A | | | 8.000 | % | 06/01/21 | 03/10/16-07/12/17 | | | 1,106,619 | | | | 1,065,938 | | | | 1.75 | % |
FMG Resources August 2006 Pty., Ltd., 144A | | | 4.750 | % | 05/15/22 | 05/09/17-03/12/20 | | | 845,908 | | | | 866,380 | | | | 1.42 | % |
FMG Resources August 2006 Pty., Ltd., 144A | | | 5.125 | % | 05/15/24 | 03/03/20 | | | 522,589 | | | | 515,000 | | | | 0.84 | % |
Hanesbrands, Inc., 144A | | | 4.625 | % | 05/15/24 | 05/03/16-01/08/19 | | | 1,016,448 | | | | 1,019,875 | | | | 1.67 | % |
Hanesbrands, Inc., 144A | | | 4.875 | % | 05/15/26 | 3/13/2020 | | | 249,402 | | | | 251,875 | | | | 0.41 | % |
Hill-Rom Holdings, Inc., 144A | | | 5.000 | % | 02/15/25 | 02/09/17 | | | 500,000 | | | | 515,105 | | | | 0.84 | % |
Hologic, Inc., 144A | | | 4.375 | % | 10/15/25 | 10/04/17-01/17/18 | | | 1,005,038 | | | | 1,009,790 | | | | 1.66 | % |
InSite Issuer LLC, Series 2016-A1, Class C, 144A | | | 6.414 | % | 11/15/46 | 10/25/16-12/18/18 | | | 849,739 | | | | 844,390 | | | | 1.38 | % |
James Hardie International Finance DAC, 144A | | | 4.750 | % | 01/15/25 | 11/29/17-11/20/18 | | | 830,272 | | | | 853,683 | | | | 1.40 | % |
Lamar Media Corp., 144A | | | 3.750 | % | 02/15/28 | 01/23/20-02/26/20 | | | 1,282,076 | | | | 1,202,070 | | | | 1.97 | % |
Meritor, Inc. 144A | | | 6.250 | % | 06/01/25 | 06/03/20 | | | 1,006,557 | | | | 1,010,000 | | | | 1.66 | % |
Netflix, Inc. , 144A | | | 4.875 | % | 06/15/30 | 04/21/20 | | | 156,712 | | | | 160,256 | | | | 0.26 | % |
Nexstar Broadcasting, Inc., 144A | | | 5.625 | % | 08/01/24 | 07/13/16-07/14/16 | | | 250,145 | | | | 251,875 | | | | 0.41 | % |
Nexstar Broadcasting, Inc., 144A | | | 5.625 | % | 07/15/27 | 11/12/19-03/03/20 | | | 788,795 | | | | 750,045 | | | | 1.23 | % |
Nielsen Co. (Luxembourg) SARL (The), 144A | | | 5.000 | % | 02/01/25 | 06/07/17-11/15/17 | | | 766,066 | | | | 746,168 | | | | 1.22 | % |
Provident Funding Associates LP/PFG Finance Corp., 144A | | | 6.375 | % | 06/15/25 | 05/24/17-06/16/20 | | | 1,383,548 | | | | 1,473,560 | | | | 2.42 | % |
QORVO, Inc., 144A | | | 4.375 | % | 10/15/29 | 4/30/2020 | | | 750,894 | | | | 768,060 | | | | 1.26 | % |
Silgan Holdings, Inc., 144A | | | 4.125 | % | 02/01/28 | 11/4/2019-06/11/20 | | | 275,364 | | | | 272,594 | | | | 0.45 | % |
Vistra Operations Co., LLC, 144A | | | 5.000 | % | 07/31/27 | 06/06/19-07/24/19 | | | 1,111,608 | | | | 1,118,425 | | | | 1.83 | % |
West Fraser Timber Co., Ltd., 144A | | | 4.350 | % | 10/15/24 | 06/20/16-12/02/16 | | | 575,061 | | | | 608,308 | | | | 1.00 | % |
| | | | | | | | | $ | 20,607,321 | | | $ | 20,526,054 | | | | 33.63 | % |
See Notes to Financial Statements.
88 |  | www.sbhfunds.com | www.sbhfunds.com
|
Segall Bryant & Hamill Municipal Opportunities Fund | Statement of Investments |
| | June 30, 2020 (Unaudited) |
| | Coupon | | | Maturity | | | Par Value | | | Value | |
MUNICIPAL BONDS — 87.3% |
Certificate Participation — 1.3% |
Lease / Rent — 1.3% |
Monterey County California COP Public Facilities Financing, Series 2015 (a) | | | 4.000 | % | | | 09/01/45 | | | $ | 185,000 | | | $ | 206,358 | |
Public Water Supply of District No. 1 of Lincoln County, Series 2019 (a) | | | 4.000 | % | | | 07/01/38 | | | | 500,000 | | | | 555,005 | |
Washington State State & Local Agency Real & Personal Property, Series 2018-C (a) | | | 5.000 | % | | | 07/01/43 | | | | 475,000 | | | | 584,221 | |
| | | | | | | | | | | | | | | | 1,345,584 | |
General Obligation — 17.8% |
Local — 17.8% |
Central Platte Valley Metropolitan District, Series 2013-A (a) | | | 5.375 | % | | | 12/01/33 | | | | 50,000 | | | | 53,086 | |
Central Platte Valley Metropolitan District, Series 2013-A (a) | | | 5.625 | % | | | 12/01/38 | | | | 70,000 | | | | 74,544 | |
Central Platte Valley Metropolitan District, Series 2013-A (a) | | | 6.000 | % | | | 12/01/38 | | | | 1,450,000 | | | | 1,557,576 | |
Central Platte Valley Metropolitan District, Series 2014 (a) | | | 5.000 | % | | | 12/01/43 | | | | 3,750,000 | | | | 3,834,375 | |
Chaffey California Joint Union High School District California, Series D (a) | | | 0.000 | % | | | 08/01/38 | | | | 1,220,000 | | | | 754,216 | |
Copperleaf Colorado Metropolitan District No. 2, Series 2015 (a) | | | 5.750 | % | | | 12/01/45 | | | | 1,000,000 | | | | 1,018,830 | |
Copperleaf Colorado Metropolitan District No. 2, Series 2019-B (a) | | | 5.000 | % | | | 12/15/49 | | | | 1,020,000 | | | | 1,029,007 | |
Denver Colorado International Business Center Metropolitan District No. 1, Series 2010 (a) | | | 5.375 | % | | | 12/01/35 | | | | 115,000 | | | | 116,065 | |
Fort Bend County Texas Levee District No. 6, Series 2019 (a) | | | 3.000 | % | | | 09/01/33 | | | | 320,000 | | | | 331,514 | |
Fort Bend County Texas Municipal Utility District No. 128, Series 2014 (a) | | | 3.650 | % | | | 09/01/29 | | | | 205,000 | | | | 214,360 | |
Fort Bend County Texas Municipal Utility District No. 25, Series 2019 (a) | | | 3.000 | % | | | 10/01/34 | | | | 895,000 | | | | 939,893 | |
Fort Bend County Texas Municipal Utility District No. 57, Series 2015 (a) | | | 3.125 | % | | | 04/01/32 | | | | 250,000 | | | | 252,500 | |
Harris County Texas Municipal Utility District No. 166, Series 2019 (a) | | | 3.000 | % | | | 09/01/29 | | | | 250,000 | | | | 262,833 | |
Hays County Water Control & Improvement District No. 2, Series 2013 (a) | | | 4.600 | % | | | 09/01/33 | | | | 390,000 | | | | 419,153 | |
High Plains Metropolitan District in the City of Aurora Arapahoe County, Colorado, Series 2017 (a) (b) | | | 5.000 | % | | | 12/01/35 | | | | 295,000 | | | | 355,788 | |
Kings Manor Texas Municipal Utility District, Series 2019 (a) | | | 3.000 | % | | | 09/01/31 | | | | 540,000 | | | | 561,406 | |
Kings Manor Texas Municipal Utility District, Series 2019 (a) | | | 3.000 | % | | | 09/01/32 | | | | 250,000 | | | | 258,432 | |
Las Vegas Nevada City Hall, Series 2015-C (a) | | | 4.000 | % | | | 09/01/38 | | | | 855,000 | | | | 955,950 | |
Lazy Nine Texas Municipal Utility District No. 1B, Series 2014 (a) | | | 4.000 | % | | | 09/01/34 | | | | 100,000 | | | | 101,542 | |
Marin California Healthcare District Election 2013, Series 2017-A (a) | | | 4.000 | % | | | 08/01/47 | | | | 600,000 | | | | 677,100 | |
Northwest Harris County Texas Municipal Utility District No. 5, Series 2013 (a) | | | 3.000 | % | | | 05/01/31 | | | | 590,000 | | | | 595,251 | |
Roseville California Joint Union High School District No. 1, Series D (a) | | | 0.000 | % | | | 08/01/41 | | | | 710,000 | | | | 395,271 | |
Roseville California Joint Union High School District No. 1, Series D (a) | | | 0.000 | % | | | 08/01/42 | | | | 845,000 | | | | 454,272 | |
Sonterra Texas Municipal Utility District, Series 2020 (a) | | | 4.000 | % | | | 08/15/39 | | | | 890,000 | | | | 948,802 | |
Traditions Metropolitan District No. 2 Arapahoe County Colorado, Series 2016 (a) | | | 4.250 | % | | | 12/01/46 | | | | 100,000 | | | | 110,213 | |
Travis County Texas Municipal Utility District No. 21, Series 2016 (a) | | | 3.000 | % | | | 09/01/27 | | | | 100,000 | | | | 109,988 | |
Travis County Texas Municipal Utility District No. 21, Series 2016 (a) | | | 3.500 | % | | | 09/01/33 | | | | 215,000 | | | | 228,689 | |
West Harris County Texas Municipal District No. 5, Series 2015 (a) | | | 3.375 | % | | | 09/01/27 | | | | 105,000 | | | | 110,434 | |
Winton Woods City Ohio School District, Series 2017-A (a) | | | 4.000 | % | | | 11/01/53 | | | | 1,950,000 | | | | 2,018,094 | |
| | | | | | | | | | | | | | | | 18,739,184 | |
Local Authority — 1.1% |
Education — 0.2% |
Administrators of the Tulane Educational Fund, Series 2013-C (a) | | | 5.000 | % | | | 10/01/47 | | | | 170,000 | | | | 180,149 | |
| |
Healthcare — 0.4% |
Denver Health & Hospital Authority, Series B (a) | | | 4.900 | % | | | 12/01/24 | | | | 410,000 | | | | 431,738 | |
| |
Tax — 0.1% |
County of Pitkin Colorado, Series 2010-A (a) | | | 6.689 | % | | | 12/01/30 | | | | 100,000 | | | | 102,020 | |
| |
Utilities — 0.4% |
Warm Spring or Reservation Confederated, Series 2019-A | | | 2.950 | % | | | 11/01/23 | | | | 250,000 | | | | 257,925 | |
Warm Spring or Reservation Confederated, Series 2019-A | | | 3.050 | % | | | 11/01/24 | | | | 200,000 | | | | 208,576 | |
| | | | | | | | | | | | | | | | 466,501 | |
See Notes to Financial Statements.
Semi-Annual Report | June 30, 2020 |  | 89 |
Segall Bryant & Hamill Municipal Opportunities Fund | Statement of Investments |
| | June 30, 2020 (Unaudited) |
| | Coupon | | | Maturity | | | Par Value | | | Value | |
Revenue — 67.1% |
Education — 5.3% |
Harris County Cultural Education Facilities Finance Corp., Series 2016 (a) | | | 4.000 | % | | | 11/15/30 | | | $ | 300,000 | | | $ | 335,622 | |
Harris County Cultural Education Facilities Finance Corp., Series 2012-A (a) | | | 5.000 | % | | | 11/15/37 | | | | 280,000 | | | | 297,349 | |
Massachusetts State Development Finance Agency, Series 2012 (a) | | | 4.000 | % | | | 09/01/49 | | | | 1,100,000 | | | | 1,124,046 | |
Miami-Dade County Educational Facilities Authority, Series 2015-A (a) | | | 5.000 | % | | | 04/01/31 | | | | 20,000 | | | | 22,534 | |
Ohio State University General Receipts Special Purpose, Series 2013-A (a) | | | 4.000 | % | | | 06/01/43 | | | | 900,000 | | | | 954,207 | |
Tulsa Industrial Authority, Series 2011 | | | 4.000 | % | | | 10/01/21 | | | | 135,000 | | | | 136,855 | |
Washington Higher Education Facilities Authority, Series 2013-A (a) | | | 5.250 | % | | | 04/01/43 | | | | 175,000 | | | | 186,389 | |
Washington Higher Education Facilities Authority, Series 2020 (a) | | | 4.000 | % | | | 05/01/45 | | | | 1,000,000 | | | | 1,100,240 | |
Washington Higher Education Facilities Authority, Series 2020 (a) | | | 4.000 | % | | | 05/01/50 | | | | 1,250,000 | | | | 1,362,437 | |
| | | | | | | | | | | | | | | | 5,519,679 | |
Healthcare — 2.3% |
Capital Trust Agency, Inc., Series 2018-B | | | 3.750 | % | | | 07/01/23 | | | | 155,000 | | | | 146,656 | |
City of Lakeland Florida, Series 2016 (a) | | | 5.000 | % | | | 11/15/29 | | | | 50,000 | | | | 59,508 | |
City of Lakeland Florida, Series 2015 (a) | | | 5.000 | % | | | 11/15/45 | | | | 100,000 | | | | 111,143 | |
Colorado Health Facilities Authority, Series 2008-D-2 | | | 5.000 | % | | | 01/01/22 | | | | 60,000 | | | | 63,524 | |
Colorado Health Facilities Authority, Series 2012 (a) | | | 5.000 | % | | | 01/01/23 | | | | 50,000 | | | | 52,839 | |
Colorado Health Facilities Authority, Series 2012 (a) | | | 5.000 | % | | | 01/01/25 | | | | 210,000 | | | | 220,922 | |
Colorado Health Facilities Authority, Series 2015 (a) | | | 5.000 | % | | | 05/15/40 | | | | 850,000 | | | | 947,351 | |
Illinois Finance Authority, Series 2015-A (a) | | | 5.000 | % | | | 11/15/34 | | | | 130,000 | | | | 147,711 | |
Illinois Finance Authority, Series 2012-A (a) | | | 4.250 | % | | | 05/15/41 | | | | 375,000 | | | | 383,741 | |
Illinois Finance Authority, Series 2016-A (a) | | | 5.000 | % | | | 02/15/45 | | | | 100,000 | | | | 117,556 | |
Illinois Finance Authority, Series 2012 (a) | | | 4.000 | % | | | 06/01/47 | | | | 35,000 | | | | 36,041 | |
Kentucky State Economic Development Finance Authority, Series 2009-B | | | 2.700 | % | | | 05/01/39 | | | | 25,000 | | | | 25,574 | |
Washington State Health Care Facilities Authority, Series 2013A-1 (a) | | | 5.250 | % | | | 01/01/40 | | | | 95,000 | | | | 104,032 | |
| | | | | | | | | | | | | | | | 2,416,598 | |
Lease / Rent — 2.6% |
Hamilton Community Authority, Series 2019-A (a) | | | 4.000 | % | | | 10/15/46 | | | | 990,000 | | | | 1,073,784 | |
San Mateo County California Joint Powers Financing Authority, Series 2018-A (a) | | | 4.000 | % | | | 07/15/52 | | | | 1,480,000 | | | | 1,670,284 | |
| | | | | | | | | | | | | | | | 2,744,068 | |
Other — 0.0% (c) |
Colorado Education & Cultural Facilities Authority, Series B (a) | | | 4.000 | % | | | 12/01/38 | | | $ | 50,000 | | | | 51,890 | |
| |
Public Services — 0.3% |
Park Creek Metropolitan District, Series 2017-A (a) | | | 5.000 | % | | | 12/01/35 | | | | 275,000 | | | | 320,265 | |
| |
Recreation — 0.2% |
Denver Colorado Convention Center Hotel Authority, Series 2016 (a) | | | 5.000 | % | | | 12/01/40 | | | | 175,000 | | | | 184,215 | |
| |
State and Non-State Appropriated Tobacco — 2.4% |
Buckeye Ohio Tobacco Settlement Financing Authority, Series 2020-A-2 CL 1 (a) | | | 4.000 | % | | | 06/01/38 | | | | 925,000 | | | | 1,060,142 | |
California County Tobacco Securitization Agency (The), Series 2020-A (a) | | | 4.000 | % | | | 06/01/34 | | | | 640,000 | | | | 748,934 | |
California County Tobacco Securitization Agency (The), Series 2020-A (a) | | | 4.000 | % | | | 06/01/35 | | | | 650,000 | | | | 756,841 | |
| | | | | | | | | | | | | | | | 2,565,917 | |
Tax — 9.6% |
City of Williston North Dakota, Series 2018-A (a) | | | 3.200 | % | | | 07/15/24 | | | | 515,000 | | | | 531,011 | |
Denver Colorado Urban Renewal Authority Tax Increment, Series 2018-A (a) | | | 5.250 | % | | | 12/01/39 | | | | 2,000,000 | | | | 2,010,720 | |
Hesperia California Community Redevelopment Agency Successor, Series 2018-A (a) | | | 3.375 | % | | | 09/01/37 | | | | 2,700,000 | | | | 2,923,506 | |
Jamestown Park District, Series A (a) | | | 4.000 | % | | | 07/01/33 | | | | 1,000,000 | | | | 1,091,090 | |
See Notes to Financial Statements.
90 |  | www.sbhfunds.com | www.sbhfunds.com
|
Segall Bryant & Hamill Municipal Opportunities Fund | Statement of Investments |
| | June 30, 2020 (Unaudited) |
| | Coupon | | | Maturity | | | Par Value | | | Value | |
Tax (continued) | | | | | | | | | | | | | | | | |
Northglenn Urban Renewal Authority, Series 2019 (a) | | | 4.000 | % | | | 12/01/34 | | | $ | 400,000 | | | $ | 433,676 | |
Northglenn Urban Renewal Authority, Series 2019 (a) | | | 4.000 | % | | | 12/01/35 | | | | 525,000 | | | | 566,165 | |
Riverside County California Redevelopment Agency, Series B | | | 0.000 | % | | | 10/01/38 | | | | 730,000 | | | | 468,039 | |
Roaring Fork County Transportation Authority Sales & Use Tax, Series 2019 (a) | | | 4.000 | % | | | 12/01/44 | | | | 150,000 | | | | 174,305 | |
Southwest Houston Texas Redevelopment Authority, Series 2017-B (a) | | | 4.000 | % | | | 09/01/40 | | | | 1,350,000 | | | | 1,500,903 | |
Successor Agency to the Orange Redevelopment Agency, Series A (a) | | | 4.000 | % | | | 09/01/34 | | | | 200,000 | | | | 236,034 | |
Village Community Development District No. 5, Series Phase 1 | | | 3.125 | % | | | 05/01/22 | | | | 160,000 | | | | 165,234 | |
| | | | | | | | | | | | | | | | 10,100,683 | |
Transportation — 40.6% |
Airport Commission of the City and County of San Francisco San Francisco International Airport, Series 2019-D (a) | | | 5.000 | % | | | 05/01/39 | | | | 175,000 | | | | 217,107 | |
Arizona Industrial Development Authority, Series 2018 (a) | | | 5.000 | % | | | 05/01/33 | | | | 500,000 | | | | 513,890 | |
Arizona Industrial Development Authority, Series 2018 (a) | | | 5.000 | % | | | 05/01/36 | | | | 1,015,000 | | | | 1,025,454 | |
Arizona Industrial Development Authority, Series 2018 (a) | | | 5.000 | % | | | 05/01/48 | | | | 375,000 | | | | 378,248 | |
Central Texas Regional Mobility Authority, Series A (a) | | | 5.000 | % | | | 01/01/45 | | | | 635,000 | | | | 693,636 | |
Cinco Southwest Municipal Utility District No. 1, Series 2019 (a) | | | 3.000 | % | | | 12/01/35 | | | | 445,000 | | | | 463,396 | |
City of Atlanta Airport Passenger Facility Charge and Subordinate, Series 2019-C (a) | | | 5.000 | % | | | 07/01/35 | | | | 500,000 | | | | 626,585 | |
City of Austin, Texas Airport Systems, Series 2017-A (a) | | | 5.000 | % | | | 11/15/46 | | | | 200,000 | | | | 232,010 | |
City of St. Louis, Missouri Airport (The), Series 2019-A (a) | | | 5.000 | % | | | 07/01/49 | | | | 520,000 | | | | 608,390 | |
Colorado High Performance Transportation Enterprise, Series 2014 (a) | | | 5.750 | % | | | 01/01/44 | | | | 750,000 | | | | 796,305 | |
Colorado High Performance Transportation Enterprise, Series 2017 (a) | | | 5.000 | % | | | 12/31/47 | | | | 100,000 | | | | 107,024 | |
Colorado High Performance Transportation Enterprise, Series 2017 (a) | | | 5.000 | % | | | 12/31/51 | | | | 1,675,000 | | | | 1,788,598 | |
Foothill Eastern Transportation Corridor Agency Toll Road, Series 2013-A | | | 5.750 | % | | | 01/15/46 | | | | 5,000,000 | | | | 5,552,700 | |
Foothill Eastern Transportation Corridor Agency Toll Road, Series 2013-B-2 | | | 3.500 | % | | | 01/15/53 | | | | 2,750,000 | | | | 2,838,825 | |
Love Field Airport Modernization Corp., Series 2017 (a) | | | 5.000 | % | | | 11/01/33 | | | | 425,000 | | | | 486,332 | |
Metropolitan Nashville Airport Authority, Series 2019-A (a) | | | 5.000 | % | | | 07/01/36 | | | | 1,155,000 | | | | 1,467,705 | |
Mid-Bay Bridge Authority, Series A (a) | | | 5.000 | % | | | 10/01/30 | | | | 1,500,000 | | | | 1,687,605 | |
Mid-Bay Bridge Authority, Series A (a) | | | 5.000 | % | | | 10/01/35 | | | | 1,180,000 | | | | 1,307,251 | |
Mid-Bay Bridge Authority, Series A (a) | | | 5.000 | % | | | 10/01/40 | | | | 1,000,000 | | | | 1,097,310 | |
New Orleans Aviation Board General Airport, Series A (a) | | | 5.000 | % | | | 01/01/38 | | | | 285,000 | | | | 332,093 | |
New Orleans Aviation Board General Airport, Series A (a) | | | 5.000 | % | | | 01/01/43 | | | | 345,000 | | | | 398,106 | |
New Orleans Aviation Board General Airport, Series B (a) | | | 5.000 | % | | | 01/01/48 | | | | 390,000 | | | | 443,656 | |
North Carolina State Turnpike Authority Monroe Expressway Toll, Series A (a) | | | 5.000 | % | | | 07/01/42 | | | | 750,000 | | | | 814,125 | |
North Carolina State Turnpike Authority Monroe Expressway Toll, Series 2019 (a) | | | 5.000 | % | | | 01/01/43 | | | | 500,000 | | | | 569,475 | |
North Carolina State Turnpike Authority Monroe Expressway Toll, Series 2019 (a) | | | 5.000 | % | | | 01/01/44 | | | | 355,000 | | | | 401,498 | |
North Texas Tollway Authority System, Series 2015-A (a) | | | 5.000 | % | | | 01/01/38 | | | | 370,000 | | | | 419,129 | |
Pennsylvania Turnpike Commission, Series 2015-B (a) | | | 5.000 | % | | | 12/01/45 | | | | 1,025,000 | | | | 1,164,851 | |
Regional Transportation District Colorado, Series 2010 (a) | | | 5.250 | % | | | 07/15/24 | | | | 500,000 | | | | 500,505 | |
Regional Transportation District Colorado, Series 2010 (a) | | | 5.375 | % | | | 01/15/25 | | | | 170,000 | | | | 170,190 | |
Regional Transportation District Colorado, Series 2010 (a) | | | 5.375 | % | | | 07/15/25 | | | | 30,000 | | | | 30,034 | |
Regional Transportation District Colorado, Series 2010 (a) | | | 6.000 | % | | | 01/15/26 | | | | 345,000 | | | | 345,569 | |
Regional Transportation District Colorado, Series 2010 (a) | | | 6.000 | % | | | 01/15/34 | | | | 1,000,000 | | | | 1,001,680 | |
State of Hawaii Airports System, Series B (a) | | | 4.000 | % | | | 07/01/45 | | | | 600,000 | | | | 647,802 | |
Texas Transportation Commission Central Texas Turnpike System, Series C | | | 5.000 | % | | | 08/15/30 | | | | 120,000 | | | | 132,838 | |
Texas Transportation Commission Central Texas Turnpike System, Series C | | | 5.000 | % | | | 08/15/37 | | | | 1,000,000 | | | | 1,086,750 | |
Texas Transportation Commission Central Texas Turnpike System, Series C | | | 5.000 | % | | | 08/15/42 | | | | 3,500,000 | | | | 3,774,190 | |
Virginia Small Business Financing Authority, Series 2017 (a) | | | 5.000 | % | | | 07/01/34 | | | | 2,500,000 | | | | 2,572,675 | |
Virginia Small Business Financing Authority, Series 2017 (a) | | | 5.000 | % | | | 01/01/40 | | | | 130,000 | | | | 133,779 | |
Virginia Small Business Financing Authority, Series 2017, 144A (a) (d) (e) | | | 3.000 | % | | | 07/01/50 | | | | 3,500,000 | | | | 3,491,285 | |
Wayne County Airport Authority, Series D (a) | | | 5.000 | % | | | 12/01/40 | | | | 2,000,000 | | | | 2,265,140 | |
| | | | | | | | | | | | | | | | 42,583,741 | |
See Notes to Financial Statements.
Semi-Annual Report | June 30, 2020 |  | 91 |
Segall Bryant & Hamill Municipal Opportunities Fund | Statement of Investments |
| | June 30, 2020 (Unaudited) |
| | Coupon | | | Maturity | | | Par Value | | | Value | |
Utilities — 3.8% |
Garland Texas Electric Utility Systems, Series 2019 (a) | | | 5.000 | % | | | 03/01/44 | | | $ | 325,000 | | | $ | 403,881 | |
Lower Colorado River Authority Texas Transmission Contract Revenue, Series 2016 (a) | | | 4.000 | % | | | 05/15/42 | | | | 500,000 | | | | 550,360 | |
Lower Colorado River Authority Texas Transmission Contract Revenue, Series 2019-A (a) | | | 4.000 | % | | | 05/15/49 | | | | 2,175,000 | | | | 2,439,219 | |
Norco California Financing Authority Enterprise, Series 2019-A (a) | | | 4.000 | % | | | 10/01/44 | | | | 500,000 | | | | 567,735 | |
| | | | | | | | | | | | | | | | 3,961,195 | |
| |
Total Municipal Bonds (Cost $88,546,857) | | $ | 91,713,427 | |
| |
CORPORATE BONDS — 2.3% |
Industrial — 2.3% |
Independent Energy — 1.7% |
PDC Energy, Inc., CV | | | 1.125 | % | | | 09/15/21 | | | $ | 2,000,000 | | | $ | 1,831,963 | |
| |
Leisure / Entertainment — 0.6% |
YMCA of Greater New York, Series 2020 | | | 2.260 | % | | | 08/01/21 | | | | 600,000 | | | | 599,827 | |
| |
Total Corporate Bonds (Cost $2,452,359) | | $ | 2,431,790 | |
| |
Investments at Value — 89.6% (Cost $90,999,216) | | $ | 94,145,217 | |
| |
Other Assets in Excess of Liabilities — 10.4% | | | 10,869,523 | |
| |
Net Assets — 100.0% | | $ | 105,014,740 | |
(a) | Security can be called and redeemed at the option of the issuer prior to the stated maturity date which is included in the Statement of Investments. |
(b) | This security is insured. In the event of a default by the bond issuer, the issuer, as noted in the security description, guarantees that scheduled principal and interest payments will be made when due. |
(c) | Percentage rounds to less than 0.1%. |
(d) | Security was purchased in transaction exempt from registration in compliance with Rule 144A of the Securities Act of 1933. This security may be resold in transactions exempt from registration, normally to qualified institutional buyers. The total value of such securities is $3,491,285 as of June 30, 2020, representing 3.3% of net assets. |
(e) | Variable rate security. Interest rate resets periodically. The rate shown is the effective interest rate as of June 30, 2020. For securities based on a published reference rate and spread, the reference rate and spread (in basis points) are indicated parenthetically. Certain variable rate securities are not based on a published reference rate and spread but are determined by the issuer or agent and are based on current market conditions. These securities, therefore, do not indicate a reference rate and spread. |
Sector and industry classifications presented herein are based on the sector and industry categorization methodology of the Adviser to the Funds. For Fund compliance purposes, the Fund’s industry classifications refer to any one or more of the industry sub-classifications used by one or more widely recognized market indexes or ratings group indexes, and/or as defined by Fund management. This definition may not apply for purposes of this report, which may combine industry sub-classifications for reporting ease. Industries are shown as a percentage of net assets.
See Notes to Financial Statements.
92 |  | www.sbhfunds.com | www.sbhfunds.com
|
Segall Bryant & Hamill Colorado Tax Free Fund | Statement of Investments |
| | June 30, 2020 (Unaudited) |
| | Coupon | | | Maturity | | | Par Value | | | Value | |
MUNICIPAL BONDS — 97.6% |
Certificate Participation — 18.7% |
Healthcare — 0.3% |
Denver Health & Hospital Authority, Series 2018 (a) | | | 5.000 | % | | | 12/01/30 | | | $ | 350,000 | | | $ | 417,816 | |
Denver Health & Hospital Authority, Series 2018 (a) | | | 5.000 | % | | | 12/01/31 | | | | 350,000 | | | | 414,348 | |
Denver Health & Hospital Authority, Series 2018 (a) | | | 5.000 | % | | | 12/01/32 | | | | 225,000 | | | | 264,105 | |
Denver Health & Hospital Authority, Series 2018 (a) | | | 5.000 | % | | | 12/01/33 | | | | 240,000 | | | | 279,878 | |
| | | | | | | | | | | | | | | | 1,376,147 | |
Lease / Rent — 18.2% |
Aspen Colorado COP, Series 2019 (a) | | | 5.000 | % | | | 12/01/44 | | | | 2,070,000 | | | | 2,613,706 | |
Berthoud Colorado COP, Series 2020 (a) | | | 4.000 | % | | | 12/01/40 | | | | 3,765,000 | | | | 4,408,401 | |
Berthoud Colorado COP, Series 2020 (a) | | | 4.000 | % | | | 12/01/49 | | | | 9,255,000 | | | | 10,646,859 | |
Breckenridge Colorado COP, Series 2020-B | | | 5.000 | % | | | 12/01/23 | | | | 25,000 | | | | 28,639 | |
Breckenridge Colorado COP, Series 2020-B (a) | | | 4.000 | % | | | 12/01/39 | | | | 1,350,000 | | | | 1,592,649 | |
Breckenridge Colorado COP, Series 2020-B (a) | | | 4.000 | % | | | 12/01/44 | | | | 3,165,000 | | | | 3,681,560 | |
Castle Pines North Metrolpolitan District Colorado COP, Series 2015 (a) | | | 4.000 | % | | | 12/01/44 | | | | 750,000 | | | | 770,543 | |
City & County of Denver Colorado, Series 2018-A (a) | | | 5.375 | % | | | 06/01/43 | | | | 7,000,000 | | | | 8,175,930 | |
City & County of Denver Colorado, Series 2018-A (a) | | | 4.000 | % | | | 06/01/48 | | | | 4,925,000 | | | | 5,112,446 | |
City of Aurora Colorado COP, Series 2017 (a) | | | 5.000 | % | | | 12/01/34 | | | | 450,000 | | | | 539,487 | |
City of Aurora Colorado COP, Series 2017 (a) | | | 5.000 | % | | | 12/01/35 | | | | 615,000 | | | | 734,820 | |
Colorado State Building Excellent Schools Today COP, Series 2019-O (a) | | | 5.000 | % | | | 03/15/36 | | | | 1,750,000 | | | | 2,203,635 | |
Colorado State Building Excellent Schools Today COP, Series 2019-O (a) | | | 4.000 | % | | | 03/15/37 | | | | 1,450,000 | | | | 1,659,438 | |
Colorado State Building Excellent Schools Today COP, Series 2018-N (a) | | | 4.000 | % | | | 03/15/39 | | | | 200,000 | | | | 223,160 | |
Colorado State COP Rural Colorado, Series 2020-A (a) | | | 4.000 | % | | | 12/15/35 | | | | 410,000 | | | | 499,601 | |
Colorado State COP Rural Colorado, Series 2018-A (a) | | | 5.000 | % | | | 12/15/37 | | | | 1,000,000 | | | | 1,254,310 | |
County of Larimer Colorado COP, Series 2019 (a) | | | 4.000 | % | | | 12/01/33 | | | | 3,400,000 | | | | 4,136,304 | |
Denver City & County School District No. 1 COP, Series 2020-A (a) | | | 5.000 | % | | | 12/01/33 | | | | 275,000 | | | | 365,849 | |
Denver City & County School District No. 1 COP, Series 2018-B (a) | | | 5.000 | % | | | 12/01/36 | | | | 3,980,000 | | | | 4,089,331 | |
Denver City & County School District No. 1 COP, Series 2020-A (a) | | | 5.000 | % | | | 12/01/38 | | | | 2,580,000 | | | | 3,378,820 | |
Denver City & County School District No. 1 COP, Series 2020-A (a) | | | 5.000 | % | | | 12/01/39 | | | | 2,055,000 | | | | 2,683,234 | |
Denver City & County School District No. 1 COP, Series 2020-A (a) | | | 5.000 | % | | | 12/01/40 | | | | 1,800,000 | | | | 2,343,006 | |
Denver City & County School District No. 1 COP, Series 2020-A (a) | | | 5.000 | % | | | 12/01/42 | | | | 1,860,000 | | | | 2,407,993 | |
Grand Junction Colorado COP, Series 2019 (a) | | | 4.000 | % | | | 12/01/35 | | | | 550,000 | | | | 651,420 | |
Gunnison County Colorado COP, Series 2020-B | | | 5.000 | % | | | 12/01/23 | | | | 105,000 | | | | 120,095 | |
Gunnison County Colorado COP, Series 2020-B | | | 5.000 | % | | | 12/01/24 | | | | 55,000 | | | | 64,822 | |
Gunnison County Colorado COP, Series 2020-B | | | 5.000 | % | | | 12/01/28 | | | | 45,000 | | | | 58,001 | |
Gunnison County Colorado COP, Series 2020-B | | | 5.000 | % | | | 12/01/30 | | | | 310,000 | | | | 412,532 | |
Gunnison County Colorado COP, Series 2020-B (a) | | | 5.000 | % | | | 12/01/31 | | | | 200,000 | | | | 263,924 | |
Gunnison County Colorado COP, Series 2020 (a) | | | 4.000 | % | | | 12/01/34 | | | | 125,000 | | | | 146,962 | |
Gunnison County Colorado COP, Series 2020-B (a) | | | 4.000 | % | | | 12/01/34 | | | | 55,000 | | | | 65,590 | |
Gunnison County Colorado COP, Series 2020 (a) | | | 4.000 | % | | | 12/01/35 | | | | 390,000 | | | | 456,409 | |
Gunnison County Colorado COP, Series 2020-B (a) | | | 4.000 | % | | | 12/01/35 | | | | 310,000 | | | | 367,834 | |
Gunnison County Colorado COP, Series 2020-B (a) | | | 4.000 | % | | | 12/01/36 | | | | 325,000 | | | | 383,926 | |
Gunnison County Colorado COP, Series 2020 (a) | | | 4.000 | % | | | 12/01/36 | | | | 810,000 | | | | 944,071 | |
Gunnison County Colorado COP, Series 2020 (a) | | | 4.000 | % | | | 12/01/37 | | | | 840,000 | | | | 975,778 | |
Platteville-Gilcrest Fire Protection District COP, Series 2018 (a) | | | 5.000 | % | | | 12/01/33 | | | | 175,000 | | | | 219,284 | |
Pueblo County School District No. 70, Series 2014 (a) | | | 2.375 | % | | | 01/15/21 | | | | 270,000 | | | | 270,343 | |
State of Colorado Department of Transportation, Series 2017 (a) | | | 5.000 | % | | | 06/15/41 | | | | 880,000 | | | | 1,050,685 | |
State of Colorado Department of Transportation, Series 2016 (a) | | | 5.000 | % | | | 06/15/41 | | | | 1,005,000 | | | | 1,008,427 | |
Town of Firestone Colorado COP, Series 2018 (a) | | | 5.000 | % | | | 12/01/42 | | | | 3,000,000 | | | | 3,608,700 | |
Winter Park Colorado COP, Series 2019 (a) | | | 4.000 | % | | | 12/01/28 | | | | 360,000 | | | | 435,413 | |
| | | | | | | | | | | | | | | | 75,053,937 | |
Local — 0.2% |
South Suburban Park & Recreation District COP, Series 2019 (a) | | | 5.000 | % | | | 12/15/31 | | | | 690,000 | | | | 893,019 | |
| |
See Notes to Financial Statements.
Semi-Annual Report | June 30, 2020 |  | 93 |
Segall Bryant & Hamill Colorado Tax Free Fund | Statement of Investments |
| | June 30, 2020 (Unaudited) |
| | Coupon | | | Maturity | | | Par Value | | | Value | |
General Obligation — 18.7% |
Local — 18.2% |
Anthem West Metropolitan District, BAM, Series 2015 (a) (b) | | | 5.000 | % | | | 12/01/35 | | | $ | 1,165,000 | | | $ | 1,389,927 | |
Arapahoe County School District No. 6 Littleton Colorado, Series 2019A (a) | | | 5.500 | % | | | 12/01/43 | | | | 5,000,000 | | | | 6,459,400 | |
Beacon Point Metropolitan District, Series 2015 (a) | | | 5.000 | % | | | 12/01/30 | | | | 1,000,000 | | | | 1,190,760 | |
BNC Metropolitan District No. 1, BAM, Series 2017-A (a) (b) | | | 5.000 | % | | | 12/01/32 | | | | 360,000 | | | | 442,735 | |
BNC Metropolitan District No. 1, BAM, Series 2017-A (a) (b) | | | 5.000 | % | | | 12/01/37 | | | | 545,000 | | | | 659,276 | |
Bradburn Metropolitan District No. 2, Series 2018-A | | | 4.000 | % | | | 12/01/28 | | | | 500,000 | | | | 505,615 | |
Bradburn Metropolitan District No. 2, Series 2018-A (a) | | | 5.000 | % | | | 12/01/38 | | | | 600,000 | | | | 632,358 | |
Bromley Park Metropolitan District No. 2, Series 2018-B (a) | | | 6.375 | % | | | 12/15/47 | | | | 1,000,000 | | | | 1,007,560 | |
Bromley Park Metropolitan District No. 2, BAM, Series 2018-A (a) (b) | | | 4.000 | % | | | 12/01/47 | | | | 2,500,000 | | | | 2,757,500 | |
Central Platte Valley Metropolitan District, Series 2013-A (a) | | | 5.500 | % | | | 12/01/29 | | | | 750,000 | | | | 809,955 | |
Central Platte Valley Metropolitan District, Series 2013-A (a) | | | 5.375 | % | | | 12/01/33 | | | | 1,600,000 | | | | 1,698,768 | |
Central Platte Valley Metropolitan District, Series 2013-A (a) | | | 6.000 | % | | | 12/01/38 | | | | 1,000,000 | | | | 1,074,190 | |
Central Platte Valley Metropolitan District, Series 2013-A (a) | | | 5.625 | % | | | 12/01/38 | | | | 2,875,000 | | | | 3,061,616 | |
Central Platte Valley Metropolitan District, Series 2014 (a) | | | 5.000 | % | | | 12/01/43 | | | | 5,750,000 | | | | 5,879,375 | |
Copperleaf Metropolitan District No. 2, Series 2015 (a) | | | 5.750 | % | | | 12/01/45 | | | | 3,000,000 | | | | 3,056,490 | |
Cornerstar Metropolitan District, Series A (a) | | | 5.125 | % | | | 12/01/37 | | | | 1,000,000 | | | | 1,006,060 | |
Cottonwood Highlands Metropolitan District No. 1, Series 2019-A (a) | | | 5.000 | % | | | 12/01/49 | | | | 900,000 | | | | 891,738 | |
Cross Creek Metropolitan District No. 2, AGM, Series 2018 (a) (b) | | | 5.000 | % | | | 12/01/34 | | | | 2,480,000 | | | | 3,135,018 | |
Douglas County Colorado School District No. RE1, Series 2009 | | | 5.250 | % | | | 12/15/21 | | | | 120,000 | | | | 128,677 | |
Dove Valley Metropolitan District Arapahoe County, BAM, Series 2019 (a) | | | 4.000 | % | | | 12/01/32 | | | | 500,000 | | | | 605,020 | |
Dove Valley Metropolitan District Arapahoe County, BAM, Series 2019 (a) | | | 4.000 | % | | | 12/01/33 | | | | 550,000 | | | | 662,156 | |
Dove Valley Metropolitan District Arapahoe County, BAM, Series 2019 (a) | | | 4.000 | % | | | 12/01/34 | | | | 550,000 | | | | 659,709 | |
Dove Valley Metropolitan District Arapahoe County, BAM, Series 2019 (a) | | | 4.000 | % | | | 12/01/35 | | | | 500,000 | | | | 596,965 | |
Dove Valley Metropolitan District Arapahoe County, BAM, Series 2019 (a) | | | 4.000 | % | | | 12/01/36 | | | | 700,000 | | | | 832,342 | |
Dove Valley Metropolitan District Arapahoe County, BAM, Series 2019 (a) | | | 4.000 | % | | | 12/01/37 | | | | 750,000 | | | | 888,817 | |
Dove Valley Metropolitan District Arapahoe County, BAM, Series 2019 (a) | | | 4.000 | % | | | 12/01/38 | | | | 500,000 | | | | 588,375 | |
Dove Valley Metropolitan District Arapahoe County, BAM, Series 2019 (a) | | | 4.000 | % | | | 12/01/39 | | | | 600,000 | | | | 701,262 | |
Eagle Shadow Metropolitan District No. 1, Series 2013-A (a) | | | 5.000 | % | | | 11/15/32 | | | | 500,000 | | | | 528,150 | |
Eaton Area Park & Recreation District, Series 2015 (a) | | | 5.500 | % | | | 12/01/30 | | | | 470,000 | | | | 486,600 | |
Fossil Ridge Metropolitan District No. 3, Series 2016 (a) | | | 5.000 | % | | | 12/01/36 | | | | 2,100,000 | | | | 2,119,866 | |
Fossil Ridge Metropolitan District No. 3, Series 2014 (a) | | | 5.000 | % | | | 12/01/44 | | | | 1,200,000 | | | | 1,209,432 | |
Grand River Hospital District, AGM, Series 2018 (a) (b) | | | 5.250 | % | | | 12/01/32 | | | | 1,000,000 | | | | 1,187,540 | |
Grand River Hospital District, AGM, Series 2018 (a) (b) | | | 5.250 | % | | | 12/01/33 | | | | 1,000,000 | | | | 1,174,150 | |
High Plains Metropolitan District, NATL, Series 2017 (a) (b) | | | 5.000 | % | | | 12/01/35 | | | | 500,000 | | | | 603,030 | |
Sand Creek County Metropolitan District, Series 2017 (a) | | | 4.000 | % | | | 12/01/35 | | | | 380,000 | | | | 441,328 | |
SBC Metropolitan District, AGM, Series 2016 (a) (b) | | | 5.000 | % | | | 12/01/34 | | | | 205,000 | | | | 252,769 | |
Serenity Ridge Metropolitan District No. 2, Series 2018-A (a) | | | 5.125 | % | | | 12/01/43 | | | | 725,000 | | | | 730,285 | |
Sierra Ridge Metropolitan District No. 2, Series 2016-A (a) | | | 5.500 | % | | | 12/01/46 | | | | 4,500,000 | | | | 4,588,740 | |
South Suburban Park & Recreation District, Series 2019 (a) | | | 4.000 | % | | | 12/15/36 | | | | 475,000 | | | | 565,070 | |
South Suburban Park & Recreation District, Series 2019 (a) | | | 4.000 | % | | | 12/15/37 | | | | 425,000 | | | | 503,901 | |
South Suburban Park & Recreation District, Series 2019 (a) | | | 4.000 | % | | | 12/15/38 | | | | 575,000 | | | | 679,662 | |
South Suburban Park & Recreation District, Series 2019 (a) | | | 4.000 | % | | | 12/15/39 | | | | 565,000 | | | | 665,965 | |
Southshore Met District No.2 in the City of Aurora Arapahoe County, Colorado, Series 2020-A-2 (a) | | | 4.000 | % | | | 12/01/46 | | | | 6,300,000 | | | | 6,850,683 | |
Sterling Hills West Metropolitan District, Series 2017 (a) | | | 5.000 | % | | | 12/01/39 | | | | 750,000 | | | | 867,255 | |
Tallyns Reach Metropolitan District No. 3, Series 2012 | | | 4.000 | % | | | 12/01/21 | | | | 820,000 | | | | 857,884 | |
Tallyns Reach Metropolitan District No. 3, Series 2016-A (a) | | | 6.750 | % | | | 11/01/38 | | | | 1,697,000 | | | | 1,712,816 | |
Tallyns Reach Metropolitan District No. 3, Series 2013 (a) | | | 5.125 | % | | | 11/01/38 | | | | 1,035,000 | | | | 1,045,754 | |
Thornton Colorado Development Authority, Series 2015 | | | 5.000 | % | | | 12/01/24 | | | | 440,000 | | | | 519,416 | |
Thornton Colorado Development Authority, Series 2015 (a) | | | 5.000 | % | | | 12/01/25 | | | | 325,000 | | | | 385,522 | |
Thornton Colorado Development Authority, Series 2015 | | | 5.000 | % | | | 12/01/26 | | | | 530,000 | | | | 628,447 | |
Vista Ridge Metropolitan District, BAM, Series 2016-A (a) (b) | | | 5.000 | % | | | 12/01/27 | | | | 485,000 | | | | 596,666 | |
Vista Ridge Metropolitan District, BAM, Series 2016-A (a) (b) | | | 5.000 | % | | | 12/01/28 | | | | 750,000 | | | | 920,093 | |
See Notes to Financial Statements.
94 |  | www.sbhfunds.com | www.sbhfunds.com
|
Segall Bryant & Hamill Colorado Tax Free Fund | Statement of Investments |
| | June 30, 2020 (Unaudited) |
| | Coupon | | | Maturity | | | Par Value | | | Value | |
Local (continued) |
Vista Ridge Metropolitan District, BAM, Series 2016-A (a) (b) | | | 5.000 | % | | | 12/01/31 | | | $ | 1,250,000 | | | $ | 1,519,750 | |
Weld County Colorado School District No. 2, Series 2019 (a) | | | 5.000 | % | | | 12/01/44 | | | | 1,030,000 | | | | 1,310,706 | |
Wheatlands Metropolitan District, BAM, Series 2015 (a) (b) | | | 5.000 | % | | | 12/01/30 | | | | 1,000,000 | | | | 1,205,850 | |
| | | | | | | | | | | | | | | | 75,478,994 | |
State — 0.5% |
Commonwealth of Puerto Rico, AGM, Series 2001-A (b) | | | 5.250 | % | | | 07/01/20 | | | | 1,800,000 | | | | 1,800,000 | |
Commonwealth of Puerto Rico, AGM, Series 2011-A (a) (b) | | | 5.250 | % | | | 07/01/24 | | | | 100,000 | | | | 103,103 | |
| | | | | | | | | | | | | | | | 1,903,103 | |
Local Authority — 3.6% |
Housing — 1.2% |
Colorado Health Facilities Authority, Series 2015 (a) | | | 4.000 | % | | | 01/15/45 | | | | 2,155,000 | | | | 2,311,044 | |
Colorado Housing & Finance Authority, Series 2018-D | | | 2.900 | % | | | 11/01/20 | | | | 435,000 | | | | 436,910 | |
Colorado Housing & Finance Authority, Series 2018-A-1 | | | 2.800 | % | | | 10/01/21 | | | | 550,000 | | | | 558,437 | |
Colorado Housing & Finance Authority, Series 2020-C-1 | | | 1.878 | % | | | 05/01/23 | | | | 295,000 | | | | 301,174 | |
Colorado Housing & Finance Authority, Series 2020-C-1 | | | 1.928 | % | | | 11/01/23 | | | | 340,000 | | | | 348,038 | |
Colorado Housing & Finance Authority, Series 2020-C-1 | | | 2.025 | % | | | 05/01/24 | | | | 150,000 | | | | 154,431 | |
Colorado Housing & Finance Authority, Series 2020-C-1 | | | 2.075 | % | | | 11/01/24 | | | | 250,000 | | | | 258,247 | |
Colorado Housing & Finance Authority, Series 2020-C-1 | | | 2.175 | % | | | 11/01/25 | | | | 500,000 | | | | 520,140 | |
| | | | | | | | | | | | | | | | 4,888,421 | |
Lease / Rent — 0.2% |
Aspen Public Facilities Authority, AGM, Series 2007-A (a) | | | 5.880 | % | | | 09/01/32 | | | | 270,000 | | | | 271,042 | |
Boulder Colorado COP, Series 2019 | | | 2.250 | % | | | 11/01/24 | | | | 500,000 | | | | 516,285 | |
| | | | | | | | | | | | | | | | 787,327 | |
Local — 0.1% |
Garfield County School District No. RE2, Series 2012-B (a) | | | 3.050 | % | | | 12/01/26 | | | | 500,000 | | | | 517,290 | |
| |
Recreation — 0.6% |
Hyland Hills Park & Recreation District, Series 2016-B | | | 2.000 | % | | | 12/15/20 | | | | 150,000 | | | | 150,499 | |
Hyland Hills Park & Recreation District, Series 2016-B | | | 2.150 | % | | | 12/15/21 | | | | 135,000 | | | | 136,392 | |
Park Creek Metropolitan District, Series 2017-B | | | 2.850 | % | | | 12/01/21 | | | | 500,000 | | | | 509,475 | |
Park Creek Metropolitan District, Series 2017-B | | | 3.150 | % | | | 12/01/23 | | | | 405,000 | | | | 424,464 | |
Park Creek Metropolitan District, Series 2017-B | | | 3.300 | % | | | 12/01/24 | | | | 425,000 | | | | 451,074 | |
Park Creek Metropolitan District, Series 2017-B | | | 3.450 | % | | | 12/01/25 | | | | 500,000 | | | | 534,930 | |
Park Creek Metropolitan District, Series 2017-B (a) | | | 3.600 | % | | | 12/01/26 | | | | 300,000 | | | | 323,166 | |
| | | | | | | | | | | | | | | | 2,530,000 | |
Tax — 1.0% |
Grand Junction Colorado, Series 2020-A | | | 1.826 | % | | | 03/01/25 | | | | 620,000 | | | | 621,184 | |
Grand Junction Colorado, Series 2020-B (a) | | | 4.000 | % | | | 03/01/49 | | | | 1,235,000 | | | | 1,421,818 | |
Park Creek Metropolitan District, Series 2018-B | | | 3.550 | % | | | 12/01/22 | | | | 665,000 | | | | 696,654 | |
Park Creek Metropolitan District, Series 2018-B | | | 3.650 | % | | | 12/01/23 | | | | 805,000 | | | | 856,432 | |
Park Creek Metropolitan District, Series 2018-B | | | 3.800 | % | | | 12/01/24 | | | | 440,000 | | | | 476,084 | |
| | | | | | | | | | | | | | | | 4,072,172 | |
Utilities — 0.5% |
Todd Creek Village Metropolitan District Colorado, Series 2018-B (a) | | | 5.875 | % | | | 12/01/38 | | | | 930,000 | | | | 932,120 | |
Town of Estes Park Colorado Power & Communications, Series 2019-B | | | 2.362 | % | | | 11/01/23 | | | | 770,000 | | | | 788,403 | |
Town of Estes Park Colorado Power & Communications, Series 2019-B | | | 2.646 | % | | | 11/01/25 | | | | 430,000 | | | | 445,282 | |
| | | | | | | | | | | | | | | | 2,165,805 | |
Prerefunded — 0.4% |
Healthcare — 0.4% |
Colorado Health Facilities Authority, Series 2017 (a) (c) | | | 5.000 | % | | | 06/01/31 | | | | 1,250,000 | | | | 1,608,250 | |
| |
Revenue — 56.2% |
Education — 6.4% |
Colorado Educational & Cultural Facilities Authority, Series 2017-A (a) | | | 4.000 | % | | | 03/01/31 | | | | 25,000 | | | | 28,256 | |
See Notes to Financial Statements.
Semi-Annual Report | June 30, 2020 |  | 95 |
Segall Bryant & Hamill Colorado Tax Free Fund | Statement of Investments |
| | June 30, 2020 (Unaudited) |
| | Coupon | | | Maturity | | | Par Value | | | Value | |
Education (continued) |
Colorado Educational & Cultural Facilities Authority, Series 2017-A (a) | | | 4.000 | % | | | 03/01/33 | | | $ | 1,125,000 | | | $ | 1,258,043 | |
Colorado Educational & Cultural Facilities Authority, Series 2016 (a) | | | 5.000 | % | | | 10/01/34 | | | | 1,975,000 | | | | 2,126,739 | |
Colorado Educational & Cultural Facilities Authority, Series 2016 (a) | | | 5.000 | % | | | 05/01/35 | | | | 3,145,000 | | | | 3,187,237 | |
Colorado Educational & Cultural Facilities Authority, Series 2016 (a) | | | 5.000 | % | | | 10/01/36 | | | | 1,500,000 | | | | 1,778,565 | |
Colorado School of Mines, Series 2018-A (1MO LIBOR + 50) (a) (d) | | | 1.160 | % | | | 02/01/23 | | | | 13,635,000 | | | | 13,416,022 | |
Colorado School of Mines, Series 2017-C (a) | | | 4.000 | % | | | 12/01/37 | | | | 225,000 | | | | 260,078 | |
Colorado State Board Community Colleges Refunding and Improvement Department Higher Education, Series 2017-A | | | 5.000 | % | | | 11/01/26 | | | | 105,000 | | | | 131,022 | |
Colorado State Board Community Colleges Refunding and Improvement Department Higher Education, Series 2017-A (a) | | | 4.000 | % | | | 11/01/41 | | | | 825,000 | | | | 938,644 | |
Metropolitan State University of Denver Colorado, Series 2016 (a) | | | 4.000 | % | | | 12/01/28 | | | | 715,000 | | | | 827,963 | |
University of Colorado Enterprise, Series 2017-A-1 (a) | | | 4.000 | % | | | 06/01/32 | | | | 300,000 | | | | 350,658 | |
University of Colorado Enterprise, Series 2017-A-2 (a) | | | 4.000 | % | | | 06/01/43 | | | | 1,750,000 | | | | 2,002,735 | |
| | | | | | | | | | | | | | | | 26,305,962 | |
Healthcare — 6.9% |
Aspen Valley Hospital District, Series 2012 (a) | | | 5.000 | % | | | 10/15/30 | | | | 1,650,000 | | | | 1,763,157 | |
Colorado Health Facilities Authority, Series 2016 | | | 4.000 | % | | | 01/01/21 | | | | 255,000 | | | | 254,936 | |
Colorado Health Facilities Authority, Series 2017 | | | 4.000 | % | | | 09/01/21 | | | | 255,000 | | | | 263,374 | |
Colorado Health Facilities Authority, Series 2017-A | | | 5.000 | % | | | 05/15/23 | | | | 370,000 | | | | 410,441 | |
Colorado Health Facilities Authority, Series 2017-A | | | 5.000 | % | | | 05/15/24 | | | | 575,000 | | | | 657,443 | |
Colorado Health Facilities Authority, Series 2012 (a) | | | 5.000 | % | | | 12/01/24 | | | | 1,000,000 | | | | 1,091,710 | |
Colorado Health Facilities Authority, Series 2017-A | | | 5.000 | % | | | 05/15/25 | | | | 790,000 | | | | 923,779 | |
Colorado Health Facilities Authority, Series 2017-A | | | 5.000 | % | | | 05/15/26 | | | | 540,000 | | | | 645,365 | |
Colorado Health Facilities Authority, Series 2017-A (a) | | | 5.000 | % | | | 05/15/28 | | | | 535,000 | | | | 647,393 | |
Colorado Health Facilities Authority, Series 2017-A (a) | | | 5.000 | % | | | 05/15/29 | | | | 425,000 | | | | 512,346 | |
Colorado Health Facilities Authority, Series B (a) | | | 5.000 | % | | | 09/01/29 | | | | 1,000,000 | | | | 1,150,330 | |
Colorado Health Facilities Authority, Series C (a) (c) | | | 5.000 | % | | | 12/01/29 | | | | 1,010,000 | | | | 1,203,193 | |
Colorado Health Facilities Authority, Series 2015 (a) | | | 5.000 | % | | | 05/15/30 | | | | 500,000 | | | | 572,650 | |
Colorado Health Facilities Authority, Series 2017-A (a) | | | 5.000 | % | | | 05/15/30 | | | | 710,000 | | | | 852,909 | |
Colorado Health Facilities Authority, Series 2017-A (a) | | | 5.000 | % | | | 05/15/31 | | | | 1,155,000 | | | | 1,376,679 | |
Colorado Health Facilities Authority, Series 2017-A (a) | | | 5.000 | % | | | 05/15/32 | | | | 1,650,000 | | | | 1,955,464 | |
Colorado Health Facilities Authority, Series 2012 (a) | | | 5.000 | % | | | 10/01/32 | | | | 500,000 | | | | 530,795 | |
Colorado Health Facilities Authority, Series 2017-A (a) | | | 4.000 | % | | | 05/15/35 | | | | 350,000 | | | | 387,016 | |
Colorado Health Facilities Authority, Series 2019-A (a) | | | 5.000 | % | | | 11/15/37 | | | | 200,000 | | | | 245,902 | |
Colorado Health Facilities Authority, Series 2019 (a) | | | 4.000 | % | | | 01/01/39 | | | | 1,200,000 | | | | 1,351,344 | |
Colorado Health Facilities Authority, Series 2019 (a) | | | 4.000 | % | | | 01/01/40 | | | | 925,000 | | | | 1,038,757 | |
Colorado Health Facilities Authority, Series 2015 (a) | | | 5.000 | % | | | 05/15/40 | | | | 1,000,000 | | | | 1,114,530 | |
Colorado Health Facilities Authority, Series 2018 (a) (d) | | | 2.800 | % | | | 05/15/42 | | | | 2,850,000 | | | | 2,981,556 | |
Colorado Health Facilities Authority, Series 2019-A (a) | | | 3.000 | % | | | 11/15/46 | | | | 985,000 | | | | 1,012,994 | |
Denver Health & Hospital Authority, Series A (a) | | | 5.000 | % | | | 12/01/39 | | | | 1,500,000 | | | | 1,612,170 | |
University of Colorado Hospital Authority, Series 2012-A (a) | | | 5.000 | % | | | 11/15/36 | | | | 2,470,000 | | | | 2,647,420 | |
University of Colorado Hospital Authority, Series 2012-A (a) | | | 4.000 | % | | | 11/15/42 | | | | 1,250,000 | | | | 1,301,600 | |
| | | | | | | | | | | | | | | | 28,505,253 | |
Industrial Development — 0.2% |
Colorado Health Facilities Authority, Series A (a) | | | 5.000 | % | | | 02/01/22 | | | | 200,000 | | | | 204,290 | |
Colorado Health Facilities Authority, Series A (a) | | | 5.000 | % | | | 02/01/23 | | | | 520,000 | | | | 537,124 | |
| | | | | | | | | | | | | | | | 741,414 | |
Lease / Rent — 1.4% |
Regional Transportation District Colorado COP, Series 2014-A (a) | | | 4.375 | % | | | 06/01/39 | | | | 4,000,000 | | | | 4,296,360 | |
Regional Transportation District Colorado COP, Series 2014-A (a) | | | 4.500 | % | | | 06/01/44 | | | | 1,555,000 | | | | 1,670,365 | |
| | | | | | | | | | | | | | | | 5,966,725 | |
Other — 4.7% |
Colorado Educational & Cultural Facilities Authority, Series 2016 (a) | | | 4.000 | % | | | 07/01/20 | | | | 175,000 | | | | 175,000 | |
Colorado Educational & Cultural Facilities Authority, Series 2012 | | | 4.000 | % | | | 04/01/22 | | | | 65,000 | | | | 66,457 | |
Colorado Educational & Cultural Facilities Authority, Series 2014 | | | 5.000 | % | | | 11/15/24 | | | | 435,000 | | | | 499,089 | |
See Notes to Financial Statements.
96 |  | www.sbhfunds.com | www.sbhfunds.com
|
Segall Bryant & Hamill Colorado Tax Free Fund | Statement of Investments |
| | June 30, 2020 (Unaudited) |
| | Coupon | | | Maturity | | | Par Value | | | Value | |
Other (continued) |
Colorado Educational & Cultural Facilities Authority, Series 2016, 144A (e) | | | 3.750 | % | | | 07/01/26 | | | $ | 1,000,000 | | | $ | 996,810 | |
Colorado Educational & Cultural Facilities Authority, Series A, 144A (a) (e) | | | 4.125 | % | | | 07/01/26 | | | | 595,000 | | | | 602,437 | |
Colorado Educational & Cultural Facilities Authority, Series 2016 (a) | | | 5.000 | % | | | 05/15/29 | | | | 2,600,000 | | | | 3,111,810 | |
Colorado Educational & Cultural Facilities Authority, Series 2014 (a) | | | 5.000 | % | | | 08/15/30 | | | | 750,000 | | | | 848,227 | |
Colorado Educational & Cultural Facilities Authority, Series 2015 (a) | | | 5.000 | % | | | 11/01/30 | | | | 500,000 | | | | 578,990 | |
Colorado Educational & Cultural Facilities Authority, Series 2014 (a) | | | 5.000 | % | | | 11/15/31 | | | | 1,000,000 | | | | 1,119,860 | |
Colorado Educational & Cultural Facilities Authority, Series 2014 | | | 5.000 | % | | | 12/01/31 | | | | 1,500,000 | | | | 1,698,180 | |
Colorado Educational & Cultural Facilities Authority, Series 2016-A (a) | | | 5.000 | % | | | 12/15/31 | | | | 715,000 | | | | 845,130 | |
Colorado Educational & Cultural Facilities Authority, Series 2014 (a) | | | 5.000 | % | | | 10/01/32 | | | | 1,340,000 | | | | 1,507,808 | |
Colorado Educational & Cultural Facilities Authority, Series 2016 (a) | | | 5.000 | % | | | 06/01/36 | | | | 1,580,000 | | | | 1,817,980 | |
Colorado Educational & Cultural Facilities Authority, Series 2016 (a) | | | 5.000 | % | | | 07/01/36 | | | | 1,000,000 | | | | 1,007,210 | |
Colorado Educational & Cultural Facilities Authority, Series 2016, 144A (a) (e) | | | 5.000 | % | | | 07/01/36 | | | | 1,000,000 | | | | 1,128,340 | |
Colorado Educational & Cultural Facilities Authority, Series 2016 (a) | | | 5.000 | % | | | 08/01/36 | | | | 1,140,000 | | | | 1,311,445 | |
Colorado Educational & Cultural Facilities Authority, Series 2016, 144A (a) (e) | | | 5.000 | % | | | 09/01/36 | | | | 1,000,000 | | | | 1,000,830 | |
Colorado Educational & Cultural Facilities Authority, Series B (a) | | | 5.625 | % | | | 01/15/44 | | | | 460,000 | | | | 483,515 | |
Colorado Educational & Cultural Facilities Authority, Series 2016, 144A (a) (e) | | | 5.000 | % | | | 09/01/46 | | | | 500,000 | | | | 487,150 | |
| | | | | | | | | | | | | | | | 19,286,268 | |
Public Services — 13.7% |
Cherry Creek Corporate Center Metropolitan District, Series 2015-A (a) | | | 5.000 | % | | | 06/01/37 | | | | 570,000 | | | | 570,781 | |
City & County of Denver Colorado, Series 2018-A-2 (a) | | | 0.000 | % | | | 08/01/35 | | | | 2,800,000 | | | | 1,767,024 | |
City & County of Denver Colorado, Series 2018-A-2 (a) | | | 0.000 | % | | | 08/01/36 | | | | 2,550,000 | | | | 1,534,463 | |
City & County of Denver Colorado, Series 2018-A-2 (a) | | | 0.000 | % | | | 08/01/37 | | | | 3,910,000 | | | | 2,243,714 | |
City & County of Denver Colorado, Series 2018-A-1 (a) | | | 5.000 | % | | | 08/01/41 | | | | 2,780,000 | | | | 3,301,500 | |
City & County of Denver Colorado, Series 2018-A-1 (a) | | | 5.000 | % | | | 08/01/48 | | | | 14,000,000 | | | | 16,423,260 | |
Park Creek Metropolitan District, Series 2015-A (a) | | | 5.000 | % | | | 12/01/26 | | | | 730,000 | | | | 878,139 | |
Park Creek Metropolitan District, Series 2015-A (a) | | | 5.000 | % | | | 12/01/27 | | | | 620,000 | | | | 743,293 | |
Park Creek Metropolitan District, Series 2017-A (a) | | | 5.000 | % | | | 12/01/36 | | | | 300,000 | | | | 348,540 | |
Park Creek Metropolitan District, Series 2017-A (a) | | | 5.000 | % | | | 12/01/37 | | | | 400,000 | | | | 463,600 | |
Park Creek Metropolitan District, Series 2017-A (a) | | | 5.000 | % | | | 12/01/41 | | | | 1,500,000 | | | | 1,726,830 | |
Park Creek Metropolitan District, Series 2015-A (a) | | | 5.000 | % | | | 12/01/45 | | | | 550,000 | | | | 629,833 | |
Park Creek Metropolitan District, Series 2017-A (a) | | | 5.000 | % | | | 12/01/46 | | | | 4,930,000 | | | | 5,645,589 | |
Plaza Metropolitan District No. 1, Series 2013, 144A (e) | | | 5.000 | % | | | 12/01/22 | | | | 1,500,000 | | | | 1,556,535 | |
Rampart Range Colorado Metropolitan District No. 1, AGM, Series 2017 (a) | | | 5.000 | % | | | 12/01/42 | | | | 1,905,000 | | | | 2,293,639 | |
Rampart Range Colorado Metropolitan District No. 1, AGM, Series 2017 (a) | | | 5.000 | % | | | 12/01/47 | | | | 8,150,000 | | | | 9,747,808 | |
Southglenn Metropolitan District Colorado, Series 2016 (a) | | | 3.500 | % | | | 12/01/26 | | | | 3,000,000 | | | | 2,904,810 | |
Southglenn Metropolitan District Colorado, Series 2016 (a) | | | 5.000 | % | | | 12/01/30 | | | | 3,505,000 | | | | 3,571,104 | |
Triview Colorado Metropolitan District Water & Wastewater Enterprise, Series 2020 (a) | | | 4.000 | % | | | 12/01/40 | | | | 410,000 | | | | 452,837 | |
| | | | | | | | | | | | | | | | 56,803,299 | |
Recreation — 0.7% |
City & County of Denver Colorado, Series 2016-A (a) | | | 5.000 | % | | | 08/01/44 | | | | 1,820,000 | | | | 2,078,950 | |
Hyland Hills Park & Recreation District, Series 2016-A | | | 2.000 | % | | | 12/15/21 | | | | 250,000 | | | | 255,752 | |
Hyland Hills Park & Recreation District, Series 2016-A | | | 2.000 | % | | | 12/15/22 | | | | 300,000 | | | | 311,544 | |
Hyland Hills Park & Recreation District, Series 2016-A | | | 3.000 | % | | | 12/15/23 | | | | 200,000 | | | | 217,224 | |
| | | | | | | | | | | | | | | | 2,863,470 | |
Tax — 4.9% |
City of Commerce Colorado, AGM, Series 2014 (a) (b) | | | 5.000 | % | | | 08/01/28 | | | | 600,000 | | | | 702,144 | |
City of Commerce Colorado, AGM, Series 2015 (a) (b) | | | 5.000 | % | | | 08/01/36 | | | | 1,945,000 | | | | 2,314,180 | |
City of Commerce Colorado, AGM, Series 2014 (a) (b) | | | 4.250 | % | | | 08/01/40 | | | | 1,155,000 | | | | 1,257,991 | |
City of Idaho Springs Colorado Sales Tax Revenue, AGM, Series 2018 (a) (b) | | | 5.000 | % | | | 12/01/33 | | | | 490,000 | | | | 597,751 | |
City of Idaho Springs Colorado Sales Tax Revenue, AGM, Series 2018 (a) (b) | | | 5.000 | % | | | 12/01/34 | | | | 525,000 | | | | 638,652 | |
Denver Colorado Urban Renewal Authority Tax Increment, Series 2013-A-1 (a) | | | 5.000 | % | | | 12/01/23 | | | | 190,000 | | | | 204,577 | |
Denver Colorado Urban Renewal Authority Tax Increment, Series 2013-A-1 (a) | | | 5.000 | % | | | 12/01/25 | | | | 1,500,000 | | | | 1,610,655 | |
Denver Colorado Urban Renewal Authority Tax Increment, Series 2018-A (a) | | | 5.250 | % | | | 12/01/39 | | | | 4,000,000 | | | | 4,021,440 | |
Denver Colorado Urban Renewal Authority Tax Increment, Series 2018-A (a) | | | 5.250 | % | | | 12/01/39 | | | | 3,000,000 | | | | 3,016,080 | |
See Notes to Financial Statements.
Semi-Annual Report | June 30, 2020 |  | 97 |
Segall Bryant & Hamill Colorado Tax Free Fund | Statement of Investments |
| | June 30, 2020 (Unaudited) |
| | Coupon | | | Maturity | | | Par Value | | | Value | |
Tax (continued) |
Grand Junction Colorado, Series 2020-B (a) | | | 4.000 | % | | | 03/01/45 | | | $ | 1,500,000 | | | $ | 1,735,200 | |
Roaring Fork County Transportation Authority Sales & Use Tax, Series 2019 (a) | | | 5.000 | % | | | 12/01/39 | | | | 100,000 | | | | 129,076 | |
Superior Open Space Sales and Use Tax Colorado, Series 2020 (a) | | | 5.000 | % | | | 06/01/35 | | | | 1,000,000 | | | | 1,281,250 | |
Superior Open Space Sales and Use Tax Colorado, Series 2020 (a) | | | 5.000 | % | | | 06/01/40 | | | | 750,000 | | | | 936,975 | |
Thornton Colorado Development Authority, Series 2015-B (a) | | | 5.000 | % | | | 12/01/30 | | | | 500,000 | | | | 589,530 | |
Thornton Colorado Development Authority, Series 2015-B (a) | | | 5.000 | % | | | 12/01/31 | | | | 1,000,000 | | | | 1,177,630 | |
| | | | | | | | | | | | | | | | 20,213,131 | |
Transportation — 9.9% |
Auraria Higher Education Center, AGM, Series 2015 (a) (b) | | | 4.000 | % | | | 04/01/29 | | | | 3,500,000 | | | | 3,928,995 | |
Colorado High Performance Transportation Enterprise C-470 Express Lanes, Series 2017 (a) | | | 5.000 | % | | | 12/31/47 | | | | 1,600,000 | | | | 1,712,384 | |
Colorado High Performance Transportation Enterprise C-470 Express Lanes, Series 2017 (a) | | | 5.000 | % | | | 12/31/51 | | | | 4,500,000 | | | | 4,805,190 | |
Denver Colorado City and County Airport, Series 2017-B (a) | | | 5.000 | % | | | 11/15/33 | | | | 900,000 | | | | 1,097,190 | |
Denver Colorado City and County Airport, Series 2018-A (a) | | | 5.000 | % | | | 12/01/43 | | | | 2,000,000 | | | | 2,380,000 | |
E-470 Public Highway Authority Colorado, Series 2017-B (1MO LIBOR + 105) (a) (d) | | | 1.342 | % | | | 09/01/39 | | | | 1,000,000 | | | | 1,000,310 | |
E-470 Public Highway Authority Colorado, Series 2020-A (a) | | | 5.000 | % | | | 09/01/40 | | | | 7,250,000 | | | | 8,239,480 | |
Grand Junction Regional Airport Authority, NATL, Series 2016-A (a) (b) | | | 5.000 | % | | | 12/01/31 | | | | 1,155,000 | | | | 1,357,471 | |
Regional Transportation District Colorado, Series 2010 (a) | | | 6.000 | % | | | 01/15/26 | | | | 800,000 | | | | 801,320 | |
Regional Transportation District Colorado, Series 2010 (a) | | | 6.000 | % | | | 01/15/34 | | | | 4,000,000 | | | | 4,006,720 | |
Regional Transportation District Colorado, Series 2010 (a) | | | 6.000 | % | | | 01/15/41 | | | | 11,830,000 | | | | 11,849,874 | |
| | | | | | | | | | | | | | | | 41,178,934 | |
Utilities — 6.7% |
Arapahoe County Water & Wastewater Public Improvement District, Series 2019 | | | 5.000 | % | | | 12/01/23 | | | | 125,000 | | | | 144,576 | |
Centennial Water & Sanitation District, Series 2019 (a) | | | 5.250 | % | | | 12/01/48 | | | | 8,750,000 | | | | 11,062,013 | |
City of Colorado Springs Colorado Utilities System, Series A-2 | | | 5.000 | % | | | 11/15/47 | | | | 5,000,000 | | | | 6,127,950 | |
Eagle River Colorado Water & Sanitation District, Series 2020-A | | | 4.000 | % | | | 12/01/27 | | | | 35,000 | | | | 42,485 | |
Eagle River Colorado Water & Sanitation District, Series 2020-A (a) | | | 4.000 | % | | | 12/01/33 | | | | 55,000 | | | | 67,019 | |
Eagle River Colorado Water & Sanitation District, Series 2020-A (a) | | | 4.000 | % | | | 12/01/45 | | | | 1,120,000 | | | | 1,319,270 | |
Eagle River Colorado Water & Sanitation District, Series 2020-A (a) | | | 4.000 | % | | | 12/01/49 | | | | 2,000,000 | | | | 2,339,340 | |
East Cherry Creek Valley Colorado Water and Sanitation District Arapahoe County, Series 2019-A (a) | | | 4.000 | % | | | 11/15/36 | | | | 350,000 | | | | 412,639 | |
East Cherry Creek Valley Colorado Water and Sanitation District Arapahoe County, Series 2019-A (a) | | | 4.000 | % | | | 11/15/38 | | | | 1,000,000 | | | | 1,169,590 | |
East Cherry Creek Valley Colorado Water and Sanitation District Arapahoe County, Series 2019-A (a) | | | 4.000 | % | | | 11/15/40 | | | | 1,000,000 | | | | 1,162,950 | |
Fort Lumpton Colorado Water System Revenue, AGM, Series 2017 (a) | | | 5.000 | % | | | 12/01/36 | | | | 800,000 | | | | 992,160 | |
Puerto Rico Electric Power Authority, AGM, Series UU (3MO LIBOR + 52) (a) (d) | | | 1.799 | % | | | 07/01/29 | | | | 400,000 | | | | 352,000 | |
Todd Creek Village Metropolitan District Colorado, Series 2018-A | | | 5.000 | % | | | 12/01/28 | | | | 1,200,000 | | | | 1,417,272 | |
Todd Creek Village Metropolitan District Colorado, Series 2018-A (a) | | | 5.250 | % | | | 12/01/38 | | | | 1,000,000 | | | | 1,159,990 | |
| | | | | | | | | | | | | | | | 27,769,254 | |
Variable Rate Demand Note — 0.7% |
City of Colorado Springs Colorado Utilities System, Series 2007-A (d) | | | 0.160 | % | | | 11/01/37 | | | | 1,640,000 | | | | 1,640,000 | |
City of Colorado Springs Colorado Utilities System, Series 2012-A (a) (d) | | | 0.170 | % | | | 11/01/41 | | | | 1,465,000 | | | | 1,465,000 | |
| | | | | | | | | | | | | | | | 3,105,000 | |
| |
Investments at Value — 97.6% (Cost $391,958,024) | | $ | 404,013,175 | |
| |
Other Assets in Excess of Liabilities — 2.4% | | | 10,073,830 | |
| |
Net Assets — 100.0% | | $ | 414,087,005 | |
(a) | Security can be called and redeemed at the option of the issuer prior to the stated maturity date which is included in the Statement of Investments. |
See Notes to Financial Statements.
98 |  | www.sbhfunds.com | www.sbhfunds.com
|
Segall Bryant & Hamill Colorado Tax Free Fund | Statement of Investments |
| | June 30, 2020 (Unaudited) |
(b) | This security is insured. In the event of a default by the bond issuer, the issuer, as noted in the security description, guarantees that scheduled principal and interest payments will be made when due. |
(c) | This security is prerefunded in advance of the next call date. |
(d) | Variable rate security. Interest rate resets periodically. The rate shown is the effective interest rate as of June 30, 2020. For securities based on a published reference rate and spread, the reference rate and spread (in basis points) are indicated parenthetically. Certain variable rate securities are not based on a published reference rate and spread but are determined by the issuer or agent and are based on current market conditions. These securities, therefore, do not indicate a reference rate and spread. |
(e) | Security was purchased in a transaction exempt from registration in compliance with Rule 144A of the Securities Act of 1933. This security may be resold in transactions exempt from registration, normally to qualified institutional buyers. The total value of such securities is $5,772,102 as of June 30, 2020, representing 1.4% of net assets. |
Sector and industry classifications presented herein are based on the sector and industry categorization methodology of the Adviser to the Funds. For Fund compliance purposes, the Fund’s industry classifications refer to any one or more of the industry sub-classifications used by one or more widely recognized market indexes or ratings group indexes, and/or as defined by Fund management. This definition may not apply for purposes of this report, which may combine industry sub-classifications for reporting ease. Industries are shown as a percentage of net assets.
See Notes to Financial Statements.
Semi-Annual Report | June 30, 2020 |  | 99 |
Segall Bryant & Hamill Funds | Statement of Investments |
| | June 30, 2020 (Unaudited) |
COMMON ABBREVIATIONS
A.B. | Aktiebolag is the Swedish equivalent of the term corporation. |
ADR | American Depositary Receipt. |
A.G. | Aktiengesellschaft is a German term that refers to a corporation that is limited by shares, i.e., owned by shareholders. |
AGM | Assured Guaranty Municipal. |
A.S. | Andonim Sirketi, Joint Stock Company in Turkey. |
A/S | Aktieselskab is a Danish Joint Stock Company. |
BAM | Build America Mutual. |
BV | Besloten Vennootschap is the Dutch term for a private limited liability corporation. |
COP | Certificate of Participation. |
CV | Convertible Security. |
KGaA | Kommanditgesellschaft auf Aktien is a German corporate designation standing for partnership limited by shares. |
LIBOR | London Interbank Offered Rate. |
LLC | Limited Liability Company. |
LP | Limited Partnership. |
Ltd. | Limited. |
NA | National Association. |
NATL | National Public Finance Guarantee Corp. |
N.V. | Naamloze Vennootschap is the Dutch term for a public limited liability corporation. |
OYJ | Julkinen osakeyhtiö means public stock company. |
PCL | Public Company Limited. |
PJSC | Public Joint-Stock Company. |
PLC | Public Limited Company. |
REIT(s) | Real Estate Investment Trust. |
S.A. | Generally designates corporations in various countries, mostly those employing the civil law. This translates literally in all languages mentioned as anonymous company. |
S.A.B de C.V. | Sociedad Anónima Bursátil de Capital Variable is the Mexican term for publicly traded companies. |
SARL | Societe Anonyme a Responsabilite Limitee is the French term for Limited Liability Company. |
S.E. | SE Regulation. A European Company which can operate on a Europe-wide basis and be governed by Community law directly applicable in all Member States. |
S.p.A. | Societa per azioni is the Italian equivalent of the term Public Limited Companies. |
LIBOR Rates as of June 30, 2020:
1MO LIBOR 0.16%
3MO LIBOR 0.30%
CURRENCY ABBREVIATIONS
AED | United Arab Emirates Dirham |
AUD | Australian Dollar |
BRL | Brazilian Dollar |
CAD | Canadian Dollar |
CHF | Swiss Franc |
CLP | Chilean Peso |
COP | Colombian Peso |
CZK | Czech Republic Koruna |
DKK | Danish Krone |
EUR | Euro Currency |
GBP | British Pound |
HKD | Hong Kong Dollar |
HUF | Hungarian Forint |
IDR | Indonesian Rupiah |
ILS | Israeli Shekel |
INR | Indian Rupee |
JPY | Japanese Yen |
KRW | South Korean Won |
MXP | Mexican Peso |
NOK | Norwegian Krone |
NZD | New Zealand Dollar |
PHP | Philippine Peso |
PLN | Polish Zloty |
QAR | Qatari Rial |
RUB | Russian Ruble |
SAR | Saudi Riyal |
SEK | Swedish Krona |
SGD | Singapore Dollar |
THB | Thai Baht |
TWD | New Taiwan Dollar |
ZAR | South African Rand |
See Notes to Financial Statements.
100 |  | www.sbhfunds.com | www.sbhfunds.com
|
Segall Bryant & Hamill Funds | Statements of Assets and Liabilities |
| | June 30, 2020 (Unaudited) |
| | Segall Bryant &
Hamill Small Cap
Value Fund | | | Segall Bryant &
Hamill Small Cap
Value Dividend
Fund | | | Segall Bryant &
Hamill Small Cap
Growth Fund | | | Segall Bryant &
Hamill Small Cap
Core Fund | |
Assets | | | | | | | | | | | | | | | | |
Investments, at cost | | $ | 210,357,502 | | | $ | 58,275,747 | | | $ | 56,421,111 | | | $ | 29,007,549 | |
Investments, at value | | | 210,630,947 | | | | 55,998,298 | | | | 73,947,841 | | | | 35,374,044 | |
Cash equivalents (Note 2) | | | 18,024,123 | | | | 2,527,946 | | | | 2,691,590 | | | | 2,275,694 | |
Receivable for Fund shares sold | | | 413,489 | | | | — | | | | 3,788 | | | | — | |
Receivable for investment securities sold | | | 254,425 | | | | — | | | | 608,608 | | | | 276,249 | |
Dividends and interest receivable | | | 136,851 | | | | 61,118 | | | | 30,772 | | | | 20,400 | |
Other assets | | | 46,555 | | | | 17,868 | | | | 15,723 | | | | 28,514 | |
Total assets | | | 229,506,390 | | | | 58,605,230 | | | | 77,298,322 | | | | 37,974,901 | |
| | | | | | | | | | | | | | | | |
Liabilities | | | | | | | | | | | | | | | | |
Payable for Fund shares redeemed | | | 225,916 | | | | — | | | | 29,016 | | | | — | |
Payable for investment securities purchased | | | — | | | | 287,787 | | | | 556,736 | | | | 42,747 | |
Payable to Adviser (Note 5) | | | 139,569 | | | | 28,560 | | | | 37,899 | | | | 1,007 | |
Accrued shareholder servicing fees (Note 5) | | | 45,240 | | | | 11,306 | | | | 14,245 | | | | 15,247 | |
Payable to third party administrator (Note 5) | | | 6,400 | | | | 3,600 | | | | 4,000 | | | | 11,585 | |
Accrued chief compliance officer fees (Note 5) | | | 1,045 | | | | 271 | | | | 346 | | | | 176 | |
Other accrued expenses | | | 29,855 | | | | 14,825 | | | | 13,887 | | | | 2,300 | |
Total liabilities | | | 448,025 | | | | 346,349 | | | | 656,129 | | | | 73,062 | |
Net Assets | | $ | 229,058,365 | | | $ | 58,258,881 | | | $ | 76,642,193 | | | $ | 37,901,839 | |
| | | | | | | | | | | | | | | | |
Net Assets Consists of | | | | | | | | | | | | | | | | |
Paid-in capital | | $ | 241,030,617 | | | $ | 70,875,911 | | | $ | 126,828,022 | | | $ | 32,300,828 | |
Total accumulated earnings (deficit) | | | (11,972,252 | ) | | | (12,617,030 | ) | | | (50,185,829 | ) | | | 5,601,011 | |
Net Assets | | $ | 229,058,365 | | | $ | 58,258,881 | | | $ | 76,642,193 | | | $ | 37,901,839 | |
| | | | | | | | | | | | | | | | | |
Net Assets | | | | | | | | | | | | | | | | |
Retail | | $ | 154,164 | | | $ | 11,030,388 | | | $ | 2,676,672 | | | $ | 235,419 | |
Institutional | | | 228,904,201 | | | | 47,228,493 | | | | 73,965,521 | | | | 37,666,420 | |
Shares of Beneficial Interest Outstanding | | | | | | | | | | | | | | | | |
Retail | | | 14,884 | | | | 1,643,902 | | | | 189,991 | | | | 24,947 | |
Institutional | | | 22,085,546 | | | | 6,974,316 | | | | 5,133,231 | | | | 3,986,721 | |
Net Asset Value and Redemption Price Per Share (Net Assets Per Share Outstanding) | | | | | | | | | | | | | | | | |
Retail | | $ | 10.36 | | | $ | 6.71 | | | $ | 14.09 | | | $ | 9.44 | |
Institutional | | $ | 10.36 | | | $ | 6.77 | | | $ | 14.41 | | | $ | 9.45 | |
See Notes to Financial Statements.
Semi-Annual Report | June 30, 2020 |  | 101 |
Segall Bryant & Hamill Funds | Statements of Assets and Liabilities |
| | June 30, 2020 (Unaudited) |
| | Segall Bryant &
Hamill Mid Cap
Value Dividend
Fund | | | Segall Bryant &
Hamill
All Cap Fund | | | Segall Bryant &
Hamill Emerging
Markets Fund | | | Segall Bryant
& Hamill
International
Small Cap Fund | |
Assets | | | | | | | | | | | | | | | | |
Investments, at cost | | $ | 25,982,885 | | | $ | 88,305,929 | | | $ | 26,688,166 | | | $ | 194,158,263 | |
Investments, at value | | | 26,792,936 | | | | 124,358,556 | | | | 28,947,586 | | | | 174,624,727 | |
Cash equivalents (Note 2) | | | 454,066 | | | | 4,403,548 | | | | — | | | | 366,097 | |
Foreign currency, at value (Cost $—, $—, $36,607 and $324,094, respectively) | | | — | | | | — | | | | 38,058 | | | | 321,213 | |
Receivable for Fund shares sold | | | 2,730 | | | | 114,716 | | | | — | | | | — | |
Receivable for investment securities sold | | | — | | | | — | | | | 44,738 | | | | 1,989,130 | |
Dividends and interest receivable | | | 57,800 | | | | 66,688 | | | | 184,840 | | | | 428,543 | |
Foreign tax reclaims receivable | | | 586 | | | | — | | | | 3,073 | | | | 520,936 | |
Due from Adviser (Note 5) | | | — | | | | — | | | | 27,848 | | | | — | |
Other assets | | | 18,739 | | | | 29,289 | | | | 16,519 | | | | 30,399 | |
Total assets | | | 27,326,857 | | | | 128,972,797 | | | | 29,262,662 | | | | 178,281,045 | |
| | | | | | | | | | | | | | | | |
Liabilities | | | | | | | | | | | | | | | | |
Due to custodian | | | — | | | | — | | | | 52,218 | | | | — | |
Payable for Fund shares redeemed | | | 894 | | | | 81,611 | | | | — | | | | 3,841 | |
Payable to Adviser (Note 5) | | | 4,573 | | | | 58,766 | | | | — | | | | 98,189 | |
Accrued shareholder servicing fees (Note 5) | | | 16,100 | | | | 20,964 | | | | 12,907 | | | | 135,096 | |
Payable to third party administrator (Note 5) | | | 3,300 | | | | 4,700 | | | | 3,000 | | | | 6,200 | |
Accrued chief compliance officer fees (Note 5) | | | 129 | | | | 595 | | | | 136 | | | | 1,005 | |
Other accrued expenses | | | 13,392 | | | | 20,328 | | | | 54,096 | | | | 74,102 | |
Total liabilities | | | 38,388 | | | | 186,964 | | | | 122,357 | | | | 318,433 | |
Net Assets | | $ | 27,288,469 | | | $ | 128,785,833 | | | $ | 29,140,305 | | | $ | 177,962,612 | |
| | | | | | | | | | | | | | | | | |
Net Assets Consists of | | | | | | | | | | | | | | | | |
Paid-in capital | | $ | 31,376,207 | | | $ | 92,522,996 | | | $ | 30,019,182 | | | $ | 289,349,460 | |
Total accumulated earnings (deficit) | | | (4,087,738 | ) | | | 36,262,837 | | | | (878,877 | ) | | | (111,386,848 | ) |
Net Assets | | $ | 27,288,469 | | | $ | 128,785,833 | | | $ | 29,140,305 | | | $ | 177,962,612 | |
| | | | | | | | | | | | | | | | | |
Net Assets | | | | | | | | | | | | | | | | |
Retail | | $ | 24,955,188 | | | $ | 23,583 | | | $ | 2,156,895 | | | $ | 54,283,891 | |
Institutional | | | 2,333,281 | | | | 128,762,250 | | | | 26,983,410 | | | | 123,678,721 | |
Shares of Beneficial Interest Outstanding | | | | | | | | | | | | | | | | |
Retail | | | 1,197,716 | | | | 1,359 | | | | 288,382 | | | | 6,126,851 | |
Institutional | | | 109,907 | | | | 7,417,095 | | | | 3,596,219 | | | | 13,929,910 | |
Net Asset Value and Redemption Price Per Share (Net Assets Per Share Outstanding) | | | | | | | | | | | | | | | | |
Retail | | $ | 20.84 | | | $ | 17.35 | | | $ | 7.48 | | | $ | 8.86 | |
Institutional | | $ | 21.23 | | | $ | 17.36 | | | $ | 7.50 | | | $ | 8.88 | |
See Notes to Financial Statements.
102 |  | www.sbhfunds.com | www.sbhfunds.com
|
Segall Bryant & Hamill Funds | Statements of Assets and Liabilities |
| | June 30, 2020 (Unaudited) |
| | Segall Bryant
& Hamill
Fundamental
International
Small Cap Fund | | | Segall Bryant &
Hamill Global
Large Cap Fund | | | Segall Bryant &
Hamill Workplace
Equality Fund | | | Segall Bryant &
Hamill Short Term
Plus Fund | |
Assets | | | | | | | | | | | | | | | | |
Investments, at cost | | $ | 25,224,044 | | | $ | 33,157,266 | | | $ | 14,953,724 | | | $ | 11,285,979 | |
Investments, at value | | | 32,542,651 | | | | 37,331,718 | | | | 15,478,903 | | | | 11,317,563 | |
Cash equivalents (Note 2) | | | 2,264,342 | | | | 927,400 | | | | 408,706 | | | | 195,875 | |
Foreign currency, at value (Cost $5,692, $—, $— and $—, respectively) | | | 5,973 | | | | — | | | | — | | | | — | |
Unrealized gain on forward foreign currency contracts | | | 261,176 | | | | — | | | | — | | | | — | |
Receivable for Fund shares sold | | | 26,232 | | | | 308 | | | | — | | | | — | |
Receivable for investment securities sold | | | — | | | | 1,127,863 | | | | 114,374 | | | | — | |
Dividends and interest receivable | | | 18,879 | | | | 76,145 | | | | 20,479 | | | | 97,415 | |
Foreign tax reclaims receivable | | | 94,374 | | | | 161,894 | | | | — | | | | — | |
Due from Adviser (Note 5) | | | — | | | | — | | | | 1,269 | | | | — | |
Other assets | | | 22,090 | | | | 17,383 | | | | 17,978 | | | | 7,308 | |
Total assets | | | 35,235,717 | | | | 39,642,711 | | | | 16,041,709 | | | | 11,618,161 | |
| | | | | | | | | | | | | | | | |
Liabilities | | | | | | | | | | | | | | | | |
Unrealized loss on forward foreign currency contracts | | | 141,469 | | | | — | | | | — | | | | — | |
Payable for Fund shares redeemed | | | 25,021 | | | | 32,428 | | | | 699 | | | | — | |
Payable for investment securities purchased | | | — | | | | 945,233 | | | | — | | | | 115,785 | |
Payable to Adviser (Note 5) | | | 29,175 | | | | 2,835 | | | | — | | | | 1,279 | |
Accrued shareholder servicing fees (Note 5) | | | 6,713 | | | | 6,157 | | | | 4,820 | | | | 1,755 | |
Payable to third party administrator (Note 5) | | | 3,400 | | | | 3,700 | | | | 2,800 | | | | 2,100 | |
Accrued chief compliance officer fees (Note 5) | | | 166 | | | | 183 | | | | 76 | | | | 53 | |
Other accrued expenses | | | 15,867 | | | | 13,395 | | | | 10,568 | | | | 11,553 | |
Total liabilities | | | 221,811 | | | | 1,003,931 | | | | 18,963 | | | | 132,525 | |
Net Assets | | $ | 35,013,906 | | | $ | 38,638,780 | | | $ | 16,022,746 | | | $ | 11,485,636 | |
| | | | | | | | | | | | | | | | |
Net Assets Consists of | | | | | | | | | | | | | | | | |
Paid-in capital | | $ | 24,944,272 | | | $ | 33,231,323 | | | $ | 15,586,361 | | | $ | 11,443,206 | |
Total accumulated earnings | | | 10,069,634 | | | | 5,407,457 | | | | 436,385 | | | | 42,430 | |
Net Assets | | $ | 35,013,906 | | | $ | 38,638,780 | | | $ | 16,022,746 | | | $ | 11,485,636 | |
| | | | | | | | | | | | | | | | | |
Net Assets | | | | | | | | | | | | | | | | |
Retail | | $ | 24,038,778 | | | $ | 36,872,408 | | | $ | 8,057,688 | | | $ | 1,158,288 | |
Institutional | | | 10,975,128 | | | | 1,766,372 | | | | 7,965,058 | | | | 10,327,348 | |
Shares of Beneficial Interest Outstanding | | | | | | | | | | | | | | | | |
Retail | | | 1,430,135 | | | | 3,841,517 | | | | 1,405,125 | | | | 114,866 | |
Institutional | | | 611,964 | | | | 186,037 | | | | 1,349,222 | | | | 1,023,204 | |
Net Asset Value and Redemption Price Per Share (Net Assets Per Share Outstanding) | | | | | | | | | | | | | | | | |
Retail | | $ | 16.81 | | | $ | 9.60 | | | $ | 5.73 | | | $ | 10.08 | |
Institutional | | $ | 17.93 | | | $ | 9.49 | | | $ | 5.90 | | | $ | 10.09 | |
See Notes to Financial Statements.
Semi-Annual Report | June 30, 2020 |  | 103 |
Segall Bryant & Hamill Funds | Statements of Assets and Liabilities |
| | June 30, 2020 (Unaudited) |
| | Segall Bryant &
Hamill Plus
Bond Fund | | | Segall Bryant &
Hamill Quality
High Yield Fund | | | Segall Bryant &
Hamill Municipal
Opportunities
Fund | | | Segall Bryant &
Hamill Colorado
Tax Free Fund | |
Assets | | | | | | | | | | | | | | | | |
Investments, at cost | | $ | 948,885,725 | | | $ | 60,531,233 | | | $ | 90,999,216 | | | $ | 391,958,024 | |
Investments, at value | | | 1,013,365,602 | | | | 60,127,928 | | | | 94,145,217 | | | | 404,013,175 | |
Cash equivalents (Note 2) | | | 18,491,747 | | | | — | | | | 12,003,853 | | | | — | |
Receivable for Fund shares sold | | | 445,740 | | | | 4,915 | | | | 197,792 | | | | 462,696 | |
Receivable for investment securities sold | | | 96,571 | | | | 1,006,078 | | | | — | | | | 7,477,320 | |
Dividends and interest receivable | | | 7,718,973 | | | | 718,688 | | | | 1,087,352 | | | | 2,845,574 | |
Other assets | | | 48,843 | | | | 16,413 | | | | 26,450 | | | | 17,434 | |
Total assets | | | 1,040,167,476 | | | | 61,874,022 | | | | 107,460,664 | | | | 414,816,199 | |
| | | | | | | | | | | | | | | | |
Liabilities | | | | | | | | | | | | | | | | |
Due to custodian | | | — | | | | 782,576 | | | | — | | | | 264,408 | |
Payable for Fund shares redeemed | | | 503,672 | | | | 20,517 | | | | 20,000 | | | | 241,560 | |
Payable for investment securities purchased | | | — | | | | — | | | | 2,360,425 | | | | — | |
Payable to Adviser (Note 5) | | | 200,842 | | | | 23,769 | | | | 25,781 | | | | 100,440 | |
Accrued shareholder servicing fees (Note 5) | | | 316,019 | | | | 14,847 | | | | 16,195 | | | | 73,235 | |
Payable to third party administrator (Note 5) | | | 21,200 | | | | 3,700 | | | | 4,400 | | | | 9,700 | |
Accrued chief compliance officer fees (Note 5) | | | 4,802 | | | | 293 | | | | 476 | | | | 1,915 | |
Other accrued expenses | | | 74,614 | | | | 15,860 | | | | 18,647 | | | | 37,936 | |
Total liabilities | | | 1,121,149 | | | | 861,562 | | | | 2,445,924 | | | | 729,194 | |
Net Assets | | $ | 1,039,046,327 | | | $ | 61,012,460 | | | $ | 105,014,740 | | | $ | 414,087,005 | |
| | | | | | | | | | | | | | | | | |
Net Assets Consists of | | | | | | | | | | | | | | | | |
Paid-in capital | | $ | 967,242,963 | | | $ | 71,195,954 | | | $ | 102,625,031 | | | $ | 406,877,547 | |
Total accumulated earnings (deficit) | | | 71,803,364 | | | | (10,183,494 | ) | | | 2,389,709 | | | | 7,209,458 | |
Net Assets | | $ | 1,039,046,327 | | | $ | 61,012,460 | | | $ | 105,014,740 | | | $ | 414,087,005 | |
| | | | | | | | | | | | | | | | | |
Net Assets | | | | | | | | | | | | | | | | |
Retail | | $ | 590,980,612 | | | $ | 37,125,059 | | | $ | 16,768,265 | | | $ | 172,484,465 | |
Institutional | | | 448,065,715 | | | | 23,887,401 | | | | 88,246,475 | | | | 241,602,540 | |
Shares of Beneficial Interest Outstanding | | | | | | | | | | | | | | | | |
Retail | | | 52,688,180 | | | | 4,275,042 | | | | 1,553,581 | | | | 14,688,877 | |
Institutional | | | 40,332,052 | | | | 2,781,393 | | | | 8,170,690 | | | | 20,502,092 | |
Net Asset Value and Redemption Price Per Share (Net Assets Per Share Outstanding) | | | | | | | | | | | | | | | | |
Retail | | $ | 11.22 | | | $ | 8.68 | | | $ | 10.79 | | | $ | 11.74 | |
Institutional | | $ | 11.11 | | | $ | 8.59 | | | $ | 10.80 | | | $ | 11.78 | |
See Notes to Financial Statements.
104 |  | www.sbhfunds.com | www.sbhfunds.com
|
Segall Bryant & Hamill Funds | Statements of Operations |
| | For the Six Months Ended June 30, 2020 (Unaudited) |
| | Segall Bryant &
Hamill Small Cap
Value Fund | | | Segall Bryant &
Hamill Small Cap
Value Dividend
Fund | | | Segall Bryant &
Hamill Small Cap
Growth Fund | | | Segall Bryant &
Hamill Small Cap
Core Fund | |
Investment Income | | | | | | | | | | | | | | | | |
Dividends | | $ | 851,734 | | | $ | 739,849 | | | $ | 130,885 | | | $ | 123,378 | |
Interest | | | 31,431 | | | | 4,863 | | | | 5,631 | | | | 5,657 | |
Foreign taxes withheld | | | (272 | ) | | | (15,027 | ) | | | (2,956 | ) | | | — | |
Total income | | | 882,893 | | | | 729,685 | | | | 133,560 | | | | 129,035 | |
| | | | | | | | | | | | | | | | |
Expenses | | | | | | | | | | | | | | | | |
Investment advisory fees (Note 5) | | | 680,814 | | | | 256,247 | | | | 220,565 | | | | 143,369 | |
Shareholder servicing fees (Note 5) | | | | | | | | | | | | | | | | |
Retail Class | | | 21 | | | | 13,263 | | | | 2,600 | | | | 87 | |
Institutional Class | | | 85,080 | | | | 15,429 | | | | 29,425 | | | | 17,834 | |
Administrative fees (Note 5) | | | 31,745 | | | | 14,707 | | | | 15,395 | | | | 5,451 | |
Registration and filing fees | | | 23,336 | | | | 21,828 | | | | 23,390 | | | | 25,912 | |
Custodian fees | | | 15,654 | | | | 5,283 | | | | 5,212 | | | | 6,305 | |
Trustee fees and expenses | | | 13,461 | | | | 4,695 | | | | 5,410 | | | | 3,674 | |
Transfer agent fees (Note 5) | | | 10,003 | | | | 10,903 | | | | 11,190 | | | | 10,256 | |
Audit and tax preparation fees | | | 10,436 | | | | 8,611 | | | | 7,231 | | | | 24,897 | |
Shareholder reporting fees | | | 9,371 | | | | 8,238 | | | | 6,769 | | | | 5,116 | |
Independent pricing service fees | | | 520 | | | | 701 | | | | 794 | | | | 591 | |
Legal fees | | | 7,906 | | | | 1,769 | | | | 2,194 | | | | 1,525 | |
Chief compliance officer fees (Note 5) | | | 5,130 | | | | 1,791 | | | | 1,677 | | | | 1,298 | |
Insurance expense | | | 3,415 | | | | 2,220 | | | | 1,682 | | | | 821 | |
Other | | | 9,074 | | | | 14,898 | | | | 15,461 | | | | 3,458 | |
Total expenses before waivers/reimbursements | | | 905,966 | | | | 380,583 | | | | 348,995 | | | | 250,594 | |
Expenses waived/reimbursed by investment adviser | | | (63,446 | ) | | | (54,005 | ) | | | (11,066 | ) | | | (73,045 | ) |
Net expenses | | | 842,520 | | | | 326,578 | | | | 337,929 | | | | 177,549 | |
Net Investment Income (Loss) | | | 40,373 | | | | 403,107 | | | | (204,369 | ) | | | (48,514 | ) |
| | | | | | | | | | | | | | | | |
Realized and Unrealized Gains (Losses) | | | | | | | | | | | | | | | | |
Net realized gains (losses) on: | | | | | | | | | | | | | | | | |
Investments | | | (14,155,302 | ) | | | (12,391,890 | ) | | | 4,837,017 | | | | (716,970 | ) |
Foreign currency | | | — | | | | 415 | | | | — | | | | — | |
| | | | (14,155,302 | ) | | | (12,391,475 | ) | | | 4,837,017 | | | | (716,970 | ) |
Change in unrealized net appreciation (depreciation) on: | | | | | | | | | | | | | | | | |
Investments | | | (10,989,534 | ) | | | (9,934,161 | ) | | | 1,635,556 | | | | (1,601,624 | ) |
| | | | | | | | | | | | | | | | | |
Net realized and unrealized gains (losses) | | | (25,144,836 | ) | | | (22,325,636 | ) | | | 6,472,573 | | | | (2,318,594 | ) |
Net Increase (Decrease) in Net Assets Resulting From Operations | | $ | (25,104,463 | ) | | $ | (21,922,529 | ) | | $ | 6,268,204 | | | $ | (2,367,108 | ) |
See Notes to Financial Statements.
Semi-Annual Report | June 30, 2020 |  | 105 |
Segall Bryant & Hamill Funds | Statements of Operations |
| | For the Six Months Ended June 30, 2020 (Unaudited) |
| | Segall Bryant &
Hamill Mid Cap
Value Dividend
Fund | | | Segall Bryant &
Hamill
All Cap Fund | | | Segall Bryant &
Hamill Emerging
Markets Fund | | | Segall Bryant
& Hamill
International
Small Cap Fund | |
Investment Income | | | | | | | | | | | | | | | | |
Dividends | | $ | 624,314 | | | $ | 645,552 | | | $ | 575,132 | | | $ | 4,373,898 | |
Interest | | | 2,073 | | | | 10,214 | | | | 117 | | | | 18 | |
Foreign taxes withheld | | | (7,902 | ) | | | (10,757 | ) | | | (52,914 | ) | | | (562,041 | ) |
Total income | | | 618,485 | | | | 645,009 | | | | 522,335 | | | | 3,811,875 | |
| | | | | | | | | �� | | | | | | | | |
Expenses | | | | | | | | | | | | | | | | |
Investment advisory fees (Note 5) | | | 177,316 | | | | 407,596 | | | | 133,638 | | | | 1,014,598 | |
Shareholder servicing fees (Note 5) | | | | | | | | | | | | | | | | |
Retail Class | | | 19,291 | | | | 8 | | | | 2,792 | | | | 55,534 | |
Institutional Class | | | 11,203 | | | | 58,080 | | | | 13,732 | | | | 90,584 | |
Administrative fees (Note 5) | | | 13,234 | | | | 23,147 | | | | 9,664 | | | | 40,735 | |
Registration and filing fees | | | 22,458 | | | | 14,041 | | | | 14,129 | | | | 35,022 | |
Custodian fees | | | 2,378 | | | | 5,501 | | | | 92,829 | | | | 99,070 | |
Trustee fees and expenses | | | 3,731 | | | | 9,230 | | | | 2,262 | | | | 16,415 | |
Transfer agent fees (Note 5) | | | 12,288 | | | | 9,847 | | | | 10,064 | | | | 10,175 | |
Audit and tax preparation fees | | | 7,841 | | | | 10,094 | | | | 12,330 | | | | 12,844 | |
Shareholder reporting fees | | | 9,058 | | | | 11,564 | | | | 6,626 | | | | 6,338 | |
Independent pricing service fees | | | 732 | | | | 373 | | | | 27,846 | | | | 25,430 | |
Legal fees | | | 1,502 | | | | 5,392 | | | | 2,846 | | | | 10,264 | |
Chief compliance officer fees (Note 5) | | | 1,559 | | | | 3,458 | | | | 942 | | | | 6,456 | |
Insurance expense | | | 1,765 | | | | 2,471 | | | | 743 | | | | 6,272 | |
Other | | | 16,009 | | | | 8,981 | | | | 27,065 | | | | 19,030 | |
Total expenses before waivers/reimbursements | | | 300,365 | | | | 569,783 | | | | 357,508 | | | | 1,448,767 | |
Expenses waived/reimbursed by investment adviser | | | (47,105 | ) | | | (81,917 | ) | | | (173,194 | ) | | | (252,924 | ) |
Net expenses | | | 253,260 | | | | 487,866 | | | | 184,314 | | | | 1,195,843 | |
Net Investment Income | | | 365,225 | | | | 157,143 | | | | 338,021 | | | | 2,616,032 | |
| | | | | | | | | | | | | | | | | |
Realized and Unrealized Gains (Losses) | | | | | | | | | | | | | | | | |
Net realized losses on: | | | | | | | | | | | | | | | | |
Investments | | | (5,326,546 | ) | | | (331,004 | ) | | | (1,964,792 | ) | | | (31,927,551 | ) |
Foreign currency | | | (86 | ) | | | — | | | | (19,640 | ) | | | (76,384 | ) |
| | | | (5,326,632 | ) | | | (331,004 | ) | | | (1,984,432 | ) | | | (32,003,935 | ) |
Change in unrealized net appreciation (depreciation) on: | | | | | | | | | | | | | | | | |
Investments | | | (9,113,247 | ) | | | 3,163,239 | | | | (3,280,423 | ) | | | (40,561,537 | ) |
Translation of assets and liabilities denoted in foreign currencies | | | (3 | ) | | | — | | | | 1,494 | | | | (4,328 | ) |
| | | | (9,113,250 | ) | | | 3,163,239 | | | | (3,278,929 | ) | | | (40,565,865 | ) |
Net realized and unrealized gains (losses) | | | (14,439,882 | ) | | | 2,832,235 | | | | (5,263,361 | ) | | | (72,569,800 | ) |
Net Increase (Decrease) in Net Assets Resulting From Operations | | $ | (14,074,657 | ) | | $ | 2,989,378 | | | $ | (4,925,340 | ) | | $ | (69,953,768 | ) |
See Notes to Financial Statements.
106 |  | www.sbhfunds.com | www.sbhfunds.com
|
Segall Bryant & Hamill Funds | Statements of Operations |
| | For the Six Months Ended June 30, 2020 (Unaudited) |
| | Segall Bryant
& Hamill
Fundamental
International
Small Cap Fund | | | Segall Bryant &
Hamill Global
Large Cap Fund | | | Segall Bryant &
Hamill Workplace
Equality Fund | | | Segall Bryant &
Hamill Short Term
Plus Fund | |
Investment Income | | | | | | | | | | | | | | | | |
Dividends | | $ | 157,873 | | | $ | 793,032 | | | $ | 235,460 | | | $ | — | |
Interest | | | 3,630 | | | | 454 | | | | 458 | | | | 103,318 | |
Foreign taxes withheld | | | (16,750 | ) | | | (69,845 | ) | | | — | | | | (273 | ) |
Total income | | | 144,753 | | | | 723,641 | | | | 235,918 | | | | 103,045 | |
| | | | | | | | | | | | | | | | |
Expenses | | | | | | | | | | | | | | | | |
Investment advisory fees (Note 5) | | | 162,914 | | | | 131,821 | | | | 52,684 | | | | 11,259 | |
Shareholder servicing fees (Note 5) | | | | | | | | | | | | | | | | |
Retail Class | | | 21,692 | | | | 19,540 | | | | 5,527 | | | | 523 | |
Institutional Class | | | 4,240 | | | | 805 | | | | 3,468 | | | | 2,786 | |
Administrative fees (Note 5) | | | 9,916 | | | | 11,182 | | | | 7,425 | | | | 2,968 | |
Registration and filing fees | | | 25,311 | | | | 22,237 | | | | 24,300 | | | | 7,345 | |
Custodian fees | | | 8,759 | | | | 4,514 | | | | 867 | | | | 1,321 | |
Trustee fees and expenses | | | 2,554 | | | | 3,103 | | | | 1,254 | | | | 762 | |
Transfer agent fees (Note 5) | | | 12,254 | | | | 13,648 | | | | 10,429 | | | | 10,037 | |
Audit and tax preparation fees | | | 9,442 | | | | 8,112 | | | | 7,813 | | | | 7,688 | |
Shareholder reporting fees | | | 8,878 | | | | 11,809 | | | | 3,252 | | | | 1,747 | |
Independent pricing service fees | | | 907 | | | | 629 | | | | 452 | | | | 4,224 | |
Legal fees | | | 1,034 | | | | 1,232 | | | | 508 | | | | 329 | |
Chief compliance officer fees (Note 5) | | | 934 | | | | 1,150 | | | | 462 | | | | 262 | |
Insurance expense | | | 795 | | | | 1,115 | | | | 418 | | | | 138 | |
Other | | | 10,662 | | | | 26,715 | | | | 8,370 | | | | 1,056 | |
Total expenses before waivers/reimbursements | | | 280,292 | | | | 257,612 | | | | 127,229 | | | | 52,445 | |
Expenses waived/reimbursed by investment adviser | | | (83,010 | ) | | | (78,628 | ) | | | (60,874 | ) | | | (33,961 | ) |
Net expenses | | | 197,282 | | | | 178,984 | | | | 66,355 | | | | 18,484 | |
Net Investment Income (Loss) | | | (52,529 | ) | | | 544,657 | | | | 169,563 | | | | 84,561 | |
| | | | | | | | | | | | | | | | |
Realized and Unrealized Gains (Losses) | | | | | | | | | | | | | | | | |
Net realized gains (losses) on: | | | | | | | | | | | | | | | | |
Investments | | | 713,775 | | | | (54,050 | ) | | | (95,652 | ) | | | 14,402 | |
Forward foreign currency contracts | | | (76,216 | ) | | | — | | | | — | | | | — | |
Foreign currency | | | (30,038 | ) | | | 265 | | | | — | | | | — | |
| | | | 607,521 | | | | (53,785 | ) | | | (95,652 | ) | | | 14,402 | |
Change in unrealized net appreciation (depreciation) on: | | | | | | | | | | | | | | | | |
Investments | | | (3,579,591 | ) | | | (6,202,178 | ) | | | (1,931,158 | ) | | | 8,922 | |
Forward foreign currency contracts | | | 26,074 | | | | — | | | | — | | | | — | |
Translation of assets and liabilities denoted in foreign currencies | | | (3,515 | ) | | | 12,417 | | | | — | | | | — | |
| | | | (3,557,032 | ) | | | (6,189,761 | ) | | | (1,931,158 | ) | | | 8,922 | |
Net realized and unrealized gains (losses) | | | (2,949,511 | ) | | | (6,243,546 | ) | | | (2,026,810 | ) | | | 23,324 | |
Net Increase (Decrease) in Net Assets Resulting From Operations | | $ | (3,002,040 | ) | | $ | (5,698,889 | ) | | $ | (1,857,247 | ) | | $ | 107,885 | |
See Notes to Financial Statements.
Semi-Annual Report | June 30, 2020 |  | 107 |
Segall Bryant & Hamill Funds | Statements of Operations |
| | For the Six Months Ended June 30, 2020 (Unaudited) |
| | Segall Bryant &
Hamill Plus
Bond Fund | | | Segall Bryant &
Hamill Quality
High Yield Fund | | | Segall Bryant &
Hamill Municipal
Opportunities
Fund | | | Segall Bryant &
Hamill Colorado
Tax Free Fund | |
Investment Income | | | | | | | | | | | | | | | | |
Interest | | $ | 16,621,981 | | | $ | 1,375,564 | | | $ | 1,580,170 | | | $ | 5,930,561 | |
| | | | | | | | | | | | | | | | | |
Expenses | | | | | | | | | | | | | | | | |
Investment advisory fees (Note 5) | | | 1,787,352 | | | | 132,063 | | | | 165,774 | | | | 775,962 | |
Shareholder servicing fees (Note 5) | | | | | | | | | | | | | | | | |
Retail Class | | | 732,667 | | | | 38,876 | | | | 17,520 | | | | 182,990 | |
Institutional Class | | | 152,827 | | | | 9,752 | | | | 21,894 | | | | 92,265 | |
Administrative fees (Note 5) | | | 160,900 | | | | 13,967 | | | | 18,333 | | | | 66,860 | |
Registration and filing fees | | | 36,021 | | | | 24,228 | | | | 26,231 | | | | 16,565 | |
Custodian fees | | | 7,950 | | | | 2,184 | | | | 503 | | | | 9,558 | |
Trustee fees and expenses | | | 82,023 | | | | 4,715 | | | | 7,451 | | | | 33,299 | |
Transfer agent fees (Note 5) | | | 16,257 | | | | 10,644 | | | | 10,631 | | | | 11,095 | |
Audit and tax preparation fees | | | 16,163 | | | | 9,979 | | | | 9,638 | | | | 10,571 | |
Shareholder reporting fees | | | 37,633 | | | | 5,188 | | | | 4,135 | | | | 7,981 | |
Independent pricing service fees | | | 13,895 | | | | 4,127 | | | | 8,959 | | | | 18,726 | |
Legal fees | | | 33,959 | | | | 1,932 | | | | 3,072 | | | | 13,889 | |
Chief compliance officer fees (Note 5) | | | 29,310 | | | | 1,679 | | | | 2,542 | | | | 11,708 | |
Insurance expense | | | 25,117 | | | | 1,398 | | | | 1,788 | | | | 8,299 | |
Other | | | 50,748 | | | | 8,098 | | | | 9,039 | | | | 21,476 | |
Total expenses before waivers/reimbursements | �� | | 3,182,822 | | | | 268,830 | | | | 307,510 | | | | 1,281,244 | |
Expenses waived/reimbursed by investment adviser | | | (699,828 | ) | | | (35,631 | ) | | | (79,506 | ) | | | (138,189 | ) |
Net expenses | | | 2,482,994 | | | | 233,199 | | | | 228,004 | | | | 1,143,055 | |
Net Investment Income | | | 14,138,987 | | | | 1,142,365 | | | | 1,352,166 | | | | 4,787,506 | |
| | | | | | | | | | | | | | | | | |
Realized and Unrealized Gains (Losses) | | | | | | | | | | | | | | | | |
Net realized gains (losses) on: | | | | | | | | | | | | | | | | |
Investments | | | 9,252,620 | | | | 9,332 | | | | (486,036 | ) | | | (381,138 | ) |
| | | | | | | | | | | | | | | | | |
Change in unrealized net appreciation (depreciation) on: | | | | | | | | | | | | | | | | |
Investments | | | 30,619,577 | | | | (1,874,459 | ) | | | 1,804,341 | | | | 1,962,342 | |
| | | | | | | | | | | | | | | | | |
Net realized and unrealized gains (losses) | | | 39,872,197 | | | | (1,865,127 | ) | | | 1,318,305 | | | | 1,581,204 | |
Net Increase (Decrease) in Net Assets Resulting From Operations | | $ | 54,011,184 | | | $ | (722,762 | ) | | $ | 2,670,471 | | | $ | 6,368,710 | |
See Notes to Financial Statements.
108 |  | www.sbhfunds.com | www.sbhfunds.com
|
Segall Bryant & Hamill Funds | Statements of Changes in Net Assets |
| | |
| | Segall Bryant & Hamill
Small Cap Value Fund | | | Segall Bryant & Hamill
Small Cap Value Dividend Fund | |
| | Six Months
Ended
June 30, 2020
(Unaudited) | | | Six Months
Ended
December 31,
2019 (a) | | | Year Ended
June 30,
2019 | | | Six Months
Ended
June 30, 2020
(Unaudited) | | | Year Ended
December 31,
2019 | |
Operations | | | | | | | | | | | | | | | | | | | | |
Net investment income | | $ | 40,373 | | | $ | 1,045,592 | | | $ | 1,018,187 | | | $ | 403,107 | | | $ | 1,874,628 | |
Net realized gains (losses) | | | (14,155,302 | ) | | | 5,344,262 | | | | 9,587,704 | | | | (12,391,475 | ) | | | 2,034,474 | |
Change in unrealized net appreciation (depreciation) | | | (10,989,534 | ) | | | 4,890,275 | | | | (3,896,259 | ) | | | (9,934,161 | ) | | | 8,985,157 | |
Net increase (decrease) in net assets resulting from operations | | | (25,104,463 | ) | | | 11,280,129 | | | | 6,709,632 | | | | (21,922,529 | ) | | | 12,894,259 | |
| | | | | | | | | | | | | | | | | | | | |
Distributions to Shareholders (Note 4) | | | | | | | | | | | | | | | | | | | | |
From distributable earnings | | | | | | | | | | | | | | | | | | | | |
Retail | | | — | | | | — | | | | — | | | | — | | | | (640,272 | ) |
Institutional | | | — | | | | (9,405,422 | ) | | | (11,088,064 | ) | | | — | | | | (2,192,395 | ) |
Decrease in net assets from distributions to shareholders | | | — | | | | (9,405,422 | ) | | | (11,088,064 | ) | | | — | | | | (2,832,667 | ) |
| | | | | | | | | | | | | | | | | | | | |
Beneficial Interest Transactions (Note 3) | | | | | | | | | | | | | | | | | | | | |
Shares sold | | | | | | | | | | | | | | | | | | | | |
Retail | | | 141,030 | | | | 10,012 | | | | — | | | | 762,047 | | | | 4,118,879 | |
Institutional | | | 110,176,235 | | | | 30,497,407 | | | | 51,525,598 | | | | 9,025,619 | | | | 16,898,343 | |
Shares issued in reinvestment of distributions | | | | | | | | | | | | | | | | | | | | |
Retail | | | — | | | | — | | | | — | | | | — | | | | 557,368 | |
Institutional | | | — | | | | 8,787,784 | | | | 9,987,881 | | | | — | | | | 2,178,644 | |
Cost of shares redeemed | | | | | | | | | | | | | | | | | | | | |
Retail | | | — | | | | (12 | ) | | | — | | | | (5,231,586 | ) | | | (6,005,061 | ) |
Institutional | | | (26,055,664 | ) | | | (12,461,155 | ) | | | (22,778,087 | ) | | | (12,587,256 | ) | | | (27,590,208 | ) |
Net increase (decrease) resulting from beneficial interest transactions | | | 84,261,601 | | | | 26,834,036 | | | | 38,735,392 | | | | (8,031,176 | ) | | | (9,842,035 | ) |
Total net increase (decrease) in net assets | | | 59,157,138 | | | | 28,708,743 | | | | 34,356,960 | | | | (29,953,705 | ) | | | 219,557 | |
| | | | | | | | | | | | | | | | | | | | |
Net Assets | | | | | | | | | | | | | | | | | | | | |
Beginning of period | | | 169,901,227 | | | | 141,192,484 | | | | 106,835,524 | | | | 88,212,586 | | | | 87,993,029 | |
End of period | | $ | 229,058,365 | | | $ | 169,901,227 | | | $ | 141,192,484 | | | $ | 58,258,881 | | | $ | 88,212,586 | |
(a) | Fund changed fiscal year to December 31. |
See Notes to Financial Statements.
Semi-Annual Report | June 30, 2020 |  | 109 |
Segall Bryant & Hamill Funds | Statements of Changes in Net Assets |
| | |
| | Segall Bryant & Hamill Small Cap
Growth Fund | | | Segall Bryant & Hamill Small Cap
Core Fund | | | Segall Bryant & Hamill Mid Cap Value
Dividend Fund | |
| | Six Months
Ended
June 30, 2020
(Unaudited) | | | Year Ended
December 31,
2019 | | | Six Months
Ended
June 30, 2020
(Unaudited) | | | Period Ended
December 31,
2019 (a) | | | Six Months
Ended
June 30, 2020
(Unaudited) | | | Year Ended
December 31,
2019 | |
Operations | | | | | | | | | | | | | | | | | | | | | | | | |
Net investment income (loss) | | $ | (204,369 | ) | | $ | (290,795 | ) | | $ | (48,514 | ) | | $ | — | | | $ | 365,225 | | | $ | 1,195,526 | |
Net realized gains (losses) | | | 4,837,017 | | | | 4,436,310 | | | | (716,970 | ) | | | — | | | | (5,326,632 | ) | | | 2,335,597 | |
Change in unrealized net appreciation (depreciation) | | | 1,635,556 | | | | 13,594,733 | | | | (1,601,624 | ) | | | — | | | | (9,113,250 | ) | | | 13,386,794 | |
Net increase (decrease) in net assets resulting from operations | | | 6,268,204 | | | | 17,740,248 | | | | (2,367,108 | ) | | | — | | | | (14,074,657 | ) | | | 16,917,917 | |
| | | | | | | | | | | | | | | | | | | | | | | | |
Distributions to Shareholders (Note 4) | | | | | | | | | | | | | | | | | | | | | | | | |
From distributable earnings | | | | | | | | | | | | | | | | | | | | | | | | |
Retail | | | — | | | | — | | | | — | | | | — | | | | — | | | | (1,240,402 | ) |
Institutional | | | — | | | | — | | | | — | | | | — | | | | — | | | | (943,524 | ) |
Return of capital | | | | | | | | | | | | | | | | | | | | | | | | |
Retail | | | — | | | | — | | | | — | | | | — | | | | — | | | | — | |
Institutional | | | — | | | | — | | | | — | | | | — | | | | — | | | | — | |
Decrease in net assets from distributions to shareholders | | | — | | | | — | | | | — | | | | — | | | | — | | | | (2,183,926 | ) |
| | | | | | | | | | | | | | | | | | | | | | | | | |
Beneficial Interest Transactions (Note 3) | | | | | | | | | | | | | | | | | | | | | | | | |
Shares sold | | | | | | | | | | | | | | | | | | | | | | | | |
Retail | | | 471,779 | | | | 2,215,402 | | | | 171,276 | | | | 77,510 | | | | 923,255 | | | | 3,563,856 | |
Institutional | | | 10,732,325 | | | | 6,491,755 | | | | 2,821,277 | | | | — | | | | 3,019,885 | | | | 4,887,000 | |
Shares issued in reinvestment of distributions | | | | | | | | | | | | | | | | | | | | | | | | |
Retail | | | — | | | | — | | | | — | | | | — | | | | — | | | | 1,218,858 | |
Institutional | | | — | | | | — | | | | — | | | | — | | | | — | | | | 929,493 | |
Cost of shares redeemed | | | | | | | | | | | | | | | | | | | | | | | | |
Retail | | | (829,114 | ) | | | (1,483,044 | ) | | | (12,012 | ) | | | — | | | | (11,604,895 | ) | | | (16,265,678 | ) |
Institutional | | | (15,178,125 | ) | | | (14,438,825 | ) | | | (725,321 | ) | | | — | | | | (26,222,527 | ) | | | (16,005,995 | ) |
Shares issued in connection with Fund Reorganization | | | | | | | | | | | | | | | | | | | | | | | | |
Retail | | | — | | | | — | | | | — | | | | — | | | | — | | | | — | |
Institutional | | | — | | | | — | | | | — | | | | 37,936,217 | | | | — | | | | — | |
Net increase (decrease) resulting from beneficial interest transactions | | | (4,803,135 | ) | | | (7,214,712 | ) | | | 2,255,220 | | | | 38,013,727 | | | | (33,884,282 | ) | | | (21,672,466 | ) |
Total net increase (decrease) in net assets | | | 1,465,069 | | | | 10,525,536 | | | | (111,888 | ) | | | 38,013,727 | | | | (47,958,939 | ) | | | (6,938,475 | ) |
| | | | | | | | | | | | | | | | | | | | | | | | | |
Net Assets | | | | | | | | | | | | | | | | | | | | | | | | |
Beginning of period | | | 75,177,124 | | | | 64,651,588 | | | | 38,013,727 | | | | — | | | | 75,247,408 | | | | 82,185,883 | |
End of period | | $ | 76,642,193 | | | $ | 75,177,124 | | | $ | 37,901,839 | | | $ | 38,013,727 | | | $ | 27,288,469 | | | $ | 75,247,408 | |
(a) | Represents the period of December 31, 2019 (commencement of operations). |
See Notes to Financial Statements.
110 |  | www.sbhfunds.com | www.sbhfunds.com
|
Segall Bryant & Hamill Funds | Statements of Changes in Net Assets |
| | |
| | Segall Bryant & Hamill All Cap Fund | | | Segall Bryant & Hamill
Emerging Markets Fund | | | Segall Bryant & Hamill
International Small Cap Fund | |
| | Six Months
Ended
June 30,
2020
(Unaudited) | | | Six Months
Ended
December 31,
2019 (a) | | | Year Ended
June 30,
2019 | | | Six Months
Ended
June 30,
2020
(Unaudited) | | | Two Months
Ended
December 31,
2019 (a) | | | Year Ended
October 31,
2019 | | | Six Months
Ended
June 30,
2020
(Unaudited) | | | Two Months
Ended
December 31,
2019 (a) | | | Year Ended
October 31,
2019 | |
Operations | | | | | | | | | | | | | | | | | | | | | | | | | | | | | | | | | | | | |
Net investment income | | $ | 157,143 | | | $ | 40,694 | | | $ | 61,914 | | | $ | 338,021 | | | $ | 66,798 | | | $ | 793,794 | | | $ | 2,616,032 | | | $ | 508,894 | | | $ | 7,901,607 | |
Net realized gains (losses) | | | (331,004 | ) | | | 415,638 | | | | 1,807,339 | | | | (1,984,432 | ) | | | 85,124 | | | | (1,289,830 | ) | | | (32,003,935 | ) | | | 300,439 | | | | (47,853,642 | ) |
Change in unrealized net appreciation (depreciation) | | | 3,163,239 | | | | 8,327,544 | | | | 8,349,993 | | | | (3,278,929 | ) | | | 2,314,383 | | | | 3,868,126 | | | | (40,565,865 | ) | | | 17,697,127 | | | | 30,860,118 | |
Net increase from payments by affiliates (b) | | | — | | | | — | | | | — | | | | — | | | | — | | | | — | | | | — | | | | — | | | | 132,086 | |
Net increase (decrease) in net assets resulting from operations | | | 2,989,378 | | | | 8,783,876 | | | | 10,219,246 | | | | (4,925,340 | ) | | | 2,466,305 | | | | 3,372,090 | | | | (69,953,768 | ) | | | 18,506,460 | | | | (8,959,831 | ) |
| | | | | | | | | | | | | | | | | | | | | | | | | | | | | | | | | | | | |
Distributions to Shareholders (Note 4) | | | | | | | | | | | | | | | | | | | | | | | | | | | | | | | | | | | | |
From distributable earnings | | | | | | | | | | | | | | | | | | | | | | | | | | | | | | | | | | | | |
Retail* | | | — | | | | — | | | | — | | | | — | | | | (57,519 | ) | | | (59,175 | ) | | | — | | | | (2,140,773 | ) | | | (481,336 | ) |
Institutional** | | | — | | | | (384,075 | ) | | | (3,099,152 | ) | | | — | | | | (811,648 | ) | | | (962,729 | ) | | | — | | | | (10,240,438 | ) | | | (8,187,235 | ) |
Return of Capital | | | | | | | | | | | | | | | | | | | | | | | | | | | | | | | | | | | | |
Retail* | | | — | | | | — | | | | — | | | | — | | | | (2,252 | ) | | | — | | | | — | | | | (32,805 | ) | | | — | |
Institutional** | | | — | | | | — | | | | — | | | | — | | | | (31,772 | ) | | | — | | | | — | | | | (156,924 | ) | | | — | |
Decrease in net assets from distributions to shareholders | | | — | | | | (384,075 | ) | | | (3,099,152 | ) | | | — | | | | (903,191 | ) | | | (1,021,904 | ) | | | — | | | | (12,570,940 | ) | | | (8,668,571 | ) |
| | | | | | | | | | | | | | | | | | | | | | | | | | | | | | | | | | | | |
Beneficial Interest Transactions (Note 3) | | | | | | | | | | | | | | | | | | | | | | | | | | | | | | | | | | | | |
Shares sold | | | | | | | | | | | | | | | | | | | | | | | | | | | | | | | | | | | | |
Retail* | | | 10,000 | | | | 10,017 | | | | — | | | | 153,000 | | | | 121,013 | | | | 206,519 | | | | 15,587,275 | | | | 70,129 | | | | 28,732,330 | |
Institutional** | | | 15,054,736 | | | | 13,705,221 | | | | 25,736,271 | | | | 825,497 | | | | 136,806 | | | | 617,275 | | | | 12,086,182 | | | | 1,213,123 | | | | 70,426,786 | |
Shares issued in reinvestment of distributions | | | | | | | | | | | | | | | | | | | | | | | | | | | | | | | | | | | | |
Retail* | | | — | | | | — | | | | — | | | | — | | | | 57,404 | | | | 56,616 | | | | — | | | | 1,953,998 | | | | 365,763 | |
Institutional** | | | — | | | | 381,427 | | | | 3,082,555 | | | | — | | | | 409,027 | | | | 466,826 | | | | — | | | | 8,547,476 | | | | 5,493,905 | |
Cost of shares redeemed | | | | | | | | | | | | | | | | | | | | | | | | | | | | | | | | | | | | |
Retail* | | | — | | | | (17 | ) | | | — | | | | (303,073 | ) | | | (18,028 | ) | | | (65,035 | ) | | | (1,338,878 | ) | | | (235,151 | ) | | | (3,548,989 | ) |
Institutional** | | | (10,008,862 | ) | | | (6,173,919 | ) | | | (11,151,548 | ) | | | (2,008,316 | ) | | | (103,576 | ) | | | (2,403,162 | ) | | | (65,351,349 | ) | | | (11,183,613 | ) | | | (178,243,315 | ) |
Net increase (decrease) resulting from beneficial interest transactions | | | 5,055,874 | | | | 7,922,729 | | | | 17,667,278 | | | | (1,332,892 | ) | | | 602,646 | | | | (1,120,961 | ) | | | (39,016,770 | ) | | | 365,962 | | | | (76,773,520 | ) |
Total net increase (decrease) in net assets | | | 8,045,252 | | | | 16,322,530 | | | | 24,787,372 | | | | (6,258,232 | ) | | | 2,165,760 | | | | 1,229,225 | | | | (108,970,538 | ) | | | 6,301,482 | | | | (94,401,922 | ) |
| | | | | | | | | | | | | | | | | | | | | | | | | | | | | | | | | | | | |
Net Assets | | | | | | | | | | | | | | | | | | | | | | | | | | | | | | | | | | | | |
Beginning of period | | | 120,740,581 | | | | 104,418,051 | | | | 79,630,679 | | | | 35,398,537 | | | | 33,232,777 | | | | 32,003,552 | | | | 286,933,150 | | | | 280,631,668 | | | | 375,033,590 | |
End of period | | $ | 128,785,833 | | | $ | 120,740,581 | | | $ | 104,418,051 | | | $ | 29,140,305 | | | $ | 35,398,537 | | | $ | 33,232,777 | | | $ | 177,962,612 | | | $ | 286,933,150 | | | $ | 280,631,668 | |
(a) | Fund changed fiscal year to December 31. |
(b) | The former custodian to the Fund reimbursed the Fund, which was an affiliate of the Fund prior to December 9, 2019, $132,086 for losses incurred from corporate action processing. |
See Notes to Financial Statements.
Semi-Annual Report | June 30, 2020 |  | 111 |
Segall Bryant & Hamill Funds | Statements of Changes in Net Assets |
| | |
| | Segall Bryant & Hamill Fundamental
International Small Cap Fund | | | Segall Bryant & Hamill
Global Large Cap Fund | | | Segall Bryant & Hamill
Workplace Equality Fund (a) | |
| | Six Months
Ended
June 30, 2020
(Unaudited) | | | Year Ended
December 31,
2019 | | | Six Months
Ended
June 30, 2020
(Unaudited) | | | Year Ended
December 31,
2019 | | | Six Months
Ended
June 30, 2020
(Unaudited) | | | Year Ended
December 31,
2019 | |
Operations | | | | | | | | | | | | | | | | | | | | | | | | |
Net investment income (loss) | | $ | (52,529 | ) | | $ | 1,995 | | | $ | 544,657 | | | $ | 986,420 | | | $ | 169,563 | | | $ | 297,046 | |
Net realized gains (losses) | | | 607,521 | | | | 3,244,686 | | | | (53,785 | ) | | | 4,343,088 | | | | (95,652 | ) | | | 800,966 | |
Change in unrealized net appreciation (depreciation) | | | (3,557,032 | ) | | | 11,761,815 | | | | (6,189,761 | ) | | | 5,320,527 | | | | (1,931,158 | ) | | | 1,832,358 | |
Net increase (decrease) in net assets resulting from operations | | | (3,002,040 | ) | | | 15,008,496 | | | | (5,698,889 | ) | | | 10,650,035 | | | | (1,857,247 | ) | | | 2,930,370 | |
| | | | | | | | | | | | | | | | | | | | | | | | | |
Distributions to Shareholders (Note 4) | | | | | | | | | | | | | | | | | | | | | | | | |
From distributable earnings | | | | | | | | | | | | | | | | | | | | | | | | |
Retail | | | — | | | | — | | | | (480,283 | ) | | | (3,783,515 | ) | | | (86,894 | ) | | | (593,080 | ) |
Institutional | | | — | | | | — | | | | (22,852 | ) | | | (219,787 | ) | | | (81,480 | ) | | | (469,937 | ) |
Decrease in net assets from distributions to shareholders | | | — | | | | — | | | | (503,135 | ) | | | (4,003,302 | ) | | | (168,374 | ) | | | (1,063,017 | ) |
| | | | | | | | | | | | | | | | | | | | | | | | | |
Beneficial Interest Transactions (Note 3) | | | | | | | | | | | | | | | | | | | | | | | | |
Shares sold | | | | | | | | | �� | | | | | | | | | | | | | | | |
Retail | | | 3,873,271 | | | | 4,086,463 | | | | 36,302 | | | | 778,940 | | | | 156,920 | | | | 676,961 | |
Institutional | | | 6,022,876 | | | | 3,342,307 | | | | 471,395 | | | | 638,239 | | | | 641,529 | | | | 7,995,471 | |
Shares issued in reinvestment of distributions | | | | | | | | | | | | | | | | | | | | | | | | |
Retail | | | — | | | | — | | | | 446,907 | | | | 3,516,512 | | | | 86,186 | | | | 588,083 | |
Institutional | | | — | | | | — | | | | 21,239 | | | | 185,180 | | | | 79,250 | | | | 460,651 | |
Cost of shares redeemed | | | | | | | | | | | | | | | | | | | | | | | | |
Retail | | | (6,262,159 | ) | | | (13,127,851 | ) | | | (4,154,642 | ) | | | (6,129,642 | ) | | | (935,763 | ) | | | (1,118,877 | ) |
Institutional | | | (3,162,835 | ) | | | (20,235,840 | ) | | | (1,085,775 | ) | | | (1,006,708 | ) | | | (163,988 | ) | | | (715,048 | ) |
Net increase (decrease) resulting from beneficial interest transactions | | | 471,153 | | | | (25,934,921 | ) | | | (4,264,574 | ) | | | (2,017,479 | ) | | | (135,866 | ) | | | 7,887,241 | |
Total net increase (decrease) in net assets | | | (2,530,887 | ) | | | (10,926,425 | ) | | | (10,466,598 | ) | | | 4,629,254 | | | | (2,161,487 | ) | | | 9,754,594 | |
| | | | | | | | | | | | | | | | | | | | | | | | | |
Net Assets | | | | | | | | | | | | | | | | | | | | | | | | |
Beginning of period | | | 37,544,793 | | | | 48,471,218 | | | | 49,105,378 | | | | 44,476,124 | | | | 18,184,233 | | | | 8,429,639 | |
End of period | | $ | 35,013,906 | | | $ | 37,544,793 | | | $ | 38,638,780 | | | $ | 49,105,378 | | | $ | 16,022,746 | | | $ | 18,184,233 | |
(a) | Prior to May 1, 2019 known as the Segall Bryant & Hamill Large Cap Dividend Fund. |
See Notes to Financial Statements.
112 |  | www.sbhfunds.com | www.sbhfunds.com
|
Segall Bryant & Hamill Funds | Statements of Changes in Net Assets |
| | |
| | Segall Bryant & Hamill
Short Term Plus Fund | | | Segall Bryant & Hamill
Plus Bond Fund | | | Segall Bryant & Hamill
Quality High Yield Fund | |
| | Six Months
Ended
June 30, 2020
(Unaudited) | | | Year Ended
December 31,
2019 | | | Six Months
Ended
June 30, 2020
(Unaudited) | | | Year Ended
December 31,
2019 | | | Six Months
Ended
June 30, 2020
(Unaudited) | | | Year Ended
December 31,
2019 | |
Operations | | | | | | | | | | | | | | | | | | | | | | | | |
Net investment income | | $ | 84,561 | | | $ | 95,097 | | | $ | 14,138,987 | | | $ | 34,782,105 | | | $ | 1,142,365 | | | $ | 2,884,529 | |
Net realized gains (losses) | | | 14,402 | | | | 3,200 | | | | 9,252,620 | | | | 13,798,359 | | | | 9,332 | | | | (188,132 | ) |
Change in unrealized net appreciation (depreciation) | | | 8,922 | | | | 21,459 | | | | 30,619,577 | | | | 47,643,207 | | | | (1,874,459 | ) | | | 4,050,465 | |
Net increase (decrease) in net assets resulting from operations | | | 107,885 | | | | 119,756 | | | | 54,011,184 | | | | 96,223,671 | | | | (722,762 | ) | | | 6,746,862 | |
| | | | | | | | | | | | | | | | | | | | | | | | | |
Distributions to Shareholders (Note 4) | | | | | | | | | | | | | | | | | | | | | | | | |
From distributable earnings | | | | | | | | | | | | | | | | | | | | | | | | |
Retail | | | (10,153 | ) | | | (11,175 | ) | | | (8,370,918 | ) | | | (28,529,912 | ) | | | (772,761 | ) | | | (2,024,965 | ) |
Institutional | | | (77,109 | ) | | | (89,261 | ) | | | (6,657,899 | ) | | | (16,009,661 | ) | | | (482,489 | ) | | | (885,526 | ) |
Decrease in net assets from distributions to shareholders | | | (87,262 | ) | | | (100,436 | ) | | | (15,028,817 | ) | | | (44,539,573 | ) | | | (1,255,250 | ) | | | (2,910,491 | ) |
| | | | | | | | | | | | | | | | | | | | | | | | | |
Beneficial Interest Transactions (Note 3) | | | | | | | | | | | | | | | | | | | | | | | | |
Shares sold | | | | | | | | | | | | | | | | | | | | | | | | |
Retail | | | 237,597 | | | | 906,311 | | | | 67,879,162 | | | | 149,701,038 | | | | 4,948,582 | | | | 3,209,457 | |
Institutional | | | 4,848,898 | | | | 5,645,172 | | | | 63,511,883 | | | | 158,018,092 | | | | 10,513,528 | | | | 9,709,569 | |
Shares issued in reinvestment of distributions | | | | | | | | | | | | | | | | | | | | | | | | |
Retail | | | 10,153 | | | | 11,175 | | | | 8,275,453 | | | | 28,269,316 | | | | 739,024 | | | | 1,950,072 | |
Institutional | | | 73,283 | | | | 88,195 | | | | 5,890,192 | | | | 14,809,802 | | | | 475,563 | | | | 872,830 | |
Cost of shares redeemed | | | | | | | | | | | | | | | | | | | | | | | | |
Retail | | | (3,497 | ) | | | (204,883 | ) | | | (105,850,663 | ) | | | (531,746,876 | ) | | | (6,822,088 | ) | | | (11,303,216 | ) |
Institutional | | | (895,800 | ) | | | (473,330 | ) | | | (65,257,367 | ) | | | (68,196,470 | ) | | | (8,236,455 | ) | | | (2,909,872 | ) |
Net increase (decrease) resulting from beneficial interest transactions | | | 4,270,634 | | | | 5,972,640 | | | | (25,551,340 | ) | | | (249,145,098 | ) | | | 1,618,154 | | | | 1,528,840 | |
Total net increase (decrease) in net assets | | | 4,291,257 | | | | 5,991,960 | | | | 13,431,027 | | | | (197,461,000 | ) | | | (359,858 | ) | | | 5,365,211 | |
| | | | | | | | | | | | | | | | | | | | | | | | | |
Net Assets | | | | | | | | | | | | | | | | | | | | | | | | |
Beginning of period | | | 7,194,379 | | | | 1,202,419 | | | | 1,025,615,300 | | | | 1,223,076,300 | | | | 61,372,318 | | | | 56,007,107 | |
End of period | | $ | 11,485,636 | | | $ | 7,194,379 | | | $ | 1,039,046,327 | | | $ | 1,025,615,300 | | | $ | 61,012,460 | | | $ | 61,372,318 | |
See Notes to Financial Statements.
Semi-Annual Report | June 30, 2020 |  | 113 |
Segall Bryant & Hamill Funds | Statements of Changes in Net Assets |
| | |
| | Segall Bryant & Hamill Municipal
Opportunities Fund | | | Segall Bryant & Hamill Colorado Tax
Free Fund | |
| | Six Months
Ended
June 30, 2020
(Unaudited) | | | Year Ended
December 31,
2019 | | | Six Months
Ended
June 30, 2020
(Unaudited) | | | Year Ended
December 31,
2019 | |
Operations | | | | | | | | | | | | | | | | |
Net investment income | | $ | 1,352,166 | | | $ | 1,908,094 | | | $ | 4,787,506 | | | $ | 7,654,015 | |
Net realized gains (losses) | | | (486,036 | ) | | | 910,342 | | | | (381,138 | ) | | | 312,276 | |
Change in unrealized net appreciation (depreciation) | | | 1,804,341 | | | | 1,585,921 | | | | 1,962,342 | | | | 12,319,333 | |
Net increase in net assets resulting from operations | | | 2,670,471 | | | | 4,404,357 | | | | 6,368,710 | | | | 20,285,624 | |
| | | | | | | | | | | | | | | | | |
Distributions to Shareholders (Note 4) | | | | | | | | | | | | | | | | |
From distributable earnings | | | | | | | | | | | | | | | | |
Retail | | | (209,903 | ) | | | (428,703 | ) | | | (2,481,546 | ) | | | (4,687,591 | ) |
Institutional | | | (1,145,938 | ) | | | (2,405,077 | ) | | | (3,432,787 | ) | | | (5,235,062 | ) |
Decrease in net assets from distributions to shareholders | | | (1,355,841 | ) | | | (2,833,780 | ) | | | (5,914,333 | ) | | | (9,922,653 | ) |
| | | | | | | | | | | | | | | | | |
Beneficial Interest Transactions (Note 3) | | | | | | | | | | | | | | | | |
Shares sold | | | | | | | | | | | | | | | | |
Retail | | | 7,492,908 | | | | 7,708,865 | | | | 50,604,975 | | | | 57,466,427 | |
Institutional | | | 27,750,094 | | | | 36,523,569 | | | | 50,291,835 | | | | 129,804,831 | |
Shares issued in reinvestment of distributions | | | | | | | | | | | | | | | | |
Retail | | | 209,903 | | | | 428,703 | | | | 2,389,885 | | | | 4,418,333 | |
Institutional | | | 1,083,403 | | | | 2,295,201 | | | | 3,025,223 | | | | 4,606,435 | |
Cost of shares redeemed | | | | | | | | | | | | | | | | |
Retail | | | (2,499,425 | ) | | | (3,385,177 | ) | | | (41,971,903 | ) | | | (81,763,303 | ) |
Institutional | | | (4,093,468 | ) | | | (12,994,139 | ) | | | (27,458,492 | ) | | | (20,779,494 | ) |
Net increase resulting from beneficial interest transactions | | | 29,943,415 | | | | 30,577,022 | | | | 36,881,523 | | | | 93,753,229 | |
Total net increase in net assets | | | 31,258,045 | | | | 32,147,599 | | | | 37,335,900 | | | | 104,116,200 | |
| | | | | | | | | | | | | | | | | |
Net Assets | | | | | | | | | | | | | | | | |
Beginning of period | | | 73,756,695 | | | | 41,609,096 | | | | 376,751,105 | | | | 272,634,905 | |
End of period | | $ | 105,014,740 | | | $ | 73,756,695 | | | $ | 414,087,005 | | | $ | 376,751,105 | |
See Notes to Financial Statements.
114 |  | www.sbhfunds.com | www.sbhfunds.com
|
Segall Bryant & Hamill Small Cap Value Fund | Financial Highlights |
For a Share Outstanding Throughout the Periods Presented |
Retail | | Six Months
Ended
June 30, 2020
(Unaudited) | | | Period Ended
December 31,
2019(a) | |
Net asset value, beginning of period | | $ | 12.71 | | | $ | 12.34 | |
Income (loss) from investment operations: | | | | | | | | |
Net investment income(b) | | | 0.01 | | | | 0.01 | |
Net realized and unrealized gains (losses) on investments | | | (2.36 | ) | | | 0.36 | |
Total from investment operations | | | (2.35 | ) | | | 0.37 | |
| | | | | | | | | |
Net asset value, end of period | | $ | 10.36 | | | $ | 12.71 | |
| | | | | | | | | |
Total Return | | | (18.49 | )%(c) | | | 3.00 | %(c) |
| | | | | | | | | |
Ratios and Supplemental Data | | | | | | | | |
Net assets, end of period (in 000s) | | $ | 154 | | | $ | 10 | |
| | | | | | | | | |
Ratio of expenses to average net assets | | | | | | | | |
With fee waivers/reimbursements | | | 1.05 | %(d) | | | 1.06 | %(d) |
Without fee waivers/reimbursements | | | 1.05 | %(d) | | | 1.06 | %(d) |
Ratio of net investment income to average net assets | | | | | | | | |
With fee waivers/reimbursements | | | 0.11 | %(d) | | | 1.37 | %(d) |
Without fee waivers/reimbursements | | | 0.11 | %(d) | | | 1.37 | %(d) |
Portfolio turnover rate | | | 34 | %(c) | | | 28 | %(c)(e) |
(a) | The Fund added a retail share class on December 9, 2019. Ratios for start up periods may not be representative of long term operating results. |
(b) | Calculated using the average shares method. |
(c) | Total return and portfolio turnover are not annualized for periods less than one full year. |
(e) | Portfolio turnover rate is calculated at the fund level and represents the six months ended December 31, 2019. |
See Notes to Financial Statements.
Semi-Annual Report | June 30, 2020 |  | 115 |
Segall Bryant & Hamill Small Cap Value Fund | Financial Highlights |
For a Share Outstanding Throughout the Periods Presented |
Institutional | | Six Months
Ended
June 30, 2020
(Unaudited) | | | Six Months
Ended
December 31,
2019(a) | | | Year Ended
June 30,
2019 | | | Year Ended
June 30,
2018 | | | Year Ended
June 30,
2017 | | | Year Ended
June 30,
2016 | | | Year Ended
June 30,
2015 | |
Net asset value, beginning of period | | $ | 12.71 | | | $ | 12.59 | | | $ | 13.18 | | | $ | 12.17 | | | $ | 10.33 | | | $ | 11.45 | | | $ | 11.39 | |
Income (loss) from investment operations: | | | | | | | | | | | | | | | | | | | | | | | | | | | | |
Net investment income(b) | | | 0.00 | (c) | | | 0.09 | | | | 0.10 | | | | 0.05 | | | | 0.01 | | | | 0.03 | | | | 0.02 | |
Net realized and unrealized gains (losses) on investments | | | (2.35 | ) | | | 0.80 | | | | 0.42 | | | | 1.81 | | | | 1.86 | | | | (0.58 | ) | | | 0.53 | |
Total from investment operations | | | (2.35 | ) | | | 0.89 | | | | 0.52 | | | | 1.86 | | | | 1.87 | | | | (0.55 | ) | | | 0.55 | |
| | | | | | | | | | | | | | | | | | | | | | | | | | | | | |
Less dividends and distributions: | | | | | | | | | | | | | | | | | | | | | | | | | | | | |
Dividends from net investment income | | | — | | | | (0.11 | ) | | | (0.08 | ) | | | (0.02 | ) | | | (0.01 | ) | | | (0.02 | ) | | | (0.01 | ) |
Distributions from net realized gains | | | — | | | | (0.66 | ) | | | (1.03 | ) | | | (0.83 | ) | | | (0.02 | ) | | | (0.55 | ) | | | (0.48 | ) |
Total distributions | | | — | | | | (0.77 | ) | | | (1.11 | ) | | | (0.85 | ) | | | (0.03 | ) | | | (0.57 | ) | | | (0.49 | ) |
| | | | | | | | | | | | | | | | | | | | | | | | | | | | | |
Paid-in capital from redemption fees | | | — | | | | 0.00 | (c) | | | 0.00 | (c) | | | 0.00 | (c) | | | 0.00 | (c) | | | 0.00 | (c) | | | 0.00 | (c) |
Net asset value, end of period | | $ | 10.36 | | | $ | 12.71 | | | $ | 12.59 | | | $ | 13.18 | | | $ | 12.17 | | | $ | 10.33 | | | $ | 11.45 | |
| | | | | | | | | | | | | | | | | | | | | | | | | | | | | |
Total Return | | | (18.49 | )%(d) | | | 7.30 | %(d) | | | 5.33 | % | | | 15.63 | % | | | 18.07 | % | | | (4.68 | )% | | | 5.21 | % |
| | | | | | | | | | | | | | | | | | | | | | | | | | | | | |
Ratios and Supplemental Data | | | | | | | | | | | | | | | | | | | | | | | | | | | | |
Net assets, end of period (in 000s) | | $ | 228,904 | | | $ | 169,891 | | | $ | 141,192 | | | $ | 106,836 | | | $ | 63,072 | | | $ | 43,105 | | | $ | 30,660 | |
| | | | | | | | | | | | | | | | | | | | | | | | | | | | | |
Ratio of expenses to average net assets | | | | | | | | | | | | | | | | | | | | | | | | | | | | |
With fee waivers/reimbursements | | | 0.99 | %(e) | | | 0.99 | %(e) | | | 0.99 | % | | | 1.01 | %(f) | | | 1.15 | %(g) | | | 1.20 | % | | | 1.20 | % |
Without fee waivers/reimbursements | | | 1.06 | %(e) | | | 1.14 | %(e) | | | 1.14 | % | | | 1.25 | % | | | 1.39 | % | | | 1.68 | % | | | 1.84 | % |
Ratio of net investment income (loss) to average net assets | | | | | | | | | | | | | | | | | | | | | | | | | | | | |
With fee waivers/reimbursements | | | 0.05 | %(e) | | | 1.38 | %(e) | | | 0.81 | % | | | 0.42 | % | | | 0.09 | % | | | 0.28 | % | | | 0.16 | % |
Without fee waivers/reimbursements | | | (0.03 | )%(e) | | | 1.23 | %(e) | | | 0.66 | % | | | 0.18 | % | | | (0.15 | )% | | | (0.20 | )% | | | (0.48 | )% |
Portfolio turnover rate | | | 34 | %(d) | | | 28 | %(d) | | | 68 | % | | | 59 | % | | | 70 | % | | | 57 | % | | | 51 | % |
(a) | Fund changed fiscal year to December 31. |
(b) | Calculated using the average shares method. |
(c) | Less than $0.005 per share. |
(d) | Total return and portfolio turnover are not annualized for periods less than one full year. |
(f) | Contractual expense limitation changed from 1.08% to 0.99% effective November 1, 2017. |
(g) | Contractual expense limitation changed from 1.20% to 1.08% effective February 1, 2017. |
See Notes to Financial Statements.
116 |  | www.sbhfunds.com | www.sbhfunds.com
|
Segall Bryant & Hamill Small Cap Value Dividend Fund | Financial Highlights |
For a Share Outstanding Throughout the Periods Presented |
Retail | | Six Months
Ended
June 30, 2020
(Unaudited) | | | Year Ended
December 31,
2019 | | | Year Ended
December 31,
2018(a) | | | Year Ended
December 31,
2017 | | | Year Ended
December 31,
2016 | | | Year Ended
December 31,
2015 | |
Net asset value, beginning of period | | $ | 8.99 | | | $ | 8.06 | | | $ | 10.68 | | | $ | 12.52 | | | $ | 10.52 | | | $ | 13.45 | |
Income (loss) from investment operations: | | | | | | | | | | | | | | | | | | | | | | | | |
Net investment income(b) | | | 0.04 | | | | 0.16 | | | | 0.11 | | | | 0.10 | | | | 0.11 | | | | 0.13 | |
Net realized and unrealized gains (losses) on investments | | | (2.32 | ) | | | 1.06 | | | | (1.52 | ) | | | (0.35 | ) | | | 3.02 | | | | (1.22 | ) |
Total from investment operations | | | (2.28 | ) | | | 1.22 | | | | (1.41 | ) | | | (0.25 | ) | | | 3.13 | | | | (1.08 | ) |
| | | | | | | | | | | | | | | | | | | | | | | | | |
Less dividends and distributions: | | | | | | | | | | | | | | | | | | | | | | | | |
Dividends from net investment income | | | — | | | | (0.17 | ) | | | (0.17 | ) | | | (0.14 | ) | | | (0.18 | ) | | | (0.10 | ) |
Distributions from net realized gains | | | — | | | | (0.12 | ) | | | (1.04 | ) | | | (1.45 | ) | | | (0.95 | ) | | | (1.75 | ) |
Total distributions | | | — | | | | (0.29 | ) | | | (1.21 | ) | | | (1.59 | ) | | | (1.13 | ) | | | (1.85 | ) |
| | | | | | | | | | | | | | | | | | | | | | | | | |
Net asset value, end of period | | $ | 6.71 | | | $ | 8.99 | | | $ | 8.06 | | | $ | 10.68 | | | $ | 12.52 | | | $ | 10.52 | |
| | | | | | | | | | | | | | | | | | | | | | | | | |
Total Return | | | (25.36 | )%(c) | | | 15.10 | % | | | (13.76 | )% | | | (1.84 | )% | | | 29.72 | % | | | (8.13 | )% |
| | | | | | | | | | | | | | | | | | | | | | | | | |
Ratios and Supplemental Data | | | | | | | | | | | | | | | | | | | | | | | | |
Net assets, end of period (in 000s) | | $ | 11,030 | | | $ | 19,821 | | | $ | 18,940 | | | $ | 63,507 | | | $ | 86,518 | | | $ | 79,038 | |
| | | | | | | | | | | | | | | | | | | | | | | | | |
Ratio of expenses to average net assets | | | | | | | | | | | | | | | | | | | | | | | | |
With fee waivers/reimbursements | | | 1.14 | %(d) | | | 1.19 | %(e) | | | 1.30 | % | | | 1.30 | % | | | 1.30 | % | | | 1.30 | % |
Without fee waivers/reimbursements | | | 1.31 | %(d) | | | 1.33 | % | | | 1.49 | % | | | 1.46 | % | | | 1.45 | % | | | 1.39 | % |
Ratio of net investment income to average net assets | | | | | | | | | | | | | | | | | | | | | | | | |
With fee waivers/reimbursements | | | 1.10 | %(d) | | | 1.75 | % | | | 0.99 | % | | | 0.87 | % | | | 0.99 | % | | | 0.99 | % |
Without fee waivers/reimbursements | | | 0.94 | %(d) | | | 1.61 | % | | | 0.80 | % | | | 0.71 | % | | | 0.84 | % | | | 0.90 | % |
Portfolio turnover rate | | | 53 | %(c) | | | 85 | % | | | 83 | % | | | 99 | % | | | 96 | % | | | 74 | % |
(a) | Prior to April 30, 2018 known as the Westcore Small-Cap Value Dividend Fund. |
(b) | Calculated using the average shares method. |
(c) | Total return and portfolio turnover are not annualized for periods less than one full year. |
(e) | Contractual expense limitation changed from 1.30% to 1.14% effective May 1, 2019. |
See Notes to Financial Statements.
Semi-Annual Report | June 30, 2020 |  | 117 |
Segall Bryant & Hamill Small Cap Value Dividend Fund | Financial Highlights |
For a Share Outstanding Throughout the Periods Presented |
Institutional | | Six Months
Ended
June 30, 2020
(Unaudited) | | | Year Ended
December 31,
2019 | | | Year Ended
December 31,
2018(a) | | | Year Ended
December 31,
2017 | | | Year Ended
December 31,
2016 | | | Year Ended
December 31,
2015 | |
Net asset value, beginning of period | | $ | 9.07 | | | $ | 8.13 | | | $ | 10.70 | | | $ | 12.53 | | | $ | 10.53 | | | $ | 13.47 | |
Income (loss) from investment operations: | | | | | | | | | | | | | | | | | | | | | | | | |
Net investment income(b) | | | 0.05 | | | | 0.17 | | | | 0.13 | | | | 0.13 | | | | 0.14 | | | | 0.15 | |
Net realized and unrealized gains (losses) on investments | | | (2.35 | ) | | | 1.07 | | | | (1.52 | ) | | | (0.36 | ) | | | 3.02 | | | | (1.21 | ) |
Total from investment operations | | | (2.30 | ) | | | 1.24 | | | | (1.39 | ) | | | (0.23 | ) | | | 3.16 | | | | (1.06 | ) |
| | | | | | | | | | | | | | | | | | | | | | | | | |
Less dividends and distributions: | | | | | | | | | | | | | | | | | | | | | | | | |
Dividends from net investment income | | | — | | | | (0.18 | ) | | | (0.14 | ) | | | (0.15 | ) | | | (0.21 | ) | | | (0.13 | ) |
Distributions from net realized gains | | | — | | | | (0.12 | ) | | | (1.04 | ) | | | (1.45 | ) | | | (0.95 | ) | | | (1.75 | ) |
Total distributions | | | — | | | | (0.30 | ) | | | (1.18 | ) | | | (1.60 | ) | | | (1.16 | ) | | | (1.88 | ) |
| | | | | | | | | | | | | | | | | | | | | | | | | |
Net asset value, end of period | | $ | 6.77 | | | $ | 9.07 | | | $ | 8.13 | | | $ | 10.70 | | | $ | 12.53 | | | $ | 10.53 | |
| | | | | | | | | | | | | | | | | | | | | | | | | |
Total Return | | | (25.36 | )%(c) | | | 15.26 | % | | | (13.55 | )% | | | (1.67 | )% | | | 29.98 | % | | | (7.98 | )% |
| | | | | | | | | | | | | | | | | | | | | | | | | |
Ratios and Supplemental Data | | | | | | | | | | | | | | | | | | | | | | | | |
Net assets, end of period (in 000s) | | $ | 47,228 | | | $ | 68,392 | | | $ | 69,053 | | | $ | 113,685 | | | $ | 130,098 | | | $ | 105,418 | |
| | | | | | | | | | | | | | | | | | | | | | | | | |
Ratio of expenses to average net assets | | | | | | | | | | | | | | | | | | | | | | | | |
With fee waivers/reimbursements | | | 0.99 | %(d) | �� | | 1.04 | %(e) | | | 1.13 | % | | | 1.12 | % | | | 1.08 | % | | | 1.13 | % |
Without fee waivers/reimbursements | | | 1.16 | %(d) | | | 1.17 | % | | | 1.29 | % | | | 1.26 | % | | | 1.24 | % | | | 1.22 | % |
Ratio of net investment income to average net assets | | | | | | | | | | | | | | | | | | | | | | | | |
With fee waivers/reimbursements | | | 1.30 | %(d) | | | 1.90 | % | | | 1.21 | % | | | 1.08 | % | | | 1.24 | % | | | 1.15 | % |
Without fee waivers/reimbursements | | | 1.13 | %(d) | | | 1.77 | % | | | 1.05 | % | | | 0.94 | % | | | 1.08 | % | | | 1.06 | % |
Portfolio turnover rate | | | 53 | %(c) | | | 85 | % | | | 83 | % | | | 99 | % | | | 96 | % | | | 74 | % |
(a) | Prior to April 30, 2018 known as the Westcore Small-Cap Value Dividend Fund. |
(b) | Calculated using the average shares method. |
(c) | Total return and portfolio turnover are not annualized for periods less than one full year. |
(e) | Contractual expense limitation changed from 1.15% to 0.99% effective May 1, 2019. |
See Notes to Financial Statements.
118 |  | www.sbhfunds.com | www.sbhfunds.com
|
Segall Bryant & Hamill Small Cap Growth Fund | Financial Highlights |
For a Share Outstanding Throughout the Periods Presented |
Retail | | Six Months
Ended
June 30, 2020
(Unaudited) | | | Year Ended
December 31,
2019 | | | Year Ended
December 31,
2018(a) | | | Year Ended
December 31,
2017 | | | Year Ended
December 31,
2016 | | | Year Ended
December 31,
2015 | |
Net asset value, beginning of period | | $ | 13.04 | | | $ | 10.15 | | | $ | 12.72 | | | $ | 10.89 | | | $ | 10.01 | | | $ | 10.52 | |
Income (loss) from investment operations: | | | | | | | | | | | | | | | | | | | | | | | | |
Net investment loss(b) | | | (0.05 | ) | | | (0.06 | ) | | | (0.11 | ) | | | (0.10 | ) | | | (0.09 | ) | | | (0.11 | ) |
Net realized and unrealized gains (losses) on investments | | | 1.10 | | | | 2.95 | | | | 0.63 | | | | 2.93 | | | | 0.97 | | | | (0.39 | ) |
Total from investment operations | | | 1.05 | | | | 2.89 | | | | 0.52 | | | | 2.83 | | | | 0.88 | | | | (0.50 | ) |
| | | | | | | | | | | | | | | | | | | | | | | | | |
Less dividends and distributions: | | | | | | | | | | | | | | | | | | | | | | | | |
Distributions from net realized gains | | | — | | | | — | | | | (2.95 | ) | | | (1.00 | ) | | | — | | | | (0.01 | ) |
Return of capital | | | — | | | | — | | | | (0.14 | ) | | | — | | | | — | | | | — | |
Total distributions | | | — | | | | — | | | | (3.09 | ) | | | (1.00 | ) | | | — | | | | (0.01 | ) |
| | | | | | | | | | | | | | | | | | | | | | | | | |
Net asset value, end of period | | $ | 14.09 | | | $ | 13.04 | | | $ | 10.15 | | | $ | 12.72 | | | $ | 10.89 | | | $ | 10.01 | |
| | | | | | | | | | | | | | | | | | | | | | | | | |
Total Return | | | 8.05 | %(c) | | | 28.47 | % | | | 3.19 | % | | | 25.98 | % | | | 8.79 | % | | | (4.77 | )% |
| | | | | | | | | | | | | | | | | | | | | | | | | |
Ratios and Supplemental Data | | | | | | | | | | | | | | | | | | | | | | | | |
Net assets, end of period (in 000s) | | $ | 2,677 | | | $ | 2,836 | | | $ | 1,570 | | | $ | 930 | | | $ | 744 | | | $ | 499 | |
| | | | | | | | | | | | | | | | | | | | | | | | | |
Ratio of expenses to average net assets | | | | | | | | | | | | | | | | | | | | | | | | |
With fee waivers/reimbursements | | | 1.13 | %(d) | | | 1.12 | % | | | 1.24 | %(e) | | | 1.26 | %(f) | | | 1.30 | % | | | 1.30 | % |
Without fee waivers/reimbursements | | | 1.14 | %(d) | | | 1.12 | % | | | 3.09 | % | | | 2.88 | % | | | 5.93 | % | | | 4.96 | %(g) |
Ratio of net investment loss to average net assets | | | | | | | | | | | | | | | | | | | | | | | | |
With fee waivers/reimbursements | | | (0.74 | )%(d) | | | (0.51 | )% | | | (0.76 | )% | | | (0.80 | )% | | | (0.87 | )% | | | (1.03 | )% |
Without fee waivers/reimbursements | | | (0.75 | )%(d) | | | (0.51 | )% | | | (2.61 | )% | | | (2.42 | )% | | | (5.50 | )% | | | (4.69 | )% |
Portfolio turnover rate | | | 29 | %(c) | | | 28 | % | | | 83 | % | | | 51 | % | | | 81 | % | | | 69 | % |
(a) | Prior to April 30, 2018 known as the Westcore Small-Cap Growth Fund. |
(b) | Calculated using the average shares method. |
(c) | Total return and portfolio turnover are not annualized for periods less than one full year. |
(e) | Contractual expense limitation changed from 1.24% to 1.14% effective December 20, 2018. |
(f) | Contractual expense limitation changed from 1.30% to 1.24% effective April 30, 2017. |
(g) | Ratios before fee waivers for start up periods may not be representative of long-term operating results. |
See Notes to Financial Statements.
Semi-Annual Report | June 30, 2020 |  | 119 |
Segall Bryant & Hamill Small Cap Growth Fund | Financial Highlights |
For a Share Outstanding Throughout the Periods Presented |
Institutional | | Six Months
Ended
June 30, 2020
(Unaudited) | | | Year Ended
December 31,
2019 | | | Year Ended
December 31,
2018(a) | | | Year Ended
December 31,
2017 | | | Year Ended
December 31,
2016 | | | Year Ended
December 31,
2015 | |
Net asset value, beginning of period | | $ | 13.33 | | | $ | 10.36 | | | $ | 12.88 | | | $ | 11.01 | | | $ | 10.09 | | | $ | 10.56 | |
Income (loss) from investment operations: | | | | | | | | | | | | | | | | | | | | | | | | |
Net investment loss(b) | | | (0.04 | ) | | | (0.05 | ) | | | (0.08 | ) | | | (0.09 | ) | | | (0.06 | ) | | | (0.07 | ) |
Net realized and unrealized gains (losses) on investments | | | 1.12 | | | | 3.02 | | | | 0.65 | | | | 2.96 | | | | 0.98 | | | | (0.39 | ) |
Total from investment operations | | | 1.08 | | | | 2.97 | | | | 0.57 | | | | 2.87 | | | | 0.92 | | | | (0.46 | ) |
| | | | | | | | | | | | | | | | | | | | | | | | | |
Less dividends and distributions: | | | | | | | | | | | | | | | | | | | | | | | | |
Distributions from net realized gains | | | — | | | | — | | | | (2.95 | ) | | | (1.00 | ) | | | — | | | | (0.01 | ) |
Return of capital | | | — | | | | — | | | | (0.14 | ) | | | — | | | | — | | | | — | |
Total distributions | | | — | | | | — | | | | (3.09 | ) | | | (1.00 | ) | | | — | | | | (0.01 | ) |
| | | | | | | | | | | | | | | | | | | | | | | | | |
Paid-in capital from redemption fees | | | — | | | | — | | | | — | | | | — | | | | 0.00 | (c) | | | — | |
Net asset value, end of period | | $ | 14.41 | | | $ | 13.33 | | | $ | 10.36 | | | $ | 12.88 | | | $ | 11.01 | | | $ | 10.09 | |
| | | | | | | | | | | | | | | | | | | | | | | | | |
Total Return | | | 8.10 | %(d) | | | 28.67 | % | | | 3.56 | % | | | 26.05 | % | | | 9.12 | % | | | (4.37 | )% |
| | | | | | | | | | | | | | | | | | | | | | | | | |
Ratios and Supplemental Data | | | | | | | | | | | | | | | | | | | | | | | | |
Net assets, end of period (in 000s) | | $ | 73,966 | | | $ | 72,341 | | | $ | 63,082 | | | $ | 4,791 | | | $ | 3,519 | | | $ | 6,011 | |
| | | | | | | | | | | | | | | | | | | | | | | | | |
Ratio of expenses to average net assets | | | | | | | | | | | | | | | | | | | | | | | | |
With fee waivers/reimbursements | | | 0.99 | %(e) | | | 0.98 | % | | | 0.99 | % | | | 1.20 | % | | | 1.05 | %(f) | | | 0.88 | %(f) |
Without fee waivers/reimbursements | | | 1.02 | %(e) | | | 0.98 | % | | | 2.26 | % | | | 2.74 | % | | | 2.63 | % | | | 2.21 | %(g) |
Ratio of net investment loss to average net assets | | | | | | | | | | | | | | | | | | | | | | | | |
With fee waivers/reimbursements | | | (0.60 | )%(e) | | | (0.38 | )% | | | (0.63 | )% | | | (0.74 | )% | | | (0.65 | )% | | | (0.61 | )% |
Without fee waivers/reimbursements | | | (0.63 | )%(e) | | | (0.38 | )% | | | (1.90 | )% | | | (2.28 | )% | | | (2.22 | )% | | | (1.94 | )% |
Portfolio turnover rate | | | 29 | %(d) | | | 28 | % | | | 83 | % | | | 51 | % | | | 81 | % | | | 69 | % |
(a) | Prior to April 30, 2018 known as the Westcore Small-Cap Growth Fund. |
(b) | Calculated using the average shares method. |
(c) | Less than $0.005 per share. |
(d) | Total return and portfolio turnover are not annualized for periods less than one full year. |
(f) | Net expense ratio is significantly less than expected rate in prospectus, effective for that period, of 1.15% due to the higher asset levels in the institutional class compared to the retail class. If the retail class assets increase relative to the institutional class assets it is expected that the net expense ratio will be closer to the 1.15% expected rate. |
(g) | Ratios before fee waivers for start up periods may not be representative of long-term operating results. |
See Notes to Financial Statements.
120 |  | www.sbhfunds.com | www.sbhfunds.com
|
Segall Bryant & Hamill Small Cap Core Fund | Financial Highlights |
For a Share Outstanding Throughout the Period Presented |
Retail | | Six Months
Ended
June 30, 2020
(Unaudited) | |
Net asset value, beginning of period | | $ | 10.00 | |
Loss from investment operations: | | | | |
Net investment loss(a) | | | (0.02 | ) |
Net realized and unrealized losses on investments | | | (0.54 | ) |
Total from investment operations | | | (0.56 | ) |
| | | | | |
Net asset value, end of period | | $ | 9.44 | |
| | | | | |
Total Return | | | (5.60 | )%(b) |
| | | | | |
Ratios and Supplemental Data | | | | |
Net assets, end of period (in 000s) | | $ | 235 | |
| | | | | |
Ratio of expenses to average net assets | | | | |
With fee waivers/reimbursements | | | 1.14 | %(c) |
Without fee waivers/reimbursements | | | 1.42 | %(c) |
Ratio of net investment loss to average net assets | | | | |
With fee waivers/reimbursements | | | (0.39 | )%(c) |
Without fee waivers/reimbursements | | | (0.68 | )%(c) |
Portfolio turnover rate | | | 33 | %(b) |
(a) | Calculated using the average shares method. |
(b) | Total return and portfolio turnover are not annualized for periods less than one full year. |
See Notes to Financial Statements.
Semi-Annual Report | June 30, 2020 |  | 121 |
Segall Bryant & Hamill Small Cap Core Fund | Financial Highlights |
For a Share Outstanding Throughout the Period Presented |
Institutional | | Six Months
Ended
June 30, 2020
(Unaudited) | |
Net asset value, beginning of period | | $ | 10.00 | |
Loss from investment operations: | | | | |
Net investment loss(a) | | | (0.01 | ) |
Net realized and unrealized losses on investments | | | (0.54 | ) |
Total from investment operations | | | (0.55 | ) |
| | | | | |
Net asset value, end of period | | $ | 9.45 | |
| | | | | |
Total Return | | | (5.50 | )%(b) |
| | | | | |
Ratios and Supplemental Data | | | | |
Net assets, end of period (in 000s) | | $ | 37,666 | |
| | | | | |
Ratio of expenses to average net assets | | | | |
With fee waivers/reimbursements | | | 0.99 | %(c) |
Without fee waivers/reimbursements | | | 1.39 | %(c) |
Ratio of net investment loss to average net assets | | | | |
With fee waivers/reimbursements | | | (0.27 | )%(c) |
Without fee waivers/reimbursements | | | (0.68 | )%(c) |
Portfolio turnover rate | | | 33 | %(b) |
(a) | Calculated using the average shares method. |
(b) | Total return and portfolio turnover are not annualized for periods less than one full year. |
See Notes to Financial Statements.
122 |  | www.sbhfunds.com | www.sbhfunds.com
|
Segall Bryant & Hamill Mid Cap Value Dividend Fund | Financial Highlights |
For a Share Outstanding Throughout the Periods Presented |
Retail | | Six Months
Ended
June 30, 2020
(Unaudited) | | | Year Ended
December 31,
2019 | | | Year Ended
December 31,
2018(a) | | | Year Ended
December 31,
2017 | | | Year Ended
December 31,
2016 | | | Year Ended
December 31,
2015 | |
Net asset value, beginning of period | | $ | 25.22 | | | $ | 21.28 | | | $ | 26.87 | | | $ | 27.46 | | | $ | 23.47 | | | $ | 26.87 | |
Income (loss) from investment operations: | | | | | | | | | | | | | | | | | | | | | | | | |
Net investment income(b) | | | 0.14 | | | | 0.34 | | | | 0.25 | | | | 0.25 | | | | 0.24 | | | | 0.26 | |
Net realized and unrealized gains (losses) on investments | | | (4.52 | ) | | | 4.35 | | | | (3.95 | ) | | | 1.38 | | | | 5.11 | | | | (0.68 | ) |
Total from investment operations | | | (4.38 | ) | | | 4.69 | | | | (3.70 | ) | | | 1.63 | | | | 5.35 | | | | (0.42 | ) |
| | | | | | | | | | | | | | | | | | | | | | | | | |
Less dividends and distributions: | | | | | | | | | | | | | | | | | | | | | | | | |
Dividends from net investment income | | | — | | | | (0.41 | ) | | | (0.29 | ) | | | (0.36 | ) | | | (0.41 | ) | | | (0.23 | ) |
Distributions from net realized gains | | | — | | | | (0.34 | ) | | | (1.60 | ) | | | (1.86 | ) | | | (0.95 | ) | | | (2.75 | ) |
Total distributions | | | — | | | | (0.75 | ) | | | (1.89 | ) | | | (2.22 | ) | | | (1.36 | ) | | | (2.98 | ) |
Net asset value, end of period | | $ | 20.84 | | | $ | 25.22 | | | $ | 21.28 | | | $ | 26.87 | | | $ | 27.46 | | | $ | 23.47 | |
| | | | | | | | | | | | | | | | | | | | | | | | |
Total Return | | | (17.37 | )%(c) | | | 22.04 | % | | | (14.12 | )% | | | 6.02 | % | | | 22.76 | % | | | (1.50 | )% |
| | | | | | | | | | | | | | | | | | | | | | | | | |
Ratios and Supplemental Data | | | | | | | | | | | | | | | | | | | | | | | | |
Net assets, end of period (in 000s) | | $ | 24,955 | | | $ | 42,954 | | | $ | 46,149 | | | $ | 44,442 | | | $ | 44,021 | | | $ | 51,742 | |
| | | | | | | | | | | | | | | | | | | | | | | | | |
Ratio of expenses to average net assets | | | | | | | | | | | | | | | | | | | | | | | | |
With fee waivers/reimbursements | | | 0.99 | %(d) | | | 1.03 | %(e) | | | 1.15 | % | | | 1.17 | %(f) | | | 1.25 | % | | | 1.20 | % |
Without fee waivers/reimbursements | | | 1.13 | %(d) | | | 1.08 | % | | | 1.15 | % | | | 1.18 | % | | | 1.28 | % | | | 1.20 | % |
Ratio of net investment income to average net assets | | | | | | | | | | | | | | | | | | | | | | | | |
With fee waivers/reimbursements | | | 1.33 | %(d) | | | 1.39 | % | | | 0.96 | % | | | 0.89 | % | | | 0.97 | % | | | 0.96 | % |
Without fee waivers/reimbursements | | | 1.19 | %(d) | | | 1.34 | % | | | 0.96 | % | | | 0.88 | % | | | 0.94 | % | | | 0.96 | % |
Portfolio turnover rate | | | 38 | %(c) | | | 74 | % | | | 125 | % | | | 94 | % | | | 78 | % | | | 62 | % |
(a) | Prior to April 30, 2018 known as the Westcore Mid-Cap Value Dividend Fund. |
(b) | Calculated using the average shares method. |
(c) | Total return and portfolio turnover are not annualized for periods less than one full year. |
(e) | Contractual expense limitation changed from 1.15% to 0.99% effective May 1, 2019. |
(f) | Contractual expense limitation changed from 1.25% to 1.15% effective April 30, 2017. |
See Notes to Financial Statements.
Semi-Annual Report | June 30, 2020 |  | 123 |
Segall Bryant & Hamill Mid Cap Value Dividend Fund | Financial Highlights |
For a Share Outstanding Throughout the Periods Presented |
Institutional | | Six Months
Ended
June 30, 2020
(Unaudited) | | | Year Ended
December 31,
2019 | | | Year Ended
December 31,
2018(a) | | | Year Ended
December 31,
2017 | | | Period Ended
December 31,
2016(b) | |
Net asset value, beginning of period | | $ | 25.71 | | | $ | 21.67 | | | $ | 27.30 | | | $ | 27.81 | | | $ | 24.89 | |
Income (loss) from investment operations: | | | | | | | | | | | | | | | | | | | | |
Net investment income(c) | | | 0.15 | | | | 0.38 | | | | 0.30 | | | | 0.30 | | | | 0.31 | |
Net realized and unrealized gains (losses) on investments | | | (4.63 | ) | | | 4.43 | | | | (4.02 | ) | | | 1.41 | | | | 3.67 | |
Total from investment operations | | | (4.48 | ) | | | 4.81 | | | | (3.72 | ) | | | 1.71 | | | | 3.98 | |
| | | | | | | | | | | | | | | | | | | | | |
Less dividends and distributions: | | | | | | | | | | | | | | | | | | | | |
Dividends from net investment income | | | — | | | | (0.43 | ) | | | (0.31 | ) | | | (0.36 | ) | | | (0.11 | ) |
Distributions from net realized gains | | | — | | | | (0.34 | ) | | | (1.60 | ) | | | (1.86 | ) | | | (0.95 | ) |
Total distributions | | | — | | | | (0.77 | ) | | | (1.91 | ) | | | (2.22 | ) | | | (1.06 | ) |
Net asset value, end of period | | $ | 21.23 | | | $ | 25.71 | | | $ | 21.67 | | | $ | 27.30 | | | $ | 27.81 | |
| | | | | | | | | | | | | | | | | | | | | |
Total Return | | | (17.43 | )%(d) | | | 22.22 | % | | | (13.97 | )% | | | 6.23 | % | | | 15.96 | %(d) |
| | | | | | | | | | | | | | | | | | | | | |
Ratios and Supplemental Data | | | | | | | | | | | | | | | | | | | | |
Net assets, end of period (in 000s) | | $ | 2,333 | | | $ | 32,293 | | | $ | 36,037 | | | $ | 39,470 | | | $ | 36,355 | |
| | | | | | | | | | | | | | | | | | | | | |
Ratio of expenses to average net assets | | | | | | | | | | | | | | | | | | | | |
With fee waivers/reimbursements | | | 0.84 | %(e) | | | 0.88 | %(f) | | | 0.96 | % | | | 0.98 | % | | | 1.00 | %(e) |
Without fee waivers/reimbursements | | | 1.06 | %(e) | | | 0.98 | % | | | 0.96 | % | | | 1.00 | % | | | 1.15 | %(e) |
Ratio of net investment income to average net assets | | | | | | | | | | | | | | | | | | | | |
With fee waivers/reimbursements | | | 1.36 | %(e) | | | 1.51 | % | | | 1.13 | % | | | 1.08 | % | | | 1.67 | %(e) |
Without fee waivers/reimbursements | | | 1.14 | %(e) | | | 1.41 | % | | | 1.13 | % | | | 1.06 | % | | | 1.52 | %(e) |
Portfolio turnover rate | | | 38 | %(d) | | | 74 | % | | | 125 | % | | | 94 | % | | | 78 | %(g) |
(a) | Prior to April 30, 2018 known as the Westcore Mid-Cap Value Dividend Fund. |
(b) | The Fund added an institutional share class on April 29, 2016. |
(c) | Calculated using the average shares method. |
(d) | Total return and portfolio turnover are not annualized for periods less than one full year. |
(f) | Contractual expense limitation changed from 0.99% to is 0.84% effective May 1, 2019. |
(g) | Porfolio turnover rate is calculated at the fund level and represents the year ended December 31, 2016. |
See Notes to Financial Statements.
124 |  | www.sbhfunds.com | www.sbhfunds.com
|
Segall Bryant & Hamill All Cap Fund | Financial Highlights |
For a Share Outstanding Throughout the Periods Presented |
Retail | | Six Months
Ended
June 30, 2020
(Unaudited) | | | Period Ended
December 31,
2019(a) | |
Net asset value, beginning of period | | $ | 17.00 | | | $ | 16.49 | |
Income (loss) from investment operations: | | | | | | | | |
Net investment income (loss)(b) | | | 0.01 | | | | (0.00 | )(c) |
Net realized and unrealized gains on investments | | | 0.34 | | | | 0.51 | |
Total from investment operations | | | 0.35 | | | | 0.51 | |
| | | | | | | | | |
Net asset value, end of period | | $ | 17.35 | | | $ | 17.00 | |
| | | | | | | | | |
Total Return | | | 2.06 | %(d) | | | 3.09 | %(d) |
| | | | | | | | | |
Ratios and Supplemental Data | | | | | | | | |
Net assets, end of period (in 000s) | | $ | 24 | | | $ | 10 | |
| | | | | | | | | |
Ratio of expenses to average net assets | | | | | | | | |
With fee waivers/reimbursements | | | 0.96 | %(e) | | | 0.98 | %(e) |
Without fee waivers/reimbursements | | | 0.97 | %(e) | | | 1.00 | %(e) |
Ratio of net investment income (loss) to average net assets | | | | | | | | |
With fee waivers/reimbursements | | | 0.11 | %(e) | | | (0.15 | )%(e) |
Without fee waivers/reimbursements | | | 0.11 | %(e) | | | (0.17 | )%(e) |
Portfolio turnover rate | | | 22 | %(d) | | | 16 | %(d)(f) |
(a) | The Fund added a retail share class on December 9, 2019. Ratios for start up periods may not be representative of long term operating results. |
(b) | Calculated using the average shares method. |
(c) | Less than $0.005 per share. |
(d) | Total return and portfolio turnover are not annualized for periods less than one full year. |
(f) | Portfolio turnover rate is calculated at the fund level and represents the six months ended December 31, 2019. |
See Notes to Financial Statements.
Semi-Annual Report | June 30, 2020 |  | 125 |
Segall Bryant & Hamill All Cap Fund | Financial Highlights |
For a Share Outstanding Throughout the Periods Presented |
Institutional | | Six Months
Ended
June 30, 2020
(Unaudited) | | | Six Months
Ended
December 31,
2019(a) | | | Year Ended
June 30,
2019 | | | Year Ended
June 30,
2018 | | | Year Ended
June 30,
2017 | | | Year Ended
June 30,
2016 | | | Year Ended
June 30,
2015 | |
Net asset value, beginning of period | | $ | 17.00 | | | $ | 15.80 | | | $ | 14.76 | | | $ | 13.37 | | | $ | 11.82 | | | $ | 12.25 | | | $ | 11.44 | |
Income (loss) from investment operations: | | | | | | | | | | | | | | | | | | | | | | | | | | | | |
Net investment income (loss)(b) | | | 0.02 | | | | 0.01 | | | | 0.01 | | | | (0.01 | ) | | | 0.00 | (c) | | | 0.00 | (c) | | | (0.01 | ) |
Net realized and unrealized gains on investments | | | 0.34 | | | | 1.25 | | | | 1.57 | | | | 1.48 | | | | 1.55 | | | | 0.00 | (c) | | | 0.94 | |
Total from investment operations | | | 0.36 | | | | 1.26 | | | | 1.58 | | | | 1.47 | | | | 1.55 | | | | 0.00 | (c) | | | 0.93 | |
| | | | | | | | | | | | | | | | | | | | | | | | | | | | | |
Less dividends and distributions: | | | | | | | | | | | | | | | | | | | | | | | | | | | | |
Dividends from net investment income | | | — | | | | (0.01 | ) | | | — | | | | — | | | | (0.00 | )(c) | | | — | | | | — | |
Distributions from net realized gains | | | — | | | | (0.05 | ) | | | (0.54 | ) | | | (0.08 | ) | | | — | | | | (0.43 | ) | | | (0.12 | ) |
Total distributions | | | — | | | | (0.06 | ) | | | (0.54 | ) | | | (0.08 | ) | | | (0.00 | )(c) | | | (0.43 | ) | | | (0.12 | ) |
| | | | | | | | | | | | | | | | | | | | | | | | | | | | | |
Paid-in capital from redemption fees | | | — | | | | 0.00 | (c) | | | 0.00 | (c) | | | 0.00 | (c) | | | 0.00 | (c) | | | 0.00 | (c) | | | 0.00 | (c) |
Net asset value, end of period | | $ | 17.36 | | | $ | 17.00 | | | $ | 15.80 | | | $ | 14.76 | | | $ | 13.37 | | | $ | 11.82 | | | $ | 12.25 | |
| | | | | | | | | | | | | | | | | | | | | | | | | | | | | |
Total Return | | | 2.12 | %(d) | | | 7.95 | %(d) | | | 11.47 | % | | | 11.01 | % | | | 13.14 | % | | | 0.07 | % | | | 8.28 | % |
| | | | | | | | | | | | | | | | | | | | | | | | | | | | | |
Ratios and Supplemental Data | | | | | | | | | | | | | | | | | | | | | | | | | | | | |
Net assets, end of period (in 000s) | | $ | 128,762 | | | $ | 120,730 | | | $ | 104,418 | | | $ | 79,631 | | | $ | 63,463 | | | $ | 42,216 | | | $ | 18,468 | |
| | | | | | | | | | | | | | | | | | | | | | | | | | | | | |
Ratio of expenses to average net assets | | | | | | | | | | | | | | | | | | | | | | | | | | | | |
With fee waivers/reimbursements | | | 0.84 | %(e) | | | 0.96 | %(e)(f) | | | 0.98 | % | | | 1.02 | %(g) | | | 1.10 | % | | | 1.10 | % | | | 1.10 | % |
Without fee waivers/reimbursements | | | 0.98 | %(e) | | | 1.12 | %(e) | | | 1.14 | % | | | 1.22 | % | | | 1.40 | % | | | 1.69 | % | | | 2.12 | % |
Ratio of net investment income (loss) to average net assets | | | | | | | | | | | | | | | | | | | | | | | | | | | | |
With fee waivers/reimbursements | | | 0.27 | %(e) | | | 0.07 | %(e) | | | 0.07 | % | | | (0.07 | )% | | | (0.02 | )% | | | 0.00 | % | | | (0.07 | )% |
Without fee waivers/reimbursements | | | 0.13 | %(e) | | | (0.09 | )%(e) | | | (0.09 | )% | | | (0.27 | )% | | | (0.32 | )% | | | (0.59 | )% | | | (1.09 | )% |
Portfolio turnover rate | | | 22 | %(d) | | | 16 | %(d) | | | 38 | % | | | 37 | % | | | 38 | % | | | 33 | % | | | 46 | % |
(a) | Fund changed fiscal year to December 31. |
(b) | Calculated using the average shares method. |
(c) | Less than $0.005 per share. |
(d) | Total return and portfolio turnover are not annualized for periods less than one full year. |
(f) | Contractual expense limitation changed from 0.98% to 0.84% effective December 9, 2019. |
(g) | Contractual expense limitation changed from 1.10% to 0.98% effective November 1, 2017. |
See Notes to Financial Statements.
126 |  | www.sbhfunds.com | www.sbhfunds.com
|
Segall Bryant & Hamill Emerging Markets Fund | Financial Highlights |
For a Share Outstanding Throughout the Periods Presented |
Retail* | | Six Months
Ended
June 30, 2020
(Unaudited) | | | Two Months
Ended
December 31,
2019(a) | | | Year Ended
October 31,
2019 | | | Year Ended
October 31,
2018 | | | Year Ended
October 31,
2017 | | | Year Ended
October 31,
2016 | | | Year Ended
October 31,
2015 | |
Net asset value, beginning of period | | $ | 8.67 | | | $ | 8.27 | | | $ | 7.70 | | | $ | 9.49 | | | $ | 7.60 | | | $ | 6.91 | | | $ | 8.43 | |
Income (loss) from investment operations: | | | | | | | | | | | | | | | | | | | | | | | | | | | | |
Net investment income(b) | | | 0.08 | | | | 0.01 | | | | 0.17 | | | | 0.18 | | | | 0.13 | | | | 0.14 | | | | 0.12 | |
Net realized and unrealized gains (losses) on investments | | | (1.27 | ) | | | 0.60 | | | | 0.62 | | | | (1.53 | ) | | | 1.90 | | | | 0.58 | | | | (1.50 | ) |
Total from investment operations | | | (1.19 | ) | | | 0.61 | | | | 0.79 | | | | (1.35 | ) | | | 2.03 | | | | 0.72 | | | | (1.38 | ) |
| | | | | | | | | | | | | | | | | | | | | | | | | | | | | |
Less dividends and distributions: | | | | | | | | | | | | | | | | | | | | | | | | | | | | |
Dividends from net investment income | | | — | | | | (0.20 | ) | | | (0.18 | ) | | | (0.13 | ) | | | (0.14 | ) | | | (0.03 | ) | | | (0.14 | ) |
Distributions from net realized gains | | | — | | | | — | | | | (0.04 | ) | | | (0.31 | ) | | | — | | | | — | | | | — | |
Return of capital | | | — | | | | (0.01 | ) | | | — | | | | — | | | | — | | | | — | | | | — | |
Total distributions | | | — | | | | (0.21 | ) | | | (0.22 | ) | | | (0.44 | ) | | | (0.14 | ) | | | (0.03 | ) | | | (0.14 | ) |
| | | | | | | | | | | | | | | | | | | | | | | | | | | | | |
Paid-in capital from redemption fees | | | — | | | | — | | | | — | | | | 0.00 | (c) | | | — | | | | — | | | | — | |
Net asset value, end of period | | $ | 7.48 | | | $ | 8.67 | | | $ | 8.27 | | | $ | 7.70 | | | $ | 9.49 | | | $ | 7.60 | | | $ | 6.91 | |
| | | | | | | | | | | | | | | | | | | | | | | | | | | | | |
Total Return | | | (13.73 | )%(d) | | | 7.52 | %(d) | | | 10.64 | % | | | (14.96 | )% | | | 27.27 | % | | | 10.42 | % | | | (16.47 | )% |
| | | | | | | | | | | | | | | | | | | | | | | | | | | | | |
Ratios and Supplemental Data | | | | | | | | | | | | | | | | | | | | | | | | | | | | |
Net assets, end of period (in 000s) | | $ | 2,157 | | | $ | 2,678 | | | $ | 2,397 | | | $ | 2,043 | | | $ | 3,116 | | | $ | 921 | | | $ | 8 | |
| | | | | | | | | | | | | | | | | | | | | | | | | | | | | |
Ratio of expenses to average net assets | | | | | | | | | | | | | | | | | | | | | | | | | | | | |
With fee waivers/reimbursements | | | 1.38 | %(e) | | | 1.46 | %(e)(f) | | | 1.48 | % | | | 1.48 | % | | | 1.48 | % | | | 1.48 | % | | | 1.48 | % |
Without fee waivers/reimbursements | | | 2.54 | %(e) | | | 3.40 | %(e) | | | 2.91 | % | | | 2.49 | % | | | 2.87 | % | | | 5.58 | % | | | 5.76 | % |
Ratio of net investment income (loss) to average net assets | | | | | | | | | | | | | | | | | | | | | | | | | | | | |
With fee waivers/reimbursements | | | 2.12 | %(e) | | | 1.01 | %(e) | | | 2.15 | % | | | 1.97 | % | | | 1.54 | % | | | 2.10 | % | | | 1.36 | % |
Without fee waivers/reimbursements | | | 0.95 | %(e) | | | (0.93 | )%(e) | | | 0.72 | % | | | 0.96 | % | | | 0.15 | % | | | (2.00 | )% | | | (2.92 | )% |
Portfolio turnover rate | | | 44 | %(d) | | | 23 | %(d) | | | 107 | % | | | 99 | % | | | 97 | % | | | 84 | % | | | 95 | % |
(a) | Fund changed fiscal year to December 31. |
(b) | Calculated using the average shares method. |
(c) | Less than $0.005 per share. |
(d) | Total return and portfolio turnover are not annualized for periods less than one full year. |
(f) | Contractual expense limitation changed from 1.48% to 1.38% effective December 9, 2019. |
See Notes to Financial Statements.
Semi-Annual Report | June 30, 2020 |  | 127 |
Segall Bryant & Hamill Emerging Markets Fund | Financial Highlights |
For a Share Outstanding Throughout the Periods Presented |
Institutional* | | Six Months
Ended
June 30, 2020
(Unaudited) | | | Two Months
Ended
December 31,
2019(a) | | | Year Ended
October 31,
2019 | | | Year Ended
October 31,
2018 | | | Year Ended
October 31,
2017 | | | Year Ended
October 31,
2016 | | | Year Ended
October 31,
2015 | |
Net asset value, beginning of period | | $ | 8.69 | | | $ | 8.31 | | | $ | 7.74 | | | $ | 9.54 | | | $ | 7.63 | | | $ | 6.92 | | | $ | 8.44 | |
Income (loss) from investment operations: | | | | | | | | | | | | | | | | | | | | | | | | | | | | |
Net investment income(b) | | | 0.09 | | | | 0.02 | | | | 0.20 | | | | 0.20 | | | | 0.15 | | | | 0.16 | | | | 0.13 | |
Net realized and unrealized gains (losses) on investments | | | (1.28 | ) | | | 0.59 | | | | 0.62 | | | | (1.54 | ) | | | 1.91 | | | | 0.58 | | | | (1.49 | ) |
Total from investment operations | | | (1.19 | ) | | | 0.61 | | | | 0.82 | | | | (1.34 | ) | | | 2.06 | | | | 0.74 | | | | (1.36 | ) |
| | | | | | | | | | | | | | | | | | | | | | | | | | | | | |
Less dividends and distributions: | | | | | | | | | | | | | | | | | | | | | | | | | | | | |
Dividends from net investment income | | | — | | | | (0.22 | ) | | | (0.21 | ) | | | (0.15 | ) | | | (0.15 | ) | | | (0.03 | ) | | | (0.16 | ) |
Distributions from net realized gains | | | — | | | | — | | | | (0.04 | ) | | | (0.31 | ) | | | — | | | | — | | | | — | |
Return of capital | | | — | | | | (0.01 | ) | | | — | | | | — | | | | — | | | | — | | | | — | |
Total distributions | | | — | | | | (0.23 | ) | | | (0.25 | ) | | | (0.46 | ) | | | (0.15 | ) | | | (0.03 | ) | | | (0.16 | ) |
| | | | | | | | | | | | | | | | | | | | | | | | | | | | | |
Paid-in capital from redemption fees | | | — | | | | — | | | | — | | | | 0.00 | (c) | | | — | | | | 0.00 | (c) | | | — | |
Net asset value, end of period | | $ | 7.50 | | | $ | 8.69 | | | $ | 8.31 | | | $ | 7.74 | | | $ | 9.54 | | | $ | 7.63 | | | $ | 6.92 | |
| | | | | | | | | | | | | | | | | | | | | | | | | | | | | |
Total Return | | | (13.69 | )%(d) | | | 7.51 | %(d) | | | 10.97 | % | | | (14.81 | )% | | | 27.68 | % | | | 10.54 | % | | | (16.19 | )% |
| | | | | | | | | | | | | | | | | | | | | | | | | | | | | |
Ratios and Supplemental Data | | | | | | | | | | | | | | | | | | | | | | | | | | | | |
Net assets, end of period (in 000s) | | $ | 26,983 | | | $ | 32,721 | | | $ | 30,836 | | | $ | 29,961 | | | $ | 32,144 | | | $ | 18,209 | | | $ | 982 | |
| | | | | | | | | | | | | | | | | | | | | | | | | | | | | |
Ratio of expenses to average net assets | | | | | | | | | | | | | | | | | | | | | | | | | | | | |
With fee waivers/reimbursements | | | 1.23 | %(e) | | | 1.23 | %(e) | | | 1.23 | % | | | 1.23 | % | | | 1.23 | % | | | 1.23 | % | | | 1.25 | % |
Without fee waivers/reimbursements | | | 2.39 | %(e) | | | 3.14 | %(e) | | | 2.66 | % | | | 2.24 | % | | | 2.62 | % | | | 5.33 | % | | | 5.42 | % |
Ratio of net investment income (loss) to average net assets | | | | | | | | | | | | | | | | | | | | | | | | | | | | |
With fee waivers/reimbursements | | | 2.29 | %(e) | | | 1.18 | %(e) | | | 2.40 | % | | | 2.22 | % | | | 1.79 | % | | | 2.35 | % | | | 1.58 | % |
Without fee waivers/reimbursements | | | 1.12 | %(e) | | | (0.73 | )%(e) | | | 0.97 | % | | | 1.21 | % | | | 0.40 | % | | | (1.75 | )% | | | (2.59 | )% |
Portfolio turnover rate | | | 44 | %(d) | | | 23 | %(d) | | | 107 | % | | | 99 | % | | | 97 | % | | | 84 | % | | | 95 | % |
(a) | Fund changed fiscal year to December 31. |
(b) | Calculated using the average shares method. |
(c) | Less than $0.005 per share. |
(d) | Total return and portfolio turnover are not annualized for periods less than one full year. |
See Notes to Financial Statements.
128 |  | www.sbhfunds.com | www.sbhfunds.com
|
Segall Bryant & Hamill International Small Cap Fund | Financial Highlights |
For a Share Outstanding Throughout the Periods Presented |
Retail* | | Six Months
Ended
June 30, 2020
(Unaudited) | | | Two Months
Ended
December 31,
2019(a) | | | Year Ended
October 31,
2019 | | | Year Ended
October 31,
2018 | | | Year Ended
October 31,
2017 | | | Year Ended
October 31,
2016 | | | Year Ended
October 31,
2015 | |
Net asset value, beginning of period | | $ | 11.64 | | | $ | 11.39 | | | $ | 11.73 | | | $ | 14.47 | | | $ | 11.74 | | | $ | 11.36 | | | $ | 11.57 | |
Income (loss) from investment operations: | | | | | | | | | | | | | | | | | | | | | | | | | | | | |
Net investment income(b) | | | 0.10 | | | | 0.02 | | | | 0.28 | | | | 0.26 | | | | 0.23 | | | | 0.26 | | | | 0.21 | |
Net realized and unrealized gains (losses) on investments | | | (2.88 | ) | | | 0.73 | | | | (0.38 | ) | | | (2.27 | ) | | | 2.69 | | | | 0.35 | | | | 0.28 | |
Total from investment operations | | | (2.78 | ) | | | 0.75 | | | | (0.10 | ) | | | (2.01 | ) | | | 2.92 | | | | 0.61 | | | | 0.49 | |
| | | | | | | | | | | | | | | | | | | | | | | | | | | | | |
Less dividends and distributions: | | | | | | | | | | | | | | | | | | | | | | | | | | | | |
Dividends from net investment income | | | — | | | | (0.49 | ) | | | (0.25 | ) | | | (0.29 | ) | | | (0.19 | ) | | | (0.17 | ) | | | (0.22 | ) |
Distributions from net realized gains | | | — | | | | — | | | | — | | | | (0.44 | ) | | | — | | | | (0.06 | ) | | | (0.48 | ) |
Return of capital | | | — | | | | (0.01 | ) | | | — | | | | — | | | | — | | | | — | | | | — | |
Total distributions | | | — | | | | (0.50 | ) | | | (0.25 | ) | | | (0.73 | ) | | | (0.19 | ) | | | (0.23 | ) | | | (0.70 | ) |
| | | | | | | | | | | | | | | | | | | | | | | | | | | | | |
Paid-in capital from redemption fees | | | — | | | | — | | | | 0.00 | (c) | | | 0.00 | (c) | | | — | | | | — | | | | — | |
| | | | | | | | | | | | | | | | | | | | | | | | | | | | | |
Net increase from payment by affiliates | | | — | | | | — | | | | 0.01 | (d) | | | — | | | | — | | | | — | | | | — | |
| | | | | | | | | | | | | | | | | | | | | | | | | | | | | |
Net asset value, end of period | | $ | 8.86 | | | $ | 11.64 | | | $ | 11.39 | | | $ | 11.73 | | | $ | 14.47 | | | $ | 11.74 | | | $ | 11.36 | |
| | | | | | | | | | | | | | | | | | | | | | | | | | | | | |
Total Return | | | (23.88 | )%(e) | | | 6.73 | %(e) | | | (0.54 | )% | | | (14.68 | )% | | | 25.27 | % | | | 5.43 | % | | | 4.47 | % |
| | | | | | | | | | | | | | | | | | | | | | | | | | | | | |
Ratios and Supplemental Data | | | | | | | | | | | | | | | | | | | | | | | | | | | | |
Net assets, end of period (in 000s) | | $ | 54,284 | | | $ | 52,668 | | | $ | 49,749 | | | $ | 23,554 | | | $ | 25,240 | | | $ | 12,013 | | | $ | 11,927 | |
| | | | | | | | | | | | | | | | | | | | | | | | | | | | |
Ratio of expenses to average net assets | | | | | | | | | | | | | | | | | | | | | | | | | | | | |
With fee waivers/reimbursements | | | 1.18 | %(f) | | | 1.25 | %(f)(g) | | | 1.28 | % | | | 1.28 | % | | | 1.28 | % | | | 1.28 | % | | | 1.29 | % |
Without fee waivers/reimbursements | | | 1.42 | %(f) | | | 1.42 | %(f) | | | 1.53 | % | | | 1.44 | % | | | 1.47 | % | | | 2.09 | % | | | 1.29 | % |
Ratio of net investment income to average net assets | | | | | | | | | | | | | | | | | | | | | | | | | | | | |
With fee waivers/reimbursements | | | 2.21 | %(f) | | | 0.94 | %(f) | | | 2.49 | % | | | 1.92 | % | | | 1.80 | % | | | 2.36 | % | | | 2.11 | % |
Without fee waivers/reimbursements | | | 1.97 | %(f) | | | 0.77 | %(f) | | | 2.24 | % | | | 1.76 | % | | | 1.61 | % | | | 1.55 | % | | | 2.11 | % |
Portfolio turnover rate | | | 53 | %(e) | | | 17 | %(e) | | | 121 | % | | | 111 | % | | | 101 | % | | | 94 | % | | | 130 | % |
(a) | Fund changed fiscal year to December 31. |
(b) | Calculated using the average shares method. |
(c) | Less than $0.005 per share. |
(d) | The custodian reimbursed the Fund $132,086 for losses incurred from corporate action processing. Payment had a positive 0.09% impact on the total return. |
(e) | Total return and portfolio turnover are not annualized for periods less than one full year. |
(g) | Contractual expense limitation changed from 1.28% to 1.18% effective December 9, 2019. |
See Notes to Financial Statements.
Semi-Annual Report | June 30, 2020 |  | 129 |
Segall Bryant & Hamill International Small Cap Fund | Financial Highlights |
For a Share Outstanding Throughout the Periods Presented |
Institutional* | | Six Months
Ended
June 30, 2020
(Unaudited) | | | Two Months
Ended
December 31,
2019(a) | | | Year Ended
October 31,
2019 | | | Year Ended
October 31,
2018 | | | Year Ended
October 31,
2017 | | | Year Ended
October 31,
2016 | | | Year Ended
October 31,
2015 | |
Net asset value, beginning of period | | $ | 11.65 | | | $ | 11.42 | | | $ | 11.77 | | | $ | 14.50 | | | $ | 11.76 | | | $ | 11.36 | | | $ | 11.57 | |
Income (loss) from investment operations: | | | | | | | | | | | | | | | | | | | | | | | | | | | | |
Net investment income(b) | | | 0.11 | | | | 0.02 | | | | 0.30 | | | | 0.29 | | | | 0.27 | | | | 0.29 | | | | 0.27 | |
Net realized and unrealized gains (losses) on investments | | | (2.88 | ) | | | 0.73 | | | | (0.37 | ) | | | (2.26 | ) | | | 2.68 | | | | 0.34 | | | | 0.23 | |
Total from investment operations | | | (2.77 | ) | | | 0.75 | | | | (0.07 | ) | | | (1.97 | ) | | | 2.95 | | | | 0.63 | | | | 0.50 | |
| | | | | | | | | | | | | | | | | | | | | | | | | | | | | |
Less dividends and distributions: | | | | | | | | | | | | | | | | | | | | | | | | | | | | |
Dividends from net investment income | | | — | | | | (0.51 | ) | | | (0.29 | ) | | | (0.32 | ) | | | (0.21 | ) | | | (0.17 | ) | | | (0.23 | ) |
Distributions from net realized gains | | | — | | | | — | | | | — | | | | (0.44 | ) | | | — | | | | (0.06 | ) | | | (0.48 | ) |
Return of capital | | | — | | | | (0.01 | ) | | | — | | | | — | | | | — | | | | — | | | | — | |
Total distributions | | | — | | | | (0.52 | ) | | | (0.29 | ) | | | (0.76 | ) | | | (0.21 | ) | | | (0.23 | ) | | | (0.71 | ) |
| | | | | | | | | | | | | | | | | | | | | | | | | | | | | |
Paid-in capital from redemption fees | | | — | | | | — | | | | 0.00 | (c) | | | 0.00 | (c) | | | 0.00 | (c) | | | — | | | | — | |
| | | | | | | | | | | | | | | | | | | | | | | | | | | | | |
Net increase from payment by affiliates | | | — | | | | — | | | | 0.01 | (d) | | | — | | | | — | | | | — | | | | — | |
| | | | | | | | | | | | | | | | | | | | | | | | | | | | | |
Net asset value, end of period | | $ | 8.88 | | | $ | 11.65 | | | $ | 11.42 | | | $ | 11.77 | | | $ | 14.50 | | | $ | 11.76 | | | $ | 11.36 | |
| | | | | | | | | | | | | | | | | | | | | | | | | | | | | |
Total Return | | | (23.78 | )%(e) | | | 6.69 | %(e) | | | (0.29 | )% | | | (14.40 | )% | | | 25.60 | % | | | 5.66 | % | | | 4.61 | % |
| | | | | | | | | | | | | | | | | | | | | | | | | | | | | |
Ratios and Supplemental Data | | | | | | | | | | | | | | | | | | | | | | | | | | | | |
Net assets, end of period (in 000s) | | $ | 123,679 | | | $ | 234,265 | | | $ | 230,883 | | | $ | 351,480 | | | $ | 298,728 | | | $ | 71,853 | | | $ | 35,367 | |
| | | | | | | | | | | | | | | | | | | | | | | | | | | | | |
Ratio of expenses to average net assets | | | | | | | | | | | | | | | | | | | | | | | | | | | | |
With fee waivers/reimbursements | | | 1.03 | %(f) | | | 1.03 | %(f) | | | 1.03 | % | | | 1.03 | % | | | 1.03 | % | | | 1.03 | % | | | 1.06 | % |
Without fee waivers/reimbursements | | | 1.25 | %(f) | | | 1.20 | %(f) | | | 1.28 | % | | | 1.19 | % | | | 1.22 | % | | | 1.84 | % | | | 1.06 | % |
Ratio of net investment income to average net assets | | | | | | | | | | | | | | | | | | | | | | | | | | | | |
With fee waivers/reimbursements | | | 2.35 | %(f) | | | 1.15 | %(f) | | | 2.74 | % | | | 2.17 | % | | | 2.05 | % | | | 2.61 | % | | | 2.34 | % |
Without fee waivers/reimbursements | | | 2.13 | %(f) | | | 0.98 | %(f) | | | 2.49 | % | | | 2.01 | % | | | 1.86 | % | | | 1.80 | % | | | 2.34 | % |
Portfolio turnover rate | | | 53 | %(e) | | | 17 | %(e) | | | 121 | % | | | 111 | % | | | 101 | % | | | 94 | % | | | 130 | % |
(a) | Fund changed fiscal year to December 31. |
(b) | Calculated using the average shares method. |
(c) | Less than $0.005 per share. |
(d) | The custodian reimbursed the Fund $132,086 for losses incurred from corporate action processing. Payment had a positive 0.09% impact on the total return. |
(e) | Total return and portfolio turnover are not annualized for periods less than one full year. |
See Notes to Financial Statements.
130 |  | www.sbhfunds.com | www.sbhfunds.com
|
Segall Bryant & Hamill
Fundamental International Small Cap Fund | Financial Highlights |
For a Share Outstanding Throughout the Periods Presented |
Retail | | Six Months
Ended
June 30, 2020
(Unaudited) | | | Year Ended
December 31,
2019 | | | Year Ended
December 31,
2018(a) | | | Year Ended
December 31,
2017 | | | Year Ended
December 31,
2016 | | | Year Ended
December 31,
2015 | |
Net asset value, beginning of period | | $ | 18.12 | | | $ | 12.67 | | | $ | 19.76 | | | $ | 15.08 | | | $ | 15.59 | | | $ | 16.71 | |
Income (loss) from investment operations: | | | | | | | | | | | | | | | | | | | | | | | | |
Net investment income (loss)(b) | | | (0.02 | ) | | | 0.00 | (c) | | | (0.03 | ) | | | 0.05 | | | | 0.08 | | | | 0.23 | |
Net realized and unrealized gains (losses) on investments | | | (1.29 | ) | | | 5.45 | | | | (4.40 | ) | | | 5.01 | | | | 0.15 | | | | (0.09 | ) |
Total from investment operations | | | (1.31 | ) | | | 5.45 | | | | (4.43 | ) | | | 5.06 | | | | 0.23 | | | | 0.14 | |
| | | | | | | | | | | | | | | | | | | | | | | | |
Less dividends and distributions: | | | | | | | | | | | | | | | | | | | | | | | | |
Dividends from net investment income | | | — | | | | — | | | | (0.08 | ) | | | (0.38 | ) | | | (0.74 | ) | | | (0.79 | ) |
Distributions from net realized gains | | | — | | | | — | | | | (2.58 | ) | | | — | | | | — | | | | (0.47 | ) |
Total distributions | | | — | | | | — | | | | (2.66 | ) | | | (0.38 | ) | | | (0.74 | ) | | | (1.26 | ) |
Net asset value, end of period | | $ | 16.81 | | | $ | 18.12 | | | $ | 12.67 | | | $ | 19.76 | | | $ | 15.08 | | | $ | 15.59 | |
| | | | | | | | | | | | | | | | | | | | | | | | |
Total Return | | | (7.23 | )%(d) | | | 43.01 | % | | | (22.98 | )% | | | 33.64 | % | | | 1.60 | % | | | 1.05 | % |
| | | | | | | | | | | | | | | | | | | | | | | | | |
Ratios and Supplemental Data | | | | | | | | | | | | | | | | | | | | | | | | |
Net assets, end of period (in 000s) | | $ | 24,039 | | | $ | 29,098 | | | $ | 28,205 | | | $ | 49,979 | | | $ | 49,746 | | | $ | 100,223 | |
| | | | | | | | | | | | | | | | | | | | | | | | | |
Ratio of expenses to average net assets | | | | | | | | | | | | | | | | | | | | | | | | |
With fee waivers/reimbursements | | | 1.25 | %(e) | | | 1.32 | %(f)(g) | | | 1.44 | %(g) | | | 1.44 | %(g) | | | 1.46 | %(g) | | | 1.50 | % |
Without fee waivers/reimbursements | | | 1.74 | %(e) | | | 1.85 | % | | | 1.78 | % | | | 1.75 | % | | | 1.77 | % | | | 1.62 | % |
Ratio of net investment income (loss) to average net assets | | | | | | | | | | | | | | | | | | | | | | | | |
With fee waivers/reimbursements | | | (0.28 | )%(e) | | | 0.00 | % | | | (0.18 | )% | | | 0.27 | % | | | 0.51 | % | | | 1.35 | % |
Without fee waivers/reimbursements | | | (0.77 | )%(e) | | | (0.53 | )% | | | (0.52 | )% | | | (0.04 | )% | | | 0.20 | % | | | 1.23 | % |
Portfolio turnover rate | | | 27 | %(d) | | | 31 | % | | | 57 | % | | | 48 | % | | | 44 | % | | | 44 | % |
(a) | Prior to April 30, 2018 known as the Westcore International Small-Cap Fund. |
(b) | Calculated using the average shares method. |
(c) | Less than $0.005 per share. |
(d) | Total return and portfolio turnover are not annualized for periods less than one full year. |
(f) | Contractual expense limitation changed from 1.50% to 1.25% effective May 1, 2019. |
(g) | For the period April 29, 2016 to April 30, 2019, a voluntary additional expense waiver reduced the ratio of expenses to average net assets from 1.50% to 1.44%. |
See Notes to Financial Statements.
Semi-Annual Report | June 30, 2020 |  | 131 |
Segall Bryant & Hamill
Fundamental International Small Cap Fund | Financial Highlights |
For a Share Outstanding Throughout the Periods Presented |
Institutional | | Six Months
Ended
June 30, 2020
(Unaudited) | | | Year Ended
December 31,
2019 | | | Year Ended
December 31,
2018(a) | | | Year Ended
December 31,
2017 | | | Period Ended
December 31,
2016(b) | |
Net asset value, beginning of period | | $ | 19.32 | | | $ | 13.48 | | | $ | 20.83 | | | $ | 15.64 | | | $ | 15.76 | |
Income (loss) from investment operations: | | | | | | | | | | | | | | | | | | | | |
Net investment income (loss)(c) | | | (0.04 | ) | | | 0.00 | (d) | | | 0.00 | (d) | | | 0.08 | | | | 0.11 | |
Net realized and unrealized gains (losses) on investments | | | (1.35 | ) | | | 5.84 | | | | (4.66 | ) | | | 5.22 | | | | (0.01 | ) |
Total from investment operations | | | (1.39 | ) | | | 5.84 | | | | (4.66 | ) | | | 5.30 | | | | 0.10 | |
| | | | | | | | | | | | | | | | | | | | | |
Less dividends and distributions: | | | | | | | | | | | | | | | | | | | | |
Dividends from net investment income | | | — | | | | — | | | | (0.11 | ) | | | (0.11 | ) | | | (0.22 | ) |
Distributions from net realized gains | | | — | | | | — | | | | (2.58 | ) | | | — | | | | — | |
Total distributions | | | — | | | | — | | | | (2.69 | ) | | | (0.11 | ) | | | (0.22 | ) |
Net asset value, end of period | | $ | 17.93 | | | $ | 19.32 | | | $ | 13.48 | | | $ | 20.83 | | | $ | 15.64 | |
| | | | | | | | | | | | | | | | | | | | | |
Total Return | | | (7.19 | )%(e) | | | 43.32 | % | | | (22.90 | )% | | | 33.89 | % | | | 0.66 | %(e) |
| | | | | | | | | | | | | | | | | | | | | |
Ratios and Supplemental Data | | | | | | | | | | | | | | | | | | | | |
Net assets, end of period (in 000s) | | $ | 10,975 | | | $ | 8,446 | | | $ | 20,266 | | | $ | 29,652 | | | $ | 20,358 | |
| | | | | | | | | | | | | | | | | | | | | |
Ratio of expenses to average net assets | | | | | | | | | | | | | | | | | | | | |
With fee waivers/reimbursements | | | 1.10 | %(f) | | | 1.20 | %(g) | | | 1.29 | % | | | 1.29 | % | | | 1.19 | %(f) |
Without fee waivers/reimbursements | | | 1.64 | %(f) | | | 1.72 | % | | | 1.62 | % | | | 1.59 | % | | | 1.65 | %(f) |
Ratio of net investment income (loss) to average net assets | | | | | | | | | | | | | | | | | | | | |
With fee waivers/reimbursements | | | (0.41 | )%(f) | | | 0.01 | % | | | (0.02 | )% | | | 0.44 | % | | | 1.06 | %(f) |
Without fee waivers/reimbursements | | | (0.96 | )%(f) | | | (0.50 | )% | | | (0.35 | )% | | | 0.14 | % | | | 0.60 | %(f) |
Portfolio turnover rate | | | 27 | %(e) | | | 31 | % | | | 57 | % | | | 48 | % | | | 44 | %(e)(h) |
(a) | Prior to April 30, 2018 known as the Westcore International Small-Cap Fund. |
(b) | The Fund added an institutional share class on April 29, 2016. |
(c) | Calculated using the average shares method. |
(d) | Less than $0.005 per share. |
(e) | Total return and portfolio turnover are not annualized for periods less than one full year. |
(g) | The contractual expense limitation is 1.10% effective May 1, 2019 (Note 5). |
(h) | Porfolio turnover rate is calculated at the fund level and represents the year ended December 31, 2016. |
See Notes to Financial Statements.
132 |  | www.sbhfunds.com | www.sbhfunds.com
|
Segall Bryant & Hamill Global Large Cap Fund | Financial Highlights |
For a Share Outstanding Throughout the Periods Presented |
Retail | | Six Months
Ended
June 30, 2020
(Unaudited) | | | Year Ended
December 31,
2019 | | | Year Ended
December 31,
2018(a) | | | Year Ended
December 31,
2017 | | | Year Ended
December 31,
2016(b) | | | Year Ended
December 31,
2015 | |
Net asset value, beginning of period | | $ | 10.98 | | | $ | 9.52 | | | $ | 11.12 | | | $ | 9.79 | | | $ | 9.45 | | | $ | 10.57 | |
Income (loss) from investment operations: | | | | | | | | | | | | | | | | | | | | | | | | |
Net investment income(c) | | | 0.13 | | | | 0.23 | | | | 0.20 | | | | 0.19 | | | | 0.17 | | | | 0.23 | |
Net realized and unrealized gains (losses) on investments | | | (1.39 | ) | | | 2.16 | | | | (1.16 | ) | | | 1.70 | | | | 0.63 | | | | (0.30 | ) |
Total from investment operations | | | (1.26 | ) | | | 2.39 | | | | (0.96 | ) | | | 1.89 | | | | 0.80 | | | | (0.07 | ) |
| | | | | | | | | | | | | | | | | | | | | | | | | |
Less dividends and distributions: | | | | | | | | | | | | | | | | | | | | | | | | |
Dividends from net investment income | | | (0.12 | ) | | | (0.25 | ) | | | (0.19 | ) | | | (0.18 | ) | | | (0.18 | ) | | | (0.23 | ) |
Distributions from net realized gains | | | — | | | | (0.68 | ) | | | (0.45 | ) | | | (0.38 | ) | | | (0.28 | ) | | | (0.82 | ) |
Total distributions | | | (0.12 | ) | | | (0.93 | ) | | | (0.64 | ) | | | (0.56 | ) | | | (0.46 | ) | | | (1.05 | ) |
Net asset value, end of period | | $ | 9.60 | | | $ | 10.98 | | | $ | 9.52 | | | $ | 11.12 | | | $ | 9.79 | | | $ | 9.45 | |
| | | | | | | | | | | | | | | | | | | | | | | | | |
Total Return | | | (11.35 | )%(d) | | | 25.36 | % | | | (8.70 | )% | | | 19.56 | % | | | 8.58 | % | | | (0.56 | )% |
| | | | | | | | | | | | | | | | | | | | | | | | | |
Ratios and Supplemental Data | | | | | | | | | | | | | | | | | | | | | | | | |
Net assets, end of year (in 000s) | | $ | 36,872 | | | $ | 46,375 | | | $ | 41,887 | | | $ | 50,894 | | | $ | 44,296 | | | $ | 37,613 | |
| | | | | | | | | | | | | | | | | | | | | | | | | |
Ratio of expenses to average net assets | | | | | | | | | | | | | | | | | | | | | | | | |
With fee waivers/reimbursements | | | 0.89 | %(e) | | | 0.89 | % | | | 0.99 | %(f) | | | 0.99 | % | | | 0.99 | % | | | 0.99 | % |
Without fee waivers/reimbursements | | | 1.27 | %(e) | | | 1.22 | % | | | 1.22 | % | | | 1.20 | % | | | 1.22 | % | | | 1.17 | % |
Ratio of net investment income to average net assets | | | | | | | | | | | | | | | | | | | | | | | | |
With fee waivers/reimbursements | | | 2.68 | %(e) | | | 2.14 | % | | | 1.88 | % | | | 1.83 | % | | | 1.79 | % | | | 2.19 | % |
Without fee waivers/reimbursements | | | 2.30 | %(e) | | | 1.81 | % | | | 1.65 | % | | | 1.62 | % | | | 1.56 | % | | | 2.01 | % |
Portfolio turnover rate | | | 19 | %(d) | | | 40 | % | | | 59 | % | | | 17 | % | | | 61 | % | | | 65 | % |
(a) | Prior to April 30, 2018 known as the Westcore Global Large-Cap Dividend Fund. |
(b) | Prior to April 29, 2016 known as the Westcore Blue Chip Dividend Fund. |
(c) | Calculated using the average shares method. |
(d) | Total return and portfolio turnover are not annualized for periods less than one full year. |
(f) | Contractual expense limitation changed from 0.99% to 0.89% effective December 20, 2018. |
See Notes to Financial Statements.
Semi-Annual Report | June 30, 2020 |  | 133 |
Segall Bryant & Hamill Global Large Cap Fund | Financial Highlights |
For a Share Outstanding Throughout the Periods Presented |
Institutional | | Six Months
Ended
June 30, 2020
(Unaudited) | | | Year Ended
December 31,
2019 | | | Year Ended
December 31,
2018(a) | | | Year Ended
December 31,
2017 | | | Year Ended
December 31,
2016(b) | | | Year Ended
December 31,
2015 | |
Net asset value, beginning of period | | $ | 10.86 | | | $ | 9.43 | | | $ | 11.04 | | | $ | 9.71 | | | $ | 9.39 | | | $ | 10.51 | |
Income (loss) from investment operations: | | | | | | | | | | | | | | | | | | | | | | | | |
Net investment income(c) | | | 0.13 | | | | 0.24 | | | | 0.23 | | | | 0.20 | | | | 0.20 | | | | 0.25 | |
Net realized and unrealized gains (losses) on investments | | | (1.38 | ) | | | 2.14 | | | | (1.16 | ) | | | 1.70 | | | | 0.60 | | | | (0.30 | ) |
Total from investment operations | | | (1.25 | ) | | | 2.38 | | | | (0.93 | ) | | | 1.90 | | | | 0.80 | | | | (0.05 | ) |
| | | | | | | | | | | | | | | | | | | | | | | | | |
Less dividends and distributions: | | | | | | | | | | | | | | | | | | | | | | | | |
Dividends from net investment income | | | (0.12 | ) | | | (0.27 | ) | | | (0.23 | ) | | | (0.19 | ) | | | (0.20 | ) | | | (0.25 | ) |
Distributions from net realized gains | | | — | | | | (0.68 | ) | | | (0.45 | ) | | | (0.38 | ) | | | (0.28 | ) | | | (0.82 | ) |
Total distributions | | | (0.12 | ) | | | (0.95 | ) | | | (0.68 | ) | | | (0.57 | ) | | | (0.48 | ) | | | (1.07 | ) |
Net asset value, end of period | | $ | 9.49 | | | $ | 10.86 | | | $ | 9.43 | | | $ | 11.04 | | | $ | 9.71 | | | $ | 9.39 | |
| | | | | | | | | | | | | | | | | | | | | | | | | |
Total Return | | | (11.38 | )%(d) | | | 25.55 | % | | | (8.53 | )% | | | 19.78 | % | | | 8.63 | % | | | (0.42 | )% |
| | | | | | | | | | | | | | | | | | | | | | | | | |
Ratios and Supplemental Data | | | | | | | | | | | | | | | | | | | | | | | | |
Net assets, end of period (in 000s) | | $ | 1,766 | | | $ | 2,730 | | | $ | 2,589 | | | $ | 5,148 | | | $ | 3,466 | | | $ | 3,391 | |
| | | | | | | | | | | | | | | | | | | | | | | | | |
Ratio of expenses to average net assets | | | | | | | | | | | | | | | | | | | | | | | | |
With fee waivers/reimbursements | | | 0.74 | %(e) | | | 0.74 | % | | | 0.84 | %(f) | | | 0.90 | % | | | 0.81 | % | | | 0.82 | % |
Without fee waivers/reimbursements | | | 1.24 | %(e) | | | 1.12 | % | | | 1.09 | % | | | 1.09 | % | | | 1.21 | % | | | 1.05 | % |
Ratio of net investment income to average net assets | | | | | | | | | | | | | | | | | | | | | | | | |
With fee waivers/reimbursements | | | 2.69 | %(e) | | | 2.32 | % | | | 2.11 | % | | | 1.91 | % | | | 2.01 | % | | | 2.38 | % |
Without fee waivers/reimbursements | | | 2.19 | %(e) | | | 1.94 | % | | | 1.86 | % | | | 1.72 | % | | | 1.61 | % | | | 2.15 | % |
Portfolio turnover rate | | | 19 | %(d) | | | 40 | % | | | 59 | % | | | 17 | % | | | 61 | % | | | 65 | % |
(a) | Prior to April 30, 2018 known as the Westcore Global Large-Cap Dividend Fund. |
(b) | Prior to April 29, 2016 known as the Westcore Blue Chip Dividend Fund. |
(c) | Calculated using the average shares method. |
(d) | Total return and portfolio turnover are not annualized for periods less than one full year. |
(f) | Contractual expense limitation changed from 0.84% to 0.74% effective December 20, 2018. |
See Notes to Financial Statements.
134 |  | www.sbhfunds.com | www.sbhfunds.com
|
Segall Bryant & Hamill Workplace Equality Fund | Financial Highlights |
For a Share Outstanding Throughout the Periods Presented |
Retail | | Six Months
Ended
June 30, 2020
(Unaudited) | | | Year Ended
December 31,
2019(a) | | | Year Ended
December 31,
2018(b) | | | Year Ended
December 31,
2017 | | | Year Ended
December 31,
2016(c) | | | Year Ended
December 31,
2015 | |
Net asset value, beginning of period | | $ | 6.45 | | | $ | 5.41 | | | $ | 6.01 | | | $ | 6.38 | | | $ | 8.96 | | | $ | 12.72 | |
Income (loss) from investment operations: | | | | | | | | | | | | | | | | | | | | | | | | |
Net investment income (loss)(d) | | | 0.06 | | | | 0.12 | | | | 0.11 | | | | 0.12 | | | | 0.01 | | | | (0.04 | ) |
Net realized and unrealized gains (losses) on investments | | | (0.72 | ) | | | 1.33 | | | | (0.18 | ) | | | 0.93 | | | | (0.01 | ) | | | 0.60 | |
Total from investment operations | | | (0.66 | ) | | | 1.45 | | | | (0.07 | ) | | | 1.05 | | | | — | | | | 0.56 | |
| | | | | | | | | | | | | | | | | | | | | | | | | |
Less dividends and distributions: | | | | | | | | | | | | | | | | | | | | | | | | |
Dividends from net investment income | | | (0.06 | ) | | | (0.11 | ) | | | (0.21 | ) | | | (0.21 | ) | | | — | | | | — | |
Distributions from net realized gains | | | — | | | | (0.30 | ) | | | (0.32 | ) | | | (1.21 | ) | | | (2.58 | ) | | | (4.32 | ) |
Total distributions | | | (0.06 | ) | | | (0.41 | ) | | | (0.53 | ) | | | (1.42 | ) | | | (2.58 | ) | | | (4.32 | ) |
Net asset value, end of period | | $ | 5.73 | | | $ | 6.45 | | | $ | 5.41 | | | $ | 6.01 | | | $ | 6.38 | | | $ | 8.96 | |
| | | | | | | | | | | | | | | | | | | | | | | | | |
Total Return | | | (10.12 | )%(e) | | | 26.85 | % | | | (1.36 | )% | | | 16.73 | % | | | (0.38 | )% | | | 4.43 | % |
| | | | | | | | | | | | | | | | | | | | | | | | | |
Ratios and Supplemental Data | | | | | | | | | | | | | | | | | | | | | | | | |
Net assets, end of period (in 000s) | | $ | 8,058 | | | $ | 9,846 | | | $ | 8,131 | | | $ | 10,022 | | | $ | 12,061 | | | $ | 24,942 | |
| | | | | | | | | | | | | | | | | | | | | | | | | |
Ratio of expenses to average net assets | | | | | | | | | | | | | | | | | | | | | | | | |
With fee waivers/reimbursements | | | 0.89 | %(f) | | | 0.89 | % | | | 0.89 | % | | | 0.98 | %(g) | | | 1.15 | % | | | 1.15 | % |
Without fee waivers/reimbursements | | | 1.58 | %(f) | | | 1.57 | % | | | 1.86 | % | | | 1.76 | % | | | 1.30 | % | | | 1.17 | % |
Ratio of net investment income (loss) to average net assets | | | | | | | | | | | | | | | | | | | | | | | | |
With fee waivers/reimbursements | | | 2.01 | %(f) | | | 1.92 | % | | | 1.85 | % | | | 1.82 | % | | | 0.14 | % | | | (0.34 | )% |
Without fee waivers/reimbursements | | | 1.32 | %(f) | | | 1.24 | % | | | 0.88 | % | | | 1.04 | % | | | (0.01 | )% | | | (0.36 | )% |
Portfolio turnover rate | | | 6 | %(e) | | | 41 | % | | | 43 | % | | | 0 | % | | | 112 | % | | | 96 | % |
(a) | Prior to May 1, 2019 known as the Segall Bryant & Hamill Large Cap Dividend Fund. |
(b) | Prior to April 30, 2018 known as the Westcore Large-Cap Dividend Fund. |
(c) | Prior to April 29, 2016 known as the Westcore Growth Fund. |
(d) | Calculated using the average shares method. |
(e) | Total return and portfolio turnover are not annualized for periods less than one full year. |
(g) | Contractual expense limitation changed from 1.15% to 0.89% effective April 30, 2017. |
See Notes to Financial Statements.
Semi-Annual Report | June 30, 2020 |  | 135 |
Segall Bryant & Hamill Workplace Equality Fund | Financial Highlights |
For a Share Outstanding Throughout the Periods Presented |
Institutional | | Six Months
Ended
June 30, 2020
(Unaudited) | | | Year Ended
December 31,
2019(a) | | | Year Ended
December 31,
2018(b) | | | Year Ended
December 31,
2017 | | | Year Ended
December 31,
2016(c) | | | Year Ended
December 31,
2015 | |
Net asset value, beginning of period | | $ | 6.64 | | | $ | 5.55 | | | $ | 6.12 | | | $ | 6.61 | | | $ | 9.16 | | | $ | 12.88 | |
Income (loss) from investment operations: | | | | | | | | | | | | | | | | | | | | | | | | |
Net investment income (loss)(d) | | | 0.06 | | | | 0.14 | | | | 0.13 | | | | 0.13 | | | | 0.03 | | | | (0.02 | ) |
Net realized and unrealized gains (losses) on investments | | | (0.74 | ) | | | 1.37 | | | | (0.20 | ) | | | 0.97 | | | | (0.00 | )(e) | | | 0.62 | |
Total from investment operations | | | (0.68 | ) | | | 1.51 | | | | (0.07 | ) | | | 1.10 | | | | 0.03 | | | | 0.60 | |
| | | | | | | | | | | | | | | | | | | | | | | | | |
Less dividends and distributions: | | | | | | | | | | | | | | | | | | | | | | | | |
Dividends from net investment income | | | (0.06 | ) | | | (0.12 | ) | | | (0.18 | ) | | | (0.38 | ) | | | — | | | | — | |
Distributions from net realized gains | | | — | | | | (0.30 | ) | | | (0.32 | ) | | | (1.21 | ) | | | (2.58 | ) | | | (4.32 | ) |
Total distributions | | | (0.06 | ) | | | (0.42 | ) | | | (0.50 | ) | | | (1.59 | ) | | | (2.58 | ) | | | (4.32 | ) |
Net asset value, end of period | | $ | 5.90 | | | $ | 6.64 | | | $ | 5.55 | | | $ | 6.12 | | | $ | 6.61 | | | $ | 9.16 | |
| | | | | | | | | | | | | | | | | | | | | | | | | |
Total Return | | | (10.11 | )%(f) | | | 27.22 | % | | | (1.25 | )% | | | 16.92 | % | | | 0.01 | % | | | 4.68 | % |
| | | | | | | | | | | | | | | | | | | | | | | | | |
Ratios and Supplemental Data | | | | | | | | | | | | | | | | | | | | | | | | |
Net assets, end of period (in 000s) | | $ | 7,965 | | | $ | 8,339 | | | $ | 298 | | | $ | 155 | | | $ | 546 | | | $ | 5,016 | |
| | | | | | | | | | | | | | | | | | | | | | | | | |
Ratio of expenses to average net assets | | | | | | | | | | | | | | | | | | | | | | | | |
With fee waivers/reimbursements | | | 0.74 | %(g) | | | 0.74 | % | | | 0.74 | % | | | 0.92 | % | | | 0.91 | % | | | 0.95 | % |
Without fee waivers/reimbursements | | | 1.55 | %(g) | | | 1.41 | % | | | 1.76 | % | | | 1.61 | % | | | 1.49 | % | | | 1.28 | % |
Ratio of net investment income (loss) to average net assets | | | | | | | | | | | | | | | | | | | | | | | | |
With fee waivers/reimbursements | | | 2.17 | %(g) | | | 2.11 | % | | | 2.11 | % | | | 1.82 | % | | | 0.37 | % | | | (0.15 | )% |
Without fee waivers/reimbursements | | | 1.36 | %(g) | | | 1.44 | % | | | 1.09 | % | | | 1.13 | % | | | (0.21 | )% | | | (0.48 | )% |
Portfolio turnover rate | | | 6 | %(f) | | | 41 | % | | | 43 | % | | | 0 | % | | | 112 | % | | | 96 | % |
(a) | Prior to April 30, 2019 known as the Segall Bryant & Hamill Large Cap Dividend Fund. |
(b) | Prior to April 30, 2018 known as the Westcore Large-Cap Dividend Fund. |
(c) | Prior to April 29, 2016 known as the Westcore Growth Fund. |
(d) | Calculated using the average shares method. |
(e) | Less than $0.005 per share. |
(f) | Total return and portfolio turnover are not annualized for periods less than one full year. |
See Notes to Financial Statements.
136 |  | www.sbhfunds.com | www.sbhfunds.com
|
Segall Bryant & Hamill Short Term Plus Fund | Financial Highlights |
For a Share Outstanding Throughout the Periods Presented |
Retail | | Six Months
Ended
June 30, 2020
(Unaudited) | | | Year Ended
December 31,
2019 | | | Period Ended
December 31,
2018(a) | |
Net asset value, beginning of period | | $ | 10.11 | | | $ | 10.02 | | | $ | 10.00 | |
Income from investment operations: | | | | | | | | | | | | |
Net investment income(b) | | | 0.09 | | | | 0.25 | | | | 0.01 | |
Net realized and unrealized gains (losses) on investments | | | (0.02 | )(c) | | | 0.10 | | | | 0.01 | |
Total from investment operations | | | 0.07 | | | | 0.35 | | | | 0.02 | |
| | | | | | | | | | | | | |
Less dividends and distributions: | | | | | | | | | | | | |
Dividends from net investment income | | | (0.10 | ) | | | (0.26 | ) | | | — | |
Distributions from net realized gains | | | — | | | | (0.00 | )(d) | | | — | |
Total distributions | | | (0.10 | ) | | | (0.26 | ) | | | — | |
Net asset value, end of period | | $ | 10.08 | | | $ | 10.11 | | | $ | 10.02 | |
| | | | | | | | | | | | | |
Total Return | | | 0.67 | %(e) | | | 3.57 | % | | | 0.20 | %(e) |
| | | | | | | | | | | | | |
Ratios and Supplemental Data | | | | | | | | | | | | |
Net assets, end of period (in 000s) | | $ | 1,158 | | | $ | 915 | | | $ | 200 | |
| | | | | | | | | | | | | |
Ratio of expenses to average net assets | | | | | | | | | | | | |
With fee waivers/reimbursements | | | 0.49 | %(f) | | | 0.49 | % | | | 0.49 | %(f) |
Without fee waivers/reimbursements | | | 1.20 | %(f) | | | 4.13 | % | | | 9.96 | %(f)(g) |
Ratio of net investment income (loss) to average net assets | | | | | | | | | | | | |
With fee waivers/reimbursements | | | 1.88 | %(f) | | | 2.50 | % | | | 2.39 | %(f) |
Without fee waivers/reimbursements | | | 1.12 | %(f) | | | (1.14 | )% | | | (7.08 | )%(f)(g) |
Portfolio turnover rate | | | 29 | %(e) | | | 32 | % | | | 0 | %(e) |
(a) | Commenced operations on December 17, 2018. |
(b) | Calculated using the average shares method. |
(c) | Represents a balancing figure derived from other amounts in the financial highlights table that captures all other changes affecting net asset value per share. This per share amount does not correlate to the aggregate of the net realized and unrealized losses on the Statement of Operations for the same period. |
(d) | Less than $0.005 per share. |
(e) | Total return and portfolio turnover are not annualized for periods less than one full year. |
(g) | Ratios before fee waivers for start up periods may not be representative of long term operating results. For the purpose of the ratio, audit and tax preparation fees have not been annualized. |
See Notes to Financial Statements.
Semi-Annual Report | June 30, 2020 |  | 137 |
Segall Bryant & Hamill Short Term Plus Fund | Financial Highlights |
For a Share Outstanding Throughout the Periods Presented |
Institutional | | Six Months
Ended
June 30, 2020
(Unaudited) | | | Year Ended
December 31,
2019 | | | Period Ended
December 31,
2018(a) | |
Net asset value, beginning of period | | $ | 10.11 | | | $ | 10.02 | | | $ | 10.00 | |
Income from investment operations: | | | | | | | | | | | | |
Net investment income(b) | | | 0.09 | | | | 0.26 | | | | 0.01 | |
Net realized and unrealized gains (losses) on investments | | | (0.01 | )(c) | | | 0.09 | | | | 0.01 | |
Total from investment operations | | | 0.08 | | | | 0.35 | | | | 0.02 | |
| | | | | | | | | | | | | |
Less dividends and distributions: | | | | | | | | | | | | |
Dividends from net investment income | | | (0.10 | ) | | | (0.26 | ) | | | — | |
Distributions from net realized gains | | | — | | | | (0.00 | )(d) | | | — | |
Total distributions | | | (0.10 | ) | | | (0.26 | ) | | | — | |
Net asset value, end of period | | $ | 10.09 | | | $ | 10.11 | | | $ | 10.02 | |
| | | | | | | | | | | | | |
Total Return | | | 0.78 | %(e) | | | 3.62 | % | | | 0.20 | %(e) |
| | | | | | | | | | | | | |
Ratios and Supplemental Data | | | | | | | | | | | | |
Net assets, end of period (in 000s) | | $ | 10,327 | | | $ | 6,279 | | | $ | 1,002 | |
| | | | | | | | | | | | | |
Ratio of expenses to average net assets | | | | | | | | | | | | |
With fee waivers/reimbursements | | | 0.40 | %(f) | | | 0.40 | % | | | 0.40 | %(f) |
Without fee waivers/reimbursements | | | 1.15 | %(f) | | | 3.68 | % | | | 9.74 | %(f)(g) |
Ratio of net investment income (loss) to average net assets | | | | | | | | | | | | |
With fee waivers/reimbursements | | | 1.80 | %(f) | | | 2.53 | % | | | 2.48 | %(f) |
Without fee waivers/reimbursements | | | 1.09 | %(f) | | | (0.75 | )% | | | (6.86 | )%(f)(g) |
Portfolio turnover rate | | | 29 | %(e) | | | 32 | % | | | 0 | %(e) |
(a) | Commenced operations on December 17, 2018. |
(b) | Calculated using the average shares method. |
(c) | Represents a balancing figure derived from other amounts in the financial highlights table that captures all other changes affecting net asset value per share. This per share amount does not correlate to the aggregate of the net realized and unrealized losses on the Statement of Operations for the same period. |
(d) | Less than $0.005 per share. |
(e) | Total return and portfolio turnover are not annualized for periods less than one full year. |
(g) | Ratios before fee waivers for start up periods may not be representative of long-term operating results. For the purpose of the ratio, audit and tax preparation fees have not been annualized. |
See Notes to Financial Statements.
138 |  | www.sbhfunds.com | www.sbhfunds.com
|
Segall Bryant & Hamill Plus Bond Fund | Financial Highlights |
For a Share Outstanding Throughout the Periods Presented |
Retail | | Six Months
Ended
June 30, 2020
(Unaudited) | | | Year Ended
December 31,
2019 | | | Year Ended
December 31,
2018(a) | | | Year Ended
December 31,
2017 | | | Year Ended
December 31,
2016 | | | Year Ended
December 31,
2015 | |
Net asset value, beginning of period | | $ | 10.79 | | | $ | 10.32 | | | $ | 10.71 | | | $ | 10.59 | | | $ | 10.55 | | | $ | 10.92 | |
Income (loss) from investment operations: | | | | | | | | | | | | | | | | | | | | | | | | |
Net investment income(b) | | | 0.15 | | | | 0.33 | | | | 0.33 | | | | 0.34 | | | | 0.33 | | | | 0.31 | |
Net realized and unrealized gains (losses) on investments | | | 0.44 | | | | 0.57 | | | | (0.36 | ) | | | 0.16 | | | | 0.07 | | | | (0.31 | ) |
Total from investment operations | | | 0.59 | | | | 0.90 | | | | (0.03 | ) | | | 0.50 | | | | 0.40 | | | | — | |
| | | | | | | | | | | | | | | | | | | | | | | | | |
Less dividends and distributions: | | | | | | | | | | | | | | | | | | | | | | | | |
Dividends from net investment income | | | (0.16 | ) | | | (0.36 | ) | | | (0.34 | ) | | | (0.37 | ) | | | (0.36 | ) | | | (0.34 | ) |
Distributions from net realized gains | | | — | | | | (0.07 | ) | | | (0.02 | ) | | | (0.01 | ) | | | (0.00 | )(c) | | | (0.03 | ) |
Total distributions | | | (0.16 | ) | | | (0.43 | ) | | | (0.36 | ) | | | (0.38 | ) | | | (0.36 | ) | | | (0.37 | ) |
Net asset value, end of period | | $ | 11.22 | | | $ | 10.79 | | | $ | 10.32 | | | $ | 10.71 | | | $ | 10.59 | | | $ | 10.55 | |
| | | | | | | | | | | | | | | | | | | | | | | | | |
Total Return | | | 5.48 | %(d) | | | 8.79 | % | | | (0.18 | )% | | | 4.74 | % | | | 3.82 | % | | | 0.01 | % |
| | | | | | | | | | | | | | | | | | | | | | | | | |
Ratios and Supplemental Data | | | | | | | | | | | | | | | | | | | | | | | | |
Net assets, end of period (in 000s) | | $ | 590,981 | | | $ | 598,220 | | | $ | 915,824 | | | $ | 1,056,835 | | | $ | 1,066,591 | | | $ | 1,309,659 | |
| | | | | | | | | | | | | | | | | | | | | | | | | |
Ratio of expenses to average net assets | | | | | | | | | | | | | | | | | | | | | | | | |
With fee waivers/reimbursements | | | 0.55 | %(e) | | | 0.55 | % | | | 0.55 | % | | | 0.55 | % | | | 0.55 | % | | | 0.55 | % |
Without fee waivers/reimbursements | | | 0.70 | %(e) | | | 0.73 | % | | | 0.76 | % | | | 0.77 | % | | | 0.78 | % | | | 0.70 | % |
Ratio of net investment income to average net assets | | | | | | | | | | | | | | | | | | | | | | | | |
With fee waivers/reimbursements | | | 2.70 | %(e) | | | 3.04 | % | | | 3.17 | % | | | 3.15 | % | | | 3.03 | % | | | 2.87 | % |
Without fee waivers/reimbursements | | | 2.55 | %(e) | | | 2.86 | % | | | 2.96 | % | | | 2.93 | % | | | 2.80 | % | | | 2.72 | % |
Portfolio turnover rate | | | 27 | %(d) | | | 52 | % | | | 59 | % | | | 38 | % | | | 52 | % | | | 51 | % |
(a) | Prior to April 30, 2018 known as the Westcore Plus Bond Fund. |
(b) | Calculated using the average shares method. |
(c) | Less than $0.005 per share. |
(d) | Total return and portfolio turnover are not annualized for periods less than one full year. |
See Notes to Financial Statements.
Semi-Annual Report | June 30, 2020 |  | 139 |
Segall Bryant & Hamill Plus Bond Fund | Financial Highlights |
For a Share Outstanding Throughout the Periods Presented |
Institutional | | Six Months
Ended
June 30, 2020
(Unaudited) | | | Year Ended
December 31,
2019 | | | Year Ended
December 31,
2018(a) | | | Year Ended
December 31,
2017 | | | Year Ended
December 31,
2016 | | | Year Ended
December 31,
2015 | |
Net asset value, beginning of period | | $ | 10.69 | | | $ | 10.23 | | | $ | 10.60 | | | $ | 10.48 | | | $ | 10.43 | | | $ | 10.79 | |
Income (loss) from investment operations: | | | | | | | | | | | | | | | | | | | | | | | | |
Net investment income(b) | | | 0.15 | | | | 0.34 | | | | 0.34 | | | | 0.35 | | | | 0.34 | | | | 0.32 | |
Net realized and unrealized gains (losses) on investments | | | 0.44 | | | | 0.56 | | | | (0.34 | ) | | | 0.15 | | | | 0.08 | | | | (0.29 | ) |
Total from investment operations | | | 0.59 | | | | 0.90 | | | | 0.00 | (c) | | | 0.50 | | | | 0.42 | | | | 0.03 | |
| | | | | | | | | | | | | | | | | | | | | | | | | |
Less dividends and distributions: | | | | | | | | | | | | | | | | | | | | | | | | |
Dividends from net investment income | | | (0.17 | ) | | | (0.37 | ) | | | (0.35 | ) | | | (0.37 | ) | | | (0.37 | ) | | | (0.36 | ) |
Distributions from net realized gains | | | — | | | | (0.07 | ) | | | (0.02 | ) | | | (0.01 | ) | | | (0.00 | )(c) | | | (0.03 | ) |
Total distributions | | | (0.17 | ) | | | (0.44 | ) | | | (0.37 | ) | | | (0.38 | ) | | | (0.37 | ) | | | (0.39 | ) |
Net asset value, end of period | | $ | 11.11 | | | $ | 10.69 | | | $ | 10.23 | | | $ | 10.60 | | | $ | 10.48 | | | $ | 10.43 | |
| | | | | | | | | | | | | | | | | | | | | | | | | |
Total Return | | | 5.53 | %(d) | | | 8.90 | % | | | 0.06 | % | | | 4.81 | % | | | 4.01 | % | | | 0.23 | % |
| | | | | | | | | | | | | | | | | | | | | | | | | |
Ratios and Supplemental Data | | | | | | | | | | | | | | | | | | | | | | | | |
Net assets, end of period (in 000s) | | $ | 448,066 | | | $ | 427,395 | | | $ | 307,253 | | | $ | 229,912 | | | $ | 121,829 | | | $ | 108,101 | |
| | | | | | | | | | | | | | | | | | | | | | | | | |
Ratio of expenses to average net assets | | | | | | | | | | | | | | | | | | | | | | | | |
With fee waivers/reimbursements | | | 0.40 | %(e) | | | 0.40 | % | | | 0.40 | % | | | 0.40 | % | | | 0.38 | % | | | 0.42 | % |
Without fee waivers/reimbursements | | | 0.52 | %(e) | | | 0.55 | % | | | 0.56 | % | | | 0.56 | % | | | 0.56 | % | | | 0.55 | % |
Ratio of net investment income to average net assets | | | | | | | | | | | | | | | | | | | | | | | | |
With fee waivers/reimbursements | | | 2.85 | %(e) | | | 3.14 | % | | | 3.33 | % | | | 3.29 | % | | | 3.20 | % | | | 2.99 | % |
Without fee waivers/reimbursements | | | 2.73 | %(e) | | | 2.99 | % | | | 3.17 | % | | | 3.13 | % | | | 3.02 | % | | | 2.86 | % |
Portfolio turnover rate | | | 27 | %(d) | | | 52 | % | | | 59 | % | | | 38 | % | | | 52 | % | | | 51 | % |
(a) | Prior to April 30, 2018 known as the Westcore Plus Bond Fund. |
(b) | Calculated using the average shares method. |
(c) | Less than $0.005 per share. |
(d) | Total return and portfolio turnover are not annualized for periods less than one full year. |
See Notes to Financial Statements.
140 |  | www.sbhfunds.com | www.sbhfunds.com
|
Segall Bryant & Hamill Quality High Yield Fund | Financial Highlights |
For a Share Outstanding Throughout the Periods Presented |
Retail | | Six Months
Ended
June 30, 2020
(Unaudited) | | | Year Ended
December 31,
2019 | | | Year Ended
December 31,
2018(a) | | | Year Ended
December 31,
2017 | | | Year Ended
December 31,
2016 | | | Year Ended
December 31,
2015 | |
Net asset value, beginning of period | | $ | 8.97 | | | $ | 8.40 | | | $ | 8.99 | | | $ | 8.86 | | | $ | 8.23 | | | $ | 8.80 | |
Income (loss) from investment operations: | | | | | | | | | | | | | | | | | | | | | | | | |
Net investment income(b) | | | 0.16 | | | | 0.43 | | | | 0.40 | | | | 0.41 | | | | 0.40 | | | | 0.42 | |
Net realized and unrealized gains (losses) on investments | | | (0.27 | ) | | | 0.58 | | | | (0.59 | ) | | | 0.13 | | | | 0.63 | | | | (0.55 | ) |
Total from investment operations | | | (0.11 | ) | | | 1.01 | | | | (0.19 | ) | | | 0.54 | | | | 1.03 | | | | (0.13 | ) |
| | | | | | | | | | | | | | | | | | | | | | | | |
Less dividends and distributions: | | | | | | | | | | | | | | | | | | | | | | | | |
Dividends from net investment income | | | (0.18 | ) | | | (0.44 | ) | | | (0.40 | ) | | | (0.41 | ) | | | (0.40 | ) | | | (0.44 | ) |
| | | | | | | | | | | | | | | | | | | | | | | | | |
Paid-in capital from redemption fees | | | — | | | | — | | | | — | | | | — | | | | 0.00 | (c) | | | 0.00 | (c) |
Net asset value, end of period | | $ | 8.68 | | | $ | 8.97 | | | $ | 8.40 | | | $ | 8.99 | | | $ | 8.86 | | | $ | 8.23 | |
| | | | | | | | | | | | | | | | | | | | | | | | | |
Total Return | | | (1.17 | )%(d) | | | 12.21 | % | | | (2.19 | )% | | | 6.18 | % | | | 12.75 | % | | | (1.64 | )% |
| | | | | | | | | | | | | | | | | | | | | | | | | |
Ratios and Supplemental Data | | | | | | | | | | | | | | | | | | | | | | | | |
Net assets, end of period (in 000s) | | $ | 37,125 | | | $ | 39,692 | | | $ | 43,045 | | | $ | 58,486 | | | $ | 56,997 | | | $ | 46,725 | |
| | | | | | | | | | | | | | | | | | | | | | | | | |
Ratio of expenses to average net assets | | | | | | | | | | | | | | | | | | �� | | | | | | |
With fee waivers/reimbursements | | | 0.85 | %(e) | | | 0.85 | % | | | 0.85 | % | | | 0.85 | % | | | 0.85 | % | | | 0.85 | % |
Without fee waivers/reimbursements | | | 0.96 | %(e) | | | 0.98 | % | | | 0.99 | % | | | 0.98 | % | | | 0.95 | % | | | 0.98 | % |
Ratio of net investment income to average net assets | | | | | | | | | | | | | | | | | | | | | | | | |
With fee waivers/reimbursements | | | 3.82 | %(e) | | | 4.86 | % | | | 4.52 | % | | | 4.52 | % | | | 4.63 | % | | | 4.86 | % |
Without fee waivers/reimbursements | | | 3.71 | %(e) | | | 4.73 | % | | | 4.38 | % | | | 4.39 | % | | | 4.53 | % | | | 4.73 | % |
Portfolio turnover rate | | | 35 | %(d) | | | 41 | % | | | 21 | % | | | 37 | % | | | 47 | % | | | 37 | % |
(a) | Prior to April 30, 2018 known as the Westcore Flexible Income Fund. |
(b) | Calculated using the average shares method. |
(c) | Less than $0.005 per share. |
(d) | Total return and portfolio turnover are not annualized for periods less than one full year. |
See Notes to Financial Statements.
Semi-Annual Report | June 30, 2020 |  | 141 |
Segall Bryant & Hamill Quality High Yield Fund | Financial Highlights |
For a Share Outstanding Throughout the Periods Presented |
Institutional | | Six Months
Ended
June 30, 2020
(Unaudited) | | | Year Ended
December 31,
2019 | | | Year Ended
December 31,
2018(a) | | | Year Ended
December 31,
2017 | | | Year Ended
December 31,
2016 | | | Year Ended
December 31,
2015 | |
Net asset value, beginning of period | | $ | 8.87 | | | $ | 8.29 | | | $ | 8.88 | | | $ | 8.75 | | | $ | 8.12 | | | $ | 8.68 | |
Income (loss) from investment operations: | | | | | | | | | | | | | | | | | | | | | | | | |
Net investment income(b) | | | 0.17 | | | | 0.44 | | | | 0.40 | | | | 0.42 | | | | 0.41 | | | | 0.43 | |
Net realized and unrealized gains (losses) on investments | | | (0.26 | ) | | | 0.57 | | | | (0.58 | ) | | | 0.13 | | | | 0.62 | | | | (0.55 | ) |
Total from investment operations | | | (0.09 | ) | | | 1.01 | | | | (0.18 | ) | | | 0.55 | | | | 1.03 | | | | (0.12 | ) |
| | | | | | | | | | | | | | | | | | | | | | | | | |
Less dividends and distributions: | | | | | | | | | | | | | | | | | | | | | | | | |
Dividends from net investment income | | | (0.19 | ) | | | (0.43 | ) | | | (0.41 | ) | | | (0.42 | ) | | | (0.41 | ) | | | (0.44 | ) |
| | | | | | | | | | | | | | | | | | | | | | | | | |
Paid-in capital from redemption fees | | | — | | | | — | | | | — | | | | — | | | | 0.01 | | | | 0.00 | (c) |
Net asset value, end of period | | $ | 8.59 | | | $ | 8.87 | | | $ | 8.29 | | | $ | 8.88 | | | $ | 8.75 | | | $ | 8.12 | |
| | | | | | | | | | | | | | | | | | | | | | | | | |
Total Return | | | (1.00 | )%(d) | | | 12.40 | % | | | (2.12 | )% | | | 6.35 | % | | | 13.10 | % | | | (1.51 | )% |
| | | | | | | | | | | | | | | | | | | | | | | | | |
Ratios and Supplemental Data | | | | | | | | | | | | | | | | | | | | | | | | |
Net assets, end of period (in 000s) | | $ | 23,887 | | | $ | 21,680 | | | $ | 12,962 | | | $ | 20,734 | | | $ | 18,488 | | | $ | 11,435 | |
| | | | | | | | | | | | | | | | | | | | | | | | | |
Ratio of expenses to average net assets | | | | | | | | | | | | | | | | | | | | | | | | |
With fee waivers/reimbursements | | | 0.70 | %(e) | | | 0.70 | % | | | 0.69 | % | | | 0.68 | % | | | 0.63 | % | | | 0.72 | % |
Without fee waivers/reimbursements | | | 0.84 | %(e) | | | 0.83 | % | | | 0.81 | % | | | 0.78 | % | | | 0.84 | % | | | 1.03 | % |
Ratio of net investment income to average net assets | | | | | | | | | | | | | | | | | | | | | | | | |
With fee waivers/reimbursements | | | 3.98 | %(e) | | | 4.99 | % | | | 4.68 | % | | | 4.67 | % | | | 4.85 | % | | | 5.06 | % |
Without fee waivers/reimbursements | | | 3.84 | %(e) | | | 4.86 | % | | | 4.56 | % | | | 4.57 | % | | | 4.64 | % | | | 4.75 | % |
Portfolio turnover rate | | | 35 | %(d) | | | 41 | % | | | 21 | % | | | 37 | % | | | 47 | % | | | 37 | % |
(a) | Prior to April 30, 2018 known as the Westcore Flexible Income Fund. |
(b) | Calculated using the average shares method. |
(c) | Less than $0.005 per share. |
(d) | Total return and portfolio turnover are not annualized for periods less than one full year. |
See Notes to Financial Statements.
142 |  | www.sbhfunds.com | www.sbhfunds.com
|
Segall Bryant & Hamill Municipal Opportunities Fund | Financial Highlights |
For a Share Outstanding Throughout the Periods Presented |
Retail | | Six Months
Ended
June 30, 2020
(Unaudited) | | | Year Ended
December 31,
2019 | | | Year Ended
December 31,
2018(a) | | | Year Ended
December 31,
2017 | | | Period Ended
December 31,
2016(b) | |
Net asset value, beginning of period | | $ | 10.67 | | | $ | 10.38 | | | $ | 10.61 | | | $ | 10.15 | | | $ | 10.00 | |
Income (loss) from investment operations: | | | | | | | | | | | | | | | | | | | | |
Net investment income(c) | | | 0.16 | | | | 0.29 | | | | 0.35 | | | | 0.32 | | | | 0.00 | (d) |
Net realized and unrealized gains (losses) on investments | | | 0.11 | | | | 0.43 | | | | (0.23 | ) | | | 0.53 | | | | 0.15 | |
Total from investment operations | | | 0.27 | | | | 0.72 | | | | 0.12 | | | | 0.85 | | | | 0.15 | |
| | | | | | | | | | | | | | | | | | | | | |
Less dividends and distributions: | | | | | | | | | | | | | | | | | | | | |
Dividends from net investment income | | | (0.15 | ) | | | (0.35 | ) | | | (0.34 | ) | | | (0.31 | ) | | | — | |
Distributions from net realized gains | | | — | | | | (0.08 | ) | | | (0.01 | ) | | | (0.08 | ) | | | — | |
Total distributions | | | (0.15 | ) | | | (0.43 | ) | | | (0.35 | ) | | | (0.39 | ) | | | — | |
Net asset value, end of period | | $ | 10.79 | | | $ | 10.67 | | | $ | 10.38 | | | $ | 10.61 | | | $ | 10.15 | |
| | | | | | | | | | | | | | | | | | | | | |
Total Return | | | 2.60 | %(e) | | | 7.00 | % | | | 1.23 | % | | | 8.44 | % | | | 1.50 | %(e) |
| | | | | | | | | | | | | | | | | | | | | |
Ratios and Supplemental Data | | | | | | | | | | | | | | | | | | | | |
Net assets, end of period (in 000s) | | $ | 16,768 | | | $ | 11,399 | | | $ | 6,405 | | | $ | 2,709 | | | $ | 406 | |
| | | | | | | | | | | | | | | | | | | | | |
Ratio of expenses to average net assets | | | | | | | | | | | | | | | | | | | | |
With fee waivers/reimbursements | | | 0.65 | %(f) | | | 0.65 | % | | | 0.65 | % | | | 0.65 | % | | | 0.65 | %(f) |
Without fee waivers/reimbursements | | | 0.88 | %(f) | | | 0.94 | % | | | 1.09 | % | | | 3.09 | %(g) | | | 19.11 | %(f)(h) |
Ratio of net investment income (loss) to average net assets | | | | | | | | | | | | | | | | | | | | |
With fee waivers/reimbursements | | | 2.97 | %(f) | | | 2.73 | % | | | 3.40 | % | | | 2.99 | % | | | 1.05 | %(f) |
Without fee waivers/reimbursements | | | 2.73 | %(f) | | | 2.44 | % | | | 2.96 | % | | | 0.55 | %(g) | | | (17.41 | )%(f)(h) |
Portfolio turnover rate | | | 77 | %(e) | | | 114 | % | | | 188 | % | | | 284 | % | | | 0 | %(e) |
(a) | Prior to April 30, 2018 known as the Westcore Municipal Opportunities Fund. |
(b) | Commenced operations on December 19, 2016. |
(c) | Calculated using the average shares method. |
(d) | Less than $0.005 per share. |
(e) | Total return and portfolio turnover are not annualized for periods less than one full year. |
(g) | Ratios before fee waivers for start up periods may not be representative of long-term operating results. |
(h) | Ratios before fee waivers for start up periods may not be representative of long-term operating results. For the purpose of the ratio, audit and tax preparation fees have not been annualized. |
See Notes to Financial Statements.
Semi-Annual Report | June 30, 2020 |  | 143 |
Segall Bryant & Hamill Municipal Opportunities Fund | Financial Highlights |
For a Share Outstanding Throughout the Periods Presented |
Institutional | | Six Months
Ended
June 30, 2020
(Unaudited) | | | Year Ended
December 31,
2019 | | | Year Ended
December 31,
2018(a) | | | Year Ended
December 31,
2017 | | | Period Ended
December 31,
2016(b) | |
Net asset value, beginning of period | | $ | 10.68 | | | $ | 10.39 | | | $ | 10.62 | | | $ | 10.15 | | | $ | 10.00 | |
Income (loss) from investment operations: | | | | | | | | | | | | | | | | | | | | |
Net investment income(c) | | | 0.17 | | | | 0.31 | | | | 0.37 | | | | 0.34 | | | | 0.00 | (d) |
Net realized and unrealized gains (losses) on investments | | | 0.11 | | | | 0.43 | | | | (0.23 | ) | | | 0.53 | | | | 0.15 | |
Total from investment operations | | | 0.28 | | | | 0.74 | | | | 0.14 | | | | 0.87 | | | | 0.15 | |
| | | | | | | | | | | | | | | | | | | | | |
Less dividends and distributions: | | | | | | | | | | | | | | | | | | | | |
Dividends from net investment income | | | (0.16 | ) | | | (0.37 | ) | | | (0.36 | ) | | | (0.32 | ) | | | — | |
Distributions from net realized gains | | | — | | | | (0.08 | ) | | | (0.01 | ) | | | (0.08 | ) | | | — | |
Total distributions | | | (0.16 | ) | | | (0.45 | ) | | | (0.37 | ) | | | (0.40 | ) | | | — | |
Net asset value, end of period | | $ | 10.80 | | | $ | 10.68 | | | $ | 10.39 | | | $ | 10.62 | | | $ | 10.15 | |
| | | | | | | | | | | | | | | | | | | | | |
Total Return | | | 2.69 | %(e) | | | 7.19 | % | | | 1.36 | % | | | 8.68 | % | | | 1.50 | %(e) |
| | | | | | | | | | | | | | | | | | | | | |
Ratios and Supplemental Data | | | | | | | | | | | | | | | | | | | | |
Net assets, end of period (in 000s) | | $ | 88,246 | | | $ | 62,358 | | | $ | 35,204 | | | $ | 21,371 | | | $ | 355 | |
| | | | | | | | | | | | | | | | | | | | | |
Ratio of expenses to average net assets | | | | | | | | | | | | | | | | | | | | |
With fee waivers/reimbursements | | | 0.50 | %(f) | | | 0.50 | % | | | 0.50 | % | | | 0.40 | % | | | 0.61 | %(f) |
Without fee waivers/reimbursements | | | 0.69 | %(f) | | | 0.76 | % | | | 0.91 | % | | | 2.29 | %(g) | | | 19.48 | %(f)(h) |
Ratio of net investment income (loss) to average net assets | | | | | | | | | | | | | | | | | | | | |
With fee waivers/reimbursements | | | 3.11 | %(f) | | | 2.90 | % | | | 3.51 | % | | | 3.24 | % | | | 1.08 | %(f) |
Without fee waivers/reimbursements | | | 2.92 | %(f) | | | 2.64 | % | | | 3.10 | % | | | 1.35 | %(g) | | | (17.79 | )%(f)(h) |
Portfolio turnover rate | | | 77 | %(e) | | | 114 | % | | | 188 | % | | | 284 | % | | | 0 | %(e) |
(a) | Prior to April 30, 2018 known as the Westcore Municipal Opportunities Fund. |
(b) | Commenced operations on December 19, 2016. |
(c) | Calculated using the average shares method. |
(d) | Less than $0.005 per share. |
(e) | Total return and portfolio turnover are not annualized for periods less than one full year. |
(g) | Ratios before fee waivers for start up periods may not be representative of long-term operating results. |
(h) | Ratios before fee waivers for start up periods may not be representative of long-term operating results. For the purpose of the ratio, audit and tax preparation fees have not been annualized. |
See Notes to Financial Statements.
144 |  | www.sbhfunds.com | www.sbhfunds.com
|
Segall Bryant & Hamill Colorado Tax Free Fund | Financial Highlights |
For a Share Outstanding Throughout the Periods Presented |
Retail | | Six Months
Ended
June 30, 2020
(Unaudited) | | | Year Ended
December 31,
2019 | | | Year Ended
December 31,
2018(a) | | | Year Ended
December 31,
2017 | | | Year Ended
December 31,
2016 | | | Year Ended
December 31,
2015 | |
Net asset value, beginning of period | | $ | 11.69 | | | $ | 11.30 | | | $ | 11.58 | | | $ | 11.32 | | | $ | 11.66 | | | $ | 11.63 | |
Income (loss) from investment operations: | | | | | | | | | | | | | | | | | | | | | | | | |
Net investment income(b) | | | 0.13 | | | | 0.27 | | | | 0.35 | | | | 0.32 | | | | 0.31 | | | | 0.32 | |
Net realized and unrealized gains (losses) on investments | | | 0.08 | | | | 0.47 | | | | (0.28 | ) | | | 0.26 | | | | (0.31 | ) | | | 0.02 | |
Total from investment operations | | | 0.21 | | | | 0.74 | | | | 0.07 | | | | 0.58 | | | | — | | | | 0.34 | |
| | | | | | | | | | | | | | | | | | | | | | | | | |
Less dividends and distributions: | | | | | | | | | | | | | | | | | | | | | | | | |
Dividends from net investment income | | | (0.16 | ) | | | (0.35 | ) | | | (0.35 | ) | | | (0.32 | ) | | | (0.31 | ) | | | (0.31 | ) |
Distributions from net realized gains | | | — | | | | — | | | | — | | | | — | | | | (0.03 | ) | | | — | |
Total distributions | | | (0.16 | ) | | | (0.35 | ) | | | (0.35 | ) | | | (0.32 | ) | | | (0.34 | ) | | | (0.31 | ) |
Net asset value, end of period | | $ | 11.74 | | | $ | 11.69 | | | $ | 11.30 | | | $ | 11.58 | | | $ | 11.32 | | | $ | 11.66 | |
| | | | | | | | | | | | | | | | | | | | | | | | | |
Total Return | | | 1.85 | %(c) | | | 6.62 | % | | | 0.60 | % | | | 5.21 | % | | | (0.07 | )% | | | 3.02 | % |
| | | | | | | | | | | | | | | | | | | | | | | | | |
Ratios and Supplemental Data | | | | | | | | | | | | | | | | | | | | | | | | |
Net assets, end of period (in 000s) | | $ | 172,484 | | | $ | 161,755 | | | $ | 176,020 | | | $ | 193,426 | | | $ | 196,237 | | | $ | 192,920 | |
| | | | | | | | | | | | | | | | | | | | | | | | | |
Ratio of expenses to average net assets | | | | | | | | | | | | | | | | | | | | | | | | |
With fee waivers/reimbursements | | | 0.65 | %(d) | | | 0.65 | % | | | 0.65 | % | | | 0.65 | % | | | 0.65 | % | | | 0.65 | % |
Without fee waivers/reimbursements | | | 0.70 | %(d) | | | 0.77 | % | | | 0.82 | % | | | 0.82 | % | | | 0.84 | % | | | 0.77 | % |
Ratio of net investment income to average net assets | | | | | | | | | | | | | | | | | | | | | | | | |
With fee waivers/reimbursements | | | 2.27 | %(d) | | | 2.29 | % | | | 3.05 | % | | | 2.80 | % | | | 2.62 | % | | | 2.73 | % |
Without fee waivers/reimbursements | | | 2.21 | %(d) | | | 2.17 | % | | | 2.88 | % | | | 2.63 | % | | | 2.43 | % | | | 2.61 | % |
Portfolio turnover rate | | | 55 | %(c) | | | 30 | % | | | 47 | % | | | 64 | % | | | 47 | % | | | 30 | % |
(a) | Prior to April 30, 2018 known as the Westcore Colorado Tax-Exempt Fund. |
(b) | Calculated using the average shares method. |
(c) | Total return and portfolio turnover are not annualized for periods less than one full year. |
See Notes to Financial Statements.
Semi-Annual Report | June 30, 2020 |  | 145 |
Segall Bryant & Hamill Colorado Tax Free Fund | Financial Highlights |
For a Share Outstanding Throughout the Periods Presented |
Institutional | | Six Months
Ended
June 30, 2020
(Unaudited) | | | Year Ended
December 31,
2019 | | | Year Ended
December 31,
2018(a) | | | Year Ended
December 31,
2017 | | | Period Ended
December 31,
2016(b) | |
Net asset value, beginning of period | | $ | 11.73 | | | $ | 11.33 | | | $ | 11.61 | | | $ | 11.34 | | | $ | 11.79 | |
Income (loss) from investment operations: | | | | | | | | | | | | | | | | | | | | |
Net investment income(c) | | | 0.14 | | | | 0.28 | | | | 0.36 | | | | 0.34 | | | | 0.22 | |
Net realized and unrealized gains (losses) on investments | | | 0.08 | | | | 0.48 | | | | (0.28 | ) | | | 0.26 | | | | (0.44 | ) |
Total from investment operations | | | 0.22 | | | | 0.76 | | | | 0.08 | | | | 0.60 | | | | (0.22 | ) |
| | | | | | | | | | | | | | | | | | | | | |
Less dividends and distributions: | | | | | | | | | | | | | | | | | | | | |
Dividends from net investment income | | | (0.17 | ) | | | (0.36 | ) | | | (0.36 | ) | | | (0.33 | ) | | | (0.20 | ) |
Distributions from net realized gains | | | — | | | | — | | | | — | | | | — | | | | (0.03 | ) |
Total distributions | | | (0.17 | ) | | | (0.36 | ) | | | (0.36 | ) | | | (0.33 | ) | | | (0.23 | ) |
Net asset value, end of period | | $ | 11.78 | | | $ | 11.73 | | | $ | 11.33 | | | $ | 11.61 | | | $ | 11.34 | |
| | | | | | | | | | | | | | | | | | | | | |
Total Return | | | 1.91 | %(d) | | | 6.80 | % | | | 0.73 | % | | | 5.34 | % | | | (1.93 | )%(d) |
| | | | | | | | | | | | | | | | | | | | | |
Ratios and Supplemental Data | | | | | | | | | | | | | | | | | | | | |
Net assets, end of period (in 000s) | | $ | 241,603 | | | $ | 214,996 | | | $ | 96,615 | | | $ | 79,263 | | | $ | 29,557 | |
| | | | | | | | | | | | | | | | | | | | | |
Ratio of expenses to average net assets | | | | | | | | | | | | | | | | | | | | |
With fee waivers/reimbursements | | | 0.50 | %(e) | | | 0.50 | % | | | 0.50 | % | | | 0.50 | % | | | 0.49 | %(e) |
Without fee waivers/reimbursements | | | 0.57 | %(e) | | | 0.61 | % | | | 0.63 | % | | | 0.64 | % | | | 0.68 | %(e) |
Ratio of net investment income to average net assets | | | | | | | | | | | | | | | | | | | | |
With fee waivers/reimbursements | | | 2.42 | %(e) | | | 2.41 | % | | | 3.20 | % | | | 2.96 | % | | | 2.81 | %(e) |
Without fee waivers/reimbursements | | | 2.35 | %(e) | | | 2.30 | % | | | 3.07 | % | | | 2.82 | % | | | 2.62 | %(e) |
Portfolio turnover rate | | | 55 | %(d) | | | 30 | % | | | 47 | % | | | 64 | % | | | 47 | %(d)(f) |
(a) | Prior to April 30, 2018 known as the Westcore Colorado Tax-Exempt Fund. |
(b) | The Fund added an institutional share class on April 29, 2016. |
(c) | Calculated using the average shares method. |
(d) | Total return and portfolio turnover are not annualized for periods less than one full year. |
(f) | Portfolio turnover rate is calculated at the fund level and represents the year ended December 31, 2016. |
See Notes to Financial Statements.
146 |  | www.sbhfunds.com | www.sbhfunds.com
|
Segall Bryant & Hamill Funds | Notes to Financial Statements |
| | June 30, 2020 (Unaudited) |
1. ORGANIZATION
Segall Bryant & Hamill Trust (the “Trust”) is registered under the Investment Company Act of 1940, as amended, as an open-end management investment company. Interests in the Segall Bryant & Hamill Small Cap Value Fund, Segall Bryant & Hamill Small Cap Value Dividend Fund, Segall Bryant & Hamill Small Cap Growth Fund, Segall Bryant & Hamill Small Cap Core Fund, Segall Bryant & Hamill Mid Cap Value Dividend Fund, Segall Bryant & Hamill All Cap Fund, Segall Bryant & Hamill Emerging Markets Fund, Segall Bryant & Hamill International Small Cap Fund, Segall Bryant & Hamill Fundamental International Small Cap Fund, Segall Bryant & Hamill Global Large Cap Fund, Segall Bryant & Hamill Workplace Equality Fund, Segall Bryant & Hamill Short Term Plus Fund, Segall Bryant & Hamill Plus Bond Fund, Segall Bryant & Hamill Quality High Yield Fund, Segall Bryant & Hamill Municipal Opportunities Fund and Segall Bryant & Hamill Colorado Tax Free Fund (the “Funds”) are represented by separate classes of beneficial interest of the Trust, which is organized as a Massachusetts business trust. All of the Funds offer Retail Class and Institutional Class shares. All classes of shares have identical rights to earnings, assets and voting privileges, except for class specific expenses and exclusive rights to vote on matters solely affecting such class.
2. SIGNIFICANT ACCOUNTING POLICIES
The following is a summary of significant accounting policies consistently followed by each Fund in the preparation of its financial statements. Each Fund is considered an investment company for financial reporting purposes. The following policies are in conformity with accounting principles generally accepted in the United States of America for investment companies.
Use of Estimates – The preparation of financial statements in accordance with accounting principles generally accepted in the United States of America requires management to make estimates and assumptions that affect the reported amounts and disclosures in the financial statements. The actual results could differ from those estimates.
Cash Equivalents – Each Fund subscribes to the Brown Brothers Harriman & Co. (“BBH”) Cash Management Service (“CMS”), whereby cash balances are automatically swept into overnight demand deposits with a branch of a pre-approved commercial bank. This fully automated program allows the Funds to earn interest on cash balances. As of June 30, 2020, the cash equivalents balances reflected on the Statements of Assets and Liabilities represent the amounts participating in the BBH CMS.
Investment Valuation – All securities of the Funds are valued as of the close of regular trading on the New York Stock Exchange (“NYSE”), currently 4:00 p.m. (Eastern Time), on each day that the NYSE is open, subject to provisions in the prospectus and/or Statement of Additional Information regarding pricing at other times in case of an emergency and optional pricing of the Funds in the event that the NYSE does not open for business because of an emergency.
Securities that are traded on a recognized domestic stock exchange are generally valued at the last sales price as of the valuation time on the principal stock exchange on which they are traded. Securities that are principally traded on the National Association of Securities Dealers Automated Quotation (“NASDAQ”) exchange are generally valued at the NASDAQ Official Closing Price (“NOCP”). Unlisted securities that are traded on the domestic over-the-counter market for which last sales prices are available, are generally valued at the last sales price as of the valuation time. In the absence of sales and NOCP, such securities are valued at the bid price.
Securities that are traded on a foreign stock exchange (and that are not listed on a recognized domestic stock exchange or traded on the NASDAQ exchange or the domestic over-the-counter market) are generally valued at the official closing price on the principal stock exchange on which they are traded. When an event occurs subsequent to the close of the foreign exchange and the close of the NYSE that was likely to have changed such value, the fair value of those securities are determined in good faith in accordance with procedures established by and under the general supervision of the Board of Trustees. The Funds will use a fair valuation model provided by an independent pricing service, which is intended to reflect fair value when a security’s value is believed to have been materially affected by a valuation event that has occurred between the close of the exchange or market on which the security is traded and the close of the regular trading day on the NYSE. In the event that closing prices are not available for such foreign securities, such securities are generally valued at the last sales price occurring prior to the closing of its principal exchange.
Forward foreign currency contracts have a fair value determined by an automated system that estimates rates on the basis of the current day foreign currency exchange rates and forward foreign currency exchange rates supplied by a pricing vendor. Foreign currency exchange rates and forward foreign currency exchange rates may generally be obtained at the close of the NYSE.
Redeemable securities issued by open-end registered investment companies are valued at the investment company’s applicable net asset value.
Fixed-income obligations, having a remaining maturity of greater than 60 days, are typically valued at the evaluated prices formulated by an independent pricing service.
When market quotations are not readily available or when events occur that make established valuation methods unreliable, securities of the Fund may be valued in good faith by or under the direction of the Board of Trustees. Factors which may be considered when determining the value of a security include (a) the fundamental data relating to the investment; (b) an evaluation of the forces which influence the market in which the security is sold, including the liquidity and depth of the market; (c) the market value at date of purchase; (d) information as to any transactions or offers with respect to the security or comparable securities; and (e) any other relevant matters.
Semi-Annual Report | June 30, 2020 |  | 147 |
Segall Bryant & Hamill Funds | Notes to Financial Statements |
| | June 30, 2020 (Unaudited) |
Market, Credit and Counterparty Risk – In the normal course of business, the Funds invest in securities and enter into transactions where risks exist due to fluctuations in the market (market risk) or failure of the issuer of a security to meet all its obligations (issuer credit risk). The value of securities held by the Funds may decline in response to certain events, including those directly involving the issuers whose securities are owned by the Funds; conditions affecting the general economy; overall market changes; local, regional, national or global political, social or economic instability; and currency and interest rate and price fluctuations. Similar to issuer credit risk, the Funds may be exposed to counterparty credit risk, or the risk that an entity with which the Funds have unsettled or open transactions may fail to or be unable to perform on its commitments. The Funds manage counterparty credit risk by entering into transactions only with counterparties that they believe have the financial resources to honor their obligations and by monitoring the financial stability of those counterparties.
Securities Traded on Foreign Exchanges – All of the Funds, except the Segall Bryant & Hamill Colorado Tax Free Fund, may invest at least a portion of their assets in foreign securities. As of June 30, 2020, all Funds were primarily invested in securities traded on U.S. exchanges, except Segall Bryant & Hamill Emerging Markets Fund, Segall Bryant & Hamill International Small Cap Fund, Segall Bryant & Hamill Fundamental International Small Cap Fund and Segall Bryant & Hamill Global Large Cap Fund. In the event that a Fund executes a security transaction on a foreign exchange, the Fund will generally enter into a foreign currency contract to settle the foreign security transaction. Foreign securities may carry more risk than U.S. securities, such as political, market and currency risks. The accounting records of the Funds are maintained in U.S. dollars. Prices of securities denominated in foreign currencies are translated into U.S. dollars at the closing rates of exchange at period end. Amounts related to the purchase and sale of foreign securities and investment income are translated at the rates of exchange prevailing on the respective dates of such transactions.
The portion of realized and unrealized gains or losses on investments due to fluctuations in foreign currency exchange rates is not separately disclosed and is included in realized and unrealized gains or losses on investments, when applicable.
Country Risk – As of June 30, 2020 the Segall Bryant & Hamill Emerging Markets Fund invested a significant percentage of its assets in China; the Segall Bryant & Hamill International Small Cap Fund invested a significant percentage of its assets in Japan and the United Kingdom and; the Segall Bryant & Hamill Fundamental International Small Cap Fund invested a significant percentage of its assets in Japan and the United Kingdom. Therefore, they may be more affected by economic developments and currency fluctuations in these countries.
Sector Concentration Risk – The Funds may concentrate investments in companies that are in a single sector or related sector. Concentrating investments in a single sector may make the Fund more susceptible to adverse economic, business, regulatory or other developments affecting that sector. If an economic downturn occurs in a sector in which the Fund’s investments are concentrated, the Fund may perform poorly during that period.
Federal Income Taxes – No provision for income taxes is included in the accompanying financial statements, as the Funds intend to distribute to shareholders all taxable investment income and realized gains and otherwise comply with Subchapter M of the Internal Revenue Code of 1986, as amended, applicable to regulated investment companies.
As of and during the six months ended June 30, 2020, the Funds did not have a liability for any unrecognized tax benefits. The Funds file U.S. federal, state, and local tax returns as required. Each Fund’s tax returns are subject to examination by the relevant tax authorities until expiration of the applicable statute of limitations which is generally three years after the filing of the tax return. Tax returns for open years have incorporated no uncertain tax positions that require a provision for income taxes.
When-Issued/Forward Commitment Securities – Each Fund may purchase or sell securities on a “when-issued” or “forward commitment” basis which involves a commitment by the Fund to purchase or sell particular securities with payment and delivery taking place at a future date. During this period, such securities do not earn interest, are subject to market fluctuation and may increase or decrease in value prior to their delivery. In accordance with SEC guidance, each Fund segregates liquid assets in an amount sufficient to satisfy the purchase price. The purchase of securities on a when-issued or forward commitment basis may increase the volatility of the Fund’s net asset value to the extent each Fund makes such purchases while remaining substantially fully invested. Settlements in the ordinary course of business, which may take substantially more than three business days for non-U.S. securities, are not treated by the Funds as “when-issued” or “forward commitment” transactions.
Security Transactions and Related Investment Income – For financial reporting purposes, the Funds’ investment transactions and shareholder transactions are recorded on trade date. Dividend income is recorded on the ex-dividend date. Foreign dividend income is recorded on the ex-dividend date or as soon as practical after the Funds determine the existence of a dividend declaration after exercising reasonable due diligence. Non-cash dividends included in dividend income, if any, are recorded at the fair value of the security received. Withholding taxes on foreign dividends have been recorded in accordance with the Funds’ understanding of the applicable country’s rules and tax rates. Interest income, which includes amortization of premiums, accretion of discounts and income earned on money market funds, is accrued and recorded daily. Realized gains and losses from investment transactions and unrealized appreciation and depreciation of investments are reported on an identified cost basis.
Investments in Real Estate Investment Trusts (REITs) – With respect to each Fund, dividend income is recorded based on the income included in distributions received from its REIT investments using published REIT reclassifications including some management estimates when actual amounts are not available. Distributions received in excess of these estimated amounts are recorded as a reduction of the cost of investments or reclassified to capital gains. The actual amounts of income, return of capital, and capital gains are only determined by each REIT after its fiscal year end, and may differ from the estimated amounts.
148 |  | www.sbhfunds.com | www.sbhfunds.com
|
Segall Bryant & Hamill Funds | Notes to Financial Statements |
| | June 30, 2020 (Unaudited) |
3. SHARES OF BENEFICIAL INTEREST
On June 30, 2020, there was an unlimited number of no par value shares of beneficial interest authorized for each Fund. Transactions in shares of beneficial interest were as follows:
| | For the
Six Months Ended
June 30, 2020 | | | For the
Six Months Ended December 31, 2019 | | | For the
Year Ended
June 30, 2019 | |
Segall Bryant & Hamill Small Cap Value Fund | | | | | | | | | | | | |
Retail: | | | | | | | | | | | | |
Shares Sold | | | 14,074 | | | | 811 | | | | — | |
Shares Issued in Reinvestment of Distributions | | | — | | | | — | | | | — | |
Total | | | 14,074 | | | | 811 | | | | — | |
Less Shares Redeemed | | | — | | | | (1 | ) | | | — | |
Net Increase | | | 14,074 | | | | 810 | | | | — | |
Institutional: | | | | | | | | | | | | |
Shares Sold | | | 11,218,115 | | | | 2,436,424 | | | | 4,049,887 | |
Shares Issued in Reinvestment of Distributions | | | — | | | | 719,131 | | | | 919,695 | |
Total | | | 11,218,115 | | | | 3,155,555 | | | | 4,969,582 | |
Less Shares Redeemed | | | (2,496,741 | ) | | | (1,005,549 | ) | | | (1,858,875 | ) |
Net Increase | | | 8,721,374 | | | | 2,150,006 | | | | 3,110,707 | |
| | For the
Six Months Ended
June 30, 2020 | | | For the
Year Ended December 31, 2019 | |
Segall Bryant & Hamill Small Cap Value Dividend Fund | | | | | | | | |
Retail: | | | | | | | | |
Shares Sold | | | 113,062 | | | | 458,869 | |
Shares Issued in Reinvestment of Distributions | | | — | | | | 61,792 | |
Total | | | 113,062 | | | | 520,661 | |
Less Shares Redeemed | | | (672,849 | ) | | | (665,495 | ) |
Net Decrease | | | (559,787 | ) | | | (144,834 | ) |
Institutional: | | | | | | | | |
Shares Sold | | | 1,245,239 | | | | 1,864,634 | |
Shares Issued in Reinvestment of Distributions | | | — | | | | 239,411 | |
Total | | | 1,245,239 | | | | 2,104,045 | |
Less Shares Redeemed | | | (1,810,821 | ) | | | (3,057,305 | ) |
Net Decrease | | | (565,582 | ) | | | (953,260 | ) |
Segall Bryant & Hamill Small Cap Growth Fund | | | | | | | | |
Retail: | | | | | | | | |
Shares Sold | | | 39,235 | | | | 182,176 | |
Shares Issued in Reinvestment of Distributions | | | — | | | | — | |
Total | | | 39,235 | | | | 182,176 | |
Less Shares Redeemed | | | (66,648 | ) | | | (119,393 | ) |
Net Increase (Decrease) | | | (27,413 | ) | | | 62,783 | |
Institutional: | | | | | | | | |
Shares Sold | | | 861,227 | | | | 520,966 | |
Shares Issued in Reinvestment of Distributions | | | — | | | | — | |
Total | | | 861,227 | | | | 520,966 | |
Less Shares Redeemed | | | (1,155,592 | ) | | | (1,182,407 | ) |
Net Decrease | | | (294,365 | ) | | | (661,441 | ) |
Semi-Annual Report | June 30, 2020 |  | 149 |
Segall Bryant & Hamill Funds | Notes to Financial Statements |
| | June 30, 2020 (Unaudited) |
| | For the
Six Months Ended
June 30, 2020 | | | For the
Year Ended December 31, 2019 | |
Segall Bryant & Hamill Small Cap Core Fund | | | | | | | | |
Retail: | | | | | | | | |
Shares Sold | | | 18,622 | | | | 7,751 | |
Shares Issued in Reinvestment of Distributions | | | — | | | | — | |
Total | | | 18,622 | | | | 7,751 | |
Less Shares Redeemed | | | (1,426 | ) | | | — | |
Net Increase | | | 17,196 | | | | 7,751 | |
Institutional: | | | | | | | | |
Shares Sold | | | 279,567 | | | | 3,793,622 | |
Shares Issued in Reinvestment of Distributions | | | — | | | | — | |
Total | | | 279,567 | | | | 3,793,622 | |
Less Shares Redeemed | | | (86,468 | ) | | | — | |
Net Increase | | | 193,099 | | | | 3,793,622 | |
Segall Bryant & Hamill Mid Cap Value Dividend Fund | | | | | | | | |
Retail: | | | | | | | | |
Shares Sold | | | 40,676 | | | | 149,263 | |
Shares Issued in Reinvestment of Distributions | | | — | | | | 48,541 | |
Total | | | 40,676 | | | | 197,804 | |
Less Shares Redeemed | | | (546,294 | ) | | | (663,537 | ) |
Net Decrease | | | (505,618 | ) | | | (465,733 | ) |
Institutional: | | | | | | | | |
Shares Sold | | | 123,225 | | | | 199,587 | |
Shares Issued in Reinvestment of Distributions | | | — | | | | 36,308 | |
Total | | | 123,225 | | | | 235,895 | |
Less Shares Redeemed | | | (1,269,150 | ) | | | (642,946 | ) |
Net Decrease | | | (1,145,925 | ) | | | (407,051 | ) |
| | For the
Six Months Ended
June 30, 2020 | | | For the
Six Months Ended
December 31, 2019 | | | For the
Year Ended
June 30, 2019 | |
Segall Bryant & Hamill All Cap Fund | | | | | | | | | | | | |
Retail: | | | | | | | | | | | | |
Shares Sold | | | 753 | | | | 607 | | | | — | |
Shares Issued in Reinvestment of Distributions | | | — | | | | — | | | | — | |
Total | | | 753 | | | | 607 | | | | — | |
Less Shares Redeemed | | | — | | | | (1 | ) | | | — | |
Net Increase | | | 753 | | | | 606 | | | | — | |
Institutional: | | | | | | | | | | | | |
Shares Sold | | | 941,916 | | | | 853,915 | | | | 1,726,878 | |
Shares Issued in Reinvestment of Distributions | | | — | | | | 23,201 | | | | 237,120 | |
Total | | | 941,916 | | | | 877,116 | | | | 1,963,998 | |
Less Shares Redeemed | | | (627,039 | ) | | | (383,750 | ) | | | (751,987 | ) |
Net Increase | | | 314,877 | | | | 493,366 | | | | 1,212,011 | |
150 |  | www.sbhfunds.com | www.sbhfunds.com
|
Segall Bryant & Hamill Funds | Notes to Financial Statements |
| | June 30, 2020 (Unaudited) |
| | For the
Six Months Ended
June 30, 2020 | | | For the
Two Months Ended
December 31, 2019 | | | For the
Year Ended
October 31, 2019 | |
Segall Bryant & Hamill Emerging Markets Fund | | | | | | | | | | | | |
Retail (Formerly Class A): | | | | | | | | | | | | |
Shares Sold | | | 22,838 | | | | 14,198 | | | | 25,055 | |
Shares Issued in Reinvestment of Distributions | | | — | | | | 7,131 | | | | 7,641 | |
Total | | | 22,838 | | | | 21,329 | | | | 32,696 | |
Less Shares Redeemed | | | (43,314 | ) | | | (2,191 | ) | | | (8,195 | ) |
Net Increase (Decrease) | | | (20,476 | ) | | | 19,138 | | | | 24,501 | |
Institutional (Formerly Class I): | | | | | | | | | | | | |
Shares Sold | | | 113,296 | | | | 16,247 | | | | 74,567 | |
Shares Issued in Reinvestment of Distributions | | | — | | | | 50,685 | | | | 62,830 | |
Total | | | 113,296 | | | | 66,932 | | | | 137,397 | |
Less Shares Redeemed | | | (282,263 | ) | | | (12,427 | ) | | | (296,492 | ) |
Net Increase (Decrease) | | | (168,967 | ) | | | 54,505 | | | | (159,095 | ) |
Segall Bryant & Hamill International Small Cap Fund | | | | | | | | | | | | |
Retail (Formerly Class A): | | | | | | | | | | | | |
Shares Sold | | | 1,751,718 | | | | 6,096 | | | | 2,638,657 | |
Shares Issued in Reinvestment of Distributions | | | — | | | | 173,843 | | | | 35,203 | |
Total | | | 1,751,718 | | | | 179,939 | | | | 2,673,860 | |
Less Shares Redeemed | | | (150,342 | ) | | | (20,479 | ) | | | (315,642 | ) |
Net Increase | | | 1,601,376 | | | | 159,460 | | | | 2,358,218 | |
Institutional (Formerly Class I): | | | | | | | | | | | | |
Shares Sold | | | 1,306,554 | | | | 105,065 | | | | 6,256,598 | |
Shares Issued in Reinvestment of Distributions | | | — | | | | 759,776 | | | | 528,768 | |
Total | | | 1,306,554 | | | | 864,841 | | | | 6,785,366 | |
Less Shares Redeemed | | | (7,478,048 | ) | | | (976,168 | ) | | | (16,422,757 | ) |
Net Decrease | | | (6,171,494 | ) | | | (111,327 | ) | | | (9,637,391 | ) |
| | For the
Six Months Ended
June 30, 2020 | | | For the
Year Ended December 31, 2019 | |
Segall Bryant & Hamill Fundamental International Small Cap Fund | | | | | | | | |
Retail: | | | | | | | | |
Shares Sold | | | 239,542 | | | | 261,029 | |
Shares Issued in Reinvestment of Distributions | | | — | | | | — | |
Total | | | 239,542 | | | | 261,029 | |
Less Shares Redeemed | | | (415,491 | ) | | | (881,691 | ) |
Net Decrease | | | (175,949 | ) | | | (620,662 | ) |
Institutional: | | | | | | | | |
Shares Sold | | | 352,023 | | | | 216,257 | |
Shares Issued in Reinvestment of Distributions | | | — | | | | — | |
Total | | | 352,023 | | | | 216,257 | |
Less Shares Redeemed | | | (177,343 | ) | | | (1,282,167 | ) |
Net Increase (Decrease) | | | 174,680 | | | | (1,065,910 | ) |
Semi-Annual Report | June 30, 2020 |  | 151 |
Segall Bryant & Hamill Funds | Notes to Financial Statements |
| | June 30, 2020 (Unaudited) |
| | For the
Six Months Ended
June 30, 2020 | | | For the
Year Ended December 31, 2019 | |
Segall Bryant & Hamill Global Large Cap Fund | | | | | | | | |
Retail: | | | | | | | | |
Shares Sold | | | 3,808 | | | | 73,564 | |
Shares Issued in Reinvestment of Distributions | | | 49,979 | | | | 323,523 | |
Total | | | 53,787 | | | | 397,087 | |
Less Shares Redeemed | | | (436,341 | ) | | | (572,735 | ) |
Net Decrease | | | (382,554 | ) | | | (175,648 | ) |
Institutional: | | | | | | | | |
Shares Sold | | | 45,802 | | | | 57,719 | |
Shares Issued in Reinvestment of Distributions | | | 2,380 | | | | 17,233 | |
Total | | | 48,182 | | | | 74,952 | |
Less Shares Redeemed | | | (113,625 | ) | | | (98,107 | ) |
Net Decrease | | | (65,443 | ) | | | (23,155 | ) |
Segall Bryant & Hamill Workplace Equality Fund | | | | | | | | |
Retail: | | | | | | | | |
Shares Sold | | | 26,045 | | | | 108,326 | |
Shares Issued in Reinvestment of Distributions | | | 16,795 | | | | 92,041 | |
Total | | | 42,840 | | | | 200,367 | |
Less Shares Redeemed | | | (163,994 | ) | | | (178,106 | ) |
Net Increase (Decrease) | | | (121,154 | ) | | | 22,261 | |
Institutional: | | | | | | | | |
Shares Sold | | | 105,251 | | | | 1,242,876 | |
Shares Issued in Reinvestment of Distributions | | | 14,949 | | | | 69,806 | |
Total | | | 120,200 | | | | 1,312,682 | |
Less Shares Redeemed | | | (27,734 | ) | | | (109,649 | ) |
Net Increase | | | 92,466 | | | | 1,203,033 | |
Segall Bryant & Hamill Short Term Plus Fund | | | | | | | | |
Retail: | | | | | | | | |
Shares Sold | | | 23,662 | | | | 89,734 | |
Shares Issued in Reinvestment of Distributions | | | 1,018 | | | | 1,108 | |
Total | | | 24,680 | | | | 90,842 | |
Less Shares Redeemed | | | (350 | ) | | | (20,306 | ) |
Net Increase | | | 24,330 | | | | 70,536 | |
Institutional: | | | | | | | | |
Shares Sold | | | 484,220 | | | | 558,932 | |
Shares Issued in Reinvestment of Distributions | | | 7,334 | | | | 8,736 | |
Total | | | 491,554 | | | | 567,668 | |
Less Shares Redeemed | | | (89,214 | ) | | | (46,804 | ) |
Net Increase | | | 402,340 | | | | 520,864 | |
Segall Bryant & Hamill Plus Bond Fund | | | | | | | | |
Retail: | | | | | | | | |
Shares Sold | | | 6,182,814 | | | | 14,085,142 | |
Shares Issued in Reinvestment of Distributions | | | 755,042 | | | | 2,649,200 | |
Total | | | 6,937,856 | | | | 16,734,342 | |
Less Shares Redeemed | | | (9,711,198 | ) | | | (49,982,596 | ) |
Net Decrease | | | (2,773,342 | ) | | | (33,248,254 | ) |
Institutional: | | | | | | | | |
Shares Sold | | | 5,840,575 | | | | 14,999,412 | |
Shares Issued in Reinvestment of Distributions | | | 542,448 | | | | 1,394,885 | |
Total | | | 6,383,023 | | | | 16,394,297 | |
Less Shares Redeemed | | | (6,047,219 | ) | | | (6,438,689 | ) |
Net Increase | | | 335,804 | | | | 9,955,608 | |
152 |  | www.sbhfunds.com | www.sbhfunds.com
|
Segall Bryant & Hamill Funds | Notes to Financial Statements |
| | June 30, 2020 (Unaudited) |
| | For the
Six Months Ended
June 30, 2020 | | | For the
Year Ended December 31, 2019 | |
Segall Bryant & Hamill Quality High Yield Fund | | | | | | | | |
Retail: | | | | | | | | |
Shares Sold | | | 571,486 | | | | 362,832 | |
Shares Issued in Reinvestment of Distributions | | | 86,737 | | | | 221,338 | |
Total | | | 658,223 | | | | 584,170 | |
Less Shares Redeemed | | | (808,393 | ) | | | (1,283,667 | ) |
Net Decrease | | | (150,170 | ) | | | (699,497 | ) |
Institutional: | | | | | | | | |
Shares Sold | | | 1,238,596 | | | | 1,115,468 | |
Shares Issued in Reinvestment of Distributions | | | 56,329 | | | | 100,016 | |
Total | | | 1,294,925 | | | | 1,215,484 | |
Less Shares Redeemed | | | (957,474 | ) | | | (334,149 | ) |
Net Increase | | | 337,451 | | | | 881,335 | |
Segall Bryant & Hamill Municipal Opportunities Fund | | | | | | | | |
Retail: | | | | | | | | |
Shares Sold | | | 702,223 | | | | 727,044 | |
Shares Issued in Reinvestment of Distributions | | | 19,744 | | | | 40,230 | |
Total | | | 721,967 | | | | 767,274 | |
Less Shares Redeemed | | | (236,257 | ) | | | (316,395 | ) |
Net Increase | | | 485,710 | | | | 450,879 | |
Institutional: | | | | | | | | |
Shares Sold | | | 2,615,770 | | | | 3,450,669 | |
Shares Issued in Reinvestment of Distributions | | | 101,827 | | | | 215,260 | |
Total | | | 2,717,597 | | | | 3,665,929 | |
Less Shares Redeemed | | | (384,821 | ) | | | (1,215,146 | ) |
Net Increase | | | 2,332,776 | | | | 2,450,783 | |
Segall Bryant & Hamill Colorado Tax Free Fund | | | | | | | | |
Retail: | | | | | | | | |
Shares Sold | | | 4,309,724 | | | | 4,949,222 | |
Shares Issued in Reinvestment of Distributions | | | 205,071 | | | | 381,847 | |
Total | | | 4,514,795 | | | | 5,331,069 | |
Less Shares Redeemed | | | (3,658,048 | ) | | | (7,078,884 | ) |
Net Increase (Decrease) | | | 856,747 | | | | (1,747,815 | ) |
Institutional: | | | | | | | | |
Shares Sold | | | 4,285,014 | | | | 11,191,620 | |
Shares Issued in Reinvestment of Distributions | | | 258,704 | | | | 395,129 | |
Total | | | 4,543,718 | | | | 11,586,749 | |
Less Shares Redeemed | | | (2,364,641 | ) | | | (1,790,408 | ) |
Net Increase | | | 2,179,077 | | | | 9,796,341 | |
Semi-Annual Report | June 30, 2020 |  | 153 |
Segall Bryant & Hamill Funds | Notes to Financial Statements |
| | June 30, 2020 (Unaudited) |
4. TAX BASIS DISTRIBUTIONS AND TAX BASIS INFORMATION
Under current law, capital losses maintain their character as short-term or long-term and are carried forward to the next tax year without expiration. As of December 31, 2019, the following amounts are available as carry forwards to the next tax year:
Fund | | Short-Term | | | Long-Term | |
Segall Bryant & Hamill Small Cap Growth Fund | | $ | 72,135,585 | | | $ | — | |
Segall Bryant & Hamill Emerging Markets Fund | | | 1,067,427 | | | | — | |
Segall Bryant & Hamill International Small Cap Fund | | | 46,092,656 | | | | 13,104,784 | |
Segall Bryant & Hamill Quality High Yield Fund | | | 176,614 | | | | 9,470,157 | |
Segall Bryant & Hamill Colorado Tax Free Fund | | | 991,747 | | | | 99,037 | |
Net qualified late year capital losses, incurred after October 31, 2019 and within the taxable year, are deemed to arise on the first day of a Fund’s next taxable year. For the year ended December 31, 2019, the following amounts were deferred to the tax year ending December 31, 2020:
Fund | | Capital Loss
Deferrals | |
Segall Bryant & Hamill Short Term Plus Fund | | $ | 104 | |
The Segall Bryant & Hamill Fundamental International Small Cap Fund elects to defer to the tax year ending December 31, 2020 late year ordinary losses in the amount of $58,816.
Distributions – Distributions of net investment income, if any, are generally made annually for the Segall Bryant & Hamill Small Cap Value Fund, Segall Bryant & Hamill Small Cap Value Dividend Fund, Segall Bryant & Hamill Small Cap Growth Fund, Segall Bryant & Hamill Small Cap Core Fund, Segall Bryant & Hamill Mid Cap Value Dividend Fund, Segall Bryant & Hamill All Cap Fund, Segall Bryant & Hamill Emerging Markets Fund, Segall Bryant & Hamill International Small Cap Fund and Segall Bryant & Hamill Fundamental International Small Cap Fund; monthly for the Segall Bryant & Hamill Short Term Plus Fund, Segall Bryant & Hamill Plus Bond Fund, Segall Bryant & Hamill Quality High Yield Fund, Segall Bryant & Hamill Municipal Opportunities Fund and Segall Bryant & Hamill Colorado Tax Free Fund and quarterly for the Segall Bryant & Hamill Workplace Equality Fund and Segall Bryant & Hamill Global Large Cap Fund. Distributions of net realized capital gains, if any, are declared at least once each year for each of the Funds. Distributions to shareholders are recorded on the ex-dividend date.
The tax character of the distributions paid during the periods ended June 30, 2020, December 31, 2019 and June 30, 2019, as applicable, were as follows:
Fund | Period Ended | | Ordinary Income | | | Long-Term
Capital Gains | | | Return of Capital | | | Tax-Exempt Income | |
Segall Bryant & Hamill Small Cap Value Fund | 6/30/2019 | | $ | 4,273,845 | | | $ | 6,814,219 | | | $ | — | | | $ | — | |
| | 12/31/2019 | | | 4,313,031 | | | | 5,092,391 | | | | — | | | | — | |
| 6/30/2020 | | | — | | | | — | | | | — | | | | — | |
Segall Bryant & Hamill Small Cap Value Dividend Fund | 12/31/2019 | | | 1,723,390 | | | | 1,109,277 | | | | — | | | | — | |
| 6/30/2020 | | | — | | | | — | | | | — | | | | — | |
Segall Bryant & Hamill Small Cap Growth Fund | 12/31/2019 | | | — | | | | — | | | | — | | | | — | |
| 6/30/2020 | | | — | | | | — | | | | — | | | | — | |
Segall Bryant & Hamill Small Cap Core Fund | 12/31/2019 | | | — | | | | — | | | | — | | | | — | |
| 6/30/2020 | | | — | | | | — | | | | — | | | | — | |
Segall Bryant & Hamill Mid Cap Value Dividend Fund | 12/31/2019 | | | 1,209,743 | | | | 974,183 | | | | — | | | | — | |
| 6/30/2020 | | | — | | | | — | | | | — | | | | — | |
Segall Bryant & Hamill All Cap Fund | 6/30/2019 | | | — | | | | 3,099,152 | | | | — | | | | — | |
| | 12/31/2019 | | | 49,658 | | | | 334,417 | | | | | | | | | |
| 6/30/2020 | | | — | | | | — | | | | — | | | | — | |
Segall Bryant & Hamill Emerging Markets Fund | 10/31/2019 | | | 860,787 | | | | 161,117 | | | | — | | | | — | |
| | 12/31/2019 | | | 869,167 | | | | — | | | | 34,024 | | | | — | |
| 6/30/2020 | | | — | | | | — | | | | — | | | | — | |
Segall Bryant & Hamill International Small Cap Fund | 10/31/2019 | | | 8,668,571 | | | | — | | | | — | | | | — | |
| | 12/31/2019 | | | 12,381,211 | | | | — | | | | 189,729 | | | | — | |
| 6/30/2020 | | | — | | | | — | | | | — | | | | — | |
154 |  | www.sbhfunds.com | www.sbhfunds.com
|
Segall Bryant & Hamill Funds | Notes to Financial Statements |
| | June 30, 2020 (Unaudited) |
Fund | Period Ended | | Ordinary Income | | | Long-Term
Capital Gains | | | Return of Capital | | | Tax-Exempt Income | |
Segall Bryant & Hamill Fundamental International | 12/31/2019 | | $ | — | | | $ | — | | | $ | — | | | $ | — | |
Small Cap Fund | 6/30/2020 | | | — | | | | — | | | | — | | | | — | |
Segall Bryant & Hamill Global Large Cap Fund | 12/31/2019 | | | 1,097,574 | | | | 2,905,728 | | | | — | | | | — | |
| 6/30/2020 | | | 503,135 | | | | — | | | | — | | | | — | |
Segall Bryant & Hamill Workplace Equality Fund | 12/31/2019 | | | 262,051 | | | | 800,966 | | | | — | | | | — | |
| 6/30/2020 | | | 168,374 | | | | — | | | | — | | | | — | |
Segall Bryant & Hamill Short Term Plus Fund | 12/31/2019 | | | 100,436 | | | | — | | | | — | | | | — | |
| 6/30/2020 | | | 87,262 | | | | — | | | | — | | | | — | |
Segall Bryant & Hamill Plus Bond Fund | 12/31/2019 | | | 38,881,131 | | | | 5,658,442 | | | | — | | | | — | |
| 6/30/2020 | | | 15,028,817 | | | | — | | | | — | | | | — | |
Segall Bryant & Hamill Quality High Yield Fund | 12/31/2019 | | | 2,910,491 | | | | — | | | | — | | | | — | |
| 6/30/2020 | | | 1,255,250 | | | | — | | | | — | | | | — | |
Segall Bryant & Hamill Municipal Opportunities Fund | 12/31/2019 | | | 799,450 | | | | 29,114 | | | | — | | | | 2,005,216 | |
| 6/30/2020 | | | 1,355,841 | | | | — | | | | — | | | | — | |
Segall Bryant & Hamill Colorado Tax Free Fund | 12/31/2019 | | | 1,440,696 | | | | — | | | | — | | | | 8,481,957 | |
| 6/30/2020 | | | 5,914,333 | | | | — | | | | — | | | | — | |
As of December 31, 2019, the components of distributable earnings on a tax basis were as follows:
| | Segall Bryant &
Hamill Small Cap
Value Fund | | | Segall Bryant &
Hamill Small Cap
Value Dividend
Fund | | | Segall Bryant &
Hamill Small Cap
Growth Fund | | | Segall Bryant &
Hamill Small Cap
Core Fund | | | Segall Bryant &
Hamill Mid Cap
Value Dividend
Fund | | | Segall Bryant &
Hamill All Cap
Fund | |
Undistributed ordinary income | | $ | 1,403,172 | | | $ | 143,703 | | | $ | — | | | $ | — | | | $ | 10,432 | | | $ | 443,890 | |
Undistributed long term capital gains | | | 963,254 | | | | 1,784,381 | | | | — | | | | — | | | | 676,540 | | | | — | |
Accumulated capital and other losses | | | — | | | | — | | | | (72,135,585 | ) | | | — | | | | — | | | | — | |
Net unrealized appreciation on investments | | | 10,765,785 | | | | 7,373,829 | | | | 15,672,055 | | | | 7,968,119 | | | | 9,645,302 | | | | 32,829,569 | |
Other temporary differences | | | — | | | | 3,586 | | | | 9,497 | | | | (7,968,119 | ) | | | (345,355 | ) | | | — | |
Total distributable earnings (accumulated deficit) | | $ | 13,132,211 | | | $ | 9,305,499 | | | $ | (56,454,033 | ) | | $ | 0 | | | $ | 9,986,919 | | | $ | 33,273,459 | |
| | Segall Bryant &
Hamill Emerging
Markets Fund | | | Segall Bryant
& Hamill
International
Small Cap Fund | | | Segall Bryant
& Hamill
Fundamental
International
Small Cap Fund | | | Segall Bryant &
Hamill Global
Large Cap Fund | | | Segall Bryant &
Hamill Workplace
Equality Fund | |
Undistributed ordinary income | | $ | — | | | $ | — | | | $ | — | | | $ | 3,229 | | | $ | 6,324 | |
Undistributed long term capital gains | | | — | | | | — | | | | 2,488,653 | | | | 1,259,810 | | | | — | |
Accumulated capital and other losses | | | (1,067,427 | ) | | | (59,197,440 | ) | | | (58,816 | ) | | | — | | | | — | |
Net unrealized appreciation on investments | | | 5,113,890 | | | | 17,764,360 | | | | 10,636,531 | | | | 10,361,682 | | | | 2,456,337 | |
Other temporary differences | | | — | | | | — | | | | 5,306 | | | | (15,240 | ) | | | (655 | ) |
Total distributable earnings (accumulated deficit) | | $ | 4,046,463 | | | $ | (41,433,080 | ) | | $ | 13,071,674 | | | $ | 11,609,481 | | | | 2,462,006 | |
| | Segall Bryant
& Hamill Short
Term Plus Fund | | | Segall Bryant &
Hamill Plus Bond
Fund | | | Segall Bryant &
Hamill Quality
High Yield Fund | | | Segall Bryant &
Hamill Municipal
Opportunities
Fund | | | Segall Bryant &
Hamill Colorado
Tax Free Fund | |
Undistributed ordinary income | | $ | — | | | $ | — | | | $ | — | | | $ | 50,857 | | | $ | — | |
Undistributed long term capital gains | | | — | | | | 612,341 | | | | — | | | | 56,950 | | | | — | |
Accumulated capital and other losses | | | (104 | ) | | | — | | | | (9,646,771 | ) | | | — | | | | (1,090,784 | ) |
Net unrealized appreciation on investments | | | 21,911 | | | | 32,208,656 | | | | 1,442,919 | | | | 967,272 | | | | 7,848,570 | |
Other temporary differences | | | — | | | | — | | | | (1,052 | ) | | | — | | | | (2,705 | ) |
Total distributable earnings (accumulated deficit) | | $ | 21,807 | | | $ | 32,820,997 | | | $ | (8,204,904 | ) | | $ | 1,075,079 | | | $ | 6,755,081 | |
Semi-Annual Report | June 30, 2020 |  | 155 |
Segall Bryant & Hamill Funds | Notes to Financial Statements |
| | June 30, 2020 (Unaudited) |
Other Temporary Differences is primarily related to deferred Trustee compensation.
The Funds recharacterize distributions received from Real Estate Investment Trust (“REIT”) investments based on information provided by the REIT into the following categories: ordinary income, long-term capital gains, and return of capital. If information is not available on a timely basis from the REIT, the recharacterization will be estimated based on available information which may include the previous year’s allocation. If new or additional information becomes available from the REIT at a later date, a recharacterization will be made in the following year.
As of June 30, 2020, net unrealized appreciation (depreciation) on investments based on federal tax cost was as follows:
| | Segall Bryant &
Hamill Small Cap
Value Fund | | | Segall Bryant &
Hamill Small Cap
Value Dividend
Fund | | | Segall Bryant &
Hamill Small Cap
Growth Fund | | | Segall Bryant &
Hamill Small Cap
Core Fund | | | Segall Bryant &
Hamill Mid Cap
Value Dividend
Fund | | | Segall Bryant &
Hamill All Cap
Fund | |
Tax cost of portfolio investments | | $ | 219,361,262 | | | $ | 59,017,295 | | | $ | 56,588,577 | | | $ | 29,073,612 | | | $ | 26,352,566 | | | $ | 88,423,584 | |
Gross unrealized appreciation | | | 21,132,494 | | | | 4,696,024 | | | | 21,559,747 | | | | 8,930,295 | | | | 3,382,995 | | | | 39,155,933 | |
Gross unrealized depreciation | | | (29,862,809 | ) | | | (7,715,021 | ) | | | (4,200,483 | ) | | | (2,629,863 | ) | | | (2,942,625 | ) | | | (3,220,961 | ) |
Net unrealized appreciation (depreciation) on portfolio investments | | $ | (8,730,315 | ) | | $ | (3,018,997 | ) | | $ | 17,359,264 | | | $ | 6,300,432 | | | $ | 440,370 | | | $ | 35,934,972 | |
| | Segall Bryant &
Hamill Emerging
Markets Fund | | | Segall Bryant
& Hamill
International
Small Cap Fund | | | Segall Bryant
& Hamill
Fundamental
International
Small Cap Fund | | | Segall Bryant &
Hamill Global
Large Cap Fund | | | Segall Bryant &
Hamill Workplace
Equality Fund | |
Tax cost of portfolio investments | | $ | 26,919,992 | | | $ | 195,016,529 | | | $ | 25,481,314 | | | $ | 33,173,471 | | | $ | 14,953,724 | |
Gross unrealized appreciation | | | 5,522,562 | | | | 10,356,353 | | | | 10,163,083 | | | | 6,422,926 | | | | 2,186,701 | |
Gross unrealized depreciation | | | (3,494,968 | ) | | | (30,748,155 | ) | | | (3,101,746 | ) | | | (2,264,679 | ) | | | (1,661,522 | ) |
Net unrealized appreciation (depreciation) on portfolio investments | | $ | 2,027,594 | | | $ | (20,381,802 | ) | | $ | 7,061,337 | | | $ | 4,158,247 | | | $ | 525,179 | |
| | Segall Bryant
& Hamill Short
Term Plus Fund | | | Segall Bryant &
Hamill Plus Bond
Fund | | | Segall Bryant &
Hamill Quality
High Yield Fund | | | Segall Bryant &
Hamill Municipal
Opportunities
Fund | | | Segall Bryant &
Hamill Colorado
Tax Free Fund | |
Tax cost of portfolio investments | | $ | 11,238,853 | | | $ | 951,444,420 | | | $ | 60,671,702 | | | $ | 91,377,041 | | | $ | 395,311,110 | |
Gross unrealized appreciation | | | 169,539 | | | | 72,412,748 | | | | 1,216,033 | | | | 3,249,801 | | | | 12,088,638 | |
Gross unrealized depreciation | | | (90,829 | ) | | | (10,491,566 | ) | | | (1,759,807 | ) | | | (481,625 | ) | | | (3,386,573 | ) |
Net unrealized appreciation (depreciation) on portfolio investments | | $ | 78,710 | | | $ | 61,921,182 | | | $ | (543,774 | ) | | $ | 2,768,176 | | | $ | 8,702,065 | |
The difference between book and tax basis cost of investments is attributable primarily to wash sales, passive foreign investment companies and tax treatment of certain other investments.
5. INVESTMENT ADVISORY FEES, ADMINISTRATIVE FEES AND OTHER RELATED PARTY TRANSACTIONS
The Trust has entered into an advisory agreement with Segall Bryant & Hamill, LLC (the “Adviser”) for all Funds. The advisory agreement has been approved by the Trust’s Board of Trustees.
156 |  | www.sbhfunds.com | www.sbhfunds.com
|
Segall Bryant & Hamill Funds | Notes to Financial Statements |
| | June 30, 2020 (Unaudited) |
Pursuant to its advisory agreement with the Trust, Segall Bryant & Hamill, LLC is entitled to an investment advisory fee, based on the average net assets of each Fund, computed daily and payable monthly as shown in the table below.
Fund | | | |
Segall Bryant & Hamill Small Cap Value Fund | | | 0.80 | % |
Segall Bryant & Hamill Small Cap Value Dividend Fund | | | 0.80 | % |
Segall Bryant & Hamill Small Cap Growth Fund | | | 0.65 | % |
Segall Bryant & Hamill Small Cap Core Fund | | | 0.80 | % |
Segall Bryant & Hamill Mid Cap Value Dividend Fund | | | 0.65 | % |
Segall Bryant & Hamill All Cap Fund | | | 0.65 | % |
Segall Bryant & Hamill Emerging Markets Fund | | | 0.90 | % |
Segall Bryant & Hamill International Small Cap Fund | | | 0.90 | % |
Segall Bryant & Hamill Fundamental International Small Cap Fund | | | 1.00 | % |
Segall Bryant & Hamill Global Large Cap Fund | | | 0.65 | % |
Segall Bryant & Hamill Workplace Equality Fund | | | 0.65 | % |
Segall Bryant & Hamill Short Term Plus Fund | | | 0.25 | % |
Segall Bryant & Hamill Plus Bond Fund | | | 0.35 | % |
Segall Bryant & Hamill Quality High Yield Fund | | | 0.45 | % |
Segall Bryant & Hamill Municipal Opportunities Fund | | | 0.35 | % |
Segall Bryant & Hamill Colorado Tax Free Fund | | | 0.35 | % |
Ultimus Fund Solutions LLC (“Ultimus”) and the Adviser serve as the Funds’ co-administrators (“Co-Administrators”). Ultimus and the Adviser are entitled to receive a total fee from each Fund for their administrative services computed daily and paid monthly based on the average daily net assets of the Trust. The Adviser receives a portion that is calculated based on 0.01% on the average daily net assets of the Trust.
The administrative fees are allocated to each Fund based upon the Fund’s relative proportion of the Trust’s net assets and are disclosed in the Statements of Operations. During the six months ended June 30, 2020, the Adviser and Ultimus received $121,705 and $323,923, respectively, for their services to the Funds.
Shareholder servicing agents provide non-distribution administrative and support services to their customers, which may include establishing and maintaining accounts and records relating to shareholders, processing dividend and distribution payments from the Funds on behalf of shareholders, forwarding communications from the Funds, providing sub-accounting with respect to Fund shares, and other similar services. The Retail Class of each Fund may pay a fee at an annual rate of up to 0.25% of its average daily net assets to shareholder servicing agents and the Institutional Class of each Fund may pay a fee at an annual rate of up to 0.10% of its average daily net assets to shareholder servicing agents. These fees are included in Shareholder Servicing Fees on the Statements of Operations.
Until at least April 30, 2021, except until at least December 31, 2021 for the the Segall Bryant & Hamill Small Cap Value Fund, the Segall Bryant & Hamill All Cap Fund, the Segall Bryant & Hamill Emerging Markets Fund and the Segall Bryant & Hamill International Small Cap Fund, the Adviser has contractually agreed to waive the investment advisory and/or administration fees and/or to reimburse other expenses (not including acquired fund fees and expenses, taxes, brokerage expenses, and extraordinary expenses), so that the ratio of expense to average net assets as reported in each Fund’s Financial Highlights will be no more than the amounts as detailed below:
Fund | | Retail Class | | | Institutional Class | |
Segall Bryant & Hamill Small Cap Value Fund | | | 1.14 | % | | | 0.99 | % |
Segall Bryant & Hamill Small Cap Value Dividend Fund | | | 1.14 | % | | | 0.99 | % |
Segall Bryant & Hamill Small Cap Growth Fund | | | 1.14 | % | | | 0.99 | % |
Segall Bryant & Hamill Small Cap Core Fund | | | 1.14 | % | | | 0.99 | % |
Segall Bryant & Hamill Mid Cap Value Dividend Fund | | | 0.99 | % | | | 0.84 | % |
Segall Bryant & Hamill All Cap Fund | | | 0.99 | % | | | 0.84 | % |
Segall Bryant & Hamill Emerging Markets Fund | | | 1.38 | % | | | 1.23 | % |
Segall Bryant & Hamill International Small Cap Fund | | | 1.18 | % | | | 1.03 | % |
Segall Bryant & Hamill Fundamental International Small Cap Fund | | | 1.25 | % | | | 1.10 | % |
Segall Bryant & Hamill Global Large Cap Fund | | | 0.89 | % | | | 0.74 | % |
Segall Bryant & Hamill Workplace Equality Fund | | | 0.89 | % | | | 0.74 | % |
Segall Bryant & Hamill Short Term Plus Fund | | | 0.49 | % | | | 0.40 | % |
Segall Bryant & Hamill Plus Bond Fund | | | 0.55 | % | | | 0.40 | % |
Segall Bryant & Hamill Quality High Yield Fund | | | 0.85 | % | | | 0.70 | % |
Segall Bryant & Hamill Municipal Opportunities Fund | | | 0.65 | % | | | 0.50 | % |
Segall Bryant & Hamill Colorado Tax Free Fund | | | 0.65 | % | | | 0.50 | % |
Semi-Annual Report | June 30, 2020 |  | 157 |
Segall Bryant & Hamill Funds | Notes to Financial Statements |
| | June 30, 2020 (Unaudited) |
Ultimus, pursuant to a Transfer Agency Agreement, serves as Transfer Agent for each of the Funds. As Transfer Agent, Ultimus has, among other things, agreed to: (a) issue and redeem shares of the Funds; (b) make dividend and other distributions to shareholders of the Funds; (c) effect transfers of shares; (d) mail communications to shareholders of the Funds, including account statements, confirmations, and dividend and distribution notices; (e) facilitate the electronic delivery of shareholder statements and reports and (f) maintain shareholder accounts. Under the Transfer Agency Agreement, Ultimus receives from the Trust an annual minimum fee per Fund, a fee based upon each shareholder account and is reimbursed for out-of-pocket expenses.
Certain officers of the Funds are also officers of the Adviser. All access persons of the Trust, as defined in the 1940 Act, and members, officers and employees of the Adviser, follow strict guidelines and policies on personal trading as outlined in the Trust’s and the Adviser’s respective Code of Ethics.
The Trustees have appointed a Chief Compliance Officer who is also the Treasurer of the Trust and a partner of the Adviser. The Trustees agreed to have the Funds pay the portion of his compensation attributable for services rendered as the Trust’s Chief Compliance Officer.
The Trust has a Trustee Deferred Compensation Plan (the “Deferral Plan”) which allows the Trustees to defer the receipt of all or a portion of Trustees fees. Under the Deferral Plan, Trustee fees are paid and invested directly into shares of the Funds elected by the Trustees in the Deferral Plan. There is no future liability related to the balance in the Deferral Plan as such amounts are paid directly out of the respective capital accounts of the elected Funds. The amount paid to the Trustees under the Deferral Plan will be determined based upon the performance of the elected funds. The balance in the Deferral Plan as of June 30, 2020 is $315,340.
6. FAIR VALUE MEASUREMENTS
A three-tier hierarchy has been established to measure fair value based on the extent of use of “observable inputs” as compared to “unobservable inputs” for disclosure purposes and requires additional disclosures about these valuation measurements. Inputs refer broadly to the assumptions that market participants would use in pricing a security. Observable inputs are inputs that reflect the assumptions market participants would use in pricing the security developed based on market data obtained from sources independent of the reporting entity. Unobservable inputs are inputs that reflect the reporting entity’s own assumptions about the assumptions market participants would use in pricing the security developed based on the best information available in the circumstances.
The three-tier hierarchy is summarized as follows:
1) | Level 1 – Unadjusted Quoted Prices in active markets for identical investments |
2) | Level 2 – Other Significant Observable Inputs (including quoted prices for similar investments, interest rates, prepayment speeds, credit risk, etc.) |
3) | Level 3 – Significant Unobservable Inputs (including the Fund’s own assumptions in determining the fair value of investments). |
The following is a summary of the inputs used as of June 30, 2020 in valuing the Funds’ assets:
Segall Bryant & Hamill Small Cap Value Fund
| | Level 1 | | | Level 2 | | | Level 3 | | | Total | |
Common Stocks | | $ | 210,630,947 | | | $ | — | | | $ | — | | | $ | 210,630,947 | |
Total | | $ | 210,630,947 | | | $ | — | | | $ | — | | | $ | 210,630,947 | |
Segall Bryant & Hamill Small Cap Value Dividend Fund
| | Level 1 | | | Level 2 | | | Level 3 | | | Total | |
Common Stocks | | $ | 55,998,298 | | | $ | — | | | $ | — | | | $ | 55,998,298 | |
Total | | $ | 55,998,298 | | | $ | — | | | $ | — | | | $ | 55,998,298 | |
Segall Bryant & Hamill Small Cap Growth Fund
| | Level 1 | | | Level 2 | | | Level 3 | | | Total | |
Common Stocks | | $ | 73,947,841 | | | $ | — | | | $ | — | | | $ | 73,947,841 | |
Total | | $ | 73,947,841 | | | $ | — | | | $ | — | | | $ | 73,947,841 | |
158 |  | www.sbhfunds.com | www.sbhfunds.com
|
Segall Bryant & Hamill Funds | Notes to Financial Statements |
| | June 30, 2020 (Unaudited) |
Segall Bryant & Hamill Small Cap Core Fund
| | Level 1 | | | Level 2 | | | Level 3 | | | Total | |
Common Stocks | | $ | 35,374,044 | | | $ | — | | | $ | — | | | $ | 35,374,044 | |
Total | | $ | 35,374,044 | | | $ | — | | | $ | — | | | $ | 35,374,044 | |
Segall Bryant & Hamill Mid Cap Value Dividend Fund
| | Level 1 | | | Level 2 | | | Level 3 | | | Total | |
Common Stocks | | $ | 26,792,936 | | | $ | — | | | $ | — | | | $ | 26,792,936 | |
Total | | $ | 26,792,936 | | | $ | — | | | $ | — | | | $ | 26,792,936 | |
Segall Bryant & Hamill All Cap Fund
| | Level 1 | | | Level 2 | | | Level 3 | | | Total | |
Common Stocks | | $ | 124,358,556 | | | $ | — | | | $ | — | | | $ | 124,358,556 | |
Total | | $ | 124,358,556 | | | $ | — | | | $ | — | | | $ | 124,358,556 | |
Segall Bryant & Hamill Emerging Markets Fund
| | Level 1 | | | Level 2 | | | Level 3 | | | Total | |
Common Stocks | | $ | 6,031,885 | | | $ | 22,011,876 | | | $ | 0 | * | | $ | 28,043,761 | |
Preferred Stocks | | | 360,166 | | | | 543,659 | | | | — | | | | 903,825 | |
Total | | $ | 6,392,051 | | | $ | 22,555,535 | | | $ | 0 | | | $ | 28,947,586 | |
Segall Bryant & Hamill International Small Cap Fund
| | Level 1 | | | Level 2 | | | Level 3 | | | Total | |
Common Stocks | | $ | 4,677,628 | | | $ | 168,720,341 | | | $ | 264,386 | * | | $ | 173,662,355 | |
Preferred Stocks | | | 265,467 | | | | 653,066 | | | | — | | | | 918,533 | |
Rights | | | 43,839 | | | | — | | | | 0 | * | | | 43,839 | |
Total | | $ | 4,986,934 | | | $ | 169,373,407 | | | $ | 264,386 | | | $ | 174,624,727 | |
Segall Bryant & Hamill Fundamental International Small Cap Fund
| | Level 1 | | | Level 2 | | | Level 3 | | | Total | |
Common Stocks | | $ | 22,824,815 | | | $ | 9,717,836 | | | $ | — | | | $ | 32,542,651 | |
Total | | $ | 22,824,815 | | | $ | 9,717,836 | | | $ | — | | | $ | 32,542,651 | |
Other Financial Instruments** | | | | | | | | | | | | | | | | |
Forward Foreign Currency Contracts, Unrealized Gain | | $ | — | | | $ | 261,176 | | | $ | — | | | $ | 261,176 | |
Forward Foreign Currency Contracts, Unrealized Loss | | | — | | | | (141,469 | ) | | | — | | | | (141,469 | ) |
Total | | $ | — | | | $ | 119,707 | | | $ | — | | | $ | 119,707 | |
Segall Bryant & Hamill Global Large Cap Fund
| | Level 1 | | | Level 2 | | | Level 3 | | | Total | |
Common Stocks | | $ | 23,876,524 | | | $ | 13,455,194 | | | $ | — | | | $ | 37,331,718 | |
Total | | $ | 23,876,524 | | | $ | 13,455,194 | | | $ | — | | | $ | 37,331,718 | |
Segall Bryant & Hamill Workplace Equality Fund
| | Level 1 | | | Level 2 | | | Level 3 | | | Total | |
Common Stocks | | $ | 15,478,903 | | | $ | — | | | $ | — | | | $ | 15,478,903 | |
Total | | $ | 15,478,903 | | | $ | — | | | $ | — | | | $ | 15,478,903 | |
Semi-Annual Report | June 30, 2020 |  | 159 |
Segall Bryant & Hamill Funds | Notes to Financial Statements |
| | June 30, 2020 (Unaudited) |
Segall Bryant & Hamill Short Term Plus Fund
| | Level 1 | | | Level 2 | | | Level 3 | | | Total | |
Corporate Bonds | | $ | — | | | $ | 10,314,594 | | | $ | — | | | $ | 10,314,594 | |
Municipal Bonds | | | — | | | | 588,153 | | | | — | | | | 588,153 | |
Asset Backed Securities | | | — | | | | 46,399 | | | | — | | | | 46,399 | |
U.S. Treasury Bonds & Notes | | | — | | | | 368,417 | | | | — | | | | 368,417 | |
Total | | $ | — | | | $ | 11,317,563 | | | $ | — | | | $ | 11,317,563 | |
Segall Bryant & Hamill Plus Bond Fund
| | Level 1 | | | Level 2 | | | Level 3 | | | Total | |
Corporate Bonds | | $ | — | | | $ | 487,335,474 | | | $ | — | | | $ | 487,335,474 | |
Municipal Bonds | | | — | | | | 101,451,264 | | | | — | | | | 101,451,264 | |
Asset Backed Securities | | | — | | | | 30,885,939 | | | | — | | | | 30,885,939 | |
Mortgage-Backed Passthrough Securities | | | — | | | | 246,440,035 | | | | — | | | | 246,440,035 | |
Residential Mortgage-Backed Securities | | | — | | | | 6,596,949 | | | | — | | | | 6,596,949 | |
U.S. Treasury Bonds & Notes | | | — | | | | 140,655,941 | | | | — | | | | 140,655,941 | |
Total | | $ | — | | | $ | 1,013,365,602 | | | $ | — | | | $ | 1,013,365,602 | |
Segall Bryant & Hamill Quality High Yield Fund
| | Level 1 | | | Level 2 | | | Level 3 | | | Total | |
Corporate Bonds | | $ | — | | | $ | 59,283,538 | | | $ | — | | | $ | 59,283,538 | |
Asset Backed Securities | | | — | | | | 844,390 | | | | — | | | | 844,390 | |
Total | | $ | — | | | $ | 60,127,928 | | | $ | — | | | $ | 60,127,928 | |
Segall Bryant & Hamill Municipal Opportunities Fund
| | Level 1 | | | Level 2 | | | Level 3 | | | Total | |
Municipal Bonds | | $ | — | | | $ | 91,713,427 | | | $ | — | | | $ | 91,713,427 | |
Corporate Bonds | | | — | | | | 2,431,790 | | | | — | | | | 2,431,790 | |
Total | | $ | — | | | $ | 94,145,217 | | | $ | — | | | $ | 94,145,217 | |
Segall Bryant & Hamill Colorado Tax Free Fund
| | Level 1 | | | Level 2 | | | Level 3 | | | Total | |
Municipal Bonds | | $ | — | | | $ | 404,013,175 | | | $ | — | | | $ | 404,013,175 | |
Total | | $ | — | | | $ | 404,013,175 | | | $ | — | | | $ | 404,013,175 | |
* | Includes securities that have been fair valued at $0. |
** | Other financial instruments are derivative financial instruments not reflected in the Statement of Investments. These forward foreign currency contracts are valued at the unrealized appreciation (depreciation) on the instrument. |
For liabilities arising from overdrafts in the custody account, the carrying amount reported in the Statements of Assets and Liabilities approximates fair value due to the relatively short-term maturity of these financial instruments. As of June 30, 2020, the liability related to custody overdrafts in the Segall Bryant & Hamill Emerging Markets Fund, Segall Bryant & Hamill Quality High Yield Fund and Segall Bryant & Hamill Colorado Tax Free Fund are based on Level 2 inputs.
The following is a reconciliation of Level 3 instruments of the Funds for which significant unobservable inputs were used to determine fair value for the six months ended June 30, 2020:
Segall Bryant & Hamill Emerging Markets Fund
Asset Type | | Balance as of
December 31,
2019 | | | Net
Purchases | | | Net Sales | | | Realized
Gains | | | Change in
Unrealized
Appreciation
(Depreciation) | | | Transfer Into
Level 3 | | | Transfer Out
of Level 3 | | | Balance as of
June 30,
2020 | |
Common Stocks | | $ | 0 | | | $ | — | | | $ | — | | | $ | — | | | $ | — | | | $ | — | | | $ | — | | | $ | 0 | |
160 |  | www.sbhfunds.com | www.sbhfunds.com
|
Segall Bryant & Hamill Funds | Notes to Financial Statements |
| | June 30, 2020 (Unaudited) |
Segall Bryant & Hamill International Small Cap Fund
Asset Type | | Balance as of
December 31,
2019 | | | Net
Purchases/
Received in
Corporate
Action | | | Net Sales | | | Paydowns | | | Realized
Gains | | | Change in
Unrealized
Appreciation
(Depreciation) | | | Transfer Into
Level 3 | | | Transfer Out
of Level 3 | | | Balance as of
June 30,
2020 | |
Common Stocks | | $ | 92,120 | | | $ | 165,030 | | | $ | — | | | $ | — | | | $ | — | | | $ | (18,377 | ) | | $ | 25,613 | | | $ | — | | | $ | 264,386 | |
Rights | | | — | | | | 0 | | | | — | | | | — | | | | — | | | | — | | | | — | | | | — | | | | 0 | |
Total | | $ | 92,120 | | | $ | 165,030 | | | $ | — | | | $ | — | | | $ | — | | | $ | (18,377 | ) | | $ | 25,613 | | | $ | — | | | $ | 264,386 | |
The following table presents additional information about valuation methodologies and inputs used for investments that are measured at fair value and categorized within Level 3 as of June 30, 2020:
| | Fair Value as of
June 30, 2020 | | | Valuation
Technique | | | Unobservable
Input(1) | | | Range | | | Impact to
Valuation from an
Increase in Input(2) | |
Segall Bryant & Hamill International Small Cap Fund | | $ | 264,386 | | | | Adjusted trade price | | | | Discount Factor | | | | 0% - 15% | | | | Decrease | |
(1) | The investment adviser considers relevant indications of value that are reasonably and timely available to it in determining the fair value to be assigned to a particular security, such as the type and cost of the security; contractual or legal restrictions on resale of the security; relevant financial or business developments of the issuer; actively traded related securities; conversion or exchange rights on the security; related corporate actions; significant events occurring after the close of trading in the security; and changes in overall market conditions. The Fund’s use of fair value pricing may cause the net asset value of Fund shares to differ from the net asset value that would be calculated using market quotations. Fair value pricing involves subjective judgments and it is possible that the fair value determined for a security may be materially different than the value that could be realized upon the sale of that security. |
(2) | This column represents the directional change in the fair value of the Level 3 investments that would result from an increase to the corresponding unobservable input. A decrease to the unobservable input would have the opposite effect. |
The inputs or methodologies used for valuing securities are not necessarily an indication of the risk associated with investing in those securities.
For fair value measurements using significant other observable inputs (Level 2), the Funds utilize an independent pricing service which utilizes evaluated pricing models that vary by asset class and incorporate available trade, bid and other market information, and for structured securities also incorporate cash flow and, when available, loan performance data. The independent pricing service’s evaluated pricing models apply available market information through processes such as benchmark curves, benchmarking of similar securities, and sector groupings. For certain securities, the independent pricing service uses model processes, such as the Option Adjusted Spread (benchmark driven) model, to assess interest rate impact and develop prepayment scenarios. With respect to trades and bids, the independent pricing service reviews the lot size to determine whether the information is representative of an orderly trading market. If the independent pricing service determines that trade or bid information is not consistent with other information available, the trade or bid will not be reflected in the evaluated price.
Corporate bonds, Municipal bonds and U.S. Treasury bonds & notes are valued using market models that consider trade data, quotations from dealers and active market makers, relevant yield curve and spread data, creditworthiness, trade data or market information on comparable securities, and other relevant security specific information. Mortgage-related and asset-backed securities are valued based on models that consider trade data, prepayment and default projections, benchmark yield and spread data and estimated cash flows of each tranche of the issuer. Forward foreign currency contracts are normally valued on the basis of quotes obtained from brokers and dealers or independent pricing services.
In the event the independent pricing service is unable to provide an evaluated price for a security or the Adviser believes the price provided is not reliable, securities of the Funds may be valued in good faith as described above in Note 2. In these instances, the co-administrators will typically seek input from the investment team of the Fund since they are typically the most knowledgeable of the relevant factors in valuing
Semi-Annual Report | June 30, 2020 |  | 161 |
Segall Bryant & Hamill Funds | Notes to Financial Statements |
| | June 30, 2020 (Unaudited) |
the securities. The Adviser may seek to find an alternative independent source, such as a broker/dealer to provide a price quote, or by using evaluated pricing models similar to the techniques and models used by the independent pricing service. These fair value measurement techniques may utilize unobservable inputs (Level 3).
At least quarterly, the Adviser receives a report on the pricing for all fair valued securities during the period along with any actual sales prices, broker quotes and/or pricing from the independent pricing service. The Adviser uses this information to analyze changes in fair value measurements over the period and as a back test of pricing methods.
Then on at least a quarterly basis, the Adviser presents the factors considered in determining the fair value measurements and presents that information to the Audit Committee of the Board of Trustees which meets at least quarterly. The Audit Committee of the Board of Trustees then will provide a recommendation to the Board of Trustees for approval of the fair value measurements.
7. FORWARD FOREIGN CURRENCY EXCHANGE CONTRACTS
The Segall Bryant & Hamill Fundamental International Small Cap Fund may purchase or sell foreign currencies on a “spot” or cash basis at the prevailing rate in the foreign currency exchange market to settle investment transactions in the proper currency. In addition, this Fund may purchase or sell forward currency contracts to adjust the portfolio’s exposure to different currencies consistent with the investment team’s targets, which consider the currency weightings within the Fund’s benchmark index.
When entering into a spot or forward foreign currency contract, the Fund agrees to receive or deliver a fixed quantity of foreign currency for an agreed upon price on an agreed future date. These contracts are valued at each portfolio valuation, and the Fund’s net equity therein, representing unrealized gain or loss on the contracts as measured by the difference between the contractual rates at the dates of entry into the contracts and the spot or forward rates at the reporting date, is included in the Statements of Assets and Liabilities. Realized gains and losses and change in unrealized appreciation and depreciation are included in the Statements of Operations. These instruments involve credit risk and market risk in excess of the amount recognized in the Statements of Assets and Liabilities. Risks arise from the possible inability of counterparties to meet the terms of their contracts and from movement in currency exchange rates.
The Fund must segregate assets determined to be liquid in accordance with procedures established by the Board of Trustees, or otherwise cover its position in a permissible manner.
During the six months ended June 30, 2020, the Fund had average forward foreign currency contract values to buy and sell of $17,063,455 and $10,796,592, respectively.
The effect of derivative instruments on the Statements of Assets and Liabilities as of June 30, 2020 is as follows:
Segall Bryant & Hamill Fundamental International Small Cap Fund
| | Asset Derivatives | Liability Derivatives |
Risk Exposure | Statement of Assets and
Liabilities Location | | Fair Value | | Statement of Assets and
Liabilities Location | | Fair Value | |
Forward Foreign Currency Contracts (Foreign Exchange Rate Risk) | Unrealized gain on forward foreign currency contracts | | $ | 261,176 | | Unrealized loss on forward foreign currency contracts | | $ | (141,469 | ) |
Total | | | $ | 261,176 | | | | $ | (141,469 | ) |
The effect of derivative instruments on the Statements of Operations for the six months ended June 30, 2020 is as follows:
Segall Bryant & Hamill Fundamental International Small Cap Fund
Risk Exposure | Statement of Operations Location | | Realized Losses
on Derivatives
Recognized in
Income | | | Change in
Unrealized
Appreciation
(Depreciation)
on Derivatives
Recognized in
Income | |
Forward Foreign Currency Contracts (Foreign Exchange Rate Risk) | Net realized gains (losses) on forward foreign currency contracts/ Change in unrealized net appreciation (depreciation) on forward foreign currency contracts | | $ | (76,216 | ) | | $ | 26,074 | |
Total | | | $ | (76,216 | ) | | $ | 26,074 | |
162 |  | www.sbhfunds.com | www.sbhfunds.com
|
Segall Bryant & Hamill Funds | Notes to Financial Statements |
| | June 30, 2020 (Unaudited) |
8. PURCHASES AND SALES OF INVESTMENTS
Investment transactions for the six months ended June 30, 2020 excluding long-term U.S. government securities and short-term investments were as follows:
Fund | | Purchases of
Securities | | | Proceeds from Sales
of Securities | |
Segall Bryant & Hamill Small Cap Value Fund | | $ | 133,799,747 | | | $ | 53,379,846 | |
Segall Bryant & Hamill Small Cap Value Dividend Fund | | | 33,234,579 | | | | 39,097,992 | |
Segall Bryant & Hamill Small Cap Growth Fund | | | 19,247,212 | | | | 23,944,963 | |
Segall Bryant & Hamill Small Cap Core Fund | | | 40,635,645 | | | | 10,911,060 | |
Segall Bryant & Hamill Mid Cap Value Dividend Fund | | | 19,848,354 | | | | 51,641,172 | |
Segall Bryant & Hamill All Cap Fund | | | 30,822,763 | | | | 25,234,627 | |
Segall Bryant & Hamill Emerging Markets Fund | | | 13,118,861 | | | | 14,200,752 | |
Segall Bryant & Hamill International Small Cap Fund | | | 118,680,535 | | | | 158,722,228 | |
Segall Bryant & Hamill Fundamental International Small Cap Fund | | | 8,434,321 | | | | 8,500,967 | |
Segall Bryant & Hamill Global Large Cap Fund | | | 7,738,692 | | | | 12,905,026 | |
Segall Bryant & Hamill Workplace Equality Fund | | | 937,738 | | | | 1,455,267 | |
Segall Bryant & Hamill Short Term Plus Fund | | | 6,468,493 | | | | 2,066,191 | |
Segall Bryant & Hamill Plus Bond Fund | | | 48,360,139 | | | | 105,092,288 | |
Segall Bryant & Hamill Quality High Yield Fund | | | 21,570,531 | | | | 19,890,203 | |
Segall Bryant & Hamill Municipal Opportunities Fund | | | 85,975,806 | | | | 63,484,187 | |
Segall Bryant & Hamill Colorado Tax Free Fund | | | 277,933,526 | | | | 210,618,824 | |
Purchases and sales of long-term U.S. Government securities for the six months ended June 30, 2020, were as follows:
Fund | | Purchase of
Long Term U.S.
Government
Obligations | | | Proceeds from
Sales of Long Term
U.S. Government
Obligations | |
Segall Bryant & Hamill Plus Bond Fund | | $ | 222,203,676 | | | $ | 167,062,519 | |
9. SUBSEQUENT EVENTS
The Funds are required to recognize in the financial statements the effects of all subsequent events that provide additional evidence about conditions that existed as of the date of the Statements of Assets and Liabilities. For non-recognized subsequent events that must be disclosed to keep the financial statements from being misleading, the Funds are required to disclose the nature of the event as well as an estimate of its financial effect, or a statement that such an estimate cannot be made. Management has evaluated subsequent events through the issuance of these financial statements and has noted no such events except as follows:
The Board of the Trust, based upon the recommendation of the Adviser, approved an Agreement and Plan of Reorganization pursuant to which the Segall Bryant & Hamill Small Cap Value Dividend Fund would be combined with and into the Segall Bryant & Hamill Small Cap Value Fund (the “Reorganization”). The Reorganization is expected to occur on or about September 25, 2020. Both the Segall Bryant & Hamill Small Cap Value Dividend Fund and the Segall Bryant & Hamill Small Cap Value Fund have declared a special distribution as a result of the merger. The distributions will be made prior to the date of the Reorganization.
The Board of the Trust, based upon the recommendation of the Adviser, has determined to close and liquidate the Segall Bryant & Hamill Mid Cap Value Dividend Fund. The Board concluded that it would be in the best interests of the Fund and its shareholders that the Fund be closed and liquidated as a series of the Trust, with an effective date on or about September 17, 2020.
The Board of the Trust approved a change to the name of the Segall Bryant & Hamill Global Large Cap Fund. Effective September 22, 2020, the Fund will change its name to “Segall Bryant & Hamill Global All Cap Fund.”
Semi-Annual Report | June 30, 2020 |  | 163 |
Segall Bryant & Hamill Funds | Change in Independent Auditor |
| | June 30, 2020 (Unaudited) |
Effective as of the close of business on May 21, 2020, Deloitte & Touche LLP (“Deloitte”) resigned as the independent registered public accounting firm for the Funds. The report of Deloitte on the Funds’ financial statements as of and for the fiscal year or period ended December 31, 2019 did not contain an adverse opinion or a disclaimer of opinion, and was not qualified or modified as to uncertainties, audit scope or accounting principles. During the Funds’ most recent fiscal year or period, and through May 21, 2020, there were no disagreements between the Funds and Deloitte on any matter of accounting principles or practices, financial statement disclosure or auditing scope or procedure, which disagreements, if not resolved to the satisfaction of Deloitte, would have caused it to make reference to the subject matter of the disagreements in its report on the financial statements of the Funds for such year or period. During the Funds’ fiscal year or period ended December 31, 2019, there were no “reportable events” (as defined in Item 304(a)(1)(v) of Regulation S-K under the Securities Exchange Act of 1934, as amended (the “Exchange Act”)).
During each Fund’s fiscal year or period ended December 31, 2019 and the subsequent interim period through August 19, 2020,neither the Funds, nor anyone on their behalf, consulted with Deloitte, on behalf of the Funds, regarding any matter that was either the subject of a “disagreement,” as defined in Item 304(a)(1)(iv) of Regulation S-K under the Securities Exchange Act of 1934, as amended (the “Exchange Act”), and the instructions thereto, or a “reportable event,” as defined in Item 304(a)(1)(v) of Regulation S-K under the Exchange Act.
On August 19, 2020, upon the recommendation of the Funds’ Audit Committee, the Board of Trustees of the Funds approved the engagement of Cohen & Company, Ltd. (“Cohen”) as the independent registered public accounting firm for each Fund for the fiscal year ending December 31, 2020. The Board and its Audit Committee considered the engagement of Cohen in connection with the resignation of the Funds’ former independent registered accounting firm on May 21, 2020.
164 |  | www.sbhfunds.com | www.sbhfunds.com
|
Segall Bryant & Hamill Funds | Liquidity Risk Management Program |
| | (Unaudited) |
Segall Bryant & Hamill Trust (“the Trust”) has adopted and implemented a liquidity risk management program (the “Program”), as consistent with Rule 22e-4 to govern the Trust’s approach to managing liquidity risk for each Fund. The Program is overseen by Segall Bryant & Hamill, LLC (the “Adviser”). The Trust’s Board of Trustees (the “Board”) has approved the designation of the Adviser to oversee the Program.
The Program’s principal objectives include supporting each Fund’s compliance with limits on investments in illiquid assets and mitigating the risk that a Fund will be unable to meet its redemption obligations in a timely manner. The Program also includes a number of elements that support the management and assessment of liquidity risk, including an annual assessment of factors that influence a Fund’s liquidity and the periodic classification and re-classification of the Fund’s investments into groupings that reflect the Adviser’s assessment of the relative liquidity under current market conditions.
At a meeting of the Board held on May 13, 2020, the Adviser provided a report (the “Report”) to the Board addressing the operation, adequacy, and effectiveness of the Program, including any material changes to the Program for the period from the inception of the Trust’s program on December 1, 2018 through March 31, 2020 (“Reporting Period”). The Report concluded that the Trust’s Program was reasonably designed to assess and manage each Fund’s liquidity risk and was adequately and effectively implemented during the Reporting Period. There were no material changes to the Program during the Reporting Period. The Report further concluded that each Fund’s investment strategies continue to be appropriate given each Fund’s status as an open-end fund.
There can be no assurance that the Program will achieve its objectives in the future. Additional information regarding risks of investing in each of the Funds, including liquidity risks presented by each Fund’s investment portfolio, is found in the Trust’s Prospectus and Statement of Additional Information.
Semi-Annual Report | June 30, 2020 |  | 165 |
Intentionally Left Blank
Segall Bryant & Hamill Trustees and Officers:
Mary K. Anstine, Chairman
Thomas J. Abood, Trustee
John A. DeTore, Trustee
Rick A. Pederson, Trustee
James A. Smith, Trustee
Douglas M. Sparks, Trustee
Janice M. Teague, Trustee
Philip L. Hildebrandt, President
Jasper R. Frontz, Treasurer & Chief Compliance Officer
Jennifer L. Leamer, Asst. Treasurer
Derek W. Smith, Secretary
Maggie Bull, Asst. Secretary

FOR MORE INFORMATION ABOUT SEGALL BRYANT & HAMILL FUNDS, PLEASE CONTACT: Segall Bryant & Hamill Funds | 225 Pictoria Drive, Suite 450 | Cincinnati, Ohio 45246
Individual Investors: (800) 392-2673 | Financial Advisors: (800) 734-9738 | www.sbhfunds.com |
A description of the policies and procedures that Segall Bryant & Hamill Funds uses to determine how to vote proxies relating to portfolio securities and information regarding how each Fund voted proxies relating to portfolio securities during the most recent 12-month period ended June 30 is available (i) without charge, upon request, by calling toll-free (800) 392-2673; (ii) on the Funds’ website, www.sbhfunds.com; and (iii) on the Securities and Exchange Commission website at www.sec.gov.
Each Fund files a complete schedule of portfolio holdings with the Securities and Exchange Commission (“SEC”) as of the end of the first and third quarters of each fiscal year on Part F to Form N-PORT within 60 days after each fiscal quarter-end. Copies of the Segall Bryant & Hamill Funds Part F to Form N-PORT are available without a charge, upon request, by contacting Segall Bryant & Hamill Funds toll-free at (800) 392-2673 and on the SEC’s website at www.sec.gov.
This report has been prepared for Segall Bryant & Hamill Funds shareholders and may be distributed to others only if preceded or accompanied by a prospectus.
Funds distributed by Ultimus Fund Distributors, LLC
Not applicable to semi-annual report.
| Item 3. | Audit Committee Financial Expert. |
Not applicable to semi-annual report.
| Item 4. | Principal Accountant Fees and Services. |
Not applicable to semi-annual report.
| Item 5. | Audit Committee of Listed Registrants. |
Not applicable
| (a) | Schedule of Investments in securities of unaffiliated issuers as of the close of the reporting period is included as part of the Reports to Stockholders filed under Item 1 of this form. |
| Item 7. | Disclosure of Proxy Voting Policies and Procedures for Closed-End Management Investment Companies. |
Not applicable
| Item 8. | Portfolio Managers of Closed-End Management Investment Companies. |
Not applicable
| Item 9. | Purchases of Equity Securities by Closed-End Management Investment Company and Affiliated Purchasers. |
Not applicable
| Item 10. | Submission of Matters to a Vote of Security Holders. |
There have been no material changes to the procedures by which shareholders may recommend nominees to the registrant’s Board of Trustees.
| Item 11. | Controls and Procedures. |
(a) The registrant’s principal executive officer and principal financial officer have concluded that the registrant’s disclosure controls and procedures (as defined in Rule 30a-3(c) under the Investment Company Act of 1940, as amended) (the “1940 Act”) (17 CFR 270.30a-3(e)) are effective based on the evaluation of these controls and procedures required by Rule 30a-3(b) under the 1940 Act (17 CFR 270.30a-3(b)) and Rules 13a-15(b) of 15d-15(b) under the Securities Exchange Act of 1934 (17 CFR 240.13a-15(b) or 240.15d-15(b)) as of a date within 90 days of the filing date of this report.
(b) There was no change in the registrant’s internal control over financial reporting (as defined in Rule 30a-3(d) under the 1940 Act (17 CFR 270-30a-3(d)) that occurred during the second fiscal quarter of the period covered by this report that has materially affected, or are reasonably likely to materially affect, the registrant’s internal control over financial reporting.
| Item 12. | Disclosure of Securities Lending Activities for Closed-End Management Investment Companies. |
Not applicable
(a)(1) Not applicable to semi-annual report.
(a)(2) The certifications required Rule 30a-2(a) under the 1940 Act (17 CFR 270.30a-2(a)) and Section 302 of the Sarbanes-Oxley Act of 2002 are attached hereto as EX-99.CERT.
(a)(3) Not applicable.
(a)(4) Change in the registrant’s independent public accountants.
(i) Effective as of the close of business on May 21, 2020, Deloitte & Touche LLP (“Deloitte”) resigned as the independent registered public accounting firm for the Funds. The report of Deloitte on the Funds’ financial statements as of and for the fiscal year or period ended December 31, 2019 did not contain an adverse opinion or a disclaimer of opinion, and was not qualified or modified as to uncertainties, audit scope or accounting principles. During the Funds’ most recent fiscal year or period, and through May 21, 2020, there were no disagreements between the Funds and Deloitte on any matter of accounting principles or practices, financial statement disclosure or auditing scope or procedure, which disagreements, if not resolved to the satisfaction of Deloitte, would have caused it to make reference to the subject matter of the disagreements in its report on the financial statements of the Funds for such year or period. During the Funds’ fiscal year or period ended December 31, 2019, there were no “reportable events” (as defined in Item 304(a)(1)(v) of Regulation S-K under the Securities Exchange Act of 1934, as amended (the “Exchange Act”)).
During each Fund’s fiscal year or period ended December 31, 2019 and the subsequent interim period through August 19, 2020, neither the Funds, nor anyone on their behalf, consulted with Deloitte, on behalf of the Funds, regarding any matter that was either the subject of a “disagreement,” as defined in Item 304(a)(1)(iv) of Regulation S-K under the Securities Exchange Act of 1934, as amended (the “Exchange Act”), and the instructions thereto, or a “reportable event,” as defined in Item 304(a)(1)(v) of Regulation S-K under the Exchange Act.
On August 19, 2020, upon the recommendation of the Funds’ Audit Committee, the Board of Trustees of the Funds approved the engagement of Cohen & Company, Ltd. (“Cohen”) as the independent registered public accounting firm for each Fund for the fiscal year ending December 31, 2020. The Board and its Audit Committee considered the engagement of Cohen in connection with the resignation of the Funds’ former independent registered accounting firm on May 21, 2020.
(ii) 2600 Letter
(b) The certifications required by Rule 30a-2(b) of the 1940 Act (17 CFR 270.30a-2(b)) and Section 906 of the Sarbanes-Oxley Act of 2002 are attached hereto as EX-99.906CERT.
SIGNATURES
Pursuant to the requirements of the Securities Exchange Act of 1934 and the Investment Company Act of 1940, the registrant has duly caused this report to be signed on its behalf by the undersigned, thereunto duly authorized.
| (Registrant) | SEGALL BRYANT & HAMILL TRUST | | |
| | | | |
| By (Signature and Title)* | /s/ Philip L. Hildebrandt | |
| | | Philip L. Hildebrandt, President/Principal Executive Officer | |
| | | | |
| Date | September 8, 2020 | | |
| | | | |
| Pursuant to the requirements of the Securities Exchange Act of 1934 and the Investment Company Act of 1940, this report has been signed below by the following persons on behalf of the registrant and in the capacities and on the dates indicated. |
| | | | |
| By (Signature and Title)* | /s/ Philip L. Hildebrandt | |
| | | Philip L. Hildebrandt, President/Principal Executive Officer | |
| | | | |
| Date | September 8, 2020 | | |
| | | | |
| By (Signature and Title)* | /s/ Jasper R. Frontz | |
| | | Jasper R. Frontz, Treasurer/Principal Financial Officer | |
| | | | |
| Date | September 8, 2020 | | |
| * | Print the name and title of each signing officer under his or her signature. |