UNITED STATES
SECURITIES AND EXCHANGE COMMISSION
Washington, D.C. 20549
FORM N-CSR
CERTIFIED SHAREHOLDER REPORT OF REGISTERED
MANAGEMENT INVESTMENT COMPANIES
| Investment Company Act file number | 811-03373 | |
SEGALL BRYANT & HAMILL TRUST
(Exact name of registrant as specified in charter)
| 225 Pictoria Drive, Suite 450 Cincinnati, Ohio | 45246 |
| (Address of principal executive offices) | (Zip code) |
Maggie Bull, Secretary |
| Segall Bryant & Hamill Trust, 225 Pictoria Drive, Suite 450 Cincinnati, Ohio 45246 |
| (Name and address of agent for service) |
| Registrant's telephone number, including area code: | (513) 587-3400 | |
| Date of fiscal year end: | December 31 | |
| | | |
| Date of reporting period: | June 30, 2022 | |
Form N-CSR is to be used by management investment companies to file reports with the Commission not later than 10 days after the transmission to stockholders of any report that is required to be transmitted to stockholders under Rule 30e-1 under the Investment Company Act of 1940 (17 CFR 270.30e-1). The Commission may use the information provided on Form N-CSR in its regulatory, disclosure review, inspection, and policymaking roles.
A registrant is required to disclose the information specified by Form N-CSR, and the Commission will make this information public. A registrant is not required to respond to the collection of information contained in Form N-CSR unless the Form displays a currently valid Office of Management and Budget ("OMB") control number. Please direct comments concerning the accuracy of the information collection burden estimate and any suggestions for reducing the burden to the Secretary, Securities and Exchange Commission, 450 Fifth Street, NW, Washington, DC 20549-0609. The OMB has reviewed this collection of information under the clearance requirements of 44 U.S.C. § 3507.
| Item 1. | Reports to Stockholders. |

Segall Bryant & Hamill Small Cap Value Fund
(Ticker Symbol: Retail - SBRVX; Institutional - SBHVX)
Segall Bryant & Hamill Small Cap Growth Fund
(Ticker Symbol: Retail - WTSGX; Institutional - WISGX)
Segall Bryant & Hamill Small Cap Core Fund
(Ticker Symbol: Retail - SBHCX; Institutional - SBASX)
Segall Bryant & Hamill All Cap Fund
(Ticker Symbol: Retail - SBRAX; Institutional - SBHAX)
Segall Bryant & Hamill Emerging Markets Fund
(Ticker Symbol: Retail - SBHEX; Institutional - SBEMX)
Segall Bryant & Hamill International Small Cap Fund
(Ticker Symbol: Retail - SBHSX; Institutional - SBSIX)
Segall Bryant & Hamill Fundamental International Small Cap Fund
(Ticker Symbol: Retail - WTIFX; Institutional - WIIFX)
Segall Bryant & Hamill Global All Cap Fund
(Ticker Symbol: Retail - WTMVX; Institutional - WIMVX)
Segall Bryant & Hamill Workplace Equality Fund
(Ticker Symbol: Retail - WEQRX; Institutional - WEQIX)
Segall Bryant & Hamill Short Term Plus Fund
(Ticker Symbol: Retail - SBHPX; Institutional - SBAPX)
Segall Bryant & Hamill Plus Bond Fund
(Ticker Symbol: Retail - WTIBX; Institutional - WIIBX)
Segall Bryant & Hamill Quality High Yield Fund
(Ticker Symbol: Retail - WTLTX; Institutional - WILTX)
Segall Bryant & Hamill Municipal Opportunities Fund
(Ticker Symbol: Retail - WTTAX; Institutional - WITAX)
Segall Bryant & Hamill Colorado Tax Free Fund
(Ticker Symbol: Retail - WTCOX; Institutional - WICOX)
SEGALL BRYANT & HAMILL
SEMI-ANNUAL REPORT
JUNE 30, 2022
Table of Contents
| | |
| SHAREHOLDER LETTER | 1 |
| | |
| FUND OVERVIEWS | |
| | |
| Segall Bryant & Hamill Small Cap Value Fund | 2 |
| | |
| Segall Bryant & Hamill Small Cap Growth Fund | 4 |
| | |
| Segall Bryant & Hamill Small Cap Core Fund | 6 |
| | |
| Segall Bryant & Hamill All Cap Fund | 8 |
| | |
| Segall Bryant & Hamill Emerging Markets Fund | 10 |
| | |
| Segall Bryant & Hamill International Small Cap Fund | 12 |
| | |
| Segall Bryant & Hamill Fundamental International Small Cap Fund | 14 |
| | |
| Segall Bryant & Hamill Global All Cap Fund | 16 |
| | |
| Segall Bryant & Hamill Workplace Equality Fund | 18 |
| | |
| Segall Bryant & Hamill Short Term Plus Fund | 20 |
| | |
| Segall Bryant & Hamill Plus Bond Fund | 22 |
| | |
| Segall Bryant & Hamill Quality High Yield Fund | 24 |
| | |
| Segall Bryant & Hamill Municipal Opportunities Fund | 26 |
| | |
| Segall Bryant & Hamill Colorado Tax Free Fund | 28 |
| | |
| FUND EXPENSES | 30 |
| | |
| IMPORTANT DISCLOSURES | 33 |
| | |
| FINANCIAL STATEMENTS | 36 |
| | |
| Statements of Investments | 36 |
| | |
| Statements of Assets and Liabilities | 90 |
| | |
| Statements of Operations | 94 |
| | |
| Statements of Changes in Net Assets | 98 |
| | |
| Financial Highlights | 103 |
| | |
| Notes to Financial Statements | 131 |
Semi-Annual Report | June 30, 2022 |  | |
Intentionally Left Blank
| Segall Bryant & Hamill Funds | Shareholder Letter |
| | June 30, 2022 (Unaudited) |
Dear Fellow Shareholders:
As we mentioned in our year-end 2021 shareholder letter, we entered 2022 flush from one of the most profitable two-year periods in the history of U.S. financial markets. The increase in asset values across asset classes (including stocks, bonds, commodities, and real estate) was driven by an unprecedented combination of artificially low interest rates, which had been held low since the great financial crisis, and government financial stimulus to combat pandemic-related economic effects. It had been our view that this combination of monetary and fiscal stimulus could eventually produce a powerful countervailing force: inflation. This has indeed been the case.
The rapid rise of prices this year, first thought to be supply chain related and temporary, has proven to be more durable and incredibly tenacious. The war in Ukraine and general political turmoil across the globe have amplified the effects of monetary-driven inflation. We believe this dramatic rise in inflation has been the catalyst for global monetary policy change. The U.S. Federal Reserve (Fed) has already raised interest rates several times this year and other central banks have followed suit. Not unexpectedly, the prices of stocks and bonds, which had risen to extreme valuation levels, are being severely impaired by the dynamics of this monetary policy change.
 |  |
Janice M. Teague
Chair | Philip L. Hildebrandt, CFA |
| President |
This revaluation of financial assets, as the returns in the first half of 2022 very amply demonstrated, produced market returns that were nearly uniformly negative across asset classes. One aspect of our fund performance during the first half that may seem counterintuitive to our long-term shareholders is that the funds did not display the superior downside capture they have historically shown in market declines. (Downside capture compares a portfolio’s performance to that of its benchmark in months in which the benchmark index declines in value.) We believe that the end of the old market policy, built as it was on the premise of an inexhaustible supply of low-cost funds from monetary authorities, will take time to play out. During this transition, identifying which companies will continue to thrive in the new order and those whose value was built solely on free money will take time to sort out.
As professional investors, we find that transitional markets such as this often create and uncover investment opportunities on which we can capitalize. Transitional markets are when disciplined, active investing can produce strong outcomes for our shareholders. Having said that, we are mindful that this is a time to protect capital rather than to aggressively seek to grow it. Does protecting capital mean engaging in wholesale selling of stocks and bonds? In short, we think not. It simply means adherence to our time-tested discipline. We remain focused on fundamental valuation to find mispriced opportunities.
We are also cognizant that periods of market dislocation as we’ve experienced this year can create doubt and uncertainty for investors. It is why we are so thankful for our strong shareholder base and the trust placed in us. Rest assured we will continue to work diligently every day to earn your trust.
| 1 | Segall Bryant & Hamill did not solicit or pay a fee to participate in P&I’s Best Places to Work in Money Management survey. |
The views of the authors and information discussed in the shareholder letter and manager commentaries are as February 18, 2022, are subject to change, and may not reflect the writers’ current views. The views expressed represent an assessment of market conditions at a specific point in time, are opinions only and should not be relied upon as investment advice regarding a particular investment or markets in general. Such information does not constitute a recommendation to buy or sell specific securities or investment vehicles. It should not be assumed that any investment will be profitable or will equal the performance of the fund or any securities or any sectors mentioned in this letter. The subject matter contained in this letter has been derived from several sources believed to be reliable and accurate at the time of compilation. Neither Segall Bryant & Hamill, Segall Bryant & Hamill Funds, nor any Segall Bryant & Hamill Fund accept any liability for losses either direct or consequential caused by the use of this information. Diversification cannot guarantee gain or prevent losses.
| Semi-Annual Report | June 30, 2022 | | 1 |
| Segall Bryant & Hamill Small Cap Value Fund | Fund Overview |
| | June 30, 2022 (Unaudited) |
Investment Objective
The Fund seeks to achieve long-term capital appreciation.
Fund Management
Mark T. Dickherber, CFA, CPA Portfolio Manager
Shaun P. Nicholson Portfolio Manager
CFA is a trademark owned by CFA Institute.
Cumulative Returns

The chart above represents historical performance of a hypothetical investment of $10,000 in the Fund over the past 10 years (or for the life of the Fund if shorter). Performance calculations are as of the end of December each year. Past performance does not guarantee future results. This chart does not reflect the deduction of taxes that a shareholder would pay on Fund distributions or the redemption of Fund shares.
Please see index definitions beginning on page 33.
Average Annual Total Returns
| | | | | | | Since | Inception |
| | 6 Months | 1 Year | 3 Years | 5 Years | 10 Years | Inception | Date |
| Retail Class (SBRVX) | (17.46)% | (16.29)% | 3.04% | 5.85% | — | 6.79% | 12/9/19 |
| Institutional Class (SBHVX) | (17.44)% | (16.26)% | 3.15% | 5.97% | — | 6.93% | 7/31/13 |
| Russell 2000® Value Index | (17.31)% | (16.28)% | 6.18% | 4.89% | — | 6.76% | |
Retail Class Annual Expense Ratio (per the current prospectus) — Total - 1.04%
Institutional Class Annual Expense Ratio (per the current prospectus) – Total - 0.97%
Performance data quoted represents past performance and does not guarantee future results. Performance information for the Retail Class shares prior to their inception is based on the performance of the Institutional Class. Current performance may be lower or higher than the performance quoted. To obtain current performance as of the most recent month-end, visit www.sbhfunds.com. Average annual total returns reflect the reinvestment of dividends, capital gains distributions, all fee waivers and expense reimbursements, if any. Without the fee waivers and expense reimbursements, total return figures would have been lower. Investment return and principal value will vary, and shares, when redeemed, may be worth more or less than their original cost. Segall Bryant & Hamill fund shares are not insured by the FDIC, the Federal Reserve Board or any other agency and are subject to investment risk.
Until at least April 30, 2023, Segall Bryant & Hamill, LLC (the “Adviser”) has contractually agreed to waive the investment advisory and/or administration fees and/or to reimburse other expenses, so that the ratio of expenses to average net assets as reported in the Fund’s Financial Highlights will be no more than 1.14% and 0.99% to the Fund’s Retail Class and Institutional Class, respectively, for such period. This agreement may not be terminated or modified by the Adviser prior to the termination date without the approval of the Board of Trustees.
Investing in small-cap funds generally will be more volatile and loss of principal could be greater than investing in larger-cap funds.
| 2 | | www.sbhfunds.com |
| Segall Bryant & Hamill Small Cap Value Fund | Fund Overview |
| | June 30, 2022 (Unaudited) |
Sector Allocation (as of 6/30/22)
| Industrials | 23.0% |
| Financials | 13.9% |
| Information Technology | 11.4% |
| Health Care | 9.1% |
| Materials | 7.6% |
| Real Estate | 7.6% |
| Consumer Staples | 7.4% |
| Utilities | 6.2% |
| Energy | 3.6% |
| Consumer Discretionary | 3.3% |
Sector classifications presented are based on the Global Industry Classification Standard (GICS) methodology.
Percentages are based on Total Net Assets.
The sector allocation table above does not include any cash or cash equivalents.
Stock Performance (12/31/2021 to 6/30/2022)
| | Average | Contribution |
| 5 Highest | Weight | to Return |
| Helmerich & Payne, Inc. | 0.95 | 0.36 |
| Mercury Systems, Inc. | 1.32 | 0.26 |
| Equity Commonwealth | 4.31 | 0.24 |
| Huron Consulting Group, Inc. | 0.53 | 0.17 |
| Dril-Quip, Inc. | 1.01 | 0.16 |
Top Ten Holdings (as of 6/30/22)
| Equity Commonwealth | 5.1% |
| Coty, Inc. | 4.2% |
| Progress Software Corp. | 3.5% |
| NCR Corp. | 2.9% |
| Hain Celestial Group, Inc. (The) | 2.9% |
| ICU Medical, Inc. | 2.7% |
| Compass Minerals International, Inc. | 2.7% |
| SPX Corp. | 2.6% |
| Orthofix Medical, Inc. | 2.5% |
| Regal Rexnord Corp. | 2.5% |
Top ten holdings do not include any cash, cash equivalents or exchange traded fund investments. Holdings are subject to change and may not reflect the current or future position of the Fund.
| | Average | Contribution |
| 5 Lowest | Weight | to Return |
| Regal Rexnord Corp. | 2.92 | -1.03 |
| Glatfelter Corp. | 1.43 | -1.07 |
| FARO Technologies, Inc. | 1.53 | -1.14 |
| Compass Minerals International, Inc. | 3.50 | -1.19 |
| Hain Celestial Group, Inc. (The) | 3.34 | -1.72 |
Past performance does not guarantee future results. These stocks do not represent all of the securities purchased, sold or recommended by the Fund’s Adviser. To request a complete list of the contribution of each Fund holding to overall Fund performance during the period, please call (800) 392-2673.
Please see page 34 for a description of the methodology used to construct this table.
| Semi-Annual Report | June 30, 2022 | | 3 |
| Segall Bryant & Hamill Small Cap Growth Fund | Fund Overview |
| | June 30, 2022 (Unaudited) |
Investment Objective
The Fund seeks to achieve long-term capital appreciation.
Fund Management
Brian C. Fitzsimons, CFA Portfolio Manager
Mitch S. Begun, CFA Portfolio Manager
CFA is a trademark owned by CFA Institute.
Cumulative Returns
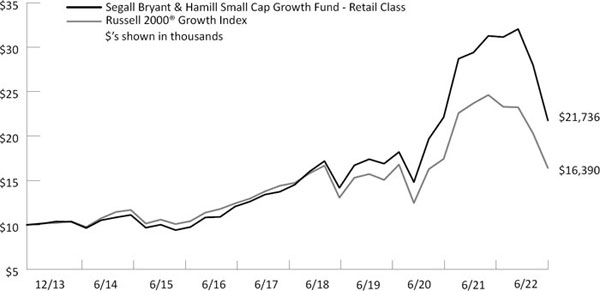
The chart above represents historical performance of a hypothetical investment of $10,000 in the Fund over the past 10 years (or for the life of the Fund if shorter). Performance calculations are as of the end of June each year. Past performance does not guarantee future results. This chart does not reflect the deduction of taxes that a shareholder would pay on Fund distributions or the redemption of Fund shares.
Please see index definitions beginning on page 33.
Average Annual Total Returns
| | | | | | | Since | Inception |
| | 6 Months | 1 Year | 3 Years | 5 Years | 10 Years | Inception | Date |
| Retail Class (WTSGX) | (32.16)% | (30.49)% | 7.71% | 11.47% | — | 9.53% | 12/20/13 |
| Institutional Class (WISGX) | (32.10)% | (30.35)% | 7.88% | 11.65% | — | 9.79% | 12/20/13 |
| Russell 2000® Growth Index | (29.45)% | (33.43)% | 1.40% | 4.80% | — | 5.97% | |
Retail Class Annual Expense Ratio (per the current prospectus) — Total: 1.03%
Institutional Class Annual Expense Ratio (per the current prospectus) — Total: 0.87%
Performance data quoted represents past performance and does not guarantee future results. Current performance may be lower or higher than the performance quoted. To obtain current performance as of the most recent month-end, visit www.sbhfunds.com. Average annual total returns reflect the reinvestment of dividends, capital gains distributions, all fee waivers and expense reimbursements, if any. Without the fee waivers and expense reimbursements, total return figures would have been lower. Investment return and principal value will vary, and shares, when redeemed, may be worth more or less than their original cost. Segall Bryant & Hamill fund shares are not insured by the FDIC, the Federal Reserve Board or any other agency and are subject to investment risk.
Until at least April 30, 2023, Segall Bryant & Hamill, LLC (the “Adviser”) has contractually agreed to waive the investment advisory and/or administration fees and/or to reimburse other expenses, so that the ratio of expenses to average net assets as reported in the Fund’s Financial Highlights will be no more than 1.14% and 0.99% for the Fund’s Retail Class and Institutional Class, respectively, for such period. This agreement may not be terminated or modified by the Adviser prior to the termination date without the approval of the Board of Trustees.
Investing in small-cap funds generally will be more volatile and loss of principal could be greater than investing in larger-cap funds.
| 4 | | www.sbhfunds.com |
| Segall Bryant & Hamill Small Cap Growth Fund | Fund Overview |
| | June 30, 2022 (Unaudited) |
Sector Allocation (as of 6/30/22)
| Health Care | 26.2% |
| Information Technology | 26.2% |
| Industrials | 16.6% |
| Consumer Discretionary | 9.0% |
| Financials | 7.6% |
| Materials | 3.5% |
| Communication Services | 3.1% |
| Real Estate | 2.3% |
| Consumer Staples | 1.7% |
Sector classifications presented are based on the Global Industry Classification Standard (GICS) methodology.
Percentages are based on Total Net Assets.
The sector allocation table above does not include any cash or cash equivalents.
Stock Performance (12/31/2021 to 6/30/2022)
| | Average | Contribution |
| 5 Highest | Weight | to Return |
| Turning Point Therapeutics, Inc. | 0.78 | 0.67 |
| Anaplan, Inc. | 1.27 | 0.52 |
| Stryker Corp. | 0.09 | 0.27 |
| AeroVironment, Inc. | 0.30 | 0.26 |
| Ritchie Bros. Auctioneers Inc. | 1.25 | 0.17 |
| Top Ten Holdings (as of 6/30/22) |
| Silicon Laboratories, Inc. | 2.4% |
| Tetra Tech, Inc. | 2.3% |
| Sprout Social, Inc. | 2.2% |
| Endava PLC | 2.1% |
| Omnicell, Inc. | 2.0% |
| Power Integrations, Inc. | 1.9% |
| Option Care Health, Inc. | 1.9% |
| MAXIMUS, Inc. | 1.8% |
| Globus Medical, Inc. | 1.8% |
| Turning Point Therapeutics, Inc. | 1.8% |
Top ten holdings do not include any cash, cash equivalents or exchange traded fund investments. Holdings are subject to change and may not reflect the current or future position of the Fund.
| | Average | Contribution |
| 5 Lowest | Weight | to Return |
| Trupanion, Inc. | 1.60 | -1.02 |
| Endava PLC | 2.27 | -1.12 |
| Warby Parker, Inc. | 1.08 | -1.18 |
| Goosehead Insurance, Inc. | 1.40 | -1.23 |
| AZEK Co., Inc. (The) | 1.69 | -1.51 |
Past performance does not guarantee future results. These stocks do not represent all of the securities purchased, sold or recommended by the Fund’s Adviser. To request a complete list of the contribution of each Fund holding to overall Fund performance during the period, please call (800) 392-2673.
Please see page 34 for a description of the methodology used to construct this table.
| Semi-Annual Report | June 30, 2022 | | 5 |
| Segall Bryant & Hamill Small Cap Core Fund | Fund Overview |
| | June 30, 2022 (Unaudited) |
Investment Objective
The Fund seeks to achieve long-term capital appreciation.
Fund Management
Jeffrey C. Paulis, CFA, Portfolio Manager
Mark T. Dickherber, CFA, CPA Portfolio Manager
CFA is a trademark owned by CFA Institute.
Cumulative Returns

The chart above represents historical performance of a hypothetical investment of $10,000 in the Fund over the past 10 years (or for the life of the Fund if shorter). Performance calculations are as of the end of June each year. Past performance does not guarantee future results. This chart does not reflect the deduction of taxes that a shareholder would pay on Fund distributions or the redemption of Fund shares.
Please see index definitions beginning on page 33.
Average Annual Total Returns*
| | | | | | | Since | Inception |
| | 6 Months | 1 Year | 3 Years | 5 Years | 10 Years | Inception | Date |
| Retail Class (SBHCX) | (21.11)% | (15.15)% | 8.56% | 9.11% | 10.13% | 8.46% | 12/31/19 |
| Institutional Class (SBASX) | (21.02)% | (15.01)% | 8.75% | 9.29% | 10.31% | 8.63% | 12/15/03 |
| Russell 2000® Index | (23.43)% | (25.20)% | 4.21% | 5.17% | 9.35% | 7.66% | |
Retail Class Annual Expense Ratio (per the current prospectus) — Gross: 1.35%, Net: 1.14%
Institutional Class Annual Expense Ratio (per the current prospectus) — Gross: 1.10%, Net: 0.99%
| * | The quoted performance of the Fund reflects the past performance of Lower Wacker Small Cap Investment Fund, LLC (the “Partnership”), an unregistered limited partnership managed by the portfolio managers of the Fund. The Partnership was organized into the Institutional Class shares on December 31, 2019, the date the Fund commenced operations. The Fund has been managed in the same style since the Partnership’s inception on December 15, 2003. The Fund’s annual returns and long-term performance reflect the actual fees and expenses that were charged when the Fund was a limited partnership. From its inception on December 15, 2003 through December 31, 2019, the Partnership was not subject to certain investment restrictions, diversification requirements and other restrictions of the Investment Company Act of 1940, as amended or Subchapter M of the Internal Revenue Code of 1986, as amended, which, if they had been applicable, might have adversely affected the Fund’s performance. |
Performance data quoted represents past performance and does not guarantee future results. Current performance may be lower or higher than the performance quoted. To obtain current performance as of the most recent month-end, visit www.sbhfunds.com. Average annual total returns reflect the reinvestment of dividends, capital gains distributions, all fee waivers and expense reimbursements, if any. Without the fee waivers and expense reimbursements, total return figures would have been lower. Investment return and principal value will vary, and shares, when redeemed, may be worth more or less than their original cost. Segall Bryant & Hamill fund shares are not insured by the FDIC, the Federal Reserve Board or any other agency and are subject to investment risk.
Until at least April 30, 2023, Segall Bryant & Hamill, LLC (the “Adviser”) has contractually agreed to waive the investment advisory and/or administration fees and/or to reimburse other expenses, so that the ratio of expenses to average net assets as reported in the Fund’s Financial Highlights will be no more than 1.14% and 0.99% to the Fund’s Retail Class and Institutional Class, respectively, for such period. This agreement may not be terminated or modified by the Adviser prior to the termination date without the approval of the Board of Trustees.
Investing in small-cap funds generally will be more volatile and loss of principal could be greater than investing in larger-cap funds.
| 6 | | www.sbhfunds.com |
| Segall Bryant & Hamill Small Cap Core Fund | Fund Overview |
| | June 30, 2022 (Unaudited) |
Sector Allocation (as of 6/30/22)
| Industrials | 21.7% |
| Information Technology | 19.4% |
| Health Care | 12.0% |
| Consumer Discretionary | 9.8% |
| Materials | 8.4% |
| Financials | 8.0% |
| Consumer Staples | 4.9% |
| Energy | 3.7% |
| Real Estate | 2.3% |
Sector classifications presented are based on the Global Industry Classification Standard (GICS) methodology.
Percentages are based on Total Net Assets.
The sector allocation table above does not include any cash or cash equivalents.
Stock Performance (12/31/2021 to 6/30/2022)
| | Average | Contribution |
| 5 Highest | Weight | to Return |
| Anaplan, Inc. | 0.96 | 0.27 |
| Devon Energy Corp. | 2.33 | 0.26 |
| Vocera Communications, Inc. | 0.39 | 0.23 |
| Agilysys, Inc. | 0.74 | 0.14 |
| BWX Technologies, Inc. | 0.76 | 0.09 |
Top Ten Holdings (as of 6/30/22)
| Devon Energy Corp. | 2.3% |
| KBR, Inc. | 2.3% |
| Carlisle Cos., Inc. | 2.1% |
| EnPro Industries, Inc. | 1.9% |
| Tenable Holdings, Inc. | 1.9% |
| Seacoast Banking Corp. of Florida | 1.9% |
| WNS Holdings, Ltd. | 1.9% |
| Graphic Packaging Holding Co. | 1.9% |
| Pure Storage, Inc. | 1.8% |
| Silicon Laboratories, Inc. | 1.8% |
Top ten holdings do not include any cash, cash equivalents or exchange traded fund investments. Holdings are subject to change and may not reflect the current or future position of the Fund.
| Average | Contribution |
| 5 Lowest | Weight | to Return |
| Under Armour, Inc. | 0.82 | -0.63 |
| Pegasystems Inc. | 0.83 | -0.68 |
| Endava PLC | 1.55 | -0.73 |
| Regal Rexnord Corp. | 2.33 | -0.80 |
| Hain Celestial Group, Inc. (The) | 1.97 | -0.91 |
Past performance does not guarantee future results. These stocks do not represent all of the securities purchased, sold or recommended by the Fund’s Adviser. To request a complete list of the contribution of each Fund holding to overall Fund performance during the period, please call (800) 392-2673.
Please see page 34 for a description of the methodology used to construct this table.
| Semi-Annual Report | June 30, 2022 | | 7 |
| Segall Bryant & Hamill All Cap Fund | Fund Overview |
| | June 30, 2022 (Unaudited) |
Investment Objective
The Fund seeks to achieve long-term capital appreciation.
Fund Management
Ralph M. Segall, CFA, CIC Portfolio Manager
Suresh Rajagopal, CFA Portfolio Manager
CFA is a trademark owned by CFA Institute.
Cumulative Returns
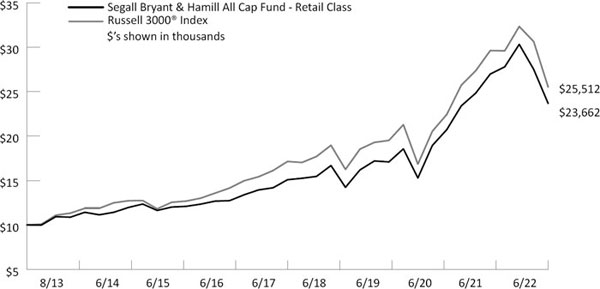
The chart above represents historical performance of a hypothetical investment of $10,000 in the Fund over the past 10 years (or for the life of the Fund if shorter). Performance calculations are as of the end of June each year. Past performance does not guarantee future results. This chart does not reflect the deduction of taxes that a shareholder would pay on Fund distributions or the redemption of Fund shares.
Please see index definitions beginning on page 33.
Average Annual Total Returns
| | | | | | | Since | Inception |
| | 6 Months | 1 Year | 3 Years | 5 Years | 10 Years | Inception | Date |
| Retail Class (SBRAX) | (21.95)% | (12.30)% | 11.21% | 11.16% | — | 10.14% | 12/9/19 |
| Institutional Class (SBHAX) | (21.90)% | (12.30)% | 11.28% | 11.27% | — | 10.28% | 7/31/13 |
| Russell 3000® Index | (21.10)% | (13.87)% | 9.77% | 10.60% | — | 11.08% | |
Retail Class Annual Expense Ratio (per the current prospectus) — Total: 0.83%
Institutional Class Annual Expense Ratio (per the current prospectus) — Gross: 0.87%, Net: 0.84%
Performance data quoted represents past performance and does not guarantee future results. Performance information for the Retail Class shares prior to their inception is based on the performance of the Institutional Class. Current performance may be lower or higher than the performance quoted. To obtain current performance as of the most recent month-end, visit www.sbhfunds.com. Average annual total returns reflect the reinvestment of dividends, capital gains distributions, all fee waivers and expense reimbursements, if any. Without the fee waivers and expense reimbursements, total return figures would have been lower. Investment return and principal value will vary, and shares, when redeemed, may be worth more or less than their original cost. Segall Bryant & Hamill fund shares are not insured by the FDIC, the Federal Reserve Board or any other agency and are subject to investment risk.
Until at least April 30, 2023, Segall Bryant & Hamill, LLC (the “Adviser”) has contractually agreed to waive the investment advisory and/or administration fees and/or to reimburse other expenses, so that the ratio of expenses to average net assets as reported in the Fund’s Financial Highlights will be no more than 0.99% and 0.84% to the Fund’s Retail Class and Institutional Class, respectively, for such period. This agreement may not be terminated or modified by the Adviser prior to the termination date without the approval of the Board of Trustees.
| 8 | | www.sbhfunds.com |
| Segall Bryant & Hamill All Cap Fund | Fund Overview |
| | June 30, 2022 (Unaudited) |
Sector Allocation (as of 6/30/22)
| Information Technology | 19.4% |
| Health Care | 17.7% |
| Financials | 16.2% |
| Industrials | 12.1% |
| Consumer Discretionary | 10.9% |
| Consumer Staples | 6.1% |
| Energy | 5.6% |
| Communication Services | 5.4% |
| Materials | 4.7% |
Sector classifications presented are based on the Global Industry Classification Standard (GICS) methodology.
Percentages are based on Total Net Assets.
The sector allocation table above does not include any cash or cash equivalents.
Stock Performance (12/31/2021 to 6/30/2022)
| | Average | Contribution |
| 5 Highest | Weight | to Return |
| McKesson Corp. | 1.84 | 0.50 |
| Suncor Energy, Inc. | 1.43 | 0.35 |
| Quanta Services, Inc. | 3.16 | 0.31 |
| Perrigo Co. PLC | 0.62 | 0.22 |
| Chevron Corp. | 2.19 | 0.19 |
Top Ten Holdings (as of 6/30/22)
| Microsoft Corp. | 4.6% |
| Alphabet, Inc. | 4.1% |
| Quanta Services, Inc. | 3.6% |
| UnitedHealth Group, Inc. | 3.0% |
| Raytheon Technologies Corp. | 2.8% |
| Visa, Inc. | 2.6% |
| Reinsurance Group of America, Inc. | 2.6% |
| Globe Life, Inc. | 2.6% |
| Amazon.com, Inc. | 2.4% |
| Catalent, Inc. | 2.4% |
Top ten holdings do not include any cash, cash equivalents or exchange traded fund investments. Holdings are subject to change and may not reflect the current or future position of the Fund.
| | Average | Contribution |
| 5 Lowest | Weight | to Return |
| Alphabet, Inc. | 4.18 | -1.03 |
| Microsoft Corp. | 4.66 | -1.03 |
| Amazon.com, Inc. | 2.84 | -1.13 |
| Zebra Technologies Corp. | 1.88 | -1.25 |
| Marvell Technology, Inc. | 2.65 | -1.61 |
Past performance does not guarantee future results. These stocks do not represent all of the securities purchased, sold or recommended by the Fund’s Adviser. To request a complete list of the contribution of each Fund holding to overall Fund performance during the period, please call (800) 392-2673.
Please see page 34 for a description of the methodology used to construct this table.
| Semi-Annual Report | June 30, 2022 | | 9 |
| Segall Bryant & Hamill Emerging Markets Fund | Fund Overview |
| | June 30, 2022 (Unaudited) |
Investment Objective
The Fund seeks to achieve long-term capital appreciation.
Fund Management
Scott E. Decatur, Ph.D. Portfolio Manager
Nicholas C. Fedako, CFA Portfolio Manager
CFA is a trademark owned by CFA Institute.
Cumulative Returns
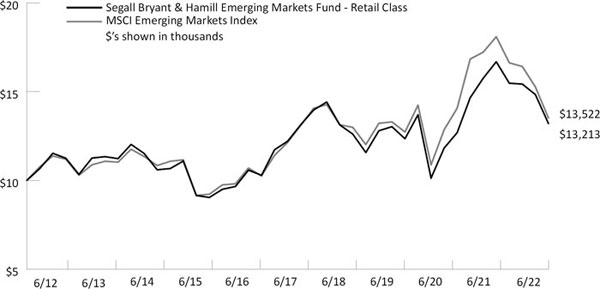
The chart above represents historical performance of a hypothetical investment of $10,000 in the Fund over the past 10 years (or for the life of the Fund if shorter). Performance calculations are as of the end of June each year. Past performance does not guarantee future results. This chart does not reflect the deduction of taxes that a shareholder would pay on Fund distributions or the redemption of Fund shares.
Please see index definitions beginning on page 33.
Average Annual Total Returns
| | | | | | | Since | Inception |
| | 6 Months | 1 Year | 3 Years | 5 Years | 10 Years | Inception | Date |
| Retail Class* (SBHEX) | (14.36)% | (20.82)% | 0.46% | 1.59% | 2.83% | 1.00% | 6/30/14 |
| Institutional Class** (SBEMX) | (14.43)% | (20.73)% | 0.60% | 1.75% | 3.01% | 1.19% | 6/30/11 |
| MSCI Emerging Markets Index | (17.63)% | (25.29)% | 0.57% | 2.18% | 3.06% | 1.17% | |
Retail Class Annual Expense Ratio (per the current prospectus) — Gross: 1.86%, Net: 1.38%
Institutional Class Annual Expense Ratio (per the current prospectus) — Gross: 1.69%, Net: 1.23%
Performance data quoted represents past performance and does not guarantee future results. Performance information for the Retail Class shares prior to their inception is based on the performance of the Institutional Class. Current performance may be lower or higher than the performance quoted. To obtain current performance as of the most recent month-end, visit www.sbhfunds.com. Average annual total returns reflect the reinvestment of dividends, capital gains distributions, all fee waivers and expense reimbursements, if any. Without the fee waivers and expense reimbursements, total return figures would have been lower. Investment return and principal value will vary, and shares, when redeemed, may be worth more or less than their original cost. Segall Bryant & Hamill fund shares are not insured by the FDIC, the Federal Reserve Board or any other agency and are subject to investment risk.
Until at least April 30, 2023, Segall Bryant & Hamill, LLC (the “Adviser”) has contractually agreed to waive the investment advisory and/or administration fees and/or to reimburse other expenses, so that the ratio of expenses to average net assets as reported in the Fund’s Financial Highlights will be no more than 1.38% and 1.23% to the Fund’s Retail Class and Institutional Class, respectively, for such period. This agreement may not be terminated or modified by the Adviser prior to the termination date without the approval of the Board of Trustees.
Investing in foreign companies are subject to special risks, including currency fluctuations, social, economic, and political uncertainties, which could increase volatility.
| 10 | | www.sbhfunds.com |
| Segall Bryant & Hamill Emerging Markets Fund | Fund Overview |
| | June 30, 2022 (Unaudited) |
Sector Allocation (as of 6/30/22)
| Financials | 21.2% |
| Information Technology | 18.6% |
| Consumer Discretionary | 15.2% |
| Communication Services | 10.2% |
| Materials | 8.7% |
| Consumer Staples | 5.7% |
| Industrials | 5.6% |
| Energy | 5.4% |
| Health Care | 3.7% |
| Utilities | 2.8% |
| Real Estate | 1.8% |
Sector classifications presented are based on the Global Industry Classification Standard (GICS) methodology.
Percentages are based on Total Net Assets.
The sector allocation table above does not include any cash or cash equivalents.
Stock Performance (12/31/2021 to 6/30/2022)
| | Average | Contribution |
| 5 Highest | Weight | to Return |
| Alinma Bank | 0.31 | 0.28 |
| Triveni Engineering and Industries, Ltd. | 0.35 | 0.23 |
| Sasol, Ltd. | 0.34 | 0.18 |
| Tongwei Group Co., Ltd. | 0.14 | 0.17 |
| Daqo New Energy Corp. | 0.21 | 0.15 |
Top Ten Holdings (as of 6/30/22)
| Taiwan Semiconductor Manufacturing Co., Ltd. | 5.0% |
| Tencent Holdings, Ltd. | 3.3% |
| Samsung Electronics Co., Ltd. | 2.3% |
| Alibaba Group Holding, Ltd. | 2.3% |
| Bank of China, Ltd. | 1.4% |
| Riyad Bank | 1.1% |
| China Construction Bank Corp. | 1.1% |
| Vale S.A. | 1.1% |
| Zhongsheng Group Holdings, Ltd. | 1.1% |
| China Tower Corp., Ltd. | 1.0% |
Top ten holdings do not include any cash, cash equivalents or exchange traded fund investments. Holdings are subject to change and may not reflect the current or future position of the Fund.
| | Average | Contribution |
| 5 Lowest | Weight | to Return |
| Surgutneftegas PJSC | 0.15 | -0.42 |
| Tencent Holdings, Ltd. | 3.18 | -0.66 |
| Gazprom PJSC | 0.23 | -0.70 |
| Samsung Electronics Co., Ltd. | 2.92 | -1.03 |
| Taiwan Semiconductor Manufacturing Co., Ltd. | 5.72 | -1.87 |
Past performance does not guarantee future results. These stocks do not represent all of the securities purchased, sold or recommended by the Fund’s Adviser. To request a complete list of the contribution of each Fund holding to overall Fund performance during the period, please call (800) 392-2673.
Please see page 34 for a description of the methodology used to construct this table.
| Semi-Annual Report | June 30, 2022 | | 11 |
| Segall Bryant & Hamill International Small Cap Fund | Fund Overview |
| | June 30, 2022 (Unaudited) |
Investment Objective
The Fund seeks to achieve long-term capital appreciation.
Fund Management
Scott E. Decatur, Ph.D. Portfolio Manager
Nicholas C. Fedako, CFA Portfolio Manager
CFA is a trademark owned by CFA Institute.
Cumulative Returns
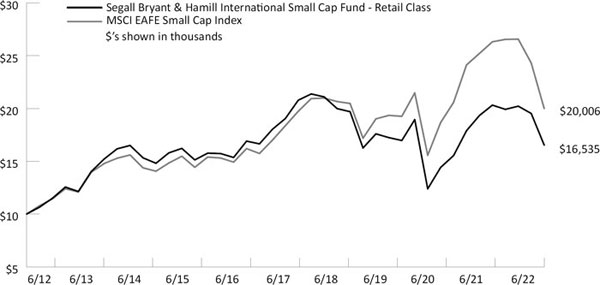
The chart above represents historical performance of a hypothetical investment of $10,000 in the Fund over the past 10 years (or for the life of the Fund if shorter). Performance calculations are as of the end of June each year. Past performance does not guarantee future results. This chart does not reflect the deduction of taxes that a shareholder would pay on Fund distributions or the redemption of Fund shares.
Please see index definitions beginning on page 33.
Average Annual Total Returns
| | | | | | | Since | Inception |
| | 6 Months | 1 Year | 3 Years | 5 Years | 10 Years | Inception | Date |
| Retail Class* (SBHSX) | (18.25)% | (18.61)% | (1.38)% | (2.80)% | 5.16% | 3.19% | 6/30/14 |
| Institutional Class** (SBSIX) | (18.21)% | (18.54)% | (1.23)% | (2.60)% | 5.38% | 3.41% | 5/31/11 |
| MSCI EAFE Small Cap Index | (24.71)% | (23.98)% | 1.12% | 1.72% | 7.18% | 4.37% | |
Retail Class Annual Expense Ratio (per the current prospectus) — Gross: 1.36%, Net: 1.18%
Institutional Class Annual Expense Ratio (per the current prospectus) — Gross: 1.13%, Net: 1.03%
Performance data quoted represents past performance and does not guarantee future results. Performance information for the Retail Class shares prior to their inception is based on the performance of the Institutional Class. Current performance may be lower or higher than the performance quoted. To obtain current performance as of the most recent month-end, visit www.sbhfunds.com. Average annual total returns reflect the reinvestment of dividends, capital gains distributions, all fee waivers and expense reimbursements, if any. Without the fee waivers and expense reimbursements, total return figures would have been lower. Investment return and principal value will vary, and shares, when redeemed, may be worth more or less than their original cost. Segall Bryant & Hamill fund shares are not insured by the FDIC, the Federal Reserve Board or any other agency and are subject to investment risk.
Until at least April 30, 2023, Segall Bryant & Hamill, LLC (the “Adviser”) has contractually agreed to waive the investment advisory and/or administration fees and/or to reimburse other expenses, so that the ratio of expenses to average net assets as reported in the Fund’s Financial Highlights will be no more than 1.18% and 1.03% to the Fund’s Retail Class and Institutional Class, respectively, for such period. This agreement may not be terminated or modified by the Adviser prior to the termination date without the approval of the Board of Trustees.
Investing in small-cap funds generally will be more volatile and loss of principal could be greater than investing in large-cap funds.
Investing in foreign companies are subject to special risks, including currency fluctuations, social, economic, and political uncertainties, which could increase volatility.
| 12 | | www.sbhfunds.com |
| Segall Bryant & Hamill International Small Cap Fund | Fund Overview |
| | June 30, 2022 (Unaudited) |
Sector Allocation (as of 6/30/22)
| Industrials | 21.9% |
| Consumer Discretionary | 12.0% |
| Real Estate | 11.5% |
| Financials | 10.9% |
| Information Technology | 9.6% |
| Materials | 9.5% |
| Health Care | 6.6% |
| Consumer Staples | 6.5% |
| Communication Services | 4.3% |
| Utilities | 3.0% |
| Energy | 2.9% |
Sector classifications presented are based on the Global Industry Classification Standard (GICS) methodology.
Percentages are based on Total Net Assets.
The sector allocation table above does not include any cash or cash equivalents.
Stock Performance (12/31/2021 to 6/30/2022)
| | Average | Contribution |
| 5 Highest | Weight | to Return |
| New Hope Corp., Ltd. | 0.65 | 0.29 |
| u-blox Holding A.G. | 0.69 | 0.21 |
| Cosmo Energy Holdings Co., Ltd. | 0.68 | 0.20 |
| Inabata & Co., Ltd. | 0.15 | 0.19 |
| Rheinmetall A.G. | 0.18 | 0.19 |
| Top Ten Holdings (as of 6/30/22) |
| |
| Scandinavian Tobacco Group A/S | 1.1% |
| u-blox Holdings A.G. | 1.0% |
| Redrow PLC | 1.0% |
| Computacenter PLC | 1.0% |
| MIRAI Corp. | 1.0% |
| Galenica A.G. | 0.9% |
| GrainCorp, Ltd. | 0.9% |
| Vistry Group PLC | 0.9% |
| Incitec Pivot, Ltd. | 0.9% |
| Television Franchaise 1 | 0.9% |
Top ten holdings do not include any cash, cash equivalents or exchange traded fund investments. Holdings are subject to change and may not reflect the current or future position of the Fund.
| | Average | Contribution |
| 5 Lowest | Weight | to Return |
| Vistry Group PLC | 0.92 | -0.33 |
| ITV PLC | 0.69 | -0.35 |
| Redrow PLC | 1.01 | -0.41 |
| Getinge A.B. | 0.91 | -0.47 |
| Royal Mail PLC | 0.78 | -0.54 |
Past performance does not guarantee future results. These stocks do not represent all of the securities purchased, sold or recommended by the Fund’s Adviser. To request a complete list of the contribution of each Fund holding to overall Fund performance during the period, please call (800) 392-2673.
Please see page 34 for a description of the methodology used to construct this table.
| Semi-Annual Report | June 30, 2022 | | 13 |
| Segall Bryant & Hamill Fundamental International Small Cap Fund | Fund Overview |
| June 30, 2022 (Unaudited) |
Investment Objective
The Fund seeks to achieve long-term capital appreciation.
Fund Management
John C. Fenley, CFA Portfolio Manager
CFA is a trademark owned by CFA Institute.
Cumulative Returns
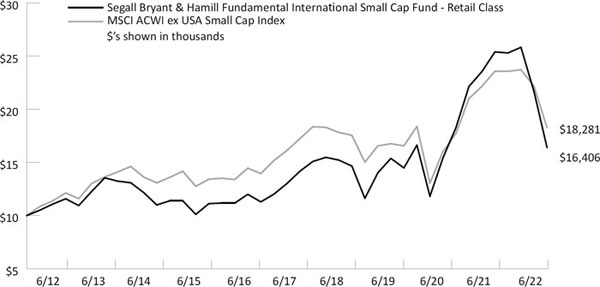
The chart above represents historical performance of a hypothetical investment of $10,000 in the Fund over the past 10 years (or for the life of the Fund if shorter). Performance calculations are as of the end of June each year. Past performance does not guarantee future results. This chart does not reflect the deduction of taxes that a shareholder would pay on Fund distributions or the redemption of Fund shares.
Please see index definitions beginning on page 33.
Average Annual Total Returns
| | | | | | | Since | Inception |
| | 6 Months | 1 Year | 3 Years | 5 Years | 10 Years | Inception | Date |
| Retail Class (WTIFX) | (36.47)% | (35.40)% | 2.18% | 4.75% | 5.07% | 5.10% | 12/15/99 |
| Institutional Class (WIIFX) | (36.40)% | (35.32)% | 2.34% | 4.91% | 5.18% | 5.15% | 4/29/16 |
| MSCI ACWI ex USA Small Cap Index | (22.92)% | (22.45)% | 2.94% | 2.55% | 6.22% | 6.06% | |
Retail Class Annual Expense Ratio (per the current prospectus) — Gross: 1.51%, Net: 1.25%
Institutional Class Annual Expense Ratio (per the current prospectus) — Gross: 1.36%, Net: 1.10%
Performance data quoted represents past performance and does not guarantee future results. Performance information for the Institutional Class shares prior to their inception is based on the performance of the Retail Class. Current performance may be lower or higher than the performance quoted. To obtain current performance as of the most recent month-end, visit www.sbhfunds.com. Average annual total returns reflect the reinvestment of dividends, capital gains distributions, all fee waivers and expense reimbursements, if any. Without the fee waivers and expense reimbursements, total return figures would have been lower. Investment return and principal value will vary, and shares, when redeemed, may be worth more or less than their original cost. Segall Bryant & Hamill fund shares are not insured by the FDIC, the Federal Reserve Board or any other agency and are subject to investment risk.
Until at least April 30, 2023, Segall Bryant & Hamill, LLC (the “Adviser”) has contractually agreed to waive the investment advisory and/or administration fees and/or to reimburse other expenses, so that the ratio of expenses to average net assets as reported in the Fund’s Financial Highlights will be no more than 1.25% and 1.10% for the Fund’s Retail Class and Institutional Class, respectively, for such period. This agreement may not be terminated or modified by the Adviser prior to the termination date without the approval of the Board of Trustees.
Investing in small-cap funds generally will be more volatile and loss of principal could be greater than investing in larger-cap funds.
Investing in foreign securities entails special risks, such as currency fluctuations and political uncertainties, which are described in more detail in the prospectus.
| 14 | | www.sbhfunds.com |
| Segall Bryant & Hamill Fundamental International Small Cap Fund | Fund Overview |
| June 30, 2022 (Unaudited) |
Sector Allocation (as of 6/30/22)
| Industrials | 29.5% |
| Information Technology | 26.6% |
| Consumer Discretionary | 23.4% |
| Financials | 9.3% |
| Consumer Staples | 2.6% |
| Health Care | 1.6% |
| Communication Services | 1.3% |
Sector classifications presented are based on the Global Industry Classification Standard (GICS) methodology.
Percentages are based on Total Net Assets.
The sector allocation table above does not include any cash or cash equivalents.
Stock Performance (12/31/2021 to 6/30/2022)
| | Average | Contribution |
| 5 Highest | Weight | to Return |
| Clipper Logistics PLC | 3.41 | 0.32 |
| Razer, Inc. | 1.29 | 0.21 |
| PAX Global Technology, Ltd. | 2.66 | 0.08 |
| Yifeng Pharmacy Chain Co., Ltd. | 1.22 | 0.05 |
| Mercell Holding A.S.A. | 0.80 | 0.03 |
Top Ten Holdings (as of 6/30/22)
| Constellation Software, Inc. | 6.2% |
| Victoria PLC | 4.7% |
| Brodrene A. & O. Johansen A/S | 4.3% |
| Fluidra S.A. | 4.2% |
| Evolution Gaming Group A.B. | 3.9% |
| GFL Environmental, Inc. | 3.8% |
| BayCurrent Consulting, Inc. | 3.7% |
| Topicus.com, Inc. | 3.6% |
| Strike Co., Ltd. | 3.6% |
| Epsilon Net S.A. | 3.5% |
Top ten holdings do not include any cash, cash equivalents or exchange traded fund investments. Holdings are subject to change and may not reflect the current or future position of the Fund.
| | Average | Contribution |
| 5 Lowest | Weight | to Return |
| Strike Co., Ltd. | 3.61 | -1.76 |
| Instalco A.B. | 3.17 | -1.81 |
| Cherry A.G. | 2.18 | -2.00 |
| Victoria PLC | 3.65 | -3.14 |
| Brodrene A. & O. Johansen A/S | 5.78 | -3.42 |
Past performance does not guarantee future results. These stocks do not represent all of the securities purchased, sold or recommended by the Fund’s Adviser. To request a complete list of the contribution of each Fund holding to overall Fund performance during the period, please call (800) 392-2673.
Please see page 34 for a description of the methodology used to construct this table.
| Semi-Annual Report | June 30, 2022 | | 15 |
| Segall Bryant & Hamill Global All Cap Fund | Fund Overview |
| | June 30, 2022 (Unaudited) |
Investment Objective
The Fund seeks to achieve long-term capital appreciation.
Fund Management
Suresh Rajagopal, CFA Portfolio Manager
Ralph M. Segall, CFA, CIC Portfolio Manager
CFA is a trademark owned by CFA Institute.
Cumulative Returns
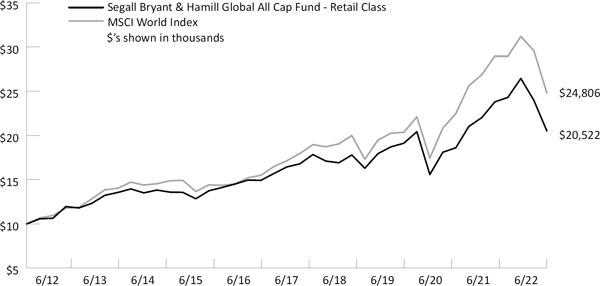
The chart above represents historical performance of a hypothetical investment of $10,000 in the Fund over the past 10 years (or for the life of the Fund if shorter). Performance calculations are as of the end of June each year. Past performance does not guarantee future results. This chart does not reflect the deduction of taxes that a shareholder would pay on Fund distributions or the redemption of Fund shares.
Please see index definitions beginning on page 33.
Average Annual Total Returns
| | | | | | | Since | Inception |
| | 6 Months | 1 Year | 3 Years | 5 Years | 10 Years | Inception | Date |
| Retail Class (WTMVX) | (22.41)% | (13.79)% | 3.12% | 4.54% | 7.45% | 7.97% | 6/1/88 |
| Institutional Class (WIMVX) | (22.28)% | (13.64)% | 3.25% | 4.68% | 7.63% | 8.04% | 9/28/07 |
| MSCI World Index | (20.51)% | (14.34)% | 7.00% | 7.67% | 9.51% | 7.11% | |
Retail Class Annual Expense Ratio (per the current prospectus) — Gross: 1.18%, Net: 0.89%
Institutional Class Annual Expense Ratio (per the current prospectus) — Gross: 1.17%, Net: 0.74%
Please note that for longer term performance numbers, prior to April 29, 2016 the Fund was known as the Westcore Blue Chip Dividend Fund, prior to April 30, 2018 the Fund was known as the Westcore Global Large-Cap Dividend Fund, and prior to September 19, 2020 the Fund was known as the Segall Bryant & Hamill Global Large Cap Fund.
Performance data quoted represents past performance and does not guarantee future results. Performance information for the Institutional Class shares prior to their inception is based on the performance of the Retail Class. Current performance may be lower or higher than the performance quoted. To obtain current performance as of the most recent month-end, visit www.sbhfunds.com. Average annual total returns reflect the reinvestment of dividends, capital gains distributions, all fee waivers and expense reimbursements, if any. Without the fee waivers and expense reimbursements, total return figures would have been lower. Investment return and principal value will vary, and shares, when redeemed, may be worth more or less than their original cost. Segall Bryant & Hamill fund shares are not insured by the FDIC, the Federal Reserve Board or any other agency and are subject to investment risk.
Until at least April 30, 2023, Segall Bryant & Hamill, LLC (the “Adviser”) has contractually agreed to waive the investment advisory and/or administration fees and/or to reimburse other expenses, so that the ratio of expenses to average net assets as reported in the Fund’s Financial Highlights will be no more than 0.89% and 0.74% for the Fund’s Retail Class and Institutional Class, respectively, for such period. This agreement may not be terminated or modified by the Adviser prior to the termination date without the approval of the Board of Trustees.
Investments in foreign companies are subject to special risks, including currency fluctuations, social, economic, and political uncertainties, which could increase volatility.
| 16 | | www.sbhfunds.com |
| Segall Bryant & Hamill Global All Cap Fund | Fund Overview |
| | June 30, 2022 (Unaudited) |
Sector Allocation (as of 6/30/22)
| Information Technology | 22.6% |
| Health Care | 17.8% |
| Consumer Discretionary | 13.9% |
| Financials | 11.5% |
| Industrials | 11.2% |
| Consumer Staples | 6.8% |
| Energy | 5.0% |
| Materials | 4.3% |
| Communication Services | 3.3% |
Sector classifications presented are based on the Global Industry Classification Standard (GICS) methodology.
Percentages are based on Total Net Assets.
The sector allocation table above does not include any cash or cash equivalents.
Stock Performance (12/31/2021 to 6/30/2022)
| | Average | Contribution |
| 5 Highest | Weight | to Return |
| Suncor Energy, Inc. | 1.69 | 0.40 |
| McKesson Corp. | 1.32 | 0.28 |
| Quanta Services, Inc. | 2.57 | 0.28 |
| Perrigo Co. PLC | 0.75 | 0.26 |
| Dollarama, Inc. | 1.75 | 0.21 |
Top Ten Holdings (as of 6/30/22)
| Microsoft Corp. | 4.4% |
| Alphabet, Inc. | 3.3% |
| Quanta Services, Inc. | 3.1% |
| UnitedHealth Group, Inc. | 2.8% |
| Linde PLC | 2.7% |
| Visa, Inc. | 2.7% |
| Diageo PLC | 2.5% |
| JPMorgan Chase & Co. | 2.5% |
| Globe Life, Inc. | 2.4% |
| Aon PLC | 2.3% |
Top ten holdings do not include any cash, cash equivalents or exchange traded fund investments. Holdings are subject to change and may not reflect the current or future position of the Fund.
| | Average | Contribution |
| 5 Lowest | Weight | to Return |
| AZEK Co., Inc. (The) | 0.90 | -0.84 |
| ASML Holding N.V. | 1.82 | -0.85 |
| Amazon.com, Inc. | 2.35 | -0.92 |
| Microsoft Corp. | 4.46 | -0.98 |
| Marvell Technology, Inc. | 2.63 | -1.52 |
Past performance does not guarantee future results. These stocks do not represent all of the securities purchased, sold or recommended by the Fund’s Adviser. To request a complete list of the contribution of each Fund holding to overall Fund performance during the period, please call (800) 392-2673.
Please see page 34 for a description of the methodology used to construct this table.
| Semi-Annual Report | June 30, 2022 | | 17 |
| Segall Bryant & Hamill Workplace Equality Fund | Fund Overview |
| | June 30, 2022 (Unaudited) |
Investment Objective
The Fund seeks to achieve long-term capital appreciation.
Fund Management
Suresh Rajagopal, CFA Portfolio Manager John N. Roberts, Esq. Portfolio Manager
William J. Barritt, CFA Portfolio Manager
CFA is a trademark owned by CFA Institute.
Cumulative Returns

The chart above represents historical performance of a hypothetical investment of $10,000 in the Fund over the past 10 years (or for the life of the Fund if shorter). Performance calculations are as of the end of June each year. Past performance does not guarantee future results. This chart does not reflect the deduction of taxes that a shareholder would pay on Fund distributions or the redemption of Fund shares.
Please see index definitions beginning on page 33.
Average Annual Total Returns
| | | | | | | Since | Inception |
| | 6 Months | 1 Year | 3 Years | 5 Years | 10 Years | Inception | Date |
| Retail Class (WEQRX) | (23.00)% | (15.54)% | 3.27% | 7.43% | 8.79% | 8.47% | 6/1/88 |
| Institutional Class (WEQIX) | (22.91)% | (15.46)% | 3.41% | 7.62% | 9.00% | 8.55% | 9/28/07 |
| Russell 1000® Index | (20.94)% | (13.04)% | 10.17% | 11.00% | 12.82% | 10.50% | |
Retail Class Annual Expense Ratio (per the current prospectus) — Gross: 1.28%, Net: 0.89%
Institutional Class Annual Expense Ratio (per the current prospectus) — Gross: 1.26%, Net: 0.74%
Please note that for the longer term performance numbers, prior to April 29, 2016 the Fund was known as the Westcore Growth Fund, prior to April 30, 2018, the Fund was known as the Westcore Large Cap Dividend Fund, and prior to May 1, 2019 the Fund was known as the Segall Bryant & Hamill Large Cap Dividend Fund.
Performance data quoted represents past performance and does not guarantee future results. Performance information for the Institutional Class shares prior to their inception is based on the performance of the Retail Class. Current performance may be lower or higher than the performance quoted. To obtain current performance as of the most recent month-end, visit www.sbhfunds.com. Average annual total returns reflect the reinvestment of dividends, capital gains distributions, all fee waivers and expense reimbursements, if any. Without the fee waivers and expense reimbursements, total return figures would have been lower. Investment return and principal value will vary, and shares, when redeemed, may be worth more or less than their original cost. Segall Bryant & Hamill fund shares are not insured by the FDIC, the Federal Reserve Board or any other agency and are subject to investment risk.
Until at least April 30, 2023, Segall Bryant & Hamill, LLC (the “Adviser”) has contractually agreed to waive the investment advisory and/or administration fees and/or to reimburse other expenses, so that the ratio of expenses to average net assets as reported in the Fund’s Financial Highlights will be no more than 0.89% and 0.74% for the Fund’s Retail Class and Institutional Class, respectively, for such period. This agreement may not be terminated or modified by the Adviser prior to the termination date without the approval of the Board of Trustees.
| 18 | | www.sbhfunds.com |
| Segall Bryant & Hamill Workplace Equality Fund | Fund Overview |
| | June 30, 2022 (Unaudited) |
Sector Allocation (as of 6/30/22)
| Information Technology | 26.9% |
| Health Care | 16.6% |
| Financials | 11.1% |
| Industrials | 10.0% |
| Consumer Discretionary | 9.7% |
| Communication Services | 7.1% |
| Consumer Staples | 5.6% |
| Energy | 4.3% |
| Materials | 3.0% |
| Real Estate | 2.9% |
Sector classifications presented are based on the Global Industry Classification Standard (GICS) methodology.
Percentages are based on Total Net Assets.
The sector allocation table above does not include any cash or cash equivalents.
Stock Performance (12/31/2021 to 6/30/2022)
| | | |
| | Average | Contribution |
| 5 Highest | Weight | to Return |
| McKesson Corp. | 1.96 | 0.47 |
| Chevron Corp. | 2.15 | 0.24 |
| Raytheon Technologies Corp. | 2.55 | 0.21 |
| UnitedHealth Group, Inc. | 2.86 | 0.10 |
| Reinsurance Group of America, Inc. | 1.76 | 0.10 |
Top Ten Holdings (as of 6/30/22)
| Microsoft Corp. | 5.4% |
| Alphabet, Inc. | 4.9% |
| UnitedHealth Group, Inc. | 3.2% |
| Visa, Inc. - Class A | 3.1% |
| Raytheon Technologies Corp. | 2.9% |
| Apple, Inc. | 2.7% |
| Danaher Corp. | 2.7% |
| Amazon.com, Inc. | 2.6% |
| Keysight Technologies, Inc. | 2.4% |
| JPMorgan Chase & Co. | 2.3% |
Top ten holdings do not include any cash, cash equivalents or exchange traded fund investments. Holdings are subject to change and may not reflect the current or future position of the Fund.
| | Average | Contribution |
| 5 Lowest | Weight | to Return |
| Applied Materials, Inc. | 2.02 | -0.95 |
| NVIDIA Corp. | 1.92 | -1.04 |
| Microsoft Corp. | 5.34 | -1.17 |
| Alphabet, Inc. | 5.06 | -1.22 |
| Amazon.com, Inc. | 3.55 | -1.38 |
Past performance does not guarantee future results. These stocks do not represent all of the securities purchased, sold or recommended by the Fund’s Adviser. To request a complete list of the contribution of each Fund holding to overall Fund performance during the period, please call (800) 392-2673.
Please see page 34 for a description of the methodology used to construct this table.
| Semi-Annual Report | June 30, 2022 | | 19 |
| Segall Bryant & Hamill Short Term Plus Fund | Fund Overview |
| | June 30, 2022 (Unaudited) |
Investment Objective
The Fund seeks to provide current income and competitive total return.
Fund Management
James D. Dadura, CFA Portfolio Manager
Gregory C. Hosbein, CFA Portfolio Manager
CFA is a trademark owned by CFA Institute.
Cumulative Returns

The chart above represents historical performance of a hypothetical investment of $10,000 in the Fund over the past 10 years (or for the life of the Fund if shorter). Performance calculations are as of the end of June each year. Past performance does not guarantee future results. This chart does not reflect the deduction of taxes that a shareholder would pay on Fund distributions or the redemption of Fund shares.
Please see index definitions beginning on page 33.
Average Annual Total Returns
| | | | | | | Since | 30-Day SEC | Inception |
| | 6 Months | 1 Year | 3 Years | 5 Years | 10 Years | Inception | Yield | Date |
| Retail Class (SBHPX) | (2.58)% | (3.05)% | 0.16% | — | — | 0.82% | 3.16% | 12/14/18 |
| Institutional Class (SBAPX) | (2.63)% | (2.97)% | 0.26% | — | — | 0.91% | 3.25% | 12/14/18 |
| Bloomberg U.S. Government/ | (3.10)% | (3.56)% | 0.31% | — | — | 1.17% | | |
| Credit 1-3 Year Index | | |
Retail Class Annual Expense Ratio (per the current prospectus) — Gross: 0.80%, Net: 0.49%
Institutional Class Annual Expense Ratio (per the current prospectus) — Gross: 0.68%, Net: 0.40%
30-Day SEC Yield figures reflect all fee waivers and expense reimbursements. Without the absorption of these fee waivers and/or expense reimbursements, the figures would have been 3.11% for the Retail Class and 3.02% for the Institutional Class.
Performance data quoted represents past performance and does not guarantee future results. Current performance may be lower or higher than the performance quoted. To obtain current performance as of the most recent month-end, visit www.sbhfunds.com. Average annual total returns reflect the reinvestment of dividends, capital gains distributions, all fee waivers and expense reimbursements, if any. Without the fee waivers and expense reimbursements, total return figures would have been lower. Investment return and principal value will vary, and shares, when redeemed, may be worth more or less than their original cost. Segall Bryant & Hamill fund shares are not insured by the FDIC, the Federal Reserve Board or any other agency and are subject to investment risk.
Until at least April 30, 2023, Segall Bryant & Hamill, LLC (the “Adviser”) has contractually agreed to waive the investment advisory and/or administration fees and/or to reimburse other expenses, so that the ratio of expenses to average net assets as reported in the Fund’s Financial Highlights will be no more than 0.49% and 0.40% for the Fund’s Retail Class and Institutional Class, respectively, for such period. This agreement may not be terminated or modified by the Adviser prior to the termination date without the approval of the Board of Trustees.
Fixed Income Risks: Fixed income Funds invest in bonds which entails interest rate risk and credit risk.
| 20 | | www.sbhfunds.com |
| Segall Bryant & Hamill Short Term Plus Fund | Fund Overview |
| | June 30, 2022 (Unaudited) |
Sector Allocation (as of 6/30/22)
| Industrial | 60.3% |
| Utility | 15.1% |
| U.S. Treasury Bonds & Notes | 11.0% |
| Municipal Bonds | 5.7% |
| Finance | 4.5% |
| Commercial Mortgage-Backed Securities | 1.0% |
Percentages are based on Total Net Assets.
The sector allocation table above does not include any cash or cash equivalents.
Top Ten Corporate Holdings (as of 6/30/22)
| Ball Corp. | 2.2% |
| Weyerhaeuser Co. | 2.1% |
| Delta Air Lines Pass Thru Trust | 2.1% |
| Vistra Operations Co., LLC. | 2.0% |
| Graphic Packaging International, Inc. | 2.0% |
| Amphenol Corp. | 2.0% |
| General Motors Financial Co., Inc. | 2.0% |
| Kinder Morgan, Inc. | 1.9% |
| Georgia Power Co. | 1.9% |
| NextEra Energy Capital Holdings, Inc. | 1.9% |
Percentages represent the Fund’s aggregate holdings in the same corporate issuer and its affiliates. Holdings are subject to change and may not reflect the current or future position of the Fund.
| Semi-Annual Report | June 30, 2022 | | 21 |
| Segall Bryant & Hamill Plus Bond Fund | Fund Overview |
| | June 30, 2022 (Unaudited) |
Investment Objective
The Fund seeks to acheive long-term total rate of return consistent with preservation of capital.
Fund Management
Troy A. Johnson, CFA Portfolio Manager Darren G. Hewitson, CFA Portfolio Manager
Kenneth A. Harris, CFA Portfolio Manager Gregory M. Shea, CFA Portfolio Manager
CFA is a trademark owned by CFA Institute.
Cumulative Returns
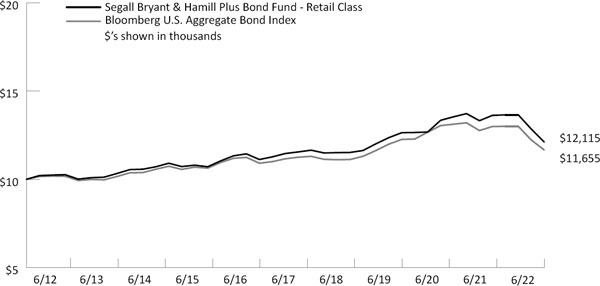
The chart above represents historical performance of a hypothetical investment of $10,000 in the Fund over the past 10 years (or for the life of the Fund if shorter). Performance calculations are as of the end of June each year. Past performance does not guarantee future results. This chart does not reflect the deduction of taxes that a shareholder would pay on Fund distributions or the redemption of Fund shares.
Please see index definitions beginning on page 33.
Average Annual Total Returns
| | | | | | | Since | 30-Day SEC | Inception |
| | 6 Months | 1 Year | 3 Years | 5 Years | 10 Years | Inception | Yield | Date |
| Retail Class (WTIBX) | (11.21)% | (11.06)% | (0.66)% | 1.12% | 1.94% | 5.35% | 4.06% | 6/1/88 |
| Institutional Class (WIIBX) | (11.17)% | (10.95)% | (0.55)% | 1.27% | 2.08% | 5.41% | 4.22% | 9/28/07 |
| Bloomberg U.S. Aggregate Bond Index | (10.35)% | (10.28)% | (0.94)% | 0.88% | 1.54% | 5.60% | | |
Retail Class Annual Expense Ratio (per the current prospectus) — Gross: 0.67%, Net: 0.55%
Institutional Class Annual Expense Ratio (per the current prospectus) — Gross: 0.51%, Net: 0.40%
30-Day SEC Yield figures reflect all fee waivers and expense reimbursements. Without the absorption of these fee waivers and/or expense reimbursements, the figures would have been 4.01% for the Retail Class and 4.15% for the Institutional Class.
Performance data quoted represents past performance and does not guarantee future results. Performance information for the Institutional Class shares prior to their inception is based on the performance of the Retail Class. Current performance may be lower or higher than the performance quoted. To obtain current performance as of the most recent month-end, visit www.sbhfunds.com. Average annual total returns reflect the reinvestment of dividends, capital gains distributions, all fee waivers and expense reimbursements, if any. Without the fee waivers and expense reimbursements, total return figures would have been lower. Investment return and principal value will vary, and shares, when redeemed, may be worth more or less than their original cost. Segall Bryant & Hamill fund shares are not insured by the FDIC, the Federal Reserve Board or any other agency and are subject to investment risk.
Until at least April 30, 2023, Segall Bryant & Hamill, LLC (the “Adviser”) has contractually agreed to waive the investment advisory and/or administration fees and/or to reimburse other expenses, so that the ratio of expenses to average net assets as reported in the Fund’s Financial Highlights will be no more than 0.55% and 0.40% for the Fund’s Retail Class and Institutional Class, respectively, for such period. This agreement may not be terminated or modified by the Adviser prior to the termination date without the approval of the Board of Trustees.
Segall Bryant & Hamill Plus Bond Fund may invest in high-yield/high-risk bonds which are subject to greater levels of liquidity risk. Additionally, investing in bonds entails interest rate risk and credit risk.
| 22 | | www.sbhfunds.com |
| Segall Bryant & Hamill Plus Bond Fund | Fund Overview |
| | June 30, 2022 (Unaudited) |
Sector Allocation (as of 6/30/22)
| Industrial | 34.7% |
| Mortgage-Backed Securities Passthrough | 21.3% |
| U.S. Treasury Bonds & Notes | 14.8% |
| Finance | 9.9% |
| Municipal Bonds | 8.8% |
| Utility | 5.2% |
| Asset Backed Securities | 3.6% |
| Residential Mortgage-Backed Securities | 0.3% |
Percentages are based on Total Net Assets.
The sector allocation table above does not include any cash or cash equivalents.
Top Ten Corporate Holdings (as of 6/30/22)
| SBA Tower Trust | 1.2% |
| American Airlines, Inc. | 1.2% |
| Wells Fargo & Co. | 1.1% |
| JPMorgan Chase & Co. | 1.1% |
| PDC Energy, Inc. | 0.9% |
| Capital One Financial Corp. | 0.9% |
| Anheuser-Busch Cos. LLC/Anheuser-Busch InBev | |
| Worldwide, Inc. | 0.9% |
| Silgan Holdings, Inc. | 0.9% |
| Ford Motor Credit Co. LLC | 0.8% |
| General Motors Financial Co., Inc. | 0.8% |
Percentages represent the Fund’s aggregate holdings in the same corporate issuer and its affiliates. Holdings are subject to change and may not reflect the current or future position of the Fund.
| Semi-Annual Report | June 30, 2022 | | 23 |
| Segall Bryant & Hamill Quality High Yield Fund | Fund Overview |
| | June 30, 2022 (Unaudited) |
Investment Objective
The Fund seeks to achieve long-term total rate of return consistent with preservation of capital.
Fund Management
Troy A. Johnson, CFA Portfolio Manager
Gregory M. Shea, CFA Portfolio Manager
CFA is a trademark owned by CFA Institute.
Cumulative Returns

The chart above represents historical performance of a hypothetical investment of $10,000 in the Fund over the past 10 years (or for the life of the Fund if shorter). Performance calculations are as of the end of June each year. Past performance does not guarantee future results. This chart does not reflect the deduction of taxes that a shareholder would pay on Fund distributions or the redemption of Fund shares.
Please see index definitions beginning on page 33.
Average Annual Total Returns
| | | | | | | Since | 30-Day SEC | Inception |
| | 6 Months | 1 Year | 3 Years | 5 Years | 10 Years | Inception | Yield | Date |
| Retail Class (WTLTX) | (12.13)% | (11.04)% | 0.17% | 1.72% | 3.78% | 6.61% | 6.11% | 6/1/88 |
| Institutional Class (WILTX) | (12.10)% | (10.93)% | 0.30% | 1.85% | 3.95% | 6.67% | 6.27% | 9/28/07 |
| Bloomberg U.S. High Yield 2% Issuer Capped Index | (14.20)% | (12.82)% | 0.18% | 2.09% | 4.47% | N/A | | |
| Bloomberg U.S. Corporate High Yield Ba Index | (13.86)% | (12.27)% | 1.24% | 2.76% | 4.76% | 7.83% | | |
Retail Class Annual Expense Ratio (per the current prospectus) — Gross: 0.88%, Net: 0.85%
Institutional Class Annual Expense Ratio (per the current prospectus) — Gross: 0.76%, Net: 0.70%
30-Day SEC Yield figures reflect all fee waivers and expense reimbursements. Without the absorption of these fee waivers and/or expense reimbursements, the figures would have been 6.10% for the Retail Class and 6.23% for the Institutional Class.
Performance data quoted represents past performance and does not guarantee future results. Performance information for the Institutional Class shares prior to their inception is based on the performance of the Retail Class. Current performance may be lower or higher than the performance quoted. To obtain current performance as of the most recent month-end, visit www.sbhfunds.com. Average annual total returns reflect the reinvestment of dividends, capital gains distributions, all fee waivers and expense reimbursements, if any. Without the fee waivers and expense reimbursements, total return figures would have been lower. Investment return and principal value will vary, and shares, when redeemed, may be worth more or less than their original cost. Segall Bryant & Hamill fund shares are not insured by the FDIC, the Federal Reserve Board or any other agency and are subject to investment risk.
Until at least April 30, 2023, Segall Bryant & Hamill, LLC (the “Adviser”) has contractually agreed to waive the investment advisory and/or administration fees and/or to reimburse other expenses, so that the ratio of expenses to average net assets as reported in the Fund’s Financial Highlights will be no more than 0.85% and 0.70% for the Fund’s Retail Class and Institutional Class, respectively, for such period. This agreement may not be terminated or modified by the Adviser prior to the termination date without the approval of the Board of Trustees.
Segall Bryant & Hamill Quality High Yield Fund may invest in high-yield/high-risk bonds which are subject to greater levels of liquidity risk. Additionally, investing in bonds entail interest rate risk and credit risk.
| 24 | | www.sbhfunds.com |
| Segall Bryant & Hamill Quality High Yield Fund | Fund Overview |
| | June 30, 2022 (Unaudited) |
Sector Allocation (as of 6/30/22)
| Industrial | 83.3% |
| Finance | 11.4% |
| Utility | 4.3% |
Percentages are based on Total Net Assets.
The sector allocation table above does not include any cash or cash equivalents.
Top Ten Holdings (as of 6/30/22)
| PDC Energy, Inc. | 3.4% |
| AmeriGas Partners LP/AmeriGas Financial Corp. | 2.9% |
| Compass Minerals International, Inc. | 2.7% |
| Occidental Petroleum Corp. | 2.5% |
| Range Resources Corp. | 2.5% |
| Lamar Media Corp. | 2.4% |
| Cedar Fair LP | 2.4% |
| Provident Funding Associates LP/PFG Finance Corp. | 2.3% |
| IIP Operating Parternship LP | 2.3% |
| KB Home | 2.1% |
Percentages represent the Fund’s aggregate holdings in the same corporate issuer and its affiliates. Holdings are subject to change and may not reflect the current or future position of the Fund.
| Semi-Annual Report | June 30, 2022 | | 25 |
| Segall Bryant & Hamill Municipal Opportunities Fund | Fund Overview |
| | June 30, 2022 (Unaudited) |
Investment Objective
The Fund seeks income exempt from Federal income taxes.
Fund Management
Nicholas J. Foley Portfolio Manager
Kenneth A. Harris, CFA Portfolio Manager
CFA is a trademark owned by CFA Institute.
Cumulative Returns
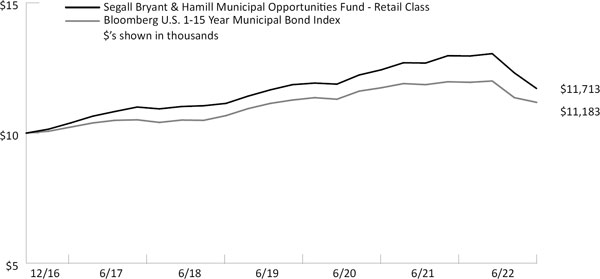
The chart above represents historical performance of a hypothetical investment of $10,000 in the Fund over the past 10 years (or for the life of the Fund if shorter). Performance calculations are as of the end of June each year. Past performance does not guarantee future results. This chart does not reflect the deduction of taxes that a shareholder would pay on Fund distributions or the redemption of Fund shares.
Please see index definitions beginning on page 33.
Average Annual Total Returns
| | | | | | | Since | 30-Day SEC | Inception | |
| | 6 Months | 1 Year | 3 Years | 5 Years | 10 Years | Inception | Yield | Date | |
| Retail Class (WTTAX) | (10.23)% | (9.70)% | 0.14% | 1.92% | — | 2.90% | 2.86% | 12/16/16 | |
| Institutional Class (WITAX) | (10.15)% | (9.48)% | 0.33% | 2.08% | — | 3.07% | 3.01% | 12/16/16 | |
| Bloomberg U.S. 1-15 Year | (6.81)% | (6.53)% | 0.12% | 1.46% | — | 2.04% | | | |
| Municipal Bond Index | | | |
Retail Class Annual Expense Ratio (per the current prospectus) — Gross: 0.74%, Net: 0.65%
Institutional Class Annual Expense Ratio (per the current prospectus) — Gross: 0.57%, Net: 0.50%
30-Day SEC Yield figures reflect all fee waivers and expense reimbursements. Without the absorption of these fee waivers and/or expense reimbursements, the figures would have been 2.58% for the Retail Class and 2.96% for the Institutional Class.
Performance data quoted represents past performance and does not guarantee future results. Current performance may be lower or higher than the performance quoted. To obtain current performance as of the most recent month-end, visit www.sbhfunds.com. Average annual total returns reflect the reinvestment of dividends, capital gains distributions, all fee waivers and expense reimbursements, if any. Without the fee waivers and expense reimbursements, total return figures would have been lower. Investment return and principal value will vary, and shares, when redeemed, may be worth more or less than their original cost. Segall Bryant & Hamill fund shares are not insured by the FDIC, the Federal Reserve Board or any other agency and are subject to investment risk.
Until at least April 30, 2023, Segall Bryant & Hamill, LLC (the “Adviser”) has contractually agreed to waive the investment advisory and/or administration fees and/or to reimburse other expenses, so that the ratio of expenses to average net assets as reported in the Fund’s Financial Highlights will be no more than 0.65% and 0.50% for the Fund’s Retail Class and Institutional Class, respectively, for such period. This agreement may not be terminated or modified by the Adviser prior to the termination date without the approval of the Board of Trustees.
Municipal bond fund income may be subject to state and local income taxes and the alternative minimum tax. Capital gains, if any, will be subject to capital gains tax.
Investments in municipal bonds are subject to interest rate risk, or the risk that the bonds will decline in value because of changes in market interest rates.
| 26 | | www.sbhfunds.com |
| Segall Bryant & Hamill Municipal Opportunities Fund | Fund Overview |
| | June 30, 2022 (Unaudited) |
Sector Allocation (as of 6/30/22)
| Revenue | 62.6% |
| General Obligation | 10.1% |
| Local Authority | 7.9% |
| Variable Rate Demand Note | 6.8% |
| U.S. Treasury Bonds & Notes | 3.4% |
| Corporate Bonds | 3.0% |
| Certificate Participation | 0.2% |
Percentages are based on Total Net Assets.
The sector allocation table above does not include any cash or cash equivalents.
Top Ten Holdings (as of 6/30/22)
| New York City Municipal Water Finance Authority | 3.4% |
| Charlotte-Mecklenburg Hospital Authority (The) | 3.4% |
| IPMI 3 LLC | 3.0% |
| County of Santa Cruz California Tax and Revenue Anticipation Notes | 2.8% |
| New York State Housing Finance Agency | 2.7% |
| Utah Infrastructure Agency | 2.5% |
| Salt Lake City Utah Airport | 2.4% |
| California Municipal Finance Authority | 2.3% |
| Port of Seattle Washington | 2.2% |
| Indiana Finance Authority Environmental Refunding | 2.2% |
Percentages represent the Fund’s aggregate holdings in the same corporate issuer and its affiliates. Holdings are subject to change and may not reflect the current or future position of the Fund.
| Semi-Annual Report | June 30, 2022 | | 27 |
| Segall Bryant & Hamill Colorado Tax Free Fund | Fund Overview |
| | June 30, 2022 (Unaudited) |
Investment Objective
The Fund seeks income exempt from both federal and Colorado state personal income taxes.
Fund Management
Nicholas J. Foley Portfolio Manager
Kenneth A. Harris, CFA Portfolio Manager
CFA is a trademark owned by CFA Institute.
Cumulative Returns
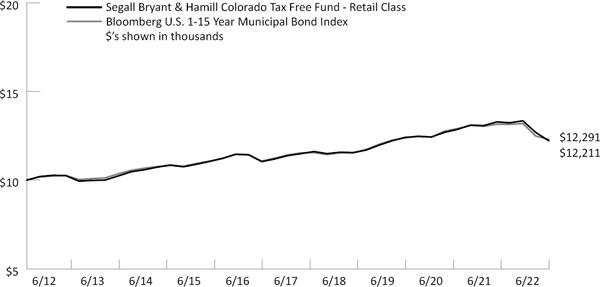
The chart above represents historical performance of a hypothetical investment of $10,000 in the Fund over the past 10 years (or for the life of the Fund if shorter). Performance calculations are as of the end of June each year. Past performance does not guarantee future results. This chart does not reflect the deduction of taxes that a shareholder would pay on Fund distributions or the redemption of Fund shares.
Please see index definitions beginning on page 33.
Average Annual Total Returns
| | | | | | | Since | 30-Day SEC | Inception | |
| | 6 Months | 1 Year | 3 Years | 5 Years | 10 Years | Inception | Yield | Date | |
| Retail Class (WTCOX) | (8.47)% | (8.03)% | (0.03)% | 1.42% | 2.02% | 4.08% | 2.62% | 6/1/91 | |
| Institutional Class (WICOX) | (8.45)% | (7.94)% | 0.11% | 1.56% | 2.11% | 4.11% | 2.77% | 4/29/16 | |
| Bloomberg U.S. 1-15 Year | (6.81)% | (6.53)% | 0.12% | 1.47% | 2.08% | N/A | | | |
| Municipal Bond Index | | | |
Retail Class Annual Expense Ratio (per the current prospectus) — Gross: 0.68%, Net: 0.65%
Institutional Class Annual Expense Ratio (per the current prospectus) — Gross: 0.52%, Net: 0.50%
30-Day SEC Yield figures reflect all fee waivers and expense reimbursements. Without the absorption of these fee waivers and/or expense reimbursements, the figures would have been 2.61% for the Retail Class and 2.74% for the Institutional Class.
Performance data quoted represents past performance and does not guarantee future results. Performance information for the Institutional Class shares prior to their inception is based on the performance of the Retail Class. Current performance may be lower or higher than the performance quoted. To obtain current performance as of the most recent month-end, visit www.sbhfunds.com. Average annual total returns reflect the reinvestment of dividends, capital gains distributions, all fee waivers and expense reimbursements, if any. Without the fee waivers and expense reimbursements, total return figures would have been lower. Investment return and principal value will vary, and shares, when redeemed, may be worth more or less than their original cost. Segall Bryant & Hamill fund shares are not insured by the FDIC, the Federal Reserve Board or any other agency and are subject to investment risk.
Until at least April 30, 2023, Segall Bryant & Hamill, LLC (the “Adviser”) has contractually agreed to waive the investment advisory and/or administration fees and/or to reimburse other expenses, so that the ratio of expenses to average net assets as reported in the Fund’s Financial Highlights will be no more than 0.65% and 0.50% for the Fund’s Retail Class and Institutional Class, respectively, for such period. This agreement may not be terminated or modified by the Adviser prior to the termination date without the approval of the Board of Trustees.
Segall Bryant & Hamill Colorado Tax Free Fund invests primarily in instruments issued by or on behalf of one state and generally will be more volatile and loss of principal could be greater due to state specific risk.
Municipal bond fund income may be subject to state and local income taxes and the alternative minimum tax. Capital gains, if any, will be subject to capital gains tax.
Investments in municipal bonds are subject to interest rate risk, or the risk that the bonds will decline in value because of changes in market interest rates.
| 28 | | www.sbhfunds.com |
| Segall Bryant & Hamill Colorado Tax Free Fund | Fund Overview |
| | June 30, 2022 (Unaudited) |
Sector Allocation (as of 6/30/22)
| Revenue | 44.8% |
| General Obligation | 22.7% |
| Certificate Participation | 19.5% |
| Local Authority | 3.4% |
| Variable Rate Demand Note | 2.4% |
| Prerefunded | 0.5% |
Percentages are based on Total Net Assets.
The sector allocation table above does not include any cash or cash equivalents.
Top Ten Holdings (as of 6/30/22)
| Colorado Health Facilities Authority | 7.2% |
| City and County of Denver Colorado | 6.9% |
| Wheat Ridge Colorado Urban Renewal | 4.1% |
| Colorado Educational & Cultural Facilities Authority | 4.0% |
| City of Colorado Springs Colorado Utilities System | 3.1% |
| Park Creek Metropolitan District | 2.8% |
| Berthoud Colorado COP | 2.7% |
| Denver Colorado City and County COP | 2.6% |
| Central Platte Valley Metropolitan District | 2.5% |
| Crested Butte Colorado Fire Protection | 2.3% |
Percentages represent the Fund’s aggregate holdings in the same corporate issuer and its affiliates. Holdings are subject to change and may not reflect the current or future position of the Fund.
| Semi-Annual Report | June 30, 2022 | | 29 |
| Segall Bryant & Hamill Funds | Fund Expenses |
| | June 30, 2022 (Unaudited) |
| | | Beginning Account | | | Ending Account | | | | | | | |
| | | Value | | | Value | | | Expense | | | Expenses Paid | |
| | | January 1, 2022 | | | June 30, 2022 | | | Ratio(a) | | | During Period(b) | |
| Segall Bryant & Hamill Small Cap Value Fund | | | | | | | | | | | | | | | | |
| Retail | | | | | | | | | | | | | | | | |
| Based on Actual Fund Return | | $ | 1,000.00 | | | $ | 825.40 | | | | 1.05 | % | | $ | 4.75 | |
| Based on Hypothetical 5% Return (before expenses) | | $ | 1,000.00 | | | $ | 1,019.59 | | | | 1.05 | % | | $ | 5.26 | |
| Institutional | | | | | | | | | | | | | | | | |
| Based on Actual Fund Return | | $ | 1,000.00 | | | $ | 825.60 | | | | 0.96 | % | | $ | 4.35 | |
| Based on Hypothetical 5% Return (before expenses) | | $ | 1,000.00 | | | $ | 1,020.03 | | | | 0.96 | % | | $ | 4.81 | |
| | | | | | | | | | | | | | | | | |
| Segall Bryant & Hamill Small Cap Growth Fund | | | | | | | | | | | | | | | | |
| Retail | | | | | | | | | | | | | | | | |
| Based on Actual Fund Return | | $ | 1,000.00 | | | $ | 678.40 | | | | 1.05 | % | | $ | 4.37 | |
| Based on Hypothetical 5% Return (before expenses) | | $ | 1,000.00 | | | $ | 1,019.59 | | | | 1.05 | % | | $ | 5.26 | |
| Institutional | | | | | | | | | | | | | | | | |
| Based on Actual Fund Return | | $ | 1,000.00 | | | $ | 679.00 | | | | 0.88 | % | | $ | 3.66 | |
| Based on Hypothetical 5% Return (before expenses) | | $ | 1,000.00 | | | $ | 1,020.43 | | | | 0.88 | % | | $ | 4.41 | |
| | | | | | | | | | | | | | | | | |
| Segall Bryant & Hamill Small Cap Core Fund | | | | | | | | | | | | | | | | |
| Retail | | | | | | | | | | | | | | | | |
| Based on Actual Fund Return | | $ | 1,000.00 | | | $ | 788.90 | | | | 1.14 | % | | $ | 5.06 | |
| Based on Hypothetical 5% Return (before expenses) | | $ | 1,000.00 | | | $ | 1,019.14 | | | | 1.14 | % | | $ | 5.71 | |
| Institutional | | | | | | | | | | | | | | | | |
| Based on Actual Fund Return | | $ | 1,000.00 | | | $ | 789.80 | | | | 0.99 | % | | $ | 4.39 | |
| Based on Hypothetical 5% Return (before expenses) | | $ | 1,000.00 | | | $ | 1,019.89 | | | | 0.99 | % | | $ | 4.96 | |
| | | | | | | | | | | | | | | | | |
| Segall Bryant & Hamill All Cap Fund | | | | | | | | | | | | | | | | |
| Retail | | | | | | | | | | | | | | | | |
| Based on Actual Fund Return | | $ | 1,000.00 | | | $ | 780.50 | | | | 0.86 | % | | $ | 3.80 | |
| Based on Hypothetical 5% Return (before expenses) | | $ | 1,000.00 | | | $ | 1,020.53 | | | | 0.86 | % | | $ | 4.31 | |
| Institutional | | | | | | | | | | | | | | | | |
| Based on Actual Fund Return | | $ | 1,000.00 | | | $ | 781.00 | | | | 0.84 | % | | $ | 3.71 | |
| Based on Hypothetical 5% Return (before expenses) | | $ | 1,000.00 | | | $ | 1,020.63 | | | | 0.84 | % | | $ | 4.21 | |
| | | | | | | | | | | | | | | | | |
| Segall Bryant & Hamill Emerging Markets Fund | | | | | | | | | | | | | | | | |
| Retail | | | | | | | | | | | | | | | | |
| Based on Actual Fund Return | | $ | 1,000.00 | | | $ | 856.40 | | | | 1.38 | % | | $ | 6.35 | |
| Based on Hypothetical 5% Return (before expenses) | | $ | 1,000.00 | | | $ | 1,017.95 | | | | 1.38 | % | | $ | 6.90 | |
| Institutional | | | | | | | | | | | | | | | | |
| Based on Actual Fund Return | | $ | 1,000.00 | | | $ | 855.70 | | | | 1.23 | % | | $ | 5.66 | |
| Based on Hypothetical 5% Return (before expenses) | | $ | 1,000.00 | | | $ | 1,018.70 | | | | 1.23 | % | | $ | 6.16 | |
| | | | | | | | | | | | | | | | | |
| Segall Bryant & Hamill International Small Cap Fund | | | | | | | | | | | | | | | | |
| Retail | | | | | | | | | | | | | | | | |
| Based on Actual Fund Return | | $ | 1,000.00 | | | $ | 817.50 | | | | 1.18% | | | $ | 5.32 | |
| Based on Hypothetical 5% Return (before expenses) | | $ | 1,000.00 | | | $ | 1,018.94 | | | | 1.18% | | | $ | 5.91 | |
| Institutional | | | | | | | | | | | | | | | | |
| Based on Actual Fund Return | | $ | 1,000.00 | | | $ | 817.90 | | | | 1.03 | % | | $ | 4.64 | |
| Based on Hypothetical 5% Return (before expenses) | | $ | 1,000.00 | | | $ | 1,019.69 | | | | 1.03 | % | | $ | 5.16 | |
| | | | | | | | | | | | | | | | | |
| Segall Bryant & Hamill Fundamental International Small Cap Fund | | | | | | | | | | | | | | | | |
| Retail | | | | | | | | | | | | | | | | |
| Based on Actual Fund Return | | $ | 1,000.00 | | | $ | 635.30 | | | | 1.25 | % | | $ | 5.07 | |
| Based on Hypothetical 5% Return (before expenses) | | $ | 1,000.00 | | | $ | 1,018.60 | | | | 1.25 | % | | $ | 6.26 | |
| Institutional | | | | | | | | | | | | | | | | |
| Based on Actual Fund Return | | $ | 1,000.00 | | | $ | 636.00 | | | | 1.10 | % | | $ | 4.46 | |
| Based on Hypothetical 5% Return (before expenses) | | $ | 1,000.00 | | | $ | 1,019.34 | | | | 1.10 | % | | $ | 5.51 | |
| 30 | | www.sbhfunds.com |
| Segall Bryant & Hamill Funds | Fund Expenses |
| | June 30, 2022 (Unaudited) |
| | | Beginning Account | | | Ending Account | | | | | | | |
| | | Value | | | Value | | | Expense | | | Expenses Paid | |
| | | January 1, 2022 | | | June 30, 2022 | | | Ratio(a) | | | During Period(b) | |
| Segall Bryant & Hamill Global All Cap Fund | | | | | | | | | | | | | | | | |
| Retail | | | | | | | | | | | | | | | | |
| Based on Actual Fund Return | | $ | 1,000.00 | | | $ | 775.90 | | | | 0.89 | % | | $ | 3.92 | |
| Based on Hypothetical 5% Return (before expenses) | | $ | 1,000.00 | | | $ | 1,020.38 | | | | 0.89 | % | | $ | 4.46 | |
| Institutional | | | | | | | | | | | | | | | | |
| Based on Actual Fund Return | | $ | 1,000.00 | | | $ | 777.20 | | | | 0.74 | % | | $ | 3.26 | |
| Based on Hypothetical 5% Return (before expenses) | | $ | 1,000.00 | | | $ | 1,021.12 | | | | 0.74 | % | | $ | 3.71 | |
| | | | | | | | | | | | | | | | | |
| Segall Bryant & Hamill Workplace Equality Fund | | | | | | | | | | | | | | | | |
| Retail | | | | | | | | | | | | | | | | |
| Based on Actual Fund Return | | $ | 1,000.00 | | | $ | 770.00 | | | | 0.89 | % | | $ | 3.91 | |
| Based on Hypothetical 5% Return (before expenses) | | $ | 1,000.00 | | | $ | 1,020.38 | | | | 0.89 | % | | $ | 4.46 | |
| Institutional | | | | | | | | | | | | | | | | |
| Based on Actual Fund Return | | $ | 1,000.00 | | | $ | 770.90 | | | | 0.74 | % | | $ | 3.25 | |
| Based on Hypothetical 5% Return (before expenses) | | $ | 1,000.00 | | | $ | 1,021.12 | | | | 0.74 | % | | $ | 3.71 | |
| | | | | | | | | | | | | | | | | |
| Segall Bryant & Hamill Short Term Plus Fund | | | | | | | | | | | | | | | | |
| Retail | | | | | | | | | | | | | | | | |
| Based on Actual Fund Return | | $ | 1,000.00 | | | $ | 974.20 | | | | 0.49 | % | | $ | 2.40 | |
| Based on Hypothetical 5% Return (before expenses) | | $ | 1,000.00 | | | $ | 1,022.36 | | | | 0.49 | % | | $ | 2.46 | |
| Institutional | | | | | | | | | | | | | | | | |
| Based on Actual Fund Return | | $ | 1,000.00 | | | $ | 973.70 | | | | 0.40 | % | | $ | 1.96 | |
| Based on Hypothetical 5% Return (before expenses) | | $ | 1,000.00 | | | $ | 1,022.81 | | | | 0.40 | % | | $ | 2.01 | |
| | | | | | | | | | | | | | | | | |
| Segall Bryant & Hamill Plus Bond Fund | | | | | | | | | | | | | | | | |
| Retail | | | | | | | | | | | | | | | | |
| Based on Actual Fund Return | | $ | 1,000.00 | | | $ | 887.90 | | | | 0.55 | % | | $ | 2.57 | |
| Based on Hypothetical 5% Return (before expenses) | | $ | 1,000.00 | | | $ | 1,022.07 | | | | 0.55 | % | | $ | 2.76 | |
| Institutional | | | | | | | | | | | | | | | | |
| Based on Actual Fund Return | | $ | 1,000.00 | | | $ | 888.30 | | | | 0.40 | % | | $ | 1.87 | |
| Based on Hypothetical 5% Return (before expenses) | | $ | 1,000.00 | | | $ | 1,022.81 | | | | 0.40 | % | | $ | 2.01 | |
| | | | | | | | | | | | | | | | | |
| Segall Bryant & Hamill Quality High Yield Fund | | | | | | | | | | | | | | | | |
| Retail | | | | | | | | | | | | | | | | |
| Based on Actual Fund Return | | $ | 1,000.00 | | | $ | 878.70 | | | | 0.85 | % | | $ | 3.96 | |
| Based on Hypothetical 5% Return (before expenses) | | $ | 1,000.00 | | | $ | 1,020.58 | | | | 0.85 | % | | $ | 4.26 | |
| Institutional | | | | | | | | | | | | | | | | |
| Based on Actual Fund Return | | $ | 1,000.00 | | | $ | 879.00 | | | | 0.70 | % | | $ | 3.26 | |
| Based on Hypothetical 5% Return (before expenses) | | $ | 1,000.00 | | | $ | 1,021.32 | | | | 0.70 | % | | $ | 3.51 | |
| | | | | | | | | | | | | | | | | |
| Segall Bryant & Hamill Municipal Opportunities Fund | | | | | | | | | | | | | | | | |
| Retail | | | | | | | | | | | | | | | | |
| Based on Actual Fund Return | | $ | 1,000.00 | | | $ | 897.70 | | | | 0.65 | % | | $ | 3.06 | |
| Based on Hypothetical 5% Return (before expenses) | | $ | 1,000.00 | | | $ | 1,021.57 | | | | 0.65 | % | | $ | 3.26 | |
| Institutional | | | | | | | | | | | | | | | | |
| Based on Actual Fund Return | | $ | 1,000.00 | | | $ | 898.50 | | | | 0.50 | % | | $ | 2.35 | |
| Based on Hypothetical 5% Return (before expenses) | | $ | 1,000.00 | | | $ | 1,022.32 | | | | 0.50 | % | | $ | 2.51 | |
| Semi-Annual Report | June 30, 2022 | | 31 |
| Segall Bryant & Hamill Funds | Fund Expenses |
| | June 30, 2022 (Unaudited) |
| | | Beginning Account | | | Ending Account | | | | | | | |
| | | Value | | | Value | | | Expense | | | Expenses Paid | |
| | | January 1, 2022 | | | June 30, 2022 | | | Ratio(a) | | | During Period(b) | |
| Segall Bryant & Hamill Colorado Tax Free Fund | | | | | | | | | | | | | | | | |
| Retail | | | | | | | | | | | | | | | | |
| Based on Actual Fund Return | | $ | 1,000.00 | | | $ | 915.30 | | | | 0.65 | % | | $ | 3.09 | |
| Based on Hypothetical 5% Return (before expenses) | | $ | 1,000.00 | | | $ | 1,021.57 | | | | 0.65 | % | | $ | 3.26 | |
| Institutional | | | | | | | | | | | | | | | | |
| Based on Actual Fund Return | | $ | 1,000.00 | | | $ | 915.50 | | | | 0.50 | % | | $ | 2.37 | |
| Based on Hypothetical 5% Return (before expenses) | | $ | 1,000.00 | | | $ | 1,022.32 | | | | 0.50 | % | | $ | 2.51 | |
| (a) | Annualized, based on each Fund’s most recent one-half year expenses. |
| (b) | Expenses are equal to each Fund’s annualized net expense ratio multiplied by the average account value over the period, muliplied by 181/365 (to reflect the one-half year period). |
| 32 | | www.sbhfunds.com |
| Segall Bryant & Hamill Funds | Important Disclosures |
| | June 30, 2022 (Unaudited) |
INDEX DEFINITIONS AND DISCLOSURES
All indices are unmanaged and index performance figures include reinvestment of dividends but do not reflect any fees, expenses or taxes. Investors cannot invest directly in an index.
The Bloomberg U.S. 10-Year Municipal Bond Index includes investment grade (Moody’s Investor Services Aaa to Baa, Standard and Poor’s Corporation AAA to BBB) tax-exempt bonds with maturities between eight and twelve years.
The Bloomberg U.S. 1-15 Year Municipal Bond Index measures the performance of investment grade (Moody’s Investor Services Aaa to Baa, Standard and Poor’s Corporation AAA to BBB) general obligation and revenue bonds with maturities ranging from one to seventeen years It is a broad index that is representative of the tax-exempt bond market.
The Bloomberg U.S. Aggregate Bond Index is a fixed income, market-value-weighted index generally representative of investment grade fixed-rate debt issues, including government, corporate, asset-backed, and mortgage-backed securities with maturities of at least one year.
The Bloomberg U.S. Corporate High Yield Ba Index measures the performance of intermediate (1 to 10 year) U.S. high yield issues. It includes fixed-rate, noninvestment grade debt issues rated Ba1 or lower by Moody’s, rated BB+ or lower by S&P, rated below investment grade by Fitch Investor’s Service or if unrated previously held a high yield rating or have been associated with a high yield issuer, and must trade accordingly.
The Bloomberg U.S. High Yield 2% Issuer Capped Index is an unmanaged index that is comprised of predominantly US High Yield Corporate Bonds and a broad cross section of leveraged loans syndicated in the United States, including dollar-denominated loans to overseas issuers. The weighting of index constituents is limited to a maximum 2%.
The Bloomberg U.S. Government/Credit 1-3 Year Index includes medium and larger issues of U.S. government, investment-grade corporate and investment-grade international dollar -denominated bonds that have maturities of between one and three years.
The MSCI ACWI ex USA Small Cap Index captures small cap representation across 22 of 23 Developed Market countries (excluding the U.S.) and 24 Emerging Market countries. With 4,334 constituents, the index covers approximately 14% of the global equity opportunity set outside the U.S. MSCI Inc. launched the MSCI ACWI ex USA Small Cap Index on June 1, 2007. Data prior to the launch date is back-tested data provided and derived by MSCI (i e calculations of how the index might have performed over that time period had the index existed) There may be material differences between back-tested performance and actual results. Past performance, whether actual or back-tested, is no indication or guarantee of future performance.
The MSCI EAFE Small Cap Index measures small cap representation across Developed Markets countries around the world, excluding the US and Canada. It is maintained by MSCI Barra, a provider of investment decision support tools; the EAFE acronym stands for Europe, Australasia and the Far East.
The MSCI Emerging Markets Index measures equity market performance of emerging markets, which consists of the following 24 emerging market indexes: Brazil, Chile, China, Colombia, Czech Republic, Egypt, Greece, Hungary, India, Indonesia, Korea, Kuwait, Malaysia, Mexico, Peru, Philippines, Poland, Qatar, Saudi Arabia, South Africa, Taiwan, Thailand, Turkey and United Arab Emirates.
The MSCI World Index captures large and mid cap representation across 23 Developed Markets countries. With 1,517 constituents, the index covers approximately 85% of the free float-adjusted market capitalization in each country.
The Russell 1000® Index measures the performance of the large-cap segment of the U.S. equity universe. It is a subset of the Russell 3000® Index and includes approximately 1000 of the largest securities based on a combination of their market cap and current index membership. The Russell 1000® Index represents approximately 92% of the U.S. market.
The Russell 2000® Index measures the performance of the small-cap segment of the U.S. equity universe. The Russell 2000® Index is a subset of the Russell 3000® Index representing approximately 10% of the total market capitalization of that index. It includes approximately 2000 of the smallest securities based on a combination of their market cap and current index membership.
The Russell 2000® Growth Index measures the performance of the small-cap growth segment of the U.S. equity universe. It includes those Russell 2000® Index companies with higher price-to-value ratios and higher forecasted growth values.
The Russell 2000® Value Index measures the performance of companies within the Russell 2000® Index having lower price-to-book ratios and lower forecasted growth values. The Russell 2000® Index includes the 2000 firms from the Russell 3000® Index with the smallest market capitalizations. The Russell 3000® Index represents 98% of the investable U.S. equity market.
The Russell 3000® Index measures the performance of the 3,000 largest U.S. stocks.
| Semi-Annual Report | June 30, 2022 | | 33 |
| Segall Bryant & Hamill Funds | Important Disclosures |
| | June 30, 2022 (Unaudited) |
“Bloomberg®” and the Bloomberg indices are service marks of Bloomberg Finance L.P. and its affiliates, including Bloomberg Index Service Limited, the administrator of the indices, and have been licensed for use for certain purposes by Segall Bryant & Hamill. Bloomberg is not affiliated with Segall Bryant & Hamill, and Bloomberg does not approve, endorse, review, or recommend the Segall Bryant & Hamill Funds. Bloomberg does not guarantee the timeliness, accurateness, or completeness of any data or information relating to the Segall Bryant & Hamill Funds.
MSCI Inc. is the source and owner of the MSCI Index data contained in this material and all trademarks and copyrights related thereto Any further dissemination or redistribution is strictly prohibited MSCI Barra is not responsible for the formatting or configuration of this material or for any inaccuracy in Segall Bryant & Hamill’s presentation thereof.
FTSE Russell is the source and owner of the Russell Index data contained in this material and all trademarks and copyrights related thereto Any further dissemination or redistribution is strictly prohibited Russell Investments is not responsible for the formatting or configuration of this material or for any inaccuracy in Segall Bryant & Hamill’s presentation thereof.
TOP 5/BOTTOM 5 STOCK PERFORMANCE CALCULATION METHODOLOGY
The calculation methodology used to construct this table took into account consistently the weighting of every holding in the Fund that contributed to the Fund’s performance during the measurement period, and the table reflects consistently the results of the calculation. The calculation determined the contribution of each Fund holding by calculating the weight (i.e., percentage of the total investments) of each holding multiplied by the rate of return for that holding during the measurement period.
DEFINITION OF TERMS
Beta: A measure of a fund’s sensitivity to market movements. The beta of the market is 1.00 by definition. A beta above 1 is more volatile than the overall market, while a beta below 1 is less volatile.
Bond Rating Categories:
| ● | AAA: An obligation rated “AAA” has the highest rating assigned by Standard & Poor’s The obligor’s capacity to meet its financial commitment on the obligation is extremely strong. |
| ● | AA+: An obligation rated “AA+” differs from the highest rated obligations only in small degree. The obligor’s capacity to meet its financial commitment on the obligation is very strong. |
| ● | AA: An obligation rated “AA” differs from the highest rated obligations only in small degree The obligor’s capacity to meet its financial commitment on the obligation is very strong. |
| ● | A: An obligation rated “A” is somewhat more susceptible to the adverse effects of changes in circumstances and economic conditions than obligations in higher-rated categories. However, the obligor’s capacity to meet its financial commitment on the obligation is still strong. |
| ● | BBB: An obligation rated “BBB” exhibits adequate protection parameters. However, adverse economic conditions or changing circumstances are more likely to lead to a weakened capacity of the obligor to meet its financial commitment on the obligation. |
| ● | Below BBB: Obligations rated “BB,” “B,” “CCC,” “CC” and “C” are regarded as having significant speculative characteristics. “BB” indicates the least degree of speculation and “C” the highest. While such obligations will likely have some quality and protective characteristics, these may be outweighed by large uncertainties or major exposures to adverse conditions Bonds rated “BB” or below are commonly referred to as “junk” bonds. |
| ● | Non-Rated: These bonds are not rated. |
Credit Quality Rating: A rating of an individual bond as determined by a nationally recognized statistical rating organization (NRSRO) such as Standard & Poor’s or Moody’s. Credit quality ratings range from highest, “AAA ” to lowest, “D”. For more information regarding rating methodologies for Standard & Poor’s, visit www.standardandpoors.com and for Moody’s, visit www.moodys.com.
Credit Spread: The difference in yield between two bonds of similar maturity, but different credit quality.
Duration: A generic description of the sensitivity of a bond’s price (as a percentage of initial price) to a change in yield.
EPS (Earnings per Share) Growth: Earnings per share is the portion of a company’s profit allocated to each outstanding share of common stock EPS growth serves as an indicator of a company’s profitability.
Effective Maturity: A weighted average of the maturities of the bonds in a portfolio.
| 34 | | www.sbhfunds.com |
| Segall Bryant & Hamill Funds | Important Disclosures |
| | June 30, 2022 (Unaudited) |
Emerging Markets: Segall Bryant & Hamill Funds consider emerging market countries to be those countries that are neither U.S. nor developed countries.
Federal Reserve (Fed): The central banking system of the United States.
Free Cash Flow to Total Enterprise Value (FCF/TEV): A valuation metric used to compare the amount of cash a firm generates to the total value of the resources used to generate that cash.
Gross Domestic Product (GDP): The market value of all officially recognized goods and services produced within a country in a given period of time.
Market Capitalization: The market capitalization represents the total value of a company or stock It is calculated by multiplying the number of shares outstanding by the current price of one share.
Modified Duration: A duration measure in which it is assumed that yield changes do not change the expected cash flows.
Number of Holdings: The Number of Holdings presented excludes short-term investments including money market mutual funds.
OPEC: Is the Organization of the Petroleum Exporting Countries.
Operating Cash Flow to Price (OCF/P): A valuation metric used to compare the amount of cash a firm generates per share from operations to the price of the stock.
Portfolio Turnover Rate: A percentage computed by taking the lesser of purchases or sales of portfolio securities (excluding short-term investments) for the year and dividing it by the monthly average of the market value of the portfolio securities during the year.
Price to Book Value (P/B) Ratio: The P/B ratio is used to compare a company’s book value to its current market price. This ratio compares the market’s valuation of a company to the value of that company as indicated on its financial statements. The higher the ratio, the higher the premium the market is willing to pay for the company above its hard assets.
Price to Cash (P/C) Flow Ratio: The P/C flow ratio is a measure of a firm’s stock price relative to its financial performance. For a fund, the P/C flow ratio is the weighted average of all stocks held in the fund It represents the amount an investor is willing to pay for a dollar generated from a particular company’s operations.
Price to Earnings (P/E) Ratio: The P/E ratio is a stock’s per share price divided by its per share earnings over a 12-month period. For a fund, the P/E ratio is the weighted average of all stocks held in the fund. The higher the P/E ratio, the more the market is willing to pay for each dollar of annual earnings.
REIT: A REIT is a real estate investment trust. REITs are securities that sell like a stock on a major exchange. REITs invest directly in real estate, either through properties or mortgages Return on Equity (ROE): A measure of how well a company used reinvested earnings to generate additional earnings It is used as a general indication of a company’s efficiency; in other words, how much profit is a company able to generate given the resources provided by its stockholders.
Risk-Adjusted Return: Is a measure of return that incorporates the value of risk involved in the return of an investment It is intended to help investors compare the returns of investments with varying levels of risk. Risk-adjusted return can be applied to individual securities, mutual funds and portfolios.
Risk On, Risk Off: A concept that describes market sentiment as either “risk on” or “risk off”. During a market sentiment of “risk on”, the market is optimistic and more willing to take on risk in exchange for possibly better returns. When market sentiment is “risk off”, the market is pessimistic and will favor investments with perceived lower risk.
SEC Yield: The SEC Yield is a standardized method of computing return on investment that the U.S. Securities and Exchange Commission (SEC) requires mutual funds to use when advertising their yields Its objective is to allow a confusion-free comparison of the performance of different funds.
| Semi-Annual Report | June 30, 2022 | | 35 |
| Segall Bryant & Hamill Small Cap Value Fund | Statement of Investments |
| | June 30, 2022 (Unaudited) |
| | | Shares | | | Value | |
| COMMON STOCKS — 93.1% | | | | | | | | |
| Consumer Discretionary — 3.3% | | | | | | | | |
| Automobiles & Components — 1.4% | | | | | | | | |
| Harley-Davidson, Inc. | | | 121,230 | | | $ | 3,838,142 | |
| Modine Manufacturing Co. (a) | | | 377,296 | | | | 3,972,927 | |
| | | | | | | | 7,811,069 | |
| Consumer Durables & Apparel — 1.1% | | | | | | | | |
| Gildan Activewear, Inc. (Canada) | | | 166,130 | | | | 4,781,221 | |
| Under Armour, Inc. - Class A (a) | | | 175,654 | | | | 1,463,198 | |
| | | | | | | | 6,244,419 | |
| Consumer Services — 0.3% | | | | | | | | |
| Papa John’s International, Inc. | | | 18,776 | | | | 1,568,172 | |
| | | | | | | | | |
| Retailing — 0.5% | | | | | | | | |
| Quotient Technology, Inc. (a) | | | 967,527 | | | | 2,873,555 | |
| | | | | | | | | |
| Consumer Staples — 7.4% | | | | | | | | |
| Food, Beverage & Tobacco — 3.2% | | | | | | | | |
| Hain Celestial Group, Inc. (The) (a) | | | 680,983 | | | | 16,166,536 | |
| TreeHouse Foods, Inc. (a) | | | 40,818 | | | | 1,707,009 | |
| | | | | | | | 17,873,545 | |
| Household & Personal Products — 4.2% | | | | | | | | |
| Coty, Inc. - Class A (a) | | | 2,895,915 | | | | 23,196,279 | |
| | | | | | | | | |
| Energy — 3.6% | | | | | | | | |
| Energy — 3.6% | | | | | | | | |
| Dril-Quip, Inc. (a) | | | 208,309 | | | | 5,374,372 | |
| Helmerich & Payne, Inc. | | | 137,605 | | | | 5,925,271 | |
| PDC Energy, Inc. | | | 69,799 | | | | 4,300,316 | |
| Range Resources Corp. (a) | | | 174,838 | | | | 4,327,241 | |
| | | | | | | | 19,927,200 | |
| Financials — 13.9% | | | | | | | | |
| Banks — 12.8% | | | | | | | | |
| Community Bank System, Inc. | | | 87,487 | | | | 5,536,177 | |
| Enterprise Financial Services Corp | | | 112,250 | | | | 4,658,375 | |
| Glacier Bancorp, Inc. | | | 133,325 | | | | 6,322,271 | |
| Lakeland Financial Corp | | | 37,145 | | | | 2,467,171 | |
| National Bank Holdings Corp. - Class A | | | 245,589 | | | | 9,398,691 | |
| Pacific Premier Bancorp, Inc. | | | 172,933 | | | | 5,056,561 | |
| Renasant Corp | | | 49,718 | | | | 1,432,376 | |
| Seacoast Banking Corp. of Florida | | | 263,005 | | | | 8,689,685 | |
| SouthState Corp | | | 61,261 | | | | 4,726,286 | |
| Umpqua Holdings Corp. | | | 523,123 | | | | 8,772,773 | |
| United Community Banks, Inc. | | | 300,830 | | | | 9,082,058 | |
| WesBanco, Inc. | | | 161,368 | | | | 5,116,979 | |
| | | | | | | | 71,259,403 | |
| Diversified Financials — 0.6% | | | | | | | | |
| Green Dot Corp. - Class A (a) | | | 136,061 | | | | 3,416,492 | |
| | | | | | | | | |
| Insurance — 0.5% | | | | | | | | |
| eHealth, Inc. (a) | | | 304,096 | | | | 2,837,216 | |
| | | | | | | | | |
| Health Care — 9.1% | | | | | | | | |
| Health Care Equipment & Services — 7.1% | | | | | | | | |
| AngioDynamics, Inc. (a) | | | 126,945 | | | | 2,456,386 | |
| | | Shares | | | Value | |
| Health Care Equipment & Services (continued) | | | | | | | | |
| ICU Medical, Inc. (a) | | | 92,568 | | | $ | 15,217,254 | |
| MEDNAX, Inc. (a) | | | 223,628 | | | | 4,698,424 | |
| Orthofix Medical, Inc. (a) | | | 603,701 | | | | 14,211,122 | |
| Surmodics, Inc. (a) | | | 77,827 | | | | 2,897,499 | |
| | | | | | | | 39,480,685 | |
| Pharmaceuticals, Biotechnology & Life Sciences — 2.0% | | | | | | | | |
| Alkermes PLC (Ireland) (a) | | | 117,148 | | | | 3,489,839 | |
| BioCryst Pharmaceuticals, Inc. (a) | | | 493,356 | | | | 5,219,706 | |
| Blueprint Medicines Corp. (a) | | | 32,382 | | | | 1,635,615 | |
| ImmunoGen, Inc. (a) | | | 228,990 | | | | 1,030,455 | |
| | | | | | | | 11,375,615 | |
| Industrials — 23.0% | | | | | | | | |
| Capital Goods — 18.8% | | | | | | | | |
| AAR Corp. (a) | | | 143,272 | | | | 5,994,500 | |
| Apogee Enterprises, Inc. | | | 203,683 | | | | 7,988,447 | |
| Astec Industries, Inc. | | | 180,608 | | | | 7,365,194 | |
| AZZ, Inc. | | | 201,098 | | | | 8,208,820 | |
| Beacon Roofing Supply, Inc. (a) | | | 41,090 | | | | 2,110,382 | |
| CIRCOR International, Inc. (a) | | | 296,748 | | | | 4,863,700 | |
| Columbus McKinnon Corp | | | 104,086 | | | | 2,952,920 | |
| EnerSys | | | 103,134 | | | | 6,080,781 | |
| Mercury Systems, Inc. (a) | | | 168,987 | | | | 10,870,934 | |
| Quanex Building Products Corp | | | 279,605 | | | | 6,361,014 | |
| Regal Rexnord Corp | | | 121,638 | | | | 13,808,346 | |
| REV Group, Inc. | | | 705,750 | | | | 7,671,502 | |
| SPX Corp. (a) | | | 272,393 | | | | 14,393,246 | |
| Sterling Construction Co., Inc. (a) | | | 273,979 | | | | 6,005,620 | |
| | | | | | | | 104,675,406 | |
| Commercial & Professional Services — 4.2% | | | | | | | | |
| Huron Consulting Group, Inc. (a) | | | 64,901 | | | | 4,217,916 | |
| KBR, Inc. | | | 191,709 | | | | 9,276,799 | |
| SP Plus Corp. (a) | | | 327,634 | | | | 10,064,916 | |
| | | | | | | | 23,559,631 | |
| Information Technology — 11.4% | | | | | | | | |
| Software & Services — 8.4% | | | | | | | | |
| Conduent, Inc. (a) | | | 913,375 | | | | 3,945,780 | |
| CSG Systems International, Inc. | | | 116,354 | | | | 6,944,007 | |
| NCR Corp. (a) | | | 522,551 | | | | 16,256,561 | |
| Progress Software Corp | | | 429,679 | | | | 19,464,459 | |
| | | | | | | | 46,610,807 | |
| Technology Hardware & Equipment — 3.0% | | | | | | | | |
| Belden, Inc. | | | 196,472 | | | | 10,466,064 | |
| FARO Technologies, Inc. (a) | | | 210,894 | | | | 6,501,862 | |
| | | | | | | | 16,967,926 | |
| Materials — 7.6% | | | | | | | | |
| Materials — 7.6% | | | | | | | | |
| Alamos Gold, Inc. - Class A (Canada) | | | 467,913 | | | | 3,284,749 | |
| Compass Minerals International, Inc. | | | 420,155 | | | | 14,869,285 | |
| Element Solutions, Inc. | | | 299,742 | | | | 5,335,408 | |
| Glatfelter Corp | | | 743,844 | | | | 5,117,647 | |
| Schnitzer Steel Industries, Inc. - Class A | | | 42,451 | | | | 1,394,091 | |
| Silgan Holdings, Inc. | | | 184,498 | | | | 7,628,992 | |
| Summit Materials, Inc. - Class A (a) | | | 201,642 | | | | 4,696,242 | |
| | | | | | | | 42,326,414 | |
See Notes to Financial Statements.
| 36 | | www.sbhfunds.com |
| Segall Bryant & Hamill Small Cap Value Fund | Statement of Investments |
| | June 30, 2022 (Unaudited) |
| | | Shares | | | Value | |
| Real Estate — 7.6% | | | | | | | | |
| Real Estate — 7.6% | | | | | | | | |
| Cousins Properties, Inc. | | | 149,803 | | | $ | 4,378,742 | |
| DigitalBridge Group, Inc. - Class A (a) | | | 500,975 | | | | 2,444,758 | |
| Empire State Realty Trust, Inc. - Class A | | | 338,927 | | | | 2,382,657 | |
| Equity Commonwealth (a) | | | 1,024,596 | | | | 28,207,128 | |
| Physicians Realty Trust | | | 271,985 | | | | 4,746,138 | |
| | | | | | | | 42,159,423 | |
| Utilities — 6.2% | | | | | | | | |
| Utilities — 6.2% | | | | | | | | |
| ALLETE, Inc. | | | 121,774 | | | | 7,157,876 | |
| Avista Corp | | | 108,849 | | | | 4,736,020 | |
| New Jersey Resources Corp. | | | 176,471 | | | | 7,858,253 | |
| OGE Energy Corp | | | 171,164 | | | | 6,600,084 | |
| PNM Resources, Inc. | | | 171,845 | | | | 8,210,754 | |
| | | | | | | | 34,562,987 | |
| Investments at Value — 93.1% | | | | | | | | |
| (Cost $524,749,296) | | | | | | $ | 518,726,244 | |
| | | | | | | | | |
| Other Assets in Excess of Liabilities — 6.9% | | | | | | | 38,682,490 | |
| | | | | | | | | |
| Net Assets — 100.0% | | | | | | $ | 557,408,734 | |
| (a) | Non-income producing security. |
The Fund’s sector and industry classifications presented herein refer to any one or more of the industry sub-classifications used by one or more widely recognized market indexes or ratings group indexes, and/ or as defined by Fund management. For Fund compliance purposes, sector and industry classifications are based on the sector and industry categorization methodology of the Adviser to the Funds. This definition may not apply for purposes of this report, which may combine industry sub-classifications for reporting ease. Industries are shown as a percentage of net assets.
See Notes to Financial Statements.
| Semi-Annual Report | June 30, 2022 | | 37 |
| Segall Bryant & Hamill Small Cap Growth Fund | Statement of Investments |
| | June 30, 2022 (Unaudited) |
| | | Shares | | | Value | |
| COMMON STOCKS — 96.2% | | | | | | | | |
| Communication Services — 3.1% | | | | | | | | |
| Media & Entertainment — 1.8% | | | | | | | | |
| Eventbrite, Inc. - Class A (a) | | | 121,272 | | | $ | 1,245,464 | |
| New York Times Co. (The) - Class A | | | 60,398 | | | | 1,685,104 | |
| | | | | | | | 2,930,568 | |
| Telecommunication Services — 1.3% | | | | | | | | |
| Cogent Communications Holdings, Inc. | | | 33,302 | | | | 2,023,429 | |
| | | | | | | | | |
| Consumer Discretionary — 9.0% | | | | | | | | |
| Automobiles & Components — 1.1% | | | | | | | | |
| Fox Factory Holding Corp. (a) | | | 21,562 | | | | 1,736,604 | |
| Consumer Durables & Apparel — 2.7% | | | | | | | | |
| Callaway Golf Co. (a) | | | 128,674 | | | | 2,624,949 | |
| YETI Holdings, Inc. (a) | | | 40,784 | | | | 1,764,724 | |
| | | | | | | | 4,389,673 | |
| Consumer Services — 4.0% | | | | | | | | |
| Bright Horizons Family Solutions, Inc. (a) | | | 20,331 | | | | 1,718,376 | |
| Churchill Downs, Inc. | | | 11,265 | | | | 2,157,585 | |
| Shake Shack, Inc. - Class A (a) | | | 33,826 | | | | 1,335,451 | |
| Wingstop, Inc. | | | 16,134 | | | | 1,206,339 | |
| | | | | | | | 6,417,751 | |
| Retailing — 1.2% | | | | | | | | |
| Boot Barn Holdings, Inc. (a) | | | 10,766 | | | | 741,885 | |
| Revolve Group, Inc. (a) | | | 48,272 | | | | 1,250,728 | |
| | | | | | | | 1,992,613 | |
| Consumer Staples — 1.7% | | | | | | | | |
| Food, Beverage & Tobacco — 1.7% | | | | | | | | |
| Simply Good Foods Co. (The) (a) | | | 70,926 | | | | 2,678,875 | |
| | | | | | | | | |
| Financials — 7.6% | | | | | | | | |
| Diversified Financials — 3.3% | | | | | | | | |
| Hamilton Lane, Inc. - Class A | | | 24,371 | | | | 1,637,244 | |
| Houlihan Lokey, Inc. | | | 23,197 | | | | 1,830,939 | |
| StepStone Group, Inc. - Class A | | | 73,964 | | | | 1,925,283 | |
| | | | | | | | 5,393,466 | |
| Insurance — 4.3% | | | | | | | | |
| Goosehead Insurance, Inc. - Class A | | | 44,145 | | | | 2,016,102 | |
| Palomar Holdings, Inc. (a) | | | 39,843 | | | | 2,565,889 | |
| Trupanion, Inc. (a) | | | 38,683 | | | | 2,331,038 | |
| | | | | | | | 6,913,029 | |
| Health Care — 26.2% | | | | | | | | |
| Health Care Equipment & Services — 17.9% | | | | | | | | |
| Addus HomeCare Corp. (a) | | | 26,850 | | | | 2,236,068 | |
| Amedisys, Inc. (a) | | | 17,383 | | | | 1,827,301 | |
| Castle Biosciences, Inc. (a) | | | 57,528 | | | | 1,262,739 | |
| CONMED Corp | | | 29,144 | | | | 2,790,829 | |
| Globus Medical, Inc. - Class A (a) | | | 51,569 | | | | 2,895,084 | |
| Inari Medical, Inc. (a) | | | 31,908 | | | | 2,169,425 | |
| Inspire Medical Systems, Inc. (a) | | | 14,859 | | | | 2,714,293 | |
| Integra LifeSciences Holdings Corp. (a) | | | 45,321 | | | | 2,448,694 | |
| Omnicell, Inc. (a) | | | 27,826 | | | | 3,165,207 | |
| Option Care Health, Inc. (a) | | | 108,430 | | | | 3,013,270 | |
| Silk Road Medical, Inc. (a) | | | 53,887 | | | | 1,960,948 | |
| | | Shares | | | Value | |
| Health Care Equipment & Services (continued) | | | | | | | | |
| Surgery Partners, Inc. (a) | | | 51,024 | | | $ | 1,475,614 | |
| Warby Parker, Inc. - Class A (a) | | | 80,991 | | | | 911,959 | |
| | | | | | | | 28,871,431 | |
| Pharmaceuticals, Biotechnology & Life Sciences — 8.3% | | | | | | | | |
| Adaptive Biotechnologies Corp. (a) | | | 43,788 | | | | 354,245 | |
| Avid Bioservices, Inc. (a) | | | 76,266 | | | | 1,163,819 | |
| Blueprint Medicines Corp. (a) | | | 24,292 | | | | 1,226,989 | |
| Fate Therapeutics, Inc. (a) | | | 43,375 | | | | 1,074,832 | |
| Medpace Holdings, Inc. (a) | | | 15,264 | | | | 2,284,563 | |
| NanoString Technologies, Inc. (a) | | | 57,108 | | | | 725,272 | |
| Natera, Inc. (a) | | | 36,303 | | | | 1,286,578 | |
| Pacira BioSciences, Inc. (a) | | | 24,417 | | | | 1,423,511 | |
| Turning Point Therapeutics, Inc. (a) | | | 37,700 | | | | 2,836,925 | |
| Xencor, Inc. (a) | | | 40,142 | | | | 1,098,687 | |
| | | | | | | | 13,475,421 | |
| Industrials — 16.6% | | | | | | | | |
| Capital Goods — 8.2% | | | | | | | | |
| Ameresco, Inc. - Class A (a) | | | 46,819 | | | | 2,133,074 | |
| AZEK Co., Inc. (The) - Class A (a) | | | 136,249 | | | | 2,280,808 | |
| Hexcel Corp | | | 47,104 | | | | 2,464,010 | |
| John Bean Technologies Corp. | | | 15,732 | | | | 1,737,127 | |
| Kratos Defense & Security Solutions, | | | | | | | | |
| Inc. (a) | | | 137,354 | | | | 1,906,474 | |
| Mercury Systems, Inc. (a) | | | 24,417 | | | | 1,570,746 | |
| TPI Composites, Inc. (a) | | | 91,317 | | | | 1,141,462 | |
| | | | | | | | 13,233,701 | |
| Commercial & Professional Services — 7.3% | | | | | | | | |
| ASGN, Inc. (a) | | | 22,163 | | | | 2,000,211 | |
| Montrose Environmental Group, Inc. (a) | | | 34,444 | | | | 1,162,829 | |
| Ritchie Bros. Auctioneers, Inc. (Canada) | | | 40,672 | | | | 2,646,120 | |
| Tetra Tech, Inc. | | | 27,258 | | | | 3,722,080 | |
| Upwork, Inc. (a) | | | 106,957 | | | | 2,211,871 | |
| | | | | | | | 11,743,111 | |
| Transportation — 1.1% | | | | | | | | |
| Saia, Inc. (a) | | | 9,469 | | | | 1,780,172 | |
| | | | | | | | | |
| Information Technology — 26.2% | | | | | | | | |
| Semiconductors & Semiconductor Equipment — 8.4% | | | | | | | | |
| Allegro MicroSystems, Inc. (a) | | | 39,055 | | | | 808,048 | |
| Azenta, Inc. | | | 11,702 | | | | 843,714 | |
| Credo Technology Group Holding, Ltd. | | | | | | | | |
| (Cayman Islands) (a) | | | 74,706 | | | | 872,566 | |
| Onto Innovation, Inc. (a) | | | 38,786 | | | | 2,704,935 | |
| Power Integrations, Inc. | | | 40,287 | | | | 3,021,928 | |
| Silicon Laboratories, Inc. (a) | | | 28,126 | | | | 3,943,828 | |
| SiTime Corp. (a) | | | 8,733 | | | | 1,423,741 | |
| | | | | | | | 13,618,760 | |
| Software & Services — 15.8% | | | | | | | | |
| BlackLine, Inc. (a) | | | 27,609 | | | | 1,838,759 | |
| Endava PLC ADR (United Kingdom) (a) | | | 38,285 | | | | 3,379,417 | |
| Envestnet, Inc. (a) | | | 40,372 | | | | 2,130,431 | |
| Everbridge, Inc. (a) | | | 25,051 | | | | 698,672 | |
| Globant S.A. (Luxembourg) (a) | | | 14,271 | | | | 2,483,154 | |
| MAXIMUS, Inc. | | | 46,855 | | | | 2,928,906 | |
| nCino, Inc. (a) | | | 55,033 | | | | 1,701,620 | |
See Notes to Financial Statements.
| 38 | | www.sbhfunds.com |
| Segall Bryant & Hamill Small Cap Growth Fund | Statement of Investments |
| | June 30, 2022 (Unaudited) |
| | | Shares | | | Value | |
| Software & Services (continued) | | | | | | | | |
| Olo, Inc. - Class A (a) | | | 90,800 | | | $ | 896,196 | |
| Rapid7, Inc. (a) | | | 29,387 | | | | 1,963,052 | |
| Shift4 Payments, Inc. - Class A (a) | | | 59,483 | | | | 1,966,508 | |
| Sprout Social, Inc. - Class A (a) | | | 59,958 | | | | 3,481,761 | |
| Workiva, Inc. (a) | | | 30,019 | | | | 1,980,954 | |
| | | | | | | | 25,449,430 | |
| Technology Hardware & Equipment — 2.0% | | | | | | | | |
| 908 Devices, Inc. (a) | | | 62,939 | | | | 1,295,914 | |
| Novanta, Inc. (Canada) (a) | | | 16,287 | | | | 1,975,125 | |
| | | | | | | | 3,271,039 | |
| Materials — 3.5% | | | | | | | | |
| Materials — 3.5% | | | | | | | | |
| Avient Corp | | | 46,088 | | | | 1,847,207 | |
| Innospec, Inc. | | | 14,470 | | | | 1,386,081 | |
| Livent Corp. (a) | | | 95,582 | | | | 2,168,756 | |
| Ranpak Holdings Corp. - Class A (a) | | | 41,572 | | | | 291,004 | |
| | | | | | | | 5,693,048 | |
| Real Estate — 2.3% | | | | | | | | |
| Real Estate — 2.3% | | | | | | | | |
| Americold Realty Trust | | | 42,116 | | | | 1,265,165 | |
| Terreno Realty Corp | | | 42,322 | | | | 2,358,605 | |
| | | | | | | | 3,623,770 | |
| Investments at Value — 96.2% | | | | | | | | |
| (Cost $181,867,485) | | | | | | $ | 155,235,891 | |
| | | | | | | | | |
| Other Assets in Excess of Liabilities — 3.8% | | | | | | | 6,168,374 | |
| | | | | | | | | |
| Net Assets — 100.0% | | | | | | $ | 161,404,265 | |
| (a) | Non-income producing security. |
The Fund’s sector and industry classifications presented herein refer to any one or more of the industry sub-classifications used by one or more widely recognized market indexes or ratings group indexes, and/ or as defined by Fund management. For Fund compliance purposes, sector and industry classifications are based on the sector and industry categorization methodology of the Adviser to the Funds. This definition may not apply for purposes of this report, which may combine industry sub-classifications for reporting ease. Industries are shown as a percentage of net assets.
See Notes to Financial Statements.
| Semi-Annual Report | June 30, 2022 | | 39 |
| Segall Bryant & Hamill Small Cap Core Fund | Statement of Investments |
| | June 30, 2022 (Unaudited) |
| | | Shares | | | Value | |
| COMMON STOCKS — 90.2% | | | | | | | | |
| Consumer Discretionary — 9.8% | | | | | | | | |
| Automobiles & Components — 2.0% | | | | | | | | |
| Fox Factory Holding Corp. (a) | | | 3,724 | | | $ | 299,931 | |
| Harley-Davidson, Inc. | | | 16,351 | | | | 517,672 | |
| Stoneridge, Inc. (a) | | | 11,513 | | | | 197,448 | |
| | | | | | | | 1,015,051 | |
| Consumer Durables & Apparel — 4.4% | | | | | | | | |
| Capri Holdings, Ltd. (a) | | | 9,457 | | | | 387,832 | |
| Gildan Activewear, Inc. (Canada) | | | 26,721 | | | | 769,030 | |
| Steven Madden, Ltd. | | | 16,668 | | | | 536,876 | |
| Under Armour, Inc. - Class A (a) | | | 30,529 | | | | 254,307 | |
| Universal Electronics, Inc. (a) | | | 10,047 | | | | 256,902 | |
| | | | | | | | 2,204,947 | |
| Consumer Services — 1.5% | | | | | | | | |
| BJ’s Restaurants, Inc. (a) | | | 10,823 | | | | 234,643 | |
| Churchill Downs, Inc. | | | 2,710 | | | | 519,046 | |
| | | | | | | | 753,689 | |
| Hotels, Restaurants & Leisure — 1.2% | | | | | | | | |
| Texas Roadhouse, Inc. | | | 7,989 | | | | 584,795 | |
| | | | | | | | | |
| Retailing — 0.7% | | | | | | | | |
| Five Below, Inc. (a) | | | 2,995 | | | | 339,723 | |
| | | | | | | | | |
| Consumer Staples — 4.9% | | | | | | | | |
| Food & Staples Retailing — 1.3% | | | | | | | | |
| Casey’s General Stores, Inc. | | | 3,525 | | | | 652,054 | |
| | | | | | | | | |
| Food, Beverage & Tobacco — 2.6% | | | | | | | | |
| Hain Celestial Group, Inc. (The) (a) | | | 23,392 | | | | 555,326 | |
| J & J Snack Foods Corp. | | | 5,397 | | | | 753,745 | |
| | | | | | | | 1,309,071 | |
| Household & Personal Products — 1.0% | | | | | | | | |
| Inter Parfums, Inc. | | | 6,528 | | | | 476,936 | |
| | | | | | | | | |
| Energy — 3.7% | | | | | | | | |
| Energy — 3.7% | | | | | | | | |
| Devon Energy Corp | | | 21,298 | | | | 1,173,733 | |
| PDC Energy, Inc. | | | 11,116 | | | | 684,857 | |
| | | | | | | | 1,858,590 | |
| Financials — 8.0% | | | | | | | | |
| Banks — 8.0% | | | | | | | | |
| Ameris Bancorp | | | 9,792 | | | | 393,443 | |
| Glacier Bancorp, Inc. | | | 16,751 | | | | 794,332 | |
| Lakeland Financial Corp | | | 3,477 | | | | 230,942 | |
| Seacoast Banking Corp. of Florida | | | 28,316 | | | | 935,561 | |
| South State Corp | | | 9,051 | | | | 698,285 | |
| United Bankshares, Inc. | | | 10,391 | | | | 364,412 | |
| United Community Banks, Inc. | | | 19,343 | | | | 583,965 | |
| | | | | | | | 4,000,940 | |
| Health Care — 12.0% | | | | | | | | |
| Health Care Equipment & Services — 8.2% | | | | | | | | |
| Amedisys, Inc. (a) | | | 5,639 | | | | 592,772 | |
| Encompass Health Corp | | | 7,294 | | | | 408,829 | |
| Ensign Group, Inc. (The) | | | 6,935 | | | | 509,514 | |
| | | Shares | | | Value | |
| Health Care Equipment & Services (continued) | | | | | | | | |
| Globus Medical, Inc. - Class A (a) | | | 10,077 | | | $ | 565,723 | |
| Heska Corp. (a) | | | 4,015 | | | | 379,458 | |
| Insulet Corp. (a) | | | 3,145 | | | | 685,421 | |
| Integra LifeSciences Holdings Corp. (a) | | | 5,583 | | | | 301,650 | |
| Orthofix Medical, Inc. (a) | | | 15,394 | | | | 362,375 | |
| Phreesia, Inc. (a) | | | 12,547 | | | | 313,800 | |
| | | | | | | | 4,119,542 | |
| Pharmaceuticals, Biotechnology & Life Sciences — 3.8% | | | | | | | | |
| Bio-Techne Corp | | | 1,330 | | | | 461,031 | |
| CareDx, Inc. (a) | | | 7,283 | | | | 156,439 | |
| Horizon Therapeutics PLC (a) | | | 7,251 | | | | 578,340 | |
| Medpace Holdings, Inc. (a) | | | 2,543 | | | | 380,611 | |
| Veracyte, Inc. (a) | | | 15,715 | | | | 312,728 | |
| | | | | | | | 1,889,149 | |
| Industrials — 21.7% | | | | | | | | |
| Capital Goods — 14.4% | | | | | | | | |
| AAR Corp. (a) | | | 12,703 | | | | 531,493 | |
| BWX Technologies, Inc. | | | 7,132 | | | | 392,902 | |
| Carlisle Cos., Inc. | | | 4,465 | | | | 1,065,394 | |
| EnerSys | | | 5,002 | | | | 294,918 | |
| EnPro Industries, Inc. | | | 11,840 | | | | 970,051 | |
| ITT, Inc. | | | 9,032 | | | | 607,312 | |
| RBC Bearings, Inc. (a) | | | 2,762 | | | | 510,832 | |
| Regal Rexnord Corp | | | 7,816 | | | | 887,272 | |
| SPX Corp. (a) | | | 9,459 | | | | 499,814 | |
| Standex International Corp | | | 3,751 | | | | 318,010 | |
| Timken Co. (The) | | | 4,095 | | | | 217,240 | |
| UFP Industries, Inc. | | | 5,711 | | | | 389,147 | |
| Zurn Water Solutions Corp | | | 19,851 | | | | 540,741 | |
| | | | | | | | 7,225,126 | |
| Commercial & Professional Services — 4.3% | | | | | | | | |
| Casella Waste Systems, Inc. - Class A (a) | | | 9,477 | | | | 688,788 | |
| KBR, Inc. | | | 23,935 | | | | 1,158,215 | |
| Tetra Tech, Inc. | | | 2,181 | | | | 297,816 | |
| | | | | | | | 2,144,819 | |
| Transportation — 3.0% | | | | | | | | |
| Allegiant Travel Co. (a) | | | 3,824 | | | | 432,456 | |
| Forward Air Corp | | | 3,916 | | | | 360,115 | |
| Hub Group, Inc. - Class A (a) | | | 9,935 | | | | 704,789 | |
| | | | | | | | 1,497,360 | |
| Information Technology — 19.4% | | | | | | | | |
| Semiconductors & Semiconductor Equipment — 4.0% | | | | | | | | |
| CMC Materials, Inc. | | | 990 | | | | 172,745 | |
| Silicon Laboratories, Inc. (a) | | | 6,528 | | | | 915,356 | |
| Universal Display Corp. | | | 3,946 | | | | 399,099 | |
| Veeco Instruments, Inc. (a) | | | 27,136 | | | | 526,438 | |
| | | | | | | | 2,013,638 | |
| Software & Services — 12.2% | | | | | | | | |
| Agilysys, Inc. (a) | | | 11,672 | | | | 551,736 | |
| Alteryx, Inc. - Class A (a) | | | 10,632 | | | | 514,802 | |
| Avalara, Inc. (a) | | | 6,589 | | | | 465,183 | |
| BlackLine, Inc. (a) | | | 7,059 | | | | 470,129 | |
| Endava PLC ADR (United Kingdom) (a) | | | 9,729 | | | | 858,779 | |
| Everbridge, Inc. (a) | | | 4,927 | | | | 137,414 | |
| Model N, Inc. (a) | | �� | 19,857 | | | | 507,942 | |
See Notes to Financial Statements.
| 40 | | www.sbhfunds.com |
| Segall Bryant & Hamill Small Cap Core Fund | Statement of Investments |
| | June 30, 2022 (Unaudited) |
| | | Shares | | | Value | |
| Software & Services (continued) | | | | | | | | |
| NCR Corp. (a) | | | 9,082 | | | $ | 282,541 | |
| Pegasystems, Inc. | | | 2,893 | | | | 138,401 | |
| Tenable Holdings, Inc. (a) | | | 21,332 | | | | 968,686 | |
| WNS Holdings, Ltd. ADR (Jersey) (a) | | | 12,516 | | | | 934,194 | |
| Workiva, Inc. (a) | | | 3,946 | | | | 260,397 | |
| | | | | | | | 6,090,204 | |
| Technology Hardware & Equipment — 3.2% | | | | | | | | |
| Badger Meter, Inc. | | | 5,767 | | | | 466,493 | |
| FARO Technologies, Inc. (a) | | | 5,968 | | | | 183,993 | |
| Pure Storage, Inc. - Class A (a) | | | 35,744 | | | | 918,978 | |
| | | | | | | | 1,569,464 | |
| Materials — 8.4% | | | | | | | | |
| Materials — 8.4% | | | | | | | | |
| Berry Global Group, Inc. (a) | | | 9,896 | | | | 540,717 | |
| Compass Minerals International, Inc. | | | 6,490 | | | | 229,681 | |
| Eagle Materials, Inc. | | | 2,599 | | | | 285,734 | |
| Element Solutions, Inc. | | | 40,982 | | | | 729,480 | |
| Graphic Packaging Holding Co | | | 45,191 | | | | 926,415 | |
| Huntsman Corp | | | 18,940 | | | | 536,949 | |
| Ingevity Corp. (a) | | | 4,086 | | | | 257,990 | |
| Materion Corp | | | 9,031 | | | | 665,856 | |
| | | | | | | | 4,172,822 | |
| Real Estate — 2.3% | | | | | | | | |
| Real Estate — 2.3% | | | | | | | | |
| Cousins Properties, Inc. | | | 20,795 | | | | 607,838 | |
| Equity Commonwealth (a) | | | 18,778 | | | | 516,958 | |
| | | | | | | | 1,124,796 | |
| Investments at Value — 90.2% | | | | | | | | |
| (Cost $45,286,649) | | | | | | $ | 45,042,716 | |
| | | | | | | | | |
| Other Assets in Excess of Liabilities — 9.8% | | | | | | | 4,920,812 | |
| | | | | | | | | |
| Net Assets — 100.0% | | | | | | $ | 49,963,528 | |
| (a) | Non-income producing security. |
The Fund’s sector and industry classifications presented herein refer to any one or more of the industry sub-classifications used by one or more widely recognized market indexes or ratings group indexes, and/ or as defined by Fund management. For Fund compliance purposes, sector and industry classifications are based on the sector and industry categorization methodology of the Adviser to the Funds. This definition may not apply for purposes of this report, which may combine industry sub-classifications for reporting ease. Industries are shown as a percentage of net assets.
See Notes to Financial Statements.
| Semi-Annual Report | June 30, 2022 | | 41 |
| Segall Bryant & Hamill All Cap Fund | Statement of Investments |
| | June 30, 2022 (Unaudited) |
| | | Shares | | | Value | |
| COMMON STOCKS — 98.1% | | | | | | | | |
| Communication Services — 5.4% | | | | | | | | |
| Media & Entertainment — 5.4% | | | | | | | | |
| Alphabet, Inc. - Class C (a) | | | 2,539 | | | $ | 5,553,935 | |
| Cable One, Inc. | | | 1,406 | | | | 1,812,784 | |
| | | | | | | | 7,366,719 | |
| Consumer Discretionary — 10.9% | | | | | | | | |
| Consumer Durables & Apparel — 1.0% | | | | | | | | |
| Capri Holdings, Ltd. (a) | | | 33,921 | | | | 1,391,100 | |
| | | | | | | | | |
| Consumer Services — 3.3% | | | | | | | | |
| Darden Restaurants, Inc. | | | 12,706 | | | | 1,437,303 | |
| Papa John’s International, Inc. | | | 20,751 | | | | 1,733,124 | |
| Vail Resorts, Inc. | | | 6,206 | | | | 1,353,218 | |
| | | | | | | | 4,523,645 | |
| Retailing — 6.6% | | | | | | | | |
| Amazon.com, Inc. (a) | | | 31,120 | | | | 3,305,255 | |
| Home Depot, Inc. (The) | | | 5,695 | | | | 1,561,968 | |
| O’Reilly Automotive, Inc. (a) | | | 3,032 | | | | 1,915,496 | |
| TJX Cos., Inc. (The) | | | 38,962 | | | | 2,176,028 | |
| | | | | | | | 8,958,747 | |
| Consumer Staples — 6.1% | | | | | | | | |
| Food & Staples Retailing — 1.8% | | | | | | | | |
| Sysco Corp | | | 28,253 | | | | 2,393,312 | |
| | | | | | | | | |
| Food, Beverage & Tobacco — 1.4% | | | | | | | | |
| Mondel z International, Inc. - Class A | | | 30,237 | | | | 1,877,415 | |
| | | | | | | | | |
| Household & Personal Products — 2.9% | | | | | | | | |
| Estee Lauder Cos., Inc. (The) - Class A | | | 7,116 | | | | 1,812,232 | |
| Unilever PLC ADR (United Kingdom) | | | 47,838 | | | | 2,192,415 | |
| | | | | | | | 4,004,647 | |
| Energy — 5.6% | | | | | | | | |
| Energy — 5.6% | | | | | | | | |
| Chevron Corp | | | 22,108 | | | | 3,200,796 | |
| ConocoPhillips | | | 25,773 | | | | 2,314,673 | |
| Suncor Energy, Inc. (Canada) | | | 61,183 | | | | 2,145,688 | |
| | | | | | | | 7,661,157 | |
| Financials — 16.2% | | | | | | | | |
| Banks — 3.2% | | | | | | | | |
| First Republic Bank | | | 12,509 | | | | 1,803,798 | |
| JPMorgan Chase & Co. | | | 23,035 | | | | 2,593,971 | |
| | | | | | | | 4,397,769 | |
| Diversified Financials — 4.7% | | | | | | | | |
| Ares Management Corp. - Class A | | | 51,179 | | | | 2,910,038 | |
| Berkshire Hathaway, Inc. - Class B (a) | | | 6,547 | | | | 1,787,462 | |
| S&P Global, Inc. | | | 4,960 | | | | 1,671,818 | |
| | | | | | | | 6,369,318 | |
| Insurance — 8.3% | | | | | | | | |
| Berkley (W.R.) Corp. | | | 29,329 | | | | 2,001,997 | |
| Globe Life, Inc. | | | 36,080 | | | | 3,516,718 | |
| Marsh & McLennan Cos., Inc. | | | 14,611 | | | | 2,268,358 | |
| Reinsurance Group of America, Inc. | | | 29,994 | | | | 3,517,996 | |
| | | | | | | | 11,305,069 | |
| | | Shares | | | Value | |
| Health Care — 17.7% | | | | | | | | |
| Health Care Equipment & Services — 5.6% | | | | | | | | |
| McKesson Corp | | | 6,965 | | | $ | 2,272,053 | |
| Tenet Healthcare Corp. (a) | | | 26,376 | | | | 1,386,323 | |
| UnitedHealth Group, Inc. | | | 7,872 | | | | 4,043,295 | |
| | | | | | | | 7,701,671 | |
| Pharmaceuticals, Biotechnology & Life Sciences — 12.1% | | | | | | | | |
| Bio-Techne Corp | | | 4,130 | | | | 1,431,623 | |
| Catalent, Inc. (a) | | | 30,710 | | | | 3,294,876 | |
| Charles River Laboratories | | | | | | | | |
| International, Inc. (a) | | | 7,013 | | | | 1,500,572 | |
| Danaher Corp | | | 8,485 | | | | 2,151,117 | |
| Mettler-Toledo International, Inc. (a) | | | 1,526 | | | | 1,753,023 | |
| Perrigo Co. PLC (Ireland) | | | 62,529 | | | | 2,536,801 | |
| Thermo Fisher Scientific, Inc. | | | 3,713 | | | | 2,017,199 | |
| Zoetis, Inc. | | | 10,329 | | | | 1,775,452 | |
| | | | | | | | 16,460,663 | |
| Industrials — 12.1% | | | | | | | | |
| Capital Goods — 10.8% | | | | | | | | |
| Advanced Drainage Systems, Inc. | | | 18,254 | | | | 1,644,138 | |
| AZEK Co., Inc. (The) - Class A (a) | | | 60,174 | | | | 1,007,313 | |
| Dover Corp | | | 15,689 | | | | 1,903,389 | |
| Quanta Services, Inc. | | | 39,192 | | | | 4,912,325 | |
| Raytheon Technologies Corp | | | 39,443 | | | | 3,790,867 | |
| Roper Technologies, Inc. | | | 3,888 | | | | 1,534,399 | |
| | | | | | | | 14,792,431 | |
| Commercial & Professional Services — 1.3% | | | | | | | | |
| Jacobs Engineering Group, Inc. | | | 13,935 | | | | 1,771,557 | |
| | | | | | | | | |
| Information Technology — 19.4% | | | | | | | | |
| Semiconductors & Semiconductor Equipment — 5.4% | | | | | | | | |
| ASML Holding N.V. ADR (Netherlands) | | | 2,991 | | | | 1,423,357 | |
| Marvell Technology, Inc. (Bermuda) | | | 60,592 | | | | 2,637,570 | |
| Monolithic Power Systems, Inc. | | | 5,193 | | | | 1,994,319 | |
| NXP Semiconductors N.V. | | | | | | | | |
| (Netherlands) | | | 9,030 | | | | 1,336,711 | |
| | | | | | | | 7,391,957 | |
| Software & Services — 9.6% | | | | | | | | |
| Adobe, Inc. (a) | | | 4,353 | | | | 1,593,459 | |
| Microsoft Corp | | | 24,707 | | | | 6,345,499 | |
| ServiceNow, Inc. (a) | | | 3,579 | | | | 1,701,886 | |
| Visa, Inc. - Class A | | | 17,946 | | | | 3,533,388 | |
| | | | | | | | 13,174,232 | |
| Technology Hardware & Equipment — 4.4% | | | | | | | | |
| Apple, Inc. | | | 13,913 | | | | 1,902,185 | |
| Keysight Technologies, Inc. (a) | | | 13,710 | | | | 1,889,924 | |
| Zebra Technologies Corp. - Class A (a) | | | 7,405 | | | | 2,176,700 | |
| | | | | | | | 5,968,809 | |
See Notes to Financial Statements.
| 42 | | www.sbhfunds.com |
| Segall Bryant & Hamill All Cap Fund | Statement of Investments |
| | June 30, 2022 (Unaudited) |
| | | Shares | | | Value | |
| Materials — 4.7% | | | | | | | | |
| Materials — 4.7% | | | | | | | | |
| Avery Dennison Corp | | | 16,684 | | | $ | 2,700,639 | |
| Eastman Chemical Co | | | 20,988 | | | | 1,884,093 | |
| Franco-Nevada Corp. (Canada) | | | 13,754 | | | | 1,809,751 | |
| | | | | | | | 6,394,483 | |
| Investments at Value — 98.1% | | | | | | | | |
| (Cost $91,206,042) | | | | | | $ | 133,904,701 | |
| | | | | | | | | |
| Other Assets in Excess of Liabilities — 1.9% | | | | | | | 2,658,900 | |
| | | | | | | | | |
| Net Assets — 100.0% | | | | | | $ | 136,563,601 | |
| (a) | Non-income producing security. |
The Fund’s sector and industry classifications presented herein refer to any one or more of the industry sub-classifications used by one or more widely recognized market indexes or ratings group indexes, and/ or as defined by Fund management. For Fund compliance purposes, sector and industry classifications are based on the sector and industry categorization methodology of the Adviser to the Funds. This definition may not apply for purposes of this report, which may combine industry sub-classifications for reporting ease. Industries are shown as a percentage of net assets.
See Notes to Financial Statements.
| Semi-Annual Report | June 30, 2022 | | 43 |
| Segall Bryant & Hamill Emerging Markets Fund | Statement of Investments |
| | June 30, 2022 (Unaudited) |
| | | Shares | | | Value | |
| COMMON STOCKS — 97.4% | | | | | | | | |
| Communication Services — 10.2% | | | | | | | | |
| Media & Entertainment — 5.3% | | | | | | | | |
| 37 Interactive Entertainment Network | | | | | | | | |
| Technology (China) | | | 73,200 | | | $ | 232,853 | |
| Astro Malaysia Holdings Bhd (Malaysia) | | | 176,100 | | | | 36,159 | |
| China South Publishing & Media Group Co., Ltd. (China) (a) | | | 128,400 | | | | 181,135 | |
| DB Corp., Ltd. (India) | | | 34,419 | | | | 32,656 | |
| Jagran Prakashan, Ltd. (India) (a) | | | 43,811 | | | | 27,829 | |
| KT Skylife Co., Ltd. (South Korea) | | | 5,343 | | | | 33,972 | |
| Media Nusantara Citra Tbk P.T. (Indonesia) | | | 1,768,900 | | | | 110,917 | |
| NetDragon Websoft Holdings, Ltd. (China) | | | 88,500 | | | | 190,071 | |
| Sun TV Network, Ltd. (India) | | | 5,400 | | | | 28,291 | |
| Tencent Holdings, Ltd. (China) | | | 34,200 | | | | 1,548,046 | |
| TV Today Network, Ltd. (India) | | | 10,420 | | | | 33,772 | |
| TV18 Broadcast, Ltd. (India) (a) | | | 73,659 | | | | 36,491 | |
| Yandex N.V. - Class A (Russia) (a)(b) | | | 810 | | | | 0 | |
| | | | | | | | 2,492,192 | |
| Telecommunication Services — 4.9% | | | | | | | | |
| América Móvil S.A.B. de C.V. - Class L | | | | | | | | |
| ADR (Mexico) | | | 7,300 | | | | 149,139 | |
| APT Satellite Holdings, Ltd. (China) | | | 700,000 | | | | 190,235 | |
| China Tower Corp., Ltd. - H Shares (China) (c) | | | 3,762,000 | | | | 484,735 | |
| Emirates Telecommunications Group Co. PJSC (United Arab Emirates) | | | 9,223 | | | | 65,528 | |
| Empresa Nacional de Telecomunicaciones S.A. (Chile) | | | 10,099 | | | | 31,574 | |
| Etihad Etisalat Co. (Saudi Arabia) | | | 4,543 | | | | 42,418 | |
| Far EasTone Telecommunications Co., Ltd (Taiwan) (a) | | | 29,000 | | | | 81,600 | |
| Indus Towers, Ltd. (India) | | | 84,411 | | | | 224,383 | |
| KT Corp. ADR (South Korea) | | | 19,100 | | | | 266,636 | |
| LG Uplus Corp. (South Korea) | | | 32,991 | | | | 327,006 | |
| Mobile TeleSystems PJSC (Kuwait) | | | 41,107 | | | | 79,668 | |
| MTN Group, Ltd. (South Africa) | | | 13,754 | | | | 111,920 | |
| Ooredoo Q.P.S.C. (Qatar) | | | 35,577 | | | | 75,248 | |
| PLDT, Inc. ADR (Philippines) | | | 4,900 | | | | 149,058 | |
| Telecom Egypt Co. (Egypt) | | | 8,974 | | | | 6,605 | |
| | | | | | | | 2,285,753 | |
| Consumer Discretionary — 15.2% | | | | | | | | |
| Automobiles & Components — 4.0% | | | | | | | | |
| Astra International Tbk P.T. (Indonesia) | | | 204,800 | | | | 91,062 | |
| BAIC Motor Corp., Ltd. - H Shares (China) (a) (c) | | | 542,000 | | | | 180,490 | |
| Brilliance China Automotive Holdings, Ltd (China) (a)(b) | | | 508,000 | | | | 376,688 | |
| China Motor Corp. (Taiwan) | | | 35,000 | | | | 73,136 | |
| DTR Automotive Corp. (South Korea) | | | 1,425 | | | | 61,583 | |
| FAW Jiefang Group Co., Ltd. - Class A (China) | | | 95,088 | | | | 132,683 | |
| Kia Motors Corp. (South Korea) | | | 5,174 | | | | 311,036 | |
| Mahindra CIE Automotive, Ltd. (India) | | | 34,177 | | | | 101,412 | |
| | | Shares | | | Value | |
| Automobiles & Components (continued) | | | | | | | | |
| Oriental Holdings Bhd (Malaysia) | | | 57,000 | | | $ | 85,690 | |
| Qingling Motors Co., Ltd. - H Shares | | | | | | | | |
| (China) | | | 784,000 | | | | 131,946 | |
| Thai Stanley Electric PCL (Thailand) | | | 20,721 | | | | 105,445 | |
| Tianneng Power International, Ltd. | | | | | | | | |
| (China) | | | 88,000 | | | | 95,485 | |
| Xingda International Holdings, Ltd. | | | | | | | | |
| (China) | | | 697,292 | | | | 130,424 | |
| | | | | | | | 1,877,080 | |
| Consumer Durables & Apparel — 3.5% | | | | | | | | |
| Arvind, Ltd. (India) (a) | | | 90,351 | | | | 104,464 | |
| Best Pacific International Holdings, Ltd. (China) | | | 54,000 | | | | 13,488 | |
| China Lilang, Ltd. (China) | | | 131,084 | | | | 65,180 | |
| Gree Electric Appliances, Inc. (China) (a) | | | 67,100 | | | | 338,496 | |
| Haier Smart Home Co., Ltd. - H Shares (China) | | | 49,800 | | | | 185,351 | |
| Himatsingka Seide, Ltd. (India) | | | 39,448 | | | | 51,417 | |
| LF Corp. (South Korea) | | | 3,796 | | | | 45,780 | |
| Raymond, Ltd. (India) | | | 8,892 | | | | 99,090 | |
| Siyaram Silk Mills, Ltd. (India) (a) | | | 16,464 | | | | 106,910 | |
| Skyworth Group, Ltd. (China) | | | 424,000 | | | | 210,427 | |
| Vardhman Textiles, Ltd. (India) | | | 23,273 | | | | 78,328 | |
| Vestel Elektronik Sanayi ve Ticaret A.S. (Turkey) | | | 52,262 | | | | 74,162 | |
| Weiqiao Textile Co. - H Shares (China) | | | 688,000 | | | | 163,081 | |
| Youngone Corp. (South Korea) | | | 2,382 | | | | 71,224 | |
| Youngone Holdings Co., Ltd. (South Korea) | | | 1,443 | | | | 52,555 | |
| | | | | | | | 1,659,592 | |
| Retailing — 7.7% | | | | | | | | |
| Alibaba Group Holding, Ltd. ADR (China) (a) | | | 9,400 | | | | 1,068,592 | |
| China Harmony New Energy Auto Holding, Ltd. (China) | | | 510,000 | | | | 232,239 | |
| China Yongda Automobiles Services Holdings, Ltd. (China) | | | 122,500 | | | | 116,137 | |
| Dogus Otomotiv Servis ve Ticaret A/S (Turkey) | | | 7,279 | | | | 32,854 | |
| Eeka Fashion Holdings, Ltd. (China) | | | 140,500 | | | | 228,270 | |
| Golden Eagle Retail Group, Ltd. (China) | | | 45,626 | | | | 32,154 | |
| Halla Holdings Corp. (South Korea) | | | 1,454 | | | | 41,404 | |
| Jarir Marketing Co. (Saudi Arabia) | | | 540 | | | | 23,443 | |
| Meituan (China) (a) (c) | | | 11,000 | | | | 274,493 | |
| Naspers, Ltd. - N Shares (South Africa) | | | 1,466 | | | | 214,154 | |
| Topsports International Holdings, Ltd. (China) (c) | | | 123,000 | | | | 112,016 | |
| Truworths International, Ltd. (South Africa) | | | 8,649 | | | | 26,932 | |
| Wuchan Zhongda Group Co., Ltd. (China) (a) | | | 625,200 | | | | 479,469 | |
| Xinhua Winshare Publishing and Media Co., Ltd. - H Shares (China) | | | 326,000 | | | | 232,553 | |
| Zhongsheng Group Holdings, Ltd. (China) | | | 71,000 | | | | 501,648 | |
| | | | | | | | 3,616,358 | |
See Notes to Financial Statements.
| 44 | | www.sbhfunds.com |
| Segall Bryant & Hamill Emerging Markets Fund | Statement of Investments |
| | June 30, 2022 (Unaudited) |
| | | Shares | | | Value | |
| Consumer Staples — 5.7% | | | | | | | | |
| Food & Staples Retailing — 0.7% | | | | | | | | |
| Cencosud S.A. (Chile) | | | 92,927 | | | $ | 118,279 | |
| Grupo Comercial Chedraui S.A. de C V (Mexico) | | | 75,768 | | | | 205,064 | |
| Organizacion Soriana S.A.B. de C. V. -Class B (Mexico) | | | 23,400 | | | | 25,893 | |
| | | | | | | | 349,236 | |
| Food, Beverage & Tobacco — 5.0% | | | | | | | | |
| Almarai Co. JSC (Saudi Arabia) | | | 1,817 | | | | 25,428 | |
| Astral Foods, Ltd. (South Africa) | | | 2,165 | | | | 25,069 | |
| China Foods, Ltd. (China) | | | 220,455 | | | | 78,104 | |
| China Modern Dairy Holdings, Ltd. (China) | | | 1,373,000 | | | | 206,606 | |
| Dali Foods Group Co., Ltd. (China) (c) | | | 390,500 | | | | 207,695 | |
| Dalmia Bharat Sugar & Industries, Ltd. (India) | | | 17,582 | | | | 69,698 | |
| Eastern Co. SAE (Egypt) | | | 149,176 | | | | 81,632 | |
| Godfrey Phillips India, Ltd. (India) | | | 8,162 | | | | 109,667 | |
| Hap Seng Plantations Holdings Bhd | | | | | | | | |
| (Malaysia) | | | 46,300 | | | | 24,167 | |
| Hey Song Corp. (Taiwan) | | | 52,000 | | | | 60,891 | |
| Indofood Sukses Makmur Tbk P.T. (Indonesia) | | | 189,100 | | | | 89,363 | |
| ITC, Ltd. (India) | | | 43,792 | | | | 152,146 | |
| JBS S.A. (Brazil) | | | 30,200 | | | | 182,319 | |
| Kim Loong Resources Bhd (Malaysia) | | | 142,000 | | | | 53,495 | |
| KRBL, Ltd. (India) | | | 12,616 | | | | 34,901 | |
| Kuala Lumpur Kepong Bhd (Malaysia) (a) | | | 14,300 | | | | 71,201 | |
| Marfrig Global Foods S.A. (Brazil) | | | 41,600 | | | | 96,275 | |
| Orion Holdings Corp. (South Korea) | | | 8,965 | | | | 104,595 | |
| Perusahaan Perkebunan London Sumatra Tbk P.T. (Indonesia) | | | 401,000 | | | | 31,176 | |
| Samyang Holdings Corp. (South Korea) | | | 791 | | | | 43,705 | |
| Sarawak Oil Palms Bhd (Malaysia) | | | 20,700 | | | | 18,847 | |
| Sawit Sumbermas Sarana Tbk P.T. (Indonesia) | | | 563,800 | | | | 45,714 | |
| Sime Darby Plantation Bhd (Malaysia) | | | 23,000 | | | | 22,607 | |
| Thai Vegetable Oil PCL (Thailand) | | | 26,400 | | | | 23,555 | |
| Tongwei Group Co., Ltd. (China) | | | 35,500 | | | | 318,092 | |
| Tunas Baru Lampung Tbk P.T. (Indonesia) | | | 465,479 | | | | 24,627 | |
| VST Industries, Ltd. (India) (a) | | | 2,646 | | | | 102,454 | |
| Want Want China Holdings, Ltd. (China) | | | 56,000 | | | | 48,835 | |
| | | | | | | | 2,352,864 | |
| Energy — 4.8% | | | | | | | | |
| Energy — 4.8% | | | | | | | | |
| Bukit Asam Tbk P.T. (Indonesia) | | | 123,800 | | | | 31,716 | |
| China Coal Energy Co., Ltd. - H Shares (China) | | | 77,000 | | | | 65,064 | |
| China Petroleum & Chemical Corp. - H Shares (China) | | | 174,000 | | | | 78,403 | |
| China Shenhua Energy Co., Ltd. -Class A (China) | | | 9,300 | | | | 46,192 | |
| | | Shares | | | Value | |
| Energy (continued) | | | | | | | | |
| China Shenhua Energy Co., Ltd. -H Shares (China) | | | 56,500 | | | $ | 162,056 | |
| Coal India, Ltd. (India) | | | 85,931 | | | | 202,280 | |
| Ecopetrol S.A. ADR (Colombia) | | | 4,900 | | | | 53,214 | |
| Exxaro Resources, Ltd. (South Africa) | | | 5,442 | | | | 66,116 | |
| Gazprom PJSC ADR (Russia) (b) | | | 50,575 | | | | 0 | |
| Hindustan Petroleum Corp., Ltd. (India) | | | 35,803 | | | | 98,854 | |
| Indian Oil Corp., Ltd. (India) | | | 87,881 | | | | 82,896 | |
| Lukoil PJSC ADR (Russia) (b) | | | 2,253 | | | | 0 | |
| Oil & Natural Gas Corp., Ltd. (India) | | | 135,549 | | | | 259,549 | |
| Petroleo Brasileiro S.A. ADR (Brazil) | | | 21,600 | | | | 252,288 | |
| Polskie Gornictwo Naftowe I Gazownictwo S.A. (Poland) | | | 8,769 | | | | 11,184 | |
| PTT Exploration & Production PCL (Thailand) | | | 17,100 | | | | 77,198 | |
| PTT PCL (Thailand) | | | 69,000 | | | | 66,528 | |
| Reliance Industries, Ltd. 144A (India) (a)(c)(d) | | | 3,713 | | | | 244,076 | |
| Rosneft Oil Co. PJSC (Russia) (b) | | | 16,950 | | | | 0 | |
| Saudi Arabian Oil Co. (Saudi Arabia) | | | 10,348 | | | | 106,953 | |
| Shaanxi Coal Industry Co., Ltd. - Class A (China) | | | 46,800 | | | | 147,940 | |
| United Tractors Tbk P.T. (Indonesia) | | | 21,900 | | | | 41,728 | |
| Yanzhou Coal Mining Co., Ltd. - Class A (China) | | | 6,800 | | | | 40,068 | |
| Yanzhou Coal Mining Co., Ltd. - H Shares (China) (a) | | | 32,000 | | | | 100,105 | |
| | | | | | | | 2,234,408 | |
| Financials — 21.2% | | | | | | | | |
| Banks — 17.6% | | | | | | | | |
| Absa Group, Ltd. (South Africa) | | | 35,104 | | | | 335,171 | |
| AFFIN Bank Bhd (Malaysia) | | | 67,100 | | | | 28,650 | |
| Agricultural Bank of China, Ltd. (China) (a) | | | 76,900 | | | | 34,683 | |
| Agricultural Bank of China, Ltd. -H Shares (China) (a) | | | 304,000 | | | | 114,927 | |
| Akbank T A S (Turkey) | | | 53,792 | | | | 25,842 | |
| Alior Bank S.A. (Poland) (a) | | | 2,343 | | | | 14,341 | |
| Alliance Bank Malaysia Bhd (Malaysia) | | | 31,300 | | | | 22,599 | |
| Banco ABC Brasil S.A. (Brazil) | | | 10,100 | | | | 29,956 | |
| Banco Bradesco S.A. (Brazil) | | | 66,032 | | | | 181,463 | |
| Banco do Brasil S.A. (Brazil) | | | 64,000 | | | | 408,263 | |
| Banco Santander Mexico S A Institucion de Banca Multiple Grupo Financiero Santand ADR (Mexico) | | | 7,900 | | | | 39,856 | |
| BanColombia S.A. ADR (Colombia) | | | 2,300 | | | | 70,909 | |
| Bank Al-Jazira (Saudi Arabia) | | | 67,122 | | | | 400,542 | |
| Bank CIMB Niaga Tbk P.T. (Indonesia) | | | 1,268,900 | | | | 85,828 | |
| Bank Mandiri Tbk P.T. (Indonesia) | | | 162,200 | | | | 86,417 | |
| Bank of Baroda (India) | | | 146,341 | | | | 181,397 | |
| Bank of Beijing Co., Ltd. - Class A (China) | | | 76,300 | | | | 51,755 | |
| Bank of China, Ltd. - H Shares (China) (a) | | | 1,690,000 | | | | 675,266 | |
| Bank of Chongqing Co., Ltd. - H Shares (China) | | | 171,500 | | | | 91,674 | |
See Notes to Financial Statements.
| Semi-Annual Report | June 30, 2022 | | 45 |
| Segall Bryant & Hamill Emerging Markets Fund | Statement of Investments |
| | June 30, 2022 (Unaudited) |
| | | Shares | | | Value | |
| Banks (continued) | | | | | | | | |
| Bank of Communications Co., Ltd. (China) (a) | | | 43,400 | | | $ | 32,289 | |
| Bank of Communications Co., Ltd. -H Shares (China) | | | 349,000 | | | | 241,906 | |
| Bank of Jiangsu Co., Ltd. (China) | | | 49,000 | | | | 52,150 | |
| Bank Pembangunan Daerah Jawa Barat Dan Banten Tbk P.T. (Indonesia) | | | 980,946 | | | | 90,361 | |
| Bank Polska Kasa Opieki S A (Poland) (a) | | | 7,552 | | | | 138,226 | |
| Bank Saint Petersburg PJSC (Russia) (a)(b) | | | 136,120 | | | | 0 | |
| Banque Saudi Fransi (Saudi Arabia) | | | 2,028 | | | | 25,692 | |
| Canara Bank (India) | | | 43,828 | | | | 101,121 | |
| China Banking Corp. (Philippines) | | | 70,100 | | | | 34,273 | |
| China CITIC Bank Corp., Ltd. - H Shares (China) | | | 171,000 | | | | 76,592 | |
| China Construction Bank Corp. - H Shares (China) | | | 790,000 | | | | 532,651 | |
| China Everbright Bank Co., Ltd. - H Shares (China) | | | 528,000 | | | | 171,120 | |
| Chongqing Rural Commercial Bank Co., Ltd - H Shares (China) | | | 131,000 | | | | 47,140 | |
| Commercial Bank P S Q C (The) (Qatar) | | | 135,466 | | | | 255,123 | |
| CTBC Financial Holding Co., Ltd. (Taiwan) | | | 217,000 | | | | 183,516 | |
| Dubai Islamic Bank PJSC (United Arab Emirates) | | | 49,556 | | | | 77,824 | |
| Emirates NBD Bank PJSC (United Arab Emirates) | | | 69,754 | | | | 251,248 | |
| Faisal Islamic Bank of Egypt (Egypt) | | | 10,576 | | | | 7,003 | |
| Federal Bank, Ltd. (India) | | | 43,676 | | | | 50,110 | |
| Gulf Bank of KSCP (Kuwait) | | | 190,917 | | | | 198,655 | |
| Hana Financial Group, Inc. (South Korea) | | | 4,703 | | | | 143,971 | |
| Hong Leong Financial Group Bhd (Malaysia) | | | 7,700 | | | | 32,334 | |
| Huaxia Bank Co., Ltd. - Class A (China) | | | 40,200 | | | | 31,296 | |
| Huishang Bank Corp., Ltd. - H Shares (China) (a) | | | 75,384 | | | | 24,297 | |
| Indian Bank (India) | | | 41,510 | | | | 79,145 | |
| Industrial & Commercial Bank of China, Ltd - H Shares (China) (a) | | | 442,000 | | | | 263,715 | |
| Industrial Bank of Korea (South Korea) | | | 6,979 | | | | 52,204 | |
| Intercorp Financial Services, Inc. (Peru) | | | 1,235 | | | | 28,899 | |
| Itausa - Investimentos Itau S A (Brazil) (a) | | | 52,000 | | | | 82,879 | |
| JB Financial Group Co., Ltd. (South Korea) | | | 13,180 | | | | 75,319 | |
| Karur Vysya Bank, Ltd. (India) (a) | | | 86,299 | | | | 49,391 | |
| Kasikornbank PCL (Thailand) | | | 19,200 | | | | 82,051 | |
| Kasikornbank PCL - Foreign Shares (Thailand) | | | 24,100 | | | | 103,736 | |
| KB Financial Group, Inc. ADR (South Korea) | | | 3,500 | | | | 130,200 | |
| Kiatnakin Phatra Bank PCL (Thailand) | | | 12,600 | | | | 22,167 | |
| LIC Housing Finance, Ltd. (India) (a) | | | 5,992 | | | | 24,960 | |
| | | Shares | | | Value | |
| Banks (continued) | | | | | | | | |
| Malaysia Building Society Bhd (Malaysia) | | | 430,500 | | | $ | 56,730 | |
| National Bank of Greece S A (Greece) (a) | | | 10,707 | | | | 32,022 | |
| Nedbank Group, Ltd. (South Africa) | | | 20,896 | | | | 267,450 | |
| Philippine National Bank (Philippines) (a) | | | 71,943 | | | | 23,262 | |
| Regional S.A.B. de C.V. (Mexico) | | | 4,600 | | | | 21,754 | |
| RHB Bank Bhd (Malaysia) | | | 68,700 | | | | 89,345 | |
| Riyad Bank (Saudi Arabia) | | | 62,800 | | | | 538,895 | |
| Sberbank of Russia PJSC (Russia) (a)(b) | | | 19,830 | | | | 0 | |
| Shinhan Financial Group Co., Ltd. ADR (South Korea) | | | 4,700 | | | | 134,232 | |
| State Bank of India (India) | | | 63,534 | | | | 376,807 | |
| VTB Bank PJSC (Russia) (b) | | | 339,760,000 | | | | 0 | |
| Woori Financial Group, Inc. (South Korea) | | | 6,240 | | | | 58,832 | |
| | | | | | | | 8,272,432 | |
| Diversified Financials — 1.7% | | | | | | | | |
| Adira Dinamika Multi Finance Tbk P.T. (Indonesia) | | | 167,000 | | | | 89,752 | |
| Bajaj Holdings & Investment, Ltd. (India) | | | 790 | | | | 45,997 | |
| Bank of Greece (Greece) | | | 1,550 | | | | 24,447 | |
| China Cinda Asset Management Co., | | | | | | | | |
| Ltd (China) | | | 156,000 | | | | 24,479 | |
| China Galaxy Securities Co., Ltd. -H Shares (China) | | | 52,000 | | | | 30,082 | |
| Concentradora Hipotecaria SAPI de C V | | | | | | | | |
| (Mexico) | | | 61,600 | | | | 57,441 | |
| Gentera S.A.B. de C.V. (Mexico) | | | 54,100 | | | | 43,345 | |
| Motilal Oswal Financial Services, Ltd. (India) (a) | | | 2,319 | | | | 22,579 | |
| Power Finance Corp., Ltd. (India) | | | 86,444 | | | | 114,671 | |
| REC, Ltd. (India) | | | 128,352 | | | | 201,713 | |
| Repco Home Finance, Ltd. (India) | | | 18,085 | | | | 30,428 | |
| Shinyoung Securities Co., Ltd. (South Korea) | | | 795 | | | | 34,065 | |
| Tata Investment Corp., Ltd. (India) | | | 4,663 | | | | 79,440 | |
| Yuanta Futures Co., Ltd. (Taiwan) | | | 15,000 | | | | 23,363 | |
| | | | | | | | 821,802 | |
| Insurance — 1.9% | | | | | | | | |
| Cathay Financial Holding Co., Ltd. (Taiwan) | | | 172,000 | | | | 294,473 | |
| Central Reinsurance Co., Ltd. (Taiwan) | | | 66,000 | | | | 57,211 | |
| China Reinsurance Group Corp. - H Shares (China) (c) | | | 591,000 | | | | 48,955 | |
| Fubon Financial Holdings Co., Ltd. (Taiwan) | | | 151,370 | | | | 304,402 | |
| People’s Insurance Co. Group of China (The) - H Shares (China) | | | 166,000 | | | | 50,826 | |
| PICC Property & Casualty Co., Ltd. - H Shares (China) | | | 96,000 | | | | 100,108 | |
| Shinkong Insurance Co., Ltd. (Taiwan) | | | 19,000 | | | | 33,155 | |
| | | | | | | | 889,130 | |
See Notes to Financial Statements.
| 46 | | www.sbhfunds.com |
| Segall Bryant & Hamill Emerging Markets Fund | Statement of Investments |
| | June 30, 2022 (Unaudited) |
| | | Shares | | | Value | |
| Health Care — 3.7% | | | | | | | | |
| Health Care Equipment & Services — 1.3% | | | | | | | | |
| Bangkok Chain Hospital PCL (Thailand) | | | 379,600 | | | $ | 201,191 | |
| SD Biosensor, Inc. (South Korea) | | | 6,215 | | | | 187,602 | |
| Sinopharm Group Co., Ltd. - H Shares | | | | | | | | |
| (China) | | | 97,600 | | | | 236,299 | |
| | | | | | | | 625,092 | |
| Pharmaceuticals, Biotechnology & Life Sciences — 2.4% | | | | | | | | |
| Caplin Point Laboratories, Ltd. (India) | | | 16,426 | | | | 147,991 | |
| China Medical System Holdings, Ltd. (China) | | | 120,000 | | | | 187,079 | |
| China Shineway Pharmaceutical Group, Ltd. (China) | | | 256,000 | | | | 219,500 | |
| Consun Pharmaceutical Group, Ltd. (China) | | | 445,170 | | | | 236,944 | |
| Dawnrays Pharmaceutical Holdings, Ltd (China) | | | 152,484 | | | | 24,906 | |
| Glenmark Pharmaceuticals, Ltd. (India) | | | 4,620 | | | | 22,663 | |
| Guangzhou Baiyunshan Pharmaceutical Co., Ltd. (China) | | | 10,000 | | | | 29,311 | |
| Guangzhou Baiyunshan Pharmaceutical Holdings Co., Ltd. (China) | | | 11,800 | | | | 55,632 | |
| Indoco Remedies, Ltd. (India) | | | 5,075 | | | | 23,697 | |
| Lotus Pharmaceutical Co., Ltd. (Taiwan) | | | 6,000 | | | | 30,996 | |
| Shandong Xinhua Pharmaceutical Co., Ltd - H Shares (China) | | | 124,000 | | | | 103,098 | |
| Sun Pharmaceutical Industries, Ltd. (India) | | | 3,608 | | | | 38,004 | |
| | | | | | | | 1,119,821 | |
| Industrials — 5.6% | | | | | | | | |
| Capital Goods — 2.7% | | | | | | | | |
| ALFA S.A.B. de C V - Class A (Mexico) | | | 111,500 | | | | 79,297 | |
| Apar Industries, Ltd. (India) | | | 3,252 | | | | 38,259 | |
| Beijing Urban Construction Design & Development Group Co., Ltd. - H Shares (China) (c) | | | 81,000 | | | | 20,078 | |
| China Communications Services Corp., Ltd - H Shares (China) | | | 62,000 | | | | 27,273 | |
| China Railway Group, Ltd. - Class A (China) | | | 57,200 | | | | 52,478 | |
| China Railway Group, Ltd. - H Shares (China) | | | 112,000 | | | | 69,331 | |
| CITIC, Ltd. (China) | | | 189,000 | | | | 192,667 | |
| DMCI Holdings, Inc. (Philippines) | | | 324,700 | | | | 52,081 | |
| Ferreycorp S.A.A. (Peru) | | | 51,409 | | | | 28,378 | |
| FSP Technology, Inc. (Taiwan) | | | 16,000 | | | | 19,700 | |
| GS Holdings Corp. (South Korea) | | | 712 | | | | 23,170 | |
| Industries Qatar Q.S.C. (Qatar) | | | 38,321 | | | | 168,189 | |
| Iochpe-Maxion S.A. (Brazil) | | | 30,800 | | | | 92,470 | |
| KAP Industrial Holdings, Ltd. (South Africa) | | | 106,324 | | | | 28,834 | |
| LG Corp. (South Korea) | | | 2,318 | | | | 140,430 | |
| LT Group, Inc. (Philippines) | | | 157,600 | | | | 23,232 | |
| LX International Corp. (South Korea) | | | 1,331 | | | | 33,517 | |
| Metallurgical Corp. of China, Ltd. - H Shares (China) | | | 118,000 | | | | 28,355 | |
| | | Shares | | | Value | |
| Capital Goods (continued) | | | | | | | | |
| Nava Bharat Ventures, Ltd. (India) (a) | | | 13,015 | | | $ | 29,417 | |
| Quinenco S.A. (Chile) | | | 16,024 | | | | 39,289 | |
| Seohee Construction Co., Ltd. (South Korea) | | | 19,685 | | | | 21,415 | |
| Sinopec Engineering Group Co., Ltd. -H Shares (China) | | | 50,000 | | | | 22,944 | |
| Thoresen Thai Agencies PCL (Thailand) | | | 86,400 | | | | 21,583 | |
| | | | | | | | 1,252,387 | |
| Commercial & Professional Services — 0.2% | | | | | | | | |
| China Everbright International, Ltd. | | | | | | | | |
| (China) | | | 80,000 | | | | 47,305 | |
| Tianjin Capital Environmental Protection Group Co., Ltd. (China) | | | 72,000 | | | | 28,482 | |
| | | | | | | | 75,787 | |
| Transportation — 2.7% | | | | | | | | |
| Allcargo Logistics, Ltd. (India) | | | 13,685 | | | | 45,618 | |
| Anhui Expressway Co., Ltd. - H Shares (China) | | | 58,000 | | | | 46,868 | |
| Cia Sud Americana de Vapores S A (Chile) | | | 627,603 | | | | 56,075 | |
| COSCO SHIPPING Holdings Co., Ltd. - Class A (China) | | | 19,997 | | | | 41,603 | |
| COSCO SHIPPING Holdings Co., Ltd. - H Shares (China) | | | 85,700 | | | | 120,291 | |
| Evergreen Marine Corp. Taiwan, Ltd. (Taiwan) | | | 58,000 | | | | 164,821 | |
| HMM Co., Ltd. (South Korea) | | | 8,828 | | | | 169,282 | |
| Hyundai Glovis Co., Ltd. (South Korea) | | | 421 | | | | 58,949 | |
| Orient Overseas International, Ltd. (China) | | | 2,000 | | | | 53,286 | |
| Pan Ocean Co., Ltd. (South Korea) | | | 5,723 | | | | 26,485 | |
| Precious Shipping PCL (Thailand) | | | 62,500 | | | | 32,712 | |
| Regional Container Lines PCL (Thailand) | | | 30,100 | | | | 32,935 | |
| Shanghai International Port Group Co., Ltd (China) | | | 135,500 | | | | 118,130 | |
| Shenzhen Expressway Co., Ltd. - H Shares (China) (a) | | | 28,000 | | | | 29,091 | |
| Sinotrans, Ltd. - H Shares (China) | | | 66,000 | | | | 18,987 | |
| Tianjin Port Development Holdings, Ltd (China) | | | 320,000 | | | | 26,691 | |
| Transport Corp. of India, Ltd. (India) | | | 5,602 | | | | 48,030 | |
| VRL Logistics, Ltd. (India) | | | 5,449 | | | | 43,258 | |
| Yang Ming Marine Transport Corp. (Taiwan) | | | 47,000 | | | | 129,969 | |
| Zhejiang Expressway Co., Ltd. - H Shares (China) (a) | | | 32,000 | | | | 29,494 | |
| | | | | | | | 1,292,575 | |
| Information Technology — 18.2% | | | | | | | | |
| Semiconductors & Semiconductor Equipment — 9.1% | | | | | | | | |
| ASE Industrial Holding Co., Ltd. ADR (Taiwan) | | | 35,500 | | | | 183,535 | |
| Chipbond Technology Corp. (Taiwan) | | | 18,000 | | | | 36,016 | |
| ChipMOS Technologies, Inc. (Taiwan) | | | 30,000 | | | | 37,376 | |
| Daqo New Energy Corp. ADR (China) (a) | | | 2,500 | | | | 178,450 | |
| DB HiTek Co., Ltd. (South Korea) | | | 448 | | | | 17,479 | |
See Notes to Financial Statements.
| Semi-Annual Report | June 30, 2022 | | 47 |
| Segall Bryant & Hamill Emerging Markets Fund | Statement of Investments |
| | June 30, 2022 (Unaudited) |
| | | Shares | | | Value | |
| Semiconductors & Semiconductor Equipment (continued) | | | | | | | | |
| Greatek Electronics, Inc. (Taiwan) | | | 12,000 | | | $ | 25,224 | |
| King Yuan Electronics Co., Ltd. (Taiwan) | | | 19,000 | | | | 25,598 | |
| Kinsus Interconnect Technology Corp. (Taiwan) (a) | | | 6,000 | | | | 28,891 | |
| LX Semicon Co., Ltd. (South Korea) | | | 2,376 | | | | 177,605 | |
| Macronix International Co., Ltd. (Taiwan) | | | 20,000 | | | | 23,900 | |
| Nanya Technology Corp. (Taiwan) | | | 25,000 | | | | 41,599 | |
| Novatek Microelectronics Corp. (Taiwan) | | | 16,000 | | | | 162,756 | |
| Powerchip Semiconductor Manufacturing Corp. (Taiwan) | | | 46,000 | | | | 62,293 | |
| Powertech Technology, Inc. (Taiwan) | | | 49,000 | | | | 144,788 | |
| Radiant Opto-Electronics Corp. (Taiwan) | | | 10,000 | | | | 29,197 | |
| Sigurd Microelectronics Corp. (Taiwan) | | | 15,000 | | | | 26,243 | |
| SIMMTECH Co., Ltd. (South Korea) | | | 634 | | | | 18,307 | |
| SK Hynix, Inc. (South Korea) | | | 4,284 | | | | 304,689 | |
| Taiwan Semiconductor Manufacturing Co., Ltd. ADR (Taiwan) | | | 28,900 | | | | 2,362,575 | |
| Taiwan Surface Mounting Technology Corp. (Taiwan) (a) | | | 7,000 | | | | 21,337 | |
| United Microelectronics Corp. (Taiwan) | | | 219,000 | | | | 292,680 | |
| Vanguard International Semiconductor Corp. (Taiwan) (a) | | | 19,000 | | | | 49,417 | |
| Windbond Electronics Corp. (Taiwan) | | | 75,000 | | | | 54,865 | |
| | | | | | | | 4,304,820 | |
| Software & Services — 1.5% | | | | | | | | |
| Digital China Holdings, Ltd. (China) (a) | | | 73,000 | | | | 36,304 | |
| eClerx Services, Ltd. (India) | | | 8,879 | | | | 216,962 | |
| Hinduja Global Solutions, Ltd. (India) | | | 17,150 | | | | 232,391 | |
| Oracle Financial Services Software, Ltd. (India) | | | 3,896 | | | | 153,342 | |
| Tech Mahindra, Ltd. (India) | | | 5,351 | | | | 68,073 | |
| | | | | | | | 707,072 | |
| Technology Hardware & Equipment — 7.6% | | | | | | | | |
| Apex International Co., Ltd. (Taiwan) (a) | | | 9,000 | | | | 20,966 | |
| Asia Vital Components Co., Ltd. (Taiwan) (a) | | | 7,000 | | | | 21,956 | |
| ASUSTek Computer, Inc. (Taiwan) | | | 19,000 | | | | 198,674 | |
| BenQ Materials Corp. (Taiwan) (a) | | | 28,000 | | | | 29,665 | |
| Cheng Uei Precision Industry Co., Ltd. (Taiwan) | | | 77,000 | | | | 85,663 | |
| Chicony Electronics Co., Ltd. (Taiwan) | | | 10,000 | | | | 24,924 | |
| China Railway Signal & Communication Corp., Ltd. - H Shares (China) (c) | | | 136,000 | | | | 45,441 | |
| Compeq Manufacturing Co., Ltd. (Taiwan) | | | 32,000 | | | | 46,771 | |
| Coretronic Corp. (Taiwan) | | | 11,000 | | | | 18,636 | |
| Gigabyte Technology Co., Ltd. (Taiwan) | | | 10,000 | | | | 29,868 | |
| Hannstar Board Corp. (Taiwan) (a) | | | 19,000 | | | | 20,262 | |
| Innodisk Corp. (Taiwan) | | | 4,000 | | | | 21,953 | |
| Intops Co., Ltd. (South Korea) | | | 1,013 | | | | 20,514 | |
| Kingboard Holdings, Ltd. (China) | | | 43,500 | | | | 164,960 | |
| Korea Circuit Co., Ltd. (South Korea) (a) | | | 1,163 | | | | 17,518 | |
| | | Shares | | | Value | |
| Legend Holdings Corp. - H Shares (China) (a) (c) | | | 48,500 | | | $ | 63,826 | |
| Lenovo Group, Ltd. (China) | | | 382,000 | | | | 358,963 | |
| LG Innotek Co., Ltd. (South Korea) | | | 1,718 | | | | 458,964 | |
| Nan Ya Printed Circuit Board Corp. (Taiwan) | | | 6,000 | | | | 52,769 | |
| Partron Co., Ltd. (South Korea) | | | 3,110 | | | | 20,468 | |
| Primax Electronics, Ltd. (Taiwan) | | | 18,000 | | | | 37,451 | |
| Redington India, Ltd. (India) | | | 140,197 | | | | 223,652 | |
| Samsung Electronics Co., Ltd. | | | | | | | | |
| (South Korea) | | | 24,779 | | | | 1,100,804 | |
| Simplo Technology Co., Ltd. (Taiwan) | | | 4,000 | | | | 34,321 | |
| Supreme Electronics Co., Ltd. | | | | | | | | |
| (Taiwan) (a) | | | 17,000 | | | | 24,072 | |
| Taiwan PCB Techvest Co., Ltd. (Taiwan) | | | 32,000 | | | | 41,127 | |
| Unimicron Technology Corp. | | | | | | | | |
| (Taiwan) (a) | | | 17,000 | | | | 90,965 | |
| Wah Lee Industrial Corp. (Taiwan) | | | 7,000 | | | | 19,885 | |
| Wasion Holdings, Ltd. (China) | | | 80,000 | | | | 26,308 | |
| WT Microelectronics Co., Ltd. (Taiwan) | | | 14,000 | | | | 31,658 | |
| Yangtze Optical Fibre and Cable Joint | | | | | | | | |
| Stock, Ltd. (China) (a)(c) | | | 21,000 | | | | 36,159 | |
| Zhen Ding Technology Holdings, Ltd. | | | | | | | | |
| (Taiwan) | | | 45,000 | | | | 155,863 | |
| | | | | | | | 3,545,026 | |
| Materials — 8.3% | | | | | | | | |
| Materials — 8.3% | | | | | | | | |
| African Rainbow Minerals, Ltd. (South Africa) | | | 4,931 | | | | 64,784 | |
| Alpek S.A.B. de C V (Mexico) | | | 57,900 | | | | 80,022 | |
| Aluminum Corporation of China, Ltd. - H Shares (China) | | | 44,000 | | | | 16,540 | |
| Anhui Conch Cement Co., Ltd. - Class A (China) | | | 4,600 | | | | 24,266 | |
| Anhui Conch Cement Co., Ltd. - H Shares (China) | | | 16,000 | | | | 69,438 | |
| ArcelorMittal South Africa, Ltd. (South Africa) (a) | | | 85,380 | | | | 30,971 | |
| CAP S.A. (Chile) | | | 2,676 | | | | 24,116 | |
| Chambal Fertilisers and Chemicals, Ltd. (India) | | | 9,449 | | | | 31,947 | |
| China Hongqiao Group, Ltd. (China) | | | 38,000 | | | | 42,808 | |
| China Lumena New Materials Corp. (China) (a)(b) | | | 1,700 | | | | 0 | |
| China National Building Material Co., Ltd - H Shares (China) | | | 50,000 | | | | 53,557 | |
| Cia Siderurgica Nacional S.A. (Brazil) | | | 12,100 | | | | 35,703 | |
| Corporacion Aceros Arequipa S A (Peru) | | | 61,109 | | | | 20,942 | |
| Dongyue Group, Ltd. (China) | | | 19,000 | | | | 23,835 | |
| Eregli Demir ve Celik Fabrikalari TAS (Turkey) | | | 40,505 | | | | 65,870 | |
| Gloria Material Technology Corp. (Taiwan) | | | 39,000 | | | | 32,964 | |
| Goldsun Building Materials Co. (Taiwan) | | | 55,000 | | | | 42,270 | |
| Gujarat Narmada Valley Fertilizers & Chemicals, Ltd. (India) | | | 7,896 | | | | 57,393 | |
See Notes to Financial Statements.
| 48 | | www.sbhfunds.com |
| Segall Bryant & Hamill Emerging Markets Fund | Statement of Investments |
| | June 30, 2022 (Unaudited) |
| | | Shares | | | Value | |
| Materials (continued) | | | | | | | | |
| Hanil Holdings Co., Ltd. (South Korea) | | | 2,166 | | | $ | 18,321 | |
| Hindalco Industries, Ltd. (India) | | | 16,142 | | | | 69,614 | |
| Hindustan Zinc, Ltd. (India) | | | 18,637 | | | | 59,018 | |
| Hubei Xingfa Chemicals Group Co., Ltd. (China) | | | 5,800 | | | | 38,187 | |
| Hyundai Steel Co., Ltd. (South Korea) | | | 2,917 | | | | 72,873 | |
| Indorama Ventures PCL (Thailand) | | | 66,400 | | | | 88,614 | |
| Industrias Penoles S.A.B. de C.V. (Mexico) | | | 7,900 | | | | 73,278 | |
| Jindal Steel & Power, Ltd. (India) (a) | | | 5,619 | | | | 23,542 | |
| Kardemir Karabuk Demir Celik Sanayi ve Ticaret A S (Turkey) | | | 31,463 | | | | 21,316 | |
| Kumba Iron Ore, Ltd. (South Africa) | | | 1,928 | | | | 62,502 | |
| Kumho Petrochemical Co., Ltd. (South Korea) | | | 380 | | | | 41,166 | |
| LOTTE Fine Chemical Co., Ltd. (South Korea) | | | 423 | | | | 21,574 | |
| Luxi Chemical Group Co., Ltd. (China) (a) | | | 12,600 | | | | 32,567 | |
| Magnitogorsk Iron & Steel Works PJSC (Russia) (b) | | | 194,390 | | | | 0 | |
| NMDC, Ltd. (India) | | | 48,687 | | | | 66,929 | |
| Novolipetsk Steel PJSC (Russia) (b)(c) | | | 2,870 | | | | 0 | |
| Orbia Advance Corp. S.A.B. de C.V. (Mexico) | | | 41,900 | | | | 98,356 | |
| Petronas Chemicals Group Bhd (Malaysia) | | | 51,600 | | | | 105,394 | |
| POSCO ADR (South Korea) | | | 3,400 | | | | 151,368 | |
| PPC, Ltd. (South Africa) (a) | | | 80,869 | | | | 14,266 | |
| SABIC Agri-Nutrients Co. (Saudi Arabia) (a) | | | 3,987 | | | | 146,697 | |
| Sahara International Petrochemical Co.SJSC (Saudi Arabia) | | | 33,880 | | | | 454,402 | |
| Sasol, Ltd. (South Africa) (a) | | | 4,388 | | | | 101,179 | |
| Satellite Chemical Co., Ltd. (China) | | | 8,814 | | | | 34,058 | |
| Shandong Hualu Hengsheng Chemical Co., Ltd. (China) | | | 10,200 | | | | 44,533 | |
| Shinkong Synthetic Fibers Corp. (Taiwan) | | | 86,000 | | | | 52,522 | |
| Sibanye-Stillwater, Ltd. ADR (South Africa) | | | 16,300 | | | | 162,511 | |
| Sichuan Yahua Industrial Group Co., Ltd (China) | | | 5,100 | | | | 24,953 | |
| Ta Ann Holdings Bhd (Malaysia) | | | 37,200 | | | | 33,600 | |
| Ta Chen Stainless Pipe Co., Ltd. (Taiwan) (a) | | | 85,000 | | | | 96,734 | |
| Taiwan Hon Chuan Enterprise Co., Ltd. (Taiwan) | | | 20,000 | | | | 51,243 | |
| Tata Steel, Ltd. (India) | | | 5,522 | | | | 60,888 | |
| Tharisa PLC (South Africa) | | | 30,632 | | | | 40,292 | |
| Tongling Nonferrous Metals Group Co., Ltd (China) | | | 47,800 | | | | 23,339 | |
| UPC Technology Corp. (Taiwan) | | | 40,000 | | | | 21,108 | |
| UPL, Ltd. (India) | | | 3,878 | | | | 31,140 | |
| Vale S.A. ADR (Brazil) | | | 34,374 | | | | 502,892 | |
| Vedanta, Ltd. (India) | | | 28,782 | | | | 81,520 | |
| West China Cement, Ltd. (China) | | | 166,000 | | | | 20,999 | |
| | | Shares | | | Value | |
| Materials (continued) | | | | | | | | |
| Yunnan Aluminium Co., Ltd. (China) | | | 15,200 | | | $ | 22,409 | |
| Yunnan Tin Co., Ltd. (China) | | | 12,100 | | | | 30,348 | |
| Zijin Mining Group Co., Ltd. (China) | | | 56,000 | | | | 68,145 | |
| | | | | | | | 3,881,823 | |
| Real Estate — 1.8% | | | | | | | | |
| Real Estate — 1.8% | | | | | | | | |
| AP Thailand PCL (Thailand) | | | 91,500 | | | | 25,951 | |
| China Jinmao Holdings Group, Ltd. (China) (a) | | | 86,000 | | | | 23,179 | |
| China Overseas Grand Oceans Group, Ltd (China) | | | 166,031 | | | | 88,592 | |
| China Overseas Land & Investment, Ltd (China) | | | 17,500 | | | | 55,666 | |
| Dipula Income Fund Ltd (South Africa) | | | 129,530 | | | | 27,866 | |
| Emaar Properties PJSC (United Arab Emirates) | | | 62,302 | | | | 88,443 | |
| Farglory Land Development Co., Ltd. (Taiwan) | | | 24,000 | | | | 50,555 | |
| Gemdale Properties and Investment Corp., Ltd. (China) | | | 320,000 | | | | 28,967 | |
| Greenland Holdings Corp., Ltd. - Class A (China) | | | 58,300 | | | | 34,511 | |
| Greenland Hong Kong Holdings, Ltd. (China) | | | 164,000 | | | | 32,454 | |
| Greentown China Holdings, Ltd. (China) | | | 14,000 | | | | 29,109 | |
| Hung Ching Development & Construction Co., Ltd. (Taiwan) | | | 75,000 | | | | 60,446 | |
| Kingdom Development Co., Ltd. (Taiwan) | | | 22,000 | | | | 24,141 | |
| Korea Real Estate Investment & Trust Co., Ltd. (South Korea) | | | 14,920 | | | | 19,781 | |
| Origin Property PCL (Thailand) | | | 90,000 | | | | 25,823 | |
| Sino-Ocean Group Holding, Ltd. (China) | | | 812,500 | | | | 138,026 | |
| Supalai PCL (Thailand) | | | 44,500 | | | | 23,459 | |
| Youngor Group Co., Ltd. (China) | | | 70,700 | | | | 70,046 | |
| | | | | | | | 847,015 | |
| Utilities — 2.7% | | | | | | | | |
| Utilities — 2.7% | | | | | | | | |
| Beijing Enterprises Holdings, Ltd. (China) | | | 40,000 | | | | 142,216 | |
| Centrais Eletricas Santa Catarina (Brazil) | | | 582 | | | | 6,284 | |
| CESC, Ltd. (India) | | | 31,840 | | | | 28,797 | |
| China Everbright Water, Ltd. (China) | | | 143,700 | | | | 29,960 | |
| China Resources Power Holdings Co., Ltd (China) | | | 46,000 | | | | 95,014 | |
| China Tian Lun Gas Holdings, Ltd. (China) | | | 28,000 | | | | 17,647 | |
| China Water Affairs Group, Ltd. (China) | | | 24,000 | | | | 22,345 | |
| Datang International Power Generation Co., Ltd. - H Shares (China) | | | 180,000 | | | | 29,889 | |
| First Philippine Holdings Corp. (Philippines) | | | 21,760 | | | | 23,927 | |
| GAIL India, Ltd. (India) (c) | | | 5,275 | | | | 54,596 | |
See Notes to Financial Statements.
| Semi-Annual Report | June 30, 2022 | | 49 |
| Segall Bryant & Hamill Emerging Markets Fund | Statement of Investments |
| | June 30, 2022 (Unaudited) |
| | | Shares | | | Value | |
| Utilities (continued) | | | | | | | | |
| Huaneng Power International, Inc. - | | | | | | | | |
| H Shares (China) (a) | | | 60,000 | | | $ | 29,872 | |
| Korea Gas Corp. (South Korea) | | | 3,139 | | | | 96,651 | |
| Kunlun Energy Co., Ltd. (China) | | | 152,000 | | | | 124,646 | |
| NTPC, Ltd. (India) | | | 109,398 | | | | 198,239 | |
| OGK-2 PJSC (Russia) (b) | | | 5,740,000 | | | | 0 | |
| Power Grid Corp. of India, Ltd. (India) | | | 61,742 | | | | 166,172 | |
| Qatar Electric & Water Co. (Qatar) | | | 16,472 | | | | 79,272 | |
| Saudi Electricity Co. (Saudi Arabia) | | | 12,340 | | | | 79,828 | |
| SGC Energy Co., Ltd. (South Korea) | | | 689 | | | | 19,507 | |
| SJVN, Ltd. (India) | | | 77,130 | | | | 26,354 | |
| | | | | | | | 1,271,216 | |
| Total Common Stocks (Cost $47,010,648) | | | | | | | 45,773,842 | |
| | | | | | | | | |
| PREFERRED STOCKS — 1.4% | | | | | | | | |
| Energy — 0.6% | | | | | | | | |
| Energy — 0.6% | | | | | | | | |
| Petroleo Brasileiro S.A. ADR (Brazil) | | | 27,000 | | | | 287,010 | |
| Surgutneftegas PJSC (Russia) (b) | | | 541,500 | | | | 0 | |
| | | | | | | | 287,010 | |
| Information Technology — 0.4% | | | | | | | | |
| Technology Hardware & Equipment — 0.4% | | | | | | | | |
| Samsung Electronics Co., Ltd. (South Korea) | | | 4,440 | | | | 179,752 | |
| | | | | | | | | |
| Materials — 0.3% | | | | | | | | |
| Materials — 0.3% | | | | | | | | |
| Gerdau S.A. (Brazil) | | | 27,100 | | | | 115,957 | |
| Usinas Siderurgicas de Minas Gerais S.A. Usiminas (Brazil) | | | 9,600 | | | | 15,869 | |
| | | | | | | | 131,826 | |
| Utilities — 0.1% | | | | | | | | |
| Utilities — 0.1% | | | | | | | | |
| Cia de Saneamento do Parana (Brazil) | | | 60,000 | | | | 42,999 | |
| Total Preferred Stocks (Cost $853,079) | | | | | | | 641,587 | |
| | | | | | | | | |
| WARRANTS — 0.0% (e) | | | | | | | | |
| Real Estate — 0.0% (e) | | | | | | | | |
| Real Estate — 0.0% (e) | | | | | | | | |
| Noble Development PCL (Thailand) (a) (Cost $0) | | | 14,775 | | | | 213 | |
| | | | | | | | | |
| | | Shares | | | Value | |
| Investments at Value — 98.8% | | | | | | | | |
| (Cost $47,863,727) | | | | | | $ | 46,415,642 | |
| | | | | | | | | |
| Other Assets in Excess of Liabilities — 1.2% | | | | | | | 563,559 | |
| | | | | | | | | |
| Net Assets — 100.0% | | | | | | $ | 46,979,201 | |
| (a) | Non-income producing security. |
| (b) | Level 3 securities fair value under procedures established by the Board of Trustees, represents 0.8% of net assets. The total value of these securities is $376,688. |
| (c) | Security is considered a restricted security however such restriction has not resulted in an illiquid classification. The total value of these securities is $1,772,560, which represents 3.8% of net assets as of June 30, 2022. |
| (d) | Security was purchased in a transaction exempt from registration in compliance with Rule 144A of the Securities Act of 1933. This security may be resold in transactions exempt from registration, normally to qualified institutional buyers. The total value of these securities is $244,076, which represents 0.5% of net assets as of June 30, 2022. |
| (e) | Percentage rounds to less than 0.1%. |
The Fund’s sector and industry classifications presented herein refer to any one or more of the industry sub-classifications used by one or more widely recognized market indexes or ratings group indexes, and/ or as defined by Fund management. For Fund compliance purposes, sector and industry classifications are based on the sector and industry categorization methodology of the Adviser to the Funds. This definition may not apply for purposes of this report, which may combine industry sub-classifications for reporting ease. Industries are shown as a percentage of net assets.
See Notes to Financial Statements.
| 50 | | www.sbhfunds.com |
| Segall Bryant & Hamill Emerging Markets Fund | Statement of Investments |
| | June 30, 2022 (Unaudited) |
| | | | | | % of Net | |
| Country | | Value | | | Assets | |
| China | | $ | 16,862,111 | | | | 35.9 | % |
| Taiwan | | | 6,504,955 | | | | 13.8 | % |
| India | | | 5,926,829 | | | | 12.6 | % |
| South Korea | | | 5,406,510 | | | | 11.5 | % |
| Brazil | | | 2,332,627 | | | | 5.0 | % |
| Saudi Arabia | | | 1,844,298 | | | | 3.9 | % |
| South Africa | | | 1,580,017 | | | | 3.4 | % |
| Thailand | | | 933,161 | | | | 2.0 | % |
| Mexico | | | 873,445 | | | | 1.9 | % |
| Indonesia | | | 818,661 | | | | 1.7 | % |
| Malaysia | | | 680,818 | | | | 1.4 | % |
| Qatar | | | 577,832 | | | | 1.2 | % |
| United Arab Emirates | | | 483,043 | | | | 1.0 | % |
| Philippines | | | 305,833 | | | | 0.7 | % |
| Kuwait | | | 278,323 | | | | 0.6 | % |
| Chile | | | 269,333 | | | | 0.6 | % |
| Turkey | | | 220,044 | | | | 0.5 | % |
| Poland | | | 163,751 | | | | 0.3 | % |
| Colombia | | | 124,123 | | | | 0.3 | % |
| Egypt | | | 95,240 | | | | 0.2 | % |
| Peru | | | 78,219 | | | | 0.2 | % |
| Greece | | | 56,469 | | | | 0.1 | % |
| Russia | | | 0 | | | | 0.0 | % |
| Total Investments | | $ | 46,415,642 | | | | 98.8 | % |
| Other Assets in Excess of Liabilities | | | 563,559 | | | | 1.2 | % |
| Net Assets | | $ | 46,979,201 | | | | 100.0 | % |
See Notes to Financial Statements.
| Semi-Annual Report | June 30, 2022 | | 51 |
| Segall Bryant & Hamill International Small Cap Fund | Statement of Investments |
| | June 30, 2022 (Unaudited) |
| | | Shares | | | Value | |
| COMMON STOCKS — 98.7% | | | | | | | | |
| Communication Services — 4.3% | | | | | | | | |
| Media & Entertainment — 2.5% | | | | | | | | |
| Arnoldo Mondadori Editore SpA (Italy) | | | 39,840 | | | $ | 71,483 | |
| Better Collective A/S (Sweden) (a) | | | 18,207 | | | | 243,483 | |
| ITV PLC (United Kingdom) | | | 807,549 | | | | 644,864 | |
| Mediaset Espana Comunicacion S A (Spain) (a) | | | 13,356 | | | | 55,036 | |
| MFE-MediaForEurope N.V. (Italy) (a) | | | 141,571 | | | | 64,954 | |
| Nine Entertainment Co. Holdings, Ltd. (Australia) | | | 92,093 | | | | 116,510 | |
| Nippon Television Holdings, Inc. (Japan) | | | 35,200 | | | | 313,197 | |
| Perion Network, Ltd. (Israel) (a) | | | 3,115 | | | | 57,213 | |
| Seven West Media, Ltd. (Australia) (a) | | | 141,401 | | | | 40,018 | |
| SKY Perfect JSAT Holdings, Inc. (Japan) | | | 47,800 | | | | 190,090 | |
| Telenet Group Holding N.V. (Belgium) | | | 2,502 | | | | 51,976 | |
| Television Francaise 1 (France) | | | 139,215 | | | | 987,344 | |
| | | | | | | | 2,836,168 | |
| Telecommunication Services — 1.8% | | | | | | | | |
| Airtel Africa PLC (United Kingdom) | | | 403,957 | | | | 671,063 | |
| Bezeq The Israeli Telecommunication Corp., Ltd. (Israel) | | | 350,094 | | | | 545,747 | |
| Millicom International Cellular S A (Sweden) (a) | | | 36,059 | | | | 516,753 | |
| Telekom Austria A.G. (Austria) (a) | | | 43,321 | | | | 288,202 | |
| | | | | | | | 2,021,765 | |
| Consumer Discretionary — 12.0% | | | | | | | | |
| Automobiles & Components — 1.9% | | | | | | | | |
| Exedy Corp. (Japan) | | | 33,700 | | | | 427,470 | |
| G-Tekt Corp. (Japan) | | | 16,300 | | | | 153,062 | |
| NGK Spark Plug Co., Ltd. (Japan) | | | 32,900 | | | | 596,747 | |
| Schaeffler A.G. - Preferred Shares (Germany) | | | 58,213 | | | | 330,767 | |
| TPR Co., Ltd. (Japan) | | | 40,400 | | | | 357,075 | |
| Trigano S.A. (France) | | | 2,894 | | | | 284,689 | |
| | | | | | | | 2,149,810 | |
| Consumer Durables & Apparel — 5.3% | | | | | | | | |
| Bellway PLC (United Kingdom) | | | 26,498 | | | | 696,678 | |
| Cairn Homes PLC (Ireland) | | | 271,446 | | | | 282,964 | |
| Cleanup Corp. (Japan) | | | 15,900 | | | | 67,189 | |
| Globeride, Inc. (Japan) (a) | | | 21,600 | | | | 339,650 | |
| Neinor Homes S.A. (Spain) (a)(b) | | | 30,064 | | | | 377,426 | |
| New Wave Group AB - B (Sweden) | | | 10,239 | | | | 136,907 | |
| Redrow PLC (United Kingdom) | | | 189,603 | | | | 1,131,962 | |
| SANKYO Co., Ltd. (Japan) | | | 21,000 | | | | 635,227 | |
| Sumitomo Forestry Co., Ltd. (Japan) | | | 38,100 | | | | 541,805 | |
| Tamron Co., Ltd. (Japan) | | | 5,000 | | | | 92,654 | |
| Texhong Textile Group, Ltd. (Hong Kong) | | | 638,000 | | | | 674,668 | |
| Vistry Group PLC (United Kingdom) | | | 101,471 | | | | 1,033,490 | |
| | | | | | | | 6,010,620 | |
| Consumer Services —1.1% | | | | | | | | |
| AcadeMedia A.B. (Sweden) (b) | | | 130,218 | | | | 580,166 | |
| Betsson AB (Sweden) (a) | | | 109,724 | | | | 663,465 | |
| Riso Kyoiku Co., Ltd. (Japan) (a) | | | 23,400 | | | | 55,030 | |
| | | | | | | | 1,298,661 | |
| | | Shares | | | Value | |
| Retailing — 3.7% | | | | | | |
| CECONOMY A.G. (Germany) | | | 69,219 | | | $ | 194,009 | |
| Delek Automotive Systems, Ltd. (Israel) | | | 42,912 | | | | 468,584 | |
| FNAC Darty S.A. (France) | | | 11,109 | | | | 472,440 | |
| Harvey Norman Holdings, Ltd. (Australia) | | | 190,674 | | | | 489,027 | |
| IDOM, Inc. (Japan) | | | 106,500 | | | | 587,586 | |
| K’s Holdings Corp. (Japan) | | | 15,700 | | | | 153,265 | |
| Nick Scali, Ltd. (Australia) | | | 15,978 | | | | 91,133 | |
| Super Retail Group, Ltd. (Australia) | | | 105,165 | | | | 617,874 | |
| VT Holdings Co., Ltd. (Japan) | | | 116,894 | | | | 414,992 | |
| Warehouse Group, Ltd. (The) (New Zealand) | | | 71,556 | | | | 151,049 | |
| XEBIO Holdings Co., Ltd. (Japan) | | | 55,600 | | | | 379,844 | |
| Yamada-Denki Co., Ltd. (Japan) | | | 56,500 | | | | 203,167 | |
| | | | | | | | 4,222,970 | |
| Consumer Staples — 6.5% | | | | | | | | |
| Food & Staples Retailing — 2.8% | | | | | | | | |
| GrainCorp, Ltd. (Australia) | | | 158,852 | | | | 1,046,244 | |
| Halows Co., Ltd. (Japan) (a) | | | 10,200 | | | | 227,635 | |
| Marks & Spencer Group PLC (United Kingdom) (a) | | | 444,072 | | | | 736,713 | |
| Mitsubishi Shokuhin Co., Ltd. (Japan) | | | 21,819 | | | | 609,330 | |
| Qol Holdings Co., Ltd. (Japan) | | | 33,847 | | | | 351,578 | |
| Sonae SGPS S.A. (Portugal) | | | 90,547 | | | | 111,074 | |
| | | | | | | | 3,082,574 | |
| Food, Beverage & Tobacco — 3.7% | | | | | | | | |
| Agrana Beteiligungs A.G. (Austria) (a) | | | 534 | | | | 9,511 | |
| Bakkavor Group PLC (United Kingdom) (b) | | | 84,642 | | | | 96,026 | |
| Bonduelle SCA (France) | | | 3,451 | | | | 56,257 | |
| Bumitama Agri, Ltd. (Singapore) | | | 144,400 | | | | 69,187 | |
| First Pacific Co. (Hong Kong) | | | 978,000 | | | | 380,149 | |
| Golden Agri-Resources, Ltd. (Singapore) | | | 2,175,700 | | | | 391,479 | |
| Itoham Yonekyu Holdings, Inc. (Japan) | | | 118,600 | | | | 604,076 | |
| Mitsui DM Sugar Holdings Co., Ltd. (Japan) | | | 28,618 | | | | 402,365 | |
| Nippon Suisan Kaisha, Ltd. (Japan) (a) | | | 70,000 | | | | 295,600 | |
| S Foods, Inc. (Japan) | | | 23,900 | | | | 550,872 | |
| Scandinavian Tobacco Group A/S (Denmark) (b) | | | 64,090 | | | | 1,256,299 | |
| Starzen Co., Ltd. (Japan) | | | 11,605 | | | | 170,337 | |
| | | | | | | | 4,282,158 | |
| Household & Personal Products — 0.0% (c) | | | | | | | | |
| Best World International, Ltd. (Singapore) (a)(d) | | | 88,900 | | | | 0 | |
| | | | | | | | | |
| Energy — 2.9% | | | | | | | | |
| Energy — 2.9% | | | | | | | | |
| Cosmo Energy Holdings Co., Ltd. (Japan) | | | 35,500 | | | | 978,844 | |
| CropEnergies A.G. (Germany) | | | 30,343 | | | | 404,683 | |
| DNO A S.A. (Norway) | | | 268,533 | | | | 372,755 | |
| New Hope Corp., Ltd. (Australia) | | | 271,605 | | | | 652,895 | |
| Oil Refineries, Ltd. (Israel) | | | 573,467 | | | | 206,075 | |
| Serica Energy PLC (United Kingdom) | | | 84,350 | | | | 292,297 | |
| Whitehaven Coal, Ltd. (Australia) | | | 130,109 | | | | 437,302 | |
| | | | | | | | 3,344,851 | |
See Notes to Financial Statements.
| 52 | | www.sbhfunds.com |
| Segall Bryant & Hamill International Small Cap Fund | Statement of Investments |
| | June 30, 2022 (Unaudited) |
| | | Shares | | | Value | |
| Financials — 10.9% | | | | | | | | |
| Banks — 6.3% | | | | | | | | |
| Banco de Sbadell S.A. (Spain) | | | 121,485 | | | $ | 97,383 | |
| Bank of Georgia Group PLC (United Kingdom) | | | 45,369 | | | | 721,256 | |
| Bank of Ireland Group PLC (Ireland) | | | 66,198 | | | | 418,298 | |
| Bank of Saga, Ltd. (The) (Japan) | | | 12,100 | | | | 131,480 | |
| BAWAG Group A.G. (Austria) (a)(b) | | | 13,993 | | | | 590,550 | |
| Genworth Mortgage Insurance Australia, Ltd. (Australia) | | | 580,337 | | | | 923,526 | |
| Keiyo Bank, Ltd. (The) (Japan) | | | 129,900 | | | | 456,975 | |
| Mebuki Financial Group, Inc. (Japan) | | | 262,400 | | | | 517,475 | |
| Nishi-Nippon Financial Holdings, Inc. | | | | | | | | |
| (Japan) | | | 81,300 | | | | 449,872 | |
| OSB Group PLC (United Kingdom) | | | 123,383 | | | | 725,104 | |
| Spar Nord Bank A/S (Denmark) | | | 40,672 | | | | 431,873 | |
| Sydbank A/S (Denmark) | | | 8,816 | | | | 271,358 | |
| TBC Bank Group PLC (United Kingdom) | | | 32,713 | | | | 503,477 | |
| Virgin Money UK PLC (United Kingdom) | | | 421,286 | | | | 675,020 | |
| Yamaguchi Financial Group, Inc. (Japan) | | | 58,200 | | | | 319,630 | |
| | | | | | | | 7,233,276 | |
| Diversified Financials — 2.5% | | | | | | | | |
| Banca IFIS S.p.A. (Italy) | | | 35,326 | | | | 500,004 | |
| Fuyo General Lease Co., Ltd. (Japan) | | | 3,600 | | | | 204,267 | |
| Insignia Financial, Ltd. (Australia) | | | 69,028 | | | | 128,665 | |
| Leonteq A.G. (Switzerland) | | | 9,128 | | | | 507,925 | |
| Ninety One PLC (United Kingdom) (a) | | | 5,602 | | | | 13,481 | |
| Resurs Holding A.B. (Sweden) (b) | | | 243,662 | | | | 484,660 | |
| Sun Hung Kai & Co., Ltd. (Hong Kong) | | | 751,424 | | | | 351,441 | |
| Tokai Tokyo Financial Holdings, Inc. (Japan) | | | 167,600 | | | | 457,398 | |
| Yangzijiang Financial Holding Pte, Ltd. (Singapore) (a) | | | 580,700 | | | | 171,358 | |
| | | | | | | | 2,819,199 | |
| Insurance — 2.1% | | | | | | | | |
| ASR Nederland N.V. (Netherlands) | | | 20,803 | | | | 838,489 | |
| Coface S.A. (France) | | | 10,524 | | | | 110,515 | |
| Mapfre S.A. (Spain) | | | 106,870 | | | | 188,934 | |
| Phoenix Holdings, Ltd. (The) (Israel) | | | 64,389 | | | | 639,396 | |
| Unipol Gruppo S.p.A. (Italy) | | | 135,765 | | | | 618,242 | |
| | | | | | | | 2,395,576 | |
| Health Care — 6.6% | | | | | | | | |
| Health Care Equipment & Services — 5.3% | | | | | | | | |
| Ambea A.B. (Sweden) (b) | | | 41,641 | | | | 190,491 | |
| BML, Inc. (Japan) | | | 23,500 | | | | 610,953 | |
| Coltene Holding A.G. (Switzerland) (a) | | | 2,213 | | | | 190,852 | |
| Craneware PLC (United Kingdom) | | | 19,845 | | | | 444,484 | |
| Galenica A.G. (Switzerland) (b) | | | 13,616 | | | | 1,047,465 | |
| Getinge A.B. - B Shares (Sweden) | | | 34,946 | | | | 809,868 | |
| Guerbet (France) (a) | | | 4,052 | | | | 94,455 | |
| Healius, Ltd. (Australia) | | | 278,443 | | | | 706,099 | |
| Ion Beam Applications S.A. (Belgium) | | | 3,717 | | | | 60,593 | |
| Japan Lifeline Co., Ltd. (Japan) (a) | | | 80,000 | | | | 539,921 | |
| Mediclinic International PLC (United Kingdom) (a) | | | 165,898 | | | | 928,378 | |
| | | Shares | | | Value | |
| Health Care Equipment & Services (continued) | | | | | | | | |
| Medipal Holdings Corp. (Japan) | | | 9,300 | | | $ | 131,181 | |
| Metall Zug A.G. (Switzerland) | | | 45 | | | | 90,036 | |
| Oriola OYJ (Finland) | | | 115,041 | | | | 228,847 | |
| | | | | | | | 6,073,623 | |
| Pharmaceuticals, Biotechnology & Life Sciences — 1.3% | | | | | | | | |
| Alliance Pharma PLC (United Kingdom) | | | 106,674 | | | | 148,290 | |
| Boiron S.A. (France) | | | 5,279 | | | | 227,862 | |
| Dermapharm Holding S E (Germany) | | | 10,308 | | | | 513,544 | |
| Towa Pharmaceutical Co., Ltd. (Japan) | | | 33,973 | | | | 616,653 | |
| | | | | | | | 1,506,349 | |
| Industrials — 21.9% | | | | | | | | |
| Capital Goods — 13.2% | | | | | | | | |
| Andritz A.G. (Austria) | | | 8,032 | | | | 324,135 | |
| Bobst Group S.A. (Switzerland) | | | 7,976 | | | | 513,323 | |
| Danieli & C Officine Meccaniche S p A (Italy) | | | 42,763 | | | | 602,522 | |
| Fletcher Building, Ltd. (New Zealand) | | | 203,031 | | | | 637,404 | |
| Hanwa Co., Ltd. (Japan) | | | 18,100 | | | | 377,809 | |
| Hochtief A.G. (Germany) | | | 8,058 | | | | 394,927 | |
| IDEC Corp. (Japan) (a) | | | 24,200 | | | | 499,758 | |
| Inwido A.B. (Sweden) | | | 30,854 | | | | 340,104 | |
| Keller Group PLC (United Kingdom) | | | 54,533 | | | | 480,913 | |
| Kloeckner & Co. S.E. (Germany) | | | 84,008 | | | | 645,672 | |
| Koninklijke BAM Groep N.V. (Netherlands) (a) | | | 207,224 | | | | 488,609 | |
| Kumagai Gumi Co., Ltd. (Japan) | | | 11,500 | | | | 232,851 | |
| Leonardo S.p.A. (Italy) | | | 69,703 | | | | 707,003 | |
| Manitou BF S.A. (France) | | | 7,262 | | | | 135,556 | |
| Morgan Sindall Group PLC (United Kingdom) | | | 37,001 | | | | 820,545 | |
| NCC A.B. (Sweden) | | | 32,692 | | | | 329,951 | |
| Nippon Steel Trading Corp. (Japan) | | | 13,200 | | | | 494,824 | |
| Noritake Co., Ltd./Nagoya Japan (Japan) | | | 18,900 | | | | 562,327 | |
| Noritsu Koki Co., Ltd. (Japan) (a) | | | 11,900 | | | | 201,469 | |
| NRW Holdings, Ltd. (Australia) | | | 746,195 | | | | 875,804 | |
| Porr A.G. (Austria) | | | 4,537 | | | | 58,705 | |
| Rexel S.A. (France) | | | 38,480 | | | | 594,434 | |
| Sodick Co., Ltd. (Japan) | | | 120,900 | | | | 725,388 | |
| Sojitz Corp. (Japan) | | | 50,800 | | | | 719,992 | |
| Star Micronics Co., Ltd. (Japan) | | | 56,100 | | | | 671,048 | |
| Sulzer A.G. (Switzerland) | | | 8,906 | | | | 555,143 | |
| Takamatsu Construction Group Co., | | | | | | | | |
| Ltd. (Japan) | | | 19,200 | | | | 291,771 | |
| TOA Corp. (Japan) | | | 16,080 | | | | 294,017 | |
| Tsubakimoto Chain Co. (Japan) | | | 29,887 | | | | 669,758 | |
| Yangzijiang Shipbuildings Holdings, Ltd. | | | | | | | | |
| (Singapore) | | | 794,200 | | | | 531,777 | |
| Yurtec Corp. (Japan) | | | 51,400 | | | | 279,215 | |
| Zumtobel Group A.G. (Austria) | | | 11,293 | | | | 83,478 | |
| | | | | | | | 15,140,232 | |
| Commercial & Professional Services — 2.9% | | | | | | | | |
| Bilfinger S.E. (Germany) | | | 9,736 | | | | 286,057 | |
| Derichebourg S.A. (France) | | | 85,140 | | | | 494,523 | |
| Elis S.A. (France) | | | 37,574 | | | | 502,620 | |
See Notes to Financial Statements.
| Semi-Annual Report | June 30, 2022 | | 53 |
| Segall Bryant & Hamill International Small Cap Fund | Statement of Investments |
| | June 30, 2022 (Unaudited) |
| | | Shares | | | Value | |
| Commercial & Professional Services (continued) | | | | | | | | |
| Loomi S.A.B. (Sweden) | | | 20,955 | | | $ | 511,845 | |
| McMillan Shakespeare, Ltd. (Australia) | | | 29,637 | | | | 199,357 | |
| PageGroup PLC (United Kingdom) | | | 133,604 | | | | 654,378 | |
| Renewi PLC (United Kingdom) (a) | | | 62,542 | | | | 550,424 | |
| Societe BIC S.A. (France) | | | 1,895 | | | | 103,950 | |
| | | | | | | | 3,303,154 | |
| Transportation — 5.8% | | | | | | | | |
| bpost S.A. (Belgium) | | | 34,013 | | | | 201,492 | |
| D/S Norden A/S (Denmark) | | | 18,637 | | | | 649,244 | |
| FirstGroup PLC (United Kingdom) (a) | | | 336,093 | | | | 522,899 | |
| Golden Ocean Group, Ltd. (Norway) | | | 64,497 | | | | 762,672 | |
| Hamakyorex Co., Ltd. (Japan) | | | 10,000 | | | | 211,549 | |
| Kawasaki Kisen Kaisha, Ltd. (Japan) | | | 6,100 | | | | 373,230 | |
| Konoike Transport Co., Ltd. (Japan) (a) | | | 24,000 | | | | 224,367 | |
| Maruzen Showa Unyu Co., Ltd. (Japan) (a) | | | 9,700 | | | | 218,030 | |
| Mitsui OSK Lines, Ltd. (Japan) | | | 18,900 | | | | 434,754 | |
| Mitsui-Soko Holdings Co., Ltd. (Japan) | | | 9,900 | | | | 210,212 | |
| MPC Container Ships A/S (Norway) | | | 142,867 | | | | 284,974 | |
| Pacific Basin Shipping, Ltd. (Hong Kong) | | | 1,447,000 | | | | 556,300 | |
| Redde Northgate PLC (United Kingdom) | | | 220,559 | | | | 905,987 | |
| Stolt-Nielsen, Ltd. (Norway) | | | 11,597 | | | | 245,749 | |
Wallenius Wilhelmsen A.S.A. (Norway) | | | 85,157 | | | | 462,393 | |
| ZIM Integrated Shipping Services, Ltd. (Israel) | | | 6,900 | | | | 325,887 | |
| | | | | | | | 6,589,739 | |
| Information Technology — 9.6% | | | | | | | | |
| Semiconductors & Semiconductor Equipment — 2.7% | | | | | | | | |
| ASM Pacific Technology, Ltd. | | | | | | | | |
| (Hong Kong) | | | 7,000 | | | | 59,578 | |
| Elmos Semiconductor A.G. (Germany) | | | 9,922 | | | | 380,894 | |
| Ferrotec Holdings Corp. (Japan) | | | 20,500 | | | | 392,417 | |
| Micronics Japan Co., Ltd. (Japan) | | | 61,100 | | | | 561,129 | |
| Shinko Electric Industries Co., Ltd. (Japan) (a) | | | 3,500 | | | | 90,391 | |
| Tokyo Seimitsu Co., Ltd. (Japan) | | | 14,400 | | | | 474,624 | |
| u-blox Holding A.G. (Switzerland) (a) | | | 11,198 | | | | 1,136,878 | |
| | | | | | | | 3,095,911 | |
| Software & Services — 4.3% | | | | | | | | |
| Bravura Solutions, Ltd. (Australia) | | | 129,817 | | | | 126,985 | |
| Computacenter PLC (United Kingdom) | | | 39,521 | | | | 1,131,741 | |
| Econocom Group S.A./N.V. (Belgium) | | | 167,699 | | | | 586,254 | |
| Formula Systems (1985), Ltd. (Israel) | | | 2,319 | | | | 210,359 | |
| Indra Sistemas S.A. (Spain) (a) | | | 52,851 | | | | 505,992 | |
| Iress, Ltd. (Australia) | | | 48,578 | | | | 386,058 | |
| Know IT A.B. (Sweden) | | | 13,070 | | | | 365,713 | |
| Malam - Team, Ltd. (Israel) | | | 2,378 | | | | 51,123 | |
| Micro Focus International PLC (United Kingdom) | | | 131,164 | | | | 446,315 | |
| TietoEVRY OYJ (Finland) | | | 31,890 | | | | 790,198 | |
| transcosmos, inc. (Japan) | | | 11,600 | | | | 299,296 | |
| | | | | | | | 4,900,034 | |
| Technology Hardware & Equipment — 2.6% | | | | | | | | |
| Citizen Watch Co., Ltd. (Japan) | | | 77,300 | | | | 314,441 | |
| Comet Holdings A.G. (Switzerland) | | | 2,571 | | | | 405,384 | |
| Hakuto Co., Ltd. (Japan) | | | 12,700 | | | | 237,266 | |
| | | Shares | | | Value | |
| Technology Hardware & Equipment (continued) | | | | | | | | |
| Ituran Location and Control, Ltd. (Israel) | | | 25,623 | | | $ | 627,507 | |
| Kaga Electronics Co., Ltd. (Japan) | | | 9,100 | | | | 203,485 | |
| Macnica Fuji Electronics Holdings, Inc. | | | | | | | | |
| (Japan) | | | 14,400 | | | | 277,749 | |
| Nippon Electric Glass Co., Ltd. (Japan) | | | 42,500 | | | | 813,933 | |
| | | | | | | | 2,879,765 | |
| Materials — 9.5% | | | | | | | | |
| Materials — 9.5% | | | | | | | | |
| Acerinox S.A. (Spain) (a) | | | 53,054 | | | | 514,990 | |
| Allkem Ltd (Australia) (a) | | | 25,220 | | | | 180,429 | |
| Atalaya Mining PLC (United Kingdom) | | | 149,068 | | | | 585,196 | |
| Champion Iron, Ltd. (Australia) | | | 12,762 | | | | 47,721 | |
| Coronado Global Resources, Inc. (Australia) (b) | | | 750,975 | | | | 864,954 | |
| Daiken Corp. (Japan) | | | 38,800 | | | | 525,407 | |
| Dowa Holdings Company, Ltd. (Japan) (a) | | | 8,700 | | | | 288,017 | |
| Elkem A.S.A. (Norway) (b) | | | 166,500 | | | | 534,813 | |
| Grange Resources, Ltd. (Australia) | | | 709,461 | | | | 621,115 | |
| Incitec Pivot, Ltd. (Australia) | | | 444,687 | | | | 1,023,607 | |
| K+S A.G. (Germany) | | | 23,981 | | | | 583,490 | |
| KANTO DENKA KOGYO Co., Ltd. (Japan) | | | 69,700 | | | | 454,608 | |
| KH Neochem Co., Ltd. (Japan) | | | 30,342 | | | | 556,345 | |
| Mitsui Mining & Smelting Co., Ltd. (Japan) | | | 11,400 | | | | 265,854 | |
| Nittetsu Mining Co., Ltd. (Japan) (a) | | | 5,200 | | | | 196,810 | |
| OCI N.V. (Netherlands) | | | 13,025 | | | | 428,351 | |
| Outokumpu OYJ (Finland) | | | 85,963 | | | | 358,683 | |
| Pan African Resources PLC (United Kingdom) | | | 2,213,977 | | | | 563,564 | |
| Salzgitter A.G. (Germany) | | | 18,880 | | | | 461,551 | |
| Semapa-Sociedade de Investimento e Gestao (Portugal) | | | 6,031 | | | | 85,028 | |
| Sims, Ltd. (Australia) | | | 29,957 | | | | 284,803 | |
| SSAB A.B. - B Shares (Sweden) | | | 120,919 | | | | 502,413 | |
| Tokyo Steel Manufacturing Co., Ltd. (Japan) | | | 34,500 | | | | 380,652 | |
| Toyo Seikan Group Holdings, Ltd. (Japan) | | | 20,300 | | | | 212,896 | |
| Yamato Kogyo Co., Ltd. (Japan) | | | 8,800 | | | | 290,803 | |
| | | | | | | | 10,812,099 | |
| Real Estate — 11.5% | | | | | | | | |
| Real Estate — 11.5% | | | | | | | | |
| Aedas Homes S.A. (Spain) (b) | | | 2,881 | | | | 64,291 | |
| AEON REIT Investment Corp. (Japan) (a) | | | 278 | | | | 314,032 | |
| Centuria Office REIT (Australia) | | | 205,307 | | | | 241,438 | |
| Charter Hall Retail REIT (Australia) | | | 32,241 | | | | 84,217 | |
| Cromwell European Real Estate Investment Trust (Singapore) | | | 137,189 | | | | 280,271 | |
| Cromwell Property Group (Australia) | | | 1,121,944 | | | | 585,594 | |
| Custodian REIT PLC (United Kingdom) | | | 111,968 | | | | 135,886 | |
| Dios Fastigheter A.B. (Sweden) | | | 69,805 | | | | 486,856 | |
| Eagle Hospitality Trust (Singapore) (a)(d) | | | 1,204,600 | | | | 0 | |
| Eurocommercial Properties N.V. (Netherlands) | | | 3,754 | | | | 80,644 | |
| Goldcrest Co., Ltd. (Japan) | | | 42,430 | | | | 537,688 | |
See Notes to Financial Statements.
| 54 | | www.sbhfunds.com |
| Segall Bryant & Hamill International Small Cap Fund | Statement of Investments |
| | June 30, 2022 (Unaudited) |
| | | Shares | | | Value | |
| Real Estate (continued) | | | | | | | | |
| Immobiliare Grande Distribuzione Società (Italy) | | | 17,724 | | | $ | 66,042 | |
| Impact Healthcare REIT plc (United Kingdom) | | | 111,410 | | | | 158,245 | |
| Isras Investment Co., Ltd. (Israel) | | | 1,721 | | | | 330,095 | |
| Kenedix Retail REIT Corp. (Japan) | | | 438 | | | | 888,964 | |
| Keppel Pacific Oak US REIT (Singapore) (a) | | | 756,900 | | | | 529,937 | |
| Kerry Properties, Ltd. (Hong Kong) | | | 111,000 | | | | 308,664 | |
| Kiwi Property Group, Ltd. (New Zealand) | | | 162,620 | | | | 98,990 | |
| MIRAI Corp. (Japan) | | | 3,028 | | | | 1,114,705 | |
| NewRiver REIT PLC (United Kingdom) (b) | | | 211,652 | | | | 227,494 | |
| Nexity S.A. (France) | | | 21,484 | | | | 576,737 | |
| Norstar Holdings, Inc. (Israel) | | | 7,328 | | | | 65,230 | |
| Peach Property Group A.G. (Switzerland) (a) | | | 9,162 | | | | 339,273 | |
| Prime US REIT (Singapore) | | | 788,100 | | | | 532,146 | |
| Regional REIT, Ltd. (United Kingdom) | | | 562,021 | | | | 496,381 | |
| Retail Estates N.V. (Belgium) | | | 5,696 | | | | 379,877 | |
| Sagax A.B. (Sweden) | | | 190,075 | | | | 428,670 | |
| Sasseur Real Estate Investment Trust (Singapore) | | | 136,500 | | | | 76,653 | |
| Savills PLC (United Kingdom) | | | 10,800 | | | | 133,163 | |
| Star Asia Investment Corp. (Japan) | | | 1,956 | | | | 885,094 | |
| Starhill Global REIT (Singapore) | | | 363,100 | | | | 151,549 | |
| TAG Immobilien A.G. (Germany) | | | 42,174 | | | | 482,738 | |
| Takara Leben Real Estate Investment Trust Corp. (Japan) | | | 404 | | | | 349,738 | |
| Tosei Corp. (Japan) | | | 43,125 | | | | 400,629 | |
| Urban Logistics REIT PLC (United Kingdom) | | | 318,239 | | | | 627,158 | |
| Wereldhave N.V. (Netherlands) | | | 42,291 | | | | 635,070 | |
| | | | | | | | 13,094,160 | |
| Utilities — 3.0% | | | | | | | | |
| Utilities — 3.0% | | | | | | | | |
| A2A S.p.A. (Italy) | | | 149,994 | | | | 190,821 | |
| Centrica PLC (United Kingdom) (a) | | | 123,222 | | | | 120,328 | |
| Drax Group PLC (United Kingdom) | | | 107,711 | | | | 845,458 | |
| Electric Power Development Co., Ltd. (Japan) | | | 52,200 | | | | 862,970 | |
| EVN A.G.. (Austria) | | | 9,936 | | | | 211,564 | |
| Genesis Energy, Ltd. (New Zealand) | | | 52,647 | | | | 87,069 | |
| Iren S.p.A. (Italy) (a) | | | 309,472 | | | | 676,906 | |
| Italgas S.p.A. (Italy) | | | 11,344 | | | | 66,178 | |
| Rubis SCA (France) | | | 3,065 | | | | 72,069 | |
| Shikoku Electric Power Co., Inc. (Japan) (a) | | | 46,500 | | | | 272,000 | |
| | | | | | | | 3,405,363 | |
| Investments at Value — 98.7% | | | | | | | | |
| (Cost $124,512,835) | | | | | | $ | 112,498,057 | |
| | | | | | | | | |
| Other Assets in Excess of Liabilities — 1.3% | | | | | | | 1,459,252 | |
| | | | | | | | | |
| Net Assets — 100.0% | | | | | | $ | 113,957,309 | |
| (a) | Non-income producing security. |
| (b) | Security is considered a restricted security however such restriction has not resulted in an illiquid classification. The total value of these securities is $6,364,635, which represents 5.6% of net assets as of June 30, 2022. |
| (c) | Percentage rounds to less than 0.1%. |
| (d) | Level 3 securities fair value under procedures established by the Board of Trustees, represents 0.0% of net assets. The total value of these securities is $0. |
The Fund’s sector and industry classifications presented herein refer to any one or more of the industry sub-classifications used by one or more widely recognized market indexes or ratings group indexes, and/ or as defined by Fund management. For Fund compliance purposes, sector and industry classifications are based on the sector and industry categorization methodology of the Adviser to the Funds. This definition may not apply for purposes of this report, which may combine industry sub-classifications for reporting ease. Industries are shown as a percentage of net assets.
See Notes to Financial Statements.
| Semi-Annual Report | June 30, 2022 | | 55 |
| Segall Bryant & Hamill International Small Cap Fund | Statement of Investments |
| | June 30, 2022 (Unaudited) |
| | | | | | % of Net | |
| Country | | Value | | | Assets | |
| Japan | | $ | 34,288,804 | | | | 30.1 | % |
| United Kingdom | | | 18,868,658 | | | | 16.6 | % |
| Australia | | | 10,771,374 | | | | 9.4 | % |
| Sweden | | | 6,591,345 | | | | 5.8 | % |
| Switzerland | | | 4,786,279 | | | | 4.2 | % |
| France | | | 4,713,451 | | | | 4.1 | % |
| Germany | | | 4,678,332 | | | | 4.1 | % |
| Italy | | | 3,564,155 | | | | 3.1 | % |
| Israel | | | 3,527,216 | | | | 3.1 | % |
| Singapore | | | 2,734,357 | | | | 2.4 | % |
| Norway | | | 2,663,356 | | | | 2.3 | % |
| Denmark | | | 2,608,774 | | | | 2.3 | % |
| Netherlands | | | 2,471,163 | | | | 2.2 | % |
| Hong Kong | | | 2,330,800 | | | | 2.0 | % |
| Spain | | | 1,804,052 | | | | 1.6 | % |
| Austria | | | 1,566,145 | | | | 1.4 | % |
| Finland | | | 1,377,728 | | | | 1.2 | % |
| Belgium | | | 1,280,192 | | | | 1.1 | % |
| New Zealand | | | 974,512 | | | | 0.9 | % |
| Ireland | | | 701,262 | | | | 0.6 | % |
| Portugal | | | 196,102 | | | | 0.2 | % |
| Total Investments | | $ | 112,498,057 | | | | 98.7 | % |
| Other Assets in Excess of Liabilities | | | 1,459,252 | | | | 1.3 | % |
| Net Assets | | $ | 113,957,309 | | | | 100.0 | % |
See Notes to Financial Statements.
| 56 | | www.sbhfunds.com |
| Segall Bryant & Hamill | |
| Fundamental International Small Cap Fund | Statement of Investments |
| | June 30, 2022 (Unaudited) |
| | | Shares | | | Value | |
| COMMON STOCKS — 94.3% | | | | | | | | |
| Communication Services — 1.3% | | | | | | | | |
| Telecommunication Services — 1.3% | | | | | | | | |
| KINX, Inc. (South Korea) | | | 20,285 | | | $ | 752,659 | |
| | | | | | | | | |
| Consumer Discretionary — 23.4% | | | | | | | | |
| Consumer Durables & Apparel — 8.1% | | | | | | | | |
| Leatt Corp. (South Africa) (a) | | | 86,030 | | | | 1,957,183 | |
| Victoria PLC (United Kingdom) (a) | | | 495,293 | | | | 2,720,970 | |
| | | | | | | | 4,678,153 | |
| Consumer Services — 12.6% | | | | | | | | |
| Evolution Gaming Group A.B. | | | | | | | | |
| (Sweden) (b) | | | 24,550 | | | | 2,245,713 | |
| Fu Shou Yuan International Group, Ltd. (China) (b) | | | 1,065,247 | | | | 767,273 | |
| NEOGAMES S.A (Israel) (a) | | | 117,414 | | | | 1,574,522 | |
| Pollard Banknote, Ltd. (Canada) | | | 87,674 | | | | 1,373,737 | |
| Webjet, Ltd. (Australia) (a) | | | 342,442 | | | | 1,268,095 | |
| | | | | | | | 7,229,340 | |
| Retailing — 2.7% | | | | | | | | |
| China Meidong Auto Holdings, Ltd. | | | | | | | | |
| (China) | | | 489,500 | | | | 1,555,459 | |
| | | | | | | | | |
| Consumer Staples — 2.6% | | | | | | | | |
| Food & Staples Retailing — 2.6% | | | | | | | | |
| Yifeng Pharmacy Chain Co., Ltd. - | | | | | | | | |
| Class A (China) | | | 189,551 | | | | 1,497,243 | |
| | | | | | | | | |
| Financials — 9.3% | | | | | | | | |
| Banks — 1.0% | | | | | | | | |
| Mortgage Advice Bureau Holdings, Ltd. (United Kingdom) | | | 49,449 | | | | 541,735 | |
| | | | | | | | | |
| Diversified Financials — 8.3% | | | | | | | | |
| Azimut Holdings S.p.A. (Italy) | | | 104,677 | | | | 1,821,517 | |
| M&A Capital Partners Co., Ltd. (Japan) (a) | | | 34,200 | | | | 902,372 | |
| Strike Co., Ltd. (Japan) | | | 81,440 | | | | 2,053,438 | |
| | | | | | | | 4,777,327 | |
| Health Care — 1.6% | | | | | | | | |
| Pharmaceuticals, Biotechnology & Life Sciences — 1.6% | | | | | | | | |
| SwedenCare A.B. (Sweden) | | | 108,150 | | | | 920,864 | |
| | | | | | | | | |
| Industrials — 29.5% | | | | | | | | |
| Capital Goods — 15.9% | | | | | | | | |
| AutoStore Holdings, Ltd. (Norway) (a)(b) | | | 456,100 | | | | 660,991 | |
| Brodrene A. & O. Johansen A/S (Denmark) | | | 255,500 | | | | 2,460,743 | |
| Diploma PLC (United Kingdom) | | | 34,480 | | | | 939,026 | |
| Fluidra S.A. (Spain) | | | 119,000 | | | | 2,420,633 | |
| IMCD N.V. (Netherlands) | | | 9,300 | | | | 1,271,290 | |
| Instalco A.B. (Sweden) | | | 328,400 | | | | 1,366,153 | |
| | | | | | | | 9,118,836 | |
| | | Shares | | | Value | |
| Commercial & Professional Services — 12.6% | | | | | | | | |
| BayCurrent Consulting, Inc. (Japan) | | | 7,900 | | | $ | 2,111,927 | |
| Boyd Group Services, Inc. (Canada) | | | 6,415 | | | | 690,995 | |
| GFL Environmental, Inc. (Canada) | | | 84,668 | | | | 2,181,026 | |
| Japan Elevator Service Holdings Company, Ltd. (Japan) (a) | | | 84,600 | | | | 884,825 | |
| Mo-BRUK S.A. (Poland) | | | 21,500 | | | | 1,377,913 | |
| | | | | | | | 7,246,686 | |
| Transportation — 1.0% | | | | | | | | |
| InPost S.A. (Poland) (a) | | | 95,500 | | | | 553,184 | |
| | | | | | | | | |
| Information Technology — 26.6% | | | | | | | | |
| IT Services — 8.7% | | | | | | | | |
| CANCOM S.E. (Germany) | | | 14,530 | | | | 490,773 | |
| Constellation Software, Inc. (Canada) | | | 2,412 | | | | 3,580,432 | |
| Keywords Studios PLC (Ireland) | | | 34,779 | | | | 929,098 | |
| | | | | | | | 5,000,303 | |
| Software — 11.4% | | | | | | | | |
| Epsilon Net S.A. (Greece) | | | 348,100 | | | | 2,034,990 | |
| GB Group PLC (United Kingdom) | | | 162,866 | | | | 794,127 | |
| LiveChat Software S.A. (Poland) | | | 31,985 | | | | 701,020 | |
| Mercell Holding A.S.A. (Norway) (a)(b) | | | 502,335 | | | | 309,277 | |
| Sinch A.B. (Sweden) (a)(b) | | | 191,750 | | | | 626,301 | |
| Topicus.com, Inc. (Netherlands) (a) | | | 36,949 | | | | 2,084,710 | |
| | | | | | | | 6,550,425 | |
| Technology Hardware & Equipment — 6.5% | | | | | | | | |
| Cherry A.G. (Germany) (a)(b) | | | 144,301 | | | | 1,256,679 | |
| Endor A.G. (Germany) | | | 36,000 | | | | 577,056 | |
| PAX Global Technology, Ltd. (Hong Kong) 2,469,200 | | | | | | | 1,924,804 | |
| | | | | | | | 3,758,539 | |
| Investments at Value — 94.3% | | | | | | | | |
| (Cost $69,490,168) | | | | | | $ | 54,180,753 | |
| | | | | | | | | |
| Other Assets in Excess of Liabilities — 5.7% | | | | | | | 3,267,460 | |
| | | | | | | | | |
| Net Assets — 100.0% | | | | | | $ | 57,448,213 | |
| (a) | Non-income producing security. |
| (b) | Security is considered a restricted security however such restriction has not resulted in an illiquid classification. The total value of these securities is $5,866,234, which represents 10.2% of net assets as of June 30, 2022. |
The Fund’s sector and industry classifications presented herein refer to any one or more of the industry sub-classifications used by one or more widely recognized market indexes or ratings group indexes, and/ or as defined by Fund management. For Fund compliance purposes, sector and industry classifications are based on the sector and industry categorization methodology of the Adviser to the Funds. This definition may not apply for purposes of this report, which may combine industry sub-classifications for reporting ease. Industries are shown as a percentage of net assets.
See Notes to Financial Statements.
| Semi-Annual Report | June 30, 2022 | | 57 |
| Segall Bryant & Hamill | |
| Fundamental International Small Cap Fund | Statement of Investments |
| | June 30, 2022 (Unaudited) |
| | | | | | % of Net | |
| Country | | Value | | | Assets | |
| Canada | | $ | 7,826,190 | | | | 13.6 | % |
| Japan | | | 5,952,562 | | | | 10.4 | % |
| Sweden | | | 5,159,031 | | | | 9.0 | % |
| United Kingdom | | | 4,995,858 | | | | 8.7 | % |
| China | | | 3,819,975 | | | | 6.7 | % |
| Netherlands | | | 3,356,000 | | | | 5.8 | % |
| Poland | | | 2,632,117 | | | | 4.6 | % |
| Denmark | | | 2,460,743 | | | | 4.3 | % |
| Spain | | | 2,420,633 | | | | 4.2 | % |
| Germany | | | 2,324,508 | | | | 4.0 | % |
| Greece | | | 2,034,990 | | | | 3.5 | % |
| South Africa | | | 1,957,183 | | | | 3.4 | % |
| Hong Kong | | | 1,924,804 | | | | 3.4 | % |
| Italy | | | 1,821,517 | | | | 3.2 | % |
| Israel | | | 1,574,522 | | | | 2.7 | % |
| Australia | | | 1,268,095 | | | | 2.2 | % |
| Norway | | | 970,268 | | | | 1.7 | % |
| Ireland | | | 929,098 | | | | 1.6 | % |
| South Korea | | | 752,659 | | | | 1.3 | % |
| Total Investments | | $ | 54,180,753 | | | | 94.3 | % |
| Other Assets in Excess of Liabilities | | | 3,267,460 | | | | 5.7 | % |
| Net Assets | | $ | 57,448,213 | | | | 100.0 | % |
See Notes to Financial Statements.
| 58 | | www.sbhfunds.com |
| Segall Bryant & Hamill | |
| Fundamental International Small Cap Fund | Statement of Investments |
| | June 30, 2022 (Unaudited) |
SCHEDULE OF FORWARD FOREIGN CURRENCY CONTRACTS
| | | | | | | | | | | | | | | | | | Asset | | | Liability | |
| | | | | | | | | | | | | | | | | | Derivatives | | | Derivatives | |
| | | Settlement | | | Fund | | | U.S. $Value at | | | Fund | | | U.S. $Value at | | | Unrealized | | | Unrealized | |
| Counterparty | | Date | | | Receiving | | | June 30, 2022 | | | Delivering | | | June 30, 2022 | | | Appreciation | | | Depreciation | |
| BNY Mellon | | | 9/29/2022 | | | | AED | | | | 143,883 | | | | USD | | | | 143,866 | | | $ | 17 | | | $ | — | |
| BNY Mellon | | | 9/29/2022 | | | | AUD | | | | 2,948,002 | | | | USD | | | | 3,088,938 | | | | — | | | | (140,936 | ) |
| BNY Mellon | | | 9/29/2022 | | | | BRL | | | | 1,043,070 | | | | USD | | | | 1,112,323 | | | | — | | | | (69,253 | ) |
| BNY Mellon | | | 9/29/2022 | | | | CHF | | | | 2,148,044 | | | | USD | | | | 2,109,320 | | | | 38,724 | | | | — | |
| BNY Mellon | | | 9/29/2022 | | | | CLP | | | | 103,366 | | | | USD | | | | 114,339 | | | | — | | | | (10,973 | ) |
| BNY Mellon | | | 9/29/2022 | | | | COP | | | | 36,344 | | | | USD | | | | 39,635 | | | | — | | | | (3,291 | ) |
| BNY Mellon | | | 9/29/2022 | | | | CZK | | | | 5,749 | | | | USD | | | | 5,862 | | | | — | | | | (113 | ) |
| BNY Mellon | | | 9/29/2022 | | | | GBP | | | | 360,162 | | | | USD | | | | 372,487 | | | | — | | | | (12,325 | ) |
| BNY Mellon | | | 9/29/2022 | | | | HUF | | | | 8,603 | | | | USD | | | | 8,937 | | | | — | | | | (334 | ) |
| BNY Mellon | | | 9/29/2022 | | | | IDR | | | | 355,785 | | | | USD | | | | 367,893 | | | | — | | | | (12,108 | ) |
| BNY Mellon | | | 9/29/2022 | | | | ILS | | | | 1,189,107 | | | | USD | | | | 1,241,017 | | | | — | | | | (51,910 | ) |
| BNY Mellon | | | 9/29/2022 | | | | INR | | | | 3,503,321 | | | | USD | | | | 3,549,805 | | | | — | | | | (46,484 | ) |
| BNY Mellon | | | 9/29/2022 | | | | JPY | | | | 8,355,921 | | | | USD | | | | 8,546,089 | | | | — | | | | (190,168 | ) |
| BNY Mellon | | | 9/29/2022 | | | | KRW | | | | 1,748,825 | | | | USD | | | | 1,800,903 | | | | — | | | | (52,078 | ) |
| BNY Mellon | | | 9/29/2022 | | | | KWD | | | | 200,275 | | | | USD | | | | 200,277 | | | | — | | | | (2 | ) |
| BNY Mellon | | | 9/29/2022 | | | | MXP | | | | 324,966 | | | | USD | | | | 332,162 | | | | — | | | | (7,196 | ) |
| BNY Mellon | | | 9/29/2022 | | | | NZD | | | | 407,595 | | | | USD | | | | 423,276 | | | | — | | | | (15,681 | ) |
| BNY Mellon | | | 9/29/2022 | | | | PHP | | | | 150,831 | | | | USD | | | | 155,971 | | | | — | | | | (5,140 | ) |
| BNY Mellon | | | 9/29/2022 | | | | QAR | | | | 165,813 | | | | USD | | | | 165,478 | | | | 335 | | | | — | |
| BNY Mellon | | | 9/29/2022 | | | | SAR | | | | 426,772 | | | | USD | | | | 426,302 | | | | 470 | | | | — | |
| BNY Mellon | | | 9/29/2022 | | | | SGD | | | | 895,904 | | | | USD | | | | 905,892 | | | | — | | | | (9,988 | ) |
| BNY Mellon | | | 9/29/2022 | | | | THB | | | | 657,193 | | | | USD | | | | 672,367 | | | | — | | | | (15,174 | ) |
| BNY Mellon | | | 9/29/2022 | | | | TRY | | | | 215,521 | | | | USD | | | | 203,881 | | | | 11,640 | | | | — | |
| BNY Mellon | | | 9/29/2022 | | | | TWD | | | | 3,668,850 | | | | USD | | | | 3,707,577 | | | | — | | | | (38,727 | ) |
| BNY Mellon | | | 9/29/2022 | | | | USD | | | | 5,514,902 | | | | CAD | | | | 5,373,108 | | | | 141,794 | | | | — | |
| BNY Mellon | | | 9/29/2022 | | | | USD | | | | 1,390,672 | | | | CNY | | | | 1,386,631 | | | | 4,041 | | | | — | |
| BNY Mellon | | | 9/29/2022 | | | | USD | | | | 2,738,489 | | | | DKK | | | | 2,679,434 | | | | 59,055 | | | | — | |
| BNY Mellon | | | 9/29/2022 | | | | USD | | | | 7,217,119 | | | | EUR | | | | 7,060,160 | | | | 156,959 | | | | — | |
| BNY Mellon | | | 9/29/2022 | | | | USD | | | | 2,444,470 | | | | HKD | | | | 2,443,005 | | | | 1,465 | | | | — | |
| BNY Mellon | | | 9/29/2022 | | | | USD | | | | 266,177 | | | | NOK | | | | 255,540 | | | | 10,637 | | | | — | |
| BNY Mellon | | | 9/29/2022 | | | | USD | | | | 2,048,718 | | | | PLN | | | | 1,957,908 | | | | 90,810 | | | | — | |
| BNY Mellon | | | 9/29/2022 | | | | USD | | | | 3,003,287 | | | | SEK | | | | 2,873,301 | | | | 129,986 | | | | — | |
| BNY Mellon | | | 9/29/2022 | | | | ZAR | | | | 675,342 | | | | USD | | | | 711,924 | | | | — | | | | (36,582 | ) |
| Total | | | | | | | | | | | | | | | | | | | | | | $ | 645,933 | | | $ | (718,463 | ) |
See Notes to Financial Statements.
| Semi-Annual Report | June 30, 2022 | | 59 |
| Segall Bryant & Hamill Global All Cap Fund | Statement of Investments |
| | June 30, 2022 (Unaudited) |
| | | Shares | | | Value | |
| COMMON STOCKS — 96.4% | | | | | | | | |
| Communication Services — 3.3% | | | | | | | | |
| Media & Entertainment — 3.3% | | | | | | | | |
| Alphabet, Inc. - Class C (a) | | | 403 | | | $ | 881,542 | |
| | | | | | | | | |
| Consumer Discretionary — 13.9% | | | | | | | | |
| Consumer Durables & Apparel — 3.3% | | | | | | | | |
| Capri Holdings, Ltd. (a) | | | 7,524 | | | | 308,559 | |
| LVMH Moet Hennessy Louis Vuitton | | | | | | | | |
| S E (France) | | | 945 | | | | 579,015 | |
| | | | | | | | 887,574 | |
| Consumer Services — 3.2% | | | | | | | | |
| Compass Group PLC (United Kingdom) | | | 26,227 | | | | 538,464 | |
| Darden Restaurants, Inc. | | | 2,919 | | | | 330,197 | |
| | | | | | | | 868,661 | |
| Retailing — 7.4% | | | | | | | | |
| Amazon.com, Inc. (a) | | | 5,200 | | | | 552,292 | |
| Dollarama, Inc. (Canada) | | | 9,736 | | | | 560,587 | |
| Home Depot, Inc. (The) | | | 1,576 | | | | 432,250 | |
| O’Reilly Automotive, Inc. (a) | | | 686 | | | | 433,387 | |
| | | | | | | | 1,978,516 | |
| Consumer Staples — 6.8% | | | | | | | | |
| Food & Staples Retailing — 1.5% | | | | | | | | |
| Costco Wholesale Corp | | | 821 | | | | 393,489 | |
| | | | | | | | | |
| Food, Beverage & Tobacco — 4.0% | | | | | | | | |
| Diageo PLC (United Kingdom) | | | 15,456 | | | | 667,571 | |
| Mondelez International, Inc. - Class A | | | 6,716 | | | | 416,996 | |
| | | | | | | | 1,084,567 | |
| Household & Personal Products — 1.3% | | | | | | | | |
| Unilever PLC (United Kingdom) | | | 7,989 | | | | 364,128 | |
| | | | | | | | | |
| Energy — 5.0% | | | | | | | | |
| Energy — 5.0% | | | | | | | | |
| Chevron Corp | | | 2,801 | | | | 405,529 | |
| ConocoPhillips | | | 4,456 | | | | 400,193 | |
| Suncor Energy, Inc. (Canada) | | | 15,299 | | | | 536,536 | |
| | | | | | | | 1,342,258 | |
| Financials — 11.5% | | | | | | | | |
| Banks — 2.5% | | | | | | | | |
| JPMorgan Chase & Co. | | | 5,903 | | | | 664,737 | |
| | | | | | | | | |
| Diversified Financials — 2.7% | | | | | | | | |
| Partners Group Holding A G | | | | | | | | |
| (Switzerland) | | | 392 | | | | 354,025 | |
| S&P Global, Inc. | | | 1,142 | | | | 384,923 | |
| | | | | | | | 738,948 | |
| Insurance — 6.3% | | | | | | | | |
| Aon PLC - Class A (Ireland) | | | 2,284 | | | | 615,949 | |
| Globe Life, Inc. | | | 6,635 | | | | 646,713 | |
| Reinsurance Group of America, Inc. | | | 3,795 | | | | 445,116 | |
| | | | | | | | 1,707,778 | |
| Health Care — 17.8% | | | | | | | | |
| Health Care Equipment & Services — 8.2% | | | | | | | | |
| Alcon, Inc. (Switzerland) | | | 5,906 | | | | 412,770 | |
| McKesson Corp | | | 1,538 | | | | 501,711 | |
| | | Shares | | | Value | |
| Health Care Equipment & Services (continued) | | | | | | | | |
| STERIS plc (Ireland) | | | 2,613 | | | $ | 538,670 | |
| UnitedHealth Group, Inc. | | | 1,474 | | | | 757,091 | |
| | | | | | | | 2,210,242 | |
| Pharmaceuticals, Biotechnology & Life Sciences — 9.6% | | | | | | | | |
| Bio-Techne Corp | | | 1,260 | | | | 436,766 | |
| Charles River Laboratories | | | | | | | | |
| International, Inc. (a) | | | 1,367 | | | | 292,497 | |
| Eurofins Scientific, Inc. (Luxembourg) | | | 3,834 | | | | 302,721 | |
| Lonza Group A.G. (Switzerland) | | | 947 | | | | 505,844 | |
| Perrigo Co. PLC (Ireland) | | | 13,715 | | | | 556,418 | |
| Zoetis, Inc. | | | 2,863 | | | | 492,121 | |
| | | | | | | | 2,586,367 | |
| Industrials — 11.2% | | | | | | | | |
| Capital Goods — 10.1% | | | | | | | | |
| AZEK Co., Inc. (The) - Class A (a) | | | 13,902 | | | | 232,720 | |
| Parker-Hannifin Corp | | | 1,623 | | | | 399,339 | |
| Quanta Services, Inc. | | | 6,739 | | | | 844,666 | |
| Raytheon Technologies Corp | | | 5,955 | | | | 572,335 | |
| Sandvik A.B. (Sweden) | | | 20,029 | | | | 326,393 | |
| Schneider Electric S E (France) | | | 3,017 | | | | 359,396 | |
| | | | | | | | 2,734,849 | |
| Commercial & Professional Services — 1.1% | | | | | | | | |
| Jacobs Engineering Group, Inc. | | | 2,284 | | | | 290,365 | |
| | | | | | | | | |
| Information Technology — 22.6% | | | | | | | | |
| Semiconductors & Semiconductor Equipment — 7.3% | | | | | | | | |
| ASML Holding N.V. (Netherlands) | | | 1,040 | | | | 491,204 | |
| Marvell Technology, Inc. (Bermuda) | | | 11,299 | | | | 491,845 | |
| Monolithic Power Systems, Inc. | | | 1,397 | | | | 536,504 | |
| NXP Semiconductors N.V. (Netherlands) | | | 3,049 | | | | 451,343 | |
| | | | | | | | 1,970,896 | |
| Software & Services — 11.6% | | | | | | | | |
| Adobe, Inc. (a) | | | 687 | | | | 251,483 | |
| Capgemini S E (France) | | | 3,418 | | | | 589,311 | |
| Microsoft Corp | | | 4,590 | | | | 1,178,850 | |
| ServiceNow, Inc. (a) | | | 849 | | | | 403,716 | |
| Visa, Inc. - Class A | | | 3,648 | | | | 718,255 | |
| | | | | | | | 3,141,615 | |
| Technology Hardware & Equipment — 3.7% | | | | | | | | |
| Apple, Inc. | | | 3,649 | | | | 498,891 | |
| Keysight Technologies, Inc. (a) | | | 3,541 | | | | 488,127 | |
| | | | | | | | 987,018 | |
See Notes to Financial Statements.
| 60 | | www.sbhfunds.com |
| Segall Bryant & Hamill Global All Cap Fund | Statement of Investments |
| | June 30, 2022 (Unaudited) |
| | | Shares | | | Value | |
| Materials — 4.3% | | | | | | | | |
| Materials — 4.3% | | | | | | | | |
| Franco-Nevada Corp. (Canada) | | | 3,232 | | | $ | 425,267 | |
| Linde PLC (United Kingdom) | | | 2,576 | | | | 740,677 | |
| | | | | | | | 1,165,944 | |
| Investments at Value — 96.4% | | | | | | | | |
| (Cost $24,063,979) | | | | | | $ | 25,999,494 | |
| | | | | | | | | |
| Other Assets in Excess of Liabilities — 3.6% | | | | | | | 975,213 | |
| | | | | | | | | |
| Net Assets — 100.0% | | | | | | $ | 26,974,707 | |
| (a) | Non-income producing security. |
The Fund’s sector and industry classifications presented herein refer to any one or more of the industry sub-classifications used by one or more widely recognized market indexes or ratings group indexes, and/ or as defined by Fund management. For Fund compliance purposes, sector and industry classifications are based on the sector and industry categorization methodology of the Adviser to the Funds. This definition may not apply for purposes of this report, which may combine industry sub-classifications for reporting ease. Industries are shown as a percentage of net assets.
| Country Breakdown | | | | | | |
| | | | | | % of Net | |
| Country | | Value | | | Assets | |
| United States | | $ | 15,591,360 | | | | 57.8 | % |
| United Kingdom | | | 2,310,840 | | | | 8.6 | % |
| Ireland | | | 1,711,037 | | | | 6.3 | % |
| France | | | 1,527,722 | | | | 5.7 | % |
| Canada | | | 1,522,390 | | | | 5.7 | % |
| Switzerland | | | 1,272,639 | | | | 4.7 | % |
| Netherlands | | | 942,547 | | | | 3.5 | % |
| Bermuda | | | 491,845 | | | | 1.8 | % |
| Sweden | | | 326,393 | | | | 1.2 | % |
| Luxembourg | | | 302,721 | | | | 1.1 | % |
| Total Investments | | $ | 25,999,494 | | | | 96.4 | % |
| Other Assets in Excess of Liabilities | | | 975,213 | | | | 3.6 | % |
| Net Assets | | $ | 26,974,707 | | | | 100.0 | % |
See Notes to Financial Statements.
| Semi-Annual Report | June 30, 2022 | | 61 |
| Segall Bryant & Hamill Workplace Equality Fund | Statement of Investments |
| | June 30, 2022 (Unaudited) |
| | | Shares | | | Value | |
| COMMON STOCKS — 97.2% | | | | | | | | |
| Communication Services — 7.1% | | | | | | | | |
| Media & Entertainment — 7.1% | | | | | | | | |
| Alphabet, Inc. - Class C (a) | | | 512 | | | $ | 1,119,975 | |
| Live Nation Entertainment, Inc. (a) | | | 5,864 | | | | 484,249 | |
| | | | | | | | 1,604,224 | |
| Consumer Discretionary — 9.7% | | | | | | | | |
| Consumer Durables & Apparel — 2.2% | | | | | | | | |
| NIKE, Inc. - Class B | | | 2,786 | | | | 284,729 | |
| Tapestry, Inc. | | | 7,300 | | | | 222,796 | |
| | | | | | | | 507,525 | |
| Consumer Services — 2.9% | | | | | | | | |
| Chipotle Mexican Grill, Inc. (a) | | | 217 | | | | 283,675 | |
| Wendy’s Co. (The) | | | 19,254 | | | | 363,516 | |
| | | | | | | | 647,191 | |
| Retailing — 4.6% | | | | | | | | |
| Amazon.com, Inc. (a) | | | 5,620 | | | | 596,900 | |
| Dollar General Corp | | | 1,843 | | | | 452,346 | |
| | | | | | | | 1,049,246 | |
| Consumer Staples — 5.6% | | | | | | | | |
| Food, Beverage & Tobacco — 3.0% | | | | | | | | |
| Constellation Brands, Inc. - Class A | | | 1,518 | | | | 353,785 | |
| Mondel z International, Inc. - Class A | | | 5,304 | | | | 329,325 | |
| | | | | | | | 683,110 | |
| Household & Personal Products — 2.6% | | | | | | | | |
| Estee Lauder Cos., Inc. (The) - Class A | | | 1,117 | | | | 284,467 | |
| Unilever PLC ADR (United Kingdom) | | | 6,516 | | | | 298,628 | |
| | | | | | | | 583,095 | |
| Energy — 4.3% | | | | | | | | |
| Energy — 4.3% | | | | | | | | |
| Chevron Corp | | | 3,552 | | | | 514,259 | |
| ConocoPhillips | | | 5,250 | | | | 471,502 | |
| | | | | | | | 985,761 | |
| Financials — 11.1% | | | | | | | | |
| Banks — 3.3% | | | | | | | | |
| First Republic Bank | | | 1,637 | | | | 236,055 | |
| JPMorgan Chase & Co. | | | 4,569 | | | | 514,515 | |
| | | | | | | | 750,570 | |
| Diversified Financials — 3.7% | | | | | | | | |
| Blackstone, Inc. | | | 5,052 | | | | 460,894 | |
| MSCI, Inc. | | | 924 | | | | 380,827 | |
| | | | | | | | 841,721 | |
| Insurance — 4.1% | | | | | | | | |
| Arthur J. Gallagher & Co. | | | 2,732 | | | | 445,425 | |
| Reinsurance Group of America, Inc. | | | 4,079 | | | | 478,426 | |
| | | | | | | | 923,851 | |
| Health Care — 16.6% | | | | | | | | |
| Health Care Equipment & Services — 8.7% | | | | | | | | |
| Abbott Laboratories | | | 3,679 | | | | 399,723 | |
| McKesson Corp | | | 1,423 | | | | 464,197 | |
| Stryker Corp | | | 2,000 | | | | 397,860 | |
| UnitedHealth Group, Inc. | | | 1,398 | | | | 718,055 | |
| | | | | | | | 1,979,835 | |
| Pharmaceuticals, Biotechnology & Life Sciences — 7.9% | | | | | | | | |
| Bio-Techne Corp | | | 1,073 | | | | 371,945 | |
| | | Shares | | | Value | |
| Pharmaceuticals, Biotechnology & Life Sciences (continued) | | | | | | | | |
| Danaher Corp | | | 2,424 | | | $ | 614,533 | |
| Thermo Fisher Scientific, Inc. | | | 823 | | | | 447,119 | |
| Zoetis, Inc. | | | 2,061 | | | | 354,265 | |
| | | | | | | | 1,787,862 | |
| Industrials — 10.0% | | | | | | | | |
| Capital Goods — 6.0% | | | | | | | | |
| Carrier Global Corp | | | 8,821 | | | | 314,557 | |
| Deere & Co | | | 1,312 | | | | 392,904 | |
| Raytheon Technologies Corp | | | 6,845 | | | | 657,873 | |
| | | | | | | | 1,365,334 | |
| Commercial & Professional Services — 4.0% | | | | | | | | |
| Jacobs Engineering Group, Inc. | | | 3,667 | | | | 466,186 | |
| Republic Services, Inc. | | | 3,371 | | | | 441,163 | |
| | | | | | | | 907,349 | |
| Information Technology — 26.9% | | | | | | | | |
| Semiconductors & Semiconductor Equipment — 6.1% | | | | | | | | |
| Advanced Micro Devices, Inc. (a) | | | 3,367 | | | | 257,474 | |
| Applied Materials, Inc. | | | 4,206 | | | | 382,662 | |
| Microchip Technology, Inc. | | | 5,920 | | | | 343,834 | |
| NVIDIA Corp | | | 2,667 | | | | 404,290 | |
| | | | | | | | 1,388,260 | |
| Software & Services — 14.3% | | | | | | | | |
| Adobe, Inc. (a) | | | 1,037 | | | | 379,604 | |
| Intuit, Inc. | | | 1,122 | | | | 432,464 | |
| Microsoft Corp | | | 4,794 | | | | 1,231,243 | |
| ServiceNow, Inc. (a) | | | 1,076 | | | | 511,660 | |
| Visa, Inc. - Class A | | | 3,559 | | | | 700,731 | |
| | | | | | | | 3,255,702 | |
| Technology Hardware & Equipment — 6.5% | | | | | | | | |
| Apple, Inc. | | | 4,556 | | | | 622,896 | |
| Keysight Technologies, Inc. (a) | | | 3,974 | | | | 547,816 | |
| Zebra Technologies Corp. - Class A (a) | | | 1,006 | | | | 295,714 | |
| | | | | | | | 1,466,426 | |
| Materials — 3.0% | | | | | | | | |
| Materials — 3.0% | | | | | | | | |
| Avery Dennison Corp | | | 2,246 | | | | 363,560 | |
| Eastman Chemical Co | | | 3,499 | | | | 314,105 | |
| | | | | | | | 677,665 | |
See Notes to Financial Statements.
| 62 | | www.sbhfunds.com |
| Segall Bryant & Hamill Workplace Equality Fund | Statement of Investments |
| | June 30, 2022 (Unaudited) |
| | | Shares | | | Value | |
| Real Estate — 2.9% | | | | | | | | |
| Real Estate — 2.9% | | | | | | | | |
| American Tower Corp | | | 1,376 | | | $ | 351,692 | |
| Iron Mountain, Inc. | | | 6,056 | | | | 294,867 | |
| | | | | | | | 646,559 | |
| | | | | | | | | |
Investments at Value — 97.2%
(Cost $21,646,377) | | | | | | $ | 22,051,286 | |
| | | | | | | | | |
| Other Assets in Excess of Liabilities — 2.8% | | | | | | | 634,256 | |
| | | | | | | | | |
| Net Assets — 100.0% | | | | | | $ | 22,685,542 | |
| (a) | Non-income producing security. |
The Fund’s sector and industry classifications presented herein refer to any one or more of the industry sub-classifications used by one or more widely recognized market indexes or ratings group indexes, and/ or as defined by Fund management. For Fund compliance purposes, sector and industry classifications are based on the sector and industry categorization methodology of the Adviser to the Funds. This definition may not apply for purposes of this report, which may combine industry sub-classifications for reporting ease. Industries are shown as a percentage of net assets.
See Notes to Financial Statements.
| Semi-Annual Report | June 30, 2022 | | 63 |
| Segall Bryant & Hamill Short Term Plus Fund | Statement of Investments |
| | June 30, 2022 (Unaudited) |
| | | Coupon | | Maturity | | Par Value | | | Value | |
| CORPORATE BONDS — 79.9% | | | | | | | | | | | | |
| Finance — 4.5% | | | | | | | | | | | | |
| Banking — 4.5% | | | | | | | | | | | | |
| American Express Co. | | 3.375% | | 05/03/24 | | $ | 450,000 | | | $ | 446,761 | |
| Bank of America Corp. | | 4.100% | | 07/24/23 | | | 755,000 | | | | 762,240 | |
| JPMorgan Chase & Co. (Yield of U.S. Treasury Note, 2.25, 3/26 + 53) (a) | | 0.697% | | 03/16/24 | | | 755,000 | | | | 738,497 | |
| | | | | | | | | | | | 1,947,498 | |
| Industrial — 60.3% | | | | | | | | | | | | |
| Automobile Manufacturing — 2.7% | | | | | | | | | | | | |
| General Motors Financial Co., Inc. | | 5.100% | | 01/17/24 | | | 850,000 | | | | 858,453 | |
| Paccar Financial Corp. | | 0.800% | | 06/08/23 | | | 315,000 | | | | 308,182 | |
| | | | | | | | | | | | 1,166,635 | |
| Beverage / Bottling — 1.2% | | | | | | | | | | | | |
| Brown Forman Corp. | | 2.250% | | 01/15/23 | | | 513,000 | | | | 510,173 | |
| | | | | | | | | | | | | |
| Building Products — 1.4% | | | | | | | | | | | | |
| Martin Marietta Materials, Inc. | | 4.250% | | 07/02/24 | | | 589,000 | | | | 591,842 | |
| | | | | | | | | | | | | |
| Chemicals — 1.4% | | | | | | | | | | | | |
| Eastman Chemical Co | | 7.250% | | 01/15/24 | | | 575,000 | | | | 596,178 | |
| | | | | | | | | | | | | |
| Construction Machinery — 3.9% | | | | | | | | | | | | |
| Brunswick Corp | | 0.850% | | 08/18/24 | | | 500,000 | | | | 462,066 | |
| Caterpillar Financial Services Corp | | 0.650% | | 07/07/23 | | | 400,000 | | | | 390,114 | |
| CNH Industrial Capital LLC | | 1.950% | | 07/02/23 | | | 850,000 | | | | 830,731 | |
| | | | | | | | | | | | 1,682,911 | |
| Diversified Manufacturing — 3.6% | | | | | | | | | | | | |
| Amphenol Corp | | 3.200% | | 04/01/24 | | | 875,000 | | | | 868,587 | |
| Roper Technologies, Inc. | | 3.650% | | 09/15/23 | | | 700,000 | | | | 700,967 | |
| | | | | | | | | | | | 1,569,554 | |
| Electronics — 1.2% | | | | | | | | | | | | |
| Dell International LLC | | 5.450% | | 06/15/23 | | | 496,000 | | | | 501,011 | |
| | | | | | | | | | | | | |
| Environmental — 2.1% | | | | | | | | | | | | |
| Republic Services, Inc. | | 2.500% | | 08/15/24 | | | 700,000 | | | | 677,787 | |
| Waste Management, Inc. | | 3.500% | | 05/15/24 | | | 233,000 | | | | 232,440 | |
| | | | | | | | | | | | 910,227 | |
| Food Processors — 1.0% | | | | | | | | | | | | |
| Conagra Brands, Inc. | | 3.200% | | 01/25/23 | | | 440,000 | | | | 439,627 | |
| Home Builders — 1.8% | | | | | | | | | | | | |
| D.R. Horton, Inc. | | 2.500% | | 10/15/24 | | | 350,000 | | | | 334,702 | |
| KB Home | | 7.625% | | 05/15/23 | | | 460,000 | | | | 465,530 | |
| | | | | | | | | | | | 800,232 | |
| Information / Data Technology — 5.6% | | | | | | | | | | | | |
| Fiserv, Inc. | | 3.800% | | 10/01/23 | | | 675,000 | | | | 675,326 | |
| KLA Corp | | 4.650% | | 11/01/24 | | | 450,000 | | | | 456,425 | |
| Moody’s Corp | | 4.875% | | 02/15/24 | | | 700,000 | | | | 713,449 | |
| Salesforce.com, Inc. | | 0.625% | | 07/15/24 | | | 650,000 | | | | 615,079 | |
| | | | | | | | | | | | 2,460,279 | |
| Media — Non-Cable — 3.2% | | | | | | | | | | | | |
| Discovery Communications LLC | | 2.950% | | 03/20/23 | | | 750,000 | | | | 744,855 | |
| Walt Disney Co. (The) | | 7.750% | | 01/20/24 | | | 624,000 | | | | 664,056 | |
| | | | | | | | | | | | 1,408,911 | |
See Notes to Financial Statements.
| 64 | | www.sbhfunds.com |
| Segall Bryant & Hamill Short Term Plus Fund | Statement of Investments |
| | June 30, 2022 (Unaudited) |
| | | Coupon | | Maturity | | Par Value | | | Value | |
| Midstream Energy — 4.5% | | | | | | | | | | | | |
| Enterprise Products Operating LLC | | 3.350% | | 03/15/23 | | $ | 333,000 | | | $ | 332,142 | |
| Kinder Morgan, Inc. | | 3.150% | | 01/15/23 | | | 850,000 | | | | 848,697 | |
| Williams Partners LP | | 3.900% | | 01/15/25 | | | 800,000 | | | | 790,310 | |
| | | | | | | | | | | | 1,971,149 | |
| Other Industrial — 2.3% | | | | | | | | | | | | |
| Cintas Corp. No. 2 | | 3.450% | | 05/01/25 | | | 225,000 | | | | 224,238 | |
| Quanta Services, Inc. | | 0.950% | | 10/01/24 | | | 850,000 | | | | 786,126 | |
| | | | | | | | | | | | 1,010,364 | |
| Packaging — 4.8% | | | | | | | | | | | | |
| Avery Dennison Corp | | 0.850% | | 08/15/24 | | | 740,000 | | | | 698,198 | |
| Ball Corp | | 4.000% | | 11/15/23 | | | 945,000 | | | | 937,615 | |
| Sonoco Products Co | | 1.800% | | 02/01/25 | | | 500,000 | | | | 469,289 | |
| | | | | | | | | | | | 2,105,102 | |
| Paper & Forest Products — 4.2% | | | | | | | | | | | | |
| Graphic Packaging International, Inc. | | 4.875% | | 11/15/22 | | | 889,000 | | | | 890,134 | |
| Weyerhaeuser Co | | 7.125% | | 07/15/23 | | | 725,000 | | | | 747,694 | |
| Weyerhaeuser Co | | 8.500% | | 01/15/25 | | | 160,000 | | | | 176,973 | |
| | | | | | | | | | | | 1,814,801 | |
| Pharmaceuticals — 1.7% | | | | | | | | | | | | |
| AstraZeneca Finance LLC | | 0.700% | | 05/28/24 | | | 800,000 | | | | 758,089 | |
| Railroads — 2.0% | | | | | | | | | | | | |
| Canadian Pacific Railway Co | | 4.450% | | 03/15/23 | | | 230,000 | | | | 230,941 | |
| Kansas City Southern | | 3.000% | | 05/15/23 | | | 650,000 | | | | 647,929 | |
| | | | | | | | | | | | 878,870 | |
| Refining — 1.1% | | | | | | | | | | | | |
| Phillips 66 | | 0.900% | | 02/15/24 | | | 490,000 | | | | 466,594 | |
| | | | | | | | | | | | | |
| Retail Stores — 1.8% | | | | | | | | | | | | |
| AutoNation, Inc. | | 3.500% | | 11/15/24 | | | 800,000 | | | | 776,284 | |
| Supermarkets — 0.6% | | | | | | | | | | | | |
| Kroger Co. (The) | | 4.000% | | 02/01/24 | | | 270,000 | | | | 270,927 | |
| | | | | | | | | | | | | |
| Transportation Services — 4.6% | | | | | | | | | | | | |
| American Airlines Group, Inc., Series 2016-1, Class B | | 5.250% | | 01/15/24 | | | 506,327 | | | | 482,796 | |
| Continental Airlines, Inc., Series 2012-2, Class A | | 4.000% | | 10/29/24 | | | 469,664 | | | | 451,201 | |
| CSX Transportation, Inc. | | 6.251% | | 01/15/23 | | | 183,272 | | | | 185,611 | |
| Delta Air Lines Pass Thru Trust, Series 2019-1, Class AA | | 3.204% | | 10/25/25 | | | 931,000 | | | | 899,909 | |
| | | | | | | | | | | | 2,019,517 | |
| Wireless Telecommunications — 1.7% | | | | | | | | | | | | |
| American Tower Corp | | 3.500% | | 01/31/23 | | | 750,000 | | | | 749,773 | |
| | | | | | | | | | | | | |
| Wireline Telecommunications — 1.9% | | | | | | | | | | | | |
| AT&T, Inc. | | 9.150% | | 02/01/23 | | | 300,000 | | | | 309,156 | |
| AT&T, Inc. | | 0.900% | | 03/25/24 | | | 530,000 | | | | 505,334 | |
| | | | | | | | | | | | 814,490 | |
| Utility — 15.1% | | | | | | | | | | | | |
| Electric — 14.0% | | | | | | | | | | | | |
| Arizona Public Service Co | | 3.350% | | 06/15/24 | | | 665,000 | | | | 656,765 | |
| Delmarva Power & Light Co | | 3.500% | | 11/15/23 | | | 362,000 | | | | 362,923 | |
| Evergy, Inc. | | 2.450% | | 09/15/24 | | | 725,000 | | | | 697,099 | |
| Eversource Energy | | 2.800% | | 05/01/23 | | | 500,000 | | | | 496,898 | |
| Georgia Power Co., Series 2020-A | | 2.100% | | 07/30/23 | | | 850,000 | | | | 837,712 | |
See Notes to Financial Statements.
| Semi-Annual Report | June 30, 2022 | | 65 |
| Segall Bryant & Hamill Short Term Plus Fund | Statement of Investments |
| | June 30, 2022 (Unaudited) |
| | | Coupon | | Maturity | | Par Value | | | Value | |
| Electric — 14.0% (continued) | | | | | | | | | | | | |
| NextEra Energy Capital Holdings, Inc. | | 0.650% | | 03/01/23 | | $ | 850,000 | | | $ | 835,404 | |
| Pacific Gas & Electric Co | | 1.700% | | 11/15/23 | | | 595,000 | | | | 573,398 | |
| PPL Electric Utilities Corp. | | 2.500% | | 09/01/22 | | | 190,000 | | | | 190,062 | |
| Virginia Electric & Power Co., Series 2015-A | | 3.100% | | 05/15/25 | | | 571,000 | | | | 561,740 | |
| Vistra Operations Co. LLC., 144A (b) | | 5.125% | | 05/13/25 | | | 900,000 | | | | 891,140 | |
| | | | | | | | | | | | 6,103,141 | |
| Other Utility — 1.1% | | | | | | | | | | | | |
| American Water Capital Corp | | 3.400% | | 03/01/25 | | | 500,000 | | | | 492,866 | |
| | | | | | | | | | | | | |
| Total Corporate Bonds (Cost $35,475,221) | | | | | | | | | | | 34,817,045 | |
| | | | | | | | | | | | | |
| MUNICIPAL BONDS — 5.7% | | | | | | | | | | | | |
| California — 0.4% | | | | | | | | | | | | |
| San Diego California Public Facilities Financing Authority Senior Water Revenue Refunding Bonds, Series 2020-B | | 1.231% | | 08/01/22 | | | 160,000 | | | | 159,888 | |
| | | | | | | | | | | | | |
| Georgia — 1.7% | | | | | | | | | | | | |
| Municipal Electric Authority of Georgia, Series 2021-B | | 0.926% | | 01/01/24 | | | 770,000 | | | | 737,550 | |
| | | | | | | | | | | | | |
| Maryland — 0.2% | | | | | | | | | | | | |
| Howard County, Maryland Refunding Consolidated Public Improvement Project and Refunding Bonds, Series 2020-C | | 1.224% | | 08/15/22 | | | 70,000 | | | | 69,951 | |
| | | | | | | | | | | | | |
| New Jersey — 0.3% | | | | | | | | | | | | |
| New Jersey Economic Development Authority Water Facilities, Series 2020-C | | 1.150% | | 06/01/23 | | | 125,000 | | | | 123,849 | |
| | | | | | | | | | | | | |
| Texas — 2.3% | | | | | | | | | | | | |
| Austin Texas Community College, Series 2020 | | 0.662% | | 02/01/23 | | | 50,000 | | | | 49,385 | |
| Central Texas Regional Mobility Authority, Series 2021-E | | 0.496% | | 01/01/23 | | | 350,000 | | | | 345,473 | |
| Central Texas Regional Mobility Authority, Series 2021-E | | 0.836% | | 01/01/24 | | | 325,000 | | | | 312,108 | |
| Central Texas Regional Mobility Authority, Series 2020-C | | 1.345% | | 01/01/24 | | | 135,000 | | | | 130,633 | |
| Fort Bend County Texas, Series 2020 | | 5.000% | | 03/01/23 | | | 185,000 | | | | 187,805 | |
| | | | | | | | | | | | 1,025,404 | |
| Wisconsin — 0.8% | | | | | | | | | | | | |
| Public Finance Authority Air Cargo Group Revenue Bonds, Series 2021 | | 1 484% | | 07/01/23 | | | 350,000 | | | | 341,537 | |
| Total Municipal Bonds (Cost $3,219,558) | | | | | | | | | | | 2,458,179 | |
| | | | | | | | | | | | | |
| COMMERCIAL MORTGAGE-BACKED SECURITIES — 1.0% | | | | | | | | | | | | |
| FHLMC Remic, Series K-029, Class A-2 (Cost $438,094) (a) | | 3.320% | | 02/25/23 | | | 430,581 | | | | 430,359 | |
| | | | | | | | | | | | | |
| Total Commercial Mortgage-Backed Securities (Cost $438,094) | | | | | | | | | | | 430,359 | |
See Notes to Financial Statements.
| 66 | | www.sbhfunds.com |
| Segall Bryant & Hamill Short Term Plus Fund | Statement of Investments |
| | June 30, 2022 (Unaudited) |
| | | Coupon | | | Maturity | | | Par Value | | | Value | |
| U.S. TREASURY BONDS & NOTES — 11.0% | | | | | | | | | | | | | | | | |
| United States Treasury | | | 0.125 | % | | | 09/30/22 | | | $ | 1,005,000 | | | $ | 1,000,817 | |
| United States Treasury | | | 0.125 | % | | | 07/15/23 | | | | 1,100,000 | | | | 1,068,332 | |
| United States Treasury | | | 2.125 | % | | | 11/30/23 | | | | 1,245,000 | | | | 1,230,702 | |
| United States Treasury | | | 2.250 | % | | | 01/31/24 | | | | 1,000,000 | | | | 988,633 | |
| United States Treasury | | | 2.375 | % | | | 08/15/24 | | | | 500,000 | | | | 493,379 | |
Total U.S. Treasury Bonds & Notes
(Cost $4,889,418) | | | | | | | | | | | | | | | 4,781,863 | |
| | | | | | | | | | | | | | | | | |
| Investments at Value — 97.6% | | | | | | | | | | | | | | | | |
| (Cost $44,022,291) | | | | | | | | | | | | | | $ | 42,487,446 | |
| | | | | | | | | | | | | | | | | |
| Other Assets in Excess of Liabilities — 2.4% | | | | | | | | | | | | | | | 1,051,485 | |
| | | | | | | | | | | | | | | | | |
| Net Assets — 100.0% | | | | | | | | | | | | | | $ | 43,538,931 | |
(a) Variable rate security. Interest rate resets periodically. The rate shown is the effective interest rate as of June 30, 2022. For securities based on a published reference rate and spread, the reference rate and spread (in basis points) are indicated parenthetically. Certain variable rate securities are not based on a published reference rate and spread but are determined by the issuer or agent and are based on current market conditions. These securities, therefore, do not indicate a reference rate and spread.
(b) Security was purchased in a transaction exempt from registration in compliance with Rule 144A of the Securities Act of 1933. This security may be resold in transactions exempt from registration, normally to qualified institutional buyers. The total value of these securities is $891,140, which represents 2.0% of net assets as of June 30, 2022.
The Fund’s sector and industry classifications presented herein refer to any one or more of the industry sub-classifications used by one or more widely recognized market indexes or ratings group indexes, and/or as defined by Fund management. For Fund compliance purposes, sector and industry classifications are based on the sector and industry categorization methodology of the Adviser to the Funds. This definition may not apply for purposes of this report, which may combine industry sub-classifications for reporting ease. Industries are shown as a percentage of net assets.
See Notes to Financial Statements.
| Semi-Annual Report | June 30, 2022 | | 67 |
| Segall Bryant & Hamill Plus Bond Fund | Statement of Investments |
| | June 30, 2022 (Unaudited) |
| | | Coupon | | Maturity | | Par Value | | | Value | |
| CORPORATE BONDS — 49.8% | | | | | | | | | | | | |
| Finance — 9.9% | | | | | | | | | | | | |
| Banking — 3.9% | | | | | | | | | | | | |
| Bank of America Corp., Series N (SOFR + 153) (a) | | 1.898% | | 07/23/31 | | $ | 3,700,000 | | | $ | 2,957,080 | |
| Bank of America Corp., Series N (3MO LIBOR + 315) (a) | | 4.083% | | 03/20/51 | | | 3,000,000 | | | | 2,585,577 | |
| Capital One Financial Corp | | 3.200% | | 02/05/25 | | | 7,640,000 | | | | 7,428,458 | |
| JPMorgan Chase & Co. (SOFR + 151) (a) | | 2.739% | | 10/15/30 | | | 10,430,000 | | | | 9,100,211 | |
| Wells Fargo & Co. (3MO LIBOR + 131) (a) | | 3.584% | | 05/22/28 | | | 9,635,000 | | | | 9,140,813 | |
| | | | | | | | | | | | 31,212,139 | |
| Broker/Asset Managers/Exchanges — 1.0% | | | | | | | | | | | | |
| Cboe Global Markets, Inc. | | 3.650% | | 01/12/27 | | | 5,270,000 | | | | 5,145,864 | |
| FMR LLC, 144A (b) | | 6.450% | | 11/15/39 | | | 2,575,000 | | | | 2,855,140 | |
| | | | | | | | | | | | 8,001,004 | |
| Life Insurance — 0.7% | | | | | | | | | | | | |
| Northwestern Mutual Life Insurance Co. (The), 144A (b) | | 3.850% | | 09/30/47 | | | 6,775,000 | | | | 5,623,706 | |
| | | | | | | | | | | | | |
| Mortgage Banking — 0.7% | | | | | | | | | | | | |
| Provident Funding Associates LP/PFG Finance Corp., 144A (b) | | 6.375% | | 06/15/25 | | | 6,295,000 | | | | 5,665,500 | |
| | | | | | | | | | | | | |
| Noncaptive Diversified Financial Companies — 1.4% | | | | | | | | | | | | |
| Aircastle, Ltd. | | 5.000% | | 04/01/23 | | | 3,000,000 | | | | 2,996,330 | |
| Aviation Capital Group LLC, 144A (b) | | 3.875% | | 05/01/23 | | | 4,250,000 | | | | 4,213,268 | |
| GATX Corp | | 3.500% | | 06/01/32 | | | 5,102,000 | | | | 4,473,619 | |
| | | | | | | | | | | | 11,683,217 | |
| Other Finance — 0.5% | | | | | | | | | | | | |
| IIP Operating Partnership LP | | 5.500% | | 05/25/26 | | | 4,615,000 | | | | 4,182,684 | |
| | | | | | | | | | | | | |
| Real Estate Investment Trusts — 1.7% | | | | | | | | | | | | |
| MPT Operating Partnership LP/MPT Finance Corp. | | 5.000% | | 10/15/27 | | | 6,175,000 | | | | 5,648,087 | |
| Ventas Realty LP | | 3.500% | | 04/15/24 | | | 3,000,000 | | | | 2,965,572 | |
| VICI Properties LP, 144A (b) | | 5.625% | | 05/01/24 | | | 5,199,000 | | | | 5,134,013 | |
| | | | | | | | | | | | 13,747,672 | |
| Industrial — 34.7% | | | | | | | | | | | | |
| Automobile Manufacturing — 1.9% | | | | | | | | | | | | |
| Ford Motor Credit Co. LLC | | 4.063% | | 11/01/24 | | | 2,000,000 | | | | 1,897,385 | |
| Ford Motor Credit Co. LLC | | 3.375% | | 11/13/25 | | | 5,500,000 | | | | 4,952,585 | |
| General Motors Financial Co., Inc. | | 5.100% | | 01/17/24 | | | 2,300,000 | | | | 2,322,873 | |
| General Motors Financial Co., Inc. | | 3.950% | | 04/13/24 | | | 4,425,000 | | | | 4,391,038 | |
| Goodyear Tire & Rubber Co | | 9.500% | | 05/31/25 | | | 1,500,000 | | | | 1,551,258 | |
| Goodyear Tire & Rubber Co | | 5.000% | | 07/15/29 | | | 500,000 | | | | 414,079 | |
| | | | | | | | | | | | 15,529,218 | |
| Beverage / Bottling — 1.2% | | | | | | | | | | | | |
| Anheuser-Busch Cos. LLC/Anheuser-Busch InBev Worldwide, Inc. | | 4.375% | | 04/15/38 | | | 7,725,000 | | | | 7,084,880 | |
| Fomento Economico Mexicano S A B de C V | | 2.875% | | 05/10/23 | | | 2,978,000 | | | | 2,938,303 | |
| | | | | | | | | | | | 10,023,183 | |
| Building Products — 1.8% | | | | | | | | | | | | |
| Allegion PLC | | 3.500% | | 10/01/29 | | | 2,498,000 | | | | 2,209,333 | |
| Allegion US Holding Co., Inc. | | 3.550% | | 10/01/27 | | | 2,550,000 | | | | 2,344,587 | |
| Masco Corp | | 6.500% | | 08/15/32 | | | 6,205,000 | | | | 6,676,341 | |
| Summit Materials LLC, 144A (b) | | 6.500% | | 03/15/27 | | | 1,450,000 | | | | 1,398,410 | |
| Summit Materials LLC, 144A (b) | | 5.250% | | 01/15/29 | | | 1,750,000 | | | | 1,526,875 | |
| | | | | | | | | | | | 14,155,546 | |
| Chemicals — 0.5% | | | | | | | | | | | | |
| Compass Minerals International, Inc., 144A (b) | | 6.750% | | 12/01/27 | | | 4,430,000 | | | | 4,009,150 | |
See Notes to Financial Statements.
| 68 | | www.sbhfunds.com |
| Segall Bryant & Hamill Plus Bond Fund | Statement of Investments |
| | June 30, 2022 (Unaudited) |
| | | Coupon | | Maturity | | Par Value | | | Value | |
| Construction Machinery — 1.5% | | | | | | | | | | | | |
| CNH Industrial N V | | 4.500% | | 08/15/23 | | $ | 3,275,000 | | | $ | 3,302,454 | |
| H&E Equipment Services, Inc., 144A (b) | | 3.875% | | 12/15/28 | | | 5,550,000 | | | | 4,488,563 | |
| United Rentals North America | | 3.875% | | 02/15/31 | | | 5,295,000 | | | | 4,466,796 | |
| | | | | | | | | | | | 12,257,813 | |
| Consumer Products — 0.5% | | | | | | | | | | | | |
| Vista Outdoor, Inc., 144A (b) | | 4.500% | | 03/15/29 | | | 5,600,000 | | | | 4,284,936 | |
| | | | | | | | | | | | | |
| Diversified Manufacturing — 1.3% | | | | | | | | | | | | |
| BWX Technologies, Inc., 144A (b) | | 4.125% | | 06/30/28 | | | 4,169,000 | | | | 3,710,410 | |
| nVent Finance SARL | | 2.750% | | 11/15/31 | | | 2,245,000 | | | | 1,824,757 | |
| Vontier Corp | | 2.400% | | 04/01/28 | | | 5,550,000 | | | | 4,652,005 | |
| | | | | | | | | | | | 10,187,172 | |
| Electronics — 1.6% | | | | | | | | | | | | |
| Amkor Technology, Inc., 144A (b) | | 6.625% | | 09/15/27 | | | 4,422,000 | | | | 4,186,263 | |
| Dell, Inc. | | 7.100% | | 04/15/28 | | | 4,492,000 | | | | 4,885,160 | |
| QORVO, Inc., 144A (b) | | 1.750% | | 12/15/24 | | | 2,840,000 | | | | 2,652,901 | |
| QORVO, Inc. | | 4.375% | | 10/15/29 | | | 775,000 | | | | 681,551 | |
| QORVO, Inc., 144A (b) | | 3.375% | | 04/01/31 | | | 500,000 | | | | 393,170 | |
| | | | | | | | | | | | 12,799,045 | |
| Healthcare Facilities / Supplies — 1.6% | | | | | | | | | | | | |
| HCA, Inc. | | 3.500% | | 09/01/30 | | | 2,500,000 | | | | 2,126,775 | |
| Hologic, Inc., 144A (b) | | 4.625% | | 02/01/28 | | | 3,146,000 | | | | 2,943,870 | |
| Teleflex, Inc. | | 4.625% | | 11/15/27 | | | 1,390,000 | | | | 1,282,275 | |
| Teleflex, Inc., 144A (b) | | 4.250% | | 06/01/28 | | | 3,741,000 | | | | 3,380,124 | |
| Tenet Healthcare Corp., 144A (b) | | 6.125% | | 10/01/28 | | | 3,333,000 | | | | 2,852,315 | |
| | | | | | | | | | | | 12,585,359 | |
| Independent Energy — 2.9% | | | | | | | | | | | | |
| Diamondback Energy, Inc. | | 3.500% | | 12/01/29 | | | 3,000,000 | | | | 2,747,892 | |
| Occidental Petroleum Corp | | 7.500% | | 05/01/31 | | | 6,085,000 | | | | 6,541,375 | |
| PDC Energy, Inc. | | 6.125% | | 09/15/24 | | | 2,932,000 | | | | 2,912,048 | |
| PDC Energy, Inc. | | 5.750% | | 05/15/26 | | | 5,000,000 | | | | 4,664,150 | |
| Range Resources Corp | | 4.875% | | 05/15/25 | | | 6,400,000 | | | | 6,242,560 | |
| | | | | | | | | | | | 23,108,025 | |
| Lease / Rent — 1.2% | | | | | | | | | | | | |
| SBA Tower Trust, 144A, Series 2019-1, Class 1-C (b) | | 2.836% | | 01/15/50 | | | 10,000,000 | | | | 9,659,561 | |
| | | | | | | | | | | | | |
| Media — Cable — 2.5% | | | | | | | | | | | | |
| CCO Holdings LLC/CCO Holdings Capital Corp., 144A (b) | | 5.000% | | 02/01/28 | | | 4,140,000 | | | | 3,819,978 | |
| Cox Communications, Inc., 144A (b) | | 2.600% | | 06/15/31 | | | 5,325,000 | | | | 4,453,211 | |
| Dish DBS Corp | | 5.875% | | 07/15/22 | | | 4,044,000 | | | | 4,021,071 | |
| Dish DBS Corp | | 7.750% | | 07/01/26 | | | 2,050,000 | | | | 1,597,975 | |
| Magallanes, Inc., 144A (b) | | 5.391% | | 03/15/62 | | | 4,480,000 | | | | 3,747,513 | |
| Sirius XM Radio, Inc., 144A (b) | | 5.500% | | 07/01/29 | | | 3,000,000 | | | | 2,733,750 | |
| | | | | | | | | | | | 20,373,498 | |
| Media — Non-Cable — 1.6% | | | | | | | | | | | | |
| AMC Networks, Inc. | | 4.750% | | 08/01/25 | | | 3,965,000 | | | | 3,693,556 | |
| Lamar Media Corp | | 3.750% | | 02/15/28 | | | 2,400,000 | | | | 2,130,552 | |
| Lamar Media Corp | | 4.875% | | 01/15/29 | | | 1,700,000 | | | | 1,530,197 | |
| Netflix, Inc. | | 4.875% | | 04/15/28 | | | 1,000,000 | | | | 941,050 | |
| Netflix, Inc. | | 6.375% | | 05/15/29 | | | 1,000,000 | | | | 1,009,950 | |
| Netflix, Inc., 144A (b) | | 4.875% | | 06/15/30 | | | 1,225,000 | | | | 1,121,175 | |
| Walt Disney Co. (The) | | 4.625% | | 03/23/40 | | | 2,630,000 | | | | 2,567,833 | |
| | | | | | | | | | | | 12,994,313 | |
| Metals / Mining — 0.8% | | | | | | | | | | | | |
| Freeport-McMoran Copper & Gold, Inc. | | 3.875% | | 03/15/23 | | | 6,687,000 | | | | 6,658,103 | |
See Notes to Financial Statements.
| Semi-Annual Report | June 30, 2022 | | 69 |
| Segall Bryant & Hamill Plus Bond Fund | Statement of Investments |
| | June 30, 2022 (Unaudited) |
| | | Coupon | | Maturity | | Par Value | | | Value | |
| Midstream Energy — 2.5% | | | | | | | | | | | | |
| Boardwalk Pipelines LP | | 3.375% | | 02/01/23 | | $ | 3,295,000 | | | $ | 3,284,688 | |
| Magellan Midstream Partners LP | | 5.000% | | 03/01/26 | | | 6,125,000 | | | | 6,261,802 | |
| Tennessee Gas Pipeline Co. LLC | | 8.375% | | 06/15/32 | | | 5,284,000 | | | | 6,205,553 | |
| Transcontinental Gas Pipe Line Co. LLC | | 7.850% | | 02/01/26 | | | 4,315,000 | | | | 4,765,067 | |
| | | | | | | | | | | | 20,517,110 | |
| Oil Field Services — 0.1% | | | | | | | | | | | | |
| Burlington Resources, Inc. | | 6.875% | | 02/15/26 | | | 1,000,000 | | | | 1,082,527 | |
| | | | | | | | | | | | | |
| Other Industrial — 0.8% | | | | | | | | | | | | |
| Quanta Services, Inc. | | 2.900% | | 10/01/30 | | | 8,000,000 | | | | 6,590,830 | |
| | | | | | | | | | | | | |
| Packaging — 1.6% | | | | | | | | | | | | |
| Ball Corp | | 4.875% | | 03/15/26 | | | 4,500,000 | | | | 4,426,875 | |
| Berry Global, Inc., 144A (b) | | 4.500% | | 02/15/26 | | | 1,418,000 | | | | 1,318,272 | |
| Silgan Holdings, Inc., 144A (b) | | 1.400% | | 04/01/26 | | | 3,000,000 | | | | 2,679,928 | |
| Silgan Holdings, Inc. | | 4.125% | | 02/01/28 | | | 4,820,000 | | | | 4,322,239 | |
| | | | | | | | | | | | 12,747,314 | |
| Paper & Forest Products — 0.9% | | | | | | | | | | | | |
| Graphic Packaging International, Inc. | | 4.875% | | 11/15/22 | | | 1,601,000 | | | | 1,603,042 | |
| West Fraser Timber Co., Ltd., 144A (b) | | 4.350% | | 10/15/24 | | | 5,425,000 | | | | 5,407,291 | |
| | | | | | | | | | | | 7,010,333 | |
| Retail Stores — 2.5% | | | | | | | | | | | | |
| Dick’s Sporting Goods, Inc. | | 3.150% | | 01/15/32 | | | 3,825,000 | | | | 3,032,396 | |
| Dick’s Sporting Goods, Inc. | | 4.100% | | 01/15/52 | | | 3,000,000 | | | | 1,994,876 | |
| Group 1 Automotive, Inc., 144A (b) | | 4.000% | | 08/15/28 | | | 5,438,000 | | | | 4,544,989 | |
| Hanesbrands, Inc., 144A (b) | | 4.625% | | 05/15/24 | | | 2,491,000 | | | | 2,438,465 | |
| Hanesbrands, Inc., 144A (b) | | 4.875% | | 05/15/26 | | | 2,000,000 | | | | 1,852,520 | |
| QVC, Inc. | | 4.850% | | 04/01/24 | | | 5,122,000 | | | | 4,788,097 | |
| QVC, Inc. | | 4.750% | | 02/15/27 | | | 2,085,000 | | | | 1,647,150 | |
| | | | | | | | | | | | 20,298,493 | |
| Services — 2.3% | | | | | | | | | | | | |
| Block Financial LLC | | 3.875% | | 08/15/30 | | | 5,340,000 | | | | 4,802,414 | |
| Factset Research Systems, Inc. | | 2.900% | | 03/01/27 | | | 4,221,000 | | | | 3,952,683 | |
| Rayonier LP | | 2.750% | | 05/17/31 | | | 6,000,000 | | | | 5,008,280 | |
| Service Corp. International | | 4.625% | | 12/15/27 | | | 483,000 | | | | 454,020 | |
| Service Corp. International | | 5.125% | | 06/01/29 | | | 4,575,000 | | | | 4,310,519 | |
| | | | | | | | | | | | 18,527,916 | |
| Supermarkets — 0.5% | | | | | | | | | | | | |
| Alimentation Couche-Tard, Inc., 144A (b) | | 3.550% | | 07/26/27 | | | 4,660,000 | | | | 4,345,511 | |
| | | | | | | | | | | | | |
| Transportation Services — 2.2% | | | | | | | | | | | | |
| American Airlines, Inc., Series 2013-2, Class A (c) | | 4.950% | | 07/15/24 | | | 9,566,356 | | | | 9,389,391 | |
| FedEx Corp | | 3.900% | | 02/01/35 | | | 6,190,000 | | | | 5,513,693 | |
| United Parcel Service, Inc. | | 5.200% | | 04/01/40 | | | 1,540,000 | | | | 1,625,081 | |
| XPO CNW, Inc. | | 6.700% | | 05/01/34 | | | 900,000 | | | | 841,197 | |
| | | | | | | | | | | | 17,369,362 | |
| Wireless Telecommunications — 0.4% | | | | | | | | | | | | |
| T-Mobile USA, Inc. | | 3.500% | | 04/15/31 | | | 3,670,000 | | | | 3,168,788 | |
| | | | | | | | | | | | | |
| Utility — 5.2% | | | | | | | | | | | | |
| Electric — 4.5% | | | | | | | | | | | | |
| Nevada Power Co | | 6.750% | | 07/01/37 | | | 3,956,000 | | | | 4,597,633 | |
| NRG Energy, Inc., 144A (b) | | 5.250% | | 06/15/29 | | | 5,575,000 | | | | 4,975,688 | |
See Notes to Financial Statements.
| 70 | | www.sbhfunds.com |
| Segall Bryant & Hamill Plus Bond Fund | Statement of Investments |
| | June 30, 2022 (Unaudited) |
| | | Coupon | | Maturity | | Par Value | | | Value | |
| Electric — 4.5% (continued) | | | | | | | | | | | | |
| Oglethorpe Power Corp., 144A (b) | | 4.500% | | 04/01/47 | | $ | 2,640,000 | | | $ | 2,290,535 | |
| Oncor Electric Delivery Co. LLC | | 5.750% | | 03/15/29 | | | 4,725,000 | | | | 5,103,973 | |
| Pacific Gas & Electric Co | | 1.700% | | 11/15/23 | | | 2,761,000 | | | | 2,660,760 | |
| PG&E Corp | | 5.000% | | 07/01/28 | | | 2,000,000 | | | | 1,687,760 | |
| Pinnacle West Capital Corp | | 1.300% | | 06/15/25 | | | 4,327,000 | | | | 3,957,351 | |
| Tenaska Virginia Partners LP, 144A (b) | | 6.119% | | 03/30/24 | | | 41,530 | | | | 41,731 | |
| Virginia Electric & Power Co., Series A | | 6.000% | | 05/15/37 | | | 5,581,000 | | | | 6,189,916 | |
| Vistra Operations Co. LLC, 144A (b) | | 5.000% | | 07/31/27 | | | 5,100,000 | | | | 4,636,461 | |
| | | | | | | | | | | | 36,141,808 | |
| Natural Gas — Distributors — 0.7% | | | | | | | | | | | | |
| AmeriGas Partners LP/AmeriGas Financial Corp. | | 5.625% | | 05/20/24 | | | 5,932,000 | | | | 5,723,943 | |
| | | | | | | | | | | | | |
| Total Corporate Bonds (Cost $443,989,484) | | | | | | | | | | | 402,264,779 | |
| | | | | | | | | | | | | |
| MUNICIPAL BONDS — 8.8% | | | | | | | | | | | | |
| California — 2.6% | | | | | | | | | | | | |
| California Educational Facilities Authority, Series 2018-A | | 4.842% | | 10/01/48 | | | 3,635,000 | | | | 3,702,382 | |
| California Municipal Finance Authority, Series 2021 (c)(d) | | 3.637% | | 07/01/30 | | | 6,940,000 | | | | 6,050,165 | |
| City of San Francisco California Public Utilities Commission Water Revenue, Series 2010-B | | 6.000% | | 11/01/40 | | | 4,100,000 | | | | 4,679,392 | |
| San Diego County Regional Airport Authority, Series 2014-B | | 5.594% | | 07/01/43 | | | 3,215,000 | | | | 3,349,007 | |
| University of California, Series 2013-AJ | | 4.601% | | 05/15/31 | | | 2,865,000 | | | | 2,948,954 | |
| | | | | | | | | | | | 20,729,900 | |
| Colorado — 0.5% | | | | | | | | | | | | |
| Denver Colorado Public Schools, Series 2013-B | | 4.242% | | 12/15/37 | | | 3,900,000 | | | | 3,784,246 | |
| | | | | | | | | | | | | |
| District of Columbia — 0.4% | | | | | | | | | | | | |
| District of Columbia Income Tax, Series 2009-E | | 5.591% | | 12/01/34 | | | 2,880,000 | | | | 3,184,399 | |
| | | | | | | | | | | | | |
| Massachusetts — 0.2% | | | | | | | | | | | | |
| Commonwealth of Massachusetts, Series 2019-D | | 2.663% | | 09/01/39 | | | 2,046,634 | | | | 1,694,959 | |
| | | | | | | | | | | | | |
| New Hampshire — 0.6% | | | | | | | | | | | | |
| National Finance Authority, Series 2021 | | 3.778% | | 01/01/36 | | | 6,000,000 | | | | 4,782,391 | |
| | | | | | | | | | | | | |
| New York — 0.9% | | | | | | | | | | | | |
| New York City Transitional Finance Authority, Series B SUB B-3 | | 3.950% | | 08/01/32 | | | 7,665,000 | | | | 7,481,729 | |
| | | | | | | | | | | | | |
| Texas — 1.5% | | | | | | | | | | | | |
| Central Texas Regional Mobility Authority, Series 2020-D | | 3.593% | | 01/01/42 | | | 4,950,000 | | | | 3,992,175 | |
| North Texas Tollway Authority System, Series 2020-B | | 2.327% | | 01/01/33 | | | 4,920,000 | | | | 4,121,931 | |
| Texas Transportation Commission Central Texas Turnpike System, Series 2020-B | | 1.980% | | 08/15/42 | | | 4,025,000 | | | | 4,022,872 | |
| | | | | | | | | | | | 12,136,978 | |
| Utah — 0.6% | | | | | | | | | | | | |
| Utah Transit Authority Sales Tax Revenue, Series 2020 | | 2.774% | | 12/15/38 | | | 5,925,000 | | | | 4,782,286 | |
| | | | | | | | | | | | | |
| Virginia — 1.1% | | | | | | | | | | | | |
| Virginia Small Business Financing Authority, Series 2017 (a)(c)(d) | | 2.250% | | 07/01/50 | | | 9,000,000 | | | | 8,941,199 | |
| | | | | | | | | | | | | |
| Washington — 0.4% | | | | | | | | | | | | |
| Port of Seattle Washington, Series 2017-B | | 3.755% | | 05/01/36 | | | 1,925,000 | | | | 1,776,355 | |
| State of Washington, Series 2010-D | | 5.481% | | 08/01/39 | | | 1,475,000 | | | | 1,628,073 | |
| | | | | | | | | | | | 3,404,428 | |
| Total Municipal Bonds (Cost $78,314,658) | | | | | | | | | | | 70,922,515 | |
See Notes to Financial Statements.
| Semi-Annual Report | June 30, 2022 | | 71 |
| Segall Bryant & Hamill Plus Bond Fund | Statement of Investments |
| | June 30, 2022 (Unaudited) |
| | | Coupon | | Maturity | | Par Value | | | Value | |
| ASSET BACKED SECURITIES — 3.6% | | | | | | | | | | | | |
| Bear Stearns, Series 2003-AC4, Class A (e) | | 5.500% | | 09/25/33 | | $ | 2,310,331 | | | $ | 2,167,250 | |
| Drive Auto Receivables Trust, Series 2018-3, Class D | | 4.300% | | 09/16/24 | | | 788,539 | | | | 790,161 | |
| DT Auto Owner Trust, Series 2019-3, Class C, 144A (b) | | 2.740% | | 04/15/25 | | | 452,415 | | | | 452,292 | |
| DT Auto Owner Trust, Series 2019-4, Class D, 144A (b) | | 2.850% | | 07/15/25 | | | 5,020,000 | | | | 4,956,248 | |
| GTP Acquisition Partners I LLC, Series 2015-1-2, Class A-15-2, 144A (b) | | 3.482% | | 06/16/25 | | | 10,800,000 | | | | 10,634,960 | |
| Renaissance Home Equity Loan Trust, Series 2005-2, Class AF-6 (a)(e) | | 4.781% | | 08/25/35 | | | 355,470 | | | | 342,438 | |
| Trinity Rail Leasing LP, Series 2022-1, Class A, 144A (b) | | 4.550% | | 05/20/52 | | | 5,000,000 | | | | 4,923,892 | |
| Verizon Master Trust, Series 2021-2, Class A | | 0.976% | | 04/20/28 | | | 4,765,000 | | | | 4,479,233 | |
| Total Asset Backed Securities (Cost $29,561,230) | | | | | | | | | | | 28,746,474 | |
| | | | | | | | | | | | | |
| RESIDENTIAL MORTGAGE-BACKED SECURITIES — 0.3% | | | | | | | | | | | | |
| American Home Mortgage Investment Trust, Series 2004-4, Class VI-A-1 (a)(e) | | 4.227% | | 02/25/45 | | | 1,127,826 | | | | 1,117,604 | |
| Banc of America Funding Trust, Series 2005-4, Class 1-A-4 | | 5.500% | | 08/25/35 | | | 45,967 | | | | 45,232 | |
| Banc of America Funding Trust, Series 2005-4, Class 2-A-4 | | 5.500% | | 08/25/35 | | | 70,917 | | | | 67,984 | |
| CWHL Mortgage Pass-Through Trust, Series 2004-HYB2, Class 5-A (a) | | 2.375% | | 07/20/34 | | | 636,286 | | | | 609,923 | |
| GSR Mortgage Loan Trust, Series 2005-3F, Class 2A-3 | | 6.000% | | 03/25/35 | | | 585,878 | | | | 464,495 | |
| PHMC Trust, Series 2007-2, Class A-2 (a) | | 5.378% | | 05/18/37 | | | 279,705 | | | | 271,950 | |
| Total Residential Mortgage-Backed Securities (Cost $2,792,650) | | | | | | | | | | | 2,577,188 | |
| | | | | | | | | | | | | |
| MORTGAGE-BACKED SECURITIES PASSTHROUGH — 21.3% | | | | | | | | | | | | |
| Fannie Mae Pool — 6.6% | | | | | | | | | | | | |
| Pool #MA2354, Series 2015 | | 3.500% | | 08/01/35 | | | 3,899,801 | | | | 3,899,889 | |
| Pool #735897 | | 5.500% | | 10/01/35 | | | 303,134 | | | | 323,616 | |
| Pool #888016 | | 5.500% | | 05/01/36 | | | 493,941 | | | | 529,514 | |
| Pool #MA4703 | | 4.000% | | 06/01/37 | | | 4,693,960 | | | | 4,745,527 | |
| Pool #889108 | | 6.000% | | 02/01/38 | | | 272,369 | | | | 298,156 | |
| Pool #889579 | | 6.000% | | 05/01/38 | | | 450,219 | | | | 493,496 | |
| Pool #995838 | | 5.500% | | 05/01/39 | | | 344,648 | | | | 370,200 | |
| Pool #AL3287, Series 2013 | | 4.500% | | 09/01/41 | | | 1,237,063 | | | | 1,266,715 | |
| Pool #MA1700, Series 2013 | | 4.500% | | 12/01/43 | | | 943,406 | | | | 969,046 | |
| Pool #MA1971 | | 4.500% | | 06/01/44 | | | 162,495 | | | | 167,317 | |
| Pool #MA2005 | | 4.500% | | 08/01/44 | | | 299,814 | | | | 307,955 | |
| Pool #CA5960 | | 2.500% | | 06/01/50 | | | 9,283,131 | | | | 8,433,484 | |
| Pool #MA4048 | | 3.000% | | 06/01/50 | | | 5,754,839 | | | | 5,371,435 | |
| Pool #MA4097 | | 3.000% | | 08/01/50 | | | 5,787,202 | | | | 5,404,898 | |
| Pool #MA4121 | | 3.000% | | 09/01/50 | | | 4,372,749 | | | | 4,093,283 | |
| Pool #MA4379 | | 2.500% | | 07/01/51 | | | 3,597,060 | | | | 3,241,464 | |
| Pool #MA4644 | | 4.000% | | 05/01/52 | | | 13,563,919 | | | | 13,391,245 | |
| | | | | | | | | | | | 53,307,240 | |
| Freddie Mac Gold Pool — 0.3% | | | | | | | | | | | | |
| Pool #G08061 | | 5.500% | | 06/01/35 | | | 39,923 | | | | 42,858 | |
| Pool #A42128 | | 5.500% | | 01/01/36 | | | 170,434 | | | | 182,999 | |
| Pool #G02252 | | 5.500% | | 07/01/36 | | | 371,558 | | | | 399,279 | |
| Pool #G02386 | | 6.000% | | 11/01/36 | | | 239,471 | | | | 262,220 | |
| Pool #G03189 | | 6.500% | | 09/01/37 | | | 463,530 | | | | 497,421 | |
| Pool #G08607 | | 4.500% | | 09/01/44 | | | 623,091 | | | | 642,179 | |
| | | | | | | | | | | | 2,026,956 | |
| Freddie Mac Non-Gold Pool — 9.4% | | | | | | | | | | | | |
| Pool #781958 (H15T1Y + 225) | | 2.375% | | 09/01/34 | | | 36,769 | | | | 37,963 | |
| Pool #SB8116 | | 2.500% | | 07/01/36 | | | 2,583,348 | | | | 2,469,686 | |
| Pool #SB8171 | | 4.000% | | 06/01/37 | | | 4,123,501 | | | | 4,168,727 | |
| Pool #SD8092 | | 3.000% | | 09/01/50 | | | 7,379,150 | | | | 6,889,133 | |
| Pool #SD8151 | | 2.500% | | 06/01/51 | | | 11,694,438 | | | | 10,533,608 | |
See Notes to Financial Statements.
| 72 | | www.sbhfunds.com |
| Segall Bryant & Hamill Plus Bond Fund | Statement of Investments |
| | June 30, 2022 (Unaudited) |
| | | Coupon | | Maturity | | Par Value | | | Value | |
| Freddie Mac Non-Gold Pool — 9.4% (continued) | | | | | | | | | | | | |
| Pool #SD8196 | | 3.500% | | 02/01/52 | | $ | 9,563,426 | | | $ | 9,209,642 | |
| Pool #SD8202 | | 3.500% | | 02/01/52 | | | 17,586,387 | | | | 16,933,866 | |
| Pool #SD8215 | | 4.000% | | 05/01/52 | | | 8,946,101 | | | | 8,836,205 | |
| Pool #SD8232 | | 5.000% | | 06/01/52 | | | 7,967,949 | | | | 8,140,330 | |
| Pool #SD8233 | | 5.000% | | 07/01/52 | | | 8,350,000 | | | | 8,531,620 | |
| | | | | | | | | | | | 75,750,780 | |
| Ginnie Mae II Pool — 5.0% | | | | | | | | | | | | |
| Pool #004496M | | 5.000% | | 07/20/39 | | | 281,409 | | | | 298,980 | |
| Pool #MA7590M | | 3.000% | | 09/20/51 | | | 9,233,477 | | | | 8,720,143 | |
| Pool #MA7649M | | 2.500% | | 10/20/51 | | | 7,601,111 | | | | 6,982,697 | |
| Pool #MA7768M | | 3.000% | | 12/20/51 | | | 14,343,751 | | | | 13,545,336 | |
| Pool #MA7769M | | 3.500% | | 12/20/51 | | | 9,696,948 | | | | 9,439,820 | |
| Pool #MA7882M | | 3.000% | | 02/20/52 | | | 1,856,657 | | | | 1,753,104 | |
| | | | | | | | | | | | 40,740,080 | |
| Total Mortgage-Backed Securities Passthrough (Cost $184,811,227) | | | | | | | | | | | 171,825,056 | |
| | | | | | | | | | | | | |
| U.S. TREASURY BONDS & NOTES — 14.8% | | | | | | | | | | | | |
| United States Treasury | | 0.250% | | 05/31/25 | | | 235,000 | | | | 216,852 | |
| United States Treasury | | 2.250% | | 11/15/25 | | | 25,915,000 | | | | 25,240,805 | |
| United States Treasury | | 2.375% | | 05/15/27 | | | 3,725,000 | | | | 3,605,975 | |
| United States Treasury | | 1.125% | | 02/29/28 | | | 14,795,000 | | | | 13,302,785 | |
| United States Treasury | | 2.625% | | 02/15/29 | | | 3,240,000 | | | | 3,154,570 | |
| United States Treasury | | 0.875% | | 11/15/30 | | | 11,825,000 | | | | 9,984,273 | |
| United States Treasury | | 3.125% | | 11/15/41 | | | 16,425,000 | | | | 15,769,925 | |
| United States Treasury | | 1.125% | | 05/15/40 | | | 2,035,000 | | | | 1,416,551 | |
| United States Treasury | | 2.875% | | 05/15/43 | | | 14,805,000 | | | | 13,500,309 | |
| United States Treasury | | 2.500% | | 02/15/45 | | | 20,675,000 | | | | 17,534,984 | |
| United States Treasury | | 1.250% | | 05/15/50 | | | 10,160,000 | | | | 6,464,300 | |
| United States Treasury | | 1.625% | | 11/15/50 | | | 14,000,000 | | | | 9,846,484 | |
| Total U.S. Treasury Bonds & Notes (Cost $133,701,559) | | | | | | | | | | | 120,037,813 | |
| | | | | | | | | | | | | |
| Investments at Value — 98.6% | | | | | | | | | | | | |
| (Cost $873,170,807) | | | | | | | | | | $ | 796,373,825 | |
| | | | | | | | | | | | | |
| Other Assets in Excess of Liabilities — 1.4% | | | | | | | | | | | 11,384,290 | |
| | | | | | | | | | | | | |
| Net Assets — 100.0% | | | | | | | | | | $ | 807,758,115 | |
| (a) | Variable rate security. Interest rate resets periodically. The rate shown is the effective interest rate as of June 30, 2022. For securities based on a published reference rate and spread, the reference rate and spread (in basis points) are indicated parenthetically. Certain variable rate securities are not based on a published reference rate and spread but are determined by the issuer or agent and are based on current market conditions. These securities, therefore, do not indicate a reference rate and spread. |
| (b) | Security was purchased in a transaction exempt from registration in compliance with Rule 144A of the Securities Act of 1933. This security may be resold in transactions exempt from registration, normally to qualified institutional buyers. The total value of these securities is $140,352,585, which represents 17.4% of net assets as of June 30, 2022. |
| (c) | Security is considered a restricted security however such restriction has not resulted in an illiquid classification. The total value of these securities is $24,380,755, which represents 3.0% of net assets as of June 30, 2022. |
| (d) | Security can be called and redeemed at the option of the issuer prior to the stated maturity date which is included in the Statement of Investments. (e) Step coupon. Rate shown is the coupon in effect as of June 30, 2022; reference rate and spread (in basis points) are indicated parenthetically. The Fund’s sector and industry classifications presented herein refer to any one or more of the industry sub-classifications used by one or more widely recognized market indexes or ratings group indexes, and/or as defined by Fund management. For Fund compliance purposes, sector and industry classifications are based on the sector and industry categorization methodology of the Adviser to the Funds. This definition may not apply for purposes of this report, which may combine industry sub-classifications for reporting ease. Industries are shown as a percentage of net assets. |
See Notes to Financial Statements.
| Semi-Annual Report | June 30, 2022 | | 73 |
| Segall Bryant & Hamill Quality High Yield Fund | Statement of Investments |
| | June 30, 2022 (Unaudited) |
| | | Coupon | | Maturity | | Par Value | | | Value | |
| CORPORATE BONDS — 99.0% | | | | | | | | | | | | |
| Finance — 11.4% | | | | | | | | | | | | |
| Mortgage Banking — 2.3% | | | | | | | | | | | | |
| Provident Funding Associates LP/PFG Finance Corp., 144A (a) | | 6.375% | | 06/15/25 | | $ | 1,973,000 | | | $ | 1,775,700 | |
| | | | | | | | | | | | | |
| Noncaptive Diversified Financial Companies — 1.2% | | | | | | | | | | | | |
| Aircastle, Ltd., 144A (a) | | 5.250% | | 08/11/25 | | | 1,000,000 | | | | 965,491 | |
| | | | | | | | | | | | | |
| Other Finance — 3.9% | | | | | | | | | | | | |
| IIP Operating Partnership LP | | 5.500% | | 05/25/26 | | | 1,950,000 | | | | 1,767,331 | |
| Outfront Media Capital LLC, 144A (a) | | 4.250% | | 01/15/29 | | | 1,610,000 | | | | 1,282,558 | |
| | | | | | | | | | | | 3,049,889 | |
| Real Estate Investment Trusts — 4.0% | | | | | | | | | | | | |
| MPT Operating Partnership LP/MPT Finance Corp. | | 5.000% | | 10/15/27 | | | 1,750,000 | | | | 1,600,673 | |
| VICI Properties LP, 144A (a) | | 4.500% | | 01/15/28 | | | 1,671,000 | | | | 1,522,774 | |
| | | | | | | | | | | | 3,123,447 | |
| Industrial — 83.3% | | | | | | | | | | | | |
| Automobile Manufacturing — 3.8% | | | | | | | | | | | | |
| Ford Motor Co | | 7.400% | | 11/01/46 | | | 1,000,000 | | | | 991,130 | |
| Ford Motor Credit Co. LLC | | 5.584% | | 03/18/24 | | | 405,000 | | | | 402,975 | |
| Goodyear Tire & Rubber Co | | 4.875% | | 03/15/27 | | | 1,725,000 | | | | 1,542,581 | |
| | | | | | | | | | | | 2,936,686 | |
| Building Products — 2.0% | | | | | | | | | | | | |
| Summit Materials LLC, 144A (a) | | 6.500% | | 03/15/27 | | | 525,000 | | | | 506,321 | |
| Summit Materials LLC, 144A (a) | | 5.250% | | 01/15/29 | | | 1,239,000 | | | | 1,081,028 | |
| | | | | | | | | | | | 1,587,349 | |
| Chemicals — 6.1% | | | | | | | | | | | | |
| Axalta Coating Systems LLC, 144A (a) | | 4.750% | | 06/15/27 | | | 520,000 | | | | 467,272 | |
| Axalta Coating Systems LLC, 144A (a) | | 3.375% | | 02/15/29 | | | 1,000,000 | | | | 816,370 | |
| Compass Minerals International, Inc., 144A (a) | | 4.875% | | 07/15/24 | | | 1,200,000 | | | | 1,113,411 | |
| Compass Minerals International, Inc., 144A (a) | | 6.750% | | 12/01/27 | | | 1,126,000 | | | | 1,019,030 | |
| Olin Corp | | 5.125% | | 09/15/27 | | | 806,000 | | | | 740,855 | |
| Olin Corp | | 5.000% | | 02/01/30 | | | 675,000 | | | | 582,997 | |
| | | | | | | | | | | | 4,739,935 | |
| Construction Machinery — 3.3% | | | | | | | | | | | | |
| H&E Equipment Services, Inc., 144A (a) | | 3.875% | | 12/15/28 | | | 1,461,000 | | | | 1,181,584 | |
| United Rentals North America, Inc. | | 4.875% | | 01/15/28 | | | 1,505,000 | | | | 1,422,947 | |
| | | | | | | | | | | | 2,604,531 | |
| Consumer Products — 3.8% | | | | | | | | | | | | |
| Central Garden & Pet Co | | 4.125% | | 10/15/30 | | | 700,000 | | | | 574,357 | |
| Scotts Miracle-Gro Co | | 4.500% | | 10/15/29 | | | 500,000 | | | | 410,115 | |
| Scotts Miracle-Gro Co | | 4.000% | | 04/01/31 | | | 875,000 | | | | 654,063 | |
| Vista Outdoor, Inc., 144A (a) | | 4.500% | | 03/15/29 | | | 1,765,000 | | | | 1,350,520 | |
| | | | | | | | | | | | 2,989,055 | |
| Diversified Manufacturing — 3.1% | | | | | | | | | | | | |
| BWX Technologies, Inc., 144A (a) | | 4.125% | | 06/30/28 | | | 1,702,000 | | | | 1,514,780 | |
| Griffon Corp | | 5.750% | | 03/01/28 | | | 1,008,000 | | | | 915,002 | |
| | | | | | | | | | | | 2,429,782 | |
| Electronics — 5.5% | | | | | | | | | | | | |
| Amkor Technology, Inc., 144A (a) | | 6.625% | | 09/15/27 | | | 1,670,000 | | | | 1,580,972 | |
| ATS Automation Tooling Systems, Inc., 144A (a) | | 4.125% | | 12/15/28 | | | 1,665,000 | | | | 1,390,275 | |
| QORVO, Inc. | | 4.375% | | 10/15/29 | | | 1,282,000 | | | | 1,127,416 | |
| Sensata Technologies, Inc., 144A (a) | | 3.750% | | 02/15/31 | | | 250,000 | | | | 200,365 | |
| | | | | | | | | | | | 4,299,028 | |
See Notes to Financial Statements.
| 74 | | www.sbhfunds.com |
| Segall Bryant & Hamill Quality High Yield Fund | Statement of Investments |
| | June 30, 2022 (Unaudited) |
| | | Coupon | | Maturity | | Par Value | | | Value | |
| Environmental — 1.1% | | | | | | | | | | | | |
| Clean Harbors, Inc., 144A (a) | | 5.125% | | 07/15/29 | | $ | 910,000 | | | $ | 825,825 | |
| | | | | | | | | | | | | |
| Healthcare Facilities / Supplies — 3.3% | | | | | | | | | | | | |
| Hologic, Inc., 144A (a) | | 3.250% | | 02/15/29 | | | 1,500,000 | | | | 1,282,050 | |
| Teleflex, Inc. | | 4.625% | | 11/15/27 | | | 825,000 | | | | 761,063 | |
| Tenet Healthcare Corp., 144A (a) | | 6.125% | | 10/01/28 | | | 622,000 | | | | 532,295 | |
| | | | | | | | | | | | 2,575,408 | |
| Home Builders — 1.9% | | | | | | | | | | | | |
| KB Home | | 6.875% | | 06/15/27 | | | 1,560,000 | | | | 1,505,525 | |
| | | | | | | | | | | | | |
| Independent Energy — 10.6% | | | | | | | | | | | | |
| Apache Corp | | 4.250% | | 01/15/30 | | | 575,000 | | | | 509,594 | |
| Apache Corp | | 5.100% | | 09/01/40 | | | 1,345,000 | | | | 1,135,691 | |
| Occidental Petroleum Corp | | 7.875% | | 09/15/31 | | | 1,800,000 | | | | 1,975,500 | |
| PDC Energy, Inc. | | 6.125% | | 09/15/24 | | | 146,000 | | | | 145,006 | |
| PDC Energy, Inc. | | 5.750% | | 05/15/26 | | | 2,712,000 | | | | 2,529,835 | |
| Range Resources Corp | | 4.875% | | 05/15/25 | | | 2,000,000 | | | | 1,950,800 | |
| | | | | | | | | | | | 8,246,426 | |
| Information / Data Technology — 2.6% | | | | | | | | | | | | |
| CDK Global, Inc. | | 5.000% | | 10/15/24 | | | 500,000 | | | | 492,723 | |
| Nielsen Co. (Luxembourg) SARL (The), 144A (a) | | 5.000% | | 02/01/25 | | | 750,000 | | | | 733,125 | |
| Nielsen Finance LLC, 144A (a) | | 4.500% | | 07/15/29 | | | 900,000 | | | | 813,047 | |
| | | | | | | | | | | | 2,038,895 | |
| Leisure / Entertainment — 2.4% | | | | | | | | | | | | |
| Cedar Fair LP | | 5.375% | | 04/15/27 | | | 937,000 | | | | 887,976 | |
| Cedar Fair LP | | 5.250% | | 07/15/29 | | | 1,100,000 | | | | 970,067 | |
| | | | | | | | | | | | 1,858,043 | |
| Media — Cable — 5.6% | | | | | | | | | | | | |
| DIRECTV Financing LLC, 144A (a) | | 5.875% | | 08/15/27 | | | 1,422,000 | | | | 1,213,066 | |
| DISH DBS Corp | | 7.750% | | 07/01/26 | | | 802,000 | | | | 625,159 | |
| Nexstar Broadcasting, Inc., 144A (a) | | 5.625% | | 07/15/27 | | | 1,385,000 | | | | 1,263,812 | |
| Sirius XM Radio, Inc., 144A (a) | | 5.500% | | 07/01/29 | | | 1,350,000 | | | | 1,230,188 | |
| | | | | | | | | | | | 4,332,225 | |
| Media — Non-Cable — 5.6% | | | | | | | | | | | | |
| AMC Networks, Inc. | | 4.750% | | 08/01/25 | | | 1,597,000 | | | | 1,487,669 | |
| Lamar Media Corp | | 3.750% | | 02/15/28 | | | 1,275,000 | | | | 1,131,856 | |
| Lamar Media Corp | | 4.875% | | 01/15/29 | | | 815,000 | | | | 733,594 | |
| Netflix, Inc. | | 5.875% | | 11/15/28 | | | 745,000 | | | | 728,394 | |
| Netflix, Inc., 144A (a) | | 4.875% | | 06/15/30 | | | 150,000 | | | | 137,287 | |
| Nexstar Broadcasting, Inc., 144A (a) | | 4.750% | | 11/01/28 | | | 225,000 | | | | 192,937 | |
| | | | | | | | | | | | 4,411,737 | |
| Metals / Mining — 1.5% | | | | | | | | | | | | |
| FMG Resources August 2006 Pty., Ltd., 144A (a) | | 5.125% | | 05/15/24 | | | 500,000 | | | | 486,520 | |
| FMG Resources August 2006 Pty., Ltd., 144A (a) | | 4.500% | | 09/15/27 | | | 800,000 | | | | 714,000 | |
| | | | | | | | | | | | 1,200,520 | |
| Natural Gas — Distributors — 2.9% | | | | | | | | | | | | |
| AmeriGas Partners LP/AmeriGas Financial Corp. | | 5.625% | | 05/20/24 | | | 2,378,000 | | | | 2,294,595 | |
| | | | | | | | | | | | | |
| Packaging — 2.3% | | | | | | | | | | | | |
| Berry Global, Inc., 144A (a) | | 4.500% | | 02/15/26 | | | 296,000 | | | | 275,182 | |
| Silgan Holdings, Inc. | | 4.125% | | 02/01/28 | | | 1,693,000 | | | | 1,518,164 | |
| | | | | | | | | | | | 1,793,346 | |
| Restaurants — 1.1% | | | | | | | | | | | | |
| Papa Johns International, Inc., 144A (a) | | 3.875% | | 09/15/29 | | | 1,000,000 | | | | 824,900 | |
See Notes to Financial Statements.
| Semi-Annual Report | June 30, 2022 | | 75 |
| Segall Bryant & Hamill Quality High Yield Fund | Statement of Investments |
| | June 30, 2022 (Unaudited) |
| | | Coupon | | Maturity | | Par Value | | | Value | |
| Retail Stores — 5.8% | | | | | | | | | | | | |
| Dick’s Sporting Goods, Inc. | | 3.150% | | 01/15/32 | | $ | 518,000 | | | $ | 410,662 | |
| Dick’s Sporting Goods, Inc. | | 4.100% | | 01/15/52 | | | 611,000 | | | | 406,290 | |
| Group 1 Automotive, Inc., 144A (a) | | 4.000% | | 08/15/28 | | | 1,164,000 | | | | 972,852 | |
| Hanesbrands, Inc., 144A (a) | | 4.625% | | 05/15/24 | | | 1,025,000 | | | | 1,003,383 | |
| Hanesbrands, Inc., 144A (a) | | 4.875% | | 05/15/26 | | | 250,000 | | | | 231,565 | |
| QVC, Inc. | | 4.850% | | 04/01/24 | | | 825,000 | | | | 771,218 | |
| QVC, Inc. | | 4.750% | | 02/15/27 | | | 970,000 | | | | 766,300 | |
| | | | | | | | | | | | 4,562,270 | |
| Services — 1.8% | | | | | | | | | | | | |
| AECOM | | 5.125% | | 03/15/27 | | | 445,000 | | | | 420,525 | |
| Service Corp. International | | 4.625% | | 12/15/27 | | | 836,000 | | | | 785,840 | |
| TopBuild Corp., 144A (a) | | 3.625% | | 03/15/29 | | | 227,000 | | | | 178,708 | |
| | | | | | | | | | | | 1,385,073 | |
| Theater Entertainment — 1.4% | | | | | | | | | | | | |
| Cinemark USA, Inc., 144A (a) | | 5.875% | | 03/15/26 | | | 1,180,000 | | | | 1,052,182 | |
| | | | | | | | | | | | | |
| Transportation Services — 1.5% | | | | | | | | | | | | |
| XPO Logistics, Inc. | | 6.700% | | 05/01/34 | | | 1,242,000 | | | | 1,160,852 | |
| | | | | | | | | | | | | |
| Vehicle Parts — 1.5% | | | | | | | | | | | | |
| Allison Transmission, Inc., 144A (a) | | 4.750% | | 10/01/27 | | | 1,300,000 | | | | 1,189,083 | |
| | | | | | | | | | | | | |
| Wireless Telecommunications — 2.8% | | | | | | | | | | | | |
| Lumen Technologies, Inc., Series W | | 6.750% | | 12/01/23 | | | 713,000 | | | | 706,322 | |
| Lumen Technologies, Inc. | | 7.995% | | 06/01/36 | | | 559,000 | | | | 419,848 | |
| T-Mobile USA, Inc. | | 4.750% | | 02/01/28 | | | 1,142,000 | | | | 1,106,838 | |
| | | | | | | | | | | | 2,233,008 | |
| Utility — 4.3% | | | | | | | | | | | | |
| Electric — 4.3% | | | | | | | | | | | | |
| NRG Energy, Inc., 144A (a) | | 3.625% | | 02/15/31 | | | 1,302,000 | | | | 1,020,755 | |
| PG&E Corp | | 5.000% | | 07/01/28 | | | 1,000,000 | | | | 843,880 | |
| Vistra Operations Co. LLC, 144A (a) | | 5.000% | | 07/31/27 | | | 1,650,000 | | | | 1,500,031 | |
| | | | | | | | | | | | 3,364,666 | |
| Investments at Value — 99.0% | | | | | | | | | | | | |
| (Cost $88,554,346) | | | | | | | | | | $ | 77,355,472 | |
| | | | | | | | | | | | | |
| Other Assets in Excess of Liabilities — 1.0% | | | | | | | | | | | 769,172 | |
| | | | | | | | | | | | | |
| Net Assets — 100.0% | | | | | | | | | | $ | 78,124,644 | |
| (a) | Security was purchased in a transaction exempt from registration in compliance with Rule 144A of the Securities Act of 1933. This security may be resold in transactions exempt from registration, normally to qualified institutional buyers. The total value of these securities is $35,441,244, which represents 45.4% of net assets as of June 30, 2022. |
The Fund’s sector and industry classifications presented herein refer to any one or more of the industry sub-classifications used by one or more widely recognized market indexes or ratings group indexes, and/or as defined by Fund management. For Fund compliance purposes, sector and industry classifications are based on the sector and industry categorization methodology of the Adviser to the Funds. This definition may not apply for purposes of this report, which may combine industry sub-classifications for reporting ease. Industries are shown as a percentage of net assets.
See Notes to Financial Statements.
| 76 | | www.sbhfunds.com |
| Segall Bryant & Hamill Municipal Opportunities Fund | Statement of Investments |
| | June 30, 2022 (Unaudited) |
| | | Coupon | | Maturity | | Par Value | | | Value | |
| MUNICIPAL BONDS — 87.6% | | | | | | | | | | | | |
| Certificate Participation — 0.2% | | | | | | | | | | | | |
| Lease / Rent — 0.2% | | | | | | | | | | | | |
| Regional Transportation District Colorado COP, Series 2015-A (a) | | 4.000% | | 06/01/40 | | $ | 20,000 | | | $ | 20,011 | |
| Washington State State & Local Agency Real & Personal Property COP, Series 2018-C (a) | | 5.000% | | 07/01/43 | | | 475,000 | | | | 515,281 | |
| | | | | | | | | | | | 535,292 | |
| General Obligation — 10.1% | | | | | | | | | | | | |
| Local — 10.1% | | | | | | | | | | | | |
| Baltic School District No. 49-1, Series 2022 | | 5.250% | | 12/01/47 | | | 1,500,000 | | | | 1,657,038 | |
| Baltic School District No. 49-1, Series 2022 | | 5.500% | | 12/01/51 | | | 1,525,000 | | | | 1,708,278 | |
| Central Platte Valley Metropolitan District, Series 2013-A (a) | | 5.375% | | 12/01/33 | | | 50,000 | | | | 50,998 | |
| Central Platte Valley Metropolitan District, Series 2013-A (a) | | 5.625% | | 12/01/38 | | | 70,000 | | | | 71,440 | |
| Central Platte Valley Metropolitan District, Series 2013-A (a) | | 6.000% | | 12/01/38 | | | 1,450,000 | | | | 1,485,584 | |
| Central Platte Valley Metropolitan District, Series 2014 (a) | | 5.000% | | 12/01/43 | | | 3,975,000 | | | | 3,829,515 | |
| Chambers County Texas Improvement District No. 1, Series 2020 (a) | | 2.000% | | 09/01/27 | | | 1,450,000 | | | | 1,381,396 | |
| Chambers County Texas Improvement District No. 1, Series 2020 (a) | | 2.000% | | 09/01/28 | | | 1,450,000 | | | | 1,350,865 | |
| Chambers County Texas Improvement District No. 1, Series 2020 (a) | | 2.000% | | 09/01/29 | | | 1,455,000 | | | | 1,324,122 | |
| Fort Bend County Texas Municipal Utility District No. 128, Series 2014 (a) | | 3.650% | | 09/01/29 | | | 205,000 | | | | 204,200 | |
| Fort Bend County Texas Municipal Utility District No. 25, Series 2019 (a) | | 3.000% | | 10/01/34 | | | 895,000 | | | | 815,076 | |
| Fort Bend County Texas Municipal Utility District No. 5, Series 2022 | | 3.625% | | 09/01/36 | | | 420,000 | | | | 413,855 | |
| Fort Bend County Texas Municipal Utility District No. 58, Series 2021 (a) | | 3.000% | | 04/01/33 | | | 800,000 | | | | 750,771 | |
| High Plains Metropolitan District City of Aurora Arapahoe County Colorado, NATL, Series 2017 (a)(b) | | 5.000% | | 12/01/35 | | | 295,000 | | | | 324,133 | |
| Kaufman County Texas Municipal Utility District No. 4, Series 2022 | | 4.000% | | 03/01/34 | | | 550,000 | | | | 555,635 | |
| Kaufman County Texas Municipal Utility District No. 5, Series 2021 (a) | | 3.000% | | 03/01/34 | | | 555,000 | | | | 500,156 | |
| Kaufman County Texas Municipal Utility District No. 5, Series 2021 (a) | | 3.000% | | 03/01/35 | | | 450,000 | | | | 399,579 | |
| King County Washington Public Hospital District No. 1, Series 2018 | | 5.000% | | 12/01/35 | | | 675,000 | | | | 727,453 | |
| Kings Manor Texas Municipal Utility District, Series 2019 (a) | | 3.000% | | 09/01/32 | | | 250,000 | | | | 233,795 | |
| Pilot Knob Texas Municipal Utility District No. 3, Series 2021 (a) | | 3.000% | | 02/15/34 | | | 450,000 | | | | 416,530 | |
| Pilot Knob Texas Municipal Utility District No. 3, Series 2021 (a) | | 3.000% | | 02/15/35 | | | 465,000 | | | | 425,806 | |
| Pilot Knob Texas Municipal Utility District No. 3, Series 2021 (a) | | 3.000% | | 02/15/36 | | | 485,000 | | | | 437,246 | |
| Pilot Knob Texas Municipal Utility District No. 3, Series 2021 (a) | | 3.000% | | 02/15/37 | | | 505,000 | | | | 446,754 | |
| Rendezvous Residential Metropolitan District Colorado, Series 2022 (a) | | 2.000% | | 12/01/29 | | | 330,000 | | | | 287,233 | |
| Rendezvous Residential Metropolitan District Colorado, Series 2022 (a) | | 2.250% | | 12/01/31 | | | 520,000 | | | | 442,462 | |
| Rendezvous Residential Metropolitan District Colorado, Series 2022 (a) | | 2.350% | | 12/01/33 | | | 465,000 | | | | 383,788 | |
| Riverview Metropolitan District Colorado, Series 2021 (a) | | 5.000% | | 12/01/41 | | | 550,000 | | | | 499,836 | |
| Riverview Metropolitan District Colorado, Series 2021 (a) | | 5.000% | | 12/01/51 | | | 500,000 | | | | 432,705 | |
| Sonterra Texas Municipal Utility District, Series 2020 (a) | | 4.000% | | 08/15/39 | | | 890,000 | | | | 892,596 | |
| Sunfield Municipal Utility District No. 3, Series 2021 (a) | | 3.000% | | 09/01/34 | | | 510,000 | | | | 467,977 | |
| Sunfield Municipal Utility District No. 3, Series 2021 (a) | | 3.000% | | 09/01/35 | | | 525,000 | | | | 475,272 | |
| Sunfield Municipal Utility District No. 3, Series 2021 (a) | | 3.000% | | 09/01/36 | | | 540,000 | | | | 478,849 | |
| Sunfield Municipal Utility District No. 3, Series 2021 (a) | | 3.000% | | 09/01/37 | | | 550,000 | | | | 481,843 | |
| Traditions Metropolitan District No. 2 Arapahoe County Colorado, Series 2016 (a) | | 4.250% | | 12/01/46 | | | 100,000 | | | | 101,420 | |
| Travis County Texas Municipal Utility District No. 21, Series 2016 (a) | | 3.000% | | 09/01/27 | | | 100,000 | | | | 99,051 | |
| Travis County Texas Municipal Utility District No. 21, Series 2016 (a) | | 3.500% | | 09/01/33 | | | 215,000 | | | | 202,240 | |
| Viridian Municipal Management District, Series 2020 (a) | | 4.000% | | 12/01/35 | | | 770,000 | | | | 788,453 | |
| Viridian Municipal Management District, Series 2020 (a) | | 4.000% | | 12/01/36 | | | 805,000 | | | | 819,986 | |
| Viridian Municipal Management District, Series 2020 (a) | | 4.000% | | 12/01/36 | | | 535,000 | | | | 544,959 | |
| West Harris County Texas Municipal District No. 5, Series 2015 (a) | | 3.375% | | 09/01/27 | | | 105,000 | | | | 105,239 | |
| | | | | | | | | | | | 27,014,134 | |
| Local Authority — 7.9% | | | | | | | | | | | | |
| Education — 2.4% | | | | | | | | | | | | |
| Administrators of the Tulane Educational Fund, Series 2013-C (a) | | 5.000% | | 10/01/47 | | | 170,000 | | | | 170,144 | |
| Public Finance Authority Taxable Educational Facilities Wisconsin, Series 2021-A (a) | | 5.625% | | 06/01/50 | | | 5,750,000 | | | | 4,418,523 | |
See Notes to Financial Statements.
| Semi-Annual Report | June 30, 2022 | | 77 |
| Segall Bryant & Hamill Municipal Opportunities Fund | Statement of Investments |
| | June 30, 2022 (Unaudited) |
| | | Coupon | | Maturity | | Par Value | | | Value | |
| Education — 2.4% (continued) | | | | | | | | | | | | |
| Virginia Commonwealth University, Series 2018-B (a) | | 4.585% | | 05/01/48 | | $ | 2,000,000 | | | $ | 1,952,966 | |
| | | | | | | | | | | | 6,541,633 | |
| Healthcare — 2.4% | | | | | | | | | | | | |
| California Municipal Finance Authority, Series 2021 (a)(c) | | 3.637% | | 07/01/30 | | | 6,960,000 | | | | 6,067,601 | |
| Denver Health & Hospital Authority, Series 2014-B (a) | | 4.900% | | 12/01/24 | | | 410,000 | | | | 410,268 | |
| | | | | | | | | | | | 6,477,869 | |
| Public Services — 0.4% | | | | | | | | | | | | |
| Port of Greater Cincinnati Ohio Development Authority, Series 2020 (a)(c) | | 5.250% | | 12/01/35 | | | 1,000,000 | | | | 966,062 | |
| | | | | | | | | | | | | |
| Transportation — 2.7% | | | | | | | | | | | | |
| Public Finance Authority Wisconsin Air Cargo, Series 2021 | | 2.012% | | 07/01/25 | | | 1,085,000 | | | | 1,014,393 | |
| Public Finance Authority Wisconsin Air Cargo, Series 2021 | | 2.312% | | 07/01/26 | | | 675,000 | | | | 624,067 | |
| San Diego County Regional Airport Authority, Series 2014-B (a) | | 5.594% | | 07/01/43 | | | 5,265,000 | | | | 5,484,454 | |
| | | | | | | | | | | | 7,122,914 | |
| Revenue — 62.6% | | | | | | | | | | | | |
| Education — 1.3% | | | | | | | | | | | | |
| Harris County Cultural Education Facilities Finance Corp., Series 2016 (a) | | 4.000% | | 11/15/30 | | | 300,000 | | | | 308,512 | |
| Miami-Dade County Educational Facilities Authority, Series 2015-A (a) | | 5.000% | | 04/01/31 | | | 20,000 | | | | 20,788 | |
| Pennsylvania Higher Educational Facilities Authority, Series 2016 (a) | | 3.000% | | 05/01/37 | | | 15,000 | | | | 12,271 | |
| University of Washington, Series 2012-C (a) | | 3.125% | | 07/01/42 | | | 2,130,000 | | | | 1,868,213 | |
| Wisconsin Health and Educational Facilities, Series 2016 (a) | | 5.000% | | 10/01/41 | | | 1,340,000 | | | | 1,404,191 | |
| | | | | | | | | | | | 3,613,975 | |
| Healthcare — 1.0% | | | | | | | | | | | | |
| City of Lakeland Florida, Series 2016 (a) | | 5.000% | | 11/15/29 | | | 100,000 | | | | 106,428 | |
| City of Lakeland Florida, Series 2015 (a) | | 5.000% | | 11/15/45 | | | 100,000 | | | | 101,846 | |
| Colorado Health Facilities Authority, Series 2012 (a) | | 5.000% | | 01/01/23 | | | 50,000 | | | | 50,111 | |
| Colorado Health Facilities Authority, Series 2012 (a) | | 5.000% | | 01/01/25 | | | 210,000 | | | | 210,327 | |
| Illinois Finance Authority, Series 2016-A (a) | | 5.000% | | 02/15/45 | | | 100,000 | | | | 103,604 | |
| Knox County Tennessee Health Educational and Housing Facility, Series 2016-A (a) | | 5.000% | | 01/01/47 | | | 895,000 | | | | 919,273 | |
| Metropolitan Government of Nashville & Davidson County Tennessee Health & | | | | | | | | | | | | |
| Educational Facilities, Series 2017-A (a) | | 5.000% | | 07/01/48 | | | 1,120,000 | | | | 1,162,972 | |
| | | | | | | | | | | | 2,654,561 | |
| Housing — 3.4% | | | | | | | | | | | | |
| Massachusetts Housing Finance Agency, Series 2022-A | | 2.650% | | 06/01/26 | | | 1,000,000 | | | | 991,208 | |
| New York State Housing Finance Agency, Series 2022-D-2 | | 3.100% | | 05/01/62 | | | 7,350,000 | | | | 7,255,799 | |
| South Dakota Housing Development Authority, Series 2022-C | | 4.125% | | 11/01/37 | | | 750,000 | | | | 745,628 | |
| | | | | | | | | | | | 8,992,635 | |
| Industrial Development — 8.2% | | | | | | | | | | | | |
| Bartow County Georgia Development Authority Pollution Control, Series | | | | | | | | | | | | |
| 1997-1 (a) | | 1.800% | | 09/01/29 | | | 3,900,000 | | | | 3,464,921 | |
| Burke County Georgia Development Authority Pollution Control, Series 1995-5 (a) | | 2.200% | | 10/01/32 | | | 1,900,000 | | | | 1,767,020 | |
| Burke County Georgia Development Authority Pollution Control, Series 2013-A | | 1.500% | | 01/01/40 | | | 3,500,000 | | | | 3,354,351 | |
| City of Whiting Indiana Environmental Facilities, Series 2017 | | 5.000% | | 11/01/47 | | | 4,420,000 | | | | 4,639,020 | |
| Indiana Finance Authority Environmental Refunding, Series 2009-A-2 | | 3.750% | | 06/01/31 | | | 5,750,000 | | | | 5,760,191 | |
| Ohio State Air Quality Development Authority, Series 2022-B | | 4.000% | | 09/01/30 | | | 3,000,000 | | | | 3,030,546 | |
| | | | | | | | | | | | 22,016,049 | |
| Lease / Rent — 0.7% | | | | | | | | | | | | |
| Hamilton Ohio Community Authority, Series 2019-A (a) | | 4.000% | | 10/15/46 | | | 990,000 | | | | 983,058 | |
| Ontario California Public Financing Authority, Series 2022-A | | 5.000% | | 11/01/37 | | | 295,000 | | | | 329,885 | |
| Ontario California Public Financing Authority, Series 2022-A | | 5.000% | | 11/01/36 | | | 160,000 | | | | 179,243 | |
| Silver Creek Indiana School Building Corp., Series 2021 (a) | | 4.000% | | 01/15/32 | | | 365,000 | | | | 388,188 | |
| | | | | | | | | | | | 1,880,374 | |
| Other — 0.0% (d) | | | | | | | | | | | | |
| Colorado Education & Cultural Facilities Authority, Series 2015-B (a) | | 4.000% | | 12/01/38 | | | 50,000 | | | | 46,731 | |
See Notes to Financial Statements.
| 78 | | www.sbhfunds.com |
| Segall Bryant & Hamill Municipal Opportunities Fund | Statement of Investments |
| | June 30, 2022 (Unaudited) |
| | | Coupon | | Maturity | | Par Value | | | Value | |
| Public Services — 3.3% | | | | | | | | | | | | |
| City and County of San Francisco Special Tax District No. 2020-1, Series | | | | | | | | | | | | |
| 2021-A (a)(c) | | 4.000% | | 09/01/46 | | $ | 1,000,000 | | | $ | 876,495 | |
| New York City Transitional Finance Authority, Series 2017-F-1 (a) | | 5.000% | | 05/01/42 | | | 2,415,000 | | | | 2,570,137 | |
| New York State Urban Development Corp., Series 2019-A (a) | | 5.000% | | 03/15/39 | | | 840,000 | | | | 908,689 | |
| Park Creek Metropolitan District, Series 2017-A (a) | | 5.000% | | 12/01/35 | | | 275,000 | | | | 291,714 | |
| Phoenix Arizona Civic Improvement Corp. Rental Car Facility, Series 2019-A (a) | | 5.000% | | 07/01/39 | | | 2,500,000 | | | | 2,690,817 | |
| Reunion Metropolitan District Colorado, Series 2021-A (a) | | 3.625% | | 12/01/44 | | | 2,000,000 | | | | 1,482,425 | |
| | | | | | | | | | | | 8,820,277 | |
| Recreation — 1.1% | | | | | | | | | | | | |
| City of Houston Texas Convention & Entertainment Facilities Department, Series 2021 (a) | | 3.000% | | 09/01/32 | | | 500,000 | | | | 468,289 | |
| Denver Colorado Convention Center Hotel Authority, Series 2016 (a) | | 5.000% | | 12/01/40 | | | 175,000 | | | | 177,762 | |
| Harris County Texas Municipal Utility District No. 500, Series 2021 (a) | | 3.000% | | 12/01/34 | | | 375,000 | | | | 343,879 | |
| Harris County Texas Municipal Utility District No. 500, Series 2021 (a) | | 3.000% | | 12/01/35 | | | 495,000 | | | | 448,278 | |
| Harris County Texas Municipal Utility District No. 500, Series 2021 (a) | | 3.000% | | 12/01/36 | | | 520,000 | | | | 466,057 | |
| Harris County Texas Municipal Utility District No. 500, Series 2021 (a) | | 3.000% | | 12/01/37 | | | 545,000 | | | | 482,545 | |
| Harris County Texas Municipal Utility District No. 500, Series 2021 (a) | | 3.000% | | 12/01/38 | | | 565,000 | | | | 491,732 | |
| | | | | | | | | | | | 2,878,542 | |
| State and Non-State Appropriated Tobacco — 0.1% | | | | | | | | | | | | |
| California County Tobacco Securitization Agency (The), Series 2020-A (a) | | 4.000% | | 06/01/34 | | | 150,000 | | | | 148,165 | |
| | | | | | | | | | | | | |
| Tax — 3.0% | | | | | | | | | | | | |
| Camino Real Regional Mobility Authority, Series 2017 (a) | | 5.000% | | 06/01/42 | | | 465,000 | | | | 497,948 | |
| City of Williston North Dakota, Series 2018-A (a) | | 3.200% | | 07/15/24 | | | 565,000 | | | | 565,303 | |
| Denver Colorado Urban Renewal Authority Tax Increment, Series 2018-A (a)(c) | | 5.250% | | 12/01/39 | | | 2,000,000 | | | | 2,033,676 | |
| Denver Colorado Urban Renewal Authority Tax Increment, Series 2018-A (a)(c) | | 5.250% | | 12/01/39 | | | 900,000 | | | | 912,019 | |
| Northglenn Urban Renewal Authority, Series 2019 (a) | | 4.000% | | 12/01/34 | | | 400,000 | | | | 383,673 | |
| Northglenn Urban Renewal Authority, Series 2019 (a) | | 4.000% | | 12/01/35 | | | 525,000 | | | | 501,891 | |
| Riverside County California Redevelopment Agency, Series 2011-B | | 0.000% | | 10/01/38 | | | 730,000 | | | | 366,964 | |
| Roaring Fork County Transportation Authority Sales & Use Tax, Series 2019 (a) | | 4.000% | | 12/01/44 | | | 150,000 | | | | 149,805 | |
| Southwest Houston Texas Redevelopment Authority, Series 2017-B (a) | | 4.000% | | 09/01/40 | | | 1,350,000 | | | | 1,363,803 | |
| Successor Agency to the Orange Redevelopment Agency, Series 2018-A (a) | | 4.000% | | 09/01/34 | | | 200,000 | | | | 205,450 | |
| Village Community Development District No. 7, Series 2015 (a) | | 4.000% | | 05/01/36 | | | 1,075,000 | | | | 1,030,853 | |
| | | | | | | | | | | | 8,011,385 | |
| Transportation — 30.4% | | | | | | | | | | | | |
| Airport Commission of the City and County of San Francisco, San Francisco | | | | | | | | | | | | |
| International Airport, Series 2016-C (a) | | 5.000% | | 05/01/46 | | | 1,245,000 | | | | 1,294,235 | |
| Board of Commissioners of The Port of New Orleans Port Facility, Series 2020-E | | 5.000% | | 04/01/29 | | | 515,000 | | | | 557,925 | |
| Chesapeake Bay Bridge and Tunnel District, Series 2016 | | 5.000% | | 07/01/51 | | | 5,000,000 | | | | 5,127,615 | |
| City of Austin Texas Airport Systems, Series 2017-A (a) | | 5.000% | | 11/15/46 | | | 200,000 | | | | 208,937 | |
| City of Long Beach California Airport, Series 2022-B | | 5.000% | | 06/01/37 | | | 400,000 | | | | 443,258 | |
| City of Long Beach California Airport, Series 2022-A | | 5.000% | | 06/01/37 | | | 300,000 | | | | 332,443 | |
| City of Long Beach California Airport, Series 2022-C | | 5.250% | | 06/01/47 | | | 500,000 | | | | 537,607 | |
| City of Long Beach California Harbor, Series 2017-B | | 5.000% | | 05/15/43 | | | 4,000,000 | | | | 4,223,432 | |
| City of St. Louis Missouri Airport (The), Series 2019-A (a) | | 5.000% | | 07/01/49 | | | 520,000 | | | | 543,930 | |
| Clark County Nevada Airport System, Series 2017-A-2 (a) | | 5.000% | | 07/01/40 | | | 1,700,000 | | | | 1,818,285 | |
| Colorado High Performance Transportation Enterprise, Series 2014 (a) | | 5.750% | | 01/01/44 | | | 750,000 | | | | 755,378 | |
| County of Santa Cruz California Tax and Revenue Anticipation Notes, Series 2022 | | 5.000% | | 07/06/23 | | | 7,300,000 | | | | 7,519,258 | |
| Florida State Mid-Bay Bridge Authority, Series 2015-A (a) | | 5.000% | | 10/01/30 | | | 1,500,000 | | | | 1,555,991 | |
| Florida State Mid-Bay Bridge Authority, Series 2015-A (a) | | 5.000% | | 10/01/35 | | | 1,180,000 | | | | 1,214,548 | |
| Florida State Mid-Bay Bridge Authority, Series 2015-A (a) | | 5.000% | | 10/01/40 | | | 1,000,000 | | | | 1,023,349 | |
| Hidalgo County Regional Mobility Authority, Series 2022-A (a) | | 0.000% | | 12/01/50 | | | 5,000,000 | | | | 1,011,456 | |
| Hidalgo County Regional Mobility Authority, Series 2022-A (a) | | 0.000% | | 12/01/52 | | | 3,030,000 | | | | 536,609 | |
| Hidalgo County Regional Mobility Authority, Series 2022-A (a) | | 0.000% | | 12/01/53 | | | 7,560,000 | | | | 1,266,704 | |
| Hidalgo County Regional Mobility Authority, Series 2022-A (a) | | 0.000% | | 12/01/54 | | | 6,585,000 | | | | 1,035,784 | |
See Notes to Financial Statements.
| Semi-Annual Report | June 30, 2022 | | 79 |
| Segall Bryant & Hamill Municipal Opportunities Fund | Statement of Investments |
| | June 30, 2022 (Unaudited) |
| | | Coupon | | Maturity | | Par Value | | | Value | |
| Transportation — 30.4% (continued) | | | | | | | | | | | | |
| Hidalgo County Regional Mobility Authority, Series 2022-A (a) | | 0.000% | | 12/01/55 | | $ | 6,100,000 | | | $ | 900,399 | |
| Hidalgo County Regional Mobility Authority, Series 2022-A (a) | | 0.000% | | 12/01/56 | | | 6,105,000 | | | | 845,306 | |
| Houston Texas Airport Systems, Series 2018-A (a) | | 5.000% | | 07/01/41 | | | 1,000,000 | | | | 1,044,378 | |
| La Paz County Arizona Industrial Development Authority, Series 2016-A (a)(c) | | 7.000% | | 11/15/38 | | | 1,575,000 | | | | 1,504,045 | |
| La Paz County Arizona Industrial Development Authority, Series 2016-A (a)(c) | | 7.125% | | 11/15/45 | | | 735,000 | | | | 686,503 | |
| Love Field Airport Modernization Corp., Series 2017 (a) | | 5.000% | | 11/01/33 | | | 425,000 | | | | 446,758 | |
| Metro Washington Airports Authority Aviation, Series 2022-A | | 5.000% | | 10/01/30 | | | 1,500,000 | | | | 1,670,657 | |
| New Orleans Aviation Board General Airport, Series 2017-A (a) | | 5.000% | | 01/01/38 | | | 285,000 | | | | 297,907 | |
| New Orleans Aviation Board General Airport, Series 2017-A (a) | | 5.000% | | 01/01/43 | | | 345,000 | | | | 358,445 | |
| New Orleans Aviation Board General Airport, Series 2015-B (a) | | 5.000% | | 01/01/45 | | | 1,000,000 | | | | 1,015,909 | |
| New Orleans Aviation Board General Airport, Series 2017-B (a) | | 5.000% | | 01/01/48 | | | 390,000 | | | | 399,903 | |
| New York Transportation Development Corporation, Series 2022 | | 5.000% | | 12/01/36 | | | 3,000,000 | | | | 3,119,069 | |
| New York Transportation Development Corporation, Series 2020-C | | 5.000% | | 12/01/38 | | | 2,125,000 | | | | 2,228,834 | |
| North Carolina Department of Transportation, Series 2015 (a) | | 5.000% | | 06/30/54 | | | 5,000,000 | | | | 5,011,038 | |
| North Carolina State Turnpike Authority Monroe Expressway Toll, Series 2016-A (a) | | 5.000% | | 07/01/42 | | | 750,000 | | | | 761,959 | |
| North Carolina State Turnpike Authority Monroe Expressway Toll, Series 2019 (a) | | 5.000% | | 01/01/43 | | | 500,000 | | | | 515,363 | |
| North Carolina State Turnpike Authority Monroe Expressway Toll, Series 2019 (a) | | 5.000% | | 01/01/44 | | | 355,000 | | | | 365,072 | |
| North Texas Tollway Authority System, Series 2017-A (a) | | 5.000% | | 01/01/43 | | | 2,790,000 | | | | 2,971,258 | |
| Pennsylvania Turnpike Commission, Series 2015-B (a) | | 5.000% | | 12/01/45 | | | 1,145,000 | | | | 1,190,739 | |
| Pennsylvania Turnpike Commission, Series 2016-A1 (a) | | 5.000% | | 12/01/46 | | | 3,990,000 | | | | 4,111,186 | |
| Pharr Texas International Toll Bridge System, Series 2021 (a) | | 4.000% | | 08/15/33 | | | 5,000 | | | | 5,046 | |
| Port of Seattle Washington, Series 2019 (a) | | 5.000% | | 04/01/33 | | | 2,210,000 | | | | 2,407,218 | |
| Port of Seattle Washington, Series 2019 (a) | | 5.000% | | 04/01/36 | | | 3,190,000 | | | | 3,425,890 | |
| Salt Lake City Utah Airport, Series 2017-B, B (a) | | 5.000% | | 07/01/47 | | | 5,875,000 | | | | 6,103,670 | |
| Salt Lake City Utah Airport, Series 2018-A (a) | | 5.250% | | 07/01/48 | | | 400,000 | | | | 419,859 | |
| Texas Transportation Commission Central Texas Turnpike System, Series 2015-C (a) | | 5.000% | | 08/15/30 | | | 135,000 | | | | 138,931 | |
| Texas Transportation Commission Central Texas Turnpike System, Series 2015-C (a) | | 5.000% | | 08/15/37 | | | 1,000,000 | | | | 1,021,302 | |
| Texas Transportation Commission Central Texas Turnpike System, Series 2015-C (a) | | 5.000% | | 08/15/42 | | | 3,525,000 | | | | 3,585,660 | |
| Virginia Small Business Financing Authority, Series 2017 (a)(c)(e) | | 2.250% | | 07/01/50 | | | 3,500,000 | | | | 3,477,133 | |
| Virginia Small Business Financing Authority, Series 2022 (a) | | 5.000% | | 12/31/57 | | | 400,000 | | | | 409,868 | |
| | | | | | | | | | | | 81,446,049 | |
| Utilities — 10.1% | | | | | | | | | | | | |
| Fort Pierce Florida Utilities Authority, Series 2022-A | | 5.000% | | 10/01/33 | | | 200,000 | | | | 226,482 | |
| Fort Pierce Florida Utilities Authority, Series 2022-A | | 5.000% | | 10/01/34 | | | 325,000 | | | | 366,754 | |
| Indiana Finance Authority Midwestern Disaster Relief, Series 2012-A | | 4.250% | | 11/01/30 | | | 4,000,000 | | | | 3,939,470 | |
| PEFA, Inc. Iowa Gas Project, Series 2019 | | 5.000% | | 09/01/49 | | | 595,000 | | | | 624,691 | |
| Philadelphia Pennsylvania Gas Works, Series 2020-A (a) | | 5.000% | | 08/01/50 | | | 1,045,000 | | | | 1,146,280 | |
| Southeast Energy Authority No. 4, Series 2022-B-1 | | 5.000% | | 05/01/53 | | | 4,720,000 | | | | 4,993,059 | |
| Southern California Public Power Authority No. 1, Series 2007-A | | 5.000% | | 11/01/33 | | | 500,000 | | | | 536,844 | |
| Southern California Public Power Authority No. 1, Series 2007-B | | 2.332% | | 11/01/38 | | | 5,550,000 | | | | 4,818,437 | |
| Texas Municipal Power Agency Transmission System, Series 2021 (a) | | 3.000% | | 09/01/34 | | | 1,000,000 | | | | 925,919 | |
| Texas Municipal Power Agency Transmission System, Series 2021 (a) | | 3.000% | | 09/01/35 | | | 1,630,000 | | | | 1,495,772 | |
| Texas Municipal Power Agency Transmission System, Series 2021 (a) | | 3.000% | | 09/01/36 | | | 1,470,000 | | | | 1,335,310 | |
| Utah Infrastructure Agency Telecommunications, Series 2021 | | 3.000% | | 10/15/24 | | | 500,000 | | | | 493,871 | |
| Utah Infrastructure Agency Telecommunications, Series 2021 | | 4.000% | | 10/15/29 | | | 600,000 | | | | 587,246 | |
| Utah Infrastructure Agency Telecommunications, Series 2021 (a) | | 4.000% | | 10/15/36 | | | 200,000 | | | | 176,880 | |
| Utah Infrastructure Agency Telecommunications, Series 2022 | | 5.000% | | 10/15/37 | | | 1,200,000 | | | | 1,182,716 | |
| Utah Infrastructure Agency Telecommunications, Series 2021 (a) | | 4.000% | | 10/15/38 | | | 1,335,000 | | | | 1,144,519 | |
| Utah Infrastructure Agency Telecommunications, Series 2022 | | 5.000% | | 10/15/46 | | | 3,250,000 | | | | 3,098,122 | |
| | | | | | | | | | | | 27,092,372 | |
| Variable Rate Demand Note — 6.8% | | | | | | | | | | | | |
| Variable Rate Demand Note — 6.8% | | | | | | | | | | | | |
| Charlotte-Mecklenburg Hospital Authority (The), Series 2007-C | | 0.000% | | 01/15/37 | | | 9,135,000 | | | | 9,135,000 | |
See Notes to Financial Statements.
| 80 | | www.sbhfunds.com |
| Segall Bryant & Hamill Municipal Opportunities Fund | Statement of Investments |
| | June 30, 2022 (Unaudited) |
| | | Coupon | | | Maturity | | | Par Value | | | Value | |
| Variable Rate Demand Note — 6.8% (continued) | | | | | | | | | | | | | | | | |
| New York City Municipal Water Finance Authority, Series 2006-CC-2 | | | 0.750 | % | | | 06/15/38 | | | $ | 9,200,000 | | | $ | 9,200,000 | |
| | | | | | | | | | | | | | | | 18,335,000 | |
| Total Municipal Bonds (Cost $251,938,292) | | | | | | | | | | | | | | | 234,594,019 | |
| U.S. TREASURY BONDS & NOTES — 3.4% | | | | | | | | | | | | | | | | |
| United States Treasury | | | 0.125 | % | | | 03/31/23 | | | | 3,000,000 | | | | 2,941,758 | |
| United States Treasury | | | 0.125 | % | | | 06/30/23 | | | | 6,500,000 | | | | 6,322,519 | |
| Total U.S. Treasury Bonds & Notes (Cost $9,353,979) | | | | | | | | | | | | | | | 9,264,277 | |
| | | | | | | | | | | | | | | | | |
| CORPORATE BONDS — 3.0% | | | | | | | | | | | | | | | | |
| Industrial — 3.0% | | | | | | | | | | | | | | | | |
| Services — 3.0% | | | | | | | | | | | | | | | | |
| IPMI 3 LLC, 144A, Series 2021 (f) | | | 3.900 | % | | | 12/01/28 | | | | 9,000,000 | | | | 7,956,269 | |
| | | | | | | | | | | | | | | | | |
| Total Corporate Bonds (Cost $9,057,190) | | | | | | | | | | | | | | | 7,956,269 | |
| | | | | | | | | | | | | | | | | |
| Investments at Value — 94.0% | | | | | | | | | | | | | | | | |
| (Cost $270,349,461) | | | | | | | | | | | | | | $ | 251,814,565 | |
| | | | | | | | | | | | | | | | | |
| Other Assets in Excess of Liabilities — 6.0% | | | | | | | | | | | | | | | 16,043,727 | |
| | | | | | | | | | | | | | | | | |
| Net Assets — 100.0% | | | | | | | | | | | | | | $ | 267,858,292 | |
| (a) | Security can be called and redeemed at the option of the issuer prior to the stated maturity date which is included in the Statement of Investments. |
| (b) | This security is insured. In the event of default by the bond issuer, the issuer, as noted in the security description, guarantees that scheduled principal and interest payments will be made when due. |
| (c) | Security is considered a restricted security however such restriction has not resulted in an illiquid classification. The total value of these securities is $16,523,534, which represents 6.2% of net assets as of June 30, 2022. |
| (d) | Percentage rounds to less than 0.1%. |
| (e) | Variable rate security. Interest rate resets periodically. The rate shown is the effective interest rate as of June 30, 2022. For securities based on a published reference rate and spread, the reference rate and spread (in basis points) are indicated parenthetically. Certain variable rate securities are not based on a published reference rate and spread but are determined by the issuer or agent and are based on current market conditions. These securities, therefore, do not indicate a reference rate and spread. |
| (f) | Security was purchased in a transaction exempt from registration in compliance with Rule 144A of the Securities Act of 1933. This security may be resold in transactions exempt from registration, normally to qualified institutional buyers. The total value of these securities is $7,956,269, which represents 3.0% of net assets as of June 30, 2022. |
The Fund’s sector and industry classifications presented herein refer to any one or more of the industry sub-classifications used by one or more widely recognized market indexes or ratings group indexes, and/or as defined by Fund management. For Fund compliance purposes, sector and industry classifications are based on the sector and industry categorization methodology of the Adviser to the Funds. This definition may not apply for purposes of this report, which may combine industry sub-classifications for reporting ease. Industries are shown as a percentage of net assets.
See Notes to Financial Statements.
| Semi-Annual Report | June 30, 2022 | | 81 |
| Segall Bryant & Hamill Colorado Tax Free Fund | Statement of Investments |
| | June 30, 2022 (Unaudited) |
| | | Coupon | | | Maturity | | | Par Value | | | Value | |
| MUNICIPAL BONDS — 93.3% | | | | | | | | | | | | | | | | |
| Certificate Participation — 19.5% | | | | | | | | | | | | | | | | |
| Healthcare — 0.3% | | | | | | | | | | | | | | | | |
| Denver Health & Hospital Authority COP, Series 2018 (a) | | | 5.000 | % | | | 12/01/30 | | | $ | 350,000 | | | $ | 375,010 | |
| Denver Health & Hospital Authority COP, Series 2018 (a) | | | 5.000 | % | | | 12/01/31 | | | | 350,000 | | | | 370,649 | |
| Denver Health & Hospital Authority COP, Series 2018 (a) | | | 5.000 | % | | | 12/01/32 | | | | 225,000 | | | | 237,561 | |
| Denver Health & Hospital Authority COP, Series 2018 (a) | | | 5.000 | % | | | 12/01/33 | | | | 240,000 | | | | 252,760 | |
| | | | | | | | | | | | | | | | 1,235,980 | |
| Lease / Rent — 19.2% | | | | | | | | | | | | | | | | |
| Aspen Colorado COP, Series 2019 (a) | | | 5.000 | % | | | 12/01/44 | | | | 2,070,000 | | | | 2,292,497 | |
| Berthoud Colorado COP, Series 2020 (a) | | | 4.000 | % | | | 12/01/40 | | | | 3,765,000 | | | | 3,770,486 | |
| Berthoud Colorado COP, Series 2020 (a) | | | 4.000 | % | | | 12/01/49 | | | | 9,255,000 | | | | 8,980,925 | |
| Castle Rock Colorado COP, Series 2020 (a) | | | 4.000 | % | | | 12/01/40 | | | | 1,025,000 | | | | 1,036,730 | |
| City & County of Denver Colorado COP, Series 2018-A (a) | | | 5.375 | % | | | 06/01/43 | | | | 7,000,000 | | | | 7,586,888 | |
| City & County of Denver Colorado COP, Series 2018-A (a) | | | 4.000 | % | | | 06/01/48 | | | | 4,925,000 | | | | 4,869,393 | |
| City of Aurora Colorado COP, Series 2017 (a) | | | 5.000 | % | | | 12/01/34 | | | | 450,000 | | | | 490,540 | |
| City of Aurora Colorado COP, Series 2017 (a) | | | 5.000 | % | | | 12/01/35 | | | | 615,000 | | | | 669,606 | |
| City of Thornton Colorado COP, Series 2018 (a) | | | 4.000 | % | | | 12/01/39 | | | | 10,305,000 | | | | 10,416,017 | |
| Colorado Higher Education Capital Construction COP, Series 2014-A | | | 5.000 | % | | | 11/01/24 | | | | 55,000 | | | | 58,738 | |
| Colorado State Building Excellent Schools Today COP, Series 2019-O (a) | | | 5.000 | % | | | 03/15/36 | | | | 1,750,000 | | | | 1,944,393 | |
| Colorado State Building Excellent Schools Today COP, Series 2017-J (a) | | | 5.000 | % | | | 03/15/37 | | | | 1,500,000 | | | | 1,632,197 | |
| Colorado State Building Excellent Schools Today COP, Series 2019-O (a) | | | 4.000 | % | | | 03/15/37 | | | | 1,450,000 | | | | 1,459,557 | |
| Colorado State Building Excellent Schools Today COP, Series 2018-N (a) | | | 4.000 | % | | | 03/15/39 | | | | 200,000 | | | | 200,513 | |
| Colorado State COP Rural Colorado, Series 2022 (a) | | | 6.000 | % | | | 12/15/34 | | | | 1,250,000 | | | | 1,563,420 | |
| Colorado State COP Rural Colorado, Series 2022 (a) | | | 6.000 | % | | | 12/15/35 | | | | 3,860,000 | | | | 4,778,258 | |
| Colorado State COP Rural Colorado, Series 2018-A (a) | | | 4.000 | % | | | 12/15/36 | | | | 500,000 | | | | 500,877 | |
| Colorado State COP Rural Colorado, Series 2018-A (a) | | | 5.000 | % | | | 12/15/37 | | | | 1,000,000 | | | | 1,103,658 | |
| Denver City & County School District No. 1 COP, Series 2020-A (a) | | | 5.000 | % | | | 12/01/33 | | | | 275,000 | | | | 312,769 | |
| Denver City & County School District No. 1 COP, Series 2020-A (a) | | | 5.000 | % | | | 12/01/42 | | | | 1,860,000 | | | | 2,067,586 | |
| Eagle Garfield & Routt County Colorado School District COP, Series 2021 (a) | | | 4.000 | % | | | 12/01/46 | | | | 2,000,000 | | | | 1,982,903 | |
| El Paso County Colorado School District No. 3 COP, Series 2021 (a) | | | 4.000 | % | | | 12/01/46 | | | | 1,200,000 | | | | 1,189,742 | |
| El Paso County Colorado School District No. 49 COP, Series 2017-B (a) | | | 5.000 | % | | | 12/15/42 | | | | 1,995,000 | | | | 2,146,568 | |
| Foothills Park & Recreation District Colorado COP, Series 2021 (a) | | | 4.000 | % | | | 12/01/41 | | | | 2,750,000 | | | | 2,757,362 | |
| Grand Fire Protection District No. 1 COP, Series 2022 | | | 5.000 | % | | | 12/15/24 | | | | 10,000 | | | | 10,632 | |
| Grand Fire Protection District No. 1 COP, Series 2022 | | | 5.000 | % | | | 12/15/29 | | | | 65,000 | | | | 73,440 | |
| Grand Fire Protection District No. 1 COP, Series 2022 | | | 5.000 | % | | | 12/15/30 | | | | 50,000 | | | | 56,741 | |
| Grand Fire Protection District No. 1 COP, Series 2022 | | | 5.000 | % | | | 12/15/31 | | | | 60,000 | | | | 68,322 | |
| Grand Fire Protection District No. 1 COP, Series 2022 | | | 5.000 | % | | | 12/15/32 | | | | 65,000 | | | | 74,171 | |
| Grand Junction Colorado COP, Series 2019 (a) | | | 4.000 | % | | | 12/01/35 | | | | 550,000 | | | | 575,509 | |
| Gunnison County Colorado COP, Series 2020-B | | | 5.000 | % | | | 12/01/24 | | | | 55,000 | | | | 58,454 | |
| Gunnison County Colorado COP, Series 2020 (a) | | | 4.000 | % | | | 12/01/34 | | | | 125,000 | | | | 130,196 | |
| Gunnison County Colorado COP, Series 2020-B (a) | | | 4.000 | % | | | 12/01/34 | | | | 55,000 | | | | 57,349 | |
| Gunnison County Colorado COP, Series 2020 (a) | | | 4.000 | % | | | 12/01/35 | | | | 390,000 | | | | 405,485 | |
| Gunnison County Colorado COP, Series 2020-B (a) | | | 4.000 | % | | | 12/01/35 | | | | 310,000 | | | | 322,597 | |
| Gunnison County Colorado COP, Series 2020 (a) | | | 4.000 | % | | | 12/01/36 | | | | 810,000 | | | | 840,636 | |
| Gunnison County Colorado COP, Series 2020-B (a) | | | 4.000 | % | | | 12/01/36 | | | | 325,000 | | | | 337,524 | |
| Gunnison County Colorado COP, Series 2020 (a) | | | 4.000 | % | | | 12/01/37 | | | | 840,000 | | | | 870,698 | |
| Hyland Hills Park and Recreation District COP, Series 2022 (a) | | | 5.000 | % | | | 12/15/35 | | | | 1,140,000 | | | | 1,294,924 | |
| Hyland Hills Park and Recreation District COP, Series 2022 (a) | | | 5.000 | % | | | 12/15/41 | | | | 2,430,000 | | | | 2,707,078 | |
| Moffat County Colorado COP, Series 2021 (a) | | | 4.000 | % | | | 03/01/41 | | | | 2,235,000 | | | | 2,233,377 | |
| Moffat County Colorado COP, Series 2021 (a) | | | 4.000 | % | | | 03/01/46 | | | | 4,060,000 | | | | 3,971,427 | |
| Moffat County Colorado COP, Series 2021 (a) | | | 4.000 | % | | | 03/01/51 | | | | 4,000,000 | | | | 3,798,935 | |
| Monument Colorado COP, Series 2020 (a) | | | 4.000 | % | | | 12/01/33 | | | | 200,000 | | | | 208,269 | |
| Monument Colorado COP, Series 2020 (a) | | | 4.000 | % | | | 12/01/40 | | | | 750,000 | | | | 756,777 | |
| Monument Colorado COP, Series 2020 (a) | | | 4.000 | % | | | 12/01/45 | | | | 750,000 | | | | 746,734 | |
See Notes to Financial Statements.
| 82 | | www.sbhfunds.com |
| Segall Bryant & Hamill Colorado Tax Free Fund | Statement of Investments |
| | June 30, 2022 (Unaudited) |
| | | Coupon | | Maturity | | Par Value | | | Value | |
| Lease / Rent — 19.2% (continued) | | | | | | | | | | | | |
| Platteville-Gilcrest Fire Protection District COP, Series 2018 (a) | | 5.000% | | 12/01/33 | | $ | 175,000 | | | $ | 191,214 | |
| Rangeview Library District Adams Country Colorado COP, Series 2022-A (a) | | 5.000% | | 12/15/34 | | | 430,000 | | | | 475,614 | |
| Rangeview Library District Adams Country Colorado COP, Series 2022-A (a) | | 5.000% | | 12/15/35 | | | 775,000 | | | | 855,255 | |
| South Suburban Park & Recreation District COP, Series 2021 (a) | | 4.000% | | 12/15/41 | | | 1,175,000 | | | | 1,186,480 | |
| State of Colorado Department of Transportation COP, Series 2017 (a) | | 5.000% | | 06/15/41 | | $ | 880,000 | | | $ | 943,175 | |
| Town of Firestone Colorado Water Enterprise COP, Series 2018 (a) | | 5.000% | | 12/01/42 | | | 3,000,000 | | | | 3,212,401 | |
| | | | | | | | | | | | 90,275,037 | |
| General Obligation — 22.7% | | | | | | | | | | | | |
| Local — 22.7% | | | | | | | | | | | | |
| Anthem West Metropolitan District, BAM, Series 2015 (a)(b) | | 5.000% | | 12/01/35 | | | 1,165,000 | | | | 1,250,235 | |
| Arapahoe County School District No. 6 Littleton Colorado, Series 2019-A (a) | | 5.500% | | 12/01/43 | | | 5,000,000 | | | | 5,669,844 | |
| BNC Metropolitan District No. 1, BAM, Series 2017-A (a)(b) | | 5.000% | | 12/01/32 | | | 360,000 | | | | 394,799 | |
| BNC Metropolitan District No. 1, BAM, Series 2017-A (a)(b) | | 5.000% | | 12/01/37 | | | 545,000 | | | | 595,410 | |
| Bradburn Metropolitan District No. 2, Series 2018-A | | 4.000% | | 12/01/28 | | | 495,000 | | | | 476,272 | |
| Bradburn Metropolitan District No. 2, Series 2018-A (a) | | 5.000% | | 12/01/38 | | | 600,000 | | | | 583,050 | |
| Bromley Park Metropolitan District No. 2, Series 2018-B (a) | | 6.375% | | 12/15/47 | | | 1,000,000 | | | | 964,108 | |
| Bromley Park Metropolitan District No. 2, BAM, Series 2018-A (a)(b) | | 4.000% | | 12/01/47 | | | 2,500,000 | | | | 2,476,837 | |
| Castle Oaks Metropolitan District No. 3 Colorado, AGM, Series 2020 (a)(b) | | 4.000% | | 12/01/40 | | | 2,455,000 | | | | 2,458,577 | |
| Castle Oaks Metropolitan District No. 3 Colorado, AGM, Series 2020 (a)(b) | | 4.000% | | 12/01/45 | | | 3,800,000 | | | | 3,677,025 | |
| Central Platte Valley Metropolitan District, Series 2013-A (a) | | 5.500% | | 12/01/29 | | | 750,000 | | | | 770,641 | |
| Central Platte Valley Metropolitan District, Series 2013-A (a) | | 5.375% | | 12/01/33 | | | 1,600,000 | | | | 1,631,941 | |
| Central Platte Valley Metropolitan District, Series 2013-A (a) | | 6.000% | | 12/01/38 | | | 1,000,000 | | | | 1,024,540 | |
| Central Platte Valley Metropolitan District, Series 2013-A (a) | | 5.625% | | 12/01/38 | | | 2,875,000 | | | | 2,934,147 | |
| Central Platte Valley Metropolitan District, Series 2014 (a) | | 5.000% | | 12/01/43 | | | 5,750,000 | | | | 5,539,549 | |
| Cherry Creek Colorado School District No. 5, Series 2021 | | 5.000% | | 12/15/28 | | | 80,000 | | | | 91,581 | |
| Colliers Hill Metropolitan District No. 2 Town of Erie Weld County Colorado, BAM, Series 2022B-1 (a)(b) | | 6.000% | | 12/15/47 | | | 2,000,000 | | | | 1,712,371 | |
| Copperleaf Metropolitan District No. 2 Colorado, BAM, Series 2020 (a)(b) | | 4.000% | | 12/01/45 | | | 2,295,000 | | | | 2,285,005 | |
| Cornerstar Metropolitan District, Series 2017-A (a) | | 5.125% | | 12/01/37 | | | 1,000,000 | | | | 975,062 | |
| Cottonwood Highlands Metropolitan District No. 1, Series 2019-A (a) | | 5.000% | | 12/01/49 | | | 900,000 | | | | 834,712 | |
| Crested Butte Colorado Fire Protection District, Series 2022 (a) | | 4.000% | | 12/01/41 | | | 4,220,000 | | | | 4,264,611 | |
| Crested Butte Colorado Fire Protection District, Series 2022 (a) | | 5.000% | | 12/01/46 | | | 5,770,000 | | | | 6,494,917 | |
| Cross Creek Metropolitan District No. 2, AGM, Series 2018 (a)(b) | | 5.000% | | 12/01/34 | | | 2,480,000 | | | | 2,727,440 | |
| Crystal Valley Metropolitan District No. 2, AGM, Series 2020 (a)(b) | | 4.000% | | 12/01/40 | | | 800,000 | | | | 809,155 | |
| Crystal Valley Metropolitan District No. 2, AGM, Series 2020-A (a)(b) | | 4.000% | | 12/01/44 | | | 3,500,000 | | | | 3,495,457 | |
| Dove Valley Metropolitan District Arapahoe County, BAM, Series 2019 (a)(b) | | 4.000% | | 12/01/35 | | | 500,000 | | | | 521,518 | |
| Dove Valley Metropolitan District Arapahoe County, BAM, Series 2019 (a)(b) | | 4.000% | | 12/01/36 | | | 700,000 | | | | 728,803 | |
| Dove Valley Metropolitan District Arapahoe County, BAM, Series 2019 (a)(b) | | 4.000% | | 12/01/37 | | | 750,000 | | | | 779,899 | |
| Dove Valley Metropolitan District Arapahoe County, BAM, Series 2019 (a)(b) | | 4.000% | | 12/01/38 | | | 500,000 | | | | 506,693 | |
| Dove Valley Metropolitan District Arapahoe County, BAM, Series 2019 (a)(b) | | 4.000% | | 12/01/39 | | | 600,000 | | | | 607,342 | |
| Erie Farm Metropolitan District, AGM, Series 2021 (a)(b) | | 5.000% | | 12/01/35 | | | 175,000 | | | | 194,560 | |
| Erie Farm Metropolitan District, AGM, Series 2021 (a)(b) | | 5.000% | | 12/01/41 | | | 570,000 | | | | 625,766 | |
| Erie Farm Metropolitan District, AGM, Series 2021 (a)(b) | | 5.000% | | 12/01/46 | | | 600,000 | | | | 651,759 | |
| Erie Farm Metropolitan District, AGM, Series 2021 (a)(b) | | 4.000% | | 12/01/51 | | | 1,100,000 | | | | 1,052,842 | |
| Flatiron Meadows Metropolitan District, BAM, Series 2022 (a)(b) | | 4.000% | | 12/01/46 | | | 560,000 | | | | 573,437 | |
| Fossil Ridge Metropolitan District No. 3 Colorado, BAM, Series 2020 (a)(b) | | 4.000% | | 12/01/32 | | | 995,000 | | | | 1,032,209 | |
| Fossil Ridge Metropolitan District No. 3 Colorado, BAM, Series 2020 (a)(b) | | 4.000% | | 12/01/33 | | | 1,030,000 | | | | 1,065,015 | |
| Fossil Ridge Metropolitan District No. 3 Colorado, BAM, Series 2020 (a)(b) | | 4.000% | | 12/01/34 | | | 1,075,000 | | | | 1,109,003 | |
| Gold Hill Mesa Metropolitan District No. 2, Series 2022-A | | 5.000% | | 12/01/22 | | | 200,000 | | | | 201,766 | |
| Gold Hill Mesa Metropolitan District No. 2, Series 2022-A | | 5.000% | | 12/01/23 | | | 305,000 | | | | 314,084 | |
| Gold Hill Mesa Metropolitan District No. 2, Series 2022-A | | 5.000% | | 12/01/24 | | | 215,000 | | | | 224,441 | |
| Gold Hill Mesa Metropolitan District No. 2, Series 2022-A | | 5.000% | | 12/01/25 | | | 135,000 | | | | 142,534 | |
| Gold Hill Mesa Metropolitan District No. 2, Series 2022-A | | 5.000% | | 12/01/26 | | | 150,000 | | | | 159,859 | |
| Gold Hill Mesa Metropolitan District No. 2, Series 2022-A | | 5.000% | | 12/01/27 | | | 225,000 | | | | 241,068 | |
See Notes to Financial Statements.
| Semi-Annual Report | June 30, 2022 | | 83 |
| Segall Bryant & Hamill Colorado Tax Free Fund | Statement of Investments |
| | June 30, 2022 (Unaudited) |
| | | Coupon | | | Maturity | | | Par Value | | | Value | |
| Local — 22.7% (continued) | | | | | | | | | | | | | | | | |
| Gold Hill Mesa Metropolitan District No. 2, Series 2022-A | | | 5.000 | % | | | 12/01/28 | | | $ | 290,000 | | | $ | 311,041 | |
| Gold Hill Mesa Metropolitan District No. 2, Series 2022-A (a) | | | 5.250 | % | | | 12/01/37 | | | | 400,000 | | | | 427,494 | |
| Gold Hill Mesa Metropolitan District No. 2, Series 2022-A (a) | | | 5.500 | % | | | 12/01/47 | | | | 600,000 | | | | 644,099 | |
| Grand River Hospital District, AGM, Series 2018 (a)(b) | | | 5.250 | % | | | 12/01/32 | | | | 1,000,000 | | | | 1,094,649 | |
| Grand River Hospital District, AGM, Series 2018 (a)(b) | | | 5.250 | % | | | 12/01/33 | | | | 1,000,000 | | | | 1,091,891 | |
| Great Western Park Metropolitan District No. 2 Colorado, AGM, Series 2021 (a)(b) | | | 4.000 | % | | | 12/01/35 | | | | 520,000 | | | | 536,924 | |
| Great Western Park Metropolitan District No. 2 Colorado, AGM, Series 2021 (a)(b) | | | 4.000 | % | | | 12/01/36 | | | | 555,000 | | | | 571,796 | |
| Ground Water Management Subdistrict of the Central Colorado Water Conservancy District, Series 2021 (a) | | | 4.000 | % | | | 12/01/34 | | | | 500,000 | | | | 507,401 | |
| High Plains Metropolitan District, NATL, Series 2017 (a)(b) | | | 5.000 | % | | | 12/01/35 | | | | 500,000 | | | | 549,379 | |
| Hogback Metropolitan District Colorado, Series 2021-A (a) | | | 5.000 | % | | | 12/01/41 | | | | 700,000 | | | | 636,352 | |
| Leyden Rock Metropolitan District, AGM, Series 2021 (a)(b) | | | 4.000 | % | | | 12/01/46 | | | | 1,250,000 | | | | 1,222,243 | |
| Longs Peak Metropolitan District Colorado, Series 2021 (a) | | | 5.250 | % | | | 12/01/51 | | | | 6,500,000 | | | | 5,354,292 | |
| North Pine Vistas Metropolitan District No. 3, AGM, Series 2021-A (a)(b) | | | 4.000 | % | | | 12/01/36 | | | | 175,000 | | | | 181,712 | |
| North Pine Vistas Metropolitan District No. 3, AGM, Series 2021-A (a)(b) | | | 4.000 | % | | | 12/01/46 | | | | 1,000,000 | | | | 991,451 | |
| North Pine Vistas Metropolitan District No. 3, AGM, Series 2021-A (a)(b) | | | 4.000 | % | | | 12/01/51 | | | | 1,250,000 | | | | 1,196,412 | |
| Prairie Center Metropolitan District No. 7 Colorado, Series 2020 (a) | | | 4.125 | % | | | 12/15/36 | | | | 500,000 | | | | 446,896 | |
| Prairie Center Metropolitan District No. 7 Colorado, Series 2020 (a) | | | 4.875 | % | | | 12/15/44 | | | | 700,000 | | | | 618,716 | |
| Sand Creek County Metropolitan District, AGM, Series 2017 (a)(b) | | | 4.000 | % | | | 12/01/35 | | | | 380,000 | | | | 400,010 | |
| Sand Creek County Metropolitan District, AGM, Series 2020-B (a)(b) | | | 4.000 | % | | | 12/01/35 | | | | 3,405,000 | | | | 3,568,722 | |
| Sand Creek County Metropolitan District, AGM, Series 2020-B (a)(b) | | | 4.000 | % | | | 12/01/40 | | | | 2,325,000 | | | | 2,351,607 | |
| SBC Metropolitan District, AGM, Series 2016 (a)(b) | | | 5.000 | % | | | 12/01/34 | | | | 205,000 | | | | 223,468 | |
| Serenity Ridge Metropolitan District No. 2, Series 2018-A (a) | | | 5.125 | % | | | 12/01/43 | | | | 725,000 | | | | 778,000 | |
| Sierra Ridge Metropolitan District No. 2, AGM, Series 2022 (a)(b) | | | 4.000 | % | | | 12/01/42 | | | | 1,750,000 | | | | 1,757,024 | |
| Sierra Ridge Metropolitan District No. 2, AGM, Series 2022 (a)(b) | | | 4.000 | % | | | 12/01/46 | | | | 1,665,000 | | | | 1,650,767 | |
| Sorrel Ranch Metropolitan District Colorado, AGM, Series 2020 (a)(b) | | | 4.000 | % | | | 12/01/33 | | | | 320,000 | | | | 336,830 | |
| Sorrel Ranch Metropolitan District Colorado, AGM, Series 2020 (a)(b) | | | 4.000 | % | | | 12/01/34 | | | | 665,000 | | | | 698,368 | |
| Sorrel Ranch Metropolitan District Colorado, AGM, Series 2020 (a)(b) | | | 4.000 | % | | | 12/01/35 | | | | 570,000 | | | | 597,407 | |
| Sorrel Ranch Metropolitan District Colorado, AGM, Series 2020 (a)(b) | | | 4.000 | % | | | 12/01/37 | | | | 500,000 | | | | 522,265 | |
| South Suburban Park & Recreation District, Series 2019 (a) | | | 4.000 | % | | | 12/15/38 | | | | 575,000 | | | | 577,914 | |
| South Suburban Park & Recreation District, Series 2019 (a) | | | 4.000 | % | | | 12/15/39 | | | | 565,000 | | | | 566,855 | |
| Southshore Metropolitan District No. 2 City of Aurora Arapahoe County Colorado, BAM, Series 2020-A-2 (a)(b) | | | 4.000 | % | | | 12/01/46 | | | | 6,300,000 | | | | 6,246,144 | |
| Sterling Hills West Metropolitan District, Series 2017 (a) | | | 5.000 | % | | | 12/01/39 | | | | 750,000 | | | | 795,522 | |
| Thornton Colorado Development Authority, Series 2015 (a) | | | 5.000 | % | | | 12/01/26 | | | | 530,000 | | | | 563,027 | |
| Vista Ridge Metropolitan District, BAM, Series 2016-A (a)(b) | | | 5.000 | % | | | 12/01/27 | | | | 485,000 | | | | 533,338 | |
| Vista Ridge Metropolitan District, BAM, Series 2016-A (a)(b) | | | 5.000 | % | | | 12/01/28 | | | | 750,000 | | | | 824,422 | |
| Vista Ridge Metropolitan District, BAM, Series 2016-A (a)(b) | | | 5.000 | % | | | 12/01/31 | | | | 1,250,000 | | | | 1,358,826 | |
| Wheatlands Metropolitan District, BAM, Series 2015 (a)(b) | | | 5.000 | % | | | 12/01/30 | | | | 1,000,000 | | | | 1,082,651 | |
| | | | | | | | | | | | | | | | 106,685,799 | |
| Local Authority — 3.4% | | | | | | | | | | | | | | | | |
| Housing — 0.3% | | | | | | | | | | | | | | | | |
| Colorado Housing & Finance Authority, Series 2020-C-1 | | | 1.878 | % | | | 05/01/23 | | | | 295,000 | | | | 291,471 | |
| Colorado Housing & Finance Authority, Series 2020-C-1 | | | 1.928 | % | | | 11/01/23 | | | | 340,000 | | | | 333,370 | |
| Colorado Housing & Finance Authority, Series 2020-C-1 | | | 2.025 | % | | | 05/01/24 | | | | 150,000 | | | | 145,873 | |
| Colorado Housing & Finance Authority, Series 2020-C-1 | | | 2.075 | % | | | 11/01/24 | | | | 250,000 | | | | 241,214 | |
| Colorado Housing & Finance Authority, Series 2020-C-1 | | | 2.175 | % | | | 11/01/25 | | | | 500,000 | | | | 476,515 | |
| | | | | | | | | | | | | | | | 1,488,443 | |
| Lease / Rent — 0.1% | | | | | | | | | | | | | | | | |
| Boulder Municipal Property COP, Series 2019 | | | 2.250 | % | | | 11/01/24 | | | | 500,000 | | | | 487,182 | |
| | | | | | | | | | | | | | | | | |
| Local — 1.6% | | | | | | | | | | | | | | | | |
| Eagle County Colorado School District, Series 2021 | | | 0.793 | % | | | 12/01/25 | | | | 3,000,000 | | | | 2,746,964 | |
| Eagle County Colorado School District, Series 2021 | | | 0.903 | % | | | 12/01/26 | | | | 5,000,000 | | | | 4,469,791 | |
See Notes to Financial Statements.
| 84 | | www.sbhfunds.com |
| Segall Bryant & Hamill Colorado Tax Free Fund | Statement of Investments |
| | June 30, 2022 (Unaudited) |
| | | Coupon | | Maturity | | Par Value | | | Value | |
| Local — 1.6% (continued) | | | | | | | | | | | | |
| Garfield County School District No. RE-2, Series 2012-B (a) | | 3.050% | | 12/01/26 | | $ | 500,000 | | | $ | 489,426 | |
| | | | | | | | | | | | 7,706,181 | |
| Recreation — 0.4% | | | | | | | | | | | | |
| Park Creek Metropolitan District, Series 2017-B | | 3.150% | | 12/01/23 | | | 405,000 | | | | 403,832 | |
| Park Creek Metropolitan District, Series 2017-B | | 3.300% | | 12/01/24 | | | 425,000 | | | | 421,517 | |
| Park Creek Metropolitan District, Series 2017-B | | 3.450% | | 12/01/25 | | | 500,000 | | | | 496,357 | |
| Park Creek Metropolitan District, Series 2017-B (a) | | 3.600% | | 12/01/26 | | | 300,000 | | | | 297,615 | |
| | | | | | | | | | | | 1,619,321 | |
| Tax — 0.5% | | | | | | | | | | | | |
| Grand Junction Colorado, Series 2020-A | | 1.826% | | 03/01/25 | | | 620,000 | | | | 595,033 | |
| Park Creek Metropolitan District, Series 2018-B | | 3.550% | | 12/01/22 | | | 665,000 | | | | 667,038 | |
| Park Creek Metropolitan District, Series 2018-B | | 3.650% | | 12/01/23 | | | 805,000 | | | | 808,156 | |
| Park Creek Metropolitan District, Series 2018-B | | 3.800% | | 12/01/24 | | | 440,000 | | | | 441,415 | |
| | | | | | | | | | | | 2,511,642 | |
| Utilities — 0.5% | | | | | | | | | | | | |
| Todd Creek Village Metropolitan District Colorado, Series 2018-B (a) | | 5.875% | | 12/01/38 | | | 875,000 | | | | 875,681 | |
| Town of Estes Park Colorado Power & Communications, Series 2019-B | | 2.362% | | 11/01/23 | | | 770,000 | | | | 761,043 | |
| Town of Estes Park Colorado Power & Communications, Series 2019-B | | 2.646% | | 11/01/25 | | | 430,000 | | | | 415,958 | |
| | | | | | | | | | | | 2,052,682 | |
| Prerefunded — 0.5% | | | | | | | | | | | | |
| Healthcare — 0.3% | | | | | | | | | | | | |
| Colorado Health Facilities Authority, Series 2017 (a) | | 5.000% | | 06/01/31 | | | 1,250,000 | | | | 1,393,396 | |
| | | | | | | | | | | | | |
| Local — 0.2% | | | | | | | | | | | | |
| Tallyns Reach Metropolitan District No. 3, Series 2013 (a) | | 5.125% | | 11/01/38 | | | 1,035,000 | | | | 1,077,506 | |
| | | | | | | | | | | | | |
| Revenue — 44.8% | | | | | | | | | | | | |
| Education — 2.3% | | | | | | | | | | | | |
| Colorado Educational & Cultural Facilities Authority, Series 2017-A (a) | | 4.000% | | 03/01/31 | | | 25,000 | | | | 26,098 | |
| Colorado Educational & Cultural Facilities Authority, Series 2017-A (a) | | 4.000% | | 03/01/33 | | | 1,125,000 | | | | 1,161,320 | |
| Colorado Educational & Cultural Facilities Authority, Series 2016 (a) | | 5.000% | | 10/01/34 | | | 1,975,000 | | | | 2,028,528 | |
| Colorado Educational & Cultural Facilities Authority, Series 2016 (a) | | 5.000% | | 05/01/35 | | | 3,145,000 | | | | 3,215,694 | |
| Colorado Educational & Cultural Facilities Authority, Series 2016 (a) | | 5.000% | | 10/01/36 | | | 1,500,000 | | | | 1,612,453 | |
| Colorado School of Mines, Series 2017-C (a) | | 4.000% | | 12/01/37 | | | 225,000 | | | | 234,018 | |
| Colorado State Board Community Colleges Refunding and Improvement Department Higher Education, Series 2017-A | | 5.000% | | 11/01/26 | | | 105,000 | | | | 115,985 | |
| Colorado State Board Community Colleges Refunding and Improvement Department Higher Education, Series 2017-A (a) | | 4.000% | | 11/01/41 | | | 825,000 | | | | 828,688 | |
| University of Colorado, Series 2017-A-2 (a) | | 4.000% | | 06/01/43 | | | 1,750,000 | | | | 1,739,679 | |
| | | | | | | | | | | | 10,962,463 | |
| Healthcare — 9.2% | | | | | | | | | | | | |
| Aspen Valley Hospital District, Series 2012 (a) | | 5.000% | | 10/15/30 | | | 1,650,000 | | | | 1,655,592 | |
| Colorado Health Facilities Authority, Series 2014-A | | 5.000% | | 02/01/23 | | | 520,000 | | | | 524,426 | |
| Colorado Health Facilities Authority, Series 2022-B | | 5.000% | | 12/01/23 | | | 875,000 | | | | 903,175 | |
| Colorado Health Facilities Authority, Series 2017-A | | 5.000% | | 05/15/24 | | | 575,000 | | | | 604,236 | |
| Colorado Health Facilities Authority, Series 2017-A | | 5.000% | | 05/15/25 | | | 790,000 | | | | 840,082 | |
| Colorado Health Facilities Authority, Series 2022-B | | 5.000% | | 12/01/25 | | | 960,000 | | | | 1,020,637 | |
| Colorado Health Facilities Authority, Series 2017-A | | 5.000% | | 05/15/26 | | | 540,000 | | | | 581,233 | |
| Colorado Health Facilities Authority, Series 2017-A (a) | | 5.000% | | 05/15/28 | | | 535,000 | | | | 577,723 | |
| Colorado Health Facilities Authority, Series 2017-A (a) | | 5.000% | | 05/15/29 | | | 425,000 | | | | 456,079 | |
| Colorado Health Facilities Authority, Series 2015-B (a) | | 5.000% | | 09/01/29 | | | 1,000,000 | | | | 1,042,212 | |
| Colorado Health Facilities Authority, Series 2016-C (a) | | 5.000% | | 12/01/29 | | | 1,010,000 | | | | 1,068,449 | |
| Colorado Health Facilities Authority, Series 2022-B | | 5.000% | | 12/01/29 | | | 1,180,000 | | | | 1,297,595 | |
| Colorado Health Facilities Authority, Series 2023-A (a) | | 3.000% | | 05/15/30 | | | 410,000 | | | | 356,978 | |
| Colorado Health Facilities Authority, Series 2017-A (a) | | 5.000% | | 05/15/30 | | | 710,000 | | | | 757,373 | |
See Notes to Financial Statements.
| Semi-Annual Report | June 30, 2022 | | 85 |
| Segall Bryant & Hamill Colorado Tax Free Fund | Statement of Investments |
| | June 30, 2022 (Unaudited) |
| | | Coupon | | Maturity | | Par Value | | | Value | |
| Healthcare — 9.2% (continued) | | | | | | | | | | | | |
| Colorado Health Facilities Authority, Series 2015 (a) | | 5.000% | | 05/15/30 | | $ | 500,000 | | | $ | 520,304 | |
| Colorado Health Facilities Authority, Series 2022-B | | 5.000% | | 12/01/30 | | | 1,245,000 | | | | 1,372,579 | |
| Colorado Health Facilities Authority, Series 2017-A (a) | | 5.000% | | 05/15/31 | | | 1,155,000 | | | | 1,225,595 | |
| Colorado Health Facilities Authority, Series 2022-B | | 5.000% | | 12/01/31 | | | 1,310,000 | | | | 1,443,568 | |
| Colorado Health Facilities Authority, Series 2017-A (a) | | 5.000% | | 05/15/32 | | | 1,650,000 | | | | 1,739,095 | |
| Colorado Health Facilities Authority, Series 2012 (a) | | 5.000% | | 10/01/32 | | | 500,000 | | | | 503,709 | |
| Colorado Health Facilities Authority, Series 2017-A (a) | | 4.000% | | 05/15/35 | | | 350,000 | | | | 351,450 | |
| Colorado Health Facilities Authority, Series 2019-A-1 (a) | | 4.000% | | 08/01/37 | | | 875,000 | | | | 846,415 | |
| Colorado Health Facilities Authority, Series 2019-A (a) | | 5.000% | | 11/15/37 | | | 200,000 | | | | 216,123 | |
| Colorado Health Facilities Authority, Series 2019 (a) | | 4.000% | | 01/01/39 | | | 1,200,000 | | | | 1,170,479 | |
| Colorado Health Facilities Authority, Series 2019 (a) | | 4.000% | | 01/01/40 | | | 925,000 | | | | 897,884 | |
| Colorado Health Facilities Authority, Series 2015 (a) | | 5.000% | | 05/15/40 | | | 1,000,000 | | | | 1,022,685 | |
| Colorado Health Facilities Authority, Series 2023-A (a) | | 4.000% | | 05/15/41 | | | 500,000 | | | | 417,310 | |
| Colorado Health Facilities Authority, Series 2019A-2 (a) | | 5.000% | | 08/01/44 | | | 4,300,000 | | | | 4,392,631 | |
| Colorado Health Facilities Authority, Series 2015 (a) | | 4.000% | | 01/15/45 | | | 2,155,000 | | | | 2,035,886 | |
| Colorado Health Facilities Authority, Series 2019-A (a) | | 3.000% | | 11/15/46 | | | 985,000 | | | | 808,590 | |
| Colorado Health Facilities Authority, Series 2022-A (a) | | 5.000% | | 12/01/47 | | | 1,835,000 | | | | 1,937,267 | |
| Colorado Health Facilities Authority, Series 2023-A (a) | | 4.000% | | 05/15/48 | | | 500,000 | | | | 388,590 | |
| Colorado Health Facilities Authority, Series 2019-A-2 (a) | | 4.000% | | 08/01/49 | | | 4,450,000 | | | | 3,986,601 | |
| Colorado Health Facilities Authority, Series 2022-A (a) | | 5.000% | | 12/01/52 | | | 3,530,000 | | | | 3,708,388 | |
| Denver Health & Hospital Authority, Series 2014-A (a) | | 5.000% | | 12/01/39 | | | 1,500,000 | | | | 1,514,758 | |
| University of Colorado Hospital Authority, Series 2012-A (a) | | 4.000% | | 11/15/42 | | | 1,265,000 | | | | 1,249,643 | |
| | | | | | | | | | | | 43,435,340 | |
| Other — 3.8% | | | | | | | | | | | | |
| Colorado Educational & Cultural Facilities Authority, Series 2014 | | 5.000% | | 11/15/24 | | | 435,000 | | | | 456,042 | |
| Colorado Educational & Cultural Facilities Authority, Series 2016 (c) | | 3.750% | | 07/01/26 | | | 500,000 | | | | 480,091 | |
| Colorado Educational & Cultural Facilities Authority, Series 2015A (a) (c) | | 4.125% | | 07/01/26 | | | 535,000 | | | | 531,406 | |
| Colorado Educational & Cultural Facilities Authority, Series 2016 (a) | | 5.000% | | 05/15/29 | | | 2,600,000 | | | | 2,764,128 | |
| Colorado Educational & Cultural Facilities Authority, Series 2014 (a) | | 5.000% | | 08/15/30 | | | 750,000 | | | | 777,721 | |
| Colorado Educational & Cultural Facilities Authority, Series 2015 (a) | | 5.000% | | 11/01/30 | | | 500,000 | | | | 525,567 | |
| Colorado Educational & Cultural Facilities Authority, Series 2014 (a) | | 5.000% | | 11/15/31 | | | 1,000,000 | | | | 1,029,644 | |
| Colorado Educational & Cultural Facilities Authority, Series 2014 (a) | | 5.000% | | 12/01/31 | | | 1,500,000 | | | | 1,554,309 | |
| Colorado Educational & Cultural Facilities Authority, Series 2016-A (a) | | 5.000% | | 12/15/31 | | | 715,000 | | | | 762,411 | |
| Colorado Educational & Cultural Facilities Authority, Series 2014 (a) | | 5.000% | | 10/01/32 | | | 1,340,000 | | | | 1,378,961 | |
| Colorado Educational & Cultural Facilities Authority, Series 2016 (a) | | 5.000% | | 06/01/36 | | | 1,580,000 | | | | 1,662,149 | |
| Colorado Educational & Cultural Facilities Authority, Series 2016 (a) (c) | | 5.000% | | 07/01/36 | | | 1,000,000 | | | | 977,374 | |
| Colorado Educational & Cultural Facilities Authority, Series 2016 (a) | | 5.000% | | 07/01/36 | | | 1,000,000 | | | | 1,040,675 | |
| Colorado Educational & Cultural Facilities Authority, Series 2016 (a) | | 5.000% | | 08/01/36 | | | 1,140,000 | | | | 1,191,299 | |
| Colorado Educational & Cultural Facilities Authority, Series 2022A (a) | | 4.000% | | 07/01/42 | | | 500,000 | | | | 488,009 | |
| Colorado Educational & Cultural Facilities Authority, Series 2014B (a) | | 5.625% | | 01/15/44 | | | 440,000 | | | | 444,642 | |
| Colorado Educational & Cultural Facilities Authority, Series 2022A (a) | | 4.000% | | 07/01/52 | | | 1,135,000 | | | | 1,067,112 | |
| Colorado Educational & Cultural Facilities Authority, Series 2022A (a) | | 4.000% | | 07/01/56 | | | 625,000 | | | | 585,377 | |
| | | | | | | | | | | | 17,716,917 | |
| Public Services — 11.2% | | | | | | | | | | | | |
| Cherry Creek Corporate Center Metropolitan District, Series 2015-A (a) | | 5.000% | | 06/01/37 | | | 500,000 | | | | 484,150 | |
| City & County of Denver Colorado, Series 2018-A-2 (a) | | 0.000% | | 08/01/35 | | | 2,800,000 | | | | 1,719,886 | |
| City & County of Denver Colorado, Series 2018-A-2 (a) | | 0.000% | | 08/01/36 | | | 2,550,000 | | | | 1,494,438 | |
| City & County of Denver Colorado, Series 2018-A-2 (a) | | 0.000% | | 08/01/37 | | | 3,910,000 | | | | 2,186,522 | |
| City & County of Denver Colorado, Series 2018-A-1 (a) | | 5.000% | | 08/01/41 | | | 2,780,000 | | | | 2,988,835 | |
| City & County of Denver Colorado, Series 2018-A-1 (a) | | 5.000% | | 08/01/48 | | | 14,000,000 | | | | 14,968,563 | |
| Park Creek Metropolitan District, Series 2015-A (a) | | 5.000% | | 12/01/26 | | | 730,000 | | | | 788,597 | |
| Park Creek Metropolitan District, Series 2015-A (a) | | 5.000% | | 12/01/27 | | | 620,000 | | | | 668,295 | |
| Park Creek Metropolitan District, Series 2017-A (a) | | 5.000% | | 12/01/36 | | | 300,000 | | | | 318,034 | |
| Park Creek Metropolitan District, Series 2017-A (a) | | 5.000% | | 12/01/37 | | | 400,000 | | | | 423,912 | |
See Notes to Financial Statements.
| 86 | | www.sbhfunds.com |
| Segall Bryant & Hamill Colorado Tax Free Fund | Statement of Investments |
| | June 30, 2022 (Unaudited) |
| | | Coupon | | Maturity | | Par Value | | | Value | |
| Public Services — 11.2% (continued) | | | | | | | | | | | | |
| Park Creek Metropolitan District, Series 2017-A (a) | | 5.000% | | 12/01/41 | | $ | 1,500,000 | | | $ | 1,585,196 | |
| Park Creek Metropolitan District, Series 2015-A (a) | | 5.000% | | 12/01/45 | | | 550,000 | | | | 581,603 | |
| Park Creek Metropolitan District, Series 2017-A (a) | | 5.000% | | 12/01/46 | | | 4,930,000 | | | | 5,185,606 | |
| Plaza Metropolitan District No. 1, Series 2013 (c) | | 5.000% | | 12/01/22 | | | 1,500,000 | | | | 1,507,433 | |
| Rampart Range Colorado Metropolitan District No. 1, AGM, Series 2017 (a)(b) | | 5.000% | | 12/01/42 | | | 1,905,000 | | | | 2,045,889 | |
| Rampart Range Colorado Metropolitan District No. 1, AGM, Series 2017 (a)(b) | | 5.000% | | 12/01/47 | | | 8,150,000 | | | | 8,703,064 | |
| Southglenn Metropolitan District Colorado, Series 2016 (a) | | 3.500% | | 12/01/26 | | | 3,000,000 | | | | 2,831,600 | |
| Southglenn Metropolitan District Colorado, Series 2016 (a) | | 5.000% | | 12/01/30 | | | 3,505,000 | | | | 3,485,368 | |
| Sterling Ranch Community Authority Colorado, Series 2020-A (a) | | 3.750% | | 12/01/40 | | | 500,000 | | | | 401,637 | |
| Triview Colorado Metropolitan District Water & Wastewater Enterprise, BAM, Series 2020 (a)(b) | | 4.000% | | 12/01/40 | | | 410,000 | | | | 413,705 | |
| | | | | | | | | | | | 52,782,333 | |
| Recreation — 1.9% | | | | | | | | | | | | |
| City & County of Denver Colorado, Series 2016-A (a) | | 5.000% | | 08/01/44 | | | 1,820,000 | | | | 1,950,227 | |
| City & County of Denver Colorado, Series 2016-A (a) | | 4.000% | | 08/01/46 | | | 7,000,000 | | | | 6,951,330 | |
| | | | | | | | | | | | 8,901,557 | |
| Tax — 6.7% | | | | | | | | | | | | |
| City of Commerce Colorado, BAM, Series 2015 (a)(b) | | 5.000% | | 08/01/36 | | | 1,945,000 | | | | 2,072,559 | |
| City of Idaho Springs Colorado Sales Tax Revenue, AGM, Series 2018 (a)(b) | | 5.000% | | 12/01/33 | | | 490,000 | | | | 534,780 | |
| City of Idaho Springs Colorado Sales Tax Revenue, AGM, Series 2018 (a)(b) | | 5.000% | | 12/01/34 | | | 525,000 | | | | 572,296 | |
| Denver Colorado Urban Renewal Authority Tax Increment, Series 2013-A-1 (a) | | 5.000% | | 12/01/23 | | | 190,000 | | | | 192,238 | |
| Denver Colorado Urban Renewal Authority Tax Increment, Series 2018-A (a) (c) | | 5.250% | | 12/01/39 | | | 3,900,000 | | | | 3,965,668 | |
| Denver Colorado Urban Renewal Authority Tax Increment, Series 2018-A (a) (c) | | 5.250% | | 12/01/39 | | | 1,400,000 | | | | 1,418,696 | |
| Grand Junction Colorado, Series 2020-B (a) | | 4.000% | | 03/01/45 | | | 1,500,000 | | | | 1,495,788 | |
| Superior Open Space Sales and Use Tax Colorado, AGM, Series 2020 (a)(b) | | 5.000% | | 06/01/35 | | | 1,000,000 | | | | 1,119,188 | |
| Superior Open Space Sales and Use Tax Colorado, AGM, Series 2020 (a)(b) | | 5.000% | | 06/01/40 | | | 750,000 | | | | 830,962 | |
| Wheat Ridge Colorado Urban Renewal Authority, Series 2021 (a) | | 4.000% | | 12/01/32 | | | 760,000 | | | | 803,795 | |
| Wheat Ridge Colorado Urban Renewal Authority, Series 2021 (a) | | 4.000% | | 12/01/34 | | | 2,000,000 | | | | 2,094,070 | |
| Wheat Ridge Colorado Urban Renewal Authority, Series 2021 (a) | | 4.000% | | 12/01/35 | | | 2,000,000 | | | | 2,081,316 | |
| Wheat Ridge Colorado Urban Renewal Authority, Series 2021 (a) | | 4.000% | | 12/01/36 | | | 3,240,000 | | | | 3,351,126 | |
| Wheat Ridge Colorado Urban Renewal Authority, Series 2021 (a) | | 4.000% | | 12/01/37 | | | 3,360,000 | | | | 3,470,013 | |
| Wheat Ridge Colorado Urban Renewal Authority, Series 2021 (a) | | 4.000% | | 12/01/38 | | | 2,000,000 | | | | 2,032,825 | |
| Wheat Ridge Colorado Urban Renewal Authority, Series 2021 (a) | | 4.000% | | 12/01/39 | | | 3,000,000 | | | | 3,045,005 | |
| Wheat Ridge Colorado Urban Renewal Authority, Series 2021 (a) | | 4.000% | | 12/01/40 | | | 2,500,000 | | | | 2,531,451 | |
| | | | | | | | | | | | 31,611,776 | |
| Transportation — 3.3% | | | | | | | | | | | | |
| Auraria Higher Education Center, AGM, Series 2015 (a)(b) | | 4.000% | | 04/01/29 | | | 3,500,000 | | | | 3,616,861 | |
| Denver Colorado City and County Airport, Series 2017-B (a) | | 5.000% | | 11/15/33 | | | 900,000 | | | | 976,085 | |
| Denver Colorado City and County Airport, Series 2018-A (a) | | 5.000% | | 12/01/43 | | | 2,000,000 | | | | 2,086,476 | |
| E-470 Public Highway Authority Colorado, Series 2020-A (a) | | 5.000% | | 09/01/40 | | | 7,250,000 | | | | 7,567,662 | |
| Grand Junction Regional Airport Authority, NATL, Series 2016-A (a)(b) | | 5.000% | | 12/01/31 | | | 1,155,000 | | | | 1,223,776 | |
| | | | | | | | | | | | 15,470,860 | |
| Utilities — 6.4% | | | | | | | | | | | | |
| Centennial Water & Sanitation District, Series 2019 (a) | | 5.250% | | 12/01/48 | | | 8,750,000 | | | | 9,818,482 | |
| Cherokee Colorado Metropolitan District Water & Wastewater, BAM, Series 2020 (a)(b) | | 4.000% | | 08/01/50 | | | 1,450,000 | | | | 1,403,555 | |
| City of Colorado Springs Colorado Utilities System, Series 2020-A | | 5.000% | | 11/15/23 | | | 155,000 | | | | 161,639 | |
| City of Colorado Springs Colorado Utilities System, Series 2020-A | | 5.000% | | 11/15/29 | | | 25,000 | | | | 28,850 | |
| City of Colorado Springs Colorado Utilities System, Series 2017-A-2 (a) | | 5.000% | | 11/15/47 | | | 5,000,000 | | | | 5,424,475 | |
| Eagle River Colorado Water & Sanitation District, AGM, Series 2020-A (b) | | 4.000% | | 12/01/27 | | | 35,000 | | | | 37,590 | |
| Eagle River Colorado Water & Sanitation District, AGM, Series 2020-A (a)(b) | | 4.000% | | 12/01/45 | | | 1,120,000 | | | | 1,115,122 | |
| Eagle River Colorado Water & Sanitation District, AGM, Series 2020-A (a)(b) | | 4.000% | | 12/01/49 | | | 2,000,000 | | | | 1,972,913 | |
| East Cherry Creek Valley Colorado Water and Sanitation District Arapahoe County, Series 2019-A (a) | | 4.000% | | 11/15/40 | | | 1,000,000 | | | | 1,010,201 | |
| Morgan County Colorado Quality Water District, AGM, Series 2020 (a)(b) | | 4.000% | | 12/01/45 | | | 1,090,000 | | | | 1,085,253 | |
See Notes to Financial Statements.
| Semi-Annual Report | June 30, 2022 | | 87 |
| Segall Bryant & Hamill Colorado Tax Free Fund | Statement of Investments |
| | June 30, 2022 (Unaudited) |
| | | Coupon | | Maturity | | Par Value | | | Value | |
| Utilities — 6.4% (continued) | | | | | | | | | | | | |
| Morgan County Colorado Quality Water District, AGM, Series 2020 (a)(b) | | 4.000% | | 12/01/50 | | $ | 1,150,000 | | | $ | 1,103,702 | |
| Puerto Rico Electric Power Authority, AGM, Series 2007-UU (3MO LIBOR + 52) (a)(b) | | 0.330% | | 07/01/29 | | | 400,000 | | | | 413,872 | |
| Stonegate Village Metropolitan District Colorado, BAM, Series 2020 (a)(b) | | 4.000% | | 12/01/45 | | | 1,435,000 | | | | 1,428,750 | |
| Todd Creek Village Metropolitan District Colorado, Series 2018-A | | 5.000% | | 12/01/28 | | | 1,200,000 | | | | 1,272,112 | |
| Todd Creek Village Metropolitan District Colorado, Series 2018-A (a) | | 5.250% | | 12/01/38 | | | 1,000,000 | | | | 1,053,771 | |
| Town of Firestone Colorado Water Enterprise, BAM, Series 2020 (b) | | 2.000% | | 12/01/23 | | | 15,000 | | | | 14,989 | |
| Town of Firestone Colorado Water Enterprise, BAM, Series 2020 (b) | | 5.000% | | 12/01/25 | | | 25,000 | | | | 27,092 | |
| Town of Firestone Colorado Water Enterprise, BAM, Series 2020 (b) | | 5.000% | | 12/01/26 | | | 20,000 | | | | 22,055 | |
| Town of Firestone Colorado Water Enterprise, BAM, Series 2020 (a)(b) | | 4.000% | | 12/01/45 | | | 1,850,000 | | | | 1,814,429 | |
| Upper Eagle Regional Water Authority, AGM, Series 2020 (a)(b) | | 4.000% | | 12/01/45 | | | 1,000,000 | | | | 995,645 | |
| | | | | | | | | | | | 30,204,497 | |
| Variable Rate Demand Note — 2.4% | | | | | | | | | | | | |
| Variable Rate Demand Note — 2.4% | | | | | | | | | | | | |
| City of Colorado Springs Colorado Utilities System, Series 2007-A (a)(d) | | 0.880% | | 11/01/37 | | | 9,200,000 | | | | 9,200,000 | |
| Colorado Health Facilities Authority, Series 2000 (d) | | 0.960% | | 10/01/30 | | | 2,240,000 | | | | 2,240,000 | |
| | | | | | | | | | | | 11,440,000 | |
| Investments at Value — 93.3% | | | | | | | | | | | | |
| (Cost $470,636,000) | | | | | | | | | | $ | 439,058,912 | |
| | | | | | | | | | | | | |
| Other Assets in Excess of Liabilities — 6.7% | | | | | | | | | | | 31,583,574 | |
| | | | | | | | | | | | | |
| Net Assets — 100.0% | | | | | | | | | | $ | 470,642,486 | |
| (a) | Security can be called and redeemed at the option of the issuer prior to the stated maturity date which is included in the Statement of Investments. |
| (b) | This security is insured. In the event of a default by the bond issuer, the issuer, as noted in the security description, guarantees that scheduled principal and interest payments will be made when due. |
| (c) | Security is considered a restricted security however such restriction has not resulted in an illiquid classification. The total value of these securities is $8,880,668, which represents 1.9% of net assets as of June 30, 2022. |
| (d) | Variable rate security. Interest rate resets periodically. The rate shown is the effective interest rate as of June 30, 2022. For securities based on a published reference rate and spread, the reference rate and spread (in basis points) are indicated parenthetically. Certain variable rate securities are not based on a published reference rate and spread but are determined by the issuer or agent and are based on current market conditions. These securities, therefore, do not indicate a reference rate and spread. |
The Fund’s sector and industry classifications presented herein refer to any one or more of the industry sub-classifications used by one or more widely recognized market indexes or ratings group indexes, and/or as defined by Fund management. For Fund compliance purposes, sector and industry classifications are based on the sector and industry categorization methodology of the Adviser to the Funds. This definition may not apply for purposes of this report, which may combine industry sub-classifications for reporting ease. Industries are shown as a percentage of net assets.
See Notes to Financial Statements.
| 88 | | www.sbhfunds.com |
| Segall Bryant & Hamill Funds | Statement of Investments |
| | June 30, 2022 (Unaudited) |
| COMMON ABBREVIATIONS | |
| | |
| A.B. | Aktiebolag is the Swedish equivalent of the term corporation. |
| ADR | American Depositary Receipt. |
| A.G. | Aktiengesellschaft is a German term that refers to a corporation that is limited by shares, i.e., owned by shareholders. |
| AGM | Assured Guaranty Municipal. |
| A.S. | Andonim Sirketi, Joint Stock Company in Turkey. |
| A/S | Aktieselskab is a Danish Joint Stock Company. |
| A.S.A | Aksjeselskop is the Norwegian term for a stock- based company. |
| BAM | Build America Mutual. |
| Bhd. | Berhad is a Malaysian term for a public limited company. |
| COP | Certificate of Participation. |
| H15T1Y | U.S. Treasury yield curve rate for U.S. Treasury note with a constant maturity of 1 year. |
| LIBOR | London Interbank Offered Rate. |
| LLC | Limited Liability Company. |
| LP | Limited Partnership. |
| Ltd. | Limited. |
| NATL | National Public Finance Guarantee Corp. |
| N.V. | Naamloze Vennootschap is the Dutch term for a public limited liability corporation. |
| OYJ | Julkinen osakeyhtiö means public stock company. |
| PCL | Public Company Limited. |
| PJSC | Public Joint-Stock Company. |
| PLC | Public Limited Company. |
| P.S.Q.C. | Pakistan Standards & Quality Control Authority. |
| Q.S.C. | Qatari Shareholding Company. |
| REIT(s) | Real Estate Investment Trust. |
| S.A. | Generally designates corporations in various countries, mostly those employing the civil law. This translates literally in all languages mentioned as anonymous company. |
| S.A.A. | Sociedad Anonima Abierta is a Peruvian term for a publicly held corporation. |
| S.A. de C.V. | Sociedad Anonima de Capital Variable is a corporative type of business in Mexico. |
| S.A.B de C.V. | Sociedad Anónima Bursátil de Capital Variable is the Mexican term for publicly traded companies. |
| S.A.K.P. | Suid Afrikaanse Kommunistiese Party. |
| SAPI de C.V. | Sociedad Anonima Promotora de Inversion de Capital Variable is a corporative type of business in Mexico. |
| SARL | Societe Anonyme a Responsabilite Limitee is the French term for Limited Liability Company. |
| S.E. | SE Regulation. A European Company which can operate on a Europe-wide basis and be governed by Community law directly applicable in all Member States. |
| SJSC | Saudi Joint-Stock Company. |
| SOFR | Secured Overnight Financing Rate. |
| S.p.A. | Societa per azioni is the Italian equivalent of the term Public Limited Companies. |
| Tbk P.T. | Terbuka Perseroan Terbatas is an Indonesia term for a public limited company. |
| | |
| LIBOR Rates as of June 30, 2022: |
| 1MO LIBOR 1.80% |
| 3MO LIBOR 2.29% |
| CURRENCY ABBREVIATIONS |
| | |
| AED | United Arab Emirates Dirham |
| AUD | Australian Dollar |
| BRL | Brazilian Dollar |
| CAD | Canadian Dollar |
| CHF | Swiss Franc |
| CLP | Chilean Peso |
| CNY | Chinese Yuan |
| COP | Colombian Peso |
| CZK | Czech Koruna |
| DKK | Danish Krone |
| EUR | Euro Currency |
| GBP | British Pound |
| HKD | Hong Kong Dollar |
| HUF | Hungarian Forint |
| IDR | Indonesian Rupiah |
| ILS | Israeli Shekel |
| INR | Indian Rupee |
| JPY | Japanese Yen |
| KRW | South Korean Won |
| KWD | Kuwaiti Dinar |
| MXP | Mexican Peso |
| NOK | Norwegian Krone |
| NZD | New Zealand Dollar |
| PHP | Philippine Peso |
| PLN | Polish Zloty |
| QAR | Qatari Rial |
| RUB | Russian Ruble |
| SAR | Saudi Riyal |
| SEK | Swedish Krona |
| SGD | Singapore Dollar |
| THB | Thai Baht |
| TRY | Turkish Lira |
| TWD | New Taiwan Dollar |
| ZAR | South African Rand |
See Notes to Financial Statements.
| Semi-Annual Report | June 30, 2022 | | 89 |
| Segall Bryant & Hamill Funds | Statements of Assets and Liabilities |
| | June 30, 2022 (Unaudited) |
| | | Segall Bryant & | | | Segall Bryant & | | | Segall Bryant & | |
| | | Hamill Small Cap | | | Hamill Small Cap | | | Hamill Small Cap | |
| | | Value Fund | | | Growth Fund | | | Core Fund | |
| Assets | | | | | | | | | | | | |
| Investments, at cost | | $ | 524,749,296 | | | $ | 181,867,485 | | | $ | 45,286,649 | |
| Investments, at value | | $ | 518,726,244 | | | $ | 155,235,891 | | | $ | 45,042,716 | |
| Cash equivalents (Note 2) | | | 38,738,403 | | | | 6,419,338 | | | | 5,384,568 | |
| Receivable for Fund shares sold | | | 670,222 | | | | 68,592 | | | | 19,980 | |
| Receivable for investment securities sold | | | 769,064 | | | | — | | | | — | |
| Dividends and interest receivable | | | 445,387 | | | | 50,342 | | | | 21,611 | |
| Other assets | | | 59,896 | | | | 27,779 | | | | 16,449 | |
| Total assets | | | 559,409,216 | | | | 161,801,942 | | | | 50,485,324 | |
| | | | | | | | | | | | | |
| Liabilities | | | | | | | | | | | | |
| Payable for Fund shares redeemed | | | 531,800 | | | | 251,330 | | | | 550 | |
| Payable for investment securities purchased | | | 968,541 | | | | — | | | | 475,402 | |
| Payable to Adviser (Note 6) | | | 383,203 | | | | 90,147 | | | | 27,110 | |
| Accrued shareholder servicing fees (Note 6) | | | 74,988 | | | | 35,033 | | | | 3,927 | |
| Payable to third party administrator (Note 6) | | | 12,600 | | | | 5,800 | | | | 3,300 | |
| Accrued chief compliance officer fees (Note 6) | | | 2,004 | | | | 696 | | | | 313 | |
| Other accrued expenses | | | 27,346 | | | | 14,671 | | | | 11,194 | |
| Total liabilities | | | 2,000,482 | | | | 397,677 | | | | 521,796 | |
| Net Assets | | $ | 557,408,734 | | | $ | 161,404,265 | | | $ | 49,963,528 | |
| | | | | | | | | | | | | |
| Net Assets Consists of | | | | | | | | | | | | |
| Paid-in capital | | $ | 561,898,405 | | | $ | 233,464,448 | | | $ | 42,251,512 | |
| Accumulated earnings (deficit) | | | (4,489,671 | ) | | | (72,060,183 | ) | | | 7,712,016 | |
| Net Assets | | $ | 557,408,734 | | | $ | 161,404,265 | | | $ | 49,963,528 | |
| | | | | | | | | | | | | |
| Net Assets | | | | | | | | | | | | |
| Retail | | $ | 7,858,457 | | | $ | 45,878,007 | | | $ | 685,159 | |
| Institutional | | | 549,550,277 | | | | 115,526,258 | | | | 49,278,369 | |
| Shares of Beneficial Interest Outstanding | | | | | | | | | | | | |
| Retail | | | 642,179 | | | | 2,945,678 | | | | 68,675 | |
| Institutional | | | 44,833,368 | | | | 7,232,219 | | | | 4,913,827 | |
| Net Asset Value and Redemption Price Per Share (Net Assets Per Share Outstanding) | | | | | | | | | | | | |
| Retail | | $ | 12.24 | | | | $15 57 | | | $ | 9.98 | |
| Institutional | | $ | 12.26 | | | $ | 15.97 | | | $ | 10.03 | |
See Notes to Financial Statements.
| 90 | | www.sbhfunds.com |
| Segall Bryant & Hamill Funds | Statements of Assets and Liabilities |
| | June 30, 2022 (Unaudited) |
| | | | | | | | | Segall Bryant | |
| | | Segall Bryant & | | | Segall Bryant & | | | & Hamill | |
| | | Hamill | | | Hamill Emerging | | | International | |
| | | All Cap Fund | | | Markets Fund | | | Small Cap Fund | |
| Assets | | | | | | | | | | | | |
| Investments, at cost | | $ | 91,206,042 | | | $ | 47,863,727 | | | $ | 124,512,835 | |
| Investments, at value | | $ | 133,904,701 | | | $ | 46,415,642 | | | $ | 112,498,057 | |
| Cash equivalents (Note 2) | | | 2,606,243 | | | | 511 | | | | | |
| Foreign currency, at value (Cost $—, $82,860, and $182,351, respectively) | | | — | | | | 82,395 | | | | 182,980 | |
| Receivable for Fund shares sold | | | 87,309 | | | | 4,980 | | | | — | |
| Receivable for investment securities sold | | | — | | | | 70,739 | | | | 190,803 | |
| Due from Adviser | | | — | | | | 8,773 | | | | — | |
| Dividends and interest receivable | | | 108,713 | | | | 472,499 | | | | 354,836 | |
| Foreign tax reclaims receivable | | | 546 | | | | 2,077 | | | | 927,825 | |
| Other assets | | | 32,288 | | | | 15,337 | | | | 26,777 | |
| Total assets | | | 136,739,800 | | | | 47,072,442 | | | | 114,181,789 | |
| | | | | | | | | | | | | |
| Liabilities | | | | | | | | | | | | |
| Due to custodian | | | — | | | | 16,866 | | | | — | |
| Payable for Fund shares redeemed | | | 70,032 | | | | — | | | | — | |
| Payable for investment securities purchased | | | — | | | | 5,657 | | | | 76,224 | |
| Accrued foreign capital gains on appreciated securities | | | — | | | | 13,297 | | | | — | |
| Payable to Adviser (Note 6) | | | 67,157 | | | | — | | | | 79,098 | |
| Accrued shareholder servicing fees (Note 6) | | | 19,998 | | | | 4,900 | | | | 25,113 | |
| Payable to third party administrator (Note 6) | | | 5,000 | | | | 3,400 | | | | 4,600 | |
| Accrued chief compliance officer fees (Note 6) | | | 618 | | | | 323 | | | | 555 | |
| Other accrued expenses | | | 13,394 | | | | 48,798 | | | | 38,890 | |
| Total liabilities | | | 176,199 | | | | 93,241 | | | | 224,480 | |
| Net Assets | | $ | 136,563,601 | | | $ | 46,979,201 | | | $ | 113,957,309 | |
| | | | | | | | | | | | | |
| Net Assets Consists of | | | | | | | | | | | | |
| Paid-in capital | | $ | 84,315,243 | | | $ | 50,017,589 | | | $ | 201,653,449 | |
| Accumulated earnings (deficit) | | | 52,248,358 | | | | (3,038,388 | ) | | | (87,696,140 | ) |
| Net Assets | | $ | 136,563,601 | | | $ | 46,979,201 | | | $ | 113,957,309 | |
| | | | | | | | | | | | | |
| Net Assets | | | | | | | | | | | | |
| Retail | | $ | 763,937 | | | $ | 2,171,322 | | | $ | 25,159,687 | |
| Institutional | | | 135,799,664 | | | | 44,807,879 | | | | 88,797,622 | |
| Shares of Beneficial Interest Outstanding | | | | | | | | | | | | |
| Retail | | | 39,929 | | | | 278,177 | | | | 2,702,304 | |
| Institutional | | | 7,092,955 | | | | 5,720,029 | | | | 9,526,657 | |
| Net Asset Value and Redemption Price Per Share (Net Assets Per Share Outstanding) | | | | | | | | | | | | |
| Retail | | $ | 19.13 | | | $ | 7.81 | | | $ | 9.31 | |
| Institutional | | $ | 19.15 | | | $ | 7.83 | | | $ | 9.32 | |
See Notes to Financial Statements.
| Semi-Annual Report | June 30, 2022 | | 91 |
| Segall Bryant & Hamill Funds | Statements of Assets and Liabilities |
| | June 30, 2022 (Unaudited) |
| | | Segall Bryant | | | | | | | | | | |
| | | & Hamill | | | | | | | | | | |
| | | Fundamental | | | Segall Bryant & | | | Segall Bryant & | | | Segall Bryant & | |
| | | International | | | Hamill Global | | | Hamill Workplace | | | Hamill Short Term | |
| | | Small Cap Fund | | | All Cap Fund | | | Equality Fund | | | Plus Fund | |
| Assets | | | | | | | | | | | | | | | | |
| Investments, at cost | | $ | 69,490,168 | | | $ | 24,063,979 | | | $ | 21,646,377 | | | $ | 44,022,291 | |
| Investments, at value | | $ | 54,180,753 | | | $ | 25,999,494 | | | $ | 22,051,286 | | | $ | 42,487,446 | |
| Cash equivalents (Note 2) | | | 2,352,493 | | | | 888,700 | | | | 730,095 | | | | 655,378 | |
| Foreign currency, at value (Cost $1,896,176, $—, $—, and $—, respectively) | | | 1,902,421 | | | | — | | | | — | | | | — | |
| Unrealized gain on forward foreign currency contracts | | | 645,933 | | | | — | | | | — | | | | — | |
| Receivable for Fund shares sold | | | 901,098 | | | | 28 | | | | 486 | | | | | |
| Due from Adviser | | | — | | | | — | | | | — | | | | 625 | |
| Dividends and interest receivable | | | 24,757 | | | | 13,312 | | | | 18,002 | | | | 387,465 | |
| Foreign tax reclaims receivable | | | 50,596 | | | | 78,264 | | | | — | | | | — | |
| Other assets | | | 29,856 | | | | 18,989 | | | | 19,030 | | | | 32,399 | |
| Total assets | | | 60,087,907 | | | | 26,998,787 | | | | 22,818,413 | | | | 43,563,799 | |
| | | | | | | | | | | | | | | | | |
| Liabilities | | | | | | | | | | | | | | | | |
| Unrealized loss on forward foreign currency contracts | | | 718,463 | | | | — | | | | — | | | | — | |
| Payable for Fund shares redeemed | | | 109,436 | | | | 3,769 | | | | — | | | | — | |
| Payable for investment securities purchased | | | 1,759,288 | | | | — | | | | 114,247 | | | | — | |
| Payable to Adviser (Note 6) | | | 18,083 | | | | 5,655 | | | | 2,587 | | | | — | |
| Accrued shareholder servicing fees (Note 6) | | | 18,133 | | | | 3,196 | | | | 4,057 | | | | 9,426 | |
| Payable to third party administrator (Note 6) | | | 3,700 | | | | 3,400 | | | | 2,900 | | | | 3,300 | |
| Accrued chief compliance officer fees (Note 6) | | | 360 | | | | 256 | | | | 242 | | | | 308 | |
| Other accrued expenses | | | 11,231 | | | | 7,804 | | | | 8,838 | | | | 11,834 | |
| Total liabilities | | | 2,638,694 | | | | 24,080 | | | | 132,871 | | | | 24,868 | |
| Net Assets | | $ | 57,449,213 | | | $ | 26,974,707 | | | $ | 22,685,542 | | | $ | 43,538,931 | |
| | | | | | | | | | | | | | | | | |
| Net Assets Consists of | | | | | | | | | | | | | | | | |
| Paid-in capital | | $ | 67,867,660 | | | $ | 24,097,087 | | | $ | 22,425,319 | | | $ | 45,335,268 | |
| Accumulated earnings (deficit) | | | (10,419,447 | ) | | | 2,877,620 | | | | 260,223 | | | | (1,796,337 | ) |
| Net Assets | | $ | 57,448,213 | | | $ | 26,974,707 | | | $ | 22,685,542 | | | $ | 43,538,931 | |
| | | | | | | | | | | | | | | | | |
| Net Assets | | | | | | | | | | | | | | | | |
| Retail | | $ | 23,430,683 | | | $ | 25,410,720 | | | $ | 8,216,188 | | | $ | 6,201,213 | |
| Institutional | | | 34,017,530 | | | | 1,563,987 | | | | 14,469,354 | | | | 37,337,718 | |
| Shares of Beneficial Interest Outstanding | | | | | | | | | | | | | | | | |
| Retail | | | 1,510,033 | | | | 2,972,810 | | | | 1,356,071 | | | | 635,616 | |
| Institutional | | | 2,028,868 | | | | 185,411 | | | | 2,311,135 | | | | 3,821,930 | |
| Net Asset Value and Redemption Price Per Share (Net Assets Per Share Outstanding) | | | | | | | | | | | | | | | | |
| Retail | | $ | 15.52 | | | | $8 55 | | | $ | 6.06 | | | $ | 9.76 | |
| Institutional | | $ | 16 77 | | | | $8 44 | | | $ | 6.26 | | | $ | 9.77 | |
See Notes to Financial Statements.
| 92 | | www.sbhfunds.com |
| Segall Bryant & Hamill Funds | Statements of Assets and Liabilities |
| | June 30, 2022 (Unaudited) |
| | | | | | | | | Segall Bryant & | | | | |
| | | Segall Bryant & | | | Segall Bryant & | | | Hamill Municipal | | | Segall Bryant & | |
| | | Hamill Plus | | | Hamill Quality | | | Opportunities | | | Hamill Colorado | |
| | | Bond Fund | | | High Yield Fund | | | Fund | | | Tax Free Fund | |
| Assets | | | | | | | | | | | | | | | | |
| Investments, at cost | | $ | 873,170,807 | | | $ | 88,554,346 | | | $ | 270,349,461 | | | $ | 470,636,000 | |
| Investments, at value | | $ | 796,373,825 | | | $ | 77,355,472 | | | $ | 251,814,565 | | | $ | 439,058,912 | |
| Cash equivalents (Note 2) | | | — | | | | — | | | | 22,325,063 | | | | 36,743,514 | |
| Receivable for Fund shares sold | | | 531,402 | | | | 1,755 | | | | 1,059,154 | | | | 1,164,580 | |
| Receivable for investment securities sold | | | 5,250,920 | | | | — | | | | 10,885,332 | | | | 4,984,396 | |
| Dividends and interest receivable | | | 6,814,312 | | | | 1,186,551 | | | | 2,079,986 | | | | 3,017,442 | |
| Other assets | | | 29,794 | | | | 16,837 | | | | 35,090 | | | | 17,890 | |
| Total assets | | | 809,000,253 | | | | 78,560,615 | | | | 288,199,190 | | | | 484,986,734 | |
| | | | | | | | | | | | | | | | | |
| Liabilities | | | | | | | | | | | | | | | | |
| Due to custodian | | | 112,135 | | | | 161,282 | | | | — | | | | — | |
| Payable for Fund shares redeemed | | | 691,453 | | | | 214,654 | | | | 195,266 | | | | 1,429,577 | |
| Payable for investment securities purchased | | | — | | | | — | | | | 19,957,327 | | | | 12,532,592 | |
| Payable to Adviser (Note 6) | | | 164,261 | | | | 28,350 | | | | 68,738 | | | | 123,489 | |
| Accrued shareholder servicing fees (Note 6) | | | 217,223 | | | | 14,702 | | | | 49,586 | | | | 143,997 | |
| Payable to third party administrator (Note 6) | | | 18,100 | | | | 4,100 | | | | 7,600 | | | | 10,800 | |
| Accrued chief compliance officer fees (Note 6) | | | 2,832 | | | | 436 | | | | 1,061 | | | | 1,662 | |
| Other accrued expenses | | | 36,134 | | | | 12,447 | | | | 61,320 | | | | 102,131 | |
| Total liabilities | | | 1,242,138 | | | | 435,971 | | | | 20,340,898 | | | | 14,344,248 | |
| Net Assets | | $ | 807,758,115 | | | $ | 78,124,644 | | | $ | 267,858,292 | | | $ | 470,642,486 | |
| | | | | | | | | | | | | | | | | |
| Net Assets Consists of | | | | | | | | | | | | | | | | |
| Paid-in capital | | $ | 899,741,938 | | | $ | 98,161,753 | | | $ | 298,022,800 | | | $ | 512,959,081 | |
| Accumulated deficit | | | (91,983,823 | ) | | | (20,037,109 | ) | | | (30,164,508 | ) | | | (42,316,595 | ) |
| Net Assets | | $ | 807,758,115 | | | $ | 78,124,644 | | | $ | 267,858,292 | | | $ | 470,642,486 | |
| | | | | | | | | | | | | | | | | |
| Net Assets | | | | | | | | | | | | | | | | |
| Retail | | $ | 364,119,872 | | | $ | 32,407,436 | | | $ | 39,140,901 | | | $ | 168,566,901 | |
| Institutional | | | 443,638,243 | | | | 45,717,208 | | | | 228,717,391 | | | | 302,075,585 | |
| Shares of Beneficial Interest Outstanding | | | | | | | | | | | | | | | | |
| Retail | | | 38,320,579 | | | | 4,083,864 | | | | 4,009,948 | | | | 15,670,384 | |
| Institutional | | | 47,171,435 | | | | 5,829,564 | | | | 23,417,340 | | | | 27,972,142 | |
| Net Asset Value and Redemption Price Per Share (Net Assets Per Share Outstanding) | | | | | | | | | | | | | | | | |
| Retail | | $ | 9.50 | | | $ | 7.94 | | | $ | 9.76 | | | $ | 10.76 | |
| Institutional | | $ | 9.40 | | | $ | 7 84 | | | $ | 9.77 | | | $ | 10.80 | |
See Notes to Financial Statements.
| Semi-Annual Report | June 30, 2022 | | 93 |
| Segall Bryant & Hamill Funds | Statements of Operations |
| For the Six Months Ended June 30, 2022 (Unaudited) |
| | | Segall Bryant & | | | Segall Bryant & | | | Segall Bryant & | |
| | | Hamill Small Cap | | | Hamill Small Cap | | | Hamill Small Cap | |
| | | Value Fund | | | Growth Fund | | | Core Fund | |
| Investment Income | | | | | | | | | | | | |
| Dividends | | $ | 3,184,523 | | | $ | 229,364 | | | $ | 192,153 | |
| Interest | | | 42,297 | | | | 5,899 | | | | 5,344 | |
| Foreign taxes withheld | | | (11,778 | ) | | | (2,893 | ) | | | (2,032 | ) |
| Total income | | | 3,215,042 | | | | 232,370 | | | | 195,465 | |
| | | | | | | | | | | | | |
| Expenses | | | | | | | | | | | | |
| Investment advisory fees (Note 6) | | | 2,427,658 | | | | 598,669 | | | | 187,291 | |
| Shareholder servicing fees (Note 6) | | | | | | | | | | | | |
| Retail Class | | | 6,815 | | | | 60,765 | | | | 1,852 | |
| Institutional Class | | | 203,536 | | | | 53,477 | | | | 6,801 | |
| Administrative fees (Note 6) | | | 100,067 | | | | 33,805 | | | | 11,837 | |
| Registration and filing fees | | | 35,955 | | | | 32,515 | | | | 21,942 | |
| Custodian fees | | | 12,058 | | | | 11,905 | | | | 7,958 | |
| Trustee fees and expenses | | | 34,834 | | | | 9,288 | | | | 2,585 | |
| Transfer agent fees (Note 6) | | | 10,945 | | | | 12,305 | | | | 10,176 | |
| Independent pricing service fees | | | 833 | | | | 865 | | | | 788 | |
| Shareholder reporting expenses | | | 19,857 | | | | 9,552 | | | | 447 | |
| Audit and tax preparation fees | | | 7,600 | | | | 6,600 | | | | 6,600 | |
| Insurance expense | | | 13,792 | | | | 4,637 | | | | 1,193 | |
| Chief compliance officer fees (Note 6) | | | 11,658 | | | | 4,148 | | | | 1,808 | |
| Legal fees | | | 14,645 | | | | 4,400 | | | | 1,115 | |
| Other | | | 16,130 | | | | 9,736 | | | | 5,011 | |
| Total expenses before waivers/reimbursements | | | 2,916,383 | | | | 852,667 | | | | 267,404 | |
| Expenses waived/reimbursed by investment adviser | | | — | | | | — | | | | (34,521 | ) |
| Net expenses | | | 2,916,383 | | | | 852,667 | | | | 232,883 | |
| Net Investment Income (Loss) | | | 298,659 | | | | (620,297 | ) | | | (37,418 | ) |
| | | | | | | | | | | | | |
| Realized and Unrealized Gains (Losses) | | | | | | | | | | | | |
| Net realized gains (losses) on: | | | | | | | | | | | | |
| Investments | | | 13,489,696 | | | | (8,363,070 | ) | | | 1,643,322 | |
| | | | | | | | | | | | | |
| Change in unrealized net appreciation/depreciation on: | | | | | | | | | | | | |
| Investments | | | (126,970,565 | ) | | | (65,762,170 | ) | | | (12,612,702 | ) |
| | | | | | | | | | | | | |
| Net realized and unrealized losses | | | (113,480,869 | ) | | | (74,125,240 | ) | | | (10,969,380 | ) |
| Net Decrease in Net Assets Resulting From Operations | | $ | (113,182,210 | ) | | $ | (74,745,537 | ) | | $ | (11,006,798 | ) |
See Notes to Financial Statements.
| 94 | | www.sbhfunds.com |
| Segall Bryant & Hamill Funds | Statements of Operations |
| For the Six Months Ended June 30, 2022 (Unaudited) |
| | | | | | | | | Segall Bryant | |
| | | Segall Bryant & | | | Segall Bryant & | | | & Hamill | |
| | | Hamill | | | Hamill Emerging | | | International | |
| | | All Cap Fund | | | Markets Fund | | | Small Cap Fund | |
| Investment Income | | | | | | | | | | | | |
| Dividends | | $ | 820,554 | | | $ | 1,422,580 | | | $ | 4,469,007 | |
| Interest | | | 3,725 | | | | 98 | | | | 399 | |
| Foreign taxes withheld | | | (13,386 | ) | | | (123,206 | ) | | | (514,699 | ) |
| Total income | | | 810,893 | | | | 1,299,472 | | | | 3,954,707 | |
| | | | | | | | | | | | | |
| Expenses | | | | | | | | | | | | |
| Investment advisory fees (Note 6) | | | 508,340 | | | | 241,698 | | | | 610,154 | |
| Shareholder servicing fees (Note 6) | | | | | | | | | | | | |
| Retail Class | | | 258 | | | | 2,812 | | | | 44,570 | |
| Institutional Class | | | 70,135 | | | | 13,262 | | | | 21,124 | |
| Administrative fees (Note 6) | | | 29,512 | | | | 13,412 | | | | 26,204 | |
| Registration and filing fees | | | 27,317 | | | | 24,298 | | | | 21,983 | |
| Custodian fees | | | 6,303 | | | | 80,816 | | | | 27,776 | |
| Trustee fees and expenses | | | 8,453 | | | | 3,088 | | | | 7,545 | |
| Transfer agent fees (Note 6) | | | 10,195 | | | | 10,327 | | | | 10,230 | |
| Independent pricing service fees | | | 671 | | | | 34,680 | | | | 20,362 | |
| Shareholder reporting fees | | | 3,203 | | | | 990 | | | | 589 | |
| Audit and tax preparation fees | | | 6,600 | | | | 9,100 | | | | 10,100 | |
| Insurance expense | | | 4,490 | | | | 1,429 | | | | 4,332 | |
| Chief compliance officer fees (Note 6) | | | 3,697 | | | | 1,941 | | | | 3,375 | |
| Legal fees | | | 3,710 | | | | 1,270 | | | | 3,204 | |
| Other | | | 7,445 | | | | 46,986 | | | | 27,123 | |
| Total expenses before waivers/reimbursements | | | 690,329 | | | | 486,109 | | | | 838,671 | |
| Expenses waived/reimbursed by investment adviser | | | (33,336 | ) | | | (153,768 | ) | | | (113,487 | ) |
| Net expenses | | | 656,993 | | | | 332,341 | | | | 725,184 | |
| Net Investment Income | | | 153,900 | | | | 967,129 | | | | 3,229,523 | |
| | | | | | | | | | | | | |
| Realized and Unrealized Gains (Losses) | | | | | | | | | | | | |
| Net realized gains (losses) on: | | | | | | | | | | | | |
| Investments | | | 7,001,209 | | | | (1,100,493 | ) (a) | | | (1,010,288 | ) |
| Foreign currency | | | (279 | ) | | | (21,534 | ) | | | (92,900 | ) |
| | | | 7,000,930 | | | | (1,122,027 | ) | | | (1,103,188 | ) |
| Change in unrealized net appreciation/depreciation on: | | | | | | | | | | | | |
| Investments | | | (47,011,891 | ) | | | (7,927,160 | ) (b) | | | (28,160,559 | ) |
| Translation of assets and liabilities denoted in foreign currencies | | | — | | | | (2,615 | ) | | | (87,734 | ) |
| | | | (47,011,891 | ) | | | (7,929,775 | ) | | | (28,248,293 | ) |
| Net realized and unrealized losses | | | (40,010,961 | ) | | | (9,051,802 | ) | | | (29,351,481 | ) |
| Net Decrease in Net Assets Resulting From Operations | | $ | (39,857,061 | ) | | $ | (8,084,673 | ) | | $ | (26,121,958 | ) |
| (a) | Net of foreign capital gains tax of $215,202. |
| (b) | Net of deferred foreign capital gains tax of $244,074. |
See Notes to Financial Statements.
| Semi-Annual Report | June 30, 2022 | | 95 |
| Segall Bryant & Hamill Funds | Statements of Operations |
| For the Six Months Ended June 30, 2022 (Unaudited) |
| | | Segall Bryant | | | | | | | | | | |
| | | & Hamill | | | | | | | | | | |
| | | Fundamental | | | Segall Bryant & | | | Segall Bryant & | | | Segall Bryant & | |
| | | International | | | Hamill Global | | | Hamill Workplace | | | Hamill Short Term | |
| | | Small Cap Fund | | | All Cap Fund | | | Equality Fund | | | Plus Fund | |
| Investment Income | | | | | | | | | | | | | | | | |
| Dividends | | $ | 699,157 | | | $ | 199,874 | | | $ | 138,048 | | | $ | — | |
| Interest | | | 2,635 | | | | 1,066 | | | | 932 | | | | 247,752 | |
| Foreign taxes withheld | | | (98,111 | ) | | | (29,729 | ) | | | (2 | ) | | | — | |
| Total income | | | 603,681 | | | | 171,211 | | | | 138,978 | | | | 247,752 | |
| | | | | | | | | | | | | | | | | |
| Expenses | | | | | | | | | | | | | | | | |
| Investment advisory fees (Note 6) | | | 372,907 | | | | 101,160 | | | | 82,967 | | | | 60,253 | |
| Shareholder servicing fees (Note 6) | | | | | | | | | | | | | | | | |
| Retail Class | | | 33,534 | | | | 13,673 | | | | 5,520 | | | | 10,589 | |
| Institutional Class | | | 21,294 | | | | 1,335 | | | | 7,970 | | | | 19,696 | |
| Administrative fees (Note 6) | | | 16,708 | | | | 9,870 | | | | 8,910 | | | | 12,497 | |
| Registration and filing fees | | | 28,971 | | | | 21,899 | | | | 24,639 | | | | 18,112 | |
| Custodian fees | | | 19,575 | | | | 8,360 | | | | 5,130 | | | | 5,400 | |
| Trustee fees and expenses | | | 3,906 | | | | 1,634 | | | | 1,405 | | | | 2,771 | |
| Transfer agent fees (Note 6) | | | 11,633 | | | | 12,411 | | | | 10,399 | | | | 10,041 | |
| Independent pricing service fees | | | 4,027 | | | | 2,154 | | | | 564 | | | | 8,383 | |
| Shareholder reporting fees | | | 4,030 | | | | 2,933 | | | | 612 | | | | 609 | |
| Audit and tax preparation fees | | | 8,100 | | | | 6,600 | | | | 6,600 | | | | 8,600 | |
| Insurance expense | | | 2,019 | | | | 895 | | | | 645 | | | | 1,015 | |
| Chief compliance officer fees (Note 6) | | | 2,290 | | | | 1,538 | | | | 1,440 | | | | 1,852 | |
| Legal fees | | | 1,795 | | | | 727 | | | | 614 | | | | 1,121 | |
| Other | | | 17,838 | | | | 4,848 | | | | 4,155 | | | | 1,962 | |
| Total expenses before waivers/reimbursements | | | 548,627 | | | | 190,037 | | | | 161,570 | | | | 162,901 | |
| Expenses waived/reimbursed by investment adviser | | | (114,435 | ) | | | (53,320 | ) | | | (59,924 | ) | | | (62,531 | ) |
| Net expenses | | | 434,192 | | | | 136,717 | | | | 101,646 | | | | 100,370 | |
| Net Investment Income | | | 169,489 | | | | 34,494 | | | | 37,332 | | | | 147,382 | |
| | | | | | | | | | | | | | | | | |
| Realized and Unrealized Gains (Losses) | | | | | | | | | | | | | | | | |
| Net realized gains (losses) on: | | | | | | | | | | | | | | | | |
| Investments | | | 1,186,141 | | | | 443,048 | | | | (228,511 | ) | | | (198,417 | ) |
| Forward foreign currency contracts | | | (892,395 | ) | | | — | | | | — | | | | — | |
| Foreign currency | | | (47,348 | ) | | | 1,850 | | | | — | | | | — | |
| | | | 246,398 | | | | 444,898 | | | | (228,511 | ) | | | (198,417 | ) |
| Change in unrealized net appreciation/depreciation on: | | | | | | | | | | | | | | | | |
| Investments | | | (35,303,009 | ) | | | (8,648,328 | ) | | | (6,607,769 | ) | | | (1,280,745 | ) |
| Forward foreign currency contracts | | | 127,122 | | | | — | | | | — | | | | — | |
| Translation of assets and liabilities denoted in foreign currencies | | | 118,066 | | | | (6,328 | ) | | | — | | | | — | |
| | | | (35,057,821 | ) | | | (8,654,656 | ) | | | (6,607,769 | ) | | | (1,280,745 | ) |
| Net realized and unrealized losses | | | (34,811,423 | ) | | | (8,209,758 | ) | | | (6,836,280 | ) | | | (1,479,162 | ) |
| Net Decrease in Net Assets Resulting From Operations | | $ | (34,641,934 | ) | | $ | (8,175,264 | ) | | $ | (6,798,948 | ) | | $ | (1,331,780 | ) |
See Notes to Financial Statements.
| 96 | | www.sbhfunds.com |
| Segall Bryant & Hamill Funds | Statements of Operations |
| For the Six Months Ended June 30, 2022 (Unaudited) |
| | | | | | | | | Segall Bryant & | | | | |
| | | Segall Bryant & | | | Segall Bryant & | | | Hamill Municipal | | | Segall Bryant & | |
| | | Hamill Plus | | | Hamill Quality | | | Opportunities | | | Hamill Colorado | |
| | | Bond Fund | | | High Yield Fund | | | Fund | | | Tax Free Fund | |
| Investment Income | | | | | | | | | | | | | | | | |
| Interest | | $ | 14,144,302 | | | $ | 2,038,273 | | | $ | 3,450,238 | | | $ | 6,507,092 | |
| | | | | | | | | | | | | | | | | |
| Expenses | | | | | | | | | | | | | | | | |
| Investment advisory fees (Note 6) | | | 1,631,293 | | | | 207,179 | | | | 496,640 | | | | 923,802 | |
| Shareholder servicing fees (Note 6) | | | | | | | | | | | | | | | | |
| Retail Class | | | 489,527 | | | | 37,113 | | | | 52,024 | | | | 230,293 | |
| Institutional Class | | | 188,133 | | | | 23,880 | | | | 99,810 | | | | 146,500 | |
| Administrative fees (Note 6) | | | 150,999 | | | | 19,382 | | | | 49,484 | | | | 87,721 | |
| Registration and filing fees | | | 35,578 | | | | 25,041 | | | | 31,612 | | | | 17,638 | |
| Custodian fees | | | 9,079 | | | | 5,690 | | | | 6,703 | | | | 6,567 | |
| Trustee fees and expenses | | | 51,659 | | | | 5,231 | | | | 16,696 | | | | 29,647 | |
| Transfer agent fees (Note 6) | | | 15,815 | | | | 10,788 | | | | 11,230 | | | | 11,003 | |
| Independent pricing service fees | | | 21,353 | | | | 8,120 | | | | 23,497 | | | | 30,442 | |
| Shareholder reporting fees | | | 28,988 | | | | 4,388 | | | | 2,057 | | | | 2,751 | |
| Audit and tax preparation fees | | | 9,600 | | | | 8,600 | | | | 7,600 | | | | 7,600 | |
| Insurance expense | | | 24,795 | | | | 2,327 | | | | 5,618 | | | | 13,109 | |
| Chief compliance officer fees (Note 6) | | | 17,311 | | | | 2,619 | | | | 6,063 | | | | 10,261 | |
| Legal fees | | | 21,906 | | | | 2,194 | | | | 6,810 | | | | 12,426 | |
| Other | | | 20,501 | | | | 3,452 | | | | 2,529 | | | | 7,894 | |
| Total expenses before waivers/reimbursements | | | 2,716,537 | | | | 366,004 | | | | 818,373 | | | | 1,537,654 | |
| Expenses waived/reimbursed by investment adviser | | | (540,554 | ) | | | (16,389 | ) | | | (77,703 | ) | | | (71,523 | ) |
| Net expenses | | | 2,175,983 | | | | 349,615 | | | | 740,670 | | | | 1,466,131 | |
| Net Investment Income | | | 11,968,319 | | | | 1,688,658 | | | | 2,709,568 | | | | 5,040,961 | |
| | | | | | | | | | | | | | | | | |
| Realized and Unrealized Losses | | | | | | | | | | | | | | | | |
| Net realized losses on: | | | | | | | | | | | | | | | | |
| Investments | | | (12,449,923 | ) | | | (261,146 | ) | | | (9,582,384 | ) | | | (4,526,225 | ) |
| | | | | | | | | | | | | | | | | |
| Change in unrealized net appreciation/depreciation on: | | | | | | | | | | | | | | | | |
| Investments | | | (112,913,611 | ) | | | (13,329,468 | ) | | | (23,882,216 | ) | | | (49,086,335 | ) |
| | | | | | | | | | | | | | | | | |
| Net realized and unrealized losses | | | (125,363,534 | ) | | | (13,590,614 | ) | | | (33,464,600 | ) | | | (53,612,560 | ) |
| Net Decrease in Net Assets Resulting From Operations | | $ | (113,395,215 | ) | | $ | (11,901,956 | ) | | $ | (30,755,032 | ) | | $ | (48,571,599 | ) |
See Notes to Financial Statements.
| Semi-Annual Report | June 30, 2022 | | 97 |
| Segall Bryant & Hamill Funds | Statements of Changes in Net Assets |
| | | Segall Bryant & Hamill | | | Segall Bryant & Hamill | | | Segall Bryant & Hamill | |
| | | Small Cap Value Fund | | | Small Cap Growth Fund | | | Small Cap Core Fund | |
| | | Six Months | | | | | | Six Months | | | | | | Six Months | | | | |
| | | Ended | | | Year Ended | | | Ended | | | Year Ended | | | Ended | | | Year Ended | |
| | | June 30, 2022 | | | December 31, | | | June 30, 2022 | | | December 31, | | | June 30, 2022 | | | December 31, | |
| | | (Unaudited) | | | 2021 | | | (Unaudited) | | | 2021 | | | (Unaudited) | | | 2021 | |
| Operations | | | | | | | | | | | | | | | | | | |
| Net investment income (loss) | | $ | 298,659 | | | $ | 1,253,332 | | | $ | (620,297 | ) | | $ | (1,104,000 | ) | | $ | (37,418 | ) | | $ | (74,093 | ) |
| Net realized gains (losses) | | | 13,489,696 | | | | 37,263,573 | | | | (8,363,070 | ) | | | 22,565,130 | | | | 1,643,322 | | | | 5,943,663 | |
| Change in unrealized net appreciation/depreciation | | | (126,970,565 | ) | | | 34,670,349 | | | | (65,762,170 | ) | | | (5,293,483 | ) | | | (12,612,702 | ) | | | 5,108,617 | |
| Net increase (decrease) in net assets resulting from operations | | | (113,182,210 | ) | | | 73,187,254 | | | | (74,745,537 | ) | | | 16,167,647 | | | | (11,006,798 | ) | | | 10,978,187 | |
| | | | | | | | | | | | | | | | | | | | | | | | | |
| Distributions to Shareholders (Note 5) | | | | | | | | | | | | | | | | | | | | | | | | |
| From distributable earnings | | | | | | | | | | | | | | | | | | | | | | | | |
| Retail | | | — | | | | (416,535 | ) | | | — | | | | — | | | | — | | | | (291,052 | ) |
| Institutional | | | — | | | | (26,594,822 | ) | | | — | | | | — | | | | — | | | | (8,394,213 | ) |
| Decrease in net assets from distributions to shareholders | | | — | | | | (27,011,357 | ) | | | — | | | | — | | | | — | | | | (8,685,265 | ) |
| | | | | | | | | | | | | | | | | | | | | | | | | |
| Beneficial Interest Transactions (Note 4) | | | | | | | | | | | | | | | | | | | | | | | | |
| Shares sold | | | | | | | | | | | | | | | | | | | | | | | | |
| Retail | | | 654,747 | | | | 3,050,835 | | | | 21,041,404 | | | | 49,463,143 | | | | 324,967 | | | | 1,417,224 | |
| Institutional | | | 164,748,461 | | | | 337,970,835 | | | | 35,911,459 | | | | 85,691,386 | | | | 9,919,775 | | | | 785,331 | |
| Shares issued in reinvestment of distributions | | | | | | | | | | | | | | | | | | | | | | | | |
| Retail | | | — | | | | 393,533 | | | | — | | | | — | | | | — | | | | 283,977 | |
| Institutional | | | — | | | | 20,138,349 | | | | — | | | | — | | | | — | | | | 5,218,137 | |
| Cost of shares redeemed | | | | | | | | | | | | | | | | | | | | | | | | |
| Retail | | | (549,208 | ) | | | (1,455,490 | ) | | | (8,861,974 | ) | | | (9,489,046 | ) | | | (961,632 | ) | | | (4,693,733 | ) |
| Institutional | | | (105,082,061 | ) | | | (217,902,088 | ) | | | (54,296,752 | ) | | | (21,282,278 | ) | | | (435,231 | ) | | | (2,020,789 | ) |
| Net increase (decrease) resulting from beneficial interest transactions | | | 59,771,939 | | | | 142,195,974 | | | | (6,205,863 | ) | | | 104,383,205 | | | | 8,847,879 | | | | 990,147 | |
| Total net increase (decrease) in net assets | | | (53,410,271 | ) | | | 188,371,871 | | | | (80,951,400 | ) | | | 120,550,852 | | | | (2,158,919 | ) | | | 3,283,069 | |
| | | | | | | | | | | | | | | | | | | | | | | | | |
| Net Assets | | | | | | | | | | | | | | | | | | | | | | | | |
| Beginning of period | | | 610,819,005 | | | | 422,447,134 | | | | 242,355,665 | | | | 121,804,813 | | | | 52,122,447 | | | | 48,839,378 | |
| End of period | | $ | 557,408,734 | | | $ | 610,819,005 | | | $ | 161,404,265 | | | $ | 242,355,665 | | | $ | 49,963,528 | | | $ | 52,122,447 | |
See Notes to Financial Statements.
| 98 | | www.sbhfunds.com |
| Segall Bryant & Hamill Funds | Statements of Changes in Net Assets |
| | | | | | | | | Segall Bryant & Hamill | | | Segall Bryant & Hamill | |
| | | Segall Bryant & Hamill All Cap Fund | | | Emerging Markets Fund | | | International Small Cap Fund | |
| | | Six Months | | | | | | Six Months | | | | | | Six Months | | | | |
| | | Ended | | | Year Ended | | | Ended | | | Year Ended | | | Ended | | | Year Ended | |
| | | June 30, 2022 | | | December 31, | | | June 30, 2022 | | | December 31, | | | June 30, 2022 | | | December 31, | |
| | | (Unaudited) | | | 2021 | | | (Unaudited) | | | 2021 | | | (Unaudited) | | | 2021 | |
| Operations | | | | | | | | | | | | | | | | | | |
| Net investment income (loss) | | $ | 153,900 | | | $ | (133,907 | ) | | $ | 967,129 | | | $ | 1,604,753 | | | $ | 3,229,523 | | | $ | 4,682,066 | |
| Net realized gains (losses) | | | 7,000,930 | | | | 19,731,227 | | | | (1,122,027 | ) | | | 2,875,107 | | | | (1,103,188 | ) | | | 26,110,906 | |
| Change in unrealized net appreciation/ depreciation | | | (47,011,891 | ) | | | 29,308,203 | | | | (7,929,775 | ) | | | (2,267,062 | ) | | | (28,248,293 | ) | | | (7,482,118 | ) |
| Net increase (decrease) in net assets resulting from operations | | | (39,857,061 | ) | | | 48,905,523 | | | | (8,084,673 | ) | | | 2,212,798 | | | | (26,121,958 | ) | | | 23,310,854 | |
| | | | | | | | | | | | | | | | | | | | | | | | | |
| Distributions to Shareholders (Note 5) | | | | | | | | | | | | | | | | | | | | | | | | |
| From distributable earnings | | | | | | | | | | | | | | | | | | | | | | | | |
| Retail | | | — | | | | (97,778 | ) | | | — | | | | (151,486 | ) | | | (452,358 | ) | | | (2,500,281 | ) |
| Institutional | | | — | | | | (19,288,179 | ) | | | — | | | | (2,874,710 | ) | | | (1,673,750 | ) | | | (5,758,347 | ) |
| Decrease in net assets from distributions to shareholders | | | — | | | | (19,385,957 | ) | | | — | | | | (3,026,196 | ) | | | (2,126,108 | ) | | | (8,258,628 | ) |
| | | | | | | | | | | | | | | | | | | | | | | | | |
| Beneficial Interest Transactions (Note 4) | | | | | | | | | | | | | | | | | | | | | | | | |
| Shares sold | | | | | | | | | | | | | | | | | | | | | | | | |
| Retail | | | 13,108 | | | | 232,310 | | | | 882,740 | | | | 952,069 | | | | 265,095 | | | | 855,562 | |
| Institutional | | | 7,542,941 | | | | 28,911,778 | | | | 1,605,067 | | | | 10,154,946 | | | | 4,716,428 | | | | 18,937,214 | |
| Shares issued in reinvestment of distributions | | | | | | | | | | | | | | | | | | | | | | | | |
| Retail | | | — | | | | 96,085 | | | | — | | | | 151,486 | | | | 170,181 | | | | 633,678 | |
| Institutional | | | — | | | | 19,024,468 | | | | — | | | | 1,615,449 | | | | 1,557,074 | | | | 5,263,684 | |
| Cost of shares redeemed | | | | | | | | | | | | | | | | | | | | | | | | |
| Retail | | | (9,959 | ) | | | (47,223 | ) | | | (1,566,395 | ) | | | (824,059 | ) | | | (15,708,972 | ) | | | (23,848,137 | ) |
| Institutional | | | (18,558,425 | ) | | | (60,719,508 | ) | | | (3,740,662 | ) | | | (1,364,913 | ) | | | (4,840,734 | ) | | | (44,380,383 | ) |
| Net increase (decrease) resulting from beneficial interest transactions | | | (11,012,335 | ) | | | (12,502,090 | ) | | | (2,819,250 | ) | | | 10,684,978 | | | | (13,840,928 | ) | | | (42,538,382 | ) |
| Total net increase (decrease) in net assets | | | (50,869,396 | ) | | | 17,017,476 | | | | (10,903,923 | ) | | | 9,871,580 | | | | (42,088,994 | ) | | | (27,486,156 | ) |
| | | | | | | | | | | | | | | | | | | | | | | | | |
| Net Assets | | | | | | | | | | | | | | | | | | | | | | | | |
| Beginning of period | | | 187,432,997 | | | | 170,415,521 | | | | 57,883,124 | | | | 48,011,544 | | | | 156,046,303 | | | | 183,532,459 | |
| End of period | | $ | 136,563,601 | | | $ | 187,432,997 | | | $ | 46,979,201 | | | $ | 57,883,124 | | | $ | 113,957,309 | | | $ | 156,046,303 | |
See Notes to Financial Statements.
| Semi-Annual Report | June 30, 2022 | | 99 |
| Segall Bryant & Hamill Funds | Statements of Changes in Net Assets |
| | | Segall Bryant & Hamill Fundamental | | | Segall Bryant & Hamill | | | Segall Bryant & Hamill | |
| | | International Small Cap Fund | | | Global All Cap Fund | | | Workplace Equality Fund | |
| | | Six Months | | | | | | Six Months | | | | | | Six Months | | | | |
| | | Ended | | | Year Ended | | | Ended | | | Year Ended | | | Ended | | | Year Ended | |
| | | June 30, 2022 | | | December 31, | | | June 30, 2022 | | | December 31, | | | June 30, 2022 | | | December 31, | |
| | | (Unaudited) | | | 2021 | | | (Unaudited) | | | 2021 | | | (Unaudited) | | | 2021 | |
| Operations | | | | | | | | | | | | | | | | | | |
| Net investment income (loss) | | $ | 169,489 | | | $ | (406,901 | ) | | $ | 34,494 | | | $ | 65,466 | | | $ | 37,332 | | | $ | 39,505 | |
| Net realized gains (losses) | | | 246,398 | | | | 8,956,032 | | | | 444,898 | | | | 2,072,136 | | | | (228,511 | ) | | | 1,713,342 | |
| Change in unrealized net appreciation/depreciation | | | (35,057,821 | ) | | | (38,269 | ) | | | (8,654,656 | ) | | | 6,199,644 | | | | (6,607,769 | ) | | | 4,021,696 | |
| Net increase (decrease) in net assets resulting from operations | | | (34,641,934 | ) | | | 8,510,862 | | | | (8,175,264 | ) | | | 8,337,246 | | | | (6,798,948 | ) | | | 5,774,543 | |
| | | | | | | | | | | | | | | | | | | | | | | | | |
| Distributions to Shareholders (Note 5) | | | | | | | | | | | | | | | | | | | | | | | | |
| From distributable earnings | | | | | | | | | | | | | | | | | | | | | | | | |
| Retail | | | — | | | | (3,257,813 | ) | | | — | | | | (1,980,616 | ) | | | — | | | | (805,364 | ) |
| Institutional | | | — | | | | (3,650,769 | ) | | | — | | | | (291,712 | ) | | | — | | | | (1,260,625 | ) |
| Decrease in net assets from distributions to shareholders | | | — | | | | (6,908,582 | ) | | | — | | | | (2,272,328 | ) | | | — | | | | (2,065,989 | ) |
| | | | | | | | | | | | | | | | | | | | | | | | | |
| Beneficial Interest Transactions (Note 4) | | | | | | | | | | | | | | | | | | | | | | | | |
| Shares sold | | | | | | | | | | | | | | | | | | | | | | | | |
| Retail | | | 3,472,311 | | | | 12,663,816 | | | | 29,117 | | | | 168,540 | | | | 411,150 | | | | 1,212,464 | |
| Institutional | | | 17,549,098 | | | | 42,479,988 | | | | 12,361 | | | | 1,198,548 | | | | 971,630 | | | | 4,642,427 | |
| Shares issued in reinvestment of distributions | | | | | | | | | | | | | | | | | | | | | | | | |
| Retail | | | — | | | | 3,241,291 | | | | — | | | | 1,851,873 | | | | — | | | | 799,569 | |
| Institutional | | | — | | | | 3,570,077 | | | | — | | | | 291,654 | | | | — | | | | 1,232,146 | |
| Cost of shares redeemed | | | | | | | | | | | | | | | | | | | | | | | | |
| Retail | | | (7,439,794 | ) | | | (9,571,092 | ) | | | (955,664 | ) | | | (5,853,444 | ) | | | (1,334,894 | ) | | | (1,299,150 | ) |
| Institutional | | | (13,895,381 | ) | | | (10,706,447 | ) | | | (2,631,410 | ) | | | (623,868 | ) | | | (115,371 | ) | | | (1,439,188 | ) |
| Net increase (decrease) resulting from beneficial interest transactions | | | (313,766 | ) | | | 41,677,633 | | | | (3,545,596 | ) | | | (2,966,697 | ) | | | (67,485 | ) | | | 5,148,268 | |
| Total net increase (decrease) in net assets | | | (34,955,700 | ) | | | 43,279,913 | | | | (11,720,860 | ) | | | 3,098,221 | | | | (6,866,433 | ) | | | 8,856,822 | |
| | | | | | | | | | | | | | | | | | | | | | | | | |
| Net Assets | | | | | | | | | | | | | | | | | | | | | | | | |
| Beginning of period | | | 92,403,913 | | | | 49,124,000 | | | | 38,695,567 | | | | 35,597,346 | | | | 29,551,975 | | | | 20,695,153 | |
| End of period | | $ | 57,448,213 | | | $ | 92,403,913 | | | $ | 26,974,707 | | | $ | 38,695,567 | | | $ | 22,685,542 | | | $ | 29,551,975 | |
See Notes to Financial Statements.
| 100 | | www.sbhfunds.com |
| Segall Bryant & Hamill Funds | Statements of Changes in Net Assets |
| | | Segall Bryant & Hamill | | | Segall Bryant & Hamill | | | Segall Bryant & Hamill | |
| | | Short Term Plus Fund | | | Plus Bond Fund | | | Quality High Yield Fund | |
| | | Six Months | | | | | | Six Months | | | | | | Six Months | | | | |
| | | Ended | | | Year Ended | | | Ended | | | Year Ended | | | Ended | | | Year Ended | |
| | | June 30, 2022 | | | December 31, | | | June 30, 2022 | | | December 31, | | | June 30, 2022 | | | December 31, | |
| | | (Unaudited) | | | 2021 | | | (Unaudited) | | | 2021 | | | (Unaudited) | | | 2021 | |
| Operations | | | | | | | | | | | | | | | | | | |
| Net investment income | | $ | 147,382 | | | $ | 212,101 | | | $ | 11,968,319 | | | $ | 23,813,902 | | | $ | 1,688,658 | | | $ | 3,166,264 | |
| Net realized gains (losses) | | | (198,417 | ) | | | 76,508 | | | | (12,449,923 | ) | | | 7,750,023 | | | | (261,146 | ) | | | 909,927 | |
| Change in unrealized net appreciation/depreciation | | | (1,280,745 | ) | | | (388,055 | ) | | | (112,913,611 | ) | | | (36,682,058 | ) | | | (13,329,468 | ) | | | (1,099,993 | ) |
| Net increase (decrease) in net assets resulting from operations | | | (1,331,780 | ) | | | (99,446 | ) | | | (113,395,215 | ) | | | (5,118,133 | ) | | | (11,901,956 | ) | | | 2,976,198 | |
| | | | | | | | | | | | | | | | | | | | | | | | | |
| Distributions to Shareholders (Note 5) | | | | | | | | | | | | | | | | | | | | | | | | |
| From distributable earnings | | | | | | | | | | | | | | | | | | | | | | | | |
| Retail | | | (25,537 | ) | | | (55,271 | ) | | | (5,724,444 | ) | | | (15,291,464 | ) | | | (676,941 | ) | | | (1,388,983 | ) |
| Institutional | | | (140,607 | ) | | | (287,775 | ) | | | (7,496,951 | ) | | | (18,728,556 | ) | | | (1,105,249 | ) | | | (1,927,139 | ) |
| Decrease in net assets from distributions to shareholders | | | (166,144 | ) | | | (343,046 | ) | | | (13,221,395 | ) | | | (34,020,020 | ) | | | (1,782,190 | ) | | | (3,316,122 | ) |
| | | | | | | | | | | | | | | | | | | | | | | | | |
| Beneficial Interest Transactions (Note 4) | | | | | | | | | | | | | | | | | | | | | | | | |
| Shares sold | | | | | | | | | | | | | | | | | | | | | | | | |
| Retail | | | 519,907 | | | | 12,423,094 | | | | 23,479,031 | | | | 68,960,401 | | | | 1,650,393 | | | | 6,338,669 | |
| Institutional | | | 6,018,315 | | | | 33,672,972 | | | | 56,629,610 | | | | 200,483,179 | | | | 6,894,088 | | | | 26,601,286 | |
| Shares issued in reinvestment of distributions | | | | | | | | | | | | | | | | | | | | | | | | |
| Retail | | | 25,537 | | | | 55,271 | | | | 5,656,116 | | | | 15,118,125 | | | | 648,398 | | | | 1,330,990 | |
| Institutional | | | 135,358 | | | | 278,284 | | | | 6,908,569 | | | | 17,133,640 | | | | 1,084,404 | | | | 1,891,759 | |
| Cost of shares redeemed | | | | | | | | | | | | | | | | | | | | | | | | |
| Retail | | | (5,943,226 | ) | | | (3,473,502 | ) | | | (74,670,141 | ) | | | (194,020,710 | ) | | | (4,463,638 | ) | | | (9,856,291 | ) |
| Institutional | | | (7,669,827 | ) | | | (17,119,670 | ) | | | (138,765,752 | ) | | | (133,949,714 | ) | | | (16,011,007 | ) | | | (7,099,896 | ) |
| Net increase (decrease) resulting from beneficial interest transactions | | | (6,913,936 | ) | | | 25,836,449 | | | | (120,762,567 | ) | | | (26,275,079 | ) | | | (10,197,362 | ) | | | 19,206,517 | |
| Total net increase (decrease) in net assets | | | (8,411,860 | ) | | | 25,393,957 | | | | (247,379,177 | ) | | | (65,413,232 | ) | | | (23,881,508 | ) | | | 18,866,593 | |
| | | | | | | | | | | | | | | | | | | | | | | | | |
| Net Assets | | | | | | | | | | | | | | | | | | | | | | | | |
| Beginning of period | | | 51,950,791 | | | | 26,556,834 | | | | 1,055,137,292 | | | | 1,120,550,524 | | | | 102,006,152 | | | | 83,139,559 | |
| End of period | | $ | 43,538,931 | | | $ | 51,950,791 | | | $ | 807,758,115 | | | $ | 1,055,137,292 | | | $ | 78,124,644 | | | $ | 102,006,152 | |
See Notes to Financial Statements.
| Semi-Annual Report | June 30, 2022 | | 101 |
| Segall Bryant & Hamill Funds | Statements of Changes in Net Assets |
| | | Segall Bryant & Hamill | | | Segall Bryant & Hamill | |
| | | Municipal Opportunities Fund | | | Colorado Tax Free Fund | |
| | | Six Months | | | | | | Six Months | | | | |
| | | Ended | | | Year Ended | | | Ended | | | Year Ended | |
| | | June 30, 2022 | | | December 31, | | | June 30, 2022 | | | December 31, | |
| | | (Unaudited) | | | 2021 | | | (Unaudited) | | | 2021 | |
| Operations | | | | | | | | | | | | |
| Net investment income | | $ | 2,709,568 | | | $ | 3,809,513 | | | $ | 5,040,961 | | | $ | 8,155,019 | |
| Net realized gains (losses) | | | (9,582,384 | ) | | | 411,990 | | | | (4,526,225 | ) | | | 2,100,578 | |
| Change in unrealized net appreciation/depreciation | | | (23,882,216 | ) | | | 1,560,791 | | | | (49,086,335 | ) | | | 135,265 | |
| Net increase (decrease) in net assets resulting from operations | | | (30,755,032 | ) | | | 5,782,294 | | | | (48,571,599 | ) | | | 10,390,862 | |
| | | | | | | | | | | | | | | | | |
| Distributions to Shareholders (Note 5) | | | | | | | | | | | | | | | | |
| From distributable earnings | | | | | | | | | | | | | | | | |
| Retail | | | (561,497 | ) | | | (888,141 | ) | | | (2,494,488 | ) | | | (4,549,634 | ) |
| Institutional | | | (3,475,450 | ) | | | (5,279,457 | ) | | | (4,508,930 | ) | | | (7,830,710 | ) |
| Decrease in net assets from distributions to shareholders | | | (4,036,947 | ) | | | (6,167,598 | ) | | | (7,003,418 | ) | | | (12,380,344 | ) |
| | | | | | | | | | | | | | | | | |
| Beneficial Interest Transactions (Note 4) | | | | | | | | | | | | | | | | |
| Shares sold | | | | | | | | | | | | | | | | |
| Retail | | | 21,377,818 | | | | 26,105,978 | | | | 30,506,311 | | | | 60,458,917 | |
| Institutional | | | 135,405,182 | | | | 119,955,842 | | | | 75,848,560 | | | | 115,221,186 | |
| Shares issued in reinvestment of distributions | | | | | | | | | | | | | | | | |
| Retail | | | 504,188 | | | | 782,090 | | | | 2,427,603 | | | | 4,399,110 | |
| Institutional | | | 3,398,153 | | | | 5,118,746 | | | | 4,030,586 | | | | 6,983,356 | |
| Cost of shares redeemed | | | | | | | | | | | | | | | | |
| Retail | | | (19,739,067 | ) | | | (13,133,062 | ) | | | (60,193,950 | ) | | | (52,813,083 | ) |
| Institutional | | | (113,841,645 | ) | | | (37,061,674 | ) | | | (113,564,013 | ) | | | (40,156,337 | ) |
| Net increase (decrease) resulting from beneficial interest transactions | | | 27,104,629 | | | | 101,767,920 | | | | (60,944,903 | ) | | | 94,093,149 | |
| Total net increase (decrease) in net assets | | | (7,687,350 | ) | | | 101,382,616 | | | | (116,519,920 | ) | | | 92,103,667 | |
| | | | | | | | | | | | | | | | | |
| Net Assets | | | | | | | | | | | | | | | | |
| Beginning of period | | | 275,545,642 | | | | 174,163,026 | | | | 587,162,406 | | | | 495,058,739 | |
| End of period | | $ | 267,858,292 | | | $ | 275,545,642 | | | $ | 470,642,486 | | | $ | 587,162,406 | |
See Notes to Financial Statements.
| 102 | | www.sbhfunds.com |
| Segall Bryant & Hamill Small Cap Value Fund | Financial Highlights |
| For a Share Outstanding Throughout the Periods Presented |
| | | Six Months | | | | | | | | | | |
| | | Ended | | | Year Ended | | | Year Ended | | | Period Ended | |
| | | June 30, 2022 | | | December 31, | | | December 31, | | | December 31, | |
| Retail | | (Unaudited) | | | 2021 | | | 2020 | | | 2019(a) | |
| Net asset value, beginning of period | | $ | 14.83 | | | $ | 13.34 | | | $ | 12.71 | | | $ | 12.34 | |
| Income (loss) from investment operations: | | | | | | | | | | | | | | | | |
| Net investment income(b) | | | 0.00 | (c) | | | 0.02 | | | | 0.23 | | | | 0.01 | |
| Net realized and unrealized gains (losses) on investments | | | (2.59 | ) | | | 2.15 | | | | 0.53 | | | | 0.36 | |
| Total from investment operations | | | (2.59 | ) | | | 2.17 | | | | 0.76 | | | | 0.37 | |
| Less dividends and distributions: | | | | | | | | | | | | | | | | |
| Distributions from net investment income | | | — | | | | (0.01 | ) | | | (0.04 | ) | | | — | |
| Distributions from net realized gains | | | — | | | | (0.67 | ) | | | (0.09 | ) | | | — | |
| Total distributions | | | — | | | | (0.68 | ) | | | (0.13 | ) | | | — | |
| Net asset value, end of period | | $ | 12.24 | | | $ | 14.83 | | | $ | 13.34 | | | $ | 12.71 | |
| Total Return | | | (17.46 | )%(d) | | | 16 47% | | | | 6 14% | | | | 3.00 | %(d) |
| Ratios and Supplemental Data | | | | | | | | | | | | | | | | |
| Net assets, end of period (in 000s) | | $ | 7,858 | | | $ | 9,414 | | | $ | 6,701 | | | $ | 10 | |
| Ratio of expenses to average net assets | | | | | | | | | | | | | | | | |
| With fee waivers/reimbursements | | | 1.05 | %(e) | | | 1.04 | % | | | 1.08 | % | | | 1.06 | %(e) |
| Without fee waivers/reimbursements | | | 1.05 | %(e) | | | 1.04 | % | | | 1.08 | % | | | 1.06 | %(e) |
| Ratio of net investment income to average net assets | | | | | | | | | | | | | | | | |
| With fee waivers/reimbursements | | | 0.00 | %(e)(f) | | | 0.13 | % | | | 1.93 | % | | | 1.37 | %(e) |
| Without fee waivers/reimbursements | | | 0.00 | %(e)(f) | | | 0.13 | % | | | 1.93 | % | | | 1.37 | %(e) |
| Portfolio turnover rate | | | 13 | %(d) | | | 32 | % | | | 44 | % | | | 28 | %(d)(g) |
| (a) | The Fund added a retail share class on December 9, 2019. Ratios for start up periods may not be representative of long term operating results. |
| (b) | Calculated using the average shares method. |
| (c) | Less than $0.005 per share. |
| (d) | Total return and portfolio turnover are not annualized for periods less than one full year. |
| (g) | Portfolio turnover rate is calculated at the fund level and represents the six months ended December 31, 2019. |
See Notes to Financial Statements.
| Semi-Annual Report | June 30, 2022 | | 103 |
| Segall Bryant & Hamill Small Cap Value Fund | Financial Highlights |
| For a Share Outstanding Throughout the Periods Presented |
| | | Six Months | | | | | | | | | Six Months | | | | | | | | | | |
| | | Ended | | | Year Ended | | | Year Ended | | | Ended | | | Year Ended | | | Year Ended | | | Year Ended | |
| | | June 30, 2022 | | | December 31, | | | December 31, | | | December 31, | | | June 30, | | | June 30, | | | June 30, | |
| Institutional | | (Unaudited) | | | 2021 | | | 2020 | | | 2019(a) | | | 2019 | | | 2018 | | | 2017 | |
| Net asset value, beginning of period | | $ | 14.85 | | | $ | 13.35 | | | $ | 12.71 | | | $ | 12.59 | | | $ | 13.18 | | | $ | 12.17 | | | $ | 10.33 | |
| Income (loss) from investment operations: | | | | | | | | | | | | | | | | | | | | | | | | | | | | |
| Net investment income(b) | | | 0.01 | | | | 0.03 | | | | 0.10 | | | | 0.09 | | | | 0.10 | | | | 0.05 | | | | 0.01 | |
| Net realized and unrealized gains (losses) on investments | | | (2.60 | ) | | | 2.16 | | | | 0.67 | | | | 0.80 | | | | 0.42 | | | | 1.81 | | | | 1.86 | |
| Total from investment operations | | | (2.59 | ) | | | 2.19 | | | | 0.77 | | | | 0.89 | | | | 0.52 | | | | 1.86 | | | | 1.87 | |
| Less dividends and distributions: | | | | | | | | | | | | | | | | | | | | | | | | | | | | |
| Dividends from net investment income | | | — | | | | (0.02 | ) | | | (0.04 | ) | | | (0.11 | ) | | | (0.08 | ) | | | (0.02 | ) | | | (0.01 | ) |
| Distributions from net realized gains | | | — | | | | (0.67 | ) | | | (0.09 | ) | | | (0.66 | ) | | | (1.03 | ) | | | (0.83 | ) | | | (0.02 | ) |
| Total distributions | | | — | | | | (0.69 | ) | | | (0.13 | ) | | | (0.77 | ) | | | (1.11) | | | | (0.85 | ) | | | (0.03 | ) |
| Paid-in capital from redemption fees | | | — | | | | — | | | | — | | | | 0.00 | (c) | | | 0.00 | (c) | | | 0.00 | (c) | | | 0.00 | (c) |
| Net asset value, end of period | | $ | 12.26 | | | $ | 14.85 | | | $ | 13.35 | | | $ | 12.71 | | | $ | 12.59 | | | $ | 13.18 | | | $ | 12.17 | |
| Total Return | | | (17.44 | )%(d) | | | 16.62 | % | | | 6.22 | % | | | 7.30 | %(d) | | | 5.33 | % | | | 15.63 | % | | | 18.07 | % |
| Ratios and Supplemental Data | | | | | | | | | | | | | | | | | | | | | | | | | | | | |
| Net assets, end of period (in 000s) | | $ | 549,550 | | | $ | 601,405 | | | $ | 415,747 | | | $ | 169,891 | | | $ | 141,192 | | | $ | 106,836 | | | $ | 63,072 | |
| Ratio of expenses to average net assets | | | | | | | | | | | | | | | | | | | | | | | | | | | | |
| With fee waivers/reimbursements | | | 0.96 | %(e) | | | 0.97 | % | | | 0.99 | % | | | 0.99 | %(e) | | | 0.99 | % | | | 1.01 | %(f) | | | 1.15 | %(g) |
| Without fee waivers/reimbursements | | | 0.96 | %(e) | | | 0.97 | % | | | 1.01 | % | | | 1.14 | % (e) | | | 1.14 | % | | | 1.25 | % | | | 1.39 | % |
| Ratio of net investment income (loss) to average net assets | | | | | | | | | | | | | | | | | | | | | | | | | | | | |
| With fee waivers/reimbursements | | | 0.10 | %(e) | | | 0.22 | % | | | 0.89 | % | | | 1.38 | %(e) | | | 0.81 | % | | | 0.42 | % | | | 0.09 | % |
| Without fee waivers/reimbursements | | | 0.10 | %(e) | | | 0.22 | % | | | 0.87 | % | | | 1.23 | %(e) | | | 0.66 | % | | | 0.18 | % | | | (0.15 | )% |
| Portfolio turnover rate | | | 13 | %(d) | | | 32 | % | | | 44 | % | | | 28 | %(d) | | | 68 | % | | | 59 | % | | | 70 | % |
| (a) | Fund changed fiscal year to December 31. |
| (b) | Calculated using the average shares method. |
| (c) | Less than $0.005 per share. |
| (d) | Total return and portfolio turnover are not annualized for periods less than one full year. |
| (f) | Contractual expense limitation changed from 1.08% to 0.99% effective November 1, 2017. |
| (g) | Contractual expense limitation changed from 1.20% to 1.08% effective February 1, 2017. |
See Notes to Financial Statements.
| 104 | | www.sbhfunds.com |
| Segall Bryant & Hamill Small Cap Growth Fund | Financial Highlights |
| For a Share Outstanding Throughout the Periods Presented |
| | | Six Months | | | | | | | | | | | | | | | | |
| | | Ended | | | Year Ended | | | Year Ended | | | Year Ended | | | Year Ended | | | Year Ended | |
| | | June 30, 2022 | | | December 31, | | | December 31, | | | December 31, | | | December 31, | | | December 31, | |
| Retail | | (Unaudited) | | | 2021 | | | 2020 | | | 2019 | | | 2018(a) | | | 2017 | |
| Net asset value, beginning of period | | $ | 22.95 | | | $ | 20.56 | | | $ | 13.04 | | | $ | 10.15 | | | $ | 12.72 | | | $ | 10.89 | |
| Income (loss) from investment operations: | | | | | | | | | | | | | | | | | | | | | | | | |
| Net investment loss(b) | | | (0.07 | ) | | | (0.17 | ) | | | (0.08 | ) | | | (0.06 | ) | | | (0.11 | ) | | | (0.10 | ) |
| Net realized and unrealized gains (losses) on investments | | | (7.31 | ) | | | 2.56 | | | | 7.60 | | | | 2.95 | | | | 0.63 | | | | 2.93 | |
| Total from investment operations | | | (7.38 | ) | | | 2.39 | | | | 7.52 | | | | 2.89 | | | | 0.52 | | | | 2.83 | |
| Less dividends and distributions: | | | | | | | | | | | | | | | | | | | | | | | | |
| Distributions from net realized gains | | | — | | | | — | | | | — | | | | — | | | | (2.95 | ) | | | (1.00 | ) |
| Return of capital | | | — | | | | — | | | | — | | | | — | | | | (0.14 | ) | | | — | |
| Total distributions | | | — | | | | — | | | | — | | | | — | | | | (3.09 | ) | | | (1.00 | ) |
| Net asset value, end of period | | | $15 57 | | | $ | 22.95 | | | $ | 20.56 | | | $ | 13.04 | | | $ | 10.15 | | | $ | 12.72 | |
| Total Return | | | (32.16 | )%(c) | | | 11.62 | % | | | 57.67 | % | | | 28.47 | % | | | 3.19 | % | | | 25.98 | % |
| Ratios and Supplemental Data | | | | | | | | | | | | | | | | | | | | | | | | |
| Net assets, end of period (in 000s) | | $ | 45,878 | | | $ | 53,652 | | | $ | 11,786 | | | $ | 2,836 | | | $ | 1,570 | | | $ | 930 | |
| Ratio of expenses to average net assets | | | | | | | | | | | | | | | | | | | | | | | | |
| With fee waivers/reimbursements | | | 1.05 | %(d) | | | 1.03 | % | | | 1.04 | % | | | 1.12 | % | | | 1.24 | %(e) | | | 1.26 | %(f) |
| Without fee waivers/reimbursements | | | 1.05 | %(d) | | | 1.03 | % | | | 1.04 | % | | | 1.12 | % | | | 3.09 | % | | | 2.88 | % |
| Ratio of net investment loss to average net assets | | | | | | | | | | | | | | | | | | | | | | | | |
| With fee waivers/reimbursements | | | (0.79 | )%(d) | | | (0.74 | )% | | | (0.54 | )% | | | (0.51 | )% | | | (0.76 | )% | | | (0.80 | )% |
| Without fee waivers/reimbursements | | | (0.79 | )%(d) | | | (0.74 | )% | | | (0.54 | )% | | | (0.51 | )% | | | (2.61 | )% | | | (2.42 | )% |
| Portfolio turnover rate | | | 27 | %(c) | | | 35 | % | | | 54 | % | | | 28 | % | | | 83 | % | | | 51 | % |
| (a) | Prior to April 30, 2018 known as the Westcore Small-Cap Growth Fund. |
| (b) | Calculated using the average shares method. |
| (c) | Total return and portfolio turnover are not annualized for periods less than one full year. |
| (e) | Contractual expense limitation changed from 1.24% to 1.14% effective December 20, 2018. |
| (f) | Contractual expense limitation changed from 1.30% to 1.24% effective April 30, 2017. |
See Notes to Financial Statements.
| Semi-Annual Report | June 30, 2022 | | 105 |
| Segall Bryant & Hamill Small Cap Growth Fund | Financial Highlights |
| For a Share Outstanding Throughout the Years Presented |
| | | Six Months | | | | | | | | | | | | | | | | |
| | | Ended | | | Year Ended | | | Year Ended | | | Year Ended | | | Year Ended | | | Year Ended | |
| | | June 30, 2022 | | | December 31, | | | December 31, | | | December 31, | | | December 31, | | | December 31, | |
| Institutional | | (Unaudited) | | | 2021 | | | 2020 | | | 2019 | | | 2018(a) | | | 2017 | |
| Net asset value, beginning of period | | $ | 23.52 | | | $ | 21.04 | | | $ | 13.33 | | | $ | 10.36 | | | $ | 12.88 | | | $ | 11.01 | |
| Income (loss) from investment operations: | | | | | | | | | | | | | | | | | | | | | | | | |
| Net investment loss(b) | | | (0.06 | ) | | | (0.13 | ) | | | (0.08 | ) | | | (0.05 | ) | | | (0.08 | ) | | | (0.09 | ) |
| Net realized and unrealized gains (losses) on investments | | | (7.49 | ) | | | 2.61 | | | | 7.79 | | | | 3.02 | | | | 0.65 | | | | 2.96 | |
| Total from investment operations | | | (7.55) | | | | 2.48 | | | | 7.71 | | | | 2.97 | | | | 0.57 | | | | 2.87 | |
| Less dividends and distributions: | | | | | | | | | | | | | | | | | | | | | | | | |
| Distributions from net realized gains | | | — | | | | — | | | | — | | | | — | | | | (2.95 | ) | | | (1.00 | ) |
| Return of capital | | | — | | | | — | | | | — | | | | — | | | | (0.14 | ) | | | — | |
| Total distributions | | | — | | | | — | | | | — | | | | — | | | | (3.09 | ) | | | (1.00 | ) |
| Net asset value, end of period | | $ | 15.97 | | | $ | 23.52 | | | $ | 21.04 | | | $ | 13.33 | | | $ | 10.36 | | | $ | 12.88 | |
| Total Return | | | (32.10 | )%(c) | | | 11.79 | % | | | 57.84 | % | | | 28.67 | % | | | 3.56 | % | | | 26.05 | % |
| Ratios and Supplemental Data | | | | | | | | | | | | | | | | | | | | | | | | |
| Net assets, end of period (in 000s) | | $ | 115,526 | | | $ | 188,703 | | | $ | 110,018 | | | $ | 72,341 | | | $ | 63,082 | | | $ | 4,791 | |
| Ratio of expenses to average net assets | | | | | | | | | | | | | | | | | | | | | | | | |
| With fee waivers/reimbursements | | | 0.88 | %(d) | | | 0.87 | % | | | 0.97 | % | | | 0.98 | % | | | 0.99 | % | | | 1.20 | % |
| Without fee waivers/reimbursements | | | 0.88 | %(d) | | | 0.87 | % | | | 0.97 | % | | | 0.98 | % | | | 2.26 | % | | | 2.74 | % |
| Ratio of net investment loss to average net assets | | | | | | | | | | | | | | | | | | | | | | | | |
| With fee waivers/reimbursements | | | (0.63 | )%(d) | | | (0.59 | )% | | | (0.50 | )% | | | (0.38 | )% | | | (0.63 | )% | | | (0.74 | )% |
| Without fee waivers/reimbursements | | | (0.63 | )%(d) | | | (0.59 | )% | | | (0.50 | )% | | | (0.38 | )% | | | (1.90 | )% | | | (2.28 | )% |
| Portfolio turnover rate | | | 27 | %(c) | | | 35 | % | | | 54 | % | | | 28 | % | | | 83 | % | | | 51 | % |
| (a) | Prior to April 30, 2018 known as the Westcore Small-Cap Growth Fund. |
| (b) | Calculated using the average shares method. |
| (c) | Total return and portfolio turnover are not annualized for periods less than one full year. |
See Notes to Financial Statements.
| 106 | | www.sbhfunds.com |
| Segall Bryant & Hamill Small Cap Core Fund | Financial Highlights |
| For a Share Outstanding Throughout the Periods Presented |
| | | Six Months | | | | | | | |
| | | Ended | | | Year Ended | | | Year Ended | |
| | | June 30, 2022 | | | December 31, | | | December 31, | |
| Retail | | (Unaudited) | | | 2021 | | | 2020 | |
| Net asset value, beginning of period | | $ | 12.65 | | | $ | 12.26 | | | $ | 10.00 | |
| Income (loss) from investment operations: | | | | | | | | | | | | |
| Net investment loss(a) | | | (0.02 | ) | | | (0.07 | ) | | | (0.03 | ) |
| Net realized and unrealized gains (losses) on investments | | | (2.65 | ) | | | 2.82 | | | | 2.29 | |
| Total from investment operations | | | (2.67 | ) | | | 2.75 | | | | 2.26 | |
| Less dividends and distributions: | | | | | | | | | | | | |
| Distributions from net realized gains | | | — | | | | (2.36 | ) | | | — | |
| Net asset value, end of period | | $ | 9.98 | | | $ | 12.65 | | | $ | 12.26 | |
| Total Return | | | (21.11 | )%(b) | | | 23.26 | % | | | 22.60 | % |
| Ratios and Supplemental Data | | | | | | | | | | | | |
| Net assets, end of period (in 000s) | | $ | 685 | | | $ | 1,663 | | | $ | 4,165 | |
| Ratio of expenses to average net assets | | | | | | | | | | | | |
| With fee waivers/reimbursements | | | 1.14 | % (c) | | | 1.14 | % | | | 1.14 | % |
| Without fee waivers/reimbursements | | | 1.36 | % (c) | | | 1.35 | % | | | 1.26 | % |
| Ratio of net investment loss to average net assets | | | | | | | | | | | | |
| With fee waivers/reimbursements | | | (0.38 | )%(c) | | | (0.25 | )% | | | (0.26 | )% |
| Without fee waivers/reimbursements | | | (0.60 | )%(c) | | | (0.46 | )% | | | (0.38 | )% |
| Portfolio turnover rate | | | 22 | %(b) | | | 36 | % | | | 74 | % |
| (a) | Calculated using the average shares method. |
| (b) | Total return and portfolio turnover are not annualized for periods less than one full year. |
See Notes to Financial Statements.
| Semi-Annual Report | June 30, 2022 | | 107 |
| Segall Bryant & Hamill Small Cap Core Fund | Financial Highlights |
| For a Share Outstanding Throughout the Periods Presented |
| | | Six Months | | | | | | | |
| | | Ended | | | Year Ended | | | Year Ended | |
| | | June 30, 2022 | | | December 31, | | | December 31, | |
| Institutional | | (Unaudited) | | | 2021 | | | 2020 | |
| Net asset value, beginning of period | | $ | 12.70 | | | $ | 12.28 | | | $ | 10.00 | |
| Income (loss) from investment operations: | | | | | | | | | | | | |
| Net investment loss(a) | | | (0.01 | ) | | | (0.02 | ) | | | (0.00 | )(b) |
| Net realized and unrealized gains (losses) on investments | | | (2.66 | ) | | | 2.80 | | | | 2.28 | |
| Total from investment operations | | | (2.67 | ) | | | 2.78 | | | | 2.28 | |
| Less dividends and distributions: | | | | | | | | | | | | |
| Distributions from net realized gains | | | — | | | | (2.36 | ) | | | — | |
| Net asset value, end of period | | $ | 10.03 | | | $ | 12.70 | | | $ | 12.28 | |
| Total Return | | | (21.02 | )%(c) | | | 23.48 | % | | | 22.80 | % |
| Ratios and Supplemental Data | | | | | | | | | | | | |
| Net assets, end of period (in 000s) | | $ | 49,278 | | | $ | 50,460 | | | $ | 44,675 | |
| Ratio of expenses to average net assets | | | | | | | | | | | | |
| With fee waivers/reimbursements | | | 0.99 | %(d) | | | 0.99 | % | | | 0.99 | % |
| Without fee waivers/reimbursements | | | 1.14 | %d) | | | 1.10 | % | | | 1.27 | % |
| Ratio of net investment loss to average net assets | | | | | | | | | | | | |
| With fee waivers/reimbursements | | | (0.15 | )%(d) | | | (0.13 | )% | | | (0.05 | )% |
| Without fee waivers/reimbursements | | | (0.30 | )%(d) | | | (0.24 | )% | | | (0.33 | )% |
| Portfolio turnover rate | | | 22 | %(c) | | | 36 | % | | | 74 | % |
| (a) | Calculated using the average shares method. |
| (b) | Less than $0.005 per share. |
| (c) | Total return and portfolio turnover are not annualized for periods less than one full year. |
See Notes to Financial Statements.
| 108 | | www.sbhfunds.com |
| Segall Bryant & Hamill All Cap Fund | Financial Highlights |
| For a Share Outstanding Throughout the Periods Presented |
| | | Six Months | | | | | | | | | | |
| | | Ended | | | Year Ended | | | Year Ended | | | Period Ended | |
| | | June 30, 2022 | | | December 31, | | | December 31, | | | December 31, | |
| Retail | | (Unaudited) | | | 2021 | | | 2020 | | | 2019(a) | |
| Net asset value, beginning of period | | $ | 24.51 | | | $ | 21.15 | | | $ | 17.00 | | | $ | 16.49 | |
| Income (loss) from investment operations: | | | | | | | | | | | | | | | | |
| Net investment income (loss)(b) | | | 0.02 | | | | (0.01 | ) | | | 0.04 | | | | (0.00 | )(c) |
| Net realized and unrealized gains (losses) on investments | | | (5.40 | ) | | | 6 16 | | | | 4.39 | | | | 0.51 | |
| Total from investment operations | | | (5.38 | ) | | | 6 15 | | | | 4.43 | | | | 0.51 | |
| Less dividends and distributions: | | | | | | | | | | | | | | | | |
| Dividends from net investment income | | | — | | | | — | | | | (0.03 | ) | | | — | |
| Distributions from net realized gains | | | — | | | | (2.79 | ) | | | (0.25 | ) | | | — | |
| Total distributions | | | — | | | | (2.79 | ) | | | (0.28 | ) | | | — | |
| Net asset value, end of period | | $ | 19.13 | | | $ | 24.51 | | | $ | 21.15 | | | $ | 17.00 | |
| Total Return | | | (21.95 | )%(d) | | | 29.57 | % | | | 26.08 | % | | | 3.09 | %(d) |
| Ratios and Supplemental Data | | | | | | | | | | | | | | | | |
| Net assets, end of period (in 000s) | | $ | 764 | | | $ | 974 | | | $ | 583 | | | $ | 10 | |
| Ratio of expenses to average net assets | | | | | | | | | | | | | | | | |
| With fee waivers/reimbursements | | | 0.86 | %(e) | | | 0.83 | % | | | 0.79 | %(e) | | | 0.98 | %(f) |
| Without fee waivers/reimbursements | | | 0.86 | %(e) | | | 0.83 | % | | | 0.79 | %(e) | | | 1.00 | %(f) |
| Ratio of net investment income (loss) to average net assets | | | | | | | | | | | | | | | | |
| With fee waivers/reimbursements | | | 0.19 | %(e) | | | (0.06 | )% | | | 0.19 | % | | | (0.15 | )%(f) |
| Without fee waivers/reimbursements | | | 0.19 | %(e) | | | (0.06 | )% | | | 0.19 | % | | | (0.17 | )%(f) |
| Portfolio turnover rate | | | 18 | %(d) | | | 30 | % | | | 38 | % | | | 16 | %(d)(g) |
| (a) | The Fund added a retail share class on December 9, 2019. Ratios for start up periods may not be representative of long term operating results. |
| (b) | Calculated using the average shares method. |
| (c) | Less than $0.005 per share. |
| (d) | Total return and portfolio turnover are not annualized for periods less than one full year. |
| (e) | During the period there were no shareholder servicing fees expensed for the Retail Class. This may not be representative of long term results. |
| (g) | Portfolio turnover rate is calculated at the fund level and represents the six months ended December 31, 2019. |
See Notes to Financial Statements.
| Semi-Annual Report | June 30, 2022 | | 109 |
| Segall Bryant & Hamill All Cap Fund | Financial Highlights |
| For a Share Outstanding Throughout the Periods Presented |
| | | Six Months | | | | | | | | | Six Months | | | | | | | | | | |
| | | Ended | | | Year Ended | | | Year Ended | | | Ended | | | Year Ended | | | Year Ended | | | Year Ended | |
| | | June 30, 2022 | | | December 31, | | | December 31, | | | December 31, | | | June 30, | | | June 30, | | | June 30, | |
| Institutional | | (Unaudited) | | | 2021 | | | 2020 | | | 2019(a) | | | 2019 | | | 2018 | | | 2017 | |
| Net asset value, beginning of period | | $ | 24.52 | | | $ | 21.16 | | | $ | 17.00 | | | $ | 15.80 | | | $ | 14.76 | | | $ | 13.37 | | | $ | 11.82 | |
| Income (loss) from investment operations: | | | | | | | | | | | | | | | | | | | | | | | | | | | | |
| Net investment income (loss)(b) | | | 0.02 | | | | (0.02 | ) | | | 0.03 | | | | 0.01 | | | | 0.01 | | | | (0.01 | ) | | | 0.00 | (c) |
| Net realized and unrealized gains (losses) on investments | | | (5.39 | ) | | | 6 17 | | | | 4.41 | | | | 1.25 | | | | 1.57 | | | | 1.48 | | | | 1.55 | |
| Total from investment operations | | | (5.37 | ) | | | 6 15 | | | | 4.44 | | | | 1.26 | | | | 1.58 | | | | 1.47 | | | | 1.55 | |
| Less dividends and distributions: | | | | | | | | | | | | | | | | | | | | | | | | | | | | |
| Dividends from net investment income | | | — | | | | — | | | | (0.03 | ) | | | (0.01 | ) | | | — | | | | — | | | | (0.00 | )(c) |
| Distributions from net realized gains | | | — | | | | (2.79 | ) | | | (0.25 | ) | | | (0.05 | ) | | | (0.54 | ) | | | (0.08 | ) | | | — | |
| Total distributions | | | — | | | | (2.79 | ) | | | (0.28 | ) | | | (0.06 | ) | | | (0.54 | ) | | | (0.08 | ) | | | (0.00 | )(c) |
| Paid-in capital from redemption fees | | | — | | | | — | | | | — | | | | 0.00 | (c) | | | 0.00 | (c) | | | 0.00 | (c) | | | 0.00 | (c) |
| Net asset value, end of period | | $ | 19.15 | | | $ | 24.52 | | | $ | 21.16 | | | $ | 17.00 | | | $ | 15.80 | | | $ | 14.76 | | | $ | 13.37 | |
| Total Return | | | (21.90 | )%(d) | | | 29.55 | % | | | 26.18 | % | | | 7.95 | %(d) | | | 11.47 | % | | | 11.01 | % | | | 13.14 | % |
| Ratios and Supplemental Data | | | | | | | | | | | | | | | | | | | | | | | | | | | | |
| Net assets, end of period (in 000s) | | $ | 135,800 | | | $ | 186,459 | | | $ | 169,833 | | | $ | 120,730 | | | $ | 104,418 | | | $ | 79,631 | | | $ | 63,463 | |
| Ratio of expenses to average net assets | | | | | | | | | | | | | | | | | | | | | | | | | | | | |
| With fee waivers/reimbursements | | | 0.84 | %(e) | | | 0.84 | % | | | 0.84 | % | | | 0.96 | %(e)(f) | | | 0.98 | % | | | 1.02 | %(g) | | | 1.10 | % |
| Without fee waivers/reimbursements | | | 0.88 | %(e) | | | 0.87 | % | | | 0.92 | % | | | 1.12 | %(e) | | | 1.14 | % | | | 1.22 | % | | | 1.40 | % |
| Ratio of net investment income (loss) to average net assets | | | | | | | | | | | | | | | | | | | | | | | | | | | | |
| With fee waivers/reimbursements | | | 0.19 | %(e) | | | (0.07 | )% | | | 0.16 | % | | | 0.07 | %(e) | | | 0.07 | % | | | (0.07 | )% | | | (0.02 | )% |
| Without fee waivers/reimbursements | | | 0.15 | %(e) | | | (0.10 | )% | | | 0.08 | % | | | (0.09 | )%(e) | | | (0.09 | )% | | | (0.27 | )% | | | (0.32 | )% |
| Portfolio turnover rate | | | 18 | %(d) | | | 30 | % | | | 38 | % | | | 16 | %(d) | | | 38 | % | | | 37 | % | | | 38 | % |
| (a) | Fund changed fiscal year to December 31. |
| (b) | Calculated using the average shares method. |
| (c) | Less than $0.005 per share. |
| (d) | Total return and portfolio turnover are not annualized for periods less than one full year. |
| (f) | Contractual expense limitation changed from 0.98% to 0.84% effective December 9, 2019. |
| (g) | Contractual expense limitation changed from 1.10% to 0.98% effective November 1, 2017. |
See Notes to Financial Statements.
| 110 | | www.sbhfunds.com |
| Segall Bryant & Hamill Emerging Markets Fund | Financial Highlights |
| For a Share Outstanding Throughout the Periods Presented |
| | | Six Months | | | | | | | | | Two Months | | | | | | | | | | |
| | | Ended | | | Year Ended | | | Year Ended | | | Ended | | | Year Ended | | | Year Ended | | | Year Ended | |
| | | June 30, 2022 | | | December 31, | | | December 31, | | | December 31, | | | October 31, | | | October 31, | | | October 31, | |
| Retail* | | (Unaudited) | | | 2021 | | | 2020 | | | 2019(a) | | | 2019 | | | 2018 | | | 2017 | |
| Net asset value, beginning of period | | $ | 9.12 | | | $ | 9.13 | | | | $8 67 | | | $ | 8.27 | | | $ | 7.70 | | | $ | 9.49 | | | $ | 7.60 | |
| Income (loss) from investment operations: | | | | | | | | | | | | | | | | | | | | | | | | | | | | |
| Net investment income(b) | | | 0.14 | | | | 0.26 | | | | 0.14 | | | | 0.01 | | | | 0.17 | | | | 0.18 | | | | 0.13 | |
| Net realized and unrealized gains (losses) on investments | | | (1.45) | | | | 0.21 | | | | 0.47 | | | | 0.60 | | | | 0.62 | | | | (1.53 | ) | | | 1.90 | |
| Total from investment operations | | | (1.31 | ) | | | 0.47 | | | | 0.61 | | | | 0.61 | | | | 0.79 | | | | (1.35 | ) | | | 2.03 | |
| Less dividends and distributions: | | | | | | | | | | | | | | | | | | | | | | | | | | | | |
| Dividends from net investment income | | | — | | | | (0.30 | ) | | | (0.15 | ) | | | (0.20 | ) | | | (0.18 | ) | | | (0.13 | ) | | | (0.14 | ) |
| Distributions from net realized gains | | | — | | | | (0.18 | ) | | | — | | | | — | | | | (0.04 | ) | | | (0.31 | ) | | | — | |
| Return of capital | | | — | | | | — | | | | — | | | | (0.01 | ) | | | — | | | | — | | | | — | |
| Total distributions | | | — | | | | (0.48 | ) | | | (0.15 | ) | | | (0.21 | ) | | | (0.22 | ) | | | (0.44 | ) | | | (0.14 | ) |
| Paid-in capital from redemption fees | | | — | | | | — | | | | — | | | | — | | | | — | | | | 0.00 | (c) | | | — | |
| Net asset value, end of period | | $ | 7.81 | | | $ | 9.12 | | | $ | 9.13 | | | $ | 8 67 | | | $ | 8.27 | | | $ | 7.70 | | | $ | 9.49 | |
| Total Return | | | (14.36 | )%(d) | | | 5.22 | % | | | 7.05 | % | | | 7.52 | %(d) | | | 10.64 | % | | | (14.96 | )% | | | 27.27 | % |
| Ratios and Supplemental Data | | | | | | | | | | | | | | | | | | | | | | | | | | | | |
| Net assets, end of period (in 000s) | | $ | 2,171 | | | $ | 3,224 | | | $ | 2,954 | | | $ | 2,678 | | | $ | 2,397 | | | $ | 2,043 | | | $ | 3,116 | |
| Ratio of expenses to average net assets | | | | | | | | | | | | | | | | | | | | | | | | | | | | |
| With fee waivers/reimbursements | | | 1.38 | %(e) | | | 1.38 | % | | | 1.38 | % | | | 1.46 | %(e)(f) | | | 1.48% | | | | 1.48% | | | | 1.48% | |
| Without fee waivers/reimbursements | | | 1.95 | %(e) | | | 1.86% | | | | 2.36 | % | | | 3.40 | %(e) | | | 2.91 | % | | | 2.49 | % | | | 2.87 | % |
| Ratio of net investment income (loss) to average net assets | | | | | | | | | | | | | | | | | | | | | | | | | | | | |
| With fee waivers/reimbursements | | | 3.23 | %(e) | | | 2.65 | % | | | 1.80 | % | | | 1.01 | %(e) | | | 2.15 | % | | | 1.97 | % | | | 1.54 | % |
| Without fee waivers/reimbursements | | | 2.66 | %(e) | | | 2.17 | % | | | 0.82 | % | | | (0.93 | )%(e) | | | 0.72 | % | | | 0.96 | % | | | 0.15 | % |
| Portfolio turnover rate | | | 43 | %(d) | | | 91 | % | | | 91 | % | | | 23 | %(d) | | | 107 | % | | | 99 | % | | | 97 | % |
| (a) | Fund changed fiscal year to December 31. |
| (b) | Calculated using the average shares method. |
| (c) | Less than $0.005 per share. |
| (d) | Total return and portfolio turnover are not annualized for periods less than one full year. |
| (f) | Contractual expense limitation changed from 1.48% to 1.38% effective December 9, 2019. |
See Notes to Financial Statements.
| Semi-Annual Report | June 30, 2022 | | 111 |
| Segall Bryant & Hamill Emerging Markets Fund | Financial Highlights |
| For a Share Outstanding Throughout the Periods Presented |
| | | Six Months | | | | | | | | | Two Months | | | | | | | | | | |
| | | Ended | | | Year Ended | | | Year Ended | | | Ended | | | Year Ended | | | Year Ended | | | Year Ended | |
| | | June 30, 2022 | | | December 31, | | | December 31, | | | December 31, | | | October 31, | | | October 31, | | | October 31, | |
| Institutional* | | | (Unaudited) | | | | 2021 | | | | 2020 | | | | 2019 | (a) | | | 2019 | | | | 2018 | | | | 2017 | |
| Net asset value, beginning of period | | $ | 9.15 | | | $ | 9.15 | | | $ | 8.69 | | | $ | 8.31 | | | $ | 7.74 | | | $ | 9.54 | | | $ | 7.63 | |
| Income (loss) from investment operations: | | | | | | | | | | | | | | | | | | | | | | | | | | | | |
| Net investment income(b) | | | 0.16 | | | | 0.28 | | | | 0.15 | | | | 0.02 | | | | 0.20 | | | | 0.20 | | | | 0.15 | |
| Net realized and unrealized gains (losses) on investments | | | (1.48) | | | | 0.21 | | | | 0.47 | | | | 0.59 | | | | 0.62 | | | | (1.54) | | | | 1.91 | |
| Total from investment operations | | | (1.32 | ) | | | 0.49 | | | | 0.62 | | | | 0.61 | | | | 0.82 | | | | (1.34 | ) | | | 2.06 | |
| Less dividends and distributions: | | | | | | | | | | | | | | | | | | | | | | | | | | | | |
| Dividends from net investment income | | | — | | | | (0.31 | ) | | | (0.16 | ) | | | (0.22 | ) | | | (0.21 | ) | | | (0.15 | ) | | | (0.15 | ) |
| Distributions from net realized gains | | | — | | | | (0.18 | ) | | | — | | | | — | | | | (0.04 | ) | | | (0.31 | ) | | | — | |
| Return of capital | | | — | | | | — | | | | — | | | | (0.01 | ) | | | — | | | | — | | | | — | |
| Total distributions | | | — | | | | (0.49 | ) | | | (0.16 | ) | | | (0.23 | ) | | | (0.25 | ) | | | (0.46 | ) | | | (0.15 | ) |
| Paid-in capital from redemption fees | | | — | | | | — | | | | — | | | | — | | | | — | | | | 0.00 | (c) | | | — | |
| Net asset value, end of period | | $ | 7.83 | | | $ | 9.15 | | | $ | 9.15 | | | $ | 8.69 | | | $ | 8.31 | | | $ | 7.74 | | | $ | 9.54 | |
| Total Return | | | (14.43 | )%(d) | | | 5.49 | % | | | 7.18 | % | | | 7.51 | %(d) | | | 10.97 | % | | | (14.81 | )% | | | 27.68 | % |
| Ratios and Supplemental Data | | | | | | | | | | | | | | | | | | | | | | | | | | | | |
| Net assets, end of period (in 000s) | | $ | 44,808 | | | $ | 54,660 | | | $ | 45,058 | | | $ | 32,721 | | | $ | 30,836 | | | $ | 29,961 | | | $ | 32,144 | |
| Ratio of expenses to average net assets | | | | | | | | | | | | | | | | | | | | | | | | | | | | |
| With fee waivers/reimbursements | | | 1.23 | %(e) | | | 1.23 | % | | | 1.23 | % | | | 1.23 | %(e) | | | 1.23 | % | | | 1.23 | % | | | 1.23 | % |
| Without fee waivers/reimbursements | | | 1.80 | %(e) | | | 1.69 | % | | | 2.19 | % | | | 3.14 | %(e) | | | 2.66 | % | | | 2.24 | % | | | 2.62 | % |
| Ratio of net investment income (loss) to average net assets | | | | | | | | | | | | | | | | | | | | | | | | | | | | |
| With fee waivers/reimbursements | | | 3.62 | %(e) | | | 2.83 | % | | | 1.93 | % | | | 1.18 | %(e) | | | 2.40 | % | | | 2.22 | % | | | 1.79 | % |
| Without fee waivers/reimbursements | | | 3.05 | %(e) | | | 2.37 | % | | | 0.97 | % | | | (0.73 | )%(e) | | | 0.97 | % | | | 1.21 | % | | | 0.40 | % |
| Portfolio turnover rate | | | 43 | %(d) | | | 91 | % | | | 91 | % | | | 23 | %(d) | | | 107 | % | | | 99 | % | | | 97 | % |
| (a) | Fund changed fiscal year to December 31. |
| (b) | Calculated using the average shares method. |
| (c) | Less than $0.005 per share. |
| (d) | Total return and portfolio turnover are not annualized for periods less than one full year. |
See Notes to Financial Statements.
| 112 | | www.sbhfunds.com |
| Segall Bryant & Hamill International Small Cap Fund | Financial Highlights |
| For a Share Outstanding Throughout the Periods Presented |
| | | Six Months | | | | | | | | | Two Months | | | | | | | | | | |
| | | Ended | | | Year Ended | | | Year Ended | | | Ended | | | Year Ended | | | Year Ended | | | Year Ended | |
| | | June 30, 2022 | | | December 31, | | | December 31, | | | December 31, | | | October 31, | | | October 31, | | | October 31, | |
| Retail* | | (Unaudited) | | | 2021 | | | 2020 | | | 2019(a) | | | 2019 | | | 2018 | | | 2017 | |
| Net asset value, beginning of period | | $ | 11.59 | | | $ | 10.83 | | | $ | 11.64 | | | $ | 11.39 | | | $ | 11.73 | | | $ | 14.47 | | | $ | 11.74 | |
| Income (loss) from investment operations: | | | | | | | | | | | | | | | | | | | | | | | | | | | | |
| Net investment income(b) | | | 0.24 | | | | 0.29 | | | | 0.16 | | | | 0.02 | | | | 0.28 | | | | 0.26 | | | | 0.23 | |
| Net realized and unrealized gains (losses) on investments | | | (2.35 | ) | | | 1.09 | | | | (0.80 | ) | | | 0.73 | | | | (0.38 | ) | | | (2.27 | ) | | | 2.69 | |
| Total from investment operations | | | (2.11 | ) | | | 1.38 | | | | (0.64 | ) | | | 0.75 | | | | (0.10 | ) | | | (2.01 | ) | | | 2.92 | |
| Less dividends and distributions: | | | | | | | | | | | | | | | | | | | | | | | | | | | | |
| Dividends from net investment income | | | (0.17 | ) | | | (0.62 | ) | | | (0.17 | ) | | | (0.49 | ) | | | (0.25 | ) | | | (0.29 | ) | | | (0.19 | ) |
| Distributions from net realized gains | | | — | | | | — | | | | — | | | | — | | | | — | | | | (0.44 | ) | | | — | |
| Return of capital | | | — | | | | — | | | | — | | | | (0.01 | ) | | | — | | | | — | | | | — | |
| Total distributions | | | (0.17 | ) | | | (0.62 | ) | | | (0.17 | ) | | | (0.50 | ) | | | (0.25 | ) | | | (0.73 | ) | | | (0.19 | ) |
| Paid-in capital from redemption fees | | | — | | | | — | | | | — | | | | — | | | | 0.00 | (c) | | | 0.00 | (c) | | | — | |
| Net increase from payment by affiliates | | | — | | | | — | | | | — | | | | — | | | | 0.01 | (d) | | | — | | | | — | |
| Net asset value, end of period | | $ | 9.31 | | | $ | 11.59 | | | $ | 10.83 | | | $ | 11.64 | | | $ | 11.39 | | | $ | 11.73 | | | $ | 14.47 | |
| Total Return | | | (18.25 | )% (e) | | | 12.97 | % | | | (5.51 | )% | | | 6.73 | % (e) | | | (0.54 | )% | | | (14.68)% | | | | 25.27 | % |
| Ratios and Supplemental Data | | | | | | | | | | | | | | | | | | | | | | | | | | | | |
| Net assets, end of period (in 000s) | | $ | 25,160 | | | $ | 47,301 | | | $ | 64,420 | | | $ | 52,668 | | | $ | 49,749 | | | $ | 23,554 | | | $ | 25,240 | |
| Ratio of expenses to average net assets | | | | | | | | | | | | | | | | | | | | | | | | | | | | |
| With fee waivers/reimbursements | | | 1.18 | % (f) | | | 1.18 | % | | | 1.18 | % | | | 1.25 | % (f)(g) | | | 1.28 | % | | | 1.28 | % | | | 1.28 | % |
| Without fee waivers/reimbursements | | | 1.39 | % (f) | | | 1.36 | % | | | 1.36 | % | | | 1.42 | % (f) | | | 1.53 | % | | | 1.44 | % | | | 1.47 | % |
| Ratio of net investment income to average net assets | | | | | | | | | | | | | | | | | | | | | | | | | | | | |
| With fee waivers/reimbursements | | | 4.36 | % (f) | | | 2.37 | % | | | 1.68 | % | | | 0.94 | % (f) | | | 2.49 | % | | | 1.92 | % | | | 1.80 | % |
| Without fee waivers/reimbursements | | | 4.15 | % (f) | | | 2.19 | % | | | 1.50 | % | | | 0.77 | % (f) | | | 2.24 | % | | | 1.76 | % | | | 1.61 | % |
| Portfolio turnover rate | | | 54 | % (e) | | | 112 | % | | | 106 | % | | | 17 | % (e) | | | 121 | % | | | 111 | % | | | 101 | % |
| (a) | Fund changed fiscal year to December 31. |
| (b) | Calculated using the average shares method. |
| (c) | Less than $0.005 per share. |
| (d) | The custodian reimbursed the Fund $132,086 for losses incurred from corporate action processing. Payment had a positive 0.09% impact on the total return. |
| (e) | Total return and portfolio turnover are not annualized for periods less than one full year. |
| (g) | Contractual expense limitation changed from 1.28% to 1.18% effective December 9, 2019. |
See Notes to Financial Statements.
| Semi-Annual Report | June 30, 2022 | | 113 |
| Segall Bryant & Hamill International Small Cap Fund | Financial Highlights |
| For a Share Outstanding Throughout the Periods Presented |
| | | Six Months | | | | | | | | | Two Months | | | | | | | | | | |
| | | Ended | | | Year Ended | | | Year Ended | | | Ended | | | Year Ended | | | Year Ended | | | Year Ended | |
| | | June 30, 2022 | | | December 31, | | | December 31, | | | December 31, | | | October 31, | | | October 31, | | | October 31, | |
| Institutional* | | (Unaudited) | | | 2021 | | | 2020 | | | 2019(a) | | | 2019 | | | 2018 | | | 2017 | |
| Net asset value, beginning of period | | $ | 11.61 | | | $ | 10.85 | | | $ | 11.65 | | | $ | 11.42 | | | $ | 11.77 | | | $ | 14.50 | | | $ | 11.76 | |
| Income (loss) from investment operations: | | | | | | | | | | | | | | | | | | | | | | | | | | | | |
| Net investment income(b) | | | 0.26 | | | | 0.31 | | | | 0.19 | | | | 0.02 | | | | 0.30 | | | | 0.29 | | | | 0.27 | |
| Net realized and unrealized gains (losses) on investments | | | (2.37 | ) | | | 1.10 | | | | (0.82 | ) | | | 0.73 | | | | (0.37 | ) | | | (2.26 | ) | | | 2.68 | |
| Total from investment operations | | | (2.11 | ) | | | 1.41 | | | | (0.63 | ) | | | 0.75 | | | | (0.07 | ) | | | (1.97 | ) | | | 2.95 | |
| Less dividends and distributions: | | | | | | | | | | | | | | | | | | | | | | | | | | | | |
| Dividends from net investment income | | | (0.18 | ) | | | (0.65 | ) | | | (0.17 | ) | | | (0.51 | ) | | | (0.29 | ) | | | (0.32 | ) | | | (0.21 | ) |
| Distributions from net realized gains | | | — | | | | — | | | | — | | | | — | | | | — | | | | (0.44 | ) | | | — | |
| Return of capital | | | — | | | | — | | | | — | | | | (0.01 | ) | | | — | | | | — | | | | — | |
| Total distributions | | | (0.18 | ) | | | (0.65 | ) | | | (0.17 | ) | | | (0.52 | ) | | | (0.29 | ) | | | (0.76 | ) | | | (0.21 | ) |
| Paid-in capital from redemption fees | | | — | | | | — | | | | — | | | | — | | | | 0.00 | (c) | | | 0.00 | (c) | | | 0.00 | (c) |
| Net increase from payment by affiliates | | | — | | | | — | | | | — | | | | — | | | | 0.01 | (d) | | | — | | | | — | |
| Net asset value, end of period | | $ | 9.32 | | | $ | 11.61 | | | $ | 10.85 | | | $ | 11.65 | | | $ | 11.42 | | | $ | 11.77 | | | $ | 14.50 | |
| Total Return | | | (18.21 | )% (e) | | | 13.19 | % | | | (5.35 | )% | | | 6.69 | % (e) | | | (0.29 | )% | | | (14.40 | )% | | | 25.60 | % |
| Ratios and Supplemental Data | | | | | | | | | | | | | | | | | | | | | | | | | | | | |
| Net assets, end of period (in 000s) | | $ | 88,798 | | | $ | 108,745 | | | $ | 119,113 | | | $ | 234,265 | | | $ | 230,883 | | | $ | 351,480 | | | $ | 298,728 | |
| Ratio of expenses to average net assets | | | | | | | | | | | | | | | | | | | | | | | | | | | | |
| With fee waivers/reimbursements | | | 1.03 | % (f) | | | 1.03 | % | | | 1.03 | % | | | 1.03 | % (f) | | | 1.03 | % | | | 1.03 | % | | | 1.03 | % |
| Without fee waivers/reimbursements | | | 1.18 | % (f) | | | 1.13 | % | | | 1.18% | | | | 1.20 | % (f) | | | 1.28 | % | | | 1.19 | % | | | 1.22 | % |
| Ratio of net investment income to average net assets | | | | | | | | | | | | | | | | | | | | | | | | | | | | |
| With fee waivers/reimbursements | | | 4.92 | % (f) | | | 2.54 | % | | | 2.00 | % | | | 1.15 | % (f) | | | 2.74 | % | | | 2.17 | % | | | 2.05 | % |
| Without fee waivers/reimbursements | | | 4.77 | % (f) | | | 2.44 | % | | | 1.85 | % | | | 0.98 | % (f) | | | 2.49 | % | | | 2.01 | % | | | 1.86 | % |
| Portfolio turnover rate | | | 54 | % (e) | | | 112 | % | | | 106 | % | | | 17 | % (e) | | | 121 | % | | | 111 | % | | | 101 | % |
| (a) | Fund changed fiscal year to December 31. |
| (b) | Calculated using the average shares method. |
| (c) | Less than $0.005 per share. |
| (d) | The custodian reimbursed the Fund $132,086 for losses incurred from corporate action processing. Payment had a positive 0.09% impact on the total return. |
| (e) | Total return and portfolio turnover are not annualized for periods less than one full year. |
See Notes to Financial Statements.
| 114 | | www.sbhfunds.com |
| Segall Bryant & Hamill | |
| Fund FundamentalInternationalSmall Cap | Financial Highlights |
| For a Share Outstanding Throughout the Periods Presented |
| | | Six Months | | | | | | | | | | | | | | | | |
| | | Ended | | | Year Ended | | | Year Ended | | | Year Ended | | | Year Ended | | | Year Ended | |
| | | June 30, 2022 | | | December 31, | | | December 31, | | | December 31, | | | December 31, | | | December 31, | |
| Retail | | (Unaudited) | | | 2021 | | | 2020 | | | 2019 | | | 2018(a) | | | 2017 | |
| Net asset value, beginning of period | | $ | 24.43 | | | $ | 22.86 | | | $ | 18.12 | | | $ | 12.67 | | | $ | 19.76 | | | $ | 15.08 | |
| Income (loss) from investment operations: | | | | | | | | | | | | | | | | | | | | | | | | |
| Net investment income (loss)(b) | | | 0.06 | | | | (0.22 | ) | | | (0.08 | ) | | | 0.00 | (c) | | | (0.03 | ) | | | 0.05 | |
| Net realized and unrealized gains (losses) on investments | | | (8.97 | ) | | | 3.83 | | | | 6.06 | | | | 5.45 | | | | (4.40 | ) | | | 5.01 | |
| Total from investment operations | | | (8.91 | ) | | | 3.61 | | | | 5.98 | | | �� | 5.45 | | | | (4.43 | ) | | | 5.06 | |
| Less dividends and distributions: | | | | | | | | | | | | | | | | | | | | | | | | |
| Dividends from net investment income | | | — | | | | — | | | | — | | | | — | | | | (0.08 | ) | | | (0.38 | ) |
| Distributions from net realized gains | | | — | | | | (2.04 | ) | | | (1.24 | ) | | | — | | | | (2.58 | ) | | | — | |
| Total distributions | | | — | | | | (2.04 | ) | | | (1.24 | ) | | | — | | | | (2.66 | ) | | | (0.38 | ) |
| Net asset value, end of period | | $ | 15.52 | | | $ | 24.43 | | | $ | 22.86 | | | $ | 18.12 | | | $ | 12.67 | | | $ | 19.76 | |
| Total Return | | | (36.47 | )% (f) | | | 16.59 | % | | | 33.23 | % | | | 43.01 | % | | | (22.98 | )% | | | 33.64 | % |
| Ratios and Supplemental Data | | | | | | | | | | | | | | | | | | | | | | | | |
| Net assets, end of period (in 000s) | | $ | 23,431 | | | $ | 42,322 | | | $ | 33,666 | | | $ | 29,098 | | | $ | 28,205 | | | $ | 49,979 | |
| Ratio of expenses to average net assets | | | | | | | | | | | | | | | | | | | | | | | | |
| With fee waivers/reimbursements | | | 1.25 | % (g) | | | 1.25 | % | | | 1.25 | % | | | 1.32 | % (d)(e) | | | 1.44 | % (e) | | | 1.44 | % (e) |
| Without fee waivers/reimbursements | | | 1.69 | % (g) | | | 1.51 | % | | | 1.69 | % | | | 1.85 | % | | | 1.78 | % | | | 1.75 | % |
| Ratio of net investment income (loss) to average net assets | | | | | | | | | | | | | | | | | | | | | | | | |
| With fee waivers/reimbursements | | | 0.59 | % (g) | | | (0.88 | )% | | | (0.43 | )% | | | 0.00 | % | | | (0.18 | )% | | | 0.27 | % |
| Without fee waivers/reimbursements | | | 0.15 | % (g) | | | (1.14 | )% | | | (0.87 | )% | | | (0.53 | )% | | | (0.52 | )% | | | (0.04 | )% |
| Portfolio turnover rate | | | 32 | % (f) | | | 56 | % | | | 59 | % | | | 31 | % | | | 57 | % | | | 48 | % |
| (a) | Prior to April 30, 2018 known as the Westcore International Small-Cap Fund. |
| (b) | Calculated using the average shares method. |
| (c) | Less than $0.005 per share. |
| (d) | Contractual expense limitation changed from 1.50% to 1.25% effective May 1, 2019. |
| (e) | For the period April 29, 2016 to April 30, 2019, a voluntary additional expense waiver reduced the ratio of expenses to average net assets from 1.50% to 1.44%. |
| (f) | Total return and portfolio turnover are not annualized for periods less than one full year. |
See Notes to Financial Statements.
| Semi-Annual Report | June 30, 2022 | | 115 |
| Segall Bryant & Hamill | |
| Fundamental International Small Cap Fund | Financial Highlights |
| For a Share Outstanding Throughout the Periods Presented |
| | | Six Months | | | | | | | | | | | | | | | | |
| | | Ended | | | Year Ended | | | Year Ended | | | Year Ended | | | Year Ended | | | Year Ended | |
| | | June 30, 2022 | | | December 31, | | | December 31, | | | December 31, | | | December 31, | | | December 31, | |
| Institutional | | (Unaudited) | | | 2021 | | | 2020 | | | 2019 | | | 2018(a) | | | 2017 | |
| Net asset value, beginning of period | | $ | 26.37 | | | $ | 24.50 | | | $ | 19.32 | | | $ | 13.48 | | | $ | 20.83 | | | $ | 15.64 | |
| Income (loss) from investment operations: | | | | | | | | | | | | | | | | | | | | | | | | |
| Net investment income (loss)(b) | | | 0.04 | | | | (0.07 | ) | | | (0.06 | ) | | | 0.00 | (c) | | | (0.00 | ) (c) | | | 0.08 | |
| Net realized and unrealized gains (losses) on investments | | | (9.64 | ) | | | 3.98 | | | | 6.48 | | | | 5.84 | | | | (4.66) | | | | 5.22 | |
| Total from investment operations | | | (9.60 | ) | | | 3.91 | | | | 6.42 | | | | 5.84 | | | | (4.66) | | | | 5.30 | |
| Less dividends and distributions: | | | | | | | | | | | | | | | | | | | | | | | | |
| Dividends from net investment income | | | — | | | | — | | | | — | | | | — | | | | (0.11 | ) | | | (0.11 | ) |
| Distributions from net realized gains | | | — | | | | (2.04 | ) | | | (1.24 | ) | | | — | | | | (2.58 | ) | | | — | |
| Total distributions | | | — | | | | (2.04 | ) | | | (1.24 | ) | | | — | | | | (2.69 | ) | | | (0.11 | ) |
| Net asset value, end of period | | $ | 16.77 | | | $ | 26.37 | | | $ | 24.50 | | | $ | 19.32 | | | $ | 13.48 | | | $ | 20.83 | |
| Total Return | | | (36.40 | )% (e) | | | 16.70 | % | | | 33.45 | % | | | 43.32 | % | | | (22.90 | )% | | | 33.89 | % |
| Ratios and Supplemental Data | | | | | | | | | | | | | | | | | | | | | | | | |
| Net assets, end of period (in 000s) | | $ | 34,018 | | | $ | 50,082 | | | $ | 15,458 | | | $ | 8,446 | | | $ | 20,266 | | | $ | 29,652 | |
| Ratio of expenses to average net assets | | | | | | | | | | | | | | | | | | | | | | | | |
| With fee waivers/reimbursements | | | 1.10 | % (f) | | | 1.10 | % | | | 1.10 | % | | | 1.20 | % (d) | | | 1.29 | % | | | 1.29 | % |
| Without fee waivers/reimbursements | | | 1.31 | % (f) | | | 1.36 | % | | | 1.57 | % | | | 1.72 | % | | | 1.62 | % | | | 1.59 | % |
| Ratio of net investment income (loss) to average net assets | | | | | | | | | | | | | | | | | | | | | | | | |
| With fee waivers/reimbursements | | | 0.35 | % (f) | | | (0.21 | )% | | | (0.31 | )% | | | 0.01 | % | | | (0.02 | )% | | | 0.44 | % |
| Without fee waivers/reimbursements | | | 0.14 | % (f) | | | (0.47 | )% | | | (0.78 | )% | | | (0.50 | )% | | | (0.35 | )% | | | 0.14 | % |
| Portfolio turnover rate | | | 32 | % (e) | | | 56 | % | | | 59 | % | | | 31 | % | | | 57 | % | | | 48 | % |
| (a) | Prior to April 30, 2018 known as the Westcore International Small-Cap Fund. |
| (b) | Calculated using the average shares method. |
| (c) | Less than $0.005 per share. |
| (d) | The contractual expense limitation is 1.10% effective May 1, 2019. |
| (e) | Total return and portfolio turnover are not annualized for periods less than one full year. |
See Notes to Financial Statements.
| 116 | | www.sbhfunds.com |
| Segall Bryant & Hamill Global All Cap Fund | Financial Highlights |
| For a Share Outstanding Throughout the Periods Presented |
| | | Six Months | | | | | | | | | | | | | | | | |
| | | Ended | | | Year Ended | | | Year Ended | | | Year Ended | | | Year Ended | | | Year Ended | |
| | | June 30, 2022 | | | December 31, | | | December 31, | | | December 31, | | | December 31, | | | December 31, | |
| Retail | | (Unaudited) | | | 2021 | | | 2020(a) | | | 2019 | | | 2018(b) | | | 2017 | |
| Net asset value, beginning of period | | $ | 11.02 | | | $ | 9.32 | | | $ | 10.98 | | | $ | 9.52 | | | $ | 11.12 | | | $ | 9.79 | |
| Income (loss) from investment operations: | | | | | | | | | | | | | | | | | | | | | | | | |
| Net investment income(c) | | | 0.00 | (d) | | | 0.02 | | | | 0.18 | | | | 0.23 | | | | 0.20 | | | | 0.19 | |
| Net realized and unrealized gains (losses) on investments | | | (2.47 | ) | | | 2.36 | | | | 0.08 | (e) | | | 2.16 | | | | (1.16 | ) | | | 1.70 | |
| Total from investment operations | | | (2.47 | ) | | | 2.38 | | | | 0.26 | | | | 2.39 | | | | (0.96 | ) | | | 1.89 | |
| Less dividends and distributions: | | | | | | | | | | | | | | | | | | | | | | | | |
| Dividends from net investment income | | | — | | | | (0.04 | ) | | | (0.18 | ) | | | (0.25 | ) | | | (0.19 | ) | | | (0.18 | ) |
| Distributions from net realized gains | | | — | | | | (0.64 | ) | | | (1.74 | ) | | | (0.68 | ) | | | (0.45 | ) | | | (0.38 | ) |
| Total distributions | | | — | | | | (0.68 | ) | | | (1.92 | ) | | | (0.93 | ) | | | (0.64 | ) | | | (0.56 | ) |
| Net asset value, end of period | | $ | 8.55 | | | $ | 11.02 | | | $ | 9.32 | | | $ | 10.98 | | | $ | 9.52 | | | $ | 11.12 | |
| Total Return | | | (22.41 | )% (f) | | | 25.83 | % | | | 2.95 | % | | | 25.36 | % | | | (8.70 | )% | | | 19.56 | % |
| Ratios and Supplemental Data | | | | | | | | | | | | | | | | | | | | | | | | |
| Net assets, end of period (in 000s) | | $ | 25,411 | | | $ | 33,821 | | | $ | 32,224 | | | $ | 46,375 | | | $ | 41,887 | | | $ | 50,894 | |
| Ratio of expenses to average net assets | | | | | | | | | | | | | | | | | | | | | | | | |
| With fee waivers/reimbursements | | | 0.89 | % (g) | | | 0.89 | % | | | 0.89 | % | | | 0.89 | % | | | 0.99 | % (h) | | | 0.99 | % |
| Without fee waivers/reimbursements | | | 1.22 | % (g) | | | 1.18 | % | | | 1.29 | % | | | 1.22 | % | | | 1.22 | % | | | 1.20 | % |
| Ratio of net investment income (loss) to average net assets | | | | | | | | | | | | | | | | | | | | | | | | |
| With fee waivers/reimbursements | | | 0.01 | % (g) | | | 0.16 | % | | | 1.83 | % | | | 2.14 | % | | | 1.88 | % | | | 1.83 | % |
| Without fee waivers/reimbursements | | | (0.32 | )% (g) | | | (0.13 | )% | | | 1.43 | % | | | 1.81 | % | | | 1.65 | % | | | 1.62 | % |
| Portfolio turnover rate | | | 16 | % (f) | | | 24 | % | | | 132 | % | | | 40 | % | | | 59 | % | | | 17 | % |
| (a) | Prior to September 19, 2020 known as the Segall Bryant & Hamill Global Large Cap Fund. |
| (b) | Prior to April 30, 2018 known as the Westcore Global Large-Cap Dividend Fund. |
| (c) | Calculated using the average shares method. |
| (d) | Less than $0.005 per share. |
| (e) | Represents a balancing figure derived from other amounts in the financial highlights table that captures all other changes affecting the net asset value per share. This per share amount does not correlate to the aggregate of the net realized and unrealized losses on the Statement of Operations for the same period. |
| (f) | Total return and portfolio turnover are not annualized for periods less than one full year. |
| (h) | Contractual expense limitation changed from 0.99% to 0.89% effective December 20, 2018. |
See Notes to Financial Statements.
| Semi-Annual Report | June 30, 2022 | | 117 |
| Segall Bryant & Hamill Global All Cap Fund | Financial Highlights |
| For a Share Outstanding Throughout the Periods Presented |
| | | Six Months | | | | | | | | | | | | | | | | |
| | | Ended | | | Year Ended | | | Year Ended | | | Year Ended | | | Year Ended | | | Year Ended | |
| | | June 30, 2022 | | | December 31, | | | December 31, | | | December 31, | | | December 31, | | | December 31, | |
| Institutional | | (Unaudited) | | | 2021 | | | 2020(a) | | | 2019 | | | 2018(b) | | | 2017 | |
| Net asset value, beginning of period | | $ | 10.86 | | | $ | 9.20 | | | $ | 10.86 | | | $ | 9.43 | | | $ | 11.04 | | | $ | 9.71 | |
| Income (loss) from investment operations: | | | | | | | | | | | | | | | | | | | | | | | | |
| Net investment income(c) | | | 0.13 | | | | 0.03 | | | | 0.18 | | | | 0.24 | | | | 0.23 | | | | 0.20 | |
| Net realized and unrealized gains (losses) on investments | | | (2.55 | ) | | | 2.33 | | | | 0.09 | (d) | | | 2.14 | | | | (1.16 | ) | | | 1.70 | |
| Total from investment operations | | | (2.42 | ) | | | 2.36 | | | | 0.27 | | | | 2.38 | | | | (0.93 | ) | | | 1.90 | |
| Less dividends and distributions: | | | | | | | | | | | | | | | | | | | | | | | | |
| Dividends from net investment income | | | — | | | | (0.06 | ) | | | (0.19 | ) | | | (0.27 | ) | | | (0.23 | ) | | | (0.19 | ) |
| Distributions from net realized gains | | | — | | | | (0.64 | ) | | | (1.74 | ) | | | (0.68 | ) | | | (0.45 | ) | | | (0.38 | ) |
| Total distributions | | | — | | | | (0.70 | ) | | | (1.93 | ) | | | (0.95 | ) | | | (0.68 | ) | | | (0.57 | ) |
| Net asset value, end of period | | $ | 8.44 | | | $ | 10.86 | | | $ | 9.20 | | | $ | 10.86 | | | $ | 9.43 | | | $ | 11.04 | |
| Total Return | | | (22.28 | )% (e) | | | 25.94 | % | | | 3.04 | % | | | 25.55 | % | | | (8.53 | )% | | | 19.78 | % |
| Ratios and Supplemental Data | | | | | | | | | | | | | | | | | | | | | | | | |
| Net assets, end of period (in 000s) | | $ | 1,564 | | | $ | 4,875 | | | $ | 3,373 | | | $ | 2,730 | | | $ | 2,589 | | | $ | 5,148 | |
| Ratio of expenses to average net assets | | | | | | | | | | | | | | | | | | | | | | | | |
| With fee waivers/reimbursements | | | 0.74 | % (f) | | | 0.74 | % | | | 0.74 | % | | | 0.74 | % | | | 0.84 | % (g) | | | 0.90 | % |
| Without fee waivers/reimbursements | | | 1.22 | % (f) | | | 1.17 | % | | | 1.20 | % | | | 1.12 | % | | | 1.09 | % | | | 1.09 | % |
| Ratio of net investment income (loss) to average net assets | | | | | | | | | | | | | | | | | | | | | | | | |
| With fee waivers/reimbursements | | | 2.77 | % (f) | | | 0.29 | % | | | 1.83 | % | | | 2.32 | % | | | 2.11 | % | | | 1.91 | % |
| Without fee waivers/reimbursements | | | 2.29 | % (f) | | | (0.14 | )% | | | 1.37 | % | | | 1.94 | % | | | 1.86 | % | | | 1.72 | % |
| Portfolio turnover rate | | | 16 | % (e) | | | 24 | % | | | 132 | % | | | 40 | % | | | 59 | % | | | 17 | % |
| (a) | Prior to September 19, 2020 known as the Segall Bryant & Hamill Global Large Cap Fund. |
| (b) | Prior to April 30, 2018 known as the Westcore Global Large-Cap Dividend Fund. |
| (c) | Calculated using the average shares method. |
| (d) | Represents a balancing figure derived from other amounts in the financial highlights table that captures all other changes affecting the net asset value per share. This per share amount does not correlate to the aggregate of the net realized and unrealized losses on the Statement of Operations for the same period. |
| (e) | Total return and portfolio turnover are not annualized for periods less than one full year. |
| (g) | Contractual expense limitation changed from 0.84% to 0.74% effective December 20, 2018. |
See Notes to Financial Statements.
| 118 | | www.sbhfunds.com |
| Segall Bryant & Hamill Workplace Equality Fund | Financial Highlights |
| For a Share Outstanding Throughout the Periods Presented |
| | | Six Months | | | | | | | | | | | | | | | | |
| | | Ended | | | Year Ended | | | Year Ended | | | Year Ended | | | Year Ended | | | Year Ended | |
| | | June 30, 2022 | | | December 31, | | | December 31, | | | December 31, | | | December 31, | | | December 31, | |
| Retail | | (Unaudited) | | | 2021 | | | 2020 | | | 2019(a) | | | 2018(b) | | | 2017 | |
| Net asset value, beginning of period | | $ | 7.87 | | | $ | 6.72 | | | $ | 6.45 | | | $ | 5.41 | | | $ | 6.01 | | | $ | 6.38 | |
| Income (loss) from investment operations: | | | | | | | | | | | | | | | | | | | | | | | | |
| Net investment income(c) | | | 0.01 | | | | 0.01 | | | | 0.07 | | | | 0.12 | | | | 0.11 | | | | 0.12 | |
| Net realized and unrealized gains (losses) on investments | | | (1.82 | ) | | | 1.72 | | | | 0.35 | | | | 1.33 | | | | (0.18 | ) | | | 0.93 | |
| Total from investment operations | | | (1.81 | ) | | | 1.73 | | | | 0.42 | | | | 1.45 | | | | (0.07 | ) | | | 1.05 | |
| Less dividends and distributions: | | | | | | | | | | | | | | | | | | | | | | | | |
| Dividends from net investment income | | | — | | | | (0.00 | ) (d) | | | (0.08 | ) | | | (0.11 | ) | | | (0.21 | ) | | | (0.21 | ) |
| Distributions from net realized gains | | | — | | | | (0.58 | ) | | | (0.07 | ) | | | (0.30 | ) | | | (0.32 | ) | | | (1.21 | ) |
| Total distributions | | | — | | | | (0.58 | ) | | | (0.15 | ) | | | (0.41 | ) | | | (0.53 | ) | | | (1.42 | ) |
| Net asset value, end of period | | $ | 6.06 | | | $ | 7.87 | | | $ | 6.72 | | | $ | 6.45 | | | $ | 5.41 | | | $ | 6.01 | |
| Total Return | | | (23.00 | )% (e) | | | 26.18 | % | | | 6.81 | % | | | 26.85 | % | | | (1.36 | )% | | | 16.73 | % |
| Ratios and Supplemental Data | | | | | | | | | | | | | | | | | | | | | | | | |
| Net assets, end of period (in 000s) | | $ | 8,216 | | | $ | 11,707 | | | $ | 9,397 | | | $ | 9,846 | | | $ | 8,131 | | | $ | 10,022 | |
| Ratio of expenses to average net assets | | | | | | | | | | | | | | | | | | | | | | | | |
| With fee waivers/reimbursements | | | 0.89 | % (f) | | | 0.89 | % | | | 0.89 | % | | | 0.89 | % | | | 0.89 | % | | | 0.98 | % (g) |
| Without fee waivers/reimbursements | | | 1.28 | % (f) | | | 1.28 | % | | | 1.53 | % | | | 1.57 | % | | | 1.86 | % | | | 1.76 | % |
| Ratio of net investment income (loss) to average net assets | | | | | | | | | | | | | | | | | | | | | | | | |
| With fee waivers/reimbursements | | | 0.19 | % (f) | | | 0.07 | % | | | 1.19 | % | | | 1.92 | % | | | 1.85 | % | | | 1.82 | % |
| Without fee waivers/reimbursements | | | (0.19 | )% (f) | | | (0.32 | )% | | | 0.55 | % | | | 1.24 | % | | | 0.88 | % | | | 1.04 | % |
| Portfolio turnover rate | | | 23 | % (e) | | | 49 | % | | | 97 | % | | | 41 | % | | | 43 | % | | | 0 | % |
| (a) | Prior to May 1, 2019 known as the Segall Bryant & Hamill Large Cap Dividend Fund. |
| (b) | Prior to April 30, 2018 known as the Westcore Large-Cap Dividend Fund. |
| (c) | Calculated using the average shares method. |
| (d) | Less than $0.005 per share. |
| (e) | Total return and portfolio turnover are not annualized for periods less than one full year. |
| (g) | Contractual expense limitation changed from 1.15% to 0.89% effective April 30, 2017. |
See Notes to Financial Statements.
| Semi-Annual Report | June 30, 2022 | | 119 |
| Segall Bryant & Hamill Workplace Equality Fund | Financial Highlights |
| For a Share Outstanding Throughout the Periods Presented |
| | | Six Months | | | | | | | | | | | | | | | | |
| | | Ended | | | Year Ended | | | Year Ended | | | Year Ended | | | Year Ended | | | Year Ended | |
| | | June 30, 2022 | | | December 31, | | | December 31, | | | December 31, | | | December 31, | | | December 31, | |
| Institutional | | (Unaudited) | | | 2021 | | | 2020 | | | 2019(a) | | | 2018(b) | | | 2017 | |
| Net asset value, beginning of period | | $ | 8.12 | | | $ | 6.93 | | | $ | 6.64 | | | $ | 5.55 | | | $ | 6.12 | | | $ | 6.61 | |
| Income (loss) from investment operations: | | | | | | | | | | | | | | | | | | | | | | | | |
| Net investment income(c) | | | 0.01 | | | | 0.02 | | | | 0.08 | | | | 0.14 | | | | 0.13 | | | | 0.13 | |
| Net realized and unrealized gains (losses) on investments | | | (1.87 | ) | | | 1.77 | | | | 0.36 | | | | 1.37 | | | | (0.20 | ) | | | 0.97 | |
| Total from investment operations | | | (1.86 | ) | | | 1.79 | | | | 0.44 | | | | 1.51 | | | | (0.07 | ) | | | 1.10 | |
| Less dividends and distributions: | | | | | | | | | | | | | | | | | | | | | | | | |
| Dividends from net investment income | | | — | | | | (0.02 | ) | | | (0.08 | ) | | | (0.12 | ) | | | (0.18 | ) | | | (0.38 | ) |
| Distributions from net realized gains | | | — | | | | (0.58 | ) | | | (0.07 | ) | | | (0.30 | ) | | | (0.32 | ) | | | (1.21 | ) |
| Total distributions | | | — | | | | (0.60 | ) | | | (0.15 | ) | | | (0.42 | ) | | | (0.50 | ) | | | (1.59 | ) |
| Net asset value, end of period | | $ | 6.26 | | | $ | 8.12 | | | $ | 6.93 | | | $ | 6.64 | | | $ | 5.55 | | | $ | 6.12 | |
| Total Return | | | (22.91 | )% (d) | | | 26.14 | % | | | 6.98 | % | | | 27.22 | % | | | (1.25 | )% | | | 16.92 | % |
| Ratios and Supplemental Data | | | | | | | | | | | | | | | | | | | | | | | | |
| Net assets, end of period (in 000s) | | $ | 14,469 | | | $ | 17,845 | | | $ | 11,299 | | | $ | 8,339 | | | $ | 298 | | | $ | 155 | |
| Ratio of expenses to average net assets | | | | | | | | | | | | | | | | | | | | | | | | |
| With fee waivers/reimbursements | | | 0.74 | % (e) | | | 0.74 | % | | | 0.74 | % | | | 0.74 | % | | | 0.74 | % | | | 0.92 | % |
| Without fee waivers/reimbursements | | | 1.26 | % (e) | | | 1.26 | % | | | 1.54 | % | | | 1.41 | % | | | 1.76 | % | | | 1.61 | % |
| Ratio of net investment income (loss) to average net assets | | | | | | | | | | | | | | | | | | | | | | | | |
| With fee waivers/reimbursements | | | 0.35 | % (e) | | | 0.22 | % | | | 1.26 | % | | | 2.11 | % | | | 2.11 | % | | | 1.82 | % |
| Without fee waivers/reimbursements | | | (0.17 | )% (e) | | | (0.30 | )% | | | 0.46 | % | | | 1.44 | % | | | 1.09 | % | | | 1.13 | % |
| Portfolio turnover rate | | | 23 | % (d) | | | 49 | % | | | 97 | % | | | 41 | % | | | 43 | % | | | 0 | % |
| (a) | Prior to April 30, 2019 known as the Segall Bryant & Hamill Large Cap Dividend Fund. |
| (b) | Prior to April 30, 2018 known as the Westcore Large-Cap Dividend Fund. |
| (c) | Calculated using the average shares method. |
| (d) | Total return and portfolio turnover are not annualized for periods less than one full year. |
See Notes to Financial Statements.
| 120 | | www.sbhfunds.com |
| Segall Bryant & Hamill Short Term Plus Fund | Financial Highlights |
| For a Share Outstanding Throughout the Periods Presented |
| | | Six Months | | | | | | | | | | | | | |
| | | Ended | | | Year Ended | | | Year Ended | | | Year Ended | | | Period Ended | |
| | | June 30, 2022 | | | December 31, | | | December 31, | | | December 31, | | | December 31, | |
| Retail | | (Unaudited) | | | 2021 | | | 2020 | | | 2019 | | | 2018(a) | |
| Net asset value, beginning of period | | $ | 10.05 | | | $ | 10.15 | | | $ | 10.11 | | | $ | 10.02 | | | $ | 10.00 | |
| Income (loss) from investment operations: | | | | | | | | | | | | | | | | | | | | |
| Net investment income(b) | | | 0.03 | | | | 0.05 | | | | 0.12 | | | | 0.25 | | | | 0.01 | |
| Net realized and unrealized gains (losses) on investments | | | (0.29 | ) | | | (0.08 | ) | | | 0.08 | | | | 0.10 | | | | 0.01 | |
| Total from investment operations | | | (0.26 | ) | | | (0.03 | ) | | | 0.20 | | | | 0.35 | | | | 0.02 | |
| Less dividends and distributions: | | | | | | | | | | | | | | | | | | | | |
| Dividends from net investment income | | | (0.03 | ) | | | (0.06 | ) | | | (0.15 | ) | | | (0.26 | ) | | | — | |
| Distributions from net realized gains | | | — | | | | (0.01 | ) | | | (0.01 | ) | | | (0.00 | ) (c) | | | — | |
| Total distributions | | | (0.03 | ) | | | (0.07 | ) | | | (0.16 | ) | | | (0.26 | ) | | | — | |
| Net asset value, end of period | | $ | 9.76 | | | $ | 10.05 | | | $ | 10.15 | | | $ | 10.11 | | | $ | 10.02 | |
| Total Return | | | (2.58 | )% (d) | | | (0.23 | )% | | | 2.05 | % | | | 3.57 | % | | | 0.20 | % (d) |
| Ratios and Supplemental Data | | | | | | | | | | | | | | | | | | | | |
| Net assets, end of period (in 000s) | | $ | 6,201 | | | $ | 11,896 | | | $ | 2,989 | | | $ | 915 | | | $ | 200 | |
| Ratio of expenses to average net assets | | | | | | | | | | | | | | | | | | | | |
| With fee waivers/reimbursements | | | 0.49 | % (e) | | | 0.49 | % | | | 0.49 | % | | | 0.49 | % | | | 0.49 | % (e) |
| Without fee waivers/reimbursements | | | 0.79 | % (e) | | | 0.80 | % | | | 1.18 | % | | | 4.13 | % | | | 9.96 | % (e)(f) |
| Ratio of net investment income (loss) to average net assets | | | | | | | | | | | | | | | | | | | | |
| With fee waivers/reimbursements | | | 0.52 | % (e) | | | 0.45 | % | | | 1.23 | % | | | 2.50 | % | | | 2.39 | % (e) |
| Without fee waivers/reimbursements | | | 0.22 | % (e) | | | 0.14 | % | | | 0.54 | % | | | (1.14 | )% | | | (7.08 | )% (e)(f) |
| Portfolio turnover rate | | | 27 | % (d) | | | 46 | % | | | 47 | % | | | 32 | % | | | 0 | % (d) |
| (a) | Commenced operations on December 17, 2018. |
| (b) | Calculated using the average shares method. |
| (c) | Less than $0.005 per share. |
| (d) | Total return and portfolio turnover are not annualized for periods less than one full year. |
| (f) | Ratios before fee waivers for start up periods may not be representative of long term operating results. For the purpose of the ratio, audit and tax preparation fees have not been annualized. |
See Notes to Financial Statements.
| Semi-Annual Report | June 30, 2022 | | 121 |
| Segall Bryant & Hamill Short Term Plus Fund | Financial Highlights |
| For a Share Outstanding Throughout the Periods Presented |
| | | Six Months | | | | | | | | | | | | | |
| | | Ended | | | Year Ended | | | Year Ended | | | Year Ended | | | Period Ended | |
| | | June 30, 2022 | | | December 31, | | | December 31, | | | December 31, | | | December 31, | |
| Institutional | | (Unaudited) | | | 2021 | | | 2020 | | | 2019 | | | 2018(a) | |
| Net asset value, beginning of period | | $ | 10.07 | | | $ | 10.16 | | | $ | 10.11 | | | $ | 10.02 | | | $ | 10.00 | |
| Income (loss) from investment operations: | | | | | | | | | | | | | | | | | | | | |
| Net investment income(b) | | | 0.03 | | | | 0.06 | | | | 0.13 | | | | 0.26 | | | | 0.01 | |
| Net realized and unrealized gains (losses) on investments | | | (0.29 | ) | | | (0.07 | ) | | | 0.09 | | | | 0.09 | | | | 0.01 | |
| Total from investment operations | | | (0.26 | ) | | | (0.01 | ) | | | 0.22 | | | | 0.35 | | | | 0.02 | |
| Less dividends and distributions: | | | | | | | | | | | | | | | | | | | | |
| Dividends from net investment income | | | (0.04 | ) | | | (0.07 | ) | | | (0.16 | ) | | | (0.26 | ) | | | — | |
| Distributions from net realized gains | | | — | | | | (0.01 | ) | | | (0.01 | ) | | | (0.00 | ) (c) | | | — | |
| Total distributions | | | (0.04 | ) | | | (0.08 | ) | | | (0.17 | ) | | | (0.26 | ) | | | — | |
| Net asset value, end of period | | $ | 9.77 | | | $ | 10.07 | | | $ | 10.16 | | | $ | 10.11 | | | $ | 10.02 | |
| Total Return | | | (2.63 | )% (d) | | | (0.05 | )% | | | 2.18 | % | | | 3.62 | % | | | 0.20 | % (d) |
| Ratios and Supplemental Data | | | | | | | | | | | | | | | | | | | | |
| Net assets, end of period (in 000s) | | $ | 37,338 | | | $ | 40,054 | | | $ | 23,568 | | | $ | 6,279 | | | $ | 1,002 | |
| Ratio of expenses to average net assets | | | | | | | | | | | | | | | | | | | | |
| With fee waivers/reimbursements | | | 0.40 | % (e) | | | 0.40 | % | | | 0.40 | % | | | 0.40 | % | | | 0.40 | % (e) |
| Without fee waivers/reimbursements | | | 0.65 | % (e) | | | 0.68 | % | | | 1.03 | % | | | 3.68 | % | | | 9.74 | % (e)(f) |
| Ratio of net investment income (loss) to average net assets | | | | | | | | | | | | | | | | | | | | |
| With fee waivers/reimbursements | | | 0.63 | % (e) | | | 0.55 | % | | | 1.32 | % | | | 2.53 | % | | | 2.48 | % (e) |
| Without fee waivers/reimbursements | | | 0.38 | % (e) | | | 0.27 | % | | | 0.69 | % | | | (0.75 | )% | | | (6.86 | )% (e)(f) |
| Portfolio turnover rate | | | 27 | % (d) | | | 46 | % | | | 47 | % | | | 32 | % | | | 0 | % (d) |
| (a) | Commenced operations on December 17, 2018. |
| (b) | Calculated using the average shares method. |
| (c) | Less than $0.005 per share. |
| (d) | Total return and portfolio turnover are not annualized for periods less than one full year. |
| (f) | Ratios before fee waivers for start up periods may not be representative of long-term operating results. For the purpose of the ratio, audit and tax preparation fees have not been annualized. |
See Notes to Financial Statements.
| 122 | | www.sbhfunds.com |
| Segall Bryant & Hamill Plus Bond Fund | Financial Highlights |
| For a Share Outstanding Throughout the Periods Presented |
| | | Six Months | | | | | | | | | | | | | | | | |
| | | Ended | | | Year Ended | | | Year Ended | | | Year Ended | | | Year Ended | | | Year Ended | |
| | | June 30, 2022 | | | December 31, | | | December 31, | | | December 31, | | | December 31, | | | December 31, | |
| Retail | | (Unaudited) | | | 2021 | | | 2020 | | | 2019 | | | 2018(a) | | | 2017 | |
| Net asset value, beginning of period | | $ | 10.85 | | | $ | 11.25 | | | $ | 10.79 | | | $ | 10.32 | | | $ | 10.71 | | | $ | 10.59 | |
| Income (loss) from investment operations: | | | | | | | | | | | | | | | | | | | | | | | | |
| Net investment income(b) | | | 0.12 | | | | 0.23 | | | | 0.27 | | | | 0.33 | | | | 0.33 | | | | 0.34 | |
| Net realized and unrealized gains (losses) on investments | | | (1.33 | ) | | | (0.30 | ) | | | 0.64 | | | | 0.57 | | | | (0.36 | ) | | | 0.16 | |
| Total from investment operations | | | (1.21 | ) | | | (0.07 | ) | | | 0.91 | | | | 0.90 | | | | (0.03 | ) | | | 0.50 | |
| Less dividends and distributions: | | | | | | | | | | | | | | | | | | | | | | | | |
| Dividends from net investment income | | | (0.14 | ) | | | (0.26 | ) | | | (0.30 | ) | | | (0.36 | ) | | | (0.34 | ) | | | (0.37 | ) |
| Distributions from net realized gains | | | — | | | | (0.07 | ) | | | (0.15 | ) | | | (0.07 | ) | | | (0.02 | ) | | | (0.01 | ) |
| Total distributions | | | (0.14 | ) | | | (0.33 | ) | | | (0.45 | ) | | | (0.43 | ) | | | (0.36 | ) | | | (0.38 | ) |
| Net asset value, end of period | | $ | 9.50 | | | $ | 10.85 | | | $ | 11.25 | | | $ | 10.79 | | | $ | 10.32 | | | $ | 10.71 | |
| Total Return | | | (11.21 | )% (c) | | | (0.58 | )% | | | 8.49 | % | | | 8.79 | % | | | (0.18 | )% | | | 4.74 | % |
| Ratios and Supplemental Data | | | | | | | | | | | | | | | | | | | | | | | | |
| Net assets, end of period (in 000s) | | $ | 364,120 | | | $ | 466,063 | | | $ | 594,559 | | | $ | 598,220 | | | $ | 915,824 | | | $ | 1,056,835 | |
| Ratio of expenses to average net assets | | | | | | | | | | | | | | | | | | | | | | | | |
| With fee waivers/reimbursements | | | 0.55 | % (d) | | | 0.55 | % | | | 0.55 | % | | | 0.55 | % | | | 0.55 | % | | | 0.55 | % |
| Without fee waivers/reimbursements | | | 0.67 | % (d) | | | 0.67 | % | | | 0.68 | % | | | 0.73 | % | | | 0.76 | % | | | 0.77 | % |
| Ratio of net investment income to average net assets | | | | | | | | | | | | | | | | | | | | | | | | |
| With fee waivers/reimbursements | | | 2.49 | % (d) | | | 2.10 | % | | | 2.38 | % | | | 3.04 | % | | | 3.17 | % | | | 3.15 | % |
| Without fee waivers/reimbursements | | | 2.37 | % (d) | | | 1.98 | % | | | 2.25 | % | | | 2.86 | % | | | 2.96 | % | | | 2.93 | % |
| Portfolio turnover rate | | | 30 | % (c) | | | 54 | % | | | 59 | % | | | 52 | % | | | 59 | % | | | 38 | % |
| (a) | Prior to April 30, 2018 known as the Westcore Plus Bond Fund. |
| (b) | Calculated using the average shares method. |
| (c) | Total return and portfolio turnover are not annualized for periods less than one full year. |
See Notes to Financial Statements.
| Semi-Annual Report | June 30, 2022 | | 123 |
| Segall Bryant & Hamill Plus Bond Fund | Financial Highlights |
| For a Share Outstanding Throughout the Periods Presented |
| | | Six Months | | | | | | | | | | | | | | | | |
| | | Ended | | | Year Ended | | | Year Ended | | | Year Ended | | | Year Ended | | | Year Ended | |
| | | June 30, 2022 | | | December 31, | | | December 31, | | | December 31, | | | December 31, | | | December 31, | |
| Institutional | | (Unaudited) | | | 2021 | | | 2020 | | | 2019 | | | 2018(a) | | | 2017 | |
| Net asset value, beginning of period | | $ | 10.74 | | | $ | 11.14 | | | $ | 10.69 | | | $ | 10.23 | | | $ | 10.60 | | | $ | 10.48 | |
| Income (loss) from investment operations: | | | | | | | | | | | | | | | | | | | | | | | | |
| Net investment income(b) | | | 0.13 | | | | 0.25 | | | | 0.28 | | | | 0.34 | | | | 0.34 | | | | 0.35 | |
| Net realized and unrealized gains (losses) on investments | | | (1.32 | ) | | | (0.30 | ) | | | 0.64 | | | | 0.56 | | | | (0.34 | ) | | | 0.15 | |
| Total from investment operations | | | (1.19 | ) | | | (0.05 | ) | | | 0.92 | | | | 0.90 | | | | 0.00 | (c) | | | 0.50 | |
| Less dividends and distributions: | | | | | | | | | | | | | | | | | | | | | | | | |
| Dividends from net investment income | | | (0.15 | ) | | | (0.28 | ) | | | (0.32 | ) | | | (0.37 | ) | | | (0.35 | ) | | | (0.37 | ) |
| Distributions from net realized gains | | | — | | | | (0.07 | ) | | | (0.15 | ) | | | (0.07 | ) | | | (0.02 | ) | | | (0.01 | ) |
| Total distributions | | | (0.15 | ) | | | (0.35 | ) | | | (0.47 | ) | | | (0.44 | ) | | | (0.37 | ) | | | (0.38 | ) |
| Net asset value, end of period | | $ | 9.40 | | | $ | 10.74 | | | $ | 11.14 | | | $ | 10.69 | | | $ | 10.23 | | | $ | 10.60 | |
| Total Return | | | (11 17 | )% (d) | | | (0.44 | )% | | | 8.65 | % | | | 8.90 | % | | | 0.06 | % | | | 4.81 | % |
| Ratios and Supplemental Data | | | | | | | | | | | | | | | | | | | | | | | | |
| Net assets, end of period (in 000s) | | $ | 443,638 | | | $ | 589,074 | | | $ | 525,992 | | | $ | 427,395 | | | $ | 307,253 | | | $ | 229,912 | |
| Ratio of expenses to average net assets | | | | | | | | | | | | | | | | | | | | | | | | |
| With fee waivers/reimbursements | | | 0.40 | % (e) | | | 0.40 | % | | | 0.40 | % | | | 0.40 | % | | | 0.40 | % | | | 0.40 | % |
| Without fee waivers/reimbursements | | | 0.51 | % (e) | | | 0.51 | % | | | 0.51 | % | | | 0.55 | % | | | 0.56 | % | | | 0.56 | % |
| Ratio of net investment income to average net assets | | | | | | | | | | | | | | | | | | | | | | | | |
| With fee waivers/reimbursements | | | 2.64 | % (e) | | | 2.24 | % | | | 2.53 | % | | | 3.14 | % | | | 3.33 | % | | | 3.29 | % |
| Without fee waivers/reimbursements | | | 2.53 | % (e) | | | 2.13 | % | | | 2.42 | % | | | 2.99 | % | | | 3.17 | % | | | 3.13 | % |
| Portfolio turnover rate | | | 30 | % (d) | | | 54 | % | | | 59 | % | | | 52 | % | | | 59 | % | | | 38 | % |
| (a) | Prior to April 30, 2018 known as the Westcore Plus Bond Fund. |
| (b) | Calculated using the average shares method. |
| (c) | Less than $0.005 per share. |
| (d) | Total return and portfolio turnover are not annualized for periods less than one full year. |
See Notes to Financial Statements.
| 124 | | www.sbhfunds.com |
| Segall Bryant & Hamill Quality High Yield Fund | Financial Highlights |
| For a Share Outstanding Throughout the Periods Presented |
| | | Six Months | | | | | | | | | | | | | | | | |
| | | Ended | | | Year Ended | | | Year Ended | | | Year Ended | | | Year Ended | | | Year Ended | |
| | | June 30, 2022 | | | December 31, | | | December 31, | | | December 31, | | | December 31, | | | December 31, | |
| Retail | | (Unaudited) | | | 2021 | | | 2020 | | | 2019 | | | 2018(a) | | | 2017 | |
| Net asset value, beginning of period | | $ | 9.21 | | | $ | 9.24 | | | $ | 8.97 | | | $ | 8.40 | | | $ | 8.99 | | | $ | 8.86 | |
| Income (loss) from investment operations: | | | | | | | | | | | | | | | | | | | | | | | | |
| Net investment income(b) | | | 0.15 | | | | 0.30 | | | | 0.34 | | | | 0.43 | | | | 0.40 | | | | 0.41 | |
| Net realized and unrealized gains (losses) on investments | | | (1.26 | ) | | | (0.01 | ) | | | 0.29 | | | | 0.58 | | | | (0.59 | ) | | | 0.13 | |
| Total from investment operations | | | (1 11) | | | | 0.29 | | | | 0.63 | | | | 1.01 | | | | (0.19 | ) | | | 0.54 | |
| Less dividends and distributions: | | | | | | | | | | | | | | | | | | | | | | | | |
| Dividends from net investment income | | | (0.16 | ) | | | (0.32 | ) | | | (0.36 | ) | | | (0.44 | ) | | | (0.40 | ) | | | (0.41 | ) |
| Net asset value, end of period | | $ | 7.94 | | | $ | 9.21 | | | $ | 9.24 | | | $ | 8.97 | | | $ | 8.40 | | | $ | 8.99 | |
| Total Return | | | (12.13 | )% (c) | | | 3.14 | % | | | 7.31 | % | | | 12.21 | % | | | (2.19 | )% | | | 6.18% | |
| Ratios and Supplemental Data | | | | | | | | | | | | | | | | | | | | | | | | |
| Net assets, end of period (in 000s) | | $ | 32,407 | | | $ | 39,879 | | | $ | 42,227 | | | $ | 39,692 | | | $ | 43,045 | | | $ | 58,486 | |
| Ratio of expenses to average net assets | | | | | | | | | | | | | | | | | | | | | | | | |
| With fee waivers/reimbursements | | | 0.85 | % (d) | | | 0.85 | % | | | 0.85 | % | | | 0.85 | % | | | 0.85 | % | | | 0.85 | % |
| Without fee waivers/reimbursements | | | 0.87 | % (d) | | | 0.88 | % | | | 0.95 | % | | | 0.98 | % | | | 0.99 | % | | | 0.98 | % |
| Ratio of net investment income to average net assets | | | | | | | | | | | | | | | | | | | | | | | | |
| With fee waivers/reimbursements | | | 3.59 | % (d) | | | 3.30 | % | | | 3.84 | % | | | 4.86 | % | | | 4.52 | % | | | 4.52 | % |
| Without fee waivers/reimbursements | | | 3.57 | % (d) | | | 3.27 | % | | | 3.74 | % | | | 4.73 | % | | | 4.38 | % | | | 4.39 | % |
| Portfolio turnover rate | | | 12 | % (c) | | | 25 | % | | | 57 | % | | | 41 | % | | | 21 | % | | | 37 | % |
| (a) | Prior to April 30, 2018 known as the Westcore Flexible Income Fund. |
| (b) | Calculated using the average shares method. |
| (c) | Total return and portfolio turnover are not annualized for periods less than one full year. |
See Notes to Financial Statements.
| Semi-Annual Report | June 30, 2022 | | 125 |
| Segall Bryant & Hamill Quality High Yield Fund | Financial Highlights |
| For a Share Outstanding Throughout the Periods Presented |
| | | Six Months | | | | | | | | | | | | | | | | |
| | | Ended | | | Year Ended | | | Year Ended | | | Year Ended | | | Year Ended | | | Year Ended | |
| | | June 30, 2022 | | | December 31, | | | December 31, | | | December 31, | | | December 31, | | | December 31, | |
| Institutional | | (Unaudited) | | | 2021 | | | 2020 | | | 2019 | | | 2018(a) | | | 2017 | |
| Net asset value, beginning of period | | $ | 9.10 | | | $ | 9.13 | | | $ | 8.87 | | | $ | 8.29 | | | $ | 8.88 | | | $ | 8.75 | |
| Income (loss) from investment operations: | | | | | | | | | | | | | | | | | | | | | | | | |
| Net investment income(b) | | | 0.16 | | | | 0.32 | | | | 0.35 | | | | 0.44 | | | | 0.40 | | | | 0.42 | |
| Net realized and unrealized gains (losses) on investments | | | (1.25 | ) | | | (0.02 | ) | | | 0.28 | | | | 0.57 | | | | (0.58 | ) | | | 0.13 | |
| Total from investment operations | | | (1.09 | ) | | | 0.30 | | | | 0.63 | | | | 1.01 | | | | (0.18 | ) | | | 0.55 | |
| Less dividends and distributions: | | | | | | | | | | | | | | | | | | | | | | | | |
| Dividends from net investment income | | | (0.17 | ) | | | (0.33 | ) | | | (0.37 | ) | | | (0.43 | ) | | | (0.41 | ) | | | (0.42 | ) |
| Net asset value, end of period | | $ | 7 84 | | | $ | 9.10 | | | $ | 9.13 | | | $ | 8.87 | | | $ | 8.29 | | | $ | 8.88 | |
| Total Return | | | (12.10 | )% (c) | | | 3.33 | % | | | 7.40 | % | | | 12.40 | % | | | (2.12 | )% | | | 6.35 | % |
| Ratios and Supplemental Data | | | | | | | | | | | | | | | | | | | | | | | | |
| Net assets, end of period (in 000s) | | $ | 45,717 | | | $ | 62,127 | | | $ | 40,912 | | | $ | 21,680 | | | $ | 12,962 | | | $ | 20,734 | |
| Ratio of expenses to average net assets | | | | | | | | | | | | | | | | | | | | | | | | |
| With fee waivers/reimbursements | | | 0.70 | % (d) | | | 0.70 | % | | | 0.70 | % | | | 0.70 | % | | | 0.69 | % | | | 0.68 | % |
| Without fee waivers/reimbursements | | | 0.75 | % (d) | | | 0.76 | % | | | 0.82 | % | | | 0.83 | % | | | 0.81 | % | | | 0.78 | % |
| Ratio of net investment income to average net assets | | | | | | | | | | | | | | | | | | | | | | | | |
| With fee waivers/reimbursements | | | 3.73 | % (d) | | | 3.43 | % | | | 3.99 | % | | | 4.99 | % | | | 4.68 | % | | | 4.67 | % |
| Without fee waivers/reimbursements | | | 3.68 | % (d) | | | 3.37 | % | | | 3.87 | % | | | 4.86 | % | | | 4.56 | % | | | 4.57 | % |
| Portfolio turnover rate | | | 12 | % (c) | | | 25 | % | | | 57 | % | | | 41 | % | | | 21 | % | | | 37 | % |
| (a) | Prior to April 30, 2018 known as the Westcore Flexible Income Fund. |
| (b) | Calculated using the average shares method. |
| (c) | Total return and portfolio turnover are not annualized for periods less than one full year. |
See Notes to Financial Statements.
| 126 | | www.sbhfunds.com |
| Segall Bryant & Hamill Municipal Opportunities Fund | Financial Highlights |
| For a Share Outstanding Throughout the Periods Presented |
| | | Six Months | | | | | | | | | | | | | | | | |
| | | Ended | | | Year Ended | | | Year Ended | | | Year Ended | | | Year Ended | | | Year Ended | |
| | | June 30, 2022 | | | December 31, | | | December 31, | | | December 31, | | | December 31, | | | December 31, | |
| Retail | | (Unaudited) | | | 2021 | | | 2020 | | | 2019 | | | 2018(a) | | | 2017 | |
| Net asset value, beginning of period | | $ | 11.02 | | | $ | 11.01 | | | $ | 10.67 | | | $ | 10.38 | | | $ | 10.61 | | | $ | 10.15 | |
| Income (loss) from investment operations: | | | | | | | | | | | | | | | | | | | | | | | | |
| Net investment income(b) | | | 0.09 | | | | 0.18 | | | | 0.24 | | | | 0.29 | | | | 0.35 | | | | 0.32 | |
| Net realized and unrealized gains (losses) on investments | | | (1.21 | ) | | | 0.12 | | | | 0.44 | | | | 0.43 | | | | (0.23 | ) | | | 0.53 | |
| Total from investment operations | | | (1.12 | ) | | | 0.30 | | | | 0.68 | | | | 0.72 | | | | 0.12 | | | | 0.85 | |
| Less dividends and distributions: | | | | | | | | | | | | | | | | | | | | | | | | |
| Dividends from net investment income | | | (0.14 | ) | | | (0.27 | ) | | | (0.30 | ) | | | (0.35 | ) | | | (0.34 | ) | | | (0.31 | ) |
| Distributions from net realized gains | | | — | | | | (0.02 | ) | | | (0.04 | ) | | | (0.08 | ) | | | (0.01 | ) | | | (0.08 | ) |
| Total distributions | | | (0.14 | ) | | | (0.29 | ) | | | (0.34 | ) | | | (0.43 | ) | | | (0.35 | ) | | | (0.39 | ) |
| Net asset value, end of period | | $ | 9.76 | | | $ | 11.02 | | | $ | 11.01 | | | $ | 10.67 | | | $ | 10.38 | | | $ | 10.61 | |
| Total Return | | | (10.23 | )% (d) | | | 2.72 | % | | | 6.54 | % | | | 7.00 | % | | | 1.23 | % | | | 8.44 | % |
| Ratios and Supplemental Data | | | | | | | | | | | | | | | | | | | | | | | | |
| Net assets, end of period (in 000s) | | $ | 39,141 | | | $ | 42,056 | | | $ | 28,344 | | | $ | 11,399 | | | $ | 6,405 | | | $ | 2,709 | |
| Ratio of expenses to average net assets | | | | | | | | | | | | | | | | | | | | | | | | |
| With fee waivers/reimbursements | | | 0.65 | % (e) | | | 0.65 | % | | | 0.65 | % | | | 0.65 | % | | | 0.65 | % | | | 0.65 | % |
| Without fee waivers/reimbursements | | | 0.72 | % (e) | | | 0.74 | % | | | 0.80 | % | | | 0.94 | % | | | 1.09 | % | | | 3.09 | % (c) |
| Ratio of net investment income to average net assets | | | | | | | | | | | | | | | | | | | | | | | | |
| With fee waivers/reimbursements | | | 1 78 | % (e) | | | 1 64% | | | | 2.17 | % | | | 2.73 | % | | | 3.40 | % | | | 2.99 | % |
| Without fee waivers/reimbursements | | | 1 71 | % (e) | | | 1 55% | | | | 2.02 | % | | | 2.44 | % | | | 2.96 | % | | | 0.55 | % (c) |
| Portfolio turnover rate | | | 142 | % (d) | | | 37 | % | | | 101 | % | | | 114 | % | | | 188 | % | | | 284 | % |
| (a) | Prior to April 30, 2018 known as the Westcore Municipal Opportunities Fund. |
| (b) | Calculated using the average shares method. |
| (c) | Ratios before fee waivers for start up periods may not be representative of long-term operating results. |
| (d) | Total return and portfolio turnover are not annualized for periods less than one full year. |
See Notes to Financial Statements.
| Semi-Annual Report | June 30, 2022 | | 127 |
| Segall Bryant & Hamill Municipal Opportunities Fund | Financial Highlights |
| For a Share Outstanding Throughout the Periods Presented |
| | | Six Months | | | | | | | | | | | | | | | | |
| | | Ended | | | Year Ended | | | Year Ended | | | Year Ended | | | Year Ended | | | Year Ended | |
| | | June 30, 2022 | | | December 31, | | | December 31, | | | December 31, | | | December 31, | | | December 31, | |
| Institutional | | (Unaudited) | | | 2021 | | | 2020 | | | 2019 | | | 2018(a) | | | 2017 | |
| Net asset value, beginning of period | | $ | 11.03 | | | $ | 11.02 | | | $ | 10.68 | | | $ | 10.39 | | | $ | 10.62 | | | $ | 10.15 | |
| Income (loss) from investment operations: | | | | | | | | | | | | | | | | | | | | | | | | |
| Net investment income(b) | | | 0.10 | | | | 0.19 | | | | 0.25 | | | | 0.31 | | | | 0.37 | | | | 0.34 | |
| Net realized and unrealized gains (losses) on investments | | | (1.21 | ) | | | 0.12 | | | | 0.45 | | | | 0.43 | | | | (0.23 | ) | | | 0.53 | |
| Total from investment operations | | | (1 11) | | | | 0.31 | | | | 0.70 | | | | 0.74 | | | | 0.14 | | | | 0.87 | |
| Less dividends and distributions: | | | | | | | | | | | | | | | | | | | | | | | | |
| Dividends from net investment income | | | (0.15 | ) | | | (0.28 | ) | | | (0.32 | ) | | | (0.37 | ) | | | (0.36 | ) | | | (0.32 | ) |
| Distributions from net realized gains | | | — | | | | (0.02 | ) | | | (0.04 | ) | | | (0.08 | ) | | | (0.01 | ) | | | (0.08 | ) |
| Total distributions | | | (0.15 | ) | | | (0.30 | ) | | | (0.36 | ) | | | (0.45 | ) | | | (0.37 | ) | | | (0.40 | ) |
| Net asset value, end of period | | $ | 9.77 | | | $ | 11.03 | | | $ | 11.02 | | | $ | 10.68 | | | $ | 10.39 | | | $ | 10.62 | |
| Total Return | | | (10.15 | )% (d) | | | 2.87 | % | | | 6.71 | % | | | 7.19 | % | | | 1.36 | % | | | 8.68 | % |
| Ratios and Supplemental Data | | | | | | | | | | | | | | | | | | | | | | | | |
| Net assets, end of period (in 000s) | | $ | 228,717 | | | $ | 233,490 | | | $ | 145,819 | | | $ | 62,358 | | | $ | 35,204 | | | $ | 21,371 | |
| Ratio of expenses to average net assets | | | | | | | | | | | | | | | | | | | | | | | | |
| With fee waivers/reimbursements | | | 0.50 | % (e) | | | 0.50 | % | | | 0.50 | % | | | 0.50 | % | | | 0.50 | % | | | 0.40 | % |
| Without fee waivers/reimbursements | | | 0.55 | % (e) | | | 0.57 | % | | | 0.62 | % | | | 0.76 | % | | | 0.91 | % | | | 2.29 | % (c) |
| Ratio of net investment income to average net assets | | | | | | | | | | | | | | | | | | | | | | | | |
| With fee waivers/reimbursements | | | 1.93 | % (e) | | | 1 74% | | | | 2.32 | % | | | 2.90 | % | | | 3.51 | % | | | 3.24 | % |
| Without fee waivers/reimbursements | | | 1.88 | % (e) | | | 1 67% | | | | 2.20 | % | | | 2.64 | % | | | 3.10 | % | | | 1.35 | % (c) |
| Portfolio turnover rate | | | 142 | % (d) | | | 37 | % | | | 101 | % | | | 114 | % | | | 188 | % | | | 284 | % |
| (a) | Prior to April 30, 2018 known as the Westcore Municipal Opportunities Fund. |
| (b) | Calculated using the average shares method. |
| (c) | Ratios before fee waivers for start up periods may not be representative of long-term operating results. |
| (d) | Total return and portfolio turnover are not annualized for periods less than one full year. |
See Notes to Financial Statements.
| 128 | | www.sbhfunds.com |
| Segall Bryant & Hamill Colorado Tax Free Fund | Financial Highlights |
| For a Share Outstanding Throughout the Periods Presented |
| | | Six Months | | | | | | | | | | | | | | | | |
| | | Ended | | | Year Ended | | | Year Ended | | | Year Ended | | | Year Ended | | | Year Ended | |
| | | June 30, 2022 | | | December 31, | | | December 31, | | | December 31, | | | December 31, | | | December 31, | |
| Retail | | (Unaudited) | | | 2021 | | | 2020 | | | 2019 | | | 2018(a) | | | 2017 | |
| Net asset value, beginning of period | | $ | 11.91 | | | $ | 11.95 | | | $ | 11.69 | | | $ | 11.30 | | | $ | 11 58 | | | $ | 11.32 | |
| Income (loss) from investment operations: | | | | | | | | | | | | | | | | | | | | | | | | |
| Net investment income(b) | | | 0.10 | | | | 0.17 | | | | 0.24 | | | | 0.27 | | | | 0.35 | | | | 0.32 | |
| Net realized and unrealized gains (losses) on investments | | | (1 10) | | | | 0.05 | | | | 0.34 | | | | 0.47 | | | | (0.28 | ) | | | 0.26 | |
| Total from investment operations | | | (1.00 | ) | | | 0.22 | | | | 0.58 | | | | 0.74 | | | | 0.07 | | | | 0.58 | |
| Less dividends and distributions: | | | | | | | | | | | | | | | | | | | | | | | | |
| Dividends from net investment income | | | (0.15 | ) | | | (0.26 | ) | | | (0.32 | ) | | | (0.35 | ) | | | (0.35 | ) | | | (0.32 | ) |
| Net asset value, end of period | | $ | 10.76 | | | $ | 11.91 | | | $ | 11.95 | | | $ | 11.69 | | | $ | 11.30 | | | $ | 11 58 | |
| Total Return | | | (8.47 | )% (c) | | | 1.87% | | | | 5.08 | % | | | 6.62 | % | | | 0.60 | % | | | 5.21 | % |
| Ratios and Supplemental Data | | | | | | | | | | | | | | | | | | | | | | | | |
| Net assets, end of period (in 000s) | | $ | 168,567 | | | $ | 216,617 | | | $ | 205,285 | | | $ | 161,755 | | | $ | 176,020 | | | $ | 193,426 | |
| Ratio of expenses to average net assets | | | | | | | | | | | | | | | | | | | | | | | | |
| With fee waivers/reimbursements | | | 0.65 | % (d) | | | 0.65 | % | | | 0.65 | % | | | 0.65 | % | | | 0.65 | % | | | 0.65 | % |
| Without fee waivers/reimbursements | | | 0.68 | % (d) | | | 0.68 | % | | | 0.70 | % | | | 0.77 | % | | | 0.82 | % | | | 0.82 | % |
| Ratio of net investment income to average net assets | | | | | | | | | | | | | | | | | | | | | | | | |
| With fee waivers/reimbursements | | | 1.82 | % (d) | | | 1.44 | % | | | 2.00 | % | | | 2.29 | % | | | 3.05 | % | | | 2.80 | % |
| Without fee waivers/reimbursements | | | 1 79 | % (d) | | | 1.41 | % | | | 1.95 | % | | | 2.17 | % | | | 2.88 | % | | | 2.63 | % |
| Portfolio turnover rate | | | 30 | % (c) | | | 15 | % | | | 71 | % | | | 30 | % | | | 47 | % | | | 64 | % |
| (a) | Prior to April 30, 2018 known as the Westcore Colorado Tax-Exempt Fund. |
| (b) | Calculated using the average shares method. |
| (c) | Total return and portfolio turnover are not annualized for periods less than one full year. |
See Notes to Financial Statements.
| Semi-Annual Report | June 30, 2022 | | 129 |
| Segall Bryant & Hamill Colorado Tax Free Fund | Financial Highlights |
| For a Share Outstanding Throughout the Periods Presented |
| | | Six Months | | | | | | | | | | | | | | | | |
| | | Ended | | | Year Ended | | | Year Ended | | | Year Ended | | | Year Ended | | | Year Ended | |
| | | June 30, 2022 | | | December 31, | | | December 31, | | | December 31, | | | December 31, | | | December 31, | |
| Institutional | | (Unaudited) | | | 2021 | | | 2020 | | | 2019 | | | 2018(a) | | | 2017 | |
| Net asset value, beginning of period | | $ | 11.96 | | | $ | 12.00 | | | $ | 11.73 | | | $ | 11.33 | | | $ | 11 61 | | | $ | 11.34 | |
| Income (loss) from investment operations: | | | | | | | | | | | | | | | | | | | | | | | | |
| Net investment income(b) | | | 0.11 | | | | 0.19 | | | | 0.25 | | | | 0.28 | | | | 0.36 | | | | 0.34 | |
| Net realized and unrealized gains (losses) on investments | | | (1 12) | | | | 0.05 | | | | 0.36 | | | | 0.48 | | | | (0.28 | ) | | | 0.26 | |
| Total from investment operations | | | (1.01 | ) | | | 0.24 | | | | 0.61 | | | | 0.76 | | | | 0.08 | | | | 0.60 | |
| Less dividends and distributions: | | | | | | | | | | | | | | | | | | | | | | | | |
| Dividends from net investment income | | | (0.15 | ) | | | (0.28 | ) | | | (0.34 | ) | | | (0.36 | ) | | | (0.36 | ) | | | (0.33 | ) |
| Net asset value, end of period | | $ | 10.80 | | | $ | 11.96 | | | $ | 12.00 | | | $ | 11.73 | | | $ | 11.33 | | | $ | 11 61 | |
| Total Return | | | (8.45 | )% (c) | | | 2.01 | % | | | 5.29 | % | | | 6.80 | % | | | 0.73 | % | | | 5.34 | % |
| Ratios and Supplemental Data | | | | | | | | | | | | | | | | | | | | | | | | |
| Net assets, end of period (in 000s) | | $ | 302,076 | | | $ | 370,546 | | | $ | 289,774 | | | $ | 214,996 | | | $ | 96,615 | | | $ | 79,263 | |
| Ratio of expenses to average net assets | | | | | | | | | | | | | | | | | | | | | | | | |
| With fee waivers/reimbursements | | | 0.50 | % (d) | | | 0.50 | % | | | 0.50 | % | | | 0.50 | % | | | 0.50 | % | | | 0.50 | % |
| Without fee waivers/reimbursements | | | 0.53 | % (d) | | | 0.52 | % | | | 0.55 | % | | | 0.61 | % | | | 0.63 | % | | | 0.64 | % |
| Ratio of net investment income to average net assets | | | | | | | | | | | | | | | | | | | | | | | | |
| With fee waivers/reimbursements | | | 1.97 | % (d) | | | 1 54% | | | | 2.15 | % | | | 2.41 | % | | | 3.20 | % | | | 2.96 | % |
| Without fee waivers/reimbursements | | | 1.94 | % (d) | | | 1.52 | % | | | 2.10 | % | | | 2.30 | % | | | 3.07 | % | | | 2.82 | % |
| Portfolio turnover rate | | | 30 | % (c) | | | 15 | % | | | 71 | % | | | 30 | % | | | 47 | % | | | 64 | % |
| (a) | Prior to April 30, 2018 known as the Westcore Colorado Tax-Exempt Fund. |
| (b) | Calculated using the average shares method. |
| (c) | Total return and portfolio turnover are not annualized for periods less than one full year. |
See Notes to Financial Statements.
| 130 | | www.sbhfunds.com |
| Segall Bryant & Hamill Funds | Notes to Financial Statements |
| | June 30, 2022 (Unaudited) |
1. ORGANIZATION
Segall Bryant & Hamill Trust (the “Trust”) is registered under the Investment Company Act of 1940, as amended, (the “1940 Act”), as an open-end management investment company. Interests in the Segall Bryant & Hamill Small Cap Value Fund, Segall Bryant & Hamill Small Cap Growth Fund, Segall Bryant & Hamill Small Cap Core Fund, Segall Bryant & Hamill All Cap Fund, Segall Bryant & Hamill Emerging Markets Fund, Segall Bryant & Hamill International Small Cap Fund, Segall Bryant & Hamill Fundamental International Small Cap Fund, Segall Bryant & Hamill Global All Cap Fund, Segall Bryant & Hamill Workplace Equality Fund, Segall Bryant & Hamill Short Term Plus Fund, Segall Bryant & Hamill Plus Bond Fund, Segall Bryant & Hamill Quality High Yield Fund, Segall Bryant & Hamill Municipal Opportunities Fund and Segall Bryant & Hamill Colorado Tax Free Fund (the “Funds”) are represented by separate classes of beneficial interest of the Trust, which is organized as a Massachusetts business trust. All of the Funds offer Retail Class and Institutional Class shares. All classes of shares have identical rights to earnings, assets and voting privileges, except for class specific expenses and exclusive rights to vote on matters solely affecting such class.
Each of the Segall Bryant & Hamill Small Cap Value Fund, Segall Bryant & Hamill Small Cap Growth Fund, Segall Bryant & Hamill Small Cap Core Fund, Segall Bryant & Hamill All Cap Fund, Segall Bryant & Hamill Emerging Markets Fund, Segall Bryant & Hamill International Small Cap Fund, Segall Bryant & Hamill Fundamental International Small Cap Fund, Segall Bryant & Hamill Global All Cap and Segall Bryant & Hamill Workplace Equality Fund seeks to achieve long-term capital appreciation. The Segall Bryant & Hamill Short Term Plus Fund seeks to provide current income and competitive total return. Each of the Segall Bryant & Hamill Plus Bond Fund and Segall Bryant & Hamill Quality High Yield Fund seeks to achieve long-term total rate of return consistent with preservation of capital. The Segall Bryant & Hamill Municipal Opportunities Fund seeks income exempt from Federal income taxes. The Segall Bryant & Hamill Colorado Tax Free Fund seeks income exempt from both federal and Colorado state personal income taxes.
The Funds (other than Segall Bryant & Hamill Emerging Markets Fund and Segall Bryant & Hamill Colorado Tax Free Fund, which are non-diversified) are diversified portfolios of the Trust for the purposes of the Investment Company Act of 1940, as amended (the “1940 Act”).
2. SIGNIFICANT ACCOUNTING POLICIES
The following is a summary of significant accounting policies consistently followed by each Fund in the preparation of its financial statements. Each Fund is considered an investment company for financial reporting purposes. The following policies are in conformity with accounting principles generally accepted in the United States of America for investment companies, under Accounting Standards Codification Topic 946 – Financial Services – Investment Companies.
Use of Estimates – The preparation of financial statements in accordance with accounting principles generally accepted in the United States of America requires management to make estimates and assumptions that affect the reported amounts of assets and liabilities and disclosure of contingent assets and liabilities in the financial statements. The actual results could differ from those estimates.
New Accounting Pronouncement – In March 2020, the Financial Accounting Standards Board issued Accounting Standards Update No. 2020-04 (“ASU 2020-04”), Reference Rate Reform (Topic 848): Facilitation of the Effects of Reference Rate Reform on Financial Reporting. ASU 2020-04 provides optional temporary financial reporting relief from the effect of certain types of contract modifications due to the planned discontinuation of the London Interbank Offered Rate (“LIBOR”) and other interbank -offered based reference rates at the end of 2021. ASU 2020-04 is effective for certain reference rate-related contract modifications that occur during the period March 12, 2020 through December 31, 2022. The Funds will consider this optional guidance prospectively, if applicable.
Cash Equivalents – Each Fund subscribes to the Brown Brothers Harriman & Co. (“BBH”) Cash Management Service (“CMS”), whereby cash balances are automatically swept into overnight demand deposits with a branch of a pre-approved commercial bank. This fully automated program allows the Funds to earn interest on cash balances. As of June 30, 2022, the cash equivalents balances reflected on the Statements of Assets and Liabilities represent the amounts participating in the BBH CMS.
Investment Valuation – All securities of the Funds are valued as of the close of regular trading on the New York Stock Exchange (“NYSE”), currently 4:00 p.m. (Eastern Time), on each day that the NYSE is open, subject to provisions in the prospectus and/or Statement of Additional Information regarding pricing at other times in case of an emergency and optional pricing of the Funds in the event that the NYSE does not open for business because of an emergency.
Securities that are traded on a recognized domestic stock exchange are generally valued at the last sales price as of the valuation time on the principal stock exchange on which they are traded. Securities that are principally traded on the National Association of Securities Dealers Automated Quotation (“NASDAQ”) exchange are generally valued at the NASDAQ Official Closing Price (“NOCP”). Unlisted securities that are traded on the domestic over-the-counter market for which last sales prices are available, are generally valued at the last sales price as of the valuation time. In the absence of sales and NOCP, such securities are valued at the bid price.
Securities that are traded on a foreign stock exchange (and that are not listed on a recognized domestic stock exchange or traded on the NASDAQ exchange or the domestic over-the-counter market) are generally valued at the official closing price on the principal stock exchange on which they are traded. When an event occurs subsequent to the close of the foreign exchange and the close of the NYSE that was likely
| Semi-Annual Report | June 30, 2022 | | 131 |
| Segall Bryant & Hamill Funds | Notes to Financial Statements |
| | June 30, 2022 (Unaudited) |
to have changed such value, the fair value of those securities are determined in good faith in accordance with procedures established by and under the general supervision of the Board of Trustees. The Funds will use a fair valuation model provided by an independent pricing service, which is intended to reflect fair value when a security’s value is believed to have been materially affected by a valuation event that has occurred between the close of the exchange or market on which the security is traded and the close of the regular trading day on the NYSE. In the event that closing prices are not available for such foreign securities, such securities are generally valued at the last sales price occurring prior to the closing of its principal exchange.
Forward foreign currency contracts have a fair value determined by an automated system that estimates rates on the basis of the current day foreign currency exchange rates and forward foreign currency exchange rates supplied by a pricing vendor. Foreign currency exchange rates and forward foreign currency exchange rates may generally be obtained at the close of the NYSE.
Redeemable securities issued by open-end registered investment companies are valued at the investment company’s applicable net asset value.
Fixed-income obligations, having a remaining maturity of greater than 60 days, are typically valued at the evaluated prices formulated by an independent pricing service.
When market quotations are not readily available or when events occur that make established valuation methods unreliable, securities of the Fund may be valued in good faith by or under the direction of the Board of Trustees. Factors which may be considered when determining the value of a security include (a) the fundamental data relating to the investment; (b) an evaluation of the forces which influence the market in which the security is sold, including the liquidity and depth of the market; (c) the market value at date of purchase; (d) information as to any transactions or offers with respect to the security or comparable securities; and (e) any other relevant matters.
Securities Traded on Foreign Exchanges – All of the Funds, except the Segall Bryant & Hamill Colorado Tax Free Fund, may invest at least a portion of their assets in foreign securities. As of June 30, 2022, all Funds were primarily invested in securities traded on U.S. exchanges, except Segall Bryant & Hamill Emerging Markets Fund, Segall Bryant & Hamill International Small Cap Fund, Segall Bryant & Hamill Fundamental International Small Cap Fund and Segall Bryant & Hamill Global All Cap Fund. In the event that a Fund executes a security transaction on a foreign exchange, the Fund will generally enter into a foreign currency contract to settle the foreign security transaction. Foreign securities may carry more risk than U.S. securities, such as political, market and currency risks. The accounting records of the Funds are maintained in U.S. dollars. Prices of securities denominated in foreign currencies are translated into U.S. dollars at the closing rates of exchange at period end. Amounts related to the purchase and sale of foreign securities and investment income are translated at the rates of exchange prevailing on the respective dates of such transactions.
The portion of realized and unrealized gains or losses on investments due to fluctuations in foreign currency exchange rates is not separately disclosed and is included in realized and unrealized gains or losses on investments, when applicable.
Federal Income Taxes – No provision for income taxes is included in the accompanying financial statements, as the Funds intend to distribute to shareholders all taxable investment income and realized gains and otherwise comply with Subchapter M of the Internal Revenue Code of 1986, as amended, applicable to regulated investment companies.
As of and during the six months ended June 30, 2022, the Funds did not have a liability for any unrecognized tax benefits. The Funds file U.S. federal, state, and local tax returns as required. Each Fund’s tax returns are subject to examination by the relevant tax authorities until expiration of the applicable statute of limitations which is generally three years after the filing of the tax return. Tax returns for open years have incorporated no uncertain tax positions that require a provision for income taxes. The Funds recognize interest and penalties, if any, related to unrecognized tax benefits as income tax expense on the Statements of Operations. During the six months ended June 30, 2022, the Funds did not incur any interest or penalties.
When-Issued/Forward Commitment Securities – Each Fund may purchase or sell securities on a “when-issued” or “forward commitment” basis which involves a commitment by the Fund to purchase or sell particular securities with payment and delivery taking place at a future date. During this period, such securities do not earn interest, are subject to market fluctuation and may increase or decrease in value prior to their delivery. In accordance with SEC guidance, each Fund segregates liquid assets in an amount sufficient to satisfy the purchase price. The purchase of securities on a when-issued or forward commitment basis may increase the volatility of the Fund’s net asset value to the extent each Fund makes such purchases while remaining substantially fully invested. Settlements in the ordinary course of business, which may take substantially more than three business days for non-U.S. securities, are not treated by the Funds as “when-issued” or “forward commitment” transactions.
Common Expenses – Expenses of the Trust not attributable solely to one of the Funds are allocated among the Funds based on the relative net assets of each Fund or based on the nature of the expense and its relative applicability to each Fund.
Allocation Between Classes – Investment income earned, realized capital gains and losses, and unrealized appreciation and depreciation are allocated daily to each class of a Fund based upon its proportionate share of total net assets of that Fund. Class-specific expenses are charged directly to the class incurring the expense. Common expenses which are not attributable to a specific class are allocated daily to each class of shares of a Fund based upon its proportionate share of total net assets of that Fund.
| 132 | | www.sbhfunds.com |
| Segall Bryant & Hamill Funds | Notes to Financial Statements |
| | June 30, 2022 (Unaudited) |
Security Transactions and Related Investment Income – For financial reporting purposes, the Funds’ investment transactions and shareholder transactions are recorded on trade date. Dividend income is recorded on the ex-dividend date. Foreign dividend income is recorded on the ex-dividend date or as soon as practical after the Funds determine the existence of a dividend declaration after exercising reasonable due diligence. Non-cash dividends, if any, included in dividend income, are recorded at the fair value of the security received. Withholding taxes on foreign dividends, net of reclaims, and foreign capital gains taxes, if any, have been recorded in accordance with the Funds’ understanding of the applicable country’s rules and tax rates. Interest income is accrued as earned. Discounts and premiums on fixed income securities are amortized using the effective interest method. Realized gains and losses from investment transactions and unrealized appreciation and depreciation of investments are reported on an identified cost basis.
Investments in Real Estate Investment Trusts (REITs) – With respect to each Fund, dividend income is recorded based on the income included in distributions received from its REIT investments using published REIT reclassifications including some management estimates when actual amounts are not available. Distributions received in excess of these estimated amounts are recorded as a reduction of the cost of investments or reclassified to capital gains. The actual amounts of income, return of capital, and capital gains are only determined by each REIT after its fiscal year end and may differ from the estimated amounts.
3. CERTAIN INVESTMENTS AND ASSOCIATED RISKS
Market, Credit and Counterparty Risk – In the normal course of business, the Funds invest in securities and enter into transactions where risks exist due to fluctuations in the market (market risk) or failure of the issuer of a security to meet all of its obligations (issuer credit risk). The value of securities held by the Funds may decline in response to certain events, including those directly involving the issuers whose securities are owned by the Funds; conditions affecting the general economy; overall market changes; local, regional, national or global political, social or economic instability; and currency and interest rate and price fluctuations. Similar to issuer credit risk, the Funds may be exposed to counterparty credit risk, or the risk that an entity with which the Funds have unsettled or open transactions may fail to or be unable to perform on its commitments. The Funds manage counterparty credit risk by entering into transactions only with counterparties that they believe have the financial resources to honor their obligations and by monitoring the financial stability of those counterparties.
Country Risk – As of June 30, 2022, the Segall Bryant & Hamill Emerging Markets Fund invested a significant percentage of its assets in China; and the Segall Bryant & Hamill International Small Cap Fund invested a significant percentage of its assets in Japan. Therefore, they may be more affected by economic developments and currency fluctuations in these countries.
Sector Concentration Risk – The Funds may concentrate investments in companies that are in a single sector or related sector. Concentrating investments in a single sector may make the Fund more susceptible to adverse economic, business, regulatory or other developments affecting that sector. If an economic downturn occurs in a sector in which a Fund’s investments are concentrated, the Fund may perform poorly during that period. Refer to each Fund’s Statement of Investments for its particular concentration in the various sectors.
4. SHARES OF BENEFICIAL INTEREST
On June 30, 2022, there was an unlimited number of no par value shares of beneficial interest authorized for each Fund. Transactions in shares of beneficial interest were as follows:
| | | For the | | | For the | |
| | | Six Months Ended | | | Year Ended | |
| | | June 30, 2022 | | | December 31, 2021 | |
| Segall Bryant & Hamill Small Cap Value Fund | | | | | | | | |
| Retail: | | | | | | | | |
| Shares Sold | | | 47,718 | | | | 202,728 | |
| Shares issued in Reinvestment of Distributions | | | — | | | | 27,558 | |
| Total | | | 47,718 | | | | 230,286 | |
| Less Shares Redeemed | | | (40,129 | ) | | | (98,009 | ) |
| Net Increase | | | 7,589 | | | | 132,277 | |
| Institutional: | | | | | | | | |
| Shares Sold | | | 12,122,804 | | | | 22,217,491 | |
| Shares issued in Reinvestment of Distributions | | | — | | | | 1,408,276 | |
| Total | | | 12,122,804 | | | | 23,625,767 | |
| Less Shares Redeemed | | | (7,779,684 | ) | | | (14,266,912 | ) |
| Net Increase | | | 4,343,120 | | | | 9,358,855 | |
| Semi-Annual Report | June 30, 2022 | | 133 |
| Segall Bryant & Hamill Funds | Notes to Financial Statements |
| | June 30, 2022 (Unaudited) |
| | | For the | | | For the | |
| | | Six Months Ended | | | Year Ended | |
| | | June 30, 2022 | | | December 31, 2021 | |
| Segall Bryant & Hamill Small Cap Growth Fund | | | | | | | | |
| Retail: | | | | | | | | |
| Shares Sold | | | 1,096,452 | | | | 2,192,952 | |
| Shares issued in Reinvestment of Distributions | | | — | | | | — | |
| Total | | | 1,096,452 | | | | 2,192,952 | |
| Less Shares Redeemed | | | (488,524 | ) | | | (428,468 | ) |
| Net Increase | | | 607,928 | | | | 1,764,484 | |
| Institutional: | | | | | | | | |
| Shares Sold | | | 1,886,097 | | | | 3,723,238 | |
| Shares issued in Reinvestment of Distributions | | | — | | | | — | |
| Total | | | 1,886,097 | | | | 3,723,238 | |
| Less Shares Redeemed | | | (2,676,859 | ) | | | (930,086 | ) |
| Net Increase (Decrease) | | | (790,762 | ) | | | 2,793,152 | |
| Segall Bryant & Hamill Small Cap Core Fund | | | | | | | | |
| Retail: | | | | | | | | |
| Shares Sold | | | 27,956 | | | | 103,776 | |
| Shares issued in Reinvestment of Distributions | | | — | | | | 23,430 | |
| Total | | | 27,956 | | | | 127,206 | |
| Less Shares Redeemed | | | (90,719 | ) | | | (335,452 | ) |
| Net Decrease | | | (62,763 | ) | | | (208,246 | ) |
| Institutional: | | | | | | | | |
| Shares Sold | | | 981,417 | | | | 55,967 | |
| Shares issued in Reinvestment of Distributions | | | — | | | | 429,123 | |
| Total | | | 981,417 | | | | 485,090 | |
| Less Shares Redeemed | | | (40,581 | ) | | | (149,348 | ) |
| Net Increase | | | 940,836 | | | | 335,742 | |
| | | | | | | | | |
| | | For the | | | For the | |
| | | Six Months Ended | | | Year Ended | |
| | | June 30, 2022 | | | December 31, 2021 | |
| Segall Bryant & Hamill All Cap Fund | | | | | | | | |
| Retail: | | | | | | | | |
| Shares Sold | | | 629 | | | | 10,114 | |
| Shares issued in Reinvestment of Distributions | | | — | | | | 4,071 | |
| Total | | | 629 | | | | 14,185 | |
| Less Shares Redeemed | | | (462 | ) | | | (1,967 | ) |
| Net Increase | | | 167 | | | | 12,218 | |
| Institutional: | | | | | | | | |
| Shares Sold | | | 348,569 | | | | 1,214,703 | |
| Shares issued in Reinvestment of Distributions | | | — | | | | 805,081 | |
| Total | | | 348,569 | | | | 2,019,784 | |
| Less Shares Redeemed | | | (859,878 | ) | | | (2,440,979 | ) |
| Net Decrease | | | (511,309 | ) | | | (421,195 | ) |
| 134 | | www.sbhfunds.com |
| Segall Bryant & Hamill Funds | Notes to Financial Statements |
| | June 30, 2022 (Unaudited) |
| | | For the | | | For the | |
| | | Six Months Ended | | | Year Ended | |
| | | June 30, 2022 | | | December 31, 2021 | |
| Segall Bryant & Hamill Emerging Markets Fund | | | | | | | | |
| Retail: | | | | | | | | |
| Shares Sold | | | 96,219 | | | | 97,339 | |
| Shares issued in Reinvestment of Distributions | | | — | | | | 16,926 | |
| Total | | | 96,219 | | | | 114,265 | |
| Less Shares Redeemed | | | (171,485 | ) | | | (84,384 | ) |
| Net Increase (Decrease) | | | (75,266 | ) | | | 29,881 | |
| Institutional: | | | | | | | | |
| Shares Sold | | | 179,836 | | | | 1,015,693 | |
| Shares issued in Reinvestment of Distributions | | | — | | | | 180,095 | |
| Total | | | 179,836 | | | | 1,195,788 | |
| Less Shares Redeemed | | | (436,536 | ) | | | (142,059 | ) |
| Net Increase (Decrease) | | | (256,700 | ) | | | 1,053,729 | |
| Segall Bryant & Hamill International Small Cap Fund | | | | | | | | |
| Retail: | | | | | | | | |
| Shares Sold | | | 23,707 | | | | 69,291 | |
| Shares issued in Reinvestment of Distributions | | | 17,933 | | | | 56,832 | |
| Total | | | 41,640 | | | | 126,123 | |
| Less Shares Redeemed | | | (1,420,686 | ) | | | (1,994,358 | ) |
| Net Decrease | | | (1,379,046 | ) | | | (1,868,235 | ) |
| Institutional: | | | | | | | | |
| Shares Sold | | | 451,022 | | | | 1,574,949 | |
| Shares issued in Reinvestment of Distributions | | | 163,902 | | | | 471,234 | |
| Total | | | 614,924 | | | | 2,046,183 | |
| Less Shares Redeemed | | | (455,469 | ) | | | (3,655,446 | ) |
| Net Increase | | | 159,455 | | | | (1,609,263 | ) |
| | | | | | | | | |
| | | For the | | | For the | |
| | | Six Months Ended | | | Year Ended | |
| | | June 30, 2022 | | | December 31, 2021 | |
| Segall Bryant & Hamill Fundamental International Small Cap Fund | | | | | | | | |
| Retail: | | | | | | | | |
| Shares Sold | | | 187,076 | | | | 493,735 | |
| Shares issued in Reinvestment of Distributions | | | — | | | | 144,895 | |
| Total | | | 187,076 | | | | 638,630 | |
| Less Shares Redeemed | | | (409,739 | ) | | | (378,627 | ) |
| Net Increase (Decrease) | | | (222,663 | ) | | | 260,003 | |
| Institutional: | | | | | | | | |
| Shares Sold | | | 813,572 | | | | 1,509,713 | |
| Shares issued in Reinvestment of Distributions | | | — | | | | 147,769 | |
| Total | | | 813,572 | | | | 1,657,482 | |
| Less Shares Redeemed | | | (683,608 | ) | | | (389,609 | ) |
| Net Increase | | | 129,964 | | | | 1,267,873 | |
| Segall Bryant & Hamill Global All Cap Fund | | | | | | | | |
| Retail: | | | | | | | | |
| Shares Sold | | | 3,175 | | | | 16,244 | |
| Shares issued in Reinvestment of Distributions | | | — | | | | 175,562 | |
| Total | | | 3,175 | | | | 191,806 | |
| Less Shares Redeemed | | | (100,130 | ) | | | (580,133 | ) |
| Net Decrease | | | (96,955 | ) | | | (388,327 | ) |
| Semi-Annual Report | June 30, 2022 | | 135 |
| Segall Bryant & Hamill Funds | Notes to Financial Statements |
| | June 30, 2022 (Unaudited) |
| | | For the | | | For the | |
| | | Six Months Ended | | | Year Ended | |
| | | June 30, 2022 | | | December 31, 2021 | |
| Institutional: | | | | | | | | |
| Shares Sold | | | 1,322 | | | | 114,822 | |
| Shares issued in Reinvestment of Distributions | | | — | | | | 28,009 | |
| Total | | | 1,322 | | | | 142,831 | |
| Less Shares Redeemed | | | (264,577 | ) | | | (60,824 | ) |
| Net Increase (Decrease) | | | (263,255 | ) | | | 82,007 | |
| Segall Bryant & Hamill Workplace Equality Fund | | | | | | | | |
| Retail: | | | | | | | | |
| Shares Sold | | | 58,771 | | | | 155,100 | |
| Shares issued in Reinvestment of Distributions | | | — | | | | 105,484 | |
| Total | | | 58,771 | | | | 260,584 | |
| Less Shares Redeemed | | | (190,936 | ) | | | (169,915 | ) |
| Net Increase (Decrease) | | | (132,165 | ) | | | 90,669 | |
| Institutional: | | | | | | | | |
| Shares Sold | | | 130,955 | | | | 588,224 | |
| Shares issued in Reinvestment of Distributions | | | — | | | | 157,394 | |
| Total | | | 130,955 | | | | 745,618 | |
| Less Shares Redeemed | | | (16,692 | ) | | | (179,809 | ) |
| Net Increase | | | 114,263 | | | | 565,809 | |
| | | | | | | | | |
| | | For the | | | For the | |
| | | Six Months Ended | | | Year Ended | |
| | | June 30, 2022 | | | December 31, 2021 | |
| Segall Bryant & Hamill Short Term Plus Fund | | | | | | | | |
| Retail: | | | | | | | | |
| Shares Sold | | | 52,335 | | | | 1,226,366 | |
| Shares issued in Reinvestment of Distributions | | | 2,590 | | | | 5,471 | |
| Total | | | 54,925 | | | | 1,231,837 | |
| Less Shares Redeemed | | | (602,477 | ) | | | (343,254 | ) |
| Net Increase (Decrease) | | | (547,552 | ) | | | 888,583 | |
| Institutional: | | | | | | | | |
| Shares Sold | | | 604,352 | | | | 3,317,870 | |
| Shares issued in Reinvestment of Distributions | | | 13,733 | | | | 27,487 | |
| Total | | | 618,085 | | | | 3,345,357 | |
| Less Shares Redeemed | | | (775,100 | ) | | | (1,686,877 | ) |
| Net Increase (Decrease) | | | (157,015 | ) | | | 1,658,480 | |
| Segall Bryant & Hamill Plus Bond Fund | | | | | | | | |
| Retail: | | | | | | | | |
| Shares Sold | | | 2,309,850 | | | | 6,254,334 | |
| Shares issued in Reinvestment of Distributions | | | 565,430 | | | | 1,377,765 | |
| Total | | | 2,875,280 | | | | 7,632,099 | |
| Less Shares Redeemed | | | (7,499,698 | ) | | | (17,544,787 | ) |
| Net Decrease | | | (4,624,418 | ) | | | (9,912,688 | ) |
| Institutional: | | | | | | | | |
| Shares Sold | | | 5,641,702 | | | | 18,332,140 | |
| Shares issued in Reinvestment of Distributions | | | 697,314 | | | | 1,578,176 | |
| Total | | | 6,339,016 | | | | 19,910,316 | |
| Less Shares Redeemed | | | (14,001,793 | ) | | | (12,301,097 | ) |
| Net Increase (Decrease) | | | (7,662,777 | ) | | | 7,609,219 | |
| 136 | | www.sbhfunds.com |
| Segall Bryant & Hamill Funds | Notes to Financial Statements |
| | June 30, 2022 (Unaudited) |
| | | For the | | | For the | |
| | | Six Months Ended | | | Year Ended | |
| | | June 30, 2022 | | | December 31, 2021 | |
| Segall Bryant & Hamill Quality High Yield Fund | | | | | | | | |
| Retail: | | | | | | | | |
| Shares Sold | | | 189,879 | | | | 686,553 | |
| Shares issued in Reinvestment of Distributions | | | 76,084 | | | | 144,558 | |
| Total | | | 265,963 | | | | 831,111 | |
| Less Shares Redeemed | | | (513,502 | ) | | | (1,071,289 | ) |
| Net Decrease | | | (247,539 | ) | | | (240,178 | ) |
| Institutional: | | | | | | | | |
| Shares Sold | | | 810,103 | | | | 2,917,981 | |
| Shares issued in Reinvestment of Distributions | | | 128,520 | | | | 207,858 | |
| Total | | | 938,623 | | | | 3,125,839 | |
| Less Shares Redeemed | | | (1,935,382 | ) | | | (778,890 | ) |
| Net Increase (Decrease) | | | (996,759 | ) | | | 2,346,949 | |
| Segall Bryant & Hamill Municipal Opportunities Fund | | | | | | | | |
| Retail: | | | | | | | | |
| Shares Sold | | | 2,087,845 | | | | 2,360,437 | |
| Shares issued in Reinvestment of Distributions | | | 49,409 | | | | 70,841 | |
| Total | | | 2,137,254 | | | | 2,431,278 | |
| Less Shares Redeemed | | | (1,944,318 | ) | | | (1,188,474 | ) |
| Net Increase | | | 192,936 | | | | 1,242,804 | |
| Institutional: | | | | | | | | |
| Shares Sold | | | 13,192,702 | | | | 10,832,665 | |
| Shares issued in Reinvestment of Distributions | | | 332,175 | | | | 463,451 | |
| Total | | | 13,524,877 | | | | 11,296,116 | |
| Less Shares Redeemed | | | (11,284,298 | ) | | | (3,354,752 | ) |
| Net Increase | | | 2,240,579 | | | | 7,941,364 | |
| Segall Bryant & Hamill Colorado Tax Free Fund | | | | | | | | |
| Retail: | | | | | | | | |
| Shares Sold | | | 2,722,819 | | | | 5,059,760 | |
| Shares issued in Reinvestment of Distributions | | | 217,504 | | | | 368,992 | |
| Total | | | 2,940,323 | | | | 5,428,752 | |
| Less Shares Redeemed | | | (5,452,278 | ) | | | (4,420,608 | ) |
| Net Increase (Decrease) | | | (2,511,955 | ) | | | 1,008,144 | |
| Institutional: | | | | | | | | |
| Shares Sold | | | 6,825,314 | | | | 9,597,634 | |
| Shares issued in Reinvestment of Distributions | | | 359,817 | | | | 583,477 | |
| Total | | | 7,185,131 | | | | 10,181,111 | |
| Less Shares Redeemed | | | (10,195,447 | ) | | | (3,352,153 | ) |
| Net Increase (Decrease) | | | (3,010,316 | ) | | | 6,828,958 | |
5. TAX BASIS DISTRIBUTIONS AND TAX BASIS INFORMATION
Distributions – Distributions of net investment income, if any, are generally made annually for the Segall Bryant & Hamill Small Cap Value Fund, Segall Bryant & Hamill Small Cap Growth Fund, Segall Bryant & Hamill Small Cap Core Fund, Segall Bryant & Hamill All Cap Fund, Segall Bryant & Hamill Emerging Markets Fund, Segall Bryant & Hamill Fundamental International Small Cap Fund, Segall Bryant & Hamill Global All Cap Fund and Segall Bryant & Hamill Workplace Equality Fund; quarterly for Segall Bryant & Hamill International Small Cap Fund; and monthly for the Segall Bryant & Hamill Short Term Plus Fund, Segall Bryant & Hamill Plus Bond Fund, Segall Bryant & Hamill Quality High Yield Fund, Segall Bryant & Hamill Municipal Opportunities Fund and Segall Bryant & Hamill Colorado Tax Free Fund. Prior to June 2022, distributions of net income were generally paid annually for Segall Bryant & Hamill International Small Cap Fund. Prior to May 1, 2021, distributions of net investment income were made quarterly for the Segall Bryant & Hamill Global All Cap Fund and Segall Bryant & Hamill Workplace Equality Fund. Distributions of net realized capital gains, if any, are declared at least once each year for each of the Funds. Distributions to shareholders are recorded on the ex-dividend date.
| Semi-Annual Report | June 30, 2022 | | 137 |
| Segall Bryant & Hamill Funds | Notes to Financial Statements |
| | June 30, 2022 (Unaudited) |
The tax character of the distributions paid during the periods ended June 30, 2022 and December 31, 2021 were as follows:
| | | | | | | | Long-Term | | | | |
| Fund | | Period Ended | | Ordinary Income* | | | Capital Gains | | | Tax-Exempt Income | |
| Segall Bryant & Hamill Small Cap Value Fund | | 6/30/2022 | | $ | — | | | $ | — | | | $ | — | |
| | | 12/31/2021 | | | 16,606,782 | | | | 10,404,575 | | | | — | |
| Segall Bryant & Hamill Small Cap Growth Fund | | 6/30/2022 | | | — | | | | — | | | | — | |
| | | 12/31/2021 | | | — | | | | — | | | | — | |
| Segall Bryant & Hamill Small Cap Core Fund | | 6/30/2022 | | | — | | | | — | | | | — | |
| | | 12/31/2021 | | | 1,802,628 | | | | 6,882,637 | | | | — | |
| Segall Bryant & Hamill All Cap Fund | | 6/30/2022 | | | — | | | | — | | | | — | |
| | | 12/31/2021 | | | 4,099,620 | | | | 15,286,337 | | | | — | |
| Segall Bryant & Hamill Emerging Markets Fund | | 6/30/2022 | | | — | | | | — | | | | — | |
| | | 12/31/2021 | | | 1,805,148 | | | | 1,221,048 | | | | — | |
| Segall Bryant & Hamill International Small Cap Fund | | 6/30/2022 | | | 2,126,108 | | | | — | | | | — | |
| | | 12/31/2021 | | | 8,258,628 | | | | — | | | | — | |
| Segall Bryant & Hamill Fundamental International Small Cap Fund | | 6/30/2022 | | | — | | | | — | | | | — | |
| | | 12/31/2021 | | | 1,002,459 | | | | 5,906,123 | | | | — | |
| Segall Bryant & Hamill Global All Cap Fund | | 6/30/2022 | | | — | | | | — | | | | — | |
| | | 12/31/2021 | | | 1,598,070 | | | | 674,258 | | | | — | |
| Segall Bryant & Hamill Workplace Equality Fund | | 6/30/2022 | | | — | | | | — | | | | — | |
| | | 12/31/2021 | | | 906,387 | | | | 1,159,602 | | | | — | |
| Segall Bryant & Hamill Short Term Plus Fund | | 6/30/2022 | | | 166,144 | | | | — | | | | — | |
| | | 12/31/2021 | | | 323,124 | | | | 19,922 | | | | — | |
| Segall Bryant & Hamill Plus Bond Fund | | 6/30/2022 | | | 13,221,395 | | | | — | | | | — | |
| | | 12/31/2021 | | | 27,243,919 | | | | 6,776,101 | | | | — | |
| Segall Bryant & Hamill Quality High Yield Fund | | 6/30/2022 | | $ | 1,782,190 | | | $ | — | | | $ | — | |
| | | 12/31/2021 | | | 3,316,122 | | | | — | | | | — | |
| Segall Bryant & Hamill Municipal Opportunities Fund | | 6/30/2022 | | | — | | | | — | | | | 4,036,947 | |
| | | 12/31/2021 | | | 1,164,651 | | | | — | | | | 5,002,947 | |
| Segall Bryant & Hamill Colorado Tax Free Fund | | 6/30/2022 | | | — | | | | — | | | | 7,003,418 | |
| | | 12/31/2021 | | | 506,229 | | | | — | | | | 11,874,115 | |
| * | Ordinary income distributions for federal income tax purposes includes distributions from net investment income and short-term capital gains. |
As of June 30, 2022, net unrealized appreciation (depreciation) on investments based on federal tax cost was as follows:
| | | Segall Bryant & | | | Segall Bryant & | | | Segall Bryant & | | | Segall Bryant & | | | Segall Bryant & | |
| | | Hamill Small Cap | | | Hamill Small Cap | | | Hamill Small Cap | | | Hamill All Cap | | | Hamill Emerging | |
| | | Value Fund | | | Growth Fund | | | Core Fund | | | Fund | | | Markets Fund | |
| Tax cost of portfolio investments | | $ | 531,553,394 | | | $ | 187,956,629 | | | $ | 45,515,629 | | | $ | 91,400,368 | | | $ | 48,588,779 | |
| Gross unrealized appreciation | | | 70,181,677 | | | | 19,497,937 | | | | 3,209,886 | | | | 48,848,262 | | | | 5,478,202 | |
| Gross unrealized depreciation | | | (83,008,827 | ) | | | (52,218,675 | ) | | | (3,682,799 | ) | | | (6,343,929 | ) | | | (7,651,339 | ) |
| Net unrealized appreciation (depreciation) on portfolio investments | | $ | (12,827,150 | ) | | $ | (32,720,738 | ) | | $ | (472,913 | ) | | $ | 42,504,333 | | | $ | (2,173,137 | ) |
| | | | | | | | | | | | | | | | | | | | | |
| | | | | | | | | Segall Bryant | | | | | | | |
| | | | | | Segall Bryant | | | & Hamill | | | | | | | |
| | | | | | & Hamill | | | Fundamental | | | Segall Bryant & | | | Segall Bryant & | |
| | | | | | International | | | International | | | Hamill Global All | | | Hamill Workplace | |
| | | | | | Small Cap Fund | | | Small Cap Fund | | | Cap Fund | | | Equality Fund | |
| Tax cost of portfolio investments | | | $ | 125,674,033 | | | $ | 70,535,726 | | | $ | 24,072,179 | | | $ | 21,680,163 | |
| Gross unrealized appreciation | | | | 7,615,468 | | | | 5,935,809 | | | | 3,813,012 | | | | 2,524,479 | |
| Gross unrealized depreciation | | | | (20,791,444 | ) | | | (22,290,782 | ) | | | (1,885,697 | ) | | | (2,153,356 | ) |
| Net unrealized appreciation (depreciation) on portfolio investments | | | $ | (13,175,976 | ) | | $ | (16,354,973 | ) | | $ | 1,927,315 | | | $ | 371,123 | |
| 138 | | www.sbhfunds.com |
| Segall Bryant & Hamill Funds | Notes to Financial Statements |
| | June 30, 2022 (Unaudited) |
| | | | | | | | | | | | Segall Bryant & | | | | |
| | | Segall Bryant & | | | Segall Bryant & | | | Segall Bryant & | | | Hamill Municipal | | | Segall Bryant & | |
| | | Hamill Short Term | | | Hamill Plus Bond | | | Hamill Quality | | | Opportunities | | | Hamill Colorado | |
| | | Plus Bond Fund | | | Fund | | | High Yield Fund | | | Fund | | | Tax Free Fund | |
| Tax cost of portfolio investments | | $ | 44,072,178 | | | $ | 874,928,274 | | | $ | 88,685,828 | | | $ | 270,673,094 | | | $ | 475,420,783 | |
| Gross unrealized appreciation | | | 1,981 | | | | 2,216,760 | | | | 144,111 | | | | 238,874 | | | | 1,201,160 | |
| Gross unrealized depreciation | | | (1,586,713 | ) | | | (80,771,209 | ) | | | (11,474,467 | ) | | | (19,097,403 | ) | | | (37,563,031 | ) |
| Net unrealized depreciation on portfolio investments | | $ | (1,584,732 | ) | | $ | (78,554,449 | ) | | $ | (11,330,356 | ) | | $ | (18,858,529 | ) | | $ | (36,361,871 | ) |
The difference between book and tax basis cost of investments is attributable primarily to wash sales, passive foreign investment companies and tax treatment of certain other investments.
As of December 31, 2021, the components of distributable earnings (deficit) on a tax basis were as follows:
| | | Segall Bryant & | | | Segall Bryant & | | | Segall Bryant & | | | Segall Bryant & | | | Segall Bryant & | |
| | | Hamill Small Cap | | | Hamill Small Cap | | | Hamill Small Cap | | | Hamill All Cap | | | Hamill Emerging | |
| | | Value Fund | | | Growth Fund | | | Core Fund | | | Fund | | | Markets Fund | |
| Undistributed ordinary income | | $ | 1,388,983 | | | $ | — | | | $ | — | | | $ | — | | | $ | — | |
| Undistributed long term capital gains | | | 4,988,247 | | | | — | | | | 957,880 | | | | 3,172,411 | | | | — | |
| Accumulated capital and other losses | | | (13,036,768 | ) | | | (36,057,239 | ) | | | — | | | | (583,079 | ) | | | (909,551 | ) |
| Net unrealized appreciation on investments | | | 115,418,656 | | | | 38,778,374 | | | | 17,761,913 | | | | 89,519,518 | | | | 5,955,162 | |
| Net unrealized appreciation on foreign currency | | | — | | | | — | | | | — | | | | — | | | | 1,707 | |
| Other temporary differences | | | (66,579 | ) | | | (35,781 | ) | | | (979 | ) | | | (3,431 | ) | | | (1,033 | ) |
| Total accumulated earnings | | $ | 108,692,539 | | | $ | 2,685,354 | | | $ | 18,718,814 | | | $ | 92,105,419 | | | $ | 5,046,285 | |
| | | | | | | | | | | | | | | | | | | | | |
| | | | | | Segall Bryant | | | | | | | | | | |
| | | Segall Bryant | | | & Hamill | | | | | | | | | | |
| | | & Hamill | | | Fundamental | | | Segall Bryant & | | | Segall Bryant & | | | Segall Bryant | |
| | | International | | | International | | | Hamill Global All | | | Hamill Workplace | | | & Hamill Short | |
| | | Small Cap Fund | | | Small Cap Fund | | | Cap Fund | | | Equality Fund | | | Term Plus Fund | |
| Undistributed ordinary income | | $ | — | | | $ | — | | | $ | — | | | $ | — | | | $ | 235 | |
| Undistributed long term capital gains | | | — | | | | 5,998,042 | | | | 494,425 | | | | 204,765 | | | | — | |
| Accumulated capital and other losses | | | (74,551,846 | ) | | | (674,851 | ) | | | — | | | | (126,634 | ) | | | — | |
| Net unrealized appreciation (depreciation) on investments | | | 15,111,182 | | | | 18,919,229 | | | | 10,583,821 | | | | 7,007,992 | | | | (297,926 | ) |
| Net unrealized appreciation (depreciation) on foreign currency | | | (3,962 | ) | | | 10,340 | | | | (151 | ) | | | — | | | | — | |
| Other temporary differences | | | (3,448 | ) | | | (30,273 | ) | | | (25,211 | ) | | | (26,952 | ) | | | (722 | ) |
| Total accumulated earnings (deficit) | | $ | (59,448,074 | ) | | $ | 24,222,487 | | | $ | 11,052,884 | | | $ | 7,059,171 | | | $ | (298,413 | ) |
| | | | | | | | | Segall Bryant & | | | | |
| | | Segall Bryant & | | | Segall Bryant & | | | Hamill Municipal | | | Segall Bryant & | |
| | | Hamill Plus Bond | | | Hamill Quality | | | Opportunities | | | Hamill Colorado | |
| | | Fund | | | High Yield Fund | | | Fund | | | Tax Free Fund | |
| Undistributed ordinary income | | $ | — | | | $ | 8,238 | | | $ | — | | | $ | — | |
| Undistributed tax-exempt income | | | — | | | | — | | | | 289 | | | | — | |
| Accumulated capital and other losses | | | (188,466 | ) | | | (8,316,184 | ) | | | (31,913 | ) | | | (490,875 | ) |
| Net unrealized appreciation on investments | | | 35,062,005 | | | | 1,983,857 | | | | 4,663,083 | | | | 13,784,412 | |
| Other temporary differences | | | (240,753 | ) | | | (28,874 | ) | | | (3,988 | ) | | | (35,115 | ) |
| Total accumulated earnings (deficit) | | $ | 34,632,786 | | | $ | (6,352,963 | ) | | $ | 4,627,471 | | | $ | 13,258,422 | |
Other Temporary Differences is primarily related to deferred Trustee compensation.
| Semi-Annual Report | June 30, 2022 | | 139 |
| Segall Bryant & Hamill Funds | Notes to Financial Statements |
| | June 30, 2022 (Unaudited) |
Under current law, capital losses maintain their character as short-term or long-term and are carried forward to the next tax year without expiration. As of December 31, 2021, the following amounts are available as carry forwards to the next tax year:
| Fund | | Short-Term | | | Long-Term | |
| Segall Bryant & Hamill Small Cap Value Fund | | $ | 8,021,430 | | | $ | 5,015,338 | |
| Segall Bryant & Hamill Small Cap Growth Fund | | | 36,057,239 | | | | — | |
| Segall Bryant & Hamill International Small Cap Fund | | | 59,016,421 | | | | 15,493,926 | |
| Segall Bryant & Hamill Quality High Yield Fund | | | 27,226 | | | | 8,288,958 | |
| Segall Bryant & Hamill Colorado Tax Free Fund | | | 225,727 | | | | 265,148 | |
As a result of the acquisition of the Segall Bryant & Hamill Small Cap Value Dividend Fund (the “target fund”), the Segall Bryant & Hamill Small Cap Value Fund (the “acquiring” fund) acquired the capital loss carry forward balances from the target fund totaling $13,279,390 ($8,170,713 short term and $5,108,677 long-term). The acquiring fund is eligible to utilize these amounts to offset future capital gains subject to annual limitations under IRC Section 382 of $242,622.
The Funds recharacterize distributions received from Real Estate Investment Trust (“REIT”) investments based on information provided by the REIT into the following categories: ordinary income, long-term capital gains, and return of capital. If information is not available on a timely basis from the REIT, the recharacterization will be estimated based on available information which may include the previous year’s allocation. If new or additional information becomes available from the REIT at a later date, a recharacterization will be made in the following year.
As a result of several court cases in certain countries across the European Union (“EU”), some Funds may file European tax reclaims for previously withheld taxes on dividends earned in those countries. These additional filings are subject to various administrative proceedings by the local jurisdictions’ tax authorities within the EU, as well as a number of related judicial proceedings. If any such reclaims are received, they are reflected as dividend income in the Statements of Operations, and related receivables, if any, are reflected within foreign tax reclaims receivable in the Statements of Assets and Liabilities. If the associated cash is received, the Funds will follow, for tax purposes, IRS guidance in Notice 2016-10 and reduce the current year foreign taxes paid by the amount of the refund. When uncertainty exists as to the ultimate resolution of these proceedings and the likelihood of receipt of these EU reclaims, no amounts are reflected in the financial statements.
6. INVESTMENT ADVISORY FEES, ADMINISTRATIVE FEES AND OTHER RELATED PARTY TRANSACTIONS
The Trust has entered into an advisory agreement with Segall Bryant & Hamill, LLC (the “Adviser”) for all Funds. The advisory agreement has been approved by the Trust’s Board of Trustees.
Pursuant to its advisory agreement with the Trust, the Adviser is entitled to investment advisory fees, based on the average net assets of each Fund, computed daily and payable monthly as shown in the table below.
| Fund | | |
| Segall Bryant & Hamill Small Cap Value Fund | | 0.80% |
| Segall Bryant & Hamill Small Cap Growth Fund | | 0.65% |
| Segall Bryant & Hamill Small Cap Core Fund | | 0.80% |
| Segall Bryant & Hamill All Cap Fund | | 0.65% |
| Segall Bryant & Hamill Emerging Markets Fund | | 0.90% |
| Segall Bryant & Hamill International Small Cap Fund | | 0.90% |
| Segall Bryant & Hamill Fundamental International Small Cap Fund | | 1.00% |
| Segall Bryant & Hamill Global All Cap Fund | | 0.65% |
| Segall Bryant & Hamill Workplace Equality Fund | | 0.65% |
| Segall Bryant & Hamill Short Term Plus Fund | | 0.25% |
| Segall Bryant & Hamill Plus Bond Fund | | 0.35% |
| Segall Bryant & Hamill Quality High Yield Fund | | 0.45% |
| Segall Bryant & Hamill Municipal Opportunities Fund | | 0.35% |
| Segall Bryant & Hamill Colorado Tax Free Fund | | 0.35% |
Ultimus Fund Solutions LLC (“Ultimus”) and the Adviser serve as the Funds’ co-administrators (“Co-Administrators”). Ultimus and the Adviser are entitled to receive a total fee from each Fund for their administrative services computed daily and payable monthly based on the average net assets of the Trust. The Adviser receives a portion that is calculated based on 0.01% on the average daily net assets of the Trust.
The administrative fees are allocated to each Fund based upon the Fund’s relative proportion of the Trust’s net assets, subject to certain minimums, and are disclosed in the Statements of Operations. During the six month ended June 30, 2022, the Adviser and Ultimus received $159,968 and $410,440, respectively, for their services to the Funds.
| 140 | | www.sbhfunds.com |
| Segall Bryant & Hamill Funds | Notes to Financial Statements |
| | June 30, 2022 (Unaudited) |
Shareholder servicing agents provide non-distribution administrative and support services to their customers, which may include establishing and maintaining accounts and records relating to shareholders, processing dividend and distribution payments from the Funds on behalf of shareholders, forwarding communications from the Funds, providing sub-accounting with respect to Fund shares, and other similar services. The Retail Class of each Fund may pay a fee at an annual rate of up to 0.25% of its average daily net assets to shareholder servicing agents and the Institutional Class of each Fund may pay a fee at an annual rate of up to 0.10% of its average daily net assets to shareholder servicing agents. These fees are included in Shareholder Servicing Fees on the Statements of Operations.
Until at least April 30, 2023, the Adviser has contractually agreed to waive the investment advisory and/or administration fees and/or to reimburse other expenses (not including acquired fund fees and expenses, taxes, brokerage expenses, and extraordinary expenses), so that the ratio of expense to average net assets as reported in each Fund’s Financial Highlights will be no more than the amounts as detailed below:
| Fund | | Retail Class | | Institutional Class |
| Segall Bryant & Hamill Small Cap Value Fund | | 1.14% | | 0.99% |
| Segall Bryant & Hamill Small Cap Growth Fund | | 1.14% | | 0.99% |
| Segall Bryant & Hamill Small Cap Core Fund | | 1.14% | | 0.99% |
| Segall Bryant & Hamill All Cap Fund | | 0.99% | | 0.84% |
| Segall Bryant & Hamill Emerging Markets Fund | | 1.38% | | 1.23% |
| Segall Bryant & Hamill International Small Cap Fund | | 1.18% | | 1.03% |
| Segall Bryant & Hamill Fundamental International Small Cap Fund | | 1.25% | | 1.10% |
| Segall Bryant & Hamill Global All Cap Fund | | 0.89% | | 0.74% |
| Segall Bryant & Hamill Workplace Equality Fund | | 0.89% | | 0.74% |
| Segall Bryant & Hamill Short Term Plus Fund | | 0.49% | | 0.40% |
| Segall Bryant & Hamill Plus Bond Fund | | 0.55% | | 0.40% |
| Segall Bryant & Hamill Quality High Yield Fund | | 0.85% | | 0.70% |
| Segall Bryant & Hamill Municipal Opportunities Fund | | 0.65% | | 0.50% |
| Segall Bryant & Hamill Colorado Tax Free Fund | | 0.65% | | 0.50% |
These amounts are not subject to recapture in future periods.
Ultimus, pursuant to a Transfer Agency Agreement, serves as Transfer Agent for each of the Funds. As Transfer Agent, Ultimus has, among other things, agreed to: (a) issue and redeem shares of the Funds; (b) make dividend and other distributions to shareholders of the Funds; (c) effect transfers of shares; (d) mail communications to shareholders of the Funds, including account statements, confirmations, and dividend and distribution notices; (e) facilitate the electronic delivery of shareholder statements and reports and (f) maintain shareholder accounts. Under the Transfer Agency Agreement, Ultimus receives from the Trust an annual minimum fee per Fund, a fee based upon each shareholder account and is reimbursed for out-of-pocket expenses.
Certain officers of the Funds are also officers of the Adviser and Ultimus. All access persons of the Trust, as defined in the 1940 Act, and officers and employees of the Adviser, follow strict guidelines and policies on personal trading as outlined in the Trust’s and the Adviser’s respective Code of Ethics.
The Trust has appointed a Chief Compliance Officer who is also the Treasurer of the Trust and an employee of the Adviser. The Trust agreed to have the Funds pay the portion of his compensation attributable for services rendered as the Trust’s Chief Compliance Officer.
The Trust has a Trustee Deferred Compensation Plan (the “Deferral Plan”) which allows the Trustees to defer the receipt of all or a portion of Trustees fees. Under the Deferral Plan, Trustee fees are paid and invested directly into shares of the Funds elected by the Trustees in the Deferral Plan. There is no future liability related to the balance in the Deferral Plan as such amounts are paid directly out of the respective capital accounts of the elected Funds. The amount paid to the Trustees under the Deferral Plan will be determined based upon the performance of the elected funds. The balance in the Deferral Plan as of June 30, 2022 is $681,190.
7. FAIR VALUE MEASUREMENTS
A three-tier hierarchy has been established to measure fair value based on the extent of use of “observable inputs” as compared to “unobservable inputs” for disclosure purposes and requires additional disclosures about these valuation measurements. Inputs refer broadly to the assumptions that market participants would use in pricing a security. Observable inputs are inputs that reflect the assumptions market participants would use in pricing the security developed based on market data obtained from sources independent of the reporting entity. Unobservable inputs are inputs that reflect the reporting entity’s own assumptions about the assumptions market participants would use in pricing the security developed based on the best information available in the circumstances.
| Semi-Annual Report | June 30, 2022 | | 141 |
| Segall Bryant & Hamill Funds | Notes to Financial Statements |
| | June 30, 2022 (Unaudited) |
The three-tier hierarchy is summarized as follows:
| 1) | Level 1 – Unadjusted Quoted Prices in active markets for identical investments |
| 2) | Level 2 – Other Significant Observable Inputs (including quoted prices for similar investments, interest rates, prepayment speeds, credit risk, etc.) |
| 3) | Level 3 – Significant Unobservable Inputs (including the Fund’s own assumptions in determining the fair value of investments). |
The following is a summary of each Fund’s investments and other financial instruments (if any) and the inputs used to value the investments and other financial instruments as of June 30, 2022:
| Segall Bryant & Hamill Small Cap Value Fund | |
| | | | | | | | | | | | | |
| | | Level 1 | | | Level 2 | | | Level 3 | | | Total | |
| Common Stocks | | $ | 518,726,244 | | | $ | — | | | $ | — | | | $ | 518,726,244 | |
| Total | | $ | 518,726,244 | | | $ | — | | | $ | — | | | $ | 518,726,244 | |
| | | | | | | | | | | | | | | | | |
| Segall Bryant & Hamill Small Cap Growth Fund | |
| | | | | | | | | | | | | |
| | | Level 1 | | | Level 2 | | | Level 3 | | | Total | |
| Common Stocks | | $ | 155,235,891 | | | $ | — | | | $ | — | | | $ | 155,235,891 | |
| Total | | $ | 155,235,891 | | | $ | — | | | $ | — | | | $ | 155,235,891 | |
| | | | | | | | | | | | | | | | | |
| Segall Bryant & Hamill Small Cap Core Fund | |
| | | | | | | | | | | | | |
| | | Level 1 | | | Level 2 | | | Level 3 | | | Total | |
| Common Stocks | | $ | 45,042,716 | | | $ | — | | | $ | — | | | $ | 45,042,716 | |
| Total | | $ | 45,042,716 | | | $ | — | | | $ | — | | | $ | 45,042,716 | |
| | | | | | | | | | | | | | | | | |
| Segall Bryant & Hamill All Cap Fund | |
| | | | | | | | | | | | | |
| | | Level 1 | | | Level 2 | | | Level 3 | | | Total | |
| Common Stocks | | $ | 133,904,701 | | | $ | — | | | $ | — | | | $ | 133,904,701 | |
| Total | | $ | 133,904,701 | | | $ | — | | | $ | — | | | $ | 133,904,701 | |
| | | | | | | | | | | | | | | | | |
| Segall Bryant & Hamill Emerging Markets Fund | |
| | | | | | | | | | | | | |
| | | Level 1 | | | Level 2 | | | Level 3 | | | Total | |
| Common Stocks | | $ | 9,577,688 | | | $ | 35,819,466 | | | $ | 376,688 | * | | $ | 45,773,842 | |
| Preferred Stocks | | | 461,836 | | | | 179,752 | | | | — | * | | | 641,588 | |
| Warrants | | | — | | | | 213 | | | | — | | | | 213 | |
| Total | | $ | 10,039,524 | | | $ | 35,999,431 | | | $ | 376,688 | | | $ | 46,415,643 | |
| | | | | | | | | | | | | | | | | |
| Segall Bryant & Hamill International Small Cap Fund | |
| | | | | | | | | | | | | |
| | | Level 1 | | | Level 2 | | | Level 3 | | | Total | |
| Common Stocks | | $ | 9,849,793 | | | $ | 102,648,264 | | | $ | — | * | | $ | 112,498,057 | |
| Total | | $ | 9,849,793 | | | $ | 102,648,264 | | | $ | — | | | $ | 112,498,057 | |
| | | | | | | | | | | | | | | | | |
| Segall Bryant & Hamill Fundamental International Small Cap Fund | |
| | | | | | | | | | | | | | | | | |
| | | Level 1 | | | Level 2 | | | Level 3 | | | Total | |
| Common Stocks | | $ | 19,057,128 | | | $ | 35,123,625 | | | $ | — | | | $ | 54,180,753 | |
| Total | | $ | 19,057,128 | | | $ | 35,123,625 | | | $ | — | | | $ | 54,180,753 | |
| Other Financial Instruments** | | | | | | | | | | | | | | | | |
| Forward Foreign Currency Contracts, Unrealized Gain | | $ | — | | | $ | 645,933 | | | $ | — | | | $ | 645,933 | |
| Forward Foreign Currency Contracts, Unrealized Loss | | | — | | | | (718,463 | ) | | | — | | | | (718,463 | ) |
| Total | | $ | — | | | $ | (72,530 | ) | | $ | — | | | $ | (72,530 | ) |
| 142 | | www.sbhfunds.com |
| Segall Bryant & Hamill Funds | Notes to Financial Statements |
| | June 30, 2022 (Unaudited) |
| Segall Bryant & Hamill Global All Cap Fund | |
| | | | | | | | | | | | | |
| | | Level 1 | | | Level 2 | | | Level 3 | | | Total | |
| Common Stocks | | $ | 20,921,423 | | | $ | 5,078,071 | | | $ | — | | | $ | 25,999,494 | |
| Total | | $ | 20,921,423 | | | $ | 5,078,071 | | | $ | — | | | $ | 25,999,494 | |
| | | | | | | | | | | | | | | | | |
| Segall Bryant & Hamill Workplace Equality Fund | |
| | | | | | | | | | | | | |
| | | Level 1 | | | Level 2 | | | Level 3 | | | Total | |
| Common Stocks | | $ | 22,051,286 | | | $ | — | | | $ | — | | | $ | 22,051,286 | |
| Total | | $ | 22,051,286 | | | $ | — | | | $ | — | | | $ | 22,051,286 | |
| | | | | | | | | | | | | | | | | |
| Segall Bryant & Hamill Short Term Plus Fund | |
| | | | | | | | | | | | | |
| | | Level 1 | | | Level 2 | | | Level 3 | | | Total | |
| Corporate Bonds | | $ | — | | | $ | 34,817,045 | | | $ | — | | | $ | 34,817,045 | |
| Municipal Bonds | | | — | | | | 2,458,179 | | | | — | | | | 2,458,179 | |
| Commercial Mortgage-Backed Securities | | | — | | | | 430,359 | | | | — | | | | 430,359 | |
| U.S. Treasury Bonds & Notes | | | — | | | | 4,781,863 | | | | — | | | | 4,781,863 | |
| Total | | $ | — | | | $ | 42,487,446 | | | $ | — | | | $ | 42,487,446 | |
| * | Includes securities that have been fair valued at $0. |
| ** | Other financial instruments are derivative financial instruments not reflected in the Statements of Investments. These forward foreign currency contracts are valued at the unrealized appreciation (depreciation) on the instrument. |
| Segall Bryant & Hamill Plus Bond Fund | |
| | | | | | | | | | | | | |
| | | Level 1 | | | Level 2 | | | Level 3 | | | Total | |
| Corporate Bonds | | $ | — | | | $ | 402,264,779 | | | $ | — | | | $ | 402,264,779 | |
| Municipal Bonds | | | — | | | | 70,922,515 | | | | — | | | | 70,922,515 | |
| Asset Backed Securities | | | — | | | | 28,746,474 | | | | — | | | | 28,746,474 | |
| Residential Mortgage-Backed Securities | | | — | | | | 2,577,188 | | | | — | | | | 2,577,188 | |
| Mortgage-Backed Securities Passthrough | | | — | | | | 171,825,056 | | | | — | | | | 171,825,056 | |
| U.S. Treasury Bonds & Notes | | | — | | | | 120,037,813 | | | | — | | | | 120,037,813 | |
| Total | | $ | — | | | $ | 796,373,825 | | | $ | — | | | $ | 796,373,825 | |
| | | | | | | | | | | | | | | | | |
| Segall Bryant & Hamill Quality High Yield Fund | |
| | | | | | | | | | | | | | | | | |
| | | Level 1 | | | Level 2 | | | Level 3 | | | Total | |
| Corporate Bonds | | $ | — | | | $ | 77,355,472 | | | $ | — | | | $ | 77,355,472 | |
| Total | | $ | — | | | $ | 77,355,472 | | | $ | — | | | $ | 77,355,472 | |
| | | | | | | | | | | | | | | | | |
| Segall Bryant & Hamill Municipal Opportunities Fund | |
| | | | | | | | | | | | | | | | | |
| | | Level 1 | | | Level 2 | | | Level 3 | | | Total | |
| Municipal Bonds | | $ | — | | | $ | 234,594,019 | | | $ | — | | | $ | 234,594,019 | |
| U.S. Treasury Bonds & Notes | | | — | | | | 9,264,277 | | | | — | | | | 9,264,277 | |
| Corporate Bonds | | | — | | | | 7,956,269 | | | | — | | | | 7,956,269 | |
| Total | | $ | — | | | $ | 251,814,565 | | | $ | — | | | $ | 251,814,565 | |
| | | | | | | | | | | | | | | | | |
| Segall Bryant & Hamill Colorado Tax Free Fund | |
| | | | | | | | | | | | | | | | | |
| | | Level 1 | | | Level 2 | | | Level 3 | | | Total | |
| Municipal Bonds | | $ | — | | | $ | 439,058,912 | | | $ | — | | | $ | 439,058,912 | |
| Total | | $ | — | | | $ | 439,058,912 | | | $ | — | | | $ | 439,058,912 | |
| Semi-Annual Report | June 30, 2022 | | 143 |
| Segall Bryant & Hamill Funds | Notes to Financial Statements |
| | June 30, 2022 (Unaudited) |
The following is a reconciliation of Level 3 instruments of the Funds for which significant unobservable inputs were used to determine fair value for the six month ended June 30, 2022:
Segall Bryant & Hamill Emerging Markets Fund
| | | | | | | | | | | | | | | Change in | | | | | | | | | | |
| | | Balance as of | | | | | | | | | | | | Unrealized | | | | | | | | | Balance as of | |
| | | December 31, | | | Net | | | | | | Realized | | | Appreciation | | | Transfer Into | | | Transfer Out | | | June 30, | |
| Asset Type | | 2021 | | | Purchases | | | Net Sales | | | Losses | | | (Depreciation) | | | Level 3 | | | of Level 3 | | | 2022 | |
| Common Stocks | | $ | 398,320 | | | $ | — | | | $ | — | | | $ | — | | | $ | (21,632 | ) | | $ | — | | | $ | — | | | $ | 376,688 | |
Segall Bryant & Hamill International Small Cap Fund
| | | | | | | | | | | | | | | | | | | Change in | | | | | | | | | | | | | |
| | | Balance as of | | | | | | | | | | | | | | | Unrealized | | | | | | | | | | | Balance as of | |
| | | December 31, | | | Net | | | | | | | Realized | | | Appreciation | | | Transfer Into | | | Transfer Out | | | June 30, | |
| Asset Type | | 2021 | | | Purchases | | | Net Sales | | | Losses | | | (Depreciation) | | | Level 3 | | | of Level 3 | | | 2022 | |
| Common Stocks | | $ | — | | | $ | — | | | $ | — | | | $ | — | | | $ | — | | | $ | — | | | $ | — | | | $ | — | |
The following table presents additional information about valuation methodologies and inputs used for investments that are measured at fair value and categorized within Level 3 as of June 30, 2022:
| | | | | | | | | | | | Impact to |
| | | Fair Value as of | | | Valuation | | Unobservable | | | | Valuation from an |
| | | June 30, 2022 | | | Technique | | Input(1) | | Value/Range | | Increase in Input(2) |
| Segall Bryant & Hamill Emerging Markets Fund | | $ | 376,688 | | | Adjusted trade price | | Discount Factor | | 21% | | Decrease |
| Segall Bryant & Hamill International Small Cap Fund | | $ | — | | | Adjusted trade price | | Discount Factor | | 100% | | Decrease |
| (1) | The investment adviser considers relevant indications of value that are reasonably and timely available to it in determining the fair value to be assigned to a particular security, such as the type and cost of the security; contractual or legal restrictions on resale of the security; relevant financial or business developments of the issuer; actively traded related securities; conversion or exchange rights on the security; related corporate actions; significant events occurring after the close of trading in the security; and changes in overall market conditions. The Fund’s use of fair value pricing may cause the net asset value of Fund shares to differ from the net asset value that would be calculated using market quotations. Fair value pricing involves subjective judgments and it is possible that the fair value determined for a security may be materially different than the value that could be realized upon the sale of that security. |
| (2) | This column represents the directional change in the fair value of the Level 3 investments that would result from an increase to the corresponding unobservable input. A decrease to the unobservable input would have the opposite effect. |
The inputs or methodologies used for valuing securities are not necessarily an indication of the risk associated with investing in those securities.
For fair value measurements using significant other observable inputs (Level 2), the Funds utilize an independent pricing service which utilizes evaluated pricing models that vary by asset class and incorporate available trade, bid and other market information, and for structured securities also incorporate cash flow and, when available, loan performance data. The independent pricing service’s evaluated pricing models apply available market information through processes such as benchmark curves, benchmarking of similar securities, and sector groupings. For certain securities, the independent pricing service uses model processes, such as the Option Adjusted Spread (benchmark driven) model, to assess interest rate impact and develop prepayment scenarios. With respect to trades and bids, the independent pricing service reviews the lot size to determine whether the information is representative of an orderly trading market. If the independent pricing service determines that trade or bid information is not consistent with other information available, the trade or bid will not be reflected in the evaluated price.
Corporate bonds, Municipal bonds and U.S. Treasury bonds & notes are valued using market models that consider trade data, quotations from dealers and active market makers, relevant yield curve and spread data, creditworthiness, trade data or market information on comparable securities, and other relevant security specific information. Mortgage-related and asset-backed securities are valued based on models that consider trade data, prepayment and default projections, benchmark yield and spread data and estimated cash flows of each tranche of the issuer. Forward foreign currency contracts are normally valued on the basis of quotes obtained from brokers and dealers or independent pricing services.
In the event the independent pricing service is unable to provide an evaluated price for a security or the Adviser believes the price provided is not reliable, securities of the Funds may be valued in good faith as described above in Note 2. In these instances, the co-administrators will typically seek input from the investment team of the Fund since they are typically the most knowledgeable of the relevant factors in valuing
| 144 | | www.sbhfunds.com |
| Segall Bryant & Hamill Funds | Notes to Financial Statements |
| | June 30, 2022 (Unaudited) |
the securities. The Adviser may seek to find an alternative independent source, such as a broker/dealer to provide a price quote, or by using evaluated pricing models similar to the techniques and models used by the independent pricing service. These fair value measurement techniques may utilize unobservable inputs (Level 3).
At least quarterly, the Adviser receives a report on the pricing for all fair valued securities during the period along with any actual sales prices, broker quotes and/or pricing from the independent pricing service. The Adviser uses this information to analyze changes in fair value measurements over the period and as a back test of pricing methods.
Then on at least a quarterly basis, the Adviser presents the factors considered in determining the fair value measurements and presents that information to the Audit Committee of the Board of Trustees which meets at least quarterly. The Audit Committee of the Board of Trustees then will provide a recommendation to the Board of Trustees for approval of the fair value measurements.
8. FORWARD FOREIGN CURRENCY EXCHANGE CONTRACTS
The Segall Bryant & Hamill Fundamental International Small Cap Fund may purchase or sell foreign currencies on a “spot” or cash basis at the prevailing rate in the foreign currency exchange market to settle investment transactions in the proper currency. In addition, this Fund may purchase or sell forward currency contracts to adjust the portfolio’s exposure to different currencies consistent with the investment team’s targets, which consider the currency weightings within the Fund’s benchmark index.
When entering into a spot or forward foreign currency contract, the Fund agrees to receive or deliver a fixed quantity of foreign currency for an agreed upon price on an agreed future date. These contracts are valued at each portfolio valuation, and the Fund’s net equity therein, representing unrealized gain or loss on the contracts as measured by the difference between the contractual rates at the dates of entry into the contracts and the spot or forward rates at the reporting date, is included in the Statements of Assets and Liabilities. Realized gains and losses and change in unrealized appreciation and depreciation are included in the Statements of Operations. These instruments involve credit risk and market risk in excess of the amount recognized in the Statements of Assets and Liabilities. Risks arise from the possible inability of counterparties to meet the terms of their contracts and from movement in currency exchange rates.
The Fund must segregate assets determined to be liquid in accordance with procedures established by the Board of Trustees, or otherwise cover its position in a permissible manner.
During the six month ended June 30, 2022, the Fund had average forward foreign currency contract values to buy and sell of $38,205,056 and $38,795,706, respectively.
The effect of derivative instruments on the Statements of Assets and Liabilities as of June 30, 2022 is as follows:
Segall Bryant & Hamill Fundamental International Small Cap Fund
| | | Asset Derivatives | | | | | Liability Derivatives |
| | | Statement of Assets and | | | | | Statement of Assets and | | | |
| Risk Exposure | | Liabilities Location | | Fair Value | | | Liabilities Location | | Fair Value | |
| Forward Foreign Currency Contracts (Foreign Exchange Rate Risk) | | Unrealized gain on forward foreign currency contracts | | $ | 645,933 | | | Unrealized loss on forward foreign currency contracts | | $ | (718,463 | ) |
| Total | | | | $ | 645,933 | | | | | $ | (718,463 | ) |
The effect of derivative instruments on the Statements of Operations for the six month ended June 30, 2022 is as follows:
Segall Bryant & Hamill Fundamental International Small Cap Fund
| | | | | | | | Change in | |
| | | | | | | | Unrealized | |
| | | | | | | | Appreciation | |
| | | | | Realized Losses | | | (Depreciation) | |
| | | | | on Derivatives | | | on Derivatives | |
| | | | | Recognized in | | | Recognized in | |
| Risk Exposure | | Statement of Operations Location | | Income | | | Income | |
| Forward Foreign Currency Contracts (Foreign Exchange Rate Risk) | | Realized and unrealized gains (losses) on forward foreign currency contracts | | $ | (892,395 | ) | | $ | 127,122 | |
| Total | | | | $ | (892,395 | ) | | $ | 127,122 | |
| Semi-Annual Report | June 30, 2022 | | 145 |
| Segall Bryant & Hamill Funds | Notes to Financial Statements |
| | June 30, 2022 (Unaudited) |
9. PURCHASES AND SALES OF INVESTMENTS
Investment transactions for the six month ended June 30, 2022 excluding long-term U.S. government securities and short-term investments were as follows:
| | | Purchases of | | | Proceeds from Sales | |
| Fund | | Securities | | | of Securities | |
| Segall Bryant & Hamill Small Cap Value Fund | | $ | 120,475,642 | | | $ | 75,501,772 | |
| Segall Bryant & Hamill Small Cap Growth Fund | | | 49,998,434 | | | | 58,058,753 | |
| Segall Bryant & Hamill Small Cap Core Fund | | | 15,441,535 | | | | 9,667,237 | |
| Segall Bryant & Hamill All Cap Fund | | | 28,059,562 | | | | 37,634,874 | |
| Segall Bryant & Hamill Emerging Markets Fund | | | 23,054,540 | | | | 25,099,091 | |
| Segall Bryant & Hamill International Small Cap Fund | | | 73,447,266 | | | | 86,265,294 | |
| Segall Bryant & Hamill Fundamental International Small Cap Fund | | | 23,561,705 | | | | 24,384,898 | |
| Segall Bryant & Hamill Global All Cap Fund | | | 4,875,358 | | | | 8,908,786 | |
| Segall Bryant & Hamill Workplace Equality Fund | | | 6,239,662 | | | | 5,808,403 | |
| Segall Bryant & Hamill Short Term Plus Fund | | | 5,813,940 | | | | 12,637,040 | |
| Segall Bryant & Hamill Plus Bond Fund | | | 147,542,862 | | | | 244,087,962 | |
| Segall Bryant & Hamill Quality High Yield Fund | | | 5,934,160 | | | | 13,051,090 | |
| Segall Bryant & Hamill Municipal Opportunities Fund | | | 210,471,373 | | | | 195,206,442 | |
| Segall Bryant & Hamill Colorado Tax Free Fund | | | 81,970,419 | | | | 133,533,200 | |
| | | | | | | | | |
| | | Purchase of | | | Proceeds from | |
| | | Long Term U.S. | | | Sales of Long Term | |
| | | Government | | | U.S. Government | |
| Fund | | Obligations | | | Obligations | |
| Segall Bryant & Hamill Short Term Plus Fund | | $ | 835,172 | | | $ | 300,000 | |
| Segall Bryant & Hamill Plus Bond Fund | | | — | | | | 15,377,424 | |
| Segall Bryant & Hamill Municipal Opportunities Fund | | | 17,681,269 | | | | 8,231,387 | |
10. INDEMNIFICATIONS
In the normal course of business, the Trust, on behalf of the Funds, enters into contracts that provide general indemnifications. The Funds’ maximum exposure under these arrangements is dependent on claims that may be made against the Funds in the future and, therefore, cannot be estimated; however, based on experience, the risk of material loss from such claims is considered remote.
11. SUBSEQUENT EVENTS
The Funds are required to recognize in the financial statements the effects of all subsequent events that provide additional evidence about conditions that existed as of the date of the Statements of Assets and Liabilities. For non-recognized subsequent events that must be disclosed to keep the financial statements from being misleading, the Funds are required to disclose the nature of the event as well as an estimate of its financial effect, or a statement that such an estimate cannot be made. Management has evaluated subsequent events through the issuance of these financial statements and has noted no such events.
| 146 | | www.sbhfunds.com |
Intentionally Left Blank
| Segall Bryant & Hamill Trustees and Officers: |
| Janice M. Teague, Chair |
| Thomas J. Abood, Trustee |
| John A. DeTore, Trustee |
| Rick A. Pederson, Trustee |
| James A. Smith, Trustee |
| Lloyd “Chip” Voneiff, Trustee |
| Philip L. Hildebrandt, President |
| Jasper R. Frontz, Treasurer & Chief Compliance Officer |
| Jennifer L. Leamer, Asst. Treasurer |
| Maggie Bull, Secretary |

A description of the policies and procedures that Segall Bryant & Hamill Funds uses to determine how to vote proxies relating to portfolio securities and information regarding how each Fund voted proxies relating to portfolio securities during the most recent 12-month period ended June 30 is available (i) without charge, upon request, by calling toll-free (800) 392-2673; (ii) on the Funds’ website, www.sbhfunds.com; and (iii) on the Securities and Exchange Commission website at www.sec.gov.
Each Fund files a complete schedule of portfolio holdings with the Securities and Exchange Commission (“SEC”) as of the end of the first and third quarters of each fiscal year as an exhibit to Form N-PORT within 60 days after each fiscal quarter-end. Copies of the Segall Bryant & Hamill Funds exhibits to Form N-PORT are available without a charge, upon request, by contacting Segall Bryant & Hamill Funds toll-free at (800) 392-2673 and on the SEC’s website at www.sec.gov.
| |
| FOR MORE INFORMATION ABOUT SEGALL BRYANT & HAMILL FUNDS, PLEASE CONTACT: |
| |
| Segall Bryant & Hamill Funds | 225 Pictoria Drive, Suite 450 | Cincinnati, Ohio 45246 |
| Individual Investors: (800) 392-2673 | Financial Advisors: (800) 734-9738 | www.sbhfunds.com |
| |
This report has been prepared for Segall Bryant & Hamill Funds shareholders and may be distributed to others only if preceded or accompanied by a prospectus. Funds distributed by Ultimus Fund Distributors, LLC
SBH-SAR-22
Not applicable to semi-annual report.
| Item 3. | Audit Committee Financial Expert. |
Not applicable to semi-annual report.
| Item 4. | Principal Accountant Fees and Services. |
Not applicable to semi-annual report.
| Item 5. | Audit Committee of Listed Registrants. |
Not applicable
| (a) | Schedule of Investments in securities of unaffiliated issuers as of the close of the reporting period is included as part of the Reports to Stockholders filed under Item 1 of this form. |
| Item 7. | Disclosure of Proxy Voting Policies and Procedures for Closed-End Management Investment Companies. |
Not applicable
| Item 8. | Portfolio Managers of Closed-End Management Investment Companies. |
Not applicable
| Item 9. | Purchases of Equity Securities by Closed-End Management Investment Company and Affiliated Purchasers. |
Not applicable
| Item 10. | Submission of Matters to a Vote of Security Holders. |
There have been no material changes to the procedures by which shareholders may recommend nominees to the registrant’s Board of Trustees.
| Item 11. | Controls and Procedures. |
(a) The registrant’s principal executive officer and principal financial officer have concluded that the registrant’s disclosure controls and procedures (as defined in Rule 30a-3(c) under the Investment Company Act of 1940, as amended) (the “1940 Act”) (17 CFR 270.30a-3(e)) are effective based on the evaluation of these controls and procedures required by Rule 30a-3(b) under the 1940 Act (17 CFR 270.30a-3(b)) and Rules 13a-15(b) of 15d-15(b) under the Securities Exchange Act of 1934 (17 CFR 240.13a-15(b) or 240.15d-15(b)) as of a date within 90 days of the filing date of this report.
(b) There was no change in the registrant’s internal control over financial reporting (as defined in Rule 30a-3(d) under the 1940 Act (17 CFR 270-30a-3(d)) that occurred during the period covered by this report that has materially affected, or are reasonably likely to materially affect, the registrant’s internal control over financial reporting.
Item 12. Disclosure of Securities Lending Activities for Closed-End Management Investment Companies.
Not applicable
(a)(1) Not applicable to semi-annual report.
(a)(2) The certifications required by Rule 30a-2(a) under the 1940 Act (17 CFR 270.30a-2(a)) and Section 302 of the Sarbanes-Oxley Act of 2002 are attached hereto as EX-99.CERT.
(a)(3) Not applicable.
(a)(4) Not applicable.
(b) The certifications required by Rule 30a-2(b) of the 1940 Act (17 CFR 270.30a-2(b)) and Section 906 of the Sarbanes-Oxley Act of 2002 are attached hereto as EX-99.906CERT.
SIGNATURES
Pursuant to the requirements of the Securities Exchange Act of 1934 and the Investment Company Act of 1940, the registrant has duly caused this report to be signed on its behalf by the undersigned, thereunto duly authorized.
| (Registrant) | SEGALL BRYANT & HAMILL TRUST | |
| | | |
| By (Signature and Title)* | /s/ Philip L. Hildebrandt |
| | Philip L. Hildebrandt, President/Principal Executive Officer |
| Date | September 07, 2022 | |
| | | |
| Pursuant to the requirements of the Securities Exchange Act of 1934 and the Investment Company Act of 1940, this report has been signed below by the following persons on behalf of the registrant and in the capacities and on the dates indicated. |
| | | |
| By (Signature and Title)* | /s/ Philip L. Hildebrandt |
| | Philip L. Hildebrandt, President/Principal Executive Officer |
| | | |
| Date | September 07, 2022 | |
| | | |
| By (Signature and Title)* | /s/ Jasper R. Frontz |
| | Jasper R. Frontz, Treasurer/Principal Financial Officer |
| | | |
| Date | September 07, 2022 | |
* Print the name and title of each signing officer under his or her signature.