| | OMB APPROVAL |
| | OMB Number: 3235-0570 Expires: July 31, 2022 Estimated average burden hours per response: 20.6 |
UNITED STATES
SECURITIES AND EXCHANGE COMMISSION
Washington, D.C. 20549
FORM N-CSR
CERTIFIED SHAREHOLDER REPORT OF REGISTERED
MANAGEMENT INVESTMENT COMPANIES
| Investment Company Act file number | 811-3373 | |
SEGALL BRYANT & HAMILL TRUST
(Exact name of registrant as specified in charter)
| 225 Pictoria Drive, Suite 450 Cincinnati, Ohio | 45246 |
| (Address of principal executive offices) | (Zip code) |
Maggie Bull, Secretary |
| Segall Bryant & Hamill Trust, 225 Pictoria Drive, Suite 450 Cincinnati, Ohio 45246 |
| (Name and address of agent for service) |
| Registrant's telephone number, including area code: | (303) 623-2577 | |
| Date of fiscal year end: | December 31 | |
| | | |
| Date of reporting period: | December 31, 2021 | |
Form N-CSR is to be used by management investment companies to file reports with the Commission not later than 10 days after the transmission to stockholders of any report that is required to be transmitted to stockholders under Rule 30e-1 under the Investment Company Act of 1940 (17 CFR 270.30e-1). The Commission may use the information provided on Form N-CSR in its regulatory, disclosure review, inspection, and policymaking roles.
A registrant is required to disclose the information specified by Form N-CSR, and the Commission will make this information public. A registrant is not required to respond to the collection of information contained in Form N-CSR unless the Form displays a currently valid Office of Management and Budget ("OMB") control number. Please direct comments concerning the accuracy of the information collection burden estimate and any suggestions for reducing the burden to the Secretary, Securities and Exchange Commission, 450 Fifth Street, NW, Washington, DC 20549-0609. The OMB has reviewed this collection of information under the clearance requirements of 44 U.S.C. § 3507.
| Item 1. | Reports to Stockholders. |

| Segall Bryant & Hamill Small Cap Value Fund |
| (Ticker Symbol: Retail - SBRVX; Institutional - SBHVX) |
| |
| Segall Bryant & Hamill Small Cap Growth Fund |
| (Ticker Symbol: Retail - WTSGX; Institutional - WISGX) |
| |
| Segall Bryant & Hamill Small Cap Core Fund |
| (Ticker Symbol: Retail - SBHCX; Institutional - SBASX) |
| |
| Segall Bryant & Hamill All Cap Fund |
| (Ticker Symbol: Retail - SBRAX; Institutional - SBHAX) |
| |
| Segall Bryant & Hamill Emerging Markets Fund |
| (Ticker Symbol: Retail - SBHEX; Institutional - SBEMX) |
| |
| Segall Bryant & Hamill International Small Cap Fund |
| (Ticker Symbol: Retail - SBHSX; Institutional - SBSIX) |
| |
| Segall Bryant & Hamill Fundamental International Small Cap Fund |
| (Ticker Symbol: Retail - WTIFX; Institutional - WIIFX) |
| |
| Segall Bryant & Hamill Global All Cap Fund |
| (Ticker Symbol: Retail - WTMVX; Institutional - WIMVX) |
| |
| Segall Bryant & Hamill Workplace Equality Fund |
| (Ticker Symbol: Retail - WEQRX; Institutional - WEQIX) |
| |
| Segall Bryant & Hamill Short Term Plus Fund |
| (Ticker Symbol: Retail - SBHPX; Institutional - SBAPX) |
| |
| Segall Bryant & Hamill Plus Bond Fund |
| (Ticker Symbol: Retail - WTIBX; Institutional - WIIBX) |
| |
| Segall Bryant & Hamill Quality High Yield Fund |
| (Ticker Symbol: Retail - WTLTX; Institutional - WILTX) |
| |
| Segall Bryant & Hamill Municipal Opportunities Fund |
| (Ticker Symbol: Retail - WTTAX; Institutional - WITAX) |
| |
| Segall Bryant & Hamill Colorado Tax Free Fund |
| (Ticker Symbol: Retail - WTCOX; Institutional - WICOX) |
| |
| ANNUAL REPORT |
| DECEMBER 31, 2021 |
| SHAREHOLDER LETTER | 1 |
| | |
| FUND OVERVIEWS | |
| | |
| Segall Bryant & Hamill Small Cap Value Fund | 2 |
| | |
| Segall Bryant & Hamill Small Cap Growth Fund | 4 |
| | |
| Segall Bryant & Hamill Small Cap Core Fund | 6 |
| | |
| Segall Bryant & Hamill All Cap Fund | 8 |
| | |
| Segall Bryant & Hamill Emerging Markets Fund | 10 |
| | |
| Segall Bryant & Hamill International Small Cap Fund | 12 |
| | |
| Segall Bryant & Hamill Fundamental International Small Cap Fund | 14 |
| | |
| Segall Bryant & Hamill Global All Cap Fund | 16 |
| | |
| Segall Bryant & Hamill Workplace Equality Fund | 18 |
| | |
| Segall Bryant & Hamill Short Term Plus Fund | 20 |
| | |
| Segall Bryant & Hamill Plus Bond Fund | 22 |
| | |
| Segall Bryant & Hamill Quality High Yield Fund | 24 |
| | |
| Segall Bryant & Hamill Municipal Opportunities Fund | 26 |
| | |
| Segall Bryant & Hamill Colorado Tax Free Fund | 28 |
| | |
| FUND EXPENSES | 30 |
| | |
| IMPORTANT DISCLOSURES | 34 |
| | |
| TRUSTEES AND OFFICERS | 37 |
| | |
| FINANCIAL STATEMENTS | 40 |
| | |
| Statements of Investments | 40 |
| | |
| Statements of Assets and Liabilities | 97 |
| | |
| Statements of Operations | 101 |
| | |
| Statements of Changes in Net Assets | 105 |
| | |
| Financial Highlights | 110 |
| | |
| Notes to Financial Statements | 138 |
| | |
| REPORT OF INDEPENDENT REGISTERED PUBLIC ACCOUNTING FIRM | 157 |
| | |
| SHAREHOLDER TAX INFORMATION | 158 |
| | |
| Annual Report | December 31, 2021 | |  | |
Intentionally Left Blank
| Segall Bryant & Hamill Funds | Shareholder Letter |
| | December 31, 2021 (Unaudited) |
Dear Fellow Shareholders:
We embark on 2022 with financial markets buoyed by several years of strong returns achieved in what paradoxically has been a period of significant political and social volatility. Although COVID certainly remains a risk that is foremost on our minds, we are encouraged by data suggesting that the highly contagious Omicron variant may cause much less-severe disease and could lead to the end of the pandemic, and the endemic phase of the virus. What we will take away from this incredible two-year period are entirely new ways of operating remotely. Video meeting technology has fundamentally changed the way we interact, both with each other and with external parties. Zoom, Microsoft Teams, etc. have reduced time and distance to where operational efficiencies will last indefinitely. Our team members have performed ably for the Funds and their shareholders throughout this period, and for that we are both proud and grateful. As a testament to the strength of the SBH team and culture, we are pleased to announce that Segall Bryant & Hamill was named a Pensions & Investments Best Places to Work in Money Management for 20211.
In our semiannual report in 2021, we mentioned inflation and how it was being characterized as transitory, primarily driven by supply chain issues. Today, the Federal Reserve (Fed) has recognized that it is more likely a result of very stimulative policy decisions in the wake of the COVID pandemic. Not only have we experienced price inflation, but nearly every asset has benefited from this economic stimulus, including the equity markets. As we have discussed in previous letters, we remained concerned with the high valuation level of stocks and historically low bond market interest rates, which when adjusted for inflation are in negative territory.
 |  |
| | |
| Janice M. Teague | Philip L. Hildebrandt, CFA |
| Chair | President |
One phenomenon we have observed is that investors, prompted by a long period when risk candidly didn’t matter, have speculatively sought out unprofitable companies in which to invest. Why they are doing this is, frankly, a mystery to us, but when rates are low, investors feel emboldened to go further and further out on the risk curve with the hope of receiving higher returns. That rarely ends well. For us, this presents opportunities to invest in the stocks and bonds of underappreciated, high-quality companies with strong management teams. While these may not always be the companies you read about in the media, identifying such companies that are trading at reasonable valuations never goes out of style.
Passive investing has also been the golden child during this period of loose money. It is fantastic when, for example, the five tech stocks that represent 25% of the total market cap of an index go up as they bring the index return along with them. It is not nearly as much fun when those same highly concentrated positions go down. As active managers, we do not have to hold the entire list of securities that make up an index, choosing rather to own a smaller list of holdings, ideally in a more favorable mix. We believe this should bode well for active managers as the Fed begins to tighten its policies.
During periods of dislocation, such as when Fed policy begins to change, we believe our focus on identifying strong investments from the bottom up increases our opportunity set. We remain committed to our investment processes regardless of the macro-environment. We believe there will always be investment opportunities presented by this disciplined approach and the search for investment opportunities has been, and will remain, our primary goal.
We want to thank you for the trust and confidence you have placed in our Funds, and we will continue to work each day to earn it.
| 1 | Segall Bryant & Hamill did not solicit or pay a fee to participate in P&I’s Best Places to Work in Money Management survey. |
The views of the authors and information discussed in the shareholder letter and manager commentaries are as February 18, 2022, are subject to change, and may not reflect the writers’ current views. The views expressed represent an assessment of market conditions at a specific point in time, are opinions only and should not be relied upon as investment advice regarding a particular investment or markets in general. Such information does not constitute a recommendation to buy or sell specific securities or investment vehicles. It should not be assumed that any investment will be profitable or will equal the performance of the fund or any securities or any sectors mentioned in this letter. The subject matter contained in this letter has been derived from several sources believed to be reliable and accurate at the time of compilation. Neither Segall Bryant & Hamill, Segall Bryant & Hamill Funds, nor any Segall Bryant & Hamill Fund accept any liability for losses either direct or consequential caused by the use of this information. Diversification cannot guarantee gain or prevent losses.
| | |
| Annual Report | December 31, 2021 | | | 1 |
| Segall Bryant & Hamill Small Cap Value Fund | Fund Overview |
| | December 31, 2021 (Unaudited) |
Fund Strategy
Investing primarily in equity securities of small-capitalization companies.
Fund Management
Mark T. Dickherber, CFA, CPA Portfolio Manager
Shaun P. Nicholson Portfolio Manager
CFA is a trademark owned by CFA Institute.
Cumulative Returns
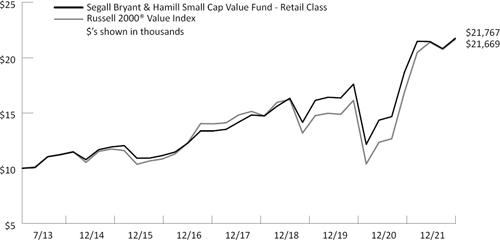
The chart above represents historical performance of a hypothetical investment of $10,000 in the Fund over the past 10 years (or for the life of the Fund if shorter). Performance calculations are as of the end of December each year. Past performance does not guarantee future results. This chart does not reflect the deduction of taxes that a shareholder would pay on Fund distributions or the redemption of Fund shares.
Please see index definitions beginning on page 34.
Average Annual Total Returns
| | | | | | Since | Inception |
| | 1 Year | 3 Years | 5 Years | 10 Years | Inception | Date |
| Retail Class (SBRVX) | 16.47% | 15.44% | 10.23% | — | 9.68% | 12/9/19 |
| Institutional Class (SBHVX) | 16.62% | 15.57% | 10.37% | — | 9.83% | 7/31/13 |
| Russell 2000® Value Index | 28.27% | 17.99% | 9.07% | — | 9.62% | |
Retail Class Annual Expense Ratio (per the current prospectus) — Gross: 1.08%, Net: 1.08%
Institutional Class Annual Expense Ratio (per the current prospectus) – Gross: 1.01%, Net: 0.99%
| | Sector Allocation (as of 12/31/21) | |
| | | |
| | Industrials | 23.1% |
| | Financials | 13.6% |
| | Information Technology | 13.4% |
| | Consumer Staples | 10.7% |
| | Materials | 9.5% |
| | Health Care | 8.5% |
| | Consumer Discretionary | 5.9% |
| | Real Estate | 5.5% |
| | Utilities | 3.4% |
| | Energy | 2.6% |
| | |
| | Sector classifications presented are based on the Global Industry Classification Standard (GICS) methodology. |
| | |
| | Sector weights may not sum to 100% due to rounding. |
| | |
| | The sector allocation table above does not include any cash or cash equivalents. |
| | |
| | Top Ten Holdings (as of 12/31/21) | |
| | | |
| | Coty, Inc. | 5.8% |
| | Regal Rexnord Corp. | 4.3% |
| | Hain Celestial Group, Inc. (The) | 4.2% |
| | Equity Commonwealth | 3.7% |
| | NCR Corp. | 3.7% |
| | Progress Software Corp. | 3.2% |
| | Compass Minerals International, Inc. | 3.1% |
| | Orthofix Medical, Inc. | 2.9% |
| | SPX Corp. | 2.2% |
| | FARO Technologies, Inc. | 2.2% |
| | |
| | Top ten holdings do not include any cash, cash equivalents or exchange traded fund investments. Holdings are subject to change and may not reflect the current or future position of the Fund. |
| | |
| | |
| | |
| | |
Performance data quoted represents past performance and does not guarantee future results. Performance information for the Retail Class shares prior to their inception is based on the performance of the Institutional Class. Current performance may be lower or higher than the performance quoted. To obtain current performance as of the most recent month-end, visit www.sbhfunds.com. Average annual total returns reflect the reinvestment of dividends, capital gains distributions, all fee waivers and expense reimbursements, if any. Without the fee waivers and expense reimbursements, total return figures would have been lower. Investment return and principal value will vary, and shares, when redeemed, may be worth more or less than their original cost. Segall Bryant & Hamill fund shares are not insured by the FDIC, the Federal Reserve Board or any other agency and are subject to investment risk.
Until at least April 30, 2022, Segall Bryant & Hamill, LLC (the “Adviser”) has contractually agreed to waive the investment advisory and/or administration fees and/or to reimburse other expenses, so that the ratio of expenses to average net assets as reported in the Fund’s Financial Highlights will be no more than 1.14% and 0.99% to the Fund’s Retail Class and Institutional Class, respectively, for such period. This agreement may not be terminated or modified by the Adviser prior to the termination date without the approval of the Board of Trustees.
Investing in small-cap funds generally will be more volatile and loss of principal could be greater than investing in larger-cap funds.
| | |
| 2 | | | www.sbhfunds.com |
| Segall Bryant & Hamill Small Cap Value Fund | Fund Overview |
| | December 31, 2021 (Unaudited) |
Manager Commentary
Market Overview and Fund Performance
The continued easy monetary policy alongside the continued tailwind of fiscal policies were major headwinds for the Segall Bryant & Hamill Small Cap Value Fund during the first half of 2021. As these factors abated, the Fund outperformed slightly in the second half of the year despite the impact of supply chain disruptions and inflation which we believe impacted the Fund’s holdings disproportionately (versus the benchmark) given the Fund’s tilt toward more asset-intensive versus asset-light businesses. Most of the headwinds from a factor and exposure standpoint in the first half of 2021 were due to market dynamics that were at odds with our investment philosophy and process. For example, zombie companies (i.e., those that haven’t earned enough profit to cover interest costs for at least three years) and companies with very high short interest and money-losing businesses markedly outperformed. We think overall investor sentiment is too high and does not accurately reflect the risks associated with potential outcomes. This is due, in our opinion, to investors’ belief that the Federal Reserve (Fed) and Congress as always (and very quickly) will step in to backstop any negative market event. While that may prove true, we believe it is prudent to maintain a risk-adjusted view of the world, investing with management teams that can improve returns by becoming more efficient, divesting businesses not deemed core, and improving overall culture and governance matters at their respective companies. For the year 2021, the Segall Bryant & Hamill Small Cap Value Fund returned 16.47% (Retail Class) compared to a return of 28.27% for its benchmark, the Russell 2000® Value Index.
Contributors to Return
Over the last twelve months, two sectors in the Fund were positive contributors on a relative basis—Consumer Staples and Communication Services. Consumer Staples holdings performed well overall with Coty Inc. (COTY) seeing strong returns. Communication Services was a sector to which the Fund had no exposure and therefore it contributed positively due only to allocation effect. The Fund was overweight Consumer Staples which contributed positively to relative performance.
Coty Inc. (COTY), PDC Energy, Inc. (PDCE) and Regal Rexnord Corp. (RRX) were among the strongest positive contributions on an absolute basis. Coty saw recognition by the market of the transformation that has been unfolding for over a year at the company as management continued to meet or beat expectations. We did trim the Fund’s position slightly. PDC Energy continued to focus on debt reduction while enjoying higher cash flows and returns as oil prices have risen. We trimmed the Fund’s position slightly. Regal Rexnord continued to execute on its own transformation plan while we believe the closing of an important acquisition positions the company to continue to compound value. We did trim the Fund’s position slightly on the stock’s appreciation.
Detractors from Return
The three sectors that detracted most over the last twelve months were Real Estate, Information Technology, and Consumer Discretionary. The Real Estate industry, which the Fund was materially underweight, saw strong gains; the Fund’s largest Real Estate holding did not perform well relative to the group. In Information Technology, the Fund’s holdings showed positive returns; however, those returns, in general, lagged the overall index returns and the Fund was materially overweight this sector. Consumer Discretionary Fund holdings generally showed strong positive returns; however, the Fund was materially underweight the sector which caused a sizeable allocation headwind.
Orthofix Medical, Inc. (OFIX), eHealth, Inc. (EHTH) and Compass Minerals International, Inc. (CMP) generated the weakest contributions to returns on an absolute basis. Orthofix has been impacted by delays and suspensions of elective surgeries which has slowed growth materially for the time being. As a result of the stock’s weakness, we added to the Fund’s position. eHealth, Inc. (EHTH) had a change in CEO during peak selling season alongside specific market dynamics that led to missing of expectations. However, with a strong activist board and high confidence in the new CEO’s pedigree and demeanor, we added to the Fund’s position. Compass Minerals International, Inc. (CMP) missed Earnings Before Interest, Taxes, Depreciation, and Amortization (EBITDA) expectations given higher logistical costs while in tandem lowering their dividend to allocate more capital to their lithium project. We added to the Fund’s position on the pullback.
Outlook and Positioning
We believe it is prudent to maintain a risk-adjusted view of the world, investing with managements that can improve returns by becoming more efficient, divesting businesses not deemed core, and improving overall culture and governance matters at their respective companies. Over the past several months, we’ve been encouraged by the market’s move to start rewarding companies with improving fundamentals, and more prudent and disciplined management teams.
We enter 2022 encouraged with the management teams of the Fund’s holdings and confident in the Fund’s holdings. In our opinion, the teams have handled with remarkable success the myriad issues with which they were faced in 2021—from pandemic challenges, supply chain issues, employment difficulties, and inflationary pressures, among others. Our years of experience managing the Fund have taught us the value, particularly during challenging times, of focusing the Fund’s investments on companies with newer management teams—those that, in our view, have better discipline and integrity, and the ability to improve returns and governance even in the face of challenging environments. This approach gives us confidence that the Fund can perform even during tough times such as that which we experienced in the first half of 2021.
| |
| Stock Performance (for the year ended 12/31/21) |
| | Average | Contribution |
| 5 Highest | Weight | to Return |
| Coty, Inc. | 3.71 | 1.21 |
| PDC Energy, Inc. | 1.14 | 1.15 |
| Regal Beloit Corp. | 3.17 | 0.98 |
| Six Flags Entertainment Corp. | 2.09 | 0.79 |
| Regal Rexnord Corp. | 1.02 | 0.78 |
| | Average | Contribution |
| 5 Lowest | Weight | to Return |
| Dril-Quip, Inc. | 0.92 | -0.31 |
| CIRCOR International, Inc. | 1.12 | -0.40 |
| Compass Minerals International, Inc. | 2.31 | -0.50 |
| eHealth, Inc. | 0.61 | -0.72 |
| Orthofix Medical, Inc. | 3.56 | -1.02 |
Past performance does not guarantee future results. These stocks do not represent all of the securities purchased, sold or recommended by the Fund’s Adviser. To request a complete list of the contribution of each Fund holding to overall Fund performance during the period, please call (800) 392-2673.
Please see page 35 for a description of the methodology used to construct this table.
| | |
| Annual Report | December 31, 2021 | | | 3 |
| Segall Bryant & Hamill Small Cap Growth Fund | Fund Overview |
| | December 31, 2021 (Unaudited) |
Fund Strategy
Investing in a diversified portfolio of equity securities of primarily small-sized companies with growth potential.
Fund Management
Brian C. Fitzsimons, CFA Portfolio Manager
Mitch S. Begun, CFA Portfolio Manager
CFA is a trademark owned by CFA Institute.
Cumulative Returns
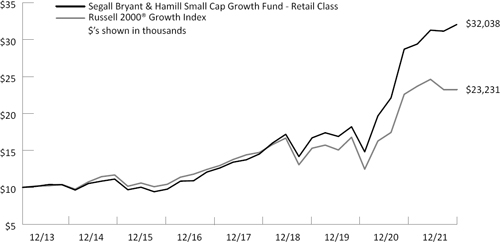
The chart above represents historical performance of a hypothetical investment of $10,000 in the Fund over the past 10 years (or for the life of the Fund if shorter). Performance calculations are as of the end of December each year. Past performance does not guarantee future results. This chart does not reflect the deduction of taxes that a shareholder would pay on Fund distributions or the redemption of Fund shares.
Please see index definitions beginning on page 34.
Average Annual Total Returns
| | | | | | Since | Inception |
| | 1 Year | 3 Years | 5 Years | 10 Years | Inception | Date |
| Retail Class (WTSGX) | 11.62% | 31.25% | 24.07% | — | 15.60% | 12/20/13 |
| Institutional Class (WISGX) | 11.79% | 31.43% | 24.25% | — | 15.88% | 12/20/13 |
| Russell 2000® Growth Index | 2.83% | 21.17% | 14.53% | — | 11.07% | |
Retail Class Annual Expense Ratio (per the current prospectus) — Gross: 1.04%, Net: 1.04%
Institutional Class Annual Expense Ratio (per the current prospectus) — Gross: 0.97%, Net: 0.97%
| | Sector Allocation (as of 12/31/21) | |
| | | |
| | Health Care | 27.5% |
| | Information Technology | 21.3% |
| | Industrials | 16.9% |
| | Financials | 10.6% |
| | Consumer Discretionary | 10.4% |
| | Materials | 4.4% |
| | Communication Services | 3.6% |
| | Real Estate | 2.1% |
| | Consumer Staples | 1.2% |
| | |
| | Sector classifications presented are based on the Global Industry Classification Standard (GICS) methodology. |
| | |
| | Sector weights may not sum to 100% due to rounding. |
| | |
| | The sector allocation table above does not include any cash or cash equivalents. |
| | |
| | Top Ten Holdings (as of 12/31/21) | |
| | | |
| | Silicon Laboratories, Inc. | 2.4% |
| | Endava PLC | 2.4% |
| | AZEK Co., Inc. (The) | 2.3% |
| | Churchill Downs, Inc. | 2.2% |
| | Trupanion, Inc. | 2.1% |
| | Omnicell, Inc. | 2.1% |
| | Tetra Tech, Inc. | 1.9% |
| | Sprout Social, Inc. | 1.9% |
| | Bright Horizons Family Solutions, Inc. | 1.9% |
| | Inspire Medical Systems, Inc. | 1.9% |
| | |
| | Top ten holdings do not include any cash, cash equivalents or exchange traded fund investments. Holdings are subject to change and may not reflect the current or future position of the Fund. |
| | |
| | |
| | |
| | |
| | |
| | |
| | |
Performance data quoted represents past performance and does not guarantee future results. Performance information for the Retail Class shares prior to their inception is based on the performance of the Institutional Class. Current performance may be lower or higher than the performance quoted. To obtain current performance as of the most recent month-end, visit www.sbhfunds.com. Average annual total returns reflect the reinvestment of dividends, capital gains distributions, all fee waivers and expense reimbursements, if any. Without the fee waivers and expense reimbursements, total return figures would have been lower. Investment return and principal value will vary, and shares, when redeemed, may be worth more or less than their original cost. Segall Bryant & Hamill fund shares are not insured by the FDIC, the Federal Reserve Board or any other agency and are subject to investment risk.
Until at least April 30, 2022, Segall Bryant & Hamill, LLC (the “Adviser”) has contractually agreed to waive the investment advisory and/or administration fees and/or to reimburse other expenses, so that the ratio of expenses to average net assets as reported in the Fund’s Financial Highlights will be no more than 1.14% and 0.99% to the Fund’s Retail Class and Institutional Class, respectively, for such period. This agreement may not be terminated or modified by the Adviser prior to the termination date without the approval of the Board of Trustees.
Investing in small-cap funds generally will be more volatile and loss of principal could be greater than investing in larger-cap funds.
| | |
| 4 | | | www.sbhfunds.com |
| Segall Bryant & Hamill Small Cap Growth Fund | Fund Overview |
| | December 31, 2021 (Unaudited) |
Manager Commentary
Market Overview and Fund Performance
For 2021, the Segall Bryant & Hamill Small Cap Growth Fund returned 11.62% (Retail Class) compared to the Fund’s benchmark, the Russell 2000® Growth Index’s 2.83% return.
The tailwinds unleashed in 2021 by the distribution of vaccines, reopening of the economy, and easy monetary conditions created an economic acceleration typically seen at the beginning of expansions. Consequently, the broader equity markets delivered extraordinary returns during the year (+25%). Notably, however, the Russell 2000® Growth Index was left behind as its lower representation of strong performing cyclical sectors was a headwind. Another contributing factor for its underperformance was its relatively high exposure to the biotechnology industry which was down 30% on the year. From our vantage point, the dispersion in returns across styles and sectors created an attractive environment for active management.
Contributors to Return
The three sectors that contributed most to the Fund’s performance relative to its benchmark in the year were Information Technology, Health Care, and Materials. Although stock selection was the primary driver of returns, the Fund’s underweight position in the biotechnology industry relative to the Russell 2000® Growth Index was also a tailwind to relative performance. Endava PLC (DAVA), a leading next-generation IT services provider, was the Fund’s best performing stock in 2021. The importance of modern, digital information technology architectures has been highlighted during the pandemic and drove an acceleration in growth for the company, which also generated best-in-class margins among its peers. Currently, we remain optimistic about the duration of its growth opportunities. Semiconductor company SiTime Corporation (SITM) was also a top contributor in 2021 as it is rapidly disrupting a large segment of the chip industry, most notably in timing solutions that essentially work as the heartbeat of electronic devices. We believe that the company is taking material market share from legacy solutions due to its superior efficiency across a host of attributes. Another semiconductor company Silicon Labs, Inc. (SLAB) also performed well in the period, particularly after reporting strong third quarter results. This was SLAB’s first quarter as a pureplay Internet-of-Things company after selling its legacy business segments. Its attractive growth profile, profitability leverage, and significant share repurchases have helped buoy the stock and we remain constructive on its prospects.
Detractors from Return
The three sectors that detracted most from the Fund’s performance relative to its benchmark in the year were Consumer Discretionary, Financials, and Consumer Staples. The Fund’s worst-performing stock in 2021 was Amedisys, Inc. (AMED), a leading provider of home health, hospice, and personal care services, after the company reported an unexpected increase in staff turnover in their hospice segment sales force in the second half of the year. While growth expectations have deteriorated, we believe the issue is a short-term setback and new hires will ramp productivity in time. Everbridge, Inc. (EVBG), a leading provider of critical event management software, was also a significant drag on performance in the year. The unexpected departure of its CEO, accompanied by a moderation in growth expectations for 2022 drove shares materially lower in the fourth quarter. While we expect some disruption from the rapid change, we believe the company has a strong competitive position with leading technologies that operate at scale. Bright Horizons Family Solutions, Inc. (BFAM), a provider of child care services, was weak in the period as utilization rates in its centers remain depressed given the ongoing pandemic. Ultimately, we believe that employers recognize the importance of providing child care as a benefit to their employees and the pandemic has made this more evident despite a potentially more hybrid workforce operating both remotely and in office.
Outlook and Positioning
As of the end of 2021, the Fund remains overweight primarily in the Financials sector and underweight primarily in the Consumer Discretionary and Consumer Staples sectors.
Equities essentially ended the year at all-time highs as investors looked beyond the recent rise of Omicron variant cases. Conversely, in our view, looming higher interest rates and normalizing, i.e., slowing, growth could present challenges in 2022. Our focus remains on building a portfolio of companies that we believe can exhibit fundamentally stable growth characteristics across an entire economic cycle as this has typically helped protect investor capital in down markets. Additionally, as economic growth peaks, we believe investors will again find high quality growth an attractive area of the market as companies with unique, disruptive products and services can typically succeed without cyclical tailwinds.
We wish you the best in 2022 and as always, thank you for your continued interest and support.
| |
| Stock Performance (for the year ended 12/31/21) |
| | Average | Contribution |
| 5 Highest | Weight | to Return |
| Endava PLC | 2.34 | 2.07 |
| SiTime Corp. | 1.22 | 1.60 |
| Globant S.A. | 2.03 | 1.30 |
| Asana, Inc. | 0.51 | 1.08 |
| Silicon Laboratories, Inc. | 2.08 | 1.07 |
| | Average | Contribution |
| 5 Lowest | Weight | to Return |
| Bright Horizons Family Solutions, Inc. | 2.36 | -0.66 |
| Turning Point Therapeutics, Inc. | 0.80 | -0.72 |
| Everbridge, Inc. | 1.16 | -0.81 |
| SelectQuote, Inc. | 0.52 | -0.92 |
| Amedisys, Inc. | 1.73 | -1.02 |
Past performance does not guarantee future results. These stocks do not represent all of the securities purchased, sold or recommended by the Fund’s Adviser. To request a complete list of the contribution of each Fund holding to overall Fund performance during the period, please call (800) 392-2673.
Please see page 35 for a description of the methodology used to construct this table.
| | |
| Annual Report | December 31, 2021 | | | 5 |
| Segall Bryant & Hamill Small Cap Core Fund | Fund Overview |
| | December 31, 2021 (Unaudited) |
Fund Strategy
Investing primarily in equity securities of small-capitalization companies.
Fund Management
Jeffrey C. Paulis, CFA, Portfolio Manager
Mark T. Dickherber, CFA, CPA Portfolio Manager
CFA is a trademark owned by CFA Institute.
Cumulative Returns
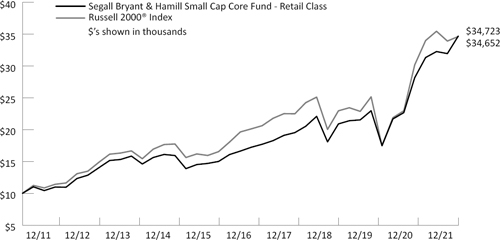
The chart above represents historical performance of a hypothetical investment of $10,000 in the Fund over the past 10 years (or for the life of the Fund if shorter). Performance calculations are as of the end of December each year. Past performance does not guarantee future results. This chart does not reflect the deduction of taxes that a shareholder would pay on Fund distributions or the redemption of Fund shares.
Please see index definitions beginning on page 34.
Average Annual Total Returns*
| | | | | | Since | Inception |
| | 1 Year | 3 Years | 5 Years | 10 Years | Inception | Date |
| Retail Class (SBHCX) | 23.26% | 24.28% | 15.85% | 13.26% | 10.15% | 12/31/19 |
| Institutional Class (SBASX) | 23.48% | 24.49% | 16.03% | 13.43% | 10.32% | 12/15/03 |
| Russell 2000® Index | 14.82% | 20.02% | 12.02% | 13.23% | 9.49% | |
Retail Class Annual Expense Ratio (per the current prospectus) — Gross: 1.26%, Net: 1.14%
Institutional Class Annual Expense Ratio (per the current prospectus) — Gross: 1.27%, Net: 0.99%
| | Sector Allocation (as of 12/31/21) | |
| | | |
| | Industrials | 25.0% |
| | Information Technology | 21.4% |
| | Health Care | 12.7% |
| | Consumer Discretionary | 12.5% |
| | Financials | 8.1% |
| | Materials | 7.8% |
| | Consumer Staples | 5.2% |
| | Energy | 2.4% |
| | Real Estate | 1.3% |
| | |
| | Sector classifications presented are based on the Global Industry Classification Standard (GICS) methodology. |
| | |
| | Sector weights may not sum to 100% due to rounding. |
| | |
| | The sector allocation table above does not include any cash or cash equivalents. |
| | |
| | Top Ten Holdings (as of 12/31/21) | |
| | | |
| | Regal Rexnord Corp. | 3.3% |
| | Hain Celestial Group, Inc. (The) | 2.4% |
| | Element Solutions, Inc. | 2.2% |
| | Silicon Laboratories, Inc. | 2.2% |
| | EnPro Industries, Inc. | 2.1% |
| | Pure Storage, Inc. | 2.0% |
| | Capri Holdings, Ltd. | 1.9% |
| | WNS Holdings, Ltd. | 1.7% |
| | Devon Energy Corp. | 1.6% |
| | Gildan Activewear, Inc. | 1.6% |
| | |
| | Top ten holdings do not include any cash, cash equivalents or exchange traded fund investments. Holdings are subject to change and may not reflect the current or future position of the Fund. |
| | |
| | |
| | |
| | |
| | |
| | |
| * | The quoted performance of the Fund reflects the past performance of Lower Wacker Small Cap Investment Fund, LLC (the “Partnership”), an unregistered limited partnership managed by the portfolio managers of the Fund. The Partnership was organized into the Institutional Class shares on December 31, 2019, the date the Fund commenced operations. The Fund has been managed in the same style since the Partnership’s inception on December 15, 2003. The Fund’s annual returns and long-term performance reflect the actual fees and expenses that were charged when the Fund was a limited partnership. From its inception on December 15, 2003 through December 31, 2019, the Partnership was not subject to certain investment restrictions, diversification requirements and other restrictions of the Investment Company Act of 1940, as amended or Subchapter M of the Internal Revenue Code of 1986, as amended, which, if they had been applicable, might have adversely affected the Fund’s performance. |
Performance data quoted represents past performance and does not guarantee future results. Current performance may be lower or higher than the performance quoted. To obtain current performance as of the most recent month-end, visit www.sbhfunds.com. Average annual total returns reflect the reinvestment of dividends, capital gains distributions, all fee waivers and expense reimbursements, if any. Without the fee waivers and expense reimbursements, total return figures would have been lower. Investment return and principal value will vary, and shares, when redeemed, may be worth more or less than their original cost. Segall Bryant & Hamill fund shares are not insured by the FDIC, the Federal Reserve Board or any other agency and are subject to investment risk.
Until at least April 30, 2022, Segall Bryant & Hamill, LLC (the “Adviser”) has contractually agreed to waive the investment advisory and/or administration fees and/or to reimburse other expenses, so that the ratio of expenses to average net assets as reported in the Fund’s Financial Highlights will be no more than 1.14% and 0.99% to the Fund’s Retail Class and Institutional Class, respectively, for such period. This agreement may not be terminated or modified by the Adviser prior to the termination date without the approval of the Board of Trustees.
Investing in small-cap funds generally will be more volatile and loss of principal could be greater than investing in larger-cap funds.
| | |
| 6 | | | www.sbhfunds.com |
| Segall Bryant & Hamill Small Cap Core Fund | Fund Overview |
| | December 31, 2021 (Unaudited) |
Manager Commentary
Market Overview and Fund Performance
The market continued its recovery from the COVID-19 pandemic as economies continued to reopen in 2021. The year began with a dramatic rise in low Return on Invested Capital (ROIC) stocks during the first quarter which ultimately subsided as risks related to COVID-19 variants, inflation, labor, supply chains, amongst others, arose through the remainder of the year. As these risks became more apparent through the year, the market rotated to higher ROIC companies, particularly in the second half of 2021, which benefited the performance of the Segall Bryant & Hamill Small Cap Core Fund. The Fund returned 23.26% (Retail Class) for the one-year period ended December 31, 2021. Its benchmark, the Russell 2000® Index, returned 14.82%.
Contributors to Return
On a sector level, Health Care, Industrials, and Information Technology were the largest contributors to the Fund’s performance relative to the benchmark. Endava Plc (DAVA) a digital technology outsourcer, was the largest individual contributor to the Fund’s return. Demand for Endava’s solutions structurally inflected higher as a result of COVID-19 as companies across industries struggled to engage digitally with their customers, accept new payment methods, and bring efficiency to their business—all things Endava’s solutions enable. Zurn Water Solutions Corporation (ZWS), a designer and manufacturer of water solutions focused on flow control, quality, and safety, was another large contributor. ZWS transformed into a pure-play water company by merging its industrial business with another company. In addition to solid business fundamentals and management execution, we believe the transformation attracted environmental, social, and governance (ESG) investors which resulted in multiple expansion and stock price appreciation.
Detractors from Return
On a sector level, Real Estate and Financials were the largest relative detractors from the Fund’s performance. Amedisys, Inc (AMED), a provider of home health and hospice services, was the largest detractor. Amedisys faced numerous internal and external headwinds during 2021. Repeated COVID-19 spikes reduced the length of patient stay in its hospice business while elevated staff quarantine levels and pandemic-related nurse burnout caused
staffing shortages which impacted the company’s short-term financial results. Anaplan, Inc (PLAN), a provider of SaaS planning solutions, was the second largest detractor. Anaplan reported solid, but inconsistent results which, coupled with a CFO and head of sales change during the year, weighed on investor sentiment and the multiple.
Outlook and Positioning
As we begin 2022, the solid economic backdrop in the U.S. continues to be challenged by many global issues related to labor and supply chains. Over the next few quarters (not first quarter 2022), we see a path for many of these issues to become incrementally less bad which, combined with the fading of the Delta/Omicron variants and an inventory restocking cycle, could strengthen investor sentiment for cyclical companies. Accordingly, the Fund’s positioning remains fairly balanced between sustainably high ROIC companies and improving ROIC companies as it had been for the last several quarters. However, entering the third year of the recovery, we also see the prospects for increasing market volatility developing driven by Federal Reserve (Fed) actions (higher rate tightening prospects and potential quantitative tightening), midterm elections, and a slowing of economic backdrop as we move through the second half of the year.
As we move through 2022, we would not be surprised to see the mix of higher ROIC companies in the strategy increase as the cycle matures and the backdrop for low ROIC companies becomes increasingly unfavorable (higher rates, slower growth). Further, many high growth names underperformed dramatically in 2021 and our team is busy evaluating the merits of many of these companies as we believe they could rebound should the Fed raise rates too aggressively or if economic growth begins to surprise to the downside. Regardless, through our research efforts, our team will remain focused on seeking to identify both higher ROIC and improving ROIC investment opportunities and seeking to ensure these investment opportunities also possess solid niche market and competitive advantaged positioning, strong management teams, and attractive risk-adjusted return potential—all attributes which have represented the key pillars to our investment approach for many years.
| |
| Stock Performance (for the year ended 12/31/21) |
| | Average | Contribution |
| 5 Highest | Weight | to Return |
| Endava PLC | 1.56 | 1.35 |
| Devon Energy Corp. | 1.09 | 1.14 |
| Zurn Water Solutions Corp. | 1.58 | 1.14 |
| Rogers Corp. | 1.70 | 0.99 |
| Silicon Laboratories, Inc. | 1.76 | 0.95 |
| | Average | Contribution |
| 5 Lowest | Weight | to Return |
| 8x8, Inc. | 0.34 | -0.32 |
| Phreesia, Inc. | 0.47 | -0.33 |
| Haemonetics Corp. | 0.27 | -0.34 |
| Anaplan, Inc. | 0.88 | -0.34 |
| Amedisys, Inc. | 1.33 | -0.83 |
Past performance does not guarantee future results. These stocks do not represent all of the securities purchased, sold or recommended by the Fund’s Adviser. To request a complete list of the contribution of each Fund holding to overall Fund performance during the period, please call (800) 392-2673.
Please see page 35 for a description of the methodology used to construct this table.
| | |
| Annual Report | December 31, 2021 | | | 7 |
| Segall Bryant & Hamill All Cap Fund | Fund Overview |
| | December 31, 2021 (Unaudited) |
Fund Strategy
Investing primarily in equity securities of any size, including small- and mid-capitalization companies.
Fund Management
Ralph M. Segall, CFA, CIC Portfolio Manager
Suresh Rajagopal, CFA Portfolio Manager
CFA is a trademark owned by CFA Institute.
Cumulative Returns

The chart above represents historical performance of a hypothetical investment of $10,000 in the Fund over the past 10 years (or for the life of the Fund if shorter). Performance calculations are as of the end of December each year. Past performance does not guarantee future results. This chart does not reflect the deduction of taxes that a shareholder would pay on Fund distributions or the redemption of Fund shares.
Please see index definitions beginning on page 34.
Average Annual Total Returns
| | | | | | Since | Inception |
| | 1 Year | 3 Years | 5 Years | 10 Years | Inception | Date |
| Retail Class (SBRAX) | 29.57% | 28.68% | 18.95% | — | 14.08% | 12/9/19 |
| Institutional Class (SBHAX) | 29.55% | 28.76% | 19.07% | — | 14.22% | 7/31/13 |
| Russell 3000® Index | 25.66% | 25.79% | 17.97% | — | 14.96% | |
Retail Class Annual Expense Ratio (per the current prospectus) — Gross: 0.99%, Net: 0.99%
Institutional Class Annual Expense Ratio (per the current prospectus) — Gross: 0.92%, Net: 0.84%
| | Sector Allocation (as of 12/31/21) | |
| | | |
| | Information Technology | 24.9% |
| | Health Care | 16.7% |
| | Financials | 15.3% |
| | Consumer Discretionary | 14.0% |
| | Industrials | 10.9% |
| | Communication Services | 5.4% |
| | Consumer Staples | 4.6% |
| | Materials | 3.5% |
| | Energy | 2.6% |
| | |
| | Sector classifications presented are based on the Global Industry Classification Standard (GICS) methodology. |
| | |
| | Sector weights may not sum to 100% due to rounding. |
| | |
| | The sector allocation table above does not include any cash or cash equivalents. |
| | |
| | Top Ten Holdings (as of 12/31/21) | |
| | | |
| | Microsoft Corp. | 4.7% |
| | Alphabet, Inc. | 4.0% |
| | Marvell Technology, Inc. | 3.5% |
| | Amazon.com, Inc. | 3.1% |
| | Quanta Services, Inc. | 2.7% |
| | Ares Management Corp. | 2.7% |
| | Visa, Inc. | 2.6% |
| | Zebra Technologies Corp. | 2.6% |
| | TJX Cos., Inc. (The) | 2.5% |
| | UnitedHealth Group, Inc. | 2.2% |
| | |
| | Top ten holdings do not include any cash, cash equivalents or exchange traded fund investments. Holdings are subject to change and may not reflect the current or future position of the Fund. |
| | |
| | |
| | |
| | |
| | |
| | |
| | |
Performance data quoted represents past performance and does not guarantee future results. Performance information for the Retail Class shares prior to their inception is based on the performance of the Institutional Class. Current performance may be lower or higher than the performance quoted. To obtain current performance as of the most recent month-end, visit www.sbhfunds.com. Average annual total returns reflect the reinvestment of dividends, capital gains distributions, all fee waivers and expense reimbursements, if any. Without the fee waivers and expense reimbursements, total return figures would have been lower. Investment return and principal value will vary, and shares, when redeemed, may be worth more or less than their original cost. Segall Bryant & Hamill fund shares are not insured by the FDIC, the Federal Reserve Board or any other agency and are subject to investment risk.
Until at least April 30, 2022, Segall Bryant & Hamill, LLC (the “Adviser”) has contractually agreed to waive the investment advisory and/or administration fees and/or to reimburse other expenses, so that the ratio of expenses to average net assets as reported in the Fund’s Financial Highlights will be no more than 0.99% and 0.84% to the Fund’s Retail Class and Institutional Class, respectively, for such period. This agreement may not be terminated or modified by the Adviser prior to the termination date without the approval of the Board of Trustees.
| | |
| 8 | | | www.sbhfunds.com |
| Segall Bryant & Hamill All Cap Fund | Fund Overview |
| | December 31, 2021 (Unaudited) |
Manager Commentary
Market Overview and Fund Performance
For the fiscal year ended December 31, 2021, the Segall Bryant & Hamill All Cap Fund returned 29.57% (Retail Class) compared to a return of 25.66% for its benchmark, the Russell 3000® Index. Security selection was the most significant contributor to relative performance for the year. As a reminder, the investment approach of the Fund is to participate in all markets by investing in companies that that we believe can generate meaningful Returns on Invested Capital (ROIC), produce quality financial metrics (e.g., free cash flow growth, consistent earnings growth, and margin expansion) and possess strong management teams.
Contributors to Return
At the sector level, the Fund’s best-performing sectors during the year relative to the benchmark were Health Care, Information Technology, and Industrials. Outperformance in the Communication Services sector was primarily from Alphabet (GOOG) and lack of exposure to underperforming names within the sector. Health Care was driven by strong idiosyncratic performance of several holdings as was Information Technology. At the individual stock level, Marvell Technology (MRVL) was a top contributor due to design wins related to its data center, 5G deployments, enterprise networking, and autos which pushed growth expectations meaningfully higher in 2022.
Detractors from Return
Materials, Energy, and Real Estate were the largest detractors on a sector level relative to the Fund’s benchmark for the year. The Energy sector suffered due to lack of exposure within the Fund, as the energy sector was the best performing sector within the benchmark index. The Fund’s holdings in the Materials sector lacked exposure to some of the basic commodity businesses that enjoyed strong year-end rallies within the benchmark. At an individual stock level, Cable One (CABO) underperformed for the year due to stepped-up capital expenditure concerns, increasing regulation and near-term concerns about user growth.
Outlook and Positioning
Investors enter 2022 flush with several strong years of returns from the financial markets, paradoxically achieved during tremendous political and social turmoil. COVID remains top of mind on our risk radar, but we are encouraged by data indicating the new super-spreading Omicron variant may be much less severe and represent the beginning of the end of the pandemic (i.e., the endemic case). How the recent surge in inflation responds to COVID-influenced demand and supply shocks is another key watch item particularly at current market valuation levels. We have been concerned about very high valuation levels for stocks and low levels of interest rates in the bond market which are now in real, that is, inflation-adjusted terms, quite negative. While the opportunity set seems to be getting smaller and smaller, the fact that the markets remain high illustrates the comment attributed to J.M. Keynes: “The market can stay irrational longer than you can stay solvent.”
Fortunately, for us, macro concerns are not a principal part of the selection process in the Fund. It always has been, and will always remain, a market of stocks rather than a stock market. In our view, there will always be investments to make in companies with the right set of investment characteristics, priced at valuations that present an attractive opportunity to reach our long-term investment goals. The constant search for such names goes on.
Thank you for your consideration and continued support.
| |
| Stock Performance (for the year ended 12/31/21) |
| | Average | Contribution |
| 5 Highest | Weight | to Return |
| Alphabet, Inc. | 3.91 | 2.23 |
| Marvell Technology, Inc. | 2.92 | 2.17 |
| Microsoft Corp. | 4.38 | 2.13 |
| Ares Management Corp. | 2.37 | 1.54 |
| Quanta Services, Inc. | 2.59 | 1.34 |
| | Average | Contribution |
| 5 Lowest | Weight | to Return |
| Autodesk, Inc. | 0.46 | -0.15 |
| CoStar Group, Inc. | 1.22 | -0.21 |
| Lamb Weston Holdings, Inc. | 0.77 | -0.24 |
| Fidelity National Information Services, Inc. | 0.58 | -0.39 |
| Cable One, Inc. | 1.65 | -0.43 |
Past performance does not guarantee future results. These stocks do not represent all of the securities purchased, sold or recommended by the Fund’s Adviser. To request a complete list of the contribution of each Fund holding to overall Fund performance during the period, please call (800) 392-2673.
Please see page 35 for a description of the methodology used to construct this table.
| | |
| Annual Report | December 31, 2021 | | | 9 |
| Segall Bryant & Hamill Emerging Markets Fund | Fund Overview |
| | December 31, 2021 (Unaudited) |
Fund Strategy
Investing primarily in equity securities of companies tied economically to emerging markets countries.
Fund Management
Scott E. Decatur, Ph.D. Portfolio Manager
Nicholas C. Fedako, CFA Portfolio Manager
CFA is a trademark owned by CFA Institute.
Cumulative Returns

The chart above represents historical performance of a hypothetical investment of $10,000 in the Fund over the past 10 years (or for the life of the Fund if shorter). Performance calculations are as of the end of December each year. Past performance does not guarantee future results. This chart does not reflect the deduction of taxes that a shareholder would pay on Fund distributions or the redemption of Fund shares.
Please see index definitions beginning on page 34.
Average Annual Total Returns
| | | | | | Since | Inception |
| | 1 Year | 3 Years | 5 Years | 10 Years | Inception | Date |
| Retail Class* (SBHEX) | 5.22% | 10.07% | 8.45% | 5.09% | 2.55% | 6/30/14 |
| Institutional Class** (SBEMX) | 5.49% | 10.34% | 8.68% | 5.29% | 2.76% | 6/30/11 |
| MSCI Emerging Markets Index | (2.54)% | 10.94% | 9.88% | 5.49% | 3.11% | |
Retail Class Annual Expense Ratio (per the current prospectus) — Gross: 2.36%, Net: 1.38%
Institutional Class Annual Expense Ratio (per the current prospectus) — Gross: 2.19%, Net: 1.23%
| | Sector Allocation (as of 12/31/21) | |
| | | |
| | Information Technology | 25.1% |
| | Financials | 19.3% |
| | Consumer Discretionary | 12.3% |
| | Communication Services | 9.1% |
| | Materials | 8.4% |
| | Energy | 6.2% |
| | Consumer Staples | 5.5% |
| | Industrials | 5.3% |
| | Health Care | 3.9% |
| | Utilities | 2.5% |
| | Real Estate | 1.9% |
| | |
| | Sector classifications presented are based on the Global Industry Classification Standard (GICS) methodology. |
| | |
| | Sector weights may not sum to 100% due to rounding. |
| | |
| | The sector allocation table above does not include any cash or cash equivalents. |
| | |
| | Top Ten Holdings (as of 12/31/21) | |
| | | |
| | Taiwan Semiconductor Manufacturing Co., Ltd. | 5.9% |
| | Tencent Holdings, Ltd. | 3.5% |
| | Samsung Electronics Co., Ltd. | 3.2% |
| | Alibaba Group Holding, Ltd. | 1.9% |
| | Bank of China, Ltd. | 1.1% |
| | Zhongsheng Group Holdings, Ltd. | 1.0% |
| | Wuchan Zhongda Group Co., Ltd. | 1.0% |
| | China Construction Bank Corp. | 1.0% |
| | KPR Mill, Ltd. | 0.9% |
| | State Bank of India | 0.9% |
| | |
| | Top ten holdings do not include any cash, cash equivalents or exchange traded fund investments. Holdings are subject to change and may not reflect the current or future position of the Fund. |
| | |
| | |
| | |
| | |
| | |
| | |
| | |
| | |
Performance data quoted represents past performance and does not guarantee future results. Performance information for the Retail Class shares prior to their inception is based on the performance of the Institutional Class. Current performance may be lower or higher than the performance quoted. To obtain current performance as of the most recent month-end, visit www.sbhfunds.com. Average annual total returns reflect the reinvestment of dividends, capital gains distributions, all fee waivers and expense reimbursements, if any. Without the fee waivers and expense reimbursements, total return figures would have been lower. Investment return and principal value will vary, and shares, when redeemed, may be worth more or less than their original cost. Segall Bryant & Hamill fund shares are not insured by the FDIC, the Federal Reserve Board or any other agency and are subject to investment risk.
Until at least April 30, 2022, Segall Bryant & Hamill, LLC (the “Adviser”) has contractually agreed to waive the investment advisory and/or administration fees and/or to reimburse other expenses, so that the ratio of expenses to average net assets as reported in the Fund’s Financial Highlights will be no more than 1.38% and 1.23% to the Fund’s Retail Class and Institutional Class, respectively, for such period. This agreement may not be terminated or modified by the Adviser prior to the termination date without the approval of the Board of Trustees.
Investing in foreign companies are subject to special risks, including currency fluctuations, social, economic, and political uncertainties, which could increase volatility.
| | |
| 10 | | | www.sbhfunds.com |
| Segall Bryant & Hamill Emerging Markets Fund | Fund Overview |
| | December 31, 2021 (Unaudited) |
Manager Commentary
Market Overview and Fund Performance
After posting an 18.31% return for the fiscal year ended December 31, 2020, the MSCI Emerging Markets Index finished down 2.54% in 2021, just the second time in the last six years it has ended in negative territory. Markets rallied to begin 2021 as optimism grew that vaccination efforts and economies reopening would provide a jumpstart to global growth. Stocks traded lower as the year went on as concerns grew that variants of the Coronavirus could lead to new restrictions and that higher inflation would cause central bankers to tighten monetary policies. Regional index performance was mixed as Asia -5.08% and Latin America -8.09% ended lower, while EMEA (Europe, Middle East, Africa) +18.01% ended higher. China -21.72% was the worst-performing country in Asia this year and second worst in the index overall as regulatory actions against technology companies, debt concerns in its property sector, and slowing growth all weighed on equities. Two bright spots in Asia were India +26.23%, which benefited from strong stimulus programs, and Taiwan +26.13%, where semiconductor companies outperformed on rising prices and demand. Returns in Latin America were dragged down by its largest economy, Brazil -17.40%, which is facing rising interest rates, slowing growth, and a possibly contentious presidential election in 2022. The region’s second largest economy, Mexico +22.53%, was the top performer in the region, aided in part by the strong economic recovery in the U.S., its largest trading partner. In EMEA, every country ended the year higher, with the exception of Turkey where stocks rose in local terms but the lira fell 44% versus the U.S. dollar as investors questioned the current leadership’s policy of cutting interest rates despite rising inflation. The countries with the largest impacts on positive returns to the Benchmark in the region for the year were Saudi Arabia +37.70%, which saw growth in its financial sector at the prospect of higher interest rates, and Russia +19.01%, where energy companies rose on higher demand. At the sector level, 6 of 11 groups ended the year higher, led by Energy +20.95% and Utilities +12.43% which benefited from rising oil, natural gas, and electricity prices as economies reopened. The two worst-performing sectors were Consumer Discretionary -29.06% and Real Estate -21.84%, which were hit especially hard from their larger weights in Chinese equities.
The Segall Bryant & Hamill Emerging Markets Fund returned 5.22% (Retail Class) for the one-year period ending December 31, 2021. The Fund’s benchmark, the MSCI Emerging Markets Index, returned -2.54%. Security
selection was strong within the Asia, Latin America and EMEA benchmark regions, but especially in Asia, where the Fund’s holdings in China, India, and Korea outperformed relative to the benchmark. Selection in Malaysia and Indonesia was a modest drag on relative returns. In Latin America, positive security selection was driven primarily by Brazil, while Peru and Chile also contributed. In EMEA, Russia was the Fund’s top performer, followed by Qatar, Poland, and Turkey. At the sector level, stock selection was positive in 10 of 11 groups with the largest relative returns coming from Consumer Discretionary, Financials, and Consumer Staples. Real Estate was the only sector where selection was negative. In our opinion, our multifactor model worked very well in 2021 as Valuation, Earnings Momentum, and Price Momentum outperformed and Profitability performed in line.
Outlook and Positioning
High-quality and value factors both performed well in emerging markets in 2021, but the best-performing segment was the intersection of the two. The Fund’s area of focus, companies we assess as high quality that we believe are trading at reasonable valuations, enjoyed strong relative returns for the year as investors began to, once again, focus on prices rather than just overly optimistic narratives when evaluating companies. Expensive companies of lesser quality, which outperformed in 2020, were the worst-performing segment this year. These trends are occurring globally but have been more pronounced in emerging markets than in other asset classes. We believe that the positioning of the Fund remains historically attractive from a valuation perspective. Even with substantial outperformance during 2021, we believe the Fund is even better positioned than it was at the end of 2020 due to the strong business performance of the companies on which we focus. We noticed a similar phenomenon during the deflation of the dot-com bubble in which the Fund’s area of focus simultaneously outperformed while becoming more attractively valued. It can be a very powerful driver of outperformance when a segment of the market that is at record valuation discounts is also performing well from a business perspective. From an asset allocation perspective, emerging markets are at some of the largest discounts versus the U.S. in 20 years, levels from which they have typically rebounded strongly. We are very optimistic on both the emerging markets asset class and the positioning of the Fund as we begin 2022.
| |
| Stock Performance (for the year ended 12/31/21) |
| | Average | Contribution |
| 5 Highest | Weight | to Return |
| Taiwan Semiconductor Manufacturing Co., Ltd. | 5.44 | 0.72 |
| KPR Mill, Ltd. | 0.48 | 0.68 |
| Evergreen Marine Corp. Taiwan, Ltd. | 0.40 | 0.56 |
| Yang Ming Marine Transport Corp. | 0.31 | 0.41 |
| Fubon Financial Holdings Co., Ltd. | 0.59 | 0.35 |
| | Average | Contribution |
| 5 Lowest | Weight | to Return |
| Meituan | 0.66 | -0.27 |
| Samsung Electronics Co., Ltd. | 3.22 | -0.30 |
| Baidu, Inc. | 0.92 | -0.38 |
| Tencent Holdings, Ltd. | 4.46 | -0.61 |
| Alibaba Group Holding, Ltd. | 3.83 | -1.94 |
Past performance does not guarantee future results. These stocks do not represent all of the securities purchased, sold or recommended by the Fund’s Adviser. To request a complete list of the contribution of each Fund holding to overall Fund performance during the period, please call (800) 392-2673.
Please see page 35 for a description of the methodology used to construct this table.
| | |
| Annual Report | December 31, 2021 | | | 11 |
| Segall Bryant & Hamill International Small Cap Fund | Fund Overview |
| | December 31, 2021 (Unaudited) |
Fund Strategy
Investing primarily in equity securities of small capitalization companies located outside of the United States, including those in emerging markets.
Fund Management
Scott E. Decatur, Ph.D. Portfolio Manager
Nicholas C. Fedako, CFA Portfolio Manager
CFA is a trademark owned by CFA Institute.
Cumulative Returns

The chart above represents historical performance of a hypothetical investment of $10,000 in the Fund over the past 10 years (or for the life of the Fund if shorter). Performance calculations are as of the end of December each year. Past performance does not guarantee future results. This chart does not reflect the deduction of taxes that a shareholder would pay on Fund distributions or the redemption of Fund shares.
Please see index definitions beginning on page 34.
Average Annual Total Returns
| | | | | | Since | Inception |
| | 1 Year | 3 Years | 5 Years | 10 Years | Inception | Date |
| Retail Class* (SBHSX) | 12.97% | 7.55% | 3.96% | 8.08% | 5.32% | 6/30/14 |
| Institutional Class** (SBSIX) | 13.19% | 7.73% | 4.21% | 8.32% | 5.56% | 5/31/11 |
| MSCI EAFE Small Cap Index | 10.10% | 15.62% | 11.04% | 10.80% | 7.82% | |
Retail Class Annual Expense Ratio (per the current prospectus) — Gross: 1.36%, Net: 1.18%
Institutional Class Annual Expense Ratio (per the current prospectus) — Gross: 1.18%, Net: 1.03%
| | Sector Allocation (as of 12/31/21) | |
| | | |
| | Industrials | 24.7% |
| | Consumer Discretionary | 12.1% |
| | Financials | 10.8% |
| | Information Technology | 10.8% |
| | Real Estate | 9.6% |
| | Materials | 8.3% |
| | Health Care | 7.7% |
| | Consumer Staples | 5.8% |
| | Communication Services | 4.5% |
| | Utilities | 2.8% |
| | Energy | 2.0% |
| | |
| | Sector classifications presented are based on the Global Industry Classification Standard (GICS) methodology. |
| | |
| | Sector weights may not sum to 100% due to rounding. |
| | |
| | The sector allocation table above does not include any cash or cash equivalents. |
| | |
| | Top Ten Holdings (as of 12/31/21) | |
| | | |
| | Scandinavian Tobacco Group A/S | 1.2% |
| | Redrow PLC | 1.2% |
| | GrainCorp, Ltd. | 1.1% |
| | Investec PLC | 1.1% |
| | Royal Mail PLC | 1.1% |
| | Vistry Group PLC | 1.0% |
| | Getinge A.B. | 1.0% |
| | Computacenter PLC | 1.0% |
| | ASR Nederland N.V. | 1.0% |
| | Inwido A.B. | 0.9% |
| | |
| | Top ten holdings do not include any cash, cash equivalents or exchange traded fund investments. Holdings are subject to change and may not reflect the current or future position of the Fund. |
| | |
| | |
| | |
| | |
| | |
| | |
| | |
| | |
| | |
Performance data quoted represents past performance and does not guarantee future results. Performance information for the Retail Class shares prior to their inception is based on the performance of the Institutional Class. Current performance may be lower or higher than the performance quoted. To obtain current performance as of the most recent month-end, visit www.sbhfunds.com. Average annual total returns reflect the reinvestment of dividends, capital gains distributions, all fee waivers and expense reimbursements, if any. Without the fee waivers and expense reimbursements, total return figures would have been lower. Investment return and principal value will vary, and shares, when redeemed, may be worth more or less than their original cost. Segall Bryant & Hamill fund shares are not insured by the FDIC, the Federal Reserve Board or any other agency and are subject to investment risk.
Until at least April 30, 2022, Segall Bryant & Hamill, LLC (the “Adviser”) has contractually agreed to waive the investment advisory and/or administration fees and/or to reimburse other expenses, so that the ratio of expenses to average net assets as reported in the Fund’s Financial Highlights will be no more than 1.18% and 1.03% to the Fund’s Retail Class and Institutional Class, respectively, for such period. This agreement may not be terminated or modified by the Adviser prior to the termination date without the approval of the Board of Trustees.
Investing in small-cap funds generally will be more volatile and loss of principal could be greater than investing in larger-cap funds.
Investing in foreign companies are subject to special risks, including currency fluctuations, social, economic, and political uncertainties, which could increase volatility.
| | |
| 12 | | | www.sbhfunds.com |
| Segall Bryant & Hamill International Small Cap Fund | Fund Overview |
| | December 31, 2021 (Unaudited) |
Manager Commentary
Market Overview and Fund Performance
In 2021, international small cap stocks, as measured by the MSCI EAFE Small Cap Index, rose for the third year in a row with a 10.10% return as global vaccination efforts expanded and governments took steps to reopen their economies from the pandemic. Stocks pared gains through the final four months of the year on inflation and Omicron variant concerns. U.S.-based investors saw local returns reduced as the dollar strengthened versus the euro, pound, and yen with the MSCI EAFE Small Cap Index ending 17.28% higher in local terms for the year. Regional index returns were mixed as Europe +15.76%, the United Kingdom +13.49%, and the Far East +10.95% posted positive returns, while Japan -2.28% dropped modestly. In Europe, the Netherlands +31.46% was the best-performing country as the nation’s stock market has become a hub of special purpose acquisition company (SPAC) and technology listings within the region. Germany +7.00% lagged its European peers as exporters were hurt by rising raw material costs and supply chain disruptions. The U.K. ended higher aided by a hot real estate market and beaten down industrials rebounding on recovery optimism. Australia +15.03% was the best performer in the Far East as metal and mining companies rallied as demand increased for raw materials. New Zealand was the only country in the region to end lower as the country reintroduced some COVID restrictions, and business and consumer confidence dropped. Japan also ended in negative territory as stricter quarantine measures remained in place, along with a weaker yen. At the sector level, 9 of 11 groups ended the year in positive territory, led by Financials +17.18% whose margins could improve if central bankers raise interest rates to combat inflation. Industrials +16.42%, Real Estate +13.91%, and Materials +11.62% also posted double-digit returns as economies reopened. Consumer Staples -5.28% led on the downside on concerns that rising input prices could negatively affect profits.
The Segall Bryant & Hamill International Small Cap Fund (SBHSX) returned 12.97% (Retail Class) for the one-year period ending December 31, 2021. The Fund’s benchmark, the MSCI EAFE Small Cap Index, returned 10.10%. Stock selection was positive in all four regions this year with the United Kingdom providing the largest relative gain. Within Europe, the Fund’s holdings in France, Norway, and Sweden were the top outperformers, while selection
in Switzerland caused the biggest drag. In the Far East, positive selection effects in New Zealand and Hong Kong were more than enough to offset negative selection in Australia. At the sector level, stock selection was additive in 9 of 11 groups with the largest benefits coming from Health Care, Information Technology, and Real Estate. Communication Services and Materials were the two sectors where selection ended modestly lower. In our opinion, our multifactor model performed well in 2021 with Valuation providing the largest positive impact, followed by Earnings Momentum and Profitability. The Price Momentum component ended the year lower but we believe performed well following a difficult first quarter.
Outlook and Positioning
2021 ended with both quality and value factors performing well. Historically, we believe that the intersection of the two is the best-performing segment, but it was the extremes of the two factors that led in 2021. We believe the international small cap space is still in a transitional phase, or “turn”, from expensive company leadership to our area of focus, companies that we assess as high quality with reasonable valuations. We noticed similar turns after the substantial market dislocations of 1999/2000 and 2008/2009. In our experience, the outperformance of lower quality companies often acts as a bridge between the outperformance of expensive growth companies back to the reasonably valued, high-quality segment that we focus on. As 2021 progressed, we observed outperformance trending away from lower-quality companies into high-quality ones. We expect this adjustment to continue in 2022, which we believe should continue to benefit our approach. Positioning remains very attractive, as relative valuations between our area of focus and the market actually improved over the course of 2021, despite the Fund outperforming. We believe this improvement was possible due to the strong fundamental performance of the companies in the Fund’s area of focus. It can be a powerful driver of outperformance when a segment of the market that is at record valuation discounts is also performing well from an underlying business perspective. We believe a historic opportunity exists in the international small cap space and we are optimistic about our prospects going forward.
| |
| Stock Performance (for the year ended 12/31/21) |
| | Average | Contribution |
| 5 Highest | Weight | to Return |
| InMode, Ltd. | 0.51 | 0.73 |
| Gamesys Group PLC | 0.21 | 0.59 |
| Mitsui OSK Lines, Ltd. | 0.56 | 0.58 |
| Redde Northgate PLC | 0.96 | 0.55 |
| Getinge A.B. | 0.87 | 0.52 |
| | Average | Contribution |
| 5 Lowest | Weight | to Return |
| Betsson A.B. | 0.60 | -0.17 |
| Digital Holdings, Inc. | 0.23 | -0.18 |
| Mount Gibson Iron, Ltd. | 0.24 | -0.21 |
| Millicom International Cellular S.A. | 0.33 | -0.27 |
| NRW Holdings, Ltd. | 0.50 | -0.40 |
Past performance does not guarantee future results. These stocks do not represent all of the securities purchased, sold or recommended by the Fund’s Adviser. To request a complete list of the contribution of each Fund holding to overall Fund performance during the period, please call (800) 392-2673.
Please see page 35 for a description of the methodology used to construct this table.
| | |
| Annual Report | December 31, 2021 | | | 13 |
Segall Bryant & Hamill
Fundamental International Small Cap Fund | Fund Overview |
| | December 31, 2021 (Unaudited) |
Fund Strategy
Investing in the stocks of small international companies that we believe are poised for growth.
Fund Management
John C. Fenley, CFA Portfolio Manager
CFA is a trademark owned by CFA Institute.
Cumulative Returns
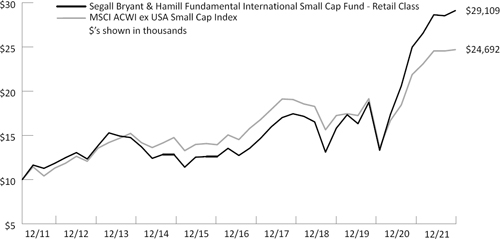
The chart above represents historical performance of a hypothetical investment of $10,000 in the Fund over the past 10 years (or for the life of the Fund if shorter). Performance calculations are as of the end of December each year. Past performance does not guarantee future results. This chart does not reflect the deduction of taxes that a shareholder would pay on Fund distributions or the redemption of Fund shares.
Please see index definitions beginning on page 34.
Average Annual Total Returns
| | | | | | Since | Inception |
| | 1 Year | 3 Years | 5 Years | 10 Years | Inception | Date |
| Retail Class (WTIFX) | 16.59% | 30.48% | 17.99% | 11.28% | 7.41% | 12/15/99 |
| Institutional Class (WIIFX) | 16.70% | 30.69% | 18.17% | 11.38% | 7.46% | 4/29/16 |
| MSCI ACWI ex USA Small Cap Index | 12.93% | 16.45% | 11.21% | 9.46% | 7.46% | |
Retail Class Annual Expense Ratio (per the current prospectus) — Gross: 1.69%, Net: 1.25%
Institutional Class Annual Expense Ratio (per the current prospectus) — Gross: 1.57%, Net: 1.10%
| | Sector Allocation (as of 12/31/21) | |
| | | |
| | Industrials | 29.3% |
| | Information Technology | 27.9% |
| | Consumer Discretionary | 26.0% |
| | Financials | 6.3% |
| | Consumer Staples | 3.9% |
| | Health Care | 2.0% |
| | Communication Services | 0.9% |
| | |
| | Sector classifications presented are based on the Global Industry Classification Standard (GICS) methodology. |
| | |
| | Sector weights may not sum to 100% due to rounding. |
| | |
| | The sector allocation table above does not include any cash or cash equivalents. |
| | |
| | Top Ten Holdings (as of 12/31/21) | |
| | | |
| | Hunter Douglas N.V. | 8.6% |
| | Brodrene A. & O. Johansen A/S | 6.3% |
| | Constellation Software, Inc. | 4.8% |
| | Instalco A.B. | 4.8% |
| | Clipper Logistics PLC | 4.3% |
| | Topicus.com, Inc. | 4.0% |
| | Evolution Gaming Group A.B. | 3.8% |
| | Pollard Banknote, Ltd. | 3.3% |
| | GFL Environmental, Inc. | 3.0% |
| | BayCurrent Consulting, Inc. | 2.8% |
| | |
| | Top ten holdings do not include any cash, cash equivalents or exchange traded fund investments. Holdings are subject to change and may not reflect the current or future position of the Fund. |
| | |
| | |
| | |
| | |
| | |
| | |
| | |
Performance data quoted represents past performance and does not guarantee future results. Performance information for the Institutional Class shares prior to their inception is based on the performance of the Retail Class. Current performance may be lower or higher than the performance quoted. To obtain current performance as of the most recent month-end, visit www.sbhfunds.com. Average annual total returns reflect the reinvestment of dividends, capital gains distributions, all fee waivers and expense reimbursements, if any. Without the fee waivers and expense reimbursements, total return figures would have been lower. Investment return and principal value will vary, and shares, when redeemed, may be worth more or less than their original cost. Segall Bryant & Hamill fund shares are not insured by the FDIC, the Federal Reserve Board or any other agency and are subject to investment risk.
Until at least April 30, 2022, Segall Bryant & Hamill, LLC (the “Adviser”) has contractually agreed to waive the investment advisory and/or administration fees and/or to reimburse other expenses, so that the ratio of expenses to average net assets as reported in the Fund’s Financial Highlights will be no more than 1.25% and 1.10% for the Fund’s Retail Class and Institutional Class, respectively, for such period. This agreement may not be terminated or modified by the Adviser prior to the termination date without the approval of the Board of Trustees.
Investing in small-cap funds generally will be more volatile and loss of principal could be greater than investing in larger-cap funds.
Investing in foreign securities entails special risks, such as currency fluctuations and political uncertainties, which are described in more detail in the prospectus.
| | |
| 14 | | | www.sbhfunds.com |
Segall Bryant & Hamill
Fundamental International Small Cap Fund | Fund Overview |
| | December 31, 2021 (Unaudited) |
Manager Commentary
Market Overview and Fund Performance
Most developed equity markets across the world performed well in 2021. Investors seemingly brushed off major global concerns such as above average inflation, continued supply chain disruptions, and the proliferation of the Omicron COVID-19 variant to push equity valuations higher on the back of improving global economic growth. Aided by the strengthening dollar, U.S. markets generally performed better than international markets during 2021.
With a mix of developed and emerging market stocks, the Segall Bryant & Hamill Fundamental International Small Cap Fund returned 16.59% (Retail Class) for 2021 compared to a return of 12.93% for its benchmark, the MSCI ACWI ex USA Small Cap Index. Owing to the discipline of investing in companies we assess as high quality, the Fund also outperformed its peer average. During periods of macro-economic uncertainty, we believe that focusing on companies with significant free cash flow, high returns, and strong balance sheets should lead to relative outperformance.
Contributors to Return
The Fund’s strong returns in Consumer Discretionary, Industrials, and Health Care added to relative performance during the year. From a holdings standpoint, Hunter Douglas was a major contributor to annual performance. The Netherlands-based company is a global leader in the manufacturing of window coverings. With its 100-year history of developing into one of the industry’s most highly regarded and recognized brands, the company has benefited recently from an uptick in the residential home improvement market. At the end of the year, investment firm 3G Capital committed to buying a majority stake in Hunter Douglas at close to a 72% premium to its previous close.
Another strong contributor to performance was Sweden-based Evolution Gaming Group, a developer and producer of live, online casino games. It markets and licenses to online casino operators across the globe. The shutdown of traditional bricks and mortar casinos during the pandemic helped accelerate demand for Evolution’s solutions as gamblers shifted to online gaming. We believe that the online gambling market will continue to grow at a fast pace for the foreseeable future.
Detractors from Return
Weak performance in Information Technology and Communication Services along with lack of exposure to Energy all detracted from performance relative to the benchmark. On a stock basis, Hong Kong-
listed PAX Global Technology (PAX) was an underperformer. PAX is one of the world’s largest electronic-funds-transfer at point-of-sale (EFT-POS) terminal providers with a focus on emerging markets like Brazil. During the year, speculation arose that PAX terminals may have been used in cyberattacks. Shares came under pressure despite a lack of evidence or official charges being issued to PAX for any wrongdoings. We decided to maintain our position in PAX shares.
Australian-based Appen was another underperformer in 2021. Appen is a language technology company that helps their customers build products that rely on natural language processing, such as speech engines (Amazon’s Alexa), search engines (Google), and social media (Facebook). COVID-related disruptions to their technology clients’ businesses had a prolonged negative effect on revenue. We believe that softening demand may also persist as the business is encountering more competition. As a result, we decided to sell the Fund’s position.
Outlook and Positioning
The direction of equity markets over the near term will most likely be influenced by a confluence of factors. These include the strong likelihood of higher inflation rates leading to rising interest rates, which may be offset by the diminishing influence of COVID and continued global economic growth. Unlike the mostly synchronous monetary policy moves over the past couple of years, changes in stimulus policies appear to be emerging as governments confront differing sets of issues with which to contend. Despite the difficulty in projecting the timing, it is almost certain that interest rates will move higher throughout the year. This will likely put pressure on already high equity valuations.
We have positioned the Fund to (hopefully) endure the rocky environment just described. By continually upgrading the Fund into what we believe to be higher quality holdings (i.e., strong free cashflow, healthy balance sheets, and high returns) coupled with our attention to valuation, we believe the Fund should be able to withstand the headwinds created from rising rates. In our view, understanding the drivers of growth for each of our investments has never been more important and we believe that this will be a stock picker’s market, an environment where we believe we perform best.
| |
| Stock Performance (for the year ended 12/31/21) |
| | Average | Contribution |
| 5 Highest | Weight | to Return |
| Evolution Gaming Group A.B. | 4.79 | 3.04 |
| Instalco A.B. | 5.15 | 2.69 |
| Hunter Douglas N.V. | 0.89 | 2.30 |
| Constellation Software, Inc. | 5.00 | 1.96 |
| SwedenCare A.B. | 2.33 | 1.86 |
| | Average | Contribution |
| 5 Lowest | Weight | to Return |
| Kambi Group PLC | 0.54 | -0.73 |
| KINX, Inc. | 1.86 | -0.80 |
| PAX Global Technology Ltd. | 2.31 | -0.90 |
| Pollard Banknote, Ltd. | 3.00 | -1.37 |
| Appen, Ltd. | 0.70 | -1.43 |
Past performance does not guarantee future results. These stocks do not represent all of the securities purchased, sold or recommended by the Fund’s Adviser. To request a complete list of the contribution of each Fund holding to overall Fund performance during the period, please call (800) 392-2673.
Please see page 35 for a description of the methodology used to construct this table.
| | |
| Annual Report | December 31, 2021 | | | 15 |
| Segall Bryant & Hamill Global All Cap Fund | Fund Overview |
| | December 31, 2021 (Unaudited) |
Fund Strategy
Investing in companies of any size, both in the United States and in developed foreign markets.
Fund Management
Suresh Rajagopal, CFA Portfolio Manager
Ralph M. Segall, CFA, CIC Portfolio Manager
CFA is a trademark owned by CFA Institute.
Cumulative Returns
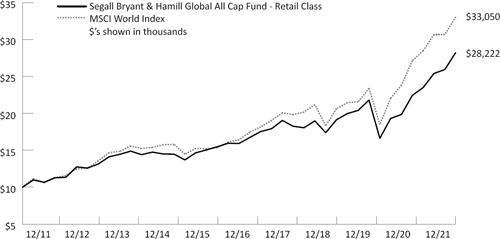
The chart above represents historical performance of a hypothetical investment of $10,000 in the Fund over the past 10 years (or for the life of the Fund if shorter). Performance calculations are as of the end of December each year. Past performance does not guarantee future results. This chart does not reflect the deduction of taxes that a shareholder would pay on Fund distributions or the redemption of Fund shares.
Please see index definitions beginning on page 34.
Average Annual Total Returns
| | | | | | Since | Inception |
| | 1 Year | 3 Years | 5 Years | 10 Years | Inception | Date |
| Retail Class (WTMVX) | 25.83% | 17.54% | 12.13% | 10.93% | 8.91% | 6/1/88 |
| Institutional Class (WIMVX) | 25.94% | 17.67% | 12.29% | 11.10% | 8.98% | 9/28/07 |
| MSCI World Index | 21.82% | 21.70% | 15.03% | 12.70% | 7.95% | |
Retail Class Annual Expense Ratio (per the current prospectus) — Gross: 1.29%, Net: 0.89%
Institutional Class Annual Expense Ratio (per the current prospectus) — Gross: 1.20%, Net: 0.74%
| | Sector Allocation (as of 12/31/21) | |
| | | |
| | Information Technology | 26.0% |
| | Health Care | 15.6% |
| | Consumer Discretionary | 15.3% |
| | Financials | 13.6% |
| | Industrials | 10.5% |
| | Consumer Staples | 8.5% |
| | Materials | 4.0% |
| | Communication Services | 3.1% |
| | Energy | 2.2% |
| | |
| | Sector classifications presented are based on the Global Industry Classification Standard (GICS) methodology. |
| | |
| | Sector weights may not sum to 100% due to rounding. |
| | |
| | The sector allocation table above does not include any cash or cash equivalents. |
| | |
| | Top Ten Holdings (as of 12/31/21) | |
| | | |
| | Microsoft Corp. | 4.5% |
| | Marvell Technology, Inc. | 3.2% |
| | Alphabet, Inc. | 3.2% |
| | UnitedHealth Group, Inc. | 2.7% |
| | Linde PLC | 2.6% |
| | Dassault Systemes S.A. | 2.6% |
| | NXP Semiconductors N.V. | 2.5% |
| | LVMH Moet Hennessy Louis Vuitton S.E. | 2.4% |
| | Amazon.com, Inc. | 2.4% |
| | Zoetis, Inc. | 2.3% |
| | |
| | Top ten holdings do not include any cash, cash equivalents or exchange traded fund investments. Holdings are subject to change and may not reflect the current or future position of the Fund. |
| | |
| | |
| | |
| | |
| | |
| | |
Performance data quoted represents past performance and does not guarantee future results. Performance information for the Institutional Class shares prior to their inception is based on the performance of the Retail Class. Current performance may be lower or higher than the performance quoted. To obtain current performance as of the most recent month-end, visit www.sbhfunds.com. Average annual total returns reflect the reinvestment of dividends, capital gains distributions, all fee waivers and expense reimbursements, if any. Without the fee waivers and expense reimbursements, total return figures would have been lower. Investment return and principal value will vary, and shares, when redeemed, may be worth more or less than their original cost. Segall Bryant & Hamill fund shares are not insured by the FDIC, the Federal Reserve Board or any other agency and are subject to investment risk.
Until at least April 30, 2022, Segall Bryant & Hamill, LLC (the “Adviser”) has contractually agreed to waive the investment advisory and/or administration fees and/or to reimburse other expenses, so that the ratio of expenses to average net assets as reported in the Fund’s Financial Highlights will be no more than 0.89% and 0.74% for the Fund’s Retail Class and Institutional Class, respectively, for such period. This agreement may not be terminated or modified by the Adviser prior to the termination date without the approval of the Board of Trustees.
Investments in foreign companies are subject to special risks, including currency fluctuations, social, economic, and political uncertainties, which could increase volatility.
| | |
| 16 | | | www.sbhfunds.com |
| Segall Bryant & Hamill Global All Cap Fund | Fund Overview |
| | December 31, 2021 (Unaudited) |
Manager Commentary
Market Overview and Fund Performance
For the fiscal year ended December 31, 2021, the Segall Bryant & Hamill Global All Cap Fund returned 25.83% (Retail Class) in 2021 compared to a return of 21.82% for its benchmark, the MSCI World Index. The investment approach of the Fund is to participate in the global developed markets by investing in companies that we believe can generate meaningful Returns on Invested Capital (ROIC), produce quality financial metrics (e.g., free cash flow growth, consistent earnings growth, and margin expansion) and possess strong management teams.
Contributors to Return
At the sector level, the Fund’s best-performing sectors during the year relative to the benchmark were Health Care, Information Technology, and Communication Services. Outperformance in the Communication Services sector was primarily related to Alphabet (GOOG) and to a lack of exposure to underperforming stocks within the benchmark index. Health Care was driven by strong idiosyncratic performance of several holdings as was Information Technology. At the individual stock level, Marvell Technology (MRVL) was a top contributor due to design wins related to its data center, 5G deployments, enterprise networking, and autos which pushed growth expectations meaningfully higher in 2022.
Detractors from Return
Financials, Energy, and Real Estate were the largest detractors from the Fund’s relative performance on a sector level for the year. The Financials sector was held back by several bank holdings that underperformed with global rate declines, particularly during the fourth quarter. The Energy and Real Estate sectors detracted from relative performance due to the Fund’s lack of exposure to them, as both sectors were top-performing sectors within the benchmark index during the year. At the individual stock level, Adidas AG (ADS) suffered as the company faces high raw material input costs and volatility induced by COVID cases/lockdowns.
Outlook and Positioning
Investors enter 2022 flush with several strong years of returns from the financial markets, paradoxically achieved during tremendous political and social turmoil. Both domestically and globally, COVID remains top of mind on our risk radar, but we are encouraged by data indicating the new super-spreading Omicron variant may be much less severe and represent the beginning of the end of the pandemic (i.e., the endemic case). How the recent surge in inflation responds to COVID-influenced demand and supply shocks is another key watch item, particularly at current global valuation levels. We have been concerned about very high valuation levels for stocks and low levels of interest rates in the global bond market which are now in real, that is, inflation-adjusted terms, quite negative in many markets. While the opportunity set seems to be getting smaller and smaller, the fact that the markets remain high illustrates the comment attributed to J.M. Keynes: “The market can stay irrational longer than you can stay solvent.”
Fortunately, for us, macro concerns are not a principal part of the selection process in the Fund. It always has been, and will always remain, a market of stocks rather than a stock market. In our view, there will always be investments to make in companies with the right set of investment characteristics, priced at valuations that present an attractive opportunity to reach our long-term investment goals. The constant search for such names goes on.
Thank you for your consideration and continued support.
| |
| Stock Performance (for the year ended 12/31/21) |
| | Average | Contribution |
| 5 Highest | Weight | to Return |
| Microsoft Corp. | 3.88 | 1.83 |
| Marvell Technology, Inc. | 2.21 | 1.72 |
| Alphabet, Inc. | 2.90 | 1.59 |
| Bio-Techne Corp. | 2.13 | 1.27 |
| NXP Semiconductors N.V. | 2.66 | 1.19 |
| | Average | Contribution |
| 5 Lowest | Weight | to Return |
| Novartis A.G. | 0.30 | -0.19 |
| Kerry Group PLC | 1.50 | -0.21 |
| CoStar Group, Inc. | 1.25 | -0.23 |
| adidas A.G. | 1.94 | -0.47 |
| Koninklijke Philips N.V. | 1.21 | -0.55 |
Past performance does not guarantee future results. These stocks do not represent all of the securities purchased, sold or recommended by the Fund’s Adviser. To request a complete list of the contribution of each Fund holding to overall Fund performance during the period, please call (800) 392-2673.
Please see page 35 for a description of the methodology used to construct this table.
| | |
| Annual Report | December 31, 2021 | | | 17 |
| Segall Bryant & Hamill Workplace Equality Fund | Fund Overview |
| | December 31, 2021 (Unaudited) |
Fund Strategy
Investing in large U.S. companies that exhibit strong Environmental, Social and Governance (ESG) and workplace equality practices.
Fund Management
| Suresh Rajagopal, CFA Portfolio Manager | John N. Roberts, Esq. Portfolio Manager |
William J. Barritt, CFA Portfolio Manager
CFA is a trademark owned by CFA Institute.
Cumulative Returns

The chart above represents historical performance of a hypothetical investment of $10,000 in the Fund over the past 10 years (or for the life of the Fund if shorter). Performance calculations are as of the end of December each year. Past performance does not guarantee future results. This chart does not reflect the deduction of taxes that a shareholder would pay on Fund distributions or the redemption of Fund shares.
Please see index definitions beginning on page 34.
Average Annual Total Returns
| | | | | | Since | Inception |
| | 1 Year | 3 Years | 5 Years | 10 Years | Inception | Date |
| Retail Class (WEQRX) | 26.18% | 19.57% | 14.50% | 12.84% | 9.45% | 6/1/88 |
| Institutional Class (WEQIX) | 26.14% | 19.74% | 14.70% | 13.05% | 9.52% | 9/28/07 |
| Russell 1000® Index | 26.46% | 26.21% | 18.43% | 16.54% | 11.44% | |
Retail Class Annual Expense Ratio (per the current prospectus) — Gross: 1.53%, Net: 0.89%
Institutional Class Annual Expense Ratio (per the current prospectus) — Gross: 1.54%, Net: 0.74%
| | Sector Allocation (as of 12/31/21) | |
| | | |
| | Information Technology | 28.4% |
| | Health Care | 16.0% |
| | Consumer Discretionary | 13.4% |
| | Financials | 11.4% |
| | Communication Services | 9.2% |
| | Industrials | 9.0% |
| | Consumer Staples | 4.7% |
| | Real Estate | 1.6% |
| | Energy | 1.4% |
| | Materials | 1.2% |
| | |
| | Sector classifications presented are based on the Global Industry Classification Standard (GICS) methodology. |
| | |
| | Sector weights may not sum to 100% due to rounding. |
| | |
| | The sector allocation table above does not include any cash or cash equivalents. |
| | |
| | Top Ten Holdings (as of 12/31/21) | |
| | | |
| | Microsoft Corp. | 5.5% |
| | Alphabet, Inc. | 5.0% |
| | Amazon.com, Inc. | 3.8% |
| | Danaher Corp. | 2.9% |
| | Keysight Technologies, Inc. | 2.8% |
| | Visa, Inc. | 2.6% |
| | UnitedHealth Group, Inc. | 2.6% |
| | Live Nation Entertainment, Inc. | 2.4% |
| | ServiceNow, Inc. | 2.4% |
| | Applied Materials, Inc. | 2.2% |
| | |
| | Top ten holdings do not include any cash, cash equivalents or exchange traded fund investments. Holdings are subject to change and may not reflect the current or future position of the Fund. |
| | |
| | |
| | |
| | |
| | |
| | |
Performance data quoted represents past performance and does not guarantee future results. Performance information for the Institutional Class shares prior to their inception is based on the performance of the Retail Class. Current performance may be lower or higher than the performance quoted. To obtain current performance as of the most recent month-end, visit www.sbhfunds.com. Average annual total returns reflect the reinvestment of dividends, capital gains distributions, all fee waivers and expense reimbursements, if any. Without the fee waivers and expense reimbursements, total return figures would have been lower. Investment return and principal value will vary, and shares, when redeemed, may be worth more or less than their original cost. Segall Bryant & Hamill fund shares are not insured by the FDIC, the Federal Reserve Board or any other agency and are subject to investment risk.
Until at least April 30, 2022, Segall Bryant & Hamill, LLC (the “Adviser”) has contractually agreed to waive the investment advisory and/or administration fees and/or to reimburse other expenses, so that the ratio of expenses to average net assets as reported in the Fund’s Financial Highlights will be no more than 0.89% and 0.74% for the Fund’s Retail Class and Institutional Class, respectively, for such period. This agreement may not be terminated or modified by the Adviser prior to the termination date without the approval of the Board of Trustees.
| | |
| 18 | | | www.sbhfunds.com |
| Segall Bryant & Hamill Workplace Equality Fund | Fund Overview |
| | December 31, 2021 (Unaudited) |
Manager Commentary
Market Overview and Fund Performance
For the fiscal year ended December 31, 2021, the Segall Bryant & Hamill Workplace Equality Fund returned 26.18% (Retail Class) compared to a return of 26.46% for its benchmark, the Russell 1000® Index. For the full year, security selection was the most significant contributor to the Fund’s relative performance. As a reminder, the investment approach of the Fund is to seek to invest in companies with progressive and inclusionary human resource policies whereby diversity and gender equality is embraced. The universe of investable names includes companies with a commitment to providing equal treatment to employees regardless of sexual orientation, gender identity or expression, or race. Within this universe, we focus on companies that we believe can generate meaningful Returns on Invested Capital (ROIC), produce quality financial metrics (e.g., free cash flow growth, consistent earnings growth, and margin expansion) and possess strong management teams.
Contributors to Return
At the sector level, the Fund’s best-performing sectors during the year relative to the benchmark were Health Care, Communication Services, and Industrials. Outperformance in the Communication Services sector was primarily related to names tied to the economic reopening following the shutdowns during the COVID pandemic. Within Health Care, the Fund benefited from stock selection as the market rewarded strong trends at Zoetis, UnitedHealth Group and McKesson. At the individual holding level, Microsoft Corporation (MSFT) was a beneficiary of continued growth in cloud storage (Azure), increased work from home software utilization, and gaming.
Detractors from Return
Consumer Discretionary, Materials, and Energy were the largest detractors on a sector level relative to the benchmark for the year. Consumer Discretionary experienced some weakness in restaurants and in eBay on disappointing earnings. The Energy sector detracted from the Fund’s relative performance due to the Fund’s lack of exposure to the sector, as it was the best
performing sector within the benchmark index during the year. The Fund’s holdings in the Materials sector lacked exposure to some of the basic commodity businesses that enjoyed strong year-end rallies. At the individual holding level, the stock of Fidelity Information Services (FIS) suffered from market concerns related to potential transaction share losses to smaller, disruptive payment technologies from competitors such as Buy Now Pay Later.
Outlook and Positioning
Investors enter 2022 flush with several strong years of returns from the financial markets, paradoxically achieved during tremendous political and social turmoil. COVID remains top of mind on our risk radar, but we are encouraged by data indicating the new super-spreading Omicron variant may be much less severe and represent the beginning of the end of the pandemic (i.e., the endemic case). How the recent surge in inflation responds to COVID-influenced demand and supply shocks is another key watch item particularly at current market valuation levels. We have been concerned about very high valuation levels for stocks and low levels of interest rates in the bond market which are now in real, that is, inflation-adjusted terms, quite negative. While the opportunity set seems to be getting smaller and smaller, the fact that the markets remain high illustrates the comment attributed to J.M. Keynes: “The market can stay irrational longer than you can stay solvent.”
Fortunately, for us, macro concerns are not a principal part of the selection process in the Fund. It always has been, and will always remain, a market of stocks rather than a stock market. In our view, there will always be investments to make in companies with the right set of investment characteristics, priced at valuations that present an attractive opportunity to reach our long-term investment goals. The constant search for such names goes on.
Thank you for your consideration and continued support.
| |
| Stock Performance (for the year ended 12/31/21) |
| | Average | Contribution |
| 5 Highest | Weight | to Return |
| Alphabet, Inc. | 5.18 | 3.08 |
| Microsoft Corp. | 5.09 | 2.44 |
| NVIDIA Corp. | 1.94 | 1.75 |
| Blackstone, Inc. | 1.92 | 1.54 |
| Intuit, Inc. | 2.05 | 1.23 |
| | Average | Contribution |
| 5 Lowest | Weight | to Return |
| Autodesk, Inc. | 1.44 | -0.16 |
| Ross Stores, Inc. | 1.23 | -0.17 |
| Walt Disney Co. (The) | 2.10 | -0.32 |
| Vertex Pharmaceuticals, Inc. | 0.82 | -0.34 |
| Fidelity National Information Services, Inc. | 1.08 | -0.56 |
Past performance does not guarantee future results. These stocks do not represent all of the securities purchased, sold or recommended by the Fund’s Adviser. To request a complete list of the contribution of each Fund holding to overall Fund performance during the period, please call (800) 392-2673.
Please see page 35 for a description of the methodology used to construct this table.
| | |
| Annual Report | December 31, 2021 | | | 19 |
| Segall Bryant & Hamill Short Term Plus Fund | Fund Overview |
| | December 31, 2021 (Unaudited) |
Fund Strategy
A fixed-income fund focusing primarily on investment quality bonds of short maturities.
Fund Management
James D. Dadura, CFA Portfolio Manager
Gregory C. Hosbein, CFA Portfolio Manager
CFA is a trademark owned by CFA Institute.
Cumulative Returns

The chart above represents historical performance of a hypothetical investment of $10,000 in the Fund over the past 10 years (or for the life of the Fund if shorter). Performance calculations are as of the end of December each year. Past performance does not guarantee future results. This chart does not reflect the deduction of taxes that a shareholder would pay on Fund distributions or the redemption of Fund shares.
Please see index definitions beginning on page 34.
Average Annual Total Returns
| | | | | | Since | 30-Day | Inception |
| | 1 Year | 3 Years | 5 Years | 10 Years | Inception | SEC Yield | Date |
| Retail Class (SBHPX) | (0.23)% | 1.78% | — | — | 1.82% | 0.71% | 12/14/18 |
| Institutional Class (SBAPX) | (0.05)% | 1.90% | — | — | 1.94% | 0.80% | 12/14/18 |
Bloomberg U.S. Government/Credit
1-3 Year Index | (0.47)% | 2.28% | — | — | 2.42% | | |
Retail Class Annual Expense Ratio (per the current prospectus) — Gross: 1.18%, Net: 0.49%
Institutional Class Annual Expense Ratio (per the current prospectus) — Gross: 1.03%, Net: 0.40%
| | Asset Allocation (as of 12/31/21) | |
| | | |
| | Industrial | 64.1% |
| | Utility | 14.5% |
| | U.S. Treasury Bonds & Notes | 6.5% |
| | Municipal Bonds | 5.9% |
| | Finance | 3.4% |
| | Commercial Mortgage-Backed Securities | 1.7% |
| | U.S. Government & Agencies | 0.9% |
| | |
| | Sector weights may not sum to 100% due to rounding. |
| | |
| | The sector allocation table above does not include any cash or cash equivalents. |
| | |
| | Top Ten Corporate Holdings (as of 12/31/21) | |
| | | |
| | HCA, Inc. | 2.0% |
| | Bank of America Corp. | 2.0% |
| | American Tower Corp. | 1.9% |
| | NextEra Energy Capital Holdings, Inc. | 1.9% |
| | QVC, Inc. | 1.9% |
| | Williams Partners LP | 1.9% |
| | Fiserv, Inc. | 1.9% |
| | Weyerhaeuser Co. | 1.9% |
| | Kinder Morgan, Inc. | 1.9% |
| | Ball Corp. | 1.9% |
| | |
| | Percentages represent the Fund’s aggregate holdings in the same corporate issuer and its affiliates. Holdings are subject to change and may not reflect the current or future position of the Fund. |
| | |
| | |
| | |
| | |
| | |
| | |
| | |
| | |
| | |
| | |
| | |
| | |
30-Day SEC Yield figures reflect all fee waivers and expense reimbursements. Without the absorption of these fee waivers and/or expense reimbursements, the figures would have been 0.67% for the Retail Class and 0.68% for the Institutional Class.
Performance data quoted represents past performance and does not guarantee future results. Current performance may be lower or higher than the performance quoted. To obtain current performance as of the most recent month-end, visit www.sbhfunds.com. Average annual total returns reflect the reinvestment of dividends, capital gains distributions, all fee waivers and expense reimbursements, if any. Without the fee waivers and expense reimbursements, total return figures would have been lower. Investment return and principal value will vary, and shares, when redeemed, may be worth more or less than their original cost. Segall Bryant & Hamill fund shares are not insured by the FDIC, the Federal Reserve Board or any other agency and are subject to investment risk.
Until at least April 30, 2022, Segall Bryant & Hamill, LLC (the “Adviser”) has contractually agreed to waive the investment advisory and/or administration fees and/or to reimburse other expenses, so that the ratio of expenses to average net assets as reported in the Fund’s Financial Highlights will be no more than 0.49% and 0.40% for the Fund’s Retail Class and Institutional Class, respectively, for such period. This agreement may not be terminated or modified by the Adviser prior to the termination date without the approval of the Board of Trustees.
Fixed Income Risks: Fixed income funds are subject to additional risk in that they may invest in high-yield/high-risk bonds and may be subject to greater levels of liquidity risk. Additionally, investing in bonds entails interest rate risk and credit risk.
| | |
| 20 | | | www.sbhfunds.com |
| Segall Bryant & Hamill Short Term Plus Fund | Fund Overview |
| | December 31, 2021 (Unaudited) |
Manager Commentary
Market Overview
Federal Reserve (Fed) policy made a big impact on the short-term market in 2021. Although the economy showed steady improvement through the year, the Fed remained committed to keeping its policy rate near 0% and adding further accommodation through asset purchases. This support from the Fed helped keep short-term interest rates low for most of the year even as rates were rising for longer maturities. This dynamic began to break down in the fourth quarter when inflation, as measured by the Consumer Price Index (CPI), rose to 6.2% in October, prompting the Fed to announce plans to taper asset purchases. By November 30, CPI clocked in at 6.8% and Fed Chairman Jerome Powell acknowledged that it might be time to retire the word “transitory” in describing inflationary pressures. The Fed then announced on December 15 it would double the pace of its tapering plans and stop new purchases by March 2022. The impact of this shift in Fed policy caused the market to begin pricing in rate hikes. As a result, 2-year yields, which began the year at 0.12% and were at 0.21% as late as mid-September, rose to 0.73% by year end. On the credit front, investment grade and high yield corporate bonds benefited from the strong fundamental corporate backdrop and outperformed Treasuries in 2021. During the year, 1-3 year maturity high yield bonds returned 0.55%, and 1-3 year maturity investment grade corporate bonds returned -0.12% versus -0.60% for 1-3 year Treasuries.
Fund Performance
The Segall Bryant & Hamill Short Term Plus Fund returned -0.23% (Retail Class) for fiscal year 2021 compared to a return of -0.47% for its benchmark, the Bloomberg U.S. Government/Credit 1-3 Year Index. The most significant drivers of relative performance during this period were security selection and duration. Security selection was most beneficial within the corporate bond sector, with the Fund’s corporate bonds returning 1.19% compared to the return of -0.12% for those in the benchmark. Also helping relative performance was the relative duration of the Fund (a measure of the sensitivity in the price of a bond to a change in interest rates)
which averaged 1.45 years over this period versus 1.95 years for the benchmark. This helped relative returns as 1-3 year Treasury yields rose during the year.
Outlook and Positioning
Shifting our view forward to 2022, the Fed, and its efforts to combat rising inflation, has both our and the market’s full attention. The Fed has suggested that with the labor market close to reaching full employment, it could start raising short-term interest rates once the taper of asset purchases is complete, likely sometime in the first half of the year. It will thereafter begin to shrink its balance sheet. As a result, the yield on short maturity securities looks very attractive to us relative to where it began last year. Over the course of 2021, the yield on 1 year maturity Treasuries rose to 0.38% from 0.10%, the yield on 2 year maturity Treasuries rose to 0.73% from 0.12% and the yield on 3 year maturity Treasuries rose to 0.96% from 0.16%.
The corporate sector continues to grapple with supply chain constraints and labor issues, both in upward wage pressures and availability. Fortunately, we believe corporate balance sheets are generally in good shape to weather these cost pressures. In our view, this strength is largely already reflected in spreads, which have stayed close to all-time lows for much of the past year. In this environment, we remain constructive on credits we deem to be high quality, which we believe should perform well in either a status quo scenario or in a credit sell-off. We continue to look for opportunities to take advantage of extra yields in smaller size issues. Short maturity high yield securities look slightly less attractive to us than investment grade securities.
| | |
| | |
| Annual Report | December 31, 2021 | | | 21 |
| Segall Bryant & Hamill Plus Bond Fund | Fund Overview |
| | December 31, 2021 (Unaudited) |
Fund Strategy
A fixed-income fund focusing on investment quality bonds of varying maturities.
Fund Management
| Troy A. Johnson, CFA Portfolio Manager | Darren G. Hewitson, CFA Portfolio Manager |
| Kenneth A. Harris, CFA Portfolio Manager | Gregory M. Shea, CFA Portfolio Manager |
CFA is a trademark owned by CFA Institute.
Cumulative Returns
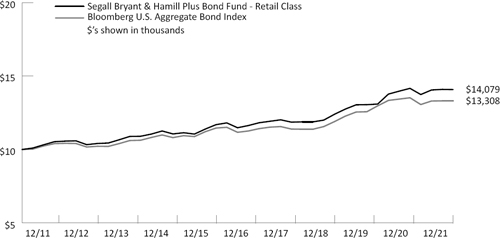
The chart above represents historical performance of a hypothetical investment of $10,000 in the Fund over the past 10 years (or for the life of the Fund if shorter). Performance calculations are as of the end of December each year. Past performance does not guarantee future results. This chart does not reflect the deduction of taxes that a shareholder would pay on Fund distributions or the redemption of Fund shares.
Please see index definitions beginning on page 34.
Average Annual Total Returns
| | | | | | Since | 30-Day | Inception |
| | 1 Year | 3 Years | 5 Years | 10 Years | Inception | SEC Yield | Date |
| Retail Class (WTIBX) | (0.58)% | 5.48% | 4.17% | 3.48% | 5.81% | 1.67% | 6/1/88 |
| Institutional Class (WIIBX) | (0.44)% | 5.61% | 4.32% | 3.63% | 5.87% | 1.82% | 9/28/07 |
Bloomberg U.S. Aggregate
Bond Index | (1.54)% | 4.79% | 3.57% | 2.90% | 6.03% | | |
Retail Class Annual Expense Ratio (per the current prospectus) — Gross: 0.68%, Net: 0.55%
Institutional Class Annual Expense Ratio (per the current prospectus) — Gross: 0.51%, Net: 0.40%
| | Asset Allocation (as of 12/31/21) | |
| | | |
| | Industrial | 36.4% |
| | Mortgage-Backed Securities Passthrough | 20.8% |
| | U.S. Treasury Bonds & Notes | 15.3% |
| | Municipal Bonds | 10.0% |
| | Finance | 8.7% |
| | Utility | 4.4% |
| | Asset Backed Securities | 2.4% |
| | Residentail Mortgage-Backed Securities | 0.3% |
| | | |
| | Percentages are based on Total Net Assets. |
| | |
| | Top Ten Corporate Holdings (as of 12/31/21) |
| | |
| | American Tower Corp. | 1.1% |
| | Cboe Global Markets, Inc. | 1.0% |
| | SBA Tower Trust | 1.0% |
| | Moody’s Corp. | 0.9% |
| | Apache Corp. | 0.9% |
| | Silgan Holdings, Inc. | 0.8% |
| | Comcast Corp. | 0.8% |
| | Diamondback Energy, Inc. | 0.8% |
| | Masco Corp. | 0.8% |
| | Quanta Services, Inc. | 0.8% |
| | | |
| | Percentages represent the Fund’s aggregate holdings in the same corporate issuer and its affiliates. Holdings are subject to change and may not reflect the current or future position of the Fund. |
| | |
| | |
| | |
| | |
| | |
| | |
| | |
| | |
| | |
| | |
| | |
| | |
| | |
| | |
| | |
30-Day SEC Yield figures reflect all fee waivers and expense reimbursements. Without the absorption of these fee waivers and/or expense reimbursements, the figures would have been 1.62% for the Retail Class and 1.76% for the Institutional Class.
Performance data quoted represents past performance and does not guarantee future results. Performance information for the Institutional Class shares prior to their inception is based on the performance of the Retail Class. Current performance may be lower or higher than the performance quoted. To obtain current performance as of the most recent month-end, visit www.sbhfunds.com. Average annual total returns reflect the reinvestment of dividends, capital gains distributions, all fee waivers and expense reimbursements, if any. Without the fee waivers and expense reimbursements, total return figures would have been lower. Investment return and principal value will vary, and shares, when redeemed, may be worth more or less than their original cost. Segall Bryant & Hamill fund shares are not insured by the FDIC, the Federal Reserve Board or any other agency and are subject to investment risk.
Until at least April 30, 2022, Segall Bryant & Hamill, LLC (the “Adviser”) has contractually agreed to waive the investment advisory and/or administration fees and/or to reimburse other expenses, so that the ratio of expenses to average net assets as reported in the Fund’s Financial Highlights will be no more than 0.55% and 0.40% for the Fund’s Retail Class and Institutional Class, respectively, for such period. This agreement may not be terminated or modified by the Adviser prior to the termination date without the approval of the Board of Trustees.
Segall Bryant & Hamill Plus Bond Fund may invest in high-yield/high-risk bonds which are subject to greater levels of liquidity risk. Additionally, investing in bonds entails interest rate risk and credit risk.
| | |
| 22 | | | www.sbhfunds.com |
| Segall Bryant & Hamill Plus Bond Fund | Fund Overview |
| | December 31, 2021 (Unaudited) |
Manager Commentary
Market Overview
In 2021, returns were generally negative for the fixed income market. The broad market, as commonly measured by the Bloomberg U.S. Aggregate Bond Index (the Agg), dropped nearly 3.5% in the first quarter, then recovered gradually throughout the rest of 2021 before ending the year with an approximate 1.5% loss. This marks just the fourth negative-return year since the index’s inception in 1970. As the year drew to a close, the market dealt with increasing inflation news and evolving responses from the Federal Reserve (Fed). At the beginning of the year, the Consumer Price Index (CPI), a year-over-year measure of inflation, was at 1.4%. By the end of October, it had risen to 6.2%, prompting the Fed to announce plans to taper asset purchases. By November 30, CPI clocked in at 6.8% and Fed Chairman Jerome Powell acknowledged that it might be time to retire the word “transitory” in describing inflationary pressures. The Fed then announced on December 15 it would double the pace of its tapering plans and stop new purchases by March 2022. Investors have long expected the Fed to start raising interest rates in 2022, and the expected timing of the first hike continues to move earlier in the year. A new COVID strain appeared (the Omicron variant), but the Fed did not waver in its plans, and risk assets outperformed Treasuries in December after digesting the news. Treasury yields showed some volatility throughout the year and ended higher across most of the curve, while credit spreads were quite stable amid mostly benign credit conditions. High yield bonds benefited from the strong fundamental corporate backdrop and were one of the top fixed income categories for the full year.
Fund Performance
The Segall Bryant & Hamill Plus Bond Fund returned -0.58% (Retail Class) in 2021 compared to a return of -1.54% for its benchmark, the Bloomberg U.S. Aggregate Bond Index. Returns were low in absolute terms as the yield earned was offset by headwinds from higher interest rates. In relative terms, the Fund benefited from sector and quality positioning, including an allocation to high yield securities, positive security selection, and additional earned income. High yield contributions were notable, reflecting exposure to shorter duration, higher quality high yield corporate bonds which offered both attractive yield and capital preservation benefits. Within mortgage-backed securities, both
the Fund’s underweighted allocation and positive selection contributed to relative returns as the sector faced headwinds from interest rate volatility and the potential of reduced market accommodation. Lastly, modestly reduced duration helped the Fund’s performance versus its benchmark, although we still see structural reasons for interest rates to remain fairly low in historical terms.
Outlook and Positioning
Shifting our view forward to 2022, the Fed, and its efforts to combat rising inflation, has both our and the market’s full attention. The Fed has suggested that with the labor market close to reaching full employment, it could start raising short-term interest rates once the taper of asset purchases is complete, likely sometime in the first half of the year. It will thereafter begin to shrink its balance sheet. The corporate sector continues to grapple with supply chain constraints and labor issues, both in upward wage pressures and availability. Fortunately, we believe corporate balance sheets are generally in good shape to weather these cost pressures. This strength is largely already reflected in spreads, which for much of the past year have stayed close to all-time tights (i.e., when the yield of corporate bonds versus U.S. Treasuries is very narrow). In this environment, we remain constructive on high quality credits, which we believe should perform well in either a status quo scenario or in a credit sell-off; and we continue to look for opportunities to take advantage of extra spread in small, less liquid issues. We maintain our positive view of taxable municipal bonds, and we remain underweight mortgage-backed securities, which we believe will be directly impacted by the Fed’s plans to withdraw monetary support to the economy. Hovering over all this, of course, is the economic impact of COVID. If the Omicron variant’s rapid spread produces a large increase in immunity without a commensurate increase in deaths, we could see less economic disruption, and we could thus envision a more normal future environment, akin to the impact of the yearly flu.
Last but surely not least, we appreciate the trust placed in us and intend to apply our usual rigor in evaluating all securities held for the benefit of the Fund’s shareholders.
| | |
| | |
| Annual Report | December 31, 2021 | | | 23 |
| Segall Bryant & Hamill Quality High Yield Fund | Fund Overview |
| | December 31, 2021 (Unaudited) |
Fund Strategy
A fixed-income fund investing in a wide variety of income-producing securities, primarily bonds and to a lesser extent convertible bonds, and equity securities.
Fund Management
Troy A. Johnson, CFA Portfolio Manager
Gregory M. Shea, CFA Portfolio Manager
CFA is a trademark owned by CFA Institute.
Cumulative Returns

The chart above represents historical performance of a hypothetical investment of $10,000 in the Fund over the past 10 years (or for the life of the Fund if shorter). Performance calculations are as of the end of December each year. Past performance does not guarantee future results. This chart does not reflect the deduction of taxes that a shareholder would pay on Fund distributions or the redemption of Fund shares.
Please see index definitions beginning on page 34.
Average Annual Total Returns
| | | | | | Since | 30-Day | Inception |
| | 1 Year | 3 Years | 5 Years | 10 Years | Inception | SEC Yield | Date |
| Retail Class (WTLTX) | 3.14% | 7.49% | 5.22% | 5.64% | 7.12% | 2.82% | 6/1/88 |
| Institutional Class (WILTX) | 3.33% | 7.61% | 5.37% | 5.82% | 7.19% | 3.06% | 9/28/07 |
Bloomberg U.S. High Yield
2% Issuer Capped Index | 5.26% | 8.81% | 6.28% | 6.82% | N/A | | |
Bloomberg U.S. Corporate
High Yield Ba Index | 4.61% | 10.01% | 6.87% | 7.04% | 8.43% | | |
Retail Class Annual Expense Ratio (per the current prospectus) — Gross: 0.95%, Net: 0.85%
Institutional Class Annual Expense Ratio (per the current prospectus) — Gross: 0.82%, Net: 0.70%
| | Asset Allocation (as of 12/31/21) | |
| | | |
| | Industrial | 84.0% |
| | Finance | 8.4% |
| | Utility | 4.0% |
| | |
| | Percentages are based on Total Net Assets. |
| | |
| | Top Ten Holdings
(as of 12/31/21) |
| | |
| | PDC Energy, Inc. | 2.9% |
| | Occidental Petroleum Corp. | 2.5% |
| | Range Resources Corp. | 2.4% |
| | Compass Minerals International, Inc. | 2.4% |
| | Apache Corp. | 2.1% |
| | Dish DBS Corp. | 2.1% |
| | Lamar Media Corp. | 2.1% |
| | AmeriGas Partners LP/AmeriGas Financial Corp. | 2.1% |
| | Cedar Fair LP | 2.0% |
| | IIP Operating Partnership LP | 2.0% |
| | | |
| | Percentages represent the Fund’s aggregate holdings in the same corporate issuer and its affiliates. Holdings are subject to change and may not reflect the current or future position of the Fund. |
| | |
| | |
| | |
| | |
| | |
| | |
| | |
| | |
| | |
| | |
| | |
| | |
| | |
| | |
| | |
| | |
| | |
| | |
| | |
| | |
| | |
30-Day SEC Yield figures reflect all fee waivers and expense reimbursements. Without the absorption of these fee waivers and/or expense reimbursements, the figures would have been 2.81% for the Retail Class and 3.04% for the Institutional Class.
Performance data quoted represents past performance and does not guarantee future results. Performance information for the Institutional Class shares prior to their inception is based on the performance of the Retail Class. Current performance may be lower or higher than the performance quoted. To obtain current performance as of the most recent month-end, visit www.sbhfunds.com. Average annual total returns reflect the reinvestment of dividends, capital gains distributions, all fee waivers and expense reimbursements, if any. Without the fee waivers and expense reimbursements, total return figures would have been lower. Investment return and principal value will vary, and shares, when redeemed, may be worth more or less than their original cost. Segall Bryant & Hamill fund shares are not insured by the FDIC, the Federal Reserve Board or any other agency and are subject to investment risk.
Until at least April 30, 2022, Segall Bryant & Hamill, LLC (the “Adviser”) has contractually agreed to waive the investment advisory and/or administration fees and/or to reimburse other expenses, so that the ratio of expenses to average net assets as reported in the Fund’s Financial Highlights will be no more than 0.85% and 0.70% for the Fund’s Retail Class and Institutional Class, respectively, for such period. This agreement may not be terminated or modified by the Adviser prior to the termination date without the approval of the Board of Trustees.
Segall Bryant & Hamill Quality High Yield Fund may invest in high-yield/high-risk bonds which are subject to greater levels of liquidity risk. Additionally, investing in bonds entail interest rate risk and credit risk.
| | |
| 24 | | | www.sbhfunds.com |
| Segall Bryant & Hamill Quality High Yield Fund | Fund Overview |
| | December 31, 2021 (Unaudited) |
Manager Commentary
Market Overview
As 2021 drew to a close, the overall fixed income market dealt with increasingly worse inflation news and evolving responses from the Federal Reserve (Fed). At the beginning of the year, the Consumer Price Index (CPI), a year-over-year measure of inflation, was at 1.4%. By the end of October, it had risen to 6.2%, prompting the Fed to announce plans to taper asset purchases. By November 30, CPI clocked in at 6.8% and Fed Chairman Jerome Powell acknowledged that it might be time to retire the word “transitory” in describing inflationary pressures. The Fed then announced on December 15 it would double the pace of its tapering plans and stop new purchases by early March 2022. Investors have long expected the Fed to start raising interest rates in 2022, and the expected timing of the first hike continues to move earlier in the year. A new COVID strain appeared (the Omicron variant), but the Fed did not waver in its plans, and risk assets outperformed Treasuries in December after digesting the news. Treasury yields showed some volatility throughout the year and ended higher across most of the curve, while credit spreads were quite stable amid mostly benign credit conditions.
For the year, high yield bonds were a bright spot in a fixed income market where returns were generally negative. Posting positive returns in every quarter of 2021, high yield bonds benefited from a strong fundamental corporate backdrop and were one of the top fixed income categories for 2021. Spreads tightened in the fourth quarter across all high yield sectors other than Communications and Technology. Bonds rated CCC lagged in the latest quarter but finished the year as the top-performing high yield ratings category (BB +4.6%, B +4.9%, CCC +8.6%). The number of high yield issuers in default steadily improved throughout the year and ended with a 1.5% last-twelve-months issuer default rate1, a level not seen since 2014.
Fund Performance
In 2021, the Segall Bryant & Hamill Quality High Yield Fund returned 3.14% (Retail Class) compared to its benchmark, the Bloomberg U.S. High Yield 2% Issuer Capped Index, return of 5.26%. The primary detractor from the Fund’s performance relative
to the benchmark was the Fund’s quality bias. Two examples of the quality bias that led to the underperformance were (1) the Fund did not own any CCC rated bonds, the lowest quality sector in the Index and the best performing rating category in high yield for the year within the Index, and (2) the Fund was overweight BBB rated bonds, which produced a negative return for the year.
Outlook and Positioning
Shifting our view forward to 2022, the Fed, and its efforts to combat rising inflation, has both our and the market’s full attention. The Fed has suggested that with the labor market close to reaching full employment, it could start raising short-term interest rates once the taper of asset purchases is complete, likely sometime in the first half of the year. It will thereafter begin to shrink its balance sheet. The corporate sector continues to grapple with supply chain constraints and labor issues, both in upward wage pressures and availability. Fortunately, we believe corporate balance sheets are generally in good shape to weather these cost pressures. In our view, this strength is largely already reflected in spreads, which have stayed close to all-time lows for much of the past year. In this environment, we remain constructive on high yield credits that we deem to be high quality. We continue to look for opportunities in “rising star” candidates transitioning to investment grade and to seek to take advantage of extra spread in small issues. Hovering over all this, of course, is the economic impact of COVID. If the Omicron variant’s rapid spread produces a large increase in immunity without a commensurate increase in deaths, we could see less economic disruption, and we could thus envision a more normal future environment, akin to the impact of the yearly flu.
Last but surely not least, we appreciate the trust placed in us by shareholders and intend to apply our usual rigor in evaluating all securities that comprise the Fund.
| 1 | Source: Bank of America Merrill Lynch |
| | |
| | |
| Annual Report | December 31, 2021 | | | 25 |
| Segall Bryant & Hamill Municipal Opportunities Fund | Fund Overview |
| | December 31, 2021 (Unaudited) |
Fund Strategy
A fixed income fund focusing primarily on investment-grade quality bonds of intermediate maturity which provide income exempt from federal taxation.
Fund Management
Kenneth A. Harris, CFA Portfolio Manager
Nicholas J. Foley Portfolio Manager
CFA is a trademark owned by CFA Institute.
Cumulative Returns

The chart above represents historical performance of a hypothetical investment of $10,000 in the Fund over the past 10 years (or for the life of the Fund if shorter). Performance calculations are as of the end of December each year. Past performance does not guarantee future results. This chart does not reflect the deduction of taxes that a shareholder would pay on Fund distributions or the redemption of Fund shares.
Please see index definitions beginning on page 34.
Average Annual Total Returns
| | | | | | Since | 30-Day | Inception |
| | 1 Year | 3 Years | 5 Years | 10 Years | Inception | SEC Yield | Date |
| Retail Class (WTTAX) | 2.72% | 5.40% | 5.15% | — | 5.42% | 0.86% | 12/16/16 |
| Institutional Class (WITAX) | 2.87% | 5.57% | 5.33% | — | 5.59% | 1.01% | 12/16/16 |
Bloomberg U.S. 1-15 Year
Municipal Bond Index | 0.86% | 3.99% | 3.57% | — | 3.68% | | |
Retail Class Annual Expense Ratio (per the current prospectus) — Gross: 0.80%, Net: 0.65%
Institutional Class Annual Expense Ratio (per the current prospectus) — Gross: 0.62%, Net: 0.50%
| | Asset Allocation (as of 12/31/21) | |
| | | |
| | Revenue | 55.2% |
| | General Obligation | 17.2% |
| | Local Authority | 12.5% |
| | Variable Rate Demand Note | 6.3% |
| | Corporate Bonds | 3.0% |
| | Certificate Participation | 0.6% |
| | Prerefunded | 0.3% |
| | | |
| | Percentages are based on Total Net Assets. |
| | |
| | Top Ten Holdings
(as of 12/31/21) |
| | |
| | San Diego County Regional Airport Authority | 4.5% |
| | North Texas Tollway Authority System | 3.1% |
| | Califormia Municipal Finance Authority | 2.7% |
| | Metropolitan Government of Nashville & Davidson County Tennessee | 2.6% |
| | Virginia Small Business Financing Authority | 2.2% |
| | Central Platte Valley Metropolitan District | 2.1% |
| | Weber County Utah Hospital | 2.1% |
| | Pennsylvania Turnpike Commission | 2.1% |
| | Public Finance Authority Taxable Educational Facilities Wisconsin | 2.1% |
| | North Carolina State Turnpike Authority Monroe Expressway Toll | 2.0% |
| | | |
| | Percentages represent the Fund’s aggregate holdings in the same corporate issuer and its affiliates. Holdings are subject to change and may not reflect the current or future position of the Fund. |
| | |
| | |
| | |
| | |
| | |
| | |
| | |
| | |
| | |
| | |
| | |
30-Day SEC Yield figures reflect all fee waivers and expense reimbursements. Without the absorption of these fee waivers and/or expense reimbursements, the figures would have been 0.85% for the Retail Class and 0.98% for the Institutional Class.
Performance data quoted represents past performance and does not guarantee future results. Current performance may be lower or higher than the performance quoted. To obtain current performance as of the most recent month-end, visit www.sbhfunds.com. Average annual total returns reflect the reinvestment of dividends, capital gains distributions, all fee waivers and expense reimbursements, if any. Without the fee waivers and expense reimbursements, total return figures would have been lower. Investment return and principal value will vary, and shares, when redeemed, may be worth more or less than their original cost. Segall Bryant & Hamill fund shares are not insured by the FDIC, the Federal Reserve Board or any other agency and are subject to investment risk.
Until at least April 30, 2022, Segall Bryant & Hamill, LLC (the “Adviser”) has contractually agreed to waive the investment advisory and/or administration fees and/or to reimburse other expenses, so that the ratio of expenses to average net assets as reported in the Fund’s Financial Highlights will be no more than 0.65% and 0.50% for the Fund’s Retail Class and Institutional Class, respectively, for such period. This agreement may not be terminated or modified by the Adviser prior to the termination date without the approval of the Board of Trustees.
Municipal bond fund income may be subject to state and local income taxes and the alternative minimum tax. Capital gains, if any, will be subject to capital gains tax. Investments in municipal bonds are subject to interest rate risk, or the risk that the bonds will decline in value because of changes in market interest rates.
| | |
| 26 | | | www.sbhfunds.com |
| Segall Bryant & Hamill Municipal Opportunities Fund | Fund Overview |
| | December 31, 2021 (Unaudited) |
Manager Commentary
A Personal Note
December 16, 2021 marked the five-year anniversary of the Segall Bryant & Hamill Municipal Opportunities Fund and as of the beginning of this year (1/12/22), the Fund had crossed $300 million in assets. We want to offer our deepest appreciation to those who took the time to understand our approach and invest in the Fund. As portfolio managers, we get to do what we are passionate about—uncovering and investing in opportunities in the municipal market—and strive each day to continue to earn your trust and confidence.
Market Overview
The fixed income markets—Treasury, credit, and municipal—had to contend with worsening inflationary news throughout 2021 and concerns about how the Federal Reserve (Fed) would respond in a policy fashion. By the end of the year, the Fed acknowledged a set of changes that would begin the process, first of slowing support for the markets in the form of a slower pace of asset purchases, and second by raising the policy rate. As the markets had anticipated this policy change, fixed income risk assets outperformed Treasuries in the fourth quarter. For the full year, the Bloomberg Municipal Bond Index, which had started the year by declining approximately 1% in the first quarter, recovered gradually throughout the rest of 2021 before ending the year with a 1.52% gain. This gain ran counter to the broad taxable market (defined by the Bloomberg U.S. Aggregate Bond Index) which posted a negative total return. We continued to see depressed municipal/Treasury ratios, which persisted throughout 2021. Flows into municipal bond funds were extremely strong while tax-exempt supply continued to be cannibalized by the refunding of taxable bonds. We believe the most likely scenario that could break this current trend would be a rate shock that disrupts the market.
Fund Performance
For the full year 2021, the Segall Bryant & Hamill Municipal Opportunities Fund returned 2.72% (Retail Class) versus 0.86% for the benchmark, the Bloomberg U.S. 1-15 Year Municipal Bond Index. The Fund’s performance versus the benchmark was largely
driven by (1) moving quickly to buy attractive credits on weakness during the brief sell-off that took place during mid-October, and (2) the income advantage the Fund experienced through a few factors. First, during the year we continued to find value in smaller special districts and certain structures, which we believe the market is still mispricing. In our view, this value is amplified by how little value can be found in large credit names with betas similar to the overall municipal market. Second, the Fund was invested in short-term taxable bonds at times when the front end of the yield curve was trading at sub 50% municipal/Treasury ratios which proved to be a significant advantage. The above two factors, in combination with our intense focus on structure pricing (i.e., how bonds with different maturities and call features are priced), continued to be a successful formula.
Outlook and Positioning
Shifting our view forward to 2022, the Fed, and its efforts to combat rising inflation, has both our and the market’s full attention. The Fed has suggested that with the labor market close to reaching full employment, it could start raising short-term interest rates once the taper of asset purchases is complete, likely sometime in the first half of the year. It will thereafter begin to shrink its balance sheet. Municipal revenue and balance sheets are, broadly speaking, in the best shape we have seen in decades. This strength is largely already reflected in spreads, which have stayed close to all-time lows versus comparable AAA municipal bonds for much of the past year. In this environment, we remain constructive on high quality credits, which we believe should perform well in either a status quo scenario or in a credit sell-off. We continue to find the most value in optionality pricing and structures which have, we believe, incorrectly sold off on rate uncertainty. Hovering over all this, of course, is the economic impact of COVID. If the Omicron variant’s rapid spread produces a large increase in immunity without a commensurate increase in deaths, we could see less economic disruption, and we could thus envision a more normal future environment, akin to the impact of the yearly flu. Last but surely not least, we appreciate the trust placed in us by shareholders and intend to apply our usual rigor in evaluating all securities that comprise the Fund.
| | |
| | |
| Annual Report | December 31, 2021 | | | 27 |
| Segall Bryant & Hamill Colorado Tax Free Fund | Fund Overview |
| | December 31, 2021 (Unaudited) |
Fund Strategy
A Colorado municipal bond fund focused on investment-grade quality bonds of intermediate maturity that provide federal and state tax-exempt income.
Fund Management
Kenneth A. Harris, CFA Portfolio Manager
Nicholas J. Foley Portfolio Manager
CFA is a trademark owned by CFA Institute.
Cumulative Returns
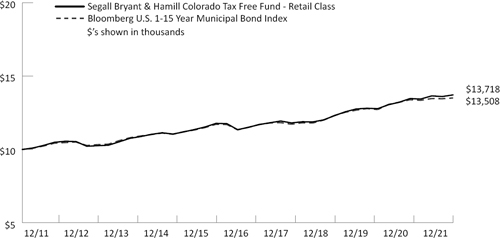
The chart above represents historical performance of a hypothetical investment of $10,000 in the Fund over the past 10 years (or for the life of the Fund if shorter). Performance calculations are as of the end of December each year. Past performance does not guarantee future results. This chart does not reflect the deduction of taxes that a shareholder would pay on Fund distributions or the redemption of Fund shares.
Please see index definitions beginning on page 34.
Average Annual Total Returns
| | | | | | Since | 30-Day | Inception |
| | 1 Year | 3 Years | 5 Years | 10 Years | Inception | SEC Yield | Date |
| Retail Class (WTCOX) | 1.87% | 4.51% | 3.86% | 3.21% | 4.45% | 0.84% | 6/1/91 |
| Institutional Class (WICOX) | 2.01% | 4.68% | 4.03% | 3.30% | 4.48% | 0.99% | 4/29/16 |
Bloomberg U.S. 1-15 Year
Municipal Bond Index | 0.86% | 3.99% | 3.57% | 3.05% | N/A | | |
Retail Class Annual Expense Ratio (per the current prospectus) — Gross: 0.70%, Net: 0.65%
Institutional Class Annual Expense Ratio (per the current prospectus) — Gross: 0.55%, Net: 0.50%
| | Asset Allocation (as of 12/31/21) | |
| | | |
| | Revenue | 48.5% |
| | General Obligation | 18.9% |
| | Certificate Participation | 15.4% |
| | Variable Rate Demand Note | 10.0% |
| | Local Authority | 3.2% |
| | Prerefunded | 0.6% |
| | | |
| | Percentages are based on Total Net Assets. |
| | |
| | Top Ten Holdings
(as of 12/31/21) |
| | |
| | Colorado Health Facilities Authority | 9.3% |
| | City & County of Denver Colorado | 6.0% |
| | Denver Colorado City and County COP | 4.6% |
| | City of Colorado Springs Colorado Utilities System | 4.3% |
| | Colorado Educational & Cultural Facilities Authority | 4.0% |
| | Wheat Ridge Colorado Urban Renewal Authority | 3.9% |
| | State of Colorado Education Loan Program | 3.4% |
| | Berthoud Colorado COP | 2.6% |
| | Park Creek Metropolitan District | 2.4% |
| | Colorado School of Mines | 2.3% |
| | | |
| | Percentages represent the Fund’s aggregate holdings in the same corporate issuer and its affiliates. Holdings are subject to change and may not reflect the current or future position of the Fund. |
| | |
| | |
| | |
| | |
| | |
| | |
| | |
| | |
| | |
| | |
| | |
| | |
| | |
| | |
| | |
30-Day SEC Yield figures reflect all fee waivers and expense reimbursements. Without the absorption of these fee waivers and/or expense reimbursements, the figures would have been 0.84% for the Retail Class and 0.98% for the Institutional Class.
Performance data quoted represents past performance and does not guarantee future results. Performance information for the Institutional Class shares prior to their inception is based on the performance of the Retail Class. Current performance may be lower or higher than the performance quoted. To obtain current performance as of the most recent month-end, visit www.sbhfunds.com. Average annual total returns reflect the reinvestment of dividends, capital gains distributions, all fee waivers and expense reimbursements, if any. Without the fee waivers and expense reimbursements, total return figures would have been lower. Investment return and principal value will vary, and shares, when redeemed, may be worth more or less than their original cost. Segall Bryant & Hamill fund shares are not insured by the FDIC, the Federal Reserve Board or any other agency and are subject to investment risk.
Until at least April 30, 2022, Segall Bryant & Hamill, LLC (the “Adviser”) has contractually agreed to waive the investment advisory and/or administration fees and/or to reimburse other expenses, so that the ratio of expenses to average net assets as reported in the Fund’s Financial Highlights will be no more than 0.65% and 0.50% for the Fund’s Retail Class and Institutional Class, respectively, for such period. This agreement may not be terminated or modified by the Adviser prior to the termination date without the approval of the Board of Trustees.
Segall Bryant & Hamill Colorado Tax Free Fund invests primarily in instruments issued by or on behalf of one state and generally will be more volatile and loss of principal could be greater due to state specific risk.
Municipal bond fund income may be subject to state and local income taxes and the alternative minimum tax. Capital gains, if any, will be subject to capital gains tax.
Investments in municipal bonds are subject to interest rate risk, or the risk that the bonds will decline in value because of changes in market interest rates.
| | |
| 28 | | | www.sbhfunds.com |
| Segall Bryant & Hamill Colorado Tax Free Fund | Fund Overview |
| | December 31, 2021 (Unaudited) |
Manager Commentary
Market Overview
Against a markedly different experience in the taxable bond market, for the full year 2021, the Bloomberg Municipal Bond Index, which had started the year by declining approximately 1% in the first quarter, recovered gradually throughout the rest of the year before ending the year with a 1.52% gain. This gain ran counter to the broad taxable market (defined by the Bloomberg U.S. Aggregate Bond Index) which posted a negative total return. We continued to see depressed municipal/Treasury ratios, which have persisted throughout the year. Flows into municipal bond funds were strong while tax-exempt supply continued to be cannibalized by the refunding of taxable bonds. We believe the most likely scenario that could break this current trend would be a rate shock that disrupts the market.
Through 2021, the Colorado economy continued to grow at a robust pace. Since the COVID pandemic began, it’s been our opinion that the pandemic would only increase the desirability of Colorado and thus people and businesses would relocate to the state. This has played out and has continued to do so. The state is now facing very different problems such as strains on infrastructure and housing scarcity, unable to keep up with the growth. While these are frustrating problems for citizens, we believe they provide opportunities for municipal bond investors.
Fund Performance
The Segall Bryant & Hamill Colorado Tax Free Fund returned 1.87% (Retail Class) compared to 0.86% for its benchmark, the Bloomberg 1-15 Year Municipal Bond Index. The Fund’s performance relative to its benchmark was largely driven by two factors. The first was the Fund’s income advantage over the benchmark that the Fund experienced through, in part, by our ability to find value in smaller, special districts and certain structures which we believe the market is still mispricing. In our view, this value is amplified by how little value can be found in larger credit names with betas similar to the overall municipal market. The second factor driving the Fund’s relative performance was the rapid pace at which we moved to buy attractive credits on weakness during the brief sell-off that took place during mid-October.
Outlook and Positioning
We see no signs of slowdown in the Colorado economy, and believe we are in the midst of a transformative phase in which Denver becomes a much larger metropolitan area. It will be interesting to see if, over the next decade, home prices continue to increase, and greater traffic and difficulty accessing the outdoors start to push people away. There is always an equilibrium in everything, but where that is, we do not know.
Shifting our view forward to 2022, the Federal Reserve (Fed), and its efforts to combat rising inflation, has both our and the market’s full attention. The Fed has suggested that with the labor market close to reaching full employment, it could start raising short-term interest rates once the taper of asset purchases is complete, likely sometime in the first half of the year. It will thereafter begin to shrink its balance sheet. Municipal revenue and balance sheets are, broadly speaking, in the best shape we have seen in decades. This strength is largely already reflected in spreads, which have stayed close to all-time lows versus comparable AAA municipal bonds for much of the past year. In this environment, we remain constructive on high quality credits, which we believe should perform well in either a status quo scenario or in a credit sell-off. We continue to find the most value in optionality pricing and structures which have, we believe, incorrectly sold off on rate uncertainty. Hovering over all this, of course, is the economic impact of COVID. If the Omicron variant’s rapid spread produces a large increase in immunity without a commensurate increase in deaths, we could see less economic disruption, and we could thus envision a more normal future environment, akin to the impact of the yearly flu. Last but surely not least, we appreciate the trust placed in us and intend to apply our usual rigor in evaluating all securities that comprise the Fund.
| | |
| | |
| Annual Report | December 31, 2021 | | | 29 |
| Segall Bryant & Hamill Funds | Fund Expenses |
| | December 31, 2021 (Unaudited) |
Disclosure of Fund Expenses
As a shareholder of a Fund, you may incur two types of costs: (1) transaction costs; and (2) ongoing costs, including management fees and other Fund expenses. The examples on the next page are intended to help you understand your ongoing costs (in dollars) of investing in a Fund and to compare these costs with the ongoing costs of investing in other mutual funds. The examples are based on an investment of $1,000 invested on July 1, 2021 and held until December 31, 2021.
Actual Expenses. The first line of the table on the next page provides information about actual account values and actual expenses. You may use the information in this line, together with the amount you invested, to estimate the expenses that you paid over the period. Simply divide your account value by $1,000 (for example, an $8,600 account value divided by $1,000 = 8.6), then multiply the result by the number in the first line under the heading “Expenses Paid During Period” to estimate the expenses you paid on your account during this period.
Hypothetical Example for Comparison Purposes. The second line of the table on the next page provides information about hypothetical account values and hypothetical expenses based on the Fund’s actual expense ratio and an assumed rate of return of 5% per year before expenses, which is not the Fund’s actual return. The hypothetical account values and expenses may not be used to estimate the actual ending account balance or expenses you paid for the period. You may use this information to compare the ongoing costs of investing in a Fund and other mutual funds. To do so, compare this 5% hypothetical example with the 5% hypothetical examples that appear in the shareholder reports of other funds.
Expenses shown in the table on the next page are meant to highlight ongoing Fund costs only and do not reflect transaction costs. Therefore, the second line of the table is useful in comparing ongoing costs only and may not help you determine the relative total costs of owning different funds. In addition, if these transactional costs were included, your costs would have been higher.
| | |
| 30 | | | www.sbhfunds.com |
| Segall Bryant & Hamill Funds | Fund Expenses |
| | December 31, 2021 (Unaudited) |
| | | Beginning Account | | | Ending Account | | | | | | | |
| | | Value | | | Value | | | Expense | | | Expenses Paid | |
| | | July 1, 2021 | | | December 31, 2021 | | | Ratio(a) | | | During Period(b) | |
| Segall Bryant & Hamill Small Cap Value Fund | | | | | | | | | | | | | | | | |
| Retail | | | | | | | | | | | | | | | | |
| Based on Actual Fund Return | | $ | 1,000.00 | | | $ | 1,014.20 | | | | 1.08 | % | | $ | 5.48 | |
| Based on Hypothetical 5% Return (before expenses) | | $ | 1,000.00 | | | $ | 1,019.76 | | | | 1.08 | % | | $ | 5.50 | |
| Institutional | | | | | | | | | | | | | | | | |
| Based on Actual Fund Return | | $ | 1,000.00 | | | $ | 1,014.30 | | | | 0.98 | % | | $ | 4.98 | |
| Based on Hypothetical 5% Return (before expenses) | | $ | 1,000.00 | | | $ | 1,020.27 | | | | 0.98 | % | | $ | 4.99 | |
| | | | | | | | | | | | | | | | | |
| Segall Bryant & Hamill Small Cap Growth Fund | | | | | | | | | | | | | | | | |
| Retail | | | | | | | | | | | | | | | | |
| Based on Actual Fund Return | | $ | 1,000.00 | | | $ | 1,024.60 | | | | 1.02 | % | | $ | 5.21 | |
| Based on Hypothetical 5% Return (before expenses) | | $ | 1,000.00 | | | $ | 1,020.06 | | | | 1.02 | % | | $ | 5.19 | |
| Institutional | | | | | | | | | | | | | | | | |
| Based on Actual Fund Return | | $ | 1,000.00 | | | $ | 1,025.70 | | | | 0.89 | % | | $ | 4.54 | |
| Based on Hypothetical 5% Return (before expenses) | | $ | 1,000.00 | | | $ | 1,020.72 | | | | 0.89 | % | | $ | 4.53 | |
| | | | | | | | | | | | | | | | | |
| Segall Bryant & Hamill Small Cap Core Fund | | | | | | | | | | | | | | | | |
| Retail | | | | | | | | | | | | | | | | |
| Based on Actual Fund Return | | $ | 1,000.00 | | | $ | 1,075.50 | | | | 1.14 | % | | $ | 5.96 | |
| Based on Hypothetical 5% Return (before expenses) | | $ | 1,000.00 | | | $ | 1,019.46 | | | | 1.14 | % | | $ | 5.80 | |
| Institutional | | | | | | | | | | | | | | | | |
| Based on Actual Fund Return | | $ | 1,000.00 | | | $ | 1,076.10 | | | | 0.99 | % | | $ | 5.18 | |
| Based on Hypothetical 5% Return (before expenses) | | $ | 1,000.00 | | | $ | 1,020.21 | | | | 0.99 | % | | $ | 5.04 | |
| | | | | | | | | | | | | | | | | |
| Segall Bryant & Hamill All Cap Fund | | | | | | | | | | | | | | | | |
| Retail | | | | | | | | | | | | | | | | |
| Based on Actual Fund Return | | $ | 1,000.00 | | | $ | 1,123.60 | | | | 0.79 | % | | $ | 4.23 | |
| Based on Hypothetical 5% Return (before expenses) | | $ | 1,000.00 | | | $ | 1,021.22 | | | | 0.79 | % | | $ | 4.02 | |
| Institutional | | | | | | | | | | | | | | | | |
| Based on Actual Fund Return | | $ | 1,000.00 | | | $ | 1,123.00 | | | | 0.84 | % | | $ | 4.49 | |
| Based on Hypothetical 5% Return (before expenses) | | $ | 1,000.00 | | | $ | 1,020.97 | | | | 0.84 | % | | $ | 4.28 | |
| | | | | | | | | | | | | | | | | |
| Segall Bryant & Hamill Emerging Markets Fund | | | | | | | | | | | | | | | | |
| Retail | | | | | | | | | | | | | | | | |
| Based on Actual Fund Return | | $ | 1,000.00 | | | $ | 924.60 | | | | 1.38 | % | | $ | 6.69 | |
| Based on Hypothetical 5% Return (before expenses) | | $ | 1,000.00 | | | $ | 1,018.25 | | | | 1.38 | % | | $ | 7.02 | |
| Institutional | | | | | | | | | | | | | | | | |
| Based on Actual Fund Return | | $ | 1,000.00 | | | $ | 926.30 | | | | 1.23 | % | | $ | 5.97 | |
| Based on Hypothetical 5% Return (before expenses) | | $ | 1,000.00 | | | $ | 1,019.00 | | | | 1.23 | % | | $ | 6.26 | |
| | | | | | | | | | | | | | | | | |
| Segall Bryant & Hamill International Small Cap Fund | | | | | | | | | | | | | | | | |
| Retail | | | | | | | | | | | | | | | | |
| Based on Actual Fund Return | | $ | 1,000.00 | | | $ | 995.50 | | | | 1.18 | % | | $ | 5.94 | |
| Based on Hypothetical 5% Return (before expenses) | | $ | 1,000.00 | | | $ | 1,019.26 | | | | 1.18 | % | | $ | 6.01 | |
| Institutional | | | | | | | | | | | | | | | | |
| Based on Actual Fund Return | | $ | 1,000.00 | | | $ | 996.00 | | | | 1.03 | % | | $ | 5.18 | |
| Based on Hypothetical 5% Return (before expenses) | | $ | 1,000.00 | | | $ | 1,020.01 | | | | 1.03 | % | | $ | 5.24 | |
| | | | | | | | | | | | | | | | | |
| Segall Bryant & Hamill Fundamental International Small Cap Fund | | | | | | | | | | | | | | | | |
| Retail | | | | | | | | | | | | | | | | |
| Based on Actual Fund Return | | $ | 1,000.00 | | | $ | 1,016.90 | | | | 1.25 | % | | $ | 6.35 | |
| Based on Hypothetical 5% Return (before expenses) | | $ | 1,000.00 | | | $ | 1,018.90 | | | | 1.25 | % | | $ | 6.36 | |
| Institutional | | | | | | | | | | | | | | | | |
| Based on Actual Fund Return | | $ | 1,000.00 | | | $ | 1,017.10 | | | | 1.10 | % | | $ | 5.59 | |
| Based on Hypothetical 5% Return (before expenses) | | $ | 1,000.00 | | | $ | 1,019.66 | | | | 1.10 | % | | $ | 5.60 | |
| | |
| Annual Report | December 31, 2021 | | | 31 |
| Segall Bryant & Hamill Funds | Fund Expenses |
| | December 31, 2021 (Unaudited) |
| | | Beginning Account | | | Ending Account | | | | | | | |
| | | Value | | | Value | | | Expense | | | Expenses Paid | |
| | | July 1, 2021 | | | December 31, 2021 | | | Ratio(a) | | | During Period(b) | |
| Segall Bryant & Hamill Global All Cap Fund | | | | | | | | | | | | | | | | |
| Retail | | | | | | | | | | | | | | | | |
| Based on Actual Fund Return | | $ | 1,000.00 | | | $ | 1,111.20 | | | | 0.89 | % | | $ | 4.74 | |
| Based on Hypothetical 5% Return (before expenses) | | $ | 1,000.00 | | | $ | 1,020.72 | | | | 0.89 | % | | $ | 4.53 | |
| Institutional | | | | | | | | | | | | | | | | |
| Based on Actual Fund Return | | $ | 1,000.00 | | | $ | 1,111.20 | | | | 0.74 | % | | $ | 3.94 | |
| Based on Hypothetical 5% Return (before expenses) | | $ | 1,000.00 | | | $ | 1,021.48 | | | | 0.74 | % | | $ | 3.77 | |
| | | | | | | | | | | | | | | | | |
| Segall Bryant & Hamill Workplace Equality Fund | | | | | | | | | | | | | | | | |
| Retail | | | | | | | | | | | | | | | | |
| Based on Actual Fund Return | | $ | 1,000.00 | | | $ | 1,096.90 | | | | 0.89 | % | | $ | 4.70 | |
| Based on Hypothetical 5% Return (before expenses) | | $ | 1,000.00 | | | $ | 1,020.72 | | | | 0.89 | % | | $ | 4.53 | |
| Institutional | | | | | | | | | | | | | | | | |
| Based on Actual Fund Return | | $ | 1,000.00 | | | $ | 1,096.60 | | | | 0.74 | % | | $ | 3.91 | |
| Based on Hypothetical 5% Return (before expenses) | | $ | 1,000.00 | | | $ | 1,021.48 | | | | 0.74 | % | | $ | 3.77 | |
| | | | | | | | | | | | | | | | | |
| Segall Bryant & Hamill Short Term Plus Fund | | | | | | | | | | | | | | | | |
| Retail | | | | | | | | | | | | | | | | |
| Based on Actual Fund Return | | $ | 1,000.00 | | | $ | 995.20 | | | | 0.49 | % | | $ | 2.46 | |
| Based on Hypothetical 5% Return (before expenses) | | $ | 1,000.00 | | | $ | 1,022.74 | | | | 0.49 | % | | $ | 2.50 | |
| Institutional | | | | | | | | | | | | | | | | |
| Based on Actual Fund Return | | $ | 1,000.00 | | | $ | 996.60 | | | | 0.40 | % | | $ | 2.01 | |
| Based on Hypothetical 5% Return (before expenses) | | $ | 1,000.00 | | | $ | 1,023.19 | | | | 0.40 | % | | $ | 2.04 | |
| | | | | | | | | | | | | | | | | |
| Segall Bryant & Hamill Plus Bond Fund | | | | | | | | | | | | | | | | |
| Retail | | | | | | | | | | | | | | | | |
| Based on Actual Fund Return | | $ | 1,000.00 | | | $ | 1,001.70 | | | | 0.55 | % | | $ | 2.77 | |
| Based on Hypothetical 5% Return (before expenses) | | $ | 1,000.00 | | | $ | 1,022.43 | | | | 0.55 | % | | $ | 2.80 | |
| Institutional | | | | | | | | | | | | | | | | |
| Based on Actual Fund Return | | $ | 1,000.00 | | | $ | 1,002.50 | | | | 0.40 | % | | $ | 2.02 | |
| Based on Hypothetical 5% Return (before expenses) | | $ | 1,000.00 | | | $ | 1,023.19 | | | | 0.40 | % | | $ | 2.04 | |
| | | | | | | | | | | | | | | | | |
| Segall Bryant & Hamill Quality High Yield Fund | | | | | | | | | | | | | | | | |
| Retail | | | | | | | | | | | | | | | | |
| Based on Actual Fund Return | | $ | 1,000.00 | | | $ | 1,012.40 | | | | 0.85 | % | | $ | 4.31 | |
| Based on Hypothetical 5% Return (before expenses) | | $ | 1,000.00 | | | $ | 1,020.92 | | | | 0.85 | % | | $ | 4.33 | |
| Institutional | | | | | | | | | | | | | | | | |
| Based on Actual Fund Return | | $ | 1,000.00 | | | $ | 1,013.30 | | | | 0.70 | % | | $ | 3.55 | |
| Based on Hypothetical 5% Return (before expenses) | | $ | 1,000.00 | | | $ | 1,021.68 | | | | 0.70 | % | | $ | 3.57 | |
| | | | | | | | | | | | | | | | | |
| Segall Bryant & Hamill Municipal Opportunities Fund | | | | | | | | | | | | | | | | |
| Retail | | | | | | | | | | | | | | | | |
| Based on Actual Fund Return | | $ | 1,000.00 | | | $ | 1,005.90 | | | | 0.65 | % | | $ | 3.29 | |
| Based on Hypothetical 5% Return (before expenses) | | $ | 1,000.00 | | | $ | 1,021.93 | | | | 0.65 | % | | $ | 3.31 | |
| Institutional | | | | | | | | | | | | | | | | |
| Based on Actual Fund Return | | $ | 1,000.00 | | | $ | 1,007.50 | | | | 0.50 | % | | $ | 2.53 | |
| Based on Hypothetical 5% Return (before expenses) | | $ | 1,000.00 | | | $ | 1,022.68 | | | | 0.50 | % | | $ | 2.55 | |
| | |
| 32 | | | www.sbhfunds.com |
| Segall Bryant & Hamill Funds | Fund Expenses |
| | December 31, 2021 (Unaudited) |
| | | Beginning Account | | | Ending Account | | | | | | | |
| | | Value | | | Value | | | Expense | | | Expenses Paid | |
| | | July 1, 2021 | | | December 31, 2021 | | | Ratio(a) | | | During Period(b) | |
| Segall Bryant & Hamill Colorado Tax Free Fund | | | | | | | | | | | | | | | | |
| Retail | | | | | | | | | | | | | | | | |
| Based on Actual Fund Return | | $ | 1,000.00 | | | $ | 1,004.90 | | | | 0.65 | % | | $ | 3.28 | |
| Based on Hypothetical 5% Return (before expenses) | | $ | 1,000.00 | | | $ | 1,021.93 | | | | 0.65 | % | | $ | 3.31 | |
| Institutional | | | | | | | | | | | | | | | | |
| Based on Actual Fund Return | | $ | 1,000.00 | | | $ | 1,005.60 | | | | 0.50 | % | | $ | 2.53 | |
| Based on Hypothetical 5% Return (before expenses) | | $ | 1,000.00 | | | $ | 1,022.68 | | | | 0.50 | % | | $ | 2.55 | |
| (a) | Annualized, based on each Fund’s most recent one-half year expenses. |
| (b) | Expenses are equal to each Fund’s annualized net expense ratio multiplied by the average account value over the period, multiplied by 184/365 (to reflect the one-half year period). |
| | |
| Annual Report | December 31, 2021 | | | 33 |
| Segall Bryant & Hamill Funds | Important Disclosures |
| | December 31, 2021 (Unaudited) |
INDEX DEFINITIONS AND DISCLOSURES
All indices are unmanaged and index performance figures include reinvestment of dividends but do not reflect any fees, expenses or taxes. Investors cannot invest directly in an index.
The Bloomberg U.S. 10-Year Municipal Bond Index includes investment grade (Moody’s Investor Services Aaa to Baa, Standard and Poor’s Corporation AAA to BBB) tax-exempt bonds with maturities between eight and twelve years.
The Bloomberg U.S. 1-15 Year Municipal Bond Index measures the performance of investment grade (Moody’s Investor Services Aaa to Baa, Standard and Poor’s Corporation AAA to BBB) general obligation and revenue bonds with maturities ranging from one to seventeen years. It is a broad index that is representative of the tax-exempt bond market.
The Bloomberg U.S. Aggregate Bond Index is a fixed income, market-value-weighted index generally representative of investment grade fixed-rate debt issues, including government, corporate, asset-backed, and mortgage-backed securities with maturities of at least one year.
The Bloomberg U.S. Corporate High Yield Ba Index measures the performance of intermediate (1 to 10 year) U.S. high yield issues. It includes fixed-rate, noninvestment grade debt issues rated Ba1 or lower by Moody’s, rated BB+ or lower by S&P, rated below investment grade by Fitch Investor’s Service or if unrated previously held a high yield rating or have been associated with a high yield issuer, and must trade accordingly.
The Bloomberg U.S. High Yield 2% Issuer Capped Index is an unmanaged index that is comprised of predominantly US High Yield Corporate Bonds and a broad cross section of leveraged loans syndicated in the United States, including dollar-denominated loans to overseas issuers. The weighting of index constituents is limited to a maximum 2%.
The Bloomberg U.S. Government/Credit 1-3 Year Index includes medium and larger issues of U.S. government, investment-grade corporate and investment-grade international dollar-denominated bonds that have maturities of between one and three years.
The MSCI ACWI ex USA Small Cap Index captures small cap representation across 22 of 23 Developed Market countries (excluding the U.S.) and 27 Emerging Market countries. With 4,413 constituents, the index covers approximately 14% of the global equity opportunity set outside the U.S. MSCI Inc. launched the MSCI ACWI ex USA Small Cap Index on June 1, 2007. Data prior to the launch date is back-tested data provided and derived by MSCI (i.e. calculations of how the index might have performed over that time period had the index existed). There may be material differences between back-tested performance and actual results. Past performance, whether actual or back-tested, is no indication or guarantee of future performance.
The MSCI EAFE Small Cap Index measures small cap representation across Developed Markets countries around the world, excluding the US and Canada. It is maintained by MSCI Barra, a provider of investment decision support tools; the EAFE acronym stands for Europe, Australasia and the Far East.
The MSCI Emerging Markets Index measures equity market performance of emerging markets, which consists of the following 27 emerging market indexes: Argentina, Brazil, Chile, China, Colombia, Czech Republic, Egypt, Greece, Hungary, India, Indonesia, Korea, Kuwait, Malaysia, Mexico, Pakistan, Peru, Philippines, Poland, Qatar, Russia, Saudi Arabia, South Africa, Taiwan, Thailand, Turkey and United Arab Emirates.
The MSCI World Index captures large and mid cap representation across 23 Developed Markets countries. With 1,563 constituents, the index covers approximately 85% of the free float-adjusted market capitalization in each country.
The Russell 1000® Index measures the performance of the large-cap segment of the U.S. equity universe. It is a subset of the Russell 3000® Index and includes approximately 1000 of the largest securities based on a combination of their market cap and current index membership. The Russell 1000® Index represents approximately 92% of the U.S. market.
The Russell 2000® Index measures the performance of the small-cap segment of the U.S. equity universe. The Russell 2000® Index is a subset of the Russell 3000® Index representing approximately 10% of the total market capitalization of that index. It includes approximately 2000 of the smallest securities based on a combination of their market cap and current index membership.
The Russell 2000® Growth Index measures the performance of the small-cap growth segment of the U.S. equity universe. It includes those Russell 2000® Index companies with higher price-to-value ratios and higher forecasted growth values.
The Russell 2000® Value Index measures the performance of companies within the Russell 2000® Index having lower price-to-book ratios and lower forecasted growth values. The Russell 2000® Index includes the 2000 firms from the Russell 3000® Index with the smallest market capitalizations. The Russell 3000® Index represents 98% of the investable U.S. equity market.
The Russell 3000® Index measures the performance of the 3,000 largest U.S. stocks.
| | |
| 34 | | | www.sbhfunds.com |
| Segall Bryant & Hamill Funds | Important Disclosures |
| | December 31, 2021 (Unaudited) |
“Bloomberg®” and the Bloomberg indices are service marks of Bloomberg Finance L.P. and its affiliates, including Bloomberg Index Service Limited, the administrator of the indices, and have been licensed for use for certain purposes by Segall Bryant & Hamill. Bloomberg is not affiliated with Segall Bryant & Hamill, and Bloomberg does not approve, endorse, review, or recommend the Segall Bryant & Hamill Funds. Bloomberg does not guarantee the timeliness, accurateness, or completeness of any data or information relating to the Segall Bryant & Hamill Funds.
MSCI Inc. is the source and owner of the MSCI Index data contained in this material and all trademarks and copyrights related thereto. Any further dissemination or redistribution is strictly prohibited. MSCI Barra is not responsible for the formatting or configuration of this material or for any inaccuracy in Segall Bryant & Hamill’s presentation thereof.
FTSE Russell is the source and owner of the Russell Index data contained in this material and all trademarks and copyrights related thereto. Any further dissemination or redistribution is strictly prohibited. Russell Investments is not responsible for the formatting or configuration of this material or for any inaccuracy in Segall Bryant & Hamill’s presentation thereof.
TOP 5/BOTTOM 5 STOCK PERFORMANCE CALCULATION METHODOLOGY
The calculation methodology used to construct this table took into account consistently the weighting of every holding in the Fund that contributed to the Fund’s performance during the measurement period, and the table reflects consistently the results of the calculation. The calculation determined the contribution of each Fund holding by calculating the weight (i.e., percentage of the total investments) of each holding multiplied by the rate of return for that holding during the year ended December 31, 2021.
DEFINITION OF TERMS
Beta: A measure of a fund’s sensitivity to market movements. The beta of the market is 1.00 by definition. A beta above 1 is more volatile than the overall market, while a beta below 1 is less volatile.
Bond Rating Categories:
| ● | AAA: An obligation rated “AAA” has the highest rating assigned by Standard & Poor’s. The obligor’s capacity to meet its financial commitment on the obligation is extremely strong. |
| ● | AA+: An obligation rated “AA+” differs from the highest rated obligations only in small degree. The obligor’s capacity to meet its financial commitment on the obligation is very strong. |
| ● | AA: An obligation rated “AA” differs from the highest rated obligations only in small degree. The obligor’s capacity to meet its financial commitment on the obligation is very strong. |
| ● | A: An obligation rated “A” is somewhat more susceptible to the adverse effects of changes in circumstances and economic conditions than obligations in higher-rated categories. However, the obligor’s capacity to meet its financial commitment on the obligation is still strong. |
| ● | BBB: An obligation rated “BBB” exhibits adequate protection parameters. However, adverse economic conditions or changing circumstances are more likely to lead to a weakened capacity of the obligor to meet its financial commitment on the obligation. |
| ● | Below BBB: Obligations rated “BB,” “B,” “CCC,” “CC” and “C” are regarded as having significant speculative characteristics. “BB” indicates the least degree of speculation and “C” the highest. While such obligations will likely have some quality and protective characteristics, these may be outweighed by large uncertainties or major exposures to adverse conditions. Bonds rated “BB” or below are commonly referred to as “junk” bonds. |
| ● | Non-Rated: These bonds are not rated. |
Credit Quality Rating: A rating of an individual bond as determined by a nationally recognized statistical rating organization (NRSRO) such as Standard & Poor’s or Moody’s. Credit quality ratings range from highest, “AAA ” to lowest, “D”. For more information regarding rating methodologies for Standard & Poor’s, visit www.standardandpoors.com and for Moody’s, visit www.moodys.com.
Credit Spread: The difference in yield between two bonds of similar maturity, but different credit quality.
Duration: A generic description of the sensitivity of a bond’s price (as a percentage of initial price) to a change in yield.
EPS (Earnings per Share) Growth: Earnings per share is the portion of a company’s profit allocated to each outstanding share of common stock. EPS growth serves as an indicator of a company’s profitability.
Effective Maturity: A weighted average of the maturities of the bonds in a portfolio.
| | |
| Annual Report | December 31, 2021 | | | 35 |
| Segall Bryant & Hamill Funds | Important Disclosures |
| | December 31, 2021 (Unaudited) |
Emerging Markets: Segall Bryant & Hamill Funds consider emerging market countries to be those countries that are neither U.S. nor developed countries.
Federal Reserve (Fed): The central banking system of the United States.
Free Cash Flow to Total Enterprise Value (FCF/TEV): A valuation metric used to compare the amount of cash a firm generates to the total value of the resources used to generate that cash.
Gross Domestic Product (GDP): The market value of all officially recognized goods and services produced within a country in a given period of time.
Market Capitalization: The market capitalization represents the total value of a company or stock. It is calculated by multiplying the number of shares outstanding by the current price of one share.
Modified Duration: A duration measure in which it is assumed that yield changes do not change the expected cash flows.
Number of Holdings: The Number of Holdings presented excludes short-term investments including money market mutual funds.
OPEC: Is the Organization of the Petroleum Exporting Countries.
Operating Cash Flow to Price (OCF/P): A valuation metric used to compare the amount of cash a firm generates per share from operations to the price of the stock.
Portfolio Turnover Rate: A percentage computed by taking the lesser of purchases or sales of portfolio securities (excluding short-term investments) for the year and dividing it by the monthly average of the market value of the portfolio securities during the year.
Price to Book Value (P/B) Ratio: The P/B ratio is used to compare a company’s book value to its current market price. This ratio compares the market’s valuation of a company to the value of that company as indicated on its financial statements. The higher the ratio, the higher the premium the market is willing to pay for the company above its hard assets.
Price to Cash (P/C) Flow Ratio: The P/C flow ratio is a measure of a firm’s stock price relative to its financial performance. For a fund, the P/C flow ratio is the weighted average of all stocks held in the fund. It represents the amount an investor is willing to pay for a dollar generated from a particular company’s operations.
Price to Earnings (P/E) Ratio: The P/E ratio is a stock’s per share price divided by its per share earnings over a 12-month period. For a fund, the P/E ratio is the weighted average of all stocks held in the fund. The higher the P/E ratio, the more the market is willing to pay for each dollar of annual earnings.
REIT: A REIT is a real estate investment trust. REITs are securities that sell like a stock on a major exchange. REITs invest directly in real estate, either through properties or mortgages.
Return on Equity (ROE): A measure of how well a company used reinvested earnings to generate additional earnings. It is used as a general indication of a company’s efficiency; in other words, how much profit is a company able to generate given the resources provided by its stockholders.
Risk-Adjusted Return: Is a measure of return that incorporates the value of risk involved in the return of an investment. It is intended to help investors compare the returns of investments with varying levels of risk. Risk-adjusted return can be applied to individual securities, mutual funds and portfolios.
Risk On, Risk Off: A concept that describes market sentiment as either “risk on” or “risk off”. During a market sentiment of “risk on”, the market is optimistic and more willing to take on risk in exchange for possibly better returns. When market sentiment is “risk off”, the market is pessimistic and will favor investments with perceived lower risk.
SEC Yield: The SEC Yield is a standardized method of computing return on investment that the U.S. Securities and Exchange Commission (SEC) requires mutual funds to use when advertising their yields. Its objective is to allow a confusion-free comparison of the performance of different funds.
| | |
| 36 | | | www.sbhfunds.com |
Segall Bryant & Hamill Funds | Trustees and Officers |
| | December 31, 2021 (Unaudited) |
The business and affairs of the Funds are managed under the direction of the Trust’s Board of Trustees in accordance with the laws of the Commonwealth of Massachusetts and the Trust’s Amended and Restated Declaration of Trust. Information pertaining to the trustees and officers of the Trust is set forth below. Trustees who are not deemed to be “interested persons” of the Trust as defined in the Investment Company Act of 1940, as amended (the “1940 Act”), are referred to as “Independent Trustees.” The Trust’s Statement of Additional Information includes additional information about the trustees and is available, without charge, upon request by calling toll free 800.392.CORE (2673).
| Name, Address and Age (1) | Position(s)
Held with
The Trust | Term of Office
and Length of
Time Served (2) | Principal Occupation(s) During Past 5 Years | Number of Funds
in Fund Complex
Overseen by
Trustee (3) | Other Directorships
Held by Trustee (4) |
| INDEPENDENT TRUSTEES |
Janice M. Teague,
CPA (Retired)
Age 68 | Chair Trustee | Since December 31, 2020 Since February 13, 2007 | ● Retired, June 2003 – present; ● Vice President, Secretary and Assistant Secretary, Berger Financial Group, LLC (investment management), October 1996 – May 2003; ● Vice President, Secretary and Assistant Secretary, Berger Funds (investment management), September 1996 – May 2003; ● Vice President and Secretary, Berger Distributors LLC (broker/dealer), August 1998 – May 2003. | 14 | None |
| | | | | | |
Thomas J. Abood
Age 58 | Trustee | Since November 1, 2018 | ● Chief Executive Officer, EVO Transportation & Energy Services, Inc., October 2019 to present; ● Director, NELSON Worldwide LLC, May 2018 to present; ● Director EVO Transportation & Energy Services, Inc., November 2016 to present; ● Past Chair of Board, Citation Jet Pilots, Inc., October 2016 to present; ● Board Member and Past Chair, MacPhail Center for Music Education, September 2011 to present (member), July 2018 to present (Chair); ● Council Member and Chair, Archdiocese Finance Council of St. Paul and Minneapolis, July 2011 to present (member), July 2014 to present (chair); ● Board Member and Chair, University of St. Thomas School of Law Board of Governors, October 2001 to October 2016; ● Member, EVP, General Counsel and Secretary, Dougherty Financial Group LLC, October 1994 to May 2014; ● Board Member and President, The Minikahda Club, November 2015 to November 2017. | 14 | Mr. Abood is Director of EVO Transportation & Energy Services, Inc. |
| | |
| Annual Report | December 31, 2021 | | | 37 |
| Segall Bryant & Hamill Funds | Trustees and Officers |
| | December 31, 2021 (Unaudited) |
| Name, Address and Age (1) | Position(s)
Held with
The Trust | Term of Office
and Length of
Time Served (2) | Principal Occupation(s) During Past 5 Years | Number of Funds
in Fund Complex
Overseen by
Trustee (3) | Other Directorships
Held by Trustee (4) |
John A. DeTore, CFA
Age 63 | Trustee | Since December 31, 2009 | ● Director of Strategic R&D, Arga Investment Management, 2021 – present; ● CIO, Capitalogix, LLC, 2018 – 2021; ● CEO/Founder, United Alpha, LLC investment management firm), 2003 – 2017; ● CIO, GRT United Alpha, LLC (investment management), 2006 – 2017; ● CIO, Denver Alternatives, (an investment management division of Denver Investments) 2009 – 2011; ● Managing Director/Director of Strategic R&D, Putnam Investments (investment management), 1999 – 2000; Managing Director/Director of Quantitative Analysis & Equity Product Development, Putnam Investments (investment management), 1994 – 1999. | 14 | None |
Rick A. Pederson
Age 68 | Trustee | Since February 13, 2007 | ● President, Foundation Properties, Inc. (a real estate investment management company), 1994 – present; ● Partner, Bow River Capital Partners (private equity management), 2003 – present; ● Advisory Board Member, Independent Bank, 2017 – present; ● Director, National Western Stock Show (not-for-profit organization), 2010 – present; ● Board Member, Kivu Consulting, Inc., 2019 – present; ● Board Member, History Colorado (nonprofit association), 2015 – 2020; ● Board Member, Strong-Bridge Consulting, 2015 – 2019; ● Board Member, Boettcher Foundation (not-for-profit), 2018 – present. | 14 | Mr. Pederson is a Trustee of ALPS ETF Trust (20 funds); and Principal Real Estate Income Fund (1 fund). |
James A. Smith
Age 69 | Trustee | Since December 31, 2009 | ● Vice Chair and Board Member, Western Rivers Conservancy (non-profit), 2014 – present; ● Private Equity Consultant, 2003 – 2016; ● Trustee, The Nature Conservancy (non- profit), July 2007 – June 2016; Chairman, June 2014 - June 2016. | 14 | None |
LLoyd “Chip” Voneiff
Age 67 | Trustee | Since April 30, 2021 | ● Retired, June 2012 – present; ● Various positions leading to Partner of PricewaterhouseCoopers, 1976 – 2012. | 14 | None |
| | |
| 38 | | | www.sbhfunds.com |
| Segall Bryant & Hamill Funds | Trustees and Officers |
| | December 31, 2021 (Unaudited) |
| Name, Address and Age(1) | Position(s)
Held with
The Trust | Term of Office
and Length of
Time Served | Principal Occupation(s) |
| OFFICERS | | |
Philip H. Hildebrandt, CFA
Age 58 | President | Since May 1, 2018 | ● Chief Executive Officer, Segall Bryant & Hamill, LLC, 2006 – present |
Jasper R. Frontz, CPA, CFA
Age 53 | Treasurer Chief Compliance Officer | Since February 12, 1997 Since September 29, 2004 | ● Chief Compliance Officer/SBH Funds, Segall Bryant & Hamill, LLC, May 1, 2018 – present ● Chief Compliance Officer and Chief Operations Officer, Denver Investments, March 31, 2014 – April 30, 2018; Partner, Denver Investments, January 1, 2014 – April 30, 2018; prior thereto, Vice President, May 2000 – December 2013, and Director of Mutual Fund Administration, June 1997 – May 2000, Denver Investments; |
Maggie Bull
Age: 55 | Secretary Assistant Secretary | Since November 16, 2021 2018-2021 | ● Senior Attorney, Ultimus Fund Solutions, LLC, June 2017 to present; ● Chief Compliance Officer and Legal Counsel, Meeder Funds, Meeder Investment Management 2011 to 2016. |
Jennifer L. Leamer
Age 45 | Assistant Treasurer | Since May 26, 2019 | ● Senior Vice President, Fund Accounting of Ultimus Fund Solutions, LLC 2014 to present; ● Ultimus Managers Trust, Treasurer, October 2014 to present; ● Ultimus Managers Trust, Assistant Treasurer, April 2014 to October 2014; ● Ultimus Fund Solutions, LLC Business Analyst, 2007 to 2014. |
| (1) | Each Trustee and Officer may be contacted by writing to the Trustee or Officer, c/o Segall Bryant & Hamill Trust, 225 Pictoria Drive, Suite 450, Cincinnati, Ohio 45246. |
| (2) | Each trustee holds offices for an indefinite term until the earliest of: (a) the election of his successor; (b) the date a trustee dies, resigns, or is removed, adjudged incompetent, or, having become incapacitated by illness or injury, is retired by the Board of Trustees in accordance with the Trust’s Amended and Restated Declaration of Trust; or (c) the Trust terminates. |
| (3) | The Fund Complex includes funds with a common investment adviser or sub-advisor which is an affiliated person. As of December 31, 2021, there were twenty-seven funds in the Fund Complex: the fourteen Segall Bryant & Hamill Funds offered to the public, PartnerSelect SBH Focused Small Value Fund, Columbia Variable Portfolio Partners Small-Cap Value Fund, and Mainstay VP Small Cap Growth Portfolio which are also advised by Segall Bryant & Hamill, LLC; Barrett Growth Fund and Barrett Opportunity Fund, advised by Barrett Asset Management, LLC; Cabana Target Drawdown 5 ETF, Cabana Target Drawdown 7 ETF, Cabana Target Drawdown 10 ETF, Cabana Target Drawdown 13 ETF, Cabana Target Drawdown 16 ETF, Cabana Target Leading Sector Conservative ETF, Cabana Target Leading Sector Moderate ETF and Cabana Target Leading Sector Aggressive ETF, advised by The Cabana Group, LLC. |
| (4) | Directorships of companies required to report to the SEC under the 1934 Act (i.e., “public companies”) or other investment companies registered under the 1940 Act. |
| | |
| Annual Report | December 31, 2021 | | | 39 |
| Segall Bryant & Hamill Small Cap Value Fund | Statement of Investments |
| | December 31, 2021 |
| | | Shares | | | Value | |
| COMMON STOCKS — 96.2% | | | | | | | | |
| Consumer Discretionary — 5.9% | | | | | | | | |
| Automobiles & Components — 1.8% | | | | | | | | |
| Harley-Davidson, Inc. | | | 198,379 | | | $ | 7,476,904 | |
| Modine Manufacturing Co. (a) | | | 340,274 | | | | 3,433,365 | |
| | | | | | | | 10,910,269 | |
| Consumer Durables & Apparel — 1.6% | | | | | | | | |
| Gildan Activewear, Inc. (Canada) | | | 152,851 | | | | 6,479,354 | |
| Under Armour, Inc. - Class A (a) | | | 161,614 | | | | 3,424,601 | |
| | | | | | | | 9,903,955 | |
| Consumer Services — 1.6% | | | | | | | | |
| Papa John’s International, Inc. | | | 17,441 | | | | 2,327,850 | |
| Six Flags Entertainment Corp. (a) | | | 170,438 | | | | 7,257,250 | |
| | | | | | | | 9,585,100 | |
| Retailing — 0.9% | | | | | | | | |
| Quotient Technology, Inc. (a) | | | 742,269 | | | | 5,507,636 | |
| | | | | | | | | |
| Consumer Staples — 10.7% | | | | | | | | |
| Food, Beverage & Tobacco — 4.7% | | | | | | | | |
| Hain Celestial Group, Inc. (The) (a) | | | 598,690 | | | | 25,510,181 | |
| TreeHouse Foods, Inc. (a) | | | 74,541 | | | | 3,021,147 | |
| | | | | | | | 28,531,328 | |
| Household & Personal Products — 6.0% | | | | | | | | |
| Coty, Inc. - Class A (a) | | | 3,363,729 | | | | 35,319,154 | |
| Inter Parfums, Inc. | | | 14,874 | | | | 1,590,031 | |
| | | | | | | | 36,909,185 | |
| Energy — 2.6% | | | | | | | | |
| Energy — 2.6% | | | | | | | | |
| Dril-Quip, Inc. (a) | | | 214,139 | | | | 4,214,255 | |
| Helmerich & Payne, Inc. | | | 140,457 | | | | 3,328,831 | |
| PDC Energy, Inc. | | | 107,020 | | | | 5,220,436 | |
| Range Resources Corp. (a) | | | 164,002 | | | | 2,924,156 | |
| | | | | | | | 15,687,678 | |
| Financials — 13.6% | | | | | | | | |
| Banks — 13.0% | | | | | | | | |
| Community Bank System, Inc. | | | 80,494 | | | | 5,995,193 | |
| Enterprise Financial Services Corp. | | | 103,277 | | | | 4,863,314 | |
| First Busey Corp. | | | 151,599 | | | | 4,111,365 | |
| Glacier Bancorp, Inc. | | | 115,671 | | | | 6,558,546 | |
| Lakeland Financial Corp. | | | 63,823 | | | | 5,114,775 | |
| National Bank Holdings Corp. - Class A | | | 225,958 | | | | 9,928,595 | |
| Pacific Premier Bancorp, Inc. | | | 147,680 | | | | 5,911,631 | |
| Renasant Corp. | | | 104,336 | | | | 3,959,551 | |
| Seacoast Banking Corp. of Florida | | | 241,982 | | | | 8,563,743 | |
| Umpqua Holdings Corp. | | | 470,485 | | | | 9,052,131 | |
| United Community Banks, Inc. | | | 276,783 | | | | 9,947,581 | |
| WesBanco, Inc. | | | 148,469 | | | | 5,194,930 | |
| | | | | | | | 79,201,355 | |
| Insurance — 0.6% | | | | | | | | |
| eHealth, Inc. (a) | | | 147,940 | | | | 3,772,470 | |
| | | | | | | | | |
| Health Care — 8.5% | | | | | | | | |
| Health Care Equipment & Services — 6.5% | | | | | | | | |
| AngioDynamics, Inc. (a) | | | 116,797 | | | | 3,221,261 | |
| Evolent Health, Inc. - Class A (a) | | | 81,134 | | | | 2,244,978 | |
| | | Shares | | | Value | |
| Health Care Equipment & Services (continued) | | | | | | | | |
| ICU Medical, Inc. (a) | | | 43,030 | | | $ | 10,212,740 | |
| MEDNAX, Inc. (a) | | | 181,893 | | | | 4,949,309 | |
| Orthofix Medical, Inc. (a) | | | 565,489 | | | | 17,581,053 | |
| Surmodics, Inc. (a) | | | 33,840 | | | | 1,629,396 | |
| | | | | | | | 39,838,737 | |
| Pharmaceuticals, Biotechnology & Life Sciences — 2.0% | | | | | | | | |
| Alkermes PLC (Ireland) (a) | | | 107,784 | | | | 2,507,056 | |
| Arena Pharmaceuticals, Inc. (a) | | | 104,672 | | | | 9,728,215 | |
| | | | | | | | 12,235,271 | |
| Industrials — 23.1% | | | | | | | | |
| Capital Goods — 19.8% | | | | | | | | |
| AAR Corp. (a) | | | 161,869 | | | | 6,317,747 | |
| Apogee Enterprises, Inc. | | | 198,655 | | | | 9,565,238 | |
| Astec Industries, Inc. | | | 98,377 | | | | 6,814,575 | |
| AZZ, Inc. | | | 180,141 | | | | 9,959,996 | |
| Beacon Roofing Supply, Inc. (a) | | | 92,950 | | | | 5,330,682 | |
| CIRCOR International, Inc. (a) | | | 274,959 | | | | 7,473,386 | |
| Columbus McKinnon Corp. | | | 95,766 | | | | 4,430,135 | |
| EnerSys | | | 102,983 | | | | 8,141,836 | |
| Quanex Building Products Corp. | | | 257,255 | | | | 6,374,779 | |
| Regal Rexnord Corp. | | | 153,987 | | | | 26,205,508 | |
| REV Group, Inc. | | | 695,297 | | | | 9,838,452 | |
| SPX Corp. (a) | | | 229,682 | | | | 13,707,422 | |
| Sterling Construction Co., Inc. (a) | | | 252,820 | | | | 6,649,166 | |
| | | | | | | | 120,808,922 | |
| Commercial & Professional Services — 3.3% | | | | | | | | |
| Huron Consulting Group, Inc. (a) | | | 59,713 | | | | 2,979,679 | |
| KBR, Inc. | | | 181,050 | | | | 8,621,601 | |
| SP Plus Corp. (a) | | | 303,264 | | | | 8,558,110 | |
| | | | | | | | 20,159,390 | |
| Information Technology — 13.4% | | | | | | | | |
| Software & Services — 8.7% | | | | | | | | |
| Conduent, Inc. (a) | | | 834,173 | | | | 4,454,484 | |
| CSG Systems International, Inc. | | | 118,300 | | | | 6,816,446 | |
| NCR Corp. (a) | | | 559,711 | | | | 22,500,382 | |
| Progress Software Corp. | | | 398,906 | | | | 19,255,192 | |
| | | | | | | | 53,026,504 | |
| Technology Hardware & Equipment — 4.7% | | | | | | | | |
| Belden, Inc. | | | 175,578 | | | | 11,540,742 | |
| FARO Technologies, Inc. (a) | | | 194,036 | | | | 13,586,401 | |
| Sierra Wireless, Inc. (Canada) (a) | | | 215,242 | | | | 3,792,564 | |
| | | | | | | | 28,919,707 | |
| Materials — 9.5% | | | | | | | | |
| Materials — 9.5% | | | | | | | | |
| Alamos Gold, Inc. - Class A (Canada) | | | 97,486 | | | | 749,667 | |
| Coeur Mining, Inc. (a) | | | 127,063 | | | | 640,398 | |
| Compass Minerals International, Inc. | | | 371,606 | | | | 18,981,634 | |
| Element Solutions, Inc. | | | 318,990 | | | | 7,745,077 | |
| Glatfelter Corp. | | | 688,994 | | | | 11,850,697 | |
| Pretium Resources, Inc. (Canada) (a) | | | 209,567 | | | | 2,952,799 | |
| Schnitzer Steel Industries, Inc. - Class A | | | 39,753 | | | | 2,063,976 | |
| Silgan Holdings, Inc. | | | 159,776 | | | | 6,844,804 | |
| Summit Materials, Inc. - Class A (a) | | | 148,094 | | | | 5,944,493 | |
| | | | | | | | 57,773,545 | |
| See Notes to Financial Statements. | |
| 40 | | | www.sbhfunds.com |
| Segall Bryant & Hamill Small Cap Value Fund | Statement of Investments |
| | December 31, 2021 |
| | | Shares | | | Value | |
| Real Estate — 5.5% | | | | | | | | |
| Real Estate — 5.5% | | | | | | | | |
| Cousins Properties, Inc. | | | 101,509 | | | $ | 4,088,783 | |
| Empire State Realty Trust, Inc. - Class A | | | 311,835 | | | | 2,775,331 | |
| Equity Commonwealth (a) | | | 876,120 | | | | 22,691,508 | |
| Physicians Realty Trust | | | 232,426 | | | | 4,376,582 | |
| | | | | | | | 33,932,204 | |
| Utilities — 3.4% | | | | | | | | |
| Utilities — 3.4% | | | | | | | | |
| ALLETE, Inc. | | | 88,506 | | | | 5,872,373 | |
| New Jersey Resources Corp. | | | 146,717 | | | | 6,024,200 | |
| OGE Energy Corp. | | | 40,897 | | | | 1,569,627 | |
| PNM Resources, Inc. | | | 157,430 | | | | 7,180,382 | |
| | | | | | | | 20,646,582 | |
| Investments at Value — 96.2% | | | | | | | | |
| (Cost $466,402,325) | | | | | | $ | 587,349,838 | |
| | | | | | | | | |
| Other Assets in Excess of Liabilities — 3.8% | | | | | | | 23,469,167 | |
| | | | | | | | | |
| Net Assets — 100.0% | | | | | | $ | 610,819,005 | |
| (a) | Non-income producing security. |
The Fund’s sector and industry classifications presented herein refer to any one or more of the industry sub-classifications used by one or more widely recognized market indexes or ratings group indexes, and/ or as defined by Fund management. For Fund compliance purposes, sector and industry classifications are based on the sector and industry categorization methodology of the Adviser to the Funds. This definition may not apply for purposes of this report, which may combine industry sub-classifications for reporting ease. Industries are shown as a percentage of net assets.
| See Notes to Financial Statements. | |
| Annual Report | December 31, 2021 | | | 41 |
| Segall Bryant & Hamill Small Cap Growth Fund | Statement of Investments |
| | December 31, 2021 |
| | | Shares | | | Value | |
| COMMON STOCKS — 98.0% | | | | | | | | |
| Communication Services — 3.6% | | | | | | | | |
| Media & Entertainment — 2.1% | | | | | | | | |
| Eventbrite, Inc. - Class A (a) | | | 123,578 | | | $ | 2,155,200 | |
| New York Times Co. (The) - Class A | | | 61,319 | | | | 2,961,708 | |
| | | | | | | | 5,116,908 | |
| Telecommunication Services — 1.5% | | | | | | | | |
| Cogent Communications Holdings, Inc. | | | 49,403 | | | | 3,615,312 | |
| | | | | | | | | |
| Consumer Discretionary — 10.4% | | | | | | | | |
| Automobiles & Components — 1.5% | | | | | | | | |
| Fox Factory Holding Corp. (a) | | | 21,890 | | | | 3,723,489 | |
| | | | | | | | | |
| Consumer Durables & Apparel — 1.5% | | | | | | | | |
| Callaway Golf Co. (a) | | | 130,632 | | | | 3,584,542 | |
| | | | | | | | | |
| Consumer Services — 6.3% | | | | | | | | |
| Bright Horizons Family Solutions, Inc. (a) | | | 36,768 | | | | 4,628,356 | |
| Churchill Downs, Inc. | | | 21,816 | | | | 5,255,474 | |
| Shake Shack, Inc. - Class A (a) | | | 34,342 | | | | 2,478,119 | |
| Wingstop, Inc. | | | 16,379 | | | | 2,830,291 | |
| | | | | | | | 15,192,240 | |
| Retailing — 1.1% | | | | | | | | |
| Revolve Group, Inc. (a) | | | 49,006 | | | | 2,746,296 | |
| | | | | | | | | |
| Consumer Staples — 1.2% | | | | | | | | |
| Food, Beverage & Tobacco — 1.2% | | | | | | | | |
| Simply Good Foods Co. (The) (a) | | | 72,007 | | | | 2,993,331 | |
| | | | | | | | | |
| Financials — 10.6% | | | | | | | | |
| Diversified Financials — 5.1% | | | | | | | | |
| Evercore, Inc. - Class A | | | 13,657 | | | | 1,855,303 | |
| Focus Financial Partners, Inc. - Class A (a) | | | 37,755 | | | | 2,254,729 | |
| Hamilton Lane, Inc. - Class A | | | 24,741 | | | | 2,563,662 | |
| Houlihan Lokey, Inc. | | | 23,549 | | | | 2,437,793 | |
| LendingTree, Inc. (a) | | | 6,863 | | | | 841,404 | |
| StepStone Group, Inc. - Class A | | | 59,639 | | | | 2,479,193 | |
| | | | | | | | 12,432,084 | |
| Insurance — 5.5% | | | | | | | | |
| Goosehead Insurance, Inc. - Class A | | | 30,568 | | | | 3,976,285 | |
| Palomar Holdings, Inc. (a) | | | 40,449 | | | | 2,619,882 | |
| SelectQuote, Inc. (a) | | | 158,455 | | | | 1,435,602 | |
| Trupanion, Inc. (a) | | | 39,270 | | | | 5,184,818 | |
| | | | | | | | 13,216,587 | |
| Health Care — 27.5% | | | | | | | | |
| Health Care Equipment & Services — 19.9% | | | | | | | | |
| Addus HomeCare Corp. (a) | | | 27,260 | | | | 2,549,083 | |
| Amedisys, Inc. (a) | | | 17,646 | | | | 2,856,535 | |
| Castle Biosciences, Inc. (a) | | | 58,402 | | | | 2,503,694 | |
| CONMED Corp. | | | 29,587 | | | | 4,194,253 | |
| Globus Medical, Inc. - Class A (a) | | | 52,352 | | | | 3,779,814 | |
| Inari Medical, Inc. (a) | | | 32,394 | | | | 2,956,600 | |
| Inspire Medical Systems, Inc. (a) | | | 19,673 | | | | 4,525,970 | |
| Integra LifeSciences Holdings Corp. (a) | | | 46,012 | | | | 3,082,344 | |
| | | Shares | | | Value | |
| Health Care Equipment & Services (continued) | | | | | | | | |
| LivaNova PLC (United Kingdom) (a) | | | 18,017 | | | $ | 1,575,226 | |
| Omnicell, Inc. (a) | | | 28,250 | | | | 5,097,430 | |
| Option Care Health, Inc. (a) | | | 110,456 | | | | 3,141,369 | |
| Silk Road Medical, Inc. (a) | | | 54,708 | | | | 2,331,108 | |
| Surgery Partners, Inc. (a) | | | 51,800 | | | | 2,766,638 | |
| Vocera Communications, Inc. (a) | | | 60,876 | | | | 3,947,200 | |
| Warby Parker, Inc. - Class A (a) | | | 64,572 | | | | 3,006,473 | |
| | | | | | | | 48,313,737 | |
| Pharmaceuticals, Biotechnology & Life Sciences — 7.6% | | | | | | | | |
| Adaptive Biotechnologies Corp. (a) | | | 44,456 | | | | 1,247,435 | |
| Amicus Therapeutics, Inc. (a) | | | 87,062 | | | | 1,005,566 | |
| Blueprint Medicines Corp. (a) | | | 24,661 | | | | 2,641,440 | |
| Fate Therapeutics, Inc. (a) | | | 44,037 | | | | 2,576,605 | |
| NanoString Technologies, Inc. (a) | | | 57,976 | | | | 2,448,326 | |
| Natera, Inc. (a) | | | 36,857 | | | | 3,442,075 | |
| Pacira BioSciences, Inc. (a) | | | 24,787 | | | | 1,491,434 | |
| Turning Point Therapeutics, Inc. (a) | | | 38,275 | | | | 1,825,718 | |
| Xencor, Inc. (a) | | | 40,751 | | | | 1,634,930 | |
| | | | | | | | 18,313,529 | |
| Industrials — 16.9% | | | | | | | | |
| Capital Goods — 8.4% | | | | | | | | |
| AeroVironment, Inc. (a) | | | 16,005 | | | | 992,790 | |
| Ameresco, Inc. - Class A (a) | | | 37,414 | | | | 3,046,996 | |
| AZEK Co., Inc. (The) - Class A (a) | | | 119,290 | | | | 5,515,969 | |
| Hexcel Corp. (a) | | | 47,822 | | | | 2,477,180 | |
| John Bean Technologies Corp. | | | 15,971 | | | | 2,452,507 | |
| Kratos Defense & Security Solutions, Inc, (a) | | | 139,443 | | | | 2,705,194 | |
| Mercury Systems, Inc. (a) | | | 24,787 | | | | 1,364,772 | |
| Proto Labs, Inc. (a) | | | 7,802 | | | | 400,633 | |
| TPI Composites, Inc. (a) | | | 92,707 | | | | 1,386,897 | |
| | | | | | | | 20,342,938 | |
| Commercial & Professional Services — 7.1% | | | | | | | | |
| ASGN, Inc. (a) | | | 22,501 | | | | 2,776,623 | |
| Huron Consulting Group, Inc. (a) | | | 36,819 | | | | 1,837,268 | |
| Montrose Environmental Group, Inc. (a) | | | 24,499 | | | | 1,727,425 | |
| Ritchie Bros. Auctioneers, Inc. (Canada) | | | 41,290 | | | | 2,527,361 | |
| Tetra Tech, Inc. | | | 27,673 | | | | 4,698,875 | |
| Upwork, Inc. (a) | | | 108,780 | | | | 3,715,925 | |
| | | | | | | | 17,283,477 | |
| Transportation — 1.4% | | | | | | | | |
| Saia, Inc. (a) | | | 9,612 | | | | 3,239,532 | |
| | | | | | | | | |
| Information Technology — 21.3% | | | | | | | | |
| Semiconductors & Semiconductor Equipment — 6.7% | | | | | | | | |
| Onto Innovation, Inc. (a) | | | 39,376 | | | | 3,986,033 | |
| Power Integrations, Inc. | | | 40,899 | | | | 3,799,108 | |
| Silicon Laboratories, Inc. (a) | | | 28,553 | | | | 5,893,910 | |
| SiTime Corp. (a) | | | 8,866 | | | | 2,593,660 | |
| | | | | | | | 16,272,711 | |
| Software & Services — 12.7% | | | | | | | | |
| Anaplan, Inc. (a) | | | 70,517 | | | | 3,233,204 | |
| Endava PLC ADR (United Kingdom) (a) | | | 34,268 | | | | 5,754,283 | |
| Envestnet, Inc. (a) | | | 40,987 | | | | 3,251,909 | |
| See Notes to Financial Statements. | |
| 42 | | | www.sbhfunds.com |
| Segall Bryant & Hamill Small Cap Growth Fund | Statement of Investments |
| | December 31, 2021 |
| | | Shares | | | Value | |
| Software & Services (continued) | | | | | | | | |
| Everbridge, Inc. (a) | | | 25,432 | | | $ | 1,712,337 | |
| MAXIMUS, Inc. | | | 47,569 | | | | 3,789,822 | |
| nCino, Inc. (a) | | | 55,872 | | | | 3,065,138 | |
| Olo, Inc. - Class A (a) | | | 92,182 | | | | 1,918,307 | |
| Shift4 Payments, Inc. - Class A (a) | | | 60,386 | | | | 3,498,161 | |
| Sprout Social, Inc. - Class A (a) | | | 51,306 | | | | 4,652,941 | |
| | | | | | | | 30,876,102 | |
| Technology Hardware & Equipment — 1.9% | | | | | | | | |
| 908 Devices, Inc. (a) | | | 63,897 | | | | 1,653,015 | |
| Novanta, Inc. (Canada) (a) | | | 16,536 | | | | 2,915,793 | |
| | | | | | | | 4,568,808 | |
| Materials — 4.4% | | | | | | | | |
| Materials — 4.4% | | | | | | | | |
| Avient Corp. | | | 46,791 | | | | 2,617,956 | |
| Ingevity Corp. (a) | | | 30,804 | | | | 2,208,647 | |
| Innospec, Inc. | | | 14,688 | | | | 1,326,914 | |
| Livent Corp. (a) | | | 184,924 | | | | 4,508,447 | |
| | | | | | | | 10,661,964 | |
| Real Estate — 2.1% | | | | | | | | |
| Real Estate — 2.1% | | | | | | | | |
| Americold Realty Trust | | | 42,756 | | | | 1,401,969 | |
| Terreno Realty Corp. | | | 42,967 | | | | 3,664,656 | |
| | | | | | | | 5,066,625 | |
| Investments at Value — 98.0% | | | | | | | | |
| (Cost $198,429,636) | | | | | | $ | 237,560,212 | |
| | | | | | | | | |
| Other Assets in Excess of Liabilities — 2.0% | | | | | | | 4,795,453 | |
| | | | | | | | | |
| Net Assets — 100.0% | | | | | | $ | 242,355,665 | |
| (a) | Non-income producing security. |
The Fund’s sector and industry classifications presented herein refer to any one or more of the industry sub-classifications used by one or more widely recognized market indexes or ratings group indexes, and/ or as defined by Fund management. For Fund compliance purposes, sector and industry classifications are based on the sector and industry categorization methodology of the Adviser to the Funds. This definition may not apply for purposes of this report, which may combine industry sub-classifications for reporting ease. Industries are shown as a percentage of net assets.
| See Notes to Financial Statements. | |
| Annual Report | December 31, 2021 | | | 43 |
| Segall Bryant & Hamill Small Cap Core Fund | Statement of Investments |
| | December 31, 2021 |
| | | Shares | | | Value | |
| COMMON STOCKS — 96.4% | | | | | | | | |
| Consumer Discretionary — 12.5% | | | | | | | | |
| Automobiles & Components — 3.3% | | | | | | | | |
| Dorman Products, Inc. (a) | | | 2,830 | | | $ | 319,818 | |
| Fox Factory Holding Corp. (a) | | | 3,937 | | | | 669,684 | |
| Harley-Davidson, Inc. | | | 14,792 | | | | 557,511 | |
| Stoneridge, Inc. (a) | | | 9,777 | | | | 192,998 | |
| | | | | | | | 1,740,011 | |
| Consumer Durables & Apparel — 6.5% | | | | | | | | |
| Capri Holdings, Ltd. (a) | | | 15,126 | | | | 981,828 | |
| Gildan Activewear, Inc. (Canada) | | | 20,007 | | | | 848,097 | |
| Steven Madden, Ltd. | | | 14,136 | | | | 656,900 | |
| Under Armour, Inc. - Class A (a) | | | 25,746 | | | | 545,558 | |
| Universal Electronics, Inc. (a) | | | 8,432 | | | | 343,604 | |
| | | | | | | | 3,375,987 | |
| Consumer Services — 1.7% | | | | | | | | |
| BJ’s Restaurants, Inc. (a) | | | 9,080 | | | | 313,714 | |
| Churchill Downs, Inc. | | | 2,319 | | | | 558,647 | |
| | | | | | | | 872,361 | |
| Retailing — 1.0% | | | | | | | | |
| Five Below, Inc. (a) | | | 2,701 | | | | 558,810 | |
| | | | | | | | | |
| Consumer Staples — 5.2% | | | | | | | | |
| Food, Beverage & Tobacco — 3.9% | | | | | | | | |
| Hain Celestial Group, Inc. (The) (a) | | | 29,688 | | | | 1,265,006 | |
| J & J Snack Foods Corp. | | | 4,912 | | | | 775,899 | |
| | | | | | | | 2,040,905 | |
| Household & Personal Products — 1.3% | | | | | | | | |
| Inter Parfums, Inc. | | | 6,139 | | | | 656,259 | |
| | | | | | | | | |
| Energy — 2.4% | | | | | | | | |
| Energy — 2.4% | | | | | | | | |
| Devon Energy Corp. | | | 19,296 | | | | 849,989 | |
| PDC Energy, Inc. | | | 8,828 | | | | 430,630 | |
| | | | | | | | 1,280,619 | |
| Financials — 8.1% | | | | | | | | |
| Banks — 8.1% | | | | | | | | |
| Ameris Bancorp | | | 12,694 | | | | 630,638 | |
| Glacier Bancorp, Inc. | | | 12,362 | | | | 700,926 | |
| Lakeland Financial Corp. | | | 5,587 | | | | 447,742 | |
| Seacoast Banking Corp. of Florida | | | 20,723 | | | | 733,387 | |
| South State Corp. | | | 7,685 | | | | 615,645 | |
| United Bankshares, Inc. | | | 13,901 | | | | 504,328 | |
| United Community Banks, Inc. | | | 16,403 | | | | 589,524 | |
| | | | | | | | 4,222,190 | |
| Health Care — 12.7% | | | | | | | | |
| Health Care Equipment & Services — 8.7% | | | | | | | | |
| Amedisys, Inc. (a) | | | 3,683 | | | | 596,204 | |
| Encompass Health Corp. | | | 5,284 | | | | 344,834 | |
| Globus Medical, Inc. - Class A (a) | | | 8,454 | | | | 610,379 | |
| Heska Corp. (a) | | | 2,906 | | | | 530,316 | |
| Insulet Corp. (a) | | | 2,322 | | | | 617,814 | |
| Integra LifeSciences Holdings Corp. (a) | | | 4,639 | | | | 310,767 | |
| Orthofix Medical, Inc. (a) | | | 12,970 | | | | 403,237 | |
| Phreesia, Inc. (a) | | | 10,512 | | | | 437,930 | |
| | | Shares | | | Value | |
| Health Care Equipment & Services (continued) | | | | | | | | |
| Vocera Communications, Inc. (a) | | | 10,243 | | | $ | 664,156 | |
| | | | | | | | 4,515,637 | |
| Pharmaceuticals, Biotechnology & Life Sciences — 4.0% | | | | | | | | |
| Bio-Techne Corp. | | | 1,127 | | | | 583,042 | |
| Horizon Therapeutics PLC (a) | | | 6,654 | | | | 717,035 | |
| Medpace Holdings, Inc. (a) | | | 1,912 | | | | 416,128 | |
| Veracyte, Inc. (a) | | | 9,022 | | | | 371,706 | |
| | | | | | | | 2,087,911 | |
| Industrials — 25.0% | | | | | | | | |
| Capital Goods — 18.0% | | | | | | | | |
| AAR Corp. (a) | | | 10,681 | | | | 416,879 | |
| BWX Technologies, Inc. | | | 8,066 | | | | 386,200 | |
| Carlisle Cos., Inc. | | | 3,290 | | | | 816,315 | |
| EnerSys | | | 5,715 | | | | 451,828 | |
| EnPro Industries, Inc. | | | 9,942 | | | | 1,094,316 | |
| ITT, Inc. | | | 8,199 | | | | 837,856 | |
| Masonite International Corp.(Canada) (a) | | | 3,548 | | | | 418,487 | |
| RBC Bearings, Inc. (a) | | | 2,148 | | | | 433,832 | |
| Regal Rexnord Corp. | | | 10,258 | | | | 1,745,706 | |
| SPX Corp. (a) | | | 8,050 | | | | 480,424 | |
| Standex International Corp. | | | 3,643 | | | | 403,134 | |
| Timken Co. (The) | | | 9,257 | | | | 641,418 | |
| UFP Industries, Inc. | | | 7,232 | | | | 665,416 | |
| Zurn Water Solutions Corp. | | | 16,764 | | | | 610,210 | |
| | | | | | | | 9,402,021 | |
| Commercial & Professional Services — 3.4% | | | | | | | | |
| Casella Waste Systems, Inc. - Class A (a) | | | 7,532 | | | | 643,383 | |
| KBR, Inc. | | | 17,559 | | | | 836,160 | |
| Tetra Tech, Inc. | | | 1,618 | | | | 274,736 | |
| | | | | | | | 1,754,279 | |
| Transportation — 3.6% | | | | | | | | |
| Allegiant Travel Co. (a) | | | 3,449 | | | | 645,101 | |
| Forward Air Corp. | | | 4,261 | | | | 515,965 | |
| Hub Group, Inc. - Class A (a) | | | 8,439 | | | | 710,901 | |
| | | | | | | | 1,871,967 | |
| Information Technology — 21.4% | | | | | | | | |
| Semiconductors & Semiconductor Equipment — 4.9% | | | | | | | | |
| CMC Materials, Inc. | | | 3,570 | | | | 684,333 | |
| Silicon Laboratories, Inc. (a) | | | 5,476 | | | | 1,130,356 | |
| Veeco Instruments, Inc. (a) | | | 25,163 | | | | 716,391 | |
| | | | | | | | 2,531,080 | |
| Software & Services — 12.4% | | | | | | | | |
| 8x8, Inc. (a) | | | 15,227 | | | | 255,204 | |
| Agilysys, Inc. (a) | | | 7,886 | | | | 350,612 | |
| Alteryx, Inc. - Class A (a) | | | 7,821 | | | | 473,170 | |
| Anaplan, Inc. (a) | | | 7,559 | | | | 346,580 | |
| BlackLine, Inc. (a) | | | 3,407 | | | | 352,761 | |
| Endava PLC ADR (United Kingdom) (a) | | | 4,907 | | | | 823,983 | |
| Everbridge, Inc. (a) | | | 3,705 | | | | 249,458 | |
| Model N, Inc. (a) | | | 13,352 | | | | 400,961 | |
| NCR Corp. (a) | | | 13,424 | | | | 539,645 | |
| Pegasystems, Inc. | | | 5,978 | | | | 668,460 | |
| Tenable Holdings, Inc. (a) | | | 11,142 | | | | 613,590 | |
| WNS Holdings, Ltd. ADR (Jersey) (a) | | | 9,926 | | | | 875,672 | |
| See Notes to Financial Statements. | |
| 44 | | | www.sbhfunds.com |
| Segall Bryant & Hamill Small Cap Core Fund | Statement of Investments |
| | December 31, 2021 |
| | | Shares | | | Value | |
| Software & Services (continued) | | | | | | | | |
| Workiva, Inc. (a) | | | 3,909 | | | $ | 510,085 | |
| | | | | | | | 6,460,181 | |
| Technology Hardware & Equipment — 4.1% | | | | | | | | |
| FARO Technologies, Inc. (a) | | | 5,109 | | | | 357,732 | |
| Pure Storage, Inc. - Class A (a) | | | 32,473 | | | | 1,056,996 | |
| Rogers Corp. (a) | | | 2,704 | | | | 738,192 | |
| | | | | | | | 2,152,920 | |
| Materials — 7.8% | | | | | | | | |
| Materials — 7.8% | | | | | | | | |
| Berry Global Group, Inc. (a) | | | 10,810 | | | | 797,562 | |
| Compass Minerals International, Inc. | | | 5,437 | | | | 277,722 | |
| Eagle Materials, Inc. | | | 2,924 | | | | 486,729 | |
| Element Solutions, Inc. | | | 46,695 | | | | 1,133,754 | |
| Huntsman Corp. | | | 18,636 | | | | 650,024 | |
| Ingevity Corp. (a) | | | 3,468 | | | | 248,655 | |
| Materion Corp. | | | 4,963 | | | | 456,298 | |
| | | | | | | | 4,050,744 | |
| Real Estate — 1.3% | | | | | | | | |
| Real Estate — 1.3% | | | | | | | | |
| Cousins Properties, Inc. | | | 16,484 | | | | 663,976 | |
| | | | | | | | | |
| Investments at Value — 96.4% | | | | | | | | |
| (Cost $37,869,089) | | | | | | $ | 50,237,858 | |
| | | | | | | | | |
| Other Assets in Excess of Liabilities — 3.6% | | | | | | | 1,884,589 | |
| | | | | | | | | |
| Net Assets — 100.0% | | | | | | $ | 52,122,447 | |
| (a) | Non-income producing security. |
The Fund’s sector and industry classifications presented herein refer to any one or more of the industry sub-classifications used by one or more widely recognized market indexes or ratings group indexes, and/ or as defined by Fund management. For Fund compliance purposes, sector and industry classifications are based on the sector and industry categorization methodology of the Adviser to the Funds. This definition may not apply for purposes of this report, which may combine industry sub-classifications for reporting ease. Industries are shown as a percentage of net assets.
| See Notes to Financial Statements. | |
| Annual Report | December 31, 2021 | | | 45 |
| Segall Bryant & Hamill All Cap Fund | Statement of Investments |
| | December 31, 2021 |
| | | Shares | | | Value | |
| COMMON STOCKS — 97.9% | | | | | | | | |
| Communication Services — 5.4% | | | | | | | | |
| Media & Entertainment — 5.4% | | | | | | | | |
| Alphabet, Inc. - Class C (a) | | | 2,608 | | | $ | 7,546,483 | |
| Cable One, Inc. | | | 1,500 | | | | 2,645,175 | |
| | | | | | | | 10,191,658 | |
| Consumer Discretionary — 14.0% | | | | | | | | |
| Consumer Durables & Apparel — 1.9% | | | | | | | | |
| Capri Holdings, Ltd. (a) | | | 55,113 | | | | 3,577,385 | |
| | | | | | | | | |
| Consumer Services — 3.6% | | | | | | | | |
| Darden Restaurants, Inc. | | | 13,552 | | | | 2,041,473 | |
| Papa John’s International, Inc. | | | 18,523 | | | | 2,472,265 | |
| Vail Resorts, Inc. | | | 6,619 | | | | 2,170,370 | |
| | | | | | | | 6,684,108 | |
| Retailing — 8.5% | | | | | | | | |
| Amazon.com, Inc. (a) | | | 1,740 | | | | 5,801,752 | |
| Home Depot, Inc. (The) | | | 6,730 | | | | 2,793,017 | |
| O’Reilly Automotive, Inc. (a) | | | 3,895 | | | | 2,750,766 | |
| TJX Cos., Inc. (The) | | | 61,532 | | | | 4,671,509 | |
| | | | | | | | 16,017,044 | |
| Consumer Staples — 4.6% | | | | | | | | |
| Food, Beverage & Tobacco — 2.9% | | | | | | | | |
| Hain Celestial Group, Inc. (The) (a) | | | 69,634 | | | | 2,967,105 | |
| Mondelēz International, Inc. - Class A | | | 38,133 | | | | 2,528,599 | |
| | | | | | | | 5,495,704 | |
| Household & Personal Products — 1.7% | | | | | | | | |
| Estée Lauder Cos., Inc. (The) - Class A | | | 8,367 | | | | 3,097,463 | |
| | | | | | | | | |
| Energy — 2.6% | | | | | | | | |
| Energy — 2.6% | | | | | | | | |
| Chevron Corp. | | | 23,194 | | | | 2,721,816 | |
| Suncor Energy, Inc. (Canada) | | | 86,773 | | | | 2,171,928 | |
| | | | | | | | 4,893,744 | |
| Financials — 15.3% | | | | | | | | |
| Banks — 5.0% | | | | | | | | |
| First Republic Bank | | | 13,342 | | | | 2,755,256 | |
| JPMorgan Chase & Co. | | | 22,241 | | | | 3,521,862 | |
| Western Alliance Bancorp | | | 29,093 | | | | 3,131,862 | |
| | | | | | | | 9,408,980 | |
| Diversified Financials — 5.0% | | | | | | | | |
| Ares Management Corp. - Class A | | | 62,688 | | | | 5,094,654 | |
| Berkshire Hathaway, Inc. - Class B (a) | | | 6,983 | | | | 2,087,917 | |
| S&P Global, Inc. | | | 4,657 | | | | 2,197,778 | |
| | | | | | | | 9,380,349 | |
| Insurance — 5.3% | | | | | | | | |
| Globe Life, Inc. | | | 35,914 | | | | 3,365,860 | |
| Marsh & McLennan Cos., Inc. | | | 17,172 | | | | 2,984,837 | |
| Reinsurance Group of America, Inc. | | | 31,991 | | | | 3,502,694 | |
| | | | | | | | 9,853,391 | |
| Health Care — 16.7% | | | | | | | | |
| Health Care Equipment & Services — 5.8% | | | | | | | | |
| Health Catalyst, Inc. (a) | | | 40,746 | | | | 1,614,357 | |
| McKesson Corp. | | | 10,907 | | | | 2,711,153 | |
| Omnicell, Inc. (a) | | | 13,203 | | | | 2,382,349 | |
| | | Shares | | | Value | |
| Health Care Equipment & Services (continued) | | | | | | | | |
| UnitedHealth Group, Inc. | | | 8,287 | | | $ | 4,161,234 | |
| | | | | | | | 10,869,093 | |
| Pharmaceuticals, Biotechnology & Life Sciences — 10.9% | | | | | | | | |
| Bio-Techne Corp. | | | 4,405 | | | | 2,278,883 | |
| Catalent, Inc. (a) | | | 22,315 | | | | 2,856,989 | |
| Charles River Laboratories | | | | | | | | |
| International, Inc. (a) | | | 9,679 | | | | 3,646,854 | |
| Danaher Corp. | | | 9,050 | | | | 2,977,541 | |
| Mettler-Toledo International, Inc. (a) | | | 1,794 | | | | 3,044,795 | |
| Thermo Fisher Scientific, Inc. | | | 3,960 | | | | 2,642,270 | |
| Zoetis, Inc. | | | 12,250 | | | | 2,989,367 | |
| | | | | | | | 20,436,699 | |
| Industrials — 10.9% | | | | | | | | |
| Capital Goods — 10.9% | | | | | | | | |
| Advanced Drainage Systems, Inc. | | | 17,332 | | | | 2,359,405 | |
| AZEK Co., Inc. (The) - Class A (a) | | | 53,912 | | | | 2,492,891 | |
| Chart Industries, Inc. (a) | | | 11,507 | | | | 1,835,252 | |
| Dover Corp. | | | 15,279 | | | | 2,774,666 | |
| Quanta Services, Inc. | | | 44,451 | | | | 5,096,752 | |
| Raytheon Technologies Corp. | | | 39,173 | | | | 3,371,228 | |
| Roper Technologies, Inc. | | | 5,101 | | | | 2,508,978 | |
| | | | | | | | 20,439,172 | |
| Information Technology — 24.9% | | | | | | | | |
| Semiconductors & Semiconductor Equipment — 8.6% | | | | | | | | |
| ASML Holding N.V. ADR (Netherlands) | | | 4,206 | | | | 3,348,565 | |
| Marvell Technology, Inc. (Bermuda) | | | 73,868 | | | | 6,462,711 | |
| Monolithic Power Systems, Inc. | | | 7,394 | | | | 3,647,682 | |
| NXP Semiconductors N V (Netherlands) | | | 11,276 | | | | 2,568,447 | |
| | | | | | | | 16,027,405 | |
| Software & Services — 11.6% | | | | | | | | |
| Adobe, Inc. (a) | | | 5,320 | | | | 3,016,759 | |
| Microsoft Corp. | | | 26,351 | | | | 8,862,368 | |
| ServiceNow, Inc. (a) | | | 5,000 | | | | 3,245,550 | |
| Visa, Inc. - Class A | | | 22,295 | | | | 4,831,550 | |
| Workday, Inc. - Class A (a) | | | 6,582 | | | | 1,798,071 | |
| | | | | | | | 21,754,298 | |
| Technology Hardware & Equipment — 4.7% | | | | | | | | |
| Keysight Technologies, Inc. (a) | | | 19,616 | | | | 4,050,900 | |
| Zebra Technologies Corp. - Class A (a) | | | 8,042 | | | | 4,786,599 | |
| | | | | | | | 8,837,499 | |
| See Notes to Financial Statements. | |
| 46 | | | www.sbhfunds.com |
| Segall Bryant & Hamill All Cap Fund | Statement of Investments |
| | December 31, 2021 |
| | | Shares | | | Value | |
| Materials — 3.5% | | | | | | | | |
| Materials — 3.5% | | | | | | | | |
| Avery Dennison Corp. | | | 13,900 | | | $ | 3,010,323 | |
| Eastman Chemical Co. | | | 14,752 | | | | 1,783,664 | |
| Franco-Nevada Corp. (Canada) | | | 13,019 | | | | 1,800,398 | |
| | | | | | | | 6,594,385 | |
| Investments at Value — 97.9% | | | | | | | | |
| (Cost $93,847,827) | | | | | | $ | 183,558,377 | |
| | | | | | | | | |
| Other Assets in Excess of Liabilities — 2.1% | | | | | | | 3,874,620 | |
| | | | | | | | | |
| Net Assets — 100.0% | | | | | | $ | 187,432,997 | |
| (a) | Non-income producing security. |
The Fund’s sector and industry classifications presented herein refer to any one or more of the industry sub-classifications used by one or more widely recognized market indexes or ratings group indexes, and/ or as defined by Fund management. For Fund compliance purposes, sector and industry classifications are based on the sector and industry categorization methodology of the Adviser to the Funds. This definition may not apply for purposes of this report, which may combine industry sub-classifications for reporting ease. Industries are shown as a percentage of net assets.
| See Notes to Financial Statements. | |
| Annual Report | December 31, 2021 | | | 47 |
| Segall Bryant & Hamill Emerging Markets Fund | Statement of Investments |
| | December 31, 2021 |
| | | Shares | | | Value | |
| COMMON STOCKS — 97.8% | | | | | | | | |
| Communication Services — 9.1% | | | | | | | | |
| Media & Entertainment — 4.5% | | | | | | | | |
| Astro Malaysia Holdings Bhd | | | | | | | | |
| (Malaysia) | | | 245,700 | | | $ | 56,024 | |
| BAIOO Family Interactive, Ltd. (China) | | | 716,000 | | | | 55,214 | |
| China South Publishing & Media Group Co., Ltd. (China) | | | 44,000 | | | | 66,272 | |
| DB Corp., Ltd. (India) | | | 34,419 | | | | 42,900 | |
| Gamania Digital Entertainment Co., Ltd. (Taiwan) | | | 16,000 | | | | 40,642 | |
| Jagran Prakashan, Ltd. (India) (a) | | | 43,811 | | | | 36,319 | |
| KT Skylife Co., Ltd. (South Korea) (a) | | | 9,481 | | | | 72,725 | |
| Media Nusantara Citra Tbk P.T. (Indonesia) | | | 1,768,900 | | | | 111,462 | |
| NetDragon Websoft Holdings, Ltd. (China) | | | 12,500 | | | | 29,416 | |
| Sun TV Network, Ltd. (India) | | | 5,400 | | | | 36,168 | |
| Tencent Holdings, Ltd. (China) | | | 34,300 | | | | 2,001,698 | |
| Yandex N V - Class A (Russia) (a) | | | 810 | | | | 48,611 | |
| | | | | | | | 2,597,451 | |
| Telecommunication Services — 4.6% | | | | | | | | |
| América Móvil S.A.B. de C.V. - Class L ADR (Mexico) | | | 10,900 | | | | 230,099 | |
| APT Satellite Holdings, Ltd. (China) | | | 700,000 | | | | 204,784 | |
| China Tower Corp., Ltd. - H Shares (China) | | | 1,546,000 | | | | 170,603 | |
| Emirates Telecommunications Group Co. PJSC (United Arab Emirates) | | | 10,547 | | | | 91,131 | |
| Empresa Nacional de Telecomunicaciones S.A. (Chile) | | | 10,633 | | | | 35,930 | |
| Globe Telecom, Inc. (Philippines) | | | 1,200 | | | | 77,759 | |
| Indus Towers, Ltd. (India) | | | 84,411 | | | | 280,826 | |
| KT Corp. ADR (South Korea) | | | 19,100 | | | | 240,087 | |
| LG Uplus Corp. (South Korea) | | | 24,592 | | | | 280,170 | |
| Link Net Tbk P.T. (Indonesia) | | | 114,200 | | | | 32,011 | |
| Mobile TeleSystems PJSC (Kuwait) | | | 28,471 | | | | 55,974 | |
| MTN Group, Ltd. (South Africa) (a) | | | 13,754 | | | | 147,269 | |
| PLDT, Inc. ADR (Philippines) | | | 5,400 | | | | 192,888 | |
| Saudi Telecom Co. (Saudi Arabia) | | | 4,912 | | | | 146,928 | |
| SK Telecom Co., Ltd. ADR (South Korea) | | | 7,349 | | | | 195,998 | |
| Telecom Egypt Co. (Egypt) | | | 47,150 | | | | 50,308 | |
| Telekomunikasi Indonesia Persero Tbk P.T. ADR (Indonesia) | | | 4,500 | | | | 130,455 | |
| Turk Telekomunikasyon A S (Turkey) | | | 47,163 | | | | 34,223 | |
| Turkcell Iletisim Hizmetleri A.S. ADR (Turkey) | | | 12,700 | | | | 45,593 | |
| | | | | | | | 2,643,036 | |
| Consumer Discretionary — 12.3% | | | | | | | | |
| Automobiles & Components — 4.0% | | | | | | | | |
| Astra Otoparts Tbk P.T. (Indonesia) | | | 1,101,826 | | | | 89,193 | |
| BAIC Motor Corp., Ltd. - H Shares (China) | | | 449,500 | | | | 193,110 | |
| Brilliance China Automotive Holdings, Ltd. (China) (a) (b) | | | 508,000 | | | | 398,320 | |
| China Motor Corp. (Taiwan) | | | 24,000 | | | | 54,796 | |
| DTR Automotive Corp. (South Korea) | | | 1,425 | | | | 85,899 | |
| | | Shares | | | Value | |
| Automobiles & Components (continued) | | | | | | | | |
| FAW Jiefang Group Co., Ltd. - Class A. (China) | | | 259,188 | | | $ | 419,577 | |
| Grupo Industrial Saltillo S.A.B. de C.V. (Mexico) | | | 42,600 | | | | 60,803 | |
| Halla Holdings Corp. (South Korea) (a) | | | 1,454 | | | | 55,956 | |
| Hankook Tire & Technology Co., Ltd. (South Korea) (a) | | | 3,340 | | | | 111,408 | |
| JK Tyre & Industries, Ltd. (India) | | | 24,719 | | | | 46,008 | |
| Kia Motors Corp. (South Korea) (a) | | | 4,793 | | | | 330,269 | |
| Kordsa Teknik Tekstil A.S. (Turkey) (a) | | | 10,708 | | | | 25,416 | |
| Qingling Motors Co., Ltd. - H Shares. (China) | | | 998,000 | | | | 202,380 | |
| Sri Trang Agro-Industry PCL (Thailand) | | | 67,900 | | | | 63,461 | |
| Xingda International Holdings, Ltd. (China) | | | 697,292 | | | | 152,935 | |
| | | | | | | | 2,289,531 | |
| Consumer Durables & Apparel — 2.9% | | | | | | | | |
| Arvind, Ltd. (India) (a) | | | 26,753 | | | | 43,169 | |
| Best Pacific International Holdings, Ltd. (China) | | | 82,000 | | | | 21,982 | |
| Cowell Fashion Co., Ltd. (South Korea) | | | 4,659 | | | | 32,993 | |
| Goodbaby International Holdings, Ltd. (China) (a) | | | 1,563,000 | | | | 200,589 | |
| Himatsingka Seide, Ltd. (India) | | | 27,259 | | | | 91,395 | |
| KPR Mill, Ltd. (India) | | | 58,790 | | | | 526,600 | |
| LF Corp. (South Korea) (a) | | | 1,898 | | | | 27,469 | |
| Oriental Weavers Group (Egypt) | | | 112,114 | | | | 61,844 | |
| Q TECHNOLOGY (Group) Co., Ltd. (China) | | | 161,000 | | | | 208,307 | |
| Ruentex Industries, Ltd. (Taiwan) | | | 7,800 | | | | 27,350 | |
| Skyworth Group, Ltd. (China) (a) | | | 46,000 | | | | 32,214 | |
| Vardhman Textiles, Ltd. (India) | | | 2,712 | | | | 84,108 | |
| Vestel Beyaz Esya Sanayi ve Ticaret A.S. (Turkey) | | | 57,832 | | | | 34,338 | |
| Vestel Elektronik Sanayi ve Ticaret A.S. (Turkey) | | | 11,770 | | | | 22,207 | |
| Weiqiao Textile Co - H Shares (China) | | | 688,000 | | | | 231,304 | |
| Youngone Holdings Co., Ltd. (South Korea) (a) | | | 1,443 | | | | 56,627 | |
| | | | | | | | 1,702,496 | |
| Consumer Services — 0.8% | | | | | | | | |
| Shenzhen Overseas Chinese Town Co., Ltd - Class A (China) | | | 416,500 | | | | 461,687 | |
| | | | | | | | | |
| Retailing — 4.6% | | | | | | | | |
| China Harmony New Energy Auto Holding, Ltd. (China) | | | 454,500 | | | | 287,394 | |
| China Yongda Automobiles Services Holdings, Ltd. (China) | | | 147,500 | | | | 197,673 | |
| Golden Eagle Retail Group, Ltd. (China) | | | 45,626 | | | | 38,741 | |
| Hyundai Home Shopping Network Corp. (South Korea) (a) | | | 521 | | | | 27,736 | |
| Meituan (China) (a) | | | 9,800 | | | | 283,427 | |
| Mitra Pinasthika Mustika Tbk P.T. (Indonesia) | | | 236,300 | | | | 18,963 | |
| Naspers, Ltd. - N Shares (South Africa) | | | 1,466 | | | | 227,294 | |
| See Notes to Financial Statements. | |
| 48 | | | www.sbhfunds.com |
| Segall Bryant & Hamill Emerging Markets Fund | Statement of Investments |
| | December 31, 2021 |
| | | Shares | | | Value | |
| Retailing (continued) | | | | | | | | |
| Shanghai Yuyuan Tourist Mart Group Co., Ltd. - Class A (China) | | | 19,200 | | | $ | 31,135 | |
| Tongwei Group Co., Ltd. (China) | | | 7,900 | | | | 55,879 | |
| Vibra Energia S.A. (Brazil) | | | 26,300 | | | | 100,945 | |
| Wuchan Zhongda Group Co., Ltd. (China) | | | 613,600 | | | | 572,267 | |
| Xinhua Winshare Publishing and Media Co., Ltd. - H Shares (China) | | | 326,000 | | | | 247,241 | |
| Zhongsheng Group Holdings, Ltd. (China) | | | 74,500 | | | | 581,420 | |
| | | | | | | | 2,670,115 | |
| Consumer Staples — 5.5% | | | | | | | | |
| Food & Staples Retailing �� 0.3% | | | | | | | | |
| Cencosud S.A. (Chile) | | | 58,459 | | | | 97,775 | |
| Grupo Comercial Chedraui S.A. de C. V. (Mexico) | | | 16,400 | | | | 33,901 | |
| WT Microelectronics Co., Ltd. (Taiwan) | | | 14,000 | | | | 37,074 | |
| | | | | | | | 168,750 | |
| Food, Beverage & Tobacco — 5.0% | | | | | | | | |
| China Feihe, Ltd. (China) | | | 55,000 | | | | 73,789 | |
| China Foods, Ltd. (China) | | | 606,455 | | | | 237,801 | |
| China Modern Dairy Holdings, Ltd. (China) | | | 1,652,000 | | | | 277,851 | |
| Dalmia Bharat Sugar & Industries, Ltd. (India) | | | 5,468 | | | | 28,027 | |
| Dharma Satya Nusantara Tbk P.T. (Indonesia) | | | 894,400 | | | | 31,363 | |
| Grupo Bimbo S.A.B. de C. V. (Mexico) | | | 34,800 | | | | 106,988 | |
| Hey Song Corp. (Taiwan) | | | 52,000 | | | | 66,979 | |
| Indofood Sukses Makmur Tbk P.T. (Indonesia) | | | 189,100 | | | | 83,874 | |
| Industrias Bachoco S.A.B. de C.V. - Series B (Mexico) | | | 70,900 | | | | 251,140 | |
| ITC, Ltd. (India) | | | 48,162 | | | | 140,602 | |
| JBS S.A. (Brazil) | | | 30,200 | | | | 205,558 | |
| Kim Loong Resources Bhd (Malaysia) | | | 142,000 | | | | 56,586 | |
| Marfrig Global Foods S.A. (Brazil) | | | 41,600 | | | | 164,669 | |
| Orion Holdings Corp. (South Korea) (a) | | | 8,965 | | | | 119,988 | |
| Perusahaan Perkebunan London Sumatra Tbk P.T. (Indonesia) | | | 401,000 | | | | 33,357 | |
| Samyang Holdings Corp. (South Korea) (a) | | | 1,425 | | | | 117,414 | |
| Sarawak Oil Palms Bhd (Malaysia) | | | 121,500 | | | | 101,777 | |
| Sawit Sumbermas Sarana Tbk P.T. (Indonesia) | | | 563,800 | | | | 38,121 | |
| Thai Union Group PCL (Thailand) | | | 52,700 | | | | 30,965 | |
| Tingyi Holding Corp. (China) | | | 98,000 | | | | 201,572 | |
| Triveni Engineering & Industries, Ltd. (India) | | | 121,874 | | | | 361,416 | |
| Tunas Baru Lampung Tbk P.T. (Indonesia) | | | 1,750,161 | | | | 97,666 | |
| Want Want China Holdings, Ltd. (China) | | | 107,000 | | | | 98,216 | |
| | | | | | | | 2,925,719 | |
| Household & Personal Products — 0.2% | | | | | | | | |
| Bajaj Consumer Care, Ltd. (India) | | | 40,894 | | | | 108,335 | |
| | | Shares | | | Value | |
| Energy — 5.2% | | | | | | | | |
| Energy — 5.2% | | | | | | | | |
| Bukit Asam Tbk P.T. (Indonesia) | | | 123,800 | | | $ | 23,541 | |
| China Coal Energy Co., Ltd. - H Shares (China) | | | 77,000 | | | | 44,522 | |
| China Petroleum & Chemical Corp - H Shares (China) | | | 174,000 | | | | 81,063 | |
| China Shenhua Energy Co., Ltd. - Class A (China) | | | 9,300 | | | | 32,992 | |
| China Shenhua Energy Co., Ltd. - H Shares (China) | | | 56,500 | | | | 132,243 | |
| Coal India, Ltd. (India) | | | 85,931 | | | | 168,085 | |
| Ecopetrol S.A. ADR (Colombia) | | | 4,900 | | | | 63,161 | |
| Exxaro Resources, Ltd. (South Africa) | | | 10,669 | | | | 102,241 | |
| Gazprom PJSC ADR (Russia) | | | 50,575 | | | | 464,784 | |
| Hindustan Petroleum Corp., Ltd. (India) | | | 45,239 | | | | 177,052 | |
| Indian Oil Corp., Ltd. (India) | | | 58,587 | | | | 87,463 | |
| Lukoil PJSC ADR (Russia) | | | 2,253 | | | | 202,319 | |
| Oil & Natural Gas Corp., Ltd. (India) | | | 135,549 | | | | 258,896 | |
| Petroleo Brasileiro S.A. ADR (Brazil) | | | 21,600 | | | | 237,168 | |
| Petronet LNG, Ltd. (India) | | | 14,712 | | | | 42,626 | |
| Polski Koncern Naftowy ORLEN S.A. (Poland) | | | 1,723 | | | | 31,720 | |
| Polskie Gornictwo Naftowe i Gazownictwo S.A. (Poland) | | | 63,049 | | | | 98,483 | |
| PTT Exploration & Production PCL (Thailand) | | | 17,100 | | | | 60,653 | |
| PTT PCL (Thailand) | | | 117,200 | | | | 133,816 | |
| Reliance Industries, Ltd. 144A (India) (c) | | | 1,297 | | | | 82,638 | |
| Rosneft Oil Co PJSC (Russia) | | | 16,950 | | | | 135,488 | |
| Shaanxi Coal Industry Co., Ltd. - Class A (China) | | | 46,800 | | | | 90,003 | |
| Shanxi Coking Coal Energy Group Co., Ltd - Class A (China) | | | 15,000 | | | | 19,552 | |
| S-Oil Corp. (South Korea) | | | 787 | | | | 56,476 | |
| United Tractors Tbk P.T. (Indonesia) | | | 21,900 | | | | 33,964 | |
| Yanzhou Coal Mining Co., Ltd. - Class A (China) | | | 6,800 | | | | 25,228 | |
| Yanzhou Coal Mining Co., Ltd. - H Shares (China) | | | 76,000 | | | | 151,070 | |
| | | | | | | | 3,037,247 | |
| Financials — 19.3% | | | | | | | | |
| Banks — 14.8% | | | | | | | | |
| Absa Group, Ltd. (South Africa) | | | 35,104 | | | | 335,602 | |
| Agricultural Bank of China, Ltd. - H Shares (China) | | | 304,000 | | | | 104,601 | |
| Alinma Bank (Saudi Arabia) | | | 16,724 | | | | 106,541 | |
| Alpha Services and Holdings S.A. (Greece) (a) | | | 24,070 | | | | 29,490 | |
| Banco Bradesco S.A. (Brazil) | | | 77,484 | | | | 224,996 | |
| Banco do Brasil S.A. (Brazil) | | | 64,000 | | | | 331,163 | |
| Bank Al-Jazira (Saudi Arabia) | | | 76,252 | | | | 391,188 | |
| Bank CIMB Niaga Tbk P.T. (Indonesia) | | | 824,200 | | | | 55,741 | |
| Bank Mandiri Tbk P.T. (Indonesia) | | | 162,200 | | | | 80,004 | |
| Bank of Baroda (India) (a) | | | 146,341 | | | | 160,317 | |
| See Notes to Financial Statements. | |
| Annual Report | December 31, 2021 | | | 49 |
| Segall Bryant & Hamill Emerging Markets Fund | Statement of Investments |
| | December 31, 2021 |
| | | Shares | | | Value | |
| Banks (continued) | | | | | | | | |
| Bank of Beijing Co., Ltd. - Class A (China) | | | 76,300 | | | $ | 53,315 | |
| Bank of China, Ltd. - H Shares (China) | | | 1,690,000 | | | | 608,082 | |
| Bank of Chongqing Co., Ltd. - H Shares (China) | | | 171,500 | | | | 98,139 | |
| Bank of Communications Co., Ltd. - H Shares (China) | | | 349,000 | | | | 211,002 | |
| Bank of India (India) (a) | | | 92,141 | | | | 63,387 | |
| Bank of Jiangsu Co., Ltd. (China) | | | 49,000 | | | | 44,962 | |
| Bank Pembangunan Daerah Jawa Barat Dan Banten Tbk P.T. (Indonesia) | | | 590,200 | | | | 55,223 | |
| Bank Pembangunan Daerah Jawa Timur Tbk P.T. (Indonesia) | | | 595,600 | | | | 31,320 | |
| Bank Saint Petersburg PJSC (Russia) | | | 24,120 | | | | 26,266 | |
| Canara Bank (India) (a) | | | 33,767 | | | | 90,175 | |
| China Banking Corp. (Philippines) | | | 70,100 | | | | 35,528 | |
| China CITIC Bank Corp., Ltd. - H Shares (China) | | | 171,000 | | | | 74,184 | |
| China Construction Bank Corp - H Shares (China) | | | 790,000 | | | | 547,498 | |
| China Development Financial Holding Corp. (Taiwan) | | | 380,520 | | | | 239,726 | |
| China Everbright Bank Co., Ltd. - H Shares (China) | | | 528,000 | | | | 186,989 | |
| Chongqing Rural Commercial Bank Co., Ltd - H Shares (China) | | | 131,000 | | | | 46,563 | |
| Commercial Bank P.S.Q.C. (The) (Qatar) | | | 162,251 | | | | 300,792 | |
| CTBC Financial Holding Co., Ltd. (Taiwan) | | | 148,000 | | | | 138,297 | |
| Dubai Islamic Bank PJSC (United Arab Emirates) | | | 19,882 | | | | 29,059 | |
| East West Banking Corp. (Philippines) (a) | | | 97,818 | | | | 18,305 | |
| Emirates NBD Bank PJSC (United Arab Emirates) | | | 59,939 | | | | 220,944 | |
| Federal Bank, Ltd. (India) | | | 68,996 | | | | 76,561 | |
| Gulf Bank of Kuwait (Kuwait) | | | 72,274 | | | | 66,556 | |
| Hana Financial Group, Inc. (South Korea) | | | 4,703 | | | | 165,896 | |
| Huishang Bank Corp., Ltd. - H Shares (China) (a) | | | 127,000 | | | | 42,533 | |
| IIFL Holdings, Ltd. (India) | | | 17,122 | | | | 64,014 | |
| Indiabulls Housing Finance, Ltd. (India) | | | 28,782 | | | | 83,894 | |
| Indian Bank (India) | | | 41,510 | | | | 77,446 | |
| Industrial & Commercial Bank of China, Ltd - H Shares (China) | | | 442,000 | | | | 249,356 | |
| Intercorp Financial Services, Inc. (Peru) | | | 1,235 | | | | 32,579 | |
| JB Financial Group Co., Ltd. (South Korea) (a) | | | 13,180 | | | | 92,287 | |
| Kasikornbank PCL (Thailand) | | | 19,200 | | | | 81,788 | |
| Kasikornbank PCL - Foreign Shares (Thailand) | | | 24,100 | | | | 102,460 | |
| KB Financial Group, Inc. ADR (South Korea) | | | 4,700 | | | | 216,952 | |
| Kiatnakin Phatra Bank PCL (Thailand) | | | 12,600 | | | | 22,627 | |
| Malaysia Building Society Bhd (Malaysia) | | | 430,500 | | | | 55,281 | |
| | | Shares | | | Value | |
| Banks (continued) | | | | | | | | |
| National Bank of Greece S.A. (Greece) (a) | | | 10,707 | | | $ | 35,712 | |
| National Bank of Kuwait S.A.K.P. (Kuwait) | | | 32,266 | | | | 106,207 | |
| Nedbank Group, Ltd. (South Africa) | | | 10,861 | | | | 119,162 | |
| Powszechna Kasa Oszczednosci Bank Polski S.A. (Poland) (a) | | | 17,024 | | | | 188,598 | |
| RHB Bank Bhd (Malaysia) | | | 68,700 | | | | 88,481 | |
| Riyad Bank (Saudi Arabia) | | | 60,086 | | | | 433,724 | |
| Sberbank of Russia PJSC (Russia) | | | 36,350 | | | | 142,874 | |
| Shinhan Financial Group Co., Ltd. ADR | | | | | | | | |
| (South Korea) | | | 4,700 | | | | 145,277 | |
| Standard Bank Group, Ltd. | | | | | | | | |
| (South Africa) | | | 19,508 | | | | 171,201 | |
| State Bank of India (India) | | | 82,177 | | | | 505,926 | |
| VTB Bank PJSC (Russia) | | | 286,440,000 | | | | 183,741 | |
| Woori Financial Group, Inc. (South Korea) | | | 6,240 | | | | 66,443 | |
| | | | | | | | 8,556,975 | |
| Diversified Financials — 2.8% | | | | | | | | |
| Adira Dinamika Multi Finance Tbk P.T. (Indonesia) | | | 123,700 | | | | 66,740 | |
| Bajaj Holdings & Investment, Ltd. (India) | | | 790 | | | | 57,472 | |
| Bank of Greece (Greece) | | | 1,550 | | | | 29,814 | |
| China Cinda Asset Management Co., Ltd. (China) | | | 296,000 | | | | 53,921 | |
| China Galaxy Securities Co., Ltd. - H Shares (China) | | | 52,000 | | | | 29,892 | |
| Concentradora Hipotecaria SAPI de C.V. (Mexico) | | | 61,600 | | | | 61,986 | |
| Corporacion Financiera Colombiana S.A. (Colombia) (a) | | | 14,671 | | | | 103,094 | |
| Far East Horizon, Ltd. (China) | | | 34,000 | | | | 30,177 | |
| Fubon Financial Holdings Co., Ltd. (Taiwan) | | | 151,370 | | | | 415,598 | |
| Gentera S.A.B de C.V. (Mexico) (a) | | | 54,100 | | | | 34,746 | |
| Haitong Securities Co., Ltd. - H Shares (China) | | | 34,000 | | | | 30,147 | |
| Korea Investment Holdings Co., Ltd. (South Korea) (a) | | | 342 | | | | 23,135 | |
| Power Finance Corp., Ltd. (India) | | | 86,444 | | | | 138,538 | |
| REC, Ltd. (India) | | | 128,352 | | | | 229,999 | |
| Repco Home Finance, Ltd. (India) | | | 18,085 | | | | 64,857 | |
| Shinyoung Securities Co., Ltd. (South Korea) | | | 795 | | | | 40,034 | |
| Tata Investment Corp., Ltd. (India) | | | 4,663 | | | | 84,759 | |
| Yuanta Financial Holding Co., Ltd. (Taiwan) | | | 177,000 | | | | 161,270 | |
| | | | | | | | 1,656,179 | |
| Insurance — 1.7% | | | | | | | | |
| Cathay Financial Holding Co., Ltd. (Taiwan) | | | 172,000 | | | | 386,513 | |
| China Reinsurance Group Corp - H Shares (China) (d) | | | 591,000 | | | | 56,852 | |
| See Notes to Financial Statements. | |
| 50 | | | www.sbhfunds.com |
| Segall Bryant & Hamill Emerging Markets Fund | Statement of Investments |
| | December 31, 2021 |
| | | Shares | | | Value | |
| Insurance (continued) | | | | | | | | |
| New China Life Insurance Co., Ltd. - H Shares (China) | | | 67,200 | | | $ | 179,824 | |
| Old Mutual, Ltd. (South Africa) | | | 66,546 | | | | 54,648 | |
| People’s Insurance Co Group of China (The) - H Shares (China) | | | 570,000 | | | | 172,631 | |
| PICC Property & Casualty Co., Ltd. - H Shares (China) | | | 96,000 | | | | 78,484 | |
| Powszechny Zaklad Ubezpieczen S.A. (Poland) | | | 5,301 | | | | 46,235 | |
| | | | | | | | 975,187 | |
| Health Care — 3.9% | | | | | | | | |
| Health Care Equipment & Services — 1.7% | | | | | | | | |
| Bangkok Chain Hospital PCL (Thailand) | | | 204,300 | | | | 123,680 | |
| Kossan Rubber Industries Bhd (Malaysia) | | | 267,400 | | | | 123,229 | |
| Shanghai Pharmaceuticals Holding Co | | | | | | | | |
| - H Shares (China) | | | 143,100 | | | | 271,573 | |
| Sinopharm Group Co., Ltd. - H Shares (China) | | | 137,600 | | | | 299,518 | |
| TaiDoc Technology Corp. (Taiwan) | | | 10,000 | | | | 65,436 | |
| Value Added Technology Co., Ltd. (South Korea) | | | 4,112 | | | | 121,950 | |
| | | | | | | | 1,005,386 | |
| Pharmaceuticals, Biotechnology & Life Sciences — 2.2% | | | | | | | | |
| China Medical System Holdings, Ltd. (China) | | | 182,000 | | | | 304,272 | |
| China Shineway Pharmaceutical Group, Ltd. (China) | | | 256,000 | | | | 226,689 | |
| Consun Pharmaceutical Group, Ltd. (China) | | | 503,538 | | | | 284,172 | |
| Dawnrays Pharmaceutical Holdings, Ltd (China) | | | 725,392 | | | | 155,377 | |
| Marksans Pharma, Ltd. (India) | | | 42,000 | | | | 33,874 | |
| Shandong Xinhua Pharmaceutical Co., Ltd - H Shares (China) | | | 188,000 | | | | 112,204 | |
| Sun Pharmaceutical Industries, Ltd. (India) | | | 3,608 | | | | 40,903 | |
| Unichem Laboratories, Ltd. (India) | | | 30,216 | | | | 101,022 | |
| | | | | | | | 1,258,513 | |
| Industrials — 5.3% | | | | | | | | |
| Capital Goods — 2.4% | | | | | | | | |
| ALFA S A B de C V - Class A (Mexico) | | | 40,700 | | | | 29,809 | |
| Apar Industries, Ltd. (India) | | | 3,252 | | | | 33,940 | |
| Beijing Urban Construction Design & Development Group Co., Ltd. - H Shares (China) | | | 81,000 | | | | 21,405 | |
| China Communications Services Corp., Ltd - H Shares (China) | | | 62,000 | | | | 30,220 | |
| China International Marine Containers Group Co., Ltd. (China) | | | 17,500 | | | | 31,445 | |
| China Railway Group, Ltd. - Class A (China) | | | 57,200 | | | | 52,147 | |
| China Railway Group, Ltd. - H Shares (China) | | | 112,000 | | | | 59,273 | |
| CITIC, Ltd. (China) | | | 189,000 | | | | 187,009 | |
| DMCI Holdings, Inc. (Philippines) | | | 324,700 | | | | 48,823 | |
| | | Shares | | | Value | |
| Capital Goods (continued) | | | | | | | | |
| FSP Technology, Inc. (Taiwan) | | | 16,000 | | | $ | 26,483 | |
| Graphite India, Ltd. (India) | | | 6,990 | | | | 47,629 | |
| Halla Corp. (South Korea) (a) | | | 5,962 | | | | 26,988 | |
| Hong Leong Industries Bhd (Malaysia) | | | 12,860 | | | | 28,308 | |
| Hubei Xingfa Chemicals Group Co., Ltd. (China) | | | 5,800 | | | | 34,622 | |
| Industries Qatar Q.S.C. (Qatar) | | | 38,321 | | | | 163,052 | |
| Iochpe-Maxion S.A. (Brazil) | | | 10,000 | | | | 27,531 | |
| Kolon Global Corp. (South Korea) | | | 2,240 | | | | 42,472 | |
| LG Corp. (South Korea) (a) | | | 2,318 | | | | 157,536 | |
| LX International Corp. (South Korea) (a) | | | 1,331 | | | | 29,499 | |
| Metallurgical Corp. of China, Ltd. - H Shares (China) | | | 118,000 | | | | 30,150 | |
| Posco International Corp. (South Korea) (a) | | | 1,405 | | | | 26,443 | |
| Raubex Group, Ltd. (South Africa) | | | 12,841 | | | | 32,038 | |
| Seohee Construction Co., Ltd. (South Korea) | | | 19,685 | | | | 27,386 | |
| Sime Darby Bhd (Malaysia) | | | 87,800 | | | | 48,927 | |
| Sinopec Engineering Group Co., Ltd. - H Shares (China) | | | 50,000 | | | | 24,681 | |
| Thoresen Thai Agencies PCL (Thailand) | | | 86,400 | | | | 24,854 | |
| Zhuzhou Kibing Group Co., Ltd. - Class A (China) | | | 30,500 | | | | 82,269 | |
| | | | | | | | 1,374,939 | |
| Commercial & Professional Services — 0.2% | | | | | | | | |
| China Everbright International, Ltd. (China) | | | 80,000 | | | | 64,265 | |
| KRUK S.A. (Poland) | | | 388 | | | | 31,452 | |
| Tianjin Capital Environmental Protection Group Co., Ltd. (China) | | | 72,000 | | | | 39,617 | |
| | | | | | | | 135,334 | |
| Transportation — 2.7% | | | | | | | | |
| Anhui Expressway Co., Ltd. - H Shares (China) | | | 58,000 | | | | 46,882 | |
| Autohellas S.A. (Greece) | | | 3,667 | | | | 37,730 | |
| Cia Sud Americana de Vapores S.A. (Chile) | | | 627,603 | | | | 53,826 | |
| COSCO SHIPPING Holdings Co., Ltd. (China) - Class A (a) | | | 19,997 | | | | 59,057 | |
| COSCO SHIPPING Holdings Co., Ltd. (China) - H Shares (a) | | | 85,700 | | | | 166,190 | |
| COSCO SHIPPING Ports, Ltd. (China) | | | 68,000 | | | | 59,108 | |
| Evergreen Marine Corp. Taiwan, Ltd. (Taiwan) | | | 58,000 | | | | 296,380 | |
| Gateway Distripark, Ltd. (India) | | | 11,466 | | | | 42,761 | |
| HMM Co., Ltd. (South Korea) (a) | | | 6,201 | | | | 140,053 | |
| Jiangsu Expressway Co., Ltd. - H Shares (China) | | | 30,000 | | | | 30,729 | |
| Pan Ocean Co., Ltd. (South Korea) (a) | | | 5,723 | | | | 25,989 | |
| Regional Container Lines PCL (Thailand) | | | 30,100 | | | | 44,569 | |
| Shanghai International Port Group Co., Ltd. (China) | | | 167,600 | | | | 144,594 | |
| Shenzhen Expressway Co., Ltd. - H Shares (China) | | | 28,000 | | | | 27,111 | |
| See Notes to Financial Statements. | |
| Annual Report | December 31, 2021 | | | 51 |
| Segall Bryant & Hamill Emerging Markets Fund | Statement of Investments |
| | December 31, 2021 |
| | | Shares | | | Value | |
| Transportation (continued) | | | | | | | | |
| Sinotrans, Ltd. - H Shares (China) | | | 66,000 | | | $ | 21,170 | |
| Tianjin Port Development Holdings, Ltd. (China) | | | 320,000 | | | | 25,456 | |
| Transport Corp. of India, Ltd. (India) | | | 5,602 | | | | 56,105 | |
| VRL Logistics, Ltd. (India) | | | 6,645 | | | | 38,054 | |
| Yang Ming Marine Transport Corp. (Taiwan) (a) | | | 47,000 | | | | 203,912 | |
| Zhejiang Expressway Co., Ltd. - H Shares (China) | | | 32,000 | | | | 28,525 | |
| | | | | | | | 1,548,201 | |
| Information Technology — 24.6% | | | | | | | | |
| Semiconductors & Semiconductor Equipment — 9.8% | | | | | | | | |
| ASE Industrial Holding Co., Ltd. ADR (Taiwan) | | | 31,400 | | | | 245,234 | |
| Chipbond Technology Corp. (Taiwan) | | | 18,000 | | | | 43,243 | |
| ChipMOS Technologies, Inc. (Taiwan) | | | 30,000 | | | | 52,417 | |
| Daqo New Energy Corp. ADR (China) (a) | | | 2,500 | | | | 100,800 | |
| Fitipower Integrated Technology, Inc. (Taiwan) | | | 4,000 | | | | 40,543 | |
| FocalTech Systems Co., Ltd. (Taiwan) | | | 4,000 | | | | 24,632 | |
| Global Mixed-Mode Technology, Inc. (Taiwan) | | | 3,000 | | | | 28,624 | |
| Greatek Electronics, Inc. (Taiwan) | | | 12,000 | | | | 33,736 | |
| King Yuan Electronics Co., Ltd. (Taiwan) | | | 19,000 | | | | 30,610 | |
| LX Semicon Co., Ltd. (South Korea) (a) | | | 2,376 | | | | 333,101 | |
| Macronix International Co., Ltd. (Taiwan) | | | 20,000 | | | | 30,354 | |
| Novatek Microelectronics Corp. (Taiwan) | | | 12,000 | | | | 232,432 | |
| Powertech Technology, Inc. (Taiwan) | | | 41,000 | | | | 144,121 | |
| Sigurd Microelectronics Corp. (Taiwan) | | | 15,000 | | | | 31,715 | |
| Sino-American Silicon Products, Inc. (Taiwan) | | | 11,000 | | | | 93,450 | |
| Sitronix Technology Corp. (Taiwan) | | | 3,000 | | | | 34,484 | |
| SK Hynix, Inc. (South Korea) | | | 2,797 | | | | 306,727 | |
| Taiwan Semiconductor Manufacturing Co., Ltd. ADR (Taiwan) | | | 28,300 | | | | 3,404,773 | |
| United Microelectronics Corp. (Taiwan) | | | 166,000 | | | | 387,919 | |
| Windbond Electronics Corp. (Taiwan) | | | 53,000 | | | | 64,733 | |
| | | | | | | | 5,663,648 | |
| Software & Services — 4.8% | | | | | | | | |
| Alibaba Group Holding, Ltd. ADR (Hong Kong) (a) | | | 9,000 | | | | 1,069,110 | |
| eClerx Services, Ltd. (India) | | | 6,905 | | | | 242,090 | |
| Hinduja Global Solutions, Ltd. (India) | | | 7,565 | | | | 335,658 | |
| NetEase, Inc. ADR (Hong Kong) | | | 4,600 | | | | 468,188 | |
| NIIT, Ltd. (India) | | | 25,858 | | | | 156,049 | |
| Oracle Financial Services Software, Ltd. (India) | | | 3,896 | | | | 206,530 | |
| Tech Mahindra, Ltd. (India) | | | 6,058 | | | | 145,036 | |
| Weibo Corp. ADR (China) (a) | | | 4,500 | | | | 139,410 | |
| | | | | | | | 2,762,071 | |
| Technology Hardware & Equipment — 10.0% | | | | | | | | |
| Acer, Inc. (Taiwan) | | | 49,000 | | | | 53,668 | |
| ASUSTek Computer, Inc. (Taiwan) | | | 14,000 | | | | 189,577 | |
| | | Shares | | | Value | |
| Technology Hardware & Equipment (continued) | | | | | | | | |
| AU Optronics Corp. (Taiwan) | | | 266,000 | | | $ | 219,337 | |
| BOE Technology Group Co., Ltd. - Class A (China) | | | 365,100 | | | | 290,168 | |
| Cheng Uei Precision Industry Co., Ltd. (Taiwan) | | | 35,000 | | | | 49,848 | |
| China Railway Signal & Communication Corp., Ltd. - H Shares (China) | | | 272,000 | | | | 99,428 | |
| Everlight Electronics Co., Ltd. (Taiwan) | | | 38,000 | | | | 72,003 | |
| Gigabyte Technology Co., Ltd. (Taiwan) | | | 10,000 | | | | 55,970 | |
| Hon Hai Precision Industry Co., Ltd. (Taiwan) | | | 40,000 | | | | 149,627 | |
| Innodisk Corp. (Taiwan) | | | 4,000 | | | | 29,395 | |
| Innolux Corp. (Taiwan) | | | 282,000 | | | | 198,773 | |
| Intops Co., Ltd. (South Korea) | | | 6,764 | | | | 182,857 | |
| Kingboard Holdings, Ltd. (China) | | | 43,500 | | | | 211,962 | |
| Kingboard Laminates Holdings, Ltd. (China) | | | 67,000 | | | | 113,970 | |
| Legend Holdings Corp - H Shares (China) | | | 48,500 | | | | 71,715 | |
| Lenovo Group, Ltd. (China) | | | 382,000 | | | | 439,083 | |
| LG Innotek Co., Ltd. (South Korea) (a) | | | 1,539 | | | | 469,774 | |
| Lite-On Technology Corp. (Taiwan) | | | 42,000 | | | | 96,471 | |
| Micro-Star International Co., Ltd. (Taiwan) | | | 26,000 | | | | 150,211 | |
| PAX Global Technology, Ltd. (China) | | | 268,000 | | | | 189,747 | |
| Primax Electronics, Ltd. (Taiwan) | | | 18,000 | | | | 36,710 | |
| Redington India, Ltd. (India) | | | 98,107 | | | | 190,183 | |
| Samsung Electronics Co., Ltd. (South Korea) | | | 28,005 | | | | 1,836,385 | |
| SAMT Co., Ltd. (South Korea) (a) | | | 10,832 | | | | 40,374 | |
| Simplo Technology Co., Ltd. (Taiwan) | | | 4,000 | | | | 47,324 | |
| Taiwan PCB Techvest Co., Ltd. (Taiwan) | | | 32,000 | �� | | | 55,986 | |
| TXC Corp. (Taiwan) | | | 10,000 | | | | 37,937 | |
| Wah Lee Industrial Corp. (Taiwan) | | | 10,000 | | | | 38,525 | |
| Yageo Corp. (Taiwan) (a) | | | 10,000 | | | | 172,460 | |
| | | | | | | | 5,789,468 | |
| Materials — 8.2% | | | | | | | | |
| Materials — 8.2% | | | | | | | | |
| Anglo American Platinum, Ltd. (South Africa) | | | 821 | | | | 93,540 | |
| ArcelorMittal South Africa, Ltd. (South Africa) (a) | | | 62,809 | | | | 35,063 | |
| Asia Polymer Corp. (Taiwan) | | | 27,540 | | | | 36,317 | |
| Baoshan Iron & Steel Co., Ltd. - Class A (China) | | | 94,000 | | | | 106,264 | |
| Braskem S.A. ADR (Brazil) | | | 4,800 | | | | 101,232 | |
| Chambal Fertilisers and Chemicals, Ltd. (India) | | | 9,449 | | | | 49,897 | |
| China Hongqiao Group, Ltd. (China) | | | 38,000 | | | | 40,169 | |
| China Lumena New Materials Corp. (China) (a) (b) | | | 1,700 | | | | 0 | |
| China Metal Recycling Holdings, Ltd. (China) (a) (b) | | | 6,000 | | | | 0 | |
| China National Building Material Co., Ltd - H Shares (China) | | | 50,000 | | | | 61,395 | |
| See Notes to Financial Statements. | |
| 52 | | | www.sbhfunds.com |
| Segall Bryant & Hamill Emerging Markets Fund | Statement of Investments |
| | December 31, 2021 |
| | | Shares | | | Value | |
| Materials (continued) | | | | | | | | |
| China Sanjiang Fine Chemicals Co., Ltd. (China) | | | 64,000 | | | $ | 20,951 | |
| China Steel Corp. (Taiwan) | | | 130,000 | | | | 165,470 | |
| Eregli Demir ve Celik Fabrikalari TAS (Turkey) | | | 40,505 | | | | 85,946 | |
| Formosa Plastics Corp. (Taiwan) | | | 17,000 | | | | 63,645 | |
| Grand Pacific Petrochemical Corp. (Taiwan) | | | 32,000 | | | | 33,047 | |
| Grupo Mexico S.A.B de C.V. - Series B (Mexico) | | | 36,100 | | | | 157,074 | |
| Gujarat Narmada Valley Fertilizers & Chemicals, Ltd. (India) | | | 7,896 | | | | 46,503 | |
| Hanil Holdings Co., Ltd. (South Korea) | | | 2,167 | | | | 24,534 | |
| Hengli Petrochemical Co., Ltd. - Class A (China) | | | 12,000 | | | | 43,408 | |
| Hindalco Industries, Ltd. (India) | | | 16,142 | | | | 102,418 | |
| Hindustan Zinc, Ltd. (India) | | | 18,637 | | | | 78,950 | |
| Hsing TA Cement Co. (Taiwan) | | | 31,000 | | | | 23,247 | |
| Huafon Chemical Co., Ltd. (China) | | | 20,286 | | | | 33,341 | |
| Hunan Valin Steel Co., Ltd. - Class A (China) | | | 42,600 | | | | 34,340 | |
| Hyundai Steel Co., Ltd. (South Korea) (a) | | | 2,917 | | | | 100,301 | |
| Indorama Ventures PCL (Thailand) | | | 66,400 | | | | 86,372 | |
| Jiangxi Copper Co., Ltd. - H Shares (China) | | | 17,000 | | | | 27,315 | |
| Jindal Steel & Power, Ltd. (India) (a) | | | 6,578 | | | | 33,120 | |
| JSW Steel, Ltd. (India) | | | 15,131 | | | | 132,664 | |
| Kumho Petrochemical Co., Ltd. (South Korea) (a) | | | 590 | | | | 82,121 | |
| LOTTE Chemical Corp. (South Korea) (a) | | | 254 | | | | 46,263 | |
| LOTTE Fine Chemical Co., Ltd. (South Korea) (a) | | | 423 | | | | 26,601 | |
| Luxi Chemical Group Co., Ltd. (China) | | | 12,600 | | | | 30,298 | |
| Magnitogorsk Iron & Steel Works PJSC (Russia) | | | 194,390 | | | | 179,766 | |
| Nan Ya Plastics Corp. (Taiwan) | | | 24,000 | | | | 73,751 | |
| Nine Dragons Paper Holdings, Ltd. (China) (a) | | | 30,000 | | | | 32,222 | |
| NMDC, Ltd. (India) | | | 48,687 | | | | 86,757 | |
| Northam Platinum Holdings, Ltd. (South Africa) (a) | | | 3,918 | | | | 51,455 | |
| Novolipetsk Steel PJSC (Russia) (d) | | | 2,870 | | | | 83,277 | |
| Orbia Advance Corp. S.A.B de C.V. (Mexico) | | | 30,600 | | | | 77,927 | |
| Petronas Chemicals Group Bhd (Malaysia) | | | 51,600 | | | | 110,475 | |
| POSCO ADR (South Korea) | | | 3,400 | | | | 198,186 | |
| PPC, Ltd. (South Africa) (a) | | | 80,869 | | | | 25,601 | |
| PTT Global Chemical PCL (Thailand) | | | 63,200 | | | | 111,761 | |
| Rongsheng Petrochemical Co., Ltd. (China) | | | 25,200 | | | | 72,108 | |
| Sahara International Petrochemical Co SJSC (Saudi Arabia) | | | 26,565 | | | | 296,069 | |
| Sasol, Ltd. (South Africa) (a) | | | 13,245 | | | | 216,621 | |
| Satellite Chemical Co., Ltd. (China) | | | 7,800 | | | | 49,200 | |
| | | Shares | | | Value | |
| Materials (continued) | | | | | | | | |
| Saudi Industrial Investment Group (Saudi Arabia) | | | 29,055 | | | $ | 240,651 | |
| Shandong Hualu Hengsheng Chemical Co., Ltd. (China) | | | 10,200 | | | | 50,213 | |
| Shanxi Taigang Stainless Steel Co., Ltd. (China) | | | 30,500 | | | | 33,935 | |
| Shinkong Synthetic Fibers Corp. (Taiwan) | | | 49,000 | | | | 35,640 | |
| Steel Authority of India, Ltd. (India) | | | 17,595 | | | | 25,186 | |
| Tata Steel, Ltd. (India) | | | 5,522 | | | | 81,928 | |
| Tharisa PLC (South Africa) | | | 15,847 | | | | 26,822 | |
| UPL, Ltd. (India) | | | 3,878 | | | | 38,737 | |
| USI Corp. (Taiwan) | | | 24,000 | | | | 27,263 | |
| Vale S.A. ADR (Brazil) | | | 18,474 | | | | 259,006 | |
| Vedanta, Ltd. (India) | | | 28,782 | | | | 131,341 | |
| West China Cement, Ltd. (China) | | | 166,000 | | | | 29,601 | |
| Xinjiang Zhongtai Chemical Co., Ltd. (China) | | | 22,700 | | | | 34,127 | |
| Yunnan Aluminium Co., Ltd. (China) (a) | | | 22,400 | | | | 39,589 | |
| Yunnan Tin Co., Ltd. (China) (a) | | | 12,100 | | | | 37,410 | |
| | | | | | | | 4,758,431 | |
| Real Estate — 1.9% | | | | | | | | |
| Real Estate — 1.9% | | | | | | | | |
| Agile Group Holdings, Ltd. (China) | | | 68,000 | | | | 36,917 | |
| A-Living Smart City Services Co., Ltd. (China) | | | 17,000 | | | | 29,046 | |
| AP Thailand PCL (Thailand) | | | 91,500 | | | | 26,314 | |
| China Overseas Grand Oceans Group, Ltd (China) | | | 80,031 | | | | 40,664 | |
| China SCE Group Holdings, Ltd. (China) | | | 200,000 | | | | 48,529 | |
| Dipula Income Fund, Ltd. (South Africa) | | | 53,971 | | | | 30,361 | |
| Emaar Properties PJSC (United Arab Emirates) | | | 146,195 | | | | 194,278 | |
| Filinvest Land, Inc. (Philippines) | | | 1,361,000 | | | | 29,183 | |
| Hopefluent Group Holdings, Ltd. (China) | | | 60,000 | | | | 10,399 | |
| Hung Ching Development & Construction Co., Ltd. (Taiwan) | | | 24,000 | | | | 26,965 | |
| Kingdom Development Co., Ltd. (Taiwan) | | | 22,000 | | | | 29,931 | |
| Korea Real Estate Investment & Trust Co., Ltd. (South Korea) (a) | | | 14,920 | | | | 32,629 | |
| Logan Group Co., Ltd. (China) | | | 51,000 | | | | 38,986 | |
| Matrix Concepts Holdings Bhd (Malaysia) | | | 99,375 | | | | 52,475 | |
| OSK Holdings Bhd (Malaysia) | | | 241,800 | | | | 50,492 | |
| Powerlong Real Estate Holdings, Ltd. (China) | | | 93,000 | | | | 48,698 | |
| Seazen Group, Ltd. (China) (a) | | | 380,000 | | | | 257,054 | |
| Seazen Holdings Co., Ltd. - Class A (China) | | | 11,200 | | | | 51,399 | |
| Shanghai Lujiazui Finance & Trade Zone Development Co., Ltd. - Class B (China) | | | 33,400 | | | | 30,444 | |
| Sunac China Holdings, Ltd. (China) | | | 31,000 | | | | 46,901 | |
| | | | | | | | 1,111,665 | |
| See Notes to Financial Statements. | |
| Annual Report | December 31, 2021 | | | 53 |
| Segall Bryant & Hamill Emerging Markets Fund | Statement of Investments |
| | December 31, 2021 |
| | | Shares | | | Value | |
| Utilities — 2.5% | | | | | | | | |
| Utilities — 2.5% | | | | | | | | |
| Aboitiz Power Corp. (Philippines) | | | 173,100 | | | $ | 100,216 | |
| Beijing Enterprises Holdings, Ltd. (China) | | | 32,000 | | | | 110,419 | |
| Canvest Environmental Protection Group Co., Ltd. (China) | | | 58,000 | | | | 30,670 | |
| CESC, Ltd. (India) | | | 31,840 | | | | 37,330 | |
| China Everbright Water, Ltd. (China) | | | 143,700 | | | | 33,563 | |
| China Tian Lun Gas Holdings, Ltd. | | | | | | | | |
| (China) | | | 28,000 | | | | 30,239 | |
| China Water Affairs Group, Ltd. (China) | | | 38,000 | | | | 54,502 | |
| Cia de Saneamento de Minas Gerais S.A. (Brazil) | | | 12,800 | | | | 29,179 | |
| Colbun S.A. (Chile) | | | 468,176 | | | | 38,081 | |
| Datang International Power Generation Co., Ltd. - H Shares (China) | | | 180,000 | | | | 40,662 | |
| Enea S.A. (Poland) (a) | | | 11,950 | | | | 25,238 | |
| GAIL India, Ltd. (India) (d) | | | 5,275 | | | | 57,747 | |
| IDGC of Centre and Volga Region PJSC (Russia) | | | 15,380,000 | | | | 47,274 | |
| Korea Gas Corp. (South Korea) (a) | | | 3,139 | | | | 103,068 | |
| Kunlun Energy Co., Ltd. (China) | | | 152,000 | | | | 142,644 | |
| NTPC, Ltd. (India) | | | 109,398 | | | | 182,119 | |
| OGK-2 PJSC (Russia) | | | 5,740,000 | | | | 48,534 | |
| Power Grid Corp. of India, Ltd. (India) | | | 61,742 | | | | 169,052 | |
| Saudi Electricity Co. (Saudi Arabia) | | | 12,340 | | | | 78,707 | |
| Seoul City Gas Co., Ltd. (South Korea) (a) | | | 334 | | | | 46,967 | |
| Yunnan Water Investment Co., Ltd. - H Shares (China) | | | 184,877 | | | | 21,557 | |
| | | | | | | | 1,427,768 | |
| Total Common Stocks (Cost $50,079,631) | | | | | | | 56,628,132 | |
| | | | | | | | | |
| PREFERRED STOCKS — 1.7% | | | | | | | | |
| Energy — 1.0% | | | | | | | | |
| Energy — 1.0% | | | | | | | | |
| Petroleo Brasileiro S.A. ADR (Brazil) | | | 27,000 | | | | 272,970 | |
| Surgutneftegas PJSC (Russia) | | | 541,500 | | | | 279,024 | |
| | | | | | | | 551,994 | |
| Financials — 0.0% (e) | | | | | | | | |
| Banks — 0.0% (e) | | | | | | | | |
| China Development Financial Holding Corp. (Taiwan) (a) | | | 83,512 | | | | 28,874 | |
| | | | | | | | | |
| Information Technology — 0.5% | | | | | | | | |
| Technology Hardware & Equipment — 0.5% | | | | | | | | |
| Samsung Electronics Co., Ltd. (South Korea) | | | 4,582 | | | | 273,514 | |
| | | | | | | | | |
| Materials — 0.2% | | | | | | | | |
| Materials — 0.2% | | | | | | | | |
| Gerdau S.A. (Brazil) | | | 27,100 | | | | 132,499 | |
| | | | | | | | | |
| Total Preferred Stocks (Cost $812,663) | | | | | | | 986,881 | |
| | | Shares | | | Value | |
| RIGHTS — 0.0% (e) | | | | | | | | |
| Real Estate — 0.0% (e) | | | | | | | | |
| Real Estate — 0.0% (e) | | | | | | | | |
| Seazen Group, Ltd. (China) (a) (Cost $0) | | | 18,095 | | | $ | 0 | |
| | | | | | | | | |
| WARRANTS — 0.0% (e) | | | | | | | | |
| Real Estate — 0.0% (e) | | | | | | | | |
| Real Estate — 0.0% (e) | | | | | | | | |
| Noble Development PCL (Thailand) (a) (Cost $0) | | | 14,775 | | | | 432 | |
| | | | | | | | | |
| Investments at Value — 99.5% | | | | | | | | |
| (Cost $50,892,294) | | | | | | $ | 57,615,445 | |
| | | | | | | | | |
| Other Assets in Excess of Liabilities — 0.5% | | | | | | | 267,679 | |
| | | | | | | | | |
| Net Assets — 100.0% | | | | | | $ | 57,883,124 | |
| (a) | Non-income producing security. |
| (b) | Level 3 securities fair value under procedures established by the Board of Trustees, represents 0.7% of net assets. The total value of these securities is $398,320. |
| (c) | Security was purchased in a transaction exempt from registration in compliance with Rule 144A of the Securities Act of 1933. This security may be resold in transactions exempt from registration, normally to qualified institutional buyers. The total value of these securities is $82,638, which represents 0.1% of net assets as of December 31, 2021. |
| (d) | Security is considered a restricted security however such restriction has not resulted in an illiquid classification. The total value of these securities is $197,876, which represents 0.3% of net assets as of December 31, 2021. |
| (e) | Percentage rounds to less than 0.1%. |
The Fund’s sector and industry classifications presented herein refer to any one or more of the industry sub-classifications used by one or more widely recognized market indexes or ratings group indexes, and/ or as defined by Fund management. For Fund compliance purposes, sector and industry classifications are based on the sector and industry categorization methodology of the Adviser to the Funds. This definition may not apply for purposes of this report, which may combine industry sub-classifications for reporting ease. Industries are shown as a percentage of net assets.
| See Notes to Financial Statements. | |
| 54 | | | www.sbhfunds.com |
| Segall Bryant & Hamill Emerging Markets Fund | Statement of Investments |
| | December 31, 2021 |
| | | | | | % of Net | |
| Country | | Value | | | Assets | |
| China | | $ | 18,165,815 | | | | 31.4 | % |
| Taiwan | | | 9,281,448 | | | | 16.0 | % |
| India | | | 7,263,561 | | | | 12.5 | % |
| South Korea | | | 7,262,957 | | | | 12.5 | % |
| Brazil | | | 2,086,916 | | | | 3.6 | % |
| Russia | | | 1,841,958 | | | | 3.2 | % |
| Saudi Arabia | | | 1,693,808 | | | | 2.9 | % |
| South Africa | | | 1,668,918 | | | | 2.9 | % |
| Hong Kong | | | 1,537,298 | | | | 2.7 | % |
| Mexico | | | 1,044,473 | | | | 1.8 | % |
| Indonesia | | | 1,012,998 | | | | 1.8 | % |
| Thailand | | | 913,752 | | | | 1.6 | % |
| Malaysia | | | 772,055 | | | | 1.3 | % |
| United Arab Emirates | | | 535,412 | | | | 0.9 | % |
| Philippines | | | 502,702 | | | | 0.9 | % |
| Qatar | | | 463,844 | | | | 0.8 | % |
| Poland | | | 421,726 | | | | 0.7 | % |
| Turkey | | | 247,723 | | | | 0.4 | % |
| Kuwait | | | 228,737 | | | | 0.4 | % |
| Chile | | | 225,612 | | | | 0.4 | % |
| Colombia | | | 166,255 | | | | 0.3 | % |
| Greece | | | 132,746 | | | | 0.2 | % |
| Egypt | | | 112,152 | | | | 0.2 | % |
| Peru | | | 32,579 | | | | 0.1 | % |
| Total Investments | | $ | 57,615,445 | | | | 99.5 | % |
| Other Assets in Excess of Liabilities | | | 267,679 | | | | 0.5 | % |
| Net Assets | | $ | 57,883,124 | | | | 100.0 | % |
| See Notes to Financial Statements. | |
| Annual Report | December 31, 2021 | | | 55 |
| Segall Bryant & Hamill International Small Cap Fund | Statement of Investments |
| | December 31, 2021 |
| | | Shares | | | Value | |
| COMMON STOCKS — 99.0% | | | | | | | | |
| Communication Services — 4.5% | | | | | | | | |
| Media — 0.3% | | | | | | | | |
| Digital Holdings, Inc. (Japan) | | | 42,561 | | | $ | 487,376 | |
| | | | | | | | | |
| Media & Entertainment — 3.1% | | | | | | | | |
| ITV PLC (United Kingdom) (a) | | | 850,803 | | | | 1,278,119 | |
| Mediaset Espana Comunicacion S.A. (Spain) (a) | | | 123,219 | | | | 578,367 | |
| Nine Entertainment Co. Holdings, Ltd. (Australia) | | | 135,485 | | | | 285,940 | |
| Nippon Television Holdings, Inc. (Japan) | | | 63,000 | | | | 638,868 | |
| Perion Network, Ltd. (Israel) (a) | | | 27,419 | | | | 666,161 | |
| ProSiebenSat.1 Media S.E. (Germany) | | | 4,975 | | | | 79,010 | |
| Television Francaise 1 (France) | | | 139,215 | | | | 1,382,903 | |
| | | | | | | | 4,909,368 | |
| Telecommunication Services — 1.1% | | | | | | | | |
| Airtel Africa PLC (United Kingdom) | | | 216,482 | | | | 389,640 | |
| Millicom International Cellular S.A. (Sweden) (a) | | | 30,611 | | | | 869,231 | |
| SpeedCast International, Ltd. (Australia) (a) (b) | | | 55,059 | | | | 0 | |
| Telekom Austria A.G. (Austria) (a) | | | 43,321 | | | | 375,718 | |
| | | | | | | | 1,634,589 | |
| Consumer Discretionary — 12.1% | | | | | | | | |
| Automobiles & Components — 3.2% | | | | | | | | |
| CIE Automotive S.A. (Spain) | | | 7,750 | | | | 239,451 | |
| Eagle Industry Co., Ltd. (Japan) | | | 38,800 | | | | 372,102 | |
| Exedy Corp (Japan) | | | 15,400 | | | | 222,816 | |
| Gestamp Automocion S.A. (Spain) (a) | | | 23,956 | | | | 120,761 | |
| NGK Spark Plug Co., Ltd. (Japan) | | | 19,500 | | | | 339,342 | |
| Pacific Industrial Co., Ltd. (Japan) | | | 27,370 | | | | 289,199 | |
| Pirelli & C S.p.A. (Italy) | | | 34,447 | | | | 238,839 | |
| SAF-Holland S.E. (Germany) (a) | | | 76,676 | | | | 1,073,429 | |
| Sumitomo Rubber Industries, Ltd. (Japan) | | | 43,300 | | | | 441,411 | |
| Toyo Tire Corp (Japan) | | | 10,000 | | | | 156,023 | |
| Toyota Boshoku Corp (Japan) | | | 45,400 | | | | 890,248 | |
| TPR Co., Ltd. (Japan) | | | 6,800 | | | | 84,219 | |
| Yokohama Rubber Co., Ltd. (Japan) | | | 30,100 | | | | 482,480 | |
| | | | | | | | 4,950,320 | |
| Consumer Durables & Apparel — 4.5% | | | | | | | | |
| Bellway PLC (United Kingdom) | | | 26,498 | | | | 1,203,242 | |
| Cleanup Corp (Japan) | | | 15,900 | | | | 75,521 | |
| Neinor Homes S.A. (Spain) (a) | | | 25,310 | | | | 303,628 | |
| Nexity S.A. (France) | | | 21,484 | | | | 1,011,406 | |
| Nikon Corp (Japan) | | | 28,000 | | | | 301,446 | |
| Nobia A.B. (Sweden) | | | 32,544 | | | | 195,760 | |
| Sumitomo Forestry Co., Ltd. (Japan) | | | 38,100 | | | | 736,095 | |
| Tamron Co., Ltd. (Japan) | | | 32,562 | | | | 807,386 | |
| Texhong Textile Group, Ltd. (Hong Kong) | | | 638,000 | | | | 842,848 | |
| Vistry Group PLC (United Kingdom) | | | 101,471 | | | | 1,621,702 | |
| | | | | | | | 7,099,034 | |
| | | Shares | | | Value | |
| Consumer Services — 1.1% | | | | | | | | |
| Betsson A.B. (Sweden) (a) | | | 132,127 | | | $ | 795,028 | |
| Kindred Group PLC (Sweden) | | | 71,366 | | | | 844,614 | |
| | | | | | | | 1,639,642 | |
| Retailing — 3.1% | | | | | | | | |
| Delek Automotive Systems, Ltd. (Israel) | | | 45,706 | | | | 648,268 | |
| FNAC Darty S.A. (France) | | | 7,389 | | | | 483,423 | |
| Harvey Norman Holdings, Ltd. (Australia) | | | 266,051 | | | | 955,011 | |
| IDOM, Inc. (Japan) | | | 35,300 | | | | 221,761 | |
| Marks & Spencer Group PLC (United Kingdom) (a) | | | 163,562 | | | | 514,066 | |
| Super Retail Group, Ltd. (Australia) | | | 113,089 | | | | 1,023,373 | |
| VT Holdings Co., Ltd. (Japan) | | | 176,900 | | | | 717,157 | |
| XEBIO Holdings Co., Ltd. (Japan) | | | 41,800 | | | | 335,047 | |
| | | | | | | | 4,898,106 | |
| Specialty Retail — 0.2% | | | | | | | | |
| Yamada-Denki Co., Ltd. (Japan) | | | 93,500 | | | | 319,463 | |
| | | | | | | | | |
| Consumer Staples — 5.8% | | | | | | | | |
| Food & Staples Retailing — 2.4% | | | | | | | | |
| Arcs Co., Ltd. (Japan) | | | 37,059 | | | | 687,853 | |
| GrainCorp, Ltd. (Australia) | | | 286,474 | | | | 1,722,263 | |
| Qol Holdings Co., Ltd. (Japan) | | | 24,247 | | | | 295,132 | |
| S Foods, Inc. (Japan) | | | 26,500 | | | | 801,820 | |
| Sonae SGPS S.A. (Portugal) | | | 191,691 | | | | 218,817 | |
| | | | | | | | 3,725,885 | |
| Food, Beverage & Tobacco — 3.4% | | | | | | | | |
| Austevoll Seafood A S A (Norway) | | | 6,775 | | | | 81,511 | |
| Bakkavor Group PLC (United Kingdom) | | | 84,642 | | | | 144,452 | |
| Bell Food Group A.G. (Switzerland) | | | 465 | | | | 148,544 | |
| First Pacific Co. (Hong Kong) | | | 1,470,000 | | | | 541,123 | |
| Golden Agri-Resources, Ltd. (Singapore) | | | 2,175,700 | | | | 395,548 | |
| Itoham Yonekyu Holdings, Inc. (Japan) | | | 118,600 | | | | 678,233 | |
| Megmilk Snow Brand Co., Ltd. (Japan) | | | 15,400 | | | | 266,837 | |
| Morinaga & Co., Ltd. (Japan) | | | 9,900 | | | | 323,619 | |
| Premier Foods PLC (United Kingdom) | | | 55,087 | | | | 83,286 | |
| Scandinavian Tobacco Group A/S (Denmark) | | | 89,286 | | | | 1,873,947 | |
| Starzen Co., Ltd. (Japan) | | | 11,605 | | | | 201,837 | |
| Tate & Lyle PLC (United Kingdom) | | | 42,066 | | | | 378,118 | |
| Vilmorin & Cie S.A. (France) | | | 2,955 | | | | 180,273 | |
| | | | | | | | 5,297,328 | |
| Household & Personal Products — 0.0% (c) | | | | | | | | |
| Best World International, Ltd. (Singapore) (a) (b) | | | 88,900 | | | | 0 | |
| | | | | | | | | |
| Energy — 2.0% | | | | | | | | |
| Energy — 2.0% | | | | | | | | |
| Cosmo Energy Holdings Co., Ltd. (Japan) | | | 39,200 | | | | 765,435 | |
| CropEnergies A.G. (Germany) | | | 5,739 | | | | 79,902 | |
| DNO A.S.A. (Norway) | | | 228,989 | | | | 270,630 | |
| FLEX LNG, Ltd. (Norway) | | | 9,159 | | | | 204,125 | |
| See Notes to Financial Statements. | |
| 56 | | | www.sbhfunds.com |
| Segall Bryant & Hamill International Small Cap Fund | Statement of Investments |
| | December 31, 2021 |
| | | Shares | | | Value | |
| Energy (continued) | | | | | | | | |
| New Hope Corp., Ltd. (Australia) | | | 490,113 | | | $ | 794,906 | |
| SBM Offshore N.V. (Netherlands) | | | 5,329 | | | | 79,416 | |
| Serica Energy PLC (United Kingdom) | | | 157,680 | | | | 513,893 | |
| Sulzer A.G. (Switzerland) | | | 1,002 | | | | 98,314 | |
| VERBIO Vereinigte BioEnergie A.G. (Germany) | | | 1,225 | | | | 83,360 | |
| Whitehaven Coal, Ltd. (Australia) (a) | | | 130,109 | | | | 247,417 | |
| | | | | | | | 3,137,398 | |
| Financials — 10.8% | | | | | | | | |
| Banks — 5.5% | | | | | | | | |
| Banco BPM S.p.A. (Italy) | | | 198,606 | | | | 594,477 | |
| Bank of Georgia Group PLC (United Kingdom) | | | 31,809 | | | | 717,506 | |
| Bank of Ireland Group PLC (Ireland) (a) | | | 224,203 | | | | 1,269,403 | |
| Bank of Saga, Ltd. (The) (Japan) | | | 12,100 | | | | 152,144 | |
| BPER Banca S.p.A. (Italy) | | | 113,649 | | | | 234,813 | |
| Genworth Mortgage Insurance Australia, Ltd. (Australia) | | | 666,170 | | | | 1,123,485 | |
| Mebuki Financial Group, Inc. (Japan) | | | 262,400 | | | | 539,796 | |
| Musashino Bank, Ltd (The) (Japan) | | | 27,061 | | | | 422,721 | |
| Nishi-Nippon Financial Holdings, Inc. (Japan) | | | 81,300 | | | | 524,783 | |
| OSB Group PLC (United Kingdom) | | | 20,821 | | | | 156,405 | |
| Spar Nord Bank A/S (Denmark) | | | 52,037 | | | | 665,462 | |
| Sydbank A/S (Denmark) | | | 4,808 | | | | 151,847 | |
| TBC Bank Group PLC (United Kingdom) | | | 32,713 | | | | 729,934 | |
| Tokyo Kiraboshi Financial Group, Inc. (Japan) | | | 24,000 | | | | 316,098 | |
| Virgin Money UK PLC (United Kingdom) (a) | | | 421,286 | | | | 1,021,114 | |
| | | | | | | | 8,619,988 | |
| Diversified Financials — 3.2% | | | | | | | | |
| Banca IFIS S.p.A. (Italy) | | | 14,907 | | | | 289,623 | |
| BOCOM International Holdings Co., Ltd. (Hong Kong) (d) | | | 484,000 | | | | 112,408 | |
| Credit Saison Co., Ltd. (Japan) | | | 46,400 | | | | 487,671 | |
| EFG International A.G. (Switzerland) (a) | | | 31,280 | | | | 238,294 | |
| Insignia Financial Ltd (Australia) | | | 186,124 | | | | 489,777 | |
| Investec PLC (United Kingdom) | | | 308,831 | | | | 1,701,138 | |
| Resurs Holding A.B. (Sweden) | | | 169,355 | | | | 710,027 | |
| Sun Hung Kai & Co., Ltd. (Hong Kong) | | | 751,424 | | | | 401,053 | |
| Tokai Tokyo Financial Holdings, Inc. (Japan) | | | 145,900 | | | | 500,061 | |
| | | | | | | | 4,930,052 | |
| Insurance — 2.1% | | | | | | | | |
| ASR Nederland N.V. (Netherlands) | | | 32,818 | | | | 1,510,945 | |
| Coface S.A. (France) | | | 35,112 | | | | 500,161 | |
| Helvetia Holding A.G. (Switzerland) | | | 4,010 | | | | 470,508 | |
| Mapfre S.A. (Spain) | | | 85,766 | | | | 175,304 | |
| Phoenix Holdings, Ltd. (The) (Israel) | | | 14,503 | | | | 187,683 | |
| Protector Forsikring A S A (Norway) | | | 32,221 | | | | 395,046 | |
| | | | | | | | 3,239,647 | |
| Health Care — 7.6% | | | | | | | | |
| Health Care Equipment & Services — 5.8% | | | | | | | | |
| BML, Inc. (Japan) | | | 23,500 | | | | 730,283 | |
| | | Shares | | | Value | |
| Health Care Equipment & Services (continued) | | | | | | | | |
| ConvaTec Group PLC (United Kingdom) | | | 82,523 | | | $ | 215,378 | |
| Draegerwerk A.G. & Co. KGaA (Germany) | | | 6,043 | | | | 369,841 | |
| Galenica A.G. (Switzerland) | | | 13,616 | | | | 1,021,315 | |
| Getinge A.B. - B Shares (Sweden) | | | 37,009 | | | | 1,611,210 | |
| Guerbet (France) | | | 4,052 | | | | 172,023 | |
| H.U. Group Holdings, Inc. (Japan) | | | 16,600 | | | | 420,904 | |
| Healius, Ltd. (Australia) | | | 372,735 | | | | 1,426,145 | |
| Humana A.B. (Sweden) (a) | | | 52,974 | | | | 425,743 | |
| InMode, Ltd. (Israel) (a) | | | 3,700 | | | | 261,146 | |
| Mediclinic International PLC (United Kingdom) (a) | | | 214,188 | | | | 926,317 | |
| MIRAI Corp (Japan) | | | 3,028 | | | | 1,301,799 | |
| Oriola OYJ (Finland) | | | 32,574 | | | | 74,592 | |
| Riverstone Holdings, Ltd. (Singapore) | | | 185,400 | | | | 96,389 | |
| | | | | | | | 9,053,085 | |
| Health Care Equipment & Supplies — 0.2% | | | | | | | | |
| Metall Zug A.G. (Switzerland) | | | 107 | | | | 241,609 | |
| | | | | | | | | |
| Pharmaceuticals, Biotechnology & Life Sciences — 1.6% | | | | | | | | |
| Alliance Pharma PLC (United Kingdom) | | | 77,793 | | | | 115,196 | |
| Dermapharm Holding S.E. (Germany) | | | 6,481 | | | | 657,841 | |
| Indivior PLC (United Kingdom) (a) | | | 119,126 | | | | 414,018 | |
| Kaken Pharmaceutical Co., Ltd. (Japan) | | | 1,948 | | | | 71,281 | |
| Tecan Group A.G. (Switzerland) | | | 640 | | | | 388,245 | |
| Towa Pharmaceutical Co., Ltd. (Japan) | | | 33,973 | | | | 846,233 | |
| | | | | | | | 2,492,814 | |
| Industrials — 24.7% | | | | | | | | |
| Capital Goods — 16.3% | | | | | | | | |
| AerCap Holdings N.V. (Netherlands) (a) | | | 8,500 | | | | 556,070 | |
| Andritz A.G. (Austria) | | | 2,715 | | | | 139,601 | |
| Bucher Industries A.G. (Switzerland) | | | 297 | | | | 146,176 | |
| Caesarstone, Ltd. (Israel) | | | 28,500 | | | | 323,190 | |
| Danieli & C. Officine Meccaniche S.p.A. (Italy) | | | 63,071 | | | | 1,232,406 | |
| Emeco Holdings, Ltd. (Australia) | | | 600,125 | | | | 384,139 | |
| Fletcher Building, Ltd. (New Zealand) | | | 218,817 | | | | 1,095,940 | |
| Hanwa Co., Ltd. (Japan) | | | 15,300 | | | | 433,818 | |
| IHI Corp (Japan) | | | 24,200 | | | | 487,028 | |
| Inabata & Co., Ltd. (Japan) | | | 68,200 | | | | 995,017 | |
| Inwido A.B. (Sweden) | | | 70,952 | | | | 1,465,312 | |
| Kamei Corp. (Japan) | | | 16,200 | | | | 146,827 | |
| Kandenko Co., Ltd. (Japan) | | | 52,600 | | | | 391,647 | |
| Keller Group PLC (United Kingdom) | | | 54,533 | | | | 726,399 | |
| Kloeckner & Co. S.E. (Germany) (a) | | | 84,008 | | | | 1,022,342 | |
| Koninklijke BAM Groep N.V. (Netherlands) (a) | | | 120,267 | | | | 369,001 | |
| Kumagai Gumi Co., Ltd. (Japan) | | | 44,800 | | | | 1,117,732 | |
| Morgan Sindall Group PLC (United Kingdom) | | | 37,001 | | | | 1,268,838 | |
| Nilfisk Holding A/S (Denmark) (a) | | | 7,942 | | | | 261,200 | |
| Nippon Steel Trading Corp (Japan) | | | 9,900 | | | | 431,998 | |
| Nishio Rent All Co., Ltd. (Japan) | | | 11,571 | | | | 288,658 | |
| Noritake Co., Ltd./Nagoya Japan (Japan) (a) | | | 6,600 | | | | 287,609 | |
| See Notes to Financial Statements. | |
| Annual Report | December 31, 2021 | | | 57 |
| Segall Bryant & Hamill International Small Cap Fund | Statement of Investments |
| | December 31, 2021 |
| | | Shares | | | Value | |
| Capital Goods (continued) | | | | | | | | |
| NRW Holdings, Ltd. (Australia) | | | 746,195 | | | $ | 957,277 | |
| OC Oerlikon Corp. A.G. (Switzerland) | | | 90,238 | | | | 921,759 | |
| Redrow PLC (United Kingdom) | | | 189,603 | | | | 1,807,885 | |
| Rexel S.A. (France) (a) | | | 21,150 | | | | 428,217 | |
| Rheinmetall A.G. (Germany) | | | 5,781 | | | | 543,895 | |
| Rieter Holding, Ltd. (Switzerland) (a) | | | 4,113 | | | | 795,420 | |
| Semperit A.G. Holding (Austria) | | | 21,439 | | | | 714,959 | |
| Sodick Co., Ltd. (Japan) | | | 64,400 | | | | 458,042 | |
| Sojitz Corp. (Japan) | | | 33,100 | | | | 497,064 | |
| Sumitomo Heavy Industries, Ltd. (Japan) | | | 25,200 | | | | 611,319 | |
| Takamatsu Construction Group Co., Ltd (Japan) | | | 15,690 | | | | 268,649 | |
| TOA Corp (Japan) | | | 44,100 | | | | 926,917 | |
| Toyo Construction Co., Ltd. (Japan) | | | 67,600 | | | | 341,421 | |
| Trelleborg A.B. (Sweden) | | | 18,603 | | | | 487,573 | |
| Tsubakimoto Chain Co (Japan) | | | 17,687 | | | | 485,770 | |
| Tsugami Corp (Japan) | | | 13,000 | | | | 198,216 | |
| Yangzijiang Shipbuildings Holdings, Ltd. (Singapore) | | | 1,117,200 | | | | 1,109,155 | |
| Zehnder Group A.G. (Switzerland) | | | 1,433 | | | | 145,662 | |
| Zumtobel Group A.G. (Austria) | | | 17,308 | | | | 151,571 | |
| | | | | | | | 25,421,719 | |
| Commercial & Professional Services — 2.8% | | | | | | | | |
| Bilfinger S.E. (Germany) | | | 28,247 | | | | 955,056 | |
| Brunel International N.V. (Netherlands) | | | 6,803 | | | | 86,831 | |
| Coronado Global Resources, Inc. (Australia) (a) (d) | | | 857,064 | | | | 772,946 | |
| Derichebourg S.A. (France) (a) | | | 85,140 | | | | 984,817 | |
| Intrum A.B. (Sweden) | | | 30,873 | | | | 794,652 | |
| Mitie Group PLC (United Kingdom) | | | 834,541 | | | | 727,925 | |
| SG Fleet Group, Ltd. (Australia) | | | 45,851 | | | | 83,162 | |
| | | | | | | | 4,405,389 | |
| Transportation — 5.6% | | | | | | | | |
| bpost S.A. (Belgium) (a) | | | 48,264 | | | | 421,148 | |
| D/S Norden A/S (Denmark) | | | 28,293 | | | | 717,714 | |
| Golden Ocean Group, Ltd. (Norway) | | | 72,386 | | | | 650,812 | |
| Kawasaki Kisen Kaisha, Ltd. (Japan) (a) | | | 6,100 | | | | 368,056 | |
| Kintetsu World Express, Inc. (Japan) | | | 14,800 | | | | 383,832 | |
| Mitsui OSK Lines, Ltd. (Japan) | | | 17,200 | | | | 1,277,635 | |
| Mitsui-Soko Holdings Co., Ltd. (Japan) | | | 4,400 | | | | 95,038 | |
| Pacific Basin Shipping, Ltd. (Hong Kong) | | | 1,796,000 | | | | 660,314 | |
| PostNL N.V. (Netherlands) | | | 156,252 | | | | 679,216 | |
| Redde Northgate PLC (United Kingdom) | | | 220,559 | | | | 1,301,933 | |
| Royal Mail PLC (United Kingdom) | | | 241,531 | | | | 1,654,485 | |
| Wallenius Wilhelmsen A.S.A (Norway) (a) | | | 85,157 | | | | 488,961 | |
| | | | | | | | 8,699,144 | |
| Information Technology — 10.8% | | | | | | | | |
| Semiconductors & Semiconductor Equipment — 2.9% | | | | | | | | |
| Elmos Semiconductor A.G. (Germany) | | | 7,939 | | | | 526,772 | |
| Ferrotec Holdings Corp (Japan) | | | 20,500 | | | | 750,864 | |
| Micronics Japan Co., Ltd. (Japan) | | | 61,100 | | | | 983,250 | |
| Tokyo Seimitsu Co., Ltd. (Japan) | | | 18,100 | | | | 801,252 | |
| | | Shares | | | Value | |
| Semiconductors & Semiconductor Equipment (continued) | | | | | | | | |
| Tower Semiconductor, Ltd. (Israel) (a) | | | 7,129 | | | $ | 282,467 | |
| u-blox Holding A.G. (Switzerland) (a) | | | 11,198 | | | | 862,115 | |
| X-Fab Silicon Foundries S.E. (France) (a) | | | 31,783 | | | | 328,595 | |
| | | | | | | | 4,535,315 | |
| Software & Services — 4.7% | | | | | | | | |
| ATEA A S A (Norway) (a) | | | 54,764 | | | | 1,018,391 | |
| Computacenter PLC (United Kingdom) | | | 39,521 | | | | 1,568,409 | |
| Econocom Group S.A./N.V. (Belgium) | | | 167,699 | | | | 700,546 | |
| Hansen Technologies, Ltd. (Australia) | | | 269,302 | | | | 1,046,767 | |
| Indra Sistemas S.A. (Spain) (a) | | | 42,549 | | | | 459,487 | |
| Malam - Team, Ltd. (Israel) | | | 3,888 | | | | 142,178 | |
| Micro Focus International PLC (United Kingdom) | | | 196,065 | | | | 1,109,190 | |
| TietoEVRY OYJ (Finland) | | | 35,839 | | | | 1,119,203 | |
| transcosmos, inc (Japan) | | | 6,000 | | | | 171,001 | |
| | | | | | | | 7,335,172 | |
| Technology Hardware & Equipment — 3.2% | | | | | | | | |
| Citizen Watch Co., Ltd. (Japan) | | | 45,700 | | | | 197,695 | |
| Comet Holdings A.G. (Switzerland) | | | 2,110 | | | | 775,025 | |
| Gilat Satellite Networks, Ltd. (Israel) | | | 43,908 | | | | 314,184 | |
| Hakuto Co., Ltd. (Japan) | | | 12,700 | | | | 291,909 | |
| Hosiden Corp (Japan) | | | 19,400 | | | | 194,219 | |
| Ituran Location and Control, Ltd. (Israel) | | | 25,623 | | | | 683,365 | |
| Kaga Electronics Co., Ltd. (Japan) | | | 9,100 | | | | 258,499 | |
| Melco Holdings, Inc. (Japan) | | | 4,911 | | | | 173,506 | |
| Nippon Electric Glass Co., Ltd. (Japan) | | | 42,500 | | | | 1,089,056 | |
| Nissha Co., Ltd. (Japan) | | | 51,900 | | | | 753,676 | |
| Quadient S.A. (France) | | | 14,794 | | | | 322,102 | |
| | | | | | | | 5,053,236 | |
| Materials — 8.3% | | | | | | | | |
| Materials — 8.2% | | | | | | | | |
| Acerinox S.A. (Spain) | | | 21,386 | | | | 275,130 | |
| Bekaert S.A. (Belgium) | | | 14,596 | | | | 648,762 | |
| Daicel Corp. (Japan) | | | 77,300 | | | | 534,645 | |
| Daiken Corp. (Japan) | | | 38,800 | | | | 731,581 | |
| DS Smith PLC (United Kingdom) | | | 16,653 | | | | 86,648 | |
| Elkem A S A (Norway) (a) | | | 188,025 | | | | 633,315 | |
| Ferrexpo PLC (United Kingdom) | | | 301,788 | | | | 1,227,240 | |
| Hokuetsu Corp (Japan) | | | 169,718 | | | | 1,060,341 | |
| Incitec Pivot, Ltd. (Australia) | | | 444,687 | | | | 1,049,711 | |
| K+S A.G. (Germany) (a) | | | 32,515 | | | | 559,163 | |
| Kobe Steel, Ltd. (Japan) | | | 45,600 | | | | 228,527 | |
| Kuraray Co., Ltd. (Japan) | | | 9,700 | | | | 84,308 | |
| Mitsui Mining & Smelting Co., Ltd. (Japan) | | | 16,900 | | | | 460,237 | |
| Nippon Light Metal Holdings Co., Ltd. (Japan) | | | 11,200 | | | | 168,087 | |
| Outokumpu OYJ (Finland) (a) | | | 124,191 | | | | 778,595 | |
| Regis Resources, Ltd. (Australia) | | | 112,572 | | | | 159,988 | |
| Salzgitter A.G. (Germany) (a) | | | 18,880 | | | | 674,363 | |
| Sandfire Resources, Ltd. (Australia) | | | 276,745 | | | | 1,327,814 | |
| Semapa-Sociedade de Investimento e Gestao (Portugal) | | | 6,031 | | | | 80,230 | |
| Sims, Ltd. (Australia) | | | 27,552 | | | | 322,090 | |
| See Notes to Financial Statements. | |
| 58 | | | www.sbhfunds.com |
| Segall Bryant & Hamill International Small Cap Fund | Statement of Investments |
| | December 31, 2021 |
| | | Shares | | | Value | |
| Materials (continued) | | | | | | | | |
| SSAB A.B. - B Shares (Sweden) (a) | | | 170,557 | | | $ | 856,051 | |
| Synthomer PLC (United Kingdom) | | | 55,235 | | | | 297,971 | |
| Tokyo Steel Manufacturing Co., Ltd. (Japan) | | | 20,400 | | | | 244,555 | |
| Toyo Seikan Group Holdings, Ltd. (Japan) | | | 14,100 | | | | 168,307 | |
| Yamato Kogyo Co., Ltd. (Japan) | | | 5,600 | | | | 181,390 | |
| | | | | | | | 12,839,049 | |
| Metals & Mining — 0.1% | | | | | | | | |
| Atalaya Mining PLC (United Kingdom) | | | 29,552 | | | | 164,451 | |
| | | | | | | | | |
| Real Estate — 9.6% | | | | | | | | |
| Real Estate — 9.6% | | | | | | | | |
| Aedas Homes S.A. (Spain) | | | 2,881 | | | | 79,026 | |
| Blue Square Real Estate, Ltd. (Israel) | | | 2,752 | | | | 249,190 | |
| Cibus Nordic Real Estate A.B. (Sweden) | | | 30,056 | | | | 965,521 | |
| Civitas Social Housing PLC (United Kingdom) | | | 211,943 | | | | 277,730 | |
| Corestate Capital Holding S.A. (Germany) (a) | | | 23,667 | | | | 301,901 | |
| Cromwell Property Group (Australia) | | | 975,397 | | | | 616,572 | |
| Custodian REIT PLC (United Kingdom) | | | 258,657 | | | | 370,774 | |
| Dios Fastigheter A.B. (Sweden) | | | 55,295 | | | | 725,280 | |
| Eagle Hospitality Trust (Singapore) (a) (b) | | | 1,204,600 | | | | 0 | |
| Eurocommercial Properties N.V. (Netherlands) | | | 27,632 | | | | 600,255 | |
| Goldcrest Co., Ltd. (Japan) | | | 42,430 | | | | 596,638 | |
| Hammerson PLC (United Kingdom) | | | 427,041 | | | | 190,698 | |
| HomeCo Daily Needs REIT (Australia) | | | 487,220 | | | | 565,006 | |
| Immobel S.A. (Belgium) | | | 1,037 | | | | 85,880 | |
| Intershop Holding A.G. (Switzerland) | | | 336 | | | | 225,399 | |
| Isras Investment Co., Ltd. (Israel) | | | 928 | | | | 246,145 | |
| Kenedix Retail REIT Corp. (Japan) | | | 438 | | | | 1,077,134 | |
| Keppel Pacific Oak US REIT (Singapore) (a) | | | 658,100 | | | | 526,480 | |
| Kerry Properties, Ltd. (Hong Kong) | | | 134,000 | | | | 349,029 | |
| Landis+Gyr Group A.G. (Switzerland) (a) | | | 1,235 | | | | 83,256 | |
| Mercialys S.A. (France) | | | 54,337 | | | | 530,177 | |
| Merlin Properties Socimi S.A. (Spain) | | | 8,113 | | | | 87,875 | |
| NewRiver REIT PLC (United Kingdom) (d) | | | 211,652 | | | | 252,161 | |
| Norstar Holdings, Inc. (Israel) | | | 15,515 | | | | 162,201 | |
| Peach Property Group A.G. (Switzerland) | | | 9,095 | | | | 631,551 | |
| Prime US REIT (Singapore) | | | 788,100 | | | | 657,832 | |
| Regional REIT, Ltd. (United Kingdom) | | | 420,760 | | | | 534,293 | |
| Safestore Holdings PLC (United Kingdom) | | | 8,802 | | | | 167,715 | |
| Sagax A.B. (Sweden) | | | 190,075 | | | | 701,813 | |
| Samty Co., Ltd. (Japan) | | | 3,800 | | | | 72,522 | |
| Sasseur Real Estate Investment Trust (Singapore) | | | 823,900 | | | | 515,737 | |
| Savills PLC (United Kingdom) | | | 12,314 | | | | 234,344 | |
| Star Asia Investment Corp (Japan) | | | 2,101 | | | | 1,154,366 | |
| Takara Leben Real Estate Investment Trust Corp (Japan) | | | 404 | | | | 407,455 | |
| | | Shares | | | Value | |
| Real Estate (continued) | | | | | | | | |
| Tosei Corp (Japan) | | | 26,000 | | | $ | 228,125 | |
| Wereldhave N.V. (Netherlands) | | | 39,109 | | | | 570,232 | |
| | | | | | | | 15,040,313 | |
| Utilities — 2.8% | | | | | | | | |
| Utilities — 2.8% | | | | | | | | |
| A2A S.p.A. (Italy) | | | 463,015 | | | | 901,984 | |
| Contact Energy, Ltd. (New Zealand) | | | 14,342 | | | | 79,446 | |
| Drax Group PLC (United Kingdom) | | | 162,033 | | | | 1,331,400 | |
| EVN A.G. (Austria) | | | 23,116 | | | | 697,248 | |
| Hokkaido Electric Power Co., Inc. (Japan) | | | 163,200 | | | | 729,483 | |
| Iren S.p.A. (Italy) | | | 196,150 | | | | 590,167 | |
| | | | | | | | 4,329,728 | |
| | | | | | | | | |
| Total Common Stocks (Cost $138,368,706) | | | | | | | 154,499,220 | |
| | | | | | | | | |
| PREFERRED STOCKS — 0.1% | | | | | | | | |
| Health Care — 0.1% | | | | | | | | |
| Health Care Equipment & Services — 0.1% | | | | | | | | |
| Draegerwerk A.G. & Co. KGaA (Germany) (Cost $155,285) | | | 2,723 | | | | 170,552 | |
| | | | | | | | | |
| Investments at Value — 99.1% (Cost $138,523,991) | | | | | | $ | 154,669,772 | |
| | | | | | | | | |
| Other Assets in Excess of Liabilities — 0.9% | | | | | | | 1,376,531 | |
| | | | | | | | | |
| Net Assets — 100.0% | | | | | | $ | 156,046,303 | |
| (a) | Non-income producing security. |
| (b) | Level 3 securities fair value under procedures established by the Board of Trustees, represents 0.0% of net assets. The total value of these securities is $0. |
| (c) | Percentage rounds to less than 0.1%. |
| (d) | Security is considered a restricted security however such restriction has not resulted in an illiquid classification. The total value of these securities is $1,137,515, which represents 0.7% of net assets as of December 31, 2021. |
The Fund’s sector and industry classifications presented herein refer to any one or more of the industry sub-classifications used by one or more widely recognized market indexes or ratings group indexes, and/ or as defined by Fund management. For Fund compliance purposes, sector and industry classifications are based on the sector and industry categorization methodology of the Adviser to the Funds. This definition may not apply for purposes of this report, which may combine industry sub-classifications for reporting ease. Industries are shown as a percentage of net assets.
| See Notes to Financial Statements. | |
| Annual Report | December 31, 2021 | | | 59 |
| Segall Bryant & Hamill International Small Cap Fund | Statement of Investments |
| | December 31, 2021 |
| Country Breakdown | | | | | | |
| | | | | | % of Net | |
| Country | | Value | | | Assets | |
| Japan | | $ | 42,537,421 | | | | 27.3 | % |
| United Kingdom | | | 27,424,013 | | | | 17.6 | % |
| Australia | | | 15,353,789 | | | | 9.8 | % |
| Sweden | | | 11,447,815 | | | | 7.3 | % |
| Switzerland | | | 7,193,192 | | | | 4.6 | % |
| Germany | | | 7,097,427 | | | | 4.5 | % |
| France | | | 6,324,097 | | | | 4.0 | % |
| Netherlands | | | 4,451,966 | | | | 2.8 | % |
| Israel | | | 4,166,178 | | | | 2.7 | % |
| Italy | | | 4,082,309 | | | | 2.6 | % |
| Norway | | | 3,742,791 | | | | 2.4 | % |
| Denmark | | | 3,670,170 | | | | 2.4 | % |
| Singapore | | | 3,301,141 | | | | 2.1 | % |
| Hong Kong | | | 2,906,775 | | | | 1.9 | % |
| Spain | | | 2,319,029 | | | | 1.5 | % |
| Austria | | | 2,079,097 | | | | 1.3 | % |
| Finland | | | 1,972,390 | | | | 1.3 | % |
| Belgium | | | 1,856,336 | | | | 1.2 | % |
| Ireland | | | 1,269,403 | | | | 0.8 | % |
| New Zealand | | | 1,175,386 | | | | 0.8 | % |
| Portugal | | | 299,047 | | | | 0.2 | % |
| Total Investments | | $ | 154,669,772 | | | | 99.1 | % |
| Other Assets in Excess of Liabilities | | | 1,376,531 | | | | 0.9 | % |
| Net Assets | | $ | 156,046,303 | | | | 100.0 | % |
| | |
| See Notes to Financial Statements. | |
| 60 | | | www.sbhfunds.com |
| Segall Bryant & Hamill | |
| Fundamental International Small Cap Fund | Statement of Investments |
| | December 31, 2021 |
| | | Shares | | | Value | |
| COMMON STOCKS — 96.3% | | | | | | | | |
| Communication Services — 0.9% | | | | | | | | |
| Telecommunication Services — 0.9% | | | | | | | | |
| KINX, Inc. (South Korea) (a) | | | 20,285 | | | $ | 849,508 | |
| | | | | | | | | |
| Consumer Discretionary — 26.0% | | | | | | | | |
| Consumer Durables & Apparel — 13.1% | | | | | | | | |
| Hunter Douglas N.V. (Netherlands) (a) | | | 40,550 | | | | 7,947,541 | |
| Leatt Corp (South Africa) (a) | | | 57,530 | | | | 1,869,725 | |
| Victoria PLC (United Kingdom) (a) | | | 142,950 | | | | 2,319,770 | |
| | | | | | | | 12,137,036 | |
| Consumer Services — 10.8% | | | | | | | | |
| Evolution Gaming Group A.B. (Sweden) | | | 24,550 | | | | 3,466,217 | |
| Fu Shou Yuan International Group, Ltd. (China) | | | 1,065,247 | | | | 837,271 | |
| NEOGAMES S.A. (Israel) (a) | | | 47,995 | | | | 1,333,301 | |
| Pollard Banknote, Ltd. (Canada) | | | 96,570 | | | | 3,043,276 | |
| Webjet, Ltd. (Australia) (a) | | | 342,442 | | | | 1,288,052 | |
| | | | | | | | 9,968,117 | |
| Retailing — 2.1% | | | | | | | | |
China Meidong Auto Holdings, Ltd. (China) | | | 376,500 | | | | 1,940,676 | |
| | | | | | | | | |
| Consumer Staples — 3.9% | | | | | | | | |
| Food & Staples Retailing — 3.9% | | | | | | | | |
| Naked Wines PLC (United Kingdom) (a) | | | 158,080 | | | | 1,391,673 | |
| Yifeng Pharmacy Chain Co., Ltd. - Class A (China) | | | 250,469 | | | | 2,171,105 | |
| | | | | | | | 3,562,778 | |
| Financials — 6.3% | | | | | | | | |
| Banks — 1.0% | | | | | | | | |
| Mortgage Advice Bureau Holdings, Ltd. (United Kingdom) | | | 49,449 | | | | 969,628 | |
| | | | | | | | | |
| Diversified Financials — 5.3% | | | | | | | | |
| Azimut Holdings S.p.A. (Italy) | | | 29,177 | | | | 815,446 | |
| Kaspi.KZ PJSC (Kazakhstan) (b) | | | 13,000 | | | | 1,508,000 | |
| Strike Co., Ltd. (Japan) | | | 57,140 | | | | 2,539,180 | |
| | | | | | | | 4,862,626 | |
| Health Care — 2.0% | | | | | | | | |
| Pharmaceuticals, Biotechnology & Life Sciences — 2.0% | | | | | | | | |
| SwedenCare A.B. (Sweden) | | | 108,150 | | | | 1,841,330 | |
| | | | | | | | | |
| Industrials — 29.3% | | | | | | | | |
| Capital Goods — 14.4% | | | | | | | | |
| AutoStore Holdings, Ltd. (Norway) (a) | | | 456,100 | | | | 1,800,344 | |
| Brodrene A. & O. Johansen A/S (Denmark) | | | 28,100 | | | | 5,845,883 | |
| Diploma PLC (United Kingdom) | | | 27,980 | | | | 1,281,619 | |
| Instalco A.B. (Sweden) | | | 91,800 | | | | 4,396,994 | |
| | | | | | | | 13,324,840 | |
| | | Shares | | | Value | |
| Commercial & Professional Services — 13.3% | | | | | | | | |
| BayCurrent Consulting, Inc. (Japan) | | | 6,600 | | | $ | 2,542,364 | |
| Boyd Group Services, Inc. (Canada) | | | 6,415 | | | | 1,012,678 | |
| Clipper Logistics PLC (United Kingdom) | | | 399,798 | | | | 3,925,154 | |
| GFL Environmental, Inc. (Canada) | | | 72,768 | | | | 2,752,401 | |
| Mo-BRUK S.A. (Poland) | | | 13,700 | | | | 1,307,511 | |
| Nihon M&A Center, Inc. (Japan) | | | 30,160 | | | | 739,369 | |
| | | | | | | | 12,279,477 | |
| Transportation — 1.6% | | | | | | | | |
| InPost S.A. (Poland) (a) | | | 122,000 | | | | 1,471,609 | |
| | | | | | | | | |
| Information Technology — 27.9% | | | | | | | | |
| IT Services — 9.1% | | | | | | | | |
| CANCOM S.E. (Germany) | | | 14,530 | | | | 973,924 | |
| Constellation Software, Inc. (Canada) | | | 2,410 | | | | 4,472,907 | |
| Keywords Studios PLC (Ireland) | | | 47,079 | | | | 1,873,050 | |
| Sansan, Inc. (Japan) (a) | | | 52,000 | | | | 1,123,815 | |
| | | | | | | | 8,443,696 | |
| Semiconductors & Semiconductor Equipment — 1.1% | | | | | | | | |
| Lasertec Corp (Japan) | | | 3,300 | | | | 1,010,207 | |
| | | | | | | | | |
| Software — 11.1% | | | | | | | | |
| Epsilon Net S.A. (Greece) | | | 402,996 | | | | 2,375,961 | |
| GB Group PLC (United Kingdom) | | | 88,266 | | | | 878,317 | |
| LiveChat Software S.A. (Poland) | | | 31,985 | | | | 926,090 | |
| Mercell Holding A.S.A. (Norway) (a) | | | 1,575,600 | | | | 1,200,046 | |
| Sinch A.B. (Sweden) (a) | | | 89,450 | | | | 1,127,505 | |
| Topicus.com, Inc. (Netherlands) (a) | | | 40,442 | | | | 3,713,092 | |
| | | | | | | | 10,221,011 | |
| Technology Hardware & Equipment — 6.6% | | | | | | | | |
| Cherry A.G. (Germany) (a) | | | 83,101 | | | | 2,321,571 | |
| Endor A.G. (Germany) | | | 36,000 | | | | 860,460 | |
| PAX Global Technology, Ltd. (Hong Kong) | | | 2,311,200 | | | | 1,636,355 | |
| Razer, Inc. (Singapore) (a) | | | 4,163,000 | | | | 1,292,654 | |
| | | | | | | | 6,111,040 | |
| | | | | | | | | |
| Investments at Value — 96.3% (Cost $69,127,107) | | | | | | $ | 88,993,579 | |
| | | | | | | | | |
| Other Assets in Excess of Liabilities — 3.7% | | | | | | | 3,410,334 | |
| | | | | | | | | |
| Net Assets — 100.0% | | | | | | $ | 92,403,913 | |
| (a) | Non-income producing security. |
| (b) | Security is considered a restricted security however such restriction has not resulted in an illiquid classification. The total value of these securities is $1,508,000, which represents 1.6% of net assets as of December 31, 2021. |
The Fund’s sector and industry classifications presented herein refer to any one or more of the industry sub-classifications used by one or more widely recognized market indexes or ratings group indexes, and/ or as defined by Fund management. For Fund compliance purposes, sector and industry classifications are based on the sector and industry categorization methodology of the Adviser to the Funds. This definition may not apply for purposes of this report, which may combine industry sub-classifications for reporting ease. Industries are shown as a percentage of net assets.
| See Notes to Financial Statements. | |
| Annual Report | December 31, 2021 | | | 61 |
| Segall Bryant & Hamill | |
| Fundamental International Small Cap Fund | Statement of Investments |
| | December 31, 2021 |
| Country Breakdown | | | | | | |
| | | | | | % of Net | |
| Country | | Value | | | Assets | |
| Netherlands | | $ | 11,660,634 | | | | 12.6 | % |
| Canada | | | 11,281,262 | | | | 12.2 | % |
| Sweden | | | 10,832,046 | | | | 11.7 | % |
| United Kingdom | | | 10,766,161 | | | | 11.7 | % |
| Japan | | | 7,954,935 | | | | 8.6 | % |
| Denmark | | | 5,845,883 | | | | 6.3 | % |
| China | | | 4,949,051 | | | | 5.4 | % |
| Germany | | | 4,155,955 | | | | 4.5 | % |
| Poland | | | 3,705,210 | | | | 4.0 | % |
| Norway | | | 3,000,390 | | | | 3.3 | % |
| Greece | | | 2,375,961 | | | | 2.6 | % |
| Ireland | | | 1,873,050 | | | | 2.0 | % |
| South Africa | | | 1,869,725 | | | | 2.0 | % |
| Hong Kong | | | 1,636,355 | | | | 1.8 | % |
| Kazakhstan | | | 1,508,000 | | | | 1.6 | % |
| Israel | | | 1,333,301 | | | | 1.4 | % |
| Singapore | | | 1,292,654 | | | | 1.4 | % |
| Australia | | | 1,288,052 | | | | 1.4 | % |
| South Korea | | | 849,508 | | | | 0.9 | % |
| Italy | | | 815,446 | | | | 0.9 | % |
| Total Investments | | $ | 88,993,579 | | | | 96.3 | % |
| Other Assets in Excess of Liabilities | | | 3,410,334 | | | | 3.7 | % |
| Net Assets | | $ | 92,403,913 | | | | 100.0 | % |
| | |
| See Notes to Financial Statements. | |
| 62 | | | www.sbhfunds.com |
| Segall Bryant & Hamill | |
| Fundamental International Small Cap Fund | Statement of Investments |
| | December 31, 2021 |
| SCHEDULE OF FORWARD FOREIGN CURRENCY CONTRACTS |
| | | | | | | | | | | | | | | Asset | | | Liability | |
| | | | | | | | | | | | | | | Derivatives | | | Derivatives | |
| | | | | | | U.S . $Value at | | | | | U.S. $Value at | | | | | | | |
| | | Settlement | | Fund | | December 31, | | | Fund | | December 31, | | | Unrealized | | | Unrealized | |
| Counterparty | | Date | | Receiving | | 2021 | | | Delivering | | 2021 | | | Appreciation | | | Depreciation | |
| BNY Mellon | | 3/28/2022 | | AED | | | 149,694 | | | USD | | | 149,756 | | | $ | — | | | $ | (63 | ) |
| BNY Mellon | | 3/28/2022 | | AUD | | | 4,643,044 | | | USD | | | 4,485,192 | | | | 157,852 | | | | — | |
| BNY Mellon | | 3/28/2022 | | BRL | | | 1,158,474 | | | USD | | | 1,135,397 | | | | 23,077 | | | | — | |
| BNY Mellon | | 3/28/2022 | | CHF | | | 3,526,211 | | | USD | | | 3,504,819 | | | | 21,392 | | | | — | |
| BNY Mellon | | 3/28/2022 | | CLP | | | 152,945 | | | USD | | | 154,987 | | | | — | | | | (2,042 | ) |
| BNY Mellon | | 3/28/2022 | | COP | | | 45,921 | | | USD | | | 46,996 | | | | — | | | | (1,075 | ) |
| BNY Mellon | | 3/28/2022 | | CZK | | | 7,064 | | | USD | | | 6,872 | | | | 192 | | | | — | |
| BNY Mellon | | 3/28/2022 | | GBP | | | 182,890 | | | USD | | | 178,956 | | | | 3,934 | | | | — | |
| BNY Mellon | | 3/28/2022 | | HUF | | | 14,042 | | | USD | | | 14,106 | | | | — | | | | (64 | ) |
| BNY Mellon | | 3/28/2022 | | IDR | | | 380,708 | | | USD | | | 372,215 | | | | 8,493 | | | | — | |
| BNY Mellon | | 3/28/2022 | | ILS | | | 1,684,169 | | | USD | | | 1,655,091 | | | | 29,078 | | | | — | |
| BNY Mellon | | 3/28/2022 | | INR | | | 4,672,847 | | | USD | | | 4,620,073 | | | | 52,774 | | | | — | |
| BNY Mellon | | 3/28/2022 | | JPY | | | 9,453,001 | | | USD | | | 9,648,167 | | | | — | | | | (195,166 | ) |
| BNY Mellon | | 3/28/2022 | | KRW | | | 2,867,260 | | | USD | | | 2,888,861 | | | | — | | | | (21,601 | ) |
| BNY Mellon | | 3/28/2022 | | KWD | | | 205,180 | | | USD | | | 204,958 | | | | 221 | | | | — | |
| BNY Mellon | | 3/28/2022 | | MXP | | | 374,227 | | | USD | | | 355,949 | | | | 18,278 | | | | — | |
| BNY Mellon | | 3/28/2022 | | NZD | | | 571,817 | | | USD | | | 563,389 | | | | 8,427 | | | | — | |
| BNY Mellon | | 3/28/2022 | | PHP | | | 235,728 | | | USD | | | 239,200 | | | | — | | | | (3,473 | ) |
| BNY Mellon | | 3/28/2022 | | QAR | | | 202,189 | | | USD | | | 201,983 | | | | 206 | | | | — | |
| BNY Mellon | | 3/28/2022 | | RUB | | | 182,562 | | | USD | | | 183,771 | | | | — | | | | (1,210 | ) |
| BNY Mellon | | 3/28/2022 | | SAR | | | 506,949 | | | USD | | | 507,062 | | | | — | | | | (114 | ) |
| BNY Mellon | | 3/28/2022 | | SGD | | | 1,136,089 | | | USD | | | 1,116,564 | | | | 19,525 | | | | — | |
| BNY Mellon | | 3/28/2022 | | THB | | | 802,161 | | | USD | | | 785,004 | | | | 17,157 | | | | — | |
| BNY Mellon | | 3/28/2022 | | TWD | | | 5,397,498 | | | USD | | | 5,409,040 | | | | — | | | | (11,542 | ) |
| BNY Mellon | | 3/28/2022 | | USD | | | 7,807,982 | | | CAD | | | 7,917,519 | | | | — | | | | (109,537 | ) |
| BNY Mellon | | 3/28/2022 | | USD | | | 1,729,827 | | | CNY | | | 1,742,935 | | | | — | | | | (13,108 | ) |
| BNY Mellon | | 3/28/2022 | | USD | | | 3,661,255 | | | DKK | | | 3,682,677 | | | | — | | | | (21,422 | ) |
| BNY Mellon | | 3/28/2022 | | USD | | | 206,684 | | | EUR | | | 207,911 | | | | — | | | | (1,227 | ) |
| BNY Mellon | | 3/28/2022 | | USD | | | 2,975,716 | | | HKD | | | 2,974,059 | | | | 1,657 | | | | — | |
| BNY Mellon | | 3/28/2022 | | USD | | | 2,253,213 | | | NOK | | | 2,351,214 | | | | — | | | | (98,001 | ) |
| BNY Mellon | | 3/28/2022 | | USD | | | 1,837,194 | | | PLN | | | 1,856,676 | | | | — | | | | (19,482 | ) |
| BNY Mellon | | 3/28/2022 | | USD | | | 3,273,434 | | | SEK | | | 3,302,968 | | | | — | | | | (29,534 | ) |
| BNY Mellon | | 3/28/2022 | | USD | | | 649,472 | | | TRY | | | 695,954 | | | | — | | | | (46,482 | ) |
| BNY Mellon | | 3/28/2022 | | ZAR | | | 835,010 | | | USD | | | 821,790 | | | | 13,220 | | | | — | |
| Total | | | | | | | | | | | | | | | | $ | 375,483 | | | $ | (575,143 | ) |
| | |
| See Notes to Financial Statements. | |
| Annual Report | December 31, 2021 | | | 63 |
| Segall Bryant & Hamill Global All Cap Fund | Statement of Investments |
| | December 31, 2021 |
| | | Shares | | | Value | |
| COMMON STOCKS — 98.8% | | | | | | | | |
| Communication Services — 3.1% | | | | | | | | |
| Media & Entertainment — 3.1% | | | | | | | | |
| Alphabet, Inc. - Class C (a) | | | 423 | | | $ | 1,223,989 | |
| | | | | | | | | |
| Consumer Discretionary — 15.3% | | | | | | | | |
| Consumer Durables & Apparel — 5.5% | | | | | | | | |
| adidas A.G. (Germany) | | | 2,127 | | | | 612,285 | |
| Capri Holdings, Ltd. (a) | | | 8,888 | | | | 576,920 | |
| LVMH Moet Hennessy Louis Vuitton S.E. (France) | | | 1,124 | | | | 928,646 | |
| | | | | | | | 2,117,851 | |
| Consumer Services — 2.6% | | | | | | | | |
| Compass Group PLC (United Kingdom) (a) | | | 23,587 | | | | 530,548 | |
| Darden Restaurants, Inc. | | | 3,063 | | | | 461,410 | |
| | | | | | | | 991,958 | |
| Retailing — 7.2% | | | | | | | | |
| Amazon.com, Inc. (a) | | | 273 | | | | 910,275 | |
| Dollarama, Inc. (Canada) | | | 10,017 | | | | 501,511 | |
| Home Depot, Inc. (The) | | | 1,888 | | | | 783,539 | |
| O’Reilly Automotive, Inc. (a) | | | 860 | | | | 607,358 | |
| | | | | | | | 2,802,683 | |
| Consumer Staples — 8.5% | | | | | | | | |
| Food & Staples Retailing — 1.7% | | | | | | | | |
| Costco Wholesale Corp | | | 1,142 | | | | 648,314 | |
| | | | | | | | | |
| Food, Beverage & Tobacco — 6.8% | | | | | | | | |
| Asahi Group Holdings, Ltd. (Japan) | | | 9,879 | | | | 384,354 | |
| Diageo PLC (United Kingdom) | | | 13,775 | | | | 752,478 | |
| Hain Celestial Group, Inc. (The) (a) | | | 11,184 | | | | 476,550 | |
| Kerry Group PLC - Class A (Ireland) | | | 3,625 | | | | 467,548 | |
| Mondel z International, Inc. - Class A | | | 8,315 | | | | 551,368 | |
| | | | | | | | 2,632,298 | |
| Energy — 2.2% | | | | | | | | |
| Energy — 2.2% | | | | | | | | |
| Chevron Corp | | | 3,447 | | | | 404,505 | |
| Suncor Energy, Inc. (Canada) | | | 18,262 | | | | 457,098 | |
| | | | | | | | 861,603 | |
| Financials — 13.6% | | | | | | | | |
| Banks — 3.7% | | | | | | | | |
| JPMorgan Chase & Co | | | 5,609 | | | | 888,185 | |
| Western Alliance Bancorp | | | 4,989 | | | | 537,066 | |
| | | | | | | | 1,425,251 | |
| Diversified Financials — 4.8% | | | | | | | | |
| IntegraFin Holdings PLC (United Kingdom) (b) | | | 63,535 | | | | 482,725 | |
| Partners Group Holding A.G. (Switzerland) | | | 449 | | | | 740,320 | |
| S&P Global, Inc. | | | 1,325 | | | | 625,307 | |
| | | | | | | | 1,848,352 | |
| Insurance — 5.1% | | | | | | | | |
| Aon PLC - Class A (Ireland) | | | 2,915 | | | | 876,132 | |
| Globe Life, Inc. | | | 7,227 | | | | 677,314 | |
| Reinsurance Group of America, Inc. | | | 3,981 | | | | 435,880 | |
| | | | | | | | 1,989,326 | |
| | | Shares | | | Value | |
| Health Care — 15.6% | | | | | | | | |
| Health Care Equipment & Services — 4.4% | | | | | | | | |
| Alcon, Inc. (Switzerland) | | | 7,730 | | | $ | 673,437 | |
| UnitedHealth Group, Inc. | | | 2,043 | | | | 1,025,872 | |
| | | | | | | | 1,699,309 | |
| Health Care Equipment & Supplies — 1.1% | | | | | | | | |
| Koninklijke Philips N.V. (Netherlands) | | | 11,640 | | | | 430,692 | |
| | | | | | | | | |
| Pharmaceuticals, Biotechnology & Life Sciences — 10.1% | | | | | | | | |
| Bio-Techne Corp | | | 1,661 | | | | 859,302 | |
| Charles River Laboratories International, Inc. (a) | | | 2,020 | | | | 761,095 | |
| Eurofins Scientific, Inc. (Luxembourg) | | | 4,022 | | | | 498,150 | |
| Lonza Group A.G. (Switzerland) | | | 1,068 | | | | 888,132 | |
| Zoetis, Inc. | | | 3,688 | | | | 899,983 | |
| | | | | | | | 3,906,662 | |
| Industrials — 10.5% | | | | | | | | |
| Capital Goods — 10.5% | | | | | | | | |
| AZEK Co., Inc. (The) - Class A (a) | | | 10,166 | | | | 470,076 | |
| Parker-Hannifin Corp | | | 1,530 | | | | 486,724 | |
| Quanta Services, Inc. | | | 7,071 | | | | 810,761 | |
| Raytheon Technologies Corp | | | 5,638 | | | | 485,206 | |
| Rockwell Automation, Inc. | | | 1,524 | | | | 531,647 | |
| Sandvik A.B. (Sweden) | | | 21,015 | | | | 585,137 | |
| Schneider Electric S.E. (France) | | | 3,468 | | | | 681,599 | |
| | | | | | | | 4,051,150 | |
| Information Technology — 26.0% | | | | | | | | |
| Semiconductors & Semiconductor Equipment — 9.8% | | | | | | | | |
| ASML Holding N.V. (Netherlands) | | | 961 | | | | 769,561 | |
| Marvell Technology, Inc. (Bermuda) | | | 14,308 | | | | 1,251,807 | |
| Monolithic Power Systems, Inc. | | | 1,637 | | | | 807,581 | |
| NXP Semiconductors N.V. (Netherlands) | | | 4,202 | | | | 957,132 | |
| | | | | | | | 3,786,081 | |
| Software & Services — 14.0% | | | | | | | | |
| Adobe, Inc. (a) | | | 953 | | | | 540,408 | |
| Capgemini S.E. (France) | | | 2,786 | | | | 682,600 | |
| Dassault Systemes S.A. (France) | | | 16,676 | | | | 989,360 | |
| Microsoft Corp | | | 5,145 | | | | 1,730,366 | |
| ServiceNow, Inc. (a) | | | 986 | | | | 640,023 | |
| Visa, Inc. - Class A | | | 3,827 | | | | 829,349 | |
| | | | | | | | 5,412,106 | |
| Technology Hardware & Equipment — 2.2% | | | | | | | | |
| Keysight Technologies, Inc. (a) | | | 4,224 | | | | 872,298 | |
| See Notes to Financial Statements. | |
| 64 | | | www.sbhfunds.com |
| Segall Bryant & Hamill Global All Cap Fund | Statement of Investments |
| | December 31, 2021 |
| | | Shares | | | Value | |
| Materials — 4.0% | | | | | | |
| Materials — 4.0% | | | | | | |
| Franco-Nevada Corp (Canada) | | | 3,806 | | | $ | 526,332 | |
| Linde PLC (United Kingdom) | | | 2,921 | | | | 1,011,922 | |
| | | | | | | | 1,538,254 | |
| | | | | | | | |
| Investments at Value — 98.8% (Cost $27,654,334) | | | | | | $ | 38,238,177 | |
| | | | | | | | | |
| Other Assets in Excess of Liabilities — 1.2% | | | | | | | 457,390 | |
| | | | | | | | | |
| Net Assets — 100.0% | | | | | | $ | 38,695,567 | |
| (a) | Non-income producing security. |
| (b) | Security is considered a restricted security however such restriction has not resulted in an illiquid classification. The total value of these securities is $482,725, which represents 1.2% of net assets as of December 31, 2021. |
The Fund’s sector and industry classifications presented herein refer to any one or more of the industry sub-classifications used by one or more widely recognized market indexes or ratings group indexes, and/ or as defined by Fund management. For Fund compliance purposes, sector and industry classifications are based on the sector and industry categorization methodology of the Adviser to the Funds. This definition may not apply for purposes of this report, which may combine industry sub-classifications for reporting ease. Industries are shown as a percentage of net assets.
| Country Breakdown | | | | | | |
| | | | | | % of Net | |
| Country | | Value | | | Assets | |
| United States | | $ | 21,558,671 | | | | 55.7 | % |
| France | | | 3,282,205 | | | | 8.5 | % |
| United Kingdom | | | 2,777,673 | | | | 7.2 | % |
| Switzerland | | | 2,301,889 | | | | 5.9 | % |
| Netherlands | | | 2,157,385 | | | | 5.6 | % |
| Canada | | | 1,484,941 | | | | 3.8 | % |
| Ireland | | | 1,343,680 | | | | 3.5 | % |
| Bermuda | | | 1,251,807 | | | | 3.2 | % |
| Germany | | | 612,285 | | | | 1.6 | % |
| Sweden | | | 585,137 | | | | 1.5 | % |
| Luxembourg | | | 498,150 | | | | 1.3 | % |
| Japan | | | 384,354 | | | | 1.0 | % |
| Total Investments | | $ | 38,238,177 | | | | 98.8 | % |
| Other Assets in Excess of Liabilities | | | 457,390 | | | | 1.2 | % |
| Net Assets | | $ | 38,695,567 | | | | 100.0 | % |
| See Notes to Financial Statements. | |
| Annual Report | December 31, 2021 | | | 65 |
| Segall Bryant & Hamill Workplace Equality Fund | Statement of Investments |
| | December 31, 2021 |
| | | Shares | | | Value | |
| COMMON STOCKS — 96.3% | | | | | | | | |
| Communication Services — 9.2% | | | | | | | | |
| Media & Entertainment — 9.2% | | | | | | | | |
| Alphabet, Inc. - Class C (a) | | | 512 | | | $ | 1,481,518 | |
| Live Nation Entertainment, Inc. (a) | | | 5,871 | | | | 702,700 | |
| Walt Disney Co. (The) (a) | | | 3,425 | | | | 530,498 | |
| | | | | | | | 2,714,716 | |
| Consumer Discretionary — 13.4% | | | | | | | | |
| Consumer Durables & Apparel — 2.7% | | | | | | | | |
| NIKE, Inc. - Class B | | | 2,786 | | | | 464,343 | |
| Tapestry, Inc. | | | 8,144 | | | | 330,646 | |
| | | | | | | | 794,989 | |
| Consumer Services — 4.1% | | | | | | | | |
| Chipotle Mexican Grill, Inc. (a) | | | 217 | | | | 379,370 | |
| Darden Restaurants, Inc. | | | 2,663 | | | | 401,154 | |
| Wendy’s Co (The) | | | 18,116 | | | | 432,067 | |
| | | | | | | | 1,212,591 | |
| Retailing — 6.6% | | | | | | | | |
| Amazon.com, Inc. (a) | | | 340 | | | | 1,133,676 | |
| Dollar General Corp. | | | 1,843 | | | | 434,635 | |
| eBay, Inc. | | | 5,957 | | | | 396,140 | |
| | | | | | | | 1,964,451 | |
| Consumer Staples — 4.7% | | | | | | | | |
| Food, Beverage & Tobacco — 3.1% | | | | | | | | |
| Hain Celestial Group, Inc. (The) (a) | | | 11,365 | | | | 484,263 | |
| Mondel z International, Inc. - Class A | | | 6,306 | | | | 418,151 | |
| | | | | | | | 902,414 | |
| Household & Personal Products — 1.6% | | | | | | | | |
| Estee Lauder Cos., Inc. (The) - Class A | | | 1,286 | | | | 476,077 | |
| | | | | | | | | |
| Energy — 1.4% | | | | | | | | |
| Energy — 1.4% | | | | | | | | |
| Chevron Corp | | | 3,552 | | | | 416,827 | |
| | | | | | | | | |
| Financials — 11.4% | | | | | | | | |
| Banks — 3.3% | | | | | | | | |
| First Republic Bank | | | 1,637 | | | | 338,057 | |
| JPMorgan Chase & Co | | | 4,109 | | | | 650,660 | |
| | | | | | | | 988,717 | |
| Diversified Financials — 4.7% | | | | | | | | |
| Blackstone, Inc. | | | 4,486 | | | | 580,443 | |
| MSCI, Inc. | | | 833 | | | | 510,371 | |
| State Street Corp | | | 3,056 | | | | 284,208 | |
| | | | | | | | 1,375,022 | |
| Insurance — 3.4% | | | | | | | | |
| Arthur J Gallagher & Co | | | 3,712 | | | | 629,815 | |
| Reinsurance Group of America, Inc. | | | 3,501 | | | | 383,325 | |
| | | | | | | | 1,013,140 | |
| Health Care — 16.0% | | | | | | | | |
| Health Care Equipment & Services — 7.2% | | | | | | | | |
| Alcon, Inc. (Switzerland) | | | 4,817 | | | | 419,657 | |
| McKesson Corp. | | | 1,615 | | | | 401,440 | |
| Stryker Corp | | | 2,000 | | | | 534,840 | |
| UnitedHealth Group, Inc. | | | 1,520 | | | | 763,253 | |
| | | | | | | | 2,119,190 | |
| | | Shares | | | Value | |
| Pharmaceuticals, Biotechnology & Life Sciences — 8.8% | | | | | | | | |
| Bio-Techne Corp | | | 1,073 | | | $ | 555,106 | |
| Danaher Corp. | | | 2,615 | | | | 860,361 | |
| Thermo Fisher Scientific, Inc. | | | 823 | | | | 549,138 | |
| Zoetis, Inc. | | | 2,685 | | | | 655,221 | |
| | | | | | | | 2,619,826 | |
| Industrials — 9.0% | | | | | | | | |
| Capital Goods — 6.6% | | | | | | | | |
| Carrier Global Corp | | | 9,901 | | | | 537,030 | |
| Deere & Co. | | | 979 | | | | 335,690 | |
| Raytheon Technologies Corp | | | 6,845 | | | | 589,081 | |
| Rockwell Automation, Inc. | | | 1,426 | | | | 497,460 | |
| | | | | | | | 1,959,261 | |
| Commercial & Professional Services — 2.4% | | | | | | | | |
| Jacobs Engineering Group, Inc. | | | 2,531 | | | | 352,391 | |
| Republic Services, Inc. | | | 2,487 | | | | 346,812 | |
| | | | | | | | 699,203 | |
| Information Technology — 28.4% | | | | | | | | |
| Semiconductors & Semiconductor Equipment — 5.8% | | | | | | | | |
| Applied Materials, Inc. | | | 4,206 | | | | 661,856 | |
| NVIDIA Corp. | | | 1,779 | | | | 523,222 | |
| Texas Instruments, Inc. | | | 2,887 | | | | 544,113 | |
| | | | | | | | 1,729,191 | |
| Software & Services — 19.8% | | | | | | | | |
| Adobe, Inc. (a) | | | 1,037 | | | | 588,041 | |
| Intuit, Inc. | | | 974 | | | | 626,496 | |
| Microsoft Corp | | | 4,794 | | | | 1,612,318 | |
| NCR Corp (a) | | | 14,375 | | | | 577,875 | |
| ServiceNow, Inc. (a) | | | 1,076 | | | | 698,442 | |
| Tyler Technologies, Inc. (a) | | | 1,131 | | | | 608,422 | |
| Visa, Inc. - Class A | | | 3,559 | | | | 771,271 | |
| Workday, Inc. - Class A (a) | | | 1,323 | | | | 361,417 | |
| | | | | | | | 5,844,282 | |
| Technology Hardware & Equipment – 2.8% | | | | | | | | |
| Keysight Technologies, Inc. (a) | | | 3,974 | | | | 820,671 | |
| | | | | | | | | |
| Materials — 1.2% | | | | | | | | |
| Materials — 1.2% | | | | | | | | |
| Eastman Chemical Co | | | 2,829 | | | | 342,054 | |
| See Notes to Financial Statements. | |
| 66 | | | www.sbhfunds.com |
| Segall Bryant & Hamill Workplace Equality Fund | Statement of Investments |
| | December 31, 2021 |
| | | Shares | | | Value | |
| Real Estate — 1.6% | | | | | | | | |
| Real Estate — 1.6% | | | | | | | | |
| American Tower Corp | | | 1,596 | | | $ | 466,830 | |
| | | | | | | | | |
| Investments at Value — 96.3% (Cost $21,446,774) | | | | | | $ | 28,459,452 | |
| | | | | | | | | |
| Other Assets in Excess of Liabilities — 3.7% | | | | | | | 1,092,523 | |
| | | | | | | | | |
| Net Assets — 100.0% | | | | | | $ | 29,551,975 | |
| (a) | Non-income producing security. |
The Fund’s sector and industry classifications presented herein refer to any one or more of the industry sub-classifications used by one or more widely recognized market indexes or ratings group indexes, and/ or as defined by Fund management. For Fund compliance purposes, sector and industry classifications are based on the sector and industry categorization methodology of the Adviser to the Funds. This definition may not apply for purposes of this report, which may combine industry sub-classifications for reporting ease. Industries are shown as a percentage of net assets.
| See Notes to Financial Statements. | |
| Annual Report | December 31, 2021 | | | 67 |
| Segall Bryant & Hamill Short Term Plus Fund | Statement of Investments |
| | December 31, 2021 |
| | | Coupon | | Maturity | | Par Value | | | Value | |
| CORPORATE BONDS — 82.0% | | | | | | | | | | | | |
| Finance — 3.4% | | | | | | | | | | | | |
| Banking — 3.4% | | | | | | | | | | | | |
| Bank of America Corp. | | 4.100% | | 07/24/23 | | $ | 970,000 | | | $ | 1,019,635 | |
| JPMorgan Chase & Co. (Yield of U.S. Treasury Note, 2.25%, 03/26 + 53) (a) | | 0.697% | | 03/16/24 | | | 755,000 | | | | 753,156 | |
| | | | | | | | | | | | 1,772,791 | |
| Industrial — 64.1% | | | | | | | | | | | | |
| Automobile Manufacturing — 2.4% | | | | | | | | | | | | |
| General Motors Financial Co., Inc. | | 5.100% | | 01/17/24 | | | 850,000 | | | | 911,405 | |
| Paccar Financial Corp. | | 0.800% | | 06/08/23 | | | 315,000 | | | | 315,248 | |
| | | | | | | | | | | | 1,226,653 | |
| Beverage / Bottling — 2.8% | | | | | | | | | | | | |
| Brown Forman Corp. | | 2.250% | | 01/15/23 | | | 513,000 | | | | 518,515 | |
| Constellation Brands, Inc. | | 3.200% | | 02/15/23 | | | 900,000 | | | | 919,302 | |
| | | | | | | | | | | | 1,437,817 | |
| Building Products — 1.2% | | | | | | | | | | | | |
| Martin Marietta Materials, Inc. | | 4.250% | | 07/02/24 | | | 589,000 | | | | 627,291 | |
| | | | | | | | | | | | | |
| Chemicals — 3.0% | | | | | | | | | | | | |
| CF Industries, Inc. | | 3.450% | | 06/01/23 | | | 885,000 | | | | 912,444 | |
| Eastman Chemical Co. | | 7.250% | | 01/15/24 | | | 575,000 | | | | 639,504 | |
| | | | | | | | | | | | 1,551,948 | |
| Construction Machinery — 3.6% | | | | | | | | | | | | |
| Brunswick Corp. | | 0.850% | | 08/18/24 | | | 500,000 | | | | 492,854 | |
| Caterpillar Financial Services Corp. | | 0.650% | | 07/07/23 | | | 400,000 | | | | 399,972 | |
| CNH Industrial Capital LLC | | 1.950% | | 07/02/23 | | | 945,000 | | | | 957,295 | |
| | | | | | | | | | | | 1,850,121 | |
| Consumer Products — 0.8% | | | | | | | | | | | | |
| Whirlpool Corp. | | 4.000% | | 03/01/24 | | | 400,000 | | | | 423,867 | |
| | | | | | | | | | | | | |
| Diversified Manufacturing — 3.3% | | | | | | | | | | | | |
| Amphenol Corp. | | 3.200% | | 04/01/24 | | | 930,000 | | | | 966,792 | |
| Roper Technologies, Inc. | | 3.650% | | 09/15/23 | | | 700,000 | | | | 728,674 | |
| | | | | | | | | | | | 1,695,466 | |
| Electronics — 1.2% | | | | | | | | | | | | |
| Dell International LLC | | 5.450% | | 06/15/23 | | | 209,000 | | | | 220,473 | |
| Qorvo, Inc., 144A (b) | | 1.750% | | 12/15/24 | | | 400,000 | | | | 400,257 | |
| | | | | | | | | | | | 620,730 | |
| Environmental — 1.9% | | | | | | | | | | | | |
| Republic Services, Inc. | | 2.500% | | 08/15/24 | | | 700,000 | | | | 720,345 | |
| Waste Management, Inc. | | 3.500% | | 05/15/24 | | | 233,000 | | | | 243,345 | |
| | | | | | | | | | | | 963,690 | |
| Food Processors — 1.3% | | | | | | | | | | | | |
| Conagra Brands, Inc. | | 3.200% | | 01/25/23 | | | 690,000 | | | | 703,085 | |
| | | | | | | | | | | | | |
| Healthcare Facilities / Supplies — 2.9% | | | | | | | | | | | | |
| Baxter International, Inc., Series J | | 2.400% | | 08/15/22 | | | 496,000 | | | | 500,985 | |
| HCA, Inc. | | 4.750% | | 05/01/23 | | | 981,000 | | | | 1,027,471 | |
| | | | | | | | | | | | 1,528,456 | |
| Home Builders — 2.0% | | | | | | | | | | | | |
| D.R. Horton, Inc. | | 2.500% | | 10/15/24 | | | 566,000 | | | | 582,387 | |
| KB Home | | 7.625% | | 05/15/23 | | | 460,000 | | | | 483,575 | |
| | | | | | | | | | | | 1,065,962 | |
| See Notes to Financial Statements. | |
| 68 | | | www.sbhfunds.com |
| Segall Bryant & Hamill Short Term Plus Fund | Statement of Investments |
| | December 31, 2021 |
| | | Coupon | | Maturity | | Par Value | | | Value | |
| Independent Energy — 2.6% | | | | | | | | | | | | |
| Apache Corp. | | 3.250% | | 04/15/22 | | $ | 850,000 | | | $ | 848,937 | |
| Diamondback Energy, Inc. | | 2.875% | | 12/01/24 | | | 510,000 | | | | 529,081 | |
| | | | | | | | | | | | 1,378,018 | |
| Information / Data Technology — 5.5% | | | | | | | | | | | | |
| Fiserv, Inc. | | 3.800% | | 10/01/23 | | | 940,000 | | | | 982,612 | |
| Moody’s Corp. | | 4.875% | | 02/15/24 | | | 764,000 | | | | 816,256 | |
| PayPal Holdings, Inc. | | 1.350% | | 06/01/23 | | | 395,000 | | | | 398,207 | |
| Salesforce.com, Inc. | | 0.625% | | 07/15/24 | | | 650,000 | | | | 643,949 | |
| | | | | | | | | | | | 2,841,024 | |
| Media — Non-Cable — 3.1% | | | | | | | | | | | | |
| Discovery Communications LLC | | 2.950% | | 03/20/23 | | | 885,000 | | | | 905,139 | |
| Walt Disney Co. (The) | | 7.750% | | 01/20/24 | | | 615,000 | | | | 696,346 | |
| | | | | | | | | | | | 1,601,485 | |
| Midstream Energy — 4.1% | | | | | | | | | | | | |
| Enterprise Products Operating LLC | | 3.350% | | 03/15/23 | | | 300,000 | | | | 306,975 | |
| Gulf South Pipeline Co. LP | | 4.000% | | 06/15/22 | | | 811,000 | | | | 816,398 | |
| Williams Partners LP | | 3.900% | | 01/15/25 | | | 928,000 | | | | 986,150 | |
| | | | | | | | | | | | 2,109,523 | |
| Other Industrial — 1.6% | | | | | | | | | | | | |
| Quanta Services, Inc. | | 0.950% | | 10/01/24 | | | 825,000 | | | | 816,048 | |
| | | | | | | | | | | | | |
| Packaging — 3.3% | | | | | | | | | | | | |
| Avery Dennison Corp. | | 0.850% | | 08/15/24 | | | 740,000 | | | | 729,170 | |
| Ball Corp. | | 4.000% | | 11/15/23 | | | 935,000 | | | | 975,906 | |
| | | | | | | | | | | | 1,705,076 | |
| Paper & Forest Products — 3.2% | | | | | | | | | | | | |
| Graphic Packaging International, Inc. | | 4.875% | | 11/15/22 | | | 659,000 | | | | 670,533 | |
| Weyerhaeuser Co. | | 7.125% | | 07/15/23 | | | 725,000 | | | | 789,689 | |
| Weyerhaeuser Co. | | 8.500% | | 01/15/25 | | | 160,000 | | | | 192,644 | |
| | | | | | | | | | | | 1,652,866 | |
| Pharmaceuticals — 1.5% | | | | | | | | | | | | |
| AstraZeneca Finance LLC | | 0.700% | | 05/28/24 | | | 800,000 | | | | 793,629 | |
| | | | | | | | | | | | | |
| Railroads — 1.3% | | | | | | | | | | | | |
| Kansas City Southern | | 3.000% | | 05/15/23 | | | 650,000 | | | | 664,915 | |
| | | | | | | | | | | | | |
| Refining — 0.9% | | | | | | | | | | | | |
| Phillips 66 | | 0.900% | | 02/15/24 | | | 490,000 | | | | 486,363 | |
| | | | | | | | | | | | | |
| Retail Stores — 2.9% | | | | | | | | | | | | |
| AutoNation, Inc. | | 3.500% | | 11/15/24 | | | 500,000 | | | | 524,338 | |
| QVC, Inc. | | 4.375% | | 03/15/23 | | | 960,000 | | | | 988,800 | |
| | | | | | | | | | | | 1,513,138 | |
| Supermarkets — 1.0% | | | | | | | | | | | | |
| Kroger Co. (The) | | 3.400% | | 04/15/22 | | | 241,000 | | | | 241,176 | |
| Kroger Co. (The) | | 4.000% | | 02/01/24 | | | 270,000 | | | | 284,000 | |
| | | | | | | | | | | | 525,176 | |
| Transportation Services — 1.6% | | | | | | | | | | | | |
| CSX Transportation, Inc. | | 6.251% | | 01/15/23 | | | 68,678 | | | | 72,131 | |
| Delta Air Lines Pass Thru Trust, Series 2019-1, Class AA | | 3.204% | | 10/25/25 | | | 733,000 | | | | 757,853 | |
| Hawaiian Airlines, Inc., Series 2013-1, Class B | | 4.950% | | 07/15/23 | | | 29,083 | | | | 29,087 | |
| | | | | | | | | | | | 859,071 | |
| See Notes to Financial Statements. | |
| Annual Report | December 31, 2021 | | | 69 |
| Segall Bryant & Hamill Short Term Plus Fund | Statement of Investments |
| | December 31, 2021 |
| | | Coupon | | Maturity | | Par Value | | | Value | |
| Wireless Telecommunications — 3.5% | | | | | | | | | | | | |
| American Tower Corp. | | 3.500% | | 01/31/23 | | $ | 975,000 | | | $ | 1,001,190 | |
| T-Mobile USA, Inc. | | 4.000% | | 04/15/22 | | | 800,000 | | | | 804,608 | |
| | | | | | | | | | | | 1,805,798 | |
| Wireline Telecommunications — 1.6% | | | | | | | | | | | | |
| AT&T, Inc. | | 9.150% | | 02/01/23 | | | 300,000 | | | | 325,895 | |
| AT&T, Inc. | | 0.900% | | 03/25/24 | | | 530,000 | | | | 527,606 | |
| | | | | | | | | | | | 853,501 | |
| Utility — 14.5% | | | | | | | | | | | | |
| Electric — 11.6% | | | | | | | | | | | | |
| Arizona Public Service Co. | | 3.350% | | 06/15/24 | | | 665,000 | | | | 692,240 | |
| Delmarva Power & Light Co. | | 3.500% | | 11/15/23 | | | 362,000 | | | | 376,617 | |
| Evergy, Inc. | | 2.450% | | 09/15/24 | | | 800,000 | | | | 820,470 | |
| Eversource Energy, Series F | | 2.800% | | 05/01/23 | | | 500,000 | | | | 508,719 | |
| Georgia Power Co., Series 2020-A | | 2.100% | | 07/30/23 | | | 900,000 | | | | 915,826 | |
| National Rural Utilities Cooperative Finance Corp. | | 2.400% | | 04/25/22 | | | 499,000 | | | | 501,344 | |
| NextEra Energy Capital Holdings, Inc. | | 0.650% | | 03/01/23 | | | 1,000,000 | | | | 997,976 | |
| Pacific Gas & Electric Co. | | 1.700% | | 11/15/23 | | | 595,000 | | | | 596,537 | |
| PPL Electric Utilities Corp. | | 2.500% | | 09/01/22 | | | 190,000 | | | | 191,506 | |
| Virginia Electric & Power Co., Series 2015-A | | 3.100% | | 05/15/25 | | | 390,000 | | | | 408,149 | |
| | | | | | | | | | | | 6,009,384 | |
| Midstream Energy — 1.9% | | | | | | | | | | | | |
| Kinder Morgan, Inc. | | 3.150% | | 01/15/23 | | | 956,000 | | | | 976,182 | |
| | | | | | | | | | | | | |
| Other Utility — 1.0% | | | | | | | | | | | | |
| American Water Capital Corp. | | 3.400% | | 03/01/25 | | | 500,000 | | | | 528,428 | |
| | | | | | | | | | | | | |
| Total Corporate Bonds (Cost $42,813,507) | | | | | | | | | | | 42,587,502 | |
| | | | | | | | | | | | | |
| MUNICIPAL BONDS — 5.9% | | | | | | | | | | | | |
| California — 0.3% | | | | | | | | | | | | |
| San Diego California Public Facilities Financing Authority Senior Water Revenue Refunding Bonds, Series 2020-B | | 1.231% | | 08/01/22 | | | 160,000 | | | | 160,856 | |
| | | | | | | | | | | | | |
| Georgia — 1.5% | | | | | | | | | | | | |
| Municipal Electric Authority of Georgia, Series 2021-B | | 0.926% | | 01/01/24 | | | 770,000 | | | | 764,191 | |
| | | | | | | | | | | | | |
| Maryland — 0.1% | | | | | | | | | | | | |
| Howard County, Maryland Refunding Consolidated Public Improvement Project and Refunding Bonds, Series 2020-C | | 1.224% | | 08/15/22 | | | 70,000 | | | | 70,376 | |
| | | | | | | | | | | | | |
| New Jersey — 0.2% | | | | | | | | | | | | |
| New Jersey Economic Development Authority Water Facilities, Series 2020-C | | 1.150% | | 06/01/23 | | | 125,000 | | | | 126,169 | |
| | | | | | | | | | | | | |
| Oklahoma — 0.9% | | | | | | | | | | | | |
| Oklahoma State Turnpike Authority, Series 2020-B | | 0.491% | | 01/01/22 | | | 465,000 | | | | 465,000 | |
| | | | | | | | | | | | | |
| Texas — 2.2% | | | | | | | | | | | | |
| Austin Texas Community College, Series 2020 | | 0.662% | | 02/01/23 | | | 50,000 | | | | 49,964 | |
| Central Texas Regional Mobility Authority, Series 2020-D | | 1.307% | | 01/01/22 | | | 100,000 | | | | 100,000 | |
| Central Texas Regional Mobility Authority, Series 2021-E | | 0.496% | | 01/01/23 | | | 350,000 | | | | 349,126 | |
| Central Texas Regional Mobility Authority, Series 2021-E | | 0.836% | | 01/01/24 | | | 325,000 | | | | 323,053 | |
| Central Texas Regional Mobility Authority, Series 2020-C | | 1.345% | | 01/01/24 | | | 135,000 | | | | 135,541 | |
| Fort Bend County Texas, Series 2020 | | 5.000% | | 03/01/23 | | | 185,000 | | | | 194,343 | |
| | | | | | | | | | | | 1,152,027 | |
| See Notes to Financial Statements. | |
| 70 | | | www.sbhfunds.com |
| Segall Bryant & Hamill Short Term Plus Fund | Statement of Investments |
| | December 31, 2021 |
| | | Coupon | | Maturity | | Par Value | | | Value | |
| Wisconsin — 0.7% | | | | | | | | | | |
| Public Finance Authority Air Cargo Group Revenue Bonds, Series 2021 | | 1.484% | | 07/01/23 | | $ | 350,000 | | | $ | 348,399 | |
| | | | | | | | | | | | | |
| Total Municipal Bonds (Cost $3,093,372) | | | | | | | | | | | 3,087,018 | |
| | | | | | | | | | | | | |
| ASSET BACKED SECURITIES — 0.0% (c) | | | | | | | | | | | | |
| Verizon Owner Trust, Series 2018-A, Class A-1A (a) (Cost $61) | | 3.230% | | 04/20/23 | | | 61 | | | | 61 | |
| | | | | | | | | | | | | |
| COMMERCIAL MORTGAGE-BACKED SECURITIES — 1.7% | | | | | | | | | | | | |
| FHLMC Remic, Series K-021, Class A-2 | | 2.396% | | 06/25/22 | | | 403,909 | | | | 406,157 | |
| FHLMC Remic, Series K-029, Class A-2 (a) | | 3.320% | | 02/25/23 | | | 437,308 | | | | 448,182 | |
| FNMA Remic Trust, Series 2012-M13, Class A-2 | | 2.377% | | 05/25/22 | | | 5,169 | | | | 5,195 | |
| Total Commercial Mortgage-Backed Securities (Cost $863,098) | | | | | | | | | | | 859,534 | |
| | | | | | | | | | | | | |
| U.S . GOVERNMENT & AGENCIES — 0.9% | | | | | | | | | | | | |
| FNMA (Cost $484,818) | | 0.310% | | 11/16/23 | | | 485,000 | | | | 482,729 | |
| | | | | | | | | | | | | |
| U.S . TREASURY BONDS & NOTES — 6.5% | | | | | | | | | | | | |
| United States Treasury | | 2.250% | | 04/15/22 | | | 300,000 | | | | 301,790 | |
| United States Treasury | | 0.125% | | 07/15/23 | | | 1,000,000 | | | | 992,773 | |
| United States Treasury | | 2.125% | | 11/30/23 | | | 1,000,000 | | | | 1,026,836 | |
| United States Treasury | | 2.250% | | 01/31/24 | | | 1,000,000 | | | | 1,030,703 | |
| Total U.S. Treasury Bonds & Notes (Cost $3,368,190) | | | | | | | | | | | 3,352,102 | |
| | | | | | | | | | | | | |
| Investments at Value — 97.0% | | | | | | | | | | | | |
| (Cost $50,623,046) | | | | | | | | | | $ | 50,368,946 | |
| | | | | | | | | | | | | |
| Other Assets in Excess of Liabilities — 3.0% | | | | | | | | | | | 1,581,845 | |
| | | | | | | | | | | | | |
| Net Assets — 100.0% | | | | | | | | | | $ | 51,950,791 | |
| (a) | Variable rate security. Interest rate resets periodically. The rate shown is the effective interest rate as of December 31, 2021. For securities based on a published reference rate and spread, the reference rate and spread (in basis points) are indicated parenthetically. Certain variable rate securities are not based on a published reference rate and spread but are determined by the issuer or agent and are based on current market conditions. These securities, therefore, do not indicate a reference rate and spread. |
| (b) | Security was purchased in a transaction exempt from registration in compliance with Rule 144A of the Securities Act of 1933. This security may be resold in transactions exempt from registration, normally to qualified institutional buyers. The total value of these securities is $400,257, which represents 0.8% of net assets as of December 31, 2021. |
| (c) | Percentage rounds to less than 0.1%. |
The Fund’s sector and industry classifications presented herein refer to any one or more of the industry sub-classifications used by one or more widely recognized market indexes or ratings group indexes, and/or as defined by Fund management. For Fund compliance purposes, sector and industry classifications are based on the sector and industry categorization methodology of the Adviser to the Funds. This definition may not apply for purposes of this report, which may combine industry sub-classifications for reporting ease. Industries are shown as a percentage of net assets.
| See Notes to Financial Statements. | |
| Annual Report | December 31, 2021 | | | 71 |
| Segall Bryant & Hamill Plus Bond Fund | Statement of Investments |
| | December 31, 2021 |
| | | Coupon | | Maturity | | Par Value | | | Value | |
| CORPORATE BONDS — 49.5% | | | | | | | | | | | | |
| Finance — 8.7% | | | | | | | | | | | | |
| Banking — 3.3% | | | | | | | | | | | | |
| Bank of America Corp., Series N (SOFR + 153) (a) | | 1.898% | | 07/23/31 | | $ | 3,700,000 | | | $ | 3,541,179 | |
| Bank of America Corp., Series N (3MO LIBOR + 315) (a) | | 4.083% | | 03/20/51 | | | 3,000,000 | | | | 3,608,480 | |
| Capital One Financial Corp. | | 3.200% | | 02/05/25 | | | 7,640,000 | | | | 8,005,366 | |
| JPMorgan Chase & Co. (SOFR + 151) (a) | | 2.739% | | 10/15/30 | | | 7,830,000 | | | | 8,045,195 | |
| Truist Financial Corp. (SOFR + 60.9) (a) | | 1.267% | | 03/02/27 | | | 4,300,000 | | | | 4,218,762 | |
| Wells Fargo & Co. (3MO LIBOR + 131) (a) | | 3.584% | | 05/22/28 | | | 7,250,000 | | | | 7,793,921 | |
| | | | | | | | | | | | 35,212,903 | |
| Broker/Asset Managers/Exchanges — 1.4% | | | | | | | | | | | | |
| Cboe Global Markets, Inc. | | 3.650% | | 01/12/27 | | | 9,800,000 | | | | 10,655,578 | |
| FMR LLC, 144A (b) | | 6.450% | | 11/15/39 | | | 2,575,000 | | | | 3,728,767 | |
| | | | | | | | | | | | 14,384,345 | |
| Life Insurance — 1.0% | | | | | | | | | | | | |
| Massachusetts Mutual Life Insurance Co., 144A (b) | | 3.729% | | 10/15/70 | | | 2,279,000 | | | | 2,522,025 | |
| Northwestern Mutual Life Insurance Co. (The), 144A (b) | | 3.850% | | 09/30/47 | | | 6,775,000 | | | | 7,637,050 | |
| | | | | | | | | | | | 10,159,075 | |
| Mortgage Banking — 0.6% | | | | | | | | | | | | |
| Provident Funding Associates LP/PFG Finance Corp., 144A (b) | | 6.375% | | 06/15/25 | | | 6,295,000 | | | | 6,405,162 | |
| | | | | | | | | | | | | |
| Noncaptive Diversified Financial Companies — 0.7% | | | | | | | | | | | | |
| Aircastle, Ltd. | | 5.000% | | 04/01/23 | | | 3,000,000 | | | | 3,131,462 | |
| Aviation Capital Group LLC, 144A (b) | | 3.875% | | 05/01/23 | | | 4,250,000 | | | | 4,374,817 | |
| | | | | | | | | | | | 7,506,279 | |
| Other Finance — 0.5% | | | | | | | | | | | | |
| IIP Operating Partnership LP, 144A (b) | | 5.500% | | 05/25/26 | | | 4,615,000 | | | | 4,885,571 | |
| | | | | | | | | | | | | |
| Real Estate Investment Trusts — 1.2% | | | | | | | | | | | | |
| MPT Operating Partnership LP/MPT Finance Corp. | | 5.000% | | 10/15/27 | | | 6,175,000 | | | | 6,460,594 | |
| Ventas Realty LP | | 3.500% | | 04/15/24 | | | 3,000,000 | | | | 3,136,808 | |
| Ventas Realty LP | | 4.400% | | 01/15/29 | | | 2,955,000 | | | | 3,353,585 | |
| | | | | | | | | | | | 12,950,987 | |
| Industrial — 36.4% | | | | | | | | | | | | |
| Aerospace / Defense — 0.4% | | | | | | | | | | | | |
| Raytheon Technologies Corp. | | 3.150% | | 12/15/24 | | | 3,696,000 | | | | 3,879,427 | |
| | | | | | | | | | | | | |
| Automobile Manufacturing — 1.6% | | | | | | | | | | | | |
| Ford Motor Credit Co. LLC | | 4.063% | | 11/01/24 | | | 2,000,000 | | | | 2,104,340 | |
| Ford Motor Credit Co. LLC | | 3.375% | | 11/13/25 | | | 5,500,000 | | | | 5,714,060 | |
| General Motors Financial Co., Inc. | | 5.100% | | 01/17/24 | | | 2,300,000 | | | | 2,466,155 | |
| General Motors Financial Co., Inc. | | 3.950% | | 04/13/24 | | | 4,425,000 | | | | 4,656,126 | |
| Goodyear Tire & Rubber Co. | | 9.500% | | 05/31/25 | | | 1,500,000 | | | | 1,621,485 | |
| Goodyear Tire & Rubber Co., 144A (b) | | 5.000% | | 07/15/29 | | | 500,000 | | | | 537,100 | |
| | | | | | | | | | | | 17,099,266 | |
| Beverage / Bottling — 1.4% | | | | | | | | | | | | |
| Anheuser-Busch Cos. LLC/Anheuser-Busch InBev Worldwide, Inc. | | 4.900% | | 02/01/46 | | | 5,700,000 | | | | 7,204,429 | |
| Fomento Economico Mexicano S A B de C V | | 2.875% | | 05/10/23 | | | 7,548,000 | | | | 7,727,265 | |
| | | | | | | | | | | | 14,931,694 | |
| Building Products — 1.6% | | | | | | | | | | | | |
| Allegion PLC | | 3.500% | | 10/01/29 | | | 4,028,000 | | | | 4,280,934 | |
| Allegion US Holding Co., Inc. | | 3.550% | | 10/01/27 | | | 2,550,000 | | | | 2,703,820 | |
| Masco Corp. | | 6.500% | | 08/15/32 | | | 6,205,000 | | | | 8,205,229 | |
| Summit Materials LLC, 144A (b) | | 6.500% | | 03/15/27 | | | 1,450,000 | | | | 1,504,375 | |
| | | | | | | | | | | | 16,694,358 | |
| See Notes to Financial Statements. | |
| 72 | | | www.sbhfunds.com |
| Segall Bryant & Hamill Plus Bond Fund | Statement of Investments |
| | December 31, 2021 |
| | | Coupon | | Maturity | | Par Value | | | Value | |
| Chemicals — 0.4% | | | | | | | | | | |
| Compass Minerals International, Inc., 144A (b) | | 6.750% | | 12/01/27 | | $ | 3,530,000 | | | $ | 3,737,670 | |
| | | | | | | | | | | | | |
| Construction Machinery — 1.7% | | | | | | | | | | | | |
| CNH Industrial N.V. | | 4.500% | | 08/15/23 | | | 3,275,000 | | | | 3,440,205 | |
| Deere & Co. | | 3.750% | | 04/15/50 | | | 1,590,000 | | | | 1,877,978 | |
| H&E Equipment Services, Inc., 144A (b) | | 3.875% | | 12/15/28 | | | 5,550,000 | | | | 5,508,375 | |
| John Deere Capital Corp. | | 1.750% | | 03/09/27 | | | 2,045,000 | | | | 2,058,914 | |
| United Rentals North America | | 3.875% | | 02/15/31 | | | 5,295,000 | | | | 5,374,425 | |
| | | | | | | | | | | | 18,259,897 | |
| Consumer Products — 0.5% | | | | | | | | | | | | |
| Vista Outdoor, Inc., 144A (b) | | 4.500% | | 03/15/29 | | | 5,600,000 | | | | 5,635,000 | |
| | | | | | | | | | | | | |
| Diversified Manufacturing — 1.1% | | | | | | | | | | | | |
| BWX Technologies, Inc., 144A (b) | | 4.125% | | 06/30/28 | | | 4,169,000 | | | | 4,231,535 | |
| nVent Finance SARL | | 2.750% | | 11/15/31 | | | 2,245,000 | | | | 2,235,592 | |
| Vontier Corp., 144A (b) | | 2.400% | | 04/01/28 | | | 5,550,000 | | | | 5,361,855 | |
| | | | | | | | | | | | 11,828,982 | |
| Electronics — 2.3% | | | | | | | | | | | | |
| Amkor Technology, Inc., 144A (b) | | 6.625% | | 09/15/27 | | | 4,422,000 | | | | 4,673,700 | |
| Analog Devices, Inc. | | 1.700% | | 10/01/28 | | | 4,180,000 | | | | 4,167,055 | |
| Dell, Inc. | | 7.100% | | 04/15/28 | | | 4,492,000 | | | | 5,627,727 | |
| QORVO, Inc., 144A (b) | | 1.750% | | 12/15/24 | | | 2,840,000 | | | | 2,841,826 | |
| QORVO, Inc. | | 4.375% | | 10/15/29 | | | 775,000 | | | | 822,469 | |
| QORVO, Inc., 144A (b) | | 3.375% | | 04/01/31 | | | 500,000 | | | | 508,970 | |
| TSMC Arizona Corp. | | 2.500% | | 10/25/31 | | | 5,200,000 | | | | 5,266,154 | |
| | | | | | | | | | | | 23,907,901 | |
| Gaming — 0.5% | | | | | | | | | | | | |
| MGM Growth Properties Operating Partnership LP/MGP Finance Co. | | 5.625% | | 05/01/24 | | | 5,199,000 | | | | 5,556,275 | |
| | | | | | | | | | | | | |
| Healthcare Facilities / Supplies — 1.1% | | | | | | | | | | | | |
| HCA, Inc. | | 3.500% | | 09/01/30 | | | 2,500,000 | | | | 2,642,187 | |
| Hologic, Inc., 144A (b) | | 4.625% | | 02/01/28 | | | 3,146,000 | | | | 3,303,300 | |
| Teleflex, Inc. | | 4.625% | | 11/15/27 | | | 1,390,000 | | | | 1,445,600 | |
| Teleflex, Inc., 144A (b) | | 4.250% | | 06/01/28 | | | 3,741,000 | | | | 3,853,941 | |
| | | | | | | | | | | | 11,245,028 | |
| Independent Energy — 3.5% | | | | | | | | | | | | |
| Apache Corp. | | 3.250% | | 04/15/22 | | | 9,041,000 | | | | 9,029,699 | |
| Diamondback Energy, Inc. | | 3.500% | | 12/01/29 | | | 7,965,000 | | | | 8,446,144 | |
| Occidental Petroleum Corp. | | 7.500% | | 05/01/31 | | | 6,085,000 | | | | 8,005,578 | |
| PDC Energy, Inc. | | 5.750% | | 05/15/26 | | | 5,000,000 | | | | 5,166,950 | |
| Range Resources Corp. | | 4.875% | | 05/15/25 | | | 6,400,000 | | | | 6,608,000 | |
| | | | | | | | | | | | 37,256,371 | |
| Information / Data Technology — 1.7% | | | | | | | | | | | | |
| Fiserv, Inc. | | 3.200% | | 07/01/26 | | | 7,475,000 | | | | 7,903,488 | |
| Moody’s Corp. | | 4.875% | | 02/15/24 | | | 9,235,000 | | | | 9,866,650 | |
| | | | | | | | | | | | 17,770,138 | |
| Lease / Rent — 1.0% | | | | | | | | | | | | |
| SBA Tower Trust, Series 2019-1, Class 1C, 144A (b) | | 2.836% | | 01/15/50 | | | 10,000,000 | | | | 10,261,515 | |
| | | | | | | | | | | | | |
| Media - Cable — 2.6% | | | | | | | | | | | | |
| CCO Holdings LLC/CCO Holdings Capital Corp., 144A (b) | | 5.000% | | 02/01/28 | | | 4,140,000 | | | | 4,305,600 | |
| Comcast Corp. | | 2.350% | | 01/15/27 | | | 8,200,000 | | | | 8,492,652 | |
| Cox Communications, Inc., 144A (b) | | 2.600% | | 06/15/31 | | | 5,325,000 | | | | 5,318,955 | |
| Dish DBS Corp. | | 5.875% | | 07/15/22 | | | 4,044,000 | | | | 4,109,715 | |
| Dish DBS Corp. | | 7.750% | | 07/01/26 | | | 2,050,000 | | | | 2,162,750 | |
| See Notes to Financial Statements. | |
| Annual Report | December 31, 2021 | | | 73 |
| Segall Bryant & Hamill Plus Bond Fund | Statement of Investments |
| | December 31, 2021 |
| | | Coupon | | Maturity | | Par Value | | | Value | |
| Media - Cable (continued) | | | | | | | | | | | | |
| Sirius XM Radio, Inc., 144A (b) | | 5.500% | | 07/01/29 | | $ | 3,000,000 | | | $ | 3,232,500 | |
| | | | | | | | | | | | 27,622,172 | |
| Media — Non-Cable — 1.4% | | | | | | | | | | | | |
| AMC Networks, Inc. | | 4.750% | | 08/01/25 | | | 3,965,000 | | | | 4,049,256 | |
| Lamar Media Corp. | | 3.750% | | 02/15/28 | | | 2,400,000 | | | | 2,406,000 | |
| Lamar Media Corp. | | 4.875% | | 01/15/29 | | | 1,700,000 | | | | 1,774,375 | |
| Netflix, Inc. | | 4.875% | | 04/15/28 | | | 1,000,000 | | | | 1,140,000 | |
| Netflix, Inc. | | 6.375% | | 05/15/29 | | | 1,000,000 | | | | 1,242,500 | |
| Netflix, Inc., 144A (b) | | 4.875% | | 06/15/30 | | | 1,225,000 | | | | 1,428,656 | |
| Walt Disney Co. (The) | | 4.625% | | 03/23/40 | | | 2,630,000 | | | | 3,269,082 | |
| | | | | | | | | | | | 15,309,869 | |
| Metals / Mining — 0.7% | | | | | | | | | | | | |
| Freeport-McMoran Copper & Gold, Inc. | | 3.875% | | 03/15/23 | | | 6,687,000 | | | | 6,921,045 | |
| | | | | | | | | | | | | |
| Midstream Energy — 2.5% | | | | | | | | | | | | |
| Boardwalk Pipelines LP | | 3.375% | | 02/01/23 | | | 3,295,000 | | | | 3,354,158 | |
| Magellan Midstream Partners LP | | 5.000% | | 03/01/26 | | | 6,125,000 | | | | 6,835,319 | |
| Tennessee Gas Pipeline Co. LLC | | 8.375% | | 06/15/32 | | | 5,284,000 | | | | 7,562,913 | |
| Transcontinental Gas Pipe Line Co. LLC | | 7.850% | | 02/01/26 | | | 4,315,000 | | | | 5,267,030 | |
| Valero Energy Partners LP | | 4.375% | | 12/15/26 | | | 2,667,000 | | | | 2,927,781 | |
| | | | | | | | | | | | 25,947,201 | |
| Oil Field Services — 0.1% | | | | | | | | | | | | |
| Burlington Resources, Inc. | | 6.875% | | 02/15/26 | | | 1,000,000 | | | | 1,195,348 | |
| | | | | | | | | | | | | |
| Other Industrial — 0.8% | | | | | | | | | | | | |
| Quanta Services, Inc. | | 2.900% | | 10/01/30 | | | 8,000,000 | | | | 8,135,497 | |
| | | | | | | | | | | | | |
| Packaging — 1.4% | | | | | | | | | | | | |
| Ball Corp. | | 4.875% | | 03/15/26 | | | 4,500,000 | | | | 4,956,750 | |
| Berry Global, Inc., 144A (b) | | 4.500% | | 02/15/26 | | | 1,418,000 | | | | 1,439,625 | |
| Silgan Holdings, Inc. | | 4.750% | | 03/15/25 | | | 779,000 | | | | 783,869 | |
| Silgan Holdings, Inc., 144A (b) | | 1.400% | | 04/01/26 | | | 3,000,000 | | | | 2,926,680 | |
| Silgan Holdings, Inc. | | 4.125% | | 02/01/28 | | | 4,820,000 | | | | 4,922,425 | |
| | | | | | | | | | | | 15,029,349 | |
| Paper & Forest Products — 0.7% | | | | | | | | | | | | |
| Graphic Packaging International, Inc. | | 4.875% | | 11/15/22 | | | 1,601,000 | | | | 1,629,017 | |
| West Fraser Timber Co., Ltd., 144A (b) | | 4.350% | | 10/15/24 | | | 5,425,000 | | | | 5,798,140 | |
| | | | | | | | | | | | 7,427,157 | |
| Railroads — 0.5% | | | | | | | | | | | | |
| Canadian Pacific Railway Co. | | 2.450% | | 12/02/31 | | | 2,000,000 | | | | 2,039,159 | |
| Kansas City Southern | | 2.875% | | 11/15/29 | | | 3,293,000 | | | | 3,410,111 | |
| | | | | | | | | | | | 5,449,270 | |
| Retail Stores — 2.0% | | | | | | | | | | | | |
| Dollar General Corp. | | 3.500% | | 04/03/30 | | | 3,550,000 | | | | 3,836,280 | |
| Group 1 Automotive, Inc., 144A (b) | | 4.000% | | 08/15/28 | | | 5,438,000 | | | | 5,417,607 | |
| Hanesbrands, Inc., 144A (b) | | 4.625% | | 05/15/24 | | | 2,491,000 | | | | 2,608,426 | |
| Hanesbrands, Inc., 144A (b) | | 4.875% | | 05/15/26 | | | 2,000,000 | | | | 2,137,500 | |
| QVC, Inc. | | 4.850% | | 04/01/24 | | | 5,122,000 | | | | 5,468,426 | |
| QVC, Inc. | | 4.750% | | 02/15/27 | | | 2,085,000 | | | | 2,143,922 | |
| | | | | | | | | | | | 21,612,161 | |
| Services — 1.6% | | | | | | | | | | | | |
| Block Financial LLC | | 3.875% | | 08/15/30 | | | 5,340,000 | | | | 5,713,349 | |
| Rayonier LP | | 2.750% | | 05/17/31 | | | 6,000,000 | | | | 5,986,097 | |
| Service Corp. International | | 4.625% | | 12/15/27 | | | 483,000 | | | | 504,131 | |
| See Notes to Financial Statements. | |
| 74 | | | www.sbhfunds.com |
| Segall Bryant & Hamill Plus Bond Fund | Statement of Investments |
| | December 31, 2021 |
| | | Coupon | | Maturity | | Par Value | | | Value | |
| Services (continued) | | | | | | | | | | | | |
| Service Corp. International | | 5.125% | | 06/01/29 | | $ | 4,575,000 | | | $ | 4,906,687 | |
| | | | | | | | | | | | 17,110,264 | |
| Supermarkets — 0.5% | | | | | | | | | | | | |
| Alimentation Couche-Tard, Inc., 144A (b) | | 3.550% | | 07/26/27 | | | 4,660,000 | | | | 4,992,355 | |
| | | | | | | | | | | | | |
| Transportation Services — 1.5% | | | | | | | | | | | | |
| American Airlines, Inc., Series 2013-2, Class A (c) | | 4.950% | | 07/15/24 | | | 7,074,409 | | | | 7,229,255 | |
| FedEx Corp. | | 3.900% | | 02/01/35 | | | 6,190,000 | | | | 6,906,989 | |
| United Parcel Service, Inc. | | 5.200% | | 04/01/40 | | | 1,540,000 | | | | 2,074,836 | |
| | | | | | | | | | | | 16,211,080 | |
| Vehicle Parts — 0.5% | | | | | | | | | | | | |
| Meritor, Inc., 144A (b) | | 6.250% | | 06/01/25 | | | 4,887,000 | | | | 5,094,697 | |
| | | | | | | | | | | | | |
| Wireless Telecommunications — 0.4% | | | | | | | | | | | | |
| T-Mobile USA, Inc. | | 3.500% | | 04/15/31 | | | 3,670,000 | | | | 3,818,195 | |
| | | | | | | | | | | | | |
| Wireline Telecommunications — 0.4% | | | | | | | | | | | | |
| AT&T, Inc. | | 3.500% | | 06/01/41 | | | 1,275,000 | | | | 1,310,373 | |
| AT&T, Inc., 144A (b) | | 3.550% | | 09/15/55 | | | 3,362,000 | | | | 3,374,200 | |
| | | | | | | | | | | | 4,684,573 | |
| Utility — 4.4% | | | | | | | | | | | | |
| Electric — 3.8% | | | | | | | | | | | | |
| Nevada Power Co. | | 6.750% | | 07/01/37 | | | 3,956,000 | | | | 5,850,367 | |
| NRG Energy, Inc., 144A (b) | | 5.250% | | 06/15/29 | | | 5,575,000 | | | | 5,972,971 | |
| Oncor Electric Delivery Co. LLC | | 5.750% | | 03/15/29 | | | 4,725,000 | | | | 5,781,671 | |
| Pacific Gas & Electric Co. | | 1.700% | | 11/15/23 | | | 2,761,000 | | | | 2,768,130 | |
| PG&E Corp. | | 5.000% | | 07/01/28 | | | 2,000,000 | | | | 2,103,640 | |
| Pinnacle West Capital Corp. | | 1.300% | | 06/15/25 | | | 4,327,000 | | | | 4,255,970 | |
| Tenaska Virginia Partners LP, 144A (b) | | 6.119% | | 03/30/24 | | | 52,483 | | | | 54,839 | |
| Virginia Electric & Power Co., Series A | | 6.000% | | 05/15/37 | | | 5,581,000 | | | | 7,630,018 | |
| Vistra Operations Co. LLC, 144A (b) | | 5.000% | | 07/31/27 | | | 5,100,000 | | | | 5,292,882 | |
| | | | | | | | | | | | 39,710,488 | |
| Natural Gas — Distributors — 0.6% | | | | | | | | | | | | |
| AmeriGas Partners LP/AmeriGas Financial Corp. | | 5.625% | | 05/20/24 | | | 5,932,000 | | | | 6,413,500 | |
| | | | | | | | | | | | | |
| Total Corporate Bonds (Cost $501,138,621) | | | | | | | | | | | 522,252,065 | |
| | | | | | | | | | | | | |
| MUNICIPAL BONDS — 10.0% | | | | | | | | | | | | |
| California — 3.0% | | | | | | | | | | | | |
| California Educational Facilities Authority, Series 2018-A | | 4.842% | | 10/01/48 | | | 3,635,000 | | | | 4,014,952 | |
| California Municipal Finance Authority, Series 2021 (c) | | 3.637% | | 07/01/30 | | | 5,975,000 | | | | 6,310,362 | |
| City of San Francisco California Public Utilities Commission Water Revenue, Series 2010-B | | 6.000% | | 11/01/40 | | | 7,750,000 | | | | 10,448,235 | |
| San Diego County Regional Airport Authority, Series 2014-B | | 5.594% | | 07/01/43 | | | 3,215,000 | | | | 3,541,539 | |
| University of California, Series 2013-AJ | | 4.601% | | 05/15/31 | | | 6,390,000 | | | | 7,439,188 | |
| | | | | | | | | | | | 31,754,276 | |
| Colorado — 0.4% | | | | | | | | | | | | |
| Denver Colorado Public Schools, Series 2013-B | | 4.242% | | 12/15/37 | | | 3,900,000 | | | | 4,580,643 | |
| | | | | | | | | | | | | |
| District of Columbia — 0.3% | | | | | | | | | | | | |
| District of Columbia Income Tax, Series 2009-E | | 5.591% | | 12/01/34 | | | 2,880,000 | | | | 3,621,399 | |
| | | | | | | | | | | | | |
| Maryland — 0.2% | | | | | | | | | | | | |
| Maryland State Economic Development Corp., Series 2021 (c) | | 3.997% | | 04/01/34 | | | 2,000,000 | | | | 2,120,303 | |
| See Notes to Financial Statements. | |
| Annual Report | December 31, 2021 | | | 75 |
| Segall Bryant & Hamill Plus Bond Fund | Statement of Investments |
| | December 31, 2021 |
| | | Coupon | | Maturity | | Par Value | | | Value | |
| Massachusetts — 0.7% | | | | | | | | | | |
| Commonwealth of Massachusetts, Series 2019-D | | 2.663% | | 09/01/39 | | $ | 7,332,114 | | | $ | 7,477,704 | |
| | | | | | | | | | | | | |
| New Hampshire — 0.6% | | | | | | | | | | | | |
| National Finance Authority, Series 2021 | | 3.778% | | 01/01/36 | | | 6,000,000 | | | | 6,325,961 | |
| | | | | | | | | | | | | |
| New York — 0.8% | | | | | | | | | | | | |
| New York City Transitional Finance Authority, Series B SUB B-3 | | 3.950% | | 08/01/32 | | | 7,665,000 | | | | 8,461,640 | |
| | | | | | | | | | | | | |
| Texas — 2.1% | | | | | | | | | | | | |
| Central Texas Regional Mobility Authority, Series 2020-D | | 3.593% | | 01/01/42 | | | 4,950,000 | | | | 4,985,955 | |
| Dallas Area Rapid Transit, Series 2010-B | | 4.920% | | 12/01/41 | | | 6,110,000 | | | | 8,109,925 | |
| North Texas Tollway Authority System, Series 2020-B | | 2.327% | | 01/01/33 | | | 4,920,000 | | | | 4,893,643 | |
| Texas Transportation Commission Central Texas Turnpike System, Series 2020-B | | 1.980% | | 08/15/42 | | | 4,025,000 | | | | 4,050,949 | |
| | | | | | | | | | | | 22,040,472 | |
| Utah — 0.6% | | | | | | | | | | | | |
| Utah Transit Authority Sales Tax Revenue, Series 2020 | | 2.774% | | 12/15/38 | | | 5,925,000 | | | | 5,907,993 | |
| | | | | | | | | | | | | |
| Virginia — 0.9% | | | | | | | | | | | | |
| Virginia Small Business Financing Authority, Series 2017 (a) (c) (d) | | 2.250% | | 07/01/50 | | | 9,000,000 | | | | 9,020,738 | |
| | | | | | | | | | | | | |
| Washington — 0.4% | | | | | | | | | | | | |
| Port of Seattle Washington, Series 2017-B | | 3.755% | | 05/01/36 | | | 1,925,000 | | | | 2,097,561 | |
| State of Washington, Series 2010-D | | 5.481% | | 08/01/39 | | | 1,475,000 | | | | 2,052,608 | |
| | | | | | | | | | | | 4,150,169 | |
| | | | | | | | | | | | | |
| Total Municipal Bonds (Cost $100,342,935) | | | | | | | | | | | 105,461,298 | |
| | | | | | | | | | | | | |
| ASSET BACKED SECURITIES — 2.4% | | | | | | | | | | | | |
| Bear Stearns, Series 2003-AC4, Class A (e) | | 5.500% | | 09/25/33 | | | 2,581,574 | | | | 2,646,868 | |
| CWABS Asset-Backed Certificates Trust, Series 2005-1, Class AF-6 (a) | | 5.030% | | 07/25/35 | | | 114 | | | | 114 | |
| Drive Auto Receivables Trust, Series 2020-1, Class B | | 2.080% | | 07/15/24 | | | 1,041,716 | | | | 1,042,615 | |
| Drive Auto Receivables Trust, Series 2018-3, Class D | | 4.300% | | 09/16/24 | | | 2,073,565 | | | | 2,099,669 | |
| DT Auto Owner Trust, Series 2019-3, Class C, 144A (b) | | 2.740% | | 04/15/25 | | | 1,966,934 | | | | 1,980,982 | |
| GTP Acquisition Partners I LLC, Series 2015-1-2, Class A-15-2, 144A (b) | | 3.482% | | 06/16/25 | | | 10,800,000 | | | | 11,226,351 | |
| Renaissance Home Equity Loan Trust, Series 2005-2, Class AF-6 (a) (e) | | 4.781% | | 08/25/35 | | | 433,841 | | | | 447,633 | |
| Santander Drive Auto Receivables Trust, Series 2019-2, Class C | | 2.900% | | 10/15/24 | | | 503,157 | | | | 505,509 | |
| Sierra Timeshare Conduit Receivables Funding LLC, Series 2017-1, Class A, 144A (b) | | 2.910% | | 03/20/34 | | | 506,106 | | | | 506,442 | |
| Verizon Master Trust, Series 2021-2 | | 0.990% | | 04/20/28 | | | 4,765,000 | | | | 4,741,122 | |
| Total Asset Backed Securities (Cost $24,810,380) | | | | | | | | | | | 25,197,305 | |
| | | | | | | | | | | | | |
| RESIDENTIAL MORTGAGE-BACKED SECURITIES — 0.3% | | | | | | | | | | | | |
| American Home Mortgage Investment Trust, Series 2004-4, Class VI-A-1 (a) (e) | | 6.000% | | 02/25/45 | | | 1,418,307 | | | | 1,461,964 | |
| Banc of America Funding Trust, Series 2005-4, Class 1-A-4 | | 5.500% | | 08/25/35 | | | 46,996 | | | | 48,052 | |
| Banc of America Funding Trust, Series 2005-4, Class 2-A-4 | | 5.500% | | 08/25/35 | | | 74,143 | | | | 75,098 | |
| CWHL Mortgage Pass-Through Trust, Series 2004-HYB2, Class 5-A (a) | | 2.184% | | 07/20/34 | | | 812,246 | | | | 821,987 | |
| GSR Mortgage Loan Trust, Series 2005-3F, Class 2A-3 | | 6.000% | | 03/25/35 | | | 712,254 | | | | 662,297 | |
| PHMC Trust, Series 2007-2, Class A-2 (a) | | 5.389% | | 05/18/37 | | | 290,918 | | | | 295,157 | |
| Total Residential Mortgage-Backed Securities (Cost $3,415,505) | | | | | | | | | | | 3,364,555 | |
| | | | | | | | | | | | | |
| MORTGAGE-BACKED SECURITIES PASSTHROUGH — 20.8% | | | | | | | | | | | | |
| Fannie Mae Pool — 8.4% | | | | | | | | | | | | |
| Pool #AC8938 | | 4.500% | | 01/01/25 | | | 657,952 | | | | 685,247 | |
| Pool #AD4268 | | 4.500% | | 03/01/25 | | | 499,764 | | | | 525,559 | |
| See Notes to Financial Statements. | |
| 76 | | | www.sbhfunds.com |
| Segall Bryant & Hamill Plus Bond Fund | Statement of Investments |
| | December 31, 2021 |
| | | Coupon | | Maturity | | Par Value | | | Value | |
| Fannie Mae Pool (continued) | | | | | | | | | | | | |
| Pool #725705 | | 5.000% | | 08/01/34 | | $ | 86,176 | | | $ | 97,302 | |
| Pool #735288 | | 5.000% | | 03/01/35 | | | 461,351 | | | | 520,610 | |
| Pool #MA2354, Series 2015 | | 3.500% | | 08/01/35 | | | 4,463,996 | | | | 4,774,263 | |
| Pool #735897 | | 5.500% | | 10/01/35 | | | 346,527 | | | | 393,569 | |
| Pool #745275 | | 5.000% | | 02/01/36 | | | 452,161 | | | | 511,204 | |
| Pool #MA4361 | | 2.500% | | 05/01/36 | | | 9,511,680 | | | | 9,870,315 | |
| Pool #888016 | | 5.500% | | 05/01/36 | | | 569,675 | | | | 648,951 | |
| Pool #MA4418 | | 2.000% | | 09/01/36 | | | 5,567,233 | | | | 5,704,762 | |
| Pool #MA4442 | | 2.000% | | 10/01/36 | | | 5,512,504 | | | | 5,648,681 | |
| Pool #190377 | | 5.000% | | 11/01/36 | | | 441,623 | | | | 498,791 | |
| Pool #888405 | | 5.000% | | 12/01/36 | | | 88,742 | | | | 100,297 | |
| Pool #889108 | | 6.000% | | 02/01/38 | | | 313,817 | | | | 363,092 | |
| Pool #889579 | | 6.000% | | 05/01/38 | | | 527,286 | | | | 611,558 | |
| Pool #995838 | | 5.500% | | 05/01/39 | | | 392,871 | | | | 449,750 | |
| Pool #AL3287, Series 2013 | | 4.500% | | 09/01/41 | | | 1,635,148 | | | | 1,807,089 | |
| Pool #AL0933, Series 2011 | | 5.000% | | 10/01/41 | | | 463,457 | | | | 525,093 | |
| Pool #MA1700, Series 2013 | | 4.500% | | 12/01/43 | | | 1,153,940 | | | | 1,266,994 | |
| Pool #MA1971 | | 4.500% | | 06/01/44 | | | 189,262 | | | | 208,753 | |
| Pool #MA2005 | | 4.500% | | 08/01/44 | | | 371,385 | | | | 407,526 | |
| Pool #CA5960 | | 2.500% | | 06/01/50 | | | 10,118,230 | | | | 10,375,210 | |
| Pool #MA4048 | | 3.000% | | 06/01/50 | | | 6,787,482 | | | | 7,038,124 | |
| Pool #MA4097 | | 3.000% | | 08/01/50 | | | 6,742,907 | | | | 6,989,371 | |
| Pool #MA4121 | | 3.000% | | 09/01/50 | | | 5,137,732 | | | | 5,324,183 | |
| Pool #MA4182 | | 2.000% | | 11/01/50 | | | 9,429,962 | | | | 9,409,281 | |
| Pool #MA4305 | | 2.000% | | 04/01/51 | | | 9,376,896 | | | | 9,356,331 | |
| Pool #MA4379 | | 2.500% | | 07/01/51 | | | 3,874,014 | | | | 3,956,184 | |
| | | | | | | | | | | | 88,068,090 | |
| Freddie Mac Gold Pool — 0.4% | | | | | | | | | | | | |
| Pool #G08061 | | 5.500% | | 06/01/35 | | | 44,514 | | | | 50,796 | |
| Pool #G08079 | | 5.000% | | 09/01/35 | | | 368,624 | | | | 417,293 | |
| Pool #G01960 | | 5.000% | | 12/01/35 | | | 125,798 | | | | 142,267 | |
| Pool #A42128 | | 5.500% | | 01/01/36 | | | 198,377 | | | | 226,373 | |
| Pool #G02064 | | 5.000% | | 02/01/36 | | | 231,123 | | | | 261,354 | |
| Pool #G05200 | | 5.000% | | 05/01/36 | | | 735,000 | | | | 830,896 | |
| Pool #G02252 | | 5.500% | | 07/01/36 | | | 425,952 | | | | 485,806 | |
| Pool #G02386 | | 6.000% | | 11/01/36 | | | 284,631 | | | | 329,477 | |
| Pool #G03189 | | 6.500% | | 09/01/37 | | | 533,211 | | | | 606,493 | |
| Pool #G08607 | | 4.500% | | 09/01/44 | | | 705,031 | | | | 774,575 | |
| | | | | | | | | | | | 4,125,330 | |
| Freddie Mac Non-Gold Pool — 6.1% | | | | | | | | | | | | |
| Pool #781958 (H15T1Y + 225) | | 2.366% | | 09/01/34 | | | 46,622 | | | | 49,376 | |
| Pool #SB0442 | | 2.500% | | 10/01/35 | | | 2,619,641 | | | | 2,728,465 | |
| Pool #SB8116 | | 2.500% | | 07/01/36 | | | 21,353,839 | | | | 22,208,985 | |
| Pool #SB8115 | | 2.000% | | 08/01/36 | | | 17,253,000 | | | | 17,679,207 | |
| Pool #SD8092 | | 3.000% | | 09/01/50 | | | 8,664,027 | | | | 9,006,968 | |
| Pool #SD8151 | | 2.500% | | 06/01/51 | | | 12,588,302 | | | | 12,855,306 | |
| | | | | | | | | | | | 64,528,307 | |
| Ginnie Mae I Pool — 0.0% (f) | | | | | | | | | | | | |
| Pool #550656X | | 5.000% | | 09/15/35 | | | 70,720 | | | | 79,567 | |
| | | | | | | | | | | | | |
| Ginnie Mae II Pool — 5.9% | | | | | | | | | | | | |
| Pool #004496M | | 5.000% | | 07/20/39 | | | 324,394 | | | | 366,250 | |
| Pool #MA7473M | | 3.000% | | 07/20/51 | | | 6,949,557 | | | | 7,199,416 | |
| Pool #MA7590M | | 3.000% | | 09/20/51 | | | 10,073,140 | | | | 10,448,297 | |
| See Notes to Financial Statements. | |
| Annual Report | December 31, 2021 | | | 77 |
| Segall Bryant & Hamill Plus Bond Fund | Statement of Investments |
| | December 31, 2021 |
| | | Coupon | | Maturity | | Par Value | | | Value | |
| Ginnie Mae II Pool (continued) | | | | | | | | | | | | |
| Pool #MA7649M | | 2.500% | | 10/20/51 | | $ | 18,040,103 | | | $ | 18,497,137 | |
| Pool #MA7768M | | 3.000% | | 12/20/51 | | | 14,910,000 | | | | 15,492,471 | |
| Pool #MA7769M | | 3.500% | | 12/20/51 | | | 10,000,000 | | | | 10,489,525 | |
| | | | | | | | | | | | 62,493,096 | |
| | | | | | | | | | | | | |
| Total Mortgage-Backed Securities Passthrough (Cost $219,976,814) | | | | | | | | | | | 219,294,390 | |
| | | | | | | | | | | | | |
| U.S. TREASURY BONDS & NOTES — 15.3% | | | | | | | | | | | | |
| United States Treasury | | 0.250% | | 05/31/25 | | | 235,000 | | | | 228,593 | |
| United States Treasury | | 2.250% | | 11/15/25 | | | 29,915,000 | | | | 31,158,342 | |
| United States Treasury | | 2.375% | | 05/15/27 | | | 3,725,000 | | | | 3,931,330 | |
| United States Treasury | | 1.125% | | 02/29/28 | | | 14,795,000 | | | | 14,580,010 | |
| United States Treasury | | 2.625% | | 02/15/29 | | | 3,240,000 | | | | 3,502,617 | |
| United States Treasury | �� | 0.875% | | 11/15/30 | | | 11,825,000 | | | | 11,242,526 | |
| United States Treasury | | 3.125% | | 11/15/41 | | | 16,425,000 | | | | 19,737,589 | |
| United States Treasury | | 1.125% | | 05/15/40 | | | 2,035,000 | | | | 1,783,646 | |
| United States Treasury | | 3.750% | | 08/15/41 | | | 4,500,000 | | | | 5,877,246 | |
| United States Treasury | | 2.875% | | 05/15/43 | | | 14,805,000 | | | | 17,203,873 | |
| United States Treasury | | 2.500% | | 02/15/45 | | | 25,675,000 | | | | 28,235,480 | |
| United States Treasury | | 3.000% | | 02/15/48 | | | 1,750,000 | | | | 2,135,957 | |
| United States Treasury | | 3.000% | | 02/15/49 | | | 120,000 | | | | 147,534 | |
| United States Treasury | | 1.250% | | 05/15/50 | | | 10,160,000 | | | | 8,627,666 | |
| United States Treasury | | 1.625% | | 11/15/50 | | | 14,000,000 | | | | 13,043,516 | |
| Total U.S. Treasury Bonds & Notes (Cost $150,480,368) | | | | | | | | | | | 161,435,925 | |
| | | | | | | | | | | | | |
| Investments at Value — 98.3% | | | | | | | | | | | | |
| (Cost $1,000,164,623) | | | | | | | | | | $ | 1,037,005,538 | |
| | | | | | | | | | | | | |
| Other Assets in Excess of Liabilities — 1.7% | | | | | | | | | | | 18,131,754 | |
| | | | | | | | | | | | | |
| Net Assets — 100.0% | | | | | | | | | | $ | 1,055,137,292 | |
| (a) | Variable rate security. Interest rate resets periodically. The rate shown is the effective interest rate as of December 31, 2021. For securities based on a published reference rate and spread, the reference rate and spread (in basis points) are indicated parenthetically. Certain variable rate securities are not based on a published reference rate and spread but are determined by the issuer or agent and are based on current market conditions. These securities, therefore, do not indicate a reference rate and spread. |
| (b) | Security was purchased in a transaction exempt from registration in compliance with Rule 144A of the Securities Act of 1933. This security may be resold in transactions exempt from registration, normally to qualified institutional buyers. The total value of these securities is $154,621,962, which represents 14.7% of net assets as of December 31, 2021. |
| (c) | Security is considered a restricted security however such restriction has not resulted in an illiquid classification. The total value of these securities is $24,680,658, which represents 2.3% of net assets as of December 31, 2021. |
| (d) | Security can be called and redeemed at the option of the issuer prior to the stated maturity date which is included in the Statement of Investments. |
| (e) | Step coupon. Rate shown is the coupon in effect as of December 31, 2021. |
| (f) | Percentage rounds to less than 0.1%. |
The Fund’s sector and industry classifications presented herein refer to any one or more of the industry sub-classifications used by one or more widely recognized market indexes or ratings group indexes, and/or as defined by Fund management. For Fund compliance purposes, sector and industry classifications are based on the sector and industry categorization methodology of the Adviser to the Funds. This definition may not apply for purposes of this report, which may combine industry sub-classifications for reporting ease. Industries are shown as a percentage of net assets.
| See Notes to Financial Statements. | |
| 78 | | | www.sbhfunds.com |
| Segall Bryant & Hamill Quality High Yield Fund | Statement of Investments |
| | December 31, 2021 |
| | | Coupon | | Maturity | | Par Value | | | Value | |
| CORPORATE BONDS — 96.4% | | | | | | | | | | | | |
| Finance — 8.4% | | | | | | | | | | | | |
| Mortgage Banking — 1.9% | | | | | | | | | | | | |
| Provident Funding Associates LP/PFG Finance Corp., 144A (a) | | 6.375% | | 06/15/25 | | $ | 1,973,000 | | | $ | 2,007,528 | |
| | | | | | | | | | | | | |
| Noncaptive Diversified Financial Companies — 1.1% | | | | | | | | | | | | |
| Aircastle, Ltd., 144A (a) | | 5.250% | | 08/11/25 | | | 1,000,000 | | | | 1,099,605 | |
| | | | | | | | | | | | | |
| Other Finance — 3.6% | | | | | | | | | | | | |
| IIP Operating Partnership LP | | 5.500% | | 05/25/26 | | | 1,950,000 | | | | 2,064,326 | |
| Outfront Media Capital LLC, 144A (a) | | 4.250% | | 01/15/29 | | | 1,610,000 | | | | 1,612,930 | |
| | | | | | | | | | | | 3,677,256 | |
| Real Estate Investment Trusts — 1.8% | | | | | | | | | | | | |
| MPT Operating Partnership LP/MPT Finance Corp. | | 5.000% | | 10/15/27 | | | 1,750,000 | | | | 1,830,938 | |
| | | | | | | | | | | | | |
| Industrial — 84.0% | | | | | | | | | | | | |
| Aerospace / Defense — 1.8% | | | | | | | | | | | | |
| Hexcel Corp. | | 4.200% | | 02/15/27 | | | 1,725,000 | | | | 1,852,138 | |
| | | | | | | | | | | | | |
| Automobile Manufacturing — 4.6% | | | | | | | | | | | | |
| Ford Motor Co. | | 7.400% | | 11/01/46 | | | 1,000,000 | | | | 1,377,586 | |
| Ford Motor Credit Co. LLC | | 5.584% | | 03/18/24 | | | 405,000 | | | | 436,387 | |
| General Motors Co. | | 6.800% | | 10/01/27 | | | 850,000 | | | | 1,043,315 | |
| Goodyear Tire & Rubber Co. | | 4.875% | | 03/15/27 | | | 1,725,000 | | | | 1,826,344 | |
| | | | | | | | | | | | 4,683,632 | |
| Building Products — 1.8% | | | | | | | | | | | | |
| Summit Materials LLC, 144A (a) | | 6.500% | | 03/15/27 | | | 525,000 | | | | 544,688 | |
| Summit Materials LLC, 144A (a) | | 5.250% | | 01/15/29 | | | 1,239,000 | | | | 1,297,729 | |
| | | | | | | | | | | | 1,842,417 | |
| Chemicals — 6.2% | | | | | | | | | | | | |
| Axalta Coating Systems LLC, 144A (a) | | 4.750% | | 06/15/27 | | | 520,000 | | | | 542,100 | |
| Axalta Coating Systems LLC, 144A (a) | | 3.375% | | 02/15/29 | | | 1,000,000 | | | | 967,500 | |
| CF Industries, Inc. | | 3.450% | | 06/01/23 | | | 875,000 | | | | 902,134 | |
| Compass Minerals International, Inc., 144A (a) | | 4.875% | | 07/15/24 | | | 1,200,000 | | | | 1,227,000 | |
| Compass Minerals International, Inc., 144A (a) | | 6.750% | | 12/01/27 | | | 1,126,000 | | | | 1,192,243 | |
| Olin Corp. | | 5.125% | | 09/15/27 | | | 806,000 | | | | 827,158 | |
| Olin Corp. | | 5.000% | | 02/01/30 | | | 675,000 | | | | 708,750 | |
| | | | | | | | | | | | 6,366,885 | |
| Construction Machinery — 3.0% | | | | | | | | | | | | |
| H&E Equipment Services, Inc., 144A (a) | | 3.875% | | 12/15/28 | | | 1,461,000 | | | | 1,450,042 | |
| United Rentals North America, Inc. | | 4.875% | | 01/15/28 | | | 1,505,000 | | | | 1,581,567 | |
| | | | | | | | | | | | 3,031,609 | |
| Consumer Products — 3.8% | | | | | | | | | | | | |
| Central Garden & Pet Co. | | 4.125% | | 10/15/30 | | | 700,000 | | | | 706,125 | |
| Scotts Miracle-Gro Co. | | 4.500% | | 10/15/29 | | | 500,000 | | | | 521,250 | |
| Scotts Miracle-Gro Co., 144A (a) | | 4.000% | | 04/01/31 | | | 875,000 | | | | 864,063 | |
| Vista Outdoor, Inc., 144A (a) | | 4.500% | | 03/15/29 | | | 1,765,000 | | | | 1,776,031 | |
| | | | | | | | | | | | 3,867,469 | |
| Diversified Manufacturing — 1.7% | | | | | | | | | | | | |
| BWX Technologies, Inc., 144A (a) | | 4.125% | | 06/30/28 | | | 1,702,000 | | | | 1,727,530 | |
| | | | | | | | | | | | | |
| Electronics — 5.8% | | | | | | | | | | | | |
| Amkor Technology, Inc., 144A (a) | | 6.625% | | 09/15/27 | | | 1,670,000 | | | | 1,765,056 | |
| ATS Automation Tooling Systems, Inc., 144A (a) | | 4.125% | | 12/15/28 | | | 1,665,000 | | | | 1,677,487 | |
| Dell, Inc. | | 7.100% | | 04/15/28 | | | 655,000 | | | | 820,606 | |
| See Notes to Financial Statements. | |
| Annual Report | December 31, 2021 | | | 79 |
| Segall Bryant & Hamill Quality High Yield Fund | Statement of Investments |
| | December 31, 2021 |
| | | Coupon | | Maturity | | Par Value | | | Value | |
| Electronics (continued) | | | | | | | | | | | | |
| QORVO, Inc. | | 4.375% | | 10/15/29 | | $ | 1,282,000 | | | $ | 1,360,523 | |
| Sensata Technologies, Inc., 144A (a) | | 3.750% | | 02/15/31 | | | 250,000 | | | | 249,113 | |
| | | | | | | | | | | | 5,872,785 | |
| Environmental — 0.9% | | | | | | | | | | | | |
| Clean Harbors, Inc., 144A (a) | | 5.125% | | 07/15/29 | | | 910,000 | | | | 964,600 | |
| | | | | | | | | | | | | |
| Food Processors — 0.7% | | | | | | | | | | | | |
| Kraft Heinz Foods Co. | | 6.875% | | 01/26/39 | | | 466,000 | | | | 684,895 | |
| | | | | | | | | | | | | |
| Gaming — 1.8% | | | | | | | | | | | | |
| MGM Growth Properties Operating Partnership LP | | 4.500% | | 01/15/28 | | | 1,671,000 | | | | 1,804,680 | |
| | | | | | | | | | | | | |
| Healthcare Facilities / Supplies — 2.3% | | | | | | | | | | | | |
| Hologic, Inc., 144A (a) | | 3.250% | | 02/15/29 | | | 1,500,000 | | | | 1,500,000 | |
| Teleflex, Inc. | | 4.625% | | 11/15/27 | | | 825,000 | | | | 858,000 | |
| | | | | | | | | | | | 2,358,000 | |
| Home Builders — 1.8% | | | | | | | | | | | | |
| KB Home | | 6.875% | | 06/15/27 | | | 1,560,000 | | | | 1,829,100 | |
| | | | | | | | | | | | | |
| Independent Energy — 11.4% | | | | | | | | | | | | |
| Apache Corp. | | 4.250% | | 01/15/30 | | | 575,000 | | | | 623,990 | |
| Apache Corp. | | 5.100% | | 09/01/40 | | | 1,345,000 | | | | 1,519,850 | |
| Diamondback Energy, Inc. | | 3.500% | | 12/01/29 | | | 1,411,000 | | | | 1,496,235 | |
| Occidental Petroleum Corp. | | 3.500% | | 08/15/29 | | | 1,000,000 | | | | 1,027,300 | |
| Occidental Petroleum Corp. | | 7.875% | | 09/15/31 | | | 1,150,000 | | | | 1,535,250 | |
| PDC Energy, Inc. | | 6.125% | | 09/15/24 | | | 146,000 | | | | 147,825 | |
| PDC Energy, Inc. | | 5.750% | | 05/15/26 | | | 2,712,000 | | | | 2,802,554 | |
| Range Resources Corp. | | 4.875% | | 05/15/25 | | | 2,000,000 | | | | 2,065,000 | |
| Range Resources Corp. | | 9.250% | | 02/01/26 | | | 400,000 | | | | 431,117 | |
| | | | | | | | | | | | 11,649,121 | |
| Information / Data Technology — 2.1% | | | | | | | | | | | | |
| CDK Global, Inc. | | 5.000% | | 10/15/24 | | | 500,000 | | | | 545,250 | |
| Nielsen Co. (Luxembourg) SARL (The), 144A (a) | | 5.000% | | 02/01/25 | | | 750,000 | | | | 761,962 | |
| Nielsen Finance LLC, 144A (a) | | 4.500% | | 07/15/29 | | | 900,000 | | | | 885,366 | |
| | | | | | | | | | | | 2,192,578 | |
| Leisure / Entertainment — 2.0% | | | | | | | | | | | | |
| Cedar Fair LP | | 5.375% | | 04/15/27 | | | 937,000 | | | | 960,425 | |
| Cedar Fair LP | | 5.250% | | 07/15/29 | | | 1,100,000 | | | | 1,127,500 | |
| | | | | | | | | | | | 2,087,925 | |
| Media — Cable — 6.4% | | | | | | | | | | | | |
| DIRECTV Financing LLC, 144A (a) | | 5.875% | | 08/15/27 | | | 1,422,000 | | | | 1,455,716 | |
| DISH DBS Corp. | | 5.875% | | 07/15/22 | | | 1,270,000 | | | | 1,290,637 | |
| DISH DBS Corp. | | 7.750% | | 07/01/26 | | | 802,000 | | | | 846,110 | |
| Nexstar Broadcasting, Inc., 144A (a) | | 5.625% | | 07/15/27 | | | 1,385,000 | | | | 1,459,956 | |
| Sirius XM Radio, Inc., 144A (a) | | 5.500% | | 07/01/29 | | | 1,350,000 | | | | 1,454,625 | |
| | | | | | | | | | | | 6,507,044 | |
| Media — Non-Cable — 5.0% | | | | | | | | | | | | |
| AMC Networks, Inc. | | 4.750% | | 08/01/25 | | | 1,597,000 | | | | 1,630,936 | |
| Lamar Media Corp. | | 3.750% | | 02/15/28 | | | 1,275,000 | | | | 1,278,187 | |
| Lamar Media Corp. | | 4.875% | | 01/15/29 | | | 815,000 | | | | 850,656 | |
| Netflix, Inc. | | 5.875% | | 11/15/28 | | | 745,000 | | | | 895,862 | |
| Netflix, Inc., 144A (a) | | 4.875% | | 06/15/30 | | | 150,000 | | | | 174,937 | |
| Nexstar Broadcasting, Inc., 144A (a) | | 4.750% | | 11/01/28 | | | 225,000 | | | | 229,219 | |
| | | | | | | | | | | | 5,059,797 | |
| See Notes to Financial Statements. | |
| 80 | | | www.sbhfunds.com |
| Segall Bryant & Hamill Quality High Yield Fund | Statement of Investments |
| | December 31, 2021 |
| | | Coupon | | Maturity | | Par Value | | | Value | |
| Metals / Mining — 2.7% | | | | | | | | | | | | |
| FMG Resources August 2006 Pty., Ltd., 144A (a) | | 5.125% | | 05/15/24 | | $ | 500,000 | | | $ | 530,000 | |
| FMG Resources August 2006 Pty., Ltd., 144A (a) | | 4.500% | | 09/15/27 | | | 800,000 | | | | 852,000 | |
| Freeport-McMoran, Inc. | | 5.400% | | 11/14/34 | | | 1,172,000 | | | | 1,426,910 | |
| | | | | | | | | | | | 2,808,910 | |
| Natural Gas — Distributors — 2.1% | | | | | | | | | | | | |
| AmeriGas Partners LP/AmeriGas Financial Corp. | | 5.625% | | 05/20/24 | | | 1,945,000 | | | | 2,102,876 | |
| | | | | | | | | | | | | |
| Packaging — 1.3% | | | | | | | | | | | | |
| Berry Global, Inc., 144A (a) | | 4.500% | | 02/15/26 | | | 296,000 | | | | 300,514 | |
| Silgan Holdings, Inc. | | 4.750% | | 03/15/25 | | | 751,000 | | | | 755,694 | |
| Silgan Holdings, Inc. | | 4.125% | | 02/01/28 | | | 275,000 | | | | 280,844 | |
| | | | | | | | | | | | 1,337,052 | |
| Paper & Forest Products — 0.8% | | | | | | | | | | | | |
| West Fraser Timber Co., Ltd., 144A (a) | | 4.350% | | 10/15/24 | | | 770,000 | | | | 822,962 | |
| | | | | | | | | | | | | |
| Restaurants — 0.5% | | | | | | | | | | | | |
| Papa Johns International, Inc., 144A (a) | | 3.875% | | 09/15/29 | | | 520,000 | | | | 517,400 | |
| | | | | | | | | | | | | |
| Retail Stores — 4.3% | | | | | | | | | | | | |
| Group 1 Automotive, Inc., 144A (a) | | 4.000% | | 08/15/28 | | | 1,164,000 | | | | 1,159,635 | |
| Hanesbrands, Inc., 144A (a) | | 4.625% | | 05/15/24 | | | 1,025,000 | | | | 1,073,318 | |
| Hanesbrands, Inc., 144A (a) | | 4.875% | | 05/15/26 | | | 250,000 | | | | 267,187 | |
| QVC, Inc. | | 4.850% | | 04/01/24 | | | 825,000 | | | | 880,799 | |
| QVC, Inc. | | 4.750% | | 02/15/27 | | | 970,000 | | | | 997,412 | |
| | | | | | | | | | | | 4,378,351 | |
| Services — 1.1% | | | | | | | | | | | | |
| Service Corp. International | | 4.625% | | 12/15/27 | | | 836,000 | | | | 872,575 | |
| TopBuild Corp., 144A (a) | | 3.625% | | 03/15/29 | | | 227,000 | | | | 228,703 | |
| | | | | | | | | | | | 1,101,278 | |
| Theater Entertainment — 1.2% | | | | | | | | | | | | |
| Cinemark USA, Inc., 144A (a) | | 5.875% | | 03/15/26 | | | 1,180,000 | | | | 1,194,750 | |
| | | | | | | | | | | | | |
| Transportation Services — 1.5% | | | | | | | | | | | | |
| XPO Logistics, Inc. | | 6.700% | | 05/01/34 | | | 1,242,000 | | | | 1,525,139 | |
| | | | | | | | | | | | | |
| Vehicle Parts — 2.9% | | | | | | | | | | | | |
| Allison Transmission, Inc., 144A (a) | | 4.750% | | 10/01/27 | | | 1,300,000 | | | | 1,353,950 | |
| Meritor, Inc., 144A (a) | | 6.250% | | 06/01/25 | | | 1,537,000 | | | | 1,602,322 | |
| | | | | | | | | | | | 2,956,272 | |
| Wireless Telecommunications — 2.5% | | | | | | | | | | | | |
| Lumen Technologies, Inc., Series W | | 6.750% | | 12/01/23 | | | 713,000 | | | | 770,040 | |
| Lumen Technologies, Inc. | | 7.995% | | 06/01/36 | | | 559,000 | | | | 626,080 | |
| T-Mobile USA, Inc. | | 4.750% | | 02/01/28 | | | 1,142,000 | | | | 1,201,955 | |
| | | | | | | | | | | | 2,598,075 | |
| See Notes to Financial Statements. | |
| Annual Report | December 31, 2021 | | | 81 |
| Segall Bryant & Hamill Quality High Yield Fund | Statement of Investments |
| | December 31, 2021 |
| | | Coupon | | Maturity | | Par Value | | | Value | |
| Utility — 4.0% | | | | | | | | | | |
| Electric — 4.0% | | | | | | | | | | |
| NRG Energy, Inc., 144A (a) | | 3.625% | | 02/15/31 | | $ | 1,302,000 | | | $ | 1,269,450 | |
| PG&E Corp. | | 5.000% | | 07/01/28 | | | 1,000,000 | | | | 1,051,820 | |
| Vistra Operations Co. LLC, 144A (a) | | 5.000% | | 07/31/27 | | | 1,650,000 | | | | 1,712,403 | |
| | | | | | | | | | | | 4,033,673 | |
| Investments at Value — 96.4% | | | | | | | | | | | | |
| (Cost $96,143,949) | | | | | | | | | | $ | 98,374,270 | |
| | | | | | | | | | | | | |
| Other Assets in Excess of Liabilities — 3.6% | | | | | | | | | | | 3,631,882 | |
| | | | | | | | | | | | | |
| Net Assets — 100.0% | | | | | | | | | | $ | 102,006,152 | |
(a) Security was purchased in a transaction exempt from registration in compliance with Rule 144A of the Securities Act of 1933. This security may be resold in transactions exempt from registration, normally to qualified institutional buyers. The total value of these securities is $41,771,620, which represents 41.0% of net assets as of December 31, 2021.
The Fund’s sector and industry classifications presented herein refer to any one or more of the industry sub-classifications used by one or more widely recognized market indexes or ratings group indexes, and/or as defined by Fund management. For Fund compliance purposes, sector and industry classifications are based on the sector and industry categorization methodology of the Adviser to the Funds. This definition may not apply for purposes of this report, which may combine industry sub-classifications for reporting ease. Industries are shown as a percentage of net assets.
| See Notes to Financial Statements. | |
| 82 | | | www.sbhfunds.com |
| Segall Bryant & Hamill Municipal Opportunities Fund | Statement of Investments |
| | December 31, 2021 |
| | | Coupon | | Maturity | | Par Value | | | Value | |
| MUNICIPAL BONDS — 92.1% | | | | | | | | | | | | |
| Certificate Participation — 0.6% | | | | | | | | | | | | |
| Lease / Rent — 0.6% | | | | | | | | | | | | |
| Monterey County California Public Facilities Financing COP, Series 2015 (a) | | 4.000% | | 09/01/45 | | $ | 185,000 | | | $ | 203,805 | |
| Public Water Supply of District No. 1 of Lincoln County COP, Series 2019 (a) | | 4.000% | | 07/01/38 | | | 500,000 | | | | 562,936 | |
| San Francisco California City & County COP, Series 2017-B | | 4.000% | | 04/01/37 | | | 425,000 | | | | 474,273 | |
| Washington State State & Local Agency Real & Personal Property COP, Series 2018-C (a) | | 5.000% | | 07/01/43 | | | 475,000 | | | | 580,661 | |
| | | | | | | | | | | | 1,821,675 | |
| General Obligation — 17.2% | | | | | | | | | | | | |
| Local — 17.2% | | | | | | | | | | | | |
| Alisal California Union School District, Series A | | 5.250% | | 08/01/47 | | | 570,000 | | | | 704,479 | |
| Bauer Landing Water Control and Improvement District, Series 2017 | | 3.875% | | 03/01/45 | | | 1,050,000 | | | | 1,051,529 | |
| Central Platte Valley Metropolitan District, Series 2013-A (a) | | 5.375% | | 12/01/33 | | | 50,000 | | | | 53,280 | |
| Central Platte Valley Metropolitan District, Series 2013-A (a) | | 5.625% | | 12/01/38 | | | 70,000 | | | | 74,592 | |
| Central Platte Valley Metropolitan District, Series 2013-A (a) | | 6.000% | | 12/01/38 | | | 1,450,000 | | | | 1,552,420 | |
| Central Platte Valley Metropolitan District, Series 2014 (a) | | 5.000% | | 12/01/43 | | | 3,975,000 | | | | 4,158,649 | |
| Chambers County Texas Improvement District No. 1, Series 2020 | | 2.000% | | 09/01/27 | | | 1,450,000 | | | | 1,498,667 | |
| Chambers County Texas Improvement District No. 1, Series 2020 | | 2.000% | | 09/01/28 | | | 1,450,000 | | | | 1,492,793 | |
| Chambers County Texas Improvement District No. 1, Series 2020 | | 2.000% | | 09/01/29 | | | 1,455,000 | | | | 1,486,984 | |
| City of New York (The) New York, Series 2018 E-1 | | 5.250% | | 03/01/35 | | | 660,000 | | | | 825,654 | |
| City of New York (The) New York, Series 2014 I-1 | | 4.000% | | 03/01/39 | | | 300,000 | | | | 322,321 | |
| City of New York (The) New York, Series 2021-C | | 4.000% | | 08/01/40 | | | 4,000,000 | | | | 4,728,788 | |
| City of Romulus Michigan, Series B | | 5.000% | | 11/01/42 | | | 400,000 | | | | 458,463 | |
| East Whittier California City School District, Series C | | 4.000% | | 08/01/47 | | | 1,835,000 | | | | 2,062,903 | |
| El Paso County Texas Hospital District, Series 2013 | | 5.000% | | 08/15/30 | | | 200,000 | | | | 213,331 | |
| El Paso County Texas Hospital District, Series 2013 | | 5.000% | | 08/15/39 | | | 450,000 | | | | 480,356 | |
| El Paso County Texas Hospital District, Series 2013 | | 5.000% | | 08/15/43 | | | 2,255,000 | | | | 2,407,568 | |
| Fort Bend County Texas Levee District No. 6, Series 2019 (a) | | 3.000% | | 09/01/33 | | | 320,000 | | | | 338,268 | |
| Fort Bend County Texas Municipal Utility District No. 128, Series 2014 (a) | | 3.650% | | 09/01/29 | | | 205,000 | | | | 207,722 | |
| Fort Bend County Texas Municipal Utility District No. 25, Series 2019 (a) | | 3.000% | | 10/01/34 | | | 895,000 | | | | 929,630 | |
| Fort Bend County Texas Municipal Utility District No. 58, Series 2021 | | 3.000% | | 04/01/33 | | | 800,000 | | | | 870,271 | |
| Fort Bend County Texas Municipal Utility District No. 58, Series 2021 | | 3.000% | | 04/01/34 | | | 695,000 | | | | 754,895 | |
| Harris County Texas Municipal Utility District No. 166, Series 2019 (a) | | 3.000% | | 09/01/29 | | | 250,000 | | | | 261,726 | |
| Harris County Texas Municipal Utility District No. 368, Series 2017 | | 4.000% | | 09/01/30 | | | 500,000 | | | | 544,264 | |
| Hays County Water Control & Improvement District No. 2, Series 2013 (a) | | 4.600% | | 09/01/33 | | | 390,000 | | | | 414,668 | |
| High Plains Metropolitan District City of Aurora Arapahoe County Colorado, NATL, Series 2017 (a) (b) | | 5.000% | | 12/01/35 | | | 295,000 | | | | 355,107 | |
| Kaufman County Texas Municipal Utility District No. 5, Series 2021 | | 3.000% | | 03/01/34 | | | 555,000 | | | | 578,924 | |
| Kaufman County Texas Municipal Utility District No. 5, Series 2021 | | 3.000% | | 03/01/35 | | | 450,000 | | | | 468,546 | |
| Kings Manor Texas Municipal Utility District, Series 2019 (a) | | 3.000% | | 09/01/31 | | | 540,000 | | | | 552,934 | |
| Kings Manor Texas Municipal Utility District, Series 2019 (a) | | 3.000% | | 09/01/32 | | | 250,000 | | | | 255,452 | |
| Las Vegas Nevada City Hall, Series 2015-C (a) | | 4.000% | | 09/01/38 | | | 855,000 | | | | 947,255 | |
| Marin California Healthcare District Election 2013, Series 2017-A (a) | | 4.000% | | 08/01/47 | | | 600,000 | | | | 680,192 | |
| Natomas Unified School District California, Series 2020-A | | 4.000% | | 08/01/49 | | | 3,000,000 | | | | 3,372,040 | |
| Pilot Knob Texas Municipal Utility District No. 3, Series 2021 | | 3.000% | | 02/15/34 | | | 450,000 | | | | 476,150 | |
| Pilot Knob Texas Municipal Utility District No. 3, Series 2021 | | 3.000% | | 02/15/35 | | | 465,000 | | | | 490,227 | |
| Pilot Knob Texas Municipal Utility District No. 3, Series 2021 | | 3.000% | | 02/15/36 | | | 485,000 | | | | 509,283 | |
| Pilot Knob Texas Municipal Utility District No. 3, Series 2021 | | 3.000% | | 02/15/37 | | | 505,000 | | | | 528,288 | |
| Pilot Point Texas, Series 2016 | | 4.000% | | 08/15/46 | | | 500,000 | | | | 563,877 | |
| Riverview Metropolitan District Colorado, Series 2021 | | 5.000% | | 12/01/41 | | | 550,000 | | | | 593,444 | |
| Riverview Metropolitan District Colorado, Series 2021 | | 5.000% | | 12/01/51 | | | 500,000 | | | | 534,185 | |
| Sonterra Texas Municipal Utility District, Series 2020 (a) | | 4.000% | | 08/15/39 | | | 890,000 | | | | 945,508 | |
| Southern York County Pennsylvania School District, Series 2019 | | 4.000% | | 09/01/47 | | | 500,000 | | | | 538,554 | |
| Sunfield Municipal Utility District No. 3, Series 2021 | | 3.000% | | 09/01/34 | | | 510,000 | | | | 535,112 | |
| Sunfield Municipal Utility District No. 3, Series 2021 | | 3.000% | | 09/01/35 | | | 525,000 | | | | 549,642 | |
| See Notes to Financial Statements. | |
| Annual Report | December 31, 2021 | | | 83 |
| Segall Bryant & Hamill Municipal Opportunities Fund | Statement of Investments |
| | December 31, 2021 |
| | | Coupon | | Maturity | | Par Value | | | Value | |
| Local (continued) | | | | | | | | | | | | |
| Sunfield Municipal Utility District No. 3, Series 2021 | | 3.000% | | 09/01/36 | | $ | 540,000 | | | $ | 563,018 | |
| Sunfield Municipal Utility District No. 3, Series 2021 | | 3.000% | | 09/01/37 | | | 550,000 | | | | 572,211 | |
| Traditions Metropolitan District No. 2 Arapahoe County Colorado, Series 2016 (a) | | 4.250% | | 12/01/46 | | | 100,000 | | | | 112,315 | |
| Travis County Texas Municipal Utility District No. 21, Series 2016 (a) | | 3.000% | | 09/01/27 | | | 100,000 | | | | 108,499 | |
| Travis County Texas Municipal Utility District No. 21, Series 2016 (a) | | 3.500% | | 09/01/33 | | | 215,000 | | | | 227,755 | |
| Viridian Municipal Management District, Series 2020 | | 4.000% | | 12/01/35 | | | 770,000 | | | | 878,673 | |
| Viridian Municipal Management District, Series 2020 | | 4.000% | | 12/01/36 | | | 535,000 | | | | 608,211 | |
| Viridian Municipal Management District, Series 2020 | | 4.000% | | 12/01/36 | | | 805,000 | | | | 915,159 | |
| West Harris County Texas Municipal District No. 5, Series 2015 (a) | | 3.375% | | 09/01/27 | | | 105,000 | | | | 108,103 | |
| Winton Woods City Ohio School District, Series 2017-A (a) | | 4.000% | | 11/01/53 | | | 1,950,000 | | | | 1,965,734 | |
| | | | | | | | | | | | 47,428,619 | |
| Local Authority — 12.5% | | | | | | | | | | | | |
| Education — 2.1% | | | | | | | | | | | | |
| Administrators of the Tulane Educational Fund, Series 2013-C (a) | | 5.000% | | 10/01/47 | | | 170,000 | | | | 174,498 | |
| Public Finance Authority Taxable Educational Facilities Wisconsin, Series 2021-A (c) | | 5.625% | | 06/01/50 | | | 5,750,000 | | | | 5,718,987 | |
| | | | | | | | | | | | 5,893,485 | |
| Health Care — 2.7% | | | | | | | | | | | | |
| California Municipal Finance Authority, Series 2021 (c) | | 3.637% | | 07/01/30 | | | 6,975,000 | | | | 7,366,489 | |
| | | | | | | | | | | | | |
| Healthcare — 0.2% | | | | | | | | | | | | |
| Denver Health & Hospital Authority, Series B (a) | | 4.900% | | 12/01/24 | | | 410,000 | | | | 426,156 | |
| | | | | | | | | | | | | |
| Lease / Rent — 1.2% | | | | | | | | | | | | |
| Maryland State Economic Development Corp., Series 2021 (c) | | 3.997% | | 04/01/34 | | | 3,000,000 | | | | 3,180,454 | |
| | | | | | | | | | | | | |
| Public Services — 0.4% | | | | | | | | | | | | |
| Port of Greater Cincinnati Ohio Development Authority, Series 2020 (c) | | 5.250% | | 12/01/35 | | | 1,000,000 | | | | 1,041,800 | |
| | | | | | | | | | | | | |
| Transportation — 5.5% | | | | | | | | | | | | |
| Port Authority of New York & New Jersey, Series 182 | | 5.310% | | 08/01/46 | | | 1,040,000 | | | | 1,138,257 | |
| Public Finance Authority Wisconsin Air Cargo, Series 2021 | | 2.312% | | 07/01/25 | | | 675,000 | | | | 667,165 | |
| Public Finance Authority Wisconsin Air Cargo, Series 2021 | | 2.012% | | 07/01/25 | | | 1,085,000 | | | | 1,070,922 | |
| San Diego County Regional Airport Authority, Series 2014-B | | 5.594% | | 07/01/43 | | | 11,265,000 | | | | 12,409,155 | |
| | | | | | | | | | | | 15,285,499 | |
| Utilities — 0.4% | | | | | | | | | | | | |
| Warm Springs Reservation of Oregon Confederated Tribes, Series 2019-A (c) | | 2.800% | | 11/01/22 | | | 500,000 | | | | 506,793 | |
| Warm Springs Reservation of Oregon Confederated Tribes, Series 2019-A (c) | | 2.950% | | 11/01/23 | | | 480,000 | | | | 492,131 | |
| Warm Springs Reservation of Oregon Confederated Tribes, Series 2019-A (c) | | 3.050% | | 11/01/24 | | | 200,000 | | | | 206,586 | |
| | | | | | | | | | | | 1,205,510 | |
| Prerefunded — 0.3% | | | | | | | | | | | | |
| Education — 0.1% | | | | | | | | | | | | |
| Harris County Cultural Education Facilities Finance Corp., Series 2012-A (a) | | 5.000% | | 11/15/37 | | | 280,000 | | | | 291,547 | |
| | | | | | | | | | | | | |
| Healthcare — 0.2% | | | | | | | | | | | | |
| Illinois Finance Authority, Series 2012-A (a) | | 4.250% | | 05/15/41 | | | 375,000 | | | | 380,611 | |
| Illinois Finance Authority, Series 2012 (a) | | 4.000% | | 06/01/47 | | | 35,000 | | | | 35,547 | |
| Washington State Health Care Facilities Authority, Series 2013A-1 (a) | | 5.250% | | 01/01/40 | | | 95,000 | | | | 99,671 | |
| | | | | | | | | | | | 515,829 | |
| Revenue — 55.2% | | | | | | | | | | | | |
| Education — 1.9% | | | | | | | | | | | | |
| Harris County Cultural Education Facilities Finance Corp., Series 2016 (a) | | 4.000% | | 11/15/30 | | | 300,000 | | | | 334,239 | |
| Massachusetts State Development Finance Agency, Series 2012 (a) | | 4.000% | | 09/01/49 | | | 1,100,000 | | | | 1,123,457 | |
| Miami-Dade County Educational Facilities Authority, Series 2015-A (a) | | 5.000% | | 04/01/31 | | | 20,000 | | | | 22,627 | |
| Ohio State University General Receipts Special Purpose, Series 2013-A (a) | | 4.000% | | 06/01/43 | | | 900,000 | | | | 939,172 | |
| See Notes to Financial Statements. | |
| 84 | | | www.sbhfunds.com |
| Segall Bryant & Hamill Municipal Opportunities Fund | Statement of Investments |
| | December 31, 2021 |
| | | Coupon | | Maturity | | Par Value | | | Value | |
| Education (continued) | | | | | | | | | | | | |
| University of Washington, Series 2012-C | | 3.125% | | 07/01/42 | | $ | 555,000 | | | $ | 565,783 | |
| Washington Higher Education Facilities Authority, Series 2017 | | 4.000% | | 01/01/37 | | | 500,000 | | | | 552,647 | |
| Washington Higher Education Facilities Authority, Series 2013-A (a) | | 5.250% | | 04/01/43 | | | 175,000 | | | | 184,369 | |
| Wisconsin Health and Educational Facilities, Series 2016 | | 5.000% | | 10/01/41 | | | 1,340,000 | | | | 1,572,206 | |
| | | | | | | | | | | | 5,294,500 | |
| Healthcare — 6.3% | | | | | | | | | | | | |
| City of Lakeland Florida, Series 2016 (a) | | 5.000% | | 11/15/29 | | | 50,000 | | | | 59,309 | |
| City of Lakeland Florida, Series 2015 (a) | | 5.000% | | 11/15/45 | | | 100,000 | | | | 111,540 | |
| Colorado Health Facilities Authority, Series 2008-D-2 | | 5.000% | | 01/01/22 | | | 60,000 | | | | 60,000 | |
| Colorado Health Facilities Authority, Series 2012 (a) | | 5.000% | | 01/01/23 | | | 50,000 | | | | 50,171 | |
| Colorado Health Facilities Authority, Series 2012 (a) | | 5.000% | | 01/01/25 | | | 210,000 | | | | 210,683 | |
| Colorado Health Facilities Authority, Series 2015 (a) | | 5.000% | | 05/15/40 | | | 850,000 | | | | 960,106 | |
| Greenville Health Hospital System, Series 2014-B | | 4.000% | | 05/01/44 | | | 990,000 | | | | 1,055,468 | |
| Illinois Finance Authority, Series 2015-A (a) | | 5.000% | | 11/15/34 | | | 130,000 | | | | 147,440 | |
| Illinois Finance Authority, Series 2016-A (a) | | 5.000% | | 02/15/45 | | | 100,000 | | | | 115,544 | |
| Knox County Tennessee Health Educational and Housing Facility, Series 2016-A | | 5.000% | | 01/01/47 | | | 875,000 | | | | 1,029,481 | |
| Metropolitan Government of Nashville & Davidson County Tennessee Health & Educational Facilities, Series 2016-A | | 5.000% | | 07/01/46 | | | 4,900,000 | | | | 5,740,211 | |
| Metropolitan Government of Nashville & Davidson County Tennessee Health & Educational Facilities, Series 2017-A | | 5.000% | | 07/01/48 | | | 1,120,000 | | | | 1,340,739 | |
| Michigan Finance Authority Hospital Revenue, Series 2016 | | 4.000% | | 11/15/46 | | | 3,635,000 | | | | 4,034,615 | |
| Virginia Commonwealth University Health System, Series B | | 5.000% | | 07/01/46 | | | 1,975,000 | | | | 2,381,000 | |
| | | | | | | | | | | | 17,296,307 | |
| Industrial Development — 2.1% | | | | | | | | | | | | |
| Bartow County Georgia Development Authority Pollution Control, Series First 1997 | | 1.800% | | 09/01/29 | | | 3,900,000 | | | | 3,912,404 | |
| Burke County Georgia Development Authority Pollution Control, Series Fifth 1995 | | 2.200% | | 10/01/32 | | | 1,900,000 | | | | 1,905,832 | |
| | | | | | | | | | | | 5,818,236 | |
| Lease / Rent — 1.7% | | | | | | | | | | | | |
| Hamilton Ohio Community Authority, Series 2019-A (a) | | 4.000% | | 10/15/46 | | | 990,000 | | | | 1,085,852 | |
| San Antonio Texas Public Facilities Corp., Series 2012 | | 4.000% | | 09/15/42 | | | 480,000 | | | | 489,499 | |
| San Mateo County California Joint Powers Financing Authority, Series 2018-A (a) | | 4.000% | | 07/15/52 | | | 1,480,000 | | | | 1,715,389 | |
| Silver Creek Indiana School Building Corp., Series 2021 | | 4.000% | | 01/15/32 | | | 365,000 | | | | 443,796 | |
| Silver Creek Indiana School Building Corp., Series 2021 | | 3.000% | | 01/15/34 | | | 800,000 | | | | 898,441 | |
| | | | | | | | | | | | 4,632,977 | |
| Other — 0.0% (d) | | | | | | | | | | | | |
| Colorado Education & Cultural Facilities Authority, Series B (a) | | 4.000% | | 12/01/38 | | | 50,000 | | | | 52,871 | |
| | | | | | | | | | | | | |
| Public Services — 6.0% | | | | | | | | | | | | |
| City of Litchfield Park Arizona, Series 2021 | | 4.000% | | 07/01/36 | | | 500,000 | | | | 559,625 | |
| City of Litchfield Park Arizona, Series 2021 | | 4.000% | | 07/01/41 | | | 775,000 | | | | 862,394 | |
| Lee County Florida Tourist Development, Series 2013 | | 4.000% | | 10/01/38 | | | 1,950,000 | | | | 2,062,277 | |
| Lee County Florida Tourist Development, Series 2013 | | 4.000% | | 10/01/43 | | | 1,040,000 | | | | 1,094,595 | |
| New York City Transitional Finance Authority, Series 2017-F-1 | | 5.000% | | 05/01/42 | | | 2,415,000 | | | | 2,899,559 | |
| New York City Transitional Finance Authority, Series 2016-S-1 | | 5.000% | | 07/15/43 | | | 1,000,000 | | | | 1,158,044 | |
| New York State Urban Development Corp., Series 2019-A | | 5.000% | | 03/15/39 | | | 840,000 | | | | 1,042,067 | |
| Park Creek Metropolitan District, Series 2017-A (a) | | 5.000% | | 12/01/35 | | | 275,000 | | | | 313,119 | |
| Phoenix Arizona Civic Improvement Corp. Rental Car Facility, Series 2019-A | | 5.000% | | 07/01/39 | | | 2,500,000 | | | | 3,067,201 | |
| Reunion Metropolitan District Colorado, Series 2021-A | | 3.625% | | 12/01/44 | | | 2,000,000 | | | | 1,984,582 | |
| San Francisco California City & County Development Special Tax District No. 2020-1, Series 2021-A (c) | | 4.000% | | 09/01/41 | | | 300,000 | | | | 343,142 | |
| San Francisco California City & County Development Special Tax District No. 2020-1, Series 2021-A (c) | | 4.000% | | 09/01/46 | | | 1,000,000 | | | | 1,134,890 | |
| | | | | | | | | | | | 16,521,495 | |
| See Notes to Financial Statements. | |
| Annual Report | December 31, 2021 | | | 85 |
| Segall Bryant & Hamill Municipal Opportunities Fund | Statement of Investments |
| | December 31, 2021 |
| | | Coupon | | Maturity | | Par Value | | | Value | |
| Recreation — 1.7% | | | | | | | | | | |
| City of Houston Texas Convention & Entertainment Facilities Department, Series 2021 | | 3.000% | | 09/01/32 | | $ | 500,000 | | | $ | 550,593 | |
| City of Houston Texas Convention & Entertainment Facilities Department, Series 2021 | | 3.000% | | 09/01/33 | | | 315,000 | | | | 346,485 | |
| Collier County Florida Tourist Development, Series 2018 | | 4.000% | | 10/01/37 | | | 750,000 | | | | 858,631 | |
| Denver Colorado Convention Center Hotel Authority, Series 2016 (a) | | 5.000% | | 12/01/40 | | | 175,000 | | | | 199,629 | |
| Harris County Texas Municipal Utility District No. 500, Series 2021 | | 3.000% | | 12/01/34 | | | 375,000 | | | | 398,216 | |
| Harris County Texas Municipal Utility District No. 500, Series 2021 | | 3.000% | | 12/01/35 | | | 495,000 | | | | 524,291 | |
| Harris County Texas Municipal Utility District No. 500, Series 2021 | | 3.000% | | 12/01/36 | | | 520,000 | | | | 549,853 | |
| Harris County Texas Municipal Utility District No. 500, Series 2021 | | 3.000% | | 12/01/37 | | | 545,000 | | | | 574,743 | |
| Harris County Texas Municipal Utility District No. 500, Series 2021 | | 3.000% | | 12/01/38 | | | 565,000 | | | | 594,113 | |
| | | | | | | | | | | | 4,596,554 | |
| State and Non-State Appropriated Tobacco — 1.3% | | | | | | | | | | | | |
| Buckeye Ohio Tobacco Settlement Financing Authority, Series 2020-A-2 CL 1 (a) | | 4.000% | | 06/01/38 | | | 925,000 | | | | 1,078,875 | |
| California County Tobacco Securitization Agency (The), Series 2020-A (a) | | 4.000% | | 06/01/34 | | | 640,000 | | | | 768,976 | |
| California County Tobacco Securitization Agency (The), Series 2020-A (a) | | 4.000% | | 06/01/35 | | | 650,000 | | | | 779,252 | |
| Tobacco Securitization Authority of Southern California, Series 2019-A | | 5.000% | | 06/01/48 | | | 740,000 | | | | 911,359 | |
| | | | | | | | | | | | 3,538,462 | |
| Tax — 6.3% | | | | | | | | | | | | |
| Bexar County Texas, Series Fifth 1995 | | 4.000% | | 08/15/44 | | | 1,000,000 | | | | 1,130,561 | |
| City of Williston North Dakota, Series 2018-A (a) | | 3.200% | | 07/15/24 | | | 515,000 | | | | 520,897 | |
| Denver Colorado Urban Renewal Authority Tax Increment, Series 2018-A (a) (c) | | 5.250% | | 12/01/39 | | | 2,000,000 | | | | 2,168,121 | |
| Denver Colorado Urban Renewal Authority Tax Increment, Series 2018-A (a) (c) | | 5.250% | | 12/01/39 | | | 900,000 | | | | 975,334 | |
| Jamestown Park District, Series A (a) | | 4.000% | | 07/01/33 | | | 1,000,000 | | | | 1,066,224 | |
| New York State Dormitory Authority, Series 2018-A | | 4.000% | | 03/15/48 | | | 4,500,000 | | | | 5,142,450 | |
| Northglenn Urban Renewal Authority, Series 2019 (a) | | 4.000% | | 12/01/34 | | | 400,000 | | | | 455,495 | |
| Northglenn Urban Renewal Authority, Series 2019 (a) | | 4.000% | | 12/01/35 | | | 525,000 | | | | 595,072 | |
| Orange County Florida Tourist Development, Series 2016-B | | 4.000% | | 10/01/36 | | | 1,425,000 | | | | 1,619,935 | |
| Riverside County California Redevelopment Agency, Series B | | 0.000% | | 10/01/38 | | | 730,000 | | | | 503,694 | |
| Roaring Fork County Transportation Authority Sales & Use Tax, Series 2019 (a) | | 4.000% | | 12/01/44 | | | 150,000 | | | | 175,664 | |
| Southwest Houston Texas Redevelopment Authority, Series 2017-B (a) | | 4.000% | | 09/01/40 | | | 1,350,000 | | | | 1,500,097 | |
| Successor Agency to the Orange Redevelopment Agency, Series A (a) | | 4.000% | | 09/01/34 | | | 200,000 | | | | 232,250 | |
| Village Community Development District No. 5, Series Phase 1 | | 3.125% | | 05/01/22 | | | 150,000 | | | | 150,983 | |
| Village Community Development District No. 7, Series 2015 | | 4.000% | | 05/01/36 | | | 1,100,000 | | | | 1,171,289 | |
| | | | | | | | | | | | 17,408,066 | |
| Transportation — 22.1% | | | | | | | | | | | | |
| Airport Commission of the City and County of San Francisco, San Francisco International Airport, Series 2019-D (a) | | 5.000% | | 05/01/39 | | | 175,000 | | | | 218,783 | |
| Airport Commission of the City and County of San Francisco, San Francisco International Airport, Series 2016-C | | 5.000% | | 05/01/46 | | | 1,215,000 | | | | 1,422,509 | |
| Buffalo & Fort Erie New York Public Bridge Authority, Series 2017 | | 5.000% | | 01/01/42 | | | 1,090,000 | | | | 1,290,924 | |
| Central Texas Regional Mobility Authority, Series A (a) | | 5.000% | | 01/01/45 | | | 635,000 | | | | 733,012 | |
| City of Austin Texas Airport Systems, Series 2017-A (a) | | 5.000% | | 11/15/46 | | | 200,000 | | | | 237,583 | |
| City of St. Louis Missouri Airport (The), Series 2019-A (a) | | 5.000% | | 07/01/49 | | | 520,000 | | | | 637,949 | |
| Clark County Nevada Airport System, Series A-2 | | 5.000% | | 07/01/40 | | | 1,520,000 | | | | 1,855,304 | |
| Colorado High Performance Transportation Enterprise, Series 2014 (a) | | 5.750% | | 01/01/44 | | | 750,000 | | | | 788,593 | |
| Florida State Mid-Bay Bridge Authority, Series A (a) | | 5.000% | | 10/01/30 | | | 1,500,000 | | | | 1,699,553 | |
| Florida State Mid-Bay Bridge Authority, Series A (a) | | 5.000% | | 10/01/35 | | | 1,180,000 | | | | 1,331,433 | |
| Florida State Mid-Bay Bridge Authority, Series A (a) | | 5.000% | | 10/01/40 | | | 1,000,000 | | | | 1,123,106 | |
| Foothill Eastern Transportation Corridor Agency Toll Road, Series 2021-A | | 4.000% | | 01/15/46 | | | 250,000 | | | | 291,371 | |
| Foothill Eastern Transportation Corridor Agency Toll Road, Series 2013-B-2 | | 3.500% | | 01/15/53 | | | 2,750,000 | | | | 3,039,161 | |
| Houston Texas Airport Systems, Series 2018-A | | 5.000% | | 07/01/41 | | | 1,000,000 | | | | 1,212,521 | |
| La Paz County Arizona Industrial Development Authority, Series A (c) | | 7.000% | | 11/15/38 | | | 1,575,000 | | | | 1,646,895 | |
| La Paz County Arizona Industrial Development Authority, Series A (c) | | 7.125% | | 11/15/45 | | | 735,000 | | | | 766,130 | |
| Love Field Airport Modernization Corp., Series 2017 (a) | | 5.000% | | 11/01/33 | | | 425,000 | | | | 502,284 | |
| See Notes to Financial Statements. | |
| 86 | | | www.sbhfunds.com |
| Segall Bryant & Hamill Municipal Opportunities Fund | Statement of Investments |
| | December 31, 2021 |
| | | Coupon | | Maturity | | Par Value | | | Value | |
| Transportation (continued) | | | | | | | | | | | | |
| New Orleans Aviation Board General Airport, Series A (a) | | 5.000% | | 01/01/38 | | $ | 285,000 | | | $ | 339,931 | |
| New Orleans Aviation Board General Airport, Series A (a) | | 5.000% | | 01/01/43 | | | 345,000 | | | | 409,016 | |
| New Orleans Aviation Board General Airport, Series B (a) | | 5.000% | | 01/01/48 | | | 390,000 | | | | 456,377 | |
| North Carolina Department of Transportation, Series 2015 | | 5.000% | | 06/30/54 | | | 5,000,000 | | | | 5,444,928 | |
| North Carolina State Turnpike Authority Monroe Expressway Toll, Series A (a) | | 5.000% | | 07/01/42 | | | 750,000 | | | | 852,106 | |
| North Carolina State Turnpike Authority Monroe Expressway Toll, Series 2019 (a) | | 5.000% | | 01/01/43 | | | 500,000 | | | | 613,052 | |
| North Carolina State Turnpike Authority Monroe Expressway Toll, Series 2019 (a) | | 5.000% | | 01/01/44 | | | 355,000 | | | | 434,165 | |
| North Texas Tollway Authority System, Series 2017-B | | 5.000% | | 01/01/28 | | | 640,000 | | | | 744,707 | |
| North Texas Tollway Authority System, Series 2015-A (a) | | 5.000% | | 01/01/38 | | | 370,000 | | | | 414,691 | |
| North Texas Tollway Authority System, Series 2020-A | | 4.000% | | 01/02/38 | | | 3,000,000 | | | | 3,515,864 | |
| North Texas Tollway Authority System, Series A | | 5.000% | | 01/01/43 | | | 2,790,000 | | | | 3,409,665 | |
| North Texas Tollway Authority System, Series A | | 4.000% | | 01/01/43 | | | 500,000 | | | | 570,358 | |
| Pennsylvania Turnpike Commission, Series 2015-B (a) | | 5.000% | | 12/01/45 | | | 1,025,000 | | | | 1,179,516 | |
| Pennsylvania Turnpike Commission, Series A-1 | | 5.000% | | 12/01/46 | | | 3,990,000 | | | | 4,580,531 | |
| Pharr Texas International Toll Bridge System, Series 2021 | | 5.000% | | 08/15/31 | | | 260,000 | | | | 336,685 | |
| Pharr Texas International Toll Bridge System, Series 2021 | | 5.000% | | 08/15/32 | | | 810,000 | | | | 1,045,330 | |
| Pharr Texas International Toll Bridge System, Series 2021 | | 4.000% | | 08/15/33 | | | 855,000 | | | | 1,020,089 | |
| Port of Seattle Washington, Series 2018-A | | 5.000% | | 05/01/37 | | | 3,000,000 | | | | 3,553,046 | |
| Salt Lake City Utah Airport, Series 2017-B | | 5.000% | | 07/01/47 | | | 550,000 | | | | 659,058 | |
| Salt Lake City Utah Airport, Series 2018-A | | 5.250% | | 07/01/48 | | | 400,000 | | | | 488,776 | |
| State of Hawaii Airports System, Series B (a) | | 4.000% | | 07/01/45 | | | 600,000 | | | | 652,285 | |
| Texas Transportation Commission Central Texas Turnpike System, Series C | | 5.000% | | 08/15/30 | | | 120,000 | | | | 133,829 | |
| Texas Transportation Commission Central Texas Turnpike System, Series C | | 5.000% | | 08/15/37 | | | 1,000,000 | | | | 1,115,450 | |
| Texas Transportation Commission Central Texas Turnpike System, Series C | | 5.000% | | 08/15/42 | | | 3,500,000 | | | | 3,900,823 | |
| Virginia Small Business Financing Authority, Series 2017 (a) | | 5.000% | | 07/01/34 | | | 2,500,000 | | | | 2,517,513 | |
| Virginia Small Business Financing Authority, Series 2017 (a) | | 5.000% | | 01/01/40 | | | 130,000 | | | | 130,911 | |
| Virginia Small Business Financing Authority, Series 2017 (a) (c) (e) | | 2.250% | | 07/01/50 | | | 3,500,000 | | | | 3,508,065 | |
| | | | | | | | | | | | 60,823,878 | |
| Utilities — 5.8% | | | | | | | | | | | | |
| Cullman Alabama Utilities Board, Series 2015-A | | 3.750% | | 09/01/45 | | | 1,100,000 | | | | 1,178,469 | |
| Indiana State Municipal Power Agency, Series 2021 | | 5.000% | | 01/01/42 | | | 795,000 | | | | 937,442 | |
| JEA Electric System, Series 2020-A | | 4.000% | | 10/01/38 | | | 1,870,000 | | | | 2,212,230 | |
| Lower Colorado River Authority Texas Transmission Contract Revenue, Series 2016 (a) | | 4.000% | | 05/15/42 | | | 500,000 | | | | 543,612 | |
| Metropolitan Government of Nashville & Davidson County Tennessee Water & Sewer, Series 2013 | | 5.000% | | 07/01/40 | | | 500,000 | | | | 535,394 | |
| Missouri Development Finance Board, Series 2014-C | | 4.000% | | 11/01/43 | | | 505,000 | | | | 546,164 | |
| Norco California Financing Authority Enterprise, Series 2019-A (a) | | 4.000% | | 10/01/44 | | | 500,000 | | | | 587,820 | |
| Philadelphia Pennsylvania Gas Works, Series 16-A | | 5.000% | | 08/01/50 | | | 2,000,000 | | | | 2,508,677 | |
| Texas Municipal Power Agency Transmission System, Series 2021 | | 3.000% | | 09/01/34 | | | 1,000,000 | | | | 1,072,817 | |
| Texas Municipal Power Agency Transmission System, Series 2021 | | 3.000% | | 09/01/35 | | | 1,605,000 | | | | 1,720,329 | |
| Texas Municipal Power Agency Transmission System, Series 2021 | | 3.000% | | 09/01/36 | | | 1,470,000 | | | | 1,573,231 | |
| Truckee Meadows Nevada Water Authority, Series 2016 | | 5.000% | | 07/01/37 | | | 500,000 | | | | 588,093 | |
| Utah Infrastructure Agency, Series 2021 | | 4.000% | | 10/15/36 | | | 200,000 | | | | 232,878 | |
| Utah Infrastructure Agency, Series 2021 | | 4.000% | | 10/15/41 | | | 1,550,000 | | | | 1,786,311 | |
| | | | | | | | | | | | 16,023,467 | |
| Variable Rate Demand Note — 6.3% | | | | | | | | | | | | |
| Variable Rate Demand Note — 6.3% | | | | | | | | | | | | |
| ABAG Finance Authority, Series 2009-A | | 0.050% | | 08/01/24 | | | 3,100,000 | | | | 3,100,000 | |
| Massachusetts State Health & Educational Facilities Authority, Series P2 | | 0.050% | | 07/01/27 | | | 3,600,000 | | | | 3,600,000 | |
| Utah Water Finance Agency, Series B | | 0.070% | | 10/01/37 | | | 4,800,000 | | | | 4,800,000 | |
| Weber County Utah Hospital, Series 2000-B | | 0.050% | | 02/15/32 | | | 5,790,000 | | | | 5,790,000 | |
| | | | | | | | | | | | 17,290,000 | |
| | | | | | | | | | | | | |
| Total Municipal Bonds (Cost $246,895,715) | | | | | | | | | | | 253,753,876 | |
| See Notes to Financial Statements. | |
| Annual Report | December 31, 2021 | | | 87 |
| Segall Bryant & Hamill Municipal Opportunities Fund | Statement of Investments |
| | December 31, 2021 |
| | | Coupon | | Maturity | | Par Value | | | Value | |
| CORPORATE BONDS — 3_0% | | | | | | | | | | | | |
| Industrial — 1.1% | | | | | | | | | | | | |
| Energy — Independent — 0.8% | | | | | | | | | | | | |
| PDC Energy, Inc. | | 5.750% | | 05/15/26 | | $ | 2,000,000 | | | $ | 2,066,780 | |
| | | | | | | | | | | | | |
| Energy — Midstream — 0.1% | | | | | | | | | | | | |
| Tennessee Gas Pipeline Co. LLC | | 8.375% | | 06/15/32 | | | 250,000 | | | | 357,822 | |
| | | | | | | | | | | | | |
| Paper & Forest Products — 0.2% | | | | | | | | | | | | |
| West Fraser Timber Co., Ltd., 144A (f) | | 4.350% | | 10/15/24 | | | 471,000 | | | | 503,396 | |
| | | | | | | | | | | | | |
| Utility — 1.9% | | | | | | | | | | | | |
| Electric — 1.9% | | | | | | | | | | | | |
| Pacific Gas & Electric Co. | | 1.700% | | 11/15/23 | | | 5,350,000 | | | | 5,363,816 | |
| | | | | | | | | | | | | |
| Total Corporate Bonds (Cost $8,247,074) | | | | �� | | | | | | | 8,291,814 | |
| | | | | | | | | | | | | |
| Investments at Value — 95.1% (Cost $255,142,789) | | | | | | | | | | $ | 262,045,690 | |
| | | | | | | | | | | | | |
| Other Assets in Excess of Liabilities — 4.9% | | | | | | | | | | | 13,499,952 | |
| | | | | | | | | | | | | |
| Net Assets — 100.0% | | | | | | | | | | $ | 275,545,642 | |
| (a) | Security can be called and redeemed at the option of the issuer prior to the stated maturity date which is included in the Statement of Investments. |
| (b) | This security is insured. In the event of a default by the bond issuer, the issuer, as noted in the security description, guarantees that scheduled principal and interest payments will be made when due. |
| (c) | Security is considered a restricted security however such restriction has not resulted in an illiquid classification. The total value of these securities is $29,055,817, which represents 10.5% of net assets as of December 31, 2021. |
| (d) | Percentage rounds to less than 0.1%. |
| (e) | Variable rate security. Interest rate resets periodically. The rate shown is the effective interest rate as of December 31, 2021. For securities based on a published reference rate and spread, the reference rate and spread (in basis points) are indicated parenthetically. Certain variable rate securities are not based on a published reference rate and spread but are determined by the issuer or agent and are based on current market conditions. These securities, therefore, do not indicate a reference rate and spread. |
| (f) | Security was purchased in a transaction exempt from registration in compliance with Rule 144A of the Securities Act of 1933. This security may be resold in transactions exempt from registration, normally to qualified institutional buyers. The total value of these securities is $503,396, which represents 0.2% of net assets as of December 31, 2021. |
The Fund’s sector and industry classifications presented herein refer to any one or more of the industry sub-classifications used by one or more widely recognized market indexes or ratings group indexes, and/or as defined by Fund management. For Fund compliance purposes, sector and industry classifications are based on the sector and industry categorization methodology of the Adviser to the Funds. This definition may not apply for purposes of this report, which may combine industry sub-classifications for reporting ease. Industries are shown as a percentage of net assets.
| See Notes to Financial Statements. | |
| 88 | | | www.sbhfunds.com |
| Segall Bryant & Hamill Colorado Tax Free Fund | Statement of Investments |
| | December 31, 2021 |
| | | Coupon | | Maturity | | Par Value | | | Value | |
| MUNICIPAL BONDS — 96.6% | | | | | | | | | | | | |
| Certificate Participation — 15.4% | | | | | | | | | | | | |
| Healthcare — 0.2% | | | | | | | | | | | | |
| Denver Health & Hospital Authority COP, Series 2018 (a) | | 5.000% | | 12/01/30 | | $ | 350,000 | | | $ | 434,148 | |
| Denver Health & Hospital Authority COP, Series 2018 (a) | | 5.000% | | 12/01/31 | | | 350,000 | | | | 432,701 | |
| Denver Health & Hospital Authority COP, Series 2018 (a) | | 5.000% | | 12/01/32 | | | 225,000 | | | | 277,696 | |
| Denver Health & Hospital Authority COP, Series 2018 (a) | | 5.000% | | 12/01/33 | | | 240,000 | | | | 295,641 | |
| | | | | | | | | | | | 1,440,186 | |
| Lease / Rent — 15.2% | | | | | | | | | | | | |
| Aspen Colorado COP, Series 2019 (a) | | 5.000% | | 12/01/44 | | | 2,070,000 | | | | 2,594,252 | |
| Berthoud Colorado COP, Series 2020 (a) | | 4.000% | | 12/01/40 | | | 3,765,000 | | | | 4,421,282 | |
| Berthoud Colorado COP, Series 2020 (a) | | 4.000% | | 12/01/49 | | | 9,255,000 | | | | 10,704,799 | |
| Castle Pines North Metropolitan District Colorado COP, Series 2015 (a) | | 4.000% | | 12/01/44 | | | 750,000 | | | | 751,527 | |
| Castle Rock Colorado COP, Series 2020 | | 4.000% | | 12/01/40 | | | 1,025,000 | | | | 1,231,603 | |
| City & County of Denver Colorado COP, Series 2018-A (a) | | 5.375% | | 06/01/43 | | | 7,000,000 | | | | 8,263,781 | |
| City & County of Denver Colorado COP, Series 2018-A (a) | | 4.000% | | 06/01/48 | | | 4,925,000 | | | | 5,436,557 | |
| City of Aurora Colorado COP, Series 2017 (a) | | 5.000% | | 12/01/34 | | | 450,000 | | | | 534,420 | |
| City of Aurora Colorado COP, Series 2017 (a) | | 5.000% | | 12/01/35 | | | 615,000 | | | | 729,726 | |
| City of Thornton Colorado COP, Series 2018 | | 4.000% | | 12/01/39 | | | 10,305,000 | | | | 12,059,699 | |
| Colorado State Building Excellent Schools Today COP, Series 2019-O (a) | | 5.000% | | 03/15/36 | | | 1,750,000 | | | | 2,198,147 | |
| Colorado State Building Excellent Schools Today COP, Series 2019-O (a) | | 4.000% | | 03/15/37 | | | 1,450,000 | | | | 1,707,734 | |
| Colorado State Building Excellent Schools Today COP, Series 2018-N (a) | | 4.000% | | 03/15/39 | | | 200,000 | | | | 230,186 | |
| Colorado State COP Rural Colorado, Series 2018-A | | 4.000% | | 12/15/36 | | | 500,000 | | | | 587,007 | |
| Colorado State COP Rural Colorado, Series 2018-A (a) | | 5.000% | | 12/15/37 | | | 1,000,000 | | | | 1,249,126 | |
| Denver City & County School District No. 1 COP, Series 2020-A (a) | | 5.000% | | 12/01/33 | | | 275,000 | | | | 358,991 | |
| Denver City & County School District No. 1 COP, Series 2020-A (a) | | 5.000% | | 12/01/42 | | | 1,860,000 | | | | 2,386,831 | |
| El Paso County Colorado School District No. 3 COP, Series 2021 | | 4.000% | | 12/01/46 | | | 1,200,000 | | | | 1,408,973 | |
| El Paso County Colorado School District No. 49 COP, Series 2017-B | | 5.000% | | 12/15/42 | | | 3,495,000 | | | | 4,085,026 | |
| Foothills Park & Recreation District Colorado COP, Series 2021 | | 4.000% | | 12/01/41 | | | 2,750,000 | | | | 3,297,719 | |
| Grand Junction Colorado COP, Series 2019 (a) | | 4.000% | | 12/01/35 | | | 550,000 | | | | 652,392 | |
| Gunnison County Colorado COP, Series 2020-B | | 5.000% | | 12/01/23 | | | 105,000 | | | | 113,891 | |
| Gunnison County Colorado COP, Series 2020-B | | 5.000% | | 12/01/24 | | | 55,000 | | | | 61,844 | |
| Gunnison County Colorado COP, Series 2020 (a) | | 4.000% | | 12/01/34 | | | 125,000 | | | | 147,429 | |
| Gunnison County Colorado COP, Series 2020-B (a) | | 4.000% | | 12/01/34 | | | 55,000 | | | | 65,779 | |
| Gunnison County Colorado COP, Series 2020 (a) | | 4.000% | | 12/01/35 | | | 390,000 | | | | 459,421 | |
| Gunnison County Colorado COP, Series 2020-B (a) | | 4.000% | | 12/01/35 | | | 310,000 | | | | 370,258 | |
| Gunnison County Colorado COP, Series 2020 (a) | | 4.000% | | 12/01/36 | | | 810,000 | | | | 952,818 | |
| Gunnison County Colorado COP, Series 2020-B (a) | | 4.000% | | 12/01/36 | | | 325,000 | | | | 387,558 | |
| Gunnison County Colorado COP, Series 2020 (a) | | 4.000% | | 12/01/37 | | | 840,000 | | | | 986,095 | |
| Moffat County Colorado COP, Series 2021 | | 4.000% | | 03/01/41 | | | 2,235,000 | | | | 2,618,242 | |
| Moffat County Colorado COP, Series 2021 | | 4.000% | | 03/01/46 | | | 2,500,000 | | | | 2,887,308 | |
| Moffat County Colorado COP, Series 2021 | | 4.000% | | 03/01/51 | | | 5,580,000 | | | | 6,414,119 | |
| Monument Colorado COP, Series 2020 | | 4.000% | | 12/01/33 | | | 200,000 | | | | 231,278 | |
| Monument Colorado COP, Series 2020 | | 4.000% | | 12/01/40 | | | 750,000 | | | | 858,465 | |
| Monument Colorado COP, Series 2020 | | 4.000% | | 12/01/45 | | | 750,000 | | | | 850,850 | |
| Platteville-Gilcrest Fire Protection District COP, Series 2018 (a) | | 5.000% | | 12/01/33 | | | 175,000 | | | | 212,494 | |
| Regional Transportation District Colorado COP, Series 2015-A | | 4.000% | | 06/01/40 | | | 725,000 | | | | 789,622 | |
| South Suburban Park & Recreation District COP, Series 2021 | | 4.000% | | 12/15/41 | | | 1,175,000 | | | | 1,385,256 | |
| State of Colorado Department of Transportation, COP, Series 2017 (a) | | 5.000% | | 06/15/41 | | | 880,000 | | | | 1,015,866 | |
| Town of Firestone Colorado Water Enterprise COP, Series 2018 (a) | | 5.000% | | 12/01/42 | | | 3,000,000 | | | | 3,475,516 | |
| | | | | | | | | | | | 89,173,887 | |
| General Obligation — 18.9% | | | | | | | | | | | | |
| Local — 18.9% | | | | | | | | | | | | |
| Anthem West Metropolitan District, BAM, Series 2015 (a) (b) | | 5.000% | | 12/01/35 | | | 1,165,000 | | | | 1,351,094 | |
| Arapahoe County School District No. 6 Littleton Colorado, Series 2019-A (a) | | 5.500% | | 12/01/43 | | | 5,000,000 | | | | 6,458,470 | |
| See Notes to Financial Statements. | |
| Annual Report | December 31, 2021 | | | 89 |
| Segall Bryant & Hamill Colorado Tax Free Fund | Statement of Investments |
| | December 31, 2021 |
| | | Coupon | | Maturity | | Par Value | | | Value | |
| Local (continued) | | | | | | | | | | | | |
| Beacon Point Metropolitan District, AGM, Series 2015 (a) (b) | | 5.000% | | 12/01/30 | | $ | 1,000,000 | | | $ | 1,163,093 | |
| BNC Metropolitan District No. 1, BAM, Series 2017-A (a) (b) | | 5.000% | | 12/01/32 | | | 360,000 | | | | 433,748 | |
| BNC Metropolitan District No. 1, BAM, Series 2017-A (a) (b) | | 5.000% | | 12/01/37 | | | 545,000 | | | | 652,616 | |
| Bradburn Metropolitan District No. 2, Series 2018-A | | 4.000% | | 12/01/28 | | | 495,000 | | | | 527,882 | |
| Bradburn Metropolitan District No. 2, Series 2018-A (a) | | 5.000% | | 12/01/38 | | | 600,000 | | | | 681,218 | |
| Bromley Park Metropolitan District No. 2, Series 2018-B (a) | | 6.375% | | 12/15/47 | | | 1,000,000 | | | | 1,061,546 | |
| Bromley Park Metropolitan District No. 2, BAM, Series 2018-A (a) (b) | | 4.000% | | 12/01/47 | | | 2,500,000 | | | | 2,822,393 | |
| Castle Oaks Metropolitan District No. 3 Colorado, AGM, Series 2020 (b) | | 4.000% | | 12/01/40 | | | 615,000 | | | | 730,526 | |
| Castle Oaks Metropolitan District No. 3 Colorado, AGM, Series 2020 (b) | | 4.000% | | 12/01/45 | | | 3,800,000 | | | | 4,450,194 | |
| Castle Oaks Metropolitan District No. 3 Colorado, AGM, Series 2020 (b) | | 4.000% | | 12/01/50 | | | 4,690,000 | | | | 5,469,562 | |
| Central Platte Valley Metropolitan District, Series 2013-A (a) | | 5.500% | | 12/01/29 | | | 750,000 | | | | 804,758 | |
| Central Platte Valley Metropolitan District, Series 2013-A (a) | | 5.375% | | 12/01/33 | | | 1,600,000 | | | | 1,704,946 | |
| Central Platte Valley Metropolitan District, Series 2013-A (a) | | 5.625% | | 12/01/38 | | | 2,875,000 | | | | 3,063,609 | |
| Central Platte Valley Metropolitan District, Series 2013-A (a) | | 6.000% | | 12/01/38 | | | 1,000,000 | | | | 1,070,635 | |
| Central Platte Valley Metropolitan District, Series 2014 (a) | | 5.000% | | 12/01/43 | | | 5,750,000 | | | | 6,015,655 | |
| Cherry Creek Colorado School District No. 5, Series 2021 | | 5.000% | | 12/15/28 | | | 80,000 | | | | 102,022 | |
| Copperleaf Metropolitan District No. 2 Colorado, BAM, Series 2020 (b) | | 4.000% | | 12/01/45 | | | 2,295,000 | | | | 2,737,427 | |
| Cornerstar Metropolitan District, Series A (a) | | 5.125% | | 12/01/37 | | | 1,000,000 | | | | 1,047,753 | |
| Cottonwood Highlands Metropolitan District No. 1, Series 2019-A (a) | | 5.000% | | 12/01/49 | | | 900,000 | | | | 961,464 | |
| Cross Creek Metropolitan District No. 2, AGM, Series 2018 (a) (b) | | 5.000% | | 12/01/34 | | | 2,480,000 | | | | 3,079,272 | |
| Crystal Valley Metropolitan District No. 2, AGM, Series 2020 (b) | | 4.000% | | 12/01/40 | | | 800,000 | | | | 953,919 | |
| Dove Valley Metropolitan District Arapahoe County, BAM, Series 2019 (a) (b) | | 4.000% | | 12/01/35 | | | 500,000 | | | | 597,198 | |
| Dove Valley Metropolitan District Arapahoe County, BAM, Series 2019 (a) (b) | | 4.000% | | 12/01/36 | | | 700,000 | | | | 834,878 | |
| Dove Valley Metropolitan District Arapahoe County, BAM, Series 2019 (a) (b) | | 4.000% | | 12/01/37 | | | 750,000 | | | | 892,687 | |
| Dove Valley Metropolitan District Arapahoe County, BAM, Series 2019 (a) (b) | | 4.000% | | 12/01/38 | | | 500,000 | | | | 592,113 | |
| Dove Valley Metropolitan District Arapahoe County, BAM, Series 2019 (a) (b) | | 4.000% | | 12/01/39 | | | 600,000 | | | | 706,814 | |
| Eagle Shadow Metropolitan District No. 1, Series 2013-A (a) | | 5.000% | | 11/15/32 | | | 500,000 | | | | 501,005 | |
| Erie Farm Metropolitan District, Series 2021 | | 5.000% | | 12/01/35 | | | 175,000 | | | | 223,690 | |
| Erie Farm Metropolitan District, Series 2021 | | 5.000% | | 12/01/41 | | | 570,000 | | | | 724,378 | |
| Erie Farm Metropolitan District, Series 2021 | | 5.000% | | 12/01/46 | | | 600,000 | | | | 754,976 | |
| Erie Farm Metropolitan District, Series 2021 | | 4.000% | | 12/01/51 | | | 1,100,000 | | | | 1,270,152 | |
| Flying Horse Metropolitan District No. 2 Colorado, AGM, Series 2020-A (b) | | 4.000% | | 12/01/50 | | | 1,750,000 | | | | 2,053,375 | |
| Fort Bend County Texas Levee Improvement Distict No. 2, Series 2019 | | 3.000% | | 04/01/42 | | | 1,350,000 | | | | 1,386,947 | |
| Fossil Ridge Metropolitan District No. 3 Colorado, BAM, Series 2020 (b) | | 4.000% | | 12/01/32 | | | 995,000 | | | | 1,171,943 | |
| Fossil Ridge Metropolitan District No. 3 Colorado, BAM, Series 2020 (b) | | 4.000% | | 12/01/33 | | | 1,030,000 | | | | 1,211,130 | |
| Fossil Ridge Metropolitan District No. 3 Colorado, BAM, Series 2020 (b) | | 4.000% | | 12/01/34 | | | 1,075,000 | | | | 1,261,350 | |
| Grand River Hospital District, AGM, Series 2018 (a) (b) | | 5.250% | | 12/01/32 | | | 1,000,000 | | | | 1,228,435 | |
| Grand River Hospital District, AGM, Series 2018 (a) (b) | | 5.250% | | 12/01/33 | | | 1,000,000 | | | | 1,226,827 | |
| Great Western Park Metropolitan District No. 2 Colorado, Series 2021 | | 4.000% | | 12/01/35 | | | 520,000 | | | | 631,532 | |
| Great Western Park Metropolitan District No. 2 Colorado, Series 2021 | | 4.000% | | 12/01/36 | | | 555,000 | | | | 672,867 | |
| High Plains Metropolitan District, NATL, Series 2017 (a) (b) | | 5.000% | | 12/01/35 | | | 500,000 | | | | 601,877 | |
| Hogback Metropolitan District Colorado, Series 2021-A | | 5.000% | | 12/01/41 | | | 700,000 | | | | 740,464 | |
| Hogback Metropolitan District Colorado, Series 2021-A | | 5.000% | | 12/01/51 | | | 1,575,000 | | | | 1,639,081 | |
| Leyden Rock Metropolitan District, Series 2021 | | 4.000% | | 12/01/46 | | | 1,250,000 | | | | 1,494,907 | |
| Longs Peak Metropolitan District Colorado, Series 2021 | | 5.250% | | 12/01/51 | | | 6,500,000 | | | | 6,507,528 | |
| North Pine Vistas Metropolitan District No. 3, Series 2021-A | | 4.000% | | 12/01/36 | | | 175,000 | | | | 205,356 | |
| North Pine Vistas Metropolitan District No. 3, Series 2021-A | | 4.000% | | 12/01/46 | | | 1,000,000 | | | | 1,152,823 | |
| North Pine Vistas Metropolitan District No. 3, Series 2021-A | | 4.000% | | 12/01/51 | | | 1,250,000 | | | | 1,433,785 | |
| Prairie Center Metropolitan District No. 7 Colorado, Series 2020 | | 4.125% | | 12/15/36 | | | 500,000 | | | | 538,787 | |
| Prairie Center Metropolitan District No. 7 Colorado, Series 2020 | | 4.875% | | 12/15/44 | | | 700,000 | | | | 754,661 | |
| Sand Creek County Metropolitan District, AGM, Series 2017 (a) (b) | | 4.000% | | 12/01/35 | | | 380,000 | | | | 437,112 | |
| Sand Creek County Metropolitan District, AGM, Series 2020-B (b) | | 4.000% | | 12/01/35 | | | 3,405,000 | | | | 4,085,594 | |
| Sand Creek County Metropolitan District, AGM, Series 2020-B (b) | | 4.000% | | 12/01/40 | | | 2,325,000 | | | | 2,763,858 | |
| SBC Metropolitan District, AGM, Series 2016 (a) (b) | | 5.000% | | 12/01/34 | | | 205,000 | | | | 243,350 | |
| See Notes to Financial Statements. | |
| 90 | | | www.sbhfunds.com |
| Segall Bryant & Hamill Colorado Tax Free Fund | Statement of Investments |
| | December 31, 2021 |
| | | Coupon | | Maturity | | Par Value | | | Value | |
| Local (continued) | | | | | | | | | | | | |
| Serenity Ridge Metropolitan District No. 2, Series 2018-A (a) | | 5.125% | | 12/01/43 | | $ | 725,000 | | | $ | 810,981 | |
| Sierra Ridge Metropolitan District No. 2, Series 2016-A (a) | | 5.500% | | 12/01/46 | | | 4,500,000 | | | | 4,642,079 | |
| Sorrel Ranch Metropolitan District Colorado, AGM, Series 2020 (b) | | 4.000% | | 12/01/33 | | | 320,000 | | | | 386,486 | |
| Sorrel Ranch Metropolitan District Colorado, AGM, Series 2020 (b) | | 4.000% | | 12/01/34 | | | 665,000 | | | | 801,447 | |
| Sorrel Ranch Metropolitan District Colorado, AGM, Series 2020 (b) | | 4.000% | | 12/01/35 | | | 570,000 | | | | 686,031 | |
| Sorrel Ranch Metropolitan District Colorado, AGM, Series 2020 (b) | | 4.000% | | 12/01/37 | | | 500,000 | | | | 599,468 | |
| South Suburban Park & Recreation District, Series 2019 (a) | | 4.000% | | 12/15/38 | | | 575,000 | | | | 683,791 | |
| South Suburban Park & Recreation District, Series 2019 (a) | | 4.000% | | 12/15/39 | | | 565,000 | | | | 670,685 | |
| Southshore Metropolitan District No. 2 City of Aurora Arapahoe County Colorado, BAM, Series 2020-A-2 (a) (b) | | 4.000% | | 12/01/46 | | | 6,300,000 | | | | 7,335,173 | |
| Sterling Hills West Metropolitan District, Series 2017 (a) | | 5.000% | | 12/01/39 | | | 750,000 | | | | 887,868 | |
| Thornton Colorado Development Authority, Series 2015 | | 5.000% | | 12/01/24 | | | 440,000 | | | | 495,435 | |
| Thornton Colorado Development Authority, Series 2015 (a) | | 5.000% | | 12/01/25 | | | 325,000 | | | | 365,846 | |
| Thornton Colorado Development Authority, Series 2015 | | 5.000% | | 12/01/26 | | | 530,000 | | | | 595,628 | |
| Vista Ridge Metropolitan District, BAM, Series 2016-A (a) (b) | | 5.000% | | 12/01/27 | | | 485,000 | | | | 578,806 | |
| Vista Ridge Metropolitan District, BAM, Series 2016-A (a) (b) | | 5.000% | | 12/01/28 | | | 750,000 | | | | 894,663 | |
| Vista Ridge Metropolitan District, BAM, Series 2016-A (a) (b) | | 5.000% | | 12/01/31 | | | 1,250,000 | | | | 1,472,694 | |
| Wheatlands Metropolitan District, BAM, Series 2015 (a) (b) | | 5.000% | | 12/01/30 | | | 1,000,000 | | | | 1,160,995 | |
| | | | | | | | | | | | 110,953,358 | |
| State — 0.0% (c) | | | | | | | | | | | | |
| Commonwealth of Puerto Rico, AGM, Series 2011-A (a)(b) | | 5.250% | | 07/01/24 | | | 100,000 | | | | 100,595 | |
| | | | | | | | | | | | | |
| Local Authority — 3_2% | | | | | | | | | | | | |
| Housing — 0.6% | | | | | | | | | | | | |
| Colorado Housing & Finance Authority, Series 2018-D | | 3.100% | | 05/01/22 | | | 505,000 | | | | 505,000 | |
| Colorado Housing & Finance Authority, Series 2020-C-1 | | 1.878% | | 05/01/23 | | | 295,000 | | | | 298,060 | |
| Colorado Housing & Finance Authority, Series 2020-C-1 | | 1.928% | | 11/01/23 | | | 340,000 | | | | 343,777 | |
| Colorado Housing & Finance Authority, Series 2020-C-1 | | 2.025% | | 05/01/24 | | | 150,000 | | | | 151,957 | |
| Colorado Housing & Finance Authority, Series 2021-E-2 | | 0.600% | | 10/01/24 | | | 1,395,000 | | | | 1,394,707 | |
| Colorado Housing & Finance Authority, Series 2020-C-1 | | 2.075% | | 11/01/24 | | | 250,000 | | | | 253,489 | |
| Colorado Housing & Finance Authority, Series 2020-C-1 | | 2.175% | | 11/01/25 | | | 500,000 | | | | 506,981 | |
| | | | | | | | | | | | 3,453,971 | |
| Lease / Rent — 0.1% | | | | | | | | | | | | |
| Boulder Colorado COP, Series 2019 | | 2.250% | | 11/01/24 | | | 500,000 | | | | 514,146 | |
| | | | | | | | | | | | | |
| Local — 1.4% | | | | | | | | | | | | |
| Eagle County Colorado School District, Series 2021 | | 0.793% | | 12/01/25 | | | 3,000,000 | | | | 2,950,376 | |
| Eagle County Colorado School District, Series 2021 | | 0.903% | | 12/01/26 | | | 5,000,000 | | | | 4,887,529 | |
| Garfield County School District No. RE2, Series 2012-B (a) | | 3.050% | | 12/01/26 | | | 500,000 | | | | 507,879 | |
| | | | | | | | | | | | 8,345,784 | |
| Recreation — 0.3% | | | | | | | | | | | | |
| Park Creek Metropolitan District, Series 2017-B | | 3.150% | | 12/01/23 | | | 405,000 | | | | 419,967 | |
| Park Creek Metropolitan District, Series 2017-B | | 3.300% | | 12/01/24 | | | 425,000 | | | | 446,506 | |
| Park Creek Metropolitan District, Series 2017-B | | 3.450% | | 12/01/25 | | | 500,000 | | | | 532,405 | |
| Park Creek Metropolitan District, Series 2017-B (a) | | 3.600% | | 12/01/26 | | | 300,000 | | | | 319,137 | |
| | | | | | | | | | | | 1,718,015 | |
| Tax — 0.4% | | | | | | | | | | | | |
| Grand Junction Colorado, Series 2020-A | | 1.826% | | 03/01/25 | | | 620,000 | | | | 623,484 | |
| Park Creek Metropolitan District, Series 2018-B | | 3.550% | | 12/01/22 | | | 665,000 | | | | 682,316 | |
| Park Creek Metropolitan District, Series 2018-B | | 3.650% | | 12/01/23 | | | 805,000 | | | | 844,195 | |
| Park Creek Metropolitan District, Series 2018-B | | 3.800% | | 12/01/24 | | | 440,000 | | | | 470,319 | |
| | | | | | | | | | | | 2,620,314 | |
| Utilities — 0.4% | | | | | | | | | | | | |
| Todd Creek Village Metropolitan District Colorado, Series 2018-B (a) | | 5.875% | | 12/01/38 | | | 875,000 | | | | 876,676 | |
| See Notes to Financial Statements. | |
| Annual Report | December 31, 2021 | | | 91 |
| Segall Bryant & Hamill Colorado Tax Free Fund | Statement of Investments |
| | December 31, 2021 |
| | | Coupon | | Maturity | | Par Value | | | Value | |
| Utilities (continued) | | | | | | | | | | | | |
| Town of Estes Park Colorado Power & Communications, Series 2019-B | | 2.362% | | 11/01/23 | | $ | 770,000 | | | $ | 788,496 | |
| Town of Estes Park Colorado Power & Communications, Series 2019-B | | 2.646% | | 11/01/25 | | | 430,000 | | | | 447,996 | |
| | | | | | | | | | | | 2,113,168 | |
| Prerefunded — 0.6% | | | | | | | | | | | | |
| Healthcare — 0.3% | | | | | | | | | | | | |
| Colorado Health Facilities Authority, Series 2017 (a) | | 5.000% | | 06/01/31 | | | 1,250,000 | | | | 1,522,173 | |
| | | | | | | | | | | | | |
| Local — 0.3% | | | | | | | | | | | | |
| Eaton Area Park & Recreation District, Series 2015 (a) | | 5.500% | | 12/01/30 | | | 470,000 | | | | 492,485 | |
| Tallyns Reach Metropolitan District No. 3, Series 2013 (a) | | 5.125% | | 11/01/38 | | | 1,035,000 | | | | 1,122,113 | |
| | | | | | | | | | | | 1,614,598 | |
| Revenue — 48.5% | | | | | | | | | | | | |
| Education — 4.4% | | | | | | | | | | | | |
| Colorado Educational & Cultural Facilities Authority, Series 2017-A (a) | | 4.000% | | 03/01/31 | | | 25,000 | | | | 28,522 | |
| Colorado Educational & Cultural Facilities Authority, Series 2017-A (a) | | 4.000% | | 03/01/33 | | | 1,125,000 | | | | 1,279,467 | |
| Colorado Educational & Cultural Facilities Authority, Series 2016 (a) | | 5.000% | | 10/01/34 | | | 1,975,000 | | | | 2,200,912 | |
| Colorado Educational & Cultural Facilities Authority, Series 2016 (a) | | 5.000% | | 05/01/35 | | | 3,145,000 | | | | 3,498,695 | |
| Colorado Educational & Cultural Facilities Authority, Series 2016 (a) | | 5.000% | | 10/01/36 | | | 1,500,000 | | | | 1,742,504 | |
| Colorado School of Mines, Series 2018-A (1MO LIBOR + 50) (a) (d) | | 0.566% | | 02/01/23 | | | 13,110,000 | | | | 13,095,179 | |
| Colorado School of Mines, Series 2017-C (a) | | 4.000% | | 12/01/37 | | | 225,000 | | | | 258,123 | |
| Colorado State Board Community Colleges Refunding and Improvement | | | | | | | | | | | | |
| Department Higher Education, Series 2017-A | | 5.000% | | 11/01/26 | | | 105,000 | | | | 126,121 | |
| Colorado State Board Community Colleges Refunding and Improvement | | | | | | | | | | | | |
| Department Higher Education, Series 2017-A (a) | | 4.000% | | 11/01/41 | | | 825,000 | | | | 946,239 | |
| Metropolitan State University of Denver Colorado, Series 2016 (a) | | 4.000% | | 12/01/28 | | | 715,000 | | | | 796,169 | |
| University of Colorado Enterprise, Series 2017-A-2 (a) | | 4.000% | | 06/01/43 | | | 1,750,000 | | | | 2,022,946 | |
| | | | | | | | | | | | 25,994,877 | |
| Healthcare — 5.7% | | | | | | | | | | | | |
| Aspen Valley Hospital District, Series 2012 (a) | | 5.000% | | 10/15/30 | | | 1,650,000 | | | | 1,690,505 | |
| Colorado Health Facilities Authority, Series 2017-A | | 5.000% | | 05/15/23 | | | 370,000 | | | | 393,034 | |
| Colorado Health Facilities Authority, Series 2017-A | | 5.000% | | 05/15/24 | | | 575,000 | | | | 634,638 | |
| Colorado Health Facilities Authority, Series 2012 (a) | | 5.000% | | 12/01/24 | | | 1,000,000 | | | | 1,039,843 | |
| Colorado Health Facilities Authority, Series 2017-A | | 5.000% | | 05/15/25 | | | 790,000 | | | | 903,619 | |
| Colorado Health Facilities Authority, Series 2017-A | | 5.000% | | 05/15/26 | | | 540,000 | | | | 637,657 | |
| Colorado Health Facilities Authority, Series 2017-A (a) | | 5.000% | | 05/15/28 | | | 535,000 | | | | 649,189 | |
| Colorado Health Facilities Authority, Series 2017-A (a) | | 5.000% | | 05/15/29 | | | 425,000 | | | | 513,094 | |
| Colorado Health Facilities Authority, Series B (a) | | 5.000% | | 09/01/29 | | | 1,000,000 | | | | 1,138,621 | |
| Colorado Health Facilities Authority, Series C (a) | | 5.000% | | 12/01/29 | | | 1,010,000 | | | | 1,190,891 | |
| Colorado Health Facilities Authority, Series 2017-A (a) | | 5.000% | | 05/15/30 | | | 710,000 | | | | 853,216 | |
| Colorado Health Facilities Authority, Series 2023-A | | 3.000% | | 05/15/30 | | | 410,000 | | | | 413,174 | |
| Colorado Health Facilities Authority, Series 2015 (a) | | 5.000% | | 05/15/30 | | | 500,000 | | | | 566,544 | |
| Colorado Health Facilities Authority, Series 2017-A (a) | | 5.000% | | 05/15/31 | | | 1,155,000 | | | | 1,383,925 | |
| Colorado Health Facilities Authority, Series 2017-A (a) | | 5.000% | | 05/15/32 | | | 1,650,000 | | | | 1,973,514 | |
| Colorado Health Facilities Authority, Series 2012 (a) | | 5.000% | | 10/01/32 | | | 500,000 | | | | 515,858 | |
| Colorado Health Facilities Authority, Series 2017-A (a) | | 4.000% | | 05/15/35 | | | 350,000 | | | | 392,891 | |
| Colorado Health Facilities Authority, Series 2019-A (a) | | 5.000% | | 11/15/37 | | | 200,000 | | | | 255,738 | |
| Colorado Health Facilities Authority, Series 2019 (a) | | 4.000% | | 01/01/39 | | | 1,200,000 | | | | 1,397,158 | |
| Colorado Health Facilities Authority, Series 2019 (a) | | 4.000% | | 01/01/40 | | | 925,000 | | | | 1,073,841 | |
| Colorado Health Facilities Authority, Series 2015 (a) | | 5.000% | | 05/15/40 | | | 1,000,000 | | | | 1,129,537 | |
| Colorado Health Facilities Authority, Series 2023-A | | 4.000% | | 05/15/41 | | | 500,000 | | | | 533,268 | |
| Colorado Health Facilities Authority, Series 2018 (a) (d) | | 2.800% | | 05/15/42 | | | 2,770,000 | | | | 2,825,526 | |
| Colorado Health Facilities Authority, Series A-1 | | 4.000% | | 08/01/44 | | | 4,045,000 | | | | 4,644,566 | |
| Colorado Health Facilities Authority, Series 2015 (a) | | 4.000% | | 01/15/45 | | | 2,155,000 | | | | 2,358,510 | |
| Colorado Health Facilities Authority, Series 2019-A (a) | | 3.000% | | 11/15/46 | | | 985,000 | | | | 1,055,672 | |
| Colorado Health Facilities Authority, Series 2023-A | | 4.000% | | 05/15/48 | | | 500,000 | | | | 523,605 | |
| See Notes to Financial Statements. | |
| 92 | | | www.sbhfunds.com |
| Segall Bryant & Hamill Colorado Tax Free Fund | Statement of Investments |
| | December 31, 2021 |
| | | Coupon | | Maturity | | Par Value | | | Value | |
| Healthcare (continued) | | | | | | | | | | | | |
| Denver Health & Hospital Authority, Series A (a) | | 5.000% | | 12/01/39 | | $ | 1,500,000 | | | $ | 1,602,055 | |
| University of Colorado Hospital Authority, Series 2012-A (a) | | 4.000% | | 11/15/42 | | | 1,250,000 | | | | 1,285,799 | |
| | | | | | | | | | | | 33,575,488 | |
| Industrial Development — 0.1% | | | | | | | | | | | | |
| Colorado Health Facilities Authority, Series A (a) | | 5.000% | | 02/01/22 | | | 200,000 | | | | 200,622 | |
| Colorado Health Facilities Authority, Series A (a) | | 5.000% | | 02/01/23 | | | 520,000 | | | | 542,811 | |
| | | | | | | | | | | | 743,433 | |
| Lease / Rent — 1.0% | | | | | | | | | | | | |
| Regional Transportation District Colorado COP, Series 2014-A (a) | | 4.375% | | 06/01/39 | | | 4,000,000 | | | | 4,179,958 | |
| Regional Transportation District Colorado COP, Series 2014-A (a) | | 4.500% | | 06/01/44 | | | 1,555,000 | | | | 1,624,638 | |
| | | | | | | | | | | | 5,804,596 | |
| Other — 2.9% | | | | | | | | | | | | |
| Colorado Educational & Cultural Facilities Authority, Series 2012 | | 4.000% | | 04/01/22 | | | 30,000 | | | | 30,252 | |
| Colorado Educational & Cultural Facilities Authority, Series 2014 | | 5.000% | | 11/15/24 | | | 435,000 | | | | 482,977 | |
| Colorado Educational & Cultural Facilities Authority, Series A (a) (e) | | 4.125% | | 07/01/26 | | | 535,000 | | | | 563,987 | |
| Colorado Educational & Cultural Facilities Authority, Series 2016 (e) | | 3.750% | | 07/01/26 | | | 500,000 | | | | 520,504 | |
| Colorado Educational & Cultural Facilities Authority, Series 2016 (a) | | 5.000% | | 05/15/29 | | | 2,600,000 | | | | 3,010,512 | |
| Colorado Educational & Cultural Facilities Authority, Series 2014 (a) | | 5.000% | | 08/15/30 | | | 750,000 | | | | 821,019 | |
| Colorado Educational & Cultural Facilities Authority, Series 2015 (a) | | 5.000% | | 11/01/30 | | | 500,000 | | | | 565,246 | |
| Colorado Educational & Cultural Facilities Authority, Series 2014 (a) | | 5.000% | | 11/15/31 | | | 1,000,000 | | | | 1,089,857 | |
| Colorado Educational & Cultural Facilities Authority, Series 2014 | | 5.000% | | 12/01/31 | | | 1,500,000 | | | | 1,648,410 | |
| Colorado Educational & Cultural Facilities Authority, Series 2016-A (a) | | 5.000% | | 12/15/31 | | | 715,000 | | | | 834,956 | |
| Colorado Educational & Cultural Facilities Authority, Series 2014 (a) | | 5.000% | | 10/01/32 | | | 1,340,000 | | | | 1,457,436 | |
| Colorado Educational & Cultural Facilities Authority, Series 2016 (a) | | 5.000% | | 06/01/36 | | | 1,580,000 | | | | 1,807,331 | |
| Colorado Educational & Cultural Facilities Authority, Series 2016 (a) | | 5.000% | | 07/01/36 | | | 1,000,000 | | | | 1,115,163 | |
| Colorado Educational & Cultural Facilities Authority, Series 2016 (a) (e) | | 5.000% | | 07/01/36 | | | 1,000,000 | | | | 1,099,341 | |
| Colorado Educational & Cultural Facilities Authority, Series 2016 (a) | | 5.000% | | 08/01/36 | | | 1,140,000 | | | | 1,308,375 | |
| Colorado Educational & Cultural Facilities Authority, Series B (a) | | 5.625% | | 01/15/44 | | | 450,000 | | | | 474,550 | |
| | | | | | | | | | | | 16,829,916 | |
| Public Services — 10.9% | | | | | | | | | | | | |
| Centerra Metropolitan District No. 1, Series 2020-A | | 5.000% | | 12/01/51 | | | 4,000,000 | | | | 4,363,762 | |
| Cherry Creek Corporate Center Metropolitan District, Series 2015-A (a) | | 5.000% | | 06/01/37 | | | 500,000 | | | | 536,607 | |
| City & County of Denver Colorado, Series 2018-A-2 (a) | | 0.000% | | 08/01/35 | | | 2,800,000 | | | | 1,829,032 | |
| City & County of Denver Colorado, Series 2018-A-2 (a) | | 0.000% | | 08/01/36 | | | 2,550,000 | | | | 1,589,024 | |
| City & County of Denver Colorado, Series 2018-A-2 (a) | | 0.000% | | 08/01/37 | | | 3,910,000 | | | | 2,323,482 | |
| City & County of Denver Colorado, Series 2018-A-1 (a) | | 5.000% | | 08/01/41 | | | 2,780,000 | | | | 3,240,787 | |
| City & County of Denver Colorado, Series 2018-A-1 (a) | | 5.000% | | 08/01/48 | | | 14,000,000 | | | | 16,192,169 | |
| Park Creek Metropolitan District, Series 2015-A (a) | | 5.000% | | 12/01/26 | | | 730,000 | | | | 845,082 | |
| Park Creek Metropolitan District, Series 2015-A (a) | | 5.000% | | 12/01/27 | | | 620,000 | | | | 715,672 | |
| Park Creek Metropolitan District, Series 2017-A (a) | | 5.000% | | 12/01/36 | | | 300,000 | | | | 341,339 | |
| Park Creek Metropolitan District, Series 2017-A (a) | | 5.000% | | 12/01/37 | | | 400,000 | | | | 454,627 | |
| Park Creek Metropolitan District, Series 2017-A (a) | | 5.000% | | 12/01/41 | | | 1,500,000 | | | | 1,698,733 | |
| Park Creek Metropolitan District, Series 2015-A (a) | | 5.000% | | 12/01/45 | | | 550,000 | | | | 620,189 | |
| Park Creek Metropolitan District, Series 2017-A (a) | | 5.000% | | 12/01/46 | | | 4,930,000 | | | | 5,555,155 | |
| Plaza Metropolitan District No. 1, Series 2013 (e) | | 5.000% | | 12/01/22 | | | 1,500,000 | | | | 1,546,311 | |
| Rampart Range Colorado Metropolitan District No. 1, AGM, Series 2017 (a) (b) | | 5.000% | | 12/01/42 | | | 1,905,000 | | | | 2,295,090 | |
| Rampart Range Colorado Metropolitan District No. 1, AGM, Series 2017 (a) (b) | | 5.000% | | 12/01/47 | | | 8,150,000 | | | | 9,760,834 | |
| Southglenn Metropolitan District Colorado, Series 2016 (a) | | 3.500% | | 12/01/26 | | | 3,000,000 | | | | 3,092,613 | |
| Southglenn Metropolitan District Colorado, Series 2016 (a) | | 5.000% | | 12/01/30 | | | 3,505,000 | | | | 3,615,896 | |
| Sterling Ranch Community Authority Colorado, Series 2020-A | | 3.750% | | 12/01/40 | | | 500,000 | | | | 545,357 | |
| Sterling Ranch Community Authority Colorado, Series 2020-A | | 4.250% | | 12/01/50 | | | 2,000,000 | | | | 2,210,946 | |
| Triview Colorado Metropolitan District Water & Wastewater Enterprise, BAM, Series 2020 (a) (b) | | 4.000% | | 12/01/40 | | | 410,000 | | | | 473,621 | |
| | | | | | | | | | | | 63,846,328 | |
| See Notes to Financial Statements. | |
| Annual Report | December 31, 2021 | | | 93 |
| Segall Bryant & Hamill Colorado Tax Free Fund | Statement of Investments |
| | December 31, 2021 |
| | | Coupon | | Maturity | | Par Value | | | Value | |
| Recreation — 1.7% | | | | | | | | | | |
| City & County of Denver Colorado, Series 2016-A (a) | | 5.000% | | 08/01/44 | | $ | 1,820,000 | | | $ | 2,111,111 | |
| City & County of Denver Colorado, Series 2016-A | | 4.000% | | 08/01/46 | | | 7,000,000 | | | | 7,728,460 | |
| | | | | | | | | | | | 9,839,571 | |
| Tax — 7.5% | | | | | | | | | | | | |
| City of Commerce Colorado, AGM, Series 2014 (a) (b) | | 5.000% | | 08/01/28 | | | 600,000 | | | | 666,153 | |
| City of Commerce Colorado, BAM, Series 2015 (a) (b) | | 5.000% | | 08/01/36 | | | 1,945,000 | | | | 2,227,041 | |
| City of Commerce Colorado, AGM, Series 2014 (a) (b) | | 4.250% | | 08/01/40 | | | 1,155,000 | | | | 1,245,165 | |
| City of Idaho Springs Colorado Sales Tax Revenue, AGM, Series 2018 (a) (b) | | 5.000% | | 12/01/33 | | | 490,000 | | | | 581,407 | |
| City of Idaho Springs Colorado Sales Tax Revenue, AGM, Series 2018 (a) (b) | | 5.000% | | 12/01/34 | | | 525,000 | | | | 621,832 | |
| Denver Colorado Urban Renewal Authority Tax Increment, Series 2013-A-1 (a) | | 5.000% | | 12/01/23 | | | 190,000 | | | | 197,023 | |
| Denver Colorado Urban Renewal Authority Tax Increment, Series 2013-A-1 (a) | | 5.000% | | 12/01/25 | | | 1,500,000 | | | | 1,554,737 | |
| Denver Colorado Urban Renewal Authority Tax Increment, Series 2018-A (a) (e) | | 5.250% | | 12/01/39 | | | 3,900,000 | | | | 4,227,836 | |
| Denver Colorado Urban Renewal Authority Tax Increment, Series 2018-A (a) (e) | | 5.250% | | 12/01/39 | | | 1,400,000 | | | | 1,517,186 | |
| Grand Junction Colorado, Series 2020-B (a) | | 4.000% | | 03/01/45 | | | 1,500,000 | | | | 1,766,424 | |
| Grand Junction Colorado, Series 2020-B (a) | | 4.000% | | 03/01/49 | | | 2,435,000 | | | | 2,856,762 | |
| Superior Open Space Sales and Use Tax Colorado, AGM, Series 2020 (a) (b) | | 5.000% | | 06/01/35 | | | 1,000,000 | | | | 1,267,665 | |
| Superior Open Space Sales and Use Tax Colorado, AGM, Series 2020 (a) (b) | | 5.000% | | 06/01/40 | | | 750,000 | | | | 942,020 | |
| Thornton Colorado Development Authority, Series 2015-B (a) | | 5.000% | | 12/01/30 | | | 500,000 | | | | 559,298 | |
| Thornton Colorado Development Authority, Series 2015-B (a) | | 5.000% | | 12/01/31 | | | 1,000,000 | | | | 1,117,064 | |
| Wheat Ridge Colorado Urban Renewal Authority, Series 2021 | | 4.000% | | 12/01/32 | | | 760,000 | | | | 932,158 | |
| Wheat Ridge Colorado Urban Renewal Authority, Series 2021 | | 4.000% | | 12/01/34 | | | 2,000,000 | | | | 2,442,778 | |
| Wheat Ridge Colorado Urban Renewal Authority, Series 2021 | | 4.000% | | 12/01/35 | | | 2,000,000 | | | | 2,439,181 | |
| Wheat Ridge Colorado Urban Renewal Authority, Series 2021 | | 4.000% | | 12/01/36 | | | 3,240,000 | | | | 3,944,598 | |
| Wheat Ridge Colorado Urban Renewal Authority, Series 2021 | | 4.000% | | 12/01/37 | | | 3,360,000 | | | | 4,080,564 | |
| Wheat Ridge Colorado Urban Renewal Authority, Series 2021 | | 4.000% | | 12/01/38 | | | 2,000,000 | | | | 2,424,143 | |
| Wheat Ridge Colorado Urban Renewal Authority, Series 2021 | | 4.000% | | 12/01/39 | | | 3,000,000 | | | | 3,628,279 | |
| Wheat Ridge Colorado Urban Renewal Authority, Series 2021 | | 4.000% | | 12/01/40 | | | 2,500,000 | | | | 3,018,011 | |
| | | | | | | | | | | | 44,257,325 | |
| Transportation — 6.3% | | | | | | | | | | | | |
| Auraria Higher Education Center, AGM, Series 2015 (a) (b) | | 4.000% | | 04/01/29 | | | 3,500,000 | | | | 3,839,320 | |
| Denver Colorado City and County Airport, Series 2017-B (a) | | 5.000% | | 11/15/33 | | | 900,000 | | | | 1,102,872 | |
| Denver Colorado City and County Airport, Series 2018-A (a) | | 5.000% | | 12/01/43 | | | 2,000,000 | | | | 2,439,676 | |
| E-470 Public Highway Authority Colorado, Series 2020-A (a) | | 5.000% | | 09/01/40 | | | 7,250,000 | | | | 8,055,998 | |
| Grand Junction Regional Airport Authority, NATL, Series 2016-A (a) (b) | | 5.000% | | 12/01/31 | | | 1,155,000 | | | | 1,354,580 | |
| State of Colorado Education Loan Program, Series 2021-A | | 2.000% | | 06/29/22 | | | 20,000,000 | | | | 20,184,262 | |
| | | | | | | | | | | | 36,976,708 | |
| Utilites — 0.4% | | | | | | | | | | | | |
| Morgan County Colorado Quality Water District, Series 2020 | | 4.000% | | 12/01/45 | | | 1,090,000 | | | | 1,274,557 | |
| Morgan County Colorado Quality Water District, Series 2020 | | 4.000% | | 12/01/50 | | | 1,150,000 | | | | 1,339,107 | |
| | | | | | | | | | | | 2,613,664 | |
| Utilities — 7.6% | | | | | | | | | | | | |
| Centennial Water & Sanitation District, Series 2019 (a) | | 5.250% | | 12/01/48 | | | 8,750,000 | | | | 10,958,916 | |
| Cherokee Colorado Metropolitan District Water & Wastewater, BAM, Series 2020 (b) | | 4.000% | | 08/01/45 | | | 1,000,000 | | | | 1,199,323 | |
| Cherokee Colorado Metropolitan District Water & Wastewater, BAM, Series 2020 (b) | | 4.000% | | 08/01/50 | | | 1,450,000 | | | | 1,711,569 | |
| City of Colorado Springs Colorado Utilities System, Series 2020-A | | 5.000% | | 11/15/23 | | | 155,000 | | | | 168,472 | |
| City of Colorado Springs Colorado Utilities System, Series 2020-A | | 5.000% | | 11/15/29 | | | 25,000 | | | | 32,578 | |
| City of Colorado Springs Colorado Utilities System, Series A-2 | | 5.000% | | 11/15/47 | | | 5,000,000 | | | | 6,012,236 | |
| Eagle River Colorado Water & Sanitation District, AGM, Series 2020-A (b) | | 4.000% | | 12/01/27 | | | 35,000 | | | | 41,198 | |
| Eagle River Colorado Water & Sanitation District, AGM, Series 2020-A (a) (b) | | 4.000% | | 12/01/45 | | | 1,120,000 | | | | 1,317,768 | |
| Eagle River Colorado Water & Sanitation District, AGM, Series 2020-A (a) (b) | | 4.000% | | 12/01/49 | | | 2,000,000 | | | | 2,344,582 | |
| East Cherry Creek Valley Colorado Water and Sanitation District Arapahoe County, Series 2019-A (a) | | 4.000% | | 11/15/40 | | | 1,000,000 | | | | 1,179,351 | |
| Johnstown Colorado Wastewater, Series 2021 | | 4.000% | | 12/01/46 | | | 2,850,000 | | | | 3,437,048 | |
| See Notes to Financial Statements. | |
| 94 | | | www.sbhfunds.com |
| Segall Bryant & Hamill Colorado Tax Free Fund | Statement of Investments |
| | December 31, 2021 |
| | | Coupon | | Maturity | | Par Value | | | Value | |
| Utilities (continued) | | | | | | | | | | | | |
| Johnstown Colorado Wastewater, Series 2021 | | 4.000% | | 12/01/51 | | $ | 2,750,000 | | | $ | 3,299,658 | |
| Puerto Rico Electric Power Authority, AGM, Series UU (3MO LIBOR + 52) (a) (b) (d) | | 0.655% | | 07/01/29 | | | 400,000 | | | | 398,719 | |
| Stonegate Village Metropolitan District Colorado, BAM, Series 2020 (b) | | 4.000% | | 12/01/45 | | | 1,435,000 | | | | 1,698,597 | |
| Todd Creek Village Metropolitan District Colorado, Series 2018-A | | 5.000% | | 12/01/28 | | | 1,200,000 | | | | 1,413,860 | |
| Todd Creek Village Metropolitan District Colorado, Series 2018-A (a) | | 5.250% | | 12/01/38 | | | 1,000,000 | | | | 1,197,382 | |
| Town of Firestone Colorado Water Enterprise, BAM, Series 2020 (b) | | 2.000% | | 12/01/23 | | | 15,000 | | | | 15,405 | |
| Town of Firestone Colorado Water Enterprise, BAM, Series 2020 (b) | | 5.000% | | 12/01/25 | | | 25,000 | | | | 29,056 | |
| Town of Firestone Colorado Water Enterprise, BAM, Series 2020 (b) | | 5.000% | | 12/01/26 | | | 20,000 | | | | 23,943 | |
| Town of Firestone Colorado Water Enterprise, BAM, Series 2020 (b) | | 4.000% | | 12/01/45 | | | 1,850,000 | | | | 2,181,479 | |
| Town of Firestone Colorado Water Enterprise, BAM, Series 2020 (b) | | 4.000% | | 12/01/49 | | | 1,350,000 | | | | 1,585,471 | |
| Upper Eagle Regional Water Authority, AGM, Series 2020 (b) | | 4.000% | | 12/01/45 | | | 1,000,000 | | | | 1,201,947 | |
| Upper Eagle Regional Water Authority, AGM, Series 2020 (b) | | 4.000% | | 12/01/50 | | | 2,500,000 | | | | 2,978,569 | |
| | | | | | | | | | | | 44,427,127 | |
| Variable Rate Demand Note — 10.0% | | | | | | | | | | | | |
| City of Colorado Springs Colorado Utilities System, Series 2007-A (d) | | 0.100% | | 11/01/37 | | | 9,200,000 | | | | 9,200,000 | |
| City of Colorado Springs Colorado Utilities System, Series 2010-C (d) | | 0.100% | | 11/01/40 | | | 5,335,000 | | | | 5,335,000 | |
| City of Colorado Springs Colorado Utilities System, Series 2012-A (a) (d) | | 0.100% | | 11/01/41 | | | 4,690,000 | | | | 4,690,000 | |
| Colorado Educational & Cultural Facilities Authority, Series SER A-12 (d) | | 0.090% | | 02/01/38 | | | 1,080,000 | | | | 1,080,000 | |
| Colorado Educational & Cultural Facilities Authority, Series 2015-B-5 (d) | | 0.090% | | 01/01/39 | | | 1,985,000 | | | | 1,985,000 | |
| Colorado Health Facilities Authority, Series B (d) | | 0.090% | | 12/01/45 | | | 20,100,000 | | | | 20,100,000 | |
| Colorado Health Facilities Authority, Series 2020-A (d) | | 0.070% | | 12/01/52 | | | 3,100,000 | | | | 3,100,000 | |
| Denver Colorado City and County COP, Series 2008-A-3 (d) | | 0.090% | | 12/01/31 | | | 13,085,000 | | | | 13,085,000 | |
| | | | | | | | | | | | 58,575,000 | |
| | | | | | | | | | | | | |
| Investments at Value — 96.6% (Cost $546,528,591) | | | | | | | | | | $ | 567,054,228 | |
| | | | | | | | | | | | | |
| Other Assets in Excess of Liabilities — 3.4% | | | | | | | | | | | 20,108,178 | |
| | | | | | | | | | | | | |
| Net Assets — 100.0% | | | | | | | | | | $ | 587,162,406 | |
| (a) | Security can be called and redeemed at the option of the issuer prior to the stated maturity date which is included in the Statement of Investments. |
| (b) | This security is insured. In the event of a default by the bond issuer, the issuer, as noted in the security description, guarantees that scheduled principal and interest payments will be made when due. |
| (c) | Percentage rounds to less than 0.1%. |
| (d) | Variable rate security. Interest rate resets periodically. The rate shown is the effective interest rate as of December 31, 2021. For securities based on a published reference rate and spread, the reference rate and spread (in basis points) are indicated parenthetically. Certain variable rate securities are not based on a published reference rate and spread but are determined by the issuer or agent and are based on current market conditions. These securities, therefore, do not indicate a reference rate and spread. |
| (e) | Security is considered a restricted security however such restriction has not resulted in an illiquid classification. The total value of these securities is $9,475,165, which represents 1.6% of net assets as of December 31, 2021. |
The Fund’s sector and industry classifications presented herein refer to any one or more of the industry sub-classifications used by one or more widely recognized market indexes or ratings group indexes, and/or as defined by Fund management. For Fund compliance purposes, sector and industry classifications are based on the sector and industry categorization methodology of the Adviser to the Funds. This definition may not apply for purposes of this report, which may combine industry sub-classifications for reporting ease. Industries are shown as a percentage of net assets.
| See Notes to Financial Statements. | |
| Annual Report | December 31, 2021 | | | 95 |
| Segall Bryant & Hamill Funds | Statement of Investments |
| | December 31, 2021 |
| COMMON ABBREVIATIONS |
| | |
| A.B. | Aktiebolag is the Swedish equivalent of the term corporation. |
| ADR | American Depositary Receipt. |
| A.G. | Aktiengesellschaft is a German term that refers to a corporation that is limited by shares, i.e., owned by shareholders. |
| AGM | Assured Guaranty Municipal. |
| A.S. | Andonim Sirketi, Joint Stock Company in Turkey. |
| A/S | Aktieselskab is a Danish Joint Stock Company. |
| A.S.A. | Aksjeselskop is the Norwegian term for a stock- based company. |
| BAM | Build America Mutual. |
| Bhd | Berhad is a Malaysian term for a public limited company. |
| COP | Certificate of Participation. |
| H15T1Y | U.S. Treasury yield curve rate for U.S. Treasury note with a constant maturity of 1 year. |
| KGaA | Kommanditgesellschaft auf Aktien is a German corporate designation standing for partnership limited by shares. |
| LIBOR | London Interbank Offered Rate. |
| LLC | Limited Liability Company. |
| LP | Limited Partnership. |
| Ltd. | Limited. |
| NATL | National Public Finance Guarantee Corp. |
| N.V. | Naamloze Vennootschap is the Dutch term for a public limited liability corporation. |
| OYJ | Julkinen osakeyhtiö means public stock company. |
| PCL | Public Company Limited. |
| PJSC | Public Joint-Stock Company. |
| PLC | Public Limited Company. |
| P.S.Q.C. | Pakistan Standards & Quality Control Authority. |
| Q.S.C. | Qatari Shareholding Company. |
| REIT(s) | Real Estate Investment Trust. |
| S.A. | Generally designates corporations in various countries, mostly those employing the civil law. This translates literally in all languages mentioned as anonymous company. |
| S.A. de C.V. | Sociedad Anonima de Capital Variable is a corporative type of business in Mexico. |
| S.A.B de C.V. | Sociedad Anónima Bursátil de Capital Variable is the Mexican term for publicly traded companies. |
| S.A.K.P. | Suid Afrikaanse Kommunistiese Party. |
| SAPI de C.V. | Sociedad Anonima Promotora de Inversion de Capital Variable is a corporative type of business in Mexixo. |
| SARL | Societe Anonyme a Responsabilite Limitee is the French term for Limited Liability Company. |
| S.E. | SE Regulation. A European Company which can operate on a Europe-wide basis and be governed by Community law directly applicable in all Member States. |
| SJSC | Saudi Joint-Stock Company. |
| SOFR | Secured Overnight Financing Rate. |
| S.p.A. | Societa per azioni is the Italian equivalent of the term Public Limited Companies. |
| Tbk P.T. | Terbuka Perseroan Terbatas is an Indonesia term for a public limited company. |
| | |
| LIBOR Rates as of December 31, 2021: |
| 1MO LIBOR 0.10% |
| 3MO LIBOR 0.21% |
| |
| CURRENCY ABBREVIATIONS |
| AED | United Arab Emirates Dirham |
| AUD | Australian Dollar |
| BRL | Brazilian Dollar |
| CAD | Canadian Dollar |
| CHF | Swiss Franc |
| CLP | Chilean Peso |
| CNY | Chinese Yuan |
| COP | Colombian Peso |
| CZK | Czech Koruna |
| DKK | Danish Krone |
| EUR | Euro Currency |
| GBP | British Pound |
| HKD | Hong Kong Dollar |
| HUF | Hungarian Forint |
| IDR | Indonesian Rupiah |
| ILS | Israeli Shekel |
| INR | Indian Rupee |
| JPY | Japanese Yen |
| KRW | South Korean Won |
| KWD | Kuwaiti Dinar |
| MXP | Mexican Peso |
| NOK | Norwegian Krone |
| NZD | New Zealand Dollar |
| PHP | Philippine Peso |
| PLN | Polish Zloty |
| QAR | Qatari Rial |
| RUB | Russian Ruble |
| SAR | Saudi Riyal |
| SEK | Swedish Krona |
| SGD | Singapore Dollar |
| THB | Thai Baht |
| TRY | Turkish Lira |
| TWD | New Taiwan Dollar |
| ZAR | South African Rand |
| See Notes to Financial Statements. | |
| 96 | | | www.sbhfunds.com |
| Segall Bryant & Hamill Funds | Statements of Assets and Liabilities |
| | December 31, 2021 |
| | | Segall Bryant & | | | Segall Bryant & | | | Segall Bryant & | |
| | | Hamill Small Cap | | | Hamill Small Cap | | | Hamill Small Cap | |
| | | Value Fund | | | Growth Fund | | | Core Fund | |
| Assets | | | | | | | | | | | | |
| Investments, at cost | | $ | 466,402,325 | | | $ | 198,429,636 | | | $ | 37,869,089 | |
| Investments, at value | | $ | 587,349,838 | | | $ | 237,560,212 | | | $ | 50,237,858 | |
| Cash equivalents (Note 2) | | | 24,448,603 | | | | 6,952,420 | | | | 1,897,961 | |
| Receivable for Fund shares sold | | | 465,348 | | | | 484,822 | | | | — | |
| Receivable for investment securities sold | | | 240,595 | | | | — | | | | — | |
| Dividends and interest receivable | | | 425,834 | | | | 62,358 | | | | 24,707 | |
| Other assets | | | 57,447 | | | | 33,572 | | | | 21,500 | |
| Total assets | | | 612,987,665 | | | | 245,093,384 | | | | 52,182,026 | |
| | | | | | | | | | | | | |
| Liabilities | | | | | | | | | | | | |
| Payable for Fund shares redeemed | | | 735,036 | | | | 28,042 | | | | — | |
| Payable for investment securities purchased | | | 898,813 | | | | 2,504,530 | | | | — | |
| Payable to Adviser (Note 6) | | | 409,019 | | | | 131,044 | | | | 34,909 | |
| Accrued shareholder servicing fees (Note 6) | | | 77,500 | | | | 44,411 | | | | 4,337 | |
| Payable to third party administrator (Note 6) | | | 13,500 | | | | 7,100 | | | | 3,100 | |
| Accrued chief compliance officer fees (Note 6) | | | 1,983 | | | | 780 | | | | 176 | |
| Other accrued expenses | | | 32,809 | | | | 21,812 | | | | 17,057 | |
| Total liabilities | | | 2,168,660 | | | | 2,737,719 | | | | 59,579 | |
| Net Assets | | $ | 610,819,005 | | | $ | 242,355,665 | | | $ | 52,122,447 | |
| | | | | | | | | | | | | |
| Net Assets Consists of | | | | | | | | | | | | |
| Paid-in capital | | $ | 502,126,466 | | | $ | 239,670,311 | | | $ | 33,403,633 | |
| Distributable earnings | | | 108,692,539 | | | | 2,685,354 | | | | 18,718,814 | |
| Net Assets | | $ | 610,819,005 | | | $ | 242,355,665 | | | $ | 52,122,447 | |
| | | | | | | | | | | | | |
| Net Assets | | | | | | | | | | | | |
| Retail | | $ | 9,414,073 | | | $ | 53,652,418 | | | $ | 1,662,568 | |
| Institutional | | | 601,404,932 | | | | 188,703,247 | | | | 50,459,879 | |
| Shares of Beneficial Interest Outstanding | | | | | | | | | | | | |
| Retail | | | 634,590 | | | | 2,337,750 | | | | 131,438 | |
| Institutional | | | 40,490,248 | | | | 8,022,981 | | | | 3,972,991 | |
| Net Asset Value and Redemption Price Per Share (Net Assets Per Share Outstanding) | | | | | | | | | | | | |
| Retail | | $ | 14.83 | | | $ | 22.95 | | | $ | 12.65 | |
| Institutional | | $ | 14.85 | | | $ | 23.52 | | | $ | 12.70 | |
| See Notes to Financial Statements. | |
| Annual Report | December 31, 2021 | | | 97 |
| Segall Bryant & Hamill Funds | Statements of Assets and Liabilities |
| December 31, 2021 |
| | | | | | | | | Segall Bryant | |
| | | Segall Bryant & | | | Segall Bryant & | | | & Hamill | |
| | | Hamill | | | Hamill Emerging | | | International | |
| | | All Cap Fund | | | Markets Fund | | | Small Cap Fund | |
| Assets | | | | | | | | | | | | |
| Investments, at cost | | $ | 93,847,827 | | | $ | 50,892,294 | | | $ | 138,523,991 | |
| Investments, at value | | $ | 183,558,377 | | | $ | 57,615,445 | | | $ | 154,669,772 | |
| Cash equivalents (Note 2) | | | 3,956,495 | | | | 465,072 | | | | 354,395 | |
| Foreign currency, at value (Cost $—, $79,733, and $2,567, respectively) | | | — | | | | 80,939 | | | | 2,515 | |
| Receivable for Fund shares sold | | | 43,622 | | | | — | | | | — | |
| Dividends and interest receivable | | | 38,317 | | | | 132,314 | | | | 372,936 | |
| Foreign tax reclaims receivable | | | 547 | | | | 1,800 | | | | 848,778 | |
| Other assets | | | 30,292 | | | | 22,565 | | | | 30,604 | |
| Total assets | | | 187,627,650 | | | | 58,318,135 | | | | 156,279,000 | |
| | | | | | | | | | | | | |
| Liabilities | | | | | | | | | | | | |
| Payable for Fund shares redeemed | | | 34,279 | | | | — | | | | — | |
| Payable for investment securities purchased | | | — | | | | 79,609 | | | | — | |
| Accrued foreign capital gains on appreciated securities | | | — | | | | 257,372 | | | | — | |
| Payable to Adviser (Note 6) | | | 106,324 | | | | 23,932 | | | | 118,472 | |
| Accrued shareholder servicing fees (Note 6) | | | 27,780 | | | | 6,200 | | | | 37,500 | |
| Payable to third party administrator (Note 6) | | | 5,900 | | | | 3,600 | | | | 5,300 | |
| Accrued chief compliance officer fees (Note 6) | | | 619 | | | | 194 | | | | 509 | |
| Other accrued expenses | | | 19,751 | | | | 64,104 | | | | 70,916 | |
| Total liabilities | | | 194,653 | | | | 435,011 | | | | 232,697 | |
| Net Assets | | $ | 187,432,997 | | | $ | 57,883,124 | | | $ | 156,046,303 | |
| | | | | | | | | | | | | |
| Net Assets Consists of | | | | | | | | | | | | |
| Paid-in capital | | $ | 95,327,578 | | | $ | 52,836,839 | | | $ | 215,494,377 | |
| Distributable earnings (accumulated deficit) | | | 92,105,419 | | | | 5,046,285 | | | | (59,448,074 | ) |
| Net Assets | | $ | 187,432,997 | | | $ | 57,883,124 | | | $ | 156,046,303 | |
| | | | | | | | | | | | | |
| Net Assets | | | | | | | | | | | | |
| Retail | | $ | 974,380 | | | $ | 3,223,578 | | | $ | 47,301,267 | |
| Institutional | | | 186,458,617 | | | | 54,659,546 | | | | 108,745,036 | |
| Shares of Beneficial Interest Outstanding | | | | | | | | | | | | |
| Retail | | | 39,762 | | | | 353,443 | | | | 4,081,350 | |
| Institutional | | | 7,604,264 | | | | 5,976,729 | | | | 9,367,202 | |
| Net Asset Value and Redemption Price Per Share (Net Assets Per Share Outstanding) | | | | | | | | | | | | |
| Retail | | $ | 24.51 | | | $ | 9.12 | | | $ | 11.59 | |
| Institutional | | $ | 24.52 | | | $ | 9.15 | | | $ | 11.61 | |
| See Notes to Financial Statements. | |
| 98 | | | www.sbhfunds.com |
| Segall Bryant & Hamill Funds | Statements of Assets and Liabilities |
| | December 31, 2021 |
| | | Segall Bryant | | | | | | | | | | |
| | | & Hamill | | | | | | | | | | |
| | | Fundamental | | | Segall Bryant & | | | Segall Bryant & | | | Segall Bryant & | |
| | | International | | | Hamill Global | | | Hamill Workplace Hamill Short Term | |
| | | Small Cap Fund | | | All Cap Fund | | | Equality Fund | | | Plus Fund | |
| Assets | | | | | | | | | | | | | | | | |
| Investments, at cost | | $ | 69,127,107 | | | $ | 27,654,334 | | | $ | 21,446,774 | | | $ | 50,623,046 | |
| Investments, at value | | $ | 88,993,579 | | | $ | 38,238,177 | | | $ | 28,459,452 | | | $ | 50,368,946 | |
| Cash equivalents (Note 2) | | | 3,722,643 | | | | 344,214 | | | | 994,952 | | | | 1,182,437 | |
| Unrealized gain on forward foreign currency contracts | | | 375,483 | | | | — | | | | — | | | | — | |
| Receivable for Fund shares sold | | | 20,530 | | | | 142 | | | | 105,980 | | | | — | |
| Dividends and interest receivable | | | 37,410 | | | | 15,065 | | | | 14,765 | | | | 428,849 | |
| Foreign tax reclaims receivable | | | 18,273 | | | | 147,015 | | | | — | | | | — | |
| Other assets | | | 26,710 | | | | 15,474 | | | | 14,225 | | | | 9,907 | |
| Total assets | | | 93,194,628 | | | | 38,760,087 | | | | 29,589,374 | | | | 51,990,139 | |
| | | | | | | | | | | | | | | | | |
| Liabilities | | | | | | | | | | | | | | | | |
| Unrealized loss on forward foreign currency contracts | | | 575,143 | | | | — | | | | — | | | | — | |
| Payable for Fund shares redeemed | | | 66,070 | | | | — | | | | — | | | | — | |
| Payable for investment securities purchased | | | 36,222 | | | | — | | | | — | | | | — | |
| Payable to Adviser (Note 6) | | | 61,995 | | | | 37,971 | | | | 13,775 | | | | 2,931 | |
| Accrued shareholder servicing fees (Note 6) | | | 23,841 | | | | 6,408 | | | | 5,130 | | | | 10,554 | |
| Payable to third party administrator (Note 6) | | | 4,400 | | | | 3,600 | | | | 3,100 | | | | 3,500 | |
| Accrued chief compliance officer fees (Note 6) | | | 291 | | | | 127 | | | | 97 | | | | 169 | |
| Other accrued expenses | | | 22,753 | | | | 16,414 | | | | 15,297 | | | | 22,194 | |
| Total liabilities | | | 790,715 | | | | 64,520 | | | | 37,399 | | | | 39,348 | |
| Net Assets | | $ | 92,403,913 | | | $ | 38,695,567 | | | $ | 29,551,975 | | | $ | 51,950,791 | |
| | | | | | | | | | | | | | | | | |
| Net Assets Consists of | | | | | | | | | | | | | | | | |
| Paid-in capital | | $ | 68,181,426 | | | $ | 27,642,683 | | | $ | 22,492,804 | | | $ | 52,249,204 | |
| Distributable earnings (accumulated deficit) | | | 24,222,487 | | | | 11,052,884 | | | | 7,059,171 | | | | (298,413 | ) |
| Net Assets | | $ | 92,403,913 | | | $ | 38,695,567 | | | $ | 29,551,975 | | | $ | 51,950,791 | |
| | | | | | | | | | | | | | | | | |
| Net Assets | | | | | | | | | | | | | | | | |
| Retail | | $ | 42,321,900 | | | $ | 33,820,862 | | | $ | 11,707,176 | | | $ | 11,896,495 | |
| Institutional | | | 50,082,013 | | | | 4,874,705 | | | | 17,844,799 | | | | 40,054,296 | |
| Shares of Beneficial Interest Outstanding | | | | | | | | | | | | | | | | |
| Retail | | | 1,732,696 | | | | 3,069,765 | | | | 1,488,236 | | | | 1,183,168 | |
| Institutional | | | 1,898,904 | | | | 448,666 | | | | 2,196,872 | | | | 3,978,945 | |
| Net Asset Value and Redemption Price Per Share (Net Assets Per Share Outstanding) | | | | | | | | | | | | | | | | |
| Retail | | $ | 24.43 | | | $ | 11.02 | | | $ | 7.87 | | | $ | 10.05 | |
| Institutional | | $ | 26.37 | | | $ | 10.86 | | | $ | 8.12 | | | $ | 10.07 | |
| See Notes to Financial Statements. | |
| Annual Report | December 31, 2021 | | | 99 |
| Segall Bryant & Hamill Funds | Statements of Assets and Liabilities |
| | December 31, 2021 |
| | | | | | | | | Segall Bryant & | | | | |
| | | Segall Bryant & | | | Segall Bryant & | | | Hamill Municipal | | | Segall Bryant & | |
| | | Hamill Plus | | | Hamill Quality | | | Opportunities | | | Hamill Colorado | |
| | | Bond Fund | | | High Yield Fund | | | Fund | | | Tax Free Fund | |
| Assets | | | | | | | | | | | | | | | | |
| Investments, at cost | | $ | 1,000,164,623 | | | $ | 96,143,949 | | | $ | 255,142,789 | | | $ | 546,528,591 | |
| Investments, at value | | $ | 1,037,005,538 | | | $ | 98,374,270 | | | $ | 262,045,690 | | | $ | 567,054,228 | |
| Cash equivalents (Note 2) | | | 7,265,661 | | | | 2,414,958 | | | | 11,605,694 | | | | 18,577,027 | |
| Receivable for Fund shares sold | | | 255,549 | | | | 31,802 | | | | 199,070 | | | | 317,648 | |
| Receivable for investment securities sold | | | 6,215,750 | | | | — | | | | — | | | | — | |
| Dividends and interest receivable | | | 7,436,550 | | | | 1,283,422 | | | | 2,755,874 | | | | 3,054,765 | |
| Other assets | | | 56,594 | | | | 17,310 | | | | 22,185 | | | | 28,675 | |
| Total assets | | | 1,058,235,642 | | | | 102,121,762 | | | | 276,628,513 | | | | 589,032,343 | |
| | | | | | | | | | | | | | | | | |
| Liabilities | | | | | | | | | | | | | | | | |
| Payable for Fund shares redeemed | | | 320,862 | | | | 30,088 | | | | 930,025 | | | | 15,067 | |
| Payable for investment securities purchased | | | 2,187,342 | | | | — | | | | — | | | | 1,454,320 | |
| Payable to Adviser (Note 6) | | | 250,206 | | | | 35,525 | | | | 68,735 | | | | 193,770 | |
| Accrued shareholder servicing fees (Note 6) | | | 260,000 | | | | 21,819 | | | | 47,817 | | | | 152,627 | |
| Payable to third party administrator (Note 6) | | | 22,800 | | | | 4,500 | | | | 7,700 | | | | 13,200 | |
| Accrued chief compliance officer fees (Note 6) | | | 3,540 | | | | 335 | | | | 910 | | | | 1,936 | |
| Other accrued expenses | | | 53,600 | | | | 23,343 | | | | 27,684 | | | | 39,017 | |
| Total liabilities | | | 3,098,350 | | | | 115,610 | | | | 1,082,871 | | | | 1,869,937 | |
| Net Assets | | $ | 1,055,137,292 | | | $ | 102,006,152 | | | $ | 275,545,642 | | | $ | 587,162,406 | |
| | | | | | | | | | | | | | | | | |
| Net Assets Consists of | | | | | | | | | | | | | | | | |
| Paid-in capital | | $ | 1,020,504,506 | | | $ | 108,359,115 | | | $ | 270,918,171 | | | $ | 573,903,984 | |
| Distributable earnings (accumulated deficit) | | | 34,632,786 | | | | (6,352,963 | ) | | | 4,627,471 | | | | 13,258,422 | |
| Net Assets | | $ | 1,055,137,292 | | | $ | 102,006,152 | | | $ | 275,545,642 | | | $ | 587,162,406 | |
| | | | | | | | | | | | | | | | | |
| Net Assets | | | | | | | | | | | | | | | | |
| Retail | | $ | 466,062,886 | | | $ | 39,879,082 | | | $ | 42,055,720 | | | $ | 216,616,763 | |
| Institutional | | | 589,074,406 | | | | 62,127,070 | | | | 233,489,922 | | | | 370,545,643 | |
| Shares of Beneficial Interest Outstanding | | | | | | | | | | | | | | | | |
| Retail | | | 42,944,997 | | | | 4,331,403 | | | | 3,817,012 | | | | 18,182,339 | |
| Institutional | | | 54,834,212 | | | | 6,826,323 | | | | 21,176,761 | | | | 30,982,458 | |
| Net Asset Value and Redemption Price Per Share (Net Assets Per Share Outstanding) | | | | | | | | | | | | | | | | |
| Retail | | $ | 10.85 | | | $ | 9.21 | | | $ | 11.02 | | | $ | 11.91 | |
| Institutional | | $ | 10.74 | | | $ | 9.10 | | | $ | 11.03 | | | $ | 11.96 | |
| See Notes to Financial Statements. | |
| 100 | | | www.sbhfunds.com |
| Segall Bryant & Hamill Funds | Statements of Operations |
| For the Year Ended December 31, 2021 |
| | | Segall Bryant & | | | Segall Bryant & | | | Segall Bryant & | |
| | | Hamill Small Cap | | | Hamill Small Cap | | | Hamill Small Cap | |
| | | Value Fund | | | Growth Fund | | | Core Fund | |
| Investment Income | | | | | | | | | | | | |
| Dividends | | $ | 6,792,661 | | | $ | 523,557 | | | $ | 306,972 | |
| Non-cash dividend income | | | — | | | | — | | | | 154,511 | |
| Interest | | | 1,894 | | | | 462 | | | | 148 | |
| Foreign taxes withheld | | | (10,394 | ) | | | (4,536 | ) | | | (2,382 | ) |
| Total income | | | 6,784,161 | | | | 519,483 | | | | 459,249 | |
| | | | | | | | | | | | | |
| Expenses | | | | | | | | | | | | |
| Investment advisory fees (Note 6) | | | 4,575,363 | | | | 1,169,266 | | | | 427,151 | |
| Shareholder servicing fees (Note 6) | | | | | | | | | | | | |
| Retail Class | | | 12,164 | | | | 79,796 | | | | 8,170 | |
| Institutional Class | | | 412,455 | | | | 118,063 | | | | 14,938 | |
| Administrative fees (Note 6) | | | 190,080 | | | | 66,674 | | | | 21,765 | |
| Registration and filing fees | | | 83,852 | | | | 63,079 | | | | 51,294 | |
| Custodian fees | | | 31,349 | | | | 17,802 | | | | 16,809 | |
| Trustee fees and expenses | | | 60,826 | | | | 20,170 | | | | 5,581 | |
| Transfer agent fees (Note 6) | | | 21,899 | | | | 24,058 | | | | 20,415 | |
| Independent pricing service fees | | | 1,014 | | | | 1,376 | | | | 1,226 | |
| Shareholder reporting fees | | | 45,281 | | | | 17,016 | | | | 1,255 | |
| Audit and tax preparation fees | | | 16,806 | | | | 13,494 | | | | 13,412 | |
| Insurance expense | | | 21,307 | | | | 6,561 | | | | 2,467 | |
| Chief compliance officer fees (Note 6) | | | 23,838 | | | | 7,557 | | | | 2,231 | |
| Legal fees | | | 18,437 | | | | 5,540 | | | | 1,807 | |
| Other | | | 16,158 | | | | 13,031 | | | | 7,641 | |
| Total expenses before waivers/reimbursements | | | 5,530,829 | | | | 1,623,483 | | | | 596,162 | |
| Expenses waived/reimbursed by investment adviser | | | — | | | | — | | | | (62,820 | ) |
| Net expenses | | | 5,530,829 | | | | 1,623,483 | | | | 533,342 | |
| Net Investment Income (Loss) | | | 1,253,332 | | | | (1,104,000 | ) | | | (74,093 | ) |
| | | | | | | | | | | | | |
| Realized and Unrealized Gains (Losses) | | | | | | | | | | | | |
| Net realized gains (losses) on: | | | | | | | | | | | | |
| Investments | | | 37,263,573 | | | | 22,565,130 | | | | 5,943,663 | |
| Change in unrealized net appreciation/depreciation on: | | | | | | | | | | | | |
| Investments | | | 34,670,349 | | | | (5,293,483 | ) | | | 5,108,617 | |
| Net realized and unrealized gains | | | 71,933,922 | | | | 17,271,647 | | | | 11,052,280 | |
| Net Increase in Net Assets Resulting From Operations | | $ | 73,187,254 | | | $ | 16,167,647 | | | $ | 10,978,187 | |
| See Notes to Financial Statements. | |
| Annual Report | December 31, 2021 | | | 101 |
| Segall Bryant & Hamill Funds | Statements of Operations |
| For the Year Ended December 31, 2021 |
| | | | | | | | | Segall Bryant | |
| | | Segall Bryant & | | | Segall Bryant & | | | & Hamill | |
| | | Hamill | | | Hamill Emerging | | | International | |
| | | All Cap Fund | | | Markets Fund | | | Small Cap Fund | |
| Investment Income | | | | | | | | | | | | |
| Dividends | | $ | 1,469,104 | | | $ | 2,588,372 | | | $ | 7,637,746 | |
| Interest | | | 221 | | | | 13 | | | | 29 | |
| Foreign taxes withheld | | | (16,677 | ) | | | (279,670 | ) | | | (904,234 | ) |
| Total income | | | 1,452,648 | | | | 2,308,715 | | | | 6,733,541 | |
| | | | | | | | | | | | | |
| Expenses | | | | | | | | | | | | |
| Investment advisory fees (Note 6) | | | 1,227,718 | | | | 511,580 | | | | 1,700,279 | |
| Shareholder servicing fees (Note 6) | | | | | | | | | | | | |
| Retail Class | | | 467 | | | | 6,900 | | | | 174,096 | |
| Institutional Class | | | 176,711 | | | | 25,946 | | | | 45,854 | |
| Administrative fees (Note 6) | | | 69,358 | | | | 27,827 | | | | 69,363 | |
| Registration and filing fees | | | 51,145 | | | | 53,474 | | | | 50,268 | |
| Custodian fees | | | 12,794 | | | | 183,779 | | | | 107,995 | |
| Trustee fees and expenses | | | 19,652 | | | | 6,053 | | | | 19,421 | |
| Transfer agent fees (Note 6) | | | 20,327 | | | | 20,683 | | | | 20,476 | |
| Independent pricing service fees | | | 846 | | | | 65,433 | | | | 41,875 | |
| Shareholder reporting fees | | | 20,036 | | | | 2,813 | | | | 2,926 | |
| Audit and tax preparation fees | | | 13,547 | | | | 18,548 | | | | 20,548 | |
| Insurance expense | | | 9,382 | | | | 2,250 | | | | 10,766 | |
| Chief compliance officer fees (Note 6) | | | 7,864 | | | | 2,358 | | | | 7,827 | |
| Legal fees | | | 6,328 | | | | 1,860 | | | | 6,399 | |
| Other | | | 10,257 | | | | 37,674 | | | | 10,722 | |
| Total expenses before waivers/reimbursements | | | 1,646,432 | | | | 967,178 | | | | 2,288,815 | |
| Expenses waived/reimbursed by investment adviser | | | (59,877 | ) | | | (263,216 | ) | | | (237,340 | ) |
| Net expenses | | | 1,586,555 | | | | 703,962 | | | | 2,051,475 | |
| Net Investment Income (Loss) | | | (133,907 | ) | | | 1,604,753 | | | | 4,682,066 | |
| | | | | | | | | | | | | |
| Realized and Unrealized Gains (Losses) | | | | | | | | | | | | |
| Net realized gains (losses) on: | | | | | | | | | | | | |
| Investments | | | 19,731,384 | | | | 2,830,020 | (a) | | | 26,190,049 | |
| Foreign currency | | | (157 | ) | | | 45,087 | | | | (79,143 | ) |
| | | | 19,731,227 | | | | 2,875,107 | | | | 26,110,906 | |
| Change in unrealized net appreciation/depreciation on: | | | | | | | | | | | | |
| Investments | | | 29,308,203 | | | | (2,268,221 | ) (b) | | | (7,430,763 | ) |
| Translation of assets and liabilities denoted in foreign currencies | | | — | | | | 1,159 | | | | (51,355 | ) |
| | | | 29,308,203 | | | | (2,267,062 | ) | | | (7,482,118 | ) |
| Net realized and unrealized gains | | | 49,039,430 | | | | 608,045 | | | | 18,628,788 | |
| Net Increase in Net Assets Resulting From Operations | | $ | 48,905,523 | | | $ | 2,212,798 | | | $ | 23,310,854 | |
| (a) | Net of foreign capital gains tax of $155,130. |
| (b) | Net of deferred foreign capital gains tax of $257,372. |
| See Notes to Financial Statements. | |
| 102 | | | www.sbhfunds.com |
| Segall Bryant & Hamill Funds | Statements of Operations |
| | For the Year Ended December 31, 2021 |
| | | Segall Bryant | | | | | | | | | | |
| | | & Hamill | | | | | | | | | | |
| | | Fundamental | | | Segall Bryant & | | | Segall Bryant & | | | Segall Bryant & | |
| | | International | | | Hamill Global | | | Hamill Workplace Hamill Short Term | |
| | | Small Cap Fund | | | All Cap Fund | | | Equality Fund | | | Plus Fund | |
| Investment Income | | | | | | | | | | | | | | | | |
| Dividends | | $ | 547,733 | | | $ | 401,154 | | | $ | 242,625 | | | $ | — | |
| Interest | | | 252 | | | | 37 | | | | 34 | | | | 377,829 | |
| Foreign taxes withheld | | | (123,299 | ) | | | (16,098 | ) | | | (339 | ) | | | — | |
| Total income | | | 424,686 | | | | 385,093 | | | | 242,320 | | | | 377,829 | |
| | | | | | | | | | | | | | | | | |
| Expenses | | | | | | | | | | | | | | | | |
| Investment advisory fees (Note 6) | | | 703,541 | | | | 237,966 | | | | 164,347 | | | | 99,818 | |
| Shareholder servicing fees (Note 6) | | | | | | | | | | | | | | | | |
| Retail Class | | | 81,009 | | | | 30,125 | | | | 11,977 | | | | 16,043 | |
| Institutional Class | | | 31,893 | | | | 3,779 | | | | 14,809 | | | | 33,092 | |
| Administrative fees (Note 6) | | | 32,084 | | | | 21,424 | | | | 17,946 | | | | 20,948 | |
| Registration and filing fees | | | 53,235 | | | | 50,754 | | | | 49,030 | | | | 28,576 | |
| Custodian fees | | | 27,893 | | | | 15,576 | | | | 12,118 | | | | 11,264 | |
| Trustee fees and expenses | | | 7,743 | | | | 3,750 | | | | 2,717 | | | | 4,432 | |
| Transfer agent fees (Note 6) | | | 23,903 | | | | 25,080 | | | | 20,824 | | | | 20,076 | |
| Independent pricing service fees | | | 7,529 | | | | 3,890 | | | | 730 | | | | 14,774 | |
| Shareholder reporting fees | | | 9,235 | | | | 7,585 | | | | 1,992 | | | | 1,331 | |
| Audit and tax preparation fees | | | 16,556 | | | | 13,521 | | | | 13,515 | | | | 17,511 | |
| Insurance expense | | | 2,976 | | | | 2,088 | | | | 1,225 | | | | 1,500 | |
| Chief compliance officer fees (Note 6) | | | 2,935 | | | | 1,517 | | | | 1,057 | | | | 1,677 | |
| Legal fees | | | 2,132 | | | | 1,188 | | | | 792 | | | | 1,274 | |
| Other | | | 11,540 | | | | 12,592 | | | | 7,918 | | | | 6,120 | |
| Total expenses before waivers/reimbursements | | | 1,014,204 | | | | 430,835 | | | | 320,997 | | | | 278,436 | |
| Expenses waived/reimbursed by investment adviser | | | (182,617 | ) | | | (111,208 | ) | | | (118,182 | ) | | | (112,708 | ) |
| Net expenses | | | 831,587 | | | | 319,627 | | | | 202,815 | | | | 165,728 | |
| Net Investment Income (Loss) | | | (406,901 | ) | | | 65,466 | | | | 39,505 | | | | 212,101 | |
| | | | | | | | | | | | | | | | | |
| Realized and Unrealized Gains (Losses) | | | | | | | | | | | | | | | | |
| Net realized gains (losses) on: | | | | | | | | | | | | | | | | |
| Investments | | | 9,620,619 | | | | 2,072,353 | | | | 1,713,342 | | | | 76,508 | |
| Forward foreign currency contracts | | | (603,045 | ) | | | — | | | | — | | | | — | |
| Foreign currency | | | (61,542 | ) | | | (217 | ) | | | — | | | | — | |
| | | | 8,956,032 | | | | 2,072,136 | | | | 1,713,342 | | | | 76,508 | |
| Change in unrealized net appreciation/depreciation on: | | | | | | | | | | | | | | | | |
| Investments | | | (82,943 | ) | | | 6,205,852 | | | | 4,021,696 | | | | (388,055 | ) |
| Forward foreign currency contracts | | | 25,612 | | | | — | | | | — | | | | — | |
| Translation of assets and liabilities denoted in foreign currencies | | | 19,062 | | | | (6,208 | ) | | | — | | | | — | |
| | | | (38,269 | ) | | | 6,199,644 | | | | 4,021,696 | | | | (388,055 | ) |
| Net realized and unrealized gains (losses) | | | 8,917,763 | | | | 8,271,780 | | | | 5,735,038 | | | | (311,547 | ) |
| Net Increase (Decrease) in Net Assets Resulting From Operations | | $ | 8,510,862 | | | $ | 8,337,246 | | | $ | 5,774,543 | | | $ | (99,446 | ) |
| See Notes to Financial Statements. | |
| Annual Report | December 31, 2021 | | | 103 |
| Segall Bryant & Hamill Funds | Statements of Operations |
| | For the Year Ended December 31, 2021 |
| | | | | | | | | Segall Bryant & | | | | |
| | | Segall Bryant & | | | Segall Bryant & | | | Hamill Municipal | | | Segall Bryant & | |
| | | Hamill Plus | | | Hamill Quality | | | Opportunities | | | Hamill Colorado | |
| | | Bond Fund | | | High Yield Fund | | | Fund | | | Tax Free Fund | |
| Investment Income | | | | | | | | | | | | | | | | |
| Interest | | $ | 28,975,620 | | | $ | 3,876,512 | | | $ | 4,963,208 | | | $ | 11,182,513 | |
| | | | | | | | | | | | | | | | | |
| Expenses | | | | | | | | | | | | | | | | |
| Investment advisory fees (Note 6) | | | 3,835,942 | | | | 422,170 | | | | 772,424 | | | | 1,900,710 | |
| Shareholder servicing fees (Note 6) | | | | | | | | | | | | | | | | |
| Retail Class | | | 1,232,649 | | | | 85,453 | | | | 83,588 | | | | 498,230 | |
| Institutional Class | | | 430,213 | | | | 44,038 | | | | 150,857 | | | | 287,810 | |
| Administrative fees (Note 6) | | | 354,609 | | | | 39,503 | | | | 79,454 | | | | 180,801 | |
| Registration and filing fees | | | 73,383 | | | | 57,358 | | | | 89,473 | | | | 39,534 | |
| Custodian fees | | | 21,849 | | | | 11,545 | | | | 11,347 | | | | 12,765 | |
| Trustee fees and expenses | | | 111,608 | | | | 9,907 | | | | 23,883 | | | | 56,768 | |
| Transfer agent fees (Note 6) | | | 31,105 | | | | 21,450 | | | | 21,747 | | | | 22,132 | |
| Independent pricing service fees | | | 37,622 | | | | 14,631 | | | | 29,769 | | | | 49,640 | |
| Shareholder reporting fees | | | 91,973 | | | | 10,879 | | | | 7,173 | | | | 12,854 | |
| Audit and tax preparation fees | | | 19,659 | | | | 17,570 | | | | 15,556 | | | | 15,555 | |
| Insurance expense | | | 63,679 | | | | 4,508 | | | | 9,378 | | | | 26,644 | |
| Chief compliance officer fees (Note 6) | | | 45,449 | | | | 3,914 | | | | 9,219 | | | | 22,558 | |
| Legal fees | | | 36,820 | | | | 3,065 | | | | 6,919 | | | | 17,789 | |
| Other | | | 36,721 | | | | 9,617 | | | | 9,213 | | | | 16,368 | |
| Total expenses before waivers/reimbursements | | | 6,423,281 | | | | 755,608 | | | | 1,320,000 | | | | 3,160,158 | |
| Expenses waived/reimbursed by investment adviser | | | (1,261,563 | ) | | | (45,360 | ) | | | (166,305 | ) | | | (132,664 | ) |
| Net expenses | | | 5,161,718 | | | | 710,248 | | | | 1,153,695 | | | | 3,027,494 | |
| Net Investment Income | | | 23,813,902 | | | | 3,166,264 | | | | 3,809,513 | | | | 8,155,019 | |
| | | | | | | | | | | | | | | | | |
| Realized and Unrealized Gains (Losses) | | | | | | | | | | | | | | | | |
| Net realized gains on: | | | | | | | | | | | | | | | | |
| Investments | | | 7,750,023 | | | | 909,927 | | | | 411,990 | | | | 2,100,578 | |
| | | | | | | | | | | | | | | | | |
| Change in unrealized net appreciation/depreciation on: | | | | | | | | | | | | | | | | |
| Investments | | | (36,682,058 | ) | | | (1,099,993 | ) | | | 1,560,791 | | | | 135,265 | |
| | | | | | | | | | | | | | | | | |
| Net realized and unrealized gains (losses) | | | (28,932,035 | ) | | | (190,066 | ) | | | 1,972,781 | | | | 2,235,843 | |
| Net Increase (Decrease) in Net Assets Resulting From Operations | | $ | (5,118,133 | ) | | $ | 2,976,198 | | | $ | 5,782,294 | | | $ | 10,390,862 | |
| See Notes to Financial Statements. | |
| 104 | | | www.sbhfunds.com |
| Segall Bryant & Hamill Funds | Statements of Changes in Net Assets |
| | | Segall Bryant & Hamill | | | Segall Bryant & Hamill | | | Segall Bryant & Hamill | |
| | | Small Cap Value Fund | | | Small Cap Growth Fund | | | Small Cap Core Fund | |
| | | Year Ended | | | Year Ended | | | Year Ended | | | Year Ended | | | Year Ended | | | Year Ended | |
| | | December 31, | | | December 31, | | | December 31, | | | December 31, | | | December 31, | | | December 31, | |
| | | 2021 | | | 2020 | | | 2021 | | | 2020 | | | 2021 | | | 2020 | |
| Operations | | | | | | | | | | | | | | | | | | |
| Net investment income (loss) | | $ | 1,253,332 | | | $ | 2,157,920 | | | $ | (1,104,000 | ) | | $ | (398,285 | ) | | $ | (74,093 | ) | | $ | (19,193 | ) |
| Net realized gains (losses) | | | 37,263,573 | | | | (11,590,747 | ) | | | 22,565,130 | | | | 13,380,135 | | | | 5,943,663 | | | | 1,216,814 | |
| Change in unrealized net appreciation/ depreciation | | | 34,670,349 | | | | 75,037,691 | | | | (5,293,483 | ) | | | 28,532,885 | | | | 5,108,617 | | | | 7,260,152 | |
| Net increase in net assets resulting from operations | | | 73,187,254 | | | | 65,604,864 | | | | 16,167,647 | | | | 41,514,735 | | | | 10,978,187 | | | | 8,457,773 | |
| | | | | | | | | | | | | | | | | | | | | | | | | |
| Distributions to Shareholders (Note 5) | | | | | | | | | | | | | | | | | | | | | | | | |
| From distributable earnings | | | | | | | | | | | | | | | | | | | | | | | | |
| Retail | | | (416,535 | ) | | | (20,967 | ) | | | — | | | | — | | | | (291,052 | ) | | | — | |
| Institutional | | | (26,594,822 | ) | | | (3,441,467 | ) | | | — | | | | — | | | | (8,394,213 | ) | | | — | |
| Decrease in net assets from distributions to shareholders | | | (27,011,357 | ) | | | (3,462,434 | ) | | | — | | | | — | | | | (8,685,265 | ) | | | — | |
| | | | | | | | | | | | | | | | | | | | | | | | | |
| Beneficial Interest Transactions (Note 4) | | | | | | | | | | | | | | | | | | | | | | | | |
| Shares sold | | | | | | | | | | | | | | | | | | | | | | | | |
| Retail | | | 3,050,835 | | | | 874,628 | | | | 49,463,143 | | | | 8,151,645 | | | | 1,417,224 | | | | 3,794,326 | |
| Institutional | | | 337,970,835 | | | | 238,806,758 | | | | 85,691,386 | | | | 23,047,734 | | | | 785,331 | | | | 3,100,147 | |
| Shares issued in reinvestment of distributions | | | | | | | | | | | | | | | | | | | | | | | | |
| Retail | | | 393,533 | | | | 19,603 | | | | — | | | | — | | | | 283,977 | | | | — | |
| Institutional | | | 20,138,349 | | | | 3,160,318 | | | | — | | | | — | | | | 5,218,137 | | | | — | |
| Cost of shares redeemed | | | | | | | | | | | | | | | | | | | | | | | | |
| Retail | | | (1,455,490 | ) | | | (832,665 | ) | | | (9,489,046 | ) | | | (1,476,848 | ) | | | (4,693,733 | ) | | | (43,464 | ) |
| Institutional | | | (217,902,088 | ) | | | (78,883,341 | ) | | | (21,282,278 | ) | | | (24,609,577 | ) | | | (2,020,789 | ) | | | (4,483,131 | ) |
| Net assets received in conjunction with fund merger | | | | | | | | | | | | | | | | | | | | | | | | |
| Retail | | | — | | | | 5,056,578 | | | | — | | | | — | | | | — | | | | — | |
| Institutional | | | — | | | | 22,201,598 | | | | — | | | | — | | | | — | | | | — | |
| Net increase resulting from beneficial interest transactions | | | 142,195,974 | | | | 190,403,477 | | | | 104,383,205 | | | | 5,112,954 | | | | 990,147 | | | | 2,367,878 | |
| Total net increase in net assets | | | 188,371,871 | | | | 252,545,907 | | | | 120,550,852 | | | | 46,627,689 | | | | 3,283,069 | | | | 10,825,651 | |
| | | | | | | | | | | | | | | | | | | | | | | | | |
| Net Assets | | | | | | | | | | | | | | | | | | | | | | | | |
| Beginning of year | | | 422,447,134 | | | | 169,901,227 | | | | 121,804,813 | | | | 75,177,124 | | | | 48,839,378 | | | | 38,013,727 | |
| End of year | | $ | 610,819,005 | | | $ | 422,447,134 | | | $ | 242,355,665 | | | $ | 121,804,813 | | | $ | 52,122,447 | | | $ | 48,839,378 | |
| See Notes to Financial Statements. | |
| Annual Report | December 31, 2021 | | | 105 |
| Segall Bryant & Hamill Funds | Statements of Changes in Net Assets |
| | | | | | | | | Segall Bryant & Hamill | | | Segall Bryant & Hamill | |
| | | Segall Bryant & Hamill All Cap Fund | | | Emerging Markets Fund | | | International Small Cap Fund | |
| | | Year Ended | | | Year Ended | | | Year Ended | | | Year Ended | | | Year Ended | | | Year Ended | |
| | | December 31, | | | December 31, | | | December 31, | | | December 31, | | | December 31, | | | December 31, | |
| | | 2021 | | | 2020 | | | 2021 | | | 2020 | | | 2021 | | | 2020 | |
| Operations | | | | | | | | | | | | | | | | | | | | | | | | |
| Net investment income (loss) | | $ | (133,907 | ) | | $ | 208,554 | | | $ | 1,604,753 | | | $ | 616,777 | | | $ | 4,682,066 | | | $ | 3,952,615 | |
| Net realized gains (losses) | | | 19,731,227 | | | | 6,817,065 | | | | 2,875,107 | | | | (1,262,269 | ) | | | 26,110,906 | | | | (36,744,742 | ) |
| Change in unrealized net appreciation/ depreciation | | | 29,308,203 | | | | 27,512,959 | | | | (2,267,062 | ) | | | 3,195,161 | | | | (7,482,118 | ) | | | 2,589,567 | |
| Net increase (decrease) in net assets resulting from operations | | | 48,905,523 | | | | 34,538,578 | | | | 2,212,798 | | | | 2,549,669 | | | | 23,310,854 | | | | (30,202,560 | ) |
| | | | | | | | | | | | | | | | | | | | | | | | | |
| Distributions to Shareholders (Note 5) | | | | | | | | | | | | | | | | | | | | | | | | |
| From distributable earnings | | | | | | | | | | | | | | | | | | | | | | | | |
| Retail | | | (97,778 | ) | | | (10,411 | ) | | | (151,486 | ) | | | (43,658 | ) | | | (2,500,281 | ) | | | (973,613 | ) |
| Institutional | | | (19,288,179 | ) | | | (2,265,665 | ) | | | (2,874,710 | ) | | | (772,321 | ) | | | (5,758,347 | ) | | | (1,890,423 | ) |
| Decrease in net assets from distributions to shareholders | | | (19,385,957 | ) | | | (2,276,076 | ) | | | (3,026,196 | ) | | | (815,979 | ) | | | (8,258,628 | ) | | | (2,864,036 | ) |
| | | | | | | | | | | | | | | | | | | | | | | | | |
| Beneficial Interest Transactions (Note 4) | | | | | | | | | | | | | | | | | | | | | | | | |
| Shares sold | | | | | | | | | | | | | | | | | | | | | | | | |
| Retail | | | 232,310 | | | | 692,983 | | | | 952,069 | | | | 538,341 | | | | 855,562 | | | | 20,774,333 | |
| Institutional | | | 28,911,778 | | | | 36,351,738 | | | | 10,154,946 | | | | 12,526,617 | | | | 18,937,214 | | | | 20,637,934 | |
| Shares issued in reinvestment of distributions | | | | | | | | | | | | | | | | | | | | | | | | |
| Retail | | | 96,085 | | | | 10,258 | | | | 151,486 | | | | 43,658 | | | | 633,678 | | | | 968,794 | |
| Institutional | | | 19,024,468 | | | | 2,245,913 | | | | 1,615,449 | | | | 753,804 | | | | 5,263,684 | | | | 1,818,728 | |
| Cost of shares redeemed | | | | | | | | | | | | | | | | | | | | | | | | |
| Retail | | | (47,223 | ) | | | (215,064 | ) | | | (824,059 | ) | | | (413,579 | ) | | | (23,848,137 | ) | | | (9,769,107 | ) |
| Institutional | | | (60,719,508 | ) | | | (21,673,390 | ) | | | (1,364,913 | ) | | | (2,569,524 | ) | | | (44,380,383 | ) | | | (104,764,777 | ) |
| Net increase (decrease) resulting from beneficial interest transactions | | | (12,502,090 | ) | | | 17,412,438 | | | | 10,684,978 | | | | 10,879,317 | | | | (42,538,382 | ) | | | (70,334,095 | ) |
| Total net increase (decrease) in net assets | | | 17,017,476 | | | | 49,674,940 | | | | 9,871,580 | | | | 12,613,007 | | | | (27,486,156 | ) | | | (103,400,691 | ) |
| | | | | | | | | | | | | | | | | | | | | | | | | |
| Net Assets | | | | | | | | | | | | | | | | | | | | | | | | |
| Beginning of year | | | 170,415,521 | | | | 120,740,581 | | | | 48,011,544 | | | | 35,398,537 | | | | 183,532,459 | | | | 286,933,150 | |
| End of year | | $ | 187,432,997 | | | $ | 170,415,521 | | | $ | 57,883,124 | | | $ | 48,011,544 | | | $ | 156,046,303 | | | $ | 183,532,459 | |
| See Notes to Financial Statements. | |
| 106 | | | www.sbhfunds.com |
| Segall Bryant & Hamill Funds | Statements of Changes in Net Assets |
| | | Segall Bryant & Hamill Fundamental | | | Segall Bryant & Hamill | | | Segall Bryant & Hamill | |
| | | International Small Cap Fund | | | Global All Cap Fund | | | Workplace Equality Fund | |
| | | Year Ended | | | Year Ended | | | Year Ended | | | Year Ended | | | Year Ended | | | Year Ended | |
| | | December 31, | | | December 31, | | | December 31, | | | December 31, | | | December 31, | | | December 31, | |
| | | 2021 | | | 2020 | | | 2021 | | | 2020 | | | 2021 | | | 2020 | |
| Operations | | | | | | | | | | | | | | | | | | | | | | | | |
| Net investment income (loss) | | $ | (406,901 | ) | | $ | (147,482 | ) | | $ | 65,466 | | | $ | 716,024 | | | $ | 39,505 | | | $ | 212,191 | |
| Net realized gains | | | 8,956,032 | | | | 3,480,377 | | | | 2,072,136 | | | | 5,141,109 | | | | 1,713,342 | | | | 600,603 | |
| Change in unrealized net appreciation/ depreciation | | | (38,269 | ) | | | 8,737,567 | | | | 6,199,644 | | | | (5,993,839 | ) | | | 4,021,696 | | | | 534,645 | |
| Net increase (decrease) in net assets resulting from operations | | | 8,510,862 | | | | 12,070,462 | | | | 8,337,246 | | | | (136,706 | ) | | | 5,774,543 | | | | 1,347,439 | |
| | | | | | | | | | | | | | | | | | | | | | | | | |
| Distributions to Shareholders (Note 5) | | | | | | | | | | | | | | | | | | | | | | | | |
| From distributable earnings | | | | | | | | | | | | | | | | | | | | | | | | |
| Retail | | | (3,257,813 | ) | | | (1,735,756 | ) | | | (1,980,616 | ) | | | (5,902,295 | ) | | | (805,364 | ) | | | (206,867 | ) |
| Institutional | | | (3,650,769 | ) | | | (752,967 | ) | | | (291,712 | ) | | | (570,370 | ) | | | (1,260,625 | ) | | | (224,360 | ) |
| Decrease in net assets from distributions to shareholders | | | (6,908,582 | ) | | | (2,488,723 | ) | | | (2,272,328 | ) | | | (6,472,665 | ) | | | (2,065,989 | ) | | | (431,227 | ) |
| | | | | | | | | | | | | | | | | | | | | | | | | |
| Beneficial Interest Transactions (Note 4) | | | | | | | | | | | | | | | | | | | | | | | | |
| Shares sold | | | | | | | | | | | | | | | | | | | | | | | | |
| Retail | | | 12,663,816 | | | | 5,346,681 | | | | 168,540 | | | | 219,977 | | | | 1,212,464 | | | | 960,943 | |
| Institutional | | | 42,479,988 | | | | 7,189,820 | | | | 1,198,548 | | | | 3,015,142 | | | | 4,642,427 | | | | 2,585,710 | |
| Shares issued in reinvestment of distributions | | | | | | | | | | | | | | | | | | | | | | | | |
| Retail | | | 3,241,291 | | | | 1,725,674 | | | | 1,851,873 | | | | 5,425,870 | | | | 799,569 | | | | 205,081 | |
| Institutional | | | 3,570,077 | | | | 738,701 | | | | 291,654 | | | | 568,280 | | | | 1,232,146 | | | | 217,335 | |
| Cost of shares redeemed | | | | | | | | | | | | | | | | | | | | | | | | |
| Retail | | | (9,571,092 | ) | | | (8,410,969 | ) | | | (5,853,444 | ) | | | (13,773,899 | ) | | | (1,299,150 | ) | | | (1,931,919 | ) |
| Institutional | | | (10,706,447 | ) | | | (4,592,439 | ) | | | (623,868 | ) | | | (2,354,031 | ) | | | (1,439,188 | ) | | | (442,442 | ) |
| Net increase (decrease) resulting from beneficial interest transactions | | | 41,677,633 | | | | 1,997,468 | | | | (2,966,697 | ) | | | (6,898,661 | ) | | | 5,148,268 | | | | 1,594,708 | |
| Total net increase (decrease) in net assets | | | 43,279,913 | | | | 11,579,207 | | | | 3,098,221 | | | | (13,508,032 | ) | | | 8,856,822 | | | | 2,510,920 | |
| | | | | | | | | | | | | | | | | | | | | | | | | |
| Net Assets | | | | | | | | | | | | | | | | | | | | | | | | |
| Beginning of year | | | 49,124,000 | | | | 37,544,793 | | | | 35,597,346 | | | | 49,105,378 | | | | 20,695,153 | | | | 18,184,233 | |
| End of year | | $ | 92,403,913 | | | $ | 49,124,000 | | | $ | 38,695,567 | | | $ | 35,597,346 | | | $ | 29,551,975 | | | $ | 20,695,153 | |
| See Notes to Financial Statements. | |
| Annual Report | December 31, 2021 | | | 107 |
| Segall Bryant & Hamill Funds | Statements of Changes in Net Assets |
| | | Segall Bryant & Hamill | | | Segall Bryant & Hamill | | | Segall Bryant & Hamill | |
| | | Short Term Plus Fund | | | Plus Bond Fund | | | Quality High Yield Fund | |
| | | Year Ended | | | Year Ended | | | Year Ended | | | Year Ended | | | Year Ended | | | Year Ended | |
| | | December 31, | | | December 31, | | | December 31, | | | December 31, | | | December 31, | | | December 31, | |
| | | 2021 | | | 2020 | | | 2021 | | | 2020 | | | 2021 | | | 2020 | |
| Operations | | | | | | | | | | | | | | | | | | | | | | | | |
| Net investment income | | $ | 212,101 | | | $ | 191,449 | | | $ | 23,813,902 | | | $ | 25,876,175 | | | $ | 3,166,264 | | | $ | 2,528,256 | |
| Net realized gains | | | 76,508 | | | | 54,927 | | | | 7,750,023 | | | | 19,316,492 | | | | 909,927 | | | | 513,028 | |
| Change in unrealized net appreciation/ depreciation | | | (388,055 | ) | | | 111,293 | | | | (36,682,058 | ) | | | 39,662,673 | | | | (1,099,993 | ) | | | 1,859,160 | |
| Net increase (decrease) in net assets resulting from operations | | | (99,446 | ) | | | 357,669 | | | | (5,118,133 | ) | | | 84,855,340 | | | | 2,976,198 | | | | 4,900,444 | |
| | | | | | | | | | | | | | | | | | | | | | | | | |
| Distributions to Shareholders (Note 5) | | | | | | | | | | | | | | | | | | | | | | | | |
| From distributable earnings | | | | | | | | | | | | | | | | | | | | | | | | |
| Retail | | | (55,271 | ) | | | (26,922 | ) | | | (15,291,464 | ) | | | (23,520,739 | ) | | | (1,388,983 | ) | | | (1,577,977 | ) |
| Institutional | | | (287,775 | ) | | | (208,475 | ) | | | (18,728,556 | ) | | | (20,086,116 | ) | | | (1,927,139 | ) | | | (1,103,106 | ) |
| Decrease in net assets from distributions to shareholders | | | (343,046 | ) | | | (235,397 | ) | | | (34,020,020 | ) | | | (43,606,855 | ) | | | (3,316,122 | ) | | | (2,681,083 | ) |
| | | | | | | | | | | | | | | | | | | | | | | | | |
| Beneficial Interest Transactions (Note 4) | | | | | | | | | | | | | | | | | | | | | | | | |
| Shares sold | | | | | | | | | | | | | | | | | | | | | | | | |
| Retail | | | 12,423,094 | | | | 2,457,046 | | | | 68,960,401 | | | | 123,454,842 | | | | 6,338,669 | | | | 12,363,127 | |
| Institutional | | | 33,672,972 | | | | 24,340,928 | | | | 200,483,179 | | | | 160,786,766 | | | | 26,601,286 | | | | 26,628,869 | |
| Shares issued in reinvestment of distributions | | | | | | | | | | | | | | | | | | | | | | | | |
| Retail | | | 55,271 | | | | 26,922 | | | | 15,118,125 | | | | 23,273,538 | | | | 1,330,990 | | | | 1,509,714 | |
| Institutional | | | 278,284 | | | | 200,699 | | | | 17,133,640 | | | | 18,141,150 | | | | 1,891,759 | | | | 1,078,857 | |
| Cost of shares redeemed | | | | | | | | | | | | | | | | | | | | | | | | |
| Retail | | | (3,473,502 | ) | | | (417,464 | ) | | | (194,020,710 | ) | | | (174,569,496 | ) | | | (9,856,291 | ) | | | (12,360,999 | ) |
| Institutional | | | (17,119,670 | ) | | | (7,367,948 | ) | | | (133,949,714 | ) | | | (97,400,061 | ) | | | (7,099,896 | ) | | | (9,671,688 | ) |
| Net increase (decrease) resulting from beneficial interest transactions | | | 25,836,449 | | | | 19,240,183 | | | | (26,275,079 | ) | | | 53,686,739 | | | | 19,206,517 | | | | 19,547,880 | |
| Total net increase (decrease) in net assets | | | 25,393,957 | | | | 19,362,455 | | | | (65,413,232 | ) | | | 94,935,224 | | | | 18,866,593 | | | | 21,767,241 | |
| | | | | | | | | | | | | | | | | | | | | | | | | |
| Net Assets | | | | | | | | | | | | | | | | | | | | | | | | |
| Beginning of year | | | 26,556,834 | | | | 7,194,379 | | | | 1,120,550,524 | | | | 1,025,615,300 | | | | 83,139,559 | | | | 61,372,318 | |
| End of year | | $ | 51,950,791 | | | $ | 26,556,834 | | | $ | 1,055,137,292 | | | $ | 1,120,550,524 | | | $ | 102,006,152 | | | $ | 83,139,559 | |
| See Notes to Financial Statements. | |
| 108 | | | www.sbhfunds.com |
| Segall Bryant & Hamill Funds | Statements of Changes in Net Assets |
| | | Segall Bryant & Hamill | | | Segall Bryant & Hamill | |
| | | Municipal Opportunities Fund | | | Colorado Tax Free Fund | |
| | | Year Ended | | | Year Ended | | | Year Ended | | | Year Ended | |
| | | December 31, | | | December 31, | | | December 31, | | | December 31, | |
| | | 2021 | | | 2020 | | | 2021 | | | 2020 | |
| Operations | | | | | | | | | | | | | | | | |
| Net investment income | | $ | 3,809,513 | | | $ | 2,547,431 | | | $ | 8,155,019 | | | $ | 9,005,450 | |
| Net realized gains | | | 411,990 | | | | 1,325,140 | | | | 2,100,578 | | | | 1,470,979 | |
| Change in unrealized net appreciation/depreciation | | | 1,560,791 | | | | 4,000,450 | | | | 135,265 | | | | 10,297,563 | |
| Net increase in net assets resulting from operations | | | 5,782,294 | | | | 7,873,021 | | | | 10,390,862 | | | | 20,773,992 | |
| | | | | | | | | | | | | | | | | |
| Distributions to Shareholders (Note 5) | | | | | | | | | | | | | | | | |
| From distributable earnings | | | | | | | | | | | | | | | | |
| Retail | | | (888,141 | ) | | | (593,632 | ) | | | (4,549,634 | ) | | | (5,107,006 | ) |
| Institutional | | | (5,279,457 | ) | | | (3,341,693 | ) | | | (7,830,710 | ) | | | (7,155,178 | ) |
| Decrease in net assets from distributions to shareholders | | | (6,167,598 | ) | | | (3,935,325 | ) | | | (12,380,344 | ) | | | (12,262,184 | ) |
| | | | | | | | | | | | | | | | | |
| Beneficial Interest Transactions (Note 4) | | | | | | | | | | | | | | | | |
| Shares sold | | | | | | | | | | | | | | | | |
| Retail | | | 26,105,978 | | | | 21,492,605 | | | | 60,458,917 | | | | 93,308,302 | |
| Institutional | | | 119,955,842 | | | | 90,080,121 | | | | 115,221,186 | | | | 107,684,107 | |
| Shares issued in reinvestment of distributions | | | | | | | | | | | | | | | | |
| Retail | | | 782,090 | | | | 583,759 | | | | 4,399,110 | | | | 4,933,623 | |
| Institutional | | | 5,118,746 | | | | 3,188,822 | | | | 6,983,356 | | | | 6,313,429 | |
| Cost of shares redeemed | | | | | | | | | | | | | | | | |
| Retail | | | (13,133,062 | ) | | | (5,680,211 | ) | | | (52,813,083 | ) | | | (57,777,135 | ) |
| Institutional | | | (37,061,674 | ) | | | (13,196,461 | ) | | | (40,156,337 | ) | | | (44,666,500 | ) |
| Net increase resulting from beneficial interest transactions | | | 101,767,920 | | | | 96,468,635 | | | | 94,093,149 | | | | 109,795,826 | |
| Total net increase in net assets | | | 101,382,616 | | | | 100,406,331 | | | | 92,103,667 | | | | 118,307,634 | |
| | | | | | | | | | | | | | | | | |
| Net Assets | | | | | | | | | | | | | | | | |
| Beginning of year | | | 174,163,026 | | | | 73,756,695 | | | | 495,058,739 | | | | 376,751,105 | |
| End of year | | $ | 275,545,642 | | | $ | 174,163,026 | | | $ | 587,162,406 | | | $ | 495,058,739 | |
| See Notes to Financial Statements. | |
| Annual Report | December 31, 2021 | | | 109 |
| Segall Bryant & Hamill Small Cap Value Fund | Financial Highlights |
| For a Share Outstanding Throughout the Periods Presented |
| | | Year Ended | | | Year Ended | | | Period Ended | |
| | | December 31, | | | December 31, | | | December 31, | |
| Retail | | 2021 | | | 2020 | | | 2019(a) | |
| Net asset value, beginning of period | | $ | 13.34 | | | $ | 12.71 | | | $ | 12.34 | |
| Income from investment operations: | | | | | | | | | | | | |
| Net investment income(b) | | | 0.02 | | | | 0.23 | | | | 0.01 | |
| Net realized and unrealized gains on investments | | | 2.15 | | | | 0.53 | | | | 0.36 | |
| Total from investment operations | | | 2.17 | | | | 0.76 | | | | 0.37 | |
| | | | | | | | | | | | | |
| Less dividends and distributions: | | | | | | | | | | | | |
| Distributions from net investment income | | | (0.01 | ) | | | (0.04 | ) | | | — | |
| Distributions from net realized gains | | | (0.67 | ) | | | (0.09 | ) | | | — | |
| Total distributions | | | (0.68 | ) | | | (0.13 | ) | | | — | |
| Net asset value, end of period | | $ | 14.83 | | | $ | 13.34 | | | $ | 12.71 | |
| | | | | | | | | | | | | |
| Total Return | | | 16.47 | % | | | 6.14 | % | | | 3.00 | % (c) |
| | | | | | | | | | | | | |
| Ratios and Supplemental Data | | | | | | | | | | | | |
| Net assets, end of period (in 000s) | | $ | 9,414 | | | $ | 6,701 | | | $ | 10 | |
| | | | | | | | | | | | | |
| Ratio of expenses to average net assets | | | | | | | | | | | | |
| With fee waivers/reimbursements | | | 1.04 | % | | | 1.08 | % | | | 1.06 | % (d) |
| Without fee waivers/reimbursements | | | 1.04 | % | | | 1.08 | % | | | 1.06 | % (d) |
| Ratio of net investment income to average net assets | | | | | | | | | | | | |
| With fee waivers/reimbursements | | | 0.13 | % | | | 1.93 | % | | | 1.37 | % (d) |
| Without fee waivers/reimbursements | | | 0.13 | % | | | 1.93 | % | | | 1.37 | % (d) |
| Portfolio turnover rate | | | 32 | % | | | 44 | % | | | 28 | % (c)(e) |
| (a) | The Fund added a retail share class on December 9, 2019. Ratios for start up periods may not be representative of long term operating results. |
| (b) | Calculated using the average shares method. |
| (c) | Total return and portfolio turnover are not annualized for periods less than one full year. |
| (e) | Portfolio turnover rate is calculated at the fund level and represents the six months ended December 31, 2019. |
| See Notes to Financial Statements. | |
| 110 | | | www.sbhfunds.com |
| Segall Bryant & Hamill Small Cap Value Fund | Financial Highlights |
| For a Share Outstanding Throughout the Periods Presented |
| | | | | | | | | Six Months | | | | | | | | | | |
| | | Year Ended | | | Year Ended | | | Ended | | | Year Ended | | | Year Ended | | | Year Ended | |
| | | December 31, | | | December 31, | | | December 31, | | | June 30, | | | June 30, | | | June 30, | |
| Institutional | | 2021 | | | 2020 | | | 2019(a) | | | 2019 | | | 2018 | | | 2017 | |
| Net asset value, beginning of period | | $ | 13.35 | | | $ | 12.71 | | | $ | 12.59 | | | $ | 13.18 | | | $ | 12.17 | | | $ | 10.33 | |
| Income from investment operations: | | | | | | | | | | | | | | | | | | | | | | | | |
| Net investment income(b) | | | 0.03 | | | | 0.10 | | | | 0.09 | | | | 0.10 | | | | 0.05 | | | | 0.01 | |
| Net realized and unrealized gains on investments | | | 2.16 | | | | 0.67 | | | | 0.80 | | | | 0.42 | | | | 1.81 | | | | 1.86 | |
| Total from investment operations | | | 2.19 | | | | 0.77 | | | | 0.89 | | | | 0.52 | | | | 1.86 | | | | 1.87 | |
| | | | | | | | | | | | | | | | | | | | | | | | | |
| Less dividends and distributions: | | | | | | | | | | | | | | | | | | | | | | | | |
| Dividends from net investment income | | | (0.02 | ) | | | (0.04 | ) | | | (0.11 | ) | | | (0.08 | ) | | | (0.02 | ) | | | (0.01 | ) |
| Distributions from net realized gains | | | (0.67 | ) | | | (0.09 | ) | | | (0.66 | ) | | | (1.03 | ) | | | (0.83 | ) | | | (0.02 | ) |
| Total distributions | | | (0.69 | ) | | | (0.13 | ) | | | (0.77 | ) | | | (1.11 | ) | | | (0.85 | ) | | | (0.03 | ) |
| | | | | | | | | | | | | | | | | | | | | | | | | |
| Paid-in capital from redemption fees | | | — | | | | — | | | | 0.00 | (c) | | | 0.00 | (c) | | | 0.00 | (c) | | | 0.00 | (c) |
| Net asset value, end of period | | $ | 14.85 | | | $ | 13.35 | | | $ | 12.71 | | | $ | 12.59 | | | $ | 13.18 | | | $ | 12.17 | |
| | | | | | | | | | | | | | | | | | | | | | | | | |
| Total Return | | | 16.62 | % | | | 6.22 | % | | | 7.30 | % (d) | | | 5.33 | % | | | 15.63 | % | | | 18.07 | % |
| | | | | | | | | | | | | | | | | | | | | | | | | |
| Ratios and Supplemental Data | | | | | | | | | | | | | | | | | | | | | | | | |
| Net assets, end of period (in 000s) | | $ | 601,405 | | | $ | 415,747 | | | $ | 169,891 | | | $ | 141,192 | | | $ | 106,836 | | | $ | 63,072 | |
| | | | | | | | | | | | | | | | | | | | | | | | | |
| Ratio of expenses to average net assets | | | | | | | | | | | | | | | | | | | | | | | | |
| With fee waivers/reimbursements | | | 0.97 | % | | | 0.99 | % | | | 0.99 | % (e) | | | 0.99 | % | | | 1.01 | % (f) | | | 1.15 | % (g) |
| Without fee waivers/reimbursements | | | 0.97 | % | | | 1.01 | % | | | 1.14 | % (e) | | | 1.14 | % | | | 1.25 | % | | | 1.39 | % |
| Ratio of net investment income (loss) to average net assets | | | | | | | | | | | | | | | | | | | | | | | | |
| With fee waivers/reimbursements | | | 0.22 | % | | | 0.89 | % | | | 1.38 | % (e) | | | 0.81 | % | | | 0.42 | % | | | 0.09 | % |
| Without fee waivers/reimbursements | | | 0.22 | % | | | 0.87 | % | | | 1.23 | % (e) | | | 0.66 | % | | | 0.18 | % | | | (0.15 | )% |
| Portfolio turnover rate | | | 32 | % | | | 44 | % | | | 28 | % (d) | | | 68 | % | | | 59 | % | | | 70 | % |
| (a) | Fund changed fiscal year to December 31. |
| (b) | Calculated using the average shares method. |
| (c) | Less than $0.005 per share. |
| (d) | Total return and portfolio turnover are not annualized for periods less than one full year. |
| (f) | Contractual expense limitation changed from 1.08% to 0.99% effective November 1, 2017. |
| (g) | Contractual expense limitation changed from 1.20% to 1.08% effective February 1, 2017. |
| See Notes to Financial Statements. | |
| Annual Report | December 31, 2021 | | | 111 |
| Segall Bryant & Hamill Small Cap Growth Fund | Financial Highlights |
| For a Share Outstanding Throughout the Years Presented |
| | | Year Ended | | | Year Ended | | | Year Ended | | | Year Ended | | | Year Ended | |
| | | December 31, | | | December 31, | | | December 31, | | | December 31, | | | December 31, | |
| Retail | | 2021 | | | 2020 | | | 2019 | | | 2018(a) | | | 2017 | |
| Net asset value, beginning of year | | $ | 20.56 | | | $ | 13.04 | | | $ | 10.15 | | | $ | 12.72 | | | $ | 10.89 | |
| Income (loss) from investment operations: | | | | | | | | | | | | | | | | | | | | |
| Net investment loss(b) | | | (0.17 | ) | | | (0.08 | ) | | | (0.06 | ) | | | (0.11 | ) | | | (0.10 | ) |
| Net realized and unrealized gains on investments | | | 2.56 | | | | 7.60 | | | | 2.95 | | | | 0.63 | | | | 2.93 | |
| Total from investment operations | | | 2.39 | | | | 7.52 | | | | 2.89 | | | | 0.52 | | | | 2.83 | |
| | | | | | | | | | | | | | | | | | | | | |
| Less dividends and distributions: | | | | | | | | | | | | | | | | | | | | |
| Distributions from net realized gains | | | — | | | | — | | | | — | | | | (2.95 | ) | | | (1.00 | ) |
| Return of capital | | | — | | | | — | | | | — | | | | (0.14 | ) | | | — | |
| Total distributions | | | — | | | | — | | | | — | | | | (3.09 | ) | | | (1.00 | ) |
| Net asset value, end of year | | $ | 22.95 | | | $ | 20.56 | | | $ | 13.04 | | | $ | 10.15 | | | $ | 12.72 | |
| | | | | | | | | | | | | | | | | | | | | |
| Total Return | | | 11.62 | % | | | 57.67 | % | | | 28.47 | % | | | 3.19 | % | | | 25.98 | % |
| | | | | | | | | | | | | | | | | | | | | |
| Ratios and Supplemental Data | | | | | | | | | | | | | | | | | | | | |
| Net assets, end of year (in 000s) | | $ | 53,652 | | | $ | 11,786 | | | $ | 2,836 | | | $ | 1,570 | | | $ | 930 | |
| | | | | | | | | | | | | | | | | | | | | |
| Ratio of expenses to average net assets | | | | | | | | | | | | | | | | | | | | |
| With fee waivers/reimbursements | | | 1.03 | % | | | 1.04 | % | | | 1.12 | % | | | 1.24 | % (c) | | | 1.26 | % (d) |
| Without fee waivers/reimbursements | | | 1.03 | % | | | 1.04 | % | | | 1.12 | % | | | 3.09 | % | | | 2.88 | % |
| Ratio of net investment loss to average net assets | | | | | | | | | | | | | | | | | | | | |
| With fee waivers/reimbursements | | | (0.74 | )% | | | (0.54 | )% | | | (0.51 | )% | | | (0.76 | )% | | | (0.80 | )% |
| Without fee waivers/reimbursements | | | (0.74 | )% | | | (0.54 | )% | | | (0.51 | )% | | | (2.61 | )% | | | (2.42 | )% |
| Portfolio turnover rate | | | 35 | % | | | 54 | % | | | 28 | % | | | 83 | % | | | 51 | % |
| (a) | Prior to April 30, 2018 known as the Westcore Small-Cap Growth Fund. |
| (b) | Calculated using the average shares method. |
| (c) | Contractual expense limitation changed from 1.24% to 1.14% effective December 20, 2018. |
| (d) | Contractual expense limitation changed from 1.30% to 1.24% effective April 30, 2017. |
| See Notes to Financial Statements. | |
| 112 | | | www.sbhfunds.com |
| Segall Bryant & Hamill Small Cap Growth Fund | Financial Highlights |
| For a Share Outstanding Throughout the Years Presented |
| | | Year Ended | | | Year Ended | | | Year Ended | | | Year Ended | | | Year Ended | |
| | | December 31, | | | December 31, | | | December 31, | | | December 31, | | | December 31, | |
| Institutional | | 2021 | | | 2020 | | | 2019 | | | 2018(a) | | | 2017 | |
| Net asset value, beginning of year | | $ | 21.04 | | | $ | 13.33 | | | $ | 10.36 | | | $ | 12.88 | | | $ | 11.01 | |
| Income (loss) from investment operations: | | | | | | | | | | | | | | | | | | | | |
| Net investment loss(b) | | | (0.13 | ) | | | (0.08 | ) | | | (0.05 | ) | | | (0.08 | ) | | | (0.09 | ) |
| Net realized and unrealized gains on investments | | | 2.61 | | | | 7.79 | | | | 3.02 | | | | 0.65 | | | | 2.96 | |
| Total from investment operations | | | 2.48 | | | | 7.71 | | | | 2.97 | | | | 0.57 | | | | 2.87 | |
| | | | | | | | | | | | | | | | | | | | | |
| Less dividends and distributions: | | | | | | | | | | | | | | | | | | | | |
| Distributions from net realized gains | | | — | | | | — | | | | — | | | | (2.95 | ) | | | (1.00 | ) |
| Return of capital | | | — | | | | — | | | | — | | | | (0.14 | ) | | | — | |
| Total distributions | | | — | | | | — | | | | — | | | | (3.09 | ) | | | (1.00 | ) |
| Net asset value, end of year | | $ | 23.52 | | | $ | 21.04 | | | $ | 13.33 | | | $ | 10.36 | | | $ | 12.88 | |
| | | | | | | | | | | | | | | | | | | | | |
| Total Return | | | 11.79 | % | | | 57.84 | % | | | 28.67 | % | | | 3.56 | % | | | 26.05 | % |
| | | | | | | | | | | | | | | | | | | | | |
| Ratios and Supplemental Data | | | | | | | | | | | | | | | | | | | | |
| Net assets, end of year (in 000s) | | $ | 188,703 | | | $ | 110,018 | | | $ | 72,341 | | | $ | 63,082 | | | $ | 4,791 | |
| | | | | | | | | | | | | | | | | | | | | |
| Ratio of expenses to average net assets | | | | | | | | | | | | | | | | | | | | |
| With fee waivers/reimbursements | | | 0.87 | % | | | 0.97 | % | | | 0.98 | % | | | 0.99 | % | | | 1.20 | % |
| Without fee waivers/reimbursements | | | 0.87 | % | | | 0.97 | % | | | 0.98 | % | | | 2.26 | % | | | 2.74 | % |
| Ratio of net investment loss to average net assets | | | | | | | | | | | | | | | | | | | | |
| With fee waivers/reimbursements | | | (0.59 | )% | | | (0.50 | )% | | | (0.38 | )% | | | (0.63 | )% | | | (0.74 | )% |
| Without fee waivers/reimbursements | | | (0.59 | )% | | | (0.50 | )% | | | (0.38 | )% | | | (1.90 | )% | | | (2.28 | )% |
| Portfolio turnover rate | | | 35 | % | | | 54 | % | | | 28 | % | | | 83 | % | | | 51 | % |
| (a) | Prior to April 30, 2018 known as the Westcore Small-Cap Growth Fund. |
| (b) | Calculated using the average shares method. |
| See Notes to Financial Statements. | |
| Annual Report | December 31, 2021 | | | 113 |
| Segall Bryant & Hamill Small Cap Core Fund | Financial Highlights |
| For a Share Outstanding Throughout the Years Presented |
| | | Year Ended | | | Year Ended | |
| | | December 31, | | | December 31, | |
| Retail | | 2021 | | | 2020 | |
| Net asset value, beginning of year | | $ | 12.26 | | | $ | 10.00 | |
| Income (loss) from investment operations: | | | | | | | | |
| Net investment loss(a) | | | (0.07 | ) | | | (0.03 | ) |
| Net realized and unrealized gains on investments | | | 2.82 | | | | 2.29 | |
| Total from investment operations | | | 2.75 | | | | 2.26 | |
| | | | | | | | | |
| Less dividends and distributions: | | | | | | | | |
| Distributions from net realized gains | | | (2.36 | ) | | | — | |
| Net asset value, end of year | | $ | 12.65 | | | $ | 12.26 | |
| | | | | | | | | |
| Total Return | | | 23.26 | % | | | 22.60 | % |
| | | | | | | | | |
| Ratios and Supplemental Data | | | | | | | | |
| Net assets, end of year (in 000s) | | $ | 1,663 | | | $ | 4,165 | |
| | | | | | | | | |
| Ratio of expenses to average net assets | | | | | | | | |
| With fee waivers/reimbursements | | | 1.14 | % | | | 1.14 | % |
| Without fee waivers/reimbursements | | | 1.35 | % | | | 1.26 | % |
| Ratio of net investment loss to average net assets | | | | | | | | |
| With fee waivers/reimbursements | | | (0.25 | )% | | | (0.26 | )% |
| Without fee waivers/reimbursements | | | (0.46 | )% | | | (0.38 | )% |
| Portfolio turnover rate | | | 36 | % | | | 74 | % |
| (a) | Calculated using the average shares method. |
| See Notes to Financial Statements. | |
| 114 | | | www.sbhfunds.com |
| Segall Bryant & Hamill Small Cap Core Fund | Financial Highlights |
| For a Share Outstanding Throughout the Years Presented |
| | | Year Ended | | | Year Ended | |
| | | December 31, | | | December 31, | |
| Institutional | | 2021 | | | 2020 | |
| Net asset value, beginning of year | | $ | 12.28 | | | $ | 10.00 | |
| Income (loss) from investment operations: | | | | | | | | |
| Net investment loss(a) | | | (0.02 | ) | | | (0.00 | ) (b) |
| Net realized and unrealized gains on investments | | | 2.80 | | | | 2.28 | |
| Total from investment operations | | | 2.78 | | | | 2.28 | |
| | | | | | | | | |
| Less dividends and distributions: | | | | | | | | |
| Distributions from net realized gains | | | (2.36 | ) | | | — | |
| Net asset value, end of year | | $ | 12.70 | | | $ | 12.28 | |
| | | | | | | | | |
| Total Return | | | 23.48 | % | | | 22.80 | % |
| | | | | | | | | |
| Ratios and Supplemental Data | | | | | | | | |
| Net assets, end of year (in 000s) | | $ | 50,460 | | | $ | 44,675 | |
| | | | | | | | | |
| Ratio of expenses to average net assets | | | | | | | | |
| With fee waivers/reimbursements | | | 0.99 | % | | | 0.99 | % |
| Without fee waivers/reimbursements | | | 1.10 | % | | | 1.27 | % |
| Ratio of net investment loss to average net assets | | | | | | | | |
| With fee waivers/reimbursements | | | (0.13 | )% | | | (0.05 | )% |
| Without fee waivers/reimbursements | | | (0.24 | )% | | | (0.33 | )% |
| Portfolio turnover rate | | | 36 | % | | | 74 | % |
| (a) | Calculated using the average shares method. |
| (b) | Less than $0.005 per share. |
| See Notes to Financial Statements. | |
| Annual Report | December 31, 2021 | | | 115 |
| Segall Bryant & Hamill All Cap Fund | Financial Highlights |
| For a Share Outstanding Throughout the Periods Presented |
| | | Year Ended | | | Year Ended | | | Period Ended | |
| | | December 31, | | | December 31, | | | December 31, | |
| Retail | | 2021 | | | 2020 | | | 2019(a) | |
| Net asset value, beginning of period | | $ | 21.15 | | | $ | 17.00 | | | $ | 16.49 | |
| Income (loss) from investment operations: | | | | | | | | | | | | |
| Net investment income (loss)(b) | | | (0.01 | ) | | | 0.04 | | | | (0.00 | ) (c) |
| Net realized and unrealized gains on investments | | | 6.16 | | | | 4.39 | | | | 0.51 | |
| Total from investment operations | | | 6.15 | | | | 4.43 | | | | 0.51 | |
| | | | | | | | | | | | | |
| Less dividends and distributions: | | | | | | | | | | | | |
| Dividends from net investment income | | | — | | | | (0.03 | ) | | | — | |
| Distributions from net realized gains | | | (2.79 | ) | | | (0.25 | ) | | | — | |
| Total distributions | | | (2.79 | ) | | | (0.28 | ) | | | — | |
| Net asset value, end of period | | $ | 24.51 | | | $ | 21.15 | | | $ | 17.00 | |
| | | | | | | | | | | | | |
| Total Return | | | 29.57 | % | | | 26.08 | % | | | 3.09 | % (d) |
| | | | | | | | | | | | | |
| Ratios and Supplemental Data | | | | | | | | | | | | |
| Net assets, end of period (in 000s) | | $ | 974 | | | $ | 583 | | | $ | 10 | |
| | | | | | | | | | | | | |
| Ratio of expenses to average net assets | | | | | | | | | | | | |
| With fee waivers/reimbursements | | | 0.83 | % | | | 0.79 | % (e) | | | 0.98 | % (f) |
| Without fee waivers/reimbursements | | | 0.83 | % | | | 0.79 | % (e) | | | 1.00 | % (f) |
| Ratio of net investment income (loss) to average net assets | | | | | | | | | | | | |
| With fee waivers/reimbursements | | | (0.06 | )% | | | 0.19 | % | | | (0.15 | )% (f) |
| Without fee waivers/reimbursements | | | (0.06 | )% | | | 0.19 | % | | | (0.17 | )% (f) |
| Portfolio turnover rate | | | 30 | % | | | 38 | % | | | 16 | % (d)(g) |
| (a) | The Fund added a retail share class on December 9, 2019. Ratios for start up periods may not be representative of long term operating results. |
| (b) | Calculated using the average shares method. |
| (c) | Less than $0.005 per share. |
| (d) | Total return and portfolio turnover are not annualized for periods less than one full year. |
| (e) | During the period there were no shareholder servicing fees expensed for the Retail Class. This may not be representative of long term results. |
| (g) | Portfolio turnover rate is calculated at the fund level and represents the six months ended December 31, 2019. |
| See Notes to Financial Statements. | |
| 116 | | | www.sbhfunds.com |
| Segall Bryant & Hamill All Cap Fund | Financial Highlights |
| For a Share Outstanding Throughout the Periods Presented |
| | | | | | | | | Six Months | | | | | | | | | | |
| | | Year Ended | | | Year Ended | | | Ended | | | Year Ended | | | Year Ended | | | Year Ended | |
| | | December 31, | | | December 31, | | | December 31, | | | June 30, | | | June 30, | | | June 30, | |
| Institutional | | 2021 | | | 2020 | | | 2019(a) | | | 2019 | | | 2018 | | | 2017 | |
| Net asset value, beginning of period | | $ | 21.16 | | | $ | 17.00 | | | $ | 15.80 | | | $ | 14.76 | | | $ | 13.37 | | | $ | 11.82 | |
| Income (loss) from investment operations: | | | | | | | | | | | | | | | | | | | | | | | | |
| Net investment income (loss)(b) | | | (0.02 | ) | | | 0.03 | | | | 0.01 | | | | 0.01 | | | | (0.01 | ) | | | 0.00 | (c) |
| Net realized and unrealized gains on investments | | | 6.17 | | | | 4.41 | | | | 1.25 | | | | 1.57 | | | | 1.48 | | | | 1.55 | |
| Total from investment operations | | | 6.15 | | | | 4.44 | | | | 1.26 | | | | 1.58 | | | | 1.47 | | | | 1.55 | |
| | | | | | | | | | | | | | | | | | | | | | | | | |
| Less dividends and distributions: | | | | | | | | | | | | | | | | | | | | | | | | |
| Dividends from net investment income | | | — | | | | (0.03 | ) | | | (0.01 | ) | | | — | | | | — | | | | (0.00 | ) (c) |
| Distributions from net realized gains | | | (2.79 | ) | | | (0.25 | ) | | | (0.05 | ) | | | (0.54 | ) | | | (0.08 | ) | | | — | |
| Total distributions | | | (2.79 | ) | | | (0.28 | ) | | | (0.06 | ) | | | (0.54 | ) | | | (0.08 | ) | | | (0.00 | ) (c) |
| | | | | | | | | | | | | | | | | | | | | | | | | |
| Paid-in capital from redemption fees | | | — | | | | — | | | | 0.00 | (c) | | | 0.00 | (c) | | | 0.00 | (c) | | | 0.00 | (c) |
| Net asset value, end of period | | $ | 24.52 | | | $ | 21.16 | | | $ | 17.00 | | | $ | 15.80 | | | $ | 14.76 | | | $ | 13.37 | |
| | | | | | | | | | | | | | | | | | | | | | | | | |
| Total Return | | | 29.55 | % | | | 26.18 | % | | | 7.95 | % (d) | | | 11.47 | % | | | 11.01 | % | | | 13.14 | % |
| | | | | | | | | | | | | | | | | | | | | | | | | |
| Ratios and Supplemental Data | | | | | | | | | | | | | | | | | | | | | | | | |
| Net assets, end of period (in 000s) | | $ | 186,459 | | | $ | 169,833 | | | $ | 120,730 | | | $ | 104,418 | | | $ | 79,631 | | | $ | 63,463 | |
| | | | | | | | | | | | | | | | | | | | | | | | | |
| Ratio of expenses to average net assets | | | | | | | | | | | | | | | | | | | | | | | | |
| With fee waivers/reimbursements | | | 0.84 | % | | | 0.84 | % | | | 0.96 | % (e)(f) | | | 0.98 | % | | | 1.02 | % (g) | | | 1.10 | % |
| Without fee waivers/reimbursements | | | 0.87 | % | | | 0.92 | % | | | 1.12 | % (e) | | | 1.14 | % | | | 1.22 | % | | | 1.40 | % |
| Ratio of net investment income (loss) to average net assets | | | | | | | | | | | | | | | | | | | | | | | | |
| With fee waivers/reimbursements | | | (0.07 | )% | | | 0.16 | % | | | 0.07 | % (e) | | | 0.07 | % | | | (0.07 | )% | | | (0.02 | )% |
| Without fee waivers/reimbursements | | | (0.10 | )% | | | 0.08 | % | | | (0.09 | )% (e) | | | (0.09 | )% | | | (0.27 | )% | | | (0.32 | )% |
| Portfolio turnover rate | | | 30 | % | | | 38 | % | | | 16 | % (d) | | | 38 | % | | | 37 | % | | | 38 | % |
| (a) | Fund changed fiscal year to December 31. |
| (b) | Calculated using the average shares method. |
| (c) | Less than $0.005 per share. |
| (d) | Total return and portfolio turnover are not annualized for periods less than one full year. |
| (f) | Contractual expense limitation changed from 0.98% to 0.84% effective December 9, 2019. |
| (g) | Contractual expense limitation changed from 1.10% to 0.98% effective November 1, 2017. |
| See Notes to Financial Statements. | |
| Annual Report | December 31, 2021 | | | 117 |
| Segall Bryant & Hamill Emerging Markets Fund | Financial Highlights |
| For a Share Outstanding Throughout the Periods Presented |
| | | | | | | | | Two Months | | | | | | | | | | |
| | | Year Ended | | | Year Ended | | | Ended | | | Year Ended | | | Year Ended | | | Year Ended | |
| | | December 31, | | | December 31, | | | December 31, | | | October 31, | | | October 31, | | | October 31, | |
| Retail* | | 2021 | | | 2020 | | | 2019(a) | | | 2019 | | | 2018 | | | 2017 | |
| Net asset value, beginning of period | | $ | 9.13 | | | $ | 8.67 | | | $ | 8.27 | | | $ | 7.70 | | | $ | 9.49 | | | $ | 7.60 | |
| Income (loss) from investment operations: | | | | | | | | | | | | | | | | | | | | | | | | |
| Net investment income(b) | | | 0.26 | | | | 0.14 | | | | 0.01 | | | | 0.17 | | | | 0.18 | | | | 0.13 | |
| Net realized and unrealized gains (losses) on investments | | | 0.21 | | | | 0.47 | | | | 0.60 | | | | 0.62 | | | | (1.53 | ) | | | 1.90 | |
| Total from investment operations | | | 0.47 | | | | 0.61 | | | | 0.61 | | | | 0.79 | | | | (1.35 | ) | | | 2.03 | |
| | | | | | | | | | | | | | | | | | | | | | | | | |
| Less dividends and distributions: | | | | | | | | | | | | | | | | | | | | | | | | |
| Dividends from net investment income | | | (0.30 | ) | | | (0.15 | ) | | | (0.20 | ) | | | (0.18 | ) | | | (0.13 | ) | | | (0.14 | ) |
| Distributions from net realized gains | | | (0.18 | ) | | | — | | | | — | | | | (0.04 | ) | | | (0.31 | ) | | | — | |
| Return of capital | | | — | | | | — | | | | (0.01 | ) | | | — | | | | — | | | | — | |
| Total distributions | | | (0.48 | ) | | | (0.15 | ) | | | (0.21 | ) | | | (0.22 | ) | | | (0.44 | ) | | | (0.14 | ) |
| | | | | | | | | | | | | | | | | | | | | | | | | |
| Paid-in capital from redemption fees | | | — | | | | — | | | | — | | | | — | | | | 0.00 | (c) | | | — | |
| Net asset value, end of period | | $ | 9.12 | | | $ | 9.13 | | | $ | 8.67 | | | $ | 8.27 | | | $ | 7.70 | | | $ | 9.49 | |
| | | | | | | | | | | | | | | | | | | | | | | | | |
| Total Return | | | 5.22 | % | | | 7.05 | % | | | 7.52 | % (d) | | | 10.64 | % | | | (14.96 | )% | | | 27.27 | % |
| | | | | | | | | | | | | | | | | | | | | | | | | |
| Ratios and Supplemental Data | | | | | | | | | | | | | | | | | | | | | | | | |
| Net assets, end of period (in 000s) | | $ | 3,224 | | | $ | 2,954 | | | $ | 2,678 | | | $ | 2,397 | | | $ | 2,043 | | | $ | 3,116 | |
| | | | | | | | | | | | | | | | | | | | | | | | | |
| Ratio of expenses to average net assets | | | | | | | | | | | | | | | | | | | | | | | | |
| With fee waivers/reimbursements | | | 1.38 | % | | | 1.38 | % | | | 1.46 | % (e)(f) | | | 1.48 | % | | | 1.48 | % | | | 1.48 | % |
| Without fee waivers/reimbursements | | | 1.86 | % | | | 2.36 | % | | | 3.40 | % (e) | | | 2.91 | % | | | 2.49 | % | | | 2.87 | % |
| Ratio of net investment income (loss) to average net assets | | | | | | | | | | | | | | | | | | | | | | | | |
| With fee waivers/reimbursements | | | 2.65 | % | | | 1.80 | % | | | 1.01 | % (e) | | | 2.15 | % | | | 1.97 | % | | | 1.54 | % |
| Without fee waivers/reimbursements | | | 2.17 | % | | | 0.82 | % | | | (0.93 | )% (e) | | | 0.72 | % | | | 0.96 | % | | | 0.15 | % |
| Portfolio turnover rate | | | 91 | % | | | 91 | % | | | 23 | % (d) | | | 107 | % | | | 99 | % | | | 97 | % |
| (a) | Fund changed fiscal year to December 31. |
| (b) | Calculated using the average shares method. |
| (c) | Less than $0.005 per share. |
| (d) | Total return and portfolio turnover are not annualized for periods less than one full year. |
| (f) | Contractual expense limitation changed from 1.48% to 1.38% effective December 9, 2019. |
| See Notes to Financial Statements. | |
| 118 | | | www.sbhfunds.com |
| Segall Bryant & Hamill Emerging Markets Fund | Financial Highlights |
| For a Share Outstanding Throughout the Periods Presented |
| | | | | | | | | Two Months | | | | | | | | | | |
| | | Year Ended | | | Year Ended | | | Ended | | | Year Ended | | | Year Ended | | | Year Ended | |
| | | December 31, | | | December 31, | | | December 31, | | | October 31, | | | October 31, | | | October 31, | |
| Institutional* | | 2021 | | | 2020 | | | 2019(a) | | | 2019 | | | 2018 | | | 2017 | |
| Net asset value, beginning of period | | $ | 9.15 | | | $ | 8.69 | | | $ | 8.31 | | | $ | 7.74 | | | $ | 9.54 | | | $ | 7.63 | |
| Income (loss) from investment operations: | | | | | | | | | | | | | | | | | | | | | | | | |
| Net investment income(b) | | | 0.28 | | | | 0.15 | | | | 0.02 | | | | 0.20 | | | | 0.20 | | | | 0.15 | |
| Net realized and unrealized gains (losses) on investments | | | 0.21 | | | | 0.47 | | | | 0.59 | | | | 0.62 | | | | (1.54 | ) | | | 1.91 | |
| Total from investment operations | | | 0.49 | | | | 0.62 | | | | 0.61 | | | | 0.82 | | | | (1.34 | ) | | | 2.06 | |
| | | | | | | | | | | | | | | | | | | | | | | | | |
| Less dividends and distributions: | | | | | | | | | | | | | | | | | | | | | | | | |
| Dividends from net investment income | | | (0.31 | ) | | | (0.16 | ) | | | (0.22 | ) | | | (0.21 | ) | | | (0.15 | ) | | | (0.15 | ) |
| Distributions from net realized gains | | | (0.18 | ) | | | — | | | | — | | | | (0.04 | ) | | | (0.31 | ) | | | — | |
| Return of capital | | | — | | | | — | | | | (0.01 | ) | | | — | | | | — | | | | — | |
| Total distributions | | | (0.49 | ) | | | (0.16 | ) | | | (0.23 | ) | | | (0.25 | ) | | | (0.46 | ) | | | (0.15 | ) |
| | | | | | | | | | | | | | | | | | | | | | | | | |
| Paid-in capital from redemption fees | | | — | | | | — | | | | — | | | | — | | | | 0.00 | (c) | | | — | |
| Net asset value, end of period | | $ | 9.15 | | | $ | 9.15 | | | $ | 8.69 | | | $ | 8.31 | | | $ | 7.74 | | | $ | 9.54 | |
| | | | | | | | | | | | | | | | | | | | | | | | | |
| Total Return | | | 5.49 | % | | | 7.18 | % | | | 7.51 | % (d) | | | 10.97 | % | | | (14.81 | )% | | | 27.68 | % |
| | | | | | | | | | | | | | | | | | | | | | | | | |
| Ratios and Supplemental Data | | | | | | | | | | | | | | | | | | | | | | | | |
| Net assets, end of period (in 000s) | | $ | 54,660 | | | $ | 45,058 | | | $ | 32,721 | | | $ | 30,836 | | | $ | 29,961 | | | $ | 32,144 | |
| | | | | | | | | | | | | | | | | | | | | | | | | |
| Ratio of expenses to average net assets | | | | | | | | | | | | | | | | | | | | | | | | |
| With fee waivers/reimbursements | | | 1.23 | % | | | 1.23 | % | | | 1.23 | % (e) | | | 1.23 | % | | | 1.23 | % | | | 1.23 | % |
| Without fee waivers/reimbursements | | | 1.69 | % | | | 2.19 | % | | | 3.14 | % (e) | | | 2.66 | % | | | 2.24 | % | | | 2.62 | % |
| Ratio of net investment income (loss) to average net assets | | | | | | | | | | | | | | | | | | | | | | | | |
| With fee waivers/reimbursements | | | 2.83 | % | | | 1.93 | % | | | 1.18 | % (e) | | | 2.40 | % | | | 2.22 | % | | | 1.79 | % |
| Without fee waivers/reimbursements | | | 2.37 | % | | | 0.97 | % | | | (0.73 | )% (e) | | | 0.97 | % | | | 1.21 | % | | | 0.40 | % |
| Portfolio turnover rate | | | 91 | % | | | 91 | % | | | 23 | % (d) | | | 107 | % | | | 99 | % | | | 97 | % |
| (a) | Fund changed fiscal year to December 31. |
| (b) | Calculated using the average shares method. |
| (c) | Less than $0.005 per share. |
| (d) | Total return and portfolio turnover are not annualized for periods less than one full year. |
| See Notes to Financial Statements. | |
| Annual Report | December 31, 2021 | | | 119 |
| Segall Bryant & Hamill International Small Cap Fund | Financial Highlights |
| For a Share Outstanding Throughout the Periods Presented |
| | | | | | | | | Two Months | | | | | | | | | | |
| | | Year Ended | | | Year Ended | | | Ended | | | Year Ended | | | Year Ended | | | Year Ended | |
| | | December 31, | | | December 31, | | | December 31, | | | October 31, | | | October 31, | | | October 31, | |
| Retail* | | 2021 | | | 2020 | | | 2019(a) | | | 2019 | | | 2018 | | | 2017 | |
| Net asset value, beginning of period | | $ | 10.83 | | | $ | 11.64 | | | $ | 11.39 | | | $ | 11.73 | | | $ | 14.47 | | | $ | 11.74 | |
| Income (loss) from investment operations: | | | | | | | | | | | | | | | | | | | | | | | | |
| Net investment income(b) | | | 0.29 | | | | 0.16 | | | | 0.02 | | | | 0.28 | | | | 0.26 | | | | 0.23 | |
| Net realized and unrealized gains (losses) on investments | | | 1.09 | | | | (0.80 | ) | | | 0.73 | | | | (0.38 | ) | | | (2.27 | ) | | | 2.69 | |
| Total from investment operations | | | 1.38 | | | | (0.64 | ) | | | 0.75 | | | | (0.10 | ) | | | (2.01 | ) | | | 2.92 | |
| | | | | | | | | | | | | | | | | | | | | | | | | |
| Less dividends and distributions: | | | | | | | | | | | | | | | | | | | | | | | | |
| Dividends from net investment income | | | (0.62 | ) | | | (0.17 | ) | | | (0.49 | ) | | | (0.25 | ) | | | (0.29 | ) | | | (0.19 | ) |
| Distributions from net realized gains | | | — | | | | — | | | | — | | | | — | | | | (0.44 | ) | | | — | |
| Return of capital | | | — | | | | — | | | | (0.01 | ) | | | — | | | | — | | | | — | |
| Total distributions | | | (0.62 | ) | | | (0.17 | ) | | | (0.50 | ) | | | (0.25 | ) | | | (0.73 | ) | | | (0.19 | ) |
| | | | | | | | | | | | | | | | | | | | | | | | | |
| Paid-in capital from redemption fees | | | — | | | | — | | | | — | | | | 0.00 | (c) | | | 0.00 | (c) | | | — | |
| | | | | | | | | | | | | | | | | | | | | | | | | |
| Net increase from payment by affiliates | | | — | | | | — | | | | — | | | | 0.01 | (d) | | | — | | | | — | |
| Net asset value, end of period | | $ | 11.59 | | | $ | 10.83 | | | $ | 11.64 | | | $ | 11.39 | | | $ | 11.73 | | | $ | 14.47 | |
| | | | | | | | | | | | | | | | | | | | | | | | | |
| Total Return | | | 12.97 | % | | | (5.51 | )% | | | 6.73 | % (e) | | | (0.54 | )% | | | (14.68 | )% | | | 25.27 | % |
| | | | | | | | | | | | | | | | | | | | | | | | | |
| Ratios and Supplemental Data | | | | | | | | | | | | | | | | | | | | | | | | |
| Net assets, end of period (in 000s) | | $ | 47,301 | | | $ | 64,420 | | | $ | 52,668 | | | $ | 49,749 | | | $ | 23,554 | | | $ | 25,240 | |
| | | | | | | | | | | | | | | | | | | | | | | | | |
| Ratio of expenses to average net assets | | | | | | | | | | | | | | | | | | | | | | | | |
| With fee waivers/reimbursements | | | 1.18 | % | | | 1.18 | % | | | 1.25 | % (f)(g) | | | 1.28 | % | | | 1.28 | % | | | 1.28 | % |
| Without fee waivers/reimbursements | | | 1.36 | % | | | 1.36 | % | | | 1.42 | % (f) | | | 1.53 | % | | | 1.44 | % | | | 1.47 | % |
| Ratio of net investment income to average net assets | | | | | | | | | | | | | | | | | | | | | | | | |
| With fee waivers/reimbursements | | | 2.37 | % | | | 1.68 | % | | | 0.94 | % (f) | | | 2.49 | % | | | 1.92 | % | | | 1.80 | % |
| Without fee waivers/reimbursements | | | 2.19 | % | | | 1.50 | % | | | 0.77 | % (f) | | | 2.24 | % | | | 1.76 | % | | | 1.61 | % |
| Portfolio turnover rate | | | 112 | % | | | 106 | % | | | 17 | % (e) | | | 121 | % | | | 111 | % | | | 101 | % |
| (a) | Fund changed fiscal year to December 31. |
| (b) | Calculated using the average shares method. |
| (c) | Less than $0.005 per share. |
| (d) | The custodian reimbursed the Fund $132,086 for losses incurred from corporate action processing. Payment had a positive 0.09% impact on the total return. |
| (e) | Total return and portfolio turnover are not annualized for periods less than one full year. |
| (g) | Contractual expense limitation changed from 1.28% to 1.18% effective December 9, 2019. |
| See Notes to Financial Statements. | |
| 120 | | | www.sbhfunds.com |
| Segall Bryant & Hamill International Small Cap Fund | Financial Highlights |
| For a Share Outstanding Throughout the Periods Presented |
| | | | | | | | | Two Months | | | | | | | | | | |
| | | Year Ended | | | Year Ended | | | Ended | | | Year Ended | | | Year Ended | | | Year Ended | |
| | | December 31, | | | December 31, | | | December 31, | | | October 31, | | | October 31, | | | October 31, | |
| Institutional* | | 2021 | | | 2020 | | | 2019(a) | | | 2019 | | | 2018 | | | 2017 | |
| Net asset value, beginning of period | | $ | 10.85 | | | $ | 11.65 | | | $ | 11.42 | | | $ | 11.77 | | | $ | 14.50 | | | $ | 11.76 | |
| Income (loss) from investment operations: | | | | | | | | | | | | | | | | | | | | | | | | |
| Net investment income(b) | | | 0.31 | | | | 0.19 | | | | 0.02 | | | | 0.30 | | | | 0.29 | | | | 0.27 | |
| Net realized and unrealized gains (losses) on investments | | | 1.10 | | | | (0.82 | ) | | | 0.73 | | | | (0.37 | ) | | | (2.26 | ) | | | 2.68 | |
| Total from investment operations | | | 1.41 | | | | (0.63 | ) | | | 0.75 | | | | (0.07 | ) | | | (1.97 | ) | | | 2.95 | |
| | | | | | | | | | | | | | | | | | | | | | | | | |
| Less dividends and distributions: | | | | | | | | | | | | | | | | | | | | | | | | |
| Dividends from net investment income | | | (0.65 | ) | | | (0.17 | ) | | | (0.51 | ) | | | (0.29 | ) | | | (0.32 | ) | | | (0.21 | ) |
| Distributions from net realized gains | | | — | | | | — | | | | — | | | | — | | | | (0.44 | ) | | | — | |
| Return of capital | | | — | | | | — | | | | (0.01 | ) | | | — | | | | — | | | | — | |
| Total distributions | | | (0.65 | ) | | | (0.17 | ) | | | (0.52 | ) | | | (0.29 | ) | | | (0.76 | ) | | | (0.21 | ) |
| | | | | | | | | | | | | | | | | | | | | | | | | |
| Paid-in capital from redemption fees | | | — | | | | — | | | | — | | | | 0.00 | (c) | | | 0.00 | (c) | | | 0.00 | (c) |
| | | | | | | | | | | | | | | | | | | | | | | | | |
| Net increase from payment by affiliates | | | — | | | | — | | | | — | | | | 0.01 | (d) | | | — | | | | — | |
| Net asset value, end of period | | $ | 11.61 | | | $ | 10.85 | | | $ | 11.65 | | | $ | 11.42 | | | $ | 11.77 | | | $ | 14.50 | |
| | | | | | | | | | | | | | | | | | | | | | | | | |
| Total Return | | | 13.19 | % | | | (5.35 | )% | | | 6.69 | % (e) | | | (0.29 | )% | | | (14.40 | )% | | | 25.60 | % |
| | | | | | | | | | | | | | | | | | | | | | | | | |
| Ratios and Supplemental Data | | | | | | | | | | | | | | | | | | | | | | | | |
| Net assets, end of period (in 000s) | | $ | 108,745 | | | $ | 119,113 | | | $ | 234,265 | | | $ | 230,883 | | | $ | 351,480 | | | $ | 298,728 | |
| | | | | | | | | | | | | | | | | | | | | | | | | |
| Ratio of expenses to average net assets | | | | | | | | | | | | | | | | | | | | | | | | |
| With fee waivers/reimbursements | | | 1.03 | % | | | 1.03 | % | | | 1.03 | % (f) | | | 1.03 | % | | | 1.03 | % | | | 1.03 | % |
| Without fee waivers/reimbursements | | | 1.13 | % | | | 1.18 | % | | | 1.20 | % (f) | | | 1.28 | % | | | 1.19 | % | | | 1.22 | % |
| Ratio of net investment income to average net assets | | | | | | | | | | | | | | | | | | | | | | | | |
| With fee waivers/reimbursements | | | 2.54 | % | | | 2.00 | % | | | 1.15 | % (f) | | | 2.74 | % | | | 2.17 | % | | | 2.05 | % |
| Without fee waivers/reimbursements | | | 2.44 | % | | | 1.85 | % | | | 0.98 | % (f) | | | 2.49 | % | | | 2.01 | % | | | 1.86 | % |
| Portfolio turnover rate | | | 112 | % | | �� | 106 | % | | | 17 | % (e) | | | 121 | % | | | 111 | % | | | 101 | % |
| (a) | Fund changed fiscal year to December 31. |
| (b) | Calculated using the average shares method. |
| (c) | Less than $0.005 per share. |
| (d) | The custodian reimbursed the Fund $132,086 for losses incurred from corporate action processing. Payment had a positive 0.09% impact on the total return. |
| (e) | Total return and portfolio turnover are not annualized for periods less than one full year. |
| See Notes to Financial Statements. | |
| Annual Report | December 31, 2021 | | | 121 |
| Segall Bryant & Hamill | |
| Fundamental International Small Cap Fund | Financial Highlights |
| For a Share Outstanding Throughout the Years Presented |
| | | Year Ended | | | Year Ended | | | Year Ended | | | Year Ended | | | Year Ended | |
| | | December 31, | | | December 31, | | | December 31, | | | December 31, | | | December 31, | |
| Retail | | 2021 | | | 2020 | | | 2019 | | | 2018(a) | | | 2017 | |
| Net asset value, beginning of year | | $ | 22.86 | | | $ | 18.12 | | | $ | 12.67 | | | $ | 19.76 | | | $ | 15.08 | |
| Income (loss) from investment operations: | | | | | | | | | | | | | | | | | | | | |
| Net investment income (loss)(b) | | | (0.22 | ) | | | (0.08 | ) | | | 0.00 | (c) | | | (0.03 | ) | | | 0.05 | |
| Net realized and unrealized gains (losses) on investments | | | 3.83 | | | | 6.06 | | | | 5.45 | | | | (4.40 | ) | | | 5.01 | |
| Total from investment operations | | | 3.61 | | | | 5.98 | | | | 5.45 | | | | (4.43 | ) | | | 5.06 | |
| | | | | | | | | | | | | | | | | | | | | |
| Less dividends and distributions: | | | | | | | | | | | | | | | | | | | | |
| Dividends from net investment income | | | — | | | | — | | | | — | | | | (0.08 | ) | | | (0.38 | ) |
| Distributions from net realized gains | | | (2.04 | ) | | | (1.24 | ) | | | — | | | | (2.58 | ) | | | — | |
| Total distributions | | | (2.04 | ) | | | (1.24 | ) | | | — | | | | (2.66 | ) | | | (0.38 | ) |
| Net asset value, end of year | | $ | 24.43 | | | $ | 22.86 | | | $ | 18.12 | | | $ | 12.67 | | | $ | 19.76 | |
| | | | | | | | | | | | | | | | | | | | | |
| Total Return | | | 16.59 | % | | | 33.23 | % | | | 43.01 | % | | | (22.98 | )% | | | 33.64 | % |
| | | | | | | | | | | | | | | | | | | | | |
| Ratios and Supplemental Data | | | | | | | | | | | | | | | | | | | | |
| Net assets, end of year (in 000s) | | $ | 42,322 | | | $ | 33,666 | | | $ | 29,098 | | | $ | 28,205 | | | $ | 49,979 | |
| | | | | | | | | | | | | | | | | | | | | |
| Ratio of expenses to average net assets | | | | | | | | | | | | | | | | | | | | |
| With fee waivers/reimbursements | | | 1.25 | % | | | 1.25 | % | | | 1.32 | % (d)(e) | | | 1.44 | % (e) | | | 1.44 | % (e) |
| Without fee waivers/reimbursements | | | 1.51 | % | | | 1.69 | % | | | 1.85 | % | | | 1.78 | % | | | 1.75 | % |
| Ratio of net investment income (loss) to average net assets | | | | | | | | | | | | | | | | | | | | |
| With fee waivers/reimbursements | | | (0.88 | )% | | | (0.43 | )% | | | 0.00 | % | | | (0.18 | )% | | | 0.27 | % |
| Without fee waivers/reimbursements | | | (1.14 | )% | | | (0.87 | )% | | | (0.53 | )% | | | (0.52 | )% | | | (0.04 | )% |
| Portfolio turnover rate | | | 56 | % | | | 59 | % | | | 31 | % | | | 57 | % | | | 48 | % |
| (a) | Prior to April 30, 2018 known as the Westcore International Small-Cap Fund. |
| (b) | Calculated using the average shares method. |
| (c) | Less than $0.005 per share. |
| (d) | Contractual expense limitation changed from 1.50% to 1.25% effective May 1, 2019. |
| (e) | For the period April 29, 2016 to April 30, 2019, a voluntary additional expense waiver reduced the ratio of expenses to average net assets from 1.50% to 1.44%. |
| See Notes to Financial Statements. | |
| 122 | | | www.sbhfunds.com |
| Segall Bryant & Hamill | |
| Fundamental International Small Cap Fund | Financial Highlights |
| For a Share Outstanding Throughout the Years Presented |
| | | Year Ended | | | Year Ended | | | Year Ended | | | Year Ended | | | Year Ended | |
| | | December 31, | | | December 31, | | | December 31, | | | December 31, | | | December 31, | |
| Institutional | | 2021 | | | 2020 | | | 2019 | | | 2018(a) | | | 2017 | |
| Net asset value, beginning of year | | $ | 24.50 | | | $ | 19.32 | | | $ | 13.48 | | | $ | 20.83 | | | $ | 15.64 | |
| Income (loss) from investment operations: | | | | | | | | | | | | | | | | | | | | |
| Net investment income (loss)(b) | | | (0.07 | ) | | | (0.06 | ) | | | 0.00 | (c) | | | (0.00 | ) (c) | | | 0.08 | |
| Net realized and unrealized gains (losses) on investments | | | 3.98 | | | | 6.48 | | | | 5.84 | | | | (4.66 | ) | | | 5.22 | |
| Total from investment operations | | | 3.91 | | | | 6.42 | | | | 5.84 | | | | (4.66 | ) | | | 5.30 | |
| | | | | | | | | | | | | | | | | | | | | |
| Less dividends and distributions: | | | | | | | | | | | | | | | | | | | | |
| Dividends from net investment income | | | — | | | | — | | | | — | | | | (0.11 | ) | | | (0.11 | ) |
| Distributions from net realized gains | | | (2.04 | ) | | | (1.24 | ) | | | — | | | | (2.58 | ) | | | — | |
| Total distributions | | | (2.04 | ) | | | (1.24 | ) | | | — | | | | (2.69 | ) | | | (0.11 | ) |
| Net asset value, end of year | | $ | 26.37 | | | $ | 24.50 | | | $ | 19.32 | | | $ | 13.48 | | | $ | 20.83 | |
| | | | | | | | | | | | | | | | | | | | | |
| Total Return | | | 16.70 | % | | | 33.45 | % | | | 43.32 | % | | | (22.90 | )% | | | 33.89 | % |
| | | | | | | | | | | | | | | | | | | | | |
| Ratios and Supplemental Data | | | | | | | | | | | | | | | | | | | | |
| Net assets, end of year (in 000s) | | $ | 50,082 | | | $ | 15,458 | | | $ | 8,446 | | | $ | 20,266 | | | $ | 29,652 | |
| | | | | | | | | | | | | | | | | | | | | |
| Ratio of expenses to average net assets | | | | | | | | | | | | | | | | | | | | |
| With fee waivers/reimbursements | | | 1.10 | % | | | 1.10 | % | | | 1.20 | % (d) | | | 1.29 | % | | | 1.29 | % |
| Without fee waivers/reimbursements | | | 1.36 | % | | | 1.57 | % | | | 1.72 | % | | | 1.62 | % | | | 1.59 | % |
| Ratio of net investment income (loss) to average net assets | | | | | | | | | | | | | | | | | | | | |
| With fee waivers/reimbursements | | | (0.21 | )% | | | (0.31 | )% | | | 0.01 | % | | | (0.02 | )% | | | 0.44 | % |
| Without fee waivers/reimbursements | | | (0.47 | )% | | | (0.78 | )% | | | (0.50 | )% | | | (0.35 | )% | | | 0.14 | % |
| Portfolio turnover rate | | | 56 | % | | | 59 | % | | | 31 | % | | | 57 | % | | | 48 | % |
| (a) | Prior to April 30, 2018 known as the Westcore International Small-Cap Fund. |
| (b) | Calculated using the average shares method. |
| (c) | Less than $0.005 per share. |
| (d) | The contractual expense limitation is 1.10% effective May 1, 2019. |
| See Notes to Financial Statements. | |
| Annual Report | December 31, 2021 | | | 123 |
| Segall Bryant & Hamill Global All Cap Fund | Financial Highlights |
| For a Share Outstanding Throughout the Years Presented |
| | | Year Ended | | | Year Ended | | | Year Ended | | | Year Ended | | | Year Ended | |
| | | December 31, | | | December 31, | | | December 31, | | | December 31, | | | December 31, | |
| Retail | | 2021 | | | 2020(a) | | | 2019 | | | 2018(b) | | | 2017 | |
| Net asset value, beginning of year | | $ | 9.32 | | | $ | 10.98 | | | $ | 9.52 | | | $ | 11.12 | | | $ | 9.79 | |
| Income (loss) from investment operations: | | | | | | | | | | | | | | | | | | | | |
| Net investment income(c) | | | 0.02 | | | | 0.18 | | | | 0.23 | | | | 0.20 | | | | 0.19 | |
| Net realized and unrealized gains (losses) on investments | | | 2.36 | | | | 0.08 | (d) | | | 2.16 | | | | (1.16 | ) | | | 1.70 | |
| Total from investment operations | | | 2.38 | | | | 0.26 | | | | 2.39 | | | | (0.96 | ) | | | 1.89 | |
| | | | | | | | | | | | | | | | | | | | | |
| Less dividends and distributions: | | | | | | | | | | | | | | | | | | | | |
| Dividends from net investment income | | | (0.04 | ) | | | (0.18 | ) | | | (0.25 | ) | | | (0.19 | ) | | | (0.18 | ) |
| Distributions from net realized gains | | | (0.64 | ) | | | (1.74 | ) | | | (0.68 | ) | | | (0.45 | ) | | | (0.38 | ) |
| Total distributions | | | (0.68 | ) | | | (1.92 | ) | | | (0.93 | ) | | | (0.64 | ) | | | (0.56 | ) |
| Net asset value, end of year | | $ | 11.02 | | | $ | 9.32 | | | $ | 10.98 | | | $ | 9.52 | | | $ | 11.12 | |
| | | | | | | | | | | | | | | | | | | | | |
| Total Return | | | 25.83 | % | | | 2.95 | % | | | 25.36 | % | | | (8.70 | )% | | | 19.56 | % |
| | | | | | | | | | | | | | | | | | | | | |
| Ratios and Supplemental Data | | | | | | | | | | | | | | | | | | | | |
| Net assets, end of year (in 000s) | | $ | 33,821 | | | $ | 32,224 | | | $ | 46,375 | | | $ | 41,887 | | | $ | 50,894 | |
| | | | | | | | | | | | | | | | | | | | | |
| Ratio of expenses to average net assets | | | | | | | | | | | | | | | | | | | | |
| With fee waivers/reimbursements | | | 0.89 | % | | | 0.89 | % | | | 0.89 | % | | | 0.99 | % (e) | | | 0.99 | % |
| Without fee waivers/reimbursements | | | 1.18 | % | | | 1.29 | % | | | 1.22 | % | | | 1.22 | % | | | 1.20 | % |
| Ratio of net investment income (loss) to average net assets | | | | | | | | | | | | | | | | | | | | |
| With fee waivers/reimbursements | | | 0.16 | % | | | 1.83 | % | | | 2.14 | % | | | 1.88 | % | | | 1.83 | % |
| Without fee waivers/reimbursements | | | (0.13 | )% | | | 1.43 | % | | | 1.81 | % | | | 1.65 | % | | | 1.62 | % |
| Portfolio turnover rate | | | 24 | % | | | 132 | % | | | 40 | % | | | 59 | % | | | 17 | % |
| (a) | Prior to September 19, 2020 known as the Segall Bryant & Hamill Global Large Cap Fund. |
| (b) | Prior to April 30, 2018 known as the Westcore Global Large-Cap Dividend Fund. |
| (c) | Calculated using the average shares method. |
| (d) | Represents a balancing figure derived from other amounts in the financial highlights table that captures all other changes affecting the net asset value per share. This per share amount does not correlate to the aggregate of the net realized and unrealized losses on the Statement of Operations for the same period. |
| (e) | Contractual expense limitation changed from 0.99% to 0.89% effective December 20, 2018. |
| See Notes to Financial Statements. | |
| 124 | | | www.sbhfunds.com |
| Segall Bryant & Hamill Global All Cap Fund | Financial Highlights |
| For a Share Outstanding Throughout the Years Presented |
| | | Year Ended | | | Year Ended | | | Year Ended | | | Year Ended | | | Year Ended | |
| | | December 31, | | | December 31, | | | December 31, | | | December 31, | | | December 31, | |
| Institutional | | 2021 | | | 2020(a) | | | 2019 | | | 2018(b) | | | 2017 | |
| Net asset value, beginning of year | | $ | 9.20 | | | $ | 10.86 | | | $ | 9.43 | | | $ | 11.04 | | | $ | 9.71 | |
| Income (loss) from investment operations: | | | | | | | | | | | | | | | | | | | | |
| Net investment income(c) | | | 0.03 | | | | 0.18 | | | | 0.24 | | | | 0.23 | | | | 0.20 | |
| Net realized and unrealized gains (losses) on investments | | | 2.33 | | | | 0.09 | (d) | | | 2.14 | | | | (1.16 | ) | | | 1.70 | |
| Total from investment operations | | | 2.36 | | | | 0.27 | | | | 2.38 | | | | (0.93 | ) | | | 1.90 | |
| | | | | | | | | | | | | | | | | | | | | |
| Less dividends and distributions: | | | | | | | | | | | | | | | | | | | | |
| Dividends from net investment income | | | (0.06 | ) | | | (0.19 | ) | | | (0.27 | ) | | | (0.23 | ) | | | (0.19 | ) |
| Distributions from net realized gains | | | (0.64 | ) | | | (1.74 | ) | | | (0.68 | ) | | | (0.45 | ) | | | (0.38 | ) |
| Total distributions | | | (0.70 | ) | | | (1.93 | ) | | | (0.95 | ) | | | (0.68 | ) | | | (0.57 | ) |
| Net asset value, end of year | | $ | 10.86 | | | $ | 9.20 | | | $ | 10.86 | | | $ | 9.43 | | | $ | 11.04 | |
| | | | | | | | | | | | | | | | | | | | | |
| Total Return | | | 25.94 | % | | | 3.04 | % | | | 25.55 | % | | | (8.53 | )% | | | 19.78 | % |
| | | | | | | | | | | | | | | | | | | | | |
| Ratios and Supplemental Data | | | | | | | | | | | | | | | | | | | | |
| Net assets, end of year (in 000s) | | $ | 4,875 | | | $ | 3,373 | | | $ | 2,730 | | | $ | 2,589 | | | $ | 5,148 | |
| | | | | | | | | | | | | | | | | | | | | |
| Ratio of expenses to average net assets | | | | | | | | | | | | | | | | | | | | |
| With fee waivers/reimbursements | | | 0.74 | % | | | 0.74 | % | | | 0.74 | % | | | 0.84 | % (e) | | | 0.90 | % |
| Without fee waivers/reimbursements | | | 1.17 | % | | | 1.20 | % | | | 1.12 | % | | | 1.09 | % | | | 1.09 | % |
| Ratio of net investment income (loss) to average net assets | | | | | | | | | | | | | | | | | | | | |
| With fee waivers/reimbursements | | | 0.29 | % | | | 1.83 | % | | | 2.32 | % | | | 2.11 | % | | | 1.91 | % |
| Without fee waivers/reimbursements | | | (0.14 | )% | | | 1.37 | % | | | 1.94 | % | | | 1.86 | % | | | 1.72 | % |
| Portfolio turnover rate | | | 24 | % | | | 132 | % | | | 40 | % | | | 59 | % | | | 17 | % |
| (a) | Prior to September 19, 2020 known as the Segall Bryant & Hamill Global Large Cap Fund. |
| (b) | Prior to April 30, 2018 known as the Westcore Global Large-Cap Dividend Fund. |
| (c) | Calculated using the average shares method. |
| (d) | Represents a balancing figure derived from other amounts in the financial highlights table that captures all other changes affecting the net asset value per share. This per share amount does not correlate to the aggregate of the net realized and unrealized losses on the Statement of Operations for the same period. |
| (e) | Contractual expense limitation changed from 0.84% to 0.74% effective December 20, 2018. |
| See Notes to Financial Statements. | |
| Annual Report | December 31, 2021 | | | 125 |
| Segall Bryant & Hamill Workplace Equality Fund | Financial Highlights |
| For a Share Outstanding Throughout the Years Presented |
| | | Year Ended | | | Year Ended | | | Year Ended | | | Year Ended | | | Year Ended | |
| | | December 31, | | | December 31, | | | December 31, | | | December 31, | | | December 31, | |
| Retail | | 2021 | | | 2020 | | | 2019(a) | | | 2018(b) | | | 2017 | |
| Net asset value, beginning of year | | $ | 6.72 | | | $ | 6.45 | | | $ | 5.41 | | | $ | 6.01 | | | $ | 6.38 | |
| Income (loss) from investment operations: | | | | | | | | | | | | | | | | | | | | |
| Net investment income(c) | | | 0.01 | | | | 0.07 | | | | 0.12 | | | | 0.11 | | | | 0.12 | |
| Net realized and unrealized gains (losses) on investments | | | 1.72 | | | | 0.35 | | | | 1.33 | | | | (0.18 | ) | | | 0.93 | |
| Total from investment operations | | | 1.73 | | | | 0.42 | | | | 1.45 | | | | (0.07 | ) | | | 1.05 | |
| | | | | | | | | | | | | | | | | | | | | |
| Less dividends and distributions: | | | | | | | | | | | | | | | | | | | | |
| Dividends from net investment income | | | (0.00 | ) (d) | | | (0.08 | ) | | | (0.11 | ) | | | (0.21 | ) | | | (0.21 | ) |
| Distributions from net realized gains | | | (0.58 | ) | | | (0.07 | ) | | | (0.30 | ) | | | (0.32 | ) | | | (1.21 | ) |
| Total distributions | | | (0.58 | ) | | | (0.15 | ) | | | (0.41 | ) | | | (0.53 | ) | | | (1.42 | ) |
| Net asset value, end of year | | $ | 7.87 | | | $ | 6.72 | | | $ | 6.45 | | | $ | 5.41 | | | $ | 6.01 | |
| | | | | | | | | | | | | | | | | | | | | |
| Total Return | | | 26.18 | % | | | 6.81 | % | | | 26.85 | % | | | (1.36 | )% | | | 16.73 | % |
| | | | | | | | | | | | | | | | | | | | | |
| Ratios and Supplemental Data | | | | | | | | | | | | | | | | | | | | |
| Net assets, end of year (in 000s) | | $ | 11,707 | | | $ | 9,397 | | | $ | 9,846 | | | $ | 8,131 | | | $ | 10,022 | |
| | | | | | | | | | | | | | | | | | | | | |
| Ratio of expenses to average net assets | | | | | | | | | | | | | | | | | | | | |
| With fee waivers/reimbursements | | | 0.89 | % | | | 0.89 | % | | | 0.89 | % | | | 0.89 | % | | | 0.98 | % (e) |
| Without fee waivers/reimbursements | | | 1.28 | % | | | 1.53 | % | | | 1.57 | % | | | 1.86 | % | | | 1.76 | % |
| Ratio of net investment income (loss) to average net assets | | | | | | | | | | | | | | | | | | | | |
| With fee waivers/reimbursements | | | 0.07 | % | | | 1.19 | % | | | 1.92 | % | | | 1.85 | % | | | 1.82 | % |
| Without fee waivers/reimbursements | | | (0.32 | )% | | | 0.55 | % | | | 1.24 | % | | | 0.88 | % | | | 1.04 | % |
| Portfolio turnover rate | | | 49 | % | | | 97 | % | | | 41 | % | | | 43 | % | | | 0 | % |
| (a) | Prior to May 1, 2019 known as the Segall Bryant & Hamill Large Cap Dividend Fund. |
| (b) | Prior to April 30, 2018 known as the Westcore Large-Cap Dividend Fund. |
| (c) | Calculated using the average shares method. |
| (d) | Less than $0.005 per share. |
| (e) | Contractual expense limitation changed from 1.15% to 0.89% effective April 30, 2017. |
| See Notes to Financial Statements. | |
| 126 | | | www.sbhfunds.com |
| Segall Bryant & Hamill Workplace Equality Fund | Financial Highlights |
| For a Share Outstanding Throughout the Years Presented |
| | | Year Ended | | | Year Ended | | | Year Ended | | | Year Ended | | | Year Ended | |
| | | December 31, | | | December 31, | | | December 31, | | | December 31, | | | December 31, | |
| Institutional | | 2021 | | | 2020 | | | 2019(a) | | | 2018(b) | | | 2017 | |
| Net asset value, beginning of year | | $ | 6.93 | | | $ | 6.64 | | | $ | 5.55 | | | $ | 6.12 | | | $ | 6.61 | |
| Income (loss) from investment operations: | | | | | | | | | | | | | | | | | | | | |
| Net investment income(c) | | | 0.02 | | | | 0.08 | | | | 0.14 | | | | 0.13 | | | | 0.13 | |
| Net realized and unrealized gains (losses) on investments | | | 1.77 | | | | 0.36 | | | | 1.37 | | | | (0.20 | ) | | | 0.97 | |
| Total from investment operations | | | 1.79 | | | | 0.44 | | | | 1.51 | | | | (0.07 | ) | | | 1.10 | |
| | | | | | | | | | | | | | | | | | | | | |
| Less dividends and distributions: | | | | | | | | | | | | | | | | | | | | |
| Dividends from net investment income | | | (0.02 | ) | | | (0.08 | ) | | | (0.12 | ) | | | (0.18 | ) | | | (0.38 | ) |
| Distributions from net realized gains | | | (0.58 | ) | | | (0.07 | ) | | | (0.30 | ) | | | (0.32 | ) | | | (1.21 | ) |
| Total distributions | | | (0.60 | ) | | | (0.15 | ) | | | (0.42 | ) | | | (0.50 | ) | | | (1.59 | ) |
| Net asset value, end of year | | $ | 8.12 | | | $ | 6.93 | | | $ | 6.64 | | | $ | 5.55 | | | $ | 6.12 | |
| | | | | | | | | | | | | | | | | | | | | |
| Total Return | | | 26.14 | % | | | 6.98 | % | | | 27.22 | % | | | (1.25 | )% | | | 16.92 | % |
| | | | | | | | | | | | | | | | | | | | | |
| Ratios and Supplemental Data | | | | | | | | | | | | | | | | | | | | |
| Net assets, end of year (in 000s) | | $ | 17,845 | | | $ | 11,299 | | | $ | 8,339 | | | $ | 298 | | | $ | 155 | |
| | | | | | | | | | | | | | | | | | | | | |
| Ratio of expenses to average net assets | | | | | | | | | | | | | | | | | | | | |
| With fee waivers/reimbursements | | | 0.74 | % | | | 0.74 | % | | | 0.74 | % | | | 0.74 | % | | | 0.92 | % |
| Without fee waivers/reimbursements | | | 1.26 | % | | | 1.54 | % | | | 1.41 | % | | | 1.76 | % | | | 1.61 | % |
| Ratio of net investment income (loss) to average net assets | | | | | | | | | | | | | | | | | | | | |
| With fee waivers/reimbursements | | | 0.22 | % | | | 1.26 | % | | | 2.11 | % | | | 2.11 | % | | | 1.82 | % |
| Without fee waivers/reimbursements | | | (0.30 | )% | | | 0.46 | % | | | 1.44 | % | | | 1.09 | % | | | 1.13 | % |
| Portfolio turnover rate | | | 49 | % | | | 97 | % | | | 41 | % | | | 43 | % | | | 0 | % |
| (a) | Prior to April 30, 2019 known as the Segall Bryant & Hamill Large Cap Dividend Fund. |
| (b) | Prior to April 30, 2018 known as the Westcore Large-Cap Dividend Fund. |
| (c) | Calculated using the average shares method. |
| See Notes to Financial Statements. | |
| Annual Report | December 31, 2021 | | | 127 |
| Segall Bryant & Hamill Short Term Plus Fund | Financial Highlights |
| For a Share Outstanding Throughout the Periods Presented |
| | | Year Ended | | | Year Ended | | | Year Ended | | | Period Ended | |
| | | December 31, | | | December 31, | | | December 31, | | | December 31, | |
| Retail | | 2021 | | | 2020 | | | 2019 | | | 2018(a) | |
| Net asset value, beginning of period | | $ | 10.15 | | | $ | 10.11 | | | $ | 10.02 | | | $ | 10.00 | |
| Income (loss) from investment operations: | | | | | | | | | | | | | | | | |
| Net investment income(b) | | | 0.05 | | | | 0.12 | | | | 0.25 | | | | 0.01 | |
| Net realized and unrealized gains (losses) on investments | | | (0.08 | ) | | | 0.08 | | | | 0.10 | | | | 0.01 | |
| Total from investment operations | | | (0.03 | ) | | | 0.20 | | | | 0.35 | | | | 0.02 | |
| | | | | | | | | | | | | | | | | |
| Less dividends and distributions: | | | | | | | | | | | | | | | | |
| Dividends from net investment income | | | (0.06 | ) | | | (0.15 | ) | | | (0.26 | ) | | | — | |
| Distributions from net realized gains | | | (0.01 | ) | | | (0.01 | ) | | | (0.00 | ) (c) | | | — | |
| Total distributions | | | (0.07 | ) | | | (0.16 | ) | | | (0.26 | ) | | | — | |
| Net asset value, end of period | | $ | 10.05 | | | $ | 10.15 | | | $ | 10.11 | | | $ | 10.02 | |
| | | | | | | | | | | | | | | | | |
| Total Return | | | (0.23 | )% | | | 2.05 | % | | | 3.57 | % | | | 0.20 | % (d) |
| | | | | | | | | | | | | | | | | |
| Ratios and Supplemental Data | | | | | | | | | | | | | | | | |
| Net assets, end of period (in 000s) | | $ | 11,896 | | | $ | 2,989 | | | $ | 915 | | | $ | 200 | |
| | | | | | | | | | | | | | | | | |
| Ratio of expenses to average net assets | | | | | | | | | | | | | | | | |
| With fee waivers/reimbursements | | | 0.49 | % | | | 0.49 | % | | | 0.49 | % | | | 0.49 | % (e) |
| Without fee waivers/reimbursements | | | 0.80 | % | | | 1.18 | % | | | 4.13 | % | | | 9.96 | % (e)(f) |
| Ratio of net investment income (loss) to average net assets | | | | | | | | | | | | | | | | |
| With fee waivers/reimbursements | | | 0.45 | % | | | 1.23 | % | | | 2.50 | % | | | 2.39 | % (e) |
| Without fee waivers/reimbursements | | | 0.14 | % | | | 0.54 | % | | | (1.14 | )% | | | (7.08 | )% (e)(f) |
| Portfolio turnover rate | | | 46 | % | | | 47 | % | | | 32 | % | | | 0 | % (d) |
| (a) | Commenced operations on December 17, 2018. |
| (b) | Calculated using the average shares method. |
| (c) | Less than $0.005 per share. |
| (d) | Total return and portfolio turnover are not annualized for periods less than one full year. |
| (f) | Ratios before fee waivers for start up periods may not be representative of long term operating results. For the purpose of the ratio, audit and tax preparation fees have not been annualized. |
| See Notes to Financial Statements. | |
| 128 | | | www.sbhfunds.com |
| Segall Bryant & Hamill Short Term Plus Fund | Financial Highlights |
| For a Share Outstanding Throughout the Periods Presented |
| | | Year Ended | | | Year Ended | | | Year Ended | | | Period Ended | |
| | | December 31, | | | December 31, | | | December 31, | | | December 31, | |
| Institutional | | 2021 | | | 2020 | | | 2019 | | | 2018(a) | |
| Net asset value, beginning of period | | $ | 10.16 | | | $ | 10.11 | | | $ | 10.02 | | | $ | 10.00 | |
| Income (loss) from investment operations: | | | | | | | | | | | | | | | | |
| Net investment income(b) | | | 0.06 | | | | 0.13 | | | | 0.26 | | | | 0.01 | |
| Net realized and unrealized gains (losses) on investments | | | (0.07 | ) | | | 0.09 | | | | 0.09 | | | | 0.01 | |
| Total from investment operations | | | (0.01 | ) | | | 0.22 | | | | 0.35 | | | | 0.02 | |
| | | | | | | | | | | | | | | | | |
| Less dividends and distributions: | | | | | | | | | | | | | | | | |
| Dividends from net investment income | | | (0.07 | ) | | | (0.16 | ) | | | (0.26 | ) | | | — | |
| Distributions from net realized gains | | | (0.01 | ) | | | (0.01 | ) | | | (0.00 | ) (c) | | | — | |
| Total distributions | | | (0.08 | ) | | | (0.17 | ) | | | (0.26 | ) | | | — | |
| Net asset value, end of period | | $ | 10.07 | | | $ | 10.16 | | | $ | 10.11 | | | $ | 10.02 | |
| | | | | | | | | | | | | | | | | |
| Total Return | | | (0.05 | )% | | | 2.18 | % | | | 3.62 | % | | | 0.20 | % (d) |
| | | | | | | | | | | | | | | | | |
| Ratios and Supplemental Data | | | | | | | | | | | | | | | | |
| Net assets, end of period (in 000s) | | $ | 40,054 | | | $ | 23,568 | | | $ | 6,279 | | | $ | 1,002 | |
| | | | | | | | | | | | | | | | | |
| Ratio of expenses to average net assets | | | | | | | | | | | | | | | | |
| With fee waivers/reimbursements | | | 0.40 | % | | | 0.40 | % | | | 0.40 | % | | | 0.40 | % (e) |
| Without fee waivers/reimbursements | | | 0.68 | % | | | 1.03 | % | | | 3.68 | % | | | 9.74 | % (e)(f) |
| Ratio of net investment income (loss) to average net assets | | | | | | | | | | | | | | | | |
| With fee waivers/reimbursements | | | 0.55 | % | | | 1.32 | % | | | 2.53 | % | | | 2.48 | % (e) |
| Without fee waivers/reimbursements | | | 0.27 | % | | | 0.69 | % | | | (0.75 | )% | | | (6.86 | )% (e)(f) |
| Portfolio turnover rate | | | 46 | % | | | 47 | % | | | 32 | % | | | 0 | % (d) |
| (a) | Commenced operations on December 17, 2018. |
| (b) | Calculated using the average shares method. |
| (c) | Less than $0.005 per share. |
| (d) | Total return and portfolio turnover are not annualized for periods less than one full year. |
| (f) | Ratios before fee waivers for start up periods may not be representative of long-term operating results. For the purpose of the ratio, audit and tax preparation fees have not been annualized. |
| See Notes to Financial Statements. | |
| Annual Report | December 31, 2021 | | | 129 |
| Segall Bryant & Hamill Plus Bond Fund | Financial Highlights |
| For a Share Outstanding Throughout the Years Presented |
| | | Year Ended | | | Year Ended | | | Year Ended | | | Year Ended | | | Year Ended | |
| | | December 31, | | | December 31, | | | December 31, | | | December 31, | | | December 31, | |
| Retail | | 2021 | | | 2020 | | | 2019 | | | 2018(a) | | | 2017 | |
| Net asset value, beginning of year | | $ | 11.25 | | | $ | 10.79 | | | $ | 10.32 | | | $ | 10.71 | | | $ | 10.59 | |
| Income (loss) from investment operations: | | | | | | | | | | | | | | | | | | | | |
| Net investment income(b) | | | 0.23 | | | | 0.27 | | | | 0.33 | | | | 0.33 | | | | 0.34 | |
| Net realized and unrealized gains (losses) on investments | | | (0.30 | ) | | | 0.64 | | | | 0.57 | | | | (0.36 | ) | | | 0.16 | |
| Total from investment operations | | | (0.07 | ) | | | 0.91 | | | | 0.90 | | | | (0.03 | ) | | | 0.50 | |
| | | | | | | | | | | | | | | | | | | | | |
| Less dividends and distributions: | | | | | | | | | | | | | | | | | | | | |
| Dividends from net investment income | | | (0.26 | ) | | | (0.30 | ) | | | (0.36 | ) | | | (0.34 | ) | | | (0.37 | ) |
| Distributions from net realized gains | | | (0.07 | ) | | | (0.15 | ) | | | (0.07 | ) | | | (0.02 | ) | | | (0.01 | ) |
| Total distributions | | | (0.33 | ) | | | (0.45 | ) | | | (0.43 | ) | | | (0.36 | ) | | | (0.38 | ) |
| Net asset value, end of year | | $ | 10.85 | | | $ | 11.25 | | | $ | 10.79 | | | $ | 10.32 | | | $ | 10.71 | |
| | | | | | | | | | | | | | | | | | | | | |
| Total Return | | | (0.58 | )% | | | 8.49 | % | | | 8.79 | % | | | (0.18 | )% | | | 4.74 | % |
| | | | | | | | | | | | | | | | | | | | | |
| Ratios and Supplemental Data | | | | | | | | | | | | | | | | | | | | |
| Net assets, end of year (in 000s) | | $ | 466,063 | | | $ | 594,559 | | | $ | 598,220 | | | $ | 915,824 | | | $ | 1,056,835 | |
| | | | | | | | | | | | | | | | | | | | | |
| Ratio of expenses to average net assets | | | | | | | | | | | | | | | | | | | | |
| With fee waivers/reimbursements | | | 0.55 | % | | | 0.55 | % | | | 0.55 | % | | | 0.55 | % | | | 0.55 | % |
| Without fee waivers/reimbursements | | | 0.67 | % | | | 0.68 | % | | | 0.73 | % | | | 0.76 | % | | | 0.77 | % |
| Ratio of net investment income to average net assets | | | | | | | | | | | | | | | | | | | | |
| With fee waivers/reimbursements | | | 2.10 | % | | | 2.38 | % | | | 3.04 | % | | | 3.17 | % | | | 3.15 | % |
| Without fee waivers/reimbursements | | | 1.98 | % | | | 2.25 | % | | | 2.86 | % | | | 2.96 | % | | | 2.93 | % |
| Portfolio turnover rate | | | 54 | % | | | 59 | % | | | 52 | % | | | 59 | % | | | 38 | % |
| (a) | Prior to April 30, 2018 known as the Westcore Plus Bond Fund. |
| (b) | Calculated using the average shares method. |
| See Notes to Financial Statements. | |
| 130 | | | www.sbhfunds.com |
| Segall Bryant & Hamill Plus Bond Fund | Financial Highlights |
| For a Share Outstanding Throughout the Years Presented |
| | | Year Ended | | | Year Ended | | | Year Ended | | | Year Ended | | | Year Ended | |
| | | December 31, | | | December 31, | | | December 31, | | | December 31, | | | December 31, | |
| Institutional | | 2021 | | | 2020 | | | 2019 | | | 2018(a) | | | 2017 | |
| Net asset value, beginning of year | | $ | 11.14 | | | $ | 10.69 | | | $ | 10.23 | | | $ | 10.60 | | | $ | 10.48 | |
| Income (loss) from investment operations: | | | | | | | | | | | | | | | | | | | | |
| Net investment income(b) | | | 0.25 | | | | 0.28 | | | | 0.34 | | | | 0.34 | | | | 0.35 | |
| Net realized and unrealized gains (losses) on investments | | | (0.30 | ) | | | 0.64 | | | | 0.56 | | | | (0.34 | ) | | | 0.15 | |
| Total from investment operations | | | (0.05 | ) | | | 0.92 | | | | 0.90 | | | | 0.00 | (c) | | | 0.50 | |
| | | | | | | | | | | | | | | | | | | | | |
| Less dividends and distributions: | | | | | | | | | | | | | | | | | | | | |
| Dividends from net investment income | | | (0.28 | ) | | | (0.32 | ) | | | (0.37 | ) | | | (0.35 | ) | | | (0.37 | ) |
| Distributions from net realized gains | | | (0.07 | ) | | | (0.15 | ) | | | (0.07 | ) | | | (0.02 | ) | | | (0.01 | ) |
| Total distributions | | | (0.35 | ) | | | (0.47 | ) | | | (0.44 | ) | | | (0.37 | ) | | | (0.38 | ) |
| Net asset value, end of year | | $ | 10.74 | | | $ | 11.14 | | | $ | 10.69 | | | $ | 10.23 | | | $ | 10.60 | |
| | | | | | | | | | | | | | | | | | | | | |
| Total Return | | | (0.44 | )% | | | 8.65 | % | | | 8.90 | % | | | 0.06 | % | | | 4.81 | % |
| | | | | | | | | | | | | | | | | | | | | |
| Ratios and Supplemental Data | | | | | | | | | | | | | | | | | | | | |
| Net assets, end of year (in 000s) | | $ | 589,074 | | | $ | 525,992 | | | $ | 427,395 | | | $ | 307,253 | | | $ | 229,912 | |
| | | | | | | | | | | | | | | | | | | | | |
| Ratio of expenses to average net assets | | | | | | | | | | | | | | | | | | | | |
| With fee waivers/reimbursements | | | 0.40 | % | | | 0.40 | % | | | 0.40 | % | | | 0.40 | % | | | 0.40 | % |
| Without fee waivers/reimbursements | | | 0.51 | % | | | 0.51 | % | | | 0.55 | % | | | 0.56 | % | | | 0.56 | % |
| Ratio of net investment income to average net assets | | | | | | | | | | | | | | | | | | | | |
| With fee waivers/reimbursements | | | 2.24 | % | | | 2.53 | % | | | 3.14 | % | | | 3.33 | % | | | 3.29 | % |
| Without fee waivers/reimbursements | | | 2.13 | % | | | 2.42 | % | | | 2.99 | % | | | 3.17 | % | | | 3.13 | % |
| Portfolio turnover rate | | | 54 | % | | | 59 | % | | | 52 | % | | | 59 | % | | | 38 | % |
| (a) | Prior to April 30, 2018 known as the Westcore Plus Bond Fund. |
| (b) | Calculated using the average shares method. |
| (c) | Less than $0.005 per share. |
| See Notes to Financial Statements. | |
| Annual Report | December 31, 2021 | | | 131 |
| Segall Bryant & Hamill Quality High Yield Fund | Financial Highlights |
| For a Share Outstanding Throughout the Years Presented |
| | | Year Ended | | | Year Ended | | | Year Ended | | | Year Ended | | | Year Ended | |
| | | December 31, | | | December 31, | | | December 31, | | | December 31, | | | December 31, | |
| Retail | | 2021 | | | 2020 | | | 2019 | | | 2018(a) | | | 2017 | |
| Net asset value, beginning of year | | $ | 9.24 | | | $ | 8.97 | | | $ | 8.40 | | | $ | 8.99 | | | $ | 8.86 | |
| Income (loss) from investment operations: | | | | | | | | | | | | | | | | | | | | |
| Net investment income(b) | | | 0.30 | | | | 0.34 | | | | 0.43 | | | | 0.40 | | | | 0.41 | |
| Net realized and unrealized gains (losses) on investments | | | (0.01 | ) | | | 0.29 | | | | 0.58 | | | | (0.59 | ) | | | 0.13 | |
| Total from investment operations | | | 0.29 | | | | 0.63 | | | | 1.01 | | | | (0.19 | ) | | | 0.54 | |
| | | | | | | | | | | | | | | | | | | | | |
| Less dividends and distributions: | | | | | | | | | | | | | | | | | | | | |
| Dividends from net investment income | | | (0.32 | ) | | | (0.36 | ) | | | (0.44 | ) | | | (0.40 | ) | | | (0.41 | ) |
| Net asset value, end of year | | $ | 9.21 | | | $ | 9.24 | | | $ | 8.97 | | | $ | 8.40 | | | $ | 8.99 | |
| | | | | | | | | | | | | | | | | | | | | |
| Total Return | | | 3.14 | % | | | 7.31 | % | | | 12.21 | % | | | (2.19 | )% | | | 6.18 | % |
| | | | | | | | | | | | | | | | | | | | | |
| Ratios and Supplemental Data | | | | | | | | | | | | | | | | | | | | |
| Net assets, end of year (in 000s) | | $ | 39,879 | | | $ | 42,227 | | | $ | 39,692 | | | $ | 43,045 | | | $ | 58,486 | |
| | | | | | | | | | | | | | | | | | | | | |
| Ratio of expenses to average net assets | | | | | | | | | | | | | | | | | | | | |
| With fee waivers/reimbursements | | | 0.85 | % | | | 0.85 | % | | | 0.85 | % | | | 0.85 | % | | | 0.85 | % |
| Without fee waivers/reimbursements | | | 0.88 | % | | | 0.95 | % | | | 0.98 | % | | | 0.99 | % | | | 0.98 | % |
| Ratio of net investment income to average net assets | | | | | | | | | | | | | | | | | | | | |
| With fee waivers/reimbursements | | | 3.30 | % | | | 3.84 | % | | | 4.86 | % | | | 4.52 | % | | | 4.52 | % |
| Without fee waivers/reimbursements | | | 3.27 | % | | | 3.74 | % | | | 4.73 | % | | | 4.38 | % | | | 4.39 | % |
| Portfolio turnover rate | | | 25 | % | | | 57 | % | | | 41 | % | | | 21 | % | | | 37 | % |
| (a) | Prior to April 30, 2018 known as the Westcore Flexible Income Fund. |
| (b) | Calculated using the average shares method. |
| See Notes to Financial Statements. | |
| 132 | | | www.sbhfunds.com |
| Segall Bryant & Hamill Quality High Yield Fund | Financial Highlights |
| For a Share Outstanding Throughout the Years Presented |
| | | Year Ended | | | Year Ended | | | Year Ended | | | Year Ended | | | Year Ended | |
| | | December 31, | | | December 31, | | | December 31, | | | December 31, | | | December 31, | |
| Institutional | | 2021 | | | 2020 | | | 2019 | | | 2018(a) | | | 2017 | |
| Net asset value, beginning of year | | $ | 9.13 | | | $ | 8.87 | | | $ | 8.29 | | | $ | 8.88 | | | $ | 8.75 | |
| Income (loss) from investment operations: | | | | | | | | | | | | | | | | | | | | |
| Net investment income(b) | | | 0.32 | | | | 0.35 | | | | 0.44 | | | | 0.40 | | | | 0.42 | |
| Net realized and unrealized gains (losses) on investments | | | (0.02 | ) | | | 0.28 | | | | 0.57 | | | | (0.58 | ) | | | 0.13 | |
| Total from investment operations | | | 0.30 | | | | 0.63 | | | | 1.01 | | | | (0.18 | ) | | | 0.55 | |
| | | | | | | | | | | | | | | | | | | | | |
| Less dividends and distributions: | | | | | | | | | | | | | | | | | | | | |
| Dividends from net investment income | | | (0.33 | ) | | | (0.37 | ) | | | (0.43 | ) | | | (0.41 | ) | | | (0.42 | ) |
| Net asset value, end of year | | $ | 9.10 | | | $ | 9.13 | | | $ | 8.87 | | | $ | 8.29 | | | $ | 8.88 | |
| | | | | | | | | | | | | | | | | | | | | |
| Total Return | | | 3.33 | % | | | 7.40 | % | | | 12.40 | % | | | (2.12 | )% | | | 6.35 | % |
| | | | | | | | | | | | | | | | | | | | | |
| Ratios and Supplemental Data | | | | | | | | | | | | | | | | | | | | |
| Net assets, end of year (in 000s) | | $ | 62,127 | | | $ | 40,912 | | | $ | 21,680 | | | $ | 12,962 | | | $ | 20,734 | |
| | | | | | | | | | | | | | | | | | | | | |
| Ratio of expenses to average net assets | | | | | | | | | | | | | | | | | | | | |
| With fee waivers/reimbursements | | | 0.70 | % | | | 0.70 | % | | | 0.70 | % | | | 0.69 | % | | | 0.68 | % |
| Without fee waivers/reimbursements | | | 0.76 | % | | | 0.82 | % | | | 0.83 | % | | | 0.81 | % | | | 0.78 | % |
| Ratio of net investment income to average net assets | | | | | | | | | | | | | | | | | | | | |
| With fee waivers/reimbursements | | | 3.43 | % | | | 3.99 | % | | | 4.99 | % | | | 4.68 | % | | | 4.67 | % |
| Without fee waivers/reimbursements | | | 3.37 | % | | | 3.87 | % | | | 4.86 | % | | | 4.56 | % | | | 4.57 | % |
| Portfolio turnover rate | | | 25 | % | | | 57 | % | | | 41 | % | | | 21 | % | | | 37 | % |
| (a) | Prior to April 30, 2018 known as the Westcore Flexible Income Fund. |
| (b) | Calculated using the average shares method. |
| See Notes to Financial Statements. | |
| Annual Report | December 31, 2021 | | | 133 |
| Segall Bryant & Hamill Municipal Opportunities Fund | Financial Highlights |
| For a Share Outstanding Throughout the Years Presented |
| | | Year Ended | | | Year Ended | | | Year Ended | | | Year Ended | | | Year Ended | |
| | | December 31, | | | December 31, | | | December 31, | | | December 31, | | | December 31, | |
| Retail | | 2021 | | | 2020 | | | 2019 | | | 2018(a) | | | 2017 | |
| Net asset value, beginning of year | | $ | 11.01 | | | $ | 10.67 | | | $ | 10.38 | | | $ | 10.61 | | | $ | 10.15 | |
| Income (loss) from investment operations: | | | | | | | | | | | | | | | | | | | | |
| Net investment income(b) | | | 0.18 | | | | 0.24 | | | | 0.29 | | | | 0.35 | | | | 0.32 | |
| Net realized and unrealized gains (losses) on investments | | | 0.12 | | | | 0.44 | | | | 0.43 | | | | (0.23 | ) | | | 0.53 | |
| Total from investment operations | | | 0.30 | | | | 0.68 | | | | 0.72 | | | | 0.12 | | | | 0.85 | |
| | | | | | | | | | | | | | | | | | | | | |
| Less dividends and distributions: | | | | | | | | | | | | | | | | | | | | |
| Dividends from net investment income | | | (0.27 | ) | | | (0.30 | ) | | | (0.35 | ) | | | (0.34 | ) | | | (0.31 | ) |
| Distributions from net realized gains | | | (0.02 | ) | | | (0.04 | ) | | | (0.08 | ) | | | (0.01 | ) | | | (0.08 | ) |
| Total distributions | | | (0.29 | ) | | | (0.34 | ) | | | (0.43 | ) | | | (0.35 | ) | | | (0.39 | ) |
| Net asset value, end of year | | $ | 11.02 | | | $ | 11.01 | | | $ | 10.67 | | | $ | 10.38 | | | $ | 10.61 | |
| | | | | | | | | | | | | | | | | | | | | |
| Total Return | | | 2.72 | % | | | 6.54 | % | | | 7.00 | % | | | 1.23 | % | | | 8.44 | % |
| | | | | | | | | | | | | | | | | | | | | |
| Ratios and Supplemental Data | | | | | | | | | | | | | | | | | | | | |
| Net assets, end of year (in 000s) | | $ | 42,056 | | | $ | 28,344 | | | $ | 11,399 | | | $ | 6,405 | | | $ | 2,709 | |
| | | | | | | | | | | | | | | | | | | | | |
| Ratio of expenses to average net assets | | | | | | | | | | | | | | | | | | | | |
| With fee waivers/reimbursements | | | 0.65 | % | | | 0.65 | % | | | 0.65 | % | | | 0.65 | % | | | 0.65 | % |
| Without fee waivers/reimbursements | | | 0.74 | % | | | 0.80 | % | | | 0.94 | % | | | 1.09 | % | | | 3.09 | % (c) |
| Ratio of net investment income to average net assets | | | | | | | | | | | | | | | | | | | | |
| With fee waivers/reimbursements | | | 1.64 | % | | | 2.17 | % | | | 2.73 | % | | | 3.40 | % | | | 2.99 | % |
| Without fee waivers/reimbursements | | | 1.55 | % | | | 2.02 | % | | | 2.44 | % | | | 2.96 | % | | | 0.55 | % (c) |
| Portfolio turnover rate | | | 37 | % | | | 101 | % | | | 114 | % | | | 188 | % | | | 284 | % |
| (a) | Prior to April 30, 2018 known as the Westcore Municipal Opportunities Fund. |
| (b) | Calculated using the average shares method. |
| (c) | Ratios before fee waivers for start up periods may not be representative of long-term operating results. |
| See Notes to Financial Statements. | |
| 134 | | | www.sbhfunds.com |
| Segall Bryant & Hamill Municipal Opportunities Fund | Financial Highlights |
| For a Share Outstanding Throughout the Years Presented |
| | | Year Ended | | | Year Ended | | | Year Ended | | | Year Ended | | | Year Ended | |
| | | December 31, | | | December 31, | | | December 31, | | | December 31, | | | December 31, | |
| Institutional | | 2021 | | | 2020 | | | 2019 | | | 2018(a) | | | 2017 | |
| Net asset value, beginning of year | | $ | 11.02 | | | $ | 10.68 | | | $ | 10.39 | | | $ | 10.62 | | | $ | 10.15 | |
| Income (loss) from investment operations: | | | | | | | | | | | | | | | | | | | | |
| Net investment income(b) | | | 0.19 | | | | 0.25 | | | | 0.31 | | | | 0.37 | | | | 0.34 | |
| Net realized and unrealized gains (losses) on investments | | | 0.12 | | | | 0.45 | | | | 0.43 | | | | (0.23 | ) | | | 0.53 | |
| Total from investment operations | | | 0.31 | | | | 0.70 | | | | 0.74 | | | | 0.14 | | | | 0.87 | |
| | | | | | | | | | | | | | | | | | | | | |
| Less dividends and distributions: | | | | | | | | | | | | | | | | | | | | |
| Dividends from net investment income | | | (0.28 | ) | | | (0.32 | ) | | | (0.37 | ) | | | (0.36 | ) | | | (0.32 | ) |
| Distributions from net realized gains | | | (0.02 | ) | | | (0.04 | ) | | | (0.08 | ) | | | (0.01 | ) | | | (0.08 | ) |
| Total distributions | | | (0.30 | ) | | | (0.36 | ) | | | (0.45 | ) | | | (0.37 | ) | | | (0.40 | ) |
| Net asset value, end of year | | $ | 11.03 | | | $ | 11.02 | | | $ | 10.68 | | | $ | 10.39 | | | $ | 10.62 | |
| | | | | | | | | | | | | | | | | | | | | |
| Total Return | | | 2.87 | % | | | 6.71 | % | | | 7.19 | % | | | 1.36 | % | | | 8.68 | % |
| | | | | | | | | | | | | | | | | | | | | |
| Ratios and Supplemental Data | | | | | | | | | | | | | | | | | | | | |
| Net assets, end of year (in 000s) | | $ | 233,490 | | | $ | 145,819 | | | $ | 62,358 | | | $ | 35,204 | | | $ | 21,371 | |
| | | | | | | | | | | | | | | | | | | | | |
| Ratio of expenses to average net assets | | | | | | | | | | | | | | | | | | | | |
| With fee waivers/reimbursements | | | 0.50 | % | | | 0.50 | % | | | 0.50 | % | | | 0.50 | % | | | 0.40 | % |
| Without fee waivers/reimbursements | | | 0.57 | % | | | 0.62 | % | | | 0.76 | % | | | 0.91 | % | | | 2.29 | % (c) |
| Ratio of net investment income to average net assets | | | | | | | | | | | | | | | | | | | | |
| With fee waivers/reimbursements | | | 1.74 | % | | | 2.32 | % | | | 2.90 | % | | | 3.51 | % | | | 3.24 | % |
| Without fee waivers/reimbursements | | | 1.67 | % | | | 2.20 | % | | | 2.64 | % | | | 3.10 | % | | | 1.35 | % (c) |
| Portfolio turnover rate | | | 37 | % | | | 101 | % | | | 114 | % | | | 188 | % | | | 284 | % |
| (a) | Prior to April 30, 2018 known as the Westcore Municipal Opportunities Fund. |
| (b) | Calculated using the average shares method. |
| (c) | Ratios before fee waivers for start up periods may not be representative of long-term operating results. |
| See Notes to Financial Statements. | |
| Annual Report | December 31, 2021 | | | 135 |
| Segall Bryant & Hamill Colorado Tax Free Fund | Financial Highlights |
| For a Share Outstanding Throughout the Years Presented |
| | | Year Ended | | | Year Ended | | | Year Ended | | | Year Ended | | | Year Ended | |
| | | December 31, | | | December 31, | | | December 31, | | | December 31, | | | December 31, | |
| Retail | | 2021 | | | 2020 | | | 2019 | | | 2018(a) | | | 2017 | |
| Net asset value, beginning of year | | $ | 11.95 | | | $ | 11.69 | | | $ | 11.30 | | | $ | 11.58 | | | $ | 11.32 | |
| Income (loss) from investment operations: | | | | | | | | | | | | | | | | | | | | |
| Net investment income(b) | | | 0.17 | | | | 0.24 | | | | 0.27 | | | | 0.35 | | | | 0.32 | |
| Net realized and unrealized gains (losses) on investments | | | 0.05 | | | | 0.34 | | | | 0.47 | | | | (0.28 | ) | | | 0.26 | |
| Total from investment operations | | | 0.22 | | | | 0.58 | | | | 0.74 | | | | 0.07 | | | | 0.58 | |
| | | | | | | | | | | | | | | | | | | | | |
| Less dividends and distributions: | | | | | | | | | | | | | | | | | | | | |
| Dividends from net investment income | | | (0.26 | ) | | | (0.32 | ) | | | (0.35 | ) | | | (0.35 | ) | | | (0.32 | ) |
| Net asset value, end of year | | $ | 11.91 | | | $ | 11.95 | | | $ | 11.69 | | | $ | 11.30 | | | $ | 11.58 | |
| | | | | | | | | | | | | | | | | | | | | |
| Total Return | | | 1.87 | % | | | 5.08 | % | | | 6.62 | % | | | 0.60 | % | | | 5.21 | % |
| | | | | | | | | | | | | | | | | | | | | |
| Ratios and Supplemental Data | | | | | | | | | | | | | | | | | | | | |
| Net assets, end of year (in 000s) | | $ | 216,617 | | | $ | 205,285 | | | $ | 161,755 | | | $ | 176,020 | | | $ | 193,426 | |
| | | | | | | | | | | | | | | | | | | | | |
| Ratio of expenses to average net assets | | | | | | | | | | | | | | | | | | | | |
| With fee waivers/reimbursements | | | 0.65 | % | | | 0.65 | % | | | 0.65 | % | | | 0.65 | % | | | 0.65 | % |
| Without fee waivers/reimbursements | | | 0.68 | % | | | 0.70 | % | | | 0.77 | % | | | 0.82 | % | | | 0.82 | % |
| Ratio of net investment income to average net assets | | | | | | | | | | | | | | | | | | | | |
| With fee waivers/reimbursements | | | 1.44 | % | | | 2.00 | % | | | 2.29 | % | | | 3.05 | % | | | 2.80 | % |
| Without fee waivers/reimbursements | | | 1.41 | % | | | 1.95 | % | | | 2.17 | % | | | 2.88 | % | | | 2.63 | % |
| Portfolio turnover rate | | | 15 | % | | | 71 | % | | | 30 | % | | | 47 | % | | | 64 | % |
| (a) | Prior to April 30, 2018 known as the Westcore Colorado Tax-Exempt Fund. |
| (b) | Calculated using the average shares method. |
| See Notes to Financial Statements. | |
| 136 | | | www.sbhfunds.com |
| Segall Bryant & Hamill Colorado Tax Free Fund | Financial Highlights |
| For a Share Outstanding Throughout the Years Presented |
| | | Year Ended | | | Year Ended | | | Year Ended | | | Year Ended | | | Year Ended | |
| | | December 31, | | | December 31, | | | December 31, | | | December 31, | | | December 31, | |
| Institutional | | 2021 | | | 2020 | | | 2019 | | | 2018(a) | | | 2017 | |
| Net asset value, beginning of year | | $ | 12.00 | | | $ | 11.73 | | | $ | 11.33 | | | $ | 11.61 | | | $ | 11.34 | |
| Income (loss) from investment operations: | | | | | | | | | | | | | | | | | | | | |
| Net investment income(b) | | | 0.19 | | | | 0.25 | | | | 0.28 | | | | 0.36 | | | | 0.34 | |
| Net realized and unrealized gains (losses) on investments | | | 0.05 | | | | 0.36 | | | | 0.48 | | | | (0.28 | ) | | | 0.26 | |
| Total from investment operations | | | 0.24 | | | | 0.61 | | | | 0.76 | | | | 0.08 | | | | 0.60 | |
| | | | | | | | | | | | | | | | | | | | | |
| Less dividends and distributions: | | | | | | | | | | | | | | | | | | | | |
| Dividends from net investment income | | | (0.28 | ) | | | (0.34 | ) | | | (0.36 | ) | | | (0.36 | ) | | | (0.33 | ) |
| Net asset value, end of year | | $ | 11.96 | | | $ | 12.00 | | | $ | 11.73 | | | $ | 11.33 | | | $ | 11.61 | |
| | | | | | | | | | | | | | | | | | | | | |
| Total Return | | | 2.01 | % | | | 5.29 | % | | | 6.80 | % | | | 0.73 | % | | | 5.34 | % |
| | | | | | | | | | | | | | | | | | | | | |
| Ratios and Supplemental Data | | | | | | | | | | | | | | | | | | | | |
| Net assets, end of year (in 000s) | | $ | 370,546 | | | $ | 289,774 | | | $ | 214,996 | | | $ | 96,615 | | | $ | 79,263 | |
| | | | | | | | | | | | | | | | | | | | | |
| Ratio of expenses to average net assets | | | | | | | | | | | | | | | | | | | | |
| With fee waivers/reimbursements | | | 0.50 | % | | | 0.50 | % | | | 0.50 | % | | | 0.50 | % | | | 0.50 | % |
| Without fee waivers/reimbursements | | | 0.52 | % | | | 0.55 | % | | | 0.61 | % | | | 0.63 | % | | | 0.64 | % |
| Ratio of net investment income to average net assets | | | | | | | | | | | | | | | | | | | | |
| With fee waivers/reimbursements | | | 1.54 | % | | | 2.15 | % | | | 2.41 | % | | | 3.20 | % | | | 2.96 | % |
| Without fee waivers/reimbursements | | | 1.52 | % | | | 2.10 | % | | | 2.30 | % | | | 3.07 | % | | | 2.82 | % |
| Portfolio turnover rate | | | 15 | % | | | 71 | % | | | 30 | % | | | 47 | % | | | 64 | % |
| (a) | Prior to April 30, 2018 known as the Westcore Colorado Tax-Exempt Fund. |
| (b) | Calculated using the average shares method. |
| See Notes to Financial Statements. | |
| Annual Report | December 31, 2021 | | | 137 |
| Segall Bryant & Hamill Funds | Notes to Financial Statements |
| | December 31, 2021 |
Segall Bryant & Hamill Trust (the “Trust”) is registered under the Investment Company Act of 1940, as amended, as an open-end management investment company. Interests in the Segall Bryant & Hamill Small Cap Value Fund, Segall Bryant & Hamill Small Cap Growth Fund, Segall Bryant & Hamill Small Cap Core Fund, Segall Bryant & Hamill All Cap Fund, Segall Bryant & Hamill Emerging Markets Fund, Segall Bryant & Hamill International Small Cap Fund, Segall Bryant & Hamill Fundamental International Small Cap Fund, Segall Bryant & Hamill Global All Cap Fund, Segall Bryant & Hamill Workplace Equality Fund, Segall Bryant & Hamill Short Term Plus Fund, Segall Bryant & Hamill Plus Bond Fund, Segall Bryant & Hamill Quality High Yield Fund, Segall Bryant & Hamill Municipal Opportunities Fund and Segall Bryant & Hamill Colorado Tax Free Fund (the “Funds”) are represented by separate classes of beneficial interest of the Trust, which is organized as a Massachusetts business trust. All of the Funds offer Retail Class and Institutional Class shares. All classes of shares have identical rights to earnings, assets and voting privileges, except for class specific expenses and exclusive rights to vote on matters solely affecting such class.
Each of the Segall Bryant & Hamill Small Cap Value Fund, Segall Bryant & Hamill Small Cap Growth Fund, Segall Bryant & Hamill Small Cap Core Fund, Segall Bryant & Hamill All Cap Fund, Segall Bryant & Hamill Emerging Markets Fund, Segall Bryant & Hamill International Small Cap Fund, Segall Bryant & Hamill Fundamental International Small Cap Fund, Segall Bryant & Hamill Global All Cap and Segall Bryant & Hamill Workplace Equality Fund seeks to achieve long-term capital appreciation. The Segall Bryant & Hamill Short Term Plus Fund seeks to provide current income and competitive total return. Each of the Segall Bryant & Hamill Plus Bond Fund and Segall Bryant & Hamill Quality High Yield Fund seeks to achieve long-term total rate of return consistent with preservation of capital. The Segall Bryant & Hamill Municipal Opportunities Fund seeks income exempt from Federal income taxes. The Segall Bryant & Hamill Colorado Tax Free Fund seeks income exempt from both federal and Colorado state personal income taxes.
The Funds (other than Segall Bryant & Hamill Emerging Markets Fund and Segall Bryant & Hamill Colorado Tax Free Fund, which are non-diversified) are diversified portfolios of the Trust for the purposes of the Investment Company Act of 1940, as amended (the “1940 Act”). Prior to June 10, 2021, the Segall Bryant & Hamill Emerging Markets Fund was a diversified portfolio.
The Board of Trustees of the Trust, based on the recommendation of the Adviser, approved an Agreement and Plan of Reorganization pursuant to which the Segall Bryant & Hamill Small Cap Value Dividend Fund, a former series of the Trust, would be combined with and into the Segall Bryant & Hamill Small Cap Value Fund. The tax-free reorganization took place on September 25, 2020.
The following is a summary of shares outstanding, net assets, net asset value (“NAV”) per share and unrealized appreciation immediately before and after the reorganization.
| | | Before Reorganization | | | After Reorganization | |
| | | Segall Bryant & | | | | | | | |
| | | Hamill Small Cap | | | Segall Bryant & | | | Segall Bryant & | |
| | | Value Dividend | | | Hamill Small Cap | | | Hamill Small Cap | |
| | | Fund | | | Value Fund | | | Value Fund | |
| Retail Class | | | | | | | | | | | | |
| Shares | | | 790,279 | | | | 30,581 | | | | 525,391 | |
| Net Assets | | $ | 5,056,578 | | | $ | 312,513 | | | $ | 5,369,091 | |
| Net Asset Value | | $ | 6.40 | | | $ | 10.22 | | | $ | 10.22 | |
| | | | | | | | | | | | | |
| Institutional Class | | | | | | | | | | | | |
| Shares | | | 3,438,443 | | | | 26,702,010 | | | | 28,872,646 | |
| Net Assets | | $ | 22,201,598 | | | $ | 273,112,348 | | | $ | 295,313,946 | |
| Net Asset Value | | $ | 6.46 | | | $ | 10.23 | | | $ | 10.23 | |
| | | | | | | | | | | | | |
| Fund Total | | | | | | | | | | | | |
| Net Assets | | $ | 27,258,176 | | | $ | 273,424,861 | | | $ | 300,683,037 | |
| Unrealized Depreciation | | $ | (23,506 | ) | | $ | (3,772,560 | ) | | $ | (3,796,066 | ) |
Assuming the reorganization had been completed on January 1, 2020, the beginning of the annual reporting period of the Segall Bryant & Hamill Small Cap Value Fund, the Segall Bryant & Hamill Small Cap Value Fund’s pro forma results of operations for the year ended December 31, 2020, would have been as follows:
| | | | | Net Increase in Net Assets Resulting |
| Net Investment Income | | Realized and Unrealized Gains | | From Operations |
| $2,731,138 | | $42,535,894 | | $45,267,032 |
| | |
| 138 | | | www.sbhfunds.com |
| Segall Bryant & Hamill Funds | Notes to Financial Statements |
| | December 31, 2021 |
For financial reporting purposes, assets received and shares issued by the Segall Bryant & Hamill Small Cap Value Fund were recorded at fair value; however, the cost basis of the investments received from the Segall Bryant & Hamill Small Cap Value Dividend Fund was carried forward to align ongoing reporting of the Segall Bryant & Hamill Small Cap Value Fund’s realized and unrealized gains and losses with amounts distributable to shareholders for tax purposes. Segall Bryant & Hamill Small Cap Value Fund was deemed to be the accounting survivor and as a result, the financial statements and financial highlights do not reflect operations of Segall Bryant & Hamill Small Cap Value Dividend Fund.
| 2. | SIGNIFICANT ACCOUNTING POLICIES |
The following is a summary of significant accounting policies consistently followed by each Fund in the preparation of its financial statements. Each Fund is considered an investment company for financial reporting purposes. The following policies are in conformity with accounting principles generally accepted in the United States of America for investment companies, under Accounting Standards Codification Topic 946 – Financial Services – Investment Companies.
Use of Estimates – The preparation of financial statements in accordance with accounting principles generally accepted in the United States of America requires management to make estimates and assumptions that affect the reported amounts of assets and liabilities and disclosure of contingent assets and liabilities in the financial statements. The actual results could differ from those estimates.
New Accounting Pronouncement – In March 2020, the Financial Accounting Standards Board issued Accounting Standards Update No. 2020-04 (“ASU 2020-04”), Reference Rate Reform (Topic 848): Facilitation of the Effects of Reference Rate Reform on Financial Reporting. ASU 2020-04 provides optional temporary financial reporting relief from the effect of certain types of contract modifications due to the planned discontinuation of the London Interbank Offered Rate (“LIBOR”) and other interbank -offered based reference rates at the end of 2021. ASU 2020-04 is effective for certain reference rate-related contract modifications that occur during the period March 12, 2020 through December 31, 2022. The Funds will consider this optional guidance prospectively, if applicable.
Cash Equivalents – Each Fund subscribes to the Brown Brothers Harriman & Co. (“BBH”) Cash Management Service (“CMS”), whereby cash balances are automatically swept into overnight demand deposits with a branch of a pre-approved commercial bank. This fully automated program allows the Funds to earn interest on cash balances. As of December 31, 2021, the cash equivalents balances reflected on the Statements of Assets and Liabilities represent the amounts participating in the BBH CMS.
Investment Valuation – All securities of the Funds are valued as of the close of regular trading on the New York Stock Exchange (“NYSE”), currently 4:00 p.m. (Eastern Time), on each day that the NYSE is open, subject to provisions in the prospectus and/or Statement of Additional Information regarding pricing at other times in case of an emergency and optional pricing of the Funds in the event that the NYSE does not open for business because of an emergency.
Securities that are traded on a recognized domestic stock exchange are generally valued at the last sales price as of the valuation time on the principal stock exchange on which they are traded. Securities that are principally traded on the National Association of Securities Dealers Automated Quotation (“NASDAQ”) exchange are generally valued at the NASDAQ Official Closing Price (“NOCP”). Unlisted securities that are traded on the domestic over-the-counter market for which last sales prices are available, are generally valued at the last sales price as of the valuation time. In the absence of sales and NOCP, such securities are valued at the bid price.
Securities that are traded on a foreign stock exchange (and that are not listed on a recognized domestic stock exchange or traded on the NASDAQ exchange or the domestic over-the-counter market) are generally valued at the official closing price on the principal stock exchange on which they are traded. When an event occurs subsequent to the close of the foreign exchange and the close of the NYSE that was likely to have changed such value, the fair value of those securities are determined in good faith in accordance with procedures established by and under the general supervision of the Board of Trustees. The Funds will use a fair valuation model provided by an independent pricing service, which is intended to reflect fair value when a security’s value is believed to have been materially affected by a valuation event that has occurred between the close of the exchange or market on which the security is traded and the close of the regular trading day on the NYSE. In the event that closing prices are not available for such foreign securities, such securities are generally valued at the last sales price occurring prior to the closing of its principal exchange.
Forward foreign currency contracts have a fair value determined by an automated system that estimates rates on the basis of the current day foreign currency exchange rates and forward foreign currency exchange rates supplied by a pricing vendor. Foreign currency exchange rates and forward foreign currency exchange rates may generally be obtained at the close of the NYSE.
Redeemable securities issued by open-end registered investment companies are valued at the investment company’s applicable net asset value.
Fixed-income obligations, having a remaining maturity of greater than 60 days, are typically valued at the evaluated prices formulated by an independent pricing service.
| | |
| Annual Report | December 31, 2021 | | | 139 |
| Segall Bryant & Hamill Funds | Notes to Financial Statements |
| | December 31, 2021 |
When market quotations are not readily available or when events occur that make established valuation methods unreliable, securities of the Fund may be valued in good faith by or under the direction of the Board of Trustees. Factors which may be considered when determining the value of a security include (a) the fundamental data relating to the investment; (b) an evaluation of the forces which influence the market in which the security is sold, including the liquidity and depth of the market; (c) the market value at date of purchase; (d) information as to any transactions or offers with respect to the security or comparable securities; and (e) any other relevant matters.
Securities Traded on Foreign Exchanges – All of the Funds, except the Segall Bryant & Hamill Colorado Tax Free Fund, may invest at least a portion of their assets in foreign securities. As of December 31, 2021, all Funds were primarily invested in securities traded on U.S. exchanges, except Segall Bryant & Hamill Emerging Markets Fund, Segall Bryant & Hamill International Small Cap Fund, Segall Bryant & Hamill Fundamental International Small Cap Fund and Segall Bryant & Hamill Global All Cap Fund. In the event that a Fund executes a security transaction on a foreign exchange, the Fund will generally enter into a foreign currency contract to settle the foreign security transaction. Foreign securities may carry more risk than U.S. securities, such as political, market and currency risks. The accounting records of the Funds are maintained in U.S. dollars. Prices of securities denominated in foreign currencies are translated into U.S. dollars at the closing rates of exchange at period end. Amounts related to the purchase and sale of foreign securities and investment income are translated at the rates of exchange prevailing on the respective dates of such transactions.
The portion of realized and unrealized gains or losses on investments due to fluctuations in foreign currency exchange rates is not separately disclosed and is included in realized and unrealized gains or losses on investments, when applicable.
Federal Income Taxes – No provision for income taxes is included in the accompanying financial statements, as the Funds intend to distribute to shareholders all taxable investment income and realized gains and otherwise comply with Subchapter M of the Internal Revenue Code of 1986, as amended, applicable to regulated investment companies.
As of and during the year ended December 31, 2021, the Funds did not have a liability for any unrecognized tax benefits. The Funds file U.S. federal, state, and local tax returns as required. Each Fund’s tax returns are subject to examination by the relevant tax authorities until expiration of the applicable statute of limitations which is generally three years after the filing of the tax return. Tax returns for open years have incorporated no uncertain tax positions that require a provision for income taxes. The Funds recognize interest and penalties, if any, related to unrecognized tax benefits as income tax expense on the Statements of Operations. During the year ended December 31, 2021, the Funds did not incur any interest or penalties.
When-Issued/Forward Commitment Securities – Each Fund may purchase or sell securities on a “when-issued” or “forward commitment” basis which involves a commitment by the Fund to purchase or sell particular securities with payment and delivery taking place at a future date. During this period, such securities do not earn interest, are subject to market fluctuation and may increase or decrease in value prior to their delivery. In accordance with SEC guidance, each Fund segregates liquid assets in an amount sufficient to satisfy the purchase price. The purchase of securities on a when-issued or forward commitment basis may increase the volatility of the Fund’s net asset value to the extent each Fund makes such purchases while remaining substantially fully invested. Settlements in the ordinary course of business, which may take substantially more than three business days for non-U.S. securities, are not treated by the Funds as “when-issued” or “forward commitment” transactions.
Common Expenses – Expenses of the Trust not attributable solely to one of the Funds are allocated among the Funds based on the relative net assets of each Fund or based on the nature of the expense and its relative applicability to each Fund.
Allocation Between Classes – Investment income earned, realized capital gains and losses, and unrealized appreciation and depreciation are allocated daily to each class of a Fund based upon its proportionate share of total net assets of that Fund. Class-specific expenses are charged directly to the class incurring the expense. Common expenses which are not attributable to a specific class are allocated daily to each class of shares of a Fund based upon its proportionate share of total net assets of that Fund.
Security Transactions and Related Investment Income – For financial reporting purposes, the Funds’ investment transactions and shareholder transactions are recorded on trade date. Dividend income is recorded on the ex-dividend date. Foreign dividend income is recorded on the ex-dividend date or as soon as practical after the Funds determine the existence of a dividend declaration after exercising reasonable due diligence. Non-cash dividends, if any, included in dividend income, are recorded at the fair value of the security received. Withholding taxes on foreign dividends, net of reclaims, and foreign capital gains taxes, if any, have been recorded in accordance with the Funds’ understanding of the applicable country’s rules and tax rates. Interest income is accrued as earned. Discounts and premiums on fixed income securities are amortized using the effective interest method. Realized gains and losses from investment transactions and unrealized appreciation and depreciation of investments are reported on an identified cost basis.
Investments in Real Estate Investment Trusts (REITs) – With respect to each Fund, dividend income is recorded based on the income included in distributions received from its REIT investments using published REIT reclassifications including some management estimates when actual amounts are not available. Distributions received in excess of these estimated amounts are recorded as a reduction of the cost of investments or reclassified to capital gains. The actual amounts of income, return of capital, and capital gains are only determined by each REIT after its fiscal year end and may differ from the estimated amounts.
| | |
| 140 | | | www.sbhfunds.com |
| Segall Bryant & Hamill Funds | Notes to Financial Statements |
| | December 31, 2021 |
| 3. | CERTAIN INVESTMENTS AND ASSOCIATED RISKS |
Market, Credit and Counterparty Risk – In the normal course of business, the Funds invest in securities and enter into transactions where risks exist due to fluctuations in the market (market risk) or failure of the issuer of a security to meet all of its obligations (issuer credit risk). The value of securities held by the Funds may decline in response to certain events, including those directly involving the issuers whose securities are owned by the Funds; conditions affecting the general economy; overall market changes; local, regional, national or global political, social or economic instability; and currency and interest rate and price fluctuations. Similar to issuer credit risk, the Funds may be exposed to counterparty credit risk, or the risk that an entity with which the Funds have unsettled or open transactions may fail to or be unable to perform on its commitments. The Funds manage counterparty credit risk by entering into transactions only with counterparties that they believe have the financial resources to honor their obligations and by monitoring the financial stability of those counterparties.
Country Risk – As of December 31, 2021, the Segall Bryant & Hamill Emerging Markets Fund invested a significant percentage of its assets in China; and the Segall Bryant & Hamill International Small Cap Fund invested a significant percentage of its assets in Japan. Therefore, they may be more affected by economic developments and currency fluctuations in these countries.
Sector Concentration Risk – The Funds may concentrate investments in companies that are in a single sector or related sector. Concentrating investments in a single sector may make the Fund more susceptible to adverse economic, business, regulatory or other developments affecting that sector. If an economic downturn occurs in a sector in which a Fund’s investments are concentrated, the Fund may perform poorly during that period. Refer to each Fund’s Statement of Investments for its particular concentration in the various sectors.
Other Risk – An outbreak of respiratory disease caused by a novel coronavirus was first detected in December 2019 and has now spread globally. This coronavirus has resulted in closing borders, enhanced health screenings, partial population vaccination, healthcare service preparation and delivery, quarantines, cancellations, disruptions to supply chains and customer activity, government sponsored fiscal stimulus programs, various moratoria on the applicability of certain laws and regulations, as well as general concern and uncertainty. The impact of COVID-19, (and the variants of such virus) and other epidemics and pandemics that may arise in the future, could affect the economies of many nations, individual companies, their securities (including equity and debt), and the market in general in ways that cannot necessarily be foreseen at the present time. In addition, the impact of infectious diseases in developing or emerging market countries may be greater due to less established health care systems. Health crises caused by the recent coronavirus outbreak may exacerbate other pre-existing political, social, financial, and economic risks in certain countries. The impact of the outbreak may last for an extended period of time.
| 4. | SHARES OF BENEFICIAL INTEREST |
On December 31, 2021, there was an unlimited number of no par value shares of beneficial interest authorized for each Fund. Transactions in shares of beneficial interest were as follows:
| | | For the | | | For the | |
| | | Year Ended | | | Year Ended | |
| | | December 31, 2021 | | | December 31, 2020 | |
| Segall Bryant & Hamill Small Cap Value Fund | | | | | | | | |
| Retail: | | | | | | | | |
| Shares Sold | | | 202,728 | | | | 573,167 | |
| Shares issued in Reinvestment of Distributions | | | 27,558 | | | | 1,539 | |
| Total | | | 230,286 | | | | 574,706 | |
| Less Shares Redeemed | | | (98,009 | ) | | | (73,203 | ) |
| Net Increase | | | 132,277 | | | | 501,503 | |
| Institutional: | | | | | | | | |
| Shares Sold | | | 22,217,491 | | | | 24,711,636 | |
| Shares issued in Reinvestment of Distributions | | | 1,408,276 | | | | 280,000 | |
| Total | | | 23,625,767 | | | | 24,991,636 | |
| Less Shares Redeemed | | | (14,266,912 | ) | | | (7,224,415 | ) |
| Net Increase | | | 9,358,855 | | | | 17,767,221 | |
| | |
| Annual Report | December 31, 2021 | | | 141 |
| Segall Bryant & Hamill Funds | Notes to Financial Statements |
| | December 31, 2021 |
| | | For the | | | For the | |
| | | Year Ended | | | Year Ended | |
| | | December 31, 2021 | | | December 31, 2020 | |
| Segall Bryant & Hamill Small Gap Growth Fund | | | | | | | | |
| Retail: | | | | | | | | |
| Shares Sold | | | 2,192,952 | | | | 459,319 | |
| Shares issued in Reinvestment of Distributions | | | — | | | | — | |
| Total | | | 2,192,952 | | | | 459,319 | |
| Less Shares Redeemed | | | (428,468 | ) | | | (103,457 | ) |
| Net Increase | | | 1,764,484 | | | | 355,862 | |
| Institutional: | | | | | | | | |
| Shares Sold | | | 3,723,238 | | | | 1,547,037 | |
| Shares issued in Reinvestment of Distributions | | | — | | | | — | |
| Total | | | 3,723,238 | | | | 1,547,037 | |
| Less Shares Redeemed | | | (930,086 | ) | | | (1,744,804 | ) |
| Net Increase (Decrease) | | | 2,793,152 | | | | (197,767 | ) |
| Segall Bryant & Hamill Small Cap Core Fund | | | | | | | | |
| Retail: | | | | | | | | |
| Shares Sold | | | 103,776 | | | | 336,564 | |
| Shares issued in Reinvestment of Distributions | | | 23,430 | | | | — | |
| Total | | | 127,206 | | | | 336,564 | |
| Less Shares Redeemed | | | (335,452 | ) | | | (4,631 | ) |
| Net Increase (Decrease) | | | (208,246 | ) | | | 331,933 | |
| Institutional: | | | | | | | | |
| Shares Sold | | | 55,967 | | | | 306,072 | |
| Shares issued in Reinvestment of Distributions | | | 429,123 | | | | — | |
| Total | | | 485,090 | | | | 306,072 | |
| Less Shares Redeemed | | | (149,348 | ) | | | (462,445 | ) |
| Net Increase (Decrease) | | | 335,742 | | | | (156,373 | ) |
| Segall Bryant & Hamill All Cap Fund | | | | | | | | |
| Retail: | | | | | | | | |
| Shares Sold | | | 10,114 | | | | 36,790 | |
| Shares issued in Reinvestment of Distributions | | | 4,071 | | | | 492 | |
| Total | | | 14,185 | | | | 37,282 | |
| Less Shares Redeemed | | | (1,967 | ) | | | (10,344 | ) |
| Net Increase | | | 12,218 | | | | 26,938 | |
| Institutional: | | | | | | | | |
| Shares Sold | | | 1,214,703 | | | | 2,038,395 | |
| Shares issued in Reinvestment of Distributions | | | 805,081 | | | | 107,563 | |
| Total | | | 2,019,784 | | | | 2,145,958 | |
| Less Shares Redeemed | | | (2,440,979 | ) | | | (1,222,717 | ) |
| Net Increase (Decrease) | | | (421,195 | ) | | | 923,241 | |
| | |
| 142 | | | www.sbhfunds.com |
| Segall Bryant & Hamill Funds | Notes to Financial Statements |
| | December 31, 2021 |
| | | For the | | | For the | |
| | | Year Ended | | | Year Ended | |
| | | December 31, 2021 | | | December 31, 2020 | |
| Segall Bryant & Hamill Emerging Markets Fund | | | | | | | | |
| Retail: | | | | | | | | |
| Shares Sold | | | 97,339 | | | | 66,253 | |
| Shares issued in Reinvestment of Distributions | | | 16,926 | | | | 4,840 | |
| Total | | | 114,265 | | | | 71,093 | |
| Less Shares Redeemed | | | (84,384 | ) | | | (56,389 | ) |
| Net Increase | | | 29,881 | | | | 14,704 | |
| Institutional: | | | | | | | | |
| Shares Sold | | | 1,015,693 | | | | 1,424,279 | |
| Shares issued in Reinvestment of Distributions | | | 180,095 | | | | 83,386 | |
| Total | | | 1,195,788 | | | | 1,507,665 | |
| Less Shares Redeemed | | | (142,059 | ) | | | (349,851 | ) |
| Net Increase | | | 1,053,729 | | | | 1,157,814 | |
| Segall Bryant & Hamill International Small Cap Fund | | | | | | | | |
| Retail: | | | | | | | | |
| Shares Sold | | | 69,291 | | | | 2,311,336 | |
| Shares issued in Reinvestment of Distributions | | | 56,832 | | | | 90,711 | |
| Total | | | 126,123 | | | | 2,402,047 | |
| Less Shares Redeemed | | | (1,994,358 | ) | | | (977,937 | ) |
| Net Increase (Decrease) | | | (1,868,235 | ) | | | 1,424,110 | |
| Institutional: | | | | | | | | |
| Shares Sold | | | 1,574,949 | | | | 2,210,492 | |
| Shares issued in Reinvestment of Distributions | | | 471,234 | | | | 169,816 | |
| Total | | | 2,046,183 | | | | 2,380,308 | |
| Less Shares Redeemed | | | (3,655,446 | ) | | | (11,505,247 | ) |
| Net Decrease | | | (1,609,263 | ) | | | (9,124,939 | ) |
| Segall Bryant & Hamill Fundamental International Small Cap Fund | | | | | | | | |
| Retail: | | | | | | | | |
| Shares Sold | | | 493,735 | | | | 311,098 | |
| Shares issued in Reinvestment of Distributions | | | 144,895 | | | | 77,768 | |
| Total | | | 638,630 | | | | 388,866 | |
| Less Shares Redeemed | | | (378,627 | ) | | | (522,257 | ) |
| Net Increase (Decrease) | | | 260,003 | | | | (133,391 | ) |
| Institutional: | | | | | | | | |
| Shares Sold | | | 1,509,713 | | | | 406,165 | |
| Shares issued in Reinvestment of Distributions | | | 147,769 | | | | 31,077 | |
| Total | | | 1,657,482 | | | | 437,242 | |
| Less Shares Redeemed | | | (389,609 | ) | | | (243,495 | ) |
| Net Increase | | | 1,267,873 | | | | 193,747 | |
| | |
| Annual Report | December 31, 2021 | | | 143 |
| Segall Bryant & Hamill Funds | Notes to Financial Statements |
| | December 31, 2021 |
| | | For the | | | For the | |
| | | Year Ended | | | Year Ended | |
| | | December 31, 2021 | | | December 31, 2020 | |
| Segall Bryant & Hamill Global All Cap Fund | | | | | | | | |
| Retail: | | | | | | | | |
| Shares Sold | | | 16,244 | | | | 22,414 | |
| Shares issued in Reinvestment of Distributions | | | 175,562 | | | | 591,612 | |
| Total | | | 191,806 | | | | 614,026 | |
| Less Shares Redeemed | | | (580,133 | ) | | | (1,380,005 | ) |
| Net Decrease | | | (388,327 | ) | | | (765,979 | ) |
| Institutional: | | | | | | | | |
| Shares Sold | | | 114,822 | | | | 291,114 | |
| Shares issued in Reinvestment of Distributions | | | 28,009 | | | | 62,726 | |
| Total | | | 142,831 | | | | 353,840 | |
| Less Shares Redeemed | | | (60,824 | ) | | | (238,661 | ) |
| Net Increase | | | 82,007 | | | | 115,179 | |
| Segall Bryant & Hamill Workplace Equality Fund | | | | | | | | |
| Retail: | | | | | | | | |
| Shares Sold | | | 155,100 | | | | 157,716 | |
| Shares issued in Reinvestment of Distributions | | | 105,484 | | | | 35,055 | |
| Total | | | 260,584 | | | | 192,771 | |
| Less Shares Redeemed | | | (169,915 | ) | | | (321,483 | ) |
| Net Increase (Decrease) | | | 90,669 | | | | (128,712 | ) |
| Institutional: | | | | | | | | |
| Shares Sold | | | 588,224 | | | | 408,772 | |
| Shares issued in Reinvestment of Distributions | | | 157,394 | | | | 35,517 | |
| Total | | | 745,618 | | | | 444,289 | |
| Less Shares Redeemed | | | (179,809 | ) | | | (69,982 | ) |
| Net Increase | | | 565,809 | | | | 374,307 | |
| Segall Bryant & Hamill Short Term Plus Fund | | | | | | | | |
| Retail: | | | | | | | | |
| Shares Sold | | | 1,226,366 | | | | 242,589 | |
| Shares issued in Reinvestment of Distributions | | | 5,471 | | | | 2,673 | |
| Total | | | 1,231,837 | | | | 245,262 | |
| Less Shares Redeemed | | | (343,254 | ) | | | (41,213 | ) |
| Net Increase | | | 888,583 | | | | 204,049 | |
| Institutional: | | | | | | | | |
| Shares Sold | | | 3,317,870 | | | | 2,407,028 | |
| Shares issued in Reinvestment of Distributions | | | 27,487 | | | | 19,897 | |
| Total | | | 3,345,357 | | | | 2,426,925 | |
| Less Shares Redeemed | | | (1,686,877 | ) | | | (727,324 | ) |
| Net Increase | | | 1,658,480 | | | | 1,699,601 | |
| Segall Bryant & Hamill Plus Bond Fund | | | | | | | | |
| Retail: | | | | | | | | |
| Shares Sold | | | 6,254,334 | | | | 11,077,454 | |
| Shares issued in Reinvestment of Distributions | | | 1,377,765 | | | | 2,087,145 | |
| Total | | | 7,632,099 | | | | 13,164,599 | |
| Less Shares Redeemed | | | (17,544,787 | ) | | | (15,768,436 | ) |
| Net Decrease | | | (9,912,688 | ) | | | (2,603,837 | ) |
| Institutional: | | | | | | | | |
| Shares Sold | | | 18,332,140 | | | | 14,500,177 | |
| Shares issued in Reinvestment of Distributions | | | 1,578,176 | | | | 1,641,594 | |
| Total | | | 19,910,316 | | | | 16,141,771 | |
| Less Shares Redeemed | | | (12,301,097 | ) | | | (8,913,026 | ) |
| Net Increase | | | 7,609,219 | | | | 7,228,745 | |
| | |
| 144 | | | www.sbhfunds.com |
| Segall Bryant & Hamill Funds | Notes to Financial Statements |
| | December 31, 2021 |
| | | For the | | | For the | |
| | | Year Ended | | | Year Ended | |
| | | December 31, 2021 | | | December 31, 2020 | |
| Segall Bryant & Hamill Quality High Yield Fund | | | | | | | | |
| Retail: | | | | | | | | |
| Shares Sold | | | 686,553 | | | | 1,391,920 | |
| Shares issued in Reinvestment of Distributions | | | 144,558 | | | | 171,987 | |
| Total | | | 831,111 | | | | 1,563,907 | |
| Less Shares Redeemed | | | (1,071,289 | ) | | | (1,417,538 | ) |
| Net Increase (Decrease) | | | (240,178 | ) | | | 146,369 | |
| Institutional: | | | | | | | | |
| Shares Sold | | | 2,917,981 | | | | 3,029,360 | |
| Shares issued in Reinvestment of Distributions | | | 207,858 | | | | 123,776 | |
| Total | | | 3,125,839 | | | | 3,153,136 | |
| Less Shares Redeemed | | | (778,890 | ) | | | (1,117,704 | ) |
| Net Increase | | | 2,346,949 | | | | 2,035,432 | |
| Segall Bryant & Hamill Municipal Opportunities Fund | | | | | | | | |
| Retail: | | | | | | | | |
| Shares Sold | | | 2,360,437 | | | | 1,980,226 | |
| Shares issued in Reinvestment of Distributions | | | 70,841 | | | | 53,913 | |
| Total | | | 2,431,278 | | | | 2,034,139 | |
| Less Shares Redeemed | | | (1,188,474 | ) | | | (527,802 | ) |
| Net Increase | | | 1,242,804 | | | | 1,506,337 | |
| Institutional: | | | | | | | | |
| Shares Sold | | | 10,832,665 | | | | 8,321,722 | |
| Shares issued in Reinvestment of Distributions | | | 463,451 | | | | 294,130 | |
| Total | | | 11,296,116 | | | | 8,615,852 | |
| Less Shares Redeemed | | | (3,354,752 | ) | | | (1,218,369 | ) |
| Net Increase | | | 7,941,364 | | | | 7,397,483 | |
| Segall Bryant & Hamill Colorado Tax Free Fund | | | | | | | | |
| Retail: | | | | | | | | |
| Shares Sold | | | 5,059,760 | | | | 7,913,358 | |
| Shares issued in Reinvestment of Distributions | | | 368,992 | | | | 419,771 | |
| Total | | | 5,428,752 | | | | 8,333,129 | |
| Less Shares Redeemed | | | (4,420,608 | ) | | | (4,991,064 | ) |
| Net Increase | | | 1,008,144 | | | | 3,342,065 | |
| Institutional: | | | | | | | | |
| Shares Sold | | | 9,597,634 | | | | 9,106,046 | |
| Shares issued in Reinvestment of Distributions | | | 583,477 | | | | 535,213 | |
| Total | | | 10,181,111 | | | | 9,641,259 | |
| Less Shares Redeemed | | | (3,352,153 | ) | | | (3,810,774 | ) |
| Net Increase | | | 6,828,958 | | | | 5,830,485 | |
| 5. | TAX BASIS DISTRIBUTIONS AND TAX BASIS INFORMATION |
Distributions – Distributions of net investment income, if any, are generally made annually for the Segall Bryant & Hamill Small Cap Value Fund, Segall Bryant & Hamill Small Cap Growth Fund, Segall Bryant & Hamill Small Cap Core Fund, Segall Bryant & Hamill All Cap Fund, Segall Bryant & Hamill Emerging Markets Fund, Segall Bryant & Hamill International Small Cap Fund, Segall Bryant & Hamill Fundamental International Small Cap Fund, Segall Bryant & Hamill Global All Cap Fund and Segall Bryant & Hamill Workplace Equality Fund; and monthly for the Segall Bryant & Hamill Short Term Plus Fund, Segall Bryant & Hamill Plus Bond Fund, Segall Bryant & Hamill Quality High Yield Fund, Segall Bryant & Hamill Municipal Opportunities Fund and Segall Bryant & Hamill Colorado Tax Free Fund. Prior to May 1, 2021, distributions of net investment income were made quarterly for the Segall Bryant & Hamill Global All Cap Fund and Segall Bryant & Hamill Workplace Equality Fund. Distributions of net realized capital gains, if any, are declared at least once each year for each of the Funds. Distributions to shareholders are recorded on the ex-dividend date.
| | |
| Annual Report | December 31, 2021 | | | 145 |
| Segall Bryant & Hamill Funds | Notes to Financial Statements |
| | December 31, 2021 |
The tax character of the distributions paid during the years ended December 31, 2021 and December 31, 2020 were as follows:
| | | | | | | | Long-Term | | | | |
| Fund | | Year Ended | | Ordinary Income* | | | Capital Gains | | | Tax-Exempt Income | |
| Segall Bryant & Hamill Small Cap Value Fund | | 12/31/2021 | | $ | 16,606,782 | | | $ | 10,404,575 | | | $ | — | |
| | | 12/31/2020 | | | 2,218,960 | | | | 1,243,474 | | | | — | |
| Segall Bryant & Hamill Small Cap Growth Fund | | 12/31/2021 | | | — | | | | — | | | | — | |
| | | 12/31/2020 | | | — | | | | — | | | | — | |
| Segall Bryant & Hamill Small Cap Core Fund | | 12/31/2021 | | | 1,802,628 | | | | 6,882,637 | | | | — | |
| | | 12/31/2020 | | | — | | | | — | | | | — | |
| Segall Bryant & Hamill All Cap Fund | | 12/31/2021 | | | 4,099,620 | | | | 15,286,337 | | | | — | |
| | | 12/31/2020 | | | 246,155 | | | | 2,029,921 | | | | — | |
| Segall Bryant & Hamill Emerging Markets Fund | | 12/31/2021 | | | 1,805,148 | | | | 1,221,048 | | | | — | |
| | | 12/31/2020 | | | 815,979 | | | | — | | | | — | |
| Segall Bryant & Hamill International Small Cap Fund | | 12/31/2021 | | | 8,258,628 | | | | — | | | | — | |
| | | 12/31/2020 | | | 2,864,036 | | | | — | | | | — | |
| Segall Bryant & Hamill Fundamental International Small Cap Fund | | 12/31/2021 | | | 1,002,459 | | | | 5,906,123 | | | | — | |
| | | 12/31/2020 | | | — | | | | 2,488,723 | | | | — | |
| Segall Bryant & Hamill Global All Cap Fund | | 12/31/2021 | | | 1,598,070 | | | | 674,258 | | | | — | |
| | | 12/31/2020 | | | 712,975 | | | | 5,759,690 | | | | — | |
| Segall Bryant & Hamill Workplace Equality Fund | | 12/31/2021 | | | 906,387 | | | | 1,159,602 | | | | — | |
| | | 12/31/2020 | | | 218,608 | | | | 212,619 | | | | — | |
| Segall Bryant & Hamill Short Term Plus Fund | | 12/31/2021 | | | 323,124 | | | | 19,922 | | | | — | |
| | | 12/31/2020 | | | 228,429 | | | | 6,968 | | | | — | |
| Segall Bryant & Hamill Plus Bond Fund | | 12/31/2021 | | | 27,243,919 | | | | 6,776,101 | | | | — | |
| | | 12/31/2020 | | | 33,783,456 | | | | 9,823,399 | | | | — | |
| Segall Bryant & Hamill Quality High Yield Fund | | 12/31/2021 | | | 3,316,122 | | | | — | | | | — | |
| | | 12/31/2020 | | | 2,681,083 | | | | — | | | | — | |
| Segall Bryant & Hamill Municipal Opportunities Fund | | 12/31/2021 | | | 1,164,651 | | | | — | | | | 5,002,947 | |
| | | 12/31/2020 | | | 841,313 | | | | 175,694 | | | | 2,918,318 | |
| Segall Bryant & Hamill Colorado Tax Free Fund | | 12/31/2021 | | | 506,229 | | | | — | | | | 11,874,115 | |
| | | 12/31/2020 | | | 1,510,955 | | | | — | | | | 10,751,229 | |
| * | Ordinary income distributions for federal income tax purposes includes distributions from net investment income and short-term capital gains. |
As of December 31, 2021, net unrealized appreciation (depreciation) on investments based on federal tax cost was as follows:
| | | Segall Bryant & | | | Segall Bryant & | | | Segall Bryant & | | | Segall Bryant & | | | Segall Bryant & | |
| | | Hamill Small Cap | | | Hamill Small Cap | | | Hamill Small Cap | | | Hamill All Cap | | | Hamill Emerging | |
| | | Value Fund | | | Growth Fund | | | Core Fund | | | Fund | | | Markets Fund | |
| Tax cost of portfolio investments | | $ | 471,931,182 | | | $ | 198,781,838 | | | $ | 32,475,945 | | | $ | 94,038,859 | | | $ | 51,660,283 | |
| Gross unrealized appreciation | | | 144,540,793 | | | | 56,631,927 | | | | 18,688,770 | | | | 90,102,780 | | | | 10,342,595 | |
| Gross unrealized depreciation | | | (29,122,137 | ) | | | (17,853,553 | ) | | | (926,857 | ) | | | (583,262 | ) | | | (4,387,433 | ) |
| Net unrealized appreciation on portfolio investments | | $ | 115,418,656 | | | $ | 38,778,374 | | | $ | 17,761,913 | | | $ | 89,519,518 | | | $ | 5,955,162 | |
| | | | | | Segall Bryant | | | | | | | |
| | | Segall Bryant | | | & Hamill | | | | | | | |
| | | & Hamill | | | Fundamental | | | Segall Bryant & | | | Segall Bryant & | |
| | | International | | | International | | | Hamill Global All | | | Hamill Workplace | |
| | | Small Cap Fund | | | Small Cap Fund | | | Cap Fund | | | Equality Fund | |
| Tax cost of portfolio investments | | $ | 139,558,590 | | | $ | 70,074,350 | | | $ | 27,654,356 | | | $ | 21,451,460 | |
| Gross unrealized appreciation | | | 23,524,081 | | | | 24,212,480 | | | | 11,028,099 | | | | 7,151,859 | |
| Gross unrealized depreciation | | | (8,412,899 | ) | | | (5,293,251 | ) | | | (444,278 | ) | | | (143,867 | ) |
| Net unrealized appreciation on portfolio investments | | $ | 15,111,182 | | | $ | 18,919,229 | | | $ | 10,583,821 | | | $ | 7,007,992 | |
| | |
| 146 | | | www.sbhfunds.com |
| Segall Bryant & Hamill Funds | Notes to Financial Statements |
| | December 31, 2021 |
| | | | | | | | | | | | Segall Bryant & | | | | |
| | | Segall Bryant | | | Segall Bryant & | | | Segall Bryant & | | | Hamill Minicipal | | | Segall Bryant & | |
| | | & Hamill Short | | | Hamill Plus Bond | | | Hamill Quality | | | Opportunities | | | Hamill Colorado | |
| | | Term Plus Fund | | | Fund | | | High Yield Fund | | | Fund | | | Tax Free Fund | |
| Tax cost of portfolio investments | | $ | 50,666,872 | | | $ | 1,001,943,533 | | | $ | 96,390,413 | | | $ | 257,382,607 | | | $ | 553,269,816 | |
| Gross unrealized appreciation | | | 14,886 | | | | 43,919,598 | | | | 2,804,093 | | | | 5,464,957 | | | | 16,705,702 | |
| Gross unrealized depreciation | | | (312,812 | ) | | | (8,857,593 | ) | | | (820,236 | ) | | | (801,874 | ) | | | (2,921,290 | ) |
| Net unrealized appreciation (depreciation) on portfolio investments | | $ | (297,926 | ) | | $ | 35,062,005 | | | $ | 1,983,857 | | | $ | 4,663,083 | | | $ | 13,784,412 | |
The difference between book and tax basis cost of investments is attributable primarily to wash sales, passive foreign investment companies and tax treatment of certain other investments.
As of December 31, 2021, the components of distributable earnings (deficit) on a tax basis were as follows:
| | | Segall Bryant & | | | Segall Bryant & | | | Segall Bryant & | | | Segall Bryant & | | | Segall Bryant & | |
| | | Hamill Small Cap | | | Hamill Small Cap | | | Hamill Small Cap | | | Hamill All Cap | | | Hamill Emerging | |
| | | Value Fund | | | Growth Fund | | | Core Fund | | | Fund | | | Markets Fund | |
| Undistributed ordinary income | | $ | 1,388,983 | | | $ | — | | | $ | — | | | $ | — | | | $ | — | |
| Undistributed long term capital gains | | | 4,988,247 | | | | — | | | | 957,880 | | | | 3,172,411 | | | | — | |
| Accumulated capital and other losses | | | (13.036,768 | ) | | | (36,057,239 | ) | | | — | | | | (583,079 | ) | | | (909,551 | ) |
| Net unrealized appreciation on investments | | | 115,418,656 | | | | 38,778,374 | | | | 17,761,913 | | | | 89,519,518 | | | | 5,955,162 | |
| Net unrealized appreciation on foreign currency | | | — | | | | — | | | | — | | | | — | | | | 1,707 | |
| Other temporary differences | | | (66,579 | ) | | | (35,781 | ) | | | (979 | ) | | | (3,431 | ) | | | (1,033 | ) |
| Total accumulated earnings | | $ | 108,692,539 | | | $ | 2,685,354 | | | $ | 18,718,814 | | | $ | 92,105,419 | | | $ | 5,046,285 | |
| | | | | | Segall Bryant | | | | | | | | | | |
| | | Segall Bryant | | | & Hamill | | | | | | | | | | |
| | | & Hamill | | | Fundamental | | | Segall Bryant & | | | Segall Bryant & | | | Segall Bryant | |
| | | International | | | International | | | Hamill Global All | | | Hamill Workplace | | | & Hamill Short | |
| | | Small Cap Fund | | | Small Cap Fund | | | Cap Fund | | | Equality Fund | | | Term Plus Fund | |
| Undistributed ordinary income | | $ | — | | | $ | — | | | $ | — | | | $ | — | | | $ | 235 | |
| Undistributed long term capital gains | | | — | | | | 5,998,042 | | | | 494,425 | | | | 204,765 | | | | — | |
| Accumulated capital and other losses | | | (74,551,846 | ) | | | (674,851 | ) | | | — | | | | (126,634 | ) | | | — | |
| Net unrealized appreciation (depreciation) on investments | | | 15,111,182 | | | | 18,919,229 | | | | 10,583,821 | | | | 7,007,992 | | | | (297,926 | ) |
| Net unrealized appreciation (depreciation) on foreign currency | | | (3,962 | ) | | | 10,340 | | | | (151 | ) | | | — | | | | — | |
| Other temporary differences | | | (3,448 | ) | | | (30,273 | ) | | | (25,211 | ) | | | (26,952 | ) | | | (722 | ) |
| Total accumulated earnings (deficit) | | $ | (59,448,074 | ) | | $ | 24,222,487 | | | $ | 11,052,884 | | | $ | 7,059,171 | | | $ | (298,413 | ) |
| | | | | | | | | Segall Bryant & | | | | |
| | | Segall Bryant & | | | Segall Bryant & | | | Hamill Municipal | | | Segall Bryant & | |
| | | Hamill Plus Bond | | | Hamill Quality | | | Opportunities | | | Hamill Colorado | |
| | | Fund | | | High Yield Fund | | | Fund | | | Tax Free Fund | |
| Undistributed ordinary income | | $ | — | | | $ | 8,238 | | | $ | — | | | $ | — | |
| Undistributed tax-exempt income | | | — | | | | — | | | | 289 | | | | — | |
| Accumulated capital and other losses | | | (188,466 | ) | | | (8,316,184 | ) | | | (31,913 | ) | | | (490,875 | ) |
| Net unrealized appreciation on investments | | | 35,062,005 | | | | 1,983,857 | | | | 4,663,083 | | | | 13,784,412 | |
| Other temporary differences | | | (240,753 | ) | | | (28,874 | ) | | | (3,988 | ) | | | (35,115 | ) |
| Total accumulated earnings (deficit) | | $ | 34,632,786 | | | $ | (6,352,963 | ) | | $ | 4,627,471 | | | $ | 13,258,422 | |
Other Temporary Differences is primarily related to deferred Trustee compensation.
| | |
| Annual Report | December 31, 2021 | | | 147 |
| Segall Bryant & Hamill Funds | Notes to Financial Statements |
| | December 31, 2021 |
Capital loss carry forwards utilized during the year ended December 31, 2021 were as follows:
| Fund | | Amount | |
| Segall Bryant & Hamill Small Cap Value Fund | | $ | 2,381,264 | |
| Segall Bryant & Hamill Small Cap Growth Fund | | | 22,756,474 | |
| Segall Bryant & Hamill Emerging Markets Fund | | | 2,453,084 | |
| Segall Bryant & Hamill International Small Cap Fund | | | 22,828,492 | |
| Segall Bryant & Hamill Quality High Yield Fund | | | 859,321 | |
| Segall Bryant & Hamill Colorado Tax Free Fund | | | 901,522 | |
Under current law, capital losses maintain their character as short-term or long-term and are carried forward to the next tax year without expiration. As of December 31, 2021, the following amounts are available as carry forwards to the next tax year:
| Fund | | Short-Term | | | Long-Term | |
| Segall Bryant & Hamill Small Cap Value Fund | | $ | 8,021,430 | | | $ | 5,015,338 | |
| Segall Bryant & Hamill Small Cap Growth Fund | | | 36,057,239 | | | | — | |
| Segall Bryant & Hamill International Small Cap Fund | | | 59,016,421 | | | | 15,493,926 | |
| Segall Bryant & Hamill Quality High Yield Fund | | | 27,226 | | | | 8,288,958 | |
| Segall Bryant & Hamill Colorado Tax Free Fund | | | 225,727 | | | | 265,148 | |
As a result of the acquisition of the Segall Bryant & Hamill Small Cap Value Dividend Fund (the “target fund”), the Segall Bryant & Hamill Small Cap Value Fund (the “acquiring” fund) acquired the capital loss carry forward balances from the target fund totaling $13,279,390 ($8,170,713 short term and $5,108,677 long-term). The acquiring fund is eligible to utilize these amounts to offset future capital gains subject to annual limitations under IRC Section 382 of $242,622.
Net qualified late year ordinary losses and capital losses, incurred after October 31, 2021 and within the taxable year, are deemed to arise on the first day of a Fund’s next taxable year. For the year ended December 31, 2021, the following amounts were deferred to the tax year ending December 31, 2022:
| | | Late Year | | | Late Year | |
| Fund | | Ordinary Losses | | | Capital Losses | |
| Segall Bryant & Hamill All Cap Fund | | $ | — | | | $ | 583,079 | |
| Segall Bryant & Hamill Emerging Markets Fund | | | 82,174 | | | | 827,379 | |
| Segall Bryant & Hamill International Small Cap Fund | | | 41,499 | | | | — | |
| Segall Bryant & Hamill Fundamental International Small Cap Fund | | | — | | | | 674,851 | |
| Segall Bryant & Hamill Workplace Equality Fund | | | — | | | | 126,634 | |
| Segall Bryant & Hamill Plus Bond Fund | | | — | | | | 188,466 | |
| Segall Bryant & Hamill Municipal Opportunities Fund | | | — | | | | 31,913 | |
| | |
| 148 | | | www.sbhfunds.com |
| Segall Bryant & Hamill Funds | Notes to Financial Statements |
| | December 31, 2021 |
For the year ended December 31, 2021, the following reclassifications were made as a result of permanent differences between the financial statement and income tax reporting requirements:
| | | | | | Total Accumulated | |
| Fund | | Paid-in Capital | | | Earnings (Deficit) | |
| Segall Bryant & Hamill Small Cap Value Fund | | $ | (745,045 | ) | | $ | 745,045 | |
| Segall Bryant & Hamill Small Cap Growth Fund | | | (1,100,419 | ) | | | 1,100,419 | |
| Segall Bryant & Hamill Small Cap Core Fund | | | — | | | | — | |
| Segall Bryant & Hamill All Cap Fund | | | 2,949,783 | | | | (2,949,783 | ) |
| Segall Bryant & Hamill Emerging Markets Fund | | | — | | | | — | |
| Segall Bryant & Hamill International Small Cap Fund | | | 312 | | | | (312 | ) |
| Segall Bryant & Hamill Fundamental International Small Cap Fund | | | (1 | ) | | | 1 | |
| Segall Bryant & Hamill Global All Cap Fund | | | — | | | | — | |
| Segall Bryant & Hamill Workplace Equality Fund | | | — | | | | — | |
| Segall Bryant & Hamill Short Term Plus Bond Fund | | | — | | | | — | |
| Segall Bryant & Hamill Plus Bond Fund | | | (1,183 | ) | | | 1,183 | |
| Segall Bryant & Hamill Quality High Yield Fund | | | — | | | | — | |
| Segall Bryant & Hamill Municipal Opportunities Fund | | | — | | | | — | |
| Segall Bryant & Hamill Colorado Tax Free Fund | | | (1,060 | ) | | | 1,060 | |
The Funds recharacterize distributions received from Real Estate Investment Trust (“REIT”) investments based on information provided by the REIT into the following categories: ordinary income, long-term capital gains, and return of capital. If information is not available on a timely basis from the REIT, the recharacterization will be estimated based on available information which may include the previous year’s allocation. If new or additional information becomes available from the REIT at a later date, a recharacterization will be made in the following year.
As a result of several court cases in certain countries across the European Union (“EU”), some Funds may file European tax reclaims for previously withheld taxes on dividends earned in those countries. These additional filings are subject to various administrative proceedings by the local jurisdictions’ tax authorities within the EU, as well as a number of related judicial proceedings. If any such reclaims are received, they are reflected as dividend income in the Statements of Operations, and related receivables, if any, are reflected within foreign tax reclaims receivable in the Statements of Assets and Liabilities. If the associated cash is received, the Funds will follow, for tax purposes, IRS guidance in Notice 2016-10 and reduce the current year foreign taxes paid by the amount of the refund. When uncertainty exists as to the ultimate resolution of these proceedings and the likelihood of receipt of these EU reclaims, no amounts are reflected in the financial statements.
| 6. | INVESTMENT ADVISORY FEES, ADMINISTRATIVE FEES AND OTHER RELATED PARTY TRANSACTIONS |
On January 25, 2021, Segall Bryant & Hamill, LLC (the “Adviser”) entered into an agreement pursuant to which 100% of the equity of the Adviser was to be acquired by CI US Holdings Inc. (the “Transaction”). The completion of the Transaction occurred on April 30, 2021. The Transaction was deemed to result in an “assignment” within the meaning of the 1940 Act. As a result, the Board of Trustees had approved an interim advisory agreement between the Adviser and the Trust, on behalf of each Fund (the “Interim Agreement”), at a meeting held on February 17, 2021. Prior to April 30, 2021, the Trust had entered into an advisory agreement (which had been approved by the Trust’s Board of Trustees) with the Adviser for all Funds.
| | |
| Annual Report | December 31, 2021 | | | 149 |
| Segall Bryant & Hamill Funds | Notes to Financial Statements |
| | December 31, 2021 |
During the period June 10, 2021 and August 19, 2021, shareholders approved a new advisory agreement with the Adviser for all Funds. Pursuant to the current advisory agreement, the prior advisory agreement and the Interim Agreement with the Trust, the Adviser is entitled to an investment advisory fee, based on the average net assets of each Fund, computed daily and payable monthly as shown in the table below.
| Fund | | |
| Segall Bryant & Hamill Small Cap Value Fund | | 0.80% |
| Segall Bryant & Hamill Small Cap Growth Fund | | 0.65% |
| Segall Bryant & Hamill Small Cap Core Fund | | 0.80% |
| Segall Bryant & Hamill All Cap Fund | | 0.65% |
| Segall Bryant & Hamill Emerging Markets Fund | | 0.90% |
| Segall Bryant & Hamill International Small Cap Fund | | 0.90% |
| Segall Bryant & Hamill Fundamental International Small Cap Fund | | 1.00% |
| Segall Bryant & Hamill Global All Cap Fund | | 0.65% |
| Segall Bryant & Hamill Workplace Equality Fund | | 0.65% |
| Segall Bryant & Hamill Short Term Plus Fund | | 0.25% |
| Segall Bryant & Hamill Plus Bond Fund | | 0.35% |
| Segall Bryant & Hamill Quality High Yield Fund | | 0.45% |
| Segall Bryant & Hamill Municipal Opportunities Fund | | 0.35% |
| Segall Bryant & Hamill Colorado Tax Free Fund | | 0.35% |
Ultimus Fund Solutions LLC (“Ultimus”) and the Adviser serve as the Funds’ co-administrators (“Co-Administrators”). Ultimus and the Adviser are entitled to receive a total fee from each Fund for their administrative services computed daily and payable monthly based on the average net assets of the Trust. The Adviser receives a portion that is calculated based on 0.01% on the average daily net assets of the Trust.
The administrative fees are allocated to each Fund based upon the Fund’s relative proportion of the Trust’s net assets, subject to certain minimums, and are disclosed in the Statements of Operations. During the year ended December 31, 2021, the Adviser and Ultimus received $336,592 and $855,244, respectively, for their services to the Funds.
Shareholder servicing agents provide non-distribution administrative and support services to their customers, which may include establishing and maintaining accounts and records relating to shareholders, processing dividend and distribution payments from the Funds on behalf of shareholders, forwarding communications from the Funds, providing sub-accounting with respect to Fund shares, and other similar services. The Retail Class of each Fund may pay a fee at an annual rate of up to 0.25% of its average daily net assets to shareholder servicing agents and the Institutional Class of each Fund may pay a fee at an annual rate of up to 0.10% of its average daily net assets to shareholder servicing agents. These fees are included in Shareholder Servicing Fees on the Statements of Operations.
Until at least April 30, 2022, the Adviser has contractually agreed to waive the investment advisory and/or administration fees and/or to reimburse other expenses (not including acquired fund fees and expenses, taxes, brokerage expenses, and extraordinary expenses), so that the ratio of expense to average net assets as reported in each Fund’s Financial Highlights will be no more than the amounts as detailed below:
| Fund | | Retail Class | | Institutional Class |
| Segall Bryant & Hamill Small Cap Value Fund | | 1.14% | | 0.99% |
| Segall Bryant & Hamill Small Cap Growth Fund | | 1.14% | | 0.99% |
| Segall Bryant & Hamill Small Cap Core Fund | | 1.14% | | 0.99% |
| Segall Bryant & Hamill All Cap Fund | | 0.99% | | 0.84% |
| Segall Bryant & Hamill Emerging Markets Fund | | 1.38% | | 1.23% |
| Segall Bryant & Hamill International Small Cap Fund | | 1.18% | | 1.03% |
| Segall Bryant & Hamill Fundamental International Small Cap Fund | | 1.25% | | 1.10% |
| Segall Bryant & Hamill Global All Cap Fund | | 0.89% | | 0.74% |
| Segall Bryant & Hamill Workplace Equality Fund | | 0.89% | | 0.74% |
| Segall Bryant & Hamill Short Term Plus Fund | | 0.49% | | 0.40% |
| Segall Bryant & Hamill Plus Bond Fund | | 0.55% | | 0.40% |
| Segall Bryant & Hamill Quality High Yield Fund | | 0.85% | | 0.70% |
| Segall Bryant & Hamill Municipal Opportunities Fund | | 0.65% | | 0.50% |
| Segall Bryant & Hamill Colorado Tax Free Fund | | 0.65% | | 0.50% |
These amounts are not subject to recapture in future periods.
| | |
| 150 | | | www.sbhfunds.com |
| Segall Bryant & Hamill Funds | Notes to Financial Statements |
| | December 31, 2021 |
Ultimus, pursuant to a Transfer Agency Agreement, serves as Transfer Agent for each of the Funds. As Transfer Agent, Ultimus has, among other things, agreed to: (a) issue and redeem shares of the Funds; (b) make dividend and other distributions to shareholders of the Funds; (c) effect transfers of shares; (d) mail communications to shareholders of the Funds, including account statements, confirmations, and dividend and distribution notices; (e) facilitate the electronic delivery of shareholder statements and reports and (f) maintain shareholder accounts. Under the Transfer Agency Agreement, Ultimus receives from the Trust an annual minimum fee per Fund, a fee based upon each shareholder account and is reimbursed for out-of-pocket expenses.
Certain officers of the Funds are also officers of the Adviser and Ultimus. All access persons of the Trust, as defined in the 1940 Act, and officers and employees of the Adviser, follow strict guidelines and policies on personal trading as outlined in the Trust’s and the Adviser’s respective Code of Ethics.
The Trustees have appointed a Chief Compliance Officer who is also the Treasurer of the Trust and an employee of the Adviser. The Trustees agreed to have the Funds pay the portion of his compensation attributable for services rendered as the Trust’s Chief Compliance Officer.
The Trust has a Trustee Deferred Compensation Plan (the “Deferral Plan”) which allows the Trustees to defer the receipt of all or a portion of Trustees fees. Under the Deferral Plan, Trustee fees are paid and invested directly into shares of the Funds elected by the Trustees in the Deferral Plan. There is no future liability related to the balance in the Deferral Plan as such amounts are paid directly out of the respective capital accounts of the elected Funds. The amount paid to the Trustees under the Deferral Plan will be determined based upon the performance of the elected funds. The balance in the Deferral Plan as of December 31, 2021 is $905,233.
| 7. | FAIR VALUE MEASUREMENTS |
A three-tier hierarchy has been established to measure fair value based on the extent of use of “observable inputs” as compared to “unobservable inputs” for disclosure purposes and requires additional disclosures about these valuation measurements. Inputs refer broadly to the assumptions that market participants would use in pricing a security. Observable inputs are inputs that reflect the assumptions market participants would use in pricing the security developed based on market data obtained from sources independent of the reporting entity. Unobservable inputs are inputs that reflect the reporting entity’s own assumptions about the assumptions market participants would use in pricing the security developed based on the best information available in the circumstances.
The three-tier hierarchy is summarized as follows:
| 1) | Level 1 – Unadjusted Quoted Prices in active markets for identical investments |
| 2) | Level 2 – Other Significant Observable Inputs (including quoted prices for similar investments, interest rates, prepayment speeds, credit risk, etc.) |
| 3) | Level 3 – Significant Unobservable Inputs (including the Fund’s own assumptions in determining the fair value of investments). |
The following is a summary of each Fund’s investments and other financial instruments (if any) and the inputs used to value the investments and other financial instruments as of December 31, 2021:
| Segall Bryant & Hamill Small Cap Value Fund | |
| | |
| | | Level 1 | | | Level 2 | | | Level 3 | | | Total | |
| Common Stocks | | $ | 587,349,838 | | | $ | — | | | $ | — | | | $ | 587,349,838 | |
| Total | | $ | 587,349,838 | | | $ | — | | | $ | — | | | $ | 587,349,838 | |
| | | | | | | | | | | | | | | | | |
| Segall Bryant & Hamill Small Cap Growth Fund | |
| | |
| | | Level 1 | | | Level 2 | | | Level 3 | | | Total | |
| Common Stocks | | $ | 237,560,212 | | | $ | — | | | $ | — | | | $ | 237,560,212 | |
| Total | | $ | 237,560,212 | | | $ | — | | | $ | — | | | $ | 237,560,212 | |
| | | | | | | | | | | | | | | | | |
| Segall Bryant & Hamill Small Cap Core Fund | |
| | |
| | | Level 1 | | | Level 2 | | | Level 3 | | | Total | |
| Common Stocks | | $ | 50,237,858 | | | $ | — | | | $ | — | | | $ | 50,237,858 | |
| Total | | $ | 50,237,858 | | | $ | — | | | $ | — | | | $ | 50,237,858 | |
| | |
| Annual Report | December 31, 2021 | | | 151 |
| Segall Bryant & Hamill Funds | Notes to Financial Statements |
| | December 31, 2021 |
| Segall Bryant & Hamill All Cap Fund | |
| | |
| | | Level 1 | | | Level 2 | | | Level 3 | | | Total | |
| Common Stocks | | $ | 183,558,377 | | | $ | — | | | $ | — | | | $ | 183,558,377 | |
| Total | | $ | 183,558,377 | | | $ | — | | | $ | — | | | $ | 183,558,377 | |
| | | | | | | | | | | | | | | | | |
| Segall Bryant & Hamill Emerging Markets Fund | |
| | |
| | | Level 1 | | | Level 2 | | | Level 3 | | | Total | |
| Common Stocks | | $ | 15,427,090 | | | $ | 40,802,722 | | | $ | 398,320 | * | | $ | 56,628,132 | |
| Preferred Stocks | | | 434,343 | | | | 552,538 | | | | — | | | | 986,881 | |
| Rights | | | — | | | | 0 | | | | — | | | | 0 | |
| Warrants | | | — | | | | 432 | | | | — | | | | 432 | |
| Total | | $ | 15,861,433 | | | $ | 41,355,692 | | | $ | 398,320 | * | | $ | 57,615,445 | |
| | | | | | | | | | | | | | | | | |
| Segall Bryant & Hamill International Small Cap Fund | |
| | |
| | | Level 1 | | | Level 2 | | | Level 3 | | | Total | |
| Common Stocks | | $ | 17,304,451 | | | $ | 137,194,769 | | | $ | 0 | * | | $ | 154,499,220 | |
| Preferred Stocks | | | — | | | | 170,552 | | | | — | | | | 170,552 | |
| Total | | $ | 17,304,451 | | | $ | 137,365,321 | | | $ | 0 | * | | $ | 154,669,772 | |
| | | | | | | | | | | | | | | | | |
| Segall Bryant & Hamill Fundamental International Small Cap Fund | |
| | |
| | | Level 1 | | | Level 2 | | | Level 3 | | | Total | |
| Common Stocks | | $ | 52,720,055 | | | $ | 36,273,524 | | | $ | — | | | $ | 88,993,579 | |
| Total | | $ | 52,720,055 | | | $ | 36,273,524 | | | $ | — | | | $ | 88,993,579 | |
| Other Financial Instruments** | |
| Forward Foreign Currency Contracts, Unrealized Gain | | $ | — | | | $ | 375,483 | | | $ | — | | | $ | 375,483 | |
| Forward Foreign Currency Contracts, Unrealized Loss | | | — | | | | (575,143 | ) | | | — | | | | (575,143 | ) |
| Total | | $ | — | | | $ | (199,660 | ) | | $ | — | | | $ | (199,660 | ) |
| | | | | | | | | | | | | | | | | |
| Segall Bryant & Hamill Global All Cap Fund | |
| | |
| | | Level 1 | | | Level 2 | | | Level 3 | | | Total | |
| Common Stocks | | $ | 27,814,043 | | | $ | 10,424,134 | | | $ | — | | | $ | 38,238,177 | |
| Total | | $ | 27,814,043 | | | $ | 10,424,134 | | | $ | — | | | $ | 38,238,177 | |
| | | | | | | | | | | | | | | | | |
| Segall Bryant & Hamill Workplace Equality Fund | |
| | |
| | | Level 1 | | | Level 2 | | | Level 3 | | | Total | |
| Common Stocks | | $ | 28,459,452 | | | $ | — | | | $ | — | | | $ | 28,459,452 | |
| Total | | $ | 28,459,452 | | | $ | — | | | $ | — | | | $ | 28,459,452 | |
| | | | | | | | | | | | | | | | | |
| Segall Bryant & Hamill Short Term Plus Fund | |
| | |
| | | Level 1 | | | Level 2 | | | Level 3 | | | Total | |
| Corporate Bonds | | $ | — | | | $ | 42,587,502 | | | $ | — | | | $ | 42,587,502 | |
| Municipal Bonds | | | — | | | | 3,087,018 | | | | — | | | | 3,087,018 | |
| Asset Backed Securities | | | — | | | | 61 | | | | — | | | | 61 | |
| Commercial Mortgage-Backed Securities | | | — | | | | 859,534 | | | | — | | | | 859,534 | |
| U.S. Government & Agencies | | | — | | | | 482,729 | | | | — | | | | 482,729 | |
| U.S. Treasury Bonds & Notes | | | — | | | | 3,352,102 | | | | — | | | | 3,352,102 | |
| Total | | $ | — | | | $ | 50,368,946 | | | $ | — | | | $ | 50,368,946 | |
| | |
| 152 | | | www.sbhfunds.com |
| Segall Bryant & Hamill Funds | Notes to Financial Statements |
| | December 31, 2021 |
| Segall Bryant & Hamill Plus Bond Fund | |
| | |
| | | Level 1 | | | Level 2 | | | Level 3 | | | Total | |
| Corporate Bonds | | $ | — | | | $ | 522,252,065 | | | $ | — | | | $ | 522,252,065 | |
| Municipal Bonds | | | — | | | | 105,461,298 | | | | — | | | | 105,461,298 | |
| Asset Backed Securities | | | — | | | | 25,197,305 | | | | — | | | | 25,197,305 | |
| Residential Mortgage-Backed Securities | | | — | | | | 3,364,555 | | | | — | | | | 3,364,555 | |
| Mortgage-Backed Securities Passthrough | | | — | | | | 219,294,390 | | | | — | | | | 219,294,390 | |
| U.S. Treasury Bonds & Notes | | | — | | | | 161,435,925 | | | | — | | | | 161,435,925 | |
| Total | | $ | — | | | $ | 1,037,005,538 | | | $ | — | | | $ | 1,037,005,538 | |
| | | | | | | | | | | | | | | | | |
| Segall Bryant & Hamill Quality High Yield Fund | |
| | |
| | | Level 1 | | | Level 2 | | | Level 3 | | | Total | |
| Corporate Bonds | | $ | — | | | $ | 98,374,270 | | | $ | — | | | $ | 98,374,270 | |
| Total | | $ | — | | | $ | 98,374,270 | | | $ | — | | | $ | 98,374,270 | |
| | | | | | | | | | | | | | | | | |
| Segall Bryant & Hamill Municipal Opportunities Fund | |
| | |
| | | Level 1 | | | Level 2 | | | Level 3 | | | Total | |
| Municipal Bonds | | $ | — | | | $ | 253,753,876 | | | $ | — | | | $ | 253,753,876 | |
| Corporate Bonds | | | — | | | | 8,291,814 | | | | — | | | | 8,291,814 | |
| Total | | $ | — | | | $ | 262,045,690 | | | $ | — | | | $ | 262,045,690 | |
| | | | | | | | | | | | | | | | | |
| Segall Bryant & Hamill Colorado Tax Free Fund | |
| | |
| | | Level 1 | | | Level 2 | | | Level 3 | | | Total | |
| Municipal Bonds | | $ | — | | | $ | 567,054,228 | | | $ | — | | | $ | 567,054,228 | |
| Total | | $ | — | | | $ | 567,054,228 | | | $ | — | | | $ | 567,054,228 | |
| * | Includes securities that have been fair valued at $0. |
| ** | Other financial instruments are derivative financial instruments not reflected in the Statements of Investments. These forward foreign currency contracts are valued at the unrealized appreciation (depreciation) on the instrument. |
The following is a reconciliation of Level 3 instruments of the Funds for which significant unobservable inputs were used to determine fair value for the year ended December 31, 2021:
| Segall Bryant & Hamill Emerging Markets Fund | |
| | |
| | | | | | | | | | | | | | | Change in | | | | | | | | | | |
| | | Balance as of | | | | | | | | | | | | Unrealized | | | | | | | | | Balance as of | |
| | | December 31, | | | Net | | | | | | Realized | | | Appreciation | | | Transfer Into | | | Transfer Out | | | December 31, | |
| Asset Type | | 2020 | | | Purchases | | | Net Sales | | | Losses | | | (Depreciation) | | | Level 3 | | | of Level 3 | | | 2021 | |
| Common Stocks | | $ | 6,371 | | | $ | — | | | $ | 6,506 | | | $ | (78,287 | ) | | $ | 65,410 | | | $ | 398,320 | | | $ | — | | | $ | 398,320 | |
| | | | | | | | | | | | | | | | | | | | | | | | | | | | | | | | | |
| Segall Bryant & Hamill International Small Cap Fund | |
| | |
| | | | | | | | | | | | | | | Change in | | | | | | | | | | |
| | | Balance as of | | | | | | | | | | | | Unrealized | | | | | | | | | Balance as of | |
| | | December 31, | | | Net | | | | | | Realized | | | Appreciation | | | Transfer Into | | | Transfer Out | | | December 31, | |
| Asset Type | | 2020 | | | Purchases | | | Net Sales | | | Losses | | | (Depreciation) | | | Level 3 | | | of Level 3 | | | 2021 | |
| Common Stocks | | $ | 283,839 | | | $ | — | | | $ | 0 | | | $ | (416,952 | ) | | $ | 133,113 | | | $ | — | | | $ | — | | | $ | 0 | |
| | | | | | | | | | | | | | | | | | | | | | | | | | | | | | | | | |
| Segall Bryant & Hamill Fundamental International Small Cap Fund | |
| | |
| | | | | | | | | | | | | | | Change in | | | | | | | | | | |
| | | Balance as of | | | | | | | | | | | | Unrealized | | | | | | | | | Balance as of | |
| | | December 31, | | | Net | | | | | | Realized | | | Appreciation | | | Transfer Into | | | Transfer Out | | | December 31, | |
| Asset Type | | 2020 | | | Purchases | | | Net Sales | | | Gains | | | (Depreciation) | | | Level 3 | | | of Level 3 | | | 2021 | |
| Common Stocks | | $ | 98,020 | | | $ | — | | | $ | — | | | $ | — | | | $ | — | | | $ | — | | | $ | (98,020 | ) | | $ | — | |
| | |
| Annual Report | December 31, 2021 | | | 153 |
| Segall Bryant & Hamill Funds | Notes to Financial Statements |
| | December 31, 2021 |
The following table presents additional information about valuation methodologies and inputs used for investments that are measured at fair value and categorized within Level 3 as of December 31, 2021:
| | | | | | | | | | | | Impact to |
| | | Fair Value as of | | | Valuation | | Unobservable | | | | Valuation from an |
| | | December 31, 2021 | | | Technique | | Input(1) | | Value/Range | | Increase in Input(2) |
| Segall Bryant & Hamill Emerging Markets Fund | | $ | 398,320 | | | Adjusted trade price | | Discount Factor | | 16% | | Decrease |
| Segall Bryant & Hamill International Small Cap Fund | | $ | 0 | | | Adjusted trade price | | Discount Factor | | 100% | | Decrease |
| (1) | The investment adviser considers relevant indications of value that are reasonably and timely available to it in determining the fair value to be assigned to a particular security, such as the type and cost of the security; contractual or legal restrictions on resale of the security; relevant financial or business developments of the issuer; actively traded related securities; conversion or exchange rights on the security; related corporate actions; significant events occurring after the close of trading in the security; and changes in overall market conditions. The Fund’s use of fair value pricing may cause the net asset value of Fund shares to differ from the net asset value that would be calculated using market quotations. Fair value pricing involves subjective judgments and it is possible that the fair value determined for a security may be materially different than the value that could be realized upon the sale of that security. |
| (2) | This column represents the directional change in the fair value of the Level 3 investments that would result from an increase to the corresponding unobservable input. A decrease to the unobservable input would have the opposite effect. |
The inputs or methodologies used for valuing securities are not necessarily an indication of the risk associated with investing in those securities.
For fair value measurements using significant other observable inputs (Level 2), the Funds utilize an independent pricing service which utilizes evaluated pricing models that vary by asset class and incorporate available trade, bid and other market information, and for structured securities also incorporate cash flow and, when available, loan performance data. The independent pricing service’s evaluated pricing models apply available market information through processes such as benchmark curves, benchmarking of similar securities, and sector groupings. For certain securities, the independent pricing service uses model processes, such as the Option Adjusted Spread (benchmark driven) model, to assess interest rate impact and develop prepayment scenarios. With respect to trades and bids, the independent pricing service reviews the lot size to determine whether the information is representative of an orderly trading market. If the independent pricing service determines that trade or bid information is not consistent with other information available, the trade or bid will not be reflected in the evaluated price.
Corporate bonds, Municipal bonds and U.S. Treasury bonds & notes are valued using market models that consider trade data, quotations from dealers and active market makers, relevant yield curve and spread data, creditworthiness, trade data or market information on comparable securities, and other relevant security specific information. Mortgage-related and asset-backed securities are valued based on models that consider trade data, prepayment and default projections, benchmark yield and spread data and estimated cash flows of each tranche of the issuer. Forward foreign currency contracts are normally valued on the basis of quotes obtained from brokers and dealers or independent pricing services.
In the event the independent pricing service is unable to provide an evaluated price for a security or the Adviser believes the price provided is not reliable, securities of the Funds may be valued in good faith as described above in Note 2. In these instances, the co-administrators will typically seek input from the investment team of the Fund since they are typically the most knowledgeable of the relevant factors in valuing the securities. The Adviser may seek to find an alternative independent source, such as a broker/dealer to provide a price quote, or by using evaluated pricing models similar to the techniques and models used by the independent pricing service. These fair value measurement techniques may utilize unobservable inputs (Level 3).
At least quarterly, the Adviser receives a report on the pricing for all fair valued securities during the period along with any actual sales prices, broker quotes and/or pricing from the independent pricing service. The Adviser uses this information to analyze changes in fair value measurements over the period and as a back test of pricing methods.
Then on at least a quarterly basis, the Adviser presents the factors considered in determining the fair value measurements and presents that information to the Audit Committee of the Board of Trustees which meets at least quarterly. The Audit Committee of the Board of Trustees then will provide a recommendation to the Board of Trustees for approval of the fair value measurements.
| 8. | FORWARD FOREIGN CURRENCY EXCHANGE CONTRACTS |
The Segall Bryant & Hamill Fundamental International Small Cap Fund may purchase or sell foreign currencies on a “spot” or cash basis at the prevailing rate in the foreign currency exchange market to settle investment transactions in the proper currency. In addition, this Fund may purchase or sell forward currency contracts to adjust the portfolio’s exposure to different currencies consistent with the investment team’s targets, which consider the currency weightings within the Fund’s benchmark index.
| | |
| 154 | | | www.sbhfunds.com |
| Segall Bryant & Hamill Funds | Notes to Financial Statements |
| | December 31, 2021 |
When entering into a spot or forward foreign currency contract, the Fund agrees to receive or deliver a fixed quantity of foreign currency for an agreed upon price on an agreed future date. These contracts are valued at each portfolio valuation, and the Fund’s net equity therein, representing unrealized gain or loss on the contracts as measured by the difference between the contractual rates at the dates of entry into the contracts and the spot or forward rates at the reporting date, is included in the Statements of Assets and Liabilities. Realized gains and losses and change in unrealized appreciation and depreciation are included in the Statements of Operations. These instruments involve credit risk and market risk in excess of the amount recognized in the Statements of Assets and Liabilities. Risks arise from the possible inability of counterparties to meet the terms of their contracts and from movement in currency exchange rates.
The Fund must segregate assets determined to be liquid in accordance with procedures established by the Board of Trustees, or otherwise cover its position in a permissible manner.
During the year ended December 31, 2021, the Fund had average forward foreign currency contract values to buy and sell of $35,061,073 and $25,269,370, respectively.
The effect of derivative instruments on the Statements of Assets and Liabilities as of December 31, 2021 is as follows:
Segall Bryant & Hamill Fundamental International Small Cap Fund
| | | Asset Derivatives | | Liability Derivatives |
| | | Statement of Assets and | | | | | Statement of Assets and | | | |
| Risk Exposure | | Liabilities Location | | Fair Value | | | Liabilities Location | | Fair Value | |
| Forward Foreign Currency Contracts (Foreign Exchange Rate Risk) | | Unrealized gain on forward foreign currency contracts | | $ | 375,483 | | | Unrealized loss on forward foreign currency contracts | | $ | (575,143 | ) |
| Total | | | | $ | 375,483 | | | | | $ | (575,143 | ) |
The effect of derivative instruments on the Statements of Operations for the year ended December 31, 2021 is as follows:
Segall Bryant & Hamill Fundamental International Small Cap Fund
| | | | | | | | Change in | |
| | | | | | | | Unrealized | |
| | | | | | | | Appreciation | |
| | | | | Realized Losses | | | (Depreciation) | |
| | | | | on Derivatives | | | on Derivatives | |
| | | | | Recognized in | | | Recognized in | |
| Risk Exposure | | Statement of Operations Location | | Income | | | Income | |
| Forward Foreign Currency Contracts (Foreign Exchange Rate Risk) | | Realized and unrealized gains (losses) on forward foreign currency contracts | | $ | (603,045 | ) | | $ | 25,612 | |
| Total | | | | $ | (603,045 | ) | | $ | 25,612 | |
| | |
| Annual Report | December 31, 2021 | | | 155 |
| Segall Bryant & Hamill Funds | Notes to Financial Statements |
| | December 31, 2021 |
| 9. | PURCHASES AND SALES OF INVESTMENTS |
Investment transactions for the year ended December 31, 2021 excluding long-term U.S. government securities and short-term investments were as follows:
| | | Purchases of | | | Proceeds from Sales | |
| Fund | | Securities | | | of Securities | |
| Segall Bryant & Hamill Small Cap Value Fund | | $ | 298,425,983 | | | $ | 167,879,977 | |
| Segall Bryant & Hamill Small Cap Growth Fund | | | 160,504,031 | | | | 59,523,401 | |
| Segall Bryant & Hamill Small Cap Core Fund | | | 18,228,042 | | | | 25,476,160 | |
| Segall Bryant & Hamill All Cap Fund | | | 55,190,616 | | | | 87,014,454 | |
| Segall Bryant & Hamill Emerging Markets Fund | | | 59,625,538 | | | | 50,950,126 | |
| Segall Bryant & Hamill International Small Cap Fund | | | 204,809,418 | | | | 251,635,210 | |
| Segall Bryant & Hamill Fundamental International Small Cap Fund | | | 68,515,140 | | | | 37,848,476 | |
| Segall Bryant & Hamill Global All Cap Fund | | | 8,502,315 | | | | 13,101,350 | |
| Segall Bryant & Hamill Workplace Equality Fund | | | 14,486,954 | | | | 12,068,666 | |
| Segall Bryant & Hamill Short Term Plus Fund | | | 41,652,123 | | | | 15,575,075 | |
| Segall Bryant & Hamill Plus Bond Fund | | | 532,322,622 | | | | 558,278,930 | |
| Segall Bryant & Hamill Quality High Yield Fund | | | 42,516,554 | | | | 22,135,650 | |
| Segall Bryant & Hamill Municipal Opportunities Fund | | | 162,981,623 | | | | 61,488,007 | |
| Segall Bryant & Hamill Colorado Tax Free Fund | | | 185,452,291 | | | | 77,034,633 | |
| | | | | | | | | |
| | | Purchase of | | | Proceeds from | |
| | | Long Term U.S. | | | Sales of Long Term | |
| | | Government | | | U.S. Government | |
| Fund | | Obligations | | | Obligations | |
| Segall Bryant & Hamill Short Term Plus Fund | | $ | 3,078,871 | | | $ | 680,214 | |
| Segall Bryant & Hamill Plus Bond Fund | | | 45,430,427 | | | | 48,309,678 | |
| Segall Bryant & Hamill Municipal Opportunities Fund | | | 15,104,766 | | | | 15,034,766 | |
In the normal course of business, the Trust, on behalf of the Funds, enters into contracts that provide general indemnifications. The Funds’ maximum exposure under these arrangements is dependent on claims that may be made against the Funds in the future and, therefore, cannot be estimated; however, based on experience, the risk of material loss from such claims is considered remote.
The Funds are required to recognize in the financial statements the effects of all subsequent events that provide additional evidence about conditions that existed as of the date of the Statements of Assets and Liabilities. For non-recognized subsequent events that must be disclosed to keep the financial statements from being misleading, the Funds are required to disclose the nature of the event as well as an estimate of its financial effect, or a statement that such an estimate cannot be made. Management has evaluated subsequent events through the issuance of these financial statements and has noted no such events.
| | |
| 156 | | | www.sbhfunds.com |
| Segall Bryant & Hamill Funds | Report of Independent | |
| Registered Public Accounting Firm | |
To the Shareholders of Segall Bryant & Hamill Funds and
Board of Trustees of Segall Bryant & Hamill Trust
Opinion on the Financial Statements
We have audited the accompanying statements of assets and liabilities, including the statements of investments, of Segall Bryant & Hamill Small Cap Value Fund, Segall Bryant & Hamill Small Cap Growth Fund, Segall Bryant & Hamill Small Cap Core Fund, Segall Bryant & Hamill All Cap Fund, Segall Bryant & Hamill Emerging Markets Fund, Segall Bryant & Hamill International Small Cap Fund, Segall Bryant & Hamill Fundamental International Small Cap Fund, Segall Bryant & Hamill Global All Cap Fund, Segall Bryant & Hamill Workplace Equality Fund, Segall Bryant & Hamill Short Term Plus Fund, Segall Bryant & Hamill Plus Bond Fund, Segall Bryant & Hamill Quality High Yield Fund, Segall Bryant & Hamill Municipal Opportunities Fund, and Segall Bryant & Hamill Colorado Tax Free Fund (the “Funds”), each a series of Segall Bryant & Hamill Trust, as of December 31, 2021, the related statements of operations for the year then ended, the statements of changes in net assets for each of the two years in the period then ended, the related notes, and the financial highlights for each of the two years in the period then ended (collectively referred to as the “financial statements”). In our opinion, the financial statements present fairly, in all material respects, the financial position of each of the Funds as of December 31, 2021, the results of their operations for the year then ended, the changes in net assets, and the financial highlights for each of the two years in the period then ended, in conformity with accounting principles generally accepted in the United States of America.
The Funds’ financial highlights for the years ended December 31, 2019, and prior were audited by other auditors, whose report dated March 2, 2020 expressed an unqualified opinion on those financial statements and financial highlights.
Basis for Opinion
These financial statements are the responsibility of the Funds’ management. Our responsibility is to express an opinion on the Funds’ financial statements based on our audits. We are a public accounting firm registered with the Public Company Accounting Oversight Board (United States) (“PCAOB”) and are required to be independent with respect to the Funds in accordance with the U.S. federal securities laws and the applicable rules and regulations of the Securities and Exchange Commission and the PCAOB.
We conducted our audits in accordance with the standards of the PCAOB. Those standards require that we plan and perform the audit to obtain reasonable assurance about whether the financial statements are free of material misstatement whether due to error or fraud.
Our audits included performing procedures to assess the risks of material misstatement of the financial statements, whether due to error or fraud, and performing procedures that respond to those risks. Such procedures included examining, on a test basis, evidence regarding the amounts and disclosures in the financial statements. Our procedures included confirmation of securities owned as of December 31, 2021, by correspondence with the custodian, brokers and counterparties; when replies were not received from brokers, we performed other auditing procedures. Our audits also included evaluating the accounting principles used and significant estimates made by management, as well as evaluating the overall presentation of the financial statements. We believe that our audits provide a reasonable basis for our opinion.
We have served as the Funds’ auditor since 2020.

COHEN & COMPANY, LTD.
Cleveland, Ohio
March 1, 2022
| | |
| Annual Report | December 31, 2021 | | | 157 |
| Segall Bryant & Hamill Funds | Shareholder Tax Information |
| | December 31, 2021 (Unaudited) |
Certain tax information regarding the Trust is required to be provided to shareholders based upon each Fund’s income and distributions for the twelve months ended December 31, 2021.
During the year ended December 31, 2021, 88.06% of the dividends paid by Segall Bryant & Hamill Municipal Opportunities Fund from net investment income should be treated as tax-exempt dividends.
During the year ended December 31, 2021, 95.91% of the dividends paid by Segall Bryant & Hamill Colorado Tax Free Fund from net investment income should be treated as tax-exempt dividends.
The Funds designate the following for federal income tax purposes for distributions made during the calendar year ended December 31, 2021:
| | | Qualified Dividend | | Dividend Received |
| | | Income (QDI) | | Deduction (DRD) |
| Segall Bryant & Hamill Small Cap Value Fund | | 29.22% | | 35.73% |
| Segall Bryant & Hamill Small Cap Growth Fund | | 0.00% | | 0.00% |
| Segall Bryant & Hamill Small Cap Core Fund | | 25.55% | | 23.70% |
| Segall Bryant & Hamill All Cap Fund | | 30.29% | | 30.45% |
| Segall Bryant & Hamill Emerging Markets Fund | | 72.93% | | 0.01% |
| Segall Bryant & Hamill International Small Cap Fund | | 27.85% | | 0.66% |
| Segall Bryant & Hamill Fundamental International Small Cap Fund | | 62.46% | | 0.00% |
| Segall Bryant & Hamill Global All Cap Fund | | 48.78% | | 26.86% |
| Segall Bryant & Hamill Workplace Equality Fund | | 33.11% | | 35.55% |
| Segall Bryant & Hamill Short Term Plus Fund | | 0.00% | | 0.00% |
| Segall Bryant & Hamill Plus Bond Fund | | 0.00% | | 0.00% |
| Segall Bryant & Hamill Quality High Yield Fund | | 0.00% | | 0.00% |
| Segall Bryant & Hamill Municipal Opportunities Fund | | 0.00% | | 0.00% |
| Segall Bryant & Hamill Colorado Tax Free Fund | | 0.00% | | 0.00% |
| | | | | |
| During the year ended December 31, 2021, the Funds paid the following long-term capital gain distributions: |
| | | | | |
| Segall Bryant & Hamill Small Cap Value Fund | | | | $ | 10,404,575 |
| Segall Bryant & Hamill Small Cap Growth Fund | | | | — |
| Segall Bryant & Hamill Small Cap Core Fund | | | | 6,882,637 |
| Segall Bryant & Hamill All Cap Fund | | | | 15,286,337 |
| Segall Bryant & Hamill Emerging Markets Fund | | | | 1,221,048 |
| Segall Bryant & Hamill International Small Cap Fund | | | | — |
| Segall Bryant & Hamill Fundamental International Small Cap Fund | | | | 5,906,123 |
| Segall Bryant & Hamill Global All Cap Fund | | | | 674,258 |
| Segall Bryant & Hamill Workplace Equality Fund | | | | 1,159,602 |
| Segall Bryant & Hamill Short Term Plus Fund | | | | 19,922 |
| Segall Bryant & Hamill Plus Bond Fund | | | | 6,776,101 |
| Segall Bryant & Hamill Quality High Yield Fund | | | | — |
| Segall Bryant & Hamill Municipal Opportunities Fund | | | | — |
| Segall Bryant & Hamill Colorado Tax Free Fund | | | | — |
| | |
| 158 | | | www.sbhfunds.com |
| Segall Bryant & Hamill Trustees and Officers: |
| Janice M. Teague, Chair |
| Thomas J. Abood, Trustee |
| John A. DeTore, Trustee |
| Rick A. Pederson, Trustee |
| James A. Smith, Trustee |
| Lloyd “Chip” Voneiff, Trustee |
| Philip L. Hildebrandt, President |
| Jasper R. Frontz, Treasurer & Chief Compliance Officer |
| Jennifer L. Leamer, Asst. Treasurer |
| Maggie Bull, Secretary |
| |

| |
| FOR MORE INFORMATION ABOUT SEGALL BRYANT & HAMILL FUNDS, PLEASE CONTACT: |
| |
| Segall Bryant & Hamill Funds | 225 Pictoria Drive, Suite 450 | Cincinnati, Ohio 45246 |
| Individual Investors: (800) 392-2673 | Financial Advisors: (800) 734-9738 | www.sbhfunds.com |
| |
A description of the policies and procedures that Segall Bryant & Hamill Funds uses to determine how to vote proxies relating to portfolio securities and information regarding how each Fund voted proxies relating to portfolio securities during the most recent 12-month period ended June 30 is available (i) without charge, upon request, by calling toll-free (800) 392-2673; (ii) on the Funds’ website, www.sbhfunds.com; and (iii) on the Securities and Exchange Commission website at www.sec.gov.
Each Fund files a complete schedule of portfolio holdings with the Securities and Exchange Commission (“SEC”) as of the end of the first and third quarters of each fiscal year as an exhibit to Form N-PORT within 60 days after each fiscal quarter-end. Copies of the Segall Bryant & Hamill Funds exhibits to Form N-PORT are available without a charge, upon request, by contacting Segall Bryant & Hamill Funds toll-free at (800) 392-2673 and on the SEC’s website at www.sec.gov.
This report has been prepared for Segall Bryant & Hamill Funds shareholders and may be distributed to others only if preceded or accompanied by a prospectus.
Funds distributed by Ultimus Fund Distributors, LLC
SBH-AR-21
| (a) | The registrant, as of the end of the period covered by this report, has adopted a code of ethics that applies to the registrant’s principal executive officer, principal financial officer, principal accounting officer or controller, or persons performing similar functions regardless of whether these individuals are employed by the registrant or a third party. |
| (c) | During the period covered by this report, no amendments were made to the provisions of the code of ethics adopted in Item 2(a) above. |
| (d) | During the period covered by this report, no implicit or explicit waivers to the provisions of the code of ethics adopted in Item 2(a) above were granted. |
| (f) | A copy of the registrant’s code of ethics is filed as Exhibit 12(a)(1) to this report. |
| Item 3. | Audit Committee Financial Expert. |
The Board of Trustees of the registrant has determined that the registrant has a least one “audit committee financial expert” serving on its audit committee. The Board of Trustees has designated Lloyd “Chip” Voneiff as the registrant’s “audit committee financial expert.” Mr. Voneiff is “independent” as defined in Item 3(a)(2) of Form N-CSR.
| Item 4. | Principal Accountant Fees and Services. |
| (a) | Audit Fees: For the registrant’s fiscal years ended December 31, 2021 and December 31, 2020, the aggregate fees billed for professional services rendered by the principal accountant for the audit of the registrant’s annual financial statements were $166,600 and $166,600, respectively. |
| (b) | Audit-Related Fees: For the registrant’s fiscal years ended December 31, 2021 and December 31, 2020, no fees were billed for assurance and related services by the principal accountant that are reasonably related to the performance of the audit of the registrant’s financial statements and are not reported under paragraph (a) of this Item. |
| (c) | Tax Fees: For the registrant’s fiscal years ended December 31, 2021 and December 31, 2020, the aggregate fees billed for professional services rendered by the principal accountant for tax compliance, tax advice and tax planning were $42,000 and $42,000, respectively. The fiscal year tax fees were for review of each Fund’s federal and excise tax returns and year-end distributions. |
| (d) | All Other Fees: For the registrant’s fiscal years ended December 31, 2021 and December 31, 2020, no fees were billed by the principal accountant for products and services other than the services reported in paragraph (a) through (c) of this Item. |
| (e) | (1) The registrant’s Audit Committee has not adopted pre-approval policies and procedures for specific services, although the Audit Committee chairman may pre-approve audit and no-audit services pursuant to delegated authority, subject to ratification by the Audit Committee at the next meeting. Instead, the Audit Committee approves on a case-by-case basis each audit or non-audit service before engaging the accountant to render such service. |
(e)(2) No services described in paragraphs (b) through (d) of this Item were approved by the Audit Committee pursuant to (c)(7)(i)(C) of Rule 2-01 of Regulation S-X.
(f) Not applicable.
(g) Aggregate non-audit fees of $42,000 and $42,000 were billed by the registrant’s principal accountant for services rendered to the registrant and to registrant’s investment adviser and any entity controlling, controlled by, or under common control with the adviser that provides ongoing services to the registrant for each of fiscal year ended December 31, 2021 and December 31, 2020, respectively. All such services were rendered to the registrant.
| Item 5. | Audit Committee of Listed Registrants. |
Not applicable
| (a) | Schedule of Investments in securities of unaffiliated issuers as of the close of the reporting period is included as part of the Reports to Stockholders filed under Item 1 of this form. |
| Item 7. | Disclosure of Proxy Voting Policies and Procedures for Closed-End Management Investment Companies. |
Not applicable
| Item 8. | Portfolio Managers of Closed-End Management Investment Companies. |
Not applicable
| Item 9. | Purchases of Equity Securities by Closed-End Management Investment Company and Affiliated Purchasers. |
Not applicable
| Item 10. | Submission of Matters to a Vote of Security Holders. |
There have been no material changes to the procedures by which shareholders may recommend nominees to the registrant’s Board of Trustees, where those changes were implemented after the registrant last provided disclosure in response to the requirements of Item 407(c)(2)(iv) of Regulation S-K or this Item.
| Item 11. | Controls and Procedures. |
(a) The registrant’s principal executive officer and principal financial officer have concluded that the registrant’s disclosure controls and procedures (as defined in Rule 30a-3(c) under the Investment Company Act of 1940, as amended) (the “1940 Act”) (17 CFR 270.30a-3(e)) are effective based on the evaluation of these controls and procedures required by Rule 30a-3(b) under the 1940 Act (17 CFR 270.30a-3(b)) and Rules 13a-15(b) of 15d-15(b) under the Securities Exchange Act of 1934 (17 CFR 240.13a-15(b) or 240.15d-15(b)) as of a date within 90 days of the filing date of this report.
(b) There was no change in the registrant’s internal control over financial reporting (as defined in Rule 30a-3(d) under the 1940 Act (17 CFR 270-30a-3(d)) that occurred during the the period covered by this report that has materially affected, or are reasonably likely to materially affect, the registrant’s internal control over financial reporting.
Item 12. Disclosure of Securities Lending Activities for Closed-End Management Investment Companies.
Not applicable
(a)(1) The registrant’s code of ethics as described in Item 2 hereof is attached hereto as Exhibit EX-99.CODE ETH.
(a)(2) The certifications required Rule 30a-2(a) under the 1940 Act (17 CFR 270.30a-2(a)) and Section 302 of the Sarbanes-Oxley Act of 2002 are attached hereto as EX-99.CERT.
(a)(3) Not applicable.
(a)(4) Not applicable.
(b) The certifications required by Rule 30a-2(b) of the 1940 Act (17 CFR 270.30a-2(b)) and Section 906 of the Sarbanes-Oxley Act of 2002 are attached hereto as EX-99.906CERT.
SIGNATURES
Pursuant to the requirements of the Securities Exchange Act of 1934 and the Investment Company Act of 1940, the registrant has duly caused this report to be signed on its behalf by the undersigned, thereunto duly authorized.
| (Registrant) | SEGALL BRYANT & HAMILL TRUST | | |
| | | | |
| By (Signature and Title)* | /s/ Philip L. Hildebrandt | |
| | | Philip L. Hildebrandt, President/Principal Executive Officer | |
| Date | March 10, 2022 | | |
| | | | |
| Pursuant to the requirements of the Securities Exchange Act of 1934 and the Investment Company Act of 1940, this report has been signed below by the following persons on behalf of the registrant and in the capacities and on the dates indicated. |
| | | | |
| By (Signature and Title)* | /s/ Philip L. Hildebrandt | |
| | | Philip L. Hildebrandt, President/Principal Executive Officer | |
| | | | |
| Date | March 10, 2022 | | |
| | | | |
| By (Signature and Title)* | /s/ Jasper R. Frontz | |
| | | Jasper R. Frontz, Treasurer/Principal Financial Officer | |
| | | | |
| Date | March 10, 2022 | | |
* Print the name and title of each signing officer under his or her signature.