UNITED STATES
SECURITIES AND EXCHANGE COMMISSION
Washington, D.C. 20549
FORM N-CSR
CERTIFIED SHAREHOLDER REPORT OF REGISTERED
MANAGEMENT INVESTMENT COMPANIES
| Investment Company Act file number | 811-03373 | |
SEGALL BRYANT & HAMILL TRUST
(Exact name of registrant as specified in charter)
| 225 Pictoria Drive, Suite 450 Cincinnati, Ohio | 45246 |
| (Address of principal executive offices) | (Zip code) |
Maggie Bull, Secretary |
| Segall Bryant & Hamill Trust, 225 Pictoria Drive, Suite 450 Cincinnati, Ohio 45246 |
| (Name and address of agent for service) |
| Registrant's telephone number, including area code: | (303) 623-2577 | |
| Date of fiscal year end: | December 31 | |
| | | |
| Date of reporting period: | December 31, 2022 | |
Form N-CSR is to be used by management investment companies to file reports with the Commission not later than 10 days after the transmission to stockholders of any report that is required to be transmitted to stockholders under Rule 30e-1 under the Investment Company Act of 1940 (17 CFR 270.30e-1). The Commission may use the information provided on Form N-CSR in its regulatory, disclosure review, inspection, and policymaking roles.
A registrant is required to disclose the information specified by Form N-CSR, and the Commission will make this information public. A registrant is not required to respond to the collection of information contained in Form N-CSR unless the Form displays a currently valid Office of Management and Budget ("OMB") control number. Please direct comments concerning the accuracy of the information collection burden estimate and any suggestions for reducing the burden to the Secretary, Securities and Exchange Commission, 450 Fifth Street, NW, Washington, DC 20549-0609. The OMB has reviewed this collection of information under the clearance requirements of 44 U.S.C. § 3507.
| Item 1. | Reports to Stockholders. |
| |
| |
| |
| |
| |
 |
| |
| |
| Segall Bryant & Hamill Small Cap Value Fund |
| (Ticker Symbol: Retail - SBRVX; Institutional - SBHVX) |
| |
| Segall Bryant & Hamill Small Cap Growth Fund |
| (Ticker Symbol: Retail - WTSGX; Institutional - WISGX) |
| |
| Segall Bryant & Hamill Small Cap Core Fund |
| (Ticker Symbol: Retail - SBHCX; Institutional - SBASX) |
| |
| Segall Bryant & Hamill All Cap Fund |
| (Ticker Symbol: Retail - SBRAX; Institutional - SBHAX) |
| |
| Segall Bryant & Hamill Emerging Markets Fund |
| (Ticker Symbol: Retail - SBHEX; Institutional - SBEMX) |
| |
| Segall Bryant & Hamill International Small Cap Fund |
| (Ticker Symbol: Retail - SBHSX; Institutional - SBSIX) |
| |
| Segall Bryant & Hamill Fundamental International Small Cap Fund |
| (Ticker Symbol: Retail - WTIFX; Institutional - WIIFX) |
| |
| Segall Bryant & Hamill Global All Cap Fund |
| (Ticker Symbol: Retail - WTMVX; Institutional - WIMVX) |
| |
| Segall Bryant & Hamill Workplace Equality Fund |
| (Ticker Symbol: Retail - WEQRX; Institutional - WEQIX) |
| |
| Segall Bryant & Hamill Short Term Plus Fund |
| (Ticker Symbol: Retail - SBHPX; Institutional - SBAPX) |
| |
| Segall Bryant & Hamill Plus Bond Fund |
| (Ticker Symbol: Retail - WTIBX; Institutional - WIIBX) |
| |
| Segall Bryant & Hamill Quality High Yield Fund |
| (Ticker Symbol: Retail - WTLTX; Institutional - WILTX) |
| |
| Segall Bryant & Hamill Municipal Opportunities Fund |
| (Ticker Symbol: Retail - WTTAX; Institutional - WITAX) |
| |
| Segall Bryant & Hamill Colorado Tax Free Fund |
| (Ticker Symbol: Retail - WTCOX; Institutional - WICOX) |
| |
| |
| |
| SEGALL BRYANT & HAMILL |
| ANNUAL REPORT |
| DECEMBER 31, 2022 |
| SHAREHOLDER LETTER | 1 |
| FUND OVERVIEWS | |
| Segall Bryant & Hamill Small Cap Value Fund | 2 |
| Segall Bryant & Hamill Small Cap Growth Fund | 4 |
| Segall Bryant & Hamill Small Cap Core Fund | 6 |
| Segall Bryant & Hamill All Cap Fund | 8 |
| Segall Bryant & Hamill Emerging Markets Fund | 10 |
| Segall Bryant & Hamill International Small Cap Fund | 12 |
| Segall Bryant & Hamill Fundamental International Small Cap Fund | 14 |
| Segall Bryant & Hamill Global All Cap Fund | 16 |
| Segall Bryant & Hamill Workplace Equality Fund | 18 |
| Segall Bryant & Hamill Short Term Plus Fund | 20 |
| Segall Bryant & Hamill Plus Bond Fund | 22 |
| Segall Bryant & Hamill Quality High Yield Fund | 24 |
| Segall Bryant & Hamill Municipal Opportunities Fund | 26 |
| Segall Bryant & Hamill Colorado Tax Free Fund | 28 |
| FUND EXPENSES | 30 |
| IMPORTANT DISCLOSURES | 34 |
| TRUSTEES AND OFFICERS | 37 |
| FINANCIAL STATEMENTS | 40 |
| Statements of Investments | 40 |
| Statements of Assets and Liabilities | 89 |
| Statements of Operations | 93 |
| Statements of Changes in Net Assets | 97 |
| Financial Highlights | 102 |
| Notes to Financial Statements | 130 |
| REPORT OF INDEPENDENT REGISTERED PUBLIC ACCOUNTING FIRM | 147 |
| SHAREHOLDER TAX INFORMATION | 148 |
| OTHER IMPORTANT INFORMATION | 149 |
| Annual Report | December 31, 2022 | |  |
Intentionally Left Blank
| Segall Bryant & Hamill Funds | Shareholder Letter |
| | December 31, 2022 (Unaudited) |
Dear Fellow Shareholders:
What a difference a year makes. We entered 2022 coming off one of the most profitable two-year periods in the history of the U.S. financial markets. Shortly after the year began, the tides began to turn and by year end, the financial markets had posted steep losses, with many indices generating their worst performance since the financial crisis in 2008.
 |  |
| | |
| Janice M. Teague | Carolyn B. Goldhaber |
| Chair | President |
The key underpinning of the economic environment of the last 12 years—the program of holding interest rates at or near zero percent—was ended by the Federal Reserve (Fed). The Fed felt compelled to end its program due to a rapid rise in inflation that most forecasters, including the Fed, thought would be “transitory.” That wasn’t the case. Various explanations—the COVID pandemic, supply chain shortages, changes in the labor force, and the war in Ukraine—were all offered as candidates for the source of the rapid rise in inflation. We believe that each of these were simply agents that accelerated or slowed the pace of inflation, thereby hastening or slowing the changes to be brought about in the economy. In our view, change will occur through a reduction of economic activity and prices of financial assets. While painful, such declines are needed before we can expect a new upswing in global economic growth that can then be reflected in the prices of financial assets.
The most frequent question asked by our longtime clients and shareholders is how much longer we believe this transition will take. The only answer, of course, is we don’t know any more than anyone else. What we do know, however, is that our investment teams continue to apply our time-tested discipline of focusing on valuation, whether in our fundamental or our quantitative strategies, to seek mispriced opportunities. Importantly, our teams strive to include, as they always have, an estimate of downside risks in their assessments of the companies they consider, with the goal of protecting shareholder capital in down markets.
Lastly, the Board of Trustees would like to extend our sincere appreciation to Phil Hildebrandt who served as the President of the SBH Funds since May 1, 2018, and we wish him all the best in his retirement. We would also like to welcome Carolyn Goldhaber as the newly elected SBH Funds’ President. Since joining the adviser close to 10 years ago, Carolyn has served on its leadership committee and is currently the President of the firm.
Thank you for your continued investment in the SBH Funds.
The views of the authors and information discussed in the shareholder letter and manager commentaries are as of February 17, 2023, are subject to change, and may not reflect the writers’ current views. The views expressed represent an assessment of market conditions at a specific point in time, are opinions only and should not be relied upon as investment advice regarding a particular investment or markets in general. Such information does not constitute a recommendation to buy or sell specific securities or investment vehicles. It should not be assumed that any investment will be profitable or will equal the performance of the fund or any securities or any sectors mentioned in this letter. The subject matter contained in this letter has been derived from several sources believed to be reliable and accurate at the time of compilation.
Neither Segall Bryant & Hamill, Segall Bryant & Hamill Funds, nor any Segall Bryant & Hamill Fund accept any liability for losses either direct or consequential caused by the use of this information. Diversification cannot guarantee gain or prevent losses.
| | |
| Annual Report | December 31, 2022 | | | 1 |
| Segall Bryant & Hamill Small Cap Value Fund | Fund Overview |
| | December 31, 2022 (Unaudited) |
Investment Objective
The Fund seeks to achieve long-term capital appreciation.
Fund Management
Mark T. Dickherber, CFA, CPA Portfolio Manager
Shaun P. Nicholson Portfolio Manager
CFA is a trademark owned by CFA Institute.
Cumulative Returns
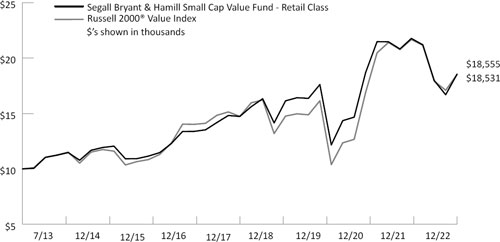
The chart above represents historical performance of a hypothetical investment of $10,000 in the Fund over the past 10 years (or for the life of the Fund if shorter). Performance calculations are as of the end of December each year. Past performance does not guarantee future results. This chart does not reflect the deduction of taxes that a shareholder would pay on Fund distributions or the redemption of Fund shares.
Please see index definitions beginning on page 34.
Average Annual Total Returns
| | | | | | Since | Inception |
| | 1 Year | 3 Years | 5 Years | 10 Years | Inception | Date |
| Retail Class (SBRVX) | (14.76)% | 1.76% | 4.60% | — | 6.78% | 12/9/19 |
| Institutional Class (SBHVX) | (14.65)% | 1.87% | 4.73% | — | 6.93% | 7/31/13 |
| Russell 2000® Value Index | (14.48)% | 4.70% | 4.13% | — | 6.77% | |
Retail Class Annual Expense Ratio (per the current prospectus) — Total - 1.04%
Institutional Class Annual Expense Ratio (per the current prospectus) – Total - 0.97%
| | Sector Allocation (as of 12/31/2022) |
| | |
| | Industrials | 23.1% |
| | Financials | 13.7% |
| | Information Technology | 8.8% |
| | Health Care | 8.6% |
| | Materials | 8.3% |
| | Real Estate | 8.2% |
| | Consumer Discretionary | 6.9% |
| | Utilities | 6.3% |
| | Consumer Staples | 4.6% |
| | Energy | 3.8% |
| | |
| | Sector classifications presented are based on the Global Industry Classification Standard (GICS) methodology. |
| | |
| | Percentages are based on Total Net Assets. |
| | |
| | The sector allocation table above does not include any cash or cash equivalents. |
| | |
| | Top Ten Holdings (as of 12/31/2022) |
| | | |
| | Equity Commonwealth | 4.5% |
| | Progress Software Corp. | 3.6% |
| | Regal Rexnord Corp. | 2.5% |
| | ICU Medical, Inc. | 2.5% |
| | Coty, Inc. | 2.5% |
| | Compass Minerals International, Inc. | 2.4% |
| | SPX Technologies, Inc. | 2.4% |
| | Belden, Inc. | 2.2% |
| | Orthofix Medical, Inc. | 2.1% |
| | SP Plus Corp. | 2.0% |
| | |
| | Top ten holdings do not include any cash, cash equivalents or exchange traded fund investments. Holdings are subject to change and may not reflect the current or future position of the Fund. |
| | |
| | |
| | |
| | |
Performance data quoted represents past performance and does not guarantee future results. Performance information for the Retail Class shares prior to their inception is based on the performance of the Institutional Class. Current performance may be lower or higher than the performance quoted. To obtain current performance as of the most recent month-end, visit www.sbhfunds.com. Average annual total returns reflect the reinvestment of dividends, capital gains distributions, all fee waivers and expense reimbursements, if any. Without the fee waivers and expense reimbursements, total return figures would have been lower. Investment return and principal value will vary, and shares, when redeemed, may be worth more or less than their original cost. Segall Bryant & Hamill fund shares are not insured by the FDIC, the Federal Reserve Board or any other agency and are subject to investment risk.
Until at least April 30, 2023, Segall Bryant & Hamill, LLC (the “Adviser”) has contractually agreed to waive the investment advisory and/or administration fees and/or to reimburse other expenses, so that the ratio of expenses to average net assets as reported in the Fund’s Financial Highlights will be no more than 1.14% and 0.99% to the Fund’s Retail Class and Institutional Class, respectively, for such period. This agreement may not be terminated or modified by the Adviser prior to the termination date without the approval of the Board of Trustees.
Investing in small-cap funds generally will be more volatile and loss of principal could be greater than investing in larger-cap funds.
| | |
| 2 | | | www.sbhfunds.com |
| Segall Bryant & Hamill Small Cap Value Fund | Fund Overview |
| | December 31, 2022 (Unaudited) |
Manager Commentary
Market Overview and Fund Performance
For the year 2022, the Segall Bryant & Hamill Small Cap Value Fund returned -14.76% (Retail Class) compared to a return of -14.48% for its benchmark, the Russell 2000® Value Index.
While the easy monetary policy has abated with interest rates rising and, therefore, cost of capital higher, we believe the market has only reacted to the interest rates and not to the longer lagging effects on profit margins and funding requirements, and the impact on the economy. Throughout 2022, the market experienced significant volatility due to an array of events including an unexpected geopolitical event with the war in Ukraine, the Federal Reserve tightening cycle which began in March and continued throughout the year, and the resurgence of supply issues. There was a lot for investors to digest in a short time period and we believe 2023 will likely continue the cycle of volatility as interest rate hikes and a liquidity tightening cycle start to impact the economy more visibly. For us, investing with a Return on Invested Capital (ROIC) mindset remains at the center of our approach; investing the Fund’s capital with management teams that we believe can improve ROIC by becoming more efficient, divesting businesses not deemed core, and improving overall culture and governance matters at their respective companies.
Contributors to Return
Over the last twelve months, the three sectors in the Fund that contributed most to returns on a relative basis were Industrials, Real Estate, and Consumer Discretionary. Modine Manufacturing Co. (MOD), SPX Technologies, Inc. (SPXC), and Helmerich & Payne, Inc. (HP) generated the largest positive contribution to returns on an absolute basis. Modine, under a new CEO, has rapidly hired new talent in its management ranks as it works to execute upon an 80/20 simplification strategy. When this strategy is successfully adopted, we believe it may lead to less complexity, stronger customer relationships, and a greater focus on pricing and improvements. Although Modine is still early in this process, we have already started to see positive signs of its focus on profitability. SPX Technologies’ management has transformed its business by divesting non-core assets and redeploying those proceeds into niche, higher ROIC and higher margin businesses. In our view, the mix of the revenue is attractive with greater than 65% of the business driven by repair/replacement demand which has typically been stable in times of economic weakness. Helmerich & Payne has focused on optimizing its drilling fleet while also focusing capital allocation on debt reduction and shareholder returns. In our view, the team
at HP is focused on ROIC-additive investments and takes a long-term view when making capital decisions, which gives us optimism despite volatile energy markets making HP’s near-term returns less predictable.
Detractors from Return
The three sectors that detracted most over the last twelve months were Consumer Staples, Energy, and Materials. Hain Celestial Group, Inc. (HAIN), Glatfelter Corp. (GLT), and NCR Corp. (NCR) generated the weakest contributions to returns on an absolute basis. Hain suffered from rising energy prices in its U.K. market while also dealing with continued supply chain challenges. Though some of these headwinds are easing, the recovery could take longer than we originally expected. Glatfelter was also caught up in the energy crisis in Europe as it has significant operations in Germany which were impacted by rapidly rising energy prices. The integration of Glatfelter’s acquisition in 2021 has been a headwind to profitability. Glatfelter is now under a new CEO who is looking to quickly take out costs and raise prices to recapture profits lost due to inflation. NCR’s weakness stemmed from the company not being able to sell themselves to private equity as the debt markets were untenable to many. Management at NCR has decided to split the company into two separate businesses and remains open to being acquired if the opportunity arises.
Outlook and Positioning
We would describe 2022 as quietly chaotic with many unexpected macro circumstances. We believe that the market has only adjusted to some of the cost of capital increases. We also believe a recession is highly probable and 2023 will show us how the market will react to contracting profit margins, a factor which usually accompanies economic downturns. It is our view that the key to the market ending 2023 on a strong note will be increased liquidity. We believe there is currently more downside than upside risk in the market; however, 2023 should be full of opportunities to buy quality companies with strong management teams. We think companies with strong balance sheets and stable free cash flow will remain important. We have an ROIC philosophy and seek to find like-minded management teams focused on improving ROIC. We learned much in 2022, not simply about the market, but about resilience in the face of volatile times. This business is not for the faint of heart. Experience is the best teacher, and we believe we are stronger investors entering 2023.
Stock Performance (12/31/2021 to 12/31/2022)
| | Average | Contribution |
| 5 Highest | Weight | To Return |
| Modine Manufacturing Co. | 0.82 | 0.67 |
| SPX Technologies, Inc. | 2.38 | 0.57 |
| Helmerich & Payne, Inc. | 1.00 | 0.56 |
| Alamos Gold, Inc. | 0.75 | 0.42 |
| SP Plus Corp. | 1.73 | 0.38 |
| | Average | Contribution |
| 5 Lowest | Weight | To Return |
| Orthofix Medical, Inc. | 2.49 | -1.25 |
| FARO Technologies, Inc. | 1.32 | -1.25 |
| NCR Corp. | 2.44 | -1.37 |
| Glatfelter Corp. | 0.94 | -1.66 |
| Hain Celestial Group, Inc. | 2.81 | -2.68 |
Past performance does not guarantee future results. These stocks do not represent all of the securities purchased, sold or recommended by the Fund’s Adviser. To request a complete list of the contribution of each Fund holding to overall Fund performance during the period, please call (800) 392-2673.
Please see page 35 for a description of the methodology used to construct this table.
| | |
| Annual Report | December 31, 2022 | | | 3 |
| Segall Bryant & Hamill Small Cap Growth Fund | Fund Overview |
| | December 31, 2022 (Unaudited) |
Investment Objective
The Fund seeks to achieve long-term capital appreciation.
Fund Management
Brian C. Fitzsimons, CFA Portfolio Manager
Mitch S. Begun, CFA Portfolio Manager
CFA is a trademark owned by CFA Institute.
Cumulative Returns
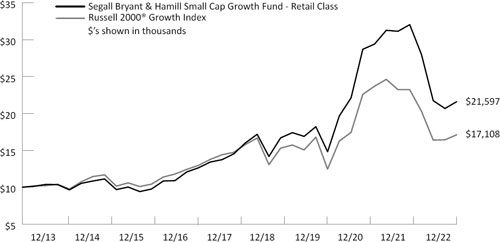
The chart above represents historical performance of a hypothetical investment of $10,000 in the Fund over the past 10 years (or for the life of the Fund if shorter). Performance calculations are as of the end of June each year. Past performance does not guarantee future results. This chart does not reflect the deduction of taxes that a shareholder would pay on Fund distributions or the redemption of Fund shares.
Please see index definitions beginning on page 34.
Average Annual Total Returns
| | | | | | Since | Inception |
| | 1 Year | 3 Years | 5 Years | 10 Years | Inception | Date |
| Retail Class (WTSGX) | (32.59)% | 5.86% | 9.48% | — | 8.90% | 12/20/13 |
| Institutional Class (WISGX) | (32.48)% | 6.01% | 9.68% | — | 9.15% | 12/20/13 |
| Russell 2000® Growth Index | (26.36)% | 0.65% | 3.51% | — | 6.13% | |
Retail Class Annual Expense Ratio (per the current prospectus) — Total: 1.03%
Institutional Class Annual Expense Ratio (per the current prospectus) — Total: 0.87%
| | Sector Allocation (as of 12/31/2022) |
| | |
| | Information Technology | 24.9% |
| | Health Care | 23.3% |
| | Industrials | 18.5% |
| | Consumer Discretionary | 9.0% |
| | Financials | 7.6% |
| | Materials | 3.7% |
| | Real Estate | 3.1% |
| | Energy | 2.9% |
| | Consumer Staples | 1.7% |
| | Communication Services | 1.2% |
| | |
| | Sector classifications presented are based on the Global Industry Classification Standard (GICS) methodology. |
| | |
| | Percentages are based on Total Net Assets. |
| | |
| | The sector allocation table above does not include any cash or cash equivalents. |
| | |
| | Top Ten Holdings (as of 12/31/2022) |
| | |
| | Tetra Tech, Inc. | 2.5% |
| | Novanta, Inc. | 2.2% |
| | Envestnet, Inc. | 2.2% |
| | MAXIMUS, Inc. | 2.2% |
| | Option Care Health, Inc. | 2.1% |
| | Ensign Group, Inc. (The) | 2.0% |
| | Endava PLC | 2.0% |
| | Workiva, Inc. | 2.0% |
| | Integra LifeSciences Holdings Corp. | 1.9% |
| | CONMED Corp. | 1.9% |
| | |
| | Top ten holdings do not include any cash, cash equivalents or exchange traded fund investments. Holdings are subject to change and may not reflect the current or future position of the Fund. |
| | |
| | |
| | |
| | |
| | |
Performance data quoted represents past performance and does not guarantee future results. Current performance may be lower or higher than the performance quoted. To obtain current performance as of the most recent month-end, visit www.sbhfunds.com. Average annual total returns reflect the reinvestment of dividends, capital gains distributions, all fee waivers and expense reimbursements, if any. Without the fee waivers and expense reimbursements, total return figures would have been lower. Investment return and principal value will vary, and shares, when redeemed, may be worth more or less than their original cost. Segall Bryant & Hamill fund shares are not insured by the FDIC, the Federal Reserve Board or any other agency and are subject to investment risk.
Until at least April 30, 2023, Segall Bryant & Hamill, LLC (the “Adviser”) has contractually agreed to waive the investment advisory and/or administration fees and/or to reimburse other expenses, so that the ratio of expenses to average net assets as reported in the Fund’s Financial Highlights will be no more than 1.14% and 0.99% for the Fund’s Retail Class and Institutional Class, respectively, for such period. This agreement may not be terminated or modified by the Adviser prior to the termination date without the approval of the Board of Trustees.
Investing in small-cap funds generally will be more volatile and loss of principal could be greater than investing in larger-cap funds.
| | |
| 4 | | | www.sbhfunds.com |
| Segall Bryant & Hamill Small Cap Growth Fund | Fund Overview |
| | December 31, 2022 (Unaudited) |
Manager Commentary
Market Overview and Fund Performance
For 2022, the Segall Bryant & Hamill Small Cap Growth Fund returned -32.59% (Retail Class) compared to the Fund’s benchmark, the Russell 2000® Growth Index’s -26.36% return. While nearly all asset classes struggled in 2022 due to rapidly rising interest rates and higher levels of inflation, growth stocks were particularly battered. The benchmark posted its worst year since the financial crisis of 2008. Additionally, for the second year in a row, growth stocks were trounced by their value counterparts, lagging the Russell 2000® Value Index by more than 11% in 2022 and 25% in 2021.
The mantra over the last decade has been growth at all costs, particularly in Silicon Valley, where technology investors were happily rewarded for higher growth that was based, in many cases, on only promises of future cash flows down the road. As interest rates have risen, the valuation of these types of growth companies has appropriately come under immense pressure. Meanwhile, investors have favored companies in cyclical sectors in this inflationary backdrop, particularly Energy, Industrials, and Materials. Historically, during economic slowdowns, these have been some of the hardest-hit sectors; however, the resilience in cash flows, especially relative to typical growth sectors, has been impressive. The Fund underperformed for the year largely due to its positioning in the aforementioned cyclical sectors.
Contributors to Return
Two sectors contributed positively to the Fund’s performance relative to its benchmark during the year, Real Estate and Information Technology. The three strongest performing stocks, which all rallied in the period, were biotechnology company Turning Point Therapeutics, Inc. (TPTX), enterprise planning software provider Anaplan, Inc. (PLAN), and provider of outsourced clinical development services Medpace Holdings, Inc. (MEDP). Turning Point Therapeutics was acquired by pharmaceutical company Bristol-Myers Squibb Co. (BMY) and Anaplan was bought by private equity firm Thoma Bravo. Despite fears around a slowing funding environment for early-stage biotechnology companies, Medpace continued to see strong demand for its services. The company expects growth to remain strong into 2023, fueled by its large and growing backlog of contracted business. Both Turning Point Therapeutics and Anaplan were sold in the period, while Medpace remained in the Fund at the end of 2022.
Detractors from Return
The three sectors that detracted most from the Fund’s performance relative to its benchmark in the period were Energy, Financials, and Industrials. The three weakest stocks, which all fell in the period, were pharmacy automation tools and services provider Omnicell, Inc. (OMCL), independent insurance agency Goosehead Insurance, Inc. (GSHD), and information technology services provider Endava PLC (DAVA). Omnicell reported an abrupt and unexpected slowdown in customer demand. The company’s customer base of large health systems is under considerable financial strain and is slowing implementation of Omnicell’s products and services. We sold the Fund’s position given the highly uncertain outlook over the next 12-18 months. Goosehead was weak as continued growth investments have created margin pressure. Additionally, investors have concerns that a slowdown in housing could reduce demand for new policies. Despite strong growth and profitability, Endava underperformed largely due to a compression in valuations for growth companies as interest rates have risen. We believe the long-term growth prospects for digital transformation services remain attractive.
Outlook and Positioning
Valuation compression in less profitable, higher growth companies is just one consequence of the current backdrop. More importantly, we have seen a sharp fundamental deterioration in many profitable bellwether companies (particularly in the Technology sector) as years of aggressive hiring have now created margin headwinds as growth rapidly slows. As it turns out, companies fueled by near-zero interest rates with little consequence for a focus on returns on invested capital are now pivoting. The ramifications, we believe, will be long-lasting and affect all sectors of the economy. We are focused, as always, on building a portfolio of companies that can demonstrate fundamentally stable growth and cash flow characteristics over the long term.
As of the end of 2022, the Fund was overweight primarily in the Information Technology and Financials sectors and underweight primarily in the Energy and Consumer Staples sectors.
Thank you for your continued interest and support.
Stock Performance (12/31/2021 to 12/31/2022)
| | Average | Contribution |
| 5 Highest | Weight | To Return |
| Turning Point Therapeutics, Inc. | 0.40 | 0.67 |
| Anaplan, Inc. | 0.63 | 0.52 |
| Medpace Holdings, Inc. | 1.29 | 0.50 |
| Silk Road Medical, Inc. | 1.25 | 0.42 |
| Inspire Medical Systems, Inc. | 1.81 | 0.29 |
| | Average | Contribution |
| 5 Lowest | Weight | To Return |
| AZEK Co., Inc. | 1.61 | -1.23 |
| Rapid7 Inc. | 0.79 | -1.32 |
| Endava PLC | 2.14 | -1.42 |
| Goosehead Insurance, Inc. | 1.29 | -1.52 |
| Omnicell, Inc. | 1.62 | -1.86 |
Past performance does not guarantee future results. These stocks do not represent all of the securities purchased, sold or recommended by the Fund’s Adviser. To request a complete list of the contribution of each Fund holding to overall Fund performance during the period, please call (800) 392-2673.
Please see page 35 for a description of the methodology used to construct this table.
| | |
| Annual Report | December 31, 2022 | | | 5 |
| Segall Bryant & Hamill Small Cap Core Fund | Fund Overview |
| | December 31, 2022 (Unaudited) |
Investment Objective
The Fund seeks to achieve long-term capital appreciation.
Fund Management
Jeffrey C. Paulis, CFA, Portfolio Manager
Mark T. Dickherber, CFA, CPA Portfolio Manager
CFA is a trademark owned by CFA Institute.
Cumulative Returns
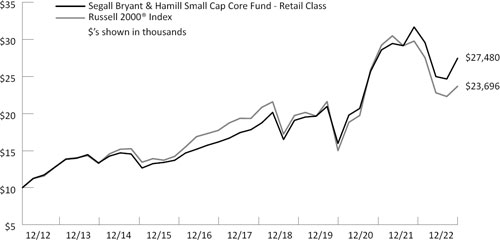
The chart above represents historical performance of a hypothetical investment of $10,000 in the Fund over the past 10 years (or for the life of the Fund if shorter). Performance calculations are as of the end of June each year. Past performance does not guarantee future results. This chart does not reflect the deduction of taxes that a shareholder would pay on Fund distributions or the redemption of Fund shares.
Please see index definitions beginning on page 34.
Average Annual Total Returns*
| | | | | | Since | Inception |
| | 1 Year | 3 Years | 5 Years | 10 Years | Inception | Date |
| Retail Class (SBHCX) | (13.26)% | 9.44% | 9.53% | 10.64% | 8.77% | 12/31/19 |
| Institutional Class (SBASX) | (13.12)% | 9.62% | 9.71% | 10.81% | 8.94% | 12/15/03 |
| Russell 2000® Index | (20.44)% | 3.10% | 4.13% | 9.01% | 7.66% | |
Retail Class Annual Expense Ratio (per the current prospectus) — Gross: 1.35%, Net: 1.14%
Institutional Class Annual Expense Ratio (per the current prospectus) — Gross: 1.10%, Net: 0.99%
| | Sector Allocation (as of 12/31/2022) |
| | |
| | Industrials | 23.2% |
| | Information Technology | 16.8% |
| | Consumer Discretionary | 12.4% |
| | Health Care | 11.2% |
| | Materials | 8.7% |
| | Financials | 8.2% |
| | Consumer Staples | 5.7% |
| | Energy | 3.7% |
| | Real Estate | 1.7% |
| | |
| | Sector classifications presented are based on the Global Industry Classification Standard (GICS) methodology. |
| | |
| | Percentages are based on Total Net Assets. |
| | |
| | The sector allocation table above does not include any cash or cash equivalents. |
| | |
| | Top Ten Holdings (as of 12/31/2022) |
| | |
| | KBR, Inc. | 2.3% |
| | Graphic Packaging Holding Co. | 2.1% |
| | EnPro Industries, Inc. | 2.0% |
| | Carlisle Cos., Inc. | 2.0% |
| | WNS Holdings, Ltd. | 1.9% |
| | Pure Storage, Inc. | 1.8% |
| | EMCOR Group, Inc. | 1.7% |
| | Insulet Corp. | 1.7% |
| | Agilysys, Inc. | 1.7% |
| | Casella Water Systems, Inc. | 1.7% |
| | |
| | Top ten holdings do not include any cash, cash equivalents or exchange traded fund investments. Holdings are subject to change and may not reflect the current or future position of the Fund. |
| | |
| | |
| | |
| | |
| | |
| | |
| | |
| * | The quoted performance of the Fund reflects the past performance of Lower Wacker Small Cap Investment Fund, LLC (the “Partnership”), an unregistered limited partnership managed by the portfolio managers of the Fund. The Partnership was organized into the Institutional Class shares on December 31, 2019, the date the Fund commenced operations. The Fund has been managed in the same style since the Partnership’s inception on December 15, 2003. The Fund’s annual returns and long-term performance reflect the actual fees and expenses that were charged when the Fund was a limited partnership. From its inception on December 15, 2003 through December 31, 2019, the Partnership was not subject to certain investment restrictions, diversification requirements and other restrictions of the Investment Company Act of 1940, as amended or Subchapter M of the Internal Revenue Code of 1986, as amended, which, if they had been applicable, might have adversely affected the Fund’s performance. |
Performance data quoted represents past performance and does not guarantee future results. Current performance may be lower or higher than the performance quoted. To obtain current performance as of the most recent month-end, visit www.sbhfunds.com. Average annual total returns reflect the reinvestment of dividends, capital gains distributions, all fee waivers and expense reimbursements, if any. Without the fee waivers and expense reimbursements, total return figures would have been lower. Investment return and principal value will vary, and shares, when redeemed, may be worth more or less than their original cost. Segall Bryant & Hamill fund shares are not insured by the FDIC, the Federal Reserve Board or any other agency and are subject to investment risk.
Until at least April 30, 2023, Segall Bryant & Hamill, LLC (the “Adviser”) has contractually agreed to waive the investment advisory and/or administration fees and/or to reimburse other expenses, so that the ratio of expenses to average net assets as reported in the Fund’s Financial Highlights will be no more than 1.14% and 0.99% to the Fund’s Retail Class and Institutional Class, respectively, for such period. This agreement may not be terminated or modified by the Adviser prior to the termination date without the approval of the Board of Trustees.
Investing in small-cap funds generally will be more volatile and loss of principal could be greater than investing in larger-cap funds.
| | |
| 6 | | | www.sbhfunds.com |
| Segall Bryant & Hamill Small Cap Core Fund | Fund Overview |
| | December 31, 2022 (Unaudited) |
Manager Commentary
Market Overview and Fund Performance
For 2022, the Segall Bryant & Hamill Small Cap Core Fund returned -13.26% (Retail Class) compared to the Fund’s benchmark, the Russell 2000® Index’s -20.44% return. The market pulled back in 2022 as higher inflation led to a rise in interest rates while the outbreak of the Russia/Ukraine war increased uncertainty. As interest rates rose, market multiples contracted, particularly in longer duration assets, as alternative investment options to equities resurfaced. Further, as the cost of capital increased and uncertainty related to the war and global economies grew, higher Return on Invested Capital (ROIC) companies outperformed.
Contributors to Return
On a sector level, Health Care, Information Technology, and Industrials were the largest contributors to the Fund’s performance relative to the benchmark. Agilysys, Inc. (AGYS), a software solutions provider to the hospitality industry, was the largest individual contributor to the Fund’s return. A complete refresh of Agilysys’s software positioned the company to benefit as consumers returned to travel with the COVID-19 pandemic waning. Agilysys’s improved competitive position was punctuated towards the end of 2022 when Marriott chose its software for a multi-year rollout, potentially its largest win ever. Model N, Inc. (MODN), a software provider to Health Care and IT companies, was another large contributor. The transition of Model N’s customers to the cloud reached an inflection point driving organic growth acceleration which, combined with less macroeconomic sensitivity, resulted in multiple expansion.
Detractors From Return
On a sector level, Energy and Utilities were the largest relative detractors from the Fund’s performance. Hain Celestial Group, Inc. (HAIN), a manufacturer of organic and natural food products, was the largest detractor. Hain incurred multiple headwinds through the year including slowing demand in Europe, supply chain issues, and higher input costs which pressured growth and margins. Endava PLC (DAVA), a digital technology outsourcer, was another detractor. Endava’s share price suffered as growing macroeconomic concern and layoffs at its customers created uncertainty about the sustainability of its revenue growth rate.
Outlook and Positioning
We enter 2023 with a sense of caution. While corporate earnings held up reasonably well through 2022, buoyed by excess consumer savings and solid backlogs, there are increasing signs of slowing in economic indicators and corporate commentary. We expect inflation to continue to soften in 2023 which, combined with softer economic conditions as the year progresses, should allow the U.S. Federal Reserve to stop raising interest rates. As inflation likely cools through 2023, however, earnings expectations are likely to continue to fall as the lagged effect of the interest rate increases materializes.
Given the headwinds seen in the data and emerging in corporate earnings results, as we enter 2023, we have weighted the Fund more towards companies that we believe have higher ROIC businesses and solid balance sheets, and that we assess have the ability to generate free cash flow. Lower ROIC companies have been underperforming as interest rates have risen and the outlook has become more uncertain. We would expect lower ROIC companies to continue to underperform should the economy worsen from here. Should fundamental weakness begin to accelerate and translate into a further market sell-off over the next quarter or two, we may begin to rotate out of higher ROIC companies and into smaller market cap, improving/lower ROIC companies that would disproportionately benefit from an economic recovery. Of course, these improving ROIC companies would be augmented with additional key attributes within our philosophical approach such as niche market positioning with defendable competitive advantages and strong management teams. Combined, we believe these attributes have the potential to produce powerful results over market cycles but also allow the Fund to be prepared for risks and surprises – of which we are sure 2023 could be full!
Stock Performance (12/31/2021 to 12/31/2022)
| | Average | Contribution |
| 5 Highest | Weight | To Return |
| Agilysys, Inc. | 1.00 | 0.88 |
| Devon Energy Corp. | 2.41 | 0.68 |
| Model N, Inc. | 1.01 | 0.52 |
| Badger Meter, Inc. | 0.66 | 0.44 |
| EMCOR Group, Inc. | 0.61 | 0.39 |
| Average | Contribution |
| 5 Lowest | Weight | To Return |
| Heska Corp. | 0.62 | -0.77 |
| Pegasystems, Inc. | 0.46 | -0.83 |
| Allegiant Travel Co. | 0.84 | -0.91 |
| Endava PLC | 1.60 | -1.07 |
| Hain Celestial Group, Inc. | 1.41 | -1.35 |
Past performance does not guarantee future results. These stocks do not represent all of the securities purchased, sold or recommended by the Fund’s Adviser. To request a complete list of the contribution of each Fund holding to overall Fund performance during the period, please call (800) 392-2673.
Please see page 35 for a description of the methodology used to construct this table.
| | |
| Annual Report | December 31, 2022 | | | 7 |
| Segall Bryant & Hamill All Cap Fund | Fund Overview |
| | December 31, 2022 (Unaudited) |
Investment Objective
The Fund seeks to achieve long-term capital appreciation.
Fund Management
Ralph M. Segall, CFA, CIC Portfolio Manager
Suresh Rajagopal, CFA Portfolio Manager
CFA is a trademark owned by CFA Institute.
Cumulative Returns
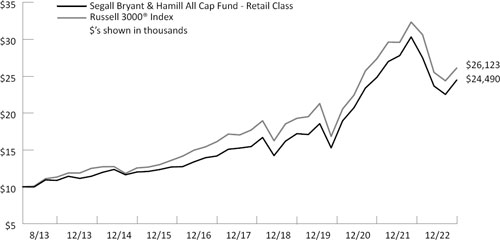
The chart above represents historical performance of a hypothetical investment of $10,000 in the Fund over the past 10 years (or for the life of the Fund if shorter). Performance calculations are as of the end of June each year. Past performance does not guarantee future results. This chart does not reflect the deduction of taxes that a shareholder would pay on Fund distributions or the redemption of Fund shares.
Please see index definitions beginning on page 34.
Average Annual Total Returns
| | | | | | Since | Inception |
| | 1 Year | 3 Years | 5 Years | 10 Years | Inception | Date |
| Retail Class (SBRAX) | (19.23)% | 9.68% | 10.17% | — | 9.98% | 12/9/19 |
| Institutional Class (SBHAX) | (19.21)% | 9.71% | 10.25% | — | 10.10% | 7/31/13 |
| Russell 3000® Index | (19.21)% | 7.07% | 8.79% | — | 10.73% | |
Retail Class Annual Expense Ratio (per the current prospectus) — Total: 0.83%
Institutional Class Annual Expense Ratio (per the current prospectus) — Gross: 0.87%, Net: 0.84%
| | |
| | Sector Allocation (as of 12/31/2022) |
| | |
| | Information Technology | 16.4% |
| | Financials | 15.9% |
| | Health Care | 15.7% |
| | Consumer Discretionary | 14.0% |
| | Industrials | 12.6% |
| | Consumer Staples | 7.7% |
| | Energy | 6.3% |
| | Materials | 4.4% |
| | Communication Services | 3.1% |
| | |
| | Sector classifications presented are based on the Global Industry Classification Standard (GICS) methodology. |
| | |
| | Percentages are based on Total Net Assets. |
| | |
| | The sector allocation table above does not include any cash or cash equivalents. |
| | |
| | Top Ten Holdings (as of 12/31/2022) |
| | | |
| | Microsoft Corp. | 4.1% |
| | Quanta Services, Inc. | 3.6% |
| | Alphabet, Inc. | 3.2% |
| | Reinsurance Group of America, Inc. | 3.0% |
| | UnitedHealth Group, Inc. | 2.8% |
| | Raytheon Technologies Corp. | 2.8% |
| | Chevron Corp. | 2.8% |
| | Visa, Inc. | 2.6% |
| | Globe Life, Inc. | 2.5% |
| | Novo Nordisk | 2.3% |
| | |
| | Top ten holdings do not include any cash, cash equivalents or exchange traded fund investments. Holdings are subject to change and may not reflect the current or future position of the Fund. |
| | |
| | |
| | |
Performance data quoted represents past performance and does not guarantee future results. Performance information for the Retail Class shares prior to their inception is based on the performance of the Institutional Class. Current performance may be lower or higher than the performance quoted. To obtain current performance as of the most recent month-end, visit www.sbhfunds.com. Average annual total returns reflect the reinvestment of dividends, capital gains distributions, all fee waivers and expense reimbursements, if any. Without the fee waivers and expense reimbursements, total return figures would have been lower. Investment return and principal value will vary, and shares, when redeemed, may be worth more or less than their original cost. Segall Bryant & Hamill fund shares are not insured by the FDIC, the Federal Reserve Board or any other agency and are subject to investment risk.
Until at least April 30, 2023, Segall Bryant & Hamill, LLC (the “Adviser”) has contractually agreed to waive the investment advisory and/or administration fees and/or to reimburse other expenses, so that the ratio of expenses to average net assets as reported in the Fund’s Financial Highlights will be no more than 0.99% and 0.84% to the Fund’s Retail Class and Institutional Class, respectively, for such period. This agreement may not be terminated or modified by the Adviser prior to the termination date without the approval of the Board of Trustees.
| | |
| 8 | | | www.sbhfunds.com |
| Segall Bryant & Hamill All Cap Fund | Fund Overview |
| | December 31, 2022 (Unaudited) |
Manager Commentary
Market Overview and Fund Performance
For 2022, the Segall Bryant & Hamill All Cap Fund returned -19.23% (Retail Class) compared to the Fund’s benchmark, the Russell 3000® Index’s -19.21% return. Security selection detracted from relative performance while sector allocation contributed, as did the Fund’s allocation to cash. As a reminder, a key element of the Fund’s strategy is to participate in all markets by investing in companies that we believe possess strong management teams, can generate High Return on Invested Capital (ROIC), and produce quality financial metrics (e.g., free cash flow growth, consistent earnings growth, and margin expansion).
Contributors to Return
At the sector level, the strategy’s best performing areas relative to the benchmark during the year were Consumer Discretionary, Financials, and Communication Services. Outperformance in the Consumer Discretionary sector was driven by favorable stock selection as the Fund held outperforming retail positions while also avoiding the negative performance of Tesla, Inc. (TSLA). Outperformance in Financials reflected an improvement in COVID-related mortality trends within life insurers Globe Life (GL) and Reinsurance Group of America, Inc. (RGA). Communication Services performance was aided by avoiding ownership in many sector names that underperformed during the year. These included Meta Platforms Inc. (META) and many other media companies tied to digital advertising that declined significantly during the year due to a weakening economy. At the individual stock level, Quanta Services, Inc. (PWR) outperformed as power grid and renewables spending continues to propel earnings growth and positive sentiment in shares. In addition, Chevron Corp. (CVX) saw outperformance as supportive commodity prices and disciplined spending drove strong cash returns at major energy companies during the year.
Detractors from Returns
Health Care, Information Technology, and Consumer Staples were the largest relative detractors on a sector level for the year. Health Care underperformance was linked to unfavorable stock selection as the Fund had positions that delivered weaker-than-anticipated earnings updates. Information Technology underperformance was tied to many of the Fund’s technology holdings underperforming throughout the year after significant outperformance during 2021. Specifically, rising rates had an outsized negative impact on many of
the Fund’s software holdings and increasing concerns related to an inventory correction in semiconductor holdings weighed on results. Consumer Staples underperformance was due to unfavorable stock selection as the Fund held names that experienced a margin squeeze from a challenging cost environment and adverse operating conditions in China due to COVID. At the individual stock level, underperformance was driven by Alphabet, Inc. (GOOG) as difficult comparisons relative to 2021 and a pullback by advertisers in many categories significantly reduced growth. In addition, profitability was impacted more than expected due to continued headcount growth and investments in the cloud. Underperformance by Marvell Technology, Inc. (MRVL) was tied to concerns related to a semiconductor inventory correction and a slowdown in data center capex spending.
Outlook and Positioning
As we enter 2023, the focus of many investors is on assessing the durability of inflationary pressures and the intentions of the Federal Reserve with respect to interest rates. Determining the timing at the macro level and whether the U.S. enters a recession is nearly an impossible task. Fortunately for us, macro concerns are not a principal part of the selection process in our approach. A key aspect of our approach is to assess company-specific business models against the impact of a new regime of deglobalization, which we expect will reduce ROIC and free cash flow as the global economy is going to labor under building new supply chains and transitioning away from fossil fuels. Both are costly and inflationary and, as a result, company profits are likely to be hit much harder than consensus expectations. For example, we believe the reshoring of semiconductor supply chains should increase chip prices significantly due to rising inventory levels and diversifying suppliers. In addition, sluggish growth—or even a marked decline in inflation—could create negative operating leverage and result in lower margins. All that said, this will not stop us from buying stocks as they move into an attractive valuation range. It always has been, and will always remain, a market of stocks rather than a stock market. In our view, there will always be investments to make in companies with the right set of investment characteristics, priced at valuations that present an attractive opportunity to reach our long-term investment goals.
Thank you for your consideration and continued support.
Stock Performance (12/31/2021 to 12/31/2022)
| | Average | Contribution |
| 5 Highest | Weight | To Return |
| Quanta Services, Inc. | 3.37 | 0.80 |
| Chevron Corp. | 2.36 | 0.79 |
| McKesson Corp. | 1.63 | 0.76 |
| Reinsurance Group of America, Inc. | 2.51 | 0.69 |
| Novo Nordisk | 0.57 | 0.57 |
| | Average | Contribution |
| 5 Lowest | Weight | To Return |
| Catalent, Inc. | 1.53 | -1.33 |
| Zebra Technologies Corp. | 1.67 | -1.49 |
| Amazon.com, Inc. | 2.53 | -1.62 |
| Marvell Technology, Inc. | 2.13 | -1.77 |
| Alphabet, Inc. | 3.96 | -1.80 |
Past performance does not guarantee future results. These stocks do not represent all of the securities purchased, sold or recommended by the Fund’s Adviser. To request a complete list of the contribution of each Fund holding to overall Fund performance during the period, please call (800) 392-2673.
Please see page 35 for a description of the methodology used to construct this table.
| | |
| Annual Report | December 31, 2022 | | | 9 |
| Segall Bryant & Hamill Emerging Markets Fund | Fund Overview |
| | December 31, 2022 (Unaudited) |
Investment Objective
The Fund seeks to achieve long-term capital appreciation.
Fund Management
Scott E. Decatur, Ph.D. Portfolio Manager
Nicholas C. Fedako, CFA Portfolio Manager
CFA is a trademark owned by CFA Institute.
Cumulative Returns
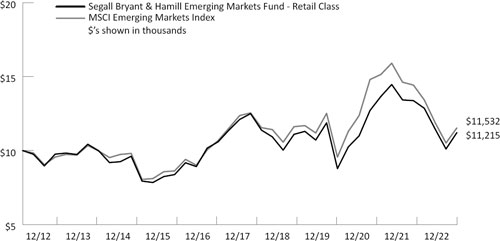
The chart above represents historical performance of a hypothetical investment of $10,000 in the Fund over the past 10 years (or for the life of the Fund if shorter). Performance calculations are as of the end of June each year. Past performance does not guarantee future results. This chart does not reflect the deduction of taxes that a shareholder would pay on Fund distributions or the redemption of Fund shares.
Please see index definitions beginning on page 34.
Average Annual Total Returns
| | | | | | Since | Inception |
| | 1 Year | 3 Years | 5 Years | 10 Years | Inception | Date |
| Retail Class* (SBHEX) | (16.17)% | (1.89)% | (1.52)% | 1.15% | 0.77% | 6/30/14 |
| Institutional Class** (SBEMX) | (16.08)% | (1.73)% | (1.33)% | 1.34% | 0.97% | 6/30/11 |
| MSCI Emerging Markets Index | (20.10)% | (2.69)% | (1.40)% | 1.44% | 0.85% | |
Retail Class Annual Expense Ratio (per the current prospectus) — Gross: 1.86%, Net: 1.38%
Institutional Class Annual Expense Ratio (per the current prospectus) — Gross: 1.69%, Net: 1.23%
| | Sector Allocation (as of 12/31/2022) |
| | |
| | Financials | 22.6% |
| | Information Technology | 18.9% |
| | Consumer Discretionary | 14.1% |
| | Communication Services | 9.8% |
| | Materials | 8.7% |
| | Consumer Staples | 6.2% |
| | Industrials | 6.0% |
| | Energy | 5.2% |
| | Health Care | 3.9% |
| | Utilities | 3.0% |
| | Real Estate | 1.9% |
| | |
| | Sector classifications presented are based on the Global Industry Classification Standard (GICS) methodology. |
| | |
| | Percentages are based on Total Net Assets. |
| | |
| | The sector allocation table above does not include any cash or cash equivalents. |
| | |
| | Top Ten Holdings (as of 12/31/2022) |
| | |
| | Taiwan Semiconductor Manufacturing Co., Ltd. | 4.8% |
| | Tencent Holdings, Ltd. | 3.2% |
| | Samsung Electronics Co., Ltd. | 2.4% |
| | Alibaba Group Holding, Ltd. | 1.6% |
| | Bank of China, Ltd. | 1.4% |
| | Fubon Finacial Holdings Co., Ltd. | 1.3% |
| | Vipshop Holdings, Ltd. | 1.2% |
| | China Construction Bank Corp. | 1.2% |
| | Vale S.A. | 1.2% |
| | China Tower Corp., Ltd. | 1.1% |
| | |
| | Top ten holdings do not include any cash, cash equivalents or exchange traded fund investments. Holdings are subject to change and may not reflect the current or future position of the Fund. |
| | |
| | |
| | |
| | |
| | |
| | |
| | |
| | |
Performance data quoted represents past performance and does not guarantee future results. Performance information for the Retail Class shares prior to their inception is based on the performance of the Institutional Class. Current performance may be lower or higher than the performance quoted. To obtain current performance as of the most recent month-end, visit www.sbhfunds.com. Average annual total returns reflect the reinvestment of dividends, capital gains distributions, all fee waivers and expense reimbursements, if any. Without the fee waivers and expense reimbursements, total return figures would have been lower. Investment return and principal value will vary, and shares, when redeemed, may be worth more or less than their original cost. Segall Bryant & Hamill fund shares are not insured by the FDIC, the Federal Reserve Board or any other agency and are subject to investment risk.
Until at least April 30, 2023, Segall Bryant & Hamill, LLC (the “Adviser”) has contractually agreed to waive the investment advisory and/or administration fees and/or to reimburse other expenses, so that the ratio of expenses to average net assets as reported in the Fund’s Financial Highlights will be no more than 1.38% and 1.23% to the Fund’s Retail Class and Institutional Class, respectively, for such period. This agreement may not be terminated or modified by the Adviser prior to the termination date without the approval of the Board of Trustees.
Investing in foreign companies are subject to special risks, including currency fluctuations, social, economic, and political uncertainties, which could increase volatility.
| | |
| 10 | | | www.sbhfunds.com |
| Segall Bryant & Hamill Emerging Markets Fund | Fund Overview |
| | December 31, 2022 (Unaudited) |
Manager Commentary
Market Overview and Fund Performance
For 2022, the Segall Bryant & Hamill Emerging Markets Fund returned -16.17% (Retail Class) compared to the Fund’s benchmark, the MSCI Emerging Markets Index’s -20.09% return. The benchmark’s annual return was its worst since the 2008 financial crisis as concerns about higher inflation, supply chain disruptions, rising interest rates, and slowing global growth following the pandemic were exacerbated by Russia’s invasion of Ukraine in March. Regional performance within the benchmark was mixed as Latin America finished in positive territory while Europe, the Middle East, and Africa (EMEA) and Asia ended the year lower. Within Latin America, commodity exporting nations including Chile and Brazil benefited from sanctions imposed on Russia. Asia finished lower as China’s COVID restrictions, housing market troubles, and tensions with the U.S. increased uncertainty regarding global economic activity. China ended the year down and dragged on other Asian nations including Taiwan and Korea. EMEA was the worst-performing region as the trading of Russian securities was suspended and removed from the benchmark at no value, negatively impacting the benchmark’s return. Hungary and Poland were also a drag for the region over concerns about the war’s effect on Ukraine’s neighbors. Turkey notably ended the year as the best performing country in the benchmark as Turkish investors bought domestic stocks to hedge against the country’s high inflation. All 11 sectors in the benchmark ended the year lower. Information Technology was the worst performer as semiconductor stocks struggled due to weaker PC and smartphone demand. Utilities, a more defensive sector, and Financials, where earnings could benefit from higher interest rates, were the most resilient.
The Fund outperformed its benchmark for the second year in a row with positive security selection in Asia, EMEA, and Latin America. Within Asia, China and India were the top performers while Taiwan was modestly lower. Security selection in Saudi Arabia was the primary driver of positive returns in EMEA and South Africa also contributed. In Latin America, positive stock selection in Mexico and Brazil more than offset negative selection in Peru, Colombia, and Chile. At the sector level, stock selection in Financials, Communication Services, and Health Care added the most to relative returns. Consumer Discretionary and Industrials were the largest detractors.
Outlook and Positioning
Exiting the fiscal year, we are optimistic about the Fund’s performance potential as we look forward given the substantial discounts on certain key valuation measures. The Fund’s holdings at year end have an average price-to-earnings (P/E) ratio of 5.34x, a price-to-book (P/B) ratio of 0.86x, with a dividend yield (DY) of 5.93%. This compares favorably to the MSCI Emerging Markets Index, which at year end had a P/E of 10.93x, P/B of 1.57x and a DY of 3.33%. The strategy is even more attractively valued when viewed in contrast to what is currently observed in domestic U.S. markets, represented by the S&P 500® Index, which trades at 18.17x P/E, 3.84x P/B, and a DY of 1.73%.
Stock Performance (12/31/2021 to 12/31/2022)
| | Average | Contribution |
| 5 Highest | Weight | To Return |
| Vipshop Holdings Ltd. | 0.29 | 0.64 |
| Bank of Baroda | 0.45 | 0.36 |
| Grupo Comercial Chedraui S.A. de C.V. | 0.38 | 0.34 |
| Alinma Bank | 0.15 | 0.28 |
| Shandong Xinhua Pharmaceutical Co. Ltd. | 0.18 | 0.26 |
| | Average | Contribution |
| 5 Lowest | Weight | To Return |
| Brilliance China Automotive Holdings Ltd. | 0.72 | -0.60 |
| Gazprom PJSC | 0.13 | -0.67 |
| Samsung Electronics Co., Ltd. | 2.70 | -0.92 |
| Tencent Holdings Ltd. | 2.97 | -0.94 |
| Taiwan Semiconductor Manufacturing Co., Ltd. | 5.29 | -2.29 |
Past performance does not guarantee future results. These stocks do not represent all of the securities purchased, sold or recommended by the Fund’s Adviser. To request a complete list of the contribution of each Fund holding to overall Fund performance during the period, please call (800) 392-2673.
Please see page 35 for a description of the methodology used to construct this table.
| | |
| Annual Report | December 31, 2022 | | | 11 |
| Segall Bryant & Hamill International Small Cap Fund | Fund Overview |
| | December 31, 2022 (Unaudited) |
Investment Objective
The Fund seeks to achieve long-term capital appreciation.
Fund Management
Scott E. Decatur, Ph.D. Portfolio Manager
Nicholas C. Fedako, CFA Portfolio Manager
CFA is a trademark owned by CFA Institute.
Cumulative Returns
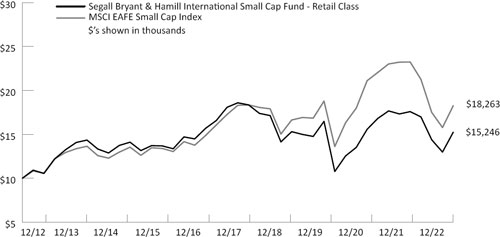
The chart above represents historical performance of a hypothetical investment of $10,000 in the Fund over the past 10 years (or for the life of the Fund if shorter). Performance calculations are as of the end of June each year. Past performance does not guarantee future results. This chart does not reflect the deduction of taxes that a shareholder would pay on Fund distributions or the redemption of Fund shares.
Please see index definitions beginning on page 34.
Average Annual Total Returns
| | | | | | Since | Inception |
| | 1 Year | 3 Years | 5 Years | 10 Years | Inception | Date |
| Retail Class* (SBHSX) | (13.31)% | (2.55)% | (3.89)% | 4.31% | 3.57% | 6/30/14 |
| Institutional Class** (SBSIX) | (13.19)% | (2.39)% | (3.70)% | 4.52% | 3.79% | 5/31/11 |
| MSCI EAFE Small Cap Index | (21.39)% | (0.93)% | (0.05)% | 6.21% | 4.92% | |
Retail Class Annual Expense Ratio (per the current prospectus) — Gross: 1.36%, Net: 1.18%
Institutional Class Annual Expense Ratio (per the current prospectus) — Gross: 1.13%, Net: 1.03%
| | Sector Allocation (as of 12/31/2022) |
| | |
| | Industrials | 22.7% |
| | Consumer Discretionary | 12.2% |
| | Financials | 11.8% |
| | Real Estate | 10.4% |
| | Materials | 9.6% |
| | Information Technology | 9.3% |
| | Health Care | 6.8% |
| | Consumer Staples | 6.3% |
| | Communication Services | 3.5% |
| | Energy | 3.1% |
| | Utilities | 3.0% |
| | |
| | Sector classifications presented are based on the Global Industry Classification Standard (GICS) methodology. |
| | |
| | Percentages are based on Total Net Assets. |
| | |
| | The sector allocation table above does not include any cash or cash equivalents. |
| | |
| | Top Ten Holdings (as of 12/31/2022) |
| | |
| | Incitec Pivot, Ltd. | 1.2% |
| | Galenica A.G. | 1.2% |
| | NRW Holdings, Ltd. | 1.0% |
| | D/S Norden A/S | 1.0% |
| | Bank of Georgia Group PLC | 1.0% |
| | Sojitz Corp. | 1.0% |
| | Helia Group, Ltd. | 1.0% |
| | TBC Bank Group PLC | 0.9% |
| | Betsson A.B. | 0.9% |
| | SANKYO Co., Ltd. | 0.9% |
| | |
| | Top ten holdings do not include any cash, cash equivalents or exchange traded fund investments. Holdings are subject to change and may not reflect the current or future position of the Fund. |
| | |
| | |
| | |
| | |
| | |
| | |
| | |
| | |
| | |
Performance data quoted represents past performance and does not guarantee future results. Performance information for the Retail Class shares prior to their inception is based on the performance of the Institutional Class. Current performance may be lower or higher than the performance quoted. To obtain current performance as of the most recent month-end, visit www.sbhfunds.com. Average annual total returns reflect the reinvestment of dividends, capital gains distributions, all fee waivers and expense reimbursements, if any. Without the fee waivers and expense reimbursements, total return figures would have been lower. Investment return and principal value will vary, and shares, when redeemed, may be worth more or less than their original cost. Segall Bryant & Hamill fund shares are not insured by the FDIC, the Federal Reserve Board or any other agency and are subject to investment risk.
Until at least April 30, 2023, Segall Bryant & Hamill, LLC (the “Adviser”) has contractually agreed to waive the investment advisory and/or administration fees and/or to reimburse other expenses, so that the ratio of expenses to average net assets as reported in the Fund’s Financial Highlights will be no more than 1.18% and 1.03% to the Fund’s Retail Class and Institutional Class, respectively, for such period. This agreement may not be terminated or modified by the Adviser prior to the termination date without the approval of the Board of Trustees.
Investing in small-cap funds generally will be more volatile and loss of principal could be greater than investing in large-cap funds.
Investing in foreign companies are subject to special risks, including currency fluctuations, social, economic, and political uncertainties, which could increase volatility.
| | |
| 12 | | | www.sbhfunds.com |
| Segall Bryant & Hamill International Small Cap Fund | Fund Overview |
| | December 31, 2022 (Unaudited) |
Manager Commentary
Market Overview and Fund Performance
For 2022, the Segall Bryant & Hamill International Small Cap Fund returned -13.31% (Retail Class) compared to the Fund’s benchmark, the MSCI EAFE Small Cap Index, which returned -21.39%. The benchmark’s return was its worst annual return since the 2008 financial crisis as higher inflation driven by pandemic-related distortions and Russia’s invasion of Ukraine led to tighter monetary policies and increased recession fears from a slowdown in economic activity. After falling for the first three quarters of the year, stocks pared losses in the fourth quarter on optimism that inflation had peaked. During the year, the U.S. dollar strengthened versus the euro, pound, and yen as risk-off sentiment sent investors to the perceived safety of dollar assets. All four major benchmark regions ended lower led by the United Kingdom after newly elected prime minister Liz Truss announced a series of unfunded tax cuts that sent stocks and the pound tumbling. The chaos caused Truss to resign after six weeks and the reversal of many of her policies helped U.K. assets to stabilize. Europe also underperformed the broader market, led on the downside by Sweden and Germany, as investors worried that a gas and oil shortage would spark a major energy crisis. These concerns partially abated as the year ended due to warmer weather in the region. In the Far East, the region’s largest constituent, Australia, was the worst performer due in part to metal and mining companies falling on concerns of a global growth slowdown. Japan was the top performing region and ended the year 0.77% higher in local currency terms as the weaker yen benefited exporters. Ten of
11 sectors ended the year lower with the exception being Energy where coal companies gained from buyers seeking substitutes for Russian oil and gas.
The Fund outperformed its benchmark for the second year in a row with strong security selection in Europe, the Far East, the United Kingdom, and Japan. The Fund’s best relative performance within Europe came from Sweden, Norway, and Denmark, while in the Far East, Australia was the primary driver of positive returns. Stock selection was additive in nine of 11 sectors as Industrials, Financials, and Information Technology were the Fund’s top performers. Selection was modestly lower in Consumer Staples and Utilities.
Outlook and Positioning
Exiting the fiscal year, we are optimistic about the Fund’s performance potential as we look forward given the substantial discounts on certain key valuation measures. The Fund’s holdings at year end have an average price-to-earnings (P/E) ratio of 5.56x, a price-to-book (P/B) ratio of 0.85x, with a dividend yield (DY) of 5.63%. This compares favorably to the MSCI EAFE Small Cap Index which at year end had a P/E of 11.28x, P/B of 1.21x and a DY of 3.10%. The strategy is even more attractively valued when viewed in contrast to what is currently observed in domestic U.S. markets, represented by the Russell 2000® Index, which trades at 10.73x P/E, 1.94x P/B, and a DY of 1.49%.
Stock Performance (12/31/2021 to 12/31/2022)
| | Average | Contribution |
| 5 Highest | Weight | To Return |
| D/S Norden A/S | 0.67 | 0.79 |
| New Hope Corp. Ltd. | 0.61 | 0.78 |
| Bank of Georgia Group PLC | 0.78 | 0.60 |
| Whitehaven Coal Ltd. | 0.47 | 0.56 |
| Coronado Global Resources Inc. | 0.83 | 0.52 |
| | Average | Contribution |
| 5 Lowest | Weight | To Return |
| Marks and Spencer Group PLC | 0.45 | -0.49 |
| Computacenter PLC | 0.98 | -0.49 |
| Getinge AB | 0.48 | -0.51 |
| International Distributions Services PLC | 0.39 | -0.57 |
| Vistry Group PLC | 0.91 | -0.63 |
Past performance does not guarantee future results. These stocks do not represent all of the securities purchased, sold or recommended by the Fund’s Adviser. To request a complete list of the contribution of each Fund holding to overall Fund performance during the period, please call (800) 392-2673.
Please see page 35 for a description of the methodology used to construct this table.
| | |
| Annual Report | December 31, 2022 | | | 13 |
Segall Bryant & Hamill
Fundamental International Small Cap Fund | Fund Overview |
| | December 31, 2022 (Unaudited) |
Investment Objective
The Fund seeks to achieve long-term capital appreciation.
Fund Management
John C. Fenley, CFA Portfolio Manager
CFA is a trademark owned by CFA Institute.
Cumulative Returns
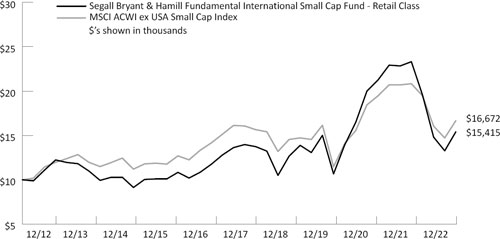
The chart above represents historical performance of a hypothetical investment of $10,000 in the Fund over the past 10 years (or for the life of the Fund if shorter). Performance calculations are as of the end of June each year. Past performance does not guarantee future results. This chart does not reflect the deduction of taxes that a shareholder would pay on Fund distributions or the redemption of Fund shares.
Please see index definitions beginning on page 34.
Average Annual Total Returns
| | | | | | Since | Inception |
| | 1 Year | 3 Years | 5 Years | 10 Years | Inception | Date |
| Retail Class (WTIFX) | (33.89)% | 0.89% | 2.50% | 4.42% | 5.17% | 12/15/99 |
| Institutional Class (WIIFX) | (33.74)% | 1.05% | 2.66% | 4.54% | 5.22% | 4/29/16 |
| MSCI ACWI ex USA Small Cap Index | (19.97)% | 1.07% | 0.67% | 5.24% | 6.10% | |
Retail Class Annual Expense Ratio (per the current prospectus) — Gross: 1.51%, Net: 1.25%
Institutional Class Annual Expense Ratio (per the current prospectus) — Gross: 1.36%, Net: 1.10%
| | Sector Allocation (as of 12/31/2022) |
| | |
| | Industrials | 33.4% |
| | Information Technology | 28.9% |
| | Consumer Discretionary | 19.6% |
| | Financials | 10.2% |
| | Health Care | 2.2% |
| | Communication Services | 1.9% |
| | Consumer Staples | 1.4% |
| | |
| | Sector classifications presented are based on the Global Industry Classification Standard (GICS) methodology. |
| | |
| | Percentages are based on Total Net Assets. |
| | |
| | The sector allocation table above does not include any cash or cash equivalents. |
| | |
| | Top Ten Holdings (as of 12/31/2022) |
| | | |
| | Brodrene A. & O. Johansen A/S | 5.5% |
| | Constellation Software, Inc. | 5.3% |
| | Epsilon Net S.A. | 5.0% |
| | GFL Environmental, Inc. | 4.8% |
| | PAX Global Technology, Ltd. | 4.6% |
| | Azimut Holdings S.p.A. | 4.6% |
| | Fluidra S.A. | 4.4% |
| | Evolution A.B. | 4.1% |
| | Topicus.com, Inc. | 3.9% |
| | Instalco A.B. | 3.6% |
| | |
| | Top ten holdings do not include any cash, cash equivalents or exchange traded fund investments. Holdings are subject to change and may not reflect the current or future position of the Fund. |
| | |
| | |
| | |
| | |
| | |
| | |
| | |
Performance data quoted represents past performance and does not guarantee future results. Performance information for the Institutional Class shares prior to their inception is based on the performance of the Retail Class. Current performance may be lower or higher than the performance quoted. To obtain current performance as of the most recent month-end, visit www.sbhfunds.com. Average annual total returns reflect the reinvestment of dividends, capital gains distributions, all fee waivers and expense reimbursements, if any. Without the fee waivers and expense reimbursements, total return figures would have been lower. Investment return and principal value will vary, and shares, when redeemed, may be worth more or less than their original cost. Segall Bryant & Hamill fund shares are not insured by the FDIC, the Federal Reserve Board or any other agency and are subject to investment risk.
Until at least April 30, 2023, Segall Bryant & Hamill, LLC (the “Adviser”) has contractually agreed to waive the investment advisory and/or administration fees and/or to reimburse other expenses, so that the ratio of expenses to average net assets as reported in the Fund’s Financial Highlights will be no more than 1.25% and 1.10% for the Fund’s Retail Class and Institutional Class, respectively, for such period. This agreement may not be terminated or modified by the Adviser prior to the termination date without the approval of the Board of Trustees.
Investing in small-cap funds generally will be more volatile and loss of principal could be greater than investing in larger-cap funds.
Investing in foreign securities entails special risks, such as currency fluctuations and political uncertainties, which are described in more detail in the prospectus.
| | |
| 14 | | | www.sbhfunds.com |
Segall Bryant & Hamill
Fundamental International Small Cap Fund | Fund Overview |
| | December 31, 2022 (Unaudited) |
Manager Commentary
Market Overview and Fund Performance
For 2022, the Segall Bryant & Hamill Fundamental International Small Cap Fund returned -33.89% (Retail Class) compared to the Fund’s benchmark, the MSCI ACWI ex USA Small-Cap Index’s -19.97% return. Faced with an abundance of global macroeconomic risks and concerns, including high inflation, rapidly rising interest rates, the war in Ukraine, and the COVID lockdowns in China, to name but a few, global equity markets struggled throughout the year.
Equity valuation levels, especially for companies with high growth rates compressed under the surging U.S. dollar, which explained most of the Fund’s negative performance. In our view, there was a difference between the stock price performance of these companies and their operating performance, which continued to be strong. We attribute this to our strict adherence to identify fundamentally strong companies.
Contributors to Return
The Fund’s relative outperformance and underweighting in Communication Services and its lack of exposure to Real Estate contributed to annual performance relative to the benchmark. From a holdings level, U.K.-based Clipper Logistics PLC (CLG.LN) was a contributor to performance. As one of the U.K.’s leading retail logistics companies, Clipper transformed its business model to accommodate the fast-changing demands of ecommerce retailers. The acceleration of ecommerce transactions due to COVID continued to propel Clipper’s earnings which garnered the attention of potential suitors. During the year, GXO Logistics (GXO) agreed to acquire Clipper at a 32% premium to Clipper’s three-month weighted-average share price.
Hong Kong-listed PAX Global Technology, Ltd. (PAX) contributed to performance as well. PAX is one of the world’s largest electronic-funds-transfer at point-of-sale (EFT-POS) terminal providers with a focus on emerging markets like Brazil. In 2021, speculation arose that PAX terminals may have been used in cyberattacks. Shares had been under pressure despite a lack of evidence of such claims. Our independent research supported maintaining the Fund’s position in PAX shares and we saw the benefits of our patience throughout 2022.
Detractors from Return
The Fund’s relative underperformance and overweighting in Industrials and Consumer Discretionary detracted from the Fund’s performance relative to the benchmark. From a holdings level, U.K.-based Victoria PLC (VCP) was a detractor to performance. Victoria manufactures and distributes primarily carpet, underlay, and tiles mostly for the European residential market. This market is highly fragmented, and Victoria has been a leading consolidator. We believe that the shares have been overlooked given that it operates in a cyclical and capital-intensive industry. We also believe the potential for continued value creative acquisitions is largely misunderstood and should provide opportunity for growth despite the negative sentiment in the industry stemming from inflationary pressures and supply chain issues.
Global pet nutrition company, Swedencare A.B. (publ), also negatively affected the Fund’s performance. The company’s two main product families, ProDen PlaqueOff and NutriScience, are sold in over 50 countries. We believe Swedencare has a significant opportunity to continue increasing penetration of its products in current markets and to launch new and existing products into fast-growing markets such as China. During the year, Swedencare reported strong top-line results but disappointed investors with below-guidance organic growth. Management cited tough comparables and large clients reducing inventory levels. While consumer sentiment remains challenged, exiting the fiscal year, we believe in maintaining the Fund’s position in Swedencare.
Outlook and Positioning
As the macro environment is likely to remain challenging, we are focused on helping to ensure that the Fund has exposure to companies that we believe can continue to flourish even in such an environment. Earnings advances will be vulnerable as companies maneuver around inflationary pressures in the face of slowing growth. We invest in companies we believe offer visibility into future earnings, such as those with recurring revenue streams or those that supply into their customers’ non-discretionary budgets. We believe that quality has been underappreciated by the market and is attractive today. The market sell-off has been largely indiscriminate. Moving forward, we believe companies that continue to generate substantial free cash flow and compelling returns should perform well in a global economic slowdown.
Stock Performance (12/31/2021 to 12/31/2022)
| | Average | Contribution |
| 5 Highest | Weight | To Return |
| M&A Capital Partners Co. Ltd. | 0.92 | 0.59 |
| Epsilon Net S.A. | 3.60 | 0.50 |
| Azimut Holding S.p.A. | 2.83 | 0.38 |
| PAX Global Technology, Ltd. | 3.34 | 0.38 |
| Clipper Logistics PLC | 1.59 | 0.34 |
| | Average | Contribution |
| 5 Lowest | Weight | To Return |
| Fluidra, S.A. | 3.09 | -2.18 |
| Swedencare A.B. | 1.48 | -2.20 |
| China MeiDong Auto Holdings Ltd. | 2.03 | -2.20 |
| Instalco AB | 3.27 | -2.21 |
| Victoria PLC | 4.26 | -3.24 |
Past performance does not guarantee future results. These stocks do not represent all of the securities purchased, sold or recommended by the Fund’s Adviser. To request a complete list of the contribution of each Fund holding to overall Fund performance during the period, please call (800) 392-2673.
Please see page 35 for a description of the methodology used to construct this table.
| | |
| Annual Report | December 31, 2022 | | | 15 |
| Segall Bryant & Hamill Global All Cap Fund | Fund Overview |
| | December 31, 2022 (Unaudited) |
Investment Objective
The Fund seeks to achieve long-term capital appreciation.
Fund Management
Suresh Rajagopal, CFA Portfolio Manager
Ralph M. Segall, CFA, CIC Portfolio Manager
CFA is a trademark owned by CFA Institute.
Cumulative Returns
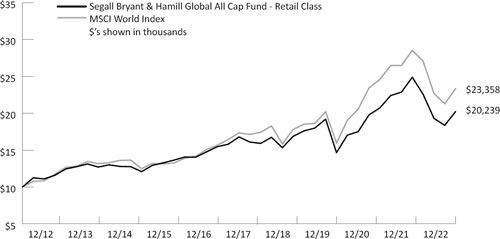
The chart above represents historical performance of a hypothetical investment of $10,000 in the Fund over the past 10 years (or for the life of the Fund if shorter). Performance calculations are as of the end of June each year. Past performance does not guarantee future results. This chart does not reflect the deduction of taxes that a shareholder would pay on Fund distributions or the redemption of Fund shares.
Please see index definitions beginning on page 34.
Average Annual Total Returns
| | | | | | Since | Inception |
| | 1 Year | 3 Years | 5 Years | 10 Years | Inception | Date |
| Retail Class (WTMVX) | (18.68)% | 1.75% | 3.81% | 7.30% | 8.00% | 6/1/88 |
| Institutional Class (WIMVX) | (18.55)% | 1.86% | 3.95% | 7.47% | 8.07% | 9/28/07 |
| MSCI World Index | (18.14)% | 4.94% | 6.14% | 8.85% | 7.09% | |
Retail Class Annual Expense Ratio (per the current prospectus) — Gross: 1.18%, Net: 0.89%
Institutional Class Annual Expense Ratio (per the current prospectus) — Gross: 1.17%, Net: 0.74%
| | Sector Allocation (as of 12/31/2022) |
| | |
| | Information Technology | 22.6% |
| | Health Care | 17.9% |
| | Consumer Discretionary | 13.3% |
| | Financials | 12.4% |
| | Industrials | 11.1% |
| | Consumer Staples | 8.1% |
| | Energy | 5.6% |
| | Materials | 4.5% |
| | Communication Services | 2.6% |
| | |
| | Sector classifications presented are based on the Global Industry Classification Standard (GICS) methodology. |
| | |
| | Percentages are based on Total Net Assets. |
| | |
| | The sector allocation table above does not include any cash or cash equivalents. |
| | |
| | Top Ten Holdings (as of 12/31/2022) |
| | | |
| | Microsoft Corp. | 4.1% |
| | Apple, Inc. | 3.7% |
| | Quanta Services, Inc. | 3.1% |
| | JPMorgan Chase & Co. | 2.9% |
| | Linde PLC | 2.8% |
| | Visa, Inc. | 2.8% |
| | Diageo PLC | 2.8% |
| | Alphabet, Inc. | 2.6% |
| | LVMH Moet Hennessy Louis Vuitton S.E. | 2.5% |
| | Aon PLC | 2.5% |
| | |
| | Top ten holdings do not include any cash, cash equivalents or exchange traded fund investments. Holdings are subject to change and may not reflect the current or future position of the Fund. |
| | |
| | |
| | |
| | |
| | |
Please note that for longer term performance numbers, prior to April 29, 2016 the Fund was known as the Westcore Blue Chip Dividend Fund, prior to April 30, 2018 the Fund was known as the Westcore Global Large-Cap Dividend Fund, and prior to September 19, 2020 the Fund was known as the Segall Bryant & Hamill Global Large Cap Fund.
Performance data quoted represents past performance and does not guarantee future results. Performance information for the Institutional Class shares prior to their inception is based on the performance of the Retail Class. Current performance may be lower or higher than the performance quoted. To obtain current performance as of the most recent month-end, visit www.sbhfunds.com. Average annual total returns reflect the reinvestment of dividends, capital gains distributions, all fee waivers and expense reimbursements, if any. Without the fee waivers and expense reimbursements, total return figures would have been lower. Investment return and principal value will vary, and shares, when redeemed, may be worth more or less than their original cost. Segall Bryant & Hamill fund shares are not insured by the FDIC, the Federal Reserve Board or any other agency and are subject to investment risk.
Until at least April 30, 2023, Segall Bryant & Hamill, LLC (the “Adviser”) has contractually agreed to waive the investment advisory and/or administration fees and/or to reimburse other expenses, so that the ratio of expenses to average net assets as reported in the Fund’s Financial Highlights will be no more than 0.89% and 0.74% for the Fund’s Retail Class and Institutional Class, respectively, for such period. This agreement may not be terminated or modified by the Adviser prior to the termination date without the approval of the Board of Trustees.
Investments in foreign companies are subject to special risks, including currency fluctuations, social, economic, and political uncertainties, which could increase volatility.
| | |
| 16 | | | www.sbhfunds.com |
| Segall Bryant & Hamill Global All Cap Fund | Fund Overview |
| | December 31, 2022 (Unaudited) |
Manager Commentary
Market Overview and Fund Performance
For 2022, the Segall Bryant & Hamill Global All Cap Fund returned -18.68% (Retail Class) compared to the Fund’s benchmark, the MSCI World Index’s -18.14% return. For the year, security selection detracted from relative performance while sector allocation and cash contributed. The investment approach of the Fund is to participate in the global developed markets by investing in companies that we believe possess strong management teams, can generate High Return on Invested Capital (ROIC), and produce quality financial metrics (e.g., free cash flow growth, consistent earnings growth, and margin expansion).
Contributors to Return
At the sector level, the Fund’s best performing areas relative to the benchmark for the year were Consumer Discretionary, Communication Services, and Materials. Outperformance in the Consumer Discretionary sector was driven by favorable stock selection as the Fund held outperforming retail/apparel positions while also avoiding the negative performance of Tesla, Inc. (TSLA). Communication Services performance was aided by avoiding ownership in many sector names that underperformed during the year. These included Meta Platforms Inc., (META) and many other media companies tied to digital advertising that declined significantly during the year due to a weakening economy. Outperformance in Materials was due to gains at quality defensive growers Linde, PLC. (LIN) and Franco-Nevada Corp. (FNV) as both companies maintain idiosyncratic growth drivers in most macroeconomic scenarios. At the individual stock level, Quanta Services, Inc. (PWR) outperformed as power grid and renewables spending continues to propel earnings growth and positive sentiment in shares. In addition, McKesson Corp. (MCK) outperformed as it was rewarded for delivering consistent upside to investor expectations and provided exposure to an end market with resiliency through a volatile macroeconomic environment.
Detractors from Return
For the year, Health Care, Information Technology, and Financials were the largest relative detractors on a sector level. Health Care underperformance was attributable to stock selection as the Fund was invested in select life science services and health care facilities names which delivered disappointing earnings updates. In addition, the Fund was underweight large cap pharma which outperformed by a wide margin and the Fund did not have exposure for much
of the year. Information Technology underperformance was tied to many of the technology holdings underperforming throughout the year after significant outperformance during 2021. Specifically, rising rates had an outsized negative impact on many of the Fund’s software holdings and increasing concerns related to an inventory correction in semiconductor holdings weighed on results. Financials underperformed as declining equity market values were a headwind to fundamentals and sentiment for capital-markets-oriented securities. At the individual stock level, underperformance by Marvell Technology, Inc. (MRVL) was tied to concerns related to a semiconductor inventory correction and a slowdown in data center capex spending. In addition, underperformance was driven by Alphabet, Inc. (GOOG) as difficult comparisons relative to 2021 and a pullback by advertisers in many categories significantly reduced growth. Profitability was also impacted more than expected due to continued headcount growth and investments in the cloud.
Outlook and Positioning
As we enter 2023, the focus of many investors is on assessing the durability of inflationary pressures and the intentions of the Federal Reserve with respect to interest rates. Determining the timing at the macro level and whether we enter a global recession is nearly an impossible task. Fortunately for us, macro concerns are not a principal part of the selection process in our approach. A key aspect of our approach is to assess company-specific business models against the impact of a new regime of deglobalization, which we expect will reduce ROIC and free cash flow as the global economy is going to labor under building new supply chains and transitioning away from fossil fuels. Both are costly and inflationary and as a result, company profits are likely to be hit much harder than consensus expectations. For example, we believe the reshoring of semiconductor supply chains should increase chip prices significantly due to rising inventory levels and diversifying suppliers. In addition, sluggish growth—or even a marked decline in inflation—could create negative operating leverage and result in lower margins. All that said, this will not stop us from buying stocks as they move into an attractive valuation range. It always has been, and will always remain, a market of stocks rather than a stock market. In our view, there will always be investments to make in companies with the right set of investment characteristics, priced at valuations that present an attractive opportunity to reach our long-term investment goals.
Thank you for your consideration and continued support.
Stock Performance (12/31/2021 to 12/31/2022)
| | Average | Contribution |
| 5 Highest | Weight | To Return |
| Quanta Services, Inc. | 2.82 | 0.72 |
| McKesson Corp. | 1.49 | 0.58 |
| Chevron Corp. | 1.55 | 0.56 |
| Globe Life, Inc. | 2.27 | 0.55 |
| Reinsurance Group of America, Inc. | 1.67 | 0.47 |
| | Average | Contribution |
| 5 Lowest | Weight | To Return |
| Apple, Inc. | 2.31 | -1.07 |
| Microsoft Corp. | 4.33 | -1.30 |
| Amazon.com, Inc. | 2.12 | -1.35 |
| Alphabet, Inc. | 3.17 | -1.44 |
| Marvell Technology, Inc. | 2.07 | -1.69 |
Past performance does not guarantee future results. These stocks do not represent all of the securities purchased, sold or recommended by the Fund’s Adviser. To request a complete list of the contribution of each Fund holding to overall Fund performance during the period, please call (800) 392-2673.
Please see page 35 for a description of the methodology used to construct this table.
| | |
| Annual Report | December 31, 2022 | | | 17 |
| Segall Bryant & Hamill Workplace Equality Fund | Fund Overview |
| | December 31, 2022 (Unaudited) |
Investment Objective
The Fund seeks to achieve long-term capital appreciation.
Fund Management
| Suresh Rajagopal, CFA Portfolio Manager | John N. Roberts, Esq. Portfolio Manager |
| William J. Barritt, CFA Portfolio Manager | |
CFA is a trademark owned by CFA Institute.
Cumulative Returns
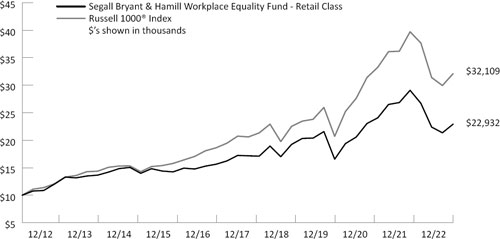
The chart above represents historical performance of a hypothetical investment of $10,000 in the Fund over the past 10 years (or for the life of the Fund if shorter). Performance calculations are as of the end of June each year. Past performance does not guarantee future results. This chart does not reflect the deduction of taxes that a shareholder would pay on Fund distributions or the redemption of Fund shares.
Please see index definitions beginning on page 34.
Average Annual Total Returns
| | | | | | Since | Inception |
| | 1 Year | 3 Years | 5 Years | 10 Years | Inception | Date |
| Retail Class (WEQRX) | (21.11)% | 2.06% | 5.87% | 8.65% | 8.41% | 6/1/88 |
| Institutional Class (WEQIX) | (20.95)% | 2.18% | 6.03% | 8.86% | 8.50% | 9/28/07 |
| Russell 1000® Index | (19.13)% | 7.35% | 9.13% | 12.37% | 10.41% | |
Retail Class Annual Expense Ratio (per the current prospectus) — Gross: 1.28%, Net: 0.89%
Institutional Class Annual Expense Ratio (per the current prospectus) — Gross: 1.26%, Net: 0.74%
| | Sector Allocation (as of 12/31/2022) |
| | |
| | Information Technology | 25.2% |
| | Health Care | 17.7% |
| | Industrials | 11.6% |
| | Financials | 11.4% |
| | Consumer Discretionary | 9.1% |
| | Consumer Staples | 6.1% |
| | Communication Services | 5.7% |
| | Energy | 5.6% |
| | Real Estate | 3.4% |
| | Materials | 1.8% |
| | |
| | Sector classifications presented are based on the Global Industry Classification Standard (GICS) methodology. |
| | |
| | Percentages are based on Total Net Assets. |
| | |
| | The sector allocation table above does not include any cash or cash equivalents. |
| | |
| | Top Ten Holdings (as of 12/31/2022) |
| | |
| | Microsoft Corp. | 5.1% |
| | Apple, Inc. | 4.8% |
| | Alphabet, Inc. | 3.8% |
| | UnitedHealth Group, Inc. | 3.4% |
| | Raytheon Technologies Corp. | 3.1% |
| | Visa, Inc. | 3.1% |
| | Chevron Corp. | 2.9% |
| | ConocoPhillips | 2.8% |
| | JPMorgan Chase & Co. | 2.4% |
| | Danaher Corp. | 2.3% |
| | |
| | Top ten holdings do not include any cash, cash equivalents or exchange traded fund investments. Holdings are subject to change and may not reflect the current or future position of the Fund. |
| | |
| | |
| | |
| | |
| | |
| | |
| | |
Please note that for the longer term performance numbers, prior to April 29, 2016 the Fund was known as the Westcore Growth Fund, prior to April 30, 2018, the Fund was known as the Westcore Large Cap Dividend Fund, and prior to May 1, 2019 the Fund was known as the Segall Bryant & Hamill Large Cap Dividend Fund.
Performance data quoted represents past performance and does not guarantee future results. Performance information for the Institutional Class shares prior to their inception is based on the performance of the Retail Class. Current performance may be lower or higher than the performance quoted. To obtain current performance as of the most recent month-end, visit www.sbhfunds.com. Average annual total returns reflect the reinvestment of dividends, capital gains distributions, all fee waivers and expense reimbursements, if any. Without the fee waivers and expense reimbursements, total return figures would have been lower. Investment return and principal value will vary, and shares, when redeemed, may be worth more or less than their original cost. Segall Bryant & Hamill fund shares are not insured by the FDIC, the Federal Reserve Board or any other agency and are subject to investment risk.
Until at least April 30, 2023, Segall Bryant & Hamill, LLC (the “Adviser”) has contractually agreed to waive the investment advisory and/or administration fees and/or to reimburse other expenses, so that the ratio of expenses to average net assets as reported in the Fund’s Financial Highlights will be no more than 0.89% and 0.74% for the Fund’s Retail Class and Institutional Class, respectively, for such period. This agreement may not be terminated or modified by the Adviser prior to the termination date without the approval of the Board of Trustees.
| | |
| 18 | | | www.sbhfunds.com |
| Segall Bryant & Hamill Workplace Equality Fund | Fund Overview |
| | December 31, 2022 (Unaudited) |
Manager Commentary
Market Overview and Fund Performance
For 2022, the Segall Bryant & Hamill Workplace Equality Fund returned -21.11% (Retail Class) compared to the Fund’s benchmark, the Russell 1000® Index’s -19.13% return. For the year, security selection detracted from relative performance while sector and cash allocations contributed to returns. As a reminder, a key element of the Fund’s strategy is to invest in companies that we believe maintain progressive and inclusionary human resource policies, whereby diversity is embraced. The universe of investable names includes companies with a commitment to providing equal treatment to employees regardless of sexual orientation, gender identity or expression, or race. Within the universe, we focus on companies that we believe possess strong management teams, can generate High Return on Invested Capital (ROIC), and produce quality financial metrics (e.g., free cash flow growth, consistent earnings growth, and margin expansion).
Contributors to Return
At the sector level, the Fund’s best performing areas relative to the benchmark during the year were Consumer Discretionary, Communication Services, and Industrials. Within Consumer Discretionary, outperformance was attributable to favorable stock selection as the Fund was invested in high quality brands and retailers such as Dollar General Corp. (DG) while also avoiding the negative performance of Tesla, Inc. (TSLA). Communication Services performance was aided by avoiding ownership in many sector names that underperformed during the year. These included Meta Platforms Inc., (META) and many other media companies tied to digital advertising that declined significantly during the year due to a weakening economy. Industrials outperformed as the Fund was overweight the sector and strong gains from Deere & Co. (DE) and Raytheon Technologies Corp. (RTX) drove most of the outperformance. Both companies have exposure to above average growth markets (agriculture, commercial aerospace, and defense) that investors favored in the year’s mixed macroeconomic environment. At the individual stock level, Chevron Corp. (CVX) outperformed as supportive commodity prices and disciplined spending drove strong cash returns at major energy companies during the year. In addition, McKesson Corp. (MCK) was rewarded as the company delivered consistent upside to investor expectations and provided exposure to an end market with resiliency through a volatile macroeconomic environment.
Detractors from Returns
Information Technology, Consumer Staples, and Health Care were the largest relative detractors on a sector level for the year. Information Technology underperformance was tied to many of the Fund technology holdings underperforming throughout the year after significant outperformance during 2021. Specifically, rising rates
had an outsized negative impact on many of the Fund’s software holdings and increasing concerns related to an inventory correction in semiconductor holdings weighed on results. Consumer Staples underperformance was attributable to unfavorable stock selection as the Fund held names that experienced a margin squeeze from a challenging cost environment and adverse operating conditions in China due to COVID. Health Care underperformance was attributable to unfavorable stock selection as the Fund was invested in select life science services and animal health names which experienced multiple compression. In addition, underperformance in Health Care was due to being underweight in large cap pharma which posted strong returns for the year. At the individual stock level, underperformance was driven by Alphabet, Inc. (GOOG) as difficult comparisons relative to 2021 and a pullback by advertisers in many categories significantly reduced growth. Profitability was also impacted more than expected due to continued headcount growth and investments in the cloud. Amazon.com, Inc. (AMZN) continues to see increasing macro pressure across both its retail and Amazon Web Services (AWS) segments. Inflation, fuel prices, and rising energy costs have all had a negative impact on sales growth and operating income.
Outlook and Positioning
As we enter 2023, the focus of many investors is on assessing the durability of inflationary pressures and the intentions of the Federal Reserve with respect to interest rates. Determining the timing at the macro level and whether the U.S. enters a recession is nearly an impossible task. Fortunately for us, macro concerns are not a principal part of the selection process in our approach. A key aspect of our approach is to assess company-specific business models against the impact of a new regime of deglobalization, which we expect will reduce ROIC and free cash flow as the global economy is going to labor under building new supply chains and transitioning away from fossil fuels. Both are costly and inflationary and as a result, company profits are likely to be hit much harder than consensus expectations. For example, we believe the reshoring of semiconductor supply chains should increase chip prices significantly due to rising inventory levels and diversifying suppliers. In addition, sluggish growth—or even a marked decline in inflation—could create negative operating leverage and result in lower margins. All that said, this will not stop us from buying stocks as they move into an attractive valuation range. It always has been, and will always remain, a market of stocks rather than a stock market. In our view, there will always be investments to make in companies with the right set of investment characteristics, priced at valuations that present an attractive opportunity to reach our long-term investment goals.
Thank you for your consideration and continued support.
Stock Performance (12/31/2021 to 12/31/2022)
| | Average | Contribution |
| 5 Highest | Weight | To Return |
| Chevron Corp. | 2.32 | 0.82 |
| McKesson Corp. | 1.89 | 0.75 |
| ConocoPhillips | 2.16 | 0.64 |
| Reinsurance Group of America, Inc. | 1.92 | 0.53 |
| Raytheon Technologies Corp. | 2.63 | 0.40 |
| | Average | Contribution |
| 5 Lowest | Weight | To Return |
| Apple, Inc. | 3.03 | -1.31 |
| NVIDIA Corp. | 1.40 | -1.35 |
| Microsoft Corp. | 5.27 | -1.50 |
| Amazon.com, Inc. | 3.02 | -1.94 |
| Alphabet, Inc. | 4.68 | -2.09 |
Past performance does not guarantee future results. These stocks do not represent all of the securities purchased, sold or recommended by the Fund’s Adviser. To request a complete list of the contribution of each Fund holding to overall Fund performance during the period, please call (800) 392-2673.
Please see page 35 for a description of the methodology used to construct this table.
| | |
| Annual Report | December 31, 2022 | | | 19 |
| Segall Bryant & Hamill Short Term Plus Fund | Fund Overview |
| | December 31, 2022 (Unaudited) |
Investment Objective
The Fund seeks to provide current income and competitive total return.
Fund Management
James D. Dadura, CFA Portfolio Manager
Gregory C. Hosbein, CFA Portfolio Manager
CFA is a trademark owned by CFA Institute.
Cumulative Returns
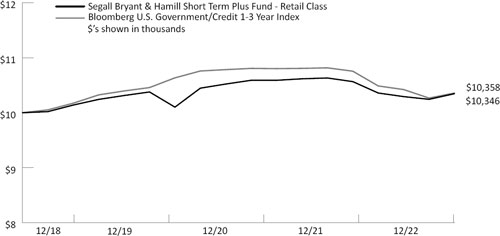
The chart above represents historical performance of a hypothetical investment of $10,000 in the Fund over the past 10 years (or for the life of the Fund if shorter). Performance calculations are as of the end of June each year. Past performance does not guarantee future results. This chart does not reflect the deduction of taxes that a shareholder would pay on Fund distributions or the redemption of Fund shares.
Please see index definitions beginning on page 34.
Average Annual Total Returns
| | | | | | Since | 30-Day | Inception |
| | 1 Year | 3 Years | 5 Years | 10 Years | Inception | SEC Yield | Date |
| Retail Class (SBHPX) | (2.07)% | (0.10)% | — | — | 0.85% | 4.37% | 12/14/18 |
| Institutional Class (SBAPX) | (1.98)% | 0.04% | — | — | 0.96% | 4.48% | 12/14/18 |
Bloomberg U.S.
Government/
Credit 1-3 Year Index | (3.69)% | (0.32)% | — | — | 0.87% | | |
Retail Class Annual Expense Ratio (per the current prospectus) — Gross: 0.80%, Net: 0.49%
Institutional Class Annual Expense Ratio (per the current prospectus) — Gross: 0.68%, Net: 0.40%
| | Sector Allocation (as of 12/31/2022) |
| | |
| | Industrial | 57.9% |
| | Utility | 17.0% |
| | U.S. Treasury Bonds & Notes | 13.7% |
| | Finance | 5.1% |
| | Municipal Bonds | 2.2% |
| | Commercial Mortgage-Backed Securities | 1.1% |
| | |
| | Percentages are based on Total Net Assets. |
| | |
| | The sector allocation table above does not include any cash or cash equivalents. |
| | |
| | Top Ten Corporate Holdings (as of 12/31/2022) |
| | |
| | Delta Air Lines Pass Thru Trust | 2.2% |
| | JPMorgan Chase & Co. | 2.0% |
| | Pacific Gas & Electric Co. | 2.0% |
| | Quanta Services, Inc. | 2.0% |
| | Evergy, Inc. | 2.0% |
| | Avery Dennison Corp. | 2.0% |
| | Williams Partners LP | 2.0% |
| | General Motors Financial Co., Inc. | 2.0% |
| | Martin Marietta Materials, Inc. | 2.0% |
| | AutoNation, Inc. | 2.0% |
| | |
| | Percentages represent the Fund’s aggregate holdings in the same corporate issuer and its affiliates. Holdings are subject to change and may not reflect the current or future position of the Fund. |
| | |
| | |
| | |
| | |
| | |
| | |
| | |
| | |
| | |
| | |
| | |
| | |
| | |
| | |
| | |
30-Day SEC Yield figures reflect all fee waivers and expense reimbursements. Without the absorption of these fee waivers and/or expense reimbursements, the figures would have been 4.24% for the Retail Class and 3.79% for the Institutional Class.
Performance data quoted represents past performance and does not guarantee future results. Current performance may be lower or higher than the performance quoted. To obtain current performance as of the most recent month-end, visit www.sbhfunds.com. Average annual total returns reflect the reinvestment of dividends, capital gains distributions, all fee waivers and expense reimbursements, if any. Without the fee waivers and expense reimbursements, total return figures would have been lower. Investment return and principal value will vary, and shares, when redeemed, may be worth more or less than their original cost. Segall Bryant & Hamill fund shares are not insured by the FDIC, the Federal Reserve Board or any other agency and are subject to investment risk.
Until at least April 30, 2023, Segall Bryant & Hamill, LLC (the “Adviser”) has contractually agreed to waive the investment advisory and/or administration fees and/or to reimburse other expenses, so that the ratio of expenses to average net assets as reported in the Fund’s Financial Highlights will be no more than 0.49% and 0.40% for the Fund’s Retail Class and Institutional Class, respectively, for such period. This agreement may not be terminated or modified by the Adviser prior to the termination date without the approval of the Board of Trustees.
Fixed Income Risks: Fixed income Funds invest in bonds which entails interest rate risk and credit risk.
| | |
| 20 | | | www.sbhfunds.com |
| Segall Bryant & Hamill Short Term Plus Fund | Fund Overview |
| | December 31, 2022 (Unaudited) |
Manager Commentary
Market Overview
Like the rest of the fixed income market, the segment of the market with the shortest maturities was not immune to the across-the-board increase in interest rates in 2022. The Federal Reserve’s (Fed) interest rate hikes had a pronounced effect on short-term interest rates: 1-year maturity Treasury yields rose to 4.69% from 0.38%, 2-year maturity Treasury yields rose to 4.43% from 0.73%, and 3-year maturity Treasury yields rose to 4.22% from 0.96%.
Although the market rallied in the fourth quarter, this comeback was small comfort as the bond market ended the calendar year with one of its worst returns in history. While corporate spreads narrowed in the fourth quarter from elevated levels, Treasuries outperformed credit for the year as investors worried that the tighter monetary policy would lead to a weaker economic environment.
Fund Performance
The Segall Bryant & Hamill Short Term Plus Fund returned -2.07% (Retail Class) for 2022 compared to a return of -3.69% for its benchmark, the Bloomberg U.S. Government/Credit 1-3 Year Index. The most significant drivers of the Fund’s relative performance during this period were security selection and duration. In the corporate credit sector, the Fund’s corporate bonds outperformed the benchmark. Also helping relative performance was a shorter duration. The Fund averaged 1.3 years over this period, shorter than the 1.9 years for the benchmark. This helped relative returns as 1- to 3-year Treasury yields rose during the year.
Outlook and Positioning
The bond market, particularly those securities with maturities three years and less, is in a significantly healthier position going into 2023. Shorter maturity bonds currently offer yields above their stated duration. For example, at year end, the yield on the Bloomberg U.S. Government/Credit 1-3 Year Index was 4.7% and the duration was 1.9 years. This yield “cushion” provides investors some return protection should interest rates increase.
Higher interest rates and increased volatility are creating pockets of opportunities for fixed income investors. Exiting the fiscal year, the Fund continues to emphasize liquidity and remains overweight the 0-1 year part of the yield curve relative to the benchmark. This positioning helps provide liquidity to capture future opportunities in an investment landscape characterized by yield levels the market has not experienced in over a decade. Entering 2023, the duration of the Fund’s holdings remains shorter than the benchmark. This positioning reflects our expectation that the Fed will need to continue raising interest rates in its effort to slow the economy and drive down inflationary pressures. The Fund’s high yield exposure remains below historical average (approximately 4% at year-end). Within the corporate sector, as of year-end, the Fund was overweight Industrial and Utility corporate securities, and underweight Financials. Entering 2023, we continue to emphasize higher yielding securities that we believe are higher quality securities overlooked by other investors.
| | |
| | |
| Annual Report | December 31, 2022 | | | 21 |
| Segall Bryant & Hamill Plus Bond Fund | Fund Overview |
| | December 31, 2022 (Unaudited) |
Investment Objective
The Fund seeks to achieve long-term total rate of return consistent with preservation of capital.
Fund Management
| Troy A. Johnson, CFA Portfolio Manager | Darren G. Hewitson, CFA Portfolio Manager |
| Gregory M. Shea, CFA Portfolio Manager | |
| CFA is a trademark owned by CFA Institute. | |
Cumulative Returns

The chart above represents historical performance of a hypothetical investment of $10,000 in the Fund over the past 10 years (or for the life of the Fund if shorter). Performance calculations are as of the end of June each year. Past performance does not guarantee future results. This chart does not reflect the deduction of taxes that a shareholder would pay on Fund distributions or the redemption of Fund shares.
Please see index definitions beginning on page 34.
Average Annual Total Returns
| | | | | | Since | 30-Day | Inception |
| | 1 Year | 3 Years | 5 Years | 10 Years | Inception | SEC Yield | Date |
| Retail Class (WTIBX) | (13.13)% | (2.15)% | 0.35% | 1.47% | 5.20% | 4.68% | 6/1/88 |
| Institutional Class (WIIBX) | (12.95)% | (1.98)% | 0.52% | 1.64% | 5.27% | 4.84% | 9/28/07 |
Bloomberg U.S. Aggregate
Bond Index | (13.01)% | (2.71)% | 0.02% | 1.06% | 5.43% | | |
Retail Class Annual Expense Ratio (per the current prospectus) — Gross: 0.67%, Net: 0.55%
Institutional Class Annual Expense Ratio (per the current prospectus) — Gross: 0.51%, Net: 0.40%
| | Sector Allocation (as of 12/31/2022) |
| | |
| | Industrial | 32.4% |
| | Mortgage-Backed Securities Passthrough | 26.1% |
| | U.S. Treasury Bonds & Notes | 12.7% |
| | Finance | 9.7% |
| | Municipal Bonds | 8.5% |
| | Utility | 4.9% |
| | Asset Backed Securities | 3.2% |
| | Residential Mortgage-Backed Securities | 0.3% |
| | |
| | Percentages are based on Total Net Assets. |
| | |
| | The sector allocation table above does not include any cash or cash equivalents. |
| | |
| | Top Ten Corporate Holdings (as of 12/31/2022) |
| | |
| | SBA Tower Trust | 1.4% |
| | American Airlines, Inc. | 1.3% |
| | Wells Fargo & Co. | 1.3% |
| | JPMorgan Chase & Co. | 1.3% |
| | Quanta Services, Inc. | 1.0% |
| | Occidental Petroleum Corp. | 1.0% |
| | Masco Corp. | 0.9% |
| | Bank of America Corp. | 0.9% |
| | Tennessee Gas Pipeline Co. LLC | 0.9% |
| | Virginia Electric & Power Co. | 0.9% |
| | |
| | Percentages represent the Fund’s aggregate holdings in the same corporate issuer and its affiliates. Holdings are subject to change and may not reflect the current or future position of the Fund. |
| | |
| | |
| | |
| | |
| | |
| | |
| | |
| | |
| | |
| | |
| | |
| | |
| | |
30-Day SEC Yield figures reflect all fee waivers and expense reimbursements. Without the absorption of these fee waivers and/or expense reimbursements, the figures would have been 4.63% for the Retail Class and 4.77% for the Institutional Class.
Performance data quoted represents past performance and does not guarantee future results. Performance information for the Institutional Class shares prior to their inception is based on the performance of the Retail Class. Current performance may be lower or higher than the performance quoted. To obtain current performance as of the most recent month-end, visit www.sbhfunds.com. Average annual total returns reflect the reinvestment of dividends, capital gains distributions, all fee waivers and expense reimbursements, if any. Without the fee waivers and expense reimbursements, total return figures would have been lower. Investment return and principal value will vary, and shares, when redeemed, may be worth more or less than their original cost. Segall Bryant & Hamill fund shares are not insured by the FDIC, the Federal Reserve Board or any other agency and are subject to investment risk.
Until at least April 30, 2023, Segall Bryant & Hamill, LLC (the “Adviser”) has contractually agreed to waive the investment advisory and/or administration fees and/or to reimburse other expenses, so that the ratio of expenses to average net assets as reported in the Fund’s Financial Highlights will be no more than 0.55% and 0.40% for the Fund’s Retail Class and Institutional Class, respectively, for such period. This agreement may not be terminated or modified by the Adviser prior to the termination date without the approval of the Board of Trustees.
Segall Bryant & Hamill Plus Bond Fund may invest in high-yield/high-risk bonds which are subject to greater levels of liquidity risk. Additionally, investing in bonds entails interest rate risk and credit risk.
| | |
| 22 | | | www.sbhfunds.com |
| Segall Bryant & Hamill Plus Bond Fund | Fund Overview |
| | December 31, 2022 (Unaudited) |
Manager Commentary
Market Overview
The bond market ended the year with its best quarterly return in over two years. The Bloomberg U.S. Aggregate Bond Index (the Agg) was up 1.87% and high yield (HY) bonds returned over 4% in the fourth quarter. While this comeback was welcome relief, the bond market ended 2022 with some of the worst returns in history.
By any measure, 2022 was an outlier. The Agg declined by 13.01%, the previous worst-ever mark being -2.92% in 1994. The decline in high yield of over 11% was the second worst in history. Long-duration assets were among the worst performers for the year, as long Treasuries lost 33% and long corporates lost 26%. After a remarkable year of rate hikes, the Federal Reserve (Fed) ended the year with an overnight Fed Funds rate range of 4.25%-4.5%, after starting the year at 0-0.25%.
Corporate bond spreads tightened across every investment grade (IG) sector in the final quarter of the year but were significantly wider through 2022. Similarly in high yield, the market saw some reprieve in the fourth quarter, as spreads tightened in almost every sector, but calendar year returns remained significantly negative in both absolute and excess return terms. Default rates remained at historically low levels, reflective of healthy corporate fundamentals. While mortgage-backed securities (MBS) posted their best quarter since early 2020, full-year returns were the worst in history by a wide margin.
Fund Performance
The Segall Bryant & Hamill Plus Bond Fund returned -13.13% (Retail Class) for the year versus -13.01% for the Bloomberg U.S. Aggregate Bond Index. In relative terms, the Fund benefitted from a modestly short duration position as interest rates rose across the yield curve. Given a backdrop of strong corporate fundamentals, the Fund remained overweighted to corporate credit, including high yield securities, through the year. This resulted in an income advantage over the benchmark, further aided by the shorter average duration of the Fund’s corporate bonds in an inverted yield curve environment.
The overweighted allocation to corporate bonds was detrimental to relative returns although the Fund’s corporate bonds outperformed those in the benchmark due to their lower spread duration. High
yield holdings outperformed investment grade; our stance has been that the Fund’s short duration high yield securities allow for yield pickup without exposing the Fund to interest rate or credit spread volatility further out the yield curve. An underweighted allocation to mortgage-backed securities (MBS) was also beneficial as the sector struggled amid volatile interest rates, along with slower prepayment speeds amid the housing slowdown.
Outlook and Positioning
The fixed income market enters the new year with support for both bullish and bearish views. Fed officials have been consistent in their “higher-for-longer” message regarding the most likely path for rates in 2023. Exiting the fiscal year, estimates of the peak Fed Funds rate were around 5.0%, implying two more quarter-point hikes before pausing. The market has seemed to rally at every hint of a Fed pause or taper, and Fed officials have been consistent in tamping down such optimism. The Fed’s efforts in fighting inflationary pressures will likely remain a major driver of market performance in 2023. That said, the fixed income market enters the new year with more of a yield cushion than existed this time one year ago, and we believe that will be a moderating factor to any further potential rate increases.
Heading into 2023, the Fund remains overweight corporate bonds relative to the benchmark. While we have been adding to its MBS exposure, as of December 31, 2022, the Fund remains underweight this asset class versus the benchmark. Recent prevailing 30-year mortgage rates peaked around 7.35% in early November, and while they have since fallen to around 6.60% as of December 31, 2022, prepayment risk on MBS pools remains low, which prompted us to moderately increase the Fund’s exposure. As of December 31, 2022, the Fund maintains exposure to taxable municipal bonds based on our view that municipal bond fundamentals are strong and offer a compelling yield for the level of risk.
As global markets grapple with mixed economic signals, we expect volatility in the fixed income market to remain high. Higher interest rates continue to create pockets of opportunity for fixed income investors. For the first time in years, the “cushion” that yield can provide gives us comfort about the prospect for returns from the asset class as we move into 2023.
| | |
| | |
| Annual Report | December 31, 2022 | | | 23 |
| Segall Bryant & Hamill Quality High Yield Fund | Fund Overview |
| | December 31, 2022 (Unaudited) |
Investment Objective
The Fund seeks to achieve long-term total rate of return consistent with preservation of capital.
Fund Management
Troy A. Johnson, CFA Portfolio Manager
Gregory M. Shea, CFA Portfolio Manager
CFA is a trademark owned by CFA Institute.
Cumulative Returns
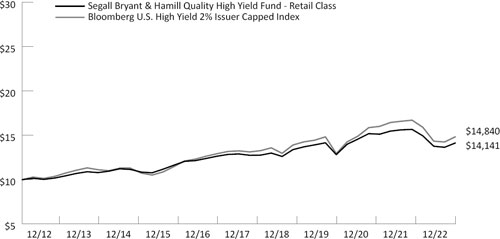
The chart above represents historical performance of a hypothetical investment of $10,000 in the Fund over the past 10 years (or for the life of the Fund if shorter). Performance calculations are as of the end of June each year. Past performance does not guarantee future results. This chart does not reflect the deduction of taxes that a shareholder would pay on Fund distributions or the redemption of Fund shares.
Please see index definitions beginning on page 34.
Average Annual Total Returns
| | | | | | Since | 30-Day | Inception |
| | 1 Year | 3 Years | 5 Years | 10 Years | Inception | SEC Yield | Date |
| Retail Class (WTLTX) | (9.75)% | (0.04)% | 1.85% | 3.53% | 6.59% | 6.86% | 6/1/88 |
| Institutional Class (WILTX) | (9.51)% | 0.14% | 2.02% | 3.71% | 6.66% | 7.01% | 9/28/07 |
Bloomberg U.S. High Yield
2% Issuer Capped Index | (11.19)% | 0.03% | 2.30% | 4.03% | N/A | | |
Bloomberg U.S. Corporate
High Yield Ba Index | (10.80)% | 0.93% | 2.99% | 4.39% | 7.82% | | |
Retail Class Annual Expense Ratio (per the current prospectus) — Gross: 0.88%, Net: 0.85%
Institutional Class Annual Expense Ratio (per the current prospectus) — Gross: 0.76%, Net: 0.70%
| | Sector Allocation (as of 12/31/2022) |
| | |
| | Industrial | 79.6% |
| | Finance | 13.3% |
| | Utility | 5.2% |
| | |
| | Percentages are based on Total Net Assets. |
| | |
| | The sector allocation table above does not include any cash or cash equivalents. |
| | |
| | |
| | Top Ten Holdings (as of 12/31/2022) |
| | |
| | Occidental Petroleum Corp. | 3.0% |
| | PDC Energy, Inc. | 2.9% |
| | IIP Operating Parternship LP | 2.6% |
| | Provident Funding Associates LP/PFG Finance Corp. | 2.6% |
| | Goodyear Tire & Rubber Co. | 2.4% |
| | KB Home | 2.4% |
| | VICI Properties LP | 2.3% |
| | Vistra Operations Co. LLC | 2.3% |
| | MPT Operating Partnership LP/MPT Finance Corp. | 2.2% |
| | ATS Automotive Tooling Systems, Inc. | 2.2% |
| | |
| | Percentages represent the Fund’s aggregate holdings in the same corporate issuer and its affiliates. Holdings are subject to change and may not reflect the current or future position of the Fund. |
| | |
| | |
| | |
| | |
| | |
| | |
| | |
| | |
| | |
| | |
| | |
| | |
| | |
| | |
| | |
| | |
| | |
30-Day SEC Yield figures reflect all fee waivers and expense reimbursements. Without the absorption of these fee waivers and/or expense reimbursements, the figures would have been 6.76% for the Retail Class and 6.84% for the Institutional Class.
Performance data quoted represents past performance and does not guarantee future results. Performance information for the Institutional Class shares prior to their inception is based on the performance of the Retail Class. Current performance may be lower or higher than the performance quoted. To obtain current performance as of the most recent month-end, visit www.sbhfunds.com. Average annual total returns reflect the reinvestment of dividends, capital gains distributions, all fee waivers and expense reimbursements, if any. Without the fee waivers and expense reimbursements, total return figures would have been lower. Investment return and principal value will vary, and shares, when redeemed, may be worth more or less than their original cost. Segall Bryant & Hamill fund shares are not insured by the FDIC, the Federal Reserve Board or any other agency and are subject to investment risk.
Until at least April 30, 2023, Segall Bryant & Hamill, LLC (the “Adviser”) has contractually agreed to waive the investment advisory and/or administration fees and/or to reimburse other expenses, so that the ratio of expenses to average net assets as reported in the Fund’s Financial Highlights will be no more than 0.85% and 0.70% for the Fund’s Retail Class and Institutional Class, respectively, for such period. This agreement may not be terminated or modified by the Adviser prior to the termination date without the approval of the Board of Trustees.
Segall Bryant & Hamill Quality High Yield Fund may invest in high-yield/high-risk bonds which are subject to greater levels of liquidity risk. Additionally, investing in bonds entail interest rate risk and credit risk.
| | |
| 24 | | | www.sbhfunds.com |
| Segall Bryant & Hamill Quality High Yield Fund | Fund Overview |
| | December 31, 2022 (Unaudited) |
Manager Commentary
Market Overview
The bond market ended the year with its best quarterly return in over two years. The Bloomberg U.S. Aggregate Bond Index (the Agg) was up 1.87% and high yield (HY) bonds returned 4.17%. While this comeback was welcome relief, the bond market ended the calendar year with some of the worst returns in history.
By any measure, 2022 was a remarkable outlier. The Agg declined by 13.01%, the previous worst-ever mark being -2.92% in 1994. The decline in high yield of 11.19% was the second worst in history. Long-duration assets were among the worst performers for the year, as long Treasuries lost 33% and long corporates lost 26%. For the full year, CCCs (-16.29%) underperformed the broader high yield market, while BB (-10.80%) and B (-10.26%) ratings categories outperformed. The HY default rate ticked slightly higher during the year to 1.6% but remains quite low versus historical standards. While every sector within HY widened over the course of the year, the least amount of widening occurred in the Energy and Utilities sectors.
Fund Performance
The Segall Bryant & Hamill Quality High Yield Fund (Retail Class) returned -9.75% for the year versus -11.18% for its benchmark, the Bloomberg U.S. High Yield 2% Issuer Capped Index. The Fund’s relative performance in 2022 was driven by our credit selection, which centers around stress testing individual issuers’ cash flows— which helps our team to understand the issuer’s ability to service its debt not only in good times but also during tough periods.
Regarding credit quality, the Fund’s quality bias and focus on capital preservation typically drive an overweight to BBB and BB rated securities, with an underweight to B and CCC rated issues. For the year, higher quality outperformed with rating category returns as follows: -9.79% for intermediate BBBs, -10.80% for BBs, -10.26% for Bs, and -16.29% for CCCs. The Fund’s duration was relatively in line with its benchmark, resulting in a negligible impact to relative performance for the year. However, the yield on the 5-year U.S. Treasury (which carries a duration of 4.4 years as of year-end 2022 and is most closely matched to the overall U.S. HY market) increased from 1.26% at the beginning of the year to 4.00% (i.e., up 274 basis points) at year end which significantly impacted the Fund’s absolute return during 2022.
Outlook and Positioning
The fixed income market enters 2023 with support for both bullish and bearish views. Fed officials have been consistent in their “higher-for-longer” message regarding the most likely path for rates in 2023. Exiting the fiscal year, estimates of the peak Fed Funds rate are around 5.0%, implying two more quarter-point hikes before pausing. The market has seemed to rally at every hint of a Fed pause or taper, and Fed officials have been consistent in tamping down such optimism. The Fed’s efforts in fighting inflationary pressures will likely remain a major driver of market performance in 2023. That said, the fixed income market enters the new year with more of a yield cushion than existed this time one year ago, and that will be a moderating factor to any further potential rate increases.
We remain constructive on high yield bonds as the global markets grapple with mixed economic signals. While we expect volatility to remain high, at fiscal year-end corporate fundamentals remained resilient and default rates sat near historic lows. Higher yields and lower dollar prices are in a more favorable position for high yield investors compared to a year ago. At approximately 9.0% yield, current levels of high yield bonds are more than double where we entered 2022 (4.2%). The average bond price is lower as well ($86.20 versus $103.50). Lower bond prices generally provide more total return opportunity for investors as well as downside protection.
Exiting 2022, our inherent quality bias is represented currently in the Fund by an overweight to BBB and BB rated securities along with an underweight to B and CCC rated securities. This Fund’s composition is driven by our independent, bottom-up fundamental analysis, which includes stress testing each issuer. Entering 2023, the Fund remains invested in what we believe to be several “rising-star” candidates. These are high yield issuers that are exhibiting improving credit quality characteristics which we feel will transition to an investment grade credit rating. As of December 31, 2022, the Fund continues to carry a duration that is relatively in line with the Bloomberg U.S. High Yield 2% Issuer Capped Index.
Although no market participant is immune in volatile markets, we believe our approach, which has always favored securities that we consider high quality, may provide some degree of relative protection against market downturns over time.
| | |
| | |
| Annual Report | December 31, 2022 | | | 25 |
| Segall Bryant & Hamill Municipal Opportunities Fund | Fund Overview |
| | December 31, 2022 (Unaudited) |
Investment Objective
The Fund seeks income exempt from Federal income taxes.
Fund Management
Nicholas J. Foley Portfolio Manager
CFA is a trademark owned by CFA Institute.
Cumulative Returns
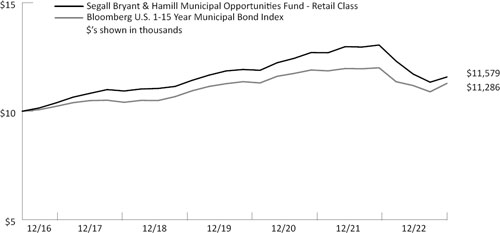
The chart above represents historical performance of a hypothetical investment of $10,000 in the Fund over the past 10 years (or for the life of the Fund if shorter). Performance calculations are as of the end of June each year. Past performance does not guarantee future results. This chart does not reflect the deduction of taxes that a shareholder would pay on Fund distributions or the redemption of Fund shares.
Please see index definitions beginning on page 34.
Average Annual Total Returns
| | | | | | Since | 30-Day | Inception |
| | 1 Year | 3 Years | 5 Years | 10 Years | Inception | SEC Yield | Date |
| Retail Class (WTTAX) | (11.25)% | (0.97)% | 1.04% | — | 2.46% | 3.15% | 12/16/16 |
| Institutional Class (WITAX) | (11.11)% | (0.81)% | 1.19% | — | 2.63% | 3.29% | 12/16/16 |
Bloomberg U.S. 1-15 Year
Municipal Bond Index | (5.95)% | (0.22)% | 1.44% | — | 2.02% | | |
Retail Class Annual Expense Ratio (per the current prospectus) — Gross: 0.74%, Net: 0.65%
Institutional Class Annual Expense Ratio (per the current prospectus) — Gross: 0.57%, Net: 0.50%
| | Sector Allocation (as of 12/31/2022) |
| | |
| | Revenue | 64.8% |
| | Variable Rate Demand Note | 9.3% |
| | U.S. Treasury Bills | 7.8% |
| | General Obligation | 7.5% |
| | Local Authority | 6.4% |
| | Corporate Bonds | 3.7% |
| | Bond Anticipation Note | 1.5% |
| | Prerefunded | 1.0% |
| | Certificate Participation | 0.0% |
| | |
| | Percentages are based on Total Net Assets. |
| | |
| | The sector allocation table above does not include any cash or cash equivalents. |
| | |
| | Top Ten Holdings (as of 12/31/2022) |
| | |
| | City of Whiting Indiana Environmental Facilities | 5.1% |
| | Washington State Economic Development Finance Authority | 4.2% |
| | Oregon State Housing & Community Services Department | 3.8% |
| | IMPI 3 LLC | 3.7% |
| | Virginia Small Business Financing Authority | 3.5% |
| | New York State Housing Finance Agency | 3.4% |
| | Clark City Nevada Jet Aviation Fuel Tax | 2.9% |
| | Indiana Finance Authority Environmental Refunding | 2.8% |
| | Arizona Health Facilities | 2.4% |
| | San Diego County Regional Airport Authority | 2.4% |
| | |
| | Percentages represent the Fund’s aggregate holdings in the same corporate issuer and its affiliates. Holdings are subject to change and may not reflect the current or future position of the Fund. |
| | |
| | |
| | |
30-Day SEC Yield figures reflect all fee waivers and expense reimbursements. Without the absorption of these fee waivers and/or expense reimbursements, the figures would have been 3.13% for the Retail Class and 3.18% for the Institutional Class.
Performance data quoted represents past performance and does not guarantee future results. Current performance may be lower or higher than the performance quoted. To obtain current performance as of the most recent month-end, visit www.sbhfunds.com. Average annual total returns reflect the reinvestment of dividends, capital gains distributions, all fee waivers and expense reimbursements, if any. Without the fee waivers and expense reimbursements, total return figures would have been lower. Investment return and principal value will vary, and shares, when redeemed, may be worth more or less than their original cost. Segall Bryant & Hamill fund shares are not insured by the FDIC, the Federal Reserve Board or any other agency and are subject to investment risk.
Until at least April 30, 2023, Segall Bryant & Hamill, LLC (the “Adviser”) has contractually agreed to waive the investment advisory and/or administration fees and/or to reimburse other expenses, so that the ratio of expenses to average net assets as reported in the Fund’s Financial Highlights will be no more than 0.65% and 0.50% for the Fund’s Retail Class and Institutional Class, respectively, for such period. This agreement may not be terminated or modified by the Adviser prior to the termination date without the approval of the Board of Trustees.
Municipal bond fund income may be subject to state and local income taxes and the alternative minimum tax. Capital gains, if any, will be subject to capital gains tax.
Investments in municipal bonds are subject to interest rate risk, or the risk that the bonds will decline in value because of changes in market interest rates.
| | |
| 26 | | | www.sbhfunds.com |
| Segall Bryant & Hamill Municipal Opportunities Fund | Fund Overview |
| | December 31, 2022 (Unaudited) |
Manager Commentary
Market Overview
By any measure, 2022 was a remarkable outlier for the fixed income market. The Bloomberg U.S. Aggregate Bond Index (the Agg) returned -13.01%, the previous worst-ever mark being -2.92% in 1994. The decline in high yield of over -11% was the second worst in history. Given the magnitude of rate increases implemented by the Federal Reserve (Fed) over the year, it is no surprise that long-duration assets were among the worst performers for the year, with long Treasuries losing 33% and long corporates losing 26%. Looking ahead, the Fed’s work is not over, and the market is currently pricing in two more quarter-point rate hikes. Recent Fed speakers have emphasized the “higher rates for longer” message, and most economists believe the economy will enter something resembling a recession in 2023. That said, the fixed income market enters the new year with more of a yield cushion than existed this time one year ago, and this may be a moderating factor to any further potential rate increases.
The municipal market ended up being the cleanest dirty shirt in the fixed income market in 2022. This was driven by a strong rally that started in November and continued through the end of the year. We have watched in amazement as municipal AAA ratios (i.e., the yield on an index of AAA-rated municipal bonds vs. the yield on the equivalent Treasury notes) have gone from fair to rich to levels that seem exuberant. We believe there are two reasons for the disconnect between the AAA scale and municipal indices’ performance relative to the broader market. The first reason is that we have continued to see large inflows into low fee products tied to an index. The second reason is due to the underlying construct of municipal market indices, some of which poorly represent the overall market in our opinion. For context, the Bloomberg U.S. Aggregate Municipal Bond Index represents approximately 6% of the total municipal debt outstanding which we believe makes it the most poorly representative index that exists for any market. The growth of passive products and ETFs directly tied to indexes has created a somewhat vicious cycle during periods of inflows. Large inflows continue to go to products that are chasing a very small subset of bonds. We believe this trend will only continue to grow in the years to come as some investors seek a cheaper and easier way to invest compared to an approach we believe may
better serve them in the long-term; one based on diligent research aimed at understanding an underlying market and finding attractive individual municipal bond to invest in.
Fund Performance
For 2022, the Segall Bryant & Hamill Municipal Opportunities Fund (Retail Class) returned -11.25% (Retail Class) versus -5.95% for the benchmark, the Bloomberg U.S. 1-15 Year Municipal Bond Index. The Fund’s underperformance was driven by several factors with the largest being the extension of short callable bonds into long duration assets as rates rose. Our decision to exit a number of these positions before the rally that began in November also detracted from the Fund’s relative performance. We stand by our decision to sell these positions even though the timing was less than ideal. As a silver lining, however, the Fund accrued a significant tax loss cushion, and we believe market dynamics continue to shift in favor of the strategy employed by the Fund.
Outlook and Positioning
Looking back on 2022, we were disappointed with the Fund’s performance for the year. While we went into the year prepared for a slowly rising yield environment, what occurred was the fastest and largest rise in rates ever seen. As we look forward to 2023, we remain steadfast in our belief that the Fund’s investment approach is the best way to allocate capital in the municipal market, particularly given the complexity of its underlying dynamics.
We have done a large restructuring of the Fund heading into 2023 and are hopeful we have seen the worst of negative price movements for this cycle. The most material change in positioning was in the structure of bonds in which the Fund invests. We have moved away from the short call, negative convexity bonds that performed well in a low interest rate, low volatility environment to bonds which do not have, or have only limited, extension risk. We believe we will be entering a cycle in which credit risks will intensify and have positioned the Fund to take advantage of this by moving up in credit quality. While short and abrupt rallies and selloffs may still occur, and volatility will certainly persist, we believe we have positioned the Fund to successfully navigate this environment in 2023 and beyond.
| | |
| | |
| Annual Report | December 31, 2022 | | | 27 |
| Segall Bryant & Hamill Colorado Tax Free Fund | Fund Overview |
| | December 31, 2022 (Unaudited) |
Investment Objective
The Fund seeks income exempt from both federal and Colorado state personal income taxes.
Fund Management
Nicholas J. Foley Portfolio Manager
CFA is a trademark owned by CFA Institute.
Cumulative Returns
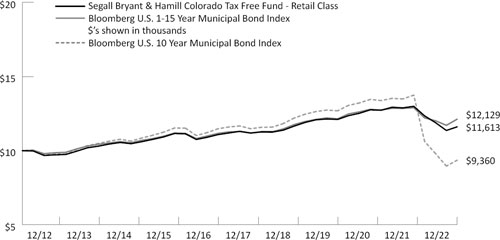
The chart above represents historical performance of a hypothetical investment of $10,000 in the Fund over the past 10 years (or for the life of the Fund if shorter). Performance calculations are as of the end of June each year. Past performance does not guarantee future results. This chart does not reflect the deduction of taxes that a shareholder would pay on Fund distributions or the redemption of Fund shares.
Please see index definitions beginning on page 34.
Average Annual Total Returns
| | | | | | Since | 30-Day | Inception |
| | 1 Year | 3 Years | 5 Years | 10 Years | Inception | SEC Yield | Date |
| Retail Class (WTCOX) | (10.64)% | (1.47)% | 0.54% | 1.51% | 3.94% | 2.81% | 6/1/91 |
| Institutional Class (WICOX) | (10.55)% | (1.32)% | 0.66% | 1.60% | 3.97% | 3.00% | 4/29/16 |
Bloomberg U.S. 1-15 Year
Municipal Bond Index | (5.95)% | (0.22)% | 1.44% | 1.95% | N/A | | |
Retail Class Annual Expense Ratio (per the current prospectus) — Gross: 0.68%, Net: 0.65%
Institutional Class Annual Expense Ratio (per the current prospectus) — Gross: 0.52%, Net: 0.50%
| | Sector Allocation (as of 12/31/2022) |
| | |
| | Variable Rate Demand Note | 30.7% |
| | Revenue | 30.0% |
| | General Obligation | 17.4% |
| | Certificate Participation | 13.3% |
| | Local Authority | 4.3% |
| | Prerefunded | 1.3% |
| | |
| | Percentages are based on Total Net Assets. |
| | |
| | The sector allocation table above does not include any cash or cash equivalents. |
| | |
| | Top Ten Holdings (as of 12/31/2022) |
| | |
| | Colorado Health Facilities Authority | 7.9% |
| | City of Colorado Springs Colorado Utilities System | 6.7% |
| | Colorado Health Facilities Authority | 5.7% |
| | Denver Colorado City & County Airport System | 3.9% |
| | City of Colorado Springs Colorado Utilities System | 3.0% |
| | University of Colorado Hospital Authority | 2.5% |
| | Colorado Health Facilities Authority | 2.3% |
| | Rampart Range Colorado Metropolitan District No. 1 | 2.2% |
| | Berthoud Colorado COP | 2.1% |
| | Crested Butte Colorado Fire Protection District | 1.6% |
| | |
| | Percentages represent the Fund’s aggregate holdings in the same corporate issuer and its affiliates. Holdings are subject to change and may not reflect the current or future position of the Fund. |
| | |
| | |
| | |
| | |
| | |
| | |
| | |
30-Day SEC Yield figures reflect all fee waivers and expense reimbursements. Without the absorption of these fee waivers and/or expense reimbursements, the figures would have been 2.80% for the Retail Class and 2.96% for the Institutional Class.
Performance data quoted represents past performance and does not guarantee future results. Performance information for the Institutional Class shares prior to their inception is based on the performance of the Retail Class. Current performance may be lower or higher than the performance quoted. To obtain current performance as of the most recent month-end, visit www.sbhfunds.com. Average annual total returns reflect the reinvestment of dividends, capital gains distributions, all fee waivers and expense reimbursements, if any. Without the fee waivers and expense reimbursements, total return figures would have been lower. Investment return and principal value will vary, and shares, when redeemed, may be worth more or less than their original cost. Segall Bryant & Hamill fund shares are not insured by the FDIC, the Federal Reserve Board or any other agency and are subject to investment risk.
Until at least April 30, 2023, Segall Bryant & Hamill, LLC (the “Adviser”) has contractually agreed to waive the investment advisory and/or administration fees and/or to reimburse other expenses, so that the ratio of expenses to average net assets as reported in the Fund’s Financial Highlights will be no more than 0.65% and 0.50% for the Fund’s Retail Class and Institutional Class, respectively, for such period. This agreement may not be terminated or modified by the Adviser prior to the termination date without the approval of the Board of Trustees.
Segall Bryant & Hamill Colorado Tax Free Fund invests primarily in instruments issued by or on behalf of one state and generally will be more volatile and loss of principal could be greater due to state specific risk.
Municipal bond fund income may be subject to state and local income taxes and the alternative minimum tax. Capital gains, if any, will be subject to capital gains tax.
Investments in municipal bonds are subject to interest rate risk, or the risk that the bonds will decline in value because of changes in market interest rates.
| | |
| 28 | | | www.sbhfunds.com |
| Segall Bryant & Hamill Colorado Tax Free Fund | Fund Overview |
| | December 31, 2022 (Unaudited) |
Manager Commentary
Market Overview
By any measure, 2022 was a remarkable outlier for the fixed income market. The Bloomberg U.S. Aggregate Bond Index (the Agg) returned -13.01%, the previous worst-ever mark being -2.92% in 1994. The decline in high yield of over -11% was the second worst in history. Given the magnitude of rate increases implemented by the Federal Reserve (Fed) over the year, it is no surprise that long-duration assets were among the worst performers for the year, with long Treasuries losing 33% and long corporates losing 26%. Given the increase in rates in 2022 and the expectation for at least a few rate hikes in 2023, the fixed income market enters the new year with more of a yield cushion than existed this time one year ago, and this will be a moderating factor to any further potential rate increases.
The municipal market ended up being the cleanest dirty shirt in the fixed income market in 2022. This was driven by a strong rally that started in November and continued through the end of the year. We have watched in amazement as municipal AAA ratios (i.e., the yield on an index of AAA-rated municipal bonds vs. the yield on the equivalent Treasury notes) have gone from fair to rich to levels that seem exuberant. We believe there are two reasons for the disconnect between the AAA scale and municipal indices’ performance relative to the broader market. The first reason is that we have continued to see large inflows into low fee products tied to an index. The second reason is due to the underlying construct of municipal market indices, some of which poorly represent the overall market in our opinion.
During 2022, Colorado’s (CO) municipal market continued to experience many positives from a credit standpoint. We continued to see positive demographic trends and job creation and business relocations across the state. We have also seen the rise of the cost of living and the stress on the underlying infrastructure of the state due to growth, especially around transportation. These are problems that are not easily or quickly solved, and we believe they could dampen growth going forward.
Fund Performance
For 2022, the Segall Bryant & Hamill Colorado Tax Free Fund returned -10.64% (Retail Class) compared to a return of -5.95% for the benchmark, the Bloomberg U.S. 1-15 Year Municipal Bond Index. The Fund’s underperformance was driven by several factors
with the largest being the adverse price behavior that callable bonds (of which the Fund held a considerable amount) exhibit in rising interest rate environments. Looking back on 2022, we were disappointed with the Fund’s performance for the year. While we went into the year prepared for a slowly rising yield environment, what occurred was the fastest and largest rise in rates ever seen. As we look forward, we remain steadfast in our belief that the Fund’s investment approach is the best way to allocate capital in the Colorado municipal market, particularly given the complexity of its underlying dynamics.
Outlook and Positioning
Colorado demographics and fundamentals remain exceptionally strong relative to most places in the United States. One concern worth highlighting is housing in Colorado. The state and major metro areas have ranked at the top of many lists for price increases and new construction, among other things. The future of housing across the country and in Colorado is complicated and it appears housing will face some headwinds. We have turned negative on many new developments that are not 50-75% built out as we believe new build projects are at risk. How these headwinds impact broader credits in the state is yet to be seen and we will keep this in mind when allocating capital.
We have done a large restructuring of the Fund heading into 2023 and are hopeful we have seen the worst of negative price movements for this cycle. The most material change in positioning was in the structure of bonds in which the Fund invests. We have moved away from the short call, negative convexity bonds that performed well in a low interest rate, low volatility environment to bonds which do not have, or have only limited, extension risk. We believe we will be entering a cycle in which credit risks will intensify and have positioned the Fund to take advantage of this by moving up in credit quality. And, in the process, the Fund has accrued a considerable tax loss cushion. While short and abrupt rallies and selloffs may still occur, and volatility will certainly persist, we believe we have positioned the Fund to successfully navigate this environment in 2023 and beyond.
| | |
| | |
| Annual Report | December 31, 2022 | | | 29 |
| Segall Bryant & Hamill Funds | Fund Expenses |
| | December 31, 2022 (Unaudited) |
Disclosure of Fund Expenses
As a shareholder of a Fund, you may incur two types of costs: (1) transaction costs; and (2) ongoing costs, including management fees and other Fund expenses. The examples on the next page are intended to help you understand your ongoing costs (in dollars) of investing in a Fund and to compare these costs with the ongoing costs of investing in other mutual funds. The examples are based on an investment of $1,000 invested on July 1, 2022 and held until December 31, 2022.
Actual Expenses. The first line of the table on the next page provides information about actual account values and actual expenses. You may use the information in this line, together with the amount you invested, to estimate the expenses that you paid over the period. Simply divide your account value by $1,000 (for example, an $8,600 account value divided by $1,000 = 8.6), then multiply the result by the number in the first line under the heading “Expenses Paid During Period” to estimate the expenses you paid on your account during this period.
Hypothetical Example for Comparison Purposes. The second line of the table on the next page provides information about hypothetical account values and hypothetical expenses based on the Fund’s actual expense ratio and an assumed rate of return of 5% per year before expenses, which is not the Fund’s actual return. The hypothetical account values and expenses may not be used to estimate the actual ending account balance or expenses you paid for the period. You may use this information to compare the ongoing costs of investing in a Fund and other mutual funds. To do so, compare this 5% hypothetical example with the 5% hypothetical examples that appear in the shareholder reports of other funds.
Expenses shown in the table on the next page are meant to highlight ongoing Fund costs only and do not reflect transaction costs. Therefore, the second line of the table is useful in comparing ongoing costs only and may not help you determine the relative total costs of owning different funds. In addition, if these transactional costs were included, your costs would have been higher.
| | |
| 30 | | | www.sbhfunds.com |
| Segall Bryant & Hamill Funds | Fund Expenses |
| | December 31, 2022 (Unaudited) |
| | | Beginning Account | | | Ending Account | | | | | | | |
| | | Value | | | Value | | | Expense | | | Expenses Paid | |
| | | July 1, 2022 | | | December 31, 2022 | | | Ratio(a) | | | During Period(b) | |
| Segall Bryant & Hamill Small Cap Value Fund | | | | | | | | | | | | | | | | |
| Retail | | | | | | | | | | | | | | | | |
| Based on Actual Fund Return | | $ | 1,000.00 | | | $ | 1,032.80 | | | | 1.08 | % | | $ | 5.53 | |
| Based on Hypothetical 5% Return (before expenses) | | $ | 1,000.00 | | | $ | 1,019.76 | | | | 1.08 | % | | $ | 5.50 | |
| Institutional | | | | | | | | | | | | | | | | |
| Based on Actual Fund Return | | $ | 1,000.00 | | | $ | 1,033.80 | | | | 0.95 | % | | $ | 4.87 | |
| Based on Hypothetical 5% Return (before expenses) | | $ | 1,000.00 | | | $ | 1,020.42 | | | | 0.95 | % | | $ | 4.84 | |
| Segall Bryant & Hamill Small Cap Growth Fund | | | | | | | | | | | | | | | | |
| Retail | | | | | | | | | | | | | | | | |
| Based on Actual Fund Return | | $ | 1,000.00 | | | $ | 993.60 | | | | 1.05 | % | | $ | 5.28 | |
| Based on Hypothetical 5% Return (before expenses) | | $ | 1,000.00 | | | $ | 1,019.91 | | | | 1.05 | % | | $ | 5.35 | |
| Institutional | | | | | | | | | | | | | | | | |
| Based on Actual Fund Return | | $ | 1,000.00 | | | $ | 994.40 | | | | 0.88 | % | | $ | 4.42 | |
| Based on Hypothetical 5% Return (before expenses) | | $ | 1,000.00 | | | $ | 1,020.77 | | | | 0.88 | % | | $ | 4.48 | |
| Segall Bryant & Hamill Small Cap Core Fund | | | | | | | | | | | | | | | | |
| Retail | | | | | | | | | | | | | | | | |
| Based on Actual Fund Return | | $ | 1,000.00 | | | $ | 1,099.50 | | | | 1.14 | % | | $ | 6.03 | |
| Based on Hypothetical 5% Return (before expenses) | | $ | 1,000.00 | | | $ | 1,019.46 | | | | 1.14 | % | | $ | 5.80 | |
| Institutional | | | | | | | | | | | | | | | | |
| Based on Actual Fund Return | | $ | 1,000.00 | | | $ | 1,100.10 | | | | 0.99 | % | | $ | 5.24 | |
| Based on Hypothetical 5% Return (before expenses) | | $ | 1,000.00 | | | $ | 1,020.21 | | | | 0.99 | % | | $ | 5.04 | |
| Segall Bryant & Hamill All Cap Fund | | | | | | | | | | | | | | | | |
| Retail | | | | | | | | | | | | | | | | |
| Based on Actual Fund Return | | $ | 1,000.00 | | | $ | 1,034.90 | | | | 0.87 | % | | $ | 4.46 | |
| Based on Hypothetical 5% Return (before expenses) | | $ | 1,000.00 | | | $ | 1,020.82 | | | | 0.87 | % | | $ | 4.43 | |
| Institutional | | | | | | | | | | | | | | | | |
| Based on Actual Fund Return | | $ | 1,000.00 | | | $ | 1,034.40 | | | | 0.84 | % | | $ | 4.31 | |
| Based on Hypothetical 5% Return (before expenses) | | $ | 1,000.00 | | | $ | 1,020.97 | | | | 0.84 | % | | $ | 4.28 | |
| Segall Bryant & Hamill Emerging Markets Fund | | | | | | | | | | | | | | | | |
| Retail | | | | | | | | | | | | | | | | |
| Based on Actual Fund Return | | $ | 1,000.00 | | | $ | 978.90 | | | | 1.38 | % | | $ | 6.88 | |
| Based on Hypothetical 5% Return (before expenses) | | $ | 1,000.00 | | | $ | 1,018.25 | | | | 1.38 | % | | $ | 7.02 | |
| Institutional | | | | | | | | | | | | | | | | |
| Based on Actual Fund Return | | $ | 1,000.00 | | | $ | 980.70 | | | | 1.23 | % | | $ | 6.14 | |
| Based on Hypothetical 5% Return (before expenses) | | $ | 1,000.00 | | | $ | 1,019.00 | | | | 1.23 | % | | $ | 6.26 | |
| Segall Bryant & Hamill International Small Cap Fund | | | | | | | | | | | | | | | | |
| Retail | | | | | | | | | | | | | | | | |
| Based on Actual Fund Return | | $ | 1,000.00 | | | $ | 1,060.40 | | | | 1.18 | % | | $ | 6.13 | |
| Based on Hypothetical 5% Return (before expenses) | | $ | 1,000.00 | | | $ | 1,019.26 | | | | 1.18 | % | | $ | 6.01 | |
| Institutional | | | | | | | | | | | | | | | | |
| Based on Actual Fund Return | | $ | 1,000.00 | | | $ | 1,061.40 | | | | 1.03 | % | | $ | 5.35 | |
| Based on Hypothetical 5% Return (before expenses) | | $ | 1,000.00 | | | $ | 1,020.01 | | | | 1.03 | % | | $ | 5.24 | |
| Segall Bryant & Hamill Fundamental International Small Cap Fund | | | | | | | | | | | | | | | | |
| Retail | | | | | | | | | | | | | | | | |
| Based on Actual Fund Return | | $ | 1,000.00 | | | $ | 1,040.70 | | | | 1.25 | % | | $ | 6.43 | |
| Based on Hypothetical 5% Return (before expenses) | | $ | 1,000.00 | | | $ | 1,018.90 | | | | 1.25 | % | | $ | 6.36 | |
| Institutional | | | | | | | | | | | | | | | | |
| Based on Actual Fund Return | | $ | 1,000.00 | | | $ | 1,041.90 | | | | 1.10 | % | | $ | 5.66 | |
| Based on Hypothetical 5% Return (before expenses) | | $ | 1,000.00 | | | $ | 1,019.66 | | | | 1.10 | % | | $ | 5.60 | |
| | |
| Annual Report | December 31, 2022 | | | 31 |
| Segall Bryant & Hamill Funds | Fund Expenses |
| | December 31, 2022 (Unaudited) |
| | | Beginning Account | | | Ending Account | | | | | | | |
| | | Value | | | Value | | | Expense | | | Expenses Paid | |
| | | July 1, 2022 | | | December 31, 2022 | | | Ratio(a) | | | During Period(b) | |
| Segall Bryant & Hamill Global All Cap Fund | | | | | | | | | | | | | | | | |
| Retail | | | | | | | | | | | | | | | | |
| Based on Actual Fund Return | | $ | 1,000.00 | | | $ | 1,048.10 | | | | 0.89 | % | | $ | 4.59 | |
| Based on Hypothetical 5% Return (before expenses) | | $ | 1,000.00 | | | $ | 1,020.72 | | | | 0.89 | % | | $ | 4.53 | |
| Institutional | | | | | | | | | | | | | | | | |
| Based on Actual Fund Return | | $ | 1,000.00 | | | $ | 1,048.10 | | | | 0.74 | % | | $ | 3.82 | |
| Based on Hypothetical 5% Return (before expenses) | | $ | 1,000.00 | | | $ | 1,021.48 | | | | 0.74 | % | | $ | 3.77 | |
| Segall Bryant & Hamill Workplace Equality Fund | | | | | | | | | | | | | | | | |
| Retail | | | | | | | | | | | | | | | | |
| Based on Actual Fund Return | | $ | 1,000.00 | | | $ | 1,024.50 | | | | 0.89 | % | | $ | 4.54 | |
| Based on Hypothetical 5% Return (before expenses) | | $ | 1,000.00 | | | $ | 1,020.72 | | | | 0.89 | % | | $ | 4.53 | |
| Institutional | | | | | | | | | | | | | | | | |
| Based on Actual Fund Return | | $ | 1,000.00 | | | $ | 1,025.30 | | | | 0.74 | % | | $ | 3.78 | |
| Based on Hypothetical 5% Return (before expenses) | | $ | 1,000.00 | | | $ | 1,021.48 | | | | 0.74 | % | | $ | 3.77 | |
| Segall Bryant & Hamill Short Term Plus Fund | | | | | | | | | | | | | | | | |
| Retail | | | | | | | | | | | | | | | | |
| Based on Actual Fund Return | | $ | 1,000.00 | | | $ | 1,005.20 | | | | 0.49 | % | | $ | 2.48 | |
| Based on Hypothetical 5% Return (before expenses) | | $ | 1,000.00 | | | $ | 1,022.74 | | | | 0.49 | % | | $ | 2.50 | |
| Institutional | | | | | | | | | | | | | | | | |
| Based on Actual Fund Return | | $ | 1,000.00 | | | $ | 1,006.70 | | | | 0.40 | % | | $ | 2.02 | |
| Based on Hypothetical 5% Return (before expenses) | | $ | 1,000.00 | | | $ | 1,023.19 | | | | 0.40 | % | | $ | 2.04 | |
| Segall Bryant & Hamill Plus Bond Fund | | | | | | | | | | | | | | | | |
| Retail | | | | | | | | | | | | | | | | |
| Based on Actual Fund Return | | $ | 1,000.00 | | | $ | 978.40 | | | | 0.55 | % | | $ | 2.74 | |
| Based on Hypothetical 5% Return (before expenses) | | $ | 1,000.00 | | | $ | 1,022.43 | | | | 0.55 | % | | $ | 2.80 | |
| Institutional | | | | | | | | | | | | | | | | |
| Based on Actual Fund Return | | $ | 1,000.00 | | | $ | 980.00 | | | | 0.40 | % | | $ | 2.00 | |
| Based on Hypothetical 5% Return (before expenses) | | $ | 1,000.00 | | | $ | 1,023.19 | | | | 0.40 | % | | $ | 2.04 | |
| Segall Bryant & Hamill Quality High Yield Fund | | | | | | | | | | | | | | | | |
| Retail | | | | | | | | | | | | | | | | |
| Based on Actual Fund Return | | $ | 1,000.00 | | | $ | 1,027.00 | | | | 0.85 | % | | $ | 4.34 | |
| Based on Hypothetical 5% Return (before expenses) | | $ | 1,000.00 | | | $ | 1,020.92 | | | | 0.85 | % | | $ | 4.33 | |
| Institutional | | | | | | | | | | | | | | | | |
| Based on Actual Fund Return | | $ | 1,000.00 | | | $ | 1,029.50 | | | | 0.70 | % | | $ | 3.58 | |
| Based on Hypothetical 5% Return (before expenses) | | $ | 1,000.00 | | | $ | 1,021.68 | | | | 0.70 | % | | $ | 3.57 | |
| Segall Bryant & Hamill Municipal Opportunities Fund | | | | | | | | | | | | | | | | |
| Retail | | | | | | | | | | | | | | | | |
| Based on Actual Fund Return | | $ | 1,000.00 | | | $ | 988.60 | | | | 0.65 | % | | $ | 3.26 | |
| Based on Hypothetical 5% Return (before expenses) | | $ | 1,000.00 | | | $ | 1,021.93 | | | | 0.65 | % | | $ | 3.31 | |
| Institutional | | | | | | | | | | | | | | | | |
| Based on Actual Fund Return | | $ | 1,000.00 | | | $ | 989.40 | | | | 0.50 | % | | $ | 2.51 | |
| Based on Hypothetical 5% Return (before expenses) | | $ | 1,000.00 | | | $ | 1,022.68 | | | | 0.50 | % | | $ | 2.55 | |
| | |
| 32 | | | www.sbhfunds.com |
| Segall Bryant & Hamill Funds | Fund Expenses |
| | December 31, 2022 (Unaudited) |
| | | Beginning Account | | | Ending Account | | | | | | | |
| | | Value | | | Value | | | Expense | | | Expenses Paid | |
| | | July 1, 2022 | | | December 31, 2022 | | | Ratio(a) | | | During Period(b) | |
| Segall Bryant & Hamill Colorado Tax Free Fund | | | | | | | | | | | | | | | | |
| Retail | | | | | | | | | | | | | | | | |
| Based on Actual Fund Return | | $ | 1,000.00 | | | $ | 976.30 | | | | 0.65 | % | | $ | 3.24 | |
| Based on Hypothetical 5% Return (before expenses) | | $ | 1,000.00 | | | $ | 1,021.93 | | | | 0.65 | % | | $ | 3.31 | |
| Institutional | | | | | | | | | | | | | | | | |
| Based on Actual Fund Return | | $ | 1,000.00 | | | $ | 977.10 | | | | 0.50 | % | | $ | 2.49 | |
| Based on Hypothetical 5% Return (before expenses) | | $ | 1,000.00 | | | $ | 1,022.68 | | | | 0.50 | % | | $ | 2.55 | |
| (a) | Annualized, based on each Fund’s most recent one-half year expenses. |
| (b) | Expenses are equal to each Fund’s annualized net expense ratio multiplied by the average account value over the period, muliplied by 184/365 (to reflect the one-half year period). |
| | |
| Annual Report | December 31, 2022 | | | 33 |
| Segall Bryant & Hamill Funds | Important Disclosures |
| | December 31, 2022 (Unaudited) |
INDEX DEFINITIONS AND DISCLOSURES
All indices are unmanaged and index performance figures include reinvestment of dividends but do not reflect any fees, expenses or taxes. Investors cannot invest directly in an index.
The Bloomberg U.S. 10-Year Municipal Bond Index includes investment grade (Moody’s Investor Services Aaa to Baa, Standard and Poor’s Corporation AAA to BBB) tax-exempt bonds with maturities between eight and twelve years.
The Bloomberg U.S. 1-15 Year Municipal Bond Index measures the performance of investment grade (Moody’s Investor Services Aaa to Baa, Standard and Poor’s Corporation AAA to BBB) general obligation and revenue bonds with maturities ranging from one to seventeen years. It is a broad index that is representative of the tax-exempt bond market.
The Bloomberg U.S. Aggregate Bond Index is a fixed income, market-value-weighted index generally representative of investment grade fixed-rate debt issues, including government, corporate, asset-backed, and mortgage-backed securities with maturities of at least one year.
The Bloomberg U.S. Corporate High Yield Ba Index measures the performance of intermediate (1 to 10 year) U.S. high yield issues. It includes fixed-rate, noninvestment grade debt issues rated Ba1 or lower by Moody’s, rated BB+ or lower by S&P, rated below investment grade by Fitch Investor’s Service or if unrated previously held a high yield rating or have been associated with a high yield issuer, and must trade accordingly.
The Bloomberg U.S. High Yield 2% Issuer Capped Index is an unmanaged index that is comprised of predominantly US High Yield Corporate Bonds and a broad cross section of leveraged loans syndicated in the United States, including dollar-denominated loans to overseas issuers. The weighting of index constituents is limited to a maximum 2%.
The Bloomberg U.S. Government/Credit 1-3 Year Index includes medium and larger issues of U.S. government, investment-grade corporate and investment-grade international dollar-denominated bonds that have maturities of between one and three years.
The MSCI ACWI ex USA Small Cap Index captures small cap representation across 22 of 23 Developed Market countries (excluding the U.S.) and 24 Emerging Market countries. With 4,334 constituents, the index covers approximately 14% of the global equity opportunity set outside the U.S. MSCI Inc. launched the MSCI ACWI ex USA Small Cap Index on June 1, 2007. Data prior to the launch date is back-tested data provided and derived by MSCI (i.e. calculations of how the index might have performed over that time period had the index existed). There may be material differences between back-tested performance and actual results. Past performance, whether actual or back-tested, is no indication or guarantee of future performance.
The MSCI EAFE Small Cap Index measures small cap representation across Developed Markets countries around the world, excluding the US and Canada. It is maintained by MSCI Barra, a provider of investment decision support tools; the EAFE acronym stands for Europe, Australasia and the Far East.
The MSCI Emerging Markets Index measures equity market performance of emerging markets, which consists of the following 24 emerging market indexes: Brazil, Chile, China, Colombia, Czech Republic, Egypt, Greece, Hungary, India, Indonesia, Korea, Kuwait, Malaysia, Mexico, Peru, Philippines, Poland, Qatar, Saudi Arabia, South Africa, Taiwan, Thailand, Turkey and United Arab Emirates.
The MSCI World Index captures large and mid cap representation across 23 Developed Markets countries. With 1,517 constituents, the index covers approximately 85% of the free float-adjusted market capitalization in each country.
The Russell 1000® Index measures the performance of the large-cap segment of the U.S. equity universe. It is a subset of the Russell 3000® Index and includes approximately 1000 of the largest securities based on a combination of their market cap and current index membership. The Russell 1000® Index represents approximately 92% of the U.S. market.
The Russell 2000® Index measures the performance of the small-cap segment of the U.S. equity universe. The Russell 2000® Index is a subset of the Russell 3000® Index representing approximately 10% of the total market capitalization of that index. It includes approximately 2000 of the smallest securities based on a combination of their market cap and current index membership.
The Russell 2000® Growth Index measures the performance of the small-cap growth segment of the U.S. equity universe. It includes those Russell 2000® Index companies with higher price-to-value ratios and higher forecasted growth values.
The Russell 2000® Value Index measures the performance of companies within the Russell 2000® Index having lower price-to-book ratios and lower forecasted growth values. The Russell 2000® Index includes the 2000 firms from the Russell 3000® Index with the smallest market capitalizations. The Russell 3000® Index represents 98% of the investable U.S. equity market.
The Russell 3000® Index measures the performance of the 3,000 largest U.S. stocks.
| | |
| 34 | | | www.sbhfunds.com |
| Segall Bryant & Hamill Funds | Important Disclosures |
| | December 31, 2022 (Unaudited) |
“Bloomberg®” and the Bloomberg indices are service marks of Bloomberg Finance L.P. and its affiliates, including Bloomberg Index Service Limited, the administrator of the indices, and have been licensed for use for certain purposes by Segall Bryant & Hamill. Bloomberg is not affiliated with Segall Bryant & Hamill, and Bloomberg does not approve, endorse, review, or recommend the Segall Bryant & Hamill Funds. Bloomberg does not guarantee the timeliness, accurateness, or completeness of any data or information relating to the Segall Bryant & Hamill Funds.
MSCI Inc. is the source and owner of the MSCI Index data contained in this material and all trademarks and copyrights related thereto. Any further dissemination or redistribution is strictly prohibited. MSCI Barra is not responsible for the formatting or configuration of this material or for any inaccuracy in Segall Bryant & Hamill’s presentation thereof.
FTSE Russell is the source and owner of the Russell Index data contained in this material and all trademarks and copyrights related thereto. Any further dissemination or redistribution is strictly prohibited. Russell Investments is not responsible for the formatting or configuration of this material or for any inaccuracy in Segall Bryant & Hamill’s presentation thereof.
TOP 5/BOTTOM 5 STOCK PERFORMANCE CALCULATION METHODOLOGY
The calculation methodology used to construct this table took into account consistently the weighting of every holding in the Fund that contributed to the Fund’s performance during the measurement period, and the table reflects consistently the results of the calculation. The calculation determined the contribution of each Fund holding by calculating the weight (i.e., percentage of the total investments) of each holding multiplied by the rate of return for that holding during the measurement period.
DEFINITION OF TERMS
Beta: A measure of a fund’s sensitivity to market movements. The beta of the market is 1.00 by definition. A beta above 1 is more volatile than the overall market, while a beta below 1 is less volatile.
Bond Rating Categories:
| ● | AAA: An obligation rated “AAA” has the highest rating assigned by Standard & Poor’s. The obligor’s capacity to meet its financial commitment on the obligation is extremely strong. |
| ● | AA+: An obligation rated “AA+” differs from the highest rated obligations only in small degree. The obligor’s capacity to meet its financial commitment on the obligation is very strong. |
| ● | AA: An obligation rated “AA” differs from the highest rated obligations only in small degree. The obligor’s capacity to meet its financial commitment on the obligation is very strong. |
| ● | A: An obligation rated “A” is somewhat more susceptible to the adverse effects of changes in circumstances and economic conditions than obligations in higher-rated categories. However, the obligor’s capacity to meet its financial commitment on the obligation is still strong. |
| ● | BBB: An obligation rated “BBB” exhibits adequate protection parameters. However, adverse economic conditions or changing circumstances are more likely to lead to a weakened capacity of the obligor to meet its financial commitment on the obligation. |
| ● | Below BBB: Obligations rated “BB,” “B,” “CCC,” “CC” and “C” are regarded as having significant speculative characteristics. “BB” indicates the least degree of speculation and “C” the highest. While such obligations will likely have some quality and protective characteristics, these may be outweighed by large uncertainties or major exposures to adverse conditions. Bonds rated “BB” or below are commonly referred to as “junk” bonds. |
| ● | Non-Rated: These bonds are not rated. |
Credit Quality Rating: A rating of an individual bond as determined by a nationally recognized statistical rating organization (NRSRO) such as Standard & Poor’s or Moody’s. Credit quality ratings range from highest, “AAA ” to lowest, “D”. For more information regarding rating methodologies for Standard & Poor’s, visit www.standardandpoors.com and for Moody’s, visit www.moodys.com.
Credit Spread: The difference in yield between two bonds of similar maturity, but different credit quality.
Duration: A generic description of the sensitivity of a bond’s price (as a percentage of initial price) to a change in yield.
EPS (Earnings per Share) Growth: Earnings per share is the portion of a company’s profit allocated to each outstanding share of common stock. EPS growth serves as an indicator of a company’s profitability.
Effective Maturity: A weighted average of the maturities of the bonds in a portfolio.
| | |
| Annual Report | December 31, 2022 | | | 35 |
| Segall Bryant & Hamill Funds | Important Disclosures |
| | December 31, 2022 (Unaudited) |
Emerging Markets: Segall Bryant & Hamill Funds consider emerging market countries to be those countries that are neither U.S. nor developed countries.
Federal Reserve (Fed): The central banking system of the United States.
Free Cash Flow to Total Enterprise Value (FCF/TEV): A valuation metric used to compare the amount of cash a firm generates to the total value of the resources used to generate that cash.
Gross Domestic Product (GDP): The market value of all officially recognized goods and services produced within a country in a given period of time.
Market Capitalization: The market capitalization represents the total value of a company or stock. It is calculated by multiplying the number of shares outstanding by the current price of one share.
Modified Duration: A duration measure in which it is assumed that yield changes do not change the expected cash flows.
Number of Holdings: The Number of Holdings presented excludes short-term investments including money market mutual funds.
OPEC: Is the Organization of the Petroleum Exporting Countries.
Operating Cash Flow to Price (OCF/P): A valuation metric used to compare the amount of cash a firm generates per share from operations to the price of the stock.
Portfolio Turnover Rate: A percentage computed by taking the lesser of purchases or sales of portfolio securities (excluding short-term investments) for the year and dividing it by the monthly average of the market value of the portfolio securities during the year.
Price to Book Value (P/B) Ratio: The P/B ratio is used to compare a company’s book value to its current market price. This ratio compares the market’s valuation of a company to the value of that company as indicated on its financial statements. The higher the ratio, the higher the premium the market is willing to pay for the company above its hard assets.
Price to Cash (P/C) Flow Ratio: The P/C flow ratio is a measure of a firm’s stock price relative to its financial performance. For a fund, the P/C flow ratio is the weighted average of all stocks held in the fund. It represents the amount an investor is willing to pay for a dollar generated from a particular company’s operations.
Price to Earnings (P/E) Ratio: The P/E ratio is a stock’s per share price divided by its per share earnings over a 12-month period. For a fund, the P/E ratio is the weighted average of all stocks held in the fund. The higher the P/E ratio, the more the market is willing to pay for each dollar of annual earnings.
REIT: A REIT is a real estate investment trust. REITs are securities that sell like a stock on a major exchange. REITs invest directly in real estate, either through properties or mortgages.
Return on Equity (ROE): A measure of how well a company used reinvested earnings to generate additional earnings. It is used as a general indication of a company’s efficiency; in other words, how much profit is a company able to generate given the resources provided by its stockholders.
Risk-Adjusted Return: Is a measure of return that incorporates the value of risk involved in the return of an investment. It is intended to help investors compare the returns of investments with varying levels of risk. Risk-adjusted return can be applied to individual securities, mutual funds and portfolios.
Risk On, Risk Off: A concept that describes market sentiment as either “risk on” or “risk off”. During a market sentiment of “risk on”, the market is optimistic and more willing to take on risk in exchange for possibly better returns. When market sentiment is “risk off”, the market is pessimistic and will favor investments with perceived lower risk.
SEC Yield: The SEC Yield is a standardized method of computing return on investment that the U.S. Securities and Exchange Commission (SEC) requires mutual funds to use when advertising their yields. Its objective is to allow a confusion-free comparison of the performance of different funds.
| | |
| 36 | | | www.sbhfunds.com |
| Segall Bryant & Hamill Funds | Trustees and Officers |
| | December 31, 2022 (Unaudited) |
The business and affairs of the Funds are managed under the direction of the Trust’s Board of Trustees in accordance with the laws of the Commonwealth of Massachusetts and the Trust’s Amended and Restated Declaration of Trust. Information pertaining to the trustees and officers of the Trust is set forth below. Trustees who are not deemed to be “interested persons” of the Trust as defined in the Investment Company Act of 1940, as amended (the “1940 Act”), are referred to as “Independent Trustees.” The Trust’s Statement of Additional Information includes additional information about the trustees and is available, without charge, upon request by calling toll free 800.392.CORE (2673).
| | | | | Number of Funds | |
| | Position(s) | Term of Office | | in Fund Complex | |
| Name, Address | Held with | and Length of | | Overseen by | Other Directorships |
| and Age(1) | The Trust | Time Served(2) | Principal Occupation(s) During Past 5 Years | Trustee(3) | Held by Trustee(4) |
| INDEPENDENT TRUSTEES | | | | |
Janice M. Teague,
CPA (Retired)
Birth year 1954 | Chair
Trustee | Since December 31, 2020
Since February 13, 2007 | ● Retired, June 2003 – present; ● Vice President, Secretary and Assistant Secretary, Berger Financial Group, LLC (investment management), October 1996 May – 2003; ● Vice President, Secretary and Assistant Secretary, Berger Funds (investment management), September 1996 May – 2003; ● Vice President and Secretary, Berger Distributors LLC (broker/dealer), August 1998 – May 2003. | 14 | None |
Thomas J. Abood
Birth year 1963 | Trustee | Since November 1, 2018 | ● Previously, Chief Executive Officer and Director, EVO Transportation & Energy Services, Inc., September 2019 to September 2022 (CEO) and 2016 to October 2022 (Director); ● Board Member, Perception Capital Corp II, Inc, March 2021 to present (member and Chair of Compensation Committee); ● Director, NELSON Worldwide LLC, May 2018 to present; ● Board member and Past Chair of Board, Citation Jet Pilots, Inc., October 2016 to present (Board member) and October 2019 to October 2020 (Chair); ● Board Member and Past Chair, MacPhail Center for Music Education, September 2011 to September 2021 (member), July 2018 to July 2020 (Chair); ● Council Member and Chair, Archdiocese Finance Council of St. Paul and Minneapolis, July 2011 to September 2021 (member), July 2014 to September 2021 (chair); ● Board Member and Chair, University of St. Thomas School of Law Board of Governors, October 2001 to October 2016 (Board Member) and 2014 to 2015 (Chair): ● Board Member and President, The Minikahda Club, November 2008; November 2011; November 2015 to November 2017 (Board Member) 2016 (President). | 14 | Board Member of Perception Capital Corp II, Inc. March 2021 to present (member and Chair of Compensation Committee) Former Director of EVO Transportation & Energy Services, Inc. |
| | |
| Annual Report | December 31, 2022 | | | 37 |
| Segall Bryant & Hamill Funds | Trustees and Officers |
| | December 31, 2022 (Unaudited) |
| | | | | Number of Funds | |
| | Position(s) | Term of Office | | in Fund Complex | |
| Name, Address | Held with | and Length of | | Overseen by | Other Directorships |
| and Age(1) | The Trust | Time Served(2) | Principal Occupation(s) During Past 5 Years | Trustee(3) | Held by Trustee(4) |
John A. DeTore,
CFA
Birth year 1958 | Trustee | Since December 31, 2009 | ● Director of Strategic R&D, Arga Investment Management, 2021 – present; ● CIO, Capitalogix, LLC, 2018 – 2021; ● CEO/Founder, United Alpha, LLC investment management firm), 2003 – 2017; ● CIO, GRT United Alpha, LLC (investment management), 2006 – 2017; ● CIO, Denver Alternatives, (an investment management division of Denver Investments) 2009 – 2011; ● Managing Director/Director of Strategic R&D, Putnam Investments (investment management), 1999 – 2000; Managing Director/Director of Quantitative Analysis & Equity Product Development, Putnam Investments (investment management), 1994 – 1999. | 14 | None |
Rick A. Pederson
Birth year 1952 | Trustee | Since February 13, 2007 | ● President, Foundation Properties, Inc. (a real estate investment management company), 1994 – present; ● Partner, Bow River Capital Partners (private equity management), 2003 – present; ● Advisory Board Member, Citywide Banks, 2017 –present; ● Director, National Western Stock Show (not-for- profit organization), 2010 –present; ● Board Member, Boettcher Foundation (not-for- profit), 2018 – present. ● Board Member, Kivu Consulting, Inc., 2019 – present; ● Advisor, Pauls Corporation, 2008 to 2018: ● Board Member, Citywide Banks, 2014-2016; ● Board Member, IRI Consulting, 2017 to 2019; ● Board Member, History Colorado (nonprofit association), 2015 – 2020; ● Board Member, Strong-Bridge Consulting, 2015 – 2019; | 14 | Mr Pederson is a Trustee of ALPS ETF Trust (20 funds); and Principal Real Estate Income Fund (1 fund). |
James A Smith
Birth year 1952 | Trustee | Since December 31, 2009 | ● Vice Chair and Board Member, Western Rivers Conservancy (non-profit), 2014 – present; ● Private Equity Consultant, 2003 – 2016; ● Trustee, The Nature Conservancy (non- profit), July 2007 – June 2016; Chairman, June 2014 - June 2016. | 14 | None |
LLoyd “Chip”
Voneiff
Birth year 1954 | Trustee | Since April 30, 2021 | ● Retired, June 2012 – present; ● Various positions leading to Partner of PricewaterhouseCoopers, 1976 – 2012. | 14 | None |
| | |
| 38 | | | www.sbhfunds.com |
| Segall Bryant & Hamill Funds | Trustees and Officers |
| | December 31, 2022 (Unaudited) |
| | Position(s) | Term of Office | |
| | Held with | and Length of | |
| Name, Address and Age(1) | The Trust | Time Served | Principal Occupation(s) |
| OFFICERS | | | |
Philip H. Hildebrandt, CFA
Birth year 1963 | President | May 1, 2018-February 15, 2023 | ● Chief Executive Officer, Segall Bryant & Hamill, LLC, 2006 – February 10, 2023 |
| | | | |
Jasper R. Frontz, CPA, CFA
Birth year 1968 | Treasurer
Chief Compliance Officer | Since February 12, 1997
Since September 29, 2004 | ● Chief Compliance Officer/SBH Funds, Segall Bryant & Hamill, LLC, May 1, 2018 – present ● Chief Compliance Officer and Chief Operations Officer, Denver Investments, March 31, 2014 – April 30, 2018; Partner, Denver Investments, January 1, 2014 – April 30, 2018; prior thereto, Vice President, May 2000 – December 2013, and Director of Mutual Fund Administration, June 1997 – May 2000, Denver Investments; |
| | | | |
Maggie Bull
Birth year 1965 | Secretary
Assistant Secretary | Since November 16, 2021
2018-2021 | ● Vice President, Senior Managing Counsel, since August 2022, Vice President, Senior Legal Counsel (February 2020 to August 2022); Senior Attorney (June 2017 to January 2020), Ultimus Fund Solutions, LLC. |
| | | | |
Jennifer L. Leamer
Birth year 1976 | Assistant Treasurer | Since May 26, 2019 | ● Senior Vice President, Fund Accounting of Ultimus Fund Solutions, LLC 2014 to present; ● Ultimus Managers Trust, Treasurer, October 2014 to present; ● Ultimus Managers Trust, Assistant Treasurer, April 2014 to October 2014; ● Ultimus Fund Solutions, LLC Business Analyst, 2007 to 2014. |
| (1) | Each Trustee and Officer may be contacted by writing to the Trustee or Officer, c/o Segall Bryant & Hamill Trust, 225 Pictoria Drive, Suite 450, Cincinnati, Ohio 45246. |
| (2) | Each trustee holds offices for an indefinite term until the earliest of: (a) the election of his successor; (b) the date a trustee dies, resigns, or is removed, adjudged incompetent, or, having become incapacitated by illness or injury, is retired by the Board of Trustees in accordance with the Trust’s Amended and Restated Declaration of Trust; or (c) the Trust terminates. |
| (3) | The Fund Complex includes funds with a common investment adviser or sub-advisor which is an affiliated person. As of December 31, 2022, there were twenty-eight funds in the Fund Complex: the fourteen Segall Bryant & Hamill Funds offered to the public. Columbia Variable Portfolio - Partners Small Cap Value Fund, , iMGP SBH Focused Small Value Fund, JNL Multi-Manager Small Cap Growth Fund, and Mainstay VP Small Cap Growth Portfolio which are also advised by Segall Bryant & Hamill, LLC; Barrett Growth Fund and Barrett Opportunity Fund, advised by Barrett Asset Management, LLC; Cabana Target Drawdown 5 ETF, Cabana Target Drawdown 7 ETF, Cabana Target Drawdown 10 ETF, Cabana Target Drawdown 13 ETF, Cabana Target Drawdown 16 ETF, Cabana Target Leading Sector Conservative ETF, Cabana Target Leading Sector Moderate ETF, and Cabana Target Leading Sector Aggressive ETF, advised by The Cabana Group, LLC. |
| (4) | Directorships of companies required to report to the SEC under the 1934 Act (i.e., “public companies”) or other investment companies registered under the 1940 Act. |
| See Notes to Financial Statements. | |
| Annual Report | December 31, 2022 | | | 39 |
| Segall Bryant & Hamill Small Cap Value Fund | Statement of Investments |
| | December 31, 2022 |
| | | Shares | | | Value | |
| COMMON STOCKS — 92.3% | | | | | | | | |
| Consumer Discretionary — 6.9% | | | | | | | | |
| Automobiles & Components — 1.8% | | | | | | | | |
| Harley-Davidson, Inc. | | | 66,806 | | | $ | 2,779,130 | |
| Modine Manufacturing Co. (a) | | | 387,580 | | | | 7,697,339 | |
| | | | | | | | 10,476,469 | |
| Consumer Durables & Apparel — 2.7% | | | | | | | | |
| Carter’s, Inc. | | | 59,142 | | | | 4,412,585 | |
| Gildan Activewear, Inc. (Canada) | | | 170,658 | | | | 4,676,029 | |
| PVH Corp. | | | 55,354 | | | | 3,907,439 | |
| Steven Madden, Ltd. | | | 89,139 | | | | 2,848,882 | |
| | | | | | | | 15,844,935 | |
| Consumer Services — 0.2% | | | | | | | | |
| Papa John’s International, Inc. | | | 19,288 | | | | 1,587,595 | |
| | | | | | | | | |
| Retailing — 2.2% | | | | | | | | |
| American Eagle Outfitters, Inc. | | | 248,245 | | | | 3,465,500 | |
| Ollie’s Bargain Outlet Holdings, Inc. (a) | | | 153,641 | | | | 7,196,545 | |
| Quotient Technology, Inc. (a) | | | 664,854 | | | | 2,280,449 | |
| | | | | | | | 12,942,494 | |
| Consumer Staples — 4.6% | | | | | | | | |
| Food, Beverage & Tobacco — 2.1% | | | | | | | | |
| Hain Celestial Group, Inc. (The) (a) | | | 658,039 | | | | 10,647,071 | |
| TreeHouse Foods, Inc. (a) | | | 41,931 | | | | 2,070,553 | |
| | | | | | | | 12,717,624 | |
| Household & Personal Products — 2.5% | | | | | | | | |
| Coty, Inc. - Class A (a) | | | 1,704,264 | | | | 14,588,500 | |
| | | | | | | | | |
| Energy — 3.8% | | | | | | | | |
| Energy — 3.8% | | | | | | | | |
| Dril-Quip, Inc. (a) | | | 213,987 | | | | 5,814,027 | |
| Helmerich & Payne, Inc. | | | 138,931 | | | | 6,886,810 | |
| PDC Energy, Inc. | | | 71,702 | | | | 4,551,643 | |
| Range Resources Corp. | | | 215,522 | | | | 5,392,360 | |
| | | | | | | | 22,644,840 | |
| Financials — 13.7% | | | | | | | | |
| Banks — 13.3% | | | | | | | | |
| Community Bank System, Inc. | | | 82,646 | | | | 5,202,566 | |
| Enterprise Financial Services Corp. | | | 115,310 | | | | 5,645,578 | |
| Glacier Bancorp, Inc. | | | 153,746 | | | | 7,598,127 | |
| Hancock Whitney Corp | | | 141,143 | | | | 6,829,910 | |
| Lakeland Financial Corp. | | | 38,157 | | | | 2,784,316 | |
| National Bank Holdings Corp. - Class A | | | 219,518 | | | | 9,235,122 | |
| Pacific Premier Bancorp, Inc. | | | 177,647 | | | | 5,606,539 | |
| Seacoast Banking Corp. of Florida | | | 270,175 | | | | 8,426,758 | |
| SouthState Corp. | | | 89,714 | | | | 6,850,561 | |
| Umpqua Holdings Corp. | | | 318,364 | | | | 5,682,797 | |
| United Community Banks, Inc. | | | 245,510 | | | | 8,298,238 | |
| WesBanco, Inc. | | | 165,766 | | | | 6,130,027 | |
| | | | | | | | 78,290,539 | |
| Diversified Financials — 0.4% | | | | | | | | |
| Green Dot Corp. - Class A (a) | | | 163,251 | | | | 2,582,631 | |
| | | Shares | | | Value | |
| Health Care — 8.6% | | | | | | | | |
| Health Care Equipment & Services — 6.1% | | | | | | | | |
| AngioDynamics, Inc. (a) | | | 130,405 | | | $ | 1,795,677 | |
| ICU Medical, Inc. (a) | | | 93,506 | | | | 14,725,325 | |
| Orthofix Medical, Inc. (a) | | | 610,246 | | | | 12,528,350 | |
| Pediatrix Medical Group, Inc. (a) | | | 227,964 | | | | 3,387,545 | |
| Surmodics, Inc. (a) | | | 92,506 | | | | 3,156,305 | |
| | | | | | | | 35,593,202 | |
| Pharmaceuticals, Biotechnology & Life Sciences — 2.5% | | | | | | | | |
| Alkermes PLC (Ireland) (a) | | | 142,399 | | | | 3,720,886 | |
| BioCryst Pharmaceuticals, Inc. (a) | | | 459,003 | | | | 5,269,354 | |
| ImmunoGen, Inc. (a) | | | 635,200 | | | | 3,150,592 | |
| NeoGenomics, Inc. (a) | | | 299,445 | | | | 2,766,872 | |
| | | | | | | | 14,907,704 | |
| Industrials — 23.1% | | | | | | | | |
| Capital Goods — 19.1% | | | | | | | | |
| AAR Corp. (a) | | | 147,177 | | | | 6,608,247 | |
| Apogee Enterprises, Inc. | | | 209,235 | | | | 9,302,588 | |
| Astec Industries, Inc. | | | 154,464 | | | | 6,280,506 | |
| AZZ, Inc. | | | 206,579 | | | | 8,304,476 | |
| Beacon Roofing Supply, Inc. (a) | | | 580 | | | | 30,618 | |
| CIRCOR International, Inc. (a) | | | 304,837 | | | | 7,303,895 | |
| Columbus McKinnon Corp. | | | 106,924 | | | | 3,471,822 | |
| Desktop Metal, Inc. (a) | | | 393,372 | | | | 534,986 | |
| EnerSys | | | 127,303 | | | | 9,400,054 | |
| Mercury Systems, Inc. (a) | | | 176,325 | | | | 7,888,780 | |
| Quanex Building Products Corp. | | | 287,226 | | | | 6,801,512 | |
| Regal Rexnord Corp. | | | 124,856 | | | | 14,980,223 | |
| REV Group, Inc. | | | 647,745 | | | | 8,174,542 | |
| SPX Technologies, Inc. (a) | | | 215,419 | | | | 14,142,257 | |
| Sterling Infrastructure, Inc. (a) | | | 277,861 | | | | 9,113,841 | |
| | | | | | | | 112,338,347 | |
| Commercial & Professional Services — 4.0% | | | | | | | | |
| Huron Consulting Group, Inc. (a) | | | 33,062 | | | | 2,400,301 | |
| KBR, Inc. | | | 185,951 | | | | 9,818,213 | |
| SP Plus Corp. (a) | | �� | 336,565 | | | | 11,685,537 | |
| | | | | | | | 23,904,051 | |
| Information Technology — 8.8% | | | | | | | | |
| Software & Services — 5.6% | | | | | | | | |
| Conduent, Inc. (a) | | | 1,072,450 | | | | 4,343,422 | |
| CSG Systems International, Inc. | | | 40,806 | | | | 2,334,103 | |
| NCR Corp. (a) | | | 169,548 | | | | 3,969,119 | |
| OneSpan, Inc. (a) | | | 72,261 | | | | 808,601 | |
| Progress Software Corp. | | | 422,942 | | | | 21,337,424 | |
| | | | | | | | 32,792,669 | |
| Technology Hardware & Equipment — 3.2% | | | | | | | | |
| Belden, Inc. | | | 177,184 | | | | 12,739,530 | |
| FARO Technologies, Inc. (a) | | | 205,813 | | | | 6,052,960 | |
| | | | | | | | 18,792,490 | |
| See Notes to Financial Statements. | |
| 40 | | | www.sbhfunds.com |
| Segall Bryant & Hamill Small Cap Value Fund | Statement of Investments |
| | December 31, 2022 |
| | | Shares | | | Value | |
| Materials — 8.3% | | | | | | | | |
| Materials — 8.3% | | | | | | | | |
| Alamos Gold, Inc. - Class A (Canada) | | | 854,170 | | | $ | 8,635,659 | |
| Compass Minerals International, Inc. | | | 345,566 | | | | 14,168,206 | |
| Element Solutions, Inc. | | | 307,723 | | | | 5,597,481 | |
| Glatfelter Corp. | | | 466,252 | | | | 1,296,181 | |
| Schnitzer Steel Industries, Inc. - Class A | | | 43,608 | | | | 1,336,585 | |
| Sensient Technologies Corp. | | | 46,160 | | | | 3,365,987 | |
| Silgan Holdings, Inc. | | | 158,024 | | | | 8,191,964 | |
| Summit Materials, Inc. - Class A (a) | | | 210,659 | | | | 5,980,609 | |
| | | | | | | | 48,572,672 | |
| Real Estate — 8.2% | | | | | | | | |
| Real Estate — 8.2% | | | | | | | | |
| Cousins Properties, Inc. | | | 153,886 | | | | 3,891,777 | |
| Empire State Realty Trust, Inc. - Class A | | | 348,165 | | | | 2,346,632 | |
| Equity Commonwealth | | | 1,056,377 | | | | 26,377,734 | |
| Physicians Realty Trust | | | 279,399 | | | | 4,042,903 | |
| STAG Industrial, Inc. | | | 185,954 | | | | 6,008,174 | |
| Terreno Realty Corp. | | | 95,249 | | | | 5,416,810 | |
| | | | | | | | 48,084,030 | |
| Utilities — 6.3% | | | | | | | | |
| Utilities — 6.3% | | | | | | | | |
| ALLETE, Inc. | | | 125,094 | | | | 8,069,814 | |
| Avista Corp. | | | 99,516 | | | | 4,412,539 | |
| New Jersey Resources Corp. | | | 166,541 | | | | 8,263,764 | |
| OGE Energy Corp. | | | 187,990 | | | | 7,435,005 | |
| PNM Resources, Inc. | | | 176,529 | | | | 8,612,850 | |
| | | | | | | | 36,793,972 | |
| Investments at Value — 92.3% | | | | | | | | |
| (Cost $513,730,640) | | | | | | $ | 543,454,764 | |
| Other Assets in Excess of Liabilities — 7.7% | | | | | | | 45,614,119 | |
| Net Assets — 100.0% | | | | | | $ | 589,068,883 | |
| (a) | Non-income producing security. |
The Fund’s sector and industry classifications presented herein refer to any one or more of the industry sub-classifications used by one or more widely recognized market indexes or ratings group indexes, and/ or as defined by Fund management. For Fund compliance purposes, sector and industry classifications are based on the sector and industry categorization methodology of the Adviser to the Funds. This definition may not apply for purposes of this report, which may combine industry sub-classifications for reporting ease. Industries are shown as a percentage of net assets.
| See Notes to Financial Statements. | |
| Annual Report | December 31, 2022 | | | 41 |
| Segall Bryant & Hamill Small Cap Growth Fund | Statement of Investments |
| | December 31, 2022 |
| | | Shares | | | Value | |
| COMMON STOCKS — 95.9% | | | | | | | | |
| Communication Services — 1.2% | | | | | | | | |
| Media & Entertainment — 1.2% | | | | | | | | |
| New York Times Co. (The) - Class A | | | 70,940 | | | $ | 2,302,712 | |
| | | | | | | | | |
| Consumer Discretionary — 9.0% | | | | | | | | |
| Automobiles & Components — 1.2% | | | | | | | | |
| Fox Factory Holding Corp. (a) | | | 25,323 | | | | 2,310,217 | |
| | | | | | | | | |
| Consumer Durables & Apparel — 1.1% | | | | | | | | |
| YETI Holdings, Inc. (a) | | | 47,902 | | | | 1,978,832 | |
| | | | | | | | | |
| Consumer Services — 4.1% | | | | | | | | |
| Bright Horizons Family Solutions, Inc. (a) | | | 23,859 | | | | 1,505,503 | |
| Churchill Downs, Inc. | | | 13,114 | | | | 2,772,693 | |
| Shake Shack, Inc. - Class A (a) | | | 39,730 | | | | 1,649,987 | |
| Wingstop, Inc. | | | 11,212 | | | | 1,542,995 | |
| | | | | | | | 7,471,178 | |
| Retailing — 2.6% | | | | | | | | |
| Boot Barn Holdings, Inc. (a) | | | 34,988 | | | | 2,187,450 | |
| Revolve Group, Inc. (a) | | | 56,696 | | | | 1,262,053 | |
| Warby Parker, Inc. - Class A (a) | | | 95,126 | | | | 1,283,250 | |
| | | | | | | | 4,732,753 | |
| Consumer Staples — 1.7% | | | | | | | | |
| Food, Beverage & Tobacco — 1.7% | | | | | | | | |
| Simply Good Foods Co. (The) (a) | | | 83,306 | | | | 3,168,127 | |
| | | | | | | | | |
| Energy — 2.9% | | | | | | | | |
| Energy — 2.9% | | | | | | | | |
| Cactus, Inc. - Class A | | | 27,786 | | | | 1,396,524 | |
| Denbury, Inc. (a) | | | 22,767 | | | | 1,981,184 | |
| Matador Resources Co. | | | 33,986 | | | | 1,945,359 | |
| | | | | | | | 5,323,067 | |
| Financials — 7.6% | | | | | | | | |
| Diversified Financials — 4.5% | | | | | | | | |
| Hamilton Lane, Inc. - Class A | | | 43,627 | | | | 2,786,893 | |
| Houlihan Lokey, Inc. | | | 37,748 | | | | 3,290,116 | |
| StepStone Group, Inc. - Class A | | | 86,875 | | | | 2,187,512 | |
| | | | | | | | 8,264,521 | |
| Insurance — 3.1% | | | | | | | | |
| Goosehead Insurance, Inc. - Class A (a) | | | 51,849 | | | | 1,780,495 | |
| Kinsale Capital Group, Inc. | | | 9,740 | | | | 2,547,205 | |
| Palomar Holdings, Inc. (a) | | | 30,170 | | | | 1,362,477 | |
| | | | | | | | 5,690,177 | |
| Health Care — 23.3% | | | | | | | | |
| Health Care Equipment & Services — 16.8% | | | | | | | | |
| Addus HomeCare Corp. (a) | | | 31,537 | | | | 3,137,616 | |
| Amedisys, Inc. (a) | | | 20,417 | | | | 1,705,636 | |
| CONMED Corp. | | | 39,388 | | | | 3,491,352 | |
| Ensign Group, Inc. (The) | | | 39,748 | | | | 3,760,558 | |
| Globus Medical, Inc. - Class A (a) | | | 33,201 | | | | 2,465,838 | |
| Inari Medical, Inc. (a) | | | 37,477 | | | | 2,382,038 | |
| Inspire Medical Systems, Inc. (a) | | | 11,863 | | | | 2,988,053 | |
| Integra LifeSciences Holdings Corp. (a) | | | 63,319 | | | | 3,550,296 | |
| Option Care Health, Inc. (a) | | | 127,353 | | | | 3,832,052 | |
| | | Shares | | | Value | |
| Health Care Equipment & Services (continued) | | | | | | | | |
| Silk Road Medical, Inc. (a) | | | 36,682 | | | $ | 1,938,644 | |
| Surgery Partners, Inc. (a) | | | 59,929 | | | | 1,669,622 | |
| | | | | | | | 30,921,705 | |
| Pharmaceuticals, Biotechnology & Life Sciences — 6.5% | | | | | | | | |
| Avid Bioservices, Inc. (a) | | | 121,507 | | | | 1,673,151 | |
| Azenta, Inc. (a) | | | 32,993 | | | | 1,920,853 | |
| Blueprint Medicines Corp. (a) | | | 30,606 | | | | 1,340,849 | |
| Fate Therapeutics, Inc. (a) | | | 50,943 | | | | 514,015 | |
| Medpace Holdings, Inc. (a) | | | 11,752 | | | | 2,496,242 | |
| Natera, Inc. (a) | | | 42,642 | | | | 1,712,929 | |
| Pacira BioSciences, Inc. (a) | | | 28,677 | | | | 1,107,219 | |
| Xencor, Inc. (a) | | | 47,148 | | | | 1,227,734 | |
| | | | | | | | 11,992,992 | |
| Industrials — 18.5% | | | | | | | | |
| Capital Goods — 9.9% | | | | | | | | |
| Ameresco, Inc. - Class A (a) | | | 28,278 | | | | 1,615,805 | |
| AZEK Co., Inc. (The) - Class A (a) | | | 91,265 | | | | 1,854,505 | |
| Comfort Systems USA, Inc. | | | 23,621 | | | | 2,718,305 | |
| Hexcel Corp. | | | 55,325 | | | | 3,255,876 | |
| John Bean Technologies Corp. | | | 23,344 | | | | 2,132,008 | |
| Kratos Defense & Security Solutions, Inc. (a) | | | 161,326 | | | | 1,664,884 | |
| Mercury Systems, Inc. (a) | | | 28,734 | | | | 1,285,559 | |
| Simpson Manufacturing Co., Inc. | | | 20,702 | | | | 1,835,439 | |
| SiteOne Landscape Supply, Inc. (a) | | | 15,594 | | | | 1,829,488 | |
| | | | | | | | 18,191,869 | |
| Commercial & Professional Services — 7.1% | | | | | | | | |
| ASGN, Inc. (a) | | | 26,033 | | | | 2,121,169 | |
| CBIZ, Inc. (a) | | | 39,122 | | | | 1,832,866 | |
| Montrose Environmental Group, Inc. (a) | | | 40,456 | | | | 1,795,842 | |
| Ritchie Bros. Auctioneers, Inc. (Canada) | | | 47,768 | | | | 2,762,423 | |
| Tetra Tech, Inc. | | | 32,016 | | | | 4,648,403 | |
| | | | | | | | 13,160,703 | |
| Transportation — 1.5% | | | | | | | | |
| Saia, Inc. (a) | | | 13,414 | | | | 2,812,647 | |
| | | | | | | | | |
| Information Technology — 24.9% | | | | | | | | |
| Semiconductors & Semiconductor Equipment — 7.1% | | | | | | | | |
| Allegro MicroSystems, Inc. (a) | | | 45,872 | | | | 1,377,078 | |
| Credo Technology Group Holding Ltd. (Cayman Islands) (a) | | | 92,391 | | | | 1,229,724 | |
| Onto Innovation, Inc. (a) | | | 45,555 | | | | 3,101,840 | |
| Power Integrations, Inc. | | | 47,320 | | | | 3,393,790 | |
| Silicon Laboratories, Inc. (a) | | | 21,276 | | | | 2,886,515 | |
| SiTime Corp. (a) | | | 10,259 | | | | 1,042,520 | |
| | | | | | | | 13,031,467 | |
| Software & Services — 15.6% | | | | | | | | |
| BlackLine, Inc. (a) | | | 43,052 | | | | 2,896,108 | |
| Box, Inc. - Class A (a) | | | 67,151 | | | | 2,090,411 | |
| Endava PLC ADR (United Kingdom) (a) | | | 48,262 | | | | 3,692,043 | |
| Envestnet, Inc. (a) | | | 66,362 | | | | 4,094,535 | |
| Everbridge, Inc. (a) | | | 61,870 | | | | 1,830,114 | |
| Globant S.A. (Luxembourg) (a) | | | 16,762 | | | | 2,818,698 | |
| MAXIMUS, Inc. | | | 55,033 | | | | 4,035,570 | |
| Sprout Social, Inc. - Class A (a) | | | 21,995 | | | | 1,241,838 | |
| See Notes to Financial Statements. | |
| 42 | | | www.sbhfunds.com |
| Segall Bryant & Hamill Small Cap Growth Fund | Statement of Investments |
| | December 31, 2022 |
| | | Shares | | | Value | |
| Software & Services (continued) | | | | | | | | |
| WNS Holdings Ltd. ADR (Jersey) (a) | | | 29,108 | | | $ | 2,328,349 | |
| Workiva, Inc. (a) | | | 43,360 | | | | 3,640,939 | |
| | | | | | | | 28,668,605 | |
| Technology Hardware & Equipment — 2.2% | | | | | | | | |
| Novanta, Inc. (Canada) (a) | | | 30,294 | | | | 4,116,046 | |
| | | | | | | | | |
| Materials — 3.7% | | | | | | | | |
| Materials — 3.7% | | | | | | | | |
| Avient Corp. | | | 54,132 | | | | 1,827,496 | |
| Innospec, Inc. | | | 26,876 | | | | 2,764,465 | |
| Livent Corp. (a) | | | 112,266 | | | | 2,230,726 | |
| | | | | | | | 6,822,687 | |
| Real Estate — 3.1% | | | | | | | | |
| Real Estate — 3.1% | | | | | | | | |
| Americold Realty Trust, Inc. | | | 84,728 | | | | 2,398,650 | |
| Terreno Realty Corp. | | | 58,677 | | | | 3,336,961 | |
| | | | | | | | 5,735,611 | |
| Investments at Value — 95.9% | | | | | | | | |
| (Cost $184,979,255) | | | | | | $ | 176,695,916 | |
| | | | | | | | | |
| Other Assets in Excess of Liabilities — 4.1% | | | | | | | 7,527,030 | |
| | | | | | | | | |
| Net Assets — 100.0% | | | | | | $ | 184,222,946 | |
| (a) | Non-income producing security. |
The Fund’s sector and industry classifications presented herein refer to any one or more of the industry sub-classifications used by one or more widely recognized market indexes or ratings group indexes, and/ or as defined by Fund management. For Fund compliance purposes, sector and industry classifications are based on the sector and industry categorization methodology of the Adviser to the Funds. This definition may not apply for purposes of this report, which may combine industry sub-classifications for reporting ease. Industries are shown as a percentage of net assets.
| See Notes to Financial Statements. | |
| Annual Report | December 31, 2022 | | | 43 |
| Segall Bryant & Hamill Small Cap Core Fund | Statement of Investments |
| | December 31, 2022 |
| | | Shares | | | Value | |
| COMMON STOCKS — 91.6% | | | | | | | | |
| Consumer Discretionary — 12.4% | | | | | | | | |
| Automobiles & Components — 2.5% | | | | | | | | |
| Fox Factory Holding Corp. (a) | | | 3,617 | | | $ | 329,979 | |
| Gentex Corp. | | | 14,614 | | | | 398,524 | |
| Harley-Davidson, Inc. | | | 14,156 | | | | 588,889 | |
| | | | | | | | 1,317,392 | |
| Consumer Durables & Apparel — 4.8% | | | | | | | | |
| Capri Holdings, Ltd. (a) | | | 7,946 | | | | 455,464 | |
| Carter’s, Inc. | | | 3,193 | | | | 238,230 | |
| Columbia Sportswear Co. | | | 5,019 | | | | 439,564 | |
| Gildan Activewear, Inc. (Canada) | | | 24,308 | | | | 666,039 | |
| Steven Madden, Ltd. | | | 16,000 | | | | 511,360 | |
| Under Armour, Inc. - Class A (a) | | | 7,149 | | | | 72,634 | |
| Universal Electronics, Inc. (a) | | | 6,180 | | | | 128,606 | |
| | | | | | | | 2,511,897 | |
| Consumer Services — 3.5% | | | | | | | | |
| BJ’s Restaurants, Inc. (a) | | | 9,650 | | | | 254,567 | |
| Churchill Downs, Inc. | | | 1,749 | | | | 369,791 | |
| Texas Roadhouse, Inc. | | | 7,759 | | | | 705,681 | |
| Vail Resorts, Inc. | | | 2,235 | | | | 532,713 | |
| | | | | | | | 1,862,752 | |
| Retailing — 1.6% | | | | | | | | |
| American Eagle Outfitters, Inc. | | | 22,436 | | | | 313,207 | |
| Five Below, Inc. (a) | | | 2,967 | | | | 524,773 | |
| | | | | | | | 837,980 | |
| Consumer Staples — 5.7% | | | | | | | | |
| Food & Staples Retailing — 1.5% | | | | | | | | |
| Casey’s General Stores, Inc. | | | 3,608 | | | | 809,454 | |
| | | | | | | | | |
| Food, Beverage & Tobacco — 3.0% | | | | | | | | |
| Coca-Cola Consolidated, Inc. | | | 895 | | | | 458,562 | |
| Hain Celestial Group, Inc. (The) (a) | | | 20,000 | | | | 323,600 | |
| J & J Snack Foods Corp. | | | 5,242 | | | | 784,780 | |
| | | | | | | | 1,566,942 | |
| Household & Personal Products — 1.2% | | | | | | | | |
| Inter Parfums, Inc. | | | 6,340 | | | | 611,937 | |
| | | | | | | | | |
| Energy — 3.7% | | | | | | | | |
| Energy — 3.7% | | | | | | | | |
| Devon Energy Corp. | | | 11,080 | | | | 681,531 | |
| Matador Resources Co. | | | 8,400 | | | | 480,816 | |
| PDC Energy, Inc. | | | 11,915 | | | | 756,364 | |
| | | | | | | | 1,918,711 | |
| Financials — 8.2% | | | | | | | | |
| Banks — 8.2% | | | | | | | | |
| Ameris Bancorp | | | 9,509 | | | | 448,254 | |
| Glacier Bancorp, Inc. | | | 17,267 | | | | 853,335 | |
| Lakeland Financial Corp. | | | 3,377 | | | | 246,420 | |
| Seacoast Banking Corp. of Florida | | | 27,500 | | | | 857,725 | |
| SouthState Corp. | | | 10,219 | | | | 780,323 | |
| United Bankshares, Inc. | | | 12,227 | | | | 495,071 | |
| United Community Banks, Inc. | | | 18,795 | | | | 635,271 | |
| | | | | | | | 4,316,399 | |
| | | Shares | | | Value | |
| Health Care — 11.2% | | | | | | | | |
| Health Care Equipment & Services — 7.2% | | | | | | | | |
| Amedisys, Inc. (a) | | | 2,000 | | | $ | 167,080 | |
| Encompass Health Corp. | | | 5,489 | | | | 328,297 | |
| Ensign Group, Inc. (The) | | | 7,280 | | | | 688,761 | |
| Globus Medical, Inc. - Class A (a) | | | 10,940 | | | | 812,514 | |
| Insulet Corp. (a) | | | 3,054 | | | | 899,067 | |
| Integra LifeSciences Holdings Corp. (a) | | | 4,902 | | | | 274,855 | |
| Orthofix Medical, Inc. (a) | | | 14,950 | | | | 306,923 | |
| Phreesia, Inc. (a) | | | 9,050 | | | | 292,858 | |
| | | | | | | | 3,770,355 | |
| Pharmaceuticals, Biotechnology & Life Sciences — 4.0% | | | | | | | | |
| Bio-Techne Corp. | | | 6,056 | | | | 501,921 | |
| Halozyme Therapeutics, Inc. (a) | | | 9,386 | | | | 534,064 | |
| Horizon Therapeutics PLC (a) | | | 5,084 | | | | 578,559 | |
| Medpace Holdings, Inc. (a) | | | 1,387 | | | | 294,613 | |
| Veracyte, Inc. (a) | | | 8,000 | | | | 189,840 | |
| | | | | | | | 2,098,997 | |
| Industrials — 23.2% | | | | | | | | |
| Capital Goods — 16.0% | | | | | | | | |
| AAR Corp. (a) | | | 12,336 | | | | 553,886 | |
| AZEK Co., Inc. (The) - Class A (a) | | | 16,312 | | | | 331,460 | |
| BWX Technologies, Inc. | | | 5,431 | | | | 315,433 | |
| Carlisle Cos., Inc. | | | 4,336 | | | | 1,021,778 | |
| EMCOR Group, Inc. | | | 6,147 | | | | 910,432 | |
| EnerSys | | | 6,260 | | | | 462,238 | |
| EnPro Industries, Inc. | | | 9,510 | | | | 1,033,642 | |
| ITT, Inc. | | | 8,771 | | | | 711,328 | |
| RBC Bearings, Inc. (a) | | | 2,168 | | | | 453,871 | |
| Regal Rexnord Corp. | | | 6,591 | | | | 790,788 | |
| SPX Technologies, Inc. (a) | | | 9,185 | | | | 602,995 | |
| Standex International Corp. | | | 3,643 | | | | 373,080 | |
| UFP Industries, Inc. | | | 5,547 | | | | 439,600 | |
| Vicor Corp. (a) | | | 2,200 | | | | 118,250 | |
| Zurn Elkay Water Solutions Corp. | | | 14,000 | | | | 296,100 | |
| | | | | | | | 8,414,881 | |
| Commercial & Professional Services — 4.6% | | | | | | | | |
| Casella Waste Systems, Inc. - Class A (a) | | | 11,217 | | | | 889,621 | |
| KBR, Inc. | | | 23,295 | | | | 1,229,976 | |
| Tetra Tech, Inc. | | | 2,117 | | | | 307,367 | |
| | | | | | | | 2,426,964 | |
| Transportation — 2.6% | | | | | | | | |
| Allegiant Travel Co. (a) | | | 2,800 | | | | 190,372 | |
| Forward Air Corp. | | | 3,803 | | | | 398,897 | |
| Hub Group, Inc. - Class A (a) | | | 9,648 | | | | 766,919 | |
| | | | | | | | 1,356,188 | |
| Information Technology — 16.8% | | | | | | | | |
| Semiconductors & Semiconductor Equipment — 2.2% | | | | | | | | |
| Silicon Laboratories, Inc. (a) | | | 5,581 | | | | 757,174 | |
| Universal Display Corp. | | | 3,832 | | | | 414,010 | |
| | | | | | | | 1,171,184 | |
| Software & Services — 10.5% | | | | | | | | |
| Agilysys, Inc. (a) | | | 11,336 | | | | 897,131 | |
| Alteryx, Inc. - Class A (a) | | | 7,800 | | | | 395,226 | |
| BlackLine, Inc. (a) | | | 5,806 | | | | 390,570 | |
| See Notes to Financial Statements. | |
| 44 | | | www.sbhfunds.com |
| Segall Bryant & Hamill Small Cap Core Fund | Statement of Investments |
| | December 31, 2022 |
| | | Shares | | | Value | |
| Software & Services (continued) | | | | | | | | |
| CCC Intelligent Solutions Holdings, Inc. (a) | | | 50,320 | | | $ | 437,784 | |
| Endava PLC ADR (United Kingdom) (a) | | | 10,000 | | | | 765,000 | |
| MAXIMUS, Inc. | | | 5,415 | | | | 397,082 | |
| Model N, Inc. (a) | | | 19,284 | | | | 782,159 | |
| Tenable Holdings, Inc. (a) | | | 12,000 | | | | 457,800 | |
| WNS Holdings, Ltd. ADR (Jersey) (a) | | | 12,155 | | | | 972,278 | |
| | | | | | | | 5,495,030 | |
| Technology Hardware & Equipment — 4.1% | | | | | | | | |
| Badger Meter, Inc. | | | 6,608 | | | | 720,470 | |
| Ciena Corp. (a) | | | 9,833 | | | | 501,286 | |
| Pure Storage, Inc. - Class A (a) | | | 34,713 | | | | 928,920 | |
| | | | | | | | 2,150,676 | |
| Materials — 8.7% | | | | | | | | |
| Materials — 8.7% | | | | | | | | |
| Berry Global Group, Inc. | | | 12,814 | | | | 774,350 | |
| Compass Minerals International, Inc. | | | 6,303 | | | | 258,423 | |
| Eagle Materials, Inc. | | | 2,036 | | | | 270,483 | |
| Element Solutions, Inc. | | | 39,800 | | | | 723,962 | |
| Graphic Packaging Holding Co. | | | 48,998 | | | | 1,090,205 | |
| Huntsman Corp. | | | 10,900 | | | | 299,532 | |
| Ingevity Corp. (a) | | | 4,590 | | | | 323,320 | |
| Materion Corp. | | | 9,396 | | | | 822,244 | |
| | | | | | | | 4,562,519 | |
| Real Estate — 1.7% | | | | | | | | |
| Real Estate — 1.7% | | | | | | | | |
| Equity Commonwealth | | | 14,000 | | | | 349,580 | |
| First Industrial Realty Trust, Inc. | | | 11,000 | | | | 530,860 | |
| | | | | | | | 880,440 | |
| Investments at Value — 91.6% | | | | | | | | |
| (Cost $41,526,637) | | | | | | $ | 48,080,698 | |
| | | | | | | | | |
| Other Assets in Excess of Liabilities — 8.4% | | | | | | | 4,380,642 | |
| | | | | | | | | |
| Net Assets — 100.0% | | | | | | $ | 52,461,340 | |
| (a) | Non-income producing security. |
The Fund’s sector and industry classifications presented herein refer to any one or more of the industry sub-classifications used by one or more widely recognized market indexes or ratings group indexes, and/ or as defined by Fund management. For Fund compliance purposes, sector and industry classifications are based on the sector and industry categorization methodology of the Adviser to the Funds. This definition may not apply for purposes of this report, which may combine industry sub-classifications for reporting ease. Industries are shown as a percentage of net assets.
| See Notes to Financial Statements. | |
| Annual Report | December 31, 2022 | | | 45 |
| Segall Bryant & Hamill All Cap Fund | Statement of Investments |
| | December 31, 2022 |
| | | Shares | | | Value | |
| COMMON STOCKS — 96.1% | | | | | | | | |
| Communication Services — 3.1% | | | | | | | | |
| Media & Entertainment — 3.1% | | | | | | | | |
| Alphabet, Inc. - Class C (a) | | | 46,403 | | | $ | 4,117,338 | |
| | | | | | | | | |
| Consumer Discretionary — 14.0% | | | | | | | | |
| Consumer Durables & Apparel — 1.4% | | | | | | | | |
| Capri Holdings, Ltd. (a) | | | 30,994 | | | | 1,776,576 | |
| | | | | | | | | |
| Consumer Services — 4.1% | | | | | | | | |
| Papa John’s International, Inc. | | | 22,535 | | | | 1,854,856 | |
| Service Corporation International | | | 32,075 | | | | 2,217,665 | |
| Vail Resorts, Inc. | | | 5,671 | | | | 1,351,683 | |
| | | | | | | | 5,424,204 | |
| Retailing — 8.5% | | | | | | | | |
| Amazon.com, Inc. (a) | | | 25,604 | | | | 2,150,736 | |
| Dollar General Corp. | | | 8,626 | | | | 2,124,153 | |
| Home Depot, Inc. (The) | | | 5,204 | | | | 1,643,735 | |
| O’Reilly Automotive, Inc. (a) | | | 2,771 | | | | 2,338,807 | |
| TJX Cos., Inc. (The) | | | 35,546 | | | | 2,829,462 | |
| | | | | | | | 11,086,893 | |
| Consumer Staples — 7.7% | | | | | | | | |
| Food & Staples Retailing — 1.3% | | | | | | | | |
| Sysco Corp. | | | 22,253 | | | | 1,701,242 | |
| | | | | | | | | |
| Food, Beverage & Tobacco — 3.0% | | | | | | | | |
| McCormick & Co., Inc. | | | 18,937 | | | | 1,569,688 | |
| Mondelēz International, Inc. - Class A | | | 34,689 | | | | 2,312,022 | |
| | | | | | | | 3,881,710 | |
| Household & Personal Products — 3.4% | | | | | | | | |
| Estée Lauder Cos., Inc. (The) - Class A | | | 6,502 | | | | 1,613,211 | |
| Unilever PLC ADR (United Kingdom) | | | 56,708 | | | | 2,855,248 | |
| | | | | | | | 4,468,459 | |
| Energy — 6.3% | | | | | | | | |
| Energy — 6.3% | | | | | | | | |
| Chevron Corp. | | | 20,201 | | | | 3,625,877 | |
| ConocoPhillips | | | 23,549 | | | | 2,778,782 | |
| Suncor Energy, Inc. (Canada) | | | 55,905 | | | | 1,773,866 | |
| | | | | | | | 8,178,525 | |
| Financials — 15.9% | | | | | | | | |
| Banks — 3.5% | | | | | | | | |
| First Republic Bank | | | 13,503 | | | | 1,645,881 | |
| JPMorgan Chase & Co. | | | 21,549 | | | | 2,889,721 | |
| | | | | | | | 4,535,602 | |
| Diversified Financials — 3.4% | | | | | | | | |
| Ares Management Corp. - Class A | | | 37,678 | | | | 2,578,682 | |
| Berkshire Hathaway, Inc. - Class B (a) | | | 5,982 | | | | 1,847,840 | |
| | | | | | | | 4,426,522 | |
| Insurance — 9.0% | | | | | | | | |
| Berkley (W.R.) Corp. | | | 33,192 | | | | 2,408,743 | |
| Globe Life, Inc. | | | 27,077 | | | | 3,264,132 | |
| Marsh & McLennan Cos., Inc. | | | 13,350 | | | | 2,209,158 | |
| Reinsurance Group of America, Inc. | | | 27,407 | | | | 3,894,261 | |
| | | | | | | | 11,776,294 | |
| | | Shares | | | Value | |
| Health Care — 15.7% | | | | | | | | |
| Health Care Equipment & Services — 4.0% | | | | | | | | |
| McKesson Corp. | | | 4,214 | | | $ | 1,580,756 | |
| UnitedHealth Group, Inc. | | | 6,929 | | | | 3,673,617 | |
| | | | | | | | 5,254,373 | |
| Pharmaceuticals, Biotechnology & Life Sciences — 11.7% | | | | | | | | |
| Bio-Techne Corp. | | | 22,732 | | | | 1,884,028 | |
| Danaher Corp. | | | 7,753 | | | | 2,057,801 | |
| Mettler-Toledo International, Inc. (a) | | | 1,395 | | | | 2,016,403 | |
| Novo Nordisk A/S ADR (Denmark) | | | 21,811 | | | | 2,951,901 | |
| Perrigo Co. PLC (Ireland) | | | 69,928 | | | | 2,383,846 | |
| Thermo Fisher Scientific, Inc. | | | 3,393 | | | | 1,868,491 | |
| Zoetis, Inc. | | | 14,982 | | | | 2,195,612 | |
| | | | | | | | 15,358,082 | |
| Industrials — 12.6% | | | | | | | | |
| Capital Goods — 10.1% | | | | | | | | |
| Advanced Drainage Systems, Inc. | | | 14,784 | | | | 1,211,844 | |
| AZEK Co., Inc. (The) - Class A (a) | | | 88,881 | | | | 1,806,062 | |
| Dover Corp. | | | 14,336 | | | | 1,941,238 | |
| Quanta Services, Inc. | | | 32,957 | | | | 4,696,372 | |
| Raytheon Technologies Corp. | | | 36,041 | | | | 3,637,258 | |
| | | | | | | | 13,292,774 | |
| Commercial & Professional Services — 2.5% | | | | | | | | |
| Jacobs Solutions, Inc. | | | 12,733 | | | | 1,528,851 | |
| Republic Services, Inc. | | | 13,256 | | | | 1,709,892 | |
| | | | | | | | 3,238,743 | |
| Information Technology — 16.4% | | | | | | | | |
| Semiconductors & Semiconductor Equipment — 3.6% | | | | | | | | |
| ASML Holding N.V. ADR (Netherlands) | | | 2,733 | | | | 1,493,311 | |
| Marvell Technology, Inc. | | | 42,810 | | | | 1,585,682 | |
| Monolithic Power Systems, Inc. | | | 4,745 | | | | 1,677,880 | |
| | | | | | | | 4,756,873 | |
| Software & Services — 7.7% | | | | | | | | |
| Microsoft Corp. | | | 22,575 | | | | 5,413,937 | |
| ServiceNow, Inc. (a) | | | 3,271 | | | | 1,270,031 | |
| Visa, Inc. - Class A | | | 16,398 | | | | 3,406,848 | |
| | | | | | | | 10,090,816 | |
| Technology Hardware & Equipment — 5.1% | | | | | | | | |
| Apple, Inc. | | | 20,946 | | | | 2,721,514 | |
| Keysight Technologies, Inc. (a) | | | 12,528 | | | | 2,143,165 | |
| Zebra Technologies Corp. - Class A (a) | | | 6,766 | | | | 1,734,870 | |
| | | | | | | | 6,599,549 | |
| See Notes to Financial Statements. | |
| 46 | | | www.sbhfunds.com |
| Segall Bryant & Hamill All Cap Fund | Statement of Investments |
| | December 31, 2022 |
| | | Shares | | | Value | |
| Materials — 4.4% | | | | | | |
| Materials — 4.4% | | | | | | |
| Avery Dennison Corp. | | | 15,245 | | | $ | 2,759,345 | |
| FMC Corp. | | | 10,124 | | | | 1,263,475 | |
| Franco-Nevada Corp. (Canada) | | | 12,568 | | | | 1,715,281 | |
| | | | | | | | 5,738,101 | |
| Investments at Value — 96.1% | | | | | | | | |
| (Cost $82,683,802) | | | | | | $ | 125,702,676 | |
| | | | | | | | | |
| Other Assets in Excess of Liabilities — 3.9% | | | | | | | 5,125,514 | |
| | | | | | | | | |
| Net Assets — 100.0% | | | | | | $ | 130,828,190 | |
| (a) | Non-income producing security. |
The Fund’s sector and industry classifications presented herein refer to any one or more of the industry sub-classifications used by one or more widely recognized market indexes or ratings group indexes, and/ or as defined by Fund management. For Fund compliance purposes, sector and industry classifications are based on the sector and industry categorization methodology of the Adviser to the Funds. This definition may not apply for purposes of this report, which may combine industry sub-classifications for reporting ease. Industries are shown as a percentage of net assets.
| See Notes to Financial Statements. | |
| Annual Report | December 31, 2022 | | | 47 |
| Segall Bryant & Hamill Emerging Markets Fund | Statement of Investments |
| | December 31, 2022 |
| | | Shares | | | Value | |
| COMMON STOCKS — 98.8% | | | | | | | | |
| Communication Services — 9.8% | | | | | | | | |
| Media & Entertainment — 5.0% | | | | | | | | |
| Autohome, Inc. ADR (China) | | | 700 | | | $ | 21,420 | |
| China South Publishing & Media Group Co., Ltd. - Class A (China) | | | 122,500 | | | | 176,866 | |
| Gamania Digital Entertainment Co., Ltd. (Taiwan) | | | 75,000 | | | | 170,346 | |
| Jagran Prakashan, Ltd. (India) | | | 43,811 | | | | 38,658 | |
| NetDragon Websoft Holdings, Ltd. (China) | | | 100,000 | | | | 213,890 | |
| Sun TV Network, Ltd. (India) | | | 10,532 | | | | 61,882 | |
| Tencent Holdings, Ltd. (China) | | | 30,600 | | | | 1,297,431 | |
| TV Today Network, Ltd. (India) | | | 10,420 | | | | 30,831 | |
| Yandex N.V. - Class A (Russia) *(a)(b) | | | 810 | | | | 0 | |
| | | | | | | | 2,011,324 | |
| Telecommunication Services — 4.8% | | | | | | | | |
| América Móvil S.A.B. de C.V. - Class L ADR (Mexico) | | | 10,500 | | | | 191,100 | |
| APT Satellite Holdings, Ltd. (China) | | | 570,000 | | | | 153,891 | |
| China Tower Corp., Ltd. - H Shares (China) (c) | | | 4,286,000 | | | | 459,910 | |
| Emirates Telecommunications Group Co. PJSC (United Arab Emirates) | | | 9,241 | | | | 57,356 | |
| Empresa Nacional de | | | | | | | | |
| Telecomunicaciones S.A. (Chile) | | | 33,783 | | | | 116,560 | |
| Etihad Etisalat Co. (Saudi Arabia) | | | 10,197 | | | | 94,244 | |
| Indus Towers, Ltd. (India) | | | 67,856 | | | | 155,852 | |
| KT Corp. ADR (South Korea) | | | 19,100 | | | | 257,850 | |
| LG Uplus Corp. (South Korea) | | | 21,213 | | | | 186,548 | |
| Mobile Telecommunications Co. KSCP (Kuwait) | | | 72,798 | | | | 134,003 | |
| MTN Group, Ltd. (South Africa) | | | 4,136 | | | | 30,887 | |
| Ooredoo Q.P.S.C. (Qatar) | | | 50,887 | | | | 128,598 | |
| | | | | | | | 1,966,799 | |
| Consumer Discretionary — 14.1% | | | | | | | | |
| Automobiles & Components — 5.1% | | | | | | | | |
| AAPICO Hitech PCL (Thailand) | | | 37,500 | | | | 32,222 | |
| Apollo Tyres, Ltd. (India) | | | 16,247 | | | | 63,710 | |
| Astra International Tbk P.T. (Indonesia) | | | 340,700 | | | | 125,053 | |
| Astra Otoparts Tbk P.T. (Indonesia) | | | 293,500 | | | | 27,615 | |
| Automotive Axles, Ltd. (India) | | | 1,927 | | | | 46,089 | |
| BAIC Motor Corp., Ltd. - H Shares (China) (c) | | | 769,500 | | | | 203,111 | |
| Bajaj Auto, Ltd. (India) | | | 1,068 | | | | 46,586 | |
| Chongqing Changan Automobile Co., Ltd. - Class A (China) | | | 37,900 | | | | 67,505 | |
| Depo Auto Parts Ind Co., Ltd (Taiwan) | | | 22,000 | | | | 51,193 | |
| Exide Industries, Ltd. (India) | | | 16,978 | | | | 36,946 | |
| Hankook Tire & Technology Co., Ltd. (South Korea) (a) | | | 1,358 | | | | 33,675 | |
| Huayu Automotive Systems Co., Ltd. - Class A (China) | | | 103,300 | | | | 258,748 | |
| Kia Corp. (South Korea) (a) | | | 4,750 | | | | 224,427 | |
| Maharashtra Scooters, Ltd. (India) | | | 743 | | | | 41,376 | |
| Mahindra CIE Automotive, Ltd. (India) | | | 20,096 | | | | 83,383 | |
| Oriental Holdings Bhd (Malaysia) | | | 57,000 | | | | 88,126 | |
| | | Shares | | | Value | |
| Automobiles & Components (continued) | | | | | | | | |
| Qingling Motors Co., Ltd. - H Shares (China) | | | 492,000 | | | $ | 62,701 | |
| S&T Motiv Co., Ltd. (South Korea) | | | 832 | | | | 27,783 | |
| SL Corp. (South Korea) (a) | | | 1,287 | | | | 23,637 | |
| Thai Stanley Electric PCL (Thailand) | | | 17,267 | | | | 92,439 | |
| Tianneng Power International, Ltd. (China) | | | 112,000 | | | | 117,917 | |
| Tong Yang Industry Co., Ltd. (Taiwan) | | | 24,000 | | | | 33,492 | |
| Xingda International Holdings, Ltd. (China) | | | 986,292 | | | | 197,983 | |
| Yadea Group Holdings, Ltd. (China) (c) | | | 44,000 | | | | 73,258 | |
| | | | | | | | 2,058,975 | |
| Consumer Durables & Apparel — 3.1% | | | | | | | | |
| 361 Degrees International, Ltd. (China) (a) | | | 302,000 | | | | 128,330 | |
| China Lilang, Ltd. (China) | | | 44,000 | | | | 21,160 | |
| Fulgent Sun International Holding Co., Ltd. (Taiwan) | | | 6,000 | | | | 29,571 | |
| Gree Electric Appliances, Inc. - Class A (China) | | | 92,900 | | | | 433,923 | |
| Hisense Home Appliances Group Co., Ltd. - H Shares (China) | | | 20,000 | | | | 21,960 | |
| LF Corp. (South Korea) | | | 3,796 | | | | 48,046 | |
| Pou Chen Corp. (Taiwan) | | | 63,000 | | | | 70,012 | |
| Siyaram Silk Mills, Ltd. (India) | | | 16,464 | | | | 104,655 | |
| Skyworth Group, Ltd. (China) | | | 408,000 | | | | 174,142 | |
| TCL Electronics Holdings, Ltd. (China) (a) | | | 52,000 | | | | 20,754 | |
| Topkey Corp. (Taiwan) | | | 4,000 | | | | 23,769 | |
| Weiqiao Textile Co. - H Shares (China) | | | 187,701 | | | | 38,369 | |
| Youngone Corp. (South Korea) (a) | | | 1,843 | | | | 69,075 | |
| Youngone Holdings Co., Ltd. (South Korea) (a) | | | 1,443 | | | | 70,377 | |
| | | | | | | | 1,254,143 | |
| Consumer Services — 0.0% (d) | | | | | | | | |
| New Oriental Education & Technology Group, Inc. (China) (a)(c) | | | 7,200 | | | | 25,380 | |
| | | | | | | | | |
| Retailing — 5.9% | | | | | | | | |
| Alibaba Group Holding, Ltd. ADR (Hong Kong) (a) | | | 7,500 | | | | 660,675 | |
| China Harmony Auto Holding, Ltd. (China) | | | 136,000 | | | | 20,810 | |
| China Yongda Automobiles Services Holdings, Ltd. (China) | | | 96,000 | | | | 71,016 | |
| Dogan Sirketler Grubu Holdings A.S. (Turkey) | | | 88,473 | | | | 49,914 | |
| Dogus Otomotiv Servis ve Ticaret A/S (Turkey) | | | 7,279 | | | | 76,543 | |
| EEKA Fashion Holdings, Ltd. (China) | | | 140,500 | | | | 201,558 | |
| Meituan - Class B (China) (a)(c) | | | 10,000 | | | | 221,555 | |
| Naspers, Ltd. - N Shares (South Africa) | | | 1,351 | | | | 225,735 | |
| Organizacion Terpel S.A. (Colombia) | | | 19,911 | | | | 33,000 | |
| Pinduoduo, Inc. ADR (Japan) (a) | | | 700 | | | | 57,085 | |
| Topsports International Holdings, Ltd. (China) (c) | | | 62,000 | | | | 48,848 | |
| Vipshop Holdings, Ltd. ADR (China) (a) | | | 36,600 | | | | 499,224 | |
| See Notes to Financial Statements. | |
| 48 | | | www.sbhfunds.com |
| Segall Bryant & Hamill Emerging Markets Fund | Statement of Investments |
| | December 31, 2022 |
| | | Shares | | | Value | |
| Retailing (continued) | | | | | | | | |
| Xinhua Winshare Publishing and Media Co., Ltd. - H Shares (China) | | | 326,000 | | | $ | 219,509 | |
| | | | | | | | 2,385,472 | |
| Consumer Staples — 6.2% | | | | | | | | |
| Food & Staples Retailing — 0.7% | | | | | | | | |
| Grupo Comercial Chedraui S.A. de C.V. (Mexico) | | | 51,968 | | | | 221,818 | |
| Migros Ticaret A.S. (Turkey) (a) | | | 5,531 | | | | 43,311 | |
| | | | | | | | 265,129 | |
| Food, Beverage & Tobacco — 5.5% | | | | | | | | |
| Anadolu Efes Biracilik Ve Malt Sanayii A/S (Turkey) | | | 9,272 | | | | 33,577 | |
| Boustead Plantations Bhd (Malaysia) | | | 202,300 | | | | 29,711 | |
| China Foods, Ltd. (China) | | | 604,455 | | | | 216,338 | |
| China Modern Dairy Holdings, Ltd. (China) | | | 432,000 | | | | 54,648 | |
| Coca-Cola Femsa S.A.B. de C.V. ADR (Mexico) | | | 500 | | | | 33,940 | |
| Daesang Corp. (South Korea) (a) | | | 1,636 | | | | 28,517 | |
| Dali Foods Group Co., Ltd. (China) (c) | | | 47,500 | | | | 21,610 | |
| Dharma Satya Nusantara Tbk P.T. (Indonesia) | | | 922,800 | | | | 35,679 | |
| FGV Holdings Bhd (Malaysia) | | | 163,089 | | | | 49,018 | |
| GFPT Public Co., Ltd. (Thailand) | | | 95,700 | | | | 35,402 | |
| Godfrey Phillips India, Ltd. (India) | | | 4,868 | | | | 116,445 | |
| Hap Seng Plantations Holdings Bhd (Malaysia) | | | 46,300 | | | | 20,452 | |
| ITC, Ltd. (India) | | | 68,105 | | | | 272,703 | |
| JBS S.A. (Brazil) | | | 42,500 | | | | 176,782 | |
| Kim Loong Resources Bhd (Malaysia) | | | 142,000 | | | | 60,041 | |
| KRBL, Ltd. (India) | | | 9,890 | | | | 46,737 | |
| KT&G Corp. (South Korea) (a) | | | 305 | | | | 22,137 | |
| Minerva S.A. (Brazil) | | | 39,400 | | | | 96,588 | |
| Orion Holdings Corp. (South Korea) (a) | | | 8,965 | | | | 109,370 | |
| Perusahaan Perkebunan London Sumatra Tbk P.T. (Indonesia) | | | 401,000 | | | | 26,223 | |
| San Miguel Food and Beverage, Inc. (Philippines) | | | 31,300 | | | | 21,860 | |
| Sarawak Oil Palms Bhd (Malaysia) | | | 31,050 | | | | 18,398 | |
| Sawit Sumbermas Sarana Tbk P.T. (Indonesia) | | | 563,800 | | | | 53,398 | |
| Thaifoods Group PCL (Thailand) | | | 814,100 | | | | 121,033 | |
| Tongwei Co., Ltd. (China) | | | 60,100 | | | | 335,269 | |
| VST Industries, Ltd. (India) | | | 4,614 | | | | 184,440 | |
| | | | | | | | 2,220,316 | |
| Household & Personal Products — 0.0% (d) | | | | | | | | |
| Hengan International Group Co., Ltd. (China) | | | 5,000 | | | | 26,509 | |
| | | | | | | | | |
| Energy — 4.7% | | | | | | | | |
| Energy — 4.7% | | | | | | | | |
| Adaro Energy Indonesia Tbk P.T. (Indonesia) | | | 115,900 | | | | 28,796 | |
| Bukit Asam Tbk P.T. (Indonesia) | | | 123,800 | | | | 29,449 | |
| | | Shares | | | Value | |
| Energy (continued) | | | | | | | | |
| China Coal Energy Co., Ltd. - H Shares (China) | | | 53,000 | | | $ | 43,032 | |
| China Petroleum & Chemical Corp. -H Shares (China) | | | 174,000 | | | | 83,834 | |
| China Shenhua Energy Co., Ltd. - Class A (China) | | | 9,300 | | | | 37,173 | |
| China Shenhua Energy Co., Ltd. - H Shares (China) | | | 35,500 | | | | 102,263 | |
| Coal India, Ltd. (India) | | | 85,931 | | | | 233,853 | |
| Ecopetrol S.A. ADR (Colombia) | | | 4,900 | | | | 51,303 | |
| Exxaro Resources, Ltd. (South Africa) | | | 5,442 | | | | 69,762 | |
| Gazprom PJSC (Russia) *(b) | | | 101,150 | | | | 0 | |
| HD Hyundai Co., Ltd. (South Korea) | | | 468 | | | | 21,269 | |
| LUKOIL PJSC ADR (Russia) *(a)(b) | | | 2,253 | | | | 0 | |
| Oil & Natural Gas Corp., Ltd. (India) | | | 135,549 | | | | 241,372 | |
| Petroleo Brasileiro S.A. ADR (Brazil) | | | 19,400 | | | | 206,610 | |
| Petronet LNG, Ltd. (India) | | | 8,295 | | | | 21,583 | |
| Polski Koncern Naftowy ORLEN S.A. (Poland) | | | 7,746 | | | | 113,889 | |
| PTT Exploration & Production PCL (Thailand) | | | 17,100 | | | | 87,119 | |
| PTT PCL (Thailand) | | | 22,300 | | | | 21,407 | |
| Reliance Industries, Ltd. 144A (India) (c)(e) | | | 3,177 | | | | 194,889 | |
| Rosneft Oil Co. PJSC (Russia) *(b) | | | 16,950 | | | | 0 | |
| Saudi Arabian Oil Co. (Saudi Arabia) | | | 16,192 | | | | 138,969 | |
| Shaanxi Coal Industry Co., Ltd. - Class A (China) | | | 26,800 | | | | 72,102 | |
| United Tractors Tbk P.T. (Indonesia) | | | 11,500 | | | | 19,335 | |
| Yankuang Energy Group Co., Ltd. - Class A (China) | | | 6,800 | | | | 33,040 | |
| Yankuang Energy Group Co., Ltd. - H Shares (China) | | | 22,000 | | | | 66,915 | |
| | | | | | | | 1,917,964 | |
| Financials — 22.6% | | | | | | | | |
| Banks — 18.2% | | | | | | | | |
| Absa Group, Ltd. (South Africa) | | | 31,671 | | | | 359,605 | |
| Agricultural Bank of China, Ltd. - Class A (China) | | | 76,900 | | | | 32,432 | |
| Agricultural Bank of China, Ltd. - H Shares (China) | | | 304,000 | | | | 103,996 | |
| Akbank T.A.S. (Turkey) | | | 80,117 | | | | 83,721 | |
| Alliance Bank Malaysia Bhd (Malaysia) | | | 61,900 | | | | 51,756 | |
| Axis Bank, Ltd. (India) (c) | | | 537 | | | | 30,305 | |
| Banco Bradesco S.A. (Brazil) | | | 66,032 | | | | 168,246 | |
| Banco del Bajio S.A. (Mexico) | | | 20,400 | | | | 64,254 | |
| Banco do Brasil S.A. (Brazil) | | | 64,000 | | | | 420,444 | |
| Banco Santander Mexico S.A. Institucion de Banca Multiple Grupo Financiero Santand ADR (Mexico) | | | 7,900 | | | | 47,637 | |
| Bank CIMB Niaga Tbk P.T. (Indonesia) | | | 1,626,600 | | | | 124,236 | |
| Bank Handlowy w Warszawie S.A. (Poland) | | | 3,187 | | | | 55,180 | |
| Bank Mandiri Persero Tbk P.T. (Indonesia) | | | 116,800 | | | | 74,706 | |
| Bank of Baroda (India) | | | 105,269 | | | | 235,832 | |
| See Notes to Financial Statements. | |
| Annual Report | December 31, 2022 | | | 49 |
| Segall Bryant & Hamill Emerging Markets Fund | Statement of Investments |
| | December 31, 2022 |
| | | Shares | | | Value | |
| Banks (continued) | | | | | | | | |
| Bank of Beijing Co., Ltd. - Class A (China) | | | 76,300 | | | $ | 47,656 | |
| Bank of China, Ltd. - H Shares (China) | | | 1,527,000 | | | | 552,658 | |
| Bank of Chongqing Co., Ltd. - H Shares (China) | | | 45,000 | | | | 23,398 | |
| Bank of Communications Co., Ltd. - H Shares (China) | | | 349,000 | | | | 200,287 | |
| Bank of India (India) | | | 27,452 | | | | 29,227 | |
| Bank of Jiangsu Co., Ltd. - Class A (China) | | | 49,000 | | | | 51,728 | |
| Bank Pembangunan Daerah Jawa Barat Dan Banten Tbk P.T. (Indonesia) | | | 980,946 | | | | 85,006 | |
| Bank Saint Petersburg PJSC (Russia) *(b) | | | 136,120 | | | | 0 | |
| Canara Bank (India) | | | 43,828 | | | | 176,175 | |
| China Banking Corp. (Philippines) | | | 70,100 | | | | 34,565 | |
| China CITIC Bank Corp., Ltd. - H Shares (China) | | | 171,000 | | | | 75,670 | |
| China Construction Bank Corp. - H Shares (China) | | | 790,000 | | | | 494,050 | |
| China Everbright Bank Co., Ltd. - H Shares (China) | | | 528,000 | | | | 160,760 | |
| Chongqing Rural Commercial Bank Co., Ltd. - H Shares (China) | | | 67,000 | | | | 22,891 | |
| DCB Bank, Ltd. (India) | | | 26,980 | | | | 41,275 | |
| Dubai Islamic Bank PJSC (United Arab Emirates) | | | 92,775 | | | | 143,993 | |
| Emirates NBD Bank PJSC (United Arab Emirates) | | | 76,715 | | | | 270,193 | |
| Faisal Islamic Bank of Egypt (Egypt) | | | 23,957 | | | | 24,673 | |
| Far Eastern International Bank (Taiwan) | | | 68,000 | | | | 24,286 | |
| Federal Bank, Ltd. (India) | | | 43,676 | | | | 73,250 | |
| Haci Omer Sabanci Holding A.S. (Turkey) | | | 25,448 | | | | 61,408 | |
| Hana Financial Group, Inc. (South Korea) | | | 4,703 | | | | 157,262 | |
| Hong Leong Financial Group Bhd (Malaysia) | | | 5,500 | | | | 23,281 | |
| Huaxia Bank Co., Ltd. - Class A (China) | | | 40,200 | | | | 30,233 | |
| Huishang Bank Corp., Ltd. - H Shares (China) | | | 75,384 | | | | 23,923 | |
| IIFL Finance, Ltd. (India) | | | 3,221 | | | | 18,696 | |
| Indian Bank (India) | | | 41,510 | | | | 142,977 | |
| Industrial & Commercial Bank of China, Ltd. - H Shares (China) | | | 442,000 | | | | 226,694 | |
| Industrial Bank Co., Ltd. - Class A (China) | | | 19,100 | | | | 48,619 | |
| Industrial Bank of Korea (South Korea) | | | 6,979 | | | | 54,468 | |
| JB Financial Group Co., Ltd. (South Korea) | | | 4,981 | | | | 31,251 | |
| Karnataka Bank, Ltd. (The) (India) | | | 12,175 | | | | 22,367 | |
| Karur Vysya Bank, Ltd. (India) | | | 86,299 | | | | 117,863 | |
| Kasikornbank PCL (Thailand) | | | 26,800 | | | | 113,980 | |
| Krung Thai Bank PCL (Thailand) | | | 49,900 | | | | 25,475 | |
| LIC Housing Finance, Ltd. (India) | | | 4,812 | | | | 24,053 | |
| | | Shares | | | Value | |
| Banks (continued) | | | | | | | | |
| Malaysia Building Society Bhd (Malaysia) (a) | | | 291,420 | | | $ | 40,832 | |
| Metropolitan Bank & Trust Co. (Philippines) | | | 48,530 | | | | 47,174 | |
| National Bank of Kuwait S.A.K.P. (Kuwait) | | | 56,824 | | | | 200,143 | |
| National Commercial Bank (Saudi Arabia) | | | 28,191 | | | | 379,377 | |
| Nedbank Group, Ltd. (South Africa) | | | 20,896 | | | | 261,404 | |
| Philippine National Bank (Philippines) (a) | | | 43,300 | | | | 14,790 | |
| Qatar National Bank QPSC (Qatar) | | | 10,498 | | | | 52,055 | |
| RHB Bank Bhd (Malaysia) | | | 68,700 | | | | 90,535 | |
| Saudi British Bank (The) (Saudi Arabia) | | | 23,971 | | | | 246,585 | |
| Saudi Investment Bank (The) (Saudi Arabia) | | | 38,631 | | | | 178,095 | |
| Sberbank of Russia PJSC (Russia) *(a)(b) | | | 19,830 | | | | 0 | |
| Shinhan Financial Group Co., Ltd. ADR (South Korea) | | | 4,700 | | | | 131,271 | |
| SinoPac Financial Holdings Co., Ltd. (Taiwan) | | | 35,000 | | | | 19,035 | |
| Turkiye Is Bankasi A.S. (Turkey) | | | 108,175 | | | | 74,023 | |
| Union Bank of India, Ltd. (India) | | | 102,542 | | | | 99,408 | |
| VTB Bank PJSC (Russia) *(a)(b) | | | 339,760,000 | | | | 0 | |
| Woori Financial Group, Inc. (South Korea) | | | 6,240 | | | | 57,243 | |
| | | | | | | | 7,398,611 | |
| Diversified Financials — 2.5% | | | | | | | | |
| Adira Dinamika Multi Finance Tbk P.T. (Indonesia) | | | 145,000 | | | | 84,053 | |
| Bajaj Holdings & Investment, Ltd. (India) | | | 790 | | | | 54,774 | |
| Bank of Greece (Greece) | | | 3,053 | | | | 54,711 | |
| Capital Securities Corp. (Taiwan) | | | 117,000 | | | | 41,184 | |
| Gentera S.A.B. de C.V. (Mexico) | | | 128,400 | | | | 144,558 | |
| Manappuram Finance, Ltd. (India) | | | 17,650 | | | | 24,763 | |
| Power Finance Corp., Ltd. (India) | | | 86,444 | | | | 147,370 | |
| REC, Ltd. (India) | | | 171,136 | | | | 240,963 | |
| Shinyoung Securities Co., Ltd. (South Korea) | | | 795 | | | | 36,040 | |
| Shriram Transport Finance Co., Ltd. (India) (a) | | | 3,057 | | | | 50,765 | |
| Tata Investment Corp., Ltd. (India) | | | 4,663 | | | | 118,892 | |
| | | | | | | | 998,073 | |
| Insurance — 1.9% | | | | | | | | |
| DB Insurance Co., Ltd. (South Korea) (a) | | | 1,012 | | | | 52,677 | |
| Farglory Life Insurance Co., Ltd. (Taiwan) | | | 55,356 | | | | 23,409 | |
| Fubon Financial Holdings Co., Ltd. (Taiwan) | | | 293,538 | | | | 536,794 | |
| People’s Insurance Co. Group of China, Ltd. (The) - H Shares (China) | | | 97,000 | | | | 32,089 | |
| PICC Property & Casualty Co., Ltd. - H Shares (China) | | | 96,000 | | | | 90,766 | |
| Shinkong Insurance Co., Ltd. (Taiwan) | | | 32,000 | | | | 50,859 | |
| | | | | | | | 786,594 | |
| See Notes to Financial Statements. | |
| 50 | | | www.sbhfunds.com |
| Segall Bryant & Hamill Emerging Markets Fund | Statement of Investments |
| | December 31, 2022 |
| | | Shares | | | Value | |
| Health Care — 3.9% | | | | | | | | |
| Health Care Equipment & Services — 1.0% | | | | | | | | |
| SD Biosensor, Inc. (South Korea) | | | 9,587 | | | $ | 230,543 | |
| Sinopharm Group Co., Ltd. - H Shares (China) | | | 25,200 | | | | 63,783 | |
| TaiDoc Technology Corp. (Taiwan) (a) | | | 17,000 | | | | 102,165 | |
| | | | | | | | 396,491 | |
| Pharmaceuticals, Biotechnology & Life Sciences — 2.9% | | | | | | | | |
| Cadila Healthcare, Ltd. (India) | | | 15,918 | | | | 80,685 | |
| China Medical System Holdings, Ltd. (China) | | | 84,000 | | | | 131,440 | |
| China Resources Pharmaceutical Group, Ltd. (China) (c) | | | 38,500 | | | | 31,053 | |
| China Shineway Pharmaceutical Group, Ltd. (China) | | | 320,000 | | | | 310,394 | |
| Consun Pharmaceutical Group, Ltd. (China) | | | 370,492 | | | | 191,437 | |
| Dr. Reddy’s Laboratories, Ltd. ADR (India) | | | 2,300 | | | | 119,025 | |
| Granules India, Ltd. (India) | | | 7,165 | | | | 27,578 | |
| SSY Group, Ltd. (China) | | | 438,000 | | | | 241,245 | |
| Tempo Scan Pacific Tbk P.T. (Indonesia) | | | 373,100 | | | | 33,894 | |
| | | | | | | | 1,166,751 | |
| Industrials — 6.0% | | | | | | | | |
| Capital Goods — 3.0% | | | | | | | | |
| ALFA S.A.B de C.V. - Class A (Mexico) | | | 95,900 | | | | 61,169 | |
| Apar Industries, Ltd. (India) | | | 3,252 | | | | 70,530 | |
| Beijing Urban Construction Design & Development Group Co., Ltd. - H Shares (China) (c) | | | 81,000 | | | | 20,133 | |
| BizLink Holding, Inc. (Taiwan) | | | 3,000 | | | | 23,032 | |
| China Communications Services Corp., Ltd. - H Shares (China) | | | 62,000 | | | | 22,557 | |
| China Railway Group, Ltd. - Class A (China) | | | 57,200 | | | | 46,012 | |
| China Railway Group, Ltd. - H Shares (China) | | | 112,000 | | | | 58,809 | |
| CITIC, Ltd. (China) | | | 69,000 | | | | 72,548 | |
| DMCI Holdings, Inc. (Philippines) | | | 324,700 | | | | 70,251 | |
| Doosan Bobcat, Inc. (South Korea) | | | 808 | | | | 22,201 | |
| FSP Technology, Inc. (Taiwan) | | | 32,000 | | | | 39,553 | |
| GS Holdings Corp. (South Korea) | | | 2,129 | | | | 74,192 | |
| Hanwha Corp. (South Korea) (a) | | | 1,033 | | | | 21,111 | |
| Hexindo Adiperkasa Tbk P.T. (Indonesia) | | | 47,960 | | | | 16,300 | |
| Industries Qatar Q.S.C. (Qatar) | | | 33,202 | | | | 117,235 | |
| Iochpe-Maxion S.A. (Brazil) | | | 30,800 | | | | 68,573 | |
| KAP Industrial Holdings, Ltd. (South Africa) | | | 148,766 | | | | 38,717 | |
| Kepler Weber S.A. (Brazil) | | | 4,900 | | | | 18,658 | |
| Kumho Industrial Co., Ltd. (South Korea) (a) | | | 4,265 | | | | 23,743 | |
| LG Balakrishnan & Bros, Ltd. (India) | | | 5,423 | | | | 45,038 | |
| LT Group, Inc. (Philippines) | | | 307,800 | | | | 50,917 | |
| LX International Corp. (South Korea) (a) | | | 1,331 | | | | 36,007 | |
| Nava, Ltd. (India) | | | 21,296 | | | | 63,117 | |
| Posco International Corp. (South Korea) (a) | | | 1,649 | | | | 29,721 | |
| | | Shares | | | Value | |
| Capital Goods (continued) | | | | | | | | |
| Power Mech Projects, Ltd. (India) | | | 1,328 | | | $ | 31,753 | |
| Sinopec Engineering Group Co., Ltd. - H Shares (China) | | | 50,000 | | | | 21,925 | |
| TBEA Co., Ltd. - Class A (China) | | | 13,000 | | | | 37,727 | |
| Zhengzhou Coal Mining Machinery Group Co., Ltd. - H Shares (China) | | | 20,000 | | | | 17,493 | |
| | | | | | | | 1,219,022 | |
| Commercial & Professional Services — 0.1% | | | | | | | | |
| Tianjin Capital Environmental Protection Group Co., Ltd. (China) | | | 72,000 | | | | 30,073 | |
| | | | | | | | | |
| Transportation — 2.9% | | | | | | | | |
| Allcargo Logistics, Ltd. (India) | | | 13,685 | | | | 66,678 | |
| Anhui Expressway Co., Ltd. - H Shares (China) | | | 58,000 | | | | 46,581 | |
| Cia Sud Americana de Vapores S.A. (Chile) | | | 627,603 | | | | 49,448 | |
| COSCO SHIPPING Holdings Co., Ltd. - Class A (China) | | | 32,397 | | | | 48,215 | |
| COSCO SHIPPING Holdings Co., Ltd. - H Shares (China) | | | 85,700 | | | | 87,116 | |
| Daqin Railway Co., Ltd. - Class A (China) | | | 26,800 | | | | 25,952 | |
| Evergreen Marine Corp. Taiwan, Ltd. (Taiwan) (a) | | | 23,200 | | | | 122,595 | |
| Grindrod, Ltd. (South Africa) | | | 87,555 | | | | 51,524 | |
| Gujarat Pipavav Port, Ltd. (India) | | | 23,103 | | | | 28,146 | |
| HMM Co., Ltd. (South Korea) (a) | | | 8,828 | | | | 138,174 | |
| Hyundai Glovis Co., Ltd. (South Korea) (a) | | | 629 | | | | 82,006 | |
| Jiangsu Expressway Co., Ltd. - H Shares (China) | | | 46,000 | | | | 41,873 | |
| Orient Overseas International, Ltd. (Hong Kong) | | | 2,000 | | | | 36,046 | |
| Pan Ocean Co., Ltd. (South Korea) (a) | | | 5,723 | | | | 26,201 | |
| Precious Shipping PCL (Thailand) | | | 62,500 | | | | 29,001 | |
| Regional Container Lines PCL (Thailand) | | | 30,100 | | | | 26,692 | |
| Shanghai International Port Group Co., Ltd. - Class A (China) | | | 102,500 | | | | 79,294 | |
| Shenzhen Expressway Corp., Ltd. - H Shares (China) | | | 28,000 | | | | 24,090 | |
| Sinotrans, Ltd. - H Shares (China) | | | 66,000 | | | | 21,422 | |
| Tianjin Port Development Holdings, Ltd. (China) | | | 320,000 | | | | 23,243 | |
| Wisdom Marine Lines Co., Ltd. (Taiwan) | | | 12,000 | | | | 23,894 | |
| Yang Ming Marine Transport Corp. (Taiwan) | | | 47,000 | | | | 99,821 | |
| | | | | | | | 1,178,012 | |
| Information Technology — 18.4% | | | | | | | | |
| Semiconductors & Semiconductor Equipment — 7.6% | | | | | | | | |
| ASE Technology Holding Co., Ltd. ADR (Taiwan) | | | 40,200 | | | | 252,054 | |
| Chipbond Technology Corp. (Taiwan) | | | 18,000 | | | | 33,553 | |
| Daqo New Energy Corp. ADR (China) (a) | | | 3,800 | | | | 146,718 | |
| See Notes to Financial Statements. | |
| Annual Report | December 31, 2022 | | | 51 |
| Segall Bryant & Hamill Emerging Markets Fund | Statement of Investments |
| | December 31, 2022 |
| | | Shares | | | Value | |
| Semiconductors & Semiconductor Equipment (continued) | | | | | | | | |
| Foxsemicon Integrated Technology, Inc. (Taiwan) | | | 4,000 | | | $ | 23,131 | |
| GCL Technology Holdings, Ltd. (China) (a) | | | 410,000 | | | | 103,448 | |
| King Yuan Electronics Co., Ltd. (Taiwan) | | | 19,000 | | | | 22,310 | |
| Kinsus Interconnect Technology Corp. (Taiwan) | | | 6,000 | | | | 20,283 | |
| Powertech Technology, Inc. (Taiwan) | | | 11,000 | | | | 28,241 | |
| Radiant Opto-Electronics Corp. (Taiwan) | | | 10,000 | | | | 34,053 | |
| SIMMTECH Co., Ltd. (South Korea) | | | 2,109 | | | | 44,663 | |
| Taiwan Semiconductor Manufacturing Co., Ltd. ADR (Taiwan) | | | 26,050 | | | | 1,940,465 | |
| United Microelectronics Corp. (Taiwan) (a) | | | 325,000 | | | | 426,936 | |
| | | | | | | | 3,075,855 | |
| Software & Services — 1.5% | | | | | | | | |
| HCL Technologies, Ltd. (India) | | | 26,650 | | | | 334,332 | |
| Hinduja Global Solutions, Ltd. (India) | | | 11,323 | | | | 182,163 | |
| Samsung SDS Co., Ltd. (South Korea) (a) | | | 1,029 | | | | 100,706 | |
| | | | | | | | 617,201 | |
| Technology Hardware & Equipment — 9.3% | | | | | | | | |
| Asia Vital Components Co., Ltd. (Taiwan) | | | 7,000 | | | | 25,403 | |
| Catcher Technology Co., Ltd. (Taiwan) | | | 32,000 | | | | 175,709 | |
| Chicony Electronics Co., Ltd. (Taiwan) | | | 10,000 | | | | 28,001 | |
| China Railway Signal & Communication Corp., Ltd. - H Shares (China) (c) | | | 496,171 | | | | 161,802 | |
| Compeq Manufacturing Co., Ltd. (Taiwan) | | | 32,000 | | | | 46,157 | |
| FLEXium Interconnect, Inc. (Taiwan) (a) | | | 8,000 | | | | 25,402 | |
| Foxconn Industrial Internet Co., Ltd. - Class A (China) | | | 17,600 | | | | 23,398 | |
| Gold Circuit Electronics, Ltd. (Taiwan) (a) | | | 9,000 | | | | 25,282 | |
| Hon Hai Precision Industry Co., Ltd. (Taiwan) | | | 92,000 | | | | 298,140 | |
| Innodisk Corp. (Taiwan) | | | 4,118 | | | | 24,830 | |
| INTOPS Co., Ltd. (South Korea) | | | 9,236 | | | | 204,209 | |
| IsuPetasys Co., Ltd. (South Korea) (a) | | | 8,693 | | | | 39,158 | |
| Lenovo Group, Ltd. (China) | | | 382,000 | | | | 311,133 | |
| LG Innotek Co., Ltd. (South Korea) (a) | | | 2,095 | | | | 424,288 | |
| Lite-On Technology Corp. (Taiwan) | | | 92,000 | | | | 190,099 | |
| Primax Electronics, Ltd. (Taiwan) | | | 18,000 | | | | 32,429 | |
| Redington, Ltd. (India) | | | 140,197 | | | | 306,063 | |
| Samsung Electronics Co., Ltd. (South Korea) | | | 22,356 | | | | 985,392 | |
| Simplo Technology Co., Ltd. (Taiwan) | | | 4,000 | | | | 37,023 | |
| Taiwan PCB Techvest Co., Ltd. (Taiwan) | | | 32,000 | | | | 37,660 | |
| Unimicron Technology Corp. (Taiwan) | | | 33,000 | | | | 128,089 | |
| Wistron Corp. (Taiwan) | | | 84,000 | | | | 80,211 | |
| Yangtze Optical Fibre and Cable Joint Stock, Ltd. - H Shares (China) (c) | | | 16,500 | | | | 29,302 | |
| Zhen Ding Technology Holdings, Ltd. (Taiwan) | | | 45,000 | | | | 153,046 | |
| | | | | | | | 3,792,226 | |
| | | Shares | | | Value | |
| Materials — 8.3% | | | | | | | | |
| Materials — 8.3% | | | | | | | | |
| Abou Kir Fertilizers & Chemical Industries (Egypt) | | | 19,957 | | | $ | 31,324 | |
| African Rainbow Minerals, Ltd. (South Africa) | | | 4,931 | | | | 83,312 | |
| Alpek S.A.B de C.V. (Mexico) | | | 57,900 | | | | 81,973 | |
| Castrol India, Ltd. (India) | | | 16,918 | | | | 25,172 | |
| Chengxin Lithium Group Co., Ltd. - Class A (China) | | | 3,100 | | | | 16,769 | |
| China BlueChemical, Ltd. - H Shares (China) | | | 92,000 | | | | 21,752 | |
| China Lumena New Materials Corp. (China) (a)(b) | | | 1,700 | | | | 0 | |
| China Metal Products Co., Ltd. (Taiwan) | | | 23,000 | | | | 21,446 | |
| China XLX Fertiliser, Ltd. (China) | | | 38,000 | | | | 19,679 | |
| Coromandel International, Ltd. (India) | | | 3,953 | | | | 42,365 | |
| Dongkuk Steel Mill Co., Ltd (South Korea) (a) | | | 2,167 | | | | 19,232 | |
| Empresas CMPC S.A. (Chile) | | | 27,214 | | | | 45,374 | |
| Fufeng Group, Ltd. (China) | | | 34,692 | | | | 21,041 | |
| Gloria Material Technology Corp. (Taiwan) | | | 39,000 | | | | 47,092 | |
| Gujarat Alkalies & Chemicals, Ltd. (India) | | | 2,229 | | | | 20,610 | |
| Gujarat Narmada Valley Fertilizers & Chemicals, Ltd. (India) | | | 7,896 | | | | 53,038 | |
| Hanil Holdings Co., Ltd. (South Korea) | | | 2,166 | | | | 18,560 | |
| Henan Shenhuo Coal & Power Co., Ltd. - Class A (China) | | | 8,500 | | | | 18,372 | |
| Hindustan Zinc, Ltd. (India) | | | 18,637 | | | | 72,459 | |
| Huaibei Mining Holdings Co., Ltd. - Class A (China) | | | 20,200 | | | | 37,424 | |
| Hubei Xingfa Chemicals Group Co., Ltd. - Class A (China) | | | 5,800 | | | | 24,314 | |
| Hyundai Steel Co. (South Korea) (a) | | | 2,917 | | | | 71,397 | |
| Impala Platinum Holdings, Ltd. (South Africa) | | | 2,473 | | | | 31,074 | |
| Indorama Ventures PCL (Thailand) | | | 66,400 | | | | 77,992 | |
| Jastrzebska Spolka Weglowa S.A. (Poland) (a) | | | 2,094 | | | | 28,137 | |
| Jinan Acetate Chemical Co., Ltd. (Taiwan) | | | 4,000 | | | | 23,085 | |
| Jindal Steel & Power, Ltd. (India) | | | 6,244 | | | | 43,810 | |
| JK Paper, Ltd. (India) | | | 4,561 | | | | 22,506 | |
| Kumho Petrochemical Co., Ltd. (South Korea) (a) | | | 380 | | | | 38,027 | |
| Luxi Chemical Group Co., Ltd. - Class A (China) | | | 12,600 | | | | 22,577 | |
| Magnitogorsk Iron & Steel Works PJSC (Russia) *(b) | | | 194,390 | | | | 0 | |
| Maharashtra Seamless, Ltd. (India) | | | 4,954 | | | | 19,381 | |
| NMDC Steel, Ltd. (India) (a) (c) | | | 48,687 | | | | 22,246 | |
| NMDC, Ltd. (India) | | | 48,687 | | | | 72,362 | |
| Novolipetsk Steel PJSC (Russia) *(a)(b)(c) | | | 2,870 | | | | 0 | |
| Omnia Holdings, Ltd. (South Africa) | | | 5,382 | | | | 19,814 | |
| PCC Rokita S.A. (Poland) | | | 1,348 | | | | 29,494 | |
| See Notes to Financial Statements. | |
| 52 | | | www.sbhfunds.com |
| Segall Bryant & Hamill Emerging Markets Fund | Statement of Investments |
| | December 31, 2022 |
| | | Shares | | | Value | |
| Materials (continued) | | | | | | | | |
| Petronas Chemicals Group Bhd (Malaysia) | | | 78,700 | | | $ | 154,202 | |
| Polyplex Thailand PCL (Thailand) | | | 35,000 | | | | 25,513 | |
| POSCO Holdings, Inc. ADR (South Korea) | | | 4,500 | | | | 245,115 | |
| Rashtriya Chemicals & Fertilizers, Ltd. (India) | | | 21,227 | | | | 34,490 | |
| SABIC Agri-Nutrients Co. (Saudi Arabia) | | | 4,177 | | | | 163,015 | |
| Sahara International Petrochemical Co. (Saudi Arabia) | | | 33,880 | | | | 309,817 | |
| Sappi, Ltd. (South Africa) (a) | | | 7,792 | | | | 22,578 | |
| Sasol, Ltd. (South Africa) | | | 12,164 | | | | 194,100 | |
| Shougang Fushan Resources Group, Ltd. (China) | | | 66,000 | | | | 21,049 | |
| Siam City Cement Public Co., Ltd. (Thailand) | | | 5,300 | | | | 23,498 | |
| Sichuan Hebang Biotechnology Co., Ltd. - Class A (China) | | | 75,000 | | | | 33,025 | |
| Sichuan Yahua Industrial Group Co., Ltd. - Class A (China) | | | 6,900 | | | | 23,201 | |
| Sitios LatinoAmerica S.A.B. de C.V. (Mexico) (a) | | | 10,500 | | | | 4,957 | |
| Ta Ann Holdings Bhd (Malaysia) | | | 37,200 | | | | 32,033 | |
| Taiwan Hon Chuan Enterprise Co., Ltd. (Taiwan) | | | 11,000 | | | | 31,056 | |
| Tharisa PLC (South Africa) | | | 30,632 | | | | 36,258 | |
| Tianqi Lithium Corp. - Class A (China) (a) | | | 2,500 | | | | 28,578 | |
| Ton Yi Insudtrial Corp. (Taiwan) | | | 75,000 | | | | 41,538 | |
| TPI Polene PCL (Thailand) | | | 473,300 | | | | 24,877 | |
| UPL, Ltd. (India) | | | 10,733 | | | | 92,731 | |
| Vale S.A. ADR (Brazil) | | | 27,774 | | | | 471,325 | |
| Vedanta, Ltd. (India) | | | 28,782 | | | | 107,162 | |
| West China Cement, Ltd. (China) | | | 166,000 | | | | 19,517 | |
| | | | | | | | 3,382,845 | |
| Real Estate — 1.9% | | | | | | | | |
| Real Estate — 1.9% | | | | | | | | |
| AP Thailand PCL (Thailand) | | | 175,900 | | | | 58,890 | |
| China Electronics Optics Valley Union Holding Co., Ltd. (China) | | | 262,577 | | | | 13,049 | |
| China Overseas Land & Investment, Ltd. (China) | | | 49,500 | | | | 129,533 | |
| Emaar Properties PJSC (United Arab Emirates) | | | 110,500 | | | | 175,793 | |
| Gemdale Properties and Investment Corp., Ltd. (China) | | | 320,000 | | | | 26,075 | |
| Huaku Development Co., Ltd. (Taiwan) | | | 8,000 | | | | 23,143 | |
| PLA Administradora Industrial S. de R.L. de C.V. (Mexico) (c) | | | 16,800 | | | | 24,147 | |
| Poly Property Group Co., Ltd. (China) | | | 173,000 | | | | 38,586 | |
| Shanghai Industrial Urban Development Group, Ltd. (China) | | | 99,862 | | | | 8,422 | |
| Shenzhen Investment, Ltd. (China) | | | 380,724 | | | | 65,208 | |
| Supalai PCL (Thailand) | | | 131,600 | | | | 92,362 | |
| Youngor Group Co., Ltd. - Class A (China) | | | 103,400 | | | | 94,815 | |
| | | | | | | | 750,023 | |
| | | Shares | | | Value | |
| Utilities — 2.9% | | | | | | | | |
| Utilities — 2.9% | | | | | | | | |
| Beijing Enterprises Holdings, Ltd. (China) | | | 54,500 | | | $ | 174,005 | |
| Canvest Environmental Protection Group Co., Ltd. (China) | | | 45,000 | | | | 24,214 | |
| China Everbright Water, Ltd. (China) | | | 143,700 | | | | 26,298 | |
| Cia de Saneamento de Minas Gerais S.A. (Brazil) | | | 7,100 | | | | 21,072 | |
| Engie Brasil Energia S.A. (Brazil) | | | 2,800 | | | | 20,063 | |
| GAIL India, Ltd. (India) (c) | | | 3,218 | | | | 22,655 | |
| Gas Malaysia Bhd (Malaysia) | | | 33,900 | | | | 25,144 | |
| Korea Gas Corp. (South Korea) (a) | | | 3,139 | | | | 90,615 | |
| Kunlun Energy Co., Ltd. (China) | | | 242,000 | | | | 172,048 | |
| Malakoff Corp. Bhd (Malaysia) | | | 159,200 | | | | 23,525 | |
| NTPC, Ltd. (India) | | | 109,398 | | | | 220,086 | |
| OGK-2 PJSC (Russia) *(b) | | | 5,740,000 | | | | 0 | |
| Perusahaan Gas Negara Tbk P.T. (Indonesia) | | | 174,900 | | | | 19,823 | |
| Power Grid Corp. of India, Ltd. (India) | | | 79,348 | | | | 204,647 | |
| Saudi Electricity Co. (Saudi Arabia) | | | 15,555 | | | | 96,141 | |
| Synergy Grid & Development Phils, Inc. (Philippines) | | | 214,600 | | | | 42,913 | |
| Total Common Stocks (Cost $39,161,742) | | | | | | | 1,183,249 | |
| | | | | | | | 40,107,037 | |
| PREFERRED STOCKS — 1.5% | | | | | | | | |
| Energy — 0.5% | | | | | | | | |
| Energy — 0.5% | | | | | | | | |
| Petroleo Brasileiro S.A. ADR (Brazil) | | | 23,700 | | | | 220,173 | |
| Surgutneftegas PJSC (Russia) *(b) | | | 541,500 | | | | 0 | |
| | | | | | | | 220,173 | |
| Industrials — 0.0% (d) | | | | | | | | |
| Capital Goods — 0.0% (d) | | | | | | | | |
| Randon S.A. Implementos e Participacoes (Brazil) | | | 11,300 | | | | 17,549 | |
| | | | | | | | | |
| Information Technology — 0.5% | | | | | | | | |
| Technology Hardware & Equipment — 0.5% | | | | | | | | |
| Samsung Electronics Co., Ltd. (South Korea) | | | 4,645 | | | | 186,921 | |
| | | | | | | | | |
| Materials — 0.4% | | | | | | | | |
| Materials — 0.4% | | | | | | | | |
| Gerdau S.A. (Brazil) | | | 27,100 | | | | 150,556 | |
| | | | | | | | | |
| Utilities — 0.1% | | | | | | | | |
| Utilities — 0.1% | | | | | | | | |
| Cia de Saneamento do Parana (Brazil) | | | 60,000 | | | | 41,425 | |
| Total Preferred Stocks (Cost $822,548) | | | | | | | 616,624 | |
| See Notes to Financial Statements. | |
| Annual Report | December 31, 2022 | | | 53 |
| Segall Bryant & Hamill Emerging Markets Fund | Statement of Investments |
| | December 31, 2022 |
| | | Shares | | | Value | |
| WARRANTS — 0.0% (d) | | | | | | |
| Real Estate — 0.0% (d) | | | | | | | | |
| Real Estate — 0.0% (d) | | | | | | | | |
| Noble Development PLC (Cost $0) | | | 14,775 | | | $ | 226 | |
| | | | | | | | | |
| Investments at Value — 100.3% | | | | | | | | |
| (Cost $39,984,290) | | | | | | $ | 40,723,887 | |
| | | | | | | | | |
| Liabilities in Excess of Other Assets — (0.3%) | | | | | | | (126,094 | ) |
| | | | | | | | | |
| Net Assets — 100.0% | | | | | | $ | 40,597,793 | |
| * | Security has been suspended of trading due to the ongoing conflict in Russia and Ukraine. As a result, management made the decision to value the security at $0. |
| (a) | Non-income producing security. |
| (b) | Level 3 securities fair value under procedures established by the Board of Trustees, represents 0.0% of net assets. The total value of these securities is $0. |
| (c) | Security is considered a restricted security however such restriction has not resulted in an illiquid classification. The total value of these securities is $1,590,204, which represents 3.9% of net assets as of December 31, 2022. |
| (d) | Percentage rounds to less than 0.1%. |
| (e) | Security was purchased in a transaction exempt from registration in compliance with Rule 144A of the Securities Act of 1933. This security may be resold in transactions exempt from registration, normally to qualified institutional buyers. |
The Fund’s sector and industry classifications presented herein refer to any one or more of the industry sub-classifications used by one or more widely recognized market indexes or ratings group indexes, and/ or as defined by Fund management. For Fund compliance purposes, sector and industry classifications are based on the sector and industry categorization methodology of the Adviser to the Funds. This definition may not apply for purposes of this report, which may combine industry sub-classifications for reporting ease. Industries are shown as a percentage of net assets.
| | | | | | % of Net | |
| Country | | Value | | | Assets | |
| China | | $ | 12,311,519 | | | | 30.3 | % |
| India | | | 6,101,773 | | | | 15.0 | % |
| Taiwan | | | 5,760,877 | | | | 14.2 | % |
| South Korea | | | 4,795,105 | | | | 11.8 | % |
| Brazil | | | 2,098,064 | | | | 5.2 | % |
| Saudi Arabia | | | 1,606,243 | | | | 4.0 | % |
| South Africa | | | 1,424,770 | | | | 3.5 | % |
| Thailand | | | 888,128 | | | | 2.2 | % |
| Mexico | | | 875,553 | | | | 2.2 | % |
| Indonesia | | | 783,566 | | | | 1.9 | % |
| Malaysia | | | 707,054 | | | | 1.8 | % |
| Hong Kong | | | 696,721 | | | | 1.7 | % |
| United Arab Emirates | | | 647,335 | | | | 1.6 | % |
| Turkey | | | 422,497 | | | | 1.1 | % |
| Kuwait | | | 334,146 | | | | 0.8 | % |
| Qatar | | | 297,888 | | | | 0.7 | % |
| Philippines | | | 282,470 | | | | 0.7 | % |
| Poland | | | 226,700 | | | | 0.6 | % |
| Chile | | | 211,382 | | | | 0.5 | % |
| Colombia | | | 84,303 | | | | 0.2 | % |
| Japan | | | 57,085 | | | | 0.1 | % |
| Egypt | | | 55,997 | | | | 0.1 | % |
| Greece | | | 54,711 | | | | 0.1 | % |
| Russia | | | 0 | | | | 0.0 | % |
| Total Investments | | $ | 40,723,887 | | | | 100.3 | % |
| Liabilities in Excess of Other Assets | | | (126,094 | ) | | | (0.3 | %) |
| Net Assets | | $ | 40,597,793 | | | | 100.0 | % |
| | | | | | | | | |
| See Notes to Financial Statements. | |
| 54 | | | www.sbhfunds.com |
| Segall Bryant & Hamill International Small Cap Fund | Statement of Investments |
| | December 31, 2022 |
| | | Shares | | | Value | |
| COMMON STOCKS — 98.7% | | | | | | | | |
| Communication Services — 3.5% | | | | | | | | |
| Media & Entertainment — 2.0% | | | | | | | | |
| ITV PLC (United Kingdom) | | | 48,938 | | | $ | 44,255 | |
| MFE-MediaForEurope N.V. - Class A (Italy) | | | 201,673 | | | | 78,160 | |
| MIXI, Inc. (Japan) (a) | | | 18,600 | | | | 346,914 | |
| Next Fifteen Communications Group plc (United Kingdom) | | | 43,057 | | | | 511,759 | |
| Seven West Media, Ltd. (Australia) (a) | | | 493,108 | | | | 132,295 | |
| SKY Perfect JSAT Holdings, Inc. (Japan) | | | 47,800 | | | | 175,637 | |
| Television Francaise 1 (France) | | | 79,730 | | | | 612,261 | |
| TX Group A.G. (Switzerland) | | | 300 | | | | 47,942 | |
| | | | | | | | 1,949,223 | |
| Telecommunication Services — 1.5% | | | | | | | | |
| Airtel Africa PLC (United Kingdom) | | | 403,957 | | | | 544,295 | |
| Bezeq-The Israeli Telecommunication Corp., Ltd. (Israel) | | | 200,635 | | | | 344,084 | |
| Millicom International Cellular S.A. (Sweden) (a) | | | 19,389 | | | | 245,682 | |
| SmarTone Telecommunications Holdings, Ltd. (Hong Kong) | | | 106,000 | | | | 63,940 | |
| Telekom Austria A.G. (Austria) (a) | | | 43,321 | | | | 267,759 | |
| | | | | | | | 1,465,760 | |
| Consumer Discretionary — 12.2% | | | | | | | | |
| Automobiles & Components — 3.6% | | | | | | | | |
| Gestamp Automocion S.A. (Spain) | | | 139,472 | | | | 538,686 | |
| Mitsubishi Motors Corp. (Japan) (a) | | | 115,400 | | | | 438,173 | |
| NGK Spark Plug Co., Ltd. (Japan) | | | 32,900 | | | | 602,865 | |
| NHK Spring Co., Ltd. (Japan) | | | 55,980 | | | | 355,892 | |
| Schaeffler A.G. - Preferred Shares (Germany) | | | 77,163 | | | | 521,422 | |
| Toyo Tire Corp. (Japan) | | | 38,200 | | | | 429,880 | |
| Vitesco Technologies Group A.G. (Germany) (a) | | | 2,082 | | | | 120,418 | |
| Yokohama Rubber Co., Ltd. (Japan) | | | 28,100 | | | | 434,739 | |
| | | | | | | | 3,442,075 | |
| Consumer Durables & Apparel — 4.9% | | | | | | | | |
| Bellway PLC (United Kingdom) | | | 7,744 | | | | 177,080 | |
| Cleanup Corp. (Japan) | | | 15,900 | | | | 77,644 | |
| Coats Group PLC (United Kingdom) | | | 636,141 | | | | 510,447 | |
| Pacific Textiles Holdings, Ltd. (Hong Kong) | | | 225,078 | | | | 73,739 | |
| Redrow PLC (United Kingdom) | | | 122,724 | | | | 672,469 | |
| SANKYO Co., Ltd. (Japan) | | | 21,000 | | | | 857,842 | |
| Stella International Holdings, Ltd. (Hong Kong) | | | 70,000 | | | | 65,915 | |
| Sumitomo Forestry Co., Ltd. (Japan) | | | 38,100 | | | | 673,242 | |
| Tamron Co., Ltd. (Japan) | | | 16,499 | | | | 371,396 | |
| Texhong Textile Group, Ltd. (Hong Kong) | | | 638,000 | | | | 508,975 | |
| Vistry Group PLC (United Kingdom) | | | 101,471 | | | | 764,224 | |
| | | | | | | | 4,752,973 | |
| Consumer Services — 1.5% | | | | | | | | |
| AcadeMedia A.B. (Sweden) (b) | | | 48,101 | | | | 205,480 | |
| Betsson A.B. (Sweden) (a) | | | 109,724 | | | | 891,919 | |
| | | Shares | | | Value | |
| Consumer Services (continued) | | | | | | | | |
| Cie des Alpes (France) (a) | | | 19,473 | | | $ | 299,785 | |
| | | | | | | | 1,397,184 | |
| Retailing — 2.2% | | | | | | | | |
| Delek Automotive Systems, Ltd. (Israel) | | | 33,084 | | | | 387,453 | |
| Harvey Norman Holdings, Ltd. (Australia) | | | 190,674 | | | | 534,215 | |
| IDOM, Inc. (Japan) | | | 78,800 | | | | 394,882 | |
| Inchcape plc (United Kingdom) | | | 4,743 | | | | 46,826 | |
| JB Hi-Fi, Ltd. (Australia) | | | 11,623 | | | | 331,242 | |
| Super Retail Group, Ltd. (Australia) | | | 58,411 | | | | 423,901 | |
| | | | | | | | 2,118,519 | |
| Consumer Staples — 6.3% | | | | | | | | |
| Food & Staples Retailing — 1.8% | | | | | | | | |
| Axial Retailing, Inc. (Japan) (a) | | | 12,256 | | | | 315,573 | |
| GrainCorp, Ltd. - Class A (Australia) | | | 148,795 | | | | 750,079 | |
| Halows Co., Ltd. (Japan) | | | 10,200 | | | | 224,869 | |
| Mitsubishi Shokuhin Co., Ltd. (Japan) | | | 19,519 | | | | 461,838 | |
| | | | | | | | 1,752,359 | |
| Food, Beverage & Tobacco — 4.4% | | | | | | | | |
| Agrana Beteiligungs A.G. (Austria) | | | 534 | | | | 8,548 | |
| Austevoll Seafood A.S.A. (Norway) | | | 29,755 | | | | 268,377 | |
| Bumitama Agri, Ltd. (Singapore) | | | 144,400 | | | | 63,678 | |
| First Pacific Co., Ltd. (Hong Kong) | | | 384,000 | | | | 114,379 | |
| Golden Agri-Resources, Ltd. (Singapore) | | | 2,175,700 | | | | 406,052 | |
| Greencore Group plc (United Kingdom) (a) | | | 499,039 | | | | 386,999 | |
| Itoham Yonekyu Holdings, Inc. (Japan) | | | 103,600 | | | | 549,655 | |
| Mitsui DM Sugar Holdings Co., Ltd. (Japan) | | | 28,618 | | | | 435,842 | |
| Morinaga & Co., Ltd. (Japan) | | | 9,500 | | | | 283,403 | |
| Origin Enterprises PLC (Ireland) (a) | | | 40,410 | | | | 186,494 | |
| Premier Foods PLC (United Kingdom) | | | 36,303 | | | | 47,660 | |
| S Foods, Inc. (Japan) | | | 19,900 | | | | 447,921 | |
| Scandinavian Tobacco Group A/S (Denmark) (b) | | | 34,127 | | | | 599,927 | |
| Starzen Co., Ltd. (Japan) | | | 4,705 | | | | 74,069 | |
| Suedzucker A.G. (Germany) | | | 3,400 | | | | 59,358 | |
| Toyo Suisan Kaisha, Ltd. (Japan) (a) | | | 7,000 | | | | 269,639 | |
| Vilmorin & Cie S.A. (France) | | | 1,134 | | | | 55,441 | |
| | | | | | | | 4,257,442 | |
| Household & Personal Products — 0.1% | | | | | | | | |
| Best World International, Ltd. (Singapore) (a) | | | 38,000 | | | | 50,500 | |
| | | | | | | | | |
| Energy — 3.1% | | | | | | | | |
| Energy — 3.1% | | | | | | | | |
| Cosmo Energy Holdings Co., Ltd. (Japan) | | | 23,800 | | | | 629,888 | |
| CropEnergies A.G. (Germany) | | | 25,903 | | | | 360,560 | |
| Delek Group, Ltd. (Israel) (a) | | | 1,082 | | | | 118,522 | |
| Etablissements Maurel et Prom S.A. (France) | | | 11,775 | | | | 50,888 | |
| Gulf Keystone Petroleum, Ltd. (United Kingdom) | | | 129,753 | | | | 316,136 | |
See Notes to Financial Statements.
| Annual Report | December 31, 2022 | | | 55 |
| Segall Bryant & Hamill International Small Cap Fund | Statement of Investments |
| | December 31, 2022 |
| | | Shares | | | Value | |
| Energy (continued) | | | | | | | | |
| Hafnia, Ltd. (Norway) | | | 42,973 | | | $ | 221,014 | |
| New Hope Corp., Ltd. (Australia) | | | 104,630 | | | | 449,306 | |
| Oil Refineries, Ltd. (Israel) | | | 573,467 | | | | 200,962 | |
| Saras S.p.A. (Italy) (a) | | | 54,500 | | | | 67,024 | |
| Whitehaven Coal, Ltd. (Australia) | | | 91,811 | | | | 584,864 | |
| | | | | | | | 2,999,164 | |
| Financials — 11.8% | | | | | | | | |
| Banks — 6.7% | | | | | | | | |
| 77 Bank, Ltd. (The) (Japan) (a) | | | 14,878 | | | | 249,333 | |
| Banco BPM S.p.A. (Italy) | | | 38,280 | | | | 136,509 | |
| Banco de Sabadell S.A. (Spain) | | | 121,485 | | | | 114,227 | |
| Bank of Georgia Group PLC (United Kingdom) | | | 30,973 | | | | 968,647 | |
| BAWAG Group A.G. (Austria) (a)(b) | | | 3,171 | | | | 169,035 | |
| BPER Banca S.p.A. (Italy) (a) | | | 168,560 | | | | 345,684 | |
| Dah Sing Financial Holdings, Ltd. (Hong Kong) | | | 45,200 | | | | 104,393 | |
| Helia Group, Ltd. (Australia) | | | 514,342 | | | | 959,710 | |
| Keiyo Bank, Ltd. (The) (Japan) | | | 129,900 | | | | 577,521 | |
| Nishi-Nippon Financial Holdings, Inc. (Japan) | | | 81,300 | | | | 594,027 | |
| OSB Group PLC (United Kingdom) | | | 61,923 | | | | 358,016 | |
| Sydbank A/S (Denmark) | | | 19,698 | | | | 828,743 | |
| TBC Bank Group PLC (United Kingdom) | | | 32,713 | | | | 897,688 | |
| Virgin Money UK PLC (United Kingdom) | | | 62,890 | | | | 138,295 | |
| | | | | | | | 6,441,828 | |
| Diversified Financials — 2.8% | | | | | | | | |
| Banca IFIS S.p.A. (Italy) | | | 23,900 | | | | 340,624 | |
| Cembra Money Bank AG (Switzerland) | | | 638 | | | | 52,953 | |
| Credit Saison Co., Ltd. (Japan) | | | 20,400 | | | | 262,992 | |
| Eclipx Group, Ltd. (Australia) (a) | | | 34,349 | | | | 46,985 | |
| Fuyo General Lease Co., Ltd. (Japan) | | | 3,600 | | | | 234,640 | |
| Jaccs Co., Ltd. (Japan) | | | 17,037 | | | | 532,995 | |
| Leonteq A.G. (Switzerland) | | | 11,174 | | | | 526,902 | |
| Resurs Holding A.B. (Sweden) (b) | | | 243,662 | | | | 582,605 | |
| TP ICAP Group plc (United Kingdom) | | | 22,863 | | | | 48,229 | |
| Yangzijiang Financial Holding, Ltd. (Singapore) (a) | | | 243,200 | | | | 64,500 | |
| | | | | | | | 2,693,425 | |
| Insurance — 2.3% | | | | | | | | |
| ASR Nederland N.V. (Netherlands) | | | 16,438 | | | | 781,275 | |
| Coface S.A. (France) | | | 10,524 | | | | 136,677 | |
| Phoenix Holdings, Ltd. (The) (Israel) | | | 47,210 | | | | 503,400 | |
| Unipol Gruppo S.p.A. (Italy) | | | 157,203 | | | | 765,625 | |
| | | | | | | | 2,186,977 | |
| Health Care — 6.8% | | | | | | | | |
| Health Care Equipment & Services — 4.6% | | | | | | | | |
| Ambea A.B. (Sweden) (b) | | | 100,251 | | | | 422,430 | |
| Ansell, Ltd. (Australia) | | | 2,488 | | | | 47,785 | |
| Australian Clinical Labs, Ltd. (Australia) | | | 213,176 | | | | 433,109 | |
| BML, Inc. (Japan) | | | 18,400 | | | | 466,701 | |
| Coltene Holding A.G. (Switzerland) (a) | | | 1,723 | | | | 142,001 | |
| Eiken Chemical Co., Ltd. (Japan) | | | 34,700 | | | | 448,438 | |
| Galenica A.G. (Switzerland) (b) | | | 13,616 | | | | 1,111,006 | |
| Guerbet (France) | | | 4,052 | | | | 73,631 | |
| | | Shares | | | Value | |
| Health Care Equipment & Services (continued) | | | | | | | | |
| H.U. Group Holdings, Inc. (Japan) | | | 23,700 | | | $ | 517,559 | |
| Medmix A.G. (Switzerland) | | | 2,833 | | | | 53,861 | |
| Oceania Healthcare, Ltd. (New Zealand) | | | 169,236 | | | | 81,635 | |
| Oriola OYJ (Finland) | | | 115,041 | | | | 214,339 | |
| Ryman Healthcare, Ltd. (New Zealand) | | | 14,276 | | | | 48,315 | |
| Synlab A.G. (Germany) | | | 24,866 | | | | 300,923 | |
| | | | | | | | 4,361,733 | |
| Pharmaceuticals, Biotechnology & Life Sciences — 2.2% | | | | | | | | |
| Alliance Pharma PLC (United Kingdom) | | | 603,032 | | | | 386,363 | |
| Boiron S.A. (France) | | | 5,279 | | | | 286,589 | |
| COSMO Pharmaceuticals N.V. (Switzerland) | | | 2,323 | | | | 153,763 | |
| Gerresheimer A.G. (Germany) | | | 1,914 | | | | 128,077 | |
| H Lundbeck A/S (Denmark) | | | 66,230 | | | | 248,051 | |
| Indivior plc (United Kingdom) (a) | | | 30,791 | | | | 689,007 | |
| Kissei Pharmaceutical Co., Ltd. (Japan) (a) | | | 5,882 | | | | 114,909 | |
| United Laboratories International Holdings, Ltd. (The) (Hong Kong) | | | 212,000 | | | | 132,346 | |
| | | | | | | | 2,139,105 | |
| Industrials — 22.7% | | | | | | | | |
| Capital Goods — 14.5% | | | | | | | | |
| Austal, Ltd. (Australia) | | | 28,833 | | | | 40,834 | |
| Balfour Beatty PLC (United Kingdom) | | | 33,932 | | | | 138,481 | |
| Danieli & C. Officine Meccaniche S.p.A. (Italy) | | | 27,381 | | | | 420,149 | |
| Deutz A.G. (Germany) | | | 90,456 | | | | 389,400 | |
| Fletcher Building, Ltd. (New Zealand) | | | 173,379 | | | | 519,173 | |
| Fujikura, Ltd. (Japan) (a) | | | 46,900 | | | | 352,492 | |
| Hanwa Co., Ltd. (Japan) | | | 12,200 | | | | 344,650 | |
| IDEC Corp. (Japan) | | | 24,200 | | | | 533,877 | |
| Implenia A.G. (Switzerland) (a) | | | 14,193 | | | | 585,534 | |
| INFRONEER Holdings, Inc. (Japan) (a) | | | 53,000 | | | | 402,724 | |
| Inwido A.B. (Sweden) | | | 18,763 | | | | 199,676 | |
| Keller Group PLC (United Kingdom) | | | 54,533 | | | | 527,386 | |
| Kitz Corp. (Japan) | | | 50,000 | | | | 299,238 | |
| Kloeckner & Co. S.E. (Germany) | | | 7,688 | | | | 75,507 | |
| Koninklijke BAM Groep N.V. (Netherlands) (a) | | | 189,519 | | | | 441,227 | |
| Leonardo S.p.A. (Italy) | | | 66,916 | | | | 577,312 | |
| Makino Milling Machine Co., Ltd. (Japan) (a) | | | 4,100 | | | | 133,927 | |
| Morgan Advanced Materials PLC (United Kingdom) | | | 12,991 | | | | 49,390 | |
| Morgan Sindall Group PLC (United Kingdom) | | | 37,001 | | | | 687,908 | |
| NCC A.B. (Sweden) | | | 7,893 | | | | 73,766 | |
| Nichias Corp. (Japan) | | | 18,600 | | | | 332,312 | |
| Noritake Co., Ltd. (Japan) | | | 7,825 | | | | 238,004 | |
| Noritsu Koki Co., Ltd. (Japan) | | | 18,000 | | | | 323,682 | |
| NRW Holdings, Ltd. (Australia) | | | 525,244 | | | | 1,002,445 | |
| OC Oerlikon Corp. A.G. (Switzerland) | | | 28,168 | | | | 184,728 | |
| Porr A.G. (Austria) | | | 16,866 | | | | 212,383 | |
| Rexel S.A. (France) | | | 38,480 | | | | 761,310 | |
See Notes to Financial Statements.
| 56 | | | www.sbhfunds.com |
| Segall Bryant & Hamill International Small Cap Fund | Statement of Investments |
| | December 31, 2022 |
| | | Shares | | | Value | |
| Capital Goods (continued) | | | | | | | | |
| Sanyo Denki Co., Ltd. (Japan) (a) | | | 7,400 | | | $ | 320,867 | |
| Signify N.V. (Netherlands) (b) | | | 2,505 | | | | 84,351 | |
| Sodick Co., Ltd. (Japan) | | | 82,800 | | | | 443,241 | |
| Sojitz Corp. (Japan) | | | 50,800 | | | | 967,769 | |
| Star Micronics Co., Ltd. (Japan) | | | 56,100 | | | | 687,013 | |
| Strabag SE (Austria) | | | 8,166 | | | | 341,890 | |
| Vesuvius PLC (United Kingdom) | | | 111,871 | | | | 546,629 | |
| Yangzijiang Shipbuilding Holdings, Ltd. (Singapore) | | | 624,200 | | | | 634,066 | |
| Yurtec Corp. (Japan) | | | 7,192 | | | | 40,002 | |
| | | | | | | | 13,913,343 | |
| Commercial & Professional Services — 2.2% | | | | | | | | |
| Applus Services S.A. (Spain) | | | 7,125 | | | | 49,065 | |
| Bilfinger S.E. (Germany) | | | 4,983 | | | | 143,596 | |
| Brunel International N.V. (Netherlands) | | | 17,164 | | | | 176,069 | |
| Elis S.A. (France) | | | 9,686 | | | | 143,020 | |
| Loomis A.B. (Sweden) | | | 15,207 | | | | 416,878 | |
| PageGroup PLC (United Kingdom) | | | 17,709 | | | | 98,595 | |
| Prosegur Cash S.A. (Spain) (a)(b) | | | 118,876 | | | | 76,119 | |
| Renewi PLC (United Kingdom) (a) | | | 11,351 | | | | 82,008 | |
| Societe BIC S.A. (France) | | | 8,375 | | | | 573,469 | |
| SThree plc (United Kingdom) | | | 76,849 | | | | 374,388 | |
| | | | | | | | 2,133,207 | |
| Transportation — 6.0% | | | | | | | | |
| bpost S.A. (Belgium) | | | 76,431 | | | | 393,067 | |
| D/S Norden A/S (Denmark) | | | 16,487 | | | | 993,729 | |
| Golden Ocean Group, Ltd. (Norway) | | | 64,497 | | | | 564,131 | |
| Kawasaki Kisen Kaisha, Ltd. (Japan) | | | 18,300 | | | | 387,461 | |
| Mitsui OSK Lines, Ltd. (Japan) | | | 15,300 | | | | 382,253 | |
| Mitsui-Soko Holdings Co., Ltd. (Japan) | | | 12,500 | | | | 339,660 | |
| MPC Container Ships A.S.A. (Norway) | | | 185,145 | | | | 305,382 | |
| NS United Kaiun Kaisha, Ltd. (Japan) (a) | | | 7,038 | | | | 206,905 | |
| Pacific Basin Shipping, Ltd. (Hong Kong) | | | 1,433,000 | | | | 482,748 | |
| Redde Northgate PLC (United Kingdom) | | | 110,559 | | | | 550,643 | |
| Stolt-Nielsen, Ltd. (Norway) | | | 16,916 | | | | 466,027 | |
| Wallenius Wilhelmsen A.S.A. (Norway) | | | 60,601 | | | | 596,865 | |
| ZIM Integrated Shipping Services, Ltd. (Israel) | | | 6,900 | | | | 118,611 | |
| | | | | | | | 5,787,482 | |
| Information Technology — 9.3% | | | | | | | | |
| Semiconductors & Semiconductor Equipment — 1.7% | | | | | | | | |
| Elmos Semiconductor S.E. (Germany) | | | 9,922 | | | | 566,947 | |
| Micronics Japan Co., Ltd. (Japan) | | | 26,400 | | | | 258,581 | |
| u-blox Holding A.G. (Switzerland) (a) | | | 7,169 | | | | 855,827 | |
| | | | | | | | 1,681,355 | |
| Software & Services — 4.1% | | | | | | | | |
| ATEA A.S.A. (Norway) (a) | | | 5,214 | | | | 60,836 | |
| Computacenter PLC (United Kingdom) | | | 35,081 | | | | 814,619 | |
| Econocom Group S.A./N.V. (Belgium) | | | 167,699 | | | | 511,713 | |
| Hansen Technologies, Ltd. (Australia) | | | 100,662 | | | | 352,112 | |
| Indra Sistemas S.A. (Spain) | | | 52,851 | | | | 602,634 | |
| Know IT A.B. (Sweden) | | | 13,070 | | | | 255,395 | |
| Learning Technologies Group PLC (United Kingdom) | | | 304,332 | | | | 424,554 | |
| | | Shares | | | Value | |
| Software & Services (continued) | | | | | | | | |
| TietoEVRY OYJ (Finland) | | | 17,142 | | | $ | 487,668 | |
| transcosmos, inc. (Japan) | | | 15,700 | | | | 385,481 | |
| | | | | | | | 3,895,012 | |
| Technology Hardware & Equipment — 3.5% | | | | | | | | |
| Alps Alpine Co., Ltd. (Japan) (a) | | | 45,200 | | | | 408,489 | |
| AT&S Austria Technologie & Systemtechnik A.G. (Austria) | | | 10,929 | | | | 374,974 | |
| Citizen Watch Co., Ltd. (Japan) | | | 94,900 | | | | 426,024 | |
| Codan, Ltd. (Australia) | | | 24,894 | | | | 68,916 | |
| Hakuto Co., Ltd. (Japan) | | | 12,700 | | | | 401,424 | |
| Hosiden Corp. (Japan) | | | 33,100 | | | | 395,443 | |
| Ituran Location and Control, Ltd. (Israel) | | | 25,623 | | | | 541,414 | |
| Kaga Electronics Co., Ltd. (Japan) | | | 12,300 | | | | 379,524 | |
| Macnica Fuji Electronics Holdings, Inc. (Japan) | | | 12,700 | | | | 300,490 | |
| SoftwareOne Holding A.G. (Switzerland) (a) | | | 7,979 | | | | 113,256 | |
| | | | | | | | 3,409,954 | |
| Materials — 9.6% | | | | | | | | |
| Materials — 9.6% | | | | | | | | |
| Acerinox S.A. (Spain) | | | 48,371 | | | | 478,310 | |
| Coronado Global Resources, Inc. (Australia) (b) | | | 537,937 | | | | 727,245 | |
| Daido Steel Co., Ltd. (Japan) | | | 3,700 | | | | 120,546 | |
| Elkem A.S.A. (Norway) (b) | | | 89,041 | | | | 320,502 | |
| Grange Resources, Ltd. (Australia) | | | 822,686 | | | | 471,834 | |
| Iluka Resources, Ltd. (Australia) | | | 53,097 | | | | 341,512 | |
| Incitec Pivot, Ltd. (Australia) | | | 444,687 | | | | 1,131,891 | |
| Israel Corp., Ltd. (Israel) | | | 100 | | | | 35,100 | |
| K+S A.G. (Germany) | | | 37,467 | | | | 738,848 | |
| Kanto Denka Kogya Co., Ltd. (Japan) | | | 39,100 | | | | 272,795 | |
| Kobe Steel, Ltd. (Japan) | | | 83,800 | | | | 406,376 | |
| Kuraray Co., Ltd. (Japan) | | | 70,400 | | | | 563,358 | |
| Mitsui Mining & Smelting Co., Ltd. (Japan) | | | 5,900 | | | | 138,066 | |
| Nippon Soda Co., Ltd. (Japan) (a) | | | 9,600 | | | | 313,928 | |
| Nittetsu Mining Co., Ltd. (Japan) | | | 10,400 | | | | 251,607 | |
| OCI N.V. (Netherlands) | | | 3,302 | | | | 118,091 | |
| Outokumpu OYJ (Finland) | | | 64,248 | | | | 326,174 | |
| Pan African Resources PLC (United Kingdom) | | | 2,213,977 | | | | 438,387 | |
| Perseus Mining, Ltd. (Australia) | | | 51,984 | | | | 74,796 | |
| RHI Magnesita N.V. (United Kingdom) | | | 1,827 | | | | 49,203 | |
| Salzgitter A.G. (Germany) | | | 12,706 | | | | 386,133 | |
| Semapa-Sociedade de Investimento e Gestao (Portugal) | | | 2,699 | | | | 35,820 | |
| SSAB A.B. - B Shares (Sweden) | | | 110,989 | | | | 578,221 | |
| Tokyo Steel Manufacturing Co., Ltd. (Japan) | | | 43,400 | | | | 389,946 | |
| Yamato Kogyo Co., Ltd. (Japan) | | | 14,300 | | | | 486,985 | |
| | | | | | | | 9,195,674 | |
| Real Estate — 10.4% | | | | | | | | |
| Real Estate — 10.4% | | | | | | | | |
| AEON REIT Investment Corp. (Japan) | | | 304 | | | | 356,720 | |
See Notes to Financial Statements.
| Annual Report | December 31, 2022 | | | 57 |
| Segall Bryant & Hamill International Small Cap Fund | Statement of Investments |
| | December 31, 2022 |
| | | Shares | | | Value | |
| Real Estate (continued) | | | | | | | | |
| Carmila S.A. (France) | | | 19,070 | | | $ | 272,372 | |
| Centuria Office REIT (Australia) | | | 363,682 | | | | 377,882 | |
| Charter Hall Retail REIT (Australia) | | | 185,496 | | | | 479,045 | |
| Cromwell European Real Estate Investment Trust (Singapore) | | | 137,189 | | | | 220,468 | |
| Eagle Hospitality Trust (Singapore) (a)(c) | | | 1,204,600 | | | | 0 | |
| Goldcrest Co., Ltd. (Japan) | | | 42,430 | | | | 541,318 | |
| Impact Healthcare REIT PLC (United Kingdom) | | | 243,447 | | | | 309,010 | |
| Intershop Holding A.G. (Switzerland) | | | 228 | | | | 148,565 | |
| Isras Investment Co., Ltd. (Israel) | | | 1,721 | | | | 328,161 | |
| K Wah International Holdings, Ltd. (Hong Kong) | | | 375,194 | | | | 130,247 | |
| Kenedix Office Investment Corp. (Japan) (a) | | | 146 | | | | 354,529 | |
| Kenedix Retail REIT Corp. (Japan) | | | 438 | | | | 846,948 | |
| Keppel Pacific Oak US REIT (Singapore) | | | 441,988 | | | | 203,442 | |
| Mori Trust Sogo REIT, Inc. (Japan) (a) | | | 143 | | | | 159,812 | |
| NewRiver REIT PLC (United Kingdom) (b) | | | 211,652 | | | | 199,570 | |
| Nexity S.A. (France) | | | 21,484 | | | | 600,277 | |
| Norstar Holdings, Inc. (Israel) | | | 8,428 | | | | 29,753 | |
| Orix JREIT, Inc. (Japan) (a) | | | 449 | | | | 636,873 | |
| Pandox A.B. (Sweden) (a) | | | 42,470 | | | | 473,907 | |
| Prime US REIT (Singapore) (a) | | | 788,100 | | | | 319,274 | |
| Regional REIT, Ltd. (United Kingdom) | | | 380,573 | | | | 271,437 | |
| Retail Estates N.V. (Belgium) | | | 2,120 | | | | 140,935 | |
| Sagax A.B. (Sweden) | | | 190,075 | | | | 487,433 | |
| Sasseur Real Estate Investment Trust (Singapore) | | | 345,506 | | | | 194,754 | |
| Takara Leben Real Estate Investment Corp. (Japan) | | | 647 | | | | 489,330 | |
| Target Healthcare REIT PLC (United Kingdom) | | | 276,848 | | | | 268,408 | |
| Tosei Corp. (Japan) | | | 43,125 | | | | 446,174 | |
| UK Commercial Property REIT, Ltd. (United Kingdom) | | | 426,170 | | | | 300,870 | |
| Wereldhave N.V. (Netherlands) | | | 31,940 | | | | 427,783 | |
| | | | | | | | 10,015,297 | |
| | | Shares | | | Value | |
| Utilities — 3.0% | | | | | | | | |
| Utilities — 3.0% | | | | | | | | |
| AGL Energy, Ltd. (Australia) | | | 17,718 | | | $ | 96,980 | |
| Centrica plc (United Kingdom) | | | 123,222 | | | | 143,305 | |
| Drax Group PLC (United Kingdom) | | | 91,276 | | | | 774,190 | |
| Electric Power Development Co., Ltd. (Japan) | | | 52,200 | | | | 828,900 | |
| Genesis Energy, Ltd. (New Zealand) | | | 176,376 | | | | 288,721 | |
| Iren S.p.A. (Italy) | | | 347,650 | | | | 546,152 | |
| Rubis SCA (France) | | | 9,266 | | | | 244,069 | |
| | | | | | | | 2,922,317 | |
| Investments at Value — 98.7% | | | | | | | | |
| (Cost $93,908,227) | | | | | | $ | 94,961,908 | |
| | | | | | | | | |
| Other Assets in Excess of Liabilities — 1.3% | | | | | | | 1,268,987 | |
| | | | | | | | | |
| Net Assets — 100.0% | | | | | | $ | 96,230,895 | |
| (a) | Non-income producing security. |
| (b) | Security is considered a restricted security however such restriction has not resulted in an illiquid classification. The total value of these securities is $4,498,270, which represents 4.7% of net assets as of December 31, 2022. |
| (c) | Level 3 securities fair value under procedures established by the Board of Trustees, represents 0.0% of net assets. The total value of these securities is $0. |
The Fund’s sector and industry classifications presented herein refer to any one or more of the industry sub-classifications used by one or more widely recognized market indexes or ratings group indexes, and/ or as defined by Fund management. For Fund compliance purposes, sector and industry classifications are based on the sector and industry categorization methodology of the Adviser to the Funds. This definition may not apply for purposes of this report, which may combine industry sub-classifications for reporting ease. Industries are shown as a percentage of net assets.
See Notes to Financial Statements.
| 58 | | | www.sbhfunds.com |
| Segall Bryant & Hamill International Small Cap Fund | Statement of Investments |
| | December 31, 2022 |
| | | | | | % of Net | |
| Country | | Value | | | Assets | |
| Japan | | $ | 30,146,662 | | | | 31.3 | % |
| United Kingdom | | | 14,557,376 | | | | 15.1 | % |
| Australia | | | 9,858,983 | | | | 10.3 | % |
| Sweden | | | 4,833,392 | | | | 5.0 | % |
| France | | | 4,109,789 | | | | 4.3 | % |
| Switzerland | | | 3,976,338 | | | | 4.1 | % |
| Germany | | | 3,791,189 | | | | 4.0 | % |
| Italy | | | 3,277,239 | | | | 3.4 | % |
| Norway | | | 2,803,134 | | | | 2.9 | % |
| Denmark | | | 2,670,450 | | | | 2.8 | % |
| Israel | | | 2,607,460 | | | | 2.7 | % |
| Singapore | | | 2,156,734 | | | | 2.2 | % |
| Netherlands | | | 2,028,796 | | | | 2.1 | % |
| Spain | | | 1,859,041 | | | | 1.9 | % |
| Hong Kong | | | 1,676,682 | | | | 1.8 | % |
| Austria | | | 1,374,589 | | | | 1.4 | % |
| Belgium | | | 1,045,715 | | | | 1.1 | % |
| Finland | | | 1,028,181 | | | | 1.1 | % |
| New Zealand | | | 937,844 | | | | 1.0 | % |
| Ireland | | | 186,494 | | | | 0.2 | % |
| Portugal | | | 35,820 | | | | 0.0 | % (a) |
| Total Investments | | $ | 94,961,908 | | | | 98.7 | % |
| Other Assets in Excess of Liabilities | | | 1,268,987 | | | | 1.3 | % |
| Net Assets | | $ | 96,230,895 | | | | 100.0 | % |
| (a) | Percentage rounds to less than 0.1%. |
See Notes to Financial Statements.
| Annual Report | December 31, 2022 | | | 59 |
Segall Bryant & Hamill
Fundamental International Small Cap Fund | Statement of Investments |
| | December 31, 2022 |
| | | Shares | | | Value | |
| COMMON STOCKS — 97.6% | | | | | | | | |
| Communication Services — 1.9% | | | | | | | | |
| Telecommunication Services — 1.9% | | | | | | | | |
| KINX, Inc. (South Korea) (a) | | | 20,285 | | | $ | 879,556 | |
| | | | | | | | | |
| Consumer Discretionary — 19.6% | | | | | | | | |
| Consumer Durables & Apparel — 4.9% | | | | | | | | |
| Leatt Corp. (South Africa) (a) | | | 55,476 | | | | 1,054,044 | |
| Victoria PLC (United Kingdom) (a) | | | 210,553 | | | | 1,224,293 | |
| | | | | | | | 2,278,337 | |
| Consumer Services — 13.3% | | | | | | | | |
| Evolution A.B. (Sweden) (b) | | | 19,350 | | | | 1,885,013 | |
| Fu Shou Yuan International Group, Ltd. (China) (b) | | | 816,247 | | | | 697,350 | |
| NEOGAMES S.A. (Israel) (a) | | | 110,094 | | | | 1,342,046 | |
| Pollard Banknote, Ltd. (Canada) | | | 87,674 | | | | 1,238,101 | |
| Webjet, Ltd. (Australia) (a) | | | 230,342 | | | | 958,625 | |
| | | | | | | | 6,121,135 | |
| Retailing — 1.4% | | | | | | | | |
| China Meidong Auto Holdings, Ltd. (China) | | | 304,500 | | | | 621,824 | |
| | | | | | | | | |
| Consumer Staples — 1.4% | | | | | | | | |
| Food & Staples Retailing — 1.4% | | | | | | | | |
| Yifeng Pharmacy Chain Co., Ltd. - Class A (China) | | | 72,251 | | | | 669,012 | |
| | | | | | | | | |
| Financials — 10.2% | | | | | | | | |
| Banks — 1.1% | | | | | | | | |
| Mortgage Advice Bureau Holdings, Ltd. (United Kingdom) | | | 81,849 | | | | 524,406 | |
| | | | | | | | | |
| Diversified Financials — 9.1% | | | | | | | | |
| Azimut Holdings S.p.A. (Italy) | | | 93,677 | | | | 2,096,742 | |
| M&A Capital Partners Co., Ltd. (Japan) (a) | | | 21,500 | | | | 750,039 | |
| Strike Co., Ltd. (Japan) | | | 39,140 | | | | 1,326,104 | |
| | | | | | | | 4,172,885 | |
| Health Care — 2.2% | | | | | | | | |
| Pharmaceuticals, Biotechnology & Life Sciences — 2.2% | | | | | | | | |
| SwedenCare A.B. (Sweden) | | | 336,082 | | | | 993,205 | |
| | | | | | | | | |
| Industrials — 33.4% | | | | | | | | |
| Capital Goods — 21.1% | | | | | | | | |
| AutoStore Holdings, Ltd. (Norway) (a)(b) | | | 557,762 | | | | 1,018,588 | |
| Brodrene A. & O. Johansen A/S - Series B (Denmark) | | | 212,133 | | | | 2,538,278 | |
| Diploma plc (United Kingdom) | | | 34,480 | | | | 1,159,059 | |
| Fluidra S.A. (Spain) | | | 130,000 | | | | 2,021,996 | |
| IMCD N.V. (Netherlands) | | | 9,300 | | | | 1,330,695 | |
| Instalco A.B. (Sweden) | | | 430,700 | | | | 1,638,746 | |
| | | | | | | | 9,707,362 | |
| | | Shares | | | Value | |
| Commercial & Professional Services — 12.3% | | | | | | | | |
| BayCurrent Consulting, Inc. (Japan) | | | 38,500 | | | $ | 1,198,313 | |
| Boyd Group Services, Inc. (Canada) | | | 4,210 | | | | 650,367 | |
| GFL Environmental, Inc. (Canada) | | | 75,968 | | | | 2,218,527 | |
| Japan Elevator Service Holdings Company, Ltd. (Japan) (a) | | | 84,600 | | | | 1,051,496 | |
| Mo-BRUK S.A. (Poland) | | | 7,819 | | | | 532,233 | |
| | | | | | | | 5,650,936 | |
| Information Technology — 28.9% | | | | | | | | |
| IT Services — 7.3% | | | | | | | | |
| CANCOM S.E. (Germany) | | | 31,000 | | | | 906,983 | |
| Constellation Software, Inc. (Canada) | | | 1,564 | | | | 2,441,917 | |
| | | | | | | | 3,348,900 | |
| Software & Services — 12.6% | | | | | | | | |
| Epsilon Net S.A. (Greece) | | | 333,514 | | | | 2,299,851 | |
| GB Group PLC (United Kingdom) | | | 248,062 | | | | 932,073 | |
| LiveChat Software S.A. (Poland) | | | 31,985 | | | | 783,637 | |
| Topicus.com, Inc. (Netherlands) (a) | | | 33,849 | | | | 1,777,263 | |
| | | | | | | | 5,792,824 | |
| Technology Hardware & Equipment — 9.0% | | | | | | | | |
| Cherry A.G. (Germany) (a)(b) | | | 186,420 | | | | 1,522,678 | |
| Endor A.G. (Germany) (a) | | | 36,000 | | | | 504,979 | |
| PAX Global Technology, Ltd. (Hong Kong) | | | 2,469,200 | | | | 2,125,344 | |
| | | | | | | | 4,153,001 | |
| Investments at Value — 97.6% | | | | | | | | |
| (Cost $49,510,917) | | | | | | $ | 44,913,383 | |
| | | | | | | | | |
| Other Assets in Excess of Liabilities — 2.4% | | | | | | | 1,103,957 | |
| | | | | | | | | |
| Net Assets — 100.0% | | | | | | $ | 46,017,340 | |
| (a) | Non-income producing security. |
| (b) | Security is considered a restricted security however such restriction has not resulted in an illiquid classification. The total value of these securities is $5,123,629, which represents 11.1% of net assets as of December 31, 2022. |
The Fund’s sector and industry classifications presented herein refer to any one or more of the industry sub-classifications used by one or more widely recognized market indexes or ratings group indexes, and/ or as defined by Fund management. For Fund compliance purposes, sector and industry classifications are based on the sector and industry categorization methodology of the Adviser to the Funds. This definition may not apply for purposes of this report, which may combine industry sub-classifications for reporting ease. Industries are shown as a percentage of net assets.
See Notes to Financial Statements.
| 60 | | | www.sbhfunds.com |
| Segall Bryant & Hamill | |
| Fundamental International Small Cap Fund | Statement of Investments |
| | December 31, 2022 |
| | | | | | % of Net | |
| Country | | Value | | | Assets | |
| Canada | | $ | 6,548,912 | | | | 14.2 | % |
| Sweden | | | 4,516,964 | | | | 9.8 | % |
| Japan | | | 4,325,952 | | | | 9.4 | % |
| United Kingdom | | | 3,839,831 | | | | 8.3 | % |
| Netherlands | | | 3,107,958 | | | | 6.8 | % |
| Germany | | | 2,934,640 | | | | 6.4 | % |
| Denmark | | | 2,538,278 | | | | 5.5 | % |
| Greece | | | 2,299,851 | | | | 5.0 | % |
| Hong Kong | | | 2,125,344 | | | | 4.6 | % |
| Italy | | | 2,096,742 | | | | 4.6 | % |
| Spain | | | 2,021,996 | | | | 4.4 | % |
| China | | | 1,988,186 | | | | 4.3 | % |
| Israel | | | 1,342,046 | | | | 2.9 | % |
| Poland | | | 1,315,870 | | | | 2.9 | % |
| South Africa | | | 1,054,044 | | | | 2.3 | % |
| Norway | | | 1,018,588 | | | | 2.2 | % |
| Australia | | | 958,625 | | | | 2.1 | % |
| South Korea | | | 879,556 | | | | 1.9 | % |
| Total Investments | | $ | 44,913,383 | | | | 97.6 | % |
| Other Assets in Excess of Liabilities | | | 1,103,957 | | | | 2.4 | % |
| Net Assets | | $ | 46,017,340 | | | | 100.0 | % |
See Notes to Financial Statements.
| Annual Report | December 31, 2022 | | | 61 |
| Segall Bryant & Hamill Global All Cap Fund | Statement of Investments |
| | December 31, 2022 |
| | | Shares | | | Value | |
| COMMON STOCKS — 98.1% | | | | | | | | |
| Communication Services — 2.6% | | | | | | | | |
| Media & Entertainment — 2.6% | | | | | | | | |
| Alphabet, Inc. - Class C (a) | | | 8,060 | | | $ | 715,164 | |
| | | | | | | | | |
| Consumer Discretionary — 13.3% | | | | | | | | |
| Consumer Durables & Apparel — 4.1% | | | | | | | | |
| Capri Holdings, Ltd. (United Kingdom) (a) | | | 7,524 | | | | 431,276 | |
| LVMH Moet Hennessy Louis Vuitton S.E. (France) | | | 945 | | | | 687,881 | |
| | | | | | | | 1,119,157 | |
| Consumer Services — 1.7% | | | | | | | | |
| Compass Group PLC (United Kingdom) | | | 19,993 | | | | 461,648 | |
| | | | | | | | | |
| Retailing — 7.5% | | | | | | | | |
| Amazon.com, Inc. (a) | | | 3,699 | | | | 310,716 | |
| Dollarama, Inc. (Canada) | | | 7,885 | | | | 461,179 | |
| Home Depot, Inc. (The) | | | 1,401 | | | | 442,520 | |
| O’Reilly Automotive, Inc. (a) | | | 604 | | | | 509,794 | |
| s.a. D’Ieteren n.v. (Belgium) | | | 1,514 | | | | 290,645 | |
| | | | | | | | 2,014,854 | |
| Consumer Staples — 8.1% | | | | | | | | |
| Food & Staples Retailing — 1.4% | | | | | | | | |
| Costco Wholesale Corp. | | | 821 | | | | 374,787 | |
| | | | | | | | | |
| Food, Beverage & Tobacco — 4.4% | | | | | | | | |
| Diageo PLC (United Kingdom) | | | 17,025 | | | | 745,166 | |
| Mondelēz International, Inc. - Class A | | | 6,716 | | | | 447,621 | |
| | | | | | | | 1,192,787 | |
| Household & Personal Products — 2.3% | | | | | | | | |
| Unilever PLC (United Kingdom) | | | 12,419 | | | | 626,966 | |
| | | | | | | | | |
| Energy — 5.6% | | | | | | | | |
| Energy — 5.6% | | | | | | | | |
| Chevron Corp. | | | 2,801 | | | | 502,752 | |
| ConocoPhillips | | | 4,456 | | | | 525,808 | |
| Suncor Energy, Inc. (Canada) | | | 15,299 | | | | 485,437 | |
| | | | | | | | 1,513,997 | |
| Financials — 12.4% | | | | | | | | |
| Banks — 2.9% | | | | | | | | |
| JPMorgan Chase & Co. | | | 5,903 | | | | 791,592 | |
| | | | | | | | | |
| Diversified Financials — 1.5% | | | | | | | | |
| Partners Group Holding A.G. (Switzerland) | | | 464 | | | | 410,891 | |
| | | | | | | | | |
| Insurance — 8.0% | | | | | | | | |
| Aon PLC - Class A (Ireland) | | | 2,284 | | | | 685,520 | |
| Beazley plc (United Kingdom) | | | 38,999 | | | | 318,929 | |
| Globe Life, Inc. | | | 5,172 | | | | 623,485 | |
| Reinsurance Group of America, Inc. | | | 3,749 | | | | 532,695 | |
| | | | | | | | 2,160,629 | |
| | | Shares | | | Value | |
| Health Care — 17.9% | | | | | | | | |
| Health Care Equipment & Services — 6.9% | | | | | | | | |
| Alcon, Inc. (Switzerland) | | | 5,906 | | | $ | 404,856 | |
| McKesson Corp. | | | 909 | | | | 340,984 | |
| STERIS PLC (Ireland) | | | 2,687 | | | | 496,262 | |
| UnitedHealth Group, Inc. | | | 1,213 | | | | 643,108 | |
| | | | | | | | 1,885,210 | |
| Pharmaceuticals, Biotechnology & Life Sciences — 11.0% | | | | | | | | |
| Bio-Techne Corp. | | | 5,040 | | | | 417,715 | |
| Johnson & Johnson | | | 1,976 | | | | 349,060 | |
| Lonza Group A.G. (Switzerland) | | | 563 | | | | 276,381 | |
| Novo Nordisk A/S - Class B (Denmark) | | | 3,871 | | | | 525,818 | |
| Perrigo Co. PLC (Ireland) | | | 16,070 | | | | 547,826 | |
| Thermo Fisher Scientific, Inc. | | | 649 | | | | 357,398 | |
| Zoetis, Inc. | | | 3,461 | | | | 507,210 | |
| | | | | | | | 2,981,408 | |
| Industrials — 11.1% | | | | | | | | |
| Capital Goods — 8.9% | | | | | | | | |
| Parker-Hannifin Corp. | | | 1,623 | | | | 472,293 | |
| Quanta Services, Inc. | | | 5,857 | | | | 834,622 | |
| Raytheon Technologies Corp. | | | 5,955 | | | | 600,979 | |
| Schneider Electric S.E. (France) | | | 3,599 | | | | 505,579 | |
| | | | | | | | 2,413,473 | |
| Commercial & Professional Services — 2.2% | | | | | | | | |
| Jacobs Solutions, Inc. | | | 2,284 | | | | 274,240 | |
| Waste Connections, Inc. (Canada) | | | 2,407 | | | | 319,072 | |
| | | | | | | | 593,312 | |
| Information Technology — 22.6% | | | | | | | | |
| Semiconductors & Semiconductor Equipment — 4.8% | | | | | | | | |
| ASML Holding N.V. (Netherlands) | | | 1,092 | | | | 595,598 | |
| Marvell Technology, Inc. | | | 8,606 | | | | 318,766 | |
| Monolithic Power Systems, Inc. | | | 1,119 | | | | 395,690 | |
| | | | | | | | 1,310,054 | |
| Software & Services — 11.9% | | | | | | | | |
| Capgemini S.E. (France) | | | 3,168 | | | | 529,777 | |
| Constellation Software, Inc. (Canada) | | | 321 | | | | 501,186 | |
| Microsoft Corp. | | | 4,590 | | | | 1,100,774 | |
| ServiceNow, Inc. (a) | | | 849 | | | | 329,641 | |
| Visa, Inc. - Class A | | | 3,648 | | | | 757,908 | |
| | | | | | | | 3,219,286 | |
| Technology Hardware & Equipment — 5.9% | | | | | | | | |
| Apple, Inc. | | | 7,614 | | | | 989,287 | |
| Keysight Technologies, Inc. (a) | | | 3,541 | | | | 605,759 | |
| | | | | | | | 1,595,046 | |
See Notes to Financial Statements.
| 62 | | | www.sbhfunds.com |
| Segall Bryant & Hamill Global All Cap Fund | Statement of Investments |
| | December 31, 2022 |
| | | Shares | | | Value | |
| Materials — 4.5% | | | | | | | | |
| Materials — 4.5% | | | | | | | | |
| Franco-Nevada Corp. (Canada) | | | 3,232 | | | $ | 441,103 | |
| Linde PLC (United Kingdom) | | | 2,364 | | | | 771,090 | |
| | | | | | | | 1,212,193 | |
| Investments at Value — 98.1% | | | | | | | | |
| (Cost $23,074,095) | | | | | | $ | 26,592,454 | |
| | | | | | | | | |
| Other Assets in Excess of Liabilities — 1.9% | | | | | | | 520,917 | |
| | | | | | | | | |
| Net Assets — 100.0% | | | | | | $ | 27,113,371 | |
| (a) | Non-income producing security. |
The Fund’s sector and industry classifications presented herein refer to any one or more of the industry sub-classifications used by one or more widely recognized market indexes or ratings group indexes, and/ or as defined by Fund management. For Fund compliance purposes, sector and industry classifications are based on the sector and industry categorization methodology of the Adviser to the Funds. This definition may not apply for purposes of this report, which may combine industry sub-classifications for reporting ease. Industries are shown as a percentage of net assets.
| | | | | | % of Net | |
| Country | | Value | | | Assets | |
| United States | | $ | 15,072,368 | | | | 55.6 | % |
| United Kingdom | | | 3,355,075 | | | | 12.4 | % |
| Canada | | | 2,207,977 | | | | 8.1 | % |
| Ireland | | | 1,729,608 | | | | 6.4 | % |
| France | | | 1,723,237 | | | | 6.4 | % |
| Switzerland | | | 1,092,128 | | | | 4.0 | % |
| Netherlands | | | 595,598 | | | | 2.2 | % |
| Denmark | | | 525,818 | | | | 1.9 | % |
| Belgium | | | 290,645 | | | | 1.1 | % |
| Total Investments | | $ | 26,592,454 | | | | 98.1 | % |
| Other Assets in Excess of Liabilities | | | 520,917 | | | | 1.9 | % |
| Net Assets | | $ | 27,113,371 | | | | 100.0 | % |
See Notes to Financial Statements.
| Annual Report | December 31, 2022 | | | 63 |
| Segall Bryant & Hamill Workplace Equality Fund | Statement of Investments |
| | December 31, 2022 |
| | | Shares | | | Value | |
| COMMON STOCKS — 97.6% | | | | | | | | |
| Communication Services — 5.7% | | | | | | | | |
| Media & Entertainment — 5.7% | | | | | | | | |
| Alphabet, Inc. - Class C (a) | | | 9,346 | | | $ | 829,271 | |
| Live Nation Entertainment, Inc. (a) | | | 5,698 | | | | 397,378 | |
| | | | | | | | 1,226,649 | |
| Consumer Discretionary — 9.1% | | | | | | | | |
| Consumer Durables & Apparel — 2.7% | | | | | | | | |
| NIKE, Inc. - Class B | | | 2,707 | | | | 316,746 | |
| Tapestry, Inc. | | | 7,094 | | | | 270,140 | |
| | | | | | | | 586,886 | |
| Consumer Services — 2.8% | | | | | | | | |
| Chipotle Mexican Grill, Inc. (a) | | | 211 | | | | 292,760 | |
| Wendy’s Co. (The) | | | 13,551 | | | | 306,659 | |
| | | | | | | | 599,419 | |
| Retailing — 3.6% | | | | | | | | |
| Amazon.com, Inc. (a) | | | 4,130 | | | | 346,920 | |
| Dollar General Corp. | | | 1,791 | | | | 441,034 | |
| | | | | | | | 787,954 | |
| Consumer Staples — 6.1% | | | | | | | | |
| Food, Beverage & Tobacco — 3.1% | | | | | | | | |
| Constellation Brands, Inc. - Class A | | | 1,475 | | | | 341,831 | |
| Mondelēz International, Inc. - Class A | | | 5,154 | | | | 343,514 | |
| | | | | | | | 685,345 | |
| Household & Personal Products — 3.0% | | | | | | | | |
| Estée Lauder Cos., Inc. (The) - Class A | | | 1,085 | | | | 269,199 | |
| Unilever PLC ADR (United Kingdom) | | | 7,525 | | | | 378,884 | |
| | | | | | | | 648,083 | |
| Energy — 5.6% | | | | | | | | |
| Energy — 5.6% | | | | | | | | |
| Chevron Corp. | | | 3,452 | | | | 619,600 | |
| ConocoPhillips | | | 5,102 | | | | 602,036 | |
| | | | | | | | 1,221,636 | |
| Financials — 11.4% | | | | | | | | |
| Banks — 3.5% | | | | | | | | |
| First Republic Bank | | | 1,967 | | | | 239,758 | |
| JPMorgan Chase & Co. | | | 3,912 | | | | 524,599 | |
| | | | | | | | 764,357 | |
| Diversified Financials — 2.6% | | | | | | | | |
| Ares Management Corporation - Class A | | | 3,100 | | | | 212,164 | |
| MSCI, Inc. | | | 775 | | | | 360,507 | |
| | | | | | | | 572,671 | |
| Insurance — 5.3% | | | | | | | | |
| Arthur J. Gallagher & Co. | | | 2,353 | | | | 443,635 | |
| Hartford Financial Services Group, Inc. (The) | | | 3,270 | | | | 247,964 | |
| Reinsurance Group of America, Inc. | | | 3,160 | | | | 449,004 | |
| | | | | | | | 1,140,603 | |
| | | Shares | | | Value | |
| Health Care — 17.7% | | | | | | | | |
| Health Care Equipment & Services — 8.6% | | | | | | | | |
| Abbott Laboratories | | | 3,575 | | | $ | 392,499 | |
| McKesson Corp. | | | 857 | | | | 321,478 | |
| Stryker Corp. | | | 1,718 | | | | 420,034 | |
| UnitedHealth Group, Inc. | | | 1,384 | | | | 733,769 | |
| | | | | | | | 1,867,780 | |
| Pharmaceuticals, Biotechnology & Life Sciences — 9.1% | | | | | | | | |
| Bio-Techne Corp. | | | 4,172 | | | | 345,775 | |
| Danaher Corp. | | | 1,894 | | | | 502,705 | |
| Johnson & Johnson | | | 1,723 | | | | 304,368 | |
| Thermo Fisher Scientific, Inc. | | | 906 | | | | 498,925 | |
| Zoetis, Inc. | | | 2,170 | | | | 318,014 | |
| | | | | | | | 1,969,787 | |
| Industrials — 11.6% | | | | | | | | |
| Capital Goods — 7.2% | | | | | | | | |
| Carrier Global Corp. | | | 10,046 | | | | 414,397 | |
| Deere & Co. | | | 1,089 | | | | 466,920 | |
| Raytheon Technologies Corp. | | | 6,651 | | | | 671,219 | |
| | | | | | | | 1,552,536 | |
| Commercial & Professional Services — 4.4% | | | | | | | | |
| Jacobs Solutions, Inc. | | | 4,003 | | | | 480,640 | |
| Republic Services, Inc. | | | 3,688 | | | | 475,715 | |
| | | | | | | | 956,355 | |
| Information Technology — 25.2% | | | | | | | | |
| Semiconductors & Semiconductor Equipment — 3.7% | | | | | | | | |
| Applied Materials, Inc. | | | 4,157 | | | | 404,809 | |
| Microchip Technology, Inc. | | | 5,618 | | | | 394,664 | |
| | | | | | | | 799,473 | |
| Software & Services — 13.5% | | | | | | | | |
| Accenture PLC - Class A (Ireland) | | | 989 | | | | 263,905 | |
| Intuit, Inc. | | | 1,099 | | | | 427,753 | |
| Microsoft Corp. | | | 4,658 | | | | 1,117,082 | |
| ServiceNow, Inc. (a) | | | 1,186 | | | | 460,488 | |
| Visa, Inc. - Class A | | | 3,194 | | | | 663,585 | |
| | | | | | | | 2,932,813 | |
| Technology Hardware & Equipment — 8.0% | | | | | | | | |
| Apple, Inc. | | | 8,078 | | | | 1,049,575 | |
| Keysight Technologies, Inc. (a) | | | 2,579 | | | | 441,189 | |
| Zebra Technologies Corp. - Class A (a) | | | 992 | | | | 254,359 | |
| | | | | | | | 1,745,123 | |
| Materials — 1.8% | | | | | | | | |
| Materials — 1.8% | | | | | | | | |
| Avery Dennison Corp. | | | 2,182 | | | | 394,942 | |
See Notes to Financial Statements.
| 64 | | | www.sbhfunds.com |
| Segall Bryant & Hamill Workplace Equality Fund | Statement of Investments |
| | December 31, 2022 |
| | | Shares | | | Value | |
| Real Estate — 3.4% | | | | | | | | |
| Real Estate — 3.4% | | | | | | | | |
| American Tower Corp. | | | 1,561 | | | $ | 330,713 | |
| Iron Mountain, Inc. | | | 8,269 | | | | 412,210 | |
| | | | | | | | 742,923 | |
| Investments at Value — 97.6% | | | | | | | | |
| (Cost $20,036,641) | | | | | | $ | 21,195,335 | |
| | | | | | | | | |
| Other Assets in Excess of Liabilities — 2.4% | | | | | | | 522,061 | |
| | | | | | | | | |
| Net Assets — 100.0% | | | | | | $ | 21,717,396 | |
| (a) | Non-income producing security. |
The Fund’s sector and industry classifications presented herein refer to any one or more of the industry sub-classifications used by one or more widely recognized market indexes or ratings group indexes, and/ or as defined by Fund management. For Fund compliance purposes, sector and industry classifications are based on the sector and industry categorization methodology of the Adviser to the Funds. This definition may not apply for purposes of this report, which may combine industry sub-classifications for reporting ease. Industries are shown as a percentage of net assets.
See Notes to Financial Statements.
| Annual Report | December 31, 2022 | | | 65 |
| Segall Bryant & Hamill Short Term Plus Fund | Statement of Investments |
| | December 31, 2022 |
| | | Coupon | | Maturity | | Par Value | | | Value | |
| CORPORATE BONDS — 80.0% | | | | | | | | | | | | |
| Finance — 5.1% | | | | | | | | | | | | |
| Banking — 5.1% | | | | | | | | | | | | |
| American Express Co. | | 3.375% | | 05/03/24 | | $ | 450,000 | | | $ | 440,838 | |
| Bank of America Corp. | | 4.100% | | 07/24/23 | | | 435,000 | | | | 433,106 | |
| JPMorgan Chase & Co. | | 0.697% | | 03/16/24 | | | 585,000 | | | | 578,848 | |
| | | | | | | | | | | | 1,452,792 | |
| Industrial — 57.9% | | | | | | | | | | | | |
| Automobile Manufacturing — 2.0% | | | | | | | | | | | | |
| General Motors Financial Co., Inc. | | 5.100% | | 01/17/24 | | | 570,000 | | | | 567,747 | |
| | | | | | | | | | | | | |
| Building Products — 2.0% | | | | | | | | | | | | |
| Martin Marietta Materials, Inc. | | 4.250% | | 07/02/24 | | | 574,000 | | | | 566,288 | |
| | | | | | | | | | | | | |
| Chemicals — 2.0% | | | | | | | | | | | | |
| Eastman Chemical Co. | | 7.250% | | 01/15/24 | | | 550,000 | | | | 562,357 | |
| | | | | | | | | | | | | |
| Construction Machinery — 4.8% | | | | | | | | | | | | |
| Brunswick Corp. | | 0.850% | | 08/18/24 | | | 500,000 | | | | 461,946 | |
| Caterpillar Financial Services Corp. | | 0.650% | | 07/07/23 | | | 400,000 | | | | 391,920 | |
| CNH Industrial Capital LLC | | 1.950% | | 07/02/23 | | | 530,000 | | | | 520,961 | |
| | | | | | | | | | | | 1,374,827 | |
| Diversified Manufacturing — 3.3% | | | | | | | | | | | | |
| Amphenol Corp. | | 3.200% | | 04/01/24 | | | 485,000 | | | | 474,169 | |
| Roper Technologies, Inc. | | 3.650% | | 09/15/23 | | | 465,000 | | | | 460,040 | |
| | | | | | | | | | | | 934,209 | |
| Electronics — 1.6% | | | | | | | | | | | | |
| Dell International LLC | | 5.450% | | 06/15/23 | | | 460,000 | | | | 460,291 | |
| | | | | | | | | | | | | |
| Environmental — 2.3% | | | | | | | | | | | | |
| Republic Services, Inc. | | 2.500% | | 08/15/24 | | | 450,000 | | | | 431,229 | |
| Waste Management, Inc. | | 3.500% | | 05/15/24 | | | 233,000 | | | | 227,285 | |
| | | | | | | | | | | | 658,514 | |
| Food Processors — 2.4% | | | | | | | | | | | | |
| Conagra Brands, Inc. | | 3.200% | | 01/25/23 | | | 290,000 | | | | 289,783 | |
| General Mills, Inc. | | 5.241% | | 11/18/25 | | | 390,000 | | | | 390,971 | |
| | | | | | | | | | | | 680,754 | |
| Home Builders — 1.2% | | | | | | | | | | | | |
| D.R. Horton, Inc. | | 2.500% | | 10/15/24 | | | 350,000 | | | | 333,276 | |
| | | | | | | | | | | | | |
| Information / Data Technology — 4.0% | | | | | | | | | | | | |
| Fiserv, Inc. | | 3.800% | | 10/01/23 | | | 455,000 | | | | 450,152 | |
| KLA Corp. | | 4.650% | | 11/01/24 | | | 250,000 | | | | 249,242 | |
| Moody’s Corp. | | 4.875% | | 02/15/24 | | | 455,000 | | | | 453,534 | |
| | | | | | | | | | | | 1,152,928 | |
| Media — Non-Cable — 1.6% | | | | | | | | | | | | |
| Walt Disney Co. (The) | | 7.750% | | 01/20/24 | | | 444,000 | | | | 457,941 | |
| | | | | | | | | | | �� | | |
| Midstream Energy — 4.8% | | | | | | | | | | | | |
| Enterprise Products Operating LLC | | 3.900% | | 02/15/24 | | | 350,000 | | | | 344,623 | |
| Kinder Morgan, Inc. | | 4.300% | | 06/01/25 | | | 475,000 | | | | 465,825 | |
| Williams Partners LP | | 3.900% | | 01/15/25 | | | 585,000 | | | | 569,691 | |
| | | | | | | | | | | | 1,380,139 | |
| See Notes to Financial Statements. | |
| 66 | | | www.sbhfunds.com |
| Segall Bryant & Hamill Short Term Plus Fund | Statement of Investments |
| | December 31, 2022 |
| | | Coupon | | Maturity | | Par Value | | | Value | |
| Other Industrial — 2.8% | | | | | | | | | | | | |
| Cintas Corp. No. 2 | | 3.450% | | 05/01/25 | | $ | 225,000 | | | $ | 217,693 | |
| Quanta Services, Inc. | | 0.950% | | 10/01/24 | | | 625,000 | | | | 575,574 | |
| | | | | | | | | | | | 793,267 | |
| Packaging — 5.6% | | | | | | | | | | | | |
| Avery Dennison Corp. | | 0.850% | | 08/15/24 | | | 615,000 | | | | 573,812 | |
| Ball Corp. | | 4.000% | | 11/15/23 | | | 570,000 | | | | 558,668 | |
| Sonoco Products Co. | | 1.800% | | 02/01/25 | | | 500,000 | | | | 464,623 | |
| | | | | | | | | | | | 1,597,103 | |
| Paper & Forest Products — 1.9% | | | | | | | | | | | | |
| Weyerhaeuser Co. | | 7.125% | | 07/15/23 | | | 385,000 | | | | 387,826 | |
| Weyerhaeuser Co. | | 8.500% | | 01/15/25 | | | 160,000 | | | | 168,946 | |
| | | | | | | | | | | | 556,772 | |
| Pharmaceuticals — 1.8% | | | | | | | | | | | | |
| AstraZeneca Finance LLC | | 0.700% | | 05/28/24 | | | 550,000 | | | | 518,374 | |
| | | | | | | | | | | | | |
| Railroads — 1.5% | | | | | | | | | | | | |
| Kansas City Southern | | 3.000% | | 05/15/23 | | | 450,000 | | | | 446,032 | |
| | | | | | | | | | | | | |
| Refining — 2.2% | | | | | | | | | | | | |
| Phillips 66 | | 0.900% | | 02/15/24 | | | 490,000 | | | | 468,302 | |
| Valero Energy Corp. | | 1.200% | | 03/15/24 | | | 180,000 | | | | 170,972 | |
| | | | | | | | | | | | 639,274 | |
| Retail Stores — 2.0% | | | | | | | | | | | | |
| AutoNation, Inc. | | 3.500% | | 11/15/24 | | | 590,000 | | | | 566,246 | |
| | | | | | | | | | | | | |
| Transportation Services — 6.0% | | | | | | | | | | | | |
| American Airlines Group, Inc., Series 2016-1, Class B | | 5.250% | | 01/15/24 | | | 487,312 | | | | 474,790 | |
| Continental Airlines, Inc., Series 2012-2, Class A | | 4.000% | | 10/29/24 | | | 452,654 | | | | 431,894 | |
| CSX Transportation, Inc. | | 6.251% | | 01/15/23 | | | 169,925 | | | | 169,981 | |
| Delta Air Lines Pass Thru Trust, Series 2019-1, Class AA | | 3.204% | | 10/25/25 | | | 645,000 | | | | 628,657 | |
| | | | | | | | | | | | 1,705,322 | |
| Wireless Telecommunications — 1.0% | | | | | | | | | | | | |
| American Tower Corp. | | 3.500% | | 01/31/23 | | | 300,000 | | | | 299,639 | |
| | | | | | | | | | | | | |
| Wireline Telecommunications — 1.1% | | | | | | | | | | | | |
| AT&T, Inc. | | 0.900% | | 03/25/24 | | | 330,000 | | | | 313,374 | |
| | | | | | | | | | | | | |
| Utility — 17.0% | | | | | | | | | | | | |
| Electric — 15.3% | | | | | | | | | | | | |
| Arizona Public Service Co. | | 3.350% | | 06/15/24 | | | 585,000 | | | | 566,189 | |
| Delmarva Power & Light Co. | | 3.500% | | 11/15/23 | | | 362,000 | | | | 357,205 | |
| Evergy, Inc. | | 2.450% | | 09/15/24 | | | 605,000 | | | | 574,366 | |
| Eversource Energy | | 2.800% | | 05/01/23 | | | 450,000 | | | | 447,710 | |
| Georgia Power Co., Series 2020-A | | 2.100% | | 07/30/23 | | | 430,000 | | | | 422,522 | |
| NextEra Energy Capital Holdings, Inc. | | 0.650% | | 03/01/23 | | | 400,000 | | | | 397,261 | |
| Pacific Gas & Electric Co. | | 1.700% | | 11/15/23 | | | 595,000 | | | | 575,853 | |
| Virginia Electric & Power Co., Series 2015-A | | 3.100% | | 05/15/25 | | | 571,000 | | | | 548,338 | |
| Vistra Operations Co. LLC, 144A (a) | | 5.125% | | 05/13/25 | | | 500,000 | | | | 488,860 | |
| | | | | | | | | | | | 4,378,304 | |
| Other Utility — 1.7% | | | | | | | | | | | | |
| American Water Capital Corp. | | 3.400% | | 03/01/25 | | | 500,000 | | | | 484,292 | |
| | | | | | | | | | | | | |
| Total Corporate Bonds (Cost $23,837,019) | | | | | | | | | | | 22,880,062 | |
| See Notes to Financial Statements. | |
| Annual Report | December 31, 2022 | | | 67 |
| Segall Bryant & Hamill Short Term Plus Fund | Statement of Investments |
| | December 31, 2022 |
| | | Coupon | | Maturity | | Par Value | | | Value | |
| MUNICIPAL BONDS — 2.2% | | | | | | | | | | | | |
| New Jersey — 0.4% | | | | | | | | | | | | |
| New Jersey Economic Development Authority Water Facilities, Series 2020-C | | 1.150% | | 06/01/23 | | $ | 125,000 | | | $ | 123,488 | |
| | | | | | | | | | | | | |
| Texas — 0.6% | | | | | | | | | | | | |
| Austin Texas Community College, Series 2020 | | 0.662% | | 02/01/23 | | | 50,000 | | | | 49,854 | |
| Central Texas Regional Mobility Authority, Series 2020-C | | 1.345% | | 01/01/24 | | | 135,000 | | | | 130,484 | |
| | | | | | | | | | | | 180,338 | |
| Wisconsin — 1.2% | | | | | | | | | | | | |
| Public Finance Authority Air Cargo Group Revenue Bonds, Series 2021 | | 1.484% | | 07/01/23 | | | 350,000 | | | | 342,217 | |
| | | | | | | | | | | | | |
| Total Municipal Bonds (Cost $660,000) | | | | | | | | | | | 646,043 | |
| | | | | | | | | | | | | |
| COMMERCIAL MORTGAGE-BACKED SECURITIES — 1.1% | | | | | | | | | | | | |
| FHLMC Remic, Series K-029, Class A-2 (b) (Cost $302,334) | | 3.305% | | 02/25/23 | | | 301,091 | | | | 300,111 | |
| | | | | | | | | | | | | |
| U.S. TREASURY BONDS & NOTES — 13.7% | | | | | | | | | | | | |
| United States Treasury | | 0.125% | | 07/15/23 | | | 475,000 | | | | 463,422 | |
| United States Treasury | | 2.125% | | 11/30/23 | | | 970,000 | | | | 947,341 | |
| United States Treasury | | 2.250% | | 01/31/24 | | | 1,000,000 | | | | 973,633 | |
| United States Treasury | | 3.125% | | 08/15/25 | | | 785,000 | | | | 762,125 | |
| United States Treasury | | 1.500% | | 03/31/23 | | | 285,000 | | | | 282,997 | |
| United States Treasury | | 2.375% | | 08/15/24 | | | 500,000 | | | | 482,422 | |
| Total U.S. Treasury Bonds & Notes (Cost $4,022,300) | | | | | | | | | | | 3,911,940 | |
| | | | | | | | | | | | | |
| Investments at Value — 97.0% (Cost $28,821,653) | | | | | | | | | | $ | 27,738,156 | |
| | | | | | | | | | | | | |
| Other Assets in Excess of Liabilities — 3.0% | | | | | | | | | | | 867,569 | |
| | | | | | | | | | | | | |
| Net Assets — 100.0% | | | | | | | | | | $ | 28,605,725 | |
| (a) | Security was purchased in a transaction exempt from registration in compliance with Rule 144A of the Securities Act of 1933. This security may be resold in transactions exempt from registration, normally to qualified institutional buyers. |
| (b) | Variable rate security. Interest rate resets periodically. The rate shown is the effective interest rate as of December 31, 2022. For securities based on a published reference rate and spread, the reference rate and spread (in basis points) are indicated parenthetically. Certain variable rate securities are not based on a published reference rate and spread but are determined by the issuer or agent and are based on current market conditions. These securities, therefore, do not indicate a reference rate and spread. |
The Fund’s sector and industry classifications presented herein refer to any one or more of the industry sub-classifications used by one or more widely recognized market indexes or ratings group indexes, and/or as defined by Fund management. For Fund compliance purposes, sector and industry classifications are based on the sector and industry categorization methodology of the Adviser to the Funds. This definition may not apply for purposes of this report, which may combine industry sub-classifications for reporting ease. Industries are shown as a percentage of net assets.
| See Notes to Financial Statements. | |
| 68 | | | www.sbhfunds.com |
| Segall Bryant & Hamill Plus Bond Fund | Statement of Investments |
| | December 31, 2022 |
| | | Coupon | | Maturity | | Par Value | | | Value | |
| CORPORATE BONDS — 47.0% | | | | | | | | | | | | |
| Finance — 9.7% | | | | | | | | | | | | |
| Banking — 3.5% | | | | | | | | | | | | |
| Bank of America Corp., Series N (SOFR + 153) (a) | | 1.898% | | 07/23/31 | | $ | 7,975,000 | | | $ | 6,120,856 | |
| JPMorgan Chase & Co. (SOFR + 151) (a) | | 2.739% | | 10/15/30 | | | 10,430,000 | | | | 8,746,765 | |
| Wells Fargo & Co. (3MO LIBOR + 131) (a) | | 3.584% | | 05/22/28 | | | 9,635,000 | | | | 8,946,050 | |
| | | | | | | | | | | | 23,813,671 | |
| Broker/Asset Managers/Exchanges — 0.4% | | | | | | | | | | | | |
| FMR LLC, 144A (b) | | 6.450% | | 11/15/39 | | | 2,575,000 | | | | 2,635,909 | |
| | | | | | | | | | | | | |
| Life Insurance — 0.8% | | | | | | | | | | | | |
| Northwestern Mutual Life Insurance Co. (The), 144A (b) | | 3.850% | | 09/30/47 | | | 6,775,000 | | | | 5,168,133 | |
| | | | | | | | | | | | | |
| Mortgage Banking — 0.8% | | | | | | | | | | | | |
| Provident Funding Associates LP/PFG Finance Corp., 144A (b) | | 6.375% | | 06/15/25 | | | 6,295,000 | | | | 5,476,650 | |
| | | | | | | | | | | | | |
| Noncaptive Diversified Financial Companies — 1.7% | | | | | | | | | | | | |
| Aircastle, Ltd. | | 5.000% | | 04/01/23 | | | 3,000,000 | | | | 2,995,148 | |
| Aviation Capital Group LLC, 144A (b) | | 3.875% | | 05/01/23 | | | 4,337,000 | | | | 4,301,722 | |
| GATX Corp. | | 3.500% | | 06/01/32 | | | 5,102,000 | | | | 4,271,331 | |
| | | | | | | | | | | | 11,568,201 | |
| Other Finance — 0.6% | | | | | | | | | | | | |
| IIP Operating Partnership LP | | 5.500% | | 05/25/26 | | | 4,615,000 | | | | 4,086,445 | |
| | | | | | | | | | | | | |
| Real Estate Investment Trusts – 1.9% | | | | | | | | | | | | |
| MPT Operating Partnership LP/MPT Finance Corp. | | 5.000% | | 10/15/27 | | | 6,175,000 | | | | 5,190,273 | |
| Ventas Realty LP | | 3.500% | | 04/15/24 | | | 3,000,000 | | | | 2,917,996 | |
| VICI Properties LP, 144A (b) | | 5.625% | | 05/01/24 | | | 5,199,000 | | | | 5,148,362 | |
| | | | | | | | | | | | 13,256,631 | |
| Industrial — 32.4% | | | | | | | | | | | | |
| Automobile Manufacturing — 1.1% | | | | | | | | | | | | |
| Ford Motor Credit Co. LLC | | 4.063% | | 11/01/24 | | | 2,000,000 | | | | 1,920,144 | |
| Ford Motor Credit Co. LLC | | 3.375% | | 11/13/25 | | | 5,500,000 | | | | 4,972,071 | |
| Goodyear Tire & Rubber Co. | | 5.000% | | 07/15/29 | | | 500,000 | | | | 417,075 | |
| | | | | | | | | | | | 7,309,290 | |
| Beverage / Bottling — 0.9% | | | | | | | | | | | | |
| Anheuser-Busch Cos. LLC/Anheuser-Busch InBev Worldwide, Inc. | | 4.375% | | 04/15/38 | | | 3,930,000 | | | | 3,513,068 | |
| Fomento Economico Mexicano S.A.B. de C.V. | | 2.875% | | 05/10/23 | | | 2,978,000 | | | | 2,946,642 | |
| | | | | | | | | | | | 6,459,710 | |
| Building Products — 2.0% | | | | | | | | | | | | |
| Allegion PLC | | 3.500% | | 10/01/29 | | | 2,498,000 | | | | 2,152,426 | |
| Allegion US Holding Co., Inc. | | 3.550% | | 10/01/27 | | | 2,550,000 | | | | 2,301,561 | |
| Masco Corp. | | 6.500% | | 08/15/32 | | | 6,205,000 | | | | 6,351,865 | |
| Summit Materials LLC, 144A (b) | | 6.500% | | 03/15/27 | | | 1,450,000 | | | | 1,420,958 | |
| Summit Materials LLC, 144A (b) | | 5.250% | | 01/15/29 | | | 1,750,000 | | | | 1,629,294 | |
| | | | | | | | | | | | 13,856,104 | |
| Chemicals — 0.6% | | | | | | | | | | | | |
| Compass Minerals International, Inc., 144A (b) | | 6.750% | | 12/01/27 | | | 4,430,000 | | | | 4,252,800 | |
| | | | | | | | | | | | | |
| Construction Machinery — 1.4% | | | | | | | | | | | | |
| Brunswick Corp. | | 2.400% | | 08/18/31 | | | 798,000 | | | | 586,686 | |
| H&E Equipment Services, Inc., 144A (b) | | 3.875% | | 12/15/28 | | | 5,550,000 | | | | 4,727,434 | |
| United Rentals North America | | 3.875% | | 02/15/31 | | | 5,295,000 | | | | 4,438,746 | |
| | | | | | | | | | | | 9,752,866 | |
| See Notes to Financial Statements. | |
| Annual Report | December 31, 2022 | | | 69 |
| Segall Bryant & Hamill Plus Bond Fund | Statement of Investments |
| | December 31, 2022 |
| | | Coupon | | Maturity | | Par Value | | | Value | |
| Consumer Products — 0.6% | | | | | | | | | | | | |
| Vista Outdoor, Inc., 144A (b) | | 4.500% | | 03/15/29 | | $ | 5,600,000 | | | $ | 4,111,744 | |
| | | | | | | | | | | | | |
| Diversified Manufacturing — 1.5% | | | | | | | | | | | | |
| BWX Technologies, Inc., 144A (b) | | 4.125% | | 06/30/28 | | | 4,169,000 | | | | 3,746,889 | |
| nVent Finance SARL | | 2.750% | | 11/15/31 | | | 2,245,000 | | | | 1,727,249 | |
| Vontier Corp. | | 2.400% | | 04/01/28 | | | 5,550,000 | | | | 4,434,647 | |
| | | | | | | | | | | | 9,908,785 | |
| Electronics — 1.8% | | | | | | | | | | | | |
| Amkor Technology, Inc., 144A (b) | | 6.625% | | 09/15/27 | | | 4,422,000 | | | | 4,376,094 | |
| Dell, Inc. | | 7.100% | | 04/15/28 | | | 4,492,000 | | | | 4,790,064 | |
| QORVO, Inc., 144A (b) | | 1.750% | | 12/15/24 | | | 2,235,000 | | | | 2,058,323 | |
| QORVO, Inc. | | 4.375% | | 10/15/29 | | | 775,000 | | | | 685,286 | |
| QORVO, Inc., 144A, (b) | | 3.375% | | 04/01/31 | | | 500,000 | | | | 401,719 | |
| | | | | | | | | | | | 12,311,486 | |
| Healthcare Facilities / Supplies — 1.4% | | | | | | | | | | | | |
| HCA, Inc. | | 3.500% | | 09/01/30 | | | 2,500,000 | | | | 2,156,191 | |
| Teleflex, Inc. | | 4.625% | | 11/15/27 | | | 755,000 | | | | 719,583 | |
| Teleflex, Inc., 144A (b) | | 4.250% | | 06/01/28 | | | 2,986,000 | | | | 2,725,800 | |
| Tenet Healthcare Corp., 144A (b) | | 6.125% | | 10/01/28 | | | 4,108,000 | | | | 3,677,975 | |
| | | | | | | | | | | | 9,279,549 | |
| Independent Energy — 2.7% | | | | | | | | | | | | |
| Occidental Petroleum Corp. | | 7.500% | | 05/01/31 | | | 6,085,000 | | | | 6,501,640 | |
| PDC Energy, Inc. | | 6.125% | | 09/15/24 | | | 2,932,000 | | | | 2,915,288 | |
| PDC Energy, Inc. | | 5.750% | | 05/15/26 | | | 5,000,000 | | | | 4,772,850 | |
| Range Resources Corp. | | 4.875% | | 05/15/25 | | | 4,400,000 | | | | 4,179,574 | |
| | | | | | | | | | | | 18,369,352 | |
| Information Technology — 0.4% | | | | | | | | | | | | |
| Oracle Corp. | | 6.250% | | 11/09/32 | | | 2,590,000 | | | | 2,710,748 | |
| | | | | | | | | | | | | |
| Lease / Rent — 1.4% | | | | | | | | | | | | |
| SBA Tower Trust, 144A, Series 2019-1, Class 1-C (b) | | 2.836% | | 01/15/50 | | | 10,000,000 | | | | 9,430,487 | |
| | | | | | | | | | | | | |
| Media — Cable — 2.3% | | | | | | | | | | | | |
| CCO Holdings LLC/CCO Holdings Capital Corp., 144A (b) | | 5.000% | | 02/01/28 | | | 4,140,000 | | | | 3,759,079 | |
| Cox Communications, Inc., 144A (b) | | 2.600% | | 06/15/31 | | | 5,325,000 | | | | 4,240,588 | |
| Dish DBS Corp. | | 7.750% | | 07/01/26 | | | 2,050,000 | | | | 1,653,099 | |
| Magallanes, Inc., 144A (b) | | 5.391% | | 03/15/62 | | | 4,480,000 | | | | 3,270,462 | |
| Sirius XM Radio, Inc., 144A (b) | | 5.500% | | 07/01/29 | | | 3,000,000 | | | | 2,738,340 | |
| | | | | | | | | | | | 15,661,568 | |
| Media — Non-Cable — 1.4% | | | | | | | | | | | | |
| AMC Networks, Inc. | | 4.750% | | 08/01/25 | | | 3,965,000 | | | | 3,013,400 | |
| Lamar Media Corp. | | 3.750% | | 02/15/28 | | | 2,400,000 | | | | 2,148,255 | |
| Lamar Media Corp. | | 4.875% | | 01/15/29 | | | 1,700,000 | | | | 1,560,901 | |
| Netflix, Inc. | | 4.875% | | 04/15/28 | | | 1,000,000 | | | | 965,586 | |
| Netflix, Inc. | | 6.375% | | 05/15/29 | | | 1,000,000 | | | | 1,029,287 | |
| Netflix, Inc., 144A (b) | | 4.875% | | 06/15/30 | | | 1,225,000 | | | | 1,142,434 | |
| | | | | | | | | | | | 9,859,863 | |
| Metals / Mining — 0.7% | | | | | | | | | | | | |
| Freeport-McMoran Copper & Gold, Inc. | | 3.875% | | 03/15/23 | | | 4,687,000 | | | | 4,674,204 | |
| | | | | | | | | | | | | |
| Midstream Energy — 1.6% | | | | | | | | | | | | |
| Tennessee Gas Pipeline Co. LLC | | 8.375% | | 06/15/32 | | | 5,284,000 | | | | 6,017,535 | |
| Transcontinental Gas Pipe Line Co. LLC | | 7.850% | | 02/01/26 | | | 4,315,000 | | | | 4,605,248 | |
| | | | | | | | | | | | 10,622,783 | |
| See Notes to Financial Statements. | |
| 70 | | | www.sbhfunds.com |
| Segall Bryant & Hamill Plus Bond Fund | Statement of Investments |
| | December 31, 2022 |
| | | Coupon | | Maturity | | Par Value | | | Value | |
| Other Industrial — 1.0% | | | | | | | | | | | | |
| Quanta Services, Inc. | | 2.900% | | 10/01/30 | | $ | 8,000,000 | | | $ | 6,577,768 | |
| | | | | | | | | | | | | |
| Packaging — 1.4% | | | | | | | | | | | | |
| Ball Corp. | | 4.875% | | 03/15/26 | | | 4,500,000 | | | | 4,358,836 | |
| Silgan Holdings, Inc., 144A (b) | | 1.400% | | 04/01/26 | | | 3,000,000 | | | | 2,646,756 | |
| Silgan Holdings, Inc. | | 4.125% | | 02/01/28 | | | 2,820,000 | | | | 2,608,944 | |
| | | | | | | | | | | | 9,614,536 | |
| Paper & Forest Products — 0.8% | | | | | | | | | | | | |
| West Fraser Timber Co., Ltd., 144A (b) | | 4.350% | | 10/15/24 | | | 5,425,000 | | | | 5,275,758 | |
| | | | | | | | | | | | | |
| Retail Stores — 2.6% | | | | | | | | | | | | |
| Dick’s Sporting Goods, Inc. | | 3.150% | | 01/15/32 | | | 3,825,000 | | | | 2,996,556 | |
| Dick’s Sporting Goods, Inc. | | 4.100% | | 01/15/52 | | | 3,000,000 | | | | 1,934,031 | |
| Group 1 Automotive, Inc., 144A (b) | | 4.000% | | 08/15/28 | | | 5,438,000 | | | | 4,602,887 | |
| Hanesbrands, Inc., 144A (b) | | 4.625% | | 05/15/24 | | | 2,491,000 | | | | 2,412,602 | |
| Hanesbrands, Inc., 144A (b) | | 4.875% | | 05/15/26 | | | 2,000,000 | | | | 1,787,142 | |
| QVC, Inc. | | 4.850% | | 04/01/24 | | | 2,557,000 | | | | 2,365,225 | |
| QVC, Inc. | | 4.750% | | 02/15/27 | | | 2,085,000 | | | | 1,475,659 | |
| | | | | | | | | | | | 17,574,102 | |
| Services — 2.1% | | | | | | | | | | | | |
| Block Financial LLC | | 3.875% | | 08/15/30 | | | 5,340,000 | | | | 4,671,970 | |
| Rayonier LP | | 2.750% | | 05/17/31 | | | 6,000,000 | | | | 4,820,179 | |
| Service Corp. International | | 4.625% | | 12/15/27 | | | 483,000 | | | | 451,146 | |
| Service Corp. International | | 5.125% | | 06/01/29 | | | 4,575,000 | | | | 4,289,176 | |
| | | | | | | | | | | | 14,232,471 | |
| Supermarkets — 0.5% | | | | | | | | | | | | |
| Alimentation Couche-Tard, Inc., 144A (b) | | 3.550% | | 07/26/27 | | | 3,810,000 | | | | 3,521,472 | |
| | | | | | | | | | | | | |
| Transportation Services — 2.2% | | | | | | | | | | | | |
| American Airlines, Inc., Series 2013-2, Class A (c) | | 4.950% | | 07/15/24 | | | 8,969,098 | | | | 8,956,846 | |
| FedEx Corp. | | 3.900% | | 02/01/35 | | | 6,190,000 | | | | 5,262,484 | |
| XPO CNW, Inc. | | 6.700% | | 05/01/34 | | | 900,000 | | | | 796,770 | |
| | | | | | | | | | | | 15,016,100 | |
| Utility – 4.9% | | | | | | | | | | | | |
| Electric — 4.3% | | | | | | | | | | | | |
| Nevada Power Co. | | 6.750% | | 07/01/37 | | | 3,956,000 | | | | 4,343,096 | |
| NRG Energy, Inc., 144A (b) | | 5.250% | | 06/15/29 | | | 4,500,000 | | | | 3,972,330 | |
| Oglethorpe Power Corp., 144A (b) | | 4.500% | | 04/01/47 | | | 2,640,000 | | | | 2,110,201 | |
| Pacific Gas & Electric Co. | | 1.700% | | 11/15/23 | | | 2,761,000 | | | | 2,672,152 | |
| PG&E Corp. | | 5.000% | | 07/01/28 | | | 2,000,000 | | | | 1,825,685 | |
| Pinnacle West Capital Corp. | | 1.300% | | 06/15/25 | | | 4,327,000 | | | | 3,939,292 | |
| Tenaska Virginia Partners LP, 144A (b) | | 6.119% | | 03/30/24 | | | 30,576 | | | | 30,188 | |
| Virginia Electric & Power Co., Series A | | 6.000% | | 05/15/37 | | | 5,581,000 | | | | 5,772,853 | |
| Vistra Operations Co. LLC, 144A (b) | | 5.000% | | 07/31/27 | | | 5,100,000 | | | | 4,733,277 | |
| | | | | | | | | | | | 29,399,074 | |
| Natural Gas — Distributors — 0.6% | | | | | | | | | | | | |
| AmeriGas Partners LP/AmeriGas Financial Corp. | | 5.625% | | 05/20/24 | | | 3,932,000 | | | | 3,816,711 | |
| | | | | | | | | | | | | |
| Total Corporate Bonds (Cost $361,695,480) | | | | | | | | | | | 319,604,971 | |
| See Notes to Financial Statements. | |
| Annual Report | December 31, 2022 | | | 71 |
| Segall Bryant & Hamill Plus Bond Fund | Statement of Investments |
| | December 31, 2022 |
| | | Coupon | | Maturity | | Par Value | | | Value | |
| MUNICIPAL BONDS — 8.5% | | | | | | | | | | | | |
| California — 2.5% | | | | | | | | | | | | |
| California Educational Facilities Authority, Series 2018-A | | 4.842% | | 10/01/48 | | $ | 3,635,000 | | | $ | 3,100,996 | |
| California Municipal Finance Authority, Series 2021 (c)(d) | | 3.637% | | 07/01/30 | | | 6,915,000 | | | | 5,745,304 | |
| City of San Francisco California Public Utilities Commission Water Revenue, Series 2010-B | | 6.000% | | 11/01/40 | | | 2,100,000 | | | | 2,256,427 | |
| San Diego County Regional Airport Authority, Series 2014-B (d) | | 5.594% | | 07/01/43 | | | 3,135,000 | | | | 3,044,242 | |
| University of California, Series 2013-AJ | | 4.601% | | 05/15/31 | | | 2,865,000 | | | | 2,813,835 | |
| | | | | | | | | | | | 16,960,804 | |
| Colorado — 0.5% | | | | | | | | | | | | |
| Denver Colorado Public Schools, Series 2013-B | | 4.242% | | 12/15/37 | | | 3,900,000 | | | | 3,549,461 | |
| | | | | | | | | | | | | |
| District of Columbia — 0.5% | | | | | | | | | | | | |
| District of Columbia Income Tax, Series 2009-E | | 5.591% | | 12/01/34 | | | 2,880,000 | | | | 2,991,990 | |
| | | | | | | | | | | | | |
| Massachusetts — 0.2% | | | | | | | | | | | | |
| Commonwealth of Massachusetts, Series 2019-D | | 2.663% | | 09/01/39 | | | 2,032,894 | | | | 1,613,055 | |
| | | | | | | | | | | | | |
| New Hampshire — 0.7% | | | | | | | | | | | | |
| National Finance Authority, Series 2021 | | 3.778% | | 01/01/36 | | | 6,000,000 | | | | 4,522,703 | |
| | | | | | | | | | | | | |
| New York — 1.0% | | | | | | | | | | | | |
| New York City Transitional Finance Authority, Series B SUB B-3 | | 3.950% | | 08/01/32 | | | 7,665,000 | | | | 6,890,919 | |
| | | | | | | | | | | | | |
| Texas — 1.1% | | | | | | | | | | | | |
| Central Texas Regional Mobility Authority, Series 2020-D | | 3.593% | | 01/01/42 | | | 4,950,000 | | | | 3,662,248 | |
| North Texas Tollway Authority System, Series 2020-B | | 2.327% | | 01/01/33 | | | 4,920,000 | | | | 3,794,848 | |
| | | | | | | | | | | | 7,457,096 | |
| Utah — 0.7% | | | | | | | | | | | | |
| Utah Transit Authority Sales Tax Revenue, Series 2020 | | 2.774% | | 12/15/38 | | | 5,925,000 | | | | 4,497,401 | |
| | | | | | | | | | | | | |
| Virginia — 1.1% | | | | | | | | | | | | |
| Virginia Small Business Financing Authority, Series 2017 (a)(c)(d) | | 6.500% | | 07/01/50 | | | 7,500,000 | | | | 7,451,628 | |
| | | | | | | | | | | | | |
| Washington — 0.2% | | | | | | | | | | | | |
| Port of Seattle Washington, Series 2017-B | | 3.755% | | 05/01/36 | | | 1,925,000 | | | | 1,654,521 | |
| | | | | | | | | | | | | |
| Total Municipal Bonds (Cost $68,313,665) | | | | | | | | | | | 57,589,578 | |
| | | | | | | | | | | | | |
| ASSET BACKED SECURITIES — 3.2% | | | | | | | | | | | | |
| Bear Stearns, Series 2003-AC4, Class A (e) | | 5.500% | | 09/25/33 | | | 2,219,922 | | | | 2,029,417 | |
| DT Auto Owner Trust, Series 2019-4, Class D, 144A (b) | | 2.850% | | 07/15/25 | | | 5,020,000 | | | | 4,930,581 | |
| GTP Acquisition Partners I LLC, Series 2015-1-2, Class A-15-2, 144A (b) | | 3.482% | | 06/16/25 | | | 10,800,000 | | | | 10,060,562 | |
| Renaissance Home Equity Loan Trust, Series 2005-2, Class AF-6 (e) | | 4.781% | | 08/25/35 | | | 358,402 | | | | 336,720 | |
| Trinity Rail Leasing LP, Series 2022-1, Class A, 144A (b) | | 4.550% | | 05/19/52 | | | 4,926,147 | | | | 4,550,609 | |
| Total Asset Backed Securities (Cost $23,365,921) | | | | | | | | | | | 21,907,889 | |
| | | | | | | | | | | | | |
| RESIDENTIAL MORTGAGE-BACKED SECURITIES — 0.3% | | | | | | | | | | | | |
| American Home Mortgage Investment Trust, Series 2004-4, Class VI-A-1 (a)(e) | | 4.135% | | 02/25/45 | | | 979,097 | | | | 953,560 | |
| Banc of America Funding Trust, Series 2005-4, Class 1-A-4 | | 5.500% | | 08/25/35 | | | 44,906 | | | | 43,103 | |
| Banc of America Funding Trust, Series 2005-4, Class 2-A-4 | | 5.500% | | 08/25/35 | | | 69,340 | | | | 64,800 | |
| CWHL Mortgage Pass-Through Trust, Series 2004-HYB2, Class 5-A (a) | | 2.840% | | 07/20/34 | | | 599,797 | | | | 556,576 | |
| GSR Mortgage Loan Trust, Series 2005-3F, Class 2A-3 | | 6.000% | | 03/25/35 | | | 585,878 | | | | 378,412 | |
| PHMC Trust, Series 2007-2, Class A-2 (a) | | 5.544% | | 05/18/37 | | | 268,303 | | | | 256,223 | |
| Total Residential Mortgage-Backed Securities (Cost $2,586,541) | | | | | | | | | | | 2,252,674 | |
| See Notes to Financial Statements. | |
| 72 | | | www.sbhfunds.com |
| Segall Bryant & Hamill Plus Bond Fund | Statement of Investments |
| | December 31, 2022 |
| | | Coupon | | Maturity | | Par Value | | | Value | |
| MORTGAGE-BACKED SECURITIES PASSTHROUGH — 26.1% | | | | | | | | | | | | |
| Agency Fixed Rate — 2.1% | | | | | | | | | | | | |
| Pool #SD8277 | | 5.500% | | 12/01/52 | | $ | 6,671,917 | | | $ | 6,689,825 | |
| Pool #MA8270M | | 5.500% | | 09/20/52 | | | 7,585,139 | | | | 7,638,579 | |
| | | | | | | | | | | | 14,328,404 | |
| Fannie Mae Pool — 10.3% | | | | | | | | | | | | |
| Pool #MA2354, Series 2015 | | 3.500% | | 08/01/35 | | | 3,624,865 | | | | 3,465,278 | |
| Pool #735897 | | 5.500% | | 10/01/35 | | | 273,791 | | | | 281,950 | |
| Pool #888016 | | 5.500% | | 05/01/36 | | | 456,109 | | | | 471,843 | |
| Pool #MA4703 | | 4.000% | | 06/01/37 | | | 4,277,720 | | | | 4,174,906 | |
| Pool #889108 | | 6.000% | | 02/01/38 | | | 250,469 | | | | 259,863 | |
| Pool #889579 | | 6.000% | | 05/01/38 | | | 409,977 | | | | 427,682 | |
| Pool #995838 | | 5.500% | | 05/01/39 | | | 322,151 | | | | 334,070 | |
| Pool #AL3287, Series 2013 | | 4.500% | | 09/01/41 | | | 1,104,892 | | | | 1,095,312 | |
| Pool #MA1700, Series 2013 | | 4.500% | | 12/01/43 | | | 839,193 | | | | 824,391 | |
| Pool #MA1971 | | 4.500% | | 06/01/44 | | | 145,226 | | | | 142,665 | |
| Pool #MA2005 | | 4.500% | | 08/01/44 | | | 286,027 | | | | 280,981 | |
| Pool #CA5960 | | 2.500% | | 06/01/50 | | | 8,776,149 | | | | 7,533,983 | |
| Pool #MA4048 | | 3.000% | | 06/01/50 | | | 5,410,723 | | | | 4,778,289 | |
| Pool #MA4097 | | 3.000% | | 08/01/50 | | | 5,400,742 | | | | 4,766,043 | |
| Pool #MA4119 | | 2.000% | | 09/01/50 | | | 6,019,717 | | | | 4,925,549 | |
| Pool #FM6110 | | 3.000% | | 09/01/50 | | | 5,474,104 | | | | 4,875,150 | |
| Pool #MA4121 | | 3.000% | | 09/01/50 | | | 4,086,152 | | | | 3,620,124 | |
| Pool #FS0672 | | 2.000% | | 01/01/51 | | | 5,461,016 | | | | 4,471,984 | |
| Pool #MA4379 | | 2.500% | | 07/01/51 | | | 3,448,288 | | | | 2,928,431 | |
| Pool #MA4644 | | 4.000% | | 05/01/52 | | | 13,104,924 | | | | 12,298,377 | |
| Pool #MA4761 | | 5.000% | | 09/01/52 | | | 7,989,392 | | | | 7,878,904 | |
| | | | | | | | | | | | 69,835,775 | |
| Freddie Mac Gold Pool — 0.3% | | | | | | | | | | | | |
| Pool #G08061 | | 5.500% | | 06/01/35 | | | 37,801 | | | | 39,156 | |
| Pool #A42128 | | 5.500% | | 01/01/36 | | | 156,470 | | | | 162,177 | |
| Pool #G02252 | | 5.500% | | 07/01/36 | | | 345,313 | | | | 358,377 | |
| Pool #G02386 | | 6.000% | | 11/01/36 | | | 216,055 | | | | 225,718 | |
| Pool #G03189 | | 6.500% | | 09/01/37 | | | 403,776 | | | | 420,241 | |
| Pool #G08607 | | 4.500% | | 09/01/44 | | | 603,038 | | | | 593,076 | |
| | | | | | | | | | | | 1,798,745 | |
| Freddie Mac Non-Gold Pool — 8.8% | | | | | | | | | | | | |
| Pool #781958 (H15T1Y + 225) (a) | | 4.375% | | 09/01/34 | | | 25,880 | | | | 26,337 | |
| Pool #SB8171 | | 4.000% | | 06/01/37 | | | 3,761,777 | | | | 3,671,364 | |
| Pool #SD8092 | | 3.000% | | 09/01/50 | | | 6,896,224 | | | | 6,075,900 | |
| Pool #SD8121 | | 2.000% | | 01/01/51 | | | 1,803,519 | | | | 1,474,407 | |
| Pool #SD8151 | | 2.500% | | 06/01/51 | | | 11,233,131 | | | | 9,536,735 | |
| Pool #SD8196 | | 3.500% | | 02/01/52 | | | 9,070,607 | | | | 8,249,878 | |
| Pool #SD8202 | | 3.500% | | 02/01/52 | | | 16,903,522 | | | | 15,374,007 | |
| Pool #SD8215 | | 4.000% | | 05/01/52 | | | 8,681,738 | | | | 8,143,925 | |
| Pool #SD8246 | | 5.000% | | 09/01/52 | | | 7,574,872 | | | | 7,470,117 | |
| | | | | | | | | | | | 60,022,670 | |
| Ginnie Mae II Pool — 4.6% | | | | | | | | | | | | |
| Pool #004496M | | 5.000% | | 07/20/39 | | | 260,185 | | | | 264,541 | |
| Pool #MA7590M | | 3.000% | | 09/20/51 | | | 8,645,240 | | | | 7,734,420 | |
| Pool #MA7649M | | 2.500% | | 10/20/51 | | | 7,209,978 | | | | 6,256,590 | |
| Pool #MA7768M | | 3.000% | | 12/20/51 | | | 8,136,272 | | | | 7,269,971 | |
| Pool #MA7769M | | 3.500% | | 12/20/51 | | | 9,221,270 | | | | 8,473,283 | |
| Pool #MA7882M | | 3.000% | | 02/20/52 | | | 1,781,558 | | | | 1,586,372 | |
| | | | | | | | | | | | 31,585,177 | |
| | | | | | | | | | | | | |
| Total Mortgage-Backed Securities Passthrough (Cost $197,093,761) | | | | | | | | 177,570,771 | |
| See Notes to Financial Statements. | |
| Annual Report | December 31, 2022 | | | 73 |
| Segall Bryant & Hamill Plus Bond Fund | Statement of Investments |
| | December 31, 2022 |
| | | Coupon | | Maturity | | Par Value | | | Value | |
| U.S. TREASURY BONDS & NOTES — 12.7% | | | | | | | | | | | | |
| United States Treasury | | 0.250% | | 05/31/25 | | $ | 235,000 | | | $ | 213,336 | |
| United States Treasury | | 2.250% | | 11/15/25 | | | 25,915,000 | | | | 24,528,143 | |
| United States Treasury | | 2.375% | | 05/15/27 | | | 3,725,000 | | | | 3,472,835 | |
| United States Treasury | | 3.125% | | 11/15/41 | | | 19,100,000 | | | | 16,504,340 | |
| United States Treasury | | 2.875% | | 05/15/43 | | | 14,805,000 | | | | 12,084,003 | |
| United States Treasury | | 2.500% | | 02/15/45 | | | 17,675,000 | | | | 13,306,651 | |
| United States Treasury | | 1.250% | | 05/15/50 | | | 15,415,000 | | | | 8,295,799 | |
| United States Treasury | | 1.625% | | 11/15/50 | | | 14,000,000 | | | | 8,330,000 | |
| Total U.S. Treasury Bonds & Notes (Cost $104,964,930) | | | | | | | | | | | 86,735,107 | |
| | | | | | | | | | | | | |
| Investments at Value — 97.8% (Cost $758,020,298) | | | | | | | | | | $ | 665,660,990 | |
| | | | | | | | | | | | | |
| Other Assets in Excess of Liabilities — 2.2% | | | | | | | | | | | 14,981,837 | |
| | | | | | | | | | | | | |
| Net Assets — 100.0% | | | | | | | | | | $ | 680,642,827 | |
| (a) | Variable rate security. Interest rate resets periodically. The rate shown is the effective interest rate as of December 31, 2022. For securities based on a published reference rate and spread, the reference rate and spread (in basis points) are indicated parenthetically. Certain variable rate securities are not based on a published reference rate and spread but are determined by the issuer or agent and are based on current market conditions. These securities, therefore, do not indicate a reference rate and spread. |
| (b) | Security was purchased in a transaction exempt from registration in compliance with Rule 144A of the Securities Act of 1933. This security may be resold in transactions exempt from registration, normally to qualified institutional buyers. |
| (c) | Security is considered a restricted security however such restriction has not resulted in an illiquid classification. The total value of these securities is $22,153,778, which represents 3.3% of net assets as of December 31, 2022. |
| (d) | Security can be called and redeemed at the option of the issuer prior to the stated maturity date which is included in the Statement of Investments. |
| (e) | Step coupon. Rate shown is the coupon in effect as of December 31, 2022; reference rate and spread (in basis points) are indicated parenthetically. |
The Fund’s sector and industry classifications presented herein refer to any one or more of the industry sub-classifications used by one or more widely recognized market indexes or ratings group indexes, and/or as defined by Fund management. For Fund compliance purposes, sector and industry classifications are based on the sector and industry categorization methodology of the Adviser to the Funds. This definition may not apply for purposes of this report, which may combine industry sub-classifications for reporting ease. Industries are shown as a percentage of net assets.
| See Notes to Financial Statements. | |
| 74 | | | www.sbhfunds.com |
| Segall Bryant & Hamill Quality High Yield Fund | Statement of Investments |
| | December 31, 2022 |
| | | Coupon | | Maturity | | Par Value | | | Value | |
| CORPORATE BONDS — 98.1% | | | | | | | | | | | | |
| Finance — 13.3% | | | | | | | | | | | | |
| Mortgage Banking — 2.6% | | | | | | | | | | | | |
| Provident Funding Associates LP/PFG Finance Corp., 144A (a) | | 6.375% | | 06/15/25 | | $ | 1,973,000 | | | $ | 1,716,510 | |
| | | | | | | | | | | | | |
| Noncaptive Diversified Financial Companies — 1.5% | | | | | | | | | | | | |
| Aircastle, Ltd., 144A (a) | | 5.250% | | 08/11/25 | | | 1,000,000 | | | | 961,738 | |
| | | | | | | | | | | | | |
| Other Finance — 4.6% | | | | | | | | | | | | |
| IIP Operating Partnership LP | | 5.500% | | 05/25/26 | | | 1,950,000 | | | | 1,726,667 | |
| Outfront Media Capital LLC, 144A (a) | | 4.250% | | 01/15/29 | | | 1,610,000 | | | | 1,335,865 | |
| | | | | | | | | | | | 3,062,532 | |
| Real Estate Investment Trusts — 4.6% | | | | | | | | | | | | |
| MPT Operating Partnership LP/MPT Finance Corp. | | 5.000% | | 10/15/27 | | | 1,750,000 | | | | 1,470,928 | |
| VICI Properties LP, 144A (a) | | 4.500% | | 01/15/28 | | | 1,671,000 | | | | 1,533,355 | |
| | | | | | | | | | | | 3,004,283 | |
| Industrial — 79.6% | | | | | | | | | | | | |
| Automobile Manufacturing — 3.3% | | | | | | | | | | | | |
| Ford Motor Co. | | 7.400% | | 11/01/46 | | | 600,000 | | | | 585,000 | |
| Goodyear Tire & Rubber Co. | | 4.875% | | 03/15/27 | | | 1,725,000 | | | | 1,577,909 | |
| | | | | | | | | | | | 2,162,909 | |
| Building Products — 2.5% | | | | | | | | | | | | |
| Summit Materials LLC, 144A (a) | | 6.500% | | 03/15/27 | | | 525,000 | | | | 514,485 | |
| Summit Materials LLC, 144A (a) | | 5.250% | | 01/15/29 | | | 1,239,000 | | | | 1,153,540 | |
| | | | | | | | | | | | 1,668,025 | |
| Chemicals — 7.5% | | | | | | | | | | | | |
| Axalta Coating Systems LLC, 144A (a) | | 4.750% | | 06/15/27 | | | 520,000 | | | | 480,688 | |
| Axalta Coating Systems LLC, 144A (a) | | 3.375% | | 02/15/29 | | | 1,000,000 | | | | 825,165 | |
| Compass Minerals International, Inc., 144A (a) | | 4.875% | | 07/15/24 | | | 1,200,000 | | | | 1,153,500 | |
| Compass Minerals International, Inc., 144A (a) | | 6.750% | | 12/01/27 | | | 1,126,000 | | | | 1,080,960 | |
| Olin Corp. | | 5.125% | | 09/15/27 | | | 806,000 | | | | 761,670 | |
| Olin Corp. | | 5.000% | | 02/01/30 | | | 675,000 | | | | 615,937 | |
| | | | | | | | | | | | 4,917,920 | |
| Construction Machinery — 4.7% | | | | | | | | | | | | |
| Brunswick Corp. | | 2.400% | | 08/18/31 | | | 590,000 | | | | 433,766 | |
| H&E Equipment Services, Inc., 144A (a) | | 3.875% | | 12/15/28 | | | 1,461,000 | | | | 1,244,465 | |
| United Rentals North America, Inc. | | 4.875% | | 01/15/28 | | | 1,505,000 | | | | 1,426,213 | |
| | | | | | | | | | | | 3,104,444 | |
| Consumer Products — 4.5% | | | | | | | | | | | | |
| Central Garden & Pet Co. | | 4.125% | | 10/15/30 | | | 700,000 | | | | 574,982 | |
| Scotts Miracle-Gro Co. | | 4.500% | | 10/15/29 | | | 500,000 | | | | 405,000 | |
| Scotts Miracle-Gro Co. | | 4.000% | | 04/01/31 | | | 875,000 | | | | 668,449 | |
| Vista Outdoor, Inc., 144A (a) | | 4.500% | | 03/15/29 | | | 1,765,000 | | | | 1,295,934 | |
| | | | | | | | | | | | 2,944,365 | |
| Diversified Manufacturing — 3.0% | | | | | | | | | | | | |
| BWX Technologies, Inc., 144A (a) | | 4.125% | | 06/30/28 | | | 1,202,000 | | | | 1,080,297 | |
| Griffon Corp. | | 5.750% | | 03/01/28 | | | 1,008,000 | | | | 922,320 | |
| | | | | | | | | | | | 2,002,617 | |
| Electronics — 6.0% | | | | | | | | | | | | |
| Amkor Technology, Inc., 144A (a) | | 6.625% | | 09/15/27 | | | 1,170,000 | | | | 1,157,854 | |
| ATS Automation Tooling Systems, Inc., 144A (a) | | 4.125% | | 12/15/28 | | | 1,665,000 | | | | 1,436,495 | |
| QORVO, Inc. | | 4.375% | | 10/15/29 | | | 1,282,000 | | | | 1,133,596 | |
| Sensata Technologies, Inc., 144A (a) | | 3.750% | | 02/15/31 | | | 250,000 | | | | 205,660 | |
| | | | | | | | | | | | 3,933,605 | |
| See Notes to Financial Statements. | |
| Annual Report | December 31, 2022 | | | 75 |
| Segall Bryant & Hamill Quality High Yield Fund | Statement of Investments |
| | December 31, 2022 |
| | | Coupon | | Maturity | | Par Value | | | Value | |
| Environmental — 1.3% | | | | | | | | | | | | |
| Clean Harbors, Inc., 144A (a) | | 5.125% | | 07/15/29 | | $ | 910,000 | | | $ | 843,981 | |
| | | | | | | | | | | | | |
| Healthcare Facilities / Supplies — 3.0% | | | | | | | | | | | | |
| Hologic, Inc., 144A (a) | | 3.250% | | 02/15/29 | | | 500,000 | | | | 429,348 | |
| Teleflex, Inc. | | 4.625% | | 11/15/27 | | | 375,000 | | | | 357,409 | |
| Tenet Healthcare Corp., 144A (a) | | 6.125% | | 10/01/28 | | | 1,372,000 | | | | 1,228,379 | |
| | | | | | | | | | | | 2,015,136 | |
| Home Builders — 2.4% | | | | | | | | | | | | |
| KB Home | | 6.875% | | 06/15/27 | | | 1,560,000 | | | | 1,569,282 | |
| | | | | | | | | | | | | |
| Independent Energy — 10.6% | | | | | | | | | | | | |
| Apache Corp. | | 4.250% | | 01/15/30 | | | 575,000 | | | | 508,821 | |
| Apache Corp. | | 5.100% | | 09/01/40 | | | 1,345,000 | | | | 1,114,618 | |
| Occidental Petroleum Corp. | | 7.875% | | 09/15/31 | | | 1,800,000 | | | | 1,987,200 | |
| PDC Energy, Inc. | | 5.750% | | 05/15/26 | | | 2,000,000 | | | | 1,909,140 | |
| Range Resources Corp. | | 4.875% | | 05/15/25 | | | 1,500,000 | | | | 1,424,855 | |
| | | | | | | | | | | | 6,944,634 | |
| Leisure / Entertainment — 2.9% | | | | | | | | | | | | |
| Cedar Fair LP | | 5.375% | | 04/15/27 | | | 937,000 | | | | 894,835 | |
| Cedar Fair LP | | 5.250% | | 07/15/29 | | | 1,100,000 | | | | 987,854 | |
| | | | | | | | | | | | 1,882,689 | |
| Media — Cable — 6.7% | | | | | | | | | | | | |
| DIRECTV Financing LLC, 144A (a) | | 5.875% | | 08/15/27 | | | 1,422,000 | | | | 1,272,207 | |
| DISH DBS Corp. | | 7.750% | | 07/01/26 | | | 802,000 | | | | 646,725 | |
| Nexstar Broadcasting, Inc., 144A (a) | | 5.625% | | 07/15/27 | | | 1,385,000 | | | | 1,270,540 | |
| Sirius XM Radio, Inc., 144A (a) | | 5.500% | | 07/01/29 | | | 1,350,000 | | | | 1,232,253 | |
| | | | | | | | | | | | 4,421,725 | |
| Media — Non-Cable — 5.0% | | | | | | | | | | | | |
| AMC Networks, Inc. | | 4.750% | | 08/01/25 | | | 1,597,000 | | | | 1,213,720 | |
| Lamar Media Corp. | | 3.750% | | 02/15/28 | | | 1,275,000 | | | | 1,141,261 | |
| Lamar Media Corp. | | 4.875% | | 01/15/29 | | | 815,000 | | | | 748,314 | |
| Nexstar Broadcasting, Inc., 144A (a) | | 4.750% | | 11/01/28 | | | 225,000 | | | | 194,625 | |
| | | | | | | | | | | | 3,297,920 | |
| Metals / Mining — 1.1% | | | | | | | | | | | | |
| FMG Resources August 2006 Pty., Ltd., 144A (a) | | 4.500% | | 09/15/27 | | | 800,000 | | | | 738,000 | |
| | | | | | | | | | | | | |
| Natural Gas — Distributors — 0.5% | | | | | | | | | | | | |
| AmeriGas Partners LP/AmeriGas Financial Corp. | | 5.625% | | 05/20/24 | | | 378,000 | | | | 366,917 | |
| | | | | | | | | | | | | |
| Restaurants — 1.3% | | | | | | | | | | | | |
| Papa John’s International, Inc., 144A (a) | | 3.875% | | 09/15/29 | | | 1,000,000 | | | | 835,000 | |
| | | | | | | | | | | | | |
| Retail Stores — 6.8% | | | | | | | | | | | | |
| Dick’s Sporting Goods, Inc. | | 3.150% | | 01/15/32 | | | 518,000 | | | | 405,808 | |
| Dick’s Sporting Goods, Inc. | | 4.100% | | 01/15/52 | | | 611,000 | | | | 393,898 | |
| Group 1 Automotive, Inc., 144A (a) | | 4.000% | | 08/15/28 | | | 1,164,000 | | | | 985,245 | |
| Hanesbrands, Inc., 144A (a) | | 4.625% | | 05/15/24 | | | 1,025,000 | | | | 992,741 | |
| Hanesbrands, Inc., 144A (a) | | 4.875% | | 05/15/26 | | | 250,000 | | | | 223,393 | |
| QVC, Inc. | | 4.850% | | 04/01/24 | | | 825,000 | | | | 763,125 | |
| QVC, Inc. | | 4.750% | | 02/15/27 | | | 970,000 | | | | 686,517 | |
| | | | | | | | | | | | 4,450,727 | |
| Services — 1.1% | | | | | | | | | | | | |
| Service Corp. International | | 4.625% | | 12/15/27 | | | 586,000 | | | | 547,353 | |
| TopBuild Corp., 144A (a) | | 3.625% | | 03/15/29 | | | 227,000 | | | | 186,118 | |
| | | | | | | | | | | | 733,471 | |
| See Notes to Financial Statements. | |
| 76 | | | www.sbhfunds.com |
| Segall Bryant & Hamill Quality High Yield Fund | Statement of Investments |
| | December 31, 2022 |
| | | Coupon | | Maturity | | Par Value | | | Value | |
| Theater Entertainment — 1.5% | | | | | | | | | | | | |
| Cinemark USA, Inc., 144A (a) | | 5.875% | | 03/15/26 | | $ | 1,180,000 | | | $ | 982,889 | |
| | | | | | | | | | | | | |
| Transportation Services — 1.7% | | | | | | | | | | | | |
| XPO Logistics, Inc. | | 6.700% | | 05/01/34 | | | 1,242,000 | | | | 1,099,543 | |
| | | | | | | | | | | | | |
| Vehicle Parts — 1.8% | | | | | | | | | | | | |
| Allison Transmission, Inc., 144A (a) | | 4.750% | | 10/01/27 | | | 1,300,000 | | | | 1,205,541 | |
| | | | | | | | | | | | | |
| Wireless Telecommunications — 0.4% | | | | | | | | | | | | |
| Lumen Technologies, Inc. | | 7.995% | | 06/01/36 | | | 559,000 | | | | 259,935 | |
| | | | | | | | | | | | | |
| Utility — 5.2% | | | | | | | | | | | | |
| Electric — 5.2% | | | | | | | | | | | | |
| NRG Energy, Inc., 144A (a) | | 3.625% | | 02/15/31 | | | 1,302,000 | | | | 989,777 | |
| PG&E Corp. | | 5.000% | | 07/01/28 | | | 1,000,000 | | | | 912,843 | |
| Vistra Operations Co. LLC, 144A (a) | | 5.000% | | 07/31/27 | | | 1,650,000 | | | | 1,531,354 | |
| | | | | | | | | | | | 3,433,974 | |
| | | | | | | | | | | | | |
| Investments at Value — 98.1% (Cost $74,260,253) | | | | | | | | | | $ | 64,560,312 | |
| | | | | | | | | | | | | |
| Other Assets in Excess of Liabilities — 1.9% | | | | | | | | | | | 1,217,618 | |
| | | | | | | | | | | | | |
| Net Assets — 100.0% | | | | | | | | | | $ | 65,777,930 | |
| (a) | Security was purchased in a transaction exempt from registration in compliance with Rule 144A of the Securities Act of 1933. This security may be resold in transactions exempt from registration, normally to qualified institutional buyers. |
The Fund’s sector and industry classifications presented herein refer to any one or more of the industry sub-classifications used by one or more widely recognized market indexes or ratings group indexes, and/or as defined by Fund management. For Fund compliance purposes, sector and industry classifications are based on the sector and industry categorization methodology of the Adviser to the Funds. This definition may not apply for purposes of this report, which may combine industry sub-classifications for reporting ease. Industries are shown as a percentage of net assets.
| See Notes to Financial Statements. | |
| Annual Report | December 31, 2022 | | | 77 |
| Segall Bryant & Hamill Municipal Opportunities Fund | Statement of Investments |
| | December 31, 2022 |
| | | Coupon | | Maturity | | Par Value | | | Value | |
| MUNICIPAL BONDS — 90.5% | | | | | | | | | | | | |
| Bond Anticipation Note — 1.5% | | | | | | | | | | | | |
| Bond Anticipation Note — 1.5% | | | | | | | | | | | | |
| Hamilton Ohio Various Purpose Bond, Series 2022 | | 4.000% | | 12/28/23 | | $ | 3,160,000 | | | $ | 3,178,067 | |
| | | | | | | | | | | | | |
| Certificate Participation — 0.0% (a) | | | | | | | | | | | | |
| Lease / Rent — 0.0% (a) | | | | | | | | | | | | |
| Regional Transportation District Colorado COP, Series 2015-A (b) | | 4.000% | | 06/01/40 | | | 20,000 | | | | 19,597 | |
| | | | | | | | | | | | | |
| General Obligation — 7.5% | | | | | | | | | | | | |
| Local — 7.5% | | | | | | | | | | | | |
| Chambers County Texas Improvement District No. 1, Series 2020 (b) | | 2.000% | | 09/01/27 | | | 1,450,000 | | | | 1,363,678 | |
| Chambers County Texas Improvement District No. 1, Series 2020 (b) | | 2.000% | | 09/01/28 | | | 1,450,000 | | | | 1,343,432 | |
| Chambers County Texas Improvement District No. 1, Series 2020 (b) | | 2.000% | | 09/01/29 | | | 1,455,000 | | | | 1,324,847 | |
| Harris-Waller Counties Municipal Utility District No. 3, Series 2022 | | 6.000% | | 09/01/31 | | | 1,310,000 | | | | 1,516,724 | |
| High Plains Metropolitan District City of Aurora Arapahoe County Colorado, NATL, Series 2017 (b)(c) | | 5.000% | | 12/01/35 | | | 295,000 | | | | 317,933 | |
| Kaufman County Texas Municipal Utility District No. 4, Series 2022 | | 4.000% | | 03/01/34 | | | 550,000 | | | | 568,065 | |
| Kaufman County Texas Municipal Utility District No. 5, Series 2021 (b) | | 3.000% | | 03/01/34 | | | 555,000 | | | | 511,242 | |
| Kaufman County Texas Municipal Utility District No. 5, Series 2021 (b) | | 3.000% | | 03/01/35 | | | 450,000 | | | | 403,377 | |
| King County Washington Public Hospital District No. 1, Series 2018 | | 5.000% | | 12/01/35 | | | 675,000 | | | | 722,307 | |
| Louisiana Local Government Environmental Facilities and Community Development Authority, Series 2021 | | 3.850% | | 12/01/46 | | | 1,500,000 | | | | 1,500,026 | |
| Northlake Texas Municipal Management District No. 1, Series 2022 | | 5.500% | | 03/01/28 | | | 275,000 | | | | 300,831 | |
| Northlake Texas Municipal Management District No. 1, Series 2022 | | 5.500% | | 03/01/29 | | | 295,000 | | | | 325,783 | |
| Northlake Texas Municipal Management District No. 1, Series 2022 | | 5.250% | | 03/01/32 | | | 580,000 | | | | 629,301 | |
| Pennsylvania Economic Development Financing Authority Solid Waste Disposal, Series 2021-A | | 4.060% | | 06/01/41 | | | 1,000,000 | | | | 971,965 | |
| Rendezvous Residential Metropolitan District Colorado, Series 2022 (b) | | 2.250% | | 12/01/31 | | | 520,000 | | | | 448,438 | |
| Rendezvous Residential Metropolitan District Colorado, Series 2022 (b) | | 2.350% | | 12/01/33 | | | 465,000 | | | | 389,641 | |
| Robla California School District, Series G | | 0.000% | | 08/01/36 | | | 750,000 | | | | 420,103 | |
| Sunfield Municipal Utility District No. 3, Series 2021 (b) | | 3.000% | | 09/01/34 | | | 510,000 | | | | 474,961 | |
| Sunfield Municipal Utility District No. 3, Series 2021 (b) | | 3.000% | | 09/01/35 | | | 525,000 | | | | 477,383 | |
| Sunfield Municipal Utility District No. 3, Series 2021 (b) | | 3.000% | | 09/01/36 | | | 540,000 | | | | 476,180 | |
| Sunfield Municipal Utility District No. 3, Series 2021 (b) | | 3.000% | | 09/01/37 | | | 550,000 | | | | 474,653 | |
| Texas Transportation Commission, Series 2014-B | | 0.650% | | 10/01/41 | | | 685,000 | | | | 623,457 | |
| Travis County Texas Municipal Utility District No. 21, Series 2016 (b) | | 3.000% | | 09/01/27 | | | 100,000 | | | | 94,438 | |
| Travis County Texas Municipal Utility District No. 21, Series 2016 (b) | | 3.500% | | 09/01/33 | | | 215,000 | | | | 194,180 | |
| West Harris County Texas Municipal District No. 5, Series 2015 (b) | | 3.375% | | 09/01/27 | | | 105,000 | | | | 101,709 | |
| | | | | | | | | | | | 15,974,654 | |
| Local Authority — 6.4% | | | | | | | | | | | | |
| Education — 3.0% | | | | | | | | | | | | |
| Administrators of the Tulane Educational Fund, Series 2013-C (b) | | 5.000% | | 10/01/47 | | | 170,000 | | | | 154,446 | |
| Public Finance Authority Taxable Educational Facilities Wisconsin, Series 2021-A (b) | | 5.625% | | 06/01/50 | | | 5,750,000 | | | | 4,478,764 | |
| Virginia Commonwealth University, Series 2018-B (b) | | 4.585% | | 05/01/48 | | | 2,000,000 | | | | 1,647,224 | |
| | | | | | | | | | | | 6,280,434 | |
| Healthcare — 0.2% | | | | | | | | | | | | |
| Denver Health & Hospital Authority, Series 2014-B (b) | | 4.900% | | 12/01/24 | | | 410,000 | | | | 399,755 | |
| | | | | | | | | | | | | |
| Public Services — 0.4% | | | | | | | | | | | | |
| Port of Greater Cincinnati Ohio Development Authority, Series 2020 (b)(d) | | 5.250% | | 12/01/35 | | | 1,000,000 | | | | 924,723 | |
| | | | | | | | | | | | | |
| Transportation — 2.8% | | | | | | | | | | | | |
| Public Finance Authority Wisconsin Air Cargo, Series 2021 | | 2.012% | | 07/01/25 | | | 1,085,000 | | | | 980,138 | |
| San Diego County Regional Airport Authority, Series 2014-B (b) | | 5.594% | | 07/01/43 | | | 5,135,000 | | | | 4,986,342 | |
| | | | | | | | | | | | 5,966,480 | |
| See Notes to Financial Statements. | |
| 78 | | | www.sbhfunds.com |
| Segall Bryant & Hamill Municipal Opportunities Fund | Statement of Investments |
| | December 31, 2022 |
| | | Coupon | | Maturity | | Par Value | | | Value | |
| Prerefunded — 1.0% | | | | | | | | | | | | |
| Transportation — 1.0% | | | | | | | | | | | | |
| Hillsborough County Florida Aviation, Series 2015-A | | 5.000% | | 10/01/40 | | $ | 1,985,000 | | | $ | 2,038,020 | |
| | | | | | | | | | | | | |
| Revenue — 64.8% | | | | | | | | | | | | |
| Education — 0.0%(a) | | | | | | | | | | | | |
| Pennsylvania Higher Educational Facilities Authority, Series 2016 (b) | | 3.000% | | 05/01/37 | | | 15,000 | | | | 12,073 | |
| | | | | | | | | | | | | |
| Healthcare — 0.0%(a) | | | | | | | | | | | | |
| Colorado Health Facilities Authority, Series 2012 (b) | | 5.000% | | 01/01/23 | | | 50,000 | | | | 50,000 | |
| Illinois Finance Authority, Series 2016-A (b) | | 5.000% | | 02/15/45 | | | 100,000 | | | | 102,839 | |
| | | | | | | | | | | | 152,839 | |
| Housing — 11.1% | | | | | | | | | | | | |
| District of Columbia Housing Finance Authority, Series 2022-B2 | | 3.000% | | 09/01/28 | | | 3,645,000 | | | | 3,551,749 | |
| Georgia Housing and Finance Authority, Series 2013-A | | 3.800% | | 12/01/37 | | | 1,155,000 | | | | 1,122,715 | |
| Maryland Community Development Administration Department, Series 2021-A | | 1.050% | | 03/01/29 | | | 500,000 | | | | 424,697 | |
| Memphis Tennessee Health, Educational and Housing Facility Board, Series 2020 | | 3.400% | | 12/01/23 | | | 1,000,000 | | | | 997,220 | |
| Minnesota State Housing Finance Agency, Series 2021-F | | 1.850% | | 07/01/32 | | | 470,000 | | | | 386,294 | |
| Missouri State Housing Development, Series 2018-A | | 3.800% | | 11/01/48 | | | 2,340,000 | | | | 2,284,129 | |
| New York City Housing Development Corporation, Series 2022-F-2-A | | 3.400% | | 11/01/62 | | | 2,500,000 | | | | 2,498,517 | |
| New York State Housing Finance Agency, Series 2020-H | | 1.800% | | 11/01/30 | | | 560,000 | | | | 468,848 | |
| New York State Housing Finance Agency, Series 2020-H | | 1.950% | | 05/01/32 | | | 2,460,000 | | | | 2,014,389 | |
| New York State Housing Finance Agency, Series 2021-J2 | | 1.000% | | 05/01/61 | | | 700,000 | | | | 631,406 | |
| New York State Housing Finance Agency, Series 2022-D-2 | | 3.100% | | 05/01/62 | | | 7,350,000 | | | | 7,184,658 | |
| New York State Mortgage Agency, Series 233 | | 1.650% | | 04/01/30 | | | 775,000 | | | | 642,527 | |
| Washington State Housing Finance Commission, Series 1N | | 3.000% | | 12/01/31 | | | 1,325,000 | | | | 1,264,307 | |
| | | | | | | | | | | | 23,471,456 | |
| Industrial Development — 20.5% | | | | | | | | | | | | |
| Bartow County Georgia Development Authority Pollution Control, Series 1997-1 (b) | | 1.800% | | 09/01/29 | | | 3,900,000 | | | | 3,479,766 | |
| Burke County Georgia Development Authority Pollution Control, Series 1995-5 (b) | | 2.200% | | 10/01/32 | | | 1,900,000 | | | | 1,562,637 | |
| Burke County Georgia Development Authority Pollution Control, Series 2013-A | | 1.500% | | 01/01/40 | | | 3,665,000 | | | | 3,463,056 | |
| City of Whiting Indiana Environmental Facilities, Series 2017 | | 5.000% | | 11/01/47 | | | 10,625,000 | | | | 10,772,214 | |
| Indiana Finance Authority Environmental Refunding, Series 2009-A-2 | | 3.750% | | 06/01/31 | | | 5,750,000 | | | | 5,815,443 | |
| Lehigh County Industrial Development Authority, Series 2016-B | | 2.625% | | 02/15/27 | | | 4,000,000 | | | | 3,876,491 | |
| Ohio State Air Quality Development Authority, Series 2022-B | | 4.000% | | 09/01/30 | | | 3,000,000 | | | | 2,988,071 | |
| Virginia Small Business Financing Authority, Series 2022 | | 3.500% | | 11/01/52 | | | 2,500,000 | | | | 2,491,109 | |
| Washington State Economic Development Finance Authority, Series 2022 | | 3.900% | | 12/01/42 | | | 9,000,000 | | | | 8,990,398 | |
| | | | | | | | | | | | 43,439,185 | |
| Other — 0.0% (a) | | | | | | | | | | | | |
| Colorado Education & Cultural Facilities Authority, Series 2015-B (b) | | 4.000% | | 12/01/38 | | | 50,000 | | | | 46,007 | |
| | | | | | | | | | | | | |
| Public Services — 1.2% | | | | | | | | | | | | |
| Phoenix Arizona Civic Improvement Corp. Rental Car Facility, Series 2019-A (b) | | 5.000% | | 07/01/39 | | | 2,500,000 | | | | 2,649,593 | |
| | | | | | | | | | | | | |
| Recreation — 0.4% | | | | | | | | | | | | |
| City of Houston Texas Convention & Entertainment Facilities Department, Series 2021 (b) | | 3.000% | | 09/01/32 | | | 500,000 | | | | 472,553 | |
| Harris County Texas Municipal Utility District No. 500, Series 2021 (b) | | 3.000% | | 12/01/34 | | | 375,000 | | | | 335,187 | |
| | | | | | | | | | | | 807,740 | |
| State and Non-State Appropriated Tobacco — 0.1% | | | | | | | | | | | | |
| California County Tobacco Securitization Agency (The), Series 2020-A (b) | | 4.000% | | 06/01/34 | | | 150,000 | | | | 146,899 | |
| See Notes to Financial Statements. | |
| Annual Report | December 31, 2022 | | | 79 |
| Segall Bryant & Hamill Municipal Opportunities Fund | Statement of Investments |
| | December 31, 2022 |
| | | Coupon | | Maturity | | Par Value | | | Value | |
| Tax — 2.9% | | | | | | | | | | | | |
| Denver Colorado Urban Renewal Authority Tax Increment, Series 2018-A (b)(d) | | 5.250% | | 12/01/39 | | $ | 2,000,000 | | | $ | 2,007,601 | |
| Denver Colorado Urban Renewal Authority Tax Increment, Series 2018-A (b)(d) | | 5.250% | | 12/01/39 | | | 900,000 | | | | 902,221 | |
| Northglenn Urban Renewal Authority, Series 2019 (b) | | 4.000% | | 12/01/34 | | | 400,000 | | | | 382,485 | |
| Northglenn Urban Renewal Authority, Series 2019 (b) | | 4.000% | | 12/01/35 | | | 525,000 | | | | 496,087 | |
| Southwest Houston Texas Redevelopment Authority, Series 2017-B (b) | | 4.000% | | 09/01/40 | | | 1,350,000 | | | | 1,332,711 | |
| Village Community Development District No. 7, Series 2015 (b) | | 4.000% | | 05/01/36 | | | 1,065,000 | | | | 1,015,813 | |
| | | | | | | | | | | | 6,136,918 | |
| Transportation — 16.0% | | | | | | | | | | | | |
| Chicago Midway Airport, Series 2014-B | | 5.000% | | 01/01/23 | | | 1,740,000 | | | | 1,740,000 | |
| Clark County Nevada Jet Aviation Fuel Tax, Series 2022-A | | 5.000% | | 07/01/23 | | | 6,000,000 | | | | 6,038,696 | |
| Colorado High Performance Transportation Enterprise, Series 2014 (b) | | 5.750% | | 01/01/44 | | | 750,000 | | | | 750,515 | |
| Denver Colorado Airport System, Series 2022-D | | 5.000% | | 11/15/25 | | | 2,000,000 | | | | 2,091,601 | |
| Denver Colorado Airport System, Series 2022-D | | 5.250% | | 11/15/26 | | | 3,500,000 | | | | 3,731,761 | |
| Florida State Mid-Bay Bridge Authority, Series 2015-A (b) | | 5.000% | | 10/01/35 | | | 1,180,000 | | | | 1,193,742 | |
| Hidalgo County Regional Mobility Authority, Series 2022-A | | 0.000% | | 12/01/50 | | | 5,000,000 | | | | 1,088,001 | |
| Hidalgo County Regional Mobility Authority, Series A | | 0.000% | | 12/01/51 | | | 3,750,000 | | | | 770,436 | |
| Hidalgo County Regional Mobility Authority, Series 2022-A (b) | | 0.000% | | 12/01/52 | | | 6,630,000 | | | | 1,285,820 | |
| Hidalgo County Regional Mobility Authority, Series 2022-A (b) | | 0.000% | | 12/01/54 | | | 1,585,000 | | | | 270,379 | |
| Hidalgo County Regional Mobility Authority, Series 2022-A (b) | | 0.000% | | 12/01/56 | | | 18,105,000 | | | | 2,674,733 | |
| La Paz County Arizona Industrial Development Authority, Series 2016-A (b)(d) | | 7.000% | | 11/15/38 | | | 1,575,000 | | | | 1,566,023 | |
| La Paz County Arizona Industrial Development Authority, Series 2016-A (b)(d) | | 7.125% | | 11/15/45 | | | 735,000 | | | | 719,963 | |
| Love Field Airport Modernization Corp., Series 2017 (b) | | 5.000% | | 11/01/33 | | | 425,000 | | | | 442,182 | |
| Pennsylvania Sate Turnpike Commission, Series 2009-E | | 6.375% | | 12/01/38 | | | 725,000 | | | | 818,958 | |
| Pharr Texas International Toll Bridge System, Series 2021 (b) | | 4.000% | | 08/15/33 | | | 5,000 | | | | 5,121 | |
| Triborough Bridge and Tunnel Authority, Series 2021-A-2 | | 2.000% | | 05/15/45 | | | 700,000 | | | | 639,171 | |
| Virginia Small Business Financing Authority, Series 2017 (b)(d)(e) | | 6.500% | | 07/01/50 | | | 7,500,000 | | | | 7,451,628 | |
| Virginia Small Business Financing Authority, Series 2022 (b) | | 5.000% | | 12/31/57 | | | 400,000 | | | | 396,454 | |
| | | | | | | | | | | | 33,675,184 | |
| Utilities — 12.6% | | | | | | | | | | | | |
| Burke County Georgia Development Authority Pollution Control, Series 1994-5 | | 2.150% | | 10/01/32 | | | 530,000 | | | | 517,304 | |
| King County Washington Sewer Revenue, Series 2020-A | | 0.625% | | 01/01/32 | | | 3,670,000 | | | | 3,547,670 | |
| Long Island Power Authority, Series 2021-B | | 1.500% | | 09/01/26 | | | 4,385,000 | | | | 4,074,203 | |
| Long Island Power Authority, Series 2020-B | | 0.850% | | 09/01/50 | | | 1,000,000 | | | | 931,969 | |
| Orlando Florida Utilities Commission, Series 2021-B | | 1.250% | | 10/01/46 | | | 1,125,000 | | | | 957,229 | |
| PEFA, Inc. Iowa Gas Project, Series 2019 | | 5.000% | | 09/01/49 | | | 595,000 | | | | 609,196 | |
| San Antonia Texas Electric & Gas Systems, Series 2015-D | | 1.125% | | 12/01/45 | | | 1,770,000 | | | | 1,554,825 | |
| Southern California Public Power Authority No. 1, Series 2007-A | | 5.000% | | 11/01/33 | | | 500,000 | | | | 536,657 | |
| Southern California Public Power Authority No. 1, Series 2007-B | | 4.445% | | 11/01/38 | | | 5,550,000 | | | | 4,770,783 | |
| Utah Infrastructure Agency Telecommunications, Series 2021 | | 3.000% | | 10/15/24 | | | 500,000 | | | | 488,137 | |
| Utah Infrastructure Agency Telecommunications, Series 2021 | | 4.000% | | 10/15/29 | | | 600,000 | | | | 580,823 | |
| Utah Infrastructure Agency Telecommunications, Series 2021 (b) | | 4.000% | | 10/15/36 | | | 200,000 | | | | 179,187 | |
| Utah Infrastructure Agency Telecommunications, Series 2021 (b) | | 4.000% | | 10/15/38 | | | 2,085,000 | | | | 1,817,936 | |
| Utah Infrastructure Agency Telecommunications, Series 2022 | | 5.000% | | 10/15/37 | | | 1,200,000 | | | | 1,211,687 | |
| Utah Infrastructure Agency Telecommunications, Series 2022 | | 5.000% | | 10/15/46 | | | 3,250,000 | | | | 3,166,041 | |
| Utah Telecommunication Open Infrastructure Agency, Series 2022 | | 5.250% | | 06/01/33 | | | 500,000 | | | | 579,194 | |
| Utah Telecommunication Open Infrastructure Agency, Series 2022 | | 5.250% | | 06/01/34 | | | 500,000 | | | | 573,520 | |
| Utah Telecommunication Open Infrastructure Agency, Series 2022 | | 5.250% | | 06/01/35 | | | 500,000 | | | | 566,445 | |
| | | | | | | | | | | | 26,662,806 | |
| Variable Rate Demand Note — 9.3% | | | | | | | | | | | | |
| Variable Rate Demand Note — 9.3% | | | | | | | | | | | | |
| Arizona Health Facilities, Series 2015-C (e) | | 3.700% | | 01/01/46 | | | 5,000,000 | | | | 5,000,000 | |
| Columbus Ohio Sewerage System, Series 2008-B (e) | | 3.790% | | 06/01/32 | | | 1,110,000 | | | | 1,110,000 | |
| JEA Florida Water and Sewer System, Series 2008-A-2 (e) | | 3.800% | | 10/01/38 | | | 1,500,000 | | | | 1,500,000 | |
| See Notes to Financial Statements. | |
| 80 | | | www.sbhfunds.com |
| Segall Bryant & Hamill Municipal Opportunities Fund | Statement of Investments |
| | December 31, 2022 |
| | | Coupon | | Maturity | | Par Value | | | Value | |
| Variable Rate Demand Note (continued) | | | | | | | | | | | | |
| King County Washington Multi-Modal Limited, Series 2019-A (e) | | 3.650% | | 01/01/46 | | $ | 4,000,000 | | | $ | 4,000,000 | |
| Oregon State Housing & Community Services Department, Series 2017-C (e) | | 3.850% | | 07/01/39 | | | 8,105,000 | | | | 8,105,000 | |
| | | | | | | | | | | | 19,715,000 | |
| | | | | | | | | | | | | |
| Total Municipal Bonds (Cost $198,781,341) | | | | | | | | | | | 191,697,430 | |
| | | | | | | | | | | | | |
| U.S. TREASURY BILLS — 7.8% | | | | | | | | | | | | |
| United States Treasury (f) | | 4.621% | | 05/18/23 | | | 7,000,000 | | | | 6,880,958 | |
| United States Treasury (f) | | 3.974% | | 09/07/23 | | | 10,000,000 | | | | 9,699,655 | |
| Total U.S. Treasury Bills (Cost $16,619,792) | | | | | | | | | | | 16,580,613 | |
| | | | | | | | | | | | | |
| CORPORATE BONDS — 3.7% | | | | | | | | | | | | |
| Industrial — 3.7% | | | | | | | | | | | | |
| Services — 3.7% | | | | | | | | | | | | |
| IPMI 3 LLC, 144A, Series 2021 (g) (Cost $9,000,000) | | 3.900% | | 12/01/28 | | | 9,000,000 | | | | 7,794,741 | |
| | | | | | | | | | | | | |
| Investments at Value — 102.0% (Cost $224,401,133) | | | | | | | | | | $ | 216,072,784 | |
| | | | | | | | | | | | | |
| Liabilities in Excess of Other Assets — (2.0%) | | | | | | | | | | | (4,267,731 | ) |
| | | | | | | | | | | | | |
| Net Assets — 100.0% | | | | | | | | | | $ | 211,805,053 | |
| (a) | Percentage rounds to less than 0.1%. |
| (b) | Security can be called and redeemed at the option of the issuer prior to the stated maturity date which is included in the Statement of Investments. |
| (c) | This security is insured. In the event of a default by the bond issuer, the issuer, as noted in the security description, guarantees that scheduled principal and interest payments will be made when due. |
| (d) | Security is considered a restricted security however such restriction has not resulted in an illiquid classification. The total value of these securities is $13,572,159, which represents 6.4% of net assets as of December 31, 2022. |
| (e) | Variable rate security. Interest rate resets periodically. The rate shown is the effective interest rate as of December 31, 2022. For securities based on a published reference rate and spread, the reference rate and spread (in basis points) are indicated parenthetically. Certain variable rate securities are not based on a published reference rate and spread but are determined by the issuer or agent and are based on current market conditions. These securities, therefore, do not indicate a reference rate and spread. |
| (f) | Rate shown is the annualized yield at time of purchase. |
| (g) | Security was purchased in a transaction exempt from registration in compliance with Rule 144A of the Securities Act of 1933. This security may be resold in transactions exempt from registration, normally to qualified institutional buyers. |
The Fund’s sector and industry classifications presented herein refer to any one or more of the industry sub-classifications used by one or more widely recognized market indexes or ratings group indexes, and/or as defined by Fund management. For Fund compliance purposes, sector and industry classifications are based on the sector and industry categorization methodology of the Adviser to the Funds. This definition may not apply for purposes of this report, which may combine industry sub-classifications for reporting ease. Industries are shown as a percentage of net assets.
| See Notes to Financial Statements. | |
| Annual Report | December 31, 2022 | | | 81 |
| Segall Bryant & Hamill Colorado Tax Free Fund | Statement of Investments |
| | December 31, 2022 |
| | | Coupon | | Maturity | | Par Value | | | Value | |
| MUNICIPAL BONDS — 97.0% | | | | | | | | | | | | |
| Certificate Participation — 13.3% | | | | | | | | | | | | |
| Healthcare — 0.3% | | | | | | | | | | | | |
| Denver Health & Hospital Authority COP, Series 2018 (a) | | 5.000% | | 12/01/30 | | $ | 350,000 | | | $ | 371,479 | |
| Denver Health & Hospital Authority COP, Series 2018 (a) | | 5.000% | | 12/01/31 | | | 350,000 | | | | 370,215 | |
| Denver Health & Hospital Authority COP, Series 2018 (a) | | 5.000% | | 12/01/32 | | | 225,000 | | | | 236,922 | |
| Denver Health & Hospital Authority COP, Series 2018 (a) | | 5.000% | | 12/01/33 | | | 240,000 | | | | 251,402 | |
| | | | | | | | | | | | 1,230,018 | |
| Lease / Rent — 13.0% | | | | | | | | | | | | |
| Berthoud Colorado COP, Series 2020 (a) | | 4.000% | | 12/01/49 | | | 9,255,000 | | | | 8,368,338 | |
| Castle Rock Colorado COP, Series 2020 (a) | | 4.000% | | 12/01/40 | | | 1,025,000 | | | | 1,018,343 | |
| City of Aurora Colorado COP, Series 2017 (a) | | 5.000% | | 12/01/34 | | | 450,000 | | | | 482,164 | |
| City of Aurora Colorado COP, Series 2017 (a) | | 5.000% | | 12/01/35 | | | 615,000 | | | | 657,086 | |
| Colorado Higher Education Capital Construction COP, Series 2014-A | | 5.000% | | 11/01/24 | | | 55,000 | | | | 57,136 | |
| Colorado State Building Excellent Schools Today COP, Series 2019-O (a) | | 5.000% | | 03/15/36 | | | 1,750,000 | | | | 1,904,817 | |
| Colorado State COP Rural Colorado, Series 2022 | | 6.000% | | 12/15/34 | | | 1,250,000 | | | | 1,549,423 | |
| Colorado State COP Rural Colorado, Series 2022 | | 6.000% | | 12/15/35 | | | 3,860,000 | | | | 4,725,227 | |
| Colorado State COP Rural Colorado, Series 2018-A (a) | | 5.000% | | 12/15/37 | | | 1,000,000 | | | | 1,089,898 | |
| Denver Colorado City & County School District No. 1 COP, Series 2020-A (a) | | 5.000% | | 12/01/42 | | | 1,860,000 | | | | 2,047,065 | |
| Foothills Park & Recreation District Colorado COP, Series 2021 (a) | | 4.000% | | 12/01/41 | | | 2,750,000 | | | | 2,674,300 | |
| Grand Fire Protection District No. 1 COP, Series 2022 | | 5.000% | | 12/15/24 | | | 10,000 | | | | 10,385 | |
| Grand Fire Protection District No. 1 COP, Series 2022 | | 5.000% | | 12/15/29 | | | 65,000 | | | | 72,779 | |
| Grand Fire Protection District No. 1 COP, Series 2022 | | 5.000% | | 12/15/30 | | | 50,000 | | | | 56,536 | |
| Grand Junction Colorado COP, Series 2019 (a) | | 4.000% | | 12/01/35 | | | 550,000 | | | | 569,906 | |
| Gunnison County Colorado COP, Series 2020-B | | 5.000% | | 12/01/24 | | | 55,000 | | | | 57,090 | |
| Gunnison County Colorado COP, Series 2020-B (a) | | 4.000% | | 12/01/34 | | | 55,000 | | | | 57,526 | |
| Gunnison County Colorado COP, Series 2020 (a) | | 4.000% | | 12/01/34 | | | 125,000 | | | | 130,024 | |
| Gunnison County Colorado COP, Series 2020-B (a) | | 4.000% | | 12/01/35 | | | 310,000 | | | | 321,767 | |
| Gunnison County Colorado COP, Series 2020 (a) | | 4.000% | | 12/01/35 | | | 390,000 | | | | 403,144 | |
| Gunnison County Colorado COP, Series 2020-B (a) | | 4.000% | | 12/01/36 | | | 325,000 | | | | 333,932 | |
| Gunnison County Colorado COP, Series 2020 (a) | | 4.000% | | 12/01/36 | | | 810,000 | | | | 829,321 | |
| Gunnison County Colorado COP, Series 2020 (a) | | 4.000% | | 12/01/37 | | | 840,000 | | | | 855,771 | |
| Hyland Hills Park and Recreation District COP, Series 2022 | | 5.000% | | 12/15/35 | | | 1,140,000 | | | | 1,284,262 | |
| Hyland Hills Park and Recreation District COP, Series 2022 | | 5.000% | | 12/15/41 | | | 2,430,000 | | | | 2,658,732 | |
| Moffat County Colorado COP, Series 2021 (a) | | 4.000% | | 03/01/41 | | | 2,235,000 | | | | 2,143,137 | |
| Moffat County Colorado COP, Series 2021 (a) | | 4.000% | | 03/01/46 | | | 4,060,000 | | | | 3,751,213 | |
| Moffat County Colorado COP, Series 2021 (a) | | 4.000% | | 03/01/51 | | | 4,000,000 | | | | 3,592,141 | |
| Monument Colorado COP, Series 2020 (a) | | 4.000% | | 12/01/33 | | | 200,000 | | | | 208,821 | |
| Platteville-Gilcrest Fire Protection District COP, Series 2018 (a) | | 5.000% | | 12/01/33 | | | 175,000 | | | | 190,787 | |
| Rangeview Library District Adams Country Colorado COP, Series 2022-A | | 5.000% | | 12/15/34 | | | 430,000 | | | | 475,299 | |
| Rangeview Library District Adams Country Colorado COP, Series 2022-A | | 5.000% | | 12/15/35 | | | 775,000 | | | | 849,166 | |
| South Suburban Park & Recreation District COP, Series 2021 (a) | | 4.000% | | 12/15/41 | | | 2,575,000 | | | | 2,432,701 | |
| Town of Breckenridge Colorado COP, Series 2022 | | 5.000% | | 12/01/42 | | | 2,325,000 | | | | 2,489,816 | |
| Town of Firestone Colorado Water Enterprise COP, Series 2018 (a) | | 5.000% | | 12/01/42 | | | 3,000,000 | | | | 3,166,821 | |
| | | | | | | | | | | | 51,514,874 | |
| General Obligation — 17.4% | | | | | | | | | | | | |
| Local — 17.4% | | | | | | | | | | | | |
| Anthem West Metropolitan District, BAM, Series 2015 (a)(b) | | 5.000% | | 12/01/35 | | | 1,165,000 | | | | 1,225,210 | |
| BNC Metropolitan District No. 1, BAM, Series 2017-A (a)(b) | | 5.000% | | 12/01/32 | | | 360,000 | | | | 390,024 | |
| BNC Metropolitan District No. 1, BAM, Series 2017-A (a)(b) | | 5.000% | | 12/01/37 | | | 545,000 | | | | 586,343 | |
| Bradburn Metropolitan District No. 2, Series 2018-A | | 4.000% | | 12/01/28 | | | 305,000 | | | | 287,909 | |
| Bradburn Metropolitan District No. 2, Series 2018-A (a) | | 5.000% | | 12/01/38 | | | 600,000 | | | | 570,344 | |
| Bromley Park Metropolitan District No. 2, Series 2018-B (a) | | 6.375% | | 12/15/47 | | | 1,000,000 | | | | 949,787 | |
| Bromley Park Metropolitan District No. 2, BAM, Series 2018-A (a)(b) | | 4.000% | | 12/01/47 | | | 2,500,000 | | | | 2,267,867 | |
| Castle Oaks Metropolitan District No. 3 Colorado, AGM, Series 2020 (b) | | 4.000% | | 12/01/50 | | | 4,690,000 | | | | 4,300,030 | |
| See Notes to Financial Statements. | |
| 82 | | | www.sbhfunds.com |
| Segall Bryant & Hamill Colorado Tax Free Fund | Statement of Investments |
| | December 31, 2022 |
| | | Coupon | | Maturity | | Par Value | | | Value | |
| Local — 17.4% (continued) | | | | | | | | | | | | |
| Central Platte Valley Metropolitan District, Series 2013-A (a) | | 5.500% | | 12/01/29 | | $ | 750,000 | | | $ | 766,374 | |
| Cherry Creek Colorado School District No. 5, Series 2021 | | 5.000% | | 12/15/28 | | | 80,000 | | | | 90,019 | |
| Colliers Hill Metropolitan District No. 2 Town of Erie Weld County Colorado, BAM, Series 2022B-1 (a)(b) | | 6.000% | | 12/15/47 | | | 2,000,000 | | | | 1,646,125 | |
| Cornerstar Metropolitan District, Series 2017-A (a) | | 5.125% | | 12/01/37 | | | 1,000,000 | | | | 957,369 | |
| Crested Butte Colorado Fire Protection District, Series 2022 (a) | | 5.000% | | 12/01/46 | | | 5,770,000 | | | | 6,337,174 | |
| Crystal Valley Metropolitan District No. 2, AGM, Series 2020-A (a)(b) | | 4.000% | | 12/01/44 | | | 3,500,000 | | | | 3,296,226 | |
| Denver Colorado City & County School District No. 1, Series 2022-B | | 5.000% | | 12/01/23 | | | 3,400,000 | | | | 3,466,187 | |
| Douglas County Colorado School District No. RE1, Series 2022 | | 5.000% | | 12/15/26 | | | 75,000 | | | | 81,693 | |
| Dove Valley Metropolitan District Arapahoe County, BAM, Series 2019 (a)(b) | | 4.000% | | 12/01/36 | | | 700,000 | | | | 724,060 | |
| Dove Valley Metropolitan District Arapahoe County, BAM, Series 2019 (a)(b) | | 4.000% | | 12/01/37 | | | 750,000 | | | | 769,609 | |
| Erie Farm Metropolitan District, AGM, Series 2021 (a)(b) | | 5.000% | | 12/01/35 | | | 175,000 | | | | 194,524 | |
| Erie Farm Metropolitan District, AGM, Series 2021 (a)(b) | | 5.000% | | 12/01/41 | | | 570,000 | | | | 617,603 | |
| Erie Farm Metropolitan District, AGM, Series 2021 (a)(b) | | 4.000% | | 12/01/51 | | | 1,100,000 | | | | 1,002,541 | |
| Fossil Ridge Metropolitan District No. 3 Colorado, BAM, Series 2020 (a)(b) | | 4.000% | | 12/01/32 | | | 995,000 | | | | 1,035,851 | |
| Fossil Ridge Metropolitan District No. 3 Colorado, BAM, Series 2020 (a)(b) | | 4.000% | | 12/01/33 | | | 1,030,000 | | | | 1,066,265 | |
| Fossil Ridge Metropolitan District No. 3 Colorado, BAM, Series 2020 (a)(b) | | 4.000% | | 12/01/34 | | | 1,075,000 | | | | 1,102,824 | |
| Gold Hill Mesa Metropolitan District No. 2, Series 2022-A | | 5.000% | | 12/01/23 | | | 305,000 | | | | 308,196 | |
| Gold Hill Mesa Metropolitan District No. 2, Series 2022-A | | 5.000% | | 12/01/24 | | | 215,000 | | | | 220,150 | |
| Gold Hill Mesa Metropolitan District No. 2, Series 2022-A | | 5.000% | | 12/01/25 | | | 135,000 | | | | 139,958 | |
| Gold Hill Mesa Metropolitan District No. 2, Series 2022-A | | 5.000% | | 12/01/26 | | | 150,000 | | | | 157,000 | |
| Great Western Park Metropolitan District No. 2 Colorado, AGM, Series 2021 (a)(b) | | 4.000% | | 12/01/35 | | | 520,000 | | | | 542,330 | |
| Great Western Park Metropolitan District No. 2 Colorado, AGM, Series 2021 (a)(b) | | 4.000% | | 12/01/36 | | | 555,000 | | | | 572,932 | |
| High Plains Metropolitan District, NATL, Series 2017 (a)(b) | | 5.000% | | 12/01/35 | | | 500,000 | | | | 538,869 | |
| Hogback Metropolitan District Colorado, Series 2021-A (a) | | 5.000% | | 12/01/41 | | | 700,000 | | | | 621,777 | |
| Longs Peak Metropolitan District Colorado, Series 2021 (a) | | 5.250% | | 12/01/51 | | | 6,500,000 | | | | 5,334,235 | |
| North Pine Vistas Metropolitan District No. 2, AGM, Series 2022 (b) | | 5.250% | | 12/01/42 | | | 625,000 | | | | 656,458 | |
| North Pine Vistas Metropolitan District No. 2, AGM, Series 2022 (b) | | 5.000% | | 12/01/52 | | | 1,000,000 | | | | 1,011,313 | |
| North Pine Vistas Metropolitan District No. 3, AGM, Series 2021-A (a)(b) | | 4.000% | | 12/01/36 | | | 175,000 | | | | 180,115 | |
| Park Creek Metropolitan District, AGM, Series 2022-A (b) | | 5.000% | | 12/01/37 | | | 370,000 | | | | 401,544 | |
| Park Creek Metropolitan District, AGM, Series 2022-A (b) | | 5.000% | | 12/01/38 | | | 655,000 | | | | 706,511 | |
| Park Creek Metropolitan District, AGM, Series 2022-A (b) | | 5.000% | | 12/01/39 | | | 730,000 | | | | 784,504 | |
| Park Creek Metropolitan District, AGM, Series 2022-A (b) | | 5.000% | | 12/01/41 | | | 500,000 | | | | 533,733 | |
| Park Creek Metropolitan District, AGM, Series 2022-A (b) | | 5.000% | | 12/01/42 | | | 500,000 | | | | 532,512 | |
| Prairie Center Metropolitan District No. 7 Colorado, Series 2020 (a) | | 4.125% | | 12/15/36 | | | 500,000 | | | | 431,523 | |
| Prairie Center Metropolitan District No. 7 Colorado, Series 2020 (a) | | 4.875% | | 12/15/44 | | | 700,000 | | | | 587,558 | |
| Sand Creek County Metropolitan District, AGM, Series 2017 (a)(b) | | 4.000% | | 12/01/35 | | | 380,000 | | | | 397,585 | |
| Sand Creek County Metropolitan District, AGM, Series 2020-B (a)(b) | | 4.000% | | 12/01/35 | | | 3,405,000 | | | | 3,558,533 | |
| Sand Creek County Metropolitan District, AGM, Series 2020-B (a)(b) | | 4.000% | | 12/01/40 | | | 2,325,000 | | | | 2,324,475 | |
| SBC Metropolitan District, AGM, Series 2016 (a)(b) | | 5.000% | | 12/01/34 | | | 205,000 | | | | 219,184 | |
| Sierra Ridge Metropolitan District No. 2, AGM, Series 2022 (a)(b) | | 4.000% | | 12/01/42 | | | 1,750,000 | | | | 1,701,352 | |
| Sierra Ridge Metropolitan District No. 2, AGM, Series 2022 (a)(b) | | 4.000% | | 12/01/46 | | | 1,665,000 | | | | 1,567,190 | |
| Sorrel Ranch Metropolitan District Colorado, AGM, Series 2020 (a)(b) | | 4.000% | | 12/01/33 | | | 320,000 | | | | 333,064 | |
| Sorrel Ranch Metropolitan District Colorado, AGM, Series 2020 (a)(b) | | 4.000% | | 12/01/34 | | | 665,000 | | | | 684,520 | |
| Sorrel Ranch Metropolitan District Colorado, AGM, Series 2020 (a)(b) | | 4.000% | | 12/01/35 | | | 570,000 | | | | 580,598 | |
| Sorrel Ranch Metropolitan District Colorado, AGM, Series 2020 (a)(b) | | 4.000% | | 12/01/37 | | | 500,000 | | | | 501,087 | |
| Southshore Metropolitan District No. 2 City of Aurora Arapahoe County Colorado, BAM, Series 2020-A-2 (a)(b) | | 4.000% | | 12/01/46 | | | 6,300,000 | | | | 5,868,093 | |
| Sterling Hills West Metropolitan District, Series 2017 (a) | | 5.000% | | 12/01/39 | | | 750,000 | | | | 785,956 | |
| Vista Ridge Metropolitan District, BAM, Series 2016-A (a)(b) | | 5.000% | | 12/01/31 | | | 1,250,000 | | | | 1,336,015 | |
| Wheatlands Metropolitan District, BAM, Series 2015 (a)(b) | | 5.000% | | 12/01/30 | | | 1,000,000 | | | | 1,058,540 | |
| | | | | | | | | | | | 68,909,368 | |
| See Notes to Financial Statements. | |
| Annual Report | December 31, 2022 | | | 83 |
| Segall Bryant & Hamill Colorado Tax Free Fund | Statement of Investments |
| | December 31, 2022 |
| | | Coupon | | Maturity | | Par Value | | | Value | |
| Local Authority — 4.3% | | | | | | | | | | | | |
| Housing — 0.4% | | | | | | | | | | | | |
| Colorado Housing & Finance Authority, Series 2020-C-1 | | 1.878% | | 05/01/23 | | $ | 295,000 | | | $ | 291,962 | |
| Colorado Housing & Finance Authority, Series 2020-C-1 | | 1.928% | | 11/01/23 | | | 340,000 | | | | 330,615 | |
| Colorado Housing & Finance Authority, Series 2020-C-1 | | 2.025% | | 05/01/24 | | | 150,000 | | | | 143,820 | |
| Colorado Housing & Finance Authority, Series 2020-C-1 | | 2.075% | | 11/01/24 | | | 250,000 | | | | 236,765 | |
| Colorado Housing & Finance Authority, Series 2020-C-1 | | 2.175% | | 11/01/25 | | | 500,000 | | | | 463,951 | |
| | | | | | | | | | | | 1,467,113 | |
| Lease / Rent — 0.1% | | | | | | | | | | | | |
| Boulder Municipal Property COP, Series 2019 | | 2.250% | | 11/01/24 | | | 500,000 | | | | 479,520 | |
| | | | | | | | | | | | | |
| Local — 2.4% | | | | | | | | | | | | |
| Board of Trustees of the Colorado School of Mines, AGM, Series 2022-C (b) | | 4.800% | | 12/01/27 | | | 2,000,000 | | | | 1,988,558 | |
| Eagle County Colorado School District, Series 2021 | | 0.793% | | 12/01/25 | | | 3,000,000 | | | | 2,686,749 | |
| Eagle County Colorado School District, Series 2021 | | 0.903% | | 12/01/26 | | | 5,000,000 | | | | 4,324,592 | |
| Garfield County School District No. RE-2, Series 2012-B (a) | | 3.050% | | 12/01/26 | | | 500,000 | | | | 469,330 | |
| | | | | | | | | | | | 9,469,229 | |
| Recreation — 0.4% | | | | | | | | | | | | |
| Park Creek Metropolitan District, Series 2017-B | | 3.150% | | 12/01/23 | | | 405,000 | | | | 399,478 | |
| Park Creek Metropolitan District, Series 2017-B | | 3.300% | | 12/01/24 | | | 425,000 | | | | 413,064 | |
| Park Creek Metropolitan District, Series 2017-B | | 3.450% | | 12/01/25 | | | 500,000 | | | | 480,539 | |
| Park Creek Metropolitan District, Series 2017-B (a) | | 3.600% | | 12/01/26 | | | 300,000 | | | | 285,502 | |
| | | | | | | | | | | | 1,578,583 | |
| Tax — 0.5% | | | | | | | | | | | | |
| Grand Junction Colorado, Series 2020-A | | 1.826% | | 03/01/25 | | | 620,000 | | | | 584,914 | |
| Park Creek Metropolitan District, Series 2018-B | | 3.650% | | 12/01/23 | | | 805,000 | | | | 797,559 | |
| Park Creek Metropolitan District, Series 2018-B | | 3.800% | | 12/01/24 | | | 440,000 | | | | 431,604 | |
| | | | | | | | | | | | 1,814,077 | |
| Utilities — 0.5% | | | | | | | | | | | | |
| Todd Creek Village Metropolitan District Colorado, Series 2018-B (a) | | 5.875% | | 12/01/38 | | | 845,000 | | | | 845,210 | |
| Town of Estes Park Colorado Power & Communications, Series 2019-B | | 2.362% | | 11/01/23 | | | 770,000 | | | | 755,789 | |
| Town of Estes Park Colorado Power & Communications, Series 2019-B | | 2.646% | | 11/01/25 | | | 430,000 | | | | 405,213 | |
| | | | | | | | | | | | 2,006,212 | |
| Prerefunded — 1.3% | | | | | | | | | | | | |
| Lease / Rent — 1.0% | | | | | | | | | | | | |
| Regional Transportation District Colorado COP, Series 2014-A | | 5.000% | | 06/01/39 | | | 3,830,000 | | | | 3,859,640 | |
| | | | | | | | | | | | | |
| Local — 0.3% | | | | | | | | | | | | |
| Tallyns Reach Metropolitan District No. 3, Series 2013 (a) | | 5.125% | | 11/01/38 | | | 1,035,000 | | | | 1,052,746 | |
| | | | | | | | | | | | | |
| Revenue — 30.0% | | | | | | | | | | | | |
| Education — 2.7% | | | | | | | | | | | | |
| Board of Trustees of the Colorado School of Mines, AGM, Series 2022-A (b) | | 5.250% | | 12/01/47 | | | 1,000,000 | | | | 1,080,633 | |
| Board of Trustees of the Colorado School of Mines, AGM, Series 2022-B (b) | | 5.250% | | 12/01/52 | | | 4,150,000 | | | | 4,442,970 | |
| Colorado Educational & Cultural Facilities Authority, Series 2016 (a) | | 5.000% | | 10/01/34 | | | 1,975,000 | | | | 2,014,438 | |
| Colorado Educational & Cultural Facilities Authority, Series 2016 (a) | | 5.000% | | 05/01/35 | | | 3,145,000 | | | | 3,205,056 | |
| Colorado State Board Community Colleges Refunding and Improvement Department Higher Education, Series 2017-A | | 5.000% | | 11/01/26 | | | 105,000 | | | | 113,419 | |
| | | | | | | | | | | | 10,856,516 | |
| Healthcare — 4.4% | | | | | | | | | | | | |
| Colorado Health Facilities Authority, Series 2014-A | | 5.000% | | 02/01/23 | | | 520,000 | | | | 520,394 | |
| Colorado Health Facilities Authority, Series 2022-B | | 5.000% | | 12/01/23 | | | 875,000 | | | | 886,516 | |
| Colorado Health Facilities Authority, Series 2017-A | | 5.000% | | 05/15/24 | | | 575,000 | | | | 589,250 | |
| Colorado Health Facilities Authority, Series 2017-A | | 5.000% | | 05/15/25 | | | 790,000 | | | | 821,626 | |
| Colorado Health Facilities Authority, Series 2022-B | | 5.000% | | 12/01/25 | | | 960,000 | | | | 1,003,626 | |
| See Notes to Financial Statements. | |
| 84 | | | www.sbhfunds.com |
| Segall Bryant & Hamill Colorado Tax Free Fund | Statement of Investments |
| | December 31, 2022 |
| | | Coupon | | Maturity | | Par Value | | | Value | |
| Healthcare (continued) | | | | | | | | | | | | |
| Colorado Health Facilities Authority, Series 2017-A | | 5.000% | | 05/15/26 | | $ | 540,000 | | | $ | 569,820 | |
| Colorado Health Facilities Authority, Series 2017-A (a) | | 5.000% | | 05/15/28 | | | 535,000 | | | | 569,561 | |
| Colorado Health Facilities Authority, Series 2017-A (a) | | 5.000% | | 05/15/29 | | | 425,000 | | | | 450,595 | |
| Colorado Health Facilities Authority, Series 2015-B (a) | | 5.000% | | 09/01/29 | | | 1,000,000 | | | | 1,032,802 | |
| Colorado Health Facilities Authority, Series 2016-C (a) | | 5.000% | | 12/01/29 | | | 1,010,000 | | | | 1,066,455 | |
| Colorado Health Facilities Authority, Series 2015 (a) | | 5.000% | | 05/15/30 | | | 500,000 | | | | 515,638 | |
| Colorado Health Facilities Authority, Series 2023-A (a) | | 3.000% | | 05/15/30 | | | 410,000 | | | | 345,855 | |
| Colorado Health Facilities Authority, Series 2017-A (a) | | 5.000% | | 05/15/30 | | | 710,000 | | | | 749,607 | |
| Colorado Health Facilities Authority, Series 2017-A (a) | | 5.000% | | 05/15/31 | | | 1,155,000 | | | | 1,218,560 | |
| Colorado Health Facilities Authority, Series 2017-A (a) | | 5.000% | | 05/15/32 | | | 1,650,000 | | | | 1,736,784 | |
| Colorado Health Facilities Authority, Series 2020 | | 4.000% | | 10/01/35 | | | 335,000 | | | | 335,189 | |
| Colorado Health Facilities Authority, Series 2019-A-1 (a) | | 4.000% | | 08/01/37 | | | 875,000 | | | | 815,132 | |
| Colorado Health Facilities Authority, Series 2019-A (a) | | 5.000% | | 11/15/37 | | | 200,000 | | | | 216,363 | |
| Colorado Health Facilities Authority, Series 2019 (a) | | 4.000% | | 01/01/39 | | | 1,200,000 | | | | 1,189,348 | |
| Colorado Health Facilities Authority, Series 2023-A (a) | | 4.000% | | 05/15/41 | | | 500,000 | | | | 392,774 | |
| Colorado Health Facilities Authority, Series 2015 (a) | | 4.000% | | 01/15/45 | | | 2,155,000 | | | | 1,947,508 | |
| Colorado Health Facilities Authority, Series 2023-A (a) | | 4.000% | | 05/15/48 | | | 500,000 | | | | 362,023 | |
| | | | | | | | | | | | 17,335,426 | |
| Other — 3.8% | | | | | | | | | | | | |
| Colorado Educational & Cultural Facilities Authority, Series 2014 | | 5.000% | | 11/15/24 | | | 435,000 | | | | 446,945 | |
| Colorado Educational & Cultural Facilities Authority, Series 2015-A (a)(c) | | 4.125% | | 07/01/26 | | | 480,000 | | | | 468,943 | |
| Colorado Educational & Cultural Facilities Authority, Series 2016 (a)(c) | | 3.750% | | 07/01/26 | | | 60,000 | | | | 56,887 | |
| Colorado Educational & Cultural Facilities Authority, Series 2016 (a) | | 5.000% | | 05/15/29 | | | 2,600,000 | | | | 2,739,633 | |
| Colorado Educational & Cultural Facilities Authority, Series 2014 (a) | | 5.000% | | 08/15/30 | | | 750,000 | | | | 771,913 | |
| Colorado Educational & Cultural Facilities Authority, Series 2015 (a) | | 5.000% | | 11/01/30 | | | 500,000 | | | | 522,747 | |
| Colorado Educational & Cultural Facilities Authority, Series 2014 (a) | | 5.000% | | 11/15/31 | | | 1,000,000 | | | | 1,025,270 | |
| Colorado Educational & Cultural Facilities Authority, Series 2014 (a) | | 5.000% | | 12/01/31 | | | 1,500,000 | | | | 1,538,193 | |
| Colorado Educational & Cultural Facilities Authority, Series 2016-A (a) | | 5.000% | | 12/15/31 | | | 715,000 | | | | 759,979 | |
| Colorado Educational & Cultural Facilities Authority, Series 2014 (a) | | 5.000% | | 10/01/32 | | | 1,340,000 | | | | 1,372,975 | |
| Colorado Educational & Cultural Facilities Authority, Series 2016 (a) | | 5.000% | | 06/01/36 | | | 1,580,000 | | | | 1,629,857 | |
| Colorado Educational & Cultural Facilities Authority, Series 2016 (a) | | 5.000% | | 07/01/36 | | | 1,000,000 | | | | 1,022,167 | |
| Colorado Educational & Cultural Facilities Authority, Series 2016 (a)(c) | | 5.000% | | 07/01/36 | | | 1,000,000 | | | | 932,935 | |
| Colorado Educational & Cultural Facilities Authority, Series 2016 (a) | | 5.000% | | 08/01/36 | | | 1,140,000 | | | | 1,174,461 | |
| Colorado Educational & Cultural Facilities Authority, Series 2014B (a) | | 5.625% | | 01/15/44 | | | 440,000 | | | | 442,512 | |
| | | | | | | | | | | | 14,905,417 | |
| Public Services — 6.1% | | | | | | | | | | | | |
| Cherry Creek Corporate Center Metropolitan District, Series 2015-A (a) | | 5.000% | | 06/01/37 | | | 500,000 | | | | 472,940 | |
| Park Creek Metropolitan District, Series 2015-A (a) | | 5.000% | | 12/01/26 | | | 730,000 | | | | 769,393 | |
| Park Creek Metropolitan District, Series 2015-A (a) | | 5.000% | | 12/01/27 | | | 620,000 | | | | 652,573 | |
| Park Creek Metropolitan District, Series 2017-A (a) | | 5.000% | | 12/01/36 | | | 300,000 | | | | 310,683 | |
| Park Creek Metropolitan District, Series 2017-A (a) | | 5.000% | | 12/01/37 | | | 400,000 | | | | 413,575 | |
| Park Creek Metropolitan District, Series 2017-A (a) | | 5.000% | | 12/01/41 | | | 1,500,000 | | | | 1,540,493 | |
| Park Creek Metropolitan District, Series 2015-A (a) | | 5.000% | | 12/01/45 | | | 550,000 | | | | 561,363 | |
| Park Creek Metropolitan District, Series 2017-A (a) | | 5.000% | | 12/01/46 | | | 4,930,000 | | | | 5,041,334 | |
| Rampart Range Colorado Metropolitan District No. 1, AGM, Series 2017 (a)(b) | | 5.000% | | 12/01/42 | | | 1,905,000 | | | | 2,026,417 | |
| Rampart Range Colorado Metropolitan District No. 1, AGM, Series 2017 (a)(b) | | 5.000% | | 12/01/47 | | | 8,150,000 | | | | 8,628,041 | |
| Southglenn Metropolitan District Colorado, Series 2016 (a) | | 5.000% | | 12/01/30 | | | 3,505,000 | | | | 3,466,127 | |
| Sterling Ranch Community Authority Colorado, Series 2020-A (a) | | 3.750% | | 12/01/40 | | | 500,000 | | | | 392,732 | |
| | | | | | | | | | | | 24,275,671 | |
| Tax — 5.8% | | | | | | | | | | | | |
| City of Idaho Springs Colorado Sales Tax Revenue, AGM, Series 2018 (a)(b) | | 5.000% | | 12/01/33 | | | 490,000 | | | | 523,718 | |
| City of Idaho Springs Colorado Sales Tax Revenue, AGM, Series 2018 (a)(b) | | 5.000% | | 12/01/34 | | | 525,000 | | | | 561,526 | |
| Denver Colorado Urban Renewal Authority Tax Increment, Series 2013-A-1 (a) | | 5.000% | | 12/01/23 | | | 190,000 | | | | 190,249 | |
| See Notes to Financial Statements. | |
| Annual Report | December 31, 2022 | | | 85 |
| Segall Bryant & Hamill Colorado Tax Free Fund | Statement of Investments |
| | December 31, 2022 |
| | | Coupon | | Maturity | | Par Value | | | Value | |
| Tax (continued) | | | | | | | | | | | | |
| Denver Colorado Urban Renewal Authority Tax Increment, Series 2018-A (a)(c) | | 5.250% | | 12/01/39 | | $ | 3,700,000 | | | $ | 3,714,062 | |
| Denver Colorado Urban Renewal Authority Tax Increment, Series 2018-A (a)(c) | | 5.250% | | 12/01/39 | | | 1,300,000 | | | | 1,303,209 | |
| Superior Open Space Sales and Use Tax Colorado, AGM, Series 2020 (a)(b) | | 5.000% | | 06/01/35 | | | 1,000,000 | | | | 1,112,708 | |
| Superior Open Space Sales and Use Tax Colorado, AGM, Series 2020 (a)(b) | | 5.000% | | 06/01/40 | | | 750,000 | | | | 816,928 | |
| Wheat Ridge Colorado Urban Renewal Authority, Series 2021 (a) | | 4.000% | | 12/01/32 | | | 760,000 | | | | 809,403 | |
| Wheat Ridge Colorado Urban Renewal Authority, Series 2021 (a) | | 4.000% | | 12/01/34 | | | 2,000,000 | | | | 2,084,627 | |
| Wheat Ridge Colorado Urban Renewal Authority, Series 2021 (a) | | 4.000% | | 12/01/35 | | | 2,000,000 | | | | 2,050,145 | |
| Wheat Ridge Colorado Urban Renewal Authority, Series 2021 (a) | | 4.000% | | 12/01/36 | | | 3,240,000 | | | | 3,284,278 | |
| Wheat Ridge Colorado Urban Renewal Authority, Series 2021 (a) | | 4.000% | | 12/01/37 | | | 3,360,000 | | | | 3,372,420 | |
| Wheat Ridge Colorado Urban Renewal Authority, Series 2021 (a) | | 4.000% | | 12/01/39 | | | 3,000,000 | | | | 2,925,727 | |
| | | | | | | | | | | | 22,749,000 | |
| Transportation — 6.1% | | | | | | | | | | | | |
| Auraria Higher Education Center, AGM, Series 2015 (a)(b) | | 4.000% | | 04/01/29 | | | 3,500,000 | | | | 3,589,396 | |
| Denver Colorado City & County Airport System, Series 2022-D | | 5.000% | | 11/15/24 | | | 15,000,000 | | | | 15,458,488 | |
| Denver Colorado City & County Airport System, Series 2020-B-2 | | 5.000% | | 11/15/31 | | | 3,840,000 | | | | 4,015,875 | |
| Grand Junction Regional Airport Authority, NATL, Series 2016-A (a)(b) | | 5.000% | | 12/01/31 | | | 1,155,000 | | | | 1,217,499 | |
| | | | | | | | | | | | 24,281,258 | |
| Utilities — 1.1% | | | | | | | | | | | | |
| City of Colorado Springs Colorado Utilities System, Series 2020-A | | 5.000% | | 11/15/23 | | | 155,000 | | | | 157,913 | |
| City of Colorado Springs Colorado Utilities System, Series 2020-A | | 5.000% | | 11/15/29 | | | 25,000 | | | | 28,626 | |
| Eagle River Colorado Water & Sanitation District, AGM, Series 2020-A (b) | | 4.000% | | 12/01/27 | | | 35,000 | | | | 36,993 | |
| Puerto Rico Electric Power Authority, AGM, Series 2007-UU (3MO LIBOR + 52) (a)(b)(d) | | 2.045% | | 07/01/29 | | | 400,000 | | | | 359,885 | |
| Stonegate Village Metropolitan District Colorado, BAM, Series 2020 (a)(b) | | 4.000% | | 12/01/45 | | | 1,435,000 | | | | 1,378,905 | |
| Todd Creek Village Metropolitan District Colorado, Series 2018-A | | 5.000% | | 12/01/28 | | | 1,200,000 | | | | 1,254,027 | |
| Todd Creek Village Metropolitan District Colorado, Series 2018-A (a) | | 5.250% | | 12/01/38 | | | 1,000,000 | | | | 1,033,302 | |
| Town of Firestone Colorado Water Enterprise, BAM, Series 2020 (b) | | 2.000% | | 12/01/23 | | | 15,000 | | | | 14,778 | |
| | | | | | | | | | | | 4,264,429 | |
| Variable Rate Demand Note — 30.7% | | | | | | | | | | | | |
| Variable Rate Demand Note — 30.7% | | | | | | | | | | | | |
| City of Colorado Springs Colorado Utilities System, Series 2007-A (a)(d) | | 3.630% | | 11/01/37 | | | 11,930,000 | | | | 11,930,000 | |
| City of Colorado Springs Colorado Utilities System, Series 2012-A (a)(d) | | 3.630% | | 11/01/41 | | | 1,840,000 | | | | 1,840,000 | |
| Colorado Health Facilities Authority, Series 2000 (d) | | 3.880% | | 10/01/30 | | | 1,950,000 | | | | 1,950,000 | |
| Colorado Health Facilities Authority, Series 2016-B (a)(d) | | 2.250% | | 12/01/45 | | | 26,490,000 | | | | 26,490,000 | |
| Colorado Health Facilities Authority, Series 2020-A (a)(d) | | 3.650% | | 12/01/52 | | | 9,000,000 | | | | 9,000,000 | |
| Colorado Health Facilities Authority, Series 2022-F (d) | | 3.560% | | 05/15/62 | | | 22,700,000 | | | | 22,700,000 | |
| Colorado Health Facilities Authority, Series 2022-E (d) | | 3.600% | | 05/15/62 | | | 31,300,000 | | | | 31,300,000 | |
| University of Colorado Hospital Authority, Series 2018-C (d) | | 3.650% | | 11/15/39 | | | 6,255,000 | | | | 6,255,000 | |
| University of Colorado Hospital Authority, Series 2019-A (d) | | 3.690% | | 11/15/49 | | | 10,000,000 | | | | 10,000,000 | |
| | | | | | | | | | | | 121,465,000 | |
| | | | | | | | | | | | | |
| Investments at Value — 97.0% (Cost $402,651,637) | | | | | | | | | | $ | 383,514,097 | |
| | | | | | | | | | | | | |
| Other Assets in Excess of Liabilities — 3.0% | | | | | | | | | | | 12,024,355 | |
| | | | | | | | | | | | | |
| Net Assets — 100.0% | | | | | | | | | | $ | 395,538,452 | |
| (a) | Security can be called and redeemed at the option of the issuer prior to the stated maturity date which is included in the Statement of Investments. |
| (b) | This security is insured. In the event of a default by the bond issuer, the issuer, as noted in the security description, guarantees that scheduled principal and interest payments will be made when due. |
| (c) | Security is considered a restricted security however such restriction has not resulted in an illiquid classification. The total value of these securities is $6,476,036, which represents 1.6% of net assets as of December 31, 2022. |
| (d) | Variable rate security. Interest rate resets periodically. The rate shown is the effective interest rate as of December 31, 2022. For securities based on a published reference rate and spread, the reference rate and spread (in basis points) are indicated parenthetically. Certain variable rate |
| See Notes to Financial Statements. | |
| 86 | | | www.sbhfunds.com |
| Segall Bryant & Hamill Colorado Tax Free Fund | Statement of Investments |
| | December 31, 2022 |
| | securities are not based on a published reference rate and spread but are determined by the issuer or agent and are based on current market conditions. These securities, therefore, do not indicate a reference rate and spread. |
The Fund’s sector and industry classifications presented herein refer to any one or more of the industry sub-classifications used by one or more widely recognized market indexes or ratings group indexes, and/or as defined by Fund management. For Fund compliance purposes, sector and industry classifications are based on the sector and industry categorization methodology of the Adviser to the Funds. This definition may not apply for purposes of this report, which may combine industry sub-classifications for reporting ease. Industries are shown as a percentage of net assets.
| See Notes to Financial Statements. | |
| Annual Report | December 31, 2022 | | | 87 |
| Segall Bryant & Hamill Funds | Statement of Investments |
| | December 31, 2022 |
| | |
| COMMON ABBREVIATIONS |
| | |
| A.B. | Aktiebolag is the Swedish equivalent of the term corporation. |
| | |
| ADR | American Depositary Receipt. |
| | |
| A.G. | Aktiengesellschaft is a German term that refers to a corporation that is limited by shares, i.e., owned by shareholders. |
| | |
| AGM | Assured Guaranty Municipal. |
| | |
| A.S. | Andonim Sirketi, Joint Stock Company in Turkey. |
| | |
| A/S | Aktieselskab is a Danish Joint Stock Company. |
| | |
| A.S.A | Aksjeselskop is the Norwegian term for a stock-based company. |
| | |
| BAM | Build America Mutual. |
| | |
| Bhd. | Berhad is a Malaysian term for a public limited company. |
| | |
| COP | Certificate of Participation. |
| | |
| H15T1Y | U.S. Treasury yield curve rate for U.S. Treasury note with a constant maturity of 1 year. |
| | |
| LIBOR | London Interbank Offered Rate. |
| | |
| LLC | Limited Liability Company. |
| | |
| LP | Limited Partnership. |
| | |
| Ltd. | Limited. |
| | |
| NATL | National Public Finance Guarantee Corp. |
| | |
| N.V. | Naamloze Vennootschap is the Dutch term for a public limited liability corporation. |
| | |
| OYJ | Julkinen osakeyhtiö means public stock company. |
| | |
| PCL | Public Company Limited. |
| | |
| PJSC | Public Joint-Stock Company. |
| | |
| PLC | Public Limited Company. |
| | |
| P.S.Q.C. | Pakistan Standards & Quality Control Authority. |
| | |
| Q.S.C. | Qatari Shareholding Company. |
| | |
| REIT(s) | Real Estate Investment Trust. |
| | |
| S.A. | Generally designates corporations in various countries, mostly those employing the civil law. This translates literally in all languages mentioned as anonymous company. |
| | |
| S.A.A. | Sociedad Anonima Abierta is a Peruvian term for a publicly held corporation. |
| | |
| S.A. de C.V. | Sociedad Anonima de Capital Variable is a corporative type of business in Mexico. |
| | |
| S.A.B de C.V. | Sociedad Anónima Bursátil de Capital Variable is the Mexican term for publicly traded companies. |
| | |
| S.A.K.P. | Suid Afrikaanse Kommunistiese Party. |
| | |
| SAPI de C.V. | Sociedad Anonima Promotora de Inversion de Capital Variable is a corporative type of business in Mexixo. |
| | |
| SARL | Societe Anonyme a Responsabilite Limitee is the French term for Limited Liability Company. |
| | |
| S.E. | SE Regulation. A European Company which can operate on a Europe-wide basis and be governed by Community law directly applicable in all Member States. |
| | |
| SJSC | Saudi Joint-Stock Company. |
| | |
| SOFR | Secured Overnight Financing Rate. |
| | |
| S.p.A. | Societa per azioni is the Italian equivalent of the term Public Limited Companies. |
| Tbk P.T. | Terbuka Perseroan Terbatas is an Indonesia term for a public limited company. |
| | |
| LIBOR Rates as of December 31, 2022: |
| | |
| 1MO LIBOR 4.40% |
| | |
| 3MO LIBOR 4.78% |
| See Notes to Financial Statements. | |
| 88 | | | www.sbhfunds.com |
| Segall Bryant & Hamill Funds | Statements of Assets and Liabilities |
| | December 31, 2022 |
| | | Segall Bryant & | | | Segall Bryant & | | | Segall Bryant & | |
| | | Hamill Small Cap | | | Hamill Small Cap | | | Hamill Small Cap | |
| | | Value Fund | | | Growth Fund | | | Core Fund | |
| Assets | | | | | | | | | | | | |
| Investments, at cost | | $ | 513,730,640 | | | $ | 184,979,255 | | | $ | 41,526,637 | |
| Investments, at value | | $ | 543,454,764 | | | $ | 176,695,916 | | | $ | 48,080,698 | |
| Cash equivalents (Note 2) | | | 43,584,502 | | | | 5,926,909 | | | | 3,508,197 | |
| Receivable for Fund shares sold | | | 506,646 | | | | 329,602 | | | | 9,310 | |
| Receivable for investment securities sold | | | 2,221,608 | | | | 1,500,443 | | | | 856,338 | |
| Dividends and interest receivable | | | 390,115 | | | | 94,534 | | | | 35,174 | |
| Other assets | | | 77,851 | | | | 36,569 | | | | 25,878 | |
| Total assets | | | 590,235,486 | | | | 184,583,973 | | | | 52,515,595 | |
| | | | | | | | | | | | | |
| Liabilities | | | | | | | | | | | | |
| Payable for Fund shares redeemed | | | 631,687 | | | | 187,997 | | | | — | |
| Payable to Adviser (Note 6) | | | 409,840 | | | | 103,067 | | | | 29,169 | |
| Accrued shareholder servicing fees (Note 6) | | | 67,155 | | | | 38,478 | | | | 2,446 | |
| Payable to third party administrator (Note 6) | | | 18,624 | | | | 7,886 | | | | 3,951 | |
| Accrued chief compliance officer fees (Note 6) | | | 2,292 | | | | 824 | | | | 354 | |
| Other accrued expenses | | | 37,005 | | | | 22,775 | | | | 18,335 | |
| Total liabilities | | | 1,166,603 | | | | 361,027 | | | | 54,255 | |
| Net Assets | | $ | 589,068,883 | | | $ | 184,222,946 | | | $ | 52,461,340 | |
| | | | | | | | | | | | | |
| Net Assets Consists of | | | | | | | | | | | | |
| Paid-in capital | | $ | 580,415,803 | | | $ | 258,430,197 | | | $ | 40,950,817 | |
| Accumulated earnings (deficit) | | | 8,653,080 | | | | (74,207,251 | ) | | | 11,510,523 | |
| Net Assets | | $ | 589,068,883 | | | $ | 184,222,946 | | | $ | 52,461,340 | |
| | | | | | | | | | | | | |
| Net Assets | | | | | | | | | | | | |
| Retail | | $ | 8,291,899 | | | $ | 42,198,865 | | | $ | 727,885 | |
| Institutional | | | 580,776,984 | | | | 142,024,081 | | | | 51,733,455 | |
| Shares of Beneficial Interest Outstanding | | | | | | | | | | | | |
| Retail | | | 663,342 | | | | 2,726,972 | | | | 67,641 | |
| Institutional | | | 46,403,389 | | | | 8,941,501 | | | | 4,783,525 | |
| Net Asset Value and Redemption Price Per Share (Net Assets Per Share Outstanding) | | | | | | | | | | | | |
| Retail | | $ | 12.50 | | | $ | 15.47 | | | $ | 10.76 | |
| Institutional | | $ | 12.52 | | | $ | 15.88 | | | $ | 10.81 | |
| See Notes to Financial Statements. | |
| Annual Report | December 31, 2022 | | | 89 |
| Segall Bryant & Hamill Funds | Statements of Assets and Liabilities |
| | December 31, 2022 |
| | | | | | | | | Segall Bryant | |
| | | Segall Bryant & | | | Segall Bryant & | | | & Hamill | |
| | | Hamill | | | Hamill Emerging | | | International | |
| | | All Cap Fund | | | Markets Fund | | | Small Cap Fund | |
| Assets | | | | | | | | | | | | |
| Investments, at cost | | $ | 82,683,802 | | | $ | 39,984,290 | | | $ | 93,908,227 | |
| Investments, at value | | $ | 125,702,676 | | | $ | 40,723,887 | | | $ | 94,961,908 | |
| Cash equivalents (Note 2) | | | 5,049,733 | | | | — | | | | — | |
| Foreign currency, at value (Cost $—, $10,926, and $—, respectively) | | | — | | | | 10,538 | | | | — | |
| Receivable for Fund shares sold | | | 129,925 | | | | — | | | | — | |
| Receivable for investment securities sold | | | — | | | | 758,285 | | | | 343,581 | |
| Due from Adviser | | | — | | | | 23,118 | | | | — | |
| Dividends and interest receivable | | | 77,791 | | | | 137,427 | | | | 286,864 | |
| Foreign tax reclaims receivable | | | 546 | | | | 1,714 | | | | 986,466 | |
| Other assets | | | 32,537 | | | | 21,680 | | | | 32,918 | |
| Total assets | | | 130,993,208 | | | | 41,676,649 | | | | 96,611,737 | |
| | | | | | | | | | | | | |
| Liabilities | | | | | | | | | | | | |
| Due to custodian | | | — | | | | 683,256 | | | | 251,601 | |
| Payable for Fund shares redeemed | | | 54,982 | | | | 136,637 | | | | 12,650 | |
| Accrued foreign capital gains on appreciated securities | | | — | | | | 195,299 | | | | — | |
| Payable to Adviser (Note 6) | | | 65,433 | | | | 43,962 | | | | — | |
| Accrued shareholder servicing fees (Note 6) | | | 17,935 | | | | 5,311 | | | | 18,423 | |
| Payable to third party administrator (Note 6) | | | 6,024 | | | | 3,657 | | | | 5,119 | |
| Accrued chief compliance officer fees (Note 6) | | | 632 | | | | 315 | | | | 506 | |
| Other accrued expenses | | | 20,012 | | | | 54,381 | | | | 48,581 | |
| Total liabilities | | | 165,018 | | | | 1,078,856 | | | | 380,842 | |
| Net Assets | | $ | 130,828,190 | | | $ | 40,597,793 | | | $ | 96,230,895 | |
| | | | | | | | | | | | | |
| Net Assets Consists of | | | | | | | | | | | | |
| Paid-in capital | | $ | 85,991,003 | | | $ | 46,380,552 | | | $ | 180,845,139 | |
| Accumulated earnings (deficit) | | | 44,837,187 | | | | (5,782,759 | ) | | | (84,614,244 | ) |
| Net Assets | | $ | 130,828,190 | | | $ | 40,597,793 | | | $ | 96,230,895 | |
| | | | | | | | | | | | | |
| Net Assets | | | | | | | | | | | | |
| Retail | | $ | 795,566 | | | $ | 1,951,966 | | | $ | 9,757,478 | |
| Institutional | | | 130,032,624 | | | | 38,645,827 | | | | 86,473,417 | |
| Shares of Beneficial Interest Outstanding | | | | | | | | | | | | |
| Retail | | | 43,676 | | | | 265,469 | | | | 1,018,223 | |
| Institutional | | | 7,133,257 | | | | 5,243,149 | | | | 9,014,045 | |
| Net Asset Value and Redemption Price Per Share (Net Assets Per Share Outstanding) | | | | | | | | | | | | |
| Retail | | $ | 18.22 | | | $ | 7.35 | | | $ | 9.58 | |
| Institutional | | $ | 18.23 | | | $ | 7.37 | | | $ | 9.59 | |
| See Notes to Financial Statements. | |
| 90 | | | www.sbhfunds.com |
| Segall Bryant & Hamill Funds | Statements of Assets and Liabilities |
| | December 31, 2022 |
| | | Segall Bryant | | | | | | | | | | |
| | | & Hamill | | | | | | | | | | |
| | | Fundamental | | | Segall Bryant & | | | Segall Bryant & | | | Segall Bryant & | |
| | | International | | | Hamill Global | | | Hamill Workplace | | | Hamill Short Term | |
| | | Small Cap Fund | | | All Cap Fund | | | Equality Fund | | | Plus Fund | |
| Assets | | | | | | | | | | | | | | | | |
| Investments, at cost | | $ | 49,510,917 | | | $ | 23,074,095 | | | $ | 20,036,641 | | | $ | 28,821,653 | |
| Investments, at value | | $ | 44,913,383 | | | $ | 26,592,454 | | | $ | 21,195,335 | | | $ | 27,738,156 | |
| Cash equivalents (Note 2) | | | 976,708 | | | | 410,786 | | | | 509,497 | | | | 612,482 | |
| Foreign currency, at value (Cost $—, $2, $—, and $—, respectively) | | | — | | | | 2 | | | | — | | | | — | |
| Receivable for Fund shares sold | | | 53,539 | | | | 127 | | | | — | | | | — | |
| Receivable for investment securities sold | | | 222,092 | | | | 41,813 | | | | — | | | | — | |
| Due from Adviser | | | — | | | | — | | | | 1,478 | | | | 13,657 | |
| Dividends and interest receivable | | | 19,459 | | | | 8,176 | | | | 22,791 | | | | 258,885 | |
| Foreign tax reclaims receivable | | | 78,495 | | | | 76,264 | | | | — | | | | — | |
| Other assets | | | 22,272 | | | | 15,234 | | | | 13,691 | | | | 16,798 | |
| Total assets | | | 46,285,948 | | | | 27,144,856 | | | | 21,742,792 | | | | 28,639,978 | |
| | | | | | | | | | | | | | | | | |
| Liabilities | | | | | | | | | | | | | | | | |
| Payable for Fund shares redeemed | | | 5 | | | | 3,689 | | | | 1,159 | | | | — | |
| Payable for investment securities purchased | | | 209,043 | | | | — | | | | — | | | | — | |
| Payable to Adviser (Note 6) | | | 19,339 | | | | 2,506 | | | | — | | | | — | |
| Accrued shareholder servicing fees (Note 6) | | | 13,866 | | | | 4,214 | | | | 4,572 | | | | 7,634 | |
| Payable to third party administrator (Note 6) | | | 3,904 | | | | 3,634 | | | | 3,088 | | | | 3,347 | |
| Accrued chief compliance officer fees (Note 6) | | | 335 | | | | 264 | | | | 245 | | | | 269 | |
| Other accrued expenses | | | 22,116 | | | | 17,178 | | | | 16,332 | | | | 23,003 | |
| Total liabilities | | | 268,608 | | | | 31,485 | | | | 25,396 | | | | 34,253 | |
| Net Assets | | $ | 46,017,340 | | | $ | 27,113,371 | | | $ | 21,717,396 | | | $ | 28,605,725 | |
| | | | | | | | | | | | | | | | | |
| Net Assets Consists of | | | | | | | | | | | | | | | | |
| Paid-in capital | | $ | 60,216,716 | | | $ | 23,573,882 | | | $ | 21,066,826 | | | $ | 30,416,084 | |
| Accumulated earnings (deficit) | | | (14,199,376 | ) | | | 3,539,489 | | | | 650,570 | | | | (1,810,359 | ) |
| Net Assets | | $ | 46,017,340 | | | $ | 27,113,371 | | | $ | 21,717,396 | | | $ | 28,605,725 | |
| | | | | | | | | | | | | | | | | |
| Net Assets | | | | | | | | | | | | | | | | |
| Retail | | $ | 21,023,429 | | | $ | 25,421,594 | | | $ | 7,504,458 | | | $ | 3,828,237 | |
| Institutional | | | 24,993,911 | | | | 1,691,777 | | | | 14,212,938 | | | | 24,777,488 | |
| Shares of Beneficial Interest Outstanding | | | | | | | | | | | | | | | | |
| Retail | | | 1,486,611 | | | | 2,898,775 | | | | 1,221,054 | | | | 392,088 | |
| Institutional | | | 1,617,114 | | | | 195,719 | | | | 2,236,339 | | | | 2,534,752 | |
| Net Asset Value and Redemption Price Per Share (Net Assets Per Share Outstanding) | | | | | | | | | | | | | | | | |
| Retail | | $ | 14.14 | | | $ | 8.77 | | | $ | 6.15 | | | $ | 9.76 | |
| Institutional | | $ | 15.46 | | | $ | 8.64 | | | $ | 6.36 | | | $ | 9.78 | |
| See Notes to Financial Statements. | |
| Annual Report | December 31, 2022 | | | 91 |
| Segall Bryant & Hamill Funds | Statements of Assets and Liabilities |
| | December 31, 2022 |
| | | | | | | | | Segall Bryant & | | | | |
| | | Segall Bryant & | | | Segall Bryant & | | | Hamill Municipal | | | Segall Bryant & | |
| | | Hamill Plus | | | Hamill Quality | | | Opportunities | | | Hamill Colorado | |
| | | Bond Fund | | | High Yield Fund | | | Fund | | | Tax Free Fund | |
| Assets | | | | | | | | | | | | | | | | |
| Investments, at cost | | $ | 758,020,298 | | | $ | 74,260,253 | | | $ | 224,401,133 | | | $ | 402,651,637 | |
| Investments, at value | | $ | 665,660,990 | | | $ | 64,560,312 | | | $ | 216,072,784 | | | $ | 383,514,097 | |
| Cash equivalents (Note 2) | | | 10,390,267 | | | | 386,273 | | | | 2,320,147 | | | | 13,651,030 | |
| Receivable for Fund shares sold | | | 1,139,769 | | | | 101,269 | | | | 476,142 | | | | 290,747 | |
| Receivable for investment securities sold | | | 147 | | | | — | | | | 9,849,586 | | | | — | |
| Dividends and interest receivable | | | 5,455,003 | | | | 1,048,695 | | | | 1,347,575 | | | | 1,659,862 | |
| Other assets | | | 48,222 | | | | 15,633 | | | | 43,746 | | | | 29,284 | |
| Total assets | | | 682,694,398 | | | | 66,112,182 | | | | 230,109,980 | | | | 399,145,020 | |
| | | | | | | | | | | | | | | | | |
| Liabilities | | | | | | | | | | | | | | | | |
| Payable for Fund shares redeemed | | | 1,658,690 | | | | 279,025 | | | | 18,168,454 | | | | 1,876,740 | |
| Payable for investment securities purchased | | | — | | | | — | | | | — | | | | 1,454,320 | |
| Payable to Adviser (Note 6) | | | 133,765 | | | | 10,578 | | | | 43,921 | | | | 104,903 | |
| Accrued shareholder servicing fees (Note 6) | | | 185,664 | | | | 15,770 | | | | 53,129 | | | | 117,327 | |
| Payable to third party administrator (Note 6) | | | 21,678 | | | | 4,369 | | | | 9,152 | | | | 13,467 | |
| Accrued chief compliance officer fees (Note 6) | | | 2,604 | | | | 403 | | | | 1,019 | | | | 1,605 | |
| Other accrued expenses | | | 49,170 | | | | 24,107 | | | | 29,252 | | | | 38,206 | |
| Total liabilities | | | 2,051,571 | | | | 334,252 | | | | 18,304,927 | | | | 3,606,568 | |
| Net Assets | | $ | 680,642,827 | | | $ | 65,777,930 | | | $ | 211,805,053 | | | $ | 395,538,452 | |
| | | | | | | | | | | | | | | | | |
| Net Assets Consists of | | | | | | | | | | | | | | | | |
| Paid-in capital | | $ | 801,630,464 | | | $ | 85,332,184 | | | $ | 248,917,090 | | | $ | 454,942,782 | |
| Accumulated deficit | | | (120,987,637 | ) | | | (19,554,254 | ) | | | (37,112,037 | ) | | | (59,404,330 | ) |
| Net Assets | | $ | 680,642,827 | | | $ | 65,777,930 | | | $ | 211,805,053 | | | $ | 395,538,452 | |
| | | | | | | | | | | | | | | | | |
| Net Assets | | | | | | | | | | | | | | | | |
| Retail | | $ | 311,041,668 | | | $ | 27,855,055 | | | $ | 35,120,303 | | | $ | 143,557,858 | |
| Institutional | | | 369,601,159 | | | | 37,922,875 | | | | 176,684,750 | | | | 251,980,594 | |
| Shares of Beneficial Interest Outstanding | | | | | | | | | | | | | | | | |
| Retail | | | 34,026,606 | | | | 3,488,720 | | | | 3,696,686 | | | | 13,876,309 | |
| Institutional | | | 40,857,185 | | | | 4,807,299 | | | | 18,585,895 | | | | 24,259,228 | |
| Net Asset Value and Redemption Price Per Share (Net Assets Per Share Outstanding) | | | | | | | | | | | | | | | | |
| Retail | | $ | 9.14 | | | $ | 7.98 | | | $ | 9.50 | | | $ | 10.35 | |
| Institutional | | $ | 9.05 | | | $ | 7.89 | | | $ | 9.51 | | | $ | 10.39 | |
| See Notes to Financial Statements. | |
| 92 | | | www.sbhfunds.com |
| Segall Bryant & Hamill Funds | Statements of Operations |
| | For the Year Ended December 31, 2022 |
| | | Segall Bryant & | | | Segall Bryant & | | | Segall Bryant & | |
| | | Hamill Small Cap | | | Hamill Small Cap | | | Hamill Small Cap | |
| | | Value Fund | | | Growth Fund | | | Core Fund | |
| Investment Income | | | | | | | | | | | | |
| Dividends | | $ | 7,869,054 | | | $ | 608,249 | | | $ | 500,347 | |
| Interest | | | 643,944 | | | | 109,182 | | | | 53,645 | |
| Foreign taxes withheld | | | (25,306 | ) | | | (4,530 | ) | | | (4,128 | ) |
| Total income | | | 8,487,692 | | | | 712,901 | | | | 549,864 | |
| | | | | | | | | | | | | |
| Expenses | | | | | | | | | | | | |
| Investment advisory fees (Note 6) | | | 4,791,487 | | | | 1,175,966 | | | | 399,217 | |
| Shareholder servicing fees (Note 6) | | | | | | | | | | | | |
| Retail Class | | | 14,471 | | | | 118,615 | | | | 2,755 | |
| Institutional Class | | | 378,337 | | | | 105,819 | | | | 14,640 | |
| Administrative fees (Note 6) | | | 196,858 | | | | 66,457 | | | | 25,137 | |
| Registration and filing fees | | | 64,254 | | | | 61,038 | | | | 40,767 | |
| Custodian fees | | | 22,097 | | | | 21,460 | | | | 17,141 | |
| Trustee fees and expenses | | | 82,633 | | | | 23,559 | | | | 6,958 | |
| Transfer agent fees (Note 6) | | | 22,054 | | | | 24,848 | | | | 20,374 | |
| Independent pricing service fees | | | 1,696 | | | | 1,719 | | | | 1,794 | |
| Shareholder reporting expenses | | | 34,614 | | | | 18,801 | | | | 2,618 | |
| Audit and tax preparation fees | | | 15,611 | | | | 13,611 | | | | 13,611 | |
| Insurance expense | | | 29,199 | | | | 9,605 | | | | 2,580 | |
| Chief compliance officer fees (Note 6) | | | 24,691 | | | | 8,767 | | | | 3,902 | |
| Legal fees | | | 23,263 | | | | 7,081 | | | | 1,912 | |
| Other | | | 29,238 | | | | 20,069 | | | | 12,171 | |
| Total expenses before waivers/reimbursements | | | 5,730,503 | | | | 1,677,415 | | | | 565,577 | |
| Expenses waived/reimbursed by investment adviser | | | — | | | | — | | | | (69,897 | ) |
| Net expenses | | | 5,730,503 | | | | 1,677,415 | | | | 495,680 | |
| Net Investment Income (Loss) | | | 2,757,189 | | | | (964,514 | ) | | | 54,184 | |
| | | | | | | | | | | | | |
| Realized and Unrealized Gains (Losses) | | | | | | | | | | | | |
| Net realized gains (losses) on: | | | | | | | | | | | | |
| Investments | | | (4,194,829 | ) | | | (29,474,046 | ) | | | (364,292 | ) |
| Foreign currency | | | (3 | ) | | | 5 | | | | — | |
| | | | (4,194,832 | ) | | | (29,474,041 | ) | | | (364,292 | ) |
| Change in unrealized net appreciation/depreciation on: | | | | | | | | | | | | |
| Investments | | | (91,223,389 | ) | | | (47,413,915 | ) | | | (5,814,708 | ) |
| | | | | | | | | | | | | |
| Net realized and unrealized losses | | | (95,418,221 | ) | | | (76,887,956 | ) | | | (6,179,000 | ) |
| Net Decrease in Net Assets Resulting From Operations | | $ | (92,661,032 | ) | | $ | (77,852,470 | ) | | $ | (6,124,816 | ) |
| See Notes to Financial Statements. | |
| Annual Report | December 31, 2022 | | | 93 |
| Segall Bryant & Hamill Funds | Statements of Operations |
| | For the Year Ended December 31, 2022 |
| | | | | | | | | Segall Bryant | |
| | | Segall Bryant & | | | Segall Bryant & | | | & Hamill | |
| | | Hamill | | | Hamill Emerging | | | International | |
| | | All Cap Fund | | | Markets Fund | | | Small Cap Fund | |
| Investment Income | | | | | | | | | | | | |
| Dividends | | $ | 1,737,648 | | | $ | 2,787,332 | | | $ | 7,185,961 | |
| Interest | | | 53,405 | | | | 12,401 | | | | 6,994 | |
| Foreign taxes withheld | | | (24,285 | ) | | | (250,579 | ) | | | (789,065 | ) |
| Total income | | | 1,766,768 | | | | 2,549,154 | | | | 6,403,890 | |
| | | | | | | | | | | | | |
| Expenses | | | | | | | | | | | | |
| Investment advisory fees (Note 6) | | | 961,533 | | | | 441,661 | | | | 1,048,022 | |
| Shareholder servicing fees (Note 6) | | | | | | | | | | | | |
| Retail Class | | | 498 | | | | 4,977 | | | | 58,424 | |
| Institutional Class | | | 132,526 | | | | 25,974 | | | | 42,565 | |
| Administrative fees (Note 6) | | | 56,163 | | | | 25,318 | | | | 46,394 | |
| Registration and filing fees | | | 48,947 | | | | 46,064 | | | | 46,185 | |
| Custodian fees | | | 12,723 | | | | 165,875 | | | | 73,367 | |
| Trustee fees and expenses | | | 19,450 | | | | 6,461 | | | | 14,604 | |
| Transfer agent fees (Note 6) | | | 20,426 | | | | 20,713 | | | | 20,485 | |
| Independent pricing service fees | | | 1,341 | | | | 65,691 | | | | 39,631 | |
| Shareholder reporting fees | | | 10,908 | | | | 3,567 | | | | 3,754 | |
| Audit and tax preparation fees | | | 13,611 | | | | 18,610 | | | | 20,611 | |
| Insurance expense | | | 8,828 | | | | 2,847 | | | | 7,902 | |
| Chief compliance officer fees (Note 6) | | | 7,515 | | | | 3,841 | | | | 6,293 | |
| Legal fees | | | 5,723 | | | | 1,917 | | | | 4,569 | |
| Other | | | 15,482 | | | | 102,013 | | | | 50,142 | |
| Total expenses before waivers/reimbursements | | | 1,315,674 | | | | 935,529 | | | | 1,482,948 | |
| Expenses waived/reimbursed by investment adviser | | | (72,908 | ) | | | (328,358 | ) | | | (248,038 | ) |
| Net expenses | | | 1,242,766 | | | | 607,171 | | | | 1,234,910 | |
| Net Investment Income | | | 524,002 | | | | 1,941,983 | | | | 5,168,980 | |
| | | | | | | | | | | | | |
| Realized and Unrealized Gains (Losses) | | | | | | | | | | | | |
| Net realized gains (losses) on: | | | | | | | | | | | | |
| Investments | | | 11,095,673 | | | | (5,099,495 | ) (a) | | | (10,144,460 | ) |
| Foreign currency | | | (1,179 | ) | | | (77,659 | ) | | | (81,281 | ) |
| | | | 11,094,494 | | | | (5,177,154 | ) | | | (10,225,741 | ) |
| Change in unrealized net appreciation/depreciation on: | | | | | | | | | | | | |
| Investments | | | (46,691,676 | ) | | | (5,921,480 | ) (b) | | | (15,092,100 | ) |
| Translation of assets and liabilities denoted in foreign currencies | | | — | | | | (1,750 | ) | | | (55,006 | ) |
| | | | (46,691,676 | ) | | | (5,923,230 | ) | | | (15,147,106 | ) |
| Net realized and unrealized losses | | | (35,597,182 | ) | | | (11,100,384 | ) | | | (25,372,847 | ) |
| Net Decrease in Net Assets Resulting From Operations | | $ | (35,073,180 | ) | | $ | (9,158,401 | ) | | $ | (20,203,867 | ) |
| (a) | Net of foreign capital gains tax of $135,147 |
| (b) | Net change in deferred foreign capital gains tax of $62,073 |
| See Notes to Financial Statements. | |
| 94 | | | www.sbhfunds.com |
| Segall Bryant & Hamill Funds | Statements of Operations |
| | For the Year Ended December 31, 2022 |
| | | Segall Bryant | | | | | | | | | | |
| | | & Hamill | | | | | | | | | | |
| | | Fundamental | | | Segall Bryant & | | | Segall Bryant & | | | Segall Bryant & | |
| | | International | | | Hamill Global | | | Hamill Workplace | | | Hamill Short Term | |
| | | Small Cap Fund | | | All Cap Fund | | | Equality Fund | | | Plus Fund | |
| Investment Income | | | | | | | | | | | | | | | | |
| Dividends | | $ | 1,029,071 | | | $ | 366,176 | | | $ | 300,819 | | | $ | — | |
| Interest | | | 9,632 | | | | 9,952 | | | | 7,246 | | | | 510,012 | |
| Foreign taxes withheld | | | (101,103 | ) | | | (41,040 | ) | | | (159 | ) | | | — | |
| Total income | | | 937,600 | | | | 335,088 | | | | 307,906 | | | | 510,012 | |
| | | | | | | | | | | | | | | | | |
| Expenses | | | | | | | | | | | | | | | | |
| Investment advisory fees (Note 6) | | | 633,877 | | | | 191,605 | | | | 158,726 | | | | 105,680 | |
| Shareholder servicing fees (Note 6) | | | | | | | | | | | | | | | | |
| Retail Class | | | 56,527 | | | | 29,015 | | | | 11,163 | | | | 16,926 | |
| Institutional Class | | | 36,442 | | | | 2,270 | | | | 15,516 | | | | 35,226 | |
| Administrative fees (Note 6) | | | 31,816 | | | | 19,197 | | | | 17,554 | | | | 23,195 | |
| Registration and filing fees | | | 53,965 | | | | 43,862 | | | | 47,612 | | | | 45,261 | |
| Custodian fees | | | 33,058 | | | | 15,109 | | | | 11,164 | | | | 13,405 | |
| Trustee fees and expenses | | | 7,862 | | | | 3,856 | | | | 3,264 | | | | 5,350 | |
| Transfer agent fees (Note 6) | | | 22,149 | | | | 24,547 | | | | 20,774 | | | | 20,100 | |
| Independent pricing service fees | | | 6,999 | | | | 3,871 | | | | 1,021 | | | | 16,010 | |
| Shareholder reporting fees | | | 7,936 | | | | 7,503 | | | | 3,048 | | | | 2,788 | |
| Audit and tax preparation fees | | | 16,611 | | | | 13,611 | | | | 13,611 | | | | 17,611 | |
| Insurance expense | | | 3,813 | | | | 1,754 | | | | 1,317 | | | | 2,121 | |
| Chief compliance officer fees (Note 6) | | | 4,326 | | | | 3,103 | | | | 2,911 | | | | 3,578 | |
| Legal fees | | | 2,535 | | | | 1,138 | | | | 947 | | | | 1,640 | |
| Other | | | 35,573 | | | | 17,826 | | | | 11,666 | | | | 10,571 | |
| Total expenses before waivers/reimbursements | | | 953,489 | | | | 378,267 | | | | 320,294 | | | | 319,462 | |
| Expenses waived/reimbursed by investment adviser | | | (215,859 | ) | | | (118,780 | ) | | | (126,237 | ) | | | (144,032 | ) |
| Net expenses | | | 737,630 | | | | 259,487 | | | | 194,057 | | | | 175,430 | |
| Net Investment Income | | | 199,970 | | | | 75,601 | | | | 113,849 | | | | 334,582 | |
| | | | | | | | | | | | | | | | | |
| Realized and Unrealized Gains (Losses) | | | | | | | | | | | | | | | | |
| Net realized gains (losses) on: | | | | | | | | | | | | | | | | |
| Investments | | | (7,945,249 | ) | | | 65,404 | | | | (463,589 | ) | | | (658,535 | ) |
| Forward foreign currency contracts | | | (560,758 | ) | | | — | | | | — | | | | — | |
| Foreign currency | | | (33,042 | ) | | | 7,975 | | | | — | | | | — | |
| | | | (8,539,049 | ) | | | 73,379 | | | | (463,589 | ) | | | (658,535 | ) |
| Change in unrealized net appreciation/depreciation on: | | | | | | | | | | | | | | | | |
| Investments | | | (24,464,006 | ) | | | (7,065,484 | ) | | | (5,853,984 | ) | | | (829,397 | ) |
| Forward foreign currency contracts | | | 199,660 | | | | — | | | | — | | | | — | |
| Translation of assets and liabilities denoted in foreign currencies | | | (1,816 | ) | | | (2,202 | ) | | | — | | | | — | |
| | | | (24,266,162 | ) | | | (7,067,686 | ) | | | (5,853,984 | ) | | | (829,397 | ) |
| Net realized and unrealized losses | | | (32,805,211 | ) | | | (6,994,307 | ) | | | (6,317,573 | ) | | | (1,487,932 | ) |
| Net Decrease in Net Assets Resulting From Operations | | $ | (32,605,241 | ) | | $ | (6,918,706 | ) | | $ | (6,203,724 | ) | | $ | (1,153,350 | ) |
| See Notes to Financial Statements. | |
| Annual Report | December 31, 2022 | | | 95 |
| Segall Bryant & Hamill Funds | Statements of Operations |
| | For the Year Ended December 31, 2022 |
| | | | | | | | | Segall Bryant & | | | | |
| | | Segall Bryant & | | | Segall Bryant & | | | Hamill Municipal | | | Segall Bryant & | |
| | | Hamill Plus | | | Hamill Quality | | | Opportunities | | | Hamill Colorado | |
| | | Bond Fund | | | High Yield Fund | | | Fund | | | Tax Free Fund | |
| Investment Income | | | | | | | | | | | | | | | | |
| Interest | | $ | 27,800,479 | | | $ | 3,889,555 | | | $ | 7,633,735 | | | $ | 12,678,170 | |
| | | | | | | | | | | | | | | | | |
| Expenses | | | | | | | | | | | | | | | | |
| Investment advisory fees (Note 6) | | | 2,938,771 | | | | 376,268 | | | | 951,972 | | | | 1,696,963 | |
| Shareholder servicing fees (Note 6) | | | | | | | | | | | | | | | | |
| Retail Class | | | 867,837 | | | | 69,040 | | | | 101,369 | | | | 402,880 | |
| Institutional Class | | | 349,421 | | | | 47,063 | | | | 199,133 | | | | 260,466 | |
| Administrative fees (Note 6) | | | 271,841 | | | | 36,014 | | | | 94,917 | | | | 161,492 | |
| Registration and filing fees | | | 64,767 | | | | 48,082 | | | | 65,683 | | | | 34,126 | |
| Custodian fees | | | 27,432 | | | | 16,106 | | | | 14,412 | | | | 15,071 | |
| Trustee fees and expenses | | | 107,744 | | | | 10,869 | | | | 37,008 | | | | 63,625 | |
| Transfer agent fees (Note 6) | | | 31,430 | | | | 21,771 | | | | 22,502 | | | | 22,218 | |
| Independent pricing service fees | | | 41,083 | | | | 15,806 | | | | 38,161 | | | | 57,612 | |
| Shareholder reporting fees | | | 48,444 | | | | 9,239 | | | | 8,606 | | | | 9,585 | |
| Audit and tax preparation fees | | | 19,611 | | | | 17,611 | | | | 15,611 | | | | 15,611 | |
| Insurance expense | | | 48,548 | | | | 4,641 | | | | 12,319 | | | | 26,326 | |
| Chief compliance officer fees (Note 6) | | | 33,420 | | | | 5,133 | | | | 12,321 | | | | 20,202 | |
| Legal fees | | | 32,619 | | | | 3,250 | | | | 10,550 | | | | 18,793 | |
| Other | | | 43,731 | | | | 14,227 | | | | 17,449 | | | | 25,305 | |
| Total expenses before waivers/reimbursements | | | 4,926,699 | | | | 695,120 | | | | 1,602,013 | | | | 2,830,275 | |
| Expenses waived/reimbursed by investment adviser | | | (998,736 | ) | | | (59,140 | ) | | | (181,589 | ) | | | (141,948 | ) |
| Net expenses | | | 3,927,963 | | | | 635,980 | | | | 1,420,424 | | | | 2,688,327 | |
| Net Investment Income | | | 23,872,516 | | | | 3,253,575 | | | | 6,213,311 | | | | 9,989,843 | |
| | | | | | | | | | | | | | | | | |
| Realized and Unrealized Losses | | | | | | | | | | | | | | | | |
| Net realized losses on: | | | | | | | | | | | | | | | | |
| Investments | | | (24,473,862 | ) | | | (1,115,170 | ) | | | (24,579,074 | ) | | | (29,614,050 | ) |
| | | | | | | | | | | | | | | | | |
| Change in unrealized net appreciation/depreciation on: | | | | | | | | | | | | | | | | |
| Investments | | | (129,200,223 | ) | | | (11,930,262 | ) | | | (15,231,250 | ) | | | (39,663,177 | ) |
| | | | | | | | | | | | | | | | | |
| Net realized and unrealized losses | | | (153,674,085 | ) | | | (13,045,432 | ) | | | (39,810,324 | ) | | | (69,277,227 | ) |
| Net Decrease in Net Assets Resulting From Operations | | $ | (129,801,569 | ) | | $ | (9,791,857 | ) | | $ | (33,597,013 | ) | | $ | (59,287,384 | ) |
| See Notes to Financial Statements. | |
| 96 | | | www.sbhfunds.com |
| Segall Bryant & Hamill Funds | Statements of Changes in Net Assets |
| | | Segall Bryant & Hamill | | | Segall Bryant & Hamill | | | Segall Bryant & Hamill | |
| | | Small Cap Value Fund | | | Small Cap Growth Fund | | | Small Cap Core Fund | |
| | | Year Ended | | | Year Ended | | | Year Ended | | | Year Ended | | | Year Ended | | | Year Ended | |
| | | December 31, | | | December 31, | | | December 31, | | | December 31, | | | December 31, | | | December 31, | |
| | | 2022 | | | 2021 | | | 2022 | | | 2021 | | | 2022 | | | 2021 | |
| Operations | | | | | | | | | | | | | | | | | | |
| Net investment income (loss) | | $ | 2,757,189 | | | $ | 1,253,332 | | | $ | (964,514 | ) | | $ | (1,104,000 | ) | | $ | 54,184 | | | $ | (74,093 | ) |
| Net realized gains (losses) | | | (4,194,832 | ) | | | 37,263,573 | | | | (29,474,041 | ) | | | 22,565,130 | | | | (364,292 | ) | | | 5,943,663 | |
| Change in unrealized net appreciation/depreciation | | | (91,223,389 | ) | | | 34,670,349 | | | | (47,413,915 | ) | | | (5,293,483 | ) | | | (5,814,708 | ) | | | 5,108,617 | |
| Net increase (decrease) in net assets resulting from operations | | | (92,661,032 | ) | | | 73,187,254 | | | | (77,852,470 | ) | | | 16,167,647 | | | | (6,124,816 | ) | | | 10,978,187 | |
| | | | | | | | | | | | | | | | | | | | | | | | | |
| Distributions to Shareholders (Note 5) | | | | | | | | | | | | | | | | | | | | | | | | |
| From distributable earnings | | | | | | | | | | | | | | | | | | | | | | | | |
| Retail | | | (94,373 | ) | | | (416,535 | ) | | | — | | | | — | | | | (14,101 | ) | | | (291,052 | ) |
| Institutional | | | (7,283,529 | ) | | | (26,594,822 | ) | | | — | | | | — | | | | (1,069,374 | ) | | | (8,394,213 | ) |
| Decrease in net assets from distributions to shareholders | | | (7,377,902 | ) | | | (27,011,357 | ) | | | — | | | | — | | | | (1,083,475 | ) | | | (8,685,265 | ) |
| | | | | | | | | | | | | | | | | | | | | | | | | |
| Beneficial Interest Transactions (Note 4) | | | | | | | | | | | | | | | | | | | | | | | | |
| Shares sold | | | | | | | | | | | | | | | | | | | | | | | | |
| Retail | | | 1,328,818 | | | | 3,050,835 | | | | 25,175,411 | | | | 49,463,143 | | | | 376,001 | | | | 1,417,224 | |
| Institutional | | | 256,225,204 | | | | 337,970,835 | | | | 90,289,646 | | | | 85,691,386 | | | | 10,979,205 | | | | 785,331 | |
| Shares issued in reinvestment of distributions | | | | | | | | | | | | | | | | | | | | | | | | |
| Retail | | | 90,845 | | | | 393,533 | | | | — | | | | — | | | | 14,101 | | | | 283,977 | |
| Institutional | | | 5,587,914 | | | | 20,138,349 | | | | — | | | | — | | | | 762,480 | | | | 5,218,137 | |
| Cost of shares redeemed | | | | | | | | | | | | | | | | | | | | | | | | |
| Retail | | | (1,050,445 | ) | | | (1,455,490 | ) | | | (16,308,602 | ) | | | (9,489,046 | ) | | | (1,033,843 | ) | | | (4,693,733 | ) |
| Institutional | | | (183,893,524 | ) | | | (217,902,088 | ) | | | (79,436,704 | ) | | | (21,282,278 | ) | | | (3,550,760 | ) | | | (2,020,789 | ) |
| Net increase resulting from beneficial interest transactions | | | 78,288,812 | | | | 142,195,974 | | | | 19,719,751 | | | | 104,383,205 | | | | 7,547,184 | | | | 990,147 | |
| Total net increase (decrease) in net assets | | | (21,750,122 | ) | | | 188,371,871 | | | | (58,132,719 | ) | | | 120,550,852 | | | | 338,893 | | | | 3,283,069 | |
| | | | | | | | | | | | | | | | | | | | | | | | | |
| Net Assets | | | | | | | | | | | | | | | | | | | | | | | | |
| Beginning of year | | | 610,819,005 | | | | 422,447,134 | | | | 242,355,665 | | | | 121,804,813 | | | | 52,122,447 | | | | 48,839,378 | |
| End of year | | $ | 589,068,883 | | | $ | 610,819,005 | | | $ | 184,222,946 | | | $ | 242,355,665 | | | $ | 52,461,340 | | | $ | 52,122,447 | |
| See Notes to Financial Statements. | |
| Annual Report | December 31, 2022 | | | 97 |
| Segall Bryant & Hamill Funds | Statements of Changes in Net Assets |
| | | | | | | | | Segall Bryant & Hamill | | | Segall Bryant & Hamill | |
| | | Segall Bryant & Hamill All Cap Fund | | | Emerging Markets Fund | | | International Small Cap Fund | |
| | | Year Ended | | | Year Ended | | | Year Ended | | | Year Ended | | | Year Ended | | | Year Ended | |
| | | December 31, | | | December 31, | | | December 31, | | | December 31, | | | December 31, | | | December 31, | |
| | | 2022 | | | 2021 | | | 2022 | | | 2021 | | | 2022 | | | 2021 | |
| Operations | | | | | | | | | | | | | | | | | | |
| Net investment income (loss) | | $ | 524,002 | | | $ | (133,907 | ) | | $ | 1,941,983 | | | $ | 1,604,753 | | | $ | 5,168,980 | | | $ | 4,682,066 | |
| Net realized gains (losses) | | | 11,094,494 | | | | 19,731,227 | | | | (5,177,154 | ) | | | 2,875,107 | | | | (10,225,741 | ) | | | 26,110,906 | |
| Change in unrealized net appreciation/depreciation | | | (46,691,676 | ) | | | 29,308,203 | | | | (5,923,230 | ) | | | (2,267,062 | ) | | | (15,147,106 | ) | | | (7,482,118 | ) |
| Net increase (decrease) in net assets resulting from operations | | | (35,073,180 | ) | | | 48,905,523 | | | | (9,158,401 | ) | | | 2,212,798 | | | | (20,203,867 | ) | | | 23,310,854 | |
| | | | | | | | | | | | | | | | | | | | | | | | | |
| Distributions to Shareholders (Note 5) | | | | | | | | | | | | | | | | | | | | | | | | |
| From distributable earnings | | | | | | | | | | | | | | | | | | | | | | | | |
| Retail | | | (63,396 | ) | | | (97,778 | ) | | | (75,527 | ) | | | (151,486 | ) | | | (736,406 | ) | | | (2,500,281 | ) |
| Institutional | | | (10,633,312 | ) | | | (19,288,179 | ) | | | (1,595,115 | ) | | | (2,874,710 | ) | | | (4,225,586 | ) | | | (5,758,347 | ) |
| Decrease in net assets from distributions to shareholders | | | (10,696,708 | ) | | | (19,385,957 | ) | | | (1,670,642 | ) | | | (3,026,196 | ) | | | (4,961,992 | ) | | | (8,258,628 | ) |
| | | | | | | | | | | | | | | | | | | | | | | | | |
| Beneficial Interest Transactions (Note 4) | | | | | | | | | | | | | | | | | | | | | | | | |
| Shares sold | | | | | | | | | | | | | | | | | | | | | | | | |
| Retail | | | 49,609 | | | | 232,310 | | | | 1,421,980 | | | | 952,069 | | | | 547,414 | | | | 855,562 | |
| Institutional | | | 12,927,549 | | | | 28,911,778 | | | | 3,683,736 | | | | 10,154,946 | | | | 5,226,401 | | | | 18,937,214 | |
| Shares issued in reinvestment of distributions | | | | | | | | | | | | | | | | | | | | | | | | |
| Retail | | | 58,266 | | | | 96,085 | | | | 75,527 | | | | 151,486 | | | | 447,533 | | | | 633,678 | |
| Institutional | | | 10,513,977 | | | | 19,024,468 | | | | 872,968 | | | | 1,615,449 | | | | 3,968,896 | | | | 5,263,684 | |
| Cost of shares redeemed | | | | | | | | | | | | | | | | | | | | | | | | |
| Retail | | | (36,698 | ) | | | (47,223 | ) | | | (2,287,039 | ) | | | (824,059 | ) | | | (32,245,727 | ) | | | (23,848,137 | ) |
| Institutional | | | (34,347,622 | ) | | | (60,719,508 | ) | | | (10,223,460 | ) | | | (1,364,913 | ) | | | (12,594,066 | ) | | | (44,380,383 | ) |
| Net increase (decrease) resulting from beneficial interest transactions | | | (10,834,919 | ) | | | (12,502,090 | ) | | | (6,456,288 | ) | | | 10,684,978 | | | | (34,649,549 | ) | | | (42,538,382 | ) |
| Total net increase (decrease) in net assets | | | (56,604,807 | ) | | | 17,017,476 | | | | (17,285,331 | ) | | | 9,871,580 | | | | (59,815,408 | ) | | | (27,486,156 | ) |
| | | | | | | | | | | | | | | | | | | | | | | | | |
| Net Assets | | | | | | | | | | | | | | | | | | | | | | | | |
| Beginning of year | | | 187,432,997 | | | | 170,415,521 | | | | 57,883,124 | | | | 48,011,544 | | | | 156,046,303 | | | | 183,532,459 | |
| End of year | | $ | 130,828,190 | | | $ | 187,432,997 | | | $ | 40,597,793 | | | $ | 57,883,124 | | | $ | 96,230,895 | | | $ | 156,046,303 | |
| See Notes to Financial Statements. | |
| 98 | | | www.sbhfunds.com |
| Segall Bryant & Hamill Funds | Statements of Changes in Net Assets |
| | | Segall Bryant & Hamill Fundamental | | | Segall Bryant & Hamill | | | Segall Bryant & Hamill | |
| | | International Small Cap Fund | | | Global All Cap Fund | | | Workplace Equality Fund | |
| | | Year Ended | | | Year Ended | | | Year Ended | | | Year Ended | | | Year Ended | | | Year Ended | |
| | | December 31, | | | December 31, | | | December 31, | | | December 31, | | | December 31, | | | December 31, | |
| | | 2022 | | | 2021 | | | 2022 | | | 2021 | | | 2022 | | | 2021 | |
| Operations | | | | | | | | | | | | | | | | | | | | | | | | |
| Net investment income (loss) | | $ | 199,970 | | | $ | (406,901 | ) | | $ | 75,601 | | | $ | 65,466 | | | $ | 113,849 | | | $ | 39,505 | |
| Net realized gains (losses) | | | (8,539,049 | ) | | | 8,956,032 | | | | 73,379 | | | | 2,072,136 | | | | (463,589 | ) | | | 1,713,342 | |
| Change in unrealized net appreciation/depreciation | | | (24,266,162 | ) | | | (38,269 | ) | | | (7,067,686 | ) | | | 6,199,644 | | | | (5,853,984 | ) | | | 4,021,696 | |
| Net increase (decrease) in net assets resulting from operations | | | (32,605,241 | ) | | | 8,510,862 | | | | (6,918,706 | ) | | | 8,337,246 | | | | (6,203,724 | ) | | | 5,774,543 | |
| | | | | | | | | | | | | | | | | | | | | | | | | |
| Distributions to Shareholders (Note 5) | | | | | | | | | | | | | | | | | | | | | | | | |
| From distributable earnings | | | | | | | | | | | | | | | | | | | | | | | | |
| Retail | | | (2,735,376 | ) | | | (3,257,813 | ) | | | (554,671 | ) | | | (1,980,616 | ) | | | (72,939 | ) | | | (805,364 | ) |
| Institutional | | | (3,262,948 | ) | | | (3,650,769 | ) | | | (40,018 | ) | | | (291,712 | ) | | | (131,938 | ) | | | (1,260,625 | ) |
| Decrease in net assets from distributions to shareholders | | | (5,998,324 | ) | | | (6,908,582 | ) | | | (594,689 | ) | | | (2,272,328 | ) | | | (204,877 | ) | | | (2,065,989 | ) |
| | | | | | | | | | | | | | | | | | | | | | | | | |
| Beneficial Interest Transactions (Note 4) | | | | | | | | | | | | | | | | | | | | | | | | |
| Shares sold | | | | | | | | | | | | | | | | | | | | | | | | |
| Retail | | | 5,023,998 | | | | 12,663,816 | | | | 46,207 | | | | 168,540 | | | | 476,110 | | | | 1,212,464 | |
| Institutional | | | 19,766,804 | | | | 42,479,988 | | | | 280,158 | | | | 1,198,548 | | | | 1,721,438 | | | | 4,642,427 | |
| Shares issued in reinvestment of distributions | | | | | | | | | | | | | | | | | | | | | | | | |
| Retail | | | 2,714,900 | | | | 3,241,291 | | | | 526,322 | | | | 1,851,873 | | | | 72,320 | | | | 799,569 | |
| Institutional | | | 3,257,008 | | | | 3,570,077 | | | | 39,740 | | | | 291,654 | | | | 129,527 | | | | 1,232,146 | |
| Cost of shares redeemed | | | | | | | | | | | | | | | | | | | | | | | | |
| Retail | | | (12,199,511 | ) | | | (9,571,092 | ) | | | (2,132,105 | ) | | | (5,853,444 | ) | | | (2,320,146 | ) | | | (1,299,150 | ) |
| Institutional | | | (26,346,207 | ) | | | (10,706,447 | ) | | | (2,829,123 | ) | | | (623,868 | ) | | | (1,505,227 | ) | | | (1,439,188 | ) |
| Net increase (decrease) resulting from beneficial interest transactions | | | (7,783,008 | ) | | | 41,677,633 | | | | (4,068,801 | ) | | | (2,966,697 | ) | | | (1,425,978 | ) | | | 5,148,268 | |
| Total net increase (decrease) in net assets | | | (46,386,573 | ) | | | 43,279,913 | | | | (11,582,196 | ) | | | 3,098,221 | | | | (7,834,579 | ) | | | 8,856,822 | |
| | | | | | | | | | | | | | | | | | | | | | | | | |
| Net Assets | | | | | | | | | | | | | | | | | | | | | | | | |
| Beginning of year | | | 92,403,913 | | | | 49,124,000 | | | | 38,695,567 | | | | 35,597,346 | | | | 29,551,975 | | | | 20,695,153 | |
| End of year | | $ | 46,017,340 | | | $ | 92,403,913 | | | $ | 27,113,371 | | | $ | 38,695,567 | | | $ | 21,717,396 | | | $ | 29,551,975 | |
| See Notes to Financial Statements. | |
| Annual Report | December 31, 2022 | | | 99 |
| Segall Bryant & Hamill Funds | Statements of Changes in Net Assets |
| | | Segall Bryant & Hamill | | | Segall Bryant & Hamill | | | Segall Bryant & Hamill | |
| | | Short Term Plus Fund | | | Plus Bond Fund | | | Quality High Yield Fund | |
| | | Year Ended | | | Year Ended | | | Year Ended | | | Year Ended | | | Year Ended | | | Year Ended | |
| | | December 31, | | | December 31, | | | December 31, | | | December 31, | | | December 31, | | | December 31, | |
| | | 2022 | | | 2021 | | | 2022 | | | 2021 | | | 2022 | | | 2021 | |
| Operations | | | | | | | | | | | | | | | | | | | | | | | | |
| Net investment income | | $ | 334,582 | | | $ | 212,101 | | | $ | 23,872,516 | | | $ | 23,813,902 | | | $ | 3,253,575 | | | $ | 3,166,264 | |
| Net realized gains (losses) | | | (658,535 | ) | | | 76,508 | | | | (24,473,862 | ) | | | 7,750,023 | | | | (1,115,170 | ) | | | 909,927 | |
| Change in unrealized net appreciation/depreciation | | | (829,397 | ) | | | (388,055 | ) | | | (129,200,223 | ) | | | (36,682,058 | ) | | | (11,930,262 | ) | | | (1,099,993 | ) |
| Net increase (decrease) in net assets resulting from operations | | | (1,153,350 | ) | | | (99,446 | ) | | | (129,801,569 | ) | | | (5,118,133 | ) | | | (9,791,857 | ) | | | 2,976,198 | |
| | | | | | | | | | | | | | | | | | | | | | | | | |
| Distributions to Shareholders (Note 5) | | | | | | | | | | | | | | | | | | | | | | | | |
| From distributable earnings | | | | | | | | | | | | | | | | | | | | | | | | |
| Retail | | | (51,331 | ) | | | (55,271 | ) | | | (11,362,913 | ) | | | (15,291,464 | ) | | | (1,350,775 | ) | | | (1,388,983 | ) |
| Institutional | | | (307,266 | ) | | | (287,775 | ) | | | (14,455,942 | ) | | | (18,728,556 | ) | | | (2,058,659 | ) | | | (1,927,139 | ) |
| Decrease in net assets from distributions to shareholders | | | (358,597 | ) | | | (343,046 | ) | | | (25,818,855 | ) | | | (34,020,020 | ) | | | (3,409,434 | ) | | | (3,316,122 | ) |
| | | | | | | | | | | | | | | | | | | | | | | | | |
| Beneficial Interest Transactions (Note 4) | | | | | | | | | | | | | | | | | | | | | | | | |
| Shares sold | | | | | | | | | | | | | | | | | | | | | | | | |
| Retail | | | 1,221,644 | | | | 12,423,094 | | | | 45,437,462 | | | | 68,960,401 | | | | 2,589,388 | | | | 6,338,669 | |
| Institutional | | | 7,394,807 | | | | 33,672,972 | | | | 115,133,246 | | | | 200,483,179 | | | | 13,363,685 | | | | 26,601,286 | |
| Shares issued in reinvestment of distributions | | | | | | | | | | | | | | | | | | | | | | | | |
| Retail | | | 51,331 | | | | 55,271 | | | | 11,226,457 | | | | 15,118,125 | | | | 1,290,869 | | | | 1,330,990 | |
| Institutional | | | 293,814 | | | | 278,284 | | | | 13,454,360 | | | | 17,133,640 | | | | 2,016,794 | | | | 1,891,759 | |
| Cost of shares redeemed | | | | | | | | | | | | | | | | | | | | | | | | |
| Retail | | | (9,042,736 | ) | | | (3,473,502 | ) | | | (142,019,102 | ) | | | (194,020,710 | ) | | | (10,822,418 | ) | | | (9,856,291 | ) |
| Institutional | | | (21,751,979 | ) | | | (17,119,670 | ) | | | (262,106,464 | ) | | | (133,949,714 | ) | | | (31,465,249 | ) | | | (7,099,896 | ) |
| Net increase (decrease) resulting from beneficial interest transactions | | | (21,833,119 | ) | | | 25,836,449 | | | | (218,874,041 | ) | | | (26,275,079 | ) | | | (23,026,931 | ) | | | 19,206,517 | |
| Total net increase (decrease) in net assets | | | (23,345,066 | ) | | | 25,393,957 | | | | (374,494,465 | ) | | | (65,413,232 | ) | | | (36,228,222 | ) | | | 18,866,593 | |
| | | | | | | | | | | | | | | | | | | | | | | | | |
| Net Assets | | | | | | | | | | | | | | | | | | | | | | | | |
| Beginning of year | | | 51,950,791 | | | | 26,556,834 | | | | 1,055,137,292 | | | | 1,120,550,524 | | | | 102,006,152 | | | | 83,139,559 | |
| End of year | | $ | 28,605,725 | | | $ | 51,950,791 | | | $ | 680,642,827 | | | $ | 1,055,137,292 | | | $ | 65,777,930 | | | $ | 102,006,152 | |
| See Notes to Financial Statements. | |
| 100 | | | www.sbhfunds.com |
| Segall Bryant & Hamill Funds | Statements of Changes in Net Assets |
| | | Segall Bryant & Hamill | | | Segall Bryant & Hamill | |
| | | Municipal Opportunities Fund | | | Colorado Tax Free Fund | |
| | | Year Ended | | | Year Ended | | | Year Ended | | | Year Ended | |
| | | December 31, | | | December 31, | | | December 31, | | | December 31, | |
| | | 2022 | | | 2021 | | | 2022 | | | 2021 | |
| Operations | | | | | | | | | | | | | | | | |
| Net investment income | | $ | 6,213,311 | | | $ | 3,809,513 | | | $ | 9,989,843 | | | $ | 8,155,019 | |
| Net realized gains (losses) | | | (24,579,074 | ) | | | 411,990 | | | | (29,614,050 | ) | | | 2,100,578 | |
| Change in unrealized net appreciation/depreciation | | | (15,231,250 | ) | | | 1,560,791 | | | | (39,663,177 | ) | | | 135,265 | |
| Net increase (decrease) in net assets resulting from operations | | | (33,597,013 | ) | | | 5,782,294 | | | | (59,287,384 | ) | | | 10,390,862 | |
| | | | | | | | | | | | | | | | | |
| Distributions to Shareholders (Note 5) | | | | | | | | | | | | | | | | |
| From distributable earnings | | | | | | | | | | | | | | | | |
| Retail | | | (1,166,481 | ) | | | (888,141 | ) | | | (4,784,042 | ) | | | (4,549,634 | ) |
| Institutional | | | (6,976,014 | ) | | | (5,279,457 | ) | | | (8,836,132 | ) | | | (7,830,710 | ) |
| Decrease in net assets from distributions to shareholders | | | (8,142,495 | ) | | | (6,167,598 | ) | | | (13,620,174 | ) | | | (12,380,344 | ) |
| | | | | | | | | | | | | | | | | |
| Beneficial Interest Transactions (Note 4) | | | | | | | | | | | | | | | | |
| Shares sold | | | | | | | | | | | | | | | | |
| Retail | | | 32,208,046 | | | | 26,105,978 | | | | 47,029,360 | | | | 60,458,917 | |
| Institutional | | | 224,651,403 | | | | 119,955,842 | | | | 188,999,709 | | | | 115,221,186 | |
| Shares issued in reinvestment of distributions | | | | | | | | | | | | | | | | |
| Retail | | | 1,051,617 | | | | 782,090 | �� | | | 4,666,333 | | | | 4,399,110 | |
| Institutional | | | 6,824,044 | | | | 5,118,746 | | | | 7,955,402 | | | | 6,983,356 | |
| Cost of shares redeemed | | | | | | | | | | | | | | | | |
| Retail | | | (34,032,529 | ) | | | (13,133,062 | ) | | | (97,785,327 | ) | | | (52,813,083 | ) |
| Institutional | | | (252,703,662 | ) | | | (37,061,674 | ) | | | (269,581,873 | ) | | | (40,156,337 | ) |
| Net increase (decrease) resulting from beneficial interest transactions | | | (22,001,081 | ) | | | 101,767,920 | | | | (118,716,396 | ) | | | 94,093,149 | |
| Total net increase (decrease) in net assets | | | (63,740,589 | ) | | | 101,382,616 | | | | (191,623,954 | ) | | | 92,103,667 | |
| | | | | | | | | | | | | | | | | |
| Net Assets | | | | | | | | | | | | | | | | |
| Beginning of year | | | 275,545,642 | | | | 174,163,026 | | | | 587,162,406 | | | | 495,058,739 | |
| End of year | | $ | 211,805,053 | | | $ | 275,545,642 | | | $ | 395,538,452 | | | $ | 587,162,406 | |
| See Notes to Financial Statements. | |
| Annual Report | December 31, 2022 | | | 101 |
| Segall Bryant & Hamill Small Cap Value Fund | Financial Highlights |
| For a Share Outstanding Throughout the Periods Presented |
| | | Year Ended | | | Year Ended | | | Year Ended | | | Period Ended | |
| | | December 31, | | | December 31, | | | December 31, | | | December 31, | |
| Retail | | 2022 | | | 2021 | | | 2020 | | | 2019(a) | |
| Net asset value, beginning of period | | $ | 14.83 | | | $ | 13.34 | | | $ | 12.71 | | | $ | 12.34 | |
| Income (loss) from investment operations: | | | | | | | | | | | | | | | | |
| Net investment income(b) | | | 0.04 | | | | 0.02 | | | | 0.23 | | | | 0.01 | |
| Net realized and unrealized gains (losses) on investments | | | (2.23 | ) | | | 2.15 | | | | 0.53 | | | | 0.36 | |
| Total from investment operations | | | (2.19 | ) | | | 2.17 | | | | 0.76 | | | | 0.37 | |
| Less dividends and distributions: | | | | | | | | | | | | | | | | |
| Distributions from net investment income | | | (0.01 | ) | | | (0.01 | ) | | | (0.04 | ) | | | — | |
| Distributions from net realized gains | | | (0.13 | ) | | | (0.67 | ) | | | (0.09 | ) | | | — | |
| Total distributions | | | (0.14 | ) | | | (0.68 | ) | | | (0.13 | ) | | | — | |
| Net asset value, end of period | | $ | 12.50 | | | $ | 14.83 | | | $ | 13.34 | | | $ | 12.71 | |
| Total Return | | | (14.76 | )% | | | 16.47 | % | | | 6.14 | % | | | 3.00 | %(c) |
| Ratios and Supplemental Data | | | | | | | | | | | | | | | | |
| Net assets, end of period (in 000s) | | $ | 8,292 | | | $ | 9,414 | | | $ | 6,701 | | | $ | 10 | |
| Ratio of expenses to average net assets | | | | | | | | | | | | | | | | |
| With fee waivers/reimbursements | | | 1.06 | % | | | 1.04 | % | | | 1.08 | % | | | 1.06 | %(d) |
| Without fee waivers/reimbursements | | | 1.06 | % | | | 1.04 | % | | | 1.08 | % | | | 1.06 | %(d) |
| Ratio of net investment income to average net assets | | | | | | | | | | | | | | | | |
| With fee waivers/reimbursements | | | 0.34 | % | | | 0.13 | % | | | 1.93 | % | | | 1.37 | %(d) |
| Without fee waivers/reimbursements | | | 0.34 | % | | | 0.13 | % | | | 1.93 | % | | | 1.37 | %(d) |
| Portfolio turnover rate | | | 26 | % | | | 32 | % | | | 44 | % | | | 28 | %(c)(e) |
| (a) | The Fund added a retail share class on December 9, 2019. Ratios for start up periods may not be representative of long term operating results. |
| (b) | Calculated using the average shares method. |
| (c) | Total return and portfolio turnover are not annualized for periods less than one full year. |
| (e) | Portfolio turnover rate is calculated at the fund level and represents the six months ended December 31, 2019. |
| See Notes to Financial Statements. | |
| 102 | | | www.sbhfunds.com |
| Segall Bryant & Hamill Small Cap Value Fund | Financial Highlights |
| For a Share Outstanding Throughout the Periods Presented |
| | | | | | | | | | | | Six Months | | | | | | | |
| | | Year Ended | | | Year Ended | | | Year Ended | | | Ended | | | Year Ended | | | Year Ended | |
| | | December 31, | | | December 31, | | | December 31, | | | December 31, | | | June 30, | | | June 30, | |
| Institutional | | 2022 | | | 2021 | | | 2020 | | | 2019(a) | | | 2019 | | | 2018 | |
| Net asset value, beginning of period | | $ | 14.85 | | | $ | 13.35 | | | $ | 12.71 | | | $ | 12.59 | | | $ | 13.18 | | | $ | 12.17 | |
| Income (loss) from investment operations: | | | | | | | | | | | | | | | | | | | | | | | | |
| Net investment income(b) | | | 0.06 | | | | 0.03 | | | | 0.10 | | | | 0.09 | | | | 0.10 | | | | 0.05 | |
| Net realized and unrealized gains (losses) on investments | | | (2.23 | ) | | | 2.16 | | | | 0.67 | | | | 0.80 | | | | 0.42 | | | | 1.81 | |
| Total from investment operations | | | (2.17 | ) | | | 2.19 | | | | 0.77 | | | | 0.89 | | | | 0.52 | | | | 1.86 | |
| Less dividends and distributions: | | | | | | | | | | | | | | | | | | | | | | | | |
| Dividends from net investment income | | | (0.03 | ) | | | (0.02 | ) | | | (0.04 | ) | | | (0.11 | ) | | | (0.08 | ) | | | (0.02 | ) |
| Distributions from net realized gains | | | (0.13 | ) | | | (0.67 | ) | | | (0.09 | ) | | | (0.66 | ) | | | (1.03 | ) | | | (0.83 | ) |
| Total distributions | | | (0.16 | ) | | | (0.69 | ) | | | (0.13 | ) | | | (0.77 | ) | | | (1.11 | ) | | | (0.85 | ) |
| Paid-in capital from redemption fees | | | — | | | | — | | | | — | | | | 0.00 | (c) | | | 0.00 | (c) | | | 0.00 | (c) |
| Net asset value, end of period | | $ | 12.52 | | | $ | 14.85 | | | $ | 13.35 | | | $ | 12.71 | | | $ | 12.59 | | | $ | 13.18 | |
| Total Return | | | (14.65 | )% | | | 16.62 | % | | | 6.22 | % | | | 7.30 | %(d) | | | 5.33 | % | | | 15.63 | % |
| Ratios and Supplemental Data | | | | | | | | | | | | | | | | | | | | | | | | |
| Net assets, end of period (in 000s) | | $ | 580,777 | | | $ | 601,405 | | | $ | 415,747 | | | $ | 169,891 | | | $ | 141,192 | | | $ | 106,836 | |
| Ratio of expenses to average net assets | | | | | | | | | | | | | | | | | | | | | | | | |
| With fee waivers/reimbursements | | | 0.96 | % | | | 0.97 | % | | | 0.99 | % | | | 0.99 | %(e) | | | 0.99 | % | | | 1.01 | %(f) |
| Without fee waivers/reimbursements | | | 0.96 | % | | | 0.97 | % | | | 1.01 | % | | | 1.14 | %(e) | | | 1.14 | % | | | 1.25 | % |
| Ratio of net investment income (loss) to average net assets | | | | | | | | | | | | | | | | | | | | | | | | |
| With fee waivers/reimbursements | | | 0.46 | % | | | 0.22 | % | | | 0.89 | % | | | 1.38 | %(e) | | | 0.81 | % | | | 0.42 | % |
| Without fee waivers/reimbursements | | | 0.46 | % | | | 0.22 | % | | | 0.87 | % | | | 1.23 | %(e) | | | 0.66 | % | | | 0.18 | % |
| Portfolio turnover rate | | | 26 | % | | | 32 | % | | | 44 | % | | | 28 | %(d) | | | 68 | % | | | 59 | % |
| (a) | Fund changed fiscal year to December 31. |
| (b) | Calculated using the average shares method. |
| (c) | Less than $0.005 per share. |
| (d) | Total return and portfolio turnover are not annualized for periods less than one full year. |
| (f) | Contractual expense limitation changed from 1.08% to 0.99% effective November 1, 2017. |
| See Notes to Financial Statements. | |
| Annual Report | December 31, 2022 | | | 103 |
| Segall Bryant & Hamill Small Cap Growth Fund | Financial Highlights |
| For a Share Outstanding Throughout the Years Presented |
| | | Year Ended | | | Year Ended | | | Year Ended | | | Year Ended | | | Year Ended | |
| | | December 31, | | | December 31, | | | December 31, | | | December 31, | | | December 31, | |
| Retail | | 2022 | | | 2021 | | | 2020 | | | 2019 | | | 2018(a) | |
| Net asset value, beginning of year | | $ | 22.95 | | | $ | 20.56 | | | $ | 13.04 | | | $ | 10.15 | | | $ | 12.72 | |
| Income (loss) from investment operations: | | | | | | | | | | | | | | | | | | | | |
| Net investment loss(b) | | | (0.11 | ) | | | (0.17 | ) | | | (0.08 | ) | | | (0.06 | ) | | | (0.11 | ) |
| Net realized and unrealized gains (losses) on investments | | | (7.37 | ) | | | 2.56 | | | | 7.60 | | | | 2.95 | | | | 0.63 | |
| Total from investment operations | | | (7.48 | ) | | | 2.39 | | | | 7.52 | | | | 2.89 | | | | 0.52 | |
| Less dividends and distributions: | | | | | | | | | | | | | | | | | | | | |
| Distributions from net realized gains | | | — | | | | — | | | | — | | | | — | | | | (2.95 | ) |
| Return of capital | | | — | | | | — | | | | — | | | | — | | | | (0.14 | ) |
| Total distributions | | | — | | | | — | | | | — | | | | — | | | | (3.09 | ) |
| Net asset value, end of year | | $ | 15.47 | | | $ | 22.95 | | | $ | 20.56 | | | $ | 13.04 | | | $ | 10.15 | |
| Total Return | | | (32.59 | )% | | | 11.62 | % | | | 57.67 | % | | | 28.47 | % | | | 3.19 | % |
| Ratios and Supplemental Data | | | | | | | | | | | | | | | | | | | | |
| Net assets, end of year (in 000s) | | $ | 42,199 | | | $ | 53,652 | | | $ | 11,786 | | | $ | 2,836 | | | $ | 1,570 | |
| Ratio of expenses to average net assets | | | | | | | | | | | | | | | | | | | | |
| With fee waivers/reimbursements | | | 1.05 | % | | | 1.03 | % | | | 1.04 | % | | | 1.12 | % | | | 1.24 | %(c) |
| Without fee waivers/reimbursements | | | 1.05 | % | | | 1.03 | % | | | 1.04 | % | | | 1.12 | % | | | 3.09 | % |
| Ratio of net investment loss to average net assets | | | | | | | | | | | | | | | | | | | | |
| With fee waivers/reimbursements | | | (0.66 | )% | | | (0.74 | )% | | | (0.54 | )% | | | (0.51 | )% | | | (0.76 | )% |
| Without fee waivers/reimbursements | | | (0.66 | )% | | | (0.74 | )% | | | (0.54 | )% | | | (0.51 | )% | | | (2.61 | )% |
| Portfolio turnover rate | | | 59 | % | | | 35 | % | | | 54 | % | | | 28 | % | | | 83 | % |
| (a) | Prior to April 30, 2018 known as the Westcore Small-Cap Growth Fund. |
| (b) | Calculated using the average shares method. |
| (c) | Contractual expense limitation changed from 1.24% to 1.14% effective December 20, 2018. |
| See Notes to Financial Statements. | |
| 104 | | | www.sbhfunds.com |
| Segall Bryant & Hamill Small Cap Growth Fund | Financial Highlights |
| For a Share Outstanding Throughout the Years Presented |
| | | Year Ended | | | Year Ended | | | Year Ended | | | Year Ended | | | Year Ended | |
| | | December 31, | | | December 31, | | | December 31, | | | December 31, | | | December 31, | |
| Institutional | | 2022 | | | 2021 | | | 2020 | | | 2019 | | | 2018(a) | |
| Net asset value, beginning of year | | $ | 23.52 | | | $ | 21.04 | | | $ | 13.33 | | | $ | 10.36 | | | $ | 12.88 | |
| Income (loss) from investment operations: | | | | | | | | | | | | | | | | | | | | |
| Net investment loss(b) | | | (0.09 | ) | | | (0.13 | ) | | | (0.08 | ) | | | (0.05 | ) | | | (0.08 | ) |
| Net realized and unrealized gains (losses) on investments | | | (7.55 | ) | | | 2.61 | | | | 7.79 | | | | 3.02 | | | | 0.65 | |
| Total from investment operations | | | (7.64 | ) | | | 2.48 | | | | 7.71 | | | | 2.97 | | | | 0.57 | |
| Less dividends and distributions: | | | | | | | | | | | | | | | | | | | | |
| Distributions from net realized gains | | | — | | | | — | | | | — | | | | — | | | | (2.95 | ) |
| Return of capital | | | — | | | | — | | | | — | | | | — | | | | (0.14 | ) |
| Total distributions | | | — | | | | — | | | | — | | | | — | | | | (3.09 | ) |
| Net asset value, end of year | | $ | 15.88 | | | $ | 23.52 | | | $ | 21.04 | | | $ | 13.33 | | | $ | 10.36 | |
| Total Return | | | (32.48 | )% | | | 11.79 | % | | | 57.84 | % | | | 28.67 | % | | | 3.56 | % |
| Ratios and Supplemental Data | | | | | | | | | | | | | | | | | | | | |
| Net assets, end of year (in 000s) | | $ | 142,024 | | | $ | 188,703 | | | $ | 110,018 | | | $ | 72,341 | | | $ | 63,082 | |
| Ratio of expenses to average net assets | | | | | | | | | | | | | | | | | | | | |
| With fee waivers/reimbursements | | | 0.88 | % | | | 0.87 | % | | | 0.97 | % | | | 0.98 | % | | | 0.99 | % |
| Without fee waivers/reimbursements | | | 0.88 | % | | | 0.87 | % | | | 0.97 | % | | | 0.98 | % | | | 2.26 | % |
| Ratio of net investment loss to average net assets | | | | | | | | | | | | | | | | | | | | |
| With fee waivers/reimbursements | | | (0.49 | )% | | | (0.59 | )% | | | (0.50 | )% | | | (0.38 | )% | | | (0.63 | )% |
| Without fee waivers/reimbursements | | | (0.49 | )% | | | (0.59 | )% | | | (0.50 | )% | | | (0.38 | )% | | | (1.90 | )% |
| Portfolio turnover rate | | | 59 | % | | | 35 | % | | | 54 | % | | | 28 | % | | | 83 | % |
| (a) | Prior to April 30, 2018 known as the Westcore Small-Cap Growth Fund. |
| (b) | Calculated using the average shares method. |
| See Notes to Financial Statements. | |
| Annual Report | December 31, 2022 | | | 105 |
| Segall Bryant & Hamill Small Cap Core Fund | Financial Highlights |
| For a Share Outstanding Throughout the Years Presented |
| | | Year Ended | | | Year Ended | | | Year Ended | |
| | | December 31, | | | December 31, | | | December 31, | |
| Retail | | 2022 | | | 2021 | | | 2020 | |
| Net asset value, beginning of year | | $ | 12.65 | | | $ | 12.26 | | | $ | 10.00 | |
| Income (loss) from investment operations: | | | | | | | | | | | | |
| Net investment loss(a) | | | (0.02 | ) | | | (0.07 | ) | | | (0.03 | ) |
| Net realized and unrealized gains (losses) on investments | | | (1.65 | ) | | | 2.82 | | | | 2.29 | |
| Total from investment operations | | | (1.67 | ) | | | 2.75 | | | | 2.26 | |
| Less dividends and distributions: | | | | | | | | | | | | |
| Distributions from net realized gains | | | (0.22 | ) | | | (2.36 | ) | | | — | |
| Net asset value, end of year | | $ | 10.76 | | | $ | 12.65 | | | $ | 12.26 | |
| Total Return | | | (13.26 | )% | | | 23.26 | % | | | 22.60 | % |
| Ratios and Supplemental Data | | | | | | | | | | | | |
| Net assets, end of year (in 000s) | | $ | 728 | | | $ | 1,663 | | | $ | 4,165 | |
| Ratio of expenses to average net assets | | | | | | | | | | | | |
| With fee waivers/reimbursements | | | 1.14 | % | | | 1.14 | % | | | 1.14 | % |
| Without fee waivers/reimbursements | | | 1.36 | % | | | 1.35 | % | | | 1.26 | % |
| Ratio of net investment loss to average net assets | | | | | | | | | | | | |
| With fee waivers/reimbursements | | | (0.19 | )% | | | (0.25 | )% | | | (0.26 | )% |
| Without fee waivers/reimbursements | | | (0.40 | )% | | | (0.46 | )% | | | (0.38 | )% |
| Portfolio turnover rate | | | 44 | % | | | 36 | % | | | 74 | % |
| (a) | Calculated using the average shares method. |
| See Notes to Financial Statements. | |
| 106 | | | www.sbhfunds.com |
| Segall Bryant & Hamill Small Cap Core Fund | Financial Highlights |
| For a Share Outstanding Throughout the Years Presented |
| | | Year Ended | | | Year Ended | | | Year Ended | |
| | | December 31, | | | December 31, | | | December 31, | |
| Institutional | | 2022 | | | 2021 | | | 2020 | |
| Net asset value, beginning of year | | $ | 12.70 | | | $ | 12.28 | | | $ | 10.00 | |
| Income (loss) from investment operations: | | | | | | | | | | | | |
| Net investment income (loss)(a) | | | 0.01 | | | | (0.02 | ) | | | (0.00 | )(b) |
| Net realized and unrealized gains (losses) on investments | | | (1.67 | ) | | | 2.80 | | | | 2.28 | |
| Total from investment operations | | | (1.66 | ) | | | 2.78 | | | | 2.28 | |
| Less dividends and distributions: | | | | | | | | | | | | |
| Dividends from net investment income | | | (0.01 | ) | | | — | | | | — | |
| Distributions from net realized gains | | | (0.22 | ) | | | (2.36 | ) | | | — | |
| Total distributions | | | (0.23 | ) | | | (2.36 | ) | | | — | |
| Net asset value, end of year | | $ | 10.81 | | | $ | 12.70 | | | $ | 12.28 | |
| Total Return | | | (13.12 | )% | | | 23.48 | % | | | 22.80 | % |
| Ratios and Supplemental Data | | | | | | | | | | | | |
| Net assets, end of year (in 000s) | | $ | 51,733 | | | $ | 50,460 | | | $ | 44,675 | |
| Ratio of expenses to average net assets | | | | | | | | | | | | |
| With fee waivers/reimbursements | | | 0.99 | % | | | 0.99 | % | | | 0.99 | % |
| Without fee waivers/reimbursements | | | 1.13 | % | | | 1.10 | % | | | 1.27 | % |
| Ratio of net investment income (loss) to average net assets | | | | | | | | | | | | |
| With fee waivers/reimbursements | | | 0.12 | % | | | (0.13 | )% | | | (0.05 | )% |
| Without fee waivers/reimbursements | | | (0.02 | )% | | | (0.24 | )% | | | (0.33 | )% |
| Portfolio turnover rate | | | 44 | % | | | 36 | % | | | 74 | % |
| (a) | Calculated using the average shares method. |
| (b) | Less than $0.005 per share. |
| See Notes to Financial Statements. | |
| Annual Report | December 31, 2022 | | | 107 |
| Segall Bryant & Hamill All Cap Fund | Financial Highlights |
| For a Share Outstanding Throughout the Periods Presented |
| | | Year Ended | | | Year Ended | | | Year Ended | | | Period Ended | |
| | | December 31, | | | December 31, | | | December 31, | | | December 31, | |
| Retail | | 2022 | | | 2021 | | | 2020 | | | 2019(a) | |
| Net asset value, beginning of period | | $ | 24.51 | | | $ | 21.15 | | | $ | 17.00 | | | $ | 16.49 | |
| Income (loss) from investment operations: | | | | | | | | | | | | | | | | |
| Net investment income (loss)(b) | | | 0.07 | | | | (0.01 | ) | | | 0.04 | | | | (0.00 | )(c) |
| Net realized and unrealized gains (losses) on investments | | | (4.77 | ) | | | 6.16 | | | | 4.39 | | | | 0.51 | |
| Total from investment operations | | | (4.70 | ) | | | 6.15 | | | | 4.43 | | | | 0.51 | |
| Less dividends and distributions: | | | | | | | | | | | | | | | | |
| Dividends from net investment income | | | (0.07 | ) | | | — | | | | (0.03 | ) | | | — | |
| Distributions from net realized gains | | | (1.52 | ) | | | (2.79 | ) | | | (0.25 | ) | | | — | |
| Total distributions | | | (1.59 | ) | | | (2.79 | ) | | | (0.28 | ) | | | — | |
| Net asset value, end of period | | $ | 18.22 | | | $ | 24.51 | | | $ | 21.15 | | | $ | 17.00 | |
| Total Return | | | (19.23 | )% | | | 29.57 | % | | | 26.08 | % | | | 3.09 | %(d) |
| Ratios and Supplemental Data | | | | | | | | | | | | | | | | |
| Net assets, end of period (in 000s) | | $ | 796 | | | $ | 974 | | | $ | 583 | | | $ | 10 | |
| Ratio of expenses to average net assets | | | | | | | | | | | | | | | | |
| With fee waivers/reimbursements | | | 0.86 | % | | | 0.83 | % | | | 0.79 | %(e) | | | 0.98 | %(f) |
| Without fee waivers/reimbursements | | | 0.86 | % | | | 0.83 | % | | | 0.79 | %(e) | | | 1.00 | %(f) |
| Ratio of net investment income (loss) to average net assets | | | | | | | | | | | | | | | | |
| With fee waivers/reimbursements | | | 0.35 | % | | | (0.06 | )% | | | 0.19 | % | | | (0.15 | )%(f) |
| Without fee waivers/reimbursements | | | 0.35 | % | | | (0.06 | )% | | | 0.19 | % | | | (0.17 | )%(f) |
| Portfolio turnover rate | | | 32 | % | | | 30 | % | | | 38 | % | | | 16 | %(d)(g) |
| (a) | The Fund added a retail share class on December 9, 2019. Ratios for start up periods may not be representative of long term operating results. |
| (b) | Calculated using the average shares method. |
| (c) | Less than $0.005 per share. |
| (d) | Total return and portfolio turnover are not annualized for periods less than one full year. |
| (e) | During the period there were no shareholder servicing fees expensed for the Retail Class. This may not be representative of long term results. |
| (g) | Portfolio turnover rate is calculated at the fund level and represents the six months ended December 31, 2019. |
| See Notes to Financial Statements. | |
| 108 | | | www.sbhfunds.com |
| Segall Bryant & Hamill All Cap Fund | Financial Highlights |
| For a Share Outstanding Throughout the Periods Presented |
| | | | | | | | | | | | Six Months | | | | | | | |
| | | Year Ended | | | Year Ended | | | Year Ended | | | Ended | | | Year Ended | | | Year Ended | |
| | | December 31, | | | December 31, | | | December 31, | | | December 31, | | | June 30, | | | June 30, | |
| Institutional | | 2022 | | | 2021 | | | 2020 | | | 2019(a) | | | 2019 | | | 2018 | |
| Net asset value, beginning of period | | $ | 24.52 | | | $ | 21.16 | | | $ | 17.00 | | | $ | 15.80 | | | $ | 14.76 | | | $ | 13.37 | |
| Income (loss) from investment operations: | | | | | | | | | | | | | | | | | | | | | | | | |
| Net investment income (loss)(b) | | | 0.07 | | | | (0.02 | ) | | | 0.03 | | | | 0.01 | | | | 0.01 | | | | (0.01 | ) |
| Net realized and unrealized gains (losses) on investments | | | (4.77 | ) | | | 6.17 | | | | 4.41 | | | | 1.25 | | | | 1.57 | | | | 1.48 | |
| Total from investment operations | | | (4.70 | ) | | | 6.15 | | | | 4.44 | | | | 1.26 | | | | 1.58 | | | | 1.47 | |
| Less dividends and distributions: | | | | | | | | | | | | | | | | | | | | | | | | |
| Dividends from net investment income | | | (0.07 | ) | | | — | | | | (0.03 | ) | | | (0.01 | ) | | | — | | | | — | |
| Distributions from net realized gains | | | (1.52 | ) | | | (2.79 | ) | | | (0.25 | ) | | | (0.05 | ) | | | (0.54 | ) | | | (0.08 | ) |
| Total distributions | | | (1.59 | ) | | | (2.79 | ) | | | (0.28 | ) | | | (0.06 | ) | | | (0.54 | ) | | | (0.08 | ) |
| Paid-in capital from redemption fees | | | — | | | | — | | | | — | | | | 0.00 | (c) | | | 0.00 | (c) | | | 0.00 | (c) |
| Net asset value, end of period | | $ | 18.23 | | | $ | 24.52 | | | $ | 21.16 | | | $ | 17.00 | | | $ | 15.80 | | | $ | 14.76 | |
| Total Return | | | (19.21 | )% | | | 29.55 | % | | | 26.18 | % | | | 7.95 | %(d) | | | 11.47 | % | | | 11.01 | % |
| Ratios and Supplemental Data | | | | | | | | | | | | | | | | | | | | | | | | |
| Net assets, end of period (in 000s) | | $ | 130,033 | | | $ | 186,459 | | | $ | 169,833 | | | $ | 120,730 | | | $ | 104,418 | | | $ | 79,631 | |
| Ratio of expenses to average net assets | | | | | | | | | | | | | | | | | | | | | | | | |
| With fee waivers/reimbursements | | | 0.84 | % | | | 0.84 | % | | | 0.84 | % | | | 0.96 | %(e)(f) | | | 0.98 | % | | | 1.02 | %(g) |
| Without fee waivers/reimbursements | | | 0.89 | % | | | 0.87 | % | | | 0.92 | % | | | 1.12 | %(e) | | | 1.14 | % | | | 1.22 | % |
| Ratio of net investment income (loss) to average net assets | | | | | | | | | | | | | | | | | | | | | | | | |
| With fee waivers/reimbursements | | | 0.35 | % | | | (0.07 | )% | | | 0.16 | % | | | 0.07 | %(e) | | | 0.07 | % | | | (0.07 | )% |
| Without fee waivers/reimbursements | | | 0.31 | % | | | (0.10 | )% | | | 0.08 | % | | | (0.09 | )%(e) | | | (0.09 | )% | | | (0.27 | )% |
| Portfolio turnover rate | | | 32 | % | | | 30 | % | | | 38 | % | | | 16 | %(d) | | | 38 | % | | | 37 | % |
| (a) | Fund changed fiscal year to December 31. |
| (b) | Calculated using the average shares method. |
| (c) | Less than $0.005 per share. |
| (d) | Total return and portfolio turnover are not annualized for periods less than one full year. |
| (f) | Contractual expense limitation changed from 0.98% to 0.84% effective December 9, 2019. |
| (g) | Contractual expense limitation changed from 1.10% to 0.98% effective November 1, 2017. |
| See Notes to Financial Statements. | |
| Annual Report | December 31, 2022 | | | 109 |
| Segall Bryant & Hamill Emerging Markets Fund | Financial Highlights |
| For a Share Outstanding Throughout the Periods Presented |
| | | | | | | | | | | | Two Months | | | | | | | |
| | | Year Ended | | | Year Ended | | | Year Ended | | | Ended | | | Year Ended | | | Year Ended | |
| | | December 31, | | | December 31, | | | December 31, | | | December 31, | | | October 31, | | | October 31, | |
| Retail* | | 2022 | | | 2021 | | | 2020 | | | 2019(a) | | | 2019 | | | 2018 | |
| Net asset value, beginning of period | | $ | 9.12 | | | $ | 9.13 | | | $ | 8.67 | | | $ | 8.27 | | | $ | 7.70 | | | $ | 9.49 | |
| Income (loss) from investment operations: | | | | | | | | | | | | | | | | | | | | | | | | |
| Net investment income(b) | | | 0.30 | | | | 0.26 | | | | 0.14 | | | | 0.01 | | | | 0.17 | | | | 0.18 | |
| Net realized and unrealized gains (losses) on investments | | | (1.77 | ) | | | 0.21 | | | | 0.47 | | | | 0.60 | | | | 0.62 | | | | (1.53 | ) |
| Total from investment operations | | | (1.47 | ) | | | 0.47 | | | | 0.61 | | | | 0.61 | | | | 0.79 | | | | (1.35 | ) |
| Less dividends and distributions: | | | | | | | | | | | | | | | | | | | | | | | | |
| Dividends from net investment income | | | (0.30 | ) | | | (0.30 | ) | | | (0.15 | ) | | | (0.20 | ) | | | (0.18 | ) | | | (0.13 | ) |
| Distributions from net realized gains | | | — | | | | (0.18 | ) | | | — | | | | — | | | | (0.04 | ) | | | (0.31 | ) |
| Return of capital | | | — | | | | — | | | | — | | | | (0.01 | ) | | | — | | | | — | |
| Total distributions | | | (0.30 | ) | | | (0.48 | ) | | | (0.15 | ) | | | (0.21 | ) | | | (0.22 | ) | | | (0.44 | ) |
| Paid-in capital from redemption fees | | | — | | | | — | | | | — | | | | — | | | | — | | | | 0.00 | (c) |
| Net asset value, end of period | | $ | 7.35 | | | $ | 9.12 | | | $ | 9.13 | | | $ | 8.67 | | | $ | 8.27 | | | $ | 7.70 | |
| Total Return | | | (16.17 | )% | | | 5.22 | % | | | 7.05 | % | | | 7.52 | %(d) | | | 10.64 | % | | | (14.96 | )% |
| Ratios and Supplemental Data | | | | | | | | | | | | | | | | | | | | | | | | |
| Net assets, end of period (in 000s) | | $ | 1,952 | | | $ | 3,224 | | | $ | 2,954 | | | $ | 2,678 | | | $ | 2,397 | | | $ | 2,043 | |
| Ratio of expenses to average net assets | | | | | | | | | | | | | | | | | | | | | | | | |
| With fee waivers/reimbursements | | | 1.38 | % | | | 1.38 | % | | | 1.38 | % | | | 1.46 | %(e)(f) | | | 1.48 | % | | | 1.48 | % |
| Without fee waivers/reimbursements | | | 2.05 | % | | | 1.86 | % | | | 2.36 | % | | | 3.40 | %(e) | | | 2.91 | % | | | 2.49 | % |
| Ratio of net investment income (loss) to average net assets | | | | | | | | | | | | | | | | | | | | | | | | |
| With fee waivers/reimbursements | | | 3.67 | % | | | 2.65 | % | | | 1.80 | % | | | 1.01 | %(e) | | | 2.15 | % | | | 1.97 | % |
| Without fee waivers/reimbursements | | | 3.00 | % | | | 2.17 | % | | | 0.82 | % | | | (0.93 | )%(e) | | | 0.72 | % | | | 0.96 | % |
| Portfolio turnover rate | | | 88 | % | | | 91 | % | | | 91 | % | | | 23 | %(d) | | | 107 | % | | | 99 | % |
| (a) | Fund changed fiscal year to December 31. |
| (b) | Calculated using the average shares method. |
| (c) | Less than $0.005 per share. |
| (d) | Total return and portfolio turnover are not annualized for periods less than one full year. |
| (f) | Contractual expense limitation changed from 1.48% to 1.38% effective December 9, 2019. |
| See Notes to Financial Statements. | |
| 110 | | | www.sbhfunds.com |
| Segall Bryant & Hamill Emerging Markets Fund | Financial Highlights |
| For a Share Outstanding Throughout the Periods Presented |
| | | | | | | | | | | | Two Months | | | | | | | |
| | | Year Ended | | | Year Ended | | | Year Ended | | | Ended | | | Year Ended | | | Year Ended | |
| | | December 31, | | | December 31, | | | December 31, | | | December 31, | | | October 31, | | | October 31, | |
| Institutional* | | 2022 | | | 2021 | | | 2020 | | | 2019(a) | | | 2019 | | | 2018 | |
| Net asset value, beginning of period | | $ | 9.15 | | | $ | 9.15 | | | $ | 8.69 | | | $ | 8.31 | | | $ | 7.74 | | | $ | 9.54 | |
| Income (loss) from investment operations: | | | | | | | | | | | | | | | | | | | | | | | | |
| Net investment income(b) | | | 0.32 | | | | 0.28 | | | | 0.15 | | | | 0.02 | | | | 0.20 | | | | 0.20 | |
| Net realized and unrealized gains (losses) on investments | | | (1.79 | ) | | | 0.21 | | | | 0.47 | | | | 0.59 | | | | 0.62 | | | | (1.54 | ) |
| Total from investment operations | | | (1.47 | ) | | | 0.49 | | | | 0.62 | | | | 0.61 | | | | 0.82 | | | | (1.34 | ) |
| Less dividends and distributions: | | | | | | | | | | | | | | | | | | | | | | | | |
| Dividends from net investment income | | | (0.31 | ) | | | (0.31 | ) | | | (0.16 | ) | | | (0.22 | ) | | | (0.21 | ) | | | (0.15 | ) |
| Distributions from net realized gains | | | — | | | | (0.18 | ) | | | — | | | | — | | | | (0.04 | ) | | | (0.31 | ) |
| Return of capital | | | — | | | | — | | | | — | | | | (0.01 | ) | | | — | | | | — | |
| Total distributions | | | (0.31 | ) | | | (0.49 | ) | | | (0.16 | ) | | | (0.23 | ) | | | (0.25 | ) | | | (0.46 | ) |
| Paid-in capital from redemption fees | | | — | | | | — | | | | — | | | | — | | | | — | | | | 0.00 | (c) |
| Net asset value, end of period | | $ | 7.37 | | | $ | 9.15 | | | $ | 9.15 | | | $ | 8.69 | | | $ | 8.31 | | | $ | 7.74 | |
| Total Return | | | (16.08 | )% | | | 5.49 | % | | | 7.18 | % | | | 7.51 | %(d) | | | 10.97 | % | | | (14.81 | )% |
| Ratios and Supplemental Data | | | | | | | | | | | | | | | | | | | | | | | | |
| Net assets, end of period (in 000s) | | $ | 38,646 | | | $ | 54,660 | | | $ | 45,058 | | | $ | 32,721 | | | $ | 30,836 | | | $ | 29,961 | |
| Ratio of expenses to average net assets | | | | | | | | | | | | | | | | | | | | | | | | |
| With fee waivers/reimbursements | | | 1.23 | % | | | 1.23 | % | | | 1.23 | % | | | 1.23 | %(e) | | | 1.23 | % | | | 1.23 | % |
| Without fee waivers/reimbursements | | | 1.90 | % | | | 1.69 | % | | | 2.19 | % | | | 3.14 | %(e) | | | 2.66 | % | | | 2.24 | % |
| Ratio of net investment income (loss) to average net assets | | | | | | | | | | | | | | | | | | | | | | | | |
| With fee waivers/reimbursements | | | 3.98 | % | | | 2.83 | % | | | 1.93 | % | | | 1.18 | %(e) | | | 2.40 | % | | | 2.22 | % |
| Without fee waivers/reimbursements | | | 3.31 | % | | | 2.37 | % | | | 0.97 | % | | | (0.73 | )%(e) | | | 0.97 | % | | | 1.21 | % |
| Portfolio turnover rate | | | 88 | % | | | 91 | % | | | 91 | % | | | 23 | %(d) | | | 107 | % | | | 99 | % |
| (a) | Fund changed fiscal year to December 31. |
| (b) | Calculated using the average shares method. |
| (c) | Less than $0.005 per share. |
| (d) | Total return and portfolio turnover are not annualized for periods less than one full year. |
| See Notes to Financial Statements. | |
| Annual Report | December 31, 2022 | | | 111 |
| Segall Bryant & Hamill International Small Cap Fund | Financial Highlights |
| For a Share Outstanding Throughout the Periods Presented |
| | | | | | | | | | | | Two Months | | | | | | | |
| | | Year Ended | | | Year Ended | | | Year Ended | | | Ended | | | Year Ended | | | Year Ended | |
| | | December 31, | | | December 31, | | | December 31, | | | December 31, | | | October 31, | | | October 31, | |
| Retail* | | 2022 | | | 2021 | | | 2020 | | | 2019(a) | | | 2019 | | | 2018 | |
| Net asset value, beginning of period | | $ | 11.59 | | | $ | 10.83 | | | $ | 11.64 | | | $ | 11.39 | | | $ | 11.73 | | | $ | 14.47 | |
| Income (loss) from investment operations: | | | | | | | | | | | | | | | | | | | | | | | | |
| Net investment income(b) | | | 0.44 | | | | 0.29 | | | | 0.16 | | | | 0.02 | | | | 0.28 | | | | 0.26 | |
| Net realized and unrealized gains (losses) on investments | | | (2.00 | ) | | | 1.09 | | | | (0.80 | ) | | | 0.73 | | | | (0.38 | ) | | | (2.27 | ) |
| Total from investment operations | | | (1.56 | ) | | | 1.38 | | | | (0.64 | ) | | | 0.75 | | | | (0.10 | ) | | | (2.01 | ) |
| Less dividends and distributions: | | | | | | | | | | | | | | | | | | | | | | | | |
| Dividends from net investment income | | | (0.45 | ) | | | (0.62 | ) | | | (0.17 | ) | | | (0.49 | ) | | | (0.25 | ) | | | (0.29 | ) |
| Distributions from net realized gains | | | — | | | | — | | | | — | | | | — | | | | — | | | | (0.44 | ) |
| Return of capital | | | — | | | | — | | | | — | | | | (0.01 | ) | | | — | | | | — | |
| Total distributions | | | (0.45 | ) | | | (0.62 | ) | | | (0.17 | ) | | | (0.50 | ) | | | (0.25 | ) | | | (0.73 | ) |
| Paid-in capital from redemption fees | | | — | | | | — | | | | — | | | | — | | | | 0.00 | (c) | | | 0.00 | (c) |
| Net increase from payment by affiliates | | | — | | | | — | | | | — | | | | — | | | | 0.01 | (d) | | | — | |
| Net asset value, end of period | | $ | 9.58 | | | $ | 11.59 | | | $ | 10.83 | | | $ | 11.64 | | | $ | 11.39 | | | $ | 11.73 | |
| Total Return | | | (13.31 | )% | | | 12.97 | % | | | (5.51 | )% | | | 6.73 | %(e) | | | (0.54 | )% | | | (14.68 | )% |
| Ratios and Supplemental Data | | | | | | | | | | | | | | | | | | | | | | | | |
| Net assets, end of period (in 000s) | | $ | 9,757 | | | $ | 47,301 | | | $ | 64,420 | | | $ | 52,668 | | | $ | 49,749 | | | $ | 23,554 | |
| | | | | | | | | | | | | | | | | | | | | | | | | |
| Ratio of expenses to average net assets | | | | | | | | | | | | | | | | | | | | | | | | |
| With fee waivers/reimbursements | | | 1.18 | % | | | 1.18 | % | | | 1.18 | % | | | 1.25 | %(f)(g) | | | 1.28 | % | | | 1.28 | % |
| Without fee waivers/reimbursements | | | 1.41 | % | | | 1.36 | % | | | 1.36 | % | | | 1.42 | %(f) | | | 1.53 | % | | | 1.44 | % |
| Ratio of net investment income to average net assets | | | | | | | | | | | | | | | | | | | | | | | | |
| With fee waivers/reimbursements | | | 4.16 | % | | | 2.37 | % | | | 1.68 | % | | | 0.94 | %(f) | | | 2.49 | % | | | 1.92 | % |
| Without fee waivers/reimbursements | | | 3.93 | % | | | 2.19 | % | | | 1.50 | % | | | 0.77 | %(f) | | | 2.24 | % | | | 1.76 | % |
| Portfolio turnover rate | | | 105 | % | | | 112 | % | | | 106 | % | | | 17 | %(e) | | | 121 | % | | | 111 | % |
| (a) | Fund changed fiscal year to December 31. |
| (b) | Calculated using the average shares method. |
| (c) | Less than $0.005 per share. |
| (d) | The custodian reimbursed the Fund $132,086 for losses incurred from corporate action processing. Payment had a positive 0.09% impact on the total return. |
| (e) | Total return and portfolio turnover are not annualized for periods less than one full year. |
| (g) | Contractual expense limitation changed from 1.28% to 1.18% effective December 9, 2019. |
| See Notes to Financial Statements. | |
| 112 | | | www.sbhfunds.com |
| Segall Bryant & Hamill International Small Cap Fund | Financial Highlights |
| For a Share Outstanding Throughout the Periods Presented |
| | | | | | | | | | | | Two Months | | | | | | | |
| | | Year Ended | | | Year Ended | | | Year Ended | | | Ended | | | Year Ended | | | Year Ended | |
| | | December 31, | | | December 31, | | | December 31, | | | December 31, | | | October 31, | | | October 31, | |
| Institutional* | | 2022 | | | 2021 | | | 2020 | | | 2019(a) | | | 2019 | | | 2018 | |
| Net asset value, beginning of period | | $ | 11.61 | | | $ | 10.85 | | | $ | 11.65 | | | $ | 11.42 | | | $ | 11.77 | | | $ | 14.50 | |
| Income (loss) from investment operations: | | | | | | | | | | | | | | | | | | | | | | | | |
| Net investment income(b) | | | 0.46 | | | | 0.31 | | | | 0.19 | | | | 0.02 | | | | 0.30 | | | | 0.29 | |
| Net realized and unrealized gains (losses) on investments | | | (2.02 | ) | | | 1.10 | | | | (0.82 | ) | | | 0.73 | | | | (0.37 | ) | | | (2.26 | ) |
| Total from investment operations | | | (1.56 | ) | | | 1.41 | | | | (0.63 | ) | | | 0.75 | | | | (0.07 | ) | | | (1.97 | ) |
| Less dividends and distributions: | | | | | | | | | | | | | | | | | | | | | | | | |
| Dividends from net investment income | | | (0.46 | ) | | | (0.65 | ) | | | (0.17 | ) | | | (0.51 | ) | | | (0.29 | ) | | | (0.32 | ) |
| Distributions from net realized gains | | | — | | | | — | | | | — | | | | — | | | | — | | | | (0.44 | ) |
| Return of capital | | | — | | | | — | | | | — | | | | (0.01 | ) | | | — | | | | — | |
| Total distributions | | | (0.46 | ) | | | (0.65 | ) | | | (0.17 | ) | | | (0.52 | ) | | | (0.29 | ) | | | (0.76 | ) |
| Paid-in capital from redemption fees | | | — | | | | — | | | | — | | | | — | | | | 0.00 | (c) | | | 0.00 | (c) |
| Net increase from payment by affiliates | | | — | | | | — | | | | — | | | | — | | | | 0.01 | (d) | | | — | |
| Net asset value, end of period | | $ | 9.59 | | | $ | 11.61 | | | $ | 10.85 | | | $ | 11.65 | | | $ | 11.42 | | | $ | 11.77 | |
| Total Return | | | (13.19 | )% | | | 13.19 | % | | | (5.35 | )% | | | 6.69 | %(e) | | | (0.29 | )% | | | (14.40 | )% |
| Ratios and Supplemental Data | | | | | | | | | | | | | | | | | | | | | | | | |
| Net assets, end of period (in 000s) | | $ | 86,473 | | | $ | 108,745 | | | $ | 119,113 | | | $ | 234,265 | | | $ | 230,883 | | | $ | 351,480 | |
| Ratio of expenses to average net assets | | | | | | | | | | | | | | | | | | | | | | | | |
| With fee waivers/reimbursements | | | 1.03 | % | | | 1.03 | % | | | 1.03 | % | | | 1.03 | %(f) | | | 1.03 | % | | | 1.03 | % |
| Without fee waivers/reimbursements | | | 1.24 | % | | | 1.13 | % | | | 1.18 | % | | | 1.20 | %(f) | | | 1.28 | % | | | 1.19 | % |
| Ratio of net investment income to average net assets | | | | | | | | | | | | | | | | | | | | | | | | |
| With fee waivers/reimbursements | | | 4.52 | % | | | 2.54 | % | | | 2.00 | % | | | 1.15 | %(f) | | | 2.74 | % | | | 2.17 | % |
| Without fee waivers/reimbursements | | | 4.31 | % | | | 2.44 | % | | | 1.85 | % | | | 0.98 | %(f) | | | 2.49 | % | | | 2.01 | % |
| Portfolio turnover rate | | | 105 | % | | | 112 | % | | | 106 | % | | | 17 | %(e) | | | 121 | % | | | 111 | % |
| (a) | Fund changed fiscal year to December 31. |
| (b) | Calculated using the average shares method. |
| (c) | Less than $0.005 per share. |
| (d) | The custodian reimbursed the Fund $132,086 for losses incurred from corporate action processing. Payment had a positive 0.09% impact on the total return. |
| (e) | Total return and portfolio turnover are not annualized for periods less than one full year. |
| See Notes to Financial Statements. | |
| Annual Report | December 31, 2022 | | | 113 |
| Segall Bryant & Hamill | |
| Fundamental International Small Fund Cap | Financial Highlights |
| For a Share Outstanding Throughout the Years Presented |
| | | Year Ended | | | Year Ended | | | Year Ended | | | Year Ended | | | Year Ended | |
| | | December 31, | | | December 31, | | | December 31, | | | December 31, | | | December 31, | |
| Retail | | 2022 | | | 2021 | | | 2020 | | | 2019 | | | 2018(a) | |
| Net asset value, beginning of year | | $ | 24.43 | | | $ | 22.86 | | | $ | 18.12 | | | $ | 12.67 | | | $ | 19.76 | |
| Income (loss) from investment operations: | | | | | | | | | | | | | | | | | | | | |
| Net investment income (loss)(b) | | | 0.04 | | | | (0.22 | ) | | | (0.08 | ) | | | 0.00 | (c) | | | (0.03 | ) |
| Net realized and unrealized gains (losses) on investments | | | (8.31 | ) | | | 3.83 | | | | 6.06 | | | | 5.45 | | | | (4.40 | ) |
| Total from investment operations | | | (8.27 | ) | | | 3.61 | | | | 5.98 | | | | 5.45 | | | | (4.43 | ) |
| Less dividends and distributions: | | | | | | | | | | | | | | | | | | | | |
| Dividends from net investment income | | | — | | | | — | | | | — | | | | — | | | | (0.08 | ) |
| Distributions from net realized gains | | | (2.02 | ) | | | (2.04 | ) | | | (1.24 | ) | | | — | | | | (2.58 | ) |
| Total distributions | | | (2.02 | ) | | | (2.04 | ) | | | (1.24 | ) | | | — | | | | (2.66 | ) |
| Net asset value, end of year | | $ | 14.14 | | | $ | 24.43 | | | $ | 22.86 | | | $ | 18.12 | | | $ | 12.67 | |
| Total Return | | | (33.89 | )% | | | 16.59 | % | | | 33.23 | % | | | 43.01 | % | | | (22.98 | )% |
| Ratios and Supplemental Data | | | | | | | | | | | | | | | | | | | | |
| Net assets, end of year (in 000s) | | $ | 21,023 | | | $ | 42,322 | | | $ | 33,666 | | | $ | 29,098 | | | $ | 28,205 | |
| Ratio of expenses to average net assets | | | | | | | | | | | | | | | | | | | | |
| With fee waivers/reimbursements | | | 1.25 | % | | | 1.25 | % | | | 1.25 | % | | | 1.32 | %(d)(e) | | | 1.44 | %(e) |
| Without fee waivers/reimbursements | | | 1.57 | % | | | 1.51 | % | | | 1.69 | % | | | 1.85 | % | | | 1.78 | % |
| Ratio of net investment income (loss) to average net assets | | | | | | | | | | | | | | | | | | | | |
| With fee waivers/reimbursements | | | 0.20 | % | | | (0.88 | )% | | | (0.43 | )% | | | 0.00 | % | | | (0.18 | )% |
| Without fee waivers/reimbursements | | | (0.11 | )% | | | (1.14 | )% | | | (0.87 | )% | | | (0.53 | )% | | | (0.52 | )% |
| Portfolio turnover rate | | | 45 | % | | | 56 | % | | | 59 | % | | | 31 | % | | | 57 | % |
| (a) | Prior to April 30, 2018 known as the Westcore International Small-Cap Fund. |
| (b) | Calculated using the average shares method. |
| (c) | Less than $0.005 per share. |
| (d) | Contractual expense limitation changed from 1.50% to 1.25% effective May 1, 2019. |
| (e) | For the period April 29, 2016 to April 30, 2019, a voluntary additional expense waiver reduced the ratio of expenses to average net assets from 1.50% to 1.44%. |
| See Notes to Financial Statements. | |
| 114 | | | www.sbhfunds.com |
Segall Bryant & Hamill | |
| Fundamental International Small Cap Fund | Financial Highlights |
| For a Share Outstanding Throughout the Years Presented |
| | | Year Ended | | | Year Ended | | | Year Ended | | | Year Ended | | | Year Ended | |
| | | December 31, | | | December 31, | | | December 31, | | | December 31, | | | December 31, | |
| Institutional | | 2022 | | | 2021 | | | 2020 | | | 2019 | | | 2018(a) | |
| Net asset value, beginning of year | | $ | 26.37 | | | $ | 24.50 | | | $ | 19.32 | | | $ | 13.48 | | | $ | 20.83 | |
| Income (loss) from investment operations: | | | | | | | | | | | | | | | | | | | | |
| Net investment income (loss)(b) | | | 0.08 | | | | (0.07 | ) | | | (0.06 | ) | | | 0.00 | (c) | | | (0.00 | )(c) |
| Net realized and unrealized gains (losses) on investments | | | (8.97 | ) | | | 3.98 | | | | 6.48 | | | | 5.84 | | | | (4.66 | ) |
| Total from investment operations | | | (8.89 | ) | | | 3.91 | | | | 6.42 | | | | 5.84 | | | | (4.66 | ) |
| Less dividends and distributions: | | | | | | | | | | | | | | | | | | | | |
| Dividends from net investment income | | | — | | | | — | | | | — | | | | — | | | | (0.11 | ) |
| Distributions from net realized gains | | | (2.02 | ) | | | (2.04 | ) | | | (1.24 | ) | | | — | | | | (2.58 | ) |
| Total distributions | | | (2.02 | ) | | | (2.04 | ) | | | (1.24 | ) | | | — | | | | (2.69 | ) |
| Net asset value, end of year | | $ | 15.46 | | | $ | 26.37 | | | $ | 24.50 | | | $ | 19.32 | | | $ | 13.48 | |
| Total Return | | | (33.74 | )% | | | 16.70 | % | | | 33.45 | % | | | 43.32 | % | | | (22.90 | )% |
| Ratios and Supplemental Data | | | | | | | | | | | | | | | | | | | | |
| Net assets, end of year (in 000s) | | $ | 24,994 | | | $ | 50,082 | | | $ | 15,458 | | | $ | 8,446 | | | $ | 20,266 | |
| Ratio of expenses to average net assets | | | | | | | | | | | | | | | | | | | | |
| With fee waivers/reimbursements | | | 1.10 | % | | | 1.10 | % | | | 1.10 | % | | | 1.20 | %(d) | | | 1.29 | % |
| Without fee waivers/reimbursements | | | 1.46 | % | | | 1.36 | % | | | 1.57 | % | | | 1.72 | % | | | 1.62 | % |
| Ratio of net investment income (loss) to average net assets | | | | | | | | | | | | | | | | | | | | |
| With fee waivers/reimbursements | | | 0.40 | % | | | (0.21 | )% | | | (0.31 | )% | | | 0.01 | % | | | (0.02 | )% |
| Without fee waivers/reimbursements | | | 0.04 | % | | | (0.47 | )% | | | (0.78 | )% | | | (0.50 | )% | | | (0.35 | )% |
| Portfolio turnover rate | | | 45 | % | | | 56 | % | | | 59 | % | | | 31 | % | | | 57 | % |
| (a) | Prior to April 30, 2018 known as the Westcore International Small-Cap Fund. |
| (b) | Calculated using the average shares method. |
| (c) | Less than $0.005 per share. |
| (d) | The contractual expense limitation is 1.10% effective May 1, 2019. |
| See Notes to Financial Statements. | |
| Annual Report | December 31, 2022 | | | 115 |
| Segall Bryant & Hamill Global All Cap Fund | Financial Highlights |
| For a Share Outstanding Throughout the Years Presented |
| | | Year Ended | | | Year Ended | | | Year Ended | | | Year Ended | | | Year Ended | |
| | | December 31, | | | December 31, | | | December 31, | | | December 31, | | | December 31, | |
| Retail | | 2022 | | | 2021 | | | 2020(a) | | | 2019 | | | 2018(b) | |
| Net asset value, beginning of year | | $ | 11.02 | | | $ | 9.32 | | | $ | 10.98 | | | $ | 9.52 | | | $ | 11.12 | |
| Income (loss) from investment operations: | | | | | | | | | | | | | | | | | | | | |
| Net investment income(c) | | | 0.02 | | | | 0.02 | | | | 0.18 | | | | 0.23 | | | | 0.20 | |
| Net realized and unrealized gains (losses) on investments | | | (2.07 | ) | | | 2.36 | | | | 0.08 | (d) | | | 2.16 | | | | (1.16 | ) |
| Total from investment operations | | | (2.05 | ) | | | 2.38 | | | | 0.26 | | | | 2.39 | | | | (0.96 | ) |
| Less dividends and distributions: | | | | | | | | | | | | | | | | | | | | |
| Dividends from net investment income | | | (0.03 | ) | | | (0.04 | ) | | | (0.18 | ) | | | (0.25 | ) | | | (0.19 | ) |
| Distributions from net realized gains | | | (0.17 | ) | | | (0.64 | ) | | | (1.74 | ) | | | (0.68 | ) | | | (0.45 | ) |
| Total distributions | | | (0.20 | ) | | | (0.68 | ) | | | (1.92 | ) | | | (0.93 | ) | | | (0.64 | ) |
| Net asset value, end of year | | $ | 8.77 | | | $ | 11.02 | | | $ | 9.32 | | | $ | 10.98 | | | $ | 9.52 | |
| Total Return | | | (18.68 | )% | | | 25.83 | % | | | 2.95 | % | | | 25.36 | % | | | (8.70 | )% |
| Ratios and Supplemental Data | | | | | | | | | | | | | | | | | | | | |
| Net assets, end of year (in 000s) | | $ | 25,422 | | | $ | 33,821 | | | $ | 32,224 | | | $ | 46,375 | | | $ | 41,887 | |
| Ratio of expenses to average net assets | | | | | | | | | | | | | | | | | | | | |
| With fee waivers/reimbursements | | | 0.89 | % | | | 0.89 | % | | | 0.89 | % | | | 0.89 | % | | | 0.99 | %(e) |
| Without fee waivers/reimbursements | | | 1.29 | % | | | 1.18 | % | | | 1.29 | % | | | 1.22 | % | | | 1.22 | % |
| Ratio of net investment income (loss) to average net assets | | | | | | | | | | | | | | | | | | | | |
| With fee waivers/reimbursements | | | 0.25 | % | | | 0.16 | % | | | 1.83 | % | | | 2.14 | % | | | 1.88 | % |
| Without fee waivers/reimbursements | | | (0.14 | )% | | | (0.13 | )% | | | 1.43 | % | | | 1.81 | % | | | 1.65 | % |
| Portfolio turnover rate | | | 31 | % | | | 24 | % | | | 132 | % | | | 40 | % | | | 59 | % |
| (a) | Prior to September 19, 2020 known as the Segall Bryant & Hamill Global Large Cap Fund. |
| (b) | Prior to April 30, 2018 known as the Westcore Global Large-Cap Dividend Fund. |
| (c) | Calculated using the average shares method. |
| (d) | Represents a balancing figure derived from other amounts in the financial highlights table that captures all other changes affecting the net asset value per share. This per share amount does not correlate to the aggregate of the net realized and unrealized losses on the Statement of Operations for the same period. |
| (e) | Contractual expense limitation changed from 0.99% to 0.89% effective December 20, 2018. |
| See Notes to Financial Statements. | |
| 116 | | | www.sbhfunds.com |
| Segall Bryant & Hamill Global All Cap Fund | Financial Highlights |
| For a Share Outstanding Throughout the Years Presented |
| | | Year Ended | | | Year Ended | | | Year Ended | | | Year Ended | | | Year Ended | |
| | | December 31, | | | December 31, | | | December 31, | | | December 31, | | | December 31, | |
| Institutional | | 2022 | | | 2021 | | | 2020(a) | | | 2019 | | | 2018(b) | |
| Net asset value, beginning of year | | $ | 10.86 | | | $ | 9.20 | | | $ | 10.86 | | | $ | 9.43 | | | $ | 11.04 | |
| Income (loss) from investment operations: | | | | | | | | | | | | | | | | | | | | |
| Net investment income(c) | | | 0.03 | | | | 0.03 | | | | 0.18 | | | | 0.24 | | | | 0.23 | |
| Net realized and unrealized gains (losses) on investments | | | (2.04 | ) | | | 2.33 | | | | 0.09 | (d) | | | 2.14 | | | | (1.16 | ) |
| Total from investment operations | | | (2.01 | ) | | | 2.36 | | | | 0.27 | | | | 2.38 | | | | (0.93 | ) |
| Less dividends and distributions: | | | | | | | | | | | | | | | | | | | | |
| Dividends from net investment income | | | (0.04 | ) | | | (0.06 | ) | | | (0.19 | ) | | | (0.27 | ) | | | (0.23 | ) |
| Distributions from net realized gains | | | (0.17 | ) | | | (0.64 | ) | | | (1.74 | ) | | | (0.68 | ) | | | (0.45 | ) |
| Total distributions | | | (0.21 | ) | | | (0.70 | ) | | | (1.93 | ) | | | (0.95 | ) | | | (0.68 | ) |
| Net asset value, end of year | | $ | 8.64 | | | $ | 10.86 | | | $ | 9.20 | | | $ | 10.86 | | | $ | 9.43 | |
| Total Return | | | (18.55 | )% | | | 25.94 | % | | | 3.04 | % | | | 25.55 | % | | | (8.53 | )% |
| Ratios and Supplemental Data | | | | | | | | | | | | | | | | | | | | |
| Net assets, end of year (in 000s) | | $ | 1,692 | | | $ | 4,875 | | | $ | 3,373 | | | $ | 2,730 | | | $ | 2,589 | |
| Ratio of expenses to average net assets | | | | | | | | | | | | | | | | | | | | |
| With fee waivers/reimbursements | | | 0.74 | % | | | 0.74 | % | | | 0.74 | % | | | 0.74 | % | | | 0.84 | %(e) |
| Without fee waivers/reimbursements | | | 1.27 | % | | | 1.17 | % | | | 1.20 | % | | | 1.12 | % | | | 1.09 | % |
| Ratio of net investment income (loss) to average net assets | | | | | | | | | | | | | | | | | | | | |
| With fee waivers/reimbursements | | | 0.33 | % | | | 0.29 | % | | | 1.83 | % | | | 2.32 | % | | | 2.11 | % |
| Without fee waivers/reimbursements | | | (0.20 | )% | | | (0.14 | )% | | | 1.37 | % | | | 1.94 | % | | | 1.86 | % |
| Portfolio turnover rate | | | 31 | % | | | 24 | % | | | 132 | % | | | 40 | % | | | 59 | % |
| (a) | Prior to September 19, 2020 known as the Segall Bryant & Hamill Global Large Cap Fund. |
| (b) | Prior to April 30, 2018 known as the Westcore Global Large-Cap Dividend Fund. |
| (c) | Calculated using the average shares method. |
| (d) | Represents a balancing figure derived from other amounts in the financial highlights table that captures all other changes affecting the net asset value per share. This per share amount does not correlate to the aggregate of the net realized and unrealized losses on the Statement of Operations for the same period. |
| (e) | Contractual expense limitation changed from 0.84% to 0.74% effective December 20, 2018. |
| See Notes to Financial Statements. | |
| Annual Report | December 31, 2022 | | | 117 |
Segall Bryant & Hamill Workplace Equality Fund | Financial Highlights |
| For a Share Outstanding Throughout the Years Presented |
| | | Year Ended | | | Year Ended | | | Year Ended | | | Year Ended | | | Year Ended | |
| | | December 31, | | | December 31, | | | December 31, | | | December 31, | | | December 31, | |
| Retail | | 2022 | | | 2021 | | | 2020 | | | 2019(a) | | | 2018(b) | |
| Net asset value, beginning of year | | $ | 7.87 | | | $ | 6.72 | | | $ | 6.45 | | | $ | 5.41 | | | $ | 6.01 | |
| Income (loss) from investment operations: | | | | | | | | | | | | | | | | | | | | |
| Net investment income(c) | | | 0.02 | | | | 0.01 | | | | 0.07 | | | | 0.12 | | | | 0.11 | |
| Net realized and unrealized gains (losses) on investments | | | (1.68 | ) | | | 1.72 | | | | 0.35 | | | | 1.33 | | | | (0.18 | ) |
| Total from investment operations | | | (1.66 | ) | | | 1.73 | | | | 0.42 | | | | 1.45 | | | | (0.07 | ) |
| Less dividends and distributions: | | | | | | | | | | | | | | | | | | | | |
| Dividends from net investment income | | | — | | | | (0.00 | )(d) | | | (0.08 | ) | | | (0.11 | ) | | | (0.21 | ) |
| Distributions from net realized gains | | | (0.06 | ) | | | (0.58 | ) | | | (0.07 | ) | | | (0.30 | ) | | | (0.32 | ) |
| Total distributions | | | (0.06 | ) | | | (0.58 | ) | | | (0.15 | ) | | | (0.41 | ) | | | (0.53 | ) |
| Net asset value, end of year | | $ | 6.15 | | | $ | 7.87 | | | $ | 6.72 | | | $ | 6.45 | | | $ | 5.41 | |
| Total Return | | | (21.11 | )% | | | 26.18 | % | | | 6.81 | % | | | 26.85 | % | | | (1.36 | )% |
| Ratios and Supplemental Data | | | | | | | | | | | | | | | | | | | | |
| Net assets, end of year (in 000s) | | $ | 7,504 | | | $ | 11,707 | | | $ | 9,397 | | | $ | 9,846 | | | $ | 8,131 | |
| Ratio of expenses to average net assets | | | | | | | | | | | | | | | | | | | | |
| With fee waivers/reimbursements | | | 0.89 | % | | | 0.89 | % | | | 0.89 | % | | | 0.89 | % | | | 0.89 | % |
| Without fee waivers/reimbursements | | | 1.33 | % | | | 1.28 | % | | | 1.53 | % | | | 1.57 | % | | | 1.86 | % |
| Ratio of net investment income (loss) to average net assets | | | | | | | | | | | | | | | | | | | | |
| With fee waivers/reimbursements | | | 0.36 | % | | | 0.07 | % | | | 1.19 | % | | | 1.92 | % | | | 1.85 | % |
| Without fee waivers/reimbursements | | | (0.08 | )% | | | (0.32 | )% | | | 0.55 | % | | | 1.24 | % | | | 0.88 | % |
| Portfolio turnover rate | | | 38 | % | | | 49 | % | | | 97 | % | | | 41 | % | | | 43 | % |
| (a) | Prior to May 1, 2019 known as the Segall Bryant & Hamill Large Cap Dividend Fund. |
| (b) | Prior to April 30, 2018 known as the Westcore Large-Cap Dividend Fund. |
| (c) | Calculated using the average shares method. |
| (d) | Less than $0.005 per share. |
| See Notes to Financial Statements. | |
| 118 | | | www.sbhfunds.com |
| Segall Bryant & Hamill Workplace Equality Fund | Financial Highlights |
| For a Share Outstanding Throughout the Years Presented |
| | | Year Ended | | | Year Ended | | | Year Ended | | | Year Ended | | | Year Ended | |
| | | December 31, | | | December 31, | | | December 31, | | | December 31, | | | December 31, | |
| Institutional | | 2022 | | | 2021 | | | 2020 | | | 2019(a) | | | 2018(b) | |
| Net asset value, beginning of year | | $ | 8.12 | | | $ | 6.93 | | | $ | 6.64 | | | $ | 5.55 | | | $ | 6.12 | |
| Income (loss) from investment operations: | | | | | | | | | | | | | | | | | | | | |
| Net investment income(c) | | | 0.04 | | | | 0.02 | | | | 0.08 | | | | 0.14 | | | | 0.13 | |
| Net realized and unrealized gains (losses) on investments | | | (1.74 | ) | | | 1.77 | | | | 0.36 | | | | 1.37 | | | | (0.20 | ) |
| Total from investment operations | | | (1.70 | ) | | | 1.79 | | | | 0.44 | | | | 1.51 | | | | (0.07 | ) |
| Less dividends and distributions: | | | | | | | | | | | | | | | | | | | | |
| Dividends from net investment income | | | — | | | | (0.02 | ) | | | (0.08 | ) | | | (0.12 | ) | | | (0.18 | ) |
| Distributions from net realized gains | | | (0.06 | ) | | | (0.58 | ) | | | (0.07 | ) | | | (0.30 | ) | | | (0.32 | ) |
| Total distributions | | | (0.06 | ) | | | (0.60 | ) | | | (0.15 | ) | | | (0.42 | ) | | | (0.50 | ) |
| Net asset value, end of year | | $ | 6.36 | | | $ | 8.12 | | | $ | 6.93 | | | $ | 6.64 | | | $ | 5.55 | |
| Total Return | | | (20.95 | )% | | | 26.14 | % | | | 6.98 | % | | | 27.22 | % | | | (1.25 | )% |
| Ratios and Supplemental Data | | | | | | | | | | | | | | | | | | | | |
| Net assets, end of year (in 000s) | | $ | 14,213 | | | $ | 17,845 | | | $ | 11,299 | | | $ | 8,339 | | | $ | 298 | |
| Ratio of expenses to average net assets | | | | | | | | | | | | | | | | | | | | |
| With fee waivers/reimbursements | | | 0.74 | % | | | 0.74 | % | | | 0.74 | % | | | 0.74 | % | | | 0.74 | % |
| Without fee waivers/reimbursements | | | 1.30 | % | | | 1.26 | % | | | 1.54 | % | | | 1.41 | % | | | 1.76 | % |
| Ratio of net investment income (loss) to average net assets | | | | | | | | | | | | | | | | | | | | |
| With fee waivers/reimbursements | | | 0.53 | % | | | 0.22 | % | | | 1.26 | % | | | 2.11 | % | | | 2.11 | % |
| Without fee waivers/reimbursements | | | (0.04 | )% | | | (0.30 | )% | | | 0.46 | % | | | 1.44 | % | | | 1.09 | % |
| Portfolio turnover rate | | | 38 | % | | | 49 | % | | | 97 | % | | | 41 | % | | | 43 | % |
| (a) | Prior to April 30, 2019 known as the Segall Bryant & Hamill Large Cap Dividend Fund. |
| (b) | Prior to April 30, 2018 known as the Westcore Large-Cap Dividend Fund. |
| (c) | Calculated using the average shares method. |
| See Notes to Financial Statements. | |
| Annual Report | December 31, 2022 | | | 119 |
| Segall Bryant & Hamill Short Term Plus Fund | Financial Highlights |
| For a Share Outstanding Throughout the Periods Presented |
| | | Year Ended | | | Year Ended | | | Year Ended | | | Year Ended | | | Period Ended | |
| | | December 31, | | | December 31, | | | December 31, | | | December 31, | | | December 31, | |
| Retail | | 2022 | | | 2021 | | | 2020 | | | 2019 | | | 2018(a) | |
| Net asset value, beginning of period | | $ | 10.05 | | | $ | 10.15 | | | $ | 10.11 | | | $ | 10.02 | | | $ | 10.00 | |
| Income (loss) from investment operations: | | | | | | | | | | | | | | | | | | | | |
| Net investment income(b) | | | 0.07 | | | | 0.05 | | | | 0.12 | | | | 0.25 | | | | 0.01 | |
| Net realized and unrealized gains (losses) on investments | | | (0.28 | ) | | | (0.08 | ) | | | 0.08 | | | | 0.10 | | | | 0.01 | |
| Total from investment operations | | | (0.21 | ) | | | (0.03 | ) | | | 0.20 | | | | 0.35 | | | | 0.02 | |
| Less dividends and distributions: | | | | | | | | | | | | | | | | | | | | |
| Dividends from net investment income | | | (0.08 | ) | | | (0.06 | ) | | | (0.15 | ) | | | (0.26 | ) | | | — | |
| Distributions from net realized gains | | | — | | | | (0.01 | ) | | | (0.01 | ) | | | (0.00 | )(c) | | | — | |
| Total distributions | | | (0.08 | ) | | | (0.07 | ) | | | (0.16 | ) | | | (0.26 | ) | | | — | |
| Net asset value, end of period | | $ | 9.76 | | | $ | 10.05 | | | $ | 10.15 | | | $ | 10.11 | | | $ | 10.02 | |
| Total Return | | | (2.07 | )% | | | (0.23 | )% | | | 2.05 | % | | | 3.57 | % | | | 0.20 | %(d) |
| Ratios and Supplemental Data | | | | | | | | | | | | | | | | | | | | |
| Net assets, end of period (in 000s) | | $ | 3,828 | | | $ | 11,896 | | | $ | 2,989 | | | $ | 915 | | | $ | 200 | |
| Ratio of expenses to average net assets | | | | | | | | | | | | | | | | | | | | |
| With fee waivers/reimbursements | | | 0.49 | % | | | 0.49 | % | | | 0.49 | % | | | 0.49 | % | | | 0.49 | %(e) |
| Without fee waivers/reimbursements | | | 0.86 | % | | | 0.80 | % | | | 1.18 | % | | | 4.13 | % | | | 9.96 | %(e)(f) |
| Ratio of net investment income (loss) to average net assets | | | | | | | | | | | | | | | | | | | | |
| With fee waivers/reimbursements | | | 0.69 | % | | | 0.45 | % | | | 1.23 | % | | | 2.50 | % | | | 2.39 | %(e) |
| Without fee waivers/reimbursements | | | 0.31 | % | | | 0.14 | % | | | 0.54 | % | | | (1.14 | )% | | | (7.08 | )%(e)(f) |
| Portfolio turnover rate | | | 22 | % | | | 46 | % | | | 47 | % | | | 32 | % | | | 0 | %(d) |
| (a) | Commenced operations on December 17, 2018. |
| (b) | Calculated using the average shares method. |
| (c) | Less than $0.005 per share. |
| (d) | Total return and portfolio turnover are not annualized for periods less than one full year. |
| (f) | Ratios before fee waivers for start up periods may not be representative of long term operating results. For the purpose of the ratio, audit and tax preparation fees have not been annualized. |
| See Notes to Financial Statements. | |
| 120 | | | www.sbhfunds.com |
| Segall Bryant & Hamill Short Term Plus Fund | Financial Highlights |
| For a Share Outstanding Throughout the Periods Presented |
| | | Year Ended | | | Year Ended | | | Year Ended | | | Year Ended | | | Period Ended | |
| | | December 31, | | | December 31, | | | December 31, | | | December 31, | | | December 31, | |
| Institutional | | 2022 | | | 2021 | | | 2020 | | | 2019 | | | 2018(a) | |
| Net asset value, beginning of period | | $ | 10.07 | | | $ | 10.16 | | | $ | 10.11 | | | $ | 10.02 | | | $ | 10.00 | |
| Income (loss) from investment operations: | | | | | | | | | | | | | | | | | | | | |
| Net investment income(b) | | | 0.08 | | | | 0.06 | | | | 0.13 | | | | 0.26 | | | | 0.01 | |
| Net realized and unrealized gains (losses) on investments | | | (0.28 | ) | | | (0.07 | ) | | | 0.09 | | | | 0.09 | | | | 0.01 | |
| Total from investment operations | | | (0.20 | ) | | | (0.01 | ) | | | 0.22 | | | | 0.35 | | | | 0.02 | |
| Less dividends and distributions: | | | | | | | | | | | | | | | | | | | | |
| Dividends from net investment income | | | (0.09 | ) | | | (0.07 | ) | | | (0.16 | ) | | | (0.26 | ) | | | — | |
| Distributions from net realized gains | | | — | | | | (0.01 | ) | | | (0.01 | ) | | | (0.00 | )(c) | | | — | |
| Total distributions | | | (0.09 | ) | | | (0.08 | ) | | | (0.17 | ) | | | (0.26 | ) | | | — | |
| Net asset value, end of period | | $ | 9.78 | | | $ | 10.07 | | | $ | 10.16 | | | $ | 10.11 | | | $ | 10.02 | |
| Total Return | | | (1.98 | )% | | | (0.05 | )% | | | 2.18 | % | | | 3.62 | % | | | 0.20 | %(d) |
| Ratios and Supplemental Data | | | | | | | | | | | | | | | | | | | | |
| Net assets, end of period (in 000s) | | $ | 24,777 | | | $ | 40,054 | | | $ | 23,568 | | | $ | 6,279 | | | $ | 1,002 | |
| Ratio of expenses to average net assets | | | | | | | | | | | | | | | | | | | | |
| With fee waivers/reimbursements | | | 0.40 | % | | | 0.40 | % | | | 0.40 | % | | | 0.40 | % | | | 0.40 | %(e) |
| Without fee waivers/reimbursements | | | 0.74 | % | | | 0.68 | % | | | 1.03 | % | | | 3.68 | % | | | 9.74 | %(e)(f) |
| Ratio of net investment income (loss) to average net assets | | | | | | | | | | | | | | | | | | | | |
| With fee waivers/reimbursements | | | 0.81 | % | | | 0.55 | % | | | 1.32 | % | | | 2.53 | % | | | 2.48 | %(e) |
| Without fee waivers/reimbursements | | | 0.48 | % | | | 0.27 | % | | | 0.69 | % | | | (0.75 | )% | | | (6.86 | )%(e)(f) |
| Portfolio turnover rate | | | 22 | % | | | 46 | % | | | 47 | % | | | 32 | % | | | 0 | %(d) |
| (a) | Commenced operations on December 17, 2018. |
| (b) | Calculated using the average shares method. |
| (c) | Less than $0.005 per share. |
| (d) | Total return and portfolio turnover are not annualized for periods less than one full year. |
| (f) | Ratios before fee waivers for start up periods may not be representative of long-term operating results. For the purpose of the ratio, audit and tax preparation fees have not been annualized. |
| See Notes to Financial Statements. | |
| Annual Report | December 31, 2022 | | | 121 |
| Segall Bryant & Hamill Plus Bond Fund | Financial Highlights |
| For a Share Outstanding Throughout the Years Presented |
| | | Year Ended | | | Year Ended | | | Year Ended | | | Year Ended | | | Year Ended | |
| | | December 31, | | | December 31, | | | December 31, | | | December 31, | | | December 31, | |
| Retail | | 2022 | | | 2021 | | | 2020 | | | 2019 | | | 2018(a) | |
| Net asset value, beginning of year | | $ | 10.85 | | | $ | 11.25 | | | $ | 10.79 | | | $ | 10.32 | | | $ | 10.71 | |
| Income (loss) from investment operations: | | | | | | | | | | | | | | | | | | | | |
| Net investment income(b) | | | 0.26 | | | | 0.23 | | | | 0.27 | | | | 0.33 | | | | 0.33 | |
| Net realized and unrealized gains (losses) on investments | | | (1.67 | ) | | | (0.30 | ) | | | 0.64 | | | | 0.57 | | | | (0.36 | ) |
| Total from investment operations | | | (1.41 | ) | | | (0.07 | ) | | | 0.91 | | | | 0.90 | | | | (0.03 | ) |
| Less dividends and distributions: | | | | | | | | | | | | | | | | | | | | |
| Dividends from net investment income | | | (0.30 | ) | | | (0.26 | ) | | | (0.30 | ) | | | (0.36 | ) | | | (0.34 | ) |
| Distributions from net realized gains | | | — | | | | (0.07 | ) | | | (0.15 | ) | | | (0.07 | ) | | | (0.02 | ) |
| Total distributions | | | (0.30 | ) | | | (0.33 | ) | | | (0.45 | ) | | | (0.43 | ) | | | (0.36 | ) |
| Net asset value, end of year | | $ | 9.14 | | | $ | 10.85 | | | $ | 11.25 | | | $ | 10.79 | | | $ | 10.32 | |
| Total Return | | | (13.13 | )% | | | (0.58 | )% | | | 8.49 | % | | | 8.79 | % | | | (0.18 | )% |
| Ratios and Supplemental Data | | | | | | | | | | | | | | | | | | | | |
| Net assets, end of year (in 000s) | | $ | 311,042 | | | $ | 466,063 | | | $ | 594,559 | | | $ | 598,220 | | | $ | 915,824 | |
| Ratio of expenses to average net assets | | | | | | | | | | | | | | | | | | | | |
| With fee waivers/reimbursements | | | 0.55 | % | | | 0.55 | % | | | 0.55 | % | | | 0.55 | % | | | 0.55 | % |
| Without fee waivers/reimbursements | | | 0.67 | % | | | 0.67 | % | | | 0.68 | % | | | 0.73 | % | | | 0.76 | % |
| Ratio of net investment income to average net assets | | | | | | | | | | | | | | | | | | | | |
| With fee waivers/reimbursements | | | 2.77 | % | | | 2.10 | % | | | 2.38 | % | | | 3.04 | % | | | 3.17 | % |
| Without fee waivers/reimbursements | | | 2.65 | % | | | 1.98 | % | | | 2.25 | % | | | 2.86 | % | | | 2.96 | % |
| Portfolio turnover rate | | | 26 | % | | | 54 | % | | | 59 | % | | | 52 | % | | | 59 | % |
| (a) | Prior to April 30, 2018 known as the Westcore Plus Bond Fund. |
| (b) | Calculated using the average shares method. |
| See Notes to Financial Statements. | |
| 122 | | | www.sbhfunds.com |
| Segall Bryant & Hamill Plus Bond Fund | Financial Highlights |
| For a Share Outstanding Throughout the Years Presented |
| | | Year Ended | | | Year Ended | | | Year Ended | | | Year Ended | | | Year Ended | |
| | | December 31, | | | December 31, | | | December 31, | | | December 31, | | | December 31, | |
| Institutional | | 2022 | | | 2021 | | | 2020 | | | 2019 | | | 2018(a) | |
| Net asset value, beginning of year | | $ | 10.74 | | | $ | 11.14 | | | $ | 10.69 | | | $ | 10.23 | | | $ | 10.60 | |
| Income (loss) from investment operations: | | | | | | | | | | | | | | | | | | | | |
| Net investment income(b) | | | 0.28 | | | | 0.25 | | | | 0.28 | | | | 0.34 | | | | 0.34 | |
| Net realized and unrealized gains (losses) on investments | | | (1.66 | ) | | | (0.30 | ) | | | 0.64 | | | | 0.56 | | | | (0.34 | ) |
| Total from investment operations | | | (1.38 | ) | | | (0.05 | ) | | | 0.92 | | | | 0.90 | | | | 0.00 | (c) |
| Less dividends and distributions: | | | | | | | | | | | | | | | | | | | | |
| Dividends from net investment income | | | (0.31 | ) | | | (0.28 | ) | | | (0.32 | ) | | | (0.37 | ) | | | (0.35 | ) |
| Distributions from net realized gains | | | — | | | | (0.07 | ) | | | (0.15 | ) | | | (0.07 | ) | | | (0.02 | ) |
| Total distributions | | | (0.31 | ) | | | (0.35 | ) | | | (0.47 | ) | | | (0.44 | ) | | | (0.37 | ) |
| Net asset value, end of year | | $ | 9.05 | | | $ | 10.74 | | | $ | 11.14 | | | $ | 10.69 | | | $ | 10.23 | |
| Total Return | | | (12.95 | )% | | | (0.44 | )% | | | 8.65 | % | | | 8.90 | % | | | 0.06 | % |
| Ratios and Supplemental Data | | | | | | | | | | | | | | | | | | | | |
| Net assets, end of year (in 000s) | | $ | 369,601 | | | $ | 589,074 | | | $ | 525,992 | | | $ | 427,395 | | | $ | 307,253 | |
| Ratio of expenses to average net assets | | | | | | | | | | | | | | | | | | | | |
| With fee waivers/reimbursements | | | 0.40 | % | | | 0.40 | % | | | 0.40 | % | | | 0.40 | % | | | 0.40 | % |
| Without fee waivers/reimbursements | | | 0.52 | % | | | 0.51 | % | | | 0.51 | % | | | 0.55 | % | | | 0.56 | % |
| Ratio of net investment income to average net assets | | | | | | | | | | | | | | | | | | | | |
| With fee waivers/reimbursements | | | 2.91 | % | | | 2.24 | % | | | 2.53 | % | | | 3.14 | % | | | 3.33 | % |
| Without fee waivers/reimbursements | | | 2.79 | % | | | 2.13 | % | | | 2.42 | % | | | 2.99 | % | | | 3.17 | % |
| Portfolio turnover rate | | | 26 | % | | | 54 | % | | | 59 | % | | | 52 | % | | | 59 | % |
| (a) | Prior to April 30, 2018 known as the Westcore Plus Bond Fund. |
| (b) | Calculated using the average shares method. |
| (c) | Less than $0.005 per share. |
| See Notes to Financial Statements. | |
| Annual Report | December 31, 2022 | | | 123 |
| Segall Bryant & Hamill Quality High Yield Fund | Financial Highlights |
| For a Share Outstanding Throughout the Years Presented |
| | | Year Ended | | | Year Ended | | | Year Ended | | | Year Ended | | | Year Ended | |
| | | December 31, | | | December 31, | | | December 31, | | | December 31, | | | December 31, | |
| Retail | | 2022 | | | 2021 | | | 2020 | | | 2019 | | | 2018(a) | |
| Net asset value, beginning of year | | $ | 9.21 | | | $ | 9.24 | | | $ | 8.97 | | | $ | 8.40 | | | $ | 8.99 | |
| Income (loss) from investment operations: | | | | | | | | | | | | | | | | | | | | |
| Net investment income(b) | | | 0.31 | | | | 0.30 | | | | 0.34 | | | | 0.43 | | | | 0.40 | |
| Net realized and unrealized gains (losses) on investments | | | (1.20 | ) | | | (0.01 | ) | | | 0.29 | | | | 0.58 | | | | (0.59 | ) |
| Total from investment operations | | | (0.89 | ) | | | 0.29 | | | | 0.63 | | | | 1.01 | | | | (0.19 | ) |
| Less dividends and distributions: | | | | | | | | | | | | | | | | | | | | |
| Dividends from net investment income | | | (0.34 | ) | | | (0.32 | ) | | | (0.36 | ) | | | (0.44 | ) | | | (0.40 | ) |
| Net asset value, end of year | | $ | 7.98 | | | $ | 9.21 | | | $ | 9.24 | | | $ | 8.97 | | | $ | 8.40 | |
| Total Return | | | (9.75 | )% | | | 3.14 | % | | | 7.31 | % | | | 12.21 | % | | | (2.19 | )% |
| Ratios and Supplemental Data | | | | | | | | | | | | | | | | | | | | |
| Net assets, end of year (in 000s) | | $ | 27,855 | | | $ | 39,879 | | | $ | 42,227 | | | $ | 39,692 | | | $ | 43,045 | |
| Ratio of expenses to average net assets | | | | | | | | | | | | | | | | | | | | |
| With fee waivers/reimbursements | | | 0.85 | % | | | 0.85 | % | | | 0.85 | % | | | 0.85 | % | | | 0.85 | % |
| Without fee waivers/reimbursements | | | 0.90 | % | | | 0.88 | % | | | 0.95 | % | | | 0.98 | % | | | 0.99 | % |
| Ratio of net investment income to average net assets | | | | | | | | | | | | | | | | | | | | |
| With fee waivers/reimbursements | | | 3.82 | % | | | 3.30 | % | | | 3.84 | % | | | 4.86 | % | | | 4.52 | % |
| Without fee waivers/reimbursements | | | 3.77 | % | | | 3.27 | % | | | 3.74 | % | | | 4.73 | % | | | 4.38 | % |
| Portfolio turnover rate | | | 9 | % | | | 25 | % | | | 57 | % | | | 41 | % | | | 21 | % |
| (a) | Prior to April 30, 2018 known as the Westcore Flexible Income Fund. |
| (b) | Calculated using the average shares method. |
| See Notes to Financial Statements. | |
| 124 | | | www.sbhfunds.com |
| Segall Bryant & Hamill Quality High Yield Fund | Financial Highlights |
| For a Share Outstanding Throughout the Years Presented |
| | | Year Ended | | | Year Ended | | | Year Ended | | | Year Ended | | | Year Ended | |
| | | December 31, | | | December 31, | | | December 31, | | | December 31, | | | December 31, | |
| Institutional | | 2022 | | | 2021 | | | 2020 | | | 2019 | | | 2018(a) | |
| Net asset value, beginning of year | | $ | 9.10 | | | $ | 9.13 | | | $ | 8.87 | | | $ | 8.29 | | | $ | 8.88 | |
| Income (loss) from investment operations: | | | | | | | | | | | | | | | | | | | | |
| Net investment income(b) | | | 0.33 | | | | 0.32 | | | | 0.35 | | | | 0.44 | | | | 0.40 | |
| Net realized and unrealized gains (losses) on investments | | | (1.19 | ) | | | (0.02 | ) | | | 0.28 | | | | 0.57 | | | | (0.58 | ) |
| Total from investment operations | | | (0.86 | ) | | | 0.30 | | | | 0.63 | | | | 1.01 | | | | (0.18 | ) |
| Less dividends and distributions: | | | | | | | | | | | | | | | | | | | | |
| Dividends from net investment income | | | (0.35 | ) | | | (0.33 | ) | | | (0.37 | ) | | | (0.43 | ) | | | (0.41 | ) |
| Net asset value, end of year | | $ | 7.89 | | | $ | 9.10 | | | $ | 9.13 | | | $ | 8.87 | | | $ | 8.29 | |
| Total Return | | | (9.51 | )% | | | 3.33 | % | | | 7.40 | % | | | 12.40 | % | | | (2.12 | )% |
| Ratios and Supplemental Data | | | | | | | | | | | | | | | | | | | | |
| Net assets, end of year (in 000s) | | $ | 37,923 | | | $ | 62,127 | | | $ | 40,912 | | | $ | 21,680 | | | $ | 12,962 | |
| Ratio of expenses to average net assets | | | | | | | | | | | | | | | | | | | | |
| With fee waivers/reimbursements | | | 0.70 | % | | | 0.70 | % | | | 0.70 | % | | | 0.70 | % | | | 0.69 | % |
| Without fee waivers/reimbursements | | | 0.79 | % | | | 0.76 | % | | | 0.82 | % | | | 0.83 | % | | | 0.81 | % |
| Ratio of net investment income to average net assets | | | | | | | | | | | | | | | | | | | | |
| With fee waivers/reimbursements | | | 3.95 | % | | | 3.43 | % | | | 3.99 | % | | | 4.99 | % | | | 4.68 | % |
| Without fee waivers/reimbursements | | | 3.86 | % | | | 3.37 | % | | | 3.87 | % | | | 4.86 | % | | | 4.56 | % |
| Portfolio turnover rate | | | 9 | % | | | 25 | % | | | 57 | % | | | 41 | % | | | 21 | % |
| (a) | Prior to April 30, 2018 known as the Westcore Flexible Income Fund. |
| (b) | Calculated using the average shares method. |
| See Notes to Financial Statements. | |
| Annual Report | December 31, 2022 | | | 125 |
| Segall Bryant & Hamill Municipal Opportunities Fund | Financial Highlights |
| For a Share Outstanding Throughout the Years Presented |
| | | Year Ended | | | Year Ended | | | Year Ended | | | Year Ended | | | Year Ended | |
| | | December 31, | | | December 31, | | | December 31, | | | December 31, | | | December 31, | |
| Retail | | 2022 | | | 2021 | | | 2020 | | | 2019 | | | 2018(a) | |
| Net asset value, beginning of year | | $ | 11.02 | | | $ | 11.01 | | | $ | 10.67 | | | $ | 10.38 | | | $ | 10.61 | |
| Income (loss) from investment operations: | | | | | | | | | | | | | | | | | | | | |
| Net investment income(b) | | | 0.21 | | | | 0.18 | | | | 0.24 | | | | 0.29 | | | | 0.35 | |
| Net realized and unrealized gains (losses) on investments | | | (1.44 | ) | | | 0.12 | | | | 0.44 | | | | 0.43 | | | | (0.23 | ) |
| Total from investment operations | | | (1.23 | ) | | | 0.30 | | | | 0.68 | | | | 0.72 | | | | 0.12 | |
| Less dividends and distributions: | | | | | | | | | | | | | | | | | | | | |
| Dividends from net investment income | | | (0.29 | ) | | | (0.27 | ) | | | (0.30 | ) | | | (0.35 | ) | | | (0.34 | ) |
| Distributions from net realized gains | | | — | | | | (0.02 | ) | | | (0.04 | ) | | | (0.08 | ) | | | (0.01 | ) |
| Total distributions | | | (0.29 | ) | | | (0.29 | ) | | | (0.34 | ) | | | (0.43 | ) | | | (0.35 | ) |
| Net asset value, end of year | | $ | 9.50 | | | $ | 11.02 | | | $ | 11.01 | | | $ | 10.67 | | | $ | 10.38 | |
| Total Return | | | (11.25 | )% | | | 2.72 | % | | | 6.54 | % | | | 7.00 | % | | | 1.23 | % |
| Ratios and Supplemental Data | | | | | | | | | | | | | | | | | | | | |
| Net assets, end of year (in 000s) | | $ | 35,120 | | | $ | 42,056 | | | $ | 28,344 | | | $ | 11,399 | | | $ | 6,405 | |
| Ratio of expenses to average net assets | | | | | | | | | | | | | | | | | | | | |
| With fee waivers/reimbursements | | | 0.65 | % | | | 0.65 | % | | | 0.65 | % | | | 0.65 | % | | | 0.65 | % |
| Without fee waivers/reimbursements | | | 0.73 | % | | | 0.74 | % | | | 0.80 | % | | | 0.94 | % | | | 1.09 | % |
| Ratio of net investment income to average net assets | | | | | | | | | | | | | | | | | | | | |
| With fee waivers/reimbursements | | | 2.16 | % | | | 1.64 | % | | | 2.17 | % | | | 2.73 | % | | | 3.40 | % |
| Without fee waivers/reimbursements | | | 2.08 | % | | | 1.55 | % | | | 2.02 | % | | | 2.44 | % | | | 2.96 | % |
| Portfolio turnover rate | | | 173 | % | | | 37 | % | | | 101 | % | | | 114 | % | | | 188 | % |
| (a) | Prior to April 30, 2018 known as the Westcore Municipal Opportunities Fund. |
| (b) | Calculated using the average shares method. |
| See Notes to Financial Statements. | |
| 126 | | | www.sbhfunds.com |
| Segall Bryant & Hamill Municipal Opportunities Fund | Financial Highlights |
| For a Share Outstanding Throughout the Years Presented |
| | | Year Ended | | | Year Ended | | | Year Ended | | | Year Ended | | | Year Ended | |
| | | December 31, | | | December 31, | | | December 31, | | | December 31, | | | December 31, | |
| Institutional | | 2022 | | | 2021 | | | 2020 | | | 2019 | | | 2018(a) | |
| Net asset value, beginning of year | | $ | 11.03 | | | $ | 11.02 | | | $ | 10.68 | | | $ | 10.39 | | | $ | 10.62 | |
| Income (loss) from investment operations: | | | | | | | | | | | | | | | | | | | | |
| Net investment income(b) | | | 0.23 | | | | 0.19 | | | | 0.25 | | | | 0.31 | | | | 0.37 | |
| Net realized and unrealized gains (losses) on investments | | | (1.45 | ) | | | 0.12 | | | | 0.45 | | | | 0.43 | | | | (0.23 | ) |
| Total from investment operations | | | (1.22 | ) | | | 0.31 | | | | 0.70 | | | | 0.74 | | | | 0.14 | |
| Less dividends and distributions: | | | | | | | | | | | | | | | | | | | | |
| Dividends from net investment income | | | (0.30 | ) | | | (0.28 | ) | | | (0.32 | ) | | | (0.37 | ) | | | (0.36 | ) |
| Distributions from net realized gains | | | — | | | | (0.02 | ) | | | (0.04 | ) | | | (0.08 | ) | | | (0.01 | ) |
| Total distributions | | | (0.30 | ) | | | (0.30 | ) | | | (0.36 | ) | | | (0.45 | ) | | | (0.37 | ) |
| Net asset value, end of year | | $ | 9.51 | | | $ | 11.03 | | | $ | 11.02 | | | $ | 10.68 | | | $ | 10.39 | |
| Total Return | | | (11.11 | )% | | | 2.87 | % | | | 6.71 | % | | | 7.19 | % | | | 1.36 | % |
| Ratios and Supplemental Data | | | | | | | | | | | | | | | | | | | | |
| Net assets, end of year (in 000s) | | $ | 176,685 | | | $ | 233,490 | | | $ | 145,819 | | | $ | 62,358 | | | $ | 35,204 | |
| Ratio of expenses to average net assets | | | | | | | | | | | | | | | | | | | | |
| With fee waivers/reimbursements | | | 0.50 | % | | | 0.50 | % | | | 0.50 | % | | | 0.50 | % | | | 0.50 | % |
| Without fee waivers/reimbursements | | | 0.56 | % | | | 0.57 | % | | | 0.62 | % | | | 0.76 | % | | | 0.91 | % |
| Ratio of net investment income to average net assets | | | | | | | | | | | | | | | | | | | | |
| With fee waivers/reimbursements | | | 2.31 | % | | | 1.74 | % | | | 2.32 | % | | | 2.90 | % | | | 3.51 | % |
| Without fee waivers/reimbursements | | | 2.24 | % | | | 1.67 | % | | | 2.20 | % | | | 2.64 | % | | | 3.10 | % |
| Portfolio turnover rate | | | 173 | % | | | 37 | % | | | 101 | % | | | 114 | % | | | 188 | % |
| (a) | Prior to April 30, 2018 known as the Westcore Municipal Opportunities Fund. |
| (b) | Calculated using the average shares method. |
| See Notes to Financial Statements. | |
| Annual Report | December 31, 2022 | | | 127 |
| Segall Bryant & Hamill Colorado Tax Free Fund | Financial Highlights |
| For a Share Outstanding Throughout the Years Presented |
| | | Year Ended | | | Year Ended | | | Year Ended | | | Year Ended | | | Year Ended | |
| | | December 31, | | | December 31, | | | December 31, | | | December 31, | | | December 31, | |
| Retail | | 2022 | | | 2021 | | | 2020 | | | 2019 | | | 2018(a) | |
| Net asset value, beginning of year | | $ | 11.91 | | | $ | 11.95 | | | $ | 11.69 | | | $ | 11.30 | | | $ | 11.58 | |
| Income (loss) from investment operations: | | | | | | | | | | | | | | | | | | | | |
| Net investment income(b) | | | 0.21 | | | | 0.17 | | | | 0.24 | | | | 0.27 | | | | 0.35 | |
| Net realized and unrealized gains (losses) on investments | | | (1.47 | ) | | | 0.05 | | | | 0.34 | | | | 0.47 | | | | (0.28 | ) |
| Total from investment operations | | | (1.26 | ) | | | 0.22 | | | | 0.58 | | | | 0.74 | | | | 0.07 | |
| Less dividends and distributions: | | | | | | | | | | | | | | | | | | | | |
| Dividends from net investment income | | | (0.30 | ) | | | (0.26 | ) | | | (0.32 | ) | | | (0.35 | ) | | | (0.35 | ) |
| Net asset value, end of year | | $ | 10.35 | | | $ | 11.91 | | | $ | 11.95 | | | $ | 11.69 | | | $ | 11.30 | |
| Total Return | | | (10.64 | )% | | | 1.87 | % | | | 5.08 | % | | | 6.62 | % | | | 0.60 | % |
| Ratios and Supplemental Data | | | | | | | | | | | | | | | | | | | | |
| Net assets, end of year (in 000s) | | $ | 143,558 | | | $ | 216,617 | | | $ | 205,285 | | | $ | 161,755 | | | $ | 176,020 | |
| Ratio of expenses to average net assets | | | | | | | | | | | | | | | | | | | | |
| With fee waivers/reimbursements | | | 0.65 | % | | | 0.65 | % | | | 0.65 | % | | | 0.65 | % | | | 0.65 | % |
| Without fee waivers/reimbursements | | | 0.68 | % | | | 0.68 | % | | | 0.70 | % | | | 0.77 | % | | | 0.82 | % |
| Ratio of net investment income to average net assets | | | | | | | | | | | | | | | | | | | | |
| With fee waivers/reimbursements | | | 1.96 | % | | | 1.44 | % | | | 2.00 | % | | | 2.29 | % | | | 3.05 | % |
| Without fee waivers/reimbursements | | | 1.94 | % | | | 1.41 | % | | | 1.95 | % | | | 2.17 | % | | | 2.88 | % |
| Portfolio turnover rate | | | 64 | % | | | 15 | % | | | 71 | % | | | 30 | % | | | 47 | % |
| (a) | Prior to April 30, 2018 known as the Westcore Colorado Tax-Exempt Fund. |
| (b) | Calculated using the average shares method. |
| See Notes to Financial Statements. | |
| 128 | | | www.sbhfunds.com |
| Segall Bryant & Hamill Colorado Tax Free Fund | Financial Highlights |
| For a Share Outstanding Throughout the Years Presented |
| | | Year Ended | | | Year Ended | | | Year Ended | | | Year Ended | | | Year Ended | |
| | | December 31, | | | December 31, | | | December 31, | | | December 31, | | | December 31, | |
| Institutional | | 2022 | | | 2021 | | | 2020 | | | 2019 | | | 2018(a) | |
| Net asset value, beginning of year | | $ | 11.96 | | | $ | 12.00 | | | $ | 11.73 | | | $ | 11.33 | | | $ | 11.61 | |
| Income (loss) from investment operations: | | | | | | | | | | | | | | | | | | | | |
| Net investment income(b) | | | 0.23 | | | | 0.19 | | | | 0.25 | | | | 0.28 | | | | 0.36 | |
| Net realized and unrealized gains (losses) on investments | | | (1.43 | ) | | | 0.05 | | | | 0.36 | | | | 0.48 | | | | (0.28 | ) |
| Total from investment operations | | | (1.25 | ) | | | 0.24 | | | | 0.61 | | | | 0.76 | | | | 0.08 | |
| Less dividends and distributions: | | | | | | | | | | | | | | | | | | | | |
| Dividends from net investment income | | | (0.32 | ) | | | (0.28 | ) | | | (0.34 | ) | | | (0.36 | ) | | | (0.36 | ) |
| Net asset value, end of year | | $ | 10.39 | | | $ | 11.96 | | | $ | 12.00 | | | $ | 11.73 | | | $ | 11.33 | |
| Total Return | | | (10.55 | )% | | | 2.01 | % | | | 5.29 | % | | | 6.80 | % | | | 0.73 | % |
| Ratios and Supplemental Data | | | | | | | | | | | | | | | | | | | | |
| Net assets, end of year (in 000s) | | $ | 251,981 | | | $ | 370,546 | | | $ | 289,774 | | | $ | 214,996 | | | $ | 96,615 | |
| Ratio of expenses to average net assets | | | | | | | | | | | | | | | | | | | | |
| With fee waivers/reimbursements | | | 0.50 | % | | | 0.50 | % | | | 0.50 | % | | | 0.50 | % | | | 0.50 | % |
| Without fee waivers/reimbursements | | | 0.53 | % | | | 0.52 | % | | | 0.55 | % | | | 0.61 | % | | | 0.63 | % |
| Ratio of net investment income to average net assets | | | | | | | | | | | | | | | | | | | | |
| With fee waivers/reimbursements | | | 2.12 | % | | | 1.54 | % | | | 2.15 | % | | | 2.41 | % | | | 3.20 | % |
| Without fee waivers/reimbursements | | | 2.09 | % | | | 1.52 | % | | | 2.10 | % | | | 2.30 | % | | | 3.07 | % |
| Portfolio turnover rate | | | 64 | % | | | 15 | % | | | 71 | % | | | 30 | % | | | 47 | % |
| (a) | Prior to April 30, 2018 known as the Westcore Colorado Tax-Exempt Fund. |
| (b) | Calculated using the average shares method. |
| See Notes to Financial Statements. | |
| Annual Report | December 31, 2022 | | | 129 |
| Segall Bryant & Hamill Funds | Notes to Financial Statements |
| | December 31, 2022 |
Segall Bryant & Hamill Trust (the “Trust”) is registered under the Investment Company Act of 1940, as amended, (the “1940 Act”), as an open-end management investment company. Interests in the Segall Bryant & Hamill Small Cap Value Fund, Segall Bryant & Hamill Small Cap Growth Fund, Segall Bryant & Hamill Small Cap Core Fund, Segall Bryant & Hamill All Cap Fund, Segall Bryant & Hamill Emerging Markets Fund, Segall Bryant & Hamill International Small Cap Fund, Segall Bryant & Hamill Fundamental International Small Cap Fund, Segall Bryant & Hamill Global All Cap Fund, Segall Bryant & Hamill Workplace Equality Fund, Segall Bryant & Hamill Short Term Plus Fund, Segall Bryant & Hamill Plus Bond Fund, Segall Bryant & Hamill Quality High Yield Fund, Segall Bryant & Hamill Municipal Opportunities Fund and Segall Bryant & Hamill Colorado Tax Free Fund (the “Funds”) are represented by separate classes of beneficial interest of the Trust, which is organized as a Massachusetts business trust. All of the Funds offer Retail Class and Institutional Class shares. All classes of shares have identical rights to earnings, assets and voting privileges, except for class specific expenses and exclusive rights to vote on matters solely affecting such class.
Each of the Segall Bryant & Hamill Small Cap Value Fund, Segall Bryant & Hamill Small Cap Growth Fund, Segall Bryant & Hamill Small Cap Core Fund, Segall Bryant & Hamill All Cap Fund, Segall Bryant & Hamill Emerging Markets Fund, Segall Bryant & Hamill International Small Cap Fund, Segall Bryant & Hamill Fundamental International Small Cap Fund, Segall Bryant & Hamill Global All Cap and Segall Bryant & Hamill Workplace Equality Fund seeks to achieve long-term capital appreciation. The Segall Bryant & Hamill Short Term Plus Fund seeks to provide current income and competitive total return. Each of the Segall Bryant & Hamill Plus Bond Fund and Segall Bryant & Hamill Quality High Yield Fund seeks to achieve long-term total rate of return consistent with preservation of capital. The Segall Bryant & Hamill Municipal Opportunities Fund seeks income exempt from Federal income taxes. The Segall Bryant & Hamill Colorado Tax Free Fund seeks income exempt from both federal and Colorado state personal income taxes.
The Funds (other than Segall Bryant & Hamill Emerging Markets Fund and Segall Bryant & Hamill Colorado Tax Free Fund, which are non-diversified) are diversified portfolios of the Trust for the purposes of the Investment Company Act of 1940, as amended (the “1940 Act”).
| 2. | SIGNIFICANT ACCOUNTING POLICIES |
The following is a summary of significant accounting policies consistently followed by each Fund in the preparation of its financial statements. Each Fund is considered an investment company for financial reporting purposes. The following policies are in conformity with accounting principles generally accepted in the United States of America for investment companies, under Accounting Standards Codification Topic 946 – Financial Services – Investment Companies.
Use of Estimates – The preparation of financial statements in accordance with accounting principles generally accepted in the United States of America requires management to make estimates and assumptions that affect the reported amounts of assets and liabilities and disclosure of contingent assets and liabilities in the financial statements. The actual results could differ from those estimates.
Recent Accounting Pronouncements – In March 2020, the Financial Accounting Standards Board (“FASB”) issued an Accounting Standards Update (“ASU”), ASU 2020-04, which provides optional guidance to ease the potential accounting burden associated with transitioning away from the London Interbank Offered Rate and other reference rates that are expected to be discontinued. ASU 2020 04 is effective for certain reference rate-related contract modifications that occur during the period March 12, 2020 through December 31, 2022. In March 2021, the administrator for LIBOR announced the extension of the publication of a majority of the USD LIBOR settings to June 30, 2023. Management is continuing to evaluate the potential effect a discontinuation of LIBOR could have on the Fund’s investments and has determined that it is unlikely the ASU’s adoption will have a material impact on the Funds’ financial statements.
In June 2022, the FASB issued Accounting Standards Update No. 2022-03 (“ASU 2022-03”), Fair Value Measurement (Topic 820)—Fair Value Measurement of Equity Securities Subject to Contractual Sales Restrictions. The amendments in ASU 2022-clarify that a contractual restriction on a sale of an equity security is not considered a part of the unit of account of the equity security and, therefore, is not considered in measuring fair value. The amendments also clarify that an entity cannot, as a separate unit of account, recognize and measure a contractual sale restriction. The amendments in ASU 2022-03 also require the following disclosures for equity securities subject to contractual sale restrictions: (i) the fair value of equity securities subject to contractual sale restrictions reflected in the balance sheet, (ii) the nature and remaining duration of the restriction(s), and (iii) the circumstances that could cause a lapse in the restriction(s). The amendments in ASU 2022-03 are effective for fiscal years beginning after December 15, 2023, and interim periods within those fiscal years for public business entities (early adoption is also permitted). Management is currently evaluating the potential effect that this ASU amendment will have on the Funds’ financial statements.
Cash Equivalents – Each Fund subscribes to the Brown Brothers Harriman & Co. (“BBH”) Cash Management Service (“CMS”), whereby cash balances are automatically swept into overnight demand deposits with a branch of a pre-approved commercial bank. This fully automated program allows the Funds to earn interest on cash balances. As of December 31, 2022, the cash equivalents balances reflected on the Statements of Assets and Liabilities represent the amounts participating in the BBH CMS.
| | |
| 130 | | | www.sbhfunds.com |
| Segall Bryant & Hamill Funds | Notes to Financial Statements |
| | December 31, 2022 |
Investment Valuation – All securities of the Funds are valued as of the close of regular trading on the New York Stock Exchange (“NYSE”), currently 4:00 p.m. (Eastern Time), on each day that the NYSE is open, subject to provisions in the prospectus and/or Statement of Additional Information regarding pricing at other times in case of an emergency and optional pricing of the Funds in the event that the NYSE does not open for business because of an emergency.
Securities that are traded on a recognized domestic stock exchange are generally valued at the last sales price as of the valuation time on the principal stock exchange on which they are traded. Securities that are principally traded on the National Association of Securities Dealers Automated Quotation (“NASDAQ”) exchange are generally valued at the NASDAQ Official Closing Price (“NOCP”). Unlisted securities that are traded on the domestic over-the-counter market for which last sales prices are available, are generally valued at the last sales price as of the valuation time. In the absence of sales and NOCP, such securities are valued at the bid price.
Securities that are traded on a foreign stock exchange (and that are not listed on a recognized domestic stock exchange or traded on the NASDAQ exchange or the domestic over-the-counter market) are generally valued at the official closing price on the principal stock exchange on which they are traded. When an event occurs subsequent to the close of the foreign exchange and the close of the NYSE that was likely to have changed such value, the fair value of those securities are determined in good faith in accordance with procedures established by and under the general supervision of the Board of Trustees. The Funds will use a fair valuation model provided by an independent pricing service, which is intended to reflect fair value when a security’s value is believed to have been materially affected by a valuation event that has occurred between the close of the exchange or market on which the security is traded and the close of the regular trading day on the NYSE. In the event that closing prices are not available for such foreign securities, such securities are generally valued at the last sales price occurring prior to the closing of its principal exchange.
Forward foreign currency contracts have a fair value determined by an automated system that estimates rates on the basis of the current day foreign currency exchange rates and forward foreign currency exchange rates supplied by a pricing vendor. Foreign currency exchange rates and forward foreign currency exchange rates may generally be obtained at the close of the NYSE. As of December 31, 2022, the Funds did not hold any forward foreign currency contracts.
Redeemable securities issued by open-end registered investment companies are valued at the investment company’s applicable net asset value.
Fixed-income obligations, having a remaining maturity of greater than 60 days, are typically valued at the evaluated prices formulated by an independent pricing service.
On August 18, 2022, the Board approved, effective September 8, 2022, the Adviser as the fund’s valuation designee to be responsible for carrying out pricing and valuation duties in accordance with the Adviser’s Valuation Procedures (the “Procedures”) pursuant to Rule 2a-5 under the Investment Company Act of 1940, as amended.
When market quotations are not readily available or when events occur that make established valuation methods unreliable, securities of the Fund may be valued in good faith by the Advisor with procedures approved by the Board as noted above. Factors which may be considered when determining the value of a security include (a) the fundamental data relating to the investment; (b) an evaluation of the forces which influence the market in which the security is sold, including the liquidity and depth of the market; (c) the market value at date of purchase; (d) information as to any transactions or offers with respect to the security or comparable securities; and (e) any other relevant matters.
Securities Traded on Foreign Exchanges – All of the Funds, except the Segall Bryant & Hamill Colorado Tax Free Fund, may invest at least a portion of their assets in foreign securities. As of December 31, 2022, all Funds were primarily invested in securities traded on U.S. exchanges, except Segall Bryant & Hamill Emerging Markets Fund, Segall Bryant & Hamill International Small Cap Fund, Segall Bryant & Hamill Fundamental International Small Cap Fund and Segall Bryant & Hamill Global All Cap Fund. In the event that a Fund executes a security transaction on a foreign exchange, the Fund will generally enter into a foreign currency contract to settle the foreign security transaction. Foreign securities may carry more risk than U.S. securities, such as political, market and currency risks. The accounting records of the Funds are maintained in U.S. dollars. Prices of securities denominated in foreign currencies are translated into U.S. dollars at the closing rates of exchange at period end. Amounts related to the purchase and sale of foreign securities and investment income are translated at the rates of exchange prevailing on the respective dates of such transactions.
The portion of realized and unrealized gains or losses on investments due to fluctuations in foreign currency exchange rates is not separately disclosed and is included in realized and unrealized gains or losses on investments, when applicable.
Federal Income Taxes – No provision for income taxes is included in the accompanying financial statements, as the Funds intend to distribute to shareholders all taxable investment income and realized gains and otherwise comply with Subchapter M of the Internal Revenue Code of 1986, as amended, applicable to regulated investment companies.
As of and during the year ended December 31, 2022, the Funds did not have a liability for any unrecognized tax benefits. The Funds file U.S. federal, state, and local tax returns as required. Each Fund’s tax returns are subject to examination by the relevant tax authorities until expiration of the applicable statute of limitations which is generally three years after the filing of the tax return. Tax returns for open years
| | |
| Annual Report | December 31, 2022 | | | 131 |
| Segall Bryant & Hamill Funds | Notes to Financial Statements |
| | December 31, 2022 |
have incorporated no uncertain tax positions that require a provision for income taxes. The Funds recognize interest and penalties, if any, related to unrecognized tax benefits as income tax expense on the Statements of Operations. During the year ended December 31, 2022, the Funds did not incur any interest or penalties.
When-Issued/Forward Commitment Securities – Each Fund may purchase or sell securities on a “when-issued” or “forward commitment” basis which involves a commitment by the Fund to purchase or sell particular securities with payment and delivery taking place at a future date. During this period, such securities do not earn interest, are subject to market fluctuation and may increase or decrease in value prior to their delivery. In accordance with SEC guidance, each Fund segregates liquid assets in an amount sufficient to satisfy the purchase price. The purchase of securities on a when-issued or forward commitment basis may increase the volatility of the Fund’s net asset value to the extent each Fund makes such purchases while remaining substantially fully invested. Settlements in the ordinary course of business, which may take substantially more than three business days for non-U.S. securities, are not treated by the Funds as “when-issued” or “forward commitment” transactions.
Common Expenses – Expenses of the Trust not attributable solely to one of the Funds are allocated among the Funds based on the relative net assets of each Fund or based on the nature of the expense and its relative applicability to each Fund.
Allocation Between Classes – Investment income earned, realized capital gains and losses, and unrealized appreciation and depreciation are allocated daily to each class of a Fund based upon its proportionate share of total net assets of that Fund. Class-specific expenses are charged directly to the class incurring the expense. Common expenses which are not attributable to a specific class are allocated daily to each class of shares of a Fund based upon its proportionate share of total net assets of that Fund.
Security Transactions and Related Investment Income – For financial reporting purposes, the Funds’ investment transactions and shareholder transactions are recorded on trade date. Dividend income is recorded on the ex-dividend date. Foreign dividend income is recorded on the ex-dividend date or as soon as practical after the Funds determine the existence of a dividend declaration after exercising reasonable due diligence. Non-cash dividends, if any, included in dividend income, are recorded at the fair value of the security received. Withholding taxes on foreign dividends, net of reclaims, and foreign capital gains taxes, if any, have been recorded in accordance with the Funds’ understanding of the applicable country’s rules and tax rates. Interest income is accrued as earned. Discounts and premiums on fixed income securities are amortized using the effective interest method. Realized gains and losses from investment transactions and unrealized appreciation and depreciation of investments are reported on an identified cost basis.
Investments in Real Estate Investment Trusts (REITs) – With respect to each Fund, dividend income is recorded based on the income included in distributions received from its REIT investments using published REIT reclassifications including some management estimates when actual amounts are not available. Distributions received in excess of these estimated amounts are recorded as a reduction of the cost of investments or reclassified to capital gains. The actual amounts of income, return of capital, and capital gains are only determined by each REIT after its fiscal year end and may differ from the estimated amounts.
| 3. | CERTAIN INVESTMENTS AND ASSOCIATED RISKS |
Market, Credit and Counterparty Risk – In the normal course of business, the Funds invest in securities and enter into transactions where risks exist due to fluctuations in the market (market risk) or failure of the issuer of a security to meet all of its obligations (issuer credit risk). The value of securities held by the Funds may decline in response to certain events, including those directly involving the issuers whose securities are owned by the Funds; conditions affecting the general economy; overall market changes; local, regional, national or global political, social or economic instability; and currency and interest rate and price fluctuations. Similar to issuer credit risk, the Funds may be exposed to counterparty credit risk, or the risk that an entity with which the Funds have unsettled or open transactions may fail to or be unable to perform on its commitments. The Funds manage counterparty credit risk by entering into transactions only with counterparties that they believe have the financial resources to honor their obligations and by monitoring the financial stability of those counterparties.
Country Risk – As of December 31, 2022, the Segall Bryant & Hamill Emerging Markets Fund invested a significant percentage of its assets in China; and the Segall Bryant & Hamill International Small Cap Fund invested a significant percentage of its assets in Japan. Therefore, they may be more affected by economic developments and currency fluctuations in these countries.
On February 24, 2022, Russia commenced a military attack on Ukraine. The outbreak of hostilities between the two countries could result in more widespread conflict and could have a severe adverse effect on the region and the markets. In addition, sanctions imposed on Russia by the United States and other countries, and any sanctions imposed in the future could have a significant adverse impact on the Russian economy and related markets. The price and liquidity of investments may fluctuate widely as a result of the conflict and related events. How long such conflict and related events will last and whether it will escalate further cannot be predicted, nor its effect on the Funds. As of December 31, 2022, the Segall Bryant & Hamill Emerging Markets Fund had investments in Russia. These investments are valued at zero.
Sector Concentration Risk – The Funds may concentrate investments in companies that are in a single sector or related sector. Concentrating investments in a single sector may make the Fund more susceptible to adverse economic, business, regulatory or other developments affecting that sector. If an economic downturn occurs in a sector in which a Fund’s investments are concentrated, the Fund may perform poorly during that period. Refer to each Fund’s Statement of Investments for its particular concentration in the various sectors.
| | |
| 132 | | | www.sbhfunds.com |
| Segall Bryant & Hamill Funds | Notes to Financial Statements |
| | December 31, 2022 |
| 4. | SHARES OF BENEFICIAL INTEREST |
On December 31, 2022, there was an unlimited number of no par value shares of beneficial interest authorized for each Fund. Transactions in shares of beneficial interest were as follows:
| | | For the | | | For the | |
| | | Year Ended | | | Year Ended | |
| | | December 31, 2022 | | | December 31, 2021 | |
| Segall Bryant & Hamill Small Cap Value Fund | | | | | | | | |
| Retail: | | | | | | | | |
| Shares Sold | | | 101,897 | | | | 202,728 | |
| Shares issued in Reinvestment of Distributions | | | 7,170 | | | | 27,558 | |
| Total | | | 109,067 | | | | 230,286 | |
| Less Shares Redeemed | | | (80,315 | ) | | | (98,009 | ) |
| Net Increase (Decrease) | | | 28,752 | | | | 132,277 | |
| Institutional: | | | | | | | | |
| Shares Sold | | | 19,536,267 | | | | 22,217,491 | |
| Shares issued in Reinvestment of Distributions | | | 440,555 | | | | 1,408,276 | |
| Total | | | 19,976,822 | | | | 23,625,767 | |
| Less Shares Redeemed | | | (14,063,681 | ) | | | (14,266,912 | ) |
| Net Increase (Decrease) | | | 5,913,141 | | | | 9,358,855 | |
| Segall Bryant & Hamill Small Cap Growth Fund | | | | | | | | |
| Retail: | | | | | | | | |
| Shares Sold | | | 1,347,839 | | | | 2,192,952 | |
| Shares issued in Reinvestment of Distributions | | | — | | | | — | |
| Total | | | 1,347,839 | | | | 2,192,952 | |
| Less Shares Redeemed | | | (958,617 | ) | | | (428,468 | ) |
| Net Increase (Decrease) | | | 389,222 | | | | 1,764,484 | |
| Institutional: | | | | | | | | |
| Shares Sold | | | 5,168,700 | | | | 3,723,238 | |
| Shares issued in Reinvestment of Distributions | | | — | | | | — | |
| Total | | | 5,168,700 | | | | 3,723,238 | |
| Less Shares Redeemed | | | (4,250,180 | ) | | | (930,086 | ) |
| Net Increase (Decrease) | | | 918,520 | | | | 2,793,152 | |
| Segall Bryant & Hamill Small Cap Core Fund | | | | | | | | |
| Retail: | | | | | | | | |
| Shares Sold | | | 32,653 | | | | 103,776 | |
| Shares issued in Reinvestment of Distributions | | | 1,295 | | | | 23,430 | |
| Total | | | 33,948 | | | | 127,206 | |
| Less Shares Redeemed | | | (97,745 | ) | | | (335,452 | ) |
| Net Increase (Decrease) | | | (63,797 | ) | | | (208,246 | ) |
| Institutional: | | | | | | | | |
| Shares Sold | | | 1,079,366 | | | | 55,967 | |
| Shares issued in Reinvestment of Distributions | | | 69,614 | | | | 429,123 | |
| Total | | | 1,148,980 | | | | 485,090 | |
| Less Shares Redeemed | | | (338,446 | ) | | | (149,348 | ) |
| Net Increase (Decrease) | | | 810,534 | | | | 335,742 | |
| | |
| Annual Report | December 31, 2022 | | | 133 |
| Segall Bryant & Hamill Funds | Notes to Financial Statements |
| | December 31, 2022 |
| | | For the | | | For the | |
| | | Year Ended | | | Year Ended | |
| | | December 31, 2022 | | | December 31, 2021 | |
| Segall Bryant & Hamill All Cap Fund | | | | | | | | |
| Retail: | | | | | | | | |
| Shares Sold | | | 2,581 | | | | 10,114 | |
| Shares issued in Reinvestment of Distributions | | | 3,167 | | | | 4,071 | |
| Total | | | 5,748 | | | | 14,185 | |
| Less Shares Redeemed | | | (1,834 | ) | | | (1,967 | ) |
| Net Increase (Decrease) | | | 3,914 | | | | 12,218 | |
| Institutional: | | | | | | | | |
| Shares Sold | | | 621,216 | | | | 1,214,703 | |
| Shares issued in Reinvestment of Distributions | | | 570,835 | | | | 805,081 | |
| Total | | | 1,192,051 | | | | 2,019,784 | |
| Less Shares Redeemed | | | (1,663,058 | ) | | | (2,440,979 | ) |
| Net Increase (Decrease) | | | (471,007 | ) | | | (421,195 | ) |
| Segall Bryant & Hamill Emerging Markets Fund | | | | | | | | |
| Retail: | | | | | | | | |
| Shares Sold | | | 170,615 | | | | 97,339 | |
| Shares issued in Reinvestment of Distributions | | | 10,276 | | | | 16,926 | |
| Total | | | 180,891 | | | | 114,265 | |
| Less Shares Redeemed | | | (268,865 | ) | | | (84,384 | ) |
| Net Increase (Decrease) | | | (87,974 | ) | | | 29,881 | |
| Institutional: | | | | | | | | |
| Shares Sold | | | 450,427 | | | | 1,015,693 | |
| Shares issued in Reinvestment of Distributions | | | 118,449 | | | | 180,095 | |
| Total | | | 568,876 | | | | 1,195,788 | |
| Less Shares Redeemed | | | (1,302,456 | ) | | | (142,059 | ) |
| Net Increase (Decrease) | | | (733,580 | ) | | | 1,053,729 | |
| Segall Bryant & Hamill International Small Cap Fund | | | | | | | | |
| Retail: | | | | | | | | |
| Shares Sold | | | 52,882 | | | | 69,291 | |
| Shares issued in Reinvestment of Distributions | | | 48,333 | | | | 56,832 | |
| Total | | | 101,215 | | | | 126,123 | |
| Less Shares Redeemed | | | (3,164,342 | ) | | | (1,994,358 | ) |
| Net Increase (Decrease) | | | (3,063,127 | ) | | | (1,868,235 | ) |
| Institutional: | | | | | | | | |
| Shares Sold | | | 506,904 | | | | 1,574,949 | |
| Shares issued in Reinvestment of Distributions | | | 428,067 | | | | 471,234 | |
| Total | | | 934,971 | | | | 2,046,183 | |
| Less Shares Redeemed | | | (1,288,128 | ) | | | (3,655,446 | ) |
| Net Increase (Decrease) | | | (353,157 | ) | | | (1,609,263 | ) |
| Segall Bryant & Hamill Fundamental International Small Cap Fund | | | | | | | | |
| Retail: | | | | | | | | |
| Shares Sold | | | 286,813 | | | | 493,735 | |
| Shares issued in Reinvestment of Distributions | | | 190,787 | | | | 144,895 | |
| Total | | | 477,600 | | | | 638,630 | |
| Less Shares Redeemed | | | (723,685 | ) | | | (378,627 | ) |
| Net Increase (Decrease) | | | (246,085 | ) | | | 260,003 | |
| Institutional: | | | | | | | | |
| Shares Sold | | | 947,663 | | | | 1,509,713 | |
| Shares issued in Reinvestment of Distributions | | | 209,453 | | | | 147,769 | |
| Total | | | 1,157,116 | | | | 1,657,482 | |
| Less Shares Redeemed | | | (1,438,906 | ) | | | (389,609 | ) |
| Net Increase (Decrease) | | | (281,790 | ) | | | 1,267,873 | |
| | |
| 134 | | | www.sbhfunds.com |
| Segall Bryant & Hamill Funds | Notes to Financial Statements |
| | December 31, 2022 |
| | | For the | | | For the | |
| | | Year Ended | | | Year Ended | |
| | | December 31, 2022 | | | December 31, 2021 | |
| Segall Bryant & Hamill Global All Cap Fund | | | | | | | | |
| Retail: | | | | | | | | |
| Shares Sold | | | 5,158 | | | | 16,244 | |
| Shares issued in Reinvestment of Distributions | | | 59,101 | | | | 175,562 | |
| Total | | | 64,259 | | | | 191,806 | |
| Less Shares Redeemed | | | (235,249 | ) | | | (580,133 | ) |
| Net Increase (Decrease) | | | (170,990 | ) | | | (388,327 | ) |
| Institutional: | | | | | | | | |
| Shares Sold | | | 30,300 | | | | 114,822 | |
| Shares issued in Reinvestment of Distributions | | | 4,525.00 | | | | 28,009 | |
| Total | | | 34,825 | | | | 142,831 | |
| Less Shares Redeemed | | | (287,772 | ) | | | (60,824 | ) |
| Net Increase (Decrease) | | | (252,947 | ) | | | 82,007 | |
| Segall Bryant & Hamill Workplace Equality Fund | | | | | | | | |
| Retail: | | | | | | | | |
| Shares Sold | | | 69,421 | | | | 155,100 | |
| Shares issued in Reinvestment of Distributions | | | 11,590 | | | | 105,484 | |
| Total | | | 81,011 | | | | 260,584 | |
| Less Shares Redeemed | | | (348,193 | ) | | | (169,915 | ) |
| Net Increase (Decrease) | | | (267,182 | ) | | | 90,669 | |
| Institutional: | | | | | | | | |
| Shares Sold | | | 249,364 | | | | 588,224 | |
| Shares issued in Reinvestment of Distributions | | | 20,051.00 | | | | 157,394 | |
| Total | | | 269,415 | | | | 745,618 | |
| Less Shares Redeemed | | | (229,948 | ) | | | (179,809 | ) |
| Net Increase (Decrease) | | | 39,467 | | | | 565,809 | |
| Segall Bryant & Hamill Short Term Plus Fund | | | | | | | | |
| Retail: | | | | | | | | |
| Shares Sold | | | 124,238 | | | | 1,226,366 | |
| Shares issued in Reinvestment of Distributions | | | 5,237 | | | | 5,471 | |
| Total | | | 129,475 | | | | 1,231,837 | |
| Less Shares Redeemed | | | (920,555 | ) | | | (343,254 | ) |
| Net Increase (Decrease) | | | (791,080 | ) | | | 888,583 | |
| Institutional: | | | | | | | | |
| Shares Sold | | | 745,157 | | | | 3,317,870 | |
| Shares issued in Reinvestment of Distributions | | | 29,974 | | | | 27,487 | |
| Total | | | 775,131 | | | | 3,345,357 | |
| Less Shares Redeemed | | | (2,219,324 | ) | | | (1,686,877 | ) |
| Net Increase (Decrease) | | | (1,444,193 | ) | | | 1,658,480 | |
| Segall Bryant & Hamill Plus Bond Fund | | | | | | | | |
| Retail: | | | | | | | | |
| Shares Sold | | | 4,673,488 | | | | 6,254,334 | |
| Shares issued in Reinvestment of Distributions | | | 1,166,685 | | | | 1,377,765 | |
| Total | | | 5,840,173 | | | | 7,632,099 | |
| Less Shares Redeemed | | | (14,758,564 | ) | | | (17,544,787 | ) |
| Net Increase (Decrease) | | | (8,918,391 | ) | | | (9,912,688 | ) |
| Institutional: | | | | | | | | |
| Shares Sold | | | 11,997,087 | | | | 18,332,140 | |
| Shares issued in Reinvestment of Distributions | | | 1,410,992 | | | | 1,578,176 | |
| Total | | | 13,408,079 | | | | 19,910,316 | |
| Less Shares Redeemed | | | (27,385,106 | ) | | | (12,301,097 | ) |
| Net Increase (Decrease) | | | (13,977,027 | ) | | | 7,609,219 | |
| | |
| Annual Report | December 31, 2022 | | | 135 |
| Segall Bryant & Hamill Funds | Notes to Financial Statements |
| | December 31, 2022 |
| | | For the | | | For the | |
| | | Year Ended | | | Year Ended | |
| | | December 31, 2022 | | | December 31, 2021 | |
| Segall Bryant & Hamill Quality High Yield Fund | | | | | | | | |
| Retail: | | | | | | | | |
| Shares Sold | | | 305,417 | | | | 686,553 | |
| Shares issued in Reinvestment of Distributions | | | 156,024 | | | | 144,558 | |
| Total | | | 461,441 | | | | 831,111 | |
| Less Shares Redeemed | | | (1,304,124 | ) | | | (1,071,289 | ) |
| Net Increase (Decrease) | | | (842,683 | ) | | | (240,178 | ) |
| Institutional: | | | | | | | | |
| Shares Sold | | | 1,622,932 | | | | 2,917,981 | |
| Shares issued in Reinvestment of Distributions | | | 245,886 | | | | 207,858 | |
| Total | | | 1,868,818 | | | | 3,125,839 | |
| Less Shares Redeemed | | | (3,887,842 | ) | | | (778,890 | ) |
| Net Increase (Decrease) | | | (2,019,024 | ) | | | 2,346,949 | |
| Segall Bryant & Hamill Municipal Opportunities Fund | | | | | | | | |
| Retail: | | | | | | | | |
| Shares Sold | | | 3,212,354 | | | | 2,360,437 | |
| Shares issued in Reinvestment of Distributions | | | 106,715 | | | | 70,841 | |
| Total | | | 3,319,069 | | | | 2,431,278 | |
| Less Shares Redeemed | | | (3,439,395 | ) | | | (1,188,474 | ) |
| Net Increase (Decrease) | | | (120,326 | ) | | | 1,242,804 | |
| Institutional: | | | | | | | | |
| Shares Sold | | | 22,495,155 | | | | 10,832,665 | |
| Shares issued in Reinvestment of Distributions | | | 690,303 | | | | 463,451 | |
| Total | | | 23,185,458 | | | | 11,296,116 | |
| Less Shares Redeemed | | | (25,776,324 | ) | | | (3,354,752 | ) |
| Net Increase (Decrease) | | | (2,590,866 | ) | | | 7,941,364 | |
| Segall Bryant & Hamill Colorado Tax Free Fund | | | | | | | | |
| Retail: | | | | | | | | |
| Shares Sold | | | 4,296,071 | | | | 5,059,760 | |
| Shares issued in Reinvestment of Distributions | | | 432,046 | | | | 368,992 | |
| Total | | | 4,728,117 | | | | 5,428,752 | |
| Less Shares Redeemed | | | (9,034,147 | ) | | | (4,420,608 | ) |
| Net Increase (Decrease) | | | (4,306,030 | ) | | | 1,008,144 | |
| Institutional: | | | | | | | | |
| Shares Sold | | | 17,584,257 | | | | 9,597,634 | |
| Shares issued in Reinvestment of Distributions | | | 734,403 | | | | 583,477 | |
| Total | | | 18,318,660 | | | | 10,181,111 | |
| Less Shares Redeemed | | | (25,041,890 | ) | | | (3,352,153 | ) |
| Net Increase (Decrease) | | | (6,723,230 | ) | | | 6,828,958 | |
| 5. | TAX BASIS DISTRIBUTIONS AND TAX BASIS INFORMATION |
Distributions – Distributions of net investment income, if any, are generally made annually for the Segall Bryant & Hamill Small Cap Value Fund, Segall Bryant & Hamill Small Cap Growth Fund, Segall Bryant & Hamill Small Cap Core Fund, Segall Bryant & Hamill All Cap Fund, Segall Bryant & Hamill Emerging Markets Fund, Segall Bryant & Hamill Fundamental International Small Cap Fund, Segall Bryant & Hamill Global All Cap Fund and Segall Bryant & Hamill Workplace Equality Fund; quarterly for Segall Bryant & Hamill International Small Cap Fund; and monthly for the Segall Bryant & Hamill Short Term Plus Fund, Segall Bryant & Hamill Plus Bond Fund, Segall Bryant & Hamill Quality High Yield Fund, Segall Bryant & Hamill Municipal Opportunities Fund and Segall Bryant & Hamill Colorado Tax Free Fund. Prior to June 2022, distributions of net income were generally paid annually for Segall Bryant & Hamill International Small Cap Fund. Prior to May 1, 2021, distributions of net investment income were made quarterly for the Segall Bryant & Hamill Global All Cap Fund and Segall Bryant & Hamill Workplace Equality Fund. Distributions of net realized capital gains, if any, are declared at least once each year for each of the Funds. Distributions to shareholders are recorded on the ex-dividend date.
| | |
| 136 | | | www.sbhfunds.com |
| Segall Bryant & Hamill Funds | Notes to Financial Statements |
| | December 31, 2022 |
The tax character of the distributions paid during the year ended December 31, 2022 and December 31, 2021 were as follows:
| | | | | | | | Long-Term | | | | |
| Fund | | Period Ended | | Ordinary Income* | | | Capital Gains | | | Tax-Exempt Income | |
| Segall Bryant & Hamill Small Cap Value Fund | | 12/31/2022 | | $ | 2,425,286 | | | $ | 4,952,616 | | | $ | — | |
| | | 12/31/2021 | | | 16,606,782 | | | | 10,404,575 | | | | — | |
| Segall Bryant & Hamill Small Cap Growth Fund | | 12/31/2022 | | | — | | | | — | | | | — | |
| | | 12/31/2021 | | | — | | | | — | | | | — | |
| Segall Bryant & Hamill Small Cap Core Fund | | 12/31/2022 | | | 55,195 | | | | 1,028,280 | | | | — | |
| | | 12/31/2021 | | | 1,802,628 | | | | 6,882,637 | | | | — | |
| Segall Bryant & Hamill All Cap Fund | | 12/31/2022 | | | 524,627 | | | | 10,172,081 | | | | — | |
| | | 12/31/2021 | | | 4,099,620 | | | | 15,286,337 | | | | — | |
| Segall Bryant & Hamill Emerging Markets Fund | | 12/31/2022 | | | 1,670,642 | | | | — | | | | — | |
| | | 12/31/2021 | | | 1,805,148 | | | | 1,221,048 | | | | — | |
| Segall Bryant & Hamill International Small Cap Fund | | 12/31/2022 | | | 4,961,992 | | | | — | | | | — | |
| | | 12/31/2021 | | | 8,258,628 | | | | — | | | | — | |
| Segall Bryant & Hamill Fundamental International Small Cap Fund | | 12/31/2022 | | | — | | | | 5,998,324 | | | | — | |
| | | 12/31/2021 | | | 1,002,459 | | | | 5,906,123 | | | | — | |
| Segall Bryant & Hamill Global All Cap Fund | | 12/31/2022 | | | 81,968 | | | | 512,721 | | | | — | |
| | | 12/31/2021 | | | 1,598,070 | | | | 674,258 | | | | — | |
| Segall Bryant & Hamill Workplace Equality Fund | | 12/31/2022 | | | 113 | | | | 204,764 | | | | — | |
| | | 12/31/2021 | | | 906,387 | | | | 1,159,602 | | | | — | |
| Segall Bryant & Hamill Short Term Plus Fund | | 12/31/2022 | | | 358,597 | | | | — | | | | — | |
| | | 12/31/2021 | | | 323,124 | | | | 19,922 | | | | — | |
| Segall Bryant & Hamill Plus Bond Fund | | 12/31/2022 | | | 25,818,855 | | | | — | | | | — | |
| | | 12/31/2021 | | | 27,243,919 | | | | 6,776,101 | | | | — | |
| Segall Bryant & Hamill Quality High Yield Fund | | 12/31/2022 | | | 3,409,434 | | | | — | | | | — | |
| | | 12/31/2021 | | | 3,316,122 | | | | — | | | | — | |
| Segall Bryant & Hamill Municipal Opportunities Fund | | 12/31/2022 | | | 2,340,636 | | | | — | | | | 5,801,859 | |
| | | 12/31/2021 | | | 1,164,651 | | | | — | | | | 5,002,947 | |
| Segall Bryant & Hamill Colorado Tax Free Fund | | 12/31/2022 | | | 911,586 | | | | — | | | | 12,708,588 | |
| | | 12/31/2021 | | | 506,229 | | | | — | | | | 11,874,115 | |
| * | Ordinary income distributions for federal income tax purposes includes distributions from net investment income and short-term capital gains. |
As of December 31, 2022, net unrealized appreciation (depreciation) on investments based on federal tax cost was as follows:
| | | Segall Bryant & | | | Segall Bryant & | | | Segall Bryant & | | | Segall Bryant & | | | Segall Bryant & | |
| | | Hamill Small Cap | | | Hamill Small Cap | | | Hamill Small Cap | | | Hamill All Cap | | | Hamill Emerging | |
| | | Value Fund | | | Growth Fund | | | Core Fund | | | Fund | | | Markets Fund | |
| Tax cost of portfolio investments | | $ | 520,289,412 | | | $ | 191,126,011 | | | $ | 36,870,386 | | | $ | 82,856,843 | | | $ | 41,006,008 | |
| Gross unrealized appreciation | | | 81,263,893 | | | | 9,936,931 | | | | 11,916,731 | | | | 46,252,683 | | | | 4,356,064 | |
| Gross unrealized depreciation | | | (58,098,541 | ) | | | (24,367,026 | ) | | | (706,419 | ) | | | (3,406,850 | ) | | | (4,638,185 | ) |
| Net unrealized appreciation (depreciation) on portfolio investments | | $ | 23,165,352 | | | $ | (14,430,095 | ) | | $ | 11,210,312 | | | $ | 42,845,833 | | | $ | (282,121 | ) |
| | | | | | | | | | | | | | | | | | | | | |
| | | | | | | | | Segall Bryant | | | | | | | |
| | | | | | Segall Bryant | | | & Hamill | | | | | | | |
| | | | | | & Hamill | | | Fundamental | | | Segall Bryant & | | | Segall Bryant & | |
| | | | | | International | | | International | | | Hamill Global All | | | Hamill Workplace | |
| | | | | | | Small Cap Fund | | | Small Cap Fund | | | Cap Fund | | | Equality Fund | |
| Tax cost of portfolio investments | | | $ | 95,013,659 | | | $ | 50,623,422 | | | $ | 23,075,782 | | | $ | 20,074,130 | |
| Gross unrealized appreciation | | | | 10,422,122 | | | | 4,682,935 | | | | 4,656,168 | | | | 2,790,380 | |
| Gross unrealized depreciation | | | | (10,473,873 | ) | | | (10,392,974 | ) | | | (1,139,496 | ) | | | (1,669,175 | ) |
| Net unrealized appreciation (depreciation) on portfolio investments | | | $ | (51,751 | ) | | $ | (5,710,039 | ) | | $ | 3,516,672 | | | $ | 1,121,205 | |
| | |
| Annual Report | December 31, 2022 | | | 137 |
| Segall Bryant & Hamill Funds | Notes to Financial Statements |
| | December 31, 2022 |
| | | | | | | | | | | | Segall Bryant & | | | | |
| | | Segall Bryant & | | | Segall Bryant & | | | Segall Bryant & | | | Hamill Municipal | | | Segall Bryant & | |
| | | Hamill Short Term | | | Hamill Plus Bond | | | Hamill Quality | | | Opportunities | | | Hamill Colorado | |
| | | Plus Bond Fund | | | Fund | | | High Yield Fund | | | Fund | | | Tax Free Fund | |
| Tax cost of portfolio investments | | $ | 28,851,830 | | | $ | 760,734,159 | | | $ | 74,490,330 | | | $ | 225,172,580 | | | $ | 406,293,895 | |
| Gross unrealized appreciation | | | 971 | | | | 268,826 | | | | 21,976 | | | | 550,580 | | | | 338,406 | |
| Gross unrealized depreciation | | | (1,114,645 | ) | | | (95,341,995 | ) | | | (9,951,994 | ) | | | (9,650,376 | ) | | | (23,118,204 | ) |
| Net unrealized appreciation (depreciation) on portfolio investments | | $ | (1,113,674 | ) | | $ | (95,073,169 | ) | | $ | (9,930,018 | ) | | $ | (9,099,796 | ) | | $ | (22,779,798 | ) |
The difference between book and tax basis cost of investments is attributable primarily to wash sales, passive foreign investment companies and tax treatment of certain other investments.
As of December 31, 2022, the components of distributable earnings (deficit) on a tax basis were as follows:
| | | Segall Bryant & | | | Segall Bryant & | | | Segall Bryant & | | | Segall Bryant & | | | Segall Bryant & | |
| | | Hamill Small Cap | | | Hamill Small Cap | | | Hamill Small Cap | | | Hamill All Cap | | | Hamill Emerging | |
| | | Value Fund | | | Growth Fund | | | Core Fund | | | Fund | | | Markets Fund | |
| Undistributed ordinary income | | $ | 1,579,203 | | | $ | — | | | $ | — | | | $ | 844 | | | $ | 215,251 | |
| Undistributed long term capital gains | | | — | | | | — | | | | 302,201 | | | | 1,996,915 | | | | — | |
| Accumulated capital and other losses | | | (16,091,475 | ) | | | (59,777,156 | ) | | | (1,990 | ) | | | (6,405 | ) | | | (5,715,846 | ) |
| Net unrealized appreciation (depreciation) on portfolio investments | | | 23,165,352 | | | | (14,430,095 | ) | | | 11,210,312 | | | | 42,845,833 | | | | (282,121 | ) |
| Net unrealized depreciation on foreign currency | | | — | | | | — | | | | — | | | | — | | | | (43 | ) |
| Total accumulated earnings (deficit) | | $ | 8,653,080 | | | $ | (74,207,251 | ) | | $ | 11,510,523 | | | $ | 44,837,187 | | | $ | (5,782,759 | ) |
| | | | | | | | | | | | | | | | | | | | | |
| | | | | | Segall Bryant | | | | | | | | | | |
| | | Segall Bryant | | | & Hamill | | | | | | | | | | |
| | | & Hamill | | | Fundamental | | | Segall Bryant & | | | Segall Bryant & | | | Segall Bryant | |
| | | International | | | International | | | Hamill Global All | | | Hamill Workplace | | | & Hamill Short | |
| | | Small Cap Fund | | | Small Cap Fund | | | Cap Fund | | | Equality Fund | | | Term Plus Fund | |
| Undistributed ordinary income | | $ | 608,198 | | | $ | — | | | $ | 2,434 | | | $ | 114,956 | | | $ | 1,384 | |
| Undistributed long term capital gains | | | — | | | | — | | | | 48,773 | | | | — | | | | — | |
| Accumulated capital and other losses | | | (85,111,723 | ) | | | (8,487,215 | ) | | | (26,037 | ) | | | (585,591 | ) | | | (698,069 | ) |
| Net unrealized appreciation (depreciation) on portfolio investments | | | (51,751 | ) | | | (5,710,039 | ) | | | 3,516,672 | | | | 1,121,205 | | | | (1,113,674 | ) |
| Net unrealized depreciation on foreign currency | | | (58,968 | ) | | | (2,122 | ) | | | (2,353 | ) | | | — | | | | — | |
| Total accumulated earnings (deficit) | | $ | (84,614,244 | ) | | $ | (14,199,376 | ) | | $ | 3,539,489 | | | $ | 650,570 | | | $ | (1,810,359 | ) |
| | | | | | | | | | | | | | | | | | | | | |
| | | | | | | | | | | | Segall Bryant & | | | | |
| | | | | | Segall Bryant & | | | Segall Bryant & | | | Hamill Municipal | | | Segall Bryant & | |
| | | | | | Hamill Plus Bond | | | Hamill Quality | | | Opportunities | | | Hamill Colorado | |
| | | | | | | Fund | | | High Yield Fund | | | Fund | | | Tax Free Fund | |
| Undistributed ordinary income | | | $ | 26,415 | | | $ | 2,173 | | | | | | | $ | — | |
| Undistributed tax-exempt income | | | | — | | | | — | | | | 14,849 | | | | — | |
| Accumulated capital and other losses | | | | (25,940,883 | ) | | | (9,626,409 | ) | | | (28,027,090 | ) | | | (36,624,532 | ) |
| Net unrealized depreciation on portfolio investments | | | | (95,073,169 | ) | | | (9,930,018 | ) | | | (9,099,796 | ) | | | (22,779,798 | ) |
| Total accumulated earnings (deficit) | | | $ | (120,987,637 | ) | | $ | (19,554,254 | ) | | $ | (37,112,037 | ) | | $ | (59,404,330 | ) |
Included in accumulated capital and other losses are other Temporary Differences primarily related to deferred Trustee compensation.
Capital loss carry forwards utilized during the year ended December 31, 2022 were as follows:
| Fund | | Amount | |
| Segall Bryant & Hamill Small Cap Value Fund | | $ | 10,062,666 | |
| Segall Bryant & Hamill International Small Cap | | $ | 693,162 | |
| | |
| 138 | | | www.sbhfunds.com |
| Segall Bryant & Hamill Funds | Notes to Financial Statements |
| | December 31, 2022 |
Under current law, capital losses maintain their character as short-term or long-term and are carried forward to the next tax year without expiration. As of December 31, 2022, the following amounts are available as carry forwards to the next tax year:
| Fund | | Short-Term | | | Long-Term | |
| Segall Bryant & Hamill Small Cap Value Fund | | $ | 10,995,532 | | | $ | 5,015,338 | |
| Segall Bryant & Hamill Small Cap Growth Fund | | | 47,463,737 | | | | 12,272,993 | |
| Segall Bryant & Hamill Emerging Markets Fund | | | 4,426,657 | | | | 1,287,170 | |
| Segall Bryant & Hamill International Small Cap Fund | | | 70,305,184 | | | | 14,800,764 | |
| Segall Bryant & Hamill Fundamental International Small Cap Fund | | | 5,633,345 | | | | 2,821,492 | |
| Segall Bryant & Hamill Workplace Equality Fund | | | 557,419 | | | | — | |
| Segall Bryant & Hamill Short Term Plus Fund | | | 437,644 | | | | 258,883 | |
| Segall Bryant & Hamill Plus Bond Fund | | | 11,619,292 | | | | 14,056,689 | |
| Segall Bryant & Hamill Quality High Yield Fund | | | 308,671 | | | | 9,286,515 | |
| Segall Bryant & Hamill Municipal Opportunities Fund | | | 15,147,111 | | | | 12,870,556 | |
| Segall Bryant & Hamill Colorado Tax Free Fund | | | 12,072,802 | | | | 24,506,512 | |
As a result of the acquisition of the Segall Bryant & Hamill Small Cap Value Dividend Fund (the “target fund”), the Segall Bryant & Hamill Small Cap Value Fund (the “acquiring” fund) acquired the capital loss carry forward balances from the target fund totaling $13,279,390 ($8,170,713 short term and $5,108,677 long-term). The acquiring fund is eligible to utilize these amounts to offset future capital gains subject to annual limitations under IRC Section 382 of $242,622.
For the year ended December 31, 2022, the following reclassifications were made as a result of permanent differences between the financial statement and income tax reporting requirements:
| | | | | | Total Accumulated | |
| Fund | | Paid-in Capital | | | Earnings (Deficit) | |
| Segall Bryant & Hamill Small Cap Value Fund | | $ | 525 | | | $ | (525 | ) |
| Segall Bryant & Hamill Small Cap Growth Fund | | | (959,865 | ) | | | 959,865 | |
| Segall Bryant & Hamill Small Cap Core Fund | | | — | | | | — | |
| Segall Bryant & Hamill All Cap Fund | | | 1,498,344 | | | | (1,498,344 | ) |
| Segall Bryant & Hamill Emerging Markets Fund | | | 1 | | | | (1 | ) |
| Segall Bryant & Hamill International Small Cap Fund | | | 311 | | | | (311 | ) |
| Segall Bryant & Hamill Fundamental International Small Cap Fund | | | (181,702 | ) | | | 181,702 | |
| Segall Bryant & Hamill Global All Cap Fund | | | — | | | | — | |
| Segall Bryant & Hamill Workplace Equality Fund | | | — | | | | — | |
| Segall Bryant & Hamill Short Term Plus Bond Fund | | | — | | | | — | |
| Segall Bryant & Hamill Plus Bond Fund | | | — | | | | — | |
| Segall Bryant & Hamill Quality High Yield Fund | | | — | | | | — | |
| Segall Bryant & Hamill Municipal Opportunities Fund | | | — | | | | — | |
| Segall Bryant & Hamill Colorado Tax Free Fund | | | (244,806 | ) | | | 244,806 | |
The Funds recharacterize distributions received from Real Estate Investment Trust (“REIT”) investments based on information provided by the REIT into the following categories: ordinary income, long-term capital gains, and return of capital. If information is not available on a timely basis from the REIT, the recharacterization will be estimated based on available information which may include the previous year’s allocation. If new or additional information becomes available from the REIT at a later date, a recharacterization will be made in the following year.
As a result of several court cases in certain countries across the European Union (“EU”), some Funds may file European tax reclaims for previously withheld taxes on dividends earned in those countries. These additional filings are subject to various administrative proceedings by the local jurisdictions’ tax authorities within the EU, as well as a number of related judicial proceedings. If any such reclaims are received, they are reflected as dividend income in the Statements of Operations, and related receivables, if any, are reflected within foreign tax reclaims receivable in the Statements of Assets and Liabilities. If the associated cash is received, the Funds will follow, for tax purposes, IRS guidance in Notice 2016-10 and reduce the current year foreign taxes paid by the amount of the refund. When uncertainty exists as to the ultimate resolution of these proceedings and the likelihood of receipt of these EU reclaims, no amounts are reflected in the financial statements.
| 6. | INVESTMENT ADVISORY FEES, ADMINISTRATIVE FEES AND OTHER RELATED PARTY TRANSACTIONS |
The Trust has entered into an advisory agreement with Segall Bryant & Hamill, LLC (the “Adviser”) for all Funds. The advisory agreement has been approved by the Trust’s Board of Trustees.
| | |
| Annual Report | December 31, 2022 | | | 139 |
| Segall Bryant & Hamill Funds | Notes to Financial Statements |
| | December 31, 2022 |
Pursuant to its advisory agreement with the Trust, the Adviser is entitled to investment advisory fees, based on the average net assets of each Fund, computed daily and payable monthly as shown in the table below.
| Fund | | |
| Segall Bryant & Hamill Small Cap Value Fund | | 0.80% |
| Segall Bryant & Hamill Small Cap Growth Fund | | 0.65% |
| Segall Bryant & Hamill Small Cap Core Fund | | 0.80% |
| Segall Bryant & Hamill All Cap Fund | | 0.65% |
| Segall Bryant & Hamill Emerging Markets Fund | | 0.90% |
| Segall Bryant & Hamill International Small Cap Fund | | 0.90% |
| Segall Bryant & Hamill Fundamental International Small Cap Fund | | 1.00% |
| Segall Bryant & Hamill Global All Cap Fund | | 0.65% |
| Segall Bryant & Hamill Workplace Equality Fund | | 0.65% |
| Segall Bryant & Hamill Short Term Plus Fund | | 0.25% |
| Segall Bryant & Hamill Plus Bond Fund | | 0.35% |
| Segall Bryant & Hamill Quality High Yield Fund | | 0.45% |
| Segall Bryant & Hamill Municipal Opportunities Fund | | 0.35% |
| Segall Bryant & Hamill Colorado Tax Free Fund | | 0.35% |
Ultimus Fund Solutions LLC (“Ultimus”) and the Adviser serve as the Funds’ co-administrators (“Co-Administrators”). Ultimus and the Adviser are entitled to receive a total fee from each Fund for their administrative services computed daily and payable monthly based on the average net assets of the Trust. The Adviser receives a portion that is calculated based on 0.01% on the average daily net assets of the Trust.
The administrative fees are allocated to each Fund based upon the Fund’s relative proportion of the Trust’s net assets, subject to certain minimums, and are disclosed in the Statements of Operations. During the year ended December 31, 2022, the Adviser and Ultimus received $298,317 and $774,036, respectively, for their services to the Funds.
Shareholder servicing agents provide non-distribution administrative and support services to their customers, which may include establishing and maintaining accounts and records relating to shareholders, processing dividend and distribution payments from the Funds on behalf of shareholders, forwarding communications from the Funds, providing sub-accounting with respect to Fund shares, and other similar services. The Retail Class of each Fund may pay a fee at an annual rate of up to 0.25% of its average daily net assets to shareholder servicing agents and the Institutional Class of each Fund may pay a fee at an annual rate of up to 0.10% of its average daily net assets to shareholder servicing agents. These fees are included in Shareholder Servicing Fees on the Statements of Operations.
Until at least April 30, 2023, the Adviser has contractually agreed to waive the investment advisory and/or administration fees and/or to reimburse other expenses (not including acquired fund fees and expenses, taxes, brokerage expenses, and extraordinary expenses), so that the ratio of expense to average net assets as reported in each Fund’s Financial Highlights will be no more than the amounts as detailed below:
| Fund | | Retail Class | | Institutional Class |
| Segall Bryant & Hamill Small Cap Value Fund | | 1.14% | | 0.99% |
| Segall Bryant & Hamill Small Cap Growth Fund | | 1.14% | | 0.99% |
| Segall Bryant & Hamill Small Cap Core Fund | | 1.14% | | 0.99% |
| Segall Bryant & Hamill All Cap Fund | | 0.99% | | 0.84% |
| Segall Bryant & Hamill Emerging Markets Fund | | 1.38% | | 1.23% |
| Segall Bryant & Hamill International Small Cap Fund | | 1.18% | | 1.03% |
| Segall Bryant & Hamill Fundamental International Small Cap Fund | | 1.25% | | 1.10% |
| Segall Bryant & Hamill Global All Cap Fund | | 0.89% | | 0.74% |
| Segall Bryant & Hamill Workplace Equality Fund | | 0.89% | | 0.74% |
| Segall Bryant & Hamill Short Term Plus Fund | | 0.49% | | 0.40% |
| Segall Bryant & Hamill Plus Bond Fund | | 0.55% | | 0.40% |
| Segall Bryant & Hamill Quality High Yield Fund | | 0.85% | | 0.70% |
| Segall Bryant & Hamill Municipal Opportunities Fund | | 0.65% | | 0.50% |
| Segall Bryant & Hamill Colorado Tax Free Fund | | 0.65% | | 0.50% |
These amounts are not subject to recapture in future periods.
| | |
| 140 | | | www.sbhfunds.com |
| Segall Bryant & Hamill Funds | Notes to Financial Statements |
| | December 31, 2022 |
Ultimus, pursuant to a Transfer Agency Agreement, serves as Transfer Agent for each of the Funds. As Transfer Agent, Ultimus has, among other things, agreed to: (a) issue and redeem shares of the Funds; (b) make dividend and other distributions to shareholders of the Funds; (c) effect transfers of shares; (d) mail communications to shareholders of the Funds, including account statements, confirmations, and dividend and distribution notices; (e) facilitate the electronic delivery of shareholder statements and reports and (f) maintain shareholder accounts. Under the Transfer Agency Agreement, Ultimus receives from the Trust an annual minimum fee per Fund, a fee based upon each shareholder account and is reimbursed for out-of-pocket expenses.
Certain officers of the Funds are also officers of the Adviser and Ultimus. All access persons of the Trust, as defined in the 1940 Act, and officers and employees of the Adviser, follow strict guidelines and policies on personal trading as outlined in the Trust’s and the Adviser’s respective Code of Ethics.
The Trust has appointed a Chief Compliance Officer who is also the Treasurer of the Trust and an employee of the Adviser. The Trust agreed to have the Funds pay the portion of his compensation attributable for services rendered as the Trust’s Chief Compliance Officer.
The Trust has a Trustee Deferred Compensation Plan (the “Deferral Plan”) which allows the Trustees to defer the receipt of all or a portion of Trustees fees. Under the Deferral Plan, Trustee fees are paid and invested directly into shares of the Funds elected by the Trustees in the Deferral Plan. There is no future liability related to the balance in the Deferral Plan as such amounts are paid directly out of the respective capital accounts of the elected Funds. The amount paid to the Trustees under the Deferral Plan will be determined based upon the performance of the elected funds. The balance in the Deferral Plan as of December 31, 2022 is $718,648.
| 7. | FAIR VALUE MEASUREMENTS |
A three-tier hierarchy has been established to measure fair value based on the extent of use of “observable inputs” as compared to “unobservable inputs” for disclosure purposes and requires additional disclosures about these valuation measurements. Inputs refer broadly to the assumptions that market participants would use in pricing a security. Observable inputs are inputs that reflect the assumptions market participants would use in pricing the security developed based on market data obtained from sources independent of the reporting entity. Unobservable inputs are inputs that reflect the reporting entity’s own assumptions about the assumptions market participants would use in pricing the security developed based on the best information available in the circumstances.
The three-tier hierarchy is summarized as follows:
| 1) | Level 1 – Unadjusted Quoted Prices in active markets for identical investments |
| 2) | Level 2 – Other Significant Observable Inputs (including quoted prices for similar investments, interest rates, prepayment speeds, credit risk, etc.) |
| 3) | Level 3 – Significant Unobservable Inputs (including the Fund’s own assumptions in determining the fair value of investments). |
The following is a summary of each Fund’s investments and other financial instruments (if any) and the inputs used to value the investments and other financial instruments as of December 31, 2022:
| Segall Bryant & Hamill Small Cap Value Fund |
| | | Level 1 | | | Level 2 | | | Level 3 | | | Total | |
| Common Stocks | | $ | 543,454,764 | | | $ | — | | | $ | — | | | $ | 543,454,764 | |
| Total | | $ | 543,454,764 | | | $ | — | | | $ | — | | | $ | 543,454,764 | |
| | | | | | | | | | | | | | | | | |
| Segall Bryant & Hamill Small Cap Growth Fund |
| | | Level 1 | | | Level 2 | | | Level 3 | | | Total | |
| Common Stocks | | $ | 176,695,916 | | | $ | — | | | $ | — | | | $ | 176,695,916 | |
| Total | | $ | 176,695,916 | | | $ | — | | | $ | — | | | $ | 176,695,916 | |
| | | | | | | | | | | | | | | | | |
| Segall Bryant & Hamill Small Cap Core Fund |
| | | Level 1 | | | Level 2 | | | Level 3 | | | Total | |
| Common Stocks | | $ | 48,080,698 | | | $ | — | | | $ | — | | | $ | 48,080,698 | |
| Total | | $ | 48,080,698 | | | $ | — | | | $ | — | | | $ | 48,080,698 | |
| | |
| Annual Report | December 31, 2022 | | | 141 |
| Segall Bryant & Hamill Funds | Notes to Financial Statements |
| | December 31, 2022 |
| Segall Bryant & Hamill All Cap Fund |
| | | Level 1 | | | Level 2 | | | Level 3 | | | Total | |
| Common Stocks | | $ | 125,702,676 | | | $ | — | | | $ | — | | | $ | 125,702,676 | |
| Total | | $ | 125,702,676 | | | $ | — | | | $ | — | | | $ | 125,702,676 | |
| | | | | | | | | | | | | | | | | |
| Segall Bryant & Hamill Emerging Markets Fund |
| | | Level 1 | | | Level 2 | | | Level 3 | | | Total | |
| Common Stocks | | $ | 8,363,048 | | | $ | 31,743,989 | (a) | | $ | 0 | * | | $ | 40,107,037 | |
| Preferred Stocks | | | 429,703 | | | | 186,921 | (a) | | | 0 | * | | | 616,624 | |
| Warrants | | | — | | | | 226 | | | | — | | | | 226 | |
| Total | | $ | 8,792,751 | | | $ | 31,931,136 | | | $ | — | | | $ | 40,723,887 | |
| | | | | | | | | | | | | | | | | |
| Segall Bryant & Hamill International Small Cap Fund |
| | | Level 1 | | | Level 2 | | | Level 3 | | | Total | |
| Common Stocks | | $ | 8,342,093 | | | $ | 86,619,815 | (a) | | $ | 0 | * | | $ | 94,961,908 | |
| Total | | $ | 8,342,093 | | | $ | 86,619,815 | | | $ | — | | | $ | 94,961,908 | |
| | | | | | | | | | | | | | | | | |
| Segall Bryant & Hamill Fundamental International Small Cap Fund |
| | | Level 1 | | | Level 2 | | | Level 3 | | | Total | |
| Common Stocks | | $ | 18,346,305 | | | $ | 26,567,078 | (a) | | $ | — | | | $ | 44,913,383 | |
| Total | | $ | 18,346,305 | | | $ | 26,567,078 | | | $ | — | | | $ | 44,913,383 | |
| | | | | | | | | | | | | | | | | |
| Segall Bryant & Hamill Global All Cap Fund |
| | | Level 1 | | | Level 2 | | | Level 3 | | | Total | |
| Common Stocks | | $ | 20,617,175 | | | $ | 5,975,279 | (a) | | $ | — | | | $ | 26,592,454 | |
| Total | | $ | 20,617,175 | | | $ | 5,975,279 | | | $ | — | | | $ | 26,592,454 | |
| | | | | | | | | | | | | | | | | |
| Segall Bryant & Hamill Workplace Equality Fund |
| | | Level 1 | | | Level 2 | | | Level 3 | | | Total | |
| Common Stocks | | $ | 21,195,335 | | | $ | — | | | $ | — | | | $ | 21,195,335 | |
| Total | | $ | 21,195,335 | | | $ | — | | | $ | — | | | $ | 21,195,335 | |
| | | | | | | | | | | | | | | | | |
| Segall Bryant & Hamill Short Term Plus Fund |
| | | Level 1 | | | Level 2 | | | Level 3 | | | Total | |
| Corporate Bonds | | $ | — | | | $ | 22,880,062 | | | $ | — | | | $ | 22,880,062 | |
| Municipal Bonds | | | — | | | | 646,043 | | | | — | | | | 646,043 | |
| Commercial Mortgage-Backed Securities | | | — | | | | 300,111 | | | | — | | | | 300,111 | |
| U.S. Treasury Bonds & Notes | | | — | | | | 3,911,940 | | | | — | | | | 3,911,940 | |
| Total | | $ | — | | | $ | 27,738,156 | | | $ | — | | | $ | 27,738,156 | |
| | | | | | | | | | | | | | | | | |
| Segall Bryant & Hamill Plus Bond Fund |
| | | Level 1 | | | Level 2 | | | Level 3 | | | Total | |
| Corporate Bonds | | $ | — | | | $ | 319,604,971 | | | $ | — | | | $ | 319,604,971 | |
| Municipal Bonds | | | — | | | | 57,589,578 | | | | — | | | | 57,589,578 | |
| Asset Backed Securities | | | — | | | | 21,907,889 | | | | — | | | | 21,907,889 | |
| Residential Mortgage-Backed Securities | | | — | | | | 2,252,674 | | | | — | | | | 2,252,674 | |
| Mortgage-Backed Securities Passthrough | | | — | | | | 177,570,771 | | | | — | | | | 177,570,771 | |
| U.S. Treasury Bonds & Notes | | | — | | | | 86,735,107 | | | | — | | | | 86,735,107 | |
| Total | | $ | — | | | $ | 665,660,990 | | | $ | — | | | $ | 665,660,990 | |
| | |
| 142 | | | www.sbhfunds.com |
| Segall Bryant & Hamill Funds | Notes to Financial Statements |
| | December 31, 2022 |
| Segall Bryant & Hamill Quality High Yield Fund |
| | | Level 1 | | | Level 2 | | | Level 3 | | | Total | |
| Corporate Bonds | | $ | — | | | $ | 64,560,312 | | | $ | — | | | $ | 64,560,312 | |
| Total | | $ | — | | | $ | 64,560,312 | | | $ | — | | | $ | 64,560,312 | |
| | | | | | | | | | | | | | | | | |
| Segall Bryant & Hamill Municipal Opportunities Fund |
| | | Level 1 | | | Level 2 | | | Level 3 | | | Total | |
| Municipal Bonds | | $ | — | | | $ | 191,697,430 | | | $ | — | | | $ | 191,697,430 | |
| U.S. Treasury Bonds & Notes | | | — | | | | 16,580,613 | | | | — | | | | 16,580,613 | |
| Corporate Bonds | | | — | | | | 7,794,741 | | | | — | | | | 7,794,741 | |
| Total | | $ | — | | | $ | 216,072,784 | | | $ | — | | | $ | 216,072,784 | |
| | | | | | | | | | | | | | | | | |
| Segall Bryant & Hamill Colorado Tax Free Fund |
| | | Level 1 | | | Level 2 | | | Level 3 | | | Total | |
| Municipal Bonds | | $ | — | | | $ | 383,514,097 | | | $ | — | | | $ | 383,514,097 | |
| Total | | $ | — | | | $ | 383,514,097 | | | $ | — | | | $ | 383,514,097 | |
| (a) | With respect to foreign equity securities that are principally traded on a market outside the United States, the Board has approved the utilization of an independent fair value pricing service to evaluate the effect of market fluctuations on these securities after the close of trading in that foreign market. To the extent that securities are valued using this service, they will be classified as Level 2 securities. |
| * | Includes securities that have been fair valued at $0. |
The following is a reconciliation of Level 3 instruments of the Funds for which significant unobservable inputs were used to determine fair value for the year ended December 31, 2022:
| Segall Bryant & Hamill Emerging Markets Fund | |
| | | | | | | | | | | | | | | Change in | | | | | | | | | | |
| | | Balance as of | | | | | | | | | | | | Unrealized | | | | | | | | | Balance as of | |
| | | December 31, | | | Net | | | | | | Realized | | | Appreciation | | | Transfer Into | | | Transfer Out | | | December 31, | |
| Asset Type | | 2021 | | | Purchases | | | Net Sales | | | Losses | | | (Depreciation) | | | Level 3 | | | of Level 3 | | | 2022 | |
| Common Stocks | | $ | 398,320 | | | $ | 151,912 | | | $ | (325,678 | ) | | $ | (203,907 | ) | | $ | (1,862,539 | ) | | $ | 1,841,958 | | | $ | — | | | $ | —0 | * |
| | | | | | | | | | | | | | | | | | | | | | | | | | | | | | | | | |
| Segall Bryant & Hamill International Small Cap Fund | |
| | | | | | | | | | | | | | | | | | | | | | | | | | | | | | | | | |
| | | | | | | | | | | | | | | Change in | | | | | | | | | | |
| | | Balance as of | | | | | | | | | | | | Unrealized | | | | | | | | | Balance as of | |
| | | December 31, | | | Net | | | | | | Realized | | | Appreciation | | | Transfer Into | | | Transfer Out | | | December 31, | |
| Asset Type | | 2021 | | | Purchases | | | Net Sales | | | Losses | | | (Depreciation) | | | Level 3 | | | of Level 3 | | | 2022 | |
| Common Stocks | | $ | 0 | * | | $ | — | | | $ | — | | | $ | — | | | $ | — | | | $ | — | | | $ | — | | | $ | 0 | * |
The following table presents additional information about valuation methodologies and inputs used for investments that are measured at fair value and categorized within Level 3 as of December 31, 2022:
| | | | | | | | | | | | Impact to |
| | | Fair Value as of | | | Valuation | | Unobservable | | | | Valuation from an |
| | | December 31, 2022 | | | Technique | | Input(1) | | Value/Range | | Increase in Input(2) |
| Segall Bryant & Hamill Emerging Markets Fund | | $ | 0 | * | | Adjusted trade price | | Discount Factor | | 100% | | Decrease |
| Segall Bryant & Hamill International Small Cap Fund | | $ | 0 | * | | Adjusted trade price | | Discount Factor | | 100% | | Decrease |
| * | Includes securities that have been fair valued at $0. |
| (1) | The investment adviser considers relevant indications of value that are reasonably and timely available to it in determining the fair value to be assigned to a particular security, such as the type and cost of the security; contractual or legal restrictions on resale of the security; relevant financial or business developments of the issuer; actively traded related securities; conversion or exchange rights on the security; related corporate actions; significant events occurring after the close of trading in the security; and changes in overall market conditions. The Fund’s use of fair value pricing may cause the net asset value of Fund shares to differ from the net asset value that would be calculated using market quotations. Fair value pricing involves subjective judgments and it is possible that the fair value determined for a security may be materially different than the value that could be realized upon the sale of that security. |
| | |
| Annual Report | December 31, 2022 | | | 143 |
| Segall Bryant & Hamill Funds | Notes to Financial Statements |
| | December 31, 2022 |
| (2) | This column represents the directional change in the fair value of the Level 3 investments that would result from an increase to the corresponding unobservable input. A decrease to the unobservable input would have the opposite effect. For Segall Bryant & Hamill International Small Cap Fund there was no change. |
Summary of Unobservable Inputs for Level 3 Investments
The ongoing conflict in Russia and Ukraine has led to significant disruption and volatility in the global stock market. This impacted the Fund in terms of suspensions of trading activities on the Russian Stock Exchange as well as suspensions of depositary receipts traded on exchanges outside of Russia. As a result, management made the decision to value all Russian securities at nil.
The inputs or methodologies used for valuing securities are not necessarily an indication of the risk associated with investing in those securities.
For fair value measurements using significant other observable inputs (Level 2), the Funds utilize an independent pricing service which utilizes evaluated pricing models that vary by asset class and incorporate available trade, bid and other market information, and for structured securities also incorporate cash flow and, when available, loan performance data. The independent pricing service’s evaluated pricing models apply available market information through processes such as benchmark curves, benchmarking of similar securities, and sector groupings. For certain securities, the independent pricing service uses model processes, such as the Option Adjusted Spread (benchmark driven) model, to assess interest rate impact and develop prepayment scenarios. With respect to trades and bids, the independent pricing service reviews the lot size to determine whether the information is representative of an orderly trading market. If the independent pricing service determines that trade or bid information is not consistent with other information available, the trade or bid will not be reflected in the evaluated price.
Corporate bonds, Municipal bonds and U.S. Treasury bonds & notes are valued using market models that consider trade data, quotations from dealers and active market makers, relevant yield curve and spread data, creditworthiness, trade data or market information on comparable securities, and other relevant security specific information. Mortgage-related and asset-backed securities are valued based on models that consider trade data, prepayment and default projections, benchmark yield and spread data and estimated cash flows of each tranche of the issuer. Forward foreign currency contracts are normally valued on the basis of quotes obtained from brokers and dealers or independent pricing services.
In the event the independent pricing service is unable to provide an evaluated price for a security or the Adviser believes the price provided is not reliable, securities of the Funds may be valued in good faith as described above in Note 2. The Adviser may seek to find an alternative independent source, such as a broker/dealer to provide a price quote, or by using evaluated pricing models similar to the techniques and models used by the independent pricing service. These fair value measurement techniques may utilize unobservable inputs (Level 3).
| 8. | FORWARD FOREIGN CURRENCY EXCHANGE CONTRACTS |
The Segall Bryant & Hamill Fundamental International Small Cap Fund may purchase or sell foreign currencies on a “spot” or cash basis at the prevailing rate in the foreign currency exchange market to settle investment transactions in the proper currency. In addition, this Fund may purchase or sell forward currency contracts to adjust the portfolio’s exposure to different currencies consistent with the investment team’s targets, which consider the currency weightings within the Fund’s benchmark index.
When entering into a spot or forward foreign currency contract, the Fund agrees to receive or deliver a fixed quantity of foreign currency for an agreed upon price on an agreed future date. These contracts are valued at each portfolio valuation, and the Fund’s net equity therein, representing unrealized gain or loss on the contracts as measured by the difference between the contractual rates at the dates of entry into the contracts and the spot or forward rates at the reporting date, is included in the Statements of Assets and Liabilities. Realized gains and losses and change in unrealized appreciation and depreciation are included in the Statements of Operations. These instruments involve credit risk and market risk in excess of the amount recognized in the Statements of Assets and Liabilities. Risks arise from the possible inability of counterparties to meet the terms of their contracts and from movement in currency exchange rates.
The Fund must segregate assets determined to be liquid in accordance with procedures established by the Board of Trustees, or otherwise cover its position in a permissible manner.
The forward foreign currency contracts were held during the period from January 1, 2022 to August 31, 2022. The Fund had average forward foreign currency contract values to buy and sell of $40,402,830 and $41,106,296, respectively.
| | |
| 144 | | | www.sbhfunds.com |
| Segall Bryant & Hamill Funds | Notes to Financial Statements |
| | December 31, 2022 |
The effect of derivative instruments on the Statements of Operations for the year ended December 31, 2022 is as follows:
Segall Bryant & Hamill Fundamental International Small Cap Fund
| | | | | | | | Change in | |
| | | | | | | | Unrealized | |
| | | | | | | | Appreciation | |
| | | | | Realized Losses | | | (Depreciation) | |
| | | | | on Derivatives | | | on Derivatives | |
| | | | | Recognized in | | | Recognized in | |
| Risk Exposure | | Statement of Operations Location | | Income | | | Income | |
| Forward Foreign Currency Contracts (Foreign Exchange Rate Risk) | | Realized and unrealized gains (losses) on forward foreign currency contracts | | $ | (560,758 | ) | | $ | 199,660 | |
| Total | | | | $ | (560,758 | ) | | $ | 199,660 | |
| 9. | PURCHASES AND SALES OF INVESTMENTS |
Investment transactions for the year ended December 31, 2022 excluding long-term U.S. government securities and short-term investments were as follows:
| | | Purchases of | | | Proceeds from Sales | |
| Fund | | Securities | | | of Securities | |
| Segall Bryant & Hamill Small Cap Value Fund | | $ | 198,616,664 | | | $ | 147,093,573 | |
| Segall Bryant & Hamill Small Cap Growth Fund | | | 120,755,787 | | | | 104,593,267 | |
| Segall Bryant & Hamill Small Cap Core Fund | | | 24,352,117 | | | | 20,329,729 | |
| Segall Bryant & Hamill All Cap Fund | | | 46,589,604 | | | | 68,781,374 | |
| Segall Bryant & Hamill Emerging Markets Fund | | | 42,944,030 | | | | 48,887,438 | |
| Segall Bryant & Hamill International Small Cap Fund | | | 121,482,524 | | | | 155,743,625 | |
| Segall Bryant & Hamill Fundamental International Small Cap Fund | | | 28,303,741 | | | | 39,974,031 | |
| Segall Bryant & Hamill Global All Cap Fund | | | 9,066,189 | | | | 13,711,954 | |
| Segall Bryant & Hamill Workplace Equality Fund | | | 8,945,303 | | | | 9,887,827 | |
| Segall Bryant & Hamill Short Term Plus Fund | | | 7,193,094 | | | | 27,259,120 | |
| Segall Bryant & Hamill Plus Bond Fund | | | 209,716,837 | | | | 383,995,747 | |
| Segall Bryant & Hamill Quality High Yield Fund | | | 6,987,947 | | | | 27,202,358 | |
| Segall Bryant & Hamill Municipal Opportunities Fund | | | 403,560,135 | | | | 432,328,080 | |
| Segall Bryant & Hamill Colorado Tax Free Fund | | | 290,181,991 | | | | 379,164,456 | |
| | | | | | | | | |
| | | Purchase of | | | Proceeds from | |
| | | Long Term U.S. | | | Sales of Long Term | |
| | | Government | | | U.S. Government | |
| Fund | | Obligations | | | Obligations | |
| Segall Bryant & Hamill Short Term Plus Fund | | $ | 1,603,929 | | | $ | 1,174,135 | |
| Segall Bryant & Hamill Plus Bond Fund | | | 8,956,260 | | | | 47,383,766 | |
| Segall Bryant & Hamill Municipal Opportunities Fund | | | 17,681,269 | | | | 17,505,039 | |
In the normal course of business, the Trust, on behalf of the Funds, enters into contracts that provide general indemnifications. The Funds’ maximum exposure under these arrangements is dependent on claims that may be made against the Funds in the future and, therefore, cannot be estimated; however, based on experience, the risk of material loss from such claims is considered remote.
| | |
| Annual Report | December 31, 2022 | | | 145 |
| Segall Bryant & Hamill Funds | Notes to Financial Statements |
| | December 31, 2022 |
The Funds are required to recognize in the financial statements the effects of all subsequent events that provide additional evidence about conditions that existed as of the date of the Statements of Assets and Liabilities. For non-recognized subsequent events that must be disclosed to keep the financial statements from being misleading, the Funds are required to disclose the nature of the event as well as an estimate of its financial effect, or a statement that such an estimate cannot be made. Management has evaluated subsequent events through the issuance of these financial statements and has noted no such events.
| | |
| 146 | | | www.sbhfunds.com |
| | Report of Independent |
| Segall Bryant & Hamill Funds | Registered Public Accounting Firm |
To the Shareholders of Segall Bryant & Hamill Funds and
Board of Trustees of Segall Bryant & Hamill Trust
Opinion on the Financial Statements
We have audited the accompanying statements of assets and liabilities, including the statements of investments, of Segall Bryant & Hamill Small Cap Value Fund, Segall Bryant & Hamill Small Cap Growth Fund, Segall Bryant & Hamill Small Cap Core Fund, Segall Bryant & Hamill All Cap Fund, Segall Bryant & Hamill Emerging Markets Fund, Segall Bryant & Hamill International Small Cap Fund, Segall Bryant & Hamill Fundamental International Small Cap Fund, Segall Bryant & Hamill Global All Cap Fund, Segall Bryant & Hamill Workplace Equality Fund, Segall Bryant & Hamill Short Term Plus Fund, Segall Bryant & Hamill Plus Bond Fund, Segall Bryant & Hamill Quality High Yield Fund, Segall Bryant & Hamill Municipal Opportunities Fund, and Segall Bryant & Hamill Colorado Tax Free Fund (the “Funds”), each a series of Segall Bryant & Hamill Trust, as of December 31, 2022, the related statements of operations for the year then ended, the statements of changes in net assets for each of the two years in the period then ended, the related notes, and the financial highlights for each of the three years in the period then ended (collectively referred to as the “financial statements”). In our opinion, the financial statements present fairly, in all material respects, the financial position of each of the Funds as of December 31, 2022, the results of their operations for the year then ended, the changes in net assets for each of the two years in the period then ended, and the financial highlights for each of the three years in the period then ended, in conformity with accounting principles generally accepted in the United States of America.
The Funds’ financial highlights for the years ended December 31, 2019, and prior were audited by other auditors, whose report dated March 2, 2020 expressed an unqualified opinion on those financial statements and financial highlights.
Basis for Opinion
These financial statements are the responsibility of the Funds’ management. Our responsibility is to express an opinion on the Funds’ financial statements based on our audits. We are a public accounting firm registered with the Public Company Accounting Oversight Board (United States) (“PCAOB”) and are required to be independent with respect to the Funds in accordance with the U.S. federal securities laws and the applicable rules and regulations of the Securities and Exchange Commission and the PCAOB.
We conducted our audits in accordance with the standards of the PCAOB. Those standards require that we plan and perform the audit to obtain reasonable assurance about whether the financial statements are free of material misstatement whether due to error or fraud.
Our audits included performing procedures to assess the risks of material misstatement of the financial statements, whether due to error or fraud, and performing procedures that respond to those risks. Such procedures included examining, on a test basis, evidence regarding the amounts and disclosures in the financial statements. Our procedures included confirmation of securities owned as of December 31, 2022, by correspondence with the custodian and brokers; when replies were not received from brokers, we performed other auditing procedures. Our audits also included evaluating the accounting principles used and significant estimates made by management, as well as evaluating the overall presentation of the financial statements. We believe that our audits provide a reasonable basis for our opinion.
We have served as the Funds’ auditor since 2020.

COHEN & COMPANY, LTD.
Cleveland, Ohio
March 1, 2023
| | |
| Annual Report | December 31, 2022 | | | 147 |
| Segall Bryant & Hamill Funds | Shareholder Tax Information |
| | December 31, 2022 (Unaudited) |
Certain tax information regarding the Trust is required to be provided to shareholders based upon each Fund’s income and distributions for the twelve months ended December 31, 2022.
During the year ended December 31, 2022, 71.26% of the dividends paid by Segall Bryant & Hamill Municipal Opportunities Fund from net investment income should be treated as tax-exempt dividends. Tax exempt distributions were $5,801,859.
During the year ended December 31, 2022, 99.31% of the dividends paid by Segall Bryant & Hamill Colorado Tax Free Fund from net investment income should be treated as tax-exempt dividends. Tax exempt distributions were $12,463,782.
The Funds designate the following for federal income tax purposes for distributions made during the calendar year ended December 31, 2022:
| | | Qualified Dividend | | | Dividend Received | |
| | | Income (QDI) | | | Deduction (DRD) | |
| Segall Bryant & Hamill Small Cap Value Fund | | | 59.17 | % | | | 62.93 | % |
| Segall Bryant & Hamill Small Cap Growth Fund | | | 0.00 | % | | | 0.00 | % |
| Segall Bryant & Hamill Small Cap Core Fund | | | 100.00 | % | | | 100.00 | % |
| Segall Bryant & Hamill All Cap Fund | | | 100.00 | % | | | 100.00 | % |
| Segall Bryant & Hamill Emerging Markets Fund | | | 67.09 | % | | | 0.00 | % |
| Segall Bryant & Hamill International Small Cap Fund | | | 100.00 | % | | | 0.00 | % |
| Segall Bryant & Hamill Fundamental International Small Cap Fund | | | 0.00 | % | | | 0.00 | % |
| Segall Bryant & Hamill Global All Cap Fund | | | 100.00 | % | | | 100.00 | % |
| Segall Bryant & Hamill Workplace Equality Fund | | | 100 | % | | | 100 | % |
| Segall Bryant & Hamill Short Term Plus Bond Fund | | | 0.00 | % | | | 0.00 | % |
| Segall Bryant & Hamill Plus Bond Fund | | | 0.00 | % | | | 0.00 | % |
| Segall Bryant & Hamill Quality High Yield Fund | | | 0.00 | % | | | 0.00 | % |
| Segall Bryant & Hamill Municipal Opportunities Fund | | | 0.00 | % | | | 0.00 | % |
| Segall Bryant & Hamill Colorado Tax Free Fund | | | 0.00 | % | | | 0.00 | % |
| | | | | | | | | |
| During the year ended December 31, 2022, the Funds paid the following long-term capital gain distributions. |
| | | | | | | | | |
| Segall Bryant & Hamill Small Cap Value Fund | | | | | | $ | 4,952,616 | |
| Segall Bryant & Hamill Small Cap Growth Fund | | | | | | | — | |
| Segall Bryant & Hamill Small Cap Core Fund | | | | | | | 1,028,280 | |
| Segall Bryant & Hamill All Cap Fund | | | | | | | 11,670,100 | |
| Segall Bryant & Hamill Emerging Markets Fund | | | | | | | 357,463 | |
| Segall Bryant & Hamill International Small Cap Fund | | | | | | | 429,312 | |
| Segall Bryant & Hamill Fundamental International Small Cap Fund | | | | | | | 5,998,042 | |
| Segall Bryant & Hamill Global All Cap Fund | | | | | | | 512,721 | |
| Segall Bryant & Hamill Workplace Equality Fund | | | | | | | 204,764 | |
| Segall Bryant & Hamill Short Term Plus Bond Fund | | | | | | | — | |
| Segall Bryant & Hamill Plus Bond Fund | | | | | | | — | |
| Segall Bryant & Hamill Quality High Yield Fund | | | | | | | — | |
| Segall Bryant & Hamill Municipal Opportunities Fund | | | | | | | — | |
| Segall Bryant & Hamill Colorado Tax Free Fund | | | | | | | — | |
| | |
| 148 | | | www.sbhfunds.com |
| Segall Bryant & Hamill Funds | Other Important Information |
| | December 31, 2022 (Unaudited) |
The Board of Trustees (the “Board”) of Segall Bryant & Hamill Trust (the “Trust”) considered information provided and reviewed at the Board meetings held on October 20, 2022 and November 16 - 17, 2022 (the “Meetings”) regarding the Segall Bryant & Hamill Small Cap Value Fund (the “Small Cap Value Fund”), Segall Bryant & Hamill Small Cap Growth Fund (the “Small Cap Growth Fund”), Segall Bryant & Hamill Small Cap Core Fund (the “Small Cap Core Fund”), Segall Bryant & Hamill All Cap Fund (the “All Cap Fund”), Segall Bryant & Hamill Emerging Markets Fund (the “Emerging Markets Fund”), Segall Bryant & Hamill International Small Cap Fund (the “International Small Cap Fund”), Segall Bryant & Hamill Fundamental International Small Cap Fund (the “Fundamental International Small Cap Fund”), Segall Bryant & Hamill Global All Cap Fund (the “Global All Cap Fund”), Segall Bryant & Hamill Workplace Equality Fund (the “Workplace Equality Fund”), Segall Bryant & Hamill Short Term Plus Fund (the “Short Term Plus Fund”), Segall Bryant & Hamill Plus Bond Fund (the “Plus Bond Fund”), Segall Bryant & Hamill Quality High Yield Fund (the “Quality High Yield Fund”), Segall Bryant & Hamill Municipal Opportunities Fund (the “Municipal Opportunities Fund”), and Segall Bryant & Hamill Colorado Tax Free Fund (the “Colorado Tax Free Fund”), each a series of the Trust (each a “Fund” and collectively, the “Funds”), and to determine whether approving the renewal for an additional one-year period of the Investment Advisory Agreement between Segall, Bryant & Hamill, LLC (“SBH” or the “Adviser”) and the Trust on behalf of the Funds (the “Advisory Agreement”) would be in the best interests of the Fund’s respective shareholders. At these meetings and throughout the consideration process, the Board, including a majority of the Trustees who are not “interested persons” as that term is defined in Section 2(a)(19) of the Investment Company Act of 1940, as amended (the “Independent Trustees”), was advised by its independent legal counsel.
In anticipation of the Board of Trustees’ meetings on October 20, 2022, and November 16 - 17, 2022, and as part of the process to consider the continuation of the Advisory Agreement with respect to each Fund, legal counsel to the Independent Trustees requested certain information from SBH. In response to these requests, the Independent Trustees received reports from SBH that addressed specific factors to be considered by the Board. The Board also received from counsel a memorandum regarding the Board’s responsibilities pertaining to the approval of the continuation of the Advisory Agreement. Further, the Board met with representatives of SBH and discussed the services of the firm provided pursuant to the Advisory Agreement, as well as the information provided by SBH.
As part of its evaluation of the continuation of the Advisory Agreement, the Board received and considered information from SBH designed to provide the Trustees with the information necessary to evaluate the terms of the Advisory Agreement, including the general plans and intentions regarding each Fund. During the review process, the Board noted the totality of the information provided with respect to the continuation of the Advisory Agreements, and the Board determined it had received sufficient information to approve the continuation of the Advisory Agreement. Based on its evaluation, the Board, including the Independent Trustees, unanimously concluded that the terms of the Advisory Agreement continue to be reasonable and fair and that its approval was in the best interests of each Fund and its shareholders. In approving SBH to continue serving as investment adviser to the Funds, and the fees charged under the Advisory Agreement, the Board concluded that no single factor reviewed by the Board was identified by the Board to be determinative as the principal factor in whether to approve the continuation of the Advisory Agreement. The following summary does not identify all the matters considered by the Board, but provides a summary of the principal matters the Board considered.
Nature, Extent and Quality of the Services under the Advisory Agreement
The Board received and considered information regarding the nature, extent and quality of services provided to each Fund under the Advisory Agreement. The Trustees reviewed, among other items, certain background materials supplied by SBH, including its Form ADV.
The Board reviewed and considered SBH’s investment advisory personnel, its history as an asset manager, its performance and the amount of assets currently under management by SBH, and reviewed the qualifications, backgrounds and responsibilities of the management teams to be primarily responsible for the day-to-day portfolio management of each Fund and the extent of the resources devoted to research and analysis of actual and potential investments. The Board also reviewed the research and decision-making processes utilized by SBH, including the methods adopted to seek to achieve compliance with the investment objectives, policies and restrictions of each Fund. The Board also reviewed accompanying compliance-related materials with respect to the Trust, and not a particular Fund, and noted that they received reports on these services and compliance issues from Trust officers and SBH periodically throughout the year. Taking into account the totality of the information considered, the Board concluded that the nature, extent and quality of services rendered by SBH under the Advisory Agreement were adequate.
Investment Advisory Fee Rate
The Board considered certain information provided regarding the gross investment advisory fee rate paid by each Fund, including comparisons against the fee rates of funds in peer groups selected by an independent provider of investment company data. The Board noted that the gross investment advisory fee rates for each Fund were lower than or near their respective peer group medians.
The Board noted that the Small Cap Value Fund’s gross advisory fee of 0.80% was in the second quartile with respect to each class of the Fund’s respective peer groups.
With respect the Small Cap Growth Fund, the Fund’s gross advisory fee of 0.65% was in the first quartile with respect to each class of the Fund’s respective peer groups.
The Board noted that the Small Cap Core Fund’s gross advisory fee of 0.80% was in the second quartile with respect to each class of the Fund’s respective peer groups.
| | |
| Annual Report | December 31, 2022 | | | 149 |
| Segall Bryant & Hamill Funds | Other Important Information |
| | December 31, 2022 (Unaudited) |
The Board noted that the All Cap Fund’s gross advisory fee of 0.65% was in the second quartile with respect to each class of the Fund’s respective peer groups.
The Emerging Markets Fund’s gross advisory fee of 0.90% was in the third quartile with respect to each class of the Fund’s respective peer groups.
The Board noted that the International Small Cap Fund’s gross advisory fee of 0.90% was in the third quartile with respect to each class of the Fund’s respective peer groups.
The Board noted that the Fundamental International Small Cap Fund’s gross advisory fee of 1.00% was in the second quartile with respect to each class of the Fund’s respective peer groups.
The Board noted that the Global All Cap Fund’s gross advisory fee of 0.65% was in the first quartile with respect to each class of the Fund’s respective peer groups.
The Workplace Equality Fund’s gross advisory fee of 0.65% was in the third quartile with respect to each class of the Fund’s respective peer groups.
The Board noted that the Short Term Plus Fund’s gross advisory fee of 0.25% was in the second quartile of each class of the Fund’s respective peer groups.
With respect to the Plus Bond Fund, the Board noted that the Fund’s gross advisory fee of 0.35% was in the second quartile with respect to each class of the Fund’s respective peer groups.
The Board noted that the Quality High Yield Fund’s gross advisory fee of 0.45% was in the first quartile of each class of the Fund’s respective peer groups.
The Board noted that the Municipal Opportunities Fund’s gross advisory fee of 0.35% was in the first quartile of each class of the Fund’s respective peer groups.
With respect to the Colorado Tax Free Fund, the Board noted that the Fund’s gross advisory fee of 0.35% was in the first quartile with respect to each class of the Fund’s respective peer group.
Taking into account the totality of the information presented, the Board concluded that each Fund’s gross advisory fee rate were within an acceptable range of its respective peer group.
Expense Ratios
The Board considered certain information provided regarding the total net expense ratio of each Fund, including comparisons against the net expense ratios of funds in peer groups selected by an independent provider of investment company data. The Board noted that the total net expense ratios for each Fund were lower than or near their respective peer group medians.
The Small Cap Value Fund’s total net expense ratio of 0.97% for the Fund’s institutional class was in the third quartile with respect to its peer group and 1.04% for the Fund’s retail class was in the first quartile with respect to its peer group.
The Small Cap Growth Fund’s total net expense ratios of 0.87% for the Fund’s institutional class and 1.03% for the Fund’s retail class were both in the first quartile of the Fund’s respective peer groups.
The Small Cap Core Fund’s total net expense ratio of 0.99% for the Fund’s institutional class and 1.14% for the Fund’s retail class were in the second and first quartile, respectively, of each class of the Fund’s peer groups.
The All Cap Fund’s total net expense ratio of 0.84% for the Fund’s institutional class and 0.83% for the Fund’s retail class were in the second quartile and first quartile, respectively, with respect to each class of the Fund’s peer groups.
The Emerging Markets Fund’s total net expense ratios of 1.23% for the Fund’s institutional class and 1.38% for the Fund’s retail class were in the third and second quartile, respectively, of the Fund’s peer groups.
With respect to the International Small Cap Fund, the Fund’s total net expense ratios of 1.03% for the Fund’s institutional class and 1.18% for the Fund’s retail class were in the second quartile and first quartile, respectively, of each class of the Fund’s peer groups.
The Fundamental International Small Cap Fund’s total net expense ratios of 1.10% for the Fund’s institutional class and 1.25% for the Fund’s retail class were in the second and first quartiles, respectively, of each class of the Fund’s peer groups.
| | |
| 150 | | | www.sbhfunds.com |
| Segall Bryant & Hamill Funds | Other Important Information |
| | December 31, 2022 (Unaudited) |
With respect to the Global All Cap Fund, the Board noted that the Fund’s total net expense ratios of 0.74% for the Fund’s institutional class and 0.89% for the Fund’s retail class were both in the first quartile of the Fund’s respective peer groups.
For the Workplace Equality Fund, the Board noted that the Fund’s total net expense ratios of 0.74% for the Fund’s institutional class and 0.89% for the Fund’s retail class were in the third quartile and second quartile, respectively, of the Fund’s peer groups.
The Board noted that the Short Term Plus Fund’s total net expense ratios of 0.40% for the Fund’s institutional class and 0.49% for the Fund’s retail class were in the second quartile and first quartile, respectively, of the Fund’s peer groups.
With respect to the Plus Bond Fund, the Board noted that the Fund’s total net expense ratios of 0.40% for the Fund’s institutional class and 0.55% for the Fund’s retail class were both in the first quartile of the Fund’s respective peer groups.
The Board noted that the Quality High Yield Fund’s total net expense ratios of 0.70% for the Fund’s institutional class and 0.85% for the Fund’s retail class were in the third quartile and second quartile, respectively, of the Fund’s peer groups.
The Board noted that the Municipal Opportunities Fund’s total net expense ratios of 0.50% for the Fund’s institutional class and 0.65% for the Fund’s retail class were both in the first quartile of the Fund’s respective peer groups.
With respect to the Colorado Tax Free Fund, the Board noted that the Fund’s total net expense ratio of 0.50% for the Fund’s institutional class and 0.65% for the Fund’s retail class were in the first quartile and second quartile, respectively, of the Fund’s peer groups.
Investment Performance
The Board reviewed performance information provided in connection with the October 20, 2022, meeting for each Fund for the three-month, one-, three-, five- and ten-year (as applicable), and since inception periods ended June 30, 2022. The review included a comparison of each Fund’s performance to the performance of a group of comparable funds selected by an independent provider of research data. The Board also considered each of SBH’s performance and reputation generally and its investment techniques, risk management controls and decision-making processes.
With respect to the Small Cap Value Fund, the Board noted that the Fund’s average annual performance for its institutional class was in the third quartile of its peer group over the three- month period, in the fourth quartile of its peer group over the one- and three-year periods, in the first quartile of its peer group for the five-year period, and in the second quartile of its peer group over the period since its inception. The Board also noted that due to the relatively short period since the inception of the retail class of the Fund on December 9, 2019, only performance information for the three-month, one-year and since inception periods was available. The Board then noted that the retail class of the Fund was in the third quartile of its peer group for the three- month period and in the fourth quartile of its peer group for the one-year and the period since its inception.
With respect to the Small Cap Growth Fund, the Board noted that the Fund’s average annual performance for both its institutional class and retail class were in the third quartile of its peer groups over the three-month period, in the second quartile of its peer groups over the one-year period, and in the first quartile of its peer groups for the three- and five-year and period since inception.
The Board also noted that due to the relatively short period since the inception of the Small Cap Core Fund on December 31, 2019, only performance information for the three-month, one-year and since inception periods was available. The Board noted that the Small Cap Core Fund’s average annual performance for both the institutional class and retail class was in the second quartile for the three-month period and in the first quartile for the one-year and period since inception, as compared to its peer groups.
With respect to the All Cap Fund, the Board noted that the Fund’s average annual performance for the institutional class over the three-month and one-year periods was in the first quartile with respect to its peer group and was in the second quartile over the three- and five-year and period since its inception with respect to its peer group. For the retail class, the Board noted that due to the relatively short period since the class’ inception on December 9, 2019, performance information was only available over the three-month, one-year and since inception periods. The Board noted that the All Cap Fund’s average annual performance for the retail class was in the first quartile over the three-month, one-year and since inception periods with respect to its peer group.
With respect to the Emerging Markets Fund, the Board noted that the institutional class of the Fund’s average annual performance was in the second quartile for the three-month and one-year periods, the third quartile for the three-year period and the first quartile for the five-year and ten- year periods and the period since its inception with respect to its peer group. With respect to the retail class of the Emerging Markets Fund, the Board noted the average annual performance was in the first quartile for the three-month and five-year periods, was in the second quartile over the one-year period and the period since the Fund’s inception, and was in the third quartile over the three-year period compared to its peer group.
The Board noted that the average annual performance of the institutional class of the International Small Cap Fund was in the third quartile for the three-month, ten-year and the period since its inception, was in the second quartile for the one-year period, and was in the fourth quartile for the three- and five-year periods with respect to its peer group. With respect to the retail class of the International Small Cap
| | |
| Annual Report | December 31, 2022 | | | 151 |
| Segall Bryant & Hamill Funds | Other Important Information |
| | December 31, 2022 (Unaudited) |
Fund, the Board noted that the Fund’s average annual performance was in the third quartile over the three-month period, was in the second quartile over the one-year period and was in the fourth quartile over the three- and five-year and the period since its inception, as compared to its peer group.
The Board noted that the average annual performance of the institutional class of the Fundamental International Small Cap Fund was in the fourth quartile for the three-month period, was in the second quartile for the one- and three-year periods and for the period since the Fund’s inception, and was in the first quartile for the five-year period with respect to its peer group. For the retail class of the Fundamental International Small Cap Fund, the Board noted the Fund’s average annual performance was in the fourth quartile for the three-month and ten-year periods, was in the second quartile for the one- and three-year periods, and was in the first quartile for the five-year periods and the period since inception with respect to its peer group.
With respect to the Global All Cap Fund, the Board noted that the average annual performance for the institutional class of the Fund was in the third quartile over the three-month and three-year periods, was in the second quartile over the one-year period and the period since inception, and was in the fourth quartile over the five- and ten-year periods compared to its peer group. With respect to the retail class of the Global All Cap Fund, the Board noted that the average annual performance was in the third quartile for the three-month period, was in the second quartile for the one-year period, was in the fourth quartile for the three-, five- and ten-year periods and was in the first quartile for the period since inception, as compared to its peer group.
With respect to the Workplace Equality Fund, the Board noted that the average annual performance for the institutional class of the Fund was in the fourth quartile of its peer group over the three- month, one-, three-, five- and ten-year periods and the period since inception. With respect to the retail class of the Workplace Equality Fund, the Board noted that the average annual performance was in the fourth quartile over the three-month, three-, five-, and ten-year periods and the period since inception, and was in the third quartile over the one-year period with respect to its peer group.
The Board noted that due to the Short Term Plus Fund’s inception on December 14, 2018, only three-month, one- and three-years and since inception performance information was available for the Fund. The Board noted that the average annual performance of the institutional class of the Short Term Plus Fund was in the first quartile for the three-month and one-year periods, was in the third quartile for the three-year period and was in the fourth quartile for the period since inception compared to its peer group. With respect to the retail class of the Short Term Plus Fund, the Board noted that the average annual performance was in the first quartile for the three-month and one-year periods, was in the second quartile for the three-year period, and was in the fourth quartile for the period since inception, as compared to its peer group.
The Board noted that the average annual performance of the institutional class of the Plus Bond Fund was in the third quartile for the three-month period, was in the second quartile for the one-, three- and ten-year periods and the period since inception, and was in the first quartile for the five- year period, as compared to its peer group. For the retail class of the Plus Bond Fund, the Board noted that the average annual performance was in the third quartile for the three-month period, was in the second quartile for the one- and three-year periods and the period since inception, and was in the first quartile for the five- and ten-year periods, as compared to its peer group.
With respect to the Quality High Yield Fund, the Board noted that the average annual performance of the institutional class of the Fund was in the first quartile over the three-month and ten-year periods, was in the second quartile over the one-, three- and five-year periods, and was in the fourth quartile over the since inception period, as compared to its peer group. For the retail class of the Quality High Yield Fund, the Board noted that the average annual performance was in the first quartile over the three-month, one-year and period since inception, and was in the second quartile over the three-, five- and ten-year periods, as compared to its peer group.
With respect to both the institutional class and retail class of the Municipal Opportunities Fund, the Board noted that the Fund’s average annual performance was in the fourth quartile for the three-month period, the third quartile for the one-year period, and the first quartile for the three- and five-year periods and the period since inception, as compared to its peer groups.
The Board noted that the average annual performance of the Colorado Tax Free Fund’s institutional class was in the second quartile with respect to its peer group over the three-month, one-year and since inception period, and in the first quartile for the three-and five-year periods with respect to its peer group. For the retail class, the Board noted the Colorado Tax Free Fund was in the third quartile of its peer group for the three-month and since inception periods, was in the first quartile of its peer group for the one-, three- and five-year periods, and was in the second quartile of its peer group for the ten-year period.
Comparable Accounts
The Board received and considered certain information provided by SBH regarding fees charged and types of services provided to certain of its other clients utilizing strategies similar to those employed for the Funds. In particular, the Board received information regarding the typical fee rates and associated breakpoints used by SBH for its strategies.
| | |
| 152 | | | www.sbhfunds.com |
| Segall Bryant & Hamill Funds | Other Important Information |
| | December 31, 2022 (Unaudited) |
The Board also noted the limitations of these comparisons given the differences in terms of strategy and processes, but determined that, based on the information presented, the comparable account fee rates were not indicative of any unreasonableness with respect to the advisory fee rates payable by the Funds in question.
Adviser Profitability
The Board received a detailed projected profitability analysis prepared by SBH based on the fees payable under the Advisory Agreement. The Board was also provided with CI Financial’s audited financial information as well as information regarding SBH’s other revenue streams and potential liabilities. The Board also considered SBH’s statements regarding its commitment to the Funds. The Board determined that SBH’s profitability in connection with its management of the Funds is not unreasonable.
Economies of Scale
The Board considered whether economies of scale in the provision of services to each Fund are being passed along to the shareholders. The Board noted the Adviser’s statements regarding economies of scale it has experienced in connection with its management of the Funds in light of the expense limitation agreements in effect for certain of the Funds. To the extent available, the Board concluded that the Funds could be expected to share in economies of scale realized by SBH if Fund assets were to increase.
Other Benefits
The Board also reviewed and considered any other benefits derived or to be derived by SBH from its relationship with each Fund, including soft dollar arrangements and publicity related to the Funds.
Conclusions
Taking into account the information considered by the Board at its meetings, the Trustees, including all of the Independent Trustees, concluded that:
| ● | The nature, extent and quality of services rendered by SBH under the Advisory Agreement were adequate; |
| ● | Taking into account the totality of the information presented, each Fund’s gross advisory fee rate was within an acceptable range of its peer group. |
| ● | The Board noted that the total net expense ratios for each Fund were lower than or near their respective peer group medians. |
| ● | Bearing in mind the limitations of comparing different types of managed accounts and the different levels of service typically associated with such accounts, the fee structures applicable to certain of SBH’s other clients employing strategies comparable to those of certain of the Funds, as applicable, were not indicative of any unreasonableness with respect to the advisory fee rates payable by each Fund; |
| ● | The profit, if any, realized by SBH in connection with its management of the Funds is not unreasonable; and |
| ● | To the extent available, the Funds could be expected to share in economies of scale to be realized by SBH if Fund assets were to increase. |
| ● | For the one-year period ended June 30, 2022, each class of each Fund outperformed its peer group median except for each class of the Municipal Opportunities Fund, Small Cap Value Fund, and Workplace Equality Fund, which underperformed their respective peer group medians. |
| ● | For the three-year period ended June 30, 2022, as applicable, each class of each Fund outperformed its respective peer group median, except for each class of the Workplace Equality Fund, Global All Cap Fund, International Small Cap Fund, and Emerging Markets Fund, and the institutional classes of the Short Term Plus Fund and Small Cap Value Fund, which underperformed their respective peer group medians. |
| ● | For the five-year period ended June 30, 2022, as applicable, each class of each Fund outperformed its respective peer group median, except for each class of the Workplace Equality Fund, Global All Cap Fund, and International Small Cap Fund, which underperformed their respective peer group medians. |
Based on the Board’s deliberations and their evaluation of the information described above, all of the Trustees, including all of the Independent Trustees, concluded that the advisory fee rates payable to SBH by each Fund were fair and reasonable in light of the nature of the services and expenses involved, its approval was in the best interests of each Fund and its shareholders, and determined to renew the Advisory Agreement with respect to each Fund for the maximum period permitted by law.
| | |
| Annual Report | December 31, 2022 | | | 153 |
Intentionally Left Blank
Intentionally Left Blank
| Segall Bryant & Hamill Trustees and Officers (as of February 15, 2023): |
| Janice M. Teague, Chair |
| Thomas J. Abood, Trustee |
| John A. DeTore, Trustee |
| Rick A. Pederson, Trustee |
| James A. Smith, Trustee |
| Lloyd “Chip” Voneiff, Trustee |
| Carolyn B. Goldhaber, President |
| Jasper R. Frontz, Treasurer & Chief Compliance Officer |
| Jennifer L. Leamer, Asst. Treasurer |
| Maggie Bull, Secretary |

A description of the policies and procedures that Segall Bryant & Hamill Funds uses to determine how to vote proxies relating to portfolio securities and information regarding how each Fund voted proxies relating to portfolio securities during the most recent 12-month period ended June 30 is available (i) without charge, upon request, by calling toll-free (800) 392-2673; (ii) on the Funds’ website, www.sbhfunds.com; and (iii) on the Securities and Exchange Commission website at www.sec.gov.
Each Fund files a complete schedule of portfolio holdings with the Securities and Exchange Commission (“SEC”) as of the end of the first and third quarters of each fiscal year as an exhibit to Form N-PORT within 60 days after each fiscal quarter-end. Copies of the Segall Bryant & Hamill Funds exhibits to Form N-PORT are available without a charge, upon request, by contacting Segall Bryant & Hamill Funds toll-free at (800) 392-2673 and on the SEC’s website at www.sec.gov.
FOR MORE INFORMATION ABOUT SEGALL BRYANT & HAMILL FUNDS, PLEASE CONTACT: Segall Bryant & Hamill Funds | 225 Pictoria Drive, Suite 450 | Cincinnati, Ohio 45246 Individual Investors: (800) 392-2673 | Financial Advisors: (800) 734-9738 | www.sbhfunds.com |
This report has been prepared for Segall Bryant & Hamill Funds shareholders and may be distributed to others only if preceded or accompanied by a prospectus. Funds distributed by Ultimus Fund Distributors, LLC
SBH-AR-22
| (a) | The registrant, as of the end of the period covered by this report, has adopted a code of ethics that applies to the registrant’s principal executive officer, principal financial officer, principal accounting officer or controller, or persons performing similar functions regardless of whether these individuals are employed by the registrant or a third party. |
| (c) | During the period covered by this report, no amendments were made to the provisions of the code of ethics adopted in Item 2(a) above. |
| (d) | During the period covered by this report, no implicit or explicit waivers to the provisions of the code of ethics adopted in Item 2(a) above were granted. |
| (f) | A copy of the registrant’s code of ethics is filed as Exhibit 12(a)(1) to this report. |
| Item 3. | Audit Committee Financial Expert. |
The Board of Trustees of the registrant has determined that the registrant has a least one “audit committee financial expert” serving on its audit committee. The Board of Trustees has designated Lloyd “Chip” Voneiff as the registrant’s “audit committee financial expert.” Mr. Voneiff is “independent” as defined in Item 3(a)(2) of Form N-CSR.
| Item 4. | Principal Accountant Fees and Services. |
| (a) | Audit Fees: For the registrant’s fiscal years ended December 31, 2022 and December 31, 2021, the aggregate fees billed for professional services rendered by the principal accountant for the audit of the registrant’s annual financial statements were $175,000 and $166,600, respectively. |
| (b) | Audit-Related Fees: For the registrant’s fiscal years ended December 31, 2022 and December 31, 2021, no fees were billed for assurance and related services by the principal accountant that are reasonably related to the performance of the audit of the registrant’s financial statements and are not reported under paragraph (a) of this Item. |
| (c) | Tax Fees: For the registrant’s fiscal years ended December 31, 2022 and December 31, 2021, the aggregate fees billed for professional services rendered by the principal accountant for tax compliance, tax advice and tax planning were $44,800 and $42,000, respectively. The fiscal year tax fees were for review of each Fund’s federal and excise tax returns and year-end distributions. |
| (d) | All Other Fees: For the registrant’s fiscal years ended December 31, 2022 and December 31, 2021, no fees were billed by the principal accountant for products and services other than the services reported in paragraph (a) through (c) of this Item. |
| (e) | (1) The registrant’s Audit Committee has not adopted pre-approval policies and procedures for specific services, although the Audit Committee chairman may pre-approve audit and no-audit services pursuant to delegated authority, subject to ratification by the Audit Committee at the next meeting. Instead, the Audit Committee approves on a case-by-case basis each audit or non-audit service before engaging the accountant to render such service. |
(e)(2) No services described in paragraphs (b) through (d) of this Item were approved by the Audit Committee pursuant to (c)(7)(i)(C) of Rule 2-01 of Regulation S-X.
| (f) | Less than 50% of hours expended on the principal accountant’s engagement to audit the registrant’s financial statements for the most recent fiscal year were attributed to work performed by persons other than the principal accountant’s full-time, permanent employees. |
| (g) | Aggregate non-audit fees of $44,800 and $42,000 were billed by the registrant’s principal accountant for services rendered to the registrant and to registrant’s investment adviser and any entity controlling, controlled by, or under common control with the adviser that provides ongoing services to the registrant for each of fiscal year ended December 31, 2022 and December 31, 2021, respectively. All such services were rendered to the registrant. |
(j) Not applicable
| Item 5. | Audit Committee of Listed Registrants. |
Not applicable
| (a) | Schedule of Investments in securities of unaffiliated issuers as of the close of the reporting period is included as part of the Reports to Stockholders filed under Item 1 of this form. |
| Item 7. | Disclosure of Proxy Voting Policies and Procedures for Closed-End Management Investment Companies. |
Not applicable
| Item 8. | Portfolio Managers of Closed-End Management Investment Companies. |
Not applicable
| Item 9. | Purchases of Equity Securities by Closed-End Management Investment Company and Affiliated Purchasers. |
Not applicable
| Item 10. | Submission of Matters to a Vote of Security Holders. |
There have been no material changes to the procedures by which shareholders may recommend nominees to the registrant’s Board of Trustees, where those changes were implemented after the registrant last provided disclosure in response to the requirements of Item 407(c)(2)(iv) of Regulation S-K or this Item.
| Item 11. | Controls and Procedures. |
(a) The registrant’s principal executive officer and principal financial officer have concluded that the registrant’s disclosure controls and procedures (as defined in Rule 30a-3(c) under the Investment Company Act of 1940, as amended) (the “1940 Act”) (17 CFR 270.30a-3(e)) are effective based on the evaluation of these controls and procedures required by Rule 30a-3(b) under the 1940 Act (17 CFR 270.30a-3(b)) and Rules 13a-15(b) of 15d-15(b) under the Securities Exchange Act of 1934 (17 CFR 240.13a-15(b) or 240.15d-15(b)) as of a date within 90 days of the filing date of this report.
(b) There was no change in the registrant’s internal control over financial reporting (as defined in Rule 30a-3(d) under the 1940 Act (17 CFR 270-30a-3(d)) that occurred during the the period covered by this report that has materially affected, or are reasonably likely to materially affect, the registrant’s internal control over financial reporting.
Item 12. Disclosure of Securities Lending Activities for Closed-End Management Investment Companies.
Not applicable
(a)(1) The registrant’s code of ethics as described in Item 2 hereof is attached hereto as Exhibit EX-99.CODE ETH.
(a)(2) The certifications required Rule 30a-2(a) under the 1940 Act (17 CFR 270.30a-2(a)) and Section 302 of the Sarbanes-Oxley Act of 2002 are attached hereto as EX-99.CERT.
(1) Not applicable.
(2) Change in the registrant’s independent public accountants: Not applicable
(b) The certifications required by Rule 30a-2(b) of the 1940 Act (17 CFR 270.30a-2(b)) and Section 906 of the Sarbanes-Oxley Act of 2002 are attached hereto as EX-99.906CERT.
SIGNATURES
Pursuant to the requirements of the Securities Exchange Act of 1934 and the Investment Company Act of 1940, the registrant has duly caused this report to be signed on its behalf by the undersigned, thereunto duly authorized.
| (Registrant) | SEGALL BRYANT & HAMILL TRUST | | |
| | | | |
| By (Signature and Title)* | /s/ Carolyn B. Goldhaber | |
| | | Carolyn B. Goldhaber, President/Principal Executive Officer | |
| Date | March 9, 2023 | | |
| | | | |
| Pursuant to the requirements of the Securities Exchange Act of 1934 and the Investment Company Act of 1940, this report has been signed below by the following persons on behalf of the registrant and in the capacities and on the dates indicated. |
| | | | |
| By (Signature and Title)* | /s/ Carolyn B. Goldhaber | |
| | | Carolyn B. Goldhaber, President/Principal Executive Officer | |
| | | | |
| Date | March 9, 2023 | | |
| | | | |
| By (Signature and Title)* | /s/ Jasper R. Frontz | |
| | | Jasper R. Frontz, Treasurer/Principal Financial Officer | |
| | | | |
| Date | March 9, 2023 | | |
* Print the name and title of each signing officer under his or her signature.